Loss of Mains Protection Dr. Adam Dyśko University of Strathclyde Glasgow, UK e-mail: [email protected]

Welcome message from author
This document is posted to help you gain knowledge. Please leave a comment to let me know what you think about it! Share it to your friends and learn new things together.
Transcript
Loss of Mains Protection
Dr. Adam Dyśko
University of Strathclyde
Glasgow, UK
e-mail: [email protected]
Outline
Background
LOM methods and practices in different countries
Existing research work LOM relay performance assessment – ETR 139
Risk assessment study performed for NVD WG
ROCOF relay performance during 28 Sept. event
Dynamic modelling of the UK transmission system
Proposed changes of settings
Possible ROCOF alternatives
Future research work
Background
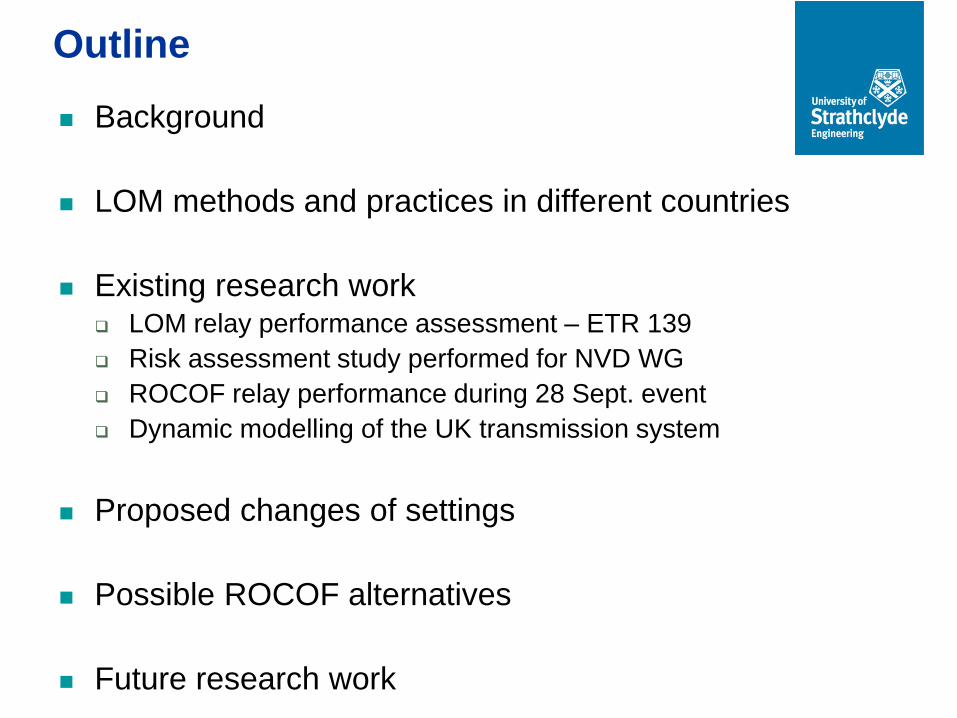
System inertia is lowering due to growing penetration of non-synchronous generation
Recent experience in Ireland has demonstrated short time wind penetration of 50% of the demand.
It is anticipated that up to 100% penetration level is achievable by 2020.
In UK n-1 contingency will increase from 1300MW to 1800MW in April 2014.
UK recommended ROCOF setting is 0.125Hz/s (G59/2), in Ireland the recommended setting is 0.4..0.55Hz/s (G10) but the increase to 2Hz/s is proposed.
Continually increasing the ROCOF setting my lead to poor ROCOF dependability.
OPEN
G
Interconnected
system
Pgen
Qgen
Psys
Qsys
Pload
Qload
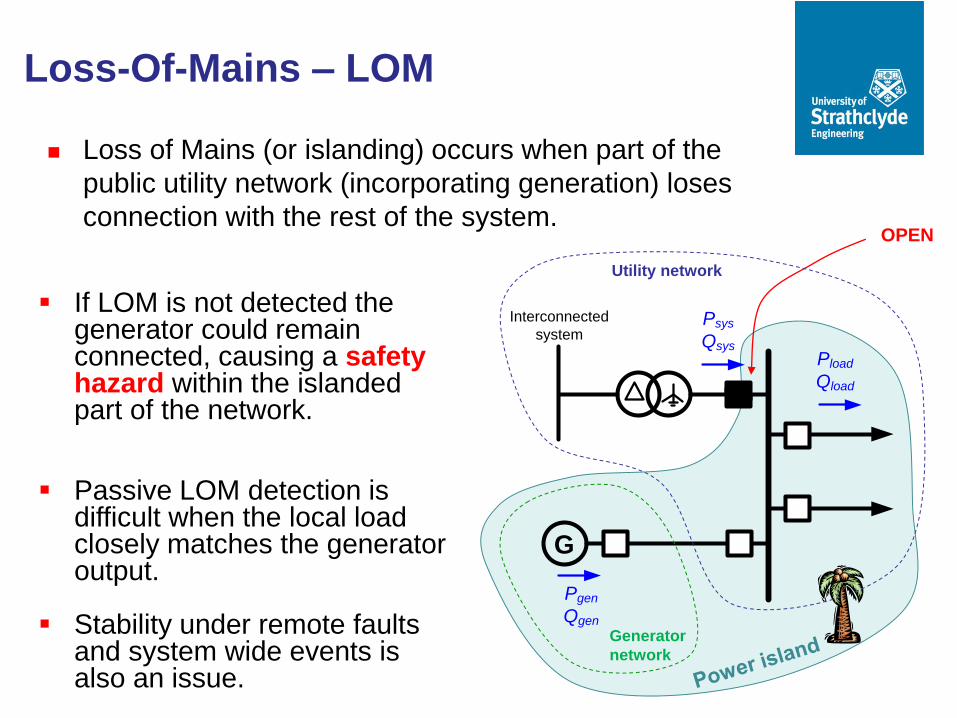
Loss-Of-Mains – LOM
Loss of Mains (or islanding) occurs when part of the
public utility network (incorporating generation) loses
connection with the rest of the system.
If LOM is not detected the generator could remain connected, causing a safety hazard within the islanded part of the network.
Passive LOM detection is difficult when the local load closely matches the generator output.
Stability under remote faults and system wide events is also an issue.
Generator
network
Utility network
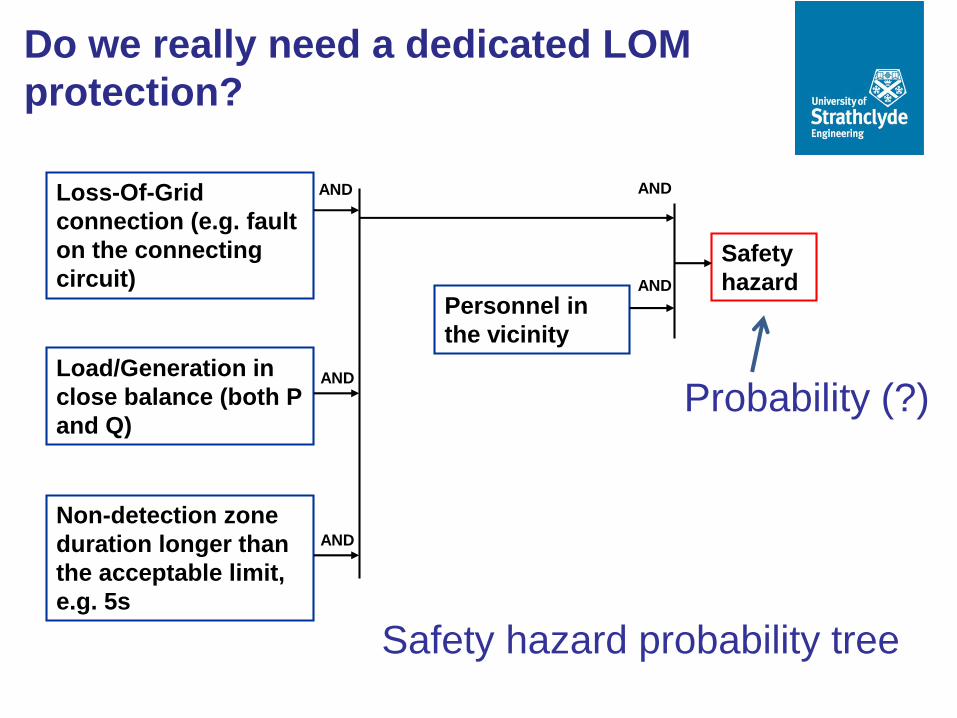
Do we really need a dedicated LOM
protection?
Safety hazard probability tree
Loss-Of-Grid
connection (e.g. fault
on the connecting
circuit)
Load/Generation in
close balance (both P
and Q)
Non-detection zone
duration longer than
the acceptable limit,
e.g. 5s
AND
AND
AND
Personnel in
the vicinity
Safety
hazard
AND
AND
Probability (?)
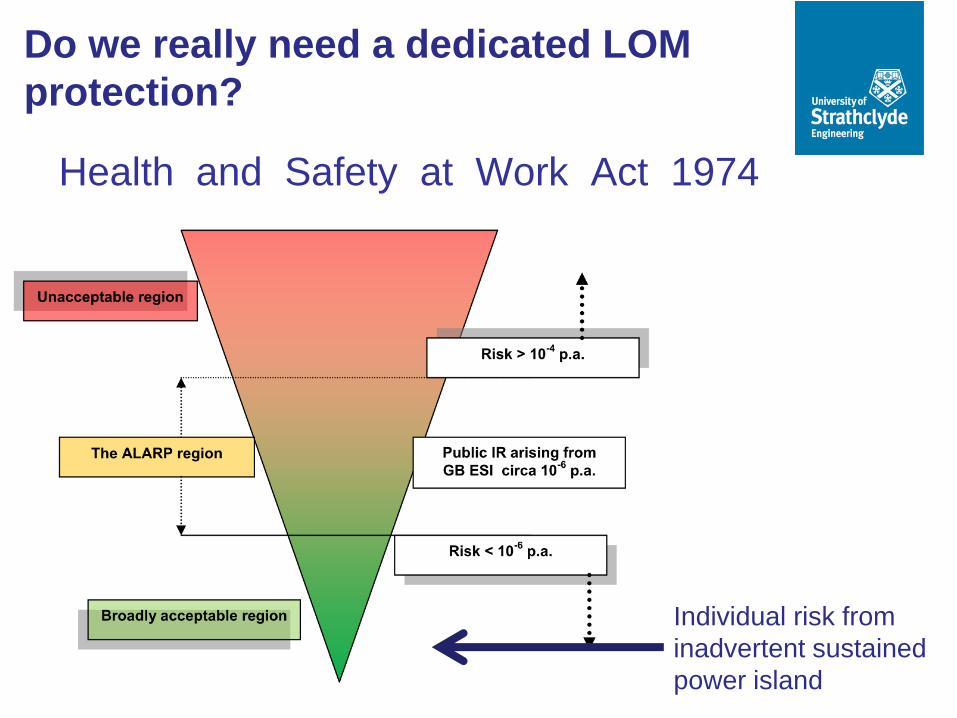
Health and Safety at Work Act 1974
Do we really need a dedicated LOM
protection?
Individual risk from
inadvertent sustained
power island
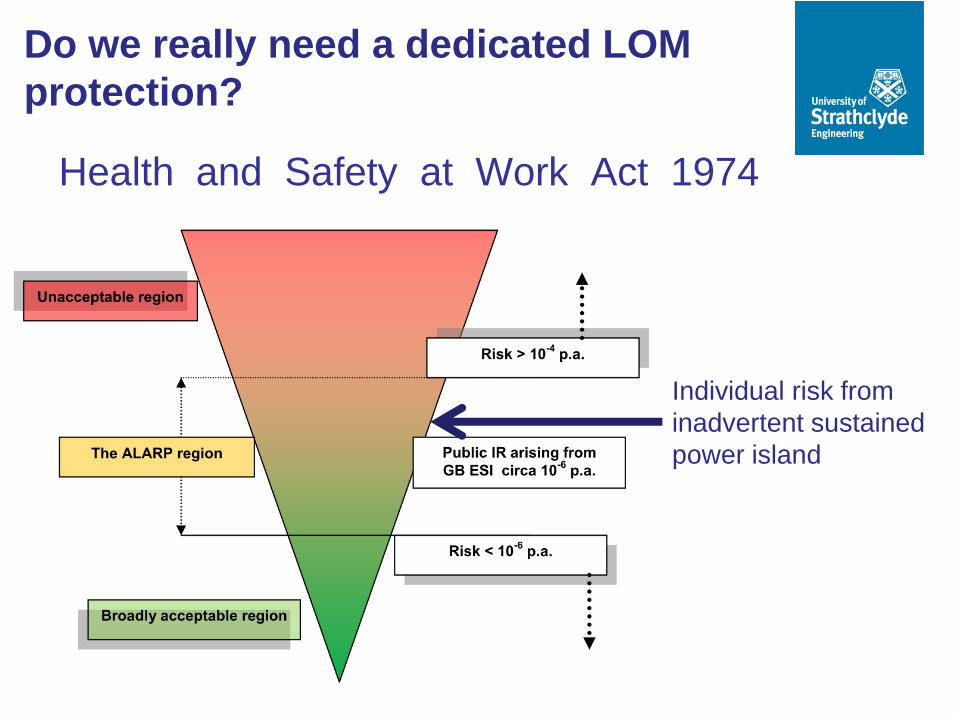
Health and Safety at Work Act 1974
Do we really need a dedicated LOM
protection?
Individual risk from
inadvertent sustained
power island
Evidence of unintentional islanding
It was reported at CIGRE 2010 session that two
unintended
islanded operations were experienced in 2009 in
Brazil with small hydro generation.
Synchrophasor measurements for LOM applications was
proposed
Islanded operation with PV generation was
experienced in Spain during maintenance
disconnection (up to 40 min.)
Safety of maintenance staff was compromised
Introduce the requirement for the telecontrol systems to
manually disconnect all PV generation
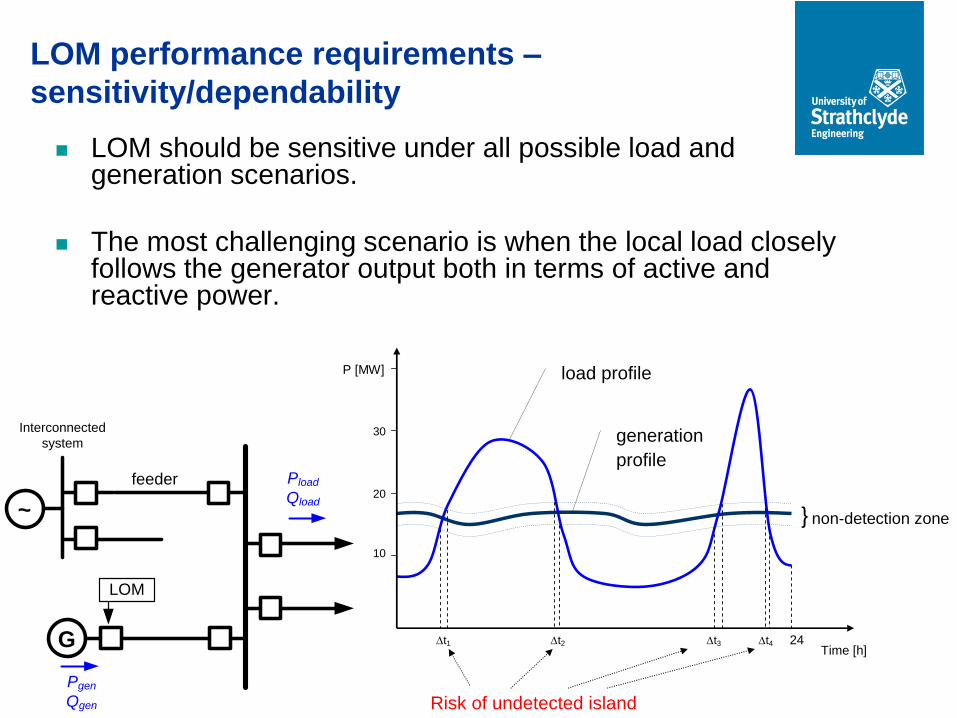
LOM performance requirements –
sensitivity/dependability
LOM should be sensitive under all possible load and generation scenarios.
The most challenging scenario is when the local load closely follows the generator output both in terms of active and reactive power.
} non-detection zone
Time [h] 24
P [MW]
10
20
30
load profile
generation
profile
Risk of undetected island
t1 t2 t3 t4 G
feeder
Interconnected
system
Pgen
Qgen
Pload
Qload
LOM
~
G
feeder
Interconnected
system
Pgen
Qgen
Pload
Qload
LOM
~
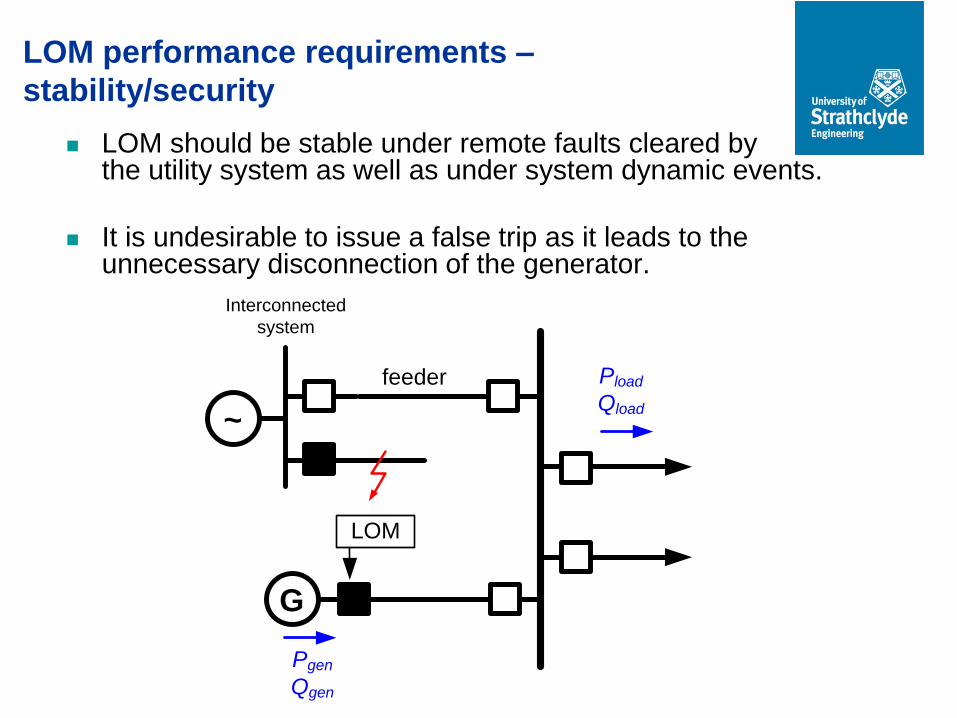
LOM performance requirements –
stability/security
LOM should be stable under remote faults cleared by the utility system as well as under system dynamic events.
It is undesirable to issue a false trip as it leads to the unnecessary disconnection of the generator.
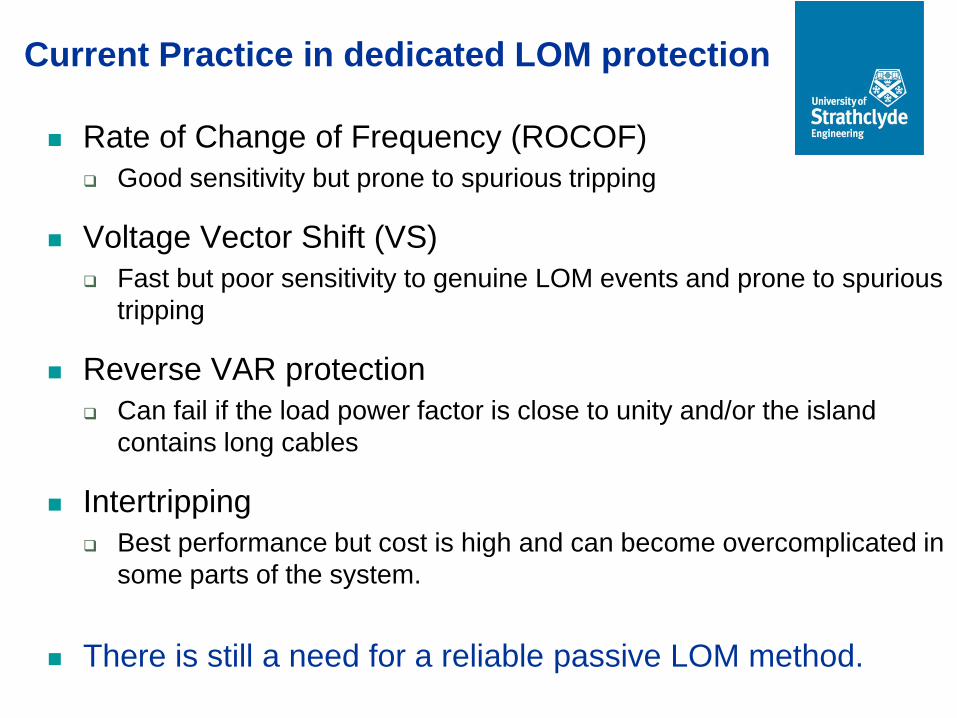
Current Practice in dedicated LOM protection
Rate of Change of Frequency (ROCOF)
Good sensitivity but prone to spurious tripping
Voltage Vector Shift (VS)
Fast but poor sensitivity to genuine LOM events and prone to spurious
tripping
Reverse VAR protection
Can fail if the load power factor is close to unity and/or the island
contains long cables
Intertripping
Best performance but cost is high and can become overcomplicated in
some parts of the system.
There is still a need for a reliable passive LOM method.
Rate-Of-Change-Of-Frequency (ROCOF) Method
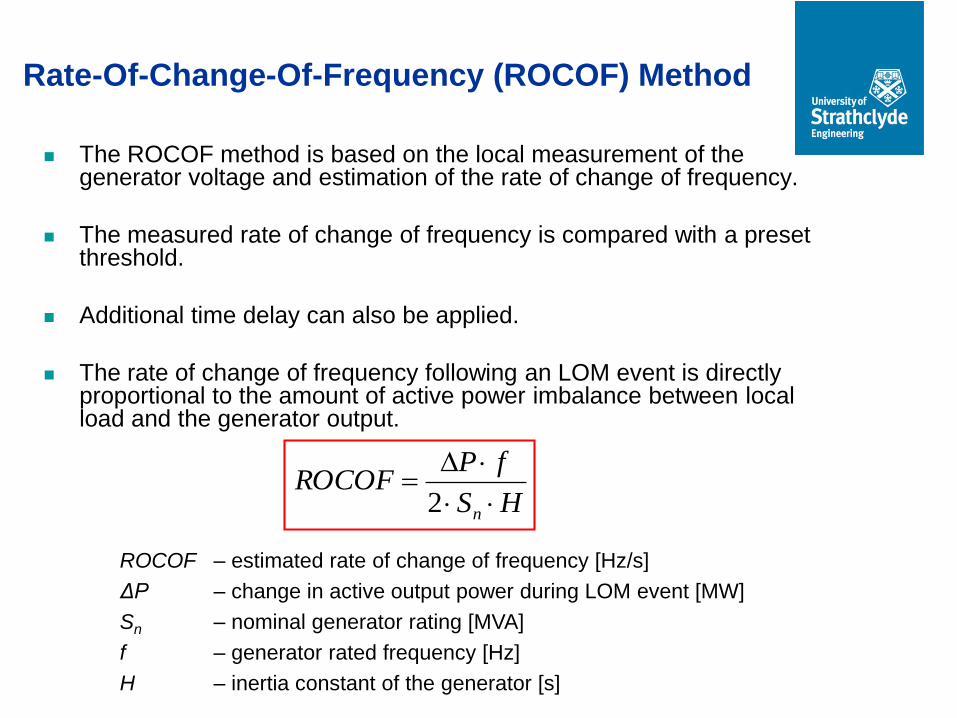
The ROCOF method is based on the local measurement of the generator voltage and estimation of the rate of change of frequency.
The measured rate of change of frequency is compared with a preset threshold.
Additional time delay can also be applied.
The rate of change of frequency following an LOM event is directly proportional to the amount of active power imbalance between local load and the generator output.
HS
fPROCOF
n
2
ROCOF – estimated rate of change of frequency [Hz/s]
ΔP – change in active output power during LOM event [MW]
Sn – nominal generator rating [MVA]
f – generator rated frequency [Hz]
H – inertia constant of the generator [s]
Voltage Vector Shift (VS) LOM Method
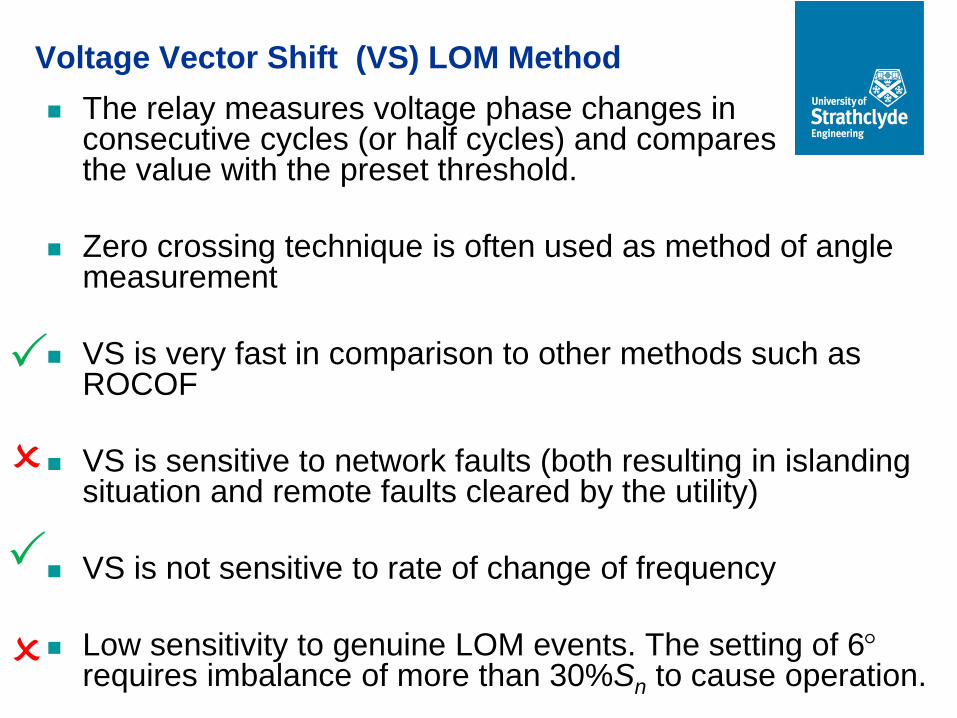
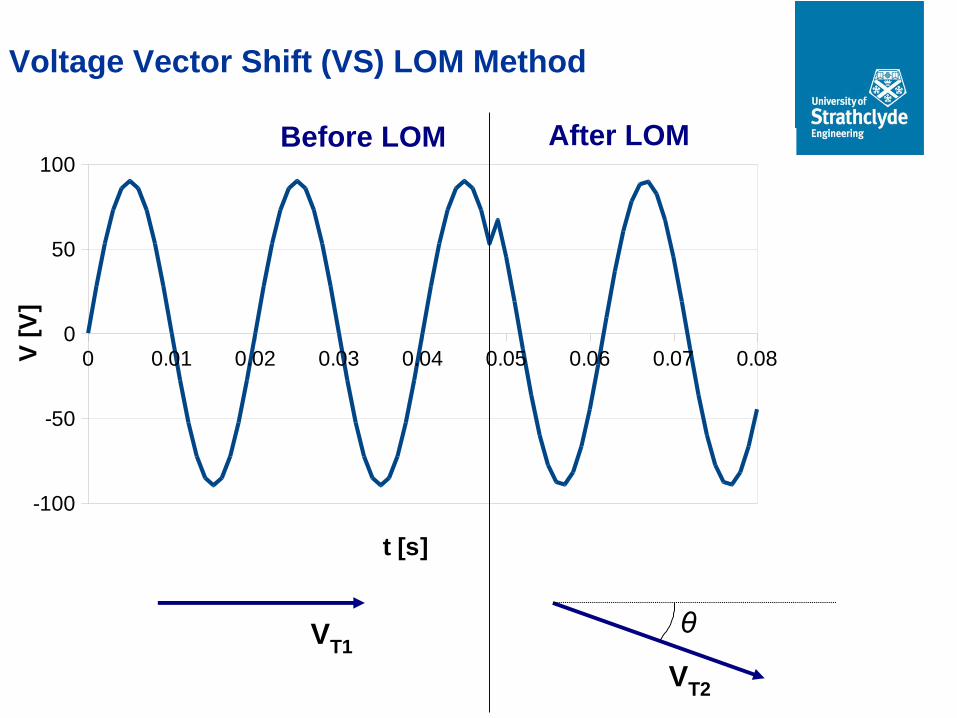
The relay measures voltage phase changes in consecutive cycles (or half cycles) and compares the value with the preset threshold.
Zero crossing technique is often used as method of angle measurement
VS is very fast in comparison to other methods such as ROCOF
VS is sensitive to network faults (both resulting in islanding situation and remote faults cleared by the utility)
VS is not sensitive to rate of change of frequency
Low sensitivity to genuine LOM events. The setting of 6requires imbalance of more than 30%Sn to cause operation.
0 0.01 0.02 0.03 0.04 0.05 0.06 0.07 0.08
-100
-50
0
50
100
t [s]
V [
V]
VT1
VT2
θ
Before LOM After LOM
Voltage Vector Shift (VS) LOM Method

Vector Shift is used to protect an Embedded Generator.
Calculate the voltage angle change if the generator output
increased from 15MW to 25MW as a result of an LOM event. Before
and islanding the generator operated at unity power factor pf1=1.
Assume that at the time of islanding the generator terminal voltage was
VT1 = 1/0°pu.
Generator: Sn = 30 MVA Vn = 33 kV
Xd” = 0.23 pu Ra = 0.05 pu
Xd
IL
VTEd
R
Xd’
Xd”
Ed’ Ed”
Example – Vector Shift Relay Operation
The resulting angle shift would be = 6.23
This is way below the recommended setting of 12.
DG protection in different countries
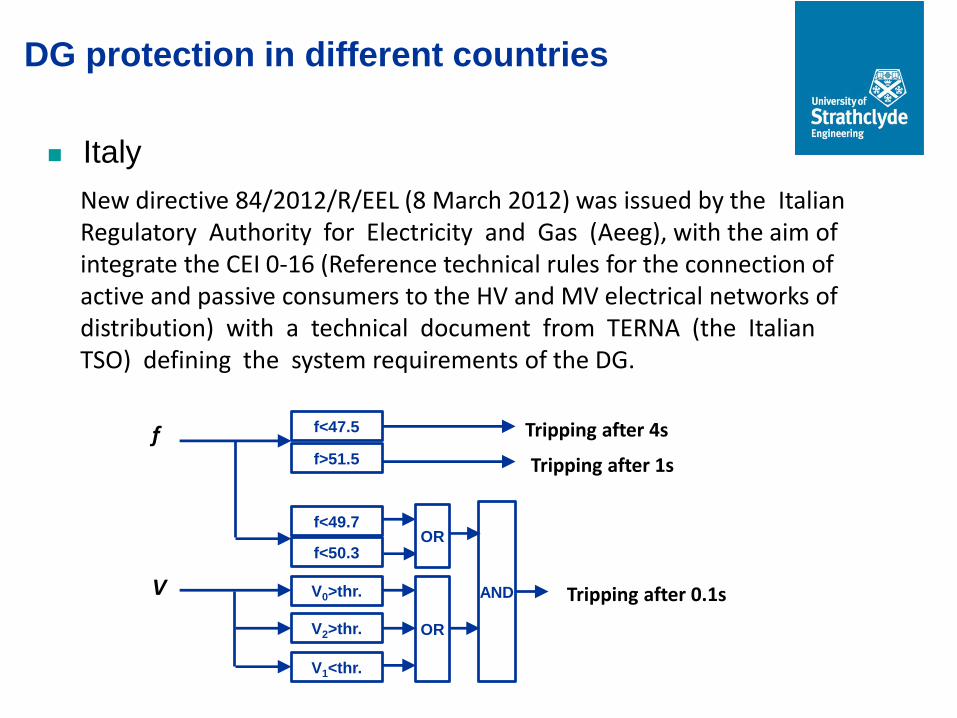
Italy
New directive 84/2012/R/EEL (8 March 2012) was issued by the Italian Regulatory Authority for Electricity and Gas (Aeeg), with the aim of integrate the CEI 0-16 (Reference technical rules for the connection of active and passive consumers to the HV and MV electrical networks of distribution) with a technical document from TERNA (the Italian TSO) defining the system requirements of the DG.
f<47.5
f>51.5
f<49.7
f<50.3
V0>thr.
V2>thr.
V1<thr.
OR
AND
OR
Tripping after 4s
Tripping after 1s
Tripping after 0.1s
f
V
Systematic LOM relay testing
ETR 139
Systematic LOM relay testing – ETR 139
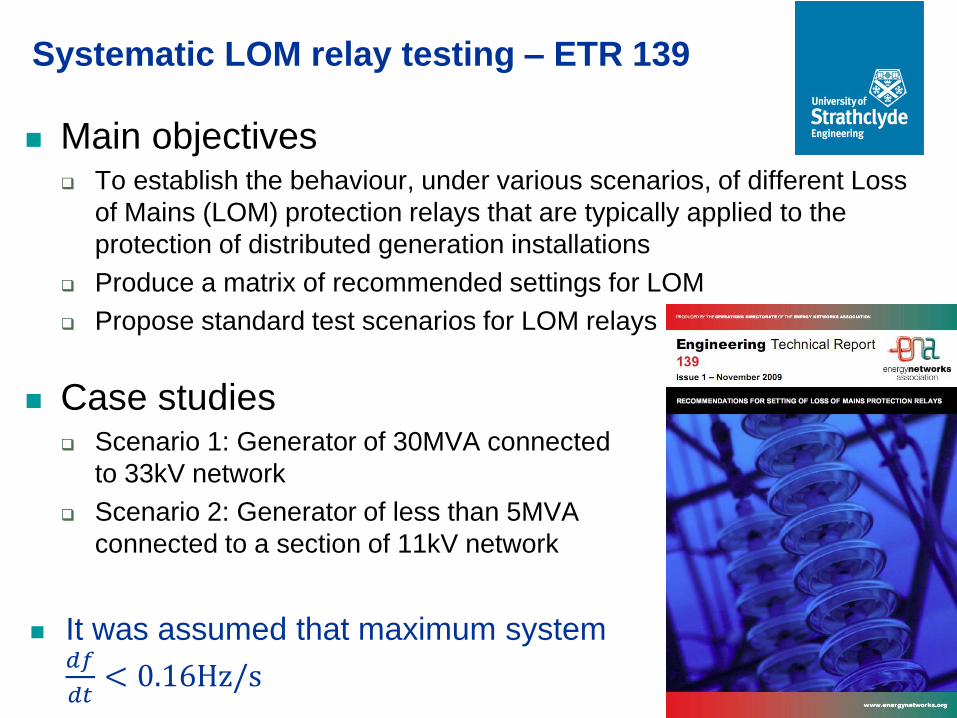
Main objectives To establish the behaviour, under various scenarios, of different Loss
of Mains (LOM) protection relays that are typically applied to the
protection of distributed generation installations
Produce a matrix of recommended settings for LOM
Propose standard test scenarios for LOM relays
Case studies Scenario 1: Generator of 30MVA connected
to 33kV network
Scenario 2: Generator of less than 5MVA
connected to a section of 11kV network
It was assumed that maximum system 𝑑𝑓
𝑑𝑡< 0.16Hz/s
Systematic LOM relay testing – ETR 139
Type of studies Genuine loss of mains events – sensitivity
Cleared system faults (where there is no actual loss of mains) on
adjacent circuits – stability
Generator types Gas turbine with synchronous machine
Wind turbine driven DFIG generator
Induction machine driven generator
(11kV scenario only)
DC/AC inverter connected source
(11kV scenario only)
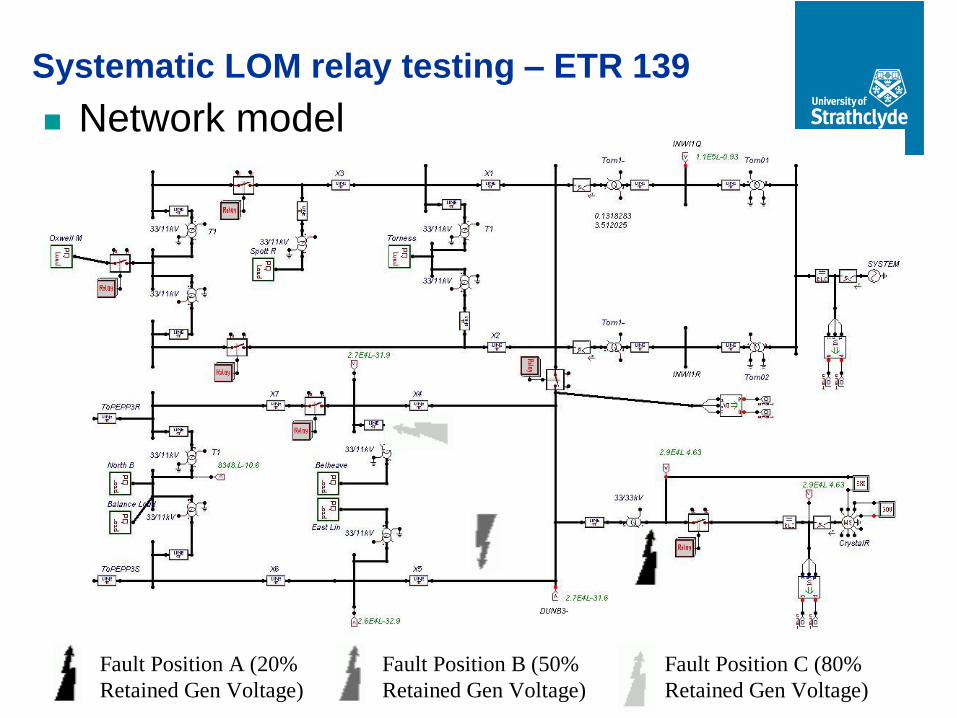
Fault Position A (20%
Retained Gen Voltage)
Fault Position B (50%
Retained Gen Voltage)
Fault Position C (80%
Retained Gen Voltage)
Systematic LOM relay testing – ETR 139
Network model
Systematic LOM relay testing – ETR 139
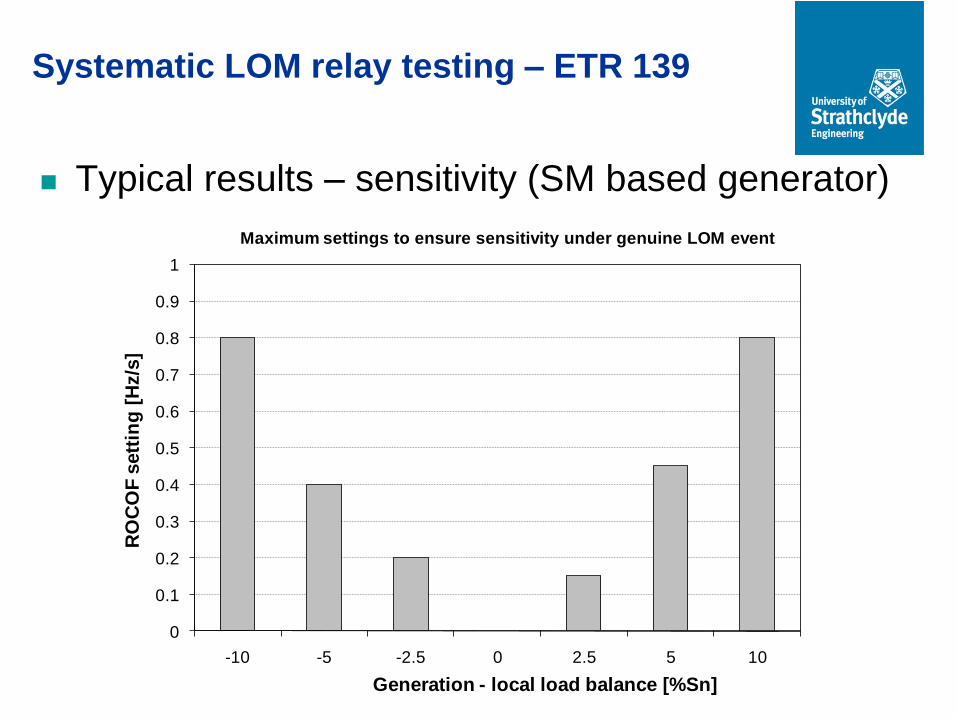
Typical results – sensitivity (SM based generator)
0
0.1
0.2
0.3
0.4
0.5
0.6
0.7
0.8
0.9
1
-10 -5 -2.5 0 2.5 5 10
RO
CO
F s
ett
ing
[H
z/s
]
Generation - local load balance [%Sn]
Maximum settings to ensure sensitivity under genuine LOM event
Systematic LOM relay testing – ETR 139
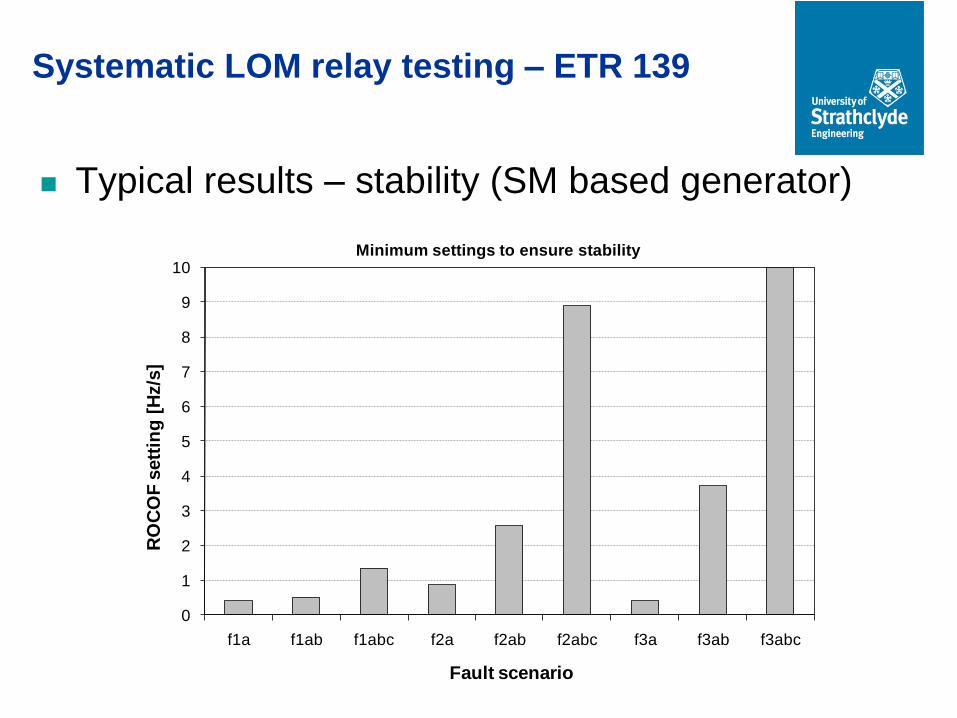
Typical results – stability (SM based generator)
0
1
2
3
4
5
6
7
8
9
10
f1a f1ab f1abc f2a f2ab f2abc f3a f3ab f3abc
RO
CO
F s
ett
ing
[H
z/s
]
Fault scenario
Minimum settings to ensure stability
Systematic LOM relay testing – ETR 139
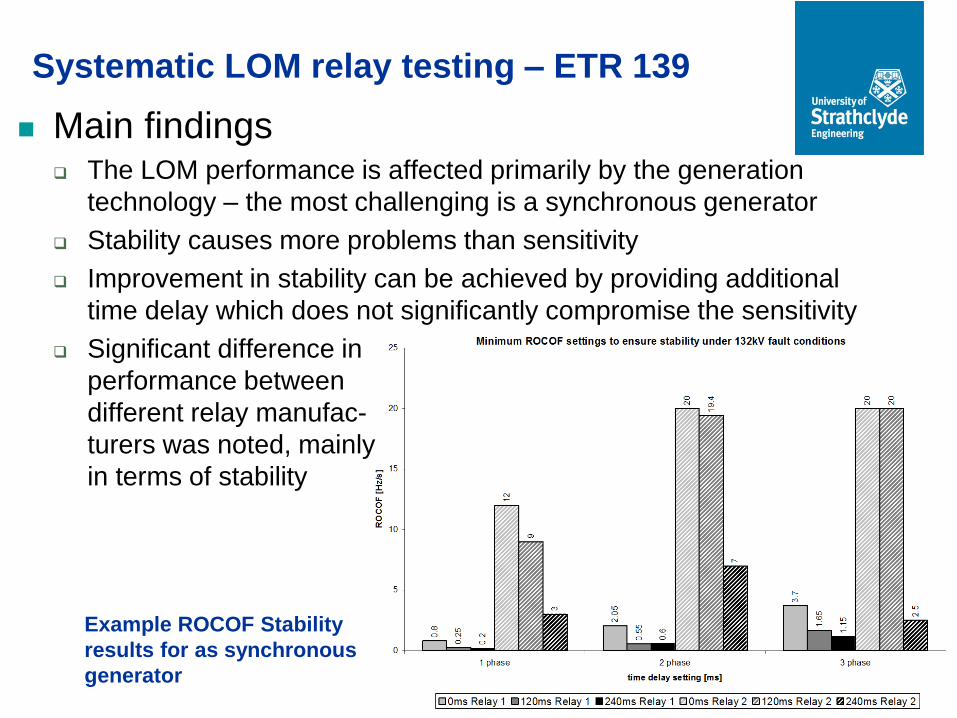
Main findings The LOM performance is affected primarily by the generation
technology – the most challenging is a synchronous generator
Stability causes more problems than sensitivity
Improvement in stability can be achieved by providing additional
time delay which does not significantly compromise the sensitivity
Significant difference in
performance between
different relay manufac-
turers was noted, mainly
in terms of stability
Example ROCOF Stability
results for as synchronous
generator

Risk assessment of NVD
protection requirement
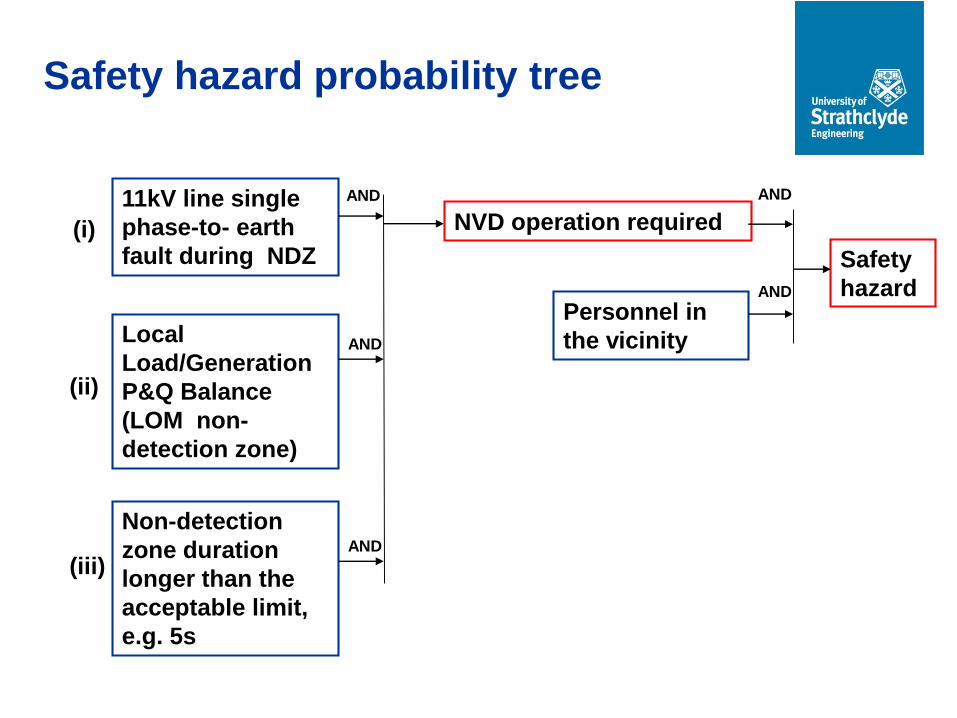
Safety hazard probability tree
11kV line single
phase-to- earth
fault during NDZ
Local
Load/Generation
P&Q Balance
(LOM non-
detection zone)
Non-detection
zone duration
longer than the
acceptable limit,
e.g. 5s
AND
AND
AND
NVD operation required(i)
(ii)
(iii)
Personnel in
the vicinity
Safety
hazard
AND
AND
0 1 2 3 4 5 6 7 8
x 104
0
0.1
0.2
0.3
0.4
0.5
0.6
0.7
P[M
W],
Q[M
VA
R]
time [s]
Pload
Qload
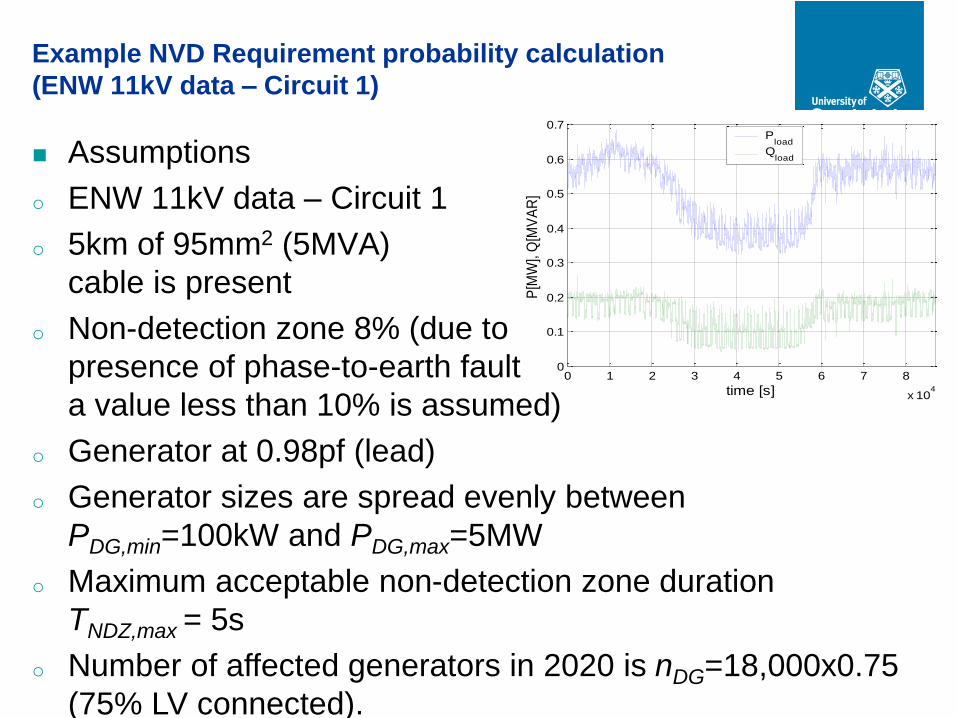
Example NVD Requirement probability calculation
(ENW 11kV data – Circuit 1)
Assumptions
o ENW 11kV data – Circuit 1
o 5km of 95mm2 (5MVA)
cable is present
o Non-detection zone 8% (due to
presence of phase-to-earth fault
a value less than 10% is assumed)
o Generator at 0.98pf (lead)
o Generator sizes are spread evenly between
PDG,min=100kW and PDG,max=5MW
o Maximum acceptable non-detection zone duration
TNDZ,max = 5s
o Number of affected generators in 2020 is nDG=18,000x0.75
(75% LV connected).
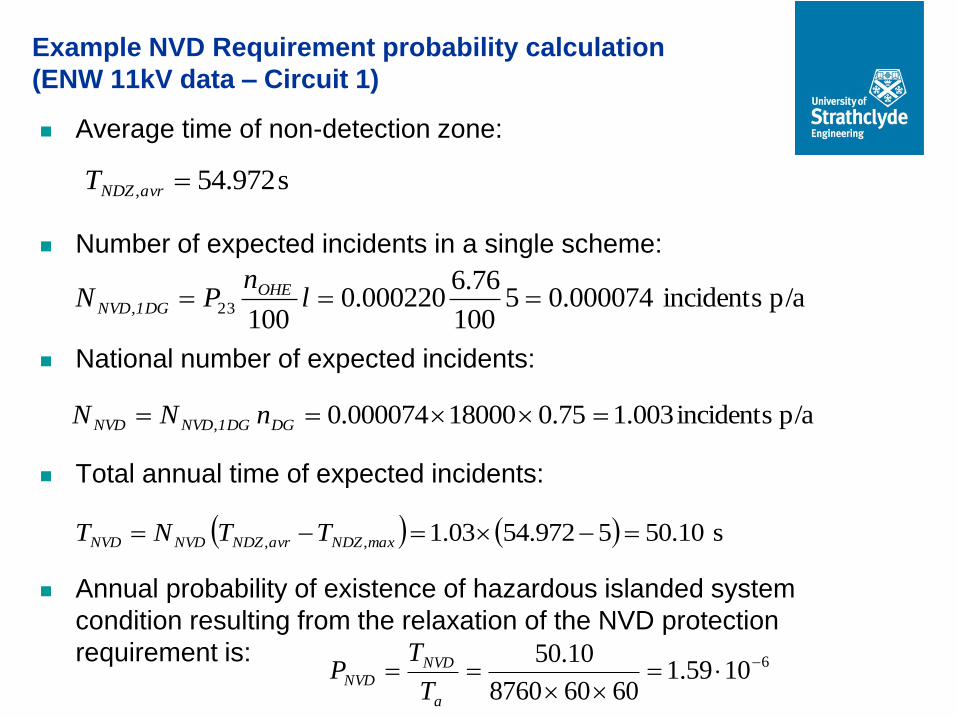
Example NVD Requirement probability calculation
(ENW 11kV data – Circuit 1)
Average time of non-detection zone:
Number of expected incidents in a single scheme:
National number of expected incidents:
Total annual time of expected incidents:
Annual probability of existence of hazardous islanded system
condition resulting from the relaxation of the NVD protection
requirement is:
s972.54, avrNDZT
p/a incidents 0.0000745100
76.6000220.0
10023, l
nPN OHE
1DGNVD
p/a incidents 003.175.018000000074.0, DG1DGNVDNVD nNN
s 50.105 54.9721.03,, maxNDZavrNDZNVDNVD TTNT
61059.160608760
10.50
a
NVD
NVDT
TP

System event
28 September 2012
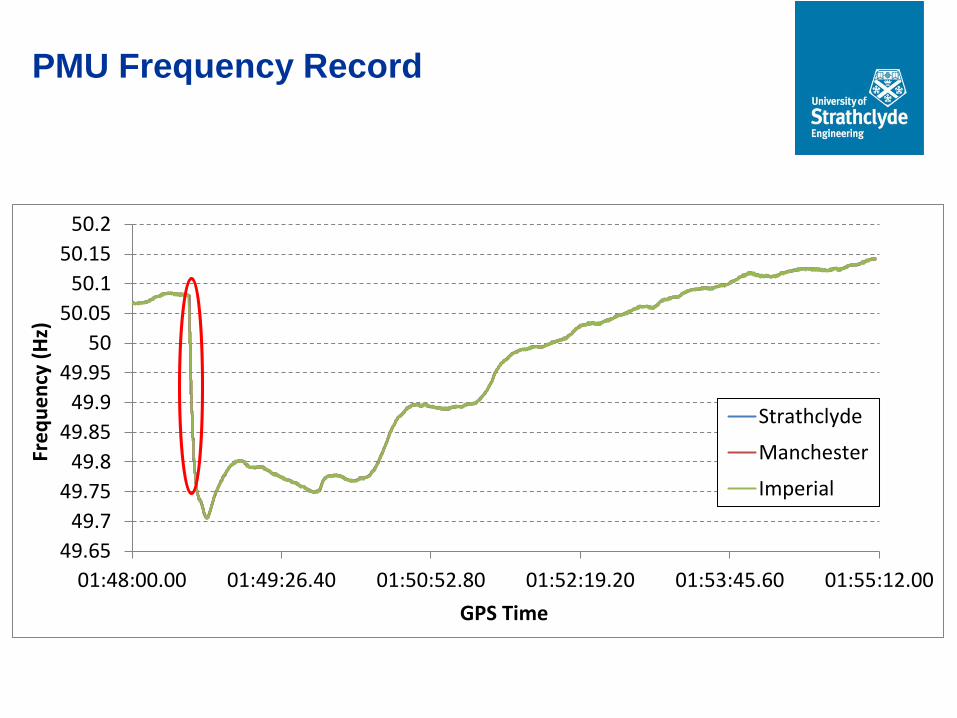
PMU Frequency Record
49.65
49.7
49.75
49.8
49.85
49.9
49.95
50
50.05
50.1
50.15
50.2
01:48:00.00 01:49:26.40 01:50:52.80 01:52:19.20 01:53:45.60 01:55:12.00
Fre
qu
en
cy (
Hz)
GPS Time
Strathclyde
Manchester
Imperial
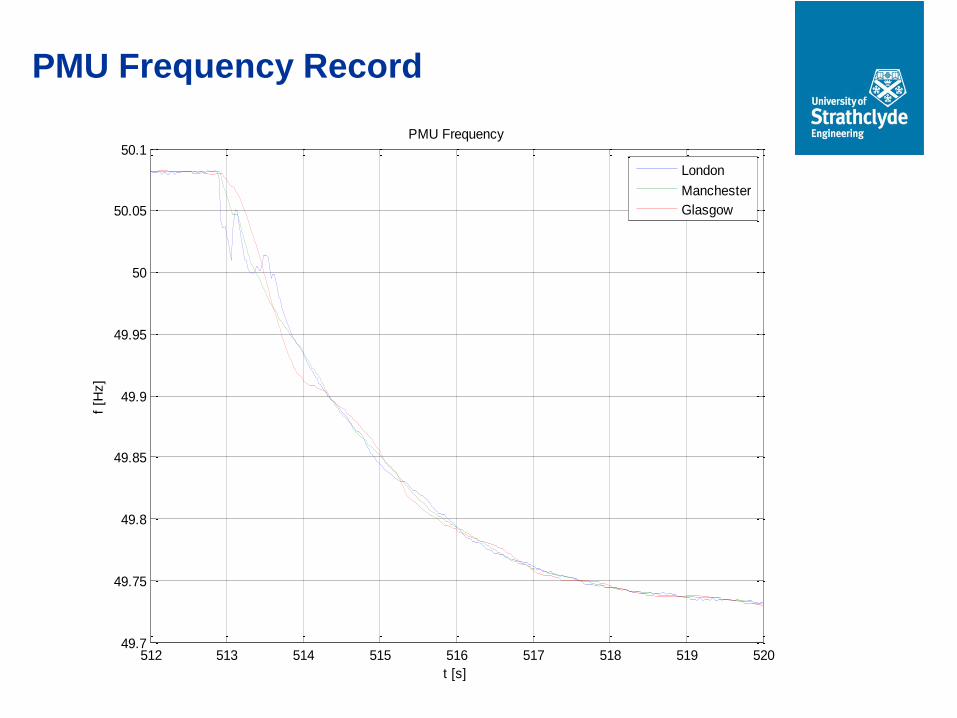
PMU Frequency Record
512 513 514 515 516 517 518 519 52049.7
49.75
49.8
49.85
49.9
49.95
50
50.05
50.1
t [s]
f [H
z]
PMU Frequency
London
Manchester
Glasgow
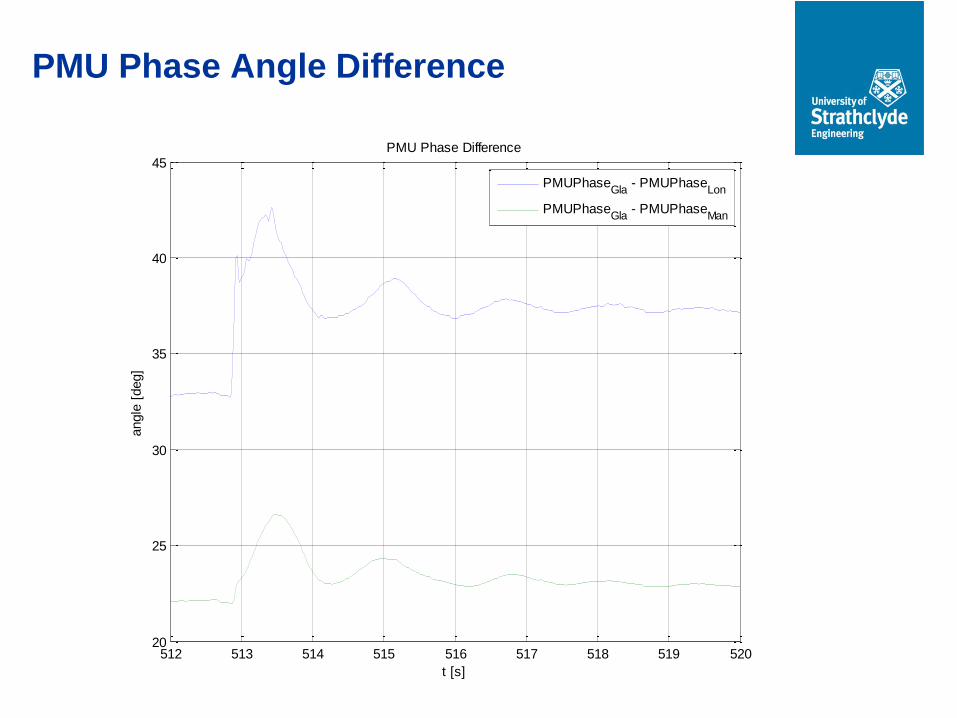
PMU Phase Angle Difference
512 513 514 515 516 517 518 519 52020
25
30
35
40
45
t [s]
angle
[deg]
PMU Phase Difference
PMUPhaseGla
- PMUPhaseLon
PMUPhaseGla
- PMUPhaseMan
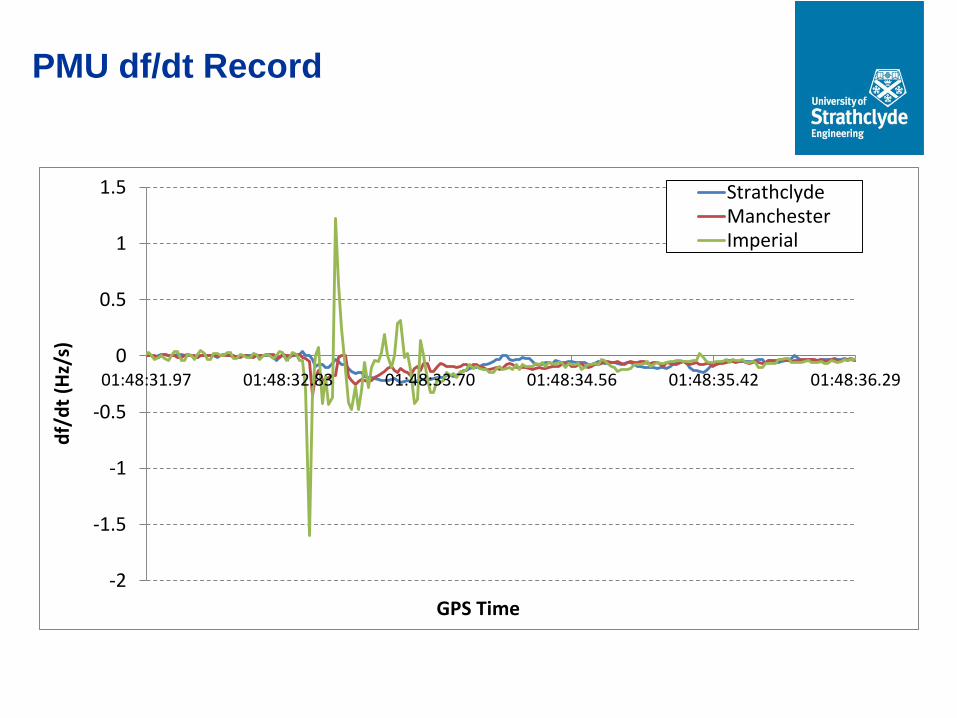
PMU df/dt Record
-2
-1.5
-1
-0.5
0
0.5
1
1.5
01:48:31.97 01:48:32.83 01:48:33.70 01:48:34.56 01:48:35.42 01:48:36.29
df/
dt
(Hz/
s)
GPS Time
StrathclydeManchesterImperial
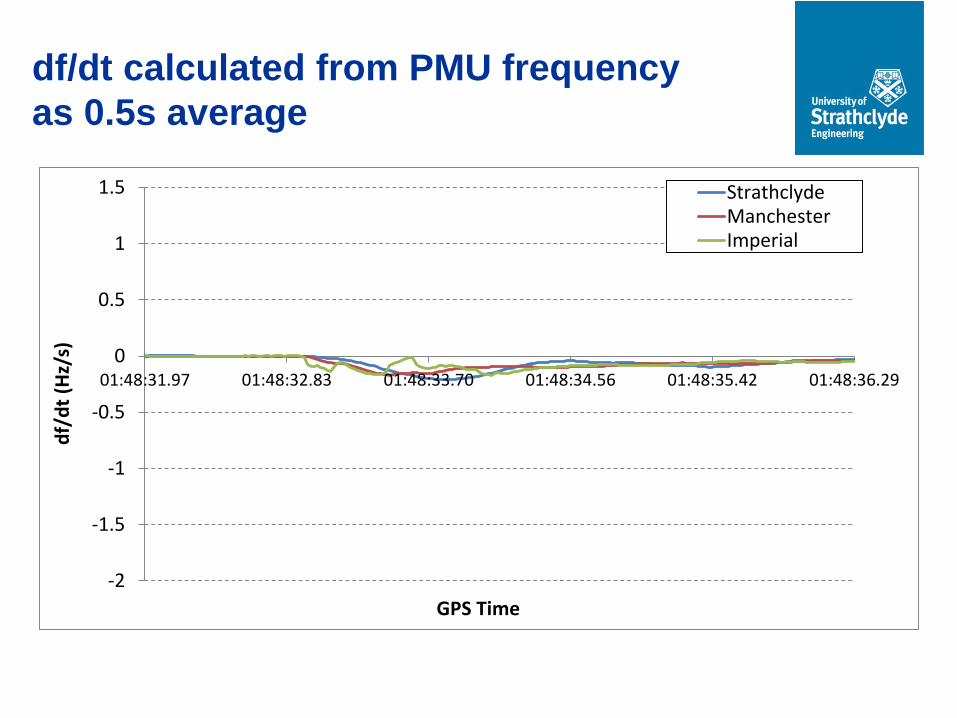
df/dt calculated from PMU frequency
as 0.5s average
-2
-1.5
-1
-0.5
0
0.5
1
1.5
01:48:31.97 01:48:32.83 01:48:33.70 01:48:34.56 01:48:35.42 01:48:36.29
df/
dt
(Hz/
s)
GPS Time
StrathclydeManchesterImperial
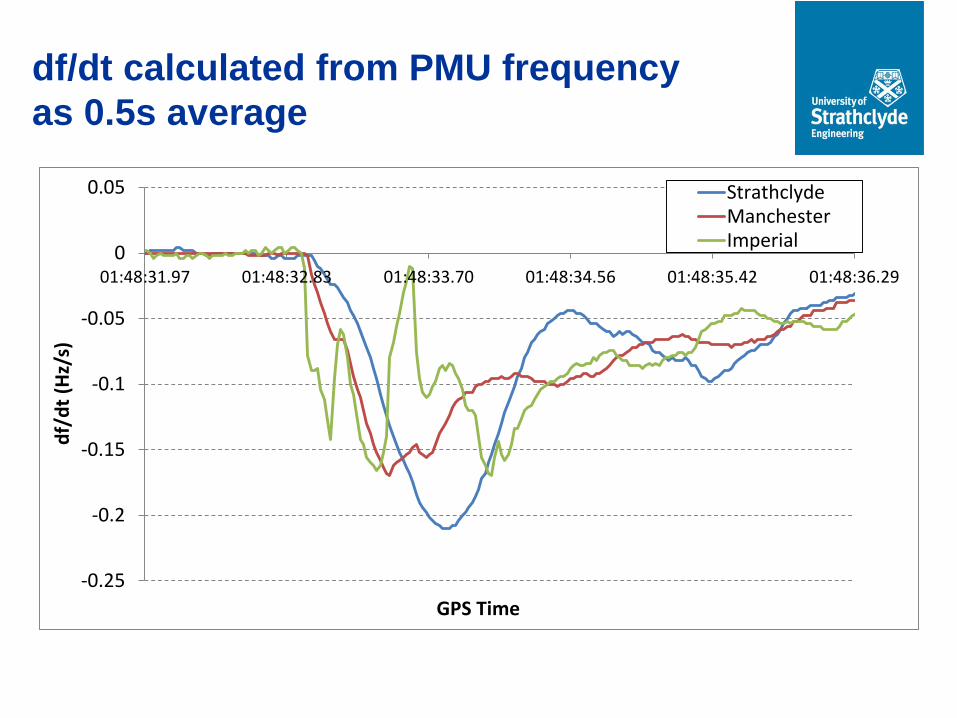
df/dt calculated from PMU frequency
as 0.5s average
-0.25
-0.2
-0.15
-0.1
-0.05
0
0.05
01:48:31.97 01:48:32.83 01:48:33.70 01:48:34.56 01:48:35.42 01:48:36.29
df/
dt
(Hz/
s)
GPS Time
StrathclydeManchesterImperial
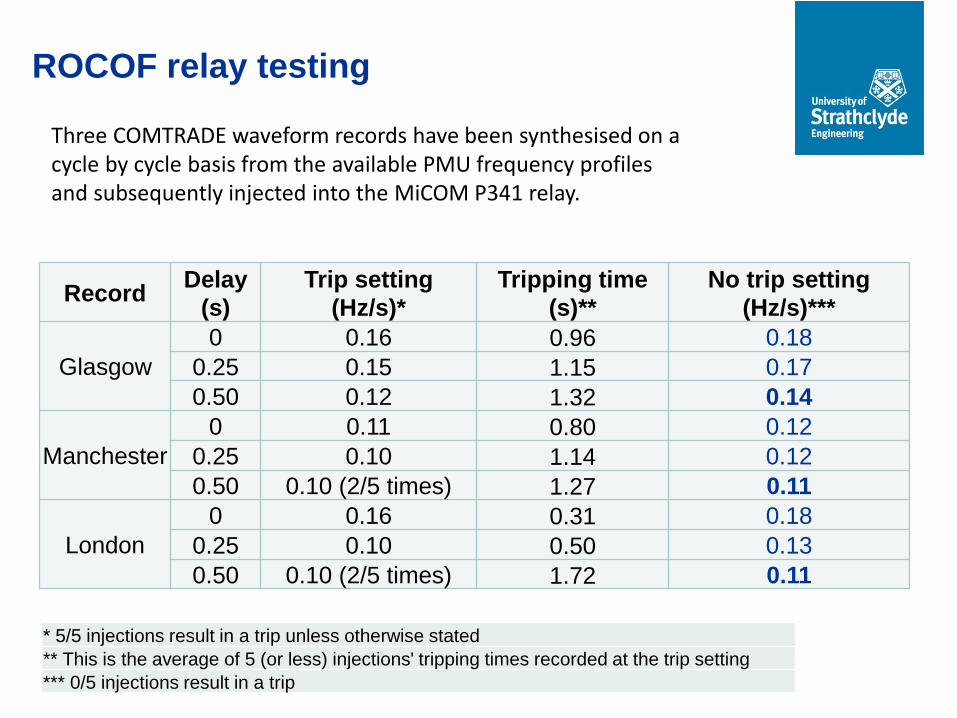
ROCOF relay testing
RecordDelay
(s)
Trip setting
(Hz/s)*
Tripping time
(s)**
No trip setting
(Hz/s)***
Glasgow
0 0.16 0.96 0.18
0.25 0.15 1.15 0.17
0.50 0.12 1.32 0.14
Manchester
0 0.11 0.80 0.12
0.25 0.10 1.14 0.12
0.50 0.10 (2/5 times) 1.27 0.11
London
0 0.16 0.31 0.18
0.25 0.10 0.50 0.13
0.50 0.10 (2/5 times) 1.72 0.11
* 5/5 injections result in a trip unless otherwise stated
** This is the average of 5 (or less) injections' tripping times recorded at the trip setting
*** 0/5 injections result in a trip
Three COMTRADE waveform records have been synthesised on a cycle by cycle basis from the available PMU frequency profiles and subsequently injected into the MiCOM P341 relay.
Observations
df/dt seen by the DG depends on the position in the
network and position in relation to the initiating event
df/df seen by the relay depends on the frequency and
ROCOF calculation method (i.e. mainly the averaging
period)
Applying additional time delay increases relay stability
Applying additional frequency dead band (e.g. 49.5Hz to
50.5Hz) will block ROCOF operation during the majority
of system wide events.
Equivalent dynamic model of
the UK transmission system
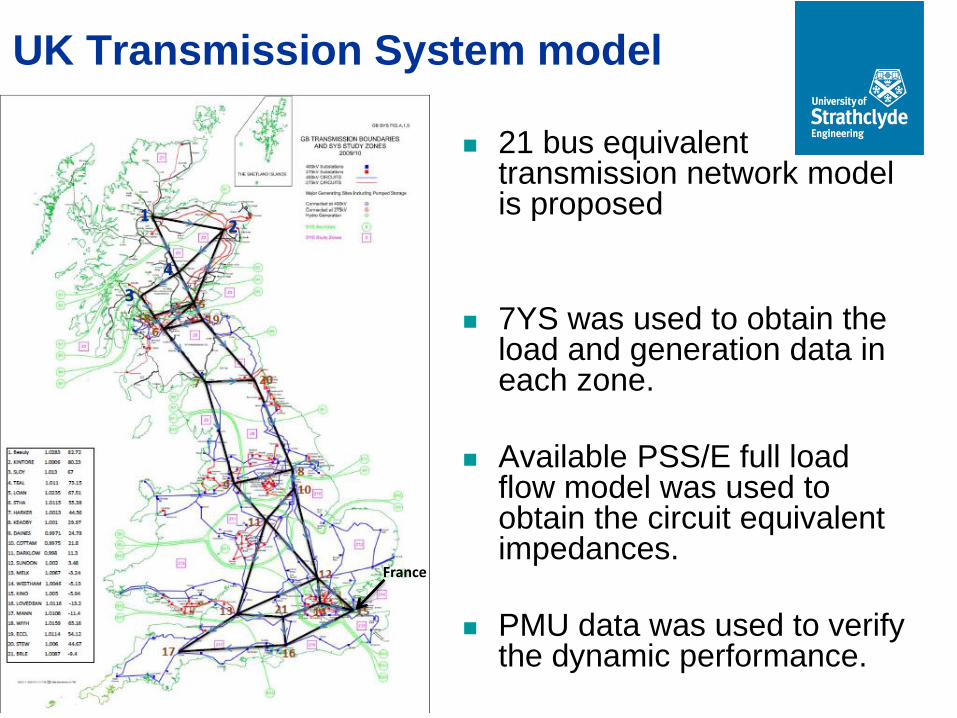
21 bus equivalent transmission network model is proposed
7YS was used to obtain the load and generation data in each zone.
Available PSS/E full load flow model was used to obtain the circuit equivalent impedances.
PMU data was used to verify the dynamic performance.
UK Transmission System model
France
12
3
4
Dynamic Validation: PMU Data
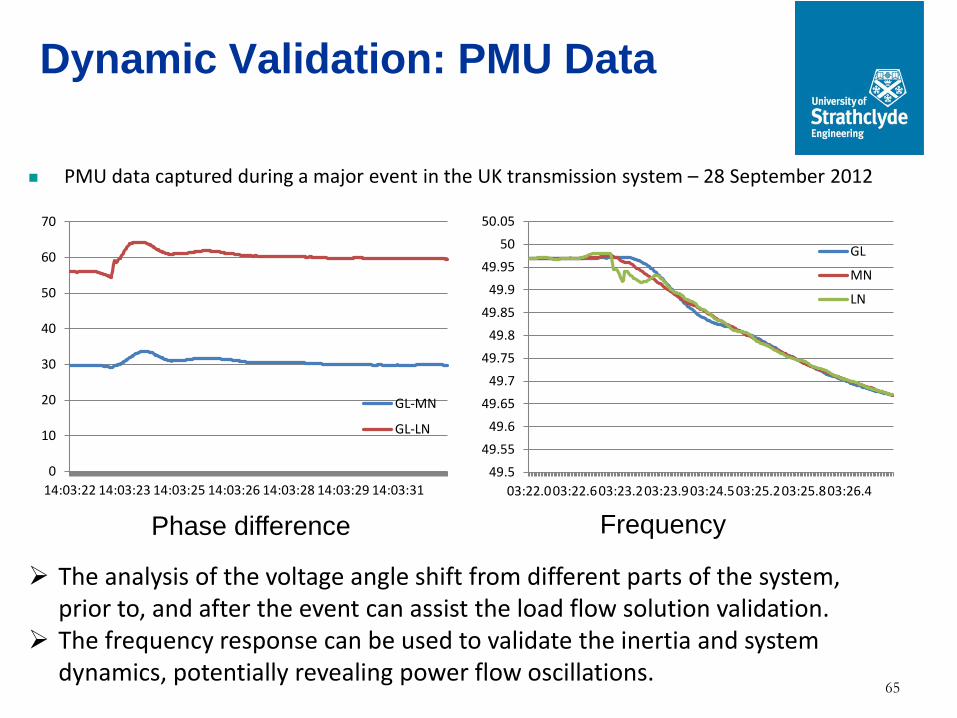
PMU data captured during a major event in the UK transmission system – 28 September 2012
65
Phase difference Frequency
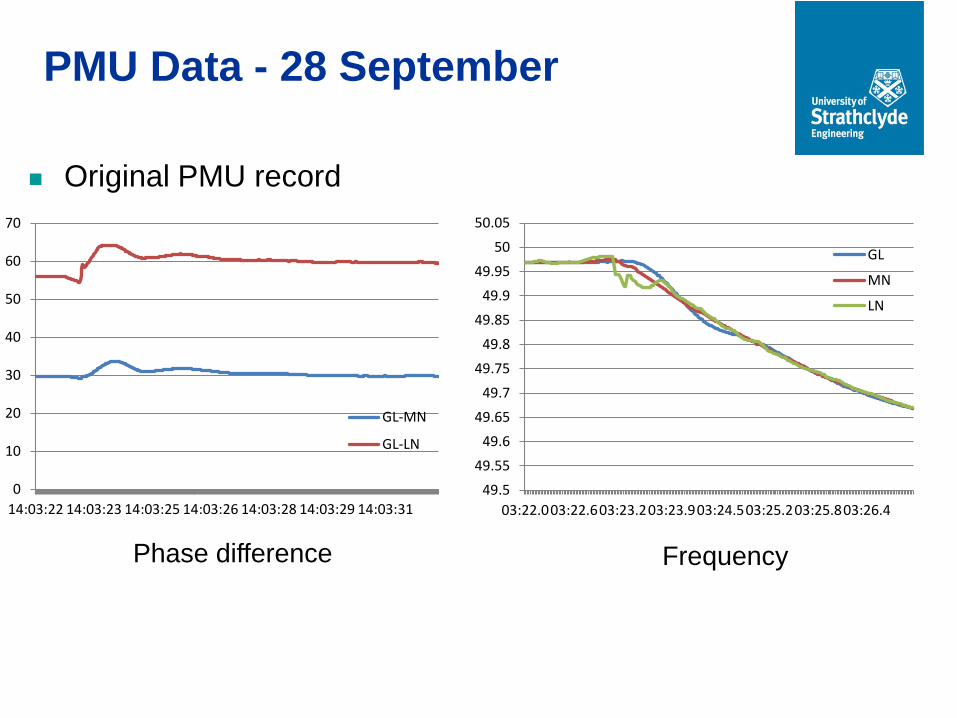
The analysis of the voltage angle shift from different parts of the system, prior to, and after the event can assist the load flow solution validation.
The frequency response can be used to validate the inertia and system dynamics, potentially revealing power flow oscillations.
0
10
20
30
40
50
60
70
14:03:22 14:03:23 14:03:25 14:03:26 14:03:28 14:03:29 14:03:31
GL-MN
GL-LN
49.5
49.55
49.6
49.65
49.7
49.75
49.8
49.85
49.9
49.95
50
50.05
03:22.003:22.603:23.203:23.903:24.503:25.203:25.803:26.4
GL
MN
LN
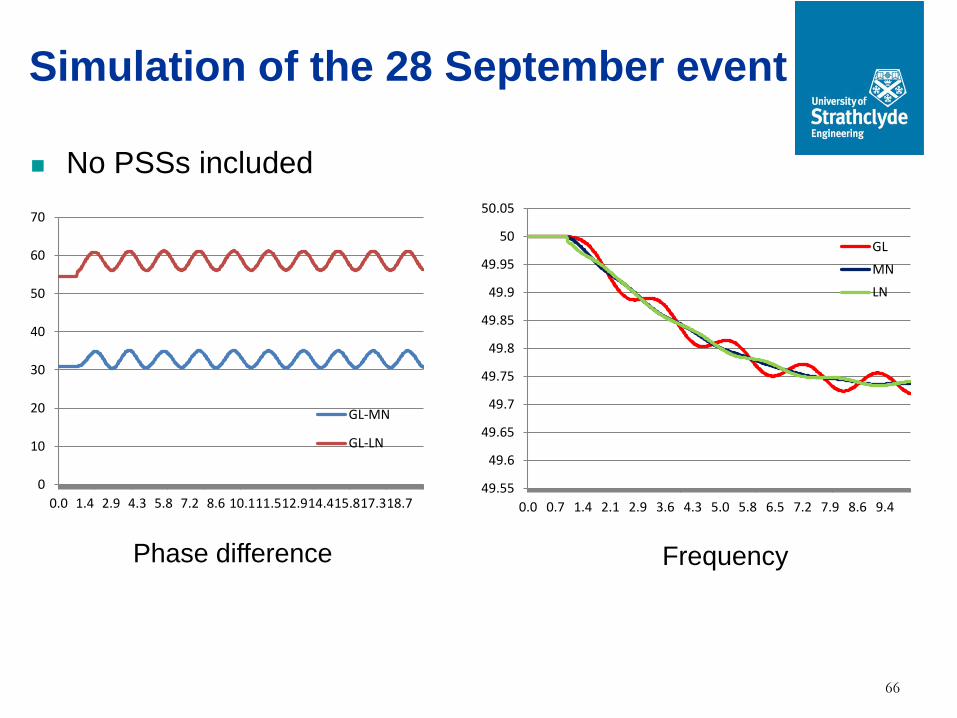
Simulation of the 28 September event
66
0
10
20
30
40
50
60
70
0.0 1.4 2.9 4.3 5.8 7.2 8.6 10.111.512.914.415.817.318.7
GL-MN
GL-LN
49.55
49.6
49.65
49.7
49.75
49.8
49.85
49.9
49.95
50
50.05
0.0 0.7 1.4 2.1 2.9 3.6 4.3 5.0 5.8 6.5 7.2 7.9 8.6 9.4
GL
MN
LN
Phase difference Frequency
No PSSs included
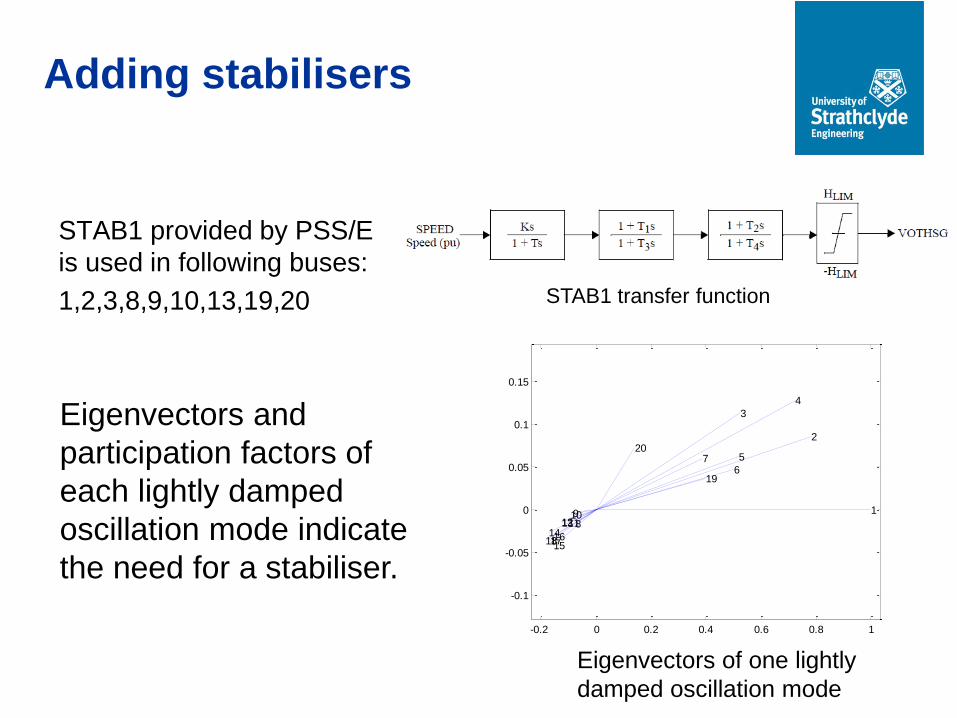
Adding stabilisers
STAB1 provided by PSS/E
is used in following buses:
1,2,3,8,9,10,13,19,20 STAB1 transfer function
-0.2 0 0.2 0.4 0.6 0.8 1
-0.1
-0.05
0
0.05
0.1
0.15
1
2
3
4
5
67
8910
11121314
15161718
19
20
Eigenvectors and
participation factors of
each lightly damped
oscillation mode indicate
the need for a stabiliser.
Eigenvectors of one lightly
damped oscillation mode
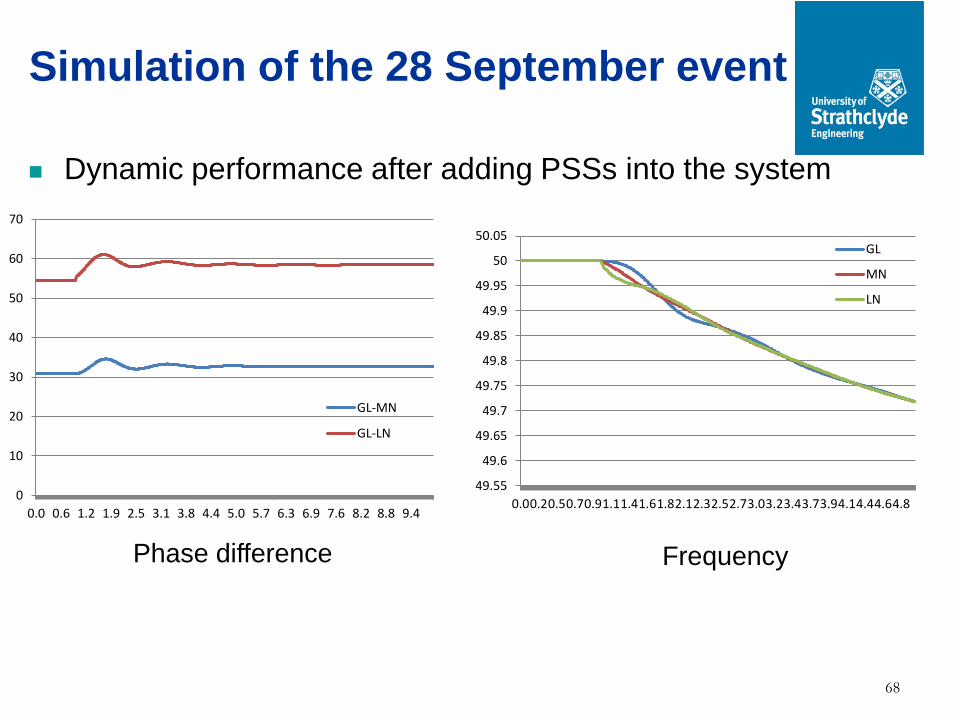
Dynamic performance after adding PSSs into the system
68
0
10
20
30
40
50
60
70
0.0 0.6 1.2 1.9 2.5 3.1 3.8 4.4 5.0 5.7 6.3 6.9 7.6 8.2 8.8 9.4
GL-MN
GL-LN
49.55
49.6
49.65
49.7
49.75
49.8
49.85
49.9
49.95
50
50.05
0.00.20.50.70.91.11.41.61.82.12.32.52.73.03.23.43.73.94.14.44.64.8
GL
MN
LN
Phase difference Frequency
Simulation of the 28 September event
PMU Data - 28 September
Original PMU record
Phase difference Frequency
0
10
20
30
40
50
60
70
14:03:22 14:03:23 14:03:25 14:03:26 14:03:28 14:03:29 14:03:31
GL-MN
GL-LN
49.5
49.55
49.6
49.65
49.7
49.75
49.8
49.85
49.9
49.95
50
50.05
03:22.003:22.603:23.203:23.903:24.503:25.203:25.803:26.4
GL
MN
LN
ROCOF settings adjustment
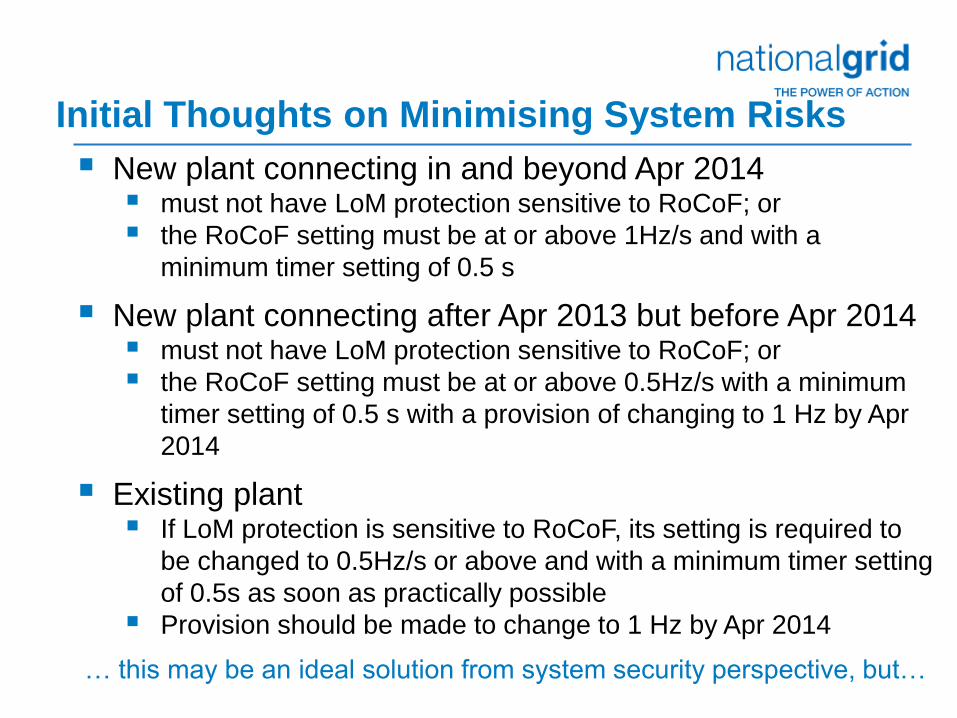
Initial Thoughts on Minimising System Risks
New plant connecting in and beyond Apr 2014 must not have LoM protection sensitive to RoCoF; or
the RoCoF setting must be at or above 1Hz/s and with a
minimum timer setting of 0.5 s
New plant connecting after Apr 2013 but before Apr 2014 must not have LoM protection sensitive to RoCoF; or
the RoCoF setting must be at or above 0.5Hz/s with a minimum
timer setting of 0.5 s with a provision of changing to 1 Hz by Apr
2014
Existing plant If LoM protection is sensitive to RoCoF, its setting is required to
be changed to 0.5Hz/s or above and with a minimum timer setting
of 0.5s as soon as practically possible
Provision should be made to change to 1 Hz by Apr 2014
… this may be an ideal solution from system security perspective, but…
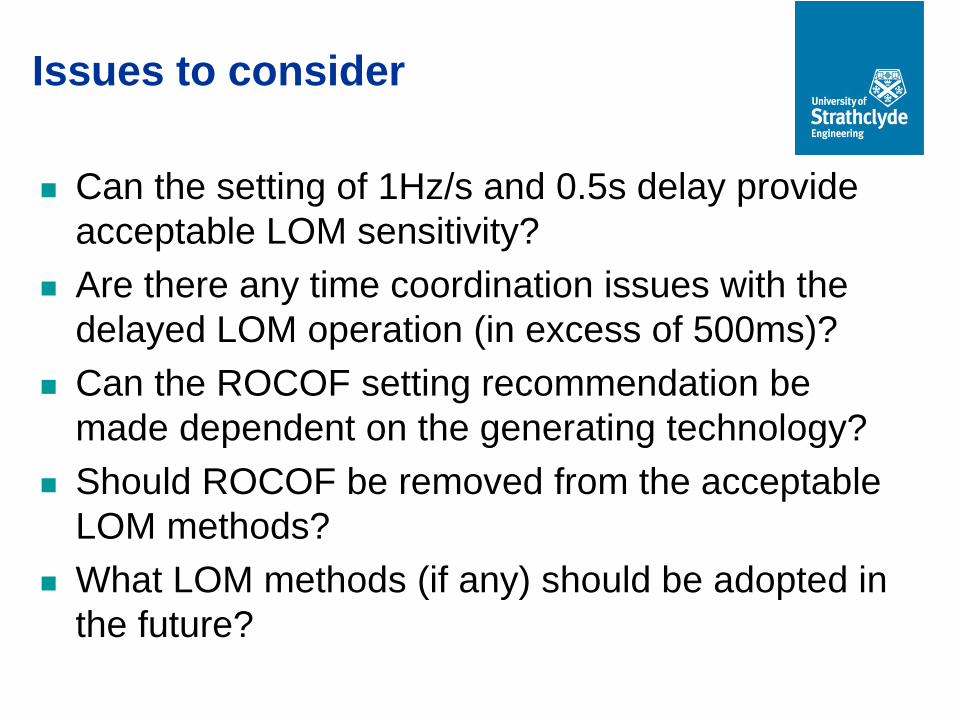
Issues to consider
Can the setting of 1Hz/s and 0.5s delay provide
acceptable LOM sensitivity?
Are there any time coordination issues with the
delayed LOM operation (in excess of 500ms)?
Can the ROCOF setting recommendation be
made dependent on the generating technology?
Should ROCOF be removed from the acceptable
LOM methods?
What LOM methods (if any) should be adopted in
the future?
Other LOM methods
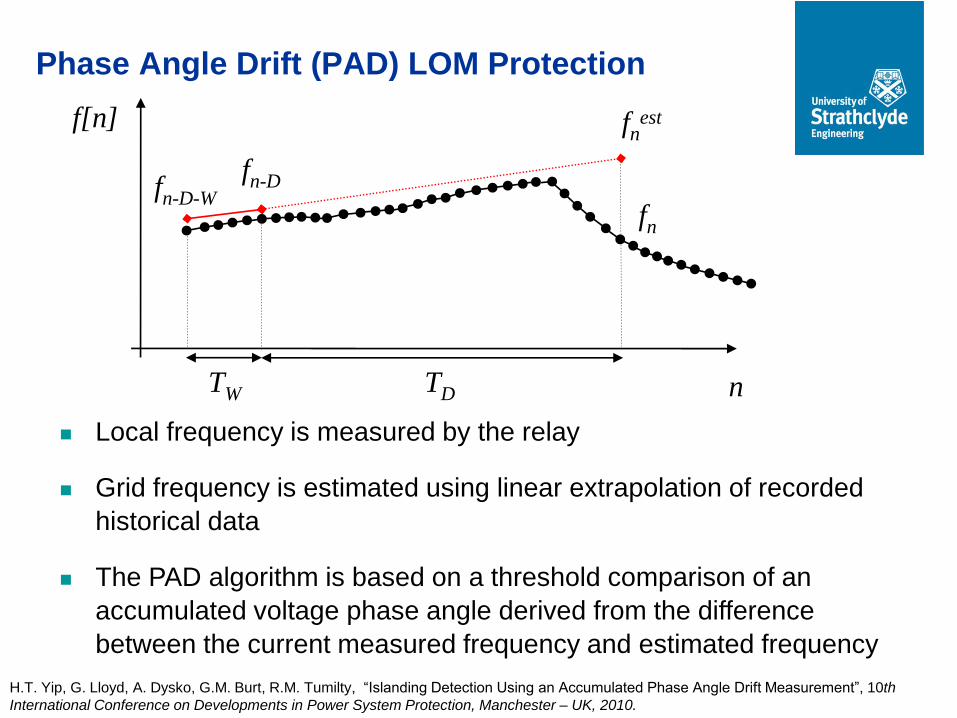
Phase Angle Drift (PAD) LOM Protection
H.T. Yip, G. Lloyd, A. Dysko, G.M. Burt, R.M. Tumilty, “Islanding Detection Using an Accumulated Phase Angle Drift Measurement”, 10th
International Conference on Developments in Power System Protection, Manchester – UK, 2010.
Local frequency is measured by the relay
Grid frequency is estimated using linear extrapolation of recorded
historical data
The PAD algorithm is based on a threshold comparison of an
accumulated voltage phase angle derived from the difference
between the current measured frequency and estimated frequency
fn
fnest
fn-Dfn-D-W
n
f[n]
TW TD
DG
~
LOM
Protection
trip
Transmission System
GPS stamped frequency signal
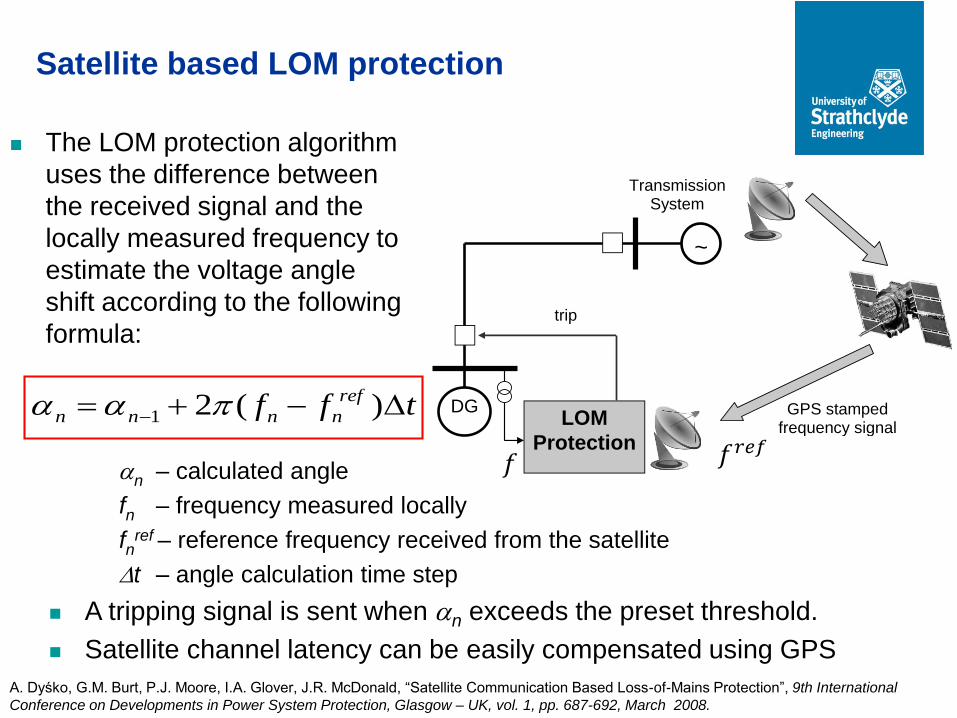
Satellite based LOM protection
The LOM protection algorithm
uses the difference between
the received signal and the
locally measured frequency to
estimate the voltage angle
shift according to the following
formula:
tff ref
nnnn )(21
n – calculated angle
fn – frequency measured locally
fnref – reference frequency received from the satellite
t – angle calculation time step
A tripping signal is sent when n exceeds the preset threshold.
Satellite channel latency can be easily compensated using GPS
A. Dyśko, G.M. Burt, P.J. Moore, I.A. Glover, J.R. McDonald, “Satellite Communication Based Loss-of-Mains Protection”, 9th International
Conference on Developments in Power System Protection, Glasgow – UK, vol. 1, pp. 687-692, March 2008.
𝑓𝑟𝑒𝑓𝑓
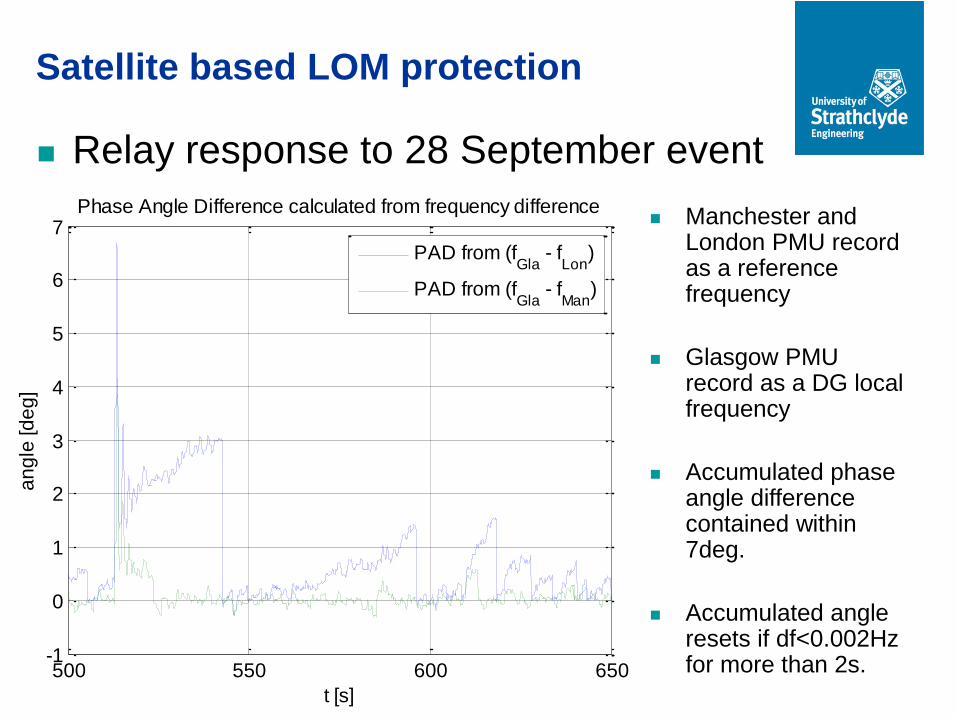
Satellite based LOM protection
Relay response to 28 September event
Manchester and London PMU record as a reference frequency
Glasgow PMU record as a DG local frequency
Accumulated phase angle difference contained within 7deg.
Accumulated angle resets if df<0.002Hz for more than 2s.500 550 600 650
-1
0
1
2
3
4
5
6
7
t [s]
an
gle
[d
eg
]
Phase Angle Difference calculated from frequency difference
PAD from (fGla
- fLon
)
PAD from (fGla
- fMan
)
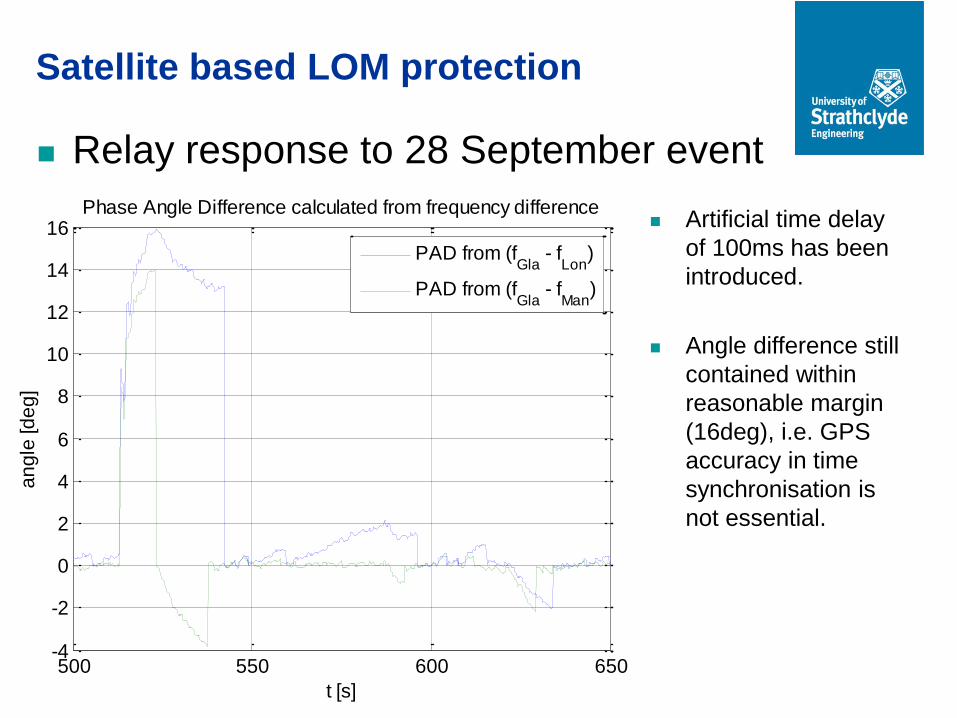
Satellite based LOM protection
Relay response to 28 September event
Artificial time delay
of 100ms has been
introduced.
Angle difference still
contained within
reasonable margin
(16deg), i.e. GPS
accuracy in time
synchronisation is
not essential.
500 550 600 650-4
-2
0
2
4
6
8
10
12
14
16
t [s]
an
gle
[d
eg
]
Phase Angle Difference calculated from frequency difference
PAD from (fGla
- fLon
)
PAD from (fGla
- fMan
)
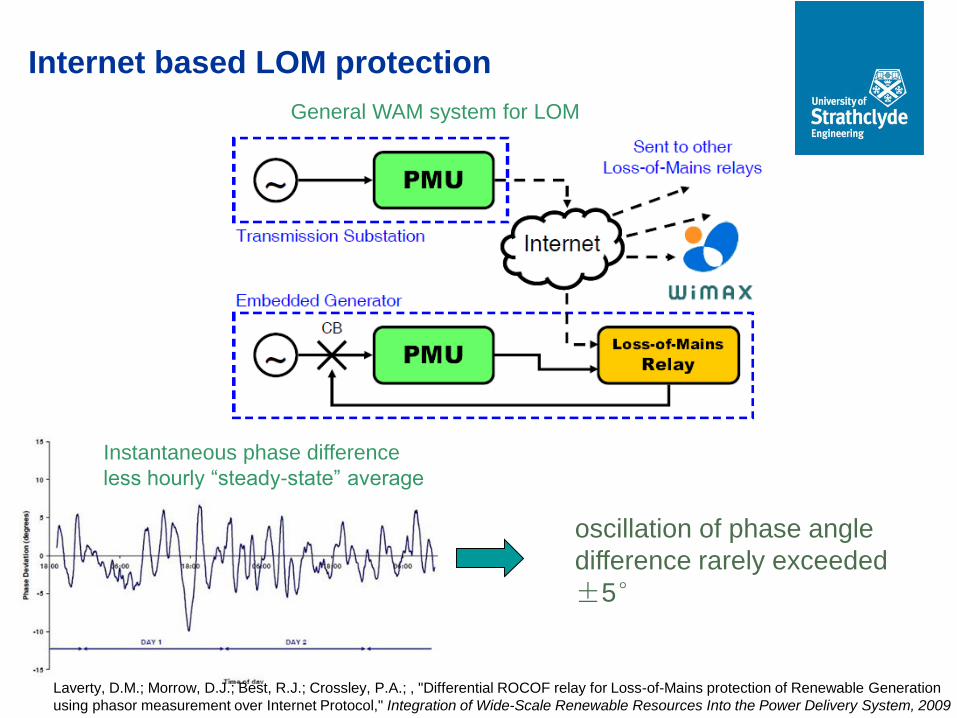
Internet based LOM protection
General WAM system for LOM
Instantaneous phase difference
less hourly “steady-state” average
oscillation of phase angle
difference rarely exceeded
±5°
Laverty, D.M.; Morrow, D.J.; Best, R.J.; Crossley, P.A.; , "Differential ROCOF relay for Loss-of-Mains protection of Renewable Generation
using phasor measurement over Internet Protocol," Integration of Wide-Scale Renewable Resources Into the Power Delivery System, 2009
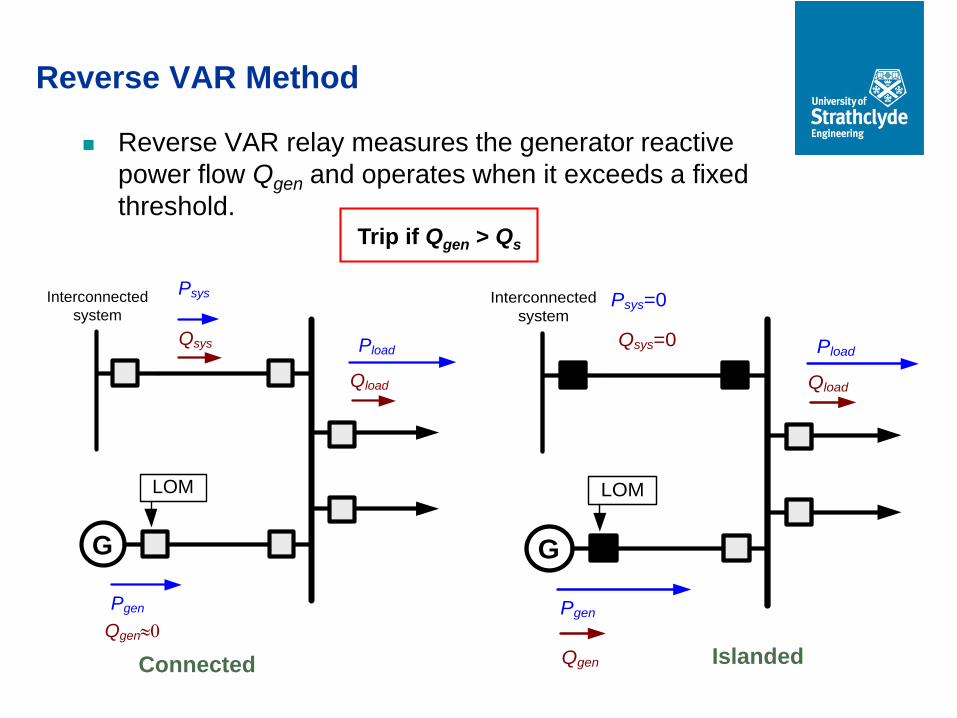
Reverse VAR Method
Reverse VAR relay measures the generator reactive
power flow Qgen and operates when it exceeds a fixed
threshold.
G
Interconnected
system
Qgen»0
Qload
LOM
Pgen
PloadQsys
Psys
G
Interconnected
system
Qload
LOM
Pgen
PloadQsys=0
Psys=0
QgenConnected Islanded
Trip if Qgen > Qs
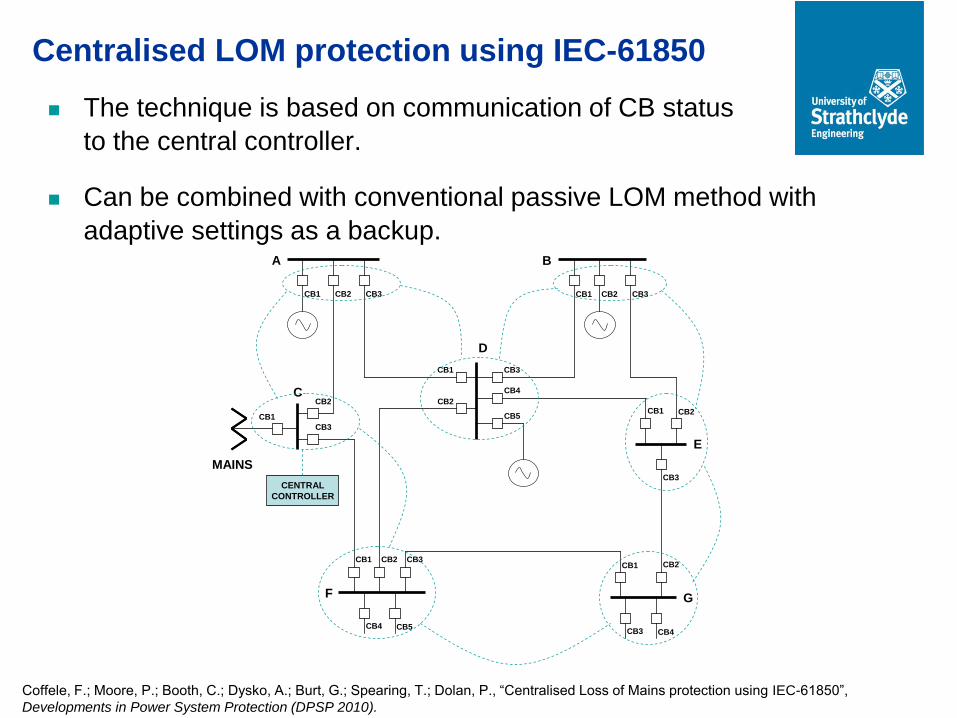
Centralised LOM protection using IEC-61850
The technique is based on communication of CB status
to the central controller.
Can be combined with conventional passive LOM method with
adaptive settings as a backup.A B
C
D
E
F G
CB1 CB3CB2CB1 CB3CB2
CB1
CB3
CB2
CB1 CB3
CB2
CB4
CB5CB1
CB3
CB2
CB1
CB3
CB2
CB4
CB1 CB3CB2
CB4 CB5
MAINS
CENTRAL
CONTROLLER
Coffele, F.; Moore, P.; Booth, C.; Dysko, A.; Burt, G.; Spearing, T.; Dolan, P., “Centralised Loss of Mains protection using IEC-61850”,
Developments in Power System Protection (DPSP 2010).
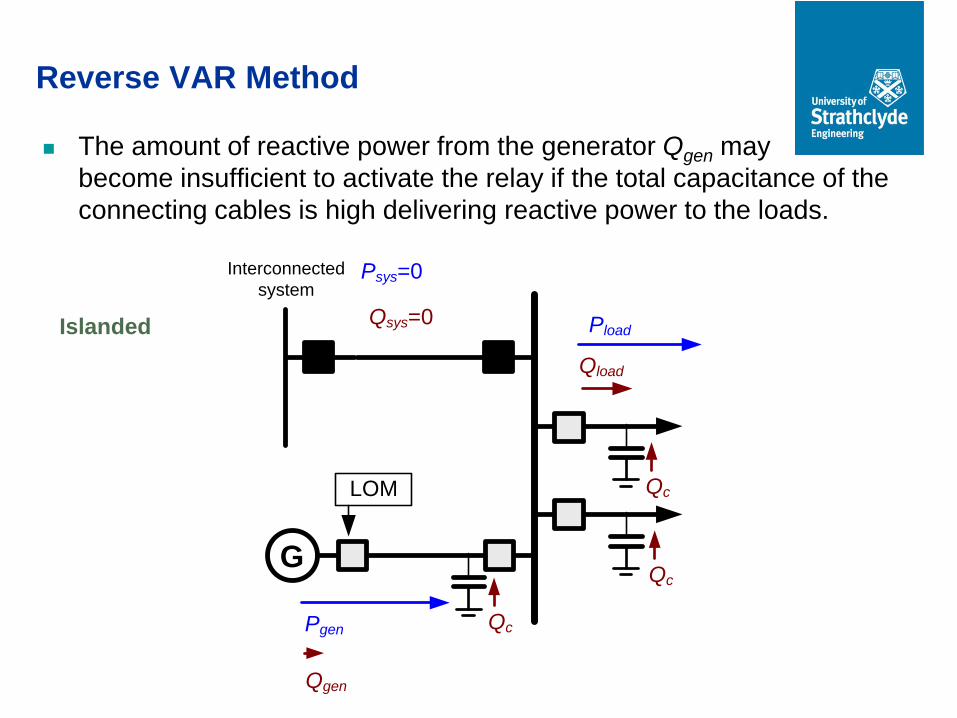
Reverse VAR Method
The amount of reactive power from the generator Qgen may
become insufficient to activate the relay if the total capacitance of the
connecting cables is high delivering reactive power to the loads.
Islanded
G
Interconnected
system
Qload
LOM
Pgen
PloadQsys=0
Psys=0
Qgen
Qc
Qc
Qc
GG
Signal send
Signal block
Signal block
Signal send
Signal receive
G
Signal receive
Signal receive
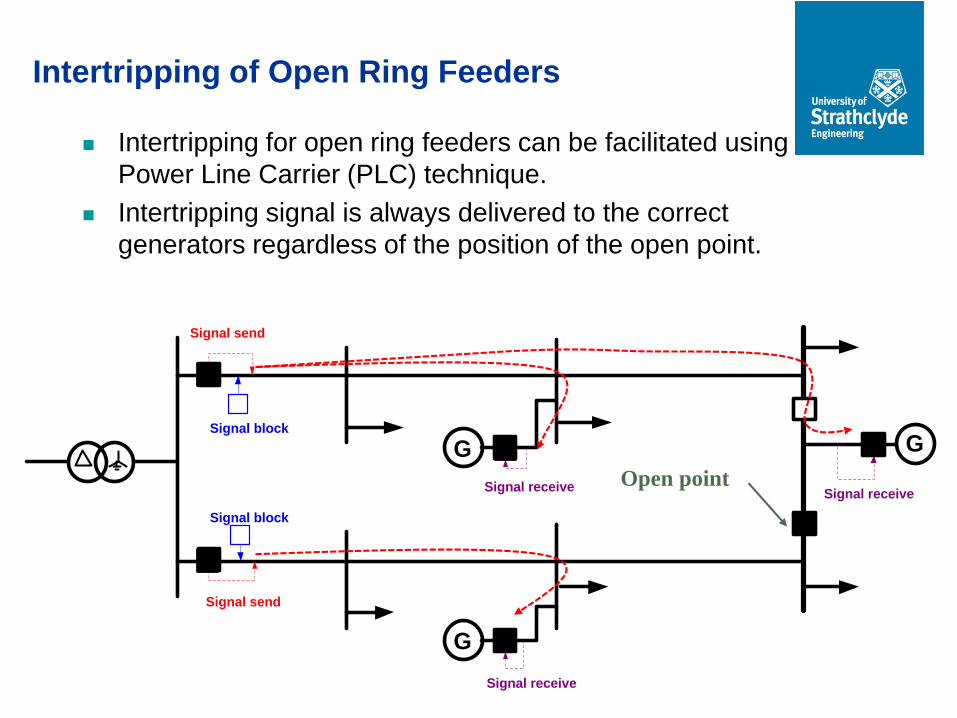
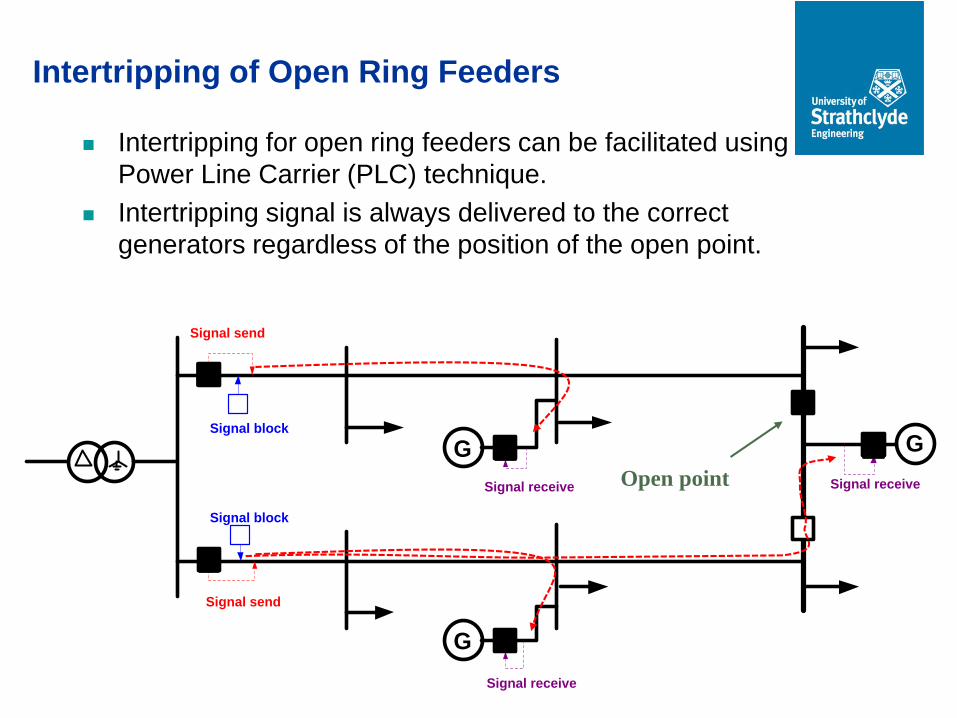
Intertripping of Open Ring Feeders
Intertripping for open ring feeders can be facilitated using
Power Line Carrier (PLC) technique.
Intertripping signal is always delivered to the correct
generators regardless of the position of the open point.
Open point
Intertripping for open ring feeders can be facilitated using
Power Line Carrier (PLC) technique.
Intertripping signal is always delivered to the correct
generators regardless of the position of the open point.
Open point
GG
Signal send
Signal block
Signal block
Signal send
Signal receive
G
Signal receive
Signal receive
Intertripping of Open Ring Feeders
Active methods
Active methods are more reliable but may be
slower and loose performance in larger groups of
generators
The use of active frequency shift method was suggested
such as Sandia Frequency Shift.
This could also be combined with ROCOF to achieve the
best performance (combined use of active and passive
methods).
The Grid Connection Code in Japan mandates the
combined use of the passive and the active methods.
Future research
One Year Satellite Applications Catapult funded
LOM demonstrator project has been awarded and will
commence in March 2013.
A research team has been set up at Strathclyde to look
into equivalent modelling of the UK transmission system.
Hardware LOM relay testing under recorded and simulated
system wide disturbances (?).
Risk assessment of the LOM protection under new
proposed setting guidelines (?).
Related Documents