UNIVERSITY OF MICHIGAN – POLITICAL SCIENCE HONORS THESIS Advertising Effects The Impact of Campaign Ads on Voter Preferences in the 2004 Presidential Election C. Joy Wilke March 25, 2011

Welcome message from author
This document is posted to help you gain knowledge. Please leave a comment to let me know what you think about it! Share it to your friends and learn new things together.
Transcript

UNIVERSITY OF MICHIGAN – POLITICAL SCIENCE HONORS THESIS
Advertising Effects The Impact of Campaign Ads on Voter Preferences in the 2004 Presidential
Election
C. Joy Wilke
March 25, 2011

March 2011
1
Research Abstract
This paper examines the effects of campaign advertisements on American public opinion in the
2004 Presidential election. It combines survey data and data about ad timing and placement
during the campaign to study the effects on respondent preferences. Ads are shown to be most
effective among respondents who watched a lot of TV (and thus had the opportunity to be
exposed to a high amount of ads), respondents who were relatively unengaged in politics, and
those interviewed early in the campaign (before they had the opportunity to learn much about the
candidates).

March 2011
2
Preface
I began working on this paper as a summer research project through the Undergraduate Research
Opportunity Program. My interest came from a class I had recently taken with Professor Brader
called “Media Effects on Public Opinion.” In Media Effects, we discussed the multiple avenues
for public opinion to be influenced by those in the media. Furthermore, from this class and
others, I learned about multiple theories of public opinion – from John Zaller‟s RAS Model to
Lodge et al.‟s Impression-Driven Model, to Phil Converse and The American Voter‟s discussion
of an uninformed public.
From these theories, it seemed to me that there was room for campaigns, and specifically
campaign ads, to change the way people think about politics. Less clear is a description of the
specific ad characteristics and voter demographics that mediate the effect of campaign ads. This
information is important for a variety of reasons, but I was most interested in understanding
which tools are best for winning elections. Who are the people most open to persuasion? What
ads are more effective at persuading Republicans and independents to vote for Democratic
candidates? Which ads encourage unlikely voters to decide to show up at the polls? Since
elections are won at the margins, even a small swing in public opinion can make the difference.
If the winning campaign is the best campaign, then knowing which tools to use is essential to
win elections.
Acknowledgments
First and foremost, I would like to sincerely thank my adviser, Professor Mike Traugott. From
his suggestion that I turn my summer research project into an honors thesis, to his dedication of
hours and hours to working with me to see it through, he has gone above and beyond anything I
could have expected from an adviser. His guidance has shaped this thesis in innumerable ways,
and he has been the most influential educator from whom I have had the pleasure of learning.
Thanks also to Professor Ted Brader. I am profoundly grateful for his instilling in me an interest
in media effects in Political Science 315, helping me to form a research question, and for
counseling me along the way.
I would also like to thank Tristram Wolf. Not only for coding the ads presented in Chapter 4 and
reading multiple drafts, but also for the continuous moral support during this process.
My parents, Rob and Ruste Wilke have also been very supportive throughout my academic
career and this year. Thanks for the helpful comments on earlier drafts, and thank you so very
much for helping me get to where I am today.
Finally, I want to thank Professor Markovits and the rest of PoliSci 493. Your feedback helped
to focus my research and demanded I present a clear, coherent story.

March 2011
3
Table of Contents
Introduction 4
Chapter One: Literature Review 8
The Negative Effects of Negativity 8
The Positive Effects of Negativity 11
The Negligible Effects of Campaign Ads 12
The Positive Effects of Campaign Ads 13
Emotional Appeals and the Theory of
Affective Intelligence
16
Chapter Two: Hypotheses 25
Chapter Three: Data and Methods 28
Chapter Four: Emotional Appeals and Ad
Content
32
Chapter Five: Advertising Placement Strategy 37
Chapter Six: Advertising Effects 45
Television Viewing Habits 47
Independents 56
Political Engagement 60
Vote Likelihood 68
Ad Focus: Policy vs. Personality 70
Effects at the End of the Campaign 76
Conclusion 80
*Appendix 1: Extra Output and Tables 86
*Appendix 2: Candidates’ Ads Codebook 92
References 94

March 2011
4
Introduction
In an era of Photoshop, brand management, and new media, it‟s no wonder that
Americans are skeptical of and hostile to much of the information they receive. Each election
cycle, news stories about campaign ads are as prevalent as the ads themselves, whether produced
by campaigns, interest groups, political parties, or PACs. Just like the politicians who air them,
campaign ads are often the subject of scandals themselves: from the infamous attacks on Dukakis
in ‟88 (“Willie” Horton ads) to the Swift Boat ads questioning Senator John Kerry‟s war record
in 2004. Because of the existence of such attack ads, Americans have become deeply critical of
political advertisements. Campaigning is described as “dirty” and “unfair,” and the media often
discuss this distaste.
One news story in particular stays in my memory: during the 2006 election cycle, NPR
interviewed Dennis Steele and Scott Sanders – voice actors who narrate campaign ads. Their
voices are deep and powerful. To demonstrate how they can make anything sound negative, they
read a slightly edited version of children‟s nursery rhymes. Sanders reads, “Humpty Dumpty sat
on a wall. He said he could put himself together again. But after wasting thousands of our tax
dollars, all the king's horses and all the king's men, he failed us. Humpty Dumpty. Wrong on wall
sitting.” Next, Steele reads, “London Bridge is falling down. Falling down, falling down. And
who's to blame for withholding needed infrastructure funding? My fair lady. Take the key and
lock her up. It's time for a change.” The point, of course, is to play on an industry that most
Americans describe as dirty. This story notes that, given the right spin and an intimidating voice,
anything will sound negative.
Furthermore, the idea of the Rational Independent – coolly weighing the issue platforms
of each candidate – plays a large and important role in the American psyche. The idea of 30-

March 2011
5
second, emotion-laden advertisements playing a role in important decisions of government
could be seen as undemocratic, with many believing that emotions are unsophisticated and easily
manipulated. If the Rational Independent is swayed by something as small as a campaign ad,
how rational or independent can they be?
If there is so much to hate about campaign advertising – it is dirty, unfair, and even
undemocratic – why do campaign managers and media advisers continue to make use of this
strategy? Because it works. Because, in spite of those who say that campaign ads don‟t affect
them, they do. Because in a campaign, the ends justify the means.
This paper seeks to understand how advertising affects the electoral process. Which
types of advertising most effectively persuade voters? Which types encourage viewers to go to
the polls on Election Day or – maybe – discourage that activity? Further, which segments of the
American population are most susceptible to the arguments presented in these campaign ads?
Can targeting certain demographics increase supporters‟ turnout on Election Day? These
questions focus on a fundamental question: What ads do voters see and how do they react to
them? This question revolves around a discussion of American public opinion and how that
opinion is subject to change.
Advertising is a multi-billion dollar industry. While most of that money goes to
influencing consumer decisions, a good portion of that money is spent on influencing the
electoral process. At best, campaign ads inform voters on the issues of the day and the
candidates‟ platforms, and even encourage turnout on Election Day. At worst, ads spread
misinformation and manipulate public opinion to support one cause or candidate over another.
This possibility for manipulation becomes especially worrisome given new rules on campaign
finance, as corporations are now able to anonymously donate to campaigns, raising questions of

March 2011
6
electoral influence and even bribery. Clearly, there are dangers involved when influencing mass
opinion. However, as Madison so aptly noted in Federalist 10 when discussing the “mischiefs of
faction,” “it could not be less folly to abolish liberty, which is essential to political life, because it
nourishes faction, than it would be to wish the annihilation of air, which is essential to animal
life, because it imparts to fire its destructive agency.” Applied to this subject, despite those who
are worried about the possible misuse of campaign ads, they remain an essential form of liberty,
the annihilation of which would be folly.
This research examines how Americans are affected by campaign advertising.
Understanding this will help campaigns spend their war chests wisely. It will also put into
perspective the criticism that campaign ads have received as the alleged cause of Americans‟
lackluster (to say the least) interest in politics. I examine voters‟ reactions to ads supporting or
attacking the two main candidates in the 2004 Presidential election: Senator John Kerry and
President George W. Bush. The thesis is formatted as follows:
Chapter One is a review which discusses the multiple threads of the literature
surrounding the effects of campaign advertisements. It discusses the research examining the
attack ads, as well as the effects of campaign ads in general. The literature review also examines
a body of research surrounding the ways that campaigns can appeal to the emotions of voters.
Chapter Two applies much of the research outlined in the literature review to this
research question in particular. Chapter Two lays out the five hypotheses designed to test the
effects of campaign ads on voter preferences. They range from expectations on the type of ad
that will be most effective at persuading voters to a test of which campaign made the most
emotional advertisements. Chapter Three discusses the datasets and variables used to test these

March 2011
7
hypotheses. It describes the measures of public opinion used to test how the ads affected voters.
Chapter Three also details the methods used to collect the data about campaign ads.
Chapter Four is the first step in understanding the content of the ads that ran during the
2004 Presidential General Election Campaign. This is where I discuss the results of a content
analysis of the ads that were run by the campaigns themselves (not the parties, interest groups, or
PACs as discussed throughout the rest of this thesis). This chapter is designed to test a
hypothesis outlined in Chapter Two, and also to give an understanding of what strategies the
campaigns used in producing their ads.
Chapter Five again examines the ad deployment strategy; this time, however, the focus is
on the timing and placement of the ads. Chapter Five discusses when and where campaign ads
were aired, demonstrating the rhythm of the campaign and the emphasis on some states over
others. From this, a sketch of the campaign emerges: advertising intensified as Election Day
drew closer. This was especially evident in areas that were competitive and electorally
significant.
Chapter Six tests the majority of my hypotheses, and answers the questions: what is
effective and who is affected? This chapter discusses how the habits, partisanship, and political
engagement of viewers all play a role in the effectiveness of exposure to campaign ads. It also
describes how variables from vote choice and favorability to likelihood of turning out to vote are
affected by these ads. Finally, it details how the effects of ads are different early in the campaign
as opposed to late in the campaign. The Conclusion outlines avenues for future research and
discusses the implications for American democracy.

March 2011
8
Chapter One: Literature Review
Though campaign advertising has been a part of politics for over five decades, scholars
are still conflicted over the effects of different types of advertising strategies. As a result, the
literature on political advertising is vast and multi-faceted. This section examines the major
threads of this debate; including those surrounding the effects of negative ads, as well as the
effects of emotional appeals in ads. I believe that the strongest evidence supports those who are
persuaded that emotional appeals and negative ads are effective on voters exposed to these ads.
The Negative Effects of Negativity
Conventional wisdom holds that political advertising in general – and negative
advertising in particular – is harmful to democracy. This is the theory that has been studied most
extensively, which has resulted in many subtle differences in the literature on the subject. The
traditional argument is that ads reduce complex and important ideas to emotion-laden, 30-second
clips, leading to a cynical electorate with low political efficacy and low trust in government.
Ansolabehere and Iyengar (1995) argue this case with a study involving a series of experiments.
They find that negative ads, while admittedly increasing knowledge about political issues, also
have undesirable demobilizing effects, such as decreasing political efficacy, trust in government,

March 2011
9
and turnout. Their experiments – though they have a very comprehensive design – do not
measure voters‟ exposure to real ads, which is a drawback when it comes to the external validity
and hence the applicability of their findings. Furthermore, this study does not look deeply into
the effects of the different characteristics of the ads, and because of this, readers cannot draw
conclusions about exactly which characteristics may contribute to demobilizing effects.
Kahn and Kenny (1999) take a slightly different approach, and partially Ansolabehere
and Iyengar‟s argument. Their research design differs in that they make use of surveys and
interviews rather than experiments. They used the 1990 American National Election Study for
one portion of their study, but also used media analysis and interviews with campaign managers
to assess campaign tone. Kahn and Kenny asked campaign managers if they would characterize
their opponent‟s actions during the campaign as “mudslinging,” or if it was portrayed that way
by the media, and thus have a working definition of “legitimate” criticism. By looking at the
ads‟ tone as opposed to overall message, Kahn and Kenny help answer the question of what ad
characteristics affect viewers. While they find that “legitimate” negative ads can serve a
democratically desirable function (this portion of their findings will be discussed in more detail
later), they suggest that mudslinging ads are associated with lower turnout.
Though the tone of ads was covered extensively by Kahn and Kenny, perhaps there‟s
something else at work in this discussion of the effects of political ads on voters, such as the
timing or content. In fact, Krupnikov (2009) finds that the timing of the ad makes a big
difference in its effects. She combines ad data and survey data (over a period of 1976-2000, and
then in 2000 more deeply), and finds that when negative ads are aired after the viewer has made
his selection of candidate preference, the ad will have a demobilizing effect, but that no
demobilizing effect occurs before the viewer has made his or her selection. Krupnikov also finds

March 2011
10
that this demobilizing effect is especially distinct among weak partisans. She goes on to argue
that Ansolabehere and Iyengar (1995) found demobilizing results of negative ads because their
study focused on ads that aired late in the election season, i.e. after people had made their
candidate selection.
Dardis, Shen, and Edwards (2008) turn away from the timing of the ad, and instead focus
on content. They use an experimental design to look at how the specific content of a negative ad
affects voter decision-making. Interestingly – and contrary to conventional wisdom – they find
that issue-based attacks are more likely to produce viewers who are cynical and have low
political efficacy, and that these effects were greatest for those who were exposed to the negative
ads most often. Perhaps, as they argue, this is because when viewers are constantly bombarded
with ads where candidates are attacking each other‟s complex issues and policy positions it
makes “government seem more unavailable, unpalatable, or Byzantine to the common citizen –
especially upon exposure after exposure.” ( p. 39) This is an interesting finding, and one that
will have implications for research studying the role of emotion in ads .
Thus, the school of thought that argues that negative ads can have demobilizing effects
includes Ansolabehere and Iyengar (1995), who make the broadest claim, arguing that negative
ads lead to much less democratically desirable behavior. Kahn and Kenny (1999) delve into
greater detail and argue that only when negative ads present irrelevant information in an
inappropriate manner (i.e. “mudslinging”) do they have demobilizing effects; Dardis, Shen, and
Edwards (2008) argue that it is exposure to issue-based attacks that leads to lower self-efficacy
and increases cynicism. And Krupnikov (2009) argues that negativity only has demobilizing
effects after candidate selection has been made by the viewer. It is worth noting that Krupnikov
(2009), Dardis, Shen, and Edwards (2008), and Ansolabehere and Iyengar (1995) use an
March 2011
11
experimental design in at least part of their studies, while Kahn and Kenny (1999) rely on survey
data. Most convincing are the scholars who look more precisely into this question, because the
claim that negative political ads always result in democratically undesirable behavior is too
broad to be convincing.
The Positive Effects of Negativity
The argument that negative campaign ads are sometimes democratically beneficial – that
is, that negative ads can have positive effects on self-efficacy, interest, and turnout – has also
been advanced by multiple scholars. For example, Dardis, Shen, and Edwards (2008), who find
that issue-based negative ads cause an increase in cynicism towards government and a decrease
in self-efficacy, also find that negative ads that are character-based have just the opposite effect.
They find that as exposure to character-based negative ads increases, so does self-efficacy.
Unlike their finding relating to high exposure to issue ads (high exposure led to a huge drop in
self-efficacy), high exposure to character ads results in much higher self-efficacy. Perhaps
seeing candidates‟ flaws gives viewers confidence in their own ability to change the system, and
that is what led to this contrary to conventional wisdom result. Similarly, Kahn and Kenny
(1999), while arguing that mudslinging has negative effects on turnout, find that negative
campaign ads have mobilizing effects when the criticisms they launch are useful – that is, when
they are “relevant and appropriate.” (p. 878)
Freedman and Goldstein (1999) also spend time looking at how negative ads (and not just
campaign advertising in general) can have a positive effect on viewers. They argue that the idea
that negative ads can have a positive effect is theoretically defensible because negative ads
provide politically relevant information, negative information is given greater weight than

March 2011
12
positive information, and the fact that negativity can give a sense that what is at stake is
important and that “the outcome matters.” (Freedman & Goldstein, 1999, p. 1190)
The Negligible Effects of Political Advertising
There are, however, scholars who remain skeptical of the effects of political ads
(beneficial or otherwise). Huber and Arceneaux (2007), for example, find that while ads do have
persuasive effects, they do not have any mobilization or educational effects on viewers. By
combining a survey and a natural experiment (which, they claim occurred in the 2000 election
where media markets based in battleground states overlapped non-battleground states, thus
exposing viewers to ads promoting candidates for whom the viewers could not vote), they argue
that their study comes closer to determining causality without sacrificing external validity.
Taking a more conventional approach, Jackson, Mondak and Huckfeldt (2009) use the
Wisconsin Advertising Project data combined with survey data to study the 2002 congressional
elections. They search for an undesirable effect of political ads, and come up short. They do not
find that negative political advertising has any effect on viewer attitudes, including respondents‟
attitudes on government and on their self-efficacy. They conclude, “the bottom line is
straightforward: present efforts have produced no empirical support for the case against negative
ads.” (p. 64)
Stevens (2009) offers another facet of the argument that political ads are ineffective. Up
to this point, most researchers have been looking only at the volume of negative ads to which
viewers are exposed. Perhaps, Stevens suggests, the proportion of negative ads to positive ads
plays a role in voter attitudes and actions. Stevens argues that when researchers focus solely on
volume of ads aired, negative advertising does have a modest effect on turnout, but when
March 2011
13
proportion of negative ads is taken into account, this effect essentially evaporates. Thus, he
argues that the results of scholars who find positive effects are “underspecified and, as a result,
potentially overly optimistic.” (p. 429) Interestingly, Stevens uses the same data as Franz et al.,
and finds no effect with his different independent variable.
Another instance of a null finding from negative campaign ads is a portion of
Krupnikov‟s (2009) study. Krupnikov uses data from the Wisconsin Advertising Project, which
is also used in this paper as well as by multiple other scholars. While she did find substantial
demobilizing effects when negativity occurred after selection of candidate preference had
occurred, negative ads shown before selection (as well as positive ads shown after selection) had
no effect on voter turnout. Thus, part of the argument drawn from Krupnikov‟s study must be
that negative ads have no demobilizing effect when they are shown before viewer selection.
These three studies that demonstrate when and how negative ads are – in the short-term –
ineffective (or at least do not have any negative effects) are important because each uses a very
different research design, yet all (with their null results) reject the conventional wisdom that
negative campaign advertisements have corrosive effects on democratically desirable
characteristics, whether the dependent variable in question is turnout (Krupnikov, 2009; Huber
& Arceneaux, 2007), self-efficacy (Jackson, Mondak & Huckfeldt, 2009), or political learning
(Huber & Arceneaux, 2007).
The Positive Effects of Political Advertising
On the other side of this debate are those who believe that negative advertisements serve
a positive function, and help to produce more alert, interested, and informed citizens. These

March 2011
14
scholars argue that political advertisements lead to increased rates of voter turnout, political
knowledge, and political efficacy. A vast majority of this research uses data from the Wisconsin
Advertising Project (incidentally, this data was also used as part of Krupnikov‟s measure of ad
exposure), a project which uses data from the Campaign Media Analysis Group and codes it for
certain characteristics. CMAG collects data (including complete text and a storyboard) on all of
the political ads that air in the top 100 media markets in the US, allowing researchers to be much
more confident in knowing what types of ads are being aired, and when.
Perhaps the largest force to be reckoned with on this side of the debate is the team of Ken
Goldstein, Michael Franz, Paul Freedman, and Travis Ridout. Together, they have written
extensively about the positive impact of negative ads; most notably, that it is effective at
persuading voters (Franz & Ridout, 2007), leads to voters who are more interested in the
campaign and know more about the candidates (Freedman, Franz & Goldstein, 2004), and
stimulates voter turnout (Freedman & Goldstein, 1999; Goldstein & Freedman, 2002). In their
book, Campaign Advertising and American Democracy, they argue that political ads are the
“multivitamin” of American politics, and that the positive effects of political ads often give the
most benefit to “those who need it most: the least informed and least engaged members of the
electorate.” (p. 138)
Franz and Ridout (2007) detour away from the question of negativity specifically, and
ask the question “Does political advertising persuade?” By looking at ads for the presidential
and US Senate races in 2004, they find that advertising does persuade, and those with less
political knowledge are the most easily persuaded. Franz and Ridout (2007) use the Wisconsin
ad data, but this time they combine it with a three-wave study. Their measurement of exposure
is a particularly valid portion of their study; they use a method of measuring TV habits referred

March 2011
15
to as the “five-program method,” or the method that asks about respondents‟ viewing patterns of
watching shows like local news, Jeopardy, Wheel of Fortune, morning news shows, and
afternoon talk shows. This is the method that Ridout, Shaw, Goldstein and Franz (2004)
concluded was the most predictive and accurate method of assessing viewing habits. Thus, that
Franz and Ridout (2007) used this method in their study of the 2004 Senate elections lends
credibility to their argument, and reassures me that their measure of exposure does, in fact, give a
good understanding of how many ads each respondent is potentially exposed to.
Franz and Ridout‟s finding that the least politically aware are most susceptible to being
persuaded by campaign ads replicated work by Valentino, Hutchings, and White (2004), who
look at the way individuals‟ characteristics affect ad effectiveness. However, Valentino,
Hutchings, and White differ from Franz and Ridout (2007) in that they argue that exposure to
political ads depresses the likelihood that politically sophisticated viewers will search out more
information. Along the same lines, Huber and Arceneaux (2007) find that the persuasiveness of
advertising is dependent on viewer characteristics; ads are most effective on “those individuals
sufficiently aware to be exposed to campaign communication but not so aware that they either
hold strong prior beliefs or can resist messages contrary to those beliefs.” (p. 974)
Thus, the research supporting the argument that political ads (including negative ads)
have a positive impact – that they teach and persuade, they lead to increased efficacy and
engagement, increase turnout, and are an all-around “multivitamin” for an anemic democratic
system – is substantial. These researchers arguing that political advertisements serve a positive
democratic purpose use a variety of tested research methods across elections of different types
and in different years, which lends credibility to the results that they are not the consequence of a
flawed research design. The reliability of different methods of measuring tone, for example, was

March 2011
16
studied by Ridout and Franz (2008) in order to assess whether differing conclusions about the
effectiveness of ads are based on different measures of campaign tone. They look at five
different measurements of tone and conclude that all standard methods are highly correlated, and
thus research design is not the cause of conflicting findings on advertising effects.
Emotional Appeals and the Theory of Affective Intelligence
Another facet of the literature surrounding the effects of campaign advertising does not
directly concern the impact of ads‟ tone or focus; rather, it addresses the way campaign
advertisements use emotional appeals to make their case to viewers. It may seem that appealing
to emotions in political ads is a manipulative tool for winning elections; that candidates who use
“scare tactics” or make false promises are the very embodiment of the politics that many
Americans despise. However, this is not the argument that most political scientists who study
emotional appeals make. Based in political psychology, some scholars have begun to argue that
advertisements with emotional appeals lead to more democratically desirable behavior than ads
without these emotional appeals (Marcus & MacKuen, 1993; Brader, 2005, 2006), and that
parties that successfully use emotional appeals win more elections (Westen, 2007). As the
literature stands, the bottom line is that the role of emotion in political decision making is
complex, with appeals to different emotions having different effects on voters.
Rational choice models assume no role for emotion in decision making, which is a
critical flaw in these models. Thus, the Affective Intelligence Theory was proposed to fill this
void. This theory was born out of research in neuroscience that found that “emotional reactions
actually precede rather than follow conscious perceptions.” (Marcus, Neuman, & MacKuen,

March 2011
17
2000, p. 35) This means that, in making decisions, people do not come to their decision and then
decide how they feel about it. Rather, subconscious emotions lead people to their decision.
This fact alone could be used by democratic skeptics who argue that the public does not
have the knowledge to make good decisions (e.g. Converse, 1960). However, Marcus and
MacKuen (1993) find that in fact, emotional reactions can serve a positive democratic function.
They have identified two emotions as playing a major role in decision-making: anxiety and
enthusiasm. Marcus, Neuman, and MacKuen (2000) developed the Theory of Affective
Intelligence to understand the role that anxiety and enthusiasm pay in political decision making.
The theory suggests that these two emotions have very different effects on voters, and that
politicians can appeal to these emotions, or, in their case, researchers can as well.
Conventional wisdom suggests that feelings of anxiety encourage voters to act without
considering the consequences, but Marcus and MacKuen show that the opposite turns out to be
true. By using panel data from the 1980 American National Election Study as well as survey
data of Missourians during the 1988 presidential campaign, they find that anxiety “stimulates
peoples‟ attention and releases them from their standing decisions” (Marcus & MacKuen, 1993,
p. 678). When people abandon their “standing decisions” (such as party loyalty), they “perk up,
gather new information, and perhaps abandon their old habits” (p. 677). Thus, when feelings of
anxiety are triggered, people rely less on routine shortcuts like partisanship and instead seek out
and use new information.
To describe the Theory of Affective Intelligence in another way, under normal conditions
(when she is not feeling anxious or threatened), a person relies on habits (such as partisan
identification, heuristics or other shortcuts) to make her decisions. This reliance on habit is
called the dispositional system, and allows us to “perform tasks without consciously considering

March 2011
18
them” (Neuman, Marcus, Crigler & MacKuen, 2007, p. 2). However, when she is in an
unfamiliar situation – and she will know she is because she feels anxious – she will rely much
more heavily on the new information that is available to her. This part of the theory is called the
surveillance system, and is “activated when something unexpected is encountered”( p. 2). She
will also seek out new information as a result of this anxiety. Thus, anxiety cues an individual to
act more “rationally,” weighing the information much more carefully.
However, knowing that this relationship exists is not enough. It is important to
understand how politicians use this information in order to cue specific emotions. Brader (2006)
found that political advertisements can trigger feelings of anxiety and fear if they contain
“images associated with death, conflict, and misery such as guns, violent crimes, barren
landscapes, pollution, and warfare” (p. 162). The music in a political ad can also cue certain
emotions. For example, in his experiment, Brader uses “high-pitched, dissonant instrumental
chords pulsating beneath the narration,” to cue anxiety in viewers of political ads. Individuals
exposed to political ads featuring images and music designed to cue feelings of fear and anxiety
relied less on prior preferences and instead put more weight on the information provided in that
ad. It was found that “cuing fear stimulates vigilance, increases reliance on contemporary
evaluations, and facilitates persuasion” (Brader, 2005, p. 388). Furthermore, Brader (2006) also
finds that appeals to anxiety “spark greater willingness to donate time to election efforts and
solidify belief in the importance of voting” (p. 96). Thus, the results from Brader (2005, 2006)
largely replicate and expand upon the findings of Marcus and MacKuen (1993) and their
colleagues.
Though anxiety can cause citizens to change their political behavior, it is not the only
emotion to have that effect. When enthusiasm is cued, for example, it increases interest and

March 2011
19
involvement in politics or a campaign. Brader‟s experimental study demonstrates that it is
possible to cue enthusiasm in political advertisements by using “warm images and music
reinforcing the campaign ad‟s message of a safe, improving community” (Brader, 2006, p. 96).
The experiment involved showing one of three sets of ads to participants: a control ad (that
contained generic images and no music), a negative ad containing fear appeals, and a positive ad
containing enthusiasm appeals. To cue enthusiasm in his participants, Brader used positive,
brightly-colored images and a “sentimental, stirring symphonic” track (p. 84).
These types of cues increase a viewer‟s “interest in the campaign, willingness to
volunteer, and intentions to vote in both the primary and general election.” (p. 107) He notes
that “emotional cues, especially enthusiasm, provide candidates with a powerful instrument for
motivating more citizens to get involved in the campaign” (p. 107). Brader‟s work supports the
theory of affective intelligence in another way as well. He notes that, regardless of the treatment
group, emotional appeals had no effect on subjects‟ cynicism about politicians and political
parties. He concludes that this fact flies in the face of theories about affect transfer (the idea that
it is possible to associate feelings about an object with feelings about a politician or a political
issue).
Marcus and MacKuen (1993), however, argue that “it is only during the fall campaign
that a candidate-induced emotional response spurs involvement” (p. 680). During that time,
however, enthusiasm becomes much more important than anxiety in spurring campaign
involvement. Clearly, there is disagreement as to just how far cues for enthusiasm can get a
candidate; however, that it certainly plays an important role in promoting involvement in a
campaign is without a doubt. Research from Marcus, MacKuen, and their colleagues makes a
strong case for the Affective Intelligence Theory, suggesting that “people use emotions as tools

March 2011
20
for efficient information processing.” (Marcus & MacKuen, 2000, p. 672) Feelings of anxiety
propel an individual to seek out new, relevant information, and they act as an alarm bell that
relying on habitual routines is not the best choice in this new, unfamiliar situation. On the other
hand, feelings of enthusiasm encourage individuals to get involved in a campaign or an election.
However, scholars have introduced multiple caveats to the Theory of Affective
Intelligence. Individual characteristics, such as personal efficacy or political sophistication, may
affect the role of emotion in political decision making. By replicating Marcus and MacKuen‟s
(1993) findings, Rudolph, Gangl, and Stevens (2000) argue that “anxiety among the highly
efficacious drives involvement while anxiety among those with low internal efficacy does not”
(p. 1189). This suggests that anxiety cues widen the gap between those with high and low
political efficacy. The politically efficacious – a group that is likely more engaged in politics to
start with – become even more engaged in politics when exposed to cues for anxiety, while those
with low political efficacy remain at the same level. They find there is “insufficient evidence to
conclude that the interaction of negative affect and low internal efficacy has a demobilizing
effect on the electorate.” (p. 1196)
Political sophistication has also been suggested as mediating the effects of emotional cues
on political behavior. Though conventional wisdom suggests that emotional appeals prey on the
emotions of naïve and unsophisticated voters, the opposite again appears to be true. Brader
(2006) finds that “A person‟s expertise in politics makes campaign advertising more relevant to
his goals and behavior and, therefore, makes the emotional cues in such advertising more
powerful in shaping his response” (p. 143). Huddy and Gunnthorsdottir (2000) find that
emotional appeals are more effective on individuals who are the most “highly involved” or most
knowledgeable about an issue to argue that citizens engage in “passionate reasoning.”

March 2011
21
Perhaps the relationship between emotions and political behavior is even more complex.
Nadeau, Niemi and Amato (1995) argue that anxiety has an indirect effect on political learning
and knowledge because of its role in determining the importance of the issue to the individual.
Emotions, then, influence issue importance, or saliency, which in turn affects political learning.
Their study examines students‟ feelings about the importance of preserving the use of the French
language in Quebec and their feelings of either anxiety or hope of success about whether or not
attempting to protect the language is a lost cause. They note, “The significance of anxiety…
emphasizes that this emotion contributes to knowledge, but that that contribution is funneled
through its impact on the perceived importance of the subject.” (Nadeau, Niemi & Amato, 1995,
p. 569) This finding suggests that – along with the conditional variables of an individual‟s
personal political efficacy and sophistication –there is perhaps a mediating variable of issue
saliency in the relationship between emotions and political behavior.
Up to this point, much of the discussion has centered on two emotions: anxiety and
enthusiasm. Though scholars disagree to some extent about the mechanics of the relationship
between emotion and political behavior, most agree that this relationship is important – whether
it is direct (Marcus, Neuman & MacKuen 2000; Marcus & MacKuen 1993; and Brader 2006),
based on political efficacy (Rudolph, Gangl & Stevens 2000), political sophistication (Brader
2000; Huddy & Gunnthorsdottir 2000), or even saliency (Nadeau, Niemi & Amato 1995).
The research presented thus far has given rise to the criticism of emotional appeals in
politics. If, as has been demonstrated, emotional affect plays a large role in citizen‟s political
behavior, and if, as researchers have also demonstrated, these emotions can be manipulated by
scholars or politicians, is this not a cause for concern? Are citizens‟ decisions being manipulated
by appeals to their emotions? Huddy and Gunnthorsdottir (2000) say “no.” Rather, they find

March 2011
22
support for an idea that they refer to as passionate reasoning; they, like Brader (2006) find that
emotional appeals are most effective on those individuals who are already highly involved with
an issue. Huddy and Gunnthorsdottir use an experimental design measuring whether support for
an environmental group changed based on the emotional content of visual images presented to
participants. They find that low-involvement environmental supporters “are no more likely to
oppose an anti-environment organization that is willing to sacrifice a cute versus an ugly animal,
nor are they more likely to support an organization attempting to save a cute animal” (Huddy &
Gunnthorsdottir, 2000, p. 762). Thus, the “cuteness” of the animal (and therefore the emotional
effect brought on by that animal) has no effect on participant‟s willingness to get involved on
behalf of that animal. They note, “Emotion… is pervasive, politically important, and serves as a
potentially useful tool for citizens as they negotiate the complexity of contemporary politics” (p.
746), suggesting an integrated model of affect and cognition. Thus, they argue that, “Our
findings challenge the longstanding view of an easily manipulated and gullible public” (p. 766).
Taken to the next logical step, this research on emotional appeals in politics has
implications for the way campaigns should operate. If, for example, one party is more
effectively appealing to the emotions of voters because of the way they are communicating their
ideas, this can have real effects on election outcomes. Westen (2007) argues just that. His thesis
is based on the idea that in the early-to-mid part of the first decade of the 21st century, the
Republican Party was more successful at appealing to the emotions of voters than the
Democratic Party, which played a role in Republicans‟ electoral success in 2000, 2002, and
2004. If Democrats want to win more elections, Westen argues that they need to appeal more
effectively to the emotions – not just the logic and reason – of American voters. He writes,
“Successful campaigns build on a strong party brand defined by core values, address conflicts
March 2011
23
within and between voters, offer principled stands on issues that matter to voters, attend to both
conscious and unconscious values and attitudes, activate and inhibit networks associated with
positive and negative emotions, and, perhaps most importantly, speak the truth to voters in a way
that is emotionally compelling” (p. 257 – emphasis mine).
For example, Westen criticizes the Democratic inability to campaign emotionally by
pointing out the Kerry campaign‟s (non-) response to the Swift Boat attack ads that appeared in
the 2004 presidential campaign. Westen argues that the day the first ad came out Kerry‟s team
should have,
“Launched a character assault – preferably in front of an audience of veterans –
against a self-proclaimed „war president‟ who ran ads dishonoring a decorated
war veteran… He should have angrily demanded that the president stand before
the American people, with his hand squarely on the Bible, and swear before God
that neither he nor Rove nor any member of his campaign had anything to do with
this unprecedented wartime attack on the honor of a decorated war veteran.” (p.
344)
Instead of responding passionately as Westen suggests, the Kerry campaign waited weeks
to respond and ultimately wrote a rather wishy-washy and round-a-bout letter to the Bush
campaign. This, Westen argues, is the type of behavior that has become the signature style of
Democratic politicians and candidates – and is exactly what they need to change in order to run
more successful campaigns. Democrats need to focus on “creating, solidifying and activating
networks that create primarily positive feelings toward [the] candidate or party and negative
feelings toward the opposition.” (p. 85)

March 2011
24
Taken together, the literature on the effects of emotion on political behavior strongly
support the argument that political debate more effectively persuades voters and stimulates
turnout and involvement if it is framed in ways that appeals to voters‟ emotions. The literature is
especially persuasive because it relies on multiple methods of studying this research question.
For example, Marcus and MacKuen (1993, 2000) used surveys to examine the effects of
emotions, and Brader (2005, 2006) utilized a combination of surveys and experiments.
Furthermore, cutting-edge technologies have been developed to study this question in new ways
(see Valentino et al., 2008). Thus, we can be sure that these results are not simply a by-product
of a flawed research design. Not only do these studies have face validity, but they draw on a
background of psychology, and examine how the brain works as a way to justify theory.
Overall, the literature surrounding the role of emotion in political decision making is
quite persuasive. Though there is slight disagreement surrounding the extent to which emotions
change political behavior, there is almost universal agreement that it does. Emotional appeals in
politics lead to changed citizen behavior, whether it is through increased involvement (when
enthusiasm is triggered), a decreased reliance on habits and increased information seeking (when
anxiety is triggered). Though these emotional appeals can be and are often used for changing
democratic participants for the better, this does not mean that they can only be used for that
purpose; cueing anger has been shown to decrease viewers‟ desire to participate in the political
process (Valentino, Hutchings, Banks & Davis, 2008; Valentino, Hutchings & White, 2002;
Valentino, Hutchings & Williams, 2004). However, the literature overwhelmingly suggests that
appeals to emotions in politics should be largely cleared of their bad reputations. Without
emotional reactions, fewer citizens would learn about and be involved in politics.

March 2011
25
The results from the research on emotional appeals in politics, and especially emotional
appeals in political ads, strongly support the argument that appeals to voters‟ emotions are more
successful than non-emotional appeals. None of these studies found undesirable effects (such as
depressed turnout, learning, or efficacy) as a result of advertisements that used emotional
appeals. Thus, I am most convinced by the research concluding that campaign advertisements
have positive effects on voter turnout, and that these effects are often the product of emotional
appeals and the existence of negativity in these advertisements. I reject the conventional wisdom
that negative ads and ads that “prey on the emotions” of voters are a detriment to democracy; the
evidence to the contrary is much too strong. It is easy to blame Americans‟ anemic interest in
political affairs on campaign advertisements; however, research has demonstrated that campaign
ads serve a positive function and help to increase desirable democratic attitudes and actions.
Chapter 2: Hypotheses
Though the literature surrounding political advertising is quite extensive, there are still
questions to be answered. For example, much of the work that has been done has been
conducted using an experimental design which can more easily establish causality but is not
always externally valid. Thus, experiments have the drawback of not offering a sense of the
persuasive power of political ads in a real life environment (when viewers may be channel
surfing, or not paying attention to the TV). This thesis explores whether or not the effects of
political advertising found in an experimental setting carry over when the researcher does not
control exposure to the ads.
I test five different hypotheses to learn more about the effects of real political ads on real
viewers and voters. The aim of these hypotheses is twofold. The first is to understand better

March 2011
26
what types of ads are more persuasive than others; in a sense, what is the best way to persuade
Americans to support and turn out for one candidate over another? Further, to understand how
different ads appeal to different sets of voters; for example, if positive ads are more effective at
persuading Independent voters. Thus, the first set of hypotheses is based around both ad
characteristics as well as viewer demographics. The second aim of these hypotheses is to
understand how political campaigns strategically spend their advertising dollars. These
hypotheses are centered not only the traditional content (the focus and tone), but also the
emotional content of political ads.
Ad Effects Hypotheses
Hypothesis 1 (Tone): Negative ads are more effective at influencing voter preferences
than positive ads. This hypothesis is based largely off the work of Freedman and Goldstein
(1999) (also Goldstein & Friedman, 2002), who find that exposure to negative ads increases the
likelihood of voting. It also stems from the work of Jackson, Mondak, and Huckfeldt (2009),
who defend negative ads from accusations of depreciating viewers‟ self-efficacy. If negative ads
are having an effect on voters‟ self-efficacy (and, as a result, voter turnout), and if voters give
more weight to negative information than to positive information (Freedman & Goldstein, 1999),
then surely there is a possibility that negative ads are more successful at persuading voters than
positive ads. If this hypothesis is true, then respondents who live in areas in which a high
number of negative political ads are aired will be more likely to express support for the candidate
who runs those ads.
Hypothesis 2 (Focus): Ads that focus on the candidates‟ personalities will be more
effective at influencing voter preferences than ads that focus on policy. If ads focusing on

March 2011
27
personality are more effective at increasing viewer self-efficacy (Kahn & Kenny, 1999), perhaps
they are also more persuasive. This is especially compelling as a number of people (reporters,
pundits, and the like.) have suggested that a major part of Bush‟s appeal was the fact that he is
the kind of guy that many would “like to have a beer with.” Whether or not voters actually kept
this “beer appeal” in mind in making their decision will be, at least to some extent, answered
with this hypothesis. If true, then respondents in areas that received a large amount of ads
focusing on the candidates‟ personality/image – as opposed to policy – will be more likely to
vote for that candidate.
Hypothesis 3 (Political Engagement): Political ad effects will be strongest for
respondents with low levels of political interest. Viewers who spend time discussing/thinking
about politics have the ability to counter messages put forward in political ads; the politically
unengaged are less likely to have this ability. If this hypothesis is true, it will confirm the
findings of Franz et al. (2007): that political ads act as a “multivitamin” for American democracy
and aid the decision-making of the least interested voters.
Hypothesis 4 (Partisans): The more partisan the viewer, the less of an effect the ad will
have on her preferences. Thus, ad effects will be greatest among Independents. The foundation
for this hypothesis is similar to that of the Political Engagement hypothesis. Not only do
partisans tend to have access to more political information than non-partisans (and are thus more
likely to act like political sophisticates), but partisanship is generally the best predictor of vote
choice. Because of this, I expect partisanship to act as an insulator of advertising effects, and
those who are not committed to one party or another will be the most likely to be persuaded by
political advertising.
March 2011
28
Ad Strategy Hypotheses
Hypothesis 5 (Strategic Emotional Appeals): I expect that the Bush campaign used
emotional appeals more often than the Kerry campaign; these emotional appeals will be heavily
concentrated in areas that are competitive. This hypothesis is designed to test the thesis outlined
by Westen (2007), or the idea that Republican candidates have appealed to the emotions of
voters more successfully than Democratic candidates, with the electoral successes of 2000
through 2006 as proof. If this hypothesis is true, the ads produced by the Bush campaign will be
more emotion-laden (contain music, emotional imagery, manipulate coloring schemes), and
these emotional ads will air in the most competitive states.
Chapter 3: Data and Methods
National Annenberg Election Survey
To test these hypotheses, it was necessary to create a unique dataset that included data
about both American citizens and the advertisements that ran during the campaign. This first
need was met with the National Rolling Cross Section (NRCS) data of the National Annenberg
Election Survey. The NRCS interviewed 81,422 respondents between October 2003 and
November 2004. For this paper, however, I examined only respondents interviewed in the nine
weeks leading up to the 2004 Presidential Election, or just after the parties‟ national nominating
conventions were held. Responses were also limited to those who live in a media market where
at least one campaign ad supporting Bush or Kerry was run during the general election
campaign. The result was a dataset that included 11,514 respondents. Important variables were
then created based on survey responses and demographic information.

March 2011
29
As the dependent variable in this study is voter preferences, I examined multiple
measures of this concept. The first is a general question, asking respondents who they would
vote for if the election were held today.1 The second and third variables measuring voter
preferences ask respondents to rate how they feel about the candidates on a scale of 0 to 10.2 I
collapsed this scale so that scores of 0 through 3 were coded as an Unfavorable Rating, 4 through
6 fell into the Neutral Rating category, and 7 to 10 were counted as a Favorable Rating.
The conditional variables studied include the respondents‟ television viewing habits,
education and partisanship, as well as his or her political engagement. Assessment of the
respondents‟ TV use was created by computing the number of times per week the respondents
reported viewing certain programs (resulting in the Television Viewing Habits Scale). Though
not exactly the same method recommended by Ridout, Shaw, Goldstein and Franz (2004)
because it was not possible with the NAES data, the spirit of the methodology is the same. That
is, respondents are asked the number of times in the past week they watched a five different
programs, which I computed to form a scale. Respondents who answered between 0 and 7
(meaning they watched one or more of the five asked-about programs a total of seven or fewer
times in the past week) were placed in the Light TV Use category, those who responded between
8 and 15 were in the Medium TV Use Category, and responses above 15 were placed in the High
TV Use category.
1 The exact question wording is: “If the 2004 presidential election were being held today, would you vote for
George W. Bush and Dick Cheney, the Republicans; John Kerry and John Edwards, the Democrats; or Ralph Nader and Peter Camejo of the Reform Party?” (Question 470) 2 “On a scale of zero to 10, how would you rate (George W. Bush/John Kerry)? Zero means very unfavorable and 10
means very favorable. Five means you do not feel favorable or unfavorable. Of course you can use any number between 0 and 10.” If don’t know: “Do you mean you don’t recognize the name, or you know the name but not well enough to rate them?”

March 2011
30
Respondents falling into the High TV Viewing category are slightly different than the
entire sample. They are slightly more Democratic than the whole sample (32.3% call themselves
strong Democrats, compared to the 24.2% identifying the same way among all respondents).3
The variables measuring party identification (referred to throughout this paper as party ID
or PID) is standard: partisanship is measured on the traditional scale of one to seven, where one
represents Strong Democrat, four is a true Independent (a respondent who says he is an
independent who does not lean towards one party or the other), and seven represents Strong
Republican. Scores of three and five on this scale represent the independents leaning towards the
Democratic or Republican Party, respectively. This scale was created by combining responses to
three questions regarding general identification, strength of identification, and the “leanings” of
political independents.4
I created the Political Engagement Scale as a measure of how tuned into politics each
respondent is. NAES asked each respondent the number of times she or he discussed politics
each week both with family and friends and at work. Possible scores on the Political
Engagement Scale include Unengaged (those who reported discussing politics with family and
friends or at work between 0 and 4 times per week), Moderately Engaged (5 to 9) and Highly
Engaged (10 to 14 times per week).
Wisconsin Advertising Project
3 For tables examining the differences in partisanship and vote choice between the whole sample and those who
fall in the High TV Viewing category, see Appendix 1. 4 Party ID question wording:
Question 258: “Generally speaking, do you usually think of yourself as a Republican, a Democrat, an Independent, or something else?” Question 259: “Do you consider yourself a strong or not a very strong (from cMA01: Republican/Democrat/Independent)?” Question 260: “Do you think of yourself as closer to the Republican or Democratic Party?”

March 2011
31
The Wisconsin Advertising Project dataset was important to utilize because it contains
data about all of the political ads that aired during the 2004 campaign. During the final eight
weeks of the campaign, 340 different Bush and Kerry advertisements were run in the top 100
media markets. These ads were aired over 349,000 times during this period. The WAP data
includes information not only on where and when the ads aired, but also on the content of the
ads. This is crucial to understanding what types of political advertisements are effective in
shaping the preferences of the electorate. Each respondent‟s possible ad exposure is measured
based on the media market that the respondent lives in and the number of ads that had been aired
up to their date of interview. Thus, the conditional variable throughout this analysis is the
number of each type of ad that every respondent theoretically could have seen before they were
interviewed by NAES.
This paper relies heavily on variables concerning the focus and tone of the ad. Ad tone is
measured based on whether the ad is primarily intended to attack, contrast, or promote the
candidates.5 This allows testing of H1 – whether or not negative ads are more effective at
influencing voter preferences than positive ads (Ansolabehere & Iyengar, 1995; Krupnikov,
2009; Stevens, 2009; Kahn & Kenny, 1999; Mayer, 1996.).
The effect of the focus of the ad has also been studied (Dardis, Shen & Edwards, 2008;
Westen, 2007) and is important for testing H2 – whether policy (issue) or personality (image) ads
are more effective tools of persuasion. The variable describing whether the primary focus of the
ad is a candidate‟s personal characteristics or policy position will help test this hypothesis.6
5 Ad tone question wording: “In your judgment, is the primary purpose of the ad to promote a specific candidate,
to attack a candidate, or to contrast the candidates?” 6 Ad focus question wording: “In your judgment, is the primary focus of this ad the personal characteristics of
either candidate or on policy matters?”

March 2011
32
Other variables I utilized from the WAP data are whether or not an American flag
appeared in the ad, the estimated cost of airing the ad (“based on normal cost of timeslot within
market”7), and the number of seconds of the ad.
Chapter 4: Ad Content and Emotional Appeals
This section tests Hypothesis 6, that the Bush campaign used more emotional appeals in
their ads than the Kerry campaign. Again, this hypothesis originates from Westen (2007); he
argues that Republicans are more successful at appealing to the emotions of voters, and this is
why Republicans made more successful electoral bids between 2000 and 2006. If the
Republican Party is making emotional appeals more frequently in their campaigns, then one
place this should manifest itself should be in their campaign ads.
Unfortunately, the WAP dataset does not include information that would enable analysis
of whether Bush or Kerry used more emotional appeals in their campaign ads. To examine this,
it was important to code the videostyle – the “verbal content, the nonverbal content, and the
film/video production techniques used in political ads” (Kaid & Johnston, 2001, p. 27)– of the
ads run by the Bush and Kerry campaigns themselves. I was able to do this because the Political
Communications Lab at Stanford University has an archive of these ads available on its website.8
I coded these ads based on their coloring schemes, positive and negative imagery, background
music, and patriotic symbols.9
As discussed in Chapter 1, two emotions have been highlighted as playing an important
role in political decision-making: anxiety and enthusiasm (Marcus & MacKuen, 1993; Marcus,
7 WiscAd 2004 Presidential Codebook, p. 2
8 http://pcl.stanford.edu/campaigns/2004/archive.html
9 See Appendix 2 for codebook

March 2011
33
Neuman & MacKuen 2000; Brader, 2006). Appeals to anxiety often make use of black and
white or dark coloring schemes. Discordant music in a minor key is also likely to raise the level
of tension in a listener. Finally, negative imagery – such as images related to terrorism, drugs or
violence, abandoned buildings, desolate landscapes or pollution, or the faces of people who look
stressed or unhappy – is also likely to be utilized in these appeals to anxiety. These images are
similar to those used by Brader (2006), and Kaid and Johnston (2001).
Appeals to enthusiasm were coded for based on the ad‟s use of bright colors and positive
imagery. Positive imagery includes ads that feature smiles, clean neighborhoods, hardworking
Americans, and schools or graduations. Finally, appeals to patriotism were coded based on the
presence of traditional American symbols – an American flag, an eagle, famous American
landscapes, an American document, or a prior President (similar to Kaid & Johnston, 2001) – in
each ad, or if the ads utilized patriotic music, such as the National Anthem or a drum march.
To test the hypothesis that Republicans use more emotional appeals than Democrats, I
compared the number of emotional appeals made by the Bush campaign to those made by the
Kerry campaign. According to the Stanford PCL website, during September and October of
2004, the Bush campaign produced 27 ads; the Kerry campaign produced 41. A comparison
with the WAP data shows some inconsistencies between the two datasets. While WAP has the
Bush campaign airing 18 ads in September and October, Stanford provides 27 ads. This could be
explained by the fact that perhaps the Bush campaign produced more ads than they eventually
decided to air. The inconsistencies between the two datasets in relation to the Kerry campaign‟s
ads, however, are less easily explained. According to the WAP data, Kerry ran 63 ads in the last
two months. However, the PLC data only contains 41 Kerry ads. While many of the ads do

March 2011
34
match between the two data sources, a major drawback is that the ad run most often by the Kerry
campaign (“Guiding Principles”) is not listed in the PCL dataset.
While this inconsistency in the data sources is certainly a flaw with the data used in this
section, it does not make the analysis any less worthwhile. Rather, it is simply important to keep
in mind that more research should be done on this area to make data sources more complete and
accurate.
Overall, I found mixed support for Hypothesis 6. No differences between the candidates‟
ads emerged among positive ads, though some results did emerge in terms of the different use of
emotional appeals in negative ads. A major difference between the campaigns, however, is in
their use of neutral imagery.
In their positive ads, the Bush and Kerry campaigns used essentially equal amounts of
appeals to enthusiasm. Of Bush and Kerry‟s positive ads, 41.7% and 41.9%, respectively, used
bright colors. Similarly, 50% of Bush‟s positive ads and 51.6% of Kerry‟s positive ads used at
least one positive image. Positive Bush ads were slightly more likely to use multiple positive
images (33.3% compared to Kerry‟s 29%), but overall the positive ads were relatively equal in
their use of appeals to enthusiasm.
No significant differences emerge in the way the two campaigns used dark coloring
schemes in their negative ads; 62.9% of Kerry‟s negative ads were shown in mostly dark colors,
and 57.9% of Bush‟s negative ads did the same. Furthermore, their use of black and white
coloring was nearly identical: Bush‟s 31.6% to Kerry‟s 31.4%. The campaigns were also similar
in their use of negative imagery in their attack ads. Almost 48% of the Bush attack ads utilized
negative imagery, and almost 43% of Kerry attack ads did so as well. However, 11.4% of
Kerry‟s attack ads used two negative images, whereas no Bush ads used more than one.

March 2011
35
An area of differentiation between the Bush and Kerry campaign ads was in their use of
American or patriotic symbols. Despite my informal expectations that the Bush campaign would
rely on patriotic appeals much more often than the Kerry campaign, the opposite turned out to be
true. In fact, 77.8% of Bush ads did not feature any patriotic imagery, whereas 61% of Kerry ads
used at least one American symbol (and 7.3% used more than one)! Similarly, as demonstrated
by Table 1, 22% of Kerry ads used marching or drumming music. No Bush ads used drums to
appeal to viewers‟ patriotism.
Table 1
Despite the above discussion of imagery, music and coloration present in the ads, one
accusation that Westen pinned on Democrats is that often they simply lack a way of “telling the
truth in a way that is emotionally compelling” (p. 257). In ads where the candidate spends a lot
of time speaking to the camera, the difference between Bush ads and Kerry ads is quite different.
In fact, in 73.2% of Kerry‟s ads, he spends time addressing the camera. This is true in only
40.7% of Bush ads. This is the greatest difference between the Bush and Kerry ads, and the area
where hypothesis 6 is most supported.
For example, Kerry‟s ad “Obligation” demonstrates this fact clearly. For almost the
entirety of the ad, Kerry is a talking head. He explains, “The obligation of a Commander-in-
Chief is to keep our country safe. In Iraq, George Bush has overextended our troops, and now

March 2011
36
failed to secure 380 tons of deadly explosives, the kind used for attacks in Iraq and for terrorist
bombings. His Iraq misjudgments put our soldiers at risk and make our country less secure.
And all he offers is more of the same. As president, I‟ll make a fresh start to protect our troops
and our nation. I‟m John Kerry, and I approve this message.” The ad is shot in an office, with
an American flag visible in the left side of the background. Soft classical music plays as Kerry
talks to the camera, and for about 8 seconds Kerry‟s head is replaced by a New York Times
article headlined “Huge Cache of Explosives Vanished from Sight in Iraq.”
While Kerry certainly criticizes Bush in this ad, it lacks the emotional appeals that Bush
makes quite successfully in many of his ads. In contrast to Kerry‟s “Obligation” ad, one of the
Bush campaign‟s ads – “Whatever It Takes” – has stuck with me long after I first watched it.
Bush stands behind a podium, giving a speech to a crowd of soldiers, veterans, and their families.
Bush stands in front of a red, white and blue background and says,
“I‟ve learned firsthand that ordering Americans into battle is the hardest decision, even
when it was right. I have returned the salute of wounded soldiers, who say they were just doing
their job.” The camera focuses on a veteran in the audience, with American flags waving in the
foreground, “I‟ve held the children of the fallen who‟ve been told their dad or mom is a hero, but
would rather just have their mom or dad. I‟ve met with the parents and wives and husbands,” the
camera focuses on a woman with tears in her eyes, holding an American flag, “who have
received a folded flag. And in those military families, I have seen the character of a great
nation.” Camera fades between cheering crowd, waving flags, and pictures of veterans.
“Because of your service and sacrifice, we are defeating the terrorists where they live and plan,
and are making America safer. I will never relent in defending America, whatever it takes.” At
this last line, the background music swells and the audience cheers.

March 2011
37
The difference in these two ads is striking. It demonstrates the fact that, despite many of
the similarities in the use of emotional appeals made through the ads‟ videostyle, a fundamental
difference distinguishes the Bush ads from the Kerry ads: the use of the talking head. In both ads
described above, the candidates were speaking about the military. Both made appeals to
viewers‟ patriotism by featuring American flags. It was the format of the ad that was noticeably
different; this format change, while certainly important in understanding the candidates‟
approach to persuasion, is the most significantly different factor between the candidates‟ ads.
Thus, the support for Hypothesis 6 is mixed. The candidates‟ ads were quite similar in
their appeals to enthusiasm and their use of negative imagery in appeals to anxiety. However,
Kerry – not Bush – was more likely to appeal to viewers‟ patriotism in his ads. The greatest
support for Hypothesis 5 comes from the fact that the Kerry campaign was much more likely to
use a non-emotional format for getting their message across: the talking head.
Chapter 5: Advertising Strategy – Timing and Placement
Political ads in any campaign are not deployed randomly; campaigns choose the timing
and location of their ads based on a number of factors, including the electoral significance of the
area and the competitiveness and candidate‟s approval in the area. Thus, ad placement is very
strategic, and understanding why the candidates placed ads the way they did is crucial to
understanding the ads‟ effects.
In total, in the nine weeks leading up to the election – which encompasses almost the
entire general election campaign – the campaigns, the parties, and interest groups ran over
348,000 ads for Bush or Kerry. In terms of the raw number of ads in the 2004 Presidential
campaign, Kerry ran almost 50% more in the top 100 media markets: 208,270 to Bush‟s 140,707

March 2011
38
ads. In every week but one (week 2), Americans saw more ads for Kerry than ads for Bush (see
Figure 1).
Figure 1
As shown in Table 2, the ads run by the campaigns themselves differed in their ad tone.
Bush was much more inclined to go on the attack: 70.3% of Bush ads were negative. Kerry, on
the other hand, was more likely to draw a contrast between himself and Bush in his ads: he did so
59% of the time. Furthermore, Kerry‟s ads made up nearly 100% of the contrast ads, as Bush
aired a contrast ad only 11 times. This is not unexpected; the Bush team likely decided to use
their incumbency as an advantage and ignored the challenger in ads. Kerry was also more likely
to run positive ads: 38.2% of his ads were positive, compared to only 29.5% of Bush‟s ads.
Further, nearly 90% of the positive ads aired during the 2004 general election were Kerry‟s.

March 2011
39
Table 2
The tone of the ads across the campaign varied widely. As shown in Figure 2, while
Bush ads were initially more positive than Kerry‟s, by the fourth week of the campaign the Bush
ads were almost entirely negative. In the final week, however, the number of negative Bush ads
dipped substantially; perhaps with the intention of leaving a positive final impression with voters
just before they headed to the polls. Alternately, Kerry ran primarily contrast ads until the
seventh week of the campaign, when the emphasis of his ads became negativity. Unlike the
Bush ads, the number of negative Kerry ads continued to increase through the end of the
campaign.

March 2011
40
Figure 2
Figure 3 does quite a bit to dispel the myth that political ads are focused on the character
of a candidate rather than on policy matters. In fact, throughout the entire campaign, the ads of
both candidates focused much more on matters of policy than on personality. In the last week of
the campaign, however, Bush ads began to focus more intensely on personality than they had
earlier in the campaign. Kerry ads also began to focus more on personality – by increasing the
number of Kerry ads that focused on both Personality and Policy – starting about two weeks out
from Election Day. Thus, though there was an uptick in the focus on personal characteristics in
the last few weeks (especially among Bush ads), throughout the campaign the ads were largely
focused on the policy positions of the candidates.

March 2011
41
Figure 3
Figures 1, 2 and 3 demonstrate how the campaigns grew in intensity as Election Day
drew nearer. Nine weeks out from the election, both campaigns were running a relatively low
number of ads. However, halfway through election season, a major difference emerged in the
level and type of advertising that the candidates were producing. For Kerry, the rise in ads was
steep and steady. The focus was increasingly negative, policy-focused ads. Bush‟s increase in
total ads was slightly more gradual and he never reached the highs that Kerry did towards the
end. However, the sharp climb in Bush attack ads around weeks four to six demonstrate the
point at which the Bush campaign clicked into gear.
While the timing of the ads is quite informative as to how the campaigns “sped up” as the
election drew nearer, the placement of the ads is important to understanding which states the
campaigns felt were worth the fight. The campaigns focused on areas which, in the presidential
election of 2000, had been won by a narrow margin. The ten media markets that received the
March 2011
42
most ads10
were based out of five states: New Mexico, Wisconsin, Florida, Ohio, and Nevada.
Each of these states was won in 2000 by less than four percent of the vote and was considered a
battleground state. These battleground states appear in the data as media markets where both
Bush and Kerry placed a high amount of ads. In fact, throughout the campaign, the placement of
Bush and Kerry ads is very highly correlated (r=.957). Figure 4 demonstrates this correlation
nicely. Each data point represents the number of Bush or Kerry ads that ran in an individual
media market throughout the nine weeks of the general election campaign. Markets that
received only a light amount of ads are located in the bottom left of Figure 4, whereas markets
with a high amount of ads are in the upper right corner. The Tampa and Miami markets received
the most ad play during the campaign, and are the markets located in the upper right corner in
Figure 4.
10
Albuquerque, Cleveland, Columbus, Green Bay, Jacksonville, Las Vegas, Miami, Milwaukee, Orlando, Toledo

March 2011
43
Figure 4
Table 3 reinforces the idea that the candidates thought that the same media markets were
important or competitive (or not), and placed their ads accordingly. Florida was the deciding
state in 2000, and it was hotly contested in the 2004 election. This is obvious by the high ad
placement in the Florida media markets. The first seven rows of Table 3 are Florida media
markets in which political ads ran during the 2004 Presidential campaign. Of the ten media
markets that broadcast in Florida, seven received a high amount of ads during the campaign. The
three that received no ads are located in the relatively lightly populated Florida panhandle.
Not all states were as hotly contested as Florida, however. California and Texas, for
example, are considered to be safe states for Democrats and Republicans, respectively. Neither
Bush nor Kerry wasted money on potential voters in these states; of the 15 markets located in
California, only San Diego received any ads during the general election campaign: it received a
single ad. Other California markets, such as San Francisco or Los Angeles market, received no

March 2011
44
ads. Similarly, rows nine to eleven in Table 3 represent the only three markets in Texas (of 19) to
receive any ads. The San Antonio market received only one ad. The Shreveport and El Paso
media markets both significantly overlap into other states: the Shreveport is market, of course,
based out of Louisiana. The El Paso media market includes part of southern New Mexico (a
battleground state). Because of this overlap into other states, both Bush and especially Kerry felt
it worthwhile to air ads in these two – but no other – Texas media markets.
Table 3
What is significant about Table 3 is not only which markets are listed. Though it is
important to observe the high number of ads that were aired in battleground states such as
Florida, just as important are the markets that are not listed. Almost all of the markets in “safe”
states were ignored because it was simply not worth the effort for either campaign to advertise
there.
This chapter is important because it gives a feel of the rhythm and pace of the campaign.
Clearly, the campaigns intensified as Election Day drew near, particularly in battleground states.
Furthermore, throughout the entire campaign, the ads were overwhelmingly focused on matters
Total Bush
Ads
Total Kerry
Ads
Total Ads
in Market
Bush Ads in
Election Week
Kerry Ads in
Election Week
Bush Ads in First
Week of Campaign
Kerry Ads in First
Week of Campaign
Ft. Myers 2,990 3,690 6,680 469 422 95 219
Mobile 3,175 3,397 6,572 762 670 123 252
Jacksonville 4,049 6,308 10,357 560 829 122 317
Orlando 5,014 7,443 12,457 913 1,252 34 296
Shreveport 0 562 562 0 562 0 0
Tampa 5,913 9,192 15,105 996 1,775 147 397
West Palm
Beach2,284 3,801 6,085 564 608 1 113
San Diego 1 0 1 0 0 0 0
Shreveport 0 562 562 0 562 0 0
San Antonio 1 0 1 0 0 0 0
El Paso 1,171 1,834 3,005 328 409 0 17
Safe and Contested Media Markets

March 2011
45
of policy and not personal characteristics of the candidates, yet the ads got significantly more
negative as the campaign progressed.
Chapter 6: Advertising Effects
This chapter examines the different variables that influence the possible effect of the
campaign ads run in the 2004 general election. It tests the majority of my hypotheses, such as
whether or not negative and personality-focused ads are more effective at swaying public
opinion than positive, policy-focused ads (Hypotheses One and Two). It also tests Hypothesis
Three: whether unengaged voters are more likely to be swayed by campaign ads, and Hypothesis
Four: whether independents are more open to influence than partisan voters. The layout of the
chapter is as follows: first is a discussion of how television viewing habits affect campaign ads‟
possible impact on voters‟ preferences. Viewers who watch a lot of television are exposed to
more ads than those who watch less. The results suggest that Kerry‟s positive and negative ads
affect Kerry‟s favorability, while Bush favorability is relatively stable under different levels of
the amount of TV use.
Second, the differences between independent and partisan voters are explained. Much of
the analysis in this chapter is based upon correlations between party ID and candidate
favorability, and how this relationship is affected by ad exposure. However, without the
predictor of attachment to one party or the other, how do ads affect the way that voters feel about
the candidates? This section explains how independent voters are affected differently than
partisan voters; independent voters were especially swayed by Kerry‟s negative ads.

March 2011
46
The third section is similar to the third, but with the focus on political engagement. If, as
has been argued (Freedman, Franz & Goldstein, 2004), campaign ads serve a “multivitamin”
function, then they should be especially effective on those who are least engaged in politics.
This was supported, and unengaged respondents were generally influenced more than the
politically engaged by an increased level of advertising.
The fourth section changes the dependent variable to focus on the respondents‟ likelihood
of voting. This tests whether exposure to certain ads makes respondents more or less likely to
turn out to vote. For the majority of the advertising types, increased exposure to ads did increase
turnout likelihood.
The chapter concludes with a discussion of the difference effects on respondents
interviewed toward the end of the campaign and those interviewed earlier in the election cycle.
These late respondents have been exposed to more ads than those interviewed in the first week of
the campaign. This means that, presumably, the ads have had more time to affect these late
respondents than others and there is a potentially greater effect of the accumulation of repeated
exposure to them.
Before beginning the analyses, however, I want to discuss the partisan inclinations of the
data briefly. First, as presented in Table 4, Republicans tended to be more loyal supporters of
Bush than Democrats were of Kerry. Strong Republicans, for example, rated Bush favorably
93.9% of the time; only 84.8% of strong Democrats rated Kerry as highly. Moreover, while 6%
of strong Democrats rated Bush favorably, only 3.7% of strong Republicans gave Kerry a similar
rating.
Independents, on the other hand, tended to feel more neutral about Kerry than they did
about Bush. True independents rated Kerry favorably 29.9% of the time, and a whopping 43.7%

March 2011
47
gave him a neutral rating. The independents were split over Bush, however, with almost exactly
a third of independents falling in each rating category.
Also important to note is that the “leaners” (Independents Leaning Democratic and
Independents Leaning Republican) tended to act more like true partisans than weak Democrats
or weak Republicans. For example, Independents leaning Republican rated Bush favorably more
often than weak Republicans (75.9% compared to 70.7%, respectively). The same was true
among Democrats: weak Democrats rated Kerry favorably only 56.2% of the time, compared to
the 65.7% of Independents leaning Democratic who rated him in the same way.
Table 4
Television Viewing Habits
Much of this analysis relies on whether or not the relationship between party
identification and candidate favorability changes based on the respondents‟ exposure to ads. For
Unfavorable Neutral Favorable Unfavorable Neutral Favorable
Count 74 304 2102 2480 1922 417 148 2487
% within
Party_ID
3.0% 12.3% 84.8% 100.0% 77.3% 16.8% 6.0% 100.0%
Count 168 396 723 1287 622 377 306 1305
% within
Party_ID
13.1% 30.8% 56.2% 100.0% 47.7% 28.9% 23.4% 100.0%
Count 67 362 822 1251 850 294 111 1255
% within
Party_ID
5.4% 28.9% 65.7% 100.0% 67.7% 23.4% 8.8% 100.0%
Count 153 253 173 579 199 191 198 588
% within
Party_ID
26.4% 43.7% 29.9% 100.0% 33.8% 32.5% 33.7% 100.0%
Count 601 399 92 1092 70 195 835 1100
% within
Party_ID
55.0% 36.5% 8.4% 100.0% 6.4% 17.7% 75.9% 100.0%
Count 528 436 147 1111 107 222 794 1123
% within
Party_ID
47.5% 39.2% 13.2% 100.0% 9.5% 19.8% 70.7% 100.0%
Count 1829 391 86 2306 51 91 2179 2321
% within
Party_ID
79.3% 17.0% 3.7% 100.0% 2.2% 3.9% 93.9% 100.0%
Count 3420 2541 4145 10106 3821 1787 4571 10179
% within
Party_ID
33.8% 25.1% 41.0% 100.0% 37.5% 17.6% 44.9% 100.0%
Scale of Kerry Favorability
Total
Party ID Strong Democrats
Weak Democrats
Independents
Leaning Democrat
True Independents
Independents
Leaning Republican
Scale of Bush Favorability
Total
Table of Party ID and Bush and Kerry Favorability
Weak Republicans
Strong Republicans
Total
March 2011
48
example, whether weak Democrats are more likely to rate Kerry favorably when they are
exposed to a high amount of Kerry‟s promotional ads. The TV Viewing Habits Scale is an
important variable because it takes respondent behavior into consideration. Theoretically, a
person who watches quite a bit of TV is more likely to see campaign ads than a person who does
not watch much TV. Combining questions about the respondents‟ television habits (which
channels they watch and how many times in the last week they watched) gives a good sense of
each respondent‟s relative TV use.
A comparison of the correlations between people who watch TV only rarely (score of
“Low” on the TV Habits Scale) and those who watch TV often (score of “High”) shows mixed
results. Bush favorability was hardly affected by whether or not the respondent watched a lot of
TV; however, Kerry favorability was greatly affected.
In terms of the Kerry ads, increasing the number of both positive ads and negative ads
strengthened the correlation between party ID and Kerry favorability. This correlation was
strengthened among both low and high TV viewers, but was stronger in both cases among high
viewers.
When Kerry ran a high amount of promotional ads in a respondent‟s market prior to their
interview date, Democrats were more likely to rate him favorably if they watched a lot of TV.
For example, strong Democrats who were exposed to the highest amount of positive Kerry ads
(because of their date of interview, their media market, and their TV habits) rated Kerry
favorably 98.2% of the time. Strong Democrats who – though also in high exposure markets –
did not watch a lot of TV only rated Kerry as favorably 86.2% of the time. The same
relationship is true for weak Democrats: in markets where Kerry ran a high amount of positive

March 2011
49
ads, high viewers rated Kerry favorably 66.7% of the time, whereas he is rated as highly only
52.4% of the time among low viewers.
Similarly, Republicans were less likely to rate him unfavorably if they saw a lot of ads
promoting Kerry than if they watched a low amount of TV. Strong Republicans in markets with
a high amount of positive Kerry ads rated him negatively only 79.4% of the time, whereas 86.5%
of strong Republicans in the same markets who did not watch much TV report negative feelings
about him. Weak Republicans in heavy placement markets also rated Kerry less negatively
when they watched a high amount of TV (40.7%) compared to a low amount of TV (65%). 11
In
sum, Kerry‟s promotional ads appear to have done what they were intended to do; as respondents
had more opportunities to see these positive ads, they felt more positively towards Kerry.
Among High TV viewers alone, however, Kerry‟s promotional ads did not have the same
effect on different partisans. As shown in Table 5, High Viewing Strong Democrats increased in
their positive feelings toward Kerry as the amount of Kerry promotional ads increased. This
pattern is even stronger among weak Democrats; when weak Democrats watch high amount of
TV, they become even more pro-Kerry as the amount of positive Kerry ads in their market
increases. As shown in Table 5, weak Democrats‟ favorability of Kerry increases linearly from
55.9% among those who are exposed to no advertising, up over 10 percentage points to 66.7%
among those who live in Heavy Exposure markets.
This relationship holds true once again for the high-viewing independents (both true
independents and also those who lean Democratic). Among true independents (those
respondents who tell interviewers that they do not lean toward one party or another), those who
saw no Kerry ads feel positively about him only 28.5% of the time, this increases to 52.6% when
11
See Appendix 1 for these tables

March 2011
50
exposed to a medium amount of Kerry promotional ads, and then dips down to 40% among those
exposed to a high amount.
Table 5
This curvilinear trend appears in multiple areas throughout the data, and as such I would
like to draw the reader‟s attention to it now. As shown in the previous chapter, markets in

March 2011
51
battleground states become saturated by the end of the campaign with both candidates‟ ads. At
some point, the ads presumably produce diminishing returns, where after a certain number of ads
have been viewed, each ad packs less and less of a punch; the markets have become
oversaturated with campaign ads. Furthermore, because of the fact that Bush‟s high impact areas
are almost always the same ones as targeted by Kerry, a respondent who is exposed to a high
number of Kerry ads is almost certainly also exposed to a high number of Bush ads. Thus, the
curvilinear trend is not unexpected.
This curvilinear effect also appears among the high TV-viewing Democratic Leaners.
Table 5 shows a clear upward trend in these Democratic Leaners‟ positive feelings towards
Kerry as the amount of Kerry promotional ads in their market increase from no ads (69.4%
report feeling warmly towards him), through a low number of positive Kerry ads (72.6%), and
peaks with the medium number of positive Kerry ads, with 80.9% of High TV watching
Democratic-leaners reporting positive feelings towards Kerry. Then, among those Democratic
leaners who are exposed to a high amount of positive Kerry ads, the percentage reporting
positive feelings towards him falls to 65%. Perhaps this change results from the relatively small
number of respondents who fall into the High exposure category for positive Kerry ads, or
perhaps it is another manifestation of the curvilinear effect as seen among true independents.
Kerry‟s positive ads have two separate effects on respondents‟ rating of Kerry. The first
is that, among all partisans, High TV viewers are more likely than Low TV viewers to rate Kerry
favorably in markets where a Kerry positive advertising was heavy. The second effect is that
this pattern is also evident among High TV Viewers at different levels of Kerry advertising:
respondents in areas where positive Kerry advertising was heavy were more likely to rate him
favorably than those in areas where Kerry ran little to no positive advertising. However, this

March 2011
52
effect was limited to Democrats and Independents; unlike the comparison between High and
Low TV viewers, Republicans did not react favorably to increased viewing of Kerry positive ads
when the scope was limited to High viewers and the change in level of Kerry advertising was the
moderating variable.
Now turning to Kerry‟s attack ads, as Kerry increased the number of attack ads, more
non-Republicans felt positively about him. When exposure to Kerry‟s attack ads increased based
on respondents‟ TV viewing habits, strong Democrats were more likely to express support for
Kerry. Among strong Democrats who lived in markets with a moderate level of Kerry attack
advertising, support for Kerry increased from 77.6% among those who watch a low amount of
TV to 85.2% who watch a high amount of TV. Further, of strong Democrats who watch a lot of
TV and live in markets with a heavy amount of Kerry attack ads, 88.3% rate Kerry favorably
(from 7 to 10 on a 0-10 scale), compared to strong Democrats who also live in high-placement
markets but who watch low levels of TV, of whom only 80% rate Kerry as highly.12
Exposure to Kerry‟s attack ads also affects the way Republicans rate his favorability.
Across all levels of ad-placement (no ads, light advertising, moderate advertising, and heavy
advertising), strong Republicans who watch a high amount of TV are less likely to rate Kerry
negatively (0 through 3 on the 0-10 scale) than those who watch a low amount of TV. This
difference is relatively small among those who live in markets where no ads were run (low TV =
82.6%, high TV = 79.8%), but is substantial in markets with a low number of ads (low TV =
88.7%, high TV = 68.3%). This difference is also quite large in markets with a medium amount
of ads (low TV =78%, high TV = 68.7%), and also apparent in those with a high amount of
attack ads (low = 82.7%, high = 78.9%). These percentages represent the proportion of strong
12
Tables on the effect of Kerry attack advertising on Kerry favorability based on Level of TV Viewing are available in Appendix 1
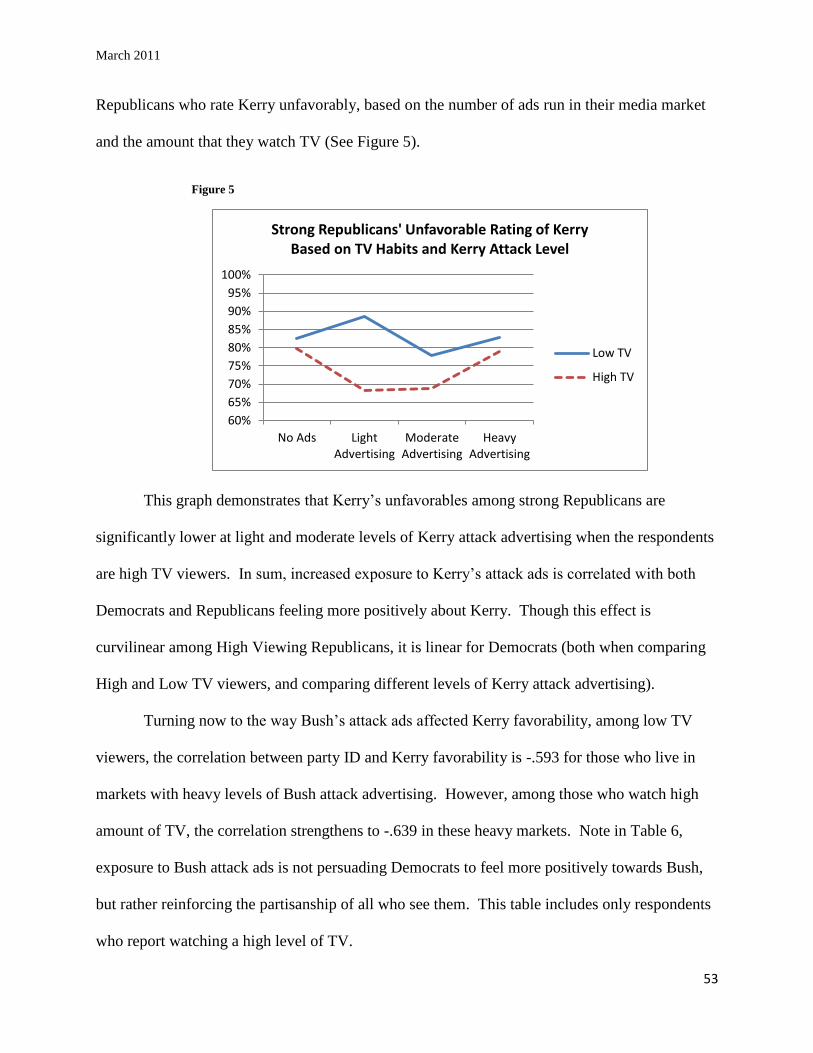
March 2011
53
Republicans who rate Kerry unfavorably, based on the number of ads run in their media market
and the amount that they watch TV (See Figure 5).
Figure 5
This graph demonstrates that Kerry‟s unfavorables among strong Republicans are
significantly lower at light and moderate levels of Kerry attack advertising when the respondents
are high TV viewers. In sum, increased exposure to Kerry‟s attack ads is correlated with both
Democrats and Republicans feeling more positively about Kerry. Though this effect is
curvilinear among High Viewing Republicans, it is linear for Democrats (both when comparing
High and Low TV viewers, and comparing different levels of Kerry attack advertising).
Turning now to the way Bush‟s attack ads affected Kerry favorability, among low TV
viewers, the correlation between party ID and Kerry favorability is -.593 for those who live in
markets with heavy levels of Bush attack advertising. However, among those who watch high
amount of TV, the correlation strengthens to -.639 in these heavy markets. Note in Table 6,
exposure to Bush attack ads is not persuading Democrats to feel more positively towards Bush,
but rather reinforcing the partisanship of all who see them. This table includes only respondents
who report watching a high level of TV.
60%
65%
70%
75%
80%
85%
90%
95%
100%
No Ads LightAdvertising
ModerateAdvertising
HeavyAdvertising
Strong Republicans' Unfavorable Rating of Kerry Based on TV Habits and Kerry Attack Level
Low TV
High TV

March 2011
54
Table 6
The interesting thing about this relationship is that strong partisans – when exposed to
Bush attack ads – are always more likely to support (in the case of Democrats) or reject (in the
case of Republicans) Kerry when they watch high levels of TV. Of strong Democrats who
watched a high amount of TV and had been exposed to heavy Bush attack advertising, 90.3%
rated Kerry favorably; compared to 79.8% of strong Democrats who watched a low amount of
TV. Perhaps one would expect that, as exposure to Bush‟s attack ads increased, Democrats
would be turned off from Kerry. However, this was not true. At all levels of the Bush Attack

March 2011
55
Scale, among strong and weak Democrats – and even independents leaning Democratic – a
higher level of TV viewership was correlated with a more favorable opinion of Kerry.
When looking just at respondents who score High on the TV Viewing Habits Scale, the
percentage of strong Republicans reporting unfavorable feelings toward Kerry starts high in
among those exposed to no Bush attack ads (78.4%), then falls to 68.9% in markets where he
runs a low amount of negative ads. However, this percentage climbs to 77.8% when exposure to
Bush‟s negative ads reaches a moderate level, and once more to 80.1% where he runs a high
amount of negative ads.
Despite the anomaly when comparing strong Republican High and Low TV Viewers, the
data surrounding the effect of Bush attack ads on Kerry favorability tells a compelling message:
Bush attack ads polarize the viewers. Democrats, when exposed to a high amount of Bush attack
ads, feel more positively about Kerry, while Republicans rate Kerry more negatively when the
amount of Bush attack ads increases.
This focus on respondents who watch a high amount of TV in this section strongly
supports the idea that campaign ads have an effect on the way voters make their decisions.
Changes in the level of both Kerry‟s promotional and attack ads, as well as Bush‟s attack
advertising were strongly correlated with a change in the relationship between party ID and
Kerry‟s favorability rating. In the case of Kerry‟s promotional ads, Democrats who were
exposed to more ads – both because of their TV viewing habits and their media market – reacted
positively and rated Kerry more favorably whereas Republicans were relatively unaffected. On
the other hand, when exposed to Kerry‟s attack ads, Kerry‟s favorability improved among both
Democrats and Republicans. Finally, viewers became more polarized in their partisanship as

March 2011
56
exposure to Bush‟s attack ads increased; while Republicans rated Kerry more unfavorably as
exposure increased, Democrats were even more firmly rooted in their approval of Kerry.
Independents
A large part of a campaign is based on an attempt to capture the Independent voters. This
section focuses on testing Hypothesis Four, to understand if and how independents respond
differently to campaign ads than partisans. During the campaign, the independents were split
over Bush and Kerry (See Tables 7 and 8). On the one hand, they liked Bush slightly more than
they liked Kerry (38.5% to 36.4%). But they also disliked Bush much more than they disliked
Kerry (37.4% to 27.4%). This dichotomy is understandable; voters had already had four years to
get to know Bush, whereas many had not heard of Kerry before the 2004 campaign began.
Voters had simply accumulated less information about Kerry from which to form an opinion.
Table 7

March 2011
57
Table 8
Among independent respondents, correlations were generally low between the ads
respondents were exposed to and their preference for one candidate or another. This is to be
expected, however; as party ID is the strongest predictor of vote choice, the room for campaign
ads to have an impact on voter preference is certainly on the margins. The strongest effect is
seen based on the number of Kerry attack ads a respondent is exposed to. For example, when
independents view no Kerry attack ads, they rate Kerry favorably only 34.3% of the time (see
Table 9). However, this favorability rating of Kerry jumps to 41% when independents view a
high level of Kerry attack ads. Similarly, Kerry‟s Unfavorability drops from 30.5% when
respondents see no Kerry ads to 25.7% when in a market with a heavy amount of Kerry attack
ads. Though this correlation is not especially strong, it is highly significant.

March 2011
58
Table 9
However, when examining the independents interviewed early in the campaign cycle
compared to the end, different results emerge. Early independents are more susceptible to Kerry
attacks; they significantly affect both Kerry and Bush Favorability. However, neither variable is
affected significantly among independents by any type of ad late in the campaign. Rather, Kerry
attacks are most effective in shaping the way viewers rate the candidates early in the campaign.
As shown in Table 10, the percentage of independents ranking Kerry favorably increases
as the level of attack advertising increases (ignoring the Heavy level – as discussed earlier, the
campaigns were much less intense in their advertising early in the campaign so there were very
few Heavy areas). Greater percentages of early independents rate Kerry favorably and fewer rate
him unfavorably.

March 2011
59
Table 10
Kerry‟s attack ads also affected these voters‟ rating of Bush early in the campaign
(although this relationship is not significant when looking at the entire campaign as a whole or
towards the end of the campaign). As shown in Table 11, as Kerry attacks more, early
independents rate Bush less favorably and more unfavorably. Though this relationship is not
quite as strong as that of the Kerry attack ads on Kerry favorability, it is nonetheless significant.
Table 11

March 2011
60
This section on independents is important for testing Hypothesis 4, whether independents
are more susceptible to political ads than partisans. The results presented here support this
hypothesis; when exposed to campaign ads, partisans return to their respective political corners.
Independents, on the other hand, are persuaded – especially when exposed to a high amount of
Kerry‟s attack ads. This trend was especially evident in the first few weeks of the campaign, but
remained strong up until the last few weeks of the election, at which point independents had
presumably been exposed to enough information about the candidates to have made up their
minds.
Political Engagement
In this section I discuss the importance of respondent engagement in politics as a
conditional variable for the ads‟ effects on voters. As discussed earlier, the correlation between
party ID and voter preference and favorability is strong; party ID has been shown to be the most
dominant factor in voters‟ decisions about how to vote. However, this relationship is
significantly weaker among the politically unengaged. Party attachment serves as much less of
an anchor among those who discuss politics rarely; yet as political engagement increases, so too
does the importance of party ID (see Table 12). Among the unengaged, the relationship
between PID and vote preference is only -.478. However, this relationship strengthens to -.594
among the moderately engaged, and to -.615 among the highly engaged.13
13
The correlation is negative because a score of 1 in Party ID represents a strong Democrat, whereas a 7 represents a strong Republican. However, with the way the NAES data are coded, those who say they plan to vote for Bush are recorded as 1, and a vote for Kerry is a 2.

March 2011
61
Table 12
Further, when the politically unengaged are exposed to political ads, the importance of
their partisan attachment changes. Table 13 demonstrates that, when unengaged strong
Republicans are exposed to an increasing amount of Bush ads, their partisanship becomes a more
significant force in determining their feelings towards Bush. As the table shows, when these
respondents see only a small number of Bush ads, they report feeling favorably towards him only
90.6% of the time. However, this percentage increases to 95.7% among respondents exposed to
a mid-level amount of ads, and then dips down to 92.6% among high exposure respondents (once
again displaying the curvilinear trend likely caused by the congruence of both candidates‟
advertising in battleground states). As the number of respondents in this analysis is over 1,500,
these differences are significant. However, increasing the level of Bush ads does not strengthen
the correlation between partisanship and support among strong Democrats; rather, as unengaged

March 2011
62
strong Democrats are exposed to a high amount of Bush ads, they report slightly lower levels of
negative feelings towards Bush. Thus, exposure to Bush ads among the unengaged resulted in
more positive feelings about Bush by all.
Table 13
Bush ads also had an impact on the way unengaged respondents viewed Kerry. When
unengaged strong Democrats were exposed to only a low amount of Bush ads, they favored
Kerry 86% of the time. However, when exposed to a high amount of Bush ads, this favor
dropped to 78.8%. Bush ads also increased the percentage of unengaged strong Republicans
who rated Kerry unfavorably: from 80% when they saw a low amount of Bush ads to 85.7%
under moderate exposure and then a slight dip back to 82.8% under high exposure.
March 2011
63
From this, it is clear that political engagement is a strong force in determining the effect
of political advertisements. Among the unengaged, seeing a high amount of Bush ads –
regardless of type – made Democrats and Republicans feel better about Bush and worse about
Kerry. Kerry ads did not have a similar effect when shown en masse; however, Kerry‟s attack
ads were quite effective at persuading the unengaged to rate Kerry more favorably. Unengaged
strong Democrats are more likely to rate Bush unfavorably as they are exposed to more of
Kerry‟s attacks (see Table 15). As Table 14 shows, strong Democrats exposed to a high number
of Kerry attack ads are 4.2 percentage points more likely to rate Kerry favorably than those
exposed to none of these ads. Kerry‟s attack ads also influence strong Republicans‟ attitudes
toward Kerry: Republicans who see none of Kerry‟s attacks ads are 4.2 percentage points more
likely to rate Kerry unfavorably than those who see a moderate amount of these ads (see Table
14 to note the curvilinear effect among strong Republicans).

March 2011
64
Table 14
The level of Bush promotional ads also has an effect on unengaged voters‟ favorability
rating of Bush. First, the correlation between Party ID and Bush Favorability is weaker among
unengaged respondents than the engaged at all levels of advertising. However, as the level of
positive Bush ads increases, the correlation changes more among the unengaged (from .521
among those who see no Bush promotional ads to .595 among those who see the highest level)
compared to the engaged (the correlation strengthens from .642 where no ads are run to a peak of
.664 among the moderate level). In areas where Bush runs no positive ads, unengaged strong

March 2011
65
Republicans rate him favorably 74.9% of the time, but when he runs a low amount strong
Republicans only rate him as highly 67.5% of the time. It then increases to 70.6% of the time
among respondents exposed to a moderate amount of positive Bush ads, and again increases to
75.8% among high exposure respondents.
This strengthening of the correlation among all respondents – but especially the
unengaged – as a response to increased exposure to Bush promotional ads demonstrates how
these ads are reinforcing partisan predispositions. The politically unengaged are less likely to be
bound by their partisanship than the engaged. As they are exposed to more of these positive
Bush ads, however, their partisanship is reinforced and becomes a more dominant force in their
decision-making. As shown in Table 15, as unengaged Democrats see more Bush ads, they are
more likely to rate Bush unfavorably. The partisanship of strong Republicans is also reinforced
as the level of Bush promotional advertising increases. This change is not as strong as it is
among Democrats; probably because unengaged Republicans at all levels of advertising already
rate Bush quite highly.
The important thing to take from Table 15 is that when unengaged respondents are
exposed to the highest level of Bush promotional advertising, they are more likely to act as
though they were engaged in the political discourse. Democrats become significantly more
likely to rate Bush unfavorably whereas Republicans are slightly more likely to rate him
favorably. The effect of Bush promotional advertising is even more apparent on unengaged
strong Republicans‟ rating of Kerry. In the areas where Bush runs no positive ads, unengaged
strong Republicans rate Kerry unfavorably 74.9% of the time, when Bush runs a low amount
strong Republicans only rate him as negatively 67.5% of the time. Kerry‟s unfavorables among
strong Republicans then increases to 70.6% under the moderate level of positive Bush ads, and

March 2011
66
again increases to 75.8% among high exposure respondents.14
Thus, the positive Bush ads affect
viewers by polarizing their feelings about both Bush and Kerry.
Table 15
The level of attack ads that Kerry runs also plays an important role in determining the
effects of advertising on unengaged respondents on the base relationship of party ID and
favorability. As shown in Table 16, the correlation between party ID and Bush favorability is
14
See appendix 1 for The Effects of Positive Bush Advertising on Kerry Favorability Rating Among Unengaged Respondents

March 2011
67
strengthened as the level of Kerry attack advertising increases. Note that there is a significant
curvilinear effect; the relationship is especially strong at the moderate level of Kerry attack
advertising, but then drops at the highest level.
Table 16
This pattern in the correlations is anchored strongly in the changes of favorability ratings
among Democrats when exposed to Kerry‟s attack ads.15
For example, unengaged strong
Democrats who are not exposed to any of Kerry‟s negative ads feel unfavorably towards Bush
only 62.8% of the time. However, this percentage increases to 71.9% among strong Democrats
15
For full crosstab, see Appendix 1.
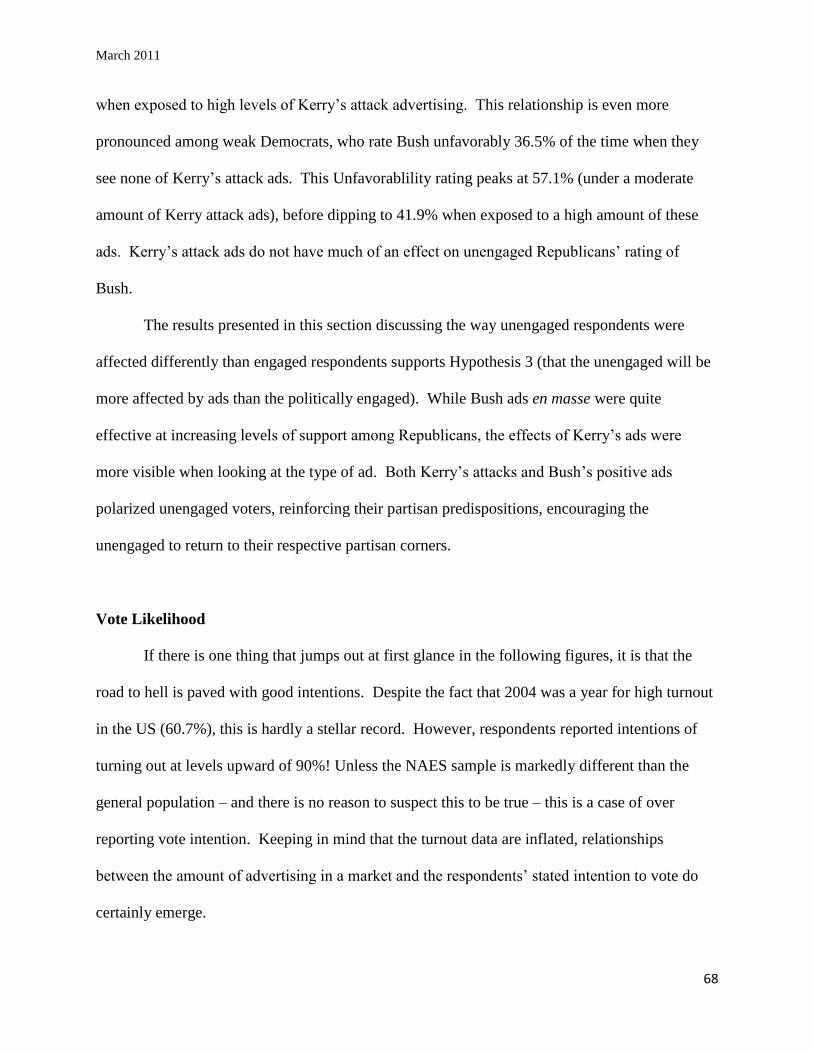
March 2011
68
when exposed to high levels of Kerry‟s attack advertising. This relationship is even more
pronounced among weak Democrats, who rate Bush unfavorably 36.5% of the time when they
see none of Kerry‟s attack ads. This Unfavorablility rating peaks at 57.1% (under a moderate
amount of Kerry attack ads), before dipping to 41.9% when exposed to a high amount of these
ads. Kerry‟s attack ads do not have much of an effect on unengaged Republicans‟ rating of
Bush.
The results presented in this section discussing the way unengaged respondents were
affected differently than engaged respondents supports Hypothesis 3 (that the unengaged will be
more affected by ads than the politically engaged). While Bush ads en masse were quite
effective at increasing levels of support among Republicans, the effects of Kerry‟s ads were
more visible when looking at the type of ad. Both Kerry‟s attacks and Bush‟s positive ads
polarized unengaged voters, reinforcing their partisan predispositions, encouraging the
unengaged to return to their respective partisan corners.
Vote Likelihood
If there is one thing that jumps out at first glance in the following figures, it is that the
road to hell is paved with good intentions. Despite the fact that 2004 was a year for high turnout
in the US (60.7%), this is hardly a stellar record. However, respondents reported intentions of
turning out at levels upward of 90%! Unless the NAES sample is markedly different than the
general population – and there is no reason to suspect this to be true – this is a case of over
reporting vote intention. Keeping in mind that the turnout data are inflated, relationships
between the amount of advertising in a market and the respondents‟ stated intention to vote do
certainly emerge.

March 2011
69
NAES measures vote intention with two questions: the first asks respondents whether or
not s/he intends to vote (if s/he has not already voted early). Ninety percent of respondents
reported that they did intend to vote. The second question asks respondents planning to vote to
report (on a scale of 1 to 10) how likely they were to vote. I chose to focus this analysis on the
second question because it allows more room for respondents to realistically evaluate their
chances of voting. Regardless of the independent variable – whether it be either Bush or Kerry,
positive ads, negative ads, or total ads – when the number of ads respondents are exposed to
increases, so too does the number of people reporting they intend to vote with absolute certainty
(10 out of 10). Figures 6 and 7 demonstrate this pattern well.
Figure 6
As shown, the increase in voter certainty is especially strong when Bush runs a high level
of attack ads, but the relationship is also strong and linear for positive Bush ads. As opposed to
Bush‟s positive and attack ads, when looking at the total amount of Bush ads a respondent is
exposed to, the likelihood of turning out to vote increases until the highest level of ads. At that
point, vote certainty dips slightly. This curvilinear trend is similar to that which has emerged
repeatedly throughout the analysis, although the reasoning is less intuitive in this instance.

March 2011
70
Figure 7
Exposure to Kerry attack ads has a similar effect on respondents‟ certainty that they will
vote. As the level of Kerry‟s positive ads increases, respondents report higher certainty of
turning out to vote. The same is generally true of Kerry‟s attack ads, but the levels of certainty
are generally lower than for the promotional ads except at the lowest and the highest levels. As a
result, when looking at Kerry‟s total ads, no definitive pattern emerges.
The Focus of the Ad: Policy vs. Character
As discussed in Chapter 1, the literature examining the focus of campaign ads (as
opposed to tone, which has been discussed in detail up to this point) suggests that ads that focus
on a candidate‟s policy positions – as opposed to the candidate‟s personality or image – can
make viewers feel more disengaged from the political process (Dardis, Shen, & Edwards, 2008).
However, in the 2004 Presidential election the vast majority of campaign ads were focused on
issues of policy. Furthermore, there is no reason to expect that 2004 was any more policy-
focused than other campaigns of this era.

March 2011
71
In Chapter 2, I outlined my hypothesis that ads focused on the personality of the
candidates would be more effective at changing the way viewers feel about the candidates than
ads focused on policy issues. Though testing this hypothesis was made somewhat difficult
because of the low number of respondents exposed to a heavy (and at times even moderate) level
of personality-focused, the results are as follows (note the small N for the character-focused ads
in the following tables; for this reason, analysis is limited to examining the difference in
exposure between respondents exposed to no ads and those exposed to a moderate level of ads).
Table 17 demonstrates that, as respondents view a higher amount of Bush‟s character-
focused ads, partisans are polarized in their feelings about Kerry. For example, as exposure to
these ads increases, strong Democrats rate Kerry slightly more favorably. The same is true for
independents leaning Democratic, whose positive rating of Kerry increases from 65% of the time
when exposed to none of Bush‟s character-focused ads, to 72.3% when exposed to a moderate
level. Further, Republicans rate Kerry more unfavorably as exposure to Bush‟s character ads
increase. Among strong Republicans, 77.8% rate Kerry unfavorably when exposed to no Bush
character ads; this increases to 82.9% when exposed to a moderate level of these image-focused
Bush ads.

March 2011
72
Table 17
Table 18 demonstrates a similar polarization of partisans when exposure to Kerry‟s
character ads increases. Among strong Democrats, the percent rating Kerry favorably increases
from 84.1% when exposed to none of Kerry‟s character ads to 87.5% when the level of exposure
is changed to a moderate level. Similarly, strong Republicans‟ dislike of Kerry increases from
79.5% among those exposed to no Kerry character ads to 85.4% when exposure increases to the
moderate level.
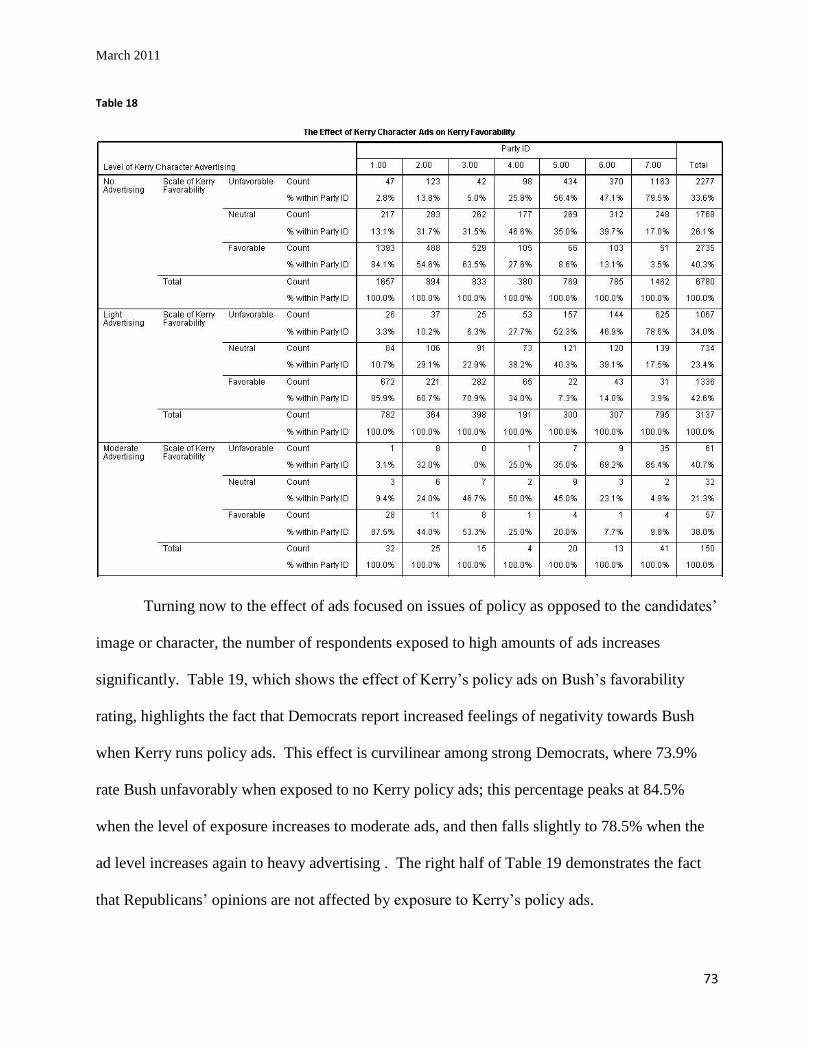
March 2011
73
Table 18
Turning now to the effect of ads focused on issues of policy as opposed to the candidates‟
image or character, the number of respondents exposed to high amounts of ads increases
significantly. Table 19, which shows the effect of Kerry‟s policy ads on Bush‟s favorability
rating, highlights the fact that Democrats report increased feelings of negativity towards Bush
when Kerry runs policy ads. This effect is curvilinear among strong Democrats, where 73.9%
rate Bush unfavorably when exposed to no Kerry policy ads; this percentage peaks at 84.5%
when the level of exposure increases to moderate ads, and then falls slightly to 78.5% when the
ad level increases again to heavy advertising . The right half of Table 19 demonstrates the fact
that Republicans‟ opinions are not affected by exposure to Kerry‟s policy ads.
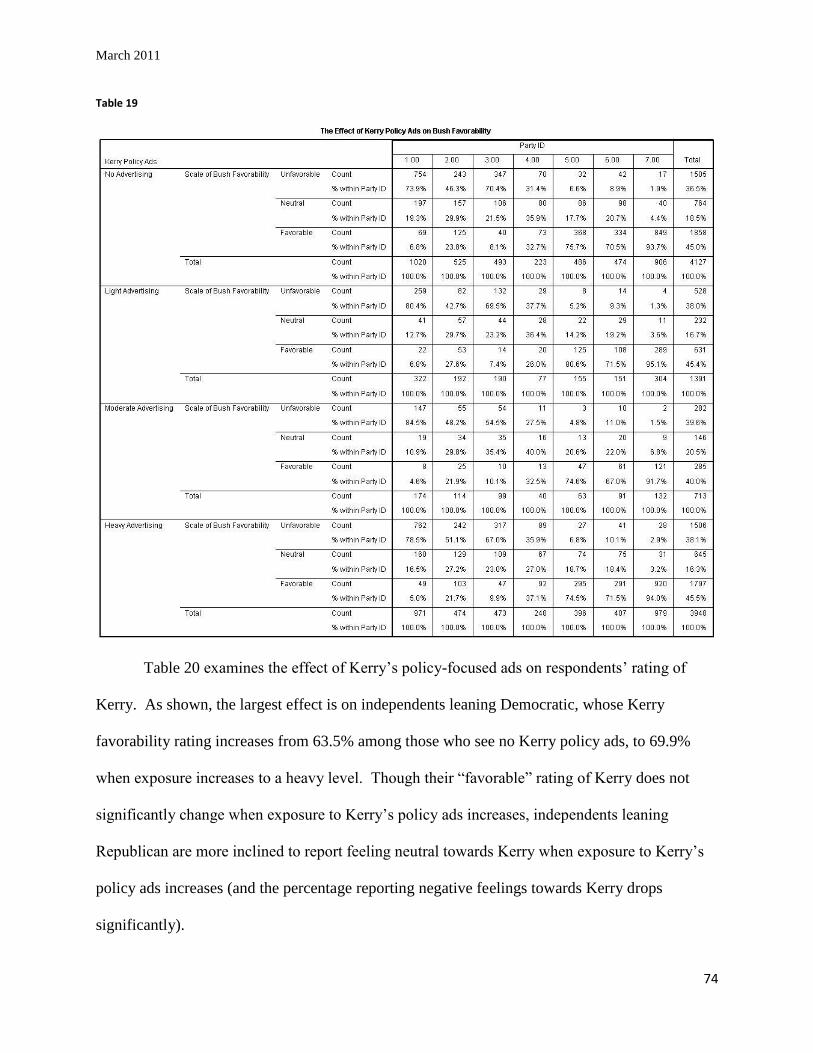
March 2011
74
Table 19
Table 20 examines the effect of Kerry‟s policy-focused ads on respondents‟ rating of
Kerry. As shown, the largest effect is on independents leaning Democratic, whose Kerry
favorability rating increases from 63.5% among those who see no Kerry policy ads, to 69.9%
when exposure increases to a heavy level. Though their “favorable” rating of Kerry does not
significantly change when exposure to Kerry‟s policy ads increases, independents leaning
Republican are more inclined to report feeling neutral towards Kerry when exposure to Kerry‟s
policy ads increases (and the percentage reporting negative feelings towards Kerry drops
significantly).

March 2011
75
Table 20
The results from this section do not generally support my hypothesis that ads that focused
on the candidates‟ personalities would be more effective at persuading viewers to support one
candidate over the other. In fact, the opposite pattern emerged; as exposure to personality-
focused ads increased, respondents reported higher levels of partisan polarization. Exposure to
ads that focused on the personality of a candidate encouraged partisans into their respective
political corners, and thus had an effect on all who saw them. This effect on all viewers,
regardless of partisanship, is unlike the effect that policy ads had on respondents. Results on the
effect of Bush‟s policy ads were not presented because no significant pattern emerged.

March 2011
76
However, as shown in Tables 19 and 20, Kerry‟s policy-focused ads did not significantly affect
the way Republicans rated Kerry; the effect was limited to strengthening the relationship
between party ID and Kerry favorability among Democrats.
Effects at the End of the Campaign
This section focuses on respondents who were interviewed towards the end of the
campaign (in the last two weeks of the election campaign). Presumably, the relationship
between party ID and favorability and preference should be quite strong among these
respondents, because they have had the most time to get to know the candidates and have their
party ID reinforced.
The most striking difference between respondents interviewed at the end of the campaign
and those earlier in the campaign is the effect that Kerry attack ads have on Bush favorability.
As expected, the correlation between Party ID and Bush favorability is stronger at the end of the
campaign than among earlier respondents; this is true in markets where Kerry runs no attack ads
as well as in those where his advertising level is high (.619 throughout the entire campaign, .629
in the last weeks).
When Kerry attacks, the relationship between PID and Bush favorability is strengthened.
This correlation changes more based on the amount of Kerry attack ads throughout the whole
campaign than in the last two weeks (the correlation strengthens .029 between no ads and heavy
ads over the whole nine weeks, compared to only a .017 strengthening in the last two weeks). At
the end of the campaign, the correlation is strongest in areas where Kerry places a high amount
of attack ads; when Kerry attacks, Democrats dislike Bush more; Republicans are indifferent to

March 2011
77
the attacks (see Table 2116
). For example, in areas with no advertising, strong Democrats
interviewed late in the campaign dislike Bush 72.1% of the time; this increases to 77.9% when
exposed to a high amount of Kerry‟s attack advertising. Unlike their effect on Bush favorability,
Kerry‟s attacks at the end of the campaign do not affect Kerry‟s own favorability.
Table 21
This effect of Kerry Attack ads on Bush favorability (as shown in Table 21) among late
respondents is the only instance where late respondents were much affected by ads. Throughout
the campaign as a whole, when Bush increased his attacks on Kerry, strong Republicans
responded by feeling more negatively about Kerry. This pattern was especially evident when
comparing the low level of Bush attacks to the high level. However, as shown in Table 21, this
pattern disappears in the last two weeks of the election.
16
The Light and Moderate Kerry ad levels are excluded from Table X because of the low number of respondents falling into these categories in the last two weeks of the election.
1.00 2.00 3.00 4.00 5.00 6.00 7.00
Count 238 82 101 19 11 6 6 463
% within
Party ID
72.12% 50.00% 67.79% 26.76% 6.88% 4.03% 2.03% 35.10%
Count 70 50 35 25 34 31 13 258
% within
Party ID
21.21% 30.49% 23.49% 35.21% 21.25% 20.81% 4.39% 19.56%
Count 22 32 13 27 115 112 277 598
% within
Party ID
6.67% 19.51% 8.72% 38.03% 71.88% 75.17% 93.58% 45.34%
Count 330 164 149 71 160 149 296 1319
% within
Party ID
100.00% 100.00% 100.00% 100.00% 100.00% 100.00% 100.00% 100.00%
Count 289 74 113 31 7 16 8 538
% within
Party ID
77.90% 48.05% 69.75% 36.47% 5.04% 13.68% 2.16% 38.46%
Count 65 42 34 24 35 22 15 237
% within
Party ID
17.52% 27.27% 20.99% 28.24% 25.18% 18.80% 4.04% 16.94%
Count 17 38 15 30 97 79 348 624
% within
Party ID
4.58% 24.68% 9.26% 35.29% 69.78% 67.52% 93.80% 44.60%
Count 371 154 162 85 139 117 371 1399
% within
Party ID
100.00% 100.00% 100.00% 100.00% 100.00% 100.00% 100.00% 100.00%
Unfavorable
Neutral
Favorable
Total
The Effect of Kerry Attack Ads on Bush Favorability Among Late Respondents
Level of Kerry Attack Ads
Party ID
Total
No
Advertising
Scale of Bush
Favorability
Unfavorable
Neutral
Favorable
Total
Heavy
Advertising
Scale of Bush
Favorability

March 2011
78
The effect of Bush‟s attacks on strong Democrats is similar. Throughout the entire
campaign, when Bush attacks more, strong Democrats feel more positively about Kerry.
However, in the last two weeks, there is no significant difference in strong Democrats‟ feelings
toward Kerry when no Bush attack ads are run in their market, compared to when a High amount
are. It would seem that, by this point late in the campaign, their feelings about Kerry have
crystalized, and are no longer open to Bush‟s negative appeals.
Table 22 is also another instance of a curvilinear pattern emerging in the data. Note that
there is no moderate level of Bush attack ads in the last two weeks; as shown in Chapter 5,
towards the end of the campaign, Bush decreased the amount of attack advertising he used.
However, the correlation between Kerry favorability and Party ID strengthens slightly at light
levels of Bush attack advertising, but then weakens when respondents are exposed to heavy
amounts.

March 2011
79
Table 22
The final case in this section is the effect of positive Kerry ads on Kerry favorability.
This relationship tells a story not about the effect of the ads, but demonstrates why it is important
to understand how ad placement affects the party ID/candidate favorability correlation. Towards
the end of the campaign, in areas where Kerry doesn‟t run any promotional ads (or few ads), the
correlation between party ID and Kerry favorability is strong and negative (strong Republicans
rate Kerry negatively, strong Democrats rate Kerry favorably). However, this relationship
weakens when Kerry runs a lot of promotional ads near the end. Recall from Chapter Five that
the areas where he runs a lot of ads at the end were hotly contested; also, Kerry did not run many
promotional ads until the end of the campaign. So there is no reason to be surprised when no
difference emerges in the party ID/Kerry Favorability relationship in the last few weeks
compared to the whole campaign.

March 2011
80
Furthermore, the weakening relationship between party ID and Kerry favorability as the
number of Kerry promotional ads increases is probably not because Kerry‟s promotional ads
suddenly began to make respondents forget their partisanship. Rather, it is a reflection of where
the Kerry team chose to put their positive ads in the final two weeks. The point of looking at this
example is to stress the point that the results presented in this analysis are probably understating
the effect of campaign ads on voter preferences. This example clearly demonstrates that the
Kerry campaign strategically placed positive ads at the end of the campaign in markets where the
biggest gains were needed. This is the drawback of using a non-experimental design; it is
difficult to ascertain if some findings are null because ad placement strategy is obscuring the
effects.
Conclusion
This thesis sought to analyze the ways in which voters are affected by campaign ads. To
do this, I examined different types of advertising that Americans are exposed to, while also
looking at different subgroups of the population to see if (and how) some groups react differently
than others. Some of my hypotheses were supported by the evidence presented here; unengaged
respondents were affected significantly more by exposure to campaign ads, supporting
Hypothesis Three. Hypothesis Four, that partisans would be insulated from persuasion effects
was also supported: persuasion was most often seen among weak partisans, not those strongly
committed to their party.
Other hypotheses, however, were not supported by the data. Hypotheses One and Two
concerned whether the tone and focus of an ad changed its effect. However, exposure to both

March 2011
81
promotional and attack ads changed the way that respondents rated the candidates, meaning that
negativity was not a more effective form of persuasion as I had predicted. Furthermore, my
hypothesis (Hypothesis Two) that character-focused ads would persuade viewers more than
policy-focused ads would also was relatively unsupported, although the low number off
character ads made this analysis difficult.
Finally, I found only mixed support for Hypothesis Five, that the Bush campaign would
use more emotional appeals than the Kerry campaign. While appeals to emotion were relatively
similar in comparing the ads‟ videostyle, major differences emerged when looking at ad format
and the amount of time the candidates spent addressing the camera in each ad.
There are multiple avenues for future research that should be pursued to understand better
the way voters are affected by campaign ads. The first, and possibly most important, would be to
look at this question at a less salient level; examining the effects of campaign ads at the mayoral,
state house, or other local level. Though this paper focuses exclusively on national level ads, I
would expect ad effects to be even more pronounced in examining local campaigns because –
unlike at the presidential level – local elections rarely saturate the news cycle. Because voters
are less aware of the partisanship, policy stances, and even date of local elections, there is more
room for campaign ads to play a role in the decision-making process.
Another related research question would be to examine how voters are affected when
candidates advertise against each other. The research presented here only examines the way
voters are affected by one candidate‟s ads at a time. However, this is certainly unrepresentative
of the way that voters are exposed to ads; as shown in chapter 5, Bush and Kerry advertised
heavily in the same markets. To fully understand advertising‟s effect on voters, it is crucial to
examine the ratio of one candidate‟s ads to the other. For example, how does the effect change

March 2011
82
when 75% of the ads that voters see are advertising for Bush as opposed to only 40%? Exploring
this area might explain some of the curvilinear trends that turned up frequently in the results
presented here.
Along those same lines, the research presented here did not consider other hypotheses
that could also affect the way citizens feel about the candidates. For example, campaign ads
aired on TV are not the only form of campaigning that Americans are exposed to. Campaigns
hold rallies and GOTV efforts; they utilize leafleting and yard signs, as well as other forms of
ads (radio, newspaper, and – more and more – new media). Televised campaign ads could
simply be reflective of the intensity of other campaign efforts in the respondents‟ area. It is
likely that areas with a heavy level of advertising are also being targeted by other methods as
well. Thus, perhaps the advertising level is just one measure of the political atmosphere in a
respondent‟s district over the course of the campaign. More research needs to be done
examining the role that televised campaign ads play compared to other forms of campaign
activities.
Though more research is certainly needed, the story presented here suggests there is no
need to be concerned of massive voter manipulation through emotion-laden advertisements.
Voters are not being persuaded to vote against their better judgment or first instinct by the ads
that they see during campaign seasons. Nor do the data suggest that the effect of ads is
negligible and that campaigns are wasting their time and money by airing these ads. Rather, the
data demonstrate that campaign ads have a moderate effect, especially on voters who see them
most (who view a lot of TV and who live in battleground areas where advertising was generally
quite high) and who are least engaged in the political process.
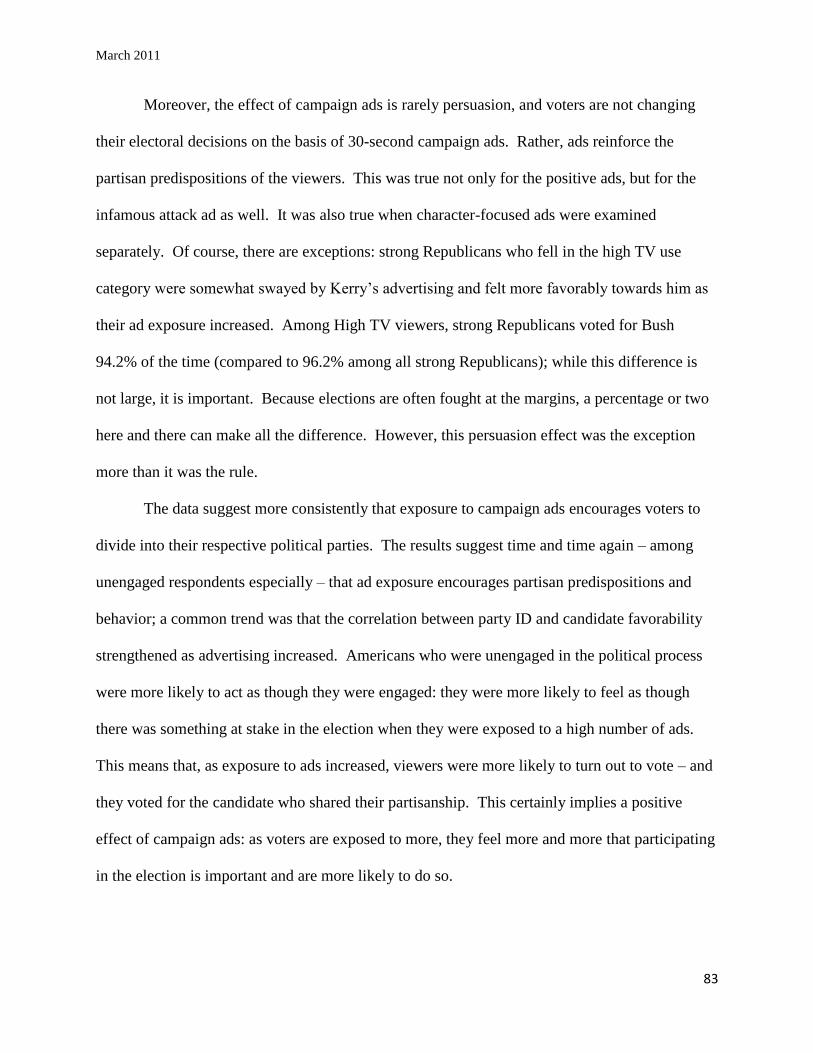
March 2011
83
Moreover, the effect of campaign ads is rarely persuasion, and voters are not changing
their electoral decisions on the basis of 30-second campaign ads. Rather, ads reinforce the
partisan predispositions of the viewers. This was true not only for the positive ads, but for the
infamous attack ad as well. It was also true when character-focused ads were examined
separately. Of course, there are exceptions: strong Republicans who fell in the high TV use
category were somewhat swayed by Kerry‟s advertising and felt more favorably towards him as
their ad exposure increased. Among High TV viewers, strong Republicans voted for Bush
94.2% of the time (compared to 96.2% among all strong Republicans); while this difference is
not large, it is important. Because elections are often fought at the margins, a percentage or two
here and there can make all the difference. However, this persuasion effect was the exception
more than it was the rule.
The data suggest more consistently that exposure to campaign ads encourages voters to
divide into their respective political parties. The results suggest time and time again – among
unengaged respondents especially – that ad exposure encourages partisan predispositions and
behavior; a common trend was that the correlation between party ID and candidate favorability
strengthened as advertising increased. Americans who were unengaged in the political process
were more likely to act as though they were engaged: they were more likely to feel as though
there was something at stake in the election when they were exposed to a high number of ads.
This means that, as exposure to ads increased, viewers were more likely to turn out to vote – and
they voted for the candidate who shared their partisanship. This certainly implies a positive
effect of campaign ads: as voters are exposed to more, they feel more and more that participating
in the election is important and are more likely to do so.

March 2011
84
It is interesting – although not entirely surprising – that Kerry favorability was the most
responsive dependent variable tested. More often than not, the advertising effects appeared only
in the way respondents rated Kerry. It was rare that Bush‟s favorability was much affected, and
even rarer when voter preference changed as a result of exposure to campaign ads. This can be
explained by considering Lodge et al.‟s “On-line Model” of candidate evaluation. If voters are
continuously updating their evaluations of candidates based on information they receive (and
then forget), there is certainly a large role for campaign ads to affect the way voters feel about a
candidate. However, if a voter has already accumulated a strong impression of a candidate (say,
if he was the incumbent President for four years), then it will take much more to change his mind
about that candidate; the opinion already has a firm foundation. In 2004, this was true for Bush,
so there was more room for respondents‟ rating of Kerry to be shaped by their exposure to
campaign ads.
This has implications for the way that campaigns are run. As shown, Bush‟s favorability
was relatively unaffected by the ads he ran. Campaigns supporting the reelection of an
incumbent candidate should focus less on persuading members of the opposite party – or even
independents – to vote for them; their image has already had a chance to be cemented in the
public mind. Rather, incumbents should focus on building enthusiasm for the candidate and
ensuring that members of their party who would not otherwise vote show up on Election Day.
On the other hand, campaign ads can be very beneficial for changing public opinion
surrounding a challenger candidate. Because Americans had relatively little information about
who Kerry was before the campaign, there was much more room for his image to be shaped by
campaign ads than there was for Bush. Challenger candidates in the future should rely heavily
on campaign ads to introduce the candidate to the public.

March 2011
85
Certainly this research has implications for running an efficient campaign. However, it
also has implications for the way Americans relate to political campaigns. If campaign ads have
democratically-beneficial effects in situations where Americans are relatively uninformed about
the issues, then campaign ads have the potential to increase desirable behaviors in low-salience
elections. There is room for campaign ads to increase interest and participation particularly at
the local level and during primaries, where historically only those highly engaged (read: highly
partisan) turn out to vote. This increase in participation is not only important for democratic
theorists; by engaging a higher number of less extreme voters at all levels of representative
selection, the candidates selected will also be more moderate.
This may seem counterintuitive based on the findings that campaign ads polarize voters
into their respective political parties. However, by increasing this level of polarization, ads also
give voters a feeling that what they are participating in is important. This rise in the number of
average Americans participating in local and primary politics – not elites, not extreme ends of
the political spectrum – could result in the moderate candidate and subsequently the moderate
representative. In American democracy, representatives do not represent all Americans; they
represent those who vote. If, as argued in this thesis, campaign ads have the ability to increase
the number of people who feel engaged in politics and turn out to vote, then they have the ability
to shape the political landscape and make room for more moderate candidates.

March 2011
86
Appendix 1: Tables

March 2011
87

March 2011
88
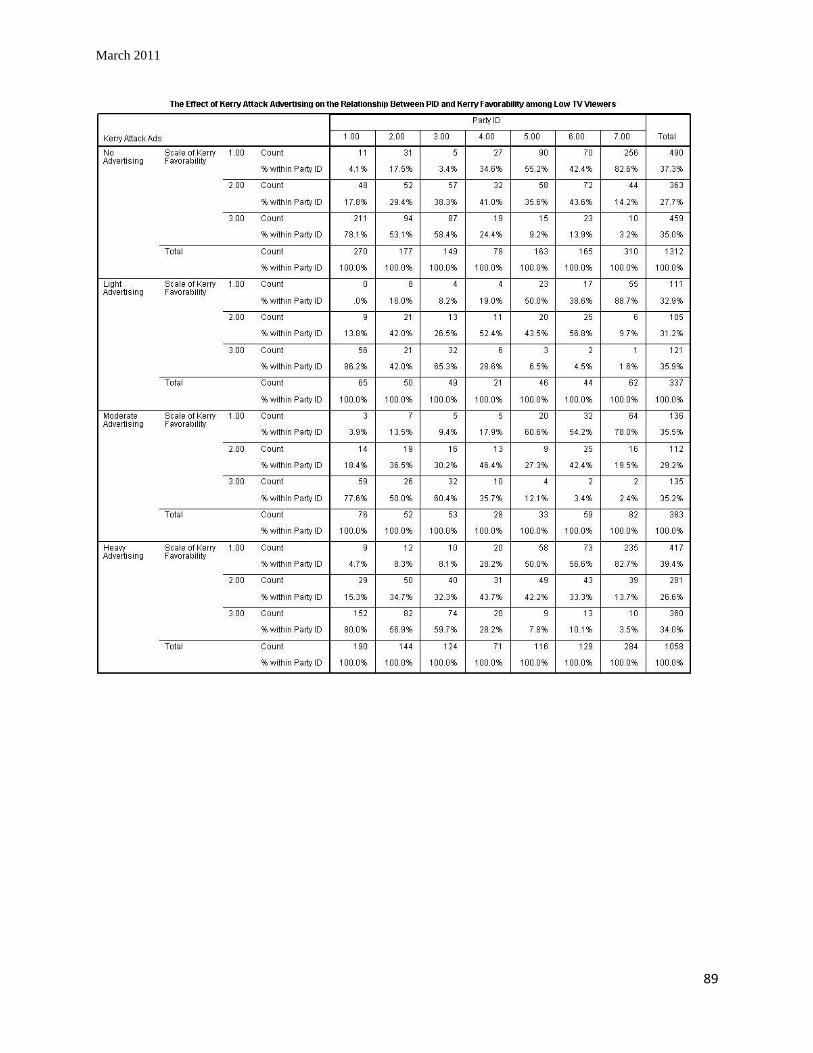
March 2011
89

March 2011
90

March 2011
91

March 2011
92
Appendix 2: 2004 Presidential Campaign Ads Codebook
Ad Message
Tone (if contrast, note first whether the ad is positive and negative in first and second occurrence
spots, then insert contrast [=3] in third occurrence – it is a contrast ad ONLY IF the contrasting
portion is more than 1 sentence.
1 = Positive
2 = Negative
3 = Contrast
Focus
1 = Personal Characteristics/Image
2 = Policy Positions/Issues
3 = Both
Theme/Issues
0 = None
1 = Women‟s health concerns (includes abortion)
2 = Education
3 = Aged/Elderly (social security benefits, administration of social security)
4 = Health problems/cost of medical care/healthcare
5 = Poverty
6 = Crime/Violence (includes guns or “law and order” issues like death penalty or prisons)
7 = General mention of Moral/Religious Decay (of nation – including sex, bad language)
8 = Government spending (balancing the budget, deficit, taxes or tax reform)
9 = Narcotics
10 = The Economy, Recession (jobs, prosperity of the nation, economic growth, GNP)
11 = Candidate‟s political background/experience
12 = Defense/terrorism (support for troops, 9/11)
13 = Candidate‟s military experience
14 = Energy Independence
15 = Other
Ad Videostyle
Music
1 = Classical/Instrumental
2 = Modern (Pop, rock, jazz)
3 = Marching music/marching drum
4 = Trumpet or announcing music
5 = Folk music/country/western
6 = National anthem
7 = Other
8 = Combination
Dominant Coloring Schemes

March 2011
93
1 = Black and white
2 = Dark colors (browns, dark blues, dark grays, etc. – scene looks dark)
3 = Bright colors (bright blues, reds, yellows, oranges, etc.)
4 = Neutral colors (normal lighting, etc.)
American Symbols/Patriotic Images
1 = Flag
2 = National bird (Eagle)
3 = Famous American Landscapes
4 = Famous Documents (i.e. Constitution, Declaration of Independents)
5 = Prior presidents
6 = Other famous patriotic symbols
Positive Imagery
1 = Smiles/happy faces
2 = Clean, well-kempt neighborhoods
3 = Americans hard at work
4 = Schools, graduations
5 = Other
Negative Imagery
1 = Terror-related images
2 = Drugs, violence
3 = Abandoned buildings
4 = Desolate landscapes, pollution
5 = Unhappy/stressed faces/frowns
6 = Other
Neutral Images
1 = Candidate giving speech, talking to camera
Actors
(code candidate as 0 until third category. Code only major actors, not a crowd.)
Race
1 = White
2 = Non-white
Gender
1 = Male
2 = Female
Candidate Featured?
0 = no
1 = yes

March 2011
94
References
Ansolabehere, S., & Iyengar, S. (1995). Going Negative: How Attack Ads Shrink and Polarize
the Electorate. New York: Free Press.
Brader, T. (2005). Striking a responsive chord: How political ads motivate and persuade voters
by appealing to emotions. Midwest Political Science Association, 49(2), 388.
Brader, T. (2006). Campaigning for Hearts and Minds: How Emotional Appeals in Political Ads
Work. Chicago: The University of Chicago Press.
Brader, T., & Valentino, N. (2007). Identities, interests, and emotions: Symbolic versus material
wellsprings of fear, anger, and enthusiasm. In W. R. Neuman, G. E. Marcus, A. N. Crigler
& M. MacKuen (Eds.), The Affect Effect (pp. 180). Chicago: The University of Chicago
Press.
Campbell, A. (1960). The American Voter. New York: Wiley.
Cheng, H. (2008). Attention, perception, and perceived effects: Negative political advertising in
a battleground state of the 2004 presidential election. Mass Communication Society, 11(2),
177.
Cheng, H., & Riffe, D. (2008). Attention, perception, and perceived effects: Negative political
advertising in a battleground state of the 2004 presidential election. Mass Communication
and Society, 11(2), 177-196.
Cho, J. (2008). Political ads and citizen communication. Communication Research, 35(4), 423-
451.

March 2011
95
Dardis, F. E., Shen, F., & Edwards, H. H. (2008). Effects of negative political advertising on
individuals' cynicism and self-efficacy: The impact of ad type and message exposures. Mass
Communication and Society,11(1), 24-42.
Finkel, S. E., & Geer, J. G. (1998). A spot check: Casting doubt on the demobilizing effect of
attack advertising. American Journal of Political Science, 42(2), 573-595.
Franz, M. M., Freedman, P., Goldstein, K., & Ridout, T. N. (2008). Understanding the effect of
political advertising on voter turnout: A response to Krasno and Green. Journal of
Politics, 70(1), 262-268.
Franz, M. M. (2007; 2007, c2008). Campaign Advertising and American Democracy.
Philadelphia: Temple University Press.
Franz, M. M., & Ridout, T. N. (2007). Does political advertising persuade? Political
Behavior, 29(4), 465-491.
Freedman, P., Franz, M., & Goldstein, K. (2004). Campaign advertising and democratic
citizenship. American Journal of Political Science, 48(4), 723-741.
Freedman, P., & Goldstein, K. (1999). Measuring media exposure and the effects of negative
campaign ads. American Journal of Political Science, 43(4), 1189-1208.
Fridkin, K. L., Kenney, P. J., & Woodall, G. S. (2009). Bad for men, better for women: The
impact of stereotypes during negative campaigns. Political Behavior, 31(1), 53-77.

March 2011
96
Golan, G. J., Banning, S. A., & Lundy, L. (2008). Likelihood to vote, candidate choice, and the
third-person effect: Behavioral implications of political advertising in the 2004 presidential
election. American Behavioral Scientist, 52(2), 278-290.
Goldstein, K., & Freedman, P. (2002). Campaign advertising and voter turnout: New evidence
for a stimulation effect. Journal of Politics, 64(3), 721-740.
Hamilton, A. (1961). The Federalist. Cambridge, Mass.: Belknap Press of Harvard University
Press.
Hershey, M. R. (2003). Party Politics in America
Huber, G. A., & Arceneaux, K. (2007). Identifying the persuasive effects of presidential
advertising. American Journal of Political Science, 51(4), 957-977.
Huddy, L., Feldman, S., & Cassese, E. (2007). On the distinct political effects of anxiety and
anger. In W. R. Neuman, G. E. Marcus, A. N. Crigler & M. MacKuen (Eds.), The Affect
Effect (pp. 202). Chicago: The University of Chicago Press.
Huddy, L., & Gunnthorsdottir, A. H. (2000). The persuasive effects of emotional visual imagery:
Superficial manipulation or the product of passionate reason? Political Psychology, 21(4),
745. Retrieved from JSTOR database.
Jackson, R. A., Mondak, J. J., & Huckfeldt, R. (2009). Examining the possible corrosive impact
of negative advertising on citizens' attitudes toward politics. Political Research
Quarterly, 62(1), 55-69.

March 2011
97
Johnston, A., & Kaid, L. L. (2002). Image ads and issue ads in U.S. presidential advertising:
Using videostyle to explore stylistic differences in televised political ads from 1952 to
2000. Journal of Communication,52(2), 281-300.
Kahn, K. F., & Kenney, P. J. (1999). Do negative campaigns mobilize or suppress turnout?
Clarifying the relationship between negativity and participation. The American Political
Science Review, 93(4), 877-889.
Kaid, L. L. (2001). Technodistortions and effects of the 2000 political advertising. American
Behavioral Scientist, 44(12), 2370.
Kaid, L. L., & Holtz-Bacha, C. (2006). The SAGE Handbook of Political Advertising. Thousand
Oaks, Calif.: SAGE Publications.
Kaid, L. L., & Johnston, A. (2001). Videostyle in Presidential Campaigns: Style and Content of
Televised Political Advertising. Westport, Conn.: Praeger.
Koch, J. W. (2008). Campaign advertisements' impact on voter certainty and knowledge of house
candidates' ideological positions. Political Research Quarterly, 61(4), 609-621.
Krasno, J. S., & Green, D. P. (2008). Do televised presidential ads increase voter turnout?
Evidence from a natural experiment. Journal of Politics, 70(1), 245-261.
Krupnikov, Y. (2009). Who Votes? How and When Negative Campaign Advertisements Affect
Voter Turnout

March 2011
98
Lau, R. R., Sigelman, L., Heldman, C., & Babbitt, P. (1999). The effects of negative political
advertisements: A meta-analytic assessment. The American Political Science Review, 93(4),
851-875.
Lodge, M. , McGraw, K. M., & Stroh, P. (1989). An impression-driven model of candidate
evaluation. The American Political Science Review, 83(2), 399-419.
MacKuen, M., Marcus, G. E., Neuman, W. R., & Keele, L. (2007). The third way: The theory of
affective intelligence and American democracy. The Affect Effect (pp. 124). Chicago: The
University of Chicago Press.
Marcus, G. E., & MacKuen, M. B. (1993). Anxiety, enthusiasm, and the vote: The emotional
underpinnings of learning and involvement during presidential campaigns. American
Political Science Review, 87(3), 672-685.
Marcus, G. E., Neuman, W. R., & MacKuen, M. (2000). Affective Intelligence and Political
Judgment. Chicago: The University of Chicago Press.
Mattes, K., Spezio, M., Kim, H., Todorov, A., Adolphs, R., & Alvarez, R. M. (2010). Predicting
election outcomes from positive and negative trait assessments of candidate
images. Political Psychology, 31(1), 41-58.
Mayer, W. G. (1996). In defense of negative campaigning. Political Science Quarterly, 111(3),
437-455.
Nadeau, R., Niemi, R. G., & Amato, T. (1995). Emotions, issue importance, and political
learning. Midwest Political Science Association, 39(3), 558.
March 2011
99
Neuman, W. R., Marcus, G. E., Crigler, A. N., & MacKuen, M. (2007). Theorizing affect's
effects. In W. R. Neuman, G. E. Marcus, A. N. Crigler & M. MacKuen (Eds.), The Affect
Effect (pp. 1). Chicago: The University of Chicago Press.
Overby, L. M., & Barth, J. (2009). The media, the medium, and malaise: Assessing the effects of
campaign media exposure with panel data. Mass Communication and Society, 12(3), 271-
290.
Parmelee, J. H. (2003). Meet the Candidate Videos: Analyzing Presidential Primary Campaign
videocassettes. Westport, Conn.: Praeger.
Rahn, W. M., & Hirshorn, R. M. (1999). Political advertising and public mood: A study of
children's political orientations. Political Communication, 16(4), 387-407.
Ridout, T. N., & Franz, M. (2008). Evaluating measures of campaign tone. Political
Communication, 25(2), 158-179.
Ridout, T. N., Shah, D. V., Goldstein, K. M., & Franz, M. M. (2004). Evaluating measures of
campaign advertising exposure on political learning. Political Behavior, 26(3), 201-225.
Romer, D. (2004). Capturing Campaign Dynamics: The National Annenberg Election Survey:
Design, Method, and Data. New York: Oxford University Press.
Rudolph, T. J., Gangl, A., & Stevens, D. (2000). The effects of efficacy and emotions on
campaign involvement. Southern Political Science Association, 62(4), 1189. Retrieved from
JSTOR database.

March 2011
100
Steele, D., & Sanders, S. "Dire Predictions and Disastrous Votes: Election Ads." Interview by
Melissa Block. Audio blog post. 6 Nov. 2006. Web. <www.NPR.org>.
Stevens, D. (2009). Elements of negativity: Volume and proportion in exposure to negative
advertising. Political Behavior, 31(3), 429-454.
Stevens, D. (2008). Measuring exposure to political advertising in surveys. Political
Behavior, 30(1), 47-72.
Stratmann, T. (2009). How prices matter in politics: The returns to campaign advertising. Public
Choice, 140(3-4), 357-377.
Sweetser, K. D., Golan, G. J., & Wanta, W. (2008). Intermedia agenda setting in television,
advertising, and blogs during the 2004 election. Mass Communication and Society, 11(2),
197-216.
Thurber, J. A., Nelson, C. J., & Dulio, D. A. (2000). Crowded Airwaves: Campaign Advertising
in Elections. Washington, D.C.: Brookings Institution Press.
Tiedens, L. Z., & Linton, S. (2001). Judgment under emotional certainty and uncertainty: The
effects of specific emotions on information processing. Journal of Personal and Social
Psychology, 81(6), 973.
Trent, J. S., & Friedenberg, R. V. (1991). Political Campaign Communication: Principles and
Practices. New York: Praeger.

March 2011
101
Valentino, N. A., Hutchings, V. L., Banks, A. J., & Davis, A. K. (2008). Is a worried citizen a
good citizen? Emotions, political information seeking, and learning via the
Internet. Political Psychology, 29(2)
Valentino, N. A., Hutchings, V. L., & White, I. K. (2002). Cues that matter: How political ads
prime racial attitudes during campaigns. American Political Science Review, 96(1), 75-90.
Valentino, N. A., Hutchings, V. L., & Williams, D. (2004). The impact of political advertising on
knowledge, internet information seeking, and candidate preference. Journal of
Communication, 54(2), 337-354.
Westen, D. (2007). The Political Brain: The Role of Emotion in Deciding the Fate of the Nation.
New York City: PublicAffairs.
Zaller, J. (1992). The Nature and Origins of Mass Opinion. Cambridge [England] ;New York,
NY, USA: Cambridge University Press.
Related Documents