ADVANTAGES AND DISADVANTAGES OF MICROPOROUS MEMBRANES IN A HOLLOW FIBER BIOREACTOR FOR SPACE APPLICATIONS by MARIA NOEL RUIZ CARERI, B.S.Ch.E. A THESIS IN CIVIL ENGINEERING Submitted to the Graduate Faculty of Texas Tech University in Partial Fulfillment of the Requirements for the Degree of MASTER OF SCIENCE IN CIVIL ENGINEERING Approved Audra Morse Chairperson of the Committee Andrew Jackson Accepted John Borrelli Dean of the Graduate School August, 2005

Welcome message from author
This document is posted to help you gain knowledge. Please leave a comment to let me know what you think about it! Share it to your friends and learn new things together.
Transcript

ADVANTAGES AND DISADVANTAGES OF MICROPOROUS
MEMBRANES IN A HOLLOW FIBER BIOREACTOR
FOR SPACE APPLICATIONS
by
MARIA NOEL RUIZ CARERI, B.S.Ch.E.
A THESIS
IN
CIVIL ENGINEERING
Submitted to the Graduate Faculty of Texas Tech University in
Partial Fulfillment of the Requirements for
the Degree of
MASTER OF SCIENCE
IN
CIVIL ENGINEERING
Approved
Audra Morse Chairperson of the Committee
Andrew Jackson
Accepted
John Borrelli Dean of the Graduate School
August, 2005

ii
ACKNOWLEDGMENTS
I would first like to thank my major advisor, Dr. Audra Morse, who guided me
through my graduate studies at Texas Tech University. I appreciate her constant support,
patience, and understanding during my thesis writing and all the help she provided me to
complete my degree. Also, my appreciation goes to Dr. Jackson, for participating on my
committee, for his review of this thesis, and also for giving me the opportunity to obtain a
remarkable work graduate experience.
Thanks to the Texas Tech Athletic Department, without them I would never have
had the opportunity to be in this country. I am very grateful to my co-workers and
friends who have been with me in the last couple of years, and without the TTU-NASA
research team this research would not have been possible. Thanks to Dr. Dallas and the
people in electrical engineering for taking their time to help me out, to Dr. Heyward
Ramsey for his encouragement and trust in the past couple of years, and to Eric
McLamore, for his patience and understanding on those crazy days where nothing made
sense, for always giving me a good laugh.
And of course, special thanks go to my family, especially my parents, who have
always been there to support me and taught me to never quit. Also, to my sister who
gave me the confidence to finish my degree and succeed in anything I do. They have
played the most important role in forming the person I am today.
iii
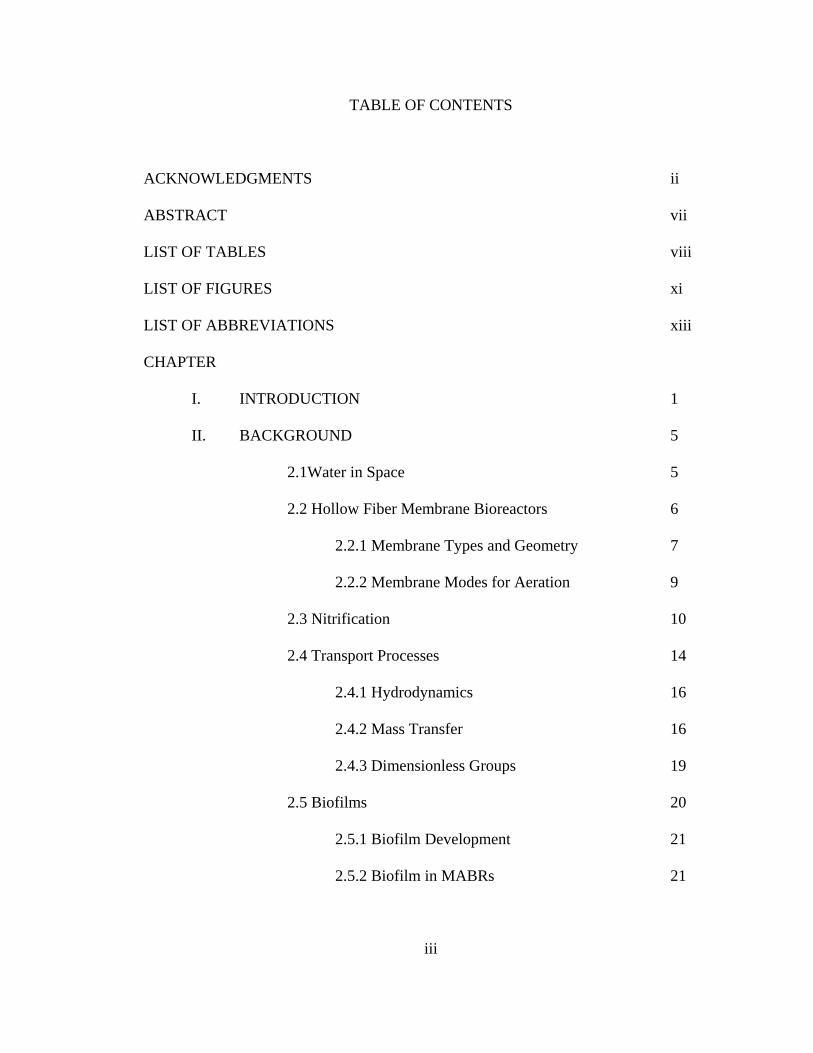
TABLE OF CONTENTS
ACKNOWLEDGMENTS ii
ABSTRACT vii
LIST OF TABLES viii
LIST OF FIGURES xi
LIST OF ABBREVIATIONS xiii
CHAPTER
I. INTRODUCTION 1
II. BACKGROUND 5
2.1Water in Space 5
2.2 Hollow Fiber Membrane Bioreactors 6
2.2.1 Membrane Types and Geometry 7
2.2.2 Membrane Modes for Aeration 9
2.3 Nitrification 10
2.4 Transport Processes 14
2.4.1 Hydrodynamics 16
2.4.2 Mass Transfer 16
2.4.3 Dimensionless Groups 19
2.5 Biofilms 20
2.5.1 Biofilm Development 21
2.5.2 Biofilm in MABRs 21

iv
III. MATERIALS AND METHODS 23
3.1 Membrane Module 23
3.2 HFMBR 25
3.2.1 Inoculation 25
3.2.2 Feed Composition 26
3.3 HFMBR Reactor System 27
3.3.1 System Components 27
3.3.1.1 Pressure Measurement 27
3.3.1.2 Connections 27
3.3.2 Analytical Methods 29
3.4 Loading Studies 29
3.5 Nitrification 30
3.6 Hydrodynamics/Tracer Studies 31
3.7 Mass Transfer Experiments 32
3.8 Biofilm Analysis 33
3.8.1 Determination of biofilm distribution throughout the bioreactor 35
3.8.1.1 Circumferential Analysis 35
3.8.1.2 Longitudinal Analysis 35
3.8.1.3 Outside-in Strategy 36
3.8.2 Identification of the bacteria present within the biofilm 37
v
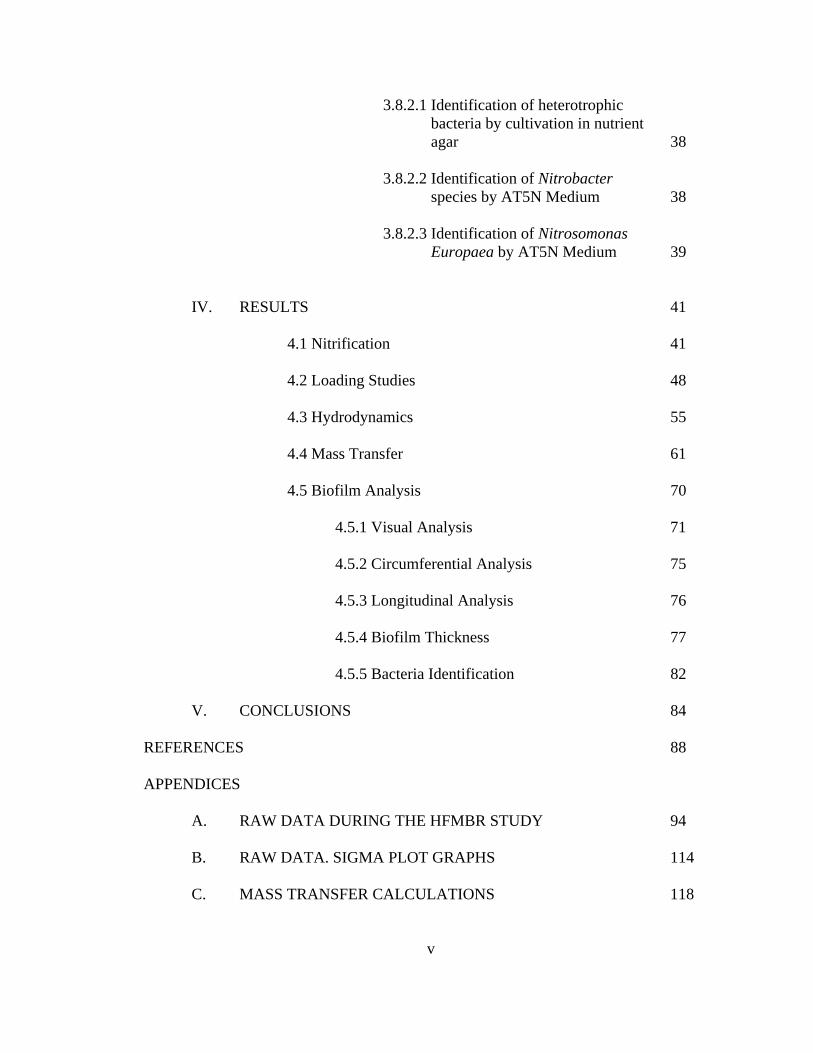
3.8.2.1 Identification of heterotrophic bacteria by cultivation in nutrient
agar 38
3.8.2.2 Identification of Nitrobacter species by AT5N Medium 38
3.8.2.3 Identification of Nitrosomonas Europaea by AT5N Medium 39
IV. RESULTS 41
4.1 Nitrification 41
4.2 Loading Studies 48
4.3 Hydrodynamics 55
4.4 Mass Transfer 61
4.5 Biofilm Analysis 70
4.5.1 Visual Analysis 71
4.5.2 Circumferential Analysis 75
4.5.3 Longitudinal Analysis 76
4.5.4 Biofilm Thickness 77
4.5.5 Bacteria Identification 82
V. CONCLUSIONS 84
REFERENCES 88
APPENDICES
A. RAW DATA DURING THE HFMBR STUDY 94
B. RAW DATA. SIGMA PLOT GRAPHS 114
C. MASS TRANSFER CALCULATIONS 118

vi
D. TRACER STUDY CALCULATIONS 128
E. T-TEST 135

vii
ABSTRACT
Texas Tech University (TTU) works in conjunction with NASA to develop a
wastewater recovery system robust enough for use on long term-space missions.
Biological treatment has been the primary focus at TTU, with specific thrusts in
developing a biological treatment system that may be operated with minimal crew
maintenance and low energy and mass requirements.
Hollow fiber membrane bioreactors (HFMBRs) may be used for biological
wastewater treatment, and may be integrated with NASA’s current research
developments. The goal of this research is to (a) evaluate the effect of mass transfer by
the use of microporous membranes and their application for microgravity conditions; (b)
compare the effect of membrane type and configuration on treatment efficiency to
previous literature values; and (c) determine the amount and distribution of biofilm
growth within the reactor. Therefore, the objective of this research was accomplished
using a microporous HFMBR.
From the experimental studies performed for this thesis it was found that the
HFMBR exhibits promising use in space applications. Maximum nitrification efficiency
at low loading rates and high HRTs were accomplished using the HFMBR. Therefore,
characteristics such as, suitable bioreactor size and the efficiency obtained during its
operation, the HFMBR offer a potential for NASA’s needs; nonetheless, developing a
system with more favorable system hydrodynamics would aid to improve treatment
efficiency in a HFMBR

viii
LIST OF TABLES
2.1 Dimensionless numbers 20
3.1 HFMBR Characteristics 25
3.2 Composition of HFMBR feed 26
3.3 Nutrient agar composition 38
3.4 AT5N medium composition (Nitrobacter) 39
3.5 AT5N Medium Composition (Nitrosomonas) 40
4.1 Evolution of nitrification process 43
4.2 Effluent results for HFMBR during +4NH -N loading 44
4.3 Ammonium-nitrogen removal rate from various treatment systems 47
4.4 Mass removed at a constant rate 54
4.5 Dispersion in the HFMBR 59
4.6 HFMBR mass transfer without biofilm 62
4.7 Oxygen transfer within the HFMBR 63
4.8 HFMBR mass transfer after biofilm formation 65
4.9 Dimmensionless numbers 67
4.10 Comparison of mass transfer correlations from literature 70
4.11 Cross-sectional mass per surface area 75
4.12 Longitudinal mass per surface area 77
4.13 Biofilm thickness 78
A1 Test point 1. Influent Concentrations (mg/L) 95

ix
A2 Test point 1. Effluent Concentrations (mg/L) 96
A3 Test point 2. Influent Concentrations (mg/L) 97
A4 Test point 2. Effluent Concentrations (mg/L) 98
A5 Test point 3. Influent Concentrations (mg/L) 99
A6 Test point 3. Effluent Concentrations (mg/L) 100
A7 Test point 4. Influent Concentrations (mg/L) 101
A8 Test point 4. Effluent Concentrations (mg/L) 102
A9 Test point 5. Influent Concentrations (mg/L) 103
A10 Test point 5. Effluent Concentrations (mg/L) 104
A11 Test point 6. Influent Concentrations (mg/L) 105
A12 Test point 6. Effluent Concentrations (mg/L) 106
A13 Test point 7. Influent Concentrations (mg/L) 107
A14 Test point 7. Effluent Concentrations (mg/L) 108
A15 Average Values 109
A16 Standard Deviation Values 110
A17 Volumetric Conversion Rates 111
A18 Mass Calculations 112
A19 Reactor Efficiency using variable surface areas 112
A20 Sample Calculations 113
C1 Initial DO calculations at 0.3 mL/min 119
C2 Initial DO calculations at 5 mL/min 120
C3 Initial DO calculations at 10 mL/min 121

x
C4 Initial DO calculations at 21 mL/min 122
C5 Initial DO calculations. Summary table 123
C6 Final DO calculations at 0.3 mL/min 124
C7 Final DO calculations at 1 mL/min 125
C8 Final DO calculations at 10 mL/min 126
C9 Final DO calculations. Summary table 127
C10 Biofilm consumption 127
D1 Initial tracer at 0.3 mL/min 129
D2 Initial tracer at 1 mL/min 130
D3 Initial tracer at 15 mL/min 131
D4 Final tracer at 0.3 mL/min 132
D5 Final tracer at 1 mL/min 133
D6 Final tracer at 15 mL/min 134

xi
LIST OF FIGURES
2.1 Mass Transfer in a nitrifying microporous HFMBR 17 3.1 Hollow fiber membrane reactor (HFMBR) schematic 24
3.2 Hollow fiber membrane reactor system layout 28
3.3 HFMBR module 28
3.4 Sampling locations within the HFMBR 34
3.5 Different cross-sections within the HFMBR 36
3.6 Membrane sampling 37
4.1 HFMBR conversion rates 42
4.2 HFMBR efficiency 45
4.3 Volumetric conversion rates 49
4.4 Conversion rates per surface area 50
4.5 Overall reactor performance 51
4.6 Conversion rate comparison 53
4.7 Comparison of the HFMBR removal efficiencies 55
4.8 Hydrodynamic experiments without biofilm 57
4.9 Hydrodynamic experiments after biofilm growth 58
4.10 Oxygen transfer within the HFMBR 64
4.11 Sherwood vs. Reynolds number. Before and after biofilm formation 69
4.12 Sampling locations within the HFMBR 71
4.13 Biofilm growth within different locations of the HFMBR 73

xii
4.14 Outside-in strategy 74
4.15 Biofilm distribution within the HFMBR 76
4.16 Biofilm thickness 78
4.17 Biofilm thickness at sections 2A and 3A 80
4.18 Biofilm thickness at sections 4A and 5A 81
B1 Raw data for pH and TDS 115 B2 Raw data for dissolved oxygen and ammonia 116 B3 Raw data for nitrogen oxides 117

xiii
LIST OF ABBREVIATIONS
d Unitless dispersion number
D Diffusion coefficient
DDI Deionized, distilled water
DO Dissolved oxygen
HFMBR Hollow fiber membrane bioreactor
HRT Hydraulic retention time
J Flux
JE Experimental flux
JM Flux consumed by microorganisms
KL Mass transfer coefficient in the liquid phase
KO Overall mass transfer coefficient
MABR Membrane aerated bioreactor
+4NH -N Ammonium
−2NO -N Nitrite
−3NO -N Nitrate
−xNO -N Nitrogen oxide
Pe Peclet number
Re Reynolds number
Sc Schmidt number
Sh Sherwood number

1
CHAPTER I
INTRODUCTION
From the early 1970s to about 1980, the primary worries for wastewater treatment
were aesthetic and environmental concerns as indicated by the reduction of biological
oxygen demand, total suspended solids, and pathogenic organisms (Metcalf & Eddy,
2003). Later, the removal of nutrients began to be addressed. As time passed, the goals,
and objectives became, and still are, more strictly related to the water quality.
Wastewater treatment methods involve physical, chemical, or biological
reactions. However, wastewater treatment is not only applied in terrestrial environments,
but also wastewater treatment is a concern in space. Long duration space missions will
require the reuse of water supplies.
NASA is currently evaluating different physical and chemical methods for the
recovery of wastewater. A Water Recovery System (WRS) is necessary for long-term
space missions due to the limited capacity for water storage due to weight and volume
requirements. It is definitely a challenge for the WRS to produce stable and healthy
water from a wastewater stream composed of gray-water (hand, body, clothes, and dish
washing), humidity condensate, and urine. Biological wastewater treatment methods, as
well as the physical and chemical methods, also provide the possibility of organic carbon
removal, as well as ammonia and nitrate from wastewater. Biological wastewater
methods have the advantage of low energy requirements, no additional chemical
requirements for the treatment process, and the production of less waste material

2
requiring storage and handling. Therefore, biological treatment is a cost-effective
method for the replacement of the physical and chemical techniques currently considered
in space.
NASA’s Johnson Space Center (JSC) and Texas Tech University (TTU) have
been working simultaneously with the purpose of developing a robust system to be
operated under microgravity conditions and cost effective enough to be used for long-
term missions. Texas Tech University (TTU) currently operates several biological
systems for wastewater treatment (Morse et al., 2003; Jackson et al., 2004; Muirhead, et
al., 2003; and McLamore, 2004) including: the TTU-WRS, two membrane aerated
bioreactors, referred to as MABRs, a commercial hollow fiber polypropylene
microporous membrane bioreactor (HFMBR), and a dual system that promotes
simultaneous nitrification and denitrification (sAMR). In the TTU-WRS system,
nitrification is promoted in a tubular reactor located downstream of a packed bed reactor,
in which denitrification occurs. Nitrification refers to the conversion of ammonium to
nitrite and nitrate under aerobic conditions, while denitrification is the conversion of
nitrite and nitrate into nitrogen gas under anaerobic conditions (Jackson et al., 2004; and
McLamore et al., 2004). This system presented several maintenance and performance
problems; therefore, the design and treatment efficiency of a membrane-aerated
bioreactor to treat NASA's simulated wastewater was considered.
MABRs are hollow fiber membrane reactors that consist of permeable tubes
through which oxygen is diffused into the system in order to support biofilm growth.
MABRs present several advantages over the tubular reactor such as bubble-free aeration,

3
low solids production, high resistance to shock loadings, and low maintenance (Morse et
al., 2003). However, effective membrane type and configuration has not been
established. For example, membranes may be placed in parallel or randomly distributed
within the reactor. Parallel membranes refer to a straight configuration where the
membranes do not come in contact with each other, while on the other hand, random
membranes refer to the arbitrarily distribution of the membranes in the reactor.
Research at TTU focuses on the use of silicone membranes randomly distributed
within MABRs. The selection of random membranes over parallel membranes was due
to the assumption that by using random membranes mixing would be enhanced;
therefore, increasing transport and improving overall reactor performance. However, the
most effective membrane type and configuration has not been established. Results show
that random membranes could increase transport but certain difficulties may be faced due
to the application of this type of packing configuration, presenting a drawback to their
application. Bao and Lipscomb (2002) analyzed the effect of packing configuration on
mass transfer, and results indicated reduction in mass transfer due to channeling
(formation of biofilm) in randomly distributed fibers. Also, the use of microporous
membranes could contribute to a more efficient treatment; however, their use could
present a problem when applied under microgravity conditions. Silicone membranes can
be operated at higher pressures without forming bubbles, while the formation of bubbles
is possible in microporous membranes due to the porosity of the membranes (Ahmed and
Semmens, 1992).

4
Hollow fiber membrane bioreactors are most commonly used for filtration
purposes. Membranes have been used to remove contaminants from wastewater in
microfiltration and ultrafiltration. For systems previously used, hollow fiber membranes
have also been used for gas stripping. By applying a vacuum through the membranes,
volatile organic compounds have been removed from wastewater streams. However, the
use of HFMBRs for stripping does not present the same problems as when used for
aeration purposes. Some of the anticipated problems presented when using HFMBRs for
aeration purposes are short circuiting as a result of biofilm growth in between the
membranes and the lack of flow control since the use of a vacuum is not applied.
Although some difficulties will arise, it is believed that the use of microporous
membranes, in comparison to silicone membranes, would increase transport of oxygen
through the membranes, improving the treatment efficiency within HFMBRs. Therefore,
the HFMBR is a possible candidate for the replacement of the tubular reactor. However,
all previous studies performed on HFMBRs have been with silicone and randomly
distributed membranes.
Thus there is a need to evaluate the effect of membrane type and configuration in
overall treatment efficiency of the reactor. The objectives of this thesis are to analyze the
advantages and disadvantages of microporous membranes in a hollow fiber membrane
bioreactor by (a) evaluating the effect of mass transfer by the use of microporous
membranes and their application for microgravity conditions; (b) comparing the effect of
membrane type and configuration on treatment efficiency to previous literature values;
and (c) determining the amount and distribution of biofilm growth within the reactor.

5
CHAPTER II
BACKGROUND
2.1 Water in Space
By the advance of science, humans have been able to explore space. Today, long-
term missions are not self sufficient. In long-term space missions, such as a trip to Mars,
astronauts need to perform the same activities in a space shuttle, without gravity, and
reduced space, but they still need to eat and drink. Therefore, the National Aeronautics
and Space Administration (NASA) has been working to develop a wastewater treatment
system for potential use in space applications.
Water is one of the most crucial provisions astronauts need to live and work in
space. That is why NASA has been working in developing physical, chemical or
biological methods to be applied to recycle the wastewater with the ultimate goal of
reducing the cost of missions by decreasing the payload weight. NASA’s focus in the
past had been physical and chemical systems to recycle water. However, NASA is
concentrating in developing biological processes for space applications.
NASA’s first four manned spaceflight projects were Mercury, Gemini, Apollo,
and SkyLab. In the past, water was generated by fuel cells that were used to provide
energy for the spacecraft and potable water was generated as a by-product, and water has
been recycled by physicochemical processes. A Water Recovery System (WRS) needs to
be 100% efficient, self-sufficient and capable of operation in microgravity conditions.
The use of a biological process for space applications may be energy efficient and

6
self-sufficient, require little or no maintenance in order to minimize the crew’s time for
other tasks, require little to no chemicals, and have low mass.
There are two main goals to be accomplished when operating a biological system;
the removal of organic constituents as well as the removal of nitrogen compounds. The
earliest version of a biological WRS was an immobilized cell bioreactor, conducted at
Johnson Space Center (JSC) in 1997 (Pickering et al., 1997). Also, other systems have
been previously analyzed (Finger et al., 1999; Petersen et al., 1991) that included
membrane technologies to develop membrane bioreactors. It is important to remember
that biological processes are followed by physiochemical to complete the water recycling
process, but they are not discussed in this thesis. The scope of this thesis is to evaluate a
membrane bioreactor for its application in space.
2.2 Hollow Fiber Membrane Bioreactors
The use of membranes for treatment of water and wastewater has increased in the
last several years. Membrane aerated bioreactors are hollow fiber membrane bioreactors
(HFMBRs), used most commonly for filtration, that represent a new technology for
aerobic wastewater treatment. Advantages such as bubble free aeration, low solids
production, high resistance to shock loadings, high nitrification efficiency, low
maintenance and a decrease in space requirements can be achieved by the use of
HFMBRs. In a hollow fiber bioreactor, oxygen flows through the lumen side of the
hollow fibers and oxygen diffuses through the wall of the membrane. Oxygen is utilized
by the bacterial population attached to the surface of the membranes, creating a driving

7
force for mass transfer. The membranes provide high oxygen permeability, ensuring the
transport of oxygen through the membranes and providing surface area for biofilm
attachment and treatment to occur.
The most important benefit obtained from HFMBRs is higher mass transfer.
Casey et al. (1999), establishes that the main advantage in process performance between
HFMBRs and conventional reactors is the active layer of biofilm formed on the
membranes and the importance of the active layer location. Depending on the waste
stream, most HFMBRs, consist of aerobic nitrifying bacteria located on the outside of the
film close to the membrane walls where oxygen is being provided and the anaerobic
denitrifying bacteria is located on the inside of the film where there is high organic
matter; therefore, dual mass transfer of oxygen and nutrients occurs from the inside and
outside of the membranes.
2.2.1 Membrane Types and Geometry
Membrane types and geometry are some important features to consider in order to
develop a low mass and energy efficient biological system. Selection of an appropriate
membrane is perhaps the most important feature. Membranes made of teflon, silicone,
gore-tex, polyetherimide, and silicone with fibrous support, silicone and polypropylene
have been used in the past for the removal of different pollutants such as synthetic
sewage, food processing wastewater, organic carbon and inorganic nitrogen between
others (Torrey, 1984). The configurations of membranes used include tubular, plate and
frame, single tube, tubular coil, and hollow fiber (Casey et al., 1999).

8
Aeration within a reactor is achieved by the use of membranes. Pressure provides
a gradient to encourage aeration through the membranes. The pressure driven
membranes are divided into three divisions based on membrane surface. These
membranes can be microporous, dense (silicone), and composite (dense coats on
microporous membranes). Membrane characteristics such as mass transfer, permeability,
pressure limitations, and membrane life span are some factors to take in consideration.
Microporous membranes present the advantage of having negligible resistance to
mass transfer; the bubble free form of aeration results in near 100 percent mass transfer
(Grimberg et al., 2000). Mass transfer takes place by diffusion through the pores of the
membrane. Nonetheless, pressure regulations are restricted due to the formation of
bubbles. The disadvantage of microporous membranes is the limitation to operating
pressure for which a pressure difference across the membrane of 2 to 3 psi was found to
cause bubbles (Ahmed and Semmens, 1991). If liquid penetrates into the micropores of
the membranes, reduction of mass transfer is observed and bubbles can be produced. The
formation of bubbles may present a drawback for the application of this type of
membranes under zero-gravity conditions. The life span of this type of membrane is
reduced due to the deposition of suspended solids and oils within the pores (Casey et al.,
1999) and they cannot be found in small diameter, and are relatively expensive.
Recent studies have investigated the replacement of porous membranes with
silicone membranes for wastewater applications (Ahmed and Semmens, 1992; Brindle
and Stephenson, 1996). Transport in dense membranes occurs via diffusion due to a
pressure differential. Oxygen has a high solubility in silicone; therefore, most dense

9
membranes are made of silicone. Dense membranes present several advantages over
microporous membranes, such as the use of high intramembrane oxygen pressures (up to
3*105 Pa) (Casey et al., 1999), high resistance to chemical and mechanical stress due to
the absence of pores, and the reduction of membrane fouling. In comparison to
microporous membranes (only when bubbles are formed), silicone membranes can also
operate at higher pressures without bubble formation, generating higher mass transfer
rates. Overall, dense membranes have better oxygen mass transfer with membrane
aeration than bubble aeration and have higher life span than microporous membranes.
2.2.2 Membrane Modes for Aeration
Membranes can be operated in two different modes. The dead-end mode, where
the membrane is pressurized with gas and one end of the fibers is sealed. In flow through
mode, gas is continuously pumped through hollow fibers and is vented to keep the partial
pressure of oxygen high along the membrane. The advantages of the dead end mode are
that the release of gases to the atmosphere is avoided and that 100 % gas transfer is
obtained since the only way the gas escapes is through diffusion through the membranes.
On the other hand, the disadvantages of this operation mode are condensation of water
inside the fiber membranes and the use of low pressures in order to obtain bubble less
aeration affecting the mass transfer rate (Ahmed and Semmens, 1992).
When operating membranes in flow through mode, vapor condensation is avoided
inside the membrane fibers and higher pressures can be utilized increasing the mass
transfer rate of a system. Since the gas is vented, complete transfer efficiency may not be

10
achieved and volatile organic compounds (VOC’s) may be stripped and vented to the
atmosphere. The VOC emissions present a concern due to their harmful effect to the
environment and the environmental compliance management costs. The process of
removing the VOCs from the environment is usually more expensive and troublesome
than avoiding the initial release of VOCs. Also, VOCs emissions present a definitely
unsafe environment in space.
HFMBRs have replaced conventional reactors for wastewater applications. The
presence of biofilm offers a higher rate of removal by the HFMBRs in comparison to
conventional treatment. Higher oxygen conversion when used with sealed end
membranes and high organic carbon removal rates can be achieved. The oxygen
diffusion rate is about 10 g/m2-d in conventional reactors while in HFMBRs up to 20
g/m2-d can be achieved (Torrey, 1984). HFMBRs can be used for simultaneous
nitrification and organic removal in a single reactor. Hollow fiber bioreactors are suitable
for simultaneous carbon substrate oxidation, nitrification (oxygen rich side of biofilm),
and denitrification (oxygen depleted biofilm) (Timberlake et al., 1988). However, a
microporous HFMBR for the sole purpose of nitrification was under scrutiny to complete
the objectives of this thesis.
2.3 Nitrification
Nitrification is a microbial process by which reduced nitrogen compounds
(primarily ammonia) are sequentially oxidized to nitrite ( −2NO ) and nitrate ( −
3NO ). This
is predominantly an aerobic chemoautotrophic process (Maier et al., 2000). Nitrifiers are

11
obligate aerobes that utilize oxygen (O2) for respiration and utilize inorganic carbon as an
energy source.
Nitrification is a two step process, typically involving two different types of
nitrifiers in the conversion of ammonia to nitrite and nitrate. True nitrifying bacteria are
considered to be those belonging to the family nitrobacteraceae. These bacteria are
strictly aerobic, gram-negative, chemolithic autotrophs. They require oxygen, utilize
mostly inorganic (without carbon) compounds as their energy source, and require carbon
dioxide (CO2) for their source of carbon. The energy sources are derived from the
chemical conversion of ammonia to nitrite, or nitrite to nitrate. Five genera are generally
accepted as ammonia-oxidizers and four genera as nitrite-oxidizers. Of these,
Nitrosomonas (ammonia-oxidizers) and Nitrobacter (nitrite-oxidizers) are the most
frequently identified genus (Watson et al., 1981).
In nitrification, first the oxidation of ammonia to −2NO (Eq. 2.1) is performed by
the Nitrosomonas, followed by the oxidation of −2NO to −
3NO (Eq. 2.2) by the
Nitrobacter species (Rittmann et al., 1994). For complete nitrification to occur, two
reactions must take place. Equation 1 shows the oxidation of ammonium to nitrite, and it
can be observed that two acid equivalents (H+) are created per mole of nitrogen oxidized.
Equation 2.2 shows the complete nitrification or conversion of the intermediate product
−2NO to −
3NO . Oxygen is required for the oxidation of ammonium and is used as the
terminal electron acceptor by the nitrifying bacteria.

12
+4NH + 1.5O2 → −
2NO + H2O + 2H+ Equation 2.1
∆G0 = -45.79 kJ per e- eq
−2NO + 0.5O2 → −
3NO Equation 2.2
∆G0 = -37.07 kJ per e- eq
The compound that gets oxidized is called the reductant and the substance that
gets reduced is called the oxidant. The oxidant is O2 and the reductant is +4NH ,
respectively (Rittmann and McCarty, 2001). Therefore, +4NH is the electron donor,
losing electrons to the electron acceptor O2, which gains an electron during the
nitrification process. When there is enough oxygen present, nitrification goes to
completion yielding −3NO ; however, an intermediate product is obtained when oxygen is
limiting in the reaction. It is important to remember that oxygen is not the only limiting
condition for nitrification, but that the carbon substrate can be limiting as well (Casey et
al., 1999). However, it can be observed from Equations 1 and 2, that the oxidation of
ammonium to nitrite is more energetically favorable in comparison to the second step in
nitrification. As a result, nitrite is fully consumed by bacteria in their environment
leading to predominantly the existence of nitrate (Rittmann et al., 1994).
Nitrification is an aerobic process that can occur not only in natural environments,
such as in lakes and rivers, but nitrification can be used for wastewater applications.
Nitrification can be accomplished in suspended or attached growth systems (Metcalf &
Eddy, 2003). Systems such as trickling filters, activated sludge, rotating biological
contactors, and packed beds have been used in the past. However, this research focuses

13
on nitrification occurring in attached growth systems, using membranes to increase
surface area per unit volume as composed to traditional attached growth systems.
The efficiency of the nitrification process is affected by the environmental
conditions (whether in environmental habitats or in a reactor), such as temperature, pH,
alkalinity, dissolved oxygen (DO), and nutrient availability (Udert et al., 2003). It has
been established that the rate of nitrification increases with increasing temperature.
Nitrification rates have been found to double for every 10°C increase in temperature
between 10°C and 30°C. According to Environmental Protection Agency (EPA)
findings, the pH levels below < 5.0, as well as pH > 8.0 have been reported to decrease
the rate of ammonium oxidation, decreasing the nitrification rates. Performance stability
is maintained at pH levels between 6.5 and 8.0. For complete nitrification to occur, the
amount of oxygen required is more than 4.57 g O2/g N, and certain wastewater
characteristics are necessary. At low DO concentrations (0.5 to 2.5 mg/L), nitrification
becomes limited (Metcalf & Eddy, 2003). A wastewater with low levels of organic
matter and the need of other micronutrients are also necessary in small amounts (P, S,
and Fe) for complete nitrification to occur.
In addition, factors such as membrane type and organic and hydraulic loading
have an effect on nitrification as well. Microporous membranes present higher surface
area per unit volume than silicone membranes. Synthetic membranes are thin, solid-
phase barriers that allow the passage of certain substances under the influence of a
driving force. Both the chemical and the physical nature of the membrane material
control membrane separation. Membrane separation occurs because of differences in

14
size, shape, chemical properties, or electrical charge of the substances to be separated.
Microporous membranes control separation by size, shape and charge discrimination,
whereas nonporous membranes depend on sorption and diffusion (Singh, 1998).
Nitrification depends on the surface area available for the attached
microorganisms, which are responsible for the conversion of ammonium to nitrate.
Nitrification is also dependent on the membrane permeability, which is dependant on the
membrane type for the diffusion of oxygen; in this case the electron acceptor. The
hydraulic loading, the rate at which the microorganisms are fed is also an important
factor to consider for high nitrification efficiency. These factors will be discussed in this
paper in subsequent sections.
Biological nitrogen removal by hollow fiber membrane bioreactors (HFMBRs) is
a promising method to remove nitrogen from wastewater. Nitrification in HFMBRs
occurs when the carbon substrate loading rate of the wastewater is low, and high oxygen
concentrations at the membrane-biofilm interface would support nitrification. A HFMBR
is used to accomplish nitrification for the removal of wastewater contaminants and the
possible use of this membrane process under microgravity conditions.
2.4 Transport Processes
There are three fundamental principles of transport processes. These mechanisms
are momentum transfer, heat transfer, and mass transfer. Momentum transfer is
concerned with the transfer of momentum, which occurs in moving media. Heat transfer
is concerned with the transfer of heat from one point to another, while mass transfer

15
involves the transfer of mass from one phase to another distinct phase (Geankoplis,
1983).
To determine a reactor’s performance, information on thermodynamics, physical
properties, hydrodynamics, and mass transfer must be known. In a HFMBR,
simultaneous mass transfer occurs. Gas diffuses through the membranes due to a
pressure differential, while at the same time, diffusion within the biofilm occurs due to
convective flow of the bulk liquid in the shell side of the reactor. Therefore, the overall
process involves diffusion of the gas through the membrane, transport from the bulk
liquid to the biofilm surface, diffusion through the biofilm, and transport of the liquid
from one point to another. Thus, the processes governing mass transport in HFMBRs are
mass transfer and hydrodynamics. The thermodynamic properties are assumed to be in
equilibrium.
In HFMBRs, the presence of packing provides a resistance to the flow of the fluid
that is greater than it would be in an empty column shell (Strigle, 1987). The non-
uniform distribution of the packing has an effect on liquid distribution of the flow as well
as gas velocity. It has been investigated in the past that the liquid flow is an active
element affecting the internal transport process in the anaerobic part of the biofilm
(Alphenaar et al., 1993); however, this has not been established due to several factors
affecting the hydrodynamics within the reactor. Parameters such as the mixing, residence
time distribution, and the influence of hydrodynamics on mass transfer are some factors
to take in consideration. Therefore, hydrodynamics and mass transfer are dependant on
each other.

16
2.4.1 Hydrodynamics
Mass transfer is influenced by the thickness of the membrane wall, the actual pore
diameter in the lumen, and the hydraulic flow through the membranes. The hydraulic
flow characteristics of complete-mix and plug-flow reactors can be described as varying
from ideal and non ideal, depending on the relationship of the incoming flow to outgoing
flow (Metcalf & Eddy, 2003).
A tracer may be used to recognize the hydraulic performance of a reactor. The
effect of short circuiting, channeling, flow patterns, and the actual residence time due to
biofilm growth can be determined by analyzing the tracer response curves. Moreover,
the tracer response curves may be used to estimate the biomass growth rates and the mass
transfer within the biofilm.
2.4.2 Mass Transfer
For a membrane system, the mass transfer process is determined by three mass
transfer resistances in series, resistance in the gas phase, the resistance due the membrane
and the resistance in the liquid. A HFMBR with microporous membranes was operated
for the purpose of this thesis. The membrane and gas resistances are considered much
smaller than the liquid resistance, thus neglected in the analysis for this report (Cote,
1989). Only the liquid mass transfer resistance is taken in consideration.
In HFMBRs simultaneous mass transfer occurs when oxygen diffuses through the
membranes within the reactor due to a pressure differential, and by forced convection
when nutrients are transported from the bulk liquid in the shell side of the reactor. Figure

17
2.1 shows the concentration profiles in the gas-membrane-liquid interfaces. Mass
transfer resistances are dependent on the hydrodynamic properties of the liquid phase and
packing structure. Resistances are smaller at larger, turbulent flows than at laminar
flows. Since mass transfer is dependent on the hydrodynamic conditions, and the
hydrodynamic conditions affect the biofilm growth within the HFMBR, the biofilm
thickness and structure affect the rate of mass transfer; therefore, affecting the overall
performance of the system.
Figure 2.1 Mass transfer in a nitrifying microporous HFMBR
Diffusion can be explained by Fick’s law and a mass transfer coefficient. Fick
proposed a linear relation between the rate of diffusion of a chemical species and the
local concentration gradient of that species (Cussler, 2002). The flux needs to be

18
calculated in order to determine the overall mass transfer coefficient. The flux, from
Equation 2.3 can be defined as the amount transferred per unit time, the flux (J).
)( cockJ −= Equation 2.3
where; J = flux of chemical at interface [M/V-T]
k = mass transfer coefficient [L/T] c = concentration of specie at interface [M/V] co = bulk concentration [M/V]
The flux, J, in Equation 2.3, includes both diffusion and convection. Mass
transfer across an interface is described in terms of a flux. Fick’s first law defines the
overall mass transfer coefficient as the sum of the three resistances in series, where the
value of each resistance is represented by its respective mass transfer coefficient. A
concentration differential is assumed and defined in Equation 2.4.
LMGO kkkk1111
++= Equation 2.4
where; 1/ Ok = overall mass transfer resistance [L/T]-1
1/ Gk = mass transfer resistance in the gas phase [L/T] -1 1/ Mk = mass transfer resistance through the membrane [L/T] -1 1/ Lk = mass transfer resistance in the bulk liquid [L/T] -1
The mass transfer resistance in the gas phase is determined by diffusion, and the
mass transfer in the liquid phase is determined by convection. Mass transfer has a strong
dependence on the biofilm structure, the hydrodynamic conditions, and substrate loading
on the biofilm surface (Viera et al., 1993). As previously stated, in a microporous hollow
fiber membrane reactor, the membrane and gas resistances are much smaller than the

19
liquid resistance, and considered negligible in mass transfer analyses of this type (Cote,
1989).
Additionally, Fick’s law takes in consideration the length and number of
membranes where diffusion is taken place; thus, the length and number of membranes
will be taken in consideration. From Equation 2.4 a new term, a diffusion coefficient (D)
and the membrane length (lm) are introduced.
lmcocDJ )( −
= Equation 2.4
where;
J = flux of chemical [M/V-T] D = diffusion coefficient [L2/T]
(c –co)= concentration difference [M/V] lm = membrane length [L] 2.4.3 Dimensionless Groups
Different correlations are used in order to express mass transfer. The Reynolds
number is the most important dimensionless number in fluid dynamics and provides a
criterion for determining dynamic similarity; the Reynolds number is used to determine
whether a flow will be laminar or turbulent. The Peclet number is a dimensionless
number relating the forced convection of a system to its heat conduction. Other
dimensionless groups such as the Schmidt and Sherwood numbers are also used in mass
transfer in general and diffusion in flowing systems calculations in particular. Table 2.1
provides the dimensionless groups used to express mass transfer (Cussler, 2002).

20
Table 2.1 Dimensionless numbers Dimensionless Groups Physical Meaning
Reynolds Number (Re = lυ0/υ) Forced convection Sherwood Number (Sh = kl/D ) Mass transfer velocity/ Diffusion velocity
Schmidt Number (Sc = υ/D ) Diffusivity of momentum/Diffusivity of mass Peclet Number (Pe = υ0l/D) Flow velocity/Diffusion velocity
2.5 Biofilms
Bacteria have an innate tendency to stick to surfaces, and the bacteria growing in
adherent, slime-encased communities are known as biofilms. A biofilm is then a layer of
organic matter and microorganisms formed by the attachment and proliferation of
bacteria on the surface of an object (Maier et al., 2000). Biofilms are important in the
engineering field due to their applications. Biofilms can be used in pollution control such
as in processes like trickling filters, rotating biological contactors, and anaerobic filters.
Hollow fiber membrane bioreactors (HFMBRs) are considered a relatively new
system for aerobic wastewater treatment. HFMBRs have the main advantage of high
oxygen transfer into biofilms and overcoming oxygen limitations while maintaining very
high oxygen conversion efficiencies leading to the treatment of high strength organic
wastewater. The main importance of biofilms, and that is the focus of these thesis, is the
use of biofilms in HFMBRs as a media for dual mass transfer to occur by the addition of
oxygen and substrates from opposite sides. The biofilm is used for the removal of
nitrogen compounds in the waste streams, known as nitrification.

21
2.5.1 Biofilm Development
Biofilm formation occurs in submersed non-sterile water or surrounded by a moist
environment. Biofilms are developed in two stages, reversible and irreversible
attachment, respectively. Reversible attachment is a transitory phase caused by
physicochemical attraction, and irreversible attachment is the actual biological
stabilization of the microorganisms (Maier et al., 2000).
A conditioning film is formed due the accumulation of organic dissolved
molecules of hydrophobic nature at the solid-liquid interface. This conditioning film is
an attractive environment for bacteria to accumulate. An initial adhesion is controlled by
the various attractive or repulsive physicochemical forces leading to passive, reversible
attachment to the surface. An irreversible attachment is a biological, time dependent
process related to the proliferation of bacterial exopolymers forming a chemical bridge to
the solid surface. By a combination of colonization and bacterial growth the mature
biofilm is formed (Marshall et al., 1985).
2.5.2 Biofilms in MABRs
The performance of biofilm processes is often diffusion limited. Substrate
removal and electron donor utilization occur within the depth of the attached growth
biofilm and subsequently the overall removal rates are a function of diffusion rates and
the electron donor and electron acceptor concentrations at various locations in the
biofilm. Dissolved oxygen concentrations of 0.5 to 2.5 mg/L can be considered limiting
for attached growth process (Metcalf & Eddy, 2003). However, in a system where

22
biofilm is absent from the membrane wall, bubble formation depends upon the flow
velocities within the gaseous and liquid phases and the degree of oxygen saturation in the
bulk aqueous phase (Cote et al., 1989).
A membrane aerated bioreactor was used to accomplish the objectives of this
research. Initially, the effect of mass transfer by the use of microporous membranes and
their application for microgravity conditions was evaluated. Also, a comparison of the
effect of membrane type and configuration on treatment efficiency to previous literature
values was performed, and finally the amount and distribution of biofilm growth within
the reactor were determined by utilizing a hollow fiber membrane bioreactor (HFMBR).

23
CHAPTER III
MATERIALS AND METHODS
The goal of this research was to (a) evaluate the effect of mass transfer by the use
of microporous membranes; and (b) compare the effect of membrane type and
configuration on treatment efficiency to previous literature values; and (c) determine the
amount and distribution of biofilm growth within the reactor. A microporous hollow
fiber membrane bioreactor (HFMBR) was used to complete the objectives. Results of
this study, if appropriate, will aid in the use of HFMBR for space applications.
3.1 Membrane Module
The HFMBR (Figure 3.1) was purchased from Liquid-Cel® Membrane
Contactors. There are 3600 hydrophobic polypropylene microporous membranes that
have 300 µm outer diameter and 200 mm long. The total surface area of the fibers is of
0.80 m2, and they have a porosity of 40 percent. The microporous membranes are located
inside a shell with an internal diameter of 31.75 mm and a length of 275 mm. The actual
measured working volume of the reactor was found to be of 63 mL. A summary of the
membrane properties is presented in Table 3.1.
The membrane module has inlet and outlet ports for the aqueous and gaseous
streams. The HFMBR was originally designed for the removal of oxygen from water and
other liquids. Water is pumped through the lumen side of the fibers, a vacuum is applied
to the shell side of the module, air diffusing from the water into the shell side of the

24
reactor. However, for this thesis, the reactor is used for aeration; water passes through
the shell side and pressurized air diffuses from the inside of the fibers into the water. The
microporous membranes within the HFMBR supply oxygen through the pores and serve
as a supporting structure for nitrification biofilm formation. Figure 1 shows a schematic
of the membrane bioreactor configuration.
Figure 3.1 Hollow fiber membrane reactor (HFMBR) schematic

25
Table 3.1 HFMBR characteristics Membrane Characteristics Porosity 40% Porosity OD/ID 300µm OD/220µm ID Potting Material Epoxy Number of Fibers 3600 Maximum Temperature/Pressure 2.8 kg/cm2 (2.8 bar, 40 psig) at 23 °C with appropriate
hose clamps. Maximum 30 °C at lower pressures Active Surface Area 0.5 m2 (5.4 ft2) Priming Volume (ID) 63 mL Housing Characteristics Material Polysulfone Flange Connections Shellside (Gas/Vacuum) Standard Female Luer Lock Supplied with two ⅛ inch
Hosebarb adaptors which mate to 1/4 inch ID tubing Lumenside (Wetted Surface) 1/2 inch Hosebarb Weight Dry 0.15 kg (0.32 lbs.) Liquid Full (Lumenside) 0.2 kg (0.44 lbs.) Shiping Weight 0.3 kg (0.66 lbs.)
3.2 HFMBR
3.2.1 Inoculation
Inoculation of the reactor was completed using nitrifying bacteria batch culture
originally obtained from the Texas Tech University-Water Recovery System. The
nitrifying bacteria were grown and acclimated in the batch culture. A known volume of
deionized, distilled water (DDI) was added as well as nutrients such as ammonium
chloride (NH4Cl), sodium bicarbonate (NaHCO3) and Winogradskys Medium Modified
(Atlas, 1995). The Winogradskys Medium Modified was selected for cultivation of
26
nitrifiers. The changes in the ammonia and nitrogen oxides ( −xNO -N, −
2NO -N, −3NO -N)
concentrations were monitored. Ammonia oxidation activity was observed by a decrease
in the ammonia concentration and an increase in the −xNO -N concentration, indicating the
presence and growth of nitrifiers. The batch was fed once or twice a week, depending on
the rate of ammonium conversion.
After assuring the presence of nitrifiers in the batch culture, the mixed solution
was added to the HFMBR. The reactor was continually fed with NH4Cl, NaHCO3, and
the Winogradskys Medium Modified. The inorganic feed was to support an autotrophic
population within the reactor. Continuous monitoring of the ammonium and nitrogen
oxides persisted, as well as other conditions suitable for the growth of nitrifiers, such as
pH and dissolved oxygen within the bioreactor.
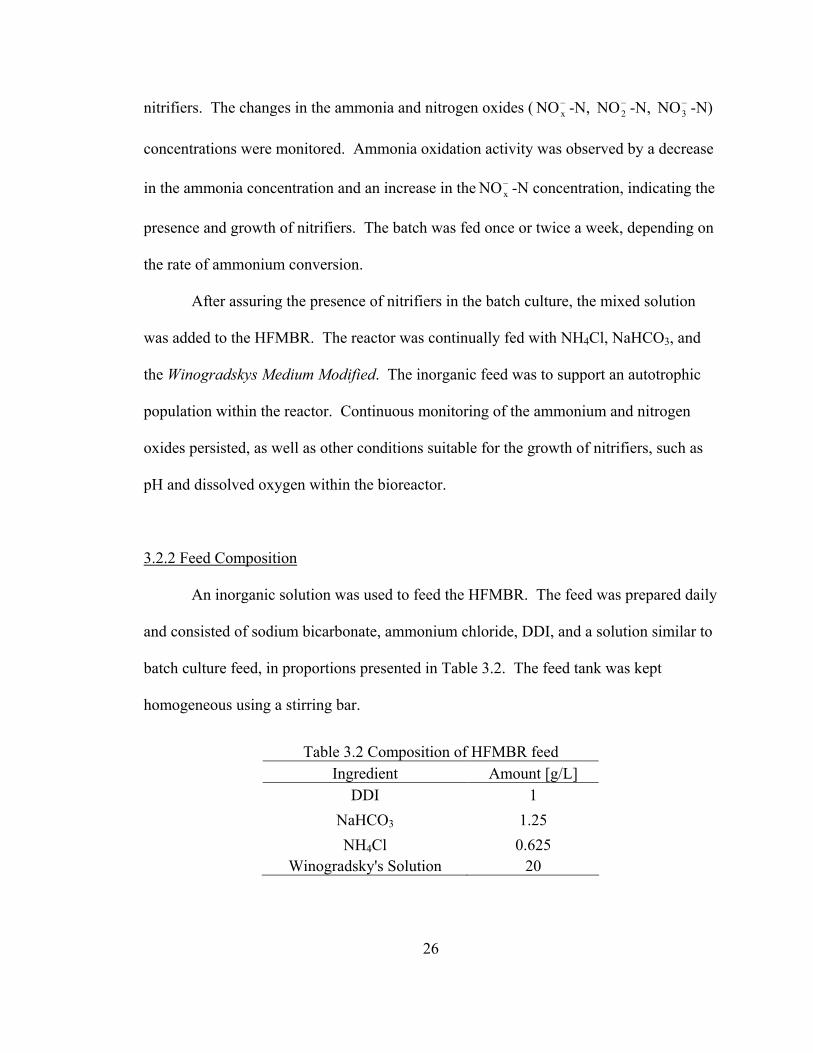
3.2.2 Feed Composition
An inorganic solution was used to feed the HFMBR. The feed was prepared daily
and consisted of sodium bicarbonate, ammonium chloride, DDI, and a solution similar to
batch culture feed, in proportions presented in Table 3.2. The feed tank was kept
homogeneous using a stirring bar.
Table 3.2 Composition of HFMBR feed Ingredient Amount [g/L]
DDI 1 NaHCO3 1.25 NH4Cl 0.625
Winogradsky's Solution 20

27
3.3 HFM Reactor System
3.3.1 System Components
The HFMBR consisted of a pump, influent and effluent tanks, silicone tubing
lines to connect the system, a mass flow controller and a pressure gage to control the air
pressure into the system. Figure 3.2 gives a simplified layout of the operated HFMBR.
3.3.1.1 Pressure Measurement
Oxygen was delivered by the addition of air to one of the cavities in the reactor
(Figure 3.3). Air was supplied from TTU facilities. A mass flow controller
manufactured by Cole Parmer (Model A-32464-16) was used to maintain a constant air
pressure within the system, while a digital pressure gage (Cole Parmer model HW-
68920-00) was used to just measure the pressure. Air was supplied to the reactor at a gas
pressure of 3.44 kPa (0.5 psi). Air flow was opposite to the water flow.
3.3.1.2 Connections
Feed and effluent tanks were connected to the reactor by the use of silicone
tubing (peroxide) obtained from Cole Parmer Instrument Co. The feed was delivered to
the reactor by 4 feet (MASTERFLEX®, L/S ™ 14) silicone tubing. The effluent line,
with the same characteristics presented above was of a length of 1 foot. The lines were
periodically cleaned and replaced to ensure that biofilm growth did not occur in the lines
but within the reactor.

28
Figure 3.2 Hollow fiber membrane reactor system layout
Figure 3.3 HFMBR module

29
3.3.2 Analytical Methods
Daily influent and effluent water samples were taken from the reactor and
measured for pH, temperature, dissolved organic carbon (DOC), −2NO -N, −
3NO -N, NH3-
N, total dissolved solids (TDS), and dissolved oxygen. All nitrogen measurements are
reported as mg-N/L.
Dissolved oxygen concentrations were measured by using a ROSS probe
(ThermoOrion 9708). All samples were filtered through sterilized membranes with
0.45 µm pore size and samples were prepared following Standard Methods (APHA,
1998). Filtrates were tested for nitrate ( −3NO -N), nitrite ( −
2NO -N) and ammonia (NH3-
N). The samples were analyzed by ion chromatography (DX-600) Dionex, USA) for the
detection of −3NO -N and −
2NO -N, a TOC machine manufactured by Shimadzu (Model
TOC-V CSH) for the detection of TOC, while NH3 was analyzed by using a ROSS probe
(ThermoOrion 9708).
3.4 Loading Studies
The performance of the HFMBR was related to the +4NH -N loading rates for
nitrification. Different loading rates were used to determine the reactor’s maximum
nitrification efficiency. The maximum nitrification efficiency within the HFMBR was
determined by analyzing the concentrations of NH3-N and −xNO -N (in mg/L) in the
influent and effluent of the system.

30
The nitrifying HFMBR was operated for approximately eight months. The feed
concentration was kept constant throughout the HFMBR operation; however, the loading
(flow) rate, at which the feed (mass ammonia fed to nitrifiers) was applied to the reactor,
changed over time. The HFMBR was operated at seven different hydraulic retention
times (HRT) including 0.15, 0.09, 0.07, 0.06, 0.04, 0.03, and 0.026 days, respectively.
After reaching steady state conditions, the loading rate (mg/day) was changed.
The need to keep the loading rates within the oxygen transfer capabilities of the
system was necessary for successful treatment of the HFMBR. The best removal
efficiency is expected at high HRTs (low flow rates) where there is enough contact time
for nitrification to occur. On the other hand, poor efficiency is expected at low HRTs
(high flow rates) where the microorganisms have little contact time for the removal of
NH3-N from the system.
Factors such as the hydrodynamics within the HFMBR influence treatment as
well as the biofilm growth and thickness in the reactor; for simplicity all these factors are
assumed to be constant throughout the experimental procedure. The reactor optimum
nitrification efficiency was therefore determined under two conditions: (1) by
determining the best loading rate for nitrification to occur, and (2) by determining the
effect of biofilm growth on mass transfer limitations.
3.5 Nitrification
Nitrification rates can be calculated by the ammonia removal rates, and the
amount of nitrite and nitrate produced. The reactor was fed with inorganic carbon to

31
support a pure culture of autotrophic bacteria; therefore, the heterotrophic population was
considered negligible. A nitrogen mass balance of the system was performed to calculate
the nitrification efficiency of the HFMBR. The ammonia oxidation percentage was
obtained by dividing the effluent nitrite plus nitrate concentration by the influent
ammonia concentration. The system performance, for −2NO -N, −
3NO -N, and ammonium
( +4NH -N) concentrations, was compared at different hydraulic retention times.
Nitrification within the system was calculated for each test point. Daily
measurements for influent NH3-N and effluent −xNO -N ( −
2NO -N + −3NO -N)
concentrations were considered. The measured NH3-N concentrations were converted to
+4NH -N in order to estimate the nitrification efficiency. Percent nitrification was
calculated using Equation 3.1.
(inf) N-NH
)eff( N-NO
4
-x
+=ionNitrificat Equation 3.1
3.6 Hydrodynamics/Tracer Studies
Tracer studies are useful to evaluate the hydraulic performance of a reactor.
Experiments were conducted on the reactor during the initial (no biofilm present) and
final (biofilm present) phases. Sodium bromide was used as a conservative tracer in a
continuous input tracer study. Sodium bromide was injected into the system at different
flow rates. Collection of influent and effluent samples continued until the effluent
bromide concentration matched the influent bromide concentration. Samples were

32
analyzed using automated ion chromatography (IC) and all values were reported as
(mg-Br/L).
The use of a tracer was used to recognize the dynamic behavior of fluid flow
through the HFMBR. The effect of short circuiting, channeling, flow patterns, and the
actual residence time due to biofilm growth were determined by analyzing the tracer
response curves. Moreover, the tracer response curves may be used to estimate the
biomass growth rates and the mass transfer within the biofilm. The number of
membranes in the reactor has an effect on the active surface area for biofilm growth
influencing the treatment efficiency. Replicates of the experiments were performed by
using different fluid flows. Hydrodynamic analyses were evaluated by using the data
collected during tracer studies at the initial (no biofilm present) and final (biofilm
present) stages of the bioreactor operation.
3.7 Mass Transfer Experiments
Oxygen was required as the terminal electron acceptor for respiration of the
microorganisms. The number of membranes in the reactor has an effect on the active
surface area for biofilm growth, directly influencing treatment efficiency. A negligible
membrane resistance for oxygen transfer is assumed due to the micro-porous size of the
membranes. Therefore, the only resistance to mass transfer is provided by the bulk
liquid. Previous research, done by Yang and Cussler (1989), had already established that
the majority of the resistance when using microporous membranes, was from the bulk
liquid.

33
To calculate the mass transfer within the hollow fiber membrane bioreactor
(HFMBR), aeration experiments were conducted. DDI was boiled and sparged with
nitrogen gas until the dissolved oxygen (DO) concentration was below 1 mg/L. The
influent and effluent DO concentrations were measured using a ROSS probe
(ThermoOrion 9708). The gas pressure was kept constant at 0.5 psi. Experiments were
conducted until saturation was reached. Experiments were conducted at different flow
rates and they were performed prior to biofilm formation, as well as after biofilm growth.
The effect of biofilm growth on mass transfer was then determined.
From the oxygen transfer experiments, the oxygen flux through the membranes,
mass transfer coefficients, and the diffusion coefficient were calculated and compared to
other researchers.
3.8 Biofilm Analysis
Biofilm growth was observed in the bioreactor. Determination of biofilm
distribution, thickness, and the determination of the bacteria present within the bioreactor
were objectives of this research. By analyzing the biofilm distribution throughout the
bioreactor, the hydrodynamics may be better understood.
To determine biofilm growth within the reactor, two different tasks were
accomplished: (1) the determination of biofilm distribution throughout the bioreactor, and
(2) the identification of the bacteria present within the biofilm. Sample strategies to
extract the biofilm attached to the membranes were developed.

34
The purpose of determining the biofilm distribution throughout the bioreactor was
to identify the preferential flow path, and predict the effect of biofilm formation on
hydrodynamics. A visual analysis was first completed. Biofilm distribution was
analyzed by obtaining the mass per surface area in the longitudinal direction and at four
different locations within the HFMBR circumference (Figure 3.4). Biofilm sampling was
accomplished in three different ways, in the longitudinal and circumferential direction
and from the outside towards the inside of the reactor, respectively.
Figure 3.4 Sampling locations within the HFMBR
35
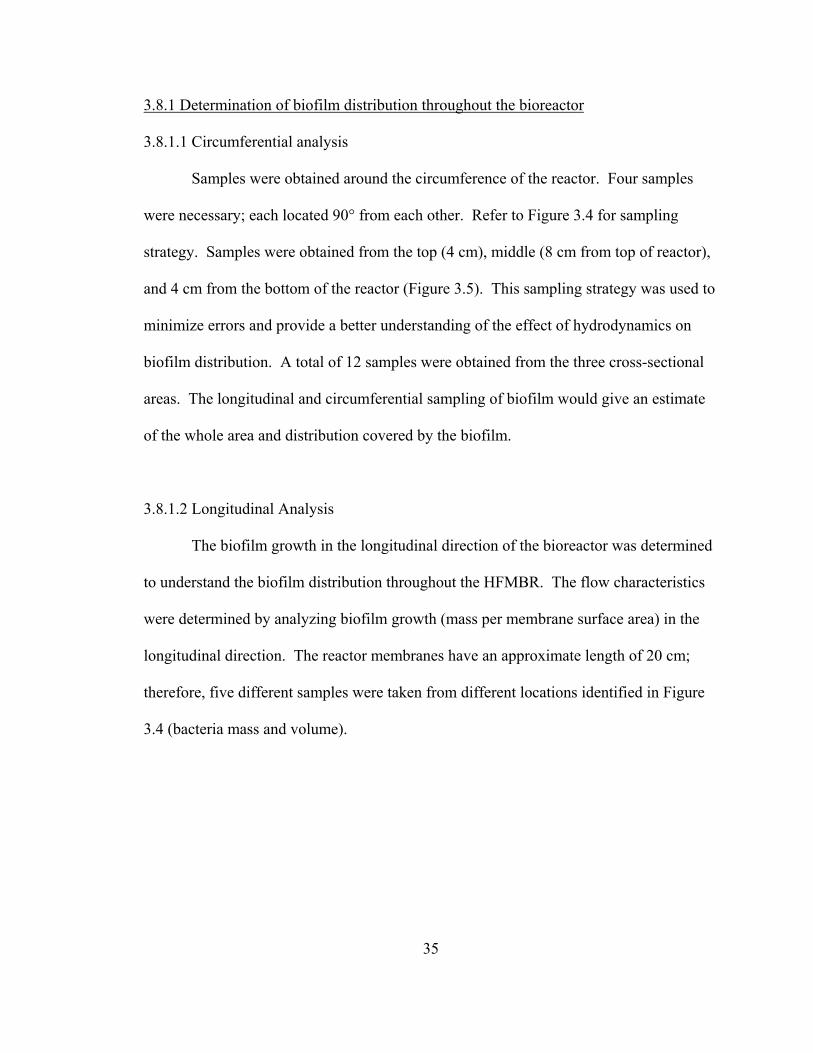
3.8.1 Determination of biofilm distribution throughout the bioreactor
3.8.1.1 Circumferential analysis
Samples were obtained around the circumference of the reactor. Four samples
were necessary; each located 90° from each other. Refer to Figure 3.4 for sampling
strategy. Samples were obtained from the top (4 cm), middle (8 cm from top of reactor),
and 4 cm from the bottom of the reactor (Figure 3.5). This sampling strategy was used to
minimize errors and provide a better understanding of the effect of hydrodynamics on
biofilm distribution. A total of 12 samples were obtained from the three cross-sectional
areas. The longitudinal and circumferential sampling of biofilm would give an estimate
of the whole area and distribution covered by the biofilm.
3.8.1.2 Longitudinal Analysis
The biofilm growth in the longitudinal direction of the bioreactor was determined
to understand the biofilm distribution throughout the HFMBR. The flow characteristics
were determined by analyzing biofilm growth (mass per membrane surface area) in the
longitudinal direction. The reactor membranes have an approximate length of 20 cm;
therefore, five different samples were taken from different locations identified in Figure
3.4 (bacteria mass and volume).

36
Figure 3.5 Different cross-sections within the HFMBR
The biofilm thickness was also determined by extracting and freezing membranes
from the longitudinal direction. The membranes were analyzed under a Watec CCD
Camera (Edmund Optics VZM450 zoom lense) and a NI IMAQ ((PCI 1200 interface) for
image capture. The thickness was used to determine the density of biofilm present.
3.8.1.3 Outside-in Strategy
Taking in consideration the 3600 membranes within the reactor, samples were
taken from the outside towards the middle of the reactor. The initial idea was to samples
in bundles, and sample from the outside towards the center of the membranes. However,
no biofilm growth was observed in the inner membranes, within a distance of 0.5 cm
from the outer membranes. Due to the size and distribution of the membranes just one
sampling within the center of the reactor was performed. The membrane sampling can be
observed in Figure 3.6.

37
Figure 3.6 Membrane sampling
The last sampling strategy was used to estimate the effect of membrane locations
on biofilm density. Wet and dry masses, as well as the biofilm thickness were measured
to try to estimate biofilm density. A total suspended solids test was conducted following
the procedure in Standard Methods (APHA, 1998). Previously it has been observed that
hydrodynamics affects biofilm density. Assuming full flow contact through all the
membranes, a denser biofilm was assumed to be found within the inner membranes of the
HFMBR, where they are closely packed in comparison to the outside membranes.
3.8.2 Identification of the Bacteria Present within the Biofilm
The purpose of identifying the bacteria present within the bioreactor was to
distinguish between the autotrophic population (Nitrosomonas and Nitrobacter species)
and the possible presence of a heterotrophic population in the nitrifying reactor. In order
to identify the bacteria present within, the biofilm three different plating methods were
applied.

38
3.8.2.1 Identification of Heterotrophic Bacteria by Cultivation in Nutrient Agar
The HFMBR was fed with inorganic carbon during its operation. The presence of
an autotrophic bacteria population was therefore established by feeding inorganic carbon
into the system. However, heterotrophs are found everywhere, and their possible
presence was assumed. Thus, in order to identify the presence of heterotrophic bacteria
within the HFMBR a Nutrient Agar was selected for the identification of a wide variety
of microorganisms. The Nutrient Agar composition is presented in Table 3.3.
Table 3.3 Nutrient Agar Composition Ingredient Amount [g/L]
Beef Extract 3 Peptone 5
Agar 15 Preparation of Medium: Suspend 23 g of the powder in 1 L of purified water. Mix thoroughly. Heat with frequent agitation and boil for 1 min. to completely dissolve the powder. Autoclave at 121° C for 15 min.
3.8.2.2 Identification of Nitrobacter Species by AT5N Medium An autotrophic population was established by feeding inorganic carbon into the
system. In order to identify the presence of autotrophs within the system two different
mediums were taken in consideration, an AT5N Medium and the Winogradsy’s Medium,
Modified. The AT5N Medium was chosen over the Winogradsy’s Medium, Modified due
to the fact that suspended precipitates exist in the latter. The AT5N Medium was
therefore chosen for cultivation and maintenance of the Nitrobacter species and
Nitrobacter Winogradsky, respectively. Table 3.4 presents a detailed composition of the

39
Medium used. For the identification of the Nitrobacter species the original medium was
altered, as for the amount of CaCO3 (due to the hardness of the water in Lubbock) and the
agar added and the replacement of (NH4)2SO4 for an appropriate nitrite source, sodium
nitrite (NaNO2), respectively.
Table 3.4 AT5N medium composition Ingredient Amount [g/L]
CaCO3 1 NaNO2 1.5 K2HPO4 0.5 MgSO4 0.05 KHCO3 0.03
CaCl22H2O 0.02 Preparation of Medium: Add components to tap water and bring volume to 1.0 L. Mix thoroughly. Gently heat and bring to boiling. Distribute into tubes or flasks. Autoclave for 15min at 15 psi pressure 121° C.
3.8.2.3 Identification of Nitrosomonas Europaea by AT5N Medium The presence of the Nitrosomonas Europaea was determined by using the AT5N
Medium as well. The Nitrosomonas bacteria are in charge of the oxidation of +4NH -N to
−2NO -N, therefore is the first step for nitrification to reach completion. Thus, analysis for
the identification of these bacteria was accomplished by utilizing the AT5N Medium. The
medium was altered by addition of agar (15 g/L) for solidification and plating purposes
(Table 3.5).

40
Table 3.5 AT5N Medium Composition Ingredient Amount [g/L]
CaCO3 1 (NH4)2SO4 1.5
K2HPO4 0.5 MgSO4 0.05 KHCO3 0.03
CaCl22H2O 0.02 Preparation of Medium: Add components to tap water and bring volume to 1.0 L. Mix thoroughly. Gently heat and bring to boiling. Distribute into tubes for flasks. Autoclave for 15min at 15 psi and 121° C.
Three different plating media were therefore used for identification of autotrophic
and heterotrophic bacteria population. Two replicates of each media at two different
dilutions at the different locations (Figure 3.4) were considered to minimize errors. The
two different dilutions, 1:1 and 1:10, respectively, were used to simulate nutrient rich and
nutrient poor environments to obtain better determination of the presence and possible
bacterial count. Plates were incubated under 30°C for a period of two to seven days
depending on bacterial growth.

41
CHAPTER IV
RESULTS AND DISCUSSION
The objective of this research was to determine and compare the advantages and
disadvantages of a microporous hollow fiber membrane bioreactor (HFMBR) to silicone
membranes. The following discussion details the results obtained for the analysis of
hydrodynamics, mass transfer, biofilm distribution throughout the bioreactor, and the
overall bioreactor performance.
4.1 Nitrification
The change in nitrification capacity of the hollow fiber membrane bioreactor
(HFMBR) is observed in Figure 4.1. The influent +4NH -N concentrations are slightly
variable throughout the experiments due to variations in feed make up, which affect the
standard deviation and results obtained in this report. Conversely, a constant pattern,
where the effluent +4NH -N decreases as the −
3NO -N increases is observed, and relatively
constant −2NO -N concentrations were found throughout the operation of the bioreactor.
Greater concentrations of −3NO -N (mg/L) compared to −
2NO -N were found in the
effluent. This fact indicates that complete nitrification ( +4NH → −
2NO → −3NO )
conversion was achieved. An HRT of 0.15 days, showed the greatest +4NH -N conversion
to −3NO -N, which is attributed to the fact that greater nitrification is obtained at longer
HRTs.

42
Hydraulic Retention Time (days)
0.00 0.02 0.04 0.06 0.08 0.10 0.12 0.14 0.16
Con
cent
ratio
n (m
g/L)
0
50
100
150
200
250
300Initial NH4-N(mg/L)Final NH4-N(mg/L)Final NO2-N(mg/L)Final NO3-N(mg/L)
Figure 4.1 HFMBR conversion rates
The average influent and effluent concentrations of +4NH -N, −
2NO -N, and −3NO -
N are presented in Table 4.1. Nitrification within the HFMBR was calculated using the
averages from each test point at its corresponding hydraulic retention time. Table 4.2
shows a summary of the operating conditions and the results obtained while operating the
HFMBR.

43
Table 4.1 Evolution of nitrification process Av. Initial Av. Final Av. Final Av. Final Av. Final
NH4-N NH4-N NO2-N NO3-N NOx-N Retention
Time (days) (mg/L) (mg/L) (mg/L) (mg/L) (mg/L) 0.15 167.7 ± 17.2 84.3 ± 16.6 4.3 ± 3.0 101 ± 15.4 104.9 ± 16.0 0.09 144.8 ± 23.8 68.6 ± 15.5 43.4 ± 23.3 43.9 ± 21.9 87.3 ± 9.3 0.07 145.9 ± 22.0 82.2 ±12.2 13.9 ± 2.9 51.8 ± 6.5 65.7 ± 7.8 0.06 158.6 ± 12.5 97 ± 14.3 15.7 ± 4.2 46 ± 5.6 61.8 ± 7.4 0.04 169.9 ± 24.9 118.6 ± 19.8 12.9 ± 5.1 50.4 ± 10.0 62.3 ± 10.7 0.03 174.7 ± 16.2 122.9 ± 19.5 14.9 ± 4.3 28.6 ± 5.9 42.5 ± 7.2 0.026 168.2 ± 19.5 145.6 ± 18.3 9.2 ± 2.87 14.4 ± 2.5 23.6 ± 7.9
Table 4.2 presents the effluent characteristics for DO and pH. The DO
characteristics were found to be a function of the biofilm growth; however, this will be
discussed in detail in Section 4.4. On the other hand, the dissociation balance for
ammonium-ammonia is dependent on the temperature and pH (Tavares et al., 2001).
Optimal nitrification rates occur at pH values in the 7.5 to 8.0 range. However, a
pH of 7 to 7.2 is normally used to maintain optimum nitrification rates (Metcalf and
Eddy, 2003). The HFMBR operated at a pH range between 7 and 8. The upper pH limits
were nearly reached (Table 4.2) when operating at 0.03 and 0.026 days, suggesting that
nitrification was insufficient within the HFMBR to lower the pH. This is believed to
affect the overall reactor performance where a sudden decrease in efficiency is observed
between the 0.03 and 0.026 HRTs. Influent and effluent pHs were compared at each test
points, a graphical pH representation can be found in Appendix B.

Tabl
e 4.
2 Ef
fluen
t res
ults
for H
FMB
R d
urin
gN
NH
4−
+ lo
adin
g Lo
adin
g 1
2 3
4 5
6 7
Day
s of O
pera
tion
143-
181
1-24
11
5-14
2 88
-114
25
-60
61-8
7 18
2-21
8 H
RT
(min
utes
) 21
0 12
6 10
5 90
63
42
37
HR
T (d
ays)
0.
15
0.09
0.
07
0.06
0.
04
0.03
0.
026
pH
7 ±
0.71
7.
01 ±
0.2
3 7.
67 ±
0.0
8 7.
66 ±
0.1
5 7.
56 ±
0.2
4 7.
801
± 0.
125
7.91
± 0
.12
DO
(m
g/L)
4.
29 ±
1.8
1 4.
13 ±
0.6
5 2.
4 ±
1.31
2.
21 ±
0.6
7 3.
41 ±
0.6
1 3.
46 ±
1.2
3.
06 ±
0.6
1
NO
x (m
g/L)
10
4.99
± 1
6 87
.34
± 9.
3 65
.72
± 7.
8 61
.76
± 7.
4 62
.26
± 10
.7
42.5
2 ±
7.2
23.6
± 4
.8
Vol
umet
ric L
oadi
ng
(g N
H4/m
2 -d)
0.94
2.
26
3.28
4.
85
10.6
1 24
.54
30.3
5
Vol
umet
ric
Con
vers
ion
Rat
e
(g N
Ox/L
-d)
4.94
11
.41
12.3
6 15
.81
32.5
3 49
.98
35.6
3
Con
vers
ion
Rat
e pe
r Su
rfac
e A
rea
(g N
Ox/L
-d)
0.59
1.
36
1.48
1.
89
3.89
5.
97
4.26
Rem
oval
Rat
e
(g N
H4/m
2 -d)
0.47
1.
07
1.85
2.
97
7.40
17
.27
26.2
7
Nitr
ifica
tion
Effic
ienc
y (%
) 74
.74
± 1
3 68
.87
± 13
.6
51.8
7 ±
10
44.1
7 ±
7.1
39.2
9 ±
10.4
28
.57
± 5.
3 15
.89
± 3.
4
44

45
From Figure 4.2 it can be observed that the percent of ammonia removed ranged
from 16 to 75 percent. The influent and effluent total dissolved solids were measured
during the data collection period (for more details refer to Appendix A). Since no
significant sloughing of the biofilm was observed, cell growth within the HFMBR was
assumed to accumulate during the experimental runs; thus, affecting the percent of
ammonia removed. Biofilm growth within the bioreactor is addressed in Section 4.5.
Hydraulic Retention Time (days)
0.00 0.02 0.04 0.06 0.08 0.10 0.12 0.14 0.16
% A
mm
onia
Con
vers
ion
0
20
40
60
80
100% Ammonia Conversion
R2 = 0.94y = -4.8+99.3*(1-e-16.8x)
Figure 4.2 HFMBR efficiency
As predicted, the HFMBR reached maximum NNH4 −+ conversion at low loading
rates and high HRTs. Low reactor performance was observed at low HRTs when there
was insufficient contact time between the NNH4 −+ in feed and the microorganisms;

46
minimal biological reactions occurred and low nitrification was observed suggesting
kinetic limitations within the HFMBR. Figure 4.2 indicates that 75 percent ammonia
conversion was achieved at a HRT of 0.15 days; however, ammonia conversion was
found to reach saturation between 69 and 75 percent. Therefore, a statistical analysis
was performed (a t-test at 99% and 95% confidence intervals), and it was observed that a
sufficient statistical difference existed between the two flow rates (0.15 and 0.09 days),
indicating that the test point with an HRT of 0.15 days cannot be rejected (Appendix E).
The experimental data from Figure 4.2 was used to obtain an empirical bacterial
growth relationship. A curve was fitted to best estimate nitrification or ammonia
conversion with respect to HRT. Thus, from the relationship in Figure 4.2 the true
intercept of the curve would be negative (-4.8). At very low HRTs low to no treatment
would occur; therefore, there is a minimum HRT necessary for nitrification to occur,
which in this case was found to be 0.03 days. This graph would aid in the determination
of an operating flow rate for a needed percent ammonia conversion within a bioreactor.
A detailed discussion would involve an understanding of the microbial kinetics process,
but this subject is beyond the scope of this thesis. The ammonia conversion within the
HFMBR was found not only to be affected by the loading rates, but also the reactor
configuration and packing density.
The stoichiometric parameters for the nitrification process were calculated using
Equation 4.1 where the ammonium ( NNH4 −+ ) influent concentration and the effluent
NNOx −− and NNH4 −
+ were taken in consideration and agreed with the results found.
(out)NHN(out)NOCl(in)NH 4x4+− +−→− Equation 4.1

47
Table 4.3 summarizes the ammonia removal rate from various nitrification
systems compared to the rate obtained from the HFMBR. Metcalf and Eddy (2003)
reported maximum surface specific nitrification rates for tertiary nitrification trickling
filter to be in the range of 1.2 to 2.9 g N/m2-d. It can be observed that the HFMBR offers
a reasonable minimum degree of ammonia removal rate (0.47 g NH4-N/m2-d). However,
in comparison to conventional treatment and other hollow fiber membrane bioreactors,
the microporous HFMBR is capable of providing higher NNH4 −+ removal rates. A
maximum nitrification rate of 26.27 g NH4-N/m2-d was achieved; therefore, the HFMBR
presents a suitable option for the replacement of conventional treatment in wastewater
applications.
Table 4.3 Ammonium-nitrogen removal rate from various treatment systems
Source Nitrification Rate (g NH4-N/m2-d) Reference
0.15-0.43 van Rijn and Rivera [1990] 0.24-0.55 Kamstra et al. [1998] 0.28-0.69 Nihof and Bovendeur [1990] 0.6-0.73 Bovendeur et al. [1990]
Tricking filter
0.94-3.92 Greiner and Timmons [1998] 0.43 Wickins [1985] Submerge biofilter 0.59 Davis and Arnold [1998]
Sequencing batch reactor 1.86 Zhu and Chen [1999] Porous gas permeable
membrane 1.1-3.1 Suzuki et al. [2000]
2.2 Yamagiwa and Ohkawa [1994] 0.023-3.0 Hibiya et al. [ 2003]
HFMBR
0.47-26.27 This work

48
4.2 Loading Studies
The overall objective of the loading studies was to optimize bioreactor efficiency.
The bioreactor was operated continuously for eight months at seven different NNH4 −+
loadings. The hydraulic retention times at which the reactor was operated were 0.15,
0.09, 0.07, 0.06, 0.04, 0.03, and 0.026 days. An increase in NNH4 −+ conversion with
increasing hydraulic retention time (HRT) was shown in Figure 4.1. Even though
maximum NNH4 −+ conversion was achieved at a HRT of 0.15 days, Table 4.2 shows that
maximum conversion per unit volume of reactor was achieved at a HRT of 0.09 days.
An increase in the ammonia conversion rate (g/L-d) was expected with increasing
HRT. However, volumetric conversion rates (g/LR-d), where LR is the volume of the
reactor, decrease with increasing HRT. This is due to the fact that at large HRTs there is
low ammonia loading rate per unit volume of the reactor (i.e., low flow ∴low mass
input). Although the concentration of ammonia removed is higher at high HRTs, the
actual mass removed per day is higher at low HRTs.
Figure 4.3 shows a different trend in comparison to Figure 4.2 where the percent
of ammonia conversion increases with increasing HRT. As expected, Figure 4.3 shows
maximum conversion of ammonia at an HRT of 0.03 days (volumetric NNH4 −+ loading
24.54 g NH4/m2-d). However, a sudden decrease in reactor performance is observed at
an HRT of 0.026 days (37 minutes). The decrease in reactor performance is due to the
fact that the reactor was kinetically limited, i.e., contact time between the substrate and
microorganisms was not long enough to sustain growth. A decrease of 50 percent in
conversion rate (15.81 g NOx/L-d) was observed at an HRT of 0.06 days in comparison

49
to a conversion rate of 32.5 g NOx/L-d at 0.04 days. Thus the decrease in reactor
performance was attributed to the microbial kinetics, which is beyond the scope of this
thesis.
Hydraulic RetentionTime (days)
0.00 0.02 0.04 0.06 0.08 0.10 0.12 0.14 0.16
Vol
umet
ric C
onve
rsio
n R
ate
(gN
Ox/
L-da
y)
0
10
20
30
40
50
60Ammonia Conversion
R2 = 0.88
y = 79.6e-22.8x
Figure 4.3 Volumetric conversion rates
An empirical relationship was obtained from the calculated data. Volumetric
conversion rates were mathematically correlated to its dependency on HRT. The data
best fit was an exponential decay relationship. Maximum conversions would occur at
low HRTs. Maximum NNH4 −+ conversion would be reached at an HRT of zero, but
this is non-realistic; therefore, 79.6 volumetric conversion would be never achieved.
A total surface area of 0.5 m2 (3600 fibers within HFMBR) was used when
calculating the conversion rates per membrane surface area, assuming uniform flow

50
throughout the reactor and full contact between the flow and fibers. Figure 4.4 shows the
conversion rate per surface area plotted against HRT, which shows the same behavior
obtained when analyzing the reactor conversion rate per unit volume. Maximum
conversion per surface area was achieved at 0.03 days with a loading rate of 24.54 g
NH4/m2-d.
Hydraulic Retention Time (days)
0.00 0.02 0.04 0.06 0.08 0.10 0.12 0.14 0.16
Con
vers
ion
Rat
e pe
r Sur
face
Are
a (g
NO
x/m
2 -d)
0
2
4
6
8
10Ammonia Conversion
Figure 4.4 Conversion rates per surface area
The HFMBR was able to achieve ammonia conversion efficiencies in the range of
16 to 75 percent. Better efficiencies were obtained at long HRTs. A maximum
conversion rate efficiency of 75 percent was achieved at a loading rate of 0.94 g NH4-
N/m2-d. The corresponding NNH4 −+ removal rates ranging from 0.47 to 26.27 g NH4-
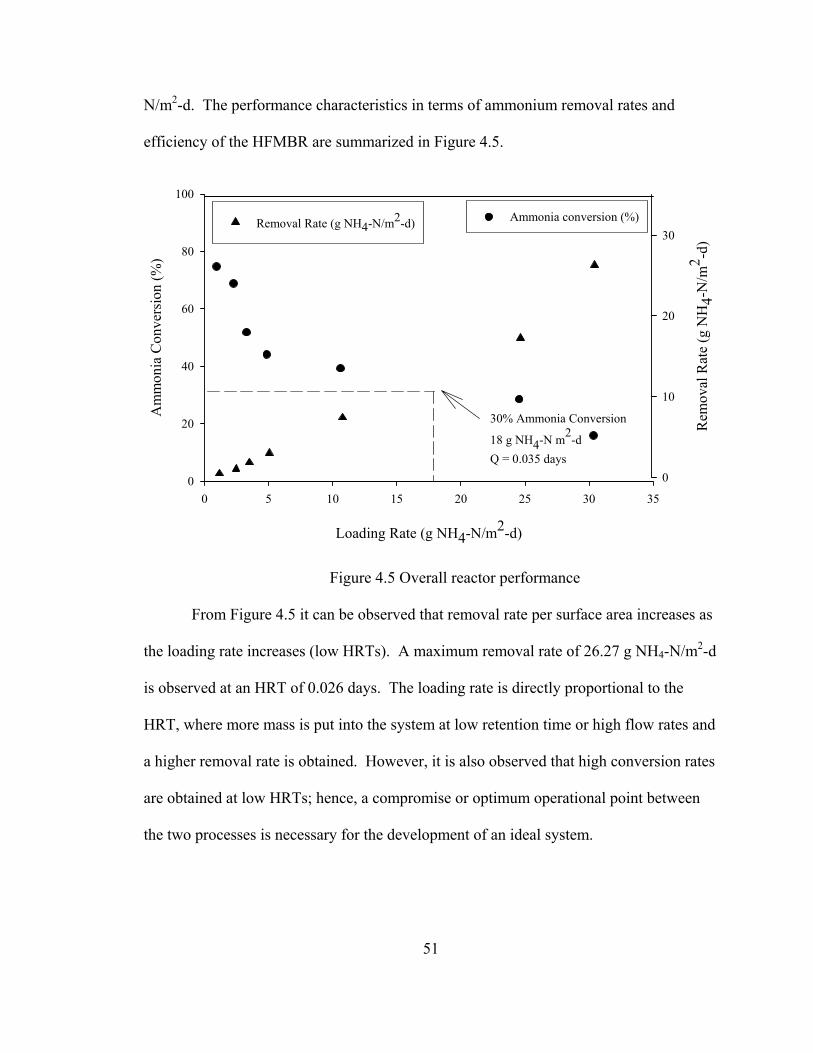
51
N/m2-d. The performance characteristics in terms of ammonium removal rates and
efficiency of the HFMBR are summarized in Figure 4.5.
Loading Rate (g NH4-N/m2-d)
0 5 10 15 20 25 30 35
Am
mon
ia C
onve
rsio
n (%
)
0
20
40
60
80
100
Ammonia conversion (%)
Rem
oval
Rat
e (g
NH
4-N
/m2 -d
)
0
10
20
30Removal Rate (g NH4-N/m2-d)
30% Ammonia Conversion
18 g NH4-N m2-dQ = 0.035 days
Figure 4.5 Overall reactor performance
From Figure 4.5 it can be observed that removal rate per surface area increases as
the loading rate increases (low HRTs). A maximum removal rate of 26.27 g NH4-N/m2-d
is observed at an HRT of 0.026 days. The loading rate is directly proportional to the
HRT, where more mass is put into the system at low retention time or high flow rates and
a higher removal rate is obtained. However, it is also observed that high conversion rates
are obtained at low HRTs; hence, a compromise or optimum operational point between
the two processes is necessary for the development of an ideal system.

52
Figure 4.5 also presents a comparison between the removal rate per surface area
and the percent of ammonia conversion obtained by the HFMBR. From this graph, the
optimum operational point can be assumed to exist at a loading rate of 18 g NH4-N /m2-d.
This assumption was made based on the fact that obtaining high percent of ammonia
conversion would involve operating the reactor at low HRTs, which is not a feasible
option because this would require either very low hydraulic loading rates or high reactor
volumes to treat the expected amount of wastewater. Also, operating the reactor to obtain
maximum mass removal rates would consequently generate very low percent of ammonia
removed from the system, thus giving an unacceptable effluent quality.
The HFMBR performance and removal rates shown in previous graphs were
calculated assuming uniform biofilm distribution throughout the bioreactor. During
experimental analyses performed near the completion of the HFMBR operation (Section
4.5), it was observed that about ¼ of the total membrane surface area was utilized for
biofilm growth. Biofilm distribution concentrated at influent and effluent ends of the
reactor, and an uneven biofilm distribution throughout the length and diameter was
observed.
A comparison of removal rates between the total and effective surface areas used
for the removal of NNOx −− is presented in Figure 4.6. The removal rate in g NNOx −
−
was calculated for each test point. A constant influent NNH4 −+ (g) was assumed to
calculate the effective (900 membranes) removal rates per surface area. A summary of
the initial and final masses for each different test point is presented in Appendix A. The
effective removal rates at three different HRTs were used (i.e., 0.03, 0.07, and 0.15 days),

53
using 900 membranes is shown in Figure 4.6. Note the effective removal rates are
greater than the conversion rates calculated assuming complete usage of the total number
of membranes within the HFMBR. Greater removal rates per surface area were obtained
with fewer membranes, indicating that the reaction rate per surface area per membrane is
the limiting factor for increasing conversion efficiency of the bioreactor.
Number of tubes
0 500 1000 1500 2000 2500 3000 3500 4000
Con
vers
ion
Rat
e pe
r Sur
face
Are
a (g
NO
x/m
2 -d)
0.0
0.2
0.4
0.6
0.8
1.0
1.2
1.4
1.6HRT = 0.15 days HRT = 0.07 daysHRT = 0.03 days
Figure 4.6 Conversion rate comparison
Based on the biofilm distribution within the HFMBR (Section 4.5) the actual
efficiencies were calculated using 900 membranes (note that this number was estimated
from the biofilm analysis; however the actual surface area could be less than estimated).
A maximum removal efficiency of 75 percent was obtained at a HRT of 0.15 days, using

54
¼ of the assumed actual surface area available (0.132 m2). If the total 0.5 m2 of the 3600
membranes within the bioreactor was used, higher removal rates would be obtained, in
turn improving the reactor overall performance.
Table 4.4 shows a summary of the different removal efficiencies obtained per
surface area. Removal rates would increase depending on the surface area available for
biofilm formation for treatment to occur. Therefore, from Figure 4.7 it can be observed,
assuming uniform biofilm coverage throughout the bioreactor that greater removal
efficiency would be obtained with an increase in surface area. However, reactor
efficiency would still depend on the HRT. This would aid in the design of HFMBRs for
NNOx −− removal and the optimization in reactor performance.
Table 4.4 Mass removed at a constant rate % Mass removed Hydraulic Retention
Time (days) 450 Membranes 900 Membranes 3600 Membranes 0.15 31.31 74.74 250.48 0.09 30.15 68.87 241.22 0.07 22.52 51.87 180.13 0.06 19.47 44.17 155.75 0.04 18.32 39.29 146.58 0.03 12.17 28.57 97.34 0.026 7.01 15.89 56.12

55
Hydraulic Retention Time (days)
0.00 0.02 0.04 0.06 0.08 0.10 0.12 0.14 0.16
Mas
s Rem
oved
%
0
100
200
300
400% Removed using 450 membranes% Removed using 900 membranes% Removed using 3600 membranes
Figure 4.7 Comparison of the HFMBR removal efficiencies
4.3 Hydrodynamics
Hydrodynamics allow for understanding of the dynamic behavior of fluid flow
through a bioreactor, affecting mass transfer and overall reactor efficiency. In this study,
the effect of hydrodynamics on nitrification efficiency was investigated. The hollow
fiber membrane bioreactor (HFMBR) was found to operate under plug flow conditions
and to have low dispersion, i.e., a Reynolds Number less than 3.0 and dispersion number
less than 0.05, respectively (Metcalf & Eddy, 2003).
Loading rate experiments were conducted at seven different flow rates including,
0.3, 0.5, 0.6, 0.7, 1.0, 1.5, and 1.7 mL/min. Initial and final tracer experiments were
performed at three different flow rates (0.3, 1.0, and 15 mL/min). Initial tracer studies
56
refer to experiments performed on the bioreactor without biofilm formation; final tracer
studies are the experiments performed after all loading rate experiments and after biofilm
formation. The results of the initial flow through hydrodynamic analysis without biofilm
are presented in Figure 4.8.
The results of the experiments without biofilm support mathematical calculations,
proving that reactor flow regime can be represented by a plug flow behavior and no
mixing or dispersion occur within the HFMBR. From Figure 4.8, an initial lag is
observed for all three data sets, forming a smooth s-shaped curve. At a flow rate of 15
mL/min, an initial lag of approximately 5 minutes is observed, while lags of 50 minutes
and 180 minutes occur for flow rates of 1.0 mL/min and 0.3 mL/min, correspondingly.
Complete recovery of the tracer (NaBr) was achieved in all cases; however, 90%
recovery was achieved around 90 min for a 15 mL/min flow rate, 120 min for 1 mL/min,
and 450 minutes for a flow rate of 0.3 mL./min.

57
Time (min)
0 200 400 600 800 1000
C/C
o (m
g-B
r/L)
0.0
0.2
0.4
0.6
0.8
1.0
Q = 0.3 mL/min, HRT = 210 minQ = 1 mL /min, HRT = 63 minQ = 15 mL/min, HRT = 4.5 min
Figure 4.8 Hydrodynamic experiments without biofilm
In comparison to the s-shape curve seen in Figure 4.8, Figure 4.9 shows an
exponential shape curve formed by the data set due to the absence of a lag time for tracer
studies conducted after biofilm development. The absence of a lag time for the final
experiments was expected due to biofilm growth within the HFMBR. As channeling
occurs, fluid flow seeks preferential paths through regions of lower packing, reducing the
working volume of the reactor and decreasing the overall HRT. However, according to
Bao and Limpscomb (2002), areas of low packing experience less mass transfer (high
KL) while areas with high packing density experience high mass transfer (low KL). This
will be addressed in detail in Section 4.4.

58
Time (min)
0 200 400 600 800 1000
C/C
o (m
g-B
r/L)
0.0
0.2
0.4
0.6
0.8
1.0
Q = 0.3 mL/min, HRT = 210 minQ = 1 mL/min, HRT = 63 minQ = 15 mL/min, HRT = 4.5 min
Figure 4.9 Hydrodynamic experiments after biofilm growth
Recovery of about 90% of the Br concentration (mg/L) takes place around 150
minutes for a flow rate of 1 mL/min in comparison to 450 minutes at a flow rate of 0.3
mL/min. In comparison to the initial tracer studies, the tracer experiments after biofilm
formation show a delay in time for 90% recovery at both flow rates while the same
recovery time (90%) is observed at a flow rate of 15 mL/min, which is due to the force of
convection. Complete recovery of the tracer was not obtained during the hydrodynamic
experiments conducted after biofilm formation. Figure 4.9 also shows the occurrence of
tailing after reaching the theoretical HRT at each flow rate, indicating that short circuiting
occurred within the HFMBR due to the formation of biofilm. Although, complete
recovery was not achieved at each HRT; a longer experimental time would overcome this
problem.
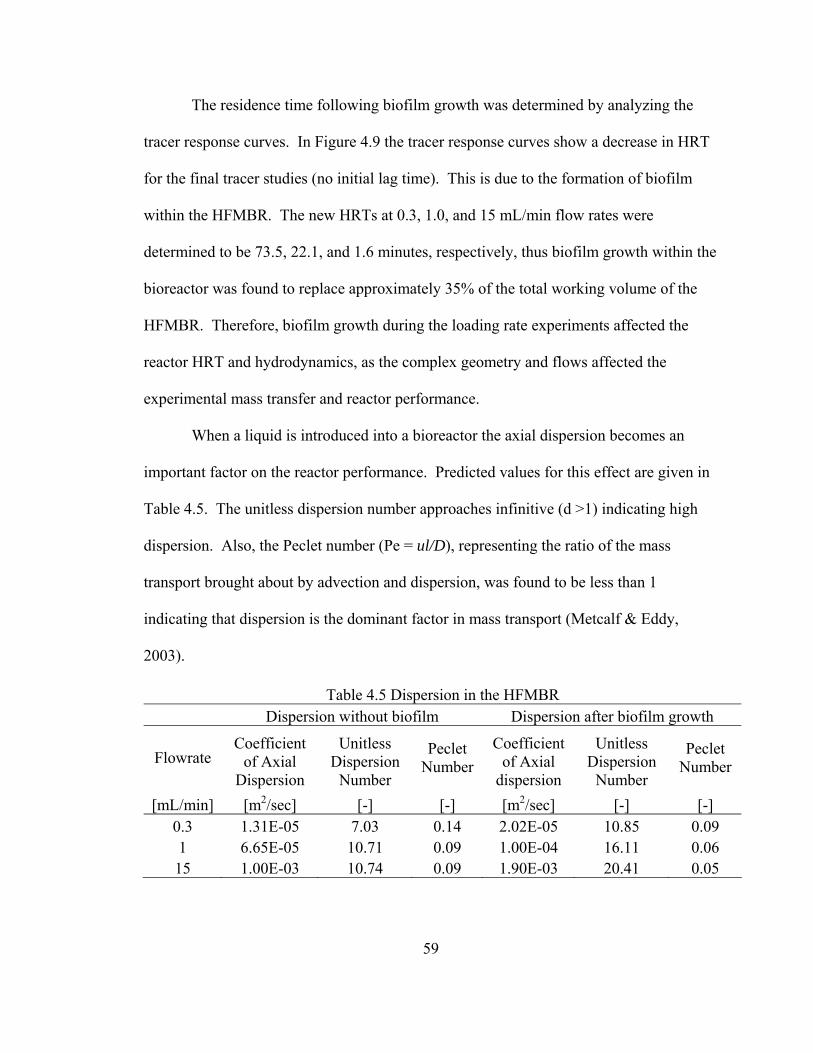
59
The residence time following biofilm growth was determined by analyzing the
tracer response curves. In Figure 4.9 the tracer response curves show a decrease in HRT
for the final tracer studies (no initial lag time). This is due to the formation of biofilm
within the HFMBR. The new HRTs at 0.3, 1.0, and 15 mL/min flow rates were
determined to be 73.5, 22.1, and 1.6 minutes, respectively, thus biofilm growth within the
bioreactor was found to replace approximately 35% of the total working volume of the
HFMBR. Therefore, biofilm growth during the loading rate experiments affected the
reactor HRT and hydrodynamics, as the complex geometry and flows affected the
experimental mass transfer and reactor performance.
When a liquid is introduced into a bioreactor the axial dispersion becomes an
important factor on the reactor performance. Predicted values for this effect are given in
Table 4.5. The unitless dispersion number approaches infinitive (d >1) indicating high
dispersion. Also, the Peclet number (Pe = ul/D), representing the ratio of the mass
transport brought about by advection and dispersion, was found to be less than 1
indicating that dispersion is the dominant factor in mass transport (Metcalf & Eddy,
2003).
Table 4.5 Dispersion in the HFMBR Dispersion without biofilm Dispersion after biofilm growth
Flowrate Coefficient
of Axial Dispersion
Unitless Dispersion
Number
Peclet Number
Coefficient of Axial
dispersion
Unitless Dispersion
Number
Peclet Number
[mL/min] [m2/sec] [-] [-] [m2/sec] [-] [-] 0.3 1.31E-05 7.03 0.14 2.02E-05 10.85 0.09 1 6.65E-05 10.71 0.09 1.00E-04 16.11 0.06 15 1.00E-03 10.74 0.09 1.90E-03 20.41 0.05

60
Analyses were also performed after biofilm formation within the HFMBR. The
morphological characteristics of biofilms (biofilm thickness, biofilm density and biofilm
surface shape) are very important for the overall performance of a biofilm reactor. These
characteristics strongly affect the biomass hold-up (biofilm attachment in a bioreactor)
and mass transfer in a biofilm reactor (Garrido et al., 1997; Tijhuis et al., 1995). The
biofilm formed would increase the dispersion within the HFMBR, having a direct effect
on the achievable biomass concentration in the reactor, and consequently on the overall
mass transfer rate. The hydrodynamics influences biofilm development, as well as the
biofilm influences the hydrodynamics. Biofilm analyses will be discussed in Section 4.5.
As biofilm density increases, local mass transfer decreases and bulk dispersion increases.
This is misleading, though because local dispersion is dynamic and may increase or
decrease, depending on the type of system.
Table 4.5 also shows greater dispersion occurring after the formation of biofilm.
This was expected due to biofilm growth. However, the unitless dispersion numbers
were found to be much greater than 1 (d ∞→ ); therefore, considered negligible due the
hydraulic characteristics of the HFMBR. At high unitless dispersion numbers, a reactor
is assumed to be ideal (approaching CFSTR behavior); however, the HFMBR was found
to behave as a plug flow. Therefore, the model used for this research was assumed to be
inappropriate to model the HFMBR. Thus, the size and membrane configuration of the
bioreactor, as well as the inflow velocity and its fluctuations had an effect on the results
obtained; indicating that the convective flow dominates and controls the mass transport
61
within the HFMBR. An incentive exists to develop a model for a membrane system with
more favorable system hydrodynamics to improve the overall reactor efficiency.
4.4 Mass Transfer
The mass transfer characteristics of polypropylene microporous hollow fiber
membranes for the oxygenation of water were studied. Three different resistances in
series are typically taken in to consideration (Equation 2.4). The model used for this
study follows the model presented by Yang and Cussler (1986) where Equation 2.4 is
simplified by neglecting the gas film and membrane resistance. When microporous
membranes are used, the gas pressure is maintained below the bubbling points and
oxygen is transported through the pore system rather than the through the polymer (Cote,
1989; Kreulen et al., 1993). The mass transfer coefficients for oxygen vary with water
flow rate but not with gas flow rate, implying that the mass transfer coefficient in the gas
phase does not contribute to the overall mass transfer (Yang and Cussler, 1986).
The membranes within the HFMBR were considered heterogeneous, composed of
the membrane material (polypropylene) and pores, 60 and 40 percent, respectively.
Further, the membranes were hydrophobic, and so the membrane pores filled with gas;
thus, the major resistance to mass transfer was expected to be the liquid resistance. The
membrane mass transfer (KM) is a function of the membrane properties (permeability),
the characteristic membrane thickness and Henry’s law constant. The polypropylene
permeability was found to be 5.69*10-19 mol/m-s-Pa; for which, KM was found to be
negligible (Appendix C). Therefore, as expected, mass transfer occurred through the

62
pores and not through the membranes. It is important to mention that bubble-less
aeration was not achieved during the experiments without biofilm. The formation of
bubbles was observed in the bulk liquid due to some water penetration within the lumen
of the membranes. The results of the initial mass transfer experiments without biofilm
are presented in Table 4.6; it can be observed that the liquid mass transfer remains
relatively constant throughout the four different test points (i.e., water flow rates 0.3, 1.0,
10, 15 mL/min), and is the only and dominating factor in the overall mass transfer
coefficient (KO).
Table 4.6 HFMBR mass transfer without biofilm Flowrate RL= 1/ KL KO Sh JE [mL/min] [min/m] [m/min] [-] [mmol-DO/sec-m2]
0.3 8.37E+04 1.19E-05 20 6.46E-04 5 8.37E+04 1.19E-05 20 1.12E-05 10 8.37E+04 1.19E-05 20 7.77E-04 21 6.69E+04 1.49E-05 25 1.00E-03
Table 4.7 shows the total oxygen transfer into the bulk liquid. The total oxygen
transfer into the bulk liquid is the sum of the measured DO in the effluent and the oxygen
consumed by the microorganisms. The oxygen consumed by the microorganisms was
estimated using Equation 4.2. From Metcalf & Eddy (2003), the biological oxidation of
oxygen is represented by Equation 4.2 for which it can be noted that for each g of
ammonia nitrogen (-N) converted, 4.25 g of O2 are utilized.
→+++20.098CO21.863O4NH Equation 4.2
+++−+ 1.98HO20.0941H30.98NO2NO7H50.0196C

63
Table 4.7 Oxygen transfer within the HFMBR
Flow rate (mL/min)
HRT (days)
Position in
Sequence
Initial DO
(mg/L)
Final DO
(mg/L)
Biofilm Oxygen consumption
(mg/L)
Oxygen Transfer (mg/L)
0.3 0.15 6 6.3 4.29 0.35 4.64 0.5 0.09 1 6.01 4.13 0.32 4.45 0.6 0.07 5 6.34 2.4 0.27 2.67 0.7 0.06 4 6.49 2.21 0.26 2.47 1 0.04 2 7.2 3.41 0.22 3.63
1.5 0.03 3 7.08 3.46 0.22 3.68 1.7 0.026 7 6.24 3.06 0.10 3.16
As the flow rate increases, the HRT decreases, thus the oxygen transfer from the
lumen side of the membranes into the bulk liquid was expected to decrease with
decreasing HRT. A decrease in oxygen transfer is observed for the initial four
operational points; however, the oxygen transfer increases at flow rates 0.04, 0.03, and
0.026 days, respectively. This decrease in oxygen transfer is related to the nitrification
efficiency obtained by the HFMBR. The variation of oxygen transfer with HRT is shown
Figure 4.10. A definite trend is not observed, which is attributed to the scatter (Table
4.7).

64
Hydraulic Retention Time (days)
0.00 0.02 0.04 0.06 0.08 0.10 0.12 0.14 0.16
DO
(mg/
L)
0
1
2
3
4
5Oxygen transfer (mg/L)
R2 = 0.3y = 10.9x + 2.7
Figure 4.10 Oxygen transfer within the HFMBR
Table 4.8 presents the mass transfer coefficients obtained after biofilm formation
within the HFMBR. Bubble-less aeration was achieved for the final mass transfer
experiments due to the formation of biofilm. The oxygen flux was calculated (JE) by
performing mass transfer experiments (change in oxygen concentration per time per
surface area). As expected, a decrease in the measured oxygen flux in the bulk liquid was
observed after biofilm formation. The decrease in flux did not consider the oxygen
consumed by the microorganisms. The experimental data just indicates the amount of
excess oxygen passing through biofilm (i.e., oxygen flux).

65
Table 4.8 HFMBR mass transfer after biofilm formation Flowrate R = 1/kL ko Sh # JE JM [mL/min] [min/m] [m/min] [-] [mmol-DO/sec-m2] [mmol-DO/sec-m2]
0.3 1.26E+05 7.97E-06 13 2.8E-04 7.20E-04 1 1.26E+05 7.97E-06 13 5.3E-04 4.93E-03 10 4.18E+04 2.39E-05 40 1.9E-04 NA
The flux or oxygen consumption by the bacteria (JM) was estimated at different
flow rates assuming uniform growth throughout the bioreactor. At flow rates of 0.3 and
1.0 mL/min, the total oxygen flux (J = JE + JM) was found to increase with biofilm growth
(Table 4.8); however, this increase was of less than an order of magnitude, which was
considered insignificant. According to Semmens et al. (2001), biofilm growing on the
surface area of a membrane, can accelerate or retard oxygen flux across the membrane
but it always reduces the rate of oxygen transfer to the external bulk liquid. Biofilm
growth within the HFMBR was found to accelerate the oxygen transfer. The bioreactor
configuration was considered to play an important role in these findings. Results are
presented in Appendix C.
The results obtained coincide with findings obtained by Wickramasinghe et al.
(1992) who analyzed the effect of mass transfer in various hollow fiber geometries and
Yang and Cussler (1986) who analyzed the design of hollow fiber contactors. The
HFMBR consisted of 3600 membranes which were believed to be closely packed
creating major channeling within the bioreactor (Section 4.3); channeling was expected to
increase with biofilm growth. Therefore, mass transfer was affected by the uneven fiber
spacing (due to biofilm growth) and major channeling through the closely packed fibers.

66
Nonetheless, oxygen fluxes are still a function of fluid velocity and substrate
concentration and this effect can be seen at a flow rate of 10 mL/min for which the
boundary layer or liquid resistance is reduced (Table 4.8). Mass transfer at high flow
rates after biofilm formation within the HFMBR was not enhanced due to the contact
time between the feed and microorganisms, the reactor size, and membrane
configuration. Convective flow becomes the governing force in mass transfer at high
flow rates. However, the bioreactor performance is not optimum due to kinetic limations;
therefore, operating the bioreactor at such high flow rates is not recommended.
The presence of biofilm was expected to increase the oxygen flux through the
membranes. As biofilm thickness increases, a greater external interfacial area is available
for the flux of substrate into the biofilm; therefore, mass transfer is increased (Semmens
et al., 2001). The effect of increasing biofilm thickness on mass transfer goes beyond the
scope of this thesis; however, Table 4.8 shows that the simple formation of biofilm did
increase oxygen flux.
Table 4.9 presents the dimensionless numbers calculated before and after biofilm
formation. The Sherwood (Sh) number is used to express mass transfer with force of
convection; it represents the ratio of the mass transfer coefficient in the liquid times the
characteristic length to the diffusivity of oxygen in water (at 20°C, D = 1.97810-9 m2/s).
The Peclet (Pe) number relates the forced convection of the system to its heat conduction
and is defined as the ratio of the fluid velocity times the characteristic length of the
reactor to the dispersion coefficient. The Schmidt (Sc) number is dimensionless
parameter used for mass transfer; it is defined as the ratio of the kinematic viscosity to the

67
mass transfer diffusion coefficient. The Schmidt number remains unchanged at all flow
rates; this is due to the negligible resistance of the membrane for which the diffusion
coefficient equals the oxygen diffusivity in water.
Table 4.9 Dimmensionless numbers Without biofilm After biofilm formation
HFMBR flow rate Re
Unitless Dispersion
Number Pe Sc Re
Unitless Dispersion
Number Pe Sc [mL/min] [-] [-] [-] [-] [-] [-] [-] [-]
0.3 0.24 7.03 0.14 509.14 0.24 10.85 0.09 509.14 1 0.81 10.71 0.09 509.14 0.81 16.11 0.06 509.14 15 12.13 10.74 0.09 509.14 12.13 20.41 0.05 509.14
A summary of the dimensionless numbers obtained after biofilm formation is also
presented in Table 4.9. The Peclet number was found to decrease after biofilm growth.
This was expected since Pe is inversely proportional to the dispersion coefficient, which
was found to increase with biofilm growth (Section 4.3). On the other hand, the Sc
number remained unchanged before and after biofilm formation. This was attributed to
the negligible resistance of the membrane for which the diffusion coefficient equals the
oxygen diffusivity in water.
Mass transport data were correlated using the common Sherwood dimensionless
relationship.
0.33nScmReSh = Equation 4.3
where;
m = constant [result of different packings] n = exponent of the Reynolds number for the empirical correlation
68
Figure 4.11 shows the variation of the mass transfer controlled by the liquid phase
before and after biofilm formation. The liquid mass transfer coefficient (KL) is
incorporated in the Sh number and the Reynolds (Re) number in this study is laminar (0.2
< Re < 12). At low Re, i.e., low flows, the Sherwood number was found to linearly
increase. The linear relationship obtained from Figure 4.10 allowed the determination of
“m” and “n” from Equation 4.3. It can be observed that before biofilm formation, the
linear relationship obtained in Figure 4.11 does not follow the tendency given by the
Sherwood correlation (Equation 4.3). The results indicate a system poor in turbulence,
but that some mass transfer influence or additional resistances in the liquid phase
probably exist. On the other hand, the relationship obtained after biofilm formation
shows a more approximate mass transfer relationship in comparison to previous studies
for which the performance of the HFMBR is controlled by the mass transfer in the liquid
phase (Yang and Cussler, 1986).

69
Re (dvL/v)
0 2 4 6 8 10 12 14 16 18
Sh(K
Ll/D
)/(Sc
(v/D
))0.
33
0
2
4
6
8
10
12Initial Experimental DataFinal Experimental Data
Figure 4.11 Sherwood vs. Reynolds number. Before and after biofilm formation
Figure 4.11 also shows the variation in Sherwood number with Reynolds number
after biofilm growth. A closer 1:1 relationship is obtained after biofilm growth, which
supports a stronger correlation where the mass transfer in the HFMBR was controlled by
the liquid phase. However, this is not true when operating at high flow rates; mass
transfer was found to be controlled by convection. The experimental data obtained after
biofilm formation was found to agree with results obtained by other researchers (Krudsen
and Katz, 1958; Wickramasinghe and Han, 2002; Yang and Cussler, 1986) as shown in
Table 4.10.

70
Table 4.10 Comparison of mass transfer correlations from literature Reference Correlation Re Range
Knudsen & Katz Sh = 0.022Re0.6Sc0.33 - Wickramasinghe & Han Sh = 0.39Re0.59Sc0.33 -
Yang & Cussler Sh = 1.25(Rede/l)0.93Sc0.33 5-3500 This Study
Before biofilm Sh = 2.45Re0.043Sc0.33 0.2-12 After biofilm formation Sh = 1.49Re0.45Sc0.33 0.2-12
4.5 Biofilm Analysis
The effect of hydrodynamics on the development of biofilm during the HFMBR
operation was analyzed. By determining the biofilm coverage and distribution within the
membranes in the bioreactor, the hydrodynamics may be understood. Sampling of the
reactor occurred at eight different locations within the circumference of the bioreactor. A
top view of the reactor and its cross-sectional sampling locations can be observed in
Figure 4.12. The biofilm analysis was divided in five different sub-sections. Initially, a
visual analysis was performed followed by, a circumferential and longitudinal biofilm
distribution analysis, respectively. Sections 4.5.4 and 4.5.5 describe biofilm thickness
throughout the bioreactor and the bacteria identification within the biofilm.

71
Figure 4.12 Sampling locations within the HFMBR
4.5.1 Visual Analysis
A non-uniform biofilm distribution within the HFMBR was observed. The
packing density and configuration of the membranes within the HFMBR have been found
to have an effect on biofilm formation, thereby affecting hydrodynamics. It was
hypothesized, according to Figure 4.12, greater biofilm growth around the influent port,
located at the bottom of the reactor, as well as closer to the effluent port, located at the
top of the reactor. High cell growth is dependent on the access to nutrients, which as
expected, in this case would be higher at the influent port. Growth, however, would be
affected by the shear forces presented by fluid flow; therefore, a denser and thinner

72
biofilm would be encountered at the ports. Longitudinal biofilm distribution was
assumed to be dependent on the preferential flow path, and minimal within the HFMBR.
By visual inspection, a more dense and dark biofilm was observed at the bottom
of section 2A of the reactor, coinciding with the influent port. All biofilm at the top of
the reactor was of a light brown color and seemed less dense, “flakey,” in comparison to
the biofilm formed at the bottom of the bioreactor. It was concluded that biofilm
distribution was greater at the top and bottom of the HFMBR, the latter being larger.
Biofilm distribution in the longitudinal direction was relatively uniform depending on the
membrane location. But, the amount of biofilm in the longitudinal direction was less
than the bottom and top sections of the reactor.
Section 2B contained greater biofilm at the bottom of the reactor in comparison to
the top, and a relatively uniform biofilm thickness was observed in the longitudinal
direction. When analyzing Section 3B, an intermittent distribution and “chunks” of
biofilm were observed at the top and bottom of the reactor, while little to no biofilm was
observed in the longitudinal direction when compared to Section 2B. On the other hand,
Section 4B contained less biofilm overall, i.e., top, bottom and in the longitudinal
direction of the HFMBR. Finally, Section 5B was studied, and an intermittent biofilm
distribution was observed similar to that of Section 3B. This was expected due to the
locations of both sections, opposite from each other and at equal distances from the
influent and effluent points at the bottom and top, respectively. Overall, Section 3B
visually appeared to have more biofilm than section 5B. The non-uniform biofilm
distribution within the HFMBR may be observed in Figure 4.13.

73
Figure 4.13 Biofilm growth within different locations of the HFMBR

74
4.5.1.1 Biofilm Distribution. Outside-in Strategy
Biofilm growth was assumed to occur over the total surface area of the HFMBR
(3600 membranes). Due to the configuration and high packing density, biofilm growth
did not occur within the inner membranes. Samples were taken in bundles, between 50
and 100 membranes, to analyze the mass per surface area in the cross-sectional sections.
However, since biofilm growth was not visually observed within 0.5 cm from the outer
membranes, the inner membranes were not tested for mass or biofilm thickness. It is
important to mention that biofilm growth was not observed by visual inspection;
however, biofilm growth did occur within inner membranes of the HFMBR as indicated
by plating experiments (Section 4.5.4). Figure 4.14 shows a comparison of the biofilm
growth in the inner and outer membranes after the experimental analyses.
Figure 4.14 Outside-in strategy

75
4.5.2 Circumferential Analysis
The reactor was analyzed for biofilm growth at the top, middle, and bottom of the
reactor (Figure 3.5). Four different samples at each location were extracted for which the
attached biofilm was analyzed for mass measurements. Mass measurements per
membrane surface area were calculated by extracting about 1 cm of membranes at each
location and 0.5 cm from the outside-in. The membranes were rinsed and placed in
aluminum pans were the biofilm mass was measured after performing a total suspended
solids (TSS) analysis (APHA, 1998).
Table 4.11 summarizes the mass per surface area obtained for each location.
Replicates were not obtained due to the reactor size and limited amount of biofilm within
the HFMBR. The results obtained from the performed experiments agree with the visual
observations initially stated. Greater biofilm mass per membrane surface area was
obtained at the bottom of the reactor. A graphical representation is shown in Figure 4.15.
Table 4.11 Cross-sectional mass per surface area 2A 3A 4A 5A
Top Section (g/m2) 0.454 0.898 0.020 0.351 Middle Section (g/m2) 0.038 0.020 0.008 0.006 Bottom Section (g/m2) 2.135 2.506 0.201 0.385

76
0
2
4
6
8
10
2A2B
3A3B
4A4B
5A
BottomMiddle
TopLongitudinal
Bio
film
Dis
tribu
tion
(g/m
2 )
Sampli
ng Se
ction
s
Location
Figure 4.15 Biofilm distribution within the HFMBR
4.5.3 Longitudinal Analysis
The biofilm growth was in the longitudinal direction of the bioreactor; however,
full coverage was not observed. This unequal distribution of biofilm was believed to be
caused by the flow distribution of the feed. Table 4.12 presents the results obtained from
the longitudinal analysis.

77
Table 4.12 Longitudinal mass per surface area Location Mass per Surface Area (g/m2)
2A 7.781 3A 7.479 4A 1.448 5A 2.081
As expected, results showed more biofilm growth per surface area in the same
direction of the moving flow. Overall, greater and more uniform biofilm growth was
observed in Section 2A. Figure 4.15 also shows that biofilm growth occurred in the same
direction of the moving flow and slowly moved around the reactor. Section 4A had a
smaller amount of mass per surface area in comparison to the other sections analyzed
within the HFMBR.
4.5.4 Biofilm Thickness
Biofilm thicknesses were calculated by extracting membranes and analyzing the
biofilm at each location specified in Figure 4.16. For simplicity of this work, it was
assumed that all membranes within a specific location (within a distance of 1 cm) within
the HFMBR were uniformly covered by biofilm with the same thickness. The
membranes were analyzed under a Watec CCD Camera (Edmund Optics VZM450 zoom
lense) and a NI IMAQ (PCI 1200 interface) for image capture. The images were
analyzed, and the thicknesses were determined using MatLab. The average biofilm
thicknesses were taken in consideration for this analysis and are summarized in Table
4.13.

78
Location
2A 2B 3A 3B 4A 4B 5A 5B
Bio
film
Thi
ckne
ss (m
m)
0.0
0.1
0.2
0.3
0.4
0.5
0.6
0.7Bottom Thickness (mm) Middle Thickness (mm) Top Thickness (mm)
Figure 4.16 Biofilm thickness
Table 4.13 Biofilm thickness Location Top Thickness
(mm) Middle Thickness
(mm) Bottom Thickness
(mm) 2A 0.207 0.035 0.333 2B 0.232 0.033 0.292 3A 0.048 0.020 0.124 3B 0.001 0.002 0.456 4A 0.002 0.042 0.159 4B 0.036 0.010 0.061 5A 0.023 0.047 0.009 5B 0.001 0.101 0.129
From Figure 4.16, it can be observed that a thicker biofilm was formed at the
bottom of the reactor, which is as expected due to the higher concentrations of nutrients
closer to the influent port of the HFMBR. Figures 4.17 and 4.18 show some of the
thicknesses obtained when analyzing the membranes under a Watec CCD Camera.
79
It was noted that the uneven distribution of biofilm was due to flow
maldistribution. The influent feed was pumped in the reactor from the bottom of the
bioreactor (Figures 3.1, 3.3); therefore, the flow was unequally distributed through the
HFMBR. Biofilm formation was observed in the same direction of the moving flow;
therefore, the assumption of an existing preferential flow path was taken in consideration
for this analysis. Channeling due to biofilm formation on the membranes was also
assumed to have an effect on the hydrodynamic behavior within the bioreactor.
Biofilm thickness was also found to be greater at the bottom of the reactor, which
supports the theory that the biofilm is affected by nutrient consumption. Nutrient
concentrations decrease as the fluid passes through the reactor; therefore, it can be
assumed that thinner biofilms would be found along the fluid’s path. However, this was
not the case shown in Figure 4.16; it was attributed primarily to the assumption of
uniform thickness within a sampling section (1 cm) and due to the possible sampling
errors when performing the experimental analysis.
Figures 4.17 and 4.18 present the different biofilm thickness at different locations
within the HFMBR. However, as expected, more biofilm grew around the bottom of the
reactor. These results suggest that the shear forces due to velocity affected biofilm
structure (Casey et al., 2000). Nevertheless, these results coincide with Gibbs and Bishop
(1995) who state that the velocity of the bulk fluid flow is one factor affecting the biofilm
thickness and density where higher velocities result in compressed (or thinner)
concentration of the biofilm. Biofilm density is not presented in this thesis due to the
sampling methods used and high error probability.

80
Figure 4.17 Biofilm thickness of sections 2A and 3A

81
Figure 4.18 Biofilm thickness of sections 4A and 5A

82
The purpose of determining the biofilm distribution throughout the bioreactor was
to identify the preferential flow path, and to predict the effect of biofilm formation on
hydrodynamics. Due to the high number of membranes and the packing density, flow did
not pass by all the membranes; the fluid flow was found to contact the outer membranes,
like in an annulus. The hydrodynamics were meant to be understood by analyzing the
biofilm growth; however, no definite conclusion was obtained. The biofilm was assumed
to affect the flow pattern, but it could be concluded that the flow pattern also affected the
biofilm growth within the HFMBR. Results have shown that the HFMBR did not operate
at maximum capacity. The loading rates, mass transfer, and hydrodynamics have been
affected by the bioreactor configuration; therefore, not operating at maximum efficiency.
4.5.5 Bacteria Identification
The reactor feed was composed of inorganic carbon in order to support an
autrotrophic population. Due to biofilm structure and heterogeneity, the possible
presence of a heterotrophic population was assumed. Samples were extracted from four
different locations at three cross-sectional areas, at the top, middle, and bottom of the
bioreactor (Figures 4.11 and 3.5). Two different medias were used to identify the
bacteria within the HFMBR, a Nutrient Agar and a AT5N Medium, for identification of
heterotrophic and autotrophic microorganisms, respectively.
Bacterial plates were made at two different dilutions (1:10 and 1:1) in order to
have better identification. Plates were incubated for 5 days; however rapid growth was
observed on the nutrient plates (heterotrophs) after 2 days while no growth was observed

83
for the nitrosomonas and nitrobacter species. As expected, heterotrophs grew faster than
autotrophs; however, the plates were incubated for the same period of time (5 days).
For all sections, heterotrophs, nitrosomonas, and nitrobacter species were found
to exist within the HFMBR. Heterotrophs were found even though the feed consisted of
inorganic carbon. The presence of heterotrophs was attributed to the initial feed used,
which contained of urine. The existence and survival of the heterotrophic population
within the HFMBR can be explained by the fact that these microorganisms fed on the
dead autotrophic bacterial cells. However, the fact that more colonies were observed
within the plates was considered to be a function of incubation time. Greater growth
occurred due to a larger incubation period of time instead of a larger population existing
within the bioreactor. Although, plate counts were beyond the scope of this thesis, a
greater population of nitrosomonas species was expected in comparison to the
nitrobacter specie. As previously mentioned, the feed consisted of inorganic carbon
(NH4Cl), which is the energy and carbon source for this specie, as opposed to −2NO -N for
nitrobacter specie.

84
CHAPTER V
CONCLUSIONS
A commercial microporous hollow fiber bioreactor (HFMBR) was analyzed for
wastewater treatment applications. The goal of this research was to (a) evaluate the
effect of mass transfer by the use of microporous membranes; (b) compare the effect of
membrane type and configuration on treatment efficiency to previous literature values;
and (c) determine the amount and distribution of biofilm growth within the reactor.
Results of this study, if appropriate, will help determine the use of the HFMBR in space
applications.
Loading rates and nitrification studies were performed in order to determine the
reactor’s optimum performance. High nitrification efficiencies can be obtained due to the
high surface area presented by the use of the microporous membranes in a HFMBR. In
this thesis, due to the high packing density and configuration of the bioreactor, the total
membrane surface area was not utilized and the reactor did not operate at its maximum
removal efficiency. However, for aeration purposes, the HFMBR may be appropriate for
wastewater treatment if the configuration is arranged to where the packing density is
reduced by increasing the spacing between membranes. Therefore, increasing the surface
area available for biofilm growth in the reactor would increase the removal efficiency,
being more suitable for wastewater treatment. If membrane spacing is not improved an
increase in reactor volume would be another option to consider for wastewater treatment.
However, for space applications, this would not be a recommended option due to

85
NASA’s requirements to reduce mass and volume of treatment systems owing to space
limitations.
Mass transfer within the HFMBR would also aid in the determination of the
design and overall reactor’s performance. The microporous membranes within the
HFMBR were considered to provide a negligible mass transfer resistance; thus, the
HFMBR has been found to provide better mass transfer in comparison to a membrane
system for which the membrane resistance is taken in consideration. Bubble-less aeration
was not achieved during the initial experiments without biofilm; however, bubbles were
not observed after biofilm formation. Mass transfer improved after biofilm formation
due to higher oxygen flux diffusing in to the biofilm increasing the total flux or mass
transfer of the bulk liquid.
The correlations between the oxygen mass transfer and fluid dispersion were
considered for the reactor performance. The bioreactor hydrodynamics were affected by
the reactor configuration, the number of membranes, and flow velocity. The effect of
flow velocity on reactor performance was mainly of interest for mass transfer analysis.
Flow velocity influenced mass transfer in the diffusion boundary layer thickness at the
biofilm liquid interface and biofilm density. Convective flow was found to be the
controlling factor on the rate of mass transfer due to the reactor size and packing density.
Uneven biofilm distribution was also found to affect the hydrodynamics of the bioreactor
due to channeling; thus, fluid flowed through preferential paths in regions of lower
packing, reducing the working volume and overall performance of the bioreactor.
86
In the HFMBR biofilm formation, thickness and density were proven to be
dependent on the fluid velocity and bioreactor configuration for which, uneven mass,
density, and thickness were observed. The morphological characteristics of biofilms such
as thickness, density, and shape are very important for the overall performance of a
biofilm reactor. These characteristics strongly affect the mass transfer in a biofilm reactor
and overall reactor performance. The biofilm heterogeneity also played an important role
in the reactor performance. The presence of a heterotrophic and autotrophic (nitrifiers)
was identified. Maximum growth was achieved by the nitrifiers as a maximum 75%
conversion rate was achieved. Maximum growth rate would not vary; however, higher
conversion rates would be achieved by increasing the nitrifying population, which will
increase conversion rates and bioreactor performance.
The advantages and disadvantages of using parallel distributed microporous
membranes within the HFMBR were analyzed. Microporous membranes in a HFMBR
present the advantage of increasing oxygen transport through the membranes in
comparison to silicone membranes. The use of parallel membranes at high packing
densities might not enhance the mass transfer in comparison to random membranes due
to biofilm formation and channeling. Short circuiting caused by channeling did occur
within the HFMBR; nevertheless, microporous membranes present higher surface area
for biofilm formation, presenting a better choice for high mass transfer to occur and high
ammonia removal rates.
The HFMBR is capable of achieving maximum nitrification efficiency at low
loading rates and high HRTs. Due to the reactor’s size, the HFMBR presents promising

87
use in space applications. These characteristics offer a potential for NASA’s needs;
nonetheless, developing a system with more favorable system hydrodynamics would aid
to improve treatment efficiency in a HFMBR.
Considering the above, it is recommended that to adequately demonstrate the
effectiveness of HFMBRs for wastewater applications under microgravity conditions a
comparison of the performance of several units is still needed. Research on the effect of
different membrane models, analyzing membrane geometry (parallel vs. random
membranes) should be addressed. Also, the determination of best operating pressure
without bubble formation, and the effect of increasing temperature for the enhancement
of treatment are factors to consider.
.

88
REFERENCES
Ahmed, T. and Semmens, M.J. 1992. The use of independently sealed microporous hollow fiber membranes for oxygenation of water: model development, J. Membrane Sci., 69, 11-20.
Ahmed, T. and Semmens, M.J. 1992. Use of sealed end hollow fibers for bubbleless
membrane aeration: experimental studies. J. Membrane Sci., 69, 1-10. Alphenaar P. A., Perez C. and Lettinga C. 1993. The influence of substrate transport on
porosity and methanogenic activity of anaerobic sludge granules. Appl. Microb. Biothech., 39, 276-280
APHA, AWWA, and WEF. 1998. Standard Methods for the Examination of Water and
Wastewater, 20th Edition. Atlas, R.M. 1995. Handbook of Media for Environmental Microbiology. CRC Press,
Boca Raton, FL. Bao, L. and Lipscomb, G. 2002. Well-developed mass transfer in axial flows through
randomly packed fiber bundles with constant wall flux. Chem. Eng. Sci., 57, 125-132. Bao, L. and Lipscomb, G. 2002. Mass transfer in axial flows through randomly packed
fiber bundles with constant wall concentration. J. Membrane Sci., 204, 207-220. Bishop, P.L., Zhang, T.C., Fu, Y.C. 1995. Effects of biofilm structure, microbial
distributions and mass-transport on biodegradation processes. Wat. Sci. Technol., 31(1), 143-152.
Bovendeur, J., Zwage, A. B., Lobee, B. and Blom, J.H. 1990. Fixed-film reactors on
aquaculture water recycle system: Effect of organic matter elimination on nitrification kinetic. Wat. Res., 24(2), 207.
Brindle, K. and Stephenson, T. 1996. Nitrification in a bubbleless oxygen mass transfer
membrane bioreactor. Wat. Sci. Technol., 34(9), 261-267. Brito A. G. and Melo L.F. 1999. Mass transfer coefficients within anaerobic biofilms:
effects of external liquid velocity. Wat. Res., 33(17), 3673-3678.

89
Casey E., Glennon B., Hamer, G. 1999. Biofilm development in a membrane aerated biofilm reactor: effect of flow velocity on performance. Biotechnol. Bioeng., 67(4) 446-486.
Casey E., Glennon B., and Hamer, G. 1999. Review of membrane aerated biofilm
reactors. Resources, Conservation and Recycling (27), 203-215. Casey, E., Glennon, B., Hamer, G. 2000. Biofilm development in a membrane-aerated
biofilm reactor: Effect of flow velocity on performance. Biotechnol. Bioeng., 67(4), 476-86.
Chen, K.C., Lee, S.C., Chin, S.C., Iloung, J.Y. 1998. Simultaneous carbon-nitrogen
removal in wastewater using phosphorylated PVA-immobilized microorganisms. Enzyme Microb. Technol., 23, 311-320.
Cote, P. 1989. Bubble-free aeration using membranes: Mass transfer analysis. J.
Membrane Sci., 47, 91-106. Cussler E. L. 2002. Diffusion, mass transfer in fluid systems. 2nd Eddition. Cambridge
University Press, U.K. Davis, D. A., and Arnold, C. R. 1998. The design, Management and production of a
recirculating raceway system for the production of marine shrimp. Aquacultural Eng., 17(3), 193.
Finger, B.W., Supra, L.N., DallBauman, L., Pickering, K.D. 1999. Development and
Testing of Membrane Biological Wastewater Processor, Proceedings 29th International Conference on Environmental Systems (ICES).
Garrido, J.M., van Benthum, W.A.J., van Loosdrecht, M.C.M. and Heijnen, J.J. 1997.
Influence of dissolved oxygen concentration on nitrite accumulation in a biofilm airlift suspension reactor. Biotechnol. Bioeng., 53(2), 168–178.
Geankoplis J. Christie. 1983. Transport processes: Momentum, Heat, and Mass. Allyn
and Bacon, Inc. Newton, MA. Gibbs, J.T. and Bishop, P.L. 1995. A method for describing biofilm surface roughtness
using geostatistical techniques. Wat. Sci. Tech., 32 (8), 91-98. Greiner, A., and Timmons, M. 1998. Evaluation of the nitrification rates of microbead
and trickling filters in an intensive recirculation tilapia production facility. Aquacultural Eng., 18(3)189.

90
Grimberg, S. J., Rury, M. J., Jimenez, K. M., and Zander, A. K. 2000. Trinitrophenol treatment in a hollow fiber membrane biofilm reactor. Wat. Sci. Technol., 41 (4), 235-238.
Hibiya, K., Terada, A., Tsuneda, S., and Hirata, A. 2003. Simultaneous nitrification and denitrification by controlling vertical and horizontal microenvironment in a membrane aerated biofilm reactor. J. Biotech., 100, 23-32.
Jackson, A., Morse, A., Ho, T. and Collins, G. 2004. Optimization and Biochemical
Characterization of Biological Reactors for Long-Term Space Habitation Waste Streams, 34th International Conference on Environmental Systems (ICES), Doubletree Hotel, Colorado Springs, CO, July 19-22.
Kamstra, A., Heul, J. W.and Nihof, M. 1998. Performance and optimization of trickling
filters on eel farms. Aquacultural Eng., 17(3), 175. Knudsen, J.G. and Katz, D.L. 1958. Fluid dynamics and heat transfer. McGraw-Hill,
New York, NY. Kreulen , H. Smolders, C.A, Versteeg, G.F., and Van Swaaij W.P.M. 1993. Microporous
hollow fibre membrane modules as gas-liquid contactors. Part 1. Physical mass transfer processes. A specific application: mass transfer in highly viscous liquids. J. Membrane Sci., 78, 197-216.
Kuenen, J.G., Robertson, L.A. 1988. Ecology of nitrification and denitrification. In: Cole,
J.A., Ferguson, S.J. (Eds.), The Nitrogen and Sulphur Cycles. Cambridge University Press, Cambridge, pp. 161-218.
Lewandowski, Z., Stoodley, P., Altobelli, S. 1995. Experimental and conceptual studies
on mass-transport in biofilms. Water Sci. Technol., 31(1) 153-162. Maier, Raina M., Pepper, Ian L., and Gerba, Charles P. 2000. Environmental
Microbiology. Academic Press, San Diego, CA. Marshall, K. C., 1985. Mechanisms of bacterial adhesion at solid-liquid interfaces. In
Bacterial Adhesion: Mechanisms and Physiological Significance. D.C. Savage, and M. Fletcher, eds. Plenum, NY, pp 131-161.
McLamore, E., Morse, A., Jackson, A. 2004. Incorporation of a Membrane-Aerated
Bioreactor in a Water Recovery System, 34th International Conference on Environmental Systems (ICES), Doubletree Hotel, Colorado Springs, Colorado, July 19-22.

91
Menoud, P., Barton, G.W. 1999. Simultaneous nitrification and denitrification using siporax ™ packing. Wat. Sci. Technol., 40 (4-5), 153-160.
Metcalf & Eddy, Inc. 2003. Wastewater engineering treatment and reuse. 4th Edition.
McGraw-Hill, NY. Morse, A., Jackson, A., Rainwater, K. and Pickering, K. 2003. Nitrification using a
Membrane-Aerated Biological Reactor, 33rd International Conference on Environmental Systems (ICES), Bayshore Resort & Marina, Vancouver, B.C., Canada, July 7-10.
Muirhead, D., Rector, T., Collins, G., Keister, H., Morse, A., Jackson, A., Pickering, K.
2003. Performance of a Small-Scale Advanced Life Support Water Recovery System, 33rd International Conference on Environmental Systems (ICES), Bayshore Resort & Marina, Vancouver, B.C., Canada, July 7-10.
Nijhof, M. and Bovendeur, J. 1990. Fixed film nitrification characteristics in sea-water
recirculation fish culture systems. Aquaculture, 87, 133. Petersen, J. N. and Davison, B. H. 1991. Modeling of an Immobilized Cell, Three-Phase
Fluidized-Bed Bioreactor. Appl. Biochem. Biotech. 28 (29), 685-98. Pickering, K.P., and Edeen M.A. 1997. Lunar-Mars life support program phase III water
recovery system operation and results. Society of Automotive Engineers Conference. Paper #981707.
Rittmann, B. and McCarty, P.L. 2001. Environmental Biotechnology: Principles and
Applications. The McGraw-Hill Companies, Inc. New York, NY. Rittmann, B. E.; Regan J. M.; and Stahl D. A. 1994. Nitrification as a source of organic
substrate in biological treatment. Wat. Sci. Technol., 30(6), 1-8. Semmens, M.J., and Essila, N.J. 2001. Modeling biofilms on gas-permeable supports:
Flux limitations. J. Environ. Eng., 126-133
Singh, Rajindar. 1998. Industrial Membrane Separation Processes. Chemtech.. 33-44.
Strigle, Ralph F. 1987. Random packings and packed towers. Design and Applications. Gulf Publishing Co. Houston, TX.
Suzuki, Y., Hatano, N., and Ikeda, H. 2000. Performance of nitrogen removal and biofilm
structure of porous gas permeable membrane reactor. Wat. Sci. Technol., 41(4), 211-217.

92
Tavares, C. R. G; Araujo Rocha, R. R; and Guedes, T. A. 2001. Nitrification and Denitrification Processes for Biologic Treatment of Industrial Effluents. App. Biochem. Biotechnol., 91(93), 437-446.
Tijhuis, L., Gjaltema A, van Loosdrecht M.C.M & Heijnen J.J. 1995. Detachment of
biomass from suspended nongrowing spherical biofilms in airlift reactors. Biotechnol. Bioeng. 46, 258–2.
Timberlake, Dennis L., Strand Stuart E., and Williamson, K. J. 1988. Combined aerobic
heterotrophic oxidation, nitrification and denitrification in a permeable-support biofilm. Wat. Res. 22 (12), 1513-1517.
Torrey, S. 1984. Membrane and ultrafiltration technology: developments since 1981.
Noyes Data Corp. Park Ridge, N.J. Udert, K.M., Fux, C., Munster, M., Larsen, T.A., Siegrist, H. and Gujer, W. 2003.
Nitrification and autotrophic denitrification of source-separated urine. Wat. Sci. Technol. 48(1), 119-130.
Van Rijn, J and Rivera, G. 1990. Aerobic and anaerobic biofiltration in an aquaculture
unit-nitrite accumulation as a result of nitrification and denitrification. Aquacultural Eng. 9, 217
Viera, M. J., Melo, L., Pinheiro, M. M. 1993. Biofilm formation: Hydrodynamic effects
on internal diffusion and structure. Biofouling 7, 67-80. Watson, S.W., F.W. Valos, and Waterbury, J.B. 1981. The Family Nitrobacteraceae. In
The Prokaryotes. M.P. Starr et al. Berlin: Springer-Verlag Wickins, J. F. 1985. Ammonia production and oxidation during the culture of marine
prawns and lobsters in laboratory recirculation systems. Aquacultural Eng. 4, 155. Wickramasinghe, S.R., Semmens, M.J., and Cussler, E.L. 1992. Mass transfer in various
hollow fiber geometries. J. Membrane Sci., 69, 235-250. Wickramasinghe, S.R. and Han, Binding. 2002. Mass and momentum transfer in
commercial blood oxygenators. Desalination, 148, 227-233. Yamagiwa, K. and Ohkawa A. 1994. Simultaneous organic carbon removal and
nitrification by biofilm formed on oxygen enrichment membrane. J. Chem. Eng. of Japan. 27(5) 638-643.
Yang, M., and Cussler, E.L. 1986. Designing Hollow-fiber contactors. AIChE Journal. 32
(11), 1910-1916.

93
Zhang, T. C., Bishop, P.L. 1994. Evaluation of tortuosity factors and effective
diffusivities in biofilms. Wat. Res. 28(11) 2279-2287. Zhu, S. and Chen, S. 1999. An experimental study on nitrification biofilm performances
using a series reactor system. Aquacultural Eng. 20(4), 245.

94
APPENDIX A
RAW DATA DURING THE HFMBR STUDY

95
Table A1. Test point 1. Influent Concentrations (mg/L)
Date Day pH TDS DO NH3-N NO2-N NO3-N NOx-N 17-Aug 1 7.85 2238.00 7.17 129.42 1.23 1.23 18-Aug 2 7.80 2459.00 5.35 212.72 3.41 3.41 19-Aug 3 7.85 2287.00 6.74 149.52 1.88 1.88 20-Aug 4 7.87 2164.00 7.44 113.50 2.36 2.36 21-Aug 5 7.82 2460.00 7.22 136.76 1.59 1.59 22-Aug 6 7.80 2423.00 6.55 132.94 4.14 4.14 23-Aug 7 7.83 2264.00 137.35 4.49 4.49 24-Aug 8 7.83 2270.00 124.76 2.31 0.43 2.74 25-Aug 9 7.78 2163.00 7.01 133.13 2.49 2.49 26-Aug 10 7.78 2202.00 6.15 144.96 2.42 2.42 27-Aug 11 7.78 2245.00 7.01 133.13 2.10 2.10 28-Aug 12 7.83 2295.00 6.77 164.98 3.16 3.16 29-Aug 13 7.85 2292.00 6.56 153.02 2.91 0.27 3.18 30-Aug 14 7.83 2279.00 6.80 142.99 1.45 1.45 31-Aug 15 7.87 2150.00 6.09 127.22 1.25 1.25 1-Sep 16 7.88 2178.00 6.33 122.69 1.15 1.15 2-Sep 17 7.83 2408.00 5.56 123.69 1.18 1.18 3-Sep 18 7.85 2233.00 6.29 103.56 1.16 0.68 1.84 4-Sep 19 7.87 2278.00 6.71 122.50 1.68 1.68 5-Sep 20 7.86 2265.00 6.29 114.35 3.98 3.98 6-Sep 21 7.89 2224.00 5.99 130.67 1.69 1.89 3.58 7-Sep 22 7.86 2240.00 6.24 102.68 0.39 0.39 8-Sep 23 8.43 2169.00 0.97 176.85 1.42 2.09 3.51 9-Sep 24 8.28 2141.00 0.95 149.46 1.86 1.86
Average 7.88 2263.63 6.01 136.79 2.15 1.07 2.38 Std.Dev 0.15 92.77 1.71 23.88 1.06 0.85 1.10
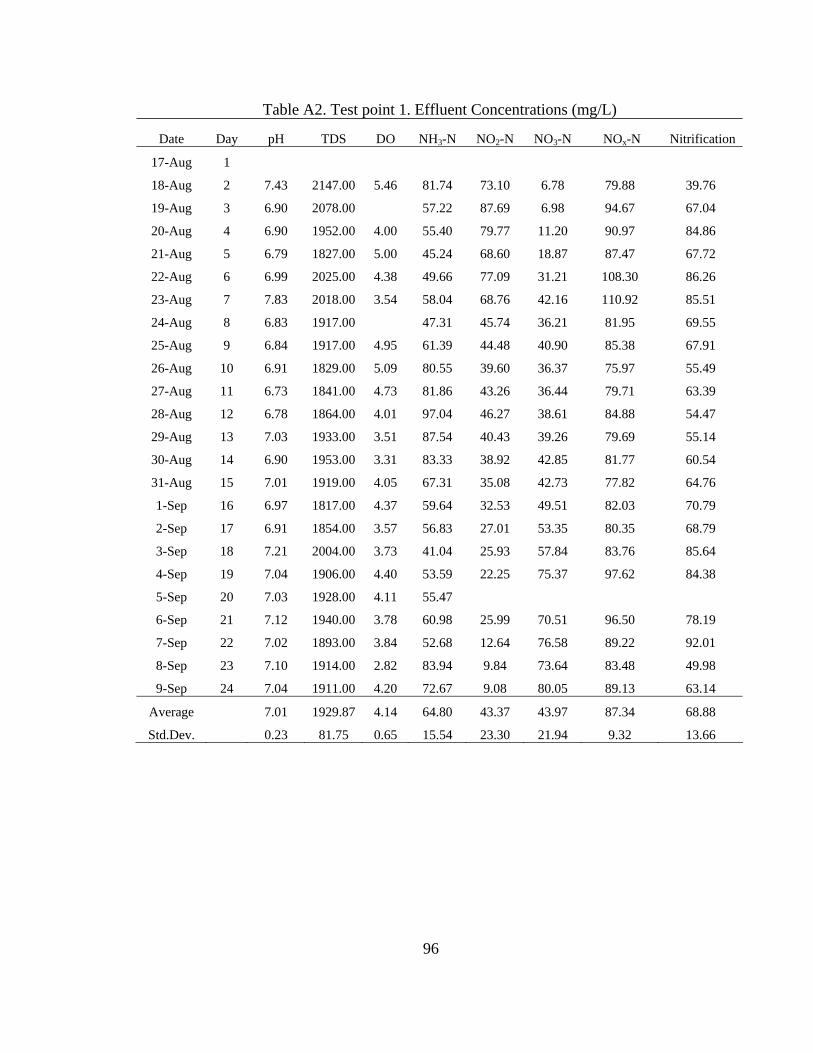
96
Table A2. Test point 1. Effluent Concentrations (mg/L)
Date Day pH TDS DO NH3-N NO2-N NO3-N NOx-N Nitrification
17-Aug 1
18-Aug 2 7.43 2147.00 5.46 81.74 73.10 6.78 79.88 39.76
19-Aug 3 6.90 2078.00 57.22 87.69 6.98 94.67 67.04
20-Aug 4 6.90 1952.00 4.00 55.40 79.77 11.20 90.97 84.86
21-Aug 5 6.79 1827.00 5.00 45.24 68.60 18.87 87.47 67.72
22-Aug 6 6.99 2025.00 4.38 49.66 77.09 31.21 108.30 86.26
23-Aug 7 7.83 2018.00 3.54 58.04 68.76 42.16 110.92 85.51
24-Aug 8 6.83 1917.00 47.31 45.74 36.21 81.95 69.55
25-Aug 9 6.84 1917.00 4.95 61.39 44.48 40.90 85.38 67.91
26-Aug 10 6.91 1829.00 5.09 80.55 39.60 36.37 75.97 55.49
27-Aug 11 6.73 1841.00 4.73 81.86 43.26 36.44 79.71 63.39
28-Aug 12 6.78 1864.00 4.01 97.04 46.27 38.61 84.88 54.47
29-Aug 13 7.03 1933.00 3.51 87.54 40.43 39.26 79.69 55.14
30-Aug 14 6.90 1953.00 3.31 83.33 38.92 42.85 81.77 60.54
31-Aug 15 7.01 1919.00 4.05 67.31 35.08 42.73 77.82 64.76
1-Sep 16 6.97 1817.00 4.37 59.64 32.53 49.51 82.03 70.79
2-Sep 17 6.91 1854.00 3.57 56.83 27.01 53.35 80.35 68.79
3-Sep 18 7.21 2004.00 3.73 41.04 25.93 57.84 83.76 85.64
4-Sep 19 7.04 1906.00 4.40 53.59 22.25 75.37 97.62 84.38
5-Sep 20 7.03 1928.00 4.11 55.47
6-Sep 21 7.12 1940.00 3.78 60.98 25.99 70.51 96.50 78.19
7-Sep 22 7.02 1893.00 3.84 52.68 12.64 76.58 89.22 92.01
8-Sep 23 7.10 1914.00 2.82 83.94 9.84 73.64 83.48 49.98
9-Sep 24 7.04 1911.00 4.20 72.67 9.08 80.05 89.13 63.14
Average 7.01 1929.87 4.14 64.80 43.37 43.97 87.34 68.88
Std.Dev. 0.23 81.75 0.65 15.54 23.30 21.94 9.32 13.66

97
Table A3. Test point 2. Influent Concentrations (mg/L) Date Day pH TDS DO NH3-N NO2-N NO3-N NOx-N
10-Sep 25 7.82 2282.00 7.36 144.38 1.41 3.27 4.69 13-Sep 28 7.85 2195.00 5.83 159.31 0.00 0.00 0.00 14-Sep 29 7.87 2142.00 6.24 135.77 2.50 4.65 7.15 15-Sep 30 7.92 2282.00 152.28 2.51 4.16 6.66 16-Sep 31 7.85 2259.00 7.31 147.28 2.79 3.47 6.26 17-Sep 32 7.85 2096.00 7.69 148.46 1.64 0.00 1.64 18-Sep 33 7.83 2188.00 9.33 144.95 1.53 1.65 3.18 20-Sep 35 7.78 2251.00 7.19 211.79 1.77 2.52 4.28 21-Sep 36 7.82 2230.00 7.53 199.92 1.30 1.27 2.58 22-Sep 37 7.82 2202.00 8.14 1.68 2.11 3.80 23-Sep 38 7.84 2268.00 6.87 1.92 1.92 24-Sep 39 7.70 2366.00 6.94 1.09 0.32 1.41 27-Sep 42 7.80 2344.00 6.54 2.65 2.65 28-Sep 43 7.82 2199.00 6.97 1.49 1.49 29-Sep 44 7.82 2123.00 7.86 1.92 0.29 2.21 30-Sep 45 7.82 2215.00 7.02 217.83 4.08 2.42 6.50 1-Oct 46 7.87 2261.00 6.98 195.42 2.08 1.40 3.48 2-Oct 47 7.92 2280.00 7.54 203.08 1.31 0.06 1.38 4-Oct 49 7.92 2233.00 7.07 161.86 1.08 1.08 5-Oct 50 7.91 2221.00 6.02 179.92 1.66 0.13 1.78 6-Oct 51 7.90 2278.00 7.05 196.20 1.61 0.23 1.85 7-Oct 52 7.90 2297.00 7.97 161.78 1.50 1.50 8-Oct 53 7.85 2331.00 7.18 175.72 4.35 4.18 8.54 9-Oct 54 7.86 2271.00 7.15 166.96 2.84 0.33 3.17
11-Oct 56 7.94 2296.00 6.54 153.71 1.37 1.37 12-Oct 57 7.91 2300.00 7.54 179.22 15-Oct 60 7.90 2637.00 7.31
Average 7.86 2261.00 7.20 160.46 1.68 2.13 3.22 Std. Dev. 0.05 98.63 0.71 24.90 0.93 1.62 2.24

98
Table A4. Test point 2. Effluent Concentrations (mg/L)
Date Day pH TDS DO NH3-N NO2-N NO3-N NOx-N Nitrification
10-Sep 25 8.59 1897.00 3.72 78.72 6.45 83.49 89.94 65.96
13-Sep 28 7.58 1807.00 3.86 95.44 7.05 28.91 35.96 23.90
14-Sep 29 7.59 1960.00 3.91 103.17 11.54 54.34 65.88 51.38
15-Sep 30 7.51 1905.00 88.65 11.79 54.31 66.11 45.96
16-Sep 31 7.42 2022.00 3.06 121.17 14.22 52.66 66.89 48.09
17-Sep 32 7.36 1961.00 2.88 112.78 13.76 56.91 70.67 50.41
18-Sep 33 7.42 1852.00 3.59 105.82 10.99 52.38 63.37 46.29
20-Sep 35 7.63 2039.00 4.41 155.47 9.93 41.52 51.45 25.72
21-Sep 36 7.56 2029.00 3.24 146.76 12.40 45.96 58.37 30.91
22-Sep 37 7.54 2006.00 3.69 12.94 43.34 56.28
23-Sep 38 7.49 1954.00 1.98 15.97 43.87 59.84
24-Sep 39 7.44 2006.00 3.24 22.73 46.89 69.62
27-Sep 42 7.72 2356.00 1.51 17.44 51.91 69.36
28-Sep 43 7.54 2127.00 3.96 21.35 44.61 65.96
29-Sep 44 7.36 1941.00 3.33 24.43 47.80 72.23
30-Sep 45 7.31 1863.00 3.56 145.07 22.56 38.68 61.23 29.76
1-Oct 46 7.37 1941.00 3.66 128.51 26.05 47.25 73.30 39.72
2-Oct 47 7.60 2011.00 3.36 117.18 16.60 47.86 64.46 33.61
4-Oct 49 7.57 2022.00 3.52 129.01 16.90 47.54 64.44 42.15
5-Oct 50 7.56 1968.00 4.04 115.31 19.03 47.39 66.42 39.09
6-Oct 51 7.65 2029.00 3.45 129.77 15.28 41.24 56.52 30.50
7-Oct 52 7.58 2046.00 3.46 102.46 15.87 42.83 58.70 38.42
8-Oct 53 7.55 2058.00 3.70 125.25 13.05 36.18 49.23 29.66
9-Oct 54 7.42 2079.00 3.28 130.79 15.96 42.82 58.78 37.28
11-Oct 56
12-Oct 57 7.48 2025.00 3.25 120.41 16.68 47.44 64.13 37.89
15-Oct 60 7.87 2058.00 4.01 8.79 30.83 39.63
Average 7.56 1994.96 3.41 112.00 12.48 50.38 62.26 39.30
Std. Dev. 0.24 104.63 0.61 19.89 5.11 10.05 10.70 10.41

99
Table A5. Test point 3. Influent Concentrations (mg/L) Date Day pH TDS DO NH3-N NO2-N NO3-N NOx-N
16-Oct 61 7.91 2541.00 5.93 163.93 18-Oct 63 7.94 2475.00 7.46 141.80 2.20 1.20 3.40 19-Oct 64 7.86 2575.00 7.44 3.13 1.35 4.47 20-Oct 65 7.78 2511.00 5.42 152.15 2.79 1.83 4.62 22-Oct 67 7.86 2529.00 6.07 2.61 1.33 3.93 23-Oct 68 7.88 2641.00 6.48 190.18 2.53 1.09 3.63 25-Oct 70 7.90 2630.00 7.95 168.80 2.81 0.09 2.90 26-Oct 71 7.95 2590.00 6.96 159.71 2.77 0.20 2.97 27-Oct 72 7.85 2583.00 6.22 157.68 1.53 0.04 1.58 28-Oct 73 7.88 2585.00 7.29 151.73 2.76 1.47 4.23 29-Oct 74 7.85 2517.00 7.85 145.04 1.79 1.35 3.13 30-Oct 75 7.92 2594.00 8.15 154.24 2.17 1.81 3.98 31-Oct 76 7.84 2600.00 9.09 160.69 1.68 0.81 2.49 1-Nov 77 7.78 2587.00 6.20 174.42 1.13 1.13 2-Nov 78 7.85 2496.00 7.80 1.36 0.15 1.52 3-Nov 79 7.76 2642.00 6.16 190.05 1.63 0.17 1.80 4-Nov 80 7.83 2623.00 7.88 157.27 1.09 0.41 1.50 8-Nov 84 7.96 2432.00 7.32 152.25 2.62 0.05 2.67 9-Nov 85 7.90 2460.00 7.46 170.83 0.84 0.08 10-Nov 86 7.83 2648.00 6.41 181.35 1.86 0.99 11-Nov 87 7.87 2575.00 7.19 198.36 1.71 Average 7.87 2563.52 7.08 165.03 2.30 1.05 2.94 Std. Dev. 0.05 62.81 0.91 16.26 0.68 0.65 1.13

100
Table A6. Test point 3. Effluent Concentrations (mg/L)
Date Day pH TDS DO NH3-N NO2-N NO3-N NOx-N Nitrification
16-Oct 61 7.96 2426.00 3.49 11.89 28.33 40.22
18-Oct 63 7.91 2244.00 4.62 107.86 9.95 24.27 34.21 25.55
19-Oct 64 7.83 2324.00 4.31 11.42 26.40 37.83
20-Oct 65 7.79 2397.00 3.82 132.15 13.54 25.66 39.21 27.28
22-Oct 67 7.72 2226.00 2.89 14.27 28.49 42.76
23-Oct 68 7.74 2339.00 2.59 134.11 19.89 35.73 55.62 30.97
25-Oct 70 7.74 2523.00 2.71 111.67 16.65 33.18 49.83 31.26
26-Oct 71 7.72 2408.00 2.67 80.44 22.06 33.70 55.75 36.96
27-Oct 72 7.57 2370.00 2.15
28-Oct 73 7.64 2372.00 2.98 88.33 18.53 31.97 50.50 35.24
29-Oct 74 7.59 2410.00 1.34 109.31 15.46 27.16 42.62 31.11
30-Oct 75 7.81 2340.00 2.69 99.89 16.19 28.01 44.20 30.34
31-Oct 76 8.10 2447.00 4.25 107.10 8.95 20.22 29.17 19.22
1-Nov 77 7.84 2449.00 3.11 128.79 10.42 26.21 36.63 22.24
2-Nov 78 7.94 2426.00 3.91 142.66 11.80 26.56 38.36
3-Nov 79 7.82 2347.00 3.45 146.11 12.51 25.64 38.16 21.26
4-Nov 80 7.88 2490.00 4.14 122.33 15.10 27.38 42.48 28.60
8-Nov 84 7.78 2346.00 3.38 100.30 20.56 24.70 45.25 31.47
9-Nov 85 7.90 2460.00 7.46 136.68 17.48 26.14
10-Nov 86 7.74 2272.00 3.52 97.03 19.77 24.26
11-Nov 87 7.82 2430.00 3.14 129.20 5.60 6.73
Average 7.80 2383.14 3.46 116.12 14.90 28.59 42.52 28.58
Std.Dev. 0.13 77.27 1.20 19.55 4.35 5.93 7.21 5.30

101
Table A7. Test point 4. Influent Concentrations (mg/L) Date Day pH TDS DO NH3-N NO2-N NO3-N NOx-N
12-Nov 88 7.89 2207.00 6.05 163.00 0.76 0.12 0.88 13-Nov 89 7.83 2196.00 7.64 155.97 0.91 0.18 1.09 15-Nov 91 7.90 2262.00 6.72 156.60 2.28 0.12 2.40 16-Nov 92 7.85 2223.00 7.05 152.75 0.79 0.17 0.96 17-Nov 93 7.87 2229.00 7.08 166.48 3.55 0.16 3.70 18-Nov 94 7.89 2302.00 7.57 150.27 2.99 0.16 3.15 19-Nov 95 7.91 2254.00 6.66 143.06 0.90 0.12 1.02 20-Nov 96 7.88 2223.00 5.91 155.92 1.62 2.42 4.04 22-Nov 98 7.86 2185.00 7.81 143.64 0.67 0.08 0.75 23-Nov 99 7.84 2095.00 6.06 136.85 1.06 0.11 1.17 29-Nov 105 7.81 2256.00 5.99 122.65 1.87 0.23 2.10 30-Nov 106 7.77 2330.00 5.92 158.60 1.97 0.13 2.10 1-Dec 107 7.70 2186.00 6.51 125.79 3.46 0.15 3.61 2-Dec 108 7.83 2236.00 5.81 139.67 2.81 0.23 3.04 3-Dec 109 7.85 2242.00 6.34 163.30 5.52 1.69 7.21 6-Dec 112 7.84 2156.00 5.92 155.22 2.72 2.72 7-Dec 113 7.77 2056.00 5.86 146.59 1.55 1.47 3.02 8-Dec 114 7.83 2148.00 6.02 160.07 2.19 0.68 2.87
Average 7.84 2210.33 6.50 149.80 2.12 0.40 2.50 Std.Dev. 0.05 67.36 0.67 12.50 1.27 0.69 1.58

102
Table A8. Test point 4. Effluent Concentrations (mg/L)
Date Day pH TDS DO NH3-N NO2-N NO3-N NOx-N Nitrification
12-Nov 88 7.80 2046.00 3.28 129.20 19.42 28.39 47.81 31.06
13-Nov 89 7.93 2064.00 1.33 113.20 4.52 42.90 47.42 32.19
15-Nov 91 7.80 2076.00 1.33 103.65 8.92 47.21 56.13 37.95
16-Nov 92 7.72 2033.00 1.65 100.15 13.40 49.56 62.95 43.64
17-Nov 93 7.81 1996.00 1.30 86.77 17.99 50.24 68.23 43.39
18-Nov 94 7.72 1993.00 1.42 91.51 14.58 45.91 60.49 42.62
19-Nov 95 7.70 2048.00 4.86 100.97 18.30 49.72 68.02 50.34
20-Nov 96 7.68 2021.00 2.11 88.56 15.25 48.03 63.28 42.97
22-Nov 98 7.38 2024.00 2.74 94.56 19.36 48.98 68.34 50.38
23-Nov 99 7.62 1988.00 3.49 87.55 14.38 51.29 65.68 50.81
29-Nov 105 7.39 1874.00 2.49 73.04 16.62 40.41 57.02 49.23
30-Nov 106 7.58 2013.00 3.28 82.88 17.13 44.96 62.09 41.45
1-Dec 107 7.67 2099.00 1.83 86.82 18.46 47.04 65.51 55.14
2-Dec 108 7.63 1996.00 1.17 94.43 16.61 44.60 61.21 46.40
3-Dec 109 7.58 2004.00 1.62 72.53 17.80 47.66 65.46 42.44
6-Dec 112 7.48 2021.00 2.01 86.48 18.45 50.10 68.54 46.76
7-Dec 113 7.54 1926.00 1.93 72.53 19.34 46.83 66.16 47.79
8-Dec 114 7.84 1911.00 1.87 84.60 8.93 36.91 45.84 30.33
Average 7.66 2007.39 2.21 91.64 15.70 46.06 61.76 44.17
Std.Dev. 26.00 0.15 57.06 0.98 14.34 4.20 5.65 7.43 7.06

103
Table A9. Test point 5. Influent Concentrations (mg/L) Date Day pH TDS DO NH3-N NO2-N NO3-N NOx-N
9-Dec 115 7.85 2262.00 6.28 138.45 4.35 1.90 6.24 10-Dec 116 7.85 2179.00 3.13 155.90 4.51 1.72 6.23 13-Dec 119 7.81 2230.00 7.64 136.63 1.42 1.99 3.40 14-Dec 120 7.85 2258.00 5.90 122.41 2.94 0.12 3.06 15-Dec 121 7.88 2215.00 6.06 124.61 2.12 2.12 16-Dec 122 7.82 2150.00 6.29 98.53 1.69 0.07 1.76 17-Dec 123 7.82 2206.00 5.53 109.77 3.44 1.59 5.02 20-Dec 126 7.89 2298.00 7.40 113.44 3.07 1.98 5.06 21-Dec 127 7.85 2237.00 6.22 115.05 2.51 2.46 4.97 22-Dec 128 7.80 2219.00 5.95 109.25 1.54 0.09 1.63 23-Dec 129 7.80 2285.00 5.61 120.01 25-Dec 131 7.85 2324.00 148.26 0.11 0.11 27-Dec 133 7.84 2287.00 8.66 165.86 2.15 5.07 7.22 28-Dec 134 7.86 2234.00 5.64 150.66 2.13 2.26 4.39 29-Dec 135 7.87 2246.00 6.65 144.74 2.38 5.16 7.54 30-Dec 136 7.91 2201.00 6.53 161.28 31-Dec 137 7.79 2248.00 171.95 2.15 2.20 4.35 1-Jan 138 7.86 2412.00 3-Jan 140 7.89 2164.00 6.99 158.71 0.90 0.15 1.05 4-Jan 141 7.91 2138.00 6.91 153.71 2.14 4.23 6.37 5-Jan 142 7.88 2294.00 6.78 157.45 1.88 0.17 2.05
Average 7.85 2242.24 6.34 137.83 2.43 1.84 4.03 Std.Dev. 0.04 63.18 1.13 22.02 0.97 1.69 2.23

104
Table A10. Test point 5. Effluent Concentrations (mg/L) Date Day pH TDS DO NH3-N NO2-N NO3-N NOx-N Nitrification
9-Dec 115 7.73 1956.00 1.26 84.60 10.37 43.85 54.21 41.46 10-Dec 116 7.79 2038.00 2.17 92.38 12.81 45.57 58.38 39.65 13-Dec 119 7.64 2023.00 1.99 78.16 13.15 48.14 61.28 47.49 14-Dec 120 7.66 2002.00 1.72 75.13 14.52 49.42 63.94 55.31 15-Dec 121 7.70 2046.00 1.37 80.13 14.07 49.98 64.05 54.42 16-Dec 122 7.63 2000.00 3.02 71.59 13.31 49.55 62.86 67.55 17-Dec 123 7.53 1929.00 1.03 51.04 13.47 48.27 61.74 59.55 20-Dec 126 7.66 2028.00 5.47 53.25 20.28 57.21 77.49 72.32 21-Dec 127 7.77 2077.00 2.50 66.72 12.74 53.73 66.46 61.16 22-Dec 128 7.71 2050.00 1.35 65.17 12.50 51.31 63.81 61.84 23-Dec 129 7.79 2000.00 1.80 72.94 25-Dec 131 7.56 2063.00 87.02 16.54 64.72 81.26 58.03 27-Dec 133 7.56 2090.00 4.56 95.80 15.17 61.74 76.90 49.09 28-Dec 134 7.46 2046.00 1.58 82.60 11.30 60.53 71.83 50.48 29-Dec 135 7.74 1964.00 1.12 74.73 11.84 61.32 73.16 53.52 30-Dec 136 7.66 2005.00 2.07 86.67 31-Dec 137 7.65 1948.00 77.78 21.12 49.86 70.98 43.71 1-Jan 138 7.65 1986.00 3-Jan 140 7.76 1976.00 4.79 93.90 15.10 45.51 60.62 40.44 4-Jan 141 7.73 1947.00 2.89 74.43 11.40 44.85 56.25 38.75 5-Jan 142 7.71 1922.00 2.67 88.42 11.07 46.65 57.72 38.82
Average 7.67 2004.57 2.41 77.62 13.93 51.79 65.72 51.87 Std.Dev. 0.09 48.85 1.31 12.22 2.94 6.53 7.84 10.27

105
Table A11. Test point 6. Influent Concentrations (mg/L) Date Day pH TDS DO NH3-N NO2-N NO3-N NOx-N 6-Jan 143 7.73 6.94 14.33 9.62 23.95 7-Jan 144 7.84 6.64 8-Jan 145 7.88 2308.00 6.92 151.26 1.08 3.89 4.97
10-Jan 147 7.86 2117.00 6.30 145.90 1.92 10.27 12.19 11-Jan 148 7.83 2313.00 7.77 156.37 0.85 8.16 9.01 12-Jan 149 7.81 2127.00 6.69 149.11 2.74 2.74 13-Jan 150 7.88 2107.00 6.89 185.51 14-Jan 151 7.87 2154.00 6.73 168.69 2.37 5.01 7.38 15-Jan 152 7.86 2166.00 7.25 153.39 1.63 1.94 3.57 16-Jan 153 7.88 2206.00 7.47 146.86 1.13 1.67 2.80 17-Jan 154 7.90 2260.00 168.02 1.26 3.74 5.00 18-Jan 155 7.87 2240.00 130.47 0.94 5.43 6.38 19-Jan 156 7.87 2262.00 119.70 1.37 5.57 6.93 20-Jan 157 7.83 2227.00 129.29 21-Jan 158 7.86 2242.00 131.93 1.46 2.57 4.03 22-Jan 159 7.89 2168.00 117.77 24-Jan 161 7.87 2016.00 4.95 157.44 0.66 4.34 5.00 25-Jan 162 7.88 2223.00 6.09 151.86 5.46 5.46 26-Jan 163 7.85 2087.00 5.98 140.17 1.31 3.84 5.15 27-Jan 164 7.86 1908.00 5.97 146.94 1.76 3.18 4.93 28-Jan 165 7.83 2185.00 5.50 146.94 0.63 5.27 5.90 29-Jan 166 7.87 2135.00 5.81 145.20 0.62 3.17 3.79 31-Jan 168 7.91 2040.00 5.23 124.43 0.24 1.97 2.21 1-Feb 169 7.91 2117.00 5.20 143.85 0.61 5.23 5.84 2-Feb 170 7.88 2137.00 5.96 137.06 2.64 2.64 3-Feb 171 7.78 2160.00 5.16 129.02 0.42 2.33 4-Feb 172 7.79 2057.00 7.00 131.94 0.74 3.02 3.76 6-Feb 174 7.87 2163.00 6.42 122.71 1.20 6.89 8.09 7-Feb 175 7.84 2154.00 6.35 170.34 1.15 6.69 7.84 8-Feb 176 7.87 2030.00 6.11 116.93 0.10 0.10 9-Feb 177 7.85 2302.00 5.00 157.37 0.67 3.60 4.27
11-Feb 179 7.77 2248.00 5.53 164.24 0.92 2.94 3.86 13-Feb 181 7.81 2211.00 6.71 171.02 1.15 4.75 5.90
Average 7.85 2163.55 6.24 158.35 1.64 4.35 5.84 Std.Dev. 0.04 93.20 0.78 17.22 2.75 2.34 4.36

106
Table A12. Test point 6. Effluent Concentrations (mg/L)
Date Day pH TDS DO NH3-N NO2-N NO3-N NOx-N
Nitrification
6-Jan 143 6.49 1949.00 2.33 8.49 92.38 100.87 7-Jan 144 7.64 2.71 8-Jan 145 7.51 1.53 93.90 13.68 128.99 142.67 99.87 10-Jan 147 6.80 2048.00 4.77 65.47 9.89 92.39 102.28 74.23 11-Jan 148 7.45 1862.00 3.83 91.61 3.40 86.83 90.23 61.09 12-Jan 149 7.93 2041.00 7.66 101.95 1.40 83.98 85.38 60.63 13-Jan 150 7.93 1920.00 5.66 93.87 14-Jan 151 7.78 1869.00 6.89 48.26 1.75 140.95 142.70 89.57 15-Jan 152 7.60 1889.00 82.70 1.24 86.86 88.10 60.81 16-Jan 153 7.47 1896.00 7.85 71.71 1.51 84.79 86.30 62.22 17-Jan 154 7.47 1923.00 67.04 2.14 92.07 94.21 59.37 18-Jan 155 7.04 1955.00 53.87 2.76 103.58 106.34 86.30 19-Jan 156 7.28 1938.00 43.14 3.05 95.47 98.52 87.15 20-Jan 157 6.73 1947.00 43.14 2.14 108.71 110.85 90.78 21-Jan 158 6.59 1936.00 52.79 6.17 106.62 112.79 90.52 22-Jan 159 7.24 1953.00 62.08 24-Jan 161 6.87 1906.00 0.88 68.97 5.43 116.60 122.04 82.07 25-Jan 162 6.56 1762.00 5.57 56.68 2.60 102.53 105.13 73.30 26-Jan 163 6.79 1907.00 3.93 64.69 4.42 98.17 102.59 77.50 27-Jan 164 6.49 1824.00 4.80 60.99 2.70 98.24 100.94 72.73 28-Jan 165 6.44 1656.00 4.87 41.37 1.68 101.20 102.89 74.14 29-Jan 166 6.87 1867.00 4.76 64.98 4.26 91.77 96.03 70.03 31-Jan 168 6.29 1858.00 2.79 2.72 100.16 102.88 87.55 1-Feb 169 4.15 1803.00 5.29 51.07 1.41 109.75 111.16 81.82 2-Feb 170 7.02 1822.00 4.93 53.60 1.41 96.18 97.59 75.39 3-Feb 171 7.43 1874.00 4.86 61.85 2.79 60.91 63.69 52.27 4-Feb 172 7.28 1892.00 2.00 97.13 5.78 87.64 93.42 74.97 6-Feb 174 7.23 1808.00 3.46 62.10 6.66 80.62 87.28 75.31 7-Feb 175 7.13 1859.00 3.70 60.59 6.83 88.15 94.98 59.04 8-Feb 176 6.52 1845.00 3.54 74.44 5.60 98.24 103.84 94.03 9-Feb 177 5.63 1775.00 4.17 67.16 2.16 97.04 99.20 66.74 11-Feb 179 6.76 2002.00 3.71 67.34 7.03 75.48 82.51 53.19 13-Feb 181 6.61 1990.00 2.31 99.54 8.17 93.05 101.22 62.67
Average 7.00 1886.04 4.29 79.61 4.31 101.05 100.94 74.74 Std.Dev. 0.73 82.10 1.74 16.61 3.02 15.42 16.00 13.02

107
Table A13. Test point 7. Influent Concentrations (mg/L) Date Day pH TDS DO NH3-N NO2-N NO3-N NOx-N
14-Feb 182 7.82 2131.00 5.28 151.16 0.85 0.68 1.53 15-Feb 183 7.89 2191.00 5.79 160.19 0.90 0.53 1.44 16-Feb 184 7.90 2202.00 5.73 160.19 1.24 0.55 1.78 17-Feb 185 7.89 2275.00 6.76 177.14 1.47 0.83 2.30 18-Feb 186 7.94 2263.00 6.85 155.31 1.55 0.96 2.51 19-Feb 187 7.92 2231.00 6.40 119.25 1.38 0.67 2.05 20-Feb 188 7.91 2270.00 5.00 168.45 1.63 0.81 2.43 21-Feb 189 7.83 2277.00 5.68 104.74 1.28 0.81 2.08 22-Feb 190 7.91 2262.00 6.69 169.20 1.50 0.48 1.99 23-Feb 191 7.84 2350.00 155.07 1.20 0.22 1.42 24-Feb 192 7.86 2227.00 7.35 167.87 1.23 0.55 1.79 25-Feb 193 7.79 2275.00 6.59 176.67 2.17 1.25 3.42 26-Feb 194 7.86 2260.00 6.53 166.25 1.97 0.79 2.77 27-Feb 195 7.88 2255.00 7.29 139.10 1.80 0.69 2.49 28-Feb 196 8.09 2251.00 6.31 151.95 1.51 0.77 2.28 1-Mar 197 7.98 2298.00 6.27 139.03 0.95 0.49 1.44 2-Mar 198 8.00 2327.00 6.70 133.86 2.69 1.03 3.72 3-Mar 199 7.99 2253.00 5.04 135.56 1.13 0.51 1.64 4-Mar 200 7.88 2238.00 5.44 196.41 1.84 1.55 3.39 5-Mar 201 7.93 2278.00 6.32 148.09 0.71 0.05 0.76 6-Mar 202 8.00 2270.00 6.25 152.75 1.14 0.54 1.68 7-Mar 203 7.95 2310.00 6.43 179.69 1.60 1.15 2.75 8-Mar 204 8.45 2212.00 167.61 0.00 0.11 0.11 9-Mar 205 7.89 2318.00 172.21 0.76 0.31 1.06
10-Mar 206 7.78 2260.00 191.17 1.22 0.91 2.12 11-Mar 207 7.89 2254.00 6.58 173.54 1.35 1.36 2.71 12-Mar 208 7.75 2281.00 6.71 171.54 0.00 0.04 0.04 13-Mar 209 7.82 2262.00 5.96 176.93 0.95 0.00 0.95 14-Mar 210 7.96 2301.00 6.04 188.96 2.75 1.19 3.94 15-Mar 211 7.86 2259.00 6.24 151.34 1.49 1.13 2.62 16-Mar 212 17-Mar 213 7.86 2216.00 5.97 144.70 0.00 0.10 0.10 18-Mar 214 7.90 2331.00 6.70 160.46 1.25 0.84 2.09 19-Mar 215 Average 7.91 2258.29 6.24 158.87 1.26 0.66 1.93 Std.Dev. 0.12 47.21 0.58 19.50 0.62 0.39 0.95

108
Table A14. Test point 7. Effluent Concentrations (mg/L) Date Day pH TDS DO NH3-N NO2-N NO3-N NOx-N Nitrification
14-Feb 182 8.31 2063.00 2.70 127.01 6.74 15.15 21.89 15.34 15-Feb 183 8.12 2045.00 6.09 116.20 4.99 14.30 19.29 12.75 16-Feb 184 7.97 2100.00 4.33 138.83 5.89 14.86 20.75 13.71 17-Feb 185 7.96 2114.00 3.91 132.53 6.29 14.20 20.49 12.25 18-Feb 186 7.92 2191.00 3.11 138.83 6.53 14.30 20.84 14.21 19-Feb 187 8.00 2157.00 3.16 113.13 5.60 11.48 17.08 15.17 20-Feb 188 7.94 2140.00 3.01 114.86 8.17 15.63 23.80 14.96 21-Feb 189 7.86 2179.00 3.25 100.58 8.03 13.77 21.80 22.04 22-Feb 190 7.81 2187.00 3.65 126.72 8.98 14.62 23.60 14.77 23-Feb 191 7.81 2162.00 143.84 10.01 16.08 26.09 17.81 24-Feb 192 7.84 2248.00 3.27 113.87 1.96 3.13 5.09 3.21 25-Feb 193 7.86 2126.00 3.12 132.50 11.97 17.32 29.30 17.56 26-Feb 194 7.89 2178.00 4.16 141.15 9.74 14.66 24.40 15.54 27-Feb 195 7.88 2163.00 3.54 125.70 10.87 16.01 26.88 20.46 28-Feb 196 8.02 2155.00 3.66 148.89 9.65 13.85 23.50 16.38 1-Mar 197 7.87 2180.00 3.78 109.81 5.52 12.26 17.78 13.54 2-Mar 198 8.03 2221.00 3.75 109.81 8.16 13.53 21.69 17.16 3-Mar 199 7.97 2234.00 3.34 108.89 6.31 13.48 19.79 15.46 4-Mar 200 7.87 2169.00 3.32 152.75 10.34 15.42 25.76 13.89 5-Mar 201 7.95 2148.00 3.65 136.54 9.95 12.41 22.36 15.99 6-Mar 202 7.87 2182.00 3.20 149.24 11.24 13.36 24.60 17.05 7-Mar 203 7.95 2185.00 3.57 158.16 8.53 12.94 21.47 12.65 8-Mar 204 7.70 2181.00 165.03 11.83 14.60 26.43 16.69 9-Mar 205 7.92 2154.00 148.09 9.88 13.88 23.76 14.61
10-Mar 206 7.70 2233.00 136.01 10.92 13.78 24.69 13.68 11-Mar 207 7.81 2188.00 3.96 150.98 8.41 13.32 21.73 13.26 12-Mar 208 7.68 2167.00 3.46 168.91 9.83 13.51 23.34 14.41 13-Mar 209 7.80 2182.00 3.67 157.55 16.95 16.47 33.42 20.00 14-Mar 210 7.88 2165.00 3.45 160.00 13.65 16.60 30.26 16.95 15-Mar 211 7.96 2197.00 3.86 149.50 10.93 17.19 28.12 19.68 16-Mar 212 17-Mar 213 7.92 2180.00 3.47 141.78 13.16 17.67 30.83 22.56 18-Mar 214 7.97 2120.00 4.01 150.95 12.61 15.78 28.39 18.73 Average 7.91 2162.44 3.61 137.51 9.17 14.43 23.60 15.89 Std.Dev. 0.12 45.17 0.61 17.88 2.87 2.51 4.89 3.42

109
Table A15. Average Values
Flow Rate (mL/min)
HRT (min)
HRT (days)
Av. Initial TDS
(mg/L)
Av. Final TDS
(mg/L)
Av. Initial NH4-N (mg/L)
Av. Final
NH4-N (mg/L)
Av. Initial NOx-N (mg/L)
Av. Final
NOx-N (mg/L)
0.3 210 0.15 2153.800 1886.000 167.660 84.293 6.880 104.990
0.5 126 0.09 2263.600 1929.800 144.832 68.612 2.370 87.340
0.6 105 0.07 2242.200 2004.600 145.938 82.186 4.030 65.720
0.7 90 0.06 2210.000 2007.400 158.612 97.025 2.490 61.760
1 63 0.04 2261.000 1994.900 169.899 118.578 3.220 62.26
1.5 42 0.029 2563.500 2383.140 174.727 122.940 2.930 42.520
1.7 37 0.026 2258.290 2162.441 168.216 145.601 1.925 23.600
Table A15. Continued
Flow Rate (mL/min)
HRT (min)
HRT (days)
Av. Initial pH
Av. Final pH
Av. Initial DO
Av. Final DO
Nitrification Efficiency
%
0.3 210 0.15 7.85 7 6.3 4.29 74.74
0.5 126 0.09 7.88 7.01 6.01 4.13 68.87
0.6 105 0.07 7.85 7.67 6.34 2.4 51.87
0.7 90 0.06 7.84 7.66 6.49 2.21 44.17
1 63 0.04 7.85 7.56 7.2 3.41 39.29
1.5 42 0.029 7.87 7.801 7.08 3.46 28.57
1.7 37 0.026 7.91 7.91 6.24 3.06 15.89

110
Table A16. Continued
Flow Rate (mL/min)
HRT (min)
HRT (days)
Std. Initial pH
Std. Final pH
Std. Initial DO
Std. Final DO
Std. % final Nitrification
0.3 210 0.15 0.03 0.71 0.76 1.81 13.02 0.5 126 0.09 0.15 0.23 1.71 0.65 13.65 0.6 105 0.07 0.03 0.08 1.13 1.31 10.27 0.7 90 0.06 0.05 0.15 0.67 0.67 7.06 1 63 0.04 0.05 0.24 0.61 0.61 10.41
1.5 42 0.029 0.05 0.125 0.91 1.2 5.3 1.7 37 0.026 0.12 0.12 0.58 0.61 3.42
Table A16. Standard Deviation Values Flow Rate
(mL/min) HRT (min)
HRT (days)
Std. Initial TDS
Std. Final TDS
Std. Initial NH4-N
Std. Final NH4-N
Std. Initial NOx-N
Std. Final
NOx-N
0.3 210 0.15 93.197 82.096 17.216 16.606 4.357 16.004
0.5 126 0.09 92.772 81.747 23.879 15.536 1.097 9.325
0.6 105 0.07 63.185 48.846 22.023 12.221 2.235 7.841
0.7 90 0.06 67.355 57.055 12.498 14.345 2.490 7.430
1 63 0.04 98.629 104.600 24.900 19.888 2.238 10.702
1.5 42 0.029 62.811 77.265 16.263 19.552 1.131 7.205
1.7 37 0.026 47.21 45.17 19.50 18.31 0.95 4.88

Tabl
e A
17. V
olum
etric
Con
vers
ion
Rat
es
Flow
Rat
e (m
L/m
in)
HR
T (m
in)
HR
T (d
ays)
Av.
Initi
al
NH
4-N
(mg/
L)
Av.
Fin
al
NO
x-N
(mg/
L)
%
Nitr
ifica
tion
Prod
uced
(N
Ox/N
H4)
Con
vers
ion
Rat
es p
er u
nit
Vol
ume
(gN
OX/L
-day
)
Con
vers
ion
Rat
es p
er
Surf
ace
Are
a (g
NO
x/m2 -d
)
N-L
oadi
ng
Rat
e (g
NH
4/m2 -d
)
N re
mov
al
rate
(g
NH
4/m2 -d
)
0.3
210
0.15
16
7.66
0 10
4.99
0 74
.74
4.94
0.
59
0.94
0.
47
0.5
126
0.09
14
4.83
2 87
.340
68
.87
11.4
1 1.
36
2.26
1.
07
0.6
105
0.07
14
5.93
8 65
.720
51
.87
12.3
6 1.
48
3.28
1.
85
0.7
90
0.06
15
8.61
2 61
.760
44
.17
15.8
1 1.
89
4.85
2.
97
1 63
0.
04
169.
899
62.2
60
39.2
9 32
.53
3.89
10
.61
7.40
1.5
42
0.02
9 17
4.72
7 42
.520
28
.57
49.9
8 5.
97
24.5
4 17
.27
1.7
37
0.02
6 16
8.21
6 23
.600
15
.89
35.6
3 4.
26
30.3
5 26
.27
111

112
Table A18. Mass Calculations
Flow Rate (mL/min)
HRT (min)
HRT (days)
Av. Initial NH4-N
(g)
Av. Final NOx (g)
Av. Effluent NH4-N
(g)
Av Inflluent NOx-N
(g) 0.3 210 0.15 0.072 0.045 0.04 0.0030 0.5 126 0.09 0.104 0.063 0.05 0.0017 0.6 105 0.07 0.126 0.057 0.07 0.0035 0.7 90 0.06 0.160 0.062 0.10 0.0025 1 63 0.04 0.245 0.090 0.17 0.0046
1.5 42 0.03 0.377 0.092 0.27 0.0063 1.7 37 0.026 0.412 0.058 0.36 0.0047
Table A19. Reactor Efficiency using variable surface areas Conversion Rates per Surface Area 900 Membranes (gNOx-N/m2-d)
Conversion Rates per Surface Area 450 Membranes (gNOx-N/m2-d)
Final NOx-N (g)
900 Membranes
% Efficiency
900 Membranes
Final NOx-N (g)
450 Membranes
% Efficiency
450 Membranes
0.34 0.69 0.0454 62.62 0.0227 31.31
0.48 0.95 0.0629 60.30 0.0314 30.15
0.43 0.86 0.0568 45.03 0.0284 22.52
0.47 0.94 0.0623 38.94 0.0311 19.47
0.68 1.36 0.0897 36.65 0.0448 18.32
0.70 1.39 0.0918 24.34 0.0459 12.17
0.44 0.88 0.0578 14.03 0.0289 7.01

113
Table A20. Sample Calculations
Flow Rate
(mL/min)
Conversion Rates per Surface Area 3600 Membranes (gNOx-N/m2-d)
Final NOx-N (g) 3600
Membranes
Efficiency (%) at a constant rate 3600 Membranes
0.3 0.086 0.1814 250.48 0.5 0.119 0.2515 241.22 0.6 0.108 0.2271 180.13 0.7 0.118 0.2490 155.75 1 0.170 0.3586 146.58
1.5 0.174 0.3674 97.34 1.7 0.110 0.2311 56.12

114
APPENDIX B
RAW DATA. SIGMA PLOT GRAPHS

115
HFMDays
0 50 100 150 200Fe
ed p
H
0
2
4
6
8
Effl
uent
pH
0
2
4
6
8
Feed
TD
S (m
g/L)
0
500
1000
1500
2000
2500
3000
Days
0 50 100 150 200
Efflu
ent T
DS
(mg/
L)
0
500
1000
1500
2000
2500
3000
x = 7.01std = 0.23
x = 7.88std = 0.15
x = 2263.6std = 92.77
x = 1929.86std = 81.74
x = 7.86std = 0.05
x = 7.55std = 0.24
x = 2261std = 98.6
x = 1994std = 104.62
x = 7.86std = 0.05
x = 7.8std = 0.12
x = 2563std =62.81
x = 2383std = 77.26
x = 7.845std =0.05
x = 7.65std = 0.15
x = 2210std = 67.35
x = 2007std = 57.05
x = 7.85std = 0.03
x = 2242.2std = 63.18
x = 2004.5std = 48.8
Flow Rate 0.5 mL/min
Flow Rate1.0 mL/min
Flow Rate 1.5 mL/min
Flow Rate0.6 mL/min
Flow Rate 0.7 mL/min
Flow Rate0.3 mL/min
x = 7.67std = 0.08
x = 7.00std = 0.73
x = 7.85std = 0.04
x = 2163std = 93.19
x = 1886.0std = 82.09
Flow Rate1.7 mL/min
x = 7.90std = 0.07
x =7.94std = 0.12
x = 2255std =49.30
x = 2157std = 54.0
Figure B1. Raw data for pH and TDS

116
HFMDays
0 50 100 150 200
Inf.
DO
(mg/
L)
0
2
4
6
8
10
Effl
. DO
(mg/
L)
0
1
2
3
4
5
6
Inf.
NH
4 (m
g/L)
0
50
100
150
200
250
Days
0 50 100 150 200
Effl
. NH
4 (m
g/L)
020406080100120140160180
x = 4.13std = 0.65
x = 136.78std = 23.87
x = 64.80std = 15.53
x = 7.19std = 0.71
x = 3.41std = 0.61
x = 160.46std = 24.9
x = 111.99std = 19.88
x = 6.00std = 1.71
x = 7.08std = 0.91
x = 3.45std = 1.20
x = 165std = 16.26
x = 116std = 19.5
x = 6.49std = 0.67
x = 2.20std = 0.98
x = 149.8std = 12.49
x = 91.6std = 14.34
x = 6.34std = 1.12
x = 2.41std = 1.31
x = 137.8std = 22.0
x = 77.623std = 12.2
Flow Rate 0.5 mL/min
Flow Rate1.0 mL/min
Flow Rate 1.5 mL/min
Flow Rate0.6 mL/min
Flow Rate 0.7 mL/min
Flow Rate0.3 mL/min
x = 6.24std = 0.77
x = 4.28std = 1.73
x = 158.34std = 17.21
x = 79.71std = 16.6
Flow Rate1.7 mL/min
x = 6.25std = 0.72
x = 3.66std = 0.73
x = 151.59std = 22.14
x = 129.37std = 16.7
Figure B2. Raw data for dissolved oxygen and ammonia

117
HFMDays
0 50 100 150 200In
f. N
Ox
(mg/
L)
0
5
10
15
20
25
30
Days
0 50 100 150 200
Effl.
NO
x (m
g/L)
0
20
40
60
80
100
120
140
160
x =2.37std = 1.1
x = 87.33std = 9.32
x = 3.22std = 2.23
x = 62.26std =10.7
x = 2.93std = 1.13
x = 42.51std = 7.20
x = 2.49std = 1.58
x = 61.76std = 7.43
x = 4.03std = 2.23
x = 65.71std = 7.84
Flow Rate 0.5 mL/min
Flow Rate1.0 mL/min
Flow Rate 1.5 mL/min
Flow Rate0.6 mL/min
Flow Rate 0.7 mL/min
Flow Rate0.3 mL/min
x = 5.84std = 4.35
x = 100.94std = 16.0
Flow Rate1.7 mL/min
x = 2.15std = 0.54
x = 21.65std = 5.53
Figure B3. Raw data for nitrogen oxides

APPENDIX C
MASS TRANSFER CALCULATIONS
118

INIT
IAL
DO
CA
LCU
LATI
ON
S
Flux
Cal
cula
tions
V=
0.06
3 L
Q
= 0.
3 cm
3 /min
Q=
cm
3 /min
Ope
ratin
g Pr
essu
re=
0.5
psi
O
pera
ting
Pres
sure
= 0.
0340
2286
at
m
H
enry
's co
nsta
nt fo
r O2=
41
100
atm
Surf
ace
Are
a pe
r HF=
1.
4645
cm
2
Tota
l Mem
bran
e Su
rfac
e A
rea=
52
72.2
cm
2
CL
(0)=
0.
45
mg-
DO
/L
M
embr
ane
Thic
knes
s=
0.00
8 cm
Mem
bran
e Th
ickn
ess=
0.
0000
8 m
Ta
ble
C1.
Initi
al D
O c
alcu
latio
ns a
t 0.3
mL/
min
Tim
e C
L (ti
me)
C
hang
e in
Con
c C
hang
e in
Ti
me
Flux
(J)
Flux
(J)
Flux
(J)
Cha
nge
in C
onc
ko
[min
] [m
g-D
O/L
] [m
mol
-DO
] [m
in]
[mm
ol-D
O/m
in-c
m2 ]
[mm
ol-D
O/m
in-m
2 ] [m
g-D
O/m
in-
m2 ]
[mg-
DO
/m3 ]
[m/m
in]
0 0.
45
- -
- -
- -
- 10
2.
18
3.41
E-03
1.
00E+
01
6.46
E-08
6.
46E-
04
2.07
E-02
1.
73E+
03
1.19
E-05
20
2.
35
3.35
E-04
1.
00E+
01
6.35
E-09
6.
35E-
05
2.03
E-03
1.
70E+
02
1.19
E-05
25
2.
37
3.94
E-05
5.
00E+
00
1.49
E-09
1.
49E-
05
4.78
E-04
2.
00E+
01
2.39
E-05
35
2.
92
1.08
E-03
1.
00E+
01
2.05
E-08
2.
05E-
04
6.57
E-03
5.
50E+
02
1.19
E-05
55
3.
26
6.69
E-04
2.
00E+
01
6.35
E-09
6.
35E-
05
2.03
E-03
3.
40E+
02
5.97
E-06
85
3.
78
1.02
E-03
3.
00E+
01
6.47
E-09
6.
47E-
05
2.07
E-03
5.
20E+
02
3.98
E-06
10
0 3.
82
7.88
E-05
1.
50E+
01
9.96
E-10
9.
96E-
06
3.19
E-04
4.
00E+
01
7.97
E-06
14
0 3.
85
5.91
E-05
4.
00E+
01
2.80
E-10
2.
80E-
06
8.96
E-05
3.
00E+
01
2.99
E-06
45
5 3.
89
7.88
E-05
3.
15E+
02
4.74
E-11
4.
74E-
07
1.52
E-05
4.
00E+
01
3.79
E-07
119

Tabl
e C
2. In
itial
DO
cal
cula
tions
at 5
mL/
min
Tim
e C
L (ti
me)
C
hang
e in
Con
c
Cha
nge
in
Tim
e Fl
ux (J
) Fl
ux (J
) Fl
ux (J
) C
hang
e in
C
onc
ko
[min
] [m
g-D
O/L
] [m
mol
-DO
] [m
in]
[mm
ol-D
O/m
in-c
m2 ]
[mm
ol-D
O/m
in-m
2 ] [m
g-D
O/m
in-m
2 ] [m
g-D
O/m
3 ] [m
/min
] 0
0.67
-
- -
- -
- -
5 2.
52
3.64
E-03
5
1.38
E-07
1.
38E-
03
4.42
E-02
18
50
2.39
E-05
10
2.
66
2.76
E-04
5
1.05
E-08
1.
05E-
04
3.35
E-03
14
0 2.
39E-
05
15
2.79
2.
56E-
04
5 9.
71E-
09
9.71
E-05
3.
11E-
03
130
2.39
E-05
30
2.
85
1.18
E-04
15
1.
49E-
09
1.49
E-05
4.
78E-
04
60
7.97
E-06
55
2.
86
1.97
E-05
25
1.
49E-
10
1.49
E-06
4.
78E-
05
10
4.78
E-06
65
2.
89
5.91
E-05
10
1.
12E-
09
1.12
E-05
3.
58E-
04
30
1.19
E-05
15
0 2.
89
0.00
E+00
85
0.
00E+
00
0.00
E+00
0.
00E+
00
0 #D
IV/0
! 17
0 2.
89
0.00
E+00
20
0.
00E+
00
0.00
E+00
0.
00E+
00
0 #D
IV/0
!
120

Tabl
e C
3. In
itial
DO
cal
cula
tions
at 1
0 m
L/m
in
Tim
e C
L (ti
me)
C
hang
e in
Con
c
Cha
nge
in
Tim
e Fl
ux (J
) Fl
ux (J
) Fl
ux (J
) C
hang
e in
C
onc
ko
[min
] [m
g-D
O/L
] [m
mol
-DO
] [m
in]
[mm
ol-D
O/m
in-
cm2 ]
[mm
ol-D
O/m
in-
m2 ]
[mg-
DO
/min
-m2 ]
[mg-
DO
/m3 ]
[m/m
in]
0 0.
45
- -
- -
- -
-
10
2.53
4.
10E-
03
10
7.77
E-08
7.
77E-
04
2.49
E-02
20
80
1.19
E-05
15
2.56
5.
91E-
05
5 2.
24E-
09
2.24
E-05
7.
17E-
04
30
2.39
E-05
30
2.58
3.
94E-
05
15
4.98
E-10
4.
98E-
06
1.59
E-04
20
7.
97E-
06
40
2.6
3.94
E-05
10
7.
47E-
10
7.47
E-06
2.
39E-
04
20
1.19
E-05
55
2.65
9.
84E-
05
15
1.24
E-09
1.
24E-
05
3.98
E-04
50
7.
97E-
06
70
2.66
1.
97E-
05
15
2.49
E-10
2.
49E-
06
7.97
E-05
10
7.
97E-
06
100
2.66
0.
00E+
00
30
0.00
E+00
0.
00E+
00
0.00
E+00
0
#DIV
/0!
145
2.66
0.
00E+
00
45
0.00
E+00
0.
00E+
00
0.00
E+00
0
#DIV
/0!
160
2.67
1.
97E-
05
15
2.49
E-10
2.
49E-
06
7.97
E-05
10
7.
97E-
06
121
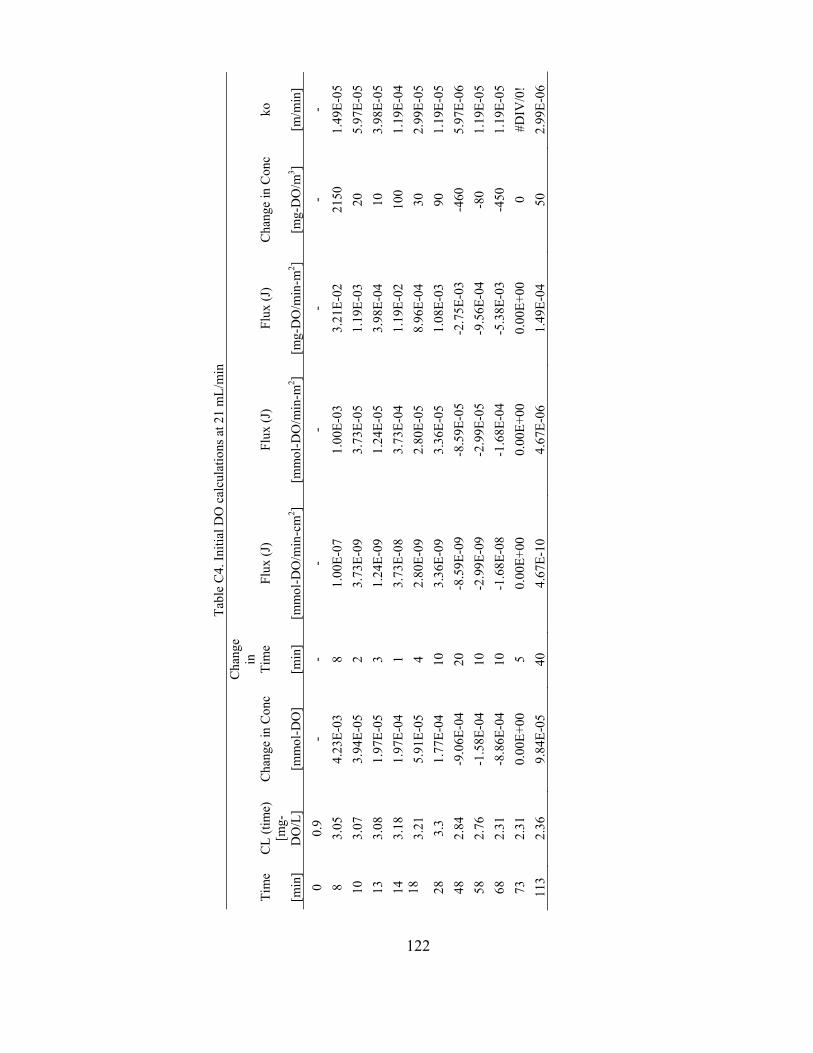
Ta
ble
C4.
Initi
al D
O c
alcu
latio
ns a
t 21
mL/
min
Tim
e C
L (ti
me)
C
hang
e in
Con
c
Cha
nge
in
Tim
e Fl
ux (J
) Fl
ux (J
) Fl
ux (J
) C
hang
e in
Con
c ko
[min
] [m
g-D
O/L
] [m
mol
-DO
] [m
in]
[mm
ol-D
O/m
in-c
m2 ]
[mm
ol-D
O/m
in-m
2 ] [m
g-D
O/m
in-m
2 ] [m
g-D
O/m
3 ] [m
/min
] 0
0.9
- -
- -
- -
- 8
3.05
4.
23E-
03
8 1.
00E-
07
1.00
E-03
3.
21E-
02
2150
1.
49E-
05
10
3.07
3.
94E-
05
2 3.
73E-
09
3.73
E-05
1.
19E-
03
20
5.97
E-05
13
3.
08
1.97
E-05
3
1.24
E-09
1.
24E-
05
3.98
E-04
10
3.
98E-
05
14
3.18
1.
97E-
04
1 3.
73E-
08
3.73
E-04
1.
19E-
02
100
1.19
E-04
18
3.
21
5.91
E-05
4
2.80
E-09
2.
80E-
05
8.96
E-04
30
2.
99E-
05
28
3.3
1.77
E-04
10
3.
36E-
09
3.36
E-05
1.
08E-
03
90
1.19
E-05
48
2.
84
-9.0
6E-0
4 20
-8
.59E
-09
-8.5
9E-0
5 -2
.75E
-03
-460
5.
97E-
06
58
2.76
-1
.58E
-04
10
-2.9
9E-0
9 -2
.99E
-05
-9.5
6E-0
4 -8
0 1.
19E-
05
68
2.31
-8
.86E
-04
10
-1.6
8E-0
8 -1
.68E
-04
-5.3
8E-0
3 -4
50
1.19
E-05
73
2.
31
0.00
E+00
5
0.00
E+00
0.
00E+
00
0.00
E+00
0
#DIV
/0!
113
2.36
9.
84E-
05
40
4.67
E-10
4.
67E-
06
1.49
E-04
50
2.
99E-
06
122

Tabl
e C
5. In
itial
DO
cal
cula
tions
. Sum
mar
y ta
ble
Flow
rate
A
ir Pr
essu
re
Max
imum
Flu
x ko
(ove
rall)
1/
ko (o
vera
ll)
1/kL
(liq
uid)
Sh
D
iffus
ion
[mL/
min
] [p
si]
[mm
ol-D
O/m
2 -min
] [m
/min
] [m
in/m
] [m
in/m
] [-
] [m
2 /min
]
0.3
0.5
0.00
0646
018
1.19
E-05
83
685.
71
8368
5.71
20
1.
18E-
07
5 0.
5 1.
1202
6E-0
5 1.
1949
5E-0
5 83
685.
71
8368
5.71
20
1.
18E-
07
10
0.5
0.00
0776
716
1.19
495E
-05
8368
5.71
83
685.
71
20
1.18
E-07
21
0.5
0.00
1003
569
1.49
368E
-05
6694
8.57
66
948.
57
25
1.18
E-07
123

FIN
AL
DO
CA
LCU
LATI
ON
S
Fl
ux C
alcu
latio
ns
V=
0.06
3 L
Q=
0.3
cm3 /m
in
Q=
cm
3 /min
O
pera
ting
Pres
sure
= 0.
5 ps
i O
pera
ting
Pres
sure
= 0.
0340
2286
at
m
Hen
ry's
cons
tant
for O
2=
4110
0 at
m
Surf
ace
Are
a pe
r HF=
1.
4645
cm
2 To
tal M
embr
ane
Surf
ace
Are
a=
5272
.2
cm2
CL
(0)=
0
mg-
DO
/L
Mem
bran
e Th
ickn
ess=
0.
008
cm
Mem
bran
e Th
ickn
ess=
0.
0000
8 m
Tabl
e C
6. F
inal
DO
cal
cula
tions
at 0
.3 m
L/m
in
Tim
e C
L (ti
me)
C
hang
e in
Con
c.
Cha
nge
in T
ime
Flux
(J)
Flux
(J)
Flux
(J)
Cha
nge
in C
onc.
ko
[m
in]
[mg-
DO
/L]
[mm
ol-D
O]
[min
] [m
mol
-DO
/min
-cm
2 ] [m
mol
-DO
/min
-m2 ]
[mg-
DO
/min
-m2 ]
[mg-
DO
/m3 ]
[m/m
in]
0 0
- -
- -
- -
- 15
1.
12
2.21
E-03
15
2.
79E-
08
2.79
E-04
8.
92E-
03
1120
7.
97E-
06
50
0.56
-1
.10E
-03
35
-5.9
7E-0
9 -5
.97E
-05
-1.9
1E-0
3 -5
60
3.41
E-06
70
0.
76
3.94
E-04
20
3.
73E-
09
3.73
E-05
1.
19E-
03
200
5.97
E-06
10
5 2.
3 3.
03E-
03
35
1.64
E-08
1.
64E-
04
5.26
E-03
15
40
3.41
E-06
14
0 1.
25
-2.0
7E-0
3 35
-1
.12E
-08
-1.1
2E-0
4 -3
.58E
-03
-105
0 3.
41E-
06
190
2.33
2.
13E-
03
50
8.07
E-09
8.
07E-
05
2.58
E-03
10
80
2.39
E-06
26
5 2.
48
2.95
E-04
75
7.
47E-
10
7.47
E-06
2.
39E-
04
150
1.59
E-06
28
0 2.
6 2.
36E-
04
15
2.99
E-09
2.
99E-
05
9.56
E-04
12
0 7.
97E-
06
124

Ta
ble
C7.
Fin
al D
O c
alcu
latio
ns a
t 1 m
L/m
in
Tim
e C
L (ti
me)
C
hang
e in
C
onc.
C
hang
e in
Tim
e Fl
ux (J
) Fl
ux (J
) Fl
ux (J
) C
hang
e in
Con
c.
ko
[min
] [m
g-D
O/L
] [m
mol
-DO
] [m
in]
[mm
ol-D
O/m
in-
cm2 ]
[mm
ol-D
O/m
in-m
2 ] [m
g-D
O/m
in-
m2 ]
[mg-
DO
/m3 ]
[m/m
in]
0 0.
5 -
- -
- -
- -
15
2.63
4.
19E-
03
15
5.30
E-08
5.
30E-
04
1.70
E-02
21
30
7.97
E-06
20
3.
16
1.04
E-03
5
3.96
E-08
3.
96E-
04
1.27
E-02
53
0 2.
39E-
05
25
2.75
-8
.07E
-04
5 -3
.06E
-08
-3.0
6E-0
4 -9
.80E
-03
-410
2.
39E-
05
40
2.78
5.
91E-
05
15
7.47
E-10
7.
47E-
06
2.39
E-04
30
7.
97E-
06
45
2.61
-3
.35E
-04
5 -1
.27E
-08
-1.2
7E-0
4 -4
.06E
-03
-170
2.
39E-
05
50
2.64
5.
91E-
05
5 2.
24E-
09
2.24
E-05
7.
17E-
04
30
2.39
E-05
60
2.
85
4.13
E-04
10
7.
84E-
09
7.84
E-05
2.
51E-
03
210
1.19
E-05
75
3.
16
6.10
E-04
15
7.
72E-
09
7.72
E-05
2.
47E-
03
310
7.97
E-06
85
3.
17
1.97
E-05
10
3.
73E-
10
3.73
E-06
1.
19E-
04
10
1.19
E-05
10
0 3.
23
1.18
E-04
15
1.
49E-
09
1.49
E-05
4.
78E-
04
60
7.97
E-06
11
0 3.
26
5.91
E-05
10
1.
12E-
09
1.12
E-05
3.
58E-
04
30
1.19
E-05
13
0 3.
29
5.91
E-05
20
5.
60E-
10
5.60
E-06
1.
79E-
04
30
5.97
E-06
13
5 3.
32
5.91
E-05
5
2.24
E-09
2.
24E-
05
7.17
E-04
30
2.
39E-
05
140
3.33
1.
97E-
05
5 7.
47E-
10
7.47
E-06
2.
39E-
04
10
2.39
E-05
15
0 3.
36
5.91
E-05
10
1.
12E-
09
1.12
E-05
3.
58E-
04
30
1.19
E-05
17
0 3.
38
3.94
E-05
20
3.
73E-
10
3.73
E-06
1.
19E-
04
20
5.97
E-06
20
0 3.
41
5.91
E-05
30
3.
73E-
10
3.73
E-06
1.
19E-
04
30
3.98
E-06
21
5 3.
52
2.17
E-04
15
2.
74E-
09
2.74
E-05
8.
76E-
04
110
7.97
E-06
26
0 3.
53
1.97
E-05
45
8.
30E-
11
8.30
E-07
2.
66E-
05
10
2.66
E-06
125

Ta
ble
C8.
Fin
al D
O c
alcu
latio
ns a
t 10
mL/
min
Tim
e C
L (ti
me)
C
hang
e in
C
onc.
C
hang
e in
Tim
e Fl
ux (J
) Fl
ux (J
) Fl
ux (J
) C
hang
e in
Con
c.
ko
[min
] [m
g-D
O/L
] [m
mol
-DO
] [m
in]
[mm
ol-D
O/m
in-c
m2 ]
[mm
ol-D
O/m
in-m
2 ] [m
g-D
O/m
in-
m2 ]
[mg-
DO
/m3 ]
[m/m
in]
0 0
- -
- -
- -
- 5
3.26
6.
42E-
03
5 2.
43E-
07
2.43
E-03
7.
79E-
02
3260
2.
39E-
05
10
2.8
-9.0
6E-0
4 5
-3.4
4E-0
8 -3
.44E
-04
-1.1
0E-0
2 -4
60
2.39
E-05
15
3.
51
1.40
E-03
5
5.30
E-08
5.
30E-
04
1.70
E-02
71
0 2.
39E-
05
20
3.77
5.
12E-
04
5 1.
94E-
08
1.94
E-04
6.
21E-
03
260
2.39
E-05
25
3.
04
-1.4
4E-0
3 5
-5.4
5E-0
8 -5
.45E
-04
-1.7
4E-0
2 -7
30
2.39
E-05
30
3
-7.8
8E-0
5 5
-2.9
9E-0
9 -2
.99E
-05
-9.5
6E-0
4 -4
0 2.
39E-
05
35
2.9
-1.9
7E-0
4 5
-7.4
7E-0
9 -7
.47E
-05
-2.3
9E-0
3 -1
00
2.39
E-05
40
4.
02
2.21
E-03
5
8.36
E-08
8.
36E-
04
2.68
E-02
11
20
2.39
E-05
45
4.
31
5.71
E-04
5
2.17
E-08
2.
17E-
04
6.93
E-03
29
0 2.
39E-
05
50
3.8
-1.0
0E-0
3 5
-3.8
1E-0
8 -3
.81E
-04
-1.2
2E-0
2 -5
10
2.39
E-05
55
3.
79
-1.9
7E-0
5 5
-7.4
7E-1
0 -7
.47E
-06
-2.3
9E-0
4 -1
0 2.
39E-
05
60
3.69
-1
.97E
-04
5 -7
.47E
-09
-7.4
7E-0
5 -2
.39E
-03
-100
2.
39E-
05
65
3.63
-1
.18E
-04
5 -4
.48E
-09
-4.4
8E-0
5 -1
.43E
-03
-60
2.39
E-05
70
3.
44
-3.7
4E-0
4 5
-1.4
2E-0
8 -1
.42E
-04
-4.5
4E-0
3 -1
90
2.39
E-05
75
3.
4 -7
.88E
-05
5 -2
.99E
-09
-2.9
9E-0
5 -9
.56E
-04
-40
2.39
E-05
85
3.
51
2.17
E-04
10
4.
11E-
09
4.11
E-05
1.
31E-
03
110
1.19
E-05
95
3.
55
7.88
E-05
10
1.
49E-
09
1.49
E-05
4.
78E-
04
40
1.19
E-05
126

Tabl
e C
9. F
inal
DO
cal
cula
tions
. Sum
mar
y ta
ble
Flow
rate
A
ir Pr
essu
re
Max
imum
Flu
x ko
(ove
rall)
1/
ko (o
vera
ll)
1/kL
(liq
uid)
Sh
D
iffus
ion
[m
L/m
in]
[psi
] [m
mol
-DO
/m2 -m
in]
[m/m
in]
[min
/m]
[min
/m]
[-]
[m2 /m
in]
0.3
0.5
0.00
0278
821
7.96
631E
-06
1255
28.5
7 12
5528
.57
13
1.18
2E-0
7 1
0.5
0.00
0530
258
7.96
631E
-06
1255
28.5
7 12
5528
.57
13
1.18
2E-0
7 10
0.
5 0.
0001
9417
9 2.
3898
9E-0
5 41
842.
86
4184
2.86
40
1.
182E
-07
C
alcu
latin
g th
e am
ount
of o
xyge
n re
quire
d by
bio
film
at d
iffer
ent f
low
rate
s
NH
4 +1.
863O
2 + 0
.098
CO
2 → 0
.019
6 C
5H7N
O2 +
0.9
8 N
O3 +
0.0
941H
2O +
1.9
8 H
2O
Tota
l Mem
bran
e Su
rfac
e A
rea=
52
72.2
cm
2
O
xyge
n co
nsum
ed p
er a
mm
onia
use
d is
=
4.25
g
O2
Tabl
e C
10. B
iofil
m C
onsu
mpt
ion
Flow
rate
(m
L/m
in)
HR
T
(min
)
NH
4-N
co
nsum
ed
(g)
Bio
film
Oxy
gen
cons
umpt
ion
(m
mol
-DO
/sec
-m2 )
0.3
210
0.03
60
7.20
E-04
0.
5 12
6 0.
0549
1.
83E-
03
0.6
105
0.05
51
2.20
E-03
0.
7 90
0.
0621
2.
90E-
03
1 63
0.
0739
4.
93E-
03
1.5
42
0.11
19
1.12
E-02
1.
7 37
0.
0554
6.
27E-
03
127

APPENDIX D
TRACER STUDY CALCULATIONS
128

Tabl
e D
1. In
itial
trac
er a
t 0.3
mL/
min
time
t/T
(C/C
o)ex
p Pa
rt A
Pa
rt B
th
eore
tical
Co
sum
sq.e
rror
su
m
0 0
0.00
00
0 0
0 0
2.88
100
0.18
0.
0045
0.
252
1.14
4 0.
288
0.08
0
L =
0.2
m
120
0.21
0.
0057
0.
230
1.10
8 0.
255
0.06
2
u =
0.00
0009
m
/s
145
0.26
0.
0102
0.
209
1.07
8 0.
225
0.04
6
D =
0.
0000
1310
m
2 /sec
150
0.27
0.
0102
0.
206
1.07
4 0.
221
0.04
4
d =
7.03
165
0.29
0.
0159
0.
196
1.06
2 0.
208
0.03
7
Pe =
0.
14
175
0.31
0.
0193
0.
190
1.05
5 0.
201
0.03
3
180
0.32
0.
0375
0.
188
1.05
2 0.
197
0.02
6
20
0 0.
36
0.06
59
0.17
8 1.
042
0.18
5 0.
014
220
0.39
0.
1136
0.
170
1.03
4 0.
175
0.00
4
280
0.50
0.
6477
0.
150
1.01
8 0.
153
0.24
5
295
0.53
0.
7523
0.
147
1.01
5 0.
149
0.36
4
325
0.58
0.
7920
0.
140
1.01
1 0.
141
0.42
4
520
0.93
0.
9716
0.
110
1.00
0 0.
110
0.74
2
560
1 0.
9807
0.
106
1.00
0 0.
106
0.76
4
129

Tabl
e D
2. In
itial
trac
er a
t 1 m
L/m
in
time
t/T
(C/C
o)ex
p Pa
rt A
Pa
rt B
th
eore
tical
C
o su
m
sq.e
rror
su
m
0 0.
000
0.00
34
0.00
00
0.00
00
0.00
00
0.00
00
3.38
20
0.06
7 0.
0034
0.
3339
1.
3565
0.
4529
0.
2021
L =
0.2
m
35
0.11
7 0.
0091
0.
2524
1.
1689
0.
2950
0.
0818
u =
0.00
0031
m
/s
50
0.16
7 0.
0159
0.
2112
1.
1021
0.
2327
0.
0470
D =
0.
0000
7 m
2 /sec
60
0.20
0 0.
0466
0.
1928
1.
0775
0.
2077
0.
0260
d =
10.7
1
90
0.30
0 0.
7864
0.
1574
1.
0389
0.
1635
0.
3879
Pe =
0.
09
10
5 0.
350
0.89
77
0.14
57
1.02
86
0.14
99
0.55
93
120
0.40
0 0.
9284
0.
1363
1.
0212
0.
1392
0.
6228
125
0.41
7 0.
9375
0.
1336
1.
0192
0.
1361
0.
6422
300
1 0.
9864
0.
0862
1.
0000
0.
0862
0.
8103
130

Tabl
e D
3. In
itial
trac
er a
t 15
mL/
min
time
t/T
(C/C
o)ex
p Pa
rt A
Pa
rt B
th
eore
tical
C
o su
m
sq.e
rror
su
m
0 0.
000
0.00
0 0.
000
0.00
0 0.
000
0.00
0 3.
780
5 0.
053
0.55
9 0.
375
1.48
7 0.
558
0.00
0
10
0.10
5 0.
645
0.26
5 1.
194
0.31
7 0.
108
L
= 0.
2 m
15
0.15
8 0.
752
0.21
7 1.
110
0.24
1 0.
261
u
= 0.
0004
7 m
/s
20
0.21
1 0.
797
0.18
8 1.
071
0.20
1 0.
355
D
=
0.00
100
m2 /s
ec
25
0.26
3 0.
844
0.16
8 1.
049
0.17
6 0.
446
d
= 10
.74
35
0.36
8 0.
875
0.14
2 1.
026
0.14
5 0.
532
Pe
=
0.09
65
0.68
4 0.
914
0.10
4 1.
003
0.10
4 0.
655
80
0.84
2 0.
921
0.09
4 1.
001
0.09
4 0.
685
95
1.00
0 0.
945
0.08
6 1.
000
0.08
6 0.
738
131
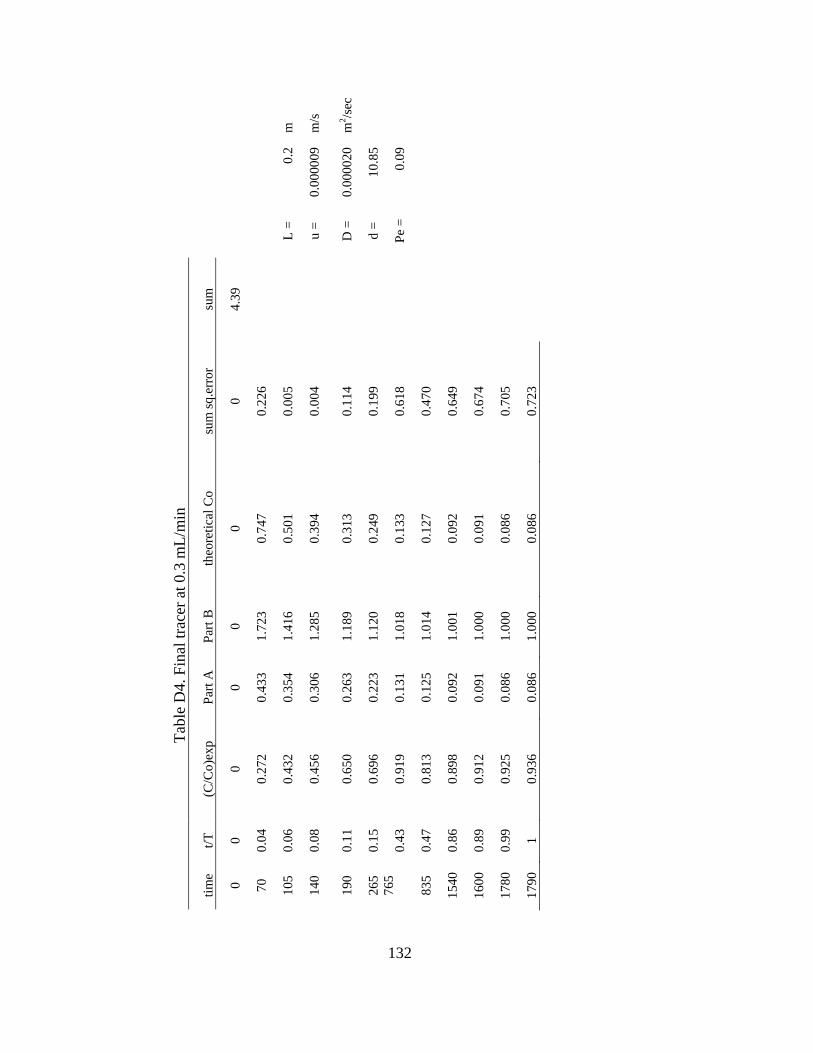
Tabl
e D
4. F
inal
trac
er a
t 0.3
mL/
min
time
t/T
(C/C
o)ex
p Pa
rt A
Pa
rt B
th
eore
tical
Co
sum
sq.e
rror
su
m
0 0
0 0
0 0
0 4.
39
70
0.04
0.
272
0.43
3 1.
723
0.74
7 0.
226
105
0.06
0.
432
0.35
4 1.
416
0.50
1 0.
005
L
= 0.
2 m
140
0.08
0.
456
0.30
6 1.
285
0.39
4 0.
004
u
= 0.
0000
09
m/s
190
0.11
0.
650
0.26
3 1.
189
0.31
3 0.
114
D
=
0.00
0020
m
2 /sec
265
0.15
0.
696
0.22
3 1.
120
0.24
9 0.
199
d
= 10
.85
76
5 0.
43
0.91
9 0.
131
1.01
8 0.
133
0.61
8
Pe =
0.
09
835
0.47
0.
813
0.12
5 1.
014
0.12
7 0.
470
1540
0.
86
0.89
8 0.
092
1.00
1 0.
092
0.64
9
1600
0.
89
0.91
2 0.
091
1.00
0 0.
091
0.67
4
1780
0.
99
0.92
5 0.
086
1.00
0 0.
086
0.70
5
1790
1
0.93
6 0.
086
1.00
0 0.
086
0.72
3
132

Tabl
e D
5. F
inal
trac
er a
t 1 m
L/m
in
time
t/T
(C/C
o)ex
p Pa
rt A
Pa
rt B
th
eore
tical
Co
sum
sq.e
rror
su
m
0 0.
000
0 0
0 0
0 4.
1077
4201
6
15
0.04
5 0.
612
0.33
2 1.
372
0.45
6 0.
024
40
0.11
9 0.
714
0.20
3 1.
106
0.22
5 0.
239
L
= 0.
2 m
45
0.13
4 0.
780
0.19
2 1.
090
0.20
9 0.
326
u
= 0.
0000
31
m/s
75
0.22
4 0.
836
0.14
9 1.
043
0.15
5 0.
464
D
=
0.00
0100
m
2 /sec
11
0 0.
328
0.82
7 0.
123
1.02
2 0.
125
0.49
2
d =
16.1
1
140
0.41
8 0.
865
0.10
9 1.
013
0.11
0 0.
569
Pe
=
0.06
150
0.44
8 0.
903
0.10
5 1.
011
0.10
6 0.
635
200
0.59
7 0.
917
0.09
1 1.
004
0.09
1 0.
681
215
0.64
2 0.
910
0.08
8 1.
003
0.08
8 0.
675
335
1.00
0 0.
931
0.07
0 1.
000
0.07
0 0.
741
133

Tabl
e D
6. F
inal
trac
er a
t 15
mL/
min
time
t/T
(C/C
o)ex
p Pa
rt A
Pa
rt B
th
eore
tical
Co
sum
sq.e
rror
su
m
0
0.00
0 0.
000
0.00
0 0.
000
0.00
0 0.
000
0.26
7934
361
1
0.00
8 0.
174
0.67
9 4.
142
2.81
1 -2
.637
L =
0.2
m
2 0.
017
0.48
2 0.
480
2.01
1 0.
965
-0.4
83
u
= 0.
0004
66
m/s
3 0.
025
0.64
9 0.
392
1.58
0 0.
619
0.02
9
D =
0.
0019
0 m
2 /sec
4
0.03
4 0.
687
0.33
9 1.
401
0.47
5 0.
212
d
= 20
.41
8
0.06
8 0.
774
0.24
0 1.
170
0.28
1 0.
494
Pe
=
0.05
10
0.08
5 0.
814
0.21
5 1.
129
0.24
2 0.
572
13
0.11
0 0.
828
0.18
8 1.
092
0.20
6 0.
622
18
0.15
3 0.
868
0.16
0 1.
059
0.16
9 0.
699
23
0.19
5 0.
908
0.14
1 1.
042
0.14
7 0.
760
28
0.23
7 0.
828
0.12
8 1.
030
0.13
2 0.
696
33
0.28
0 0.
934
0.11
8 1.
023
0.12
1 0.
814
38
0.32
2 0.
946
0.11
0 1.
018
0.11
2 0.
834
53
0.44
9 0.
955
0.09
3 1.
008
0.09
4 0.
861
63
0.53
4 0.
946
0.08
5 1.
005
0.08
6 0.
860
73
0.61
9 0.
971
0.07
9 1.
003
0.08
0 0.
891
88
0.74
6 0.
992
0.07
2 1.
001
0.07
2 0.
920
108
0.91
5 0.
971
0.06
5 1.
000
0.06
5 0.
905
118
1.00
0 0.
980
0.06
2 1.
000
0.06
2 0.
917
134

135
APPENDIX E
T-TEST

Sam
ple
Cal
cula
tions
for T
-test
T-T
est
T*
=[x-
µ]/(S
/(n^0
.5))
W
here
t* is
the
devi
atio
n of
the
estim
ated
mea
n fr
om th
e po
pula
tion
mea
n, m
easu
red
in te
rms o
f the
un
it S/
(n^0
.5)
A lo
w v
alue
of t
* in
dica
tes l
ittle
diff
eren
ce b
etw
een
the
mea
ns
A
hig
h va
lue
of t*
indi
cate
s a la
rge
diff
eren
ce, p
rovi
ding
mor
e ju
stifi
catio
n fo
r rej
ectin
g th
e nu
ll hy
poth
esis
IF
t* >
tc, w
e re
ject
the
null
hypo
thes
is a
nd c
oncl
ude
ther
e is
a
diff
eren
ce
IF
t* <
tc, w
e ca
nnot
reje
ct th
e nu
ll hy
poth
esis
. The
evi
denc
e su
gges
ts th
e sa
mpl
e ha
s not
dev
iate
d fr
om th
e po
pula
tion
Fl
ow
Rat
e H
RT
(day
s)
%
Nitr
ifica
tion
0.3
0.15
74
.74
0.5
0.09
68
.87
0.6
0.07
51
.87
0.7
0.06
44
.17
1 0.
04
39.2
9
1.
5 0.
029
28.5
7
1.
7 0.
026
15.8
9
Mea
n =
46.2
Std.
Dev
iatio
n =
21.0
n =
7
(n-1
) =
6
tc (5
%) =
1.
943
(1 si
de
test
)
tc (1
%) =
3.
143
(1 si
de
test
)
136

13
8
For
the
95%
con
fiden
ce li
mits
t* (
74.7
) =
3.6
t* >
tc in
dica
tes s
tatis
tical
ly si
gnifi
cant
diff
eren
ce, n
ull h
ypot
hesi
s rej
ecte
d t*
( 68
.9) =
2.
9 t*
> tc
indi
cate
s sta
tistic
ally
sign
ifica
nt d
iffer
ence
, nul
l hyp
othe
sis r
ejec
ted
Fo
r th
e 99
% c
onfid
ence
lim
its
t*
( 74
.7) =
3.
6 t*
> tc
indi
cate
s sta
tistic
ally
sign
ifica
nt d
iffer
ence
, nul
l hyp
othe
sis r
ejec
ted
t* (
68.9
) =
2.9
t* <
tc te
st in
dica
tes i
nsuf
ficie
nt e
vide
nce
for a
stat
istic
ally
sign
ifica
nt
diff
eren
ce.
137

PERMISSION TO COPY
In presenting this thesis in partial fulfillment of the requirements for a master’s
degree at Texas Tech University or Texas Tech University Health Sciences Center, I
agree that the Library and my major department shall make it freely available for
research purposes. Permission to copy this thesis for scholarly purposes may be granted
by the Director of the Library or my major professor. It is understood that any copying
or publication of this thesis for financial gain shall not be allowed without my further
written permission and that any user may be liable for copyright infringement.
Agree (Permission is granted.)
Maria Noel Ruiz Careri 03/08/2005 Student Signature Date Disagree (Permission is not granted.) _______________________________________________ ____________ Student Signature Date
Related Documents