Advancing STEM Education with GIS August 2012

Welcome message from author
This document is posted to help you gain knowledge. Please leave a comment to let me know what you think about it! Share it to your friends and learn new things together.
Transcript

Advancing STEM Education with GIS
August 2012
2Advancing STEM Education with GIS
Table of Contents
3 Introduction
Advancing STEM in Formal Education with GIS
6 Combining Math, GIS, and Community Service
11 Texas Students Use GIS to Track H1N1 Flu
14 Visualizing the Results of High-Impact Student Field Experiences
Enriching STEM in Informal Education with GIS
18 Geospatial Summer Camp
24 4-H Club GIS Programs Support Science and Technology Training
28 Intensive Summer Course for High School Students
Strengthening STEM Career Paths with GIS
32 Maine High School Geography Teacher Emphasizes Geospatial Thinking
35 The Learning is Exponential: Using a Community-Based Approach
38 Spatial Statistics Provide New Insights: Researcher Sees Possible Links Between MS and Other Diseases
Collaborations and Partnerships
42 Unlocking the Educational Potential of Citizen Science
45 Students and Farmers Become Citizen Scientists
52 Helping Conserve Resources in Natural Caves
55 Conclusion: A Closer Look at the Benefits of GIS in STEM Learning
57 Learn More

3IntroductionAdvancing STEM Education with GIS
Science, technology, engineering, and math (STEM) education
is a multidisciplinary approach to improving education, the work
force, and national competitiveness. President Barack Obama
noted that “Strengthening STEM education is vital to preparing
our students to compete in the twenty-first century economy,
and we need to recruit and train math and science teachers to
support our nation’s students.” (White House Press Release,
September 27, 2010).
Why is STEM important?
High-quality STEM education directly supports STEM-based
careers and, collectively, a work force that is more globally
competitive. STEM education requires effective curriculum
standards, high-quality teacher preparation, and support for
national policies and frameworks.
Central to global competitiveness and economic development,
STEM careers are at the forefront of innovation and are stable,
lucrative, and rapidly growing. “Technological innovation
accounted for almost half of US economic growth over the past
50 years, and almost all the 30 fastest-growing occupations in the
next decade will require at least some background in STEM.”
•At all levels of educational attainment, STEM job holders earn
11 percent higher wages compared with their same-degree
counterparts in other jobs.
•Over the past 10 years, STEM jobs grew three times faster
than non-STEM jobs. STEM jobs are expected to grow by
17 percent during the 2008–2018 period versus 9.8 percent
growth for non-STEM jobs.
•In 2010, the unemployment rate for STEM workers was 5.3
percent; for all other occupations, it was 10 percent.
STEM education is about robust and coherent STEM curriculum
and experiences that are multidisciplinary, integrative problem-
solving inquiries that foster critical and computationally driven
thinking. It is about engaging students with real data in real
problems that are approached creatively and collaboratively,
the way professionals need to work. More broadly, the STEM
education initiative is also about ensuring an adequate supply of
highly qualified and effective STEM teachers.
Advancing STEM Education with GIS
IntroductionBy Tom Baker, Esri Education Manager

Advancing STEM Education with GIS 4Introduction
How does GIS enhance STEM learning?
Geographic information system (GIS) technology can engage
several critical elements in STEM curriculum and instruction. GIS
tools and techniques lead to understanding cross-disciplinary
phenomena and solving problems rooted in academic and real-
world concepts. People use GIS to make maps, analyze data,
and decide on best solutions. From a curricular perspective,
GIS allows us to study climate change, design cities, inventory
geologic samples, plan ecological growth models, catalog
contents of an archaeological site, and countless other activities.
GIS and related geospatial technologies of global positioning
systems (GPS) and remote sensing can be used to simultaneously
engage students in science, technology, engineering, and math.
Instructionally, GIS is well suited to driving problem-based
learning (PBL), an approach to classroom inquiry that is guided by
a question, with students collecting data and making analytical
conclusions. PBL and inquiry are specifically suggested by the
National Science Education Standards as instructional frameworks
best suited to support deep, meaningful learning. GIS allows
students to collect and visualize authoritative data about the
question of interest, adding their own data to the map before
performing a wide range of analyses on the data in question.
GIS problems are steeped in both critical thinking and spatial
thinking elements, motivating learners as they learn work force-
ready skills. In short, GIS allows STEM students to do exactly what
STEM professionals do in thousands of career fields daily.

5Advancing STEM in Formal Education with GISAdvancing STEM Education with GIS
Advancing STEM in Formal Education with GIS

6Combining Math, GIS, and Community ServiceAdvancing STEM Education with GIS
Steve Obenhaus, a math teacher at Olathe North High School
in Olathe, Kansas, has proved that you do not need extensive
GIS training to effectively and meaningfully integrate geospatial
technologies into a high school curriculum.
Integrating GIS in secondary curricula is a relatively new concept.
Finding an approach that will hold students’ short- and long-
term interest can be difficult. Obenhaus has succeeded in
incorporating GIS in his math courses and has helped his students
produce high-quality GIS projects.
Students in the school’s Distinguished Scholars program spend
one hour per day during their senior year completing a senior
project. This program offers students individualized lesson plans
in a specific discipline. Since Obenhaus and another teacher
introduced GIS to the school, student scholars in geoscience,
biotechnology, and math have used GIS in their projects.
Obenhaus has a simple approach: ask a question about
something that is bothering you and use GIS combined with
math to answer the question. “I teach math, which is more of a
tool than a subject,” explained Obenhaus. “By combining GIS
and math, students use both tools to answer spatial questions
about the world. Only with GIS can they quickly perform multiple
analytic functions and see spatial patterns that are not apparent
with a graph or table.”
Combining Math, GIS, and Community ServiceTeacher Inspires Students to Use GIS to Solve Real Problems
By Steve Obenhaus, Olathe North High School
Obenhaus and former student Elizabeth Vidaurre test water at one of the newly built wells in Haiti.

Advancing STEM Education with GIS 7Combining Math, GIS, and Community Service
His official GIS training was a two-week institute at a local
university. Most of his GIS training has been informal. “I realized
that GIS is very flexible. I played around with it and realized it
could be used in so many ways in my classes. You don’t need
six months of training to have students do simple projects,” said
Obenhaus.
When questions arise that he cannot answer, Obenhaus
challenges students to figure out the answers before he does
using ArcView online help. When questions cannot be answered
using online help, Obenhaus calls on city and county GIS
professionals who help. Some local professionals come into class.
According to Obenhaus, students really enjoy learning from
people who use GIS in their career.
In Obenhaus’ classroom, the first step in creating a project
is having the students think spatially about a problem. He
says that coming up with a question is the easy part, because
most problems have a spatial component. “I learn from
others’ examples, so when I find good data online, I think
about a question students can answer with it. When I see how
professionals solve problems, I start to see the possibilities of
what can be done in my own community.” This year, his students
are collecting data about the water quality of a local stream
before, during, and after a construction project. They are using
GIS to look at changes not only along the length of the stream
but also over time.
His next step is helping students figure out a problem-solving
approach that combines math and GIS. Students learn the
basic functions of ArcView during in-class lessons taken from
the Esri Press book series Our World GIS Education. These
textbooks include interdisciplinary GIS lesson plans for different
academic levels. Once students have a basic understanding of
GIS, they stop working on prepared lessons and start working
With help from a Kansas GIS professional, Vidaurre used ArcView to identify the highest clusters of children without access to clean water. With this information, she located six new wells where they would benefit the greatest number of children.

Advancing STEM Education with GIS 8Combining Math, GIS, and Community Service
on independent projects. In these projects, they ask a spatial
question and find the data needed to answer it.
Obenhaus gives students the necessary tools, GIS training, a
question, and an approach to problem solving. Then he lets
students figure out a solution. “They pick up GIS really quickly
when they play with ArcView during their own project, learning by
trial and error,” said Obenhaus.
There is a common thread in his students’ projects. In addition to
answering a spatial question, students have followed Obenhaus’
philanthropic example and worked on projects that serve
communities, whether these communities or local or half a world
away.
Obenhaus and his wife do volunteer work for a maternity and
neonatal clinic, Maison de Naissance, in a rural area of southern
Haiti. The clinic’s mission is to decrease maternal and infant
mortality rates in an area with extreme poverty.
Water-based diarrheal diseases are the leading cause of infant
mortality in the developing world. When the clinic received
funding to build wells to give more families access to clean water
sources, the clinic director asked Obenhaus if he and his students
could locate these wells.
He agreed. When he began the project, Obenhaus had little
knowledge of water testing and locating water sources. He began
by asking a water analyst how to test water quality. He then
traveled to Haiti with donated supplies and trained Haitians to
test the water.
This work was assisted by one of Obenhaus’ students, Elizabeth
Vidaurre, who went on to develop her own related project.
A distinguished math scholar at Olathe North High School,
Vidaurre combined her math and GIS skills in a senior project for
determining how to select well locations that would benefit the
greatest number of children in need.
The water testing results, combined with the clinic’s records on
the number of children and where they live, were the basis for
Vidaurre’s research project. “We had two unique data layers that
no one else had,” said Obenhaus, who had students use ArcView
to create basemaps from the data.
“At first I thought it would be like playing a computer game, but it
was serious work to use GIS,” said Vidaurre. “It’s a tool that helps
you solve real problems. I could have done the project without
GIS, but it would have taken much longer to analyze data and
would not have been as accurate.”
With help from a Kansas GIS professional, Vidaurre used ArcView
to create buffers around the homes of families living more than
350 meters from a clean water source. With this information, she
analyzed where the highest clusters of children without access to
clean water were located.

Advancing STEM Education with GIS 9Combining Math, GIS, and Community Service
The project was successful, but it took a few attempts to get
it right. Obenhaus and Vidaurre worked together to find a
quantitative approach for locating wells. Vidaurre ran chi-square
tests to first determine if access to a deep-drilled well was an
advantage. She found there was an advantage: the data showed
a strong correlation between the presence of E. coli and hand-
dug wells and open springs. By finding the best location for six
wells, 1,180 children in need would have access to clean water.
“Because of learning GIS, writing the paper, and presenting the
results, I feel more prepared for life,” said Vidaurre. “As a high
school senior, I was networking with CEOs to fund-raise for my
project. It helped me feel more confident as an intern working
at a health systems IT company.” The CEO and others were
impressed by her project and, during her summer internship, had
Vidaurre present ways GIS could benefit their company.
Presentations about her work in Haiti not only resulted in
donations for her project but made her a recipient of the Spirit
of Philanthropy Youth award from the Association of Fundraising
Professionals (AFP).
After graduation, Obenhaus brought Vidaurre to Haiti to see the
results of her work. Looking back on the experience Vidaurre
said, “I have traveled in Latin America, but I had never seen a
country that was so underdeveloped. I saw babies who were
malnourished and kids with bellies bloated from worms. It was
important to me to see the places I mapped and meet people. It
wasn’t just about wells, because personal experiences and new
relationships remain most important to me.”
Obenhaus keeps Vidaurre, who is now a junior at the University
of Rochester, up-to-date on the latest work done at Maison de
Naissance. Difficulties in gathering data have made it difficult
to show a decline in rates of pediatric water-related diseases.
Nonetheless, Dr. Stan Shaffer, director of Maison de Naissance,
sees the work of Obenhaus and his students as beneficial.
In developing countries, children often do most of the water collection. Closer access to safe water not only improves their health but also gives them greater opportunities to attend school.

Advancing STEM Education with GIS 10Combining Math, GIS, and Community Service
“In poor communities, such as the villages of rural Haiti, it is
critically important that health needs be carefully defined so that
critical resources can be targeted for their highest impact,” said
Shaffer. “Steve and students such as Liz are demonstrating how
mapping is an essential tool for organizing health information.
You wouldn’t attempt microbiology without a microscope, so
it’s not surprising that Steve Obenhaus says that we shouldn’t
attempt community health work without good maps.”
Obenhaus’ students continue working on the wells project. For
example, they found that not only were new wells needed, but
old wells had to be repaired. The latest student projects look at
other health-related issues such as what happens to the quality
of water once it leaves a well. Students found that just because
water is clean at its source does not mean people drink clean
water, so they are now trying to figure out how collection and
storage methods affect water quality.
Obenhaus, who is clearly an inspiration to his students,
downplays his influence. “It’s easy to look good when you
are surrounded by smart kids who work really hard to make a
difference in the world,” said Obenhaus. “To me, this is not work,
it’s fun.” In 2007, Obenhaus was selected at the state level to
receive a Presidential Award for Excellence in Mathematics and
Science Teaching.
Obenhaus’ teaching approach can be replicated for advanced
placement human geography, math, community service
programs, and other courses, both traditional and nontraditional.
(This article originally appeared in the Spring 2009 issue of ArcUser.)

11Texas Students Use GIS to Track H1N1 FluAdvancing STEM Education with GIS
Last April, when the spread of H1N1 (swine) flu began, students
in Texas watched with a vested interest. The Texas Education
Agency made recommendations to reschedule or cancel area
and state-level competitions in an effort to limit student travel
and minimize contact. With events approaching, like prom, spring
concerts, and even graduation ceremonies, students waited
as local school districts made careful decisions. Some districts
halted student travel and others canceled school classes for a
period of weeks.
Lubbock Independent School District GIS teacher Penny
Carpenter knew GIS tools would be used to monitor and inform
the public of the flu’s pandemic potential, and she saw a unique
opportunity for her students. Philosophically, Carpenter motivates
students with relevant real-world topics, and the reality of H1N1
flu had certainly captured her students’ attention. They found
maps of countries and states with confirmed flu cases but none
of Texas counties. Because the outbreak originated in Mexico,
students looked to the border towns for reported infections, and
that is when geographic inquiry began: Where were the counties
in Texas with confirmed H1N1 flu cases?
The Texas Department of Health’s Web site posted a confirmed
case count by county and provided daily updates. Students
created a list of Texas counties in a spreadsheet and entered
the data of confirmed cases. Next, students used the school’s
Texas Students Use GIS to Track H1N1 FluBy Penny Carpenter, Byron Martin Advanced Technology Center, Lubbock Independent School District
Students join flu data from a spreadsheet to the Texas counties attribute table to symbolize the case counts with graduated colors. In addition, data containing major highways, large cities, and locations of H1N1 flu deaths were layered.

Advancing STEM Education with GIS 12Texas Students Use GIS to Track H1N1 Flu
ArcGIS Desktop ArcMap application to create a basemap of
Texas counties. They joined the map’s attribute table to the
spreadsheet data by matching county names. After discussing
appropriate breaks for the data range, the quantities of confirmed
cases were mapped using graduated colors.
During the initial analysis, students discovered the darkest colors,
representing the highest number of confirmed cases, appeared
in the heavily populated areas, not the border counties. They
discussed common aspects these areas shared that could explain
the flu’s spread. In the GIS, students added a layer of roadways
and airports for comparison. Although each major area had a
large airport, all areas were connected with major highways. This
analysis supported the theory that travel by car was more likely to
explain and continue the spread.
Students continued to update the data over the next several days
and watched the flu spread along the roadways. Confirmed cases
colored counties on the map moving west on Interstate 20, the
major highway that connects Lubbock to the rest of the state via
Highway 84. On the last day of school, the first confirmed case
for Lubbock County was announced. The local television station
broke the story and featured the work of Carpenter’s students.
Their GIS skills created a visual element that was relevant and
meaningful to all of western Texas.
Student Tyler Funk explains, “I’m just in awe that I can build the
maps in GIS to help other people understand the data and how
it affects them.” Funk now contemplates areas of study that
will develop his ability to construct datasets and analyze them
through graphic representation. Carpenter believes she teaches
more than building maps. “When students can visualize and see
the data on a map, they begin to analyze, and this promotes
higher-level thinking skills,” she says.
KCBD TV reporter Ann Wyatt films Tyler Funk as he uses ArcGIS Desktop to animate the spread of H1N1 flu in Texas counties.

Advancing STEM Education with GIS 13Texas Students Use GIS to Track H1N1 Flu
About the Program
Penny Carpenter teaches Geographic Information Systems and
Global Positioning Systems (GIS/GPS), an innovative course she
proposed that was approved by the Texas Education Agency. It
is one of many skill-based or career and technology education
courses offered at her campus, the Byron Martin Advanced
Technology Center (ATC). Courses are available at the ATC
to all students from the four high schools within the Lubbock
Independent School District. These weighted credit electives
require no special application process, and many allow students
to earn technical preparation or dual college credit. These
courses promote career skills, and some provide opportunities for
students to earn industry-recognized certifications. Career and
technology education courses like GIS/GPS provide students with
a pathway to the workforce and/or higher education.
(This article originally appeared in the Winter 2009/2010 issue of ArcNews.)

14Visualizing the Results of High-Impact Student Field ExperiencesAdvancing STEM Education with GIS
Since the 2007 publication of an Indiana University study on
the value of engaged student learning, institutions of higher
education throughout the world have increased their focus on
what are now referred to as high-impact learning experiences.
Dr. George Kuh, the study’s principal author, defines high-impact
learning as instructional practices that measurably increase
student retention and engagement. Such experiences can range
from internships or mentoring interactions to hands-on laboratory
or fieldwork. Kuh offers 10 specific types of high-impact learning
available to educators. These include collaborative projects,
undergraduate research, common intellectual experiences, and
community-based learning. Regardless of their exact structure,
the evidence is clear that high-impact opportunities enhance
both early comprehension and durable knowledge in students.
Kuh says:
“The results clearly show that colleges and universities should do
everything possible to encourage undergraduates to participate
in at least two high-impact activities, one in the first year and
one later in their studies. Such experiences will better prepare
students for a productive, satisfying lifetime of continuous
learning.”
With the emphasis now placed on high-impact practices,
professors face a sometimes daunting task of developing and
offering engaging, impactful learning experiences for their
undergraduate students. GIS can serve as an excellent tool to
enhance such lessons and complement high-impact experiences
in a variety of fields and disciplines.
A recent summer research project offered an opportunity to
couple high-impact learning practices with ArcGIS through an
Esri educational teaching and research lab kit. One professor and
two undergraduate students at Washington & Jefferson (W&J)
College, a small, private, four-year school just south of Pittsburgh,
Pennsylvania, were afforded the chance to travel to the country
of Costa Rica, where they participated in a water quality and
contamination research study. Together with their faculty mentor,
the students traveled to various regions of Costa Rica to sample
river water downstream from population centers and industrial
activity. Water samples were collected at numerous river sites
and tested for mercury and other contaminant metals, as well
as petrochemicals, that could be washed into river systems
as a result of urban residential, manufacturing, or commercial
agricultural activity.
Visualizing the Results of High-Impact Student Field ExperiencesBy Matthew North, Associate Professor of Information Technology Leadership, Washington & Jefferson College

Advancing STEM Education with GIS 15Visualizing the Results of High-Impact Student Field Experiences
This project alone was a high-impact experience for the two
students who were fortunate enough to participate in the field;
however, once back on campus, the data collected and the field
experience design have resulted in opportunities for numerous
additional students, as well. ArcGIS has played a central role in
enriching learning for students. Through the use of joins and
relates in the software, students have been able to integrate the
field data collected in Costa Rica into existing GIS data in a lab
setting to explore spatial relationships. For example, they can
investigate the relationship between the prevalence of various
river contaminants and their proximity and impact to such areas
as sea turtle nesting grounds. In turn, students are able to use
GIS to model and analyze upstream zoning, environmental
mitigation, and compliance enforcement efforts as they relate
to contaminated rivers. This hands-on approach, using authentic
data, has markedly improved students’ comprehension and
retention of spatial skills and competencies.
Water Quality Closer to Home
Further, the use of authentic field experiences and ArcGIS analysis
has been successfully replicated in less expensive and less travel-
intensive ways closer to home. Southwestern Pennsylvania, where
W&J College is situated, is the current heart of Marcellus shale
natural gas exploration and development. Hydraulic fracturing, or
“fracking,” as it has come to be known, is a primary process used
in the extraction of shale gas—a process that yields thousands of
gallons of contaminated water each day at sites throughout the
Marcellus formation region. Much of this water finds its way into
natural waterways in the college’s immediate vicinity. Students are
now able to learn about, research, analyze, and report on issues
in the area they call home, adding a sense of personalization
and urgency to their college experience. Some of these students
come from families that earn their livelihood in the natural gas
Using ArcGIS for Desktop in the lab, authentic Costa Rica field data was joined with existing GIS layers. Rio Parismina and Rio Jimenez (labeled) do not flow from heavily populated areas yet show elevated levels of heavy metals. These rivers flow toward a nesting area for multiple sea turtle species.

Advancing STEM Education with GIS 16Visualizing the Results of High-Impact Student Field Experiences
industry, so an inherent opposition to gas drilling is not prevalent,
especially prior to lab exercises. As students have collected and
analyzed water quality data, an appreciation for the impacts of
fossil fuel exploitation has been observed, opening the door
for meaningful and informed conversations about meeting the
world’s energy demands while caring for an increasingly taxed
planet.
Through high-impact learning experiences such as these, a
generation of college graduates armed with an understanding of
competing forces and the ability to use tools such as ArcGIS to
make informed decisions is what is needed to strike the delicate
balance required for future energy and environmental stability.
Dr. Matthew North is an associate professor of information
technology leadership and an affiliated faculty member with
the Environmental Studies Program at Washington & Jefferson
College in Washington, Pennsylvania. He has published works
on GPS and GIS technologies and is the author of Life Lessons &
Leadership, Agami Press, 2011.
The author offers sincere thanks to Dr. Robert Hijmans of the
University of California, Davis, for the use of GIS data from the
DIVA-GIS project.
(This article originally appeared in the Winter 2011/2012 issue of ArcNews.)

17Enriching STEM in Informal Education with GISAdvancing STEM Education with GIS
Enriching STEM in Informal Education with GIS

18Geospatial Summer Camp Advancing STEM Education with GIS
The Harbor Discoveries Summer Camp is an environmental
science day camp with a marine science focus. Harbor Discoveries
is the first camp program to make extensive use of the Boston
Harbor Islands National Recreation Area as a living laboratory
for aquatic science education and environmental stewardship.
Through a combination of hands-on science and traditional camp
activities, the program seeks to foster an appreciation of the
importance of habitats for all life and helps prepare campers to
become future advocates for the planet.
The academic component of Harbor Discoveries sets this summer
program apart from many others. Each week’s curriculum focuses
on a particular theme. Using inquiry-based methods, the camp
examines the interdependence of living things and compares
similarities and differences among local habitats. By emphasizing
scientific process skills, the program imparts informal science
learning almost without students realizing it. Through hands-on,
field-based experiences, participants are exposed to a variety of
environmental issues pertaining to the marine environment.
GIS and GPS technologies are integrated into the camp week
called Sea Lab, which is focused on budding marine scientists
in the eighth and ninth grades. The Sea Lab week uses current
research practices to explore marine biology, ecology, and
now geography. This week was chosen because it focuses on
hypothesis-driven research, which allows spatial thinking and
concepts to be easily integrated with these activities. To keep the
GIS and GPS component a hands-on one for all campers, class
size was limited to 12 students and counselors ensured that each
camper had the opportunity to interact with the GIS system and a
GPS unit.
Geospatial Summer Camp Role of Technologies Expanded from Research to Teaching
By Kerry Lagueux, Heather Deschenes, and Maria Elena Derrien
Campers search for crabs located in the survey plot.

Advancing STEM Education with GIS 19Geospatial Summer Camp
During this rigorous week, campers worked side by side with
New England Aquarium researchers and camp counselors. They
learned about scientific inquiry by developing hypotheses,
performing fieldwork, and analyzing results. Before heading out
into the field, they spent time in the classroom learning about the
ecological components of the study, methodology, techniques,
and technology. Classroom time also included fun team-building
exercises. The aquarium is just a short boat ride away from the
Boston Harbor Islands National Recreation Area, which provided
an excellent field laboratory for the study of marine ecology.
During the week, campers explored the six islands, took samples
and measurements, and recorded and mapped the results.
Real-World Examples of GIS Use
The New England Aquarium has used GIS in its research
analyzing the spatial patterns of North Atlantic right whales
(Eubalaena glacialis) relative to fishing and shipping activities,
which are two of the leading causes of mortality for this
species. Because geospatial technology is an important and
growing component of the New England Aquarium’s research,
camp program directors wanted to incorporate GIS and GPS
technology into the analysis of the data collected by campers.
Researchers and counselors teamed up with campers and
provided examples of how the aquarium employs these
technologies in its research.
In addition, having a GIS and GPS component in the curriculum
gave campers the opportunity to acquire spatial-thinking skills.
President George W. Bush’s High Growth Job Training Initiative
has defined geospatial technologies as one of the leading job
growth areas, and spatial thinking has been identified by the U.S.
National Research Council as critical to success in the workplace
and science.
After a short introductory lecture on GIS and GPS technology,
campers worked a small tutorial that taught them the essential
elements of a map and how to add data and symbolize layers.
Before heading out into the field, campers also tested GPS
units. They could explore the units of latitude and longitude,
as well as positional accuracy, and how this relates to potential
problems with buildings that block the direct line of sight to the
A summer camper takes a dissolved oxygen measurement of the sample site.

Advancing STEM Education with GIS 20Geospatial Summer Camp
sky. Counselors gathered the coordinates students collected and
displayed these locations using the GO TO X,Y tool in ArcGIS 9.2.
These coordinates were displayed on a map with high-resolution
photographs.
Enhancing Crab Study with GIS
This year’s study focused on crab ecology. specifically crab
population dynamics relating to water quality and substrate.
Campers, organized into small groups, collected data on
dominant crab species, diversity of crab species, percentage of
females, and percentage of pregnant females. Along with the
crab information, the campers collected information on water
temperature, pH, salinity, dissolved oxygen, and substrate type.
Secondary topics covered were water pollution, invasive species,
and potential correlation between environmental variables and
crab biology.
As they explored the biological and physical diversity of this area,
campers visited seven Boston Harbor Islands. When the campers
arrived at the sampling site, they laid down a quadrat (a sample
area, in this case, a square- meter rectangle) within the intertidal
zone. Intertidal height varied at each site depending on the tidal
stage, but the study mainly focused on midintertidal regions.
At each site, the campers used the GPS units to determine the
latitude and longitude position and recorded this information
on a data sheet. Next, campers took measurements of various
water quality parameters using appropriate instruments (e.g.,
pH meters, salinity meters). In the last step, all the crabs in the
quadrat were collected and placed in a bucket to be sorted by
species, then sized and sexed. Finally, it was determined which
females were pregnant.
At the end of each day, campers transferred data from field
data sheets to a spreadsheet that replicated the data sheet
but also automatically converted the degrees, minutes, and
seconds obtained from the GPS units to decimal degrees for easy
integration with ArcGIS.
Campers also spent a night on one of the islands. This trip
featured many fun activities and required that campers make at
least five maps. Each group received detailed instructions that
included how to bring the Microsoft Excel spreadsheet into the
GIS program; change the symbolization; and add a title, north
arrow, and scale bar to their final maps.
Advancing STEM Education with GIS 21Geospatial Summer Camp
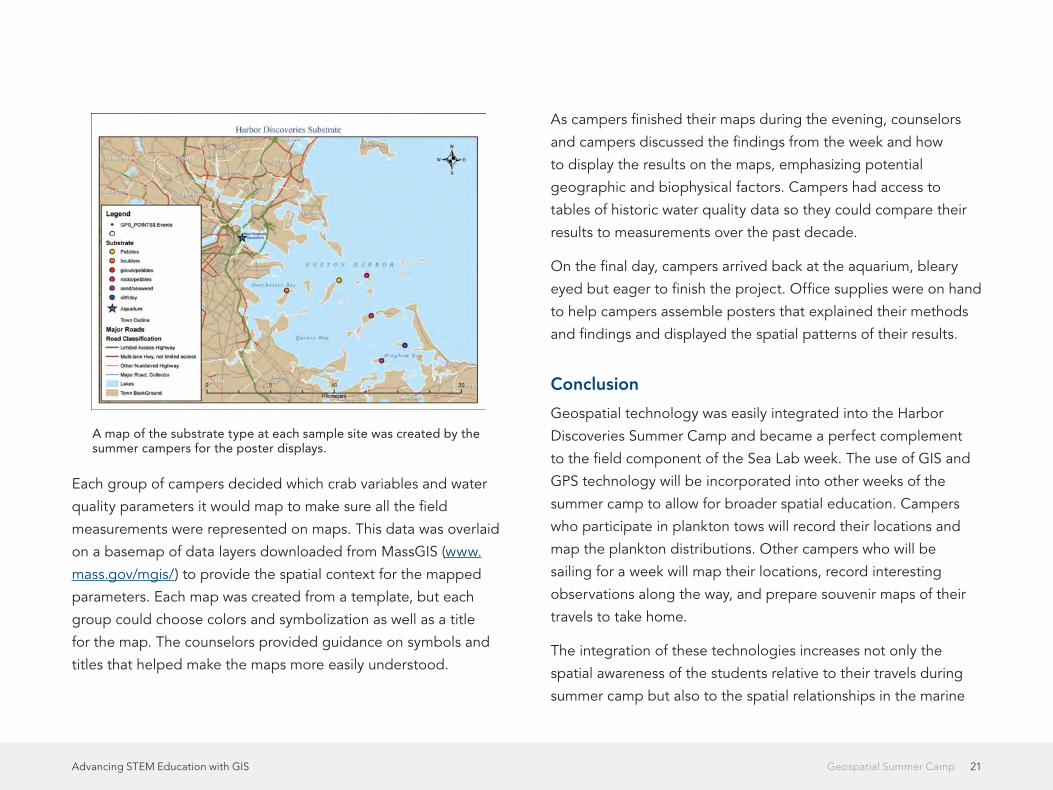
Each group of campers decided which crab variables and water
quality parameters it would map to make sure all the field
measurements were represented on maps. This data was overlaid
on a basemap of data layers downloaded from MassGIS (www.
mass.gov/mgis/) to provide the spatial context for the mapped
parameters. Each map was created from a template, but each
group could choose colors and symbolization as well as a title
for the map. The counselors provided guidance on symbols and
titles that helped make the maps more easily understood.
As campers finished their maps during the evening, counselors
and campers discussed the findings from the week and how
to display the results on the maps, emphasizing potential
geographic and biophysical factors. Campers had access to
tables of historic water quality data so they could compare their
results to measurements over the past decade.
On the final day, campers arrived back at the aquarium, bleary
eyed but eager to finish the project. Office supplies were on hand
to help campers assemble posters that explained their methods
and findings and displayed the spatial patterns of their results.
Conclusion
Geospatial technology was easily integrated into the Harbor
Discoveries Summer Camp and became a perfect complement
to the field component of the Sea Lab week. The use of GIS and
GPS technology will be incorporated into other weeks of the
summer camp to allow for broader spatial education. Campers
who participate in plankton tows will record their locations and
map the plankton distributions. Other campers who will be
sailing for a week will map their locations, record interesting
observations along the way, and prepare souvenir maps of their
travels to take home.
The integration of these technologies increases not only the
spatial awareness of the students relative to their travels during
summer camp but also to the spatial relationships in the marine
A map of the substrate type at each sample site was created by the summer campers for the poster displays.

Advancing STEM Education with GIS 22Geospatial Summer Camp
world. Next year, the camp directors will work on ensuring all
study variables have logical ecological connections.
Acknowledgments
The authors thank Esri for the generous donation of three ArcGIS
Desktop ArcView licenses. This project would not have been
possible without this support. Also, Harbor Discoveries thanks
these founding corporate sponsors: New Balance Foundation,
Germeshausen Foundation, Roy A. Hunt Foundation, TJX
Foundation and the AGM Summer Fund, and the City of Boston.
These organizations make it possible for 50 percent of the camp
participants, who are Boston residents, to come to camp for
little more than a minimal copay. Scholarship applicants must
complete a two-part art and essay project to be eligible for a
scholarship.
Kerry Lagueux is an associate scientist at the New England
Aquarium where his research focuses on analyzing patterns
of marine animals relative to oceanographic variables and
anthropogenic impacts. He holds a master’s degree in geography
from Western Washington University and a bachelor’s degree
in geography from San Diego State University. His professional
interests include spatial modeling, satellite tagging, marine GIS,
geographic visualizations, and education relating to geospatial
technologies.
Heather Deschenes is the supervisor of the Harbor Discoveries
camp and has worked at the aquarium for more than 10 years.
She has helped forge many partnerships between the program
and scientists willing to share their expertise with the camp
participants.
Maria Elena Derrien graduated with dual bachelor’s degrees in
biology and marine science from East Stroudsburg University
and received a master’s degree in marine ecology from the
University of Massachusetts, Dartmouth. During more than 10
years working in the field of science education, she has taught
environmental education and created curriculum for the New
England Aquarium’s Harbor Discoveries program. She is currently
an elementary science teacher for kindergarten, first, and fourth
grades at Buckingham Browne and Nichols School in Cambridge,
Massachusetts.
(This article originally appeared in the January–March 2008 issue of ArcUser.)

234-H Club GIS Programs Support Science and Technology TrainingAdvancing STEM Education with GIS
Across the United States, 4-H clubs have implemented GIS
programs—supported by grants from Esri—that have enhanced
members’ understanding of science and technology and enriched
their communities.
Jim Kahler, 4-H program specialist, United States Department of
Agriculture (USDA), comments, “GIS technology contributes to
the 4-H science program goals because it teaches youth about
a technology that most have never used. They also learn more
about the subject that they are mapping—plants and animals,
wildlife, natural resources, or historic places. GIS is also a good
tool to integrate with other 4-H content areas, such as nutrition
and health, citizenship, and communications.”
A. B. Graham, a school principal in Springfield, Ohio, is credited
with starting what was to become the 4-H Club. In 1902,
motivated by the large numbers of young people who were
leaving their farms for work in the city, Graham began promoting
after-school programs to educate youth in the practical arts
of scientific agriculture to improve crop harvests and safely
preserve food. The national 4-H organization was officially
formed in 1914 when the United States Congress created the
Cooperative Extension Service within USDA, consolidating
4-H Club GIS Programs Support Science and Technology Training
Members Prepare for Future Education and Employment
By Jim Baumann, Esri
A joint project between two 4-H Club Tech Teams in Iowa to map the trails and facilities available in local recreational areas.

Advancing STEM Education with GIS 244-H Club GIS Programs Support Science and Technology Training
various boys’ and girls’ clubs that were involved with agriculture,
home economics, and related subjects.
Later, the 4-H after-school curriculum was expanded to include
technical programs, such as the 4-H Science Initiative, which
supports the STEM program implemented by the US government
to improve the science and technical skills of elementary and
secondary school students.
The goals of the 4-H Science Initiative and STEM program are
being promoted through projects such as the USDA’s Economic
Research Services Food Environment Atlas. For this project, 4-H
clubs have collected data regarding the availability of wholesome
food within their communities. Other projects have included work
with local US Fish and Wildlife professionals, mapping wildlife
refuges and identifying areas of concern for future monitoring.
Clubs have also mapped invasive weed infestations and assisted
with local disaster preparedness plans. These projects allow club
members to not only improve their STEM skills but also meet 4-H
requirements for community service projects.
Since its inception in 2004, the 4-H GIS Software Grant Program,
sponsored by Esri, has helped more than 725 4-H clubs begin
and sustain GIS programs for their members with grants of
ArcGIS software and Virtual Campus training.
Esther Worker, informal education manager at Esri, says, “The GIS
software grants have empowered 4-H youth to take an active role
in researching and investigating their communities. 4-H youth are
A map depicting all the conservation areas and cities in Mahaska County, Iowa. It was the first map created by the 4-H Southeast Area Tech Team.

Advancing STEM Education with GIS 254-H Club GIS Programs Support Science and Technology Training
learning about community, technology, and careers as a result of
their GIS service projects.
“Another benefit derived from the relationship between Esri and
4-H is the opportunity for the 4-H national GIS/GPS leadership
team to send delegates to Esri’s annual Education User
Conference [EdUC]. The team comprises selected 4-H youth and
their adult mentors from across the United States. At the EdUC,
they participate in local mapping projects, attend sessions and
workshops, and present projects they have been working on
during the preceding year.”
Debbie Stevens, adjunct professor at William Penn University,
has been a volunteer with her local 4-H Club in Oskaloosa, Iowa,
for more than six years. The area has a long history with 4-H,
and many current members have great-grandparents who were
once in the same local club. Because 4-H is a traditional part of
community life, Stevens has been successful in raising money
from local businesses for funding special projects, such as buying
the equipment needed for their mobile tech lab.
“Our community leaders didn’t know much about GIS at the
time,” says Stevens, “but because we were focusing on the
benefits to youth and using emerging technology, prominent
businessmen supported the project and had faith that our 4-H
youth would benefit, as would our community. We were able to
purchase 10 laptops, a wireless printer, digital camera, GPS kit
(with 10 Garmin eTrex units and 10 compasses), and 2 Recons.”
Since her involvement with the club, the local 4-H Southeast Area
Tech Team has completed a number of GIS-based community
projects that include plotting the location of available industrial
properties for economic redevelopment; creating trail and facility
maps in local recreational areas; and mapping cultural, retail, and
commercial downtown districts for the Oskaloosa Chamber of
Commerce.
A map of available industrial properties in Oskaloosa, Iowa, created for the local economic development group for strategic planning purposes.

Advancing STEM Education with GIS 264-H Club GIS Programs Support Science and Technology Training
The group is currently preparing a major project with officials
in Oskaloosa that involves a citywide inventory of all ash trees.
The data collected will be used to institute an abatement
program in the event of an emerald ash borer infestation. This
highly destructive insect was first detected in the United States
about 10 years ago and has spread rapidly since that time. The
data collected by the 4-H group will also be made available to
the USDA Animal and Plant Health Inspection Service, which is
coordinating a national effort to minimize the ecological impact
of this invasive insect.
The club also maps the locations of local hog confinements,
referred to as confined animal feeding operations. Mapping
these sites provides critical health and planning information
for the community, as hogs living in confined areas produce
excessive amounts of excrement that decomposes into a variety
of particulate matter and toxic gases, including ammonia and
hydrogen sulfide. When these gases are released into the
atmosphere, they can be detrimental to the health of those in the
area.
Stevens concludes, “This is the information age, and it is
critically important for youth to learn IT skills. I can think of no
better information management system than GIS—all pertinent
information is stored in tables directly related to locations on a
map. The map is used to paint a picture with that data. Whether
it is about climate or transportation, a map is much easier to read
and understand than analyzing the related spreadsheet.
“So when you can connect young people to an activity that is
relevant in nearly any career path—transportation, government,
business, science, conservation, environment, education,
agriculture, emergency planning, forestry, fire fighting,
community planning, health care—and the application is fun, you
can’t lose!”
(This article originally appeared in the Winter 2011/2012 issue of ArcNews
Online.)

27Intensive Summer Course for High School StudentsAdvancing STEM Education with GIS
A summer program for Delaware high school students used GIS
and GPS technologies to reinforce math and science skills while
studying how water flows in and around the Georgetown campus
of Delaware Technical & Community College (DTCC). This U.S.
Department of Education funded TRIO program met one day per
week for six weeks during the summer of 2007.
Four presentations kicked off the first day of the summer
program. “Using GIS to Study Human Impact,” “Understanding
Watersheds,” “Using GIS as a Tool for the Research Question,”
and “GPS/Geocache Instruction” introduced various aspects of
the research that the student would undertake. Students also
learned how to use GPS units by participating in a scavenger
hunt on campus that also introduced them to geospatial-related
career choices. After locating each station using coordinates,
students listened to presentations by professionals in a variety of
fields including nursing/paramedics, soil and water conservation,
communications, biotechnology, educational technology, and
architectural engineering.
The second day began with a presentation on how surface
porosity affects a watershed’s health. Students discussed surface
types they had seen on campus with their leader and teacher.
They looked at examples of the techniques Villanova University is
using to control flow rate and filter runoff. Using ArcGIS, students
learned how to heads-up digitize pervious and impervious
surfaces using a high-resolution, infrared digital orthophotograph
Intensive Summer Course for High School StudentsSkills Flow from Water Study Program
By Nicole Minni, University of Delaware
Students diligently placed storm drain medallions on the DTCC campus, creating awareness that the storm water leads to Deep Creek and that what we do on land affects water quality.

Advancing STEM Education with GIS 28Intensive Summer Course for High School Students
as a basemap. They digitized data on sidewalks, parking lots,
storm water ponds, building footprints, and grass areas.
After reviewing the watershed connection—how what is done
on land affects water quality—at the beginning of the third day,
students used GIS to look at where they were on campus in
relation to water bodies. They discovered that water from the
campus flows from Deep Creek into the Nanticoke River, which
empties into the Chesapeake Bay.
The students began feeling they were a part of something bigger.
A guest speaker from DTCC’s grounds maintenance staff told
how a storm in 2006 destroyed two bridges on campus. The staff
reexamined how the storm drainage system worked and made
improvements to it. Using a map and GPS units, the students
collected location data for storm drains, infiltration trenches, and
manholes.
The group was divided into indoor and outdoor teams on the
fourth day. The indoor team continued working on the data
needed to finalize their research and maps, while the outdoor
team placed storm drain medallions around the campus that
read “No Dumping, Drains to Creek.” Students chose medallions
One of the high-quality and detailed maps that students created for this project
Through their use of GPS and GIS, students were able to learn the importance of drainage systems, identify drainage problems on campus, and find solutions for these problems.

Advancing STEM Education with GIS 29Intensive Summer Course for High School Students
with a frog graphic because frogs can tell quite a bit about water
quality.
On day five, the students journeyed to Trap Pond State Park.
Located in the Nanticoke Watershed, it is also known as
Delaware’s Cypress Swamp. Students learned some of the history
and benefits of bald cypress trees and how non-point-source
pollution runoff resulted in a ban on swimming at the park. Next
they took a tour of Perdue’s AgriRecycle Center, where they
learned that farmers are helping clean up Delaware’s waterways
by having chicken litter removed from their farms, recycled, and
shipped to other places to use as fertilizer.
On the sixth and final day, the students recapped what they had
learned. Through their use of GPS and GIS, students were able
to learn the importance of drainage systems, identify drainage
problems on campus, and find solutions for these problems while
creating awareness in the community. They observed that poor
drainage leads to pollution and land runoff which, in turn, affects
the land or body of water into which it drains. With storm water,
sediments and other pollutants damage the fish, wildlife, and
plants.
The students’ energy and excitement was evident. Some of their
suggestions for improvements on the college campus included
•Replacing the raised bed by the entrance with a bioinfiltration
traffic island
•Creating a native-plantings buffer around the southern end of
the storm water pond
•Placing more trash receptacles around the campus
•Replacing blacktop with pervious pavement in staff parking
areas
•Investigating the idea of green roofs on campus
They asserted that through maintaining and respecting the
environment, students and others in the community can foster a
better quality of life.
To learn more about the TRIO program, visit http://www.dtcc.
edu/owens/ccp/SSS_Trio/Pages/TRIO1.htm. To learn more about
GIS in Delaware, visit http://stateplanning.delaware.gov/dgdc/.
(This article originally appeared in the Summer 2009 issue of GIS Educator
newsletter.)

30Strengthening STEM Career Paths with GISAdvancing STEM Education with GIS
Strengthening STEM Career Paths with GIS
31Maine High School Geography Teacher Emphasizes Geospatial Thinking Advancing STEM Education with GIS
Longtime Bangor High School geography teacher Margaret
Chernosky’s epiphany came nearly 10 years ago in an advanced
placement (AP) human geography training course.
“The instructor showed us some of the Atlanta [Georgia]
demographic data in a desktop GIS, and I sat there completely
enthralled. Completely. I realized that this is how you teach
geography.”
Chernosky knew that to successfully integrate GIS technology
into her own classroom instruction, she would have to first master
it herself. Initially, she took online classes. Later, she attended
training seminars in Colorado, Costa Rica, and New Zealand.
“Besides being fun,” says Chernosky, “the travel brought me
into contact with people around the world that were equally
enthusiastic about GIS. I’m still in contact with many of the
people I met at the seminars. It’s a real community.”
During this period, in addition to her full-time teaching
responsibilities, Chernosky earned a masters of education degree
in geospatial education. “My motivation was to not only learn as
much about geospatial technology as I could but also to learn
how to think geospatially. And this is what I try to bring to my
students—this new way of looking at the landscape.”
Throughout this period, Chernosky had become familiar with
ArcGIS software and Esri’s training courses. When she introduced
GIS to Bangor High School students in small steps, she assigned
participation in Esri’s Community Atlas project to her 2005 AP
human geography class. Students and teachers throughout the
United States annually contribute to the Community Atlas by
Maine High School Geography Teacher Emphasizes Geospatial Thinking By Jim Baumann, Esri
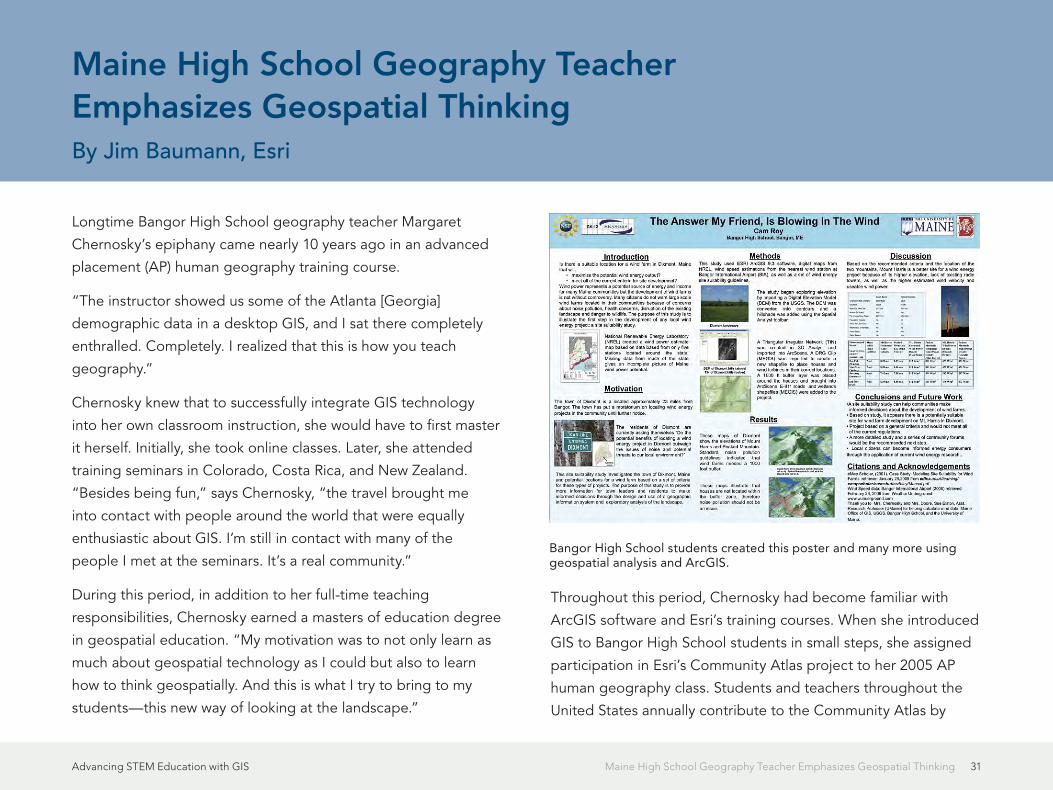
Bangor High School students created this poster and many more using geospatial analysis and ArcGIS.

Advancing STEM Education with GIS 32Maine High School Geography Teacher Emphasizes Geospatial Thinking
examining aspects of where they live, then posting descriptions
and maps of their community related to their findings.
The following year, Chernosky proposed the addition of an
elective class, GIS in geography, to the Bangor Area School
District, which was subsequently approved. Today, because of
strong student demand, two sections of the GIS in geography
course are offered. While they are open to all students,
Chernosky encourages sophomore participation so that those
students can apply the GIS skills they have gained to their other
high school courses, such as history and science. The maximum
class size for the GIS course is 16 students. Because the classes
have a limited number of students and the required projects that
the students work on are completed in pairs, there is a great deal
of interaction and cooperation among the students. Stacy Doore,
a GK12 Sensor fellow, University of Maine, Spatial Engineering,
has worked with Chernosky for several years to develop and
teach the GIS in geography course.
The five steps of geographic inquiry provide the basis of
instruction that Chernosky employs in her classroom to direct
her students in the creation and completion of GIS projects.
The steps include the following: ask geographic questions,
acquire geographic resources, explore geographic data, analyze
geographic information, and act on geographic knowledge.
She introduces the concepts gradually to the class, discussing
articles found in ArcNews and ArcUser so that students can gain
a greater understanding of the geographic inquiry method.
Students complete two major projects during the year. The first
is participation in National Geographic’s annual Geography
Action! program. Themes change each year and focus on either
a location, such as Europe and Africa, or an aspect of physical
or human geography, for example, conservation, cultures, and
habitats. Chernosky tries to get her class to complete this project
by mid-November in time for Geography Awareness Week.
She has forged a relationship with the local newspaper, Bangor
Daily News, and the editor publishes a full-page color spread
highlighting the classroom work for five successive days.
Says Chernosky, “We have a relatively small, close-knit
community here in Bangor, and the newspaper is truly committed
to education. In addition, the editor and I have developed a
reciprocal relationship. When needed, I help him with graphics
that require maps. For example, on election night I plot the
results in ArcGIS Desktop in time for him to meet the press
deadline for the next morning’s newspaper.”
The students’ year-end capstone projects focus on the analysis of
local or regional issues that have a direct impact on the students
themselves or their community. Chernosky initially holds a
brainstorming session with the class, and they discuss local issues
to develop the related geographic questions necessary to direct
their projects.
“Basically, we look for projects that are of local interest, deal
with local concerns, and have relevant data available,” explains

Advancing STEM Education with GIS 33Maine High School Geography Teacher Emphasizes Geospatial Thinking
Chernosky. “The majority of our data comes from the Maine
Office of GIS. Its rich datasets are online and downloadable. From
there, we get topographic maps, contours, rivers, roads—really
high-quality, complete base files to work with. We acquire other
required geospatial data from local agencies. Or if need be, we
create our own data.” The students have a variety of GIS software
available to them, including ArcGIS, ArcGIS 3D Analyst, ArcGIS
Spatial Analyst, ArcGIS Network Analyst, ArcGIS Publisher, and
ArcLogistics.
The completed capstone projects are subsequently entered
into the Maine State GIS Championships, where the students
personally present their finished work to the judging panel. In the
2009 contest, a sampling of the projects included “The Answer,
My Friend, Is Blowing in the Wind,” “Optimizing School Bus
Routes,” “Air Quality Monitoring in Penobscot County, Maine,”
“Determining Wireless Signal Using Indoor GIS,” “Access to
Health Care in Rural Maine,” and “Cancer and Poverty in Maine.”
In 2010, students examined the temporal and spatial patterns of
crimes to motor vehicles in Bangor. After the contest, students
presented their work to the Bangor Police Department.
Concludes Chernosky, “I’m not necessarily trying to convince
my students to follow careers in GIS, though I believe there are
many very exciting opportunities open to them. My goal is to get
them to see things in a new way. I want them to really understand
the spatial component of the steady stream of information
bombarding their daily lives and how geospatial thinking can
provide them with a greater understanding and awareness of the
many things they will encounter.
(This article originally appeared in the Winter 2010/2011 issue of ArcNews.)

34The Learning is Exponential: Using a Community-Based Approach Advancing STEM Education with GIS
This article is the first in a series honoring
individuals who have made a difference in the
world by applying a GIS solution to challenges or
needs within their communities. Since these unique
individuals have been selected for their innovations
or special achievements in a particular field, the
series is appropriately named GIS Heroes. The
first honoree, Mark G. Ericson, works in the field of
education.
Over its 110-year history, the Santa Fe Indian School (SFIS) has
evolved from a federally run school to becoming, in the 1970s,
the nation’s first Indian-run school for Native Americans. Today
owned and operated by the 19 Pueblos of New Mexico, the
middle school and high school accommodate both day and
boarding students from tribes all over New Mexico. Appropriate
for its Native American student population, the school offers
coursework in Native American history but also strives to prepare
students with technical skills they need in the modern world.
Not only are the students at SFIS learning computer skills and
scientific research concepts in the process, but they are also
learning how to communicate and work with professionals
and elders in their tribal communities. This program, called
Community Based Education Model (CBEM), is an innovative
approach that seeks to motivate and strengthen learning by
involving students in real world issues that require math and
science skills. CBEM also seeks, through community involvement,
to motivate students to continue their educations and return to
their communities to work.
When SFIS science instructor
Mark G. Ericson helped design
SFIS’s first CBEM curriculum in
1996, he already had almost
a decade of experience
teaching at SFIS, so he had a
good understanding of local
education and community
issues. He is also the catalyst for
using GIS to bring his students
and their communities together.
For the past five years, under
Ericson’s instruction, SFIS students have been using GIS skills
to participate in and contribute to environmental and water
management programs in their communities.
The Learning is Exponential: Using a Community-Based Approach By Susan Harp, Esri

Advancing STEM Education with GIS 35The Learning is Exponential: Using a Community-Based Approach
“I was looking for something that could be used as a foundation
to create an expandable base that students could add to based
upon their work in the community,” says Ericson. “The use of GIS
has been the technological core.” He and other CBEM curriculum
developers worked with community members as equal partners
to select relevant projects. Since many issues were based on the
environment, Ericson investigated combining computers and
geography as a way to use the 24-computer laboratory that Intel
Corporation had provided for CBEM. Program funding came
from the U.S. Department of Energy. Through contact with local
agencies involved in land management, Ericson heard about
ArcView software and started teaching himself how to use it for
classroom instruction; later, he would go to Esri headquarters in
Redlands for more training.
Ericson’s course teaches students GIS software skills to use in
community projects. Over the past seven years, CBEM students
have used GIS to map back roads and tribal land boundaries.
They have participated in wetlands restoration projects, ground
and surface water monitoring, and longitudinal aquatic habitat
assessments. They use U.S. Geological Survey data on their
reservations and watersheds and digital elevation models to
create a master map with the ArcGIS Spatial Analyst extension.
Their master map provides a base for further learning such as
using ArcView software’s hydrologic modeling extension to derive
stream channels and watershed basin flows. In the process, they Top and bottom: CBEM students use GIS and hydrologic modeling to visualize the extent of the watersheds that feed their reservations.

Advancing STEM Education with GIS 36The Learning is Exponential: Using a Community-Based Approach
have learned skills that help them continue their educations or
find jobs.
“When students wade through a stream trying to get a clear GPS
signal to map study area boundaries, the learning is substantial;
when the data is then realized in a multidimensional mapping
database, the learning is exponential,” says Ericson.
He adds that students also discover new things about themselves,
such as their ability to understand and apply technical concepts,
communicate these ideas to others in a public setting, and
contribute as citizens to their communities. As a result, more than
half of the approximately 200 students who have participated in
CBEM continue in further education and community work related
to issues studied during their coursework.
“Mark’s use of GIS has given the CBEM students the opportunity
to learn in high school at the highest level in terms of computers
and technology,” says CBEM community liaison Matthew S.
Pecos. “The communities get the direct benefit of the skills and
knowledge these students have acquired.”
“The kids are proud of what they can do, they are lifting their
heads up high because they know they have a skill that many
other people do not have, and they have progressed in other
areas because of that,” says Theresa Chavez, past CBEM
coordinator and currently SFIS middle school coordinator. Many
students have worked summer jobs doing community GIS
projects such as mapping utility manholes and georeferencing
house addresses.
As a measure of the school’s success, in 1987 the United States
Department of Education listed the school as one of 270
outstanding secondary schools in America. Of the 70 to 90
students graduating each year, about 90 percent of them plan to
go on to attend postsecondary schools.
For more information on, or to suggest a candidate for, the GIS
Heroes series, contact [email protected].
(This article originally appeared in the Fall 2006 issue of GIS Educator
newsletter.)

37Advancing STEM Education with GIS Spatial Statistics Provide New Insights: Researcher Sees Possible Links Between MS and Other Diseases
George de Mestral envisioned the design of the Velcro fastener
in 1948 while picking burr-covered seedpods from his dog’s
fur after a mountain hike. As the story goes, the Swiss citizen
stopped to observe the sticking qualities of Mother Nature’s
design and made the leap to a new, creative application. With
the avalanche of information available to researchers today, the
catalyst that helps produce this kind of “ah hah!” moment is
extremely valuable.
For Megan M. Blewett, a young 21st-century researcher, spatial
geography played a role in both her ah-hah! experience and her
research. Blewett turned 18 in 2007, but five years ago, she was
already reading a neuroscience textbook and asking questions
about a mysterious disease—multiple sclerosis (MS)—that she
found described in its pages. Blewett said, “I started researching
MS when I was 12 and have since fallen in love with discovering
the insights spatial statistics can give.”
MS affects the central nervous system. Although its cause is
unknown, many researchers think environmental triggers might
be a factor. This unsolved puzzle caught Blewett’s attention.
She started collecting data about MS cases in her home state of
New Jersey, learned to map their distribution with GIS, and has
been using spatial statistics tools to analyze that distribution. She
has continued reading about the neurological and biochemical
aspects of the disease. However, her ah hah! moment occurred at
a science fair while she was talking with one of the judges about
her map of MS distribution in New Jersey.
Spatial Statistics Provide New Insights: Researcher Sees Possible Links Between MS and Other Diseases By Susan Harp, Esri
Normalized count of multiple sclerosis deaths by county for 1998 over 1990 census data

Advancing STEM Education with GIS 38Spatial Statistics Provide New Insights: Researcher Sees Possible Links Between MS and Other Diseases
“I just got lucky there,” commented Blewett. “I was looking at
a state map of MS distribution and saw that my county, Morris
County, has a high incidence of MS. You could see individual
towns, and I knew the town next to me had a high incidence of
Lyme disease.” A bacterial infection, Lyme disease is spread by
tick-borne spirochetes. She was already using ArcGIS Desktop
to map MS distribution, so when she started thinking about a
possible Lyme disease correlation, she added Lyme data to her
map layers.
“I saw all these correlations and results that I hadn’t been able
to see before and still don’t think I would have been able to see
if I had been using more conventional chemical research to look
at individual proteins at work,” Blewett added. “Spatial statistics
allowed me to see the bigger picture. Then I zoomed in to look
at proteins at work in MS and related demyelinating diseases. I
like to say my research path is analogous to reading the summary
before reading the book.”
The data collection process was one of the harder parts her
research. Data came from TheDataWeb, an online set of libraries,
and DataFerrett, a data mining tool, both provided free to the
public by the United States Bureau of the Census and the Centers
for Disease Control and Prevention (CDC). When Lyme disease
data was not available online, Blewett had to contact the state
epidemiologist and request data. Eventually she received data
from every state. “To my knowledge, it is the largest standardized
dataset of Lyme information in existence,” said Blewett about the
dataset. She also said she is willing to make the data available to
other researchers.
Blewett ran a correlation analysis. She calculated a Pearson’s
correlation coefficient (r) (for the normally distributed variables)
or Kendall’s tau-b or Spearman’s rho for data that was not
normally distributed. All correlation analyses assumed a linear
relationship between the variables so the appropriate coefficient
was calculated for pairs of variables in three datasets. All variable
values were converted to z-scores for use in a regression analysis.
Finally, cartographic analyses compared MS, Lyme (from other Normalized count of Lyme disease deaths by county for 1998 over 1990 census data

Advancing STEM Education with GIS 39Spatial Statistics Provide New Insights: Researcher Sees Possible Links Between MS and Other Diseases
specified arthropod-borne diseases data), and control data from
external cause of death data.
“The two disease distributions were pretty similar—they correlate
and the control doesn’t,” explained Blewett. “Biochemically
they are also very similar, so it has just taken off from there.” She
hypothesizes that both diseases may share a common spirochetal
basis, and MS might develop from a secondary tick bite.
Blewett consulted with Esri spatial statistics expert Lauren Scott
on using GIS in her research. “While biologists and medical
researchers investigate this hypothesis at the cellular level,
Megan’s work examines the spatial fingerprint of these two
diseases at broad spatial scales and then tests hypotheses
regarding their spatial correlation,” said Scott.
“I wish to expand my research from a national to a global scale,
while also testing my models in smaller geographic areas,”
Blewett said. “A recent study suggests that MS is, in fact, 50
percent more common than previously predicted.”
Blewett presented her work at the 2006 Esri International User
Conference and participated in the Academic Fair during the
2006 Esri Health GIS Conference. In 2007, she was accepted
into several top universities and awarded seventh place in the
prestigious 66th Annual Intel Science Talent Search.
(This article originally appeared in the October–December 2007 issue of
ArcUser.)
Control data: normalized count of external causes of death by county for 1998 over 1990 census data

40Collaborations and PartnershipsAdvancing STEM Education with GIS
Collaborations and Partnerships

41Unlocking the Educational Potential of Citizen ScienceAdvancing STEM Education with GIS
I have been a fan of citizen science
for many years, but I do not think
the citizen science movement has
had the educational impact that it
could. Citizen science is the name
for scientific research projects that
engage members of the public in
some aspect of their research. There
have been some high-profile citizen
science projects recently in which members of the public have
conducted image analysis and solved protein-folding problems,
but the overwhelming majority of citizen science projects involve
crowdsourced data collection
For example, some of the largest and longest-running citizen
science projects are in ornithology. In projects like the National
Audubon Society’s Christmas Bird Count and the British Trust
for Ornithology’s Garden Birdwatch, birders contribute their
observations to databases that scientists use to track trends in
bird populations and species distributions.
These two projects, like many others, fall into a category of citizen
science project that I call community geography. In community
geography projects, the data is georeferenced and used for
spatial analysis.
Community geography projects can be a boon for researchers.
Volunteer data collectors provide investigators with the
opportunity to obtain a quantity and geographic range of data
that would not be practical through any other mechanism. They
are also a boon to participants, who get to join a community;
participate in something meaningful; and, in many cases, learn
some new science.
For as long as I’ve known about them, I’ve been fascinated by the
educational possibilities of community geography projects. I’m
a big believer in both inquiry-based learning and breaking down
the boundaries between school and the real world. Community
geography does both—except for one thing. Collecting data
is only one part of the scientific process, and most community
geography projects only engage participants in data collection.
In the stereotypical community geography project, participants
take measurements or record observations and submit them
to a central database for scientists to analyze. In some cases,
participants are able to see a map of the data that has been
submitted or see results of previous analyses that have been
Unlocking the Educational Potential of Citizen Science“Geo Learning”
A column by Daniel C. Edelson,Vice President for Education, National Geographic Society

Advancing STEM Education with GIS 42Unlocking the Educational Potential of Citizen Science
conducted by scientists. However, it is very rare that participants
have a chance to create and interpret visualizations or analyze
data themselves.
After talking to organizers of community geography projects,
I’ve learned that most of them would prefer to provide their
participants with opportunities to work with the data, but they
lack the resources or expertise to create tools that would enable
their participants to do their own visualization or analysis.
So, a few years ago, National Geographic—with support from
Esri and others—set out to create a web-based platform for
community geography that would provide participants with the
ability to visualize and analyze their own data using GIS. We call
this platform FieldScope. The idea behind FieldScope is that it
is designed specifically to support citizen scientists—individuals
who are interested and invested in researching a specific scientific
question but who lack the training or technical skills of a scientist.
This has required that we create easy-to-use interfaces and offer
users a set of analytic tools that are either familiar or easy for a
novice to grasp.
One of the first FieldScope projects that we deployed is
dedicated to studying water quality in the tributaries to the
Chesapeake Bay. Working together with environmental educators
throughout the Chesapeake Bay watershed, we identified
a set of water quality measurements that could be done by
students and teachers across a wide range of grades, and we
created a FieldScope application that displays not just student-
collected water quality data but also a wide variety of data
layers describing the land in the watershed, including land use,
impermeability, and nitrogen yield.
We also provided users with analysis tools that enable them to
create time plots and scatterplots for the data that they have
collected, and we implemented a set of hydrologic analysis tools
that will help them understand the underlying dynamics of the
watershed. For example, we have provided users with a flow path
tool that allows them to click anywhere in the watershed and see
the path that water will flow from that point to the bay. Users
A FieldScope map from the Chesapeake Water Quality Project showing a student's water quality measurement.

Advancing STEM Education with GIS 43Unlocking the Educational Potential of Citizen Science
might employ this tool to see the portion of the river system that
would be affected by a point source of pollution.
This Chesapeake water quality project has proved very popular in
public schools; in the two years that it has been active, more than
600 teachers have received training on the software, and we have
recorded more than 40,000 visits to the site. It is also succeeding
in engaging users in analysis. In the first three quarters of 2011,
we recorded more than 75,000 geoprocessing events and more
than 45,000 uses of the query tools.
In the 2011–12 school year, both Fairfax County, Virginia, and
Anne Arundel County, Maryland, have incorporated the project
into their science curricula for all middle school students.
With support from the National Science Foundation, we are
currently in the process of expanding FieldScope’s functionality
and creating authoring tools that will enable the broadest
possible community of citizen science projects to build
FieldScope applications for their own users. This spring, we will
be launching FieldScope applications for two national community
geography projects: Project BudBurst, which is studying
plant phenology, and Frogwatch, USA, which is studying the
distribution of amphibian species.
FieldScope, with its carefully designed user interface and
specially selected GIS tools, is beginning to unlock the potential
of citizen science as a learning experience. Teachers and students
have responded enthusiastically to the opportunity to participate
in geospatial analysis of data. In part, their enthusiasm stems
from the fact that it’s data about their own community that they
helped collect. Administrators, in turn, are seeing that the entire
experience of community geography is enabling them to achieve
important learning outcomes for both science understanding and
science skills.
Our goal over the next few years is to bring this powerful
educational experience to as broad an audience as possible,
young and old, in school and out.
For more information about National Geographic FieldScope
and the Community Geography Initiative, visit natgeoed.org/
fieldscope.
Read other articles in the GeoLearning series.
(This article originally appeared in the Spring 2012 issue of ArcNews.)

44Students and Farmers Become Citizen ScientistsAdvancing STEM Education with GIS
Editor’s note: Attendees at the 2005 Esri International
User Conference Plenary Session witnessed a live ArcView
demonstration by three fifth-grade students. The demonstration
was an example of how GIS technology was infused into school
curriculum and field activities. These students represented 126
others who participated in a citizen science research project
called Adopt-a-Farmer.
It all started in 1993 when Diane Petersen and Cathi Nelson,
fourth- and fifth-grade teachers at Waterville Elementary
School in the state of Washington, were investigating ways to
engage their students in meaningful science inquiry. Traditional
curriculum messages of saving tropical rainforests and
endangered species had little appeal to youngsters most familiar
with the farm fields in the high plateau of eastern Washington.
Petersen and Nelson discovered the NatureMapping program,
which was designed to develop citizen scientists (both students
and community members) by nurturing the local knowledge
of place through science projects created in collaboration with
the needs of regional biologists. The NatureMapping program
provides initial teacher training and guidance to implement
a comprehensive curriculum based on scientific inquiry. The
program then helps develop local projects in part to verify range
distribution maps modeled for every terrestrial vertebrate in the
state.
The Development of a Long-Term Project
Early in the project development with Waterville Elementary
School, students discovered that local observations of short-
Students and Farmers Become Citizen ScientistsGIS Helps Community Investigate Local Lizard
By Karen Dvornich, University of Washington and Dan Hannafious, Hood Canal Salmon Enhancement Group
Waterville Elementary School students observed short-horned lizards (Phrynosoma douglassii) in farm fields in areas that conflicted with the modeled range distribution maps.

Advancing STEM Education with GIS 45Students and Farmers Become Citizen Scientists
horned lizards (Phrynosoma douglassii) in farm fields were in
conflict with the modeled range distribution maps. The statewide
maps, created by the Washington Gap Analysis Project, were
modeled from 96 historical observations presented in the
1997 report, Amphibians and Reptiles of Washington State:
Location Data and Predicted Distributions. Though students and
community members have lived with the lizards (also known as
horny toads) in the farm fields, the modeled range distribution
maps showed that the lizards weren’t supposed to be there.
Scientists, teachers, and students reviewed horny toad literature
and local knowledge, developed a list of questions, and designed
a spreadsheet with 22 attributes. Students first collated data
on paper, then in the spreadsheet. Each year, the new students
would use data from previous years to build their knowledge
about scientific methodology, database management, and GIS.
The new class of students would contribute additional data to
the project and each year expanded the scope of the project to
answer their own questions.
Parents and Local Community
In 1999, the Adopt-a-Farmer project began. This project is a
creative way to obtain more data by asking farmers to report
observations when they are out in their fields. The fourth-grade
students wrote letters to the farmers they wanted to adopt.
The NatureMapping program scientists supported the project
by providing habitat descriptions and classification codes and
worked with the students to design a data collection form.
Students sent the form with instructions to their adopted farmers.
Horny toad sighting observations were marked on the maps and labeled with numbered dots.

Advancing STEM Education with GIS 46Students and Farmers Become Citizen Scientists
Farmers were asked to visit the school in the fall and bring their
data from the fields. In preparation for their first visit, the class
created a slide presentation that introduced the project and GIS.
Inviting the farmers, parents, and members of the local
conservation district to help the students in a research project
opened the door for questions such as What is GIS? What is
Esri, and is that different from ArcView? What good is GIS in the
classroom? How is this project going to help my child in school?
Are horny toads an endangered species? The audience initially
felt that GIS was a technology reserved for trained professionals
and had difficulty imagining the technology being used by
elementary school students. The audience was won over not
only by the teachers’ perseverance but also by the work students
posted on their Web site and their explanation of what they did
and why they needed more data.
Visiting the Classroom
The farmers were not only familiar with topographic maps, but
they were also very good at training students how to use them.
Horny toad sighting observations were marked on the maps and
labeled with numbered dots. The other attributes from the data
collection forms were reported on large poster paper at different
stations within the classroom. After the farmers’ visit, students
used the labeled maps as the basis for on-screen digitizing
of these locations using digital topographic maps in ArcView.
Accompanying data was entered into the project spreadsheet at
the same time.
By the fourth year, Waterville students and their adopted farmers
had collected more than 300 data observations. The expanding
database was linked to the digitized points and overlaid on digital
orthophotos and other statewide data coverage of rivers and
roads. This allowed students to query the data and enforced
database structure. It also helped these students develop a
deeper sense of science inquiry.
The cooperative development of a science plan that would work
in the classroom and in the field with the farmers was critical for
the long-term success of this ongoing school project. In addition,
the observations provided by the participating farmers as well
as the students helped these students become state experts on
short-horned lizards.
For students, it was important that GIS was used to answer their
questions using their data. For teachers, it was about the genuine
enthusiasm created by engaging the students in their local
interests.
GIS Mentorship
There were two roles for the GIS mentor. The first involved
database management. Computers set up in the classroom and
the school district computer network did not come with standard
protocols for file storage and access. It was essential that the

Advancing STEM Education with GIS 47Students and Farmers Become Citizen Scientists
Waterville School District had outside technical support for GIS
to help manage the data structure and nomenclature. Installing
ArcView on a variety of classroom computers was efficient for
teaching purposes as long as there was someone to help teachers
maintain data integrity. The GIS mentor, whose phone number
was written on the edge of the computer screen, could be called
at any time when students were working with ArcView.
Students tended to select their type of involvement in the project
based on expertise and interest. Many students had an aptitude
for technology and were not afraid to learn and use ArcView.
Typically, two to four students each year were taught Microsoft
Excel and ArcView 3.2 by the GIS mentor. In turn, they trained
their peers. Students not directly involved with ArcView assisted
by writing text, making graphs, creating graphics, and taking and
posting pictures for the Web site. However, all students learned
to create map layouts of their farmers’ lands and the associated
horny toad observations.
Support from School Administrators
Initially, support from the community, school administration,
scientists, and GIS mentors made it possible for the teachers
to build their confidence and knowledge about scientific
methodology, database management, and GIS. Students’
questions prompted additional research, which resulted in the
overwintering project, food preference study, behavioral studies,
and the radio tracking project. Teachers also learned how to
use other GIS tools for performing queries, making distance
measurements, converting individual farmers’ fields into separate
shapefiles, and creating layouts. The database, which began with
Some students were taught Microsoft Excel and ArcView 3.2 by the GIS mentor, then trained their peers. Other students wrote text; created graphics; took and posted pictures for the Web site; and, as shown here, created graphs.

Advancing STEM Education with GIS 48Students and Farmers Become Citizen Scientists
96 historic records collected by scientists, now has more than 600
new records from farmers and students.
The NatureMapping program’s teacher training focuses on
understanding the scientific, mathematic, geographic, and
technical content necessary to teach what students need to learn
to work on their projects as well as helping teachers understand
how to connect what is taught with school district and state
standard requirements for that grade level. Many components of
GIS are part of the Washington state tests, even if GIS is not. The
comprehensive integration of other subjects with the associated
science gives students many avenues to contribute to a project in
ways that interest them.
As a result of the success of the Adopt-a-Farmer project,
students have been asked to provide presentations in state and
national conferences. Travel, presentations, and networking with
the professional community as well as their own community
have instilled a greater confidence in these students. Even the
students’ parents have become more interested in participating
in the education process because the program is based on local
knowledge.
Continuing support by the Waterville School District
administrators has allowed travel during school, helped cover
substitute costs, helped find grants to cover equipment costs
for fieldwork, and supported the teachers. It was also important
that the mentors and the professional community provided
financial support to the project to allow student travel, which has
translated into success for everyone involved.
In 2006
Each fall, farmers come back to the classroom to submit their
data to a new group of students. In 2006, students showed
the farmers how to digitize their observations onto digital
orthophotos. In the past, the farmers spent a lot of time watching
students navigate to a location on the computer screen. Farmers
expressed an interest in learning more about the technology,
and they were given an opportunity to digitize the horny toad
observations under the guidance of the fourth graders.
Several students who were fourth graders in 2005 will present
a book of maps that was requested by one of the farmers. The
book contains the location of all the farmers’ fields. Each field
is highlighted and labeled with driving instructions, crops, and
other information. This GIS project was more than creating
maps and learning local geographic terminology—it allowed
the students and the farmer to design and develop a project
together. The students will offer other farmers the same product
as an after-school project.
A significant change has come to Waterville Elementary School
and the surrounding community. Farmers and community
members are asking for specific maps. Students who participated
in the project in previous years are being solicited for these

Advancing STEM Education with GIS 49Students and Farmers Become Citizen Scientists
projects. Teachers in the higher grade levels, with encouragement
from school administrators, are trying to find ways to integrate
these requests into their curriculum.
Teachers are also beginning to ask their own scientific questions
and wondering if GIS can be applied to these questions. A search
for more GIS mentors in the community is taking place. The
supporting scientist will continue to help teachers design projects
that range from bird inventories, a map of healthy and diseased
trees in the city, and insect bioblitzes (i.e., quick inventories) to
finding what insects horny toads eat, addressing water quality
and quantity issues, and locating noxious weeds on farmers’
fields. These projects will be designed through a series of
continuing NatureMapping workshops.
Students that were involved in the Adopt-a-Farmer project now
range from fifth graders to juniors in high school, and they are
excited to get back to doing research projects. Some of these
students may take over the more sophisticated aspects of the
horny toad research project such as using data loggers and
thermocouplers to see if horny toads do freeze in the winter.
Karen Dvornich is the cofounder and national director of the
NatureMapping program in the Washington Cooperative Fish
and Wildlife Research Unit at the University of Washington. She
was the project assistant for the Washington Gap Analysis Project,
where she was responsible for collecting all databases and
datasets and led the amphibian and reptile distribution modeling
efforts.
Dan Hannafious works as a fish biologist and GIS technician for
the Hood Canal Salmon Enhancement Group. He is also active
in outdoor education—he provides overnight camps based
on salmon activities as well as summertime “bat talks” to the
community. He has been associated with the NatureMapping
program since 1995 and helps identify the support mechanisms
needed for NatureMapping schools using GIS.
(This article originally appeared in the January–March 2007 issue of ArcUser.)
Students used the labeled maps as the basis for on-screen digitizing of the locations of farmers' observations using digital topographic maps in ArcView. Students, and now also the farmers, digitize observations onto digital orthophotos.

50Helping Conserve Resources in Natural CavesAdvancing STEM Education with GIS
Since 2003, students from Browning and Bigfork high schools,
both in northwestern Montana, have volunteered at Glacier
National Park, mapping, monitoring, and conserving resources in
natural caves. Recently, the project adopted a GIS component to
help students manage and present their data.
Prior to using GIS, students and their teacher/ sponsor, Hans
Bodenhamer, mapped and established monitoring in 13 park
caves. One of these caves is more than one mile long. Cave
locations were recorded using GPS, but underground surveys
were completed using compasses, inclinometers, and tape
measures. Cave maps were at a scale of 1:240. After drafting
maps, students returned to the caves to photograph, record,
and assess the natural resources in each cave. The results of
monitoring efforts were drafted on maps created in Adobe
Photoshop, which were explained in a series of reports submitted
to the park. The number of student reports submitted since 2003
exceeds 200 pages and includes many oversized maps. One map
covers two sheets, each 8 feet long by 3 feet wide.
In fall 2007, Denny Rae, GIS specialist with Flathead County,
approached Bodenhamer with a proposal to incorporate
GIS into his curriculum. Bodenhamer showed copies of the
students’ reports to Rae, who suggested that putting the data
into GIS would be an excellent student project. Rae contacted
Bern Szukalski, Esri’s cave and karst program coordinator, who
prompted Esri to donate ArcGIS 9.3 software to Bigfork High
School. At that point, it became apparent that none of the
school’s computers were capable of running ArcGIS. For the next
Helping Conserve Resources in Natural CavesMontana High School Students Incorporate GIS
By Hans Bodenhamer, Bigfork High School
Students from Browning and Bigfork high schools, both in northwestern Montana, volunteer at Glacier National Park, mapping, monitoring, and conserving resources in natural caves.

Advancing STEM Education with GIS 51Helping Conserve Resources in Natural Caves
year and a half, Bodenhamer applied for grants. Finally, in spring
2009, Bigfork High School received a $10,000 grant from Best
Buy. This grant, one of only 15 awarded nationally, was given for
its innovative proposal to use real-world technology in a K–12
setting. Using the grant, computers were purchased for a GIS
cave lab at the high school.
With computers on the way, Bodenhamer contacted Ben
Sainsbury, GIS specialist at Central Washington University. In
2000, as a graduate student at Northern Arizona University,
Sainsbury used GIS to present 10 years of photo monitoring of
cave resources in Arizona. Sainsbury volunteered to help with
the students’ cave project in Montana. He spent countless hours
tutoring Bodenhamer in GIS and developed a procedure by
which students could enter and manipulate their cave maps and
monitoring data. Bodenhamer took Sainsbury’s proceduresback
to his students, who were eager and quickly learned the material.
In less than a month—thanks to many extracurricular hours—the
students had entered most of the data that had been amassed
over five years. In early June of 2009, the students presented their
GIS to a gathering of about 20 park managers. The group was
very impressed and suggested the student project be expanded
to caves on nearby U.S. Forest Service lands and in other parks.
Bigfork High School’s cave GIS uses scans of detailed cave
maps, which are cleaned up and oriented using Photoshop. The
cleaned-up maps are georeferenced on a topographic map as
raster images and are set to be visible below a scale of 1:800. In
addition to the detailed cave maps, a filled-in vector image of
the cave map is included as a separate layer. The vector image
can be turned on to show the orientation of caves with respect
to one another and the overlying topographic map or to provide
background for the raster cave map and other layers.
Beyond raster and vector cave maps, a layer that provides
general information is tied to the entrance of each cave. General
information includes entrance elevation, cave length and depth,
average air temperatures, and overall classification of the cave’s
resource significance in comparison to other caves in the region.
Classified resources include biology, mineralogy, paleontology,
archaeology, geology, meteorology, and hydrology. Significance
classes use readily understandable terms—none, poor, fair, good,
and outstanding—that are qualified in accompanying text.
Specific cave resources within each cave are also included in
Bigfork High School’s cave GIS. Cave temperatures, graffiti (if
present), mineralogy, biology, and photo points are all included
on separate layers. Points and polygons for these layers are
located relative to features on the cave map. For mineralogy
and biology, features are described and classified according
to significance, fragility, condition, and proposed management
action. Simple terms are used for each class, which are explained
in accompanying text.

Advancing STEM Education with GIS 52Helping Conserve Resources in Natural Caves
Acknowledgments
In addition to the contributions of Ben Sainsbury, Denny Rae, and
Bern Szukalski, this project would not have been possible without
the support and enthusiasm of Park Service managers Jack
Potter, chief of science and resource management; Kyle Johnson,
West Lakes District Backcountry Coordinator; Richard Menicke,
park GIS specialist, and Chas Cartwright, park superintendent.
Support funding for fieldwork was generously provided by the
Glacier National Park Fund.
(This article originally appeared in the Winter 2010 issue of GIS Educator
newsletter.)

53Conclusion: A Closer Look at the Benefits of GIS in STEM Learning Advancing STEM Education with GIS
Just as STEM disciplines share such goals as using the scientific
method to solve problems, employing quantitative techniques,
and integrating technology, so too can GIS be used across these
disciplines. GIS by its very nature is a multidisciplinary tool.
Therefore, students and educators using GIS in STEM understand
phenomena from a wide variety of disciplinary perspectives.
STEM prepares students for meaningful careers. Students using
GIS in the classroom and in the field gain skills that will help them
secure careers that are in demand in the work force. A key reason
is given by the national science education standards (Center for
Science, Mathematics, and Engineering Education, 1996), which
state, “More and more jobs demand advanced skills, requiring
that people be able to learn, reason, think creatively, make
decisions, and solve problems. An understanding of science and
the processes of science contributes in an essential way to these
skills.” Therefore, students using GIS tools are primed for STEM-
based careers as wildlife biologists, soil scientists, landscape
architects, civil engineers, environmental scientists, and hundreds
of other positions.
Students who use GIS in tandem with STEM education develop
key critical thinking skills. These skills include understanding
how to carefully evaluate and use data. By being able to ask
questions of multiple datasets, students can analyze concepts
and processes in a holistic fashion. Consider climate as one
example. Climate underpins our agriculture, biodiversity, and our
very civilization. Climatic variables are intricately tied to locations
and are therefore affected by spatial relationships—of mountains
to ocean currents, of depressions to soil types, of vegetation to
human impact, and much more. Through GIS, students use maps,
satellite images, graphs, and databases that are focused on the
question of “where” to analyze patterns, trends, and influences
in the past, present, and future. These spatial thinking skills
may be of particular value to STEM students, as recent research
suggests STEM students with strong spatial skills are more likely
to experience early academic success in the field.
Every key issue of our time has a scientific component
and, therefore, those issues can be examined from a STEM
perspective using GIS. Moreover, investigating these topics with
GIS lends relevancy and real-world contexts to the topics. Each
of these issues occurs somewhere and typically occurs in multiple
locations and at a variety of scales. For example, natural hazards
have experienced much change in how they are perceived
and managed throughout history and around the globe. The
Conclusion: A Closer Look at the Benefits of GIS in STEM Learning By Joseph Kerski, Esri Education Manager

Advancing STEM Education with GIS 54Conclusion: A Closer Look at the Benefits of GIS in STEM Learning
geographic perspective is therefore important in understanding
scientific issues, and GIS provides a rich toolset with which to use
the geographic perspective.
Not only are STEM-based topics enhanced by GIS, but
conversely, the use of GIS is enhanced by a firm grounding
in STEM. This grounding provides the framework by which
questions can be formulated and solutions pursued. Science is
a powerful way of looking at the world; even more fundamental
than the contents of each branch is the methodology. Asking
questions is the first part of scientific inquiry: it forms the basis
for knowing what types of social data to collect, what data to
analyze, and what decisions to make.
Given the widespread concerns faced by the modern world,
it is imperative that students study and understand STEM not
only to equip them for life in the twenty-first century but also to
ensure that we emerge at the end of the twenty-first century in
a sustainable way. Experience with geospatial technology builds
the integrated contextual background plus the skills in critical
thinking, problem solving, communicating, and collaborating that
are so vital for finding solutions to the many challenges we face.

55Learn MoreAdvancing STEM Education with GIS
•Esri Education Community: edcommunity.esri.com/stem
•ArcLessons: edcommunity.esri.com/arclessons
•Esri Education on YouTube: http://www.youtube.com/
esriedteam
•GIS Education Case Studies: edcommunity.esri.com/
community/caseStudies/
•GIS and Science Blog: http://gisandscience.com/
•ArcGIS Online: arcgis.com
Learn More

Copyright © 2012 EsriAll rights reserved.Printed in the United States of America.
The information contained in this document is the exclusive property of Esri. This work is protected under United States copyright law and other international copyright treaties and conventions. No part of this work may be reproduced or transmitted in any form or by any means, electronic or mechanical, including photocopying and recording, or by any information storage or retrieval system, except as expressly permitted in writing by Esri. All requests should be sent to Attention: Contracts and Legal Services Manager, Esri, 380 New York Street, Redlands, CA 92373-8100, USA.
The information contained in this document is subject to change without notice.
US Government Restricted/Limited RightsAny software, documentation, and/or data delivered hereunder is subject to the terms of the License Agreement. The commercial license rights in the License Agreement strictly govern Licensee’s use, reproduction, or disclosure of the software, data, and documentation. In no event shall the US Government acquire greater than RESTRICTED/LIMITED RIGHTS. At a minimum, use, duplication, or disclosure by the US Government is subject to restrictions as set forth in FAR §52.227-14 Alternates I, II, and III (DEC 2007); FAR §52.227-19(b) (DEC 2007) and/or FAR §12.211/12.212 (Commercial Technical Data/Computer Software); and DFARS §252.227-7015 (DEC 2011) (Technical Data – Commercial Items) and/or DFARS §227.7202 (Commercial Computer Software and Commercial Computer Software Documentation), as applicable. Contractor/Manufacturer is Esri, 380 New York Street, Redlands, CA 92373-8100, USA.
Esri Trademarks and Service Marks: @esri.com, 3D Analyst, ACORN, Address Coder, ADF, AML, ArcAtlas, ArcCAD, ArcCatalog, ArcCOGO, ArcData, ArcDoc, ArcEdit, ArcEditor, ArcEurope, ArcExplorer, ArcExpress, ArcGIS, ArcGlobe, ArcGrid, ArcIMS, ARC/INFO, ArcInfo, ArcInfo Librarian, ArcLessons, ArcLocation, ArcLogistics, ArcMap, ArcNetwork, ArcNews, ArcObjects, ArcOpen, ArcPad, ArcPlot, ArcPress, ArcPy, ArcReader, ArcScan, ArcScene, ArcSchool, ArcScripts, ArcSDE, ArcSdl, ArcSketch, ArcStorm, ArcSurvey, ArcTIN, ArcToolbox, ArcTools, ArcUSA, ArcUser, ArcView, ArcVoyager, ArcWatch, ArcWeb, ArcWorld, ArcXML, Atlas GIS, AtlasWare, Avenue, BAO, Business Analyst, Business Analyst Online, BusinessMAP, CommunityInfo, Database Integrator, DBI Kit, EDN, Esri, Esri—Team GIS, Esri—The GIS Company, Esri—The GIS People, Esri—The GIS Software Leader, FormEdit, GeoCollector, Geographic Design System, Geography Matters, Geography Network, GIS by Esri, GIS Day, GIS for Everyone, GISData Server, JTX, MapIt, Maplex, MapObjects, MapStudio, ModelBuilder, MOLE, MPS—Atlas, PLTS, Rent-a-Tech, SDE, SML, Sourcebook·America, SpatiaLABS, Spatial Database Engine, StreetMap, Tapestry, the ARC/INFO logo, the ArcGIS logo, the ArcGIS Explorer logo, the ArcPad logo, the Esri globe logo, the Esri Press logo, the GIS Day logo, the MapIt logo, The Geographic Advantage, The Geographic Approach, The World’s Leading Desktop GIS, Water Writes, arcgis.com, esri.com, geographynetwork.com, gis.com, gisday.com, and Your Personal Geographic Information System are trademarks, service marks, or registered trademarks or service marks of Esri in the United States, the European Community, or certain other jurisdictions.
Other companies and products mentioned herein may be trademarks or registered trademarks of their respective trademark owners.

Printed in USA
Contact Esri
380 New York Street Redlands, California 92373-8100 usa
1 800 447 9778 t 909 793 2853 f 909 793 5953 [email protected] esri.com
Offices worldwide esri.com/locations
Esri inspires and enables people to positively impact their future through a deeper, geographic understanding of the changing world around them.
Governments, industry leaders, academics, and nongovernmental
organizations trust us to connect them with the analytic knowledge they
need to make the critical decisions that shape the planet. For more than
40 years, Esri has cultivated collaborative relationships with partners
who share our commitment to solving earth’s most pressing challenges
with geographic expertise and rational resolve. Today, we believe that
geography is at the heart of a more resilient and sustainable future.
Creating responsible products and solutions drives our passion for
improving quality of life everywhere.
G54239 ESRI7/12dh
Related Documents