Advances in UHPLC/HPLC AN LCGC EUROPE SUPPLEMENT May 2020 | Volume 33 Number s5 www.chromatographyonline.com

Welcome message from author
This document is posted to help you gain knowledge. Please leave a comment to let me know what you think about it! Share it to your friends and learn new things together.
Transcript
Advances in UHPLC/HPLC
AN LCGC EUROPE SUPPLEMENT
May 2020 | Volume 33 Number s5www.chromatographyonline.com

WE ARE HERE FOR YOU!
As we all navigate through these difficult times, we want to assure you that we will continue to provide you with the most uninterrupted service possible. KNAUER is a confirmed critical infrastructure company and continues to manufacture and supply chromatography products.
In April we started the production of hand disinfectants. We are proud to make a small contribution to the fight against COVID-19: KNAUER FPLC systems are used in re-search for RNA purification and protein fractionation. Our almost 60-year history has seen some turbulent times and our goal is to continue to be a reliable partner in the future.
Stay healthy!
Science Together
Chat with us:www.knauer.net
Chat with us:www.knauer.net
Sales, production and deliveries are in operation!
KNAUER GmbH • Hegauer Weg 38 • 14163 Berlin, Germany • Phone +49 30 809727-0 • [email protected]
6 From The Guest EditorGert DesmetOur Guest Editor reveals the content of this special supplement from LCGC Europe.
7 Next Generation of Chromatographic Columns and Systems: From Theories to Possible Future PracticesFabrice Gritti A series of theoretical, visualization, and simulation tools to improve the structure and chemistry of the next generation of liquid chromatography (LC) columns is briefly reviewed. The attributes of the next generation of chromatographic systems and columns are discussed as well as the potential of narrow-bore columns packed with sub-1-µm particles to provide “ultra-ultra-high-pressure” liquid chromatography (UUHPLC) systems.
17 A Theoretical and Practical Approach to Manage High Peak Capacity and Low Dilution in On-Line Comprehensive Reversed-Phase LC×Reversed-Phase LC: A Comparison with 1D-Reversed-Phase LCSoraya Chapel, Florent Rouvière, and Sabine Heinisch
On-line comprehensive two-dimensional liquid chromatography (on-line LC×LC) provides much higher separation power (higher peak capacity) than one-dimensional liquid chromatography (1D-LC). This article demonstates that higher peak capacity and higher peak intensity can be achieved in on-line reversed-phase LC×reversed-phase LC.
27 Is There Still Room for Innovation in Chiral Stationary Phases for Liquid Chromatography? The Fortunate Case of Zwitterionic-TeicoplaninSimona Felletti, Chiara De Luca, Giulio Lievore, Giulia Mazzoccanti, Simone Manetto, Francesco Gasparrini, Alberto Cavazzini, and Martina Catani An update on novel zwitterionic-teicoplanin chiral sationary phases (CSPs) and their applications.
Image credit: flashmovie/stock.adobe.com
May | 2020
Volume 33 Number s5
4 Advances in UHPLC/HPLC May 2020
CONTENTS
Group Vice PresidentMike [email protected]
Editorial DirectorLaura [email protected]
Editor-in-ChiefAlasdair [email protected]
Managing EditorKate [email protected]
Associate EditorLewis [email protected]
Associate PublisherOliver [email protected]
Sales ExecutiveLiz [email protected]
Sales Operations ExecutiveSarah [email protected]
Senior Director, Digital MediaMichael [email protected]
Webcast Operations ManagerKristen [email protected]
Project ManagerVania [email protected]
Digital Production ManagerSabina [email protected]
Managing Editor, Special ProjectsKaylynn [email protected]
Creative Director, PublishingMelissa [email protected]
Art DirectorGwendolyn [email protected]
Graphic DesignerCourtney [email protected]
Corporate Chairman & Founder Mike Hennessy Sr
Vice ChairmanJack Lepping
President & CEOMike Hennessy Jr
Chief Financial OfficerNeil Glasser, CPA/CFE
Executive Vice President, Global Medical Affairs & Corporate DevelopmentJoe Petroziello
Executive Vice President, OperationsTom Tolvé
Senior Vice President, ContentSilas Inman
Senior Vice President, I.T. & Enterprise SystemsJohn Moricone
Senior Vice President, Audience Generation & Product FulfillmentJoy Puzzo
Vice President, Human Resources & AdministrationShari Lundenberg
Vice President, Business IntelligenceChris Hennessy
Executive Creative Director, Creative ServicesJeff Brown
Subscriber Customer ServiceVisit chromatographyonline.com to request or change a subscription or email [email protected].
Multimedia UK, LLC, Sycamore House, Suite 2 Ground Floor, Lloyd Drive, Cheshire Oaks Business Park, Ellesmere Port, CH65 9HQ, UK Tel: +44 (0)151 705 7601
Daniel W. ArmstrongUniversity of Texas, Arlington, Texas, USAGünther K. BonnInstitute of Analytical Chemistry and Radiochemistry, University of Innsbruck, AustriaDeirdre CabooterDepartment of Pharmaceutical and Pharmacological Sciences, University of Leuven, BelgiumPeter CarrDepartment of Chemistry, University of Minnesota, Minneapolis, Minnesota, USAJean-Pierre ChervetAntec Scientific, Zoeterwoude, The NetherlandsJan H. ChristensenDepartment of Plant and Environmental Sciences, University of Copenhagen, Copenhagen, DenmarkAdrian ClarkeNovartis, SwitzerlandDanilo CorradiniIstituto di Cromatografia del CNR, Rome, ItalyGert DesmetTransport Modelling and Analytical Separation Science, Vrije Universiteit, Brussels, BelgiumJohn W. DolanLC Resources, McMinnville, Oregon, USAAnthony F. FellPharmaceutical Chemistry, University of Bradford, Bradford, UKAttila FelingerProfessor of Chemistry, Department of Analytical and Environmental Chemistry, University of Pécs, Pécs, HungaryPaul FergusonAstraZeneca, UKFrancesco GasparriniDipartimento di Studi di Chimica e Tecnologia delle Sostanze Biologicamente Attive, Università “La Sapienza”, Rome, ItalyJoseph L. GlajchMomenta Pharmaceuticals, Cambridge, Massachusetts, USADavy GuillarmeSchool of Pharmaceutical Sciences, University of Geneva, University of Lausanne, Geneva, SwitzerlandJun HaginakaSchool of Pharmacy and Pharmaceutical Sciences, Mukogawa Women’s University, Nishinomiya, JapanJavier Hernández-BorgesDepartment of Chemistry (Analytical Chemistry Division), University of La Laguna Canary Islands, SpainJohn V. HinshawServeron Corp., Beaverton, Oregon, USATuulia HyötyläinenVVT Technical Research of Finland, FinlandHans-Gerd JanssenVan’t Hoff Institute for the Molecular Sciences, Amsterdam, The NetherlandsKiyokatsu JinnoSchool of Materials Sciences, Toyohasi University of Technology, Japan
Huba KalászSemmelweis University of Medicine, Budapest, HungaryHian Kee LeeNational University of Singapore, SingaporeWolfgang LindnerInstitute of Analytical Chemistry, University of Vienna, AustriaHenk LingemanFaculteit der Scheikunde, Free University, Amsterdam, The NetherlandsTom LynchAnalytical consultant, Newbury, UKRonald E. MajorsAnalytical consultant, West Chester, Pennsylvania, USADebby MangelingsDepartment of Analytical Chemistry and Pharmaceutical Technology, Vrije Universiteit, Brussels, BelgiumPhillip MarriotMonash University, School of Chemistry, Victoria, AustraliaDavid McCalleyDepartment of Applied Sciences, University of West of England, Bristol, UKRobert D. McDowallMcDowall Consulting, Bromley, Kent, UKMary Ellen McNallyDuPont Crop Protection, Newark, Delaware, USAImre MolnárMolnar Research Institute, Berlin, GermanyLuigi MondelloDipartimento Farmaco-chimico, Facoltà di Farmacia, Università di Messina, Messina, ItalyPeter MyersDepartment of Chemistry, University of Liverpool, Liverpool, UKJanusz PawliszynDepartment of Chemistry, University of Waterloo, Ontario, Canada Colin Poole Wayne State University, Detroit, Michigan, USAFred E. RegnierDepartment of Biochemistry, Purdue University, West Lafayette, Indiana, USAHarald RitchieAdvanced Materials Technology, Chester, UKKoen SandraResearch Institute for Chromatography, Kortrijk, BelgiumPat SandraResearch Institute for Chromatography, Kortrijk, BelgiumPeter SchoenmakersDepartment of Chemical Engineering, Universiteit van Amsterdam, Amsterdam, The NetherlandsRobert ShellieDeakin University, Melbourne, AustraliaYvan Vander HeydenVrije Universiteit Brussel, Brussels, Belgium
The Publishers of LCGC Europe would like to thank the members of the Editorial Advisory Board for their continuing support and expert advice. The high standards and editorial quality associated with LCGC Europe are maintained largely through the tireless efforts of these individuals. LCGC Europe provides troubleshooting information and application solutions on all aspects of separation science so that laboratory-based analytical chemists can enhance their practical knowledge to gain competitive advantage. Our scientific quality and commercial objectivity provide readers with the tools necessary to deal with real-world analysis issues, thereby increasing their efficiency, productivity and value to their employer.
EDITORIAL ADVISORY BOARD
Follow us @ LC_GC
‘Like’ our page LCGC
Join the LCGC LinkedIn group
SUBSCRIPTIONS: LCGC Europe is free to qualified readers in Europe.To apply for a free subscription, or to change your name or address, go to www.chromatographyonline.com, click on Subscribe, and follow the prompts. To cancel your subscription, please email your request to: [email protected], putting LCE in the subject line. Please quote your subscription number if you have it.MANUSCRIPTS: For manuscript preparation guidelines, visit www.chromatographyonline.com or call the Editor, +44 (0)151 705 7601. All submissions will be handled with reasonable care, but the publisher assumes no responsibility for safety of artwork, photographs or manuscripts. Every precaution is taken to ensure accuracy, but the publisher cannot accept responsibility for the accuracy of information supplied herein or for any opinion expressed.DIRECT MAIL LIST: Telephone: +44 (0)151 705 7601.Reprints: Reprints of all articles in this issue and past issues of this publication are available (250 minimum). Licensing and Reuse of Content: Contact Mike Tessalone at MJH Life Sciences. Telephone: (732) 346 3016. E-mail: [email protected]© 2020 Multimedia UK, LLC all rights reserved. No part of the publication may be reproduced in any material form (including photocopying or storing it in any medium by electronic means and whether or not transiently or incidentally to some other use of this publication) without the written permission of the copyright owner except in accordance with the provisions of the Copyright Designs & Patents Act (UK) 1988 or under the terms of the license issued by the Copyright License Agency’s 90 Tottenham Court Road, London W1P 0LP, UK. Applications for the copyright owner’s permission to reproduce any part of this publication outside of the Copyright Designs & Patents Act (UK) 1988 provisions, should be forwarded in writing to Permission Dept. email: [email protected]. Warning: the doing of an unauthorized act in relation to a copyright work may result in both a civil claim for damages and criminal prosecution 10% Post
ConsumerWaste
5www.chromatographyonline.com
This year, we celebrate the 50-year anniversay of Csaba Horvath’s 1970 Pittcon lecture in which he coined the famous “HPLC” acronym we are now so accustomed to. And, oh boy, what enormous progress our field has made since then. While 50 years ago an analysis with a resolution of N = 1000 plates required about half an hour (for a complete analysis where the last component elutes with a retention factor of 10), a fully optimized system today can easily produce more than 100 000 theoretical plates in the same time, constituting a gain of more than two orders of magnitude. The gain in analysis speed is even more impressive, as we can back-calculate that, for example, the time needed to produce 30 000 theoretical plates in a complete analysis was on the order of some 12 hours in 1970, while today a fully optimised system would produce the same number of plates in about 1.5 minutes. An account of this progress is given in the main feature of the upcoming June edition of LCGC Europe, comparing the progress made over the last 50 years to Moore’s law, the empirical law that was first used to describe the long-term progress made in terms of memory capacity and processor speed realised in the micro-electronics industry. Moore’s law predicts that progress occurs exponentially, a sign of a technology that is of an evolutionary nature, meaning it is driven by external needs for better performance.
With this look-back in mind, Fabrice Gritti looks into the future of instrumentation and column technology, in this special supplement from LCGC Europe. He does this based on the sound fundaments of plate height theory, and modern visualisation and simulation technologies. These technologies cover all the different scales encountered in a (U)HPLC-column, going from the retention sites inside the particle’s mesopore to the scale of the metal column housing. Fabrice is rather gloomy about the possibility to further shrink particle sizes and push pressures, as the tremendous viscous heating problems require the use of narrow-bore columns and these appear to suffer from a fundamental packing problem. Innovative column technologies will have to be developed to circumvent this limitation. Nevertheless, he also convincingly shows that the current fast gradient separation speeds realised in the pharmaceutical industry using conventional UHPLC systems could easily be accelerated by one order of magnitude by adopting a zero extra-column volume system with short 1-cm columns packed with sub-2-μm core-shell particles and operated at high temperatures around 70 °C.
As we can expect our future will be more and more dominated by 2D-LC separations, I am convinced the contribution of
Soraya Chapel, Florent Rouvière, and Sabine Heinisch on the reconciliation of a high peak capacity with a minimal dilution, the latter being one of the often-cited foes of 2D-LC, will appeal to many readers. In a very elegant way, they demonstrate both theoretically and experimentally how tuning the injected volume to the expected variance of the column can significantly suppress peak dilution without compromising the achievable peak capacity too much. They convincingly show how, in the case of a relatively short gradient time (order 30 min), 2D-LC separations in the reverse-phase LC×reverse-phase LC mode can easily produce peaks that are five times more concentrated than in 1D-LC, while offering a double peak capacity. At larger gradient times, the possibilities to further reduce the dilution compared to 1D-LC while further enhancing the peak capacity only become larger.
Next to this, I am also delighted that the contribution from Martina Catani, Alberto Cavazzini, et al., which shows how fundamental work on particle chemistry can still lead to significant improvements in selectivity. They report on a case study in chiral analysis, where the innovative chemistry of a novel zwitterionic-teicoplanin chiral stationary phase has been proven key to efficiently and productively resolving very challenging chiral separations. Owing to the combination with core-shell technology and the possibility to use acetonitrile-rich mobile phases, the efficiency of the separations with this material can be very high so that the technology can also be used in ultra-fast applications, to meet a rapidly-growing need from industry.
An introduction from the guest editor of this special supplement from LCGC Europe revealing innovative developments in high performance liquid chromatography (HPLC) and ultra-high-pressure liquid chromatography (UHPLC).
Gert Desmet heads the department of chemical engineering at the Vrije Universiteit Brussel, [email protected]
Current fast gradient separation speeds could easily be accelerated by one order of magnitude by adopting a zero extra-column volume system with short 1-cm columns packed with sub-2-μm core-shell particles and operated at temperatures around 70 °C.
6 Advances in UHPLC/HPLC May 2020
FROM THE GUEST EDITOR
Next Generation of Chromatographic Columns and Systems: From Theories to Possible Future Practices Fabrice Gritti, Waters Corporation, Milford, Massachusetts, USA
A series of theoretical, visualization, and simulation tools that are used to improve the structure and chemistry of the next generation of liquid chromatography (LC) columns is briefly reviewed. The article describes how this combination of visualization and simulation techniques can accurately predict column performance and support method development in a “dry-lab” approach. The potential for the next generation of chromatographic systems and columns to overcome the current resolution and speed limitations of one-dimensional chromatography is also explored. Potential developments include the next generation of narrow-bore columns packed with sub-1-µm particles for “ultra-ultra-high-pressure” liquid chromatography (UUHPLC) up to 7 kbar, high-throughput three-dimensional (3D)-printed technologies for delivering materials with feature sizes smaller than 5 µm, and the next generation of zero extracolumn volume systems for ultrafast gradient LC using 1-cm-long narrow-bore columns for sub-5-seconds routine gradients.
High performance liquid chromatography (HPLC) is more than 50 years old (1) and has established itself as one of the most widely used techniques for separation and analysis. Over half a century, both systems and chromatographic columns have evolved dramatically. This development has mainly been driven by the insatiable search for faster analyses and more efficient columns, leading to the development of smaller fully porous particles (FPPs) (2), sub-3-μm core-shell particles (3,4), and to the application of ultrahigh pressures around 1 kbar (5). In 2020, ultrahigh-pressure (UHP) and ultralow dispersive LC instruments, which were introduced to the separation field 15 years ago
to run columns packed with sub-2-μm particles, have not evolved much. They still remain the state-of-the-art technology that sets the limits of the speed-resolution power in unidimensional LC (6). As well as these instrument and column evolutions, the nature of the applications has also changed considerably over the past 50 years. LC now needs to adapt to new separation challenges from growing research areas in biology. From amino acids, peptides, proteins, DNA, monoclonal antibodies (mAbs), virus-like particles to exosomes, new designs rivalling the conventional porous or superficially porous chromatographic materials are also needed (7).
While trial-and-error, design of experiments (DOEs), and, more recently, artificial intelligence (AI) are frequently used to develop new structures and surface chemistries for targeted purposes, the underlying rules of physical chemistry still have a huge role to play in the design of new technologies in LC. To reduce research and development times in the industry, quality by design (QbD) approaches are preferred to random or statistical methods. However, they require expertise and strong fundamental understanding of the process. Given the complexity of the separation mechanism of complex mixtures, which involves knowledge in both adsorption (thermodynamics) and mass
7www.chromatographyonline.com
GRITTI
transport (kinetics) in a multiscale system, there is a constant push in the separation community towards bridging the persistent gap between the performance predicted by either statistical models or approximate theories and that observed by the chromatographer in the laboratory.
The first goal of this article is to assess the power of well-known basic theories of chromatography (plate, rate, and stochastic theories) for the development of new chromatographic materials and to pinpoint their limits with respect to the actual phenomena of retention and band broadening taking place in real chromatographic columns. To that end, the advances in the physical reconstruction of the multiscale structure of an entire chromatographic column (macroporous and mesoporous space) combined with fluid dynamics, Brownian, and molecular dynamics simulation techniques (for the determination of actual flow velocity profile, diffusivity, and distribution of the analyte [8]) is discussed and illustrated in the case of size-exclusion chromatography (SEC). The second goal of this work is to report data on the latest progress in the development of “ultra-ultra-high-pressure liquid chromatography” (UUHPLC) using 3-cm-long narrow-bore columns packed with sub-1-μm particles (dp = 700 nm), three-dimensional (3D)-printed columns based on different technologies, and in ultrafast gradient LC using very short 1-cm-long columns. The potential of these three different techniques in the years to come will be discussed and assessed.
ExperimentalFor the isocratic runs, the flow rate is set at 0.45 mL/min, the volume
fraction of acetonitrile in water is 65%, and the temperature was fixed at 27
ºC. The injection volumes were set at 1 μL and 10 nL when using an Acquity I-Class UHPLC system (Waters) and the reduced volume research prototype system, respectively.
For the gradient runs, the flow rate is set at 2.00 mL/min and the volume fraction of acetonitrile in water increases from 5% to 95%. The two solvent lines containing pure water and pure acetonitrile contain 0.02% (v/v) trifluoroacetic acid (TFA). The gradient times were set at 1.17 min and 0.10 min, the temperatures at 45 ºC and 70 ºC, the flow rates at 1.0 mL/min and 2.0 mL/min, the detection wavelengths at 210 nm and 257 nm, and the injection volumes at 1 μL and 10 nL when using an Acquity I-Class UHPLC system (Waters) and the reduced volume research prototype system, respectively.
Contribution and Limits of Theories of Chromatography for Column Technology DevelopmentPlate Theories: The very first theory of mass transport in a chromatographic column was proposed by Martin and Synge. Their well-known plate theory for a two liquid-phase system (8) saw the birth of partition chromatography and they both received the Nobel Prize in Chemistry for this discovery in 1952. The theory accounts for band broadening by considering a series of plates of equal height in which equilibrium always applies. By analogy to the distillation process, the smaller the plate height is, the larger the number of chemical fractions to be separated and the larger the column efficiency. However, for either open tubular columns (OTCs)
or particulate columns, the notion of plates is remote from the reality because it does not relate directly to the physical parameters controlling analyte dispersion. As a result, the plate theory is merely lumping all the phenomena of band broadening into a single and apparent height, H, which carries no clear physical relevance for the user, and so, the plate theory is not really helpful for column development. Rate Theories: For the reasons mentioned previously, the so-called rate theories flourished and were hugely successful in the 1950s, the golden decade of chromatography (9,10). Indeed, rate theories considered relevant dispersion parameters (such as the bulk diffusion coefficient Dm, the axial dispersion coefficient Da, the eluent linear velocity U, the global mass transfer coefficient Cs between the stationary and mobile phase, and the equilibrium constant K) and provided explicit expressions for the peak or breakthrough concentration profiles as a function of these parameters. Both chemists and analysts are now disposing of a solid physical model for performance optimization by selecting the most appropriate combination of speed, axial dispersion (particle size or open-tube column internal diameter [i.d.]), and diffusivity in the stationary phase (temperature, particle size, particle porosity, pore size). Van Deemter (11) was the first to unify the plate and rate theories in 1956. He derived his well-known equation in which H became an explicit function of U and three main coefficients related to longitudinal diffusion (called B), eddy dispersion (called A), and mass transfer resistance in the stationary phase (called C). The plate height
8 Advances in UHPLC/HPLC May 2020
GRITTI
H received a physical meaning and became an unambiguous function of Dm, U, dp, Cs, and K.
Unfortunately, the experience shows that any attempt to fit the van Deemter equation to experimental H versus U data always returned meaningless parameters, for example, diffusion coefficients, which are significantly different from the actual ones (12). This sets the limits of rate theories as being an oversimplification of the actual separation process. Stochastic Theories: To further bridge the gap between theory and observation, in 1955 Giddings and Eyring elaborated the very first probabilistic or stochastic theory of chromatography (13), assuming random adsorption and desorption events for each individual analyte molecule (such adsorption and desorption events were assumed to follow a Poisson distribution). This early stochastic theory was not fully comprehensive because it did not account for the known sources of band broadening pertaining to natural diffusion and flow heterogeneity in the chromatographic column. This gave birth to what is considered the most elegant theory of band broadening based on the simple one-dimensional (1D) random walk model, which can quantitatively describe all sources of zone dispersion in a chromatographic column including longitudinal diffusion, trans-channel, short-range inter-channel, long-range inter-channel, and trans-column eddy dispersion, as well as mass transfer resistance as a result of finite diffusivity in the stationary phase and to slow adsorption–desorption (14). In particular, this stochastic model revealed that the dispersion
of small molecules in randomly packed beds can be significant at high speed, suggesting the design of more ordered structures to minimize flow heterogeneity in the chromatographic column.
Even though there cannot be any better theory of mass
transport than the stochastic theory of chromatography, it cannot properly account for all the relevant specificities of LC columns and porous materials. For example, neither the true external geometry of the particles, their actual size distribution, the real flow velocity profile across the
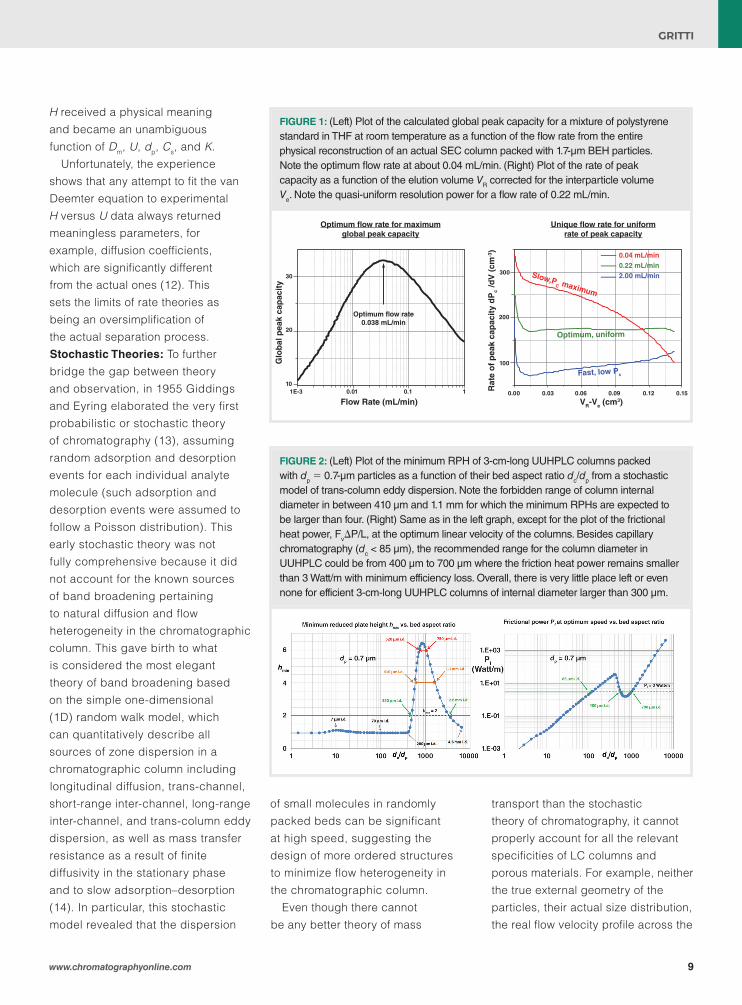
FIGURE 2: (Left) Plot of the minimum RPH of 3-cm-long UUHPLC columns packed with dp = 0.7-µm particles as a function of their bed aspect ratio dc/dp from a stochastic model of trans-column eddy dispersion. Note the forbidden range of column internal diameter in between 410 µm and 1.1 mm for which the minimum RPHs are expected to be larger than four. (Right) Same as in the left graph, except for the plot of the frictional heat power, FvΔP/L, at the optimum linear velocity of the columns. Besides capillary chromatography (dc < 85 µm), the recommended range for the column diameter in UUHPLC could be from 400 µm to 700 µm where the friction heat power remains smaller than 3 Watt/m with minimum efficiency loss. Overall, there is very little place left or even none for efficient 3-cm-long UUHPLC columns of internal diameter larger than 300 µm.
Optimum flow rate for maximumglobal peak capacity
Unique flow rate for uniformrate of peak capacity
Flow Rate (mL/min) VR-Ve (cm3)
Glo
bal
pea
k ca
pac
ity
Rat
e o
f p
eak
cap
acit
y d
Pc
/dV
(cm
-3)
1E-3 0.01 0.1 110
20
30
0.00 0.03 0.06 0.09 0.12 0.15
100
200
300
0.04 mL/min0.22 mL/min2.00 mL/minSlow,P
C maximum
Optimum, uniform
Fast, low Pc
Optimum flow rate0.038 mL/min
FIGURE 1: (Left) Plot of the calculated global peak capacity for a mixture of polystyrene standard in THF at room temperature as a function of the flow rate from the entire physical reconstruction of an actual SEC column packed with 1.7-µm BEH particles. Note the optimum flow rate at about 0.04 mL/min. (Right) Plot of the rate of peak capacity as a function of the elution volume VR corrected for the interparticle volume Ve. Note the quasi-uniform resolution power for a flow rate of 0.22 mL/min.
9www.chromatographyonline.com
GRITTI
diameter of a column, nor the actual internal structure of a mesoporous packing material are properly considered by these theories (15). Yet, these column and particle properties control the chromatographic performance and are highly relevant.
Morphology Reconstruction,
Multiscale Imaging, and Simulation
Techniques: The gap between the theories mentioned previously and observation is still important today for the lack of an accurate description of the true morphological features
of a column and band broadening mechanism. Even the most elaborate rate or stochastic theories ignore some of the most relevant structural features of a chromatographic column pertaining to the macroporous space (mobile interstitial volume), mesoporous space (stagnant internal volume), and to the distribution or density and diffusivities of the solvent and analyte molecules within a single pore. A complete morphological characterization of the column bed is first needed to make physically relevant predictions for the main column properties (retention and efficiency) (16). This task has been supported by the advances in microscopy (optical and electronic), imaging technologies, and computer resources. Focused ion beam scanning electron microscopy (FIB-SEM) (17) or confocal laser scanning microscopy (CLSM, a few nm resolution) (18) are applied for the reconstruction of the mesoporous space while scanning transmission electron microscopy (STEM, a few Å resolution) (19) enables the accurate reconstruction of the mesoporous space inside the particle. Finally, at the molecular level and within a single pore, either Monte-Carlo (20) or molecular dynamics (21,22) simulations are performed to determine the expected density profiles of both solvent and analyte molecules from the pore wall (of various possible surface chemistries) to the centre of a single mesopore. It is striking to see how complex the solvent and analyte density distributions are when visualizing their many ups and downs in their profiles. They underlie the intrinsic heterogeneous nature of the interface between the pore wall and the bulk pore volume.
!"#$%&"'()*"'+','µ- !"#$%&"'()*"'+'.'µ-
8&$)9',-60.':'';<'µ%'/';<<'µ%'/'';'3%8&$)9',-60.':'';='µ%'/'>;?'µ%'/''@'%
!"#$%&'*
Feature size: 5 µm Feature size: 1 µm
Build range: 18 µm x 315 µm x 2 m Build range: 10 µm x 100 µm x 1 cm
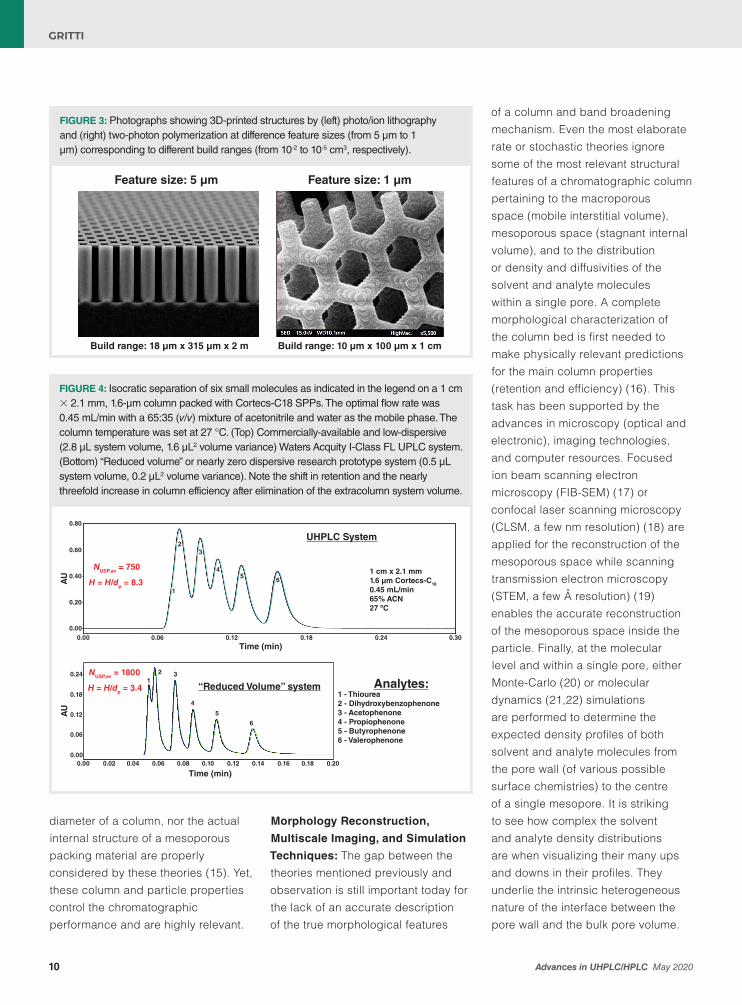
FIGURE 3: Photographs showing 3D-printed structures by (left) photo/ion lithography and (right) two-photon polymerization at difference feature sizes (from 5 µm to 1 µm) corresponding to different build ranges (from 10-2 to 10-5 cm3, respectively).
Time (min)
Time (min)
AU
AU
0.80
0.60
0.40
0.20
0.000.00 0.06 0.12 0.18 0.24 0.30
0.24
0.18
0.12
0.06
0.000.00 0.02 0.04 0.06 0.08 0.10 0.12 0.14 0.16 0.18 0.20
UHPLC System
Analytes:“Reduced Volume” system1 - Thiourea2 - Dihydroxybenzophenone3 - Acetophenone4 - Propiophenone5 - Butyrophenone6 - Valerophenone
NUSP,av = 750
H = H/dp = 8.3
NUSP,av = 1800
H = H/dp = 3.41
2 3
4
5
6
1
23
56
4 1 cm x 2.1 mm1.6 µm Cortecs-C180.45 mL/min65% ACN27 ºC
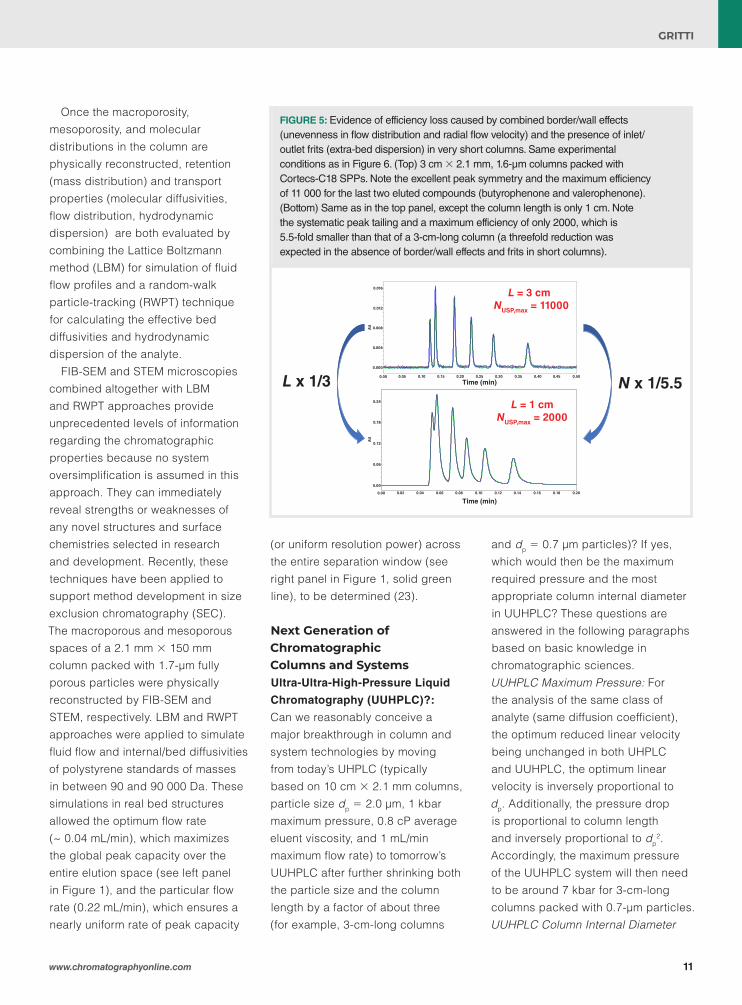
FIGURE 4: Isocratic separation of six small molecules as indicated in the legend on a 1 cm × 2.1 mm, 1.6-µm column packed with Cortecs-C18 SPPs. The optimal flow rate was 0.45 mL/min with a 65:35 (v/v) mixture of acetonitrile and water as the mobile phase. The column temperature was set at 27 °C. (Top) Commercially-available and low-dispersive (2.8 µL system volume, 1.6 µL2 volume variance) Waters Acquity I-Class FL UPLC system. (Bottom) “Reduced volume” or nearly zero dispersive research prototype system (0.5 µL system volume, 0.2 µL2 volume variance). Note the shift in retention and the nearly threefold increase in column efficiency after elimination of the extracolumn system volume.
10 Advances in UHPLC/HPLC May 2020
GRITTI
Once the macroporosity, mesoporosity, and molecular distributions in the column are physically reconstructed, retention (mass distribution) and transport properties (molecular diffusivities, flow distribution, hydrodynamic dispersion) are both evaluated by combining the Lattice Boltzmann method (LBM) for simulation of fluid flow profiles and a random-walk particle-tracking (RWPT) technique for calculating the effective bed diffusivities and hydrodynamic dispersion of the analyte.
FIB-SEM and STEM microscopies combined altogether with LBM and RWPT approaches provide unprecedented levels of information regarding the chromatographic properties because no system oversimplification is assumed in this approach. They can immediately reveal strengths or weaknesses of any novel structures and surface chemistries selected in research and development. Recently, these techniques have been applied to support method development in size exclusion chromatography (SEC). The macroporous and mesoporous spaces of a 2.1 mm × 150 mm column packed with 1.7-μm fully porous particles were physically reconstructed by FIB-SEM and STEM, respectively. LBM and RWPT approaches were applied to simulate fluid flow and internal/bed diffusivities of polystyrene standards of masses in between 90 and 90 000 Da. These simulations in real bed structures allowed the optimum flow rate (~ 0.04 mL/min), which maximizes the global peak capacity over the entire elution space (see left panel in Figure 1), and the particular flow rate (0.22 mL/min), which ensures a nearly uniform rate of peak capacity
(or uniform resolution power) across the entire separation window (see right panel in Figure 1, solid green line), to be determined (23).
Next Generation of Chromatographic Columns and Systems Ultra-Ultra-High-Pressure Liquid
Chromatography (UUHPLC)?:
Can we reasonably conceive a major breakthrough in column and system technologies by moving from today’s UHPLC (typically based on 10 cm × 2.1 mm columns, particle size dp = 2.0 μm, 1 kbar maximum pressure, 0.8 cP average eluent viscosity, and 1 mL/min maximum flow rate) to tomorrow’s UUHPLC after further shrinking both the particle size and the column length by a factor of about three (for example, 3-cm-long columns
and dp = 0.7 μm particles)? If yes, which would then be the maximum required pressure and the most appropriate column internal diameter in UUHPLC? These questions are answered in the following paragraphs based on basic knowledge in chromatographic sciences.UUHPLC Maximum Pressure: For the analysis of the same class of analyte (same diffusion coefficient), the optimum reduced linear velocity being unchanged in both UHPLC and UUHPLC, the optimum linear velocity is inversely proportional to dp. Additionally, the pressure drop is proportional to column length and inversely proportional to dp
2. Accordingly, the maximum pressure of the UUHPLC system will then need to be around 7 kbar for 3-cm-long columns packed with 0.7-μm particles.UUHPLC Column Internal Diameter
!"
#$###
#$##%
#$##&
#$#'(
#$#')
*+,-./0#$## #$#1 #$'# #$'1 #$(# #$(1 #$2# #$21 #$%# #$%1 #$1#
!"
#$##
#$#%
#$&'
#$&(
#$')
*+,-./0#$## #$#' #$#) #$#% #$#( #$&# #$&' #$&) #$&% #$&( #$'#
%&/'.'7-!!"#$(%)/'8111
% /'3'7-!!"#$(%)/..111
!"#"$%&'&("#"$%)
!"#$%&',
L x 1/3 N x 1/5.50.00
0.000
0.004
0.008
0.012
0.016
AU
0.00
0.00
0.06
0.12
0.18
0.24
AU
Time (min)
Time (min)
0.05 0.10 0.15 0.20 0.25 0.30 0.35 0.40 0.45 0.50
0.02 0.04 0.06 0.08 0.10 0.12 0.14 0.16 0.18 0.20
NUSP,max = 11000L = 3 cm
NUSP,max = 2000L = 1 cm
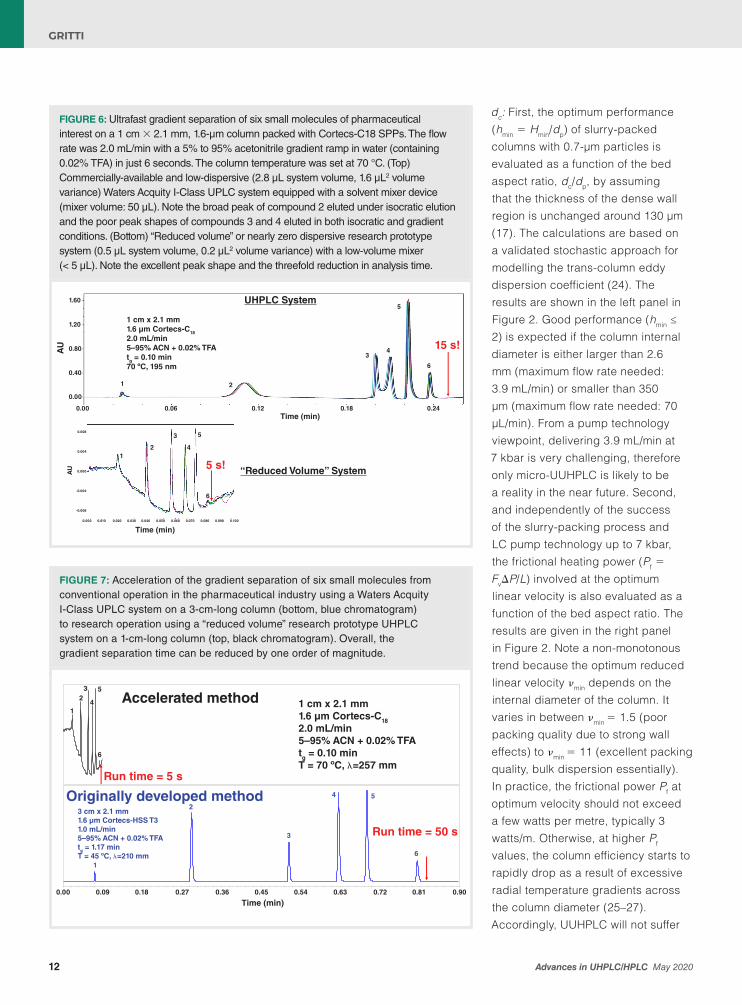
FIGURE 5: Evidence of efficiency loss caused by combined border/wall effects (unevenness in flow distribution and radial flow velocity) and the presence of inlet/outlet frits (extra-bed dispersion) in very short columns. Same experimental conditions as in Figure 6. (Top) 3 cm × 2.1 mm, 1.6-µm columns packed with Cortecs-C18 SPPs. Note the excellent peak symmetry and the maximum efficiency of 11 000 for the last two eluted compounds (butyrophenone and valerophenone). (Bottom) Same as in the top panel, except the column length is only 1 cm. Note the systematic peak tailing and a maximum efficiency of only 2000, which is 5.5-fold smaller than that of a 3-cm-long column (a threefold reduction was expected in the absence of border/wall effects and frits in short columns).
11www.chromatographyonline.com
GRITTI
dc: First, the optimum performance (hmin = Hmin/dp) of slurry-packed columns with 0.7-μm particles is evaluated as a function of the bed aspect ratio, dc/dp, by assuming that the thickness of the dense wall region is unchanged around 130 μm (17). The calculations are based on a validated stochastic approach for modelling the trans-column eddy dispersion coefficient (24). The results are shown in the left panel in Figure 2. Good performance (hmin ≤ 2) is expected if the column internal diameter is either larger than 2.6 mm (maximum flow rate needed: 3.9 mL/min) or smaller than 350 μm (maximum flow rate needed: 70 μL/min). From a pump technology viewpoint, delivering 3.9 mL/min at 7 kbar is very challenging, therefore only micro-UUHPLC is likely to be a reality in the near future. Second, and independently of the success of the slurry-packing process and LC pump technology up to 7 kbar, the frictional heating power (Pf = FvΔP/L) involved at the optimum linear velocity is also evaluated as a function of the bed aspect ratio. The results are given in the right panel in Figure 2. Note a non-monotonous trend because the optimum reduced linear velocity νmin depends on the internal diameter of the column. It varies in between νmin = 1.5 (poor packing quality due to strong wall effects) to νmin = 11 (excellent packing quality, bulk dispersion essentially). In practice, the frictional power Pf at optimum velocity should not exceed a few watts per metre, typically 3 watts/m. Otherwise, at higher Pf values, the column efficiency starts to rapidly drop as a result of excessive radial temperature gradients across the column diameter (25–27). Accordingly, UUHPLC will not suffer
UHPLC System
15 s!
1 cm x 2.1 mm1.6 µm Cortecs-C182.0 mL/min5–95% ACN + 0.02% TFAtg = 0.10 min70 ºC, 195 nm
“Reduced Volume” System
Time (min)
Time (min)
5 s!
AU
0.00
0.40
0.80
1.20
1.60
0.00
1 2
0.06 0.12 0.18 0.24
34
6
5
AU
0.008
0.004
0.000
-0.004
-0.008
0.000 0.010 0.020 0.030 0.040 0.050 0.060 0.070 0.080 0.090 0.100
12
3
4
6
5
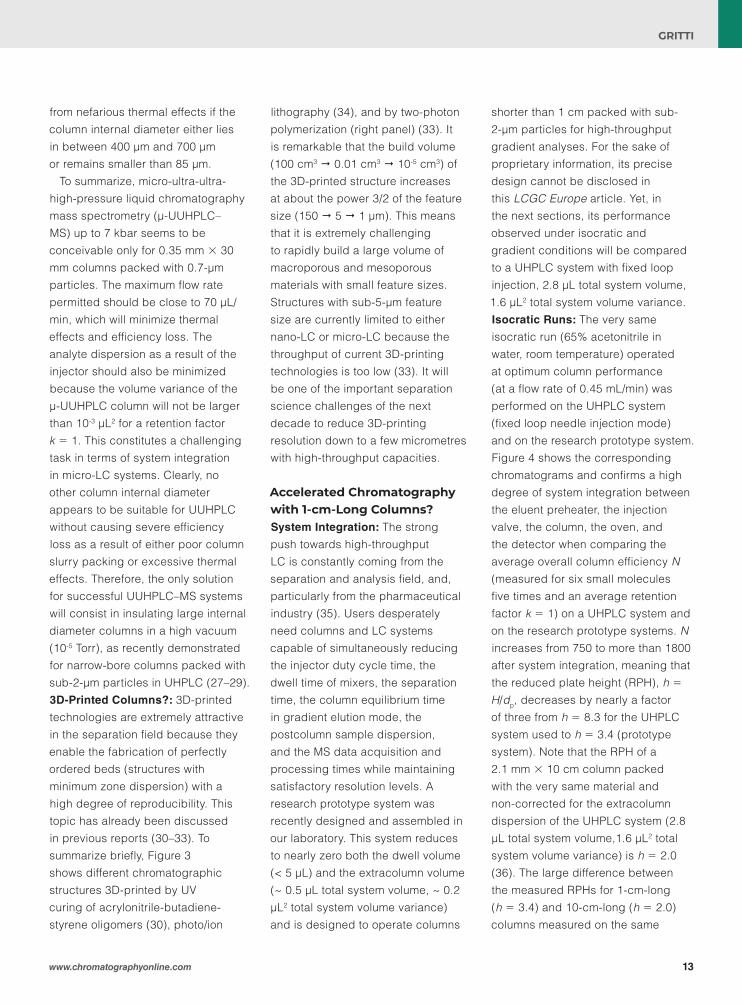
FIGURE 6: Ultrafast gradient separation of six small molecules of pharmaceutical interest on a 1 cm × 2.1 mm, 1.6-µm column packed with Cortecs-C18 SPPs. The flow rate was 2.0 mL/min with a 5% to 95% acetonitrile gradient ramp in water (containing 0.02% TFA) in just 6 seconds. The column temperature was set at 70 °C. (Top) Commercially-available and low-dispersive (2.8 µL system volume, 1.6 µL2 volume variance) Waters Acquity I-Class UPLC system equipped with a solvent mixer device (mixer volume: 50 µL). Note the broad peak of compound 2 eluted under isocratic elution and the poor peak shapes of compounds 3 and 4 eluted in both isocratic and gradient conditions. (Bottom) “Reduced volume” or nearly zero dispersive research prototype system (0.5 µL system volume, 0.2 µL2 volume variance) with a low-volume mixer (< 5 µL). Note the excellent peak shape and the threefold reduction in analysis time.
!"#$%&'()(( ()(* ()+, ()-. ()/0 ()12 ()21 ()0/ ().- (),+ ()*(
!"#$#%&''()*+,+'-.+*)/+01-*
1
2
3
4 5
6
1
23
4
5
6
233+'+"&0+*)/+01-*
3 cm x 2.1 mm1.6 um Cortecs-HSS T31.0 mL/min5–95% ACN + 0.02% TFAtg = 1.17 minT = 45 oC, ! = 210 nm
1 cm x 2.1 mm1.6 um Cortecs-C182.0 mL/min5–95% ACN + 0.02% TFAtg= 0.10 minT = 70 oC, ! = 257 nm
!"#$%&'($)$*$+
!"#$%&'($)$*,$+
!"#$%&'0
Accelerated method
Originally developed method
Time (min)
1 cm x 2.1 mm1.6 µm Cortecs-C182.0 mL/min5–95% ACN + 0.02% TFAtg = 0.10 minT = 70 ºC, λ=257 mm
3 cm x 2.1 mm1.6 µm Cortecs-HSS T31.0 mL/min5–95% ACN + 0.02% TFAtg = 1.17 minT = 45 ºC, λ=210 mm
Run time = 50 s
Run time = 5 s
1
23
4
5
6
1
2
3
4 5
6
0.00 0.09 0.18 0.27 0.36 0.45 0.54 0.63 0.72 0.81 0.90
FIGURE 7: Acceleration of the gradient separation of six small molecules from conventional operation in the pharmaceutical industry using a Waters Acquity I-Class UPLC system on a 3-cm-long column (bottom, blue chromatogram) to research operation using a “reduced volume” research prototype UHPLC system on a 1-cm-long column (top, black chromatogram). Overall, the gradient separation time can be reduced by one order of magnitude.
12 Advances in UHPLC/HPLC May 2020
GRITTI
from nefarious thermal effects if the column internal diameter either lies in between 400 μm and 700 μm or remains smaller than 85 μm.
To summarize, micro-ultra-ultra-high-pressure liquid chromatography mass spectrometry (μ-UUHPLC–MS) up to 7 kbar seems to be conceivable only for 0.35 mm × 30 mm columns packed with 0.7-μm particles. The maximum flow rate permitted should be close to 70 μL/min, which will minimize thermal effects and efficiency loss. The analyte dispersion as a result of the injector should also be minimized because the volume variance of the μ-UUHPLC column will not be larger than 10-3 μL2 for a retention factor k = 1. This constitutes a challenging task in terms of system integration in micro-LC systems. Clearly, no other column internal diameter appears to be suitable for UUHPLC without causing severe efficiency loss as a result of either poor column slurry packing or excessive thermal effects. Therefore, the only solution for successful UUHPLC–MS systems will consist in insulating large internal diameter columns in a high vacuum (10-5 Torr), as recently demonstrated for narrow-bore columns packed with sub-2-μm particles in UHPLC (27–29). 3D-Printed Columns?: 3D-printed technologies are extremely attractive in the separation field because they enable the fabrication of perfectly ordered beds (structures with minimum zone dispersion) with a high degree of reproducibility. This topic has already been discussed in previous reports (30–33). To summarize briefly, Figure 3 shows different chromatographic structures 3D-printed by UV curing of acrylonitrile-butadiene-styrene oligomers (30), photo/ion
lithography (34), and by two-photon polymerization (right panel) (33). It is remarkable that the build volume (100 cm3 0.01 cm3 10-5 cm3) of the 3D-printed structure increases at about the power 3/2 of the feature size (150 5 1 μm). This means that it is extremely challenging to rapidly build a large volume of macroporous and mesoporous materials with small feature sizes. Structures with sub-5-μm feature size are currently limited to either nano-LC or micro-LC because the throughput of current 3D-printing technologies is too low (33). It will be one of the important separation science challenges of the next decade to reduce 3D-printing resolution down to a few micrometres with high-throughput capacities.
Accelerated Chromatography with 1-cm-Long Columns?System Integration: The strong push towards high-throughput LC is constantly coming from the separation and analysis field, and, particularly from the pharmaceutical industry (35). Users desperately need columns and LC systems capable of simultaneously reducing the injector duty cycle time, the dwell time of mixers, the separation time, the column equilibrium time in gradient elution mode, the postcolumn sample dispersion, and the MS data acquisition and processing times while maintaining satisfactory resolution levels. A research prototype system was recently designed and assembled in our laboratory. This system reduces to nearly zero both the dwell volume (< 5 μL) and the extracolumn volume (~ 0.5 μL total system volume, ~ 0.2 μL2 total system volume variance) and is designed to operate columns
shorter than 1 cm packed with sub-2-μm particles for high-throughput gradient analyses. For the sake of proprietary information, its precise design cannot be disclosed in this LCGC Europe article. Yet, in the next sections, its performance observed under isocratic and gradient conditions will be compared to a UHPLC system with fixed loop injection, 2.8 μL total system volume, 1.6 μL2 total system volume variance. Isocratic Runs: The very same isocratic run (65% acetonitrile in water, room temperature) operated at optimum column performance (at a flow rate of 0.45 mL/min) was performed on the UHPLC system (fixed loop needle injection mode) and on the research prototype system. Figure 4 shows the corresponding chromatograms and confirms a high degree of system integration between the eluent preheater, the injection valve, the column, the oven, and the detector when comparing the average overall column efficiency N (measured for six small molecules five times and an average retention factor k = 1) on a UHPLC system and on the research prototype systems. N increases from 750 to more than 1800 after system integration, meaning that the reduced plate height (RPH), h =
H/dp, decreases by nearly a factor of three from h = 8.3 for the UHPLC system used to h = 3.4 (prototype system). Note that the RPH of a 2.1 mm × 10 cm column packed with the very same material and non-corrected for the extracolumn dispersion of the UHPLC system (2.8 μL total system volume,1.6 μL2 total system volume variance) is h = 2.0 (36). The large difference between the measured RPHs for 1-cm-long (h = 3.4) and 10-cm-long (h = 2.0) columns measured on the same
13www.chromatographyonline.com
GRITTI
system is essentially caused by the presence of the two 0.21 mm × 1 mm frit (0.7 μL void volume, ~ 0.2 μL2 volume variance each [37]). The band dispersion caused by the same frits has obviously more impact on short than on long columns. The elution volume, VR, and the volume variance, σ2
bed, of the packed bed alone (intrinsic RPH hint = 1.2 measured on a 10-cm-long column after removing both frit and system dispersion, total bed porosity 55%, and k = 1) are 38 μL and 0.28 μL2, respectively, for a 1-cm-long column. So, VR = 380 μL and σ2
bed = 2.8 μL2 for a 10-cm-long column. Therefore, the overall and observed efficiency, N = V2
R/ σ2
total, of a 1-cm-long column with and without frit operated on two different instruments can easily be estimated:
N1 cm, frit + UHPLC system = (38 + 2 × 0.7 + 2.8)2/(0.28 + 2 × 0.2 + 1.6) = 780 and h = 8.0 for the 1-cm-long column mounted on the UHPLC sytem with fixed loop,
N1 cm, no frit, UHPLC system = (38 + 2.8)2/(0.28 + 1.6) = 885 and h = 7.1 for the UHPLC system in the absence of frits,
N1cm, frit + prototype system = (38 + 2 × 0.7 + 0.5)2/(0.28 + 2 × 0.2 + 0.2) = 1 810 and h = 3.5 for the integrated research prototype system,
N1 cm, no frit, prototype system = (38 + 0.5)2/(0.28 + 0.2) = 3 090 and h = 2.0 for the integrated research prototype system in the absence of frits.
The first and third RPH calculations are in very good agreement with the observation (h = 8.3 and 3.4), and the second and fourth RPH calculations reveal that frits have a severe impact on the efficiency of very short columns and that the
apparent efficiency of a 1-cm-long column mounted on the integrated research prototype instrument could be improved by over 70% from N = 1810 to N = 3090 if there were no frit at both ends of this short column.
Figure 5 demonstrates that 1-cm- long columns intrinsically suffer from significant sample dispersion caused by the two frits and by border (uneven flow distribution) and wall (uneven flow profile) effects. This causes systematic peak tailing (bottom chromatogram in Figure 5), which almost completely vanishes for longer columns (example: 3 cm, top chromatogram in Figure 5) packed with the same material. For instance, the maximum USP efficiency of a 3-cm-long column measured on the same research prototype “reduced volume” instrument is 11 000 with excellent peak symmetry. However, reducing the column length by a factor of 3 does not reduce the column efficiency by just a factor of 3 as would have been expected for the very same packing quality but by a factor of 5.5 (the maximum efficiency is only around 2000 instead of the expected 3700 plates).Gradient Runs: Figure 6 compares two gradient chromatograms recorded for the very same gradient run (see insert in the top left corner in Figure 6) except for the system configuration. The top chromatogram was recorded on the above-described standard UHPLC system equipped with a 50-μL mixer, while the bottom gradient chromatogram was recorded on the “reduced volume” research prototype system. The temperature was set at 70 °C to allow the operation of a 1-cm-long column at a maximum flow rate of 2 mL/min (total system pressure around 8000 psi). The gradient time
tg was extremely short and set at only 0.1 min. The sample mixture contained small molecules relevant to pharmaceutical analysis. It is striking to observe that some early eluting compounds (for example, compound 2: sulfamethazine) are not even caught by the gradient front before their elution, even for a dwell time as short as 1.5 s. Most compounds that were not well focused at the column head show very poor peak shape because they were first eluted under isocratic conditions and then eluted under gradient conditions. The average peak width was of the order of 1 s, with quite poor resolution between compounds 3 and 4. This peak deformation can be explained by the fact that compounds 3 and 4 are first eluted under isocratic elution then under gradient conditions after they have been caught by the gradient front. In the end, the analysis time was about 15 s.
In contrast, repeating the very same gradient method but on the “reduced volume” system with nearly zero dwell volume and extracolumn dispersion enabled the run to be completed in just 5 s, with a complete baseline resolution of the six compounds. The average peak width was significantly reduced to only 0.15 s. Overall, Figure 7 illustrates how a chromatographic method initially developed on a standard UHPLC system with a 3-cm-long column can be modified on the “reduced volume” system to shrink the analysis time by more than one order of magnitude while maintaining satisfactory levels of peak resolution for both identification and quantification.
ConclusionThis article has demonstrated that the past and approximate theories
14 Advances in UHPLC/HPLC May 2020
GRITTI
of chromatography based on either plate (Martin and Synge), rate (van Deemter), or stochastic (Giddings) approaches can be successfully refined by combining today’s high spatial resolution visualization techniques (FIB-SEM, STEM) and fluid and molecular modelling tools (LBM, MD, and RWPT). Altogether, these techniques enable the nearly exact physical reconstruction of the actual macropore and mesopore space in a chromatographic column and the accurate prediction of their retention and mass transport properties. Though these tools are currently seen as highly sophisticated for the regular chromatography practitioner and researcher and are expert-driven, they will inevitably play an increasing role in the way research will be conducted in the future for the development of new stationary phase chemistries (optimization of selectivity for particular separation problems) and novel macropore and mesopore structures (performance optimization).
This article has also revealed that the next and significant improvement in the performance of narrow-bore columns, similar to that which occurred in the mid-2000s from HPLC to UHPLC, is unlikely to be supported in the next decade by either current 3D-printing technologies (for the lack of spatial resolution and high throughput for small feature sizes) or ultra-ultra-high-pressure liquid chromatography (UUHPLC) up to 7 kbar using sub-1-μm fully porous particle FPP or superficially porous particle (SPP) technology in 3-cm-long column format. The fundamental reasons behind such pessimistic views about UUHPLC are that (i) The resolution power of 400-μm- to 1-mm-i.d. slurry-packed columns will not be sufficiently high as a result
of inevitable wall effects (38,39) and (ii) Frictional heating and peak distortions will be too excessive for column internal diameters larger than 1 mm. The possible success of narrow-bore column technology above a few kbar will only rely on the full thermal insulation of the column, as was recently demonstrated by
applying a high vacuum (10-5 Torr) around the column walls (36,37). A major breakthrough in column performance still remains possible without resorting to high-vacuum pumps, but it will be confined to either nano- or at best to micro-LC as demonstrated by Jorgenson with 10-μm- to 150-μm-i.d. capillary columns
15www.chromatographyonline.com
GRITTI
Discover more at www.ymc.de
Reproducibility in BioLC ...YMC!
• RP-BioLC (U)HPLC
• High Recovery IEX
• High Efficiency HIC and SEC
packed with 1-μm particles (41,42), and by Desmet with 2D-ordered pillar-array columns (32). The remaining barrier for packed column technology will be to adjust the proper agglomeration of sub-1-μm particles and their slurry concentration for optimized packing conditions.
Finally, it has been demonstrated experimentally that the current gradient separation speed applied in the pharmaceutical industry (based on 3-cm-long columns and conventional UHPLC systems) could easily be accelerated by one order of magnitude by adopting a zero-extracolumn-volume system with short 1 cm × 2.1 mm i.d. columns packed with sub-2-μm SPPs at standard flow rates of 2 mL/min and a high temperature of around 70 °C. The remaining limitations in ultrafast gradient LC are related to the long duty cycle of the injector (move needle or vial, draw sample volume, and wash needle), the poor efficiency of short columns (as a result of border and wall effects and frit dispersion), and the low full scan rates (~10 Hz maximum) and large postcolumn dispersion (~2 μL2 minimum) of easy-to-use quadrupole-based MS detectors for accurate analyte identification and quantification. These current limitations will set the roadmap for future developments in LC instruments in the years to come.
AcknowledgementsThe author acknowledges Michael Fogwill (Waters Corporation Milford, Massachusetts, USA) for designing and assembling the essential pieces of the research protype “reduced volume” UHPLC instrument, and Sebastien Besner (Waters Corporation, Milford, Massachusetts, USA) for preparing the specific optical detection cell used
for the research prototype “reduced volume” UHPLC instrument.
References1) C. Horvath and S.R. Lipsky, Nature
211, 748–23 (1966).2) J.E. MacNair, K.D. Patel, and J.W. Jorgenson,
Anal. Chem. 71, 700–708 (1999).3) J.J. Kirkland, T.J. Langlois, and J.J. DeStefano,
Amer. Lab. 39, 18–21 (2007).4) F. Gritti, A. Cavazzini, N. Marchetti, and G.
Guiochon, J. Chromatogr. A. 1157, 289–303 (2007).5) J.R. Mazzeo, U.D. Neue, M. Kele, and R.S.
Plumb, Anal. Chem. 77, 460A–467A (2005). 6) G. Guiochon, J. Chromatogr. A. 1126, 6–49 (2006).7) T.F. Bruce, T.J. Slonecki, L. Wang, S.
Huang, R.R. Powell, and R.K. Marcus, Electrophoresis 40, 571–581 (2019).
8) A.J.P. Martin and R.L.M. Synge, Biochemical. J. 35, 1358–1368 (1941).
9) L. Lapidus and N.R. Amundson, J. Phys. Chem. 566, 984–988 (1952).
10) R. Aris, Proc. R. Soc. Lond. A. 235, 67–77 (1956). 11) J.J. Van Deemter, F.J. Zuiderberg, and
A. Klinkenberg, Chemical Engineering, Science 5, 271–289 (1956).
12) F. Gritti and G. Guiochon, J. Chromatogr. A. 1302, 1–13 (2013).
13) J.C. Giddings and H. Eyring, J. Phys. Chem. 59, 416–421 (1955).
14) J.C. Giddings, in Dynamics of Chromatography, (Marcel Dekker, New York, New York, USA, 1965).
15) F. Gritti, J. Chromatogr. A. 121, 2–40 (2012).16) U. Tallarek, D. Hlushkou, J. Rybka, and A. Höltzel,
J. Phys. Chem. C. 123, 15099–15112 (2019).17) A.E. Reising, S. Schlabach, V. Baranau,
D. Stoeckel, and U. Tallarek, J. Chromatogr. A. 1302, 1–13 (2013).
18) S. Bruns and U. Tallarek, J. Chromatogr. A. 1218, 1849–1860 (2011).
19) S.J. Reich, A. Svidrytski, D. Hlushkou, D. Stoeckel, C. Kübel, A. Höltzel, and U. Tallarek, Ind. Eng. Chem. Res. 57, 3031–3042 (2018).
20) R. Lindsey, J. Rafferty, B. Eggimann, J. Siepmann, and M. Schure, J. Chromatogr. A. 1287, 60–82 (2013).
21) S.M. Melnikov, A. Höltzel, A. Seidel-Morgenstern, and U. Tallarek, Angew. Chem. Int. Ed. 51, 6251–6254 (2012).
22) J. Rybka, A. Höltzel, A. Steinhoff, and U. Tallarek, J. Phys. Chem. C. 123, 3672–3681 (2019).
23) F. Gritti, J. Hochstrasser, A. Svidrystski, D. Hlushkou, and U. Tallarek, J. Chromatogr. A. 460991 (2020).
24) F. Gritti, J. Chromatogr. A. 1302, 1–13 (2013).25) F. Gritti and G. Guiochon, Anal.
Chem. 80, 5009–5020 (2008).
26) F. Gritti and G. Guiochon, J. Chromatogr. A. 1216, 1353–1362 (2009).
27) F. Gritti, M. Gilar, and J. Jarrell, J. Chromatogr. A. 1444, 86–98 (2016).
28) F. Gritti, LCGC North America 36(s6),18–23 (2018).29) F. Gritti, LCGC North America 36(s6),10–16 (2019).30) C. Fee, S. Nawada, and S. Dimartino, J.
Chromatogr. A. 1333, 18–24 (2014).31) S. Nawada, S. Dimartino, and C. Fee,
Chem. Eng. Sci. 164, 90–98 (2017).32) F. Dolamore, C. Fee, and S. Dimartino, J.
Chromatogr. A. 1532, 150–160 (2018).33) K. Broeckhoven, D. Cabooter, S. Eeltink, W.
De Malsche, F. Matheuse, and G. Desmet, LCGC North America 36(s6), 9–17 (2018).
34) W. De Malsche, D. Clicq, V. Verdoold, P. Gzil, G. Desmet, and H. Gardeniers, Lab Chip 7, 1705–1711 (2007).
35) C. Welch, ACS. Cent. Sci. 3, 823–829 (2017).36) F. Gritti, S. Shiner, J. Fairchild, and G. Guiochon,
J. Sep. Sci. 37, 3418–3425 (2014).37) F. Gritti and M. Gilar, J. Chromatogr.
A. 1591, 110–119 (2019).38) F. Gritti and G. Guiochon, Anal.
Chem. 85, 3017–3035 (2013).39) F. Gritti and F. Wahab, LCGC North
America 36, 82–98 (2018).40) F. Gritti, LCGC Europe 36(s5), 8–13 (2019).41) K.D. Patel, A.D. Jerkovich, J.C. Link, and J.W.
Jorgenson, Anal. Chem. A. 76, 5777–5786 (2004). 42) J. Godinho, A. Reising, U. Tallarek,
and J.W. Jorgenson, J. Chromatogr. A. 1462, 165–169 (2016).
Fabrice Gritti is currently a Principal
Consulting Scientist at Waters
Corporation, which he joined in 2015.
He received his PhD in chemistry and
physics of condensed matter from
the University of Bordeaux (France)
in 2001 and pursued fundamental
research in Prof. Georges Guiochon’s
laboratory as a Research Scientist
at the University of Tennessee
Knoxville (USA) until 2014. Dr.
Gritti’s main research interests
involve liquid/solid adsorption
thermodynamics and mass transfer
mechanism in heterogeneous
media for characterization and
design optimization of new liquid
chromatography instrument/columns.
16 Advances in UHPLC/HPLC May 2020
GRITTI
A Theoretical and Practical Approach to Manage High Peak Capacity and Low Dilution in On-line Comprehensive Reversed-Phase LC × Reversed-Phase LC: A Comparison with 1D-Reversed-Phase LCSoraya Chapel, Florent Rouvière, and Sabine Heinisch, Institut des Sciences Analytiques, Université de Lyon, France
On-line comprehensive two-dimensional liquid chromatography (on-line LC×LC) provides much higher separation power (higher peak capacity) than one-dimensional liquid chromatography (1D-LC). However, it is also often thought that a larger peak capacity should be obtained at the expense of a higher dilution (lower peak intensity). From a theoretical approach, it is demonstrated that both demands can go hand-in-hand in on-line reversed-phase LC×reversed-phase LC (higher peak capacity and higher peak intensity). Examples involving “sub-hour” separations of a tryptic digest show how this approach can be applied in practice.
As a result of its huge separation power within relatively short analysis times, comprehensive two-dimensional liquid chromatography (LC×LC) has been used in a wide variety of applications over the past ten years. The large number of recent books and reviews dealing with 2D-LC applications is an indication of the attractiveness of this separation technique (1–4). The final goal of LC×LC is to obtain the highest possible separation power (high peak capacity) with the highest possible peak intensity (low dilution), within the shortest possible analysis time. Among these three conflicting goals, the separation power (peak capacity) and the analysis time (the gradient
time of the first dimension) are usually considered as the critical quality descriptors, while the dilution is most often disregarded. For the separation of peptides or, more generally, for the separation of ionizable compounds, the use of reversed-phase LC in both dimensions allows impressive peak capacities by simply changing the pH between both dimensions to be achieved (5). For given analysis times, recent studies have compared the peak capacities obtained in 1D-reversed-phase LC against reversed-phase LC×reversed-phase LC. For peptides, it was found that reversed-phase LC×reversed-phase LC outperforms 1D-reversed-phase LC above a total analysis time of 5 min
(6). More recently, a peak capacity of 10 000 was achieved in four hours using an active modulation approach (7). Compared to conventional one-dimensional liquid chromatography (1D-LC), LC×LC is usually thought to provide limited performance in terms of sensitivity as a result of solute dilution during the separation process. However, a comprehensive and fair comparison of dilution between these two separation techniques has never been investigated so far. In this article, the concept of dilution in gradient elution is revisited to provide efficient tools to compare in a reliable manner the dilution factors between 1D-reversed-phase LC and reversed-phase
17www.chromatographyonline.com
CHAPEL ET AL.
LC×reversed-phase LC. The validity of the proposed method is assessed through the separations of peptides in 1D-reversed-phase LC and in reversed-phase LC×reversed-phase LC.
Theoretical ApproachIn gradient elution, the effective peak capacity, neff, can be estimated by:
пeff =tG
4σpeak[1]
Where tG is the gradient time and σpeak, the average peak standard deviation in time units, resulting from band broadening into the entire separation system (instrument and column).
In 1D-LC, the sample dilution depends on both the injection volume and the peak width. Assuming a Gaussian peak shape, the dilution factor, DF, is given by the following relationship:
DF =σcol 2�ß х Vi
[2]
Where σcol is the column peak standard deviation in volume units, and Vi, the injected volume. β corrects for additional band broadening due to extra-column dispersion (β = σcol/σpeak). It may vary from 0 to 1 depending on the importance of extra-column dispersion. Ideally, β should be higher than 0.7 (β² > 0.5) otherwise the loss in plates becomes too significant (>50%) and, furthermore, the assumption of a Gaussian peak shape becomes unacceptable (6). According to equation 1, β represents the fraction of remaining peak capacity. It is given by:
ß =1
1 + x2[3]
With x², the ratio of the peak variance, resulting from extra-column dispersion, to the peak variance, resulting from column dispersion (σ2
col):
x2 = X X σ 2ext
+Vi
2
σ 2col
1
δ2
1
CF
[4]
σ2ext is the additional extra-column
variance due to band broadening in the capillary tubes and in the detector cell, δ2 is a correction factor which depends on the injection process (12 for an ideal injection plug and close to 4 in practice) (8). CF is the peak injection compression factor: CF > 1 if the injection plug is narrowed by on-column focusing (injection solvent weaker than the mobile phase), CF < 1 if the injection plug is broadened when travelling across the column (injection solvent stronger than the mobile phase), and CF = 1 if the injection solvent corresponds to the mobile phase. In gradient elution, the considered mobile phase is the solvent which accompanies solute elution. Assuming that the injection process is the main cause of extra-column dispersion, σ2
ext can be considered as close to 0 and then the combination of equations 3 and 4 leads to:
Vi = X X X σ col δ CF- 11
ß2 [5]
For a given injection compression factor, equation 5 permits the calculation of the injected volume able to keep a given β value (ideally > 0.7 as mentioned previously). For example, in the situation where the injection solvent corresponds to the elution composition of the first eluted solute, that is, CF = 1 for this one), the volume that can be injected while keeping 90% or more of the peak capacity for all peaks (exactly 90% for the first
Column length(mm)
Injectionvolume (µL)
Columnlength (mm)
Peak capacity
Gra
die
nt
tim
e (m
in)
100000
1000
100
10
1
0.11 10 100 1000 10000
110 900
23 450
12 30013.2 1509.5 1507.0 1504.5 1504.4 1007.2 505.4 503.5 504.0 303.1 30
3050100150300450600900
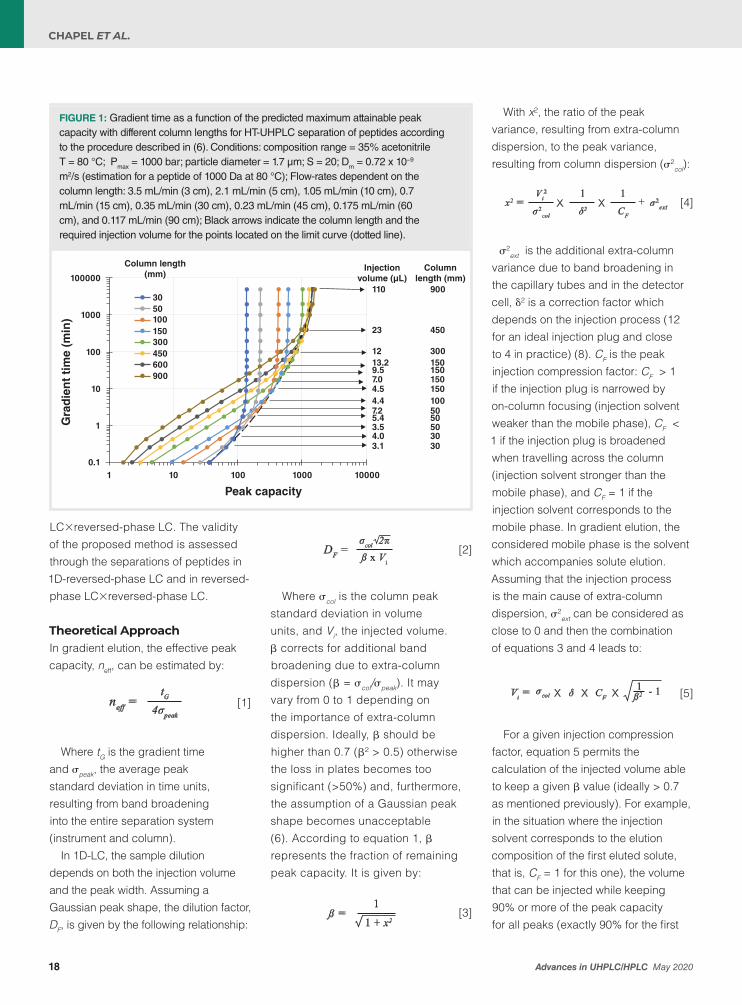
FIGURE 1: Gradient time as a function of the predicted maximum attainable peak capacity with different column lengths for HT-UHPLC separation of peptides according to the procedure described in (6). Conditions: composition range = 35% acetonitrile T = 80 °C; Pmax = 1000 bar; particle diameter = 1.7 µm; S = 20; Dm = 0.72 x 10⁻⁹ m2/s (estimation for a peptide of 1000 Da at 80 °C); Flow-rates dependent on the column length: 3.5 mL/min (3 cm), 2.1 mL/min (5 cm), 1.05 mL/min (10 cm), 0.7 mL/min (15 cm), 0.35 mL/min (30 cm), 0.23 mL/min (45 cm), 0.175 mL/min (60 cm), and 0.117 mL/min (90 cm); Black arrows indicate the column length and the required injection volume for the points located on the limit curve (dotted line).
18 Advances in UHPLC/HPLC May 2020
CHAPEL ET AL.

Pure Chromatography
• Technical Articles & Applications
• Videos & ChromaBLOGraphy
• FAQs & Troubleshooting
• Education & Instruction
• Online Tools & Calculators
• Product Selection Assistance
Sign up today to access Restek’s years of chromatography knowledge atwww.restek.com/advantage
ADVANTAGESee What It Can Do for You and Your Lab
eluted one) should be close to the column standard deviation (Vi = σcol).
If the injection volume is selected from equation 5, the dilution factor can then be expressed as:
DF = 2�δ X CF X 1 - ß2 [6]
According to equation 6, the dilution factor should be 2.9 for the least retained compound in the above example (assuming δ = 2). More generally, if the injected volume is selected as a multiple (λ) of the column standard deviation in such a way that β remains very close to 1 (x close to 0), then the dilution factor is close to √2πλ for all peaks in any gradient conditions (equation 2). In most reported studies dealing with the comparison of performance between different separation techniques, the injection volume is either fixed (9) or adapted to the column dead volume (6), but never adapted to the gradient conditions and hence to the column standard deviation. However, this latter approach, based on a proper preliminary selection of λ, is much more attractive because, in this case, dilution and, therefore, peak intensity becomes independent of gradient conditions, that is, flow-rate, column geometry, gradient time, column plate number. Of course, that requires a reliable prediction of the column standard deviation, which is given in gradient elution by:
σcol = G X X ( 1+ ke )V0
Ncol
[7]
Where V0 is the column dead volume which can be calculated from both the column dimensions and the total column porosity. Ncol is the column plate number which can be estimated from the column length, the particle diameter,
!
!
!
!
!"# $%&'(')*+,-
!.#'$%&'('/0+,-
!1#'$%&'('$00+,-
!2#'$%&'(')00+,-
!"#$%&')
Dilu
tio
n f
acto
rD
iluti
on
fac
tor
Dilu
tio
n f
acto
rD
iluti
on
fac
tor
Effective peak capacity
Effective peak capacity
Effective peak capacity
Effective peak capacity
0 1000 2000 3000 4000 5000 6000 7000 8000
0 1000 2000 3000 4000 5000 6000 7000 8000
0 1000 2000 3000 4000 5000 6000 7000 8000
0 1000 2000 3000 4000 5000 6000 7000 8000
0.0
0.1
1.0
10.0
0.0
0.1
1.0
10.0
0.0
0.1
1.0
10.0
0.0
0.1
1.0
10.0
(a) 1tG = 26 min
(b) 1tG = 40 min
(c) 1tG = 100 min
(d) 1tG = 200 min
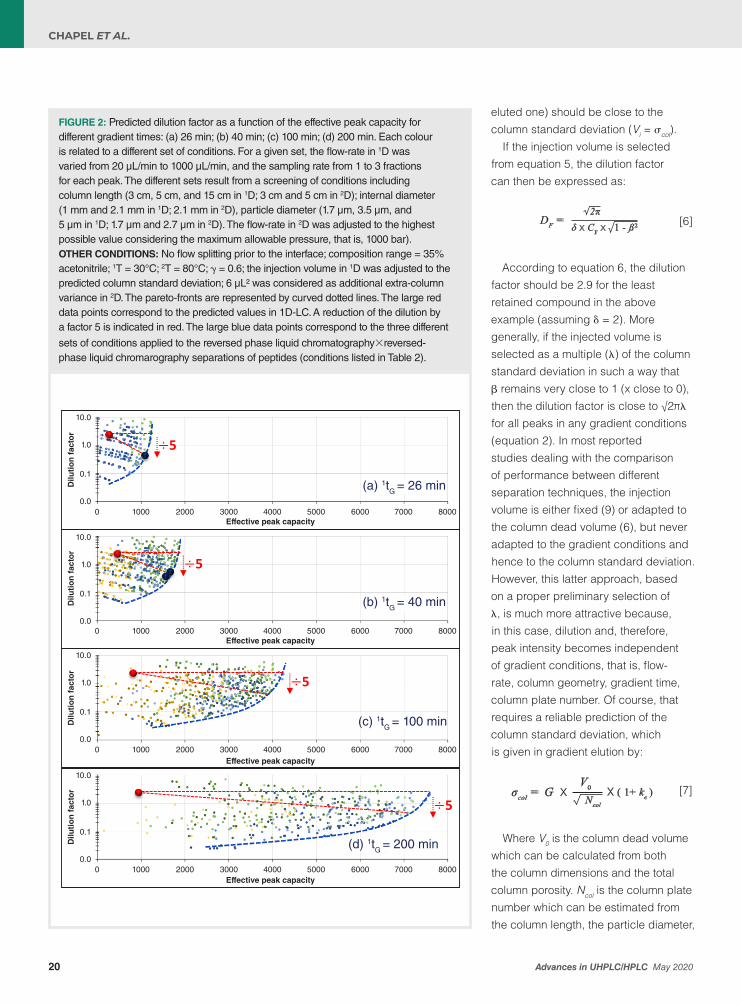
FIGURE 2: Predicted dilution factor as a function of the effective peak capacity for different gradient times: (a) 26 min; (b) 40 min; (c) 100 min; (d) 200 min. Each colour is related to a different set of conditions. For a given set, the flow-rate in 1D was varied from 20 µL/min to 1000 µL/min, and the sampling rate from 1 to 3 fractions for each peak. The different sets result from a screening of conditions including column length (3 cm, 5 cm, and 15 cm in 1D; 3 cm and 5 cm in 2D); internal diameter (1 mm and 2.1 mm in 1D; 2.1 mm in 2D), particle diameter (1.7 µm, 3.5 µm, and 5 µm in 1D; 1.7 µm and 2.7 µm in 2D). The flow-rate in 2D was adjusted to the highest possible value considering the maximum allowable pressure, that is, 1000 bar).OTHER CONDITIONS: No flow splitting prior to the interface; composition range = 35% acetonitrile; 1T = 30°C; 2T = 80°C; γ = 0.6; the injection volume in 1D was adjusted to the predicted column standard deviation; 6 µL² was considered as additional extra-column variance in 2D. The pareto-fronts are represented by curved dotted lines. The large red data points correspond to the predicted values in 1D-LC. A reduction of the dilution by a factor 5 is indicated in red. The large blue data points correspond to the three different
sets of conditions applied to the reversed phase liquid chromatography×reversed-phase liquid chromarography separations of peptides (conditions listed in Table 2).
20 Advances in UHPLC/HPLC May 2020
CHAPEL ET AL.
Knox curve coefficients and predicted diffusion coefficients (10), ke is the retention factor at the time the solute is eluted, and G is the peak compression factor (11), taking into account band compression, especially in the case of very steep gradients. For the rest of this study, G will be assumed to be close to 1 in every gradient conditions.
For linear solvent strength (LSS) gradients (12) such as linear gradients in reversed-phase liquid chromatography (RPLC) and for large retention factors at initial composition, ke can be expressed as:
ke = 2.3 X S X s1
[8]
Where s is the normalized gradient slope (s = ∆C X
t0
tG, with ∆C the
composition range and t0, the column dead time) and S, the slope of the relationship between the logarithm of the retention factor and the eluent composition. It should be noted that the calculation of σcol makes it also possible to predict the peak capacity in any gradient conditions according to equation 1. Figure 1 shows the calculated kinetic curves for different column lengths. Each curve represents the gradient time as a function of the predicted maximum attainable peak capacity. These curves were calculated for peptides (assuming a β value close to 1) according to the procedure described in reference 6. For a given particle diameter and a given column temperature, each column length, that is, each curve, is related to the highest possible flow-rate considering the maximum allowable pressure (here 1000 bar), thereby leading to the highest column plate number that can be achieved with the resulting column dead time (13–15). It is widely accepted that reducing the
particle size and increasing column temperature allows an increase in the column plate number per time unit (16). The curves in Figure 1 were therefore predicted under high-temperature-ultra-high performance liquid chromatography (HT-UHPLC)
conditions (sub-2-µm particles, here 1.7 µm were used at a temperature of 80 °C which is the highest column temperature that can be applied to current silica-based columns for a long term period). The limit curve (dotted line in Figure 1) gives the maximum
! " #$
!" # $
!" # $
! " #
$
% &'(
%
%
%
(
(
(
'&
' &
&'
)*+,-.*/0,12.13.0 435+,-6 .-7*0,
,& 8/9:/;-2<-/8/=>?@<?AB/6;C/D?/E$C?>F/;GH;-2
,& 8/I?/;-2<-/8/I>9@<?AB/6;C/D?/E$C?>F/;GH;-2
,& 8/I?/;-2<-/8/A:>=@<?
B/6;C/=?/E$C?>B/;GH;-2
,& 8/J/;-2<-/8/A>I@<?AB/6;C/D?/E$C/?>F/;GH;-2
K1L KML
K6L K.L
K*L KNL
K7L KOL
!"#$%&'*Peptide standards Tryptic digest
0 1 2 3 4 5 6Time (min) Time (min)
Time (min) Time (min)
Time (min) Time (min)
Time (min) Time (min)
0 2 4 6 8 10 12
0 2 4 6 8 10 12 14 16 18
0 5 10 15 20
16
-200-150-100-50
050
100150200250300
mA
u
-200-150-100-50
50100150200250300
mA
u
0
-200-150-100-50
50100150200250300
mA
u
0
-200-150-100-50
50100150200250300
mA
u
200
050
100150
250300350400450500
mA
u
0 2 4 6 8 10
0 5 10 15 20 25 30
0 5 10 15 20 25 30 35 40
0 5 10 15 20 25 30 35 40
2300
1800
1300
800
300
-200
mA
u
2300
1800
1300
800
300
-200
mA
u
2300
1800
1300
800
300
-200
mA
u
2300
1800
1300
800
300
-200
mA
u
tG = 9 minVi = 1.4%V0
15 cm; 80 ˚C;0.7 mL/min
tG = 26 minVi = 3.0%V0
15 cm; 80 ˚C;0.7 mL/min
tG = 40 minVi = 4.2%V0
15 cm; 80 ˚C;0.7 mL/min
tG = 40 minVi = 16.3%V0
5 cm; 30 ˚C;0.5 mL/min
(a)
(c)
(e)
(g) (h)
(f)
(d)
(b)FD E HG
B
C
A
F D E H
GB
C
A
FD E H
GBC
A
FD
E H GB
C
A
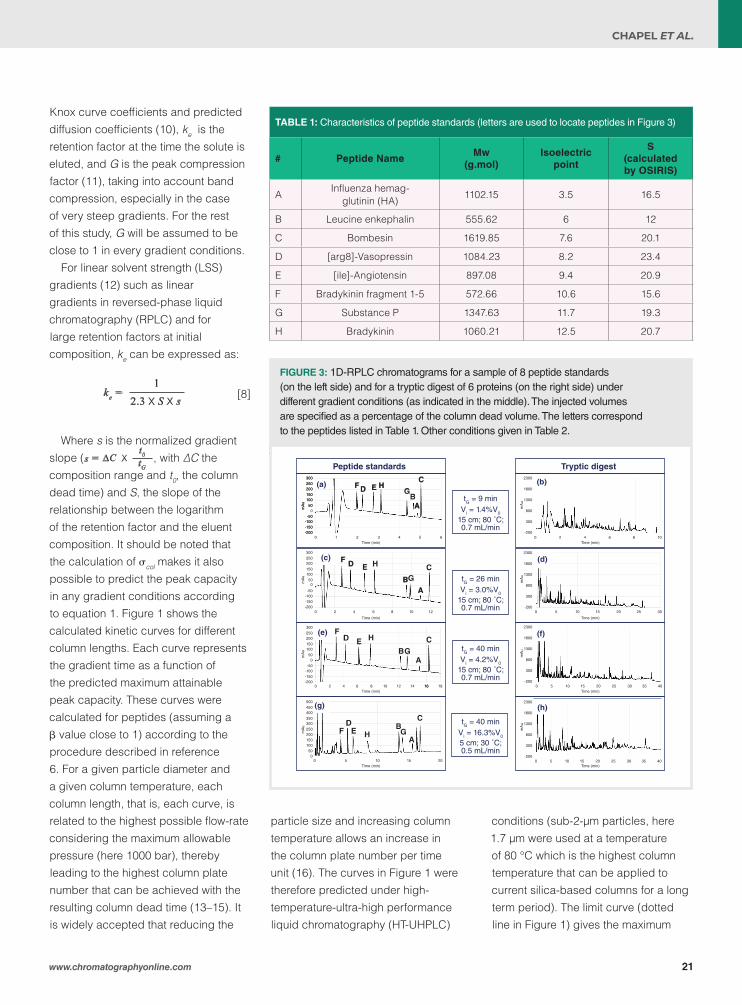
FIGURE 3: 1D-RPLC chromatograms for a sample of 8 peptide standards (on the left side) and for a tryptic digest of 6 proteins (on the right side) under different gradient conditions (as indicated in the middle). The injected volumes are specified as a percentage of the column dead volume. The letters correspond to the peptides listed in Table 1. Other conditions given in Table 2.
TABLE 1: Characteristics of peptide standards (letters are used to locate peptides in Figure 3)
# Peptide NameMw
(g.mol)Isoelectric
point
S(calculated by OSIRIS)
AInfluenza hemag-
glutinin (HA) 1102.15 3.5 16.5
B Leucine enkephalin 555.62 6 12
C Bombesin 1619.85 7.6 20.1
D [arg8]-Vasopressin 1084.23 8.2 23.4
E [ile]-Angiotensin 897.08 9.4 20.9
F Bradykinin fragment 1-5 572.66 10.6 15.6
G Substance P 1347.63 11.7 19.3
H Bradykinin 1060.21 12.5 20.7
21www.chromatographyonline.com
CHAPEL ET AL.
attainable peak capacity for a given gradient time, for example, 530 in 30 min, or the shortest gradient time for a given peak capacity, for example, 3 days for 1500. It is important to insist on the fact that the limit curve to the best existing sets of conditions in 1D-LC, with packed columns, for the separation of peptides. In such HT-UHPLC conditions, the peak capacity seems to tend towards a limit of about 2000. Each circle data point located
on the limit curve corresponds to a set of conditions including column length, flow-rate, gradient time, and also the calculated to provide similar peak intensities in all gradient conditions. The arrows in Figure 1 indicate the column lengths and the injection volumes for a λ value of 1. The required injection volume increases with the gradient time for a given column length.
In addition to be more attractive due to its ability to standardize the dilution
in 1D-LC, the proposed approach is, in our opinion, the only way to provide a relevant comparison in term of dilution between 1D-LC and on-line LC×LC. This is of prime importance in the light of the smooth gradients usually applied in the first dimension (1D) which lead to large peaks and hence high dilution when the injected volume is not properly adapted. Injection volumes in 1D calculated in a similar way than as in 1D-LC (same λ value) should
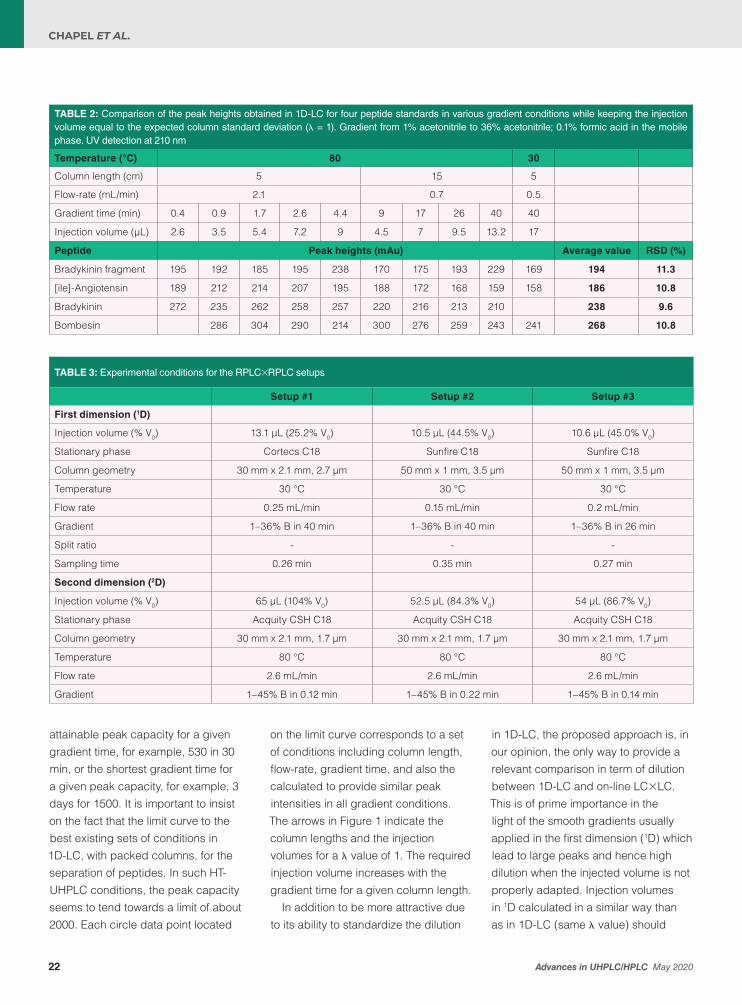
TABLE 2: Comparison of the peak heights obtained in 1D-LC for four peptide standards in various gradient conditions while keeping the injection volume equal to the expected column standard deviation (λ = 1). Gradient from 1% acetonitrile to 36% acetonitrile; 0.1% formic acid in the mobile phase. UV detection at 210 nm
Temperature (°C) 80 30
Column length (cm) 5 15 5
Flow-rate (mL/min) 2.1 0.7 0.5
Gradient time (min) 0.4 0.9 1.7 2.6 4.4 9 17 26 40 40
Injection volume (µL) 2.6 3.5 5.4 7.2 9 4.5 7 9.5 13.2 17
Peptide Peak heights (mAu) Average value RSD (%)
Bradykinin fragment 195 192 185 195 238 170 175 193 229 169 194 11.3
[ile]-Angiotensin 189 212 214 207 195 188 172 168 159 158 186 10.8
Bradykinin 272 235 262 258 257 220 216 213 210 238 9.6
Bombesin 286 304 290 214 300 276 259 243 241 268 10.8
TABLE 3: Experimental conditions for the RPLC×RPLC setups
Setup #1 Setup #2 Setup #3
First dimension (1D)
Injection volume (% V0) 13.1 µL (25.2% V0) 10.5 µL (44.5% V0) 10.6 µL (45.0% V0)
Stationary phase Cortecs C18 Sunfire C18 Sunfire C18
Column geometry 30 mm x 2.1 mm, 2.7 µm 50 mm x 1 mm, 3.5 µm 50 mm x 1 mm, 3.5 µm
Temperature 30 °C 30 °C 30 °C
Flow rate 0.25 mL/min 0.15 mL/min 0.2 mL/min
Gradient 1–36% B in 40 min 1–36% B in 40 min 1–36% B in 26 min
Split ratio - - -
Sampling time 0.26 min 0.35 min 0.27 min
Second dimension (2D)
Injection volume (% V0) 65 µL (104% V0) 52.5 µL (84.3% V0) 54 µL (86.7% V0)
Stationary phase Acquity CSH C18 Acquity CSH C18 Acquity CSH C18
Column geometry 30 mm x 2.1 mm, 1.7 µm 30 mm x 2.1 mm, 1.7 µm 30 mm x 2.1 mm, 1.7 µm
Temperature 80 °C 80 °C 80 °C
Flow rate 2.6 mL/min 2.6 mL/min 2.6 mL/min
Gradient 1–45% B in 0.12 min 1–45% B in 0.22 min 1–45% B in 0.14 min
22 Advances in UHPLC/HPLC May 2020
CHAPEL ET AL.
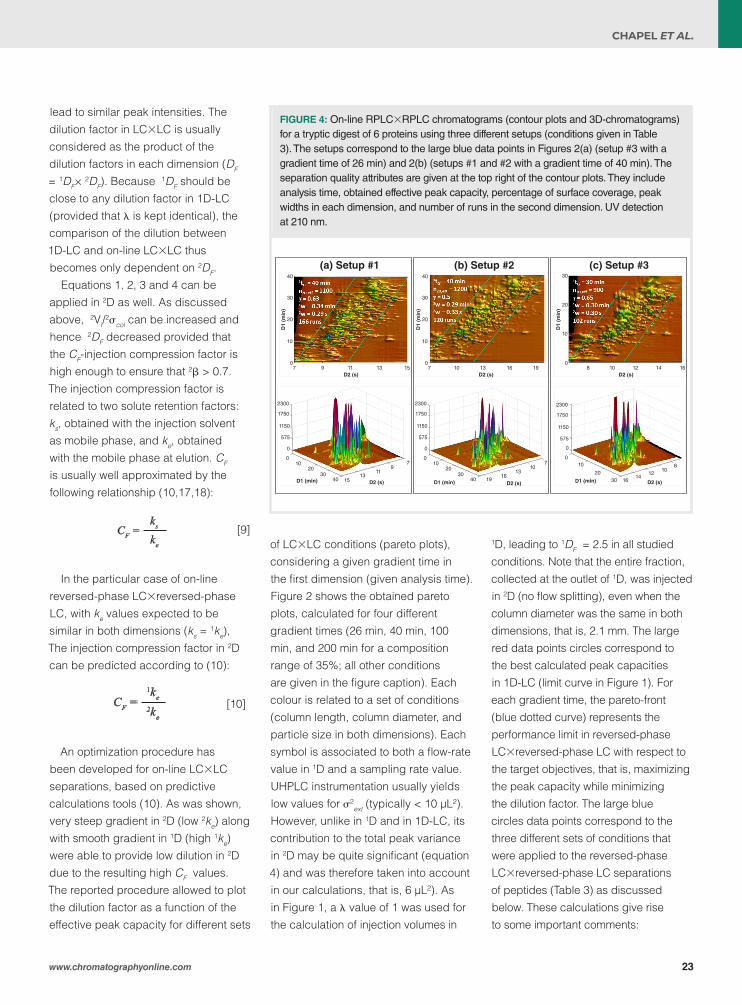
lead to similar peak intensities. The dilution factor in LC×LC is usually considered as the product of the dilution factors in each dimension (DF = 1DF× 2DF). Because 1DF should be close to any dilution factor in 1D-LC (provided that λ is kept identical), the comparison of the dilution between 1D-LC and on-line LC×LC thus becomes only dependent on 2DF.
Equations 1, 2, 3 and 4 can be applied in 2D as well. As discussed above, 2Vi/
2σcol can be increased and hence 2DF decreased provided that the CF-injection compression factor is high enough to ensure that 2β > 0.7. The injection compression factor is related to two solute retention factors: ks, obtained with the injection solvent as mobile phase, and ke, obtained with the mobile phase at elution. CF is usually well approximated by the following relationship (10,17,18):
CF =ke
ks [9]
In the particular case of on-line reversed-phase LC×reversed-phase LC, with ke values expected to be similar in both dimensions (ks = 1ke), The injection compression factor in 2D can be predicted according to (10):
CF =2ke
1ke[10]
An optimization procedure has been developed for on-line LC×LC separations, based on predictive calculations tools (10). As was shown, very steep gradient in 2D (low 2ke) along with smooth gradient in 1D (high 1ke) were able to provide low dilution in 2D due to the resulting high CF values. The reported procedure allowed to plot the dilution factor as a function of the effective peak capacity for different sets
of LC×LC conditions (pareto plots), considering a given gradient time in the first dimension (given analysis time). Figure 2 shows the obtained pareto plots, calculated for four different gradient times (26 min, 40 min, 100 min, and 200 min for a composition range of 35%; all other conditions are given in the figure caption). Each colour is related to a set of conditions (column length, column diameter, and particle size in both dimensions). Each symbol is associated to both a flow-rate value in 1D and a sampling rate value. UHPLC instrumentation usually yields low values for σ2
ext (typically < 10 µL²). However, unlike in 1D and in 1D-LC, its contribution to the total peak variance in 2D may be quite significant (equation 4) and was therefore taken into account in our calculations, that is, 6 µL²). As in Figure 1, a λ value of 1 was used for the calculation of injection volumes in
1D, leading to 1DF = 2.5 in all studied conditions. Note that the entire fraction, collected at the outlet of 1D, was injected in 2D (no flow splitting), even when the column diameter was the same in both dimensions, that is, 2.1 mm. The large red data points circles correspond to the best calculated peak capacities in 1D-LC (limit curve in Figure 1). For each gradient time, the pareto-front (blue dotted curve) represents the performance limit in reversed-phase LC×reversed-phase LC with respect to the target objectives, that is, maximizing the peak capacity while minimizing the dilution factor. The large blue circles data points correspond to the three different sets of conditions that were applied to the reversed-phase LC×reversed-phase LC separations of peptides (Table 3) as discussed below. These calculations give rise to some important comments:
!"#$%&'+
(a) Setup #1 (b) Setup #2 (c) Setup #340
30
20
10
07 9 11 13 15
D2 (s)
D1
(min
)40
30
20
10
07 10 13 16 19
D2 (s)
D1
(min
)
30
20
10
08 10 12 14 16
D2 (s)
D1
(min
)
D2 (s) D2 (s) D2 (s)D1 (min) D1 (min) D1 (min)
2300
1750
1150
575
0
010
2030
40 1513
119
7
2300
1750
1150
575
0
010
2030
40 1916
1310
7
2300
1750
1150
575
0
010
2030 16
1412
108
FIGURE 4: On-line RPLC×RPLC chromatograms (contour plots and 3D-chromatograms) for a tryptic digest of 6 proteins using three different setups (conditions given in Table 3). The setups correspond to the large blue data points in Figures 2(a) (setup #3 with a gradient time of 26 min) and 2(b) (setups #1 and #2 with a gradient time of 40 min). The separation quality attributes are given at the top right of the contour plots. They include analysis time, obtained effective peak capacity, percentage of surface coverage, peak widths in each dimension, and number of runs in the second dimension. UV detection at 210 nm.
23www.chromatographyonline.com
CHAPEL ET AL.
1. The maximum expected peak capacities are 1250, 1850, 4200, and 7600 in 26 min, 40 min, 100 min, and 200 min, respectively. Interestingly, the dilution factors at the maximum peak capacity are very close to the one predicted in 1D-LC, that is 2.5 (horizontal dotted line). It is important to underline that if post-first-dimension flow splitting was taken into account, pareto optimum curves would be shifted towards even more impressive peak capacities but also higher dilution.
2. The dilution factors in LC×LC can be decreased by a factor 5 without sacrificing too much of the peak capacity as highlighted by the red dotted lines.
3. The dilution factors can be further decreased while keeping fairly good peak capacities. For example, a decrease in the dilution factor by a factor of 25 only leads to a decrease of 40% (26 min), 39% (40 min), 31% (100 min), and 28% (200 min) of the peak capacity.
4. Among the various conditions evaluated, those involving a short column in 1D (typically 5 cm) and a very short column packed with sub-2-µm particles in 2D (typically 3 cm and 1.7 µm) were always located onto or close to the pareto curve. This is surprising for long analysis times, for example, 200 min, for which longer columns in 1D are usually recommended.
5. It is noteworthy that dilution factors are not higher when using a 1-mm column diameter, rather than a 2.1-mm column diameter in 1D. This is confirmed experimentally in the next section.
Methods and MaterialsChemicals: Acetonitrile (LC–MS grade) was purchased from Sigma-Aldrich (Steinheim, Germany). An Elga Purelab Classic UV purification system from Veolia water STI (Décines-Charpieu, France) was used for water purification and deionization. Formic acid (LC/MS grade), ammonium acetate, and ammonium bicarbonate (both analytical reagent grade) were obtained from Fisher Scientific (Illkirch, France). DL-1,4-dithiothreitol (DTT, 99%) and iodoacetamide (98%) were obtained from Acros Organics (Geel, Belgium). Trypsin, human serum albumin (HSA), bovine serum albumine (BSA), β-casein, myoglobin, lysozyme, and cytochrom C were all obtained from Sigma-Aldrich (Steinheim, Germany). Influenza hemaglutinin (HA), leucine encephalin, bombesin, [arg8]-Vasopressin, [ile]-Angiotensin, bradykinin fragment 1-5, substance P, and bradykinin were obtained from Merck (Molsheim, France). The protein digest sample was obtained by tryptic digestion of six proteins (HSA, BSA, β-casein, myoglobin, lysozyme and cytochrome C) following a protocol described elsewhere (10,19). The ratio enzyme to substrate was 1/70, resulting in a complex sample containing 196 peptides with an average concentration of 120 mg/L.
The standard sample was obtained by diluting eight peptides in pure water at a concentration of 32 mg/L. Their characteristics are listed in Table 1.
Both samples were filtered on a 0.22-µm PVDF (polyvinylidene) membrane before injection.Instrumentation: 2D-LC experiments were performed on a 1290 Infinity series 2D-LC system from Agilent Technologies (Waldbronn, Germany). The system includes: two high-pressure binary solvent
delivery pumps, an autosampler with a flow-through needle injector, two thermostated column compartments with low-dispersion preheaters, and two diode-array detectors (DAD) with 0.6 µL flow-cells. The interface connecting the two dimensions was a 2-position/4-port duo valve, equipped with two identical 80-µL loops. The loops were emptied in back-flush mode to minimize band dispersion. A pressure release kit was placed between 1D outlet and the interface inlet to minimize the pressure downstream coming from the valve switching. The measured dwell volumes and extra-column volumes were respectively 140 µL and 22 µL in 1D, and 45 µL and 8.5 µL in 2D (loop volumes excluded). For 1D-LC experiments, only the first dimension of this system was used. In both cases, the system was hyphenated to a quadrupole-time-of-flight (QTOF) high resolution mass spectrometer (model G6560B) from Agilent Technologies, equipped with a JetStream electrospray ionization (ESI) source. As a result of the very high flow rates operated in 2D, the effluent coming from 2D was split (1:2) before entering the source. Instrument controlling was performed with OpenLab CDS Chemstration software (Agilent) for the 2D-LC-UV system, and MassHunter software (Agilent) for the mass spectrometer. UV data were acquired at 210 nm with an acquisition rate of 40 Hz in 1D-LC, 20 Hz in 1D, and 80 Hz in 2D. High resolution mass spectrometry (HRMS) data were acquired in positive ion mode from 100 to 3200 Da, with an acquisition rate of 20 spectra/s. The operational parameters for the QTOF instrument were the following: drying gas temperature (300 °C), drying gas flow (11 L/min), nebulizer gas pressure (40 psi), sheath gas temperature (350 °C), sheath gas
24 Advances in UHPLC/HPLC May 2020
CHAPEL ET AL.
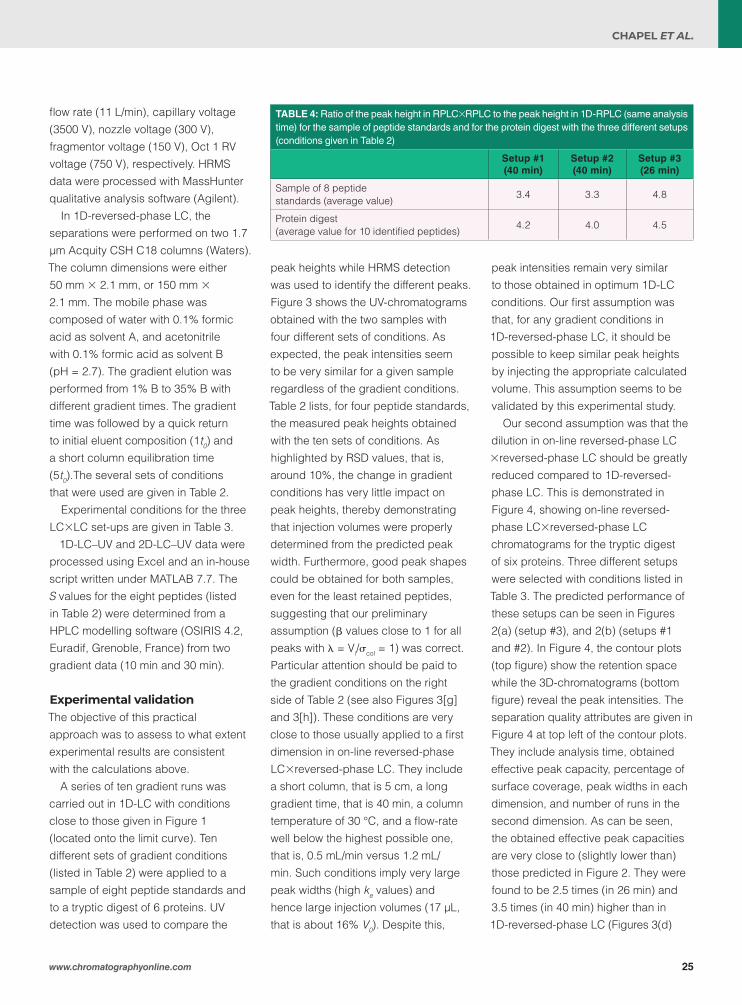
flow rate (11 L/min), capillary voltage (3500 V), nozzle voltage (300 V), fragmentor voltage (150 V), Oct 1 RV voltage (750 V), respectively. HRMS data were processed with MassHunter qualitative analysis software (Agilent).
In 1D-reversed-phase LC, the separations were performed on two 1.7 µm Acquity CSH C18 columns (Waters). The column dimensions were either 50 mm × 2.1 mm, or 150 mm × 2.1 mm. The mobile phase was composed of water with 0.1% formic acid as solvent A, and acetonitrile with 0.1% formic acid as solvent B (pH = 2.7). The gradient elution was performed from 1% B to 35% B with different gradient times. The gradient time was followed by a quick return to initial eluent composition (1t0) and a short column equilibration time (5t0).The several sets of conditions that were used are given in Table 2.
Experimental conditions for the three LC×LC set-ups are given in Table 3.
1D-LC–UV and 2D-LC–UV data were processed using Excel and an in-house script written under MATLAB 7.7. The S values for the eight peptides (listed in Table 2) were determined from a HPLC modelling software (OSIRIS 4.2, Euradif, Grenoble, France) from two gradient data (10 min and 30 min).
Experimental validationThe objective of this practical approach was to assess to what extent experimental results are consistent with the calculations above.
A series of ten gradient runs was carried out in 1D-LC with conditions close to those given in Figure 1 (located onto the limit curve). Ten different sets of gradient conditions (listed in Table 2) were applied to a sample of eight peptide standards and to a tryptic digest of 6 proteins. UV detection was used to compare the
peak heights while HRMS detection was used to identify the different peaks. Figure 3 shows the UV-chromatograms obtained with the two samples with four different sets of conditions. As expected, the peak intensities seem to be very similar for a given sample regardless of the gradient conditions. Table 2 lists, for four peptide standards, the measured peak heights obtained with the ten sets of conditions. As highlighted by RSD values, that is, around 10%, the change in gradient conditions has very little impact on peak heights, thereby demonstrating that injection volumes were properly determined from the predicted peak width. Furthermore, good peak shapes could be obtained for both samples, even for the least retained peptides, suggesting that our preliminary assumption (β values close to 1 for all peaks with λ = Vi/σcol = 1) was correct. Particular attention should be paid to the gradient conditions on the right side of Table 2 (see also Figures 3[g] and 3[h]). These conditions are very close to those usually applied to a first dimension in on-line reversed-phase LC×reversed-phase LC. They include a short column, that is 5 cm, a long gradient time, that is 40 min, a column temperature of 30 °C, and a flow-rate well below the highest possible one, that is, 0.5 mL/min versus 1.2 mL/min. Such conditions imply very large peak widths (high ke values) and hence large injection volumes (17 µL, that is about 16% V0). Despite this,
peak intensities remain very similar to those obtained in optimum 1D-LC conditions. Our first assumption was that, for any gradient conditions in 1D-reversed-phase LC, it should be possible to keep similar peak heights by injecting the appropriate calculated volume. This assumption seems to be validated by this experimental study.
Our second assumption was that the dilution in on-line reversed-phase LC ×reversed-phase LC should be greatly reduced compared to 1D-reversed-phase LC. This is demonstrated in Figure 4, showing on-line reversed-phase LC×reversed-phase LC chromatograms for the tryptic digest of six proteins. Three different setups were selected with conditions listed in Table 3. The predicted performance of these setups can be seen in Figures 2(a) (setup #3), and 2(b) (setups #1 and #2). In Figure 4, the contour plots (top figure) show the retention space while the 3D-chromatograms (bottom figure) reveal the peak intensities. The separation quality attributes are given in Figure 4 at top left of the contour plots. They include analysis time, obtained effective peak capacity, percentage of surface coverage, peak widths in each dimension, and number of runs in the second dimension. As can be seen, the obtained effective peak capacities are very close to (slightly lower than) those predicted in Figure 2. They were found to be 2.5 times (in 26 min) and 3.5 times (in 40 min) higher than in 1D-reversed-phase LC (Figures 3(d)
TABLE 4: Ratio of the peak height in RPLC×RPLC to the peak height in 1D-RPLC (same analysis time) for the sample of peptide standards and for the protein digest with the three different setups (conditions given in Table 2)
Setup #1(40 min)
Setup #2(40 min)
Setup #3(26 min)
Sample of 8 peptide standards (average value)
3.4 3.3 4.8
Protein digest (average value for 10 identified peptides)
4.2 4.0 4.5
25www.chromatographyonline.com
CHAPEL ET AL.
and 3(f) respectively). More important is the increase in peak intensity (reported in Table 4) for both studied samples. Peak intensities were multiplied by an average factor of 3.3 to 4.5 depending on the setup. Such increase is in very good agreement with the predictions shown in Figure 2 (a predicted factor of 5). It can also be noted that setups #1 and #2 which differ from the column diameter in 1D (that is, 2.1 mm and 1 mm respectively), lead to quite similar peak capacities (no additional band broadening with 2.1 mm) and quite similar peak intensities (no additional dilution with 1 mm). The number of runs in 2D could be the final quality attribute (120 with 1 mm versus 166 with 2.1 mm) to define the best set of conditions.
Conclusion From both a theoretical approach and an experimental study on peptides, it has been shown that similar dilution factors and hence similar peak heights can be obtained in any 1D-reversed-phase LC gradient conditions, by injecting the appropriate volume, based on a multiple of the column standard deviation.
This approach, applied to the first dimension of on-line reversed-phase LC×reversed-phase LC, allows an unbiased comparison between the dilution factors obtained in 1D-reversed-phase LC and those in on-line reversed-phase LC×reversed-phase LC. As a result of an important focusing effect in the second dimension (high CF values), very large volumes can be injected, thereby significantly reducing the dilution factor in the second dimension and hence the dilution factor in reversed-phase LC×reversed-phase LC, even when the column diameter is smaller in the first dimension, for example, 1 mm versus 2.1 mm. According to our calculations,
the dilution factor might be reduced by a factor of up to 25 in on-line reversed-phase LC×reversed-phase LC while keeping an impressive peak capacity compared to 1D-reversed-phase LC. This seems to be especially attractive for long analysis times (> one hour).
For sub-hour separations of a protein digest, our experimental results were in perfect agreement with the predicted ones. For an analysis time of 40 min, the peak intensities could be increased by a factor close to 5 in reversed-phase LC×reversed-phase LC while the peak capacity was increased by a factor of 3 compared to the optimum 1D-reversed-phase LC separation.
References1) S. Chapel, F. Rouvière, M. Sarrut, and
S. Heinisch, Two-Dimensional Liquid Chromatography Coupled to High-Resolution Mass Spectrometry for the Analysis of ADCsin Antibody-Drug Conjugates: Methods and Protocols (ed. Tumey, L. N.), 163–185 (Springer US, New York, NY, 2020). doi:10.1007/978-1-4939-9929-3_11
2) M. Sarrut, G. Crétier, and S. Heinisch, TrAC Trends in Analytical Chemistry 63, 104–112 (2014).
3) B.W.J. Pirok, D.R. Stoll, and P.J. Schoenmakers, Anal. Chem. 91(1), 240–263 (2019).
4) D.R. Stoll and P.W. Carr, Anal. Chem. 89(1) 519–531 (2017).
5) A. D’Attoma, C. Grivel, and S. Heinisch, J. Chromatogr. A. 1262, 148–159 (2012).
6) M. Sarrut, F. Rouvière, and S. Heinisch, J. Chromatogr. A. 1498, 183–195 (2017).
7) D.R. Stoll et al., J. Chromatogr. B. 1134–1135, 121832 (2019).
8) J.C. Sternberg, in: J.C. Giddings, R.A. Keller (Eds.), Advances in Chromatography, vol. 2, Dekker, New York, 1966, p. 205
9) G. Vivó-Truyols, S.J. van der Wal, and P.J. Schoenmakers, Anal. Chem. 82(20), 8525–8536 (2010).
10) M. Sarrut, A. D’Attoma, and S. Heinisch, J. Chromatogr. A. 1421, 48–59 (2015).
11) L.R. Snyder and D.L. Saunders, J. Chromatogr. Sci. 7(4), 195–208 (1969).
12) L.R. Snyder, J.W. Dolan, and J.R. Gant, J. Chromatogr. A. 165(1), 3–30 (1979).
13) H. Poppe, J. Chromatogr. A. 778(1), 3–21 (1997).14) J.C. Giddings, Anal. Chem. 37(1), 60–63 (1965).15) G. Desmet, D. Clicq, and P. Gzil, Anal.
Chem. 77(13), 4058–4070 (2005).
16) S. Heinisch and J.L. Rocca, J. Chromatogr. A. 1216(4), 642–658 (2009).
17) S.R. Groskreutz and S.G. Weber, J. Chromatogr. A. 1409, 116–124 (2015).
18) M. Martin, M. Mishra, A. De Wit, C. Grivel, and S. Heinisch, in: 28th International Symposium on Chromatography ISC, Valencia, 2010.
19) S. Chapel, F. Rouvière, and S. Heinisch, J. Chromatogr. A. 460753 (2019).
doi:10.1016/j.chroma.2019.460753
Sabine Heinisch is a research
team leader at ISA (Institute of
Analytical Science), Université de
Lyon, France. She is interested in
the fundamentals and applications of
liquid chromatography. Her primary
research topic is on the development
of on-line LC×LC-HRMS for the
separation of pharmaceuticals,
peptides or therapeutic proteins.
Her research interest also covers
the development of LC×SFC for
chiral compounds or biomass
byproducts. She has published
more than 70 referred articles, five
book chapters, and has given
more than 150 oral presentations.
Soraya Chapel obtained her M.Sc.
degree in 2017 from the University
of Toulouse, France. She now is a
Ph.D. student under the supervision
of Sabine Heinisch at the Université
de Lyon. Her research focuses
on the optimization of on-line
LC×LC for the characterization of
biomolecules, such as peptides,
monoclonal antibodies, and antibody-
drug conjugates. She received
the Best Oral Communication
AFSEP Award at the SEP 2019
conference in Paris, France, and
was among the 10 finalists for the
Csaba Horváth Young Scientist
Award at HPLC 2019 in Milan, Italy.
Florent Rouvière is a technician
at the Institute of Analytical
Science (Lyon, France) in the
team led by Sabine Heinisch.
26 Advances in UHPLC/HPLC May 2020
CHAPEL ET AL.
Is There Still Room for Innovation in Chiral Stationary Phases for Liquid Chromatography? The Fortunate Case of the Zwitterionic-TeicoplaninSimona Felletti1, Chiara De Luca1, Giulio Lievore1, Giulia Mazzoccanti2, Simone Manetto2, Francesco Gasparrini2, Alberto Cavazzini1,
and Martina Catani1, 1Department of Chemistry and Pharmaceutical Sciences, University of Ferrara, Ferrara, Italy, 2Department of Drug
Chemistry and Technology, “La Sapienza” Università di Roma, Rome, Italy
This article reports on a recently developed zwitterionic-teicoplanin chiral stationary phase (CSP). As a result of the innovative chemistry used to immobilize the chiral selector, the CSP is characterized at neutral pH by the simultaneous presence of both a negative (carboxylate) and a positive (quaternary ammonium) charge. This feature has proved to be pivotal in efficiently and productively resolving very challenging problems. It is worth mentioning the simultaneous separation of chiral active pharmaceutical ingredients (APIs) from their counterions and the separation of neutral-nonpolar, neutral-polar, acidic, and basic N-Fmoc chiral amino-acids. Examples of highly-efficient ultrafast chiral separations achieved on this CSP, as a result of use of effective superficially- and porous-particles, are provided.
The world of chiral stationary phases (CSPs) for liquid chromatography (LC) is very wide and continuously evolving. A universal CSP—that is, one able to resolve any kind of enantiomeric mixtures—does not exist. Literature is filled with examples of “novel” CSPs, whose applicability is, however, frequently very limited or even restricted to a single class of molecules. Very often, these CSPs have been obtained through modifications, either in the chemistry of the chiral selector or in the particle type employed as a support (fully-porous particles [FPPs] versus superficially-porous particles [SPPs]) (1–13). As a matter of fact, they are generally prepared by starting from already existing CSPs mostly belonging to the fundamental macroclasses of: antibiotics (8–11), proteins (5),
Pirkle-type (1–4), and cellulose (6,7,12,13). In a large number of cases, advantages of novel CSPs are scarcely evident, over their predecessors.
Chiral separations represent a very challenging and complex research field. For a CSP to be successful, basic thermodynamic requirements—namely, the need of molecularly recognizing the enantiomers through the formation of diastereomeric transient complexes—must be balanced by important kinetic considerations, dictated by the (increasingly pressing) need of fast, highly-efficient separations (14,15). A proper combination of these two features can be very complicated to achieve. This explains why only a few of the novel CSPs become commercially available.
In chromatography, thermodynamics and kinetics can be singled-out
through selectivity (enantioselectivity, in the case of separation of enantiomers) and efficiency, respectively. Enantioselectivity is chromatographically defined as the ratio between the retention factor of the more retained enantiomer over that of the less retained one. It describes the ability of a given CSP to separate (recognize) the enantiomers of a certain molecule. It is widely acknowledged that enantioselectivity directly depends on the specific loading of the chiral selector (expressed as µmol of chiral selector per square metre of silica). Generally, the larger the loading, the larger the enantioselectivity. The rationale for this is that the larger the surface coverage with selective sites, the smaller the contribution to retention (equal for both enantiomers)
27www.chromatographyonline.com
CAVAZZINI ET AL.
by nonselective ones (16,17). However, especially for chemically-bonded CSPs, that is, those where the chiral selector has been chemically anchored to the surface, it is not possible to predict the outcome of particle functionalization (in terms of loading) based on the
particle properties, such as their specific surface area, nominal pore size, and even whether are they fully- or superficially-porous (14,15,18). On the other hand, chemically-bonded CSPs are the preferred choice compared to physically-coated ones,
in virtue of longer stability and larger compatibility with different mobile phases (MPs). Enantioselectivity is not informative about the speed at which enantiorecognition occurs.
Separation efficiency is assessed as the height equivalent to a theoretical plate, or simply the plate height (H). H is an index expressing the rate of growth of peak variance along the separation path. Numerically, efficiency is expressed by the number of theoretical plates per metre (N/m), the higher the number the better the efficiency. Differently from achiral chromatography, in chiral chromatography, the kinetics of the adsorption-desorption can be very slow and its contribution to H relevant (14,15,18,19). Indeed, adsorption-desorption kinetics is often the dominant contributor to H in chiral chromatography. A slow adsorption-desorption process constitutes the real bottleneck to the realization of high-speed enantioseparations (18). Therefore, the use of either very small FPPs (sub-2-µm) or SPPs is not a warranty to achieve highly-efficient CSPs, per se.
The feasibility of a fast or very-fast chiral separation strongly depends
HOHO
HN
O
O
O
O
O
O
O
O
O
HO
HO
HO HOO
OH
O
O
O
O
O
O
O
OH OH
CH2OH
CH2OH
OHHN
Cl
CH3
NH
HN
NH
NH
HN
NH
OH
Cl
CH2OH
OOC-
H
N+
H
CH2
Titan 1201.9 µmFPP
Titan 1201.9 µmFPPHOOC
NH
O
O
O
O
O OHO
HO
HN
CH3
CH2OH
OH
O
O
HO
HO HO OH
HO
CH2OH
O
O
O
OO
O
O
O
O
OH
OH
OH
HN
NH
HN
NH
NH
Cl
HNCH2OH
Cl
NH NH
O
FIGURE 1: Schematics of teicoplanin-CSPs. Left: zwitterionic-teicoplanin; right: traditional teicoplanin. Differences between the two CSPs have been evidenced through red (amino groups or modified amino groups) and blue (carboxylic groups) colours. Adapted with permission from reference 27.
(a)
(b)
(c)
(d)
Time (min)
N/m1:42 700
N/m1:31 010
N/m1:24 170
N/m1:24 430
Cl-
Cl-
Cl-
Cl-
t0
0 2 4 6 8 10 12
FIGURE 2: Chromatograms showing the separation of Propionyl-D, L-carnitine hydrochloride enantiomers on 100 mm × 4.6 mm columns packed with (a) 1.9-µm FPPs zwitterionic teicoplanin CSP; (b) 2.0-µm SPPs zwitterionic teicoplanin CSP; (c) 2.7-µm SPPs zwitterionic teicoplanin CSP; and (d) traditional teicoplanin CSP (Teicoshell 2.7-µm SPPs). MP: methanol-rich. Flow rate: 1.0 mL/min. Detection: CAD. Adapted with permission from reference 27.
28 Advances in UHPLC/HPLC May 2020
CAVAZZINI ET AL.
on kinetic and thermodynamic properties of the enantiorecognition process of the analyte on the CSP. In addition, some experimental variables, firstly the MP composition, may dramatically affect the speed and efficiency of enantioseparations. It is worth mentioning cases where a change in the MP composition has induced the inversion in the elution order of enantiomers, with just as important consequences in terms of separation efficiency (20). Recently, many examples of fast or ultrafast chiral separations have been reported on macrocyclic-antibiotics (including teicoplanin) (21,22), cellulose-based (23), and Pirkle-type CSPs (especially Whelk-O 1) (1–3,18).
This article focuses on a new teicoplanin CSP prepared by means of an innovative bonding strategy (22,25,26) that has allowed to obtain a zwitterionic-version of the well-known CSP designed by Armstrong and coworkers more than twenty years ago (16,24). The zwitterionic CSP was designed with the aim of eliminating, or at least reducing, some limitations of traditional teicoplanin, such as the phenomenon of Donnan’s exclusion of anions from the CSP (27,28). At neutral pH, the novel CSP is characterized by the simultaneous presence of both a negative and a positive charge (Figure 1). The first comes from the deprotonation of the carboxylic moiety as it happens on the traditional version of the CSP (evidenced in blue in Figure 1). The positive charge is instead due to the protonation of the nitrogen atom of the secondary amine that replaces the neutral ureido-group of the traditional teicoplanin (represented in red in Figure 1). This difference has profoundly impacted the behaviour of the zwitterionic-teicoplanin CSP. As will be demonstrated by study cases reported below, indeed, the zwitterionic-teicoplanin has allowed to significantly
expand the applicability of teicoplanin-based CSPs to very challenging and important separations, which could not be faced by the traditional teicoplanin.
Experimental ConditionsColumns and Materials: All solvents and reagents were from Merck. A teicoplanin chiral selector (Merck)
was used to functionalize both Titan monodispersed FPPs (1.9-µm particle size, 120 Å pore size, 282 m2/g specific surface area) (Merck) and Halo SPPs (2.0 µm and 2.7 µm, 90 Å, 125 m2/g) (Advanced Material Technologies). The CSPs were packed into 100 mm, 50 mm, or 20 mm × 4.6 mm (ultrafast applications) stainless steel columns.
(a)
(b)
(c)
(a)
(b)
(c)
k1: 4.64
Time (min) Time (min)0 1 2 3 4 0 1 2 73 4 5 6
k2: 5.54
N/m: 226 960
N/m: 147 440
α: 1.19
Rs: 3.50
k2: 1.41
k1: 0.68
N/m: 81 440
N/m: 33 580 α: 2.07
Rs: 4.26
k1: 3.23 k2: 3.65
N/m: 197 620 N/m: 201 440α: 1.13
Rs: 2.37
k1: 1.25
k2: 1.67N/m: 224 460
N/m: 158 860α: 1.33
Rs: 4.08
k1: 4.33 k2: 7.44
N/m: 175 900 N/m: 70 140α: 1.72
Rs: 7.83
k1: 8.23 k2: 10.0N/m: 184 680 N/m: 132 940α: 1.21
Rs: 3.92
FIGURE 3: Examples of chiral separations of N-Fmoc amino acids on a zwitterionic-column (50 mm × 4.6 mm, 2.0 µm particle diameter SPPs) with either the acetonitrile-rich on the left or the methanol-rich MP on the right. (a) Neutral nonpolar Fmoc-(D,L)-Leu enantiomers; (b) Neutral polar Fmoc-(D,L)-Ser enantiomers; (c) basic Fmoc-(D,L)-Lys enantiomers. Flow rate: 1 mL/min. Detection: DAD.
k’: 1.81D,L-Proglumide N/m: 204710
α: 1.11
Fmoc-D,L-Glu
Dansyl-D,L-Met
Z-D,L-Met
N/m: 190740k’: 2.01
Rs: 2.48
(a)
(c)
(b)
(d)Time (min)
Time (min)
Time (min)
Time (min)
k’: 1.42N/m: 215530
α: 1.46
N/m: 160780k’: 2.07
Rs: 8.11
k’: 4.41N/m: 210910
α: 1.18
N/m: 186030k’: 5.19
Rs: 4.72
k’: 1.94N/m: 237370
α: 1.57
N/m: 193470k’: 3.05
Rs: 11.50
k’: 1.27N/m: 141200
α: 1.16
N/m: 125580k’: 1.47
Rs: 2.41
k’: 1.10N/m: 148740
α: 1.77
N/m: 86740k’: 1.95
Rs: 8.72
k’: 1.51N/m: 170160
α: 1.83
N/m: 111590k’: 2.77
Rs: 11.53
k’: 3.37N/m: 135140
α: 1.29
N/m: 94770k’: 4.34
Rs: 5.24
k’: 1.37N/m: 234760
α: 1.20
N/m: 203480k’: 1.65
Rs: 3.99
k’: 1.21N/m: 242860
α: 1.73
N/m: 146070k’: 2.09
Rs: 11.09
k’: 1.64N/m: 263990
α: 1.77
N/m: 175280k’: 2.91
Rs: 13.90
k’: 3.71N/m: 215790
α: 1.27
N/m: 175250k’: 4.70
Rs: 6.68
0.0 0.5 1.0 1.5 2.0 2.5 3.0 3.5
0 1 2 3 4 5 6 7 8
0.0 0.5 1.0 1.5 2.0 2.5 3.0 3.5
0.0 0.5 1.0 1.5 2.0 2.5 3.0 3.5 4.0 4.5
FIGURE 4: Chromatograms showing the separation of (a) D,L-Proglumide; (b) Dansyl-D,L-Methionine; (c) Fmoc-D,L-Glutamine; (d) Z-D,L-Methionine on the three 100 mm × 4.6 mm zwitterionic-teicoplanin columns packed with 1.9-µm FPPs (green), 2.7-µm SPPs (red), and 2.0-µm SPPs (black). MP: acetonitrile-rich. Flow rate: 1.0 mL/min. Detection: DAD. Adapted with permission from reference 22.
29www.chromatographyonline.com
CAVAZZINI ET AL.
Preparation of zwitterionic CSPs and packing procedure are reported in reference 25. A 100 mm × 4.6 mm, 2.7-µm (SPPs) TeicoShell column from AZYP LLC was employed for comparative purposes.Chromatographic Conditions: The ultrahigh-pressure liquid chromatography (UHPLC) equipment used for measurements was an UltiMate 3000 RS Separations system (Thermo Fisher Dionex) equipped with a dual gradient pump, an autosampler, a thermostated column compartment, and a diode array detector with a low dispersion 2.0-µL cell. A second diode array detector (DAD) (Thermo Fisher) with a 2.5 µL cell was used for separations at flow rates higher than 4 mL/min. Filter time constant was 0.002 s, data collection rate 100 Hz, and response time 0.04 s. Two Viper tubings (Thermo Fisher) were used for the connection from the autosampler
to the columns and from the column to the detector. Data acquisition and processing were performed by Chromeleon Software (Thermo Fisher). In addition, a charged aerosol detector (CAD) (Thermo Fisher) was used for the detection of inorganic ions.
The MPs employed in this work are always either 85:15 (v/v) methanol–H2O + 15 mM ammonium acetate or 85:15 (v/v) acetonitrile–H2O + 15 mM ammonium acetate. In both cases, the pH of organic solutions was between 7 and 7.5. They will be referred to as methanol- or acetonitrile-rich MPs. Injection volume was 0.1 µL. A constant temperature of 35 °C was set for all the experiments.
Results and DiscussionThe following shows some striking examples of the great potential of zwitterionic-teicoplanin CSPs. They are from recent works performed in
our research group. For the sake of convenience, we have organized this section based on the type of application, by focusing in particular on: 1. direct separation of chiral active pharmaceutical ingredients (APIs) from their counterions in the same chromatographic run (with the possibility to also quantify the counterions); 2. separation of N-protected amino acids, including the very important class of Fmoc amino acids; and 3. fast or ultrafast enantioseparations.
Direct Separation of Chiral APIs
from their Counterions: Many chiral pharmaceuticals can be found in salt form. The development of chromatographic methods allowing the simultaneous separation of chiral pharmaceuticals from their counterions is an important task. Traditoional teicoplanin CSPs have been routinely employed to separate chiral APIs from cations. If the counterion is an inorganic anion, they cannot be used. Anions indeed are usually not retained and often excluded from the stationary phase as a result of electrostatic Donnan’s repulsion (26).
These limitations can be overtaken by using zwitterionic-teicoplanin CSPs. As demonstrated by Ismail et al. (27), zwitterionic-teicoplanin can be successfully employed not only for the separation of chiral APIs from positive counterions, but also when counterions are negatively charged. As an example, Figure 2(a–c) shows the chromatograms obtained for the separation of propionyl-D, L-carnitine hydrochloride enantiomers on three zwitterionic CSPs, differing from each other in the characteristics of packing particles. In all cases, the methanol-rich MP was employed. As can be observed, zwitterionic CSPs have
Time (s)0 2 4 6 88 10
N/m: 76 000
N/m: 62 700
Rs: 1.53
Rs: 1.65
tr,2: 8.6 s
tr,2: 4.0 sN/m: 55 400
N/m: 63 950
N/m: 59 150
Rs: 2.11Rs: 2.02
tr,2: 7.2 s
tr,2: 3.4 sN/m: 63 450
N/m: 63 400N/m: 67 650
FIGURE 5: Ultrafast enantioseparations of a mixture of haloxyfop and ketorolac on 20 mm × 4.6 mm columns packed with 1.9-µm FPPs zwitterionic-teicoplanin CSP (red) and 2.0-µm SPPs zwitterionic-teicoplanin CSP (black). MP: acetonitrile-rich. Flow rate: 8.0 mL/min. Detection: DAD. Adapted with permission from reference 22.
30 Advances in UHPLC/HPLC May 2020
CAVAZZINI ET AL.

allowed for the baseline resolution of enantiomers. In addition, they were also able to retain the counterions (Cl-) by exhibiting thus remarkable chemo- and enantioselectivity. Under these conditions, quantification of chloride ions can be easily performed. For the sake of comparison, the last chromatogram of Figure 2(d) shows the outcome of the same separation on the traditional teicoplanin column. As it is clearly evident, in this case, the simultaneous separation of chloride from APIs was not possible, as Cl- was not retained on this CSP.
Separation of N-Protected Amino
Acids and Other Different Classes
of Chiral Compounds: It is well known that one of the most positive characteristics of teicoplanin CSPs is their large versatility. They have indeed been applied for the separation of different classes of chiral compounds, including many kinds of drugs (such as β-blockers, non-steroidal anti-inflammatory agents, peptides), agrochemical compounds, and N-derivatized amino acids (N-Fmoc, N-Boc, N-Z, N-Dansyl). In particular, the challenging separation of N-protected amino acids is a topic of great interest from an industrial point of view. Many of them are indeed employed as building blocks in the solid-phase synthesis of peptides, usually in the form of N-Fmoc and N-Boc. N-protection increases the acidic character of amino acids. As a consequence, N-protected amino acids are characterized by a completely different chromatographic behaviour compared to that of their underivatized precursors. Their chromatographic separation can become truly challenging. A very recent publication (29) reported the separation of 31 N-Fmoc chiral proteinogenic amino acids (neutral-polar, neutral-nonpolar,
acidic, and basic) on zwitterionic-teicoplanin CSPs. It was demonstrated that the use of acetonitrile-rich MPs strongly enhances both the efficiency and the speed of separation, while the use of methanol-rich ones favours enantioselectivity. Noticeably, it was also shown that through zwitterionic-teicoplanin it was possible to efficiently separate N-Fmoc racemates that, due to their characteristics, were excluded (eluted before the hold-up time) on the traditional teicoplanin column, under the experimental conditions reported above. Figure 3 reports an example of separation of neutral-polar, neutral-nonpolar, and basic N-Fmoc amino acids (see figure caption for details) on a zwitterionic-teicoplanin column packed with SPPs (2.0 µm). It is worth noting the strong effect of the MP composition on the efficiency, speed, and enantioresolution. On the left of this figure, separations performed with the acetonitrile-rich MP are reported. On the right, those achieved with the methanol-rich MP. As a further example, Figure 4 shows the baseline separation of different compounds, including other N-protected amino acids, and D,L-proglumide enantiomers on the same three zwitterionic columns of Figure 2, by using the acetonitrile-rich MP (22). As can be observed, very high efficiencies (larger than 200 000 N/m) were obtained on the 2.0-µm SPPs and the 1.9-µm FPPs with resolution values in some cases larger than 10 (Z-D,L-Met enantiomers).
Ultrafast Enantioseparations: Zwitterionic teicoplanin CSPs prepared on very fine particles (2.0 µm SPPs and 1.9 µm FPPs) have also been successfully employed for ultrafast enantioseparations. A kinetic performance analysis (22) has revealed that, in many cases (depending on the
specific enantiomers to be separated), on these CSPs no remarkable loss of efficiency is observed even when they are operated at significantly higher flow-rate than the optimal one. Therefore, in these cases, it is possible to envisage ultrafast enantioseparations. As an example, Figure 5 reports the simultaneous separation of two racemates of pharmaceutical interest, haloxyfop and ketorolac, on the two zwitterionic-teicoplanin CSPs. To the purpose, two short columns (20 mm × 4.6 mm) were used. By using the acetonitrile-rich MP and operating the system at the maximum flow-rate achievable on the equipment (8 mL/min) (22), the separation of both racemates was completed in about 8 s. Remarkably, haloxyfop enantiomers were baseline-resolved in only 3.4 s with a resolution as large as 2.
ConclusionZwitterionic-teicoplanins represent a new class of CSPs with very interesting properties and applications. Born with the idea of entirely preserving the fundamental features of teicoplanin (which is a zwitterionic molecule), even when the chiral selector is in supported- or heterogenized-form, these phases have overcome some of the most stringent limitations encountered on traditional teicoplanin CSPs. In particular, by restoring the basic nature of the amino-group linked to the silica surface, Donnan’s exclusion of anionic compounds from the stationary phase (very frequent on the traditional teicoplanin) was in fact eliminated, with important consequences in terms of retention and selectivity. Thus, separation of very important classes of ionic or polar compounds (Fmoc amino acids, APIs from their counterions) was
31www.chromatographyonline.com
CAVAZZINI ET AL.
performed with very large chemo- and enantioselectivity. In the meantime, by using acetonitrile-rich MPs, the efficiency of separation was very high and so zwitterionic-teicoplanin CSPs could also be efficiently used in ultrafast applications.
Acknowledgements The authors thank the Italian University and Scientific Research Ministry (grant PRIN 2017Y2PAB8 003, entitled “Cutting-edge Analytical Chemistry Methodologies and Bio-Tools to Boost Precision Medicine in Hormone-related Diseases”).
References1) G. Cancelliere, A. Ciogli, I. D’Acquarica, F.
Gasparrini, J. Kocergin, D. Misiti, M. Pierini, H. Ritchie, P. Simone, and C. Villani, J. Chromatogr. A. 1217, 990–999 (2010).
2) D. Kotoni, A. Ciogli, C. Molinaro, I. D’Acquarica, J. Kocergin, T. Szczerba, H. Ritchie, C. Villani, and F. Gasparrini, Anal. Chem. 84, 6805–6813 (2012).
3) D. Kotoni, A. Ciogli, I. D’Acquarica, J. Kocergin, T. Szczerba, H. Ritchie, C. Villani, and F. Gasparrini, J. Chromatogr. A. 1269, 226–241 (2012) .
4) A. Cavazzini, N. Marchetti, R. Guzzinati, M. Pierini, A. Ciogli, D. Kotoni, I. D’Acquarica, C. Villani, and F. Gasparrini, Trends Anal. Chem. 63, 95–103 (2014).
5) R.J. Reischl, L. Hartmanova, M. Carrozzo, M. Huszar, P. Frühauf, and W. Lindner, J. Chromatogr. A. 1218, 8379–8387 (2011).
6) K. Lomsadze, G. Jibuti, T. Farkas, and B. Chankvetadze, J. Chromatogr. A. 1234, 50–55 (2012).
7) D.A. Spudeit, M.D. Dolzan, Z.S. Breitbach, W.E. Barber, G.A. Micke, and D.W. Armstrong, J. Chromatogr. A. 1363, 89–95 (2014).
8) C.L. Barhate, Z.S. Breitbach, E.C. Pinto, E.L. Regalado, C.J. Welch, and D.W. Armstrong, J. Chromatogr. A. 1426, 241–247 (2015).
9) D.C. Patel, M.F. Wahab, D.W. Armstrong, and Z.S. Breitbach, J. Chromatogr. A. 1467, 2–18 (2016).
10) D.C. Patel, M.F. Wahab, D.W.
Armstrong, and Z.S. Breitbach, Anal.
Chem. 88, 8821–8826 (2016).11) C.L. Barhate, D.A. Lopez, A.A. Makarov,
X. Bu, W.J. Morris, A. Lekhal, R. Hartman, D.W. Armstrong, and E.L. Regalado, J. Chromatogr. A. 1539, 87–92 (2018).
12) L. Bezhitashvili, A. Bardavelidze, A. Mskhiladze, M. Gumustas, S.A. Ozkan, A. Volonterio, T. Farkas, and B. Chankvetadze, J. Chromaotogr. A. 1571, 132–129 (2018).
13) Q. Kharaishvili, G. Jibuti, T. Farkas, and B. Chankvetade, J. Chromatogr. A. 1467, 163–168 (2016).
14) M. Catani, O.H. Ismail, F. Gasparrini, M. Antonelli, L. Pasti, N. Marchetti, S. Felletti, and A. Cavazzini, Analyst 142, 555–566 (2017).
15) O.H. Ismail, S. Felletti, C. De Luca, L. Pasti, N. Marchetti, V. Costa, F. Gasparrini, A. Cavazzini, and M. Catani, Molecules 23, 2709–2721 (2018).
16) D.W. Armstrong, Y. Liu, and H. Ekborgott, Chirality 7, 474–497 (1995).
17) M. Lammerhöfer, J. Chromatogr. A. 1217 814–856 (2010).
18) O.H. Ismail, L. Pasti, A. Ciogli, C. Villani, J. Kocergin, S. Anderson, F. Gasparrini, A. Cavazzini, and M. Catani, J. Chromatogr. A. 1466, 96–102 (2016).
19) M. Catani, S. Felletti, O.H. Ismail, F. Gasparrini, L. Pasti, N. Marchetti, C. De Luca, V. Costa, and A. Cavazzini, Anal. Bioanal. Chem. 410, 2457–2465 (2018).
20) L. Chankvetadze, N. Ghibradze, M. Karchkadze, L. Peng, T. Farkas and B. Chankvetadze, J. Chromatogr. A. 1218, 6554–6560 (2011).
21) D.C. Patel, Z.S. Breitbach, M.F. Wahab, C.L. Barhate, and D.W. Armstrong, Anal. Chem. 87, 9137–9148 (2015).
22) O.H. Ismail, M. Antonelli, A. Ciogli, C. Villani, A. Cavazzini, M. Catani, S. Felletti, D.S. Bell, and F. Gasparrini, J. Chromatogr. A. 1520, 91–102 (2017).
23) N. Khundadze, S. Pantsulaia, C. Fanali, T. Farkas, and B. Chankvetadze, J. Chromatogr. A. 1572, 37–43 (2018).
24) D.W. Armstrong, Y. Tang, C. Bagwill, and J. Chen, Anal. Chem. 66, 1473–1484 (1994).
25) O.H. Ismail, A. Ciogli, C. Villani, M. de Martino, M. Pierini, A. Cavazzini, D.S. Bell, and F Gasparrini, J. Chromatogr. A. 1427, 55–68 (2016).
26) A. Cavazzini, G. Nadalini, F. Dondi, F. Gasparrini, A. Ciogli, and C. Villani, J. Chromatogr. A. 1031, 143–158 (2004).
27) O.H. Ismail, M. Antonelli, A. Ciogli, M. de Martino, M. Catani, C. Villani, A. Cavazzini, M. Ye, D.S. Bell, and F. Gasparrini, J. Chromatogr. A. 1576, 42–50 (2018).
28) F.G. Donnan, Chem. Rev. 1, 73–90 (1924).
29) G. Mazzoccanti, S. Manetto, A Ricci, W. Cabri, A. Orlandin, M. Catani, S. Felletti, A. Cavazzini, M. Ye, H. Ritchie, C. Villani, and F. Gasparrini, Submitted
for publication, J. Chromatogr. A.
Simona Felletti received her Ph.D.
from the University of Ferrara, Italy
in February 2020. She is currently
working as a post-doctoral research
fellow at the same University.
Chiara De Luca is a Ph.D. student
at the University of Ferrara, Italy.
Giulio Lievore is a Ph.D. student
at the University of Ferrara, Italy.
Giulia Mazzoccanti received her
Ph.D. from “Sapienza” University of
Rome, Italy, in 2018. She is currently
working as a post-doctoral research
fellow at the same University.
Simone Manetto is a Ph.D. student at
“Sapienza” University of Rome, Italy.
Francesco Gasparrini is Professor
Emeritus at “Sapienza” University
of Rome, Italy. He has been Full
Professor of Organic Chemistry
since 1986 at the same University.
He has authored more than 200
peer-reviewed papers and 15 patents.
Alberto Cavazzini has been Full
Professor of Analytical Chemistry at
the University of Ferrara, Italy, since
2014, after having been employed
as researcher at the same University
(2002–13) and research fellow at the
University of Tennessee, Knoxville
(USA) with Prof. Georges Guiochon
(2000–2). He has authored more than
120 papers in peer-reviewed journals.
Martina Catani received a Ph.D.
from the University of Ferrara, Italy,
in 2018. She is currently working as
a research associate at the same
University. In 2019 she spent a period
as a post-doctoral research fellow at
ETH Zurich, Switzerland. She won
the Csaba Horváth Young Scientist
Award at HPLC 2018 Washington.
32 Advances in UHPLC/HPLC May 2020
CAVAZZINI ET AL.
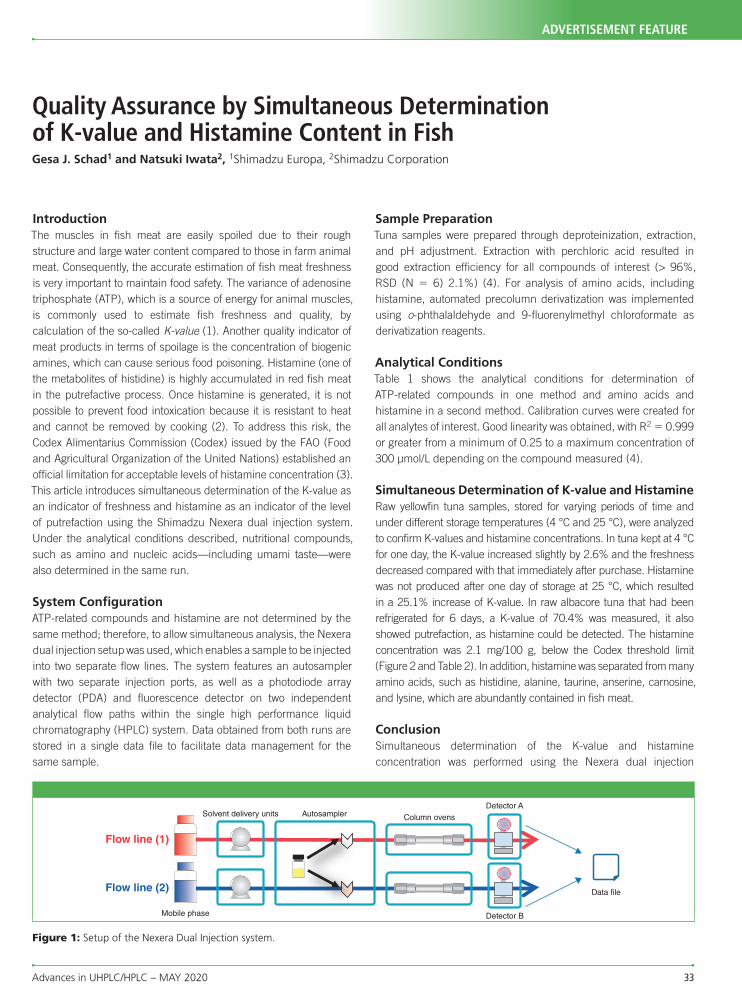
Advances in UHPLC/HPLC – MAY 2020 33
ADVERTISEMENT FEATURE
Quality Assurance by Simultaneous Determination of K-value and Histamine Content in FishGesa J. Schad1 and Natsuki Iwata2, 1Shimadzu Europa, 2Shimadzu Corporation
Flow line (1)
Flow line (2)
Solvent delivery units Autosampler Column ovensDetector A
Detector B
Data �le
Mobile phase
Figure 1: Setup of the Nexera Dual Injection system.
IntroductionThe muscles in fish meat are easily spoiled due to their rough structure and large water content compared to those in farm animal meat. Consequently, the accurate estimation of fish meat freshness is very important to maintain food safety. The variance of adenosine triphosphate (ATP), which is a source of energy for animal muscles, is commonly used to estimate fish freshness and quality, by calculation of the so-called K-value (1). Another quality indicator of meat products in terms of spoilage is the concentration of biogenic amines, which can cause serious food poisoning. Histamine (one of the metabolites of histidine) is highly accumulated in red fish meat in the putrefactive process. Once histamine is generated, it is not possible to prevent food intoxication because it is resistant to heat and cannot be removed by cooking (2). To address this risk, the Codex Alimentarius Commission (Codex) issued by the FAO (Food and Agricultural Organization of the United Nations) established an official limitation for acceptable levels of histamine concentration (3). This article introduces simultaneous determination of the K-value as an indicator of freshness and histamine as an indicator of the level of putrefaction using the Shimadzu Nexera dual injection system. Under the analytical conditions described, nutritional compounds, such as amino and nucleic acids—including umami taste—were also determined in the same run.
System ConfigurationATP-related compounds and histamine are not determined by the same method; therefore, to allow simultaneous analysis, the Nexera dual injection setup was used, which enables a sample to be injected into two separate flow lines. The system features an autosampler with two separate injection ports, as well as a photodiode array detector (PDA) and fluorescence detector on two independent analytical flow paths within the single high performance liquid chromatography (HPLC) system. Data obtained from both runs are stored in a single data file to facilitate data management for the same sample.
Sample PreparationTuna samples were prepared through deproteinization, extraction, and pH adjustment. Extraction with perchloric acid resulted in good extraction efficiency for all compounds of interest (> 96%, RSD (N = 6) 2.1%) (4). For analysis of amino acids, including histamine, automated precolumn derivatization was implemented using o-phthalaldehyde and 9-fluorenylmethyl chloroformate as derivatization reagents.
Analytical ConditionsTable 1 shows the analytical conditions for determination of ATP-related compounds in one method and amino acids and histamine in a second method. Calibration curves were created for all analytes of interest. Good linearity was obtained, with R2 = 0.999 or greater from a minimum of 0.25 to a maximum concentration of 300 µmol/L depending on the compound measured (4).
Simultaneous Determination of K-value and HistamineRaw yellowfin tuna samples, stored for varying periods of time and under different storage temperatures (4 °C and 25 °C), were analyzed to confirm K-values and histamine concentrations. In tuna kept at 4 °C for one day, the K-value increased slightly by 2.6% and the freshness decreased compared with that immediately after purchase. Histamine was not produced after one day of storage at 25 °C, which resulted in a 25.1% increase of K-value. In raw albacore tuna that had been refrigerated for 6 days, a K-value of 70.4% was measured, it also showed putrefaction, as histamine could be detected. The histamine concentration was 2.1 mg/100 g, below the Codex threshold limit (Figure 2 and Table 2). In addition, histamine was separated from many amino acids, such as histidine, alanine, taurine, anserine, carnosine, and lysine, which are abundantly contained in fish meat.
ConclusionSimultaneous determination of the K-value and histamine concentration was performed using the Nexera dual injection
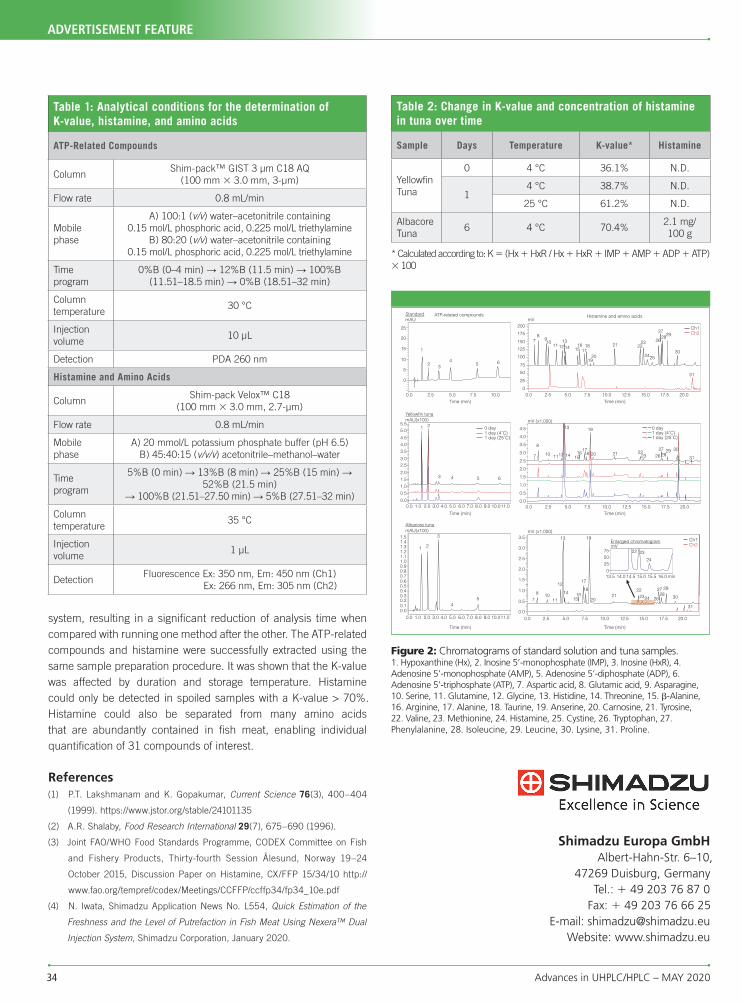
34 Advances in UHPLC/HPLC – MAY 2020
ADVERTISEMENT FEATURE
system, resulting in a significant reduction of analysis time when compared with running one method after the other. The ATP-related compounds and histamine were successfully extracted using the same sample preparation procedure. It was shown that the K-value was affected by duration and storage temperature. Histamine could only be detected in spoiled samples with a K-value > 70%. Histamine could also be separated from many amino acids that are abundantly contained in fish meat, enabling individual quantification of 31 compounds of interest.
References(1) P.T. Lakshmanam and K. Gopakumar, Current Science 76(3), 400–404
(1999). https://www.jstor.org/stable/24101135
(2) A.R. Shalaby, Food Research International 29(7), 675–690 (1996).
(3) Joint FAO/WHO Food Standards Programme, CODEX Committee on Fish
and Fishery Products, Thirty-fourth Session Ålesund, Norway 19–24
October 2015, Discussion Paper on Histamine, CX/FFP 15/34/10 http://
www.fao.org/tempref/codex/Meetings/CCFFP/ccffp34/fp34_10e.pdf
(4) N. Iwata, Shimadzu Application News No. L554, Quick Estimation of the
Freshness and the Level of Putrefaction in Fish Meat Using Nexera™ Dual
Injection System, Shimadzu Corporation, January 2020.
Shimadzu Europa GmbHAlbert-Hahn-Str. 6–10,
47269 Duisburg, GermanyTel.: + 49 203 76 87 0
Fax: + 49 203 76 66 25E-mail: [email protected]
Website: www.shimadzu.eu
1
2 34
5 6
1 2
3 4 5
1 2
3
45
6
ATP-related compoundsStandardmAU mV
mV (x1,000)
mV (x1,000)
Yellowfin tunamAU(x100)
Albacore tunamAU(x100)
25
20
15
10
5
0
0.0
0.0 1.0 2.0 3.0 4.0 5.0 6.0 7.0 8.0 9.0 10.011.0
2.5 5.0 7.5 10.0
0 day1 day (4˚C)1 day (25˚C)
0.0 1.0 2.0 3.0 4.0 5.0 6.0 7.0 8.0 9.0 10.011.0
200
175
150
125
100
75
50
25
4.5
4.0
3.5
3.0
2.5
2.0
1.5
1.0
0.5
0.5
1.0
1.5
2.0
2.5
3.0
3.5
0.0
00.0 2.5 5.0 7.5 10.0 12.5 15.0 17.5 20.0
78
910
11 1213
14 1516 18
1720
19
21 2223
2425
26
272829
30
Ch1Ch2
31
0.0
0.00.0 2.5 5.0 7.5 10.0 12.5 15.0 17.5 20.0
2.5 5.0 7.5 10.0 12.5 15.0 17.5 20.0
7
8
10 1112
13
14 1516
1718
19
20 21 2223
2726 28
29 30
31
0 day,,,
1 day (4˚C)1 day (25˚C)
78 10
11
12
14
13
1516
17
18
2021
19
222324 26
27 2928 30
31
22 23
24
mVEnlarged chromatogram
755025
013.5 14.0 14.5 15.0 15.5 16.0 min
Ch1Ch2
Histamine and amino acids
5.55.0
4.54.03.5
3.02.5
2.01.51.00.5
0.0
1.51.41.31.21.11.00.90.80.70.60.50.40.30.20.10.0
Time (min)
Time (min)
Time (min)
Time (min)
Time (min)
Time (min)
Figure 2: Chromatograms of standard solution and tuna samples. 1. Hypoxanthine (Hx), 2. Inosine 5’-monophosphate (IMP), 3. Inosine (HxR), 4. Adenosine 5’-monophosphate (AMP), 5. Adenosine 5’-diphosphate (ADP), 6. Adenosine 5’-triphosphate (ATP), 7. Aspartic acid, 8. Glutamic acid, 9. Asparagine, 10. Serine, 11. Glutamine, 12. Glycine, 13. Histidine, 14. Threonine, 15. β-Alanine, 16. Arginine, 17. Alanine, 18. Taurine, 19. Anserine, 20. Carnosine, 21. Tyrosine, 22. Valine, 23. Methionine, 24. Histamine, 25. Cystine, 26. Tryptophan, 27. Phenylalanine, 28. Isoleucine, 29. Leucine, 30. Lysine, 31. Proline.
Table 1: Analytical conditions for the determination of K-value, histamine, and amino acids
ATP-Related Compounds
Column Shim-pack™ GIST 3 μm C18 AQ
(100 mm × 3.0 mm, 3-μm)
Flow rate 0.8 mL/min
Mobile phase
A) 100:1 (v/v) water–acetonitrile containing0.15 mol/L phosphoric acid, 0.225 mol/L triethylamine
B) 80:20 (v/v) water–acetonitrile containing 0.15 mol/L phosphoric acid, 0.225 mol/L triethylamine
Time program
0%B (0–4 min) → 12%B (11.5 min) → 100%B (11.51–18.5 min) → 0%B (18.51–32 min)
Column temperature
30 °C
Injection volume
10 µL
Detection PDA 260 nm
Histamine and Amino Acids
Column Shim-pack Velox™ C18
(100 mm × 3.0 mm, 2.7-μm)
Flow rate 0.8 mL/min
Mobile phase
A) 20 mmol/L potassium phosphate buffer (pH 6.5)B) 45:40:15 (v/v/v) acetonitrile–methanol–water
Time program
5%B (0 min) → 13%B (8 min) → 25%B (15 min) → 52%B (21.5 min)
→ 100%B (21.51–27.50 min) → 5%B (27.51–32 min)
Column temperature
35 °C
Injection volume
1 µL
DetectionFluorescence Ex: 350 nm, Em: 450 nm (Ch1) Ex: 266 nm, Em: 305 nm (Ch2)
Table 2: Change in K-value and concentration of histamine in tuna over time
Sample Days Temperature K-value* Histamine
Yellowfin Tuna
0 4 °C 36.1% N.D.
14 °C 38.7% N.D.
25 °C 61.2% N.D.
Albacore Tuna
6 4 °C 70.4%2.1 mg/ 100 g
* Calculated according to: K = (Hx + HxR / Hx + HxR + IMP + AMP + ADP + ATP) × 100
The micro-Chip Chromatography Company
Changing the ART of analytical chromatography with µPACTM.
These micro Pillar Array Columns feature a perfectly-ordered separation bed of free-standing pillars ensuring:• excellent separation power• unprecedented reproducibility• unrivalled robustness
LOOK BEYOND THE SUPERFICIAL
Discover our products on www.pharma�uidics.com or contact us via info@pharma�uidics.comTel: +32 9 241 56 57
Why should you use µPACTM
50 cm μPAC™0.1 - 2.0 µL/minFor faster high-throughput analyseswhile maintaining superior performance
μPAC™-compatible EASY-Spray™ EmitterProviding plug-and-play connectivitywith Thermo Fisher Scienti�c EASY-Spray™source-equipped mass spectrometers
μPAC™ capLC1 - 15 µL/minFor routine analyses with increased robustness and high sensitivity
200 cm μPAC™0.1 - 1.0 µL/minFor a deep coverage of very complexsamples with long gradient times
Find the right product for your application
Outperforming reproducibilityDue to the mask-based etching process
Less column replacementsDue to the high number of injections
Increased sensitivityDue to high degree of order
Less prone to cloggingDue to high column permeability
Excellent separation powerDue to the exceptional column length
Unrivalled robustnessDue to the solid silicon backbone
μPAC™ Trapping columnUp to 20 µL/minReduce the sample loading timesfor dilute samples
Related Documents