Copyright © 2012 Inderscience Enterprises Ltd. Progress in Computational Fluid Dynamics, Vol. 12, Nos. 2/3, 2012 153 Advances in the Large-Eddy and Interface Simulation (LEIS) of interfacial multiphase flows in pipes D. Lakehal*, M. Labois and C. Narayanan ASCOMP GmbH, 8005 Zurich, Switzerland E-mail: [email protected] E-mail: [email protected] E-mail: [email protected] *Corresponding author Abstract: Interface Tracking Techniques (ITM) are used for stratified slug- flow in pipes. ITM is combined with the Very-Large Eddy Simulation (V-LES) approach to cope with turbulence. We first present 2D validation results, and then discuss new results of transition from stratified to slug flow. We will then present results of droplet entrainment in a stratified flow with lower water cut. While turbulence has long been addressed using RANS, we show that new approaches are mature enough to be employed as viable alternatives to statistical approaches, including the filter-based approach, also known as V-LES, which constitutes a blend between URANS and LES. Keywords: V-LES; very-large eddy simulation; LES; large eddy simulation; stratified flow; slug flow; flow transition; droplet entrainment. Reference to this paper should be made as follows: Lakehal, D., Labois, M., Thomas, S. and Narayanan, C. (2012) ‘Advances in the Large-Eddy and Interface Simulation (LEIS) of interfacial multiphase flows in channels and pipes’, Progress in Computational Fluid Dynamics, Vol. 12, No. 2/3, pp.153–163. 1 Introduction Gasliquid flow appear in various industrial processes and in the petroleum industry in particular, where mixture of gas with associated liquids (light and heavy components of oil, solid particles, hydrates, condensate and/or water) are produced and transported together. During their co-current flow in a pipe the sheared interfaces acquires various characteristic topologies or patterns (Badie, 2000; Hewitt, 2005). Understanding the transition from stratified flow to slug flow is important in hydrocarbon transportation systems, and as such it has constantly stimulated the research in this direction (Valluri et al., 2008). Slug flow is a commonly observed pattern in horizontal and upslope gas liquid flows. The regime is associated with large coherent disturbances, owing to intermittent appearance of aerated liquid masses that fill the pipe cross-section and travel downstream. This causes large pressure fluctuations and variations in flow rates, affecting process equipments. Earlier techniques for the prediction of slugs were based on various linear stability theories. The transition from stratified to slug flow regime has often been associated with the sudden growth of interfacial waves owing to the KelvinHelmholtz instability (Taitel and Dukler, 1976; Barnea and Taitel, 1993), without accounting for wall shear and interfacial stress. The long-wave assumption is still adopted in the formulation of 1D lump parameter models, because it lends itself to integral momentum balance. Although the criteria for linear instability based on these theoretical investigations show good agreement with the data as to slug formation, the basic assumptions are still questionable (e.g., Lin and Hanratty, 1986). Issa (2003) used the multi-fluid simulation approach for slugging phenomena in horizontal channels and developed a mechanistic approach to the prediction of hydrodynamic slug initiation, growth and subsequent development into continuous slug flow in pipelines. A systematic study of numerical simulation of slug flow in horizontal pipes using the two-fluid formulation was carried out by Frank (2003), who showed that the formation of slug flow strongly depends on the wall friction of the liquid phase. In simulations using inlet/ outlet boundary conditions, it was found that the formation of slug flow regimes strongly depends on the perturbation in the inlet boundary condition. He also showed that the length of the computational domain plays an important role in slug formation. Besides slug formation, the stratifying annular flow regime occurs in pipeline transport systems of natural gas and condensates, too. In this regime the liquid layer flowing on the wall is subject to droplet dispersion in the gas core. From the flow assurance standpoint, it is essential to understand the relationship between the continuous liquid

Welcome message from author
This document is posted to help you gain knowledge. Please leave a comment to let me know what you think about it! Share it to your friends and learn new things together.
Transcript
Copyright © 2012 Inderscience Enterprises Ltd.
Progress in Computational Fluid Dynamics, Vol. 12, Nos. 2/3, 2012 153
Advances in the Large-Eddy and Interface Simulation (LEIS) of interfacial multiphase flows in pipes
D. Lakehal*, M. Labois and C. NarayananASCOMP GmbH, 8005 Zurich, Switzerland E-mail: [email protected] E-mail: [email protected] E-mail: [email protected] *Corresponding author
Abstract: Interface Tracking Techniques (ITM) are used for stratified slug-flow in pipes. ITM is combined with the Very-Large Eddy Simulation (V-LES) approach to cope with turbulence. We first present 2D validation results, and then discuss new results of transition from stratified to slug flow. We will then present results of droplet entrainment in a stratified flow with lower water cut. While turbulence has long been addressed using RANS, we show that new approaches are mature enough to be employed as viable alternatives to statistical approaches, including the filter-based approach, also known as V-LES, which constitutes a blend between URANS and LES.
Keywords: V-LES; very-large eddy simulation; LES; large eddy simulation; stratified flow; slug flow; flow transition; droplet entrainment.
Reference to this paper should be made as follows: Lakehal, D., Labois, M., Thomas, S. and Narayanan, C. (2012) ‘Advances in the Large-Eddy and Interface Simulation (LEIS) of interfacial multiphase flows in channels and pipes’, Progress in Computational Fluid Dynamics, Vol. 12, No. 2/3, pp.153–163.
1 Introduction
Gasliquid flow appear in various industrial processes and in the petroleum industry in particular, where mixture of gas with associated liquids (light and heavy components of oil, solid particles, hydrates, condensate and/or water) are produced and transported together. During their co-current flow in a pipe the sheared interfaces acquires various characteristic topologies or patterns (Badie, 2000; Hewitt, 2005). Understanding the transition from stratified flow to slug flow is important in hydrocarbon transportation systems, and as such it has constantly stimulated the research in this direction (Valluri et al., 2008). Slug flow is a commonly observed pattern in horizontal and upslope gas liquid flows. The regime is associated with large coherent disturbances, owing to intermittent appearance of aerated liquid masses that fill the pipe cross-section and travel downstream. This causes large pressure fluctuations and variations in flow rates, affecting process equipments.
Earlier techniques for the prediction of slugs were based on various linear stability theories. The transition from stratified to slug flow regime has often been associated with the sudden growth of interfacial waves owing to the KelvinHelmholtz instability (Taitel and Dukler, 1976; Barnea and Taitel, 1993), without accounting for wall shear and interfacial stress. The long-wave assumption is still adopted
in the formulation of 1D lump parameter models, because it lends itself to integral momentum balance. Although the criteria for linear instability based on these theoretical investigations show good agreement with the data as to slug formation, the basic assumptions are still questionable (e.g., Lin and Hanratty, 1986).
Issa (2003) used the multi-fluid simulation approach for slugging phenomena in horizontal channels and developed a mechanistic approach to the prediction of hydrodynamic slug initiation, growth and subsequent development into continuous slug flow in pipelines. A systematic study of numerical simulation of slug flow in horizontal pipes using the two-fluid formulation was carried out by Frank (2003), who showed that the formation of slug flow strongly depends on the wall friction of the liquid phase. In simulations using inlet/outlet boundary conditions, it was found that the formation of slug flow regimes strongly depends on the perturbation in the inlet boundary condition. He also showed that the length of the computational domain plays an important role in slug formation.
Besides slug formation, the stratifying annular flow regime occurs in pipeline transport systems of natural gas and condensates, too. In this regime the liquid layer flowing on the wall is subject to droplet dispersion in the gas core. From the flow assurance standpoint, it is essential to understand the relationship between the continuous liquid

154 D. Lakehal et al.
multigrid algorithm is employed for the pressure equation, involving relaxation, restriction and prolongation up to six levels, to achieve high rates of convergence and error estimation. Multiphase flows can be tackled using:
•• interface tracking techniques (Level Set, VOF with interface reconstruction, and Phase Field)
•• N-phase, phase-averaged mixture with Algebraic Slip
•• Lagrangian particle tracking (one-to-four way coupling).
Re-distancing of level set is ensured via 3rd order WENO scheme in Cartesian meshes and via fast marching BFC grids. Mass conservation is enforced using global and local mass and volume conserving schemes.
Besides BFC meshing, TransAT also uses the Immersed Surfaces Technique (IST) to map complex geometries into a rectangular Cartesian grid (IST was used in the 3D problems treated here). Near wall regions are treated with Block Mesh Refinement (BMR), a sort of geometrical multi-grid approach in which refined grid blocks or manifolds are placed where adequate. This multigrid is different from the algebraic multigrid algorithm discussed above, in that each BMR block is separately solved and the solutions are passed from one block to the next as an initial flow field. The connectivity between blocks can be achieved in parallel up to 8-to-1 cell mapping. The combination IST/BMR saves up to 70% grid cells in selected 3D problems and allows for conjugate-heat transfer and rigid body motion.
2.2 OntheV-LESstrategyforturbulentflow
Very-Large Eddy Simulation (V-LES) (Labois and Lakehal, 2011) also known as filter-based approach (Johansen et al., 2004) is based on the concept of filtering a larger part of turbulent fluctuations as compared with V-LES. This directly implies the use of a more elaborate sub-scale statistical modelling strategy than a zero-equation model like in LES. The V-LES implemented in TransAT is based on the use of k-e model as a sub-filter model. The filter width is no longer related to the grid size (~Dx); instead it is made proportional to a characteristics length-scale (L), which should be larger than (Dx), but necessarily smaller than the macro length-scale of the flow. Increasing the filter width beyond the largest length scales will lead to predictions similar to the output of RANS models, whereas in the limit of a small filter-width (approaching the grid size) the model predictions should tend towards those of LES. If the filter width is smaller than the length scale of turbulence provided by the RANS model, then larger turbulent flow structures will be able to develop during the simulation, provided that the grid resolution and simulation parameters are adequately set (in particular regarding time stepping and the order and accuracy of the time marching schemes employed).
For a more detailed presentation and a discussion on the values of the model constants, the reader can refer to
film around the periphery and the thicker liquid pool at the bottom of the pipe (Brown et al., 2008). Until recently, droplet entrainment rates have long been determined with lump-parameter models based on heuristic correlations. In this mechanism, droplets are entrained from the film at the bottom of the pipe and are transported towards the upper part of the pipe where they deposit and form a liquid film, which drains downwards towards the bottom. Thus, there is a process of continuous renewal and drainage of the film in the upper part of the pipe. Replenishment of the film by droplet deposition is then equal, in fully developed flow, to the deposition of the droplets on the surface (Anderson and Russell, 1970).
ITM have proven robust and accurate in predicting interfacial flows (Lakehal, 2008), revealing to some extent the occurrence events similar to KelvinHelmholtz driven instabilities leading to sealing in pipe flows. We extend the prospect here by addressing slug formation and subsequent droplet entrainment. Use is made of ITM to bypass the limitations of phase-average models, in particular as to inter-phase friction, combined with large scale, time-dependent simulation to better capture turbulence anisotropy and/or non-homogeneity and its transient motion. This combination is arguably more interesting than using the two-fluid approach with k-e model; this is now known as LEIS (Lakehal, 2010), short for Large Eddy and Interface Simulation, and is implemented in the Computational Multi-Fluid Dynamics (CMFD) code TRANSAT User Manual (2010). LEIS could be used in conjunction with LES or V-LES, short for Very-Large Eddy Simulation. This concept is attractive since it combines the strength of ITM with the advantage of unsteady, large-scale prediction of turbulence, allowing capturing transients of interfaces and associated turbulence, while minimising modelling efforts of both turbulence and interface dynamics.
We discuss here the results of two-phase flow regime transition to slug in a 37 m long pipe under turbulent flow conditions. The data were extracted from the WASP facility of Imperial College (Ujang, 2003; Ujang et al., 2006). Then we present first results of droplet entrainment and detachment in a low-water-holdup stratified pipe flow under turbulent, strongly sheared interfacial conditions.
2 Model description
2.1 Multiphysics code TransAT©
TransAT© is a multi-physics, finite-volume code based on solving single and multi-fluid NavierStokes equations on structured multi-block meshes. The grid arrangement is collocated and can thus handle more easily Body-Fitted Coordinates (BFC) grids. The solver is pressure based (Projection Type), corrected using the Karki-Patankar technique for subsonic to supersonic compressible flows. High-order time marching and convection schemes can be employed; up to 3rd order Monotone and TVD-bounded schemes in space and 5th order RK in time. An algebraic

Advances in the Large-Eddy and Interface Simulation (LEIS) of interfacial multiphase flows in pipes 155
onset on the instability, Thorpe observed the growth of the waves for approximately 0.52 s, before rolling up. At this time the amplitude of the waves was about 2amax = 6–8 mm (Fig. 1). The downward wave speed was also measured to 2.6 cm/s.
Figure 1 Sketch of the Thorpe experiment
Very recently, the group of UCL Belgium (Schrooyen and Thiry, 2010) has reproduced the experiment of Thorpe at the laboratory scale, using more advanced flow acquisition material and control. This is now called the ‘The refurbished’ ‘Thorpe experiment’. Novel features of this experiment compared with the previous one include:
•• calculated acceleration ramp to minimize initial perturbations
•• high speed camera
•• PIV (2D and stereoscopic)
•• fluids fully characterised in-house (surface tensions, densities, viscosities).
The measured flow-instabilty characteristics from UCL Belgium are shown in Table 1. The main differences with the original Thorpe experiment relate mainly to the values of the most unstable wave-number and time for onset of the instability.
Table 1 Flow instability characteristics, experiments vs. CMFD
Flow-instabiltyparameters
Thorpe’s exp. (1969)
UCL exp. (2010) TransAT CMFD
lc [cm] 2.5–4.5 3.32–4.45 4.1–4.7kc [1/m] 139.6–251.3 141.2–189.2 133.7–153.2amax [mm] 6–8 6.1–7.3 6.05–7.23tonset [s] 1.88+/–0.007 2.09–2.19 2.1–2.2
3.2 Simulation setup and results
The simulation of the test case has been very recently performed at ASCOMP, and first qualitative results are presented in Figure 2. Use was made of the TransAT CMFD code, using for this flow the Level Set technique to track the interface. High-order schemes were employed
Johansen et al. (2004) and Labois and Lakehal (2011). One of the key hypotheses in V-LES though is that the Kolmogorov equilibrium spectrum is supposed to apply to the sub-filter flow portion too.
2.3 On interface tracking
Interfacial flows refer to multi-phase flow problems that involve two or more immiscible fluids separated by sharp interfaces, which evolve in time. Typically, when the fluid on one side of the interface is a gas that exerts shear (tangential) stress upon the interface, the latter is referred to as a free surface. ITM’s are best suited for these flows, because the interface topology is accurately resolved. When the exact shape of the interfaces is not relevant one may resort to phase averaged approaches, where separate conservation equations are required for each phase (or as a mixture) with appropriate exchange forces. Both formulations can virtually deal with interfacial flows, but not with the same precision. ITM’s are the cornerstone algorithms of the single-fluid formalism that solves a set of conservation equations with variable material properties (Lakehal et al., 2002). The strategy is rather accurate as it minimises modelling assumptions and deals naturally with heat and mass transfer across interfaces.
3 Model validation: Kelvin-Helmholtz instabilities in Thorpe’s experiment
3.1 Problem description
Thorpe’s (1969) experiment is a setup enabling to observe and characterise KelvinHelmholtz instabilities in an interfacial, stratified two-fluid flow. The complete details about the experiment and comparisons with CFD results can be found in Bartosiewicz et al. (2008). The experiment consists of a rectangular channel (Fig. 1) half-filled by water and half-filled by paraffin, with fluid material properties r1, r2 = 783, 1000 kg/m3, m1, m2 = 0.0017,0.001 Pa · s and surface tension s = 0.032 N/m. The channel is then gradually tilted at an angle of b = 4.1289° until surface instabilities develop and grow, before decaying. The authors of the experiment have changed the channel height (3 and 5 cm) and found no appreciable differences as to the main flow-instabilty parameters, including time for onset, critical wave length, wave number wave amplitude and wave speed (tonset, lc, kc, 2amax, c), respectively. Thorpe (1969) took ten pictures of the interface, separated by a time interval of 0.059 s. The first picture is taken at a time of onset of the instability has been observed. This time is tonset = 1.88 ± 0.07 s and includes half the time taken to tilt the channel (about 0.25 s). In his paper, Thorpe claims that this uncertainty might be even larger. The most unstable wave-number is estimated with the distance between two wave crests (Fig. 1) to be equal to lc = 2.5–4.5 cm (uncertainty raises from the different critical wavelengths observed under the same operating conditions). After the

156 D. Lakehal et al.
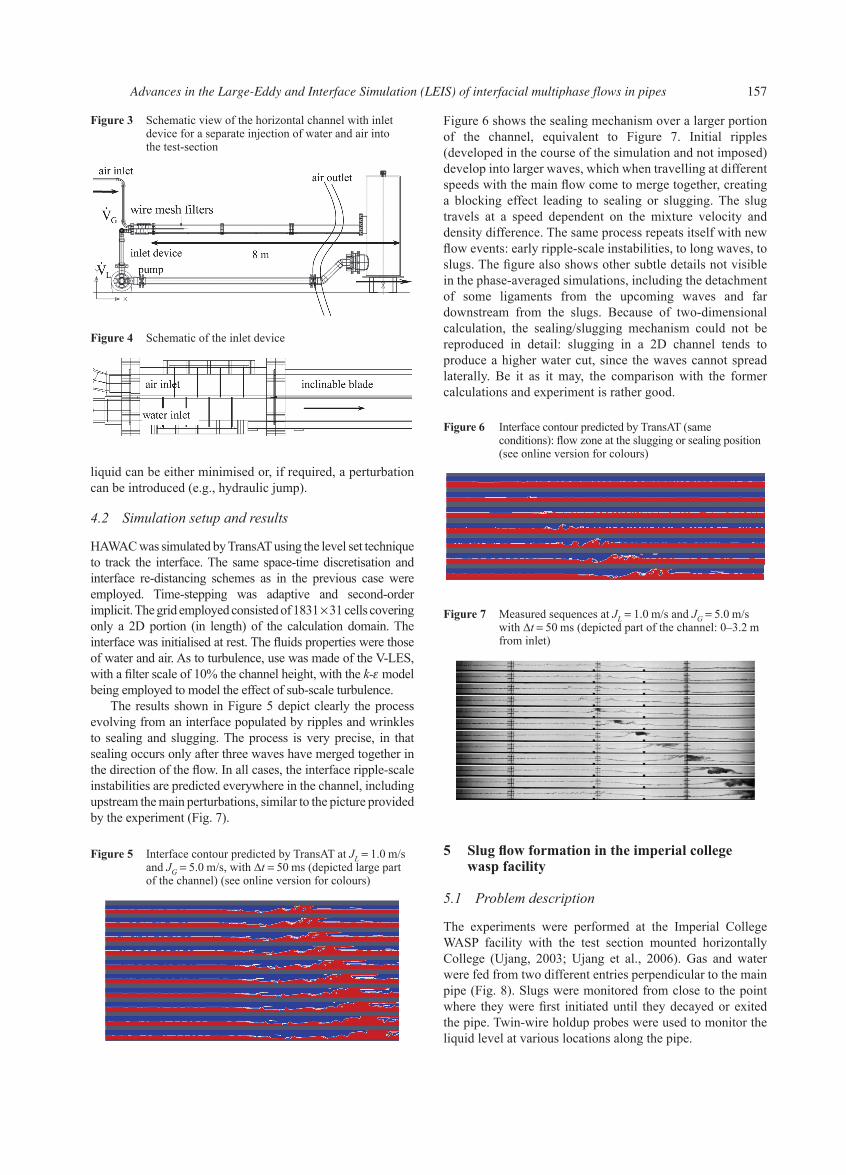
a mesh size of 1.06 mm. The wire-mesh filters were used to provide homogenous velocities at the inlet, and to produce a pressure drop that attenuates the effect of the pressure surge created by slug flow on the fluid supply systems.
Air and water streams merge at the trailing edge of a 500 mm long blade separating the phases downstream of the filter segment. The free inlet cross-section for each phase can be controlled by inclining the blade up and down. In this way, the perturbation caused by the first contact between gas and
for space discretisation (Quick) and interface re-distancing (WENO). The time-stepping was adaptive and second-order implicit. The pressure solver was GMRES with SIP as pre-conditioner. The grid employed consisted of 1831 × 31 cells to cover a calculation domain of 1.8 m × 0.03 m. The liquidoil interface was initialised as a sine-wave with different modes with amplitude of 0.2 mm. The fluids properties were set as specified in the experiment, and the channel was then tilted at an angle of b = 4.1289°.
Before discussing the comparison, it is perhaps useful to note that this problem is primarily dependent on the way initial conditions were set, in particular as to the interface. Several trials were performed before the right ingredients were found for a workable test-case. Although this piece of work lacks a detailed flow analysis as has been done previously, the results obtained compare very well with the experiment (Fig. 2). The first panels up to t = 2.29 s reflect the period of time during which the interface builds its inherent instability.
The panels for t = 2.09 and 2.19 s are important ones, since they reflect the onset of the KH instability. TransAT simulations predict perfectly the trend, but with additional sub-modes that cannot be visualised in the experiment. Beyond the point of onset of instabilty, the prediction of the experimental instabilty characteristics (e.g., inclined steep, travelling waves) is overall excellent, in particular for the wave amplitude and time for onset, as shown in Table 1. Finally, while Thorpe observed that the wave ceases to grow at tdecay ≈ 2.4 s, the UCL experiments show actually that this occurs slightly later, at tdecay ≈ 2.59 s, which is exactly the outcome of the simulations by TransAT, a difference that can only attributed to the difference in fluid properties.
4 Modelvalidation:2DslugflowformationintheHawac experiment
4.1 Problem description
The Horizontal Air/Water Channel (HAWAC) shown in Figure 3 was devoted to conduct co-current flow experiments. A special inlet device provides defined inlet boundary conditions by separate injection of water and air into the test-section. A blade separating the streams can be moved up and down to control the free inlet cross-section for each phase (Fig. 4), which influences the evolution of the flow regime. The cross-section of this channel is smaller than the one used earlier by Vallée et al. (2008), with dimensions 100 × 30 mm² (height × width). The test-section is about 8 m long, and therefore the length-to-height ratio L/h is 80, or L/Dh = 173 (Dh is the hydraulic diameter).
The inlet device (Fig. 4) was designed for separate injec-tion of air (through the upper part) and water (through the lower part) into the channel. As the inlet geometry introduc-es perturbations into the flow (bends, transition from pipes to rectangular cross-section), four wire-mesh filters were mounted in each part of the device. The filters were made of stainless steel wires with a diameter of 0.63 mm and have
Figure 2 Comparison of interfacial model evolution and propagation (TransAT (b) vs. Experiment performed at UCL (a)) (see online version for colours)
Advances in the Large-Eddy and Interface Simulation (LEIS) of interfacial multiphase flows in pipes 157
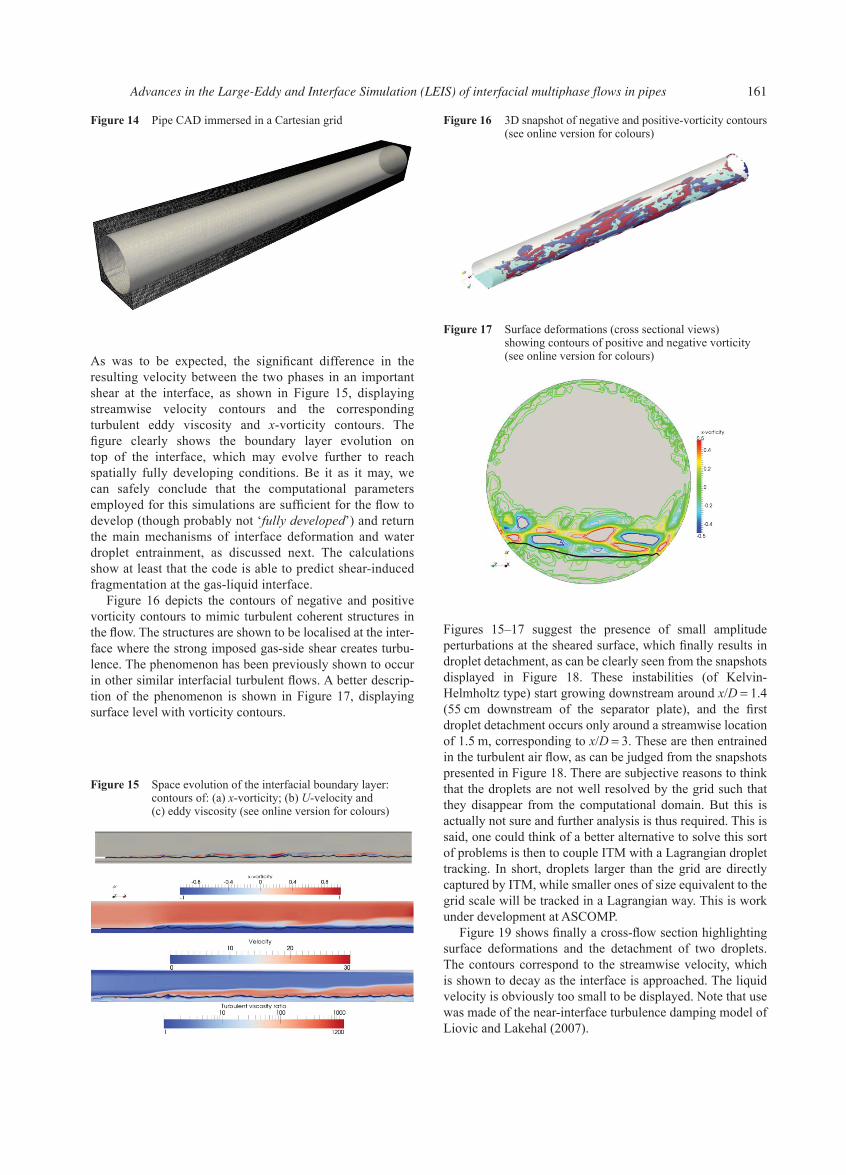
Figure 6 shows the sealing mechanism over a larger portion of the channel, equivalent to Figure 7. Initial ripples (developed in the course of the simulation and not imposed) develop into larger waves, which when travelling at different speeds with the main flow come to merge together, creating a blocking effect leading to sealing or slugging. The slug travels at a speed dependent on the mixture velocity and density difference. The same process repeats itself with new flow events: early ripple-scale instabilities, to long waves, to slugs. The figure also shows other subtle details not visible in the phase-averaged simulations, including the detachment of some ligaments from the upcoming waves and far downstream from the slugs. Because of two-dimensional calculation, the sealing/slugging mechanism could not be reproduced in detail: slugging in a 2D channel tends to produce a higher water cut, since the waves cannot spread laterally. Be it as it may, the comparison with the former calculations and experiment is rather good.
Figure 6 Interface contour predicted by TransAT (same conditions): flow zone at the slugging or sealing position (see online version for colours)
Figure 7 Measured sequences at JL = 1.0 m/s and JG = 5.0 m/s with ∆t = 50 ms (depicted part of the channel: 0–3.2 m from inlet)
5 Slugflowformationintheimperialcollegewasp facility
5.1 Problem description
The experiments were performed at the Imperial College WASP facility with the test section mounted horizontally College (Ujang, 2003; Ujang et al., 2006). Gas and water were fed from two different entries perpendicular to the main pipe (Fig. 8). Slugs were monitored from close to the point where they were first initiated until they decayed or exited the pipe. Twin-wire holdup probes were used to monitor the liquid level at various locations along the pipe.
liquid can be either minimised or, if required, a perturbation can be introduced (e.g., hydraulic jump).
4.2 Simulation setup and results
HAWAC was simulated by TransAT using the level set technique to track the interface. The same space-time discretisation and interface re-distancing schemes as in the previous case were employed. Time-stepping was adaptive and second-order implicit. The grid employed consisted of 1831 × 31 cells covering only a 2D portion (in length) of the calculation domain. The interface was initialised at rest. The fluids properties were those of water and air. As to turbulence, use was made of the V-LES, with a filter scale of 10% the channel height, with the k-e model being employed to model the effect of sub-scale turbulence.
The results shown in Figure 5 depict clearly the process evolving from an interface populated by ripples and wrinkles to sealing and slugging. The process is very precise, in that sealing occurs only after three waves have merged together in the direction of the flow. In all cases, the interface ripple-scale instabilities are predicted everywhere in the channel, including upstream the main perturbations, similar to the picture provided by the experiment (Fig. 7).
Figure 5 Interface contour predicted by TransAT at JL = 1.0 m/s and JG = 5.0 m/s, with ∆t = 50 ms (depicted large part of the channel) (see online version for colours)
Figure 3 Schematic view of the horizontal channel with inlet device for a separate injection of water and air into the test-section
Figure 4 Schematic of the inlet device

158 D. Lakehal et al.
imposed filter width equal to 0.1 D (Labois and Lakehal, 2011). The inflow boundary conditions involve fixing the superficial gas and liquid velocities and the void fraction, as specified in the experiment. Specifically at the inflow, the following values for the turbulent flow conditions were set: gas superficial velocity UsG = 4.64 m/s; liquid superficial velocity UsL = 0.611 m/s; void fraction = 50%. Initial flow disturbances based on the wall shear Reynolds number were applied in the entire flow domain to sustain turbulence.
5.3 Two-dimensionalresults
Figure 9 shows the measured liquid hold-up at different probe locations along the axis: 5.01, 5.69, 6.99 and 13.32 m. The signals display distinct large-wave structures developing along the pipe that could in fact be considered as slug-structures (Ujang, 2003). While a traditional slug is a structure blocking the cross section of the pipe completely, large-wave structures with a length scale larger than the pipe diameter can also be termed as ‘slugs’. The 3D simulations discussed next will help make the distinction between the different structures. Slugs or large-wave structures are captured around location x = 3 m and beyond (results not shown here). The periodicity of slug occurrence is clearly visible from these locations (x > 5 m).
Figure 9 Measured liquid holdup for case UsL = 0.611 m/s and UsG = 4.64 m/s. Probe location from 5.01 to 13.319 m (see online version for colours)
Figure 10 depicts the calculated water holdup in 2D at different probe locations along the axis, from 5.65 to 14.4 m. While the signal is qualitatively similar to the measured one in terms of slug or large-wave structures intermittency, it is unclear whether slugs were indeed captured; various locations exhibit water holdup of about hL/D = 0.8–0.9. Be it as it may, large surface perturbations were already captured upstream close to the inflow, at x = 0.76 m, while the experiment there shows liquid hold-up not exceeding hL/D = 0.2. For the locations shown in the figure, the experiment and CFD provide a similar picture as to wave frequency. It is also important to note that in some location immediately beyond full sealing (100% water holdup), e.g., at t = 12.5 s in panel 2, and at t = 37 s in Panels 2 and 3, the surface deformations show a sort of decay in their fluctuations. This can be explained by the
Slugs were discriminated from large waves by measuring the velocity using cross correlation of the outputs of successive probes (the waves travel at a lesser velocity that that of the mixture and slugs travel at a velocity higher than that of the mixture). The length of the stainless steel test section is 37 m and its diameter is 77.92 mm, the pressure at the outlet is 1 atm, and the temperature is 25°C. The liquid water is introduced below a stratification plate at the bottom of the test-line and the gas is introduced above it. The superficial velocities of the two phases (air and water) are: UsL = 0.611 m/s and UsG = 4.64 m/s, respectively.
5.2 Problem setup for CMFD
Use was made here of the IST technique to mesh the pipe. The pipe CAD file was created using Rhinoceros software, and immersed into a Cartesian grid, as shown in Figure 8. The 2D simulations were performed in a pipe of length 17 m. The 3D simulations were performed in a shorter domain of 8 m, consisting of 715.000 cells, then in a longer one of 16 m, consisting of 1.200.000 cells. The simulation time for the 8 m pipe simulation was 10 days on a low-bandwidth Dell PC (2 nodes × 4 cores; Open MP parallel protocol) for 20 s real time, and 53 H on a high bandwidth 18 nodes IBM multicore computer (MPI parallel protocol).
The LEIS approach was employed here, with a filter width of 0.1 D, combining the Level-Set technique for interface tracking and LES and URANS for superscale and subscale turbulence, respectively, segregated with an
Figure 8 Computational IST grid. The CAD file is immersed in a Cartesian grid. Air and water inflow are shown (see online version for colours)

Advances in the Large-Eddy and Interface Simulation (LEIS) of interfacial multiphase flows in pipes 159
flow events; after it empties the pipe, a quite substantial time is needed for the pipe to re-fill again, an observation confirmed by both experimentalists (Hewitt, 2010) and present computer predictions. Although the lower panels of the figure do not show a 100% water holdup filling the pipe as in the first one, the liquid structures are travelling at a higher speed than the mean flow, which makes them ‘slugs’, independently from the liquid holdup. Here, one observes
fact that when the channel/pipe has once totally filled up (HL/d = 1), the slug empties it, and a period of time is then required for the free surface to reestablishes before creating other instabilities.
5.4 Three-dimensional results
The objective of the 3D simulations was to reproduce a series of slugs travelling in the pipe. To address the effect of pipe length on the results, the flow was reproduced in two pipes with different lengths: 8 m and 16 m, using the same flow conditions and grid resolution (proportional to the length of the pipe).
Figure 11 shows the development structures at different probe locations along the axis, at 5.01, 5.695 and 6.995 m. These were obtained from 3D simulations in the short pipe (L = 8 m). The distinct patterns at different locations show the variations in the slug frequencies.
Slug frequency decays as the location of the probe is moved further downstream. Slugs or large-wave structures are predicted rather at downstream locations close to the pipe end: x = 7 m, in contrast to the experiment and longer-pipe simulations, both indicating a shorter position for the early slugs. Further, in contrast to the 2D results discussed earlier, slugs or large disturbances of the surfaces are not predicted upstream close to the inflow, but rather downstream. These results are interpreted later on in terms of slug frequency, and compared to the longer pipe results.
Turning now to the 16 m long pipe, the formation of the different types of slugs is well illustrated in Figure 12. The first panel exhibits a ‘large-scale slug’, which, in the experiments is often referred to as ‘operation slug’. This slug is formed upstream (x < 3 m) and fills entirely the pipe (hL/D = 1) with an average size of the order of 2–4 D. This slug has the unique feature to ‘dictate’ the subsequent
Figure 10 Calculated liquid holdup for case UsL = 0.611 m/s and UsG = 4.64 m/s. 2D (L = 17 m). Probe location from 5.7 to 14.4 m
Figure 11 Calculated liquid holdup for case UsL = 0.611 m/s and UsG = 4.64 m/s. 3D (L = 8 m). Probe location is from 5 to 7 m (see online version for colours)
Figure 12 The formation of different types of slugs (see online version for colours)

160 D. Lakehal et al.
6 Droplet entrainment and detachment
6.1 Background
In annular interfacial pipe flow the wall-adjacent liquid layer maybe subject to droplet detachment and dispersion in the gas core. Droplets are entrained from the film at the bottom of the pipe and are transported towards the upper part of the pipe where they deposit and form a liquid film, which drains downwards towards the bottom. Thus, there is a process of continuous renewal and drainage of the film in the upper part of the pipe. Replenishment of the film by droplet deposition is then equal, in fully developed flow, to the deposition of the droplets on the surface (Anderson and Russell, 1970). Understanding the relationship between the liquid film around the periphery and the liquid pool at the bottom of the pipe (Brown et al., 2008) is of importance from the flow-assurance standpoint.
6.2 Problemdefinition
In a first step, prior to tackling the annular flow with peripheral liquid film drainage, we first attempted to reproduce droplet entrainment and detachment in a stratified gasliquid flow in a shorter pipe than the previous one, of diameter 0.5 m and of length 5 m. The pipe contains though water at a low water holdup, i.e., hL/D = 0.14, injected at a velocity of 0.2 m/s. Air is injected at a bulk velocity of 20 m/s, making the flow rather turbulent (ReG = 1.6 · 105). A splitter plate has been placed by purpose between the two phases for the first 16 cm to help flow development and avoid raising issues with two-phase inlet conditions.
To perform the simulations, V-LES has been used in order to capture the unsteady behaviour of the flow, in line with the recommendations and learnt-lessons from the section presenting the 2D simulations, that three-dimensional effects are important for free surface deformations. All the more, 3D simulations increase the likelihood of correctly representing the appearance of the first droplets including their size and shape. To be pragmatic though, it is clear that predicting droplets of the mm size would require a very dense grid, which is beyond reach of basic computational resources. To alleviate this limitation, one could rather resort to a time evolving, interfacial flow, and using periodic boundary conditions (e.g., Gulati et al., 2011).
6.3 Simulation setup and results
This flow is simulated on a grid consisting of 1.6 million cells, with regular cells of 1 cm in all directions (580 along the pipe and 58 × 54 for the cross section). Use was made of the IST meshing technique introduced in an early section to represent the pipe inside a simple Cartesian grid (Fig. 14). Only high order schemes were employed, for both space discretization and time marching (3rd order RK). Five days were necessary on a 16-core PC to achieve 3.6 s of flow time (5600 time steps at Dt = 6.5e-4 s).
Figure 13 Comparison of experiment and simulations of slug frequency for two pipe lengths; L = 8 m and 16 m. Upper panel: threshold = 0.8; Lower panel: threshold = 0.85 (see online version for colours)
that gas bubbles are caught inside the slug, which explains that the measured liquid hold up hL/D is less than unity (usually hL/D lies between 0.80 and 0.95).
The slug- or large-wave structures frequency results shown in Figure 13 are qualitatively similar to the structures observed in the experiment. The lines in green correspond to the 16 m pipe simulations; the red ones to the 8 m simulations; both in 3D indeed. The shift in the frequency peak observed for the two simulations is clearly owing to the difference in length of the pipes, as the outflow boundary condition has an important impact on the flow. The frequency of the slugs is measured as a function of the abscissa of the pipe. In the 16 m case, better results are obtained as a peak frequency around 3.5 m, which is almost equal to the value delivered in the experiments.
There is however a difference in terms of interpretation, when the frequency of slugs is evaluated based on a holdup of hL/D = 0.8 or 0.85. It is clear the simulation and measurement agree best for hL/D = 0.85. Moreover, the evolution of the slug frequency along the axis of the pipe is in good agreement with the data, although the result suggests that the simulation time was not long enough to acquire all the slugs with lower frequency (0.3 Slug/s). We thus conclude that the data could probably be better predicted with this size of the domain, but for longer simulation time.
Advances in the Large-Eddy and Interface Simulation (LEIS) of interfacial multiphase flows in pipes 161
Figure 16 3D snapshot of negative and positive-vorticity contours (see online version for colours)
Figure 17 Surface deformations (cross sectional views) showing contours of positive and negative vorticity (see online version for colours)
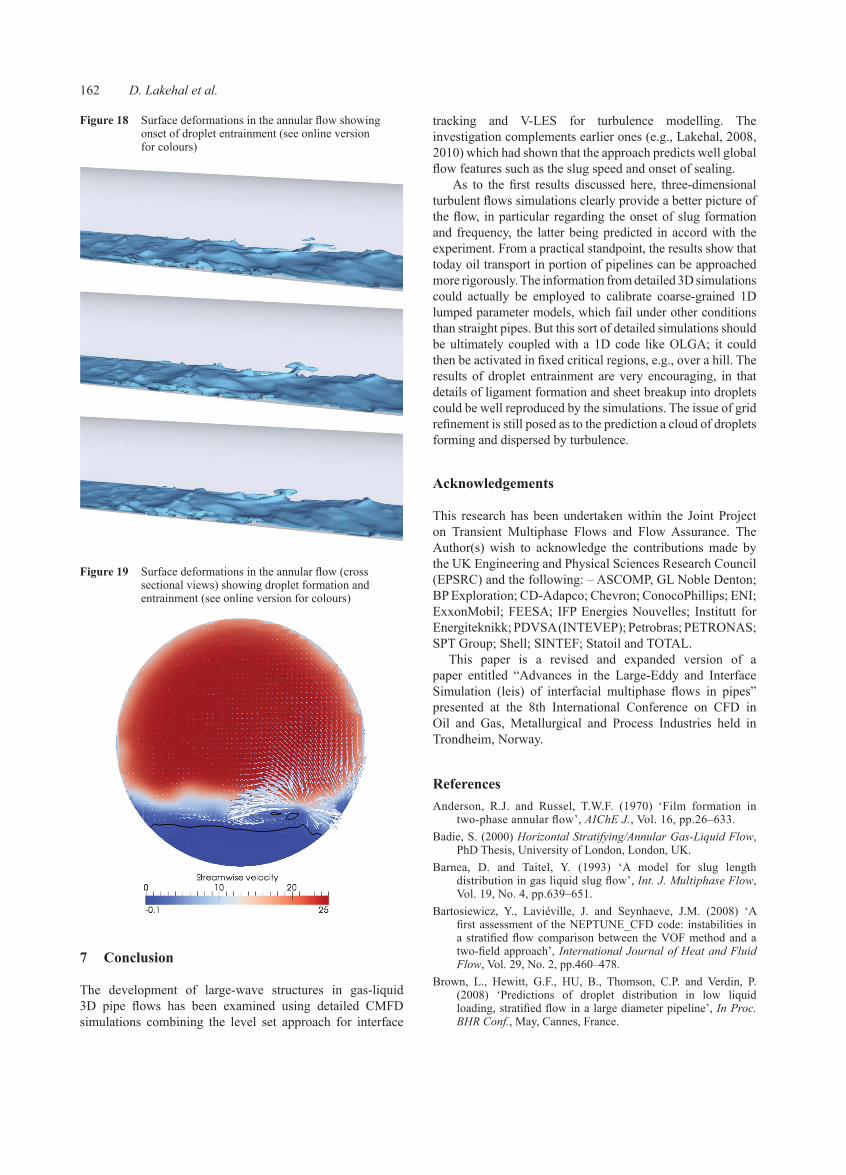
Figures 15–17 suggest the presence of small amplitude perturbations at the sheared surface, which finally results in droplet detachment, as can be clearly seen from the snapshots displayed in Figure 18. These instabilities (of Kelvin-Helmholtz type) start growing downstream around x/D = 1.4 (55 cm downstream of the separator plate), and the first droplet detachment occurs only around a streamwise location of 1.5 m, corresponding to x/D = 3. These are then entrained in the turbulent air flow, as can be judged from the snapshots presented in Figure 18. There are subjective reasons to think that the droplets are not well resolved by the grid such that they disappear from the computational domain. But this is actually not sure and further analysis is thus required. This is said, one could think of a better alternative to solve this sort of problems is then to couple ITM with a Lagrangian droplet tracking. In short, droplets larger than the grid are directly captured by ITM, while smaller ones of size equivalent to the grid scale will be tracked in a Lagrangian way. This is work under development at ASCOMP.
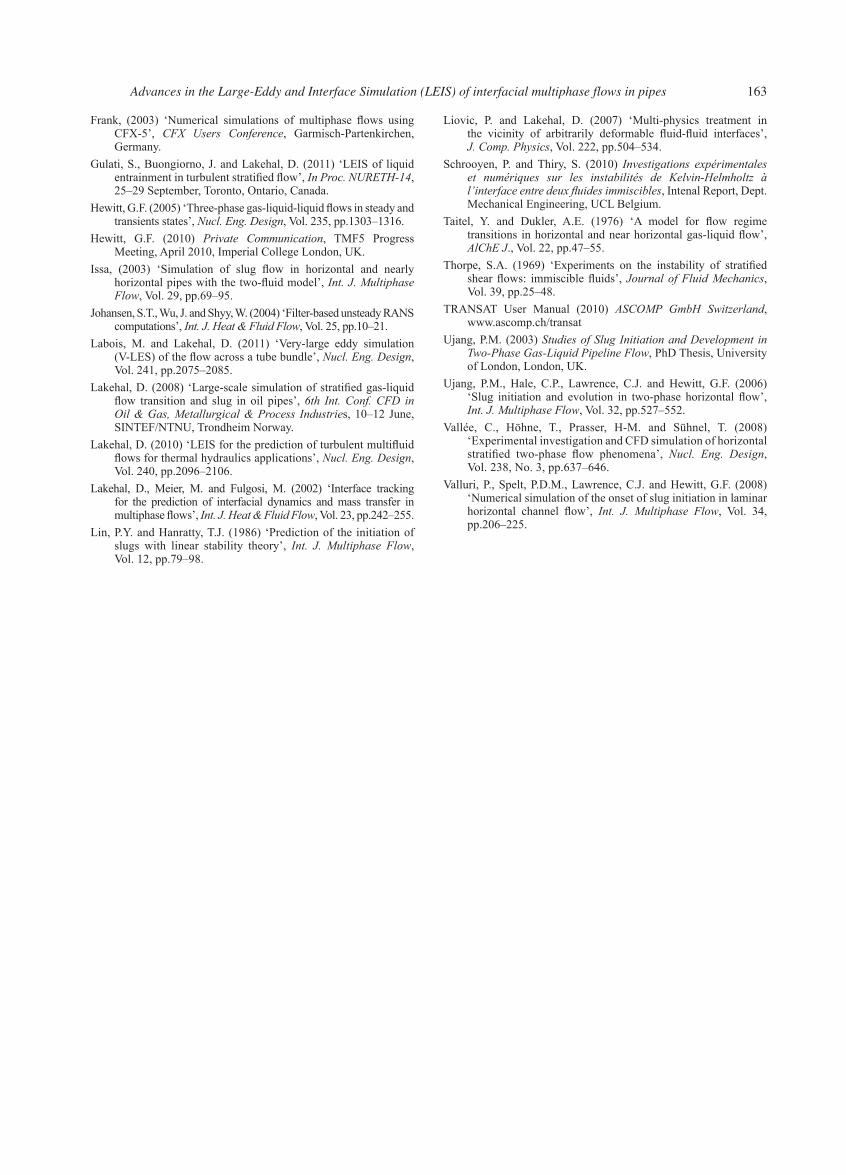
Figure 19 shows finally a cross-flow section highlighting surface deformations and the detachment of two droplets. The contours correspond to the streamwise velocity, which is shown to decay as the interface is approached. The liquid velocity is obviously too small to be displayed. Note that use was made of the near-interface turbulence damping model of Liovic and Lakehal (2007).
As was to be expected, the significant difference in the resulting velocity between the two phases in an important shear at the interface, as shown in Figure 15, displaying streamwise velocity contours and the corresponding turbulent eddy viscosity and x-vorticity contours. The figure clearly shows the boundary layer evolution on top of the interface, which may evolve further to reach spatially fully developing conditions. Be it as it may, we can safely conclude that the computational parameters employed for this simulations are sufficient for the flow to develop (though probably not ‘fully developed’) and return the main mechanisms of interface deformation and water droplet entrainment, as discussed next. The calculations show at least that the code is able to predict shear-induced fragmentation at the gas-liquid interface.
Figure 16 depicts the contours of negative and positive vorticity contours to mimic turbulent coherent structures in the flow. The structures are shown to be localised at the inter-face where the strong imposed gas-side shear creates turbu-lence. The phenomenon has been previously shown to occur in other similar interfacial turbulent flows. A better descrip-tion of the phenomenon is shown in Figure 17, displaying surface level with vorticity contours.
Figure 15 Space evolution of the interfacial boundary layer: contours of: (a) x-vorticity; (b) U-velocity and (c) eddy viscosity (see online version for colours)
Figure 14 Pipe CAD immersed in a Cartesian grid
162 D. Lakehal et al.
tracking and V-LES for turbulence modelling. The investigation complements earlier ones (e.g., Lakehal, 2008, 2010) which had shown that the approach predicts well global flow features such as the slug speed and onset of sealing.
As to the first results discussed here, three-dimensional turbulent flows simulations clearly provide a better picture of the flow, in particular regarding the onset of slug formation and frequency, the latter being predicted in accord with the experiment. From a practical standpoint, the results show that today oil transport in portion of pipelines can be approached more rigorously. The information from detailed 3D simulations could actually be employed to calibrate coarse-grained 1D lumped parameter models, which fail under other conditions than straight pipes. But this sort of detailed simulations should be ultimately coupled with a 1D code like OLGA; it could then be activated in fixed critical regions, e.g., over a hill. The results of droplet entrainment are very encouraging, in that details of ligament formation and sheet breakup into droplets could be well reproduced by the simulations. The issue of grid refinement is still posed as to the prediction a cloud of droplets forming and dispersed by turbulence.
Acknowledgements
This research has been undertaken within the Joint Project on Transient Multiphase Flows and Flow Assurance. The Author(s) wish to acknowledge the contributions made by the UK Engineering and Physical Sciences Research Council (EPSRC) and the following: – ASCOMP, GL Noble Denton; BP Exploration; CD-Adapco; Chevron; ConocoPhillips; ENI; ExxonMobil; FEESA; IFP Energies Nouvelles; Institutt for Energiteknikk; PDVSA (INTEVEP); Petrobras; PETRONAS; SPT Group; Shell; SINTEF; Statoil and TOTAL.
This paper is a revised and expanded version of a paper entitled “Advances in the Large-Eddy and Interface Simulation (leis) of interfacial multiphase flows in pipes” presented at the 8th International Conference on CFD in Oil and Gas, Metallurgical and Process Industries held in Trondheim, Norway.
ReferencesAnderson, R.J. and Russel, T.W.F. (1970) ‘Film formation in
two-phase annular flow’, AIChE J., Vol. 16, pp.26–633. Badie, S. (2000) HorizontalStratifying/AnnularGas-LiquidFlow,
PhD Thesis, University of London, London, UK.Barnea, D. and Taitel, Y. (1993) ‘A model for slug length
distribution in gas liquid slug flow’, Int.J.MultiphaseFlow, Vol. 19, No. 4, pp.639–651.
Bartosiewicz, Y., Laviéville, J. and Seynhaeve, J.M. (2008) ‘A first assessment of the NEPTUNE_CFD code: instabilities in a stratified flow comparison between the VOF method and a two-field approach’, International Journal of Heat and Fluid Flow, Vol. 29, No. 2, pp.460–478.
Brown, L., Hewitt, G.F., HU, B., Thomson, C.P. and Verdin, P. (2008) ‘Predictions of droplet distribution in low liquid loading, stratified flow in a large diameter pipeline’, In Proc. BHR Conf., May, Cannes, France.
Figure 19 Surface deformations in the annular flow (cross sectional views) showing droplet formation and entrainment (see online version for colours)
7 Conclusion
The development of large-wave structures in gas-liquid 3D pipe flows has been examined using detailed CMFD simulations combining the level set approach for interface
Figure 18 Surface deformations in the annular flow showing onset of droplet entrainment (see online version for colours)
Advances in the Large-Eddy and Interface Simulation (LEIS) of interfacial multiphase flows in pipes 163
Liovic, P. and Lakehal, D. (2007) ‘Multi-physics treatment in the vicinity of arbitrarily deformable fluid-fluid interfaces’, J. Comp. Physics, Vol. 222, pp.504–534.
Schrooyen, P. and Thiry, S. (2010) Investigations expérimentales et numériques sur les instabilités de Kelvin-Helmholtz à l’interfaceentredeuxfluidesimmiscibles, Intenal Report, Dept. Mechanical Engineering, UCL Belgium.
Taitel, Y. and Dukler, A.E. (1976) ‘A model for flow regime transitions in horizontal and near horizontal gas-liquid flow’, AlChE J., Vol. 22, pp.47–55.
Thorpe, S.A. (1969) ‘Experiments on the instability of stratified shear flows: immiscible fluids’, Journal of Fluid Mechanics, Vol. 39, pp.25–48.
TRANSAT User Manual (2010) ASCOMP GmbH Switzerland, www.ascomp.ch/transat
Ujang, P.M. (2003) Studies of Slug Initiation and Development in Two-PhaseGas-LiquidPipelineFlow, PhD Thesis, University of London, London, UK.
Ujang, P.M., Hale, C.P., Lawrence, C.J. and Hewitt, G.F. (2006) ‘Slug initiation and evolution in two-phase horizontal flow’, Int.J.MultiphaseFlow, Vol. 32, pp.527–552.
Vallée, C., Höhne, T., Prasser, H-M. and Sühnel, T. (2008) ‘Experimental investigation and CFD simulation of horizontal stratified two-phase flow phenomena’, Nucl. Eng. Design, Vol. 238, No. 3, pp.637–646.
Valluri, P., Spelt, P.D.M., Lawrence, C.J. and Hewitt, G.F. (2008) ‘Numerical simulation of the onset of slug initiation in laminar horizontal channel flow’, Int. J. Multiphase Flow, Vol. 34, pp.206–225.
Frank, (2003) ‘Numerical simulations of multiphase flows using CFX-5’, CFX Users Conference, Garmisch-Partenkirchen, Germany.
Gulati, S., Buongiorno, J. and Lakehal, D. (2011) ‘LEIS of liquid entrainment in turbulent stratified flow’, In Proc. NURETH-14, 25–29 September, Toronto, Ontario, Canada.
Hewitt, G.F. (2005) ‘Three-phase gas-liquid-liquid flows in steady and transients states’, Nucl. Eng. Design, Vol. 235, pp.1303–1316.
Hewitt, G.F. (2010) Private Communication, TMF5 Progress Meeting, April 2010, Imperial College London, UK.
Issa, (2003) ‘Simulation of slug flow in horizontal and nearly horizontal pipes with the two-fluid model’, Int. J. Multiphase Flow, Vol. 29, pp.69–95.
Johansen, S.T., Wu, J. and Shyy, W. (2004) ‘Filter-based unsteady RANS computations’, Int.J.Heat&FluidFlow, Vol. 25, pp.10–21.
Labois, M. and Lakehal, D. (2011) ‘Very-large eddy simulation (V-LES) of the flow across a tube bundle’, Nucl. Eng. Design, Vol. 241, pp.2075–2085.
Lakehal, D. (2008) ‘Large-scale simulation of stratified gas-liquid flow transition and slug in oil pipes’, 6th Int. Conf. CFD in Oil & Gas, Metallurgical & Process Industries, 10–12 June, SINTEF/NTNU, Trondheim Norway.
Lakehal, D. (2010) ‘LEIS for the prediction of turbulent multifluid flows for thermal hydraulics applications’, Nucl. Eng. Design, Vol. 240, pp.2096–2106.
Lakehal, D., Meier, M. and Fulgosi, M. (2002) ‘Interface tracking for the prediction of interfacial dynamics and mass transfer in multiphase flows’, Int.J.Heat&FluidFlow, Vol. 23, pp.242–255.
Lin, P.Y. and Hanratty, T.J. (1986) ‘Prediction of the initiation of slugs with linear stability theory’, Int. J. Multiphase Flow, Vol. 12, pp.79–98.
Related Documents