Dipl. Min. Alexander Seyfarth BRUKER AXS Inc., Madison WI, USA Dr. Arnt Kern BRUKER AXS, Karlsruhe, Germany Advances in quantitative Rietveld Analysis XRPD for Minerals and Mining Applications 4/2/2011 GSA 2011 1

Welcome message from author
This document is posted to help you gain knowledge. Please leave a comment to let me know what you think about it! Share it to your friends and learn new things together.
Transcript

Dipl. Min. Alexander Seyfarth BRUKER AXS Inc., Madison WI, USA
Dr. Arnt Kern BRUKER AXS, Karlsruhe, Germany
Advances in quantitative RietveldAnalysis XRPD for Minerals and Mining Applications
4/2/2011 GSA 2011 1

Outline
• Why X-Ray Powder Diffraction (XRPD)?
• XRPD application areas and capabilities
• Recent advances in quantitative phase analysis with XRPD
• Example applications
• Process / production control
• Conclusions
4/2/2011 2GSA 2011

Why X-Ray Powder Diffraction?
• X-Ray Powder Diffraction (XRPD) is an analytical tool for materials characterization, including but not limited to
• qualitative phase analysis (phase identification),
• quantitative phase analysis,
• crystal structure determination and refinement
• and much more
• XRPD is sensitive to the crystal structure of each phase present in the sample
• The emphasis of this presentation is on quantitative phase analysis
4/2/2011 3GSA 2011

Why X-Ray Powder Diffraction?
Alternative (non XRPD) methods for quantitative phase analysis:
• Point countingusing an optical microscope, scanning electron microscope or electron microprobe, now usually combined with digital image analysis
• rather slow, difficult on-line automation->not usable for process
• surface sensitive, can result in poor statistics
• limited by fine grain size
4/2/2011 4GSA 2011
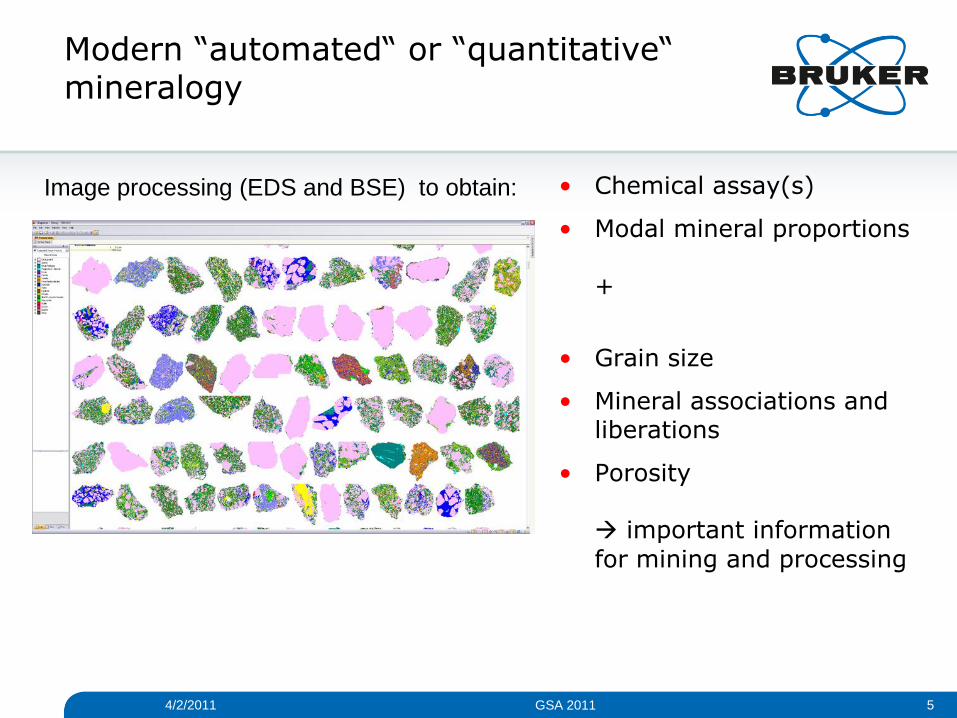
Modern “automated“ or “quantitative“ mineralogy
• Chemical assay(s)
• Modal mineral proportions
+
• Grain size
• Mineral associations and liberations
• Porosity
important information
for mining and processing
4/2/2011
Image processing (EDS and BSE) to obtain:
5GSA 2011

Ultra fast element mapping + Mineral IDAutomated MINERALOGY (SEM/BSE)
• Mineral
• 20 kV / 10 nA
• 250 kcps
• 1024 x 768
• 15 min (1 detector)
4/2/2011 6GSA 2011

Rutile (with hematite)Anatase (with calcite)
Why X-Ray Powder Diffraction?
• Example: TiO2
"Give rutile and anatase to chemists and
they will tell you they are both 100% TiO2"(Ian Madsen, CSIRO)
4/2/2011 7GSA 2011

Why X-Ray Powder Diffraction?
Anatase
a
b
c
PowderCell 2 .0
101
103
004
112
200
202
105
211
213
204
a
b
c PowderCell 2 .0
101
200
111
210
211
220
002
Rutile
Crystal structure X-ray powder pattern
Tetragonal TiO2
Trigonal TiO2
4/2/2011 8GSA 2011

Why X-Ray Powder Diffraction?
• Example: Iron, iron oxides, iron hydroxides
Elemental analysis cannot
distinguish between the
different Fe phases
4/2/2011 9GSA 2011

X-Ray Diffraction and Scattering
Single crystal
Micro sample
Textured material
Powder
Strainedmaterial
Debye cones
Single rings
X-Raybeam
2q
g direction
4/2/2011 10GSA 2011

Why X-Ray Powder Diffraction?
• Peak positions and intensities are functions of the crystal structure of a crystalline phase
• In mixtures, intensities are related to phase abundance
Quantitative phase analysis
• An X-ray powder pattern is characteristic for a crystalline phase with its particular elemental composition and crystal structure
"Fingerprint" phase identification
Why is this important?
4/2/2011 11GSA 2011

Why X-Ray Powder Diffraction?
• Materials properties are not solely determined by their chemistry as e.g. determined by XRF, but by its mineralogy, i.e. the crystal structure (s) of the constituent compound (s)
• Crystal structure governs properties such as
• Knowledge of these properties is a prerequisite for optimum processing
• Crystal habit / morphology
• Crystal surfaces
• Surface charge distribution
• Hardness
• Density
• ...
• Grindability
• Flowability
• Solubility
• Floatation properties
• ...
4/2/2011 12GSA 2011

XRPD capabilities
• Sample amounts: m-grams (micro-diffraction) up to grams
• Ideal grain size required: <10m
• XRPD is sensitive to fine grain size
• XRPD cannot provide information about particle size and shape, mineral association and liberation
• Quantitative analysis:
linear concentration range from 0.1-3%*) to 100%
typical accuracy 0.1-3%*) and reproducibility <0.1%*)
absolute
typical detection limits: 0.1-1%*)
*) depends strongly on sample presentation and sample properties, such as elemental composition (scattering power), crystal structure symmetry, degree of crystallinity
XRPD application areas and capabilities
4/2/2011 13GSA 2011

The Rietveld method
• The Rietveld method generates a calculated diffraction pattern that is compared with the observed data
• Qualitative phase analysis required
• The differences between observed and calculated diffraction patterns are minimized using least-squares procedures
Recent advances in quantitative phase analysis with XRPD
Observed pattern
Calculated pattern
Difference
Refinement
4/2/2011 14GSA 2011

Quantitative X-ray Mineralogyusing the Rietveld Method
• Hill & Howardt (1987) J. Appl. Cryst. 20, 467-74
• all phases identified
• all phases crystalline
• all crystal structures known
• Benefits
• No need for artificial calibration mixtures
• ZMV is the calibration constant
• ZMV known from crystal structure
4/2/2011 15GSA 2011
W= Weight %
S = Rietveld scale factor
Z = No. of formula units in unit cell
M = Molecular mass of formula unit
V = Unit cell volume
n
k
kk VMZS
VMZSW
1

Recent advances in quantitative phase analysis with XRPD
A new generation of Rietveld software: TOPAS (since 1997)
In addition to RECIPE based ONE button use:
• A convolution based instrument function approach for describing observed X-ray line profile shapes Fundamental Parameters Approach
• REDUCES PARAMETERS which need to be fitted DRAMATICALLY and enables REAL STABLE REPEATABLE refinements
• No divergence approach….
4/2/2011 16GSA 2011

Recent advances in quantitative phase analysis with XRPD
Fundamental Parameters Approach
• The observed line profile shapes in a powder pattern are calculated from the known instrument geometry
• This allows a more reliable decomposition of peak overlaps at much higher degrees of peak overlap, compared to traditional analytical profile functions (e.g. pseudo-Voigt, PearsonVII)
• The number of refineable profile parameters and therefore parameter correlation is significantly reduced
• Analytical profile fitting : ~7 (U,V,W,X,Y,Z,Asymmetry)
• Fundamental parameters approach : ~1-2 (size, strain)
• Complex line profile shapes as found in clays can be modeled
4/2/2011 17GSA 2011

Quantitative X-ray MineralogyAmorphous material – PONKCS
• Use if spiking not feasible
• Quantification of Phases Of No Known Crystal Structure
• amorphous
• unknown or partly known structure
• Scarlett & Madsen (2006)PowderDiffraction 21(4), 278 – 284
• Calibration of an unknown phase via internal standard s in TOPAS as
• unindexed peaks phase
• indexed hkl-phase
4/2/2011 18GSA 2011
ZMV known for standard,but calibrated for unknown
s
s
s
VMZS
S
W
WVMZ
W= Weight %
S = Rietveld scale factor
Z = No. of formula units in unit cell
M = Molecular mass of formula unit
V = Unit cell volume

Example applications:production control / industrial
4/2/2011 19GSA 2011

Quantitative Rietveld AnalysisTypical Recent Subjects
• Mineral processing products at mining operations
• Composition of ores
• Mine tailings and waste rocks (environmental mineralogy)
• Acid mine and rock drainage
• Mineralogy of asbestos mine tailings (CO2 sequestration)
• Undesirable deposits, clogs, etc. in furnaces, boilers, pipes, etc.
• E.g. early warning of blockage
• Mineralogy of (exotic) slags
• Miscellaneous corrosion products
4/2/2011 20GSA 2011

Quantitative Rietveld AnalysisPorphyry Copper Deposit Host Rock
FPA: 11 ParamsAPF: ~77 Params
Quartz monzonite to granodiorite in composition
• E.g. determination of the acid producing / neutralisation potential
4/2/2011 21GSA 2011

Quantitative Rietveld AnalysisGold Mine Waste Rock
FPA: 12 ParamsAPF: ~84 Params
• E.g. determination of the acid producing / neutralisation potential
4/2/2011 22GSA 2011

Objective: XRD to support mine operation and ore processing
• Provide data for better planning and forecasting
• resources
• estimate ore reserves
• ore control
• haulage
• energy / chemicals consumption
4/2/2011 23GSA 2011

Quantitative Rietveld AnalysisPhosphate Ore
As extracted Concentrate Tailing
Quartz
Quartz Quartz
ApatiteApatite
4/2/2011 24GSA 2011

Quantitative Rietveld AnalysisPhosphate Ore
Phase As extracted Concentrate Tailing
• Quartz 33.10 2.05 41.81
• Hematite 1.42 5.54
• Hydroxyapatite 38.20 89.20 17.55
• Dolomite 3.33 2.40 2.59
• Calcite 2.93 4.40 2.40
• Goethite 6.23 9.86
• Vermiculite 4.83 8.14
• Ilmenite 3.49 1.48
• Anatase 1.31 1.70
• Barite 0.41 1.95 0.64
• Diopside 2.36 3.75
• Microcline 2.40 4.43
4/2/2011 25GSA 2011

Quantitative X-ray MineralogyResults reconciliation
• Accuracy of the XRD method can be validated by comparing against independent methods
• chemical analysis (XRF, ICP-MS, AA, …)
• optical microscopy (quantitative point counting)
• SEM-EDS
4/2/2011 26GSA 2011
Copper concentrate
0%
10%
20%
30%
40%
50%
60%
70%
80%
90%
100%
Total Silicate 21.95 20.03
Total Ca Sulfate 1.93 1.22
Total Carbonate 5.34 3.68
Total Fe Oxide 1.28 1.87
Total Pb-Sulfide 0.32 0.32
Total Mo Sulfide 0 0
Total Zn Sulfide 3.04 3.04
Total Fe Sulfide 12.42 11.76
Total Cu Sulfide 53.73 59.38
XRD_secondary QUEMSCAN_secondary
XRD and QUEMSCAN
secondary minerals list

Quantitative Rietveld AnalysisCO2 Sequestration
• Wilson, S.A., Raudsepp, M. & Dipple, G.M. (2006). American Mineralogist 91, 1331-1341.
• The sequestration of anthropogenic CO2 may be required to meet Canada’s commitment to the Kyoto Protocol
• The carbonation of serpentine-group minerals in ultramafic mine tailings presents an opportunity to implement carbon sequestration in the mining industry
• Globally, ultramafic mines could sequester 108 tonnes of CO2/year
• The trouble with serpentine: Stacking disorder - no reliable crystal structure
4/2/2011 27GSA 2011

Quantitative Rietveld AnalysisStructureless Fitting of Crysotile
Chrysotile
4/2/2011 28GSA 2011

CO2 SequestrationClinton Creek Mine, BC, Canada
164 000 tonnes of CO2
4/2/2011 29GSA 2011

Conclusion
• XRPD is a direct and accurate analytical method for determining the presence and absolute amounts of mineral species in a sample
• STANDARDLESS QUANTIFICATION is a reality and PROCESS ready with accuracies of better than 5% relative
• Significant advances have been made in quantification of disordered materials (e.g. clays) with new functionality in TOPAS
• IN LEACHING (HEAP) XRD is used as THE CONTROL TOOL
4/2/2011 30GSA 2011

Conclusion
• Important limitations are
• The relatively high lower limit of detection, particularly for poorly crystalline phases
• The requirement for appropriate sample preparation. Overgrinding may destroy soft phases, resulting in an underestimation.
Note, that microscopes/microprobes, XRF, and XRD are highly complementary methods,
but they look at different samples!
4/2/2011 31GSA 2011

QUESTIONS ?
4/2/2011 32GSA 2011

References
Scarlett, N.V.Y. & Madsen, I.C. (2006)
Quantification of phases with partial or no known crystal structure
Powder Diffraction, 21(4), 278-284
Wilson, S.A., Raudsepp, M. & Dipple, G.M. (2006). American Mineralogist 91, 1331-1341.
Webinars (recorded) or Online Classes
TOPAS WEBINAR, 2008 , please contact [email protected]
CEMENT WEBINAR, 2008, please contact [email protected]
4/2/2011 33GSA 2011

4/2/2011 34GSA 20112. April 2011 34© Copyright Bruker Corporation. All rights reserved
Related Documents