Advances in Neuroimmunology Donna Gruol www.mdpi.com/journal/brainsci Edited by Printed Edition of the Special Issue Published in Brain Sciences brain sciences

Welcome message from author
This document is posted to help you gain knowledge. Please leave a comment to let me know what you think about it! Share it to your friends and learn new things together.
Transcript
Advances in Neuroimmunology
Donna Gruol
www.mdpi.com/journal/brainsci
Edited by
Printed Edition of the Special Issue Published in Brain Sciences
brainsciences
Advances in
Neuroimmunology
Special Issue Editor Donna Gruol
MDPI • Basel • Beijing • Wuhan • Barcelona • Belgrade
Special Issue Editor
Donna Gruol
The Scripps Research Institute
USA
Editorial Office
MDPI AG
St. Alban-Anlage 66
Basel, Switzerland
This edition is a reprint of the Special Issue published online in the open access
journal Brain Sciences (ISSN 2076-3425) from 2016–2017 (available at:
http://www.mdpi.com/journal/brainsci/special_issues/neuroimmunology).
For citation purposes, cite each article independently as indicated on the article
page online and as indicated below:
Author 1; Author 2. Article title. Journal Name Year, Article number, page range.
First Edition 2017
ISBN 978-3-03842-570-0 (Pbk)
ISBN 978-3-03842-571-7 (PDF)
Articles in this volume are Open Access and distributed under the Creative Commons Attribution license (CC BY), which allows users to download, copy and build upon published articles even for commercial purposes, as long as the author and publisher are properly credited, which ensures maximum dissemination and a wider impact of our publications. The book taken as a whole is © 2017 MDPI, Basel, Switzerland, distributed under the terms and conditions of the Creative Commons license CC BY-NC-ND (http://creativecommons.org/licenses/by-nc-nd/4.0/).
iii
Table of Contents
About the Special Issue Editor ..................................................................................................................... v
Preface to “Advances in Neuroimmunology” ........................................................................................... vii
Donna Gruol
Impact of Increased Astrocyte Expression of IL-6, CCL2 or CXCL10 in Transgenic Mice on Hippocampal Synaptic Function
Reprinted from: Brain Sci. 2016, 6(2), 19; doi: 10.3390/brainsci6020019 ................................................. 1
Maria Erta, Mercedes Giralt, Silvia Jiménez, Amalia Molinero, Gemma Comes
and Juan Hidalgo
Astrocytic IL-6 Influences the Clinical Symptoms of EAE in Mice
Reprinted from: Brain Sci. 2016, 6(12), 15; doi: 10.3390/brainsci6020015 ............................................... 18
Gatambwa Mukandala, Ronan Tynan, Sinead Lanigan and John J. O’Connor
The Effects of Hypoxia and Inflammation on Synaptic Signaling in the CNS
Reprinted from: Brain Sci. 2016, 6(1), 6; doi: 10.3390/brainsci6010006 ................................................... 29
Simone Mori, Pamela Maher and Bruno Conti
Neuroimmunology of the Interleukins 13 and 4
Reprinted from: Brain Sci. 2016, 6(2), 18; doi: 10.3390/brainsci6020018 ................................................. 43
Bethany Grimmig, Josh Morganti, Kevin Nash and Paula C Bickford
Immunomodulators as Therapeutic Agents in Mitigating the Progression of Parkinson’s Disease
Reprinted from: Brain Sci. 2016, 6(4), 41; doi: 10.3390/brainsci6040041 ................................................. 52
Simon Alex Marshall, Chelsea Rhea Geil and Kimberly Nixon
Prior Binge Ethanol Exposure Potentiates the Microglial Response in a Model of Alcohol-Induced
Neurodegeneration
Reprinted from: Brain Sci. 2016, 6(2), 16; doi: 10.3390/brainsci6020016 ................................................. 64
Darin J. Knapp, Kathryn M. Harper, Buddy A. Whitman, Zachary Zimomra
and George R. Breese
Stress and Withdrawal from Chronic Ethanol Induce Selective Changes in Neuroimmune mRNAs in Differing Brain Sites
Reprinted from: Brain Sci. 2016, 6(3), 25; doi: 10.3390/brainsci6030025 ................................................. 83
Sulie L. Chang, Wenfei Huang, Xin Mao and Sabroni Sarkar
NLRP12 Inflammasome Expression in the Rat Brain in Response to LPS during Morphine Tolerance
Reprinted from: Brain Sci. 2017, 7(2), 14; doi: 10.3390/brainsci7020014 ................................................. 102
Han Liu, Enquan Xu, Jianuo Liu and Huangui Xiong
Oligodendrocyte Injury and Pathogenesis of HIV-1-Associated Neurocognitive Disorders
Reprinted from: Brain Sci. 2016, 6(3), 23; doi: 10.3390/brainsci6030023 ................................................. 116

iv
Damir Nizamutdinov and Lee A. Shapiro
Overview of Traumatic Brain Injury: An Immunological Context Reprinted from: Brain Sci. 2017, 7(1), 11; doi: 10.3390/brainsci7010011 ................................................. 130

v
About the Special Issue Editor
Donna Gruol is an Associate Professor in the Department of Neuroscience at the Scripps Research Institute. She has studied the role of neuroimmune factors in normal brain physiology and disease states for over fifteen years, and has made significant contributions to an understanding of the actions of
neuroimmune factors on neuronal excitability and synaptic function. Her current research focuses on the role of neuroimmune factors in the effect of alcohol on brain structure and function.

vii
Preface to “Advances in Neuroimmunology”
It is now widely accepted that an innate immune system exists within the brain and plays an important role in both physiological and pathological processes [1,2]. This neuroimmune system is comprised of brain cells that produce and secrete chemicals that are historically considered signaling factors of the peripheral immune system, such as cytokines and chemokines. Cells of the brain, primarily glia cells (e.g., astrocytes and microglia) but also neurons under some conditions, produce a large number of immune factors. In addition, endothelial cells of the brain and peripheral immune cells that enter the brain can contribute to the immune environment of the brain [3].
In general, pathological conditions are associated with elevated levels of neuroimmune factors in the brain, whereas low levels of neuroimmune factors are found in the normal brain. For example, elevated levels of neuroimmune factors in the brain have been reported for a number of conditions including brain injury, infection, neurodegenerative and psychiatric disorders, and drug abuse [4–6]. Considerable effort has been devoted to identifying the neuroimmune factors that play a role in these conditions, but much work is yet to be done, especially with respect to the biological actions of individual neuroimmune factors and their role in specific brain disorders.
Neuroimmune factors, like their counterpart in the periphery, produce their biological actions through interactions with cognate membrane receptor systems that translate the chemical signal through the intervention of intracellular signaling pathways. These signaling systems are complex and many have yet to be fully elucidated. Of importance is that during pathological conditions, typically multiple signaling factors are simultaneously present in the cellular environment and may activate different signaling pathways on the same cell. These intracellular pathways may interact, a complexity that is a challenge to an understanding of mechanisms responsible for the biological actions associated with a particular brain condition and the development of specific therapeutic strategies.
In this Special issue, recent advances in an understanding of the neuroimmune system of the brain and the actions of neuroimmune factors are presented for ten areas under study; most areas are associated with pathological conditions. Together these studies are illustrative of the breadth and status of the field, the experimental approaches being employed, and areas for future research.
The review by Gruol [7], summarizes studies on the effects of three neuroimmune factors, the proinflammatory cytokine IL-6, the chemokine CCL2, and the chemokine CXCL10, on an essential aspect of brain function, synaptic transmission. The goal of these studies is to understand the actions of specific neuroimmune factors on this process. The majority of the studies discussed employ transgenic mice that express elevated levels of a neuroimmune factor (IL-6, CCL2 or CXCL10) in the brain through increased expression by astrocytes.
Transgenic mice that express elevated levels of IL-6 in the brain through increased astrocyte expression are also used in studies reported in the original article by Erta et al [8]. Transgenic mice null for astrocyte IL-6 expression are also used. The goal of these studies is to identify the role of astrocyte production of IL-6 in the symptomatology of experimental autoimmune encephalomyelitis (EAE), an animal model for multiple sclerosis in humans.
The review by Mukandala et al [9] summarizes studies that investigate the role of neuroimmune factors in acute and chronic hypoxia, and the consequences of neuroinflammation induced by hypoxia on hippocampal synaptic function. Hypoxia and neuroinflammation are two conditions that play a central role in ischemia. Complex signaling pathways involving the proinflammatory cytokine TNF-
alpha and other factors are described along with their proposed roles in hypoxia and altered synaptic function associated with hypoxia.
Mori et al. [10] review the current state of knowledge on the expression and actions of two cytokines, IL-13 and IL-4, in the brain. Production of these cytokines by neurons and glia of the brain has been reported, but information is still limited. Both IL-13 and IL-4 can signal through a receptor complex comprised of IL-13 and IL-4 receptor subunits, although IL-4 also interacts with a separate IL-4 receptor.
Evidence of a role for one of both of these cytokines in hypoxia, EAE and Parkinson’s disease is presented, along with evidence for modulatory actions on dopaminergic neurons.
viii
Parkinson’s disease is also a topic of the review by Grimmig et al. [11]. This review focuses on the role of neuroimmunology and neuron-glia interactions in the pathophysiology of Parkinson’s disease in the context of aging. Pathological mechanisms are described along with potential therapeutic agents and strategies. Fractalkine, a protein constitutively expressed by neurons in the brain, and the antioxidant astaxanthin, a xanthophyll carotenoid that occurs naturally, are discussed as potential therapeutic agents.
Three original articles in this Special issue focus on the role of neuroimmune factors in the actions of
drugs of abuse on the brain. Recent studies have revealed that several abused drugs, including alcohol and morphine, induce glial cells of the brain, primarily astrocytes and microglia, to secrete neuroimmune factors [2,12,13]. Microglial activation and elevated secretion of neuroimmune factors are thought to contribute to neuronal damage and cognitive dysfunction associated excessive drug use and other pathological conditions [14].
The original article by Marshall et al. [15] reports results from studies on the effects of a binge pattern of alcohol exposure on microglial activation and expression of neuroimmune factors in the brain of rats. Differences in the consequences of single versus repetitive alcohol exposure on microglial activation are addressed. In the original article by Knapp et al. [16], studies are reported that examine the expression of neuroimmune mRNAs in the brain after treatment of rats to an experimental paradigm involving chronic alcohol exposure followed by alcohol withdrawal. Results from the alcohol exposure/withdrawn animals are compared to neuroimmune mRNA expression produced in rats by stress, which is a risk factor for alcohol relapse.
Chang et al. [17] report effects of the bacterial endotoxin lipopolysaccharide (LPS) on expression of
genes for proteins localized in multi-protein complexes called inflammasomes, which are important producers of neuroimmune factors and regulators of the inflammatory response. A number of different inflammasomes have been identified [18]. The studies focus on LPS-induced expression of genes for proteins housed in the inflammasomes in the context of morphine tolerance, which results from prolonged exposure to morphine. LPS is used in these studies to model invasion by a pathogen, which causes an inflammatory response. Morphine is known to affect the inflammatory response elicited by pathogens. A variety of inflammasome–related genes (e.g., for neuroimmune factors and downstream signaling partners) are examined in brains of morphine naïve rats and rats chronically exposed to morphine in these studies.
The review article by Liu et al. [19] focuses on another brain glial cell, the oligodendrocyte, and injury that occurs to this brain cell during HIV-1 infection. Oligodendrocytes are responsible for axonal
myelination, which is essential for normal neuronal and synaptic processes that mediate brain function. Oligodendrocytes also contribute to the immunology of the brain by producing a wide range of neuroimmune mediators [20]. Process and mediators involved in oligodendrocyte and myelin damage as a consequence of HIV-1 are discussed in this article.
Nizamutdinov and Shapiro [21] provide a comprehensive review of the traumatic brain injury (TBI), and the role of neuroimmunity and peripheral immunity in the complex pathology of this condition. Traumatic brain injury is a broad area that encompasses many types of brain injury. A number of TBI experimental models are discussed along with mechanisms of neuropathology and the involvement of neuroimmunity. Neuroimmune factors have been reported to play a critical role in TBI outcomes.
Donna Gruol
Special Issue Editor
References
1. Nistico, R.; Salter, E.; Nicolas, C.; Feligioni, M.; Mango, D.; Bortolotto, Z.A.; Gressens, P.; Collingridge, G.L.; Peineau, S. Synaptoimmunology—Roles in health and disease. Mol. Brain 2017, 10, 26.
ix
2. Cui, C.; Shurtleff, D.; Harris, R.A. Neuroimmune mechanisms of alcohol and drug addiction. Int.
Rev. Neurobiol. 2014, 118, 1–12.
3. Erickson, M.A.; Dohi, K.; Banks, W.A. Neuroinflammation: A common pathway in cns diseases as mediated at the blood-brain barrier. Neuroimmunomodulation 2012, 19, 121–130.
4. Shie, F.S.; Chen, Y.H.; Chen, C.H.; Ho, I.K. Neuroimmune pharmacology of neurodegenerative and mental diseases. J. Neuroimmune Pharmacol. 2011, 6, 28–40.
5. Crews, F.T.; Lawrimore, C.J.; Walter, T.J.; Coleman, L.G., Jr. The role of neuroimmune signaling in alcoholism. Neuropharmacology 2017, 122, 56–73.
6. Northrop, N.A.; Yamamoto, B.K. Neuroimmune pharmacology from a neuroscience perspective. J. Neuroimmune Pharmacol. 2011, 6, 10–19.
7. Gruol, D.L. Impact of increased astrocyte expression of IL-6, CCL2 or CXCL10 in transgenic mice on hippocampal synaptic function. Brain Sci. 2016, 6.
8. Erta, M.; Giralt, M.; Jimenez, S.; Molinero, A.; Comes, G.; Hidalgo, J. Astrocytic il-6 influences the clinical symptoms of eae in mice. Brain Sci. 2016, 6.
9. Mukandala, G.; Tynan, R.; Lanigan, S.; O’Connor, J.J. The effects of hypoxia and inflammation on synaptic signaling in the cns. Brain Sci. 2016, 6.
10. Mori, S.; Maher, P.; Conti, B. Neuroimmunology of the interleukins 13 and 4. Brain Sci. 2016, 6.
11. Grimmig, B.; Morganti, J.; Nash, K.; Bickford, P.C. Immunomodulators as therapeutic agents in mitigating the progression of parkinson's disease. Brain Sci. 2016, 6.
12. Lacagnina, M.J.; Rivera, P.D.; Bilbo, S.D. Glial and neuroimmune mechanisms as critical modulators of drug use and abuse. Neuropsychopharmacology 2017, 42, 156–177.
13. Montesinos, J.; Alfonso-Loeches, S.; Guerri, C. Impact of the innate immune response in the actions of ethanol on the central nervous system. Alcohol. Clin. Exp. Res. 2016, 40, 2260–2270.
14. Gonzalez, H.; Elgueta, D.; Montoya, A.; Pacheco, R. Neuroimmune regulation of microglial activity involved in neuroinflammation and neurodegenerative diseases. J. Neuroimmunol. 2014, 274, 1–13.
15. Marshall, S.A.; Geil, C.R.; Nixon, K. Prior binge ethanol exposure potentiates the microglial response in a model of alcohol-induced neurodegeneration. Brain Sci. 2016, 6.
16. Knapp, D.J.; Harper, K.M.; Whitman, B.A.; Zimomra, Z.; Breese, G.R. Stress and withdrawal from chronic ethanol induce selective changes in neuroimmune mrnas in differing brain sites. Brain Sci.
2016, 6.
17. Chang, S.L.; Huang, W.; Mao, X.; Sarkar, S. Nlrp12 inflammasome expression in the rat brain in response to lps during morphine tolerance. Brain Sci. 2017, 7.
18. Sharma, D.; Kanneganti, T.D. The cell biology of inflammasomes: Mechanisms of inflammasome activation and regulation. J. Cell Biol. 2016, 213, 617–629.
19. Liu, H.; Xu, E.; Liu, J.; Xiong, H. Oligodendrocyte injury and pathogenesis of HIV-1-associated
neurocognitive disorders. Brain Sci. 2016, 6.
20. Zeis, T.; Enz, L.; Schaeren-Wiemers, N. The immunomodulatory oligodendrocyte. Brain Res. 2016, 1641, 139–148.
21. Nizamutdinov, D.; Shapiro, L.A. Overview of traumatic brain injury: An immunological context. Brain Sci. 2017, 7.

brainsciences
Review
Impact of Increased Astrocyte Expression of IL-6,CCL2 or CXCL10 in Transgenic Mice on HippocampalSynaptic Function
Donna Gruol
Molecular and Cellular Neuroscience Department, The Scripps Research Institute, La Jolla, CA 92037, USA;
[email protected]; Tel.: +1-858-784-7060; Fax: +1-858-784-7393
Academic Editor: Balapal S. Basavarajappa
Received: 17 May 2016; Accepted: 13 June 2016; Published: 17 June 2016
Abstract: An important aspect of CNS disease and injury is the elevated expression of neuroimmune
factors. These factors are thought to contribute to processes ranging from recovery and repair to
pathology. The complexity of the CNS and the multitude of neuroimmune factors that are expressed
in the CNS during disease and injury is a challenge to an understanding of the consequences of
the elevated expression relative to CNS function. One approach to address this issue is the use of
transgenic mice that express elevated levels of a specific neuroimmune factor in the CNS by a cell
type that normally produces it. This approach can provide basic information about the actions of
specific neuroimmune factors and can contribute to an understanding of more complex conditions
when multiple neuroimmune factors are expressed. This review summarizes studies using transgenic
mice that express elevated levels of IL-6, CCL2 or CXCL10 through increased astrocyte expression.
The studies focus on the effects of these neuroimmune factors on synaptic function at the Schaffer
collateral to CA1 pyramidal neuron synapse of the hippocampus, a brain region that plays a key role
in cognitive function.
Keywords: pyramidal neurons; Schaffer collaterals; LTP; neuroimmune; alcohol; field potential
recordings; cytokine; chemokine
1. Introduction
Several lines of evidence have confirmed the existence of a neuroimmune system in the CNS, and a
role for neuroimmune communication in CNS homeostasis, function, and pathology. Glial cells, and in
particular astrocytes and microglia, are the main cellular components of the CNS neuroimmune
system. Glial cells initiate neuroimmune communication primarily through the production of
small protein signaling factors with distinct structure and function. These neuroimmune factors
include members of the cytokine superfamily such as proinflammatory cytokines and chemokines.
Typically, proinflammatory cytokines and chemokines are present at low levels in the normal CNS,
while elevate levels are associated with CNS disease and injury. For example, elevated levels of
proinflammatory cytokines and/or chemokines in the CNS are typical hallmarks of CNS inflammatory
and neurodegenerative diseases such as HIV infection [1], Alzheimer’s disease [2], epilepsy [3],
multiple sclerosis [4], alcoholism and fetal alcohol spectrum disorders [5–7], and psychiatric disorders
(e.g., autism spectrum disorders, schizophrenia, depression) [8–10]. The elevated levels are thought
contribute to pathological processes occurring in these conditions, although protective actions could
also play a role. Elevated levels of these neuroimmune factors also occur in normal aging, and may
play a role in cognitive decline that can occur with normal aging [11,12].
Brain Sci. 2016, 6, 19 1 www.mdpi.com/journal/brainsci
Brain Sci. 2016, 6, 19
CNS glial cells are capable of producing a variety of proinflammatory cytokines and chemokines,
but the specific biological actions and roles of these neuroimmune factors have yet to be fully elucidated,
and are likely to depend on the cell source and physiological or pathological context. During conditions
associated with CNS disease and injury, multiple neuroimmune factors are commonly, and often
chronically produced. The complexity of this situation makes it difficult to identify the actions of
specific neuroimmune factors and the cell source, especially if pharmacological, biological, or other
types of tools are lacking. A number of approaches have been used to circumvent this problem. This
article focuses on one approach, the use of transgenic mice that endogenously produce elevated levels
of a specific neuroimmune factor in the CNS by a cell type that normally produces it, and within the
anatomical integrity and physiological pathways of the CNS. The transgenic mice of interest in this
review express elevated levels of the proinflammatory cytokine Interleukin-6 (IL-6), the chemokine
CCL2 (CC chemokine ligand 2, previously known as monocyte chemoattractant protein-1 or MCP-1),
or the chemokine CXCL10 (previously known as interferon-gamma inducible protein 10 or IP10)
through increased astrocyte expression. The review summarizes studies on the consequences of the
increased astrocyte expression on a basic mechanism of CNS function, synaptic function, and in
particular, hippocampal synaptic function. The hippocampus plays a critical role in learning and
memory, and alterations in hippocampal synaptic function can significantly affect cognition [13].
Studies in experimental models have shown that altered hippocampal synaptic function is associated
with CNS conditions known to involve elevated expression of neuroimmune factors (e.g., [14–26]).
The transgenic mice have also been a useful model for a number of other types of studies related to
CNS conditions during disease and injury, a topic that is not addressed in this review (e.g., [27–34]).
2. Astrocytes Are a Primary Source of Neuroimmune Factors in the CNS
Astrocytes are the most abundant cell type in the CNS and a key component of the neuroimmune
system of the CNS [35]. Astrocytes play a variety of roles in the CNS, as regulators/mediators of normal
physiology and responders to adverse conditions, such as those occurring during injury and infection,
when astrocytes contribute to repair and recovery processes [36,37]. A large number of cytokines
and chemokines are produced by astrocytes, including IL-6, CCL2, and CXCL10, but relatively
little is known about the specific roles and biological actions of these factors under physiological
or pathophysiological conditions when astrocytes are the initial cell source of these factors. Astrocytes
are in close association with neurons and synapses, making them ideally positioned to influence
neuronal circuit activity, which is essential for normal CNS function and is often compromised in CNS
disorders [38,39]. In this review, studies on the consequence of elevated astrocyte expression IL-6,
CCL2, or CXCL10 on synaptic function at the Schaffer collateral to CA1 pyramidal neuron synapse of
the hippocampus are summarized. The Schaffer collateral to CA1 pyramidal neuron synapse is one of
the most highly studied synapse in the CNS [40]. Output from the CA1 region provides important
input to other brain regions and plays a key role in learning, memory, and other cognitive functions.
3. Signal Transduction Pathways
IL-6, CCL2 and CXCL10 initiate biological actions through the activation of specific membrane
receptors, IL-6R, CCR2, and CXCR3, respectively. However, downstream signal transduction pathways
differ. CCR2 and CXCR3 are G-protein coupled receptors (GPCRs), whereas IL-6R is linked to a tyrosine
kinase signal transduction pathway (Figure 1). Moreover, IL-6R associated signal transduction can
occur through two pathways, a classic pathway and trans-signaling [41] (Figure 1).
The classic IL-6 pathway involves membrane bound IL-6R, which interacts with another
membrane bound protein, gp130, the signaling subunit of IL-6R and other cytokine receptors.
Trans-signaling involves IL-6R that has been released from cells into the extracellular fluid and
is referred to as soluble IL-6R. Soluble IL-6R can bind to IL-6 in the extracellular fluid and the ligand/
receptor complex can then bind to membrane bound gp130. Because gp130 is ubiquitously expressed
in CNS cells, trans-signaling can occur in cells that do not express membrane bound IL-6R, and
2
Brain Sci. 2016, 6, 19
consequently trans-signaling greatly expands the target area of IL-6 actions. Trans-signaling appears
to be the primary pathway involved in the pathological actions of IL-6 in the CNS [42].
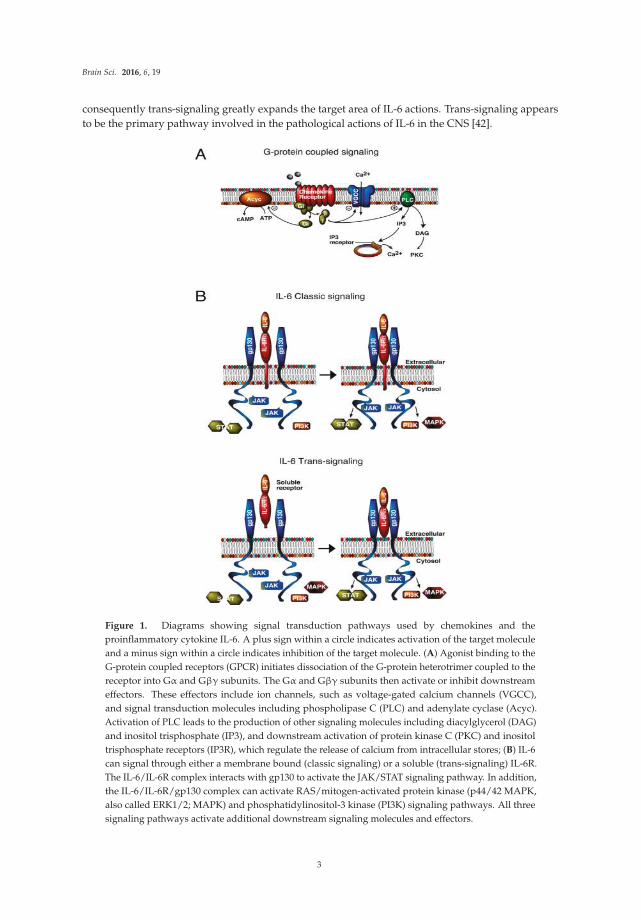
Figure 1. Diagrams showing signal transduction pathways used by chemokines and the
proinflammatory cytokine IL-6. A plus sign within a circle indicates activation of the target molecule
and a minus sign within a circle indicates inhibition of the target molecule. (A) Agonist binding to the
G-protein coupled receptors (GPCR) initiates dissociation of the G-protein heterotrimer coupled to the
receptor into Gα and Gβγ subunits. The Gα and Gβγ subunits then activate or inhibit downstream
effectors. These effectors include ion channels, such as voltage-gated calcium channels (VGCC),
and signal transduction molecules including phospholipase C (PLC) and adenylate cyclase (Acyc).
Activation of PLC leads to the production of other signaling molecules including diacylglycerol (DAG)
and inositol trisphosphate (IP3), and downstream activation of protein kinase C (PKC) and inositol
trisphosphate receptors (IP3R), which regulate the release of calcium from intracellular stores; (B) IL-6
can signal through either a membrane bound (classic signaling) or a soluble (trans-signaling) IL-6R.
The IL-6/IL-6R complex interacts with gp130 to activate the JAK/STAT signaling pathway. In addition,
the IL-6/IL-6R/gp130 complex can activate RAS/mitogen-activated protein kinase (p44/42 MAPK,
also called ERK1/2; MAPK) and phosphatidylinositol-3 kinase (PI3K) signaling pathways. All three
signaling pathways activate additional downstream signaling molecules and effectors.
3
Brain Sci. 2016, 6, 19
The differences in signal transduction pathways utilized by IL-6 and chemokines could indicate
different biological actions. However, signal transduction pathways downstream of the G-protein and
tyrosine kinase step can merge at common pathway partners or targets and lead to similar biological
actions. Thus, it is not surprising that all three neuroimmune factors have neuronal or synaptic actions,
although the actions are not identical.
Both neurons and glial cells express receptors and signal transduction pathways utilized by
IL-6R [41,43], CCR2 [44–46], and CXCR3 [47,48], and are potential downstream cellular targets of
the astrocyte produced neuroimmune factors. Because of the close association of astrocytes with
neurons and synapses [39], actions of cytokines or chemokines on either cell type could potentially
alter neuronal and synaptic function. Downstream molecular targets of GPCR and IL-6R pathways can
regulate gene expression, which may be instrumental in directing neuroadaptive changes associated
with elevated expression of IL-6, CCL2, and CXCL10 in the CNS of the transgenic mice.
4. IL-6, CCL2, or CXCL10 Transgenic Mice
All three lines of transgenic mice with increased astrocyte expression of IL-6, CCL2, or CXCL10
were generated by a similar approach, insertion of the transgene (mouse or human) for the
neuroimmune factor under transcriptional control of the glial fibrillary acidic protein (GFAP) gene
promoter [29,34,49,50]. GFAP is an intermediate filament protein expressed almost exclusively by
astrocytes in the adult CNS and commonly used as a marker for astrocytes [50,51]. More than one
line was generated for each neuroimmune factor. Heterozygotes from the following lines were used
for the studies discussed in this review: IL-6 transgenic line 167 (IL-6 tg), CXCL10 transgenic line
CXCL10-10 (CXCL10 tg), CCL2 transgenic line on a SJL background (CCL2-tg SJL mice), and CCL2
transgenic line on a C57Bl/6J background (CCL2-tg), which were developed from the CCL2-tg SJL
mice. Non-transgenic littermates of the respective transgenic line were used as controls. In general,
elevated expression of other neuroimmune factors was not evident, or at low level in these transgenic
lines [29,34,52], enabling investigation of the consequences of elevated expression of the transgene
alone or in combination with other experimental manipulations.
4.1. Expression of IL-6, CCL2, or CXCL10 in the Transgenic Mice
Because transgene expression in the transgenic mice is under control of the GFAP promoter,
elevated expression of IL-6, CCL2, or CXCL10 is linked to GFAP expression. GFAP expression in
astrocytes is initiated during the developmental period, which occurs primarily during the first 3 weeks
of postnatal life in mice. GFAP expression in the mouse hippocampus is evident at 1 day postnatal,
increases with age until 6 days postnatal, and then levels off and remains stable through adulthood [53].
Thus, neuronal/synaptic exposure to these neuroimmune factors in the transgenic mice occurs during
an important period of structural and synaptic development and could affect developmental patterns.
Evidence is limited on this topic, but in general, neuropathology in the hippocampus of the IL-6, CCL2,
and CXCL10 heterozygous mice is absent or minimal up to 3–6 months of age, although homozygous
mice can show pathology at early ages [29,32,54,55]. Thus, if the elevated expression of IL-6, CCL2,
or CXCL10 altered CNS development in the transgenic mice, the effects on development were not
pathological or were compensated for by other changes. In this review, discussion of the transgenic
mice refers to the heterozygotes.
CNS expression of IL-6, CCL2, or CXCL10 has been quantified in the respective transgenic mice
at the mRNA and/or protein levels. Studies of IL-6-tg mice showed that IL-6 mRNA was evident
in the CNS at 7 days postnatal, increased with age and reached a peak at 3 months postnatal (adult
stage), after which a decline was observed [52]. IL-6 transgene expression was demonstrated in
hippocampal astrocytes by expression of the lacZ reporter gene and immunohistochemical detection
of β-gal [55]. Constitutive secretion of IL-6 from astrocytes was demonstrated in studies of astrocyte
cultures prepared from CNS of the IL-6 tg mice [49]. IL-6 levels were ~150 pg/mL in the supernatant
from astrocyte cultures prepared from CNS of IL-6 tg mice, compared with <5 pg/mL for supernatant
4
Brain Sci. 2016, 6, 19
from astrocyte cultures prepared from CNS of non-tg mice. Interestingly, ELISA analysis of IL-6 levels
in the hippocampus have revealed low levels and no differences between the IL-6 tg and non-tg
hippocampus, although higher levels and genotypic differences were noted in the cerebellum [52,56].
The cerebellum is the CNS region with the highest level of IL-6 mRNA expression in the transgenic mice,
particularly in the Bergman glial [49]. These results may indicate that IL-6 produced by hippocampal
astrocytes in vivo is rapidly released and degraded. Others have noted difficulty in measuring IL-6
levels in CNS tissue using commercial ELISA kits, which may mean that there are technical issues
to be resolved [57]. In spite of the lack of differences in measureable levels of IL-6 protein, increase
expression of IL-6 regulated genes (e.g., GFAP, eb22, Socs3) and elevated levels of STAT3 and the
activated form of STAT3 (phosphoSTAT3), the downstream partner of IL-6 signal transduction through
which IL-6 acts to increase GFAP [58–60], were observed in the CNS of IL-6 tg mice. These results are
consistent with actions of elevated levels of IL-6 in the IL-6 tg CNS.
Protein measurements in the CNS of the two CCL2 transgenic lines showed that the older CCL2-tg
SJL mice express higher levels of CCL2 in the hippocampus than in the CCL2-tg mice. CCL2 levels
measured by ELISA were ~1.3 ng/mL at 3–4 months of age and ~3.0 ng/mL at 7–9 months of age in
hippocampal homogenate from the CCL2-tg SJL mice [61]. In the CCL2-tg mice, CCL2 levels measured
by ELISA were ~1.2 ng/mL at 3–5 months of age and ~1.5 ng/mL at 7–9 [58]. CCL2 levels were
~0.2 ng/mL in hippocampal homogenates from the non-tg mice from both the CCL2-tg and CCL2-tg
SJL lines. Studies of supernatants from astrocyte cultures prepared from CNS of CCL2-tg SJL mice
showed that astrocytes constitutively secrete large amounts of CCL2 (e.g., ~3.5 ng/mL) [34].
Expression of CXCL-10 in the CNS of CXCL10-tg mice has been characterized at the mRNA level
by in situ hybridization [29]. The highest levels of CXCL10 mRNA were observed in the hippocampus,
olfactory bulb, periventricular zone, cortical areas, cerebellum, and choroid plexus of the CXCL10-tg
CNS (mice 5–6 months of age). Western blot studies confirmed high levels of CXCL10 protein in
the hippocampus, and immunohistochemical staining confirmed expression of CXCL10 protein in
astrocytes [29]. No CXCL10 mRNA or protein expression was observed in non-tg mice. Levels of
CXCL10 protein in the CNS of CXCL10-tg mice have not been measured by ELISA.
Elevated levels of neuroimmune factors are typically associated with pathological conditions,
whereas low levels appear to exist under physiological conditions. However, the range of protein levels
expressed during physiological and pathophysiological conditions has yet to be fully elucidated for
most neuroimmune factors. Although elevated levels IL-6, CCL2 and CXCL-10 mRNA and/or protein
have been documented in the CNS of the respective transgenic mice, it is unknown if protein levels for
the three transgenic lines are functionally comparable. However, mRNA or protein levels were shown
to be within the range associated with experimentally induced pathophysiological conditions in the
CNS of IL-6 tg [62], CXCL10-tg [29] and CCL2-tg SJL mice [34].
4.2. Neuropathology
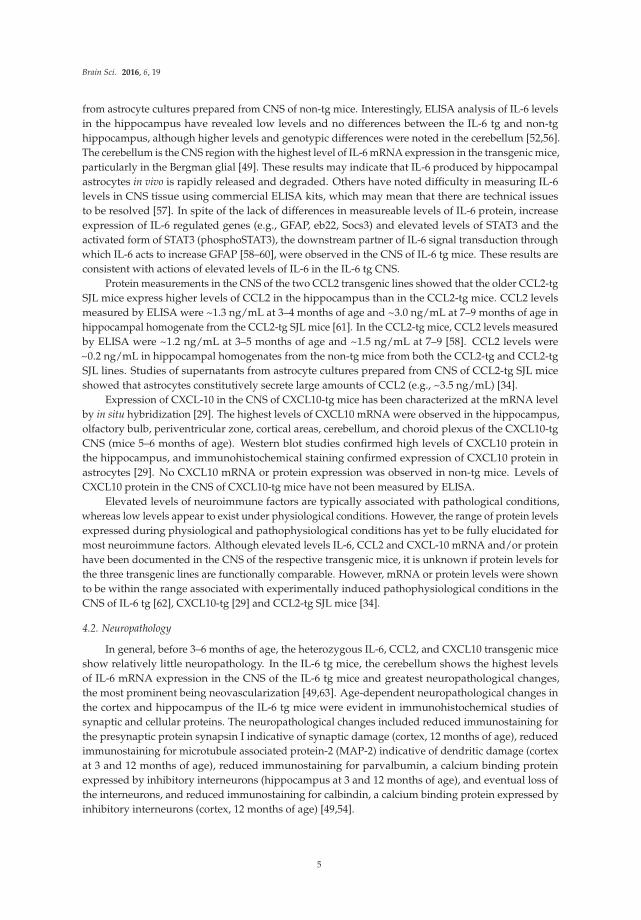
In general, before 3–6 months of age, the heterozygous IL-6, CCL2, and CXCL10 transgenic mice
show relatively little neuropathology. In the IL-6 tg mice, the cerebellum shows the highest levels
of IL-6 mRNA expression in the CNS of the IL-6 tg mice and greatest neuropathological changes,
the most prominent being neovascularization [49,63]. Age-dependent neuropathological changes in
the cortex and hippocampus of the IL-6 tg mice were evident in immunohistochemical studies of
synaptic and cellular proteins. The neuropathological changes included reduced immunostaining for
the presynaptic protein synapsin I indicative of synaptic damage (cortex, 12 months of age), reduced
immunostaining for microtubule associated protein-2 (MAP-2) indicative of dendritic damage (cortex
at 3 and 12 months of age), reduced immunostaining for parvalbumin, a calcium binding protein
expressed by inhibitory interneurons (hippocampus at 3 and 12 months of age), and eventual loss of
the interneurons, and reduced immunostaining for calbindin, a calcium binding protein expressed by
inhibitory interneurons (cortex, 12 months of age) [49,54].
5
Brain Sci. 2016, 6, 19
Histological studies of the CNS of CCL2-tg and CXCL10-tg mice are limited. However, CCL2-tg
SJL mice have been reported to be free of neurological impairment before 6 month of age [34]. Routine
histological analysis of the CNS of the CXCL10 mice showed no apparent neuropathological changes
relative to the CNS of the non-tg mice [29].
5. Synaptic Function in the Hippocampus from IL-6, CCL2, and CXCL10 Transgenic Mice
For all three transgenic lines, physiological studies to assess synaptic function have been
carried out at the Schaffer collateral to CA1 pyramidal neuron synapse of the hippocampus using
a similar protocol that involved extracellular field potential recordings from acutely isolated slices
of hippocampus (Figure 2). This approach has been extensively used for physiological studies of
hippocampal synaptic function. One potential limitation to this approach is that the normal level of
neuroimmune factors could be altered by the slice preparation and recording procedures. However,
such effects would presumably also occur in the non-tg slices and thus be controlled for.
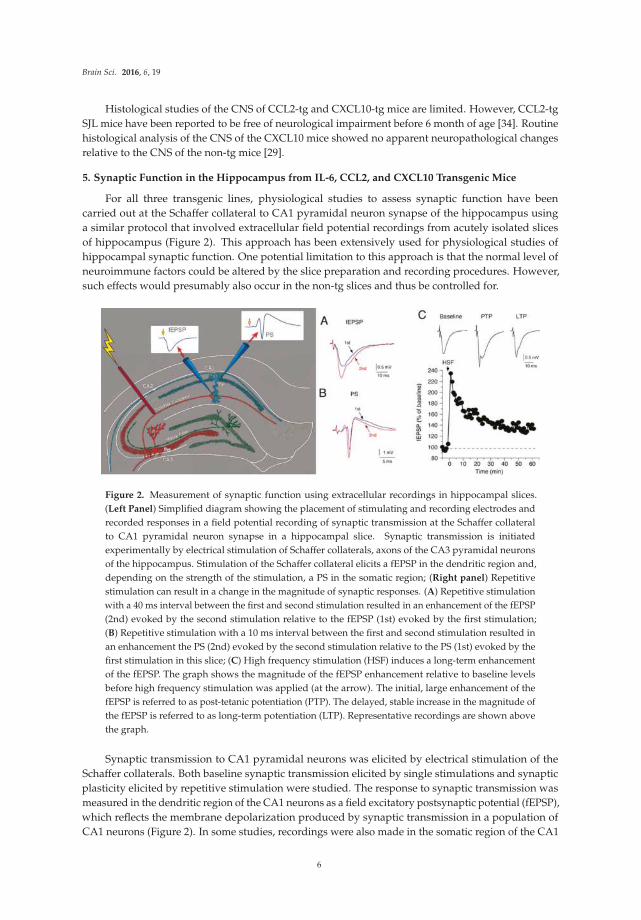
Figure 2. Measurement of synaptic function using extracellular recordings in hippocampal slices.
(Left Panel) Simplified diagram showing the placement of stimulating and recording electrodes and
recorded responses in a field potential recording of synaptic transmission at the Schaffer collateral
to CA1 pyramidal neuron synapse in a hippocampal slice. Synaptic transmission is initiated
experimentally by electrical stimulation of Schaffer collaterals, axons of the CA3 pyramidal neurons
of the hippocampus. Stimulation of the Schaffer collateral elicits a fEPSP in the dendritic region and,
depending on the strength of the stimulation, a PS in the somatic region; (Right panel) Repetitive
stimulation can result in a change in the magnitude of synaptic responses. (A) Repetitive stimulation
with a 40 ms interval between the first and second stimulation resulted in an enhancement of the fEPSP
(2nd) evoked by the second stimulation relative to the fEPSP (1st) evoked by the first stimulation;
(B) Repetitive stimulation with a 10 ms interval between the first and second stimulation resulted in
an enhancement the PS (2nd) evoked by the second stimulation relative to the PS (1st) evoked by the
first stimulation in this slice; (C) High frequency stimulation (HSF) induces a long-term enhancement
of the fEPSP. The graph shows the magnitude of the fEPSP enhancement relative to baseline levels
before high frequency stimulation was applied (at the arrow). The initial, large enhancement of the
fEPSP is referred to as post-tetanic potentiation (PTP). The delayed, stable increase in the magnitude of
the fEPSP is referred to as long-term potentiation (LTP). Representative recordings are shown above
the graph.
Synaptic transmission to CA1 pyramidal neurons was elicited by electrical stimulation of the
Schaffer collaterals. Both baseline synaptic transmission elicited by single stimulations and synaptic
plasticity elicited by repetitive stimulation were studied. The response to synaptic transmission was
measured in the dendritic region of the CA1 neurons as a field excitatory postsynaptic potential (fEPSP),
which reflects the membrane depolarization produced by synaptic transmission in a population of
CA1 neurons (Figure 2). In some studies, recordings were also made in the somatic region of the CA1
6
Brain Sci. 2016, 6, 19
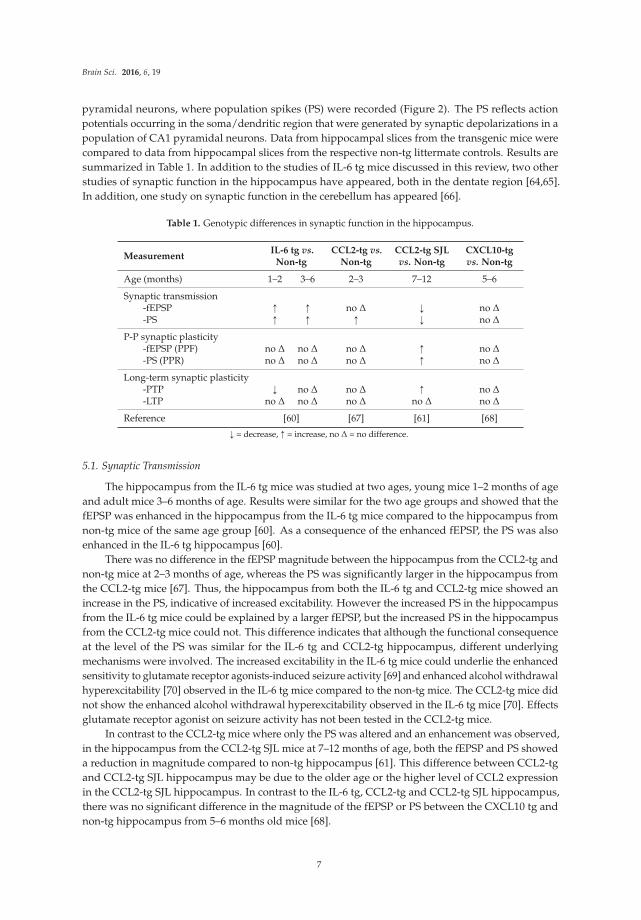
pyramidal neurons, where population spikes (PS) were recorded (Figure 2). The PS reflects action
potentials occurring in the soma/dendritic region that were generated by synaptic depolarizations in a
population of CA1 pyramidal neurons. Data from hippocampal slices from the transgenic mice were
compared to data from hippocampal slices from the respective non-tg littermate controls. Results are
summarized in Table 1. In addition to the studies of IL-6 tg mice discussed in this review, two other
studies of synaptic function in the hippocampus have appeared, both in the dentate region [64,65].
In addition, one study on synaptic function in the cerebellum has appeared [66].
Table 1. Genotypic differences in synaptic function in the hippocampus.
MeasurementIL-6 tg vs.
Non-tgCCL2-tg vs.
Non-tgCCL2-tg SJLvs. Non-tg
CXCL10-tgvs. Non-tg
Age (months) 1–2 3–6 2–3 7–12 5–6
Synaptic transmission-fEPSP Ò Ò no ∆ Ó no ∆
-PS Ò Ò Ò Ó no ∆
P-P synaptic plasticity-fEPSP (PPF) no ∆ no ∆ no ∆ Ò no ∆
-PS (PPR) no ∆ no ∆ no ∆ Ò no ∆
Long-term synaptic plasticity-PTP Ó no ∆ no ∆ Ò no ∆
-LTP no ∆ no ∆ no ∆ no ∆ no ∆
Reference [60] [67] [61] [68]
Ó = decrease, Ò = increase, no ∆ = no difference.
5.1. Synaptic Transmission
The hippocampus from the IL-6 tg mice was studied at two ages, young mice 1–2 months of age
and adult mice 3–6 months of age. Results were similar for the two age groups and showed that the
fEPSP was enhanced in the hippocampus from the IL-6 tg mice compared to the hippocampus from
non-tg mice of the same age group [60]. As a consequence of the enhanced fEPSP, the PS was also
enhanced in the IL-6 tg hippocampus [60].
There was no difference in the fEPSP magnitude between the hippocampus from the CCL2-tg and
non-tg mice at 2–3 months of age, whereas the PS was significantly larger in the hippocampus from
the CCL2-tg mice [67]. Thus, the hippocampus from both the IL-6 tg and CCL2-tg mice showed an
increase in the PS, indicative of increased excitability. However the increased PS in the hippocampus
from the IL-6 tg mice could be explained by a larger fEPSP, but the increased PS in the hippocampus
from the CCL2-tg mice could not. This difference indicates that although the functional consequence
at the level of the PS was similar for the IL-6 tg and CCL2-tg hippocampus, different underlying
mechanisms were involved. The increased excitability in the IL-6 tg mice could underlie the enhanced
sensitivity to glutamate receptor agonists-induced seizure activity [69] and enhanced alcohol withdrawal
hyperexcitability [70] observed in the IL-6 tg mice compared to the non-tg mice. The CCL2-tg mice did
not show the enhanced alcohol withdrawal hyperexcitability observed in the IL-6 tg mice [70]. Effects
glutamate receptor agonist on seizure activity has not been tested in the CCL2-tg mice.
In contrast to the CCL2-tg mice where only the PS was altered and an enhancement was observed,
in the hippocampus from the CCL2-tg SJL mice at 7–12 months of age, both the fEPSP and PS showed
a reduction in magnitude compared to non-tg hippocampus [61]. This difference between CCL2-tg
and CCL2-tg SJL hippocampus may be due to the older age or the higher level of CCL2 expression
in the CCL2-tg SJL hippocampus. In contrast to the IL-6 tg, CCL2-tg and CCL2-tg SJL hippocampus,
there was no significant difference in the magnitude of the fEPSP or PS between the CXCL10 tg and
non-tg hippocampus from 5–6 months old mice [68].
7
Brain Sci. 2016, 6, 19
5.2. Synaptic Plasticity in IL-6 tg, CCL2-tg and CXCL-10 tg Mice
Synaptic plasticity is a change in the magnitude of synaptic responses that results when a synapse
is repetitively stimulated. Synaptic plasticity is considered to be an important cellular mechanism of
memory and learning [71]. Short-term and/or long-term synaptic plasticity at the Schaffer collateral to
CA1 pyramidal neuron synapse has been studied in one or more of the transgenic lines. Results are
summarized in Table 1.
5.2.1. Short-Term Synaptic Plasticity
In this form of synaptic plasticity, repetitive activation of a synapse at short intervals (<1 s) elicits a
transient increase or decrease in the magnitude of the synaptic response. Short-term synaptic plasticity
is experimentally determined by applying repetitive stimulation to the Schaffer collaterals using a
paired-pulse (P-P) paradigm. The magnitude of the plasticity is indicated by the paired-pulse ratio
(PPR, magnitude of the response to the 2nd stimulation divided by magnitude of the response to
the 1st stimulation). At the Schaffer collateral to CA1 pyramidal neuron synapse the paired-pulse
protocol results in an enhancement the fEPSP (i.e., a PPR greater than 1, Figure 2A). This enhancement
is referred to as paired-pulse facilitation (PPF). PPF reflects greater transmitter release with the 2nd
stimulation due to actions of residue Ca2+ on the probably of transmitter release in the presynaptic
terminals of the Schaffer collaterals [72–74].
There was no difference in PPF of the fEPSP between the hippocampus from IL-6 tg and non-tg
mice at either age studied (1–2 and 3–6 months of age) [60]. The hippocampus from CCL2-tg and
non-tg mice studied at 2–3 months of age also showed no difference in PPF of the fEPSP [67]. In the
7–12 months CCL2-tg SJL mice, PPF of the fEPSP was increased at the 40 ms paired-pulse interval but
not at longer intervals compared to the hippocampus from non-tg mice, indicating activity-induced
presynaptic changes that impact excitatory synaptic transmission in a limited manner [61]. There was
no significant difference in the PPF between the CXCL10 tg and non-tg hippocampus from 5–6 months
old mice [68].
A second form of short-term plasticity induced by synaptic activation occurs in the somatic region
of the CA1 neurons and affects the PS that is generated by the fEPSP. Plasticity of the PS can result in a
PPR greater than one (less inhibition; Figure 2B) or less than one (more inhibition) depending on the
relative contribution of somatic/dendritic excitability and recurrent inhibition to the somatic region.
There was no difference in PPR of the PS between the hippocampus from IL-6 tg and non-tg mice
at either age studied (1–2 and 3–5 months of age) [60], or between the hippocampus from CCL2-tg
and non-tg mice at 2–3 months of age [67]. PPR of the PS in the hippocampus from 7–12 months old
CCL2-tg SJL mice was increased compared to the hippocampus from non-tg mice, indicating decreased
inhibitory influences in the soma/dendritic region [61]. There was no significant difference in PPR of
the PS between the CXCL10 tg and non-tg hippocampus from 5–6 months old mice [68].
5.2.2. Long-Term Synaptic Plasticity
Long-lasting changes in synaptic transmission are also observed at the Schaffer collateral to CA1
pyramidal neuron synapse. These changes can involve an increase in the magnitude of the synaptic
response, referred to as long-term potentiation (LTP), or a decrease in the magnitude of the synaptic
response, referred to as long-term depression (LTD). LTP is experimentally induced by brief, high
frequency stimulation of the Schaffer collaterals, whereas LTD is induced experimentally by prolonged
stimulation of the Schaffer collaterals at low frequency. LTP has been studied in hippocampal slices
from the IL-6 tg, CCL2-tg, CCL2-tg SJL and CXCL10-tg mice, but studies on LTD have not appeared.
High frequency stimulation (HFS) of the Schaffer collaterals induces an immediate and dramatic
increase in the amplitude of the fEPSP, after which the enhancement declines somewhat to a steady,
stable level reflecting LTP (Figure 2C). The initial enhancement is a shorter form of synaptic plasticity
referred to as post-tetanic potentiation (PTP). PTP results from the impact of HFS on presynaptic
8
Brain Sci. 2016, 6, 19
mechanisms involved in transmitter release. LTP, the delayed, persistent, stable increase in the
magnitude of the fEPSP is primarily a result of activity-induced changes in post-synaptic mechanisms.
Results from studies of long-term synaptic plasticity are shown in Table 1.
In the IL-6 tg line, there was no genotypic difference in LTP between IL-6 and non-tg hippocampus
from both young (1–2 months of age) and adult (3–6 months of age) mice. PTP was reduced in the
hippocampus from young (1–2 months of age) IL-6 tg mice compared to the hippocampus from non-tg
mice, indicating changes in presynaptic function, a genotypic effect that was not observed for IL-6 and
non-tg hippocampus from adult mice (3–6 months of age) [60]. In both the CCL2-tg and CXCL10-tg
lines, no genotypic effect on PTP or LTP was observed between the hippocampus from transgenic vs.
non-tg mice [67,68]. PTP was enhanced in the hippocampus from the CCL2-tg SJL mice compared
with the hippocampus from the non-tg mice, but there was no genotypic difference in LTP.
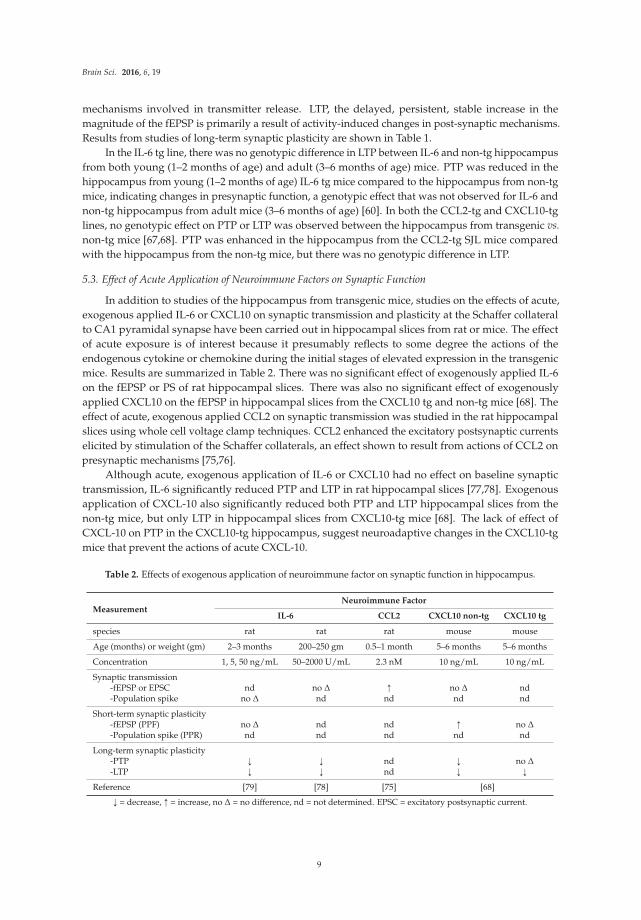
5.3. Effect of Acute Application of Neuroimmune Factors on Synaptic Function
In addition to studies of the hippocampus from transgenic mice, studies on the effects of acute,
exogenous applied IL-6 or CXCL10 on synaptic transmission and plasticity at the Schaffer collateral
to CA1 pyramidal synapse have been carried out in hippocampal slices from rat or mice. The effect
of acute exposure is of interest because it presumably reflects to some degree the actions of the
endogenous cytokine or chemokine during the initial stages of elevated expression in the transgenic
mice. Results are summarized in Table 2. There was no significant effect of exogenously applied IL-6
on the fEPSP or PS of rat hippocampal slices. There was also no significant effect of exogenously
applied CXCL10 on the fEPSP in hippocampal slices from the CXCL10 tg and non-tg mice [68]. The
effect of acute, exogenous applied CCL2 on synaptic transmission was studied in the rat hippocampal
slices using whole cell voltage clamp techniques. CCL2 enhanced the excitatory postsynaptic currents
elicited by stimulation of the Schaffer collaterals, an effect shown to result from actions of CCL2 on
presynaptic mechanisms [75,76].
Although acute, exogenous application of IL-6 or CXCL10 had no effect on baseline synaptic
transmission, IL-6 significantly reduced PTP and LTP in rat hippocampal slices [77,78]. Exogenous
application of CXCL-10 also significantly reduced both PTP and LTP hippocampal slices from the
non-tg mice, but only LTP in hippocampal slices from CXCL10-tg mice [68]. The lack of effect of
CXCL-10 on PTP in the CXCL10-tg hippocampus, suggest neuroadaptive changes in the CXCL10-tg
mice that prevent the actions of acute CXCL-10.
Table 2. Effects of exogenous application of neuroimmune factor on synaptic function in hippocampus.
MeasurementNeuroimmune Factor
IL-6 CCL2 CXCL10 non-tg CXCL10 tg
species rat rat rat mouse mouse
Age (months) or weight (gm) 2–3 months 200–250 gm 0.5–1 month 5–6 months 5–6 months
Concentration 1, 5, 50 ng/mL 50–2000 U/mL 2.3 nM 10 ng/mL 10 ng/mL
Synaptic transmission-fEPSP or EPSC nd no ∆ Ò no ∆ nd-Population spike no ∆ nd nd nd nd
Short-term synaptic plasticity-fEPSP (PPF) no ∆ nd nd Ò no ∆
-Population spike (PPR) nd nd nd nd nd
Long-term synaptic plasticity-PTP Ó Ó nd Ó no ∆
-LTP Ó Ó nd Ó Ó
Reference [79] [78] [75] [68]
Ó = decrease, Ò = increase, no ∆ = no difference, nd = not determined. EPSC = excitatory postsynaptic current.
9
Brain Sci. 2016, 6, 19
Taken together, these results show that mechanisms that induce LTP and PTP are sensitive to acute
exposure to IL-6 or CXCL10. Thus, the lack of genotypic differences in LTP and PTP between the IL-6
tg and non-tg hippocampus and the CXCL10-tg and non-tg hippocampus may reflect neuroadaptive
changes in mechanisms that induce LTP and PTP. These neuroadaptive changes produced an apparent
normalization of function. Effects of acute, exogenous application of CCL2 on PTP and LTP have not
been reported.
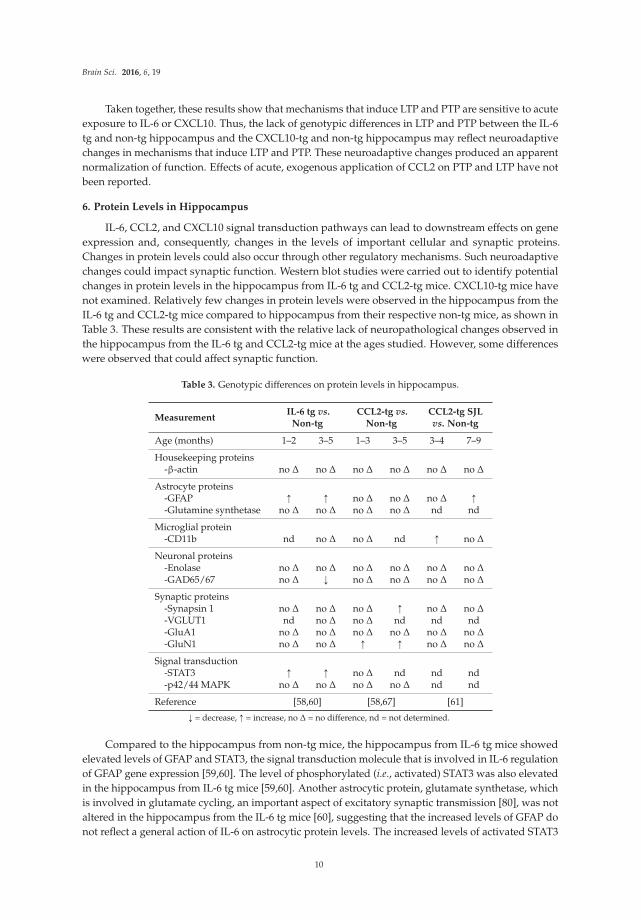
6. Protein Levels in Hippocampus
IL-6, CCL2, and CXCL10 signal transduction pathways can lead to downstream effects on gene
expression and, consequently, changes in the levels of important cellular and synaptic proteins.
Changes in protein levels could also occur through other regulatory mechanisms. Such neuroadaptive
changes could impact synaptic function. Western blot studies were carried out to identify potential
changes in protein levels in the hippocampus from IL-6 tg and CCL2-tg mice. CXCL10-tg mice have
not examined. Relatively few changes in protein levels were observed in the hippocampus from the
IL-6 tg and CCL2-tg mice compared to hippocampus from their respective non-tg mice, as shown in
Table 3. These results are consistent with the relative lack of neuropathological changes observed in
the hippocampus from the IL-6 tg and CCL2-tg mice at the ages studied. However, some differences
were observed that could affect synaptic function.
Table 3. Genotypic differences on protein levels in hippocampus.
MeasurementIL-6 tg vs.
Non-tgCCL2-tg vs.
Non-tgCCL2-tg SJLvs. Non-tg
Age (months) 1–2 3–5 1–3 3–5 3–4 7–9
Housekeeping proteins-β-actin no ∆ no ∆ no ∆ no ∆ no ∆ no ∆
Astrocyte proteins-GFAP Ò Ò no ∆ no ∆ no ∆ Ò
-Glutamine synthetase no ∆ no ∆ no ∆ no ∆ nd nd
Microglial protein-CD11b nd no ∆ no ∆ nd Ò no ∆
Neuronal proteins-Enolase no ∆ no ∆ no ∆ no ∆ no ∆ no ∆
-GAD65/67 no ∆ Ó no ∆ no ∆ no ∆ no ∆
Synaptic proteins-Synapsin 1 no ∆ no ∆ no ∆ Ò no ∆ no ∆
-VGLUT1 nd no ∆ no ∆ nd nd nd-GluA1 no ∆ no ∆ no ∆ no ∆ no ∆ no ∆
-GluN1 no ∆ no ∆ Ò Ò no ∆ no ∆
Signal transduction-STAT3 Ò Ò no ∆ nd nd nd-p42/44 MAPK no ∆ no ∆ no ∆ no ∆ nd nd
Reference [58,60] [58,67] [61]
Ó = decrease, Ò = increase, no ∆ = no difference, nd = not determined.
Compared to the hippocampus from non-tg mice, the hippocampus from IL-6 tg mice showed
elevated levels of GFAP and STAT3, the signal transduction molecule that is involved in IL-6 regulation
of GFAP gene expression [59,60]. The level of phosphorylated (i.e., activated) STAT3 was also elevated
in the hippocampus from IL-6 tg mice [59,60]. Another astrocytic protein, glutamate synthetase, which
is involved in glutamate cycling, an important aspect of excitatory synaptic transmission [80], was not
altered in the hippocampus from the IL-6 tg mice [60], suggesting that the increased levels of GFAP do
not reflect a general action of IL-6 on astrocytic protein levels. The increased levels of activated STAT3
10
Brain Sci. 2016, 6, 19
in the hippocampus of IL-6 tg mice could affect synaptic function. STAT3 has been shown to be highly
expressed in CNS neurons, where it is present in the postsynaptic density, and to regulate synaptic
plasticity (LTD) in the hippocampus [1]. In addition to increased levels of GFAP and STAT3, reduced
levels of GAD65/67, the synthetic enzyme for the inhibitory transmitter GABA, were observed in
the IL-6 tg hippocampus [60], consistent with the immunohistochemical studies indicating a negative
effect of the elevated levels of IL-6 on the structure of inhibitory interneurons [49,54].
Compared to the hippocampus from non-tg mice, the hippocampus from CCL2-tg mice showed
elevated levels of synapsin 1, a presynaptic protein involved in transmitter release, and GluN1,
the essential subunit of NMDA receptors [58,67]. NMDA receptors play a critical role in neuronal
development, synaptic plasticity, and neuronal toxicity, and are an important target site for therapeutic
intervention in a number of neurological disorders [81,82]. The neuroadaptive changes in synapsin 1
and GluN1 levels were not evident in the CCL2-tg SJL hippocampus, where the only changes were
an increase in CD11b and GFAP [61]. Taken together, these results show that neuroadaptive changes
occur at the level of synaptic proteins in the IL-6 tg and CCL2-tg hippocampus. The differences
in proteins targeted in the IL-6 tg and CCL2-tg hippocampus could contribute to differences in the
synaptic properties altered in the two transgenic lines.
7. Behavioral Studies
Alterations in synaptic function can result in changes in behavior. Two behavioral tests that
evaluate the functioning of the hippocampus are the avoidance learning test and the contextual fear
conditioning test. These behavioral tests were used examine hippocampal function in the IL-6 tg or
CCL2-tg lines. Behavior has not been tested in the CXCL10-tg line. The IL-6 tg mice did not show a
behavioral deficit compared to non-tg mice in the avoidance learning when tested at 3 months of age.
However, by 6 months of age the IL-6 tg mice exhibited a significant deficit in their ability to learn
the avoidance response, which declined further by 12 months of age [54]. The CCL2-tg mice were
examined in behavioral tests for contextual fear conditioning at 2–3 months of age. There were no
significant differences between the CCL2-tg and non-tg mice in these tests [67]. These results suggest
the lack of significant hippocampal dysfunction at 3 months of age in both the IL-6 tg and CCL2 tg
mice, at least under baseline conditions in these tests.
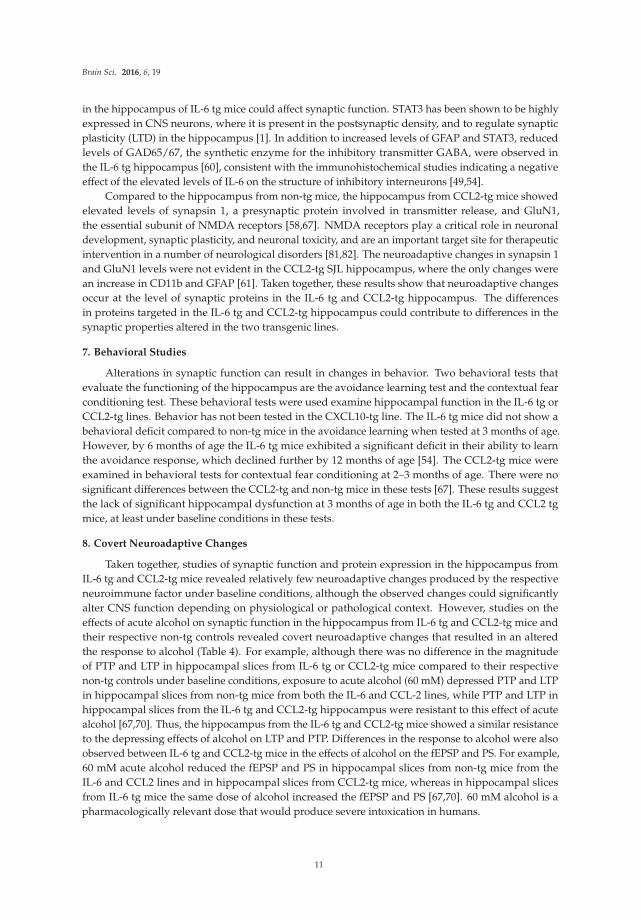
8. Covert Neuroadaptive Changes
Taken together, studies of synaptic function and protein expression in the hippocampus from
IL-6 tg and CCL2-tg mice revealed relatively few neuroadaptive changes produced by the respective
neuroimmune factor under baseline conditions, although the observed changes could significantly
alter CNS function depending on physiological or pathological context. However, studies on the
effects of acute alcohol on synaptic function in the hippocampus from IL-6 tg and CCL2-tg mice and
their respective non-tg controls revealed covert neuroadaptive changes that resulted in an altered
the response to alcohol (Table 4). For example, although there was no difference in the magnitude
of PTP and LTP in hippocampal slices from IL-6 tg or CCL2-tg mice compared to their respective
non-tg controls under baseline conditions, exposure to acute alcohol (60 mM) depressed PTP and LTP
in hippocampal slices from non-tg mice from both the IL-6 and CCL-2 lines, while PTP and LTP in
hippocampal slices from the IL-6 tg and CCL2-tg hippocampus were resistant to this effect of acute
alcohol [67,70]. Thus, the hippocampus from the IL-6 tg and CCL2-tg mice showed a similar resistance
to the depressing effects of alcohol on LTP and PTP. Differences in the response to alcohol were also
observed between IL-6 tg and CCL2-tg mice in the effects of alcohol on the fEPSP and PS. For example,
60 mM acute alcohol reduced the fEPSP and PS in hippocampal slices from non-tg mice from the
IL-6 and CCL2 lines and in hippocampal slices from CCL2-tg mice, whereas in hippocampal slices
from IL-6 tg mice the same dose of alcohol increased the fEPSP and PS [67,70]. 60 mM alcohol is a
pharmacologically relevant dose that would produce severe intoxication in humans.
11
Brain Sci. 2016, 6, 19
Table 4. Effects of alcohol on synaptic function in hippocampus.
Measurement60 mM Alcohol vs. Baseline
Non-tg IL-6 tg Non-tg CCL2-tg
Synaptic transmission-fEPSP Ó Ò Ó Ó
-PS Ó Ò Ó Ó
P-P synaptic plasticity-fEPSP (PPF) no ∆ no ∆ no ∆ no ∆
-PS (PPR) Ò no ∆ Ò no ∆
Long-term synaptic plasticity-PTP Ó no ∆ Ó no ∆
-LTP Ó no ∆ Ó no ∆
Reference [70] [67]
Ó = decrease, Ò = increase, no ∆ = no difference.
A difference in response to alcohol was also observed in behavioral studies of alcohol actions.
In one study of alcohol withdrawal hyperexcitability, IL-6 tg and CCL2-tg mice and their non-tg
littermates were exposed to an acute, high dose of alcohol (4 gm/kg, i.p.), which initially causes
sedation, but during the phase of declining blood alcohol levels, CNS hyperexcitability is produced.
The hyperexcitability was measured by handling induced convulsions (HIC) [83,84]. The IL-6 tg mice
showed significantly higher HIC scores than their non-tg controls, indicating greater hyperexcitability,
whereas CCL2-tg and their non-tg mice showed similar HIC scores [70]. In behavioral tests for
contextual fear conditioning, there were no significant differences between the CCL2-tg and non-tg
mice under baseline conditions. Acute alcohol (1 gm/kg, i.p.) significantly impaired the non-tg
mice but not the CCL2-tg mice in this behavioral test [67]. In contrast, in the rotorod test, which is
considered primarily a cerebellar mediated behavior, CCL2-tg and non-tg mice show no difference
in recovery from the effects of acute alcohol (2 gm/kg, i.p.) [67]. A similar result was obtained for
the effects of acute alcohol (2 gm/kg, i.p.) on IL-6 tg and non-tg mice in the rotarod test (recovery
time = 176.2 ˘ 9.3 min for non-tg and 171.2 ˘ 9.0 min for IL-6 tg).
Covert changes were also revealed in other studies of the IL-6 tg mice. Systemic exposure
(i.p. injection) to a low dose of kainate or NMDA induced prominent seizures and lethality in IL-6-tg
mice but not in the non-tg mice, which required a higher dose to produce such effects [69]. Also,
basal plasma corticosterone levels were normal in IL-6-tg mice but, after restraint stress, abnormally
increased levels were observed in the IL-6 tg mice compared to non-tg mice [85]. Thus, in addition to
the detected neuroadaptive changes in baseline functions and behavior, covert neuroadaptive changes
are produced by the chronic exposure to IL-6 and CCL2 and can be revealed within certain contexts.
Such neuroadaptive changes could play an important role in pathophysiological conditions.
9. Conclusions
Although a large literature has demonstrated elevated CNS expression of cytokines and
chemokines in CNS disease and injury, a relatively small number of studies have examined the
consequences of the elevated expression at the synaptic level. The transgenic approach provides tools
for such studies. Transgenic models that target astrocyte production of neuroimmune factors have
enabled studies that provide a basic understanding of the synaptic consequence of persistent elevated
expression of a specific neuroimmune factor by this CNS cell type. This information can facilitate
identification of potential contributions of the neuroimmune factor to a more complex condition when
multiple neuroimmune factors are expressed. This information may also be useful for identification of
the actions/role of specific neuroimmune factors in CNS physiology. The astrocyte targeted transgenic
models complement traditional approaches involving knock out (KO) models. In the KO model,
all cell types are affected and, therefore, the KO models provide more global information about
12
Brain Sci. 2016, 6, 19
the involvement of a specific neuroimmune factor in CNS development, function or dysfunction.
One caveat to these models is that expression in the transgenic model or lack of expression in the KO
model occurs over the lifespan of the animal, which could influence CNS development. It is unclear
if or how potential development effects would impact studies in adult animals. However, emerging
research on the actions of neuroimmune factors on CNS development is starting to provide answers to
this question.
Overall, the studies of synaptic function in the hippocampus from the three transgenic lines
revealed relatively few alterations. This result is consistent with the relative lack of neuropathology in
the hippocampus of the transgenic mice at the ages studied, and raises the possibility that additional
factors may be necessary when pathology is observed. Both similarities and differences were observed
in the effects of the three neuroimmune factors on synaptic function, suggesting that similarities and
differences exist in underlying mechanisms, and are likely to be reflected in the consequences of
elevated expression under different pathological contexts.
Although only a limited number of neuroadaptive changes in synaptic function were identified
under basal conditions, several experimental manipulations revealed that covert neuroadaptive
changes were produced by elevated expression of the neuroimmune factors. These covert
neuroadaptive changes may have been responsible for the apparent normalization of function under
baseline conditions such that genotypic differences were not observed. The identification of covert
actions illustrates the importance of physiological or pathological context in the consequence of
cytokine or chemokine actions in the CNS. Both the identified and covert neuroadaptive changes
resulting from increased astrocyte production of the neuroimmune factors could contribute to cognitive
impairment in a pathological context.
The mechanisms and molecular targets underlying the neuroadaptive changes produced by IL-6,
CCL2, and CXCL10 have yet to be elucidated. Studies to address these issues are an important future
direction, and are essential for a more complete understanding of the actions and roles of IL-6, CCL2
and CXCL10 in CNS physiology and pathology. The level of expression, duration of exposure, presence
of other neuroimmune factors, and biological context are all likely to be important variables, and their
biological impact will also need to be resolved in future studies. Taken together, such information
could reveal new targets for therapeutic intervention for a range of pathophysiological conditions that
are associated with increased expression of IL-6, CCL2 and/or CXCL10 in the CNS.
Acknowledgments: Supported by NIAAA Grant AA019261.
Conflicts of Interest: The author declares no conflict of interest.
References
1. Nicolas, C.S.; Peineau, S.; Amici, M.; Csaba, Z.; Fafouri, A.; Javalet, C.; Collett, V.J.; Hildebrandt, L.;
Seaton, G.; Choi, S.L.; et al. The JAK/STAT pathway is involved in synaptic plasticity. Neuron 2012, 73,
374–390. [CrossRef] [PubMed]
2. Zheng, C.; Zhou, X.W.; Wang, J.Z. The dual roles of cytokines in Alzheimer’s disease: Update on interleukins,
TNF-α, TGF-β and IFN-γ. Transl. Neurodegener. 2016. [CrossRef] [PubMed]
3. De Vries, E.E.; van den Munckhof, B.; Braun, K.P.; van Royen-Kerkhof, A.; de Jager, W.; Jansen, F.E.
Inflammatory mediators in human epilepsy: A systematic review and meta-analysis. Neurosci. Biobehav. Rev.
2016, 63, 177–190. [CrossRef] [PubMed]
4. Rothhammer, V.; Quintana, F.J. Control of autoimmune CNS inflammation by astrocytes.
Semin. Immunopathol. 2015, 37, 625–638. [CrossRef] [PubMed]
5. Crews, F.T.; Vetreno, R.P. Neuroimmune basis of alcoholic brain damage. Int. Rev. Neurobiol. 2014, 118,
315–357. [PubMed]
6. Drew, P.D.; Kane, C.J. Fetal alcohol spectrum disorders and neuroimmune changes. Int. Rev. Neurobiol. 2014,
118, 41–80. [PubMed]
7. Chastain, L.G.; Sarkar, D.K. Role of microglia in regulation of ethanol neurotoxic action. Int. Rev. Neurobiol.
2014, 118, 81–103. [PubMed]
13
Brain Sci. 2016, 6, 19
8. Tomasik, J.; Rahmoune, H.; Guest, P.C.; Bahn, S. Neuroimmune biomarkers in schizophrenia. Schizophr. Res.
2014. in press.
9. Shie, F.S.; Chen, Y.H.; Chen, C.H.; Ho, I.K. Neuroimmune pharmacology of neurodegenerative and mental
diseases. J. Neuroimmune Pharmacol. 2011, 6, 28–40. [CrossRef] [PubMed]
10. Gottfried, C.; Bambini-Junior, V.; Francis, F.; Riesgo, R.; Savino, W. The impact of neuroimmune alterations
in autism spectrum disorder. Front. Psychiatry 2015. [CrossRef] [PubMed]
11. Hein, A.M.; O’Banion, M.K. Neuroinflammation and cognitive dysfunction in chronic disease and aging.
J. Neuroimmune Pharmacol. 2012, 7, 3–6. [CrossRef] [PubMed]
12. Patterson, S.L. Immune dysregulation and cognitive vulnerability in the aging brain: Interactions of microglia,
IL-1β, BDNF and synaptic plasticity. Neuropharmacology 2015, 96, 11–18. [CrossRef] [PubMed]
13. Eichenbaum, H. Hippocampus: Cognitive processes and neural representations that underlie declarative
memory. Neuron 2004, 44, 109–120. [CrossRef] [PubMed]
14. Di Filippo, M.; Chiasserini, D.; Gardoni, F.; Viviani, B.; Tozzi, A.; Giampa, C.; Costa, C.; Tantucci, M.;
Zianni, E.; Boraso, M.; et al. Effects of central and peripheral inflammation on hippocampal synaptic
plasticity. Neurobiol. Dis. 2013, 52, 229–236. [CrossRef] [PubMed]
15. Zink, W.E.; Anderson, E.; Boyle, J.; Hock, L.; Rodriguez-Sierra, J.; Xiong, H.; Gendelman, H.E.; Persidsky, Y.
Impaired spatial cognition and synaptic potentiation in a murine model of human immunodeficiency virus
type 1 encephalitis. J. Neurosci. 2002, 22, 2096–2105. [PubMed]
16. Savanthrapadian, S.; Wolff, A.R.; Logan, B.J.; Eckert, M.J.; Bilkey, D.K.; Abraham, W.C. Enhanced
hippocampal neuronal excitability and LTP persistence associated with reduced behavioral flexibility in the
maternal immune activation model of schizophrenia. Hippocampus 2013, 23, 1395–1409. [CrossRef] [PubMed]
17. Mosayebi, G.; Soleyman, M.R.; Khalili, M.; Mosleh, M.; Palizvan, M.R. Changes in synaptic transmission
and long-term potentiation induction as a possible mechanism for learning disability in an animal model of
multiple sclerosis. Int. Neurourol. J. 2016, 20, 26–32. [CrossRef] [PubMed]
18. Fernandez-Fernandez, D.; Dorner-Ciossek, C.; Kroker, K.S.; Rosenbrock, H. Age-related synaptic dysfunction
in tg2576 mice starts as a failure in early long-term potentiation which develops into a full abolishment of
late long-term potentiation. J. Neurosci. Res. 2016, 94, 266–281. [CrossRef] [PubMed]
19. Imamura, Y.; Wang, H.; Matsumoto, N.; Muroya, T.; Shimazaki, J.; Ogura, H.; Shimazu, T. Interleukin-1β
causes long-term potentiation deficiency in a mouse model of septic encephalopathy. Neuroscience 2011, 187,
63–69. [CrossRef] [PubMed]
20. Batti, L.; O’Connor, J.J. Tumor necrosis factor-α impairs the recovery of synaptic transmission from hypoxia
in rat hippocampal slices. J. Neuroimmunol. 2010, 218, 21–27. [CrossRef] [PubMed]
21. Rossi, S.; Motta, C.; Studer, V.; Barbieri, F.; Buttari, F.; Bergami, A.; Sancesario, G.; Bernardini, S.; de
Angelis, G.; Martino, G.; et al. Tumor necrosis factor is elevated in progressive multiple sclerosis and causes
excitotoxic neurodegeneration. Mult. Scler. 2014, 20, 304–312. [CrossRef] [PubMed]
22. Bateup, H.S.; Johnson, C.A.; Denefrio, C.L.; Saulnier, J.L.; Kornacker, K.; Sabatini, B.L. Excitatory/inhibitory
synaptic imbalance leads to hippocampal hyperexcitability in mouse models of tuberous sclerosis. Neuron
2013, 78, 510–522. [CrossRef] [PubMed]
23. Costa, C.; Sgobio, C.; Siliquini, S.; Tozzi, A.; Tantucci, M.; Ghiglieri, V.; di Filippo, M.; Pendolino, V.;
de Iure, A.; Marti, M.; et al. Mechanisms underlying the impairment of hippocampal long-term potentiation
and memory in experimental Parkinson’s disease. Br. J. Neurol. 2012, 135, 1884–1899. [CrossRef] [PubMed]
24. Scott-McKean, J.J.; Costa, A.C. Exaggerated NMDA mediated LTD in a mouse model of down syndrome
and pharmacological rescuing by memantine. Learn. Mem. 2011, 18, 774–778. [CrossRef] [PubMed]
25. Roberto, M.; Nelson, T.E.; Ur, C.L.; Gruol, D.L. Long-term potentiation in the rat hippocampus is reversibly
depressed by chronic intermittent ethanol exposure. J. Neurophysiol. 2002, 87, 2385–2397. [PubMed]
26. Biber, K.; Pinto-Duarte, A.; Wittendorp, M.C.; Dolga, A.M.; Fernandes, C.C.; von Frijtag Drabbe Kunzel, J.;
Keijser, J.N.; de Vries, R.; Ijzerman, A.P.; Ribeiro, J.A.; et al. Interleukin-6 upregulates neuronal adenosine
A1 receptors: Implications for neuromodulation and neuroprotection. Neuropsychopharmacology 2008, 33,
2237–2250. [CrossRef] [PubMed]
27. Penkowa, M.; Giralt, M.; Lago, N.; Camats, J.; Carrasco, J.; Hernandez, J.; Molinero, A.; Campbell, I.L.;
Hidalgo, J. Astrocyte-targeted expression of IL-6 protects the CNS against a focal brain injury. Exp. Neurol.
2003, 181, 130–148. [CrossRef]
14
Brain Sci. 2016, 6, 19
28. Millington, C.; Sonego, S.; Karunaweera, N.; Rangel, A.; Aldrich-Wright, J.R.; Campbell, I.L.; Gyengesi, E.;
Munch, G. Chronic neuroinflammation in Alzheimer’s disease: New perspectives on animal models and
promising candidate drugs. BioMed Res. Int. 2014. [CrossRef] [PubMed]
29. Boztug, K.; Carson, M.J.; Pham-Mitchell, N.; Asensio, V.C.; DeMartino, J.; Campbell, I.L. Leukocyte
infiltration, but not neurodegeneration, in the CNS of transgenic mice with astrocyte production of the CXC
chemokine ligand 10. J. Immunol. 2002, 169, 1505–1515. [CrossRef] [PubMed]
30. Kiyota, T.; Yamamoto, M.; Xiong, H.; Lambert, M.P.; Klein, W.L.; Gendelman, H.E.; Ransohoff, R.M.; Ikezu, T.
CCL2 accelerates microglia-mediated Aβ oligomer formation and progression of neurocognitive dysfunction.
PLoS ONE 2009, 4, e6197. [CrossRef] [PubMed]
31. Elhofy, A.; Wang, J.; Tani, M.; Fife, B.T.; Kennedy, K.J.; Bennett, J.; Huang, D.; Ransohoff, R.M.; Karpus, W.J.
Transgenic expression of CCL2 in the central nervous system prevents experimental autoimmune
encephalomyelitis. J. Leukoc. Biol. 2005, 77, 229–237. [CrossRef] [PubMed]
32. Huang, D.; Wujek, J.; Kidd, G.; He, T.T.; Cardona, A.; Sasse, M.E.; Stein, E.J.; Kish, J.; Tani, M.; Charo, I.F.; et al.
Chronic expression of monocyte chemoattractant protein-1 in the central nervous system causes delayed
encephalopathy and impaired microglial function in mice. FASEB J. 2005, 19, 761–772. [CrossRef] [PubMed]
33. Almolda, B.; Villacampa, N.; Manders, P.; Hidalgo, J.; Campbell, I.L.; Gonzalez, B.; Castellano, B. Effects of
astrocyte-targeted production of interleukin-6 in the mouse on the host response to nerve injury. Glia 2014,
62, 1142–1161. [CrossRef] [PubMed]
34. Huang, D.; Tani, M.; Wang, J.; Han, Y.; He, T.T.; Weaver, J.; Charo, I.F.; Tuohy, V.K.; Rollins, B.J.;
Ransohoff, R.M. Pertussis toxin-induced reversible encephalopathy dependent on monocyte chemoattractant
protein-1 overexpression in mice. J. Neurosci. 2002, 22, 10633–10642. [PubMed]
35. Jensen, C.J.; Massie, A.; de Keyser, J. Immune players in the CNS: The astrocyte. J. Neuroimmune Pharmacol.
2013, 8, 824–839. [CrossRef] [PubMed]
36. Ransom, B.R.; Ransom, C.B. Astrocytes: Multitalented stars of the central nervous system. Methods Mol. Biol.
2012, 814, 3–7. [PubMed]
37. Finsterwald, C.; Magistretti, P.J.; Lengacher, S. Astrocytes: New targets for the treatment of neurodegenerative
diseases. Curr. Pharma. Des. 2015, 21, 3570–3581. [CrossRef]
38. Halassa, M.M.; Fellin, T.; Haydon, P.G. The tripartite synapse: Roles for gliotransmission in health and
disease. Trends Mol. Med. 2007, 13, 54–63. [CrossRef] [PubMed]
39. Ota, Y.; Zanetti, A.T.; Hallock, R.M. The role of astrocytes in the regulation of synaptic plasticity and memory
formation. Neural Plast. 2013. [CrossRef] [PubMed]
40. Gruart, A.; Delgado-Garcia, J.M. Activity-dependent changes of the hippocampal CA3-CA1 synapse during
the acquisition of associative learning in conscious mice. Genes Brain Behav. 2007, 6, 24–31. [CrossRef]
[PubMed]
41. Gruol, D.L. IL-6 regulation of synaptic function in the CNS. Neuropharmacology 2015. [CrossRef] [PubMed]
42. Campbell, I.L.; Erta, M.; Lim, S.L.; Frausto, R.; May, U.; Rose-John, S.; Scheller, J.; Hidalgo, J. Trans-signaling
is a dominant mechanism for the pathogenic actions of interleukin-6 in the brain. J. Neurosci. 2014, 34,
2503–2513. [CrossRef] [PubMed]
43. Vollenweider, F.; Herrmann, M.; Otten, U.; Nitsch, C. Interleukin-6 receptor expression and localization after
transient global ischemia in gerbil hippocampus. Neurosci. Lett. 2003, 341, 49–52. [CrossRef]
44. Chang, G.Q.; Karatayev, O.; Leibowitz, S.F. Prenatal exposure to ethanol stimulates hypothalamic CCR2
chemokine receptor system: Possible relation to increased density of orexigenic peptide neurons and ethanol
drinking in adolescent offspring. Neuroscience 2015, 310, 163–175. [CrossRef] [PubMed]
45. Van der Meer, P.; Ulrich, A.M.; Gonzalez-Scarano, F.; Lavi, E. Immunohistochemical analysis of CCR2, CCR3,
CCR5, and CXCR4 in the human brain: Potential mechanisms for HIV dementia. Exp. Mol. Pathol. 2000, 69,
192–201. [CrossRef] [PubMed]
46. Banisadr, G.; Gosselin, R.D.; Mechighel, P.; Rostene, W.; Kitabgi, P.; Parsadaniantz, S.M. Constitutive neuronal
expression of CCR2 chemokine receptor and its colocalization with neurotransmitters in normal rat brain:
Functional effect of MCP-1/CCL2 on calcium mobilization in primary cultured neurons. J. Comp. Neurol.
2005, 492, 178–192. [CrossRef] [PubMed]
47. Ragozzino, D. CXC chemokine receptors in the central nervous system: Role in cerebellar neuromodulation
and development. J. Neurovirol. 2002, 8, 559–572. [CrossRef] [PubMed]
15
Brain Sci. 2016, 6, 19
48. Xia, M.Q.; Bacskai, B.J.; Knowles, R.B.; Qin, S.X.; Hyman, B.T. Expression of the chemokine receptor CXCR3
on neurons and the elevated expression of its ligand IP-10 in reactive astrocytes: In vitro ERK1/2 activation
and role in Alzheimer’s disease. J. Neuroimmunol. 2000, 108, 227–235. [CrossRef]
49. Campbell, I.L.; Abraham, C.R.; Masliah, E.; Kemper, P.; Inglis, J.D.; Oldstone, M.B.; Mucke, L. Neurologic
disease induced in transgenic mice by cerebral overexpression of interleukin 6. Proc. Natl. Acad. Sci. USA
1993, 90, 10061–10065. [CrossRef] [PubMed]
50. Brenner, M.; Messing, A. GFAP transgenic mice. Methods 1996, 10, 351–364. [CrossRef] [PubMed]
51. Su, M.; Hu, H.; Lee, Y.; D’Azzo, A.; Messing, A.; Brenner, M. Expression specificity of GFAP transgenes.
Neurochem. Res. 2004, 29, 2075–2093. [CrossRef] [PubMed]
52. Chiang, C.S.; Stalder, A.; Samimi, A.; Campbell, I.L. Reactive gliosis as a consequence of interleukin-6
expression in the brain: Studies in transgenic mice. Dev. Neurosci. 1994, 16, 212–221. [CrossRef] [PubMed]
53. Kim, J.S.; Kim, J.; Kim, Y.; Yang, M.; Jang, H.; Kang, S.; Kim, J.C.; Kim, S.H.; Shin, T.; Moon, C. Differential
patterns of nestin and glial fibrillary acidic protein expression in mouse hippocampus during postnatal
development. J. Vet. Sci. 2011, 12, 1–6. [CrossRef] [PubMed]
54. Heyser, C.J.; Masliah, E.; Samimi, A.; Campbell, I.L.; Gold, L.H. Progressive decline in avoidance learning
paralleled by inflammatory neurodegeneration in transgenic mice expressing interleukin 6 in the brain.
Proc. Natl. Acad. Sci. USA 1997, 94, 1500–1505. [CrossRef] [PubMed]
55. Vallieres, L.; Campbell, I.L.; Gage, F.H.; Sawchenko, P.E. Reduced hippocampal neurogenesis in adult
transgenic mice with chronic astrocytic production of interleukin-6. J. Neurosci. 2002, 22, 486–492. [PubMed]
56. Gruol, D.L.; Vo, K.; Bray, J.G.; Roberts, A.J. CCL2-ethanol interactions and hippocampal synaptic protein
expression in a transgenic mouse model. Front. Integr. Neurosci. 2014. [CrossRef] [PubMed]
57. Quintana, A.; Erta, M.; Ferrer, B.; Comes, G.; Giralt, M.; Hidalgo, J. Astrocyte-specific deficiency of
interleukin-6 and its receptor reveal specific roles in survival, body weight and behavior. Brain Behav. Immun.
2013, 27, 162–173. [CrossRef] [PubMed]
58. Gruol, D.L.; Vo, K.; Bray, J.G. Increased astrocyte expression of IL-6 or CCL2 in transgenic mice alters levels
of hippocampal and cerebellar proteins. Front. Cell Neurosci. 2014. [CrossRef] [PubMed]
59. Sanz, E.; Hofer, M.J.; Unzeta, M.; Campbell, I.L. Minimal role for stat1 in interleukin-6 signaling and actions
in the murine brain. Glia 2008, 56, 190–199. [CrossRef] [PubMed]
60. Nelson, T.E.; Engberink, A.O.; Hernandez, R.; Puro, A.; Huitron-Resendiz, S.; Hao, C.; de Graan, P.N.;
Gruol, D.L. Altered synaptic transmission in the hippocampus of transgenic mice with enhanced central
nervous systems expression of interleukin-6. Brain Behav. Immun. 2012, 26, 959–971. [CrossRef] [PubMed]
61. Nelson, T.E.; Hao, C.; Manos, J.; Ransohoff, R.M.; Gruol, D.L. Altered hippocampal synaptic transmission in
transgenic mice with astrocyte-targeted enhanced CCL2 expression. Brain Behav. Immun. 2011, 25 (Suppl. S1),
S106–S119. [CrossRef] [PubMed]
62. Campbell, I.L. Structural and functional impact of the transgenic expression of cytokines in the CNS.
Annu. N. Y. Acad. Sci. 1998, 840, 83–96. [CrossRef]
63. Brett, F.M.; Mizisin, A.P.; Powell, H.C.; Campbell, I.L. Evolution of neuropathologic abnormalities associated
with blood-brain barrier breakdown in transgenic mice expressing interleukin-6 in astrocytes. J. Neuropathol.
Exp. Neurol. 1995, 54, 766–775. [CrossRef] [PubMed]
64. Steffensen, S.C.; Campbell, I.L.; Henriksen, S.J. Site-specific hippocampal pathophysiology due to cerebral
overexpression of interleukin-6 in transgenic mice. Brain Res. 1994, 652, 149–153. [CrossRef]
65. Bellinger, F.P.; Madamba, S.G.; Campbell, I.L.; Siggins, G.R. Reduced long-term potentiation in the dentate
gyrus of transgenic mice with cerebral overexpression of interleukin-6. Neurosci. Lett. 1995, 198, 95–98.
[CrossRef]
66. Nelson, T.E.; Campbell, I.L.; Gruol, D.L. Altered physiology of purkinje neurons in cerebellar slices from
transgenic mice with chronic central nervous system expression of interleukin-6. Neuroscience 1999, 89,
127–136. [CrossRef]
67. Bray, J.G.; Reyes, K.C.; Roberts, A.J.; Ransohoff, R.M.; Gruol, D.L. Synaptic plasticity in the hippocampus
shows resistance to acute ethanol exposure in transgenic mice with astrocyte-targeted enhanced CCL2
expression. Neuropharmacology 2013, 67, 115–125. [CrossRef] [PubMed]
68. Vlkolinsky, R.; Siggins, G.R.; Campbell, I.L.; Krucker, T. Acute exposure to cxc chemokine ligand 10, but not
its chronic astroglial production, alters synaptic plasticity in mouse hippocampal slices. J. Neuroimmunol.
2004, 150, 37–47. [CrossRef] [PubMed]
16
Brain Sci. 2016, 6, 19
69. Samland, H.; Huitron-Resendiz, S.; Masliah, E.; Criado, J.; Henriksen, S.J.; Campbell, I.L. Profound increase
in sensitivity to glutamatergic- but not cholinergic agonist-induced seizures in transgenic mice with astrocyte
production of IL-6. J. Neurosci. Res. 2003, 73, 176–187. [CrossRef] [PubMed]
70. Hernandez, R.V.; Puro, A.C.; Manos, J.C.; Huitron-Resendiz, S.; Reyes, K.C.; Liu, K.; Vo, K.; Roberts, A.J.;
Gruol, D.L. Transgenic mice with increased astrocyte expression of IL-6 show altered effects of acute ethanol
on synaptic function. Neuropharmacology 2015, 103, 27–43. [CrossRef] [PubMed]
71. Lynch, M.A. Long-term potentiation and memory. Physiol. Rev. 2004, 84, 87–136. [CrossRef] [PubMed]
72. Wu, L.G.; Saggau, P. Presynaptic calcium is increased during normal synaptic transmission and paired-pulse
facilitation, but not in long-term potentiation in area ca1 of hippocampus. J. Neurosci. 1994, 14, 645–654.
[PubMed]
73. Zucker, R.S.; Regehr, W.G. Short-term synaptic plasticity. Annu. Rev Physiol. 2002, 64, 355–405. [CrossRef]
[PubMed]
74. Jackman, S.L.; Turecek, J.; Belinsky, J.E.; Regehr, W.G. The calcium sensor synaptotagmin 7 is required for
synaptic facilitation. Nature 2016, 529, 88–91. [CrossRef] [PubMed]
75. Zhou, Y.; Tang, H.; Liu, J.; Dong, J.; Xiong, H. Chemokine CCL2 modulation of neuronal excitability and
synaptic transmission in rat hippocampal slices. J. Neurochem. 2011, 116, 406–414. [CrossRef] [PubMed]
76. Zhou, Y.; Tang, H.; Xiong, H. Chemokine CCL2 enhances nmda receptor-mediated excitatory
postsynaptic current in rat hippocampal slices-a potential mechanism for HIV-1-associated neuropathy?
J. Neuroimmune Pharmacol. 2016, 11, 306–315. [CrossRef] [PubMed]
77. Tancredi, V.; D’Antuono, M.; Cafe, C.; Giovedi, S.; Bue, M.C.; D’Arcangelo, G.; Onofri, F.; Benfenati, F.
The inhibitory effects of interleukin-6 on synaptic plasticity in the rat hippocampus are associated with an
inhibition of mitogen-activated protein kinase erk. J. Neurochem. 2000, 75, 634–643. [CrossRef] [PubMed]
78. Li, A.J.; Katafuchi, T.; Oda, S.; Hori, T.; Oomura, Y. Interleukin-6 inhibits long-term potentiation in rat
hippocampal slices. Brain Res. 1997, 748, 30–38. [CrossRef]
79. Tancredi, V.; D’Arcangelo, G.; Grassi, F.; Tarroni, P.; Palmieri, G.; Santoni, A.; Eusebi, F. Tumor necrosis factor
alters synaptic transmission in rat hippocampal slices. Neurosci. Lett. 1992, 146, 176–178. [CrossRef]
80. Rose, C.F.; Verkhratsky, A.; Parpura, V. Astrocyte glutamine synthetase: Pivotal in health and disease.
Biochem. Soc. Trans. 2013, 41, 1518–1524. [CrossRef] [PubMed]
81. Gonzalez, J.; Jurado-Coronel, J.C.; Avila, M.F.; Sabogal, A.; Capani, F.; Barreto, G.E. NMDARs in neurological
diseases: A potential therapeutic target. Int. J. Neurosci. 2015, 125, 315–327. [CrossRef] [PubMed]
82. Zhou, Q.; Sheng, M. NMDA receptors in nervous system diseases. Neuropharmacology 2013, 74, 69–75.
[CrossRef] [PubMed]
83. Goldstein, D.B.; Pal, N. Alcohol dependence produced in mice by inhalation of ethanol: Grading the
withdrawal reaction. Science 1971, 172, 288–290. [CrossRef] [PubMed]
84. Metten, P.; Crabbe, J.C. Alcohol withdrawal severity in inbred mouse (mus musculus) strains. Behav. Neurosci.
2005, 119, 911–925. [CrossRef] [PubMed]
85. Raber, J.; O’Shea, R.D.; Bloom, F.E.; Campbell, I.L. Modulation of hypothalamic-pituitary-adrenal function
by transgenic expression of interleukin-6 in the CNS of mice. J. Neurosci. 1997, 17, 9473–9480. [PubMed]
© 2016 by the author. Licensee MDPI, Basel, Switzerland. This article is an open access
article distributed under the terms and conditions of the Creative Commons Attribution
(CC BY) license (http://creativecommons.org/licenses/by/4.0/).
17
brainsciences
Article
Astrocytic IL-6 Influences the Clinical Symptoms ofEAE in Mice
Maria Erta 1,2, Mercedes Giralt 1,2, Silvia Jiménez 1, Amalia Molinero 1,2, Gemma Comes 1,2 and
Juan Hidalgo 1,2,*
1 Department of Cellular Biology, Physiology and Immunology, Animal Physiology Unit,
Faculty of Biosciences, Universitat Autònoma de Barcelona, Bellaterra 08193, Spain;
[email protected] (M.E.); [email protected] (M.G.); [email protected] (S.J.);
[email protected] (A.M.); [email protected] (G.C.)2 Institute of Neurosciences, Universitat Autònoma de Barcelona, Bellaterra 08193, Spain
* Correspondence: [email protected]; Tel.: +34-935-812-037; Fax: +34-935-812-390
Academic Editor: Donna Gruol
Received: 12 February 2016; Accepted: 10 May 2016; Published: 17 May 2016
Abstract: Interleukin-6 (IL-6) is a multifunctional cytokine that not only plays major roles in the
immune system, but also serves as a coordinator between the nervous and endocrine systems. IL-6 is
produced in multiple cell types in the CNS, and in turn, many cells respond to it. It is therefore
important to ascertain which cell type is the key responder to IL-6 during both physiological and
pathological conditions. In order to test the role of astrocytic IL-6 in neuroinflammation, we studied
an extensively-used animal model of multiple sclerosis, experimental autoimmune encephalomyelitis
(EAE), in mice with an IL-6 deficiency in astrocytes (Ast-IL-6 KO). Results indicate that lack of
astrocytic IL-6 did not cause major changes in EAE symptomatology. However, a delay in the onset of
clinical signs was observed in Ast-IL-6 KO females, with fewer inflammatory infiltrates and decreased
demyelination and some alterations in gliosis and vasogenesis, compared to floxed mice. These results
suggest that astrocyte-secreted IL-6 has some roles in EAE pathogenesis, at least in females.
Keywords: interleukin-6; astrocyte; EAE
1. Introduction
Interleukin 6 (IL-6) is a multifunctional four-helix bundle cytokine, originally identified as a B-cell
differentiation factor in 1985 [1], which has been linked to numerous biological functions. It is now known
to be one of the main cytokines controlling the immune system, and in addition, it acts as a coordinator
between the nervous and endocrine systems. IL-6 plays an essential role in the central nervous system
(CNS) in many physiological, inflammatory and disease conditions, being able to exert dual actions (for a
review, see [2]). Although many cells in the CNS produce IL-6 [3], astrocytes are the main producer [2,4].
Multiple sclerosis (MS) is one of the most common inflammatory disorders of the CNS and a
leading cause of disability in young adults. It is estimated that 2–2.5 million people are currently living
with this demyelinating disease worldwide [5]. Its pathological hallmarks consist of local demyelination,
inflammation and variable axonal destruction. Experimental autoimmune encephalomyelitis (EAE) [6]
is a well-known animal model to study this inflammatory condition. Cytokines are key mediators
in the pathogenesis of inflammatory lesions in CNS, presenting both helpful and harmful effects [7].
IL-6 plays a crucial role in MS as demonstrated by its presence in acute and chronic active plaques of
MS patients [8]. In addition, it has been shown that IL-6-deficient mice are resistant to EAE [9–13]
presumably because of a lack of differentiation of naive T cells into MOG-specific T helper cells
producing IL-17 (Th17) and the subsequent reduction of their infiltration into the CNS [14], although
the exact mechanism is not fully understood.
Brain Sci. 2016, 6, 15 18 www.mdpi.com/journal/brainsci
Brain Sci. 2016, 6, 15
A thorough understanding of the role of the cellular context in this and other diseases is necessary
to clarify the putative roles of IL-6 in the CNS [15,16]. We recently characterized the role of astrocytic
IL-6 in normal (basal) conditions by using transgenic mice with astrocyte-specific IL-6 deficiency,
showing effects on behavior and body weight in a sex-dependent manner [17,18]. The role of astrocytic IL-6
during pathological situations remained to be assessed, and here, we report the initial studies with EAE.
2. Materials and Methods
2.1. Animals
The generation of astrocyte-IL-6 KO (Ast-IL6 KO) and floxed littermate mice, which served as
controls, was as described previously [17]. A number of studies have shown that GFAP is primarily
expressed in astrocytes of the CNS, with minimal expression in peripheral regions [19]. All mice
were kept under constant temperature with free access to food (Harlan global diet 2918) and water.
Ethical approval for the use and experimentation of all mice in this study was obtained from the
Animal and Human Experimentation Ethics Committee of the Universitat Autònoma de Barcelona
(no 4017, approved 3 September 2015).
2.2. EAE Induction and Clinical Evaluation
For the induction of EAE, two-month-old male and female mice were used. EAE was induced by
active immunization with MOG35–55 peptide. On Day 0, all mice, under isoflurane anesthesia, were
injected subcutaneously into the hind flanks with an emulsion of 100 μL MOG35–55 (3 mg/mL) and
100 μL Complete Freund’s Adjuvant (CFA) (Sigma-Aldrich, St. Louis, MO, USA) supplemented with
4 mg/mL Mycobacterium tuberculosis H37RA (Difco, Detroit, MI, USA). In addition, animals received
an intraperitoneal injection of 500 ng pertussis toxin (Sigma-Aldrich, St. Louis, MO, USA), which was
repeated two days later.
After immunization, mice were examined daily, weighed and scored for EAE. The EAE clinical
score was assessed for each animal according to the following criteria: 0 = no signs of disease,
0.5 = partial loss of tail tonus, 1 = loss of tail tonus, 2 = moderate hind limb paraparesis, 2.5 = severe
hind limb paraparesis, 3 = partial hind limb paralysis, 3.5 = hind limb paralysis, 4 = hind limb paralysis
plus partial front leg paralysis, 4.5 = moribund/total paralysis and 5 = death. Finally, for each animal,
we determined the time to disease onset (clinical score ě1), time to peak disease, peak-score, cumulative
score (sum of all scores from disease onset to Day 20) and grade of remission (difference between peak
score and outcome).
Three independent EAE experiments were carried out (Table 1). Experiment 1 was carried out for
0–22 days post-immunization (dpi); Experiment 2 was carried out for 0–20 dpi; and Experiment 3 was
carried out for 0–46 dpi. For each experiment, littermates were used. Female mice from 20–22 dpi were
grouped before comparison to 46 dpi mice. Male Ast-IL-6 KO mice did not differ from male floxed
mice at 20–22 dpi and, thus, were not examined at 46 dpi. In all cases, all surviving mice were euthanized
at the indicated days post-immunization by decapitation. Spinal cords were immediately removed and
fixed for 48 h in 4% paraformaldehyde and embedded in paraffin for immunohistochemistry (IHC) and
histochemistry (HC) analyses. Spinal cords from additional healthy female mice were processed in parallel.
Table 1. Number of mice per genotype, sex and experiment.
GenotypeExperiment 1 (0–22 dpi) Experiment 2 (0–20 dpi) Experiment 3 (0–46 dpi)
Males Females Males Females Females
Floxed 7 3 11 17 8Ast-IL-6 KO 3 7 8 8 8
dpi, days post-immunization; Ast, astrocyte.
19
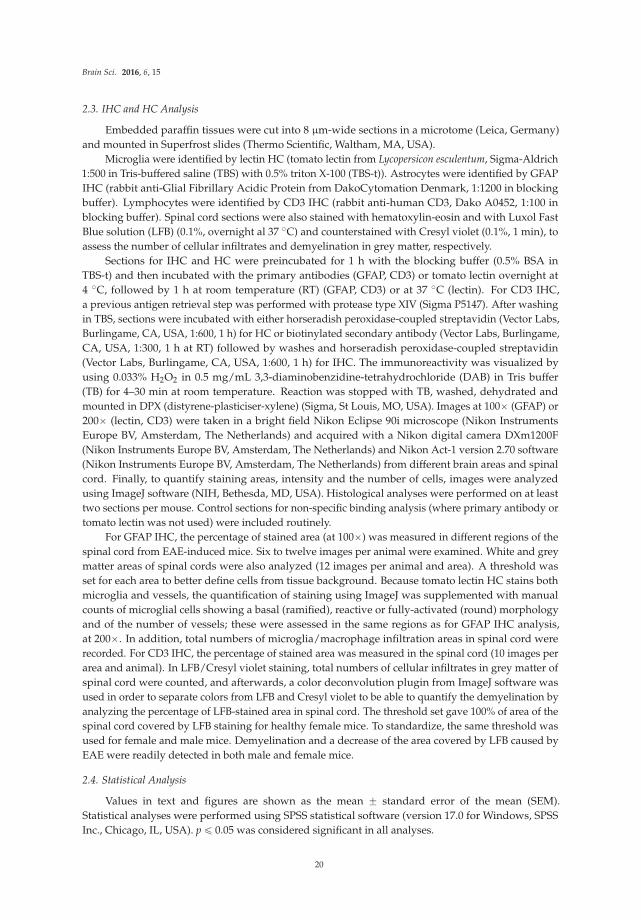
Brain Sci. 2016, 6, 15
2.3. IHC and HC Analysis
Embedded paraffin tissues were cut into 8 μm-wide sections in a microtome (Leica, Germany)
and mounted in Superfrost slides (Thermo Scientific, Waltham, MA, USA).
Microglia were identified by lectin HC (tomato lectin from Lycopersicon esculentum, Sigma-Aldrich
1:500 in Tris-buffered saline (TBS) with 0.5% triton X-100 (TBS-t)). Astrocytes were identified by GFAP
IHC (rabbit anti-Glial Fibrillary Acidic Protein from DakoCytomation Denmark, 1:1200 in blocking
buffer). Lymphocytes were identified by CD3 IHC (rabbit anti-human CD3, Dako A0452, 1:100 in
blocking buffer). Spinal cord sections were also stained with hematoxylin-eosin and with Luxol Fast
Blue solution (LFB) (0.1%, overnight al 37 ˝C) and counterstained with Cresyl violet (0.1%, 1 min), to
assess the number of cellular infiltrates and demyelination in grey matter, respectively.
Sections for IHC and HC were preincubated for 1 h with the blocking buffer (0.5% BSA in
TBS-t) and then incubated with the primary antibodies (GFAP, CD3) or tomato lectin overnight at
4 ˝C, followed by 1 h at room temperature (RT) (GFAP, CD3) or at 37 ˝C (lectin). For CD3 IHC,
a previous antigen retrieval step was performed with protease type XIV (Sigma P5147). After washing
in TBS, sections were incubated with either horseradish peroxidase-coupled streptavidin (Vector Labs,
Burlingame, CA, USA, 1:600, 1 h) for HC or biotinylated secondary antibody (Vector Labs, Burlingame,
CA, USA, 1:300, 1 h at RT) followed by washes and horseradish peroxidase-coupled streptavidin
(Vector Labs, Burlingame, CA, USA, 1:600, 1 h) for IHC. The immunoreactivity was visualized by
using 0.033% H2O2 in 0.5 mg/mL 3,3-diaminobenzidine-tetrahydrochloride (DAB) in Tris buffer
(TB) for 4–30 min at room temperature. Reaction was stopped with TB, washed, dehydrated and
mounted in DPX (distyrene-plasticiser-xylene) (Sigma, St Louis, MO, USA). Images at 100ˆ (GFAP) or
200ˆ (lectin, CD3) were taken in a bright field Nikon Eclipse 90i microscope (Nikon Instruments
Europe BV, Amsterdam, The Netherlands) and acquired with a Nikon digital camera DXm1200F
(Nikon Instruments Europe BV, Amsterdam, The Netherlands) and Nikon Act-1 version 2.70 software
(Nikon Instruments Europe BV, Amsterdam, The Netherlands) from different brain areas and spinal
cord. Finally, to quantify staining areas, intensity and the number of cells, images were analyzed
using ImageJ software (NIH, Bethesda, MD, USA). Histological analyses were performed on at least
two sections per mouse. Control sections for non-specific binding analysis (where primary antibody or
tomato lectin was not used) were included routinely.
For GFAP IHC, the percentage of stained area (at 100ˆ) was measured in different regions of the
spinal cord from EAE-induced mice. Six to twelve images per animal were examined. White and grey
matter areas of spinal cords were also analyzed (12 images per animal and area). A threshold was
set for each area to better define cells from tissue background. Because tomato lectin HC stains both
microglia and vessels, the quantification of staining using ImageJ was supplemented with manual
counts of microglial cells showing a basal (ramified), reactive or fully-activated (round) morphology
and of the number of vessels; these were assessed in the same regions as for GFAP IHC analysis,
at 200ˆ. In addition, total numbers of microglia/macrophage infiltration areas in spinal cord were
recorded. For CD3 IHC, the percentage of stained area was measured in the spinal cord (10 images per
area and animal). In LFB/Cresyl violet staining, total numbers of cellular infiltrates in grey matter of
spinal cord were counted, and afterwards, a color deconvolution plugin from ImageJ software was
used in order to separate colors from LFB and Cresyl violet to be able to quantify the demyelination by
analyzing the percentage of LFB-stained area in spinal cord. The threshold set gave 100% of area of the
spinal cord covered by LFB staining for healthy female mice. To standardize, the same threshold was
used for female and male mice. Demyelination and a decrease of the area covered by LFB caused by
EAE were readily detected in both male and female mice.
2.4. Statistical Analysis
Values in text and figures are shown as the mean ˘ standard error of the mean (SEM).
Statistical analyses were performed using SPSS statistical software (version 17.0 for Windows, SPSS
Inc., Chicago, IL, USA). p ď 0.05 was considered significant in all analyses.
20
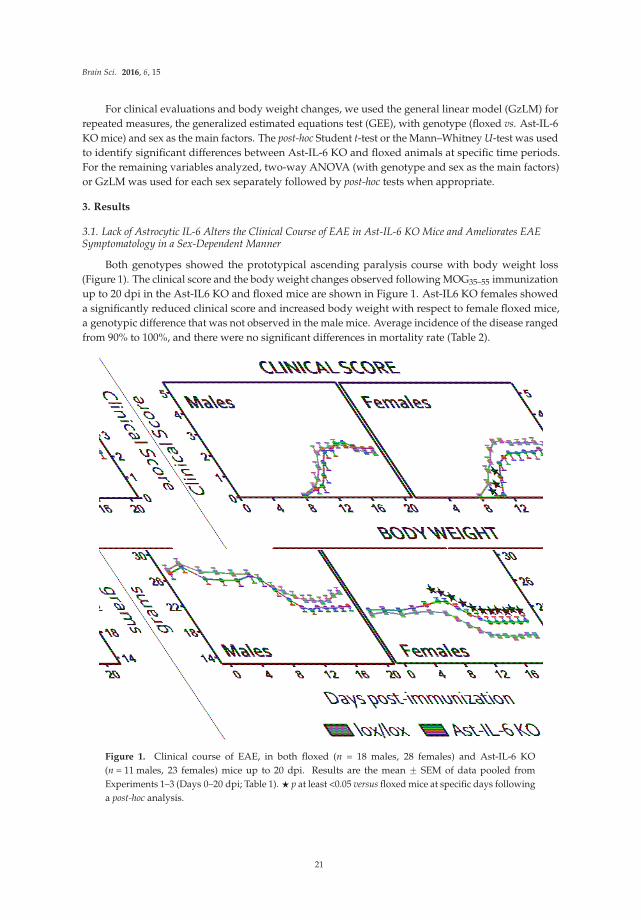
Brain Sci. 2016, 6, 15
For clinical evaluations and body weight changes, we used the general linear model (GzLM) for
repeated measures, the generalized estimated equations test (GEE), with genotype (floxed vs. Ast-IL-6
KO mice) and sex as the main factors. The post-hoc Student t-test or the Mann–Whitney U-test was used
to identify significant differences between Ast-IL-6 KO and floxed animals at specific time periods.
For the remaining variables analyzed, two-way ANOVA (with genotype and sex as the main factors)
or GzLM was used for each sex separately followed by post-hoc tests when appropriate.
3. Results
3.1. Lack of Astrocytic IL-6 Alters the Clinical Course of EAE in Ast-IL-6 KO Mice and Ameliorates EAESymptomatology in a Sex-Dependent Manner
Both genotypes showed the prototypical ascending paralysis course with body weight loss
(Figure 1). The clinical score and the body weight changes observed following MOG35–55 immunization
up to 20 dpi in the Ast-IL6 KO and floxed mice are shown in Figure 1. Ast-IL6 KO females showed
a significantly reduced clinical score and increased body weight with respect to female floxed mice,
a genotypic difference that was not observed in the male mice. Average incidence of the disease ranged
from 90% to 100%, and there were no significant differences in mortality rate (Table 2).
Figure 1. Clinical course of EAE, in both floxed (n = 18 males, 28 females) and Ast-IL-6 KO
(n = 11 males, 23 females) mice up to 20 dpi. Results are the mean ˘ SEM of data pooled from
Experiments 1–3 (Days 0–20 dpi; Table 1). ‹ p at least <0.05 versus floxed mice at specific days following
a post-hoc analysis.
21
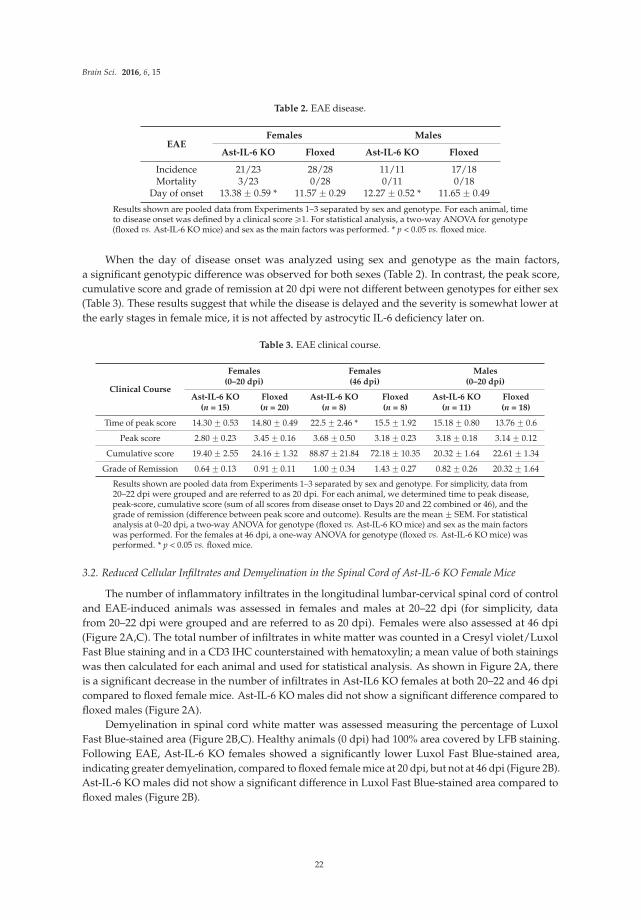
Brain Sci. 2016, 6, 15
Table 2. EAE disease.
EAEFemales Males
Ast-IL-6 KO Floxed Ast-IL-6 KO Floxed
Incidence 21/23 28/28 11/11 17/18Mortality 3/23 0/28 0/11 0/18
Day of onset 13.38 ˘ 0.59 * 11.57 ˘ 0.29 12.27 ˘ 0.52 * 11.65 ˘ 0.49
Results shown are pooled data from Experiments 1–3 separated by sex and genotype. For each animal, timeto disease onset was defined by a clinical score ě1. For statistical analysis, a two-way ANOVA for genotype(floxed vs. Ast-IL-6 KO mice) and sex as the main factors was performed. * p < 0.05 vs. floxed mice.
When the day of disease onset was analyzed using sex and genotype as the main factors,
a significant genotypic difference was observed for both sexes (Table 2). In contrast, the peak score,
cumulative score and grade of remission at 20 dpi were not different between genotypes for either sex
(Table 3). These results suggest that while the disease is delayed and the severity is somewhat lower at
the early stages in female mice, it is not affected by astrocytic IL-6 deficiency later on.
Table 3. EAE clinical course.
Clinical Course
Females(0–20 dpi)
Females(46 dpi)
Males(0–20 dpi)
Ast-IL-6 KO(n = 15)
Floxed(n = 20)
Ast-IL-6 KO(n = 8)
Floxed(n = 8)
Ast-IL-6 KO(n = 11)
Floxed(n = 18)
Time of peak score 14.30 ˘ 0.53 14.80 ˘ 0.49 22.5 ˘ 2.46 * 15.5 ˘ 1.92 15.18 ˘ 0.80 13.76 ˘ 0.6
Peak score 2.80 ˘ 0.23 3.45 ˘ 0.16 3.68 ˘ 0.50 3.18 ˘ 0.23 3.18 ˘ 0.18 3.14 ˘ 0.12
Cumulative score 19.40 ˘ 2.55 24.16 ˘ 1.32 88.87 ˘ 21.84 72.18 ˘ 10.35 20.32 ˘ 1.64 22.61 ˘ 1.34
Grade of Remission 0.64 ˘ 0.13 0.91 ˘ 0.11 1.00 ˘ 0.34 1.43 ˘ 0.27 0.82 ˘ 0.26 20.32 ˘ 1.64
Results shown are pooled data from Experiments 1–3 separated by sex and genotype. For simplicity, data from20–22 dpi were grouped and are referred to as 20 dpi. For each animal, we determined time to peak disease,peak-score, cumulative score (sum of all scores from disease onset to Days 20 and 22 combined or 46), and thegrade of remission (difference between peak score and outcome). Results are the mean ˘ SEM. For statisticalanalysis at 0–20 dpi, a two-way ANOVA for genotype (floxed vs. Ast-IL-6 KO mice) and sex as the main factorswas performed. For the females at 46 dpi, a one-way ANOVA for genotype (floxed vs. Ast-IL-6 KO mice) wasperformed. * p < 0.05 vs. floxed mice.
3.2. Reduced Cellular Infiltrates and Demyelination in the Spinal Cord of Ast-IL-6 KO Female Mice
The number of inflammatory infiltrates in the longitudinal lumbar-cervical spinal cord of control
and EAE-induced animals was assessed in females and males at 20–22 dpi (for simplicity, data
from 20–22 dpi were grouped and are referred to as 20 dpi). Females were also assessed at 46 dpi
(Figure 2A,C). The total number of infiltrates in white matter was counted in a Cresyl violet/Luxol
Fast Blue staining and in a CD3 IHC counterstained with hematoxylin; a mean value of both stainings
was then calculated for each animal and used for statistical analysis. As shown in Figure 2A, there
is a significant decrease in the number of infiltrates in Ast-IL6 KO females at both 20–22 and 46 dpi
compared to floxed female mice. Ast-IL-6 KO males did not show a significant difference compared to
floxed males (Figure 2A).
Demyelination in spinal cord white matter was assessed measuring the percentage of Luxol
Fast Blue-stained area (Figure 2B,C). Healthy animals (0 dpi) had 100% area covered by LFB staining.
Following EAE, Ast-IL-6 KO females showed a significantly lower Luxol Fast Blue-stained area,
indicating greater demyelination, compared to floxed female mice at 20 dpi, but not at 46 dpi (Figure 2B).
Ast-IL-6 KO males did not show a significant difference in Luxol Fast Blue-stained area compared to
floxed males (Figure 2B).
22
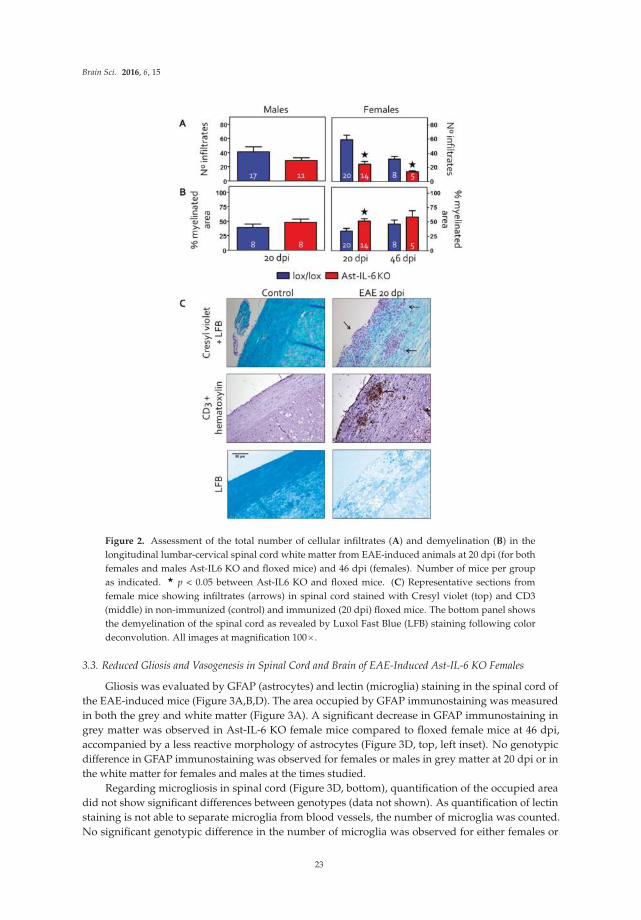
Brain Sci. 2016, 6, 15
Figure 2. Assessment of the total number of cellular infiltrates (A) and demyelination (B) in the
longitudinal lumbar-cervical spinal cord white matter from EAE-induced animals at 20 dpi (for both
females and males Ast-IL6 KO and floxed mice) and 46 dpi (females). Number of mice per group
as indicated. ‹ p < 0.05 between Ast-IL6 KO and floxed mice. (C) Representative sections from
female mice showing infiltrates (arrows) in spinal cord stained with Cresyl violet (top) and CD3
(middle) in non-immunized (control) and immunized (20 dpi) floxed mice. The bottom panel shows
the demyelination of the spinal cord as revealed by Luxol Fast Blue (LFB) staining following color
deconvolution. All images at magnification 100ˆ.
3.3. Reduced Gliosis and Vasogenesis in Spinal Cord and Brain of EAE-Induced Ast-IL-6 KO Females
Gliosis was evaluated by GFAP (astrocytes) and lectin (microglia) staining in the spinal cord of
the EAE-induced mice (Figure 3A,B,D). The area occupied by GFAP immunostaining was measured
in both the grey and white matter (Figure 3A). A significant decrease in GFAP immunostaining in
grey matter was observed in Ast-IL-6 KO female mice compared to floxed female mice at 46 dpi,
accompanied by a less reactive morphology of astrocytes (Figure 3D, top, left inset). No genotypic
difference in GFAP immunostaining was observed for females or males in grey matter at 20 dpi or in
the white matter for females and males at the times studied.
Regarding microgliosis in spinal cord (Figure 3D, bottom), quantification of the occupied area
did not show significant differences between genotypes (data not shown). As quantification of lectin
staining is not able to separate microglia from blood vessels, the number of microglia was counted.
No significant genotypic difference in the number of microglia was observed for either females or
23
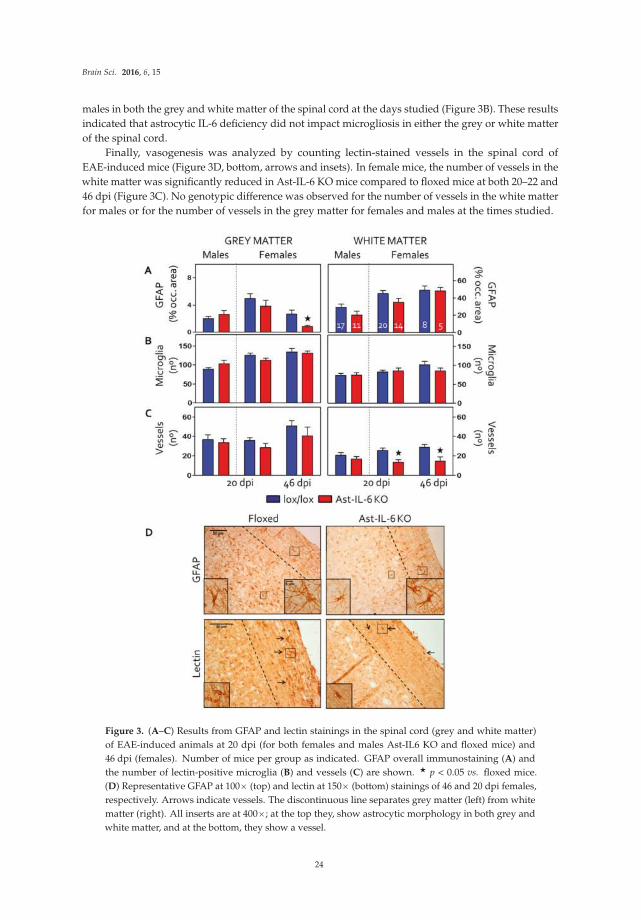
Brain Sci. 2016, 6, 15
males in both the grey and white matter of the spinal cord at the days studied (Figure 3B). These results
indicated that astrocytic IL-6 deficiency did not impact microgliosis in either the grey or white matter
of the spinal cord.
Finally, vasogenesis was analyzed by counting lectin-stained vessels in the spinal cord of
EAE-induced mice (Figure 3D, bottom, arrows and insets). In female mice, the number of vessels in the
white matter was significantly reduced in Ast-IL-6 KO mice compared to floxed mice at both 20–22 and
46 dpi (Figure 3C). No genotypic difference was observed for the number of vessels in the white matter
for males or for the number of vessels in the grey matter for females and males at the times studied.
Figure 3. (A–C) Results from GFAP and lectin stainings in the spinal cord (grey and white matter)
of EAE-induced animals at 20 dpi (for both females and males Ast-IL6 KO and floxed mice) and
46 dpi (females). Number of mice per group as indicated. GFAP overall immunostaining (A) and
the number of lectin-positive microglia (B) and vessels (C) are shown. ‹ p < 0.05 vs. floxed mice.
(D) Representative GFAP at 100ˆ (top) and lectin at 150ˆ (bottom) stainings of 46 and 20 dpi females,
respectively. Arrows indicate vessels. The discontinuous line separates grey matter (left) from white
matter (right). All inserts are at 400ˆ; at the top they, show astrocytic morphology in both grey and
white matter, and at the bottom, they show a vessel.
24
Brain Sci. 2016, 6, 15
4. Discussion
IL-6 is implicated in the pathogenesis of autoimmune disorders, such as MS in humans [20,21].
A critical role of IL-6 in the animal model of MS, EAE, has been demonstrated by a number of studies:
systemic IL-6 KO mice are resistant to EAE [9–13], and neutralization of IL-6 with antibodies leads to
a reduced disease [22], by not well-defined mechanisms. Moreover, studies have demonstrated that
the transgenic expression of IL-6 in the CNS by viral systems reduces EAE [23] and that the systemic
administration of IL-6 also reduces the clinical symptoms in a viral model of EAE [24]. Thus, IL-6
can potentiate, but also inhibit EAE, reflecting the complexity of its actions. Key questions remain,
however, including the identity of the key cell types that produce and respond to IL-6 and whether the
critical actions of IL-6 are peripheral or central.
Because the production of IL-6 during the course of EAE arises from diverse cellular sources both
in the periphery and in the CNS, the specific contribution of each source of IL-6 to the development of
the disease needs to be established. We have previously demonstrated a role of CNS IL-6 in regulating
EAE, because mice expressing IL-6 only by astrocytes (GFAP-IL6-IL-6 KO mice) were capable of
developing the atypical EAE known to occur in GFAP-IL6 mice [13]. Furthermore, in adoptive transfer
experiments, EAE is less severe in IL-6KO mice than in wild-type mice, which suggests that IL-6 locally
mediates the disease in the CNS [10]. Thus, although EAE has always been considered a disease mostly
induced peripherally, it seems that CNS IL-6 may also play an important role. Because astrocytic IL-6 plays
a major role in neuroinflammation [25,26] and because astrocytes are the most abundant cell in the CNS,
astrocytic IL-6 seemed to be an excellent candidate to examine as the key regulator of EAE in the CNS.
We have previously shown that compared to floxed mice, Ast-IL-6 KO mice exhibit a number of
altered behaviors under normal (basal) conditions, including changes in activity, anxiety and learning;
a prosurvival role of astrocytic IL-6 is also apparent [17,18]. Here, we present results from studies
involving a neuropathological condition, MOG35–55-induced EAE. In contrast to results in systemic
IL-6 KO mice, astrocytic-specific IL-6 deficiency is unable to prevent typical signs of EAE induction
and has no prominent neuropathologic effects. However, astrocyte IL-6 KO mice did show significant
delays of the onset of the EAE, at least in female mice, ameliorating the clinical signs in the early stages
of EAE.
Autoreactive T-cells can result in inflammatory demyelination of the CNS, and knowing that
the frequency of Tregs in MS patients is unchanged from controls [27] (although their function is
impaired) could be a clue to the decreased demyelination seen only in Ast-IL-6 KO females, the only
group that presented a decrease in T lymphocyte infiltration. Thus, a lower EAE score at early stages
could be due to an initial impaired T cell infiltration of the CNS. This possibility is consistent with our
results showing that Ast-IL-6 KO female (but not male) mice had a decreased number of infiltrates
in the spinal cord and lower scores for clinical signs. However, it is important to note that we only
carried out Cresyl violet and CD3 immunostaining for T cells, so we cannot rule out that a change in
T cell subpopulations is responsible for the different clinical signs observed in Ast-IL-6 KO female
mice. IL-6 has a major role in Th17 cell differentiation from naive CD4+ T-cells (reviewed in [28]),
particularly in the EAE model [14,29]. EAE-resistant IL-6 KO mice show a deficiency in Th17 cell
infiltrates in the CNS [30]. When responsiveness to IL-6 is experimentally eliminated in T helper cells,
mice show resistance to EAE induction, as the IL-21 pathway is intact, but not active in the absence of
IL-6 signaling [31]. Th17 cells produce IL-17 (among other cytokines), which enhances IL-6 production
by astrocytes, which, in turn, induces the differentiation of Th17 cells in a positive feed-back loop
between IL-17 and IL-6 via activation of NF-κB and STAT-3 [32,33]. This loop may be compromised
in our Ast-IL-6 KO animals, where astrocyte production of IL-6 has been eliminated. However, since
Ast-IL-6 KO mice only show a delay in EAE, but are not resistant to EAE, we can speculate that this
astrocytic loop is not necessary for the development of the disease; and/or that neuronal, endothelial
and microglial IL-6 could instead allow this positive feedback between IL-17 and IL-6. In order to test
these hypotheses, a detailed study of the exact lymphocytic population present in the infiltrates would
be important, particularly with further backcrossing to C57/Bl6 mice.
25
Brain Sci. 2016, 6, 15
Somewhat surprisingly, considering the importance of astrocytic IL-6 in neuroinflammation [2,4,25,26],
we did not observe dramatic effects of astrocytic IL-6 deficiency on either astrocytes or microglia at
the times studied. This result makes it unlikely that changes in glial cell reactivity are underlying the
differences in clinical signs between Ast-IL-6 KO mice and floxed mice. Nevertheless, overall staining
and cell morphologies are limited approaches, and more detailed studies are needed to assess other
roles of glial cells (other than IL-6 production by astrocytes) in clinical signs of EAE. Finally, regarding
the number of vessels, we observed a decrease in Ast-IL-6 KO mice, which is in agreement with results
in mice overexpressing IL-6, which show extensive revascularization, both in basal conditions [25,26]
and after an injury [34], indicative of a role of IL-6 in vasogenesis. Other studies also support the
idea that IL-6 promotes vasogenesis [35]. Probably, this is secondary to the number and/or type of
inflammatory cells present in the spinal cord, since no differences were observed in male mice.
The extent of the reduction of IL-6 in astrocytes of the Ast-IL-6 KO mice in vivo has yet to be
determined. However, studies of cultured astrocytes from the Ast-IL-6 KO mice demonstrated that the
astrocytes are deficient in IL-6 production. In these studies, analysis of culture supernatant after 24 h
of stimulation (10 ng/mL of LPS and 10 ng/mL of INF-γ) showed that astrocytes from floxed mice
produced approximately 13 ng/mL of IL-6, whereas astrocytes from Ast-IL-6 KO mice only produced
2 ng/mL IL-6 [17,18]. Regardless of the extent of the astrocytic IL-6 deficiency in the Ast-IL-6 KO mice,
a delay in onset to clinical symptoms was evident in females, including less demyelination at 20–22 dpi
in accordance with the lower clinical scores. However, this was a transient effect, and sometime after
20–22 dpi, the EAE was similar in both genotypes (as indicated by the lack of significant differences in
demyelination at 46 dpi), indicating the astrocytic IL-6 no longer played a role.
5. Conclusions
In conclusion, we have shown that lack of astrocytic IL-6 is not sufficient to prevent EAE disease,
but it is able to delay the disease and to ameliorate clinical scoring and the inflammatory milieu in
female mice. These results support the idea that the local CNS production of IL-6 is important in
this disease. Several interesting questions remain to be addressed. For example, due to the delayed
onset of clinical signs of disease in Ast-IL-6 KO females, it will be important to analyze in detail the
priming and inflammatory infiltrates in the CNS of female and male Ast-IL-6 KO mice and their floxed
controls. Furthermore, studies of males at later dpi may reveal genotypic differences at later stages.
Moreover, a comparison of the immunized Ast-IL-6 KO and floxed mice with a CFA immunized
control group could reveal specific EAE effects in Ast-ILK-6 KO mice. Future studies will address
these and other relevant issues relative to the role of astrocytic IL-6 in the EAE.
Acknowledgments: This work was supported by SAF2011-23272 and SFA2014-56546-R to Juan Hidalgo.Maria Erta gratefully acknowledges a PhD fellowship from Universitat Autònoma de Barcelona.
Author Contributions: M.E., M.G., S.J., A.M. and G.C. were involved in several aspects of the experiments carriedout. M.E. led most of the experimental work. J.H. conceived of the experiments. M.E. and J.H. wrote the paper.
Conflicts of Interest: The authors declare no conflict of interest. The founding sponsors had no role in the designof the study; in the collection, analyses or interpretation of data; in the writing of the manuscript; nor in thedecision to publish the results.
References
1. Hirano, T.; Taga, T.; Nakano, N.; Yasukawa, K.; Kashiwamura, S.; Shimizu, K.; Nakajima, K.; Pyun, K.H.;
Kishimoto, T. Purification to homogeneity and characterization of human B-cell differentiation factor (BCDF
or BSFp-2). Proc. Natl. Acad. Sci. USA 1985, 82, 5490–5494. [CrossRef] [PubMed]
2. Gruol, D.L.; Nelson, T.E. Physiological and pathological roles of interleukin-6 in the central nervous system.
Mol. Neurobiol. 1997, 15, 307–339. [CrossRef] [PubMed]
3. Schöbitz, B.; de Kloet, E.R.; Sutanto, W.; Holsboer, F. Cellular localization of interleukin 6 mRNA and
interleukin 6 receptor mrna in rat brain. Eur. J. Neurosci. 1993, 5, 1426–1435. [CrossRef] [PubMed]
26
Brain Sci. 2016, 6, 15
4. Van Wagoner, N.J.; Benveniste, E.N. Interleukin-6 expression and regulation in astrocytes. J. Neuroimmunol.
1999, 100, 124–139. [CrossRef]
5. Milo, R.; Kahana, E. Multiple sclerosis: Geoepidemiology, genetics and the environment. Autoimmun. Rev.
2010, 9, A387–A394. [CrossRef] [PubMed]
6. Baxter, A.G. The origin and application of experimental autoimmune encephalomyelitis. Nat. Rev. Immunol.
2007, 7, 904–912. [CrossRef] [PubMed]
7. Merrill, J.E.; Benveniste, E.N. Cytokines in inflammatory brain lesions: Helpful and harmful. Trends Neurosci.
1996, 19, 331–338. [CrossRef]
8. Maimone, D.; Guazzi, G.C.; Annunziata, P. IL-6 detection in multiple sclerosis brain. J. Neurol. Sci. 1997, 146,
59–65. [CrossRef]
9. Eugster, H.-P.; Frei, K.; Kopf, M.; Lassmann, H.; Fontana, A. IL-6 deficient mice resist myelin oligodendrocyte
glycoprotein-induced autoimmune encephalomyelitis. Eur. J. Immunol. 1998, 28, 2178–2187. [CrossRef]
10. Mendel, I.; Katz, A.; Kozak, N.; Ben-Nun, A.; Revel, M. Interleukin-6 functions in autoimmune
encephalomyelitis: A study in gene-targeted mice. Eur. J. Immunol. 1998, 28, 1727–1737. [CrossRef]
11. Okuda, Y.; Sakoda, S.; Bernard, C.C.; Fujimura, H.; Saeki, Y.; Kishimoto, T.; Yanagihara, T. IL-6-deficient
mice are resistant to the induction of experimental autoimmune encephalomyelitis provoked by myelin
oligodendrocyte glycoprotein. Int. Immunol. 1998, 10, 703–708. [CrossRef] [PubMed]
12. Samoilova, E.B.; Horton, J.L.; Hilliard, B.; Liu, T.S.; Chen, Y. IL-6-deficient mice are resistant to experimental
autoimmune encephalomyelitis: Roles of IL-6 in the activation and differentiation of autoreactive T cells.
J. Immunol. 1998, 161, 6480–6486. [PubMed]
13. Giralt, M.; Ramos, R.; Quintana, A.; Ferrer, B.; Erta, M.; Castro-Freire, M.; Comes, G.; Sanz, E.; Unzeta, M.;
Pifarré, P.; et al. Induction of atypical EAE mediated by transgenic production of IL-6 in astrocytes in the
absence of systemic IL-6. Glia 2013, 61, 587–600. [CrossRef] [PubMed]
14. Serada, S.; Fujimoto, M.; Mihara, M.; Koike, N.; Ohsugi, Y.; Nomura, S.; Yoshida, H.; Nishikawa, T.; Terabe, F.;
Ohkawara, T.; et al. IL-6 blockade inhibits the induction of myelin antigen-specific Th17 cells and Th1 cells in
experimental autoimmune encephalomyelitis. Proc. Natl. Acad. Sci. USA 2008, 105, 9041–9046. [CrossRef]
[PubMed]
15. Spooren, A.; Kolmus, K.; Laureys, G.; Clinckers, R.; De Keyser, J.; Haegeman, G.; Gerlo, S. Interleukin-6, a mental
cytokine. Brain Res. Rev. 2011, 67, 157–183. [CrossRef] [PubMed]
16. Erta, M.; Quintana, A.; Hidalgo, J. Interleukin-6, a major cytokine in the central nervous system. Int. J. Biol. Sci.
2012, 8, 1254–1266. [CrossRef] [PubMed]
17. Quintana, A.; Erta, M.; Ferrer, B.; Comes, G.; Giralt, M.; Hidalgo, J. Astrocyte-specific deficiency of interleukin-6
and its receptor reveal specific roles in survival, body weight and behavior. Brain Behav. Immun. 2013, 27,
162–173. [CrossRef] [PubMed]
18. Erta, M.; Giralt, M.; Esposito, F.L.; Fernandez-Gayol, O.; Hidalgo, J. Astrocytic IL-6 mediates locomotor
activity, exploration, anxiety, learning and social behavior. Horm. Behav. 2015, 73, 64–74. [CrossRef] [PubMed]
19. Su, M.; Hu, H.; Lee, Y.; d’Azzo, A.; Messing, A.; Brenner, M. Expression specificity of GFAP transgenes.
Neurochem. Res. 2004, 29, 2075–2093. [CrossRef] [PubMed]
20. Mycko, M.P.; Papoian, R.; Boschert, U.; Raine, C.S.; Selmaj, K.W. Cdna microarray analysis in multiple
sclerosis lesions: Detection of genes associated with disease activity. Brain 2003, 126, 1048–1057. [CrossRef]
[PubMed]
21. Lock, C.; Hermans, G.; Pedotti, R.; Brendolan, A.; Schadt, E.; Garren, H.; Langer-Gould, A.; Strober, S.;
Cannella, B.; Allard, J.; et al. Gene-microarray analysis of multiple sclerosis lesions yields new targets
validated in autoimmune encephalomyelitis. Nat. Med. 2002, 8, 500–508. [CrossRef] [PubMed]
22. Gijbels, K.; Brocke, S.; Abrams, J.S.; Steinman, L. Administration of neutralizing antibodies to interleukin-6
(IL-6) reduces experimental autoimmune encephalomyelitis and is associated with elevated levels of IL-6
bioactivity in central nervous system and circulation. Mol. Med. 1995, 1, 795–805. [PubMed]
23. Willenborg, D.O.; Fordham, S.A.; Cowden, W.B.; Ramshaw, I.A. Cytokines and murine autoimmune
encephalomyelitis: Inhibition or enhancement of disease with antibodies to select cytokines, or by delivery
of exogenous cytokines using a recombinant vaccinia virus system. Scand. J. Immunol. 1995, 41, 31–41.
[CrossRef] [PubMed]
24. Rodriguez, M.; Pavelko, K.D.; McKinne, C.W.; Leibowitz, J.L. Recombinant human IL-6 suppresses
demyelination in a viral model of multiple sclerosis. J. Immunol. 1994, 153, 3811–3821. [PubMed]
27
Brain Sci. 2016, 6, 15
25. Campbell, I.L.; Abraham, C.R.; Masliah, E.; Kemper, P.; Inglis, J.D.; Oldstone, M.B.A.; Mucke, L.
Neurologic disease in transgenic mice by cerebral overexpression of interleukin 6. Proc. Natl. Acad. Sci. USA
1993, 90, 10061–10065. [CrossRef] [PubMed]
26. Campbell, I.L.; Erta, M.; Lim, S.L.; Frausto, R.; May, U.; Rose-John, S.; Scheller, J.; Hidalgo, J. Trans-signaling is
a dominant mechanism for the pathogenic actions of interleukin-6 in the brain. J. Neurosci. 2014, 34, 2503–2513.
[CrossRef] [PubMed]
27. Costantino, C.M.; Baecher-Allan, C.; Hafler, D.A. Multiple sclerosis and regulatory T cells. J. Clin. Immunol.
2008, 28, 697–706. [CrossRef] [PubMed]
28. Kimura, A.; Kishimoto, T. Il-6: Regulator of Treg/Th17 balance. Eur. J. Immunol. 2010, 40, 1830–1835.
[CrossRef] [PubMed]
29. Murphy, A.C.; Lalor, S.J.; Lynch, M.A.; Mills, K.H. Infiltration of th1 and Th17 cells and activation of microglia
in the CNS during the course of experimental autoimmune encephalomyelitis. Brain Behav. Immun. 2010, 24,
641–651. [CrossRef] [PubMed]
30. Bettelli, E.; Carrier, Y.; Gao, W.; Korn, T.; Strom, T.B.; Oukka, M.; Weiner, H.L.; Kuchroo, V.K.
Reciprocal developmental pathways for the generation of pathogenic effector Th17 and regulatory T cells.
Nature 2006, 441, 235–238. [CrossRef] [PubMed]
31. Korn, T.; Mitsdoerffer, M.; Croxford, A.L.; Awasthi, A.; Dardalhon, V.A.; Galileos, G.; Vollmar, P.;
Stritesky, G.L.; Kaplan, M.H.; Waisman, A.; et al. IL-6 controls Th17 immunity in vivo by inhibiting the
conversion of conventional t cells into Foxp3+ regulatory T cells. Proc. Natl. Acad. Sci. USA 2008, 105,
18460–18465. [CrossRef] [PubMed]
32. Ma, X.; Reynolds, S.L.; Baker, B.J.; Li, X.; Benveniste, E.N.; Qin, H. IL-17 enhancement of the IL-6 signaling
cascade in astrocytes. J. Immunol. 2010, 184, 4898–4906. [CrossRef] [PubMed]
33. Ogura, H.; Murakami, M.; Okuyama, Y.; Tsuruoka, M.; Kitabayashi, C.; Kanamoto, M.; Nishihara, M.;
Iwakura, Y.; Hirano, T. Interleukin-17 promotes autoimmunity by triggering a positive-feedback loop via
interleukin-6 induction. Immunity 2008, 29, 628–636. [CrossRef] [PubMed]
34. Swartz, K.R.; Liu, F.; Sewell, D.; Schochet, T.; Campbell, I.; Sandor, M.; Fabry, Z. Interleukin-6 promotes
post-traumatic healing in the central nervous system. Brain Res. 2001, 896, 86–95. [CrossRef]
35. Fee, D.; Grzybicki, D.; Dobbs., M.; Ihyer, S.; Clotfelter, J.; Macvilay, S.; Hart, M.N.; Sandor, M.; Fabry, Z.
Interleukin 6 promotes vasculogenesis of murine brain microvessel endothelial cells. Cytokine 2000, 12,
655–665. [CrossRef] [PubMed]
© 2016 by the authors. Licensee MDPI, Basel, Switzerland. This article is an open access
article distributed under the terms and conditions of the Creative Commons Attribution
(CC BY) license (http://creativecommons.org/licenses/by/4.0/).
28
brainsciences
Review
The Effects of Hypoxia and Inflammation on SynapticSignaling in the NS
Gatambwa Mukandala, Ronan Tynan, Sinead Lanigan and John J. O’Connor *
UCD School of Biomolecular and Biomedical Science, UCD Conway Institute of Biomolecular and Biomedical
Research, Belfield, Dublin 4, Ireland; [email protected] (G.M.);
[email protected] (R.T.); [email protected] (S.L.)
* Correspondence: [email protected]; Tel.: +353-1-716-6765
Academic Editor: Donna Gruol
Received: 17 December 2015; Accepted: 2 February 2016; Published: 17 February 2016
Abstract: Normal brain function is highly dependent on oxygen and nutrient supply and when the
demand for oxygen exceeds its supply, hypoxia is induced. Acute episodes of hypoxia may cause
a depression in synaptic activity in many brain regions, whilst prolonged exposure to hypoxia leads
to neuronal cell loss and death. Acute inadequate oxygen supply may cause anaerobic metabolism
and increased respiration in an attempt to increase oxygen intake whilst chronic hypoxia may give
rise to angiogenesis and erythropoiesis in order to promote oxygen delivery to peripheral tissues.
The effects of hypoxia on neuronal tissue are exacerbated by the release of many inflammatory agents
from glia and neuronal cells. Cytokines, such as TNF-α, and IL-1β are known to be released during
the early stages of hypoxia, causing either local or systemic inflammation, which can result in cell
death. Another growing body of evidence suggests that inflammation can result in neuroprotection,
such as preconditioning to cerebral ischemia, causing ischemic tolerance. In the following review we
discuss the effects of acute and chronic hypoxia and the release of pro-inflammatory cytokines on
synaptic transmission and plasticity in the central nervous system. Specifically we discuss the effects
of the pro-inflammatory agent TNF-α during a hypoxic event.
Keywords: hypoxia; TNF-α; adenosine; HIF-1α; hippocampus; long-term potentiation; prolyl
hydroxylase inhibitor
1. Introduction
In the central nervous system, hypoxia occurs when there is an inadequate supply of oxygen
to neuronal tissue. During acute hypoxia multiple oxygen sensors are deployed allowing neurons
to adapt to the response. These responses to hypoxia include synaptic signaling decreases usually
as a result of anerobic metabolism changes whilst chronic hypoxia may give rise to more severe
perturbations of synaptic transmission and the activation of transcription factors that regulate oxygen
homoestasis [1]. Different neurons adapt to a decreased oxygen supply to the brain in many ways,
reflecting the diverse role of neuronal functions and also the extent of the hypoxia experienced. It is
now known that an hypoxic event in brain tissue can cause ATP to drop by as much as 90% in less than
5 min. Additionally, oxygen-sensitive ion channals including Na+ and K+ are activated bringing about
changes in excitation and inhibition of neuronal and glial cells [2]. Depolarisation of cells may also
take place causing the uptake of Na+ and Cl´ into cells followed by passive influx of water, resulting
in swelling and oedema [2]. Hypoxic insults may also activate voltage-gated Ca2+ and K+ ion channels
and glutamate transporters, eventually causing excess glutamate to spill into the synaptic regions
causing excitotoxicity. On the other hand, many of the long-term hypoxic responses are mediated by
hypoxia inducible factors (HIF), such as HIF-1α [3,4]. HIF-1α is a universally expressed transcriptional
Brain Sci. 2016, 6, 6 29 www.mdpi.com/journal/brainsci
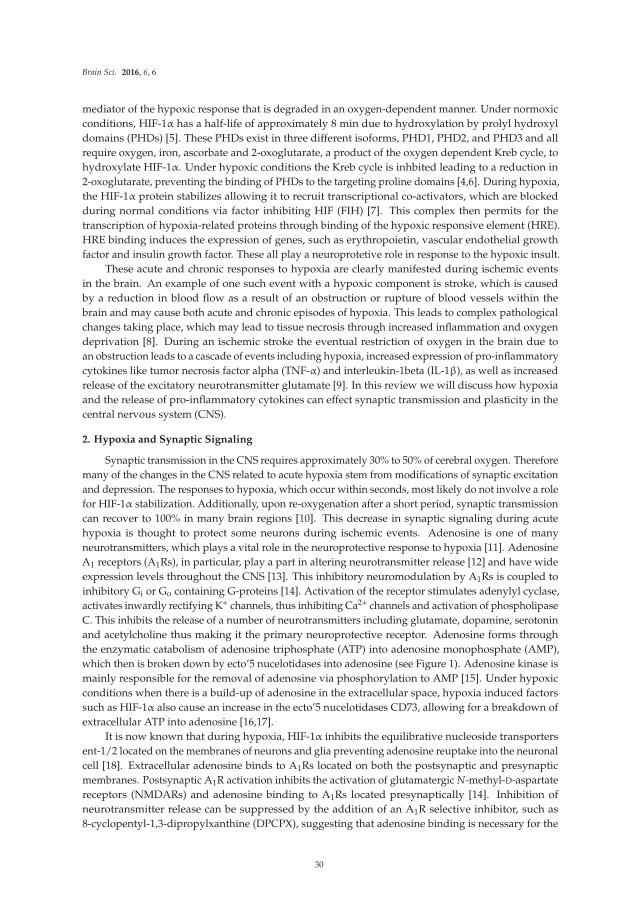
Brain Sci. 2016, 6, 6
mediator of the hypoxic response that is degraded in an oxygen-dependent manner. Under normoxic
conditions, HIF-1α has a half-life of approximately 8 min due to hydroxylation by prolyl hydroxyl
domains (PHDs) [5]. These PHDs exist in three different isoforms, PHD1, PHD2, and PHD3 and all
require oxygen, iron, ascorbate and 2-oxoglutarate, a product of the oxygen dependent Kreb cycle, to
hydroxylate HIF-1α. Under hypoxic conditions the Kreb cycle is inhbited leading to a reduction in
2-oxoglutarate, preventing the binding of PHDs to the targeting proline domains [4,6]. During hypoxia,
the HIF-1α protein stabilizes allowing it to recruit transcriptional co-activators, which are blocked
during normal conditions via factor inhibiting HIF (FIH) [7]. This complex then permits for the
transcription of hypoxia-related proteins through binding of the hypoxic responsive element (HRE).
HRE binding induces the expression of genes, such as erythropoietin, vascular endothelial growth
factor and insulin growth factor. These all play a neuroprotetive role in response to the hypoxic insult.
These acute and chronic responses to hypoxia are clearly manifested during ischemic events
in the brain. An example of one such event with a hypoxic component is stroke, which is caused
by a reduction in blood flow as a result of an obstruction or rupture of blood vessels within the
brain and may cause both acute and chronic episodes of hypoxia. This leads to complex pathological
changes taking place, which may lead to tissue necrosis through increased inflammation and oxygen
deprivation [8]. During an ischemic stroke the eventual restriction of oxygen in the brain due to
an obstruction leads to a cascade of events including hypoxia, increased expression of pro-inflammatory
cytokines like tumor necrosis factor alpha (TNF-α) and interleukin-1beta (IL-1β), as well as increased
release of the excitatory neurotransmitter glutamate [9]. In this review we will discuss how hypoxia
and the release of pro-inflammatory cytokines can effect synaptic transmission and plasticity in the
central nervous system (CNS).
2. Hypoxia and Synaptic Signaling
Synaptic transmission in the CNS requires approximately 30% to 50% of cerebral oxygen. Therefore
many of the changes in the CNS related to acute hypoxia stem from modifications of synaptic excitation
and depression. The responses to hypoxia, which occur within seconds, most likely do not involve a role
for HIF-1α stabilization. Additionally, upon re-oxygenation after a short period, synaptic transmission
can recover to 100% in many brain regions [10]. This decrease in synaptic signaling during acute
hypoxia is thought to protect some neurons during ischemic events. Adenosine is one of many
neurotransmitters, which plays a vital role in the neuroprotective response to hypoxia [11]. Adenosine
A1 receptors (A1Rs), in particular, play a part in altering neurotransmitter release [12] and have wide
expression levels throughout the CNS [13]. This inhibitory neuromodulation by A1Rs is coupled to
inhibitory Gi or Go containing G-proteins [14]. Activation of the receptor stimulates adenylyl cyclase,
activates inwardly rectifying K+ channels, thus inhibiting Ca2+ channels and activation of phospholipase
C. This inhibits the release of a number of neurotransmitters including glutamate, dopamine, serotonin
and acetylcholine thus making it the primary neuroprotective receptor. Adenosine forms through
the enzymatic catabolism of adenosine triphosphate (ATP) into adenosine monophosphate (AMP),
which then is broken down by ecto’5 nucelotidases into adenosine (see Figure 1). Adenosine kinase is
mainly responsible for the removal of adenosine via phosphorylation to AMP [15]. Under hypoxic
conditions when there is a build-up of adenosine in the extracellular space, hypoxia induced factors
such as HIF-1α also cause an increase in the ecto’5 nucelotidases CD73, allowing for a breakdown of
extracellular ATP into adenosine [16,17].
It is now known that during hypoxia, HIF-1α inhibits the equilibrative nucleoside transporters
ent-1/2 located on the membranes of neurons and glia preventing adenosine reuptake into the neuronal
cell [18]. Extracellular adenosine binds to A1Rs located on both the postsynaptic and presynaptic
membranes. Postsynaptic A1R activation inhibits the activation of glutamatergic N-methyl-D-aspartate
receptors (NMDARs) and adenosine binding to A1Rs located presynaptically [14]. Inhibition of
neurotransmitter release can be suppressed by the addition of an A1R selective inhibitor, such as
8-cyclopentyl-1,3-dipropylxanthine (DPCPX), suggesting that adenosine binding is necessary for the
30
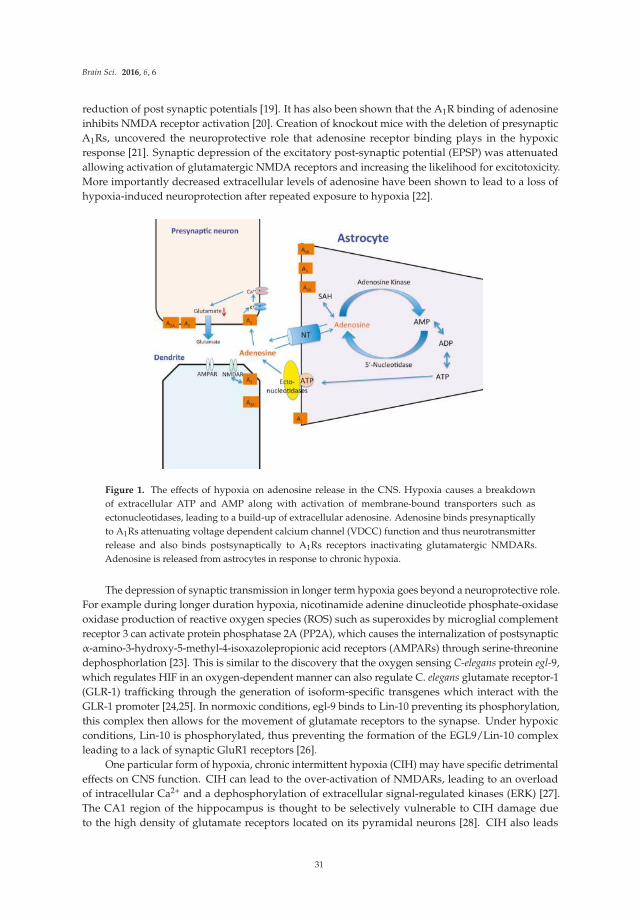
Brain Sci. 2016, 6, 6
reduction of post synaptic potentials [19]. It has also been shown that the A1R binding of adenosine
inhibits NMDA receptor activation [20]. Creation of knockout mice with the deletion of presynaptic
A1Rs, uncovered the neuroprotective role that adenosine receptor binding plays in the hypoxic
response [21]. Synaptic depression of the excitatory post-synaptic potential (EPSP) was attenuated
allowing activation of glutamatergic NMDA receptors and increasing the likelihood for excitotoxicity.
More importantly decreased extracellular levels of adenosine have been shown to lead to a loss of
hypoxia-induced neuroprotection after repeated exposure to hypoxia [22].
Figure 1. The effects of hypoxia on adenosine release in the CNS. Hypoxia causes a breakdown
of extracellular ATP and AMP along with activation of membrane-bound transporters such as
ectonucleotidases, leading to a build-up of extracellular adenosine. Adenosine binds presynaptically
to A1Rs attenuating voltage dependent calcium channel (VDCC) function and thus neurotransmitter
release and also binds postsynaptically to A1Rs receptors inactivating glutamatergic NMDARs.
Adenosine is released from astrocytes in response to chronic hypoxia.
The depression of synaptic transmission in longer term hypoxia goes beyond a neuroprotective role.
For example during longer duration hypoxia, nicotinamide adenine dinucleotide phosphate-oxidase
oxidase production of reactive oxygen species (ROS) such as superoxides by microglial complement
receptor 3 can activate protein phosphatase 2A (PP2A), which causes the internalization of postsynaptic
α-amino-3-hydroxy-5-methyl-4-isoxazolepropionic acid receptors (AMPARs) through serine-threonine
dephosphorlation [23]. This is similar to the discovery that the oxygen sensing C-elegans protein egl-9,
which regulates HIF in an oxygen-dependent manner can also regulate C. elegans glutamate receptor-1
(GLR-1) trafficking through the generation of isoform-specific transgenes which interact with the
GLR-1 promoter [24,25]. In normoxic conditions, egl-9 binds to Lin-10 preventing its phosphorylation,
this complex then allows for the movement of glutamate receptors to the synapse. Under hypoxic
conditions, Lin-10 is phosphorylated, thus preventing the formation of the EGL9/Lin-10 complex
leading to a lack of synaptic GluR1 receptors [26].
One particular form of hypoxia, chronic intermittent hypoxia (CIH) may have specific detrimental
effects on CNS function. CIH can lead to the over-activation of NMDARs, leading to an overload
of intracellular Ca2+ and a dephosphorylation of extracellular signal-regulated kinases (ERK) [27].
The CA1 region of the hippocampus is thought to be selectively vulnerable to CIH damage due
to the high density of glutamate receptors located on its pyramidal neurons [28]. CIH also leads
31
Brain Sci. 2016, 6, 6
to a reduction in the levels of the transcription factor cAMP response element-binding protein
(CREB) in its phosphorylated form [29]. This reduction in activated CREB leads to a lowering of
CREB transcriptional targets, such as brain-derived neurotrophic factor (BDNF), causing cognitive
dysfunction [30]. The CIH-induced cognitive dysfunction was shown to be repaired through exogenous
application of BDNF to the hypoxic cell [30]. Perinatal hypoxic events may also lead to increases in
excitability in hippocampal regions. These events usually occur after asphyxia events just after birth
and can lead to long term synaptic changes. Changes in excitability in some local brain regions such
as the CA1 region have also been noted [31]. The pursuant neonatal seizures may be related to the
phosphorylation of the AMPA GLUA1 receptors on serine 183 and serine 845. This may enhance
AMPA receptor excitatory post synaptic currents (EPSCs) which allows for a decrease in the percentage
of silent synapses and an increase in AMPA receptor function [32]. This loss of silent synapses is
thought to be the mechanism, which attenuates synaptic plasticity in adult life [33]. In critical cases of
hypoxia-re-oxygenation the brain loses the ability to form new memories. This anterograde amnesia is
decoupled from the hippocampus and its primarily caused by adenosine up-regulation of caspase 1 and
then IL-1β in the amygdala [34]. These effects were shown to last up to five hours after re-oxygenation
with caspase inhibitors, such as YVAD-CMK, able to shorten the recovery time [34]. The links of
hypoxia to cognitive disorders, as well as ability to cause neuronal apoptosis through hyper-excitability,
displays the importance of understanding hypoxia and preventing its long-term effects.
3. Hypoxia and Synaptic Plasticity
As previously mentioned, hippocampal neuron exposure to hypoxia may lead to cognitive deficits
due to synaptic plasticity impairments [35]. Many studies have investigated the relationship between
oxygen deprivation and synaptic plasticity. Early studies indicated that brief periods of hypoxia could
disrupt long-term potentiation (LTP) in the CA1 hippocampus and that this effect could be reproduced
with brief application of adenosine prior to the induction of LTP [36–38]. It was later discovered that
a brief anoxic episode, as opposed to hypoxia, applied to brain slices, could generate a new type of
LTP although still voltage-, NMDA- [39], protein kinase C (PKC)- and NO-dependent [40–42]. It is
proposed that it is the re-oxygenation and not initial de-oxygenation of neurons and the subsequent
high concentration of glutamate that in fact causes the excessive activation of NMDARs and subsequent
large influx of Ca2+ [43]. It has also been shown that chemically-induced hypoxia with the use of
PHD inhibitors, and thus hypoxia mimetics, whilst having no effect on synaptic signaling at low
concentrations per se, could inhibit LTP in the hippocampus [44,45]. Application of the iron chelator
deferoxamine mesylate (DFO) or dimethyloxaloglycine (DMOG), both non-specific pharmacological
inhibitors of PHD, and thus increasers of HIF-1α expression [46] could impair LTP in the CA1
hippocampus [4,44,45,47]. Interestingly the application of DMOG to the dentate gyrus region of
hippocampal slices did not impair LTP [29]. It is believed that these effects of PHD inhibitors are
not HIF-dependent. There is also increasing evidence for a role for CIH in synaptic plasticity and
specifically LTP. Initial reports in early 2000 demonstrated that CIH treated animals demonstrated
impaired LTP in isolated rat hippocampal slices [48,49]. More recently two reports have put forward
evidence for a role for BDNF in this impairment [30,50]. They found that application of BDNF reversed
the IH-induced impairment of LTP. In our own laboratories we have implicated a role for PHDs in this
inhibition of LTP by intermittent hypoxia [29].
4. Hypoxia and Neuroinflammation in the CNS
During an ischemic stroke and resulting hypoxia, inflammatory cytokines are released by
microglia, neurons and astrocytes with glutamate largely released by neurons. The up-regulation of
pro-inflammatory cytokines through the activation of microglia and astrocytes in the brain contribute
a great deal to ischemic brain damage [51]. During hypoxia, HIF-1α binds to HRE like binding
sites allowing for the up-regulation of cytokines, such as IL-β, IL-6, IL-8, and TNF-α. Mutations in
either the HIF-1α gene or its binding site at the promoter inhibit this cytokine up-regulation [46].
32
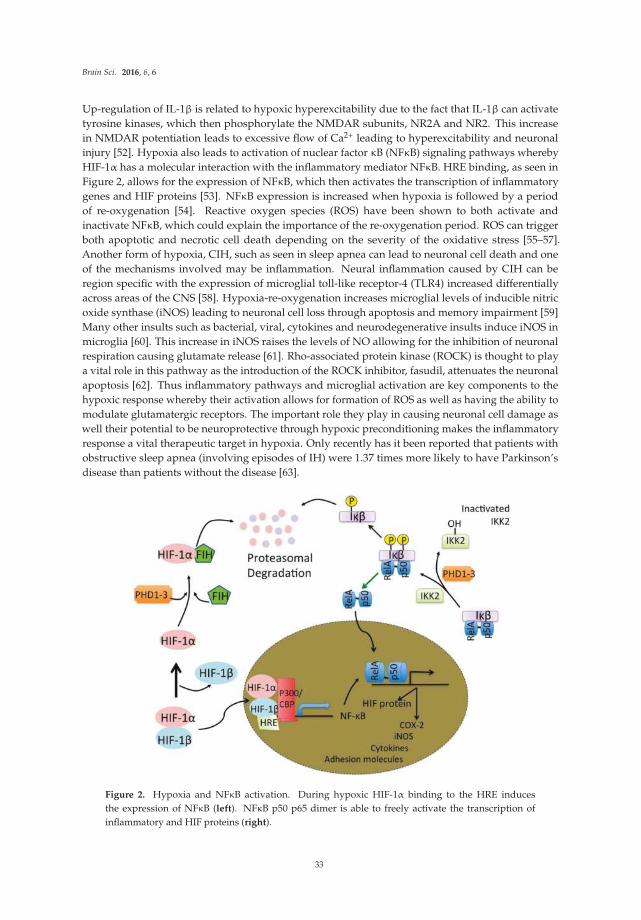
Brain Sci. 2016, 6, 6
Up-regulation of IL-1β is related to hypoxic hyperexcitability due to the fact that IL-1β can activate
tyrosine kinases, which then phosphorylate the NMDAR subunits, NR2A and NR2. This increase
in NMDAR potentiation leads to excessive flow of Ca2+ leading to hyperexcitability and neuronal
injury [52]. Hypoxia also leads to activation of nuclear factor κB (NFκB) signaling pathways whereby
HIF-1α has a molecular interaction with the inflammatory mediator NFκB. HRE binding, as seen in
Figure 2, allows for the expression of NFκB, which then activates the transcription of inflammatory
genes and HIF proteins [53]. NFκB expression is increased when hypoxia is followed by a period
of re-oxygenation [54]. Reactive oxygen species (ROS) have been shown to both activate and
inactivate NFκB, which could explain the importance of the re-oxygenation period. ROS can trigger
both apoptotic and necrotic cell death depending on the severity of the oxidative stress [55–57].
Another form of hypoxia, CIH, such as seen in sleep apnea can lead to neuronal cell death and one
of the mechanisms involved may be inflammation. Neural inflammation caused by CIH can be
region specific with the expression of microglial toll-like receptor-4 (TLR4) increased differentially
across areas of the CNS [58]. Hypoxia-re-oxygenation increases microglial levels of inducible nitric
oxide synthase (iNOS) leading to neuronal cell loss through apoptosis and memory impairment [59]
Many other insults such as bacterial, viral, cytokines and neurodegenerative insults induce iNOS in
microglia [60]. This increase in iNOS raises the levels of NO allowing for the inhibition of neuronal
respiration causing glutamate release [61]. Rho-associated protein kinase (ROCK) is thought to play
a vital role in this pathway as the introduction of the ROCK inhibitor, fasudil, attenuates the neuronal
apoptosis [62]. Thus inflammatory pathways and microglial activation are key components to the
hypoxic response whereby their activation allows for formation of ROS as well as having the ability to
modulate glutamatergic receptors. The important role they play in causing neuronal cell damage as
well their potential to be neuroprotective through hypoxic preconditioning makes the inflammatory
response a vital therapeutic target in hypoxia. Only recently has it been reported that patients with
obstructive sleep apnea (involving episodes of IH) were 1.37 times more likely to have Parkinson’s
disease than patients without the disease [63].
Figure 2. Hypoxia and NFκB activation. During hypoxic HIF-1α binding to the HRE induces
the expression of NFκB (left). NFκB p50 p65 dimer is able to freely activate the transcription of
inflammatory and HIF proteins (right).
33
Brain Sci. 2016, 6, 6
5. TNF-α and Hypoxia
TNF-α, a pro-inflammatory cytokine produced primarily by monocytes and macrophages in the
periphery and microglia and neurons in the CNS, is involved in the promotion of the inflammatory
response and cognitive dysfunction [64,65]. TNF-α is initially produced as a 212-amino acid-long type
II transmembrane that is stable as a homotrimer. The cleavage of the membrane-integrated form by
TNF-α converting enzyme produces a soluble homotrimer, which binds to either of two receptors,
TNF receptor type 1 (TNFR1) or TNF receptor type 2 (TNFR2). TNFR1 is constitutively expressed
throughout most tissues and is thought to be the main TNF signaling receptor. The activation of
TNF-R1 leads to either apoptotic cell death or the activation of either the caspase-8 pathway or c-Jun
NH2-terminal kinase (JNK) pathways, or neuroprotection through the binding of IκB kinase (IKK)
complex and the subsequent activation of the NFκB pathway [66]. The signaling network in TNF-R1 is
interesting due to the extensive crosstalk between the NFκB, and JNK signaling pathways. The cells
susceptibility to apoptosis increases in the absence of NFκB. The activation of TNFR2 leads to the
activation of the NFκB pathway, phosphatidyl-inositol-3 kinase (PI3K) and subsequent transcription of
neuroprotective mediators like calbindin and manganese superoxide dismutase [67,68]. Specifically in
microglia activation of TNFR2 anti-inflammatory pathways may be induced [69]. A putative role for
TNF-α has been shown in rats infused with lipopolysaccharide (LPS may promote the secretion of
pro-inflammatory cytokines including TNF-α and IL-1β) into the fourth ventricle to induce chronic
neuroinflammation [70]. TNF-α synthesis inhibition was found to restore the neuronal function as
well as reverse cognitive deficits induced by the chronic neuroinflammation [70].
It is becoming apparent that TNF-α is one of the most important inflammatory cytokines to be
studied in relation to neuronal damage caused by the absence of oxygen due to the fact that it actively
participates in the immune-mediated inflammation of stroke and other neurodegenerative diseases
with an hypoxia component [71]. The release of TNF-α is a result of the pathogenesis of disorders
such as stroke [72], Alzheimer’s disease [73], Parkinson’s disease [74] and severe infections such as
meningitis [75], yet its role during hypoxia is not fully understood. In severe ischemia TNF-α levels
appear to be elevated in affected brain tissue after 24 h [76]. One such critical role in neuroinflammation
has been illustrated whereby TNF-α can damage dopaminergic neurons and thus anti-TNF agents may
ameliorate Parkinson’s disease [74]. Despite many research papers in this field few laboratories have
investigated the effects of acute hypoxia and inflammatory mediators on synaptic transmission [77,78].
Recently our laboratory reported that recovery of synaptic transmission in CA1 neurons was impaired
post-hypoxia in the presence of TNF-α [77]. It also been shown that HIF-1α has a binding site for the
Fas Associated Death Domain promoter, which is an adapter molecule in TNFR1 mediated cell death.
Therefore it has a direct role in TNF-α mediated apoptosis which may help explain the poor recovery
of EPSPs following a hypoxic insult [79].
A growing body of evidence indicates that TNF-α may play a role in the regulation of tolerance to
chronic hypoxia such as occurs in ischemia yet it has a deleterious effect in ischemic brain injury after
stroke [80]. It seems that administration of a high dose of lipopolysaccharide (LPS) may induce a robust
inflammatory response that can result in lethal septic shock whereas administration of a low dose of
LPS may induce a protective state of tolerance to subsequent exposure to LPS at doses that might cause
serious injury [81,82]. In fact LPS preconditioning is known to exert neuroprotection from cerebral
ischemia [83,84]. In cerebellar granule neurons the neuroprotective effects of LPS preconditioning were
said to be independent of endogenous IL-1β but dependent on endogenous TNF-α and also IL-6 [85].
Our laboratories have recently provided evidence that TNF-α has a preconditioning effect following
a glutamate toxic insult 24 h later in the CA1 region of rat organotypic slices [65]. We suggested that
the preconditioning effects may be as a result of changing resting Ca2+ levels and Ca2+ influx in the
presence of TNF-α.
34
Brain Sci. 2016, 6, 6
6. TNF-α and Synaptic Plasticity
A growing body of evidence has highlighted the role of TNF-α in glutamatergic synaptic plasticity
and scaling. It has been shown that TNF-α has an inhibitory effect on LTP in both the CA1 and dentate
gyrus [76,86–89]. Studies initially carried out by Tancredi et al. (1992) [90] showed an inhibitory effect
of TNF-α on LTP induction in the CA1 region, which was concentration-dependent. However, they
demonstrated that short-term application of TNF-α (>50 min) did not affect LTP. These findings and
others highlight the various parameters involved in the regulatory role that this cytokine plays in
synaptic plasticity. The inhibitory actions of TNF-α on LTP have been shown to be mediated through
the signaling pathways, P38 MAP kinase and JNK [91]. Butler et al. (2004) [88] reported that the
inhibition of LTP by TNF-α was in fact a biphasic response. SB203580, a P38 MAPK inhibitor, blocked
the early inhibition of LTP by TNF-α but did not reverse its late inhibition (3 h following induction),
possibly due to the requirement for new protein synthesis. Using antagonists for metabotropic
glutamate receptor 5 (mGluR5) and ryanodine, a potential role for metabotropic glutamate receptors
and ryanodine sensitive intracellular Ca2+ stores in TNF-α mediated inhibition of LTP have also been
proposed [87].
Other studies have provided evidence that exogenous application of TNF-α whilst not inhibiting
LTP in the CA1 region of the hippocampus may alter homeostatic plasticity (synaptic scaling) rather
than synaptic plasticity [92]. These studies have shown that glia released TNF-α is required for
synaptic scaling through AMPAR trafficking to the membrane [92–94]. Others have reported that
the increase in AMPAR expression on the cell surface is mediated through the P13 kinase pathway
and the AMPARs trafficked were lacking the GLR-2 subunit. Since LTP is dependent on synaptic
glutamate it is also interesting to note that TNF-α has been shown to increase glutamate release
from astrocytes [95], block glutamate transporters [96], and also may have a modulatory effect on
the expression of GLT-1 and GLT-2. These effects combined may result in increased glutamate
concentrations in the synaptic cleft [97,98]. TNFR1, but not TNFR2, may play an important role
in AMPAR localization on the membrane of cortical neurons. Deletion of TNFR1 resulted in a decrease
of AMPAR clustering on the synaptic membrane, which was not rescued by exogenous application
of TNF-α [99]. These observations indicate a potential therapeutic approach for TNF-α via TNFR1 in
mediating AMPAR excitotoxicity. Glutamatergic gliotransmission is an important stimulatory input to
excitatory synapses and it has been shown that TNF-α is a modulator of this process in the dentate
gyrus [100]. Many of the discrepancies observed with regard to the effects of TNF-α on LTP may be
region specific or indeed depend on the induction protocol used to induce LTP. There are many factors
regulating the magnitude of LTP induced by different parameters such as high frequency stimulation
and theta burst stimulation [101] (Figure 3). Recently, we have shown that the stimulation parameters
used to induce LTP may have an influence on TNF-α’s ability to inhibit LTP [102]. TNF-α has no
inhibitory effect on LTP when induced with prolonged high frequency stimulation (HFS) whereas full
inhibition was observed when LTP was induced by theta burst stimulation (TBS). Figure 3 illustrates
a potential mechanism that might explain this discrepancy whereby TBS may trigger alternative
signaling cascades to HFS that can be modulated by TNF-α.
7. TNF-α, Hypoxia and Synaptic Plasticity
Hippocampal slices exposed to acute hypoxia may recover when oxygen is re-introduced. Recently
it has been shown that in the presence of TNF-α there is an impairment in the recovery of synaptic
transmission in the CA1 region post-hypoxia [77]. Conversely, hypoxia has also been shown to
increase intercellular Ca2+ levels and activate calmodulin-dependent protein kinase II (CaMKII)
through a TNF-α independent mechanism [103]. However CaMKII is also capable of activating
the PI3K-PKCλ-AMPAR signaling pathway. TNF-α has been found to play roles in cell adhesion
up-regulation, disruption of the blood brain barrier and is a key component for the participation of
glial cells in the physiological control of synaptic transmission and plasticity through the release of
glutamate, a process known as glutamatergic gliotranmission [100,104]. TNF-α has been shown to
35
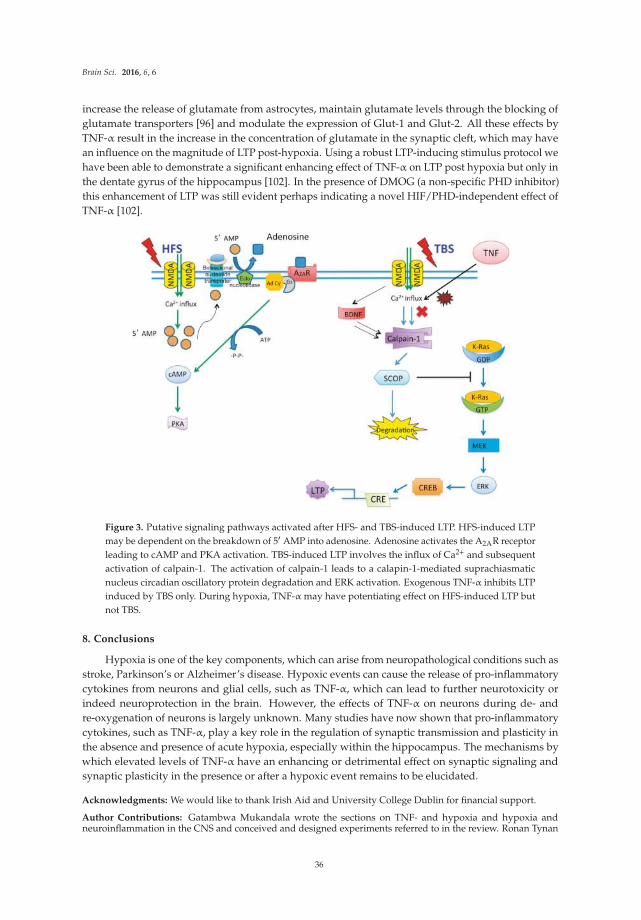
Brain Sci. 2016, 6, 6
increase the release of glutamate from astrocytes, maintain glutamate levels through the blocking of
glutamate transporters [96] and modulate the expression of Glut-1 and Glut-2. All these effects by
TNF-α result in the increase in the concentration of glutamate in the synaptic cleft, which may have
an influence on the magnitude of LTP post-hypoxia. Using a robust LTP-inducing stimulus protocol we
have been able to demonstrate a significant enhancing effect of TNF-α on LTP post hypoxia but only in
the dentate gyrus of the hippocampus [102]. In the presence of DMOG (a non-specific PHD inhibitor)
this enhancement of LTP was still evident perhaps indicating a novel HIF/PHD-independent effect of
TNF-α [102].
Figure 3. Putative signaling pathways activated after HFS- and TBS-induced LTP. HFS-induced LTP
may be dependent on the breakdown of 51 AMP into adenosine. Adenosine activates the A2AR receptor
leading to cAMP and PKA activation. TBS-induced LTP involves the influx of Ca2+ and subsequent
activation of calpain-1. The activation of calpain-1 leads to a calapin-1-mediated suprachiasmatic
nucleus circadian oscillatory protein degradation and ERK activation. Exogenous TNF-α inhibits LTP
induced by TBS only. During hypoxia, TNF-α may have potentiating effect on HFS-induced LTP but
not TBS.
8. Conclusions
Hypoxia is one of the key components, which can arise from neuropathological conditions such as
stroke, Parkinson’s or Alzheimer’s disease. Hypoxic events can cause the release of pro-inflammatory
cytokines from neurons and glial cells, such as TNF-α, which can lead to further neurotoxicity or
indeed neuroprotection in the brain. However, the effects of TNF-α on neurons during de- and
re-oxygenation of neurons is largely unknown. Many studies have now shown that pro-inflammatory
cytokines, such as TNF-α, play a key role in the regulation of synaptic transmission and plasticity in
the absence and presence of acute hypoxia, especially within the hippocampus. The mechanisms by
which elevated levels of TNF-α have an enhancing or detrimental effect on synaptic signaling and
synaptic plasticity in the presence or after a hypoxic event remains to be elucidated.
Acknowledgments: We would like to thank Irish Aid and University College Dublin for financial support.
Author Contributions: Gatambwa Mukandala wrote the sections on TNF- and hypoxia and hypoxia andneuroinflammation in the CNS and conceived and designed experiments referred to in the review. Ronan Tynan
36
Brain Sci. 2016, 6, 6
wrote the sections on hypoxia and synaptic signaling and hypoxia and synaptic plasticity. Sinead Lanigan wrotethe introduction and edited the final version of the manuscript and figures. John J. O’Connor conceived anddesigned the experiments referred to in the review, contributed reagents/materials/analysis tools and wrotethe paper.
Conflicts of Interest: The authors declare no conflict of interest.
Abbreviations
A1Rs Adenosine A1 receptors
AMP adenosine monophosphate
AMPARs α-amino-3-hydroxy-5-methyl-4-isoxazolepropionic acid receptors
ATP adenosine triphosphate
BDNF brain-derived neurotrophic factor
CaMKII calmodulin-dependent protein kinase II
CIH chronic intermittent hypoxia
CNS central nervous system
CREB cAMP response element-binding protein
DMOG dimethyloxaloglycine
DPCPX 8-cyclopentyl-1,3-dipropylxanthine
EPSP excitatory post-synaptic potential
ERK extracellular signal-regulated kinases
HIF hypoxia inducible factors
HRE hypoxic responsive element
IL-1β interleukin-1beta
iNOS inducible nitric oxide synthase
LPS lipopolysaccharide
LTP long-term potentiation
NFkB nuclear factor kB
NMDAR N-methyl-D-aspartate receptors
PHDs prolyl hydroxyl domains
PI3K phosphatidyl-inositol-3 kinase
ROCK Rho-associated protein kinase
ROS reactive oxygen species
TNF-α tumor necrosis factor alpha
References
1. Sharp, F.R.; Bernaudin, M. HIF1 and oxygen sensing in the brain. Nat. Rev. Neurosci. 2004, 5, 437–448.
[CrossRef] [PubMed]
2. Bickler, P.E.; Donohoe, P.H. Adaptive responses of vertebrate neurons to hypoxia. J. Exp. Biol. 2002, 205,
3579–3586.
3. Eltzschig, H.K.; Bratton, D.L.; Colgan, S.P. Targeting hypoxia signaling for the treatment of ischaemic and
inflammatory diseases. Nat. Rev. Drug Discov. 2014, 13, 852–869. [CrossRef] [PubMed]
4. Corcoran, A.; O’Connor, J.J. Hypoxia-inducible factor signaling mechanisms in the central nervous system.
Acta Physiol. 2013, 208, 298–310. [CrossRef] [PubMed]
5. Moroz, E.; Carlin, S.; Dyomina, K.; Burke, S.; Thaler, H.T.; Blasberg, R.; Serganova, I. Real-time imaging of
HIF-1α stabilization and degradation. PLoS ONE 2009, 4, e5077. [CrossRef] [PubMed]
6. Webb, J.D.; Coleman, M.L.; Pugh, C.W. Hypoxia, hypoxia-inducible factors (HIF), HIF hydroxylases and
oxygen sensing. Cell. Mol. Life Sci. 2009, 66, 3539–3554. [CrossRef] [PubMed]
7. Semenza, G.L. Oxygen sensing, hypoxia-inducible factors, and disease pathophysiology. Annu. Rev. Pathol.
2014, 9, 47–71. [CrossRef] [PubMed]
37
Brain Sci. 2016, 6, 6
8. Kamel, H.; Iadecola, C. Brain-immune interactions and ischemic stroke: Clinical implications. Arch Neurol.
2012, 69, 576–581. [PubMed]
9. Amantea, D.; Micieli, G.; Tassorelli, C.; Cuartero, M.I.; Ballesteros, I.; Certo, M.; Moro, M.A.; Lizasoain, I.;
Bagetta, G. Rational modulation of the innate immune system for neuroprotection in ischemic stroke.
Front. Neurosci. 2015, 9, 147. [CrossRef] [PubMed]
10. Lipton, P.; Whittingham, T.S. The effect of hypoxia on evoked potentials in the in vitro hippocampus. J. Physiol.
1979, 287, 427–438. [CrossRef] [PubMed]
11. Björklund, O.; Shang, M.; Tonazzini, I.; Daré, E.; Fredholm, B.B. Adenosine A1 and A3 receptors protect
astrocytes from hypoxic damage. Eur. J. Pharmacol. 2008, 596, 6–13. [CrossRef] [PubMed]
12. Palmer, T.M.; Stiles, G.L. Adenosine receptors. Neuropharmacology 1995, 34, 683–694. [CrossRef]
13. Reppert, S.M.; Weaver, D.R.; Stehle, J.H.; Rivkees, S.A. Molecular cloning and characterization of a rat
A1-adenosine receptor that is widely expressed in brain and spinal cord. Mol. Endocrinol. 1991, 5, 1037–1048.
[CrossRef] [PubMed]
14. McCool, B.A.; Farroni, J.S. A1 adenosine receptors inhibit multiple voltage-gated Ca2+ channel subtypes in
acutely isolated rat basolateral amygdala neurons. Br. J. Pharmacol. 2001, 132, 879–888. [CrossRef] [PubMed]
15. Boison, D. Adenosine kinase, epilepsy and stroke: Mechanisms and therapies. Trends Pharmacol. Sci. 2006, 27,
652–658. [CrossRef] [PubMed]
16. Görlach, A. Control of adenosine transport by hypoxia. Circ. Res. 2005, 97, 1–3. [CrossRef] [PubMed]
17. Takahashi, T.; Otsuguro, K.; Ohta, T.; Ito, S. Adenosine and inosine release during hypoxia in the isolated
spinal cord of neonatal rats. Br. J. Pharmacol. 2010, 161, 1806–1816. [CrossRef] [PubMed]
18. Morote-Garcia, J.C.; Rosenberger, P.; Nivillac, N.M.; Coe, I.R.; Eltzschig, H.K. Hypoxia-inducible
factor-dependent repression of equilibrative nucleoside transporter 2 attenuates mucosal inflammation
during intestinal hypoxia. Gastroenterology 2009, 136, 607–618. [CrossRef] [PubMed]
19. Choi, I.S.; Cho, J.H.; Lee, M.G.; Jang, I.S. Enzymatic conversion of ATP to adenosine contributes to
ATP-induced inhibition of glutamate release in rat medullary dorsal horn neurons. Neuropharmacology
2015, 93, 94–102. [CrossRef] [PubMed]
20. De Mendonça, A.; Sebastião, A.M.; Ribeiro, J.A. Inhibition of NMDA receptor-mediated currents in isolated
rat hippocampal neurones by adenosine A1 receptor activation. Neuroreport 1995, 6, 1097–1100. [CrossRef]
[PubMed]
21. Arrigoni, E.; Crocker, A.J.; Saper, C.B.; Greene, R.W.; Scammell, T.E. Deletion of presynaptic adenosine
A1 receptors impairs the recovery of synaptic transmission after hypoxia. Neuroscience 2005, 132, 575–580.
[CrossRef] [PubMed]
22. Cui, M.; Bai, X.; Li, T.; Chen, F.; Dong, Q.; Zhao, Y.; Liu, X. Decreased extracellular adenosine levels lead to
loss of hypoxia-induced neuroprotection after repeated episodes of exposure to hypoxia. PLoS ONE 2013, 8,
e57065. [CrossRef] [PubMed]
23. Zhang, J.; Malik, A.; Choi, H.B.; Ko, R.W.; Dissing-Olesen, L.; MacVicar, B.A. Microglial CR3 activation
triggers long-term synaptic depression in the hippocampus via NADPH oxidase. Neuron 2014, 82, 195–207.
[CrossRef] [PubMed]
24. Ma, D.K.; Vozdek, R.; Bhatla, N.; Horvitz, H.R. CYSL-1 interacts with the O2-sensing hydroxylase EGL-9
to promote H2S-modulated hypoxia-induced behavioral plasticity in C. elegans. Neuron 2012, 73, 925–940.
[CrossRef] [PubMed]
25. Park, E.C.; Ghose, P.; Shao, Z.; Ye, Q.; Kang, L.; Xu, X.Z.; Powell-Coffman, J.A.; Rongo, C. Hypoxia regulates
glutamate receptor trafficking through an HIF-independent mechanism. EMBO J. 2012, 31, 1379–1393.
[CrossRef] [PubMed]
26. Epstein, A.C.; Gleadle, J.M.; McNeill, L.A.; Hewitson, K.S.; O’Rourke, J.; Mole, D.R.; Mukherji, M.; Metzen, E.;
Wilson, M.I.; Dhanda, A.; et al. C. elegans EGL-9 and mammalian homologs define a family of dioxygenases
that regulate HIF by prolyl hydroxylation. Cell 2001, 107, 43–54. [CrossRef]
27. Wang, J.; Ming, H.; Chen, R.; Ju, J.M.; Peng, W.D.; Zhang, G.X.; Liu, C.F. CIH-induced neurocognitive
impairments are associated with hippocampal Ca2+ overload, apoptosis, and dephosphorylation of ERK1/2
and CREB that are mediated by overactivation of NMDARs. Brain Res. 2015, 1625, 64–72. [CrossRef]
[PubMed]
28. McDonald, J.W.; Johnston, M.V. Physiological and pathophysiological roles of excitatory amino acids during
central nervous system development. Brain Res. Brain Res. Rev. 1990, 15, 41–70. [CrossRef]
38
Brain Sci. 2016, 6, 6
29. Wall, A.M.; Corcoran, A.E.; O’Halloran, K.D.; O’Connor, J.J. Effects of prolyl-hydroxylase inhibition and
chronic intermittent hypoxia on synaptic transmission and plasticity in the rat CA1 and dentate gyrus.
Neurobiol. Dis. 2014, 62, 8–17. [CrossRef] [PubMed]
30. Xie, H.; Leung, K.L.; Chen, L.; Chan, Y.S.; Ng, P.C.; Fok, T.F.; Wing, Y.K.; Ke, Y.; Li, A.M.; Yung, W.H.
Brain-derived neurotrophic factor rescues and prevents chronic intermittent hypoxia-induced impairment of
hippocampal long-term synaptic plasticity. Neurobiol. Dis. 2010, 40, 155–162. [CrossRef] [PubMed]
31. Jensen, F.E.; Wang, C.; Stafstrom, C.E.; Liu, Z.; Geary, C.; Stevens, M.C. Acute and chronic increases
in excitability in rat hippocampal slices after perinatal hypoxia in vivo. J. Neurophysiol. 1998, 79, 73–81.
[PubMed]
32. Zhou, C.; Lippman, J.J.; Sun, H.; Jensen, F.E. Hypoxia-induced neonatal seizures diminish silent synapses
and long-term potentiation in hippocampal CA1 neurons. J. Neurosci. 2011, 31, 18211–18222. [CrossRef]
[PubMed]
33. Kerchner, G.A.; Nicoll, R.A. Silent synapses and the emergence of a postsynaptic mechanism for LTP.
Nat. Rev. Neurosci. 2008, 9, 813–825. [CrossRef] [PubMed]
34. Chiu, G.S.; Chatterjee, D.; Darmody, P.T.; Walsh, J.P.; Meling, D.D.; Johnson, R.W.; Freund, G.G.
Hypoxia/reoxygenation impairs memory formation via adenosine-dependent activation of caspase 1.
J. Neurosci. 2012, 32, 13945–13955. [CrossRef] [PubMed]
35. Row, B.W.; Liu, R.; Xu, W.; Kheirandish, L.; Gozal, D. Intermittent hypoxia is associated with oxidative
stress and spatial learning deficits in the rat. Am. J. Respir. Crit. Care Med. 2003, 167, 1548–1553. [CrossRef]
[PubMed]
36. Arai, A.; Kessler, M.; Lynch, G. The effects of adenosine on the development of long-term potentiation.
Neurosci. Lett. 1990, 119, 41–44. [CrossRef]
37. Arai, A.; Vanderklish, P.; Kessler, M.; Lee, K.; Lynch, G. A brief period of hypoxia causes proteolysis of
cytoskeletal proteins in hippocampal slices. Brain Res. 1990, 555, 276–280. [CrossRef]
38. Lyubkin, M.; Durand, D.M.; Haxhiu, M.A. Interaction between tetanus long-term potentiation and
hypoxia-induced potentiation in the rat hippocampus. J. Neurophysiol. 1997, 78, 2475–2482. [PubMed]
39. Hammond, C.; Crépel, V.; Gozlan, H.; Ben-Ari, Y. Anoxic LTP sheds light on the multiple facets of NMDA
receptors. Trends Neurosci. 1994, 17, 497–503. [CrossRef]
40. Hsu, K.S.; Huang, C.C. Characterization of the anoxia-induced long-term synaptic potentiation in area CA1
of the rat hippocampus. Br. J. Pharmacol. 1997, 122, 671–681. [CrossRef] [PubMed]
41. Huang, C.C.; Hsu, K.S. Nitric oxide signaling is required for the generation of anoxia-induced long-term
potentiation in the hippocampus. Eur. J. Neurosci. 1997, 9, 2202–2206. [CrossRef] [PubMed]
42. Weilinger, N.L.; Tang, P.L.; Thompson, R.J. Anoxia-induced NMDA receptor activation opens pannexin
channels via Src family kinases. J. Neurosci. 2012, 32, 12579–12588. [CrossRef] [PubMed]
43. Kass, I.S.; Lipton, T.P. Calcium and Long-term transmission damage following anoxia in dentate gyrus and
CA1 regions of the rat hippocampal slice. J. Physiol. 1986, 378, 313–334. [CrossRef] [PubMed]
44. Muñoz, P.; Humeres, A.; Elgueta, C.; Kirkwood, A.; Hidalgo, C.; Núñez, M.T. Iron mediates
N-methyl-D-aspartate receptor-dependent stimulation of calcium-induced pathways and hippocampal
synaptic plasticity. J. Biol. Chem. 2011, 286, 13382–13392. [CrossRef] [PubMed]
45. Corcoran, A.; Kunze, R.; Harney, S.C.; Breier, G.; Marti, H.H.; O’Connor, J.J. A role for prolyl hydroxylase
domain proteins in hippocampal synaptic plasticity. Hippocampus 2013, 872, 861–872. [CrossRef] [PubMed]
46. Zhang, W.; Petrovic, J.M.; Callaghan, D.; Jones, A.; Cui, H.; Howlett, C.; Stanimirovic, D. Evidence that
hypoxia-inducible factor-1 (HIF-1) mediates transcriptional activation of interleukin-1beta (IL-1β) in astrocyte
cultures. J. Neuroimmunol. 2006, 174, 63–73. [CrossRef] [PubMed]
47. Batti, L.; Taylor, C.T.; O’Connor, J.J. Hydroxylase inhibition reduces synaptic transmission and protects
against a glutamate-induced ischemia in the CA1 region of the rat hippocampus. Neuroscience 2010, 167,
1014–1024. [CrossRef] [PubMed]
48. Wang, X.R.; Ma, Q.; Ding, A.S.; Zeng, B.X.; Wang, F.Z. Effects of intermittent hypoxia on long-term
potentiation in hippocampal dentate gyrus of rat. Zhongguo Ying Yong Sheng Li Xue Za Zhi 2001, 17, 18–20.
[PubMed]
49. Payne, R.S.; Goldbart, A.; Gozal, D.; Schurr, A. Effect of intermittent hypoxia on long-term potentiation in
rat hippocampal slices. Brain Res. 2004, 1029, 195–199. [CrossRef] [PubMed]
39
Brain Sci. 2016, 6, 6
50. Xie, H.; Yung, W. Chronic intermittent hypoxia-induced deficits in synaptic plasticity and neurocognitive
functions: A role for brain-derived neurotrophic factor. Acta Pharmacol. Sin. 2012, 33, 5–10. [CrossRef]
[PubMed]
51. Domac, F.M.; Somay, G.; Misirli, H.; Erenoglu, N.Y. Tumor necrosis factor alpha serum levels and
inflammatory response in acute ischemic stroke. Neurosciences 2007, 12, 25–30. [PubMed]
52. Viviani, B.; Bartesaghi, S.; Gardoni, F.; Vezzani, A.; Behrens, M.M.; Bartfai, T.; Binaglia, M.; Corsini, E.; Di
Luca, M.; Galli, C.L.; Marinovich, M. Interleukin-1beta enhances NMDA receptor-mediated intracellular
calcium increase through activation of the Src family of kinases. J. Neurosci. 2003, 23, 8692–8700. [PubMed]
53. Eltzschig, H.K.; Carmeliet, P. Hypoxia and inflammation. N. Engl. J. Med. 2011, 364, 656–665. [PubMed]
54. Stanimirovic, D.; Zhang, W.; Howlett, C.; Lemieux, P.; Smith, C. Inflammatory gene transcription in human
astrocytes exposed to hypoxia: Roles of the nuclear factor-kappaB and autocrine stimulation. J. Neuroimmunol.
2001, 119, 365–376. [CrossRef]
55. Morgan, M.J.; Liu, Z.-G. Crosstalk of reactive oxygen species and NF-κB signaling. Cell Res. 2011, 21, 103–115.
[CrossRef] [PubMed]
56. Saito, Y.; Nishio, K.; Ogawa, Y.; Kimata, J.; Kinumi, T.; Yoshida, Y.; Noguchi, N.; Niki, E. Turning point in
apoptosis/necrosis induced by hydrogen peroxide. Free Radic. Res. 2006, 40, 619–630. [CrossRef] [PubMed]
57. Takeda, M.; Shirato, I.; Kobayashi, M.; Endou, H. Hydrogen peroxide induces necrosis, apoptosis, oncosis
and apoptotic oncosis of mouse terminal proximal straight tubule cells. Nephron 1999, 81, 234–238. [CrossRef]
[PubMed]
58. Smith, S.M.; Friedle, S.A.; Watters, J.J. Chronic intermittent hypoxia exerts CNS region-specific effects on rat
microglial inflammatory and TLR4 gene expression. PLoS ONE 2013, 8, e81584. [CrossRef] [PubMed]
59. Udayabanu, M.; Kumaran, D.; Nair, R.U.; Srinivas, P.; Bhagat, N.; Aneja, R.; Katyal, A. Nitric oxide associated
with iNOS expression inhibits acetylcholinesterase activity and induces memory impairment during acute
hypobaric hypoxia. Brain Res. 2008, 1230, 138–149. [CrossRef] [PubMed]
60. Saha, R.N.; Pahan, K. Regulation of Inducible Nitric Oxide Synthase Gene in Glial Cells. Antioxid. Redox
Signal. 2006, 8, 929–947. [CrossRef] [PubMed]
61. Yang, Q.; Wang, Y.; Feng, J.; Cao, J.; Chen, B. Intermittent hypoxia from obstructive sleep apnea may cause
neuronal impairment and dysfunction in central nervous system: The potential roles played by microglia.
Neuropsychiatr. Dis. Treat. 2013, 9, 1077–1086. [PubMed]
62. Ding, J.; Li, Q.Y.; Wang, X.; Sun, C.H.; Lu, C.Z.; Xiao, B.G. Fasudil protects hippocampal neurons against
hypoxia-reoxygenation injury by suppressing microglial inflammatory responses in mice. J. Neurochem.
2010, 114, 1619–1629. [CrossRef] [PubMed]
63. Yeh, N.C.; Tien, K.J.; Yang, C.M.; Wang, J.J.; Weng, S.F. Increased risk of Parkinson’s disease in patients
with obstructive sleep apnea: A population-based, propensity score-matched, longitudinal follow-up study.
Medicine 2016, 95, e2293. [CrossRef] [PubMed]
64. Baune, B.T.; Camara, M.-L.; Eyre, H.; Jawahar, C.; Anscomb, H.; Körner, H. Tumour necrosis factor—Alpha
mediated mechanisms of cognitive dysfunction. Transl. Neurosci. 2012, 3, 263–277. [CrossRef]
65. Watters, O.; O’Connor, J.J. A role for tumor necrosis factor-α in ischemia and ischemic preconditioning.
J. Neuroinflamm. 2011, 8, 1–8. [CrossRef] [PubMed]
66. Chen, G.; Goeddel, D.V. TNF-R1 signaling: A beautiful pathway. Science 2002, 296, 1634–1635. [CrossRef]
[PubMed]
67. Glazner, G.W.; Mattson, M.P. Differential effects of BDNF, ADNF9, and TNFα on levels of NMDA receptor
subunits, calcium homeostasis, and neuronal vulnerability to excitotoxicity. Exp. Neurol. 2000, 161, 442–452.
[CrossRef] [PubMed]
68. Marchetti, L.; Klein, M.; Schlett, K.; Pfizenmaier, K.; Eisel, U.L. Tumor necrosis factor (TNF)-mediated
neuroprotection against glutamate-induced excitotoxicity is enhanced by N-methyl-D-aspartate receptor
activation. Essential role of a TNF receptor 2-mediated phosphatidylinositol 3-kinase-dependent NF-kappa
B pathway. J. Biol. Chem. 2004, 279, 32869–32881. [CrossRef] [PubMed]
69. Veroni, C.; Gabriele, L.; Canini, I.; Castiello, L.; Coccia, E.; Remoli, M.E.; Columba-Cabezas, S.; Aricò, E.;
Aloisi, F. Agresti, C. Activation of TNF receptor 2 in microglia promotes induction of anti-inflammatory
pathways. Mol. Cell. Neurosci. 2010, 45, 234–244. [CrossRef] [PubMed]
40

Brain Sci. 2016, 6, 6
70. Belarbi, K.; Jopson, T.; Tweedie, D.; Arellano, C.; Luo, W.; Greig, N.H.; Rosi, S. TNF-α protein synthesis
inhibitor restores neuronal function and reverses cognitive deficits induced by chronic neuroinflammation.
J. Neuroinflamm. 2012, 9, 23. [CrossRef] [PubMed]
71. Marousi, S.; Antonacopoulou, A.; Kalofonos, H.; Papathanasopoulos, P.; Karakantza, M.; Ellul, J. Functional
inflammatory genotypes in ischemic stroke: Could we use them to predict age of onset and long-term
outcome? Stroke Res. Treat. 2011, 2011, 792923. [CrossRef] [PubMed]
72. Klein, B.D.; White, H.S.; Callahan, K.S. Cytokine and intracellular signaling regulation of tissue factor
expression in astrocytes. Neurochem. Int. 2000, 36, 441–449. [CrossRef]
73. Tsoi, L.-M.; Wong, K.-Y.; Liu, Y.-M.; Ho, Y.-Y. Apoprotein E isoform-dependent expression and secretion of
pro-inflammatory cytokines TNF-alpha and IL-6 in macrophages. Arch. Biochem. Biophys. 2007, 460, 33–40.
[CrossRef] [PubMed]
74. Lull, M.E.; Block, M.L. Microglial activation and chronic neurodegeneration. Neurotherapeutics 2010, 7,
354–365. [CrossRef] [PubMed]
75. Barichello, T.; dos Santos, I.; Savi, G.D.; Simões, L.R.; Silvestre, T.; Comim, C.M.; Sachs, D.; Teixeira, M.M.;
Teixeira, A.L.; Quevedo, J. TNF-α, IL-1β, IL-6, and cinc-1 levels in rat brain after meningitis induced by
Streptococcus pneumoniae. J. Neuroimmunol. 2010, 221, 42–45. [CrossRef] [PubMed]
76. Liu, T.; Clark, R.K.; McDonnell, P.C.; Young, P.R.; White, R.F.; Barone, F.C.; Feuerstein, G.Z. Tumor necrosis
factor-alpha expression in ischemic neurons. Stroke 1994, 25, 1481–1488. [CrossRef] [PubMed]
77. Batti, L.; O’Connor, J.J. Tumor necrosis factor-alpha impairs the recovery of synaptic transmission from
hypoxia in rat hippocampal slices. J. Neuroimmunol. 2010, 218, 21–27. [CrossRef] [PubMed]
78. O’Connor, J.J. Targeting tumour necrosis factor-α in hypoxia and synaptic signaling. Ir. J. Med. Sci. 2013, 182,
157–162. [CrossRef] [PubMed]
79. Hindryckx, P.; De Vos, M.; Jacques, P.; Ferdinande, L.; Peeters, H.; Olievier, K.; Bogaert, S.; Brinkman, B.;
Vandenabeele, P.; Elewaut, D. Hydroxylase inhibition abrogates TNF-α-induced intestinal epithelial damage
by hypoxia-inducible factor-1-dependent repression of FADD. J. Immunol. 2010, 185, 6306–6316. [CrossRef]
[PubMed]
80. Rosenzweig, H.L.; Minami, M.; Lessov, N.S.; Coste, S.C.; Stevens, S.L.; Henshall, D.C.; Meller, R.; Simon, R.P.;
Stenzel-Poore, M.P. Endotoxin preconditioning protects against the cytotoxic effects of TNFα after stroke:
A novel role for TNFalpha in LPS-ischemic tolerance. J. Cereb Blood Flow Metab. 2007, 27, 1663–1674.
[CrossRef] [PubMed]
81. Fan, H.; Cook, J.A. Molecular mechanisms of endotoxin tolerance. J. Endotoxin Res. 2004, 10, 71–84. [CrossRef]
[PubMed]
82. Stetler, R.A.; Leak, R.K.; Gan, Y.; Li, P.; Zhang, F.; Hu, X.; Jing, Z.; Chen, J.; Zigmond, M.J.; Gao, Y.
Preconditioning provides neuroprotection in models of CNS disease: Paradigms and clinical significance.
Prog. Neurobiol. 2014, 114, 58–83. [CrossRef] [PubMed]
83. Bastide, M.; Gelé, P.; Pétrault, O.; Pu, Q.; Caliez, A.; Robin, E.; Deplanque, D.; Duriez, P.; Bordet, R. Delayed
cerebrovascular protective effect of lipopolysaccharide in parallel to brain ischemic tolerance. J. Cereb. Blood
Flow Metab. 2003, 23, 399–405. [CrossRef] [PubMed]
84. Karikó, K.; Weissman, D.; Welsh, F.A. Inhibition of toll-like receptor and cytokine signaling—A unifying
theme in ischemic tolerance. J. Cereb. Blood Flow Metab. 2004, 24, 1288–1304. [CrossRef] [PubMed]
85. Lastres-Becker, I.; Cartmell, T.; Molina-Holgado, F. Endotoxin preconditioning protects neurones from in vitro
ischemia: Role of endogenous IL-1beta and TNF-alpha. J. Neuroimmunol. 2006, 173, 108–116. [CrossRef]
[PubMed]
86. Pickering, M.; O’Connor, J.J. Pro-inflammatory cytokines and their effects in the dentate gyrus.
Prog. Brain Res. 2007, 163, 339–354. [PubMed]
87. Cumiskey, D.; Butler, M.P.; Moynagh, P.N.; O’Connor, J.J. Evidence for a role for the group I metabotropic
glutamate receptor in the inhibitory effect of tumor necrosis factor-alpha on long-term potentiation. Brain Res.
2007, 1136, 13–19. [CrossRef] [PubMed]
88. Butler, M.P.; O’Connor, J.J.; Moynagh, P.N. Dissection of tumor-necrosis factor-alpha inhibition of long-term
potentiation (LTP) reveals a p38 mitogen-activated protein kinase-dependent mechanism which maps to
early-but not late-phase LTP. Neuroscience 2004, 124, 319–326. [CrossRef] [PubMed]
41
Brain Sci. 2016, 6, 6
89. Cunningham, A.J.; Murray, C.A.; O’Neill, L.A.J.; Lynch, M.A.; O’Connor, J.J. Interleukin-1β (IL-1β) and
tumour necrosis factor (TNF) inhibit long-term potentiation in the rat dentate gyrus in vitro. Neurosci. Lett.
1996, 203, 17–20. [CrossRef]
90. Tancredi, V.; D’Arcangelo, G.; Grassi, F.; Tarroni, P.; Palmieri, G.; Santoni, A.; Eusebi, F. Tumor necrosis factor
alters synaptic transmission in rat hippocampal slices. Neurosci. Lett. 1992, 146, 176–178. [CrossRef]
91. Curran, B.; Murray, H.; O’Connor, J.J. A role for c-jun n-terminal kinase in the inhibition of long-term
potentiation by interleukin-1β and long-term depression in the rat dentate gyrus in vitro. Neuroscience
2003, 118, 347–357. [CrossRef]
92. Stellwagen, D.; Malenka, R.C. Synaptic scaling mediated by glial TNF-alpha. Nature 2006, 440, 1054–1059.
[CrossRef] [PubMed]
93. Beattie, E.C.; Stellwagen, D.; Morishita, W.; Bresnahan, J.C.; Ha, B.K.; Von Zastrow, M.; Beattie, M.S.;
Malenka, R.C. Control of synaptic strength by glial TNFalpha. Science 2002, 295, 2282–2285. [CrossRef]
[PubMed]
94. Stellwagen, D.; Beattie, E.C.; Seo, J.Y.; Malenka, R.C. Differential regulation of AMPA receptor and GABA
receptor trafficking by tumor necrosis factor-alpha. J. Neurosci. 2005, 25, 3219–3228. [CrossRef] [PubMed]
95. Vesce, S.; Rossi, D.; Brambilla, L.; Volterra, A. Glutamate release from astrocytes in physiological conditions
and in neurodegenerative disorders characterized by neuroinflammation. Int. Rev. Neurobiol. 2007, 82, 57–71.
[PubMed]
96. Korn, T.; Magnus, T.; Jung, S. Autoantigen specific T cells inhibit glutamate uptake in astrocytes by
decreasing expression of astrocytic glutamate transporter GLAST: A mechanism mediated by tumor necrosis
factor-alpha. FASEB J. 2005, 19, 1878–1880. [CrossRef] [PubMed]
97. Boycott, H.E.; Wilkinson, J.A.; Boyle, J.P.; Pearson, H.A.; Peers, C. Differential involvement of TNF alpha in
hypoxic suppression of astrocyte glutamate transporters. Glia 2008, 56, 998–1004. [CrossRef] [PubMed]
98. Carmen, J.; Rothstein, J.D.; Kerr, D.A. Tumor necrosis factor-alpha modulates glutamate transport in the
CNS and is a critical determinant of outcome from viral encephalomyelitis. Brain Res. 2009, 1263, 143–154.
[CrossRef] [PubMed]
99. He, P.; Liu, Q.; Wu, J.; Shen, Y. Genetic deletion of TNF receptor suppresses excitatory synaptic transmission
via reducing AMPA receptor synaptic localization in cortical neurons. FASEB J. 2012, 26, 334–345. [CrossRef]
[PubMed]
100. Santello, M.; Bezzi, P.; Volterra, A. TNF-α controls glutamatergic gliotransmission in the hippocampal
dentate gyrus. Neuron 2011, 69, 988–1001. [CrossRef] [PubMed]
101. Arai, A.; Lynch, G. Factors regulating the magnitude of long-term potentiation induced by theta pattern
stimulation. Brain Res. 1992, 598, 173–184. [CrossRef]
102. Wall, A.M.; Mukandala, G.; Nigel, H.; O’Connor, J.J. Tumor necrosis factor-α potentiates long-term
potentiation in the rat dentate gyrus after acute hypoxia. J. Neurosci. Res. 2015, 93, 815–829. [CrossRef]
[PubMed]
103. Culver, C.; Sundqvist, A.; Mudie, S.; Melvin, A.; Xirodimas, D.; Rocha, S. Mechanism of hypoxia-induced
NF-kappaB. Mol. Cell. Biol. 2010, 30, 4901–4921. [CrossRef] [PubMed]
104. Pickering, M.; Cumiskey, D.; O’Connor, J.J. Actions of TNF-α on glutamatergic synaptic transmission in the
central nervous system. Exp. Physiol. 2005, 90, 663–670. [CrossRef] [PubMed]
© 2016 by the authors. Licensee MDPI, Basel, Switzerland. This article is an open access
article distributed under the terms and conditions of the Creative Commons Attribution
(CC BY) license (http://creativecommons.org/licenses/by/4.0/).
42
brainsciences
Article
Neuroimmunology of the Interleukins 13 and 4
Simone Mori 1, Pamela Maher 2 and Bruno Conti 1,*
1 Department of Chemical Physiology, The Scripps Research Institute, 10550 North Torrey Pines Road,
La Jolla, CA 92037, USA; [email protected] Cellular Neurobiology Laboratory, Salk Research Institute, La Jolla, CA 92037, USA; [email protected]
* Correspondence: [email protected]; Tel.: +1-858-784-9069
Academic Editor: Donna Gruol
Received: 26 April 2016; Accepted: 2 June 2016; Published: 13 June 2016
Abstract: The cytokines interleukin 13 and 4 share a common heterodimeric receptor and are important
modulators of peripheral allergic reactions. Produced primarily by T-helper type 2 lymphocytes, they
are typically considered as anti-inflammatory cytokines because they can downregulate the synthesis
of T-helper type 1 pro-inflammatory cytokines. Their presence and role in the brain is only beginning to
be investigated and the data collected so far shows that these molecules can be produced by microglial
cells and possibly by neurons. Attention has so far been given to the possible role of these molecules in
neurodegeneration. Both neuroprotective or neurotoxic effects have been proposed based on evidence
that interleukin 13 and 4 can reduce inflammation by promoting the M2 microglia phenotype and
contributing to the death of microglia M1 phenotype, or by potentiating the effects of oxidative stress
on neurons during neuro-inflammation. Remarkably, the heterodimeric subunit IL-13Rα1 of their
common receptor was recently demonstrated in dopaminergic neurons of the ventral tegmental area
and the substantia nigra pars compacta, suggesting the possibility that both cytokines may affect
the activity of these neurons regulating reward, mood, and motor coordination. In mice and man,
the gene encoding for IL-13Rα1 is expressed on the X chromosome within the PARK12 region of
susceptibility to Parkinson’s disease (PD). This, together with finding that IL-13Rα1 contributes to
loss of dopaminergic neurons during inflammation, indicates the possibility that these cytokines may
contribute to the etiology or the progression of PD.
Keywords: Interleukin 13; Interleukin 4; neuron; microglia; Parkinson; brain; neurodegeneration;
neuroinflammation; neurotoxic; neuroprotection
1. Introduction
In this review we summarize the current body of knowledge on the role of IL-13 in the central
nervous system. Although the study of this subject is in its infancy and only a limited amount of
work has been done at this stage, it is likely that this will change in the near future. In fact, one of the
interesting aspects of investigating the biology of IL-13 in the central nervous system (CNS) is that
its canonical receptor, alpha type I (IL-13Rα1), appears to be expressed not only in glial cells during
pathological conditions, but also in specific subsets of neurons in the healthy brain. Specifically, IL-13Rα1
has, so far, been found on dopaminergic neurons of the Substantia Nigra pars compacta (SNc) and
the Ventral Tegmental Area (VTA) [1]. This finding indicates that its ligands, IL-13 and IL-4, could be
important regulators of dopaminergic function and cell survival, and may provide a direct link between
the immune system and the neurobiology of reward, addiction, or motor coordination.
2. What We Know about IL-13 Comes from Studies of Its Biology in the Immune System
The cytokines Interleukin 13 (IL-13) and interleukin-4 (IL-4) are two secreted proteins recognized
for their role in promoting T-helper type 2 (Th2) lymphocyte-mediated allergic inflammation and
Brain Sci. 2016, 6, 18 43 www.mdpi.com/journal/brainsci
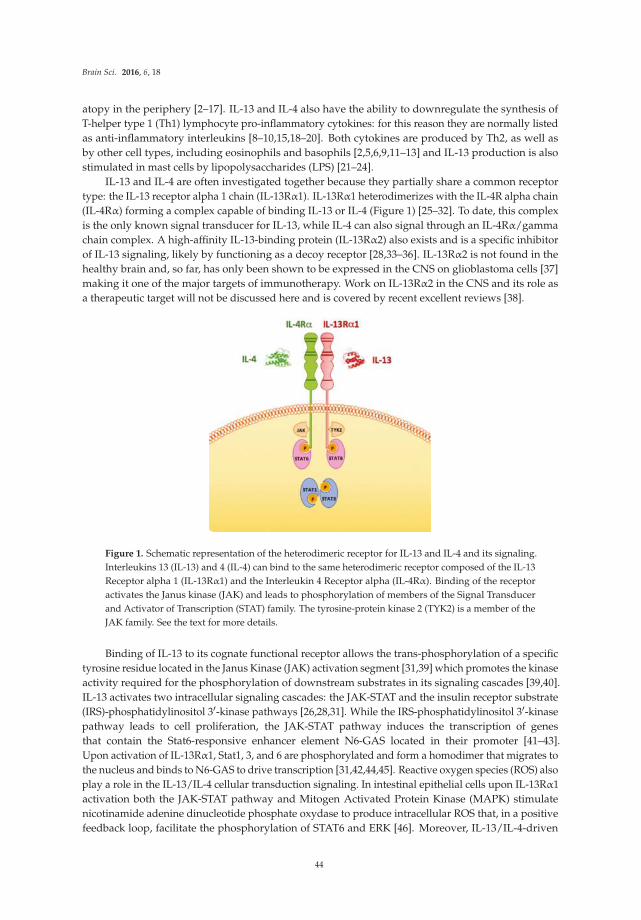
Brain Sci. 2016, 6, 18
atopy in the periphery [2–17]. IL-13 and IL-4 also have the ability to downregulate the synthesis of
T-helper type 1 (Th1) lymphocyte pro-inflammatory cytokines: for this reason they are normally listed
as anti-inflammatory interleukins [8–10,15,18–20]. Both cytokines are produced by Th2, as well as
by other cell types, including eosinophils and basophils [2,5,6,9,11–13] and IL-13 production is also
stimulated in mast cells by lipopolysaccharides (LPS) [21–24].
IL-13 and IL-4 are often investigated together because they partially share a common receptor
type: the IL-13 receptor alpha 1 chain (IL-13Rα1). IL-13Rα1 heterodimerizes with the IL-4R alpha chain
(IL-4Rα) forming a complex capable of binding IL-13 or IL-4 (Figure 1) [25–32]. To date, this complex
is the only known signal transducer for IL-13, while IL-4 can also signal through an IL-4Rα/gamma
chain complex. A high-affinity IL-13-binding protein (IL-13Rα2) also exists and is a specific inhibitor
of IL-13 signaling, likely by functioning as a decoy receptor [28,33–36]. IL-13Rα2 is not found in the
healthy brain and, so far, has only been shown to be expressed in the CNS on glioblastoma cells [37]
making it one of the major targets of immunotherapy. Work on IL-13Rα2 in the CNS and its role as
a therapeutic target will not be discussed here and is covered by recent excellent reviews [38].
Figure 1. Schematic representation of the heterodimeric receptor for IL-13 and IL-4 and its signaling.
Interleukins 13 (IL-13) and 4 (IL-4) can bind to the same heterodimeric receptor composed of the IL-13
Receptor alpha 1 (IL-13Rα1) and the Interleukin 4 Receptor alpha (IL-4Rα). Binding of the receptor
activates the Janus kinase (JAK) and leads to phosphorylation of members of the Signal Transducer
and Activator of Transcription (STAT) family. The tyrosine-protein kinase 2 (TYK2) is a member of the
JAK family. See the text for more details.
Binding of IL-13 to its cognate functional receptor allows the trans-phosphorylation of a specific
tyrosine residue located in the Janus Kinase (JAK) activation segment [31,39] which promotes the kinase
activity required for the phosphorylation of downstream substrates in its signaling cascades [39,40].
IL-13 activates two intracellular signaling cascades: the JAK-STAT and the insulin receptor substrate
(IRS)-phosphatidylinositol 31-kinase pathways [26,28,31]. While the IRS-phosphatidylinositol 31-kinase
pathway leads to cell proliferation, the JAK-STAT pathway induces the transcription of genes
that contain the Stat6-responsive enhancer element N6-GAS located in their promoter [41–43].
Upon activation of IL-13Rα1, Stat1, 3, and 6 are phosphorylated and form a homodimer that migrates to
the nucleus and binds to N6-GAS to drive transcription [31,42,44,45]. Reactive oxygen species (ROS) also
play a role in the IL-13/IL-4 cellular transduction signaling. In intestinal epithelial cells upon IL-13Rα1
activation both the JAK-STAT pathway and Mitogen Activated Protein Kinase (MAPK) stimulate
nicotinamide adenine dinucleotide phosphate oxydase to produce intracellular ROS that, in a positive
feedback loop, facilitate the phosphorylation of STAT6 and ERK [46]. Moreover, IL-13/IL-4-driven
44
Brain Sci. 2016, 6, 18
ROS production has been recently shown in alternatively-activated monocytes/macrophages through
activation of monoamino oxydase A (MAO-A) [44].
3. Expression of IL-13 and IL-4 in the CNS
As mentioned above, IL-13 and IL-4 were demonstrated to be produced peripherally. To date,
there is no evidence that these two proteins, both with molecular weights in the range of 15 kDa, can
cross the blood-brain barrier. However, experimental work shows, instead, their local production in
the CNS. Expression of IL-13 in the rodent brain was described in microglia, where its production
was enhanced by peripheral injection of LPS or the neurotoxin 1-metil-4-fenil-1,2,3,6-tetraidropiridina
(MPTP) [47–51].
Evidence also exists that both IL-13 and IL-4 can be produced by neuronal cells of the hippocampus
and the cortex in experimental models of ischemic insult [52,53]. In this context it has speculated
that the production of IL-4 and IL-13, inducing alternative activation of microglia—known as the M2
state—can exert a protective effect against neuronal damage [53–55]. Neuronal production of IL-4 has
been described lately in the noradrenergic neurons of the locus coeruleus, in which its release appears
to be sensitive to behavioral stress [56]. Preliminary work in our laboratory also showed that IL-13 can
be produced in neurons [57].
4. What Is the Role of IL-13 and IL-4 in the CNS?
Few studies have tested the effects of IL-13 and IL-4 in the CNS. Most of these have investigated
a possible action on neuronal survival with some studies finding that IL-13 and/or IL-4 potentiate
the effects of LPS and Interferon gamma (IFN-y), increasing oxidative damage and contributing to
neuronal death [47–50,58–61]. On the other hand, other studies indicated that IL-13 and/or IL-4 could
be neuroprotective either by directly reducing inflammation or by inducing the death of microglia cells
that are considered to be cellular mediators of neuronal damage [47–50,59–65]. Notably, both IL-13
and IL-4 can potentiate LPS-induced sickness behavior when co-injected centrally with LPS, whereas
only IL-4, and not IL-13, attenuates LPS-induced sickness behavior when administered several hours
before LPS [47,66]. Recently, our laboratory collected evidence that IL-13 and IL-4 are not toxic when
administered alone but can greatly increase the susceptibility of neurons to oxidative damage and
contribute to their demise if they express IL-13Rα1 [1].
5. IL-13 and IL-4 in Multiple Sclerosis
Multiple sclerosis (MS) is an autoimmune disorder affecting the CNS with a relapsing-remitting
time course. IL-13 seems to exert a protective role in this context, as it is believed that in the development
of the disease, a crucial role is played by the imbalance between pro-inflammatory cytokines (IL-1β; TNF;
INF-γ; IL-17) and anti-inflammatory cytokines (IL-4, IL-5, IL-10 and IL-13) [67,68]. IL-13 polymorphisms
are associated with autoimmune diseases and also increase susceptibility to MS [69].
A study in humans with MS found that high levels of IL-13 in the cerebral spinal fluid (CSF) might
exert a neuroprotective effect by enhancing Gamma Aminobuthirric Acid (GABA) over glutamate
transmission [64]. Interestingly, an earlier report describes IL-4 having the same neural effect
of increasing the GABA-induced inward current in neurons in a dose-dependent and reversible
manner [70]. Moreover, the copolymer glatiramer acetate, an immunomodulatory drug currently
used to treat MS, has shown to significantly increase the TH2- lymphocyte production of IL-13 in
patients [71].
Consistently, using the mouse experimental model of MS, experimental autoimmune
encephalomyelitis (EAE), Cash and colleagues showed that IL-13 exerts its anti-inflammatory action
by inactivating macrophages and reducing oxidative stress [72]. In the same model, an increase in
circulating and spleen IL-13 prevented axonal injury [73] alone or in synergy with IL-4 [74], whereas
IL-13 reduction was associated with loss of protection [75].
45
Brain Sci. 2016, 6, 18
Sex difference can play a role in affecting the role of IL-13 in the MS model. While autoimmune
diseases, including MS, are more common in women [76], the incidence and severity of EAE in mice,
null for IL-13, was lower in females compared to males, suggesting the possibility that the contribution
of IL-13 to EAE/MS may be gender specific [77]. To this end, it is interesting to note that the expression
of IL-13 mRNA can be decreased by estrogen in a mouse model of inflammatory intestine disease [78]
and that the gene encoding for IL-13Rα1 is located on the X chromosome in both humans and mice.
Together, these studies suggest that IL-13 may have a neuroprotective role in MS. Although this
may be different in other neurodegenerative diseases that, unlike MS, are not characterized by
a severely-compromised blood-brain barrier, and are not primarily mediated by peripheral immune
cells, IL-13 and IL-4 also showed protection in a mouse model of Alzheimer’s disease (AD).
Specifically, intracerebral injection of a mixture of IL-13 and IL-4 reduced amyloid deposition and
improved spatial learning and memory in an AD transgenic mouse model when applied to young
mice but did not show protective effects when administered in adult animals [79].
6. Parkinson’s Disease
The IL-13 system may have a specific role in the pathogenesis and/or the progression of Parkinson’s
disease (PD). Data mining using the Online Mendelian Inheritance in Man (OMIM) database [80]
showed that IL-13Rα1 lies within the PARK12 region of susceptibility to PD. Although PARK12
comprises a large portion of DNA, it is located on the X chromosome, an observation that may be of
interest in that PD has a higher incidence in men than in women. Even more intriguing was the finding
that expression of IL-13Rα1 in the brain appeared to be specific to the dopaminergic neurons of the
VTA and of the SNc, the region affected by PD. Double-immunostaining studies also revealed that
approximately 80% of the SNc neurons expressing the dopaminergic marker tyrosine hydroxylase also
expressed IL-13Rα1 [1].
The possible contribution of IL-13Rα1 to neuronal fate was measured using a pro-inflammatory
experimental mouse model of PD. Animals received periodic peripheral intraperitoneal injections of
bacterial LPS over a period of six months, a regimen previously demonstrated to induce central loss
of dopaminergic SNc neurons [81]. Comparative analysis showed that mice lacking IL-13Rα1 were
protected from neuronal loss when compared to their wild-type littermates, suggesting a neurotoxic
action of its ligands, IL-13 and/or IL-4. In vitro experiments using a dopaminergic cell line showed,
however, that neither IL-13 nor IL-4 had cytotoxic effects when administered alone. However, both
cytokines increased the toxicity of non-toxic doses of oxidants in a dose-dependent manner.
Thus, activation of IL-13Rα1 may be one of the mechanisms whereby the vulnerability of
dopaminergic neurons is increased during inflammation, when both cytokines and ROS are produced.
On the other hand, the lack of neurotoxicity of IL-13 or IL-4 in the absence of ROS suggests that
these cytokines may be capable of regulating neuronal function by affecting the neurobiology of those
neurons that participate in reward, addiction, and motor control.
Investigating these phenomena is likely to provide important information on the mechanisms of
how IL-13 and IL-4 and, more generally, the immune system, may be capable of influencing behavior
or can contribute to neurodegeneration.
7. Conclusions
Although in its infancy, the investigation of the central role of the interleukins 13 and 4 has is
an exciting area of research. What makes it so attractive is that these two cytokines can be produced
locally in the CNS and are active on both microglia and neuronal cells. Of special interest is the fact
that they act through a common heterodimeric receptor that is expressed in dopaminergic neurons.
Although these two Th2 cytokines are considered anti-inflammatory, studies conducted so far show
that they can have cytotoxic effects on both glia and neurons. Interestingly these actions are not due to
an intrinsic toxicity of IL-13 and IL-4 but rather to their ability to increase the cellular susceptibility to
oxidative stress. This suggest that under pathological conditions, such as neuroinflammation when
46
Brain Sci. 2016, 6, 18
reactive oxygen species are produced, IL-13 and IL-4 can participate to tissue damage and thus to
Parkinson’s disease or other neurodegenerative disorders. Instead, under physiological conditions,
these two cytokines can contribute to the regulation of neuronal function via direct action through
neuronal IL-13Rα1. Thus, they have the requisites of being potential neuromodulators.
Acknowledgments: Supported by the NIH (NS085155) and by The Michael J. Fox Foundation.
Author Contributions: S.M., P.M. and B.C. wrote the paper.
Conflicts of Interest: The authors declare no conflict of interest. The founding sponsors had no role in the designof the study; in the collection, analyses, or interpretation of data; in the writing of the manuscript, and in thedecision to publish the results.
References
1. Morrison, B.E.; Marcondes, M.C.; Nomura, D.K.; Sanchez-Alavez, M.; Sanchez-Gonzalez, A.; Saar, I.;
Kim, K.S.; Bartfai, T.; Maher, P.; Sugama, S.; et al. Cutting edge: IL-13Rα1 expression in dopaminergic
neurons contributes to their oxidative stress-mediated loss following chronic peripheral treatment with
lipopolysaccharide. J. Immunol. 2012, 189, 5498–5502. [CrossRef] [PubMed]
2. Gibbs, B.F.; Haas, H.; Falcone, F.H.; Albrecht, C.; Vollrath, I.B.; Noll, T.; Wolff, H.H.; Amon, U. Purified human
peripheral blood basophils release interleukin-13 and preformed interleukin-4 following immunological
activation. Eur. J. Immunol. 1996, 26, 2493–2498. [CrossRef] [PubMed]
3. Haas, H.; Falcone, F.H.; Holland, M.J.; Schramm, G.; Haisch, K.; Gibbs, B.F.; Bufe, A.; Schlaak, M.
Early interleukin-4: Its role in the switch towards a Th2 response and IgE-mediated allergy. Int. Arch.
Allergy Immunol. 1999, 119, 86–94. [CrossRef] [PubMed]
4. Howard, M.; Paul, W.E. Interleukins for B lymphocytes. Lymphokine Res. 1982, 1, 1–4. [PubMed]
5. Jaffe, J.S.; Raible, D.G.; Post, T.J.; Wang, Y.; Glaum, M.C.; Butterfield, J.H.; Schulman, E.S. Human lung mast
cell activation leads to IL-13 mRNA expression and protein release. Am. J. Respir. Cell Mol. Biol. 1996, 15,
473–481. [CrossRef] [PubMed]
6. Kim, E.Y.; Battaile, J.T.; Patel, A.C.; You, Y.; Agapov, E.; Grayson, M.H.; Benoit, L.A.; Byers, D.E.; Alevy, Y.;
Tucker, J.; et al. Persistent activation of an innate immune response translates respiratory viral infection into
chronic lung disease. Nat. Med. 2008, 14, 633–640. [CrossRef] [PubMed]
7. Lee, Y.C.; Lee, K.H.; Lee, H.B.; Rhee, Y.K. Serum levels of interleukins (IL)-4, IL-5, IL-13, and
interferon-gamma in acute asthma. J. Asthma 2001, 38, 665–671. [CrossRef] [PubMed]
8. McKenzie, A.N.; Culpepper, J.A.; de Waal Malefyt, R.; Briere, F.; Punnonen, J.; Aversa, G.; Sato, A.; Dang, W.;
Cocks, G.B.; Menon, S.; et al. Interleukin 13, a T-cell-derived cytokine that regulates human monocyte and
B-cell function. Proc. Natl. Acad. Sci. USA 1993, 90, 3735–3739. [CrossRef] [PubMed]
9. Minty, A.; Chalon, P.; Derocq, J.M.; Dumont, X.; Guillemot, J.C.; Kaghad, M.; Labit, C.; Leplatois, P.;
Liauzun, P.; Miloux, B.; et al. Interleukin-13 is a new human lymphokine regulating inflammatory and
immune responses. Nature 1993, 362, 248–250. [CrossRef] [PubMed]
10. Morgan, J.G.; Dolganov, G.M.; Robbins, S.E.; Hinton, L.M.; Lovett, M. The selective isolation of novel cDNAs
encoded by the regions surrounding the human interleukin 4 and 5 genes. Nucleic Acids Res. 1992, 20,
5173–5179. [CrossRef] [PubMed]
11. Ochensberger, B.; Daepp, G.C.; Rihs, S.; Dahinden, C.A. Human blood basophils produce interleukin-13 in
response to IgE-receptor-dependent and -independent activation. Blood 1996, 88, 3028–3037. [PubMed]
12. Reglier, H.; Arce-Vicioso, M.; Fay, M.; Gougerot-Pocidalo, M.A.; Chollet-Martin, S. Lack of IL-10 and IL-13
production by human polymorphonuclear neutrophils. Cytokine 1998, 10, 192–198. [CrossRef] [PubMed]
13. Schmid-Grendelmeier, P.; Altznauer, F.; Fischer, B.; Bizer, C.; Straumann, A.; Menz, G.; Blaser, K.; Wuthrich, B.;
Simon, H.U. Eosinophils express functional IL-13 in eosinophilic inflammatory diseases. J. Immunol. 2002,
169, 1021–1027. [CrossRef] [PubMed]
14. Silvestri, M.; Bontempelli, M.; Giacomelli, M.; Malerba, M.; Rossi, G.A.; Di Stefano, A.; Rossi, A.;
Ricciardolo, F.L. High serum levels of tumour necrosis factor-α and interleukin-8 in severe asthma: Markers
of systemic inflammation? Clin. Exp. Allergy 2006, 36, 1373–1381. [CrossRef] [PubMed]
15. Wills-Karp, M.; Luyimbazi, J.; Xu, X.; Schofield, B.; Neben, T.Y.; Karp, C.L.; Donaldson, D.D. Interleukin-13:
Central mediator of allergic asthma. Science 1998, 282, 2258–2261. [CrossRef] [PubMed]
47
Brain Sci. 2016, 6, 18
16. Wong, C.K.; Ho, C.Y.; Ko, F.W.; Chan, C.H.; Ho, A.S.; Hui, D.S.; Lam, C.W. Proinflammatory cytokines (IL-17,
IL-6, IL-18 and IL-12) and Th cytokines (IFN-gamma, IL-4, IL-10 and IL-13) in patients with allergic asthma.
Clin. Exp. Immunol. 2001, 125, 177–183. [CrossRef] [PubMed]
17. Wynn, T.A. IL-13 effector functions. Annu. Rev. Immunol. 2003, 21, 425–456. [CrossRef] [PubMed]
18. Brown, K.D.; Zurawski, S.M.; Mosmann, T.R.; Zurawski, G. A family of small inducible proteins secreted by
leukocytes are members of a new superfamily that includes leukocyte and fibroblast-derived inflammatory
agents, growth factors, and indicators of various activation processes. J. Immunol. 1989, 142, 679–687.
[PubMed]
19. Kuperman, D.A.; Schleimer, R.P. Interleukin-4, interleukin-13, signal transducer and activator of transcription
factor 6, and allergic asthma. Curr. Mol. Med. 2008, 8, 384–392. [CrossRef] [PubMed]
20. Wills-Karp, M. Interleukin-13 in asthma pathogenesis. Immunol. Rev. 2004, 202, 175–190. [CrossRef]
[PubMed]
21. Chiba, N.; Masuda, A.; Yoshikai, Y.; Matsuguchi, T. Ceramide inhibits LPS-induced production of IL-5, IL-10,
and IL-13 from mast cells. J. Cell. Physiol. 2007, 213, 126–136. [CrossRef] [PubMed]
22. Galli, S.J.; Gordon, J.R.; Wershil, B.K. Cytokine production by mast cells and basophils. Curr. Opin. Immunol.
1991, 3, 865–872. [CrossRef]
23. Masuda, A.; Yoshikai, Y.; Aiba, K.; Matsuguchi, T. Th2 cytokine production from mast cells is directly induced
by lipopolysaccharide and distinctly regulated by c-Jun N-terminal kinase and p38 pathways. J. Immunol.
2002, 169, 3801–3810. [CrossRef] [PubMed]
24. Supajatura, V.; Ushio, H.; Nakao, A.; Okumura, K.; Ra, C.; Ogawa, H. Protective roles of mast cells against
enterobacterial infection are mediated by Toll-like receptor 4. J. Immunol. 2001, 167, 2250–2256. [CrossRef]
[PubMed]
25. Aman, M.J.; Tayebi, N.; Obiri, N.I.; Puri, R.K.; Modi, W.S.; Leonard, W.J. cDNA cloning and characterization
of the human interleukin 13 receptor α chain. J. Biol. Chem. 1996, 271, 29265–29270. [PubMed]
26. Callard, R.E.; Matthews, D.J.; Hibbert, L. IL-4 and IL-13 receptors: Are they one and the same? Immunol. Today
1996, 17, 108–110. [CrossRef]
27. Hilton, D.J.; Zhang, J.G.; Metcalf, D.; Alexander, W.S.; Nicola, N.A.; Willson, T.A. Cloning and characterization
of a binding subunit of the interleukin 13 receptor that is also a component of the interleukin 4 receptor.
Proc. Natl. Acad. Sci. USA 1996, 93, 497–501. [CrossRef] [PubMed]
28. Jiang, H.; Harris, M.B.; Rothman, P. IL-4/IL-13 signaling beyond JAK/STAT. J. Allergy Clin. Immunol. 2000,
105 Pt 1, 1063–1070. [CrossRef] [PubMed]
29. Leonard, W.J.; O’Shea, J.J. Jaks and STATs: Biological implications. Annu. Rev. Immunol. 1998, 16, 293–322.
[CrossRef] [PubMed]
30. Lin, J.X.; Migone, T.S.; Tsang, M.; Friedmann, M.; Weatherbee, J.A.; Zhou, L.; Yamauchi, A.; Bloom, E.T.;
Mietz, J.; John, S.; et al. The role of shared receptor motifs and common Stat proteins in the generation
of cytokine pleiotropy and redundancy by IL-2, IL-4, IL-7, IL-13, and IL-15. Immunity 1995, 2, 331–339.
[CrossRef]
31. Nelms, K.; Keegan, A.D.; Zamorano, J.; Ryan, J.J.; Paul, W.E. The IL-4 receptor: Signaling mechanisms and
biologic functions. Annu. Rev. Immunol. 1999, 17, 701–738. [CrossRef] [PubMed]
32. Orchansky, P.L.; Ayres, S.D.; Hilton, D.J.; Schrader, J.W. An interleukin (IL)-13 receptor lacking the
cytoplasmic domain fails to transduce IL-13-induced signals and inhibits responses to IL-4. J. Biol. Chem.
1997, 272, 22940–22947. [CrossRef] [PubMed]
33. Caput, D.; Laurent, P.; Kaghad, M.; Lelias, J.M.; Lefort, S.; Vita, N.; Ferrara, P. Cloning and characterization
of a specific interleukin (IL)-13 binding protein structurally related to the IL-5 receptor α chain. J. Biol. Chem.
1996, 271, 16921–16926. [PubMed]
34. Donaldson, D.D.; Whitters, M.J.; Fitz, L.J.; Neben, T.Y.; Finnerty, H.; Henderson, S.L.; O’Hara, R.M., Jr.;
Beier, D.R.; Turner, K.J.; Wood, C.R.; et al. The murine IL-13 receptor α 2: Molecular cloning, characterization,
and comparison with murine IL-13 receptor α 1. J. Immunol. 1998, 161, 2317–2324. [PubMed]
35. Feng, N.; Lugli, S.M.; Schnyder, B.; Gauchat, J.F.; Graber, P.; Schlagenhauf, E.; Schnarr, B.; Wiederkehr-Adam, M.;
Duschl, A.; Heim, M.H.; et al. The interleukin-4/interleukin-13 receptor of human synovial fibroblasts:
Overexpression of the nonsignaling interleukin-13 receptor α2. Lab. Investig. 1998, 78, 591–602. [PubMed]
48
Brain Sci. 2016, 6, 18
36. Liu, H.; Jacobs, B.S.; Liu, J.; Prayson, R.A.; Estes, M.L.; Barnett, G.H.; Barna, B.P. Interleukin-13 sensitivity
and receptor phenotypes of human glial cell lines: Non-neoplastic glia and low-grade astrocytoma differ
from malignant glioma. Cancer Immunol. Immunother. 2000, 49, 319–324. [CrossRef] [PubMed]
37. Debinski, W.; Gibo, D.M.; Hulet, S.W.; Connor, J.R.; Gillespie, G.Y. Receptor for interleukin 13 is a marker
and therapeutic target for human high-grade gliomas. Clin. Cancer Res. 1999, 5, 985–990. [PubMed]
38. Sengupta, S.; Thaci, B.; Crawford, A.C.; Sampath, P. Interleukin-13 receptor α 2-targeted glioblastoma
immunotherapy. Biomed. Res. Int. 2014, 2014, 952128. [CrossRef] [PubMed]
39. Haque, S.J.; Wu, Q.; Kammer, W.; Friedrich, K.; Smith, J.M.; Kerr, I.M.; Stark, G.R.; Williams, B.R.
Receptor-associated constitutive protein tyrosine phosphatase activity controls the kinase function of JAK1.
Proc. Natl. Acad. Sci. USA 1997, 94, 8563–8568. [CrossRef] [PubMed]
40. Johnson, L.N.; Noble, M.E.; Owen, D.J. Active and inactive protein kinases: Structural basis for regulation.
Cell 1996, 85, 149–158. [CrossRef]
41. Hou, J.; Schindler, U.; Henzel, W.J.; Ho, T.C.; Brasseur, M.; McKnight, S.L. An interleukin-4-induced
transcription factor: IL-4 Stat. Science 1994, 265, 1701–1706. [CrossRef] [PubMed]
42. Mikita, T.; Campbell, D.; Wu, P.; Williamson, K.; Schindler, U. Requirements for interleukin-4-induced gene
expression and functional characterization of Stat6. Mol. Cell. Biol. 1996, 16, 5811–5820. [CrossRef] [PubMed]
43. Schindler, U.; Wu, P.; Rothe, M.; Brasseur, M.; McKnight, S.L. Components of a Stat recognition code:
Evidence for two layers of molecular selectivity. Immunity 1995, 2, 689–697. [CrossRef]
44. Bhattacharjee, A.; Shukla, M.; Yakubenko, V.P.; Mulya, A.; Kundu, S.; Cathcart, M.K. IL-4 and IL-13 employ
discrete signaling pathways for target gene expression in alternatively activated monocytes/macrophages.
Free Radic. Biol. Med. 2013, 54, 1–16. [CrossRef] [PubMed]
45. Darnell, J.E., Jr.; Kerr, I.M.; Stark, G.R. Jak-STAT pathways and transcriptional activation in response to IFNs
and other extracellular signaling proteins. Science 1994, 264, 1415–1421. [CrossRef] [PubMed]
46. Mandal, D.; Fu, P.; Levine, A.D. REDOX regulation of IL-13 signaling in intestinal epithelial cells: Usage of
alternate pathways mediates distinct gene expression patterns. Cell. Signal. 2010, 22, 1485–1494. [CrossRef]
[PubMed]
47. Bluthe, R.M.; Bristow, A.; Lestage, J.; Imbs, C.; Dantzer, R. Central injection of interleukin-13 potentiates
LPS-induced sickness behavior in rats. Neuroreport 2001, 12, 3979–3983. [CrossRef] [PubMed]
48. Shin, W.H.; Lee, D.Y.; Park, K.W.; Kim, S.U.; Yang, M.S.; Joe, E.H.; Jin, B.K. Microglia expressing interleukin-13
undergo cell death and contribute to neuronal survival in vivo. Glia 2004, 46, 142–152. [CrossRef] [PubMed]
49. Yang, M.-S.; Ji, K.-A.; Jeon, S.-B.; Jin, B.-K.; Kim, S.U.; Jou, N.; Joe, E. Interleukin-13 enhances cyclooxygenase-2
expression in activated rat brain microglia: Implications for death of activated microglia. J. Immunol. 2006,
177, 1323–1329. [CrossRef] [PubMed]
50. Yang, M.S.; Park, E.J.; Sohn, S.; Kwon, H.J.; Shin, W.H.; Pyo, H.K.; Jin, B.; Choi, K.S.; Jou, I.; Joe, E.H.
Interleukin-13 and -4 induce death of activated microglia. Glia 2002, 38, 273–280. [CrossRef] [PubMed]
51. Yasuda, Y.; Shimoda, T.; Uno, K.; Tateishi, N.; Furuya, S.; Yagi, K.; Suzuki, K.; Fujita, S. The effects of
MPTP on the activation of microglia/astrocytes and cytokine/chemokine levels in different mice strains.
J. Neuroimmunol. 2008, 204, 43–51. [CrossRef] [PubMed]
52. Yu, J.T.; Lee, C.H.; Yoo, K.Y.; Choi, J.H.; Li, H.; Park, O.K.; Yan, B.; Hwang, I.K.; Kwon, Y.G.; Kim, Y.M.; et al.
Maintenance of anti-inflammatory cytokines and reduction of glial activation in the ischemic hippocampal
CA1 region preconditioned with lipopolysaccharide. J. Neurol. Sci. 2010, 296, 69–78. [CrossRef] [PubMed]
53. Zhao, X.; Wang, H.; Sun, G.; Zhang, J.; Edwards, N.J.; Aronowski, J. Neuronal interleukin-4 as a modulator
of microglial pathways and ischemic brain damage. J. Neurosci. 2015, 35, 11281–11291. [CrossRef] [PubMed]
54. Latta, C.H.; Sudduth, T.L.; Weekman, E.M.; Brothers, H.M.; Abner, E.L.; Popa, G.J.; Mendenhall, M.D.;
Gonzalez-Oregon, F.; Braun, K.; Wilcock, D.M. Determining the role of IL-4 induced neuroinflammation in
microglial activity and amyloid-β using BV2 microglial cells and APP/PS1 transgenic mice. J. Neuroinflamm.
2015, 12, 41. [CrossRef] [PubMed]
55. Xiong, X.; Xu, L.; Wei, L.; White, R.E.; Ouyang, Y.B.; Giffard, R.G. IL-4 is required for sex differences in
vulnerability to focal ischemia in mice. Stroke 2015, 46, 2271–2276. [CrossRef] [PubMed]
56. Lee, H.J.; Park, H.J.; Starkweather, A.; An, K.; Shim, I. Decreased interleukin-4 release from the neurons of
the Locus Coeruleus in response to immobilization stress. Med. Inflamm. 2016, 2016, 3501905. [CrossRef]
[PubMed]
57. Conti, B. The Scripps Research Institute, CA, USA. Unpublished work, 2016.
49
Brain Sci. 2016, 6, 18
58. Nam, J.H.; Park, K.W.; Park, E.S.; Lee, Y.B.; Lee, H.G.; Baik, H.H.; Kim, Y.S.; Maeng, S.; Park, J.; Jin, B.K.
Interleukin-13/-4-induced oxidative stress contributes to death of hippocampal neurons in aβ1-42-treated
hippocampus in vivo. Antioxid. Redox Signal. 2012, 16, 1369–1383. [CrossRef] [PubMed]
59. Park, K.W.; Baik, H.H.; Jin, B.K. Interleukin-4-induced oxidative stress via microglial NADPH oxidase
contributes to the death of hippocampal neurons in vivo. Curr. Aging Sci. 2008, 1, 192–201. [CrossRef]
[PubMed]
60. Park, K.W.; Baik, H.H.; Jin, B.K. IL-13-induced oxidative stress via microglial NADPH oxidase contributes to
death of hippocampal neurons in vivo. J. Immunol. 2009, 183, 4666–4674. [CrossRef] [PubMed]
61. Yadav, M.C.; Burudi, E.M.; Alirezaei, M.; Flynn, C.C.; Watry, D.D.; Lanigan, C.M.; Fox, H.S. IFN-gamma-induced
IDO and WRS expression in microglia is differentially regulated by IL-4. Glia 2007, 55, 1385–1396. [CrossRef]
[PubMed]
62. Clarke, R.M.; Lyons, A.; O’Connell, F.; Deighan, B.F.; Barry, C.E.; Anyakoha, N.G.; Nicolaou, A.; Lynch, M.A.
A pivotal role for interleukin-4 in atorvastatin-associated neuroprotection in rat brain. J. Biol. Chem. 2008,
283, 1808–1817. [CrossRef] [PubMed]
63. Deboy, C.A.; Xin, J.; Byram, S.C.; Serpe, C.J.; Sanders, V.M.; Jones, K.J. Immune-mediated neuroprotection of
axotomized mouse facial motoneurons is dependent on the IL-4/STAT6 signaling pathway in CD4(+) T cells.
Exp. Neurol. 2006, 201, 212–224. [CrossRef] [PubMed]
64. Rossi, S.; Mancino, R.; Bergami, A.; Mori, F.; Castelli, M.; De Chiara, V.; Studer, V.; Mataluni, G.; Sancesario, G.;
Parisi, V.; et al. Potential role of IL-13 in neuroprotection and cortical excitability regulation in multiple
sclerosis. Mult. Scler. J. 2011, 17, 1301–1312. [CrossRef] [PubMed]
65. Won, S.Y.; Kim, S.R.; Maeng, S.; Jin, B.K. Interleukin-13/Interleukin-4-induced oxidative stress contributes to
death of prothrombinkringle-2 (pKr-2)-activated microglia. J. Neuroimmunol. 2013, 265, 36–42. [CrossRef]
[PubMed]
66. Bluthe, R.M.; Lestage, J.; Rees, G.; Bristow, A.; Dantzer, R. Dual effect of central injection of recombinant rat
interleukin-4 on lipopolysaccharide-induced sickness behavior in rats. Neuropsychopharmacology 2002, 26,
86–93. [CrossRef]
67. Linker, R.A.; Sendtner, M.; Gold, R. Mechanisms of axonal degeneration in EAE—Lessons from CNTF and
MHC I knockout mice. J. Neurol. Sci. 2005, 233, 167–172. [CrossRef] [PubMed]
68. Zeis, T.; Graumann, U.; Reynolds, R.; Schaeren-Wiemers, N. Normal-appearing white matter in multiple
sclerosis is in a subtle balance between inflammation and neuroprotection. Brain 2008, 131, 288–303.
[CrossRef] [PubMed]
69. Seyfizadeh, N.; Kazemi, T.; Farhoudi, M.; Reza Aliparasti, M.; Sadeghi-Bazargani, H.; Almasi, S.; Babaloo, Z.
Association of IL-13 single nucleotide polymorphisms in Iranian patients to multiple sclerosis. Am. J. Clin.
Exp. Immunol. 2014, 3, 124–129. [PubMed]
70. Rozsa, K.S.; Rubakhin, S.S.; Szucs, A.; Hughes, T.K.; Stefano, G.B. Opposite effects of interleukin-2 and
interleukin-4 on GABA-induced inward currents of dialysed lymnaea neurons. Gen. Pharmacol. 1997, 29,
73–77. [CrossRef]
71. Sanna, A.; Fois, M.L.; Arru, G.; Huang, Y.M.; Link, H.; Pugliatti, M.; Rosati, G.; Sotgiu, S. Glatiramer
acetate reduces lymphocyte proliferation and enhances IL-5 and IL-13 production through modulation of
monocyte-derived dendritic cells in multiple sclerosis. Clin. Exp. Immunol. 2006, 143, 357–362. [CrossRef]
[PubMed]
72. Cash, E.; Minty, A.; Ferrara, P.; Caput, D.; Fradelizi, D.; Rott, O. Macrophage-inactivating IL-13 suppresses
experimental autoimmune encephalomyelitis in rats. J. Immunol. 1994, 153, 4258–4267. [PubMed]
73. Offner, H.; Subramanian, S.; Wang, C.; Afentoulis, M.; Vandenbark, A.A.; Huan, J.; Burrows, G.G. Treatment
of passive experimental autoimmune encephalomyelitis in SJL mice with a recombinant TCR ligand induces
IL-13 and prevents axonal injury. J. Immunol. 2005, 175, 4103–4111. [CrossRef] [PubMed]
74. Young, D.A.; Lowe, L.D.; Booth, S.S.; Whitters, M.J.; Nicholson, L.; Kuchroo, V.K.; Collins, M. IL-4, IL-10,
IL-13, and TGF-β from an altered peptide ligand-specific Th2 cell clone down-regulate adoptive transfer of
experimental autoimmune encephalomyelitis. J. Immunol. 2000, 164, 3563–3572. [CrossRef] [PubMed]
75. Ochoa-Repáraz, J.; Rynda, A.; Ascón, M.A.; Yang, X.; Kochetkova, I.; Riccardi, C.; Callis, G.; Trunkle, T.;
Pascual, D.W. IL-13 production by regulatory T cells protects against experimental autoimmune
encephalomyelitis independently of autoantigen. J. Immunol. 2008, 181, 954–968. [CrossRef] [PubMed]
76. Compston, A.; Coles, A. Multiple sclerosis. Lancet 2008, 372, 1502–1517. [CrossRef]
50
Brain Sci. 2016, 6, 18
77. Sinha, S.; Kaler, L.J.; Proctor, T.M.; Teuscher, C.; Vandenbark, A.A.; Offner, H. IL-13-mediated gender
difference in susceptibility to autoimmune encephalomyelitis. J. Immunol. (Baltim. Md. 1950) 2008, 180,
2679–2685. [CrossRef]
78. Verdu, E.F.; Deng, Y.; Bercik, P.; Collins, S.M. Modulatory effects of estrogen in two murine models of
experimental colitis. Am. J. Physiol. Gastrointest. Liver Physiol. 2002, 283, 27–36. [CrossRef] [PubMed]
79. Kawahara, K.; Suenobu, M.; Yoshida, A.; Koga, K.; Hyodo, A.; Ohtsuka, H.; Kuniyasu, A.; Tamamaki, N.;
Sugimoto, Y.; Nakayama, H. Intracerebral microinjection of interleukin-4/interleukin-13 reduces β-amyloid
accumulation in the ipsilateral side and improves cognitive deficits in young amyloid precursor protein 23
mice. Neuroscience 2012, 207, 243–260. [CrossRef] [PubMed]
80. Man (OMIM) database. Available online: http://www.omim.org (accessed on 9 June 2016).
81. Frank-Cannon, T.C.; Tran, T.; Ruhn, K.A.; Martinez, T.N.; Hong, J.; Marvin, M.; Hartley, M.; Trevino, I.;
O’Brien, D.E.; Casey, B.; et al. Parkin deficiency increases vulnerability to inflammation-related nigral
degeneration. J. Neurosci. 2008, 28, 10825–10834. [CrossRef] [PubMed]
© 2016 by the authors. Licensee MDPI, Basel, Switzerland. This article is an open access
article distributed under the terms and conditions of the Creative Commons Attribution
(CC BY) license (http://creativecommons.org/licenses/by/4.0/).
51
brainsciences
Review
Immunomodulators as Therapeutic Agents inMitigating the Progression of Parkinson’s Disease
Bethany Grimmig 1, Josh Morganti 2, Kevin Nash 3 and Paula C Bickford 1,4,*
1 Center of Excellence for Aging and Brain Repair, Department of Neurosurgery and Brain Repair,
Morsani College of Medicine, University of South Florida, Tampa, FL 33612, USA;
[email protected] Sanders-Brown Center on Aging, Department of Anatomy and Neurobiology, University of Kentucky,
Lexington, KY 40508, USA; [email protected] Byrd Alzheimer’s Institute, Department of Molecular Pharmacology and Physiology,
Morsani College of Medicine, University of South Florida, Tampa, FL 33613, USA; [email protected] James A Haley VA Hospital, 13000 Bruce B Downs Blvd, Tampa, FL 33612, USA
* Correspondence: [email protected]; Tel.: +1-813-974-3238
Academic Editor: Donna Gruol
Received: 9 July 2016; Accepted: 20 September 2016; Published: 23 September 2016
Abstract: Parkinson’s disease (PD) is a common neurodegenerative disorder that primarily afflicts
the elderly. It is characterized by motor dysfunction due to extensive neuron loss in the substantia
nigra pars compacta. There are multiple biological processes that are negatively impacted during the
pathogenesis of PD, and are implicated in the cell death in this region. Neuroinflammation is evidently
involved in PD pathology and mitigating the inflammatory cascade has been a therapeutic strategy.
Age is the number one risk factor for PD and thus needs to be considered in the context of disease
pathology. Here, we discuss the role of neuroinflammation within the context of aging as it applies
to the development of PD, and the potential for two representative compounds, fractalkine and
astaxanthin, to attenuate the pathophysiology that modulates neurodegeneration that occurs in
Parkinson’s disease.
Keywords: Parkinson’s disease; neuroinflammation; microglia; fractalkine; astaxanthin
1. Parkinson’s Disease
Parkinson’s disease (PD) is a debilitating condition that affects millions of people worldwide.
With the development of drugs to treat complications associated with significant morbidity and
mortality, patients are living up to 20 years after the diagnosis of PD. Although the use of medications
has led to a relative improvement in quality of life, these patients are often substantially disabled,
requiring significant health care and compensation for loss of wages. It has been projected that the
prevalence of PD will double by 2040, indicating severe economic consequences to come as the incidence
increases. There are currently no available medications that prevent or reverse the neurodegeneration
that causes these disabilities [1].
Parkinson’s disease is primarily characterized neuroanatomically by the degeneration of the
neurons in the substantia nigra pars compacta (SN), resulting in a substantial loss of dopamine
(DA) afferents to the striatum and subsequent motor impairment. It is estimated that nearly 50% of
dopaminergic cells in the SN have been lost prior to clinical presentation of motor dysfunction.
It is now understood that PD pathology extends to extra nigral regions including the locus
coeruleus, nucleus basalis of Meynert, peduculopontine nucleus, intralaminar thalamus, and lateral
hypothalamus suggesting dysfunction and neurodegeneration in many areas of the brain [2]. It is
histopathologically characterized by the formation of Lewy bodies, intraneuronal protein inclusions
Brain Sci. 2016, 6, 41 52 www.mdpi.com/journal/brainsci
Brain Sci. 2016, 6, 41
comprised predominantly of α-synuclein (α-syn). These protein aggregates have been observed
throughout the brain, and pathological α-syn deposition is thought to begin in the medulla and spread
throughout the midbrain to cortical regions in a manner that corresponds to the onset of clinical
symptoms [2]. These protein aggregates are associated with microgliosis [3], and impaired cellular
physiology, although the precise mechanisms leading to cytotoxicity are currently unknown.
The vast majority of Parkinson’s disease cases are classified as idiopathic, but approximately 5%
of PD cases are genetically linked. There are several gene mutations that confer susceptibility or are
associated with the development of PD, including mutations in leucine-rich repeat kinase 2 (LRRK),
PTEN Induced putative kinase 1 (PINK1), and the protein deglycase (DJ1). However, α-syn has proven
to have a very strong association and relevance to PD and similar disorders collectively known as
synucleinopathies. Abnormalities in the SNCA gene that encodes the α-syn protein are strongly
correlated with the development of an autosomal dominant familial form of PD [4]. Multiplications of
the SNCA gene are known to increase the expression of the α-syn protein, whereas certain missense
mutations of the gene (A53T, A30P, E46K) produce variants of α-syn, both of which have known
pathological attributes related to the increased propensity to aggregate.
The physiological role of α-syn, along with the isoforms β- and γ-synuclein, is related to
neurotransmission, and they are primarily located in the synapse. Increased concentrations of α-syn
protein or mutated forms of α-syn make the protein susceptible to misfolding and polymerization by
self-assembly. These misfolded aggregates have heterogeneous conformations that have not been clearly
elucidated. These aggregates are associated with various deleterious biological activities including (1)
the permeabilization of the cellular membranes [5], associated with an alteration of intracellular ion
concentrations [6]; (2) disruption of energy production through interactions with the mitochondria [7];
and (3) interruption of intracellular transport via physical interference of motor proteins, or direct
interaction with organelles and vesicles [8]. The formation of soluble oligomeric species is presumed
to be relatively more toxic than fibrils, through the energetically favorable association within the
phospholipids that forms pores in the cellular membrane [9]. The amount of LB formations throughout
the brain reflects the severity of impairment [10]. However, it has been postulated that the organizing
of fibrils into Lewy Bodies may serve as a protective mechanism to divert toxic aggregate species into
less harmful formations to preserve normal cellular physiology [11].
2. The Interaction with Aging
Aging is a major risk factor for the development of PD [12], evidenced by the fact that the
incidence increases for every decade over 50 years of age. While aging contributes to PD, it is also
underrepresented in PD research, as it is common for the experimental models to be carried out using
young animals. However, the impact of aging is essential to consider in terms of the disease process
because many of the physiological changes that occur in aged animals can drive or exacerbate the
pathological mechanisms that lead to PD and alter both the course and tempo of the disease.
The impact of aging on the incidence of PD is compounded by the fact that the dopaminergic
neurons of the SN seem to have a unique vulnerability to cellular stressors in the microenvironment [12].
Although it is not completely understood what sets these cells apart from those of other DA pathways,
the neurons of this nucleus are more susceptible to the homeostatic disturbances and degenerate
significantly more compared to similar or adjacent regions [13]. This can be grossly attributed to high
oxidative stress and inflammation. It is known that the SN is exposed to higher levels of oxidation
compared to other dopaminergic centers [11]. This is partly due to an unusually high concentration of
iron, which through the Fenton reaction, can generate free radicals, as well as nitric oxide released
by microglia that densely populate this region [14,15]. In addition to the accumulation of reactive
oxygen and nitrogen species, the SN is also ill-equipped to neutralize them, due to a low expression
of glutathione, an important endogenous antioxidant molecule, leading to an inevitable increase in
oxidative stress [16]. Aging is also associated with increased levels of oxidative stress and altered
53
Brain Sci. 2016, 6, 41
microglial function and this combined with the SN’s reduced resilience to reactive oxygen species
(ROS) could promote neurodegeneration.
The role of neuroinflammation in PD is also particularly important in the context of aging.
Inflammation is known to increase with age. This is largely attributed to the age related changes in
microglial physiology. Microglia, myeloid derived macrophages, are the resident immune cell of the
CNS and constitute 10% of the cell population. Their highly ramified processes are highly motile
and constantly survey parenchyma, facilitating the detection and the cellular response to infection
and injury. However, microglia are also involved in many homeostatic functions and are now known
to be highly active during post-natal synaptic pruning and synaptic plasticity [17,18]. Microglia are
known to undergo a phenomenon known as priming with age. This describes a propensity for
microglia to attain a pro-inflammatory state and is characterized by 4 principal features: (1) primed
microglia will exhibit higher levels of inflammatory mediators and surface makers even in the absence
of immune stimulation; (2) microglia also demonstrate hyperactivity upon subsequent activation
where they release exaggerated amounts of cytokines and reactive oxygen/nitrogen species; (3) they
are also resistant to regulatory mechanisms that typically restore microglia back to their inactivated
state, causing them to remain in an aggravated state for a longer period of time [19]; and (4) they
do not respond to stimuli, such as IL4, that promote anti-inflammatory factors, angiogenesis, and
neurotrophic factor secretion [19,20]. For example, Lee, Ruiz et al. (2013) induced microglial activation
in the brains of young and old mice with the application of a cytokine cocktail designed to elicit an M1,
pro-inflammatory phenotype (IL1β + IL12) or an anti-inflammatory, M2 phenotype (IL-4 + IL-13).
These authors demonstrated that M1 cocktail elicits an increased response microglia from the aged
brain, while the same aged cells were less responsive to the M2 cocktail. This phenomenon has been
reproduced with isolated microglia and has been termed priming [21].
In order to elucidate the molecular underpinnings of the age-related alterations in microglial
function, numerous researchers have begun to assess the differential expression of genes and protein
in primary microglia. A recent study using RNAseq comparing the transcriptional profiles of isolated
microglia to whole brain has identified the microglial sensome [22]. These authors further assessed
the sensome in microglia isolated from aged animals and demonstrated that many of the genes
related to sensing endogenous ligands were down regulated, whereas genes pertaining to host defense
were up-regulated. Furthermore, another recent study using gene microarrays of isolated microglia
identified an up-regulation of NFκB related genes in these aged cells [23]. Sustained microglial
activation and microglial priming can perpetuate neurodegeneration by increasing cellular stress both
from enhanced release of cytotoxic substances, but also from the loss of trophic support as a result of
impaired microglial homeostatic function.
3. Role of Neuroinflammation
The precise pathophysiology that precipitates the development of PD is unknown,
although it is understood that a few key biological processes are often impacted in patients,
including mitochondrial function, proteostaisis, immune function leading to oxidative stress and
inflammation. Neuroinflammation is critical factor in the disease process that clearly contributes
significantly to the neurodegeneration seen in PD. However, it is difficult to ascertain if inflammation
initiates pathological features of PD, or is triggered by the widespread protein aggregation and neuronal
death that occurs during disease progression. McGeer et al. (1988) described the presence of increased
reactive gliosis and infiltrating T-cells around the SN in post mortem analysis of PD brains [24].
Their observations provided some of the first indications that increased neuroinflammation is associated
with DA cell death. Many other studies have reported features of inflammation in post-mortem samples,
such as increased levels of inflammatory mediators like iNos and Cox-2 [25], supporting the contribution
of increased neuroinflammation during advanced stages of the disease. Similar patterns of activated
microglia have been detected in the brain areas associated with clinical symptoms of the disease [26].
Interestingly, this distribution of gliosis was evident in both newly diagnosed patients and those
54
Brain Sci. 2016, 6, 41
with advanced pathology. Elevated levels of pro-inflammatory cytokines have also been detected
in the cerebrospinal fluid and plasma of PD patients at early stages of the disease. These findings
suggest that microglial activation may be initiated in early stages and remain an ongoing process
throughout the disease. Furthermore, inflammatory insults and injuries are known to increase the risk
of developing PD. Traumatic brain injuries (TBI) have been linked to an increased risk of developing
the disease in a frequency and severity dependent manner; multiple injuries or injuries requiring
hospitalization were more strongly correlated with PD onset [27]. This occurrence is largely attributed
to the neuroinflammatory cascade that follows trauma. Certain infections causing neuroinflammation
have been known to lead to a post-encephalitic Parkinsonism. This may be because the SN is densely
populated by microglia [28], rendering it is especially susceptible to inflammatory stimuli. For example,
intracranial injections of lipopolysaccharide (LPS), a bacterial antigen, dramatically activate microglia
and leads to nigrostriatal degeneration and motor symptoms of PD [29]. Parkinsonism is a separate
condition distinct from PD, but these observations of inflammatory insults leading to cell death may
have important implications for PD itself. Taken together, these data suggest a potential role of
neuroinflammation in ongoing cell death that occurs in PD.
Furthermore, pathological forms of α-syn are associated with microglial activation in the brains of
PD patients and this is consistently recapitulated in animal models. The presence of α-syn aggregates
modulates glial activity, often eliciting the release of inflammatory mediators. Codolo et al. (2013)
treated monocytes with various species of α-syn to demonstrate that the aggregated and pathogenic
forms of the protein can facilitate the secretion of IL-1β though stimulation of the inflammasome [30].
The nitration of α-syn is a common modification associated with pathology thought to be promoted in
an oxidative environment. Stimulation of microglial cells with nitrated and aggregated α-syn alters
the cellular morphology and transcriptional profile to a pro-inflammatory phenotype, with increased
transcription of IL-1β, TNF-α, and IFN-γ as well as induction of NF-Kβ signaling [31]. Additionally,
this α-syn activation of microglia seems to be related to phagocytic capacity, as inflammatory cascades
and activation of NADPH oxidase are initiated after the glial cells take up the aggregates [3,32,33].
Zhang et al. (2005) demonstrated that impeding phagocytosis of primary microglia attenuates the
release of superoxide from these cells when exposed to α-syn in vitro. This detection and engulfment
of α-syn seems to be dependent on the FCγ receptor, as FCγ deficient mice are protected the
resultant neurodegeneration from AAV driven over expression of α-syn [32,33]. It is thought that this
inflammatory response to abnormal α-syn will perpetuate neural dysfunction through the release of
cytotoxic compounds that leads to cell death. Many of these studies were done using either glial cell
lines or in young animals, neglecting the impact of the pro-inflammatory actions of α-syn within the
primed glial environment of an aging brain, thus causing even more damage. In fact, when α-syn is
introduced into an aged animal it is more cytotoxic compared to the young controls [34].
4. Fractalkine as an Anti-Inflammatory Treatment
There is promising pre-clinical experimental evidence to support that reducing inflammation,
specifically by suppressing microglial activity, can modify the progression of the loss of DA
neurons [35–38]. Non-steroidal anti-inflammatory drugs have been suggested to reduce the risk of PD
onset [39]. Also, the use of minocycline, a tetracycline with pharmaceutical actions that extend beyond
the classical antimicrobial activity, has been shown to reduce cell death in a neurotoxic model of PD using
1-methyl-4-phenyl-1,2,3,6-tetrahydropyridine (MPTP). These researchers attributed the neuroprotective
effect to the down-regulation of iNOS expression and glial activation [40]. Minocycline was also shown
to inhibit apoptosis through a reduction of related inflammatory mediators [41]. Because glial activation
is associated with the release of pro-inflammatory factors capable of damaging neurons, this data
suggests that mediating the excessive inflammation in PD is a viable therapeutic strategy. There are
several signals produced by neurons that have an anti-inflammatory action on microglia, including
CD200, CD22, CD47 and fractalkine (FKN, CX3CL1), which could be potential therapeutic targets.
55
Brain Sci. 2016, 6, 41
Fractalkine is a protein expressed constitutively by neurons in a membrane bound form that can
be cleaved by disintegrin and metalloproteinase (ADAM) 10 and 17. This proteolysis releases a soluble
form of the protein, but both isoforms are thought to ligate the cognate receptor, CX3CR1, located on the
surface of microglia in the CNS [42]. This neuron-glia interaction serves as an important endogenous
mechanism to suppress microglial activation and regulate the output of inflammatory mediators and other
damaging molecules [42]. It has been shown that increasing fractalkine levels using an AAV9 gene therapy
approach can be neuroprotective [35,36], while the absence of this FKN-CX3CR1 signaling cascade confers
susceptibility to neurodegeneration in rodent models of PD. Cardona et al. (2006) demonstrated that
CX3CR1 deficiency lead to increase neurotoxicity to both peripheral LPS and MPTP injections. In these
experiments, both heterozygous and homozygous mice exhibited increased neurodegeneration and IL-1β
expression compared to the intact wild-type controls [43]. There is evidence indicating that fractalkine can
regulate microglial function and subsequently reduce inflammation in the CNS. Multiple in vitro studies
have established that enhancing fractalkine signaling through application of the ligand or stimulation
of the receptor can protect against cell death in culture; FKN-ligand decreases microglial apoptosis
and protects against neurotoxicity by both LPS and TNF-α. It has been demonstrated that maintaining
or enhancing communication of FKN/CX3CR1 is neuroprotective in multiple rodent models of PD.
Pabon et al. (2011) [37] attenuated the neurotoxicity of 6 hydroxydopamine (6OHDA) by delivering
a chronic intrastriatal infusion of recombinant fractalkine ligand. This preservation of dopaminergic
terminals in the striatum was also associated with decreased microglial activation around the lesion
site, indicated by a reduced expression of the MHCII surface marker. To further examine the action
of fractalkine in a model of PD where synuclein is introduced in the SN via AAV, Nash et al. (2015)
corroborated the neuroprotective effects of FKN by using a viral vector to over express the different
isoforms of FKN; membrane-bound (mFKN) or the soluble portion (sFKN). In this study, sFKN reduced
DA cell death in young rats with overexpression α-syn in the SN via AAV9. These findings may
be due to altered FKN-CX3CR1 signaling [44] and a reduction in pro-inflammatory cytokines and
modulation of microglial function into a more protective role (Figure 1). These results suggest that
supraphysiological levels of the fractalkine are protective against the neurodegeneration occurring in
two separate experimental models of PD. Morganti et al. (2012) [36] also illustrated the importance
of neuron-glial communication by administering MPTP to animals deficient in the fractalkine ligand.
These FKN knockouts were extremely susceptible to MPTP toxicity, and display both a dramatic loss
of TH in the SN and the robust gliosis associated with the lesion site. Not only does this work indicate
that FKN-CX3CR1 communication is necessary for moderating cell death and subsequent detrimental
inflammatory events, but it also suggests that further enhancing or supplementing this signaling
pathway above baseline activity is sufficient to achieve neuroprotection against these potent toxins
(Figure 1). However, the action of fractalkine is quite complex; CX3CR1 knockout mice have been
shown to increase phagocytosis of amyloid, but decrease phagocytosis of synuclein [44]. It is unclear if
this action is mediated by membrane bound fractalkine or the cleaved, soluble form. Several studies
have tried to clarify the roles of the differential processing of fractalkine and there does not appear to
be a clear conclusion at this point. When an obligate soluble version of fractalkine is used, as described
here with a gene therapy approach, it has been shown to be beneficial in models of PD and AD tau
pathology [35,36,45]. However, in other models where an obligate soluble fractalkine mouse is used,
opposite results have been observed, and this paper concludes that the membrane anchored fractalkine
is associated with phagocytosis of Aβ [46].
Much of the current data regarding the therapeutic potential of FKN in the treatment of
inflammatory and neurodegenerative conditions stems from studies involving young animals. However,
it is essential to note that aged microglia have been shown to be resistant to their regulatory
signals [20,47]. Furthermore, communication via the FKN/CX3CR1 axis becomes dysregulated with
age and can also contribute to microglial priming and dysfunction. There are age associated changes
affecting both the ligand and receptor. It has been has shown that FKN is reduced by in the aged
hippocampus [48], although the extent of FKN downregulation in the SN has not yet been fully
56
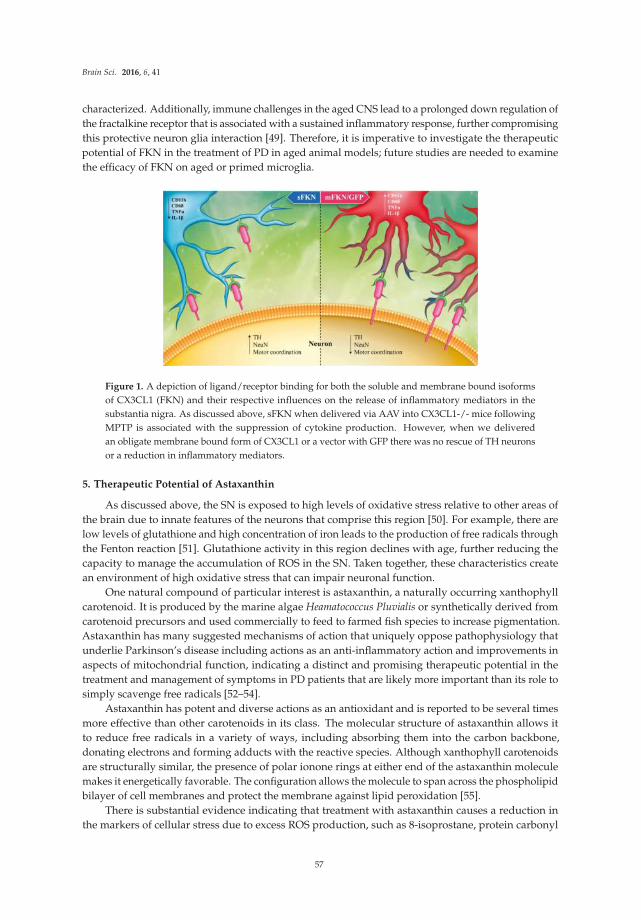
Brain Sci. 2016, 6, 41
characterized. Additionally, immune challenges in the aged CNS lead to a prolonged down regulation of
the fractalkine receptor that is associated with a sustained inflammatory response, further compromising
this protective neuron glia interaction [49]. Therefore, it is imperative to investigate the therapeutic
potential of FKN in the treatment of PD in aged animal models; future studies are needed to examine
the efficacy of FKN on aged or primed microglia.
Figure 1. A depiction of ligand/receptor binding for both the soluble and membrane bound isoforms
of CX3CL1 (FKN) and their respective influences on the release of inflammatory mediators in the
substantia nigra. As discussed above, sFKN when delivered via AAV into CX3CL1-/- mice following
MPTP is associated with the suppression of cytokine production. However, when we delivered
an obligate membrane bound form of CX3CL1 or a vector with GFP there was no rescue of TH neurons
or a reduction in inflammatory mediators.
5. Therapeutic Potential of Astaxanthin
As discussed above, the SN is exposed to high levels of oxidative stress relative to other areas of
the brain due to innate features of the neurons that comprise this region [50]. For example, there are
low levels of glutathione and high concentration of iron leads to the production of free radicals through
the Fenton reaction [51]. Glutathione activity in this region declines with age, further reducing the
capacity to manage the accumulation of ROS in the SN. Taken together, these characteristics create
an environment of high oxidative stress that can impair neuronal function.
One natural compound of particular interest is astaxanthin, a naturally occurring xanthophyll
carotenoid. It is produced by the marine algae Heamatococcus Pluvialis or synthetically derived from
carotenoid precursors and used commercially to feed to farmed fish species to increase pigmentation.
Astaxanthin has many suggested mechanisms of action that uniquely oppose pathophysiology that
underlie Parkinson’s disease including actions as an anti-inflammatory action and improvements in
aspects of mitochondrial function, indicating a distinct and promising therapeutic potential in the
treatment and management of symptoms in PD patients that are likely more important than its role to
simply scavenge free radicals [52–54].
Astaxanthin has potent and diverse actions as an antioxidant and is reported to be several times
more effective than other carotenoids in its class. The molecular structure of astaxanthin allows it
to reduce free radicals in a variety of ways, including absorbing them into the carbon backbone,
donating electrons and forming adducts with the reactive species. Although xanthophyll carotenoids
are structurally similar, the presence of polar ionone rings at either end of the astaxanthin molecule
makes it energetically favorable. The configuration allows the molecule to span across the phospholipid
bilayer of cell membranes and protect the membrane against lipid peroxidation [55].
There is substantial evidence indicating that treatment with astaxanthin causes a reduction in
the markers of cellular stress due to excess ROS production, such as 8-isoprostane, protein carbonyl
57
Brain Sci. 2016, 6, 41
moieties and 8OHdG [56]. Additionally, astaxanthin has been shown to increase the efficacy of
endogenous antioxidant mechanisms in vivo including increasing the expression or activity of
glutathione, catalase, thioredoxin reductase and superoxide dismutase (SOD) [57,58]. It has also
been shown to upregulate heme-oxygenease 1 (HO-1) through increase in NRF [59,60]. These findings
suggest that astaxanthin treatment may help alleviate some of the ongoing oxidative stress that occurs
during the progression of PD as it contributes to cellular dysfunction.
However, in addition to oxidative damage, there are a number of physiological changes that
occur with age that exacerbate the cellular stress in the SN. Mitochondrial dynamics, proteosomal
efficiency [61] and levels of synuclein [62] are all altered with age, likely rendering the DA cells
more vulnerable to neurodegeneration. Aging also leads to microglial priming and may facilitate
PD disease progression. Chronic microglial activation results in prolonged exposure to cytotoxic,
pro-inflammatory cytokines, increasing cellular stress and ultimately leading to neurodegeneration [33].
Age_induced primed microglia are hyperactive upon subsequent stimulation and release exaggerated
amounts of cytokines. They are resistant to reversion back to a state of tissue repair and maintenance
of homeostasis, as they are less responsive to regulatory mechanisms [20,63,64]. As stated above,
synuclein aggregation may also directly facilitate the release of these inflammatory mediators. It is
thought that this inflammatory response to abnormal α-syn will perpetuate neural dysfunction through
the release of cytotoxic compounds that overwhelm the DA cells, inevitably leading to cell death.
Given the range of pathological mechanisms involved in neurodegeneration seen in PD,
astaxanthin seems to have a unique potential for the treatment of this disorder. Many diverse biological
activities have been described in the literature that are particular relevant to that pathophysiology of PD,
as well as normal aging. Based on this knowledge, the interaction of aging and parkinsonian symptoms
should be responsive to treatment with astaxanthin. For example, astaxanthin has also been implicated
in modulating microglial activity. Experiments using astaxanthin to treat a transformed microglial
cell line can reduce the expression of IL-6 and iNOS/NO in vitro when exposed to an immune
stimulus such as LPS [65]. These results were corroborated by other studies using aged animals where
astaxanthin reduced the release of nitric oxide [56]. These molecules are released in high amounts by
activated microglia and are associated with neuronal damage; attenuating the output of inflammatory
mediators with astaxanthin may offer some neuroprotection from the inflammatory cascades occurring
in the SN.
Some authors have reported alterations in mitochondrial function after astaxanthin treatment.
Although most of these studies were conducted in vitro, this is of great interest to the treatment of
PD. Mitochondrial dysfunction has been implicated in the etiology of the disorder evidenced by the
common toxins that induce Parkinsonism. Both MPTP and rotenone are used to produce Parkinson’s
models by selectively targeting mitochondria leading to the death of SN neurons. Multiple genetic
mutations of proteins involved in mitochondrial dynamics have been clearly linked to the development
of familial Parkinson’s. Furthermore, some of these mitochondrial proteins are associated with a loss
of function with age, and may contribute to the increased incidence of diagnosis over the lifespan.
Furthermore, it has been demonstrated recently that mitochondria are a significant source of
oxidative stress not only in these DA neurons, but also in additional nuclei known to degenerate in
PD. For example, both the locus coeruleus and SN express L-type calcium channels that allow for
an extraneous calcium influx that taxes the mitochondria [66,67]. The presence of these channels
and their associated calcium burden has been proposed to be a common physiological feature
that contributes to the cellular vulnerability for the brain regions affected in PD. Attenuating this
mitochondrial derived oxidative stress that results from calcium overload has led to the use of calcium
channel antagonists for the treatment of PD [68]. These dihydropyrdines, specifically israpidine,
have been shown to be tolerable and safe among PD patients are now in Phase III clinical trial [69].
The success of these drugs lends support for the therapeutic use of AXT as well. There is
substantial evidence to suggest that astaxanthin works at the level of the mitochondria. According to
HPLC analysis of cellular fractions, astaxanthin will accumulate in mitochondria, and has the capacity
58
Brain Sci. 2016, 6, 41
to increase mitochondrial activity as indicated by increased respiration and mitochondrial membrane
potential (MMP) [70]. Mitochondrial dysfunction is a common pathophysiological observation
in PD, and is recapitulated in the α-synuclein model. It has been shown that treating isolated
mitochondria with α-synuclein oligomers induced mitochondrial dysfunction by inhibiting complex 1
and associated with reduced calcium retention time, release of ROS and induced mitochondrial
swelling [7]. In specific studies related to PD, astaxanthin has been shown to protect SH-SY5Y cells
from 6-OHDA [53]. In a similar experiment, astaxanthin treatment mitigated cytotoxicity in PC12 cells
from MPP+ induced cytotoxicity. MPP+ is a toxic metabolite of the dopaminergic neurotoxin MPTP
used in experimental animal models of PD [71]. These cell culture results were corroborated by an
in vivo study using astaxanthin to prevent the neurodegeneration in the SN in response to dose of
MPTP (1 i.p. dose 30 mg/kg daily for 28 days) [54]. This treatment regimen effectively protected
against the loss of tyrosine hydroxylase in the SN and striatum after chronic exposure to the neurotoxin.
However, it is important to understand that many drugs that have been successful in some pre-clinical
models of PD have failed to translate to patients with PD. Developing and testing pre-clinical models
involving disease relevant proteins such as α-synuclein and the impact of aging must be considered
for future studies.
6. Conclusions
Parkinson’s disease is primarily characterized by degeneration of the dopaminergic neurons of
the substantia nigra. The pathophysiology underlying this cell death is not yet clearly understood,
although it is evident that many biological processes are impaired in this vulnerable brain region,
explaining the rapid deterioration of the SN with age. Neuroinflammation is an integral factor
perpetuating cellular damage during progression of the disease, and efforts to mitigate the
inflammatory cascade have been successful in experimental settings, suggesting that anti-inflammatory
treatments are a viable therapeutic strategy to employ in managing Parkinson’s disease. Fractalkine
signaling has proven to be a critical pathway in inflammation-mediated cell death that occurs in animal
models of PD. Astaxanthin has diverse biological activities that have been reported in the literature,
many of which seem to directly oppose the pathological mechanisms involved in neurodegeneration
of the SN. Both fractalkine and astaxanthin represent two promising novel therapeutic agents for the
treatment and management of PD.
Acknowledgments: This work was supported by NIA grants AG04418 (PCB), AG044919 (PCB); VA IO1BX000231(PCB), and the Michael J Fox foundation (KN/PCB). This work was supported by the federal government.The contents of this manuscript do not represent the views of the Department of Veterans Affairs or theUnited States Government.
Author Contributions: This is a review paper, but P.C.B., K.N., and J.M. conceived and designed the experimentsfrom our lab that are cited within the document; B.G. and J.M. performed the previous experiments and analyzedthe data discussed within the text; B.G., P.C.B., and K.N. wrote the paper.
Conflicts of Interest: The authors declare no conflict of interest. The founding sponsors had no role in the designof the study; in the collection, analyses, or interpretation of data; in the writing of the manuscript, and in thedecision to publish the results.
References
1. Kowal, S.L.; Dall, T.M.; Chakrabarti, R.; Storm, M.V.; Jain, A. The current and projected economic burden of
Parkinson’s disease in the United States. Mov. Disord. 2013, 28, 311–318. [CrossRef] [PubMed]
2. Braak, H.; Ghebremedhin, E.; Rüb, U.; Bratzke, H.; Del Tredici, K. Stages in the development of Parkinson’s
disease-related pathology. Cell Tissue Res. 2004, 318, 121–134. [CrossRef] [PubMed]
3. Zhang, W.; Wang, T.; Pei, Z.; Miller, D.S.; Wu, X.; Block, M.L.; Wilson, B.; Zhang, W.; Zhou, Y.; Hong, J.-S.S.;
Zhang, J. Aggregated alpha-synuclein activates microglia: A process leading to disease progression in
Parkinson’s disease. FASEB J. 2005, 19, 533–542. [CrossRef] [PubMed]
4. Stefanis, L. α-Synuclein in Parkinson’s disease. Cold Spring Harb. Perspect. Med. 2012, 2, a009399. [CrossRef]
[PubMed]
59
Brain Sci. 2016, 6, 41
5. Stefanovic, A.N.; Stöckl, M.T.; Claessens, M.M.; Subramaniam, V. α-Synuclein oligomers distinctively
permeabilize complex model membranes. FEBS J. 2014, 281, 2838–2850. [CrossRef] [PubMed]
6. Danzer, K.M.; Haasen, D.; Karow, A.R.; Moussaud, S.; Habeck, M.; Giese, A.; Kretzschmar, H.; Hengerer, B.;
Kostka, M. Different species of alpha-synuclein oligomers induce calcium influx and seeding. J. Neurosci.
2007, 27, 9220–9232. [CrossRef] [PubMed]
7. Luth, E.S.; Stavrovskaya, I.G.; Bartels, T.; Kristal, B.S.; Selkoe, D.J. Soluble, prefibrillar α-synuclein oligomers
promote complex I-dependent, Ca2+-induced mitochondrial dysfunction. J. Biol. Chem. 2014, 289, 21490–21507.
[CrossRef] [PubMed]
8. Volpicelli-Daley, L.A.; Gamble, K.L.; Schultheiss, C.E.; Riddle, D.M.; West, A.B.; Lee, V.M. Formation
of α-synuclein Lewy neurite-like aggregates in axons impedes the transport of distinct endosomes.
Mol. Biol. Cell 2014, 25, 4010–4023. [CrossRef] [PubMed]
9. Lashuel, H.A.; Petre, B.M.; Wall, J.; Simon, M.; Nowak, R.J.; Walz, T.; Lansbury, P.T. Alpha-synuclein,
especially the Parkinson’s disease-associated mutants, forms pore-like annular and tubular protofibrils.
J. Mol. Biol. 2002, 322, 1089–1102. [CrossRef]
10. Hurtig, H.I.; Trojanowski, J.Q.; Galvin, J.; Ewbank, D.; Schmidt, M.L.; Lee, V.M.; Clark, C.M.; Glosser, G.;
Stern, M.B.; Gollomp, S.M.; et al. Alpha-synuclein cortical Lewy bodies correlate with dementia in
Parkinson’s disease. Neurology 2000, 54, 1916–1921. [CrossRef] [PubMed]
11. Tanaka, M.; Kim, Y.M.; Lee, G.; Junn, E.; Iwatsubo, T.; Mouradian, M.M. Aggresomes formed by
alpha-synuclein and synphilin-1 are cytoprotective. J. Biol. Chem. 2004, 279, 4625–4631. [CrossRef] [PubMed]
12. Reeve, A.; Simcox, E.; Turnbull, D. Ageing and Parkinson’s disease: Why is advancing age the biggest risk
factor? Ageing Res. Rev. 2014, 14, 19–30. [CrossRef] [PubMed]
13. Hirsch, E.; Graybiel, A.M.; Agid, Y.A. Melanized dopaminergic neurons are differentially susceptible to
degeneration in Parkinson’s disease. Nature 1988, 334, 345–348. [CrossRef] [PubMed]
14. Dias, V.; Junn, E.; Mouradian, M.M. The role of oxidative stress in Parkinson’s disease. J. Parkinsons Dis.
2013, 3, 461–491. [PubMed]
15. Bharath, S.; Hsu, M.; Kaur, D.; Rajagopalan, S.; Andersen, J.K. Glutathione, iron and Parkinson’s disease.
Biochem. Pharmacol. 2002, 64, 1037–1048. [CrossRef]
16. Venkateshappa, C.; Harish, G.; Mythri, R.B.; Mahadevan, A.; Bharath, M.M.; Shankar, S.K. Increased
oxidative damage and decreased antioxidant function in aging human substantia nigra compared to striatum:
Implications for Parkinson’s disease. Neurochem. Res. 2012, 37, 358–369. [CrossRef] [PubMed]
17. Paolicelli, R.C.; Gross, C.T. Microglia in development: Linking brain wiring to brain environment.
Neuron Glia Biol. 2011, 7, 77–83. [CrossRef] [PubMed]
18. Schafer, D.P.; Lehrman, E.K.; Kautzman, A.G.; Koyama, R.; Mardinly, A.R.; Yamasaki, R.; Ransohoff, R.M.;
Greenberg, M.E.; Barres, B.A.; Stevens, B. Microglia sculpt postnatal neural circuits in an activity and
complement-dependent manner. Neuron 2012, 74, 691–705. [CrossRef] [PubMed]
19. Jurgens, H.A.; Johnson, R.W. Dysregulated neuronal-microglial cross-talk during aging, stress and
inflammation. Exp. Neurol. 2012, 233, 40–48. [CrossRef] [PubMed]
20. Lee, D.C.; Ruiz, C.R.; Lebson, L.; Selenica, M.-L.B.L.; Rizer, J.; Hunt, J.B.; Rojiani, R.; Reid, P.; Kammath, S.;
Nash, K.; et al. Aging enhances classical activation but mitigates alternative activation in the central nervous
system. Neurobiol. Aging 2013, 34, 1610–1620. [CrossRef] [PubMed]
21. Norden, D.M.; Muccigrosso, M.M.; Godbout, J.P. Microglial priming and enhanced reactivity to secondary
insult in aging, and traumatic CNS injury, and neurodegenerative disease. Neuropharmacology 2015, 96, 29–41.
[CrossRef] [PubMed]
22. Hickman, S.E.; Kingery, N.D.; Ohsumi, T.K.; Borowsky, M.L.; Wang, L.C.; Means, T.K.; El Khoury, J.
The microglial sensome revealed by direct RNA sequencing. Nat. Neurosci. 2013, 16, 1896–1905. [CrossRef]
[PubMed]
23. Cho, S.-H.H.; Chen, J.A.; Sayed, F.; Ward, M.E.; Gao, F.; Nguyen, T.A.; Krabbe, G.; Sohn, P.D.; Lo, I.; Minami, S.;
et al. SIRT1 deficiency in microglia contributes to cognitive decline in aging and neurodegeneration via
epigenetic regulation of IL-1β. J. Neurosci. 2015, 35, 807–818. [CrossRef] [PubMed]
24. McGeer, P.L.; Itagaki, S.; Akiyama, H.; McGeer, E.G. Rate of cell death in parkinsonism indicates active
neuropathological process. Ann. Neurol. 1988, 24, 574–576. [CrossRef] [PubMed]
25. Knott, C.; Stern, G.; Wilkin, G.P. Inflammatory regulators in Parkinson’s disease: iNOS, lipocortin-1,
and cyclooxygenases-1 and -2. Mol. Cell. Neurosci. 2000, 16, 724–739. [CrossRef] [PubMed]
60
Brain Sci. 2016, 6, 41
26. Gerhard, A.; Trender-Gerhard, I.; Turkheimer, F.; Quinn, N.P.; Bhatia, K.P.; Brooks, D.J. In vivo imaging of
microglial activation with [11C](R)-PK11195 PET in progressive supranuclear palsy. Mov. Disord. 2006, 21,
89–93. [CrossRef] [PubMed]
27. Goldman, S.M.; Tanner, C.M.; Oakes, D.; Bhudhikanok, G.S.; Gupta, A.; Langston, J.W. Head injury and
Parkinson’s disease risk in twins. Ann. Neurol. 2006, 60, 65–72. [CrossRef] [PubMed]
28. Lawson, L.J.; Perry, V.H.; Dri, P.; Gordon, S. Heterogeneity in the distribution and morphology of microglia
in the normal adult mouse brain. Neuroscience 1990, 39, 151–170. [CrossRef]
29. Sharma, N.; Nehru, B. Characterization of the lipopolysaccharide induced model of Parkinson’s disease:
Role of oxidative stress and neuroinflammation. Neurochem. Int. 2015, 87, 92–105. [CrossRef] [PubMed]
30. Codolo, G.; Plotegher, N.; Pozzobon, T.; Brucale, M.; Tessari, I.; Bubacco, L.; de Bernard, M. Triggering of
inflammasome by aggregated α-synuclein, an inflammatory response in synucleinopathies. PLoS ONE 2013,
8, e55375. [CrossRef] [PubMed]
31. Reynolds, A.D.; Glanzer, J.G.; Kadiu, I.; Ricardo-Dukelow, M.; Chaudhuri, A.; Ciborowski, P.; Cerny, R.;
Gelman, B.; Thomas, M.P.; Mosley, R.L.; et al. Nitrated alpha-synuclein-activated microglial profiling for
Parkinson’s disease. J. Neurochem. 2008, 104, 1504–1525. [CrossRef] [PubMed]
32. Cao, S.; Theodore, S.; Standaert, D.G. Fcγ receptors are required for NF-κB signaling, microglial
activation and dopaminergic neurodegeneration in an AAV-synuclein mouse model of Parkinson’s disease.
Mol. Neurodegener. 2010, 5, 42. [CrossRef] [PubMed]
33. Cao, S.; Standaert, D.G.; Harms, A.S. The gamma chain subunit of Fc receptors is required for
alpha-synuclein-induced pro-inflammatory signaling in microglia. J. Neuroinflamm. 2012, 9, 259. [CrossRef]
[PubMed]
34. Polinski, N.K.; Gombash, S.E.; Manfredsson, F.P.; Lipton, J.W.; Kemp, C.J.; Cole-Strauss, A.; Kanaan, N.M.;
Steece-Collier, K.; Kuhn, N.C.; Wohlgenant, S.L.; et al. Recombinant adenoassociated virus 2/5-mediated
gene transfer is reduced in the aged rat midbrain. Neurobiol. Aging 2015, 36, 1110–1120. [CrossRef] [PubMed]
35. Nash, K.R.; Moran, P.; Finneran, D.J.; Hudson, C.; Robinson, J.; Morgan, D.; Bickford, P.C. Fractalkine over
expression suppresses α-synuclein-mediated neurodegeneration. Mol. Ther. 2015, 23, 17–23. [CrossRef]
[PubMed]
36. Morganti, J.M.; Nash, K.R.; Grimmig, B.A.; Ranjit, S.; Small, B.; Bickford, P.C.; Gemma, C. The soluble isoform
of CX3CL1 is necessary for neuroprotection in a mouse model of Parkinson’s disease. J. Neurosci. 2012, 32,
14592–14601. [CrossRef] [PubMed]
37. Pabon, M.M.; Jernberg, J.N.; Morganti, J.; Contreras, J.; Hudson, C.E.; Klein, R.L.; Bickford, P.C.
A spirulina-enhanced diet provides neuroprotection in an α-synuclein model of Parkinson’s disease.
PLoS ONE 2012, 7, e45256. [CrossRef] [PubMed]
38. Pabon, M.M.; Bachstetter, A.D.; Hudson, C.E.; Gemma, C.; Bickford, P.C. CX3CL1 reduces neurotoxicity and
microglial activation in a rat model of Parkinson’s disease. J. Neuroinflamm. 2011, 8, 9. [CrossRef] [PubMed]
39. Rees, K.; Stowe, R.; Patel, S.; Ives, N.; Breen, K.; Clarke, C.E.; Ben-Shlomo, Y. Non-steroidal anti-inflammatory
drugs as disease-modifying agents for Parkinson’s disease: Evidence from observational studies.
Cochrane Database Syst. Rev. 2011, 11, CD008454. [PubMed]
40. Du, Y.; Ma, Z.; Lin, S.; Dodel, R.C.; Gao, F.; Bales, K.R.; Triarhou, L.C.; Chernet, E.; Perry, K.W.;
Nelson, D.L.; et al. Minocycline prevents nigrostriatal dopaminergic neurodegeneration in the MPTP
model of Parkinson’s disease. Proc. Natl. Acad. Sci. USA 2001, 98, 14669–14674. [CrossRef] [PubMed]
41. Lee, S.M.; Yune, T.Y.; Kim, S.J.; Kim, Y.C.; Oh, Y.J.; Markelonis, G.J.; Oh, T.H. Minocycline inhibits apoptotic
cell death via attenuation of TNF-alpha expression following iNOS/NO induction by lipopolysaccharide in
neuron/glia co-cultures. J. Neurochem. 2004, 91, 568–578. [CrossRef] [PubMed]
42. Jones, B.A.; Beamer, M.; Ahmed, S. Fractalkine/CX3CL1: A potential new target for inflammatory diseases.
Mol. Interv. 2010, 10, 263–270. [CrossRef] [PubMed]
43. Cardona, A.E.; Pioro, E.P.; Sasse, M.E.; Kostenko, V.; Cardona, S.M.; Dijkstra, I.M.; Huang, D.; Kidd, G.;
Dombrowski, S.; Dutta, R.; et al. Control of microglial neurotoxicity by the fractalkine receptor. Nat. Neurosci.
2006, 9, 917–924. [CrossRef] [PubMed]
44. Thome, A.D.; Standaert, D.G.; Harms, A.S. Fractalkine signaling regulates the inflammatory response in
an α-synuclein model of Parkinson disease. PLoS ONE 2015, 10, e0140566. [CrossRef] [PubMed]
61
Brain Sci. 2016, 6, 41
45. Nash, K.R.; Lee, D.C.; Hunt, J.B.; Morganti, J.M.; Selenica, M.-L.L.; Moran, P.; Reid, P.; Brownlow, M.;
Yang, C.G.; Savalia, M.; et al. Fractalkine overexpression suppresses tau pathology in a mouse model of
tauopathy. Neurobiol. Aging 2013, 34, 1540–1548. [CrossRef] [PubMed]
46. Lee, S.; Xu, G.; Jay, T.R.; Bhatta, S.; Kim, K.-W.W.; Jung, S.; Landreth, G.E.; Ransohoff, R.M.; Lamb, B.T.
Opposing effects of membrane-anchored CX3CL1 on amyloid and tau pathologies via the p38 MAPK
pathway. J. Neurosci. 2014, 34, 12538–12546. [CrossRef] [PubMed]
47. Norden, D.M.; Godbout, J.P. Review: Microglia of the aged brain: Primed to be activated and resistant to
regulation. Neuropathol. Appl. Neurobiol. 2013, 39, 19–34. [CrossRef] [PubMed]
48. Bachstetter, A.D.; Morganti, J.M.; Jernberg, J.; Schlunk, A.; Mitchell, S.H.; Brewster, K.W.; Hudson, C.E.;
Cole, M.J.; Harrison, J.K.; Bickford, P.C.; et al. Fractalkine and CX 3 CR1 regulate hippocampal neurogenesis
in adult and aged rats. Neurobiol. Aging 2011, 32, 2030–2044. [CrossRef] [PubMed]
49. Wynne, A.M.; Henry, C.J.; Huang, Y.; Cleland, A.; Godbout, J.P. Protracted downregulation of CX3CR1
on microglia of aged mice after lipopolysaccharide challenge. Brain Behav. Immun. 2010, 24, 1190–1201.
[CrossRef] [PubMed]
50. Surmeier, D.J.; Guzman, J.N.; Sanchez-Padilla, J. Calcium, cellular aging, and selective neuronal vulnerability
in Parkinson’s disease. Cell Calcium 2010, 47, 175–182. [CrossRef] [PubMed]
51. Surmeier, D.; Guzman, J.; Sanchez-Padilla, J.; Goldberg, J. What causes the death of dopaminergic neurons
in Parkinson’s Disease? Prog. Brain Res. 2010, 183, 59–77. [PubMed]
52. Kim, Y.H.; Koh, H.-K.K.; Kim, D.-S.S. Down-regulation of IL-6 production by astaxanthin via ERK-, MSK-,
and NF-κB-mediated signals in activated microglia. Int. Immunopharmacol. 2010, 10, 1560–1572. [CrossRef]
[PubMed]
53. Liu, X.; Shibata, T.; Hisaka, S.; Osawa, T. Astaxanthin inhibits reactive oxygen species-mediated cellular
toxicity in dopaminergic SH-SY5Y cells via mitochondria-targeted protective mechanism. Brain Res. 2009,
1254, 18–27. [CrossRef] [PubMed]
54. Lee, D.-H.H.; Kim, C.-S.S.; Lee, Y.J. Astaxanthin protects against MPTP/MPP+-induced mitochondrial
dysfunction and ROS production in vivo and in vitro. Food Chem. Toxicol. 2011, 49, 271–280. [CrossRef]
[PubMed]
55. Kidd, P. Astaxanthin, a cell membrane nutrient with diverse clinical benefits and anti aging potential.
Am. Med. Rev. 2011, 16, 355–364.
56. Park, J.; Mathison, B.; Hayek, M.; Zhang, J.; Reinhart, G.; Chew, B. Astaxanthin modulates age-associated
mitochondrial dysfunction in healthy dogs. J. Anim. Sci. 2012, 91, 268275. [CrossRef] [PubMed]
57. Otton, R.; Marin, D.P.; Bolin, A.P.; Santos, R.C.; Polotow, T.G.; Sampaio, S.C.; de Barros, M.P. Astaxanthin
ameliorates the redox imbalance in lymphocytes of experimental diabetic rats. Chem. Biol. Interact. 2010, 186,
306–315. [CrossRef] [PubMed]
58. Augusti, P.R.; Quatrin, A.; Somacal, S.; Conterato, G.M.; Sobieski, R.; Ruviaro, A.R.; Maurer, L.H.;
Duarte, M.M.; Roehrs, M.; Emanuelli, T. Astaxanthin prevents changes in the activities of thioredoxin
reductase and paraoxonase in hypercholesterolemic rabbits. J. Clin. Biochem. Nutr. 2012, 51, 42–49. [CrossRef]
[PubMed]
59. Li, Z.; Dong, X.; Liu, H.; Chen, X.; Shi, H.; Fan, Y.; Hou, D.; Zhang, X. Astaxanthin protects ARPE-19 cells
from oxidative stress via upregulation of Nrf2-regulated phase II enzymes through activation of PI3K/Akt.
Mol. Vis. 2013, 19, 1656–1666. [PubMed]
60. Wang, H.-Q.Q.; Sun, X.-B.B.; Xu, Y.-X.X.; Zhao, H.; Zhu, Q.-Y.Y.; Zhu, C.-Q.Q. Astaxanthin upregulates heme
oxygenase-1 expression through ERK1/2 pathway and its protective effect against beta-amyloid-induced
cytotoxicity in SH-SY5Y cells. Brain Res. 2010, 1360, 159–167. [CrossRef] [PubMed]
61. Brunk, U.T.; Terman, A. The mitochondrial-lysosomal axis theory of aging: Accumulation of damaged
mitochondria as a result of imperfect autophagocytosis. Eur. J. Biochem. 2002, 269, 1996–2002. [CrossRef]
[PubMed]
62. Collier, T.J.; Kanaan, N.M.; Kordower, J.H. Ageing as a primary risk factor for Parkinson’s disease: Evidence
from studies of non-human primates. Nat. Rev. Neurosci. 2011, 12, 359–366. [CrossRef] [PubMed]
63. Qin, Y.; Sun, X.; Shao, X.; Cheng, C.; Feng, J.; Sun, W.; Gu, D.; Liu, W.; Xu, F.; Duan, Y. Macrophage-microglia
networks drive M1 microglia polarization after mycobacterium infection. Inflammation 2015, 38, 1609–1616.
[CrossRef] [PubMed]
62
Brain Sci. 2016, 6, 41
64. Minogue, A.M.; Jones, R.S.; Kelly, R.J.; McDonald, C.L.; Connor, T.J.; Lynch, M.A. Age-associated
dysregulation of microglial activation is coupled with enhanced blood-brain barrier permeability and
pathology in APP/PS1 mice. Neurobiol. Aging 2014, 35, 1442–1452. [CrossRef] [PubMed]
65. Choi, S.-K.K.; Park, Y.-S.S.; Choi, D.-K.K.; Chang, H.-I.I. Effects of astaxanthin on the production of NO and
the expression of COX-2 and iNOS in LPS-stimulated BV2 microglial cells. J. Microbiol. Biotechnol. 2008, 18,
1990–1996. [PubMed]
66. Sanchez-Padilla, J.; Guzman, J.N.; Ilijic, E.; Kondapalli, J.; Galtieri, D.J.; Yang, B.; Schieber, S.; Oertel, W.;
Wokosin, D.; Schumacker, P.T.; et al. Mitochondrial oxidant stress in locus coeruleus is regulated by activity
and nitric oxide synthase. Nat. Neurosci. 2014, 17, 832–840. [CrossRef] [PubMed]
67. Dryanovski, D.I.; Guzman, J.N.; Xie, Z.; Galteri, D.J.; Volpicelli-Daley, L.A.; Lee, V.M.; Miller, R.J.;
Schumacker, P.T.; Surmeier, D.J. Calcium entry and α-synuclein inclusions elevate dendritic mitochondrial
oxidant stress in dopaminergic neurons. J. Neurosci. 2013, 33, 10154–10164. [CrossRef] [PubMed]
68. Surmeier, D.J.; Guzman, J.N.; Sanchez-Padilla, J.; Schumacker, P.T. The role of calcium and mitochondrial
oxidant stress in the loss of substantia nigra pars compacta dopaminergic neurons in Parkinson’s disease.
Neuroscience 2011, 198, 221–231. [CrossRef] [PubMed]
69. Parkinson Study Group. Phase II safety, tolerability, and dose selection study of isradipine as a potential
disease-modifying intervention in early Parkinson’s disease (STEADY-PD). Mov. Disord. 2013, 28, 1823–1831.
70. Wolf, A.M.; Asoh, S.; Hiranuma, H.; Ohsawa, I.; Iio, K.; Satou, A.; Ishikura, M.; Ohta, S. Astaxanthin protects
mitochondrial redox state and functional integrity against oxidative stress. J. Nutr. Biochem. 2010, 21, 381–389.
[CrossRef] [PubMed]
71. Ye, Q.; Huang, B.; Zhang, X.; Zhu, Y.; Chen, X. Astaxanthin protects against MPP(+)-induced oxidative stress
in PC12 cells via the HO-1/NOX2 axis. BMC Neurosci. 2012, 13, 156. [CrossRef] [PubMed]
© 2016 by the authors. Licensee MDPI, Basel, Switzerland. This article is an open access
article distributed under the terms and conditions of the Creative Commons Attribution
(CC BY) license (http://creativecommons.org/licenses/by/4.0/).
63
brainsciences
Article
Prior Binge Ethanol Exposure Potentiates theMicroglial Response in a Model ofAlcohol-Induced Neurodegeneration
Simon Alex Marshall 1, Chelsea Rhea Geil 2 and Kimberly Nixon 2,*
1 Department of Psychology & Neuroscience; University of North Carolina-Chapel Hill, Chapel Hill,
NC 27599, USA; [email protected] Department of Pharmaceutical Sciences, College of Pharmacy, University of Kentucky, Lexington,
KY 40536, USA; [email protected]
* Correspondence: [email protected]; Tel.: +1-859-215-1025
Academic Editor: Donna Gruol
Received: 5 April 2016; Accepted: 16 May 2016; Published: 26 May 2016
Abstract: Excessive alcohol consumption results in neurodegeneration which some hypothesize is
caused by neuroinflammation. One characteristic of neuroinflammation is microglial activation,
but it is now well accepted that microglial activation may be pro- or anti-inflammatory. Recent
work indicates that the Majchrowicz model of alcohol-induced neurodegeneration results in
anti-inflammatory microglia, while intermittent exposure models with lower doses and blood alcohol
levels produce microglia with a pro-inflammatory phenotype. To determine the effect of a repeated
binge alcohol exposure, rats received two cycles of the four-day Majchrowicz model. One hemisphere
was then used to assess microglia via immunohistochemistry and while the other was used for ELISAs
of cytokines and growth factors. A single binge ethanol exposure resulted in low-level of microglial
activation; however, a second binge potentiated the microglial response. Specifically, double binge
rats had greater OX-42 immunoreactivity, increased ionized calcium-binding adapter molecule 1
(Iba-1+) cells, and upregulated tumor necrosis factor-α (TNF-α) compared with the single binge
ethanol group. These data indicate that prior ethanol exposure potentiates a subsequent microglia
response, which suggests that the initial exposure to alcohol primes microglia. In summary, repeated
ethanol exposure, independent of other immune modulatory events, potentiates microglial activity.
Keywords: alcohol; ethanol; microglia; cytokines; TNF-alpha; alcoholism; microglial priming;
neurodegeneration
1. Introduction
Nearly 14% of the United States population meets the diagnostic criteria for an alcohol use
disorder (AUD) in any given year [1]. Excessive alcohol consumption produces neurodegeneration
in humans [2–4], an effect that has been confirmed in various pre-clinical models [5–8]. Due to its
preventable nature, alcoholism traditionally has not been defined as a neurodegenerative disorder, but
chronic, excessive consumption may cause damage in the temporal lobe on par with diseases such
as Alzheimer’s [4]. Indeed, alcoholic-related dementia is the second leading cause of dementia in
the United States only behind Alzheimer’s disease [9,10]. Even in the absence of dementia, cognitive
deficits such as increased impulsivity and impaired executive decision-making are found in many with
AUDs [11,12]. Alcohol-induced neurodegeneration and the associated cognitive deficits are thought to
be critical factors in the development of AUDs [13–15].
Brain Sci. 2016, 6, 16 64 www.mdpi.com/journal/brainsci
Brain Sci. 2016, 6, 16
Despite the number of reports in human and preclinical models describing the neurotoxic effects
of alcohol, the mechanism of how alcohol produces neurodegeneration is unclear [16]. One such
mechanism that has recently gained attention is the impact of excessive alcohol consumption on the
neuroimmune system, and particularly, microglia [17,18]. Analysis of the brains of human alcoholics
suggests that excessive alcohol consumption leads to microglial activation [19–21], but whether this
activation is the cause or consequence of alcohol-induced neurodegeneration is an active debate [22].
This discussion is due, in part, to a lack of understanding of the effect of alcohol on microglia coupled
with the recent appreciation of the role of microglia in both neurodegenerative and regenerative
processes [22–25]. Although microglia have historically been discussed as the phagocytes of the central
nervous system (CNS), these cells are far more complex, existing in a continuum of phenotypes or stages
of activation [26]. Microglia are constantly surveying the parenchyma in non-pathological conditions;
where in response to even a subtle change in their environment, microglia alter their morphological
and functional characteristics, a process termed microglial activation [27]. The nomenclature for
these stages or phenotypes vary. Terms like M1 and classical activation are applied when microglia
have an amoeboid morphology and secrete pro-inflammatory cytokines, whereas M2 and alternative
activation are used to describe microglia with bushier ramifications that secrete anti-inflammatory
cytokines [26,28]. In neurodegenerative diseases where microglial activation drives neuronal loss,
microglia are generally fully or classically activated (i.e., M1 phenotype), secreting pro-inflammatory
factors and undergoing uncontrolled phagocytosis [25,29]. How alcohol affects microglia is not well
described and appears to vary depending on the model. Most reports of alcohol-induced microglia
activation assume that all activated microglia are pro-inflammatory [19,23,30]. However, in the one
model with alcohol-induced neurodegeneration, the Majchrowicz four-day binge model, only a low
level of activation or alternative (M2) phenotype has been observed [22,24,31].
The variability of microglial phenotypes observed across different AUD models may be due to the
pattern of alcohol exposure, specifically intermittent versus sustained intoxication. Interestingly, the
intermittent exposure models show stronger evidence of pro-inflammatory microglia even with lower
doses of ethanol [22,30]. These disparate findings across models led us to question whether the initial hit
of alcohol exposure “primes” microglia such that intermittent exposure leads to a potentiated response.
Primed microglia have similar morphology and cytokine/growth factor profiles as the M2/alternative
microglia, but primed microglial activation is potentiated when subsequent neuroimmunomodulators
are applied [28,32,33]. Ethanol’s ability to prime microglia and exacerbate the neuroimmune response
to subsequent neuroimmune stimuli is suggested also by the enhanced microglia response to LPS
following alcohol exposure [23,34,35]. However, the ability of a second “hit” or insult of ethanol to
potentiate the neuroimmune response (independent of peripheral immunomodulators) has not been
examined. Therefore, the current study determines whether a second binge ethanol exposure can
potentiate the microglia response to binge alcohol exposure. Investigating whether repeated ethanol
exposure differentially affects microglia is important considering that the majority of individuals
suffering from an AUD drink in a binge pattern that produces periods of high BECs interspersed with
periods of withdrawal and abstinence [36–38]. Specifically, this study examines both functional and
morphological indices of microglial activation in the hippocampus and entorhinal cortex, regions
consistently damaged in this model [7,8].
2. Materials and Methods
2.1. Alcohol Administration Model
A total of 33 adult male Sprague-Dawley rats (Table 1; Charles River Laboratories; Raleigh, NC,
USA) were used in these experiments. Procedures performed were approved by the University of
Kentucky Institutional Animal Care and Use Committee (protocol #2008-0321, approved 20/6/2008)
and conformed to the Guidelines for the Care and Use of Laboratory Animals [39]. Animals weighed
approximately 275–300 g at arrival and were pair-housed in a University of Kentucky AALAC
65
Brain Sci. 2016, 6, 16
accredited vivarium with a 12 h light:dark cycle. Rats were allowed to acclimate to the vivarium
for two days followed by three days of handling before any experimentation. Except during the
binge periods, animals had ad libitum food and water access. Following acclimation, rats underwent
a modified version of the Majchrowicz AUD model similar to previously published reports [40–42];
however, animals used in this study underwent the Majchrowicz 4-day paradigm twice separated
by seven days. Rats were divided into four groups of comparable weights as summarized in Table 1.
Briefly, rats were gavaged intragastrically with either ethanol (25% w/v) or control diet (isocaloric
dextrose) in Vanilla Ensure Plus® (Abbott Laboratories; Chicago, IL, USA) every 8 h. Initially, each
rat in an ethanol group received 5 g/kg of ethanol, but subsequent doses were titrated using the
individual rat’s behavioral intoxication score on a six-point scale identical to previous reports [40].
Control rats received an average of the volume given to the ethanol group. All rats were then given
seven days of recovery with ad libitum access to food and water. A seven-day recovery period was
chosen because microglial activation is elevated for a week after ethanol exposure [22], and seven
days allowed animals to recover from withdrawal and regain body mass lost during the prior binge.
Thus, on the 11th day, the Majchrowicz binge model was repeated with rats receiving either ethanol or
control diet (Table 1). A separate group had ad libitum access to food and water throughout all periods.
For all groups, body weights were assessed daily during the binge procedures. The percent difference
in weight at the start and end of the 15-day treatment period was calculated.
Table 1. Experimental Design.
Group Binge 1 (4 Days) Recovery (7 Days) Binge 2 (4 Days)
Con/Con (n = 10) Control Diet Control DietCon/EtOH (n = 11) Control Diet Ad libitum chow Ethanol DietEtOH/EtOH (n = 8) Ethanol Diet Ethanol Diet
Ad libitum (n = 4) N/A N/A
2.2. Blood Ethanol Concentration Determination
To determine blood ethanol concentrations (BECs), tail blood was collected ninety minutes after
the seventh session of ethanol dosing during Binge 1 and/or at euthanasia (Binge 2). Bloods were
centrifuged for 5 min at 1800 ˆ g to separate plasma from red blood cells and immediately stored
at ´20 ˝C. BECs were determined from supernatant serum on an AM1 Alcohol Analyser (Analox;
London, UK) calibrated against a 300 mg/dL external standard. Each sample was run in triplicate and
the average of these runs was calculated and expressed in mg/dL ˘ SEM.
2.3. Tissue Processing
Rats were euthanized within 2–4 h of their final gavage by rapid decapitation. Brains were
extracted and dissected into two hemispheres on ice. The left hemisphere was fixed by immersion in
4% paraformaldehyde in phosphate buffer (pH = 7.4) for 2 h, rinsed and stored in phosphate buffered
saline at 4 ˝C until use in immunohistochemical experiments. The right hemisphere was further
dissected to remove the hippocampus and entorhinal cortex. Extracted regions were snap frozen on
dry ice and stored at ´80 ˝C until use in enzyme linked immunosorbent assays (ELISAs).
2.4. Immunohistochemistry
Immunohistochemical procedures were similar to previous reports [22,31]. The left hemisphere
was sectioned in a 1:12 series at 40 μm thickness with a vibrating microtome (Leica VT1000S; Wetzlar,
Germany) and sections were stored in cryoprotectant at ´20 ˝C. Adjacent series of every 12th section
were processed for immunohistochemistry. Briefly, after a series of washes (TBS, pH = 7.5), quenching
of endogenous peroxidases (0.6% H2O2 in TBS) and blocking of nonspecific antibody binding (TBS,
0.1% triton X-100, and 3% horse or goat serum as appropriate), tissue series was incubated overnight in
66
Brain Sci. 2016, 6, 16
one of the following primary antibodies at 4 ˝C: mouse anti-OX-42 (1:1000; Serotec MCA275; Raleigh,
NC, USA), mouse anti-ED-1 (1:500; Serotec MCA341), mouse anti-OX-6 (1:500; Serotec, MC2687), or
rabbit anti-Iba-1 (1:1000; Wako, 019-19741; Richmond, VA, USA). Primaries were chosen for their
specificity for microglia phenotypes [26,43]. OX-42 was selected as a marker of microglial activation
because it recognizes cluster of differentiation molecule 11b/c (CD11b/c) of complement receptor 3
(CR3), which is constitutively expressed in microglia; however, upregulation of CD11b/c is one of the
first indications of microglial activation [44–46]. Both ED-1 and OX-6 are selective for more classical
forms of microglial activation [26]. ED-1 recognizes the lysosomal membranes of microglia and is
thought to be an indication of phagocytic activity [47]. OX-6, however, is an antibody against the
major histocompatibility complex-II that elicits T-helper cell activation [26,48]. The Iba-1 antibody
was selected because it recognizes a calcium binding protein expressed in all microglia [49]. Sections
were incubated in secondary antibody (biotinylated horse anti-mouse, rat adsorbed, or biotinylated
goat anti-rabbit, Vector Laboratories, Burlingame, CA, USA), avidin-biotin-peroxidase complex
(ABC Elite Kit, Vector Laboratories) and the chromagen, nickel-enhanced 3,31-diaminobenzidine
tetrahydrochloride (Polysciences; Warrington, PA, USA), as previously described [22,31]. Following
the final wash, all processed sections were mounted onto glass slides, dried and coverslipped with
Cytoseal® (Stephens Scientific, Wayne, NJ, USA).
During quantification, slides were coded to ensure the experimenter was blind to treatment
condition. To determine OX-42 immunoreactivity, images of the hippocampus (Bregma ´2.50 and
´4.00 mm) or entorhinal cortex (Bregma ´3.00 and ´6.00 mm) were obtained with a 10ˆ objective on
an Olympus BX-51 microscope (Olympus, Center Valley, PA, USA) linked to a motorized stage (Prior,
Rockland, MA, USA), microcator and DP70 digital camera (Olympus) [50]. OX-42 immunoreactivity
was determined by optical density with Visiomorph™ (Visiopharm, Hørsholm, Denmark). Subregions
of the hippocampus (dentate gyrus (DG), cornu amonis (CA1 and CA2/3)) and the entorhinal cortex
were traced separately and the percent area of OX-42 immunopositive pixels within each region of
interest was determined. Immunoreactivity was then normalized to the ad libitum control group and
expressed as percent of control.
For ED-1 or OX-6 immunohistochemistry, sections were qualitatively assessed in the hippocampus
and entorhinal cortex as in past reports [22]. To determine the impact of ethanol on microglia number,
Iba-1+ cells were counted within the hippocampus and the entorhinal cortex. Iba-1+ cells within
the subregions of the hippocampus were estimated by unbiased stereological methods as previously
reported [22,51]. NewCAST™ Stereology software (Visiopharm version 3.6.4.0) coupled to the same
Olympus BX-51 microscope system above applied a 70 μm ˆ 70 μm counting frame and cells were
randomly sampled using a 20 μm dissector height with 2 μm guard zones within the CA1 (400 μm x,y
step length), CA2/3 (250 μm x,y step length), and DG (250 μm x,y step length). Total Iba-1+ cells were
calculated using the equation (1):
N “ÿ
Q ˆ 1{asf ˆ 1{tsf ˆ 1{ssf (1)
where Q is the number of cells counted, asf is the area sampling fraction, tsf is the thickness sampling
fraction, and ssf is the section sampling fraction [52]. Coefficients of error ranged from 0.011 to 0.039
and averaged 0.023 ˘ 0.001. For the entorhinal cortex, microglia number was determined using a profile
counting method [53]. Images of the entorhinal cortex were collected with a 10ˆ objective using a SPOT
Advanced™ camera (SPOT Imaging Solutions, Sterling Heights, MI, USA). Iba-1+ cells were quantified
in collected images by an automated counting system (Image Pro Plus 6.3; Media Cybernetics, Rockville,
MD, USA) and expressed as mean Iba-1+ cells/section ˘ SEM as previously described [22].
2.5. Enzyme Linked Immunosorbent Assay
Hippocampus and entorhinal cortex from the right hemisphere were processed for ELISA as
reported previously [22,54]. Briefly, tissues were homogenized in an ice-cold lysis buffer (1 mL of
67
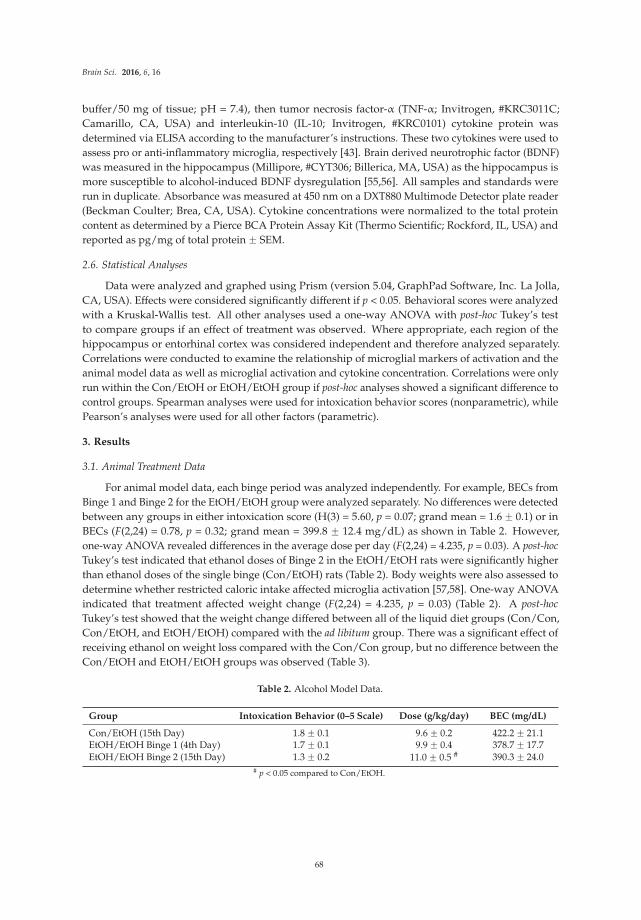
Brain Sci. 2016, 6, 16
buffer/50 mg of tissue; pH = 7.4), then tumor necrosis factor-α (TNF-α; Invitrogen, #KRC3011C;
Camarillo, CA, USA) and interleukin-10 (IL-10; Invitrogen, #KRC0101) cytokine protein was
determined via ELISA according to the manufacturer’s instructions. These two cytokines were used to
assess pro or anti-inflammatory microglia, respectively [43]. Brain derived neurotrophic factor (BDNF)
was measured in the hippocampus (Millipore, #CYT306; Billerica, MA, USA) as the hippocampus is
more susceptible to alcohol-induced BDNF dysregulation [55,56]. All samples and standards were
run in duplicate. Absorbance was measured at 450 nm on a DXT880 Multimode Detector plate reader
(Beckman Coulter; Brea, CA, USA). Cytokine concentrations were normalized to the total protein
content as determined by a Pierce BCA Protein Assay Kit (Thermo Scientific; Rockford, IL, USA) and
reported as pg/mg of total protein ˘ SEM.
2.6. Statistical Analyses
Data were analyzed and graphed using Prism (version 5.04, GraphPad Software, Inc. La Jolla,
CA, USA). Effects were considered significantly different if p < 0.05. Behavioral scores were analyzed
with a Kruskal-Wallis test. All other analyses used a one-way ANOVA with post-hoc Tukey’s test
to compare groups if an effect of treatment was observed. Where appropriate, each region of the
hippocampus or entorhinal cortex was considered independent and therefore analyzed separately.
Correlations were conducted to examine the relationship of microglial markers of activation and the
animal model data as well as microglial activation and cytokine concentration. Correlations were only
run within the Con/EtOH or EtOH/EtOH group if post-hoc analyses showed a significant difference to
control groups. Spearman analyses were used for intoxication behavior scores (nonparametric), while
Pearson’s analyses were used for all other factors (parametric).
3. Results
3.1. Animal Treatment Data
For animal model data, each binge period was analyzed independently. For example, BECs from
Binge 1 and Binge 2 for the EtOH/EtOH group were analyzed separately. No differences were detected
between any groups in either intoxication score (H(3) = 5.60, p = 0.07; grand mean = 1.6 ˘ 0.1) or in
BECs (F(2,24) = 0.78, p = 0.32; grand mean = 399.8 ˘ 12.4 mg/dL) as shown in Table 2. However,
one-way ANOVA revealed differences in the average dose per day (F(2,24) = 4.235, p = 0.03). A post-hoc
Tukey’s test indicated that ethanol doses of Binge 2 in the EtOH/EtOH rats were significantly higher
than ethanol doses of the single binge (Con/EtOH) rats (Table 2). Body weights were also assessed to
determine whether restricted caloric intake affected microglia activation [57,58]. One-way ANOVA
indicated that treatment affected weight change (F(2,24) = 4.235, p = 0.03) (Table 2). A post-hoc
Tukey’s test showed that the weight change differed between all of the liquid diet groups (Con/Con,
Con/EtOH, and EtOH/EtOH) compared with the ad libitum group. There was a significant effect of
receiving ethanol on weight loss compared with the Con/Con group, but no difference between the
Con/EtOH and EtOH/EtOH groups was observed (Table 3).
Table 2. Alcohol Model Data.
Group Intoxication Behavior (0–5 Scale) Dose (g/kg/day) BEC (mg/dL)
Con/EtOH (15th Day) 1.8 ˘ 0.1 9.6 ˘ 0.2 422.2 ˘ 21.1EtOH/EtOH Binge 1 (4th Day) 1.7 ˘ 0.1 9.9 ˘ 0.4 378.7 ˘ 17.7EtOH/EtOH Binge 2 (15th Day) 1.3 ˘ 0.2 11.0 ˘ 0.5 # 390.3 ˘ 24.0
# p < 0.05 compared to Con/EtOH.
68
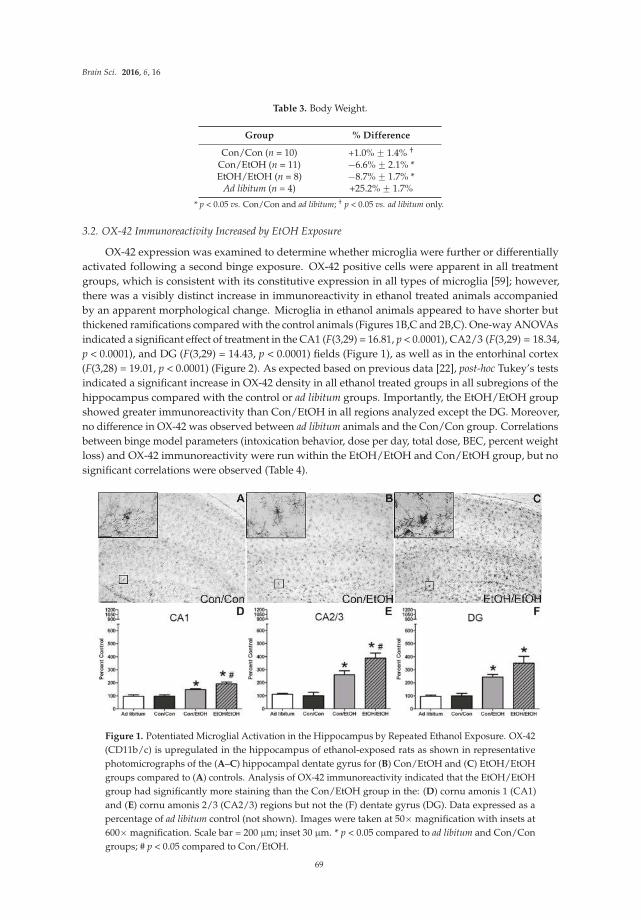
Brain Sci. 2016, 6, 16
Table 3. Body Weight.
Group % Difference
Con/Con (n = 10) +1.0% ˘ 1.4% †
Con/EtOH (n = 11) ´6.6% ˘ 2.1% *EtOH/EtOH (n = 8) ´8.7% ˘ 1.7% *
Ad libitum (n = 4) +25.2% ˘ 1.7%
* p < 0.05 vs. Con/Con and ad libitum; † p < 0.05 vs. ad libitum only.
3.2. OX-42 Immunoreactivity Increased by EtOH Exposure
OX-42 expression was examined to determine whether microglia were further or differentially
activated following a second binge exposure. OX-42 positive cells were apparent in all treatment
groups, which is consistent with its constitutive expression in all types of microglia [59]; however,
there was a visibly distinct increase in immunoreactivity in ethanol treated animals accompanied
by an apparent morphological change. Microglia in ethanol animals appeared to have shorter but
thickened ramifications compared with the control animals (Figures 1B,C and 2B,C). One-way ANOVAs
indicated a significant effect of treatment in the CA1 (F(3,29) = 16.81, p < 0.0001), CA2/3 (F(3,29) = 18.34,
p < 0.0001), and DG (F(3,29) = 14.43, p < 0.0001) fields (Figure 1), as well as in the entorhinal cortex
(F(3,28) = 19.01, p < 0.0001) (Figure 2). As expected based on previous data [22], post-hoc Tukey’s tests
indicated a significant increase in OX-42 density in all ethanol treated groups in all subregions of the
hippocampus compared with the control or ad libitum groups. Importantly, the EtOH/EtOH group
showed greater immunoreactivity than Con/EtOH in all regions analyzed except the DG. Moreover,
no difference in OX-42 was observed between ad libitum animals and the Con/Con group. Correlations
between binge model parameters (intoxication behavior, dose per day, total dose, BEC, percent weight
loss) and OX-42 immunoreactivity were run within the EtOH/EtOH and Con/EtOH group, but no
significant correlations were observed (Table 4).
Figure 1. Potentiated Microglial Activation in the Hippocampus by Repeated Ethanol Exposure. OX-42
(CD11b/c) is upregulated in the hippocampus of ethanol-exposed rats as shown in representative
photomicrographs of the (A–C) hippocampal dentate gyrus for (B) Con/EtOH and (C) EtOH/EtOH
groups compared to (A) controls. Analysis of OX-42 immunoreactivity indicated that the EtOH/EtOH
group had significantly more staining than the Con/EtOH group in the: (D) cornu amonis 1 (CA1)
and (E) cornu amonis 2/3 (CA2/3) regions but not the (F) dentate gyrus (DG). Data expressed as a
percentage of ad libitum control (not shown). Images were taken at 50ˆ magnification with insets at
600ˆ magnification. Scale bar = 200 μm; inset 30 μm. * p < 0.05 compared to ad libitum and Con/Con
groups; # p < 0.05 compared to Con/EtOH.
69
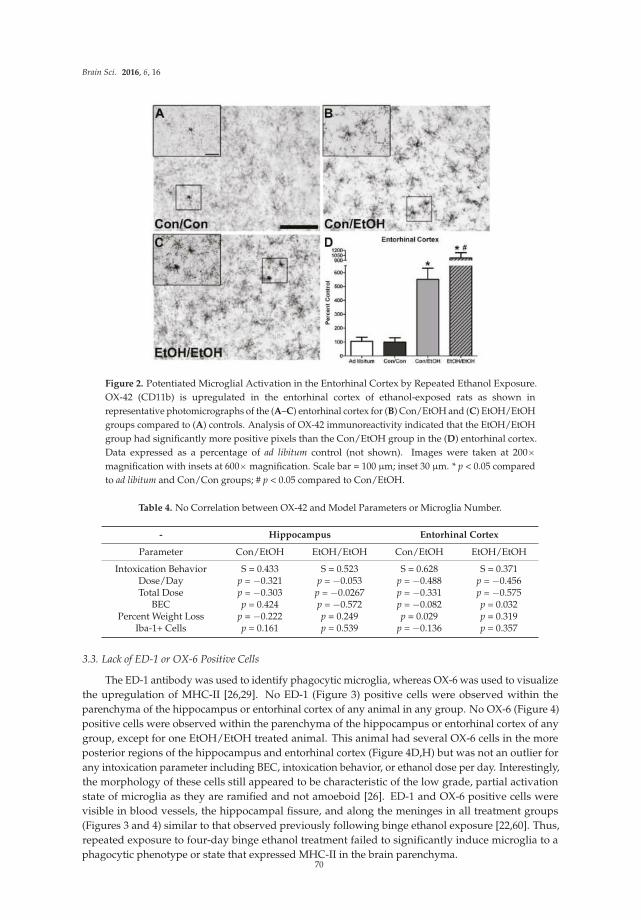
Brain Sci. 2016, 6, 16
Figure 2. Potentiated Microglial Activation in the Entorhinal Cortex by Repeated Ethanol Exposure.
OX-42 (CD11b) is upregulated in the entorhinal cortex of ethanol-exposed rats as shown in
representative photomicrographs of the (A–C) entorhinal cortex for (B) Con/EtOH and (C) EtOH/EtOH
groups compared to (A) controls. Analysis of OX-42 immunoreactivity indicated that the EtOH/EtOH
group had significantly more positive pixels than the Con/EtOH group in the (D) entorhinal cortex.
Data expressed as a percentage of ad libitum control (not shown). Images were taken at 200ˆ
magnification with insets at 600ˆ magnification. Scale bar = 100 μm; inset 30 μm. * p < 0.05 compared
to ad libitum and Con/Con groups; # p < 0.05 compared to Con/EtOH.
Table 4. No Correlation between OX-42 and Model Parameters or Microglia Number.
- Hippocampus Entorhinal Cortex
Parameter Con/EtOH EtOH/EtOH Con/EtOH EtOH/EtOH
Intoxication Behavior S = 0.433 S = 0.523 S = 0.628 S = 0.371Dose/Day p = ´0.321 p = ´0.053 p = ´0.488 p = ´0.456Total Dose p = ´0.303 p = ´0.0267 p = ´0.331 p = ´0.575
BEC p = 0.424 p = ´0.572 p = ´0.082 p = 0.032Percent Weight Loss p = ´0.222 p = 0.249 p = 0.029 p = 0.319
Iba-1+ Cells p = 0.161 p = 0.539 p = ´0.136 p = 0.357
3.3. Lack of ED-1 or OX-6 Positive Cells
The ED-1 antibody was used to identify phagocytic microglia, whereas OX-6 was used to visualize
the upregulation of MHC-II [26,29]. No ED-1 (Figure 3) positive cells were observed within the
parenchyma of the hippocampus or entorhinal cortex of any animal in any group. No OX-6 (Figure 4)
positive cells were observed within the parenchyma of the hippocampus or entorhinal cortex of any
group, except for one EtOH/EtOH treated animal. This animal had several OX-6 cells in the more
posterior regions of the hippocampus and entorhinal cortex (Figure 4D,H) but was not an outlier for
any intoxication parameter including BEC, intoxication behavior, or ethanol dose per day. Interestingly,
the morphology of these cells still appeared to be characteristic of the low grade, partial activation
state of microglia as they are ramified and not amoeboid [26]. ED-1 and OX-6 positive cells were
visible in blood vessels, the hippocampal fissure, and along the meninges in all treatment groups
(Figures 3 and 4) similar to that observed previously following binge ethanol exposure [22,60]. Thus,
repeated exposure to four-day binge ethanol treatment failed to significantly induce microglia to a
phagocytic phenotype or state that expressed MHC-II in the brain parenchyma.70
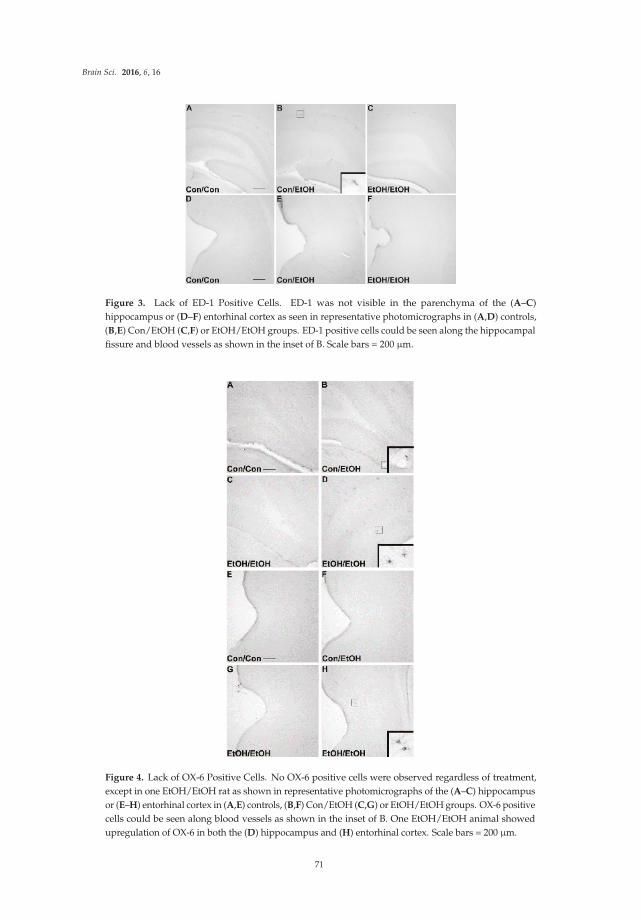
Brain Sci. 2016, 6, 16
Figure 3. Lack of ED-1 Positive Cells. ED-1 was not visible in the parenchyma of the (A–C)
hippocampus or (D–F) entorhinal cortex as seen in representative photomicrographs in (A,D) controls,
(B,E) Con/EtOH (C,F) or EtOH/EtOH groups. ED-1 positive cells could be seen along the hippocampal
fissure and blood vessels as shown in the inset of B. Scale bars = 200 μm.
Figure 4. Lack of OX-6 Positive Cells. No OX-6 positive cells were observed regardless of treatment,
except in one EtOH/EtOH rat as shown in representative photomicrographs of the (A–C) hippocampus
or (E–H) entorhinal cortex in (A,E) controls, (B,F) Con/EtOH (C,G) or EtOH/EtOH groups. OX-6 positive
cells could be seen along blood vessels as shown in the inset of B. One EtOH/EtOH animal showed
upregulation of OX-6 in both the (D) hippocampus and (H) entorhinal cortex. Scale bars = 200 μm.
71
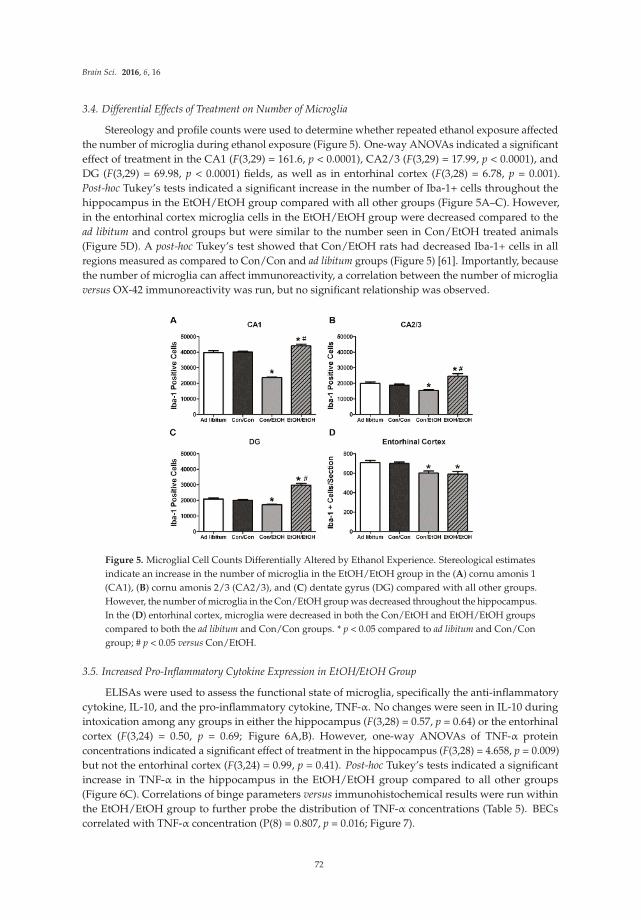
Brain Sci. 2016, 6, 16
3.4. Differential Effects of Treatment on Number of Microglia
Stereology and profile counts were used to determine whether repeated ethanol exposure affected
the number of microglia during ethanol exposure (Figure 5). One-way ANOVAs indicated a significant
effect of treatment in the CA1 (F(3,29) = 161.6, p < 0.0001), CA2/3 (F(3,29) = 17.99, p < 0.0001), and
DG (F(3,29) = 69.98, p < 0.0001) fields, as well as in entorhinal cortex (F(3,28) = 6.78, p = 0.001).
Post-hoc Tukey’s tests indicated a significant increase in the number of Iba-1+ cells throughout the
hippocampus in the EtOH/EtOH group compared with all other groups (Figure 5A–C). However,
in the entorhinal cortex microglia cells in the EtOH/EtOH group were decreased compared to the
ad libitum and control groups but were similar to the number seen in Con/EtOH treated animals
(Figure 5D). A post-hoc Tukey’s test showed that Con/EtOH rats had decreased Iba-1+ cells in all
regions measured as compared to Con/Con and ad libitum groups (Figure 5) [61]. Importantly, because
the number of microglia can affect immunoreactivity, a correlation between the number of microglia
versus OX-42 immunoreactivity was run, but no significant relationship was observed.
Figure 5. Microglial Cell Counts Differentially Altered by Ethanol Experience. Stereological estimates
indicate an increase in the number of microglia in the EtOH/EtOH group in the (A) cornu amonis 1
(CA1), (B) cornu amonis 2/3 (CA2/3), and (C) dentate gyrus (DG) compared with all other groups.
However, the number of microglia in the Con/EtOH group was decreased throughout the hippocampus.
In the (D) entorhinal cortex, microglia were decreased in both the Con/EtOH and EtOH/EtOH groups
compared to both the ad libitum and Con/Con groups. * p < 0.05 compared to ad libitum and Con/Con
group; # p < 0.05 versus Con/EtOH.
3.5. Increased Pro-Inflammatory Cytokine Expression in EtOH/EtOH Group
ELISAs were used to assess the functional state of microglia, specifically the anti-inflammatory
cytokine, IL-10, and the pro-inflammatory cytokine, TNF-α. No changes were seen in IL-10 during
intoxication among any groups in either the hippocampus (F(3,28) = 0.57, p = 0.64) or the entorhinal
cortex (F(3,24) = 0.50, p = 0.69; Figure 6A,B). However, one-way ANOVAs of TNF-α protein
concentrations indicated a significant effect of treatment in the hippocampus (F(3,28) = 4.658, p = 0.009)
but not the entorhinal cortex (F(3,24) = 0.99, p = 0.41). Post-hoc Tukey’s tests indicated a significant
increase in TNF-α in the hippocampus in the EtOH/EtOH group compared to all other groups
(Figure 6C). Correlations of binge parameters versus immunohistochemical results were run within
the EtOH/EtOH group to further probe the distribution of TNF-α concentrations (Table 5). BECs
correlated with TNF-α concentration (P(8) = 0.807, p = 0.016; Figure 7).
72
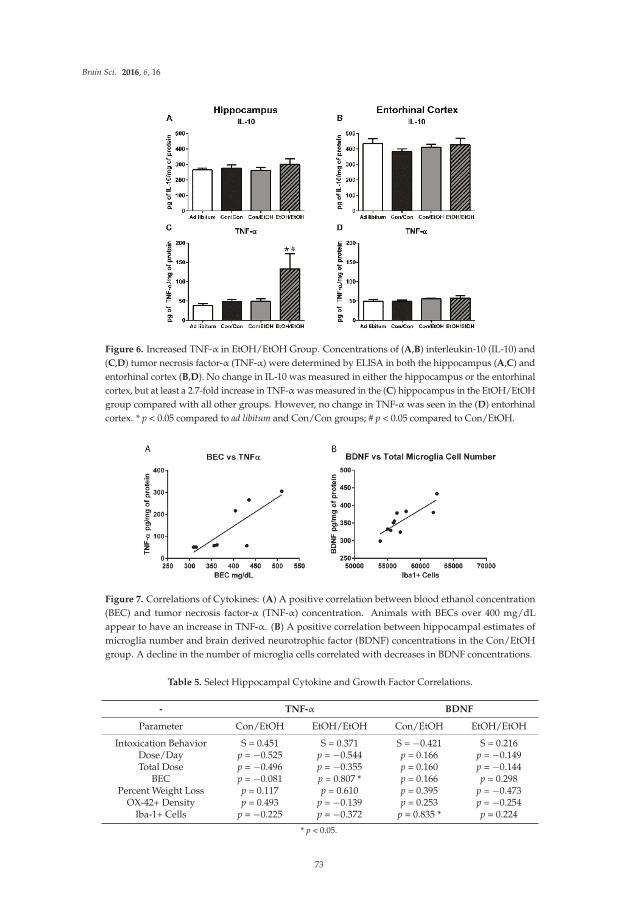
Brain Sci. 2016, 6, 16
Figure 6. Increased TNF-α in EtOH/EtOH Group. Concentrations of (A,B) interleukin-10 (IL-10) and
(C,D) tumor necrosis factor-α (TNF-α) were determined by ELISA in both the hippocampus (A,C) and
entorhinal cortex (B,D). No change in IL-10 was measured in either the hippocampus or the entorhinal
cortex, but at least a 2.7-fold increase in TNF-α was measured in the (C) hippocampus in the EtOH/EtOH
group compared with all other groups. However, no change in TNF-α was seen in the (D) entorhinal
cortex. * p < 0.05 compared to ad libitum and Con/Con groups; # p < 0.05 compared to Con/EtOH.
Figure 7. Correlations of Cytokines: (A) A positive correlation between blood ethanol concentration
(BEC) and tumor necrosis factor-α (TNF-α) concentration. Animals with BECs over 400 mg/dL
appear to have an increase in TNF-α. (B) A positive correlation between hippocampal estimates of
microglia number and brain derived neurotrophic factor (BDNF) concentrations in the Con/EtOH
group. A decline in the number of microglia cells correlated with decreases in BDNF concentrations.
Table 5. Select Hippocampal Cytokine and Growth Factor Correlations.
- TNF-α BDNF
Parameter Con/EtOH EtOH/EtOH Con/EtOH EtOH/EtOH
Intoxication Behavior S = 0.451 S = 0.371 S = ´0.421 S = 0.216Dose/Day p = ´0.525 p = ´0.544 p = 0.166 p = ´0.149Total Dose p = ´0.496 p = ´0.355 p = 0.160 p = ´0.144
BEC p = ´0.081 p = 0.807 * p = 0.166 p = 0.298Percent Weight Loss p = 0.117 p = 0.610 p = 0.395 p = ´0.473
OX-42+ Density p = 0.493 p = ´0.139 p = 0.253 p = ´0.254Iba-1+ Cells p = ´0.225 p = ´0.372 p = 0.835 * p = 0.224
* p < 0.05.
73
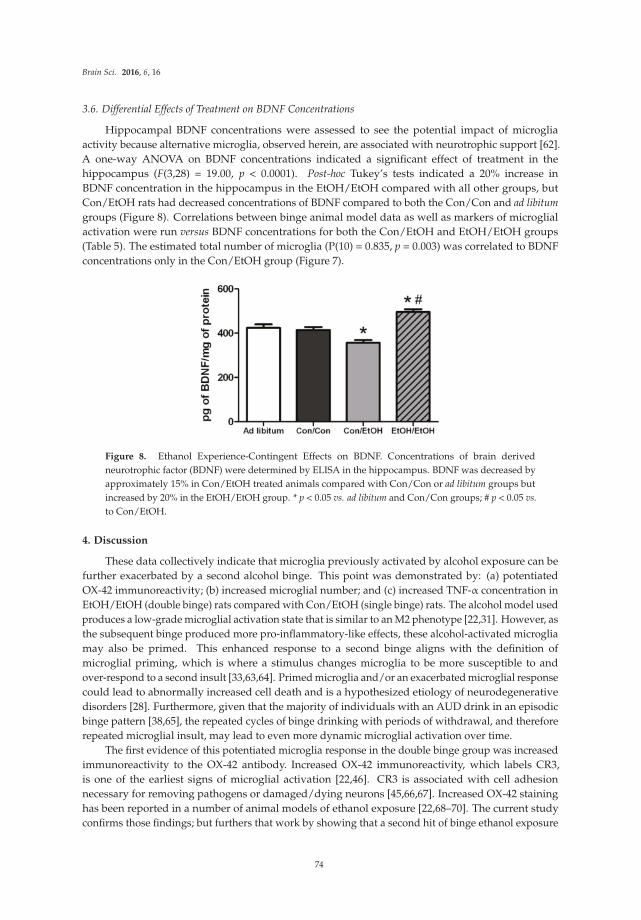
Brain Sci. 2016, 6, 16
3.6. Differential Effects of Treatment on BDNF Concentrations
Hippocampal BDNF concentrations were assessed to see the potential impact of microglia
activity because alternative microglia, observed herein, are associated with neurotrophic support [62].
A one-way ANOVA on BDNF concentrations indicated a significant effect of treatment in the
hippocampus (F(3,28) = 19.00, p < 0.0001). Post-hoc Tukey’s tests indicated a 20% increase in
BDNF concentration in the hippocampus in the EtOH/EtOH compared with all other groups, but
Con/EtOH rats had decreased concentrations of BDNF compared to both the Con/Con and ad libitum
groups (Figure 8). Correlations between binge animal model data as well as markers of microglial
activation were run versus BDNF concentrations for both the Con/EtOH and EtOH/EtOH groups
(Table 5). The estimated total number of microglia (P(10) = 0.835, p = 0.003) was correlated to BDNF
concentrations only in the Con/EtOH group (Figure 7).
Figure 8. Ethanol Experience-Contingent Effects on BDNF. Concentrations of brain derived
neurotrophic factor (BDNF) were determined by ELISA in the hippocampus. BDNF was decreased by
approximately 15% in Con/EtOH treated animals compared with Con/Con or ad libitum groups but
increased by 20% in the EtOH/EtOH group. * p < 0.05 vs. ad libitum and Con/Con groups; # p < 0.05 vs.
to Con/EtOH.
4. Discussion
These data collectively indicate that microglia previously activated by alcohol exposure can be
further exacerbated by a second alcohol binge. This point was demonstrated by: (a) potentiated
OX-42 immunoreactivity; (b) increased microglial number; and (c) increased TNF-α concentration in
EtOH/EtOH (double binge) rats compared with Con/EtOH (single binge) rats. The alcohol model used
produces a low-grade microglial activation state that is similar to an M2 phenotype [22,31]. However, as
the subsequent binge produced more pro-inflammatory-like effects, these alcohol-activated microglia
may also be primed. This enhanced response to a second binge aligns with the definition of
microglial priming, which is where a stimulus changes microglia to be more susceptible to and
over-respond to a second insult [33,63,64]. Primed microglia and/or an exacerbated microglial response
could lead to abnormally increased cell death and is a hypothesized etiology of neurodegenerative
disorders [28]. Furthermore, given that the majority of individuals with an AUD drink in an episodic
binge pattern [38,65], the repeated cycles of binge drinking with periods of withdrawal, and therefore
repeated microglial insult, may lead to even more dynamic microglial activation over time.
The first evidence of this potentiated microglia response in the double binge group was increased
immunoreactivity to the OX-42 antibody. Increased OX-42 immunoreactivity, which labels CR3,
is one of the earliest signs of microglial activation [22,46]. CR3 is associated with cell adhesion
necessary for removing pathogens or damaged/dying neurons [45,66,67]. Increased OX-42 staining
has been reported in a number of animal models of ethanol exposure [22,68–70]. The current study
confirms those findings; but furthers that work by showing that a second hit of binge ethanol exposure
74
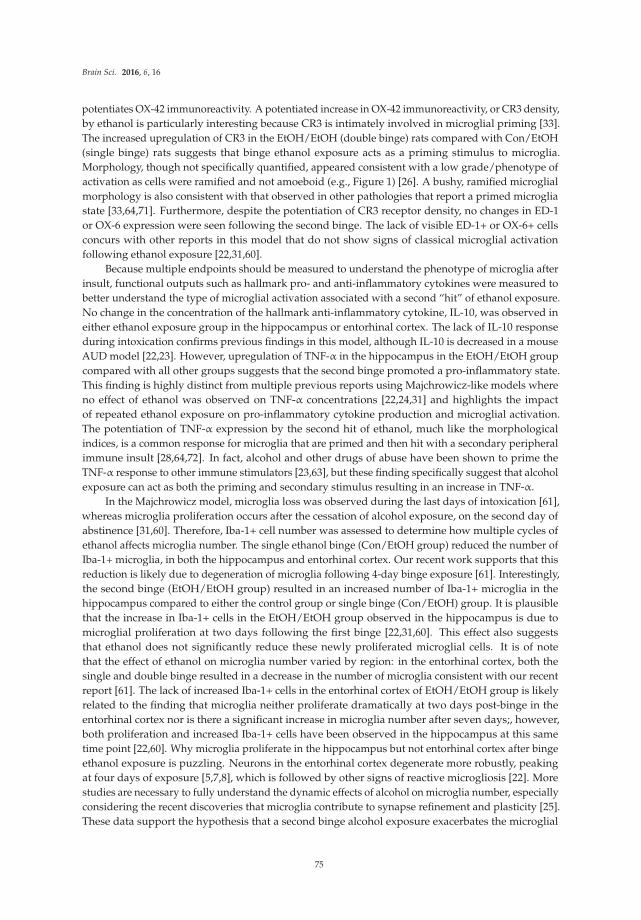
Brain Sci. 2016, 6, 16
potentiates OX-42 immunoreactivity. A potentiated increase in OX-42 immunoreactivity, or CR3 density,
by ethanol is particularly interesting because CR3 is intimately involved in microglial priming [33].
The increased upregulation of CR3 in the EtOH/EtOH (double binge) rats compared with Con/EtOH
(single binge) rats suggests that binge ethanol exposure acts as a priming stimulus to microglia.
Morphology, though not specifically quantified, appeared consistent with a low grade/phenotype of
activation as cells were ramified and not amoeboid (e.g., Figure 1) [26]. A bushy, ramified microglial
morphology is also consistent with that observed in other pathologies that report a primed microglia
state [33,64,71]. Furthermore, despite the potentiation of CR3 receptor density, no changes in ED-1
or OX-6 expression were seen following the second binge. The lack of visible ED-1+ or OX-6+ cells
concurs with other reports in this model that do not show signs of classical microglial activation
following ethanol exposure [22,31,60].
Because multiple endpoints should be measured to understand the phenotype of microglia after
insult, functional outputs such as hallmark pro- and anti-inflammatory cytokines were measured to
better understand the type of microglial activation associated with a second “hit” of ethanol exposure.
No change in the concentration of the hallmark anti-inflammatory cytokine, IL-10, was observed in
either ethanol exposure group in the hippocampus or entorhinal cortex. The lack of IL-10 response
during intoxication confirms previous findings in this model, although IL-10 is decreased in a mouse
AUD model [22,23]. However, upregulation of TNF-α in the hippocampus in the EtOH/EtOH group
compared with all other groups suggests that the second binge promoted a pro-inflammatory state.
This finding is highly distinct from multiple previous reports using Majchrowicz-like models where
no effect of ethanol was observed on TNF-α concentrations [22,24,31] and highlights the impact
of repeated ethanol exposure on pro-inflammatory cytokine production and microglial activation.
The potentiation of TNF-α expression by the second hit of ethanol, much like the morphological
indices, is a common response for microglia that are primed and then hit with a secondary peripheral
immune insult [28,64,72]. In fact, alcohol and other drugs of abuse have been shown to prime the
TNF-α response to other immune stimulators [23,63], but these finding specifically suggest that alcohol
exposure can act as both the priming and secondary stimulus resulting in an increase in TNF-α.
In the Majchrowicz model, microglia loss was observed during the last days of intoxication [61],
whereas microglia proliferation occurs after the cessation of alcohol exposure, on the second day of
abstinence [31,60]. Therefore, Iba-1+ cell number was assessed to determine how multiple cycles of
ethanol affects microglia number. The single ethanol binge (Con/EtOH group) reduced the number of
Iba-1+ microglia, in both the hippocampus and entorhinal cortex. Our recent work supports that this
reduction is likely due to degeneration of microglia following 4-day binge exposure [61]. Interestingly,
the second binge (EtOH/EtOH group) resulted in an increased number of Iba-1+ microglia in the
hippocampus compared to either the control group or single binge (Con/EtOH) group. It is plausible
that the increase in Iba-1+ cells in the EtOH/EtOH group observed in the hippocampus is due to
microglial proliferation at two days following the first binge [22,31,60]. This effect also suggests
that ethanol does not significantly reduce these newly proliferated microglial cells. It is of note
that the effect of ethanol on microglia number varied by region: in the entorhinal cortex, both the
single and double binge resulted in a decrease in the number of microglia consistent with our recent
report [61]. The lack of increased Iba-1+ cells in the entorhinal cortex of EtOH/EtOH group is likely
related to the finding that microglia neither proliferate dramatically at two days post-binge in the
entorhinal cortex nor is there a significant increase in microglia number after seven days;, however,
both proliferation and increased Iba-1+ cells have been observed in the hippocampus at this same
time point [22,60]. Why microglia proliferate in the hippocampus but not entorhinal cortex after binge
ethanol exposure is puzzling. Neurons in the entorhinal cortex degenerate more robustly, peaking
at four days of exposure [5,7,8], which is followed by other signs of reactive microgliosis [22]. More
studies are necessary to fully understand the dynamic effects of alcohol on microglia number, especially
considering the recent discoveries that microglia contribute to synapse refinement and plasticity [25].
These data support the hypothesis that a second binge alcohol exposure exacerbates the microglial
75
Brain Sci. 2016, 6, 16
response, since an increase in the number of activated microglia would likely result in a potentiated
neuroimmune response during the second binge.
Hippocampal BDNF concentrations were determined in order to assess the impact of microglia
reactivity and changes in microglia number on the surrounding environment. BDNF plays a pivotal
role in neuronal integrity and its dysregulation is associated with neurodegeneration [73]. In the
Con/EtOH group, BDNF was decreased, the number of microglia were decreased and there was a
significant correlation between the number of microglia and BDNF protein expression. However,
in the EtOH/EtOH treated animals, where microglia were more activated and their numbers were
increased, a significantly higher BDNF concentration was observed, though this value did not correlate
significantly to microglia number. It is possible that the increase in BDNF concentrations is due to cells
other than microglia, such as astrocytes, neurons, and other CNS cells secreting BDNF [74]. In addition,
the effect of ethanol on BDNF expression is quite complex [75]. Nevertheless, the interplay between
the increased cytokine and neurotrophin production observed in the EtOH/EtOH group requires
further study to understand its functional implications.
The experimental design to use the same animals for both immunohistochemical and ELISA
experiments allowed for a series of correlations to help determine what aspect of ethanol exposure, in
this AUD model, was associated with microglial reactivity. OX-42 immunoreactivity did not correlate
to average dose per day or to the total dose of ethanol in either the Con/EtOH or EtOH/EtOH
groups. This lack of correlation is important as immune modulators such as LPS have dose-dependent
responses in microglia reactivity [76]. The lack of correlation between OX-42 and total dose of ethanol
suggests that ethanol potentiates the OX-42 response by acting as a secondary stimulus rather than
an additive effect of the accumulative dose. Moreover, no relationship between the number of Iba-1+
cells and OX-42 immunoreactivity were observed, supporting that increased OX-42 immunoreactivity
was a result of microglial activation and not an artifact of the change in cell number [77]. Correlations
were also used to examine the relationship between OX-42 immunoreactivity or Iba-1 cell number
and functional indices (cytokine/neurotrophin production). However, neither CR3 receptor (OX-42)
upregulation nor Iba-1+ cell number was significantly correlated with TNF-α expression. Interestingly,
the bimodal distribution of TNF-α production observed in the EtOH/EtOH group did map on to BECs.
Although the mechanism by which BECs are related to TNF-α were not measured, at minimum, this
correlation suggests that as BECs increase with repeated exposure, a primed microglial state may cause
increased pro-inflammatory cytokines. Finally, in relation to BDNF, only microglia cell number in the
Con/EtOH group showed a significant correlation with BDNF concentrations supporting the idea that
microglial dysfunction and subsequent loss of trophic factors may contribute to neurodegeneration,
especially alcoholic brain damage [61]. Correlations are not being interpreted as causation, but they do
provide direction for what aspects of alcohol-exposure impact microglia reactivity leading to a primed
microglial state.
Some evidence of classical activation has been observed in other AUD models, an effect
that may be attributable to species differences and/or variations in the duration and pattern of
exposure [30,69]. While previous reports suggested that the difference in microglia reactivity was due
to these aforementioned variations in AUD models, the current data in this report more definitively
indicates that it is the repeated insult that may drive the greater microglial response. For example,
a model of alcohol exposure with lower total doses of alcohol dispersed over a longer period of
time produced more OX-6 positive cells than the exposure used herein, where OX-6 expression may
have been an anomaly in a single animal [30]. The appearance of the OX-6+ cells, however, in both
models still appeared to be the bushy, ramified morphology associated with a low-level or M2-like
activation. Indeed, the only alcohol study, human or animal, where ED-1+ microglia have been
observed, is from a study in which rats underwent four cycles of a Majchrowicz-like model with three
days between binges. However, the high mortality rate and severe weight loss of rats in that report
make interpretations difficult. One interpretation is that microglial activation may have occurred due
to the stress of repetitive gavage and/or weight loss [57,78–80]. Thus, the current study specifically
76
Brain Sci. 2016, 6, 16
used a seven day abstinence period to allow rats to recover from four days of intoxication and the
significant withdrawal sequelae that occurs in this model [40]. Moreover, because some weight loss is
observed in the Majchrowicz model [40], repetitive gavage may be stressful [81], and both of these
aspects modulate microglial reactivity [78,82], a group with ad libitum access to food and water was
included. None of the measures of microglia activation were different between the ad libitum group
and the Con/Con group despite their slight weight loss and experience with gavage. Moreover, weight
loss did not correlate with any measure of microglial activation in animals receiving ethanol.
The potentiated microglia activation seen in this double binge AUD model suggests that the
microglial response can be altered by ethanol alone and supports the idea that chronic ethanol exposure
can elicit a more pro-inflammatory state than a single bout of binge exposure. The lack of expression of
ED-1 and morphology of OX-42+ and Iba-1+ cells support that even with the two binges, cells are not
fully or classically activated. However, microglia are “further” down the spectrum towards classical
activation than a single binge alone. These data coupled with the lack of evidence for classically
activated microglia in human alcoholic brain—whether the markers are not expressed or no one has
examined those particular markers—supports that initially microglia activation is likely a consequence
of alcoholic neuropathology and not a cause. Whether this increased response causes microglia
to over-respond to insult or if it makes the brain more susceptible to ongoing neuroinflammation
should be considered in future experiments. In addition, how these effects relate to changes in
neurodegeneration, specifically neuronal or volume loss, is an important area for future study. Because
microglia have the capacity to maintain low grade activation or a primed state for extensive periods
following insult, including alcohol exposure [22,83], the episodic nature of binge drinking would lead
to a cycle of repeated priming and over-response in individuals suffering from an AUD [18,38,65].
Understanding the mechanisms that underlie or contribute to alcohol-induced neurodegeneration may
provide a novel therapeutic target to ameliorate damage and prevent the downward spiral into an
AUD [14,84].
5. Conclusions
In summary, these studies present a novel view of the impact of alcohol abuse on microglial
activity. Specifically, data presented herein indicate that alcohol causes a shift in microglial phenotypes
to a primed state. Although this study focuses on how later bouts of alcohol can exacerbate the
microglial response, the implications of an alcohol-induced primed microglial state also extend to how
the microglia of alcoholics may respond to infections or other alcohol related immune responses in the
peripheral system. This research provides a context in which to consider the implications of microglia
on alcohol-induced neurodegeneration and further indicates that targeting the neuroimmune system
may alleviate deficits caused by excessive alcohol consumption.
Acknowledgments: The authors gratefully acknowledge support from NIAAA (R01AA016959; F31AA023459),NIDA (T32DA016176), and NIGMS (K12GM000678).
Author Contributions: Alex Marshall and Kimberly Nixon conceived and designed the experiments;Alex Marshall and Chelsea Geil performed the experiments; Alex Marshall analyzed the data; and all authorscontributed to the interpretation of the data, writing and editing the manuscript.
Conflicts of Interest: The authors declare no conflict of interest.
Abbreviations
The following abbreviations are used in this manuscript:
AALAC Association for the Assessment and Accreditation of Laboratory Animal Care
ANOVA Analysis of Variance
AUD Alcohol Use Disorder
BBB Blood Brain Barrier
BEC Blood Ethanol Concentration
77
Brain Sci. 2016, 6, 16
BDNF Brain Derived Neurotrophic Factor
CA Cornu Amonis
CNS Central Nervous System
Con Control
CR3 Complement Receptor 3
DG Dentate Gyrus
ELISA Enzyme-Linked ImmunoSorbent Assay
EtOH Ethanol
Iba-1 Ionized calcium-Binding Adapter molecule 1
IL-10 InterLeukin-10
ip Intraperitoneal
TBS Tris-Buffered Saline
TNF-α Tumor Necrosis Factor alpha
References
1. Grant, B.F.; Saha, T.D.; Ruan, W.J.; Goldstein, R.B.; Chou, S.P.; Jung, J.; Zhang, H.; Smith, S.M.; Pickering, R.P.;
Huang, B.; et al. Epidemiology of DSM-5 drug use disorder: Results from the national epidemiologic survey
on alcohol and related conditions-III. JAMA Psychiatry 2016, 73, 39–47. [CrossRef] [PubMed]
2. Zahr, N.M.; Kaufman, K.L.; Harper, C.G. Clinical and pathological features of alcohol-related brain damage.
Nat. Rev. Neurol. 2011, 7, 284–294. [CrossRef] [PubMed]
3. Sullivan, E.V.; Marsh, L.; Mathalon, D.H.; Lim, K.O.; Pfefferbaum, A. Age-related decline in MRI volumes of
temporal lobe gray matter but not hippocampus. Neurobiol. Aging 1995, 16, 591–606. [CrossRef]
4. Pfefferbaum, A.; Lim, K.O.; Zipursky, R.B.; Mathalon, D.H.; Rosenbloom, M.J.; Lane, B.; Ha, C.N.;
Sullivan, E.V. Brain gray and white matter volume loss accelerates with aging in chronic alcoholics:
A quantitative MRI study. Alcohol Clin. Exp. Res. 1992, 16, 1078–1089. [CrossRef] [PubMed]
5. Obernier, J.A.; Bouldin, T.W.; Crews, F.T. Binge ethanol exposure in adult rats causes necrotic cell death.
Alcohol Clin. Exp. Res. 2002, 26, 547–557. [CrossRef] [PubMed]
6. Pascual, M.; Blanco, A.M.; Cauli, O.; Minarro, J.; Guerri, C. Intermittent ethanol exposure induces
inflammatory brain damage and causes long-term behavioural alterations in adolescent rats. Eur. J. Neurosci.
2007, 25, 541–550. [CrossRef] [PubMed]
7. Collins, M.A.; Corse, T.D.; Neafsey, E.J. Neuronal degeneration in rat cerebrocortical and olfactory regions
during subchronic “binge” intoxication with ethanol: Possible explanation for olfactory deficits in alcoholics.
Alcohol Clin. Exp. Res. 1996, 20, 284–292. [CrossRef] [PubMed]
8. Kelso, M.L.; Liput, D.J.; Eaves, D.W.; Nixon, K. Upregulated vimentin suggests new areas of
neurodegeneration in a model of an alcohol use disorder. Neuroscience 2011, 197, 381–393. [CrossRef]
[PubMed]
9. Gupta, S.; Warner, J. Alcohol-related dementia: A 21st-century silent epidemic? Br. J. Psychiatry 2008, 193,
351–353. [CrossRef] [PubMed]
10. Smith, D.M.; Atkinson, R.M. Alcoholism and dementia. Int. J. Addict. 1995, 30, 1843–1869. [CrossRef]
[PubMed]
11. Petry, N.M. Delay discounting of money and alcohol in actively using alcoholics, currently abstinent
alcoholics, and controls. Psychopharmacology 2001, 154, 243–250. [CrossRef] [PubMed]
12. Nixon, S.J.; Prather, R.; Lewis, B. Sex differences in alcohol-related neurobehavioral consequences.
Handb. Clin. Neurol. 2014, 125, 253–272. [PubMed]
13. Crews, F.T.; Boettiger, C.A. Impulsivity, frontal lobes and risk for addiction. Pharm. Biochem. Behav. 2009, 93,
237–247. [CrossRef] [PubMed]
14. Koob, G.F.; Le Moal, M. Drug abuse: Hedonic homeostatic dysregulation. Science 1997, 278, 52–58. [CrossRef]
[PubMed]
15. Crews, F.T. Alcohol and neurodegeneration. CNS Drug Rev. 1999, 5, 379–394. [CrossRef]
16. Crews, F.T.; Nixon, K. Mechanisms of neurodegeneration and regeneration in alcoholism. Alcohol Alcohol
2009, 44, 115–127. [CrossRef] [PubMed]
78
Brain Sci. 2016, 6, 16
17. Crews, F.T.; Vetreno, R.P. Neuroimmune basis of alcoholic brain damage. Int. Rev. Neurobiol. 2014, 118,
315–357. [PubMed]
18. Crews, F.T.; Zou, J.; Qin, L. Induction of innate immune genes in brain create the neurobiology of addiction.
Brain Behav. Immun. 2011, 25, S4–S12. [CrossRef] [PubMed]
19. Qin, L.; Crews, F.T. Nadph oxidase and reactive oxygen species contribute to alcohol-induced microglial
activation and neurodegeneration. J. Neuroinflamm. 2012, 9, 5. [CrossRef] [PubMed]
20. He, J.; Crews, F.T. Increased MCP-1 and microglia in various regions of the human alcoholic brain. Exp. Neurol.
2008, 210, 349–358. [CrossRef] [PubMed]
21. Dennis, C.V.; Sheahan, P.J.; Graeber, M.B.; Sheedy, D.L.; Kril, J.J.; Sutherland, G.T. Microglial proliferation in
the brain of chronic alcoholics with hepatic encephalopathy. Metab. Brain Dis. 2014, 29, 1027–1039. [CrossRef]
[PubMed]
22. Marshall, S.A.; McClain, J.A.; Kelso, M.L.; Hopkins, D.M.; Pauly, J.R.; Nixon, K. Microglial activation is
not equivalent to neuroinflammation in alcohol-induced neurodegeneration: The importance of microglia
phenotype. Neurobiol. Dis. 2013, 54, 239–251. [CrossRef] [PubMed]
23. Qin, L.; He, J.; Hanes, R.N.; Pluzarev, O.; Hong, J.S.; Crews, F.T. Increased systemic and brain cytokine
production and neuroinflammation by endotoxin following ethanol treatment. J. Neuroinflamm. 2008, 5, 10.
[CrossRef] [PubMed]
24. Zahr, N.M.; Luong, R.; Sullivan, E.V.; Pfefferbaum, A. Measurement of serum, liver, and brain cytokine
induction, thiamine levels, and hepatopathology in rats exposed to a 4-day alcohol binge protocol.
Alcohol Clin. Exp. Res. 2010, 34, 1858–1870. [CrossRef] [PubMed]
25. Tremblay, M.E.; Stevens, B.; Sierra, A.; Wake, H.; Bessis, A.; Nimmerjahn, A. The role of microglia in the
healthy brain. J. Neurosci. 2013, 31, 16064–16069. [CrossRef] [PubMed]
26. Raivich, G.; Bohatschek, M.; Kloss, C.U.; Werner, A.; Jones, L.L.; Kreutzberg, G.W. Neuroglial activation
repertoire in the injured brain: Graded response, molecular mechanisms and cues to physiological function.
Brain Res. Rev. 1999, 30, 77–105. [CrossRef]
27. Nimmerjahn, A.; Kirchhoff, F.; Helmchen, F. Resting microglial cells are highly dynamic surveillants of brain
parenchyma in vivo. Science 2005, 308, 1314–1318. [CrossRef] [PubMed]
28. Perry, V.H.; Holmes, C. Microglial priming in neurodegenerative disease. Nat. Rev. Neurol. 2014, 10, 217–224.
[CrossRef] [PubMed]
29. Graeber, M.B.; Streit, W.J. Microglia: Biology and pathology. Acta Neuropathol. 2009, 119, 89–105. [CrossRef]
[PubMed]
30. Ward, R.J.; Colivicchi, M.A.; Allen, R.; Schol, F.; Lallemand, F.; de Witte, P.; Ballini, C.; Corte, L.D.; Dexter, D.
Neuro-inflammation induced in the hippocampus of ‘binge drinking’ rats may be mediated by elevated
extracellular glutamate content. J. Neurochem. 2009, 111, 1119–1128. [CrossRef] [PubMed]
31. McClain, J.A.; Morris, S.A.; Deeny, M.A.; Marshall, S.A.; Hayes, D.M.; Kiser, Z.M.; Nixon, K. Adolescent
binge alcohol exposure induces long-lasting partial activation of microglia. Brain Behav. Immun. 2011, 25,
S120–S128. [CrossRef] [PubMed]
32. Bilbo, S.D.; Schwarz, J.M. Early-life programming of later-life brain and behavior: A critical role for the
immune system. Front. Behav. Neurosci. 2009, 3, 14. [CrossRef] [PubMed]
33. Ramaglia, V.; Hughes, T.R.; Donev, R.M.; Ruseva, M.M.; Wu, X.; Huitinga, I.; Baas, F.; Neal, J.W.; Morgan, B.P.
C3-dependent mechanism of microglial priming relevant to multiple sclerosis. Proc. Natl. Acad. Sci. USA
2012, 109, 965–970. [CrossRef] [PubMed]
34. Qin, L.; Crews, F.T. Chronic ethanol increases systemic TLR3 agonist-induced neuroinflammation and
neurodegeneration. J. Neuroinflamm. 2012, 9, 130. [CrossRef] [PubMed]
35. Qin, L.; Liu, Y.; Hong, J.S.; Crews, F.T. Nadph oxidase and aging drive microglial activation, oxidative
stress, and dopaminergic neurodegeneration following systemic LPS administration. Glia 2013, 61, 855–868.
[CrossRef] [PubMed]
36. Harford, T.C.; Grant, B.F.; Yi, H.Y.; Chen, C.M. Patterns of DSM-IV alcohol abuse and dependence criteria
among adolescents and adults: Results from the 2001 national household survey on drug abuse. Alcohol Clin.
Exp. Res. 2005, 29, 810–828. [CrossRef] [PubMed]
37. White, A.M.; Kraus, C.L.; Swartzwelder, H. Many college freshmen drink at levels far beyond the binge
threshold. Alcohol Clin. Exp. Res. 2006, 30, 1006–1010. [CrossRef] [PubMed]
79
Brain Sci. 2016, 6, 16
38. Hunt, W.A. Are binge drinkers more at risk of developing brain damage? Alcohol 1993, 10, 559–561.
[CrossRef]
39. NRC. Guide for the Care and Use of Laboratory Animals; The National Academies Press: Washington, DC,
USA, 1996.
40. Morris, S.A.; Kelso, M.L.; Liput, D.J.; Marshall, S.A.; Nixon, K. Similar withdrawal severity in adolescents
and adults in a rat model of alcohol dependence. Alcohol 2010, 44, 89–98. [CrossRef] [PubMed]
41. McClain, J.A.; Morris, S.A.; Marshall, S.A.; Nixon, K. Ectopic hippocampal neurogenesis in adolescent male
rats following alcohol dependence. Addict. Biol. 2014, 19, 687–699. [CrossRef] [PubMed]
42. Majchrowicz, E. Induction of physical dependence upon ethanol and the associated behavioral changes in
rats. Psychopharmacologia 1975, 43, 245–254. [CrossRef] [PubMed]
43. Raivich, G.; Jones, L.L.; Werner, A.; Bluthmann, H.; Doetschmann, T.; Kreutzberg, G.W. Molecular signals for
glial activation: Pro- and anti-inflammatory cytokines in the injured brain. Acta Neurochir. Suppl. 1999, 73,
21–30. [PubMed]
44. Hynes, R.O. Integrins: Versatility, modulation, and signaling in cell adhesion. Cell 1992, 69, 11–25. [CrossRef]
45. Morioka, T.; Kalehua, A.N.; Streit, W.J. Progressive expression of immunomolecules on microglial cells in rat
dorsal hippocampus following transient forebrain ischemia. Acta Neuropathol. 1992, 83, 149–157. [CrossRef]
[PubMed]
46. Robinson, A.P.; White, T.M.; Mason, D.W. Macrophage heterogeneity in the rat as delineated by two
monoclonal antibodies MRC OX-41 and MRC OX-42, the latter recognizing complement receptor type 3.
Immunology 1986, 57, 239–247. [PubMed]
47. Bauer, J.; Sminia, T.; Wouterlood, F.G.; Dijkstra, C.D. Phagocytic activity of macrophages and microglial
cells during the course of acute and chronic relapsing experimental autoimmune encephalomyelitis.
J. Neurosci. Res. 1994, 38, 365–375. [CrossRef] [PubMed]
48. O’Keefe, G.M.; Nguyen, V.T.; Benveniste, E.N. Regulation and function of class ii major histocompatibility
complex, CD40, and B7 expression in macrophages and microglia: Implications in neurological diseases.
J. Neurovirol. 2002, 8, 496–512. [CrossRef] [PubMed]
49. Ito, D.; Imai, Y.; Ohsawa, K.; Nakajima, K.; Fukuuchi, Y.; Kohsaka, S. Microglia-specific localisation of a
novel calcium binding protein, iba1. Mol. Brain Res. 1998, 57, 1–9. [CrossRef]
50. Paxinos, G.; Watson, C. The Rat Brain in Stereotaxic Coordinates/George Paxinos, Charles Watson, Compact, 6th ed.;
Elsevier Academic: London, UK, 2009.
51. Long, J.M.; Kalehua, A.N.; Muth, N.J.; Hengemihle, J.M.; Jucker, M.; Calhoun, M.E.; Ingram, D.K.;
Mouton, P.R. Stereological estimation of total microglia number in mouse hippocampus. J. Neurosci. Methods
1998, 84, 101–108. [CrossRef]
52. West, M.J.; Slomianka, L.; Gundersen, H.J.G. Unbiased stereological estimation of the total number of
neurons in the subdivisions of the rat hippocampus using the optical fractionator. Anat. Rec. 1991, 231,
482–497. [CrossRef] [PubMed]
53. Francisco, J.S.; Moraes, H.P.; Dias, E.P. Evaluation of the image-pro plus 4.5 software for automatic counting
of labeled nuclei by PCNA immunohistochemistry. Braz. Oral Res. 2004, 18, 100–104. [CrossRef] [PubMed]
54. Rabuffetti, M.; Sciorati, C.; Tarozzo, G.; Clementi, E.; Manfredi, A.A.; Beltramo, M. Inhibition of caspase-1-like
activity by Ac-Tyr-Val-Ala-Asp-chloromethyl ketone induces long-lasting neuroprotection in cerebral
ischemia through apoptosis reduction and decrease of proinflammatory cytokines. J. Neurosci. 2000, 20,
4398–4404. [PubMed]
55. Miller, M.W.; Mooney, S.M. Chronic exposure to ethanol alters neurotrophin content in the basal
forebrain-cortex system in the mature rat: Effects on autocrine-paracrine mechanisms. J. Neurobiol. 2004, 60,
490–498. [CrossRef] [PubMed]
56. Miller, M.W. Repeated episodic exposure to ethanol affects neurotrophin content in the forebrain of the
mature rat. Exp. Neurol. 2004, 189, 173–181. [CrossRef] [PubMed]
57. Loncarevic-Vasiljkovic, N.; Pesic, V.; Todorovic, S.; Popic, J.; Smiljanic, K.; Milanovic, D.; Ruzdijic, S.;
Kanazir, S. Caloric restriction suppresses microglial activation and prevents neuroapoptosis following
cortical injury in rats. PLoS ONE 2012, 7, e37215. [CrossRef] [PubMed]
58. Tu, Y.F.; Lu, P.J.; Huang, C.C.; Ho, C.J.; Chou, Y.P. Moderate dietary restriction reduces p53-mediated
neurovascular damage and microglia activation after hypoxic ischemia in neonatal brain. Stroke 2012, 43,
491–498. [CrossRef] [PubMed]
80
Brain Sci. 2016, 6, 16
59. Akiyama, H.; McGeer, P.L. Brain microglia constitutively express beta-2 integrins. J. Neuroimmunol. 1990, 30,
81–93. [CrossRef]
60. Nixon, K.; Kim, D.H.; Potts, E.N.; He, J.; Crews, F.T. Distinct cell proliferation events during abstinence
after alcohol dependence: Microglia proliferation precedes neurogenesis. Neurobiol. Dis. 2008, 31, 218–229.
[CrossRef] [PubMed]
61. Marshall, S.A.; McClain, J.A.; Nixon, K. Microglial dystrophy following binge-like alcohol exposure in
adolescent and adult rats. Eur. J. Neurosci. 2016. submitted for publication.
62. Lai, A.Y.; Todd, K.G. Differential regulation of trophic and proinflammatory microglial effectors is dependent
on severity of neuronal injury. Glia 2008, 56, 259–270. [CrossRef] [PubMed]
63. Chao, C.C.; Gekker, G.; Sheng, W.S.; Hu, S.; Tsang, M.; Peterson, P.K. Priming effect of morphine on the
production of tumor necrosis factor-alpha by microglia: Implications in respiratory burst activity and human
immunodeficiency virus-1 expression. J. Pharmacol. Exp. Ther. 1994, 269, 198–203. [PubMed]
64. Dilger, R.N.; Johnson, R.W. Aging, microglial cell priming, and the discordant central inflammatory response
to signals from the peripheral immune system. J. Leukoc. Biol. 2008, 84, 932–939. [CrossRef] [PubMed]
65. McMahon, R.C.; Davidson, R.S.; Gersh, D.; Flynn, P. A comparison of continuous and episodic drinkers
using the MCMI, MMPI, and alceval-r. J. Clin. Psychol. 1991, 47, 148–159. [CrossRef]
66. Relman, D.; Tuomanen, E.; Falkow, S.; Golenbock, D.T.; Saukkonen, K.; Wright, S.D. Recognition of a
bacterial adhesion by an integrin: Macrophage CR3 (αMβ2, CD11b/CD18) binds filamentous hemagglutinin
of Bordetella pertussis. Cell 1990, 61, 1375–1382. [CrossRef]
67. Tyler, C.M.; Boulanger, L.M. Complement-mediated microglial clearance of developing retinal ganglion cell
axons. Neuron 2012, 74, 597–599. [CrossRef] [PubMed]
68. Fernandez-Lizarbe, S.; Pascual, M.; Guerri, C. Critical role of TLR4 response in the activation of microglia
induced by ethanol. J. Immunol. 2009, 183, 4733–4744. [CrossRef] [PubMed]
69. Zhao, Y.N.; Wang, F.; Fan, Y.X.; Ping, G.F.; Yang, J.Y.; Wu, C.F. Activated microglia are implicated in cognitive
deficits, neuronal death, and successful recovery following intermittent ethanol exposure. Behav. Brain Res.
2013, 236, 270–282. [CrossRef] [PubMed]
70. Crews, F.; Nixon, K.; Kim, D.; Joseph, J.; Shukitt-Hale, B.; Qin, L.; Zou, J. BHT blocks NF-κB activation and
ethanol-induced brain damage. Alcohol Clin. Exp. Res. 2006, 30, 1938–1949. [CrossRef] [PubMed]
71. Sierra, A.; Gottfried-Blackmore, A.C.; McEwen, B.S.; Bulloch, K. Microglia derived from aging mice exhibit
an altered inflammatory profile. Glia 2007, 55, 412–424. [CrossRef] [PubMed]
72. Perry, V.H.; Cunningham, C.; Holmes, C. Systemic infections and inflammation affect chronic
neurodegeneration. Nat. Rev. Immunol. 2007, 7, 161–167. [CrossRef] [PubMed]
73. Lipsky, R.H.; Marini, A.M. Brain-derived neurotrophic factor in neuronal survival and behavior-related
plasticity. Ann. N. Y. Acad. Sci. 2007, 1122, 130–143. [CrossRef] [PubMed]
74. Bejot, Y.; Prigent-Tessier, A.; Cachia, C.; Giroud, M.; Mossiat, C.; Bertrand, N.; Garnier, P.; Marie, C.
Time-dependent contribution of non neuronal cells to BDNF production after ischemic stroke in rats.
Neurochem. Int. 2011, 58, 102–111. [CrossRef] [PubMed]
75. Davis, M.I. Ethanol-BDNF interactions: Still more questions than answers. Pharmacol. Ther. 2008, 118, 36–57.
[CrossRef] [PubMed]
76. Houdek, H.M.; Larson, J.; Watt, J.A.; Rosenberger, T.A. Bacterial lipopolysaccharide induces a
dose-dependent activation of neuroglia and loss of basal forebrain cholinergic cells in the rat brain.
Inflamm. Cell Signal. 2014, 1, e47. [PubMed]
77. Matos, L.L.; Trufelli, D.C.; de Matos, M.G.; da Silva Pinhal, M.A. Immunohistochemistry as an important
tool in biomarkers detection and clinical practice. Biomark Insights 2010, 5, 9–20. [CrossRef] [PubMed]
78. Radler, M.E.; Wright, B.J.; Walker, F.R.; Hale, M.W.; Kent, S. Calorie restriction increases
lipopolysaccharide-induced neuropeptide y immunolabeling and reduces microglial cell area in the arcuate
hypothalamic nucleus. Neuroscience 2015, 285, 236–247. [CrossRef] [PubMed]
79. Sharrett-Field, L.; Butler, T.R.; Berry, J.N.; Reynolds, A.R.; Prendergast, M.A. Mifepristone pretreatment
reduces ethanol withdrawal severity in vivo. Alcohol Clin. Exp. Res. 2013, 37, 1417–1423. [CrossRef] [PubMed]
80. Frank, M.G.; Baratta, M.V.; Sprunger, D.B.; Watkins, L.R.; Maier, S.F. Microglia serve as a neuroimmune
substrate for stress-induced potentiation of CNS pro-inflammatory cytokine responses. Brain Behav. Immun.
2007, 21, 47–59. [CrossRef] [PubMed]
81

Brain Sci. 2016, 6, 16
81. Arantes-Rodrigues, R.; Henriques, A.; Pinto-Leite, R.; Faustino-Rocha, A.; Pinho-Oliveira, J.;
Teixeira-Guedes, C.; Seixas, F.; Gama, A.; Colaco, B.; Colaco, A.; et al. The effects of repeated oral gavage on
the health of male CD-1 mice. Lab. Anim. 2012, 41, 129–134. [CrossRef] [PubMed]
82. Sugama, S. Stress-induced microglial activation may facilitate the progression of neurodegenerative disorders.
Med. Hypotheses 2009, 73, 1031–1034. [CrossRef] [PubMed]
83. Obernier, J.A.; White, A.M.; Swartzwelder, H.S.; Crews, F.T. Cognitive deficits and CNS damage after a 4-day
binge ethanol exposure in rats. Pharmacol. Biochem. Behav. 2002, 72, 521–532. [CrossRef]
84. Vetreno, R.P.; Crews, F.T. Current hypotheses on the mechanisms of alcoholism. Handb. Clin. Neurol. 2014,
125, 477–497. [PubMed]
© 2016 by the authors. Licensee MDPI, Basel, Switzerland. This article is an open access
article distributed under the terms and conditions of the Creative Commons Attribution
(CC BY) license (http://creativecommons.org/licenses/by/4.0/).
82
brainsciences
Article
Stress and Withdrawal from Chronic Ethanol InduceSelective Changes in Neuroimmune mRNAs inDiffering Brain Sites
Darin J. Knapp 1,2,†,*, Kathryn M. Harper 1,†, Buddy A. Whitman 1,3,†, Zachary Zimomra 1 and
George R. Breese 1,2,3,4,5
1 Bowles Center for Alcohol Studies, The University of North Carolina at Chapel Hill, CB7178, Chapel Hill,
NC 27599-7178, USA; [email protected] (K.M.H.); [email protected] (B.A.W.);
[email protected] (Z.Z.); [email protected] (G.R.B.)2 Department of Psychiatry, The University of North Carolina at Chapel Hill, CB7178, Chapel Hill,
NC 27599-7178, USA3 Curriculum in Neurobiology, The University of North Carolina at Chapel Hill, CB7178, Chapel Hill,
NC 27599-7178, USA4 Department of Pharmacology, The University of North Carolina at Chapel Hill, CB7178, Chapel Hill,
NC 27599-7178, USA5 UNC Neuroscience Center, The University of North Carolina at Chapel Hill, CB7178, Chapel Hill,
NC 27599-7178, USA
* Correspondence: [email protected]; Tel.: +1-919-966-0505; Fax: +1-919-966-5679
† These authors contributed equally to this work.
Academic Editor: Donna Gruol
Received: 16 April 2016; Accepted: 20 July 2016; Published: 27 July 2016
Abstract: Stress is a strong risk factor in alcoholic relapse and may exert effects that mimic aspects of
chronic alcohol exposure on neurobiological systems. With the neuroimmune system becoming a
prominent focus in the study of the neurobiological consequences of stress, as well as chronic alcohol
exposure proving to be a valuable focus in this regard, the present study sought to compare the effects
of stress and chronic ethanol exposure on induction of components of the neuroimmune system.
Rats were exposed to either 1 h exposure to a mild stressor (restraint) or exposure to withdrawal
from 15 days of chronic alcohol exposure (i.e., withdrawal from chronic ethanol, WCE) and assessed
for neuroimmune mRNAs in brain. Restraint stress alone elevated chemokine (C–C motif) ligand 2
(CCL2), interleukin-1-beta (IL-1β), tumor necrosis factor alpha (TNFα) and toll-like receptor 4 (TLR4)
mRNAs in the cerebral cortex within 4 h with a return to a control level by 24 h. These increases were
not accompanied by an increase in corresponding proteins. Withdrawal from WCE also elevated
cytokines, but did so to varying degrees across different cytokines and brain regions. In the cortex,
stress and WCE induced CCL2, TNFα, IL-1β, and TLR4 mRNAs. In the hypothalamus, only WCE
induced cytokines (CCL2 and IL-1β) while in the hippocampus, WCE strongly induced CCL2 while
stress and WCE induced IL-1β. In the amygdala, only WCE induced CCL2. Finally—based on the
previously demonstrated role of corticotropin-releasing factor 1 (CRF1) receptor inhibition in blocking
WCE-induced cytokine mRNAs—the CRF1 receptor antagonist CP154,526 was administered to a
subgroup of stressed rats and found to be inactive against induction of CCL2, TNFα, or IL-1β mRNAs.
These differential results suggest that stress and WCE manifest broad neuroimmune effects in brain
depending on the cytokine and brain region, and that CRF inhibition may not be a relevant mechanism
in non-alcohol exposed animals. Overall, these effects are complex in terms of their neuroimmune
targets and neuroanatomical specificity. Further investigation of the differential distribution of
cytokine induction across neuroanatomical regions, individual cell types (e.g., neuronal phenotypes
and glia), severity of chronic alcohol exposure, as well as across differing stress types may prove
useful in understanding differential mechanisms of induction and for targeting select systems for
pharmacotherapeutic intervention in alcoholism.
Brain Sci. 2016, 6, 25 83 www.mdpi.com/journal/brainsci
Brain Sci. 2016, 6, 25
Keywords: restraint stress; chronic ethanol withdrawal; cytokine mRNAs; CRF; alcohol; CP154,526
1. Introduction
Acute withdrawal from chronic ethanol (WCE) exposure is associated with increased anxiety-like
behavior [1–3]. Breese et al. [4] also found in a three-withdrawal protocol that stress substituted for the
initial two withdrawals such that withdrawal from a single five-day cycle of chronic ethanol induced
anxiety. Subsequently, Breese et al. [5] found that the anxiety-like response to restraint stress was
facilitated when the stress was applied after WCE—a finding in agreement with other reports that
stress after WCE can enhance negative effects [6,7].
Breese et al. [8] and Knapp et al. [9] also reported that administration of lipopolysaccharide (LPS)
or a cytokine into the brain substituted for the initial intermittent ethanol exposures applied prior to
a single CE exposure to induce negative effects. This latter outcome was comparable to the change
observed with prior exposure to stress [4,5] or after WCE [2,3,10]. More recently, Whitman et al. [9]
reported that WCE increased cytokine mRNAs in the cortex—a cytokine immune response that was
not related to infection [11–13]. Whitman et al. [9] also observed increases in mRNAs for toll-like
receptor 4 (TLR4) and High Mobility Group Box 1 Protein (HMGB1) which serve as an endogenous
system that activates neuroimmune function [11,12,14–16]. The induction of cytokine mRNAs increases
after WCE was blocked by a CRF1 receptor (CRF1R) antagonist [9]—a finding possibly linking the
cytokine mRNA changes to CRF involvement in the anxiety-like behavior that accompanies WCE and
stress [3–5].
Various studies have linked stress to increases in cytokine mRNAs in various brain sites [17–25].
Collectively, these reports provided new information about the effects of various stressors (social
stress/defeat, footshock or tailshock, restraint, forced swim, glucose/insulin challenge, or cold stress)
on neuroimmune mRNA responses of the hypothalamus, hippocampus, cerebellum, posterior cortex,
and nucleus of the solitary tract. Relatedly, work from our group had shown that restraint stress could
substitute for the initial repeated exposures to chronic alcohol to induce a negative emotional state
following a future withdrawal as inferred from anxiety-like behavior, (e.g., [4]). To explore the potential
relevance of stress effects on neuroimmune responses in a chronic ethanol and withdrawal model,
Breese et al. [8] administered LPS or a pro-inflammatory cytokine into brain to substitute for the initial
intermittent ethanol withdrawals or mild stress to induce anxiety-like behavior following a single ethanol
withdrawal that otherwise would be incapable of eliciting anxiety [4,5]. Missing from this strategy was
an assessment of whether the restraint stress itself induced neuroimmune changes consistent with
functional effects on behavior. Thus, a key new component of the current studies was to assess whether
stress, which by itself has been shown in some studies to increase brain cytokines (e.g., [18,20,21,26]),
produced changes comparable to those triggered by WCE. Additionally, comparisons were made of
cytokine mRNA in different brain regions after stress or WCE. Finally, to complement earlier studies
with WCE and cortical cytokines, the present study explored whether a corticotrophin-releasing factor
receptor antagonist would attenuate stress-induced cytokines in the cortex. This line of inquiry is
pertinent to understanding the relative overlap of neuroimmune effects of stress and the WCE model
in relation to alcohol abuse, drug addiction, and several psychiatric disorders (see [6–8,27–35]).
2. Materials and Methods
2.1. Animals
Adult male Sprague–Dawley (S–D) rats or Wistar Rats (Charles-River, Raleigh, NC, USA)
weighing 180–200 g upon arrival were group housed and fed RMH3000 rat chow (Test Diets, Richmond,
IN, USA) for 2–3 days prior to study to acclimate them to the new environment (temperatures
70–72 ˝F; humidity 40%–60%; and light/dark cycle 12 h:12 h with lights from 7:00 a.m. to 7:00 p.m.).
84
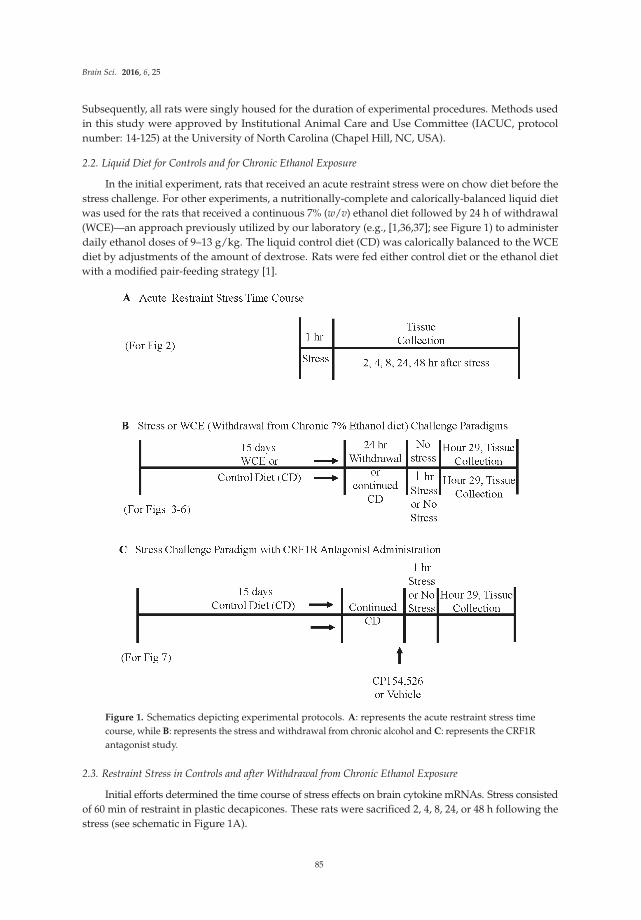
Brain Sci. 2016, 6, 25
Subsequently, all rats were singly housed for the duration of experimental procedures. Methods used
in this study were approved by Institutional Animal Care and Use Committee (IACUC, protocol
number: 14-125) at the University of North Carolina (Chapel Hill, NC, USA).
2.2. Liquid Diet for Controls and for Chronic Ethanol Exposure
In the initial experiment, rats that received an acute restraint stress were on chow diet before the
stress challenge. For other experiments, a nutritionally-complete and calorically-balanced liquid diet
was used for the rats that received a continuous 7% (w/v) ethanol diet followed by 24 h of withdrawal
(WCE)—an approach previously utilized by our laboratory (e.g., [1,36,37]; see Figure 1) to administer
daily ethanol doses of 9–13 g/kg. The liquid control diet (CD) was calorically balanced to the WCE
diet by adjustments of the amount of dextrose. Rats were fed either control diet or the ethanol diet
with a modified pair-feeding strategy [1].
Figure 1. Schematics depicting experimental protocols. A: represents the acute restraint stress time
course, while B: represents the stress and withdrawal from chronic alcohol and C: represents the CRF1R
antagonist study.
2.3. Restraint Stress in Controls and after Withdrawal from Chronic Ethanol Exposure
Initial efforts determined the time course of stress effects on brain cytokine mRNAs. Stress consisted
of 60 min of restraint in plastic decapicones. These rats were sacrificed 2, 4, 8, 24, or 48 h following the
stress (see schematic in Figure 1A).
85
Brain Sci. 2016, 6, 25
2.4. Brain Tissue Collection and Real-Time PCR Analysis for Tissue mRNA
Following experimental procedures, rats were rapidly decapitated and brain tissue stored at
´80 ˝C for subsequent extractions for PCR. To initiate PCR procedures, total RNA was extracted with
Trizol (Invitrogen, Carlsbad, CA, USA) from homogenized dissected brain regions from control
and ethanol-treated experimental brain sections followed by use of the SV total RNA isolation
system (Promega, Madison, WI, USA). This tissue was then used for reverse transcription PCR using
the Superscript First Strand or Superscript III First Strand Synthesis Super mix (Life Technologies,
Grand Island, NY, USA) [38]. The primer sequences used for the cortex were chemokine (C–C motif)
ligand 2 (CCL2) = 51-TCACGCTTCTGGGCCTGTTG-31 (forward) and 51-CAGCCGACTCATTGGGATC
ATC-31 (reverse); Interleukin-1β (IL-1β) = 51-GAAACAGCAATGGTCGGGAC-31 (forward) and 51-AA
GACACGGGTTCCATGGTG-31 (reverse); tumor necrosis factor-α (TNFα) = 51-ATGTGGAACTGGCAG
AGGAG-31 (forward) and 51-ACGAGCAGGAATGAGAAGAGG-31(reverse); Toll-like-receptor-4
(TLR4) = 51-GCCGGAAAGTTATTGTGGTGGT-31 (forward) and 51-ATGGGTTTTAGGCGCAGAGTT
T-31 (reverse); β-actin, 51-ATGGTGGGTATGGGTCAGAAGG-31 (forward) and 51-GCTCATTGTAG
AAAGTGTGGTGCC-31 (reverse). SYBR green PCR master mix (Applied Biosystems, Foster City,
CA, USA) was used for real-time PCR analysis of the cortex on the Bio-Rad MyiQ (Bio-Rad,
Hercules, CA, USA). For other brain regions (and the CP154,526 study), mRNA analyses were
optimized with TaqMan® (Thermo Fisher Scientific, Waltham, MA, USA) expression assays—CCL2
(Rn00580555_m1), TNFα (Rn01525859_g1), IL-1β (Rn00580432_m1), TLR4 (Rn00569848_m1),
and β-actin (Rn00667869_m1)—and samples were run on a StepOnePlus real time PCR machine
(Life Technologies, Grand Island, NY, USA). For all data, the cycle time (Ct) values were normalized
with β-actin to assess the relative differences in expression between groups. Ct values of β-actin never
differed across groups therefore β-actin was an appropriate choice as a housekeeping gene. Calculated
values were expressed as relative change to a designated control set as 100%.
2.5. Enzyme-linked Immunosorbent Assay (ELISA) for Cytokines
Because changes in levels of cytokine proteins in the S–D rats have been found to correlate poorly
with mRNA changes (see [38,39]) initially only expression of mRNAs for cytokines was assessed.
Nonetheless, because of interest in the relationship between mRNA and proteins induced by stress,
ELISA assays for cytokine proteins in cortex were first performed 4 h after stress in the time course
determination in the S–D rats (Figure 2). Subsequently, assays of cytokine proteins were performed 4 h
after an acute restraint stress to Wistar rats (Charles River, Raleigh, NC, USA). Each cortical sample
was homogenized in Iscove’s Modified Dulbecco Medium (Invitrogen, #12440046, Carlsbad, CA,
USA) containing 1 tablet per 50 mL of the complete protease inhibitor cocktail (Roche Diagnostics
#11697498001, Indianapolis, IN, USA). Homogenized specimens were then centrifuged at 12,000ˆ g
for 10 min at 4 ˝C and the supernatants collected and stored at ´80 ˝C until the ELISA determination
was made. ELISA kits were purchased for IL-1β and TNFα from R & D Systems, (Minneapolis, MN,
USA), and for the CCL2 from BD Bio-Sciences (San Jose, CA, USA). ELISA procedures were performed
according to the manufacturer’s instructions. Standards for IL-1β and TNFα were serially diluted
4 times to concentrations of 1.95 pg/mL and 0.78 pg/mL, respectively, and the standard for CCL2 was
used as supplied. All tissue cytokine levels were corrected for protein using Pierce® BCA Protein assay
(Thermo Scientific, Rockford, IL, USA).
86
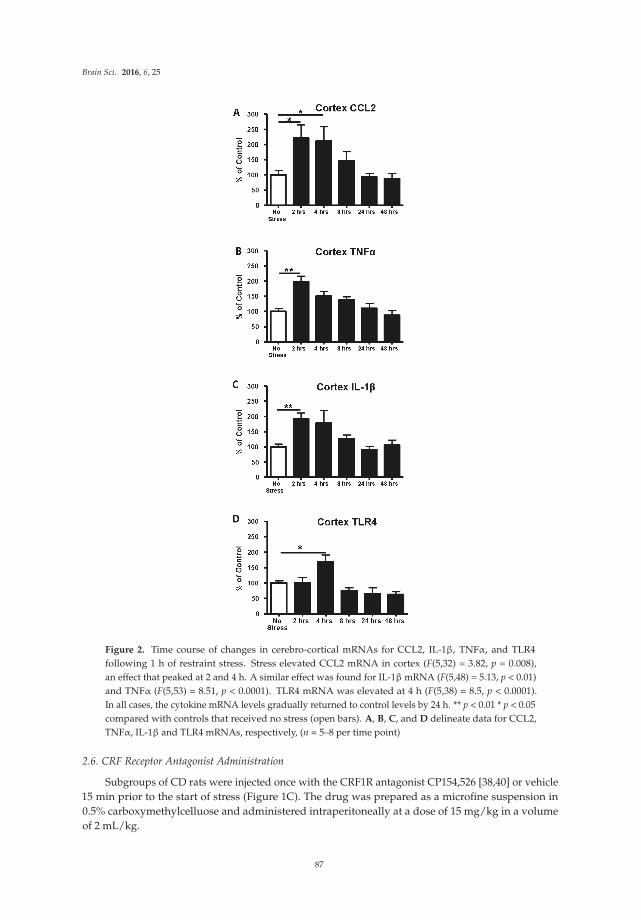
Brain Sci. 2016, 6, 25
Figure 2. Time course of changes in cerebro-cortical mRNAs for CCL2, IL-1β, TNFα, and TLR4
following 1 h of restraint stress. Stress elevated CCL2 mRNA in cortex (F(5,32) = 3.82, p = 0.008),
an effect that peaked at 2 and 4 h. A similar effect was found for IL-1β mRNA (F(5,48) = 5.13, p < 0.01)
and TNFα (F(5,53) = 8.51, p < 0.0001). TLR4 mRNA was elevated at 4 h (F(5,38) = 8.5, p < 0.0001).
In all cases, the cytokine mRNA levels gradually returned to control levels by 24 h. ** p < 0.01 * p < 0.05
compared with controls that received no stress (open bars). A, B, C, and D delineate data for CCL2,
TNFα, IL-1β and TLR4 mRNAs, respectively, (n = 5–8 per time point)
2.6. CRF Receptor Antagonist Administration
Subgroups of CD rats were injected once with the CRF1R antagonist CP154,526 [38,40] or vehicle
15 min prior to the start of stress (Figure 1C). The drug was prepared as a microfine suspension in
0.5% carboxymethylcelluose and administered intraperitoneally at a dose of 15 mg/kg in a volume
of 2 mL/kg.
87
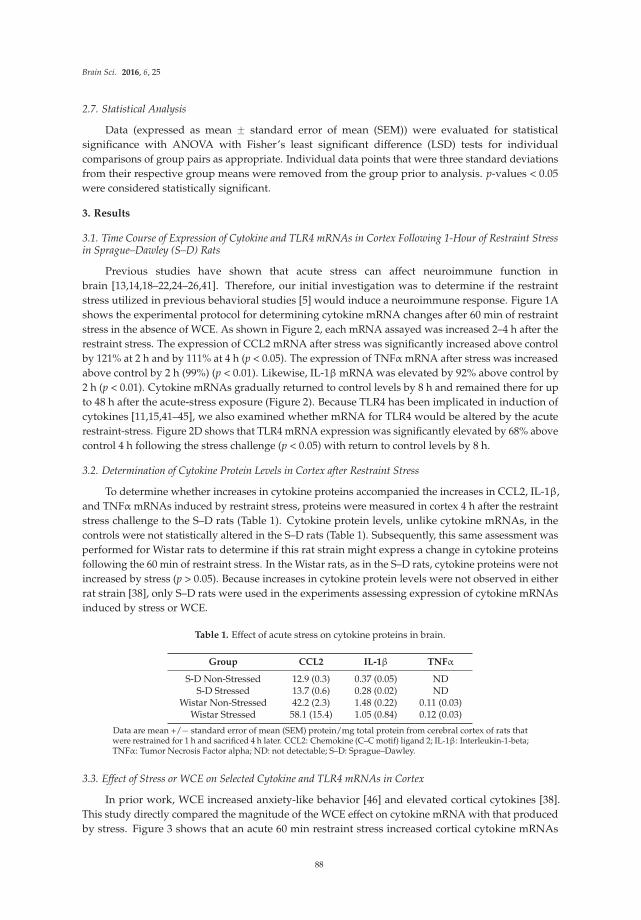
Brain Sci. 2016, 6, 25
2.7. Statistical Analysis
Data (expressed as mean ˘ standard error of mean (SEM)) were evaluated for statistical
significance with ANOVA with Fisher’s least significant difference (LSD) tests for individual
comparisons of group pairs as appropriate. Individual data points that were three standard deviations
from their respective group means were removed from the group prior to analysis. p-values < 0.05
were considered statistically significant.
3. Results
3.1. Time Course of Expression of Cytokine and TLR4 mRNAs in Cortex Following 1-Hour of Restraint Stressin Sprague–Dawley (S–D) Rats
Previous studies have shown that acute stress can affect neuroimmune function in
brain [13,14,18–22,24–26,41]. Therefore, our initial investigation was to determine if the restraint
stress utilized in previous behavioral studies [5] would induce a neuroimmune response. Figure 1A
shows the experimental protocol for determining cytokine mRNA changes after 60 min of restraint
stress in the absence of WCE. As shown in Figure 2, each mRNA assayed was increased 2–4 h after the
restraint stress. The expression of CCL2 mRNA after stress was significantly increased above control
by 121% at 2 h and by 111% at 4 h (p < 0.05). The expression of TNFα mRNA after stress was increased
above control by 2 h (99%) (p < 0.01). Likewise, IL-1β mRNA was elevated by 92% above control by
2 h (p < 0.01). Cytokine mRNAs gradually returned to control levels by 8 h and remained there for up
to 48 h after the acute-stress exposure (Figure 2). Because TLR4 has been implicated in induction of
cytokines [11,15,41–45], we also examined whether mRNA for TLR4 would be altered by the acute
restraint-stress. Figure 2D shows that TLR4 mRNA expression was significantly elevated by 68% above
control 4 h following the stress challenge (p < 0.05) with return to control levels by 8 h.
3.2. Determination of Cytokine Protein Levels in Cortex after Restraint Stress
To determine whether increases in cytokine proteins accompanied the increases in CCL2, IL-1β,
and TNFα mRNAs induced by restraint stress, proteins were measured in cortex 4 h after the restraint
stress challenge to the S–D rats (Table 1). Cytokine protein levels, unlike cytokine mRNAs, in the
controls were not statistically altered in the S–D rats (Table 1). Subsequently, this same assessment was
performed for Wistar rats to determine if this rat strain might express a change in cytokine proteins
following the 60 min of restraint stress. In the Wistar rats, as in the S–D rats, cytokine proteins were not
increased by stress (p > 0.05). Because increases in cytokine protein levels were not observed in either
rat strain [38], only S–D rats were used in the experiments assessing expression of cytokine mRNAs
induced by stress or WCE.
Table 1. Effect of acute stress on cytokine proteins in brain.
Group CCL2 IL-1β TNFα
S-D Non-Stressed 12.9 (0.3) 0.37 (0.05) NDS-D Stressed 13.7 (0.6) 0.28 (0.02) ND
Wistar Non-Stressed 42.2 (2.3) 1.48 (0.22) 0.11 (0.03)Wistar Stressed 58.1 (15.4) 1.05 (0.84) 0.12 (0.03)
Data are mean +/´ standard error of mean (SEM) protein/mg total protein from cerebral cortex of rats thatwere restrained for 1 h and sacrificed 4 h later. CCL2: Chemokine (C–C motif) ligand 2; IL-1β: Interleukin-1-beta;TNFα: Tumor Necrosis Factor alpha; ND: not detectable; S–D: Sprague–Dawley.
3.3. Effect of Stress or WCE on Selected Cytokine and TLR4 mRNAs in Cortex
In prior work, WCE increased anxiety-like behavior [46] and elevated cortical cytokines [38].
This study directly compared the magnitude of the WCE effect on cytokine mRNA with that produced
by stress. Figure 3 shows that an acute 60 min restraint stress increased cortical cytokine mRNAs
88
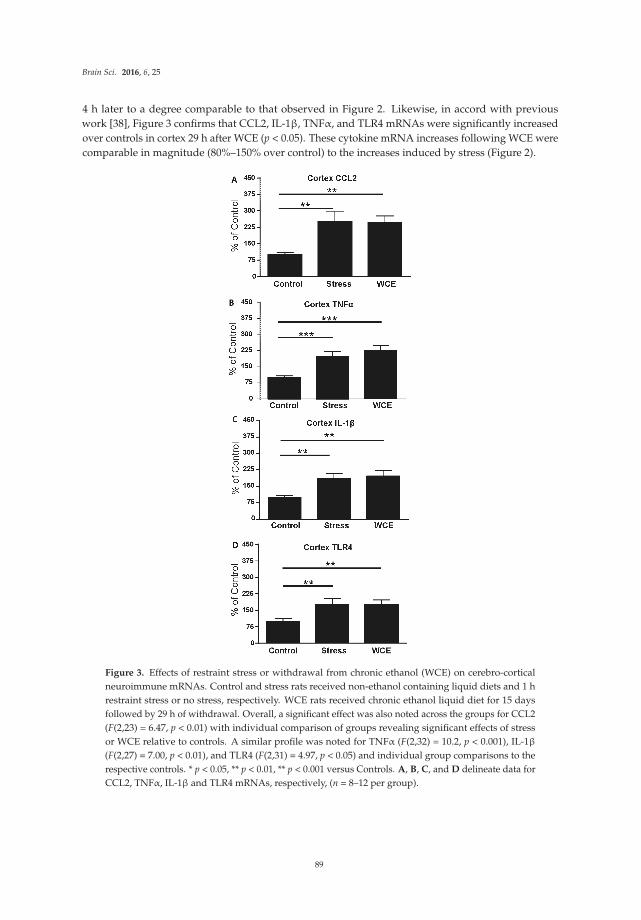
Brain Sci. 2016, 6, 25
4 h later to a degree comparable to that observed in Figure 2. Likewise, in accord with previous
work [38], Figure 3 confirms that CCL2, IL-1β, TNFα, and TLR4 mRNAs were significantly increased
over controls in cortex 29 h after WCE (p < 0.05). These cytokine mRNA increases following WCE were
comparable in magnitude (80%–150% over control) to the increases induced by stress (Figure 2).
Figure 3. Effects of restraint stress or withdrawal from chronic ethanol (WCE) on cerebro-cortical
neuroimmune mRNAs. Control and stress rats received non-ethanol containing liquid diets and 1 h
restraint stress or no stress, respectively. WCE rats received chronic ethanol liquid diet for 15 days
followed by 29 h of withdrawal. Overall, a significant effect was also noted across the groups for CCL2
(F(2,23) = 6.47, p < 0.01) with individual comparison of groups revealing significant effects of stress
or WCE relative to controls. A similar profile was noted for TNFα (F(2,32) = 10.2, p < 0.001), IL-1β
(F(2,27) = 7.00, p < 0.01), and TLR4 (F(2,31) = 4.97, p < 0.05) and individual group comparisons to the
respective controls. * p < 0.05, ** p < 0.01, ** p < 0.001 versus Controls. A, B, C, and D delineate data for
CCL2, TNFα, IL-1β and TLR4 mRNAs, respectively, (n = 8–12 per group).
89
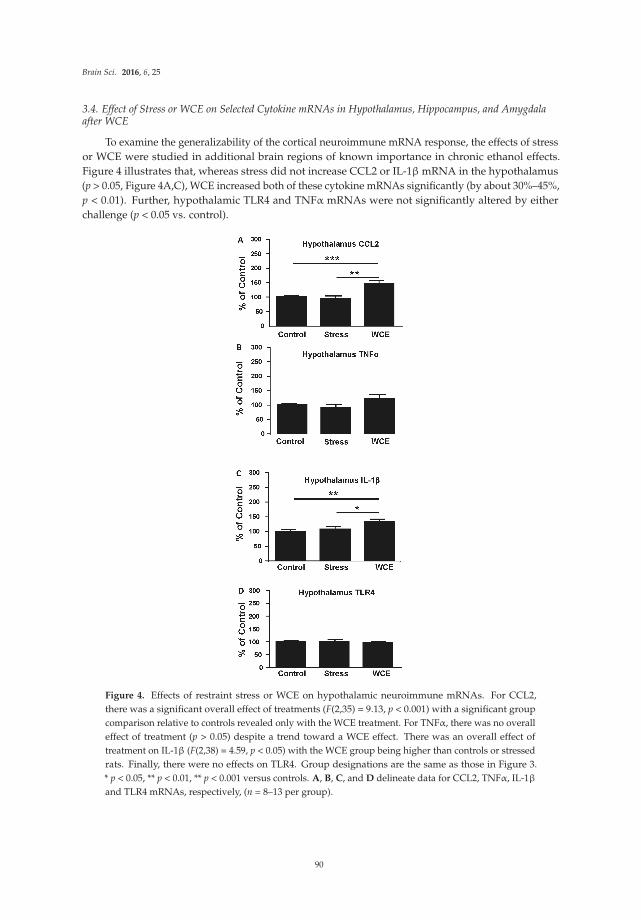
Brain Sci. 2016, 6, 25
3.4. Effect of Stress or WCE on Selected Cytokine mRNAs in Hypothalamus, Hippocampus, and Amygdalaafter WCE
To examine the generalizability of the cortical neuroimmune mRNA response, the effects of stress
or WCE were studied in additional brain regions of known importance in chronic ethanol effects.
Figure 4 illustrates that, whereas stress did not increase CCL2 or IL-1β mRNA in the hypothalamus
(p > 0.05, Figure 4A,C), WCE increased both of these cytokine mRNAs significantly (by about 30%–45%,
p < 0.01). Further, hypothalamic TLR4 and TNFα mRNAs were not significantly altered by either
challenge (p < 0.05 vs. control).
Figure 4. Effects of restraint stress or WCE on hypothalamic neuroimmune mRNAs. For CCL2,
there was a significant overall effect of treatments (F(2,35) = 9.13, p < 0.001) with a significant group
comparison relative to controls revealed only with the WCE treatment. For TNFα, there was no overall
effect of treatment (p > 0.05) despite a trend toward a WCE effect. There was an overall effect of
treatment on IL-1β (F(2,38) = 4.59, p < 0.05) with the WCE group being higher than controls or stressed
rats. Finally, there were no effects on TLR4. Group designations are the same as those in Figure 3.
* p < 0.05, ** p < 0.01, ** p < 0.001 versus controls. A, B, C, and D delineate data for CCL2, TNFα, IL-1β
and TLR4 mRNAs, respectively, (n = 8–13 per group).
90
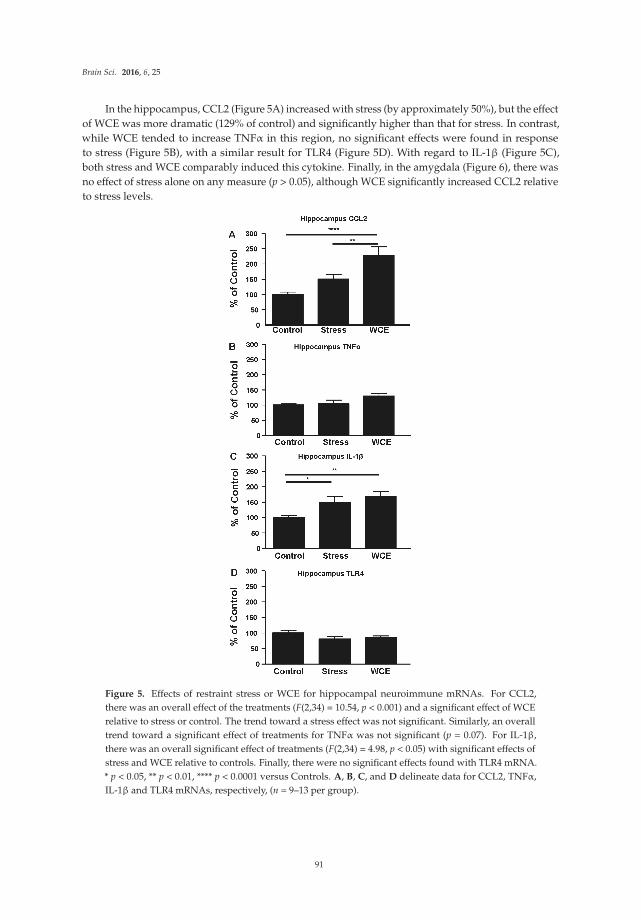
Brain Sci. 2016, 6, 25
In the hippocampus, CCL2 (Figure 5A) increased with stress (by approximately 50%), but the effect
of WCE was more dramatic (129% of control) and significantly higher than that for stress. In contrast,
while WCE tended to increase TNFα in this region, no significant effects were found in response
to stress (Figure 5B), with a similar result for TLR4 (Figure 5D). With regard to IL-1β (Figure 5C),
both stress and WCE comparably induced this cytokine. Finally, in the amygdala (Figure 6), there was
no effect of stress alone on any measure (p > 0.05), although WCE significantly increased CCL2 relative
to stress levels.
Figure 5. Effects of restraint stress or WCE for hippocampal neuroimmune mRNAs. For CCL2,
there was an overall effect of the treatments (F(2,34) = 10.54, p < 0.001) and a significant effect of WCE
relative to stress or control. The trend toward a stress effect was not significant. Similarly, an overall
trend toward a significant effect of treatments for TNFα was not significant (p = 0.07). For IL-1β,
there was an overall significant effect of treatments (F(2,34) = 4.98, p < 0.05) with significant effects of
stress and WCE relative to controls. Finally, there were no significant effects found with TLR4 mRNA.
* p < 0.05, ** p < 0.01, **** p < 0.0001 versus Controls. A, B, C, and D delineate data for CCL2, TNFα,
IL-1β and TLR4 mRNAs, respectively, (n = 9–13 per group).
91
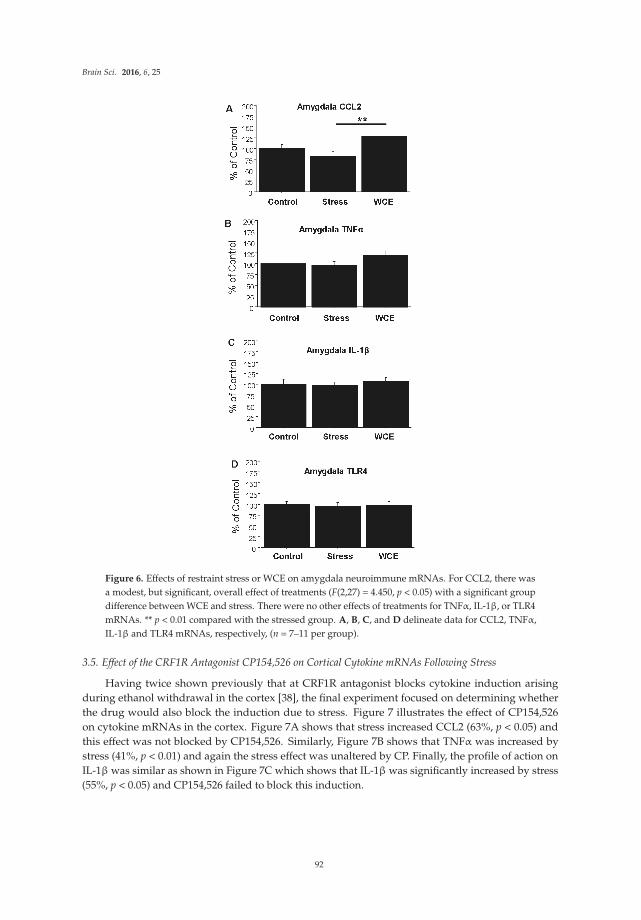
Brain Sci. 2016, 6, 25
Figure 6. Effects of restraint stress or WCE on amygdala neuroimmune mRNAs. For CCL2, there was
a modest, but significant, overall effect of treatments (F(2,27) = 4.450, p < 0.05) with a significant group
difference between WCE and stress. There were no other effects of treatments for TNFα, IL-1β, or TLR4
mRNAs. ** p < 0.01 compared with the stressed group. A, B, C, and D delineate data for CCL2, TNFα,
IL-1β and TLR4 mRNAs, respectively, (n = 7–11 per group).
3.5. Effect of the CRF1R Antagonist CP154,526 on Cortical Cytokine mRNAs Following Stress
Having twice shown previously that at CRF1R antagonist blocks cytokine induction arising
during ethanol withdrawal in the cortex [38], the final experiment focused on determining whether
the drug would also block the induction due to stress. Figure 7 illustrates the effect of CP154,526
on cytokine mRNAs in the cortex. Figure 7A shows that stress increased CCL2 (63%, p < 0.05) and
this effect was not blocked by CP154,526. Similarly, Figure 7B shows that TNFα was increased by
stress (41%, p < 0.01) and again the stress effect was unaltered by CP. Finally, the profile of action on
IL-1β was similar as shown in Figure 7C which shows that IL-1β was significantly increased by stress
(55%, p < 0.05) and CP154,526 failed to block this induction.
92
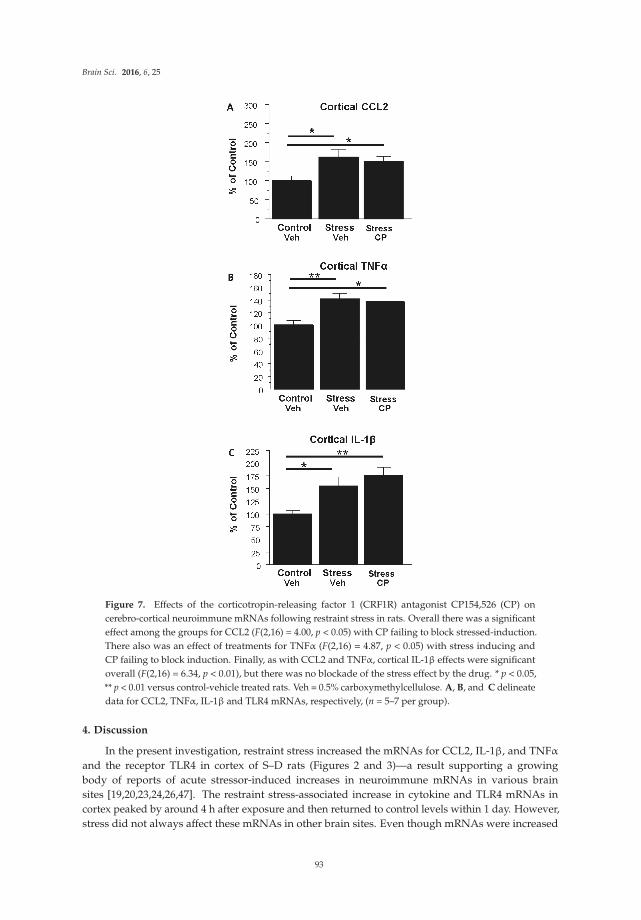
Brain Sci. 2016, 6, 25
Figure 7. Effects of the corticotropin-releasing factor 1 (CRF1R) antagonist CP154,526 (CP) on
cerebro-cortical neuroimmune mRNAs following restraint stress in rats. Overall there was a significant
effect among the groups for CCL2 (F(2,16) = 4.00, p < 0.05) with CP failing to block stressed-induction.
There also was an effect of treatments for TNFα (F(2,16) = 4.87, p < 0.05) with stress inducing and
CP failing to block induction. Finally, as with CCL2 and TNFα, cortical IL-1β effects were significant
overall (F(2,16) = 6.34, p < 0.01), but there was no blockade of the stress effect by the drug. * p < 0.05,
** p < 0.01 versus control-vehicle treated rats. Veh = 0.5% carboxymethylcellulose. A, B, and C delineate
data for CCL2, TNFα, IL-1β and TLR4 mRNAs, respectively, (n = 5–7 per group).
4. Discussion
In the present investigation, restraint stress increased the mRNAs for CCL2, IL-1β, and TNFα
and the receptor TLR4 in cortex of S–D rats (Figures 2 and 3)—a result supporting a growing
body of reports of acute stressor-induced increases in neuroimmune mRNAs in various brain
sites [19,20,23,24,26,47]. The restraint stress-associated increase in cytokine and TLR4 mRNAs in
cortex peaked by around 4 h after exposure and then returned to control levels within 1 day. However,
stress did not always affect these mRNAs in other brain sites. Even though mRNAs were increased
93
Brain Sci. 2016, 6, 25
4 h after stress exposure in controls, corresponding cytokine proteins were not altered at this time
point in either S–D or Wistar Rats (Table 1). Neuroimmune responses to WCE sometimes followed
the response to stress and sometimes did not. While CCL2, TNFα, IL-1β, and TLR4 responses in
the cortex were generally comparably high with either challenge, responses in the amygdala were
comparably minimal. However, in the hippocampus, responses varied by type of challenge and across
neuroimmune markers with a robust CCL2 response to withdrawal and a comparable IL-1β response
to either challenge. In the hypothalamus, stress was inactive while withdrawal elevated CCL2 and
IL-1β. Finally, the results showed that CRF1R inhibition did not alter stress-induced neuroimmune
responses in the cortex, a result inconsistent with the earlier findings that CRF1R inhibition blocked
cytokine responses to chronic withdrawal [38].
The reason that stress increased select cytokine mRNAs but not corresponding cytokine proteins
is unknown. This pattern of mRNA versus protein results is similar to that observed in studies in
other areas of rat brain. For example, Hueston et al. [21] demonstrated an increase in IL-1β mRNA
without an accompanying increase in IL-1β protein in the paraventricular nucleus (PVN) to restraint
stress. Deak et al. [19] found that IL-1β protein did not increase in the hypothalamus of S–D rats after
restraint stress alone but did observe an increase in IL-1β to stress in the hypothalamus after applying
a combination of restraint and shaking (i.e., a more severe stress). Additionally, Porterfield et al. [39]
found that 2 h of restraint increased expression of IL-1β mRNA in the hypothalamus and caused a
corresponding increase in this cytokine protein in the more stress-responsive Fischer 344 rats, but not in
S–D rats [39]. However, Whitman et al. [38] found that an acute LPS challenge increased both selected
cytokine proteins and corresponding cytokine mRNAs in the cortex of S–D rats [38]. While a focus on
the hypothalamus and IL-1 (e.g., [19,23]) has been a fruitful focus of prior research so far as consistent
effects of stress are concerned, reports of combinations of stressors may be particularly worthy of
follow up. In addition to the work of Deak et al. [19] and Porterfield et al. [39] noted above, prior cold
stress rendered animals’ neuroimmune systems responsive to future LPS treatment [20], as shown
by elevated hypothalamic and prefrontal cortical neuroimmune markers). Considered in aggregate,
such studies suggest that genetic background and/or the degree and combinations of stress or challenge
to the neuroimmune system may be at least in part responsible for the presence of a neuroimmune
response and possibly for differences in protein versus mRNA responses as well. It may be particularly
interesting in this context to examine the possibility that differentially engaged molecular mechanisms
of mRNA versus protein processing across time may account for asynchrony of these constructs.
That is, the observation of a stress-associated increase in cytokine mRNAs without corresponding
changes in cytokine proteins could also be explained by release, utilization, and degradation of the
protein during the stress challenge. Relatedly, habituation or exhaustion of mRNA generation could
also be a factor in some cases. In this context, Minami et al. [23] showed that the IL-1β mRNA response
in the hypothalamus declined over four hours despite continued immobilization stress. Such an
effect could conceivably have influenced our amygdala and hypothalamic findings, but would be
harder to extend to our cortical and hippocampal results. Also relevant is the more recent report of
Vecchiarelli et al. [26] who found that increasing the length of restraint stress in Sprague–Dawley rats to
two hours elevated protein levels of amygdala TNFα, decreased IL-6, while monocyte chemoattractant
protein-1 (MCP-1/CCL2) remained unchanged. Based on our data, it is unlikely that any such
diminished cortical response would apply to the cortex globally. Differential responses across
subregions of the cortex might be critical with the net effect of global cortical responses being an
increased response that must be dependent on some region(s) being particularly sensitive. Extending
this logic to the hippocampus or hypothalamus may be premature, as Vecchiarelli did not see changes
in these regions. The single hour of restraint stress in the present work did not alter amygdala or
hypothalamic TNFα mRNA but did increase cortical IL-1β, TNFα and CCL2, and hippocampal IL-1β.
Perhaps the length or severity of stress, along with a focus on cortical subregions represent key
prerequisites to examinations of either individual or combinatorial challenges. Further research to
94
Brain Sci. 2016, 6, 25
explore these various possibilities is warranted, including combinations of different intensities, times,
and types of stress with chronic alcohol challenges, circadian rhythms, and genetic background.
To assess the possible contribution of other components to neuroimmune activation pathways that
result in the effects observed here, TLR4 mRNA was also assessed after restraint stress. A significant
increase in TLR4 mRNA, was observed only at 4 h in cortical tissue following stress, returned to
control level by 8 h, and remained at this level through 48 h after the stress (Figure 2D). This fairly
tight time-response relative to the other mRNAs was one of the reasons for focusing on 29 h of
withdrawal (4 h post stress relative to non-stressed alcohol withdrawn rats) as the target for comparison.
A consideration here is that prior assessments [38] focused mostly on alcohol withdrawal-derived
mRNA data from the 24th hour of withdrawal although they showed that mRNAs can remain elevated
for longer periods, thus it seems unlikely that mRNA levels would be meaningfully different across
these two time points within the present study. Regardless, these results agree with Blandino et al. [18]
who found no change in cortical TLR4 mRNA at their 2 h time point post footshock or LPS treatment.
It is notable that stress or WCE elevated TLR4 mRNA only in the cortex. The reasons for this specific
effect on TLR4 are unknown, but suggests differential neuroimmune regulation and possibly lower
thresholds for activation across brain regions. The TLR4 receptor complex is a prominent driver in
neuroimmune processes in general and in alcoholism (e.g., see [48]) and animal models in particular
(e.g., [38,49,50]). In fact, the TLR4 receptor may play a role in a positive feedback loop that amplifies
the intensity of overall neuroimmune activation in alcoholism [51]. Such reduced thresholds for
neuroimmune activation may be represented most profoundly following endotoxin where activation
progresses to neurodegeneration in the substantia nigra with corresponding behavioral deficits [52].
While WCE alone generally elevated cortical cytokines (and see [38]) and hippocampal CCL2
and IL-1β, WCE or stress alone did not consistently do so for some mRNAs in some regions
(e.g., the hippocampus and hypothalamus, Figures 4 and 5). The limited TNFα response in these regions
contrasts with the effects of pain-associated stress such as footshock reported by Blandino et al. [18] and
thus supports the idea that the type of stress may be important in cytokine induction. Again, the pattern
of results suggests that unique mechanisms are operating across brain regions and it would likely be
productive to further examine neuroimmune mRNAs more generally on a region by region basis and
thus speak to the relatively understudied yet critical issue of how neuroimmune changes across regions
or networks could produce neuropathology. The potential differential induction of anti-inflammatory
cytokines such as IL-10 could also be informative. These future studies should elucidate how stress
induction of some cytokine mRNAs, but not others, contributes to the profile of neuroimmune
activation in models of alcoholism [3–5,9].
One potentially important focus in identifying mechanisms of cytokine regulation in this
experimental context relates to the corticotropin-releasing factor (CRF) system. The data herein show
that the CRF1R antagonist CP154,526 was inactive against stress induction of neuroimmune mRNAs.
This effect provides an interesting comparison with previous work [38] that focused on the effect of this
drug on cytokine mRNAs elevated by WCE. The mechanisms that explain how the drug comes to exert
an effect on one challenge and not the other are unknown, but differential engagement of adaptive
mechanisms might be one possibility. That is, the drug may affect a recruited process unique to rats
experiencing WCE. This interesting possibility is reminiscent of the work of Koob and colleagues who
noted that CRF receptor antagonist effects were generally not manifest unless rats were dependent on
alcohol (e.g., [53]). It is important to note that the CP154,526 study herein was limited in its scope and
could be expanded in future studies to examine related questions. For example, the drug could be
employed in examining the effect on cytokine mRNAs in the context of combined stress and WCE
which is arguably a very relevant experience in some alcohol abusers.
While the current research corroborates the demonstration by Whitman et al. [38] that cytokine
mRNAs are increased in the cortex 24 h after WCE and extends our inquiry into other brain sites and
to the effects of stress, the studies do not address this potentially interesting combinatorial effects of
the two challenges. What our results do show is that effects of these challenges are each themselves
95
Brain Sci. 2016, 6, 25
complex and perhaps more nuanced in their consequence on the neuroimmune system than may have
previously been appreciated. Such findings prompt considerations of the work of others where it
was shown that the neuroimmune system may respond differently to stress depending on the degree
and nature of prior challenges [17,20]. In related research, Buck et al. [54] reported that a single
dose of ethanol before foot-shock stress had no effect on immune function and did not enhance the
stress-induced increase in IL-1β mRNA in the PVN. In general, a second challenge before or after
the WCE would seem appropriate strategy to gain new evidence for the possibility that an initial
challenge to the neuroimmune system may permit or alter induction of select neuroimmune mediators
by a second challenge. Thus, sufficient previous activation of immune function by chronic ethanol
exposure might render stress capable of further increasing cytokine mRNAs, as previously noted
behaviorally [2,4,10,55]. Thus, identification of the conditions under which prior stress or chronic
alcohol exposure alters future responses to either challenge would seem to be a productive avenue
for research.
Whatever future combinatorial stress studies might reveal, the present results nonetheless do
provide an interesting contrast with Whitman et al. [38], who demonstrated that a CRF1R antagonist
prevented the cytokine mRNA increases induced by the WCE alone. It would also be of interest to
identify differential physiological effects of the drug in context of the two challenges. For example,
in considering the idea that cytokines may have specific neurophysiological and behavioral actions
manifest in select brain regions (e.g., [9,56]), it would seem likely that broadening the neuroanatomical
focus of these CRF/cytokine interactions would very likely be a productive endeavor (see also [57]).
Collectively, these studies implicate CRF involvement in the increased expression of cytokine mRNAs
during the 24 h withdrawal from the WCE and suggest that there may be functional consequences.
In this regard, amygdala CRF-amplified CCL2 regulation of alcohol self-administration [58] and
elevated CRF-dependent amygdala CCL2 in human alcoholics [48] are consistent with a role of
cytokines and CRF interacting to regulate alcohol consumption. These findings considered in
the context of chronic alcohol dependent CCL2 induction within the central amygdala and robust
elevations of the TNF receptor (Tnfrsf1a) in rats, support the idea that neuroimmune mechanisms in
the amygdala are potentially critical in the behavioral pathology in alcoholism [59]. Thus, a future
experiment should be undertaken to further examine the interactions of stress and WCE across
additional relevant brain regions and to further isolate relevant mechanisms. Likewise, based upon
the report by Johnson et al. [22] that norepinephrine-receptor antagonists blocked the stress increase in
hypothalamic IL-1β protein induced by inescapable tail shock (i.e., a severe stress), and the finding
that the beta-adrenergic agonist isoproterenol can enhance IL-1 production in the amygdala following
chronic stress (Porterfield et al., [39]), the effects of this drug class on the cytokine mRNA changes across
different brain regions after restraint stress in the presence and absence of WCE should also be explored.
5. Conclusions
The present findings provide additional evidence for neuroimmune involvement in brain function
associated with stress or WCE and the differential induction of neuroimmune mRNAs and adds the
novel observation that a CRF1R antagonist is inactive against a mild stress. The results herein show
that some neuroimmune components are readily inducible in a brain-region-dependent manner while
others are not. Such evidence adds to a growing literature that implicates neuroimmune dysfunction
in alcoholism, other substance abuse disorders, and other neurobehavioral disorders associated with
stress [7,9,27,28,32,60,61]. Our findings and others prompt questions about how some challenges exert
specific neuroimmune effects within neuroanatomically limited areas and suggest further studies
should be done to examine combinations of challenges/conditions thought to impact on alcoholism
and associated neuropsychiatric conditions. Moreover, our findings, considered in the context of
the documented roles of the neuroimmune system and stress in alcohol consumption and negative
emotional symptoms due to chronic ethanol consumption [9,58,62–65], support the idea that specific
neuroimmune processes are engaged in neurobehavioral processes fundamental to alcohol abuse.
96
Brain Sci. 2016, 6, 25
It may be productive to ask whether risk of relapse in alcoholics relates to differential neuroimmune
responses to stress as a consequence of prior chronic ethanol exposure history and to further develop
animal models around this concept. These findings also have potentially broader implications in that
neuroimmune system dysfunction has been implicated in other neurobehavioral disorders as well
including insomnia [33], depression [31,34,66–68], and anxiety [6,35,60,69]. In particular, neuroimmune
system regulation of anxiety associated with chronic alcohol and withdrawal are notable [8,9,49].
Identifying overlapping and independent neuroimmune processes across these pathologies would be
worthy of further study.
While the current studies document that neural mechanisms associated with stress may at least
partially overlap with the mechanisms that drive cytokine mRNA expression after WCE, the profile of
effects shown herein for the two challenges do not completely overlap across neuroimmune marker or
brain region. Further, the responses reported herein were elicited with relatively limited challenges
(i.e., just 1 h of stress or 15 days of exposure to ethanol). Thus, it may be valuable to examine similar
endpoints following exposure to the more chronic and/or severe challenges/stressors that define
many neurobehavioral disorders. Of these effects, one could ask which are transient (yet perhaps
behaviorally relevant), and which induce long term maladaptations that influence behavioral pathology.
By understanding how stress and WCE engage the neuroimmune system, and worsens symptoms,
therapeutic options by which to mitigate stress-associated neuroimmune dysfunction in drug addiction
and other central nervous system disorders could emerge [29,32].
Acknowledgments: The authors wish to thank A. Leslie Morrow for generous contribution of time, space andequipment to this project. We also acknowledge Bob Angel and Todd O’Buckley for their excellent technicalassistance. This work was supported by the National Institutes of Health, National Institute on Alcohol Abuse andAlcoholism (AA11605, AA14949, AA17462, AA021275, AA007573), and the Bowles Center for Alcohol Studies.
Author Contributions: D.J.K. participated in all phases of the research, was lead writer on the manuscript andco-wrote the funding behind the project with G.R.B.; K.M.H., B.A.W., and Z.Z. assisted with dietary manipulations,assays and statistical summaries, while B.A.W. prepared an initial summary draft of the manuscript. All authorsreviewed and edited multiple drafts of the manuscript.
Conflicts of Interest: The authors declare no conflict of interest.
Abbreviations
ANOVA analysis of variance
CCL2 chemokine (C-C motif) ligand 2
CRF corticotropin releasing hormone
IL-1β interleukin-1 beta
mRNA messenger ribonucleic acid
S-D Sprague-Dawley
TLR4 toll-like receptor 4
TNFα tumor necrosis factor-alpha
WCE withdrawal from chronic ethanol
qPCR quantitative polymerase chain reaction
References
1. Overstreet, D.H.; Knapp, D.J.; Breese, G.R. Accentuated decrease in social interaction in rats subjected to
repeated ethanol withdrawals. Alcohol. Clin. Exp. Res. 2002, 26, 1259–1268. [CrossRef] [PubMed]
2. Rassnick, S.; Heinrichs, S.C.; Britton, K.T.; Koob, G.F. Microinjection of CRF antagonist into the central
nucleus of the amygdala reverses anxiogenic-like effects of ethanol withdrawal. Brain Res. 1993, 605, 25–32.
[CrossRef]
3. Valdez, G.R.; Zorrilla, E.P.; Roberts, A.J.; Koob, G.F. Antagonism of corticotropin releasing factor attenuates
the enhanced responsiveness to stress observed during protracted ethanol abstinence. Alcohol 2003, 29, 55–60.
[CrossRef]
97
Brain Sci. 2016, 6, 25
4. Breese, G.R.; Knapp, D.J.; Overstreet, D.H. Stress sensitization of ethanol withdrawal-induced reduction
in social interaction: Inhibition by CRF-1 and benzodiazepine receptor antagonists and a 5-HT1A receptor
agonist. Neuropsychopharmacology 2004, 29, 470–482. [CrossRef] [PubMed]
5. Breese, G.R.; Overstreet, D.H.; Knapp, D.J.; Navarro, M. Prior multiple ethanol withdrawals enhance
stress-induced anxiety-like behavior: Inhibition by CRF-1 and benzodiazepine-receptor antagonists and a
5-HT1A receptor antagonists. Neuropsychopharmacology 2005, 30, 1662–1669. [CrossRef] [PubMed]
6. Breese, G.R.; Sinha, R.; Heilig, M. Chronic ethanol neuroadaptation and stress contribute to susceptibility for
ethanol craving and relapse. Pharmacol. Ther. 2011, 129, 149–171. [CrossRef] [PubMed]
7. Sinha, R. How does stress increase risk of drug abuse and relapse? Psychopharmacology 2001, 158, 343–359.
[CrossRef] [PubMed]
8. Breese, G.R.; Knapp, D.J.; Overstreet, D.H.; Navarro, M.; Wills, T.A.; Angel, R.A. Repeated
lipopolysaccharide (LPS) or cytokine treatments sensitize ethanol withdrawal-induced anxiety-like behavior.
Neuropsychopharmacology 2008, 33, 867–876. [CrossRef] [PubMed]
9. Knapp, D.J.; Whitman, B.A.; Wills, T.A.; Angel, R.A.; Overstreet, D.H.; Criswell, H.E.; Ming, Z.; Breese, G.R.
Cytokine involvement in stress may depend on corticotrophin releasing factor to sensitize ethanol withdrawal
anxiety. Brain Behav. Immun. 2011, 25, S146–S154. [CrossRef] [PubMed]
10. Huang, M.M.; Overstreet, D.H.; Knapp, D.J.; Angel, R.; Wills, T.A.; Navarro, M.; Rivier, J.; Vale, W.;
Breese, G.R. Corticotropin-releasing factor (CRF) sensitization of ethanol withdrawal-induced anxiety-like
behavior is site specific and mediated by CRF-1 receptors: Relation to stress-induced sensitization.
J. Pharmacol. Exp. Ther. 2010, 332, 298–307. [CrossRef] [PubMed]
11. Andersson, U.; Tracey, K.J. HMGB1 is a therapeutic target for sterile inflammation and infection.
Ann. Rev. Immunol. 2011, 29, 139–162. [CrossRef] [PubMed]
12. Fleshner, M. Stress-evoked sterile inflammation, danger associated molecular patterns (DAMLPs), microbial
associated molecular patterns (MAMPS) and the inflammasome. Brain Behav. Immun. 2013, 27, 1–7.
[CrossRef] [PubMed]
13. Suzuki, E.; Shintani, F.; Kanba, S.; Asai, M.; Nakaki, T. Immobilization stress increases mRNA levels of
interleukin-1 receptor antagonist in various rat brain regions. Cell Mol. Neurobiol. 1997, 17, 557–562.
[CrossRef] [PubMed]
14. Park, J.S.; Svetkauskaite, D.; He, Q.; Kim, J.Y.; Strassheim, D.; Ishizaka, A.; Esward, A. Involvement of
toll-like receptors 2 and 4 in cellular activation by high mobility group box 1 protein. J. Biol. Chem. 2004,
279, 7370–7377. [CrossRef] [PubMed]
15. Park, J.S.; Gamboni-Robertson, F.; He, Q.; Svetkauskaite, D.; Kim, J.Y.; Strassheim, D.; Sohn, J.W.; Yamada, S.;
Maruyama, I.; Banerjee, A.; et al. High mobility group box 1 protein interacts with multiple Toll-like receptors.
Am. J. Physiol. Cell Physiol. 2006, 290, C917–C924. [CrossRef] [PubMed]
16. Bianchi, M.E. HMGB1 Loves Company. J. Leukoc. Biol. 2009, 86, 573–576. [CrossRef] [PubMed]
17. Barnum, C.J.; Blandino, P., Jr.; Deak, T. Social status modulates basal IL-1 concentrations in the hypothalamus
of pair-housed rats and influences certain features of stress reactivity. Brain Behav. Immun. 2008, 22, 517–527.
[CrossRef] [PubMed]
18. Blandino, P.; Barnum, C.J.; Solomon, L.G.; Larish, Y.; Lankow, B.S.; Deak, T. Gene expression changes in the
hypothalamus provide evidence for regionally-selective changes in IL-1 and microglial markers after acute
stress. Brain Behav. Immun. 2009, 23, 958–968. [CrossRef] [PubMed]
19. Deak, T.; Bordner, K.A.; McElderry, N.K.; Barnum, C.J.; Blandino, P., Jr.; Deak, M.M.; Tammariello, S.P.
Stress-induced increases in hypothalamic IL-1: A systematic analysis of multiple stressor paradigms.
Brain Res. Bull. 2005, 64, 541–556. [CrossRef] [PubMed]
20. Girotti, M.; Donegan, J.J.; Morilak, D.A. Chronic intermittent cold stress sensitizes neuroimmune reactivity
in the rat brain. Psychoneuroendocrinology 2011, 36, 1164–1174. [CrossRef] [PubMed]
21. Hueston, C.M.; Barnum, C.J.; Eberle, J.A.; Ferraioli, F.J.; Buck, H.M.; Deak, T. Stress-dependent changes in
neuroinflammatory markers observed after common laboratory stressors are not seen following acute social
defeat of the Sprague Dawley rat. Physiol. Behav. 2011, 104, 187–198. [CrossRef] [PubMed]
22. Johnson, J.D.; Campisi, J.; Sharkey, C.M.; Kennedy, S.L.; Nickerson, M.; Greenwood, B.N.; Fleshner, M.
Catecholamines mediate stress-induced increases in peripheral and central inflammatory cytokines.
Neuroscience 2005, 135, 1295–1307. [CrossRef] [PubMed]
98
Brain Sci. 2016, 6, 25
23. Minami, M.; Kuraishi, Y.; Yamaguchi, T.; Nakai, S.; Hirai, Y.; Satoh, M. Immobilization stress induces
interleukin-1 beta mRNA in the rat hypothalamus. Neurosci. Lett. 1991, 123, 254–256. [CrossRef]
24. Nguyen, K.T.; Deak, T.; Owens, S.M.; Kohno, T.; Fleshner, M.; Watkins, L.R.; Maier, S.F. Exposure to acute
stress induces brain interleukin-1beta protein in the rat. J. Neurosci. 1998, 18, 2239–2246. [PubMed]
25. Nguyen, K.T.; Deak, T.; Will, M.J.; Hansen, M.K.; Hunsaker, B.N.; Fleshner, M.; Watkins, L.R.; Maier, S.F.
Time course and corticosterone sensitivity of the brain, pituitary, and serum interleukin-1beta protein
response to acute stress. Brain Res. 2000, 859, 193–201. [CrossRef]
26. Vecchiarelli, H.A.; Gandhi, C.P.; Gray, J.M.; Morena, M.; Hassan, K.I.; Hill, M.N. Divergent responses of
inflammatory mediators within the amygdala and medial prefrontal cortex to acute psychological stress.
Brain Behav. Immun. 2016, 51, 70–91. [CrossRef] [PubMed]
27. Crews, F.T.; Zou, J.; Qin, L. Induction of innate immune genes in brain create the neurobiology of addiction.
Brain Behav. Immun. 2011, 25, S4–S12. [CrossRef] [PubMed]
28. Crews, F.T.; Qin, L.; Sheedy, D.; Vetreno, R.P.; Zou, J. High mobility group box 1/Toll-like receptor danger
signaling increases brain neuroimmune activation in alcohol dependence. Biol. Psychiatry 2013, 73, 602–612.
[CrossRef] [PubMed]
29. Dodd, S.; Maes, M.; Anderson, G.; Dean, O.M.; Moylan, S.; Berk, M. Putative neuroprotective agents in
neuropsychiatric disorders. Prog. Neuropsychopharm. Biol. Psychiatry 2013, 42, 135–145. [CrossRef] [PubMed]
30. Felger, J.C.; Lotrich, F.E. Inflammatory cytokines in depression: Neurobiological mechanisms and therapeutic
implications. Neuroscience 2013, 246, 199–229. [CrossRef] [PubMed]
31. Hammen, C. Stress and Depression. Annu. Rev. Clin. Psychol. 2005, 1, 293–319. [CrossRef] [PubMed]
32. Koob, G.F. Neurobiological substrates for the dark side of compulsivity in addiction. Neuropharmacology
2008, 56, 18–31. [CrossRef] [PubMed]
33. Krueger, J.M.; Rector, D.M.; Churchill, L. Sleep and cytokines. Sleep Med. Clin. 2007, 2, 161–169. [CrossRef]
[PubMed]
34. Miller, A.H.; Maletic, V.; Raison, C.L. Inflammation and its discontents: The role of cytokines in the
pathophysiology of major depression. Biol. Psychiat. 2009, 65, 732–741. [CrossRef] [PubMed]
35. Shin, L.M.; Liberzon, I. The neurocircuitry of fear, stress, and anxiety disorders. Neuropsychopharmacology
2010, 35, 169–191. [CrossRef] [PubMed]
36. Frye, G.D.; McCown, T.J.; Breese, G.R. Characterization of susceptibility to audiogenic seizures in
ethanol-dependent rats after microinjection of gamma-aminobutyric acid (GABA) agonists into the inferior
colliculus, substantia nigra or medial septum. J. Pharmacol. Exp. Ther. 1983, 227, 663–670. [PubMed]
37. McCown, T.J.; Breese, G.R. Multiple withdrawals from chronic ethanol “kindles” inferior collicular seizure
activity: Evidence for kindling of seizures associated with alcoholism. Alcohol. Clin. Exp. Res. 1990, 14, 394–399.
[CrossRef] [PubMed]
38. Whitman, B.A.; Knapp, D.J.; Werner, D.F.; Crews, F.T.; Breese, G.R. The cytokine-mRNA Increase induced
by withdrawal from chronic ethanol in the sterile environment of brain is mediated by CRF and HMGB1
Release. Alcohol. Clin. Exp. Res. 2013, 37, 2086–2097. [CrossRef] [PubMed]
39. Porterfield, V.M.; Zimomra, Z.R.; Caldwell, E.A.; Camp, R.M.; Gabella, K.M.; Johnson, J.D. Rat strain
differences in restraint stress-induced brain cytokines. Neuroscience 2011, 188, 48–54. [CrossRef] [PubMed]
40. Overstreet, D.H.; Knapp, D.J.; Breese, G.R. Drug challenges reveal differences in mediation of stress
facilitation of voluntary alcohol drinking and withdrawal-induced anxiety in alcohol-preferring P rats.
Alcohol Clin. Exp. Res. 2007, 31, 1473–1481. [CrossRef] [PubMed]
41. Faraco, G.; Fossati, S.; Bianchi, M.E.; Patrone, M.; Pedrazzi, M.; Sparatore, B.; Moroni, F.; Chiarugi, A.
High mobility group box 1 protein is released by neural cells upon different stresses and worsens ischemic
neurodegeneration in vitro and in vivo. J. Neurochem. 2007, 103, 590–603. [CrossRef] [PubMed]
42. Akira, S.; Takeda, K. Toll-like receptor signaling. Nat. Rev. Immunol. 2004, 4, 499–511. [CrossRef] [PubMed]
43. Yamada, S.; Maruyama, I. HMGB1, a novel inflammatory cytokine. Clin. Chim. Acta 2007, 375, 36–42.
[PubMed]
44. Yang, H.; Wang, H.; Czura, C.J.; Tracey, K.J. The cytokine activity of HMGB1. J. Leukoc. Biol. 2005, 78, 1–8.
[CrossRef] [PubMed]
45. Yu, M.; Wang, H.; Ding, A.; Golenbock, D.T.; Latz, E.; Czura, C.J.; Fenton, M.J.; Tracey, K.J.; Yang, H. HMGB1
signals through toll-like receptor (TLR) 4 and TLR2. Shock 2006, 26, 174–179. [CrossRef] [PubMed]
99
Brain Sci. 2016, 6, 25
46. Knapp, D.J.; Overstreet, D.H.; Breese, G.R. Modulation of ethanol withdrawal-induced anxiety-like behavior
during later withdrawals by treatment of early withdrawals with benzodiazepine/gamma-aminobutyric
acid ligands. Alcohol Clin. Exp. Res. 2005, 29, 553–563. [CrossRef] [PubMed]
47. Shizuya, K.; Komori, T.; Fujiwara, R.; Miyahara, S.; Ohmori, M.; Nomura, J. The influence of restraint stress
on the expression of mRNAs for IL-6 and the IL-6 receptor in the hypothalamus and midbrain of the rat.
Life Sci. 1997, 61, 135–140. [CrossRef]
48. He, J.; Crews, F.T. Increased MCP-1 and microglia in various regions of the human alcoholic brain. Exp. Neurol.
2008, 210, 349–358. [CrossRef] [PubMed]
49. Pascual, M.; Baliño, P.; Aragón, C.M.; Guerri, C. Cytokines and chemokines as biomarkers of ethanol-induced
neuroinflammation and anxiety-related behavior: Role of TLR4 and TLR2. Neuropharmacology 2015,
89, 352–359. [CrossRef] [PubMed]
50. Crews, F.T.; Vetreno, R.P. Neuroimmune basis of alcoholic brain damage. Int. Rev. Neurobiol. 2014, 118, 315–357.
[PubMed]
51. Crews, F.T.; Vetreno, R.P. Mechanisms of neuroimmune gene induction in alcoholism. Psychopharmacology (Berl.)
2016, 333, 1543–1547. [CrossRef] [PubMed]
52. Liu, Y.; Qin, L.; Wilson, B.; Wu, X.; Qian, L.; Granholm, A.C.; Crews, F.T.; Hong, J.S. Endotoxin induces
a delayed loss of TH-IR neurons in substantia nigra and motor behavioral deficits. Neurotoxicology 2008,
29, 864–870. [CrossRef] [PubMed]
53. Funk, C.K.; O’Dell, L.E.; Crawford, E.F.; Koob, G.F. Corticotropin-releasing factor within the central nucleus
of the amygdala mediates enhanced ethanol self-administration in withdrawn, ethanol-dependent rats.
J. Neurosci. 2006, 26, 11324–11332. [CrossRef] [PubMed]
54. Buck, H.M.; Hueston, C.M.; Bishop, C.; Deak, T. Enhancement of the hypothalamic-pituitary-adrenal axis
but not cytokine responses to stress challenges imposed during withdrawal from acute alcohol exposure in
Sprague-Dawley rats. Psychopharmacology 2011, 218, 203–215. [CrossRef] [PubMed]
55. Baldwin, H.A.; Rassnick, S.; Rivier, J.; Koob, G.F.; Britton, K.T. CRF antagonist reverses the “anxiogenic”
response to ethanol withdrawal in the rat. Psychopharmacology 1991, 103, 227–232. [CrossRef] [PubMed]
56. Ming, Z.; Criswell, H.E.; Breese, G.R. Evidence for TNFα action on excitatory and inhibitory neurotransmission
in the central amygdala: A brain site influenced by stress. Brain Behav. Immun. 2013, 33, 102–111.
57. Breese, G.R.; Knapp, D.J. Persistent adaptation by chronic alcohol is facilitated by neuroimmune activation
linked to stress and CRF. Alcohol 2016, 52, 9–23. [CrossRef] [PubMed]
58. June, H.L.; Liu, J.; Warnock, K.T.; Bell, K.A.; Balan, I.; Bollion, D.; Puche, A.; Aurelian, L. CRF-amplified
neuronal TLR4/MCP-1 signaling regulates alcohol self-administration. Neuropsychopharmacology 2015, 40,
1549–1559. [CrossRef] [PubMed]
59. Freeman, K.; Brureau, A.; Vadigepalli, R.; Staehle, M.M.; Brureau, M.M.; Gonye, G.E.; Hoek, J.B.; Hooper, D.C.;
Schwaber, J.S. Temporal changes in innate immune signals in a rat model of alcohol withdrawal in emotional
and cardiorespiratory homeostatic nuclei. J. Neuroinflamm. 2012, 9, 97. [CrossRef] [PubMed]
60. Breese, G.R.; Overstreet, D.H.; Knapp, D.J. Conceptual framework for the etiology of alcoholism:
A “kindling”/stress hypothesis. Psychopharmacology 2005, 178, 367–380. [CrossRef] [PubMed]
61. Heilig, M.; Koob, G.F. A key role of corticotropin-releasing factor in alcohol dependence. Trends Neurosci.
2007, 30, 399–406. [CrossRef] [PubMed]
62. Blednov, Y.A.; Bergeson, S.E.; Walker, D.; Ferreira, V.M.M.; Kuziel, W.A.; Harris, R.A. Perturbation of
chemokine networks by gene deletion alters the reinforcing actions of ethanol. Behav. Brain Res. 2005,
165, 110–125. [CrossRef] [PubMed]
63. Blednov, Y.A.; Ponomarev, I.; Geil, C.; Bergeson, S.; Koob, G.F.; Harris, R.A. Neuroimmune regulation of
alcohol consumption: Behavioral validation of genes obtained from genomic studies. Addict. Biol. 2012,
17, 108–120. [CrossRef] [PubMed]
64. Robinson, G.; Most, D.; Ferguson, L.B.; Mayfield, J.; Harris, R.A.; Blednov, Y.A. Neuroimmune
pathways in alcohol consumption: Evidence from behavioral and genetic studies in rodents and humans.
Int. Rev. Neurobiol. 2014, 118, 13–39. [PubMed]
65. Valenta, J.P.; Gonzales, R.A. Chronic Intracerebroventricular Infusion of Monocyte Chemoattractant Protein-1
leads to a persistent increase in sweetened ethanol consumption during operant self-administration but does
not influence sucrose consumption in Long-Evans rats. Alcohol. Clin. Exp. Res. 2016, 40, 187–195. [CrossRef]
[PubMed]
100
Brain Sci. 2016, 6, 25
66. Lotrich, F.E. Psychiatric clearance for patients started on interferon-alpha-based therapies. Am. J. Psychiatry
2013, 170, 592–597. [CrossRef] [PubMed]
67. Raison, C.L.; Miller, A.H. Malaise, melancholia and madness: The evolutionary legacy of an inflammatory
bias. Brain Behav. Immun. 2013, 31, 1–8. [CrossRef] [PubMed]
68. Iwata, M.; Ota, K.T.; Duman, R.S. The inflammasome: Pathways linking psychological stress, depression,
and systemic illnesses. Brain Behav. Immun. 2013, 31, 105–114. [CrossRef] [PubMed]
69. Sinha, R.; Fox, H.C.; Hong, K.I.; Hansen, J.; Tuit, K.; Kreek, M.J. Effects of adrenal sensitivity, stress- and
cue-induced craving, and anxiety on subsequent ethanol relapse and treatment outcomes. Arch. Gen. Psychiat.
2011, 68, 942–952. [CrossRef] [PubMed]
© 2016 by the authors. Licensee MDPI, Basel, Switzerland. This article is an open access
article distributed under the terms and conditions of the Creative Commons Attribution
(CC BY) license (http://creativecommons.org/licenses/by/4.0/).
101
brainsciences
Article
NLRP12 Inflammasome Expression in the Rat Brain inResponse to LPS during Morphine Tolerance
Sulie L. Chang 1,2,*, Wenfei Huang 1, Xin Mao 1 and Sabroni Sarkar 1
1 Institute of NeuroImmune Pharmacology, Seton Hall University, 400 South Orange Avenue, South Orange,
NJ 07079, USA; [email protected] (W.H.); [email protected] (X.M.);
[email protected] (S.S.)2 Department of Biological Sciences, Seton Hall University, 400 South Orange Avenue, South Orange,
NJ 07079, USA
* Correspondence: [email protected]; Tel.: +1-973-761-9456; Fax: +1-973-275-2489
Academic Editor: Donna Gruol
Received: 22 June 2016; Accepted: 16 January 2017; Published: 6 February 2017
Abstract: Morphine, an effective but addictive analgesic, can profoundly affect the inflammatory
response to pathogens, and long-term use can result in morphine tolerance. Inflammasomes are
protein complexes involved in the inflammatory response. The nucleotide-binding oligomerization
domain-like receptor (NLR) Family Pyrin Domain Containing (NLRP) 12 (NLRP12) inflammasome
has been reported to have anti-inflammatory activity. In this study, we examined the expression of
NLRP12 inflammasome related genes in the adult F344 rat brain in response to the bacterial endotoxin
lipopolysaccharide (LPS) in the presence and absence of morphine tolerance. Morphine tolerance was
elicited using the 2 + 4 morphine-pelleting protocol. On Day 1, the rats were pelleted subcutaneously
with 2 pellets of morphine (75 mg/pellet) or a placebo; on Days 2 and 4 pellets were given.
On Day 5, the animals were randomly assigned to receive either 250 µg/kg LPS or saline (i.p.).
The expression of 84 inflammasome related genes in the rat brain was examined using a Ploymerase
Chain Reaction (PCR) array. In response to LPS, there was a significant increase in the expression
of the pro-inflammatory cytokine/chemokine genes interleukin-1 beta (Il-1β), interleukin-6 (Il-6),
C-C motif chemokine ligand 2 (Ccl2), C-C motif chemokine ligand 7 (Ccl7), C-X-C motif chemokine
ligand 1 (Cxcl1), and C-X-C motif chemokine ligand 3 (Cxcl3) and a significant decrease in the
anti-inflammatory NLRP12 gene in both morphine-tolerant and placebo-control rats compared to
saline-treated rats, although the changes were greater in the placebo-control animals. The Library of
Integrated Network-Based Cellular Signatures’ (LINCS) connectivity map was used to analyze the list
of affected genes to identify potential targets associated with the interactions of LPS and morphine
tolerance. Our data indicate that, in the morphine tolerant state, the expression of NLRP12 and its
related genes is altered in response to LPS and that the Vacuolar protein-sorting-associated protein 28
(VPS28), which is involved in the transport and sorting of proteins into sub-cellular vesicles, may be
the key regulator of these alterations.
Keywords: morphine tolerance; NLRP12 inflammasome; LPS
1. Introduction
Morphine is a potent analgesic that is widely used clinically for pain management. However,
long-term use of morphine can lead to morphine tolerance and addiction [1]. In addition, morphine
can profoundly and detrimentally affect the body’s immune system, at both the cellular and molecular
levels. Morphine suppresses lymphocyte trafficking; decreases natural killer cell activity; inhibits
the production of pro-inflammatory cytokines, such as tumor necrosis factor-alpha (TNF-α) and
Brain Sci. 2017, 7, 14 102 www.mdpi.com/journal/brainsci
Brain Sci. 2017, 7, 14
interleukin-1 beta (IL-1β) [2–4]; and induces atrophy of immune organs, such as the spleen and
thymus [5–9].
Morphine-induced immunosuppression significantly increases the risk of bacterial infection [10].
Although the immunosuppressive effects of morphine have been widely studied, the mechanisms
involved in the body’s inflammatory response to pathogens during morphine tolerance have not been
fully investigated.
Inflammasomes are multi-protein complexes assembled from nucleotide oligomerization domain
receptor proteins known as nucleotide-binding oligomerization domain (NOD)-like receptors
(NLR) [11]. They function as important mediators of innate immunity. Inflammasomes play a key
role in the regulation of inflammation and immune responses by participating in the production
of pro-inflammatory cytokines, including IL-1β and interleukin-18 (IL-18) [11–13]. Both IL-1β
and IL-18 produce a wide variety of biological effects associated with infection, inflammation,
and autoimmune processes.
There have been about 20 NLR inflammasomes identified in humans. The most commonly
studied ones include NLR Family Pyrin Domain Containing 1 (NLPR1), NLR family apoptosis
inhibitory protein 6 (NAIP2), NLR Family Pyrin Domain Containing 3 (NLRP3), NLR Family Pyrin
Domain Containing 5 (NLRP5), NLR Family Pyrin Domain Containing 6 (NLRP6), NLR Family Pyrin
Domain Containing 12 (NLRP12), NLR family member X1 (NLRPX1), and NLR Family CARD Domain
Containing 4 (NLRC4) [14]. Inflammasomes have been sub-divided into two groups; pro-inflammatory
inflammasomes and anti-inflammatory inflammasomes. The pro-inflammatory inflammasomes
include NLRP3 and NLRC4, and their functions have been widely studied. The anti-inflammatory
inflammasomes include NLRP12, NLRX1, NLRC3, and NLRC5. They appear to function by limiting
or suppressing a pro-inflammatory response; however, this group has not been well studied to date.
There have been a few recent reports characterizing the anti-inflammatory properties of
NLRP12 [15,16]. NLRP12 can inhibit NF-κB signaling through both the canonical and non-canonical
pathways, which are important in the control and regulation of innate immune responses [15,16].
NLRP12 inhibits IL-1 receptor-associated kinase 1 (IRAK1), a downstream component of the pathogen
activated Toll-like receptor (TLR) pathway, which, in turn, decreases the signaling of the canonical
NF-κB pathway [17]. In the non-canonical NF-κB pathway, NLRP12 interacts with and rapidly
degrades NF-κB-inducing kinase (NIK), thereby suppressing NF-κB signaling [18].
The Library of Integrated Network-Based Cellular Signatures (LINCS) [19] is a database which
implements a biological network-based strategy to make assessments regarding the impact of drugs,
genetics, and related biological perturbations (alterations induced by external or internal mechanisms)
on cellular states. The library database is based on the philosophy that typical human pathology,
biology, and pharmacology are most aptly understood using a systems-level approach. It was
constructed to generate a robust approach for perturbing a diversity of cell types, measuring cellular
responses, integrating and analyzing data, and visualizing and interrogating the database for a variety
of biomedical research applications [19]. This library allows researchers to access a wide variety of
data by using a matrix consisting of cell type by experimental treatment by phenotypic assay. Using
LINCS, researchers are able to inquire about information regarding mechanism-based relationships
among the effects of different drug responses and their targets (perturbents) as well as associations
among responding cellular components, in the format of network interactions and structure-function
relationships [20].
In this study, we used an inflammasome PCR array containing 84 inflammasome-related genes
to investigate the expression of inflammasomes during an inflammatory response to the bacterial
endotoxin, lipopolysaccharide (LPS), in the rat brain during morphine tolerance. LINCS was then
used to project possible candidate targets from the mRNA gene expression profiles generated from the
PCR array analysis.
103
Brain Sci. 2017, 7, 14
2. Materials and Methods
2.1. Animals
Fisher/NHsd 344 (F344) rats were purchased from Harlan Laboratories (Indianapolis, IN, USA).
The animals were housed in groups of 3–5 animals in a temperature controlled (21 ◦C–22 ◦C) animal
holding room, under a 12-h light/12-h dark illumination cycle (lights on at 7:00 a.m.). Food and tap
water were provided ad libitum. The Institutional Animal Care and Use Committee (IACUC) at Seton
Hall University, South Orange, NJ, USA approved the experimental protocol.
2.2. Morphine and LPS Administration
A 2 + 4 regimen was used to produce morphine tolerance in 7–8 mo old (250–350 g) male F344
rats [5,21–24]. The rats (n = 16) were randomly assigned into two groups. The morphine-tolerant group
received two 75 mg morphine sulfate pellets (NIDA, Rockville, MD, USA) on Day 1 via subcutaneous
(s.c.) implantation and four pellets on Day 2, whereas the control group received placebo pellets on
both days. On Day 5, the two groups were randomly assigned to receive either LPS (250 µg/kg, Sigma,
St. Louis, MO, USA) or saline (vehicle) [5,21–24]. Thus, the four experimental groups were placebo-control +
saline, placebo-control + LPS, morphine-tolerant + saline, and morphine-tolerant + LPS. Two hours
after the treatment with LPS or saline, the animals were euthanized and the brains were harvested.
2.3. RNA Isolation and Preparation of cDNA
Total RNA was extracted from the brain tissue using TRIZOL (Invitrogen, Carlsbad, CA, USA),
following the manufacturer’s protocol. To remove contaminating DNA, the total RNA samples were
treated with RNase-free DNase (Qiagen, Valencia, CA, USA), followed by further purification using an
RNeasy Mini Kit (Qiagen, Valencia, CA, USA). The RNA quality and quantity were assessed using
a nanodrop spectrophotometer (Thermo Scientific, Waltham, MA, USA). An equal amount of RNA
(400 ng) from each sample was then converted into first-strand cDNA using a RT2 First Strand Kit
(SABiosciences, Frederick, MD, USA) for a PCR array.
2.4. Real-Time PCR Array
The expression of 84 key genes involved in the function of inflammasomes, general NLR signaling,
and cytokine and chemokine genes was quantified using a custom PCR array and RT2 SYBR Green
Fluorescein qPCR Master Mix (SABiosciences, Frederick, MD, USA), according to the manufacturer’s
protocol. Using an ABI Prism 7900HT Fast Detection System (Applied Biosystems, Foster, CA, USA),
real-time PCR was performed by first denaturing the PCR mix at 95 ◦C for 10 min, followed by
40 cycles at 95 ◦C for 15 s and at 60 ◦C for 1 min.
2.5. PCR Array Data Analysis
The expression of each gene was normalized to housekeeping genes and calculated using the
∆∆Ct method. The threshold and baseline values were set manually, and the resulting threshold
cycle values (Ct) were analyzed using the PCR array data analysis template supplied on the
manufacturer’s website [25]. The mean fold change in mRNA expression from 3 to 5 biological
replicates was considered significant at p < 0.05. The gene profile signatures were created for every
two groups compared.
2.6. LINCS Analysis
The differentially expressed genes were input into the Query App (apps.lincscloud.org/query),
as described previously [26,27]. Based on the LINCS database, LincsCloud utilized gene profile
signatures generated from the PCR array to generate a report, including probability outcomes in terms
of gene knockdown effects and drug mimics. The scores given in the report evaluated how much a
104
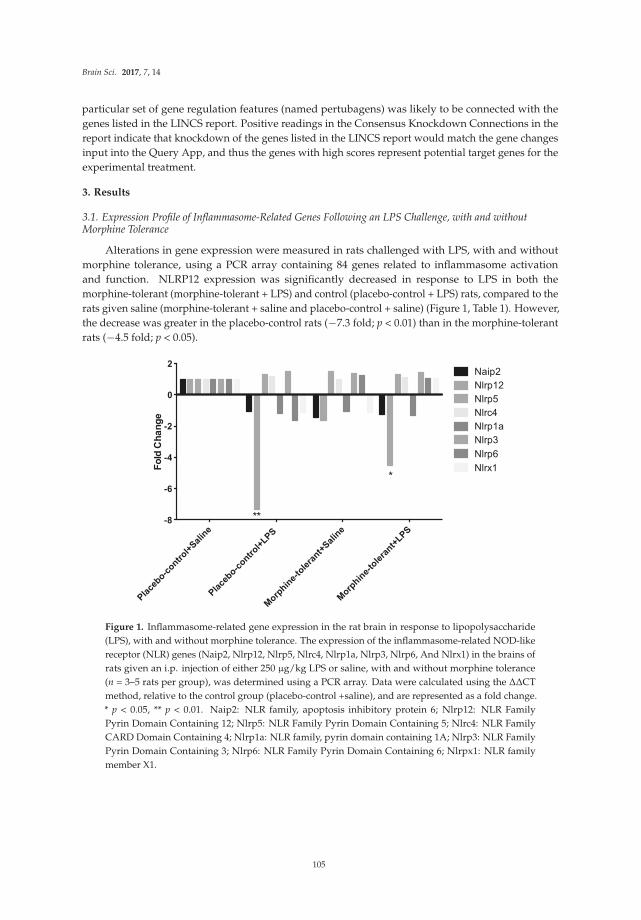
Brain Sci. 2017, 7, 14
particular set of gene regulation features (named pertubagens) was likely to be connected with the
genes listed in the LINCS report. Positive readings in the Consensus Knockdown Connections in the
report indicate that knockdown of the genes listed in the LINCS report would match the gene changes
input into the Query App, and thus the genes with high scores represent potential target genes for the
experimental treatment.
3. Results
3.1. Expression Profile of Inflammasome-Related Genes Following an LPS Challenge, with and withoutMorphine Tolerance
Alterations in gene expression were measured in rats challenged with LPS, with and without
morphine tolerance, using a PCR array containing 84 genes related to inflammasome activation
and function. NLRP12 expression was significantly decreased in response to LPS in both the
morphine-tolerant (morphine-tolerant + LPS) and control (placebo-control + LPS) rats, compared to the
rats given saline (morphine-tolerant + saline and placebo-control + saline) (Figure 1, Table 1). However,
the decrease was greater in the placebo-control rats (−7.3 fold; p < 0.01) than in the morphine-tolerant
rats (−4.5 fold; p < 0.05).
Pla
cebo-c
ontrol+
Sal
ine
Pla
cebo-c
ontrol+
LPS
Morp
hine-
tole
rant+
Sal
ine
Morp
hine-
tole
rant+
LPS
-8
-6
-4
-2
0
2
Fo
ld C
ha
ng
e
Naip2
Nlrp12
Nlrp5
Nlrc4
Nlrp1a
Nlrp3
Nlrp6
Nlrx1
**
*
Figure 1. Inflammasome-related gene expression in the rat brain in response to lipopolysaccharide
(LPS), with and without morphine tolerance. The expression of the inflammasome-related NOD-like
receptor (NLR) genes (Naip2, Nlrp12, Nlrp5, Nlrc4, Nlrp1a, Nlrp3, Nlrp6, And Nlrx1) in the brains of
rats given an i.p. injection of either 250 µg/kg LPS or saline, with and without morphine tolerance
(n = 3–5 rats per group), was determined using a PCR array. Data were calculated using the ∆∆CT
method, relative to the control group (placebo-control +saline), and are represented as a fold change.
* p < 0.05, ** p < 0.01. Naip2: NLR family, apoptosis inhibitory protein 6; Nlrp12: NLR Family
Pyrin Domain Containing 12; Nlrp5: NLR Family Pyrin Domain Containing 5; Nlrc4: NLR Family
CARD Domain Containing 4; Nlrp1a: NLR family, pyrin domain containing 1A; Nlrp3: NLR Family
Pyrin Domain Containing 3; Nlrp6: NLR Family Pyrin Domain Containing 6; Nlrpx1: NLR family
member X1.
105
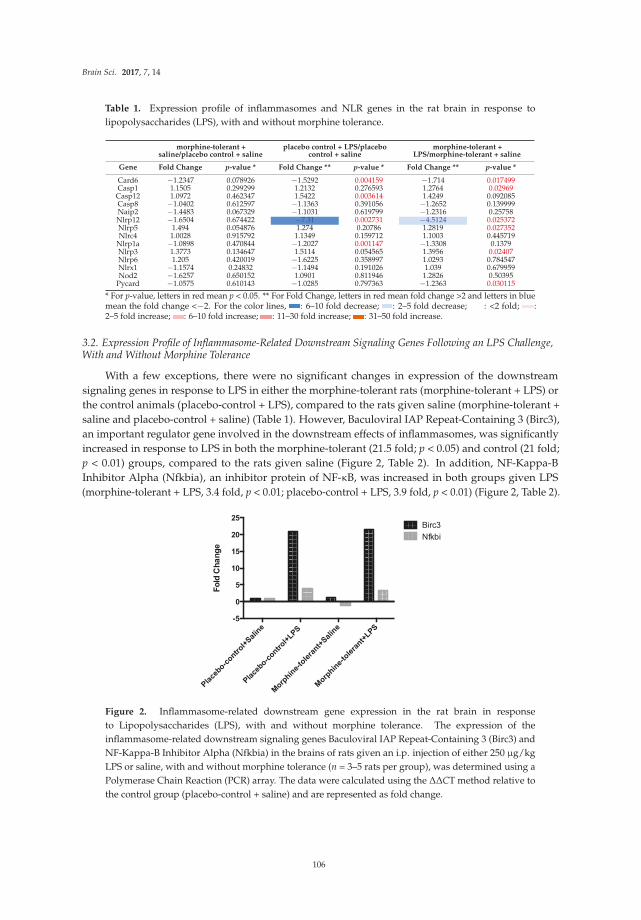
Brain Sci. 2017, 7, 14
Table 1. Expression profile of inflammasomes and NLR genes in the rat brain in response to
lipopolysaccharides (LPS), with and without morphine tolerance.
morphine-tolerant +saline/placebo control + saline
placebo control + LPS/placebocontrol + saline
morphine-tolerant +LPS/morphine-tolerant + saline
Gene Fold Change p-value * Fold Change ** p-value * Fold Change ** p-value *
Card6 −1.2347 0.078926 −1.5292 0.004159 −1.714 0.017499Casp1 1.1505 0.299299 1.2132 0.276593 1.2764 0.02969Casp12 1.0972 0.462347 1.5422 0.003614 1.4249 0.092085Casp8 −1.0402 0.612597 −1.1363 0.391056 −1.2652 0.139999Naip2 −1.4483 0.067329 −1.1031 0.619799 −1.2316 0.25758Nlrp12 −1.6504 0.674422 −7.31 0.002731 −4.5124 0.025372Nlrp5 1.494 0.054876 1.274 0.20786 1.2819 0.027352Nlrc4 1.0028 0.915792 1.1349 0.159712 1.1003 0.445719
Nlrp1a −1.0898 0.470844 −1.2027 0.001147 −1.3308 0.1379Nlrp3 1.3773 0.134647 1.5114 0.054565 1.3956 0.02407Nlrp6 1.205 0.420019 −1.6225 0.358997 1.0293 0.784547Nlrx1 −1.1574 0.24832 −1.1494 0.191026 1.039 0.679959Nod2 −1.6257 0.650152 1.0901 0.811946 1.2826 0.50395
Pycard −1.0575 0.610143 −1.0285 0.797363 −1.2363 0.030115
* For p-value, letters in red mean p < 0.05. ** For Fold Change, letters in red mean fold change >2 and letters in bluemean the fold change <−2. For the color lines, : 6–10 fold decrease; : 2–5 fold decrease; : <2 fold; :2–5 fold increase; : 6–10 fold increase; : 11–30 fold increase; : 31–50 fold increase.
3.2. Expression Profile of Inflammasome-Related Downstream Signaling Genes Following an LPS Challenge,With and Without Morphine Tolerance
With a few exceptions, there were no significant changes in expression of the downstream
signaling genes in response to LPS in either the morphine-tolerant rats (morphine-tolerant + LPS) or
the control animals (placebo-control + LPS), compared to the rats given saline (morphine-tolerant +
saline and placebo-control + saline) (Table 1). However, Baculoviral IAP Repeat-Containing 3 (Birc3),
an important regulator gene involved in the downstream effects of inflammasomes, was significantly
increased in response to LPS in both the morphine-tolerant (21.5 fold; p < 0.05) and control (21 fold;
p < 0.01) groups, compared to the rats given saline (Figure 2, Table 2). In addition, NF-Kappa-B
Inhibitor Alpha (Nfkbia), an inhibitor protein of NF-κB, was increased in both groups given LPS
(morphine-tolerant + LPS, 3.4 fold, p < 0.01; placebo-control + LPS, 3.9 fold, p < 0.01) (Figure 2, Table 2).
Fo
ld C
ha
ng
e
Pla
cebo-c
ontrol+
Sal
ine
Pla
cebo-c
ontrol+
LPS
Morp
hine-
tole
rant+
Salin
e
Morp
hine-
tole
rant+
LPS
-5
0
5
10
15
20
25Birc3
Nfkbi
Figure 2. Inflammasome-related downstream gene expression in the rat brain in response
to Lipopolysaccharides (LPS), with and without morphine tolerance. The expression of the
inflammasome-related downstream signaling genes Baculoviral IAP Repeat-Containing 3 (Birc3) and
NF-Kappa-B Inhibitor Alpha (Nfkbia) in the brains of rats given an i.p. injection of either 250 µg/kg
LPS or saline, with and without morphine tolerance (n = 3–5 rats per group), was determined using a
Polymerase Chain Reaction (PCR) array. The data were calculated using the ∆∆CT method relative to
the control group (placebo-control + saline) and are represented as fold change.
106
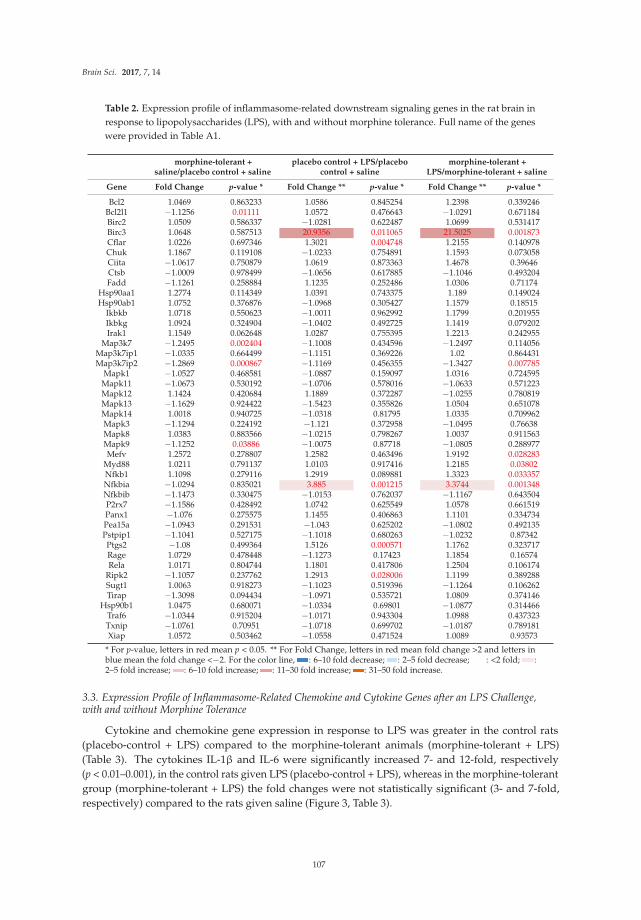
Brain Sci. 2017, 7, 14
Table 2. Expression profile of inflammasome-related downstream signaling genes in the rat brain in
response to lipopolysaccharides (LPS), with and without morphine tolerance. Full name of the genes
were provided in Table A1.
morphine-tolerant +saline/placebo control + saline
placebo control + LPS/placebocontrol + saline
morphine-tolerant +LPS/morphine-tolerant + saline
Gene Fold Change p-value * Fold Change ** p-value * Fold Change ** p-value *
Bcl2 1.0469 0.863233 1.0586 0.845254 1.2398 0.339246Bcl2l1 −1.1256 0.01111 1.0572 0.476643 −1.0291 0.671184Birc2 1.0509 0.586337 −1.0281 0.622487 1.0699 0.531417Birc3 1.0648 0.587513 20.9356 0.011065 21.5025 0.001873Cflar 1.0226 0.697346 1.3021 0.004748 1.2155 0.140978Chuk 1.1867 0.119108 −1.0233 0.754891 1.1593 0.073058Ciita −1.0617 0.750879 1.0619 0.873363 1.4678 0.39646Ctsb −1.0009 0.978499 −1.0656 0.617885 −1.1046 0.493204Fadd −1.1261 0.258884 1.1235 0.252486 1.0306 0.71174
Hsp90aa1 1.2774 0.114349 1.0391 0.743375 1.189 0.149024Hsp90ab1 1.0752 0.376876 −1.0968 0.305427 1.1579 0.18515
Ikbkb 1.0718 0.550623 −1.0011 0.962992 1.1799 0.201955Ikbkg 1.0924 0.324904 −1.0402 0.492725 1.1419 0.079202Irak1 1.1549 0.062648 1.0287 0.755395 1.2213 0.242955
Map3k7 −1.2495 0.002404 −1.1008 0.434596 −1.2497 0.114056Map3k7ip1 −1.0335 0.664499 −1.1151 0.369226 1.02 0.864431Map3k7ip2 −1.2869 0.000867 −1.1169 0.456355 −1.3427 0.007785
Mapk1 −1.0527 0.468581 −1.0887 0.159097 1.0316 0.724595Mapk11 −1.0673 0.530192 −1.0706 0.578016 −1.0633 0.571223Mapk12 1.1424 0.420684 1.1889 0.372287 −1.0255 0.780819Mapk13 −1.1629 0.924422 −1.5423 0.355826 1.0504 0.651078Mapk14 1.0018 0.940725 −1.0318 0.81795 1.0335 0.709962Mapk3 −1.1294 0.224192 −1.121 0.372958 −1.0495 0.76638Mapk8 1.0383 0.883566 −1.0215 0.798267 1.0037 0.911563Mapk9 −1.1252 0.03886 −1.0075 0.87718 −1.0805 0.288977Mefv 1.2572 0.278807 1.2582 0.463496 1.9192 0.028283
Myd88 1.0211 0.791137 1.0103 0.917416 1.2185 0.03802Nfkb1 1.1098 0.279116 1.2919 0.089881 1.3323 0.033357Nfkbia −1.0294 0.835021 3.885 0.001215 3.3744 0.001348Nfkbib −1.1473 0.330475 −1.0153 0.762037 −1.1167 0.643504P2rx7 −1.1586 0.428492 1.0742 0.625549 1.0578 0.661519Panx1 −1.076 0.275575 1.1455 0.406863 1.1101 0.334734Pea15a −1.0943 0.291531 −1.043 0.625202 −1.0802 0.492135Pstpip1 −1.1041 0.527175 −1.1018 0.680263 −1.0232 0.87342Ptgs2 −1.08 0.499364 1.5126 0.000571 1.1762 0.323717Rage 1.0729 0.478448 −1.1273 0.17423 1.1854 0.16574Rela 1.0171 0.804744 1.1801 0.417806 1.2504 0.106174
Ripk2 −1.1057 0.237762 1.2913 0.028006 1.1199 0.389288Sugt1 1.0063 0.918273 −1.1023 0.519396 −1.1264 0.106262Tirap −1.3098 0.094434 −1.0971 0.535721 1.0809 0.374146
Hsp90b1 1.0475 0.680071 −1.0334 0.69801 −1.0877 0.314466Traf6 −1.0344 0.915204 −1.0171 0.943304 1.0988 0.437323Txnip −1.0761 0.70951 −1.0718 0.699702 −1.0187 0.789181Xiap 1.0572 0.503462 −1.0558 0.471524 1.0089 0.93573
* For p-value, letters in red mean p < 0.05. ** For Fold Change, letters in red mean fold change >2 and letters inblue mean the fold change <−2. For the color line, : 6–10 fold decrease; : 2–5 fold decrease; : <2 fold; :2–5 fold increase; : 6–10 fold increase; : 11–30 fold increase; : 31–50 fold increase.
3.3. Expression Profile of Inflammasome-Related Chemokine and Cytokine Genes after an LPS Challenge,with and without Morphine Tolerance
Cytokine and chemokine gene expression in response to LPS was greater in the control rats
(placebo-control + LPS) compared to the morphine-tolerant animals (morphine-tolerant + LPS)
(Table 3). The cytokines IL-1β and IL-6 were significantly increased 7- and 12-fold, respectively
(p < 0.01–0.001), in the control rats given LPS (placebo-control + LPS), whereas in the morphine-tolerant
group (morphine-tolerant + LPS) the fold changes were not statistically significant (3- and 7-fold,
respectively) compared to the rats given saline (Figure 3, Table 3).
107
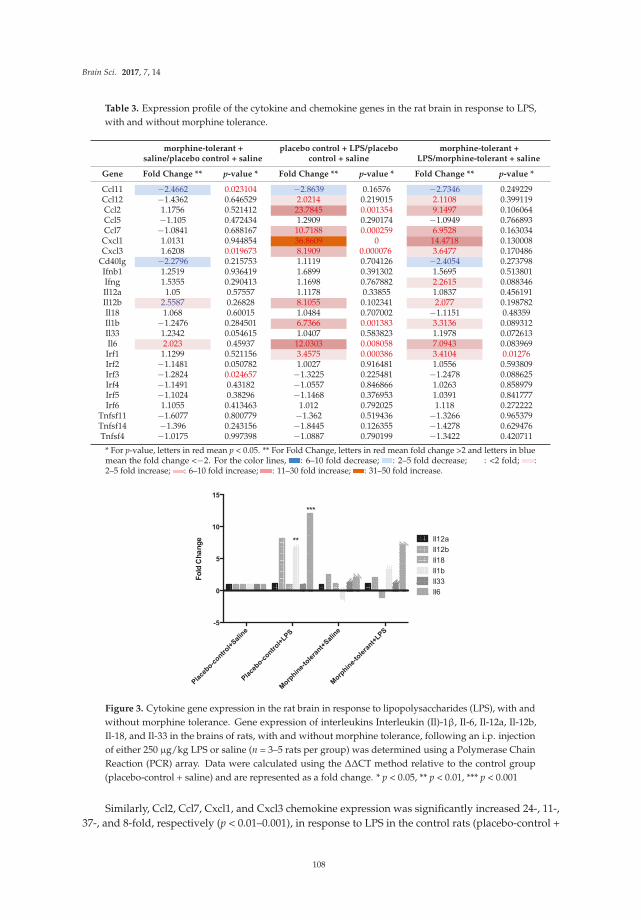
Brain Sci. 2017, 7, 14
Table 3. Expression profile of the cytokine and chemokine genes in the rat brain in response to LPS,
with and without morphine tolerance.
morphine-tolerant +saline/placebo control + saline
placebo control + LPS/placebocontrol + saline
morphine-tolerant +LPS/morphine-tolerant + saline
Gene Fold Change ** p-value * Fold Change ** p-value * Fold Change ** p-value *
Ccl11 −2.4662 0.023104 −2.8639 0.16576 −2.7346 0.249229Ccl12 −1.4362 0.646529 2.0214 0.219015 2.1108 0.399119Ccl2 1.1756 0.521412 23.7845 0.001354 9.1497 0.106064Ccl5 −1.105 0.472434 1.2909 0.290174 −1.0949 0.766893Ccl7 −1.0841 0.688167 10.7188 0.000259 6.9528 0.163034
Cxcl1 1.0131 0.944854 36.8609 0 14.4718 0.130008Cxcl3 1.6208 0.019673 8.1909 0.000076 3.6477 0.170486
Cd40lg −2.2796 0.215753 1.1119 0.704126 −2.4054 0.273798Ifnb1 1.2519 0.936419 1.6899 0.391302 1.5695 0.513801Ifng 1.5355 0.290413 1.1698 0.767882 2.2615 0.088346Il12a 1.05 0.57557 1.1178 0.33855 1.0837 0.456191Il12b 2.5587 0.26828 8.1055 0.102341 2.077 0.198782Il18 1.068 0.60015 1.0484 0.707002 −1.1151 0.48359Il1b −1.2476 0.284501 6.7366 0.001383 3.3136 0.089312Il33 1.2342 0.054615 1.0407 0.583823 1.1978 0.072613Il6 2.023 0.45937 12.0303 0.008058 7.0943 0.083969Irf1 1.1299 0.521156 3.4575 0.000386 3.4104 0.01276Irf2 −1.1481 0.050782 1.0027 0.916481 1.0556 0.593809Irf3 −1.2824 0.024657 −1.3225 0.225481 −1.2478 0.088625Irf4 −1.1491 0.43182 −1.0557 0.846866 1.0263 0.858979Irf5 −1.1024 0.38296 −1.1468 0.376953 1.0391 0.841777Irf6 1.1055 0.413463 1.012 0.792025 1.118 0.272222
Tnfsf11 −1.6077 0.800779 −1.362 0.519436 −1.3266 0.965379Tnfsf14 −1.396 0.243156 −1.8445 0.126355 −1.4278 0.629476Tnfsf4 −1.0175 0.997398 −1.0887 0.790199 −1.3422 0.420711
* For p-value, letters in red mean p < 0.05. ** For Fold Change, letters in red mean fold change >2 and letters in bluemean the fold change <−2. For the color lines, : 6–10 fold decrease; : 2–5 fold decrease; : <2 fold; :2–5 fold increase; : 6–10 fold increase; : 11–30 fold increase; : 31–50 fold increase.
Fo
ld C
ha
ng
e
Pla
cebo-c
ontrol+
Sal
ine
Pla
cebo-c
ontrol+
LPS
Morp
hine-
tole
rant+
Sal
ine
Morp
hine-
tole
rant+
LPS
-5
0
5
10
15
Il12a
Il12b
Il18
Il1b
Il33
Il6
**
***
Figure 3. Cytokine gene expression in the rat brain in response to lipopolysaccharides (LPS), with and
without morphine tolerance. Gene expression of interleukins Interleukin (Il)-1β, Il-6, Il-12a, Il-12b,
Il-18, and Il-33 in the brains of rats, with and without morphine tolerance, following an i.p. injection
of either 250 µg/kg LPS or saline (n = 3–5 rats per group) was determined using a Polymerase Chain
Reaction (PCR) array. Data were calculated using the ∆∆CT method relative to the control group
(placebo-control + saline) and are represented as a fold change. * p < 0.05, ** p < 0.01, *** p < 0.001
Similarly, Ccl2, Ccl7, Cxcl1, and Cxcl3 chemokine expression was significantly increased 24-, 11-,
37-, and 8-fold, respectively (p < 0.01–0.001), in response to LPS in the control rats (placebo-control +
108
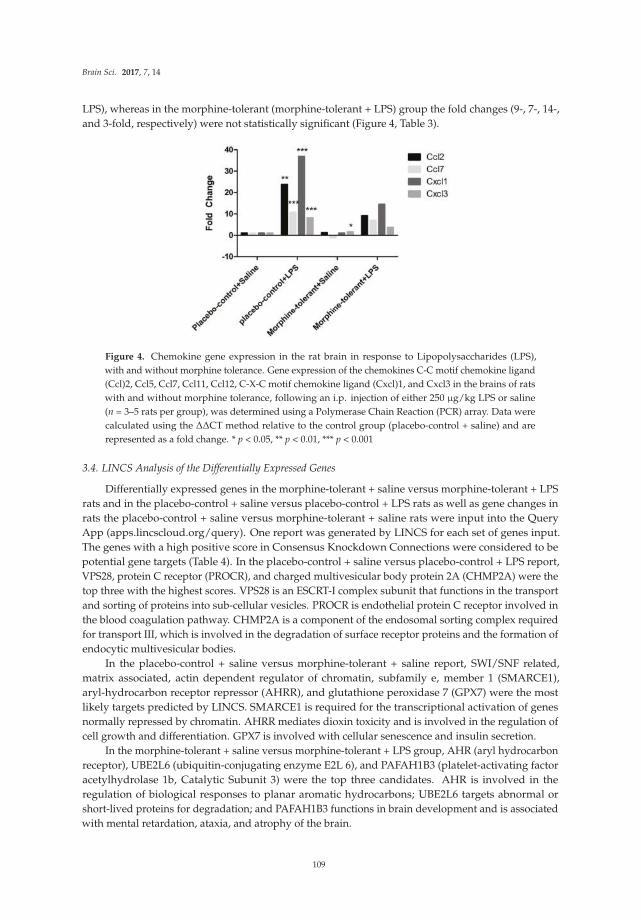
Brain Sci. 2017, 7, 14
LPS), whereas in the morphine-tolerant (morphine-tolerant + LPS) group the fold changes (9-, 7-, 14-,
and 3-fold, respectively) were not statistically significant (Figure 4, Table 3).
Figure 4. Chemokine gene expression in the rat brain in response to Lipopolysaccharides (LPS),
with and without morphine tolerance. Gene expression of the chemokines C-C motif chemokine ligand
(Ccl)2, Ccl5, Ccl7, Ccl11, Ccl12, C-X-C motif chemokine ligand (Cxcl)1, and Cxcl3 in the brains of rats
with and without morphine tolerance, following an i.p. injection of either 250 µg/kg LPS or saline
(n = 3–5 rats per group), was determined using a Polymerase Chain Reaction (PCR) array. Data were
calculated using the ∆∆CT method relative to the control group (placebo-control + saline) and are
represented as a fold change. * p < 0.05, ** p < 0.01, *** p < 0.001
3.4. LINCS Analysis of the Differentially Expressed Genes
Differentially expressed genes in the morphine-tolerant + saline versus morphine-tolerant + LPS
rats and in the placebo-control + saline versus placebo-control + LPS rats as well as gene changes in
rats the placebo-control + saline versus morphine-tolerant + saline rats were input into the Query
App (apps.lincscloud.org/query). One report was generated by LINCS for each set of genes input.
The genes with a high positive score in Consensus Knockdown Connections were considered to be
potential gene targets (Table 4). In the placebo-control + saline versus placebo-control + LPS report,
VPS28, protein C receptor (PROCR), and charged multivesicular body protein 2A (CHMP2A) were the
top three with the highest scores. VPS28 is an ESCRT-I complex subunit that functions in the transport
and sorting of proteins into sub-cellular vesicles. PROCR is endothelial protein C receptor involved in
the blood coagulation pathway. CHMP2A is a component of the endosomal sorting complex required
for transport III, which is involved in the degradation of surface receptor proteins and the formation of
endocytic multivesicular bodies.
In the placebo-control + saline versus morphine-tolerant + saline report, SWI/SNF related,
matrix associated, actin dependent regulator of chromatin, subfamily e, member 1 (SMARCE1),
aryl-hydrocarbon receptor repressor (AHRR), and glutathione peroxidase 7 (GPX7) were the most
likely targets predicted by LINCS. SMARCE1 is required for the transcriptional activation of genes
normally repressed by chromatin. AHRR mediates dioxin toxicity and is involved in the regulation of
cell growth and differentiation. GPX7 is involved with cellular senescence and insulin secretion.
In the morphine-tolerant + saline versus morphine-tolerant + LPS group, AHR (aryl hydrocarbon
receptor), UBE2L6 (ubiquitin-conjugating enzyme E2L 6), and PAFAH1B3 (platelet-activating factor
acetylhydrolase 1b, Catalytic Subunit 3) were the top three candidates. AHR is involved in the
regulation of biological responses to planar aromatic hydrocarbons; UBE2L6 targets abnormal or
short-lived proteins for degradation; and PAFAH1B3 functions in brain development and is associated
with mental retardation, ataxia, and atrophy of the brain.
109
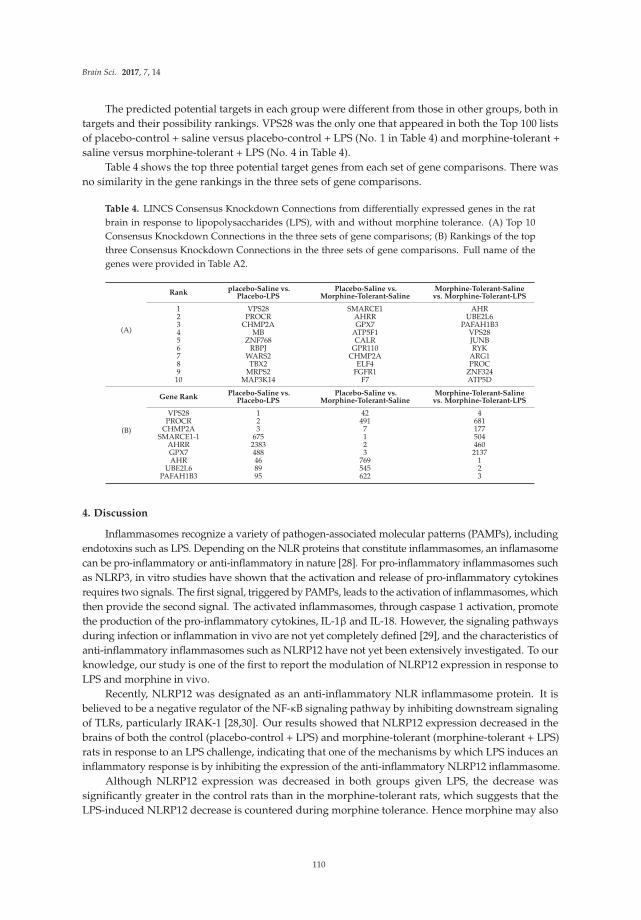
Brain Sci. 2017, 7, 14
The predicted potential targets in each group were different from those in other groups, both in
targets and their possibility rankings. VPS28 was the only one that appeared in both the Top 100 lists
of placebo-control + saline versus placebo-control + LPS (No. 1 in Table 4) and morphine-tolerant +
saline versus morphine-tolerant + LPS (No. 4 in Table 4).
Table 4 shows the top three potential target genes from each set of gene comparisons. There was
no similarity in the gene rankings in the three sets of gene comparisons.
Table 4. LINCS Consensus Knockdown Connections from differentially expressed genes in the rat
brain in response to lipopolysaccharides (LPS), with and without morphine tolerance. (A) Top 10
Consensus Knockdown Connections in the three sets of gene comparisons; (B) Rankings of the top
three Consensus Knockdown Connections in the three sets of gene comparisons. Full name of the
genes were provided in Table A2.
(A)
Rankplacebo-Saline vs.
Placebo-LPSPlacebo-Saline vs.
Morphine-Tolerant-SalineMorphine-Tolerant-Saline
vs. Morphine-Tolerant-LPS
1 VPS28 SMARCE1 AHR2 PROCR AHRR UBE2L63 CHMP2A GPX7 PAFAH1B34 MB ATP5F1 VPS285 ZNF768 CALR JUNB6 RBPJ GPR110 RYK7 WARS2 CHMP2A ARG18 TBX2 ELF4 PROC9 MRPS2 FGFR1 ZNF32410 MAP3K14 F7 ATP5D
(B)
Gene RankPlacebo-Saline vs.
Placebo-LPSPlacebo-Saline vs.
Morphine-Tolerant-SalineMorphine-Tolerant-Saline
vs. Morphine-Tolerant-LPS
VPS28 1 42 4PROCR 2 491 681
CHMP2A 3 7 177SMARCE1-1 675 1 504
AHRR 2383 2 460GPX7 488 3 2137AHR 46 769 1
UBE2L6 89 545 2PAFAH1B3 95 622 3
4. Discussion
Inflammasomes recognize a variety of pathogen-associated molecular patterns (PAMPs), including
endotoxins such as LPS. Depending on the NLR proteins that constitute inflammasomes, an inflamasome
can be pro-inflammatory or anti-inflammatory in nature [28]. For pro-inflammatory inflammasomes such
as NLRP3, in vitro studies have shown that the activation and release of pro-inflammatory cytokines
requires two signals. The first signal, triggered by PAMPs, leads to the activation of inflammasomes, which
then provide the second signal. The activated inflammasomes, through caspase 1 activation, promote
the production of the pro-inflammatory cytokines, IL-1β and IL-18. However, the signaling pathways
during infection or inflammation in vivo are not yet completely defined [29], and the characteristics of
anti-inflammatory inflammasomes such as NLRP12 have not yet been extensively investigated. To our
knowledge, our study is one of the first to report the modulation of NLRP12 expression in response to
LPS and morphine in vivo.
Recently, NLRP12 was designated as an anti-inflammatory NLR inflammasome protein. It is
believed to be a negative regulator of the NF-κB signaling pathway by inhibiting downstream signaling
of TLRs, particularly IRAK-1 [28,30]. Our results showed that NLRP12 expression decreased in the
brains of both the control (placebo-control + LPS) and morphine-tolerant (morphine-tolerant + LPS)
rats in response to an LPS challenge, indicating that one of the mechanisms by which LPS induces an
inflammatory response is by inhibiting the expression of the anti-inflammatory NLRP12 inflammasome.
Although NLRP12 expression was decreased in both groups given LPS, the decrease was
significantly greater in the control rats than in the morphine-tolerant rats, which suggests that the
LPS-induced NLRP12 decrease is countered during morphine tolerance. Hence morphine may also
110
Brain Sci. 2017, 7, 14
modulate NLRP12 activity, directly or indirectly, thereby exerting its immunosuppressive effects and
opposing the LPS-induced decrease in NLRP12 in the presence of morphine tolerance.
Birc3, a downstream regulator of inflammasome signaling, is essential for controlling the synthesis
of cytokines and chemokines in the inflammatory Mapk and NF-κB pathways. It is also required
for inflammasome activation, subsequent caspase 1 activity, and IL-1β formation [31]. In our study,
Birc3 expression was significantly increased in both the placebo-control and morphine-tolerant rats in
response to LPS, indicating that LPS is able to induce an inflammatory response through Birc3 activity,
following inhibition of the anti-inflammatory NLRP12. However, in response to LPS, Birc3 expression
in the morphine-tolerant rats did not change in comparison to the placebo-control rats. This indicates
that morphine may not be able to modulate Birc3 expression, and therefore there is no change, increase
or decrease, in its expression in the morphine tolerant state.
NF-κB is important in the activation of inflammatory mediators such as cytokines and
chemokines [16]. Previous studies have reported that NLRP12 inhibits both canonical and non-canonical
NF-κB activation [16,28] and that Nfkbia, a downstream regulator of inflammasomes, inhibits the
activity of dimeric NF-κB/Rel complexes [32]. In our study, Nfkbia was significantly increased in
response to LPS in both the placebo-control and morphine-tolerant rats. During an inflammatory
response, one would expect the expression and activity of a positive regulator of inflammation to be
increased, whereas that of a negative regulator would be decreased. However, from a physiological
standpoint, there is a constant effort to balance pro- and anti-inflammatory activity [33,34]. This quest to
balance the pro- and anti-inflammatory responses could be one of the reasons for an increase in Nfkbia,
which is known to inhibit the activity of the pro-inflammatory dimeric NF-κB/REL, thus reducing the
production of pro-inflammatory mediators.
As expected, we found that the expression of pro-inflammatory cytokines (IL-1β and IL-6) and
chemokines (Ccl2, Ccl7, Cxcl1, and Cxcl3) was increased in response to LPS in the placebo-control
rats [35–37]. In the morphine-tolerant rats, however, the LPS-induced cytokine and chemokine
expression levels were lower, suggesting that NLRP12 inhibition in response to LPS may be opposed
or subdued in the morphine tolerant state.
In a previous study, we observed that, in peripheral immune organs such as the spleen,
NLRP3 expression, but not NLRP12 expression, is altered in response to LPS, with and without
morphine tolerance [38], suggesting that the mechanism(s) of inflammasome activation in response to
pathogens may be different in peripheral immune organs, compared to the central nervous system.
During morphine tolerance, the LPS-induced expression of NLRP3, as well as that of cytokines and
chemokines, is reduced in comparison to the placebo-control rats given LPS [38]. These observations are
consistent with previous studies showing that immune activation, including an inflammatory response,
is diminished during morphine tolerance [39]. Therefore, the data from the present study, as well as
from our previous report [38], collectively indicate that morphine may exert its effects through both
pro- and anti-inflammatory inflammasomes.
LINCS analysis is able to predict potential target genes based on a certain treatment and the
gene profile signatures in its database. In our study, LINCS was able to generate a report of potential
targets with a p value of <0.05 from the list of genes with altered expression in response to LPS
in control rats (placebo-control + saline versus placebo-control + LPS) but not from the other two
comparisons (placebo-control + saline versus morphine-tolerant + saline, morphine-tolerant + saline
versus morphine-tolerant + LPS), because there were not enough significant gene features in those two
groups. When enlarging the set of gene features for the comparison of placebo-control + saline versus
placebo-control + LPS to a p-value of <0.1, LINCS generated a report with similar potential targets.
Thus, the gene features were then studied with a p-value of <0.1 on all three sets of comparisons.
VPS28, PROCR, and CHMP2A were the top three with the highest scores in LINCS report generated
based on placebo-control + saline versus placebo-control + LPS gene alternations, suggesting that
Vps28, Procr and Chmp2a were potential targets of LPS. In the report for placebo-control + saline
versus morphine-tolerant + saline, SMARCE1, AHRR, and GPX7 were the most likely targets altered in
111
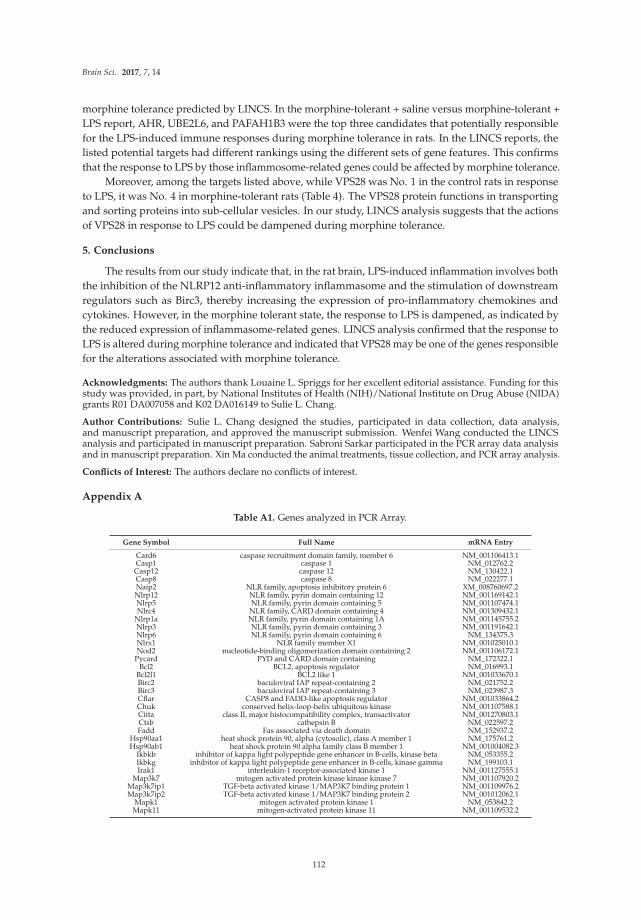
Brain Sci. 2017, 7, 14
morphine tolerance predicted by LINCS. In the morphine-tolerant + saline versus morphine-tolerant +
LPS report, AHR, UBE2L6, and PAFAH1B3 were the top three candidates that potentially responsible
for the LPS-induced immune responses during morphine tolerance in rats. In the LINCS reports, the
listed potential targets had different rankings using the different sets of gene features. This confirms
that the response to LPS by those inflammosome-related genes could be affected by morphine tolerance.
Moreover, among the targets listed above, while VPS28 was No. 1 in the control rats in response
to LPS, it was No. 4 in morphine-tolerant rats (Table 4). The VPS28 protein functions in transporting
and sorting proteins into sub-cellular vesicles. In our study, LINCS analysis suggests that the actions
of VPS28 in response to LPS could be dampened during morphine tolerance.
5. Conclusions
The results from our study indicate that, in the rat brain, LPS-induced inflammation involves both
the inhibition of the NLRP12 anti-inflammatory inflammasome and the stimulation of downstream
regulators such as Birc3, thereby increasing the expression of pro-inflammatory chemokines and
cytokines. However, in the morphine tolerant state, the response to LPS is dampened, as indicated by
the reduced expression of inflammasome-related genes. LINCS analysis confirmed that the response to
LPS is altered during morphine tolerance and indicated that VPS28 may be one of the genes responsible
for the alterations associated with morphine tolerance.
Acknowledgments: The authors thank Louaine L. Spriggs for her excellent editorial assistance. Funding for thisstudy was provided, in part, by National Institutes of Health (NIH)/National Institute on Drug Abuse (NIDA)grants R01 DA007058 and K02 DA016149 to Sulie L. Chang.
Author Contributions: Sulie L. Chang designed the studies, participated in data collection, data analysis,and manuscript preparation, and approved the manuscript submission. Wenfei Wang conducted the LINCSanalysis and participated in manuscript preparation. Sabroni Sarkar participated in the PCR array data analysisand in manuscript preparation. Xin Ma conducted the animal treatments, tissue collection, and PCR array analysis.
Conflicts of Interest: The authors declare no conflicts of interest.
Appendix A
Table A1. Genes analyzed in PCR Array.
Gene Symbol Full Name mRNA Entry
Card6 caspase recruitment domain family, member 6 NM_001106413.1Casp1 caspase 1 NM_012762.2Casp12 caspase 12 NM_130422.1Casp8 caspase 8 NM_022277.1Naip2 NLR family, apoptosis inhibitory protein 6 XM_008760697.2Nlrp12 NLR family, pyrin domain containing 12 NM_001169142.1Nlrp5 NLR family, pyrin domain containing 5 NM_001107474.1Nlrc4 NLR family, CARD domain containing 4 NM_001309432.1
Nlrp1a NLR family, pyrin domain containing 1A NM_001145755.2Nlrp3 NLR family, pyrin domain containing 3 NM_001191642.1Nlrp6 NLR family, pyrin domain containing 6 NM_134375.3Nlrx1 NLR family member X1 NM_001025010.1Nod2 nucleotide-binding oligomerization domain containing 2 NM_001106172.1
Pycard PYD and CARD domain containing NM_172322.1Bcl2 BCL2, apoptosis regulator NM_016993.1
Bcl2l1 BCL2 like 1 NM_001033670.1Birc2 baculoviral IAP repeat-containing 2 NM_021752.2Birc3 baculoviral IAP repeat-containing 3 NM_023987.3Cflar CASP8 and FADD-like apoptosis regulator NM_001033864.2Chuk conserved helix-loop-helix ubiquitous kinase NM_001107588.1Ciita class II, major histocompatibility complex, transactivator NM_001270803.1Ctsb cathepsin B NM_022597.2Fadd Fas associated via death domain NM_152937.2
Hsp90aa1 heat shock protein 90, alpha (cytosolic), class A member 1 NM_175761.2Hsp90ab1 heat shock protein 90 alpha family class B member 1 NM_001004082.3
Ikbkb inhibitor of kappa light polypeptide gene enhancer in B-cells, kinase beta NM_053355.2Ikbkg inhibitor of kappa light polypeptide gene enhancer in B-cells, kinase gamma NM_199103.1Irak1 interleukin-1 receptor-associated kinase 1 NM_001127555.1
Map3k7 mitogen activated protein kinase kinase kinase 7 NM_001107920.2Map3k7ip1 TGF-beta activated kinase 1/MAP3K7 binding protein 1 NM_001109976.2Map3k7ip2 TGF-beta activated kinase 1/MAP3K7 binding protein 2 NM_001012062.1
Mapk1 mitogen activated protein kinase 1 NM_053842.2Mapk11 mitogen-activated protein kinase 11 NM_001109532.2
112
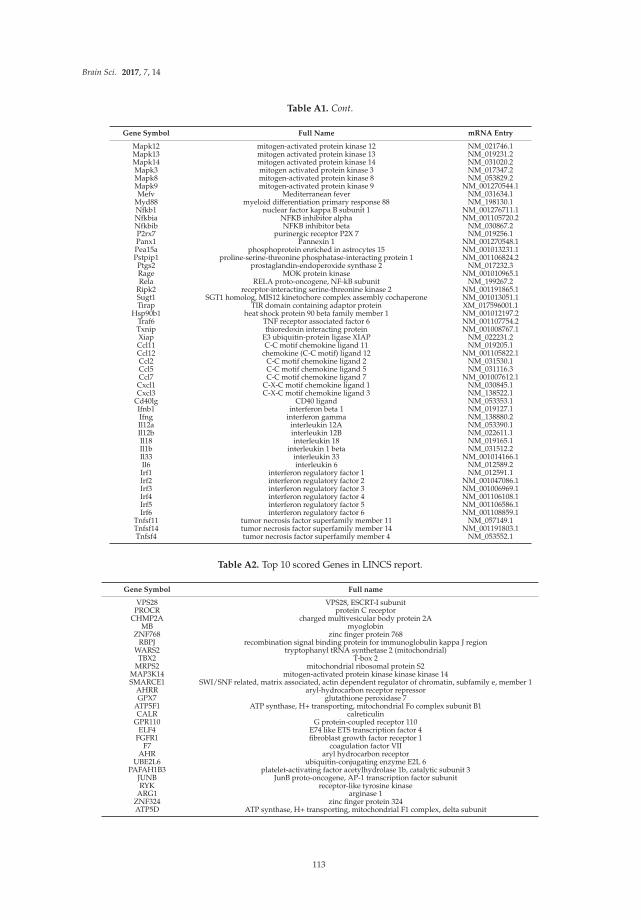
Brain Sci. 2017, 7, 14
Table A1. Cont.
Gene Symbol Full Name mRNA Entry
Mapk12 mitogen-activated protein kinase 12 NM_021746.1Mapk13 mitogen activated protein kinase 13 NM_019231.2Mapk14 mitogen activated protein kinase 14 NM_031020.2Mapk3 mitogen activated protein kinase 3 NM_017347.2Mapk8 mitogen-activated protein kinase 8 NM_053829.2Mapk9 mitogen-activated protein kinase 9 NM_001270544.1Mefv Mediterranean fever NM_031634.1
Myd88 myeloid differentiation primary response 88 NM_198130.1Nfkb1 nuclear factor kappa B subunit 1 NM_001276711.1Nfkbia NFKB inhibitor alpha NM_001105720.2Nfkbib NFKB inhibitor beta NM_030867.2P2rx7 purinergic receptor P2X 7 NM_019256.1Panx1 Pannexin 1 NM_001270548.1Pea15a phosphoprotein enriched in astrocytes 15 NM_001013231.1Pstpip1 proline-serine-threonine phosphatase-interacting protein 1 NM_001106824.2Ptgs2 prostaglandin-endoperoxide synthase 2 NM_017232.3Rage MOK protein kinase NM_001010965.1Rela RELA proto-oncogene, NF-kB subunit NM_199267.2
Ripk2 receptor-interacting serine-threonine kinase 2 NM_001191865.1Sugt1 SGT1 homolog, MIS12 kinetochore complex assembly cochaperone NM_001013051.1Tirap TIR domain containing adaptor protein XM_017596001.1
Hsp90b1 heat shock protein 90 beta family member 1 NM_001012197.2Traf6 TNF receptor associated factor 6 NM_001107754.2Txnip thioredoxin interacting protein NM_001008767.1Xiap E3 ubiquitin-protein ligase XIAP NM_022231.2Ccl11 C-C motif chemokine ligand 11 NM_019205.1Ccl12 chemokine (C-C motif) ligand 12 NM_001105822.1Ccl2 C-C motif chemokine ligand 2 NM_031530.1Ccl5 C-C motif chemokine ligand 5 NM_031116.3Ccl7 C-C motif chemokine ligand 7 NM_001007612.1
Cxcl1 C-X-C motif chemokine ligand 1 NM_030845.1Cxcl3 C-X-C motif chemokine ligand 3 NM_138522.1
Cd40lg CD40 ligand NM_053353.1Ifnb1 interferon beta 1 NM_019127.1Ifng interferon gamma NM_138880.2Il12a interleukin 12A NM_053390.1Il12b interleukin 12B NM_022611.1Il18 interleukin 18 NM_019165.1Il1b interleukin 1 beta NM_031512.2Il33 interleukin 33 NM_001014166.1Il6 interleukin 6 NM_012589.2Irf1 interferon regulatory factor 1 NM_012591.1Irf2 interferon regulatory factor 2 NM_001047086.1Irf3 interferon regulatory factor 3 NM_001006969.1Irf4 interferon regulatory factor 4 NM_001106108.1Irf5 interferon regulatory factor 5 NM_001106586.1Irf6 interferon regulatory factor 6 NM_001108859.1
Tnfsf11 tumor necrosis factor superfamily member 11 NM_057149.1Tnfsf14 tumor necrosis factor superfamily member 14 NM_001191803.1Tnfsf4 tumor necrosis factor superfamily member 4 NM_053552.1
Table A2. Top 10 scored Genes in LINCS report.
Gene Symbol Full name
VPS28 VPS28, ESCRT-I subunitPROCR protein C receptor
CHMP2A charged multivesicular body protein 2AMB myoglobin
ZNF768 zinc finger protein 768RBPJ recombination signal binding protein for immunoglobulin kappa J region
WARS2 tryptophanyl tRNA synthetase 2 (mitochondrial)TBX2 T-box 2
MRPS2 mitochondrial ribosomal protein S2MAP3K14 mitogen-activated protein kinase kinase kinase 14SMARCE1 SWI/SNF related, matrix associated, actin dependent regulator of chromatin, subfamily e, member 1
AHRR aryl-hydrocarbon receptor repressorGPX7 glutathione peroxidase 7
ATP5F1 ATP synthase, H+ transporting, mitochondrial Fo complex subunit B1CALR calreticulin
GPR110 G protein-coupled receptor 110ELF4 E74 like ETS transcription factor 4
FGFR1 fibroblast growth factor receptor 1F7 coagulation factor VII
AHR aryl hydrocarbon receptorUBE2L6 ubiquitin-conjugating enzyme E2L 6
PAFAH1B3 platelet-activating factor acetylhydrolase 1b, catalytic subunit 3JUNB JunB proto-oncogene, AP-1 transcription factor subunitRYK receptor-like tyrosine kinase
ARG1 arginase 1ZNF324 zinc finger protein 324ATP5D ATP synthase, H+ transporting, mitochondrial F1 complex, delta subunit
113
Brain Sci. 2017, 7, 14
References
1. Ossipov, M.H.; Lai, J.; King, T.; Vanderah, T.W.; Malan, T.P., Jr.; Hruby, V.J.; Porreca, F. Antinociceptive and
nociceptive actions of opioids. J. Neurobiol. 2004, 61, 126–148. [CrossRef] [PubMed]
2. Bonnet, M.P.; Beloeil, H.; Benhamou, D.; Mazoit, J.X.; Asehnoune, K. The µ opioid receptor mediates
morphine-induced tumor necrosis factor and interleukin-6 inhibition in toll-like receptor 2-stimulated
monocytes. Anesth. Analg. 2008, 106, 1142–1149. [CrossRef] [PubMed]
3. Hutchinson, M.R.; Coats, B.D.; Lewis, S.S.; Zhang, Y.; Sprunger, D.B.; Rezvani, N.; Baker, E.M.; Jekich, B.M.;
Wieseler, J.L.; Somogyi, A.A.; et al. Proinflammatory cytokines oppose opioid-induced acute and chronic
analgesia. Brain Behav. Immun. 2008, 22, 1178–1189. [CrossRef] [PubMed]
4. Mohan, S.; Davis, R.L.; DeSilva, U.; Stevens, C.W. Dual regulation of mu opioid receptors in
SK-N-SH neuroblastoma cells by morphine and interleukin-1beta: Evidence for opioid-immune crosstalk.
J. Neuroimmunol. 2010, 227, 26–34. [CrossRef] [PubMed]
5. Ocasio, F.M.; Jiang, Y.; House, S.D.; Chang, S.L. Chronic morphine accelerates the progression of
lipopolysaccharide-induced sepsis to septic shock. J. Neuroimmunol. 2004, 149, 90–100. [CrossRef] [PubMed]
6. Flores, L.R.; Wahl, S.M.; Bayer, B.M. Mechanisms of morphine-induced immunosuppression: Effect of acute
morphine administration on lymphocyte trafficking. J. Pharmacol. Exp. Ther. 1995, 272, 1246–1251. [PubMed]
7. Gomez-Flores, R.; Weber, R.J. Inhibition of interleukin-2 production and downregulation of IL-2 and
transferrin receptors on rat splenic lymphocytes following pag morphine administration: A role in natural
killer and T cell suppression. J. Interferon Cytokine Res. 1999, 19, 625–630. [CrossRef] [PubMed]
8. Patel, N.A.; Romero, A.A.; Zadina, J.E.; Chang, S.L. Chronic exposure to morphine attenuates expression of
interleukin-1 beta in the rat hippocampus. Brain Res. 1996, 712, 340–344. [CrossRef]
9. Roy, S.; Charboneau, R.G.; Barke, R.A. Morphine synergizes with lipopolysaccharide in a chronic
endotoxemia model. J. Neuroimmunol. 1999, 95, 107–114. [CrossRef]
10. Hilburger, M.E.; Adler, M.W.; Truant, A.L.; Meissler, J.J., Jr.; Satishchandran, V.; Rogers, T.J.; Eisenstein, T.K.
Morphine induces sepsis in mice. J. Infect. Dis. 1997, 176, 183–188. [CrossRef] [PubMed]
11. Martinon, F.; Burns, K.; Tschopp, J. The inflammasome: A molecular platform triggering activation of
inflammatory caspases and processing of proil-beta. Mol. Cell 2002, 10, 417–426. [CrossRef]
12. Guarda, G.; Zenger, M.; Yazdi, A.S.; Schroder, K.; Ferrero, I.; Menu, P.; Tardivel, A.; Mattmann, C.; Tschopp, J.
Differential expression of NLRP3 among hematopoietic cells. J. Immunol. 2011, 186, 2529–2534. [CrossRef]
[PubMed]
13. Martinon, F.; Mayor, A.; Tschopp, J. The inflammasomes: Guardians of the body. Annu. Rev. Immunol. 2009,
27, 229–265. [CrossRef] [PubMed]
14. Strowig, T.; Henao-Mejia, J.; Elinav, E.; Flavell, R. Inflammasomes in health and disease. Nature 2012, 481,
278–286. [CrossRef] [PubMed]
15. Allan, S.M.; Tyrrell, P.J.; Rothwell, N.J. Interleukin-1 and neuronal injury. Nat. Rev. Immunol. 2005, 5, 629–640.
[CrossRef] [PubMed]
16. Allen, I.C.; Wilson, J.E.; Schneider, M.; Lich, J.D.; Roberts, R.A.; Arthur, J.C.; Woodford, R.M.; Davis, B.K.;
Uronis, J.M.; Herfarth, H.H.; et al. NLRP12 suppresses colon inflammation and tumorigenesis through the
negative regulation of noncanonical NF-kappab signaling. Immunity 2012, 36, 742–754. [CrossRef] [PubMed]
17. Williams, K.L.; Lich, J.D.; Duncan, J.A.; Reed, W.; Rallabhandi, P.; Moore, C.; Kurtz, S.; Coffield, V.M.;
Accavitti-Loper, M.A.; Su, L.; et al. The caterpiller protein monarch-1 is an antagonist of toll-like
receptor-, tumor necrosis factor alpha-, and mycobacterium tuberculosis-induced pro-inflammatory signals.
J. Biol. Chem. 2005, 280, 39914–39924. [CrossRef] [PubMed]
18. Lich, J.D.; Williams, K.L.; Moore, C.B.; Arthur, J.C.; Davis, B.K.; Taxman, D.J.; Ting, J.P. Monarch-1 suppresses
non-canonical NF-kappab activation and P52-dependent chemokine expression in monocytes. J. Immunol.
2007, 178, 1256–1260. [CrossRef] [PubMed]
19. National Institute of Health (NIH) Library of Network-Based Cellular Signatures (LINCS) Program. Available
online: http://www.lincsproject.org/ (accessed on 11 June 2016).
20. Lamb, J.; Crawford, E.D.; Peck, D.; Modell, J.W.; Blat, I.C.; Wrobel, M.J.; Lerner, J.; Brunet, J.P.;
Subramanian, A.; Ross, K.N.; et al. The connectivity map: Using gene-expression signatures to connect small
molecules, genes, and disease. Science 2006, 313, 1929–1935. [CrossRef] [PubMed]
114
Brain Sci. 2017, 7, 14
21. Chang, S.L.; Moldow, R.L.; House, S.D.; Zadina, J.E. Morphine affects the brain-immune axis by modulating
an interleukin-1 beta dependent pathway. Adv. Exp. Med. Biol. 1996, 402, 35–42. [PubMed]
22. Graf, J.A.; Patel, J.A.; Chang, S.L. Chronic exposure to morphine, but not ethanol, attenuates the expression
of interleukin-1 beta converting enzyme in rat spleen. Immunol. Lett. 1997, 58, 153–157. [CrossRef]
23. Zadina, J.E.; Kastin, A.J.; Harrison, L.M.; Ge, L.J.; Chang, S.L. Opiate receptor changes after chronic exposure
to agonists and antagonists. Ann. N. Y. Acad. Sci. 1995, 757, 353–361. [CrossRef] [PubMed]
24. House, S.D.; Mao, X.; Wu, G.; Espinelli, D.; Li, W.X.; Chang, S.L. Chronic morphine potentiates the
inflammatory response by disrupting interleukin-1beta modulation of the hypothalamic-pituitary-adrenal
axis. J. Neuroimmunol. 2001, 118, 277–285. [CrossRef]
25. RT2 Profiler PCR Array Date Analysis version 3.5. Available online: http://pcrdataanalysis.sabiosciences.
com/pcr/arrayanalysis.php (accessed 22 January 2017).
26. Ma, J.; Malladi, S.; Beck, A.H. Systematic analysis of sex-linked molecular alterations and therapies in cancer.
Sci. Rep. 2016, 6, 19119. [CrossRef] [PubMed]
27. Siavelis, J.C.; Bourdakou, M.M.; Athanasiadis, E.I.; Spyrou, G.M.; Nikita, K.S. Bioinformatics methods in
drug repurposing for Alzheimer’s disease. Brief. Bioinform. 2016, 17, 322–335. [CrossRef] [PubMed]
28. Allen, I.C.; Lich, J.D.; Arthur, J.C.; Jania, C.M.; Roberts, R.A.; Callaway, J.B.; Tilley, S.L.; Ting, J.P.
Characterization of NLRP12 during the development of allergic airway disease in mice. PLoS ONE 2012, 7,
e30612. [CrossRef] [PubMed]
29. Dostert, C.; Guarda, G.; Romero, J.F.; Menu, P.; Gross, O.; Tardivel, A.; Suva, M.L.; Stehle, J.C.; Kopf, M.;
Stamenkovic, I.; et al. Malarial hemozoin is a NALP3 inflammasome activating danger signal. PLoS ONE
2009, 4, e6510. [CrossRef] [PubMed]
30. Zaki, M.H.; Vogel, P.; Malireddi, R.K.; Body-Malapel, M.; Anand, P.K.; Bertin, J.; Green, D.R.; Lamkanfi, M.;
Kanneganti, T.D. The nod-like receptor NLRP12 attenuates colon inflammation and tumorigenesis.
Cancer Cell 2011, 20, 649–660. [CrossRef] [PubMed]
31. Beug, S.T.; Cheung, H.H.; LaCasse, E.C.; Korneluk, R.G. Modulation of immune signalling by inhibitors of
apoptosis. Trends Immunol. 2012, 33, 535–545. [CrossRef] [PubMed]
32. Scherer, D.C.; Brockman, J.A.; Chen, Z.; Maniatis, T.; Ballard, D.W. Signal-induced degradation of I kappa
B alpha requires site-specific ubiquitination. Proc. Natl. Acad. Sci. USA 1995, 92, 11259–11263. [CrossRef]
[PubMed]
33. Homji, N.F.; Mao, X.; Langsdorf, E.F.; Chang, S.L. Endotoxin-induced cytokine and chemokine expression in
the HIV-1 transgenic rat. J. Neuroinflamm. 2012, 9, 3. [CrossRef] [PubMed]
34. Del Fresno, C.; Garcia-Rio, F.; Gomez-Pina, V.; Soares-Schanoski, A.; Fernandez-Ruiz, I.; Jurado, T.;
Kajiji, T.; Shu, C.; Marin, E.; Gutierrez del Arroyo, A.; et al. Potent phagocytic activity with impaired
antigen presentation identifying lipopolysaccharide-tolerant human monocytes: Demonstration in isolated
monocytes from cystic fibrosis patients. J. Immunol. 2009, 182, 6494–6507. [CrossRef] [PubMed]
35. Fang, H.; Pengal, R.A.; Cao, X.; Ganesan, L.P.; Wewers, M.D.; Marsh, C.B.; Tridandapani, S.
Lipopolysaccharide-induced macrophage inflammatory response is regulated by ship. J. Immunol. 2004, 173,
360–366. [CrossRef] [PubMed]
36. Martich, G.D.; Boujoukos, A.J.; Suffredini, A.F. Response of man to endotoxin. Immunobiology 1993, 187,
403–416. [CrossRef]
37. Porter, K.J.; Gonipeta, B.; Parvataneni, S.; Appledorn, D.M.; Patial, S.; Sharma, D.; Gangur, V.; Amalfitano, A.;
Parameswaran, N. Regulation of lipopolysaccharide-induced inflammatory response and endotoxemia by
beta-arrestins. J. Cell Physiol. 2010, 225, 406–416. [CrossRef] [PubMed]
38. Mao, X.; Sarkar, S.; Chang, S.L. Involvement of the NLRP3 inflammasome in the modulation of
an LPS-induced inflammatory response during morphine tolerance drug and alcohol dependence.
Drug Alcohol Depend. 2013, 132, 38–46. [CrossRef] [PubMed]
39. Limiroli, E.; Gaspani, L.; Panerai, A.E.; Sacerdote, P. Differential morphine tolerance development in the
modulation of macrophage cytokine production in mice. J. Leukoc. Biol. 2002, 72, 43–48. [PubMed]
© 2017 by the authors. Licensee MDPI, Basel, Switzerland. This article is an open access
article distributed under the terms and conditions of the Creative Commons Attribution
(CC BY) license (http://creativecommons.org/licenses/by/4.0/).
115
brainsciences
Review
Oligodendrocyte Injury and Pathogenesis ofHIV-1-Associated Neurocognitive Disorders
Han Liu, Enquan Xu, Jianuo Liu and Huangui Xiong *
Department of Pharmacology and Experimental Neuroscience, University of Nebraska Medical Center, Omaha,
NE 68198-5880, USA; [email protected] (H.L.); [email protected] (E.X.); [email protected] (J.L.)
* Correspondence: [email protected]; Tel.: +1-402-559-5140; Fax: +1-402-559-3744
Academic Editor: Donna Gruol
Received: 2 April 2016; Accepted: 20 July 2016; Published: 22 July 2016
Abstract: Oligodendrocytes wrap neuronal axons to form myelin, an insulating sheath which is
essential for nervous impulse conduction along axons. Axonal myelination is highly regulated by
neuronal and astrocytic signals and the maintenance of myelin sheaths is a very complex process.
Oligodendrocyte damage can cause axonal demyelination and neuronal injury, leading to neurological
disorders. Demyelination in the cerebrum may produce cognitive impairment in a variety of neurological
disorders, including human immunodeficiency virus type one (HIV-1)-associated neurocognitive
disorders (HAND). Although the combined antiretroviral therapy has markedly reduced the incidence
of HIV-1-associated dementia, a severe form of HAND, milder forms of HAND remain prevalent
even when the peripheral viral load is well controlled. HAND manifests as a subcortical dementia
with damage in the brain white matter (e.g., corpus callosum), which consists of myelinated axonal
fibers. How HIV-1 brain infection causes myelin injury and resultant white matter damage is an
interesting area of current HIV research. In this review, we tentatively address recent progress on
oligodendrocyte dysregulation and HAND pathogenesis.
Keywords: HIV-1; dementia; oligodendrocyte; myelin sheath
1. Introduction
With the introduction of combined antiretroviral therapy (cART), there was a significant decline
in human immunodeficiency virus type one (HIV-1)-associated neurocognitive disorders (HAND).
As HIV-1-infected patients live a longer lifespan with a cART regimen, it is becoming increasingly
evident that the prevalence of milder forms of HAND seems to be on the rise [1–3]. Many studies have
revealed a preferential damage to subcortical white matter (e.g., corpus callosum) in the HIV-1-infected
brain, and such damage is prevalent even in the era of cART and more severe in patients with
HAND [4,5]. HIV-1-related white matter damage includes demyelination and axonal dysfunction and
injury. The demyelination occurs when myelin sheaths of neuronal axons are impaired in the central
nervous system (CNS) or peripheral nervous system (PNS). Myelination, formation of myelin sheaths
by oligodendrocytes wrapping neuronal axons in the CNS or Schwann cells in the PNS, is highly
regulated by neuronal and astrocytic signals and maintenance of myelin sheaths is a complex process.
The oligodendrocyte injury is a hallmark in demyelination and white matter damage. Such damage
can be induced by an alteration of genetics, viral infections, inflammation, autoimmunity, and other
unknown factors. HIV-1-associated oligodendrocyte/myelin damage has been observed both in cell
culture [6] and patients [7].
The earlier studies demonstrate that human polyomavirus JC (JCV) primarily causes
demyelination in HIV-1-infected brain. Compared to HIV-1 infection of astrocytes and microglia in the
brain, JCV predominately infects oligodendrocytes and, thus, causes oligodendrocyte damage and
further demyelination. Additionally, JCV is also the main causative factor for progressive multifocal
Brain Sci. 2016, 6, 23 116 www.mdpi.com/journal/brainsci
Brain Sci. 2016, 6, 23
leukoencephalopathy (PML), a frequent opportunistic infection in the CNS and a common complication
seen in AIDS patients [7,8]. Recent studies have shown that HIV-1 viral proteins per se can act on
oligodendrocytes and produce detrimental effects, which are independent of JCV [6,9,10]. HIV-1
viral proteins, including the envelope glycoprotein 120 (gp120), trans-activator of transcription (Tat),
and negative regulatory factor (Nef), have been implicated in HIV-1-associated oligodendrocyte
injury [9,11–14]. Among these viral proteins, Tat has consistently been detected in both infected and
uninfected oligodendrocytes in the brains of AIDS patients [7], and exhibited a synergistic detrimental
effect with JCV or with addictive drugs, such as morphine. In this review, we tentatively address
recent progress in HIV-1-associated oligodendrocyte pathophysiology, aiming at understanding the
pathogenesis of milder forms of HAND.
2. Myelin/Oligodendrocyte Injury in HIV-1 Patients
The oligodendrocyte and myelin injury have been observed clinically from neurological imaging
studies, serum biochemistry, and brain biopsies [15–18]. The diffusion tensor magnetic resonance imaging
(DTI) promotes the investigations of white matter damage in early HAND and allows revealing the
microstructures of myelin and oligodendrocytes. The changes of water molecules’ diffusive parameters
in brain white matter of HIV-1 patients, which indicate demyelination, have been detected in several
DTI studies [15,19,20]. These findings were supported by a recent study on HIV-1-infected humanized
mice that a decreased expression of myelin structural proteins was observed in whisker barrels, the
corpus callosum, and the hippocampus, suggesting the loss of myelin elements [21]. In the sera and CSF
of patients with HAND, antibody titers of myelin oligodendrocyte glycoprotein (MOG), an important
myelin structural protein indicating CNS-specific autoimmune reaction for primary demyelination, are
significantly higher compared with asymptomatic HAND patients and HIV-1-negative patients with
other neurological diseases. In particular, the CSF anti-MOG antibodies exhibit a high sensitivity
and specificity (85.7% and 76.2%) for discriminating patients with active HAND from those with
asymptomatic HAND. The performance on HIV dementia scale tests is significantly worse and the
viral loads in the CSF are higher in MOG immunopositive HAND patients than those in asymptomatic
HAND patients [22], suggesting the dysfunction of oligodendrocytes is closely related with HIV-1
infection and HAND.
Compared to astrocytes that appear to promote recovery in response of injury, oligodendrocytes
have a more passive role and tend to be damaged as a general response to insults [23]. In biopsy
studies, the absolute number of nerve fibers and axons significantly decreased in HIV-1-infected brain,
in particular in the frontal and occipital parts of the corpus callosum. The myelin sheath thickness
diminished in corpus callosum as well [18]. Weighted gene co-expression network analysis showed
that the oligodendrocyte-related genes are particularly elevated in the HIV encephalitis (HIVE) group,
suggesting specific dysfunction of this cell type in those with HIVE [24].
In HIV-1 positive patients with PML, the myelin loss is apparent both macroscopically and
microscopically [25]. Neuroimaging studies showed the myelin lesions were more frequently seen in the
sub-cortical white matter areas [26]. PML is believed to be developed exclusively in immunosuppressive
patients with significantly higher incidence in patients with AIDS, particularly in AIDS patients without
cART and with a low CD4+ lymphocyte count, than in patients with any other immunosuppressive
conditions. Although cART has decreased the incidence of PML and improved patient survival [27],
PML continues to occur in HIV-1-positive patients with good access to cART, and even with normal
CD4+ lymphocyte counts [28,29]. These findings suggest PML-related oligodendrocyte/myelin damage
is often, but not necessarily, associated with severe immunosuppression or an immune reconstitution
inflammatory syndrome (IRIS) in the cART era [30].
3. Fate of Oligodendrocytes in HIV-1-Infected Brain
Early publications reported that HIV-1 cannot be detected in oligodendrocytes [31,32] and this may
due to the limitation of methodologies to identify oligodendrocytes. Dissenting results were found
117
Brain Sci. 2016, 6, 23
in purified human oligodendrocytes from temporal lobe resections, HIV-1 (IIIB and BaL) infectivity
was confirmed by detection of p24gag antigen and PCR amplification [33]. It is well-known that HIV-1
attaches and infects human host cells through CD4 receptors, along with CXCR4 and CCR5 as co-receptors.
The oligodendrocytes are CD4- and CCR5-negative, but do express CXCR4 [31,34,35], which designedly
promote the oligodendrocyte progenitor cell (OPC) migration and remyelination [36], and may provide the
anchor for HIV-1-induced oligodendrocyte injury. However, most investigators agree that HIV-1 primarily
infects microglial cells in the brain, but not oligodendrocytes. HIV-1-associated oligodendrocyte injury
is believed to be mediated through viral proteins shed off from virions or released from infected other
cells [9,11,12].
In HIV-1 patients with PML complication, Tat and JCV both are present in oligodendrocytes. Tat has
been shown to synergize with JCV, and facilitate of JCV gene transcription and replication, leading to
robust JCV infection [37,38]. Tat stimulates JCV gene transcription by cooperating with SMAD proteins,
the intracellular effectors of TGF-beta, at the JCV DNA control region [37]. The effectiveness of Tat
on facilitating JCV transcription and replication varies from different HIV-1 clades [38]. Since Tat is
expressed in the brain at relative high levels while the viral load is controlled in blood, this may, at least
in part, explain why some HIV-1 patients still develop PML despite having a good access to cART [39].
In addition to the synergistic effect of Tat and JCV in oligodendrocytes, cytotoxic CD8+ T cells aggregate
at demyelinated lesion sites in the brain to engage JCV-infected oligodendrocytes, which tend to control
JCV dissemination, but at the cost of oligodendrocyte death and further demyelination in PML [40].
In addition to Tat, gp120 seems to be also involved in HIV-1-associated oligodendrocytes/myelin
injury. It has been shown that gp120 inhibits myelination in rat cerebral cortex culture [12] and induces
functional dysregulation and apoptosis in cultured oligodendrocytes [11,41], which is discussed in
a subsequent section. In addition to the primary oligodendrocyte injury, which leads to secondary
axonal injury (outside-in) to further exacerbate neurocognitive impairments, oligodendrocyte injury
can be caused by primary axonopathy as well (inside-out) [42]. The recent study has shown that
gp120-induced β-APP accumulation and axon injury in the corpus callosum was attenuated by a
CXCR4 antagonist, exampling HIV-1 injury of oligodendrocyte/myelin via CXCR4 [35]. Although it
is not clear whether gp120 causes such a detrimental effect through an “outside-in” or “inside-out”
mechanism, or both, CXCR4 expressed in oligodendrocytes can be a potential target [42].
4. Association between Blood-Brain Barrier (BBB) Disruption and Myelin Injury
Increasing evidence indicates that myelin injury may be associated with a dysregulated
blood-brain barrier (BBB) since myelin pallor is often observed in perivascular sectors during white
matter edema [43,44]. The BBB is a critically-protective barrier for the brain and serves as a highly
selective layer that separates the CNS from the rest of the body. In HIV-1-infected brains, the BBB
disruption is believed to be mediated by both viral and cellular factors, released from HIV-1-infected
and immune-activated mononuclear phagocytes and endothelial cells [45,46]. The reported direct
mechanisms underlying HIV-1-associated BBB disruption are often related to alterations of vascular
tight junctions, direct toxicity of brain endothelial cells, production of matrix metalloproteinases,
and N-Methyl-D-Aspartate (NMDA) receptor activation [47,48]. The disruption of BBB is essential
for HIV-1 entrance to the brain, resulting in brain white matter damage and consequent neurologic
deficits in patients with neuroHIV. This notion is supported by an observation that HIV-1 patients
with impaired BBB showed poorer neurologic status than those with intact BBB [49]. However, myelin
damage may also be related to BBB disruption without HIV-1 brain invasion. In a case report, diffuse
myelin pallor in white matter and massive perivascular dilatation were observed in an AIDS patient
without evidence of brain HIV-1 infection, significant inflammation, or microglial activation [50].
Postmortem studies on the brains of AIDS patients revealed discrete myelin pallor areas always
associated with capillaries or venules [44]. These findings suggest that BBB breakdown may contribute
to the observed oligodendrocyte/myelin/white matter injury.
118
Brain Sci. 2016, 6, 23
Under physiological conditions, the BBB endothelial cells and components of the extracellular matrix
support OPC survival, and promote neural progenitor cells (NPC) differentiate to neurons, astrocytes,
and oligodendrocytes [51–53]. The critical function of BBB and the consequences of BBB disruption imply
its involvement in HIV-1-associated oligodendrocyte/myelin injury. It is not surprising that the disrupted
BBB promotes the entrance of viruses, infected T cells, and toxic substances from the blood to the brain,
resulting in OPC/oligodendrocyte/myelin injury. Inhibition of OPC proliferation can be caused by
plasma, serum, thrombin, and plasmin in primary culture. Thrombin also suppresses the differentiation
of OPCs into mature oligodendrocytes [54]. In addition, elevated levels of TNF-α, an inflammatory
cytokine promoting oligodendrocyte death [55], were detected in blood mononuclear phagocytes in
HIV-infected patients [56]. HIV-1 infection also induces interleukin (IL)-1β production from mononuclear
phagocytes [57]. IL-1β promotes oligodendrocyte death through glutamate excitotoxicity [58]. These
findings suggest that BBB disruption contributes to HIV-1-associated myelin/oligodendrocyte damage.
5. Cellular Mechanisms for Oligodendrocyte Injury in HIV-1-Infected Brain
Apoptotic signal activation of oligodendrocytes has been observed in HAND patients [59]. Such
an apoptotic activation of oligodendrocytes could be caused directly by HIV-1 viral proteins or induced
indirectly by immune and inflammatory factors.
It is well-known that tumor suppressor p53 induces apoptosis by activating transcription of
various pro-apoptotic genes [60]. Activation of p53 was detected in the oligodendrocyte lineage cells in
the brains of HAND patients, but not in control brains [59]. Due to the difficulties in distinguishing the
differentiating stages of oligodendrocyte lineage on autopsy samples, the detected p53 reactivity reflects
apoptosis of mature oligodendrocytes and OPCs. These suggest that, in addition to oligodendrocyte
injury, proliferation of OPCs is also impaired in HAND.
Gp120 was shown to cause slow but progressive oligodendrocyte cytosolic Ca2+ rise in a mixed
culture of cerebellar cortex cells [41] and the rise of introcellular Ca2+ concentration may trigger
oligodendrocytic apoptosis. Exposure of oligodendrocytes to Tat also produced a rapid increase in
intracellular Ca2+ levels through NMDA and α-amino-3-hydroxy-5-methyl-4-isoxazolepropionic acid
(AMPA) receptors, causing oligodendrocyte injury. It is worth mentioning that the roles of NMDA and
AMPA receptors appear to be different and dependent on the stage of OPC differentiation. Tat-induced
OPC death can be blocked by either NMDA or AMPA receptor antagonists. However, Tat’s detrimental
effects on mature oligodendrocytes can only be reversed by NMDA receptor antagonists, but not
AMPA receptor blockade [6]. Tat was also found to cause oligodendrocyte apoptosis in vitro and
myelin injury ex vivo by enhancing voltage-dependent K+ channel (Kv) 1.3 activity [61]. The loss of
K+ ions may cause cell regulatory volume decrease (shrinkage), leading to cell apoptosis [62]. The
involvement of Tat in oligodendrocyte apoptosis has been demonstrated in an HIV-1 Tat transgenic
mouse model. The oligodendrocytes within the striatum exhibit a high sensitivity to morphine in
HIV-1 Tat transgenic mice and they are the only apoptotic cell type in response to combined morphine
exposure and Tat induction in Tat transgenic mice [9]. Tat also interacts with morphine to decrease the
proliferation of OPCs [63]. Opioid abuse produces synergistic toxic activity in HIV-1-infected brains
by direct actions on immature astrocytes and oligodendrocytes, which express µ-opioid or κ-opioid
receptors [64].
In other viral-induced demyelination, there is clear evidence that mouse hepatitis virus (MHV) can
directly infect and activate microglia during acute inflammation, which eventually causes phagocytosis
of the myelin sheath, leading to demyelination during the chronic inflammation stage [65]. A similar
theory has been proposed for multiple sclerosis, which is the most prevalent demyelinating disease,
that immune-activated microglia strip the myelin. Recent evidence has shown that microglia become
phagocytic in response to HIV-1 Tat [66,67]. It might be possible that the infected and activated
microglia phagocyte oligodendrocytes and myelin sheath lead to the myelin damage and consequent
HAND pathogenesis, although there is no direct evidence indicating microglia phagocytosis of
oligodendrocyte in neuroHIV [68].
119
Brain Sci. 2016, 6, 23
6. Myelin Maintenance and Remyelination in HIV-1-Infected Brain
Repair of the damaged myelin sheath, which is termed remyelination, is physiologically required
to maintain myelin homeostasis. The myelin injury in neuroHIV may also be induced by abnormalities
of remyelination, in addition to the loss of existing myelin sheath. Remyelination requires proliferation
and survival of OPCs, migration of OPCs to the damaged site, and development of OPCs from
immature to mature myelinating oligodendrocytes. HIV-1 disrupts OPC development, migration, and
remyelination processes.
6.1. Alteration of OPC Proliferation and Differentiation in HIV-1-Infected Brains
In HIV-1-infected brains, mild degrees of myelin damage were associated with an increase in
oligodendrocyte numbers, an initial reactive hyperplasia which was believed to represent an attempt
to repair myelin damage. Such a change was reversed in the presence of severe myelin damage [69].
In agreement with the aforementioned results, mRNA levels of transcription factor Olig2, a marker
expressed with higher levels in OPCs and lower levels in mature oligodendrocytes [70], are elevated
in the front cortex of patients with HIVE [24], indicating an increase of OPC proliferation needed for
repairing the damaged myelin sheath. Mature oligodendrocyte defects are also observed in animal
models of secondary degeneration, which represents additional loss of neurons, myelin, and glial cells
through toxic events. Early onset of secondary degeneration triggers OPC proliferation, but the cell
numbers decrease in a long-term degenerative condition [71]. However, Tat exposure reduces the
population of undifferentiated Sox2+ NPC (ancestor of OPC) and Olig2+ OPCs, but progenitor survival
is unaffected [63], suggesting the proliferation was interrupted. Tat may inhibit NPC proliferation by
downregulating cyclin D1, which is an important cell cycle component interacts with cyclin-dependent
kinase 4 and 6 [72]. Over all, HIV-1 infection or viral protein exposure appears to incline NPC fate
toward production of glia/astroglia at the expense of neurons and/or oligodendrocytes [63,73,74].
Thus, OPC differentiation and maturation are likely the key processes affected during remyelination
in neuroHIV.
6.2. Imbalance of OPC Differentiation and Remyelination in HIV-1-Infected Brain
It has been shown that differentiation of OPCs into post-mitotic oligodendrocytes is a major
checkpoint in the myelination process and such an oligodendrocyte differentiation is controlled by
a number of factors, many of which act to inhibit myelination, including leucine-rich repeat and
immunoglobulin domain-containing-1 (LINGO-1) [75,76], Notch-1 [77,78], and Wnt [79,80], whereas
p38 MAPK [81,82] and AKT [83] have been shown to be required for oligodendrocyte differentiation
and myelination. While molecular mechanisms in the regulation of developmental myelination are
discussed in excellent review papers published elsewhere [84,85], the direct interaction between HIV-1
and these molecules remains largely unknown. It is, however, believed that HIV-1 may disturb the
complex regulating network leading to the remyelination imbalance based on the following findings:
(1) HIV-1 alters the cell cycle by Wnt signaling pathways and further impacts the cell proliferation
and differentiation in different cell types, including peripheral blood mononuclear cells [86], HEK293
cells [87], and astrocytes [88]; (2) HIV-1 infection of astrocytes altered the astrocytic Wnt profile by
elevating Wnt family members 2b and 10b [88]; (3) elevation of secreted Wnt from astrocytes may
negatively regulate oligodendrocyte differentiation in neuroHIV; (4) Notch-1 signaling is permissive
for OPC expansion, but inhibit differentiation and myelin formation [89]; and (5) in Kaposi’s sarcoma
cells, which is a neoplasm in HIV-1-infected individuals, overexpression of activated Notch-1 signaling
is detected [90]. However, to our knowledge, there is no report yet on how OPC/oligodendrocyte
Notch-1 signaling in responding to HIV-1. Moreover, CD44, a predominant hyaluronan receptor
widely expressed in the nervous system, plays a negative role in OPC differentiation and myelination.
Overexpression of CD44 in precursor cells inhibits differentiation toward oligodendrocytes and
promotes differentiation into astrocytes, cause progressive demyelination in conditional transgenic
120
Brain Sci. 2016, 6, 23
mouse model [91,92]. In lymphocyte cell lines of Jurkat and U937 cells, HIV-1 infection-caused particle
production is accompanied by CD44 upregulation [93]. In HIV-1-related diffuse large B-cell lymphoma
patients, the CD44 levels significantly increased compared with HIV-1-unrelated diffuse large B-cell
lymphoma patients (87% vs. 56%) [94]. These findings suggest CD44 may play a role in HIV-1-related
remyelination failure.
Neurotrophins are important factors in the regulation of oligodendrocyte myelination and
remyelination. The main cellular sources for neurotrophins in the brain are astrocytes, microglial
cells, and neurons, in addition to lymphocytes’ contribution through the blood circulation. Being
aware of excellent reviews on the alteration of neurotrophins in HAND [95] and immunological
communications between oligodendrocytes and microglia [96], we focus here on the HIV-1-induced
alterations of neurotrophins that are potentially associated with oligodendrocyte abnormalities.
The platelet-derived growth factor (PDGF) is the most predominant mitogen for oligodendrocyte
lineage cells. PDGF A and B chains both promote proliferation through activating PDGF receptor
alpha (PDGFRα) expressed on OPCs, whereas the PDGF B chain appears to be more important
for early NPC expansion [97,98]. It has been shown that PDGF regulates OPC development via
glycogen synthase kinase-3β (GSK-3β) signaling pathway, which is a negative regulator of OPC
differentiation and remyelination [99,100]. PDGF-BB prevents NPC from Tat-mediated proliferating
impairment by inactivating GSK-3β/β-catenin pathways and, this effect is significantly inhibited by
the p38 and JNK inhibitors [101]. The levels of fibroblast growth factor (FGF), which is an important
pro-survival signal to stimulate OPC proliferation [102], increased in the sera of HIV-1-infected
patients [103,104], but decreased in CSF [103]. FGF signaling complex is interrupted in HIV-1-infected
brains, resulting in the abnormal activation of downstream signals, including GSK-3β [105,106], p38,
ERK, and JNK cascades [107] in neurons through the surface receptors, such as NMDA receptor
and CXCR4, which are also expressed on oligodendrocytes [36,108,109]. In addition, HIV-1 Tat and
FGF-2 share a common core mechanism of unconventional secretion [110], although it is not clear
whether they compete for the secretory routine. The brain-derived neurotrophic factor (BDNF),
predominantly derived from astrocytes, has also been found to be essential for oligodendrocyte lineage
development [68,111–113]. In rat primary neurons, gp120 promotes a time-dependent proBDNF
accumulation at both intracellular and extracellular spaces by decreasing the expression level of
intracellular furin, an enzyme required for cleavage and release of mature BDNF, leading to a reduction
in mature BDNF. A similar imbalance in the ratio of proBDNF/mature BDNF was confirmed in
postmortem brains of HAND patients [114]. These findings suggest that HIV-1 decreases the brain
BDNF level by infecting astrocytes and gp120-associated neurotoxicity, resulting in downregulated
remyelination. As BDNF is believed to protect neurons from HIV-1-induced apoptosis, thus, the
reduction of BDNF may make the oligodendrocyte lose the support from neuronal axons that
consequently cause myelin damage through the “inside-out” mechanism as proposed [42].
In addition to these signaling molecules, HIV-1 Tat interacting protein (TIP30), a co-factor that
specifically enhances HIV-1 Tat-activated transcription [115], negatively regulates oligodendrocyte
development. Overexpression of TIP30 dramatically inhibits the OPC differentiation, while knockdown
of TIP30 enhances the differentiation of OPC remarkably [116]. The blockade of TIP30 may have
dual benefits on inhibiting Tat-dependent gene transcription and promoting OPC differentiation,
which is a potential therapeutic strategy for HIV-associated demyelination. Potassium channels are
also involved in regulation of OPC development. Kv1.3 [117,118], Kv1.6 [117], Kv2.1 [119], and
inward-rectified K+ channel 4.1 [120,121] play crucial roles in regulation of OPC/oligodendrocyte
proliferation and differentiation. Generally, channel expressions on oligodendrocyte lineage cells
correlate with differentiating stages and are more complex in OPCs than in oligodendrocytes.
Particularly, Kv1.3 channel plays an important role in G1/S transition in proliferating OPCs through
regulating AKT signaling [118,122]. Moreover, L-type voltage-operated Ca2+ channel 1.2 knockdown
induces a decrease in the proportion of oligodendrocytes expressing myelin proteins, and an increase
in the population of immature oligodendrocyte [123].
121
Brain Sci. 2016, 6, 23
Most recent studies proposed that myelin injury in HAND is partially due to the effects
of antiretroviral drugs on oligodendrocyte survival and differentiation. The common prescribed
antiretroviral drugs, ritonavir and lopinavir, impair both the differentiation of OPCs into myelin-producing
oligodendrocytes and the maintenance of myelin proteins in vivo. Ritonavir induces accumulation of
reactive oxygen species, which arrest the oligodendrocyte differentiation process [124,125]. Controversial
results were reported in HIV-1-infected children in Africa that significant myelin loss in cART-naïve
children was observed in comparison with cART-treated children. However, cART-treated children
also exhibited a significant myelin loss in the corpus callosum [126]. Interestingly, myelin-related genes
encoding myelin-associated oligodendrocyte basic protein, myelin transcription factor 1, and myelin basic
protein are downregulated in both cART-treated and untreated HAND patients [127]. Apparently, the
impact of antiretroviral drugs on oligodendrocyte pathophysiology requires further investigation.
7. Summary and Prospects
HIV-1 persists in the brain despite cART. The cART-treated subjects are not able to purge the
virus from their brains and show concomitant and persistent white matter abnormalities. There are
increasing interests in understanding how HIV-1 causes myelin sheath loss and white matter damage
in HIV-1-infected brains. In this article, we try to address the clinical and postmortem manifestations of
myelin damage in HAND patients and possible involvement of BBB integrity disruption, oligodendrocyte
apoptosis mechanisms, and OPC regulation imbalance in HIV-1-induced oligodendrocyte/myelin
abnormalities. The studies on direct toxicity of HIV-1 viral proteins on oligodendrocytes and OPCs
are emerging. As the transcription of HIV-1 viral protein continues in the CNS, even when the viral
load is at a low level [128], the persistence of the virus and viral proteins in the brain has changed the
pattern of HAND pathogenesis, by which inflammation, encephalitis, and neurodegeneration have
been significantly decreased by the advent of cART.
The methods of regulation of oligodendrocyte lineage cell development are well-established,
including the extracellular pathways, cell to cell contact, and intracellular pathways. As NG2+ cells
are the largest population of progenitor cells in the human adult brain, a decrease of absolute cell
number and proliferation of NPC and OPC may contribute less to myelin deficits in HAND. In contrast,
HIV-1-related OPC differentiation and remyelination imbalance may better correlate with an impaired
remyelination in HAND patients. The strategies for promoting axonal remyelination have been
introduced especially in those demyelinating disease like multiple sclerosis. It is anticipated that
those strategies for promoting axonal remyelination in other neurodegenerative disorders can be
applied for HIV-1-associated oligodendrocyte/myelin injury, though studies are needed to elucidate
the underlying mechanisms for HIV-1-associated brain white matter damage.
Further studies on understanding the mechanisms underlying HIV-1-associated oligodendrocyte/
myelin injury may be hampered by the following potential difficulties: first, oligodendrocytes share
many common extracellular signals and intracellular signaling pathways with neurons, the proposed
“inside-out” and “outside-in” mechanisms for virus-induced demyelination are indistinguishable
under these conditions [42]; and, second, the pro-proliferation signals for OPC are sometimes
anti-maturative [129–131]. This will be a significant challenge to identify the certain time window
to access proper remyelination in vivo. Overall, promoting remyelination could be an important
therapeutic strategy for HAND and other neurodegenerative disorders in the future.
Acknowledgments: This work was supported by NIH grant R01 NS077873.
Author Contributions: H.L. and X.H. did literature research and wrote the paper, E.X. and J.L. participated inliterature research and contributed to discussion in Sections 6 and 7.
Conflicts of Interest: The authors declare no conflict of interest.
122
Brain Sci. 2016, 6, 23
References
1. Antinori, A.; Arendt, G.; Becker, J.T.; Brew, B.J.; Byrd, D.A.; Cherner, M.; Clifford, D.B.; Cinque, P.;
Epstein, L.G.; Goodkin, K.; et al. Updated research nosology for HIV-associated neurocognitive disorders.
Neurology 2007, 69, 1789–1799. [CrossRef] [PubMed]
2. Heaton, R.K.; Franklin, D.R.; Ellis, R.J.; McCutchan, J.A.; Letendre, S.L.; LeBlanc, S.; Corkran, S.H.;
Duarte, N.A.; Clifford, D.B.; Woods, S.P. HIV-associated neurocognitive disorders before and during the era
of combination antiretroviral therapy: Differences in rates, nature, and predictors. J. Neurovirol. 2011, 17,
3–16. [CrossRef] [PubMed]
3. Tozzi, V.; Balestra, P.; Bellagamba, R.; Corpolongo, A.; Salvatori, M.F.; Visco-Comandini, U.; Vlassi, C.;
Giulianelli, M.; Galgani, S.; Antinori, A.; et al. Persistence of neuropsychologic deficits despite long-term
highly active antiretroviral therapy in patients with HIV-related neurocognitive impairment: Prevalence and
risk factors. J. Acquir. Immune Defic. Syndr. 2007, 45, 174–182. [CrossRef] [PubMed]
4. Chen, Y.; An, H.; Zhu, H.; Stone, T.; Smith, J.K.; Hall, C.; Bullitt, E.; Shen, D.; Lin, W. White matter
abnormalities revealed by diffusion tensor imaging in non-demented and demented HIV+ patients.
Neuroimage 2009, 47, 1154–1162. [CrossRef] [PubMed]
5. Gosztonyi, G.; Artigas, J.; Lamperth, L.; Webster, H.D. Human immunodeficiency virus (HIV) distribution in
HIV encephalitis: Study of 19 cases with combined use of in situ hybridization and immunocytochemistry.
J. Neuropathol. Exp. Neurol. 1994, 53, 521–534. [CrossRef] [PubMed]
6. Zou, S.; Fuss, B.; Fitting, S.; Hahn, Y.K.; Hauser, K.F.; Knapp, P.E. Oligodendrocytes are targets of HIV-1 tat:
Nmda and ampa receptor-mediated effects on survival and development. J. Neurosci. 2015, 35, 11384–11398.
[CrossRef] [PubMed]
7. Del Valle, L.; Croul, S.; Morgello, S.; Amini, S.; Rappaport, J.; Khalili, K. Detection of HIV-1 tat and JCV
capsid protein, VP1, in AIDS brain with progressive multifocal leukoencephalopathy. J. Neurovirol. 2000, 6,
221–228. [CrossRef] [PubMed]
8. Bellizzi, A.; Nardis, C.; Anzivino, E.; Rodio, D.; Fioriti, D.; Mischitelli, M.; Chiarini, F.; Pietropaolo, V. Human
polyomavirus JC reactivation and pathogenetic mechanisms of progressive multifocal leukoencephalopathy
and cancer in the era of monoclonal antibody therapies. J. Neurovirol. 2012, 18, 1–11. [CrossRef] [PubMed]
9. Hauser, K.F.; Hahn, Y.K.; Adjan, V.V.; Zou, S.; Buch, S.K.; Nath, A.; Bruce-Keller, A.J.; Knapp, P.E. HIV-1 tat
and morphine have interactive effects on oligodendrocyte survival and morphology. Glia 2009, 57, 194–206.
[CrossRef] [PubMed]
10. Li, R.; Mi, H.; Zhao, J.; Yuan, D.; Ding, J.; Li, H. White matter damage and effects of nadir CD4+ count on
patients with asymptomatic HIV associated dementia complex–A DTI study. Radiol. Infect. Dis. 2014, 1,
11–16. [CrossRef]
11. Bernardo, A.; Agresti, C.; Levi, G. HIV-gp120 affects the functional activity of oligodendrocytes and their
susceptibility to complement. J. Neurosci. Res. 1997, 50, 946–957. [CrossRef]
12. Kimura-Kuroda, J.; Nagashima, K.; Yasui, K. Inhibition of myelin formation by HIV-1 gp120 in rat cerebral
cortex culture. Arch. Virol. 1994, 137, 81–99. [CrossRef] [PubMed]
13. Nukuzuma, S.; Kameoka, M.; Sugiura, S.; Nakamichi, K.; Nukuzuma, C.; Miyoshi, I.; Takegami, T. Exogenous
human immunodeficiency virus-1 protein, tat, enhances replication of JC virus efficiently in neuroblastoma
cell lines. J. Med. Virol. 2012, 84, 555–561. [CrossRef] [PubMed]
14. Radja, F.; Kay, D.G.; Albrecht, S.; Jolicoeur, P. Oligodendrocyte-specific expression of human
immunodeficiency virus type 1 NEF in transgenic mice leads to vacuolar myelopathy and alters
oligodendrocyte phenotype in vitro. J. Virol. 2003, 77, 11745–11753. [CrossRef] [PubMed]
15. Correa, D.G.; Zimmermann, N.; Doring, T.M.; Wilner, N.V.; Leite, S.C.; Cabral, R.F.; Fonseca, R.P.; Bahia, P.R.;
Gasparetto, E.L. Diffusion tensor mr imaging of white matter integrity in HIV-positive patients with planning
deficit. Neuroradiology 2015, 57, 475–482. [CrossRef] [PubMed]
16. Gongvatana, A.; Schweinsburg, B.C.; Taylor, M.J.; Theilmann, R.J.; Letendre, S.L.; Alhassoon, O.M.; Jacobus, J.;
Woods, S.P.; Jernigan, T.L.; Ellis, R.J.; et al. White matter tract injury and cognitive impairment in human
immunodeficiency virus-infected individuals. J. Neurovirol. 2009, 15, 187–195. [CrossRef] [PubMed]
17. Uban, K.A.; Herting, M.M.; Williams, P.L.; Ajmera, T.; Gautam, P.; Huo, Y.; Malee, K.M.; Yogev, R.;
Csernansky, J.G.; Wang, L.; et al. White matter microstructure among youth with perinatally acquired
HIV is associated with disease severity. AIDS 2015, 29, 1035–1044. [CrossRef] [PubMed]
123
Brain Sci. 2016, 6, 23
18. Wohlschlaeger, J.; Wenger, E.; Mehraein, P.; Weis, S. White matter changes in HIV-1 infected brains:
A combined gross anatomical and ultrastructural morphometric investigation of the corpus callosum.
Clin. Neurol. Neurosurg. 2009, 111, 422–429. [CrossRef] [PubMed]
19. Leite, S.C.; Correa, D.G.; Doring, T.M.; Kubo, T.T.; Netto, T.M.; Ferracini, R.; Ventura, N.; Bahia, P.R.;
Gasparetto, E.L. Diffusion tensor mri evaluation of the corona radiata, cingulate gyri, and corpus callosum
in HIV patients. J. Magn. Reson. Imaging 2013, 38, 1488–1493. [CrossRef] [PubMed]
20. Xuan, A.; Wang, G.B.; Shi, D.P.; Xu, J.L.; Li, Y.L. Initial study of magnetic resonance diffusion tensor imaging
in brain white matter of early aids patients. Chin. Med. J. (Engl.) 2013, 126, 2720–2724. [PubMed]
21. Boska, M.D.; Dash, P.K.; Knibbe, J.; Epstein, A.A.; Akhter, S.P.; Fields, N.; High, R.; Makarov, E.; Bonasera, S.;
Gelbard, H.A.; et al. Associations between brain microstructures, metabolites, and cognitive deficits during
chronic HIV-1 infection of humanized mice. Mol. Neurodegener. 2014, 9, 58. [CrossRef] [PubMed]
22. Lackner, P.; Kuenz, B.; Reindl, M.; Morandell, M.; Berger, T.; Schmutzhard, E.; Eggers, C. Antibodies to
myelin oligodendrocyte glycoprotein in HIV-1 associated neurocognitive disorder: A cross-sectional cohort
study. J. Neuroinflamm. 2010, 7, 79. [CrossRef] [PubMed]
23. Fitting, S.; Booze, R.M.; Hasselrot, U.; Mactutus, C.F. Dose-dependent long-term effects of tat in the rat
hippocampal formation: A design-based stereological study. Hippocampus 2010, 20, 469–480. [CrossRef]
[PubMed]
24. Levine, A.J.; Miller, J.A.; Shapshak, P.; Gelman, B.; Singer, E.J.; Hinkin, C.H.; Commins, D.; Morgello, S.;
Grant, I.; Horvath, S. Systems analysis of human brain gene expression: Mechanisms for HIV-associated
neurocognitive impairment and common pathways with Alzheimer’s disease. BMC Med. Genom. 2013, 6, 4.
[CrossRef] [PubMed]
25. Berger, J.R.; Aksamit, A.J.; Clifford, D.B.; Davis, L.; Koralnik, I.J.; Sejvar, J.J.; Bartt, R.; Major, E.O.; Nath, A.
Pml diagnostic criteria: Consensus statement from the aan neuroinfectious disease section. Neurology 2013,
80, 1430–1438. [CrossRef] [PubMed]
26. Del Valle, L.; Pina-Oviedo, S. HIV disorders of the brain: Pathology and pathogenesis. Front. Biosci. 2006, 11,
718–732. [CrossRef] [PubMed]
27. Sacktor, N. The epidemiology of human immunodeficiency virus-associated neurological disease in the era
of highly active antiretroviral therapy. J. Neurovirol. 2002, 8, 115–121. [CrossRef] [PubMed]
28. Crossley, K.M.; Agnihotri, S.; Chaganti, J.; Rodriguez, M.L.; McNally, L.P.; Venna, N.; Turbett, S.E.;
Gutman, M.; Morey, A.; Koralnik, I.J.; et al. Recurrence of progressive multifocal leukoencephalopathy
despite immune recovery in two HIV seropositive individuals. J. Neurovirol. 2016, 22, 541–545. [CrossRef]
[PubMed]
29. Mascarello, M.; Lanzafame, M.; Lattuada, E.; Concia, E.; Ferrari, S. Progressive multifocal
leukoencephalopathy in an HIV patient receiving successful long-term haart. J. Neurovirol. 2011, 17, 196–199.
[CrossRef] [PubMed]
30. Gates, T.M.; Cysique, L.A. The chronicity of HIV infection should drive the research strategy of neuroHIV
treatment studies: A critical review. CNS Drugs 2016, 30, 53–69. [CrossRef] [PubMed]
31. Sharpless, N.; Gilbert, D.; Vandercam, B.; Zhou, J.M.; Verdin, E.; Ronnett, G.; Friedman, E.; Dubois-Dalcq, M.
The restricted nature of HIV-1 tropism for cultured neural cells. Virology 1992, 191, 813–825. [CrossRef]
32. Takahashi, K.; Wesselingh, S.L.; Griffin, D.E.; McArthur, J.C.; Johnson, R.T.; Glass, J.D. Localization of
HIV-1 in human brain using polymerase chain reaction/in situ hybridization and immunocytochemistry.
Ann. Neurol. 1996, 39, 705–711. [CrossRef] [PubMed]
33. Albright, A.V.; Strizki, J.; Harouse, J.M.; Lavi, E.; O’Connor, M.; Gonzalez-Scarano, F. HIV-1 infection of
cultured human adult oligodendrocytes. Virology 1996, 217, 211–219. [CrossRef] [PubMed]
34. Albright, A.; Lavi, E.; O’Connor, M.; González-Scarano, F. HIV-1 infection of a CD4-negative primary cell
type: The oligodendrocyte. Perspect. Drug Discov. Des. 1996, 5, 43–50. [CrossRef]
35. Zhang, J.; Liu, J.; Katafiasz, B.; Fox, H.; Xiong, H. HIV-1 gp120-induced axonal injury detected by
accumulation of β-amyloid precursor protein in adult rat corpus callosum. J. Neuroimmune Pharmacol.
2011, 6, 650–657. [CrossRef] [PubMed]
36. Patel, J.R.; McCandless, E.E.; Dorsey, D.; Klein, R.S. CXCR4 promotes differentiation of oligodendrocyte
progenitors and remyelination. Proc. Natl. Acad. Sci. USA 2010, 107, 11062–11067. [CrossRef] [PubMed]
124
Brain Sci. 2016, 6, 23
37. Stettner, M.R.; Nance, J.A.; Wright, C.A.; Kinoshita, Y.; Kim, W.K.; Morgello, S.; Rappaport, J.; Khalili, K.;
Gordon, J.; Johnson, E.M. Smad proteins of oligodendroglial cells regulate transcription of JC virus early and
late genes coordinately with the tat protein of human immunodeficiency virus type 1. J. Gen. Virol. 2009, 90,
2005–2014. [CrossRef] [PubMed]
38. Wright, C.A.; Nance, J.A.; Johnson, E.M. Effects of tat proteins and tat mutants of different human
immunodeficiency virus type 1 clades on glial JC virus early and late gene transcription. J. Gen. Virol.
2013, 94, 514–523. [CrossRef] [PubMed]
39. Cinque, P.; Pierotti, C.; Vigano, M.G.; Bestetti, A.; Fausti, C.; Bertelli, D.; Lazzarin, A. The good and evil of
haart in HIV-related progressive multifocal leukoencephalopathy. J. Neurovirol. 2001, 7, 358–363. [PubMed]
40. Martin-Blondel, G.; Bauer, J.; Cuvinciuc, V.; Uro-Coste, E.; Debard, A.; Massip, P.; Delisle, M.B.; Lassmann, H.;
Marchou, B.; Mars, L.T.; et al. In situ evidence of jc virus control by CD8+ t cells in pml-iris during HIV
infection. Neurology 2013, 81, 964–970. [CrossRef] [PubMed]
41. Codazzi, F.; Menegon, A.; Zacchetti, D.; Ciardo, A.; Grohovaz, F.; Meldolesi, J. HIV-1 gp120 glycoprotein
induces [Ca2+]i responses not only in type-2 but also type-1 astrocytes and oligodendrocytes of the rat
cerebellum. Eur. J. Neurosci. 1995, 7, 1333–1341. [CrossRef] [PubMed]
42. Tsunoda, I.; Fujinami, R.S. Inside-out versus outside-in models for virus induced demyelination: Axonal
damage triggering demyelination. Springer Semin. Immunopathol. 2002, 24, 105–125. [CrossRef] [PubMed]
43. Langford, T.D.; Letendre, S.L.; Marcotte, T.D.; Ellis, R.J.; McCutchan, J.A.; Grant, I.; Mallory, M.E.;
Hansen, L.A.; Archibald, S.; Jernigan, T.; et al. Severe, demyelinating leukoencephalopathy in AIDS
patients on antiretroviral therapy. AIDS 2002, 16, 1019–1029. [CrossRef] [PubMed]
44. Smith, T.W.; DeGirolami, U.; Henin, D.; Bolgert, F.; Hauw, J.J. Human immunodeficiency virus (HIV)
leukoencephalopathy and the microcirculation. J. Neuropathol. Exp. Neurol. 1990, 49, 357–370. [CrossRef]
[PubMed]
45. Miller, F.; Afonso, P.V.; Gessain, A.; Ceccaldi, P.E. Blood-brain barrier and retroviral infections. Virulence 2012,
3, 222–229. [CrossRef] [PubMed]
46. Strazza, M.; Pirrone, V.; Wigdahl, B.; Nonnemacher, M.R. Breaking down the barrier: The effects of HIV-1 on
the blood-brain barrier. Brain Res. 2011, 1399, 96–115. [CrossRef] [PubMed]
47. Louboutin, J.P.; Strayer, D.S. Blood-brain barrier abnormalities caused by HIV-1 gp120: Mechanistic and
therapeutic implications. ScientificWorldJournal 2012, 2012. [CrossRef] [PubMed]
48. Titulaer, M.J.; Dalmau, J. Antibodies to nmda receptor, blood-brain barrier disruption and schizophrenia:
A theory with unproven links. Mol. Psychiatry 2014, 19, 1054. [CrossRef] [PubMed]
49. Avison, M.; Nath, A.; Avison, R.; Schmitt, F.; Greenberg, R.; Berger, J. Viremia in the presence of blood-brain
barrier compromise increases severity of HIV-associated neurocognitive impairment. In Annals of Neurology;
Wiley-Liss Div John Wiley & Sons Inc.: New York, NY, USA, 2003; p. S49.
50. Gray, F.; Belec, L.; Chretien, F.; Dubreuil-Lemaire, M.L.; Ricolfi, F.; Wingertsmann, L.; Poron, F.; Gherardi, R.
Acute, relapsing brain oedema with diffuse blood-brain barrier alteration and axonal damage in the acquired
immunodeficiency syndrome. Neuropathol. Appl. Neurobiol. 1998, 24, 209–216. [CrossRef] [PubMed]
51. Chintawar, S.; Cayrol, R.; Antel, J.; Pandolfo, M.; Prat, A. Blood-brain barrier promotes differentiation of
human fetal neural precursor cells. Stem Cells 2009, 27, 838–846. [CrossRef] [PubMed]
52. Plane, J.M.; Andjelkovic, A.V.; Keep, R.F.; Parent, J.M. Intact and injured endothelial cells differentially
modulate postnatal murine forebrain neural stem cells. Neurobiol. Dis. 2010, 37, 218–227. [CrossRef]
[PubMed]
53. Relucio, J.; Menezes, M.J.; Miyagoe-Suzuki, Y.; Takeda, S.; Colognato, H. Laminin regulates postnatal
oligodendrocyte production by promoting oligodendrocyte progenitor survival in the subventricular zone.
Glia 2012, 60, 1451–1467. [CrossRef] [PubMed]
54. Juliet, P.A.; Frost, E.E.; Balasubramaniam, J.; Del Bigio, M.R. Toxic effect of blood components on perinatal
rat subventricular zone cells and oligodendrocyte precursor cell proliferation, differentiation and migration
in culture. J. Neurochem. 2009, 109, 1285–1299. [CrossRef] [PubMed]
55. Antel, J.P.; Williams, K.; Blain, M.; McRea, E.; McLaurin, J. Oligodendrocyte lysis by CD4+ T cells independent
of tumor necrosis factor. Ann. Neurol. 1994, 35, 341–348. [CrossRef] [PubMed]
56. Navikas, V.; Link, J.; Persson, C.; Olsson, T.; Hojeberg, B.; Ljungdahl, A.; Link, H.; Wahren, B. Increased mrna
expression of IL-6, IL-10, TNF-α, and perforin in blood mononuclear cells in human HIV infection. J. Acquir.
Immune Defic. Syndr. Hum. Retrovirol. 1995, 9, 484–489. [CrossRef] [PubMed]
125
Brain Sci. 2016, 6, 23
57. Guo, H.; Gao, J.; Taxman, D.J.; Ting, J.P.; Su, L. HIV-1 infection induces interleukin-1beta production via
TLR8 protein-dependent and NLRP3 inflammasome mechanisms in human monocytes. J. Biol. Chem. 2014,
289, 21716–21726. [CrossRef] [PubMed]
58. Takahashi, J.L.; Giuliani, F.; Power, C.; Imai, Y.; Yong, V.W. Interleukin-1β promotes oligodendrocyte death
through glutamate excitotoxicity. Ann. Neurol. 2003, 53, 588–595. [CrossRef] [PubMed]
59. Jayadev, S.; Yun, B.; Nguyen, H.; Yokoo, H.; Morrison, R.S.; Garden, G.A. The glial response to CNS HIV
infection includes p53 activation and increased expression of p53 target genes. J. Neuroimmune Pharmacol.
2007, 2, 359–370. [CrossRef] [PubMed]
60. Amaral, J.D.; Xavier, J.M.; Steer, C.J.; Rodrigues, C.M. The role of p53 in apoptosis. Discov. Med. 2010, 9,
145–152. [PubMed]
61. Liu, H.; Xiong, H.; University of Nebraska Medical Center, Omaha, NE, USA. Unpublished work, 2016.
62. Remillard, C.V.; Yuan, J.X. Activation of k+ channels: An essential pathway in programmed cell death.
Am. J. Physiol. Lung Cell Mol. Physiol. 2004, 286, L49–L67. [CrossRef] [PubMed]
63. Hahn, Y.K.; Podhaizer, E.M.; Hauser, K.F.; Knapp, P.E. HIV-1 alters neural and glial progenitor cell dynamics
in the central nervous system: Coordinated response to opiates during maturation. Glia 2012, 60, 1871–1887.
[CrossRef] [PubMed]
64. Buch, S.K.; Khurdayan, V.K.; Lutz, S.E.; Knapp, P.E.; El-Hage, N.; Hauser, K.F. Glial-restricted precursors:
Patterns of expression of opioid receptors and relationship to human immunodeficiency virus-1 tat and
morphine susceptibility in vitro. Neuroscience 2007, 146, 1546–1554. [CrossRef] [PubMed]
65. Chatterjee, D.; Biswas, K.; Nag, S.; Ramachandra, S.G.; Das Sarma, J. Microglia play a major role in direct
viral-induced demyelination. Clin. Dev. Immunol. 2013, 2013. [CrossRef] [PubMed]
66. Marker, D.F.; Puccini, J.M.; Mockus, T.E.; Barbieri, J.; Lu, S.M.; Gelbard, H.A. LRRK2 kinase inhibition
prevents pathological microglial phagocytosis in response to HIV-1 Tat protein. J. Neuroinflamm. 2012, 9, 261.
[CrossRef] [PubMed]
67. Tremblay, M.E.; Marker, D.F.; Puccini, J.M.; Muly, E.C.; Lu, S.M.; Gelbard, H.A. Ultrastructure of
microglia-synapse interactions in the HIV-1 Tat-injected murine central nervous system. Commun. Integr. Biol.
2013, 6, e27670. [CrossRef] [PubMed]
68. Fulmer, C.G.; VonDran, M.W.; Stillman, A.A.; Huang, Y.; Hempstead, B.L.; Dreyfus, C.F. Astrocyte-derived
bdnf supports myelin protein synthesis after cuprizone-induced demyelination. J. Neurosci. 2014, 34,
8186–8196. [CrossRef] [PubMed]
69. Esiri, M.M.; Morris, C.S.; Millard, P.R. Fate of oligodendrocytes in HIV-1 infection. AIDS 1991, 5, 1081–1088.
[CrossRef] [PubMed]
70. Bradl, M.; Lassmann, H. Oligodendrocytes: Biology and pathology. Acta Neuropathol. 2010, 119, 37–53.
[CrossRef] [PubMed]
71. Payne, S.C.; Bartlett, C.A.; Savigni, D.L.; Harvey, A.R.; Dunlop, S.A.; Fitzgerald, M. Early proliferation does
not prevent the loss of oligodendrocyte progenitor cells during the chronic phase of secondary degeneration
in a cns white matter tract. PLoS ONE 2013, 8, e65710. [CrossRef] [PubMed]
72. Mishra, M.; Taneja, M.; Malik, S.; Khalique, H.; Seth, P. Human immunodeficiency virus type 1 Tat modulates
proliferation and differentiation of human neural precursor cells: Implication in neuroaids. J. Neurovirol.
2010, 16, 355–367. [CrossRef] [PubMed]
73. Hahn, Y.K.; Vo, P.; Fitting, S.; Block, M.L.; Hauser, K.F.; Knapp, P.E. β-chemokine production by neural and
glial progenitor cells is enhanced by HIV-1 Tat: Effects on microglial migration. J. Neurochem. 2010, 114,
97–109. [CrossRef] [PubMed]
74. Peng, H.; Sun, L.; Jia, B.; Lan, X.; Zhu, B.; Wu, Y.; Zheng, J. HIV-1-infected and immune-activated macrophages
induce astrocytic differentiation of human cortical neural progenitor cells via the stat3 pathway. PLoS ONE
2011, 6, e19439. [CrossRef] [PubMed]
75. Mi, S.; Lee, X.; Shao, Z.; Thill, G.; Ji, B.; Relton, J.; Levesque, M.; Allaire, N.; Perrin, S.; Sands, B.; et al. Lingo-1
is a component of the nogo-66 receptor/p75 signaling complex. Nat. Neurosci. 2004, 7, 221–228. [CrossRef]
[PubMed]
76. Mi, S.; Miller, R.H.; Lee, X.; Scott, M.L.; Shulag-Morskaya, S.; Shao, Z.; Chang, J.; Thill, G.; Levesque, M.;
Zhang, M.; et al. Lingo-1 negatively regulates myelination by oligodendrocytes. Nat. Neurosci. 2005, 8,
745–751. [CrossRef] [PubMed]
126
Brain Sci. 2016, 6, 23
77. Bongarzone, E.R.; Byravan, S.; Givogri, M.I.; Schonmann, V.; Campagnoni, A.T. Platelet-derived growth
factor and basic fibroblast growth factor regulate cell proliferation and the expression of notch-1 receptor in
a new oligodendrocyte cell line. J. Neurosci. Res. 2000, 62, 319–328. [CrossRef]
78. Kim, H.; Shin, J.; Kim, S.; Poling, J.; Park, H.C.; Appel, B. Notch-regulated oligodendrocyte specification from
radial glia in the spinal cord of zebrafish embryos. Dev. Dyn. 2008, 237, 2081–2089. [CrossRef] [PubMed]
79. Shimizu, T.; Kagawa, T.; Wada, T.; Muroyama, Y.; Takada, S.; Ikenaka, K. Wnt signaling controls the timing
of oligodendrocyte development in the spinal cord. Dev. Biol. 2005, 282, 397–410. [CrossRef] [PubMed]
80. Zhang, Z.-H.; Li, J.-J.; Wang, Q.-J.; Zhao, W.-Q.; Hong, J.; Lou, S.-j.; Xu, X.-H. WNK1 is involved in Nogo66
inhibition of OPC differentiation. Mol. Cell. Neurosci. 2015, 65, 135–142. [CrossRef] [PubMed]
81. Bhat, N.R.; Zhang, P.; Mohanty, S.B. P38 map kinase regulation of oligodendrocyte differentiation with creb
as a potential target. Neurochem. Res. 2007, 32, 293–302. [CrossRef] [PubMed]
82. Chew, L.J.; Coley, W.; Cheng, Y.; Gallo, V. Mechanisms of regulation of oligodendrocyte development by p38
mitogen-activated protein kinase. J. Neurosci. 2010, 30, 11011–11027. [CrossRef] [PubMed]
83. Flores, A.I.; Narayanan, S.P.; Morse, E.N.; Shick, H.E.; Yin, X.; Kidd, G.; Avila, R.L.; Kirschner, D.A.;
Macklin, W.B. Constitutively active akt induces enhanced myelination in the cns. J. Neurosci. 2008, 28,
7174–7183. [CrossRef] [PubMed]
84. Mitew, S.; Hay, C.M.; Peckham, H.; Xiao, J.; Koenning, M.; Emery, B. Mechanisms regulating the development
of oligodendrocytes and central nervous system myelin. Neuroscience 2014, 276, 29–47. [CrossRef] [PubMed]
85. Tanaka, T.; Yoshida, S. Mechanisms of remyelination: Recent insight from experimental models.
Biomol. Concepts 2014, 5, 289–298. [CrossRef] [PubMed]
86. Wu, J.Q.; Saksena, M.M.; Soriano, V.; Vispo, E.; Saksena, N.K. Differential regulation of cytotoxicity pathway
discriminating between HIV, HCV mono-and co-infection identified by transcriptome profiling of PBMCs.
Virol. J. 2015, 12, 1–16. [CrossRef] [PubMed]
87. Weiser, K.; Barton, M.; Gershoony, D.; DasGupta, R.; Cardozo, T.; Tang, S.-J. HIV’s nef interacts with β-catenin
of the wnt signaling pathway in hek293 cells. PLoS ONE 2013, 8, e77865. [CrossRef] [PubMed]
88. Richards, M.H.; Narasipura, S.D.; Kim, S.; Seaton, M.S.; Lutgen, V.; Al-Harthi, L. Dynamic interaction
between astrocytes and infiltrating PBMCs in context of neuroAIDS. Glia 2015, 63, 441–451. [CrossRef]
[PubMed]
89. Zhang, Y.; Argaw, A.T.; Gurfein, B.T.; Zameer, A.; Snyder, B.J.; Ge, C.; Lu, Q.R.; Rowitch, D.H.; Raine, C.S.;
Brosnan, C.F.; et al. Notch1 signaling plays a role in regulating precursor differentiation during CNS
remyelination. Proc. Natl. Acad. Sci. USA 2009, 106, 19162–19167. [CrossRef] [PubMed]
90. Curry, C.L.; Reed, L.L.; Golde, T.E.; Miele, L.; Nickoloff, B.J.; Foreman, K.E. Gamma secretase inhibitor
blocks notch activation and induces apoptosis in kaposi's sarcoma tumor cells. Oncogene 2005, 24, 6333–6344.
[CrossRef] [PubMed]
91. Liu, Y.; Han, S.S.; Wu, Y.; Tuohy, T.M.; Xue, H.; Cai, J.; Back, S.A.; Sherman, L.S.; Fischer, I.; Rao, M.S. CD44
expression identifies astrocyte-restricted precursor cells. Dev. Biol. 2004, 276, 31–46. [CrossRef] [PubMed]
92. Tuohy, T.M.; Wallingford, N.; Liu, Y.; Chan, F.H.; Rizvi, T.; Xing, R.; Bebo, B.; Rao, M.S.; Sherman, L.S. CD44
overexpression by oligodendrocytes: A novel mouse model of inflammation-independent demyelination
and dysmyelination. Glia 2004, 47, 335–345. [CrossRef] [PubMed]
93. Suyama, M.; Daikoku, E.; Goto, T.; Sano, K.; Morikawa, Y. Reactivation from latency displays HIV particle
budding at plasma membrane, accompanying CD44 upregulation and recruitment. Retrovirology 2009, 6, 63.
[CrossRef] [PubMed]
94. Chao, C.; Silverberg, M.J.; Xu, L.; Chen, L.H.; Castor, B.; Martinez-Maza, O.; Abrams, D.I.; Zha, H.D.;
Haque, R.; Said, J. A comparative study of molecular characteristics of diffuse large b-cell lymphoma from
patients with and without human immunodeficiency virus infection. Clin. Cancer Res. 2015, 21, 1429–1437.
[CrossRef] [PubMed]
95. Fields, J.; Dumaop, W.; Langford, T.D.; Rockenstein, E.; Masliah, E. Role of neurotrophic factor alterations in
the neurodegenerative process in HIV associated neurocognitive disorders. J. Neuroimmune Pharmacol. 2014,
9, 102–116. [CrossRef] [PubMed]
96. Peferoen, L.; Kipp, M.; van der Valk, P.; van Noort, J.M.; Amor, S. Oligodendrocyte-microglia cross-talk in
the central nervous system. Immunology 2014, 141, 302–313. [CrossRef] [PubMed]
127
Brain Sci. 2016, 6, 23
97. Erlandsson, A.; Brannvall, K.; Gustafsdottir, S.; Westermark, B.; Forsberg-Nilsson, K. Autocrine/paracrine
platelet-derived growth factor regulates proliferation of neural progenitor cells. Cancer Res. 2006, 66,
8042–8048. [CrossRef] [PubMed]
98. Jiang, Y.; Boije, M.; Westermark, B.; Uhrbom, L. PDGF-B can sustain self-renewal and tumorigenicity of
experimental glioma-derived cancer-initiating cells by preventing oligodendrocyte differentiation. Neoplasia
2011, 13, 492–503. [CrossRef] [PubMed]
99. Azim, K.; Butt, A.M. GSK3β negatively regulates oligodendrocyte differentiation and myelination in vivo.
Glia 2011, 59, 540–553. [CrossRef] [PubMed]
100. Luo, F.; Burke, K.; Kantor, C.; Miller, R.H.; Yang, Y. Cyclin-dependent kinase 5 mediates adult OPC maturation
and myelin repair through modulation of Akt and GSK-3β signaling. J. Neurosci. 2014, 34, 10415–10429.
[CrossRef] [PubMed]
101. Chao, J.; Yang, L.; Yao, H.; Buch, S. Platelet-derived growth factor-BB restores HIV Tat -mediated impairment
of neurogenesis: Role of GSK-3β/β-catenin. J. Neuroimmune Pharmacol. 2014, 9, 259–268. [CrossRef]
[PubMed]
102. Frederick, T.J.; Min, J.; Altieri, S.C.; Mitchell, N.E.; Wood, T.L. Synergistic induction of cyclin D1 in
oligodendrocyte progenitor cells by IGF-I and FGF-2 requires differential stimulation of multiple signaling
pathways. Glia 2007, 55, 1011–1022. [CrossRef] [PubMed]
103. Albrecht, D.; Garcia, L.; Cartier, L.; Kettlun, A.M.; Vergara, C.; Collados, L.; Valenzuela, M.A. Trophic factors
in cerebrospinal fluid and spinal cord of patients with tropical spastic paraparesis, HIV, and creutzfeldt-jakob
disease. AIDS Res. Hum. Retrovir. 2006, 22, 248–254. [CrossRef] [PubMed]
104. Ascherl, G.; Sgadari, C.; Bugarini, R.; Bogner, J.; Schatz, O.; Ensoli, B.; Sturzl, M. Serum concentrations of
fibroblast growth factor 2 are increased in HIV type 1-infected patients and inversely related to survival
probability. AIDS Res. Hum. Retrovir. 2001, 17, 1035–1039. [CrossRef] [PubMed]
105. Maggirwar, S.B.; Tong, N.; Ramirez, S.; Gelbard, H.A.; Dewhurst, S. HIV-1 tat-mediated activation of
glycogen synthase kinase-3β contributes to Tat-mediated neurotoxicity. J. Neurochem. 1999, 73, 578–586.
[CrossRef] [PubMed]
106. Sui, Z.; Sniderhan, L.F.; Fan, S.; Kazmierczak, K.; Reisinger, E.; Kovacs, A.D.; Potash, M.J.; Dewhurst, S.;
Gelbard, H.A.; Maggirwar, S.B. Human immunodeficiency virus-encoded tat activates glycogen synthase
kinase-3β to antagonize nuclear factor-kappab survival pathway in neurons. Eur. J. Neurosci. 2006, 23,
2623–2634. [CrossRef] [PubMed]
107. Lannuzel, A.; Barnier, J.V.; Hery, C.; Huynh, V.T.; Guibert, B.; Gray, F.; Vincent, J.D.; Tardieu, M. Human
immunodeficiency virus type 1 and its coat protein gp120 induce apoptosis and activate JNK and ERK
mitogen-activated protein kinases in human neurons. Ann. Neurol. 1997, 42, 847–856. [CrossRef] [PubMed]
108. Cavaliere, F.; Benito-Muñoz, M.; Panicker, M.; Matute, C. Nmda modulates oligodendrocyte differentiation
of subventricular zone cells through pkc activation. Front. Cell. Neurosci. 2013, 7, 261. [CrossRef] [PubMed]
109. Lundgaard, I.; Luzhynskaya, A.; Stockley, J.H.; Wang, Z.; Evans, K.A.; Swire, M.; Volbracht, K.; Gautier, H.O.;
Franklin, R.J.; Attwell, D.; et al. Neuregulin and BDNF induce a switch to nmda receptor-dependent
myelination by oligodendrocytes. PLoS Biol. 2013, 11, e1001743. [CrossRef] [PubMed]
110. Zeitler, M.; Steringer, J.P.; Muller, H.M.; Mayer, M.P.; Nickel, W. HIV-tat forms phosphoinositide dependent
membrane pores implicated in unconventional protein secretion. J. Biol. Chem. 2015, 290, 21976–21984.
[CrossRef] [PubMed]
111. Ramos-Cejudo, J.; Gutierrez-Fernandez, M.; Otero-Ortega, L.; Rodriguez-Frutos, B.; Fuentes, B.;
Vallejo-Cremades, M.T.; Hernanz, T.N.; Cerdan, S.; Diez-Tejedor, E. Brain-derived neurotrophic factor
administration mediated oligodendrocyte differentiation and myelin formation in subcortical ischemic
stroke. Stroke 2015, 46, 221–228. [CrossRef] [PubMed]
112. Tsiperson, V.; Huang, Y.; Bagayogo, I.; Song, Y.; VonDran, M.W.; DiCicco-Bloom, E.; Dreyfus, C.F.
Brain-derived neurotrophic factor deficiency restricts proliferation of oligodendrocyte progenitors following
cuprizone-induced demyelination. ASN Neuro 2015, 7. [CrossRef] [PubMed]
113. Vondran, M.W.; Clinton-Luke, P.; Honeywell, J.Z.; Dreyfus, C.F. BDNF+/´ mice exhibit deficits in
oligodendrocyte lineage cells of the basal forebrain. Glia 2010, 58, 848–856. [CrossRef] [PubMed]
114. Bachis, A.; Avdoshina, V.; Zecca, L.; Parsadanian, M.; Mocchetti, I. Human immunodeficiency virus type 1
alters brain-derived neurotrophic factor processing in neurons. J. Neurosci. 2012, 32, 9477–9484. [CrossRef]
[PubMed]
128
Brain Sci. 2016, 6, 23
115. Xiao, H.; Tao, Y.; Greenblatt, J.; Roeder, R.G. A cofactor, tip30, specifically enhances HIV-1 tat-activated
transcription. Proc. Natl. Acad. Sci. USA 1998, 95, 2146–2151. [CrossRef] [PubMed]
116. Yang, W.; Xiao, L.; Li, C.; Liu, X.; Liu, M.; Shao, Q.; Wang, D.; Huang, A.; He, C. Tip30 inhibits oligodendrocyte
precursor cell differentiation via cytoplasmic sequestration of olig1. Glia 2015, 63, 684–698. [CrossRef]
[PubMed]
117. Attali, B.; Wang, N.; Kolot, A.; Sobko, A.; Cherepanov, V.; Soliven, B. Characterization of delayed rectifier kv
channels in oligodendrocytes and progenitor cells. J. Neurosci. 1997, 17, 8234–8245. [PubMed]
118. Chittajallu, R.; Chen, Y.; Wang, H.; Yuan, X.; Ghiani, C.A.; Heckman, T.; McBain, C.J.; Gallo, V. Regulation of
kv1 subunit expression in oligodendrocyte progenitor cells and their role in g1/s phase progression of the
cell cycle. Proc. Natl. Acad. Sci. USA 2002, 99, 2350–2355. [CrossRef] [PubMed]
119. Peretz, A.; Gil-Henn, H.; Sobko, A.; Shinder, V.; Attali, B.; Elson, A. Hypomyelination and increased activity
of voltage-gated k+ channels in mice lacking protein tyrosine phosphatase epsilon. EMBO J. 2000, 19,
4036–4045. [CrossRef] [PubMed]
120. Kalsi, A.S.; Greenwood, K.; Wilkin, G.; Butt, A.M. Kir4.1 expression by astrocytes and oligodendrocytes in
CNS white matter: A developmental study in the rat optic nerve. J. Anat. 2004, 204, 475–485. [CrossRef]
[PubMed]
121. Neusch, C.; Rozengurt, N.; Jacobs, R.E.; Lester, H.A.; Kofuji, P. Kir4.1 potassium channel subunit is crucial
for oligodendrocyte development and in vivo myelination. J. Neurosci. 2001, 21, 5429–5438. [PubMed]
122. Tegla, C.A.; Cudrici, C.; Rozycka, M.; Soloviova, K.; Ito, T.; Singh, A.K.; Khan, A.; Azimzadeh, P.;
Andrian-Albescu, M.; Niculescu, F.; et al. C5b-9-activated, k(v)1.3 channels mediate oligodendrocyte
cell cycle activation and dedifferentiation. Exp. Mol. Pathol. 2011, 91, 335–345. [CrossRef] [PubMed]
123. Cheli, V.T.; Santiago Gonzalez, D.A.; Spreuer, V.; Paez, P.M. Voltage-gated Ca2+ entry promotes
oligodendrocyte progenitor cell maturation and myelination in vitro. Exp. Neurol. 2015, 265, 69–83.
[CrossRef] [PubMed]
124. French, H.M.; Reid, M.; Mamontov, P.; Simmons, R.A.; Grinspan, J.B. Oxidative stress disrupts
oligodendrocyte maturation. J. Neurosci. Res. 2009, 87, 3076–3087. [CrossRef] [PubMed]
125. Jensen, B.K.; Monnerie, H.; Mannell, M.V.; Gannon, P.J.; Espinoza, C.A.; Erickson, M.A.; Bruce-Keller, A.J.;
Gelman, B.B.; Briand, L.A.; Pierce, R.C.; et al. Altered oligodendrocyte maturation and myelin maintenance:
The role of antiretrovirals in HIV-associated neurocognitive disorders. J. Neuropathol. Exp. Neurol. 2015, 74,
1093–1118. [CrossRef] [PubMed]
126. Hoare, J.; Fouche, J.P.; Phillips, N.; Joska, J.A.; Paul, R.; Donald, K.A.; Thomas, K.G.; Stein, D.J. White matter
micro-structural changes in art-naive and art-treated children and adolescents infected with HIV in south
Africa. AIDS 2015, 29, 1793–1801. [CrossRef] [PubMed]
127. Borjabad, A.; Morgello, S.; Chao, W.; Kim, S.Y.; Brooks, A.I.; Murray, J.; Potash, M.J.; Volsky, D.J. Significant
effects of antiretroviral therapy on global gene expression in brain tissues of patients with HIV-1-associated
neurocognitive disorders. PLoS Pathog. 2011, 7, e1002213. [CrossRef] [PubMed]
128. Heaton, R.K.; Clifford, D.B.; Franklin, D.R., Jr.; Woods, S.P.; Ake, C.; Vaida, F.; Ellis, R.J.; Letendre, S.L.;
Marcotte, T.D.; Atkinson, J.H.; et al. HIV-associated neurocognitive disorders persist in the era of potent
antiretroviral therapy: Charter study. Neurology 2010, 75, 2087–2096. [CrossRef] [PubMed]
129. Baas, D.; Bourbeau, D.; Sarlieve, L.L.; Ittel, M.E.; Dussault, J.H.; Puymirat, J. Oligodendrocyte maturation
and progenitor cell proliferation are independently regulated by thyroid hormone. Glia 1997, 19, 324–332.
[CrossRef]
130. Grinspan, J.B.; Stern, J.L.; Franceschini, B.; Pleasure, D. Trophic effects of basic fibroblast growth factor
(bFGF) on differentiated oligodendroglia: A mechanism for regeneration of the oligodendroglial lineage.
J. Neurosci. Res. 1993, 36, 672–680. [CrossRef] [PubMed]
131. Miller, R.H. Regulation of oligodendrocyte development in the vertebrate CNS. Prog. Neurobiol. 2002, 67,
451–467. [CrossRef]
© 2016 by the authors. Licensee MDPI, Basel, Switzerland. This article is an open access
article distributed under the terms and conditions of the Creative Commons Attribution
(CC BY) license (http://creativecommons.org/licenses/by/4.0/).
129
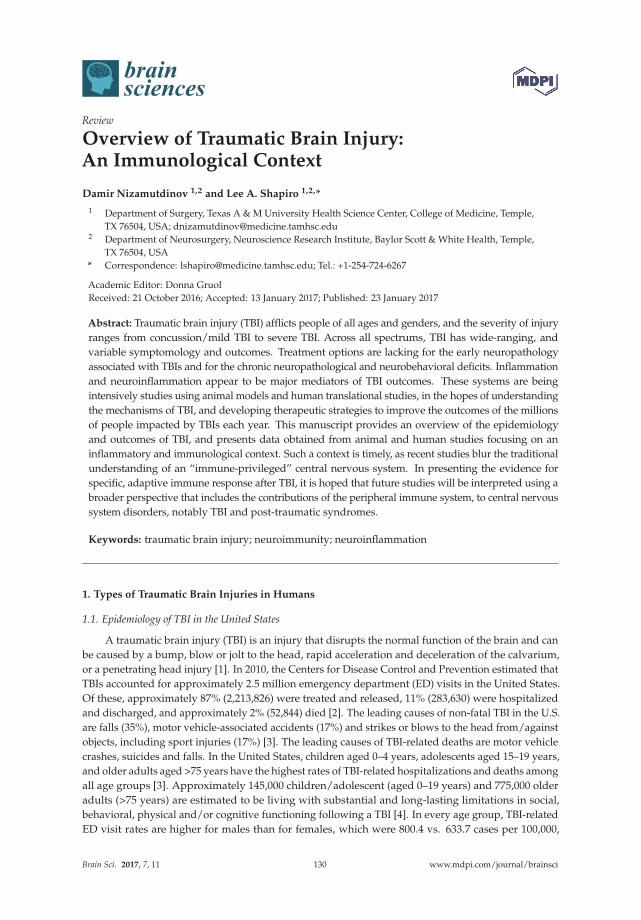
brainsciences
Review
Overview of Traumatic Brain Injury:An Immunological Context
Damir Nizamutdinov 1,2 and Lee A. Shapiro 1,2,*
1 Department of Surgery, Texas A & M University Health Science Center, College of Medicine, Temple,
TX 76504, USA; [email protected] Department of Neurosurgery, Neuroscience Research Institute, Baylor Scott & White Health, Temple,
TX 76504, USA
* Correspondence: [email protected]; Tel.: +1-254-724-6267
Academic Editor: Donna Gruol
Received: 21 October 2016; Accepted: 13 January 2017; Published: 23 January 2017
Abstract: Traumatic brain injury (TBI) afflicts people of all ages and genders, and the severity of injury
ranges from concussion/mild TBI to severe TBI. Across all spectrums, TBI has wide-ranging, and
variable symptomology and outcomes. Treatment options are lacking for the early neuropathology
associated with TBIs and for the chronic neuropathological and neurobehavioral deficits. Inflammation
and neuroinflammation appear to be major mediators of TBI outcomes. These systems are being
intensively studies using animal models and human translational studies, in the hopes of understanding
the mechanisms of TBI, and developing therapeutic strategies to improve the outcomes of the millions
of people impacted by TBIs each year. This manuscript provides an overview of the epidemiology
and outcomes of TBI, and presents data obtained from animal and human studies focusing on an
inflammatory and immunological context. Such a context is timely, as recent studies blur the traditional
understanding of an “immune-privileged” central nervous system. In presenting the evidence for
specific, adaptive immune response after TBI, it is hoped that future studies will be interpreted using a
broader perspective that includes the contributions of the peripheral immune system, to central nervous
system disorders, notably TBI and post-traumatic syndromes.
Keywords: traumatic brain injury; neuroimmunity; neuroinflammation
1. Types of Traumatic Brain Injuries in Humans
1.1. Epidemiology of TBI in the United States
A traumatic brain injury (TBI) is an injury that disrupts the normal function of the brain and can
be caused by a bump, blow or jolt to the head, rapid acceleration and deceleration of the calvarium,
or a penetrating head injury [1]. In 2010, the Centers for Disease Control and Prevention estimated that
TBIs accounted for approximately 2.5 million emergency department (ED) visits in the United States.
Of these, approximately 87% (2,213,826) were treated and released, 11% (283,630) were hospitalized
and discharged, and approximately 2% (52,844) died [2]. The leading causes of non-fatal TBI in the U.S.
are falls (35%), motor vehicle-associated accidents (17%) and strikes or blows to the head from/against
objects, including sport injuries (17%) [3]. The leading causes of TBI-related deaths are motor vehicle
crashes, suicides and falls. In the United States, children aged 0–4 years, adolescents aged 15–19 years,
and older adults aged >75 years have the highest rates of TBI-related hospitalizations and deaths among
all age groups [3]. Approximately 145,000 children/adolescent (aged 0–19 years) and 775,000 older
adults (>75 years) are estimated to be living with substantial and long-lasting limitations in social,
behavioral, physical and/or cognitive functioning following a TBI [4]. In every age group, TBI-related
ED visit rates are higher for males than for females, which were 800.4 vs. 633.7 cases per 100,000,
Brain Sci. 2017, 7, 11 130 www.mdpi.com/journal/brainsci
Brain Sci. 2017, 7, 11
respectively [2]. Males aged 0–4 years have the highest rates for TBI-related emergency department
visits, hospitalizations and deaths combined. Regarding the military, Department of Defense data
revealed that from 2000–2011, 235,046 service members (4.2% of the 5,603,720 who served in the Army,
Air Force, Navy and Marine Corps) were diagnosed with a TBI [5]. Thus, TBI afflicts millions of people
each year, including civilian and military populations. It is pertinent to note that these statistics do
not account for those people suffering from concussion/mild TBI who did not receive medical care or
had outpatient/office-based visits, estimated by some to be hundreds of thousands, if not millions of
people each year [3].
1.2. Classification of TBI
The severity of TBIs is typically categorized using the Glasgow Coma Scale and can range from:
(a) mild; (b) moderate; to (c) severe [6]. TBI outcomes are often determined by using the Glasgow
Outcome Scale, which categorizes gross neurobehavioral ranges of recovery: (a) dead; (b) vegetative
state; (c) severe disability; (d) moderate disability; (e) good recovery [7]. An alternative prognosis,
using Russell and Smith’s classification, is divided as severe or very severe [8]. Considering that
detailed classification helps to determine the severity of injury, informs treatment options and is used
to assess prognosis and functional recovery, recent suggestions have indicated that better diagnostic
and assessment criteria are needed in the TBI field [9,10].
1.3. TBI Prognosis
The effects of TBI can adversely affect quality of life, including cognitive, behavioral, emotional
and physical deficiencies. Any one or more of these can negatively impact interpersonal, social
and occupational functioning, as well as families, communities and the economy in general [11,12].
Impairment of cognitive function can lead to difficulties with memory, attention, learning, coordination
and sleep disturbances [12] and can persist for days, months or even years following the initial injury.
Other long-term deficiencies include: language and communication problems (19%), dysarthria (30%),
dysphagia (17%) [13], mood disorders [14,15] and cognitive impairment, even six months after mild
TBI [16]. Another post-traumatic syndrome that can have a relatively delayed onset is post-traumatic
epilepsy [14,15,17]. While all epilepsies are seizure disorders, not all seizures are epilepsy. As such,
the incidence of early post-traumatic seizures (seizures immediately following, up to the first few days
after the TBI) is higher than the incidence of post-traumatic epilepsy. Notably, about 25% of brain
contusion patients and 32%–53% of patients with penetrating TBI develop different degrees of early
post-traumatic seizures. Post-traumatic seizures also seem to be more prevalent following severe TBIs,
although mild and moderate TBIs can also result in seizures [18]. Considering the negative impact
of these numerous disorders associated with post-traumatic deficiencies, as well as the significant
numbers of people suffering from the chronic effects of TBIs, research efforts are underway in the
hopes of better understanding the pathogenic progression, and developing successful treatments of
and diagnostic criterion for TBI.
2. A Brief Review of Experimental TBI Animal Models
In view of the heterogeneous clinical nature of TBI, numerous animal models have been developed
for experimentation. Although larger animals are closer in size and physiology to humans, rodents
are a valuable and commonly-used model in TBI research. Their modest cost, biological similarities,
more manageable size and standardized outcome measurements are all advantageous. Such models
have been incorporated for studies aimed at improving our understanding of the detrimental, complex
molecular cascades that are initiated by head trauma, as well as the long-term neurological and
behavioral consequences. Therefore, unless otherwise indicated, this review focuses on data from
animal models (primarily rodents) of TBI. Among them, several models are widely used in research:
fluid percussion injury (FPI) [19–22], cortical impact injury (CCI) [23–25], penetrating ballistic-like
brain injury [26], weight drop/impact acceleration injury [27] and blast TBI injury [28,29]. Although
131
Brain Sci. 2017, 7, 11
we will highlight the two most highly-cited animal models, FPI and CCI, it is important to note that
many similarities with regard to the general neuroinflammatory responses are observed across rodent
models of TBI, despite the different methods and modalities of the injuries.
2.1. Percussion Injury Animal Models
In percussive injury models, there are two devices that are most commonly incorporated
into experiments. In the FPI model, the insult is inflicted by a pendulum striking the piston of
a reservoir of fluid, and this generates a fluid pressure pulse that is delivered to the intact dura,
via a syringe secured over an opened midline or lateral craniotomy [30,31]. In the second percussive
TBI, an injury is delivered by a piston that is controlled either pneumatically or via a piezoelectric
mechanism [32–34]. The percussion produces brief displacement and deformation of brain tissue,
and the severity of injury depends on the strength of the pressure pulse [31], as well as the location
of the craniotomy/injury. FPI models replicate clinical TBI without skull fracture [35] and, despite
the craniotomy, are considered a closed head injury model [36]. The FPI model is often considered
to be of mild to moderate severity, rather than severe [30]. A number of studies have shown that FPI
can reliably reproduce intracranial hemorrhage [30,31], swelling [31,37], neuroinflammation [37–39]
and gray matter damage [19,30], all of which are pathophysiological changes observed in human
TBIs [40]. Based on the position of the craniotomy, FPI models can be divided into midline (centered
on the sagittal suture), parasagittal (<3.5 mm lateral to midline) and lateral models (>3.5 mm lateral
to midline; LFPI) [31,41–43]. The midline FPI model of TBI was first developed for use in cats and
rabbits [37,44], secondly adapted for rats [30] and subsequently modified for use in mice [19,31]. FPI
has also been used for studying TBI pathophysiology and pharmacology in other species [37,45,46],
although the volume of literature pales in comparison to that for rodents.
In rodents, FPI produces a rapid combination of focal cortical contusion and diffuse subcortical
(such as hippocampus and thalamus) neuronal injury. These can occur within minutes of the impact,
progress to a loss of neurons by 12 h and are accompanied by a rapid neuroinflammatory response that
is initially focused in the peri-injury region [38,39]. Neuronal death and neuroinflammatory signaling
seem to peak at around three days after FPI and in many other models [38]. This inflammation persists,
albeit at levels lower than the peak, well into chronic time points (≥1 month). In the days and months
following the injury, progressive degenerative cascades that include chronic inflammation continue to
be observed in a variety of brain regions implicated in higher cognitive functions. These include the
hippocampus, thalamus, medial septum, striatum and amygdala [35,47,48]. It is often deduced that
the neuropathology in these regions underlies the observed neurobehavioral and cognitive deficits that
are commonly seen in the FPI model [36,49,50]. Of significance is the fact that analogous symptoms
are often seen in patients with TBI-related injuries to corresponding brain regions [36,49].
2.2. Controlled Cortical Impact Injury Animal Model
The CCI model uses a pneumatic or electromagnetic impact device to drive a rigid impactor
onto the exposed intact dura and mimics cortical tissue loss, acute subdural hematoma, axonal
injury, concussion, blood-brain barrier (BBB) dysfunction and even coma [23–25]. It has been
applied to a number of animals, such as ferrets [24], swine and monkeys [51] and, most prominently,
rodents [23,25]. CCI is delivered to the intact dura through a craniotomy and results in deformation
of the underlying cortex [23]. The damage created is highly reproducible and includes a rapid and
sometimes widespread neuropathological damage. This damage is most prominent in the peri-injury
area, includes neurodegenerative and neuroinflammatory responses [52], and can also encompass
cortical, hippocampal and thalamic degeneration [53]. The histopathological severity of CCI rises
with increasing cortical deformation, as does the cognitive impairment that is likely related to the
extent of damage [54–59]. Similar to the FPI model, the neuropathology and associated cognitive
and behavioral deficits after CCI persist chronically, and diffuse neuropathology is evident [60,61].
132
Brain Sci. 2017, 7, 11
Similarly, the neuroinflammatory response appears to play a major role in both the early and chronic
deficiencies observed following TBI.
3. Mechanisms of Neuropathology Following TBI
It is now widely acknowledged that TBI is a complex multimodal disease process, not a single
pathophysiological event [62]. It causes structural and functional damage, which lead to deficits
resulting from both primary and secondary injury mechanisms [63]. The primary injury is the result
of the immediate mechanical damage from direct contact and/or inertial forces to the brain that
occurs at the moment of the traumatic impact. This damage can include direct neuronal, glial and
other cellular damage, contusion, damage to blood vessels (hemorrhage) and axonal shearing [64,65].
Secondary injury evolves over minutes, to days, to months, to years after the primary injury and is
the result of cascades of metabolic, cellular and molecular events. These occur concurrently with,
and contribute to, alterations of endogenous neurochemical, inflammatory and neuroinflammatory
mechanisms. Such mechanisms ultimately lead to brain cell death or rescue, plasticity, tissue damage
and atrophy [35,66,67]. Many biochemical alterations responsible for secondary injury have also been
identified. These include, perturbation of cellular calcium homeostasis, glutamate excitotoxicity,
mitochondrial dysfunction, increased free radical generation, inflammation, neuroinflammation,
increased lipid peroxidation, apoptosis and diffuse axonal injury (DAI) [68]. Interestingly, all of these
alterations can be linked either directly or indirectly to neuroinflammation, and such inflammation has
been implicated in the early and chronic components of TBI-induced neuropathology [69–71].
4. Inflammation Following TBI: An Immunological Perspective
4.1. Innate, Non-Specific Immune Response to TBI
At present, the prevailing viewpoint in the TBI field has been that most, if not all of the inflammation
that follows a TBI can be considered components of the innate immune response [72–74]. However,
accumulating evidence using updated technology suggests that specific adaptive immune mechanisms
are also at play. Thus, a working operational definition is needed to define immune specificity after TBI,
and few authors have adequately separated innate from adaptive immune components after a TBI. The
early neuroinflammatory response across injuries and injury models occurs in a relatively stereotypical
manner and can largely be considered to consist mainly of innate immune mechanisms. When damage
to the brain takes place during TBI, it triggers the release and production of cytokines and chemokines,
which activate receptors, and results in local and systemic immune responses [72,75,76]. The net effect
of these innate inflammatory mediators is aimed at limiting the spread of the injury and restoring
homeostatic balance [77].
4.2. Cytokines in TBI
Cytokines are categorized by structural and functional components, can be either pro- and/or
anti-inflammatory and, in a classical immunological sense, are mediators of the cellular immune
response, as well as of antibody synthesis and release. Cytokines can be synthesized and/or released by
a wide variety of cells, including microglia, macrophages, T and B lymphocytes, endothelial and mast
cells [78,79]. Although a full discussion of cytokine changes and functions after TBI is beyond the scope
of this review, several reports indicate that interleukin (IL) IL1-β, IL18 and tumor necrosis factor alpha
(TNFα) are involved in the onset and development of the inflammatory cascade after TBI in rodents
and humans [72–74]. IL1-β binds to IL1-receptors, primarily localized on microglia and astrocytes
in the brain, but also to other cell types, including infiltrating immune cells [80,81]. Activation of
the neuroglial and immune cell IL1-receptors initiates the production and release of inflammatory
cytokines, including increased production of IL1-β and IL18 [82]. This results in a self-perpetuating,
pro-inflammatory environment, which may be damaging to the CNS parenchyma [75,76,83,84].
133
Brain Sci. 2017, 7, 11
The damaging effects of IL1-β can also be related to activation of other pro-inflammatory pathways,
such as, TNFα [85] and IL18 [72].
Several studies support the evidence of rapid and sustained induction of TNFα in damaged brain
tissue, within one hour after TBI in rodent models [75,76,86]. TNFα triggers the production of other
cytokines (IL1-β, IL6), chemokines [75] and nuclear factor kappa B (NF-κB) family (p50, p52 and p65)
of transcription factors. Thus, TNFα is an important modulator of inflammation, at the transcriptional
and translational levels, in the nervous system and in non-neural tissues [87,88]. IL18 also appears to
play an important inflammatory role after TBI. IL18 has been shown to be elevated following a number
of CNS inflammatory insults [89–91], including TBI [72]. In humans and rodents, the IL18 pathway
can contribute to delayed neuronal injury, up to 14 days following TBI [72]. Activated neuroglial and
immune cells in the area of injury secrete IL18, which binds to the IL18 receptor. Activation of the IL18
receptor initiates inflammatory signaling cascades [92]. Thus, cytokines, some of which have been
mentioned here, are major contributors to the inflammatory and neuroinflammatory response.
4.3. Chemokines in TBI
Chemokines (CCL) are chemotactic inflammatory proteins that mediate interactions among
inflammatory cells and target cells. In general, chemokines are typically 10 KDa or smaller. CCLs are
synthesized and/or released along with other mediator molecules by a variety of cell types that include:
astrocytes, microglia, macrophages, eosinophils, neutrophils, dendritic cells, mast cells and natural
killer cells (NK cells) [93–95]. Release of chemokines serves to chemotactically guide receptor-sensitive
cells, primarily through activation of G protein-coupled receptors [96]. Similar to cytokines, chemokines
can be either pro- and/or anti-inflammatory. After a TBI, chemokines contribute to the attraction
of a wide range of immune cells to the site of damage [97,98]. The specific activities of classes of
chemokines have been elucidated following TBIs [99–101]. Although a full discussion is beyond the
scope of this review, one example, CXC chemokines, activates the migration of neutrophils to the site of
the lesion [96]. Alternatively, chemokines CCL2, CCL3, CCL5, CCL7, CCL8, CCL13, CCL17 and CCL22
attract monocytes and macrophages [102–104]. Other chemokines, such as, CCL1, CCL2, CCL17 and
CCL22, are involved in the recruitment of T-lymphocytes [103].
Another important role of cytokine and chemokine release is to activate pattern recognition receptors
(PRRs). PRRs are proteins of the innate immune system and identify danger-associated molecular
patterns (DAMPs) of cellular stress. This identification, and the ensuing response, helps defend against
cell and/or tissue damage [105,106]. The PRRs are divided into several subgroups, depending on cell
localization, type and function. One such group is the nucleotide-binding domain leucine-rich repeats
(NLRs) [107], which are also called the nucleotide oligomerization domain (NOD)-like receptors. These
receptors are located in the cytoplasm and help to regulate the host inflammatory, apoptotic and innate
immune responses [108,109]. The NLR family of proteins can be activated by multiple types of cell/tissue
damage that are seen in TBI and can form multi-protein complexes called “inflammasomes” [110]. The
unique compositions of these inflammasomes depend on the extent and type of cell and tissue damage.
Some reports suggested the specific contributions of NLR family proteins (NLRP3-inflammasome) after
TBI [110,111]. The NLRP3-inflammasome has been detected in neurons, astrocytes and microglia in
the cortex after TBI [110], and the NLRP3-inflammasome complex is associated with increases in the
aforementioned IL1-β and IL18 [108,110,112]. Interestingly, the NLRP3-inflammasome has also been
demonstrated to associate with other CNS inflammatory disorders, including Alzheimer’s disease
(AD) [113], which is an increased risk factor following TBI.
Thus, the overall contributions of the cytokines and chemokines released after TBI are mediated
by the release, and subsequent recruitment of immune cells to the site of injury, and to coordinate the
ensuing activity of these cells. These immune cells are an essential part of the innate immune response
and also the putative transition to the adaptive immune response and will be discussed below.
134
Brain Sci. 2017, 7, 11
4.4. Cellular Immune Response to TBI
Several reports show that TBI and the associated neuroinflammation lead to local deposition
of specific immune cells at the peri-injury area and beyond [97,114,115]. In addition, peripheral
inflammation can also influence TBI outcomes [116]. There appears to be a rapid expansion and
activation of peripheral immune cells after experimental TBI, as well as a significant extravasation of
immune cells from the spleen, resulting in splenic hypotrophy following TBI [117,118]. It is also known
that some of these immune cells that exit the spleen can contribute to the innate immune response,
and some may also contribute to an ensuing adaptive immune response following a TBI [116,119,120].
Similarly, it is also known that some of these immune cells will infiltrate the CNS [121–123]. Immune
cells involved in coordinating the innate immune response include: (1) monocytes, which develop into
macrophages; (2) mast cells; (3) granulocytes (basophils, eosinophils and neutrophils); (4) dendritic
cells (DC); and (5) natural killer cells.
Neutrophils and macrophages strongly infiltrate the brain in the early phase of TBI [121,123,124].
Neutrophils appear to be the most numerous type of granulocytes and possess high phagocytic
potential. These cells are highly migratory and were reported to be involved in phagocytosing
damaged elements within the brain parenchyma following a TBI [115,122]. The processes whereby
neutrophils function are by: (1) secreting lysosomal enzymes; (2) releasing free radicals; (3) decreasing
blood flow by direct physical microvascular occlusion; (4) increasing vascular permeability [125–127].
Interestingly, neutrophils can be found in the microvasculature lining the peri-injury region by as
early as 2 h after injury and in brain parenchyma shortly thereafter [115,122]. Thus, neutrophils can
contribute to the development of BBB breakdown and subsequent brain edema formation [122,128].
It is possible that neutrophils contribute to the secondary damage seen after TBI. Consistent with this
notion, blocking neutrophil migration and adhesion decreases the total area of neuronal damage after
a TBI in rabbits [129].
It has been hypothesized that accumulation of DCs at the site of damaged brain parenchyma can
negatively contribute to brain tissue damage after the onset of TBI [122,130]. Infiltrating DCs may
be activated by contact with the damaged cells at the site of injury. Antigen materials get processed
by DCs, which can than travel to distant lymph nodes, present antigen and generate a local immune
response. Once this response is initiated, antigen-specific T cells may migrate into CNS parenchyma
and cause extended, chronic damage to the brain [131,132]. T cell accumulation at the site of injury,
concurrent with DC accumulation, has also been indicated to negatively influence TBI outcomes [115].
Activated macrophages and/or microglia also contribute to neuronal damage [122,133]. It has
been reported that different molecules released after TBI contribute to microglia/macrophage
phenotype shifts [134,135]. Although the utility of classifying the M1/M2 phenotype in vivo has
come into question [136,137], it is still useful to review the potential impact of the different phenotypes.
For example, damaged endothelial cells can mediate microglia/macrophage polarization through
secretion of cytokines [138], such as TNF-α, IL-6, IL-25, transforming growth factor beta (TGF-β),
interferon-gamma (IFN-gamma), including substance-P and lipocalin-2 [139–141]. Additionally,
infiltrating peripheral immune cells (T lymphocytes specifically) can induce macrophage/microglial
phenotype transformation [142]. Recent studies suggest that such phenotype changes can alter
neurogenesis after TBI, such that macrophage polarization from M2 toward M1 stimulates the release of
soluble factors that impair basal neurogenesis [138], and this may impair functional recovery [134,143].
Thus, macrophages and/or microglial cells can be acted upon by a number of factors that ultimately
determine the functional consequences of these cell types.
Macrophages, including both resident (microglia) and infiltrating (peripheral macrophages),
are observed in relatively high numbers following TBIs [133]. Macrophages appeared to be abundant
between 12 and 72 h and predominate in damaged cortical regions [122,144]. These cells accumulate
near the area of injury [144], and this accumulation is a result of at least two mechanisms. One is
through attractions by locally-secreted chemo- and cytokines released at the site of injury, as previously
discussed. The other mechanism appears to occur via the T-cell activation. Once in the damaged
135
Brain Sci. 2017, 7, 11
area, the T cells get activated by direct contact with antigen presentation on DCs, macrophages
and microglia [145,146]. It is this latter activation which is the hallmark of a transition from a
non-specific innate immune response, to a specific adaptive immune response; e.g. T cell recognition
of presented antigen.
T lymphocytes play an important role in the development and maintenance of secondary brain
injury after TBI, through engagement of different cell types and mechanisms. Steady increases in
the number and composition of T cells at the site of injury are highly suggestive of a transition to an
adaptive immune response following a TBI. The peak of brain tissue infiltration by T cells after TBI,
seems to occur within a range of 1–5 days, although the data on this topic are inconsistent [147,148].
Despite these inconsistencies, it appears that gamma delta T cells (γδ T cells), which are a distinct class
of T cells largely developed in thymus and express γδ receptors, rather than αβ T-cell receptor (TCR) on
their surface, are early responders to the site of brain injury [149]. Combined with CD8+ T lymphocytes
and CD4+ T-helper 1 (TH1) cells, these cells may worsen damage by cytotoxic and pro-inflammatory
actions [150,151]. However, some suggest that the infiltration of immune cells into the CNS after TBI
can also be neuroprotective [120,152,153]. This hypothesis is substantiated by the supposition that
antigen-activated T cells provide protection, maintenance of neurological integrity and repair of tissue
after a TBI [154]. Reports indicate that CD4+ T-helper 2 (TH2) cells specific for myelin basic protein
(MBP) and CD4+ T cells may play such role of protection in neuronal survival [155,156]. Despite the
pathogenic potential of anti-MBP T cells, they were also found in human immune system of healthy
individuals [157,158]. It seems that regulatory T cells (CD4+ CD25+ Foxp3+) might also play important
role in protection by suppressing autoimmune activity [159,160]. They derive from naive CD4 cells and
are known for their immunosuppressive action, which downregulate the induction and proliferation
of effector T cells [159,160].
Thus, it is possible that after TBI, the inflammatory sequelae result in antigen processing and
presentation, as well as an eventual transition to an adaptive immune response. The implications
of a transition to an adaptive immune response after a TBI are poorly understood and may have a
positive and/or negative impact on the CNS. Here, we will summarize the existing data supporting an
adaptive immune response after TBI, and we will provide a novel hypothesis to generate a foundation
from which ensuing studies can occur in the context of adaptive immunity and TBI.
4.5. Adaptive Immune Response to TBI
Although scant, following TBI, some studies have provided strong evidence for a switch from a
non-specific innate immune response, to a specific, adaptive immune response. As such, a paradigm
shift in thinking may be necessary to fully understand and appreciate the sequelae that occur in
the early and chronic stages after a TBI. A switch to an adaptive immune response has occurred,
once antigen is processed and presented by professional antigen-presenting cells (APCs), and T cells
recognize the presented antigen. The evidence supporting the transition to an adaptive immune
response following TBI has been observed following retinal crush studies [161,162], fluid percussion
injury in mice [116] and in human TBI patients [163]. The cellular components of the adaptive immune
response may entail resident brain cells and/or infiltrating immune cells, as described above. In the
case of infiltrating immune cells, they can gain access to the CNS via the compromised BBB, as well as
the aforementioned chemotactic signaling. The humoral component of the adaptive immunity can be
initially mediated by B cells and subsequently by T cells, which produce antigen-specific antibodies.
Although the evidence is lacking for a direct connection between antibody production by T cells
and neurodegeneration, accumulating evidence supports a role in the adaptive immune response
in neurodegeneration. Once a transition from an adaptive immune response occurs, the possible
outcomes have the potential to profoundly influence the outcomes for TBI.
In the case of most TBIs, the injuries are non-penetrating; thus, it would seem, if an adaptive
immune response is occurring, then the antibody response is likely to be against self-antigen. Indeed,
in human patients, evidence for this is found in the fact that antibodies to glial fibrillary acidic
136
Brain Sci. 2017, 7, 11
protein (GFAP)-fragments have been observed in the cerebral spinal fluid (CSF), at various time points
after a TBI [164]. Moreover, proteolytic fragments of MBP, neuron specific enolase and to ubiquitin
D-terminal hydrolase-L-1 (UCH-L1), which is a highly specific protein to neurons and an essential
component of the ubiquitin proteasome system, have also been observed in humans and animal
models of TBI [165–168]. Moreover, auto-reactive T cell responses to MBP have been documented in
humans after TBI [169], further supporting a switch to an adaptive immune response. Considering that
white matter loss has been reported after TBI in humans and animals, the observation of antibodies
and T cells to MBP could have a tremendous implication on the loss of white matter and axonal
degeneration that is observed at chronic time points after a TBI. A potential consequence of antibody
production and the implied transition to an adaptive immune response is that memory immune
cells are formed. It is possible that reactivation of the memory T cells, by another injury or perhaps
by other neuroinflammatory stimulus, such as bacterial or viral infections [170], might re-open the
BBB and expose the memory immune cells to self-antigens, such as GFAP, UCH-L1 or MBP. In this
scenario, the subsequent appearance of post-traumatic syndromes may only appear after appropriate
spatial and temporal stimuli, hence explaining the wide variation in when, why and what types of
post-traumatic syndromes appear. Therefore, the development of post-TBI auto-antibody response
might be highly pathogenic and contribute to chronic neuropathology that persists for a relatively long
duration (days, week, months, years) after injury, and there is evidence in support of this notion from
a wide swath of neurological and immunological studies [171–174].
Resident brain immune cells, such as microglial cells, infiltrate the CNS very early during
development [175,176] and do not seem as likely a candidate to present self-antigen, despite the
fact that these resident microglial cells are highly competent, professional APCs, and they can also
express major histocompatibility complex class II molecules (MHCII). Considering that resident
microglial cells in the brain are continuously exposed to GFAP, UCH-L1 and MBP and there does not
seem to be any auto-reactivity in normal conditions, one alternative scenario is that infiltrating immune
cells are responding to the antigenic peptide fragments of GFAP, UCH-L1 and MBP [165–167,177–180].
Another important factor to consider in the context of an adaptive immune response after TBI is
the recent reports of two distinct lymphatic portals that directly service the brain. First, sitting subjacent
to the superior sagittal sinus is a lymphatic area that has recently been shown to have white blood cells
that dip in and out of the CNS, even in normal conditions [181,182]. Immune signals from the CNS have
been shown to directly signal through this lymphatic portal and to initiate a global immune response
that can exacerbate the severity of an injury [147,183,184]. Second is the “glymphatic” system, which
allows for clearance of CNS waste products and soluble proteins. This system also has been shown to
provide a substrate for the signaling of CNS components to the more classically-defined peripheral
lymphatic system [184–187]. In either of these two CNS “lymphatic compartments”, there can be a
rapid communication between the CNS and the periphery, and this signaling can exacerbate injuries,
such as stroke or TBI [184,188]. In the stroke literature, removing the spleen (splenectomy) and,
therefore, reducing the number of B and T cells capable of responding to the TBI results in a significant
improvement in lesion size and functional outcome measures. However, the data were inconsistent
between humans and rodent models [189–191]; thus, the true functional implications require further
examination. Interestingly, other studies that have blocked the expansion and activation of B and T
cells in the spleen after a TBI have demonstrated significant neuroprotection [116]. Thus, the role of
peripheral immune cells after TBI might provide novel targets for the development of therapeutic
options to treat TBIs and post-traumatic syndromes.
5. Conclusions
TBI remains a complex, multi-system pathology, with a wide-ranging potential for short- and
long-term detrimental outcomes. Using the existing and newly-developed animal models, as well as
clinical and translational studies, research continues to unravel the complex interactions between the
137
Brain Sci. 2017, 7, 11
brain, the periphery and the immune system. New understanding of these interactions will lead to
novel therapeutic targets, with the hope of improving the outcomes for millions of people each year.
Acknowledgments: This work was supported by a Department of Defense (DOD) research grant.
Author Contributions: Conception and design of the research: Damir Nizamutdinov, Lee A. Shapiro. Drafted themanuscript: Damir Nizamutdinov, Lee A. Shapiro. Edited and revised the manuscript: Damir Nizamutdinov,Lee A. Shapiro. Approved the final version of the manuscript: Damir Nizamutdinov, Lee A. Shapiro.
Conflicts of Interest: The authors declare no conflict of interest.
References
1. Marr, A.L.; Coronado, V.G. Central Nervous System Injury Surveillance Data Submission Standards—2002;
Department of Health and Human Services: Washington, DC, USA, 2004.
2. Centers for Disease Control and Prevention (CDC). Traumatic Brain Injury in the United States: Fact
Sheet. Available online: https://www.cdc.gov/traumaticbraininjury/get_the_facts.html (accessed on
15 September 2016).
3. Faul, M.X.; Xu, L.; Wald, M.M.; Coronad, V.G. Traumatic Brain Injury in the United States: Emergency
Department Visits, Hospitalizations and Deaths 2002–2006. Available online: https://www.cdc.gov/
traumaticbraininjury/pdf/blue_book.pdf (accessed on 15 September 2016).
4. Zaloshnja, E.; Miller, T.; Langlois, J.A.; Selassie, A.W. Prevalence of long-term disability from traumatic
brain injury in the civilian population of the United States, 2005. J. Head Trauma Rehabil. 2008, 23, 394–400.
[CrossRef] [PubMed]
5. Centers for Disease Control and Prevention (CDC); United States Department of Defense (DOD);
VA Leadership Panel. Report to Congress on Traumatic Brain Injury in the United States: Understanding the
Public Health Problem among Current and Former Military Personnel. Available online: https://www.cdc.
gov/traumaticbraininjury/pdf/report_to_congress_on_traumatic_brain_injury_2013-a.pdf (accessed on
15 September 2016).
6. Teasdale, G.; Jennett, B. Assessment of coma and impaired consciousness. A practical scale. Lancet 1974, 2,
81–84. [CrossRef]
7. Jennett, B.; Bond, M. Assessment of outcome after severe brain damage. Lancet 1975, 1, 480–484. [CrossRef]
8. Nakase-Richardson, R.; Sherer, M.; Seel, R.T.; Hart, T.; Hanks, R.; Arango-Lasprilla, J.C.; Yablon, S.A.;
Sander, A.M.; Barnett, S.D.; Walker, W.C.; et al. Utility of post-traumatic amnesia in predicting 1-year
productivity following traumatic brain injury: Comparison of the Russell and Mississippi PTA classification
intervals. J. Neurol. Neurosurg. Psychiatry 2011, 82, 494–499. [CrossRef] [PubMed]
9. Brenner, L.A.; Vanderploeg, R.D.; Terrio, H. Assessment and diagnosis of mild traumatic brain injury,
posttraumatic stress disorder, and other polytrauma conditions: Burden of adversity hypothesis.
Rehabil. Psychol. 2009, 54, 239–246. [CrossRef] [PubMed]
10. Turan, N.; Miller, B.A.; Heider, R.A.; Nadeem, M.; Sayeed, I.; Stein, D.G.; Pradilla, G. Neurobehavioral
testing in subarachnoid hemorrhage: A review of methods and current findings in rodents. J. Cereb. Blood
Flow Metab. 2016. [CrossRef] [PubMed]
11. Riggio, S.; Wong, M. Neurobehavioral sequelae of traumatic brain injury. Mt. Sinai J. Med. 2009, 76, 163–172.
[CrossRef] [PubMed]
12. Walker, W.C.; Pickett, T.C. Motor impairment after severe traumatic brain injury: A longitudinal multicenter
study. J. Rehabil. Res. Dev. 2007, 44, 975–982. [CrossRef] [PubMed]
13. Safaz, I.; Alaca, R.; Yasar, E.; Tok, F.; Yilmaz, B. Medical complications, physical function and communication
skills in patients with traumatic brain injury: A single centre 5-year experience. Brain Inj. 2008, 22, 733–739.
[CrossRef] [PubMed]
14. Rosenthal, M.; Christensen, B.K.; Ross, T.P. Depression following traumatic brain injury. Arch. Phys.
Med. Rehabil. 1998, 79, 90–103. [CrossRef]
15. Hart, T.; Brenner, L.; Clark, A.N.; Bogner, J.A.; Novack, T.A.; Chervoneva, I.; Nakase-Richardson, R.;
Arango-Lasprilla, J.C. Major and minor depression after traumatic brain injury. Arch. Phys. Med. Rehabil.
2011, 92, 1211–1219. [CrossRef] [PubMed]
138
Brain Sci. 2017, 7, 11
16. Stulemeijer, M.; Vos, P.E.; Bleijenberg, G.; van der Werf, S.P. Cognitive complaints after mild traumatic brain
injury: Things are not always what they seem. J. Psychosom. Res. 2007, 63, 637–645. [CrossRef] [PubMed]
17. Agrawal, A.; Timothy, J.; Pandit, L.; Manju, M. Post-traumatic epilepsy: An overview. Clin. Neurol. Neurosurg.
2006, 108, 433–439. [CrossRef] [PubMed]
18. Bazarian, J.J.; Cernak, I.; Noble-Haeusslein, L.; Potolicchio, S.; Temkin, N. Long-term neurologic outcomes
after traumatic brain injury. J. Head Trauma Rehabil. 2009, 24, 439–451. [CrossRef] [PubMed]
19. Carbonell, W.S.; Maris, D.O.; McCall, T.; Grady, M.S. Adaptation of the fluid percussion injury model to the
mouse. J. Neurotrauma 1998, 15, 217–229. [CrossRef] [PubMed]
20. Dixon, C.E.; Lighthall, J.W.; Anderson, T.E. Physiologic, histopathologic, and cineradiographic
characterization of a new fluid-percussion model of experimental brain injury in the rat. J. Neurotrauma 1988,
5, 91–104. [CrossRef] [PubMed]
21. Dixon, C.E.; Lyeth, B.G.; Povlishock, J.T.; Findling, R.L.; Hamm, R.J.; Marmarou, A.; Young, H.F.; Hayes, R.L.
A fluid percussion model of experimental brain injury in the rat. J. Neurosurg. 1987, 67, 110–119. [CrossRef]
[PubMed]
22. Mukherjee, S.; Zeitouni, S.; Cavarsan, C.F.; Shapiro, L.A. Increased seizure susceptibility in mice 30 days
after fluid percussion injury. Front. Neurol. 2013, 4, 28. [CrossRef] [PubMed]
23. Dixon, C.E.; Clifton, G.L.; Lighthall, J.W.; Yaghmai, A.A.; Hayes, R.L. A controlled cortical impact model of
traumatic brain injury in the rat. J. Neurosci. Methods 1991, 39, 253–262. [CrossRef]
24. Lighthall, J.W. Controlled cortical impact: A new experimental brain injury model. J. Neurotrauma 1988, 5,
1–15. [CrossRef] [PubMed]
25. Smith, D.H.; Soares, H.D.; Pierce, J.S.; Perlman, K.G.; Saatman, K.E.; Meaney, D.F.; Dixon, C.E.; McIntosh, T.K.
A model of parasagittal controlled cortical impact in the mouse: Cognitive and histopathologic effects.
J. Neurotrauma 1995, 12, 169–178. [CrossRef] [PubMed]
26. Williams, A.J.; Hartings, J.A.; Lu, X.C.; Rolli, M.L.; Dave, J.R.; Tortella, F.C. Characterization of a new rat
model of penetrating ballistic brain injury. J. Neurotrauma 2005, 22, 313–331. [CrossRef] [PubMed]
27. Marmarou, A.; Foda, M.A.; van den Brink, W.; Campbell, J.; Kita, H.; Demetriadou, K. A new model of
diffuse brain injury in rats. Part I: Pathophysiology and biomechanics. J. Neurosurg. 1994, 80, 291–300.
[CrossRef] [PubMed]
28. Cernak, I.; Savic, J.; Malicevic, Z.; Zunic, G.; Radosevic, P.; Ivanovic, I.; Davidovic, L. Involvement of the
central nervous system in the general response to pulmonary blast injury. J. Trauma 1996, 40, S100–S104.
[CrossRef] [PubMed]
29. Warden, D. Military tbi during the iraq and afghanistan wars. J. Head Trauma Rehabil. 2006, 21, 398–402.
[CrossRef] [PubMed]
30. McIntosh, T.K.; Noble, L.; Andrews, B.; Faden, A.I. Traumatic brain injury in the rat: Characterization of a
midline fluid-percussion model. Cent. Nerv. Syst. Trauma 1987, 4, 119–134. [CrossRef] [PubMed]
31. McIntosh, T.K.; Vink, R.; Noble, L.; Yamakami, I.; Fernyak, S.; Soares, H.; Faden, A.L. Traumatic brain injury
in the rat: Characterization of a lateral fluid-percussion model. Neuroscience 1989, 28, 233–244. [CrossRef]
32. Kabadi, S.V.; Hilton, G.D.; Stoica, B.A.; Zapple, D.N.; Faden, A.I. Fluid-percussion-induced traumatic brain
injury model in rats. Nat. Protoc. 2010, 5, 1552–1563. [CrossRef] [PubMed]
33. Walter, B.; Bauer, R.; Fritz, H.; Jochum, T.; Wunder, L.; Zwiener, U. Evaluation of micro tip pressure
transducers for the measurement of intracerebral pressure transients induced by fluid percussion.
Exp. Toxicol. Pathol. 1999, 51, 124–129. [CrossRef]
34. Alder, J.; Fujioka, W.; Lifshitz, J.; Crockett, D.P.; Thakker-Varia, S. Lateral fluid percussion: Model of traumatic
brain injury in mice. J. Vis. Exp. 2011, 54, e3063. [CrossRef] [PubMed]
35. Thompson, H.J.; Lifshitz, J.; Marklund, N.; Grady, M.S.; Graham, D.I.; Hovda, D.A.; McIntosh, T.K. Lateral
fluid percussion brain injury: A 15-year review and evaluation. J. Neurotrauma 2005, 22, 42–75. [CrossRef]
[PubMed]
36. Morales, D.M.; Marklund, N.; Lebold, D.; Thompson, H.J.; Pitkanen, A.; Maxwell, W.L.; Longhi, L.; Laurer, H.;
Maegele, M.; Neugebauer, E.; et al. Experimental models of traumatic brain injury: Do we really need to
build a better mousetrap? Neuroscience 2005, 136, 971–989. [CrossRef] [PubMed]
37. Hartl, R.; Medary, M.; Ruge, M.; Arfors, K.E.; Ghajar, J. Blood-brain barrier breakdown occurs early after
traumatic brain injury and is not related to white blood cell adherence. Acta Neurochir. Suppl. 1997, 70,
240–242. [PubMed]
139
Brain Sci. 2017, 7, 11
38. Das, M.; Leonardo, C.C.; Rangooni, S.; Pennypacker, K.R.; Mohapatra, S.; Mohapatra, S.S. Lateral fluid
percussion injury of the brain induces CCL20 inflammatory chemokine expression in rats. J. Neuroinflamm.
2011, 8, 148. [CrossRef] [PubMed]
39. Xiong, Y.; Mahmood, A.; Chopp, M. Animal models of traumatic brain injury. Nat. Rev. Neurosci. 2013, 14,
128–142. [CrossRef] [PubMed]
40. Graham, D.I.; McIntosh, T.K.; Maxwell, W.L.; Nicoll, J.A. Recent advances in neurotrauma. J. Neuropathol.
Exp. Neurol. 2000, 59, 641–651. [CrossRef] [PubMed]
41. Sanders, M.J.; Dietrich, W.D.; Green, E.J. Cognitive function following traumatic brain injury: Effects of
injury severity and recovery period in a parasagittal fluid-percussive injury model. J. Neurotrauma 1999, 16,
915–925. [CrossRef] [PubMed]
42. Vink, R.; Mullins, P.G.; Temple, M.D.; Bao, W.; Faden, A.I. Small shifts in craniotomy position in the lateral
fluid percussion injury model are associated with differential lesion development. J. Neurotrauma 2001, 18,
839–847. [CrossRef] [PubMed]
43. Floyd, C.L.; Golden, K.M.; Black, R.T.; Hamm, R.J.; Lyeth, B.G. Craniectomy position affects morris water
maze performance and hippocampal cell loss after parasagittal fluid percussion. J. Neurotrauma 2002, 19,
303–316. [CrossRef] [PubMed]
44. Hayes, R.L.; Stalhammar, D.; Povlishock, J.T.; Allen, A.M.; Galinat, B.J.; Becker, D.P.; Stonnington, H.H. A new
model of concussive brain injury in the cat produced by extradural fluid volume loading: II. Physiological
and neuropathological observations. Brain Inj. 1987, 1, 93–112. [CrossRef] [PubMed]
45. Millen, J.E.; Glauser, F.L.; Fairman, R.P. A comparison of physiological responses to percussive brain trauma
in dogs and sheep. J. Neurosurg. 1985, 62, 587–591. [CrossRef] [PubMed]
46. Pfenninger, E.G.; Reith, A.; Breitig, D.; Grunert, A.; Ahnefeld, F.W. Early changes of intracranial pressure,
perfusion pressure, and blood flow after acute head injury. Part 1: An experimental study of the underlying
pathophysiology. J. Neurosurg. 1989, 70, 774–779. [CrossRef] [PubMed]
47. Hicks, R.; Soares, H.; Smith, D.; McIntosh, T. Temporal and spatial characterization of neuronal injury
following lateral fluid-percussion brain injury in the rat. Acta Neuropathol. 1996, 91, 236–246. [CrossRef]
[PubMed]
48. Liu, Y.R.; Cardamone, L.; Hogan, R.E.; Gregoire, M.C.; Williams, J.P.; Hicks, R.J.; Binns, D.; Koe, A.;
Jones, N.C.; Myers, D.E.; et al. Progressive metabolic and structural cerebral perturbations after traumatic
brain injury: An in vivo imaging study in the rat. J. Nucl. Med. 2010, 51, 1788–1795. [CrossRef] [PubMed]
49. Hamm, R.J. Neurobehavioral assessment of outcome following traumatic brain injury in rats: An evaluation
of selected measures. J. Neurotrauma 2001, 18, 1207–1216. [CrossRef] [PubMed]
50. Pierce, J.E.; Smith, D.H.; Trojanowski, J.Q.; McIntosh, T.K. Enduring cognitive, neurobehavioral and
histopathological changes persist for up to one year following severe experimental brain injury in rats.
Neuroscience 1998, 87, 359–369. [CrossRef]
51. King, C.; Robinson, T.; Dixon, C.E.; Rao, G.R.; Larnard, D.; Nemoto, C.E. Brain temperature profiles during
epidural cooling with the chillerpad in a monkey model of traumatic brain injury. J. Neurotrauma 2010, 27,
1895–1903. [CrossRef] [PubMed]
52. Acosta, S.A.; Tajiri, N.; Shinozuka, K.; Ishikawa, H.; Grimmig, B.; Diamond, D.M.; Sanberg, P.R.; Bickford, P.C.;
Kaneko, Y.; Borlongan, C.V. Long-term upregulation of inflammation and suppression of cell proliferation
in the brain of adult rats exposed to traumatic brain injury using the controlled cortical impact model.
PLoS ONE 2013, 8, e53376. [CrossRef]
53. Hall, E.D.; Sullivan, P.G.; Gibson, T.R.; Pavel, K.M.; Thompson, B.M.; Scheff, S.W. Spatial and temporal
characteristics of neurodegeneration after controlled cortical impact in mice: More than a focal brain injury.
J. Neurotrauma 2005, 22, 252–265. [CrossRef] [PubMed]
54. Goodman, J.C.; Cherian, L.; Bryan, R.M., Jr.; Robertson, C.S. Lateral cortical impact injury in rats: Pathologic
effects of varying cortical compression and impact velocity. J. Neurotrauma 1994, 11, 587–597. [CrossRef]
[PubMed]
55. Saatman, K.E.; Feeko, K.J.; Pape, R.L.; Raghupathi, R. Differential behavioral and histopathological responses
to graded cortical impact injury in mice. J. Neurotrauma 2006, 23, 1241–1253. [CrossRef] [PubMed]
140
Brain Sci. 2017, 7, 11
56. Petraglia, A.L.; Plog, B.A.; Dayawansa, S.; Chen, M.; Dashnaw, M.L.; Czerniecka, K.; Walker, C.T.; Viterise, T.;
Hyrien, O.; Iliff, J.J.; et al. The spectrum of neurobehavioral sequelae after repetitive mild traumatic brain
injury: A novel mouse model of chronic traumatic encephalopathy. J. Neurotrauma 2014, 31, 1211–1224.
[CrossRef] [PubMed]
57. Fox, G.B.; Fan, L.; Levasseur, R.A.; Faden, A.I. Sustained sensory/motor and cognitive deficits with neuronal
apoptosis following controlled cortical impact brain injury in the mouse. J. Neurotrauma 1998, 15, 599–614.
[CrossRef] [PubMed]
58. Washington, P.M.; Forcelli, P.A.; Wilkins, T.; Zapple, D.N.; Parsadanian, M.; Burns, M.P. The effect of injury
severity on behavior: A phenotypic study of cognitive and emotional deficits after mild, moderate, and
severe controlled cortical impact injury in mice. J. Neurotrauma 2012, 29, 2283–2296. [CrossRef] [PubMed]
59. Marklund, N.; Hillered, L. Animal modelling of traumatic brain injury in preclinical drug development:
Where do we go from here? Br. J. Pharmacol. 2011, 164, 1207–1229. [CrossRef] [PubMed]
60. Dixon, C.E.; Kraus, M.F.; Kline, A.E.; Ma, X.; Yan, H.Q.; Griffith, R.G.; Wolfson, B.M.; Marion, D.W.
Amantadine improves water maze performance without affecting motor behavior following traumatic
brain injury in rats. Restor. Neurol. Neurosci. 1999, 14, 285–294. [PubMed]
61. Dixon, C.E.; Kochanek, P.M.; Yan, H.Q.; Schiding, J.K.; Griffith, R.G.; Baum, E.; Marion, D.W.; DeKosky, S.T.
One-year study of spatial memory performance, brain morphology, and cholinergic markers after moderate
controlled cortical impact in rats. J. Neurotrauma 1999, 16, 109–122. [CrossRef] [PubMed]
62. Masel, B.E.; DeWitt, D.S. Traumatic brain injury: A disease process, not an event. J. Neurotrauma 2010, 27,
1529–1540. [CrossRef] [PubMed]
63. Davis, A.E. Mechanisms of traumatic brain injury: Biomechanical, structural and cellular considerations.
Crit. Care Nurs. Q. 2000, 23, 1–13. [CrossRef] [PubMed]
64. Gaetz, M. The neurophysiology of brain injury. Clin. Neurophysiol. 2004, 115, 4–18. [CrossRef]
65. Cernak, I. Animal models of head trauma. NeuroRx 2005, 2, 410–422. [CrossRef] [PubMed]
66. Bramlett, H.M.; Dietrich, W.D. Progressive damage after brain and spinal cord injury: Pathomechanisms and
treatment strategies. Prog. Brain Res. 2007, 161, 125–141. [PubMed]
67. Marklund, N.; Bakshi, A.; Castelbuono, D.J.; Conte, V.; McIntosh, T.K. Evaluation of pharmacological
treatment strategies in traumatic brain injury. Curr. Pharm. Des. 2006, 12, 1645–1680. [CrossRef] [PubMed]
68. Povlishock, J.T.; Christman, C.W. The pathobiology of traumatically induced axonal injury in animals and
humans: A review of current thoughts. J. Neurotrauma 1995, 12, 555–564. [CrossRef] [PubMed]
69. Arvin, B.; Neville, L.F.; Barone, F.C.; Feuerstein, G.Z. Brain injury and inflammation. A putative role of TNF
alpha. Ann. N. Y. Acad. Sci. 1995, 765, 62–71. [CrossRef] [PubMed]
70. Isaksson, J.; Lewen, A.; Hillered, L.; Olsson, Y. Up-regulation of intercellular adhesion molecule 1 in cerebral
microvessels after cortical contusion trauma in a rat model. Acta Neuropathol. 1997, 94, 16–20. [CrossRef]
[PubMed]
71. Yang, K.; Mu, X.S.; Xue, J.J.; Whitson, J.; Salminen, A.; dixon, C.E.; Liu, P.K.; Hayes, R.L. Increased expression
of c-fos mRNA and AP-1 transcription factors after cortical impact injury in rats. Brain Res. 1994, 664,
141–147. [CrossRef]
72. Yatsiv, I.; Morganti-Kossmann, M.C.; Perez, D.; Dinarello, C.A.; Novick, D.; Rubinstein, M.; Otto, V.I.;
Rancan, M.; Kossmann, T.; Redaelli, C.A.; et al. Elevated intracranial IL-18 in humans and mice after
traumatic brain injury and evidence of neuroprotective effects of IL-18-binding protein after experimental
closed head injury. J. Cereb. Blood Flow Metab. 2002, 22, 971–978. [CrossRef] [PubMed]
73. Hutchinson, P.J.; O’Connell, M.T.; Rothwell, N.J.; Hopkins, S.J.; Nortje, J.; Carpenter, K.L.; Timofeev, I.;
Al-Rawi, P.G.; Menon, D.K.; Pickard, J.D. Inflammation in human brain injury: Intracerebral concentrations
of IL-1alpha, IL-1beta, and their endogenous inhibitor IL-1ra. J. Neurotrauma 2007, 24, 1545–1557. [CrossRef]
[PubMed]
74. Utagawa, A.; Truettner, J.S.; Dietrich, W.D.; Bramlett, H.M. Systemic inflammation exacerbates behavioral
and histopathological consequences of isolated traumatic brain injury in rats. Exp. Neurol. 2008, 211, 283–291.
[CrossRef] [PubMed]
75. Minami, M.; Kuraishi, Y.; Satoh, M. Effects of kainic acid on messenger RNA levels of IL-1 beta, IL-6, TNF
alpha and lif in the rat brain. Biochem. Biophys. Res. Commun. 1991, 176, 593–598. [CrossRef]
76. Liu, T.; Clark, R.K.; McDonnell, P.C.; Young, P.R.; White, R.F.; Barone, F.C.; Feuerstein, G.Z. Tumor necrosis
factor-alpha expression in ischemic neurons. Stroke 1994, 25, 1481–1488. [CrossRef] [PubMed]
141
Brain Sci. 2017, 7, 11
77. Chizzolini, C.; Dayer, J.M.; Miossec, P. Cytokines in chronic rheumatic diseases: Is everything lack of
homeostatic balance? Arthritis Res. Ther. 2009, 11, 246. [CrossRef] [PubMed]
78. Iwasaki, A.; Medzhitov, R. Regulation of adaptive immunity by the innate immune system. Science 2010, 327,
291–295. [CrossRef] [PubMed]
79. Zhang, J.M.; An, J. Cytokines, inflammation, and pain. Int. Anesthesiol. Clin. 2007, 45, 27–37. [CrossRef]
[PubMed]
80. Dinarello, C.A. Immunological and inflammatory functions of the interleukin-1 family. Annu. Rev. Immunol.
2009, 27, 519–550. [CrossRef] [PubMed]
81. Garlanda, C.; Dinarello, C.A.; Mantovani, A. The interleukin-1 family: Back to the future. Immunity 2013, 39,
1003–1018. [CrossRef] [PubMed]
82. Pearson, V.L.; Rothwell, N.J.; Toulmond, S. Excitotoxic brain damage in the rat induces interleukin-1beta
protein in microglia and astrocytes: Correlation with the progression of cell death. Glia 1999, 25, 311–323.
[CrossRef]
83. Dinarello, C.A. Blocking IL-1 in systemic inflammation. J. Exp. Med. 2005, 201, 1355–1359. [CrossRef]
[PubMed]
84. Dinarello, C.A. Interleukin 1 and interleukin 18 as mediators of inflammation and the aging process. Am. J.
Clin. Nutr. 2006, 83, 447S–455S. [PubMed]
85. Lu, K.T.; Wang, Y.W.; Wo, Y.Y.; Yang, Y.L. Extracellular signal-regulated kinase-mediated IL-1-induced
cortical neuron damage during traumatic brain injury. Neurosci. Lett. 2005, 386, 40–45. [CrossRef] [PubMed]
86. Liu, T.; Young, P.R.; McDonnell, P.C.; White, R.F.; Barone, F.C.; Feuerstein, G.Z. Cytokine-induced neutrophil
chemoattractant mRNA expressed in cerebral ischemia. Neurosci. Lett. 1993, 164, 125–128. [CrossRef]
87. Grilli, M.; Memo, M. Nuclear factor-kappaB/Rel proteins: A point of convergence of signalling pathways
relevant in neuronal function and dysfunction. Biochem. Pharmacol. 1999, 57, 1–7. [CrossRef]
88. Baeuerle, P.A.; Baltimore, D. NF-kappa B: Ten years after. Cell 1996, 87, 13–20. [CrossRef]
89. Jander, S.; Stoll, G. Differential induction of interleukin-12, interleukin-18, and interleukin-1beta converting
enzyme mRNA in experimental autoimmune encephalomyelitis of the lewis rat. J. Neuroimmunol. 1998, 91,
93–99. [CrossRef]
90. Losy, J.; Niezgoda, A. IL-18 in patients with multiple sclerosis. Acta Neurol. Scand. 2001, 104, 171–173.
[CrossRef] [PubMed]
91. Fassbender, K.; Mielke, O.; Bertsch, T.; Muehlhauser, F.; Hennerici, M.; Kurimoto, M.; Rossol, S.
Interferon-gamma-inducing factor (IL-18) and interferon-gamma in inflammatory CNS diseases. Neurology
1999, 53, 1104–1106. [CrossRef] [PubMed]
92. Sims, J.E.; Smith, D.E. The IL-1 family: Regulators of immunity. Nat. Rev. Immunol. 2010, 10, 89–102.
[CrossRef] [PubMed]
93. Kremlev, S.G.; Roberts, R.L.; Palmer, C. Differential expression of chemokines and chemokine receptors
during microglial activation and inhibition. J. Neuroimmunol. 2004, 149, 1–9. [CrossRef] [PubMed]
94. Gyoneva, S.; Ransohoff, R.M. Inflammatory reaction after traumatic brain injury: Therapeutic potential
of targeting cell-cell communication by chemokines. Trends Pharmacol. Sci. 2015, 36, 471–480. [CrossRef]
[PubMed]
95. Choi, S.S.; Lee, H.J.; Lim, I.; Satoh, J.; Kim, S.U. Human astrocytes: Secretome profiles of cytokines and
chemokines. PLoS ONE 2014, 9, e92325. [CrossRef] [PubMed]
96. Ono, S.J.; Nakamura, T.; Miyazaki, D.; Ohbayashi, M.; Dawson, M.; Toda, M. Chemokines: Roles in leukocyte
development, trafficking, and effector function. J. Allergy Clin. Immunol. 2003, 111, 1185–1199. [CrossRef]
[PubMed]
97. Helmy, A.; Carpenter, K.L.; Menon, D.K.; Pickard, J.D.; Hutchinson, P.J. The cytokine response to human
traumatic brain injury: Temporal profiles and evidence for cerebral parenchymal production. J. Cereb. Blood
Flow Metab. 2011, 31, 658–670. [CrossRef] [PubMed]
98. Helmy, A.; Antoniades, C.A.; Guilfoyle, M.R.; Carpenter, K.L.; Hutchinson, P.J. Principal component analysis
of the cytokine and chemokine response to human traumatic brain injury. PLoS ONE 2012, 7, e39677.
[CrossRef] [PubMed]
99. Glabinski, A.R.; Tani, M.; Aras, S.; Stoler, M.H.; Tuohy, V.K.; Ransohoff, R.M. Regulation and function of
central nervous system chemokines. Int. J. Dev. Neurosci. 1995, 13, 153–165. [CrossRef]
142
Brain Sci. 2017, 7, 11
100. Ghirnikar, R.S.; Lee, Y.L.; Eng, L.F. Inflammation in traumatic brain injury: Role of cytokines and chemokines.
Neurochem. Res. 1998, 23, 329–340. [CrossRef] [PubMed]
101. Cartier, L.; Hartley, O.; Dubois-Dauphin, M.; Krause, K.H. Chemokine receptors in the central nervous
system: Role in brain inflammation and neurodegenerative diseases. Brain Res. Brain Res. Rev. 2005, 48,
16–42. [CrossRef] [PubMed]
102. Proudfoot, A.E.; Handel, T.M.; Johnson, Z.; Lau, E.K.; LiWang, P.; Clark-Lewis, I.; Borlat, F.; Wells, T.N.;
Kosco-Vilbois, M.H. Glycosaminoglycan binding and oligomerization are essential for the in vivo activity of
certain chemokines. Proc. Natl. Acad. Sci. USA 2003, 100, 1885–1890. [CrossRef] [PubMed]
103. Mantovani, A.; Sica, A.; Sozzani, S.; Allavena, P.; Vecchi, A.; Locati, M. The chemokine system in diverse
forms of macrophage activation and polarization. Trends Immunol. 2004, 25, 677–686. [CrossRef] [PubMed]
104. Shi, C.; Pamer, E.G. Monocyte recruitment during infection and inflammation. Nat. Rev. Immunol. 2011, 11,
762–774. [CrossRef] [PubMed]
105. Tang, D.; Kang, R.; Coyne, C.B.; Zeh, H.J.; Lotze, M.T. PAMPs and DAMPs: Signal 0s that spur autophagy
and immunity. Immunol. Rev. 2012, 249, 158–175. [CrossRef] [PubMed]
106. Sansonetti, P.J. The innate signaling of dangers and the dangers of innate signaling. Nat. Immunol. 2006, 7,
1237–1242. [CrossRef] [PubMed]
107. Trinchieri, G.; Sher, A. Cooperation of toll-like receptor signals in innate immune defence. Nat. Rev. Immunol.
2007, 7, 179–190. [CrossRef] [PubMed]
108. Ting, J.P.; Lovering, R.C.; Alnemri, E.S.; Bertin, J.; Boss, J.M.; Davis, B.K.; Flavell, R.A.; Girardin, S.E.;
Godzik, A.; Harton, J.A.; et al. The NLR gene family: A standard nomenclature. Immunity 2008, 28, 285–287.
[CrossRef] [PubMed]
109. Strober, W.; Murray, P.J.; Kitani, A.; Watanabe, T. Signalling pathways and molecular interactions of NOD1
and NOD2. Nat. Rev. Immunol. 2006, 6, 9–20. [CrossRef] [PubMed]
110. Liu, H.D.; Li, W.; Chen, Z.R.; Hu, Y.C.; Zhang, D.D.; Shen, W.; Zhou, M.L.; Zhu, L.; Hang, C.H. Expression
of the NLRP3 inflammasome in cerebral cortex after traumatic brain injury in a rat model. Neurochem. Res.
2013, 38, 2072–2083. [CrossRef] [PubMed]
111. Needham, E.; Zandi, M.S. Recent advances in the neuroimmunology of cell-surface CNS autoantibody
syndromes, Alzheimer’s disease, traumatic brain injury and schizophrenia. J. Neurol. 2014, 261, 2037–2042.
[CrossRef] [PubMed]
112. Martinon, F.; Burns, K.; Tschopp, J. The inflammasome: A molecular platform triggering activation of
inflammatory caspases and processing of proil-beta. Mol. Cell 2002, 10, 417–426. [CrossRef]
113. Halle, A.; Hornung, V.; Petzold, G.C.; Stewart, C.R.; Monks, B.G.; Reinheckel, T.; Fitzgerald, K.A.; Latz, E.;
Moore, K.J.; Golenbock, D.T. The NALP3 inflammasome is involved in the innate immune response to
amyloid-beta. Nat. Immunol. 2008, 9, 857–865. [CrossRef] [PubMed]
114. Trahanas, D.M.; Cuda, C.M.; Perlman, H.; Schwulst, S.J. Differential activation of infiltrating
monocyte-derived cells after mild and severe traumatic brain injury. Shock 2015, 43, 255–260. [CrossRef]
[PubMed]
115. Rhodes, J. Peripheral immune cells in the pathology of traumatic brain injury? Curr. Opin. Crit. Care 2011,
17, 122–130. [CrossRef] [PubMed]
116. Tobin, R.P.; Mukherjee, S.; Kain, J.M.; Rogers, S.K.; Henderson, S.K.; Motal, H.L.; Newell Rogers, M.K.;
Shapiro, L.A. Traumatic brain injury causes selective, CD74-dependent peripheral lymphocyte activation
that exacerbates neurodegeneration. Acta Neuropathol. Commun. 2014, 2, 143. [CrossRef] [PubMed]
117. Schwulst, S.J.; Trahanas, D.M.; Saber, R.; Perlman, H. Traumatic brain injury-induced alterations in peripheral
immunity. J. Trauma Acute Care Surg. 2013, 75, 780–788. [CrossRef] [PubMed]
118. Rasouli, J.; Lekhraj, R.; Ozbalik, M.; Lalezari, P.; Casper, D. Brain-spleen inflammatory coupling: A literature
review. Einstein J. Biol. Med. 2011, 27, 74–77. [CrossRef] [PubMed]
119. Schwartz, M.; Deczkowska, A. Neurological disease as a failure of brain-immune crosstalk: The multiple
faces of neuroinflammation. Trends Immunol. 2016, 37, 668–679. [CrossRef] [PubMed]
120. Schwartz, M. Helping the body to cure itself: Immune modulation by therapeutic vaccination for spinal cord
injury. J. Spinal Cord Med. 2003, 26, S6–S10. [CrossRef] [PubMed]
121. Foley, L.M.; Hitchens, T.K.; Ho, C.; Janesko-Feldman, K.L.; Melick, J.A.; Bayir, H.; Kochanek, P.M. Magnetic
resonance imaging assessment of macrophage accumulation in mouse brain after experimental traumatic
brain injury. J. Neurotrauma 2009, 26, 1509–1519. [CrossRef] [PubMed]
143
Brain Sci. 2017, 7, 11
122. Soares, H.D.; Hicks, R.R.; Smith, D.; McIntosh, T.K. Inflammatory leukocytic recruitment and diffuse neuronal
degeneration are separate pathological processes resulting from traumatic brain injury. J. Neurosci. 1995, 15,
8223–8233. [PubMed]
123. Kenne, E.; Erlandsson, A.; Lindbom, L.; Hillered, L.; Clausen, F. Neutrophil depletion reduces edema
formation and tissue loss following traumatic brain injury in mice. J. Neuroinflamm. 2012, 9, 17. [CrossRef]
[PubMed]
124. Clark, R.S.; Schiding, J.K.; Kaczorowski, S.L.; Marion, D.W.; Kochanek, P.M. Neutrophil accumulation
after traumatic brain injury in rats: Comparison of weight drop and controlled cortical impact models.
J. Neurotrauma 1994, 11, 499–506. [CrossRef] [PubMed]
125. Harlan, J.M. Leukocyte-endothelial interactions. Blood 1985, 65, 513–525. [PubMed]
126. Kochanek, P.M.; Hallenbeck, J.M. Polymorphonuclear leukocytes and monocytes/macrophages in the
pathogenesis of cerebral ischemia and stroke. Stroke 1992, 23, 1367–1379. [CrossRef] [PubMed]
127. Lucchesi, B.R.; Mullane, K.M. Leukocytes and ischemia-induced myocardial injury. Annu. Rev.
Pharmacol. Toxicol. 1986, 26, 201–224. [CrossRef] [PubMed]
128. Burke-Gaffney, A.; Keenan, A.K. Modulation of human endothelial cell permeability by combinations of the
cytokines interleukin-1 alpha/beta, tumor necrosis factor-alpha and interferon-gamma. Immunopharmacology
1993, 25, 1–9. [CrossRef]
129. Clark, W.M.; Madden, K.P.; Rothlein, R.; Zivin, J.A. Reduction of central nervous system ischemic injury in
rabbits using leukocyte adhesion antibody treatment. Stroke 1991, 22, 877–883. [CrossRef] [PubMed]
130. Schwartz, M.; Yoles, E. Macrophages and dendritic cells treatment of spinal cord injury: From the bench to
the clinic. Acta Neurochir. Suppl. 2005, 93, 147–150. [PubMed]
131. Zindler, E.; Zipp, F. Neuronal injury in chronic CNS inflammation. Best Pract. Res. Clin. Anaesthesiol. 2010,
24, 551–562. [CrossRef] [PubMed]
132. Herz, J.; Zipp, F.; Siffrin, V. Neurodegeneration in autoimmune CNS inflammation. Exp. Neurol. 2010, 225,
9–17. [CrossRef] [PubMed]
133. Jin, X.; Ishii, H.; Bai, Z.; Itokazu, T.; Yamashita, T. Temporal changes in cell marker expression and cellular
infiltration in a controlled cortical impact model in adult male C57BL/6 mice. PLoS ONE 2012, 7, e41892.
[CrossRef] [PubMed]
134. Hu, X.; Li, P.; Guo, Y.; Wang, H.; Leak, R.K.; Chen, S.; Gao, Y.; Chen, J. Microglia/macrophage polarization
dynamics reveal novel mechanism of injury expansion after focal cerebral ischemia. Stroke 2012, 43, 3063–3070.
[CrossRef] [PubMed]
135. Rolls, A.; Shechter, R.; London, A.; Segev, Y.; Jacob-Hirsch, J.; Amariglio, N.; Rechavi, G.; Schwartz, M.
Two faces of chondroitin sulfate proteoglycan in spinal cord repair: A role in microglia/macrophage
activation. PLoS Med. 2008, 5, e171. [CrossRef] [PubMed]
136. Heppner, F.L.; Ransohoff, R.M.; Becher, B. Immune attack: The role of inflammation in alzheimer disease.
Nat. Rev. Neurosci. 2015, 16, 358–372. [CrossRef] [PubMed]
137. Martinez, F.O.; Gordon, S. The M1 and M2 paradigm of macrophage activation: Time for reassessment.
F1000Prime Rep. 2014, 6, 13. [CrossRef] [PubMed]
138. Verma, S.; Nakaoke, R.; Dohgu, S.; Banks, W.A. Release of cytokines by brain endothelial cells: A polarized
response to lipopolysaccharide. Brain Behav. Immun. 2006, 20, 449–455. [CrossRef] [PubMed]
139. Jang, E.; Lee, S.; Kim, J.H.; Kim, J.H.; Seo, J.W.; Lee, W.H.; Mori, K.; Nakao, K.; Suk, K. Secreted protein
lipocalin-2 promotes microglial M1 polarization. FASEB J. 2013, 27, 1176–1190. [CrossRef] [PubMed]
140. Starossom, S.C.; Mascanfroni, I.D.; Imitola, J.; Cao, L.; Raddassi, K.; Hernandez, S.F.; Bassil, R.; Croci, D.O.;
Cerliani, J.P.; Delacour, D.; et al. Galectin-1 deactivates classically activated microglia and protects from
inflammation-induced neurodegeneration. Immunity 2012, 37, 249–263. [CrossRef] [PubMed]
141. Rocher, C.; Singla, D.K. SMAD-PI3K-Akt-mTOR pathway mediates BMP-7 polarization of monocytes into
M2 macrophages. PLoS ONE 2013, 8, e84009. [CrossRef] [PubMed]
142. Biswas, S.K.; Mantovani, A. Macrophage plasticity and interaction with lymphocyte subsets: Cancer as a
paradigm. Nat. Immunol. 2010, 11, 889–896. [CrossRef] [PubMed]
143. Roughton, K.; Andreasson, U.; Blomgren, K.; Kalm, M. Lipopolysaccharide-induced inflammation aggravates
irradiation-induced injury to the young mouse brain. Dev. Neurosci. 2013, 35, 406–415. [CrossRef] [PubMed]
144
Brain Sci. 2017, 7, 11
144. Mukherjee, S.; Katki, K.; Arisi, G.M.; Foresti, M.L.; Shapiro, L.A. Early tbi-induced cytokine alterations are
similarly detected by two distinct methods of multiplex assay. Front. Mol. Neurosci. 2011, 4, 21. [CrossRef]
[PubMed]
145. Ni, K.; O’Neill, H.C. The role of dendritic cells in T cell activation. Immunol. Cell Biol. 1997, 75, 223–230.
[CrossRef] [PubMed]
146. Pozzi, L.A.; Maciaszek, J.W.; Rock, K.L. Both dendritic cells and macrophages can stimulate naive CD8 T
cells in vivo to proliferate, develop effector function, and differentiate into memory cells. J. Immunol. 2005,
175, 2071–2081. [CrossRef] [PubMed]
147. Kelso, M.L.; Gendelman, H.E. Bridge between neuroimmunity and traumatic brain injury. Curr. Pharm. Des.
2014, 20, 4284–4298. [CrossRef] [PubMed]
148. Gyoneva, S.; Kim, D.; Katsumoto, A.; Kokiko-Cochran, O.N.; Lamb, B.T.; Ransohoff, R.M. Ccr2 deletion
dissociates cavity size and tau pathology after mild traumatic brain injury. J. Neuroinflamm. 2015, 12, 228.
[CrossRef] [PubMed]
149. Gelderblom, M.; Arunachalam, P.; Magnus, T. Gammadelta T cells as early sensors of tissue damage and
mediators of secondary neurodegeneration. Front. Cell Neurosci. 2014, 8, 368. [CrossRef] [PubMed]
150. Sobottka, B.; Harrer, M.D.; Ziegler, U.; Fischer, K.; Wiendl, H.; Hunig, T.; Becher, B.; Goebels, N. Collateral
bystander damage by myelin-directed CD8+ T cells causes axonal loss. Am. J. Pathol. 2009, 175, 1160–1166.
[CrossRef] [PubMed]
151. Melzer, N.; Meuth, S.G.; Wiendl, H. CD8+ T cells and neuronal damage: Direct and collateral mechanisms of
cytotoxicity and impaired electrical excitability. FASEB J. 2009, 23, 3659–3673. [CrossRef] [PubMed]
152. Serpe, C.J.; Coers, S.; Sanders, V.M.; Jones, K.J. CD4+ T, but not CD8+ or B, lymphocytes mediate facial
motoneuron survival after facial nerve transection. Brain Behav. Immun. 2003, 17, 393–402. [CrossRef]
153. Schwartz, M.; Shechter, R. Systemic inflammatory cells fight off neurodegenerative disease. Nat. Rev. Neurol.
2010, 6, 405–410. [CrossRef] [PubMed]
154. Cohen, I.R. The cognitive paradigm and the immunological homunculus. Immunol. Today 1992, 13, 490–494.
[CrossRef]
155. Moalem, G.; Leibowitz-Amit, R.; Yoles, E.; Mor, F.; Cohen, I.R.; Schwartz, M. Autoimmune T cells protect
neurons from secondary degeneration after central nervous system axotomy. Nat. Med. 1999, 5, 49–55.
[PubMed]
156. Bradl, M.; Bauer, J.; Flugel, A.; Wekerle, H.; Lassmann, H. Complementary contribution of CD4 and CD8
T lymphocytes to T-cell infiltration of the intact and the degenerative spinal cord. Am. J. Pathol. 2005, 166,
1441–1450. [CrossRef]
157. Burns, J.; Rosenzweig, A.; Zweiman, B.; Lisak, R.P. Isolation of myelin basic protein-reactive T-cell lines from
normal human blood. Cell. Immunol. 1983, 81, 435–440. [CrossRef]
158. Martin, R.; Jaraquemada, D.; Flerlage, M.; Richert, J.; Whitaker, J.; Long, E.O.; McFarlin, D.E.; McFarland, H.F.
Fine specificity and HLA restriction of myelin basic protein-specific cytotoxic T cell lines from multiple
sclerosis patients and healthy individuals. J. Immunol. 1990, 145, 540–548. [PubMed]
159. Sakaguchi, S. Naturally arising Foxp3-expressing CD25+CD4+ regulatory T cells in immunological tolerance
to self and non-self. Nat. Immunol. 2005, 6, 345–352. [CrossRef] [PubMed]
160. Fontenot, J.D.; Gavin, M.A.; Rudensky, A.Y. Foxp3 programs the development and function of CD4+CD25+
regulatory T cells. Nat. Immunol. 2003, 4, 330–336. [CrossRef] [PubMed]
161. Ben Simon, G.J.; Hovda, D.A.; Harris, N.G.; Gomez-Pinilla, F.; Goldberg, R.A. Traumatic brain injury induced
neuroprotection of retinal ganglion cells to optic nerve crush. J. Neurotrauma 2006, 23, 1072–1082. [CrossRef]
[PubMed]
162. Fisher, J.; Levkovitch-Verbin, H.; Schori, H.; Yoles, E.; Butovsky, O.; Kaye, J.F.; Ben-Nun, A.; Schwartz, M.
Vaccination for neuroprotection in the mouse optic nerve: Implications for optic neuropathies. J. Neurosci.
2001, 21, 136–142. [PubMed]
163. Hazeldine, J.; Lord, J.M.; Belli, A. Traumatic brain injury and peripheral immune suppression: Primer and
prospectus. Front. Neurol. 2015, 6, 235. [CrossRef] [PubMed]
164. Jesse, S.; Steinacker, P.; Cepek, L.; von Arnim, C.A.; Tumani, H.; Lehnert, S.; Kretzschmar, H.A.; Baier, M.;
Otto, M. Glial fibrillary acidic protein and protein s-100b: Different concentration pattern of glial proteins in
cerebrospinal fluid of patients with alzheimer’s disease and creutzfeldt-jakob disease. J. Alzheimers Dis. 2009,
17, 541–551. [CrossRef] [PubMed]
145
Brain Sci. 2017, 7, 11
165. Posti, J.P.; Takala, R.S.; Runtti, H.; Newcombe, V.F.; Outtrim, J.; Katila, A.J.; Frantzen, J.; Ala-Seppala, H.;
Coles, J.P.; Hossain, M.I.; et al. The levels of glial fibrillary acidic protein and ubiquitin c-terminal hydrolase-l1
during the first week after a traumatic brain injury: Correlations with clinical and imaging findings.
Neurosurgery 2016, 79, 456–464. [PubMed]
166. Mondello, S.; Kobeissy, F.; Vestri, A.; Hayes, R.L.; Kochanek, P.M.; Berger, R.P. Serum concentrations of
ubiquitin c-terminal hydrolase-l1 and glial fibrillary acidic protein after pediatric traumatic brain injury.
Sci. Rep. 2016, 6, 28203. [CrossRef] [PubMed]
167. Yan, E.B.; Satgunaseelan, L.; Paul, E.; Bye, N.; Nguyen, P.; Agyapomaa, D.; Kossmann, T.; Rosenfeld, J.V.;
Morganti-Kossmann, M.C. Post-traumatic hypoxia is associated with prolonged cerebral cytokine production,
higher serum biomarker levels, and poor outcome in patients with severe traumatic brain injury.
J. Neurotrauma 2014, 31, 618–629. [CrossRef] [PubMed]
168. Ottens, A.K.; Golden, E.C.; Bustamante, L.; Hayes, R.L.; Denslow, N.D.; Wang, K.K. Proteolysis of multiple
myelin basic protein isoforms after neurotrauma: Characterization by mass spectrometry. J. Neurochem. 2008,
104, 1401–1414. [CrossRef] [PubMed]
169. Cox, A.L.; Coles, A.J.; Nortje, J.; Bradley, P.G.; Chatfield, D.A.; Thompson, S.J.; Menon, D.K. An investigation
of auto-reactivity after head injury. J. Neuroimmunol. 2006, 174, 180–186. [CrossRef] [PubMed]
170. Kalia, V.; Sarkar, S.; Ahmed, R. Cd8 t-cell memory differentiation during acute and chronic viral infections.
Adv. Exp. Med. Biol. 2010, 684, 79–95. [PubMed]
171. Goverman, J. Autoimmune t cell responses in the central nervous system. Nat. Rev. Immunol. 2009, 9,
393–407. [CrossRef] [PubMed]
172. McFarland, H.F.; Martin, R. Multiple sclerosis: A complicated picture of autoimmunity. Nat. Immunol. 2007,
8, 913–919. [CrossRef] [PubMed]
173. Lucchinetti, C.; Bruck, W.; Parisi, J.; Scheithauer, B.; Rodriguez, M.; Lassmann, H. Heterogeneity of multiple
sclerosis lesions: Implications for the pathogenesis of demyelination. Ann. Neurol. 2000, 47, 707–717.
[CrossRef]
174. Ransohoff, R.M.; Kivisakk, P.; Kidd, G. Three or more routes for leukocyte migration into the central nervous
system. Nat. Rev. Immunol. 2003, 3, 569–581. [CrossRef] [PubMed]
175. Ginhoux, F.; Lim, S.; Hoeffel, G.; Low, D.; Huber, T. Origin and differentiation of microglia. Front. Cell Neurosci.
2013, 7, 45. [CrossRef] [PubMed]
176. Harry, G.J. Microglia during development and aging. Pharmacol. Ther. 2013, 139, 313–326. [CrossRef]
[PubMed]
177. Papa, L.; Brophy, G.M.; Welch, R.D.; Lewis, L.M.; Braga, C.F.; Tan, C.N.; Ameli, N.J.; Lopez, M.A.;
Haeussler, C.A.; Mendez Giordano, D.I.; et al. Time course and diagnostic accuracy of glial and neuronal
blood biomarkers gfap and uch-l1 in a large cohort of trauma patients with and without mild traumatic
brain injury. JAMA Neurol. 2016, 73, 551–560. [CrossRef] [PubMed]
178. Zoltewicz, J.S.; Scharf, D.; Yang, B.; Chawla, A.; Newsom, K.J.; Fang, L. Characterization of antibodies that
detect human gfap after traumatic brain injury. Biomark. Insights 2012, 7, 71–79. [CrossRef] [PubMed]
179. Bogoslovsky, T.; Wilson, D.; Chen, Y.; Hanlon, D.; Gill, J.; Jeromin, A.; Song, L.; Moore, C.; Gong, Y.;
Kenney, K.; et al. Increases of plasma levels of glial fibrillary acidic protein, tau, and amyloid beta up to
90 days after traumatic brain injury. J. Neurotrauma 2017, 34, 66–73. [CrossRef] [PubMed]
180. Su, E.; Bell, M.J.; Kochanek, P.M.; Wisniewski, S.R.; Bayir, H.; Clark, R.S.; Adelson, P.D.; Tyler-Kabara, E.C.;
Janesko-Feldman, K.L.; Berger, R.P. Increased csf concentrations of myelin basic protein after tbi in infants
and children: Absence of significant effect of therapeutic hypothermia. Neurocrit. Care 2012, 17, 401–407.
[CrossRef] [PubMed]
181. Raper, D.; Louveau, A.; Kipnis, J. How do meningeal lymphatic vessels drain the cns? Trends Neurosci. 2016,
39, 581–586. [CrossRef] [PubMed]
182. Louveau, A.; Da Mesquita, S.; Kipnis, J. Lymphatics in neurological disorders: A neuro-lympho-vascular
component of multiple sclerosis and alzheimer’s disease? Neuron 2016, 91, 957–973. [CrossRef] [PubMed]
183. Brait, V.H.; Arumugam, T.V.; Drummond, G.R.; Sobey, C.G. Importance of t lymphocytes in brain injury,
immunodeficiency, and recovery after cerebral ischemia. J. Cereb. Blood Flow Metab. 2012, 32, 598–611.
[CrossRef] [PubMed]
146
Brain Sci. 2017, 7, 11
184. Louveau, A.; Smirnov, I.; Keyes, T.J.; Eccles, J.D.; Rouhani, S.J.; Peske, J.D.; Derecki, N.C.; Castle, D.;
Mandell, J.W.; Lee, K.S.; et al. Structural and functional features of central nervous system lymphatic vessels.
Nature 2015, 523, 337–341. [CrossRef] [PubMed]
185. Yang, L.; Kress, B.T.; Weber, H.J.; Thiyagarajan, M.; Wang, B.; Deane, R.; Benveniste, H.; Iliff, J.J.;
Nedergaard, M. Evaluating glymphatic pathway function utilizing clinically relevant intrathecal infusion of
csf tracer. J. Transl. Med. 2013, 11, 107. [CrossRef] [PubMed]
186. Iliff, J.J.; Lee, H.; Yu, M.; Feng, T.; Logan, J.; Nedergaard, M.; Benveniste, H. Brain-wide pathway for waste
clearance captured by contrast-enhanced mri. J. Clin. Invest. 2013, 123, 1299–1309. [CrossRef] [PubMed]
187. Xie, L.; Kang, H.; Xu, Q.; Chen, M.J.; Liao, Y.; Thiyagarajan, M.; O’Donnell, J.; Christensen, D.J.; Nicholson, C.;
Iliff, J.J.; et al. Sleep drives metabolite clearance from the adult brain. Science 2013, 342, 373–377. [CrossRef]
[PubMed]
188. Aspelund, A.; Antila, S.; Proulx, S.T.; Karlsen, T.V.; Karaman, S.; Detmar, M.; Wiig, H.; Alitalo, K. A dural
lymphatic vascular system that drains brain interstitial fluid and macromolecules. J. Exp. Med. 2015, 212,
991–999. [CrossRef] [PubMed]
189. Li, M.; Li, F.; Luo, C.; Shan, Y.; Zhang, L.; Qian, Z.; Zhu, G.; Lin, J.; Feng, H. Immediate splenectomy decreases
mortality and improves cognitive function of rats after severe traumatic brain injury. J. Trauma 2011, 71,
141–147. [CrossRef] [PubMed]
190. Chu, W.; Li, M.; Li, F.; Hu, R.; Chen, Z.; Lin, J.; Feng, H. Immediate splenectomy down-regulates the
mapk-nf-kappab signaling pathway in rat brain after severe traumatic brain injury. J. Trauma Acute Care Surg.
2013, 74, 1446–1453. [CrossRef] [PubMed]
191. Teixeira, P.G.; Karamanos, E.; Okoye, O.T.; Talving, P.; Inaba, K.; Lam, L.; Demetriades, D. Splenectomy in
patients with traumatic brain injury: Protective or harmful? A national trauma data bank analysis. J. Trauma
Acute Care Surg. 2013, 75, 596–601. [CrossRef] [PubMed]
© 2017 by the authors. Licensee MDPI, Basel, Switzerland. This article is an open access
article distributed under the terms and conditions of the Creative Commons Attribution
(CC BY) license (http://creativecommons.org/licenses/by/4.0/).
147


MDPI AG
St. Alban-Anlage 66
4052 Basel, Switzerland
Tel. +41 61 683 77 34
Fax +41 61 302 89 18
http://www.mdpi.com
Brain Sciences Editorial Office
E-mail: [email protected]
http://www.mdpi.com/journal/brainsci


MDPI AG
St. Alban-Anlage 66
4052 Basel
Switzerland
Tel: +41 61 683 77 34
Fax: +41 61 302 89 18
www.mdpi.com ISBN 978-3-03842-571-7
Related Documents