ADVANCES IN BUSINESS-RELATED SCIENTIFIC RESEARCH JOURNAL ISSN 1855-931X VOLUME 3 (2012), NUMBER 2 CONTENTS: SEGMENTING PREFERENCES FOR INVESTMENT BONDS USING LATENT VARIABLE MIXTURE MODELS LIBERATO CAMILLERI HELENA FRANCALANZA ……………..…. 105 (JEL CLASSIFICATION: M30, M31, G10) PROCYCLICALITY OF LOAN LOSS PROVISIONS – THE CASE OF POLAND MAŁGORZATA OLSZAK ……………………………………………………………………………………………………. 121 (JEL CLASSIFICATION: E32, E44, G21) EFFECT OF TRAINING COURSES ON COPING STRATEGIES MARTIN RABE SALVATORE GIACOMUZZI ……………………………………………………………………………………………. 135 (JEL CLASSIFICATION: M53, M50, J40) CONSUMER ATTITUDES TO GLOBAL WARMING IN GAUTENG, SOUTH AFRICA M. A. O. DOS SANTOS …………………………………………………………………………………………….. 147 (JEL CLASSIFICATION: M30, M31, Q54) IMPROVING REPRESENTATIVENESS IN ONLINE SURVEYS USING A COMBINED INTERNET/POSTAL APPROACH: EVIDENCE FROM A UK-WIDE SURVEY OF CONSUMERS PETER ATOROUGH BILL DONALDSON AINSLIE HARRIS ………………………………. 161 (JEL CLASSIFICATION: C83, M30, M31) RESPECTING CUSTOMERS: ANALYZING AND DETERMINING ITS NATURE AND THE BOOMERANG EFFECT SITI HARYATI SHAIKH ALI …………………………………………... 171 (JEL CLASSIFICATION: M31, M30, I11) TOWARDS A COMPOSITE COST FUNCTION FOR AN ENTREPRENEUR NOT SO RATIONAL: AN INSTITUTIONAL APPROACH TO COST FUNCTION OF SMALL AND TINY INDUSTRY OF VARANASI REGION SHALINI SINGH BHUPENDRA V. SINGH ………………………… 181 (JEL CLASSIFICATION: D24, L26, B52) EDITOR: BOSTJAN ANTONCIC

Welcome message from author
This document is posted to help you gain knowledge. Please leave a comment to let me know what you think about it! Share it to your friends and learn new things together.
Transcript

ADVANCES IN BUSINESS-RELATED SCIENTIFIC RESEARCH JOURNAL
ISSN 1855-931X
VOLUME 3 (2012), NUMBER 2 CONTENTS: SEGMENTING PREFERENCES FOR INVESTMENT BONDS USING LATENT VARIABLE MIXTURE MODELS LIBERATO CAMILLERI HELENA FRANCALANZA ……………..…. 105
(JEL CLASSIFICATION: M30, M31, G10) PROCYCLICALITY OF LOAN LOSS PROVISIONS – THE CASE OF POLAND MAŁGORZATA OLSZAK ……………………………………………………………………………………………………. 121
(JEL CLASSIFICATION: E32, E44, G21) EFFECT OF TRAINING COURSES ON COPING STRATEGIES MARTIN RABE SALVATORE GIACOMUZZI ……………………………………………………………………………………………. 135
(JEL CLASSIFICATION: M53, M50, J40) CONSUMER ATTITUDES TO GLOBAL WARMING IN GAUTENG, SOUTH AFRICA M. A. O. DOS SANTOS …………………………………………………………………………………………….. 147
(JEL CLASSIFICATION: M30, M31, Q54) IMPROVING REPRESENTATIVENESS IN ONLINE SURVEYS USING A COMBINED INTERNET/POSTAL APPROACH: EVIDENCE FROM A UK-WIDE SURVEY OF CONSUMERS PETER ATOROUGH BILL DONALDSON AINSLIE HARRIS ………………………………. 161
(JEL CLASSIFICATION: C83, M30, M31) RESPECTING CUSTOMERS: ANALYZING AND DETERMINING ITS NATURE AND THE BOOMERANG EFFECT SITI HARYATI SHAIKH ALI …………………………………………... 171
(JEL CLASSIFICATION: M31, M30, I11) TOWARDS A COMPOSITE COST FUNCTION FOR AN ENTREPRENEUR NOT SO RATIONAL: AN INSTITUTIONAL APPROACH TO COST FUNCTION OF SMALL AND TINY INDUSTRY OF VARANASI REGION SHALINI SINGH BHUPENDRA V. SINGH ………………………… 181
(JEL CLASSIFICATION: D24, L26, B52) EDITOR: BOSTJAN ANTONCIC

ABSRJ - mednarodna znanstvena revija ADVANCES IN BUSINESS RELATED SCIENTIFIC RESEARCH JOURNAL ISSN 1855-931X
Copyrights: GEA College – Faculty of Entrepreneurship Editor: Bostjan Antoncic Issued and published by: GEA College – Faculty of Entrepreneurship, Kidricevo nabrezje 2, SI6330 Piran, Slovenia
-
)
Volume (Year : 3 (2012) Number: 2 Electronic publication: www.absrc.org Number of issued CDs: 200
SCOPE Advances in Business-Related Scientific Research Journal (ABSRJ) is an international journal, which publishes scientific papers on diverse topics on business and economics and business-related sciences research. The aim of the journal is to publish new, contemporary, and quality research, including conceptual and empirical research papers. The papers are subject to double blind peer review. The journal is open and encourages the use of various research methods (conceptual development, various univariate and multivariate quantitative methods, various qualitative methods including case studies, action research, ethnographic research, etc.). Diverse business and business-related issues are covered in ABSRJ, which include, but are not limited to, the following topic groups: Business strategy Change management and organizational development Conflict management Critical management Economic growth Economics for business decisions Entrepreneurship Gender, diversity and social issues Human resource management and career development Humanities and arts and business Industry, area or region specific studies International business Language in organizations Law and business Macroeconomics
Management consulting Management education, training and development Managerial and organizational cognition and psychology Marketing and consumer behavior Microeconomics Natural sciences and business Organizational behavior Organizational information and communication systems Organizations and financing Production and operations management Research methods Social sciences and business Sustainable development Technology and innovation management
SUBMISSIONS The expected research papers’ length is about 7,000 to 8,000 words, but also shorter or longer contributions may be considered. Submissions should be sent to: [email protected]

EDITOR Bostjan Antoncic, University of Ljubljana, Ljubljana, Slovenia SCIENTIFIC EDITORIAL BOARD Suavi Ahipasaoglu, Okan University, Istanbul, Turkey Bostjan Antoncic, University of Ljubljana, Ljubljana, Slovenia Heri Bezic, University of Rijeka, Rijeka, Croatia Patrycja Chodnicka, University of Warsaw, Warsaw, Poland Alex F. DeNoble, San Diego State University, San Diego, California, U. S. A. Giorgio Dominese, LUISS University Rome, Rome, University of Udine, Udine, University of Rome Tor Vergata, Rome, Italy Doris Gomezelj Omerzel, University of Primorska, Koper, Slovenia Dietmar Grichnik, University of St. Gallen, St. Gallen, Switzerland Katherine Gundolf, GSCM - Montpellier Business School, Montpellier, France Robert D. Hisrich, Thunderbird School of Global Management, Phoenix, Arizona, U. S. A. Claudine Kearney, University College Dublin, Dublin, Ireland Ekaterina Kostina, Novosibirsk State Pedagogical University, Novosibirsk, Russia Abey Kuruvilla, University of Wisconsin Parkside, Kenosha, Wisconsin, U. S. A. Leonard H. Lynn, Case Western Reserve University, Cleveland, Ohio, U. S. A. Doug Lyon, Fort Lewis College, Durango, Colorado, U. S. A. Stephen O. Migiro, Graduate School of Business Leadership, Midrand, South Africa Rickie Moore, EM Lyon, Lyon, France Malgorzata Olszak, University of Warsaw, Warsaw, Poland Figen Ozulke, Okan University, Istanbul, Turkey N. Panchanatham, Annamalai University, Tamil Nadu, India Cezar Scarlat, University Politehnica of Bucharest, Bucharest, Romania Gangaram Singh, San Diego State University, San Diego, California, U. S. A. Jaka Vadnjal, GEA College, Piran, Slovenia Drasko Veselinovic, GEA College, Piran, Slovenia ABSRJ ACCESS Advances in Business-Related Scientific Research Journal (ABSRJ) is an open access journal. Licensing conditions are described under a Creative Commons Attribution 3.0 Unported (CC BY 3.0) License. ABSRJ PUBLICATION ETHICS AND PUBLICATION MALPRACTICE STATEMENT ABSRJ has the commitment to maintain the highest standards of publication ethics and to take all possible measures against any publication malpractices. Authors, who submit to the journal their works for publication as original articles: (1) declare that the submitted works represent contributions of their authors and that the submitted works have not been copied or plagiarized in whole or in part from other works; (2) acknowledge that they have disclosed all conflicts of interest with their work (any actual or potential conflicts of interest or partial benefits associated with the work). ABSRJ IS LISTED/INDEXED IN DOAJ Directory of Open Access Journals EconBiz - Virtuelle Fachbibliothek Wirtschaftswissenschaften Elektronische Zeitschriftenbibliothek EZB (Electronic Journals Library) Journal Finder Journalseeker Researchbib New Jour - Electronic Journals & Newsletters Search-Document WorldCat

Advances in Business-Related Scientific Research Journal (ABSRJ)
Volume 3 (2012), Number 2
ISSN 1855-931X
SEGMENTING PREFERENCES FOR INVESTMENT BONDS USING LATENT VARIABLE MIXTURE MODELS
Liberato Camilleri
Depar men of S atistics and Operations Research; University of Malta t t t
f t
Malta
Helena Francalanza*
Department o Ma hematics; Junior College
Malta [email protected]
Abstract
Market segmentation is a key component of conjoint analysis which addresses consumer preference heterogeneity. Members in a segment are assumed to be homogenous in their views and preferences when worthing an item but distinctly heterogenous to members of other segments. Latent class methodology is one of the several conjoint segmentation procedures that overcome the limitations of aggregate analysis and a-priori segmentation. The main benefit of Latent class models is that market segment membership and regression parameters of each derived segment are estimated simultaneously. The Latent class model presented in this paper uses mixtures of multivariate conditional normal distributions to analyze rating data, where the likelihood is maximized using the EM algorithm. The application focuses on customer preferences for investment bonds described by four attributes; currency, coupon rate, redemption term and price. A number of demographic variables are used to generate segments that are accessible and actionable.
Key words: Latent class models, EM algorithm, Market Segmentation, Conjoint Analysis
Topic Group: Marketing and Consumer behaviour
INTRODUCTION
Market segmentation has become a dominant concept in marketing practice. Besides being one of the major ways of operationalizing the marketing concept, segmentation provides guidelines for a firm’s marketing strategy and resource allocation to increase the expected
ABSRJ 3(2): 105

Advances in Business-Related Scientific Research Journal (ABSRJ)
Volume 3 (2012), Number 2
profitability (Wind 1978). Understanding the diversity of preferences and sensitivities of customers in the market is one of the greatest challenges of market research. Market segmentation describes the division of a market into homogenous clusters, whose members respond differently to promotion, advertising, communication and other marketing variables. These clusters are created to group customers with similar needs, tastes and preferences, so that products or services can be optimally designed and targeted. Market segmentation was first described by (Smith 1956) who recognized that segments are directly derived from the diversity of customer wants. The market environment is not static and market segments change composition over time. It is the interest of every market researcher to identify these changes. With more direct access to customers via databases, the market environment presents new challenges and opportunities for market segmentation. New developments in information technology provide marketers with much richer information on consumer behaviour. The rapid growth of new technologies in information, development of product, production and distribution enables a new company to make more efficient use of marketing resources, focussing on the best segments for its market products. The ability of a firm to differentiate its products relative to competing firms is essential for its survival. This survival depends on finding and addressing a niche rather than trying to be all things to all consumers. Consequently, marketers are focussing on smaller segments with micro marketing and direct marketing approaches. On the other hand, the increasing globalisation of most product markets is leading many multi-product manufacturers to look at global markets that cut across continents. Six criteria have been frequently put forward as being essential for effective and profitable marketing strategies. The identifiablity criterion is the extent that marketers identify differences between distinct groups of customers in the market and the ability to classify each customer into one or more segments. The substantiality criterion refers to the size issue. If the identified segment is large enough to ensure profitability then it warrants separate market targeting. In micro markets and mass customisation, smaller segments become profitable due to lower marginal marketing costs; whereas in direct marketing, the criterion of substantiality can be applied to each individual customer. The accessibility criterion is the degree to which marketers are able to reach the targeted segment by a distinct marketing mix strategy. Once segments are identified and products are designed to suit their tastes, the marketer must be able to identify members of the segments so that marketing efforts can be directed to them. In other words, the message must reach the right market segment by using the right promotional strategies, media sources and distributional efforts to target these people. The responsiveness criterion is the degree by which segments respond uniquely to marketing effort targeted at them. Responsiveness is crucial for the effectiveness of any market segmentation strategy. Once the market is segmented, stability is necessary in which the segments do not change their composition or behaviour during the period for the identification of members and the implementation of the segmented market strategy. It is very likely that the segment will not be viable if its existence is the result of a short-term phenomenon,. The actionability criterion refers to the extent to which the identified market segments provide direction of marketing efforts. Segments are actionable if their identification provides guidance for decisions on the effective specification of associated marketing strategies towards segment targets.
ABSRJ 3(2): 106
Advances in Business-Related Scientific Research Journal (ABSRJ)
Volume 3 (2012), Number 2
CONJOINT SEGMENTATION METHODS
In most of the traditional a-priori segmentation approaches the type and number of segments were determined in advance by the researcher in which consumers were, very often, assigned to segments on the basis of demographic and socio-economic variables. Subsequently segmentation shifted to post-hoc predictive approaches because its recent developments allow for the grouping of consumers according to how they respond to product features in making choice decisions. Segmentation methods differ in three aspects: the type of partitioning assumed; the algorithms and estimation procedures used and the criterion being optimized. Some of these conjoint segmentation methods are summarized in the subsequent section.
A review of segmentation methods
A conjoint segmentation procedure proposed by (Green and DeSarbo 1979) is componential segmentation in which consumer descriptive variables are used. Consumer profiles are first generated on the basis of such characteristics. Respondents matching these profiles are chosen from a sample frame and asked to complete a conjoint task. From these evaluations, the componential segmentation model estimates both the main effects of the design variables and interactions between design variables of product and subject profiles. Estimation is carried out by minimizing the error sum of squares and the segmentation scheme is non-overlapping. In the traditional two-stage conjoint segmentation approach estimation and clustering are conducted consecutively. Individual-level parameter estimates are first obtained by using least squares regression. At the second stage, subjects are clustered into segments on the basis of similarity of the estimated parameters through hierarchical or nonhierarchical nonoverlapping clustering procedures. One of the limitations of this two stage approach is that it ignores biasing errors. A second problem is that the use of fractional factorial designs often leaves few degrees of freedom for estimation at the individual level. This makes the parameter estimates unreliable as they become more sensitive to the measurement error. A third problem arises when the predictors are collinear. Near linear dependencies render it more difficult to sort out the impact of each predictor on the response and parameters estimates tend to be unreliable. This in turn may cause misclassification of individuals and negatively affects the goodness-of-fit and the power of the significance tests. A fourth limitation is that least squares regression and clustering procedures optimize different criteria. (Green and Srinivasan 1978) proposed an alternative two-stage procedure. In the first step, consumers are clustered on the basis of their preference ratings whereas in the second step, separate conjoint models are estimated across the subjects in each of the identified segments. So rather than clustering consumers on the basis of similar parameter estimates at individual level, this method applies regression to the responses in each cluster to obtain more reliable parameter estimates. This procedure in effect increases the number of observations available for estimating the parameters and thus reduces the error of estimation. (Hagerty 1985) proposed a method based on a weighting scheme which represents a factor-type partitioning of the sample. This weighting scheme presents an optimal overlapping partitioning obtained by a Q-factor analysis of the between-subject correlation matrix of preferences. A possible problem with this method is the interpretation of the factor solution
ABSRJ 3(2): 107

Advances in Business-Related Scientific Research Journal (ABSRJ)
Volume 3 (2012), Number 2
in terms of segments. The number of extracted factors need not be an adequate indicator of the number of segments. Another problem is that the factoring solutions are not unique, given the rotational indeterminacy of such factor solutions. Procedures proposed to identify segments on the basis of the factor solution, very often, result in a loss in predictive accuracy. In response to the limitations of a-priori and two-stage procedures several integrated conjoint segmentation methods were proposed in which the parameters within the segments are estimated at the same time that the segments are identified. (Kamakura 1988) suggested a hierarchical clusterwise regression procedure that allows for prediction within segments. At the first stage of the algorithm a regression equation is estimated for each subject using ordinary least squares, yielding regression parameter estimates of several independent variables for each subject. In the second stage a weighting scheme is devised that group subjects to maximise the accuracy with which preferences are predicted from product profiles. The fusion of any two subjects that yields the minimum increase in the total residual sum of squares of the regression across all clusters is retained and the two subjects are combined. The agglomerative process is similar to that of Ward’s method. In each successive stage, segments that provide the smallest possible increase in the pooled within-segment error variance are linked together. A predictive accuracy index is computed at each aggregation level and provides an intuitive criterion for deciding how many segments to retain. There are two disadvantages to this agglomerative hierarchical method. First, the clustering process implies that this method depends in the initial stages on parameter estimates at the individual level, thereby creating the danger of misclassification at an early stage due to unreliable estimates. This misclassification may extend to higher levels in the hierarchical clustering process. Second, the number of parameters at the individual level may exceed the number of responses and so cannot be estimated. Models that are over-parameterised at the individual level yield unstable individual parameter estimates due to lack of degrees of freedom. Statistical tests to check for the significance of parameter estimates and check for homogeneity within the segments cannot be used because the asymptotic properties do not apply when the number of estimated parameters is close to the number of observations. (Ogawa 1987) presented an approach for rank order preferences that employs simultaneous segmentation and estimation of conjoint models by using a hierarchical, non-overlapping clustering method. His formulation employs a stochastic logit framework. To evade problems with uniqueness of parameter estimates the author proposed a ridge regression-like procedure to estimate parameters at the individual level using multinomial logit models. An information criterion is also proposed to aggregate consumers hierarchically. This agglomerative method starts with single subject clusters and segments are combined iteratively to give a minimum reduction of the aggregate log-likelihood. Several non-hierarchical procedures based on optimisation criteria are descriptive clustering methods that do not distinguish between dependent and independent variables. (Spath 1979, 1982) proposed a clusterwise linear regression procedure to find homogeneous groups in terms of the relationship between dependent and independent variables and simultaneously estimate corresponding regression functions within the clusters such that the sum of the error sums of squares over all clusters is minimized. Spath’s method handles only one observation per individual. (Wedel and Kistemaker 1989) proposed a generalization of clusterwise regression by extending Spath’s method to handle more than one observation per individual and which estimates parameters and segments simultaneously. Their
ABSRJ 3(2): 108
Advances in Business-Related Scientific Research Journal (ABSRJ)
Volume 3 (2012), Number 2
procedure uses (Banfield and Bassil 1977) exchange algorithm to maximize the likelihood and yields nonoverlapping, nonhierarchical segments. (DeSarbo et al., 1989) proposed an overlapping clusterwise regression procedure that uses a simulated annealing algorithm for optimisation. This methodology can accommodate more general clusterwise linear regression formulations. It allows for multiple dependent variables, replicated observations by respondent, overlapping and nonoverlapping clusters and constraints on cluster membership. Computationally, simulated annealing has been devised as a general optimisation methodology to find the global optimum of a function that may have several local optima. This technique is based on a controlled random search that samples the objective function in a feasible region of the parameter space. The simulated annealing procedure starts from a random initial partition of the sample, and iteratively specifies steps in a random direction in the parameter space. If the new value of the objective function improves the criterion then the new solution is accepted. If the new value of the objective function does not improve the criterion then the new solution is rejected with a probability proportional to the decrease in the criterion value. The merit of this procedure is that it is less burdened with convergence to local optima. (Wedel and Steenkamp 1989) proposed a fuzzy clusterwise regression algorithm that differs from the other fuzzy procedures since clusters are defined from regressions of the dependent variable on a set of explanatory variables. Similar to other fuzzy algorithms, partitioning of the data is carried out by minimizing the residual sum of squares criterion, which represents the sum of the distances of subjects from the regression equations in all clusters. The clustering algorithm iterates between two steps: computing regression parameters within each cluster and calculating fuzzy membership of subjects in clusters. (Wedel and Steenkamp 1991) generalizes this fuzzy clusterwise procedure to allow for a simultaneous grouping of both consumers and brands into groups, making possible the identification of market segments and market structures at the same time. There are two potential problems with this approach. The first is that the users must subjectively specify a fuzzy weight parameter that influences the degree of separation of the clusters and the second is that the statistical properties of the estimators are not established. Probably, the advent of latent class models stands out to be the most extensive development in market segmentation. The works of (Wedel and DeSarbo 1995) and (DeSarbo et al., 1992) brought major changes in market segmentation applications. The major merit of these models is that they allow for simultaneous estimation and segmentation and enable correct statistical inference. In an excellent review, (Vriens, Wedel and Wilms 1996) conducted a Monte Carlo comparison of several traditional and integrated conjoint segmentation methods. The authors found that latent class segmentation models performed best in terms of parameter recovery, segment membership recovery and predictive accuracy.
THEORETICAL FRAMEWORK OF LATENT CLASS MODEL
One of the criteria for effective market segmentation is to identify differences between distinct groups of customers in the market and be able to classify each customer into a segment. The general principle of latent class models is that each segment defines a different probability structure for the response variable. For the segmentation procedure a latent class model with K segments is proposed.
ABSRJ 3(2): 109

Advances in Business-Related Scientific Research Journal (ABSRJ)
Volume 3 (2012), Number 2
( ) ( )1
; , , , , ,K
n k nk nk
H fπ=
=∑y π X β Σ y X β Σk k
NK
1, ,n = K respondents; 1, ,k = K derived segments;
kπ is the proportion of respondents in segment k and ( )1,..., Kπ π=π;
ny is the vector of response ratings elicited by consumer n; X is the data matrix;
kβ is the vector of parameter estimates for segment k and ; ( )'1,..., K=β β β
kΣ is the covariance matrix estimated for segment k and . ( )'1,..., K=Σ Σ Σ
It is assumed that 1
1Kkπ =∑ and each nkf has a conditional multivariate normal
distribution.
( ) ( ) ( ) ( )1 ' 122 1, , 2 exp
2J
nk n k k k n k k n kf π −− −⎡ ⎤= − − −⎢ ⎥⎣ ⎦y X β Σ Σ y Xβ Σ y Xβ
The log-likelihood expression for N independent respondents is given by:
( ) ( ) ( )1 11
ln , , , ln ; , , , ln . , ,N N K
n k nk nn kn
L H fπ= ==
= =∑ ∑∏π X β Σ y π X β Σ y X β Σk k
The derivatives of the expected log-likelihood function ( )ln , , ,E L⎡ ⎤⎣ ⎦π X β Σ with respect to
the parameters are not straightforward. An effective procedure to fit a latent class model with K segments is to maximize the expected complete log-likelihood function using the iterative EM algorithm proposed by (Dempster et al., 1977). The idea behind the EM algorithm is to augment the observed data by introducing unobserved data nkλ . This is a 0-1
indicator indicating whether respondent n is in segment k. Given the matrix ( )nkλ=Λ the
complete log-likelihood function is given by:
( ) ( ) ( )1 1 1 1
ln , , , .ln , , .lnN K N K
nk nk n k k nk kn k n k
L fλ λ π= = = =
= +∑∑ ∑∑π X β Σ Λ y X β Σ
(ln , , , L π X β Σ Λ) has a simpler form than ( )ln , , ,L π X β Σ and the derivatives are
manageable. Each iteration is composed of two steps - an E-step and an M-step. In the E-step, the expected log-likelihood function is calculated with respect to the conditional distribution of the unobserved data matrix ( )nkλ=Λ given the data and the provisional
parameter estimates . This is carried out by replacing ˆ ˆˆ , and k kπ β kΣ ( )nkE λ by the posterior
probabilities ˆnkp
ABSRJ 3(2): 110

Advances in Business-Related Scientific Research Journal (ABSRJ)
Volume 3 (2012), Number 2
( ) ( ) ( )1 1 1 1
ˆ ˆln , , , .ln , , .lnN K N K
nk nk n k k nk kn k n k
E L p f p π= = = =
⎡ ⎤ = +⎣ ⎦ ∑∑ ∑∑π X β Σ Λ y X β Σ
( )( )( )
1
ˆ ˆˆ . , ,ˆ
ˆ ˆˆ . , ,
k nk n k k
nk nk K
k nk n k kk
fp E
f
πλ
π=
= =
∑
y X β Σ
y X β Σ and
1
ˆ 1K
nkk
p=
=∑
In the M-step the two terms of ( )ln , , , E L⎡ ⎤⎣ ⎦π X β Σ Λ are maximized separately with
respect to the parameters kπ and . Maximizing the first term of the expected log-
likelihood function with respect to leads to independently solving each of the K expressions
kβ
kβ
( )1
ˆ . ln , ,N
nk nk n k kn k
p f=
∂∂∑ y X β Σβ
for Kk ,...,2,1=
Maximizing the second term of the expected log-likelihood function with respect to kπ ,
subject to the constraint , yields 1
1K
kkπ
=
=∑
1
1ˆ ˆN
k nn
kpN
π=
= ∑ for Kk ,...,2,1=
METHODOLOGY AND IMPLEMENTATION
The EM algorithm for fitting latent class models is implemented as a set of GLIM macros. This is equivalent to the iterative fitting of a weighted generalized linear model with posterior probabilities recalculated at each iteration. The iterative procedure is initiated by setting random values to . The algorithm then alternately updates the parameters and the probabilities until the process converges. The assignment of individuals to segments is done probabilistically by Bayes’ Theorem. Individuals are assigned to the segment with the highest posterior probability
ˆ nkp ˆ ˆˆ , and k kπ β Σk
ˆ nkp
ˆnkp . A problem associated with the application of the EM algorithm to latent class models is its convergence to local maxima. It is caused by the likelihood being multimodal, so that the algorithm becomes sensitive to the starting values used. A procedure that widens the search for the global maximum is to perturb the posterior probabilities at each iteration by adding to each probability a pseudo-random real value multiplied by a scalar. The pseudo-random real values are generated from a uniform distribution in the range [0,1] from and the scalar is initially set to 0.1. These modified posterior probabilities are rescaled such that they sum to 1 across the segments. This scalar is reduced systematically after a number of iterations so that the iterative procedure will eventually converge.
ABSRJ 3(2): 111

Advances in Business-Related Scientific Research Journal (ABSRJ)
Volume 3 (2012), Number 2
APPLICATION
Bond investment strategies vary between policyholders. Some policyholders may give more relevance to coupon rate and duration of investment; whereas other policyholders may give more importance to the issue price and credit rating of the issuer. Indeed the choices policyholders make depend upon several factors, which include their knowledge, their time frames, investment goals and the amount of risk that they are willing to take. To illustrate the methodology a conjoint study on 300 policyholders was conducted to investigate their preference for investment bonds. Four product attributes, which included issue price, duration of investment, coupon rate and credit rating of issuing company were identified as being key determinant attributes. The study compared three issue prices (97, 100 and 103) with two investment periods (10 and 20 years) with three coupon rates (3%, 4% and 5%) and with two levels of credit rating (A and B). A complete factorial design was utilized which included 36 combinations of attribute manifestations. For data collection a full profile approach was used in which all the profiles had a unique attribute combination for an investment bond. Such a design guarantees orthogonality (independence) of the attributes and eventually this will result in an efficient estimation of the parameters. To reduce information overload on respondents two blocks of cards were presented and each respondent was handed a set of 18 cards with random assignment to block. Preference ratings were measured on a seven point scale where 1 corresponds to ‘worst’ and 7 corresponds to ‘best’. A rating scale was chosen over a ranking scale on the merit that it express more the intensity of a preference. The data collection procedure used was person-to-person interview as this ensured a higher return rate. The linear predictor which relates the expected worth of an investment bond to its product attributes includes all main effects and all pairwise interactions. To make the derived market segments more accessible and actionable two subject profiles were also recorded including gender and their knowledge about investment bonds. The sample of 300 participants comprised equal number of males and females and equal number of participants with good knowledge and limited knowledge about investment bonds. Most respondents with good knowledge were employees in the financial sector. Latent class models assume that observed data is made up of several unknown homogeneous segments which are mixed up in an unknown proportion. The first statistical objective is to discover the true number of segments. To address this issue, three criteria were used to identify the correct number of homogeneous groups of respondents in a heterogeneous population. Two of these information criteria are based on the bias-corrected log-likelihood.
( )2logC L dc= − +Ψ
d is the number of estimated parameters and c is a penalty constant and measures the complexity of the model. For the Akaike information criterion (AIC), and for the Bayesian information criterion (BIC),
2c =( )lnc N= , where N is the sample size. The third
criterion includes an additional entropy term which is related to posterior probabilities ˆnkp .
( ) ( )1 1
ˆ ˆ logK N
nk nk nkk n
ˆEN p p p= =
= −∑∑
ABSRJ 3(2): 112
Advances in Business-Related Scientific Research Journal (ABSRJ)
Volume 3 (2012), Number 2
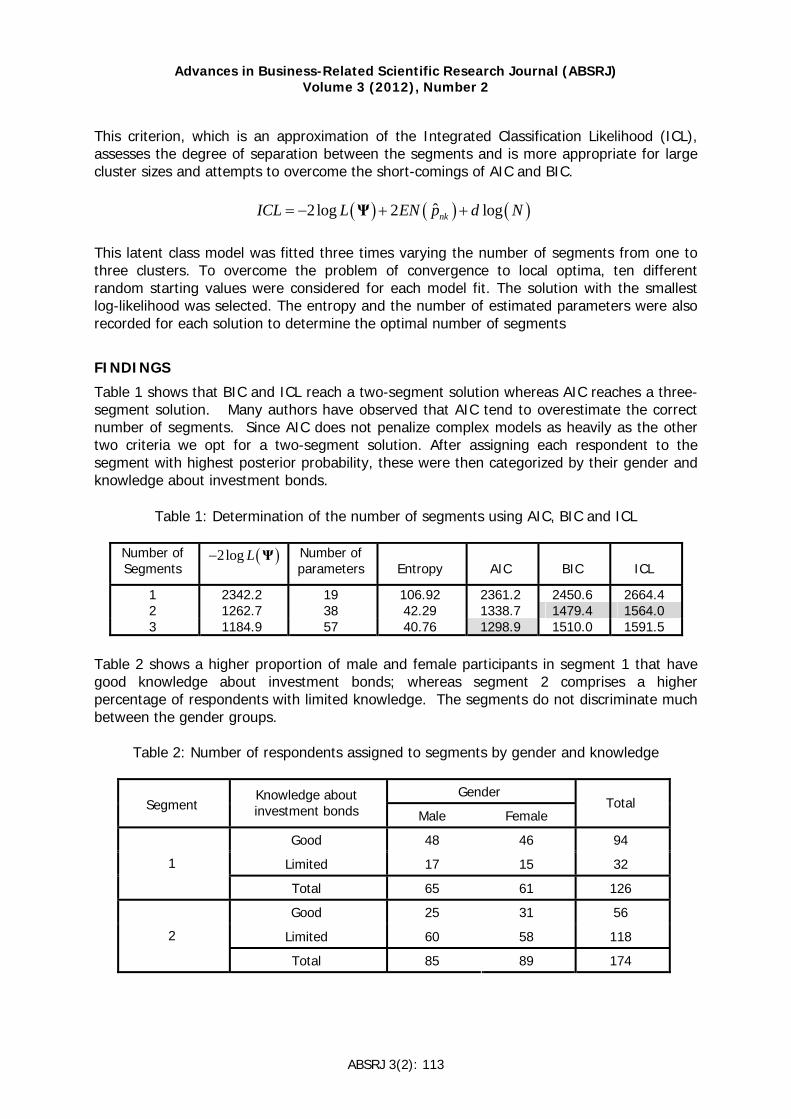
This criterion, which is an approximation of the Integrated Classification Likelihood (ICL), assesses the degree of separation between the segments and is more appropriate for large cluster sizes and attempts to overcome the short-comings of AIC and BIC.
( ) ( ) ( )ˆ2log 2 lognkICL L EN p d N= − + +Ψ This latent class model was fitted three times varying the number of segments from one to three clusters. To overcome the problem of convergence to local optima, ten different random starting values were considered for each model fit. The solution with the smallest log-likelihood was selected. The entropy and the number of estimated parameters were also recorded for each solution to determine the optimal number of segments
FINDINGS
Table 1 shows that BIC and ICL reach a two-segment solution whereas AIC reaches a three-segment solution. Many authors have observed that AIC tend to overestimate the correct number of segments. Since AIC does not penalize complex models as heavily as the other two criteria we opt for a two-segment solution. After assigning each respondent to the segment with highest posterior probability, these were then categorized by their gender and knowledge about investment bonds.
Table 1: Determination of the number of segments using AIC, BIC and ICL
Number of Segments
( )2log L− Ψ
Number of parameters
Entropy
AIC
BIC
ICL
1 2342.2 19 106.92 2361.2 2450.6 2664.4 2 1262.7 38 42.29 1338.7 1479.4 1564.0 3 1184.9 57 40.76 1298.9 1510.0 1591.5
Table 2 shows a higher proportion of male and female participants in segment 1 that have good knowledge about investment bonds; whereas segment 2 comprises a higher percentage of respondents with limited knowledge. The segments do not discriminate much between the gender groups.
Table 2: Number of respondents assigned to segments by gender and knowledge
Gender
Segment Knowledge about investment bonds Male Female
Total
Good 48 46 94
Limited 17 15 32 1
Total 65 61 126
Good 25 31 56
Limited 60 58 118 2
Total 85 89 174
ABSRJ 3(2): 113
Advances in Business-Related Scientific Research Journal (ABSRJ)
Volume 3 (2012), Number 2
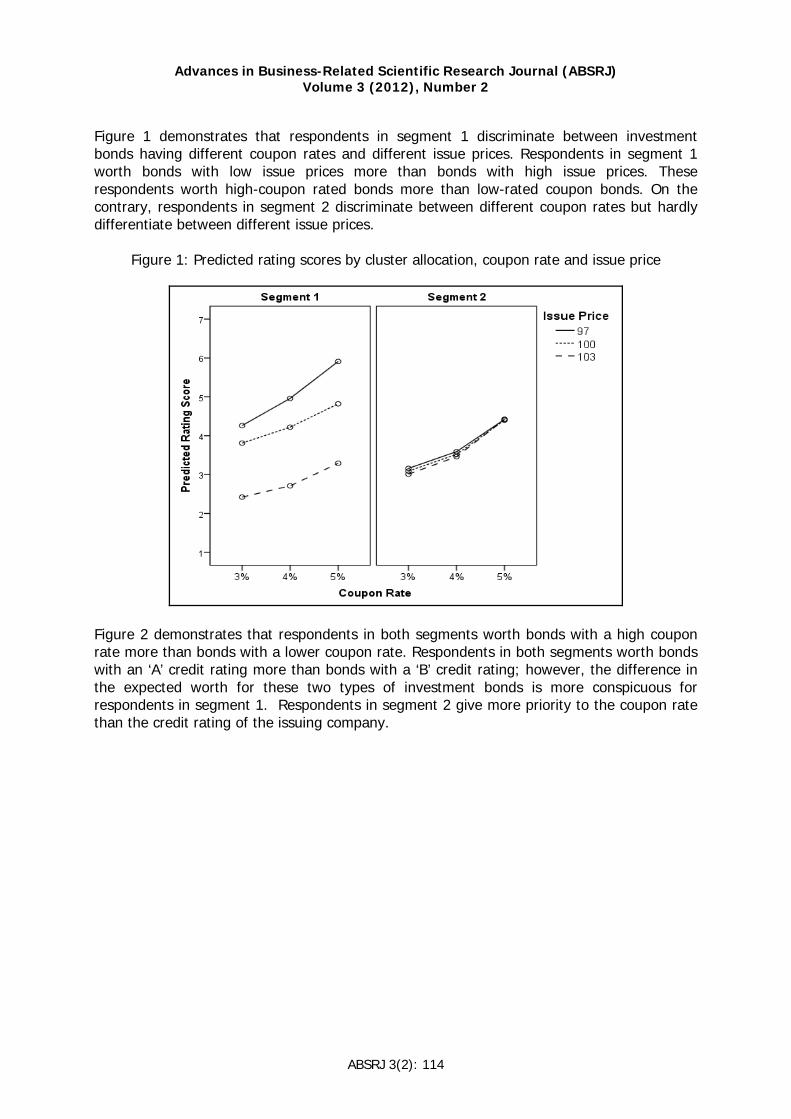
Figure 1 demonstrates that respondents in segment 1 discriminate between investment bonds having different coupon rates and different issue prices. Respondents in segment 1 worth bonds with low issue prices more than bonds with high issue prices. These respondents worth high-coupon rated bonds more than low-rated coupon bonds. On the contrary, respondents in segment 2 discriminate between different coupon rates but hardly differentiate between different issue prices.
Figure 1: Predicted rating scores by cluster allocation, coupon rate and issue price
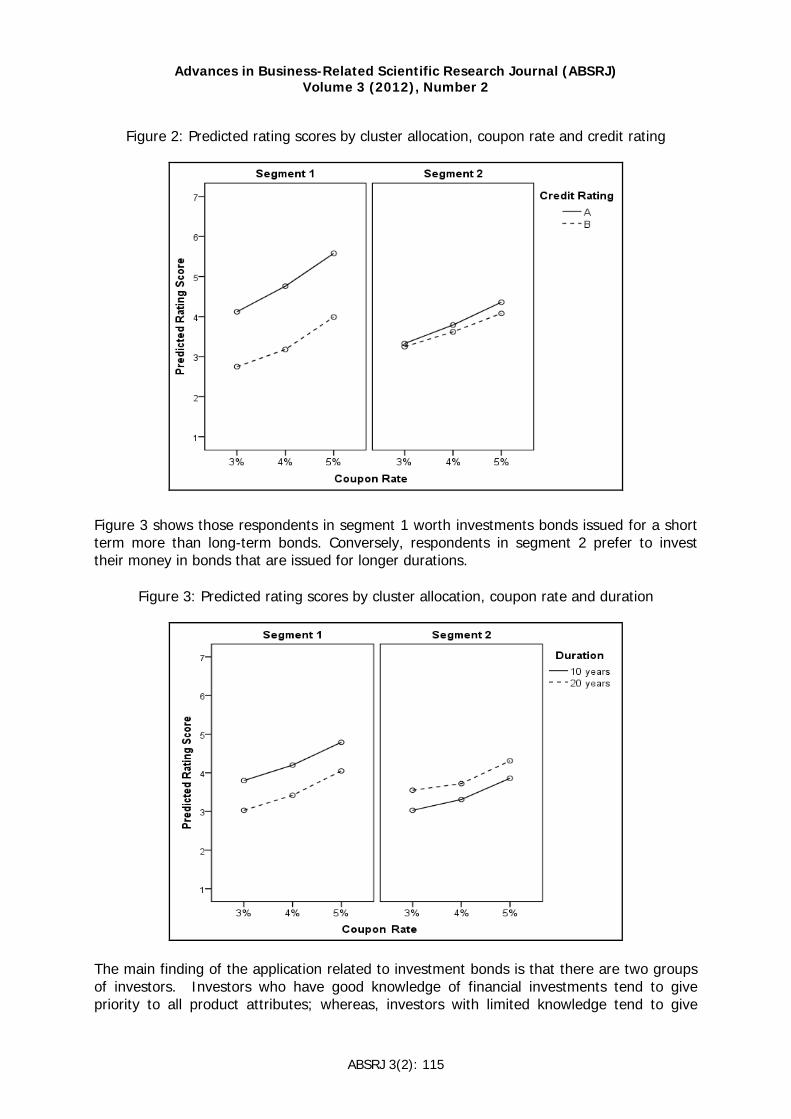
Figure 2 demonstrates that respondents in both segments worth bonds with a high coupon rate more than bonds with a lower coupon rate. Respondents in both segments worth bonds with an ‘A’ credit rating more than bonds with a ‘B’ credit rating; however, the difference in the expected worth for these two types of investment bonds is more conspicuous for respondents in segment 1. Respondents in segment 2 give more priority to the coupon rate than the credit rating of the issuing company.
ABSRJ 3(2): 114
Advances in Business-Related Scientific Research Journal (ABSRJ)
Volume 3 (2012), Number 2
Figure 2: Predicted rating scores by cluster allocation, coupon rate and credit rating
Figure 3 shows those respondents in segment 1 worth investments bonds issued for a short term more than long-term bonds. Conversely, respondents in segment 2 prefer to invest their money in bonds that are issued for longer durations.
Figure 3: Predicted rating scores by cluster allocation, coupon rate and duration
The main finding of the application related to investment bonds is that there are two groups of investors. Investors who have good knowledge of financial investments tend to give priority to all product attributes; whereas, investors with limited knowledge tend to give
ABSRJ 3(2): 115

Advances in Business-Related Scientific Research Journal (ABSRJ)
Volume 3 (2012), Number 2
more priority to coupon rates and dividend returns than to the issue price of the bond and credit rating of the issueing company. Moreover, investors with good knowledge of financial investments tend to invest their money for shorter terms than their counterparts with limited knowledge.
IMPLICATIONS FOR THEORY AND PRACTICE
Segmentation has proved to be a very useful concept to managers and modelling consumer heterogeneity is the central focus of many statistical marketing applications. Models that approximate market heterogeneity by a number of unobserved segments have great managerial appeal in many applications. Moreover, managers seem comfortable with the idea of market segments based on the assumption that consumers can be grouped into relatively homogeneous segments and the models appear to do a good job of identifying useful groups. Although segment-level models are very compelling from a managerial standpoint, they can over-simplify the market scenario and may have limited predictive validity. One of the major concerns underlined by market researchers is whether segment-level models enable marketers to customize their products or services to very small segments, particularly micro-marketing, direct marketing and mass customisation. Segment-level models may not be sufficiently accurate in estimating responses to marketing variables at the consumer level. The rapid growth of new technologies is enabling marketers to customize their products or services to very small segments where each consumer may represent a segment and the responses to marketing variables are estimated at the individual level. In other words, a set of idiosyncratic parameters is estimated for each subject, where the posterior distribution of individual-level parameters can be estimated using Bayesian methods. Bayesian estimation methods have gained popularity recently and their main advantage lies in obtaining posterior distributions of individual-level parameters based on the parameters of the prior distribution. The majority of market research applications assume a discrete distribution. The popularity of this approach is partly due to the fact that the marginal likelihood is easily evaluated as a sum over a discrete number of mass points. (Heckman and Singer 1984) emphasize that any distribution can be approximated, to a high degree of accuracy, by a discrete distribution for a sufficient number of mass points. However, other authors argue that consumer heterogeneity is better described by a continuous rather than a discrete distribution. (Allenby and Rossi 1999), pointed out that the underlying assumption of a limited number of segments of individuals that are perfectly homogeneous within segments in finite mixture models is overly restrictive.nThe authors argue that by segmenting the market into a small number of homogeneous clusters leads to an artificial partition of the continuous distribution because a limited number of mass points may inadequately capture the full extent of heterogeneity in the data. (Lenk, DeSarbo, Green and Young 1996) argue that a discrete latent class or mixture approach to heterogeneity ignores the inherent differences across consumers and may result in a loss of predictive performance. In micro or direct marketing applications a continuous approximation of consumer heterogeneity may be more appropriate because targeting individual customers is more essential than identifying segments. (Allenby and Lenk 1994; Allenby and Ginter 1995) suggest that consumer preferences, tastes and response to marketing variables are distributed over the consumer population according to a continuous distribution rather than assuming a discrete distribution across homogeneous segments. Both discrete and continuous representations have advantages and disadvantages and there is no evidence that one representation outperforms the other. It is still an empirical question under which conditions one representation is more
ABSRJ 3(2): 116

Advances in Business-Related Scientific Research Journal (ABSRJ)
Volume 3 (2012), Number 2
appropriate than the other. (Arora, Allenby and Ginter 1998; Lenk and DeSarbo 2000) have developed segmentation models that reach a compromise between the two philosophies to account for both discrete segments and within segment heterogeneity. Their methodology combines discrete and continuous heterogeneity approaches. Both discrete and continuouos heterogeneity models can in principle be estimated with either maximum likelihood or Bayesian methods.
LIMITATIONS AND FUTURE RESEARCH
Our discussion focussed mainly on latent class models that address heterogeneity through a discrete distribution. These segment-level models assume that subjects within each segment respond similarly to a marketing mix but respond differently to others in other clusters. The main advantage of these models over traditional clustering techniques lies in simultaneous estimation and segmentation. The algorithm was devised to implement latent class models for normally-distributed rating responses, where the parameters are estimated using a maximum likelihood approach. The limitation of the algorithm is that the normality assumption may not always be adequate and inappropriate statistical assumptions may lead to deficiencies in the performance of the analyses, particularly when the distribution of rating scores is skewed. An alternative approach is to modify the algorithm by combining the Proportion odds model with the EM algorithm. The Proportion Odds model is more appropriate since it accommodates skewed ordinal categorical responses better when the normality assumption is not satisfied. Moreover, when the data set comprises response categories that have a natural ordering it is more sensible to work with cumulative link models since they utilize the ordering better. Consider an ordinal scale from 1 to R and let jϒ represent the R -category responses then
can be defined as the cumulative probability of the item for .
The cumulative probabilities reflect the ordering since;
( jP ϒ ≤ )r
1
thr thj 1, 2,...,r R=
( 1) ( 2) ... ( )j j jP P P Rϒ ≤ ≤ ϒ ≤ ≤ ≤ ϒ ≤ =
Assuming that is the design matrix containing the values of the explanatory variables, the
row X
thj jx of contains the values of the explanatory variables for the item. Also,
letting
X thj
1( ,..., )pβ β=β be a vector of parameters for the explanatory variables and
1( ,..., )R 1α α −=α be a vector of threshold parameters such that 1 2 1... Rα α α −≤ ≤ ≤ 0α = −∞,
and Rα = ∞ . The proportional odds model, which is the appropriate model for analyzing ordinal categorical responses is given by:
( ) ( )j r iP r F α ηϒ ≤ = + for 1, 2,..., 1r R= − where and is a cumulative distribution function. The link function is a
strictly monotonic function in the range [0 onto the real line. The cumulative link model
links the cumulative probabilities
j jη ′= x β F 1F −
,1]( jP )rϒ ≤ to the real line, using the link function . 1F −
1[ ( )]j rF P r jα η− ϒ ≤ = +
ABSRJ 3(2): 117

Advances in Business-Related Scientific Research Journal (ABSRJ)
Volume 3 (2012), Number 2
)r
(.)F can be the logistic, normal or the extreme value distributions leading to logit, probit
and complementary log-log link functions. The model suggested by (McCullagh 1980), for predicting the probabilities (j jPµ = ϒ = is given by
1( ) ( ) ( 1) ( ) ( )j j j r j rP r P r P r F F jα η α −ϒ = = ϒ ≤ − ϒ ≤ − = + − +η
For the segmentation procedure a latent class model with K segments is considered
1
( , , ) ( ,K
j k jk
P r P r )α β π π α β=
ϒ = = ϒ =∑
where 1( , ) ( ) (j r j rP r F Fα β α α −
′ϒ = = + − +x β x β)j′ and kπ is the proportion of
respondents in the segment. The likelihood function is maximized using the EM algorithm which is equivalent to iterative fitting of a weighted GLM with posterior probabilities recalculated at each iteration. Moreover, the parameters within the segments are estimated at the same time that segment membership is identified.
thk
REFERENCES
Allenby, G. M. & Ginter, J. L. (1995). Using Extremes to Design Products and Segment Markets, Journal of Ma keting Research, 32, 392-405. r
t
Allenby, G. M. & Lenk, P. J. (1994). Modelling Household Purchase Behaviour with Logistic Normal Regression, Journal of the American Statistical Association 89, 1218-1231.
Allenby, G. M. & Rossi, P. E. (1999). Marketing Models of Heterogeneity, Journal of Econome rics, 89, 57-78.
Arora, N., Allenby, G. M. & Ginter, J. L. (1998). A hierarchical Bayes model of primary and secondary demand. Marketing Science, 17, 29-44.
Bagozzi, R. P. (1994), Advanced Methods of Marketing Research, Blackwell Publisher. Banfield, C. F. & Bassil, L. C. (1977). Transfer Algorithm for Nonhierarchical Classification,
Applied Statistics, 26, 206-210. Dempster, A. P., Laird, N. M. & Rubin, D. B. (1977). Maximum Likelihood from Incomplete
Data via the EM algorithm, Journal of the Royal Statistical Society, B, 39, 1-38. DeSarbo, W. S., Oliver, R. L. & Rangaswamy, A. (1989). A Simulated Annealing Methodology
for Clusterwise Linear Regression, Psychometrika, 54, 707-736. DeSarbo, W. S., Wedel, M., Vriens, M. & Ramaswamy, V. (1992). Latent Class Metric
Conjoint Analysis, Marketing Letters, 3, 273-288. Green, P. E. & DeSarbo, W. S. (1979). Componential Segmentation in the Analysis of
Consumer Trade-offs; Journal of Marketing, 43, 83-91. Green, P. E. & Srinivasan, V. (1978). Conjoint Analysis in Consumer Research: Issues and
Outlook, Journal of Consumer Research, 5, 103-123. Hagerty, M. R. (1985). Improving the predictive Power of Conjoint Analysis: The Use of
Factor Analysis and Cluster Analysis, Journal of Marketing Research, 22, 168-184. Heckman, J. J. & Singer, B. (1984). A Method for Minimizing the Impact of Distributional
Assumption in Econometric Models for Duration Data, Econometrica, 52, 271-320. Kamakura, W. A. (1988). A Least Squares Procedure for Benefit Segmentation with Conjoint
Experiments, Journal of Marketing Research, 25, 157-167.
ABSRJ 3(2): 118

Advances in Business-Related Scientific Research Journal (ABSRJ)
Volume 3 (2012), Number 2
t
Lenk, P. J. & DeSarbo, W. S. (2000). Bayesian Inference for Finite Mixture of Generalized Linear Models with Random Effects, Psychometrika, 65, 93-119.
Lenk, P. J., DeSarbo, W. S., Green, P. E. & Young, M. R. (1996). Hierarchical Bayes Conjoint Analysis: Recovery of Partworth Heterogeneity from Reduced Experimental Designs, Marketing Science, 15, 152-173.
McCullagh, P. (1980). Regression models for ordinal data. J. R. Sa ist. Soc. B 42, 109-142. Ogawa, K. (1987). An Approach to Simultaneous Estimation and Segmentation in Conjoint
Analysis, Marketing Science, 6, 66-81. Rossi, P. E., Allenby, G. M. & McCulloch, R. (2006). Bayesian Statistics and Marketing, John
Wiley and Sons Ltd. Smith, W. (1956). Product Differentiation and Market Segmentation as Alternative Marketing
Strategies, Journal of Marketing, 21, 3-8. Spath, H. (1979). Clusterwise Linear Regression, Computing, 22, 367-373. Spath, H. (1982). An Algorithm for Clusterwise Linear Regression, Computing, 29, 175-181. Vriens, M., Oppewal, H. & Wedel, M. (1998). Ratings-based versus Choice-based Latent
Class Conjoint Models – An empirical comparison, Journal of the Market Research Society, 40, 237-248.
Wedel, M. & DeSarbo, W. S. (1995). A Mixture Likelihood Approach for Generalized Linear Models, Journal of Classification, 12, 1-35.
Wedel, M. & Kamakura, W. A. (2000). Market Segmentation: Conceptual and MethodologicalFoundations, Kluwer Academic Publishers.
Wedel, M. & Kistemaker, C. (1989). Consumer Benefit Segmentation using Clusterwise Linear Regression, International Journal of Research Marketing, 6, 45-49
Wedel, M. & Steenkamp, J. B. (1989). Fuzzy Clusterwise Regression Approach to Benefit Segmentation, International Journal of Research in Marketing, 6, 241-258.
Wedel, M. & Steenkamp, J. B. (1991). A Clusterwise Regression Method for Simultaneous Fuzzy Market Structuring and Benefit Segmentation, Journal of Market Research, 28, 385-396.
Wind, Y. (1978). Issues and Advances in Segmentation Research, Journal of Market Research, 15, 317-337.
ABSRJ 3(2): 119

Advances in Business-Related Scientific Research Journal (ABSRJ)
Volume 3 (2012), Number 2
ABSRJ 3(2): 121
ISSN 1855-931X
PROCYCLICALITY OF LOAN LOSS PROVISIONS – THE CASE OF POLAND
Małgorzata Olszak
University of Warsaw, Faculty of Management
Poland
Abstract The recent debate over the role of prudential regulations in amplifying the cyclicality of bank lending focuses on two fundamental sources of it: capital adequacy regulations and loan loss provisioning system. Previous research shows that loan loss provisioning system can amplify the business cycle fluctuations, and its impact on it is even stronger than that of capital regulations. A dynamic model based on quarterly aggregated commercial banks data for the period 1998–2009 is used to determine if banks’ behavior, induced by the loan loss provisioning system in Poland, may amplify credit cycle fluctuations. The paper finds that provisioning in Poland is substantially higher when GDP growth is lower, which leads to the conclusion that Polish loan loss provisioning system is procyclical. This impact is mitigated slightly by earnings management.
Key words: income smoothing, earnings management, procyclicality
JEL classification: E32, E44, G21
INTRODUCTION
In the aftermath of the last financial crisis the Basel Committee on Banking Supervision and the European Commission have decided to introduce regulations aimed at curbing procyclicality of bank lending (BIS, 2008; BCBS, 2009, 2010). These regulatory changes are focused mainly on new, more stringent capital regulations. Only a limited guidance is given in the area of bank loan loss provisions. In the literature, however, it has been proved that loan loss provisioning scheme is of great importance for the effectiveness of capital regulations (Nier and Zicchino, 2006; Beatty and Liao, 2009). Both capital and loan loss provisions are recognized as two distinct categories of shock absorbers. Loan loss reserves (especially general loan loss provisions) are intended to cope with expected losses, that is losses which occur on average and can be measured by the mean value of the frequency distribution of loan losses. Bank regulatory capital, instead,

Advances in Business-Related Scientific Research Journal (ABSRJ)
Volume 3 (2012), Number 2
should absorb unexpected losses, that is losses which are large but rare and that therefore can be located far in the tail of the frequency distribution of loan losses. Although in reality the distinction may be seen as artificial – it is very important. Banks that have loan loss provisions properly measured to cover expected losses, e.g. have forward-looking provisioning framework in place – should be less influenced by business cycle fluctuations. Evidence of this provide Beatty and Liao (2009), who building on capital crunch1 research in the US, find that banks who have prudent loan loss provisioning are less affected by capital crunch during recessions. The new regulatory changes proposed by the Basel Committee and the European Commission will have to be introduced in Poland too. Thus far Polish banking sector has not suffered strongly from the effects of international financial crisis. Therefore, it seems reasonable to answer the question whether Polish banks loan loss provisioning scheme is procyclical. The problem will be resolved by testing hypothesis that loan loss provisions are negatively associated with GDP growth in Poland. Following previous research we will also test whether the possible procyclicality of loan loss provisions is mitigated by income smoothing, by capital management and by sound credit risk management practices reflected in recognizing the increase of credit risk during business cycle expansions. The empirical analyses of these hypotheses indicate that Polish commercial banks loan loss provisioning system is deeply procyclical. It is mitigated slightly by income smoothing and by sound risk management practices. The remainder of this paper is organized as follows. In theory part we present sources of procyclicality in bank lending as well as empirical evidence on loan loss provisions procyclicality. The data and methodology section shows sources and characteristics of data employed and the model used to test the hypotheses put forward in this paper. The findings part comprises OLS regression results of our model. In the discussion we indicate the contributions of this paper. The final section comprises main conclusions of the paper and its implications for the practice.
THEORY
Sources of procyclicality in banking
The term procyclicality2 is referred to describe the mutually reinforcing mechanisms through which the financial system can amplify business cycle fluctuations and possibly cause or exacerbate financial instability (BIS, 2008). These feedback mechanisms are particularly disruptive during an economic downturn or when the financial system is facing strains – e.g.
1 Capital crunch is a reduction in lending by banks constrained by capital. Peek and Rosengren (1995b: 625), Wagster (1996), Jackson et al. (1999) show that during the early 1990-ties US recession banks decreased lending to achieve higher capital requirements or to maintain existing requirements (see also Haubrich and Wachtel, 1993)). Capital crunch may result in a credit crunch, however for this to happen, loan supply must fall faster than loan demand. Evidence of credit crunch arising from capital crunch is provided by Peek and Rosengren (1997, 2000) who found that binding risk-based capital requirements associated with the Japanese stock market decline resulted in a decrease in lending by Japanese banks in the United States that was both economically and statistically significant (see also Gibbon, 1995 and Owualah, 1999). Chiuri, Ferri and Majnoni (2002) suggest that the supervisors enforcement of capital requirements – according to the 1988 Basel Accord – significantly curtailed credit supply, particularly at less-well-capitalized banks in emerging economies. 2 The subject of procyclicality is not new. The first formal theories of business cycles were written by Ludwig von Mises in 1916 (the so called Austrian business cycle theory) and then developed by Hayek in 1931 (see Khoury (2009) for a short presentation of the theory).
ABSRJ 3(2): 122

Advances in Business-Related Scientific Research Journal (ABSRJ)
Volume 3 (2012), Number 2
during financial crisis. The reasons of procyclicality can be explained by theory of behavioral finance, which addresses the psychological aspects and their impact on financial markets. As Borio et al. (2001) state misperceptions of risk or inappropriate responses to it are at the roots of procyclicality in banking. They examine two sets of factors that can result in either misperceptions of risk or wrong reactions to it. Formation of persistent misperceptions of risk can arise from two types of well-documented cognitive biases: disaster myopia and cognitive dissonance (including institutional memory deterioration). Disaster myopia (Guttentag and Herring, 1984) emphasizes that banks tend over time to underestimate the likelihood of high-loss low-probability events. Such events might be the change in the economic conditions, a change in the regulatory framework or a natural or man-made disaster. If bank managers cannot envisage the effects of a future negative event, e.g. recession, then they may be prone to credit expansion, and when the recession sets in (i.e. the negative event happens), they may dramatically cut down lending. Cognitive dissonance refers to the tendency to interpret information in a biased way, so that it reinforces the belief entertained by the economic agent (Borio et al., 2001). Berger and Udell ( 2004) have developed institutional memory hypothesis to explain why banks tend to misevaluate risk, particularly during expansions. They test the hypothesis that the deterioration in the ability of loan officers over the bank’s lending cycle resulting in an easing of credit standards is one of reasons of bank procyclical behavior. Their empirical analysis supports the hypothesis. Wrong responses to risk may arise from the fact that economic agents take actions which may be reasonable when seen from the perspective of an individual, however when taken as a group they result in procyclicality. For example, during boom it may be reasonable for an individual bank to loosen lending standards. Other banks, when faced with similar situation, considering competitive pressures (see Rajan, 1994; Jiménez and Saurina, 2006), would have incentive to do likewise. The result might be a widespread increase in the availability of banking funds, even to negative net present value projects, that normally would have been rejected by bank loan officers. Eventually this leads to overextension and credit crunch or even banking crisis. Herding behavior – where agents conform their behavior to that of their peers, is another phenomenon that may bring about procyclicality. The most common reason behind this phenomenon is reward structures that limit blame in the case of collective, as opposed to individual, failure. For instance, banks’ managers may not be blamed for the failure of their bank if failures are widespread (see Jain and Gupta, 1987). Misperceptions and inappropriate responses to risk may be a result of wrong risk measurement methodologies. Most of currently used methodologies have difficulty in measuring the systematic component of risk associated with financial and business cycle (see Borio et al., 2001:19-24). For instance, the contemporary credit risk models which are employed by banks focus on relatively short time horizons and have a “point-in-time” nature. While external credit rating agencies attempt to rate borrowers “through the cycle” – so that the ratings are less likely to move over the course of the business cycle and with the borrowers being assessed on their probability of defaulting in a constant hypothetical downside scenario, this approach does not guarantee that the ratings will be countercyclical. Bank supervisors also spend considerable amount of time on evaluation of a bank’s risk. There is no standardized approach in this respect. It should be stressed, however, that supervisory risk assessment methodologies (e.g. Supervisory Review and Evaluation Process, SREP in the EU; CAMELS in the US; BION in Poland) have one feature in common. All of them include a method of identifying risky financial institutions by peer group analysis
ABSRJ 3(2): 123
Advances in Business-Related Scientific Research Journal (ABSRJ)
Volume 3 (2012), Number 2
focused on information coming from a one year horizon. This approach, by definition, has limited ability to identify changes in risk over time.
Empirical evidence on loan loss provisions procyclicality
There are several papers dealing with the issue of procyclicality of bank provisions (Cavallo and Majnoni, 2001; Bikker and Hu, 2002; Leaven and Majnoni, 2003; Bikker and Metzemakers, 2003, 2004; Bouvatier and Lepetit, 2008; Perez et al, 2008). All of the papers have one feature in common – they use the model traditionally employed, mainly by US researchers (Greenawalt and Sinkey,1988; Collins et al., 1995; Liu and Ryan, 1995; Beatty et al., 2002; Kanagaretnam et al., 2003; Liu and Ryan, 2006), to test income smoothing3
hypothesis4. The model of income smoothing used for testing procyclicality of loan loss provision is modified by inclusion of macroeconomic variables, as indicators of economic conditions. A very distinct feature of papers examining the problem of procyclicality is time span of analysis. The research is designed to capture variations in loan loans provisions over the whole business cycle – so the timeline must comprise at least ten years of observations. One of the conclusions following from the current research on loan loss dependence on economic cycle is that banks tend to make fewer provisions for loan-losses during an economic upturn (when economic conditions are favorable and the perceived probability of business defaults is relatively low), but increase them in an economic downturn (when economic conditions deteriorate and observed loan defaults increase). Consequently, bank provisioning is said to be pro-cyclical, as it tends to re-enforce current developments in the business cycle. When analyzing findings of previous papers one should bear in mind the fact that they differ in research methodology. For instance, the analysis by Leaven and Majnoni (2003) and the research conducted by Bikker and Metzemakers (2005) only seemingly produce similar results, as there are differences in specification of dependent and independent variables as well as in the samples examined.
DATA AND METHODOLOGY
The data sources
We use aggregated time series Polish commercial banks data over a 10-year period from 1999 to 2009. This episode covers a full business cycle for Poland. The cycle develops from a through around 1999-2001, an economic boom in mid 2000 (2004-2007) to a financial crisis slowdown in 2008-2009. All the bank specific data were taken from Polish Banking Supervisory Authority and Polish Financial Supervisory Authority quarterly reports published in years 1998 – 2010. Macroeconomic variables – Gross Domestic Product and inflation measured by Consumer Price Index come from Chief Statistical Authority (GUS, Główny Urząd Statystyczny) web page. Unlike the analyses mentioned above (see Cavallo and Majnoni, 2001; Bikker and Hu, 2002; Leaven and Majnoni, 2003; Bikker and Metzemakers, 2003, 2004; Bouvatier and Lepetit,
3 Income smoothing is an example of earnings management used to reduce volatility of banks profits. A very accessible overview of definitions of earnings management present Dechow and Skinner (2000). Healy and Whalen (1999) summarize the major motivations to manage earnings, whereas Wall and Koch (2000) analyze possible consequences of this strategy. 4 There is now a huge literature that has tested the income smoothing hypotheses. Some studies find a positive relationship between loan-loss provisions and bank earnings (Greenawalt and Sinkey, 1988; Kanagaretnam et al., 2003), while others have found no relationship (Ahmed et al. 1999).
ABSRJ 3(2): 124

Advances in Business-Related Scientific Research Journal (ABSRJ)
Volume 3 (2012), Number 2
(2008), we focus on one country, so we do not include in our model country specific variables.
The model for loan loss provisioning
The variables chosen as possibly explanatory of LLP are variables traditionally used for the income smoothing hypothesis (see Greenawalt and Sinkey, 1988; Beatty et al., 2002; Liu and Ryan, 2006) modified by inclusion of GDP growth (as in Laeven and Majnoni, 2003; Bikker and Metzemakers, 2005). The basic model we employ to verify hypothesis of loan loss dependence on business cycle as well as to test the hypothesis of income smoothing and earnings management reads as: LLP = c + α1*GDP + α2*L + α3 *NPL + α4*P + α5*CAP + ε The dependent variable (LLP) is the quarterly real rate of growth of loan loss provision of a bank. The explanatory variables in the equation can be divided into two sets. The first one is macroeconomic variables –measured by the growth rate of real GDP. The other is bank specific (i.e. micro variables) and comprises: L – the real loan growth; NPL – the real growth of nonperforming loans; P – the real growth rate of profits (before taxes and before provisions); CAP – the real rate of growth of bank capital. The c is constant, while ε is white-noise error term. The growth rate of real GDP is used in the equation to proxy the business cycle. If banks behave procyclically, the rate of economic growth will be negatively correlated with provisioning, because an economic downturn is usually followed by growth in the volume of provisions. In our model, economic growth is regarded as the main indicator of demand for banking services (including loans) and is thus a direct determinant of banks’ earnings. Loan growth and nonperforming loans are included in order to capture credit risk. The real growth rate of loans is thought to be positively associated with bank risk, given that rapid growth of bank lending is generally associated with lower monitoring efforts and a deterioration of the quality of loan portfolios (see Rajan, 1994; Borio et al., 2001; Berger and Udell, 2004). Banks who behave prudently should therefore show a positive relationship between loan loss provisions and the growth rate of their portfolios (as posited by Leaven and Majnoni, 2003; Bikker and Matzemakers, 2004, Bouvatier and Lepetit, 2008; Perez et al, 2008). However, in case of unsound provisioning practices, this relationship might as well be negative – as evidenced by Frait and Komárková (2010). The nonperforming loans variable is a good indicator of the risk of default on banks’ loans. Bouvatier and Lepetit (2008) suggest that this relationship should be positive, indicating bank awareness of credit risk. Profits (P) and capital (CAP) have been included in the model to control for income smoothing and capital management5. Banks who manage their earnings by the practice of income smoothing may be regarded as prudent (see Borio et al, 2001; Leaven and Majnoni, 2003). In case of prudent bank behavior in this area, the association between loan loss provisions and profits should be positive. As is evidenced mainly for the US, banks use loan
5. Traditional capital management hypothesis states that bank managers use LLP to reduce expected regulatory costs associated with violating capital requirements, a negative relationship being predicted between capital ratios and loan loss provisions for the US (Beatty at al., 1995; Ahmed et al., 1999; Galai et al., 2003). We argue that banks prefer to have a steadily increasing amount of capital, as it is a nominator of capital adequacy ratio, and with the expansion of their credit activity it helps them keep stable level of capital adequacy ratio. A stable capital adequacy ratio should make banks lending activity less sensitive to recessions and less procyclical.
ABSRJ 3(2): 125

Advances in Business-Related Scientific Research Journal (ABSRJ)
Volume 3 (2012), Number 2
loss provisions not only for income smoothing, but also for capital management purposes (Beatty at al., 1995; Ahmed et al., 1999; Galai et al., 2003). It should be stressed here that, in contrast to the US loan loss allowances accounting, in Poland loan loss provisions cannot be included in regulatory capital, so the relationship between the two variables could be positive, instead of the negative relationship predicted for the US banks (see also Pérez et al, 2008 for the Spanish banking sector). We use real growth rates of the variables to counteract potential nonstationarity of aggregate variables included in the model. All rates are calculated as natural logarithms of real dynamics6.
Data characteristics
Table 1 provides some descriptive statistics about the variables in our estimation sample. The real growth rate of LLP equals 0,16 on average (with a standard deviation of 0,65). The average GDP growth rate is 0,039 with a standard deviation of 0,02. The mean level of nonperforming loans growth is 0,07 (standard deviation of 0,26). Loan growth average is equal to 0,11 (with a standard deviation on 0,15). Profits growth rate was 0,05 on average with a standard deviation of 0,15. CAP growth rate equals 0,09 on average with 0,08 standard deviation.
Table 1: Summary descriptive statistics of key regression variables
Variables: Statistics:
LLP GDP NPL L P CAP Mean 0,162 0,039 0,070 0,108 0,047 0,085 Median 0,183 0,041 0,121 0,077 0,084 0,092 Maximum 1,443 0,072 0,619 0,311 0,279 0,273 Minimum -1,738 0,005 -0,368 -0,032 -0,290 -0,107 Standard deviation 0,645 0,020 0,255 0,102 0,146 0,079 No of observations: 43 43 43 43 43 43
Considering the fact that the variables included in the model are aggregates that may be prone to nonstationarity we have decided to examine their stationarity by Augmented Dickey Fuller test. Results of the test applied to all variables are presented in table 2. The analysis shows that all variables are stationary.
Table 2: Stationarity tests of key regression variables
Variables: LLP GDP NPL L P CAP
Augmented Dickey-Fuller test statistic -2,72 -2,75 -1,75 -1,99 -2,51 -1,66
Probability* 0,01 0,07 0,08 0,05 0,01 0,09 *MacKinnon (1996) one-sided p-values.
6 We use such a measure considering the fact that the relationship between rate at moment t (rt) and dynamics of dependent and independent variables, e.g. loan loss provisions(LLP), may be expressed as follows : rt =ln(LLPt/LLPt-1) =( ∆ LLPt/LLPt-1)
ABSRJ 3(2): 126

Advances in Business-Related Scientific Research Journal (ABSRJ)
Volume 3 (2012), Number 2
Table 3 presents correlation matrix of all the regression variables. The results in the table indicate significant correlations between loan loss provisions and each of the explanatory variables. The correlation between loan loss provisions and GDP is around -26 percent, suggesting that banks provision too late, when negative conditions set in. The correlation between loans and nonperforming loans is positive, and at a level of around 50 percent – relatively strong, indicating that banks tend to provision more when credit risk is build up. The correlation between loan loss provisions and profits is around 4 percent suggesting imprudent behavior by the average bank. The correlation between loan loss provisions and capital is 63 percent, suggesting capital management under Polish accounting standards.
Table 3. Correlation matrix of key regression variables
LLP GDP L NPL P CAP LLP 1,000 GDP -0,255 1,000 L 0,486 0,434 1,000 NPL 0,548 -0,538 -0,088 1,000 P 0,035 0,451 0,292 -0,610 1,000 CAP 0,628 -0,474 0,425 0,342 0,083 1,000
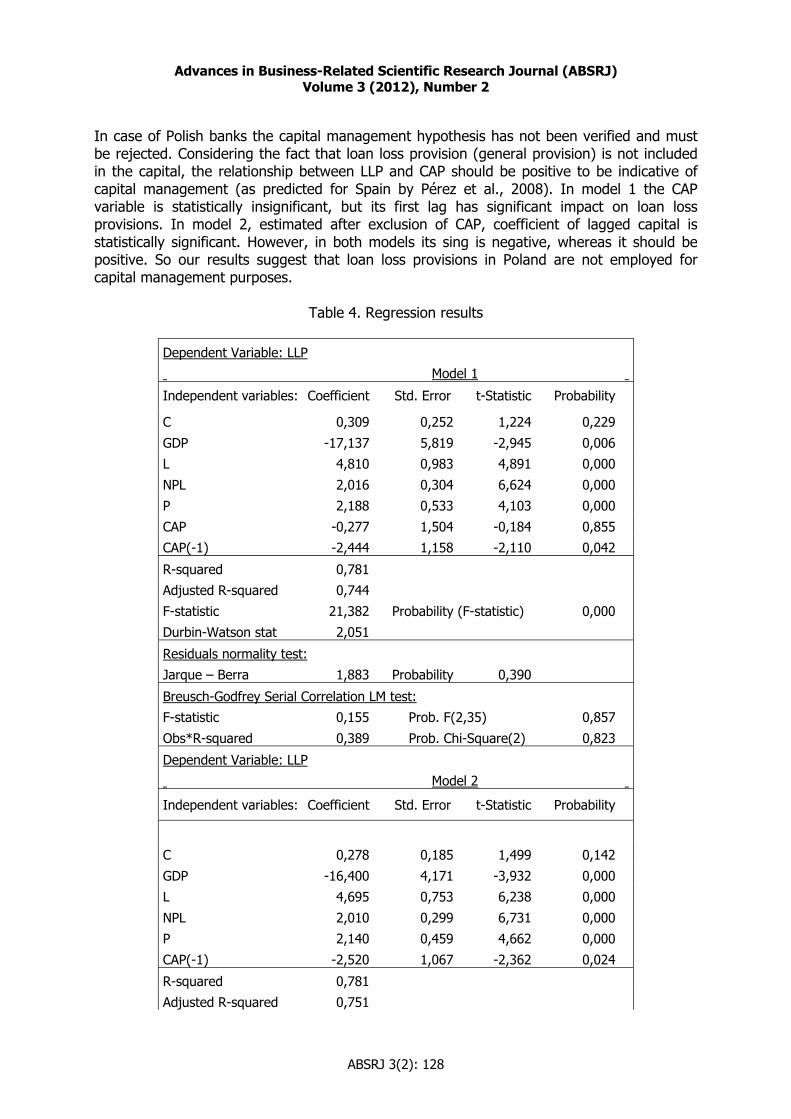
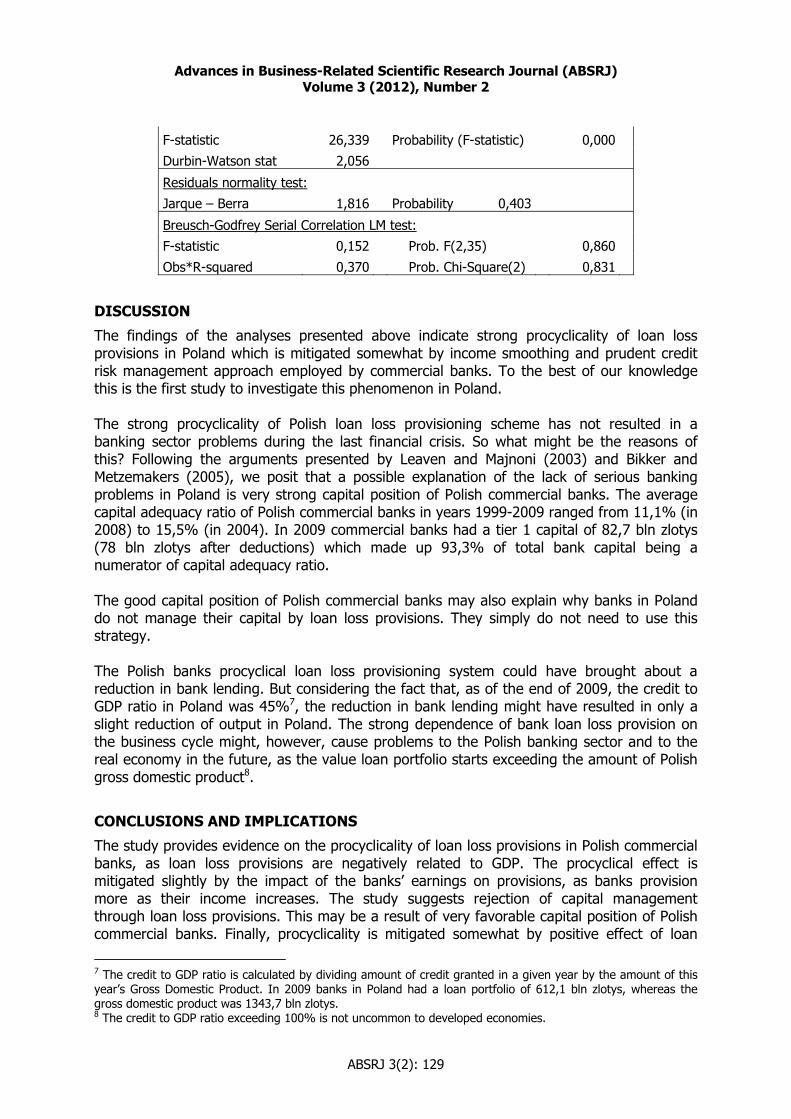
FINDINGS
Table 4 presents OLS estimation results for our sample. We analyze two models. Model 1 includes the capital variable (CAP) as well as its first lag. Model 2 omits the CAP variable due to its statistical insignificance in model 1. The estimation results indicate normality of residual series distribution (tested by Jarque – Berra statistics). The value of the Durbin-Watson statistic reported in table 4 is indicative of no presence of serial correlation in the residuals of the estimated equation. A more general Breusch-Godfrey test for serial correlation in the residuals leads to the same conclusion. All explanatory variables, except the capital, have statistically significant effects on loan loss provisions. In line with expectations, the GDP growth coefficient is significantly negative, indicating that provisions indeed rise when the business cycle falls (see Leaven and Majnoni, 2003; Bikker and Metzemakers, 2005; Bouvatier and Lepetit, 2008; Pérez et al., 2008). Loans growth and nonperforming loans as a proxy of increased credit risk appear to be significantly positive determinant of provisioning, suggesting bank awareness of risk build up during boom periods (see also Bikker and Metzemakers, 2005; Bouvatier and Lepetit, 2008; Pérez et al., 2008). This countercyclical outcome is dominated, however, by the overall procyclical provisioning behavior as indicated by the very strong GDP effect. The procyclical behavior as reflected by the level of coefficient of GDP might be also mitigated somewhat by the impact of banks’ earnings on provisions, as banks in Poland do provision considerably more when earnings are high and vice versa. This behavior may contribute to financial soundness of banks and possibly reduces the degree of procyclicality, which would have been stronger if it were not for this forward-looking provisioning (see Borio et al., 2001).
ABSRJ 3(2): 127
Advances in Business-Related Scientific Research Journal (ABSRJ)
Volume 3 (2012), Number 2
In case of Polish banks the capital management hypothesis has not been verified and must be rejected. Considering the fact that loan loss provision (general provision) is not included in the capital, the relationship between LLP and CAP should be positive to be indicative of capital management (as predicted for Spain by Pérez et al., 2008). In model 1 the CAP variable is statistically insignificant, but its first lag has significant impact on loan loss provisions. In model 2, estimated after exclusion of CAP, coefficient of lagged capital is statistically significant. However, in both models its sing is negative, whereas it should be positive. So our results suggest that loan loss provisions in Poland are not employed for capital management purposes.
Table 4. Regression results
Dependent Variable: LLP
Model 1
Independent variables: Coefficient Std. Error t-Statistic Probability
C 0,309 0,252 1,224 0,229
GDP -17,137 5,819 -2,945 0,006
L 4,810 0,983 4,891 0,000
NPL 2,016 0,304 6,624 0,000
P 2,188 0,533 4,103 0,000
CAP -0,277 1,504 -0,184 0,855
CAP(-1) -2,444 1,158 -2,110 0,042
R-squared 0,781
Adjusted R-squared 0,744
F-statistic 21,382 Probability (F-statistic) 0,000
Durbin-Watson stat 2,051
Residuals normality test:
Jarque – Berra 1,883 Probability 0,390
Breusch-Godfrey Serial Correlation LM test:
F-statistic 0,155 Prob. F(2,35) 0,857
Obs*R-squared 0,389 Prob. Chi-Square(2) 0,823
Dependent Variable: LLP
Model 2
Independent variables: Coefficient Std. Error t-Statistic Probability
C 0,278 0,185 1,499 0,142
GDP -16,400 4,171 -3,932 0,000
L 4,695 0,753 6,238 0,000
NPL 2,010 0,299 6,731 0,000
P 2,140 0,459 4,662 0,000
CAP(-1) -2,520 1,067 -2,362 0,024
R-squared 0,781
Adjusted R-squared 0,751
ABSRJ 3(2): 128
Advances in Business-Related Scientific Research Journal (ABSRJ)
Volume 3 (2012), Number 2
F-statistic 26,339 Probability (F-statistic) 0,000
Durbin-Watson stat 2,056
Residuals normality test:
Jarque – Berra 1,816 Probability 0,403
Breusch-Godfrey Serial Correlation LM test:
F-statistic 0,152 Prob. F(2,35) 0,860
Obs*R-squared 0,370 Prob. Chi-Square(2) 0,831
DISCUSSION
The findings of the analyses presented above indicate strong procyclicality of loan loss provisions in Poland which is mitigated somewhat by income smoothing and prudent credit risk management approach employed by commercial banks. To the best of our knowledge this is the first study to investigate this phenomenon in Poland. The strong procyclicality of Polish loan loss provisioning scheme has not resulted in a banking sector problems during the last financial crisis. So what might be the reasons of this? Following the arguments presented by Leaven and Majnoni (2003) and Bikker and Metzemakers (2005), we posit that a possible explanation of the lack of serious banking problems in Poland is very strong capital position of Polish commercial banks. The average capital adequacy ratio of Polish commercial banks in years 1999-2009 ranged from 11,1% (in 2008) to 15,5% (in 2004). In 2009 commercial banks had a tier 1 capital of 82,7 bln zlotys (78 bln zlotys after deductions) which made up 93,3% of total bank capital being a numerator of capital adequacy ratio. The good capital position of Polish commercial banks may also explain why banks in Poland do not manage their capital by loan loss provisions. They simply do not need to use this strategy. The Polish banks procyclical loan loss provisioning system could have brought about a reduction in bank lending. But considering the fact that, as of the end of 2009, the credit to GDP ratio in Poland was 45%7, the reduction in bank lending might have resulted in only a slight reduction of output in Poland. The strong dependence of bank loan loss provision on the business cycle might, however, cause problems to the Polish banking sector and to the real economy in the future, as the value loan portfolio starts exceeding the amount of Polish gross domestic product8.
CONCLUSIONS AND IMPLICATIONS
The study provides evidence on the procyclicality of loan loss provisions in Polish commercial banks, as loan loss provisions are negatively related to GDP. The procyclical effect is mitigated slightly by the impact of the banks’ earnings on provisions, as banks provision more as their income increases. The study suggests rejection of capital management through loan loss provisions. This may be a result of very favorable capital position of Polish commercial banks. Finally, procyclicality is mitigated somewhat by positive effect of loan
7 The credit to GDP ratio is calculated by dividing amount of credit granted in a given year by the amount of this year’s Gross Domestic Product. In 2009 banks in Poland had a loan portfolio of 612,1 bln zlotys, whereas the gross domestic product was 1343,7 bln zlotys. 8 The credit to GDP ratio exceeding 100% is not uncommon to developed economies.
ABSRJ 3(2): 129
Advances in Business-Related Scientific Research Journal (ABSRJ)
Volume 3 (2012), Number 2
growth and nonperforming loans on loan loss provisions. This suggests prudent approach of Polish commercial banks to credit risk management. The research contributes to the empirical literature on loan loss provisioning by verifying the hypothesis of LLP procyclicality for Poland. To the best of the author’s knowledge this is the first study for Polish commercial banks. The findings are based on contemporary data – opposite to the analyses mentioned in this paper. This study is of theoretical significance, as it shows that procyclicality of loan loss provisions in a given country does not have to bring about banking crisis and financial sector instability. The research stresses that country specific factors, such as the level of banking sector capital during the recession period as well as the level of financial sector development, measured e.g. by credit to GDP ratio should be considered in this respect. As has been shown in this paper, although Polish commercial banks loan loss provisioning is procyclical, it has not resulted in serious banking sector problems in the last years. The findings of this research have at least one implication for practice. Although currently the problem of loan loss provisions procyclicality seems not to be so important for the Polish economy, because of the low level of credit to GDP ratio, in the future it may be troublesome, as is evidenced in case of developed economies. That’s why it advisable that Polish regulators and banking supervisory authorities should gradually introduce changes in loan loss provisioning framework to counteract the possible negative side effects of strong procyclicality in the future. These new regulations should promote more forward –looking provisioning. The empirical part of this paper has two limitations. The first one, is the type of data employed. The significance of the findings presented in this paper would increase with inclusion of a panel data model, instead of aggregates. The other, is omission of cooperative banks from the analysis. Such an analysis would create opportunity for comparisons between commercial and cooperative banks categories. Therefore, the future research should be based on data collected for individual commercial and cooperative banks operating in Poland. The research should aim to find out whether there are differences between specified types of banks (e.g. between publicly traded, privately held and cooperative banks, large versus small, etc.) in the association between loan loss provisions and GDP, and if so, what are the determinants of these potential differences.
REFERENCES
Ahmed, A., Takeda, C. & Thomas, S. (1999). Bank Loan Loss Provisions: A Re-examination of Capital Management, Earnings Management and Signaling Effects. Journal of Accounting and Economics 28, 1-25.
Bank for International Settlements (BIS) (2008) Addressing financial system procyclicality: a possible framework. Note for the FSF Working Group on Market and Institutional Resilience, Basel: Bank for International Settlements.
Basel Committee on Banking Supervision (BCBS) (2009) Strengthening the resilience of the banking sector. Consultative Document, Basel: Bank For International Settlements.
Basel Committee on Banking Supervision (BCBS) (2010) Basel III: a global regulatory framework for more resilient banks and banking systems. Basel: Bank For International Settlements.
ABSRJ 3(2): 130

Advances in Business-Related Scientific Research Journal (ABSRJ)
Volume 3 (2012), Number 2
Beatty, A., Chamberlain, S. L. & Magliolo, J. (1995). Managing Financial Reports of Commercial.
Banks: The Influence of Taxes, Regulatory Capital and Earnings, Journal of Accounting Research, 33 (2), 231-261.
Beatty, A. L., Ke, B. & Petroni, K. R. (2002). Earnings Management to Avoid Earnings Declines across Publicly and Privately Held Banks. The Accounting Review, 77 (3), 547-570.
Beatty, A. & Liao, S. (2009). Regulatory Capital Ratios, Loan Loss Provisioning and Pro-cyclicality, Working Paper for seminar at Indiana University and University of Missouri
Berger, A. N. & Udell, G. F. (2004). The institutional memory hypothesis and the procyclicality of bank lending behavior. Journal of Financial Intermediation 13, 458-495.
Bikker, J. A. & Hu, H. (2002). Cyclical Patterns in Profits, Provisioning and Lending of Banks. DNB Staff Reports n. 86, Amsterdam.
Bikker, J. A. & Metzemakers, P. A. J. (2005). Bank provisioning behaviour and procyclicality. Journal of International Financial Markets, Institutions and Money, 15, 141–157.
Borio, C., Furfine, C. & Lowe, P. (2001). Procyclicality of the financial system and financial stability: issues and policy options. BIS Papers 1, Basel: Bank for International Settlements.
Bouvatier, V. & Lepetit, L. (2008). Banks’ procyclical behavior: does provisioning matter? Journal of International Financial Markets, Institutions and Money 18, 513-526.
Brinkmann, E. & Horvitz, P. (1995). Risk-based capital standards and the credit crunch. Journal of Money, Credit, and Banking 27, 848–863.
Cavallo, M. & Majnoni, G. (2001). Do Banks Provision for Bad Loans in Good Times? Empirical Evidence and Policy Implications, Working Paper.
Chiurri, M. C., Ferri, G. & Majnoni, G. (2002). The macroeconomic impact of bank capital requirements in emerging economies: Past evidence to assess the future. Journal of Banking and Finance 26, 881-904.
Collins, J., Shackelford, D. & Wahlen, J. (1995). Bank differences in the coordination of regulatory capital, earnings, and taxes. Journal of Accounting Research 33, 263-291.
Dechow, P. M. & Skinner, D. J. (2000). Earnings Management: Reconciling the Views of Accounting Academics, Practitioners, and Regulators. Accounting Review, 14 (2), 235-250.
Financial Stability Forum (2009). Report of the Financial Stability Forum on Addressing Procyclicality in the Financial System. Financial Stability Forum, 2 April 2009
Frait, J. & Komárková, Z. (2010). Instruments for curbing fluctuations in lending over the business cycle. Financial Stability Report 2008/2009, Prague: Czech National Bank, 72-78.
Galai, D., Sulganik, E. & Wiener, Z. (2003). Accounting Values versus Market Values and Earnings Management in Banks. Working Paper, The Hebrew University of Jerusalem, Israel.
Gibbon, M. S. (1995). Can Bank Health Affect Investment? Evidence from Japan. The Journal of Business 3, 281 – 308.
Greenawalt, M. B. & Sinkey, J. F. (1988). Bank Loan-Loss Provisions and the Income-Smoothing Hypothesis: An Empirical Analysis, 1976-1984. Journal of Financial Services Research 1, 301-318.
Guttentag, J. M. & Herring, R. J. (1984). Credit Rationing and Financial Disorder. Journal of Finance 39 (5), 1359-1382.
ABSRJ 3(2): 131

Advances in Business-Related Scientific Research Journal (ABSRJ)
Volume 3 (2012), Number 2
Hancock, D. & Wilcox J. A. (1994a). Bank Capital and the Credit Crunch: The Roles of Risk- Weighted and Unweighted Capital Regulation. Journal of the American Real Estate and Urban Economics Association, 22, 59-94.
Hancock, D. & Wilcox, J. A. (1994b). Bank Capital, Loan Delinquencies, and Real Estate Lending. Journal of Housing Economics, 3, 121-146.
Hancock, D. & Wilcox J. A. (1997). Bank capital, Non-bank Finance, and Real Estate Activity. Journal of Housing Research, 8, 75-105.
Hancock, D. & Wilcox, J. A. (1998). The “Credit Crunch” and the Availability of Credit to Small Business. Journal of Banking and Finance 22 (6–8), 983–1014.
Haubrich, J. & Wachtel, P. (1993). Capital Requirements and Shifts in Commercial Bank Portfolios. Federal Reserve Bank of Cleveland Economic Review, 29, 2-15.
Healy, P. M. & Whalen, J. M. (1999). A Review of the Earnings Management Literature and its Implications for Standard Setting. Accounting Horizons, 13 (4), 365-383.
Jackson, P., Furfine, C., Groeneveld, H., Hancock, D., Jones, D., Perraudin, W., Radecki, L. & Yoneyama, M. (1999). Capital Requirements and Bank Behaviour: The Impact of The Basle Accord. Basle: Bank for International Settlements.
Jain, A. & Gupta, S. (1987). Some Evidence on “Herding” Behavior of U.S. Banks. Journal of Money, Credit and Banking, 19 (1), 78-89.
Jiménez, G. & Saurina, J. (2006). Credit cycles, credit risk, and prudential regulation. International Journal of Central Banking (2), 65-98.
Kanagaretnam, K., Lobo, G. J. & Mathieu, R. (2003). Managerial Incentives for Income Smoothing Through Bank Loan Loss Provisions. Review of Quantitative Finance and Accounting, 20, 63-80.
Khoury, G. E. (2009). Procyclicality of the banking system: the prudential and accounting framework of the procyclicality of bank balance sheet. Working paper, University of Liege.
Laeven, L. & Majnoni G. (2003). Loan loss provisioning and economic slowdowns: too much, too late?, Journal of Financial Intermediation 12 (2003), 178-197.
Liu, Ch.-Ch. & Ryan, G. S. (2006). Income Smoothing over the Business Cycle: Changes in Banks’ Coordinated Management of Provisions for Loan Losses and Loan Charge-Offs from the Pre-1990 bust to the 1990s Boom. The Accounting Review, 81 (2), 421-441.
Nier, E. & Zicchino, L. (2006). Bank weakness, loan supply and monetary policy, Working paper, Bank of England.
Owualah, S. I. (1999). Banking Crisis, Reforms, and the Availability of Credit to Japanese Small and Medium Enterprises. Asian Survey (4), 656 – 667.
Peek, J. & Rosengren, E. (1994). Bank real estate lending and the New England capital crunch. Journal of American Real Estate and Urban Economics Association 22, 33-58
Peek, J. & Rosengren, E. (1995a). The capital crunch: Neither a borrower nor a lender be. Journal of Money, Credit, and Banking 27, 625–638.
Peek, J. & Rosengren, E. (1995b). Bank regulation and the credit crunch. Journal of Banking and Finance 19, 679–692.
Peek, J. & Rosengren, E. (1997). The International Transmission of Financial Shocks: The Case of Japan. American Economic Review, 87 (4), 495–505.
Peek, J. & Rosengren, E. (2000). Collateral Damage: Effects of the Japanese Banking Crisis on Real Activity in the United States. American Economic Review, 90 (1), 30–45.
Pérez, D., Salas, V. & Saurina, J. (2006). Earnings and Capital Management in alternative Loan Loss Provision Regulatory Regimes. Working Paper No. 614, Banco de España.
Pérez, D., Salas, V. & Saurina J. (2008). Earnings and Capital Management in alternative Loan Loss Provision Regulatory Regimes. European Accounting Review, 17 (3), 423-445.
ABSRJ 3(2): 132

Advances in Business-Related Scientific Research Journal (ABSRJ)
Volume 3 (2012), Number 2
Rajan, R. J. (1994). Why Bank Credit Policies Fluctuate: A Theory and some Evidence, Quarterly Journal of Economics, 109 (2), 399-411.
Wagster, J. D. (1996). Impact of the 1988 Basle Accord on International Banks. Journal of Finance, 51, 1321-1346.
Wall, L. D. & Koch, T. W. (2000). Bank loan-Loss Accounting: A Review of Theoretical and Empirical Evidence. Economic Review, Federal Reserve Bank of Atlanta.
ABSRJ 3(2): 133


Advances in Business-Related Scientific Research Journal (ABSRJ)
Volume 3 (2012), Number 2
ABSRJ 3(2): 135
ISSN 1855-931X
EFFECT OF TRAINING COURSES ON COPING STRATEGIES
Martin Rabe*
Institute for Public Health, UMIT – The Health and Life Sciences University
Hall/Tyrol - Austria
Salvatore Giacomuzzi
Institute for Public Health, UMIT – The Health and Life Sciences University
Hall/Tyrol - Austria
Abstract
For the profession of works councils, skills and knowledge are generally important for performing the daily work and its prevailing competition. These capabilities are directly related to enhanced coping strategies. This article examines the trade-off between recent coping strategies and training courses of the trade union IG Metal Germany for work councils. It is assumed that, based on the results of this and following researches, developments of adaptive training course approaches are more purposeful than the current implementation.
Key Words: Coping, training courses, trade union officers, social dialogue
Topic Group: Human resources management, Business strategy
INTRODUCTION
In order to compete in a global economy with rapid social and technological changes, skills and knowledge become more and more important. These changes do also have far reaching implications for the work environment and the labour market. Companies, employees and employers are affected, so there are increasing demands for „high-skilled“ employees and decreasing demands for less qualified labour. In addition, less qualified employees face grater job insecurity (ILO, 1998). As the link between employers and employees in industrial relations, work councils have to manage the worker´s interests against the interests of the employer. Tietel defines the specific role structure of this lobbyist group as ‘triadic relationships’ (2006:25).

Advances in Business-Related Scientific Research Journal (ABSRJ)
Volume 3 (2012), Number 2
This role of representing employees’ interest is associated with mental strength, competence and control, while helplessness and failure are perceived as disadvantageous. Due to this particular constellation of pressures, Minssen et al. (2005) as well as Tietel (2006) see an increased risk of the emergence of stress. In literature there are many studies dealing with the role of work councils. This study, however, refers to the topic of coping strategies related to training courses and trade union education, which has remained largely unstudied both in the German-speaking countries and internationally. There are strong indications that the significant predictors arise in the development of stress in daily operations (Minssen et al., 2005). This research is about the role trade union training courses play for the coping strategies of work councils.
THEORY
Work-councils as the employees’ representative have to deal in a “triadic relationships” (Tietel, 2006) and have to improve strategies for coping with both, employees and employers demands. Considering demands for coping strategies with occupational stress the explanation of stress is related to the work-councils´ resources. The model of resource conservation by Hobfoll forms takes into account the resources of the individual and the community that are "necessary and healthy lifestyle while preventing the loss of resources, the preservation of existing resources and gaining the necessary resources" (Hobfoll et al. 2004: 91). In contrast to self-regulating and transactional stress-models (Lazarus 1966; McGrath 1970; Bodenmann 1995; Zapf 2004), objective and subjective environmental factors are included in the coping process. These models determine stress as an individually perceived difference between one's own coping capacity and environmental requirements, and define the subjective perception of the discrepancy as important. The individual considers both individual variations and the consequences as important. Environmental variables have been assigned a secondary importance, because perceptions and evaluations of defining stress and coping are primary. The main focus of the theory of resource conservation is the assumption that the circumstances are such that the individuals protect and support their "own integrity, but also their family and their nation" (Hobfoll et al. 2004: 93, Hobfoll 1998). Therefore, the actions of individuals are always seen within the context of their social environment, given the act of preserving and protecting their social relationships and the "establishment in the social context" (Hobfoll et al. 2004:93). The COR theory considered reactions to environmental events which have an impact on the individual resources. Hence psychological distress is defined as a reaction to the environment, where
1) Loss of resources is threatening 2) Loss of resources occurs 3) The appropriate resources-profit for a resource-investment fails.
The threat or actual loss of resources is perceived as particularly stressful because this leads to lower resource endowments and hence to a lower capacity to deal with future challenges. If resource-investment does not generate an adequate resource-profit, this also causes stress because the failed investment has consequences for the actual loss of resources. Due
ABSRJ 3(2): 136

Advances in Business-Related Scientific Research Journal (ABSRJ)
Volume 3 (2012), Number 2
to this, the COR theory defines resources as the only necessary element for the assessment of stress. Hobfoll distinguishes between the following resources:
• Objects that are valued for their physical condition and / or provide a status. As an example, a small economical car has a benefit but a luxury car is an additional status symbol.
• Personal resources such as optimism are useful for someone’s coping strategies. • Conditions are defined as valuable and worthy resources, examples here are marriage
or an office.
• Energy such as money, time or knowledge are useful in the acquisition of further resources
He points out that the resources are interdependent, so that a change in a resource-category can have effects on other resources. Another substantial core statement is that resource changes are not necessarily viewed negatively. Although the loss of resources leads to stress, gaining resources can act as a buffer for resource losses and is therefore associated with different experiences of individuals (Hobfoll et al. 2004):
• The loss of resources has a stronger effect than resource gains • Resources have to be invested to obtain resources • Resources have to be invested to prevent the deprivation of resources
People who have inherently lower resource endowments are more vulnerable to the experience of loss spirals, as a failed resource investment restricts future investment. In contrast, people with rich resource endowments invest more and thus gain more resources. According to Zapf et al. (2004), stress research assumes that stress marks an imbalance of the relationship between a human being and the situation and can be attributed to two basic assumptions:
• According to Selye (1981), any imbalance leads to stress. Here he differentiates between positive and negative stress.
• According to Lazarus (1961, 1981), during the development of stress the quality of imbalance is significant. Stress only arises from unpleasant imbalance.
Taking the perspective of resources, the model of resource conservation proposed by S.E. Hobfoll (1989, 1998, 2001) summarizes the results of previous stress research. The key message is that the losses of resources are central to the emergence of stress. Hobfoll advocates the results of life event research which assumes that adverse events have negative impacts on health (Thoits 1983; 2010) and interpreted the undesirability with resource loss. This model implicates that people strive for the construction and preservation of this treasured resource, which is to be seen as synonymous with health and well being. The risk of loss is threatening and leads to stress. Accordingly, stress is defined as an environmental reaction where
ABSRJ 3(2): 137

Advances in Business-Related Scientific Research Journal (ABSRJ)
Volume 3 (2012), Number 2
a) There is the risk of resource loss b) Existing resources disappear c) Pareto-optimal allocation of resources exists, so an investment does not necessarily
generate the expected profit. The differentiation between resources is seen as
a) Objects (things from the physical environment), living conditions (professional status, partnership), personal characteristics (optimism) and energy (money, information and knowledge)
b) Means to reach these resources. As is evident from this distinction of both subjective and universal criteria, normative values exist concerning who has the resources, both in terms of objective and subjective components. According to Frieling et al. (1999, 2007) it is assumed that stress develops only from loss of resources – resource-gaining stress does not occur. Basically, this model assumes that people compensate feared or actual loss of resources through the investment of other available resources, such as money or time, and strive to replace or compensate losses by equivalent resources. Hobfoll defines this as "proactive coping" (2001, p. 13) and differentiates between the behavioural level (for example, loss management) and the cognitive level (for example, the relativization of the threatened or lost resource). It has to be said that cognitive coping is only possible to a restricted extent, so that self and world-view of the person is not at risk (Hobfoll 1989). According to Hobfoll, compliancy of resources and requirements is essential for stress management. Larger available resources (at a personal, social and cultural level) enable a higher investment than fewer available resources. While people with lots of resources can easily compensate for a loss, poorer people can only make limited investments given their need to keep an emergency reserve (Hobfoll, 2001). This leads to the situation that relevant groups such as the poor, elderly, sick and underprivileged social groups are characterized by a defensive strategy, as the lack of resources is missing for a proactive approach. Furthermore, Hobfoll defines an interaction of certain key resources. They are, for example, high self-efficacy and good availability of social support. He calls these "resource caravans" (2001, p. 34) and also indicates a reciprocal mode of action. Concerning the weighting between resource gain and loss, Hobfoll (1989,1998) indicates that the loss of essential resources is more problematic than a corresponding gain of resources, unless this can compensate the suffered loss. Interestingly, a profit or loss spiral exists, because the growth of resources leads to further growth and losses to other losses. It is essential here that the loss spirals are stronger and grow faster than the gain spirals.
HYPOTHESES
The current research about the impact of trade union training courses on coping strategies is a less explored area at its present stage. To reveal influences or relationships of possible causal sequences, additional investigations have to performed. In order to provide further
ABSRJ 3(2): 138

Advances in Business-Related Scientific Research Journal (ABSRJ)
Volume 3 (2012), Number 2
information of this topic, our cross-sectional study focuses on the relationship of soft and hard skills trainings courses of the trade union IG Metal for works councils. According to Vegchel et al. (2005) and Kristensen (1996) we suppose that disadvantageous mental stress situations lead to increased strain and complaints. Therefore, regarding the common theories by Karasek (1990), Siegrist (1996) and Vegchel et al. (2005) we have formulated the following hypotheses:
(a) Hypotheses To analyse the relationship between the correlation of soft and hard skills training courses and coping strategies of work councils, we formulate two hypotheses:
(i) According to Kompier et al. (2011) periodical participation of trade union training courses has a positive effect on work council’s subjective perceived health and stress management skills.
(ii) According to Hasselhorn et al. (2007) work councils who participate regularly in trade union training sessions have higher scores concerning life satisfaction and well-being than work councils participating in training courses irregularly.
METHODS AND DATA COLLECTION
Data collection was conducted via e-mail and personal stating the purpose of the survey. Questionnaires were sent to 13 German companies engaged mostly in IT services and metal industries. 40 usable responses were returned. Due to the fact that this study is intend to be a pilot study for further investigations, the number of participants and the number of addressed companies is not to be representative for work councils in Germany. The study-design was selected as a cross-sectional analysis. The methodological approach was chosen as deductive-nomological model. This means that ‘a specific statement is derived from a general theory. The resulting prediction or explanation is to be checked by empirical evaluations“ (Bortz, Döring; 2006). For data collection the written questionnaire was chosen by using validated test instruments and a self-designed questionnaire to collect quantitative primary data. Every full-time or volunteer work council came into question as participants of this study. Participation in the survey was voluntary. The Health-Related Quality of Life (HRQoL), the degree of psychological stress and stress at work, data for training courses and human resource development by the trade union IG Metal and socio-demographic data were chosen as dependent variables. The Health-Related Quality of Life (HRQoL) should be operationalized by using the following validated test instruments:
• German version of Short Form 36 Health Survey Questionnaire (SF 36) – questionnaire for state of health (Bullinger & Kirchberger 1998).
• German version of Nottingham Health Profiles (NHP) • Psychological stress and stress at work should be evaluated by using the Copenhagen
Psychosocial Questionnaire (COPSOQ)
ABSRJ 3(2): 139

Advances in Business-Related Scientific Research Journal (ABSRJ)
Volume 3 (2012), Number 2
Before beginning the statistical data analysis, the distribution of the metric variables have to be checked for normal distribution: If there is a normal distribution the bivariate relationships are analysed using the correlation of Pearson. Relationships. Between ordinal variables or variables where the normal distribution is not given, verification must be carried out using the rank correlation of Spearman-Rho. Furthermore, the influence of education and training courses on the health-related quality of life (HRQoL) and the degree of psychological stress and strain are examined.
RESULTS
To prove the hypotheses they were tested by investigating correlation coefficient between the rate of individually-assessed state of health and completed training courses. Of 40 participants responding to the questionnaire, 32 (82.5%) were male und 7 (17.5%) were female. The vast majority (57.5% [23/40]) indicates being employed by a company with over 2.000 staff members, 20% (8/40) in a company with about 500-1000 employees, 15% (6/40) in a company with about 100-500 employees and the remaining 7.5% (3/40) are employed by a company with less than 100 employees. 62.5% (25/40) stated they were mostly mentally active while the remaining 37.5% (15/40) indicated being both mentally and physically active. Only 5% (2/40) of the participants are employed part-time, with 95% (38/40) in full-time employment. By analysing the distribution of participants’ birth years, the median is 1964 and the middle 50% were born between 1960 and 1969. The relationship between attended training courses of IG Metal (or congeneric) and scales of Nottingham Health Profile (NHP) are not significant. The directions of relationships between scales of “Emotional Reaction”, “Energy” and “Physical Mobility” were negative and thus conform to the hypothesis. It is to say that the strength of relationship is consistently very weak. In addition, no significant positive relationship could be found between the numbers of attended training courses of IG Metal (or congeneric) and the index of the quality-of-life instrument EuroQuol 5d. The direction of the relationship is to be declared conform to the hypothesis, but also to be estimated as being very weak. In analysing the relationship between the numbers of attended training courses of IG Metal (or congeneric) and the scales of Short Form 36 Health Survey Questionnaire (SF-36), no significant relations could be determined. Only the scale “ROH SF-36 health change” shows a weak relationship, whilst the rest indicates a very weak relation. Moreover, the direction is not consistent and thus in some parts not hypothesis-compliant. The relationship between the numbers of attended training courses of IG Metal (or congeneric) and the scales of screening-instrument for assessing mental strain and stress at work (COPSOQ) is shown in Table 1. Here significant relations between attended training courses of IG Metal and six scales of COPSOQ are determined:
ABSRJ 3(2): 140

Advances in Business-Related Scientific Research Journal (ABSRJ)
Volume 3 (2012), Number 2
Table 1: Relationship between numbers of attended training courses of IG Metal (or congeneric) and scales of screening-instrument for assessing mental strain and stress at
work (COPSOQ)
Between the numbers of attended training courses and the scale “Emotional demands”, a significant positive association can be determined, while the strength of this relationship can be described as weak. This implicates that frequent attendance of training courses of IG Metal enables participants to deal with higher emotional demands. In addition, a significant positive correlation between the number of training courses and the scale “Demands for hiding emotions” can be determined. This relationship is also of low intensity. Visiting several educational seminars thus leads to an increase in ability to hide emotions. The variable ‘Commitment to the work place’ is significantly correlated positively with the number of training seminars attended by IG Metall. This relationship can be described as weak. Thus, frequent attendance of training courses is associated with a high affinity to the workplace. The number of training courses by IG Metal is significantly positively correlated with the scale “Influence and development”. The strength of the relationship can be described as weak, meaning that frequent attendance of educational seminars leads to an expanding influence and opportunities to develop. In addition, a significant positive relationship between the numbers of training seminars attended by IG Metal with the scale of predictability COPSOQ was determined. The relationship can be described as weak. Frequent attendance of educational seminars is thus combined with increased predictability.
ABSRJ 3(2): 141

Advances in Business-Related Scientific Research Journal (ABSRJ)
Volume 3 (2012), Number 2
DISCUSSION
It is the aim of this study to investigate relationships of coping strategies of work-related stress, such as physical and psychological, and trade union training courses. As a result of the statistical analysis, SF 36 and experience of NHP were not significantly associated with coping strategies. Thus, analysing COPSOQ reveals significant correlations of relationships between coping strategies and training courses. As stated in the hypotheses, it was expected that works councils who attend to training courses more often would show higher psychosocial demands indicated by COPSOQ compared to less attended works councils. The results, however, only partially supported our hypothesis. By analysing the outcomes there was no general trend indicating significant relationship between health-related quality of life and training courses, whereas certain scales of COPSOQ are significantly associated with higher attendance of training courses, and this could lead to better coping strategies. Our hypothesis regarding coping strategies was based on one theoretical perspective. Due to Hobfoll’s theory (2004) it was an assumption that increasing numbers of training courses would lead to higher resources for works councils and also increase coping strategies. This explanatory model thus explains resources as a kind of training course for the importance of improving coping strategies. However, concerning the extent to which correlation between COPSOQ and training courses indicating a positive meaning, this study was not able to affirm the identification of specific courses. Interestingly, demands regarding emotions and social relationships are significant. It could be one reason that works councils, having a strong relationship and commitment to their workplace, perceive their working situation as more meaningful. Compared to employees feeling less involved or less committed to the workplace, they feel themselves more important in working life and thus attend to more training courses in order to gain a higher level of experience. In particular, there may be an influence accentuating the specific occupational group of employees´ representatives, works councils. Due to their work tasks they are responsible for employee´s needs, problems and wishes and feel strongly related to their colleagues. For analysing the „commitment to the work-place” and „meaning of work“ the identically named scale vales were used. Assessing commitment values the relevant items are comparable to the scale „affective organizational commitment“ by of Meyer et al. (1993). Both indicate relations between employees, this also includes works councils and the work place. Analysing the scale „meaning of work“ both aim on the relationship between employees and the daily work. Taking the reflections on the concept of works councils in the introduction into account, there are quite similar meanings in these scales. The scale „emotional demands“ indicates correlation to the number of attended training courses and seems to confirm the hypotheses. The outcomes of this research is a starting point for further investigations adding the knowledge on recent training courses of trade union IG Metal, coping strategies of works councils and organizational commitment.
ABSRJ 3(2): 142

Advances in Business-Related Scientific Research Journal (ABSRJ)
Volume 3 (2012), Number 2
To gain detailed information of coping strategies, an examination of both temporal distance and the contents of a work council could lead to the following conclusion:
• There are training courses which have a significant influence on coping strategies of work councils
• A temporal sequence and organization of training courses can be seen to best
develop coping strategies for new work councils • Based on these theories, but not forced upon them, the COPSOQ enables more
options for the examination of coping theories. To clarify these relationships, further studies are necessary.
LIMITATIONS AND STRENGTHS
The instruments used to analyse Health-Related Quality of Life by SF 36 and NHP contains no significant information concerning the underlying presumption of training course attendance being related to physical and psychological health. It can be considered a weakness of our research that at this present stage we are unable to identify more specific types of questionnaires that are sensitive to measure a relation between psychosocial demands and training courses. We think that using the coping questionnaire SVF 78 by Jahnke et al. (2002) could be an improvement to measure Health-Related Quality of Life. Either way, taking the limited quality of research into account, the results of the relationship between coping strategies and training courses by COPSOQ. As a second weakness of our research we have to consider we were not able providing evidence of the association between SF36, NHP and training courses should be considered primary. Due tot he fact that this preliminary study is based on a survey collected from work councils of 14 German companies the results do not attempt to be representative for all employees´ representatives. Additional we did an anonymous research and so we could not measure numbers of non-respondents. Taking the number and the setting of this study into account we do not claim validity of the results for the entire group of works councils in the branch of the trade union IG Metal. However, we do not expect that results of non-attended works councils differ significantly from our outcomes. We suggest that the general tendencies would stand in the same line and underline the results and it would be important for further investigations to be based on a larger data-setting to gain more credibility. In addition it could be useful to adjust the questionnaire with further instruments, such as SVF 78.
CONCLUSION
This cross-sectional study is, to the author´s knowledge, the first scientific approach investigating a trade of between psychosocial stress and strain of work councils and training courses held by the trade union IG Metal. Mainly we analysed different screening instruments to identify psychosocial stress and strain for further investigations on this specific group. We used the German version of Short form 36 Health Survey Questionnaire, COPSOQ and Nottingham Health Profiles. As one implication we identified only COPSOQ as being sensitive enough to measure psychosocial workload. Furthermore we found out that, due to the complex role as the employee´s representative, work councils could answer some
ABSRJ 3(2): 143

Advances in Business-Related Scientific Research Journal (ABSRJ)
Volume 3 (2012), Number 2
of the questions from different point of views, the employee´s and the work council´s view. Thus the instrument can be used with minor restrictions. We expected that employees as work councils with frequent training courses would have better coping strategies than employees with infrequent training courses. However, the results show that infrequent training courses are associated with lower correlation of 5 important sectors evaluated by COPSOQ. Confirming the hypotheses it seems that frequent training courses do have a positive, meaning a protective effect, when compared with low levels. It has to be said that this cross-sectional study is not sufficient for further explanations but is set to be the basis for a bigger cross-sectional and longitudinal study in 2011 and 2012 on work councils investigating the trade-of between training courses and coping strategies. By analysing the Copenhagen Psychosocial Questionnaire, significant correlations between attended training courses and coping strategies can be found. Especially emotional-related demands increase by attending training courses. These relationships are especially fostered by the model of resource conservation (COR-theory) by Hobfoll. Attending training courses leads to higher resources of coping strategies and personal skills. Higher resources mean higher coping strategies. The economic outcome of this study is the assumption that it is possible to create a training program helping young work councils to cope the specific daily stress and strain more successfully than the current situation. For this is a longitudinal study needed which will start in 2012, based on the outcome of the current study. More likely the results of the following investigations will be transferable as a template for researches on management qualification and prevention of psychosocial stress.
REFERENCES
Baillod, J. (1989). Arbeitszeitgestaltung. Chance zur Verbesserung der Arbeitswelt: Handbuch Arbeitszeit. Hg. v. J. Baillod, T. Holenweger, K. Ley und P. Saxenhofer. Zürich: Verlag der Fachvereine.
Baillod, J. & Schär Moser, M. (2003). Arbeitszufriedenheit, Belastungen und Qualität in der Pflege – Resultate aus einer Untersuchung im Kanton Bern. In E. Ulich (Hrsg.), Arbeitspsychologie in Krankenhaus und Arztpraxis. Arbeitsbedingungen, Belastungen, Ressourcen 213-234. Bern: Huber.
Bodenmann, G.: A systemic-transactional conzeptualization of stress and coping in couples. In: Schweizerische Zeitschrift für Psychologie 1995 (54), 34-49.
Frieling, Ekkehart, Sonntag, Karlheinz (1999). Lehrbuch Arbeitspsychologie. 2., vollst. überarb. und erw. Aufl. Bern: Huber (Aus dem Programm Huber).
Frieling, Ekkehart, Bigalk, Debora, Gösel, Christian & Müller von Waxmann, Rudolf (2007). Lernvoraussetzungen an gewerblichen Arbeitsplätzen messen, bewerten und verbessern: Bericht über Erfahrungen mit dem Einsatz des Lernförderlichkeitsinventars LFI in Betrieben der Zulieferindustrie. Waxmann-Verlag
Hasselhorn, H. M., Nübling, M., Stößel, U., Hofmann, F. & Michaelis, M.: Psychosocial work load of Occupational Physicians in comparison to other professional groups. Ergo Med (01). http://www.ergo-med.de
Hobfoll, Stevan E. (1988). The Ecology of Stress. New York: Hemisphere Publ. Corp. Hobfoll, Stevan E. (1989). Conservation of Resources. A New Attemp at Conzeptualizing
Stress. In: American Psychologist, 1989 (44), 513-524.
ABSRJ 3(2): 144

Advances in Business-Related Scientific Research Journal (ABSRJ)
Volume 3 (2012), Number 2
Hobfoll, Stevan E. (1998). Stress, culture, and community. The psychology and philosophy of stress. New York: Plenum Press (The Plenum series on stress and coping).
Hobfoll, Stevan E. (2001). The Influence of Culture, Community, and the Nested-Self in the Stress-Process. In: Applied Psychology: An International Review, 2001 (50), 337–421.
Hobfoll, S. E. & Buchwald, P. (2004). Stress gemeinsam bewältigen: Ressourcenmanagement und multiaxiales Coping. Hogrefe-Verlag.
International Labour Organisation (ILO) (1998). http://www.ilo.org/public/german/region/eurpro/bonn/download/ilo-erklaerung.pdf
Janke, W., Erdmann, G. & Kallus, K. W. (2002). Stressverarbeitungsfragebogen (SVF mit SVF 120 und SVF 78). Manual (3. erweiterte Auflage). Göttingen: Hogrefe.
Karasek, Robert & Theorell, Töres (1990). Healthy work. Stress, productivity, and the reconstruction of working life. New York: Basic Books.
Karasek, Robert, Clays, Els, Leynen, Francois, De Bacquer, Dirk, Kornitzer, Marcel, Kittel, France & De Backer, Guy (2007). Journal of Occupational & Environmental Medicine 49 (4), 360-367.
Kompier, M. & Taris, T. (2011). Understanding the causal relations between psychosocial factors at work and health – a circular process. Scand J Work Environ Health 37 (4), 259-261.
Lazarus, Richard (1966). Psychological stress and the coping process. New York: McGraw-Hill.
Lazarus, Richard (1981): The stress and coping paradigm. Hg. v. C. Eisdorfer, D. Cohan, A. Kleinmann und P. Maxim.
Lazarus, R. (1984). On the primacy of cognition. In: American Psychologist (2), 124–129. Lazarus, R. (2006). Stress and Emotion. A New Synthesis. Springer-Verlag; ISBN-10:0-8261-
0261-1. Luczak, Holger, Schlick, Christoph & Bruder, Ralph (2010). Arbeitswissenschaften. Berlin:
Springer-Verlag. Meyer, J. P., Allen, N. J. & Smith, C. A. Commitment to organizationsand occupations:
extension and test of a three-component conceptualization. J Appl Psychol 1993; 78 (4), 538–551.
McGrath, Joseph Edward & Altman, Irwin (1970). Social and psychological factors in stress. New York: Holt, Rinehart and Winston.
Minssen, Heiner & Riese, Christian (2005). Der Co-Manager und seine Arbeitsweise. Die interne Arbeitsorganisation von Betriebsräten im Öffentlichen Personennahverkehr. In: Industrielle Beziehungen 12 (4), 367–393.
Rutenfranz, J., Knauth, P. & Nachreiner, F. (1993). Arbeitszeitgestaltung. In: H. Schmidtke (Hg.): Ergonomie. München: Carl Hanser, 574–599.
Semmer, Norbert & Zapf, Dieter (1996). 'Shared job strain': A new approach for assessing the validity of job stress measurements. In: Journal of Occupational & Organizational Psychology 69 (3), 293–310.
Semmer, N. K., Gerber, H., Grebner, S. & Elfering, A. (2001). Stressful Experiences at Work. Report to the Swiss National Science Fondation. Bern.
Seyle, H. (1981). Geschichte und Grundzüge des Stresskonzepts. Bern: H. Huber. In: Stress,Theorien, Untersuchungen, Massnahmen.
Thoits, Peggy A. (1983). Multiple identities and psychological well-being: A reformulation and test of the social isolation hypothesis. In: American Sociological Review 48 (2), 174–187.
Thoits, Peggy A. (2010). Stress and Health. Major Findings and Policy Implication. In: Journal of Health and Social Behaviour (51), 41-53.
ABSRJ 3(2): 145

Advances in Business-Related Scientific Research Journal (ABSRJ)
Volume 3 (2012), Number 2
Tietel, Erhard (2006). Konfrontation - Kooperation - Solidarität. Betriebsräte in der sozialen und emotionalen Zwickmühle. Berlin: Ed. Sigma (Forschung aus der Hans-Böckler-Stiftung, 79).
Udris, I. & Frese, M. (1988). Belastung, Streß, Beanspruchung und ihre Folgen. In: Angewandte Psychologie, 427–447.
Udris, Ivar & Baumgartner, Corinne (2006). Das “Züricher Modell” der Arbeitszufriedenheit. Göttingen: Hogrefe-Verlag.
Vegchel, N., Jonge, J., Bosma, H. & Schaufeli, W. (2005). Reviewing the effort-reward imbalance model: drawing up the balance of 45 empirical studies. Social Science & Medicine (60), 1117-31.
Zapf, Dieter & Frese, M. (1991). Soziale Stressoren am Arbeitsplatz und psychische Gesundheit. In: S. Greis, E. Bamberg und N. K. Semmer (Hg.): Psychischer Stress am Arbeitsplatz. Göttingen: Hogrefe, 168–184.
Zapf, Dieter (1999a). Mobbing in Organisationen. Ein Überblick zum Stand der Forschung. In: Zeitschrift für Arbeits- & Organisationspsychologie (43), 1–25.
Zapf, D. & Semmer, N. K. (2004). Streß und Gesundheit in Organisationen. 2. Aufl. Göttingen: Hogrefe (Enzyklopädie der Psychologie, 3), 1007–1112.
Zapf, D., Machowski, S. & Trumpold, K. (2009). Hoher Einsatz mit Nebenwirkungen. Emotionsarbeit in Serviceberufen. Personalführung, 42, 18-29.
ABSRJ 3(2): 146

Advances in Business-Related Scientific Research Journal (ABSRJ)
Volume 3 (2012), Number 2
ABSRJ 3(2): 147
ISSN 1855-931X
CONSUMER ATTITUDES TO GLOBAL WARMING IN GAUTENG, SOUTH AFRICA
M. A. O. Dos Santos
University o Johannesburg f
South Africa
Topic Group: Marketing and Consumer Behaviour, Natural Sciences and Business
Abstract Global warming is a macro-environmental variable that predominately affects the global community in a negative manner. This study investigates the persuasion (attitude) stage of innovation-decision process to determine consumer attitudes to global warming. This study is descriptive and the data collected was obtained by means questionnaire that was administered to consumers using mall intercept. The results obtained revealed that consumers are passively involved with the global warming phenomenon; many do not discuss global warming issues within their social circle although many are interested in the government’s response to global warming issues. Consumers in this study were concerned about global warming and its consequences to South Africa. These results are significant within the context of motivating consumers to participate in global warming mitigation efforts in South Africa.
Key words: Innovation decision process, consumer attitudes and social responsibility, global warming
INTRODUCTION
Global warming is a macro-environmental variable that is focusing stakeholders’ attention on the impact of human activity on the natural environment. Spence (2005:45) states that scientific evidence has demonstrated that global warming and climate change is happening right now; while Page (2006:6) and Lorenzoni & Hulme, (2009:383) state that the vast majority of experts now agree that human activity can affect the world’s climate and it is happening right now. According to Page (2006:6), the tremendous advances in meteorology and climatology in the last fifty years have demonstrated that the greenhouse gases released into the atmosphere by human activity is affecting the global climate. As the concentration of

Advances in Business-Related Scientific Research Journal (ABSRJ)
Volume 3 (2012), Number 2
greenhouse gases continue to increase in the earth’s lower atmosphere, the climate of the planet will accordingly respond to these changes. In order for consumers to participate in and use their purchasing vote (Shaw, Newholm and Dickinson, 2006:1051-1052) to encourage businesses to become more environmentally sustainable, they need to adopt the scientific fact of global warming and they need to be willing to participate in its mitigation. The innovation decision process model (Rogers, 2003:164) suggests that consumers go through a series of stages before they adopt an innovation, in this instance global warming. This study examines consumers’ attitudes to global warming based on the persuasion stage of Rogers’ innovation decision process model.
LITERATURE REVIEW
As scientists focus their energies on investigating global warming, their knowledge about its causes, consequences and mitigation continues to grow; thereby facilitating future predictions of global warming outcomes. The main concern with global warming is the fact that its negative consequences are perceived to be greater than its positive ones. For example Shiva (2008:10-13) states that global warming has modified India’s weather patterns and has affected agricultural output. In India’s Bundelkand region, people are starving and committing suicide due to a prolonged drought brought about by climate change. Some of the outcomes associated with global warming according to the 2007 report by the International Panel on Climate Change (IPCC) Working Group II (WGII) include changes to natural systems in all continents and in most oceans due to increasing regional temperatures. Some examples include changes to the concentrations and distribution of fauna and flora in ecosystems (IPCC WGII: 37), an increase in the number and size of glacial lakes as well as growing ground instability in permafrost regions (IPCC WGII, 2007:8) Global warming also impacts negatively on human societies and infrastructure through coastal flooding (IPCC WGII, 2007:12), changing rainfall patterns (IPCC WGII, 2007:48), increased ranges for vector borne diseases (IPCC WGII, 2007:439) and extreme events such as hurricanes, floods and heat waves that become more intense and frequent. Shiva (2008:9-13) states that global warming and climate change kills and displaces millions of people around the world as a result of extreme events such as flooding, droughts and tropical cyclones. In addition Shiva (2008:3) states that in 2001, 165 million people were affected by climate related disasters around the world and in Mumbai on the 26th of July 2005, 100 people were killed and civic and public transport in the city collapsed due to 94.4 mm of rain that fell that day. The damage caused by this rain that day cost the Indian government Rs 17 billion. Changing rainfall patterns are also significant in countries that use rain fed agriculture to produce food for their people since farming becomes increasingly more uncertain and unpredictable. Although the negative outcomes of global warming tend to be emphasised in the literature, it has been recognised that global warming does benefit the environment to a limited extent. For example, it increases the photosynthetic activity of plants in response to higher temperatures and higher concentrations of carbon dioxide, although these benefits are not sustainable in the long term (Cox, 2007:123). In addition, climate change is seen to have a positive impact on some of the colder regions of this planet where inhabitants experience increases in agricultural output as well as decreases in energy demand and winter mortality.
ABSRJ 3(2): 148

Advances in Business-Related Scientific Research Journal (ABSRJ)
Volume 3 (2012), Number 2
The greenhouse gases responsible for global warming include; carbon dioxide which occurs due to the burning of fossil fuels for energy purposes; methane which is emitted from rice cultivation, livestock, biomass burning and landfills; nitrous oxide which is produced from the use of artificial fertilizers in the agricultural sector and the halocarbons that are produced for industrial applications such as refrigerants and solvents (Dressler and Parson, 2007:2, 9). One of the most powerful greenhouse gases in the atmosphere is water vapour, which is determined by the balance between evaporation from the oceans and precipitation worldwide. Other naturally occurring phenomena that can influence global warming include particulate matter in the atmosphere that is released through volcanic and tectonic activity; solar and internal variability as well as orbital variations (Dressler and Parson, 2007:67-71). Although some of the greenhouse gases that are blamed for the current warming of the planet exist naturally and are responsible for keeping the average surface temperature of the earth at approximately 150C, this has changed as a human activity on this planet annually increases the concentrations of these gases in the planet’s lower atmosphere. As these gases accumulate, the earth’s average surface temperature increases in response and world’s climate continues to change. In order to prevent or minimise the net annual accumulation of greenhouse gases in the earth’s lower atmosphere, consumers worldwide need to adopt the scientific fact of global warming and they need to implement mitigation measures since they personally contribute this phenomenon in their daily lives and they support businesses that are not environmentally friendly.
Global Warming Mitigation by Consumers
Although firms annually contribute huge volumes of greenhouse gases into the earth’s lower atmosphere; consumers encourage this behaviour by purchasing their products and services. If no market existed for the products and services that negatively impact on the environment then these would not be produced. In addition, consumers’ contribute to the emission of greenhouse gases in the earth’s lower atmosphere through their attitudes, behaviours and lifestyles that reflect a materialistic approach to life that encourages and facilitates planned obsolescence. Spence (2005:125-173) proposes that consumers can participate in the mitigation of greenhouse gases and save money at the same time by adopting some simple measures, that from an aggregate point of view (6.7 billion people on this planet {Robinson 2010}) would have a significant impact on volumes of greenhouse gases emitted. The impact of large numbers of people on greenhouse gas emissions is demonstrated by Cox (2007:129), who states that China with a population of 1.32 billion people who on average consume approximately 10-15% of the energy per capita of the average US citizen, is currently the world’s second largest emitter of greenhouse gases. Shiva (2008:3) states that all aspects of human life in all sectors of society, need to change in terms of how they shop, move, live and eat if greenhouse gas mitigation is to occur. Fundamentally there are two ways that consumers can assist in greenhouse gas mitigation. The first of these is for consumers to identify and support via their purchasing vote (Shaw, Newholm and Dickinson, 2006:1051-1052)), those businesses that are implementing environmentally sustainable business practices. Dobers and Wolff (2000:144) suggest that consumers can influence a business’ behaviour by means of a “pull” strategy whereby the purchase and consumption of environmentally friendly products encourages firms to satisfy this need in the marketplace. The second way that consumers can assist in greenhouse gas mitigation is to implement basic measures that reduce their energy and fuel consumption in
ABSRJ 3(2): 149

Advances in Business-Related Scientific Research Journal (ABSRJ)
Volume 3 (2012), Number 2
r t r
f
their daily lives. They can also support political candidates who are concerned about global warming’s impact on the planet and who are prepared to introduce the appropriate incentives to encourage greenhouse gas mitigation.
Rogers’ Innovation Decision Process
An innovation is defined by Rogers (2003:12) “as an idea, p ac ice o object that is perceived as new by the individual or other unit of adoption.” Rogers (2003:1) states that many innovations take a long time to become adopted by the target market and this is particularly true in the case of a “preventive innovation” which is defined as “ the prevention of an undesired event in the uture by the adoption of a new idea (Rogers, 2003:176). This study suggests that global warming is a preventive innovation and consumers need to adopt this scientific fact before they are likely to assist in its mitigation. The fact that global warming has been debated for some time does not mean that it cannot be regarded as an innovation. Rogers (2003:12) states that the newness in an innovation need not just involve new knowledge since the consumer may have known about it for some time but been indifferent toward it and neither adopted or rejected it. Rogers (2003:164) and Engel, Blackwell and Miniard (1995: 891-898) suggest that in order for a consumer to adopt an innovation, s/he needs to go through the innovation-decision process that is conceptualised as consisting of five stages that include: • The knowledge stage which occurs once the consumer is exposed to the innovation
and gains some understanding of how it functions. • The persuasion stage happens when the consumer develops a favourable or
unfavourable attitude toward the innovation. • The decision stage occurs when the consumer participates in activities that lead to a
choice to adopt or reject the innovation • The implementation stage happens when the consumer uses the innovation. In this
instance the consumer implements global warming mitigation measures. • Re-invention of the innovation sometimes occurs at this stage • The confirmation stage occurs when the consumer seeks reassurance that the decision
that they have made regarding the innovation is the correct one. The innovation decision process by the individual consumer is influenced by a number of factors relating to the innovation itself (in this case global warming). These characteristics have been defined by Rogers (2003:14) and Solomon, Marshall & Stuart (2009:259) as being: • Relative advantage – do consumers derive more benefits from the natural
environment as a result of global warming? Currently the negative outcomes of global warming are seen to outweigh the benefits.
• Compatibility – does the advent of global warming require any changes to consumer attitudes, values, and behaviours?
• Complexity –Do consumers find the global warming difficult to understand and explain?
• Trialability – Are consumers able to experience global warming on a limited or trial basis?
• Observability – Are consumers able to observe the changes that are brought about by global warming?
ABSRJ 3(2): 150

Advances in Business-Related Scientific Research Journal (ABSRJ)
Volume 3 (2012), Number 2
Although the characteristics of an innovation influence the innovation decision process itself, consumer characteristics also affect the adoption process. For example the consumer’s degree of innovativeness; their level of involvement in global warming issues and their concern for the natural environment and society. In this study, the knowledge stage of Rogers’ innovation-decision process is investigated to determine consumers’ attitudes toward this phenomenon.
PROBLEM STATEMENT
Global warming is a macro-environmental variable that has significant implications for the planet and its inhabitants. Dressler and Parson (2001:2) state that it is the most difficult and serious environmental issue that needs to be resolved. Part of the solution to this problem is to get consumers to behave in a more socially responsible manner towards this phenomenon by supporting environmentally friendly businesses and reducing their own emissions and contribution to global warming and climate change. To achieve this, consumers need to develop an attitude that will motivate them to adopt the scientific fact of global warming. Once this occurs, the likelihood of consumers participating in its mitigation is likely to increase.
OBJECTIVES
The primary objective of this study is to determine consumers’ attitudes to global warming in Gauteng, South Africa. The secondary objectives for this study are: 1. To discuss all the relevant issues associated with global warming and its mitigation. 2. To comment on the innovation-decision process proposed by Rogers (2003:168-172) and
the factors that influence it. 3. To evaluate and discuss consumer’s attitudes in Gauteng, South Africa to global
warming, taking into account the persuasion (attitude) stage of Rogers’ (2003:168-172) model on the innovation-decision process.
RESEARCH METHODOLOGY
To design a questionnaire that addressed the appropriate issues in relation to the persuasion stage of Rogers (2003:168-172) innovation-decision process model, the researcher carried out secondary research using academic textbooks and journal articles downloaded from electronic data bases that discussed global warming and the innovation-decision process. The questionnaire was designed using a 5 point Likert scale and consumers were asked to indicate their degree of agreement or disagreement with each of a series of statements that were based on the information gathered from the secondary research. The values that were assigned to each response variable varied from 1 (strongly disagree) to 5 (strongly agree) while 3 represented the neutral option, neither agree nor disagree. The questionnaire was evaluated by three renowned researchers and a statistician who analysed and commented on the design and statements made. The comments given by these individuals were then used to modify the questionnaire. The questionnaire was pretested in the field using four respondents who were similar to the target audience in order to determine whether they experienced any difficulties. Once this had been done, the questionnaire was administered to 548 respondents in the Gauteng province of South Africa. The population for this study consisted of individuals aged 18 and over who shopped at anyone one of the following malls namely: Eastgate/East Rand Mall, Southgate and the
ABSRJ 3(2): 151
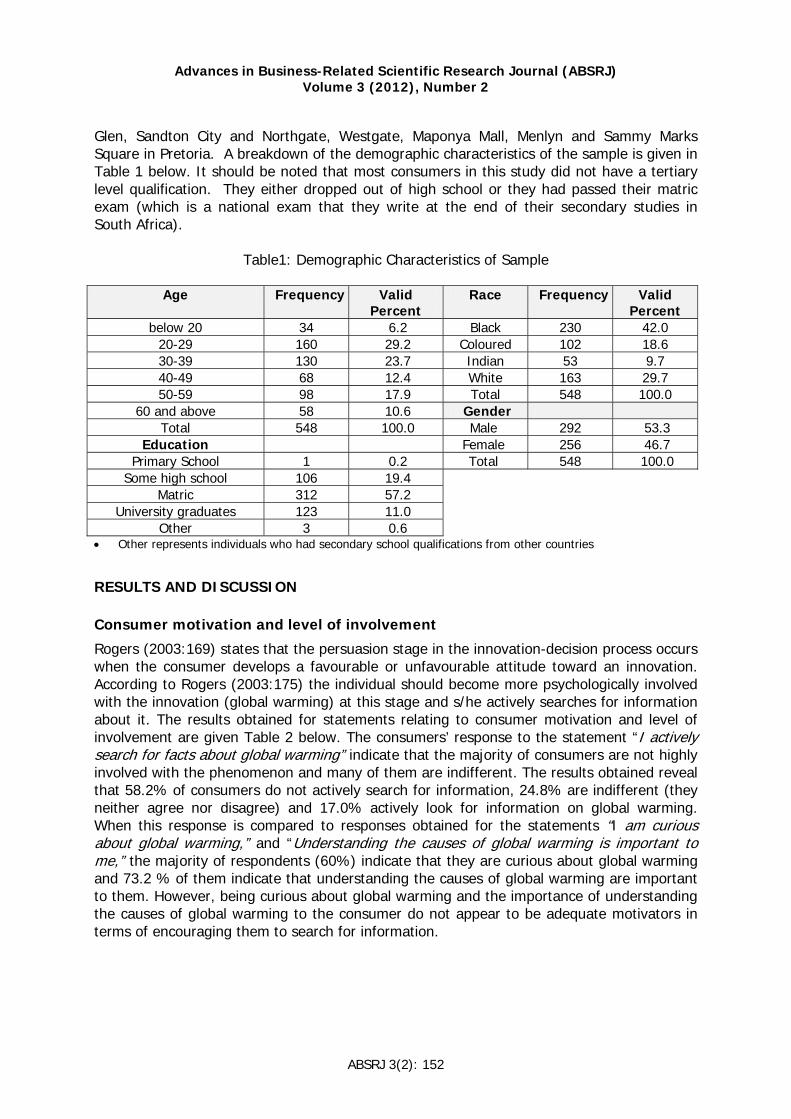
Advances in Business-Related Scientific Research Journal (ABSRJ)
Volume 3 (2012), Number 2
Glen, Sandton City and Northgate, Westgate, Maponya Mall, Menlyn and Sammy Marks Square in Pretoria. A breakdown of the demographic characteristics of the sample is given in Table 1 below. It should be noted that most consumers in this study did not have a tertiary level qualification. They either dropped out of high school or they had passed their matric exam (which is a national exam that they write at the end of their secondary studies in South Africa).
Table1: Demographic Characteristics of Sample
Age Frequency Valid
Percent Race Frequency Valid
Percent below 20 34 6.2 Black 230 42.0
20-29 160 29.2 Coloured 102 18.6 30-39 130 23.7 Indian 53 9.7 40-49 68 12.4 White 163 29.7 50-59 98 17.9 Total 548 100.0
60 and above 58 10.6 Gender Total 548 100.0 Male 292 53.3
Education Female 256 46.7 Primary School 1 0.2 Total 548 100.0
Some high school 106 19.4 Matric 312 57.2
University graduates 123 11.0 Other 3 0.6
• Other represents individuals who had secondary school qualifications from other countries
RESULTS AND DISCUSSION
Consumer motivation and level of involvement
Rogers (2003:169) states that the persuasion stage in the innovation-decision process occurs when the consumer develops a favourable or unfavourable attitude toward an innovation. According to Rogers (2003:175) the individual should become more psychologically involved with the innovation (global warming) at this stage and s/he actively searches for information about it. The results obtained for statements relating to consumer motivation and level of involvement are given Table 2 below. The consumers’ response to the statement “I ac ively search for facts about global warming” indicate that the majority of consumers are not highly involved with the phenomenon and many of them are indifferent. The results obtained reveal that 58.2% of consumers do not actively search for information, 24.8% are indifferent (they neither agree nor disagree) and 17.0% actively look for information on global warming. When this response is compared to responses obtained for the statements “I am curious about global warming,” and “Understanding the causes of global warming is important to me,” the majority of respondents (60%) indicate that they are curious about global warming and 73.2 % of them indicate that understanding the causes of global warming are important to them. However, being curious about global warming and the importance of understanding the causes of global warming to the consumer do not appear to be adequate motivators in terms of encouraging them to search for information.
t
ABSRJ 3(2): 152

Advances in Business-Related Scientific Research Journal (ABSRJ)
Volume 3 (2012), Number 2
Table 2: Consumer motivation and level of involvement N=548
Motivation and level of involvement
n Mean Standard Deviation
Valid % of respondents that disagree
Valid % of respondents that neither agree nor disagree
Valid % of respondents that agree
Understanding the causes of global warming is important to me
548 3.97 0.94 5.5 21.3 73.2
I am curious about global warming
547 3.70 1.01 10.4 26.7 62.9
I am interested in listening to programmes on global warming
547 3.56 1.10 17.0 23.8 59.2
I am interested in watching programmes about global warming
548 3.54 1.11 18.4 22.3 59.3
I am interested in watching movies (e.g. Al Gore’s) on global warming
548 3.44 1.16 22.3 25.0 52.7
I am interested in reading articles about global warming
548 3.37 1.13 22.6 25.4 52.0
I actively search for facts on global warming
548 2.39 1.12 58.2 24.8 17.0
Over half of the sample in this study either listens to programmes about global warming, reads about it or watches programmes or movies about it. The rest of the sample population is either indifferent or they do not pay attention to communications about global warming issues. The fact that the consumers do not actively search for information on global warming but over 50% of them are interested in communications on global warming, suggests that they are passively involved with it. In other words, consumers are interested in what global warming communications have to say if they come across them in their daily lives, but they do not actively search for these. For the rest of the sample, any communication that is presented to them about global warming, they are either indifferent (not involved) or they will disregard the communication in the different media.
Social influences and global warming
Rogers (2003: 175-176) suggests that at the persuasion stage of the innovation decision process, the consumer seeks information that reduces the uncertainty associated with the innovation’s expected consequences. At this stage of the innovation-decision process, consumers prefer to get this information from their near peers that are perceived to be more credible and accessible than experts and scientific sources. Arnould, Price and Zinchan (2005: 597-598) suggest that consumers tend to rely on others when acquiring the expertise needed to evaluate a product (global warming) choice that is challenging. In this instance, the consumer relies on others to guide their own attitudes, values and behaviours.
ABSRJ 3(2): 153

Advances in Business-Related Scientific Research Journal (ABSRJ)
Volume 3 (2012), Number 2
Table 3: Social influences in relation to global warming N=548
Social influences in relation to global warming
n Mean Standard Deviation
Valid % of respondents that disagree
Valid % of respondents that neither agree nor disagree
Valid % of respondents that agree
I discuss global warming with my friends in order to get their opinions about it.
548 2.66 1.17 51.1 19.3 29.6
I discuss global warming with someone who is knowledgeable about it in order to get their opinions about global warming
548 2.73 1.21 50.2 19.0 30.8
I discuss global warming with my family in order to get their opinions about it
548 2.64 1.15 50.4 20.3 29.4
I discuss global warming with people other than my family and friends in order to get their opinions about it
548 2.61 1.15 52.0 21.0 27.0
Global warming is quite a complex phenomenon which is difficult to understand particularly in relation to the impact of greenhouses on the world’s climate and its subsequent influence on the lives of ordinary consumers. As Table 3 indicates, over 50% of consumers in this study do not discuss global warming issues with their families, friends, acquaintances and opinion leaders, while approximately 20% of consumers are indifferent and approximately 30% are more proactive in this respect. This result supports previous findings in relation to motivation and involvement with global warming in that they suggest that majority of consumers are not highly involved with the phenomenon and perhaps do not see global warming as something that will touch their lives since they do not discuss it amongst themselves.
Reference group influence in relation to global warming
A reference group is defined as an individual or group who is referred to by consumers to inform and guide their values, attitudes or behaviours (Arnould, Price & Zinkhan, 2005: 609; Schiffman and Kanuk, 2007: 312). In this study the statements “I am interested in South African celebrities’ opinions of global warming” and “I am interes ed in the Sou h African’s government’s reaction to global warming” were incorporated to determine to what extent these two reference groups could influence consumer attitudes towards global warming and its mitigation. Celebrities are often used in advertising since they are perceived to attract the consumer’s attention to and influence their attitude toward an advertisement; they can inspire consumer trust particularly if they are perceived to be experts in a particular field and consumers often imitate the behaviour and style of the celebrity (Hawkins and Mothersbaugh, 2010:408; Schiffman and Kanuk, 2007:321).
t t
ABSRJ 3(2): 154

Advances in Business-Related Scientific Research Journal (ABSRJ)
Volume 3 (2012), Number 2
Table 4: Reference group influence in relation to global warming N=548
Attitudes toward global warming
n Mean Standard Deviation
Valid % of respondents that disagree
Valid % of respondents that neither agree nor disagree
Valid % of respondents that agree
I am interested in South African’s celebrities’ opinions of global warming
548 2.79 1.30 42.5 24.8 32.7
I am interested in the South African government’s reaction to global warming
548 3.58 1.21 17.5 17.7 64.8
As can be seen in Table 3 above, most of the consumers (42.5%) in this study were not interested in South African celebrities’ opinions about global warming, 24.8% were indifferent while 32.7% were interested. This finding suggests that using celebrities to promote global warming mitigation may not be as effective as using the South African government to promote it. The results of the statement “I am interested in the South Africangovernment’s reaction to global warming,” indicate that 64.8% of consumers are interested in the government’s reaction while the remaining 35.2% are either indifferent (17.7%) or they are not interested at all (17.5%).
Consumer Attitudes to Global Warming
An attitude, according to Hawkins and Mothersbaugh (2010:392), is the way an individual thinks, feels and acts toward some aspect of his/her environment while Arnould et al (2005:635) suggest that it is the evaluation of a concept or object. In this study consumers were asked if they were concerned about global warming and its consequences on the fauna and flora of this country; its impact on South Africa as a tourist destination; and the possible introduction by government of additional taxes. The responses to these questions indicate that the majority of consumers are concerned about all these issues. For example approximately 90% of respondents were concerned about global warming and its impact on South Africa’s fauna and flora. The number of respondents that were concerned about global warming’s impact on South Africa as a tourist destination dropped somewhat to 85.4%. This response suggests that even though respondents are concerned about the survival of South Africa’s fauna and flora, approximately 6% do not see it as having an impact on South Africa as a tourist destination even though South Africa’s fauna and flora is a major tourist attraction. The responses obtained for the statement “I feel that we should be concerned about possible taxes that the government will introduce as a result of global warming” were high with 72.7% of consumers indicating that they were concerned about this issue and approximately 27.3% of consumers were either indifferent or unconcerned even after the introduction of a carbon dioxide tax on new cars in South Africa. This result may suggest that some of the consumers were either not aware of this issue or they were unconcerned as they probably could not afford to purchase their own transport.
ABSRJ 3(2): 155

Advances in Business-Related Scientific Research Journal (ABSRJ)
Volume 3 (2012), Number 2
Table 5: Attitudes toward Global Warming
Attitudes toward global warming
N Mean Standard Deviation
Valid % of respondents that disagree
Valid % of respondents that neither agree nor disagree
Valid % of respondents that agree
I feel that global warming is something we should be concerned about
548 4.31 0.78 2.7 8.0 89.3
I believe we should be concerned about what global warming will do to our wild life
548 4.30 0.77 3.1 5.8 91.1
I feel that we should be concerned about what global warming will do to our indigenous plants
548 4.36 1.48 2.6 6.2 91.2
I believe that we should be concerned about what global warming will do to South Africa as a tourist destination
548 4.22 0.87 4.7 9.9 85.4
I feel that we should be concerned about possible taxes that the government will introduce as a result of global warming
548 4.22 0.99 6.9 20.4 72.7
MANAGERIAL IMPLICATIONS
Linder (2006:103) states that international environmental groups and a few Western governments have invested considerable resources marketing global warming and its negative impacts. In addition, Linder (2006:103) states that these marketing programmes emphasise personal culpability and assign responsibility to the individuals rather than to industrial sources. This is understandable since demand in business markets is ultimately derived from consumer demand. The results obtained in this study suggest that although the majority of consumers in the Gauteng Province of South Africa are concerned about the consequences of global warming, there are a number of issues relating to consumer attitudes that need to be addressed. The first of these issues is the fact that 62.9% of consumers state that they are curious about global warming and 73.2% feel that understanding the causes of global warming is important to them. However, only 17% of consumers in this study state that they actively search for global warming information. As stated earlier, this result suggests that curiosity and interest in global warming issues does adequately motivate consumers to search for information about this phenomenon. This unwillingness by consumers to actively search for information suggests to stakeholders, who are interested in global warming mitigation that they need to make information readily accessible in the target market’s favourite media. This conclusion is supported by the fact that consumers do expose themselves, by varying degrees, to global warming information in different media. For example over 59% of consumers’ surveyed watch or listen to programmes on global warming while over 52% watch movies or read articles about it. The number of consumers that are indifferent or who
ABSRJ 3(2): 156

Advances in Business-Related Scientific Research Journal (ABSRJ)
Volume 3 (2012), Number 2
f
do not expose themselves to information on global warming is quite high and research needs to be done to determine why this is so, since this posses a major barrier to global warming mitigation by individuals. In his discussion on the persuasion stage of the decision making process, Rogers (2003: 175-176) suggests that consumers seek information about innovation consequences from their near peers as this source is perceived to be more credible and accessible than experts. This study revealed that the majority of consumers surveyed either disagreed or were indifferent to statements referring to discussions on global warming issues within their social circle. This result suggests that mass media interventions would probably be more successful in educating or informing consumers about global warming and its mitigation than encouraging word of mouth communication at this stage. The fact that consumers do not discuss global warming issues with their near peers suggests that consumers may not see global warming as something that is discussed in a social context or they may not feel a sense of urgency when it comes to this phenomenon since it may be perceived as “something out there” that does not really impact on their personal lives. From a stakeholder perspective, this outcome suggests that communication in South Africa about global warming should address the individual’s contribution to this phenomenon and its impact on their personal lives. The mitigation of global warming in South Africa is particularly significant as Africa is perceived to be particularly vulnerable to the outcomes of global warming (IPCC, 2007: 435). The survey results on reference group influence demonstrate that the use of celebrities to encourage consumers to be more proactive in terms of global warming and its mitigation would probably not be very successful. This is could be due to the fact that celebrities are not seen as experts in the field of global warming. However, the major of consumers (64.8%) in this study were interested in the South African government’s reaction to global warming. This result suggests that either South Africans are concerned about the mitigation measures introduced by government or South Africans look to government to take a leadership role in this instance. If this is in fact so, then perhaps the South African government should take a more pro-active role persuading consumers to participate in global warming mitigation without the introduction of taxes. Responses by consumers to statements relating to global warming and its consequences demonstrate that the majority of respondents (over 85%) in the sample were concerned about global warming’s impact on both South Africa as a tourist destination and on its fauna and flora. This result indicates that most South Africans are aware of the negative impact of global warming on South Africa’s natural resources and its standing as a tourist destination. Although the majority (72.7%) of South African consumers in this study were concerned about the imposition of taxes by the South African government as a result of global warming, this response rate was not as high as the previous response rate obtained for concern about global warming and its consequences to South Africa as a tourist destination and to its fauna and flora. The imposition of additional taxes as a result of global warming is a possible realty in the face of the destruction and reinforcement of infrastructure due to extreme events. The Environmental Management Services Department, Rand Water South Africa states that “South A rica may have to reassess the standards for its bridges, railways, and even roads to withstand more frequent flooding due to climate change.”
ABSRJ 3(2): 157

Advances in Business-Related Scientific Research Journal (ABSRJ)
Volume 3 (2012), Number 2
CONCLUSIONS
Global warming is an environmental issue that needs to be addressed by all consumers on this planet as it impacts on everyone lives. This study demonstrates that although consumers are concerned about global warming, the majority of them do not actively search information on global warming and they do not discuss global warming issues within their social circle. These findings suggest that consumers’ level of involvement with global warming is passive and perhaps they do not feel a sense of urgency about global warming as they do not perceive it as impacting their lives directly. This is of concern to stakeholders of global warming mitigation because consumer participation is needed if they are to reduce the annual emission of greenhouses into the atmosphere.
REFERENCES
Arnould, E. J., Price, L. L. & Zinkman, G. M. (2005). Consumers. Second Edition (International Edition) McGraw-Hill/Irwin, 1221 Avenue of the Americas, New York, NY 10020.
Costa, P. M. (2005). Confronting the Challenges related to reducing greenhouse gas emissions. In Brown, C., (Ed) The sustainable enterprise: profiting from best practice, Kogan Page Limited, 120 Pentonville Road, London N1 9 JN United Kingdom.
Cox, H. M. (2007). Current issues in Global Warming and Mitigation Efforts: Focus on California. APCG Year Book, 69, 115-132.
Dessler, A. E. & Parson, E. A. (2007). The Science and Politics of Global Climate Change: A Guide to the Debate. Cambridge University Press, The Edinburg Building, Cambridge, CB2 8RU, UK.
Dobers, P. & Wolff, R. (2000). Competing with ‘soft’ issues- From managing the environment to sustainable business strategies. Business Strategy and the Environment, 9, 143-150.
Engel, JF. Blackwell, RD. & Miniard, PW. (1995). Consumer Behaviour. (International and Eighth Edition) The Dryden Press, Harcourt Brace & Company, 6277 Sea Harbour Drive, Orlando, Florida.
Environmental Management Services Department, Rand Water. (2011). Water Wise Climate Change. Pamphlet
Hawkins, D. I., Mothersbaugh, D. L. & Best, R. J. (2007). Consumer Behaviour: Building Marketing Strategy. (Tenth Edition) McGraw-Hill/Irwin, 1221 Avenue of the Americas, New York, NY, 10020.
Houghton, J. (2004). Global Warming: The Complete Briefing. (Third Edition), Cambridge University Press, The Pitt Building, Trumpington Street, Cambridge, UK.
Intergovernmental Panel on Climate Change, Working Group II. (2007). Climate Change 2007: Impacts, Adaptation and Vulnerability. Cambridge University Press, Cambridge, UK.
Linder, S. H. (2006). Cashing-in on Risk Claims: On the For-profit Inversion of Signifiers for “Global Warming,” Social Semiotics, 16 (1), 103-132.
Lorenzoni, I. & Hulme, M. (2009). Believing is Seeing: Laypeople’s Views of Future Socio-economic and Climate Change in England and Italy. Public Understanding of Sciences, 18 (2009), 343-400.
Page, E. A. (2006). Climate Change, Justice and Future Generations. Edward Elgar Publishing Limited, Glensanda House, Montpellier Parade, Cheltenham, Glos GL50 1 UA, UK.
Rogers, E. M. (2003). Diffusion of Innovations (Fifth Edition) The Free Press, A Division of Simon and Schuster, Inc. 1230 Avenue of the Americas, New York, N.Y. 10020.
ABSRJ 3(2): 158

Advances in Business-Related Scientific Research Journal (ABSRJ)
Volume 3 (2012), Number 2
Shaw, D., Newholm, T. & Dickinson, R. (2006). Consumption as voting: an exploration of consumer empowerment. European Journal of Marketing, 40 (9/10), 1049-1067.
Schiffman, L. G. & Kanuk, L. L. (2007). Consumer Behaviour. Ninth Edition. Pearson Education, Inc., Upper Saddle River, New Jersey, 07458.
Shiva V. (2008). SOIL NOT Oil: Climate Change, Peak Oil and Food Insecurity, Zed Books Ltd, 7 Cynthia Street, London, N1 9JF, UK.
Solomon, M. R., Marshall, G. W. & Stuart, E. W. (2009). Marketing Real People Choices, 6th Edition, Pearson Education, Inc., Upper Saddle River, New Jersey 07458.
Spence, C. (2005). Global Warming: Personal Solutions for a Healthy Planet. Palgrave Macmillan, 175 Fifth Avenue, New York, N.Y. 10010.
ABSRJ 3(2): 159


Advances in Business-Related Scientific Research Journal (ABSRJ)
Volume 3 (2012), Number 2
ABSRJ 3(2): 161
ISSN 1855-931X
IMPROVING REPRESENTATIVENESS IN ONLINE SURVEYS USING A COMBINED INTERNET/POSTAL APPROACH: EVIDENCE
FROM A UK-WIDE SURVEY OF CONSUMERS
Peter Atorough*
Aberdeen Business School, Robert Gordon University, Aberdeen
United Kingdom
Bill Donaldson
Aberdeen Business School, Robert Gordon University, Aberdeen
United Kingdom
Ainslie Harris
Aberdeen Business School, Robert Gordon University, Aberdeen
United Kingdom
Abstract
The Internet is fast gaining popularity as a medium for undertaking various forms of research, particularly research of a quantitative and survey nature. While the benefits of undertaking such research are numerous and have been recognised in many empirical projects, it has become clear that a major drawback of Internet research is the inability of researchers to achieve representative samples drawn from well-informed scientific sampling techniques. As a result, a review of studies using Internet sample recruitment techniques reveals a predominant bias towards convenience samples, with the attendant weakening of conclusions therein. In this paper, we discuss a survey sampling approach used by the researchers to recruit samples that improved representativeness and at the same time reduced systematic non-response bias. This paper will be of Interest to those considering using Internet based surveys, especially if they are concerned about the generalisability of their results to include

Advances in Business-Related Scientific Research Journal (ABSRJ)
Volume 3 (2012), Number 2
wider and non-Internet-based populations. While the approach used herein is not entirely new to the research methods community, our findings provide further proof that a combined online and off-line method toward Internet sampling is more robust and useful for reaching strong, reliable conclusions.
Keywords: Internet, survey, representative samples, non-response bias.
Topic Group: Research Methods
INTRODUCTION
There is ample evidence that a growing number of researchers are using the Internet as a medium via which to reach research audiences of various objectifications. Its pervasive and ubiquitous reach makes it ideal for disseminating research findings and sharing subject knowledge to the researcher’s audience, be they near or far dispersed. Equally, for the researcher or student seeking supporting material and information, the Internet has become an indispensable tool by which previous research, information and data can be mined and easily accessed (Benfield and Szlemko, 2006). Indeed in some cases the Internet has completely replaced paper-based published sources, for example some journals are now published entirely online. An even more pervasive use of the Internet for research is the gathering of primary data directly from respondents by way of surveys; some of the reasons identified for this are that the cost is lower, the turnaround time faster and the presentation more intuitive (Furrer and Sudharshan, in Evans and Mathur, 2005). However, while it is relatively easy to accumulate usage and similar statistics by tracking user activity, when it is required to engage the user consumer’s participation directly through eliciting of responses, Internet researchers have fared poorly thus far in achieving representativeness and reducing non-response bias as well as attrition (Mathy et al., 2003; Fricker and Schonlau, 2002, in: Evans and Mathur, 2005). Indeed these problems are common in non-Internet surveys as well, however, unlike in traditional face to face, postal and telephone surveys, the novelty of the Internet medium means that researchers have as yet not fully developed techniques to reduce poor survey results arising from low response rates, attrition, and lack of generalizability; nor have they perfected the means to improve the quality of Internet surveys by following scientifically sound sampling methods. The immediate questions that come to mind are (i) how can Internet samples recruitment be made more representative and generalisable through the application of proven scientific techniques? And (ii) how can non-response bias arising from skewed convenience coverage of potential respondents be reduced in Internet based surveys? Zhang (in Benfield and Szlemko, 2006) states that response rates to Internet surveys can be dismal enough to make the time-honoured mail-in surveys more attractive. For example, typical response rates for online surveys still stand at about 6% to 7%, a relatively poor rate compared to rates that have been achieved in telephone and postal and person administered surveys (Evans and Mathur, 2005). Therefore a secondary question arising from the literature relates to how sampling can be approached so that response rates are improved across all groups of interest to the Internet survey researcher. There are instances where purely Internet recruited samples are appropriate, or indeed the most justifiable; however, several instances of Internet recruitment methods are related to research that focuses on topics of wider applicability. For example, in the study of online shopping adoption and behaviour, the population of interest is arguably more general (for example, the national socio-economic population at large) than that of an Internet based panel or forum (for example, population of Internet users); it is this research on a wider
ABSRJ 3(2): 162
Advances in Business-Related Scientific Research Journal (ABSRJ)
Volume 3 (2012), Number 2
population, and for more general topics, that we focus on in the present paper, and this is why this paper is of great relevance to any researcher involved in, or contemplating, collecting research data by means of Internet administered surveys to large populations of the general public. In this paper, we share our experience of undertaking a UK-wide survey of consumers using an Internet questionnaire tool. By doing so, this paper contributes to the general discussion on improving Internet survey quality and specifically, shows how, by carefully adopting elements of traditional sampling designs, the quality of Internet surveys can be improved along the important dimensions of representativeness and response rate. We first provide a brief review of the literature on Internet surveys in the next section. Thereafter, we describe the methodology used in this research, focusing on the sample plan and survey design and actualisation (Section 3). In Section 4 we describe the results obtained and discuss these results in relation to representativeness, response error, attrition and validity. We conclude in Section 5, drawing recommendations for future practice.
LITERATURE REVIEW
The development of Internet technology has greatly influenced the way research is conducted today (Evans and Mathur, 2005) and although there are several forms of research that can be conducted on the Internet, the most prevalent appears to be the survey research (McDonald and Adam, 2003; Evans and Mathur 2005). This is reflected in the increasing number of influential publications that use Internet survey methodologies or describe and define the use of these methods for data collection (for example Dolnicar et al., 2009). Current Internet surveys are designed around the basis of accessible but narrow sample frames – the samples usually consist of specific interest panels or are non-probabilistically drawn from social networks and online recruitment by way of techniques such as self-selection invites, snowballing, saturation sampling and sifting (Zhao and Jin, 2006). While these approaches can potentially provide the required data in specific instances, in the context of a more representative national survey, the trouble with these approaches lies in the fact that oftentimes, the demographics of these sources are dissimilar to those of the wider population that uses the Internet more generally, for example as a means of conducting commercial and purchasing activities. Hence the analysis and conclusions drawn from the data obtained are often severely limited or weakened by this constraint (Evans and Mathur, 2005). Mathy et al. (2003) argue that to the extent that a sample population is not representative of a population, the generalisability of results and findings is limited and may also be further confounded by response patterns in an Internet-based protocol versus mailing or telephone. Yet the potential advantages of undertaking research surveys via the Internet are numerous (Weible and Wallace, 1998, In McDonald and Adam, 2003), warranting that researchers strive to identify ways of eliminating or at the least minimising compromised data while fully exploiting these advantages. It is easy to see how the Internet has become a very attractive medium for undertaking survey research. According to Schleyer and Forrest (in Hung and Law, in press) the most commonly cited benefits are low costs and quick turnaround times. For instance Adam and Deans (2000) reported a turnaround of 40% of total responses within seven days while McDonald and Adam (2003) reported a much improved 85% of total responses within the same time frame. Table 1 summarises some of the advantages that have been commonly cited in a selection of past papers. Internet survey tools do have their drawbacks, however, with invitations sent online being sometimes perceived as spam, impersonal, or raising
ABSRJ 3(2): 163

Advances in Business-Related Scientific Research Journal (ABSRJ)
Volume 3 (2012), Number 2
potential respondents concerns about protection of their anonymity should they choose to participate (Evans and Mathur 2005). Also, the proliferation of research studies using this method leads one to caution that as respondents are increasingly tasked with numerous survey requests, their willingness to partake will diminish, meaning that future Internet surveys may suffer even more from low response rates. The benefits of online surveys appear to outweigh the drawbacks, and as a result of these highlighted advantages, Internet survey research has become commonplace, especially in pure marketing insights research where issues of representation are of less concern than in academic or government oriented research. Increasingly, however, Internet research is also being used to conduct academic quality research on a wide range of policy, health, social and business issues (Couper et al., 2007; also see Berrens et al., 2003 and Hung and Law, in press). To satisfy the rigorous expectations related to such applications, more attention is necessarily focused on quality issues of representativeness, generalisability and non-bias. Several methods have been advanced in response to the need to achieve representativeness and mitigate non-response bias in online survey methods. Mathy el al. (2002) used block sampling to obtain a small but representative sample of a lesbian population from online and then compared their profile with the larger Gallup Poll sample. Overall they found that their sample was more robust and representative than the Gallup Poll sample, thus providing evidence that adapting strategies conventionally used in offline research can yield representative samples comparable to those obtained by more traditional means of sampling. Yun and Trumbo (in Andrews et al., 2003) achieved a 72% return rate across the sample of interest within a one-month period by combining postal, email and Web-based survey forms. Finally, Atkeson and Adams (2010) used a mixed mode approach to sample and administer a Web-based survey, concluding that this approach achieved a highly representative sample.
Table 1: Advantages of Internet Surveys (adapted from Hung and Law, in press).
Low cost Braunsberger et al., 2007; Duffy et al., 2005,
Evans and Mathur, 2005 Fast response time Couper et al., 2007, Evans and Mathur 2005 Easy access to wider range of geo-demographic populations
Couper et al., 2007; Fadner and Mandese, 2004
Instant data entry Reips, 2002 Personalization Ranchhold and Zhou, 2001 Wide geographic reach Evans & Mathur, 2005 Recruiting difficult to reach samples Mathy et al., 2002 Control of answer order Required completion of answers Interactive design/question Detail answers to open-ended questions Easy to obtain a large sample Easy follow up for non-responses
Evans and Mathur, 2005
Anonymity Mathy et al., 2003 Avoid interviewer effects Evans and Mathur (2005), Wiley et al. (2009)
METHODOLOGY
The purpose of our original research was to examine the relationship between adoption, usage and continuance of Internet shopping with individual personality variables, using the
ABSRJ 3(2): 164

Advances in Business-Related Scientific Research Journal (ABSRJ)
Volume 3 (2012), Number 2
Regulatory Focus (Higgins, 1997) framework, and to develop a generalised base model for understanding consumers’ engagement with online shopping – the regulatory focus classification of online shoppers (REFCOS). To this end, we required a sample that reflected characteristics of current and possible Internet user population at a national level, in order to eliminate extant socio-demographic bias. Therefore, we surveyed a sample of the overall UK population using a multi-stage stratification scheme. The UK Office of National Statistics maintains a system of population groupings called “supergroups”, a scheme segmenting the overall population based on shared social, economic and demographic characteristics (ONS, 2001). This segmentation uses output area classifications derived from the UK-wide census of 2001. Figure 1 below shows that there are seven supergroups overall, consisting of every postcode and address within the regions of the UK; however each supergroup is further broken down into “groups” and “subgroups”, giving a final total of 52 clusters or subgroups. Various neighbourhoods from geographically dispersed areas of the UK are clustered into subgroups according shared characteristics, so that all officially identifiable population patterns are represented irrespective of geographic spread and location. The consequence of this is that capturing responses from a particular neighbourhood effectively equated to capturing responses from all neighbourhoods that belonged to that particular cluster. Therefore if at least one neighbourhood within a cluster responded adequately to the survey, then it was irrelevant if the remaining neighbourhoods demonstrated a poorer response rate, assuming no further intervening circumstances.
Figure 1: Structure of the output area classifications (source: ONS, 2001).
The number of neighbourhoods within a subgroup varies according to population size and number of postcodes but is generally between 20 and 50 neighbourhoods per cluster. It was these subgroups that we based our initial sampling on. We randomly selected an equal number of three neighbourhoods from each subgroup to generate a “neighbourhoods” sample of 156, with household addresses in these neighbourhoods constituting a final frame. From this “neighbourhoods” frame, we stepped down a level to randomly select a total of 4800 household addresses, which constituted our final sample. The decision to survey a large household sample was intended to account for invitees who might still not have participated in any form of online shopping. We did not, however, expect these particular type of invitees to be of a significant size, given that recent research suggests as much as 80% of UK adult population has used the Internet for shopping or another reason within the past year (Kalapesi et al., 2010), and that seven in ten households have Internet access (ONS, 2010).
ABSRJ 3(2): 165

Advances in Business-Related Scientific Research Journal (ABSRJ)
Volume 3 (2012), Number 2
A letter was addressed to the householder via surface mail inviting recipients to complete an online survey. To encourage participation and increase response rates, entry into a £250 prize draw was offered as a reward. The online survey was deployed using Limesurvey, a free survey tool. 655 useful responses were obtained from a total of 805 reponses which represents a response rate of approximately 17%. This rate represents an improvement on other Internet surveys; but significantly, a review of the responses showed no systemic non-response bias as similar response rates were obtained from all supergroups and from subgroups within, as a result of which no targeted follow-up was deemed necessary.
RESULTS AND DISCUSSION
Response demographics are summarised in Table 2 above and show that all categories compare favourably with national characteristics when compared to the ONS statistics on national Internet user demographics (see ONS: Opinion Survey, 2010). In fact these results show that in both age and education categories, respondent demographics in this study were closer to actual national characteristics than to results reported by the ONS on Internet usage profiles in the UK. Thus whereas the ONS results show a significant skew for Internet usage towards respondents aged 18 to 24 years, our results show that Internet shopping usage is more general and reflective of national population characteristics. Similarly, using our method, we found that response rates from lower education categories were a significant improvement on reported findings. Although degree level demographics outperformed other categories, by comparison to ONS figures, respondents with lower levels of education improved considerably. Our gender demographic showed results similar to the ONS. These findings begin to illustrate the potential for improving Internet survey representativeness by using a combined recruitment and sampling. In this case, the use of a surface mail recruitment and invitation method combined with a Web-based survey instrument clearly improved response rates, reduced response bias and improved representativeness of the sample to the interesting population. This finding represents a key contribution to our knowledge about Internet research methods, especially with regards to survey sample planning. We now know that it is possible to adapt the methodology such that a scientifically rigorous approach can be adopted toward the recruitment plan, using a combination of Internet and non-Internet instruments. To this end, researchers can overcome the issues identified earlier about the generalizability, representativeness and usability of survey research that is undertaken on the Internet. Our contribution is in line with previous findings (for example Mathy et al. 2002, Atkeson and Adams, 2010) and provides further evidence that combining traditional methods of quantitative research with emerging electronic tools significantly improves the quality of the results obtained.
ABSRJ 3(2): 166
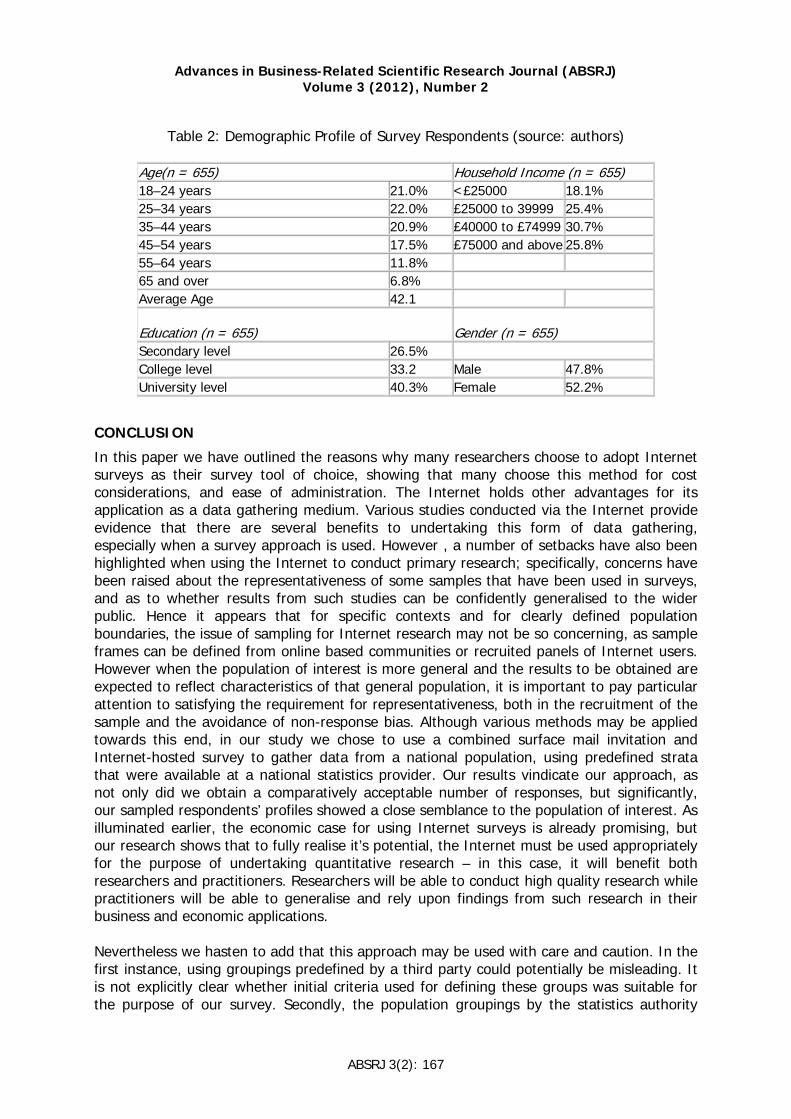
Advances in Business-Related Scientific Research Journal (ABSRJ)
Volume 3 (2012), Number 2
Table 2: Demographic Profile of Survey Respondents (source: authors)
Age(n = 655) Household Income (n = 655) 18–24 years 21.0% <£25000 18.1% 25–34 years 22.0% £25000 to 39999 25.4% 35–44 years 20.9% £40000 to £74999 30.7% 45–54 years 17.5% £75000 and above 25.8% 55–64 years 11.8% 65 and over 6.8% Average Age 42.1 Education (n = 655) Gender (n = 655) Secondary level 26.5% College level 33.2 Male 47.8% University level 40.3% Female 52.2%
CONCLUSION
In this paper we have outlined the reasons why many researchers choose to adopt Internet surveys as their survey tool of choice, showing that many choose this method for cost considerations, and ease of administration. The Internet holds other advantages for its application as a data gathering medium. Various studies conducted via the Internet provide evidence that there are several benefits to undertaking this form of data gathering, especially when a survey approach is used. However , a number of setbacks have also been highlighted when using the Internet to conduct primary research; specifically, concerns have been raised about the representativeness of some samples that have been used in surveys, and as to whether results from such studies can be confidently generalised to the wider public. Hence it appears that for specific contexts and for clearly defined population boundaries, the issue of sampling for Internet research may not be so concerning, as sample frames can be defined from online based communities or recruited panels of Internet users. However when the population of interest is more general and the results to be obtained are expected to reflect characteristics of that general population, it is important to pay particular attention to satisfying the requirement for representativeness, both in the recruitment of the sample and the avoidance of non-response bias. Although various methods may be applied towards this end, in our study we chose to use a combined surface mail invitation and Internet-hosted survey to gather data from a national population, using predefined strata that were available at a national statistics provider. Our results vindicate our approach, as not only did we obtain a comparatively acceptable number of responses, but significantly, our sampled respondents’ profiles showed a close semblance to the population of interest. As illuminated earlier, the economic case for using Internet surveys is already promising, but our research shows that to fully realise it’s potential, the Internet must be used appropriately for the purpose of undertaking quantitative research – in this case, it will benefit both researchers and practitioners. Researchers will be able to conduct high quality research while practitioners will be able to generalise and rely upon findings from such research in their business and economic applications. Nevertheless we hasten to add that this approach may be used with care and caution. In the first instance, using groupings predefined by a third party could potentially be misleading. It is not explicitly clear whether initial criteria used for defining these groups was suitable for the purpose of our survey. Secondly, the population groupings by the statistics authority
ABSRJ 3(2): 167

Advances in Business-Related Scientific Research Journal (ABSRJ)
Volume 3 (2012), Number 2
were based on 2001 UK National Census figures, which at the time of our research had significantly aged. It is therefore possible that actual national demographics had changed and were no more reflective of our findings; furthermore, as this research only covered consumers within the United Kingdom, the applicability of its findings in other economies requires testing. Finally, one of the appeals of Internet research is the potential to significantly lower costs; but in contrast to this benefit, our research involved a significantly higher financial outlay than a purely Internet based study would have required. Future researchers should therefore consider innovating on ways to overcome these limitations and still achieve high quality Internet survey results.
REFERENCES
Adam, S. & Deans, K. R. (2000). Online Business in Australia and New Zealand: Crossing a Chasm. Proceedings of AUSWEB2K, The Sixth Australian World Wide Web. Cairns: Southern Cross University, 19-34.
Andrews, D., Nonnecke, B. & Preece, J. (2003). Electronic survey methodology: A case study in reaching hard-to-involve Internet users. International Journal of Human-Computer Interaction, 16 (2), 185-210.
Atkeson, L. R. & Adams, A. (2010). Mixed Mode (Internet and Mail) Probability Samples and Survey Representativeness: The Case of New Mexico 2008. Western Political Science Association 2010 Annual Meeting Paper. Accessed 15/01/2011 at http://ssrn.com/abstract=1580588
Benfield, J. A. & Szlemko, W. J. (2006). Internet-based data collection: promises and realities. Journal of Research Practice, 2(2). Accessed 10/09/2010 at http://jrp.icaap.org/index.php/jrp/article/view/30/51
Berrens, R. P., Bohara, A. K., Jenkins-Smith, H., Silva, C. & Weimer, D. L. (2003). The advent of internet surveys for political research: a comparison of telephone and Internet samples. Political Analysis, 11 (1), 1-22.
Couper, M. P., Kapteyn, A., Schonlau, M. & Winter, J. (2007). Noncoverage and nonresponse in an internet survey. Social Science Research, 36, 131-148.
Dolnicar, S., Laesser, C. & Matus, K. (2009). ONLINE VERSUS PAPER: Format effects in tourism surveys. Faculty of Commerce - Papers (2009). Accessed 02/09/2010 at http://works.bepress.com/sdolnicar/226
Evans, J. R., & Mathur, A. (2005). The value of online surveys. Internet Research, 13, 195-219.
Higgins, E. T. (1997). Beyond pleasure and pain. American Psychologist, 52, 1280–1300. Hung, K. & Law, R. (in press). An overview of Internet-based surveys in hospitality and
tourism journals. Tourism Management, article in press. Accessed 20/07/2010 at http://www.sciencedirect.com/science/article/B6V9R-50DXCV4-2/2/ff1f288ebe77e35ee3045b93acb6d064
Kalapesi, C., Willersdorf, S. & Zwillenberg, P. (2010). The Connected Kingdom: how the Internet is transforming the UK economy. Report of the Boston Consulting Group, in association with Google accessed on 22/12/2010 at www.connectedkingdom.co.uk
Mathy, R. M., Kerr, D. L & Hydin, B. M. (2003). Methodological rigor and ethical considerations in Internet-mediated research. Psychotherapy: Theory, Research, Practice, Training, 40 (1/2), 77-85.
McDonald, H. & Adam, S. (2003). A comparison of online and postal data collection methods in marketing research. Marketing Intelligence and Planning, 21 (2), 85-95.
Office of National Statistics (2010). ONS: Opinion Survey. Accessed 27/11/2010 at http://www.statistics.gov.uk/cci/nugget.asp?id=8
ABSRJ 3(2): 168

Advances in Business-Related Scientific Research Journal (ABSRJ)
Volume 3 (2012), Number 2
Office of National Statistics (2001). ONS Neighbourhood Statistics. Accessed 12/01/2009 at http://www.neighbourhood.statistics.gov.uk/dissemination/Info.do?page=userguide/detailedguidance/casestudies/censusareaclassification/case-studies-classification.htm
Zhao, W. & Jin, Y. (2006). A study of sampling method for Internet surveys. International Journal of Business and Management, April, 69-77.
ABSRJ 3(2): 169

Advances in Business-Related Scientific Research Journal (ABSRJ)
Volume 3 (2012), Number 2
ABSRJ 3(2): 171
ISSN 1855-931X
RESPECTING CUSTOMERS: ANALYZING AND DETERMINING ITS NATURE AND THE BOOMERANG EFFECT
Siti Haryati Shaikh Ali
Nottingham University Business School, University of Nottingham (Malaysia Campus)Selangor
,
Malaysia
Abstract Recent growth of the service sector and increase competition have forced managers to look for new and cost effective ways to differentiate their services from competitors. Firms are recognizing the value of establishing quality relationships with their customers as means of retaining them. One of the ways in trying to establish close relationships with customers is by respecting them. The purpose of this paper is to examine the concept of respect and how it affects relationship quality and customer loyalty. The study draws from existing literature and empirical study of customers of dental clinics in Kuala Terengganu and Kuala Lumpur, Malaysia. The research hypotheses connecting the three dimensions of respect and customer loyalty were tested using structural equation modeling. The research also tested the mediation effect of relationship quality on customer loyalty. The results provide some support for most of the hypothesized relationships.
Key Words: interpersonal relationships, respect, loyalty, service
Topic Group: Business Strategy
INTRODUCTION
Today’s rapidly changing environmental demands service companies to seek for more creative and flexible means to deal with competition. Managers are looking for new ways to differentiate their services from those of competitors. Besides looking for new ways, they are also looking for cost effective ways to experience the ‘boomerang effect’ or customer retention strategies. These include delivering the best quality of service and having long-term relationship. Previous research suggests as customer relationship with the company lengthens, companies can increase profit by almost 100 per cent by retaining just five per cent of their customers (Winsted, 2000). The question of how customers are treated plays an important role in building quality relationship and loyalty. One of the ways is to have good interpersonal relationships with the customers.
Advances in Business-Related Scientific Research Journal (ABSRJ)
Volume 3 (2012), Number 2
Good interpersonal relationship is considered as one of a key element of any service offering (Czepiel, 1990; Berry, 1995) and has a positive impact on customer-to-firm relationships. This paper is based the finding that closeness of interpersonal friendship is a potential antecedent of customer loyalty towards the firm (Butcher, Sparks & O’Callaghan, 2001). However, a big question mark remains – what is actually the right dimension to describe interpersonal relationship? In this paper, we are suggesting that ‘respecting customers’ as one of the dimensions in building good interpersonal relationship with customers. As “understanding how and why a sense of loyalty develops in customers remains one of the crucial management issues” (Rawlins, 1992), the general goal of this article is to explore the role of ‘respect’ in gaining and developing customer loyalty to the company. In doing so, the paper will identify the dimensions of respect and their importance in affecting customer loyalty. In addition, it will also estimate the moderation effect of different types of service on respect and customer loyalty.
THEORETICAL BACKGROUND AND HYPOTHESES
The term ‘respect’ is not uncommon to most of us. In fact, the word is used very extensively in our everyday lives and each time when the word ‘respect’ is mentioned, the term is used colloquially, as if everyone understands. However, in actual academic world, the term ‘respect’ is very complex. Even though the term respect is widely used in the society, its dimensions and consequences are unclear especially in marketing. In marketing, the “feeling of respect” is strongly believed to be an important determinant of successful marketing relationship (eg. Berry, 1996; Bitran & Hoech, 1990, Costley et al., 2005). However, the concept is poorly defined (Dickert and Kass, 2009; Costley et al., 2005). The concept of respect seems to be virtually ignored in the marketing literature (e.g. Winsted, 2000). Not only the concept is being ignored, it is also being poorly defined in the marketing circle (Costley, 2005). Most of marketing literature discusses ‘respect’ as overall reciprocal relationship and personal liking between customer and service provider. The relationship is known with various names; for instance friendship relationship (Rawlins, 1992), interpersonal obligation (Yau et al., 1999) and social bonding (Mavondo and Rodrigo,2001). Most of researches do not discuss the concept of respect per se, but rather an overall of mixed dimensions. For instance, interpersonal trust, degree of familiarity, self-disclosure and rapport have been acknowledged as proxies in building friendship relationships (Butcher et al., 2001; Rawlins, 1992). For the purpose of this paper, the care respect concept by Dillon (1992) is thought to be the best basis in conceptualizing respecting customers due to its unique blend of morality, compassion, responsiveness and caring for other individual (1992). The whole idea of care respect is what is known as “meeting the others morally” (Noddings, 1994). Dillon (1992) proposes a concept with three dimensions; namely attention and valuing of the particularity, understanding, and, responsibility. Dillon (1992) believes the combination of the three dimensions will produce a kind of respect that we (as individuals) owe to all people and not just our loved ones. Most importantly, it is also applicable in the context of service provider – customer interactions. As mentioned earlier, Dillon’s (1992) dimension of respect can be divided into three which include: 1) attention and valuing, 2) understanding and 3) responsibility. The first dimension of care respect requires attending to a particularity in the mode of appreciating and cherishing each person as an unrepeatable individual. It involves an acceptance of the
ABSRJ 3(2): 172

Advances in Business-Related Scientific Research Journal (ABSRJ)
Volume 3 (2012), Number 2
t
tt
differences of others that goes beyond toleration. Attention here also carries the need to be sympathetic, concern to be involved in engagement with participation of the other. All in all, this dimension urges the need to value differences in others rather than viewing differences as a barrier to be overcome. The second dimension, understanding is about trying to understand a person in his own terms. Understanding is not simply a precondition to care respect but also trying to understand a person own consciousness, his activities and his purposes (Dillon, 1992). According to this view, one should avoid making assumptions because that will diminish the other effort being put into understanding the other. At the same time it demands great efforts which are curbed by our limited abilities to understand others (Dillon, 1992). Last but not least is responsibility. Care respect here highlights our individual responsibility as care respecter in a community. Among others, this dimension involves caring for people in the sense of helping them to pursue their end, acting to promote their goods and assisting them to satisfy their needs and wants (Dillon, 1992). Combining all elements, we believe that based on the social exchange theory, the concept of respect will result in a favorable outcome for the service provider in the form of customer loyalty. In the stream of literature, the customer loyalty construct has been conceptualized and measured in very different ways. Most authors treat loyalty as a construct consisting of behavioural dimension (repeat purchase or consumption) (e.g. Baldinger & Rubinson, 1996) and intentional dimension (to recommend and intention to repurchase) (e.g. Wong & Sohal, 2003). On the other hand, there are authors who define as multidimensional in nature (Price & Arnould, 1999). Loyalty is also being described as a situation when repeat purchase behaviour is accompanied by a psychological bond (Jarvis & Wilcox, 1977); and repeat purchase intentions and behaviours (Peter & Olson, 1990). One thing for sure, customer loyalty has been regarded as the outcome for good business relationship (eg. Hennig-Thurau et al.., 2002). This paper argues that ‘respecting’ will increase loyalty among customers however the level will differ depending on different type of service being offered. From there, the following hypotheses were developed. H1a : There is a significant positive relationship between a tention and relationship quality.H1b : There is a significant positive relationship between responsibility and relationship quali y. H1c : There is a significant positive relationship between a tention and relationship quality.H2a : There is a significant positive relationship between attention and customer loyalty. H2b: There is a significant positive relationship between responsibility and customer
loyalty. H2c: There is a significant positive relationship between respect understanding and customer loyalty. H3 : There is a significant positive relationship between relationship quality and customer
loyalty. H4a : Relationship quality mediates the relationship between attention and customer loyalty H4b : Relationship quality mediates the relationship between responsibility and customer loyalty
ABSRJ 3(2): 173

Advances in Business-Related Scientific Research Journal (ABSRJ)
Volume 3 (2012), Number 2
H4c : Relationship quality mediates the relationship between understanding and customer loyalty
METHODOLOGY
The methodology inconducting the analysis are as follow:
Sample and Data Collection
Data was collected via structured questionnaire for over a two weeks period. Respondents were customers of various commercial banks and dental clinics in Kuala Lumpur, Malaysia. The respondents were chosen using a systematic random sampling technique. The customers have previously encountered service offered by those businesses and have developed a relationship with the service provider. The questionnaire items for respect were adapted from the concept by Dillon (1992) and Dickert and Kass (2009) whereas the items for customer loyalty were adapted from Ndubisi (2009). All measures used in this study were estimated on a seven point Likert scales ranging from 1 (strongly disagree) to 7 (strongly agree).
Validation and Analysis
Factor and reliability analysis were conducted to ensure the validity of the measures. In order to test construct validity of this study, factor analysis using SPSS was used. The construct validity of each category was evaluated using maximum likelihood rotation method (Hair et al., 1998). Promax extraction method was performed to identify the underlying dimensions of the data and those with high cross-loadings were removed.
RESULTS
All in all, 1200 survey forms were handed out and 663 (55 per cent) were returned. However, 100 were void because of incomplete data, resulting in 563 usable responses. The participants in this study were predominantly females (56.3 per cent), majority (45.2%) of the respondents were aged between 18 - 28 years old, Malay (29.5 per cent) and possessed a bachelor degree (22.7 per cent) and working in the private sector (20.3 per cent). Most of the respondents were middle income earners with their monthly salary below RM4000 (25 per cent).
Factor and Reliability Analysis
Table 1 below shows the results of the factor analyses of the key dimensions items and loadings. The results are based on parsimonious sets of variables guided by conceptual and practical considerations (i.e. the acceptance of factor loadings of 0.50 and above – this level is considered practically significant (Hair et al., 1998).
Table 1: Remaining Factor for Analysis
F1 – Attention and Valuing to the particularity • The service provider sees customers as they really are (AA2)
• The service provider values customers (AA3) • The service treat customers well regardless of their background (AA4)
ABSRJ 3(2): 174

Advances in Business-Related Scientific Research Journal (ABSRJ)
Volume 3 (2012), Number 2
F2 – Understanding • The service provider does not make any assumptions towards the customers. (AB9) • The service provider is sympathetic to the customers. (AB10) • The service provider is interested to relate his/her experience to the customers (AB11
F3- Responsibility • The service provider responds to me as part of his / her responsibilities (AC13) • The service provider regards customers as important. (AC14) • The service provider is happy to have me as customer (AC16)
F4- Relationship Quality • My relationship with the service provider is what I really want (DA1) • I have a very close relationship with this service provider (DA2) • My relationship with the service provider meets my goals (DA3) • My relationship with the service provider fulfils my expectations (DA4) • Overall, I have a good relationship with the service provider (DA5)
F5 – Customer Loyalty
• I consider this bank / clinic as my first choice among other banks / clinics in the area (EA1)
• The bank / clinic is the first that comes to my mind when I am in need of service (EA2)
The internal consistency of the instrument was tested via reliability analysis. Reliability estimates (Cronbach’s alpha) for the construct dimension are as follows: Attention & Valuing of the Particularity (0.76), Understanding (0.89), Responsibility (0.93) and customer loyalty (0.81) suggesting a higher degree of reliability. The results very much exceed 0.60 lower limit of acceptability (Hair, et.al., 1995).
Confirmatory Factor Analysis
In order to ensure the unidimensionality of the scales measuring each construct and to validate the measurement model, confirmatory factor analysis was conducted. The result of CFA for all the dimensions of respect is as follows. The chi-square (χ2) is 106.062 with 32 degrees of freedom (p < 0.001 ). The ratio of χ2/df which is (3.314) somehow gives an indication that the model can still be improved. The same goes with comparative fit index (CFI) = 0.969, incremental fit index (IFI) = 0.969 and Tucker-Lewis index (TLI) = 0.947, which can be improved for a good model fit. Before testing the overall measurement model, the unidimensionality of each construct was examined one by one (Sethi and King, 1994) and unacceptable items were eliminated. The remaining items for CFA revealed a good model fit.
Structural Model
A structural model with six constructs was estimated. Fit indices provided by AMOS indicated that the model had an acceptable fit. Chi-square (χ2) was 225.124 with 94 degrees of freedom (p < 0.01), CFI = 0.976, IFI = 0.976, TLI = 0.951, and RMSEA = 0.035. Values of CFI, IFI and TLI are ranged from 0 to 1, with values closer to 1, indicating a good fit (Byrne, 1989). The ratio of χ2/df is 2.395, which is near to 2, indicates good model fit.
ABSRJ 3(2): 175
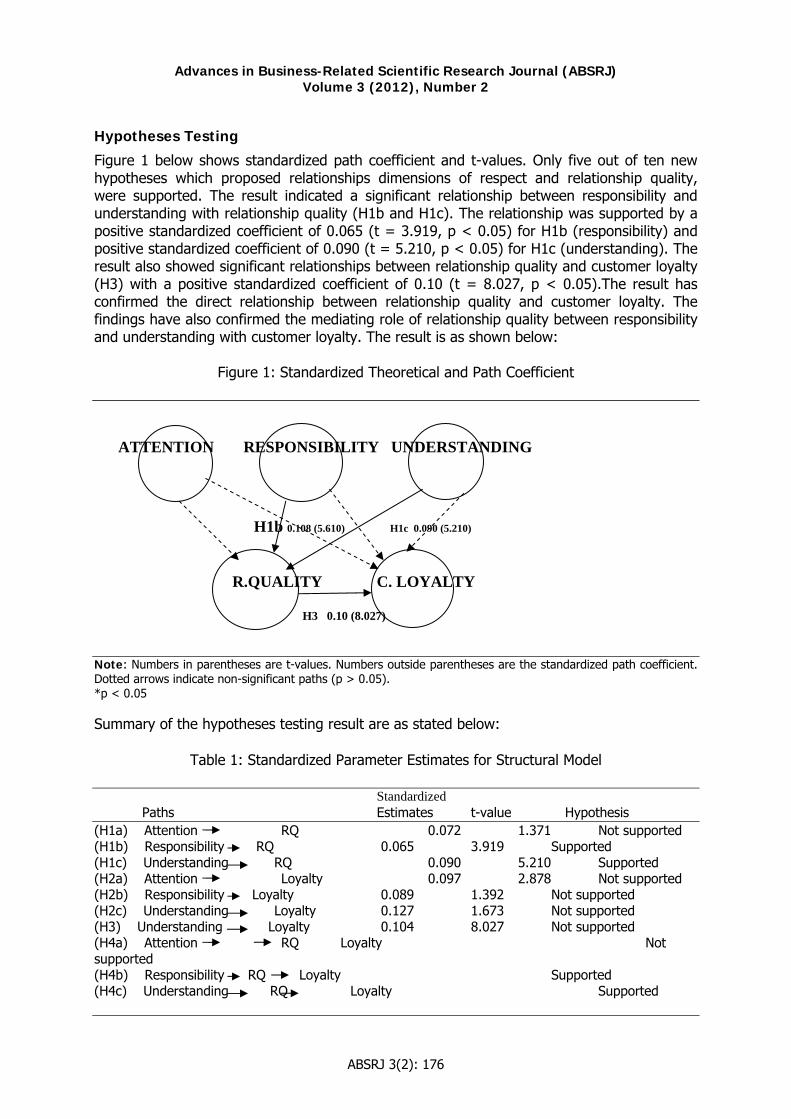
Advances in Business-Related Scientific Research Journal (ABSRJ)
Volume 3 (2012), Number 2
Hypotheses Testing
Figure 1 below shows standardized path coefficient and t-values. Only five out of ten new hypotheses which proposed relationships dimensions of respect and relationship quality, were supported. The result indicated a significant relationship between responsibility and understanding with relationship quality (H1b and H1c). The relationship was supported by a positive standardized coefficient of 0.065 (t = 3.919, p < 0.05) for H1b (responsibility) and positive standardized coefficient of 0.090 (t = 5.210, p < 0.05) for H1c (understanding). The result also showed significant relationships between relationship quality and customer loyalty (H3) with a positive standardized coefficient of 0.10 (t = 8.027, p < 0.05).The result has confirmed the direct relationship between relationship quality and customer loyalty. The findings have also confirmed the mediating role of relationship quality between responsibility and understanding with customer loyalty. The result is as shown below:
Figure 1: Standardized Theoretical and Path Coefficient
ATTENTION RESPONSIBILITY UNDERSTANDING
H1b 0.108 (5.610) H1c 0.090 (5.210)
R.QUALITY C. LOYALTY H3 0.10 (8.027) Note: Numbers in parentheses are t-values. Numbers outside parentheses are the standardized path coefficient. Dotted arrows indicate non-significant paths (p > 0.05). *p < 0.05 Summary of the hypotheses testing result are as stated below:
Table 1: Standardized Parameter Estimates for Structural Model Standardized
Paths Estimates t-value Hypothesis (H1a) Attention RQ 0.072 1.371 Not supported (H1b) Responsibility RQ 0.065 3.919 Supported (H1c) Understanding RQ 0.090 5.210 Supported (H2a) Attention Loyalty 0.097 2.878 Not supported (H2b) Responsibility Loyalty 0.089 1.392 Not supported (H2c) Understanding Loyalty 0.127 1.673 Not supported (H3) Understanding Loyalty 0.104 8.027 Not supported (H4a) Attention RQ Loyalty Not supported (H4b) Responsibility RQ Loyalty Supported (H4c) Understanding RQ Loyalty Supported
ABSRJ 3(2): 176

Advances in Business-Related Scientific Research Journal (ABSRJ)
Volume 3 (2012), Number 2
The result shows that there are relationships between responsibility and understanding with relationship quality. It is learnt that there is no direct relationship between respect and relationship quality. However, relationship quality plays an important mediation role between respect and customer loyalty.
CONCLUSION
From the results, it is clear that most of the dimensions of respect except attention and valuing of the particularity significantly affect loyalty. In other words, respect is a key dimension for relationship quality. Therefore, it does matter in the relationship between customers and service provider to show respect to customers. The first important dimension of respect is responsibility. The findings support the research by Gallagher (2007) who states that service providers need to not only recognize but also to be responsive to the customers. Understanding is another important driver of respect in building up loyalty among customers. Evidence from two service sectors (banking and clinics) in the Metropolitan City of Kuala Lumpur, Malaysia supports the notion of respect as a robust driver of customer loyalty. This result could mean that irrespective of the nature of the service, respect is an important factor shaping customer loyalty. It is true after all that as competition in service industries increases, reflecting a new age of service commoditization (Pine and Gilmore, 1998), managers are looking for new ways to differentiate their service products. The whole research proved that respecting customers, proper conflict handling and rapport are indeed examples of cost-effective customer retention strategies. The idea is that a personal relationship whether in the form of friendship or simple camaraderie, creates in service customers a perception of high overall relationship quality with service providers.
IMPLICATIONS OF THE STUDY
The findings offer important implication for theory and management of services, especially on ways to improve the effectiveness of relationship between customers and service provider. The contributions described from the perspective of academic contribution and managerial implications. Theoretically, in relationship marketing, attracting new customers costs organizations more than keeping existing ones (Reicheld & Sasser, 1990). However, retaining customers demands efforts and sacrifices. Hence, this study tries to prove that one of the ways is by respecting customers. Although the issues of respect has been discussed in other fields, their application in marketing (especially in services) is still new. Furthermore, most of those researches on respect in other fields are not empirically backed up. This study contributes in providing study with strong dimensions of respect in service marketing. Secondly, this study also contributes to further understand the mediating function of relationship quality in the overall relationship. This suggests the inclusion of respect in the loyalty model is important as both direct drivers and indirect predictors via overall relationship quality. In order to be successful in the long-term, the focus of management lies in instituting (maintaining) a customer orientation. For a short term perspectives, perhaps it is easier to focus on cost reduction and turnover. However, things are not as easy when the focus is to build long term quality relationship with the customers. In other words, in order to be
ABSRJ 3(2): 177

Advances in Business-Related Scientific Research Journal (ABSRJ)
Volume 3 (2012), Number 2
successful in the long run, the focus of management should be on how many satisfied and loyal customers are created rather than how many are served. The result of this research has shown that by having the correct way of how to respect customers will contribute in building quality relationship, which will lead to customer loyalty. It does matter in the relationship between customers and service provider to show respect to customers. The significant result of how respect affects relationship quality and customer loyalty suggests that customers seek quality of relatioship from service provider. Service providers should be aware that respecting customers is necessary to enhance the quality of relationship with customers. Apart from that, the results also indicate that respect significantly although not directly will affect customer loyalty. In fact, research by Mattila (2001) revealed that many loyalty programs run by companies have proven to be ineffective in generating true customer loyalty. Loyalty program alone is not enough. Companies should make customers feel respected and that they are special (Morais, Dorsch and Backman, 2004)
LIMITATIONS
This study itself opens avenues for further research to be conducted. This study has developed an initial model which needs further rigorous testing and refinement. First, the data were collected from customers of dental clinics and banks representing high contact service and low contact service business. As such, one type of business of each section may not represent the entire possible classification of service situations to yield more conclusive results. Future research should be replicated in other services and businesses in general. These efforts will result in more generalizable outcomes. Secondly, this is limited to customers in Kuala Lumpur. Perhaps in the future, the study should be projected to the entire country or even other foreign countries with marked cultural differences from Malaysia for a bigger picture of customers' perceptions on relationship quality.
REFERENCES
Baldinger, A. L. & Rubinson, J. (1996). Brand Loyalty: The link between attitude and behaviour. Journal of Advertising Research, 36 (6), 22-34.
Berry, L. (1995). Relationship marketing of services: Growing interest, emerging perspectives. Journal of Academy Marketing Science, 2 (4), 236-245.
Berry, L. (1996). Retailers with a future. Marketing Management, 5 (1), 39-46. Bitran, G. R. & Hoech, J. (1990). The humanization of service: Respect at the moment of
truth. Sloan Management Review, 89 (Winter), 1990, 89-96. Butcher, K., Sparks, B. & O'Callaghan, F. (2001). Evaluative and relational Influences on
service loyalty. International Journal of Service Industry Management, 12 (4), 310-327. Costley, C., Friend, L. & Babis, P.(2005). Respect in the marketplace. Journal of Research for
Consumers. 9. Czepiel, J. A. (1990). Managing relationships with customers: A differentiation philosophy of
marketing. In Service Management Effectiveness. San Francisco: Jossey-Bass. Dickert, N. W. and Kass, N. E. (2009). Understanding respect: Learning from patients,
Journal of Medical Ethics, 10 (1136), 2009, 419-423. Dillon, R. S. (1992). Care and respect, In E. B. Cole, Coultrap-McQuin, Eds Explorations in
Feminist Ethics. Bloomington: Indiana University Press.
ABSRJ 3(2): 178

Advances in Business-Related Scientific Research Journal (ABSRJ)
Volume 3 (2012), Number 2
Hair, J. G., Anderson, R. E., Tatham, R. L. & Black, W. C. (1998). Multivariate Analysis. New Jersey: Prentice Hall Inc.
Hennig-Thurau, T., Gwinner, K. P. & Gremler, D. D. (2002). Understanding relationship marketing outcomes: An integration of relational benefits and relationship quality. Journal of Service Research, 4 (3), 230-247.
Gallagher, A. (2007). The Respecful Nurse. Nursing Ethics, 13 (3), 360-371. Jarvis, L. P. & Wilcox, J. B. (1977). True vendor loyalty or simply repeat purchase behaviour.
Industrial Marketing Management, vol 6 (1), 9-14. Mattila, A. S. (2001). Emotional bonding and restaurant loyalty. Cornell Hotel and Restaurant
Administration Quarterly, 42 (6), 73-79. Mavondo, F. T. and Rodrigo, E. M. (2001). The effect of relationship dimensions on
interpersonal and inter-organizational commitments in organizations conducting business between Australia and China. Journal of the Academy of Marketing Science, 29 (2), 111-121.
Morais, D. B., Dorsch, M. J., & Backman, S. J. (2004). Can tourism buy their customers loyalty: Examining the influence of customer- provider investments on loyalty. Journal of Travel Research, 42 (3), 235-243.
Ndubisi, N. O. (2007). Relationship quality antecedents: The Malaysian retail banking perspective. International Journal of Quality & Reliability Management, 24 (8), 829-845.
Ndubisi, N. O., Malhotra, N. K. & Chan. K. W. (2009). Relationship Marketing, Customer Satisfaction and Loyalty: A Theoretical and Empirical Analysis From An Asian Perspective. International Consumer Marketing Journal., 21 (1), 5-16.
Noddings, N, (1994). Caring: A Feminine Approach to Ethical Moral Education. Berkeley, CA: University of California Press.
Peter, J. P. & Olson, J. C. (1990). Consumer Behaviour and Marketing Strategy. Homewood IL: Richard D. Irwin.
Price, L. L. & Arnould, E. J. (1999). Commercial friendships: Service provider- client relationships in service context". Journal of Marketing, 63 (April), 38-56.
Pritchard, M. P., Havitz, M. E. & Howard D. R. (1999). Analysing the commitment - loyalty link in service context. Journal of the Academy of Marketing Science, 27 (3), 333-348.
Rawlins, W. K. (1992). Friendship Matters. Hawthorne, NY: Aldine de Gruyter. Reichheld, F. & Sasser, W. E. (1990). Zero Defections: Quality Comes to Services. Harvard
Business Review, 68 (5), 105-111. Winstead, K. F., (2000). Service behaviours that lead to satisfied customers. European
Journal of Marketing, 34 (3/4), 399. Wong, W. & Sohal, A. S. (2006). Understanding the quality of relationships in consumer
services. International Journal of Quality & Reliability Management, 23 (3), 244-264. Yau, O. H. M., McFetridge, P. R., Chow, R. P. M., Lee, J. S. Y., Sin, L. Y. M. & Tse, A. C. B.
(1999). Is relationship marketing for everyone?, European Journal of Marketing, 34 (9/10), 111-127.
ABSRJ 3(2): 179


Advances in Business-Related Scientific Research Journal (ABSRJ)
Volume 3 (2012), Number 2
ISSN 1855-931X
TOWARDS A COMPOSITE COST FUNCTION FOR AN ENTREPRENEUR NOT SO RATIONAL: AN INSTITUTIONAL
APPROACH TO COST FUNCTION OF SMALL AND TINY INDUSTRY OF VARANASI REGION
Shalini Singh1
Depar men of Economics, Banaras Hindu University t t
t t
t
India
Bhupendra V. Singh
Depar men of Economics, Banaras Hindu University
India
Abstract
The axiomatic approaches towards cost relationship rely on the Homoeconomicus brand entrepreneur that performs in a free and frictionless world (in absence of institution). Successive developments differ in terms of objective of the individual assuming absolute rationality (may be of different magnitude or bounded one) and dealt with one or the other. The present approach differs ab ini io to rely on personal construct and emanating different action tendencies there from. It proposes that final action is a weighted combination of different action tendencies and therefore in determining shape of a cost curve the relative weight assign to different action tendencies and the institution play important role. The endeavor verifies the proposition empirically employing cross sectional data from small and tiny industries. Using a production function extended by relative permittivity of institution and deriving a composite cost function, the finding suggests that due to institution curve takes a particular form.
Key Words: Institution, Rationality, Relative Permittivity, Composite Cost Function.
Topic Groups: Entrepreneurship, Economics and business
1 Corresponding Author
ABSRJ 3(2): 181

Advances in Business-Related Scientific Research Journal (ABSRJ)
Volume 3 (2012), Number 2
INTRODUCTION
Economists acceded to the basic definition of individual entrepreneur2 as he is rational. The main goal of so defined ‘Homoeconomicus’ is to earn profit and to pursue self interest. The studies attempt to delimit the entrepreneurial behavior in one contour and by granting ‘ceteris paribus’ the real self of human existence is lost in artificial axioms. Optimization of the objective function is one such assumption that underpinned the life as collection of discrete objects rather than to be a process. The Successive developments such as managerial theory, behavioral theory, and transaction cost theory that tried to capture diverse goal of the firm, for example, sales maximization, productivity maximization etc. are the partial expression of a complete picture. Nevertheless, they provide a starting point to begin with. The axiomatic approach assumes that the homoeconomicus performs in a free and frictionless world i.e., he does not derive from the society he lives in, or he is free from social restrains and regulations, laws, and also the psychological impulses to move and to perform in a particular situation. Precisely, if we club these dimensions of psychological construct, the formal regulations (Law of the land) and informal regulations (unwritten law of the land such as, social customs, taboos, religious, faith, etc.) in one word- The Institution- the axiomatic or traditional approach does not incorporate ‘the institution’ in any direct manner. We begin with the faith that individual is a complex construct of different psychological impulses. Every single impulse has defined action tendency. A genuine combination of all impulses is the resultant action of the individual. Also, the individual performs in a medium defined by written and unwritten laws, so to say, and not in a vacuum. This way the institution comes into the theory by three corners; one, the individual construct, two, the written laws, and three, the unwritten laws. The medium permits the individual to perform as it causes frictions or it facilitates. The study differs ab initio as it avoids excess of scientific methods i.e. to begin with clearly mentioned axioms, assumptions, inferences and conclusions and that is empirically verified. It also differs to assume an artificially imposed ‘Absolute Rationality’; rather it relies on the Psychological construct of the individual entrepreneur where by different whims enables him to produce contradictory or complimentary action tendencies. The final or the actual action is the combination of all such action tendencies having weights of ranks annexed with it. The ranks may be a cognitive or emotive judgment or both. Obviously, this is denial of practice of positivism. This also adds the dimension of different perspectives of individual specificity and the social perspective given by the law of land, social customs and taboos. Therefore, the endeavor does not intend to find ‘Meta – truth’ that is independent of specific perspective. This way we may expect greater predictability of the cost curve. The present endeavor is to find the role of institution on cost function of small and tiny industries. It has been divided in to five sections; Section I provides the theoretical development in the area of cost function; Section II and section III discuses the model and methodology respectively; the empirical findings are given in Section IV, finally conclusions of the effort is given in the section V.
2 By putting individual before entrepreneur we try to symbolize that entrepreneur is not an abstract existence, rather he is an individual in the ownership of the business who possesses characteristic of enterprise together with other individual characteristics.
ABSRJ 3(2): 182

Advances in Business-Related Scientific Research Journal (ABSRJ)
Volume 3 (2012), Number 2
I
Individual is basically defined on the basis of rationality & self interest and accordingly, the optimization of objective function is the derived action tendency. This portrayal is arranged via classical economists. They define individual as Homo Economicus. However, in the real world Homo Economicus brand individual does not exist. Subsequently, some theories have come into being with the flexibility in the individual characteristics such as given by Managerial, Behavioral, and the Transaction costs (TC) approach. They explain the objective of the entrepreneur on their own inference on behalf of individual. They differ in terms of one axiom or the other. Managerial theory works for the utility function of the managers (it differentiates the ownership from the management) and hence managers do not try to maximize the profit of the firm. They would give priority to their own objective function perhaps that could be the consolidation of power position in the firm (Williamson, 1963; Baumol, 1968). Their goal may be sales maximization, growth maximization, and so on. The pedestal for this diversification in theories is same as that of classical. Behavioral theory is based on the bounded rationality and satisfaction of behavior rather than maximization (Dew, Nicholas, et. al., 2008; Cyert and March, 1963). Much of this depended on concerning behavior in situations of uncertainty, which argued that “people posses limited cognitive ability and so can exercise only ‘bounded rationality’ when making decisions in complex uncertain situations”. Thus individuals and groups tend to ‘satieties’ - that is, to attempt to attain realistic goals rather than maximize a utility or profit function. There is a basic similarity amidst all these approaches i.e., they axiomize the rationality as absolute existence- be it smaller (the bounded rationality axiom) or greater in magnitude (the absolute rationality axiom). In itself, this method is useful but these rely on partial view of a complete self. TC came into existence with the claim that it provides new approach. Ronald Coase defines firm theoretically in relation to the market (Coase, 1937, 1960 Williamson, 1975, 1979). Accordingly, there are costs in carrying out transactions and these transactions costs differ depending on the nature of the transactions and on the way they are organized. The basic objective of the firm is to organize itself in such a way as to minimize these transaction costs. Institutionalists have attempted to find out the ways to reduce transaction cost e.g., Coase (1960, 1988), Williamson (1975), and North (1990). They have explained that entrepreneur wants to minimize the transaction cost. The transaction cost emanates due to the friction in the system are due to existence of the institution. This way the transaction cost adds to rows and/or column of an accounting process. Hence, transaction cost adds the number of variables in the accounting of cost. Therefore, despite the fact that TC approach came in to being with new institutional economics but it does not add to understanding of the nature of cost. We argue that a pure subjective measure should begin with the complete self of an individual.
II
Institution: The Individual
Individual is at the pivot and he is emotional, social, rational and much more. His decision is governed by all the dimensions of his nature. The other aspect of institution is a medium in which performance of agents and the relationships take place vis -a –vis the influence of medium on the personal construct. He has multiple self within and the multiplicities are often
ABSRJ 3(2): 183

Advances in Business-Related Scientific Research Journal (ABSRJ)
Volume 3 (2012), Number 2
at conflict with each other3. Emotion represents a social relationship but it is an individual mind that creates them. Emotions are representations of governed phenomena and must as such be taken. They are more fundamental in the organization of human behavior than cognitions. That, in effect people may be emoters before they are cognizers. The problem of combining emotions and cognitions is multifold. It is due to emotions that the combination will be indeterminate. The answer to the indeterminacy lies in value system of an individual (Mishra and Singh, 2003b). It is the combination of emotion and cognition, which ensures a value system. It is proposed that the complete self of the individual is represented by his 'value system' (Singh and Singh, 2010). A value is not just a preference but is a preference, which is felt and/or is justified morally or by aesthetic judgment. Patterns of value orientation have been singled out as the most crucial culture elements. Culture has value stands-cognitive, appreciative, and moral. All normal people are metaphysician; all have some desire to locate themselves in a 'system', a 'universe', a 'process' (Mishra and Singh, 2003a). Value can be subjective or objective, good or bad. There is always difference between imagination and the real situation. The difference is defined as ‘value dissonance’. It is believed that ‘Value Dissonance’ results when individual have preferences over actual possessions which conflict with superior values inculcated into them (Singh and Singh, 2003). Entrepreneur tries to minimize this gap. This is the value dissonance that motivates the individual to deviate from the one value of profit maximization. Different value dissonance cause different impulses. We have proposed nine impulses of the individual entrepreneur and they are- profit, pride, productivity, market size, self satisfaction, high price, financial proficiency, production, and consumer satisfaction. Following the impulse, entrepreneurs have action tendencies. Impulse profit is being achieved through profit maximization and the impulses market size, self satisfaction and production are achieved through the action tendency, output maximization. Revenue maximization is being adopted to accomplish pride. However, revenue per unit cost and productivity maximization is the action tendencies resorted to by the entrepreneurs is governed by financial proficiency and pride, respectively. The impulse, high price is materialized through the action tendencies price maximization and profit per unit cost maximization. We have taken into consideration seven action tendencies, and hence we should have seven different equations representing equilibrium given each one of them. However, we have only three equations as the first order maximization condition for the action tendencies profit, output, revenue and revenue per unit cost is similar. Price and profit per unit cost maximization are given by condition of price maximization. The productivity maximization is given by itself (See Table 1).
3 Cases of Multiple Personality Disorder lends support to the prima face existence of multiple self.
ABSRJ 3(2): 184

Advances in Business-Related Scientific Research Journal (ABSRJ)
Volume 3 (2012), Number 2
Table 1: Impulse and their Action Tendencies
Profit
Pride
Market Size
Self Satisfaction
Financial
Production
High Price
Productivity
Profit maximization
Output Maximization
Revenue Maximization
Revenue per Unit Cost Maximization
Price Maximization
Productivity
ACTION TENDENCY
Profit per unit Cost Maximization
Profit maximization
Productivity
Price Maximization
MAXIMIZATION CONDITION FIRST ORDER
IMPULSE
Consumer S ti f ti
Institution: The Medium
Institution as the medium incorporates written and unwritten laws. North (1990) has also classified institution in to two parts, one formal and informal the other. However, his distinctions are not free from ambiguities (Hodgson, 2006). The law of the land has been taken as visible representative of institution. Unwritten laws incorporates religion, culture, social customs, taboos, social and individual values etc. All the variables of unwritten laws are related to one another. The individual operates given an Institutionally Augmented Production Function.
Institutionally Augmented Production Function
The analysis of production mostly proceeds with solving a production function that occupies an important place in the activities related to production of goods and services at a firm level. A production function is defined as a functional relationship between physical inputs and physical output. We begin with the proposition that physical existence is governed by the individual. They should be treated as living being and therefore as institutional existence. The behavior of economic agents performing as institution may be captured by incorporating relative permittivity. In fact, permittivity is what permits the realization of the actual capacity. Given the complicated existence of the individual, in absolute term individual’s capacity cannot be measured. The capacity of one person is governed by the others. Hence, two propositions have been taken (Singh, et al., 2008 a; Singh and Singh, 2008 b) that-
ABSRJ 3(2): 185

Advances in Business-Related Scientific Research Journal (ABSRJ)
Volume 3 (2012), Number 2
The realization of ith factor be proportional to the magnitude (given capacity) of factor i and the magnitude (given capacity) of its nearest factor (or composite factor) j of same type; and Realization of ith factor in the initial condition ‘o’ be inversely proportional to the inter-relationship between the factor i and j of same type (e.g., one labor is related to another labor) rij. This is used as deflator to eliminate overlapping, gives
a bipm Fg Fg ipoF Fη ψ=
(Singh and Singh, 2009) -------------------
(1)
Where ipmF and ipoF are the realizations of ith factor in the medium ‘o’ (initial) ‘m’ (other
medium). Fη and Fψ
are the components of written laws and unwritten laws; g is the ratio
of one to another medium; ‘a’ and ‘b’ are share of written and unwritten laws.
a bFg Fgη ψ represents the relative permittivity; and may be defined as the ratio of relationships
between the two situations of institution. Vacuum like situation never exist in the real world. The institution of nature holds even in the vacuum (absence of institution). Therefore for analysis relative permittivity is solved for two alternative situations of institution from initial to present one. Therefore, Equation (1) can be translated for labor, capital, and technology as -
ipm Lg Lg ipoL Lω ρη ψ= ; ipm Kg Kg ipoK Kτ υη ψ= ; ----------------
-----(2) ipm Tg Tg ipoT φ λη ψ= T
Where ω and ρ are the share of written and unwritten laws for labor, τ andυ are the share of written and unwritten laws for capital and φ and λ are the share of written and unwritten laws for technology. The productions function4 with the incorporation of institution may be given as:
( ), , , , , , , , ; , , , , , , , ,ipo ipo ipo Lg Kg Tg Lg Kg TgO f L K T η η η ψ ψ ψ α β σ ω τ φ ρ γ λ=
Also, the Cost Relation5 incorporating institutional and non institutional costs may be given as:
( )1 1 1 2 2 2 3 3 3, , , , , , , , ; , , , , , , , ,ipo ipo ipo Lg Kg Tg Lg Kg TgC f L K T w r s w r s w r sη η η ψ ψ ψ=
Where , ,ipo ipo ipoL K T are used to represent labor, capital and technology; , ,Lg Kg Tgη η η and
, ,Lg Kg Tgψ ψ ψ for their written and unwritten laws. are the marginal shares of factors for the given cost.
1 1 1 2 2 2 3 3 3, , , , , , , ,w r s w r s w r s
The Cost Function
Cost functions are derived functions6. They are derived from the production function which describes the available efficient methods of production at any one time. Cost is a function of output given as Cost =f (Output). With the change in impulses and their action tendencies, the cost equation will be changed, and hence the shape. If the action tendency is profit, the
4 In the present endeavor the production function is of Cobb- Douglass type has been taken. 5 A liner function is defined for the cost relationship. 6The cost function in the light of institution has been changed and is given as:
( )1 1 1 2 2 2 3 3 3; , , , , , , , , , , , , , , , , ,C f O w r s w r s w r sα β σ ω τ φ ρ γ λ=
ABSRJ 3(2): 186

Advances in Business-Related Scientific Research Journal (ABSRJ)
Volume 3 (2012), Number 2
shape of the cost curve will be different from the action tendency of output, sales maximization or so on. And the firm’s behavior will differ. Even with the incorporation of relative permittivity (i.e., the measure of institution) the shape of the cost curve will be different for profit maximization action tendency. Given an action tendency the cost equation has been solved as under:
Action Tendency: Profit Maximization
Profit maximization is the action tendency for impulse profit. And after solving it, we have got the equation as:
2 3 1 3 2 3 1 31 2
3 3 32 1 1 2 2 1
1
1 1 11
1
1 1 1 2 2 2 3 3 31
. .. . . . .. . . . . . . . .
. . . . . .
X X X X X X X XX X X XX X XX
X X XX X X X X XX
X
O r s w r s w r s wC BA
β σ α τβ φσ ωα γβ λσ ρα
ωα ρα τβ γβ φσ λσ
α β σ α ω β τσ β α σ α β σ β α σ
ω ρ τ γ φ λσ
+ + + ++⎛ ⎞ ⎛ ⎞ ⎛ ⎞ ⎛ ⎞⎛ ⎞+ + + +⎜ ⎟ ⎜ ⎟ ⎜ ⎟ ⎜ ⎟⎜ ⎟
⎛ ⎞ ⎝ ⎠⎝ ⎠ ⎝ ⎠ ⎝ ⎠ ⎝ ⎠= + ⎜ ⎟⎝ ⎠
+
3
1X
X
2 3 1 32 1 2
3 31 2 2 1 1 2
1 11 1
. . . .. . . .
X X X XX X XX X X XX XX X
X XX X X X X X
φ α ρ β γ σ λα β β σ α σ α β
+ ++ +
⎡ ⎤⎢ ⎥⎢ ⎥⎢ ⎥⎢ ⎥
⎛ ⎞ ⎛ ⎞⎛ ⎞ ⎛ ⎞⎢ ⎥+ + +⎜ ⎟ ⎜ ⎟⎜ ⎟ ⎜ ⎟⎢ ⎥⎝ ⎠ ⎝ ⎠⎝ ⎠ ⎝ ⎠⎣ ⎦
Where, ( ) represents profit maximization; 1C π and B are used to symbolize profit and error term; and (1 ) (1 ) (1 )X α ω ρ β τ γ σ φ λ= + + + + + + + + and 1 (1 )X α ω ρ= + + , 2 (1 )X β τ γ= + + ,
3 (1 )X σ φ λ= + + . We have got the same equation from the geometric programming technique.
Action Tendency: Output Maximization
Output maximization is the action tendency of impulses- Market size, Self Satisfaction and Financial Proficiency. We maximize output, subject to condition cost. Derived cost equation for output maximization ( ) is as: 2C
2 3 1 3 2 3 1 31 2
3 3 32 1 1 2 2 1
1
1 1 11
1
1 1 1 2 2 2 3 3 32
. .. . . . .. . . . . . . . .
. . . . . .
X X X X X X X XX X X XX X XX
X X XX X X X X XX
X
O r s w r s w r s wC BA
β σ α τβ φσ ωα γβ λσ ρα
ωα ρα τβ γβ φσ λσ
α β σ α ω β τσ β α σ α β σ β α σ
ω ρ τ γ φ λσ
+ + + ++⎛ ⎞ ⎛ ⎞ ⎛ ⎞ ⎛ ⎞⎛ ⎞+ + + +⎜ ⎟ ⎜ ⎟ ⎜ ⎟ ⎜ ⎟⎜ ⎟
⎛ ⎞ ⎝ ⎠⎝ ⎠ ⎝ ⎠ ⎝ ⎠ ⎝ ⎠= + ⎜ ⎟⎝ ⎠
+
3
1X
X
2 3 1 32 1 2
3 31 2 2 1 1 2
1 11 1
. . . .. . . .
X X X XX X XX X X XX XX X
X XX X X X X X
φ α ρ β γ σ λα β β σ α σ α β
+ ++ +
⎡ ⎤⎢ ⎥⎢ ⎥⎢ ⎥⎢ ⎥
⎛ ⎞ ⎛ ⎞⎛ ⎞ ⎛ ⎞⎢ ⎥+ + +⎜ ⎟ ⎜ ⎟⎜ ⎟ ⎜ ⎟⎢ ⎥⎝ ⎠ ⎝ ⎠⎝ ⎠ ⎝ ⎠⎣ ⎦
Action Tendency: Revenue Maximization
Revenue Maximization is the action tendency of the impulse ‘pride’. We maximize Revenue subject to condition Output. Therefore, derived cost equation for revenue maximization ( ) is given below.
3C
2 3 1 3 2 3 1 31 2
3 3 32 1 1 2 2 1
1
1 1 11
1
1 1 1 2 2 2 3 3 33
. .. . . . .. . . . . . . . .
. . . . . .
X X X X X X X XX X X XX X XX
X X XX X X X X XX
X
O r s w r s w r s wC BA
β σ α τβ φσ ωα γβ λσ ρα
ωα ρα τβ γβ φσ λσ
α β σ α ω β τσ β α σ α β σ β α σ
ω ρ τ γ φ λσ
+ + + ++⎛ ⎞ ⎛ ⎞ ⎛ ⎞ ⎛ ⎞⎛ ⎞+ + + +⎜ ⎟ ⎜ ⎟ ⎜ ⎟ ⎜ ⎟⎜ ⎟
⎛ ⎞ ⎝ ⎠⎝ ⎠ ⎝ ⎠ ⎝ ⎠ ⎝ ⎠= + ⎜ ⎟⎝ ⎠
+
3
1X
X
2 3 1 32 1 2
3 31 2 2 1 1 2
1 11 1
. . . .. . . .
X X X XX X XX X X XX XX X
X XX X X X X X
φ α ρ β γ σ λα β β σ α σ α β
+ ++ +
⎡ ⎤⎢ ⎥⎢ ⎥⎢ ⎥⎢ ⎥
⎛ ⎞ ⎛ ⎞⎛ ⎞ ⎛ ⎞⎢ ⎥+ + +⎜ ⎟ ⎜ ⎟⎜ ⎟ ⎜ ⎟⎢ ⎥⎝ ⎠ ⎝ ⎠⎝ ⎠ ⎝ ⎠⎣ ⎦
Action Tendency: Revenue per Unit Cost Maximization
Impulse, Financial Proficiency is being observed by the action tendency Revenue per Unit Cost. Instead of profit revenue per unit cost R
C⎛ ⎞⎜ ⎟⎝ ⎠
has been employed. Derived equation for
revenue per unit cost maximization ( ) is as follows: 4C
ABSRJ 3(2): 187

Advances in Business-Related Scientific Research Journal (ABSRJ)
Volume 3 (2012), Number 2
2 3 1 3 2 3 1 31 2
3 3 32 1 1 2 2 1
1
1 1 11
1
1 1 1 2 2 2 3 3 34
. .. . . . .. . . . . . . . .
. . . . . .
X X X X X X X XX X X XX X XX
X X XX X X X X XX
X
O r s w r s w r s wC BA
β σ α τβ φσ ωα γβ λσ ρα
ωα ρα τβ γβ φσ λσ
α β σ α ω β τσ β α σ α β σ β α σ
ω ρ τ γ φ λσ
+ + + ++⎛ ⎞ ⎛ ⎞ ⎛ ⎞ ⎛ ⎞⎛ ⎞+ + + +⎜ ⎟ ⎜ ⎟ ⎜ ⎟ ⎜ ⎟⎜ ⎟
⎛ ⎞ ⎝ ⎠⎝ ⎠ ⎝ ⎠ ⎝ ⎠ ⎝ ⎠= + ⎜ ⎟⎝ ⎠
+
3
1X
X
2 3 1 32 1 2
3 31 2 2 1 1 2
1 11 1
. . . .. . . .
X X X XX X XX X X XX XX X
X XX X X X X X
φ α ρ β γ σ λα β β σ α σ α β
+ ++ +
⎡ ⎤⎢ ⎥⎢ ⎥⎢ ⎥⎢ ⎥
⎛ ⎞ ⎛ ⎞⎛ ⎞ ⎛ ⎞⎢ ⎥+ + +⎜ ⎟ ⎜ ⎟⎜ ⎟ ⎜ ⎟⎢ ⎥⎝ ⎠ ⎝ ⎠⎝ ⎠ ⎝ ⎠⎣ ⎦
Action Tendency: Price Maximization
Price Maximization is the action tendencies of the impulse High Price. Here price is defined as the combination of Gross Profit Margin (GPM) and Average Cost Pricing (AVC i.e. Cost
Output). When
we apply maximization condition GPM will be constant. And after solving it, we have got the derived equation of cost for price maximization condition ( ) as. 5C
31 2
11
1 1 1 2 2 2 3 3 35
. . . . . . . .. . . . . . . .
XX
XX X
O w r s w r s w r sC BA
α β σ ωα τβ φσ ρα γβ λσ
ωα τβ φσ ρα γβ λσα β σ ω τ φ ρ γ λ⎛ ⎞⎛ ⎞= + ⎜ ⎟⎜ ⎟
⎝ ⎠ ⎝ ⎠
Action Tendency: Profit per Unit Cost Maximization
Profit per unit cost Maximization is the action tendency of High Price. At this moment we maximize Profit per unit cost
CΠ⎛ ⎞
⎜ ⎟⎝ ⎠
. Derived cost equation for Profit (Rate) Maximization ( ) is
given below:
6C
31 2
11
1 1 1 2 2 2 3 3 36
. . . . . . . .. . . . . . . .
XX
XX X
O w r s w r s w r sC BA
α β σ ωα τβ φσ ρα γβ λσ
ωα τβ φσ ρα γβ λσα β σ ω τ φ ρ γ λ⎛ ⎞⎛ ⎞= + ⎜ ⎟⎜ ⎟
⎝ ⎠ ⎝ ⎠
Action Tendency: Productivity Maximization
When the impulse is productivity, the adopted action tendency is Productivity Maximization. Productivity in terms of labor has been used to solve the problem. Productivity (of labor) is being maximized, subject to constraint cost. The derived cost equation for productivity maximization ( ) is given as under: 7C
( ) ( ) [ ]1 32
1
1 1 1 2 2 2 3 3 37
. . . . . . . . . 1. . . . . . . 1 . .
X
X XX
O r s w r s w r s wC B XA
β σ α τβ φσ ωα γβ λσ ρα
α αωα ρα τβ γβ φσ λσω ρ τ γ φ λ α α β σ−
⎛ ⎞⎜ ⎟= + −⎜ ⎟−⎝ ⎠
Composite Cost Equation:
The Composite Cost function is the linear combination of all cost functions emanating from respective Action Tendencies. That is –
7
1i i
i
C p=
= ∑ C
Where ip are the allotted weights to different action tendencies according to value preference. Here personal construct of the individual (institution at inner level) is being incorporated. Individual is not yielding in for maximization of objective function rather he gives weight to his different impulses and the act simultaneously. Therefore he is able to understand the actual cost. We get, in fact, three derived cost equations. The First order maximization condition for the action tendency profit, output, revenue and revenue per unit cost are same, and hence the derived equations are same. Action tendencies for Price and profit (rate) offer similar first order maximization condition and hence the equation. The weight for impulses is determined by the rank marked against different impulse
ABSRJ 3(2): 188

Advances in Business-Related Scientific Research Journal (ABSRJ)
Volume 3 (2012), Number 2
)
III
The data are raised by a schedule administered on the small and tiny industries of Varanasi Region of Uttar Pradesh (India) during Feb. - March 2008. The aggregate sample size is 196. Definitions and measurements of the variables are given in Appendix 1. For the qualitative observation, care is taken for objectivity. Reliability and validity of the scale is verified. Standardization of scores is done by using formulae:
(( )
m
m m
M ax of score - Actual score
M ax of score - M in of score for ascending ranks.
Observations on all variables are standardized for making qualitative and quantitative variables comparable. The packages SPSS, MATLAB and MS excel have been used for computation.
IV
As the cost equations pertaining to action tendencies 1-4 (Profit Maximization, Output Maximization/ Revenue Maximization/ Revenue per Unit Cost Maximization) giving C1 – C4 are same, they are represented by one equation given by Figure 1. When output is zero the cost is 1.20 and output is one, cost is 1.235. As output increases cost also increases. There is gradual change in cost with the change in output. At 5 (output), cost is again at 1.275 and after 1.275 the cost starts to decline and at 6 the cost is at 1.265. However, In the Absence of Institution, the relationship has been shown in the figure (2). The change in magnitude and direction is apparent. Figure: 1 Figure: 2
At the stage of zero production (fig. 1 & 2) the cost is 1.20 in the presence of institution while in the absence of institution the cost is 3.1. There is one important point also i.e., in the presence of institution the cost increases from 1.20 to 1.265 while in the absence of institution the cost is among 3.1 to 4.25. Institution supports the cost function of industry. Institution alleviates the production at lower cost. In the absence of institution the cost is increases in positive direction. Cost equations pertaining to action tendencies 5-6 (Price Maximization and Profit per unit cost) giving C5 – C6 are same, they are represented by one equation given by Figure 3. In the presence of institution we have got quadratic shape of the cost curve. At the stage of zero production, the cost is 1.20. The cost curve gradually increases up to output level 4
ABSRJ 3(2): 189

Advances in Business-Related Scientific Research Journal (ABSRJ)
Volume 3 (2012), Number 2
(cost is 1.268), and starts to decline. For the Absence of Institution, the relationship has been shown in the figure 4. Cost increases with the increment in output. Figure: 3 Figure: 4
In the presence of institution (fig. 3 & 4) at the zero production cost is 1.20 while in the absence of institution the cost is 3.053. In both cases we have get quadratic shape, but the slope is deeper in the presence in comparison to the absence of institution. The cost is very high in the absence of institution. Certainly the reason is institution and this facilitates the industry. Cost equations pertaining to action tendencies 7 (Productivity Maximization) giving C7 is given by Figure 5. In the presence of institution, cost increases from 1.20 to 1.236 and starts to decline after this. The curve is quadratic and slope is deep. In the absence of institution, we interestingly get downward sloping curve. This is quite different from other action tendencies. The curve (6) starts from 3.0625 (at zero production) and decreases gradually. Only for this one we get a downward sloping cost curve. And, at zero production, the cost is the highest in comparison to others, even in the absence of institution. Figure: 5 Figure: 6
In the absence of institution, for productivity maximization condition, we get downward sloping curve (fig. 5 & 6). The curve takes a possible curvilinear shape due to institution.
ABSRJ 3(2): 190

Advances in Business-Related Scientific Research Journal (ABSRJ)
Volume 3 (2012), Number 2
Determining the weights for Impulses
As the composite or the resultant cost function is the linear combination of different individual cost relationships emanating from respective impulses and action tendencies weight are determined by the rank accorded to the Impulses by the individual entrepreneur. Personal construct of the entrepreneur (or individual) is incorporated at this level. This is also the measure of institution from the subject of old institutional economics. To determine the weights (given by coefficient of regression) non- trivially, ranks are deflated by the rank accorded to the impulse- consumer satisfaction. The results of the regression are given in the Table 2.
Table: 2
IMPULSE ESTIMATED WEIGHT PROFIT 0.186862 PRIDE 0.137632 PRODUCTIVITY 0.196211 PRODUCTON 0.161894 MARKRT_SIZE 0.117248 SELF_SATISFACTION 0.127741 HIGH_PRICE 0.103463 FINANCIAL_PROFICIENCY 0.07483
The Resultant Impulse: The Composite Cost Function The Composite Cost Function ‘C’ is given by the curve in Figure 7. The nature of the curve is quadratic. At the zero production, cost is 1.458. The cost is increases up to 1.534 and starts to decline from this point.
Figure: 7
From the table 3 we can see that in the presence of institution for separate maximization conditions, cost is lower in comparison to composite impulse.
ABSRJ 3(2): 191
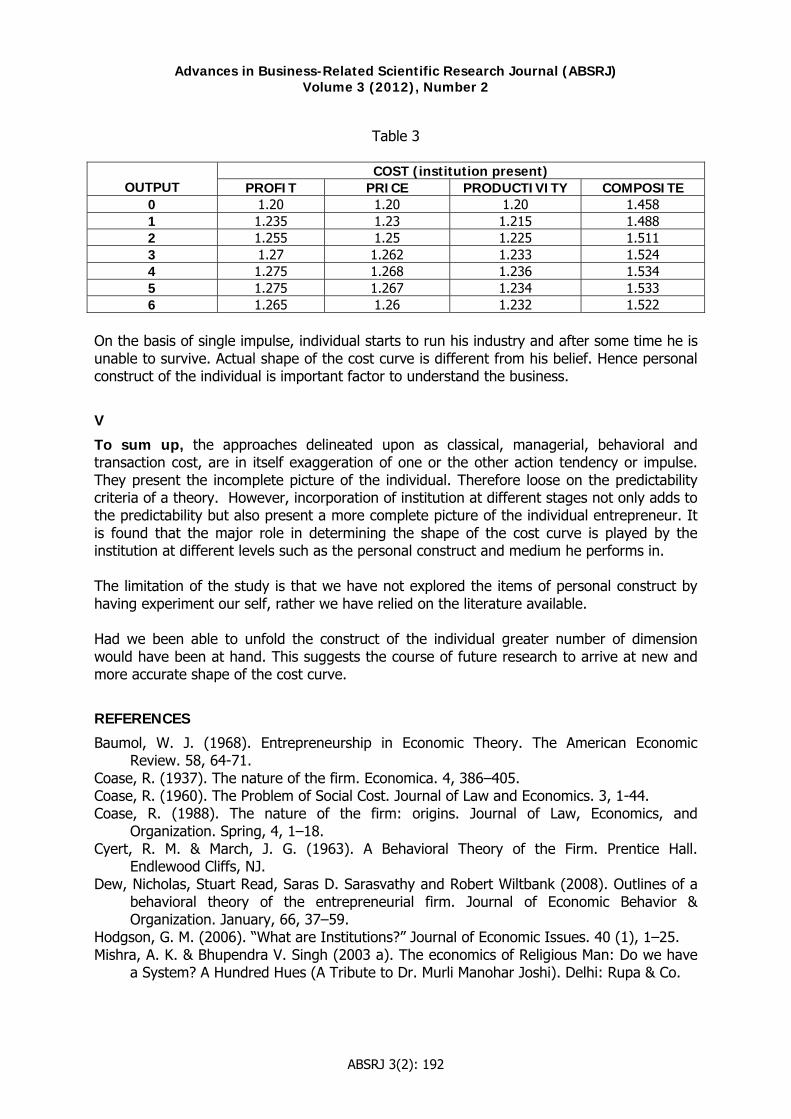
Advances in Business-Related Scientific Research Journal (ABSRJ)
Volume 3 (2012), Number 2
Table 3
COST (institution present) OUTPUT PROFIT PRICE PRODUCTIVITY COMPOSITE
0 1.20 1.20 1.20 1.458 1 1.235 1.23 1.215 1.488 2 1.255 1.25 1.225 1.511 3 1.27 1.262 1.233 1.524 4 1.275 1.268 1.236 1.534 5 1.275 1.267 1.234 1.533 6 1.265 1.26 1.232 1.522
On the basis of single impulse, individual starts to run his industry and after some time he is unable to survive. Actual shape of the cost curve is different from his belief. Hence personal construct of the individual is important factor to understand the business.
V
To sum up, the approaches delineated upon as classical, managerial, behavioral and transaction cost, are in itself exaggeration of one or the other action tendency or impulse. They present the incomplete picture of the individual. Therefore loose on the predictability criteria of a theory. However, incorporation of institution at different stages not only adds to the predictability but also present a more complete picture of the individual entrepreneur. It is found that the major role in determining the shape of the cost curve is played by the institution at different levels such as the personal construct and medium he performs in. The limitation of the study is that we have not explored the items of personal construct by having experiment our self, rather we have relied on the literature available. Had we been able to unfold the construct of the individual greater number of dimension would have been at hand. This suggests the course of future research to arrive at new and more accurate shape of the cost curve.
REFERENCES
Baumol, W. J. (1968). Entrepreneurship in Economic Theory. The American Economic Review. 58, 64-71.
Coase, R. (1937). The nature of the firm. Economica. 4, 386–405. Coase, R. (1960). The Problem of Social Cost. Journal of Law and Economics. 3, 1-44.Coase, R. (1988). The nature of the firm: origins. Journal of Law, Economics, and
Organization. Spring, 4, 1–18. Cyert, R. M. & March, J. G. (1963). A Behavioral Theory of the Firm. Prentice Hall.
Endlewood Cliffs, NJ. Dew, Nicholas, Stuart Read, Saras D. Sarasvathy and Robert Wiltbank (2008). Outlines of a
behavioral theory of the entrepreneurial firm. Journal of Economic Behavior & Organization. January, 66, 37–59.
Hodgson, G. M. (2006). “What are Institutions?” Journal of Economic Issues. 40 (1), 1–25. Mishra, A. K. & Bhupendra V. Singh (2003 a). The economics of Religious Man: Do we have
a System? A Hundred Hues (A Tribute to Dr. Murli Manohar Joshi). Delhi: Rupa & Co.
ABSRJ 3(2): 192

Advances in Business-Related Scientific Research Journal (ABSRJ)
Volume 3 (2012), Number 2
Mishra, A. K. & Bhupendra V. Singh (2003 b). Religion and Economics: Thesis and Antithesis. Some perspectives on Values in Higher Education. 1st ed. Varanasi: Mishra Trading Corporation. 59-65.
North, D. C. (1990). Institutions, institutional change and economic performance. Cambridge: Cambridge University Press.
Singh, Shalini & B. V. Singh (2008 b). Effect of Institution on Production Function of small and tiny industries. UPUEA Economic Journal. 1 (1), 75-93.
Singh, Shalini, Singh, B. V. & Akhilesh, K. Sharma (2008 a). Efficacy of Law in Realising Capability of Factors of Production: A Study of Extended Production Function from a Panel of small and tiny industries. The Indian Economic Journal. 56 (3), 79-87.
Singh, Shalini & Singh, B. V. (2009). Institution and Production Function: A Case Study of Small and Tiny Industries. http://aslea.org/program/ 5th Annual Conference of Asian Law and Economics Association.
Singh, Shalini & Singh, B. V. (2010). Is Profit Maximization Ultimate Goal of Entrepreneurs? Advances in Business-Related Scientific Research Conference-ABSRC 2010. Conference proceeding.
Singh, Nripendra P. & Bhupendra, V. Singh (2003). From Psychology to a Value Based Economic Behavior: The Homoeconomicus on his Marks Again. Some perspectives on Values in Higher Education. 1st ed. Varanasi: Mishra Trading Corporation. 66-75.
Williamson, O. E. (1963). Managerial Discretion and Business Behaviour. American Economic Review.
Williamson, O. E. (1975). Markets and Hierarchies: Analysis and Antitrust Implications. Free Press, New York.
Williamson, O. E. (1979). Transaction-cost economics: the governance of contractual relations. Journal of Law and Economics. 22 (2), 233–261.
ABSRJ 3(2): 193

Advances in Business-Related Scientific Research Journal (ABSRJ)
Volume 3 (2012), Number 2
APPENDIX: 1 Definitions and Measurement of Variables
Variable Name
Definition
Measure/Scale
Labor (L)
Labor Hour
Sum of all types of workers- family & hired (male & female; skilled& unskilled)- Employed during the year considering 8 hours equal to 1 day. Male and female have been equally weighted.
Capital (K)
Capital Stock
Annual worth of fixed capital and working capital deflated by price index of the year.
Technology (T)
Ratio of Capital to Labor (For capital deepening) & Labor to Capital (For labor deepening)
K/L & L/K
Cost (C) Annual Cost
Sum of the expenditure on labor, capital and market and all the expenditure that entered at the end of entrepreneur over the year including the cost of contract and hush money.
Output (Y)
Annual output
Monetary value of output over the year deflated by price.
Written Laws (Labor -ηLg
Capital - ηKg Technology - ηTg)
Medium of written Laws of the same in which economic activities takes place.
Scales have been prepared for written laws to obtain the data by the schedule containing questions capturing the degree of hindrances caused by laws pertaining to economic activities. It contained question on labor in terms of wage law, minimum hour of work, etc.; questions on capital are property right, establishment of industry, etc. questions on technology are acquiring new machinery, intellectual property rights, marketing, etc.
Unwritten Laws (Labor - ψLg
Capital - ψKg Technology - ψTg)
Medium of unwritten Laws in which economic activities takes place.
Scales have been prepared for unwritten laws to obtain the data by the schedule containing questions capturing the degree of hindrances caused by unwritten laws pertaining to economic activities. It comprises questions such as, impact of culture, religion, values, social customs, taboos etc. on labor, capital and technology (factors of production).
ABSRJ 3(2): 194
Related Documents