1 Advances in Bolometer-Based Passive Imagers for Homeland Security and Law Enforcement 12 Michael Jack , Eli Gordon, Glenn Graham Raytheon Vision Systems 75 Coromar Drive, Goleta, CA 93117 Dr. Harold Fetterman, Ilya Dunayevskiy University of California Electrical Engineering Dept, 420 Westwood Plaza, Los Angeles, CA 90095-1594 Russell Lombardo Lombardo Technical Services Santa Barbara, CA 93105 ABSTRACT Millimeter-wave (mmw) imagers offer advantages for numerous applications, including: all weather reconnaissance, search and rescue, law enforcement, and security screening for homeland defense. The use of bolometer-based imagers for mmw provides potential advantages of low power, small size, weight, and cost. In addition, bolometer- based imagers provide the unique capability of detection over an enormous spectral range, i.e., from mmw through the sub-mmw (from 100 GHz through greater than 1 THz). We report on high-resolution materials transmission measurements as well as advances in mmw imager architectures that seek to exploit improved imager sensitivity and resolution enabled by operation at sub-mmw and THz frequencies. 1. INTRODUCTION Raytheon successfully developed, tested, and demonstrated the first 24 x 28 millimeter wave (mmw) focal plane array (FPA) with response from 75 to 150 GHz (covering W and D bands). Millimeter-wave applications and atmospheric transmission are shown. A concealed weapons demonstration is presented . Raytheon is also developing new technology that will permit micro-bolometer based two-dimensional arrays to operate at higher frequencies with correspondingly improved spatial resolution and will discuss this new approach with expected performance result.. In response to concealed weapon detection material transmission studies from 100 GHz to 1 THz are also presented. Figure 1 shows the history of micro-bolometer based millimeter-wave imagers at Raytheon. 1 Supported in part by AFRL Contract No. A8750-04-C-0016, Funded by National Institute of Justice 2 Work supported in part by Contract MDA-972-00-C-0044 with DARPA (Ray Balcerak Sponsor)

Welcome message from author
This document is posted to help you gain knowledge. Please leave a comment to let me know what you think about it! Share it to your friends and learn new things together.
Transcript

1
Advances in Bolometer-Based Passive Imagers for Homeland Security and Law Enforcement 12
Michael Jack, Eli Gordon, Glenn Graham
Raytheon Vision Systems 75 Coromar Drive, Goleta, CA 93117
Dr. Harold Fetterman,
Ilya Dunayevskiy University of California
Electrical Engineering Dept, 420 Westwood Plaza, Los Angeles, CA 90095-1594
Russell Lombardo
Lombardo Technical Services Santa Barbara, CA 93105
ABSTRACT Millimeter-wave (mmw) imagers offer advantages for numerous applications, including: all weather reconnaissance, search and rescue, law enforcement, and security screening for homeland defense. The use of bolometer-based imagers for mmw provides potential advantages of low power, small size, weight, and cost. In addition, bolometer-based imagers provide the unique capability of detection over an enormous spectral range, i.e., from mmw through the sub-mmw (from 100 GHz through greater than 1 THz). We report on high-resolution materials transmission measurements as well as advances in mmw imager architectures that seek to exploit improved imager sensitivity and resolution enabled by operation at sub-mmw and THz frequencies.
1. INTRODUCTION
Raytheon successfully developed, tested, and demonstrated the first 24 x 28 millimeter wave (mmw) focal plane array (FPA) with response from 75 to 150 GHz (covering W and D bands). Millimeter-wave applications and atmospheric transmission are shown. A concealed weapons demonstration is presented . Raytheon is also developing new technology that will permit micro-bolometer based two-dimensional arrays to operate at higher frequencies with correspondingly improved spatial resolution and will discuss this new approach with expected performance result.. In response to concealed weapon detection material transmission studies from 100 GHz to 1 THz are also presented. Figure 1 shows the history of micro-bolometer based millimeter-wave imagers at Raytheon.
1 Supported in part by AFRL Contract No. A8750-04-C-0016, Funded by National Institute of Justice 2 Work supported in part by Contract MDA-972-00-C-0044 with DARPA (Ray Balcerak Sponsor)

2
28
24
PMMWI Chip Utilizes Standard Uncooled IR Package
Bowtie Antenna
Bolometer
Bowtie Antenna
Bolometer
1999 1999 --2000 2000 -- DARPA Phase IDARPA Phase I
Test Chips Build Using VOX SMBTest Chips Build Using VOX SMB
Measurements/Models AgreeMeasurements/Models Agree
NEP (30Hz)~ 20pW; NEDT ~ 50KNEP (30Hz)~ 20pW; NEDT ~ 50K
2000 2000 –– 2002 DARPA Phase II2002 DARPA Phase II
24 x 28 Fully Integrated SCA Built24 x 28 Fully Integrated SCA Built
3x FPA Size Reduction By Optical Immersion3x FPA Size Reduction By Optical Immersion
Diffraction Limited Active Imaging Diffraction Limited Active Imaging
Spectral Range: 80 Spectral Range: 80 –– 140GHz140GHz
20032003 EOC funded Demonstration ProgramEOC funded Demonstration Program
Penetration through Wood/Wall BoardPenetration through Wood/Wall Board
Active Imaging of Concealed Weapon DemoActive Imaging of Concealed Weapon Demo
IR Pixel
mmW Pixel
IR Pixel
mmW Pixel
BridgeBridge
Bowtie AntennasBowtie Antennas
Visible Image mmW Image
24 x 28 24 x 28 mmWmmW SCA in SCA in UncooledUncooled PkgPkg
Diffraction Diffraction Limited Limited ImagingImaging
Figure 1. Raytheon has a long history in the development and evaluation of mmw-based imagers.
2. MILLIMETER-WAVE APPLICATIONS
Applications for millimeter-wave based imagers continue to expand. Surveillance in either ground- or air-based unmanned vehicles offers great performance — and when combined with visible, near-IR, SWIR, mid-IR, or LWIR, the synergy of this technology via sensor fusion holds the promise of true all-weather conditions operation, through fog, rain, clouds, dust, etc. Table 1 presents an updated list of mmw applications. Applications for sub-mmw bands include military defense uses as well as commercial and industrial uses offer promising advantages to this here-to-fore unexploited wavelength band from 500 GHz to 10 THz.
3
Table 1. Millimeter-Wave Applications for both Military and Commercial are presented.
Military Commercial Concealed Weapons Detection
Helicopter Landing Aid
Unmanned Aerial Vehicle (UAV) – all weather imaging and navigation
Biological and chemical agent identification in the atmosphere Explosives detection3
Close range target and aim point detection in fog or obscurants - anti-missile
Inspection4 of processes, e.g., post office mail screening, inspection of products within boxes Buried mine detection
Spectroscopic imaging
Semiconductor inspection/defect evaluation
Medical imaging for tissue burn evaluation reflectometry, carcinoma identification, dental imaging, mammography, etc. Satellite atmospheric sounding for weather prediction and geophysical imaging
Manufacturing inspection and process/quality control Art painting authentication
Reflection imaging reconstruction tomography
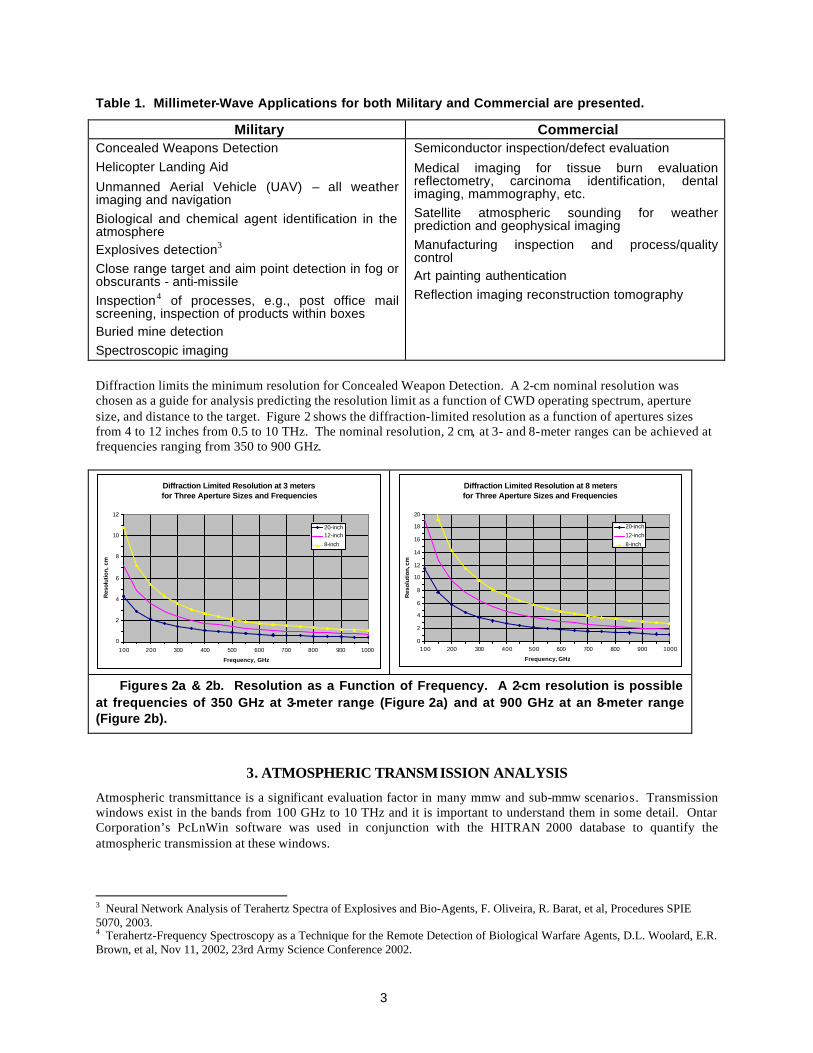
Diffraction limits the minimum resolution for Concealed Weapon Detection. A 2-cm nominal resolution was chosen as a guide for analysis predicting the resolution limit as a function of CWD operating spectrum, aperture size, and distance to the target. Figure 2 shows the diffraction-limited resolution as a function of apertures sizes from 4 to 12 inches from 0.5 to 10 THz. The nominal resolution, 2 cm, at 3- and 8-meter ranges can be achieved at frequencies ranging from 350 to 900 GHz.
Diffraction Limited Resolution at 3 meters for Three Aperture Sizes and Frequencies
0
2
4
6
8
10
12
100 200 300 400 500 600 700 800 900 1000
Frequency, GHz
Res
olut
ion,
cm
20-inch12-inch
8-inch
Diffraction Limited Resolution at 8 meters for Three Aperture Sizes and Frequencies
0
2
4
6
8
10
12
14
16
18
20
100 200 300 400 500 600 700 800 900 1000
Frequency, GHz
Res
olut
ion,
cm
20-inch
12-inch
8-inch
Figures 2a & 2b. Resolution as a Function of Frequency. A 2-cm resolution is possible at frequencies of 350 GHz at 3-meter range (Figure 2a) and at 900 GHz at an 8-meter range (Figure 2b).
3. ATMOSPHERIC TRANSMISSION ANALYSIS
Atmospheric transmittance is a significant evaluation factor in many mmw and sub-mmw scenarios. Transmission windows exist in the bands from 100 GHz to 10 THz and it is important to understand them in some detail. Ontar Corporation’s PcLnWin software was used in conjunction with the HITRAN 2000 database to quantify the atmospheric transmission at these windows.
3 Neural Network Analysis of Terahertz Spectra of Explosives and Bio-Agents, F. Oliveira, R. Barat, et al, Procedures SPIE 5070, 2003. 4 Terahertz-Frequency Spectroscopy as a Technique for the Remote Detection of Biological Warfare Agents, D.L. Woolard, E.R. Brown, et al, Nov 11, 2002, 23rd Army Science Conference 2002.
4
Table 2 shows the significant transmission lines with bandwidth from 100 GHz to 10 THz for either a 1-km pathlength (to 5oo GHz) or a 100-meter transmission case with 23 km (standard clear) and 0.2 km (Advection Fog, 0.2 km visibility) transmission from 100 GHz to 10 THz. It is noteworthy that only a small reduction in transmission is seen at lower frequencies in the range 670 GHZ to 1.3 THz. A modest transmission level in clear transmission occurs at the highest frequencies ~ 8.8 – 10 THz. Table 2. Sub-mmw Transmission Windows. HITRAN 2000 database was used to provide these transmission windows from 100 GHz to 10 THz. These data are based on a I –km pathlength from 100 to 500 GHz and a 100-meter vertical path length above 500 GHz. Two atmospheric conditions were used, 23 and 0.2 km visibility.
Significant Transmission Windows from 100 GHz to 10 THz No. Wavelength,
µm Frequency,
Hz Transmission,
Clear Transmission,
Fog Percentage of
Clear 1 1900-3000 1.00E+11 to
1.58E+11 61.4% 45.1% 74%
2 1440 2.08E+11 64.2% 45.3% 71%
3 993 3.02E+11 34.6% 15.4% 45% 4 880 3.41E+11 26.5% 10.2% 38% 5 731 4.10E+11 10.5% 3.3% 31%
6 448 6.697E+11 26.39% 22.10% 84%
7 364 8.244E+11 16.69% 13.56% 81%
8 353 8.50E+11 28.00% 22.64% 81%
9 340 8.81E+11 37.39% 30.07% 80%
10 323 9.30E+11 12.56% 10.02% 80%
11 233 1.29E+12 1.21% 0.64% 53%
12 201 1.49E+12 2.43% 1.06% 44%
13 38 7.84E+12 0.38% 0.04% 9%
14 37 8.11E+12 0.47% 0.04% 9%
15 35 8.59E+12 0.22% 0.02% 9%
16 34 8.85E+12 1.95% 0.17% 9%
17 33 9.22E+12 3.88% 0.34% 9%
18 32 9.32E+12 3.82% 0.33% 9%
19 32 9.38E+12 2.88% 0.25% 9%
20 31 9.59E+12 6.12% 0.52% 8%
21 30 9.96E+12 7.89% 0.66% 8%
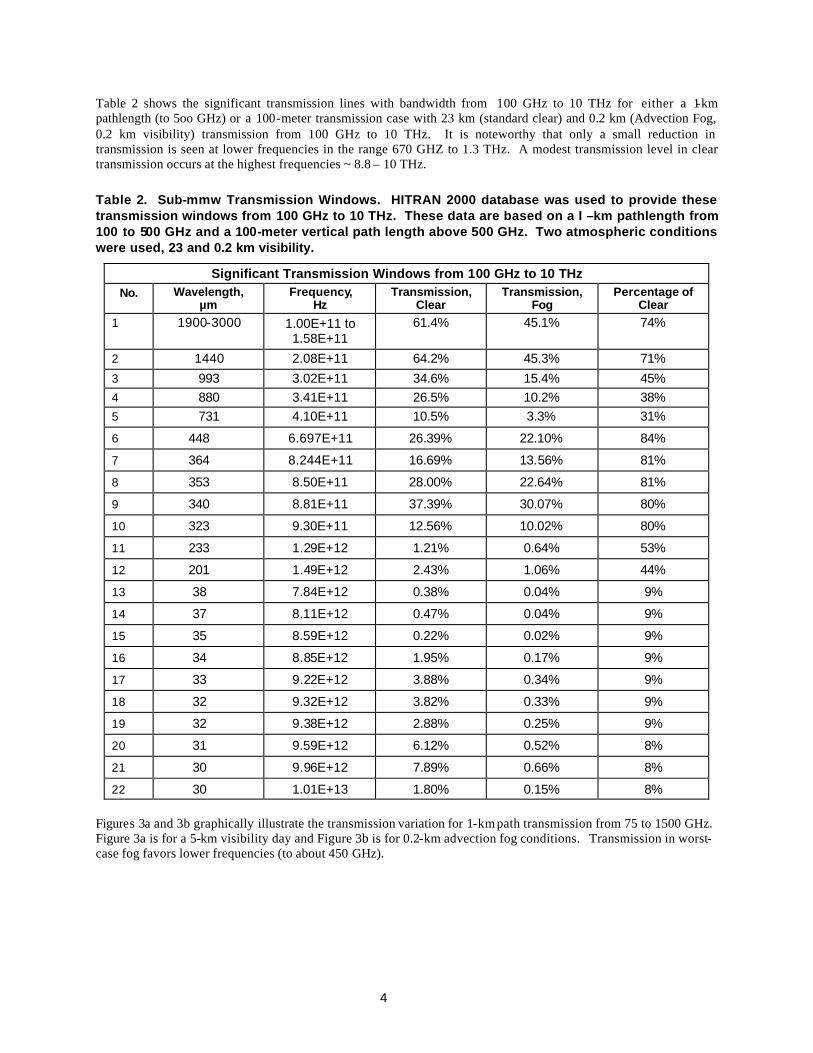
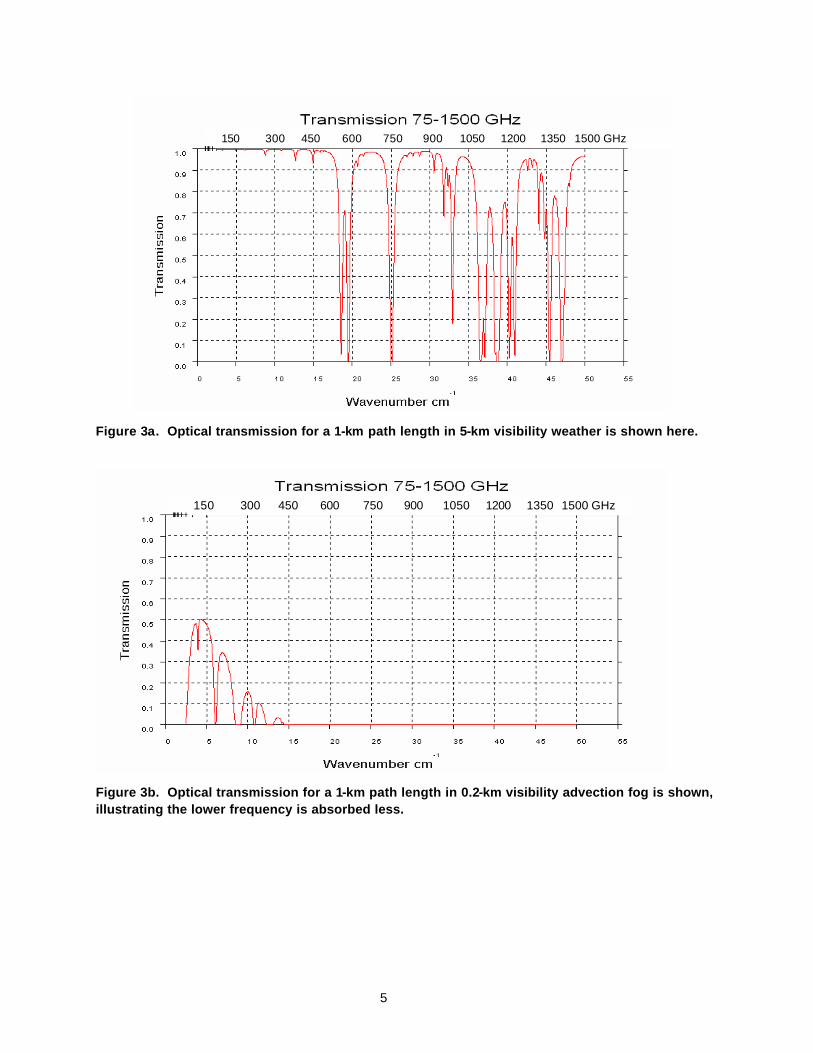
22 30 1.01E+13 1.80% 0.15% 8% Figures 3a and 3b graphically illustrate the transmission variation for 1-km path transmission from 75 to 1500 GHz. Figure 3a is for a 5-km visibility day and Figure 3b is for 0.2-km advection fog conditions. Transmission in worst-case fog favors lower frequencies (to about 450 GHz).
5
150 300 450 600 750 900 1050 1200 1350 1500 GHz150 300 450 600 750 900 1050 1200 1350 1500 GHz
Figure 3a. Optical transmission for a 1-km path length in 5-km visibility weather is shown here.
150 300 450 600 750 900 1050 1200 1350 1500 GHz150 300 450 600 750 900 1050 1200 1350 1500 GHz
Figure 3b. Optical transmission for a 1-km path length in 0.2-km visibility advection fog is shown, illustrating the lower frequency is absorbed less.
6
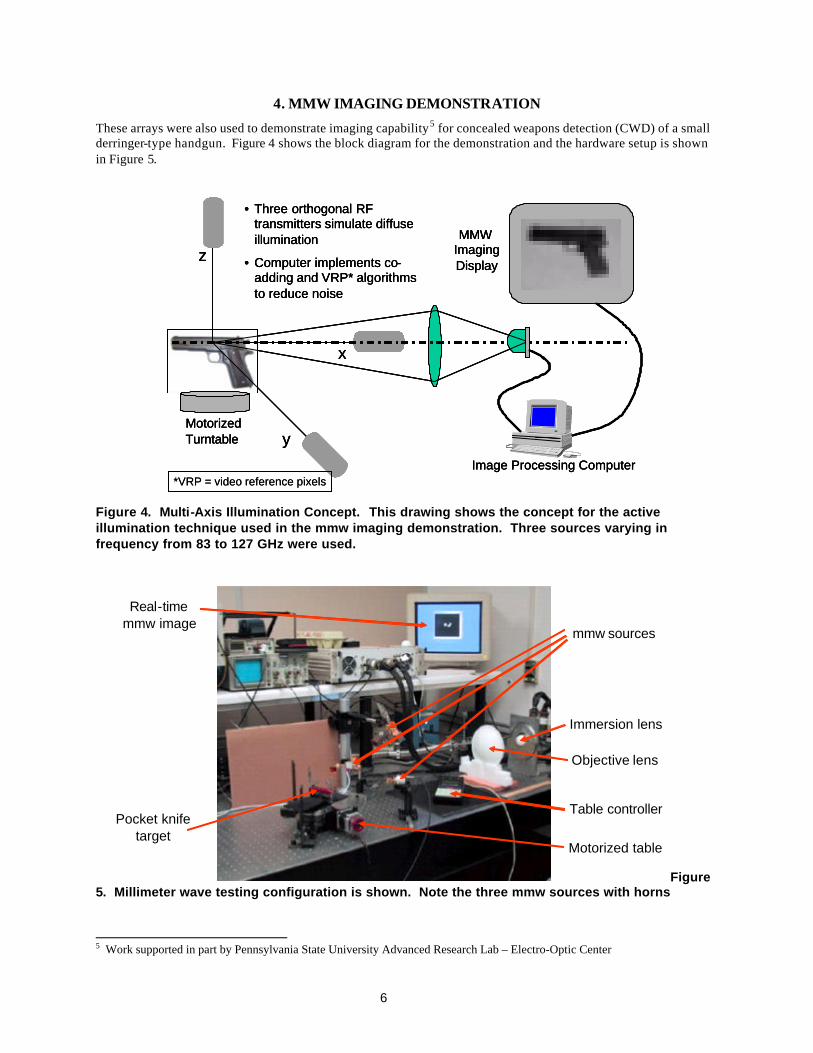
4. MMW IMAGING DEMONSTRATION
These arrays were also used to demonstrate imaging capability5 for concealed weapons detection (CWD) of a small derringer-type handgun. Figure 4 shows the block diagram for the demonstration and the hardware setup is shown in Figure 5.
z
x
y
MMW ImagingDisplay
Image Processing Computer
• Three orthogonal RF transmitters simulate diffuse illumination
• Computer implements co-adding and VRP* algorithms to reduce noise
MotorizedTurntable
*VRP = video reference pixels
z
x
y
MMW ImagingDisplay
Image Processing Computer
• Three orthogonal RF transmitters simulate diffuse illumination
• Computer implements co-adding and VRP* algorithms to reduce noise
MotorizedTurntable
z
x
y
MMW ImagingDisplay
Image Processing Computer
• Three orthogonal RF transmitters simulate diffuse illumination
• Computer implements co-adding and VRP* algorithms to reduce noise
MotorizedTurntable
*VRP = video reference pixels
Figure 4. Multi-Axis Illumination Concept. This drawing shows the concept for the active illumination technique used in the mmw imaging demonstration. Three sources varying in frequency from 83 to 127 GHz were used.
Real-timemmw image
Objective lens
Immersion lens
Motorized table
Pocket knife target
mmw sources
Table controller
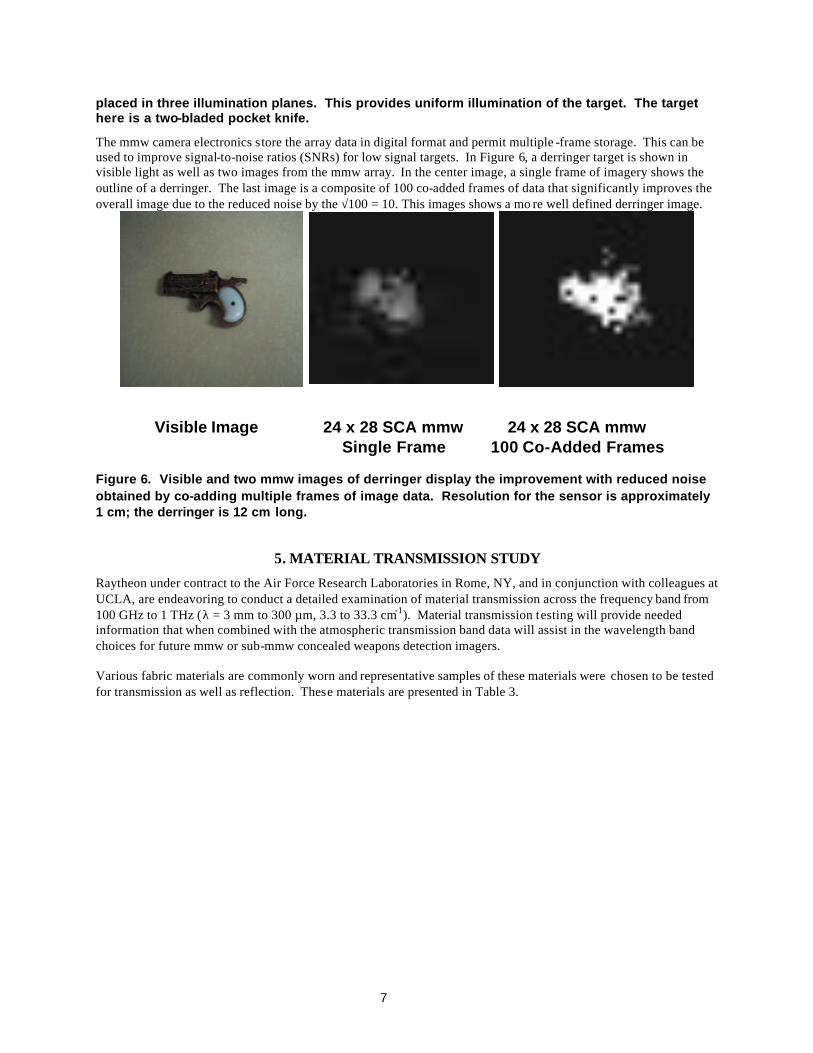
Figure 5. Millimeter wave testing configuration is shown. Note the three mmw sources with horns
5 Work supported in part by Pennsylvania State University Advanced Research Lab – Electro-Optic Center
7
placed in three illumination planes. This provides uniform illumination of the target. The target here is a two-bladed pocket knife.
The mmw camera electronics store the array data in digital format and permit multiple -frame storage. This can be used to improve signal-to-noise ratios (SNRs) for low signal targets. In Figure 6, a derringer target is shown in visible light as well as two images from the mmw array. In the center image, a single frame of imagery shows the outline of a derringer. The last image is a composite of 100 co-added frames of data that significantly improves the overall image due to the reduced noise by the √100 = 10. This images shows a mo re well defined derringer image.
Visible Image 24 x 28 SCA mmw Single Frame
24 x 28 SCA mmw 100 Co-Added Frames
Figure 6. Visible and two mmw images of derringer display the improvement with reduced noise obtained by co-adding multiple frames of image data. Resolution for the sensor is approximately 1 cm; the derringer is 12 cm long.
5. MATERIAL TRANSMISSION STUDY
Raytheon under contract to the Air Force Research Laboratories in Rome, NY, and in conjunction with colleagues at UCLA, are endeavoring to conduct a detailed examination of material transmission across the frequency band from 100 GHz to 1 THz (λ = 3 mm to 300 µm, 3.3 to 33.3 cm-1). Material transmission testing will provide needed information that when combined with the atmospheric transmission band data will assist in the wavelength band choices for future mmw or sub-mmw concealed weapons detection imagers. Various fabric materials are commonly worn and representative samples of these materials were chosen to be tested for transmission as well as reflection. These materials are presented in Table 3.
8
Table 3. A list of materials that will be tested for transmission and reflection from 100 GHz to 1 THz as part of the AFRL Program.
Natural Materials Man-Made Materials
• Leather, suede – animal hide, cured by tanning
• Knitted fabric/yarn
• Cotton including terry cloth, corduroy, flannel, felt, twill; Crinoline – cotton or horsehair; Cheesecloth – cotton gauze
• Tarpaulins, canvas; marine (water proof) material(s) – from cotton, hemp, or flax
• Wool – sheep, goat, or alpaca hair consisting of cylindrical fibers of keratin
• Polyester
• Rayon
• Nylon
• Velvet – from rayon or nylon
• Kevlar
• Cordura
• Gortex
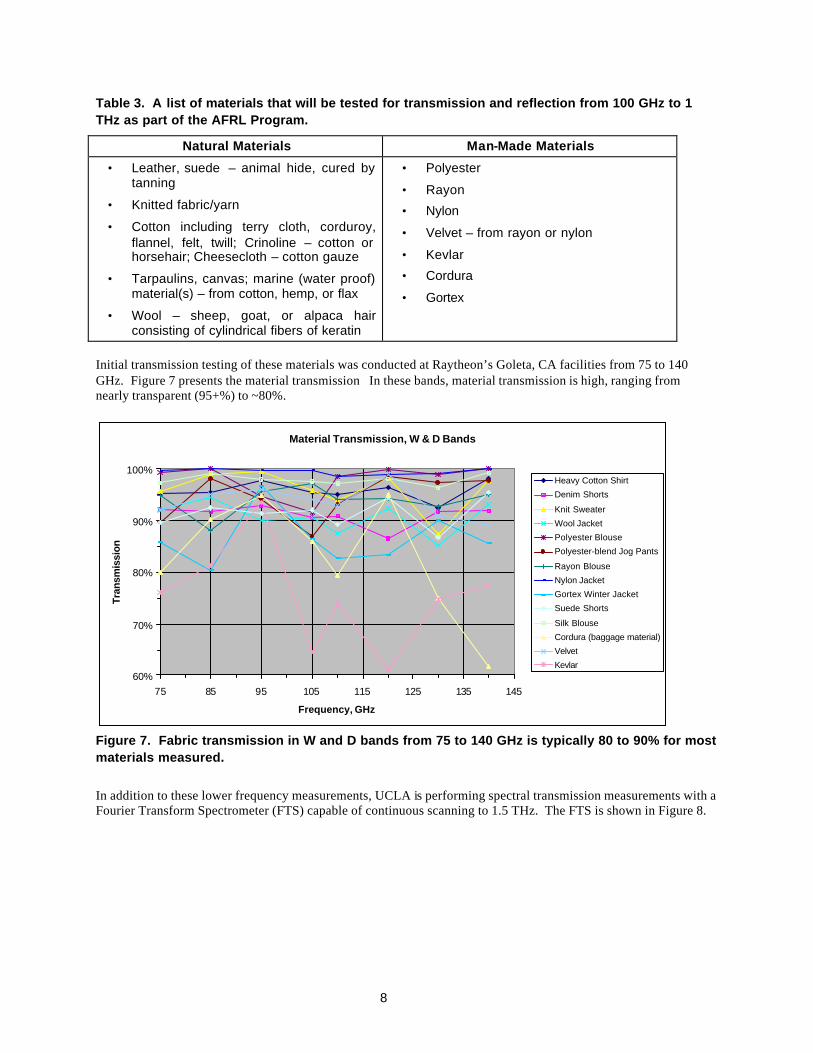
Initial transmission testing of these materials was conducted at Raytheon’s Goleta, CA facilities from 75 to 140 GHz. Figure 7 presents the material transmission In these bands, material transmission is high, ranging from nearly transparent (95+%) to ~80%.
Material Transmission, W & D Bands
60%
70%
80%
90%
100%
75 85 95 105 115 125 135 145
Frequency, GHz
Tran
smis
sion
Heavy Cotton Shirt
Denim Shorts
Knit Sweater
Wool Jacket
Polyester Blouse
Polyester-blend Jog Pants
Rayon Blouse
Nylon Jacket
Gortex Winter Jacket
Suede Shorts
Silk Blouse
Cordura (baggage material)
Velvet
Kevlar
Figure 7. Fabric transmission in W and D bands from 75 to 140 GHz is typically 80 to 90% for most materials measured.
In addition to these lower frequency measurements, UCLA is performing spectral transmission measurements with a Fourier Transform Spectrometer (FTS) capable of continuous scanning to 1.5 THz. The FTS is shown in Figure 8.
9
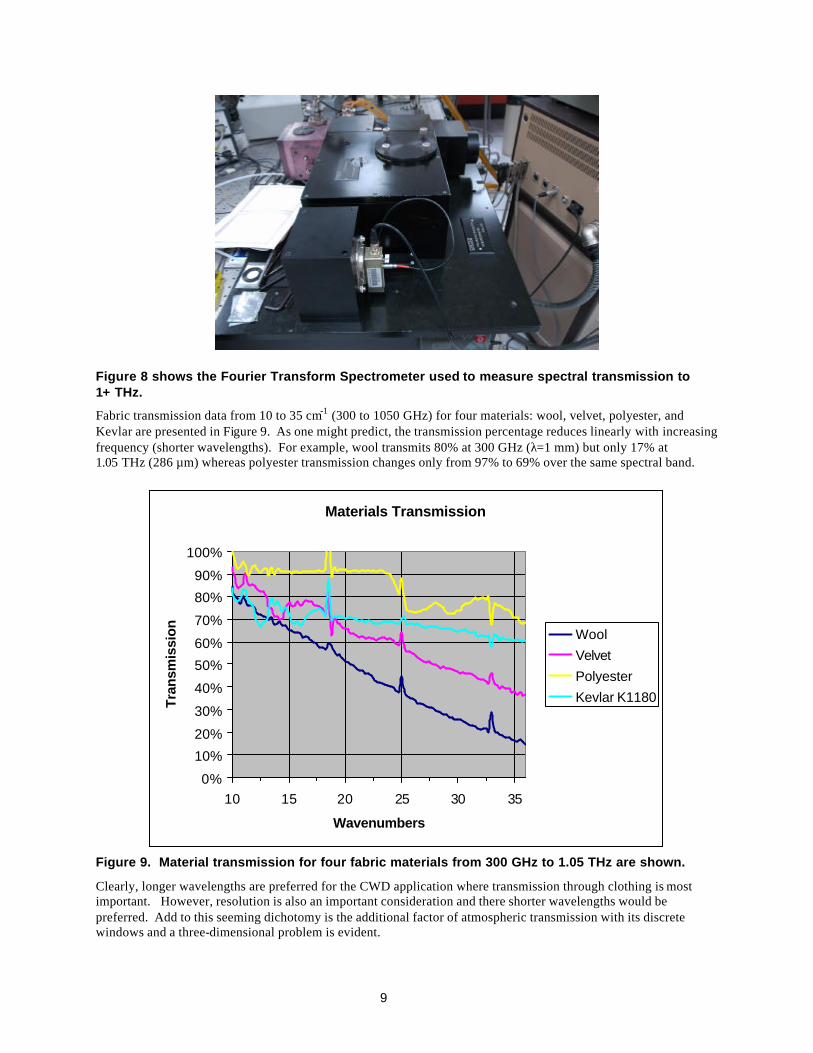
Figure 8 shows the Fourier Transform Spectrometer used to measure spectral transmission to 1+ THz.
Fabric transmission data from 10 to 35 cm-1 (300 to 1050 GHz) for four materials: wool, velvet, polyester, and Kevlar are presented in Figure 9. As one might predict, the transmission percentage reduces linearly with increasing frequency (shorter wavelengths). For example, wool transmits 80% at 300 GHz (λ=1 mm) but only 17% at 1.05 THz (286 µm) whereas polyester transmission changes only from 97% to 69% over the same spectral band.
Materials Transmission
0%
10%
20%
30%
40%
50%
60%
70%
80%
90%
100%
10 15 20 25 30 35
Wavenumbers
Tran
smis
sion Wool
Velvet
Polyester
Kevlar K1180
Figure 9. Material transmission for four fabric materials from 300 GHz to 1.05 THz are shown.
Clearly, longer wavelengths are preferred for the CWD application where transmission through clothing is most important. However, resolution is also an important consideration and there shorter wavelengths would be preferred. Add to this seeming dichotomy is the additional factor of atmospheric transmission with its discrete windows and a three-dimensional problem is evident.

10
All these data will assist in choosing the theoretical ideal band(s) for concealed weapons detection or other mmw or sub-mmw applications. However another issue is the detector and its relative spectral sensitivity. This topic will be discussed in the following section.
6. DETECTOR DESIGN CONSIDERATIONS Many considerations need to be taken into account for a mmw or sub-mmw based focal plane array. The first step typically is the theoretical analysis performed with EM models such as CST Microwave Studio or Ansoft High Frequency Simulation Software (HFSS). Figure 10 illustrates the EM modeling prediction for a broadband antenna design with a full-octave of operation from 50 to 500 GHz.
(a) (b) Figure 10. (a) Antenna efficiency, power absorbed in the antenna versus incident power and (b) VSWR as a function of frequency. Efficiency > 40% is achieved from 95 to 500 GHz.
Fabrication of these antenna structures requires only minor changes to the standard Raytheon IR bolometer process. As such, the integration of such detectors on a chip with IR bolometers is only of matter of layout, and does not require significant process development. Each of these three designs has certain advantages and disadvantages outlined in the Table 4. The fabrication techniques of these designs are similar, thus examples of each design can be fabricated simultaneously on a single wafer.
Table 4. Advantages and Disadvantages of three different approached for Antenna-Coupled mmw Detectors
Design Advantages Disadvantages Capacitively Coupled
- Low thermal mass bolometer - Low thermal conductance - Bolometer size independent from wavelength
- Difficult to achieve good coupling efficiency - Lower expected yield in higher performance designs
Resistively Coupled - Low thermal mass - Bolometer size independent from wavelength
- Very high thermal conductance
Direct Coupling - Best expected coupling - Large thermal mass decreased sensitivity - Bolometer size dependent on wavelength - Lossless antenna add to thermal mass
7. SUMMARY AND CONCLUSIONS This paper presented a brief overview of current activities in mmw and sub-mmw detector development activities at Raytheon. We continue to be excited by the potential of integrated passive mmw focal plane array sensors based upon bolometers because of the advantages including small size, low cost, and low power. Many applications have been identified including CWD, unmanned aerial and ground vehicles, law enforcement, all-weather reconnaissance imaging, search and rescue, and homeland security. Another promising aspect of these low-cost, high-performance mmw and sub-mmw FPAs is when they are used in sensor fusion applications to augment existing infrared systems.

11
Raytheon built and successfully demonstrated a 24 x 28 mmw FPA with broad response from 75 to 140+ GHz. Subsequent imaging tests demonstrated the potential for concealed weapons detection. Ongoing efforts are researching material transmission characteristics in conjunction with atmospheric windows to recommend intelligent sensor designs for further development. In Phase II of the AFRL program, we will develop a sub-mmw detector based upon the results of this effort.
8. ACKNOWLEGEMENTS The authors would like to acknowledge the support and encouragement of Peter Costianes and Bernie Clarke of the Air Force Research Labs. We would also like to thank our internal sponsors, Stefan Baur, Len Chen, and Lucy Thoms -Harrington. Many people contributed to these efforts including Karl Harris and Gene Pochapsky of Penn State’s Electro -Optical Center, as well as continuing support from Phil Lubin UCSB and Glenn Boreman UCF-CREOL. Thanks to these and many others who have helped.
Related Documents