University of California San Francisco 46th ANNUAL Advances & Controversies in Clinical Pediatrics THURSDAY - SATURDAY MAY 16-18, 2013 THE WESTIN SAN FRANCISCO MARKET STREET • CALIFORNIA SPECIAL GUEST FACULTY: Angela C. Anderson, MD Emergency Medicine Pain & Palliative Care Hasbro Children’s Hospital Jordan D. Metzl, MD Sports Medicine Hospital for Special Surgery Weill Cornell Medical College Andrew T. Pavia, MD Infectious Diseases University of Utah ucsfpediatricadvances.com

Welcome message from author
This document is posted to help you gain knowledge. Please leave a comment to let me know what you think about it! Share it to your friends and learn new things together.
Transcript
University of CaliforniaSan Francisco
46th ANNUAL
Advances & Controversiesin Clinical Pediatrics
THURSDAY
- SAT
URDAY
MAY 16-18, 2013
THE WESTIN SAN FRANCISCO MARKET STREET • CALIFORNIA
SPECIAL GUEST FACULTY:
Angela C. Anderson, MDEmergency MedicinePain & Palliative CareHasbro Children’s Hospital
Jordan D. Metzl, MDSports MedicineHospital for Special SurgeryWeill Cornell Medical College
Andrew T. Pavia, MDInfectious DiseasesUniversity of Utah
ucsfpediatricadvances.com
Acknowledgements
This CME activity was supported in part by educational grant(s) from the following:
Grantor
Mead Johnson Nutrition
Exhibitors
Alcon Labs
Mead Johnson Nutrition
Merck Vaccine
Pfizer
Sanofi‐Pasteur
Lippincott
UCSF Referral Liaison Service
The UCSF Benioff Children’s Hospital
presents
46th Annual
Advances & Controversies in
Clinical Pediatrics
May 16‐18, 2013 Westin San Francisco Market Street
San Francisco, California
Course Chair Andrea C. Sello, MD
Clinical Professor of Pediatrics University of California, San Francisco
University of California, San Francisco School of Medicine

TABLE OF CONTENTS
USE LINKS BELOW TO ADVANCE
Course Program
Course Overview
Educational Objectives
Accreditation
General Information
Faculty List
Faculty Disclosures
Suggested Lunch Locations
Local Area Map
Attendee List
Credit Hours Calculation

46th Annual
Advances & Controversies in Clinical Pediatrics May 16‐18, 2013
San Francisco, California
THURSDAY • MAY 16, 2013 Moderator: Dr. Donna Ferriero 7:30 am Registration / Continental Breakfast 8:00 Welcome
Dr. Donna Ferriero
KEYNOTE 8:15 am P Making Sense of Health Reform:
Everything You Wanted to Know About Obamacare, But Were Afraid to Ask Dr. Kevin Grumbach
STAYING TECHNOLOGICALLY SAVVY 9:00 Interacting with the Electronic Syllabus 9:15 Social Media in Healthcare: Get Connected
Dr. Seth Bokser
9:45 P Discussion 10:05 Break TOXICOLOGY & TRAVEL TIPS 10:20 P Toxicologic Look‐Alikes:
Poisonings Which Mimic Pediatric Illnesses Dr. Angela Anderson
11:10 Topical Toxicity in Tots Dr. Renee Howard
11:40 Trying to Prevent Illness in Kids Who Travel… Diagnosing it When They Return Dr. Jay Tureen
12:10 pm P Discussion 12:30 pm Lunch On Your Own

THURSDAY • MAY 16, 2013 Moderator: Dr. Karen Sun RELATING HOSPITALIST MEDICINE TO OFFICE PRACTICE 1:45 pm P So What’s New? Pediatric Hospital Medicine
Dr. Bradley Monash
2:15 Failure to Thrive: Rethinking Our Treatment Goals Dr. Darren Fiore
2:45 P Tubes, Trachs, & Technology: Caring for Medically Complex Children Dr. Glenn Rosenbluth
3:15 P Discussion 3:35 Break PALLIATING PAIN 3:50 P Taking the Pain Out of Pain Management
Dr. Angela Anderson
4:40 P Triptans for Kids Dr. Amy Gelfand
5:10 P Discussion 5:30 pm Adjourn
FRIDAY, MAY 17, 2013 Moderator: Dr. Myles Abbott 7:30 am Continental Breakfast RESPIRATORY TREE POTPOURRI 8:15 am What's New in Pneumonia? More Than You May Think
Dr. Andrew Pavia
9:05 Managing Bronchiolitis: Just Stand There or Do Something? Dr. Michele Long
9:35 P ALTE: Apparently a Lot of Terror for Everybody! A Conundrum – Apparent Life Threatening Events Dr. Timothy Kelly
10:05 P Discussion 10:25 Break

EMERGENCY ENCOUNTERS 10:40 P You Got WHAT Stuck WHERE??
Foreign Bodies ‐ Fun Ways to Get Them Off or Out Dr. Angela Anderson
11:20 P Sports Medicine in The Office: You Make the Call Dr. Jordan Metzl
12:00 pm Dermatologic Emergencies: What's That? Dr. Erin Mathes
12:30 P Discussion 12:50 pm Lunch On Your Own
FRIDAY, MAY 17, 2013 Moderator: Dr. Martha Taylor PRACTICAL PREVENTIVE MEDICINE 2:00 pm P Sports Medicine: The Time for Prevention is Now!
Dr. Jordan Metzl
2:50 P Preventing the Unintended: Contraception News & Evidence Dr. Norma Jo Waxman
3:20 Influenza in 2013: Continuing Evolution & Challenges
Dr. Andrew Pavia
3:50 P Discussion 4:10 Break CARING FOR CHILDREN WITH CHRONIC CONDITIONS 4:25 P Pediatric Foie Gras: Non‐Alcoholic Fatty Liver Disease
Dr. Patrika Tsai
4:55 P Type I Diabetes: A Techy Disease Dr. Saleh Adi
5:25 P Discussion 5:45 pm Adjourn
UCSF Resident, Fellow, Faculty & Alumni Reception 5:45 ‐ 7:45 pm
LOCATION: City Room, Third Floor
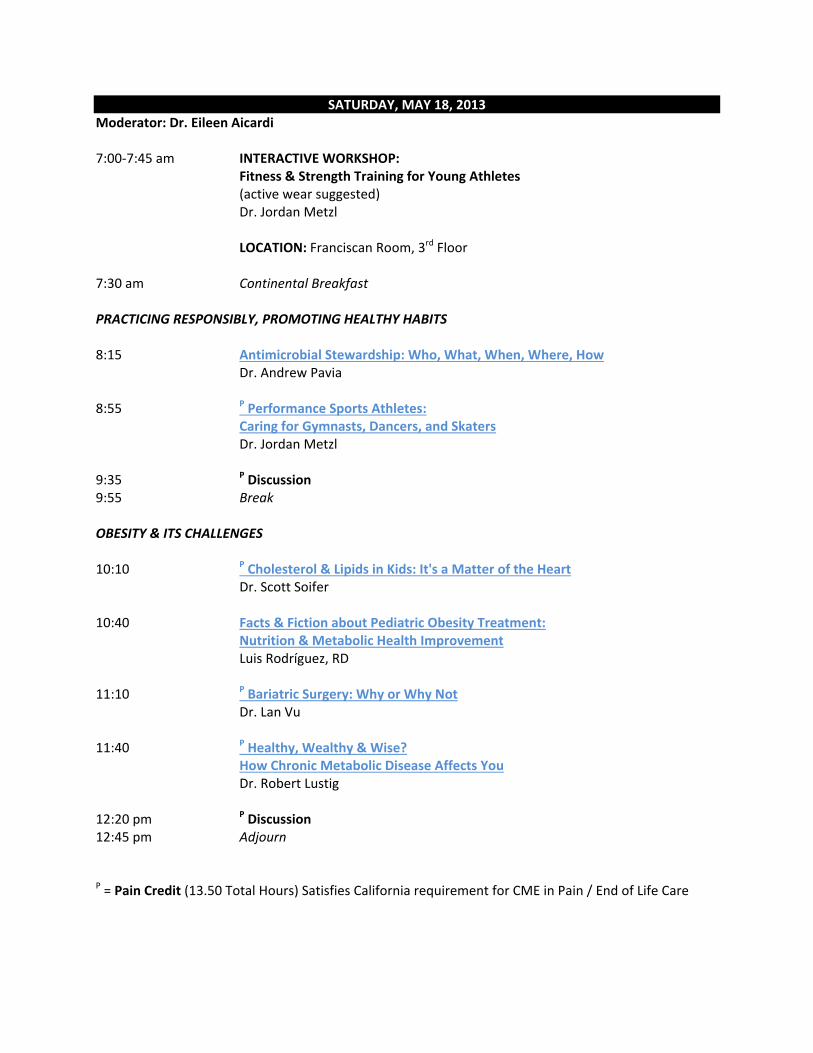
SATURDAY, MAY 18, 2013 Moderator: Dr. Eileen Aicardi 7:00‐7:45 am INTERACTIVE WORKSHOP:
Fitness & Strength Training for Young Athletes (active wear suggested) Dr. Jordan Metzl LOCATION: Franciscan Room, 3rd Floor
7:30 am Continental Breakfast PRACTICING RESPONSIBLY, PROMOTING HEALTHY HABITS 8:15 Antimicrobial Stewardship: Who, What, When, Where, How
Dr. Andrew Pavia
8:55 P Performance Sports Athletes: Caring for Gymnasts, Dancers, and Skaters Dr. Jordan Metzl
9:35 P Discussion 9:55 Break OBESITY & ITS CHALLENGES 10:10 P Cholesterol & Lipids in Kids: It's a Matter of the Heart
Dr. Scott Soifer
10:40 Facts & Fiction about Pediatric Obesity Treatment: Nutrition & Metabolic Health Improvement Luis Rodríguez, RD
11:10 P Bariatric Surgery: Why or Why Not Dr. Lan Vu
11:40 P Healthy, Wealthy & Wise? How Chronic Metabolic Disease Affects You Dr. Robert Lustig
12:20 pm P Discussion 12:45 pm Adjourn P = Pain Credit (13.50 Total Hours) Satisfies California requirement for CME in Pain / End of Life Care
Course Overview
The UCSF Benioff Children’s Hospital in San Francisco invites you to attend the 46th Annual Advances & Controversies in Clinical Pediatrics, May 16 ‐ 18, 2013, at The Westin San Francisco Market Street Hotel, 50 Third Street, San Francisco, California. The program endeavors to provide research, academic, and clinical information in a format that emphasizes the practical application of current concepts relevant to office practice and to professionals involved in the care of children. Pediatric, Family Practice and Emergency Room Physicians, as well as Physician Assistants, Nurses and Nurse Practitioners report that they consistently benefit from their participation in this program, where nationally recognized guest faculty present a series of lectures that are complemented by UCSF faculty and Bay Area experts speaking about a variety of other current or controversial pediatric issues, which will ultimately result in better care for children of all ages, infants through adolescents. This year’s course focuses on emergency & hospital medicine, infectious diseases, sports medicine, and obesity.
Educational Objectives Upon completion of this conference, participants should be able to:
Appropriately implement strategies to recognize and manage pain, poisonings mimicking illness, and foreign body removal;
Improve evaluation and management of pneumonia, influenza, bronchiolitis, and antimicrobial stewardship;
Evaluate and apply effective treatment to prevent sports’ injuries and care for performance sports athletes;
Improve evaluation and understanding of obesity: the role of sugar, nutrition, non‐alcoholic fatty liver disease, lipids, preventive cardiology, and bariatric surgery;
Develop strategies for diagnosis and management of failure to thrive, apparent life threatening events, urgent needs of medically complex children, and dermatologic toxicities & emergencies;
Understand and utilize new technologies in contraception, Type I Diabetes, and pediatric hospital medicine.
Accreditation
The University of California, San Francisco School of Medicine (UCSF) is accredited by the Accreditation Council for Continuing Medical Education to provide continuing medical education for physicians. UCSF designates this educational activity for a maximum of 20.50 AMA PRA Category 1 Credit(s)TM. The optional workshop Fitness & Strength Training for Young Athletes is designated for .75 AMA PRA Category 1 TM)Credits. This CME activity meets the requirements under California Assembly Bill 1195, continuing education and cultural and linguistic competency. AAFP: This Live activity, Advances and Controversies in Clinical Pediatrics, with a beginning date of 05/16/13, has been reviewed and is acceptable for up to 19.25 Prescribed credit(s) by the American Academy of Family Physicians. Physicians should claim only the credit commensurate with the extent of their participation in the activity.

The approved credits shown above include 13.50 credits toward meeting the requirement under California Assembly Bill 487, Pain Management and End‐of‐Life Care Nurses: For the purpose of recertification, the American Nurses Credentialing Center accepts AMA PRA Category 1 Credit TM issued by organizations accredited by the ACCME. Pharmacists: The California Board of Pharmacy accepts as continuing professional education those courses that meet the standard of relevance to pharmacy practice and have been approved for AMA PRA Category 1 Credit TM. AAPA accepts category 1 credit from AOACCME, Prescribed credit from AAFP, and AMA category 1 Credit for the PRA for organizations accredited by the ACCME.
General Information CME Certificates Please complete the sign‐in registration form located at the front desk area of the meeting. Make certain to sign‐in at the start of the meeting and to indicate your total number of credits collected at the end of the meeting. Daily sign‐in is not required. Certificates will be mailed to you, at the address you registered with, in two to four weeks. Evaluation Your cooperation in completing and returning the course evaluation is an important part of our future course planning. The evaluation is the colored sheet you received with your course syllabus. Please turn in the evaluation at the registration desk at course adjourn. Security We urge caution with regard to your personal belongings and syllabi. We are unable to replace these in the event of loss. Please do not leave any personal belongings unattended in the meeting room during lunches or breaks.
Lunch Registration does not include lunch. Please see the list of local lunch restaurants included in this syllabus. Tourist Information Some tourist information is available at the Registration Desk. If you need further information, contact the San Francisco Convention and Visitors Bureau at 415‐974‐6900. Additionally, the concierge at the Hotel will be pleased to assist with your inquiries. Miscellaneous Please turn cell phones and pagers to silent mode. The room temperature tends to fluctuate; for your individual comfort, you may want to bring a sweater to the sessions.
Linguistic Access and Services for Limited English Proficient Persons
I. Purpose.
This document is intended to satisfy the requirements set forth in California Business and Professions code 2190.1. California law requires physicians to obtain training in cultural and linguistic competency as part of their continuing medical education programs. This document and the attachments are intended to provide physicians with an overview of federal and state laws regarding linguistic access and services for limited English proficient (“LEP”) persons. Other federal and state laws not reviewed below also may govern the manner in which physicians and healthcare providers render services for disabled, hearing impaired or other protected categories.
II. Federal Law – Federal Civil Rights Act of 1964, Executive Order 13166, August 11, 2000,
and Department of Health and Human Services (“HHS”) Regulations and LEP Guidance. The Federal Civil Rights Act of 1964, as amended, and HHS regulations require recipients of federal financial assistance (“Recipients”) to take reasonable steps to ensure that LEP persons have meaningful access to federally funded programs and services. Failure to provide LEP individuals with access to federally funded programs and services may constitute national origin discrimination, which may be remedied by federal agency enforcement action. Recipients may include physicians, hospitals, universities and academic medical centers who receive grants, training, equipment, surplus property and other assistance from the federal government. HHS recently issued revised guidance documents for Recipients to ensure that they understand their obligations to provide language assistance services to LEP persons. A copy of HHS’s summary document entitled “Guidance for Federal Financial Assistance Recipients Regarding Title VI and the Prohibition Against National Origin Discrimination Affecting Limited English Proficient Persons – Summary” is available at HHS’s website at: http://www.hhs.gov/ocr/lep/ . As noted above, Recipients generally must provide meaningful access to their programs and services for LEP persons. The rule, however, is a flexible one and HHS recognizes that “reasonable steps” may differ depending on the Recipient’s size and scope of services. HHS advised that Recipients, in designing an LEP program, should conduct an individualized assessment balancing four factors, including: (i) the number or proportion of LEP persons eligible to be served or likely to be encountered by the Recipient; (ii) the frequency with which LEP individuals come into contact with the Recipient’s program; (iii) the nature and importance of the program, activity or service provided by the Recipient to its beneficiaries; and (iv) the resources available to the Recipient and the costs of interpreting and translation services. Based on the Recipient’s analysis, the Recipient should then design an LEP plan based on five recommended steps, including: (i) identifying LEP individuals who may need assistance; (ii) identifying language assistance measures; (iii) training staff; (iv) providing notice to LEP persons; and (v) monitoring and updating the LEP plan. A Recipient’s LEP plan likely will include translating vital documents and providing either on‐site interpreters or telephone interpreter services, or using shared interpreting services with other Recipients. Recipients may take other reasonable steps depending on the emergent or non‐emergent needs of the LEP individual, such as hiring bilingual staff who are competent in the skills required for medical translation, hiring staff interpreters, or contracting with outside public or private agencies that provide interpreter services. HHS’s guidance provides detailed examples of the mix of services that a Recipient should consider and implement. HHS’s guidance also establishes a “safe harbor” that
Recipients may elect to follow when determining whether vital documents must be translated into other languages. Compliance with the safe harbor will be strong evidence that the Recipient has satisfied its written translation obligations. In addition to reviewing HHS guidance documents, Recipients may contact HHS’s Office for Civil Rights for technical assistance in establishing a reasonable LEP plan.
III. California Law – Dymally‐Alatorre Bilingual Services Act. The California legislature enacted the California’s Dymally‐Alatorre Bilingual Services Act (Govt. Code 7290 et seq.) in order to ensure that California residents would appropriately receive services from public agencies regardless of the person’s English language skills. California Government Code section 7291 recites this legislative intent as follows:
“The Legislature hereby finds and declares that the effective maintenance and development of a free and democratic society depends on the right and ability of its citizens and residents to communicate with their government and the right and ability of the government to communicate with them. The Legislature further finds and declares that substantial numbers of persons who live, work and pay taxes in this state are unable, either because they do not speak or write English at all, or because their primary language is other than English, effectively to communicate with their government. The Legislature further finds and declares that state and local agency employees frequently are unable to communicate with persons requiring their services because of this language barrier. As a consequence, substantial numbers of persons presently are being denied rights and benefits to which they would otherwise be entitled. It is the intention of the Legislature in enacting this chapter to provide for effective communication between all levels of government in this state and the people of this state who are precluded from utilizing public services because of language barriers.”
The Act generally requires state and local public agencies to provide interpreter and written document translation services in a manner that will ensure that LEP individuals have access to important government services. Agencies may employ bilingual staff, and translate documents into additional languages representing the clientele served by the agency. Public agencies also must conduct a needs assessment survey every two years documenting the items listed in Government Code section 7299.4, and develop an implementation plan every year that documents compliance with the Act. You may access a copy of this law at the following url: http://www.spb.ca.gov/bilingual/dymallyact.htm

Course Faculty
Course Chair: Andrea C. Sello, MD Clinical Professor of Pediatrics University of California, San Francisco
Guest Faculty: Angela C. Anderson, MD Associate Professor of Pediatrics & Emergency Medicine Director, Pediatric Pain & Palliative Care Hasbro Children's Hospital The Warren Alpert School of Medicine at Brown University Jordan D. Metzl, MD Associate Professor of Pediatrics Sports Medicine Hospital for Special Surgery Weil Cornell Medical College Andrew T. Pavia, MD George and Esther Gross Presidential Professor & Chief, Pediatric Infectious Diseases University of Utah
UCSF School of Medicine Faculty: Saleh Adi, MD Clinical Professor of Pediatrics Director, Madison Clinic for Pediatric Diabetes at UCSF Seth J. Bokser, MD, MPH Associate Professor of Pediatrics Medical Director, Information Technology UCSF Benioff Children's Hospital Donna M. Ferriero, MD, MS W.H. and Marie Wattis Distinguished Professor & Chair of Pediatrics Physician‐in‐Chief, UCSF Benioff Children's Hospital Darren Fiore, MD Assistant Clinical Professor of Pediatrics Director, Fellowship Program, Pediatric Hospital Medicinec c

Amy A. Gelfand, MD Clinical Instructor in Neurology & Pediatrics Kevin Grumbach, MD Professor and Chair of Family & Community Medicine Renee M. Howard, MD Associate Professor of Dermatology Timothy W. Kelly, MD HS Clinical Professor of Pediatrics Director, Advanced Clerkships & Intern Selection Attending Pediatric Hospitalist Michele Long, MD Associate Professor of Pediatrics Pediatric Hospitalist Robert H. Lustig, MD Professor of Clinical Pediatrics Division of Pediatric Endocrinology Erin F. D. Mathes, MD Assistant Professor of Dermatology & Pediatrics Bradley Monash, MD Assistant Clinical Professor of Medicine & Pediatrics Assistant Chief, Medical Service Division of Hospital Medicine Luis A. Rodríguez, RD, CNSC Pediatric Clinical Dietition UCSF WATCH Clinic Glenn Rosenbluth, MD Associate Clinical Professor of Pediatrics Director, Quality & Safety Programs Graduate Medical Education Scott J. Soifer, MD, MS Professor & Vice Chair of Pediatrics Patrika M. Tsai, MD, MPH Assistant Professor of Pediatrics Pediatric Gastroenterology, Hepatology, & Nutrition Director, Pediatric Celiac Clinic Jay H. Tureen, MD HS Clinical Professor of Pediatrics

Lan Vu, MD Assistant Professor of Surgery Norma Jo Waxman, MD Associate Clinical Professor of Family & Community Medicine Faculty, Bixby Center for Global Reproductive Health
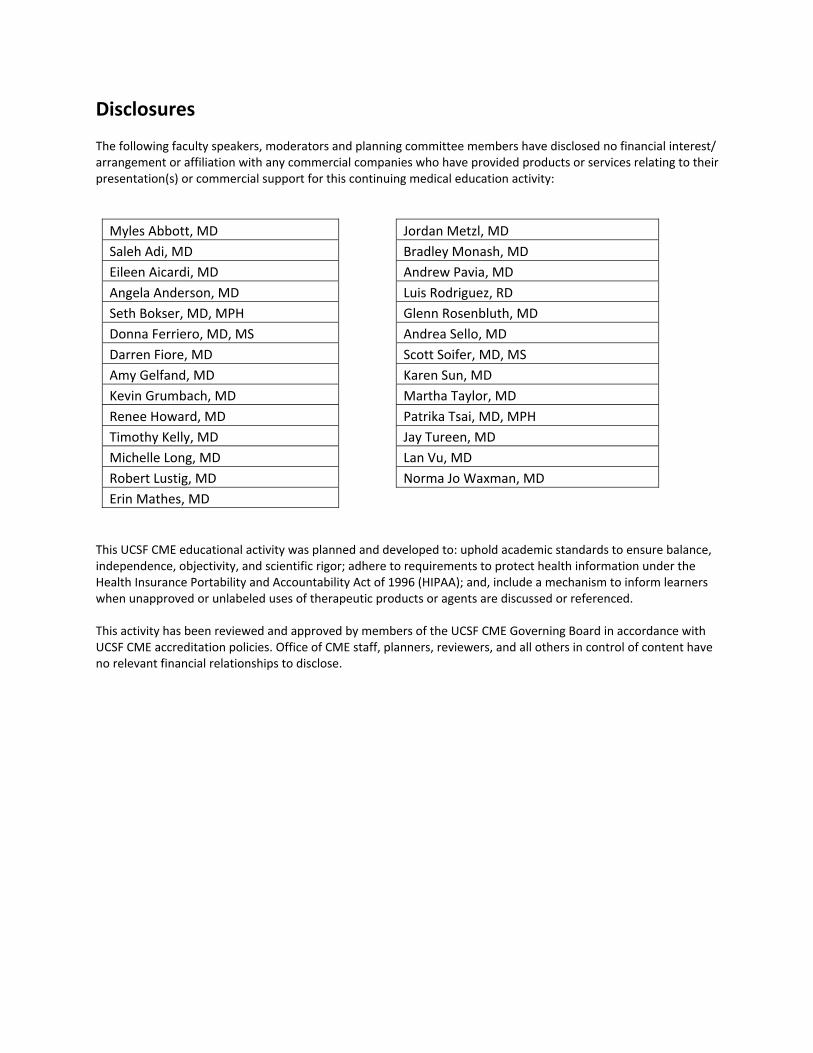
Disclosures
The following faculty speakers, moderators and planning committee members have disclosed no financial interest/ arrangement or affiliation with any commercial companies who have provided products or services relating to their presentation(s) or commercial support for this continuing medical education activity:
Myles Abbott, MD Jordan Metzl, MD
Saleh Adi, MD Bradley Monash, MD
Eileen Aicardi, MD Andrew Pavia, MD
Angela Anderson, MD Luis Rodriguez, RD
Seth Bokser, MD, MPH Glenn Rosenbluth, MD
Donna Ferriero, MD, MS Andrea Sello, MD
Darren Fiore, MD Scott Soifer, MD, MS
Amy Gelfand, MD Karen Sun, MD
Kevin Grumbach, MD Martha Taylor, MD
Renee Howard, MD Patrika Tsai, MD, MPH
Timothy Kelly, MD Jay Tureen, MD
Michelle Long, MD Lan Vu, MD
Robert Lustig, MD Norma Jo Waxman, MD
Erin Mathes, MD
This UCSF CME educational activity was planned and developed to: uphold academic standards to ensure balance, independence, objectivity, and scientific rigor; adhere to requirements to protect health information under the Health Insurance Portability and Accountability Act of 1996 (HIPAA); and, include a mechanism to inform learners when unapproved or unlabeled uses of therapeutic products or agents are discussed or referenced. This activity has been reviewed and approved by members of the UCSF CME Governing Board in accordance with UCSF CME accreditation policies. Office of CME staff, planners, reviewers, and all others in control of content have no relevant financial relationships to disclose.

Local Lunch Restaurants
A G Ferrari 688 Mission St. (at 3rd St.) (415) 344‐0644 www.agferrari.com Boudin Bakery & Cafe 619 Market St. (near 2nd St.) (415) 281‐8200 www.boudinbakery.com Boudin Bakery & Cafe Macy's Union Square (cellar food court) 251 Geary St. (415) 296‐4740 (Cellar) www.boudinbakery.com Caffe Museo (SF MOMA) Categories: Coffee & Tea, American (New) 151 3rd Street (btw Masset Pl & Minna St) (415) 357‐4500 California Pizza Kitchen Categories: Pizza, American (New) 53 3rd St (415) 278‐0443 www.cpk.com Fang Category: Chinese 660 Howard St (btw Hawthorne St & 3rd St) (415) 777‐8568 www.fangrestaurant.com Ferry Building Marketplace Categories: Specialty Food, Variety 1 Ferry Bldg (at Embarcadero) (415) 693‐0996 www.ferrybuildingmarketplace.com Mixt Greens Categories: Vegetarian, Fruits & Veggies, Sandwiches 560 Mission St (between Anthony St & Shaw Aly) (415) 543‐2505 www.mixtgreens.com
Paladar Category: Cuban 329 Kearny St (between Bush St & Pine St) (415) 398‐4899 www.paladarcafecubano.com Perilla Category: Vietnamese 510 Mission St (between 1st St & Ecker Pl) (415) 777‐1893 www.perillasf.com Samovar Tea Lounge 730 Howard St Yerba Buena Gardens ‐ Upper Terrace (415) 227‐9400 www.samovarlife.com Sellars Market 595 Market Street (415) 227‐9850 www.sellersmarkets.com Soup Freaks 90 New Montgomery St. (at Mission) (415) 369‐9600 www.soupfreaks.com Specialty's Cafe & Bakery Categories: Bakeries, Caterers, Sandwiches 101 New Montgomery St (between Mission St & Minna St) (925) 299‐2507 www.specialtys.com Starbucks Category: Coffee & Tea 7 3rd St. (between Kearny St & Market St) (415) 979‐9530 www.starbucks.com Tropisueño Category: Mexican 75 Yerba Buena Lane (415) 243‐0299 www.tropisueno.com Westfield San Francisco Centre Food Emporium Category: Variety, Chinese, Mexican, Vietnamese 865 Market St (Sub‐Level) www.westfield.com/sanfrancisco
THURSDAY, MAY 16, 2013
8:15
KEYNOTE
P Making Sense of Health Reform: Everything You Wanted to Know About Obamacare,
But Were Afraid to Ask
Dr. Kevin Grumbach
1
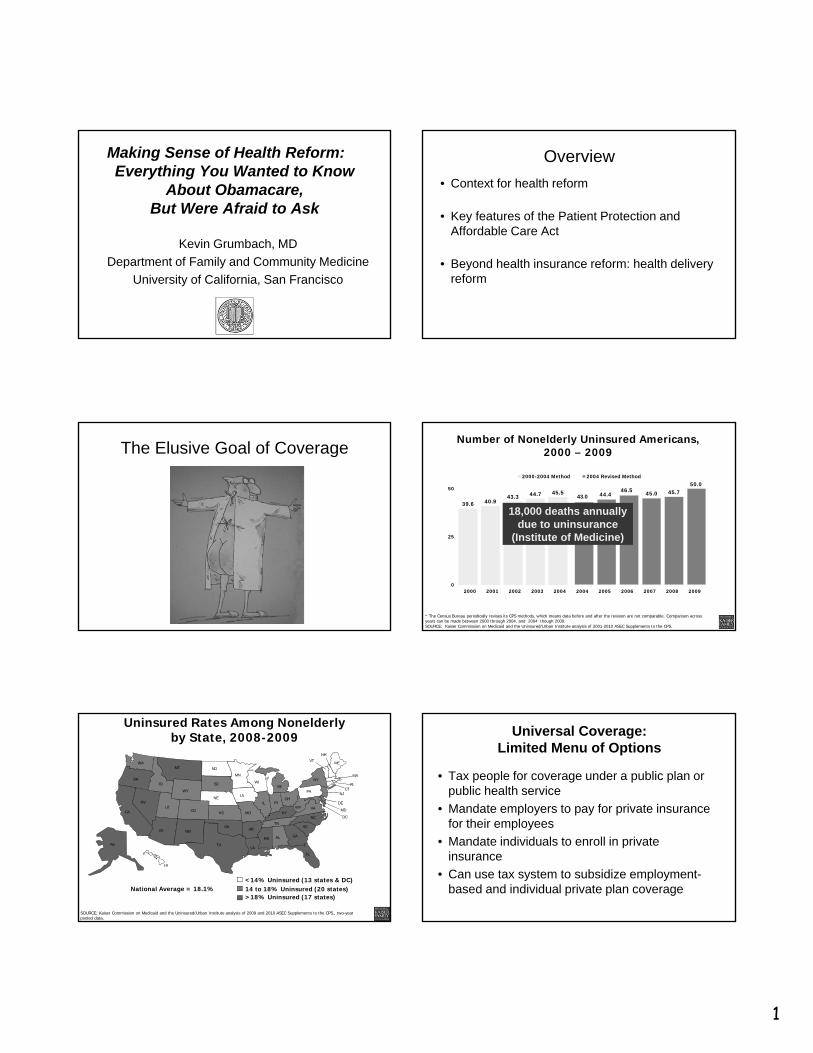
Making Sense of Health Reform:Everything You Wanted to Know
About Obamacare,But Were Afraid to Ask
Kevin Grumbach, MD
Department of Family and Community Medicine
University of California, San Francisco
Overview
• Context for health reform
• Key features of the Patient Protection and Affordable Care Act
• Beyond health insurance reform: health delivery reform
The Elusive Goal of CoverageNumber of Nonelderly Uninsured Americans,
2000 – 2009
39.6 40.943.3 44.7 45.5
43.0 44.446.5 45.0 45.7
50.0
0
25
50
2000 2001 2002 2003 2004 2004 2005 2006 2007 2008 2009
2000-2004 Method 2004 Revised Method
* The Census Bureau periodically revises its CPS methods, which means data before and after the revision are not comparable. Comparison across years can be made between 2000 through 2004, and 2004 though 2009.SOURCE: Kaiser Commission on Medicaid and the Uninsured/Urban Institute analysis of 2001-2010 ASEC Supplements to the CPS.
18,000 deaths annually due to uninsurance
(Institute of Medicine)
Uninsured Rates Among Nonelderly by State, 2008-2009
<14% Uninsured (13 states & DC)14 to 18% Uninsured (20 states)National Average = 18.1%
SOURCE: Kaiser Commission on Medicaid and the Uninsured/Urban Institute analysis of 2009 and 2010 ASEC Supplements to the CPS., two-year pooled data.
AZ
WA
WY
ID
UT
OR
NV
CA
MT
HI
AK
AR
MS
LA
MN
ND
CO
IA
WISD
MOKS
TN
NMOK
TX
AL
MI
ILOH
IN
KYNC
PA
VAWV
SC
GA
FL
ME
NY
NH
MA
VT
NJ
DE
MD
RI
DC
CT
>18% Uninsured (17 states)
NE
Universal Coverage:Limited Menu of Options
• Tax people for coverage under a public plan or public health service
• Mandate employers to pay for private insurance for their employees
• Mandate individuals to enroll in private insurance
• Can use tax system to subsidize employment-based and individual private plan coverage
2
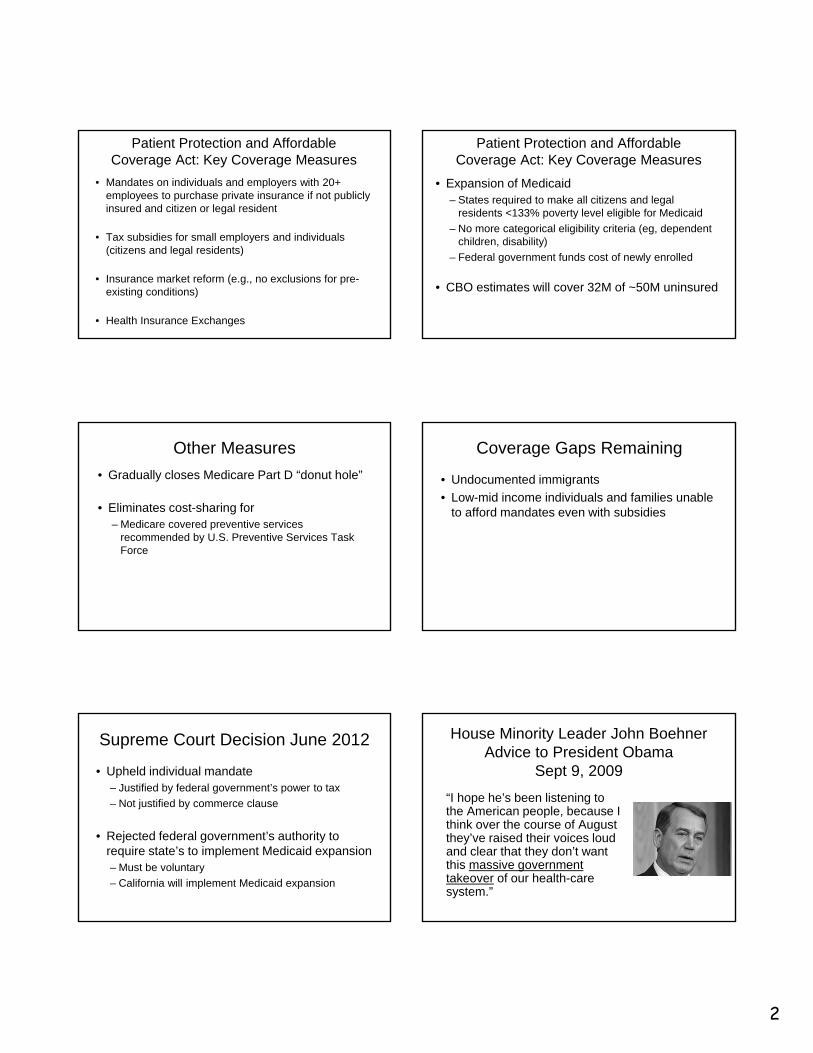
Patient Protection and Affordable Coverage Act: Key Coverage Measures
• Mandates on individuals and employers with 20+ employees to purchase private insurance if not publicly insured and citizen or legal resident
• Tax subsidies for small employers and individuals (citizens and legal residents)
• Insurance market reform (e.g., no exclusions for pre-existing conditions)
• Health Insurance Exchanges
Patient Protection and Affordable Coverage Act: Key Coverage Measures
• Expansion of Medicaid– States required to make all citizens and legal
residents <133% poverty level eligible for Medicaid
– No more categorical eligibility criteria (eg, dependent children, disability)
– Federal government funds cost of newly enrolled
• CBO estimates will cover 32M of ~50M uninsured
Other Measures
• Gradually closes Medicare Part D “donut hole”
• Eliminates cost-sharing for – Medicare covered preventive services
recommended by U.S. Preventive Services Task Force
Coverage Gaps Remaining
• Undocumented immigrants
• Low-mid income individuals and families unable to afford mandates even with subsidies
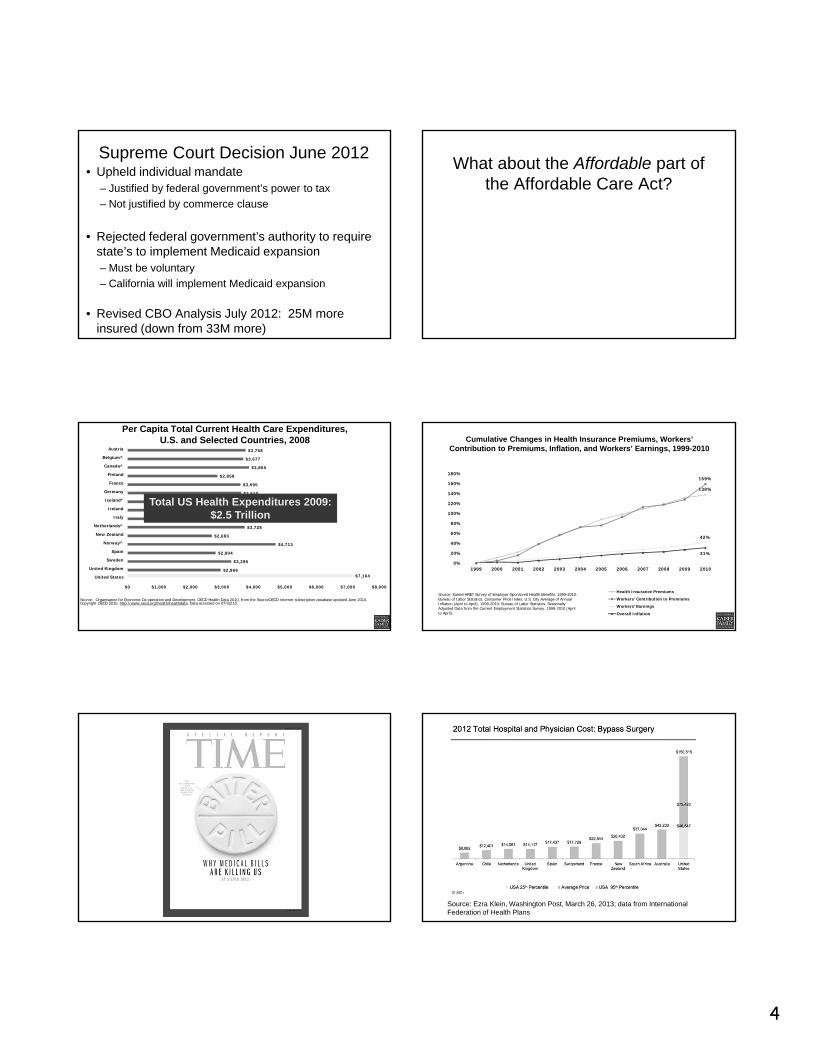
Supreme Court Decision June 2012
• Upheld individual mandate– Justified by federal government’s power to tax
– Not justified by commerce clause
• Rejected federal government’s authority to require state’s to implement Medicaid expansion– Must be voluntary
– California will implement Medicaid expansion
House Minority Leader John Boehner Advice to President Obama
Sept 9, 2009
“I hope he’s been listening to the American people, because I think over the course of August they’ve raised their voices loud and clear that they don’t want this massive government takeover of our health-care system.”

3
AMA Campaign vs Medicare Bill“Write those letters now. Call your friends, and tell them to write them. If you don't, this program I promise you will pass just as surely as the sun will come up tomorrow. And behind it will come other federal programs that will invade every area of freedom as we have known it in this country, until, one day, as Norman Thomas said, we will awake to find that we have socialism. And if you don't do this, and if I don't do it, one of these days, you and I are going to spend our sunset years telling our children, and our children’s children, what it was once like in America when men were free.”
Socialist SocialistSocialistNot a
Socialist
“Whatever happens, the Government better not get involved with my Medicare.”
PP&ACA: Coverage Timeline
• High risk health insurance pools for individuals with no insurance due to pre-existing conditions (7/2010)
• Expansion of dependent coverage for young adults up to age 26 (9/2010)
• Elimination of provisions that allow health insurers to cap lifetime benefits or deny coverage to children based on pre-existing conditions (9/2010)
• Expansion of Medicaid (2014)
PP&ACA: Coverage Timeline
• Individual health insurance mandate (2014)
• Subsidized health insurance exchanges for the uninsured to purchase insurance (2014)
• Elimination of provisions that allow health insurers to deny coverage based on pre-existing conditions, etc. (2014)
• Employer requirements related to provision of health care coverage or payment of a penalty (2014)
Coverage Gaps Remaining
• Undocumented immigrants
• Low-mid income individuals and families unable to afford mandates even with subsidies
4
Supreme Court Decision June 2012• Upheld individual mandate
– Justified by federal government’s power to tax
– Not justified by commerce clause
• Rejected federal government’s authority to require state’s to implement Medicaid expansion– Must be voluntary
– California will implement Medicaid expansion
• Revised CBO Analysis July 2012: 25M more insured (down from 33M more)
What about the Affordable part of the Affordable Care Act?
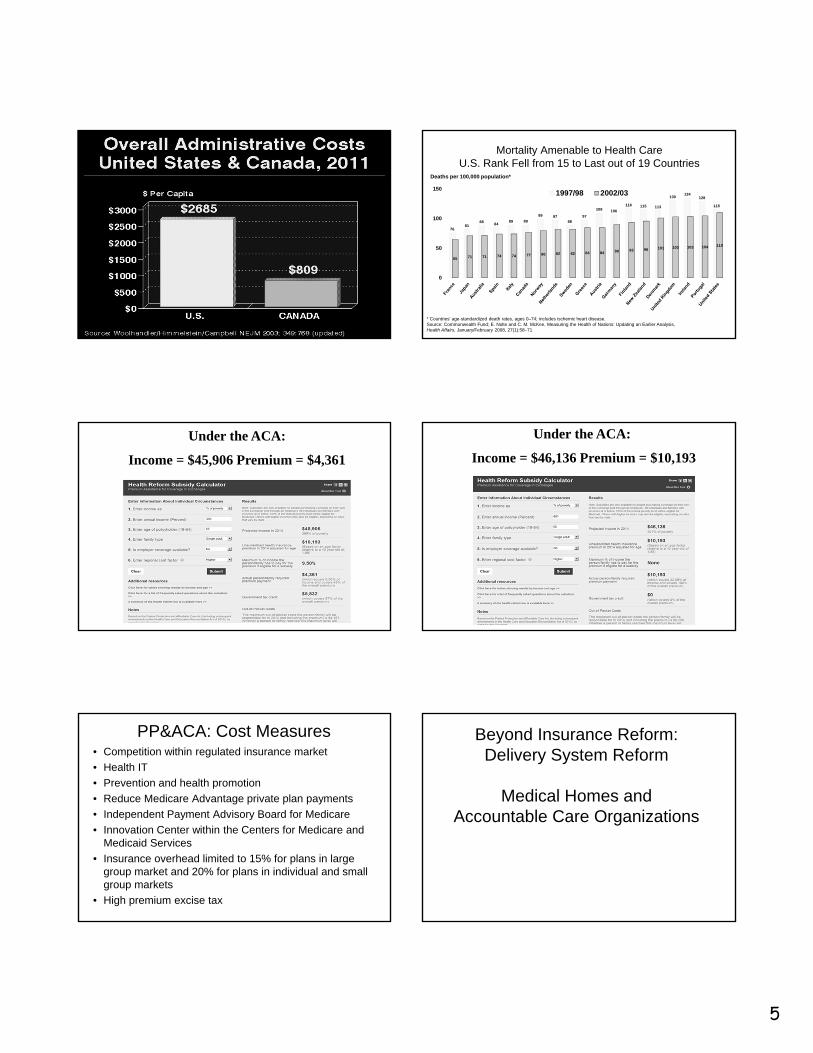
Per Capita Total Current Health Care Expenditures, U.S. and Selected Countries, 2008
$2,966
$3,295
$2,804
$4,713
$2,683
$3,728
$2,750
$3,632
$3,359
$3,610
$3,595
$2,858
$3,865
$3,677
$3,758
$7,164
$0 $1,000 $2,000 $3,000 $4,000 $5,000 $6,000 $7,000 $8,000
United States
United Kingdom
Sweden
Spain
Norway^
New Zealand
Netherlands^
Italy
Ireland
Iceland*
Germany
France
Finland
Canada^
Belgium^
Austria
Source: Organisation for Economic Co-operation and Development. OECD Health Data 2010, from the SourceOECD Internet subscription database updated June 2010. Copyright OECD 2010, http://www.oecd.org/health/healthdata. Data accessed on 07/02/10.
Total US Health Expenditures 2009: $2.5 Trillion
Cumulative Changes in Health Insurance Premiums, Workers’ Contribution to Premiums, Inflation, and Workers’ Earnings, 1999-2010
138%
159%
42%
31%
0%
20%
40%
60%
80%
100%
120%
140%
160%
180%
1999 2000 2001 2002 2003 2004 2005 2006 2007 2008 2009 2010
Health Insurance Premiums
Workers' Contribution to Premiums
Workers' Earnings
Overall Inflation
Source: Kaiser/HRET Survey of Employer-Sponsored Health Benefits, 1999-2010. Bureau of Labor Statistics, Consumer Price Index, U.S. City Average of Annual Inflation (April to April), 1999-2010; Bureau of Labor Statistics, Seasonally Adjusted Data from the Current Employment Statistics Survey, 1999-2010 (April to April).
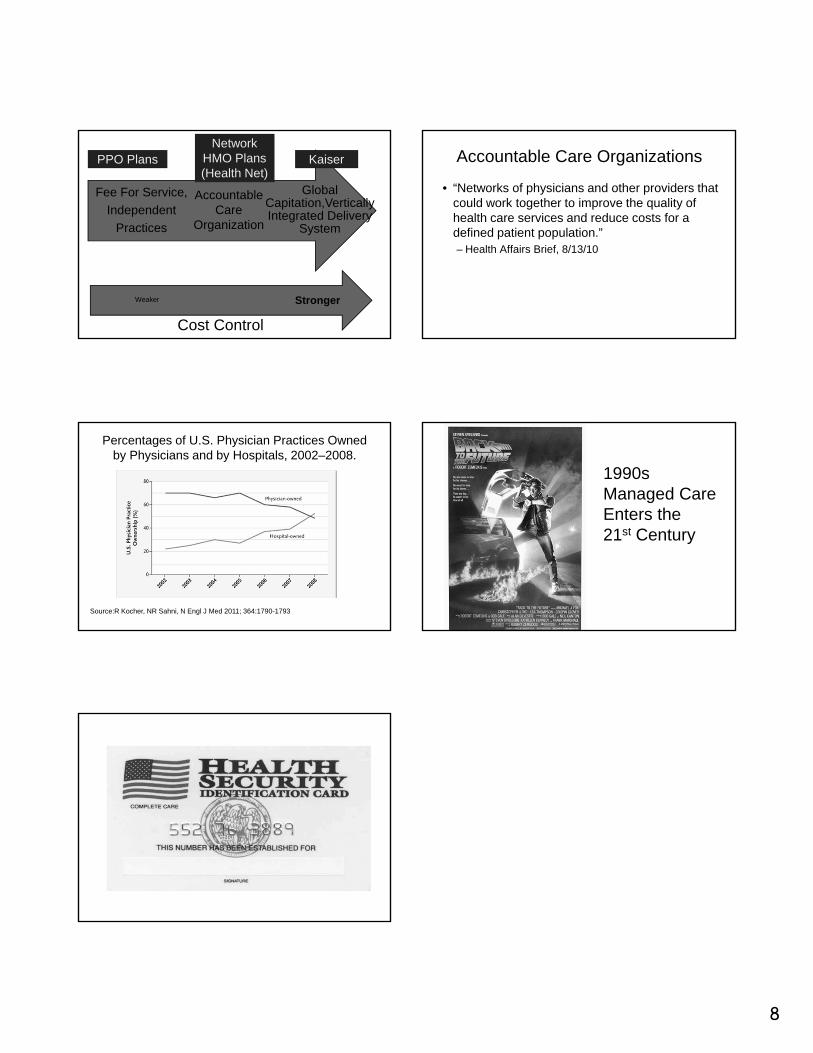
Source: Ezra Klein, Washington Post, March 26, 2013; data from International Federation of Health Plans
5
Mortality Amenable to Health CareU.S. Rank Fell from 15 to Last out of 19 Countries
7681
8884
89 89
99 9788
97
109 106
116 115 113
130134
128
115
65 71 71 74 74 77 80 82 82 84 84 90 93 96 101 103 103 104 110
0
50
100
1501997/98 2002/03
Deaths per 100,000 population*
* Countries’ age-standardized death rates, ages 0–74; includes ischemic heart disease.Source: Commonwealth Fund; E. Nolte and C. M. McKee, Measuring the Health of Nations: Updating an Earlier Analysis, Health Affairs, January/February 2008, 27(1):58–71
Under the ACA:
Income = $45,906 Premium = $4,361
Under the ACA:
Income = $46,136 Premium = $10,193
PP&ACA: Cost Measures• Competition within regulated insurance market
• Health IT
• Prevention and health promotion
• Reduce Medicare Advantage private plan payments
• Independent Payment Advisory Board for Medicare
• Innovation Center within the Centers for Medicare and Medicaid Services
• Insurance overhead limited to 15% for plans in large group market and 20% for plans in individual and small group markets
• High premium excise tax
Beyond Insurance Reform: Delivery System Reform
Medical Homes andAccountable Care Organizations

6
Dr. Katherine J. Atkinson of Amherst, Mass., has a waiting list for her family practice; she has added 50 patients since November.
In Massachusetts, Universal Coverage Strains Care
April 5, 2008
Bodenheimer T. N Engl J Med 2006;355:861-864
Family Medicine Residency Positions and Number Filled by U.S. Medical School Graduates
Supply of General Pediatricians per 100,000 Children in the US
Source: Shipman SA, Lurie JD, Goodman DC. Pediatrics 2004;113:435.
The President Wants More and Stronger
Primary Care
“It used to be that most of us had a family doctor; you would consult with that family doctor; they knew your history, they knew your family, they knew your children, they helped deliver babies. How do we get more primary physicians, number one; and number two, how do we give them more power so that they are the hub around which a patient-centered medical system exists, right? ” June 8, 2010, Town Hall with Seniors
Senator Orrin HatchSenate Finance Committee Roundtable
Reforming America’s Health Care Delivery System April 21, 2009
“The US is first in providing rescue care, but this care has little or no impact on the general population. We must put more focus on primary care and preventive medicine. How do we transform the system to do this?”
July 6, 2009
7
Randy MacDonald, Sr VP House Ways and Means Hearing April 29, 2009
• “I will start with the very last question asked by the committee--what is the single most important thing to fix in healthcare? Primary care. Strengthen primary care -- transform it and pay differently using a model like the Patient Centered Medical Home.”
• Congressman: “And the second issue?”
• “Well, if you don't fix the first issue and do not have a foundation of powerful primary care then you can do nothing else. You have to fix primary care before you can even begin to address a second issue.”
Joint Principles of the Patient Centered Medical Home
February 2007
American Academy of Family Physicians American Academy of Pediatrics American College of Physicians
American Osteopathic Association
Transforming the Delivery of Primary Care:
The Patient Centered Medical Home• Rittenhouse & Shortell: 4
Cornerstones of the PCMH• Primary Care
– first Contact (access)
– Comprehensiveness
– Continuity
– Coordination
• Patient-Centered
• New Model Practice
• Payment Reform
Affordable Care Act:Measures to Revitalize Primary Care
• Physician payment reform– Medicare fee 10% increase for PC– Medicaid PC fee increases to Medicare rates (2013-2015)
• Infrastructure investment and facilitating practice redesign– CMS Innovations Center– Medical Home pilot programs– Primary Care Extension Program– ARRA HIT incentives and TA
• Training pipeline– More NHSC scholarships and loan repayment– New Primary Care Training Grants
From Medical Homes to Medical Neighborhoods
• High performing primary care necessary but not sufficient
• Need the entire system to work together in a coordinated, integrated, patient-centered manner
3° Care
1° Care
2° Care
Medical Neighborhood
Medical Home
8
Global Capitation,VerticallyIntegrated Delivery
System
Fee For Service,
Independent
Practices
StrongerWeaker
Cost Control
Accountable Care
Organization
PPO Plans KaiserNetwork
HMO Plans(Health Net)
Accountable Care Organizations
• “Networks of physicians and other providers that could work together to improve the quality of health care services and reduce costs for a defined patient population.”– Health Affairs Brief, 8/13/10
Percentages of U.S. Physician Practices Owned by Physicians and by Hospitals, 2002–2008.
Source:R Kocher, NR Sahni, N Engl J Med 2011; 364:1790-1793
1990s Managed Care Enters the 21st Century
THURSDAY, MAY 16, 2013
STAYING TECHNOLOGICALLY SAVVY
Moderator: Dr. Donna Ferriero
THURSDAY, MAY 16, 2013
9:15
Social Media in Healthcare: Get Connected
Dr. Seth Bokser
4/30/2013
1
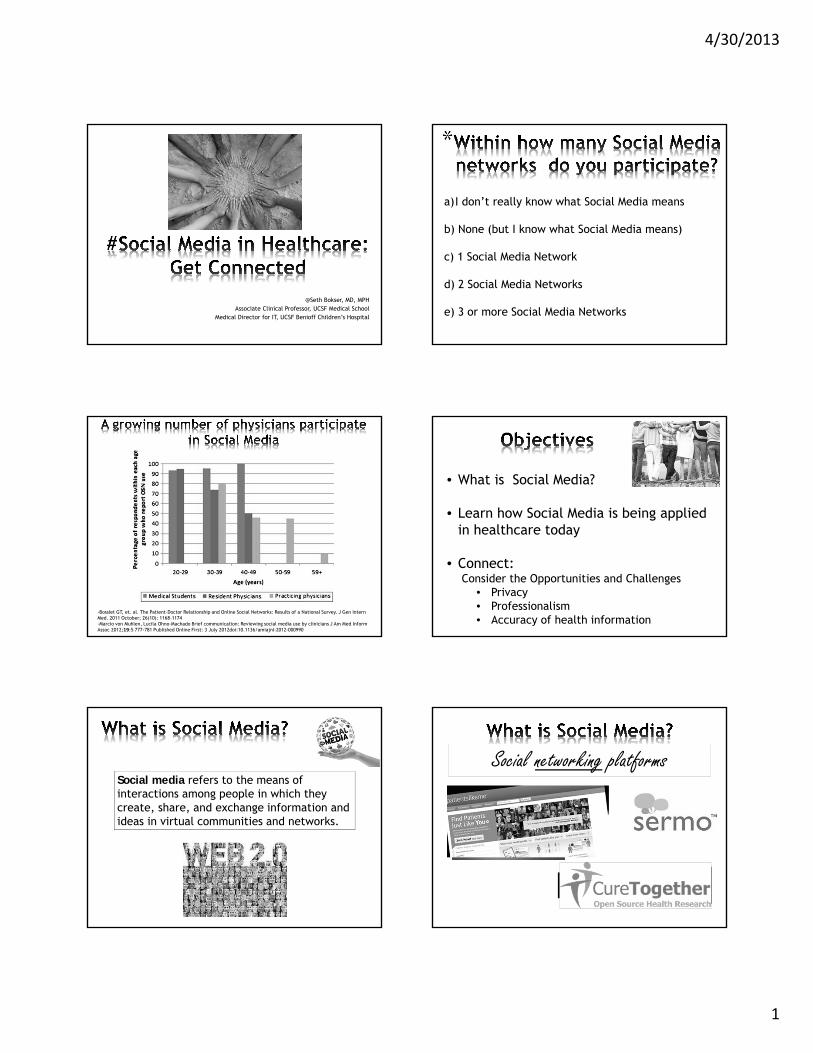
@Seth Bokser, MD, MPHAssociate Clinical Professor, UCSF Medical School
Medical Director for IT, UCSF Benioff Children’s Hospital
#
*
a)I don’t really know what Social Media means
b) None (but I know what Social Media means)
c) 1 Social Media Network
d) 2 Social Media Networks
e) 3 or more Social Media Networks
-Bosslet GT, et. al. The Patient–Doctor Relationship and Online Social Networks: Results of a National Survey. J Gen Intern Med. 2011 October; 26(10): 1168–1174-Marcio von Muhlen, Lucila Ohno-Machado Brief communication: Reviewing social media use by clinicians J Am Med Inform Assoc 2012;19:5 777-781 Published Online First: 3 July 2012doi:10.1136/amiajnl-2012-000990
• What is Social Media?
• Learn how Social Media is being applied in healthcare today
• Connect: Consider the Opportunities and Challenges
• Privacy• Professionalism• Accuracy of health information
Social media refers to the means of interactions among people in which they create, share, and exchange information and ideas in virtual communities and networks.
Social networking platforms
4/30/2013
2
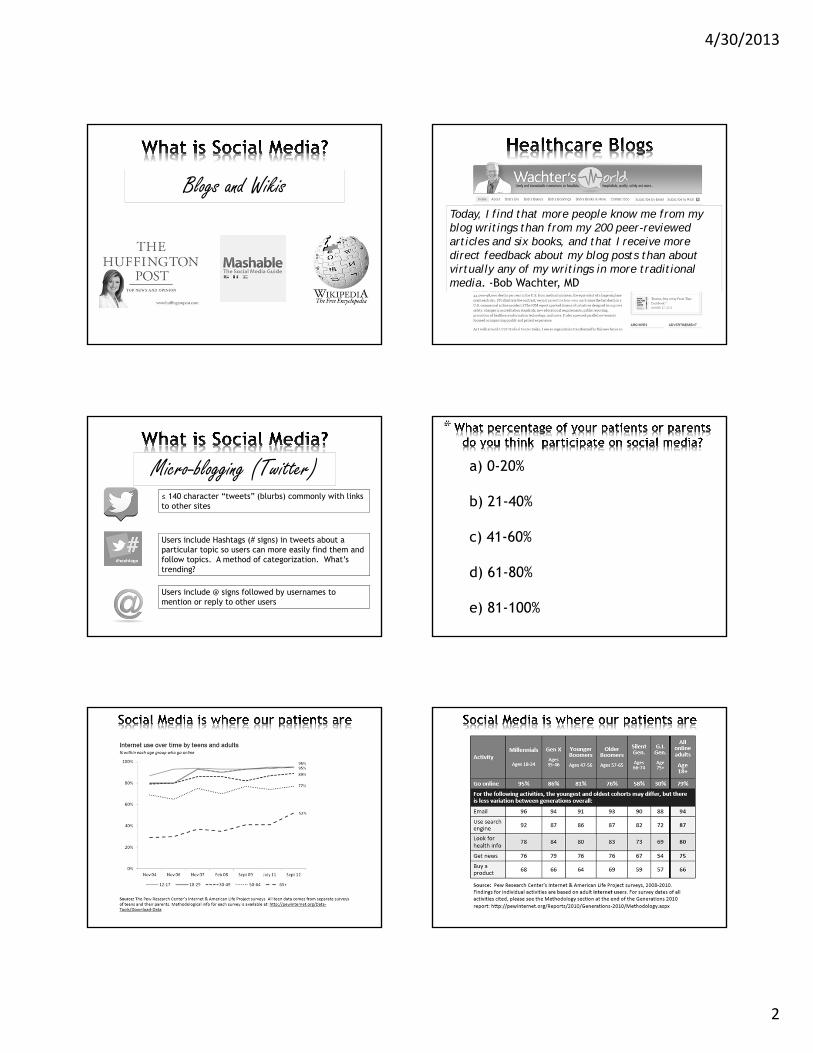
Blogs and WikisToday, I find that more people know me from my blog writings than from my 200 peer-reviewed articles and six books, and that I receive more direct feedback about my blog posts than about virtually any of my writings in more traditional media. -Bob Wachter, MD
Micro-blogging (Twitter)≤ 140 character “tweets” (blurbs) commonly with links to other sites
Users include Hashtags (# signs) in tweets about a particular topic so users can more easily find them and follow topics. A method of categorization. What’s trending?
Users include @ signs followed by usernames to mention or reply to other users
*
a) 0-20%
b) 21-40%
c) 41-60%
d) 61-80%
e) 81-100%
4/30/2013
3
*
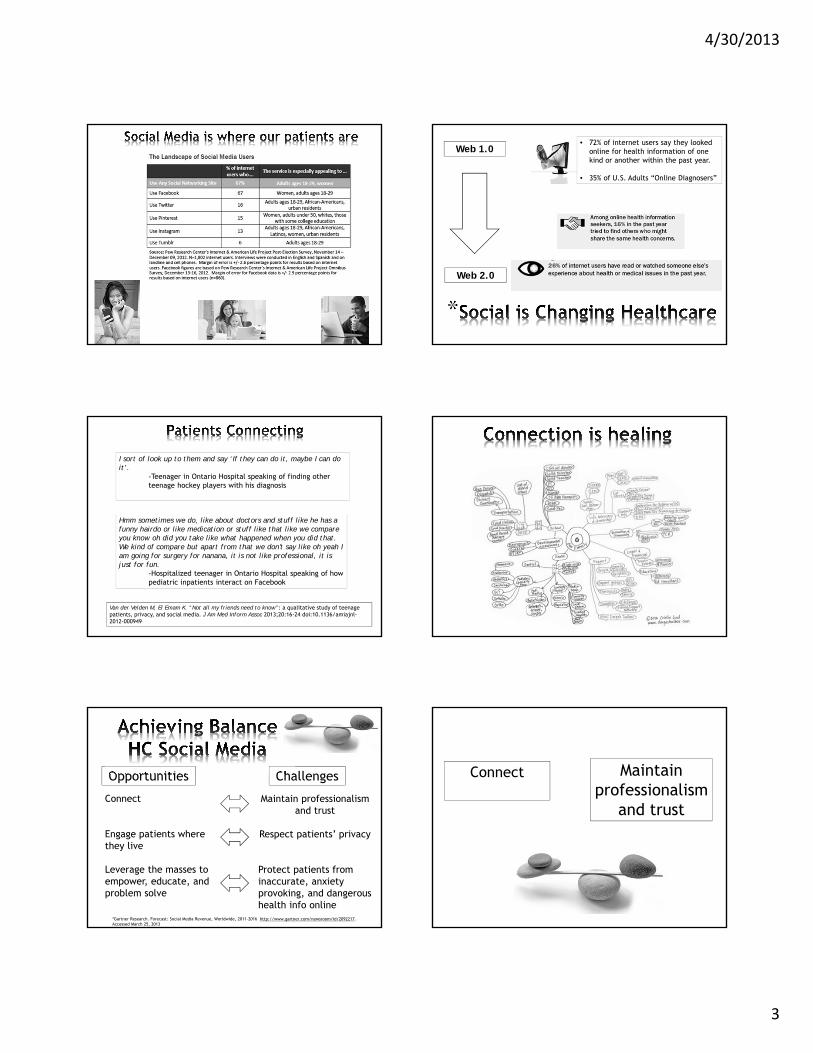
Web 1.0
Web 2.0
• 72% of internet users say they looked online for health information of one kind or another within the past year.
• 35% of U.S. Adults “Online Diagnosers”
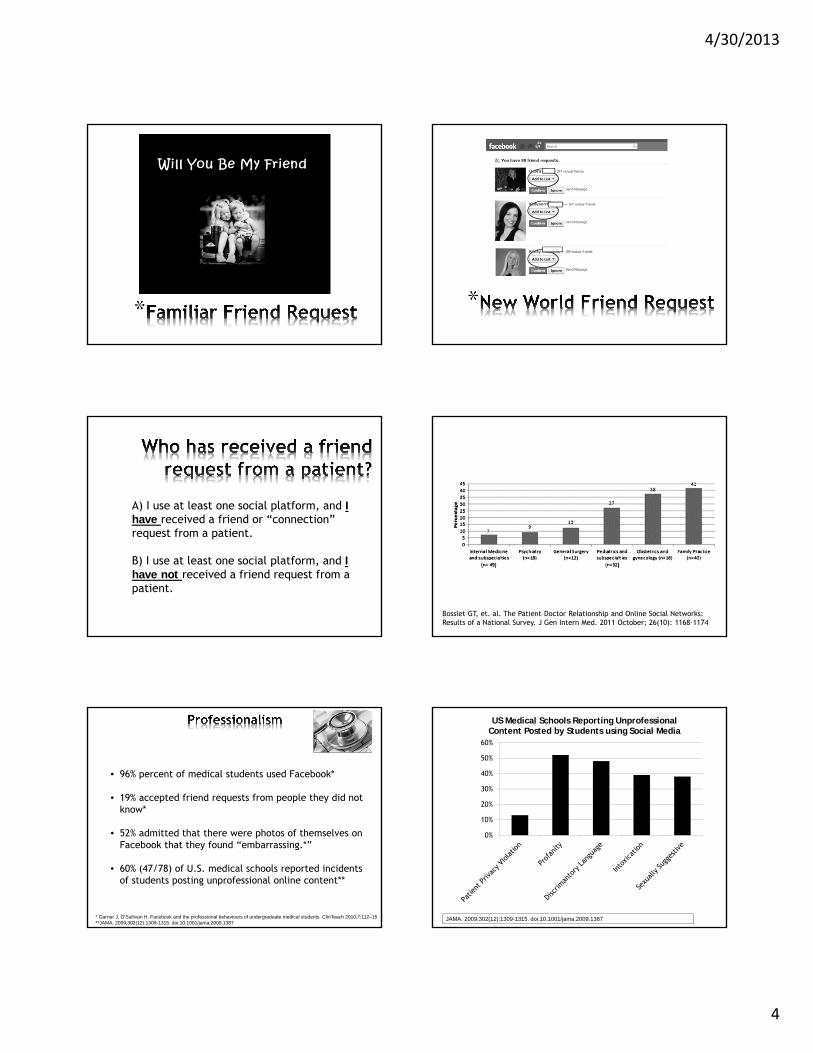
I sort of look up to them and say ‘If they can do it, maybe I can do it’.
-Teenager in Ontario Hospital speaking of finding other teenage hockey players with his diagnosis
Hmm sometimes we do, like about doctors and stuff like he has a funny hairdo or like medication or stuff like that like we compare you know oh did you take like what happened when you did that. We kind of compare but apart from that we don't say like oh yeah I am going for surgery for nanana, it is not like professional, it is just for fun.
-Hospitalized teenager in Ontario Hospital speaking of how pediatric inpatients interact on Facebook
Van der Velden M, El Emam K. “Not all my friends need to know”: a qualitative study of teenage patients, privacy, and social media. J Am Med Inform Assoc 2013;20:16-24 doi:10.1136/amiajnl-2012-000949
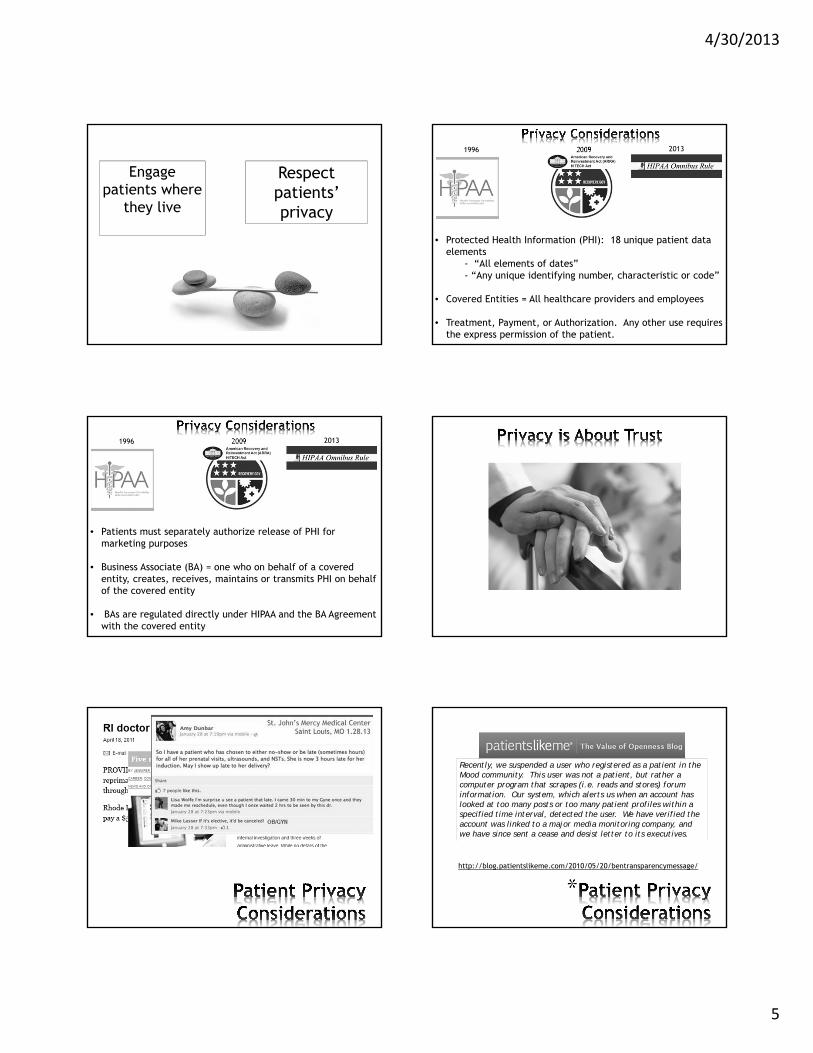
Connect
Engage patients where they live
Leverage the masses to empower, educate, and problem solve
Maintain professionalism and trust
Respect patients’ privacy
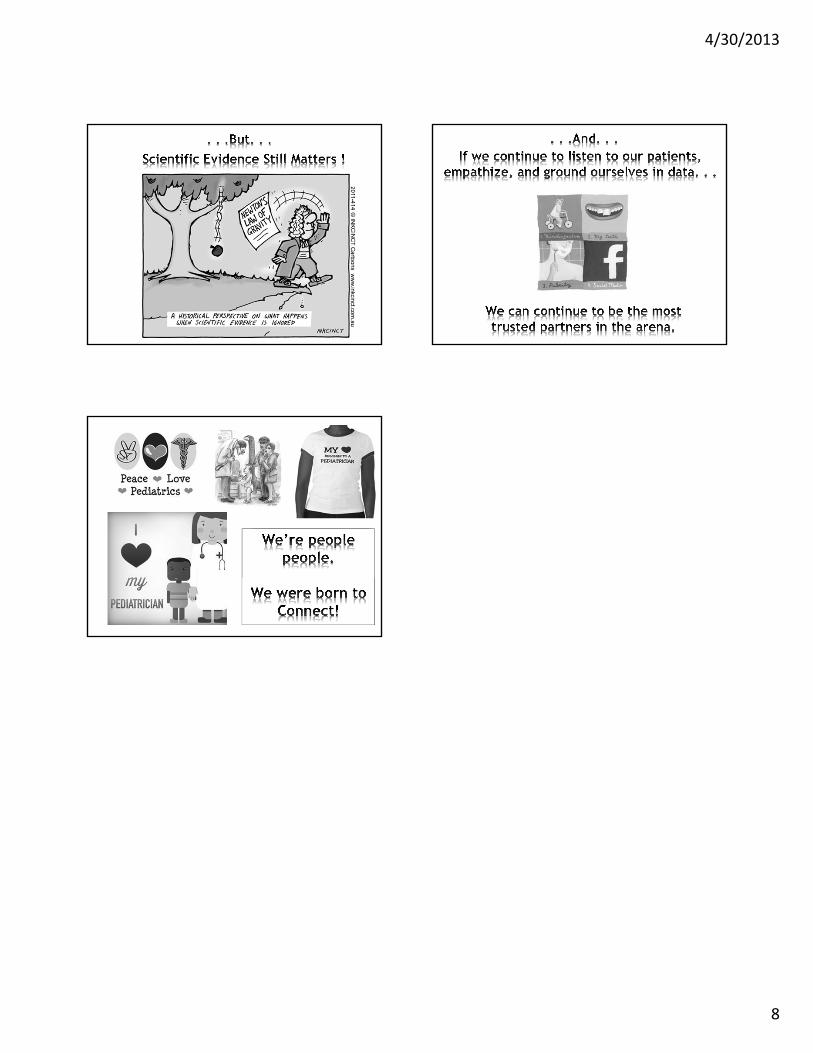
Protect patients from inaccurate, anxiety provoking, and dangerous health info online
Opportunities Challenges
*Gartner Research. Forecast: Social Media Revenue, Worldwide, 2011-2016 http://www.gartner.com/newsroom/id/2092217. Accessed March 25, 2013
Connect Maintain professionalism
and trust
4/30/2013
4
* *
A) I use at least one social platform, and I have received a friend or “connection” request from a patient.
B) I use at least one social platform, and I have not received a friend request from a patient.
Bosslet GT, et. al. The Patient–Doctor Relationship and Online Social Networks: Results of a National Survey. J Gen Intern Med. 2011 October; 26(10): 1168–1174
* Garner J, O'Sullivan H. Facebook and the professional behaviours of undergraduate medical students. ClinTeach 2010;7:112–15**JAMA. 2009;302(12):1309-1315. doi:10.1001/jama.2009.1387
• 96% percent of medical students used Facebook*
• 19% accepted friend requests from people they did not know*
• 52% admitted that there were photos of themselves on Facebook that they found “embarrassing.*”
• 60% (47/78) of U.S. medical schools reported incidents of students posting unprofessional online content**
0%
10%
20%
30%
40%
50%
60%
US Medical Schools Reporting Unprofessional Content Posted by Students using Social Media
JAMA. 2009;302(12):1309-1315. doi:10.1001/jama.2009.1387
4/30/2013
5
Engage patients where
they live
Respect patients’ privacy
• Protected Health Information (PHI): 18 unique patient data elements
- “All elements of dates”- “Any unique identifying number, characteristic or code”
• Covered Entities = All healthcare providers and employees
• Treatment, Payment, or Authorization. Any other use requires the express permission of the patient.
1996 2009 2013
1996 2009 2013
• Patients must separately authorize release of PHI for marketing purposes
• Business Associate (BA) = one who on behalf of a covered entity, creates, receives, maintains or transmits PHI on behalf of the covered entity
• BAs are regulated directly under HIPAA and the BA Agreement with the covered entity
*
Recently, we suspended a user who registered as a patient in the Mood community. This user was not a patient, but rather a computer program that scrapes (i.e. reads and stores) forum information. Our system, which alerts us when an account has looked at too many posts or too many patient profiles within a specified time interval, detected the user. We have verified the account was linked to a major media monitoring company, and we have since sent a cease and desist letter to its executives.
http://blog.patientslikeme.com/2010/05/20/bentransparencymessage/
4/30/2013
6
http://www.aap.org/en-us/my-aap/Documents/SocialMedia_guidelines.pdf
“Social media comes down to this Golden Rule: If it applies to traditional media or the Internet, it probably applies to most public social media platforms too”
• Separate personal and professional personas
• Do not use text messaging for medical interaction
• Establish a professional online profile so that it appear first in Google search
• Develop educational programs to prevent trainees from harming their future careers
JM Farnan, et al. Online Medical Professionalism: Patient and Public Relationships: Policy Statement From the American College of Physicians and the Federation of State Medical Boards. Annals of Internal Medicine. 2013 Apr;158(8):620-627.
• Set personal account privacy settings to High
• Do not discuss specific patients in social media forums
- Avoid: “I saw a patient today with DKA”- Okay: “Children with DKA typically present with nausea. . .”
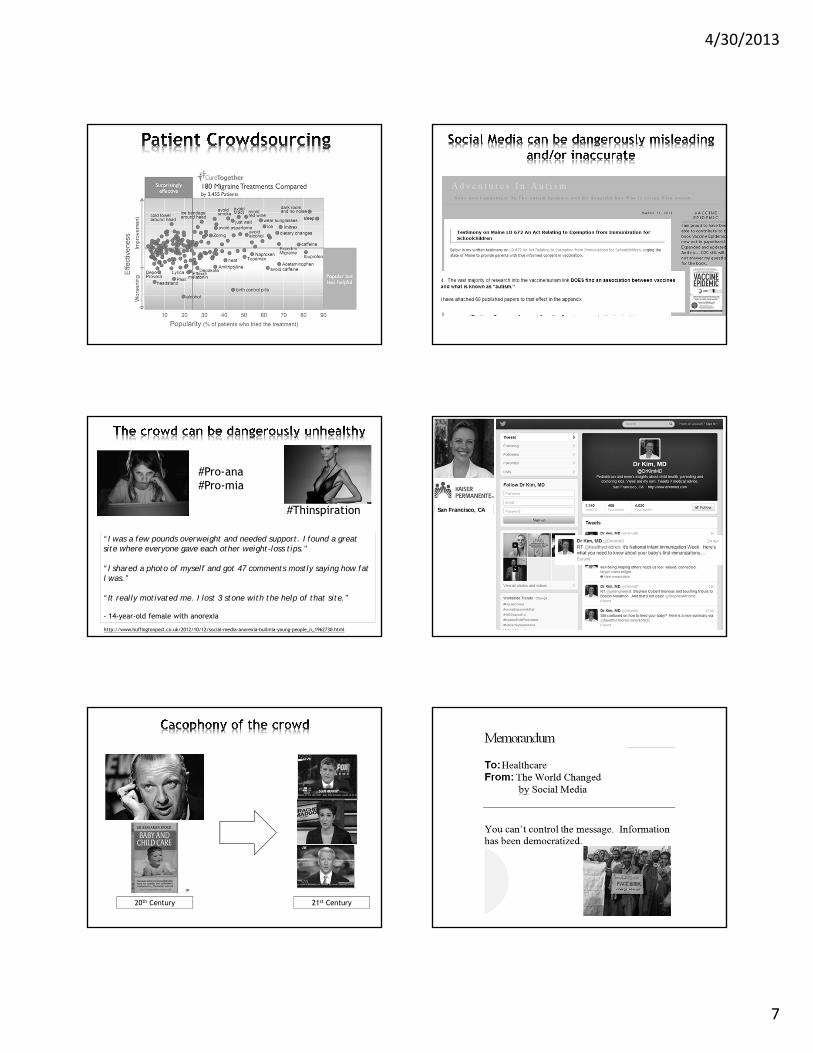
Empowering, Educating, Crowd
Sourcing
Validity of Health Information
*Brabham, Daren (2008), "Crowdsourcing as a Model for Problem Solving: An Introduction and Cases", Convergence: The International Journal of Research into New Media Technologies 14 (1): 75–90
The practice of obtaining needed services, ideas, or content by soliciting contributions from a large group of people, and especially from an online community, rather than from traditional employees or suppliers.
Scientific/Healthcare Context = Crowdsourcing is an online, distributed problem-solving and production model.*
Crowd + Outsourcing = Crowdsourcing
4/30/2013
7
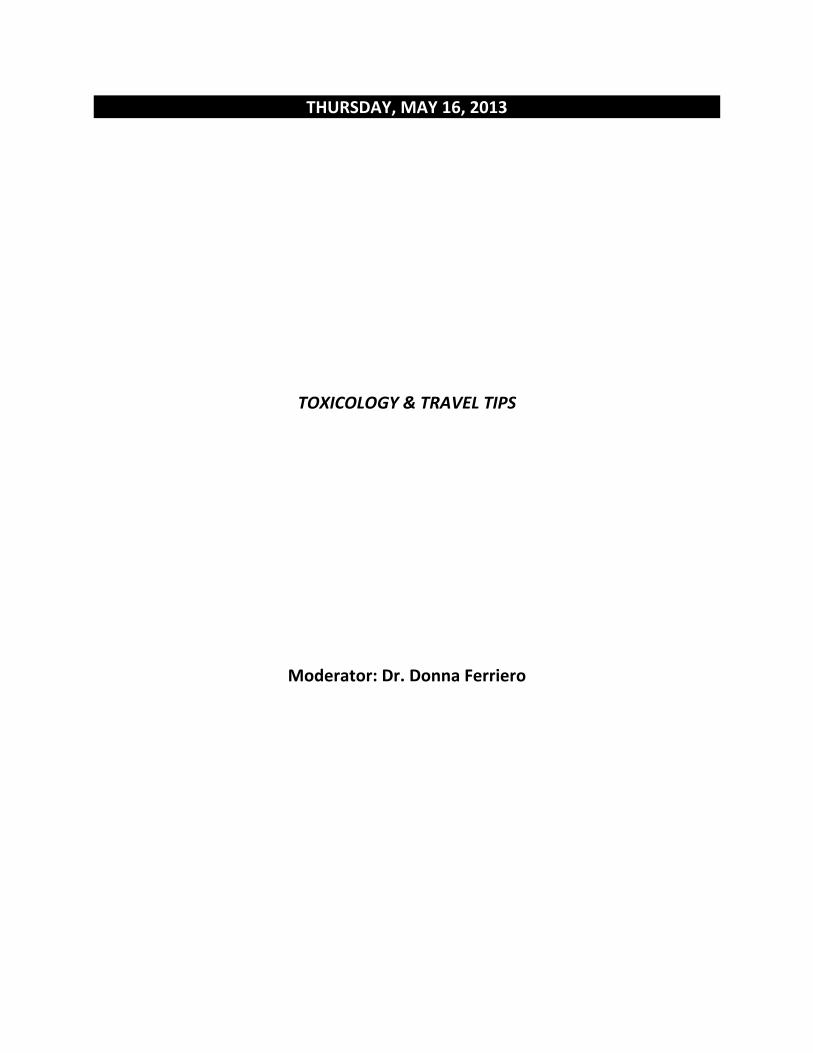
#Pro-ana#Pro-mia
#Thinspiration
“I was a few pounds overweight and needed support. I found a great site where everyone gave each other weight-loss tips.”
“I shared a photo of myself and got 47 comments mostly saying how fat I was.”
“It really motivated me. I lost 3 stone with the help of that site.”
- 14-year-old female with anorexia
http://www.huffingtonpost.co.uk/2012/10/12/social-media-anorexia-bulimia-young-people_n_1962730.html
San Francisco, CA
20th Century 21st Century
4/30/2013
8
THURSDAY, MAY 16, 2013
TOXICOLOGY & TRAVEL TIPS
Moderator: Dr. Donna Ferriero

THURSDAY, MAY 16, 2013
10:20
P Toxicologic Look‐Alikes: Poisonings Which Mimic Pediatric Illnesses
Dr. Angela Anderson
5/2/2013
1
Toxicology Look‐A‐Likes:Poisonings Which Mimic
Pediatric Illnesses
Angela C. Anderson, MD, FAAP
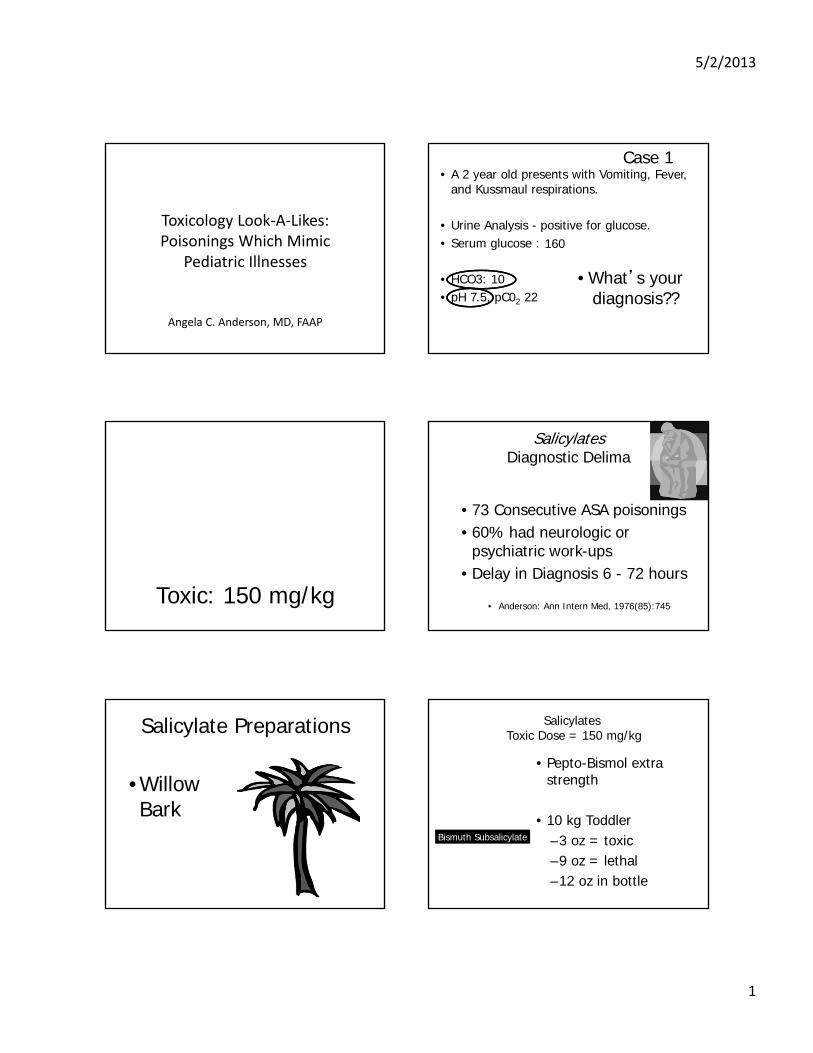
Case 1• A 2 year old presents with Vomiting, Fever,
and Kussmaul respirations.
• Urine Analysis - positive for glucose.• Serum glucose :
• HCO3: 10• pH 7.5, pC02 22
160
• What’s your diagnosis??
Toxic: 150 mg/kg
SalicylatesDiagnostic Delima
• 73 Consecutive ASA poisonings• 60% had neurologic or
psychiatric work-ups • Delay in Diagnosis 6 - 72 hours
• Anderson: Ann Intern Med, 1976(85):745
Salicylate Preparations
• Willow Bark
SalicylatesToxic Dose = 150 mg/kg
• Pepto-Bismol extra strength
• 10 kg Toddler–3 oz = toxic–9 oz = lethal–12 oz in bottle
Bismuth Subsalicylate
5/2/2013
2
• 1 Ounce ?• 21 Aspirin =
• 7,000 mg ASA
Oil of Wintergreen
• One tsp ?• 21 ASA 7000mg =• Death
Salicylate Pathophysiology
• Stimulates Medulla• Increases Metabolism• Promotes Bleeding
SalicylatesMechanisms of Toxicity
• Stimulation of Medulla
–Respiratory Alkalosis
Salicylates-Mechanisms of Toxicity
• Uncouple Oxidative Phosphorylation– Impaired O2 use
– Increased metabolism and lactic acid production• Increased heat production• [Glucose] Decreased or Increased• Metabolic Acidosis
Anion Gap Metabolic Acidosis [Na+ + K +] - [HCO3 -+ Cl -]> 10
• M - Methanol• U - Uremia• D - DKA• P - Paraldehyde• I - Iron• L - Lactic Acidosis• E - Ethylene Glycol• S - Salicylates
5/2/2013
3
SalicylatesMechanisms of Toxicity
• Decreased platelet aggregation• Decreased clotting factors• Increased capillary permeability
Cerebral edema Pulmonary edema
SalicylatesClinical Presentation
• Temp• HR• RR
– Kussmaul respirations– +/- Rales
• Tinnitus
SalicylatesClinical Presentation
• Vomiting• Agitation / MS / Szs. • Hyperventilation• Diaphoresis
What’s your diagnosis??..
• Vomiting, Kussmaul respirations, urine dip (+) for glucose = ?
• Fever, increased RR, rales = ?• Hyperventilating, anxious =?• Fever, vomiting, mental status change =?
Salicylate Intoxication
•Management
Activated Charcoal
• Prevent drug absorption
• Best if w/in 1 hour of ingestion
5/2/2013
4
SalicylateManagement –Prevent Absorption
• Whole Bowel Irrigation–GoLYTELY
•2L/hr adults•500cc/hr children
SalicylateManagement
Enhance Elimination
• Urine Alkalinization
• Hemodialysis
•Ionizes ASA
*
SalicylatesManagement
• Enhance Elimination–Urine Alkalinization
• 2 amps (100mEq) NaHCO3 +• D5W• Goal = pH >=7.5
–CHECK IT!!!
Salicylate - Final Tips
• Weird respiratory symptoms? • Weird fever?• Weird?• [pH = 7.5] + [HCO3 = 10] ?
Consider Salicylates !
5/2/2013
5
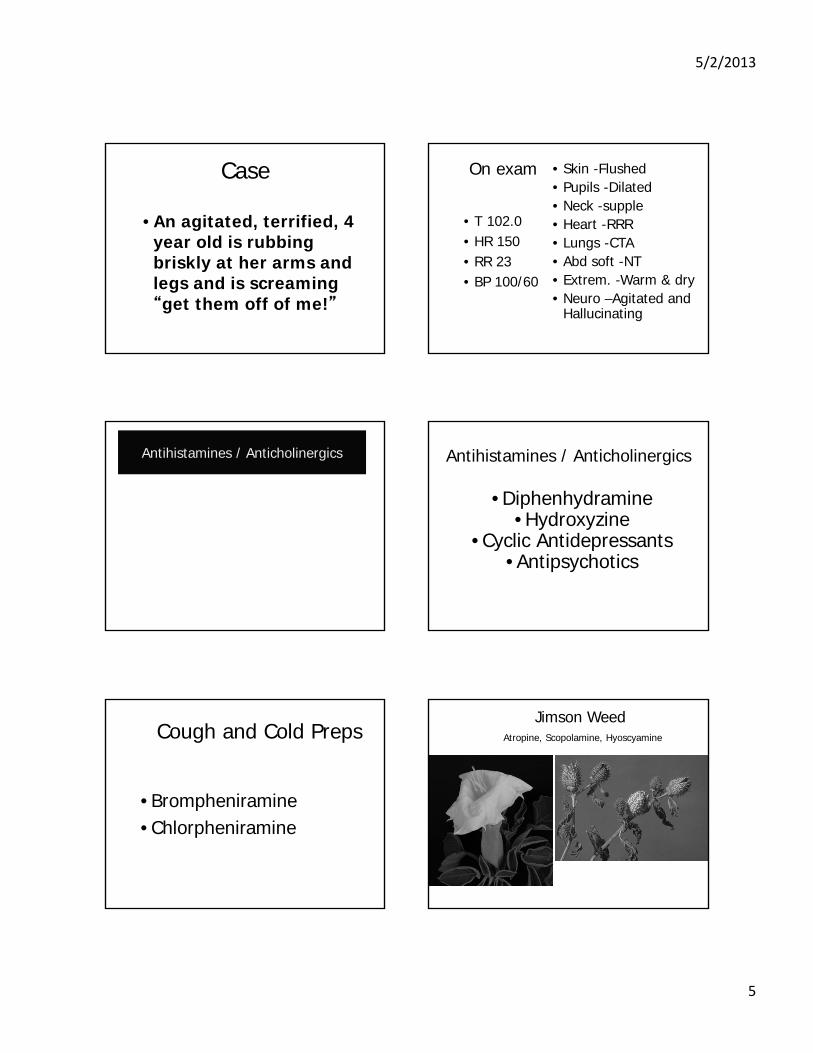
Case
• An agitated, terrified, 4 year old is rubbing briskly at her arms and legs and is screaming “get them off of me!”
On exam
• T 102.0• HR 150• RR 23• BP 100/60
• Skin -Flushed• Pupils -Dilated• Neck -supple• Heart -RRR• Lungs -CTA• Abd soft -NT• Extrem. -Warm & dry• Neuro –Agitated and
Hallucinating
Antihistamines / Anticholinergics Antihistamines / Anticholinergics
• Diphenhydramine• Hydroxyzine
• Cyclic Antidepressants• Antipsychotics
Cough and Cold Preps
• Brompheniramine• Chlorpheniramine
Jimson WeedAtropine, Scopolamine, Hyoscyamine
5/2/2013
6
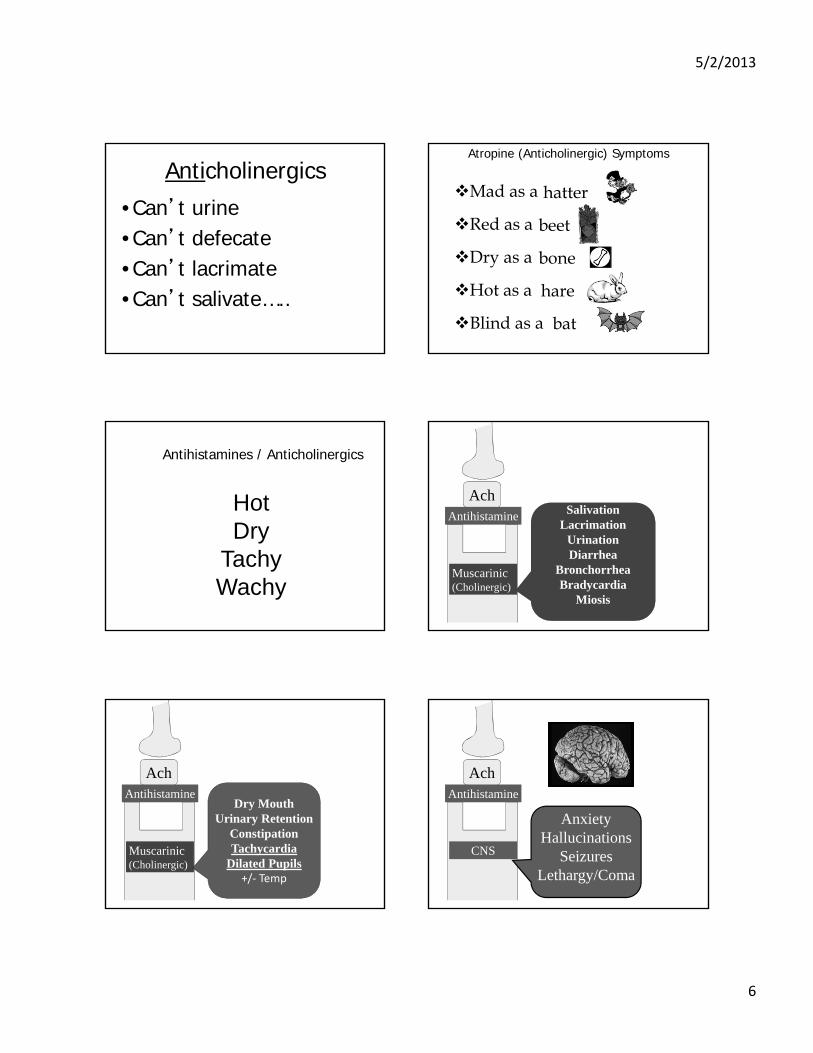
Anticholinergics• Can’t urine• Can’t defecate• Can’t lacrimate• Can’t salivate…..
Atropine (Anticholinergic) Symptoms
Mad as a
Red as a
Dry as a
Hot as a
Blind as a
hatter
beet
bone
hare
bat
Antihistamines / Anticholinergics
Hot Dry
TachyWachy
AchSalivation
LacrimationUrinationDiarrhea
BronchorrheaBradycardia
Miosis
Muscarinic(Cholinergic)
Antihistamine
Ach
Muscarinic(Cholinergic)
AntihistamineDry Mouth
Urinary RetentionConstipationTachycardia
Dilated Pupils+/‐ Temp
Ach
CNS
Antihistamine
AnxietyHallucinations
SeizuresLethargy/Coma
5/2/2013
7
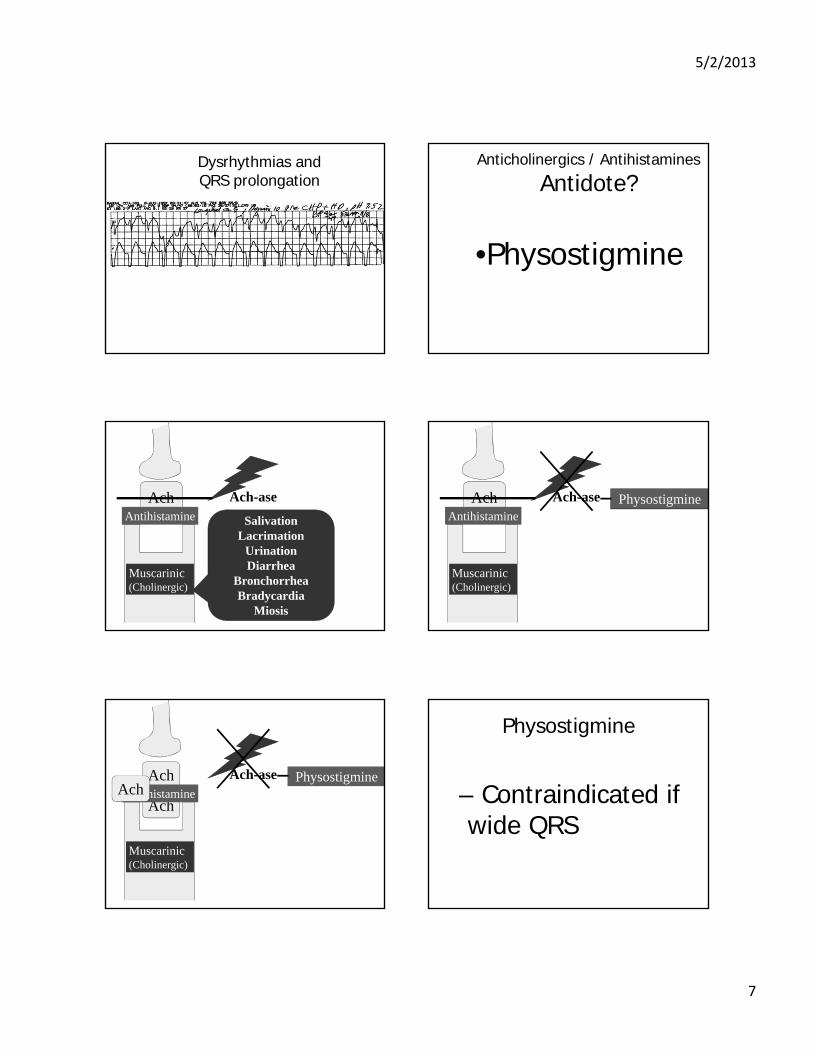
Dysrhythmias and QRS prolongation
Anticholinergics / Antihistamines
Antidote?
•Physostigmine
Ach
SalivationLacrimation
UrinationDiarrhea
BronchorrheaBradycardia
Miosis
Muscarinic(Cholinergic)
Ach-aseAntihistamine
Muscarinic(Cholinergic)
Ach-ase PhysostigmineAchAntihistamine
Ach
Muscarinic(Cholinergic)
Ach-ase Physostigmine
AchAntihistamineAch
Physostigmine
– Contraindicated if wide QRS
5/2/2013
8
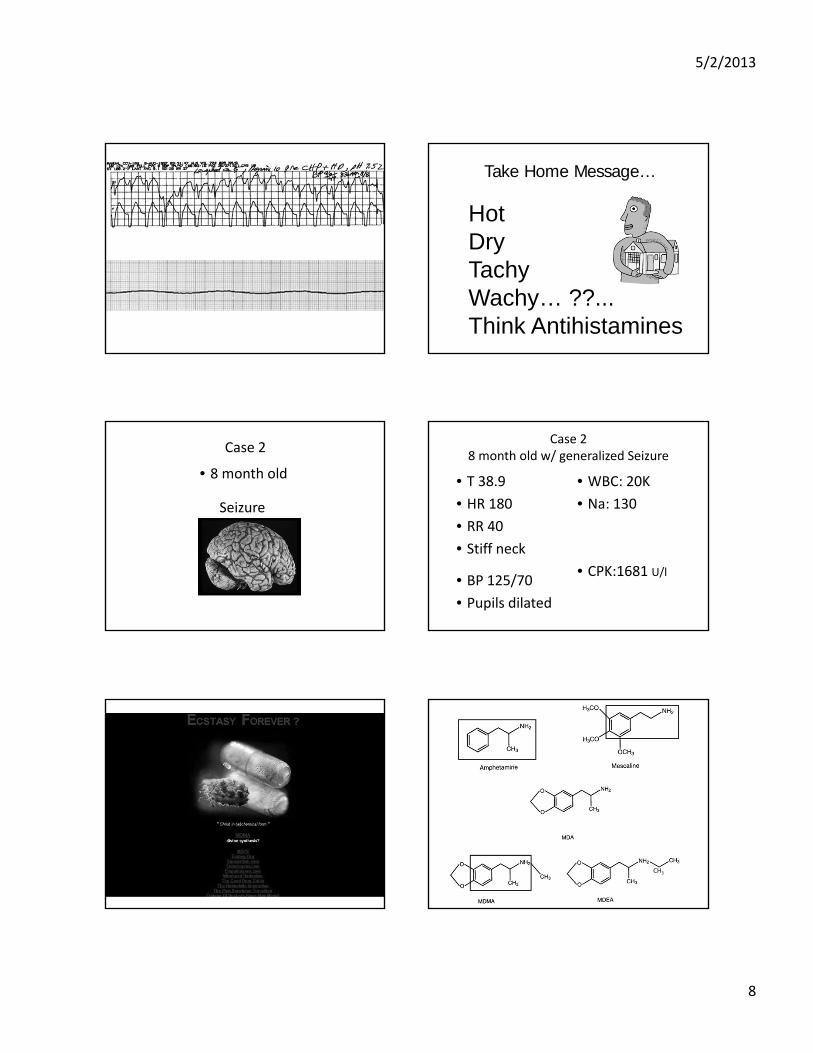
Take Home Message…
Hot DryTachyWachy… ??...Think Antihistamines
Case 2
Seizure
• 8 month old
Case 28 month old w/ generalized Seizure
• T 38.9
• HR 180
• RR 40
• Stiff neck
• WBC: 20K
• Na: 130
• CPK:1681 U/l• BP 125/70
• Pupils dilated
CH3
5/2/2013
9
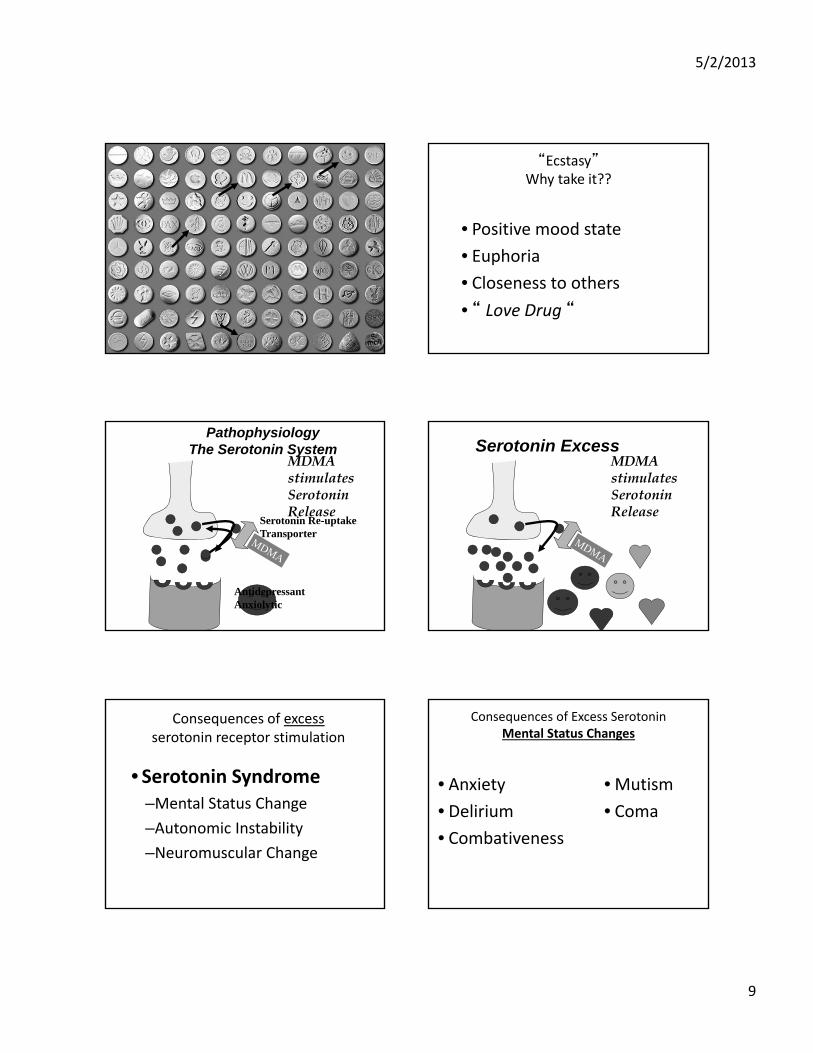
“Ecstasy”Why take it??
• Positive mood state
• Euphoria
• Closeness to others
• “ Love Drug “
PathophysiologyThe Serotonin System
MDMA stimulates Serotonin Release
AntidepressantAnxiolytic
Serotonin Re-uptake Transporter
Serotonin ExcessMDMA stimulates Serotonin Release
Consequences of excess serotonin receptor stimulation
• Serotonin Syndrome–Mental Status Change
–Autonomic Instability
–Neuromuscular Change
Consequences of Excess SerotoninMental Status Changes
• Anxiety
• Delirium
• Combativeness
• Mutism
• Coma
5/2/2013
10
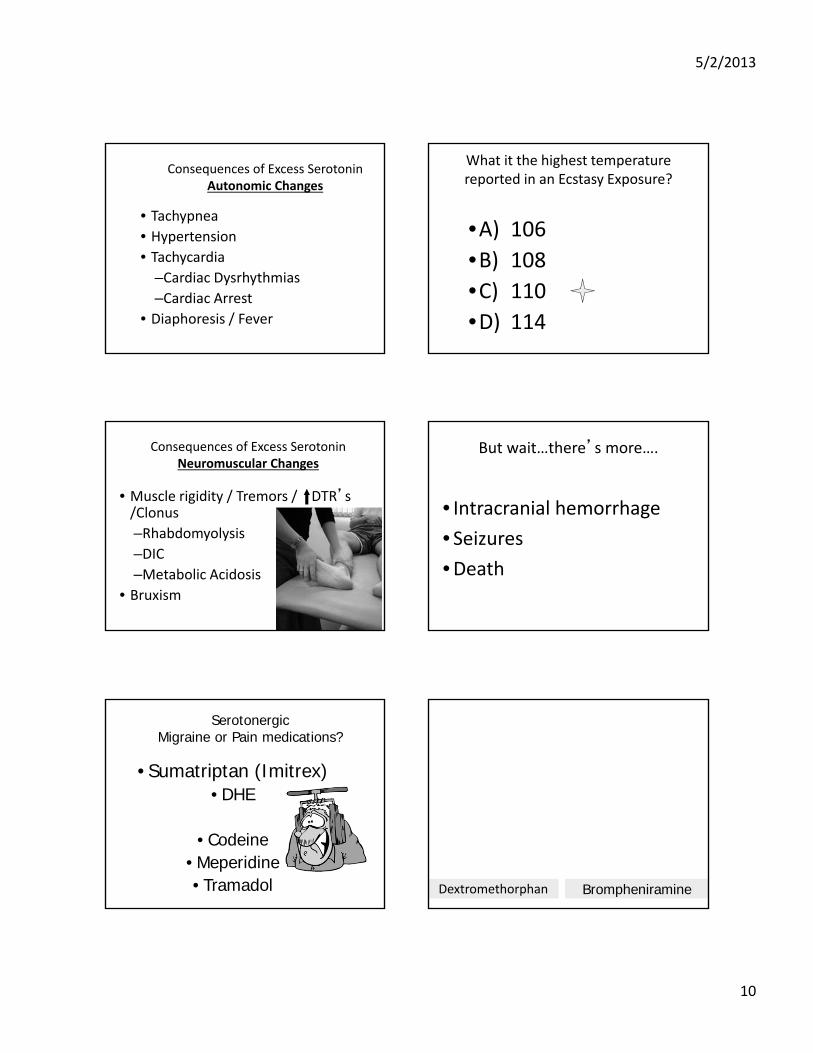
Consequences of Excess SerotoninAutonomic Changes
• Tachypnea• Hypertension• Tachycardia
–Cardiac Dysrhythmias
–Cardiac Arrest • Diaphoresis / Fever
What it the highest temperature reported in an Ecstasy Exposure?
•A) 106
•B) 108
•C) 110
•D) 114
Consequences of Excess SerotoninNeuromuscular Changes
• Muscle rigidity / Tremors / DTR’s /Clonus
–Rhabdomyolysis
–DIC–Metabolic Acidosis
• Bruxism
But wait…there’s more….
• Intracranial hemorrhage
• Seizures
•Death
SerotonergicMigraine or Pain medications?
• Sumatriptan (Imitrex) • DHE
• Codeine• Meperidine• Tramadol Dextromethorphan Brompheniramine
5/2/2013
11
Herbal Remedies
• St. John’s Wart and Ginseng–Inhibits serotonin re-uptake
• L-tryptophan (“smart drink”)–Serotonin precursor
Illicit Drugs (Serotonergic)
• Cocaine• Amphetamines
• LSD • Ecstasy
How much is too much??
• Toxicity may be idiosyncratic !• Asymptomatic survival following 40 tablets
• Death reported from 2 tablets
Some Die,… Some Don’t
• Historians unpredictable
• Composition unpredictable
• ? Ability to metabolize MDMA?
?
Serotonin Syndrome Treatment
• Discontinue the offending drug
• Supportive
• Benzo’s
• ? Cyproheptadine
Case 3
• A 6 yr old presents with vomiting and diarrhea
5/2/2013
12
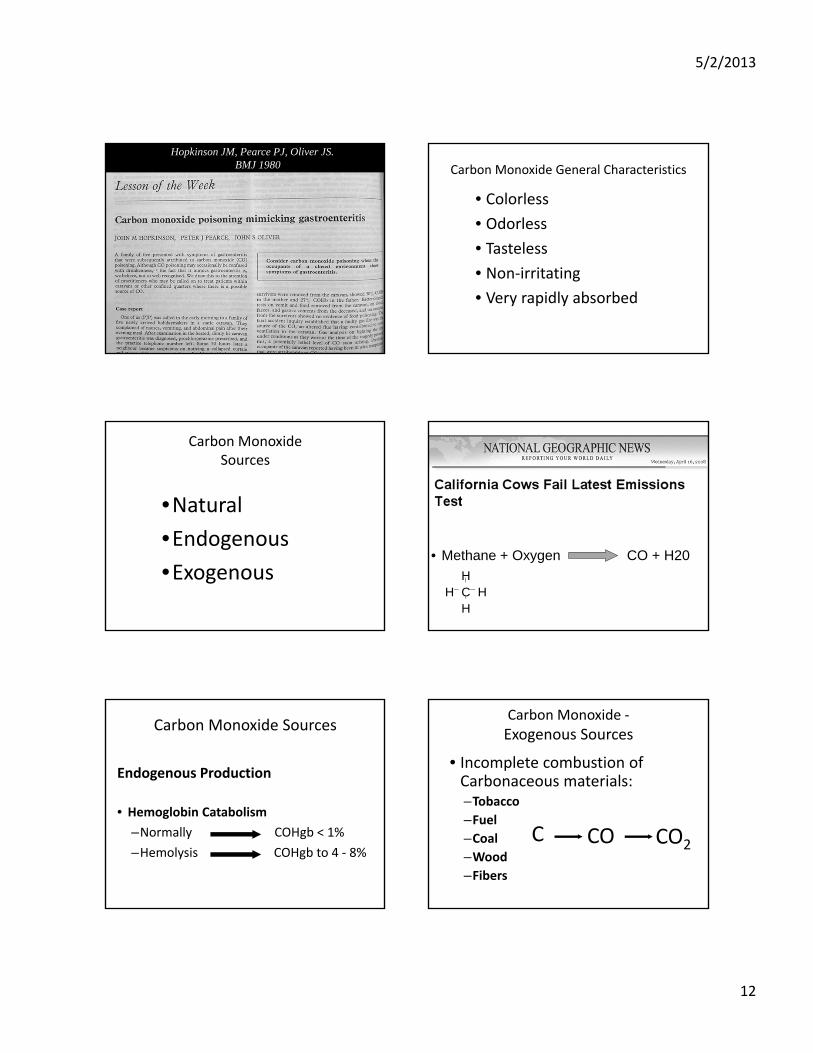
Hopkinson JM, Pearce PJ, Oliver JS. BMJ 1980 Carbon Monoxide General Characteristics
• Colorless
• Odorless
• Tasteless
• Non‐irritating
• Very rapidly absorbed
Carbon MonoxideSources
•Natural
•Endogenous
•Exogenous• Methane + Oxygen CO + H20
C HH
HH
Carbon Monoxide Sources
Endogenous Production
• Hemoglobin Catabolism
–Normally COHgb < 1%
–Hemolysis COHgb to 4 ‐ 8%
Carbon Monoxide ‐
Exogenous Sources
• Incomplete combustion of Carbonaceous materials:–Tobacco–Fuel–Coal–Wood
–Fibers
C CO CO2

5/2/2013
13
Carbon Monoxide Sources
• Tobacco Smoke
–1 pack/day COHgb = 5‐6%
–Passive inhalation
2.5 Xx
Fires
• CO levels may reach 10%
• COHgb levels to 75% in 1 min. –w/out respiratory
protection
Automobile Exhaust
• Increased cardiovascular deaths
Catalytic converter9% CO 1% CO
•Lethal CO levels in a closed garage in 10 min.
Automobile Exhaust
Carbon Monoxide Sources
• Zamboni
Absorption of Carbon Monoxide
Rate determined by:
–1) Minute ventilation &
– 2) Cardiac output
5/2/2013
14
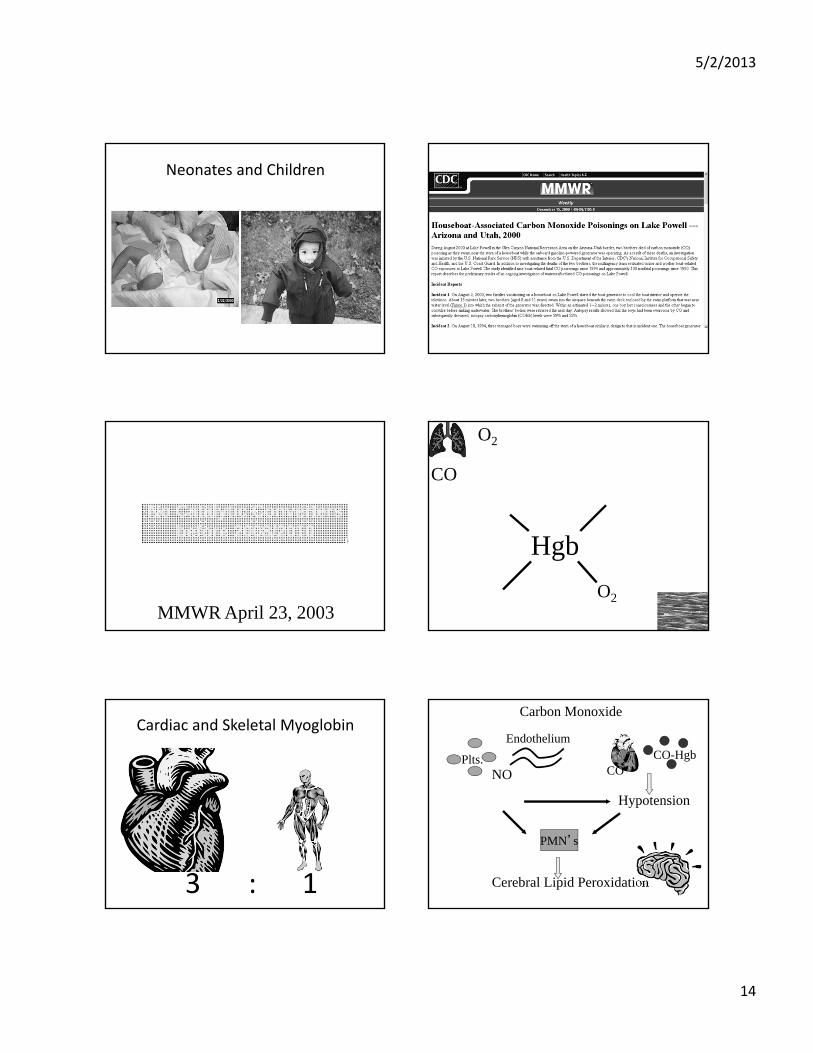
Neonates and Children
MMWR April 23, 2003
No Catalytic Convertersbefore 2008/2010
Hgb
CO
O2
O2
Cardiac and Skeletal Myoglobin
3 : 1
Carbon Monoxide
NO
PMN’s
Hypotension
Plts.
Endothelium
Cerebral Lipid Peroxidation
CO-HgbCO
5/2/2013
15
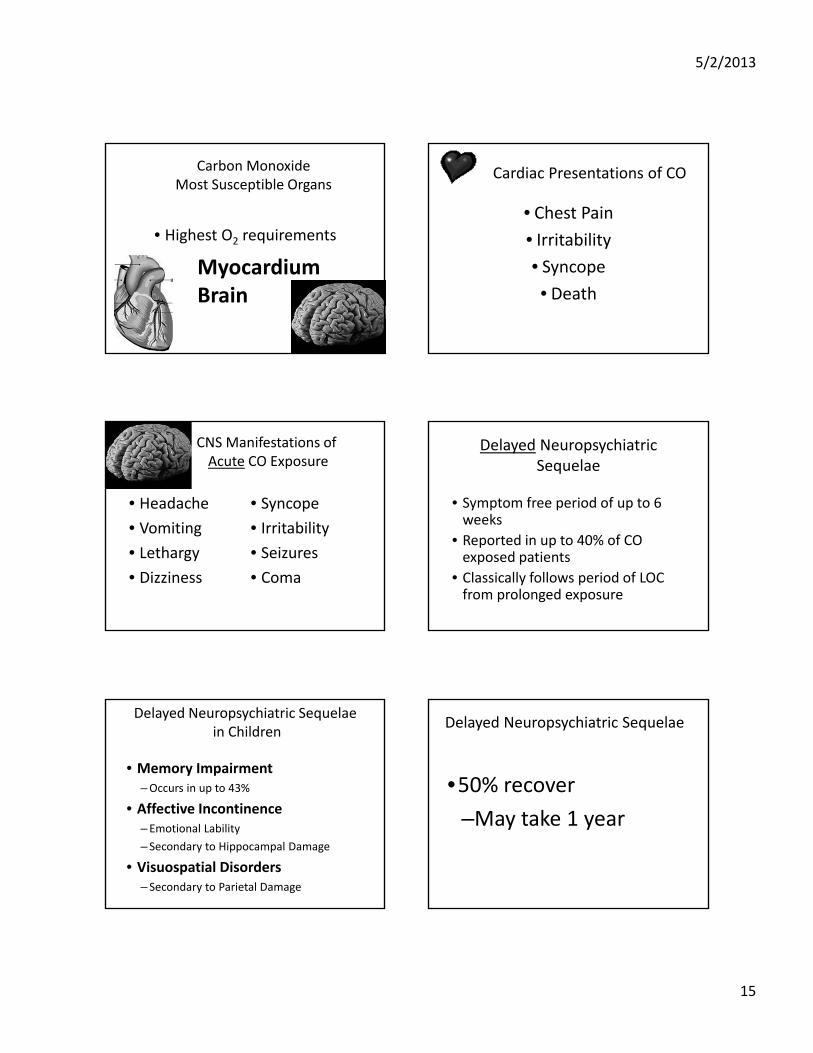
Carbon MonoxideMost Susceptible Organs
• Highest O2 requirements
MyocardiumBrain
Cardiac Presentations of CO
• Chest Pain
• Irritability
• Syncope
• Death
CNS Manifestations of Acute CO Exposure
• Headache
• Vomiting
• Lethargy
• Dizziness
• Syncope
• Irritability
• Seizures
• Coma
Delayed Neuropsychiatric Sequelae
• Symptom free period of up to 6 weeks
• Reported in up to 40% of CO exposed patients
• Classically follows period of LOC from prolonged exposure
Delayed Neuropsychiatric Sequelaein Children
• Memory Impairment–Occurs in up to 43%
• Affective Incontinence– Emotional Lability
– Secondary to Hippocampal Damage
• Visuospatial Disorders– Secondary to Parietal Damage
Delayed Neuropsychiatric Sequelae
•50% recover
–May take 1 year
5/2/2013
16
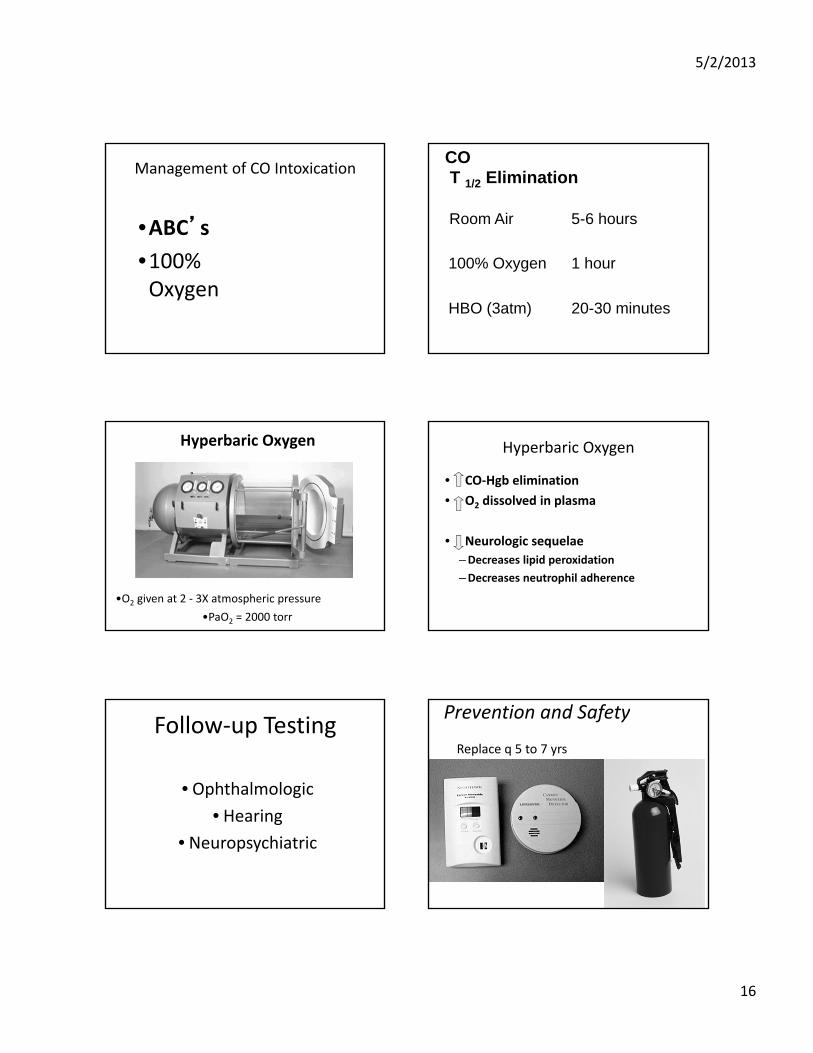
Management of CO Intoxication
•ABC’s
•100% Oxygen
COT 1/2 Elimination
Room Air 5-6 hours
100% Oxygen 1 hour
HBO (3atm) 20-30 minutes
Hyperbaric Oxygen
•O2 given at 2 ‐ 3X atmospheric pressure
•PaO2 = 2000 torr
Hyperbaric Oxygen
• CO‐Hgb elimination
• O2 dissolved in plasma
• Neurologic sequelae
–Decreases lipid peroxidation
–Decreases neutrophil adherence
Follow‐up Testing
• Ophthalmologic
• Hearing
• Neuropsychiatric
Prevention and Safety
Replace q 5 to 7 yrs
5/2/2013
17
Take Home Points
• No Domino effect– Everyone got sick at the same time
• Improvement with change of environment
• History of Car or Boat travel
• Sports
THURSDAY, MAY 16, 2013
11:10
Topical Toxicity in Tots
Dr. Renee Howard
4/18/2013
1
Topical Toxicity in Tots
Renee Howard MDAssociate Professor of DermatologyUniversity of California, San Francisco
Disclosures
Topical Toxicity in TotsEndocrine Disrupting Chemicals (EDC’s)
• Who is worried and why?
– Sources of societal concern
– Endocrine disruption & low level exposures
• Should we worry?
1. Oxybenzone
2. Phthalates
3. Parabens
4. Triclosan
• Should our patients/parents worry?
San Francisco Bay Area, California
local organic sustainable green artisanal humane free-range grass-fed safe natural healthy
Activist Network
• Breast Cancer Activists– Zero Breast Cancer
• Advocates collaborating with Breast Cancer and the Environment Research Program (BCERP)
– Breast Cancer Fund
• Environmental Groups– Environmental Working Group (EWG)
• Campaign for Safe Cosmetics/Skin deep
– Teens Turning Green
Endocrine Disrupting Chemicals (EDC’s) in Skin Care Products
• Ubiquitous
• Can potentiate or inhibit hormone effect or both
– Nonlinear dose response curve so low doses relevant
– “The dose makes the poison”?
Fagin 2012, Guillette 2012, Myers 2009, Vandenberg 2012

4/18/2013
2
Toxicologists vs. Endocrinologists (linear vs. non‐monotonic)
Fagin D, The Learning Curve. Nature 2012;290:462-465.
Endocrine Disrupting Chemicals
• Animal, cell culture studies
• Human studies difficult
– National Health and Nutrition Education Study (NHANES)
• Long lag time to see effects
• Critical periods of exposure?
www.cdc.gov/nchs/nhanes.htmFagin 2012, Guillette 2012, Myers 2009, Vandenberg 2012, Wang 2011
1954 Age 2
1963 Age 10
1993 Age 39 2007 Age 53
Teresa Howard Wootton 1954-2007
Breast Cancer Fund “State of the Evidence 2010”
SunscreenL(OMC), octyl‐dimethyl‐PABA(OD‐PABA), bexophenome‐3(Bp‐3) and homosalate (HMS)(Schlumpf, 2001). The results for4‐MBC have been replicated inanother laboratory (Klann, 2005).A recent laboratory rat study hasdemonstrated that application ofOMC to the skin of the animalsenhances the penetration of theendocrine‐disrupting herbicide2,4‐D (Brand, 2007).M. Tobacco smoke: Active andpassive exposures [I‐K, N‐K; EDC]Tobacco smoke contains PAHs,which may explain a potential linkbetween increased breast cancerrisk and both active and passivesmoking.
www.breastcancerfund.org/about/victories/#178103400
==?
EDC Health Concerns
• Breast & other cancer
• Early puberty
• Obesity
• Infertility
• Immune dysfunction
– Savage 2012
• Developmental Problems
– Meeker 2012
“Poisoned by everyday life. Gender bending chemicals…found in every home may cause breast cancer, asthma, infertility, and birth defects…”
Zerobreastcancer.org
Guilette TJ, Iguchi T. Life in a contaminated world. Science 2012;337:1614.
4/18/2013
3
PARANOIAGENS EDC Health Concerns
• Breast & other cancer
• Early puberty
• Obesity
• Infertility
• Immune dysfunction
– Savage 2012
• Developmental Problems
– Meeker 2012
“Poisoned by everyday life. Gender bending chemicals…found in every home may cause breast cancer, asthma, infertility, and birth defects…”
Zerobreastcancer.org
Guilette TJ, Iguchi T. Life in a contaminated world. Science 2012;337:1614.
Early Puberty
• Increasing numbers of young acne patients
• Hysteria around early puberty studies 1997, 2010
Goldberg 2011, Herman‐Giddens 1997, Biro 2010
1970
Average age of menarche today only slightly younger (12.5 vs. 12.8) but puberty takes longer—secondary sexual characteristics showing up earlier
1963
“Typical acne patient”
13 year old boy 15 year old girl
Initiation vs. Completion of Puberty
Age eightt
• Early onset acne
Menarche age 13
Age 8
Age 3.5
4/18/2013
4
Why is Puberty Taking Longer?
• Worry about peripheral, exogenous triggers of development ‐‐ environmental toxins (EDC’s)– “I think we need to think about the stuff we’re exposing our bodies to and the bodies of our kids…This is a wake‐up call, and I think we need to pay attention to it.”
‐ Frank Biro*
Biro 2003, Biro 2010, Herman‐Giddens 1997, Weil 2012 *Grady New York Times 2010
BCERP.org: Early Puberty
• “environmental exposures, including chemicals in personal and household products that may be hormonally active; lifestyle factors, such as food intake and physical activity; body size and development; and psychosocial factors”
Topical Toxicity in TotsEndocrine Disrupting Chemicals
• Who is worried and why?
– Sources of societal concern
– Endocrine disruption: low level exposure
• Should we worry?
1. Oxybenzone
2. Phthalates
3. Parabens
4. Triclosan
• Should our patients/parents worry?
EDC’s in Skin Care Products
• Oxybenzone
• Parabens
• Phthalate esters
• Triclosan
Diamante‐Kandradarakis 2009, Vandenberg 2012
4/18/2013
5
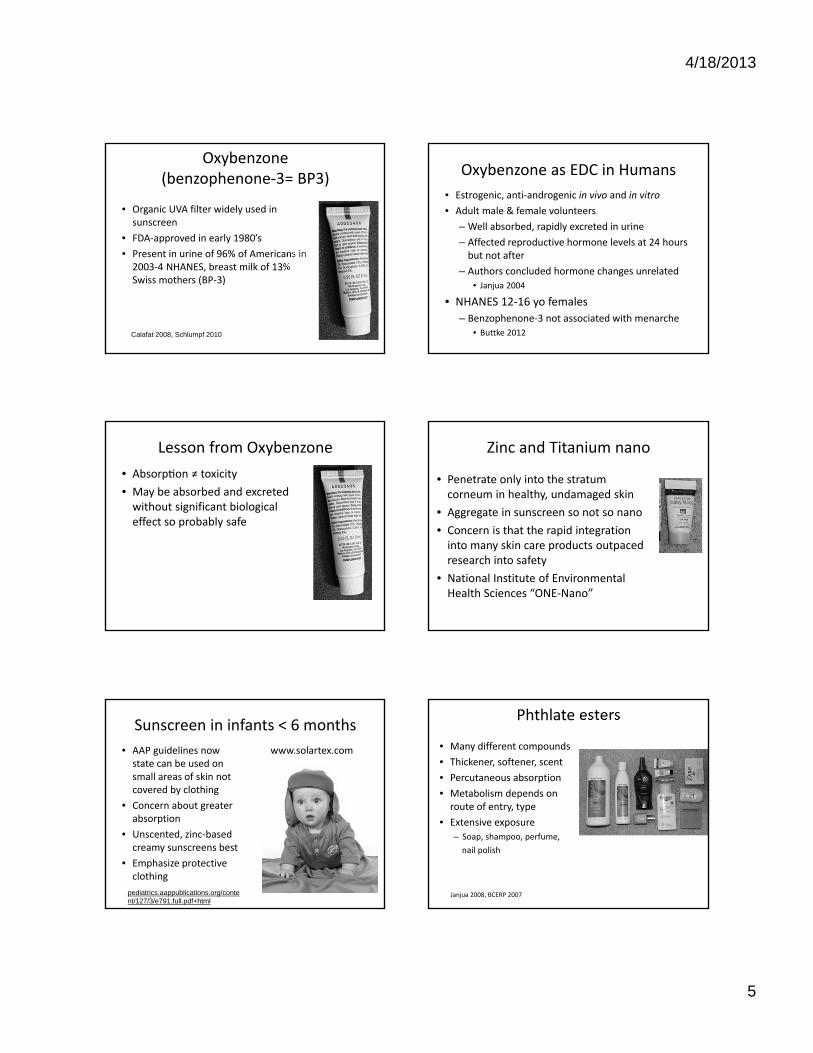
Oxybenzone(benzophenone‐3= BP3)
• Organic UVA filter widely used in sunscreen
• FDA‐approved in early 1980’s
• Present in urine of 96% of Americans in 2003‐4 NHANES, breast milk of 13% Swiss mothers (BP‐3)
Calafat 2008, Schlumpf 2010
Oxybenzone as EDC in Humans
• Estrogenic, anti‐androgenic in vivo and in vitro
• Adult male & female volunteers
– Well absorbed, rapidly excreted in urine
– Affected reproductive hormone levels at 24 hours but not after
– Authors concluded hormone changes unrelated
• Janjua 2004
• NHANES 12‐16 yo females
– Benzophenone‐3 not associated with menarche
• Buttke 2012
Lesson from Oxybenzone
• Absorp on ≠ toxicity
• May be absorbed and excreted without significant biological effect so probably safe
Zinc and Titanium nano
• Penetrate only into the stratum corneum in healthy, undamaged skin
• Aggregate in sunscreen so not so nano
• Concern is that the rapid integration into many skin care products outpaced research into safety
• National Institute of Environmental Health Sciences “ONE‐Nano”
Sunscreen in infants < 6 months
• AAP guidelines now state can be used on small areas of skin not covered by clothing
• Concern about greater absorption
• Unscented, zinc‐based creamy sunscreens best
• Emphasize protective clothing
www.solartex.com
pediatrics.aappublications.org/content/127/3/e791.full.pdf+html
Phthlate esters
• Many different compounds
• Thickener, softener, scent
• Percutaneous absorption
• Metabolism depends on route of entry, type
• Extensive exposure
– Soap, shampoo, perfume,
nail polish
Janjua 2008, BCERP 2007
4/18/2013
6
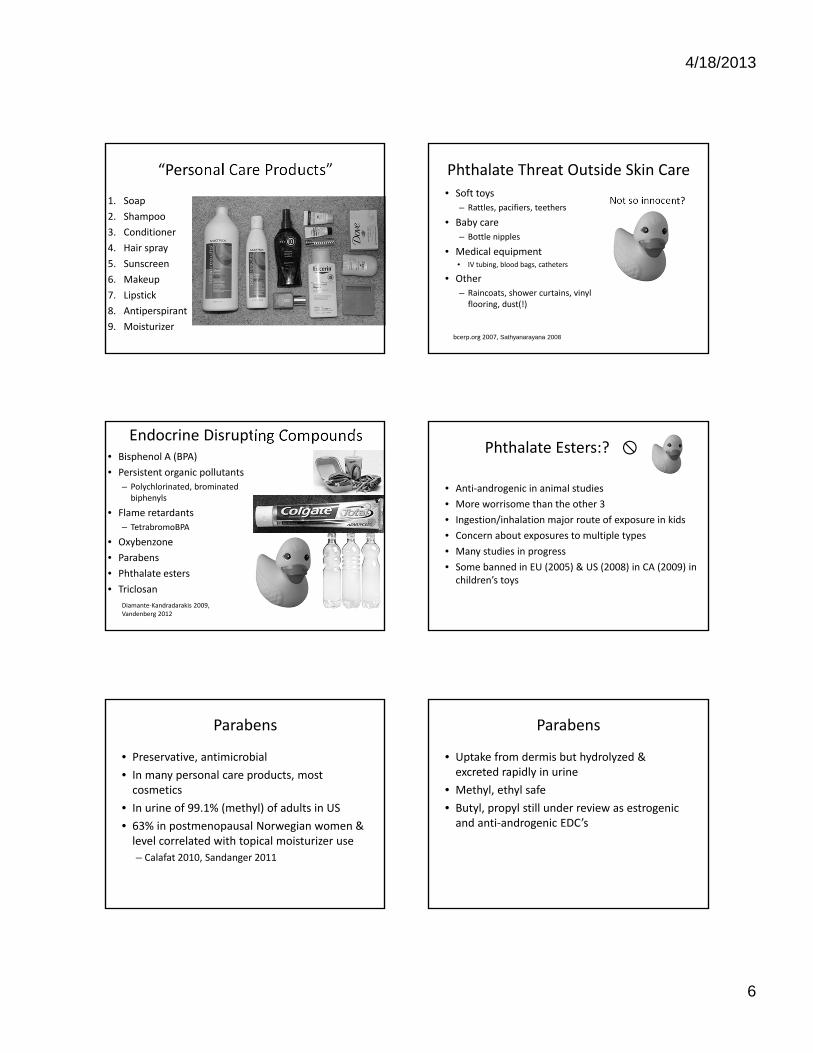
“Personal Care Products”
1. Soap
2. Shampoo
3. Conditioner
4. Hair spray
5. Sunscreen
6. Makeup
7. Lipstick
8. Antiperspirant
9. Moisturizer
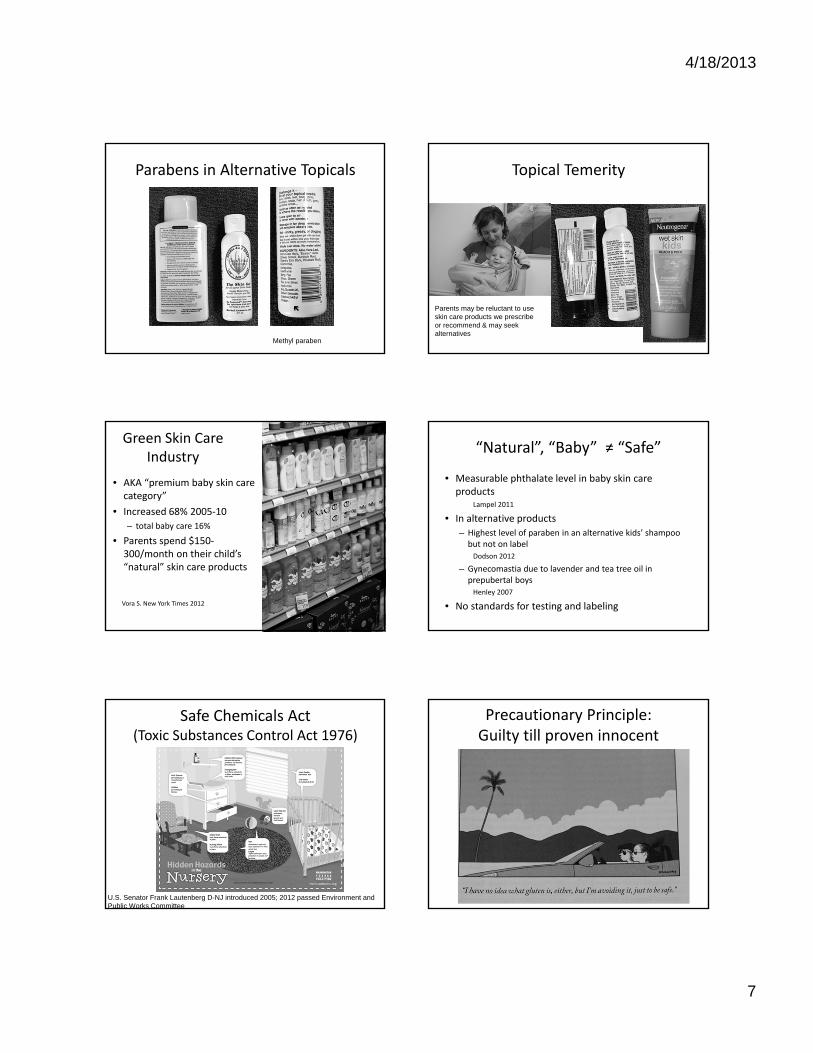
Phthalate Threat Outside Skin Care
• Soft toys
– Rattles, pacifiers, teethers
• Baby care
– Bottle nipples
• Medical equipment• IV tubing, blood bags, catheters
• Other
– Raincoats, shower curtains, vinyl flooring, dust(!)
Not so innocent?
bcerp.org 2007, Sathyanarayana 2008
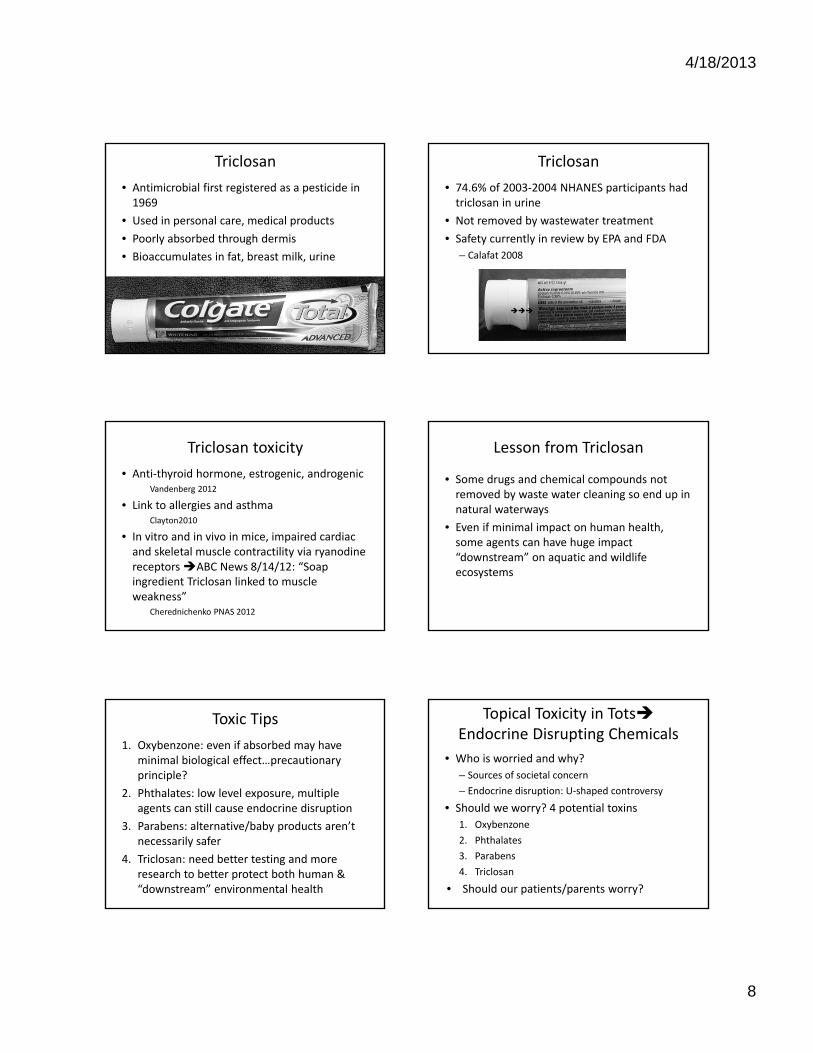
Endocrine Disrupting Compounds• Bisphenol A (BPA)
• Persistent organic pollutants
– Polychlorinated, brominated biphenyls
• Flame retardants
– TetrabromoBPA
• Oxybenzone
• Parabens
• Phthalate esters
• Triclosan
Diamante‐Kandradarakis 2009, Vandenberg 2012
Phthalate Esters:?
• Anti‐androgenic in animal studies
• More worrisome than the other 3
• Ingestion/inhalation major route of exposure in kids
• Concern about exposures to multiple types
• Many studies in progress
• Some banned in EU (2005) & US (2008) in CA (2009) in children’s toys
Parabens
• Preservative, antimicrobial
• In many personal care products, most cosmetics
• In urine of 99.1% (methyl) of adults in US
• 63% in postmenopausal Norwegian women & level correlated with topical moisturizer use
– Calafat 2010, Sandanger 2011
Parabens
• Uptake from dermis but hydrolyzed & excreted rapidly in urine
• Methyl, ethyl safe
• Butyl, propyl still under review as estrogenic and anti‐androgenic EDC’s
4/18/2013
7
Parabens in Alternative Topicals
Methyl paraben
Topical Temerity
Parents may be reluctant to use skin care products we prescribe or recommend & may seek alternatives
Green Skin Care Industry
• AKA “premium baby skin care category”
• Increased 68% 2005‐10
– total baby care 16%
• Parents spend $150‐300/month on their child’s “natural” skin care products
• insert photo of shelf of these at local Good Earth
Vora S. New York Times 2012
“Natural”, “Baby” ≠ “Safe”
• Measurable phthalate level in baby skin care products
Lampel 2011
• In alternative products
– Highest level of paraben in an alternative kids’ shampoo but not on labelDodson 2012
– Gynecomastia due to lavender and tea tree oil in prepubertal boysHenley 2007
• No standards for testing and labeling
Safe Chemicals Act(Toxic Substances Control Act 1976)
U.S. Senator Frank Lautenberg D-NJ introduced 2005; 2012 passed Environment and Public Works Committee
Precautionary Principle: Guilty till proven innocent
4/18/2013
8
Triclosan
• Antimicrobial first registered as a pesticide in 1969
• Used in personal care, medical products
• Poorly absorbed through dermis
• Bioaccumulates in fat, breast milk, urine
Triclosan
• 74.6% of 2003‐2004 NHANES participants had triclosan in urine
• Not removed by wastewater treatment
• Safety currently in review by EPA and FDA
– Calafat 2008
Triclosan toxicity
• Anti‐thyroid hormone, estrogenic, androgenicVandenberg 2012
• Link to allergies and asthma Clayton2010
• In vitro and in vivo in mice, impaired cardiac and skeletal muscle contractility via ryanodine receptors ABC News 8/14/12: “Soap ingredient Triclosan linked to muscle weakness”
Cherednichenko PNAS 2012
Lesson from Triclosan
• Some drugs and chemical compounds not removed by waste water cleaning so end up in natural waterways
• Even if minimal impact on human health, some agents can have huge impact “downstream” on aquatic and wildlife ecosystems
Toxic Tips
1. Oxybenzone: even if absorbed may have minimal biological effect…precautionary principle?
2. Phthalates: low level exposure, multiple agents can still cause endocrine disruption
3. Parabens: alternative/baby products aren’t necessarily safer
4. Triclosan: need better testing and more research to better protect both human & “downstream” environmental health
Topical Toxicity in TotsEndocrine Disrupting Chemicals
• Who is worried and why?
– Sources of societal concern
– Endocrine disruption: U‐shaped controversy
• Should we worry? 4 potential toxins
1. Oxybenzone
2. Phthalates
3. Parabens
4. Triclosan
• Should our patients/parents worry?
4/18/2013
9
How can we reassure patients?
• Convey perspective
– Acknowledge uncertainty
– Inconclusiveness of studies
– Risk/benefit
• Research your local retail outlets, internet
– Pricing, safety
• Don’t fight the fanatic
• Listen to activist groups
What advice should we give?
• Be a minimalist: eliminate unnecessary products
• Don’t be fooled by marketing
• Avoid scented & antimicrobial agents
• Rely on covering up for sun protection, zinc?
• Eat organic if possible
“Johnson & Johnson to remove formaldehyde from products”
“Even though as a scientist I will sit here and tell you these things are perfectly safe,” consumers are worried about reports that call her conclusions into question, Ms. Nettesheimsaid. “I understand that and we can’t ignore that.”Vice President of Product Stewardship inNew York Times 8/15/2012
The End
Selected References
• Diamanti‐Dandarakis E, Bourguignon JP, Giudice LC, Hauser R, Prins GS, Soto AM, Zoeller RT, Gore AC. Endocrine‐disrupting chemicals: an Endocrine Society scientific statement. Endocr Rev 2009;30:293‐342.
• Fagin D. The Learning Curve. Nature 2012;290:462‐465.
• Guillette LJ, Iguchi T. Life in a contaminated world. Science 2012;337:1614‐1616.
• Vandenberg LN, Colborn T, Hayes TB, Heindel JJ, Jacobs DR Jr, Lee DH, Shioda T, Soto AM, vom Saal FS, Welshons WV, Zoeller RT, Myers JP. Hormones and endocrine‐disrupting chemicals: low‐dose effects and nonmonotonic dose responses. Endocr Rev 2012 Jun;33(3):378‐455.
• For complete list of references: [email protected]
TopicalToxicityinTots ReneeHowardMDUCSFPediatricAdvances 5/16/13Learningobjectives:1)Outlinetheconcernsofenvironmentalandcanceractivistsaswellasparentsregardingchildren’slowlevelexposurestotoxiccompoundsinprescriptionandoverthecountertopicalagents.2)Reviewsafetyissuesaroundspecificagentssuchasparabens,phthalates,oxybenzone,andtriclosan.3)Discusshowclinicianscanreasonablyapproachthisproblemwithparentsandpatients.References:EndocrineDisruptorsDiamanti‐KandarakisE,BourguignonJP,GiudiceLC,HauserR,PrinsGS,SotoAM,ZoellerRT,GoreAC.Endocrine‐disruptingchemicals:anEndocrineSocietyscientificstatement.EndocrRev.2009;30:293‐342.
FaginD.TheLearningCurve.Nature2012;290:462‐465.
GuilletteLJ,IguchiT.Lifeinacontaminatedworld.Science2012;337:1614‐1616.
MeekerJD.Exposuretoenvironmentalendocrinedisruptorsandchilddevelopment.ArchPediatrAdolescMed.2012Oct;166(10):952‐8.
MyersJP,ZoellerRT,vomSaalFS.Aclashofoldandnewscientificconceptsintoxicity,withimportantimplicationsforpublichealth.EnvironHealthPerspect.2009Nov;117(11):1652‐5.Epub2009Jul30.PubMedPMID:20049113;PubMedCentralPMCID:PMC2801170.
VandenbergLN,ColbornT,HayesTB,HeindelJJ,JacobsDRJr,LeeDH,ShiodaT,SotoAM,vomSaalFS,WelshonsWV,ZoellerRT,MyersJP.Hormonesandendocrine‐disruptingchemicals:low‐doseeffectsandnonmonotonicdoseresponses.EndocrRev.2012Jun;33(3):378‐455.doi:10.1210/er.2011‐1050.Epub2012Mar14.Review.PMID:22419778[PubMed‐indexedforMEDLINE]PubertyBiroFM,LuckyAW,SimbartiLA,BartonBA,DanielsSR,Striegel‐MooreR,KronsbergSS,MorrisonJA.Pubertalmaturationingirlsandtherelationshiptoanthropometricchanges:pathwaysthroughpuberty.JPediatr.2003Jun;142(6):643‐6.
BiroFM,GalvezMP,GreenspanLC,etal.Pubertalassessmentmethodandbaselinecharacteristicsinamixedlongitudinalstudyofgirls.Pediatrics2010;126e583‐e590.Grady,Denise.Girlsshowingsignsofpubertyearlier,studysays.NewYorkTimesAugust9,2010.Herman‐Giddens,ME,SloraEJ,WassermanRC,etal.Secondarysexualcharacteristicsandmensesinyounggirlsseeninofficepractice:astudyfromthePediatricResearchinOfficeSettingsNetwork.Pediatrics1997;99:505‐512.Klass,Perryhttp://well.blogs.nytimes.com/2013/01/07/needed‐more‐attention‐to‐boys‐development/Weil,Elizabeth.Theincredibleshrinkingchildhood.NewYorkTimesSundayMagazinepp30‐35April1,2012
“Natural”and“Baby”SkinCareProductsDodsonRE,NishiokaM,StandleyLJ,PerovichLJ,BrodyJG,RudelRA.Endocrinedisruptorsandasthma‐associatedchemicalsinconsumerproducts.EnvironHealthPerspect.2012Jul;120(7):935‐43.doi:10.1289/ehp.1104052.Epub2012Feb21.PMID:22398195[PubMed‐indexedforMEDLINE]FreePMCArticle
HenleyDV,LipsonN,KorachKS,BlochCA.Prepubertalgynecomastialinkedtolavenderandteatreeoils.NEnglJMed.2007Feb1;356(5):479‐85.PMID:17267908[PubMed‐indexedforMEDLINE]Vora,ShivaniStartingearly,startingyoung.NewYorkTImes3/29/12p.E3.
Oxybenzone
ButtkeDE,SircarK,MartinC.Exposurestoendocrine‐disruptingchemicalsandageofmenarcheinadolescentgirlsinNHANES(2003‐2008).EnvironHealthPerspect.2012Nov;120(11):1613‐8.doi:10.1289/ehp.1104748.Epub2012Aug13.CalafatAM,WongLY,YeX,ReidyJA,NeedhamLL.Concentrationsofthesunscreenagentbenzophenone‐3inresidentsoftheUnitedStates:NationalHealthandNutritionExaminationSurvey2003‐‐2004.EnvironHealthPerspect.2008;116(7):893‐7.doi:10.1289/ehp.11269.PMID:18629311[PubMed‐indexedforMEDLINE]SchlumpfMetal.ExposurepatternsofUVfilters,fragrances,parabens,phthalates,organochlorpesticides,PBDEs,andPCBsinhumanmilk:CorrelationofUVfilterswithuseofcosmetics.Chemosphere2010;81:1171–1183WangSQ,BurnettME,LimHW.Safetyofoxybenzone:puttingnumbersintoperspective.ArchDermatol.2011Jul;147(7):865‐6.doi:10.1001/archdermatol.2011.173.Noabstractavailable.PMID:21768493[PubMed‐indexedforMEDLINE]KrauseM,KlitA,BlombergJensenM,SøeborgT,FrederiksenH,SchlumpfM,LichtensteigerW,SkakkebaekNE,DrzewieckiKT.Sunscreens:aretheybeneficialforhealth?AnoverviewofendocrinedisruptingpropertiesofUV‐filters.IntJAndrol.201235(3):424‐36.doi:10.1111/j.1365‐2605.2012.01280.x.
PhthalatesandParabens
BobergJ,TaxvigC,ChristiansenS,HassU.Possibleendocrinedisruptingeffectsofparabensandtheirmetabolites.ReprodToxicol.2010Sep;30(2):301‐12.doi:10.1016/j.reprotox.2010.03.011.Epub2010Apr8.CalafatAM,YeX,WongLY,BishopAM,NeedhamLL.UrinaryconcentrationsoffourparabensintheU.S.population:NHANES2005‐2006.EnvironHealthPerspect.2010May;118(5):679‐85.doi:10.1289/ehp.0901560.Epub2010Jan4.CastelainF,CastelainM.Parabens:arealhazardorascarestory?EurJDermatol.2012Nov‐Dec;22(6):723‐7.doi:10.1684/ejd.2012.1835.
SandangerTM,HuberS,MoeMK,BraathenT,LeknesH,LundE.Plasmaconcentrationsofparabensinpostmenopausalwomenandself‐reporteduseofpersonalcareproducts:theNOWACpostgenomestudy.JExpoSciEnvironEpidemiol.2011Nov‐Dec;21(6):595‐600.doi:10.1038/jes.2011.22.Epub2011May25.PhthalatesLampelHP,JacobSE.Phthalatesinbabyskincareproducts.Dermatitis.2011Sep‐Oct;22(5):272‐6.doi:10.2310/6620.2011.11065.PMID:22652904[PubMed‐indexedforMEDLINE]SathyanarayanaS,KarrCJ,LozanoP,BrownE,CalafatAM,LiuF,SwanSH.Babycareproducts:possiblesourcesofinfantphthalateexposure.Pediatrics.2008Feb;121(2):e260‐8.doi:10.1542/peds.2006‐3766.SilvaMJ,BarrDB,ReidyJA,etal.UrinarylevelsofsevenphthalatemetabolitesintheU.S.populationfromtheNationalHealthandNutritionExaminationSurvey(NHANES)1999‐2000.EnvironHealthPerspect2004;112:331‐8,doi:10.1289/ehp.6723.
CettaF,LambertGH,RosSP.Newbornchemicalexposurefromover‐the‐counterskincareproducts.ClinPediatr(Phila).1991May;30(5):286‐9.
TriclosanCalafatAM,YeX,WongLY,ReidyJA,NeedhamLL.UrinaryconcentrationsoftriclosanintheU.S.population:2003‐2004.EnvironHealthPerspect.2008Mar;116(3):303‐7.doi:10.1289/ehp.10768.PMID:18335095[PubMed‐indexedforMEDLINE]CherednichenkoG,ZhangR,BannisterRA,TimofeyevV,LiN,FritschEB,FengW,BarrientosGC,SchebbNH,HammockBD,BeamKG,ChiamvimonvatN,PessahIN.Triclosanimpairsexcitation‐contractioncouplingandCa2+dynamicsinstriatedmuscle.ProcNatlAcadSciUSA.2012Aug28;109(35):14158‐63.doi:10.1073/pnas.1211314109.Epub2012Aug13.Erratumin:ProcNatlAcadSciUSA.2012Oct2;109(40):16393.ClaytonEM,ToddM,DowdJB,AielloAE.TheimpactofbisphenolAandtriclosanonimmuneparametersintheU.S.population,NHANES2003‐2006.EnvironHealthPerspect.2011Mar;119(3):390‐6.doi:10.1289/ehp.1002883.Epub2010Nov9.PMID:21062687[PubMed‐indexedforMEDLINE]Marin,A.Popularantibacterialchemicalraisessafetyissues.NewYorkTimes8/20/11PageB1.JessicaH.Savage,MD,MHS,aElizabethC.Matsui,MD,MHS,bRobertA.Wood,MD,bandCorinneA.Keet,MD,MSbUrinarylevelsoftriclosanandparabensareassociatedwithaeroallergenandfoodsensitization.JAllergyClinImmunol2012;130:453‐60.

Books
FullBodyBurden.GrowingupintheshadowofRockyFlats.ByKristenIversen2012RandomHouseInc.,NewYork
Plastic:AToxicLoveStorybySusanFreinkel2011HoughtonMifflenHarcourtBoston,NewYork
MediaReferencesOpEdonObesogens:http://www.nytimes.com/2013/01/20/opinion/sunday/kristof‐warnings‐from‐a‐flabby‐mouse.html?_r=0Storyonpremiumbabyskincare:http://www.nytimes.com/2012/03/29/fashion/beauty‐products‐for‐babies.htmlwww.cdc.gov/nchs/nhanes.htmOnBPA:InfeastofdataonBPAplastic,nofinalanswer.ByDeniseGradyNewYorkTimesSept.7,2010.RadiodiscussionswithBCERCresearchersfrom2010www.kqed.org/a/forum/R201008120900InterviewwithBCERCresearcherswww.npr.org/blogs/health/2010www.npr.org/.../puberty‐comes‐earlier‐for‐today‐s‐girls‐BPAEnvironmental&BreastCanceradvocatewebsitesEnvironmentalWorkingGroupEWG.orgTeensTurningGreenwww.teensturninggreen.orgSkinDeepcosmeticsafetydatabase:www.cosmeticsdatabase.comJohnson&JohnsonSafetyWebsitehttp://www.safetyandcarecommitment.comBreastCancerFundwww.breastcancerfund.orgStateoftheEvidence2010Sixthedition2010,byJanetGray,Ph.D.Withanall‐newadvocacysection,FromSciencetoAction,byJanetNudelmanM.A.,ConnieEngel,Ph.D.ZeroBreastCancerwww.zerobreastcancer.org
THURSDAY, MAY 16, 2013
11:40
Trying to Prevent Illness in Kids Who Travel… Diagnosing it When They Return
Dr. Jay Tureen
4/18/2013
1
Trying to Prevent Illness in Kids Who Travel…
Diagnosing it when they Return
46th Advances & Controversies
in Clinical Pediatrics
Jay Tureen, M.D.
Disclosure
• I have nothing to disclose
International Travel with Kids
• Health and Travel – general information
• Outbound
• Inbound
Health and Travel
• CDC estimates ~ 1.9 M children travel to developing countries annually
• 22-64% of all travelers self report illness during or after travel
• Car accidents and drowning are most common cause of death in international travelers
• Infection is a rare cause of death, a common cause of morbidity, mostly preventable
• 8% of all travelers require medical care during or after travel (Freedman DO, NEJM, 2006)
Outbound
• Anticipatory guidance
• Immunizations
• Medications
• Other stuff
Anticipatory guidance: Data
• Contact Card with information to have in one place
• Personal ID for minor children (but not visible)
• Notarized letter from other parent if single parent traveling with child internationally
4/18/2013
2
Contact Card
• Travelers should carry a contact card with the addresses and phone numbers of the following:
• Designated person back home contact information
• Health care provider(s) at home
• Place of lodging at the destination
• Medical insurance information, Travel insurance and medical evacuation insurance information
• Area hospitals or clinics, including emergency services
• MDs in other countries: ISTM.org, IAMAT.org
• US embassy or consulate in the destination country or countries
Anticipatory Guidance: Stuff
• Safety considerations – car seats, sunblock
• Medical kits (CDC website)• Water sterilization tabs/ORS powder• Chart for estimating dehydration
Immunizations for Travelers
• General principles
• Required
• Recommended
Immunizations: General
• Make sure current on routine
• Anticipate risk of exposure
• Season, Location and Type of travel
• Traveler specific issues
• PCP can do all (easily) except– YF, JE, rabies
Immunizations: Required
• Yellow Fever– For endemic countries or regions –
Sub-Saharan Africa, Tropical So America –
or if traversing
– Live virus – contraindicated if immune-comp
– For 9 mos or older, contraindicated < 4 mo
• Meningococcal vaccine
- Required for pilgrims to Hajj age 15 or older
Immunizations: Recommended
• Routine immunizations need to be UTD• Hepatitis A (common vaccine preventable)• Meningococcal
– Recommended for Sub Saharan meningitis belt in dry winter months of Nov-June
• Typhoid – Vi polysaccharide, IM, 2y/0; Ty 21a, oral, 6 yr)
• Rabies (risk determined)• Japanese B encephalitis (risk determined)
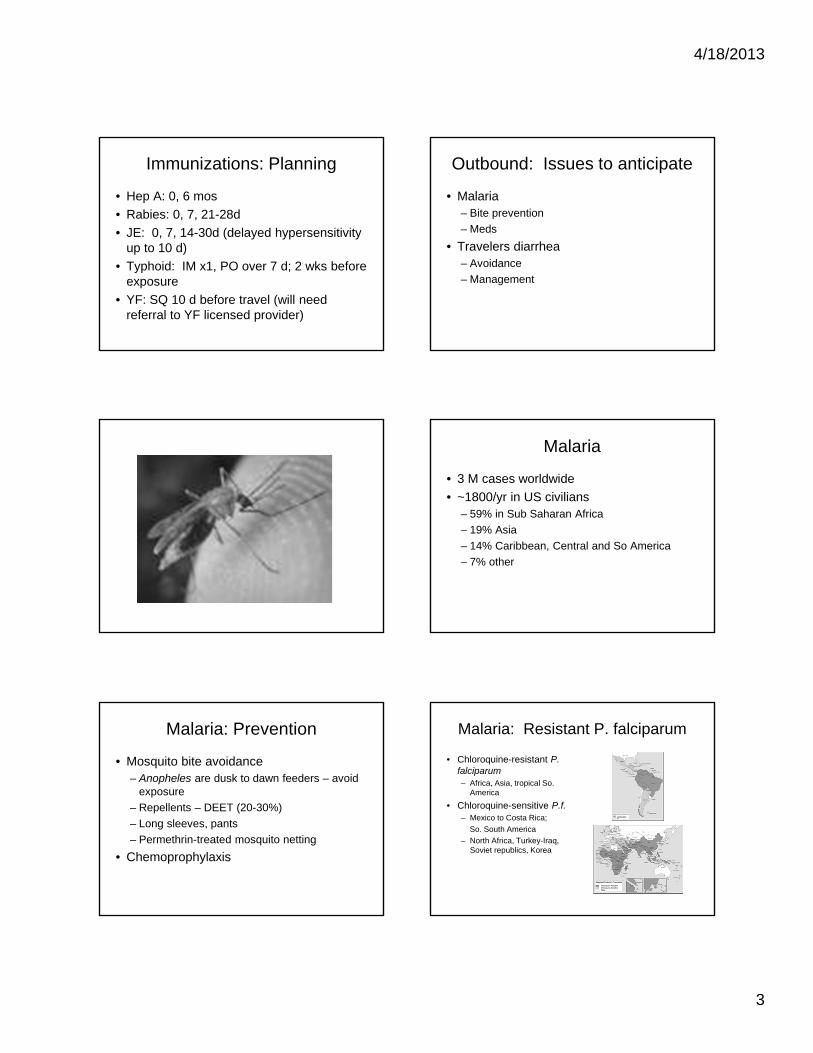
4/18/2013
3
Immunizations: Planning
• Hep A: 0, 6 mos
• Rabies: 0, 7, 21-28d
• JE: 0, 7, 14-30d (delayed hypersensitivity up to 10 d)
• Typhoid: IM x1, PO over 7 d; 2 wks before exposure
• YF: SQ 10 d before travel (will need referral to YF licensed provider)
Outbound: Issues to anticipate
• Malaria– Bite prevention
– Meds
• Travelers diarrhea– Avoidance
– Management
Malaria
• 3 M cases worldwide
• ~1800/yr in US civilians– 59% in Sub Saharan Africa
– 19% Asia
– 14% Caribbean, Central and So America
– 7% other
Malaria: Prevention
• Mosquito bite avoidance– Anopheles are dusk to dawn feeders – avoid
exposure
– Repellents – DEET (20-30%)
– Long sleeves, pants
– Permethrin-treated mosquito netting
• Chemoprophylaxis
Malaria: Resistant P. falciparum
• Chloroquine-resistant P. falciparum– Africa, Asia, tropical So.
America
• Chloroquine-sensitive P.f.– Mexico to Costa Rica;
So. South America
– North Africa, Turkey-Iraq, Soviet republics, Korea
4/18/2013
4
Malaria Chemoprophylaxis
• Mefloquine– infants (5 kg) and children
• Malarone (atovaquone-proquanil)– toddlers (11 kg) and children
• Doxycyline– children >8 yr
• Chloroquine– infants and children
Malaria: terminal prophy
• Primaquine– Used to eliminate hepatic reservoir of P vivax
and P ovale
– Contraindicated in G6PD def (test if at risk)
– Used in patients with prolonged exposure
Traveler’s Diarrhea
• Most common travel health problem– Fecal-oral transmission
• Bacteria (80%)– ETEC, campylobacter, salmonella, shigella
• Viruses– rotavirus, norovirus
• Parasites• Giardia, amoeba, cryptosporidium
TD: Prevention
• Risk reduction– “Cook it, peel it, boil it or don’t eat it”
– Advise bottled drinks, no ice
• Prophylaxis– bismuth subsalicylate: (65% effective)
– Antibiotic prophylaxis: (90% effective)
• Short-term manage with loperamide with Abx as back up
– Cipro, azithro (esp SE Asia), rifaxamin
TD: if it happens
• Assessment of fluid losses
• Assessment of Clinical severity
Assessment of dehydration in infants (Modified from CDC)
SIGN MILD MODERATE SEVERE
GENERAL Thirsty, agitated Thirsty, irritable Less responsive,rapid respiration
FONTANELLE, EYES
Normal Sunken Very sunken
TEARS Present Absent Absent
MUCOUS MEMBRANES
Slightly dry Dry Dry
URINE OUTPUT Normal Reduced None for several hours
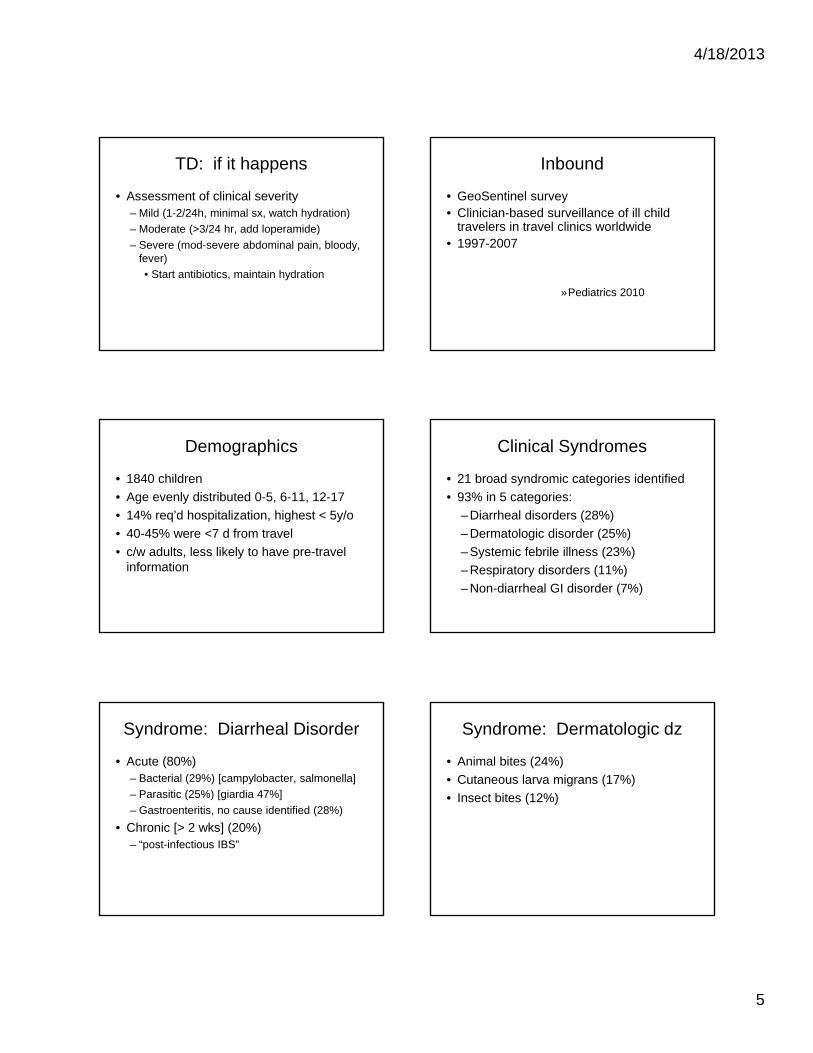
4/18/2013
5
TD: if it happens
• Assessment of clinical severity– Mild (1-2/24h, minimal sx, watch hydration)
– Moderate (>3/24 hr, add loperamide)
– Severe (mod-severe abdominal pain, bloody, fever)
• Start antibiotics, maintain hydration
Inbound
• GeoSentinel survey• Clinician-based surveillance of ill child
travelers in travel clinics worldwide• 1997-2007
»Pediatrics 2010
Demographics
• 1840 children
• Age evenly distributed 0-5, 6-11, 12-17
• 14% req’d hospitalization, highest < 5y/o
• 40-45% were <7 d from travel
• c/w adults, less likely to have pre-travel information
Clinical Syndromes
• 21 broad syndromic categories identified
• 93% in 5 categories:
– Diarrheal disorders (28%)
– Dermatologic disorder (25%)
– Systemic febrile illness (23%)
– Respiratory disorders (11%)
– Non-diarrheal GI disorder (7%)
Syndrome: Diarrheal Disorder
• Acute (80%)– Bacterial (29%) [campylobacter, salmonella]
– Parasitic (25%) [giardia 47%]
– Gastroenteritis, no cause identified (28%)
• Chronic [> 2 wks] (20%)– “post-infectious IBS”
Syndrome: Dermatologic dz
• Animal bites (24%)
• Cutaneous larva migrans (17%)
• Insect bites (12%)
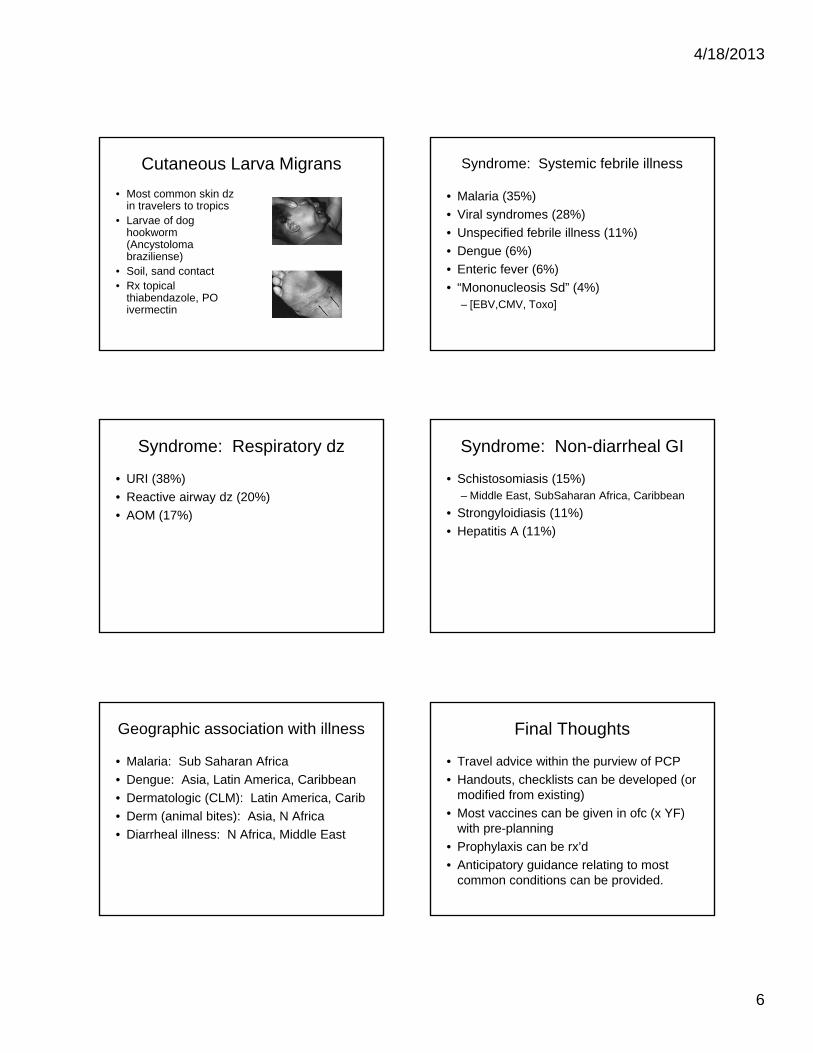
4/18/2013
6
Cutaneous Larva Migrans
• Most common skin dz in travelers to tropics
• Larvae of dog hookworm (Ancystoloma braziliense)
• Soil, sand contact• Rx topical
thiabendazole, PO ivermectin
Syndrome: Systemic febrile illness
• Malaria (35%)
• Viral syndromes (28%)
• Unspecified febrile illness (11%)
• Dengue (6%)
• Enteric fever (6%)
• “Mononucleosis Sd” (4%) – [EBV,CMV, Toxo]
Syndrome: Respiratory dz
• URI (38%)
• Reactive airway dz (20%)
• AOM (17%)
Syndrome: Non-diarrheal GI
• Schistosomiasis (15%)– Middle East, SubSaharan Africa, Caribbean
• Strongyloidiasis (11%)
• Hepatitis A (11%)
Geographic association with illness
• Malaria: Sub Saharan Africa
• Dengue: Asia, Latin America, Caribbean
• Dermatologic (CLM): Latin America, Carib
• Derm (animal bites): Asia, N Africa
• Diarrheal illness: N Africa, Middle East
Final Thoughts
• Travel advice within the purview of PCP
• Handouts, checklists can be developed (or modified from existing)
• Most vaccines can be given in ofc (x YF) with pre-planning
• Prophylaxis can be rx’d
• Anticipatory guidance relating to most common conditions can be provided.
4/18/2013
7
References: Travel Medicine
• www.cdc.gov/travel
• www.who.int
• Travel Medicine; Keystone, Kozarsky, Freedman, Nothdurft, Connor, 2004
• Health Information for International Travel 2005-2006; Arguin, Kozarsky, Navin, Eds. CDC
• Illness in Children after International Travel: Analysis from the GeoSentinal Surveillance Network. Hagmann S et al, Pediatrics 2010, e1072
Travel: Summary
1. Pre-travel advice/guidance by the PCP may prevent some adverse health outcomes.
2. Custody issues may arise with a sole parent and children crossing international borders.
3. Malaria prevention - bite avoidance and chemoprophylaxis - should be instituted for all family members.
4. Traveler’s diarrhea is a common problem in most developing countries.
5. Workup for illness upon return from international destinations needs to be primarily guided by areas visited.
THURSDAY, MAY 16, 2013
RELATING HOSPITALIST MEDICINE TO OFFICE PRACTICE
Moderator: Dr. Karen Sun
THURSDAY, MAY 16, 2013
1:45
P So What’s New? Pediatric Hospital Medicine
Dr. Bradley Monash
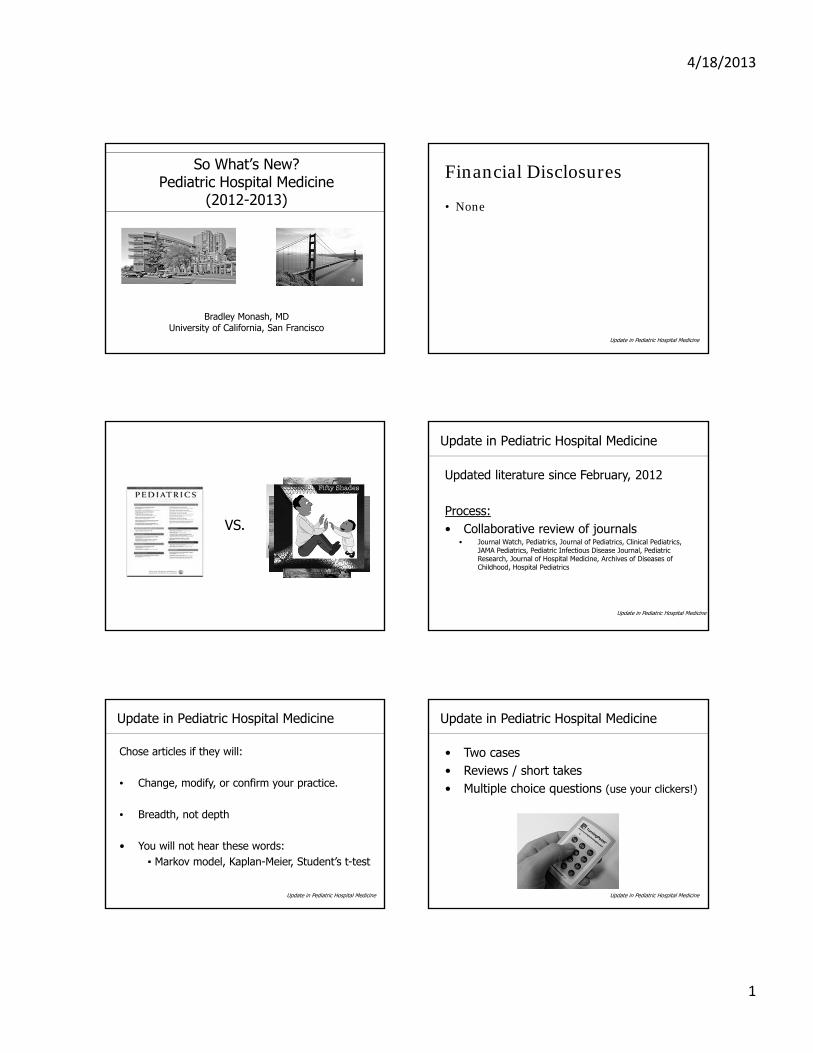
4/18/2013
1
So What’s New?Pediatric Hospital Medicine
(2012-2013)
Bradley Monash, MDUniversity of California, San Francisco
Financial Disclosures
• None
Update in Pediatric Hospital Medicine
VS.
Update in Pediatric Hospital Medicine
Updated literature since February, 2012
Process:• Collaborative review of journals
• Journal Watch, Pediatrics, Journal of Pediatrics, Clinical Pediatrics, JAMA Pediatrics, Pediatric Infectious Disease Journal, Pediatric Research, Journal of Hospital Medicine, Archives of Diseases of Childhood, Hospital Pediatrics
Update in Pediatric Hospital Medicine
Chose articles if they will:
• Change, modify, or confirm your practice.
• Breadth, not depth
• You will not hear these words:▪ Markov model, Kaplan-Meier, Student’s t-test
Update in Pediatric Hospital Medicine
Update in Pediatric Hospital Medicine
• Two cases• Reviews / short takes• Multiple choice questions (use your clickers!)
Update in Pediatric Hospital Medicine
Update in Pediatric Hospital Medicine
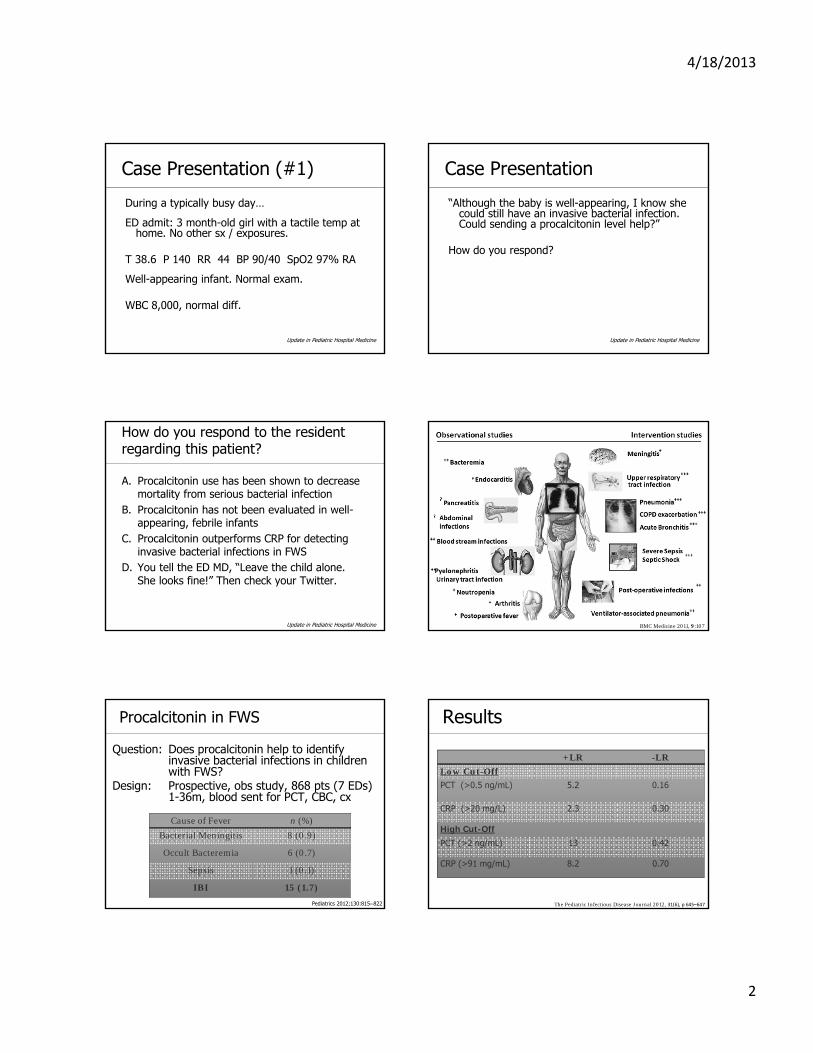
4/18/2013
2
Case Presentation (#1)
During a typically busy day…
ED admit: 3 month-old girl with a tactile temp at home. No other sx / exposures.
T 38.6 P 140 RR 44 BP 90/40 SpO2 97% RA
Well-appearing infant. Normal exam.
WBC 8,000, normal diff.
Update in Pediatric Hospital Medicine
Case Presentation
“Although the baby is well-appearing, I know she could still have an invasive bacterial infection. Could sending a procalcitonin level help?”
How do you respond?
Update in Pediatric Hospital Medicine
How do you respond to the resident regarding this patient?
A. Procalcitonin use has been shown to decrease mortality from serious bacterial infection
B. Procalcitonin has not been evaluated in well-appearing, febrile infants
C. Procalcitonin outperforms CRP for detecting invasive bacterial infections in FWS
D. You tell the ED MD, “Leave the child alone. She looks fine!” Then check your Twitter.
Update in Pediatric Hospital MedicineUpdate in Hospital Medicine
BMC Medicine 2011, 9:107
Procalcitonin in FWS
Question: Does procalcitonin help to identify invasive bacterial infections in children with FWS?
Design: Prospective, obs study, 868 pts (7 EDs) 1-36m, blood sent for PCT, CBC, cx
Pediatrics 2012;130:815–822
Cause of Fever n (%)
Bacterial Meningitis 8 (0.9)
Occult Bacteremia 6 (0.7)
Sepsis 1 (0.1)
IBI 15 (1.7)
Results
The Pediatric Infectious Disease Journal 2012, 31(6), p 645–647
+LR -LR
Low Cut-Off
PCT (>0.5 ng/mL) 5.2 0.16
CRP (>20 mg/L) 2.3 0.30
High Cut-Off
PCT (>2 ng/mL) 13 0.42
CRP (>91 mg/mL) 8.2 0.70
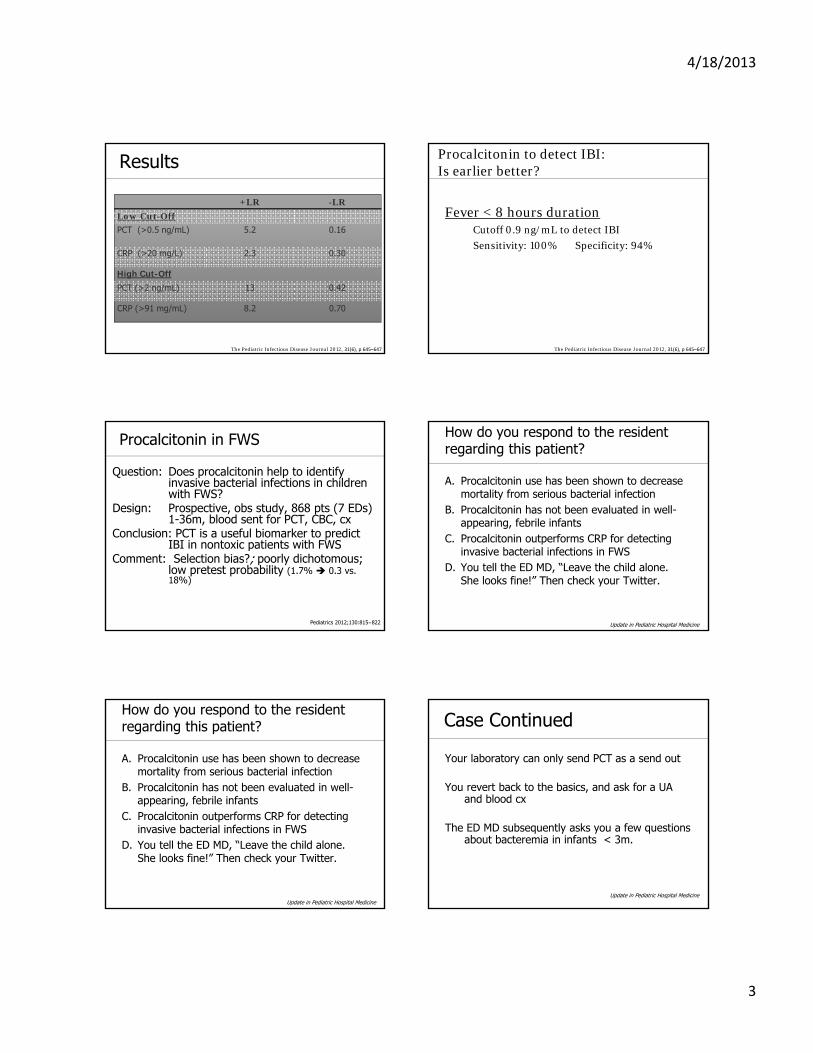
4/18/2013
3
Results
The Pediatric Infectious Disease Journal 2012, 31(6), p 645–647
+LR -LR
Low Cut-Off
PCT (>0.5 ng/mL) 5.2 0.16
CRP (>20 mg/L) 2.3 0.30
High Cut-Off
PCT (>2 ng/mL) 13 0.42
CRP (>91 mg/mL) 8.2 0.70
Procalcitonin to detect IBI: Is earlier better?
Fever < 8 hours durationCutoff 0.9 ng/mL to detect IBI
Sensitivity: 100% Specificity: 94%
The Pediatric Infectious Disease Journal 2012, 31(6), p 645–647
Procalcitonin in FWS
Question: Does procalcitonin help to identify invasive bacterial infections in children with FWS?
Design: Prospective, obs study, 868 pts (7 EDs) 1-36m, blood sent for PCT, CBC, cx
Conclusion: PCT is a useful biomarker to predict IBI in nontoxic patients with FWS
Comment: Selection bias?; poorly dichotomous; low pretest probability (1.7% 0.3 vs.18%)
Pediatrics 2012;130:815–822
How do you respond to the resident regarding this patient?
A. Procalcitonin use has been shown to decrease mortality from serious bacterial infection
B. Procalcitonin has not been evaluated in well-appearing, febrile infants
C. Procalcitonin outperforms CRP for detecting invasive bacterial infections in FWS
D. You tell the ED MD, “Leave the child alone. She looks fine!” Then check your Twitter.
Update in Pediatric Hospital Medicine
How do you respond to the resident regarding this patient?
A. Procalcitonin use has been shown to decrease mortality from serious bacterial infection
B. Procalcitonin has not been evaluated in well-appearing, febrile infants
C. Procalcitonin outperforms CRP for detecting invasive bacterial infections in FWS
D. You tell the ED MD, “Leave the child alone. She looks fine!” Then check your Twitter.
Update in Pediatric Hospital Medicine
Case Continued
Your laboratory can only send PCT as a send out
You revert back to the basics, and ask for a UA and blood cx
The ED MD subsequently asks you a few questions about bacteremia in infants < 3m.
Update in Pediatric Hospital Medicine
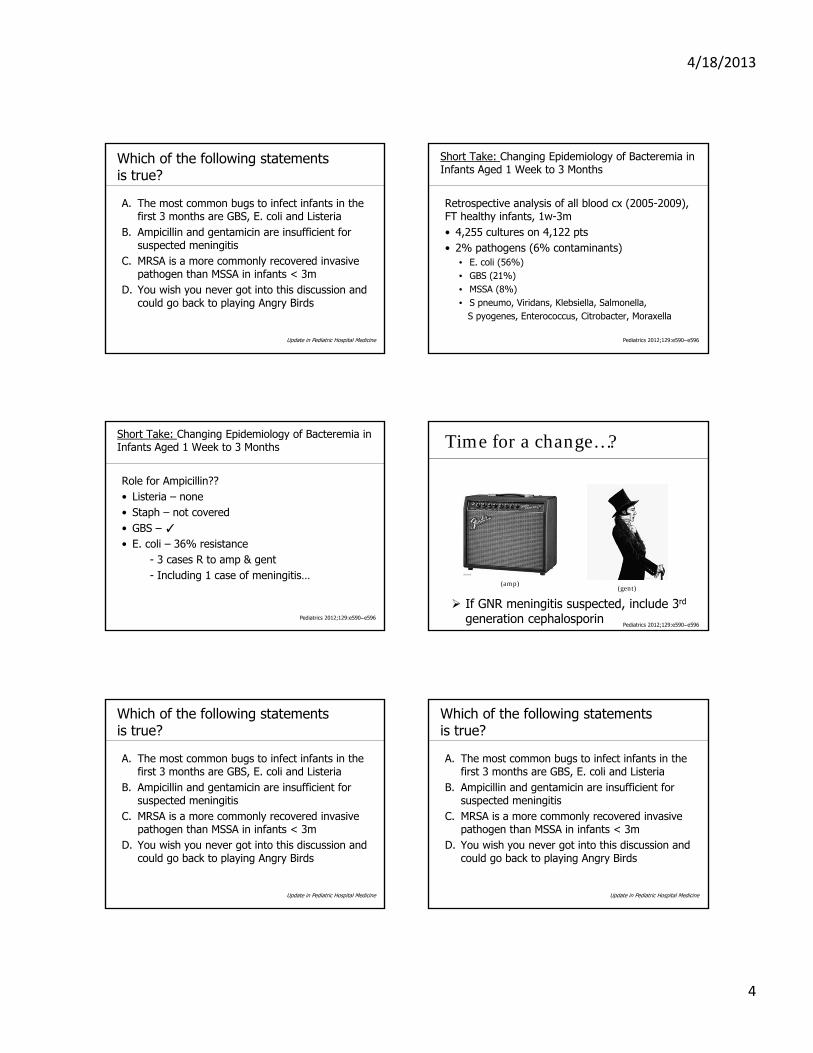
4/18/2013
4
Which of the following statements is true?
A. The most common bugs to infect infants in the first 3 months are GBS, E. coli and Listeria
B. Ampicillin and gentamicin are insufficient for suspected meningitis
C. MRSA is a more commonly recovered invasive pathogen than MSSA in infants < 3m
D. You wish you never got into this discussion and could go back to playing Angry Birds
Update in Pediatric Hospital Medicine
Short Take: Changing Epidemiology of Bacteremia in Infants Aged 1 Week to 3 Months
Retrospective analysis of all blood cx (2005-2009), FT healthy infants, 1w-3m• 4,255 cultures on 4,122 pts• 2% pathogens (6% contaminants)
• E. coli (56%)• GBS (21%)• MSSA (8%)• S pneumo, Viridans, Klebsiella, Salmonella,
S pyogenes, Enterococcus, Citrobacter, Moraxella
Pediatrics 2012;129:e590–e596
Short Take: Changing Epidemiology of Bacteremia in Infants Aged 1 Week to 3 Months
Role for Ampicillin??• Listeria – none• Staph – not covered• GBS – ✓
• E. coli – 36% resistance- 3 cases R to amp & gent- Including 1 case of meningitis…
Pediatrics 2012;129:e590–e596
Time for a change…?
(amp)(gent)
If GNR meningitis suspected, include 3rd
generation cephalosporinPediatrics 2012;129:e590–e596
Which of the following statements is true?
A. The most common bugs to infect infants in the first 3 months are GBS, E. coli and Listeria
B. Ampicillin and gentamicin are insufficient for suspected meningitis
C. MRSA is a more commonly recovered invasive pathogen than MSSA in infants < 3m
D. You wish you never got into this discussion and could go back to playing Angry Birds
Update in Pediatric Hospital Medicine
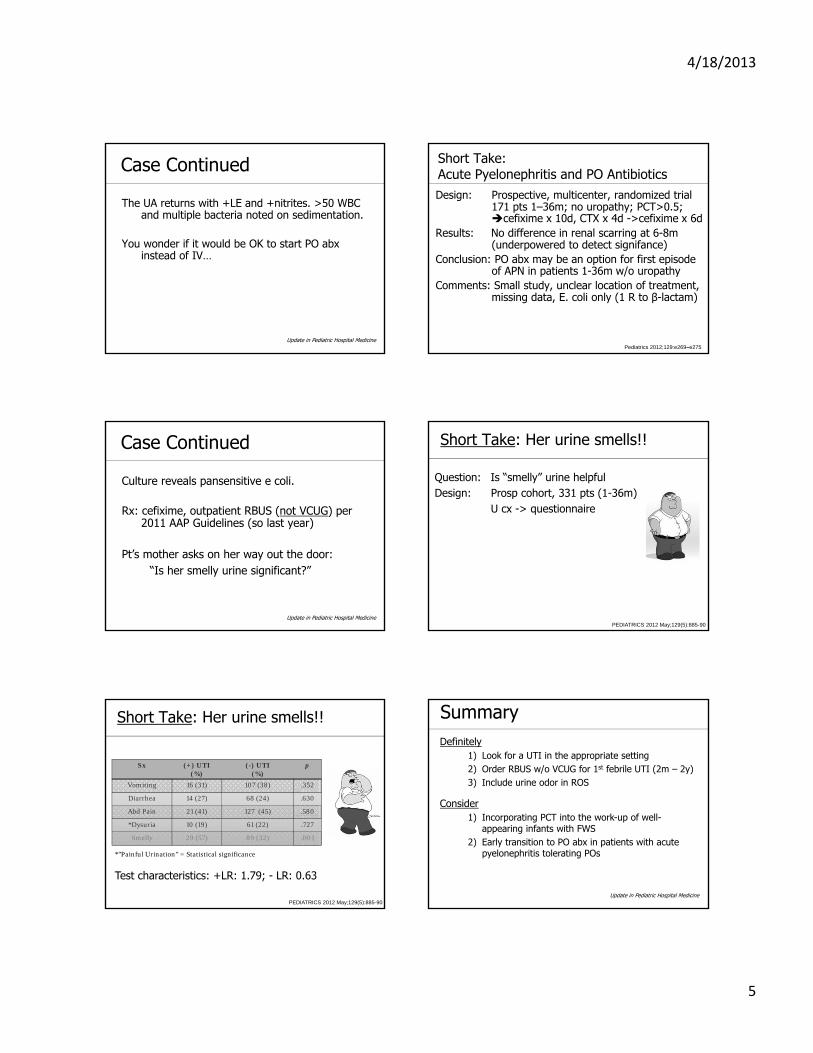
4/18/2013
5
Case Continued
The UA returns with +LE and +nitrites. >50 WBC and multiple bacteria noted on sedimentation.
You wonder if it would be OK to start PO abxinstead of IV…
Update in Pediatric Hospital Medicine
Short Take:Acute Pyelonephritis and PO AntibioticsDesign: Prospective, multicenter, randomized trial
171 pts 1–36m; no uropathy; PCT>0.5; cefixime x 10d, CTX x 4d ->cefixime x 6d
Results: No difference in renal scarring at 6-8m (underpowered to detect signifance)
Conclusion: PO abx may be an option for first episode of APN in patients 1-36m w/o uropathy
Comments: Small study, unclear location of treatment, missing data, E. coli only (1 R to β-lactam)
Pediatrics 2012;129:e269–e275
Case Continued
Culture reveals pansensitive e coli.
Rx: cefixime, outpatient RBUS (not VCUG) per 2011 AAP Guidelines (so last year)
Pt’s mother asks on her way out the door:“Is her smelly urine significant?”
Update in Pediatric Hospital Medicine
Short Take: Her urine smells!!
PEDIATRICS 2012 May;129(5):885-90
Question: Is “smelly” urine helpfulDesign: Prosp cohort, 331 pts (1-36m)
U cx -> questionnaire
Short Take: Her urine smells!!
Sx (+) UTI(%)
(-) UTI(%)
p
Vomiting 16 (31) 107 (38) .352
Diarrhea 14 (27) 68 (24) .630
Abd Pain 21 (41) 127 (45) .580
*Dysuria 10 (19) 61 (22) .727
Smelly 29 (57) 89 (32) .001
*”Painful Urination” = Statistical significance
PEDIATRICS 2012 May;129(5):885-90
Test characteristics: +LR: 1.79; - LR: 0.63
SummaryDefinitely
1) Look for a UTI in the appropriate setting2) Order RBUS w/o VCUG for 1st febrile UTI (2m – 2y)3) Include urine odor in ROS
Consider1) Incorporating PCT into the work-up of well-
appearing infants with FWS2) Early transition to PO abx in patients with acute
pyelonephritis tolerating POs
Update in Pediatric Hospital Medicine
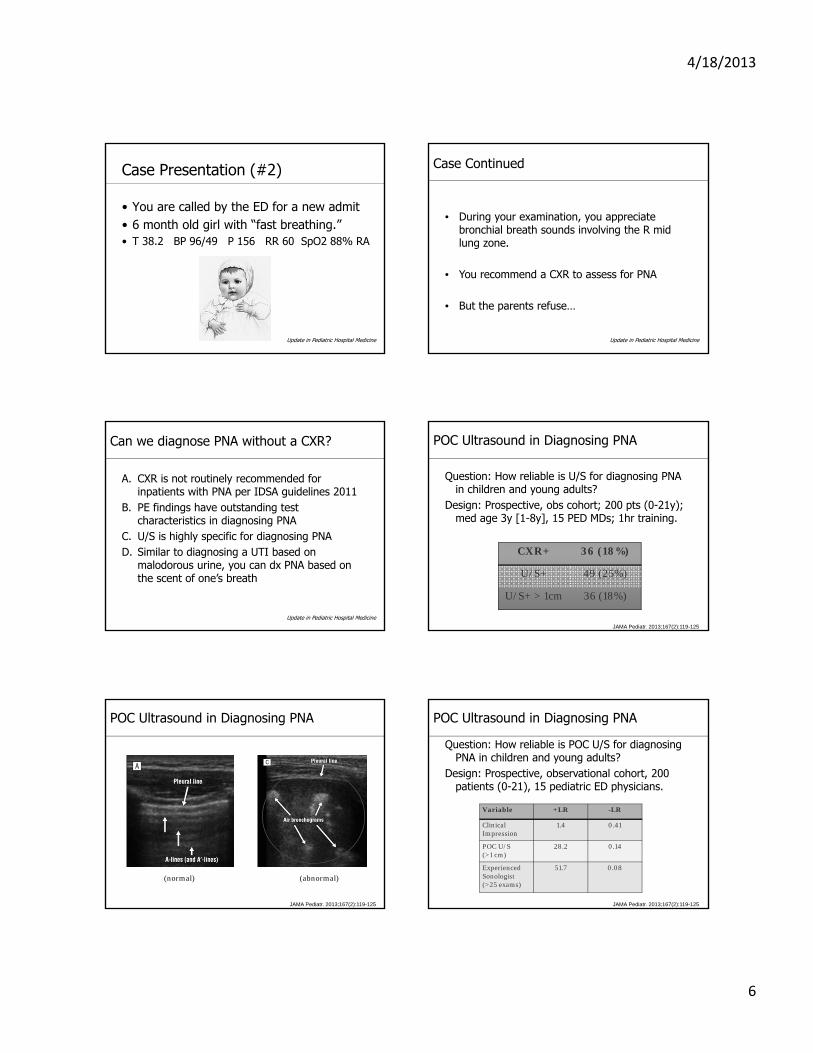
4/18/2013
6
Case Presentation (#2)
• You are called by the ED for a new admit• 6 month old girl with “fast breathing.”• T 38.2 BP 96/49 P 156 RR 60 SpO2 88% RA
Update in Pediatric Hospital Medicine
Case Continued
• During your examination, you appreciate bronchial breath sounds involving the R mid lung zone.
• You recommend a CXR to assess for PNA
• But the parents refuse…
Update in Pediatric Hospital Medicine
Can we diagnose PNA without a CXR?
A. CXR is not routinely recommended for inpatients with PNA per IDSA guidelines 2011
B. PE findings have outstanding test characteristics in diagnosing PNA
C. U/S is highly specific for diagnosing PNAD. Similar to diagnosing a UTI based on
malodorous urine, you can dx PNA based on the scent of one’s breath
Update in Pediatric Hospital MedicineJAMA Pediatr. 2013;167(2):119-125
POC Ultrasound in Diagnosing PNA
Question: How reliable is U/S for diagnosing PNA in children and young adults?
Design: Prospective, obs cohort; 200 pts (0-21y); med age 3y [1-8y], 15 PED MDs; 1hr training.
CXR+ 36 (18%)
U/S+ 49 (25%)
U/S+ > 1cm 36 (18%)
JAMA Pediatr. 2013;167(2):119-125
POC Ultrasound in Diagnosing PNA
(normal) (abnormal)
JAMA Pediatr. 2013;167(2):119-125
POC Ultrasound in Diagnosing PNA
Question: How reliable is POC U/S for diagnosing PNA in children and young adults?
Design: Prospective, observational cohort, 200 patients (0-21), 15 pediatric ED physicians.
Variable +LR -LR
Clinical Impression
1.4 0.41
POC U/S(>1 cm)
28.2 0.14
ExperiencedSonologist(>25 exams)
51.7 0.08
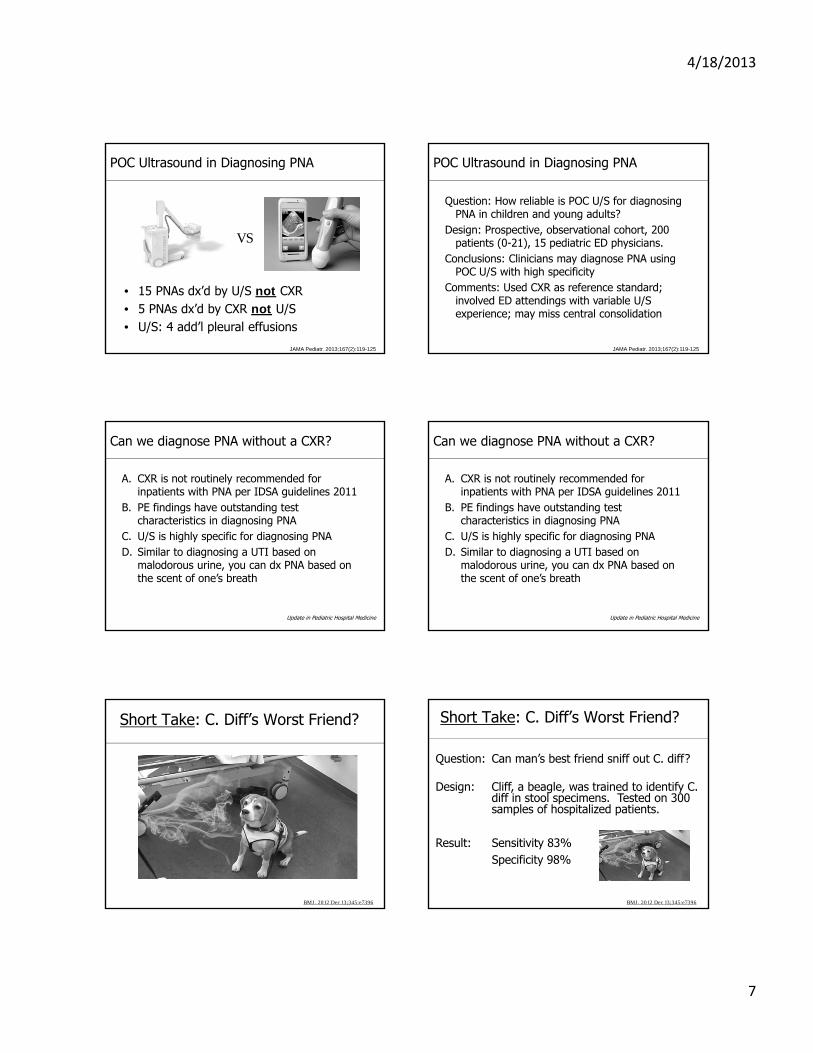
4/18/2013
7
JAMA Pediatr. 2013;167(2):119-125
POC Ultrasound in Diagnosing PNA
• 15 PNAs dx’d by U/S not CXR• 5 PNAs dx’d by CXR not U/S• U/S: 4 add’l pleural effusions
VS
POC Ultrasound in Diagnosing PNA
Question: How reliable is POC U/S for diagnosing PNA in children and young adults?
Design: Prospective, observational cohort, 200 patients (0-21), 15 pediatric ED physicians.
Conclusions: Clinicians may diagnose PNA using POC U/S with high specificity
Comments: Used CXR as reference standard; involved ED attendings with variable U/S experience; may miss central consolidation
JAMA Pediatr. 2013;167(2):119-125
Can we diagnose PNA without a CXR?
A. CXR is not routinely recommended for inpatients with PNA per IDSA guidelines 2011
B. PE findings have outstanding test characteristics in diagnosing PNA
C. U/S is highly specific for diagnosing PNAD. Similar to diagnosing a UTI based on
malodorous urine, you can dx PNA based on the scent of one’s breath
Update in Pediatric Hospital Medicine
Can we diagnose PNA without a CXR?
A. CXR is not routinely recommended for inpatients with PNA per IDSA guidelines 2011
B. PE findings have outstanding test characteristics in diagnosing PNA
C. U/S is highly specific for diagnosing PNAD. Similar to diagnosing a UTI based on
malodorous urine, you can dx PNA based on the scent of one’s breath
Update in Pediatric Hospital Medicine
Short Take: C. Diff’s Worst Friend?
BMJ. 2012 Dec 13;345:e7396
Short Take: C. Diff’s Worst Friend?
BMJ. 2012 Dec 13;345:e7396
Question: Can man’s best friend sniff out C. diff?
Design: Cliff, a beagle, was trained to identify C. diff in stool specimens. Tested on 300 samples of hospitalized patients.
Result: Sensitivity 83%Specificity 98%
4/18/2013
8
SummaryDefinitely
1) Include ultrasound in your diagnostic armamentarium for PNA
Consider1) Investing in dog treats
Update in Pediatric Hospital Medicine
Acknowledgments• Phuoc Le, MD• Brad Sharpe, MD• UCSF Division of Pediatric Hospital Medicine• You!
Update in Pediatric Hospital Medicine
Update in Pediatric Hospital Medicine 2012-2013
Bradley Monash, MDPhuoc Le, MD, MPH
Appendix 1: Likelihood Ratios
Likelihood Ratios
+LR = T+D+------T+D-
-LR = T-D+------T-D-
Appendix 2: Additional Studies
• Pediatric bugs are not little adult bugs (Pediatrics 2012;130:e615–e622)
• Probiotics reduce antibiotic-associated diarrhea(JAMA. 2012;307(18):1959-1969)
• Risk factors for CAA in Kawasaki disease(Ped Inf Dis J. 2012. 31(9): 894–898)
• Steroids in high-risk Kawasaki disease(Lancet. 2012 (379) p 1613-1620)
• Discharging bronchiolitis on supplemental O2(Pediatrics 2012;129:e605–e610)
• Reliability of CXR in diagnosing PNA(J Hosp Med 2012;7:294–298)
• Radiation risks of CT(Lancet 2012;380(9840):499-505)
THURSDAY, MAY 16, 2013
2:15
Failure to Thrive: Rethinking Our Treatment Goals
Dr. Darren Fiore

4/18/2013
1
FAILURE TO THRIVE: RETHINKING OUR TREATMENT GOALS
Darren Fiore, MD
University of California San Francisco
Division of Pediatric Hospital Medicine
Disclosures
• I have nothing to disclose.
Learning Objectives
• Recognize that most children with FTT do not have an underlying medical condition.
• Approach evaluation in a targeted, rational way, limiting excessive diagnostic tests and hospitalization.
• Discuss importance of observation of feeding behaviors and recording of nutritional intake over time in the evaluation of FTT.
Introduction
• FTT is not a diagnosis, but a sign describing an underlying problem.
• Describes combination of undernutrition and deficient growth over time.
• Typically refers to poor weight gain, but may impact length and HC in severe cases.
• Other terms include: poor growth, undernutrition, or growth deficiency.
Question: How is FTT defined?
1. Weight < 5th percentile
2. Crossing of two %ile lines on growth curve
3. Weight for length < 10th percentile
4. Rate of daily wt gain < than expected for age
5. All of the above
6. None of the above
Definition• Several definitions based on anthropometric criteria, but
none is uniformly accepted:• Weight < 5th percentile • Crossing of two percentile lines on growth curve• Weight for height < 10th percentile• BMI < 5th percentile• Rate of daily weight gain < than expected for age
• Most of these are flawed.
• Practical definition: Inadequate growth over time relative to standard growth charts after taking into account age, gender, ethnicity.
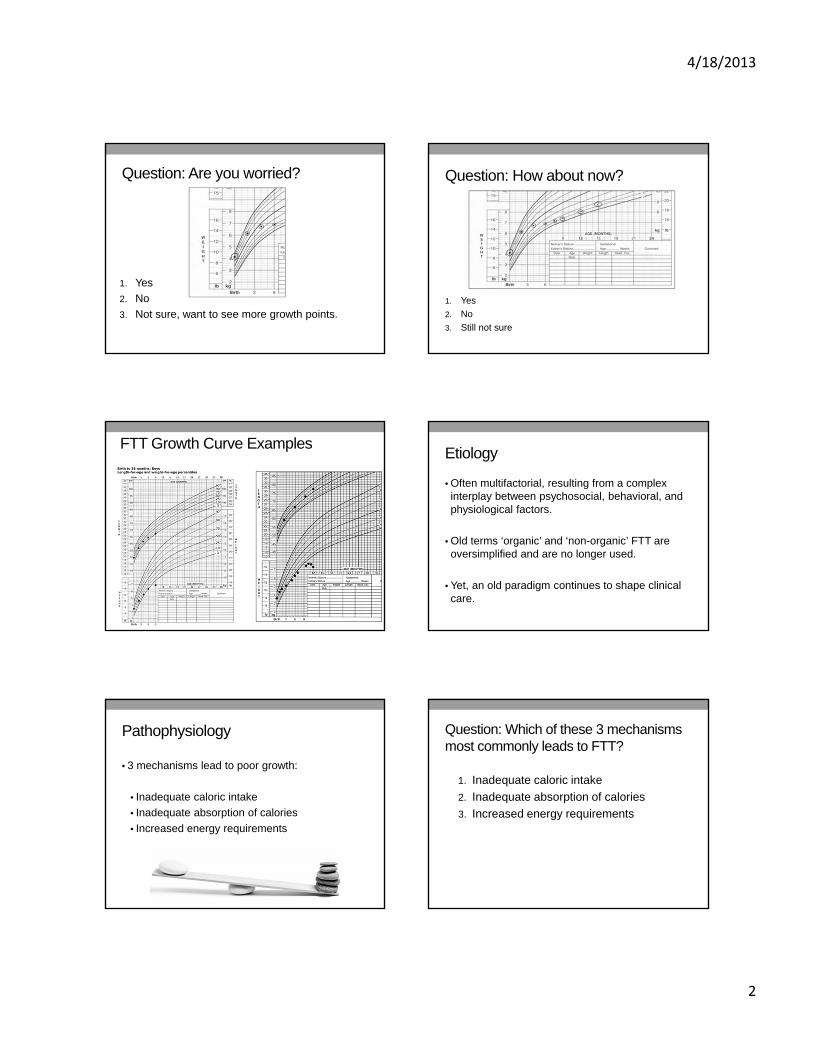
4/18/2013
2
Question: Are you worried?
1. Yes
2. No
3. Not sure, want to see more growth points.
Question: How about now?
1. Yes
2. No
3. Still not sure
FTT Growth Curve ExamplesEtiology
• Often multifactorial, resulting from a complex interplay between psychosocial, behavioral, and physiological factors.
• Old terms ‘organic’ and ‘non-organic’ FTT are oversimplified and are no longer used.
• Yet, an old paradigm continues to shape clinical care.
Pathophysiology
• 3 mechanisms lead to poor growth:
• Inadequate caloric intake
• Inadequate absorption of calories
• Increased energy requirements
Question: Which of these 3 mechanisms most commonly leads to FTT?
1. Inadequate caloric intake
2. Inadequate absorption of calories
3. Increased energy requirements

4/18/2013
3
Inadequate Intake• Due to:
• Abnormal suck/swallow • Aversion• Early satiety• Psychosocial factors (often considered dx of exclusion, but in
reality it’s often immediately obvious from history)
• Common examples:• Anatomic or neurologic abnormalities can interfere with feeding
• Cleft palate or other oropharyngeal anomaly
• Brain injury
• Delayed gastric emptying causing early satiety
• GERD causing pain after eating (with secondary oral aversion or habitual early cessation of feeding)
• Psychosocial problems or inadequate feeding
Inadequate Absorption
• Inherited or acquired GI conditions:
• CF
• Cow’s milk protein allergy
• Post-infectious villous atrophy
• Malabsorption syndromes (typically cause abnormal stool):
• Smelly bulky stools (cystic fibrosis)
• Bloody or mucousy stools (cow’s milk allergy)
• Persistent watery stools (villous atrophy)
Increased Metabolic Demand
• Cardiac disease (CHF)
• Pulmonary disease (BPD/CLD)
• Severe chronic anemia
• Chronic acidosis (RTA)
• Chronic inflammation (IBD)
• Endocrinopathy (hyperthyroidism)
• Malignancy
• Inborn error of metabolism
• Chronic infection (HIV)
Key Point
• The long list of causes of uncommon causes of FTT often triggers an exhaustive, expensive, and poorly-focused evaluation rather than a targeted, rational, limited work-up based on history, physical and common conditions.
Why Does This Happen?
• Flawed paradigm handed down over decades.
• Assumes all causes are equally likely.
• Teaches us to rule out the ‘bad stuff’ before evaluating common psychosocial and behavioral causes (‘diagnosis of exclusion’).
• Confuses having a problem with having a disease.
• Assumes FTT is a diagnosis rather than a symptom of a larger problem.
Rethinking Our Approach
• Approach FTT as a symptom of undernutrition.
• Most children with FTT are not sick, but some may have a problem that needs to be addressed.
• Those that are sick can usually be readily identified by their symptoms.
• For the tiny number of children who are sick, and who don’t have other symptoms, it is extremely rare that a delay in that diagnosis would affect outcome.

4/18/2013
4
Rethinking Our Approach
• Furthermore…
• For the large majority of kids with poor growth due to social and behavioral factors, extensive diagnostic work-ups harm the patient and undermine efforts to focus on the real issues.
Evaluation
• Begins with thoughtful H&P.
• Meticulous diet, feeding, and
social history.
• Judicious use of diagnostic tests.
• Laboratory investigation is unlikely to reveal an organic cause in the absence of evidence from the initial H&P.
Question:
2,607 lab tests on 185 patients with FTT. How many test results helped establish a diagnosis? (Sills, JAMA, 1974)
1. 0.4%
2. 4%
3. 14%
4. 24%
5. 54%
Newer Evidence?
• No
• Today, there still is no evidence to support the extensive, systematic use of screening laboratory evaluations in diagnosing FTT.
Exam• The goals of PE include identification of signs of genetic
disorders or medical diseases contributing to undernutrition and child abuse or neglect.
• Observe feeding
• Suck/swallow
• Caretaker response to hunger/satiety
• Tone of the feeding interaction
• Is the caretaker irritable, punitive, disengaged, intrusive?
• Is child apathetic, irritable, noncompliant, provocative?
Systematic Approach
• Consider whether or not there is actually a problem:
• Is child symptomatic?
• Is growth pattern a variation of normal?
• What’s the child’s behavior and development like?
• Who is worried: parent or you?
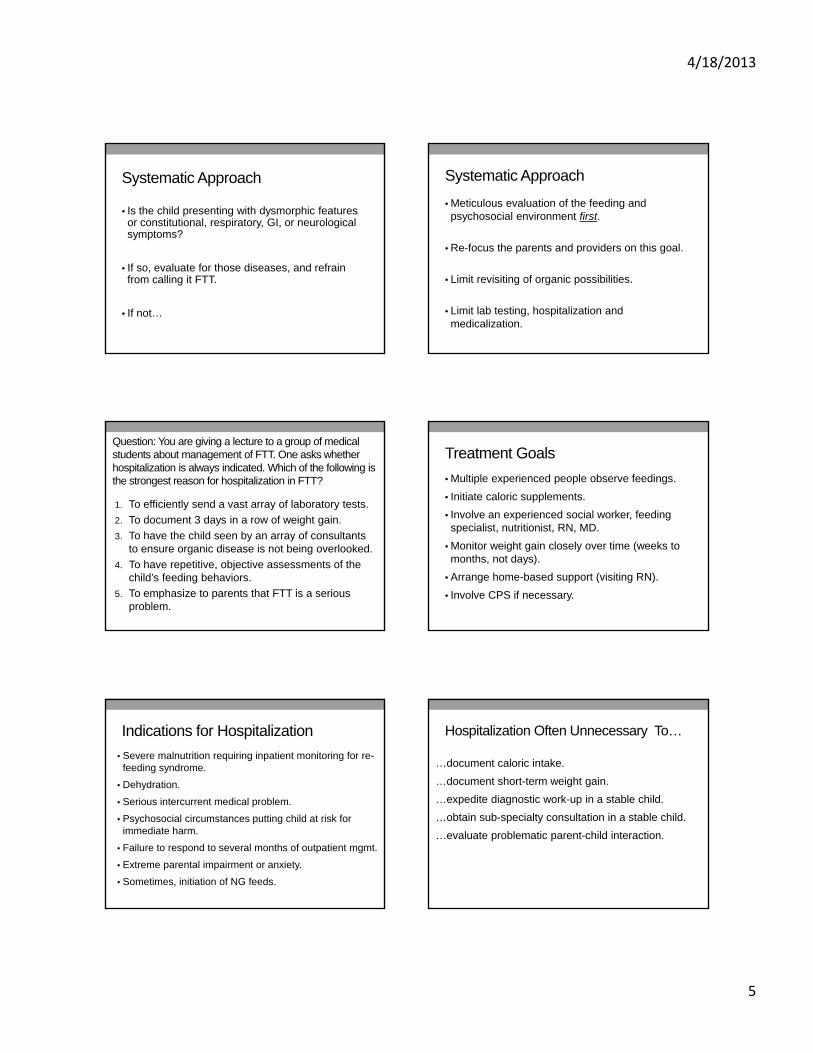
4/18/2013
5
Systematic Approach
• Is the child presenting with dysmorphic features or constitutional, respiratory, GI, or neurological symptoms?
• If so, evaluate for those diseases, and refrain from calling it FTT.
• If not…
Systematic Approach
• Meticulous evaluation of the feeding and psychosocial environment first.
• Re-focus the parents and providers on this goal.
• Limit revisiting of organic possibilities.
• Limit lab testing, hospitalization and medicalization.
Question: You are giving a lecture to a group of medical students about management of FTT. One asks whether hospitalization is always indicated. Which of the following is the strongest reason for hospitalization in FTT?
1. To efficiently send a vast array of laboratory tests.
2. To document 3 days in a row of weight gain.
3. To have the child seen by an array of consultants to ensure organic disease is not being overlooked.
4. To have repetitive, objective assessments of the child’s feeding behaviors.
5. To emphasize to parents that FTT is a serious problem.
Treatment Goals
• Multiple experienced people observe feedings.
• Initiate caloric supplements.
• Involve an experienced social worker, feeding specialist, nutritionist, RN, MD.
• Monitor weight gain closely over time (weeks to months, not days).
• Arrange home-based support (visiting RN).
• Involve CPS if necessary.
Indications for Hospitalization
• Severe malnutrition requiring inpatient monitoring for re-feeding syndrome.
• Dehydration.
• Serious intercurrent medical problem.
• Psychosocial circumstances putting child at risk for immediate harm.
• Failure to respond to several months of outpatient mgmt.
• Extreme parental impairment or anxiety.
• Sometimes, initiation of NG feeds.
Hospitalization Often Unnecessary To…
…document caloric intake.
…document short-term weight gain.
…expedite diagnostic work-up in a stable child.
…obtain sub-specialty consultation in a stable child.
…evaluate problematic parent-child interaction.
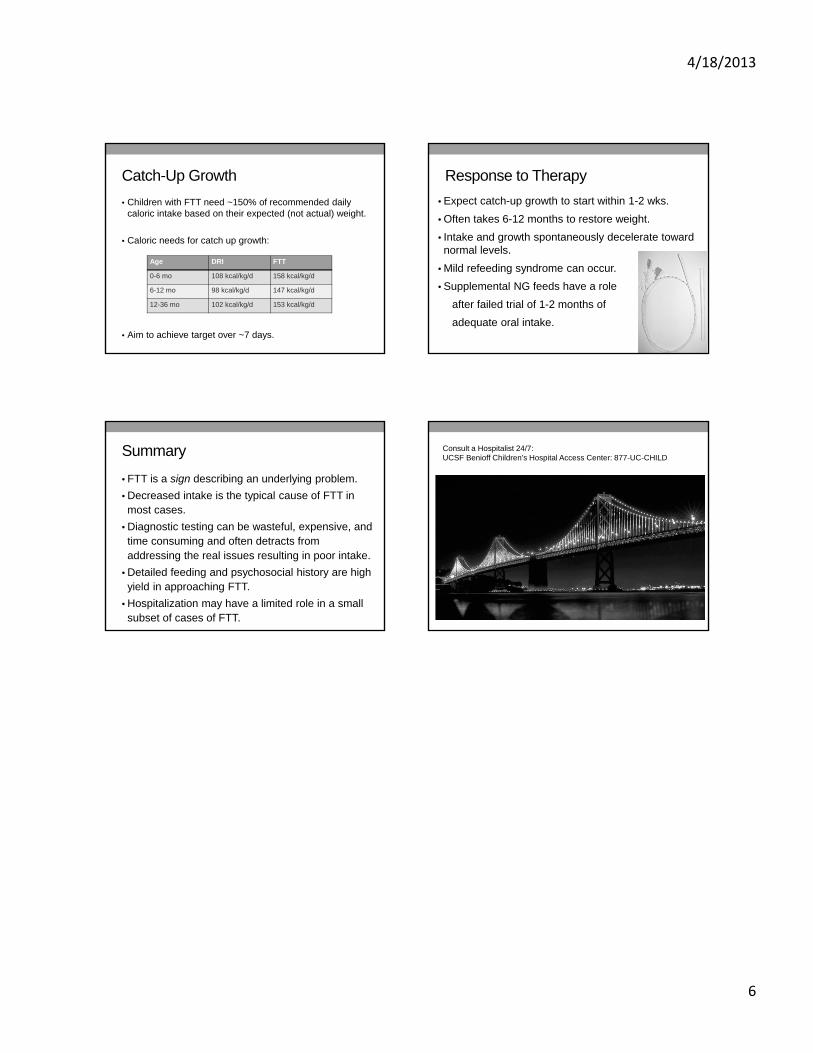
4/18/2013
6
Catch-Up Growth
• Children with FTT need ~150% of recommended daily caloric intake based on their expected (not actual) weight.
• Caloric needs for catch up growth:
• Aim to achieve target over ~7 days.
Age DRI FTT
0-6 mo 108 kcal/kg/d 158 kcal/kg/d
6-12 mo 98 kcal/kg/d 147 kcal/kg/d
12-36 mo 102 kcal/kg/d 153 kcal/kg/d
Response to Therapy
• Expect catch-up growth to start within 1-2 wks.
• Often takes 6-12 months to restore weight.
• Intake and growth spontaneously decelerate toward normal levels.
• Mild refeeding syndrome can occur.
• Supplemental NG feeds have a role
after failed trial of 1-2 months of
adequate oral intake.
Summary
• FTT is a sign describing an underlying problem.
• Decreased intake is the typical cause of FTT in most cases.
• Diagnostic testing can be wasteful, expensive, and time consuming and often detracts from addressing the real issues resulting in poor intake.
• Detailed feeding and psychosocial history are high yield in approaching FTT.
• Hospitalization may have a limited role in a small subset of cases of FTT.
Consult a Hospitalist 24/7:UCSF Benioff Children’s Hospital Access Center: 877-UC-CHILD
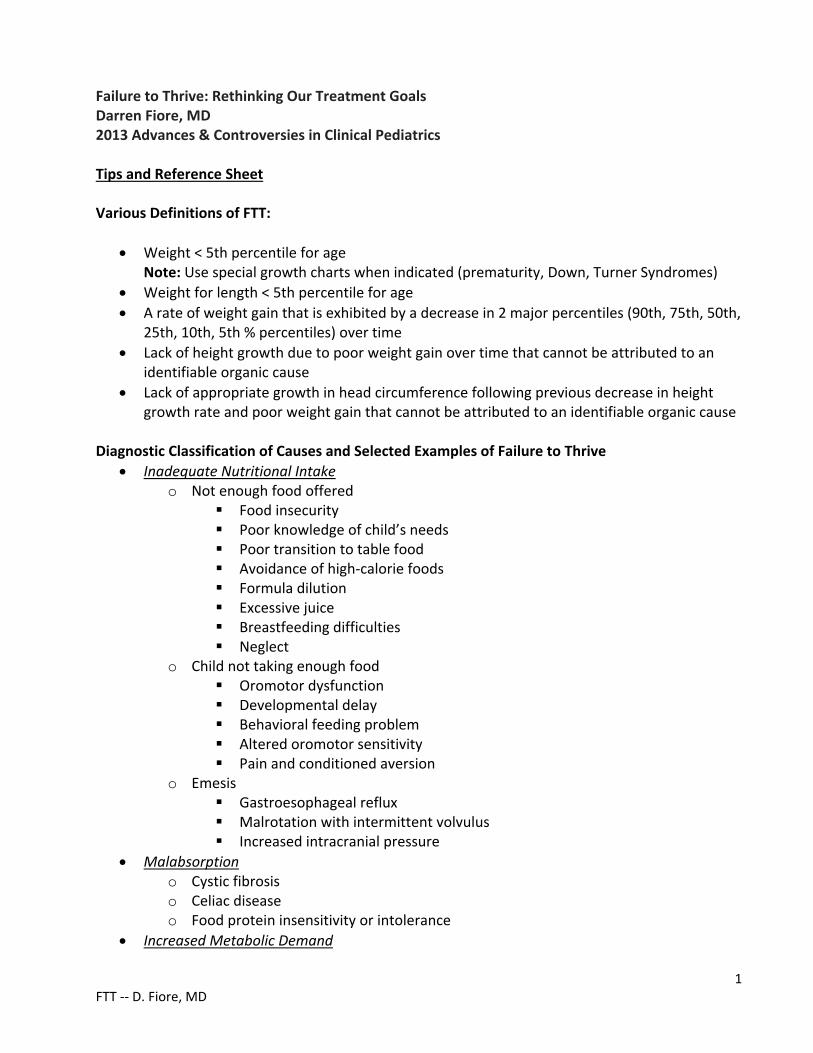
1 FTT ‐‐ D. Fiore, MD
Failure to Thrive: Rethinking Our Treatment Goals Darren Fiore, MD 2013 Advances & Controversies in Clinical Pediatrics Tips and Reference Sheet Various Definitions of FTT:
Weight < 5th percentile for age Note: Use special growth charts when indicated (prematurity, Down, Turner Syndromes)
Weight for length < 5th percentile for age
A rate of weight gain that is exhibited by a decrease in 2 major percentiles (90th, 75th, 50th, 25th, 10th, 5th % percentiles) over time
Lack of height growth due to poor weight gain over time that cannot be attributed to an identifiable organic cause
Lack of appropriate growth in head circumference following previous decrease in height growth rate and poor weight gain that cannot be attributed to an identifiable organic cause
Diagnostic Classification of Causes and Selected Examples of Failure to Thrive
Inadequate Nutritional Intake o Not enough food offered
Food insecurity Poor knowledge of child’s needs Poor transition to table food Avoidance of high‐calorie foods Formula dilution Excessive juice Breastfeeding difficulties Neglect
o Child not taking enough food Oromotor dysfunction Developmental delay Behavioral feeding problem Altered oromotor sensitivity Pain and conditioned aversion
o Emesis Gastroesophageal reflux Malrotation with intermittent volvulus Increased intracranial pressure
Malabsorption o Cystic fibrosis o Celiac disease o Food protein insensitivity or intolerance
Increased Metabolic Demand
2 FTT ‐‐ D. Fiore, MD
o Insulin resistance (e.g., intrauterine growth restriction) o Congenital infections (e.g., human immunodeficiency virus, TORCH) o Syndromes (e.g., Russell‐Silver, Turner, Down) o Chronic disease (e.g., cardiac, renal, endocrine)
Some Points to Consider When Taking FTT History
Feeding History
When, where, and with whom the child eats.
Feeding/breastfeeding position.
Does infant make eye contact while feeding?
Distractions during feeding (TV, toys, siblings).
Duration of each feeding, tiring out.
Does patient seem hungry at feeding time?
Does the infant or child resist eating?
How does caretaker know when child is hungry/full?
Are there struggles over feeding?
Spit‐up or vomiting associated with feeds?
Diet History
Details of everything the child eats.
Be specific, keep a detailed food log.
Assess if formula is prepared properly.
Quantify caloric intake (diet log).
History of excessive juice, soda, cow’s milk.
Vegetarian or unusual diet.
Social History
How does the child interact with the family?
Parental description of patient’s temperament.
Financial stressors, difficulty buying food.
Identify all caregivers who feed the patient.
Parental history of depression or mental illness.
Indicators of substance abuse in the family.
Indicators of domestic violence.
History of CPS involvement with the family.
Recommendations
A consistent, multidisciplinary group of healthcare providers (including, but not limited to, social workers, occupational/speech therapists, nutritionists/dietitians, nurses, advanced practice nurses, and pediatricians) should be involved in the management of children with FTT (Hobbs 1996).
Standardized admission to an inpatient unit is not necessary for all children with FTT. Note: While studies have shown that children with FTT do have improved catch‐up growth when admitted to an inpatient unit, these studies lack long term follow‐up of growth following discharge and assessment of developmental outcomes (Fryer 1988).
3 FTT ‐‐ D. Fiore, MD
An institution or practice might consider the establishment of an organized, multidisciplinary team of health care providers to form a “Grow Team” in order to improve the ease of access to services for families with children who carry the diagnosis of FTT.
There is insufficient evidence and lack of consensus to make a recommendation for routine or standardized inpatient management of FTT, including criteria for when discharge is appropriate.
There is no evidence that a panel of standardized or routine laboratory screening tests for FTT is indicated in the absence of guiding evidence from the history and physical.
When the physician feels that laboratory studies are warranted, even when there are no specific clinical indications, a reasonable selection might include a CBC with red cell indices (to evaluate for anemia and iron deficiency), a complete chemistry panel (including tests for renal and hepatic function), celiac screening, stool examination for fats and reducing substances, and a sweat chloride test for cystic fibrosis. Screening for hypothyroidism or growth hormone deficiency should be considered only if the child’s length has decelerated and is below the 50th percentile on the length‐for‐age chart.
Children diagnosed with failure to thrive need to receive about 150 percent of the recommended daily caloric intake for their expected, not actual, weight for age:
Age Daily Recommended Intake Needed in FTT for catch‐up
0‐6 mo 108 kcal/kg/d 158 kcal/kg/d
6‐12 mo 98 kcal/kg/d 147 kcal/kg/d
12‐36 mo 102 kcal/kg/d 153 kcal/kg/d
Discussion/summary of evidence
FTT in the pediatric population has traditionally been a challenging diagnosis for health care providers to evaluate and treat in both the inpatient and outpatient setting. Treatment protocols for FTT vary immensely between healthcare providers. There is insufficient evidence in the literature to support a specific protocol for management of FTT that would result in improvement in the sustained growth of children with FTT.
In 1988, Fryer published a meta‐analysis that compiled the evidence from eight trials that studied the efficacy of inpatient admission for FTT (Fryer 1988). This study concluded that hospitalization favorably influenced the growth of children with FTT, stating that hospitalization approximately doubled their probability of catch‐up growth. In contrast, psychosocial development only moderately improved with inpatient admission. The author was careful to note, however, that none of the studies in the meta‐analysis evaluated long‐term growth and developmental outcomes in children admitted for FTT. Therefore, while inpatient admission may result in short‐term improvements in growth, the long‐term efficacy of inpatient admission for FTT is unknown. While
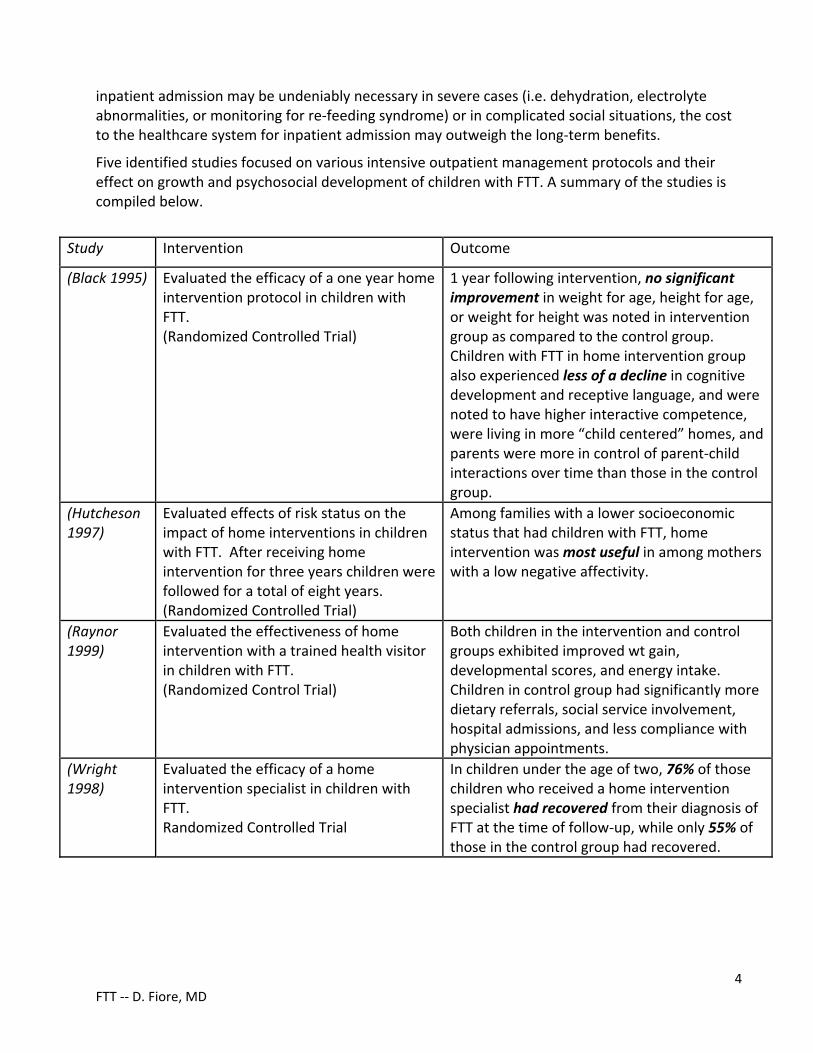
4 FTT ‐‐ D. Fiore, MD
inpatient admission may be undeniably necessary in severe cases (i.e. dehydration, electrolyte abnormalities, or monitoring for re‐feeding syndrome) or in complicated social situations, the cost to the healthcare system for inpatient admission may outweigh the long‐term benefits.
Five identified studies focused on various intensive outpatient management protocols and their effect on growth and psychosocial development of children with FTT. A summary of the studies is compiled below.
Study Intervention Outcome
(Black 1995)
Evaluated the efficacy of a one year home intervention protocol in children with FTT. (Randomized Controlled Trial)
1 year following intervention, no significant improvement in weight for age, height for age, or weight for height was noted in intervention group as compared to the control group. Children with FTT in home intervention group also experienced less of a decline in cognitive development and receptive language, and were noted to have higher interactive competence, were living in more “child centered” homes, and parents were more in control of parent‐child interactions over time than those in the control group.
(Hutcheson 1997)
Evaluated effects of risk status on the impact of home interventions in children with FTT. After receiving home intervention for three years children were followed for a total of eight years. (Randomized Controlled Trial)
Among families with a lower socioeconomic status that had children with FTT, home intervention was most useful in among mothers with a low negative affectivity.
(Raynor 1999)
Evaluated the effectiveness of home intervention with a trained health visitor in children with FTT. (Randomized Control Trial)
Both children in the intervention and control groups exhibited improved wt gain, developmental scores, and energy intake. Children in control group had significantly more dietary referrals, social service involvement, hospital admissions, and less compliance with physician appointments.
(Wright 1998)
Evaluated the efficacy of a home intervention specialist in children with FTT. Randomized Controlled Trial
In children under the age of two, 76% of those children who received a home intervention specialist had recovered from their diagnosis of FTT at the time of follow‐up, while only 55% of those in the control group had recovered.
5 FTT ‐‐ D. Fiore, MD
References Review Articles Krugman, S.D., & Dubowitz, H. (2003). Failure to thrive. American Family Physician, 68(5), 879. Jaffe, A.C. (2011). Failure to thrive: current clinical concepts. Pediatrics in Review, 32(3), 100‐108. Other References Sills, R.H. (1978). Failure to thrive: the role of clinical and laboratory evaluation. Archives of Pediatrics & Adolescent Medicine, 132(10), 967 Berwick, D.M., Levy, J.C., & Kleinerman, R. (1982). Failure to thrive: diagnostic yield of hospitalisation. Archives of Disease in Childhood, 57(5), 347‐351. Black, M. M., Dubowitz, H., Hutcheson, J., Berenson‐Howard, J., & Starr, R. H. (1995). A randomized clinical trial of home intervention for children with failure to thrive. Pediatrics, 95(6), 807‐814. Black, M. M., Dubowitz, H., Krishnakumar, A., & Starr Jr, R. H. (2007). Early intervention and recovery among children with failure to thrive: follow‐up at age 8. Pediatrics, 120(1), 59‐69. Fryer Jr, G. E. (1988). The efficacy of hospitalization of nonorganic failure‐to‐thrive children: a meta‐analysis. Child abuse & neglect, 12(3), 375‐381. Hobbs, C., & Hanks, H. G. I. (1996). A multidisciplinary approach for the treatment of children with
failure to thrive. Child: care, health and development,22(4), 273‐284.
Raynor, P., Rudolf, M. C., Cooper, K., Marchant, P., & Cottrell, D. (1999). A randomised controlled trial of specialist health visitor intervention for failure to thrive. Archives of disease in childhood, 80(6), 500‐506. Wright, C. M., Callum, J., Birks, E., & Jarvis, S. (1998). Effect of community based management in failure to thrive: randomised controlled trial. BMJ: British Medical Journal, 317(7158), 571. Wood, J. et al. (2009). Cincinnati Children’s Best Evidence Statement. Failure to Thrive Treatment Protocol.

THURSDAY, MAY 16, 2013
2:45
P Tubes, Trachs, & Technology: Caring for Medically Complex Children
Dr. Glenn Rosenbluth

5/2/2013
1
Tubes, Trachs and Technology:
Caring for Medically Complex Children
Glenn Rosenbluth, MDAssociate Clinical Professor of PediatricsDivision of Pediatric Hospital Medicine
Disclosures
I have no relevant disclosures.
The content for this activity, including any presentation of therapeutic options, is well-balanced, unbiased, and to the extent possible, evidence-based.
Goals for this talk
Review common technologies that your patients may use
Provide some basic guidelines of what can be done at home, in the office, and in the hospital
Provide some data on psychosocial aspects of caring for technology-dependent children
Outline steps primary care providers can take to provide support
Definition
Technology-dependent children: Children who need ‘‘both a medical device
to compensate for the loss of a vital bodily function and substantial and ongoing nursing care to avert death or further disability’’
– U.S. Congress, Office of Technology Assessment, 1987
0.10% - 0.25% of children in the U.S.
Definition
Technology-dependent children: Children who need ‘‘both a medical device
to compensate for the loss of a vital bodily function and substantial and ongoing nursing care to avert death or further disability’’
– U.S. Congress, Office of Technology Assessment, 1987
Medical device are not necessarily electronic Parents provide lots of nursing care
Common technologies
Enteral feeding tubes (nasogastric/gastrostomy) Long-term central venous access
Parenteral nutrition (TPN) IV therapies (e.g. antibiotics, clotting factor) Dialysis
VP Shunts and associated needs Respiratory therapies
Oxygen therapy Cardio-respiratory monitoring Tracheostomy tube Mechanical ventilation or CPAP
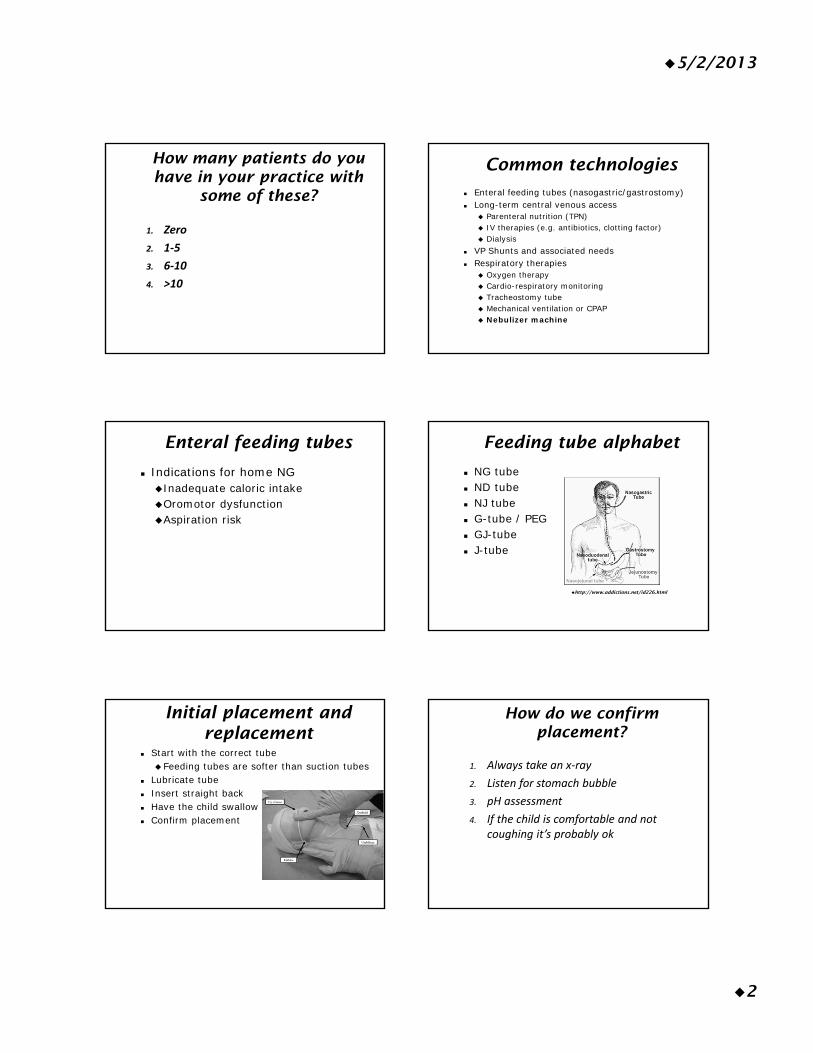
5/2/2013
2
How many patients do you have in your practice with
some of these?
1. Zero
2. 1‐5
3. 6‐10
4. >10
Common technologies
Enteral feeding tubes (nasogastric/gastrostomy) Long-term central venous access
Parenteral nutrition (TPN) IV therapies (e.g. antibiotics, clotting factor) Dialysis
VP Shunts and associated needs Respiratory therapies
Oxygen therapy Cardio-respiratory monitoring Tracheostomy tube Mechanical ventilation or CPAP Nebulizer machine
Enteral feeding tubes
Indications for home NGInadequate caloric intakeOromotor dysfunctionAspiration risk
Feeding tube alphabet
NG tube ND tube NJ tube G-tube / PEG GJ-tube J-tube
http://www.addictions.net/id226.html
Initial placement and replacement
Start with the correct tube Feeding tubes are softer than suction tubes
Lubricate tube Insert straight back Have the child swallow Confirm placement
How do we confirm placement?
1. Always take an x‐ray
2. Listen for stomach bubble
3. pH assessment
4. If the child is comfortable and not coughing it’s probably ok

5/2/2013
3
Confirming placement
pH of gastric aspirate is most common method in the hospital
X-ray may be used Other techniques (used at home)Listen for air bubbleCheck for gastric aspirate
Clogged NG tubes
First step is to remove and replace
If no additional tubes are available, or if tube is transpyloric:Coca-colaClog-zapperPancreatic enzymes
Pumps Feeding tube alphabet
NG tube ND tube NJ tube G-tube / PEG GJ-tube J-tube
http://www.addictions.net/id226.html
G-tube complications
InfectionsDistinguish from granulation tissueGram positive organisms are most commonUsually can feed through the infection
Dislodgement Immediately replace tube Foley catheter if tube not available
Changing a Mic-key
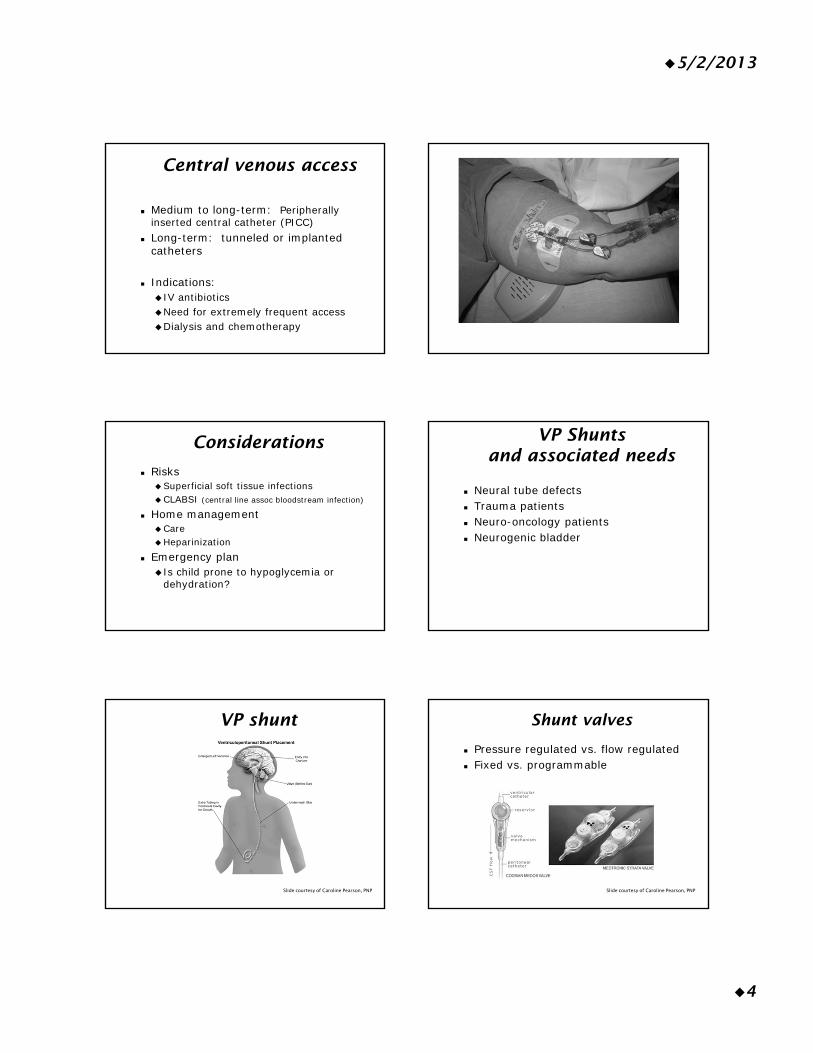
5/2/2013
4
Central venous access
Medium to long-term: Peripherally inserted central catheter (PICC)
Long-term: tunneled or implanted catheters
Indications: IV antibioticsNeed for extremely frequent accessDialysis and chemotherapy
Considerations
RisksSuperficial soft tissue infectionsCLABSI (central line assoc bloodstream infection)
Home managementCareHeparinization
Emergency plan Is child prone to hypoglycemia or
dehydration?
VP Shunts and associated needs
Neural tube defects Trauma patients Neuro-oncology patients Neurogenic bladder
VP shunt
Slide courtesy of Caroline Pearson, PNP
Shunt valves
Pressure regulated vs. flow regulated Fixed vs. programmable
Slide courtesy of Caroline Pearson, PNP
5/2/2013
5
Signs of VP shunt infection or malfunction
Altered Mental Status Fever and:
Tenderness over shunt or tubing ErythemaAbdominal pain
Higher level of concern with abdominal infections
Clean intermittent catheterization
Usually every 3 hours during the day Clean hands are fine Catheters are re-used
Wash with soap and waterDry on a towel or hang-dry
Ditropan (oxybutynin) is commonly usedRelaxes bladder so less reflux
Respiratory Therapies Home oxygen
Indications Chronic lung disease Bronchiolitis in some regions, esp high elevations Cystic fibrosis Interstitial lung disease Pulmonary hypertension
Benefits Decrease in hospitalizations Optimization of physical growth and development Improvement in quality of sleep Prevention of worsening disease
Home oxygen
Types of deliveryOxygen cylindersOxygen concentrators Liquid oxygen
Usually via nasal cannula Usually 100% FiO2 Usually not on home monitors
Home monitors
Apnea monitors Pulse oximetry
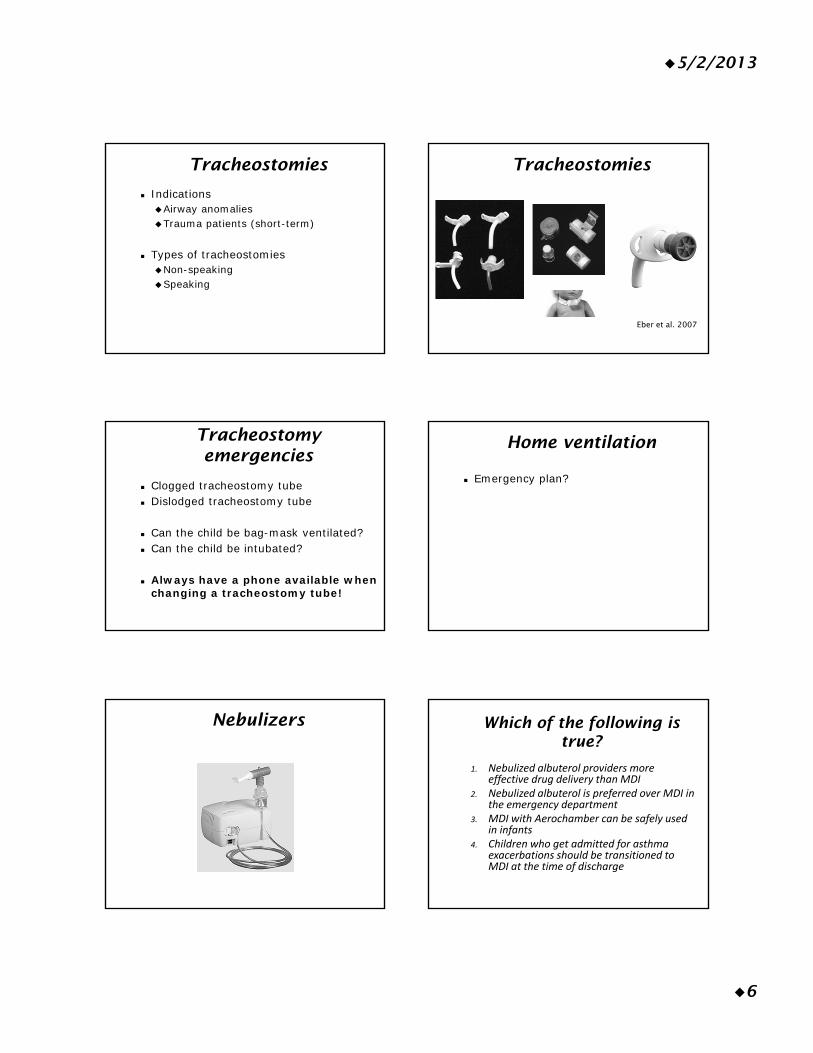
5/2/2013
6
Tracheostomies
IndicationsAirway anomaliesTrauma patients (short-term)
Types of tracheostomiesNon-speakingSpeaking
Tracheostomies
Eber et al. 2007
Tracheostomy emergencies
Clogged tracheostomy tube Dislodged tracheostomy tube
Can the child be bag-mask ventilated? Can the child be intubated?
Always have a phone available when changing a tracheostomy tube!
Home ventilation
Emergency plan?
Nebulizers Which of the following is true?
1. Nebulized albuterol providers more effective drug delivery than MDI
2. Nebulized albuterol is preferred over MDI in the emergency department
3. MDI with Aerochamber can be safely used in infants
4. Children who get admitted for asthma exacerbations should be transitioned to MDI at the time of discharge

5/2/2013
7
Nebulizers
Are they necessary? MDI’s are just as effective for many
Includes acute exacerbations Settings where nebulizer may be
necessary: Infants or toddlersSevere exacerbationsParental preferenceExpert consensus (the EPR-3) and
evidence-based
Goals for this talk
Review common technologies that your patients may use
Review indications Provide some basic guidelines of what
can be done at home, in the office, and in the hospital
Provide some data on psychosocial aspects of caring for technology-dependent children
Impact on children
Emotional impact Prolonged hospital stays Low self-esteemSense of burden on parents
Social impactDisruption of social life Less time with peersVery little “alone time”
Mesman et al. 2012, Carnevale et al. 2006
Impact on children
School impactMainstream vs. special ed vs. special school Increased physical demands Lost time from medical treatmentsMissing school for appts creates additional
stress Quality of Life impact
Overall scores seem to be lowerNeed to balance against illness
Mesman et al. 2012
“Many parents struggle with significant emotional strain, the physical and psychological dependence of the child, the impact on family relationships, living with the daily threat of death, and feeling that they had no choice but to agree to the technology dependency because they would never let their child die.”
Mesman et al. 2012

5/2/2013
8
Impact on family
Emotional impactMood difficultiesSleep disruptionStress from lack of information and
educationStress of long hospitalizations
Different behaviors in front of staffTime away from other children and
spouse Economic burdens
Mesman et al. 2012
Impact on family
Social impactDisruption of social life Lost friendshipsAvoid public outings due to embarrassmentNeed for respite
Mesman et al. 2012
Impact on family
Family relationshipsDual role of parent and nurse Parents may do painful or distressing
proceduresMedical personnel in the homeSiblings emotions:
guilt, embarrassment, frustration, jealousy Less stable home life
Mesman et al. 2012
Advocating for our patients
“He only takes those type of patients on certain days”Challenges accessing subspecialty care 50% report at least one unmet medical need
Disabled CSHCN have even higher rates of needs and unmet needs specialty care, therapy services, mental
health services, home health, assistive devices, medical supplies, and DME
(CSHCN – children with special health care needs)
Other things we can do
Regular psychosocial assessments with a multidisciplinary team
Advocacy for a coordinated community-based system of support
Increased awareness by clinical providers of family impact
Financial and organizational support for practices
Support for multidisciplinary clinical models
Mesman et al. 2012
Other things we can do
Disaster preparedness Emergency preparedness
5/2/2013
9
©1999 by American Academy of Pediatrics ©1999 by American Academy of Pediatrics
Final Notes
Technology does not have to be complicated
Technology does not have to be scary Primary care physicians are the first line
of support for families of CSHCN and Technology-dependent children
Be aware of psychosocial needs Have an emergency plan
References
Mesman et al. The Impact of Technology Dependence on Children and Their Families. J Pediatr Health Care. 2012.
Carnavale et al. Daily living with distress and enrichment: the moral experience of families with ventilator-assisted children at home. Pediatrics. 2006.
Sakashita et al. Disaster Preparedness for Technology- and Electricity-Dependent Children and Youth With Special Health Care Needs. Clin Pediatr. 2013.
AAP Policy Statement - Emergency Preparedness for Children With Special Health Care Needs.
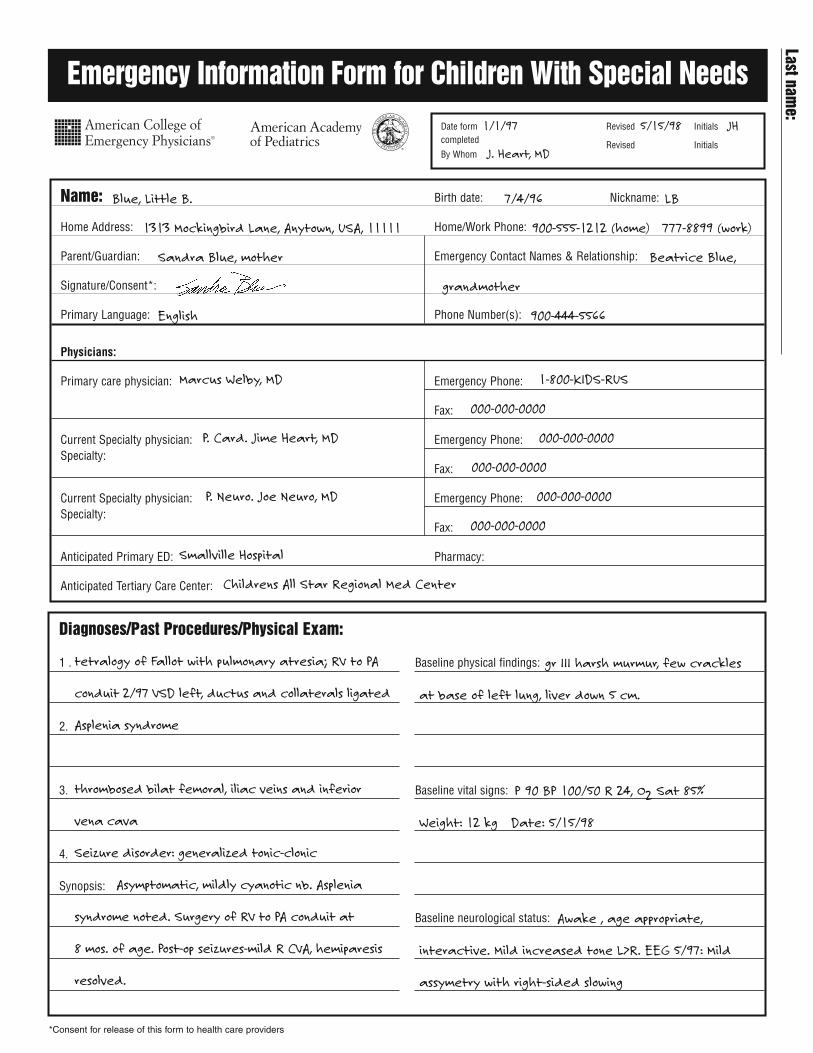
*Consent for release of this form to health care providers
Emergency Information Form for Children With Special Needs
Name: Birth date: Nickname:
Home Address: Home/Work Phone:
Parent/Guardian: Emergency Contact Names & Relationship:
Signature/Consent*:
Primary Language: Phone Number(s):
Physicians:
Primary care physician: Emergency Phone:
Fax:
Current Specialty physician: Emergency Phone:Specialty:
Fax:
Current Specialty physician: Emergency Phone:Specialty:
Fax:
Anticipated Primary ED: Pharmacy:
Anticipated Tertiary Care Center:
Diagnoses/Past Procedures/Physical Exam:
1 .
2.
3.
4.
Synopsis:
Baseline physical findings:
Baseline vital signs:
Baseline neurological status:
Date form completed
By Whom
Revised Initials
Revised Initials
1/1/97 5/15/98 JH
J. Heart, MD
Blue, Little B. 7/4/96 LB
1313 Mockingbird Lane, Anytown, USA, 11111 900-555-1212 (home) 777-8899 (work)
Sandra Blue, mother Beatrice Blue,
grandmother
English 900-444-5566
Marcus Welby, MD 1-800-KIDS-RUS
000-000-0000
P. Card. Jime Heart, MD 000-000-0000
000-000-0000
P. Neuro. Joe Neuro, MD 000-000-0000
000-000-0000
Smallville Hospital
Childrens All Star Regional Med Center
tetralogy of Fallot with pulmonary atresia; RV to PA
conduit 2/97 VSD left, ductus and collaterals ligated
Asplenia syndrome
thrombosed bilat femoral, iliac veins and inferior
vena cava
Seizure disorder: generalized tonic-clonic
Asymptomatic, mildly cyanotic nb. Asplenia
syndrome noted. Surgery of RV to PA conduit at
8 mos. of age. Post-op seizures-mild R CVA, hemiparesis
resolved.
gr III harsh murmur, few crackles
at base of left lung, liver down 5 cm.
P 90 BP 100/50 R 24, O2 Sat 85%
Weight: 12 kg Date: 5/15/98
Awake , age appropriate,
interactive. Mild increased tone L>R. EEG 5/97: Mild
assymetry with right-sided slowing
Last name:
Management Data:
Allergies: Medications/Foods to be avoided and why:
1.
2.
3.
Procedures to be avoided and why:
1.
2.
3.
Common Presenting Problems/Findings With Specific Suggested Managements
Problem Suggested Diagnostic Studies Treatment Considerations
Immunizations
Dates
DPT
OPV
MMR
HIB
Dates
Hep B
Varicella
TB status
Other
Antibiotic prophylaxis: Indication: Medication and dose:
Diagnoses/Past Procedures/Physical Exam continued:
Medications:
1.
2.
3.
4.
5.
6.
Significant baseline ancillary findings (lab, x-ray, ECG):
Prostheses/Appliances/Advanced Technology Devices:
Comments on child, family, or other specific medical issues:
Physician/Provider Signature: Print Name:
Digoxin 50 mcg=lcc BID
Lasix 10 mg BID
Amoxil 200 mg BID
Phenobarb 40 mg BID
Betadine rash
femoral venous puncture no fem veins
instillation of air into venous catheters R to L intracardiac shunt
9/4/96 11/4/96 1/4/97 1/10/98X X X XX X X X
XX X X
9/4/96 11/4/96 1/4/97 1/10/98X
Pneumovax
Mother is an excellent caregiver a nd knows when
LB is blue.
Worsened CHF cxr increase lasixStatus Epilepticus check electrolytes-Na midazolam, correct lytes
check phenobarbitol level
Fever sepsis w/u broad spectrum atbx for asplenic individual
Asplenia Amoxil 200 mg BIDSBE Prophylaxis Amoxil 50 mg/kg one hour prior to procedure
moderate cardiomegaly on cxr
chronic LLL atelectasis on cxr
RVH on EKG
homograft
conduit RV to MPA — no extra precautions. Sternal wires
and clips on vessels — no MRI until 6 mos post-op
Last name:
Jime Heart, MD
© American College of Emergency Physicians and American Academy of Pediatrics. Permission to reprint granted with acknowledgement.

THURSDAY, MAY 16, 2013
PALLIATING PAIN
Moderator: Dr. Karen Sun
THURSDAY, MAY 16, 2013
3:50
P Taking the Pain Out of Pain Management
Dr. Angela Anderson

4/18/2013
1
Angela C. Anderson, MD
I have no financial relationships with a commercial entity producing heathcare-related products and/or services relevant to the content I am presenting.
.
Children who require chronic opioids for chronic pain are at significant risk of developing opioid addiction?
The risk of developing drug addiction from opioid administration to patients with pain is:
A) 0.19%B) 1.9%C) 10.9%D) 19%
If…No h/o abuse or addictionRisk of addiction or abuse = 0.19%
Patients who ask for more pain meds within an hour or less of receiving IV opioids are most likely drug seeking?

4/18/2013
2
“Headache! “Pseudoaddiction
“Headache! “
“Headache! ““Headache!!! “
Drug Seeking?
Fibio says he’s in painFibio has been sleepingHis Vitals are normalIs Fibio fibbing?
Marco. Acad Emerg Med 2006 13: 974-979
NephrolithiasisMyocardial infarction Small bowel
obstruction Fracture
Burn Crush injury Stab wound Amputation
Painful Diagnoses:
ACADEMIC EMERGENCY MEDICINE 2006; 13:974–979
Decreased pain thresholds • Increased risk of chronic pain
Increased vulnerability to • Stress/ Anxiety disorders as adults• ADHD
Cell death in cortical and subcortical areas• Decreased short-term and long-term
memory
Anand et al Physiology & Behavior,(1999) 66(4) :627–637Anand et al. Pediatric Research (2007) 62, 283–290;
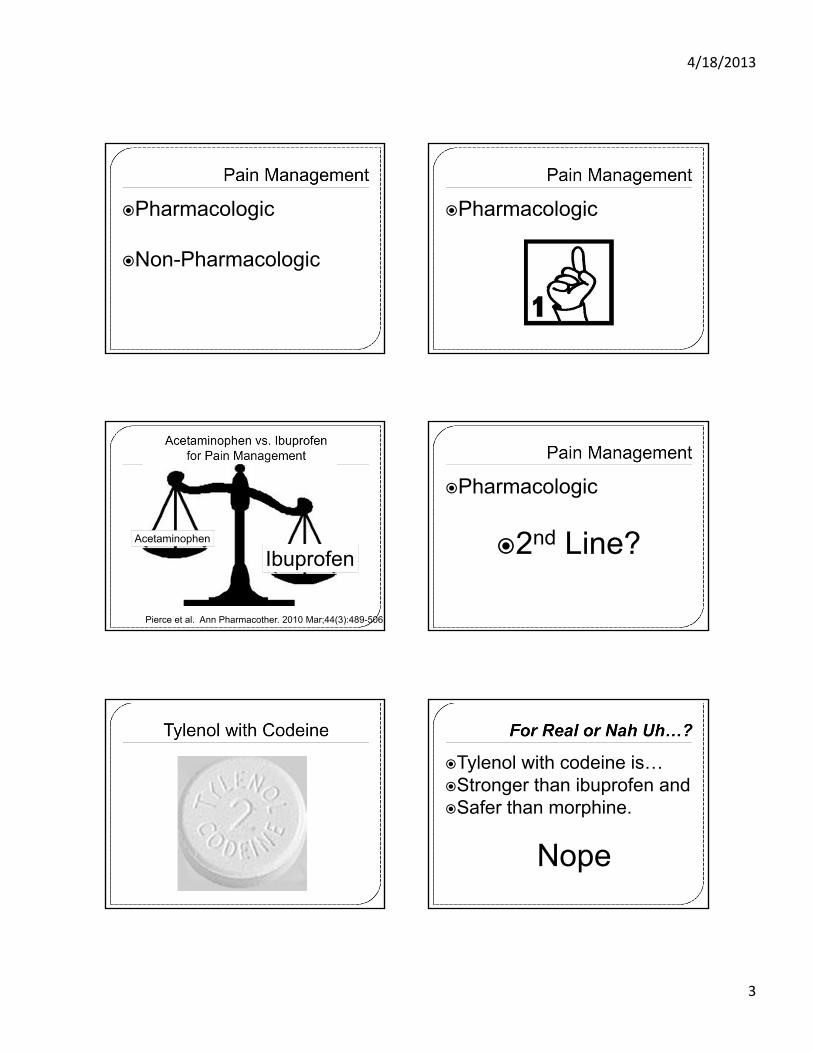
4/18/2013
3
Pharmacologic
Non-Pharmacologic
Pharmacologic
IbuprofenAcetaminophen
Pierce et al. Ann Pharmacother. 2010 Mar;44(3):489-506
Pharmacologic
2nd Line?
Tylenol with codeine is…Stronger than ibuprofen andSafer than morphine.
Nope
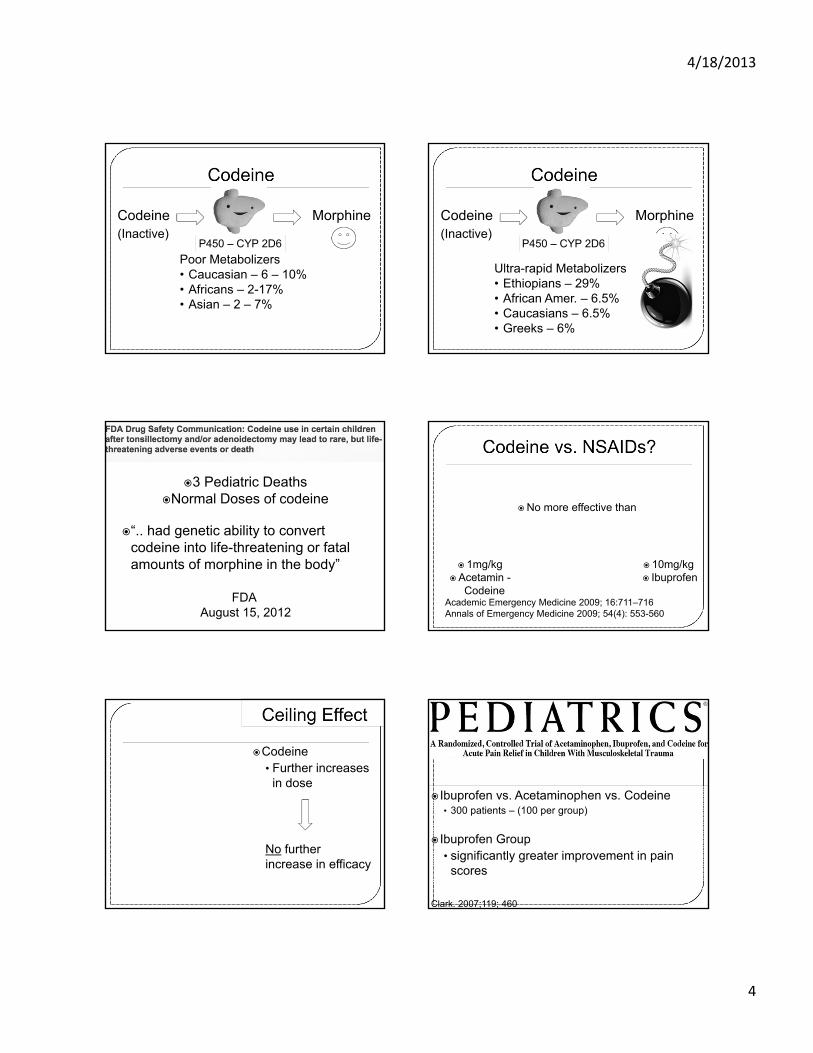
4/18/2013
4
Codeine
Poor Metabolizers• Caucasian – 6 – 10%• Africans – 2-17%• Asian – 2 – 7%
P450 – CYP 2D6
Morphine(Inactive)
Codeine
P450 – CYP 2D6
Morphine
Ultra-rapid Metabolizers• Ethiopians – 29%• African Amer. – 6.5%• Caucasians – 6.5%• Greeks – 6%
(Inactive)
3 Pediatric Deaths Normal Doses of codeine
“.. had genetic ability to convert codeine into life-threatening or fatal amounts of morphine in the body”
FDA August 15, 2012
No more effective than
Academic Emergency Medicine 2009; 16:711–716Annals of Emergency Medicine 2009; 54(4): 553-560
1mg/kg Acetamin -
Codeine
10mg/kg Ibuprofen
Codeine• Further increases
in dose
No further increase in efficacy
Ibuprofen vs. Acetaminophen vs. Codeine• 300 patients – (100 per group)
Ibuprofen Group• significantly greater improvement in pain
scores
Clark. 2007;119; 460
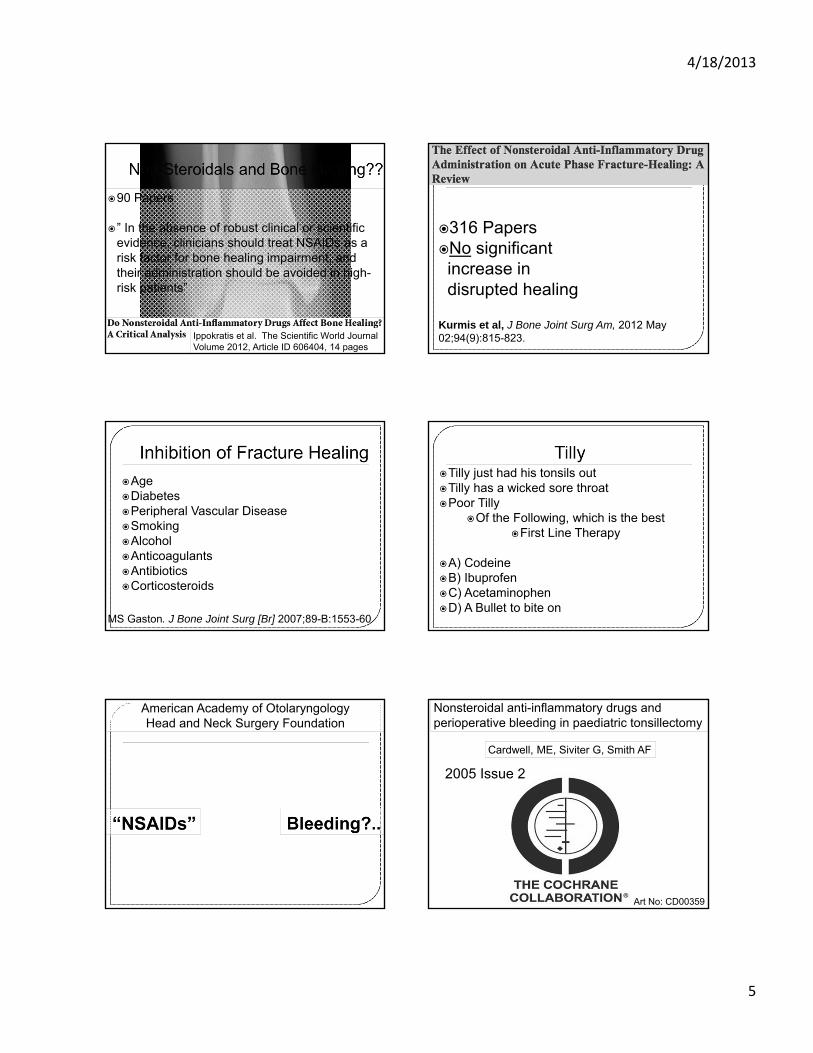
4/18/2013
5
Ippokratis et al. The Scientific World JournalVolume 2012, Article ID 606404, 14 pages
90 Papers
” In the absence of robust clinical or scientific evidence, clinicians should treat NSAIDs as a risk factor for bone healing impairment, and their administration should be avoided in high-risk patients”
Kurmis et al, J Bone Joint Surg Am, 2012 May 02;94(9):815-823.
316 PapersNo significant increase in disrupted healing
AgeDiabetesPeripheral Vascular DiseaseSmokingAlcoholAnticoagulantsAntibioticsCorticosteroids
MS Gaston. J Bone Joint Surg [Br] 2007;89-B:1553-60
Tilly just had his tonsils outTilly has a wicked sore throatPoor Tilly
Of the Following, which is the best First Line Therapy
A) CodeineB) IbuprofenC) AcetaminophenD) A Bullet to bite on
American Academy of OtolaryngologyHead and Neck Surgery Foundation
2005 Issue 2
Art No: CD00359
Nonsteroidal anti-inflammatory drugs and perioperative bleeding in paediatric tonsillectomy
Cardwell, ME, Siviter G, Smith AF
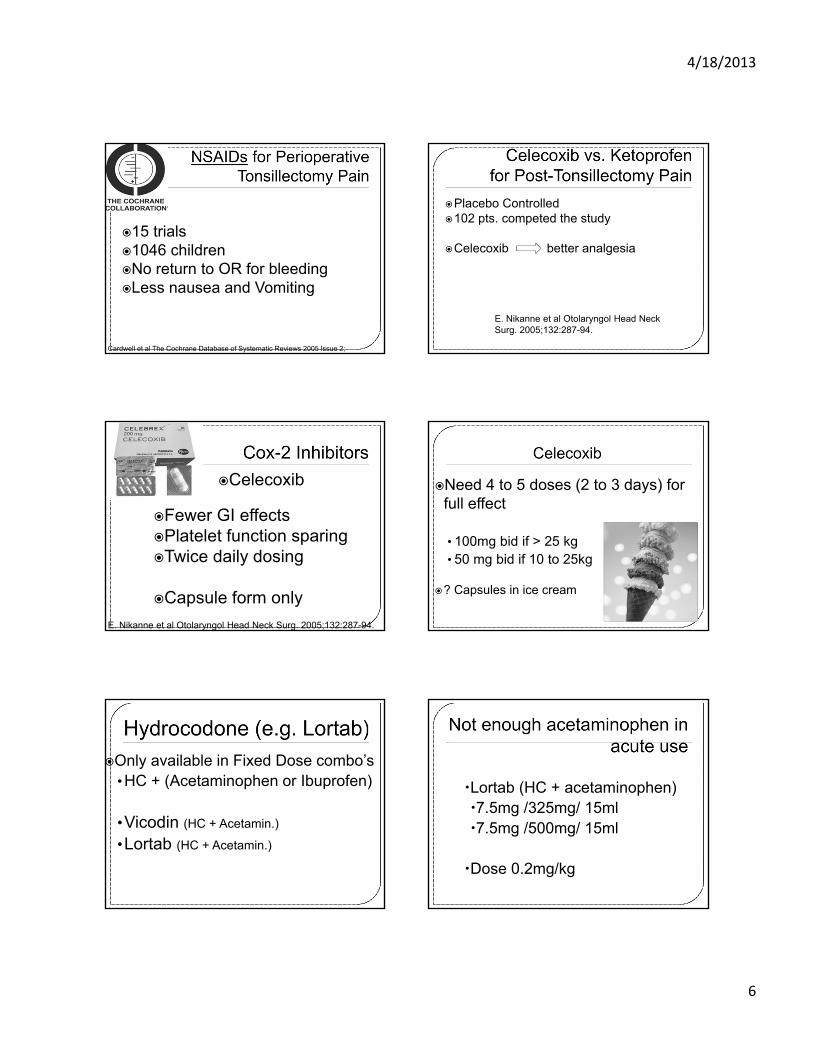
4/18/2013
6
15 trials1046 children No return to OR for bleedingLess nausea and Vomiting
Cardwell et al The Cochrane Database of Systematic Reviews 2005 Issue 2;
Placebo Controlled102 pts. competed the study
Celecoxib better analgesia
E. Nikanne et al Otolaryngol Head Neck Surg. 2005;132:287-94.
Celecoxib
Fewer GI effectsPlatelet function sparingTwice daily dosing
Capsule form only
E. Nikanne et al Otolaryngol Head Neck Surg. 2005;132:287-94.
Need 4 to 5 doses (2 to 3 days) for full effect
• 100mg bid if > 25 kg• 50 mg bid if 10 to 25kg
? Capsules in ice cream
Only available in Fixed Dose combo’s• HC + (Acetaminophen or Ibuprofen)
•Vicodin (HC + Acetamin.)
•Lortab (HC + Acetamin.)
Lortab (HC + acetaminophen) 7.5mg /325mg/ 15ml7.5mg /500mg/ 15ml
Dose 0.2mg/kg
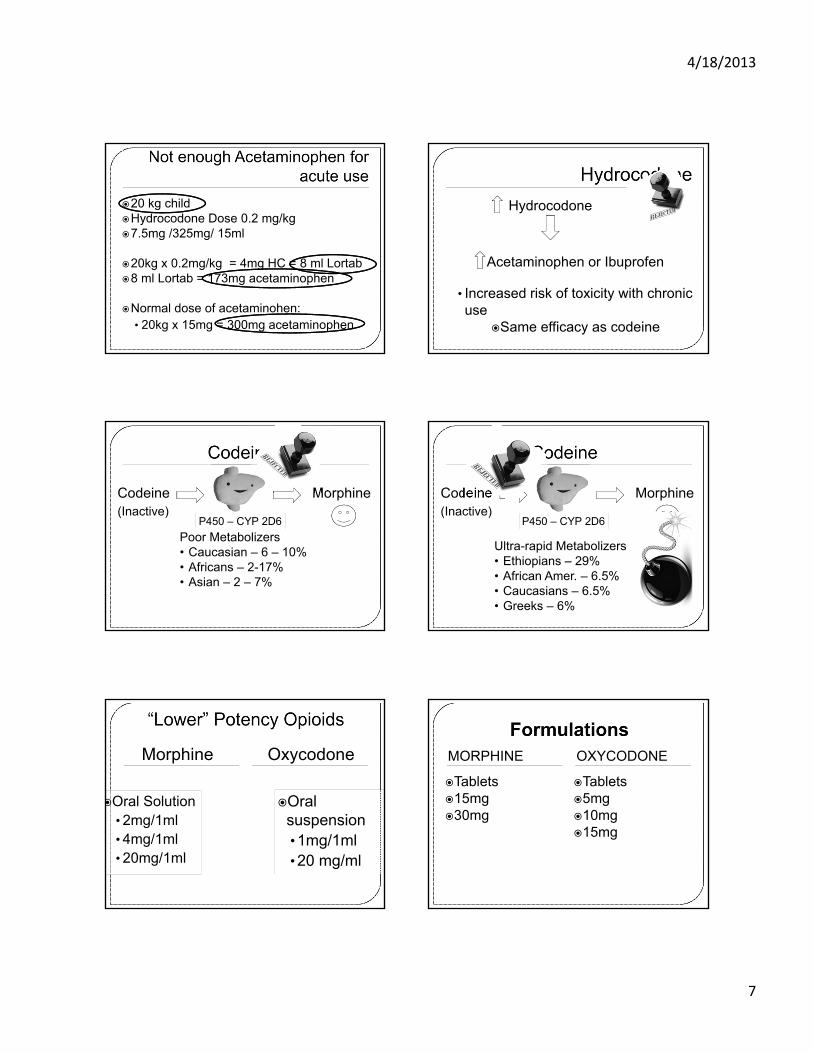
4/18/2013
7
20 kg childHydrocodone Dose 0.2 mg/kg7.5mg /325mg/ 15ml
20kg x 0.2mg/kg = 4mg HC = 8 ml Lortab8 ml Lortab = 173mg acetaminophen
Normal dose of acetaminohen:• 20kg x 15mg = 300mg acetaminophen
• Increased risk of toxicity with chronic use
Same efficacy as codeine
Acetaminophen or Ibuprofen
Hydrocodone
Codeine
Poor Metabolizers• Caucasian – 6 – 10%• Africans – 2-17%• Asian – 2 – 7%
P450 – CYP 2D6
Morphine(Inactive)
Codeine
P450 – CYP 2D6
Morphine
Ultra-rapid Metabolizers• Ethiopians – 29%• African Amer. – 6.5%• Caucasians – 6.5%• Greeks – 6%
(Inactive)
Morphine Oxycodone
Oral Solution• 2mg/1ml• 4mg/1ml• 20mg/1ml
Oral suspension• 1mg/1ml• 20 mg/ml
MORPHINE OXYCODONE
Tablets15mg30mg
Tablets5mg10mg15mg
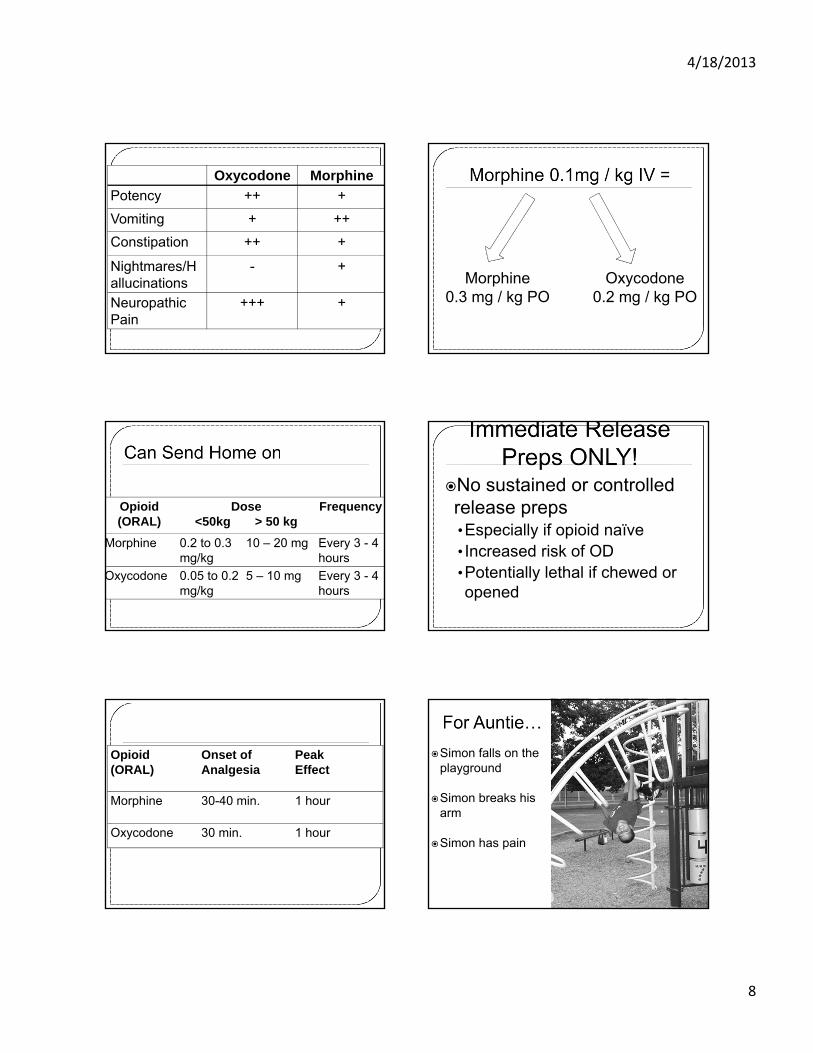
4/18/2013
8
Oxycodone Morphine
Potency ++ +
Vomiting + ++
Constipation ++ +
Nightmares/Hallucinations
- +
Neuropathic Pain
+++ +
Morphine0.3 mg / kg PO
Oxycodone0.2 mg / kg PO
Opioid (ORAL)
Dose<50kg > 50 kg
Frequency
Morphine 0.2 to 0.3mg/kg
10 – 20 mg Every 3 - 4 hours
Oxycodone 0.05 to 0.2mg/kg
5 – 10 mg Every 3 - 4 hours
No sustained or controlled release preps•Especially if opioid naïve• Increased risk of OD•Potentially lethal if chewed or opened
Opioid (ORAL)
Onset of Analgesia
PeakEffect
Morphine 30-40 min. 1 hour
Oxycodone 30 min. 1 hour
Simon falls on the playground
Simon breaks his arm
Simon has pain
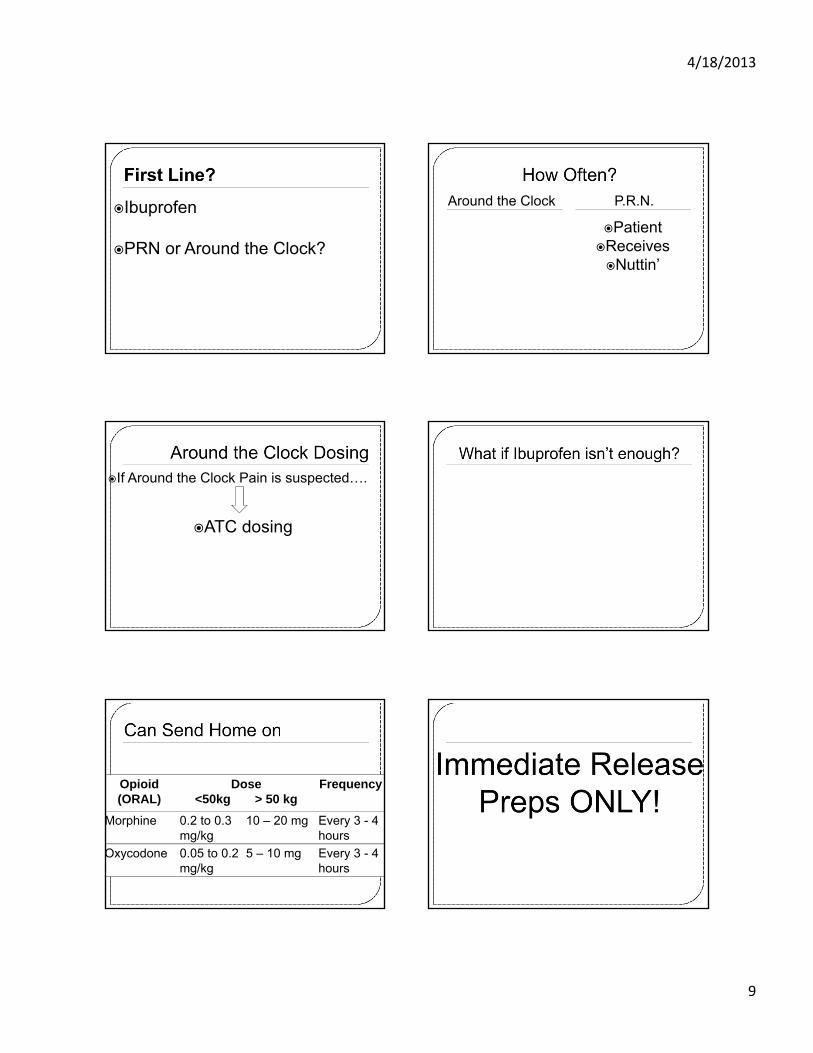
4/18/2013
9
Ibuprofen
PRN or Around the Clock?
Around the Clock P.R.N.
PatientReceivesNuttin’
If Around the Clock Pain is suspected….
ATC dosing
Opioid (ORAL)
Dose<50kg > 50 kg
Frequency
Morphine 0.2 to 0.3mg/kg
10 – 20 mg Every 3 - 4 hours
Oxycodone 0.05 to 0.2mg/kg
5 – 10 mg Every 3 - 4 hours
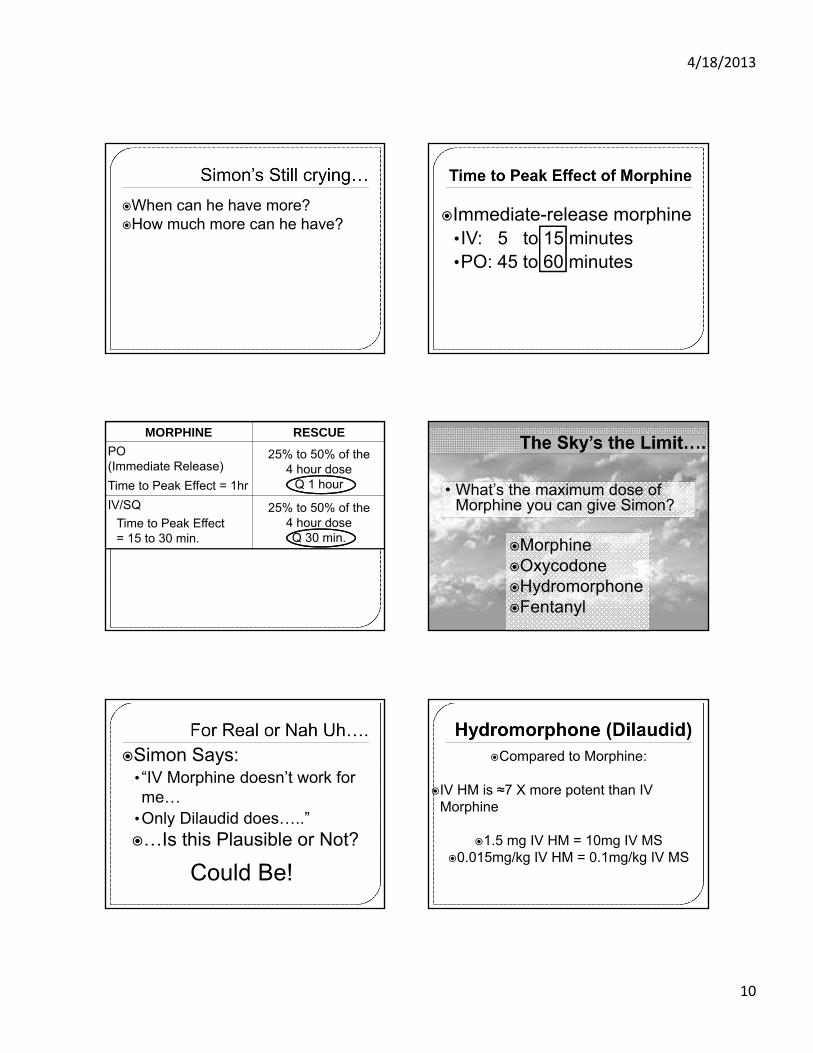
4/18/2013
10
When can he have more?How much more can he have? Immediate-release morphine
•IV: 5 to 15 minutes•PO: 45 to 60 minutes
MORPHINE RESCUE
PO (Immediate Release)
25% to 50% of the 4 hour dose
Q 1 hour
IV/SQ 25% to 50% of the 4 hour dose Q 30 min.
Time to Peak Effect = 1hr
Time to Peak Effect = 15 to 30 min.
MorphineOxycodoneHydromorphoneFentanyl
• What’s the maximum dose of Morphine you can give Simon?
Simon Says: • “IV Morphine doesn’t work for me…
•Only Dilaudid does…..”…Is this Plausible or Not?
Could Be!
Compared to Morphine:
IV HM is ≈7 X more potent than IV Morphine
1.5 mg IV HM = 10mg IV MS0.015mg/kg IV HM = 0.1mg/kg IV MS

4/18/2013
11
? Less Nausea ? Less Pruritus? Less Sedation
Lower third (just past anal sphincter)• No 1st pass metabolism• Goes directly into circulation
Proximal 2/3• Drains Hepatic vein Liver
14 Fr Suction Catheter2.Air
1.Medication
3.Add Tip
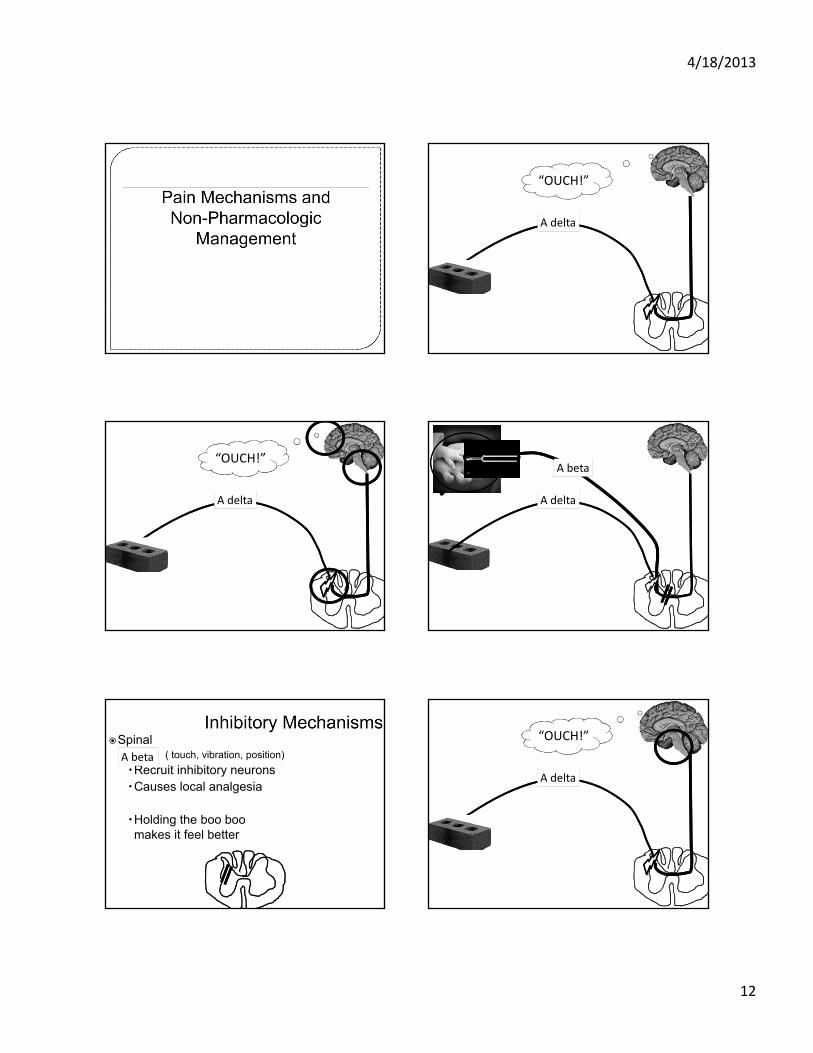
4/18/2013
12
A delta
“OUCH!”
A delta
“OUCH!”
A delta
A beta
Spinal• ( touch, vibration, position)
Recruit inhibitory neuronsCauses local analgesia
Holding the boo boo makes it feel better
A beta
A delta
“OUCH!”
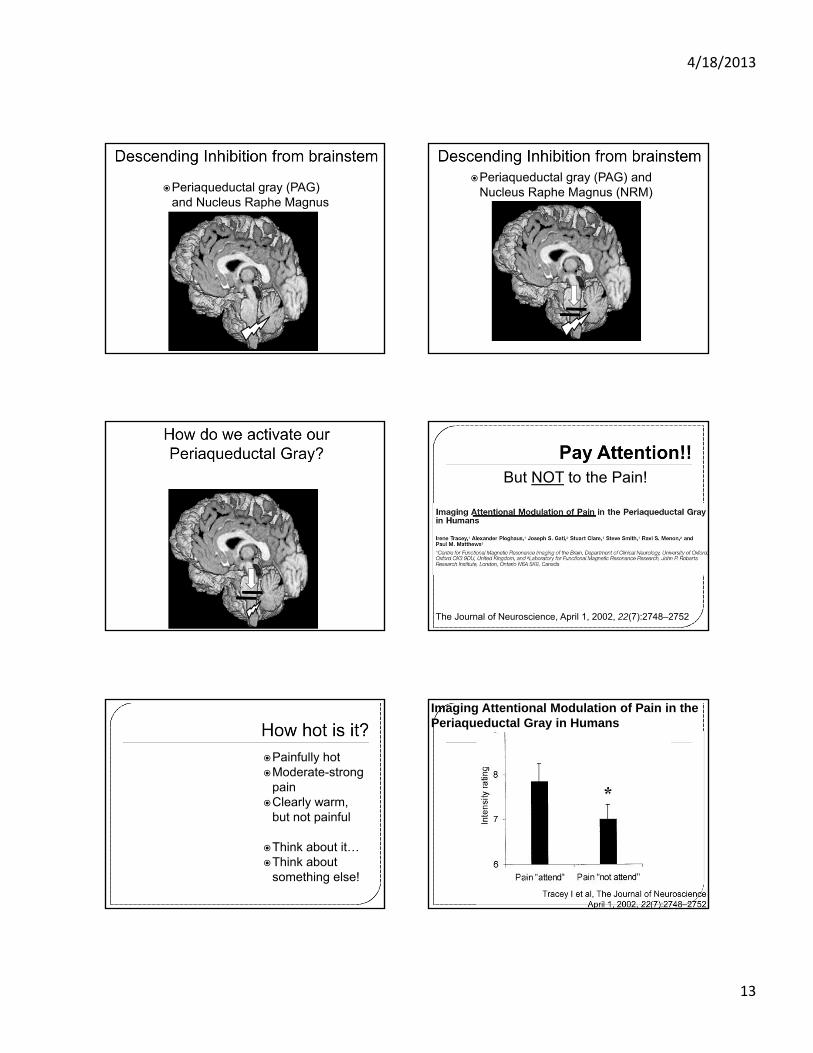
4/18/2013
13
Periaqueductal gray (PAG) and Nucleus Raphe Magnus (NRM)
Periaqueductal gray (PAG) and Nucleus Raphe Magnus (NRM)
But NOT to the Pain!
The Journal of Neuroscience, April 1, 2002, 22(7):2748–2752
Painfully hotModerate-strong
painClearly warm,
but not painful
Think about it…Think about
something else!
Imaging Attentional Modulation of Pain in the Periaqueductal Gray in Humans
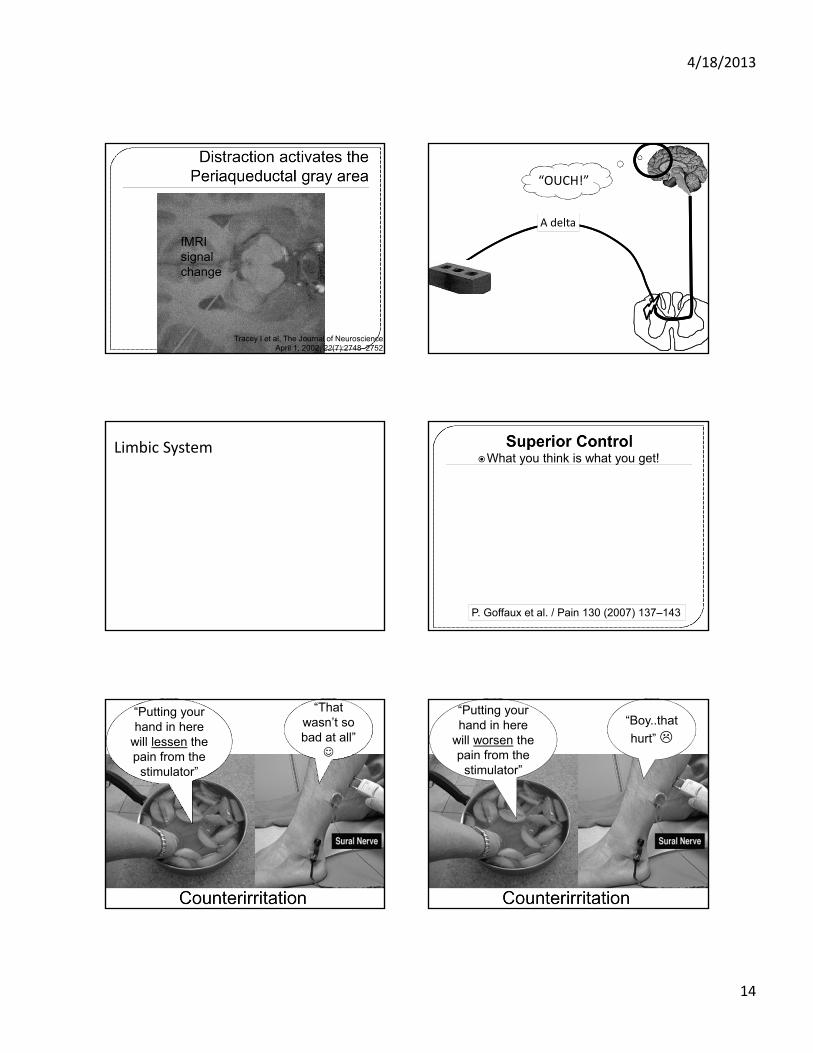
4/18/2013
14
fMRI signal change
Tracey I et al, The Journal of NeuroscienceApril 1, 2002, 22(7):2748–2752
A delta
“OUCH!”
Limbic SystemWhat you think is what you get!
P. Goffaux et al. / Pain 130 (2007) 137–143
“Putting your “Putting your hand in here
will lessen the pain from the
stimulator”
“That “That wasn’t so bad at all”
“Putting your
stimulator”
“Putting your hand in here
will worsen the pain from the
stimulator”
“Boy..that
hurt”
4/18/2013
15
HarderOpen‐ended / Extending
SofterHelp confine/familiarize/imply manageability
This will hurt It might feel (very): sore, achy, scratchy, snug, full…
The medicine will burn Some children say they feel a warm feeling
The medicine will taste bad
The medicine may taste differentthan anything you’ve tasted before
As big as (e.g. size of catheter)
Smaller than….
As long as ( duration of procedure)
For less time than it takes to…
As much as… Less than… From Kuttner – A Child in Pain
A. Vanhaudenhuyse et al. / NeuroImage 47 (2009) 1047–1054
- one packet or cube of sugar in 10 mL water
- Up to 12 months
Crying reduced by 82%Grimacing reduced by 65%
Lower rise in HR
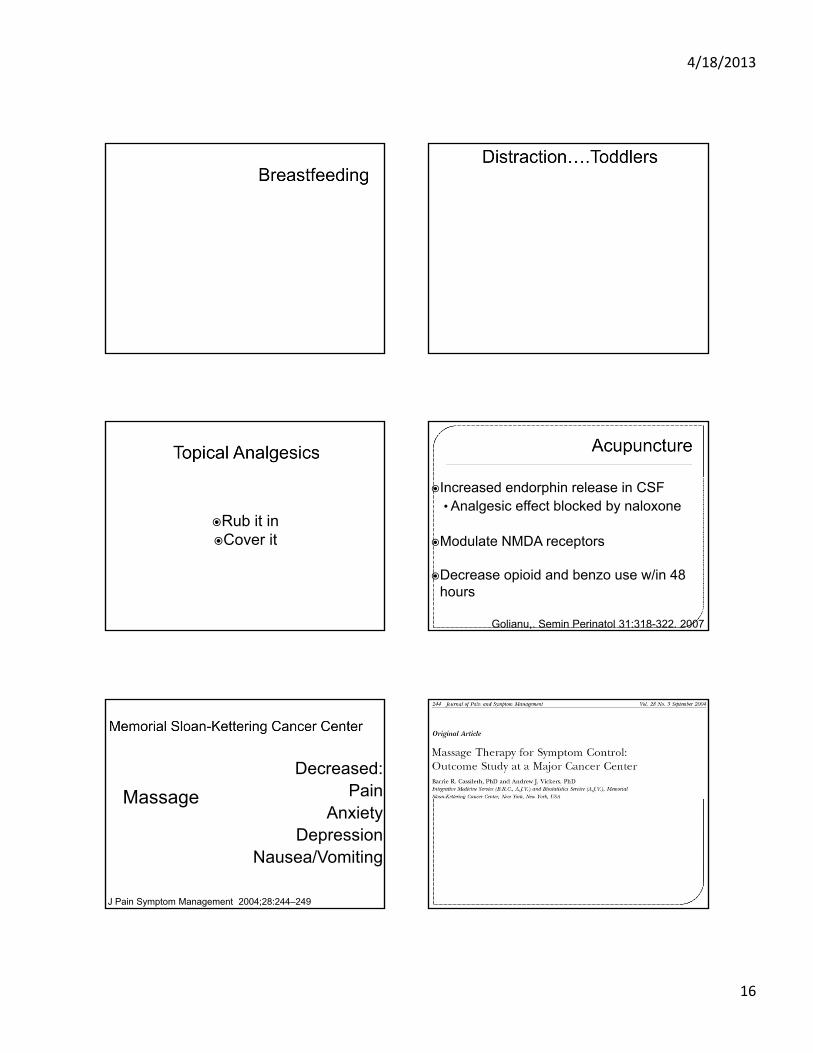
4/18/2013
16
Rub it inCover it
Increased endorphin release in CSF• Analgesic effect blocked by naloxone
Modulate NMDA receptors
Decrease opioid and benzo use w/in 48 hours
Golianu,. Semin Perinatol 31:318-322. 2007
J Pain Symptom Management 2004;28:244–249
Decreased: Pain
AnxietyDepression
Nausea/Vomiting
Massage
THURSDAY, MAY 16, 2013
4:40
P Triptans for Kids
Dr. Amy Gelfand
4/18/2013
1
Triptans for Kids
Amy A. Gelfand, MD
Departments of Neurology and Pediatrics
UCSF Child Neurology and Headache Center
Disclosures
I receive grant funding from:
NIH/NINDS
UCSF CTSI
And honoraria from Journal Watch Neurology
Some off-label uses of medications will be discussed
Goals
• Review Epidemiology and Diagnostic Criteria for migraine in children/adolescents
• Overview of treatment of acute migraine in children/adolescents
• Detailed review of the evidence for the use of triptans in children/adolescents
Epidemiology of Migraine
One-year period-prevalence for migraine by age and sex
Victor et al, Cephalalgia, 2010
Diagnostic Criteria for Migraine
A. At least 5 attacks B. Duration 1-72 hoursC. At least two of:
• Pounding quality• Moderate or severe intensity• Unilateral or bilateral location• Movement sensitivity
D. At least one of: (can be inferred from behavior)•Photophobia and phonophobia• Nausea and/or vomiting
E. Not attributable to another disorder
ICHD-II, Cephalalgia, 2004
Disability from Migraine
• Disability from headache can be measured using PedMIDAS
• Areas of disability:-Missed school1
-Impaired performance in school1
-Impaired ability to participate in sports and other extra-curricular activities
• Impact on Quality of Life• Impact on other family members (parents, sibs)
1Arruda, Neurology, 2012

4/18/2013
2
Overview of Pediatric Acute Migraine Treatment
Non-pharmacologic measures: Quiet, dark environment Encourage PO fluid intake
Pharmacologic measures:1) Non-specific analgesics: Studied down to Age 4
•Acetaminophen•NSAIDs: Naproxen, Ibuprofen, Ketorolac
2) Dopamine receptor antagonists: e.g. prochlorperazine3) Dihydroergotamine (DHE): IM, IV, NS4) Opioids5) Barbiturate containing compounds (i.e. Fioricet)6) Triptans
Triptans
• 5HT1B/1D receptor agonists• Most efficacious taken when pain is still mild,
which tends to be early in the attack• 7 currently on the U.S. market• 2 FDA-labeled for use in pediatric patients, and
others studied • 3 formulations: PO, nasal spray, injection• Generally, oral formulations easiest, though not
always possible due to nausea or speed of headache onset
Question #1
You’re seeing a 15 year old girl who has migraine attacks twice a month. The pain during her attacks is severe and associated with photophobia and phonophobia, but not nausea or vomiting. Naproxen (Aleve) helps a bit but she is still not able to get out of bed during an attack. Would you:
A) Refer her to Neurology for treatment recommendations
B) Curbside Neurology regarding which triptan would be appropriate in her age group and what dose
C) Prescribe a triptanD) Prescribe another class of medication
When to consider a triptan
Child has moderate or severe pain with attacks
NSAIDs or acetaminophen inadequately treat the pain
When not to consider a triptan
History of stroke or myocardial infarction Uncontrolled hypertension Hemiplegic or basilar-type migraine Pregnancy (relative contra-indication)
In someone with triptan overuse medication overuse headache; a risk when using triptans ≥10 triptan days/month for ≥3 months
Question #2
You would like to try a triptan to treat the 15 year old patient from Question #1. Which one would you choose?
A) Sumatriptan POB) Sumatriptan NSC) Frovatriptan POD) Zolmitriptan NSE) Rizatriptan MLT

4/18/2013
3
Sumatriptan
In clinical use in the U.S. since early 1990s 3 forms:
PO Nasal spray (NS) Subcutaneous injection (SC)
Pediatric studies: PO: one negative trial, but… SC: Open-label use suggests efficacy NS:
3 positive double-blind, placebo-controlled trials Labeled for use in 12-17 year-olds in the UK, now
generic so unlikely to ever get labeled in U.S.
Sumatriptan NS
Ages studied Dose Used Pain Relief
6-9 years1 20 mg 86% at 2 hours
12-17 years2 5-20 mg 66% at 2 hours
8-17 years3 10-20 mg 64% at 2 hours
1Ueberall, Neurology, 19992Winner, Pediatrics, 20003Ahonen, Neurology, 20044Lewis, Neurology, 2004
•2004 Practice Parameter from American Academy of Neurology and Child Neurology Society: “Sumatriptan nasal spray is effective and should be considered for the acute treatment of migraine in adolescents”4
Almotriptan
FDA-labeled for treatment of acute migraine in adolescents 12-17 years old
Randomized, double-blind, placebo-controlled, parallel-group trial in 12-17 year olds of 6.25 or 12.5 mg PO: pain relief in 72-73% at 2 hours1
1Linder, Headache, 2008
Rizatriptan
FDA-labeled for treatment of acute migraine in ages 6-17
Labeled dosing: <40 kg: 5 mg MLT≥40 kg: 10 mg MLT
Randomized, double-blind, placebo-controlled trial: 73-74% had pain relief at 2 hours1
Second RCT: higher 2 hour pain freedom rate in rizatriptan vs. placebo.2
1Ahonen, Neurology, 20062Ho, Cephalalgia, 2012
Zolmitriptan
Off label for pediatric use Nasal spray formulation: better absorption than
sumatriptan NS Positive trials:
Negative trial: A second oral trial was negative, placebo response rate very high (58%)
Ages studied Dose Used Pain Relief
6-18 years1 2.5 mg PO 62% at 2 hours, 64% in those <13
12-17 years2 5 mg NS 58% at 1 hour
1Evers, Neurology, 20062Lewis, Pediatrics, 2007
Question #3
Your 15 year-old migraine patient responds within 2 hours to rizatriptan 10 mg MLT and has no side effects. However, about half the time the headache comes back the next morning. What do you tell her?
A) There’s no way to decrease the likelihood of recurrent headache
B) Take a second dose of rizatriptan before bedC) Take naproxen with the rizatriptan
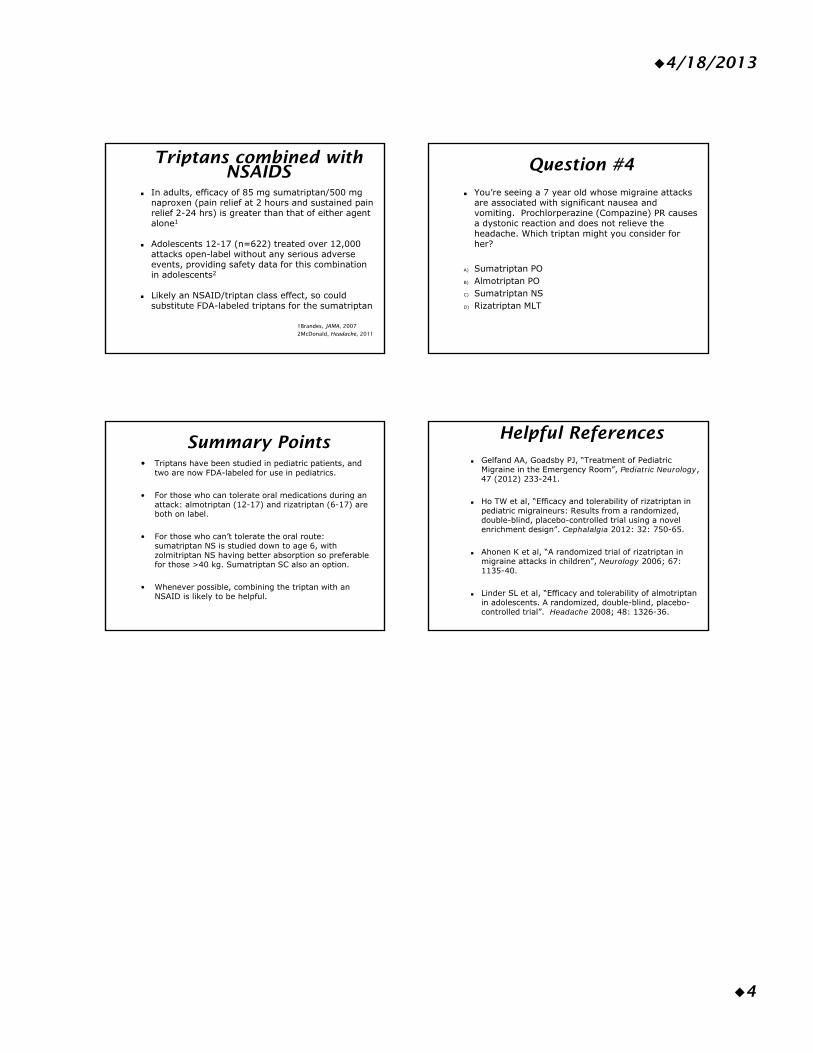
4/18/2013
4
Triptans combined with NSAIDS
In adults, efficacy of 85 mg sumatriptan/500 mg naproxen (pain relief at 2 hours and sustained pain relief 2-24 hrs) is greater than that of either agent alone1
Adolescents 12-17 (n=622) treated over 12,000 attacks open-label without any serious adverse events, providing safety data for this combination in adolescents2
Likely an NSAID/triptan class effect, so could substitute FDA-labeled triptans for the sumatriptan
1Brandes, JAMA, 20072McDonald, Headache, 2011
Question #4
You’re seeing a 7 year old whose migraine attacks are associated with significant nausea and vomiting. Prochlorperazine (Compazine) PR causes a dystonic reaction and does not relieve the headache. Which triptan might you consider for her?
A) Sumatriptan POB) Almotriptan POC) Sumatriptan NSD) Rizatriptan MLT
Summary Points• Triptans have been studied in pediatric patients, and
two are now FDA-labeled for use in pediatrics.
• For those who can tolerate oral medications during an attack: almotriptan (12-17) and rizatriptan (6-17) are both on label.
• For those who can’t tolerate the oral route: sumatriptan NS is studied down to age 6, with zolmitriptan NS having better absorption so preferable for those >40 kg. Sumatriptan SC also an option.
• Whenever possible, combining the triptan with an NSAID is likely to be helpful.
Helpful References Gelfand AA, Goadsby PJ, “Treatment of Pediatric
Migraine in the Emergency Room”, Pediatric Neurology, 47 (2012) 233-241.
Ho TW et al, “Efficacy and tolerability of rizatriptan in pediatric migraineurs: Results from a randomized, double-blind, placebo-controlled trial using a novel enrichment design”. Cephalalgia 2012: 32: 750-65.
Ahonen K et al, “A randomized trial of rizatriptan in migraine attacks in children”, Neurology 2006; 67: 1135-40.
Linder SL et al, “Efficacy and tolerability of almotriptanin adolescents. A randomized, double-blind, placebo-controlled trial”. Headache 2008; 48: 1326-36.
FRIDAY, MAY 17, 2013
RESPIRATORY TREE POTPOURRI
Moderator: Dr. Myles Abbott
FRIDAY, MAY 17, 2013
8:15
What's New in Pneumonia? More Than You May Think
Dr. Andrew Pavia
1
Pavia 2010
What’s new in pneumonia?:
More than you may think
Andrew Pavia MDGeorge and Esther Gross Presidential
ProfessorUniversity of Utah
Pavia
Disclosures
• Conflicts: None
• Funding:– CDC 1U181P000303
– NIH/NIAID 1 R01 AI089489-01
Pavia
Outline
• What is pneumonia?
• Epidemiology
• Diagnosis
• Complications
• Guidelines
• The way forward
Pavia
History
• Pneumonia: The Captain of the Men of Death
– Sir William Osler (1849-1919)
• Death due to empyema during the Spanish influenza pandemic
Pavia
Statement of the clinical problems• Respiratory viral infections cause the majority of lower
respiratory tract infection in children
• Viruses are also important causes of CAP in adults and the immunocompromised overlapping bacterial infection
• Antibiotics are over prescribed for bronchitis and viral pneumonia and empiric therapy may be overly broad
• Antivirals are under utilized for influenza
• BUT…. Diagnosing the etiology of pneumonia remains difficult
Pavia
Definitions• Pneumonia is infection of the lung involving the
alveoli and distal airways
• CAP is the presence of signs and symptoms of pneumonia in a previously healthy child due to an infection acquired outside of the hospital
• Signs and symptoms
– Best positive predictive value
• Nasal flaring (<12 months)
• Oxygen saturation < 94% (sea level)
• Tachypnea/retractions
– Best Negative Predictive Value
• Absence of tachypnea or other respiratory signs
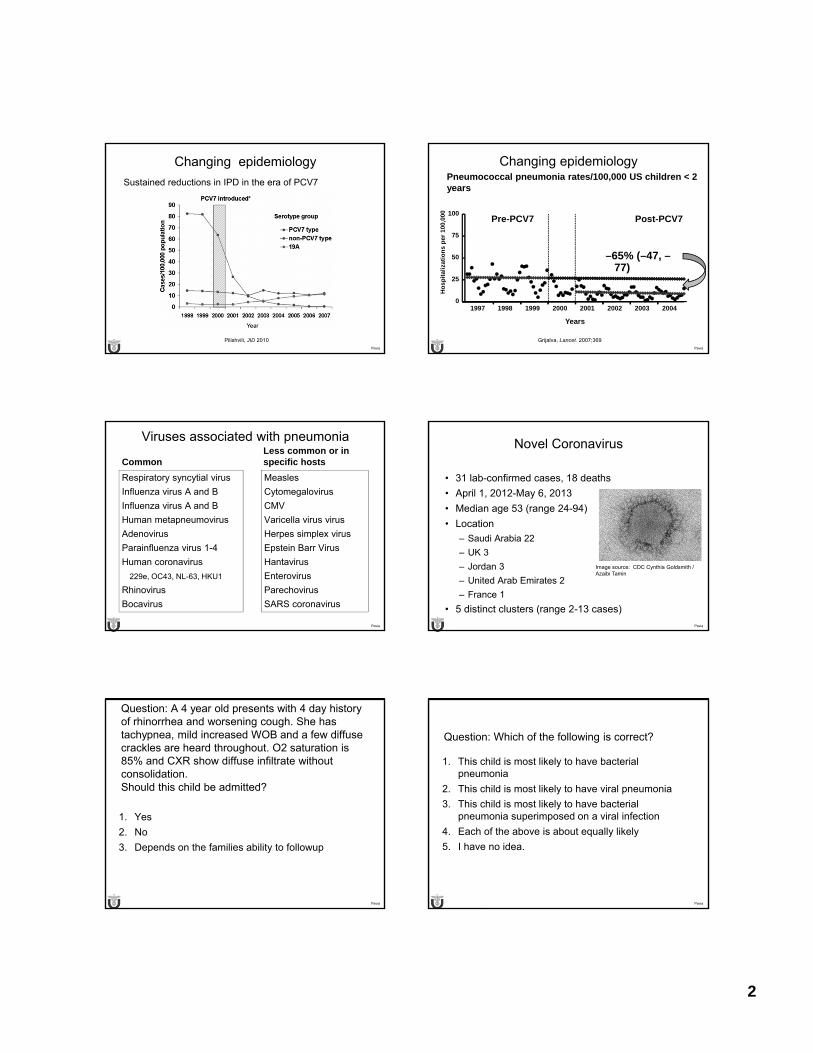
2
Pavia
Changing epidemiology
Sustained reductions in IPD in the era of PCV7
Pilishvili, JID 2010Pavia
Changing epidemiologyPneumococcal pneumonia rates/100,000 US children < 2 years
Grijalva, Lancet. 2007;369
–65% (–47, –77)
1997 1998 1999 2000 2001 2002 2003 20040
25
50
75
100Pre-PCV7 Post-PCV7
Years
Ho
spit
aliz
atio
ns
per
100
,000
Pavia
Viruses associated with pneumonia
Common
Respiratory syncytial virus
Influenza virus A and B
Influenza virus A and B
Human metapneumovirus
Adenovirus
Parainfluenza virus 1-4
Human coronavirus
229e, OC43, NL-63, HKU1
Rhinovirus
Bocavirus
Less common or in specific hosts
Measles
Cytomegalovirus
CMV
Varicella virus virus
Herpes simplex virus
Epstein Barr Virus
Hantavirus
Enterovirus
Parechovirus
SARS coronavirus
Pavia
Novel Coronavirus
• 31 lab-confirmed cases, 18 deaths
• April 1, 2012-May 6, 2013
• Median age 53 (range 24-94)
• Location
– Saudi Arabia 22
– UK 3
– Jordan 3
– United Arab Emirates 2
– France 1
• 5 distinct clusters (range 2-13 cases)
Image source: CDC Cynthia Goldsmith / Azaibi Tamin
Pavia
Question: A 4 year old presents with 4 day history of rhinorrhea and worsening cough. She has tachypnea, mild increased WOB and a few diffuse crackles are heard throughout. O2 saturation is 85% and CXR show diffuse infiltrate without consolidation. Should this child be admitted?
1. Yes
2. No
3. Depends on the families ability to followup
Pavia
Question: Which of the following is correct?
1. This child is most likely to have bacterial pneumonia
2. This child is most likely to have viral pneumonia
3. This child is most likely to have bacterial pneumonia superimposed on a viral infection
4. Each of the above is about equally likely
5. I have no idea.
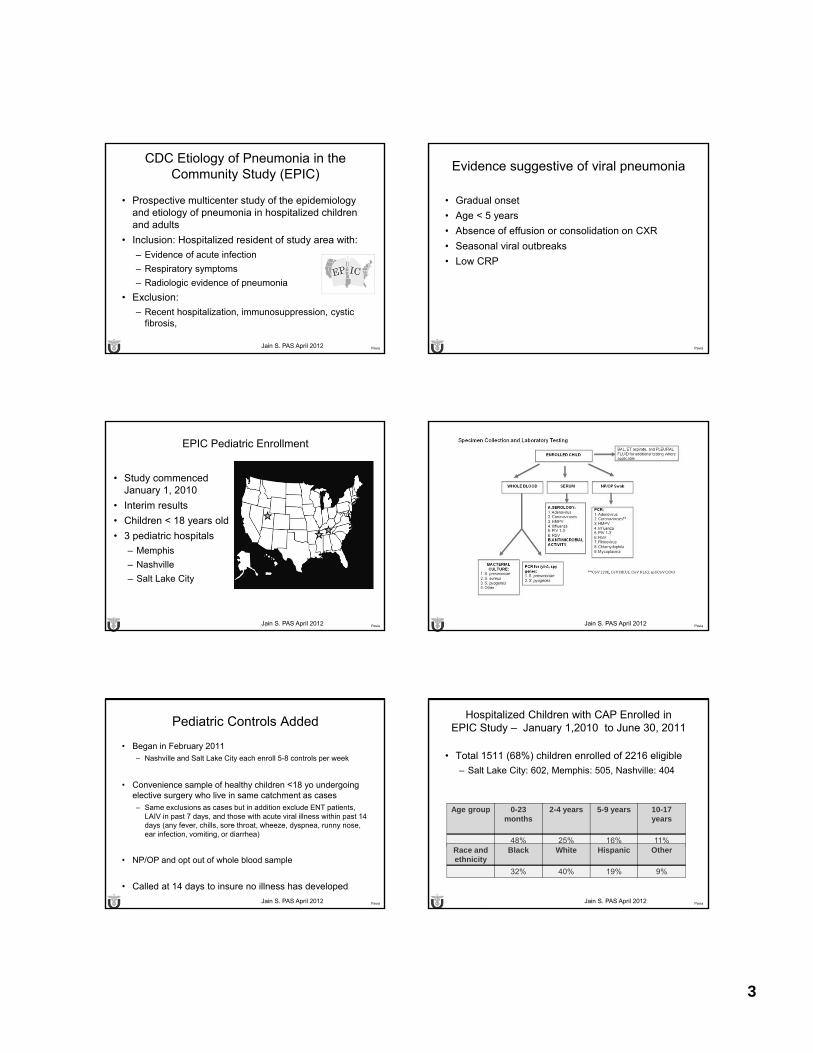
3
Pavia
CDC Etiology of Pneumonia in the Community Study (EPIC)
• Prospective multicenter study of the epidemiology and etiology of pneumonia in hospitalized children and adults
• Inclusion: Hospitalized resident of study area with:
– Evidence of acute infection
– Respiratory symptoms
– Radiologic evidence of pneumonia
• Exclusion:
– Recent hospitalization, immunosuppression, cystic fibrosis,
Jain S. PAS April 2012 Pavia
Evidence suggestive of viral pneumonia
• Gradual onset
• Age < 5 years
• Absence of effusion or consolidation on CXR
• Seasonal viral outbreaks
• Low CRP
Pavia
EPIC Pediatric Enrollment
• Study commenced January 1, 2010
• Interim results
• Children < 18 years old
• 3 pediatric hospitals
– Memphis
– Nashville
– Salt Lake City
Jain S. PAS April 2012 Pavia Jain S. PAS April 2012
Pavia
Pediatric Controls Added
• Began in February 2011– Nashville and Salt Lake City each enroll 5-8 controls per week
• Convenience sample of healthy children <18 yo undergoing elective surgery who live in same catchment as cases– Same exclusions as cases but in addition exclude ENT patients,
LAIV in past 7 days, and those with acute viral illness within past 14 days (any fever, chills, sore throat, wheeze, dyspnea, runny nose, ear infection, vomiting, or diarrhea)
• NP/OP and opt out of whole blood sample
• Called at 14 days to insure no illness has developed
Jain S. PAS April 2012 Pavia
Hospitalized Children with CAP Enrolled in EPIC Study – January 1,2010 to June 30, 2011
• Total 1511 (68%) children enrolled of 2216 eligible
– Salt Lake City: 602, Memphis: 505, Nashville: 404
Age group 0-23months
2-4 years 5-9 years 10-17years
48% 25% 16% 11%Race and ethnicity
Black White Hispanic Other
32% 40% 19% 9%
Jain S. PAS April 2012
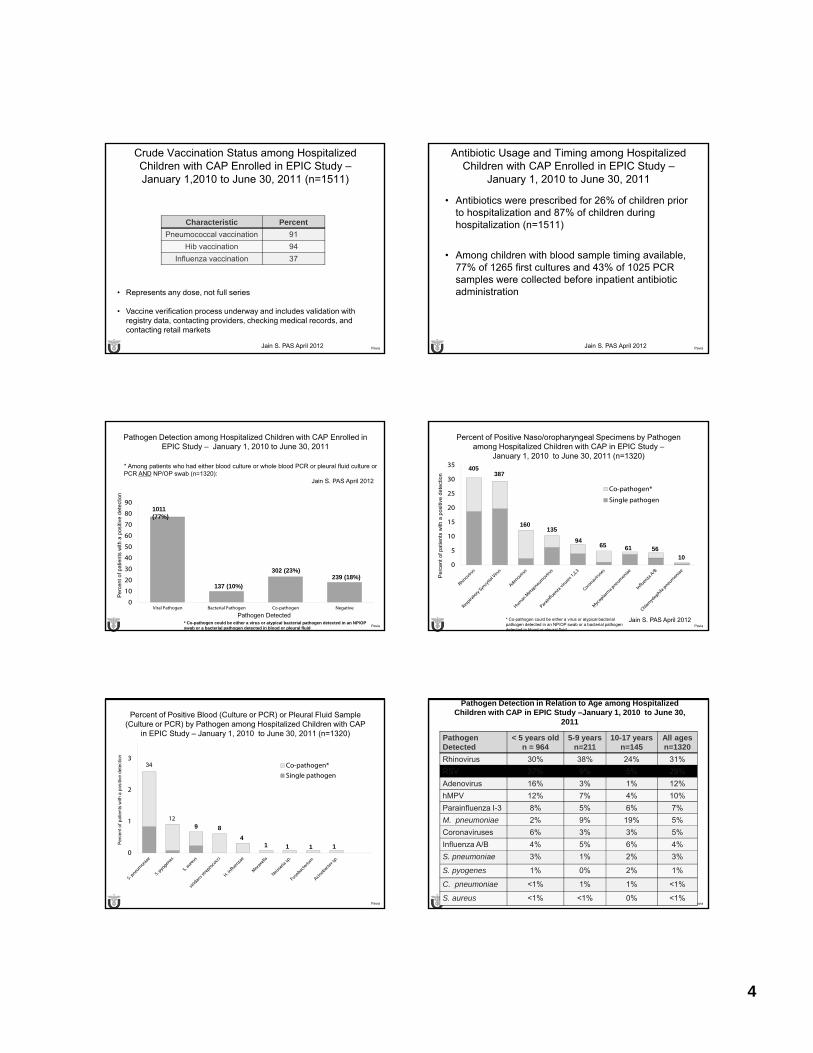
4
Pavia
Crude Vaccination Status among Hospitalized Children with CAP Enrolled in EPIC Study –January 1,2010 to June 30, 2011 (n=1511)
Characteristic Percent
Pneumococcal vaccination 91
Hib vaccination 94
Influenza vaccination 37
• Represents any dose, not full series
• Vaccine verification process underway and includes validation with registry data, contacting providers, checking medical records, and contacting retail markets
Jain S. PAS April 2012 Pavia
Antibiotic Usage and Timing among Hospitalized Children with CAP Enrolled in EPIC Study –
January 1, 2010 to June 30, 2011
• Antibiotics were prescribed for 26% of children prior to hospitalization and 87% of children during hospitalization (n=1511)
• Among children with blood sample timing available, 77% of 1265 first cultures and 43% of 1025 PCR samples were collected before inpatient antibiotic administration
Jain S. PAS April 2012
Pavia
Pathogen Detection among Hospitalized Children with CAP Enrolled in EPIC Study – January 1, 2010 to June 30, 2011
0
10
20
30
40
50
60
70
80
90
Viral Pathogen Bacterial Pathogen Co-pathogen Negative
Pathogen Detected
Pe
rcen
t of
pat
ient
s w
ith a
pos
itive
de
tect
ion
* Co-pathogen could be either a virus or atypical bacterial pathogen detected in an NP/OP swab or a bacterial pathogen detected in blood or pleural fluid
1011 (77%)
137 (10%)
302 (23%)239 (18%)
* Among patients who had either blood culture or whole blood PCR or pleural fluid culture or PCR AND NP/OP swab (n=1320):
Jain S. PAS April 2012
Pavia
Percent of Positive Naso/oropharyngeal Specimens by Pathogen among Hospitalized Children with CAP in EPIC Study –
January 1, 2010 to June 30, 2011 (n=1320)
0
5
10
15
20
25
30
35
Co-pathogen*
Single pathogen
Pe
rcen
t of
pat
ient
s w
ith a
pos
itive
det
ectio
n
* Co-pathogen could be either a virus or atypical bacterial pathogen detected in an NP/OP swab or a bacterial pathogen detected in blood or pleural fluid
405387
160135
946165
5610
Jain S. PAS April 2012
Pavia
Percent of Positive Blood (Culture or PCR) or Pleural Fluid Sample (Culture or PCR) by Pathogen among Hospitalized Children with CAP
in EPIC Study – January 1, 2010 to June 30, 2011 (n=1320)
0
1
2
3Co-pathogen*
Single pathogen
12
Pe
rce
nt o
f p
atie
nts
with
a p
osi
tive
det
ect
ion
34
8
4
9
1 1 1 1
Pavia
Pathogen Detection in Relation to Age among Hospitalized Children with CAP in EPIC Study –January 1, 2010 to June 30,
2011
Pathogen Detected
< 5 years oldn = 964
5-9 yearsn=211
10-17 years n=145
All agesn=1320
Rhinovirus 30% 38% 24% 31%
RSV 37% 9% 5% 29%
Adenovirus 16% 3% 1% 12%
hMPV 12% 7% 4% 10%
Parainfluenza I-3 8% 5% 6% 7%
M. pneumoniae 2% 9% 19% 5%
Coronaviruses 6% 3% 3% 5%
Influenza A/B 4% 5% 6% 4%
S. pneumoniae 3% 1% 2% 3%
S. pyogenes 1% 0% 2% 1%
C. pneumoniae <1% 1% 1% <1%
S. aureus <1% <1% 0% <1%
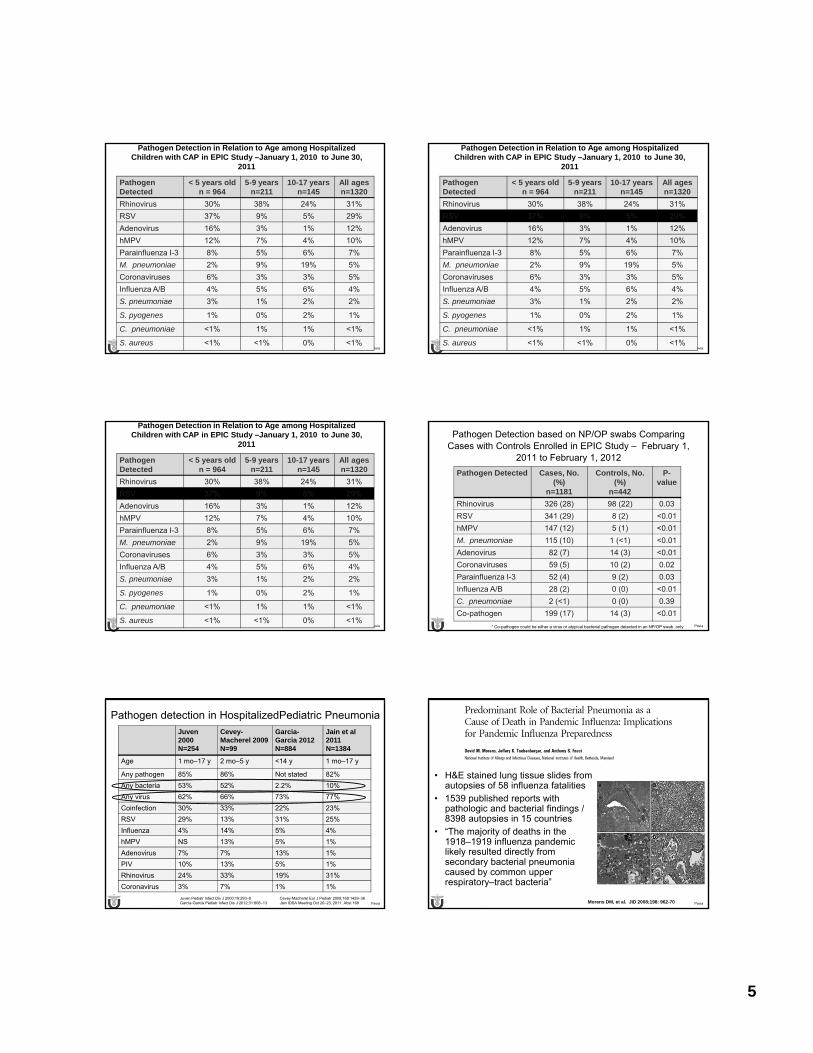
5
Pavia
Pathogen Detection in Relation to Age among Hospitalized Children with CAP in EPIC Study –January 1, 2010 to June 30,
2011
Pathogen Detected
< 5 years oldn = 964
5-9 yearsn=211
10-17 years n=145
All agesn=1320
Rhinovirus 30% 38% 24% 31%
RSV 37% 9% 5% 29%
Adenovirus 16% 3% 1% 12%
hMPV 12% 7% 4% 10%
Parainfluenza I-3 8% 5% 6% 7%
M. pneumoniae 2% 9% 19% 5%
Coronaviruses 6% 3% 3% 5%
Influenza A/B 4% 5% 6% 4%
S. pneumoniae 3% 1% 2% 2%
S. pyogenes 1% 0% 2% 1%
C. pneumoniae <1% 1% 1% <1%
S. aureus <1% <1% 0% <1%Pavia
Pathogen Detection in Relation to Age among Hospitalized Children with CAP in EPIC Study –January 1, 2010 to June 30,
2011
Pathogen Detected
< 5 years oldn = 964
5-9 yearsn=211
10-17 years n=145
All agesn=1320
Rhinovirus 30% 38% 24% 31%
RSV 37% 9% 5% 29%
Adenovirus 16% 3% 1% 12%
hMPV 12% 7% 4% 10%
Parainfluenza I-3 8% 5% 6% 7%
M. pneumoniae 2% 9% 19% 5%
Coronaviruses 6% 3% 3% 5%
Influenza A/B 4% 5% 6% 4%
S. pneumoniae 3% 1% 2% 2%
S. pyogenes 1% 0% 2% 1%
C. pneumoniae <1% 1% 1% <1%
S. aureus <1% <1% 0% <1%
Pavia
Pathogen Detection in Relation to Age among Hospitalized Children with CAP in EPIC Study –January 1, 2010 to June 30,
2011
Pathogen Detected
< 5 years oldn = 964
5-9 yearsn=211
10-17 years n=145
All agesn=1320
Rhinovirus 30% 38% 24% 31%
RSV 37% 9% 5% 29%
Adenovirus 16% 3% 1% 12%
hMPV 12% 7% 4% 10%
Parainfluenza I-3 8% 5% 6% 7%
M. pneumoniae 2% 9% 19% 5%
Coronaviruses 6% 3% 3% 5%
Influenza A/B 4% 5% 6% 4%
S. pneumoniae 3% 1% 2% 2%
S. pyogenes 1% 0% 2% 1%
C. pneumoniae <1% 1% 1% <1%
S. aureus <1% <1% 0% <1%Pavia
Pathogen Detection based on NP/OP swabs Comparing Cases with Controls Enrolled in EPIC Study – February 1,
2011 to February 1, 2012
Pathogen Detected Cases, No. (%)
n=1181
Controls, No. (%)
n=442
P-value
Rhinovirus 326 (28) 98 (22) 0.03
RSV 341 (29) 8 (2) <0.01
hMPV 147 (12) 5 (1) <0.01
M. pneumoniae 115 (10) 1 (<1) <0.01
Adenovirus 82 (7) 14 (3) <0.01
Coronaviruses 59 (5) 10 (2) 0.02
Parainfluenza I-3 52 (4) 9 (2) 0.03
Influenza A/B 28 (2) 0 (0) <0.01
C. pneumoniae 2 (<1) 0 (0) 0.39
Co-pathogen 199 (17) 14 (3) <0.01
* Co-pathogen could be either a virus or atypical bacterial pathogen detected in an NP/OP swab only
Pavia
Pathogen detection in HospitalizedPediatric Pneumonia
Juven2000 N=254
Cevey-Macherel 2009 N=99
Garcia-Garcia 2012 N=884
Jain et al 2011 N=1384
Age 1 mo–17 y 2 mo–5 y <14 y 1 mo–17 y
Any pathogen 85% 86% Not stated 82%
Any bacteria 53% 52% 2.2% 10%
Any virus 62% 66% 73% 77%
Coinfection 30% 33% 22% 23%
RSV 29% 13% 31% 25%
Influenza 4% 14% 5% 4%
hMPV NS 13% 5% 1%
Adenovirus 7% 7% 13% 1%
PIV 10% 13% 5% 1%
Rhinovirus 24% 33% 19% 31%
Coronavirus 3% 7% 1% 1%
Juven Pediatr Infect Dis J 2000;19:293–8 Cevey-Macherel Eur J Pediatr 2009;168:1429–36Garcia-Garcia Pediatr Infect Dis J 2012;31:808–13 Jain IDSA Meeting Oct 20–23, 2011. Abst 168 Pavia
• H&E stained lung tissue slides from autopsies of 58 influenza fatalities
• 1539 published reports with pathologic and bacterial findings / 8398 autopsies in 15 countries
• “The majority of deaths in the 1918–1919 influenza pandemic likely resulted directly from secondary bacterial pneumonia caused by common upper respiratory–tract bacteria”
Morens DM, et al. JID 2008;198: 962-70
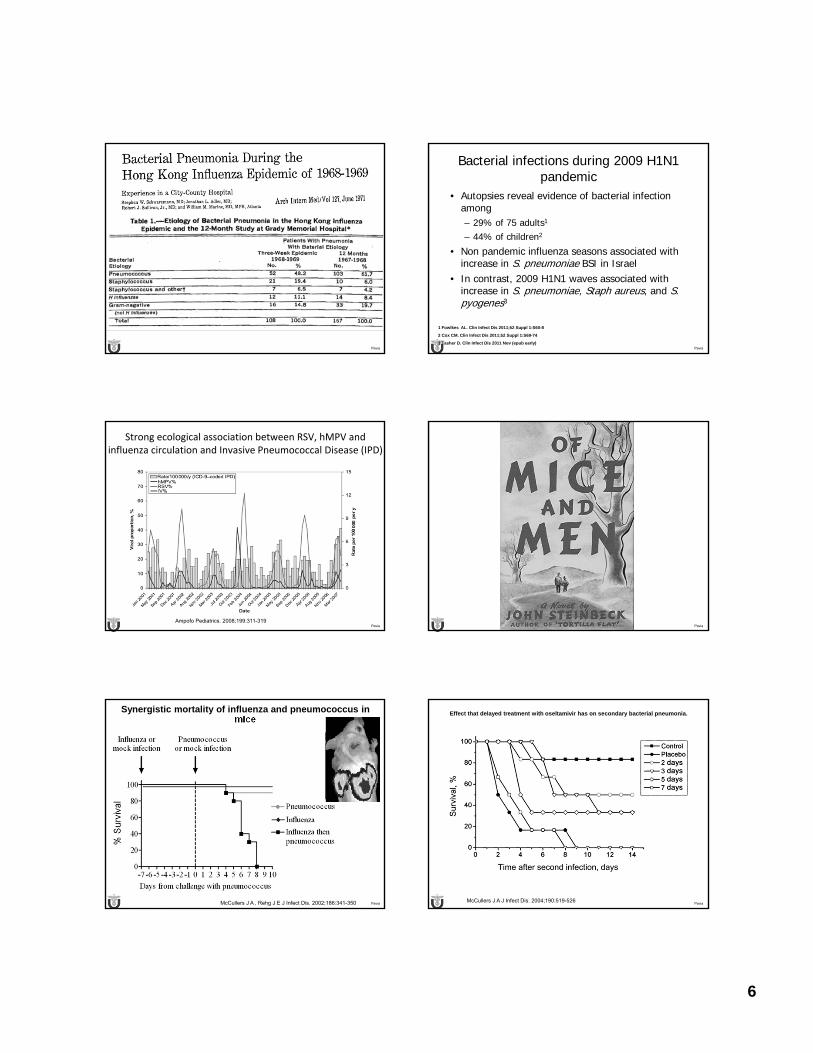
6
Pavia Pavia
Bacterial infections during 2009 H1N1 pandemic
• Autopsies reveal evidence of bacterial infection among– 29% of 75 adults1
– 44% of children2
• Non pandemic influenza seasons associated with increase in S. pneumoniae BSI in Israel
• In contrast, 2009 H1N1 waves associated with increase in S. pneumoniae, Staph aureus, and S. pyogenes3
1 Fowlkes AL. Clin Infect Dis 2011;52 Suppl 1:S60-8
2 Cox CM. Clin Infect Dis 2011;52 Suppl 1:S69-74
3 Tasher D. Clin Infect Dis 2011 Nov (epub early)
Pavia
Strong ecological association between RSV, hMPV and influenza circulation and Invasive Pneumococcal Disease (IPD)
Ampofo Pediatrics. 2008;199:311-319Pavia
Pavia
Synergistic mortality of influenza and pneumococcus in mice
McCullers J A , Rehg J E J Infect Dis. 2002;186:341-350 Pavia
Effect that delayed treatment with oseltamivir has on secondary bacterial pneumonia.
McCullers J A J Infect Dis. 2004;190:519-526
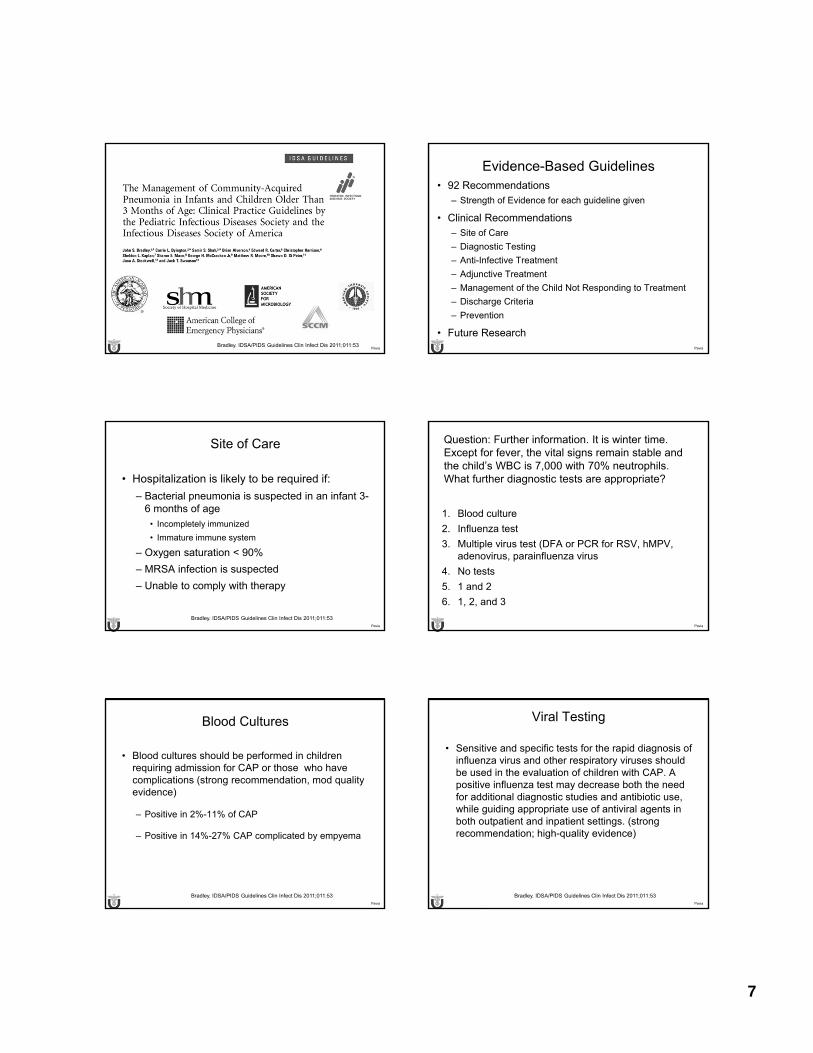
7
Pavia Bradley. IDSA/PIDS Guidelines Clin Infect Dis 2011;011:53
Pavia
Evidence-Based Guidelines• 92 Recommendations
– Strength of Evidence for each guideline given
• Clinical Recommendations– Site of Care
– Diagnostic Testing
– Anti-Infective Treatment
– Adjunctive Treatment
– Management of the Child Not Responding to Treatment
– Discharge Criteria
– Prevention
• Future Research
Pavia
Site of Care
• Hospitalization is likely to be required if:
– Bacterial pneumonia is suspected in an infant 3-6 months of age
• Incompletely immunized
• Immature immune system
– Oxygen saturation < 90%
– MRSA infection is suspected
– Unable to comply with therapy
Bradley. IDSA/PIDS Guidelines Clin Infect Dis 2011;011:53 Pavia
Question: Further information. It is winter time. Except for fever, the vital signs remain stable and the child’s WBC is 7,000 with 70% neutrophils.What further diagnostic tests are appropriate?
1. Blood culture
2. Influenza test
3. Multiple virus test (DFA or PCR for RSV, hMPV, adenovirus, parainfluenza virus
4. No tests
5. 1 and 2
6. 1, 2, and 3
Pavia
Blood Cultures
• Blood cultures should be performed in children requiring admission for CAP or those who have complications (strong recommendation, mod quality evidence)
– Positive in 2%-11% of CAP
– Positive in 14%-27% CAP complicated by empyema
Bradley. IDSA/PIDS Guidelines Clin Infect Dis 2011;011:53 Pavia
Viral Testing
• Sensitive and specific tests for the rapid diagnosis of influenza virus and other respiratory viruses should be used in the evaluation of children with CAP. A positive influenza test may decrease both the need for additional diagnostic studies and antibiotic use, while guiding appropriate use of antiviral agents in both outpatient and inpatient settings. (strong recommendation; high-quality evidence)
Bradley. IDSA/PIDS Guidelines Clin Infect Dis 2011;011:53
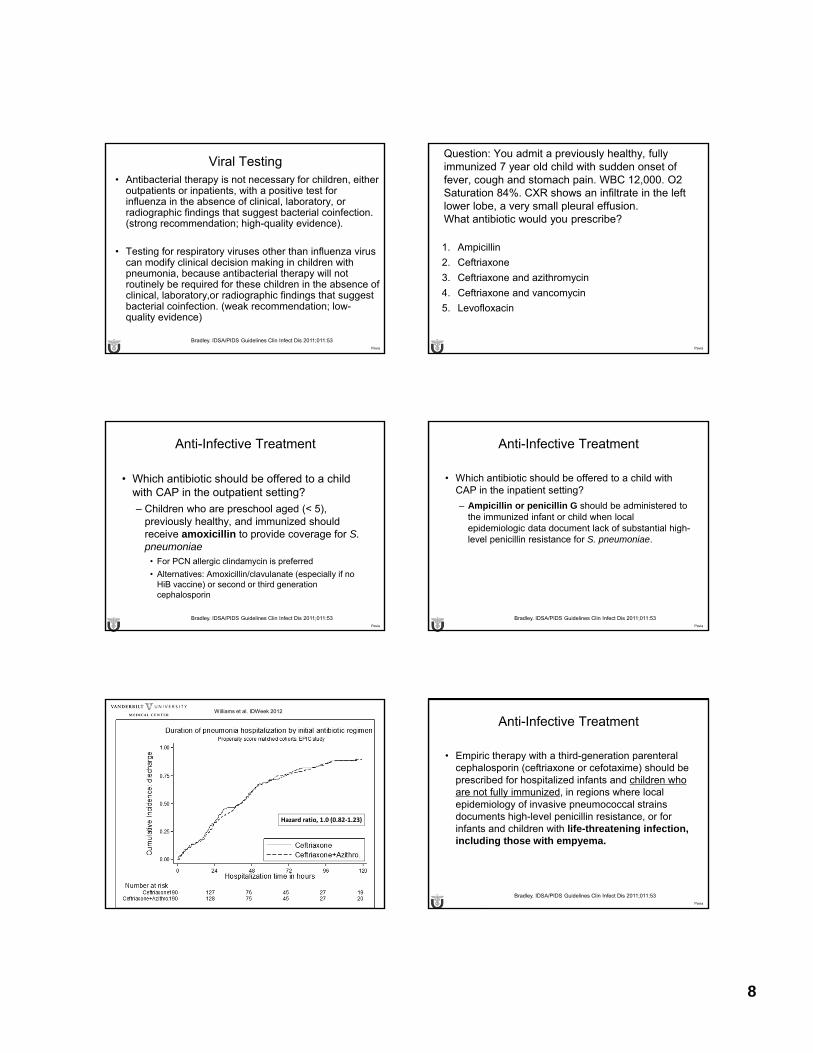
8
Pavia
Viral Testing• Antibacterial therapy is not necessary for children, either
outpatients or inpatients, with a positive test for influenza in the absence of clinical, laboratory, or radiographic findings that suggest bacterial coinfection. (strong recommendation; high-quality evidence).
• Testing for respiratory viruses other than influenza virus can modify clinical decision making in children with pneumonia, because antibacterial therapy will not routinely be required for these children in the absence of clinical, laboratory,or radiographic findings that suggest bacterial coinfection. (weak recommendation; low-quality evidence)
Bradley. IDSA/PIDS Guidelines Clin Infect Dis 2011;011:53 Pavia
Question: You admit a previously healthy, fully immunized 7 year old child with sudden onset of fever, cough and stomach pain. WBC 12,000. O2 Saturation 84%. CXR shows an infiltrate in the left lower lobe, a very small pleural effusion.What antibiotic would you prescribe?
1. Ampicillin
2. Ceftriaxone
3. Ceftriaxone and azithromycin
4. Ceftriaxone and vancomycin
5. Levofloxacin
Pavia
Anti-Infective Treatment
• Which antibiotic should be offered to a child with CAP in the outpatient setting?
– Children who are preschool aged (< 5), previously healthy, and immunized should receive amoxicillin to provide coverage for S. pneumoniae
• For PCN allergic clindamycin is preferred
• Alternatives: Amoxicillin/clavulanate (especially if no HiB vaccine) or second or third generation cephalosporin
Bradley. IDSA/PIDS Guidelines Clin Infect Dis 2011;011:53 Pavia
Anti-Infective Treatment
• Which antibiotic should be offered to a child with CAP in the inpatient setting?
– Ampicillin or penicillin G should be administered to the immunized infant or child when local epidemiologic data document lack of substantial high-level penicillin resistance for S. pneumoniae.
Bradley. IDSA/PIDS Guidelines Clin Infect Dis 2011;011:53
Hazard ratio, 1.0 (0.82‐1.23)
Williams et al. IDWeek 2012
Pavia
Anti-Infective Treatment
• Empiric therapy with a third-generation parenteral cephalosporin (ceftriaxone or cefotaxime) should be prescribed for hospitalized infants and children who are not fully immunized, in regions where local epidemiology of invasive pneumococcal strains documents high-level penicillin resistance, or for infants and children with life-threatening infection, including those with empyema.
Bradley. IDSA/PIDS Guidelines Clin Infect Dis 2011;011:53
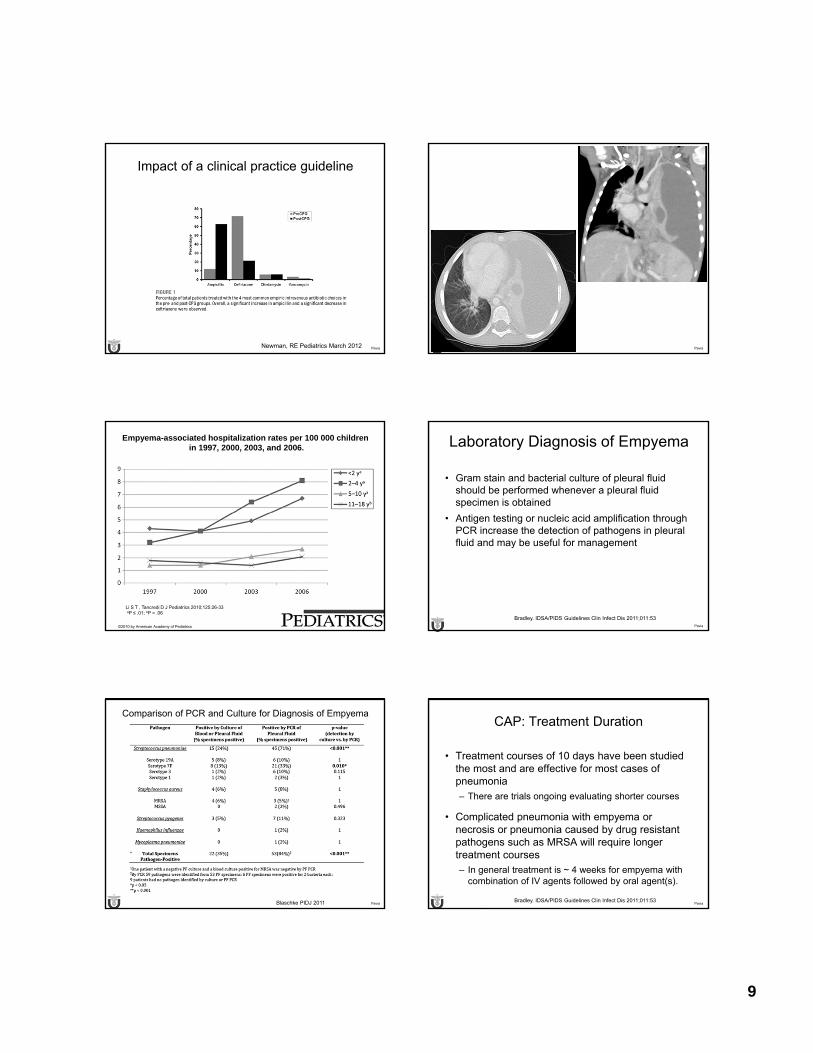
9
Pavia Newman, RE Pediatrics March 2012
Impact of a clinical practice guideline
Pavia
©2010 by American Academy of Pediatrics
Li S T , Tancredi D J Pediatrics 2010;125:26-33aP ≤ .01; bP = .06
Empyema-associated hospitalization rates per 100 000 childrenin 1997, 2000, 2003, and 2006.
Pavia
Laboratory Diagnosis of Empyema
• Gram stain and bacterial culture of pleural fluid should be performed whenever a pleural fluid specimen is obtained
• Antigen testing or nucleic acid amplification through PCR increase the detection of pathogens in pleural fluid and may be useful for management
Bradley. IDSA/PIDS Guidelines Clin Infect Dis 2011;011:53
Pavia Blaschke PIDJ 2011
Comparison of PCR and Culture for Diagnosis of Empyema
Pavia
CAP: Treatment Duration
• Treatment courses of 10 days have been studied the most and are effective for most cases of pneumonia– There are trials ongoing evaluating shorter courses
• Complicated pneumonia with empyema or necrosis or pneumonia caused by drug resistant pathogens such as MRSA will require longer treatment courses– In general treatment is ~ 4 weeks for empyema with
combination of IV agents followed by oral agent(s).
Bradley. IDSA/PIDS Guidelines Clin Infect Dis 2011;011:53
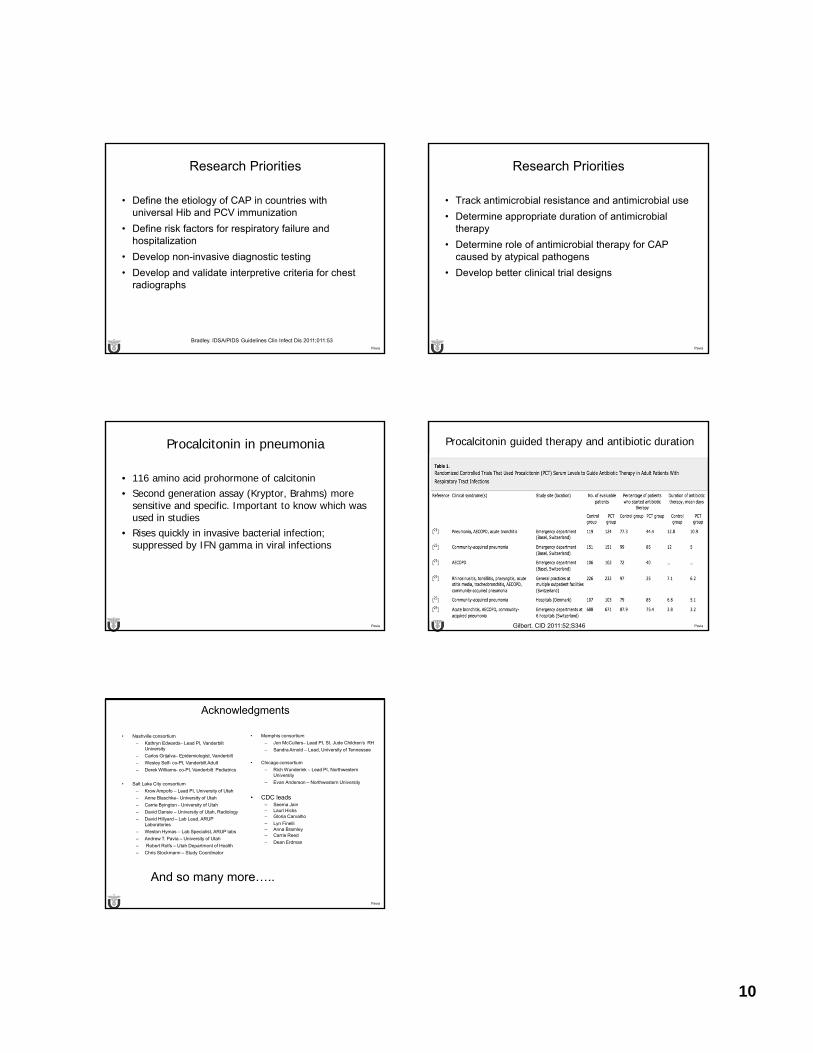
10
Pavia
Research Priorities
• Define the etiology of CAP in countries with universal Hib and PCV immunization
• Define risk factors for respiratory failure and hospitalization
• Develop non-invasive diagnostic testing
• Develop and validate interpretive criteria for chest radiographs
Bradley. IDSA/PIDS Guidelines Clin Infect Dis 2011;011:53 Pavia
Research Priorities
• Track antimicrobial resistance and antimicrobial use
• Determine appropriate duration of antimicrobial therapy
• Determine role of antimicrobial therapy for CAP caused by atypical pathogens
• Develop better clinical trial designs
Pavia
Procalcitonin in pneumonia
• 116 amino acid prohormone of calcitonin• Second generation assay (Kryptor, Brahms) more
sensitive and specific. Important to know which was used in studies
• Rises quickly in invasive bacterial infection; suppressed by IFN gamma in viral infections
Pavia
Procalcitonin guided therapy and antibiotic duration
Gilbert. CID 2011:52;S346
Pavia
Acknowledgments
• Nashville consortium
– Kathryn Edwards– Lead PI, Vanderbilt University
– Carlos Grijalva– Epidemiologist, Vanderbilt
– Wesley Self- co-PI, Vanderbilt Adult
– Derek Williams- co-PI, Vanderbilt Pediatrics
• Salt Lake City consortium
– Krow Ampofo – Lead PI, University of Utah
– Anne Blaschke– University of Utah
– Carrie Byington - University of Utah
– David Dansie – University of Utah, Radiology
– David Hillyard – Lab Lead, ARUP Laboratories
– Weston Hymas – Lab Specialist, ARUP labs
– Andrew T. Pavia – University of Utah
– Robert Rolfs – Utah Department of Health
– Chris Stockmann – Study Coordinator
• Memphis consortium
– Jon McCullers– Lead PI, St. Jude Children’s RH
– Sandra Arnold – Lead, University of Tennessee
• Chicago consortium
– Rich Wunderink – Lead PI, Northwestern University
– Evan Anderson – Northwestern University
• CDC leads– Seema Jain– Lauri Hicks– Gloria Carvalho
– Lyn Finelli– Anna Bramley– Carrie Reed
– Dean Erdman
And so many more…..
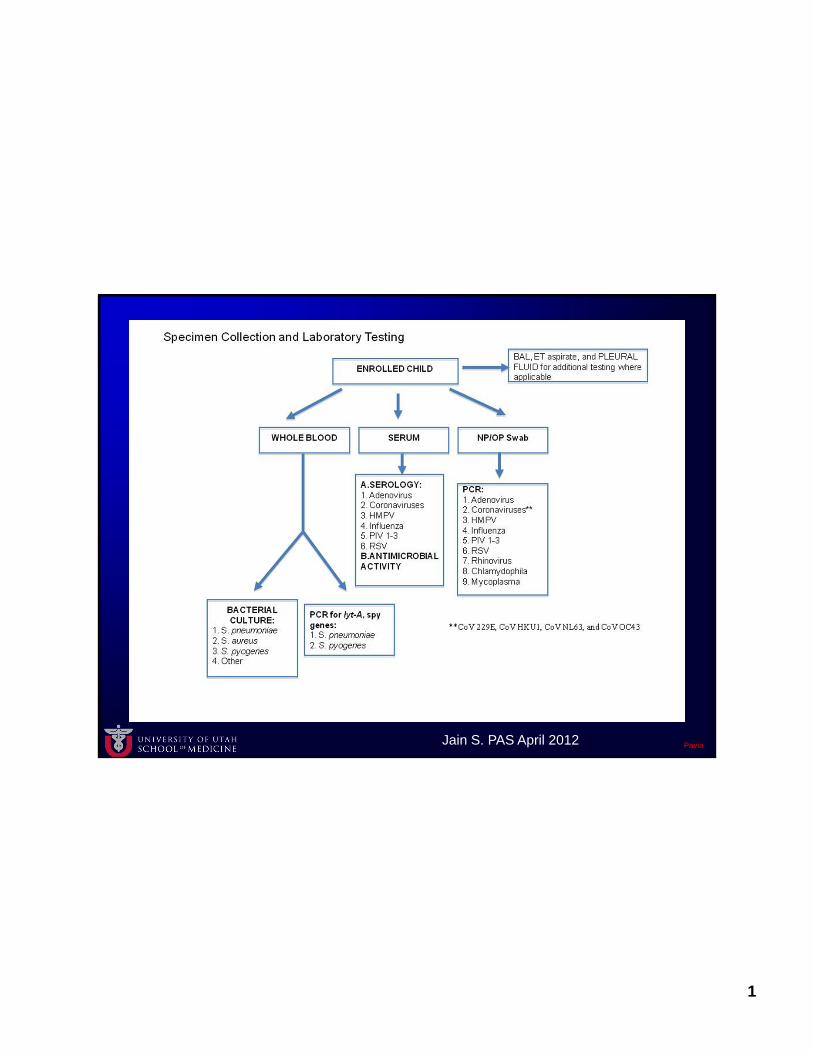
1
Pavia Jain S. PAS April 2012

FRIDAY, MAY 17, 2013
9:05
Managing Bronchiolitis: Just Stand There or Do Something?
Dr. Michele Long
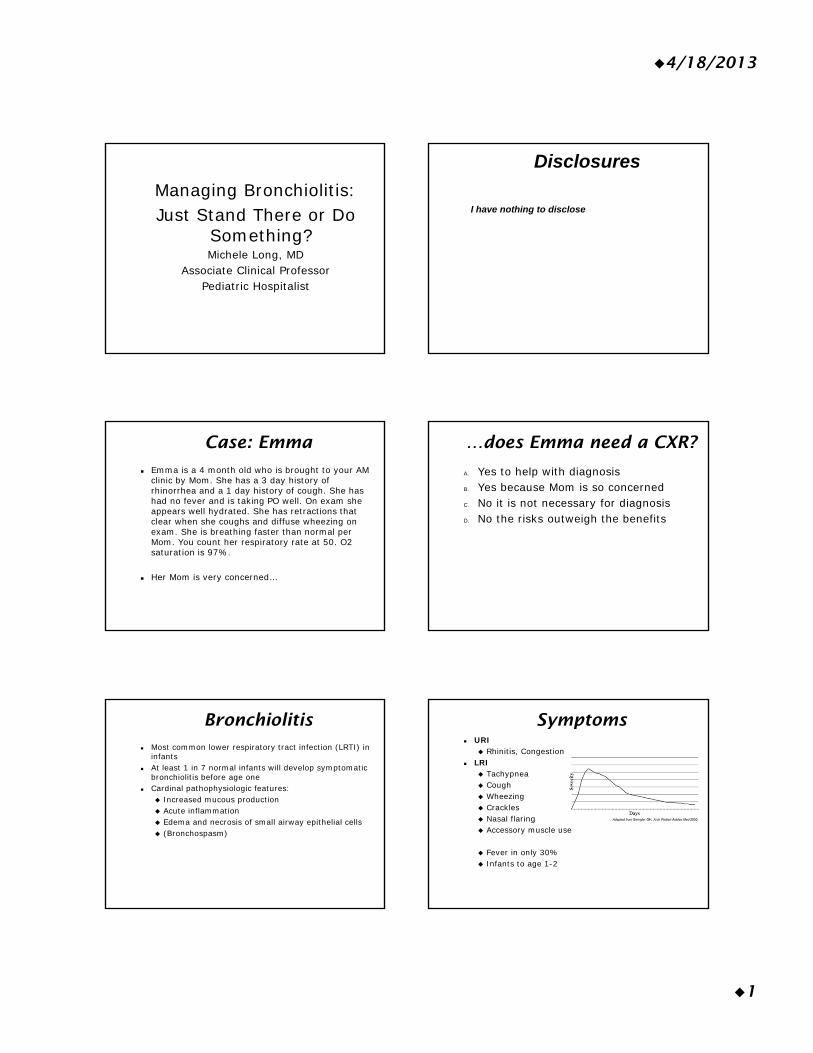
4/18/2013
1
Managing Bronchiolitis:Just Stand There or Do
Something?Michele Long, MD
Associate Clinical ProfessorPediatric Hospitalist
Disclosures
I have nothing to disclose
Case: Emma
Emma is a 4 month old who is brought to your AM clinic by Mom. She has a 3 day history of rhinorrhea and a 1 day history of cough. She has had no fever and is taking PO well. On exam she appears well hydrated. She has retractions that clear when she coughs and diffuse wheezing on exam. She is breathing faster than normal per Mom. You count her respiratory rate at 50. O2 saturation is 97%.
Her Mom is very concerned…
…does Emma need a CXR?
A. Yes to help with diagnosisB. Yes because Mom is so concernedC. No it is not necessary for diagnosisD. No the risks outweigh the benefits
Bronchiolitis Most common lower respiratory tract infection (LRTI) in
infants At least 1 in 7 normal infants will develop symptomatic
bronchiolitis before age one Cardinal pathophysiologic features:
Increased mucous production Acute inflammation Edema and necrosis of small airway epithelial cells (Bronchospasm)
Symptoms URI
Rhinitis, Congestion LRI
Tachypnea Cough Wheezing Crackles Nasal flaring Accessory muscle use
Fever in only 30% Infants to age 1-2
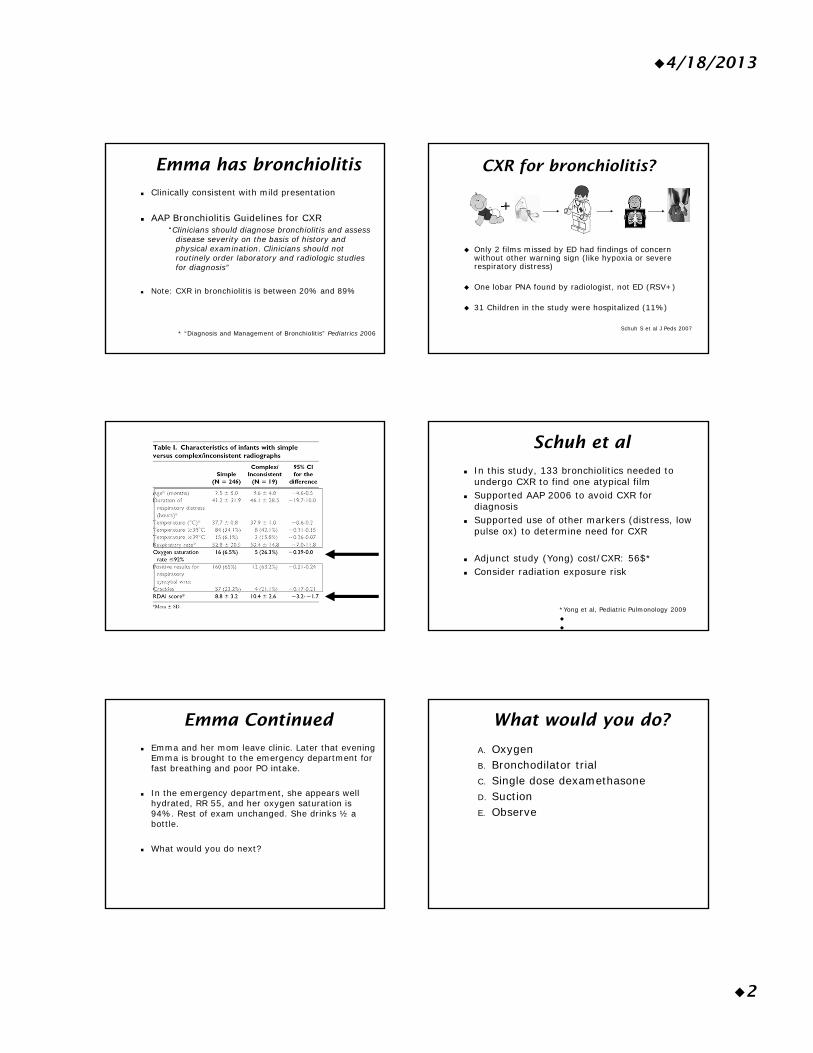
4/18/2013
2
Emma has bronchiolitis
Clinically consistent with mild presentation
AAP Bronchiolitis Guidelines for CXR“Clinicians should diagnose bronchiolitis and assess
disease severity on the basis of history and physical examination. Clinicians should not routinely order laboratory and radiologic studies for diagnosis”
Note: CXR in bronchiolitis is between 20% and 89%
* “Diagnosis and Management of Bronchiolitis” Pediatrics 2006
CXR for bronchiolitis?
+
Only 2 films missed by ED had findings of concern without other warning sign (like hypoxia or severe respiratory distress)
One lobar PNA found by radiologist, not ED (RSV+)
31 Children in the study were hospitalized (11%)
Schuh S et al J Peds 2007
Schuh et al
In this study, 133 bronchiolitics needed to undergo CXR to find one atypical film
Supported AAP 2006 to avoid CXR for diagnosis
Supported use of other markers (distress, low pulse ox) to determine need for CXR
Adjunct study (Yong) cost/CXR: 56$* Consider radiation exposure risk
*Yong et al, Pediatric Pulmonology 2009
Emma Continued
Emma and her mom leave clinic. Later that evening Emma is brought to the emergency department for fast breathing and poor PO intake.
In the emergency department, she appears well hydrated, RR 55, and her oxygen saturation is 94%. Rest of exam unchanged. She drinks ½ a bottle.
What would you do next?
What would you do?
A. OxygenB. Bronchodilator trialC. Single dose dexamethasoneD. SuctionE. Observe
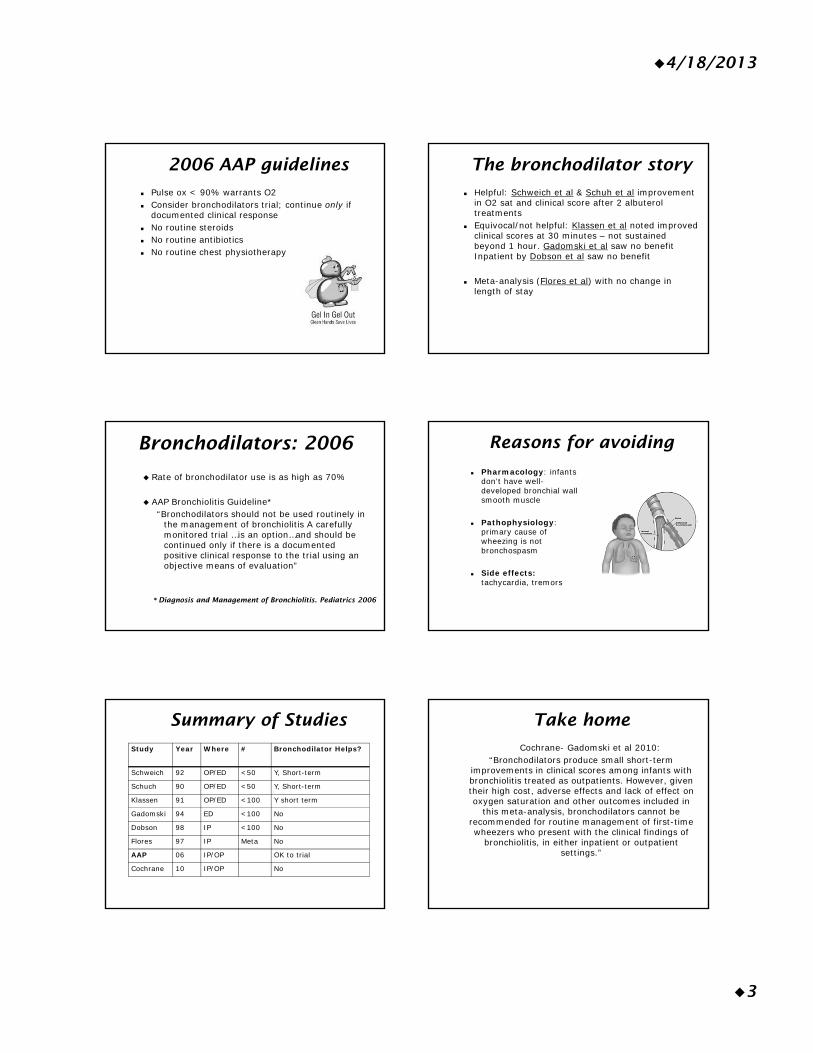
4/18/2013
3
2006 AAP guidelines
Pulse ox < 90% warrants O2 Consider bronchodilators trial; continue only if
documented clinical response No routine steroids No routine antibiotics No routine chest physiotherapy
The bronchodilator story
Helpful: Schweich et al & Schuh et al improvement in O2 sat and clinical score after 2 albuterol treatments
Equivocal/not helpful: Klassen et al noted improved clinical scores at 30 minutes – not sustained beyond 1 hour. Gadomski et al saw no benefit Inpatient by Dobson et al saw no benefit
Meta-analysis (Flores et al) with no change in length of stay
Bronchodilators: 2006
Rate of bronchodilator use is as high as 70%
AAP Bronchiolitis Guideline*“Bronchodilators should not be used routinely in
the management of bronchiolitis A carefully monitored trial …is an option…and should be continued only if there is a documented positive clinical response to the trial using an objective means of evaluation”
* Diagnosis and Management of Bronchiolitis. Pediatrics 2006
Reasons for avoiding
Pharmacology: infants don’t have well-developed bronchial wall smooth muscle
Pathophysiology: primary cause of wheezing is not bronchospasm
Side effects: tachycardia, tremors
Summary of Studies
Study Year Where # Bronchodilator Helps?
Schweich 92 OP/ED <50 Y, Short-term
Schuch 90 OP/ED <50 Y, Short-term
Klassen 91 OP/ED <100 Y short term
Gadomski 94 ED <100 No
Dobson 98 IP <100 No
Flores 97 IP Meta No
AAP 06 IP/OP OK to trial
Cochrane 10 IP/OP No
Take home
Cochrane- Gadomski et al 2010: “Bronchodilators produce small short-term
improvements in clinical scores among infants with bronchiolitis treated as outpatients. However, given their high cost, adverse effects and lack of effect on oxygen saturation and other outcomes included in
this meta-analysis, bronchodilators cannot be recommended for routine management of first-time wheezers who present with the clinical findings of
bronchiolitis, in either inpatient or outpatient settings.”
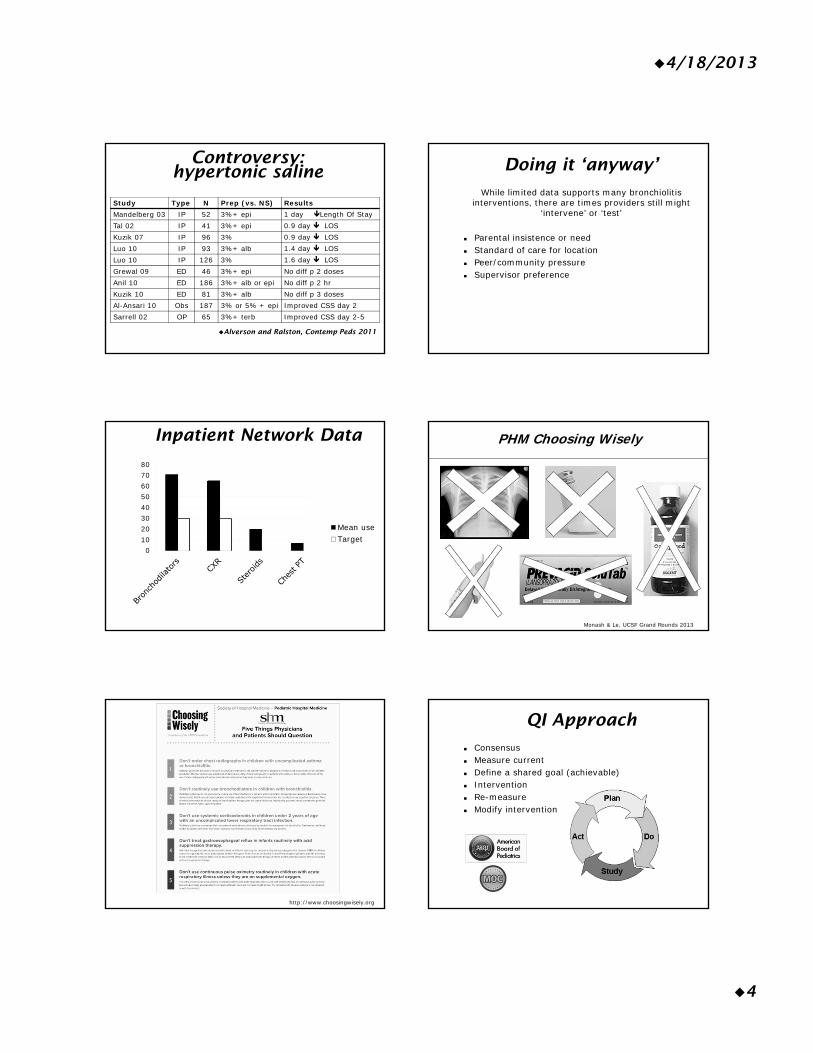
4/18/2013
4
Controversy: hypertonic saline
Study Type N Prep (vs. NS) ResultsMandelberg 03 IP 52 3%+ epi 1 day Length Of StayTal 02 IP 41 3%+ epi 0.9 day LOSKuzik 07 IP 96 3% 0.9 day LOSLuo 10 IP 93 3%+ alb 1.4 day LOSLuo 10 IP 126 3% 1.6 day LOSGrewal 09 ED 46 3%+ epi No diff p 2 dosesAnil 10 ED 186 3%+ alb or epi No diff p 2 hrKuzik 10 ED 81 3%+ alb No diff p 3 dosesAl-Ansari 10 Obs 187 3% or 5% + epi Improved CSS day 2Sarrell 02 OP 65 3%+ terb Improved CSS day 2-5
Alverson and Ralston, Contemp Peds 2011
Doing it ‘anyway’
While limited data supports many bronchiolitis interventions, there are times providers still might
‘intervene’ or ‘test’
Parental insistence or need Standard of care for location Peer/community pressure Supervisor preference
Inpatient Network Data
01020304050607080
Mean useTarget
PHM Choosing Wisely
Monash & Le, UCSF Grand Rounds 2013
http://www.choosingwisely.org
QI Approach
Consensus Measure current Define a shared goal (achievable) Intervention Re-measure Modify intervention
4/18/2013
5
Summary Slide Current best evidence does not support ordering
CXRs for diagnosis of uncomplicated bronchiolitis
Current best evidence does not support routine use of bronchodilators in bronchiolitis
Good hand washing and avoiding cigarette smoke are among the best evidence-supported advice we can provide patients
Changing practice patterns takes time and may be more effective with local consensus, team approaches, and if we commit to ‘Choosing Wisely’
Acknowledgements
Timothy Kelly MD
Karen Sun MD
Brad Monash MD
Brian Alverson MD
Key References and Resources Choosing Wisely- Pediatric Hospital Medicine guidelines.
Feb 2011 www.choosingwisely.org.
American Academy of Pediatrics. Diagnosis and Management of Bronchiolitis, Subcommittee on Diagnosis and Management of Bronchiolitis. Pediatrics. 2006 Oct;118(4):1774-93.
Gadomski AM, Brower M. Bronchodilators for bronchiolitis. Cochrane Database of Systematic Reviews 2010.
Alverson B, Ralston S. Bronchiolitis: focus on hypertonic saline. Contemporary Pediatrics. Feb 2011.
Wright M, Mullett CJ, Piedimonte G. Pharmacologic Management of Acute Bronchiolitis. Ther Clin Risk Manag. 2008 Oct;4(5):895-903.
References and Resources Schuh S, Canny G, Reisman JJ, et al. Nebulized albuterol in
acute bronchiolitis. J Pediatr. 1990;117:633–7.
Schweich PJ, Hurt TL, Walkley EI, et al. The use of nebulized albuterol in wheezing infants. Pediatr Emerg Care. 1992;8:184–8.
Klassen TP, Rowe PC, Sutcliffe T, et al. Randomized trial of salbutamol in acute bronchiolitis. J Pediatr. 1991;118:807–11.
Gadomski AM, Lichenstein R, Horton L, et al. Efficacy of albuterol in the management of bronchiolitis. Pediatrics. 1994;93:907–12.
Dobson JV, Stephens-Groff SM, Mcmahon SR, et al. The use of albuterol in hospitalized infants with bronchiolitis. Pediatrics. 1998;101:361–8.
References and Resources Flores G, Horwitz RI. Efficacy of beta2-agonists in
bronchiolitis: a reappraisal and meta-analysis. Pediatrics. 1997;100:233–9.
Schuh S, Coates AL, Binnie R, Allin T, Goia C, Corey M, et al. Efficacy of oral dexamethasone in outpatients with acute bronchiolitis. J Pediatr 2002;140:27-32.
Corneli HM, Zorc JJ, Mahajan P, Shaw KN, Holubkov R, Reeves SD, et al. A multicenter, randomized, controlled trial of dexamethasone for bronchiolitis. N Engl J Med 2007;357:331-9.
Yong JHE et al. A cost effectiveness analysis of omitting radiography in diagnosis of acute bronchiolitis. Pediatric Pulmonology 44:122-127, 2009
References and Resources Schuh S et al. Evaluation of the Utility of Radiography in
Acute Bronchiolitis. J of Pediatrics. 2007;150:429–433.
Von Woensel JB, van Aalderen WM, Kimpen JL. Viral lower respiratory tract infection in infants and young children. BMJ 2003 Jul 5;327(7405):36–40.
PEM Bronchiolitis Blog pemcincinnati.com
AAP Section on Hospital Medicine Listserv
UCSFAdvances&ControversiesinClinicalPediatrics‐May2013Presentation:ManagingBronchiolitis:JustStandThereorDo
Something?Speaker:MicheleLong,MD
ReferencePageofKeyUsefulReferences
ChoosingWisely‐PediatricHospitalMedicineguidelines.Feb2011www.choosingwisely.org.AmericanAcademyofPediatrics.DiagnosisandManagementofBronchiolitis,SubcommitteeonDiagnosisandManagementofBronchiolitis.Pediatrics.2006Oct;118(4):1774‐93.GadomskiAM,BrowerM.Bronchodilatorsforbronchiolitis.CochraneDatabaseofSystematicReviews2010.WrightM,MullettCJ,PiedimonteG.PharmacologicManagementofAcuteBronchiolitis.TherClinRiskManag.2008Oct;4(5):895‐903.AlversonB,RalstonS.Bronchiolitis:focusonhypertonicsaline.ContemporaryPediatrics.Feb2011.
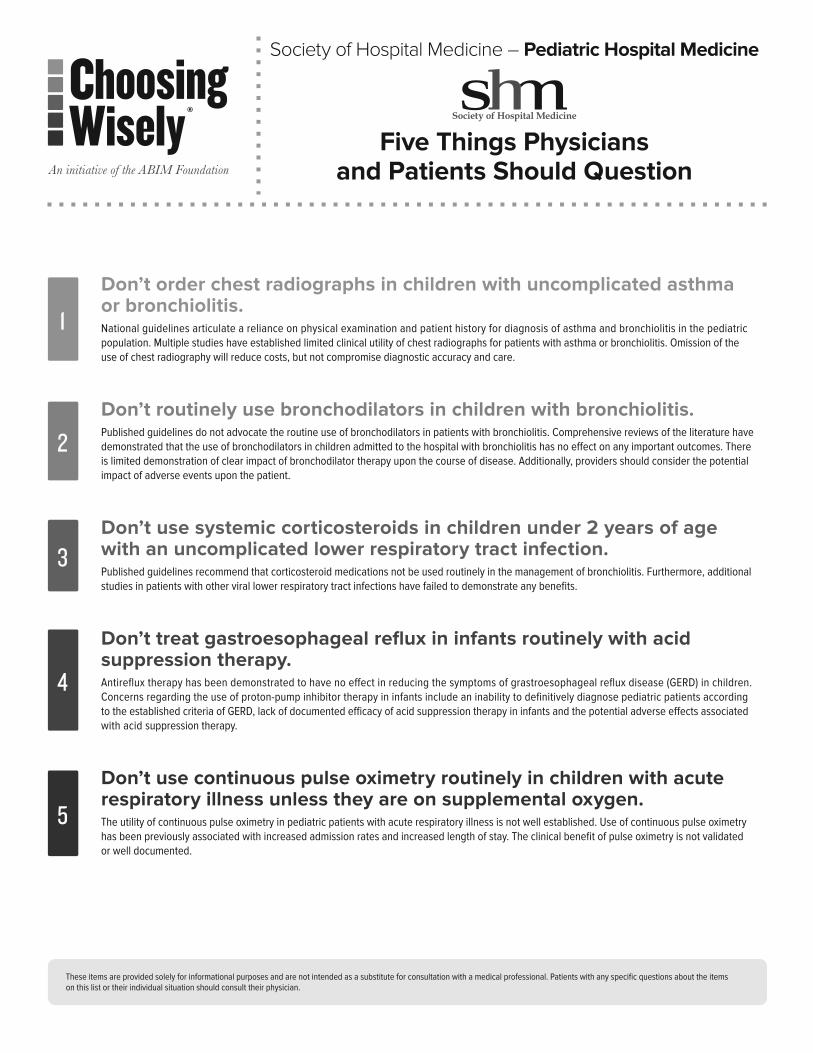
Don’t order chest radiographs in children with uncomplicated asthma or bronchiolitis.National guidelines articulate a reliance on physical examination and patient history for diagnosis of asthma and bronchiolitis in the pediatric population. Multiple studies have established limited clinical utility of chest radiographs for patients with asthma or bronchiolitis. Omission of the use of chest radiography will reduce costs, but not compromise diagnostic accuracy and care.
Don’t routinely use bronchodilators in children with bronchiolitis.Published guidelines do not advocate the routine use of bronchodilators in patients with bronchiolitis. Comprehensive reviews of the literature have demonstrated that the use of bronchodilators in children admitted to the hospital with bronchiolitis has no e ect on any important outcomes. here is limited demonstration of clear impact of bronchodilator therapy upon the course of disease. Additionally, providers should consider the potential impact of adverse events upon the patient.
Don’t use systemic corticosteroids in children under 2 years of age with an uncomplicated lower respiratory tract infection.Published guidelines recommend that corticosteroid medications not be used routinely in the management of bronchiolitis. Furthermore, additional studies in patients with other viral lower respiratory tract infections have failed to demonstrate any bene ts.
Don’t treat gastroesophageal re u in infants routinely with acid suppression therapy.Antire ux therapy has been demonstrated to have no e ect in reducing the symptoms of grastroesophageal re ux disease in children. Concerns regarding the use of proton pump inhibitor therapy in infants include an inability to de nitively diagnose pediatric patients according to the established criteria of , lac of documented e cacy of acid suppression therapy in infants and the potential adverse e ects associated with acid suppression therapy.
Don’t use continuous pulse o imetry routinely in children with acute respiratory illness unless they are on supplemental o ygen.
he utility of continuous pulse oximetry in pediatric patients with acute respiratory illness is not well established. se of continuous pulse oximetry has been previously associated with increased admission rates and increased length of stay. he clinical bene t of pulse oximetry is not validated or well documented.
3
1
2
5
4
hese items are provided solely for informational purposes and are not intended as a substitute for consultation with a medical professional. Patients with any speci c uestions about the items on this list or their individual situation should consult their physician.
Society of Hospital Medicine – Pediatric Hospital Medicine
Five Things Physicians and Patients Should Question

American Academy of Pediatrics, iagnosis and Management of ronchiolitis, ubcommittee on iagnosis and Management of ronchiolitis, Pediatrics. Oct .
National eart, ung and lood nstitute, National Asthma ducation and Prevention Program. xpert panel report uidelines for the diagnosis and management of asthma. ethesda M National nstitutes of ealth Aug. p. eport No. .
awson P, ong A, ennedy , Mogridge N. he chest radiograph in acute bronchiolitis. Paediatr Child ealth. .
obac M , reitlein A. Chest radiograph in the evaluation of rst time whee ing episodes review of current clinical e cacy. Pediatr merg Care. un .
American Academy of Pediatrics. iagnosis and Management of ronchiolitis, ubcommittee on iagnosis and Management of ronchiolitis. Pediatrics. Oct .
adoms i AM, rower M. ronchodilators for bronchiolitis. Cochrane atabase yst ev. C .
American Academy of Pediatrics. iagnosis and Management of ronchiolitis, ubcommittee on iagnosis and Management of ronchiolitis. Pediatrics. Oct .
lassen P, utcli e , atters , ells A, Allen , i MM. examethasone in salbutamol treated inpatients with acute bronchiolitis A randomi ed, controlled trial. Pediatr. Feb .
Patel , Platt , o ano M, ang . lucocorticoids for acute viral bronchiolitis in infants and young children. Cochrane atabase yst ev. C .
e oec , an der Aa N, an ierde , Corbeel , ec els . espiratory syncytial virus bronchiolitis a double blind dexamethasone e cacy study. Pediatr. ec .
on oensel , van Aalderen M, impen . iral lower respiratory tract infection in infants and young children. M ul .
Panic ar , a hanpaul M, ambert PC, enia P, tephenson , myth A, rigg . Oral prednisolone for preschool children with acute virus induced whee ing. N ngl Med. an .
andenplas , udolph C , i oren o C, assall , ipta , Ma ur , ondheimer , taiano A, homson M, eereman auters , en l , North American ociety for Pediatric astroenterology epatology and Nutrition, uropean ociety for Pediatric astroenterology epatology and Nutrition. Pediatric gastroesophageal re ux clinical practice guidelines oint recommendations of the
North American ociety for Pediatric astroenterology, epatology, and Nutrition NA P AN and the uropean ociety for Pediatric astroenterology, epatology, and Nutrition P AN . Pediatr astroenterol Nutr. .
van der Pol , mits M , van i MP, Omari , abbers MM, enninga MA. cacy of proton pump inhibitors in children with gastroesophageal re ux disease a systematic review. Pediatrics. May .
ibbons , old . he use of proton pump inhibitors in children a comprehensive review. Paediatr rugs. .
Orenstein , assall . nfants and proton pump inhibitors tribulations, no trials. Pediatr astroenterol Nutr. .
hoshoo , dell , hompson A, ubin M. Are we overprescribing antire ux medications for infants with regurgitation Pediatrics. Nov .
American Academy of Pediatrics. iagnosis and Management of ronchiolitis, ubcommittee on iagnosis and Management of ronchiolitis. Pediatrics. Oct .
chroeder A , Marmor A , Pantell , Newman . mpact of pulse oximetry and oxygen therapy on length of stay in bronchiolitis hospitali ations. Arch Ped Adolesc Med. un .
unt C , Corwin M , ister , eese Mayer , Neuman M , insley , aird M, eens , Cabral . ongitudinal assessment of hemoglobin oxygen saturation in healthy infants during the rst months of age. Pediatr. Nov .
Alverson , McCulloh , oehn . Continuous versus intermittent pulse oximetry monitoring of children hospitali ed for bronchiolitis. Abstract presented at ee . and iego CA . Oct .
3
4
5
1
2
The mission of the ABIM Foundation is to advance medical professionalism to improve the health care system. We achieve this by collaborating with physicians and physician leaders, medical trainees, health care delivery systems, payers, policymakers, consumer organizations and patients to foster a shared understanding of professionalism and how they can adopt the tenets of professionalism in practice.
Representing the fastest growing specialty in modern healthcare, the Society of Hospital Medicine (SHM) is the leading medical society for more than 34,000 hospitalists and their patients. SHM is dedicated to promoting the highest quality care for all hospitalized patients and overall excellence in the practice of hospital medicine through quality improvement, education, advocacy and research. Over the past decade, studies have shown that hospitalists can contribute to decreased patient lengths of stay, reductions in hospital costs and readmission rates, and increased patient satisfaction.
®
About the ABIM Foundation About the Society of Hospital Medicine
How This List Was CreatedA elphi panel of pediatric hospital medicine physicians with wide geographic representation was convened by the ociety of ospital Medicine M . he panel developed an initial list of items with input from colleagues at each of the panelists home institutions, which was then discussed and reduced to items via consensus of the panel. A comprehensive literature review was underta en for these items, while they were concurrently circulated on the electronic listservs of M s Pediatric Committee and the American Academy of Pediatrics ection on ospital Medicine. he collated comments along with the results of the evidence review were then presented to the members of the panel.
wo rounds of elphi voting too place via electronic submission of votes by the panel. alidity and feasibility of each item was assessed by the elphi panel on a nine point scale for each of the items and the mean of each item was obtained. he aggregate score of the means of validity and feasibility decided the nal
ve items. hese recommendations were then submitted to the M oard for review and approval.
M s disclosure and con ict of interest policy can be found at www.hospitalmedicine.org/industry.
For more information or to see other lists of Five Things Physicians and Patients Should Question, visit www.choosingwisely.org.
For more information about SHM and hospital medicine, visit www.hospitalmedicine.org.
To learn more about the ABIM Foundation, visit www.abimfoundation.org.
Sources
FRIDAY, MAY 17, 2013
9:35
P ALTE: Apparently a Lot of Terror for Everybody! A Conundrum – Apparent Life Threatening Events
Dr. Timothy Kelly
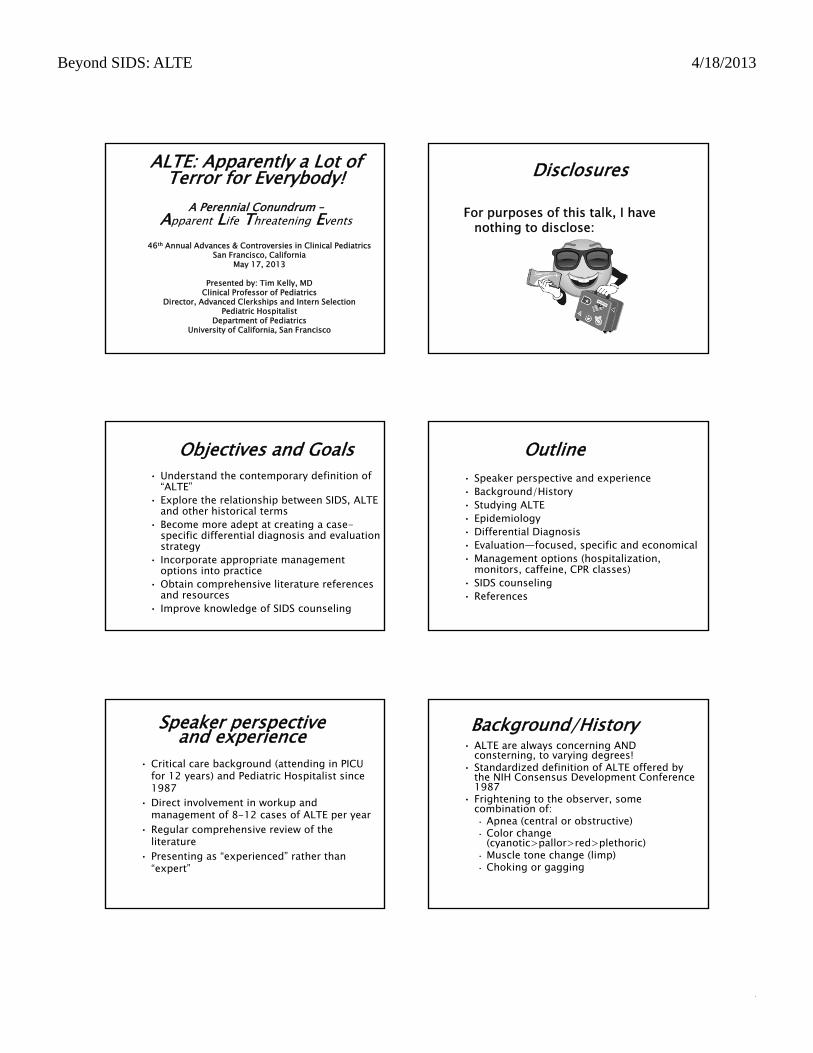
Beyond SIDS: ALTE 4/18/2013
Advances & Controversies in Clinical Pediatrics 2006 1
ALTE: Apparently a Lot of Terror for Everybody!
A Perennial Conundrum –Apparent Life Threatening Events
46th Annual Advances & Controversies in Clinical PediatricsSan Francisco, California
May 17, 2013
Presented by: Tim Kelly, MDClinical Professor of Pediatrics
Director, Advanced Clerkships and Intern SelectionPediatric Hospitalist
Department of PediatricsUniversity of California, San Francisco
Disclosures
For purposes of this talk, I have nothing to disclose:
Objectives and Goals• Understand the contemporary definition of
“ALTE”• Explore the relationship between SIDS, ALTE
and other historical terms• Become more adept at creating a case-
specific differential diagnosis and evaluation strategy
• Incorporate appropriate management options into practice
• Obtain comprehensive literature references and resources
• Improve knowledge of SIDS counseling
Outline• Speaker perspective and experience • Background/History• Studying ALTE• Epidemiology• Differential Diagnosis• Evaluation—focused, specific and economical• Management options (hospitalization,
monitors, caffeine, CPR classes)• SIDS counseling• References
Speaker perspective and experience
• Critical care background (attending in PICU for 12 years) and Pediatric Hospitalist since 1987
• Direct involvement in workup and management of 8-12 cases of ALTE per year
• Regular comprehensive review of the literature
• Presenting as “experienced” rather than “expert”
Background/History• ALTE are always concerning AND
consterning, to varying degrees!• Standardized definition of ALTE offered by
the NIH Consensus Development Conference 1987
• Frightening to the observer, some combination of:• Apnea (central or obstructive)• Color change
(cyanotic>pallor>red>plethoric)• Muscle tone change (limp)• Choking or gagging
mtrojnar
Rectangle
mtrojnar
Rectangle

Beyond SIDS: ALTE 4/18/2013
Advances & Controversies in Clinical Pediatrics 2006 2
Studying ALTE•Definition too broad?—some exclude obvious choking or include only “major” episodes•Definition too narrow?--some include altered Mental Status•Descriptions often quite subjective by frightened, inexperienced caregiver--“objective” and “measurable” criteria elusive•No ICD-9 code—ALTE is NOT a diagnosis, rather a symptom complex, “chief complaint” or presenting problem—hard to track or include in studies
Studying ALTE (cont.)Study design is complex: •Retrospectively, selection bias based on variable inclusion/exclusion criteria as noted above make Multi-Center study problematic—dyspnea, apnea vs. cyanosis, choking/gagging. Discharge diagnoses are often determined by “coders” which may further complicate the selection of appropriate patients. Are causes of ALTE then excluded?•Prospectively how to capture patients—general vs. specialty services within an institution•# needed to draw meaningful conclusions?
ARS1 mo boy, brief choking and gagging episode. ED evaluation is well, normal exam. Observe for a while—no spells. Discharge him directly to home from the ED if his ONLY risk factor for having another spell is that:
A. Nasal swab RSV +B. Frequent spit upsC. Delivered at 32 weeks post conceptionD. One previous similar episodeE. Mother smoked cigarettes throughout the pregnancy
Epidemiology•Almost half of monitored healthy children had at least one apnea > 20 seconds•Estimates are that 1-2% of infants in the general population will have an ALTE and 0.2-0.8% will have an apneic event leading to admission•Maternal smoking and single parent households seem to be risk factors•Median age 8 weeks, male=female•Post conception age < 44 weeks of age at higher risk (immature respiratory center); preemies; prior ALTE also higher risk
Epidemiology (cont.)
•SIDS ≠ ALTE—no causal relationship has ever been found, despite the obvious “frightening” nature of the event. •SIDS ≠ALTE—only ~5% of SIDS victims had a prior ALTE (consider recall bias).•SIDS ≠ ALTE—risk of subsequent death among all infants with ALTE is estimated at most 1-2%, but is increased in the (rare) subgroup of infants who have ALTE while asleep and who require CPR when discovered (“severe”) ALTE.•SIDS ≠ ALTE—recurrent, severe ALTE is the highest risk group and therefore get the most extensive workups and monitoring.
ARSPreviously healthy 1 mo runny nose, cough x 2days. 3rd day—brief apnea, pale motionless—gentle stimulation and he is back to normal. Likely cause?:
A. Seizure B. Organic acid disorderC. RSVD. Cardiac dysrhythmiaE. Intentional poisoning
mtrojnar
Rectangle
mtrojnar
Rectangle
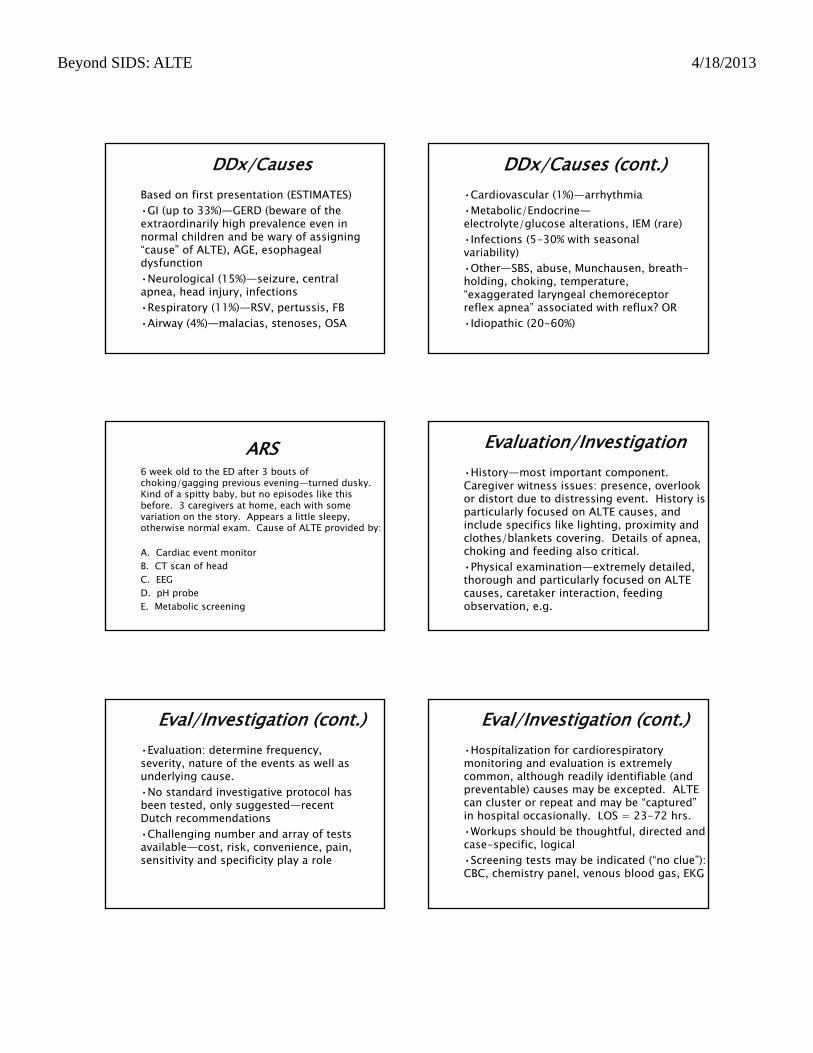
Beyond SIDS: ALTE 4/18/2013
Advances & Controversies in Clinical Pediatrics 2006 3
DDx/CausesBased on first presentation (ESTIMATES)•GI (up to 33%)—GERD (beware of the extraordinarily high prevalence even in normal children and be wary of assigning “cause” of ALTE), AGE, esophageal dysfunction•Neurological (15%)—seizure, central apnea, head injury, infections•Respiratory (11%)—RSV, pertussis, FB•Airway (4%)—malacias, stenoses, OSA
DDx/Causes (cont.)•Cardiovascular (1%)—arrhythmia•Metabolic/Endocrine—electrolyte/glucose alterations, IEM (rare)•Infections (5-30% with seasonal variability)•Other—SBS, abuse, Munchausen, breath-holding, choking, temperature, “exaggerated laryngeal chemoreceptor reflex apnea” associated with reflux? OR•Idiopathic (20-60%)
ARS6 week old to the ED after 3 bouts of choking/gagging previous evening—turned dusky. Kind of a spitty baby, but no episodes like this before. 3 caregivers at home, each with some variation on the story. Appears a little sleepy, otherwise normal exam. Cause of ALTE provided by:
A. Cardiac event monitorB. CT scan of headC. EEGD. pH probeE. Metabolic screening
Evaluation/Investigation•History—most important component. Caregiver witness issues: presence, overlook or distort due to distressing event. History is particularly focused on ALTE causes, and include specifics like lighting, proximity and clothes/blankets covering. Details of apnea, choking and feeding also critical.•Physical examination—extremely detailed, thorough and particularly focused on ALTE causes, caretaker interaction, feeding observation, e.g.
Eval/Investigation (cont.)•Evaluation: determine frequency, severity, nature of the events as well as underlying cause.•No standard investigative protocol has been tested, only suggested—recent Dutch recommendations•Challenging number and array of tests available—cost, risk, convenience, pain, sensitivity and specificity play a role
Eval/Investigation (cont.)•Hospitalization for cardiorespiratory monitoring and evaluation is extremely common, although readily identifiable (and preventable) causes may be excepted. ALTE can cluster or repeat and may be “captured” in hospital occasionally. LOS = 23-72 hrs.•Workups should be thoughtful, directed and case-specific, logical•Screening tests may be indicated (“no clue”): CBC, chemistry panel, venous blood gas, EKG
mtrojnar
Rectangle
mtrojnar
Rectangle
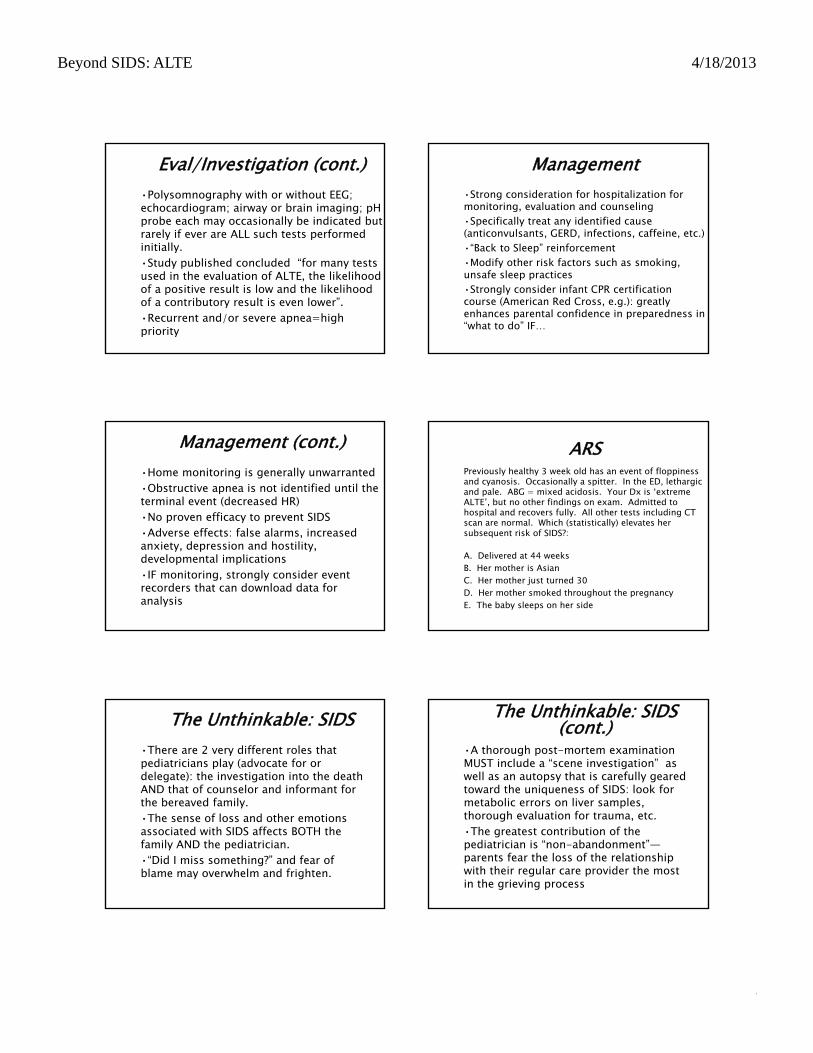
Beyond SIDS: ALTE 4/18/2013
Advances & Controversies in Clinical Pediatrics 2006 4
Eval/Investigation (cont.)•Polysomnography with or without EEG; echocardiogram; airway or brain imaging; pH probe each may occasionally be indicated but rarely if ever are ALL such tests performed initially.•Study published concluded “for many tests used in the evaluation of ALTE, the likelihood of a positive result is low and the likelihood of a contributory result is even lower”.•Recurrent and/or severe apnea=high priority
Management•Strong consideration for hospitalization for monitoring, evaluation and counseling•Specifically treat any identified cause (anticonvulsants, GERD, infections, caffeine, etc.)•“Back to Sleep” reinforcement•Modify other risk factors such as smoking, unsafe sleep practices•Strongly consider infant CPR certification course (American Red Cross, e.g.): greatly enhances parental confidence in preparedness in “what to do” IF…
Management (cont.)•Home monitoring is generally unwarranted•Obstructive apnea is not identified until the terminal event (decreased HR)•No proven efficacy to prevent SIDS•Adverse effects: false alarms, increased anxiety, depression and hostility, developmental implications•IF monitoring, strongly consider event recorders that can download data for analysis
ARSPreviously healthy 3 week old has an event of floppiness and cyanosis. Occasionally a spitter. In the ED, lethargic and pale. ABG = mixed acidosis. Your Dx is ‘extreme ALTE’, but no other findings on exam. Admitted to hospital and recovers fully. All other tests including CT scan are normal. Which (statistically) elevates her subsequent risk of SIDS?:
A. Delivered at 44 weeksB. Her mother is AsianC. Her mother just turned 30D. Her mother smoked throughout the pregnancyE. The baby sleeps on her side
The Unthinkable: SIDS•There are 2 very different roles that pediatricians play (advocate for or delegate): the investigation into the death AND that of counselor and informant for the bereaved family.•The sense of loss and other emotions associated with SIDS affects BOTH the family AND the pediatrician.•“Did I miss something?” and fear of blame may overwhelm and frighten.
The Unthinkable: SIDS (cont.)
•A thorough post-mortem examination MUST include a “scene investigation” as well as an autopsy that is carefully geared toward the uniqueness of SIDS: look for metabolic errors on liver samples, thorough evaluation for trauma, etc.•The greatest contribution of the pediatrician is “non-abandonment”—parents fear the loss of the relationship with their regular care provider the most in the grieving process
mtrojnar
Rectangle
mtrojnar
Rectangle
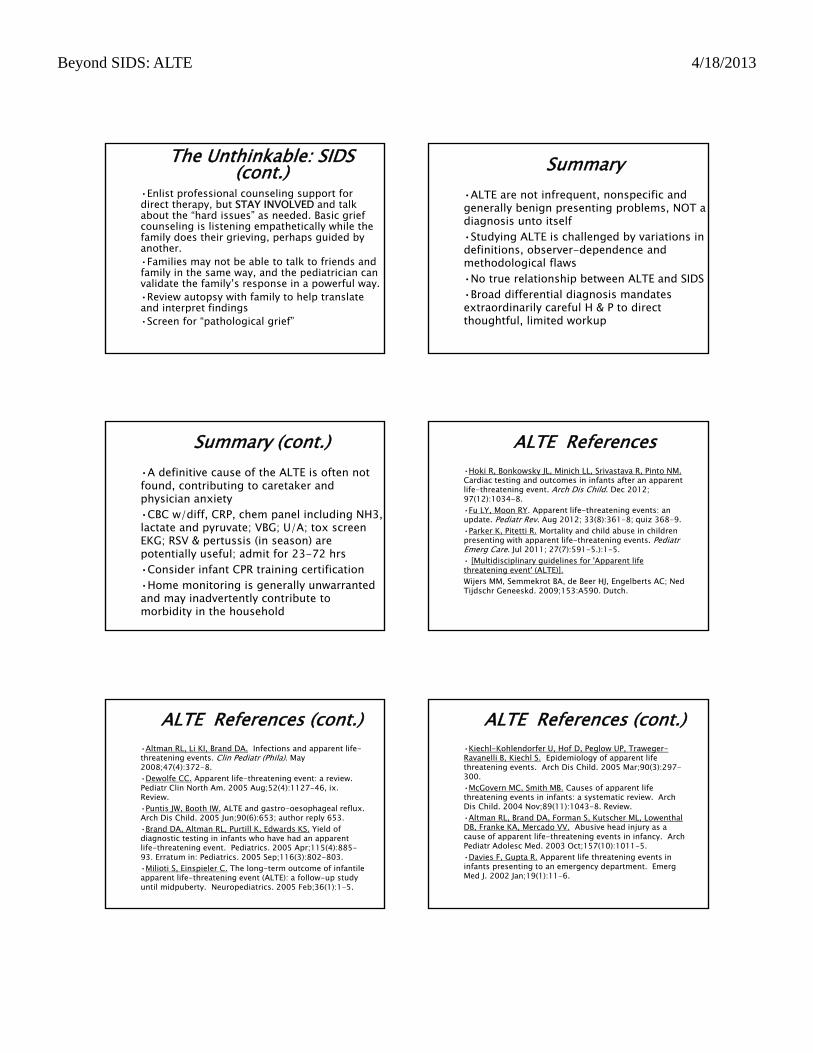
Beyond SIDS: ALTE 4/18/2013
Advances & Controversies in Clinical Pediatrics 2006 5
The Unthinkable: SIDS (cont.)
•Enlist professional counseling support for direct therapy, but STAY INVOLVED and talk about the “hard issues” as needed. Basic grief counseling is listening empathetically while the family does their grieving, perhaps guided by another.•Families may not be able to talk to friends and family in the same way, and the pediatrician can validate the family’s response in a powerful way.•Review autopsy with family to help translate and interpret findings•Screen for “pathological grief”
Summary•ALTE are not infrequent, nonspecific and generally benign presenting problems, NOT a diagnosis unto itself•Studying ALTE is challenged by variations in definitions, observer-dependence and methodological flaws•No true relationship between ALTE and SIDS•Broad differential diagnosis mandates extraordinarily careful H & P to direct thoughtful, limited workup
Summary (cont.)•A definitive cause of the ALTE is often not found, contributing to caretaker and physician anxiety•CBC w/diff, CRP, chem panel including NH3, lactate and pyruvate; VBG; U/A; tox screen EKG; RSV & pertussis (in season) are potentially useful; admit for 23-72 hrs•Consider infant CPR training certification•Home monitoring is generally unwarranted and may inadvertently contribute to morbidity in the household
ALTE References•Hoki R, Bonkowsky JL, Minich LL, Srivastava R, Pinto NM.Cardiac testing and outcomes in infants after an apparent life-threatening event. Arch Dis Child. Dec 2012; 97(12):1034-8.•Fu LY, Moon RY. Apparent life-threatening events: an update. Pediatr Rev. Aug 2012; 33(8):361-8; quiz 368-9.•Parker K, Pitetti R. Mortality and child abuse in children presenting with apparent life-threatening events. PediatrEmerg Care. Jul 2011; 27(7):591-5.):1-5.• [Multidisciplinary guidelines for 'Apparent life threatening event' (ALTE)].Wijers MM, Semmekrot BA, de Beer HJ, Engelberts AC; Ned Tijdschr Geneeskd. 2009;153:A590. Dutch.
ALTE References (cont.)•Altman RL, Li KI, Brand DA. Infections and apparent life-threatening events. Clin Pediatr (Phila). May 2008;47(4):372-8.•Dewolfe CC. Apparent life-threatening event: a review.Pediatr Clin North Am. 2005 Aug;52(4):1127-46, ix. Review. •Puntis JW, Booth IW. ALTE and gastro-oesophageal reflux. Arch Dis Child. 2005 Jun;90(6):653; author reply 653. •Brand DA, Altman RL, Purtill K, Edwards KS. Yield of diagnostic testing in infants who have had an apparent life-threatening event. Pediatrics. 2005 Apr;115(4):885-93. Erratum in: Pediatrics. 2005 Sep;116(3):802-803. •Milioti S, Einspieler C. The long-term outcome of infantile apparent life-threatening event (ALTE): a follow-up study until midpuberty. Neuropediatrics. 2005 Feb;36(1):1-5.
ALTE References (cont.)•Kiechl-Kohlendorfer U, Hof D, Peglow UP, Traweger-Ravanelli B, Kiechl S. Epidemiology of apparent life threatening events. Arch Dis Child. 2005 Mar;90(3):297-300. •McGovern MC, Smith MB. Causes of apparent life threatening events in infants: a systematic review. Arch Dis Child. 2004 Nov;89(11):1043-8. Review. •Altman RL, Brand DA, Forman S, Kutscher ML, LowenthalDB, Franke KA, Mercado VV. Abusive head injury as a cause of apparent life-threatening events in infancy. Arch Pediatr Adolesc Med. 2003 Oct;157(10):1011-5.•Davies F, Gupta R. Apparent life threatening events in infants presenting to an emergency department. EmergMed J. 2002 Jan;19(1):11-6.
mtrojnar
Rectangle
mtrojnar
Rectangle
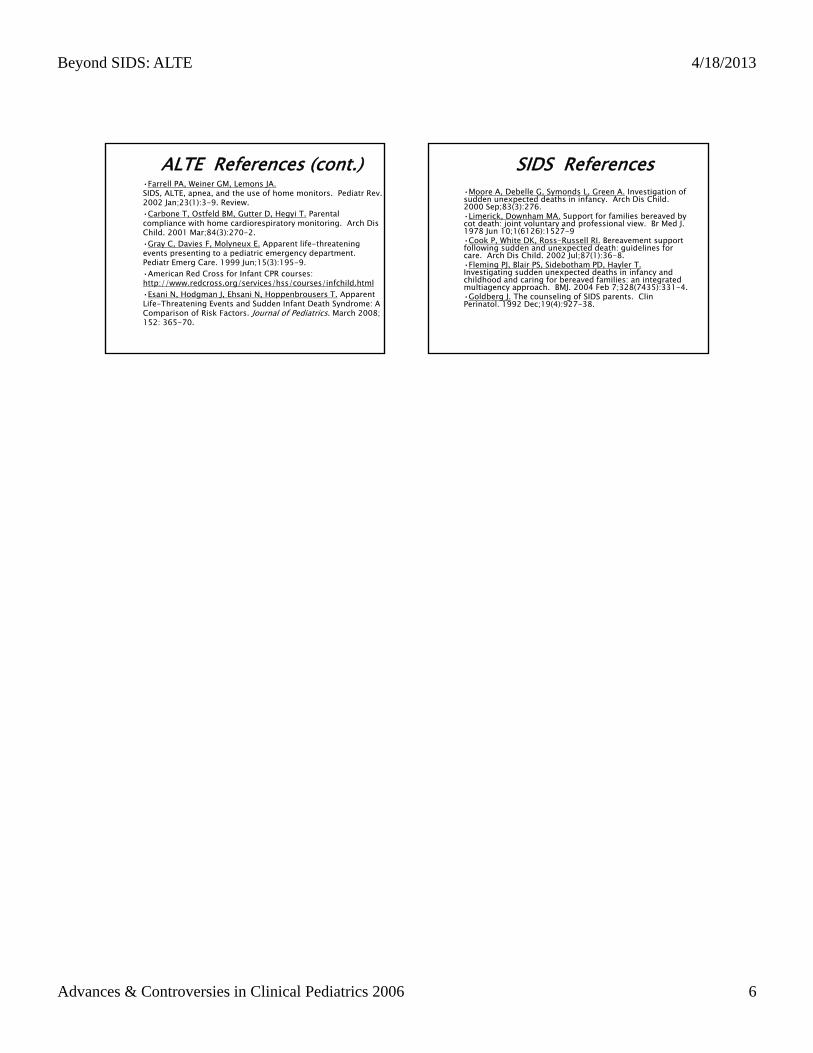
Beyond SIDS: ALTE 4/18/2013
Advances & Controversies in Clinical Pediatrics 2006 6
ALTE References (cont.)•Farrell PA, Weiner GM, Lemons JA.SIDS, ALTE, apnea, and the use of home monitors. Pediatr Rev. 2002 Jan;23(1):3-9. Review. •Carbone T, Ostfeld BM, Gutter D, Hegyi T. Parental compliance with home cardiorespiratory monitoring. Arch Dis Child. 2001 Mar;84(3):270-2.•Gray C, Davies F, Molyneux E. Apparent life-threatening events presenting to a pediatric emergency department. Pediatr Emerg Care. 1999 Jun;15(3):195-9.•American Red Cross for Infant CPR courses: http://www.redcross.org/services/hss/courses/infchild.html•Esani N, Hodgman J, Ehsani N, Hoppenbrousers T. Apparent Life-Threatening Events and Sudden Infant Death Syndrome: A Comparison of Risk Factors. Journal of Pediatrics. March 2008; 152: 365-70.
SIDS References•Moore A, Debelle G, Symonds L, Green A. Investigation of sudden unexpected deaths in infancy. Arch Dis Child. 2000 Sep;83(3):276. •Limerick, Downham MA. Support for families bereaved by cot death: joint voluntary and professional view. Br Med J. 1978 Jun 10;1(6126):1527-9 •Cook P, White DK, Ross-Russell RI. Bereavement support following sudden and unexpected death: guidelines for care. Arch Dis Child. 2002 Jul;87(1):36-8. •Fleming PJ, Blair PS, Sidebotham PD, Hayler T.Investigating sudden unexpected deaths in infancy and childhood and caring for bereaved families: an integrated multiagency approach. BMJ. 2004 Feb 7;328(7435):331-4.•Goldberg J. The counseling of SIDS parents. ClinPerinatol. 1992 Dec;19(4):927-38.
mtrojnar
Rectangle
FRIDAY, MAY 17, 2013
EMERGENCY ENCOUNTERS
Moderator: Dr. Myles Abbott

FRIDAY, MAY 17, 2013
10:40
P You Got WHAT Stuck WHERE?? Foreign Bodies ‐ Fun Ways to Get Them Off or Out
Dr. Angela Anderson

4/18/2013
1
Foreign BodiesFun Ways to Get Them Off or Out
Angela C. Anderson, MD, FAAPPediatric Emergency Medicine
Brown University Medical SchoolHasbro Children’s HospitalProvidence, Rhode Island
You Got WHAT Stuck WHERE??
Complications: Incr’d Risk if
>24 hours
Thoracic InletAortic Arch
GE Sphincter
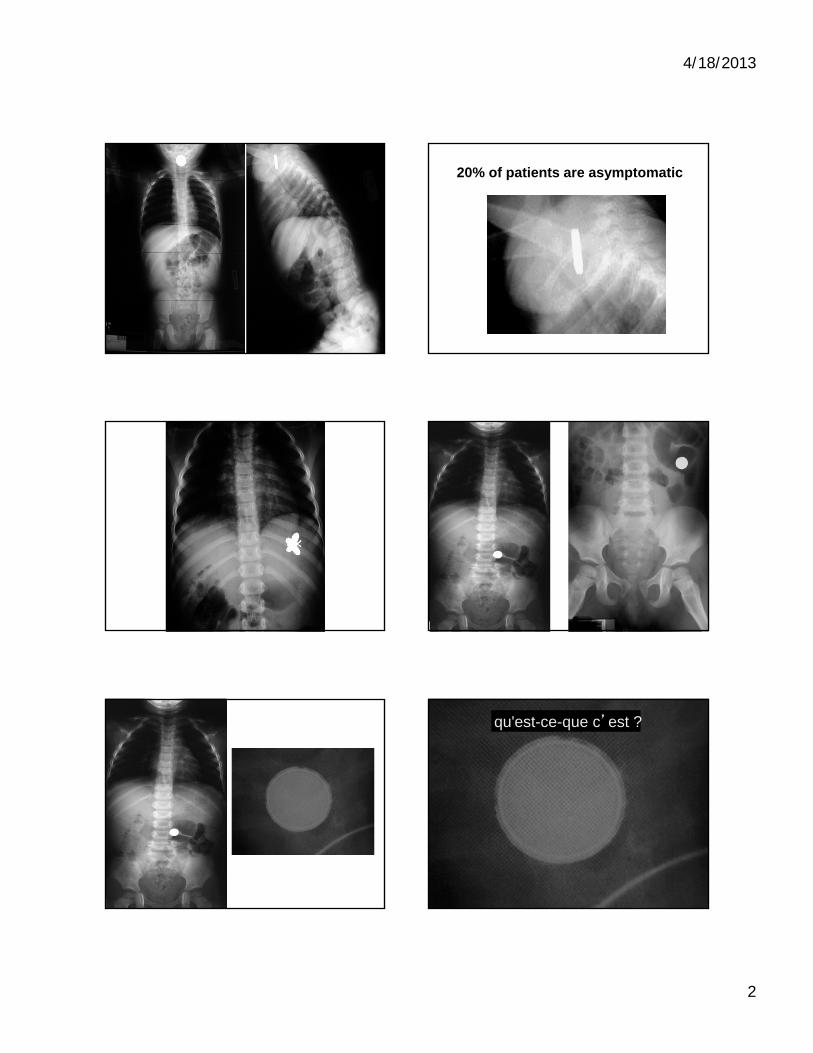
4/18/2013
2
20% of patients are asymptomatic
qu'est-ce-que c’est ?
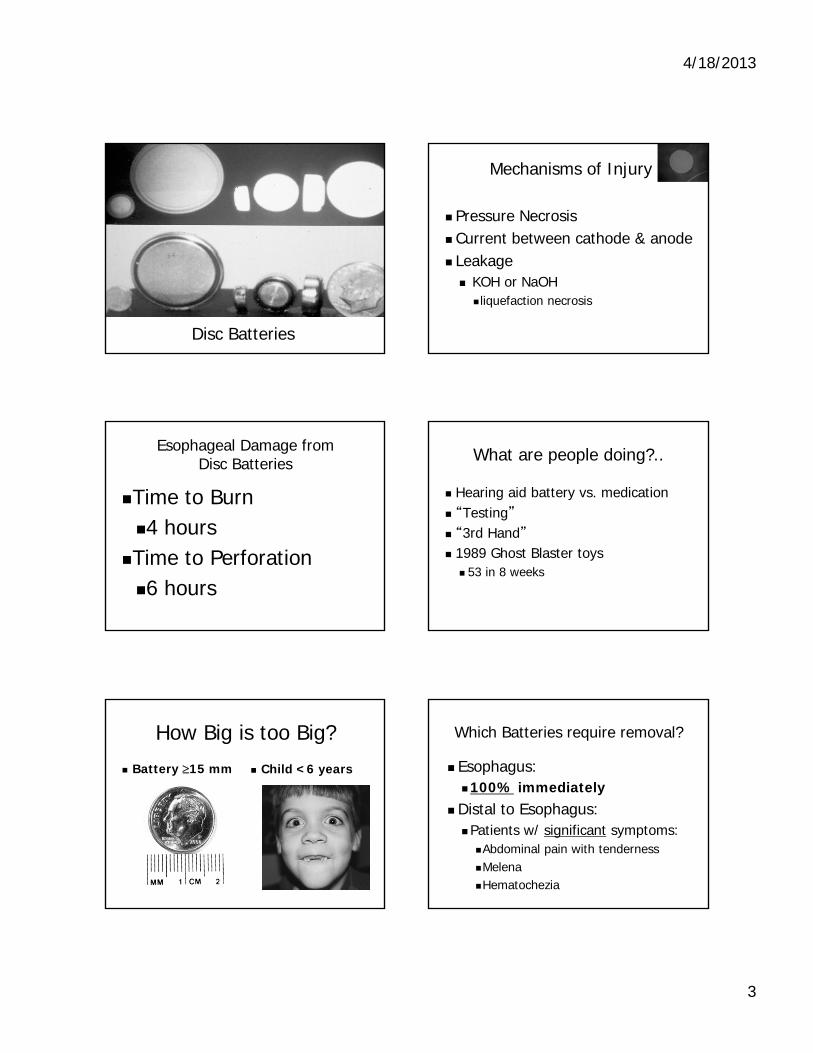
4/18/2013
3
Disc Batteries
Mechanisms of Injury
Pressure Necrosis Current between cathode & anode Leakage KOH or NaOH liquefaction necrosis
Esophageal Damage from Disc Batteries
Time to Burn 4 hours
Time to Perforation 6 hours
What are people doing?..
Hearing aid battery vs. medication “Testing” “3rd Hand” 1989 Ghost Blaster toys 53 in 8 weeks
How Big is too Big?
Battery 15 mm Child <6 years
Which Batteries require removal?
Esophagus:100% immediately
Distal to Esophagus:Patients w/ significant symptoms:Abdominal pain with tendernessMelenaHematochezia
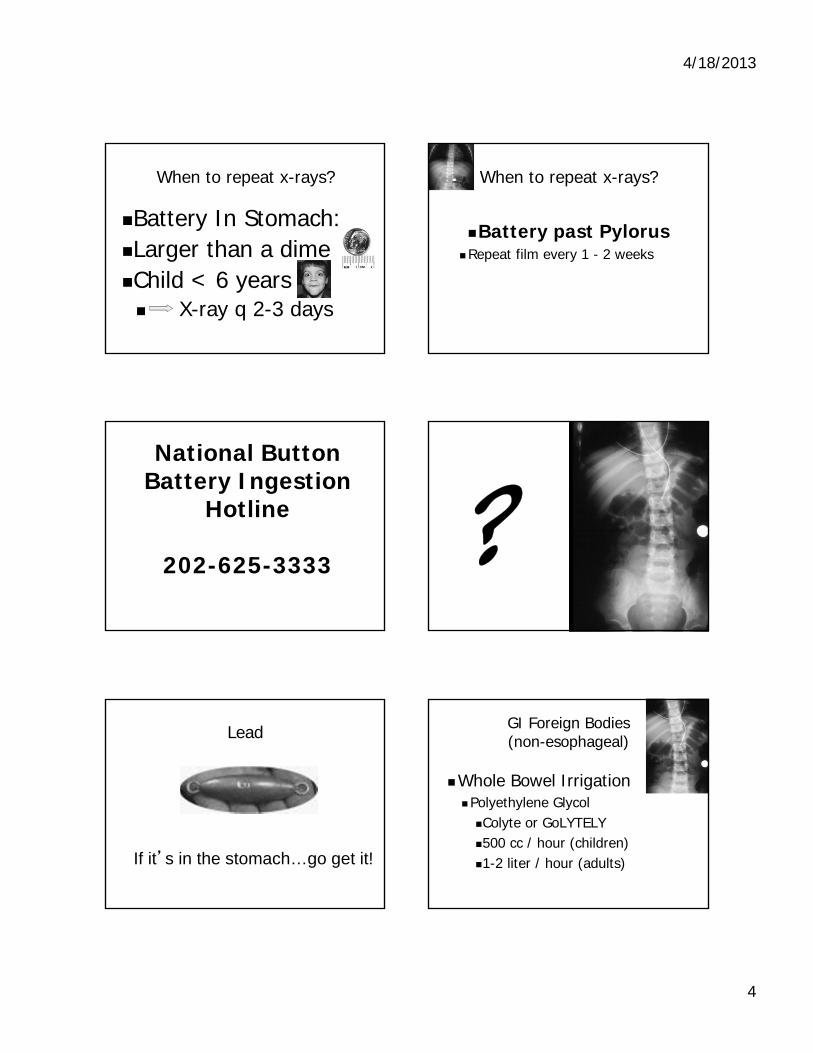
4/18/2013
4
When to repeat x-rays?
Battery In Stomach:Larger than a dimeChild < 6 years X-ray q 2-3 days
When to repeat x-rays?
Battery past PylorusRepeat film every 1 - 2 weeks
National Button Battery Ingestion
Hotline
202-625-3333
Lead
If it’s in the stomach…go get it!
GI Foreign Bodies(non-esophageal)
Whole Bowel IrrigationPolyethylene GlycolColyte or GoLYTELY500 cc / hour (children)1-2 liter / hour (adults)
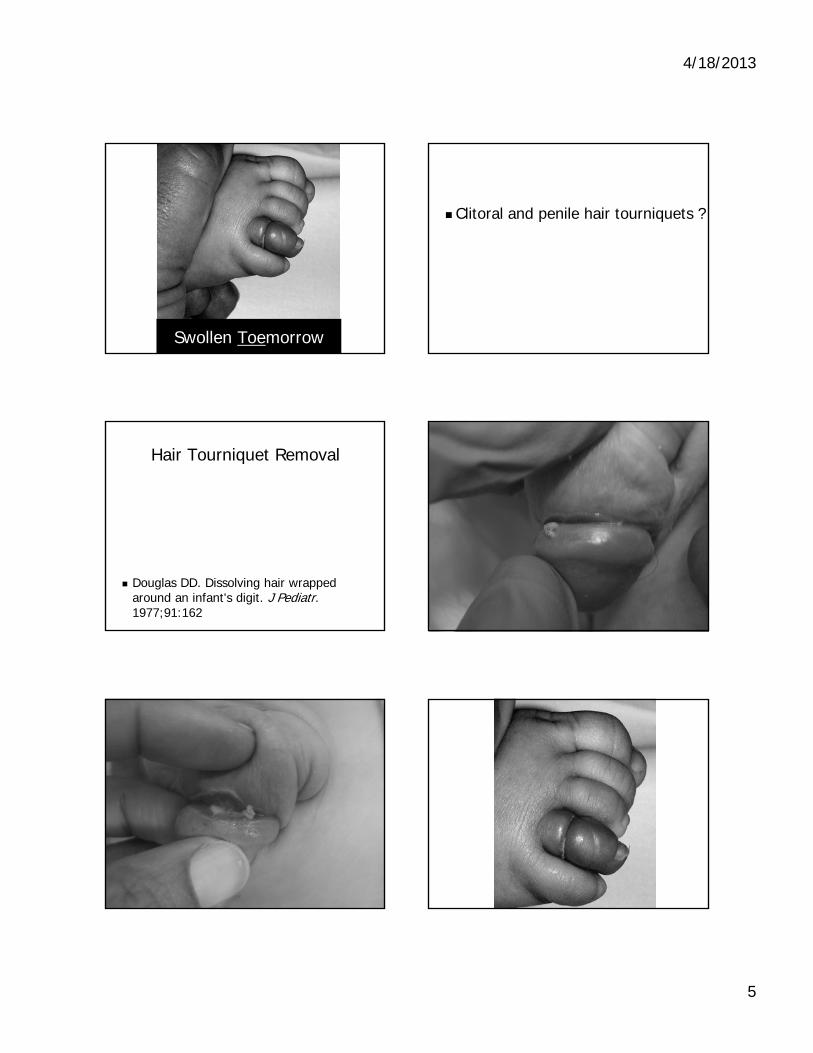
4/18/2013
5
Swollen Toemorrow
Clitoral and penile hair tourniquets ?
Hair Tourniquet Removal
Douglas DD. Dissolving hair wrapped around an infant's digit. J Pediatr.1977;91:162

4/18/2013
6
Ticks
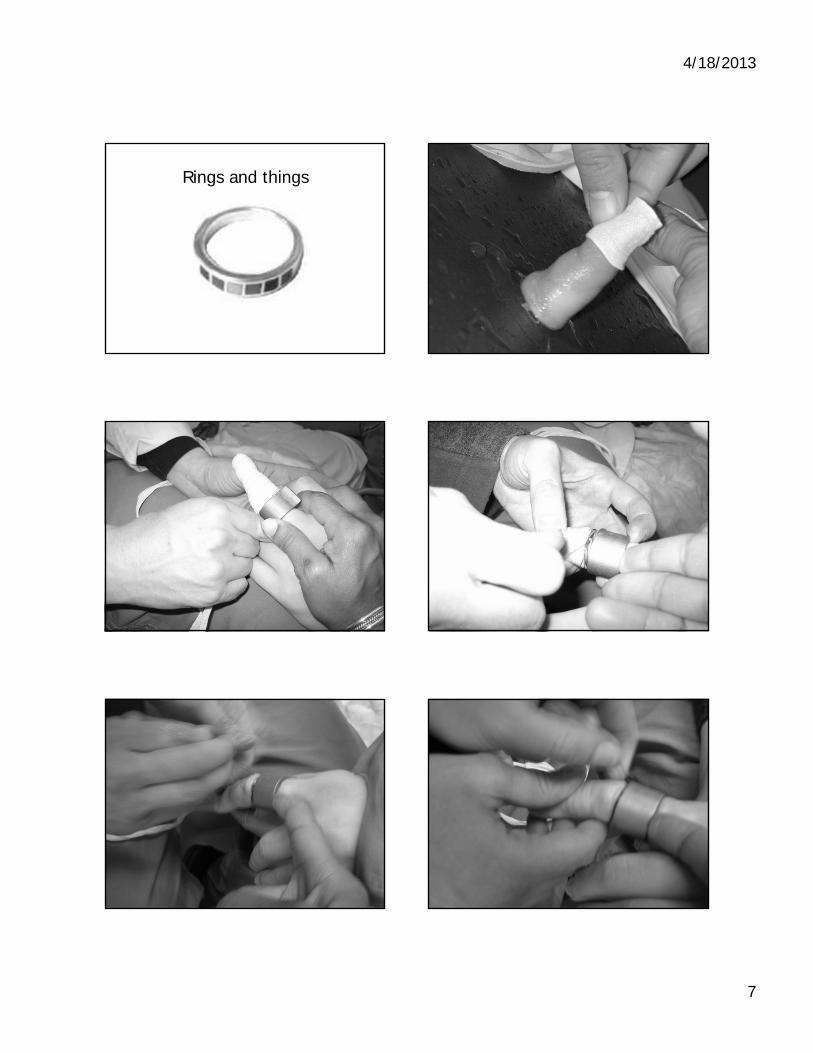
4/18/2013
7
Rings and things
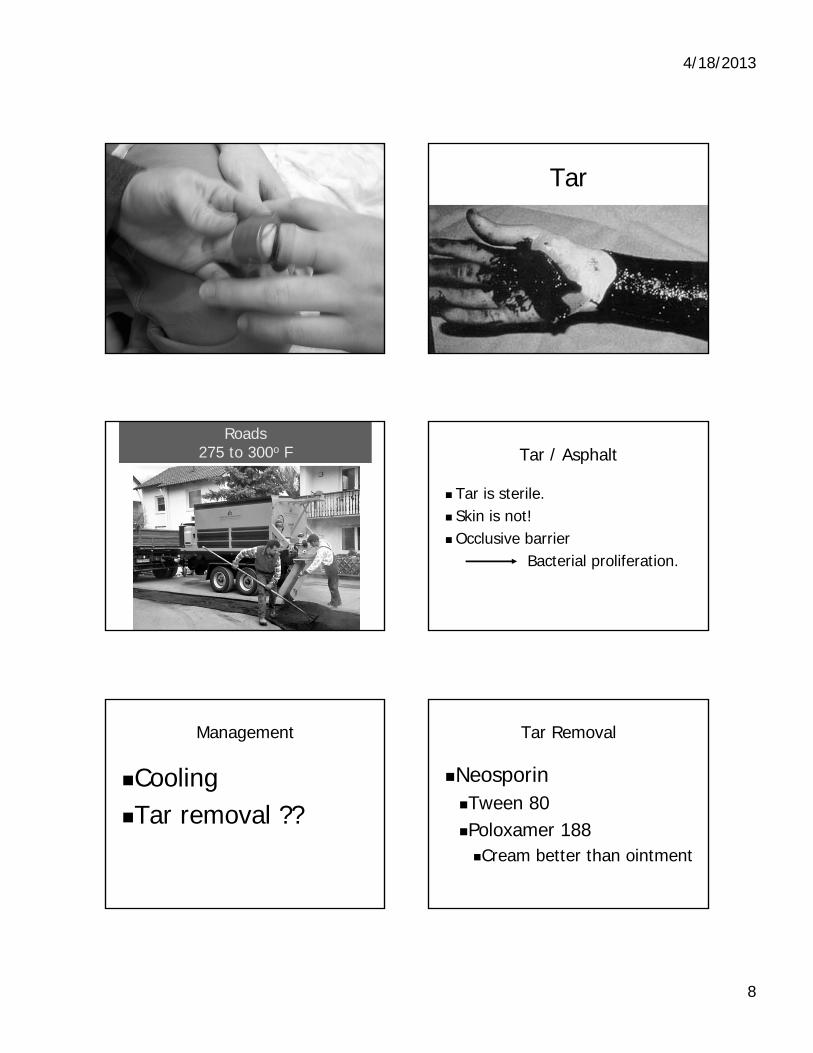
4/18/2013
8
Tar
Roads275 to 300o F Tar / Asphalt
Tar is sterile. Skin is not!Occlusive barrier
Bacterial proliferation.
Management
CoolingTar removal ??
Tar Removal
NeosporinTween 80Poloxamer 188Cream better than ointment

4/18/2013
9
EarsDo you care?
A 15 year old girl presents with intractable coughing.
On exam: Lungs: CTAHeart: RRR no murmursHEENT: hair in the left ear canal
Unusual Side Effects of Aural Foreign Bodies
Persistent coughHiccups
First Described in 1832
The Lancet Vol 360,Aug,2002
7 yo with cough x 7 yearsThe Hair and The Ant
Annals Emergency MedJan 1982, 11(1): 24
New England Journal of MedMarch 1988, 318(11):711
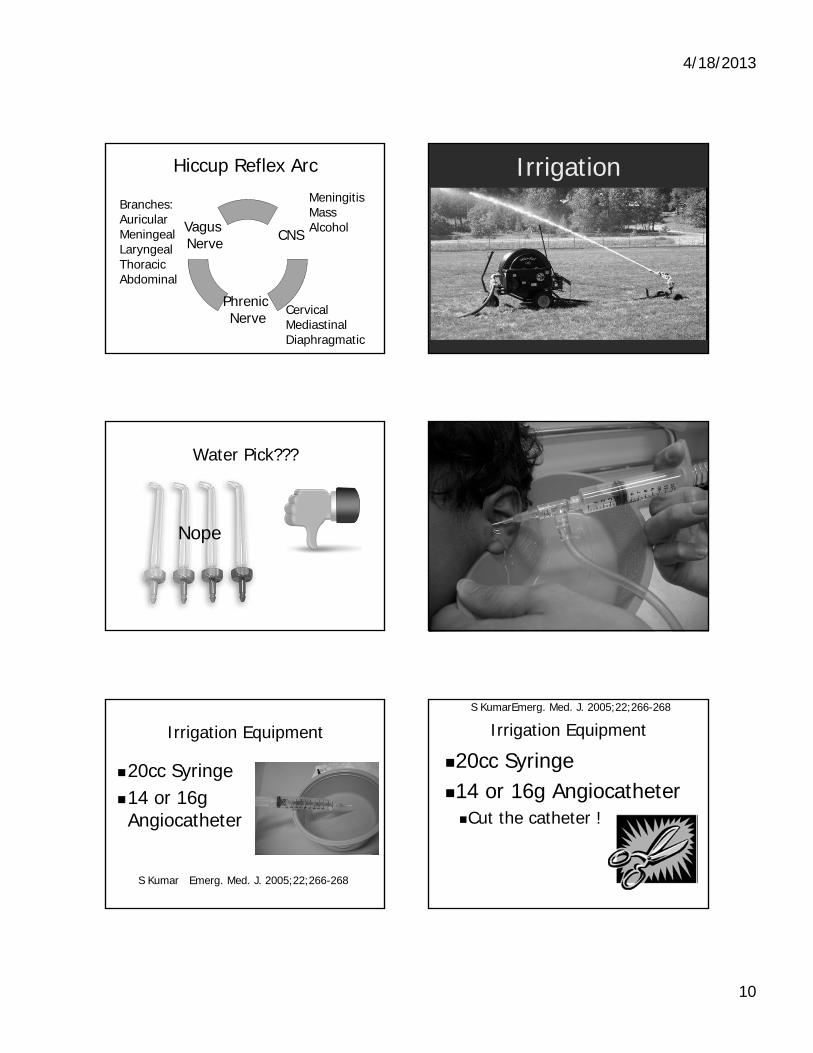
4/18/2013
10
Hiccup Reflex Arc
CNS
Phrenic Nerve
Vagus Nerve
MeningitisMassAlcohol
CervicalMediastinal Diaphragmatic
Branches:AuricularMeningealLaryngealThoracicAbdominal
Irrigation
Water Pick???
Nope
Irrigation Equipment
20cc Syringe14 or 16g Angiocatheter
S Kumar Emerg. Med. J. 2005;22;266-268
Irrigation Equipment
20cc Syringe14 or 16g AngiocatheterCut the catheter !
S KumarEmerg. Med. J. 2005;22;266-268
4/18/2013
11
Pressure generated by20cc syringe and cannulas
14 gauge: 8 kPa 60 mmHg
16 gauge: 7 kPa 50 mmHg
18 gauge: 4 kPa 30 mmHg
Median Pressure to rupture the TM: 60 kPa
S Kumar Emerg. Med. J. 2005;22;266-268
Elephant EAR
Washer System
Auricular IrrigationNot if:TM is perforatedBattery
Not for:Hygroscopic objects vegetables, beans, etc.
Cyanoacrylates to Remove Ear FB’s
“A novel approach to the removal of
Superglue from the ear.”
Persaud R - J Laryngol Otol - 01-Nov-2001; 115(11): 901-2
Warm 3% hydrogen peroxide
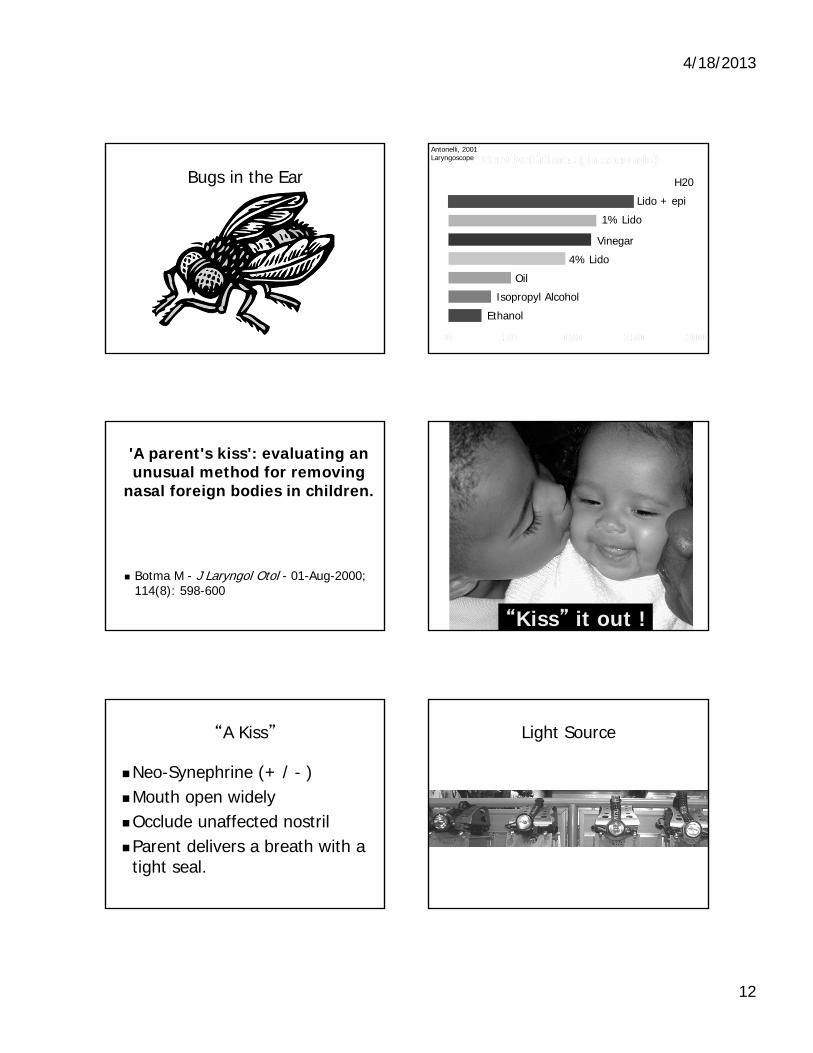
4/18/2013
12
Bugs in the Ear
Ethanol
Isopropyl Alcohol
Vinegar
4% Lido
1% Lido
H20
Lido + epi
Oil
Antonelli, 2001Laryngoscope
'A parent's kiss': evaluating an unusual method for removing
nasal foreign bodies in children.
Botma M - J Laryngol Otol - 01-Aug-2000; 114(8): 598-600
“Kiss” it out !
“A Kiss”
Neo-Synephrine (+ / - )Mouth open widelyOcclude unaffected nostril Parent delivers a breath with a tight seal.
Light Source
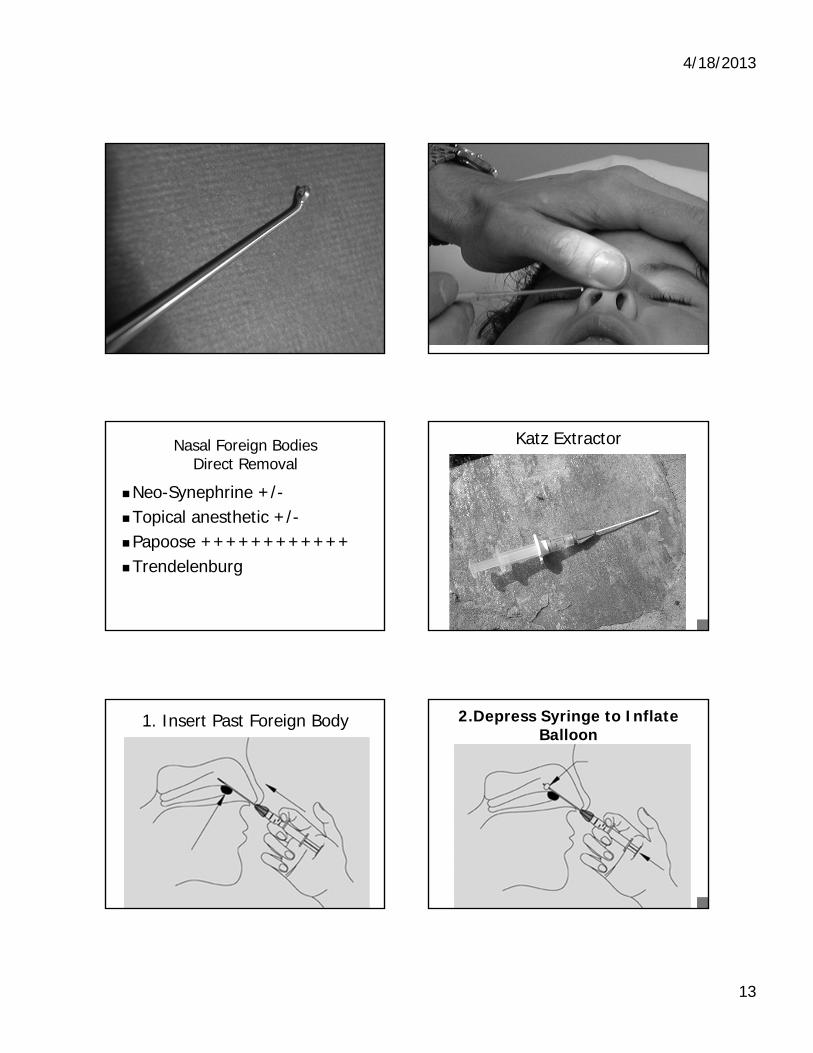
4/18/2013
13
Nasal Foreign BodiesDirect Removal
Neo-Synephrine +/-Topical anesthetic +/-Papoose ++++++++++++Trendelenburg
Katz Extractor
1. Insert Past Foreign Body 2.Depress Syringe to Inflate Balloon
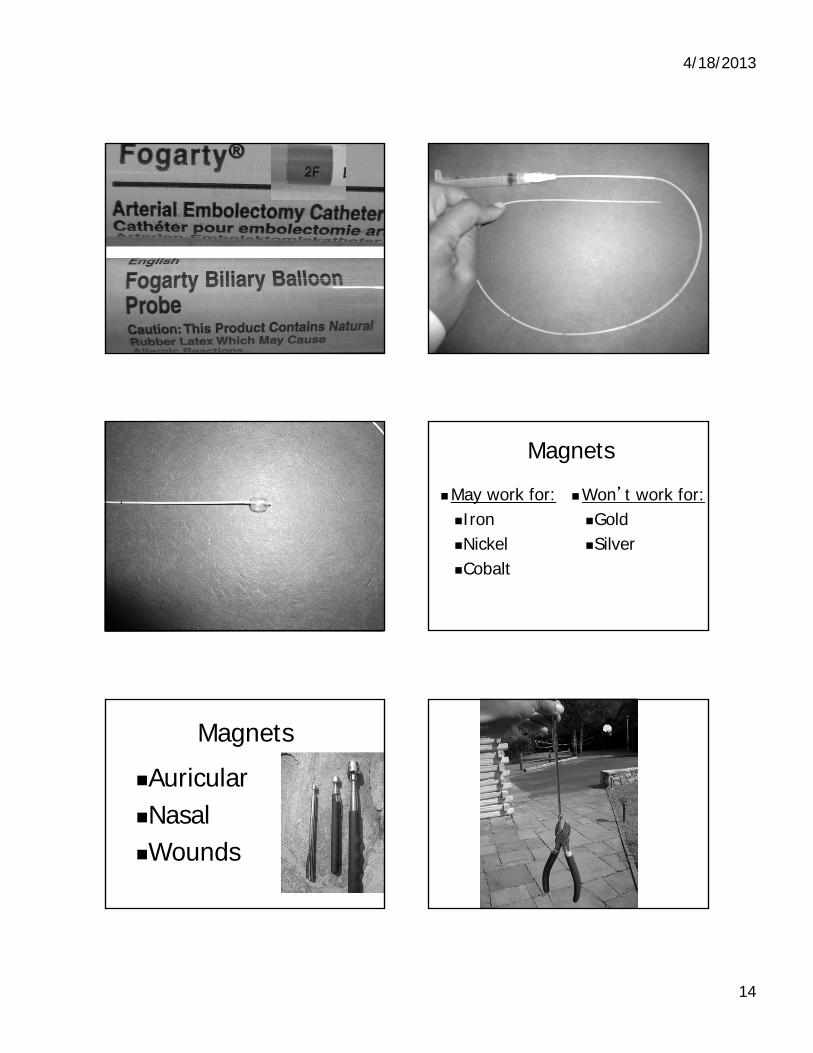
4/18/2013
14
Magnets
May work for:Iron Nickel Cobalt
Won’t work for:GoldSilver
Magnets
AuricularNasalWounds
4/18/2013
15
Magill Forceps
Uh, oh….
+ = ??Superglue
Glue Eye Management
Mineral oil compresses overnight

FRIDAY, MAY 17, 2013
11:20
P Sports Medicine in The Office: You Make the Call
Dr. Jordan Metzl

4/18/2013
1
Sports Medicine in the Office: You Make The Call
Jordan D. Metzl, MD@drjordanmetzl
www.DrJordanMetzl.com
Hospital for Special SurgeryNew York, NY
Case History #1
• 14 year old soccer player comes into the office
• “Hit in the Head” during game
• 2 days after injury
• Headache
• When do you return to competition?
The Adolescent Brain
Concussion
• A complex pathophysiological process affecting the brain brought on by biomechanical forces
• “Concussion” comes from the Latin verb concutere “to shake violently”
• Spectrum of injury
Concussion Definition
• Traumatically induced alteration in brain function manifested by– Alteration in awareness
• Dinged, dazed, stunned, woozy, foggy, amnesic, LOC, etc
– Signs of symptoms of post-concussive syndrome
• Headache, vertigo, light-headedness, balance disturbance, cognitive dysfunction, memory disturbance, hearing loss, tinnitus, vision disturbance, personality changes, drowsiness, lethargy, fatigue, inability to perform daily activities
4/18/2013
2
Each Athlete With A Concussion is Different
• Age of athlete
• ? Gender
• Sport
• Return to activity is an individual decision
• Zackery Lystedt law
Concussion Epidemiology
• Are we seeing more concussions or recognizing them more effectively?
• Until recently difficult to define and monitor
• Teen concussions– School based reporting
– Pediatrician office reporting
– Emergency department reporting
Concussion Epidemiology in Children/Adolescents
• Estimated 44 million children and adolescents participate in organized sports in the US
• Estimated 170 million adults participate in physical activities including sports
• Estimated 1.7 million TBI’s in the US annually
• CDC estimates 1.6 to 3.8 million concussions occur annually in sports and recreational activities and has deemed it a public health issue
Classification of Symptoms
Physical
• Headache
• Nausea
• Vomiting
• Visual Problems
• Fatigue
• Light and Noise Sensitivity
Cognitive
• Foggy
• Slowed down
• Difficulty concentrating
• Forgetful
• Confused
Classification of Symptoms
Emotional
• Irritability
• Sadness
• Emotional lability
Sleep
• Drowsiness
• Sleeping more than usual
• Sleeping less than usual
How Do Concussions Affect Your Practice?
• Sideline Care
• Office Based Management
• Parental Anxiety
• Sport Selection
• Prevention?
4/18/2013
3
Post-concussive Symptoms
• Headache
• Irritability
• Sleeplessness
• Dizziness
• Anxiety
Sideline Evaluation
• What is the diagnosis?– Is it a concussion
• What is the severity of the injury?– Does it matter
• Can the athlete return to play safely?– That event– When
• Do they need further evaluation?– Now– Later
Concussion in the OfficeNeuropsychiatric Testing
• Paper and pencil– 6 to 8 hours
– Expensive
• Simplified computer tests– ImPACT most popular
– 20 minutes
– Program measures multiple aspects of cognitive functioning
– Concerns regarding validation and use in children/adolescents
ImPACT Testing
Widely usedNFL, NHL, NCAA, etc
Is it useful?identifying athletes that are lying about their symptoms or truly having no symptoms but not fully recovered from their injury
Baseline data criticalLooks promisingAttempt to more objectively and quickly assess
and monitor concussions
ImPACT
Is it validated clinically?One prospective study (poor control group) with original
version and none with current versionIs it validated psychometrically?
Broglio et al ’07 – in a normal cohort tested at baseline, day 45, and day 50 there was a measured impairment of 40% on day 45 and 20% on day 50 controlling for effort (false positive)
Maelender et al ’10 - study comparing ImPACT to a two hour neurospsych test and there conclusion was that ImPACT is limited as a screening tool
Concussion:What Your Patients Need to Know
Not every hit in the head is a concussion
4/18/2013
4
1) What Sport Is The Most Dangerous?
Collegiate Data on Concussion per 1,000 exposure hours
Men’s• Spring FB .54 • Ice hockey .41 • Football .37 • Soccer .28 • Lacrosse .25 • Wrestling .25 • Basketball .16 • Baseball .07
Women’s• Ice hockey .91* • Soccer .41 • Lacrosse .25 • Basketball .22 • Field hockey .18 • Gymnastics .16 • Softball .14 • Volleyball .09
2) Are Pediatric and Adult Concussions the Same?
Effect of Growth and Maturation
• High school aged children (14-18) may have prolonged cognitive recovery when compared with young adults (18-25 years), although symptom recovery is equivalent
– Field 2003
• No information available for younger children
Recovery Times from Adolescent Concussion
• Sport-related concussion and age: number of days to neurocognitive baseline
• Zuckerman SL et al, Neurosurgery, Aug 2012• 200 “adolescent” concussions, subjects matched
based on previous number of concussions– 100 – group 13-16– 100 – group 18-22
• Verbal memory, visual memory, reaction time, and post concussive symptom time all greater in 13-16 year old group
3) Concussion, What’s The Worst That Can Happen?
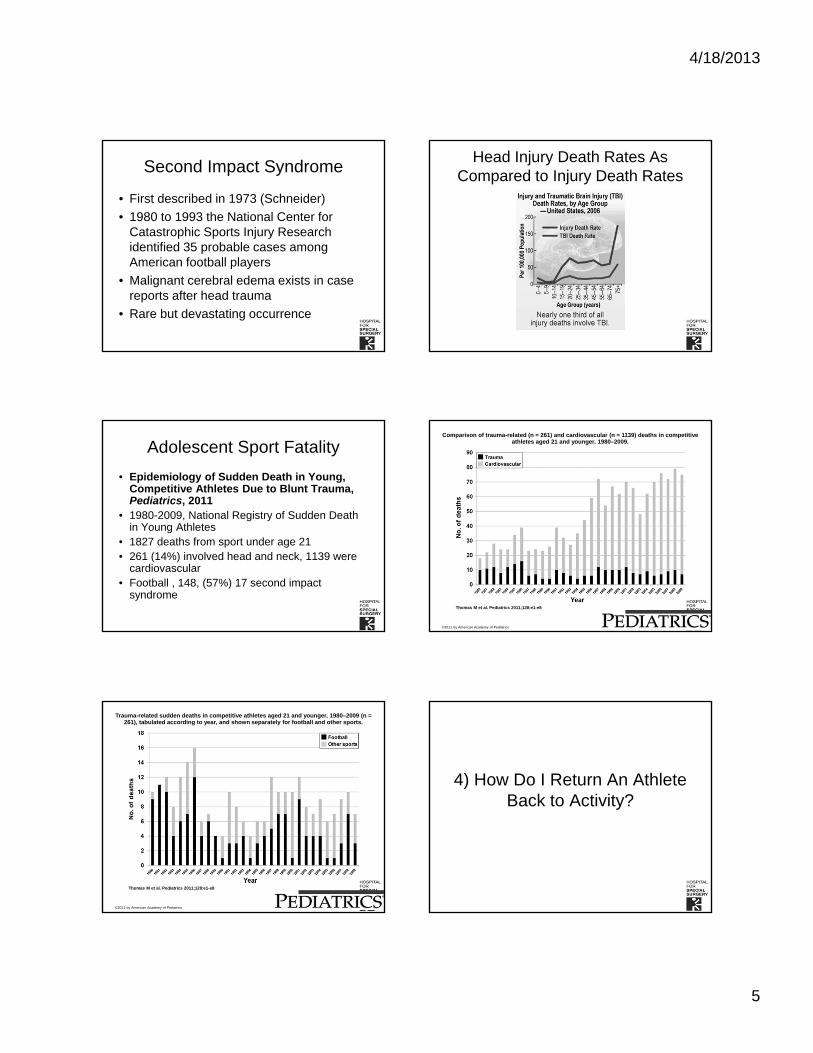
4/18/2013
5
Second Impact Syndrome
• First described in 1973 (Schneider)
• 1980 to 1993 the National Center for Catastrophic Sports Injury Research identified 35 probable cases among American football players
• Malignant cerebral edema exists in case reports after head trauma
• Rare but devastating occurrence
Head Injury Death Rates As Compared to Injury Death Rates
Adolescent Sport Fatality
• Epidemiology of Sudden Death in Young, Competitive Athletes Due to Blunt Trauma, Pediatrics, 2011
• 1980-2009, National Registry of Sudden Death in Young Athletes
• 1827 deaths from sport under age 21• 261 (14%) involved head and neck, 1139 were
cardiovascular • Football , 148, (57%) 17 second impact
syndrome
Comparison of trauma-related (n = 261) and cardiovascular (n = 1139) deaths in competitive athletes aged 21 and younger, 1980–2009.
Thomas M et al. Pediatrics 2011;128:e1-e8
©2011 by American Academy of Pediatrics
Trauma-related sudden deaths in competitive athletes aged 21 and younger, 1980–2009 (n = 261), tabulated according to year, and shown separately for football and other sports.
Thomas M et al. Pediatrics 2011;128:e1-e8
©2011 by American Academy of Pediatrics
4) How Do I Return An Athlete Back to Activity?

4/18/2013
6
Concussion Rehabilitation/Stepwise Return to Play
Rehabilitation Stage Functional Exercise
1. No activity Complete physical and cognitive rest2. Light aerobic activity
Walking, swimming, stationary cycling at 70% maximum heart rate; no resistance exercises
3. Sport-specific exercise Specific sport-related drills but no head impact
4. Noncontact training drills More complex drills, may start light resistance training
5. Full-contact practice After medical clearance, participate in normal training
6. Return to play
Case #2 – Hip Pain in the Soccer Player
• 15 year old soccer player
• Kicking ball
• Feels “pop” in hip
• Limps into office next day for evaluation
• Hey Doc, Can I play?
Sports Injuries in the Athletic Patient
• Acute Traumatic– Fractures
– Ligament Injury
– Concussion
• Overuse– Stress Fracture
– Osteochondritis Dessicans
Developmental Anatomy
• Physis
• Epiphysis
• Apophysis
Acute Apophyseal Injury
• Acute injury
• Index of suspicion
• Rapid skeletal growth
• Loss of flexibility
Differential Diagnosis of Hip Pain in the Adolescent
• Acute Injury– SCFE– Apophyseal Injury– ? Labrum tear
• Overuse Injury– Muscular (Iliopsoas tendonitis)– Stress fracture (Femoral, Pelvic)– ? Labrum tear
• Referred Pain– Spondylolysis
• Others– Neoplasm (Osteoid Osteoma)
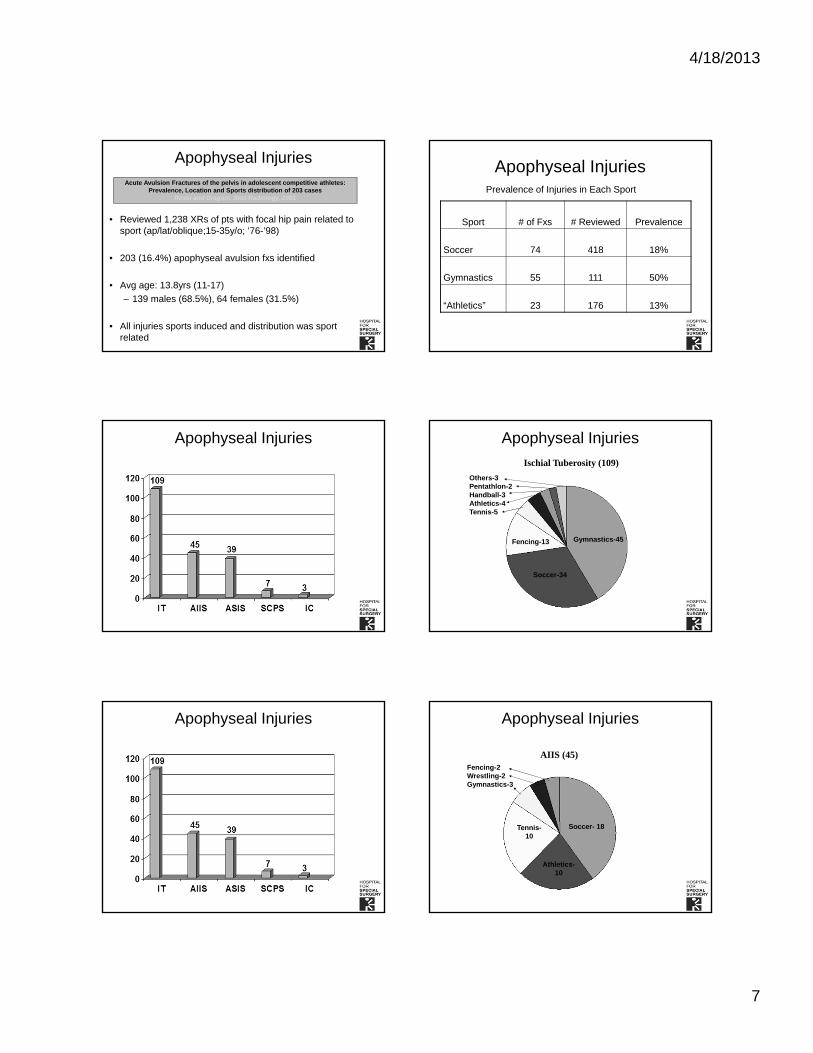
4/18/2013
7
Apophyseal Injuries
• Reviewed 1,238 XRs of pts with focal hip pain related to sport (ap/lat/oblique;15-35y/o; ’76-’98)
• 203 (16.4%) apophyseal avulsion fxs identified
• Avg age: 13.8yrs (11-17)
– 139 males (68.5%), 64 females (31.5%)
• All injuries sports induced and distribution was sport related
Acute Avulsion Fractures of the pelvis in adolescent competitive athletes:Prevalence, Location and Sports distribution of 203 cases
Rossi and Dragoni, Skel Radiology, 2001
Apophyseal Injuries
Sport # of Fxs # Reviewed Prevalence
Soccer 74 418 18%
Gymnastics 55 111 50%
“Athletics” 23 176 13%
Prevalence of Injuries in Each Sport
Apophyseal Injuries Apophyseal Injuries
Ischial Tuberosity (109)
Gymnastics-45
Soccer-34
Fencing-13
Others-3Pentathlon-2Handball-3Athletics-4Tennis-5
Apophyseal Injuries Apophyseal Injuries
AIIS (45)
Soccer- 18
Athletics-10
Tennis-10
Fencing-2Wrestling-2Gymnastics-3
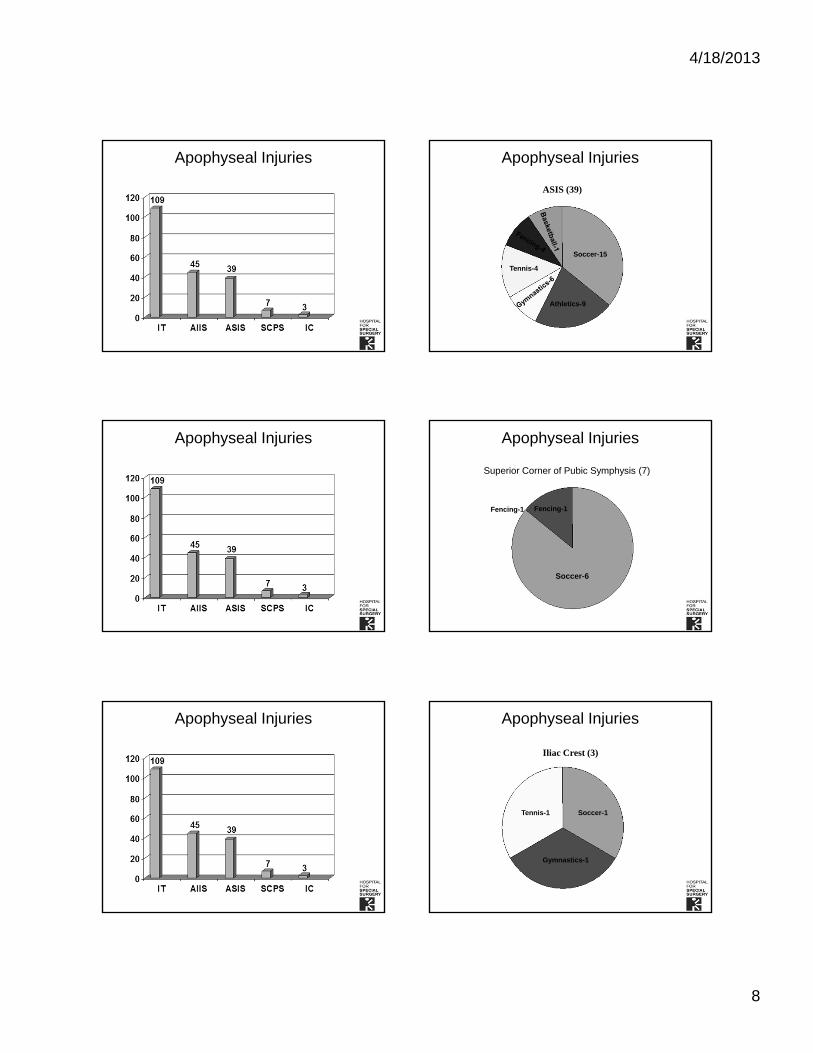
4/18/2013
8
Apophyseal Injuries Apophyseal Injuries
Soccer-15
Athletics-9
Tennis-4
ASIS (39)
Apophyseal Injuries Apophyseal Injuries
Superior Corner of Pubic Symphysis (7)
Soccer-6
Fencing-1 Fencing-1
Apophyseal Injuries Apophyseal Injuries
Soccer-1
Gymnastics-1
Tennis-1
Iliac Crest (3)
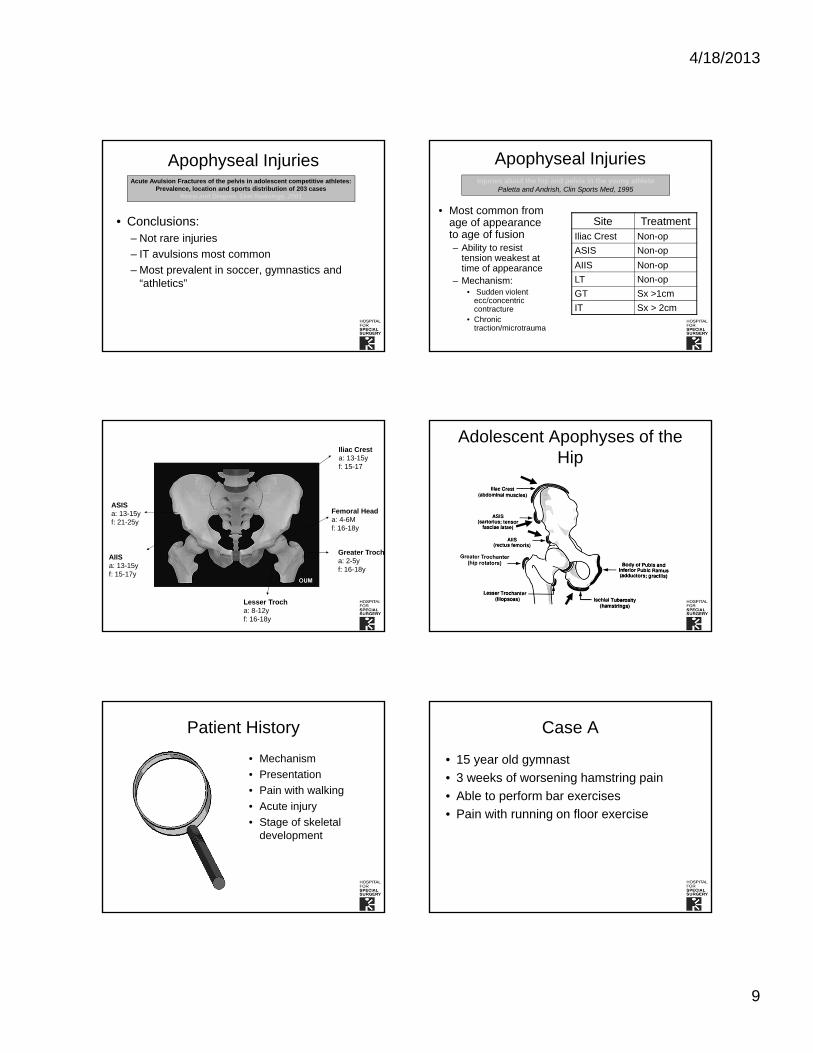
4/18/2013
9
• Conclusions:– Not rare injuries
– IT avulsions most common
– Most prevalent in soccer, gymnastics and “athletics”
Apophyseal InjuriesAcute Avulsion Fractures of the pelvis in adolescent competitive athletes:
Prevalence, location and sports distribution of 203 casesRossi and Dragoni, Skel Radiology, 2001
Apophyseal Injuries
• Most common from age of appearance to age of fusion– Ability to resist
tension weakest at time of appearance
– Mechanism:• Sudden violent
ecc/concentric contracture
• Chronic traction/microtrauma
Site TreatmentIliac Crest Non-op
ASIS Non-op
AIIS Non-op
LT Non-op
GT Sx >1cm
IT Sx > 2cm
Injuries about the hip and pelvis in the young athletePaletta and Andrish, Clin Sports Med, 1995
Iliac Cresta: 13-15yf: 15-17
Femoral Heada: 4-6Mf: 16-18y
Greater Trocha: 2-5yf: 16-18y
Lesser Trocha: 8-12yf: 16-18y
ASISa: 13-15yf: 21-25y
AIISa: 13-15yf: 15-17y
Adolescent Apophyses of the Hip
Patient History
• Mechanism
• Presentation
• Pain with walking
• Acute injury
• Stage of skeletal development
Case A
• 15 year old gymnast
• 3 weeks of worsening hamstring pain
• Able to perform bar exercises
• Pain with running on floor exercise
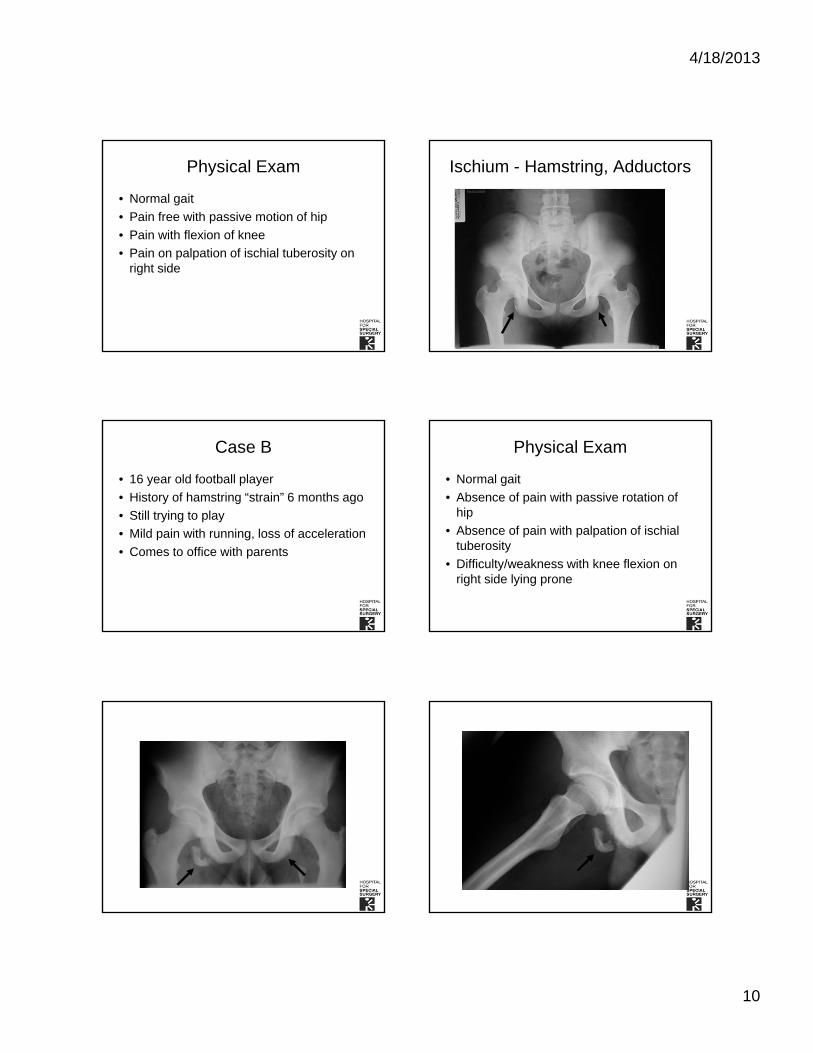
4/18/2013
10
Physical Exam
• Normal gait
• Pain free with passive motion of hip
• Pain with flexion of knee
• Pain on palpation of ischial tuberosity on right side
Ischium - Hamstring, Adductors
Case B
• 16 year old football player
• History of hamstring “strain” 6 months ago
• Still trying to play
• Mild pain with running, loss of acceleration
• Comes to office with parents
Physical Exam
• Normal gait
• Absence of pain with passive rotation of hip
• Absence of pain with palpation of ischial tuberosity
• Difficulty/weakness with knee flexion on right side lying prone
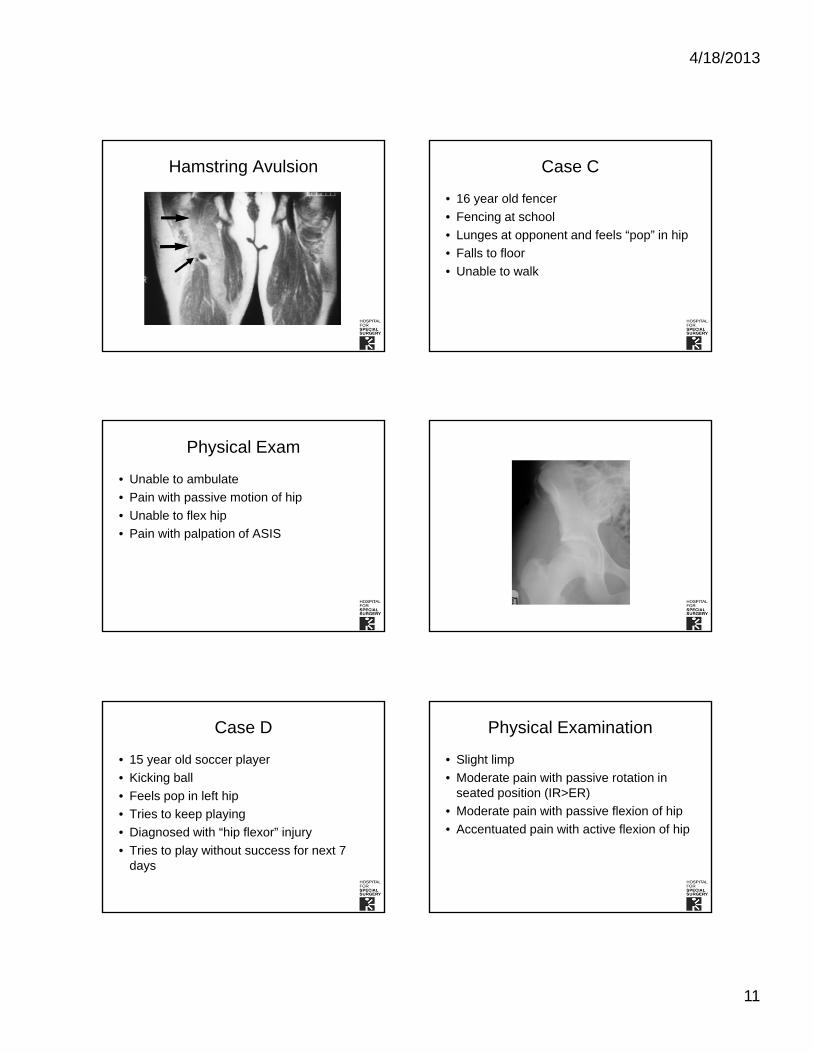
4/18/2013
11
Hamstring Avulsion Case C
• 16 year old fencer
• Fencing at school
• Lunges at opponent and feels “pop” in hip
• Falls to floor
• Unable to walk
Physical Exam
• Unable to ambulate
• Pain with passive motion of hip
• Unable to flex hip
• Pain with palpation of ASIS
Case D
• 15 year old soccer player
• Kicking ball
• Feels pop in left hip
• Tries to keep playing
• Diagnosed with “hip flexor” injury
• Tries to play without success for next 7 days
Physical Examination
• Slight limp
• Moderate pain with passive rotation in seated position (IR>ER)
• Moderate pain with passive flexion of hip
• Accentuated pain with active flexion of hip

4/18/2013
12
SCFE AIIS - Rectus Femoris
4 week follow up visit
• Patient PWB for 4 weeks
• Moderately compliant
• Pain disappeared
• Still with slight limitation of IR in affected side
4/18/2013
13
Return to Activity and Acute Traumatic Injury
• Able to walk
• Able to run
• Able to do sports-specific skills
• “Ready” to return?

FRIDAY, MAY 17, 2013
12:00
Dermatologic Emergencies: What's That?
Dr. Erin Mathes
Dermatologic Emergencies: What’s That?
Erin Mathes, MD
Assistant Professor
Dermatology and Pediatrics
UCSF
I have no relevant conflicts of interest.
Objectives
• Identify, appropriately work-up, and stabilize urgent/emergent dermatologic conditions
• 3 cases that illustrate:– Erythema Multiforme– Stevens-Johnson Syndrome– Toxic Epidermal Necrolysis– Staph Scalded Skin Syndrome– Eczema herpeticum– Eczema coxsackium– Staph superinfection
Clues: When to Worry
• Age (newborn and young infants)
• High fever, toxicity
• Morphology – blistering, mucosal involvement, hemorrhage
• Specific medications– anti-convulsants, antibiotics, NSAIDS
How to describe what you are seeing... over the phone
• A picture is worth a thousand words
• Extent: What body surface area is involved?– the patient’s palm = 1%
Case 1:
This 5 yo boy with a seizure disorder and language delay has had fever, malaise, lymphadenopathy and a sore throat for 4 days. He has been taking Tylenol for 4 days, and lamotrigine for 6 weeks.
What is the most likely diagnosis?
Case 1: 5 yo with sz d/o and rash. What is the most likely diagnosis?
1. Erythema multiforme
2. Kawasaki Disease
3. Stevens-Johnson syndrome (SJS)
4. Vasculitis
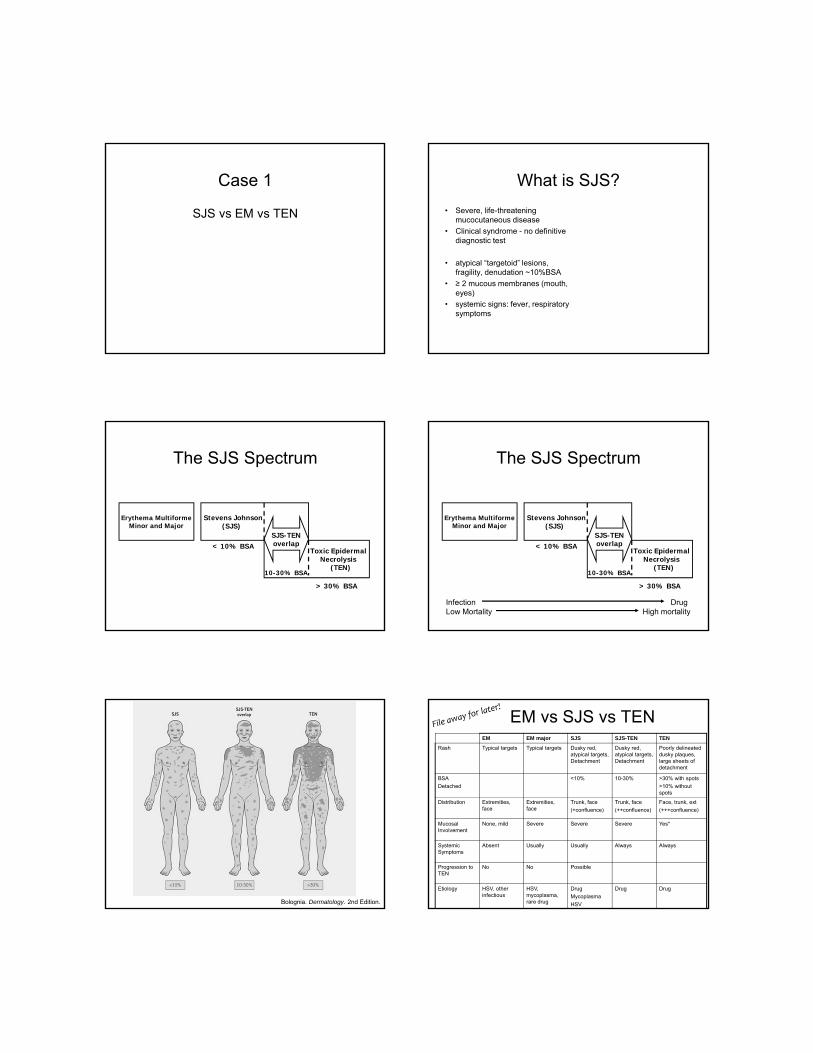
Case 1
SJS vs EM vs TEN
What is SJS?
• Severe, life-threatening mucocutaneous disease
• Clinical syndrome - no definitive diagnostic test
• atypical “targetoid” lesions, fragility, denudation ~10%BSA
• ≥ 2 mucous membranes (mouth, eyes)
• systemic signs: fever, respiratory symptoms
The SJS Spectrum
Erythema MultiformeMinor and Major
Stevens Johnson(SJS)
Toxic EpidermalNecrolysis
(TEN)
SJS-TENoverlap< 10% BSA
> 30% BSA
10-30% BSA
The SJS Spectrum
Erythema MultiformeMinor and Major
Stevens Johnson(SJS)
Toxic EpidermalNecrolysis
(TEN)
SJS-TENoverlap< 10% BSA
> 30% BSA
10-30% BSA
Infection DrugLow Mortality High mortality
Bolognia. Dermatology. 2nd Edition.
EM vs SJS vs TENEM EM major SJS SJS-TEN TEN
Rash Typical targets Typical targets Dusky red, atypical targets, Detachment
Dusky red, atypical targets, Detachment
Poorly delineated dusky plaques, large sheets of detachment
BSA
Detached
<10% 10-30% >30% with spots
>10% without spots
Distribution Extremities, face
Extremities, face
Trunk, face
(+confluence)
Trunk, face
(++confluence)
Face, trunk, ext
(+++confluence)
Mucosal Involvement
None, mild Severe Severe Severe Yes*
Systemic Symptoms
Absent Usually Usually Always Always
Progression to TEN
No No Possible
Etiology HSV, other infectious
HSV, mycoplasma, rare drug
Drug
Mycoplasma
HSV
Drug Drug
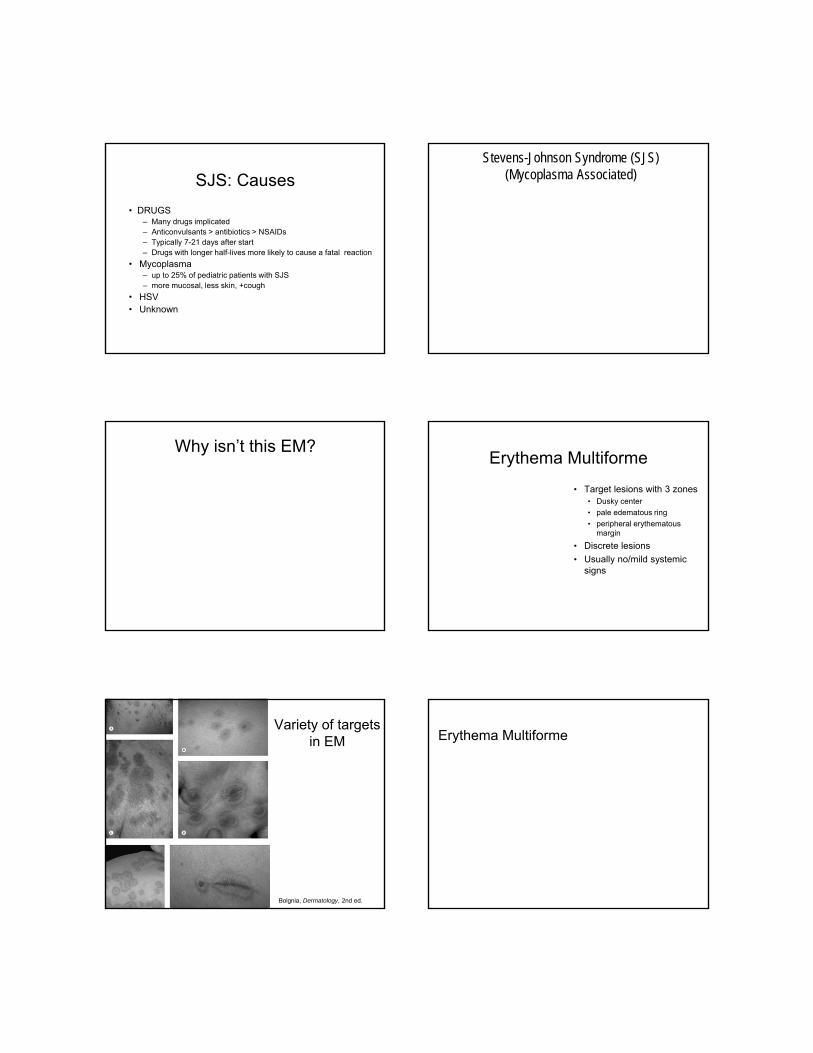
SJS: Causes
• DRUGS– Many drugs implicated– Anticonvulsants > antibiotics > NSAIDs – Typically 7-21 days after start – Drugs with longer half-lives more likely to cause a fatal reaction
• Mycoplasma – up to 25% of pediatric patients with SJS – more mucosal, less skin, +cough
• HSV• Unknown
Stevens-Johnson Syndrome (SJS)(Mycoplasma Associated)
Why isn’t this EM?Erythema Multiforme
• Target lesions with 3 zones• Dusky center
• pale edematous ring
• peripheral erythematous margin
• Discrete lesions
• Usually no/mild systemic signs
Variety of targets in EM
Bolgnia, Dermatology, 2nd ed.
Erythema Multiforme
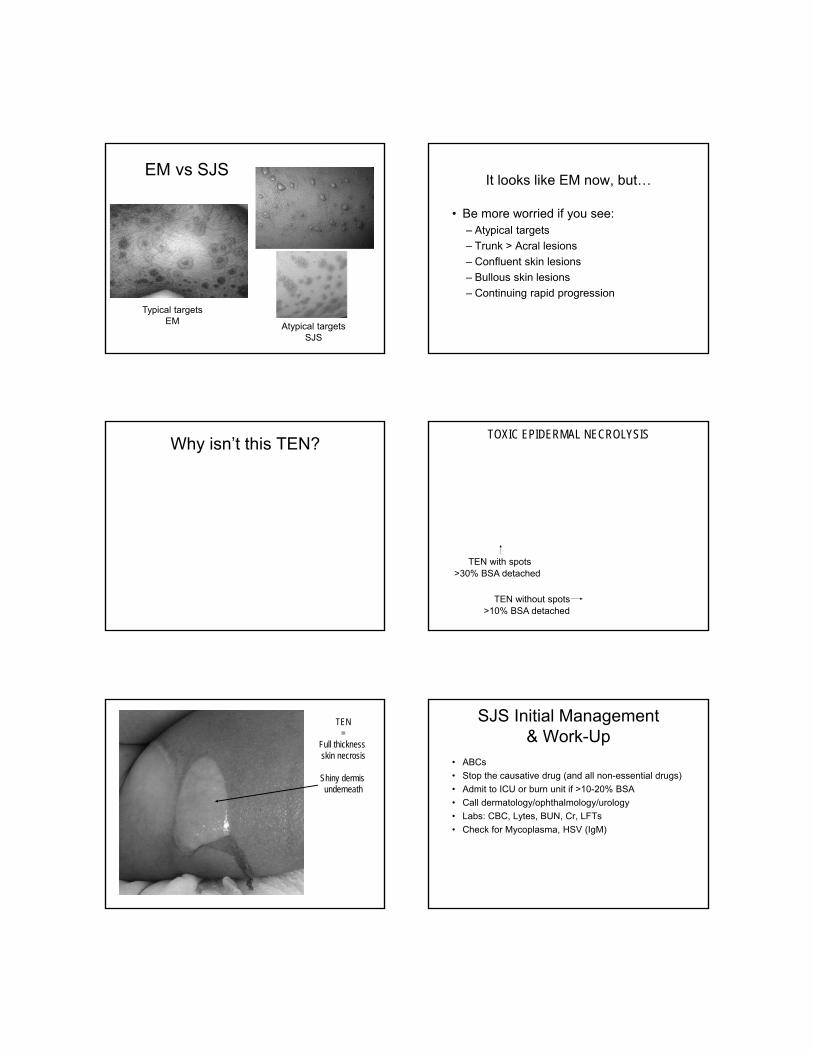
EM vs SJS
Typical targetsEM Atypical targets
SJS
It looks like EM now, but…
• Be more worried if you see: – Atypical targets
– Trunk > Acral lesions
– Confluent skin lesions
– Bullous skin lesions
– Continuing rapid progression
Why isn’t this TEN?TOXIC EPIDERMAL NECROLYSIS
TEN with spots
TEN without spots
>30% BSA detached
>10% BSA detached
TEN=
Full thickness skin necrosis
Shiny dermis underneath
SJS Initial Management& Work-Up
• ABCs
• Stop the causative drug (and all non-essential drugs)
• Admit to ICU or burn unit if >10-20% BSA
• Call dermatology/ophthalmology/urology
• Labs: CBC, Lytes, BUN, Cr, LFTs
• Check for Mycoplasma, HSV (IgM)
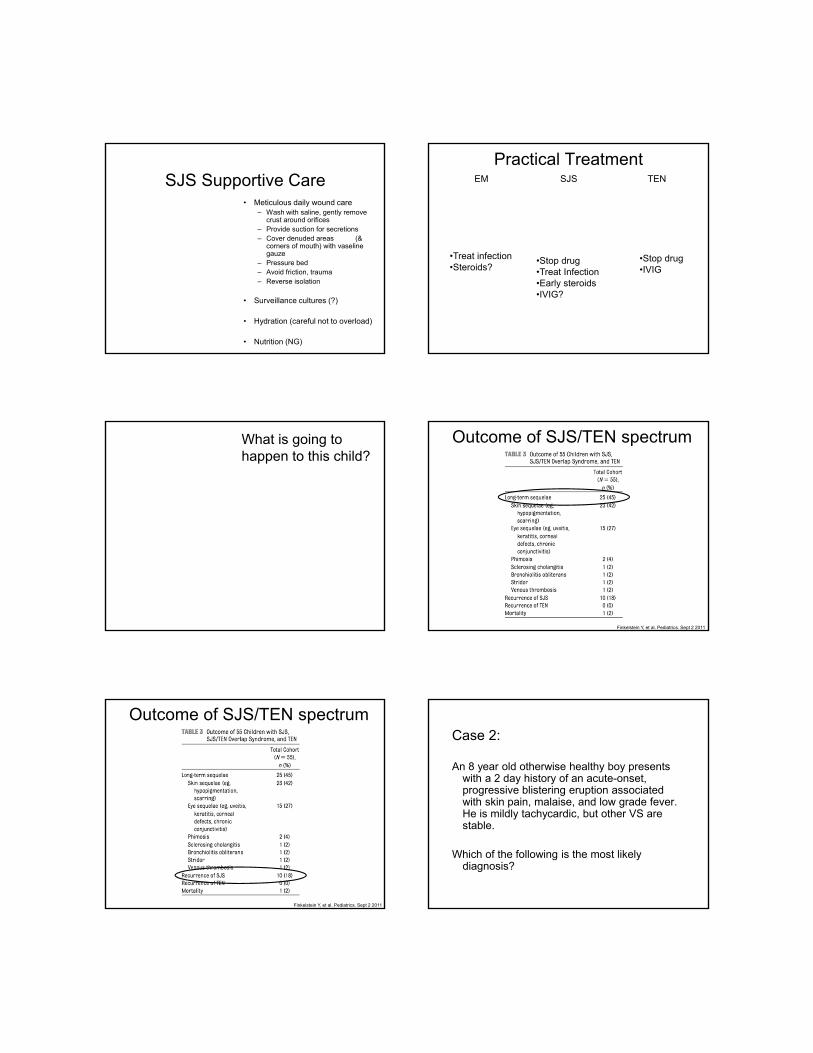
SJS Supportive Care• Meticulous daily wound care
– Wash with saline, gently remove crust around orifices
– Provide suction for secretions– Cover denuded areas (&
corners of mouth) with vaselinegauze
– Pressure bed– Avoid friction, trauma– Reverse isolation
• Surveillance cultures (?)
• Hydration (careful not to overload)
• Nutrition (NG)
Practical Treatment
•Treat infection•Steroids?
•Stop drug•Treat Infection•Early steroids •IVIG?
•Stop drug •IVIG
EM SJS TEN
What is going to happen to this child?
Outcome of SJS/TEN spectrum
Finkelstein Y, et al. Pediatrics. Sept 2 2011
Outcome of SJS/TEN spectrum
Finkelstein Y, et al. Pediatrics. Sept 2 2011
Case 2:
An 8 year old otherwise healthy boy presents with a 2 day history of an acute-onset, progressive blistering eruption associated with skin pain, malaise, and low grade fever. He is mildly tachycardic, but other VS are stable.
Which of the following is the most likely diagnosis?
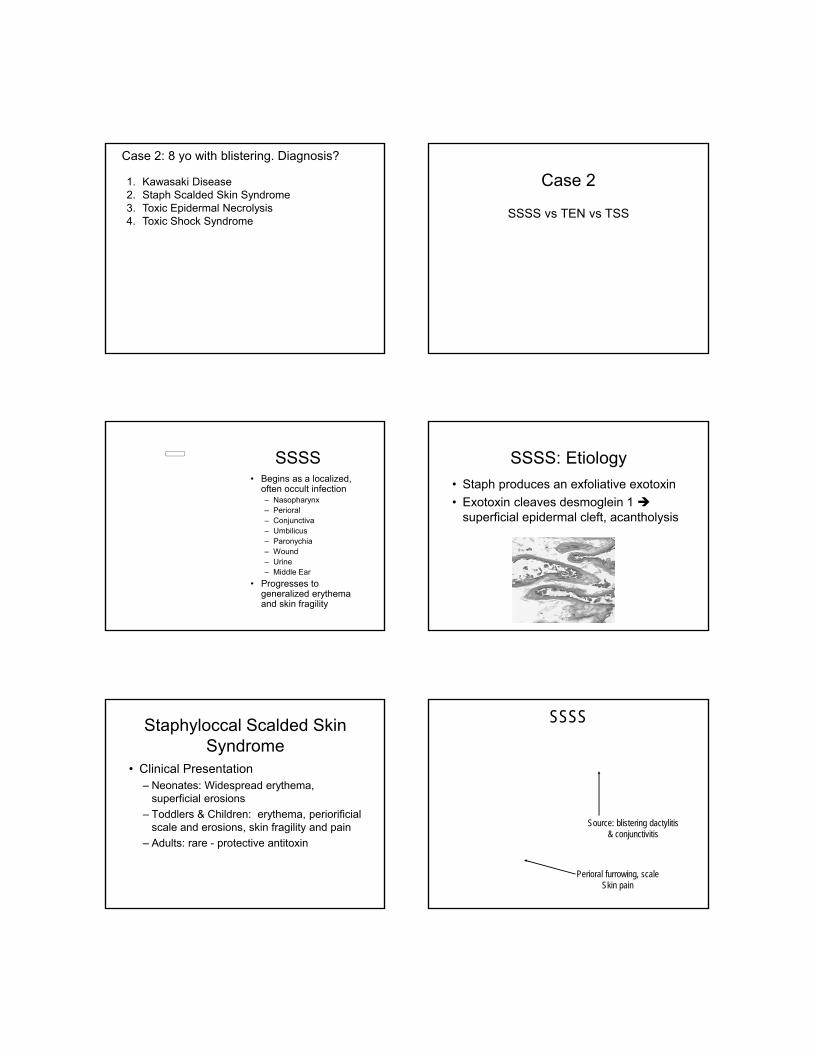
Case 2: 8 yo with blistering. Diagnosis?
1. Kawasaki Disease2. Staph Scalded Skin Syndrome3. Toxic Epidermal Necrolysis4. Toxic Shock Syndrome
Case 2
SSSS vs TEN vs TSS
SSSS• Begins as a localized,
often occult infection– Nasopharynx– Perioral – Conjunctiva– Umbilicus– Paronychia– Wound– Urine– Middle Ear
• Progresses to generalized erythema and skin fragility
SSSS: Etiology
• Staph produces an exfoliative exotoxin
• Exotoxin cleaves desmoglein 1 superficial epidermal cleft, acantholysis
Staphyloccal Scalded Skin Syndrome
• Clinical Presentation– Neonates: Widespread erythema,
superficial erosions
– Toddlers & Children: erythema, periorificialscale and erosions, skin fragility and pain
– Adults: rare - protective antitoxin
SSSS
Perioral furrowing, scaleSkin pain
Source: blistering dactylitis& conjunctivitis
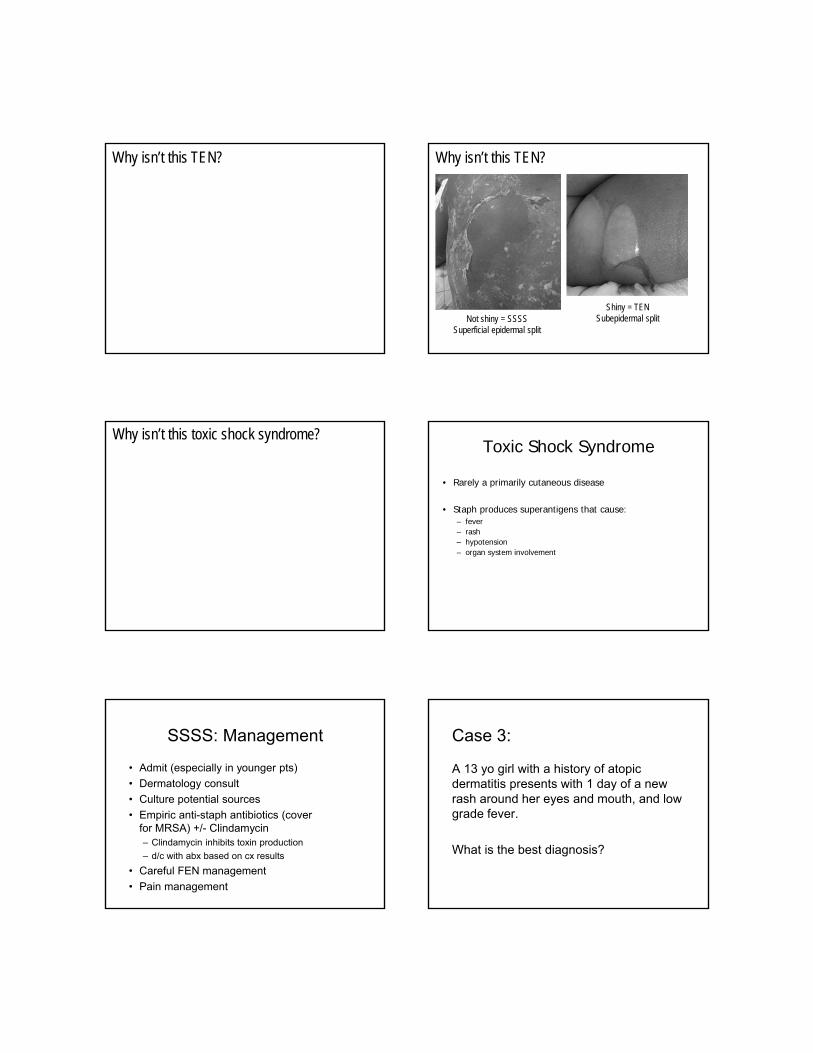
Why isn’t this TEN? Why isn’t this TEN?
Not shiny = SSSSSuperficial epidermal split
Shiny = TENSubepidermal split
Why isn’t this toxic shock syndrome?Toxic Shock Syndrome
• Rarely a primarily cutaneous disease
• Staph produces superantigens that cause: – fever– rash– hypotension– organ system involvement
SSSS: Management
• Admit (especially in younger pts)
• Dermatology consult
• Culture potential sources
• Empiric anti-staph antibiotics (cover for MRSA) +/- Clindamycin– Clindamycin inhibits toxin production
– d/c with abx based on cx results
• Careful FEN management
• Pain management
Case 3:
A 13 yo girl with a history of atopic dermatitis presents with 1 day of a new rash around her eyes and mouth, and low grade fever.
What is the best diagnosis?
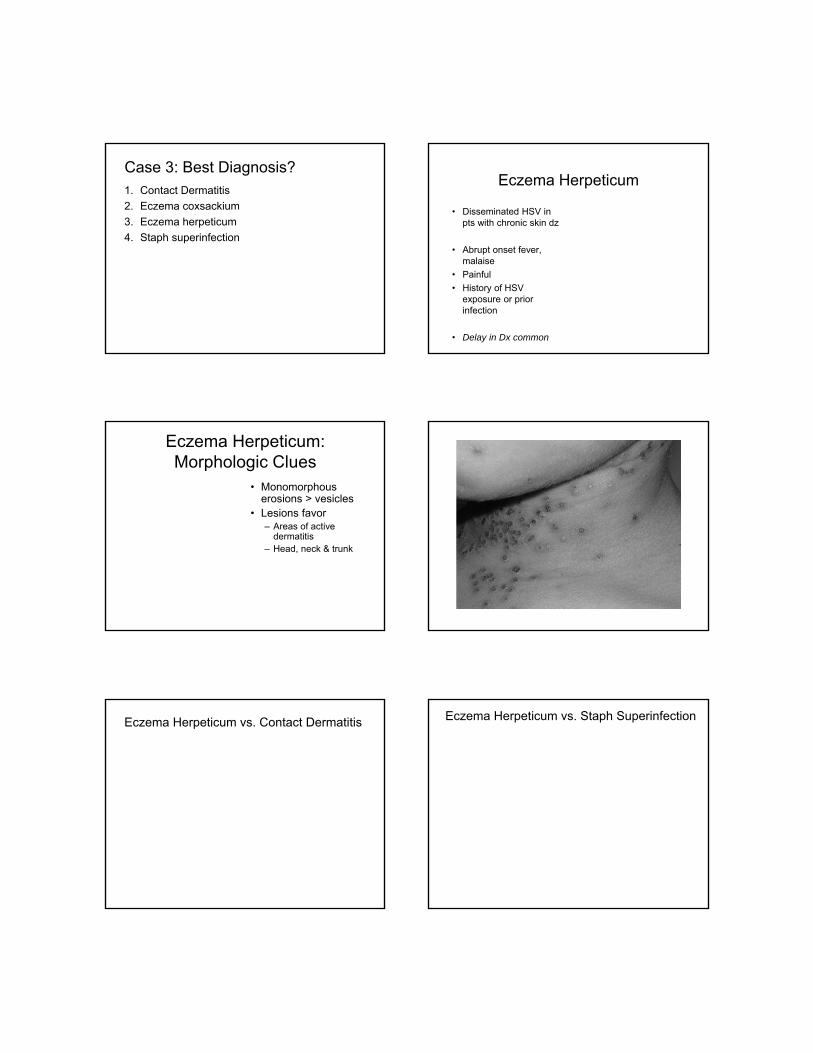
Case 3: Best Diagnosis?1. Contact Dermatitis
2. Eczema coxsackium
3. Eczema herpeticum
4. Staph superinfection
Eczema Herpeticum
• Disseminated HSV in pts with chronic skin dz
• Abrupt onset fever, malaise
• Painful
• History of HSV exposure or prior infection
• Delay in Dx common
Eczema Herpeticum: Morphologic Clues
• Monomorphouserosions > vesicles
• Lesions favor – Areas of active
dermatitis– Head, neck & trunk
Eczema Herpeticum vs. Contact Dermatitis Eczema Herpeticum vs. Staph Superinfection
Strep SuperinfectionEczema Herpeticum vs. Eczema Coxsackium
Eczema HerpeticumTreatment
• Culture, DFA or PCR
• Culture for bacteria
• Ophthalmology consult (for periocular involvement)
• Dermatology consult
• Prompt high dose acyclovir
• Empiric antibiotics if signs of bloodstream infection
• Topical steroids okay
• Avoid systemic steroidsAronson PL. Pediatrics. 2011. Aronson PL x 2. Pediatr Dermatol. 2013.
Eczema HerpeticumSequelae
• Scarring
• Ocular complications
• Recurrent infections
• Prolonged hospital stays
Summary
• Case 1: Stevens-Johnson Syndrome– Watch for atypical targets, classic mucous membrane
involvement, calculate BSA
• Case 2: Staph Scalded Skin Syndrome– Look for a superficial epidermal split, non-toxic child,
culture potential sources, can do a frozen section
• Case 3: Eczema Herpeticum– Look for monomorphous erosions in a patient with
AD, consult ophtho if close to eyes, prompt acyclovir
Thank You!
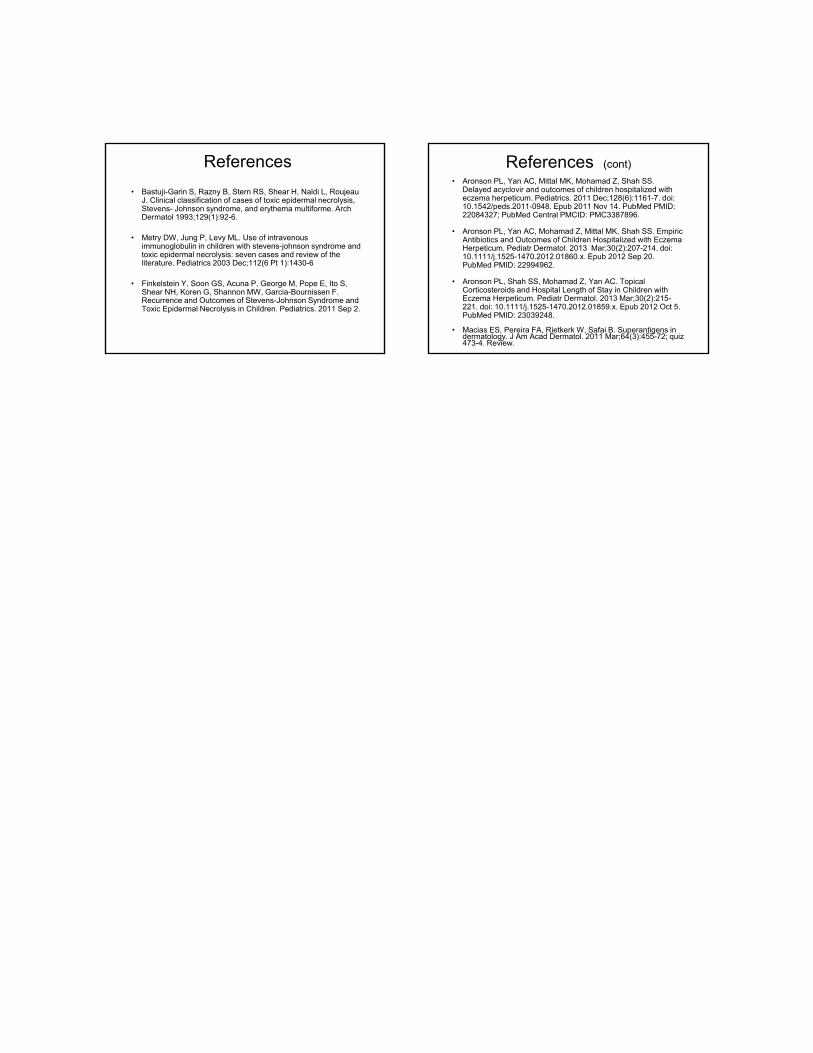
References
• Bastuji-Garin S, Razny B, Stern RS, Shear H, Naldi L, RoujeauJ. Clinical classification of cases of toxic epidermal necrolysis, Stevens- Johnson syndrome, and erythema multiforme. Arch Dermatol 1993;129(1):92-6.
• Metry DW, Jung P, Levy ML. Use of intravenous immunoglobulin in children with stevens-johnson syndrome and toxic epidermal necrolysis: seven cases and review of the literature. Pediatrics 2003 Dec;112(6 Pt 1):1430-6
• Finkelstein Y, Soon GS, Acuna P, George M, Pope E, Ito S, Shear NH, Koren G, Shannon MW, Garcia-Bournissen F. Recurrence and Outcomes of Stevens-Johnson Syndrome and Toxic Epidermal Necrolysis in Children. Pediatrics. 2011 Sep 2.
References (cont)
• Aronson PL, Yan AC, Mittal MK, Mohamad Z, Shah SS. Delayed acyclovir and outcomes of children hospitalized with eczema herpeticum. Pediatrics. 2011 Dec;128(6):1161-7. doi: 10.1542/peds.2011-0948. Epub 2011 Nov 14. PubMed PMID: 22084327; PubMed Central PMCID: PMC3387896.
• Aronson PL, Yan AC, Mohamad Z, Mittal MK, Shah SS. Empiric Antibiotics and Outcomes of Children Hospitalized with Eczema Herpeticum. Pediatr Dermatol. 2013 Mar;30(2):207-214. doi: 10.1111/j.1525-1470.2012.01860.x. Epub 2012 Sep 20. PubMed PMID: 22994962.
• Aronson PL, Shah SS, Mohamad Z, Yan AC. Topical Corticosteroids and Hospital Length of Stay in Children with Eczema Herpeticum. Pediatr Dermatol. 2013 Mar;30(2):215-221. doi: 10.1111/j.1525-1470.2012.01859.x. Epub 2012 Oct 5. PubMed PMID: 23039248.
• Macias ES, Pereira FA, Rietkerk W, Safai B. Superantigens in dermatology. J Am Acad Dermatol. 2011 Mar;64(3):455-72; quiz 473-4. Review.
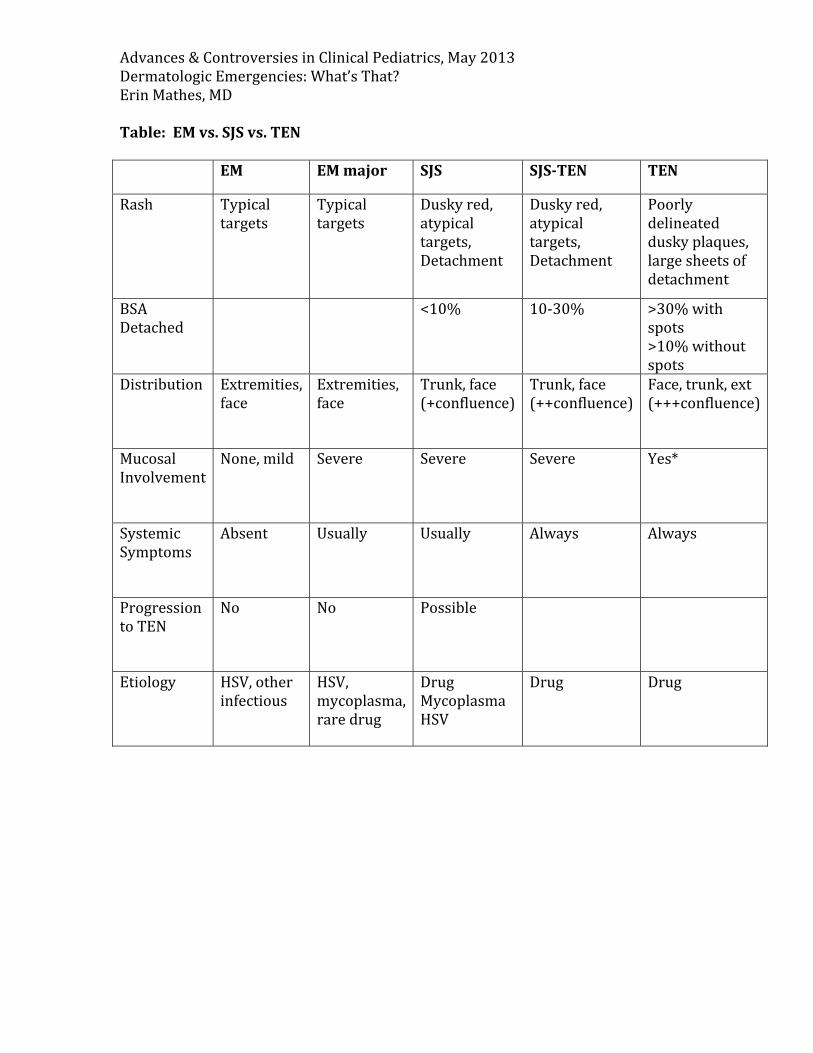
Advances&ControversiesinClinicalPediatrics,May2013DermatologicEmergencies:What’sThat?ErinMathes,MDTable:EMvs.SJSvs.TEN EM EMmajor SJS SJS‐TEN TEN
Rash Typicaltargets
Typicaltargets
Duskyred,atypicaltargets,Detachment
Duskyred,atypicaltargets,Detachment
Poorlydelineatedduskyplaques,largesheetsofdetachment
BSADetached
<10% 10‐30% >30%withspots>10%withoutspots
Distribution Extremities,face
Extremities,face
Trunk,face(+confluence)
Trunk,face(++confluence)
Face,trunk,ext(+++confluence)
MucosalInvolvement
None,mild Severe Severe Severe Yes*
SystemicSymptoms
Absent Usually Usually Always Always
ProgressiontoTEN
No No Possible
Etiology HSV,otherinfectious
HSV,mycoplasma,raredrug
DrugMycoplasmaHSV
Drug Drug
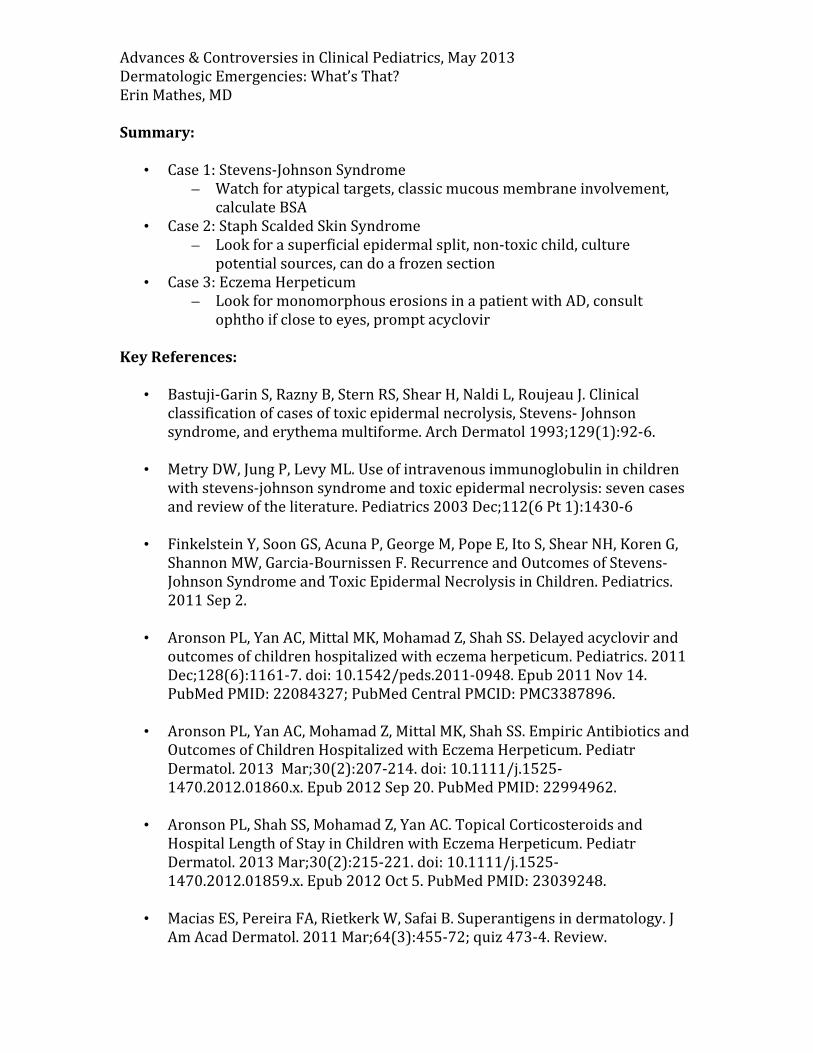
Advances&ControversiesinClinicalPediatrics,May2013DermatologicEmergencies:What’sThat?ErinMathes,MDSummary:
• Case1:Stevens‐JohnsonSyndrome– Watchforatypicaltargets,classicmucousmembraneinvolvement,
calculateBSA• Case2:StaphScaldedSkinSyndrome
– Lookforasuperficialepidermalsplit,non‐toxicchild,culturepotentialsources,candoafrozensection
• Case3:EczemaHerpeticum– LookformonomorphouserosionsinapatientwithAD,consult
ophthoifclosetoeyes,promptacyclovirKeyReferences:
• Bastuji‐GarinS,RaznyB,SternRS,ShearH,NaldiL,RoujeauJ.Clinicalclassificationofcasesoftoxicepidermalnecrolysis,Stevens‐Johnsonsyndrome,anderythemamultiforme.ArchDermatol1993;129(1):92‐6.
• MetryDW,JungP,LevyML.Useofintravenousimmunoglobulininchildrenwithstevens‐johnsonsyndromeandtoxicepidermalnecrolysis:sevencasesandreviewoftheliterature.Pediatrics2003Dec;112(6Pt1):1430‐6
• FinkelsteinY,SoonGS,AcunaP,GeorgeM,PopeE,ItoS,ShearNH,KorenG,
ShannonMW,Garcia‐BournissenF.RecurrenceandOutcomesofStevens‐JohnsonSyndromeandToxicEpidermalNecrolysisinChildren.Pediatrics.2011Sep2.
• AronsonPL,YanAC,MittalMK,MohamadZ,ShahSS.Delayedacyclovirand
outcomesofchildrenhospitalizedwitheczemaherpeticum.Pediatrics.2011Dec;128(6):1161‐7.doi:10.1542/peds.2011‐0948.Epub2011Nov14.PubMedPMID:22084327;PubMedCentralPMCID:PMC3387896.
• AronsonPL,YanAC,MohamadZ,MittalMK,ShahSS.EmpiricAntibioticsand
OutcomesofChildrenHospitalizedwithEczemaHerpeticum.PediatrDermatol.2013Mar;30(2):207‐214.doi:10.1111/j.1525‐1470.2012.01860.x.Epub2012Sep20.PubMedPMID:22994962.
• AronsonPL,ShahSS,MohamadZ,YanAC.TopicalCorticosteroidsand
HospitalLengthofStayinChildrenwithEczemaHerpeticum.PediatrDermatol.2013Mar;30(2):215‐221.doi:10.1111/j.1525‐1470.2012.01859.x.Epub2012Oct5.PubMedPMID:23039248.
• MaciasES,PereiraFA,RietkerkW,SafaiB.Superantigensindermatology.J
AmAcadDermatol.2011Mar;64(3):455‐72;quiz473‐4.Review.
FRIDAY, MAY 17, 2013
PRACTICAL PREVENTIVE MEDICINE
Moderator: Dr. Martha Taylor
FRIDAY, MAY 17, 2013
2:00
P Sports Medicine: The Time for Prevention is Now!
Dr. Jordan Metzl
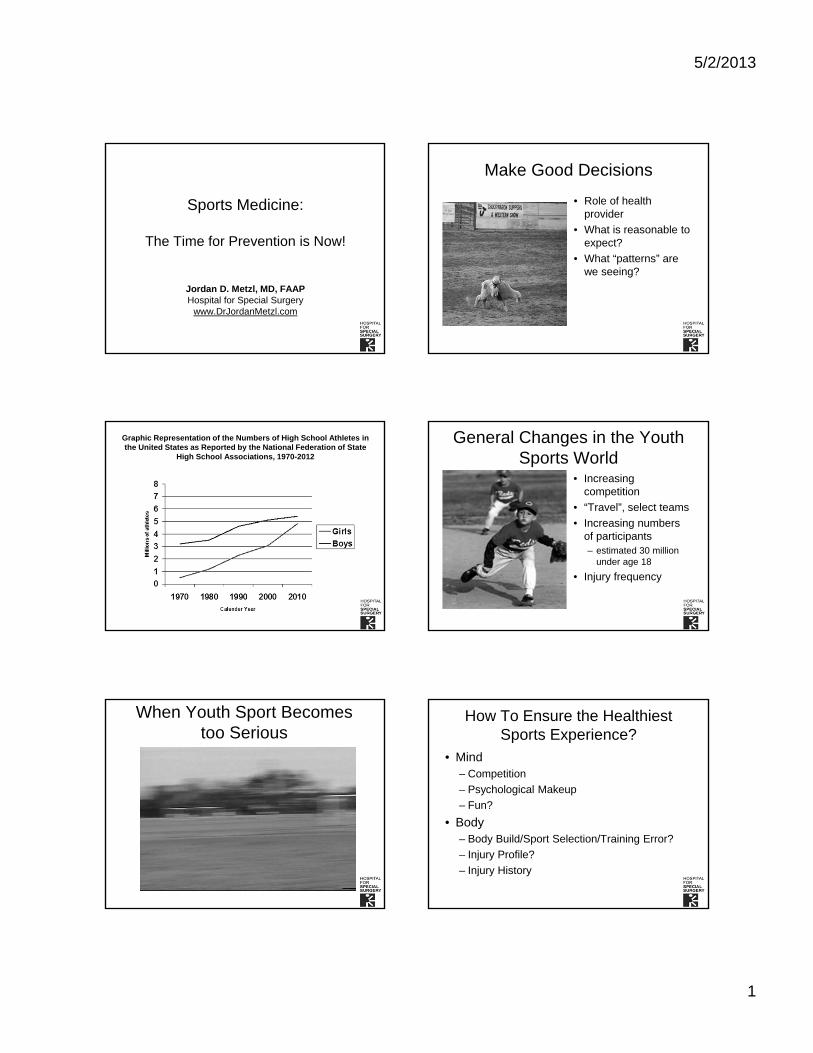
5/2/2013
1
Sports Medicine:
The Time for Prevention is Now!
Jordan D. Metzl, MD, FAAPHospital for Special Surgery
www.DrJordanMetzl.com
Make Good Decisions
• Role of health provider
• What is reasonable to expect?
• What “patterns” are we seeing?
Graphic Representation of the Numbers of High School Athletes in the United States as Reported by the National Federation of State
High School Associations, 1970-2012
General Changes in the Youth Sports World
• Increasing competition
• “Travel”, select teams
• Increasing numbers of participants– estimated 30 million
under age 18
• Injury frequency
When Youth Sport Becomes too Serious
How To Ensure the Healthiest Sports Experience?
• Mind– Competition
– Psychological Makeup
– Fun?
• Body– Body Build/Sport Selection/Training Error?
– Injury Profile?
– Injury History
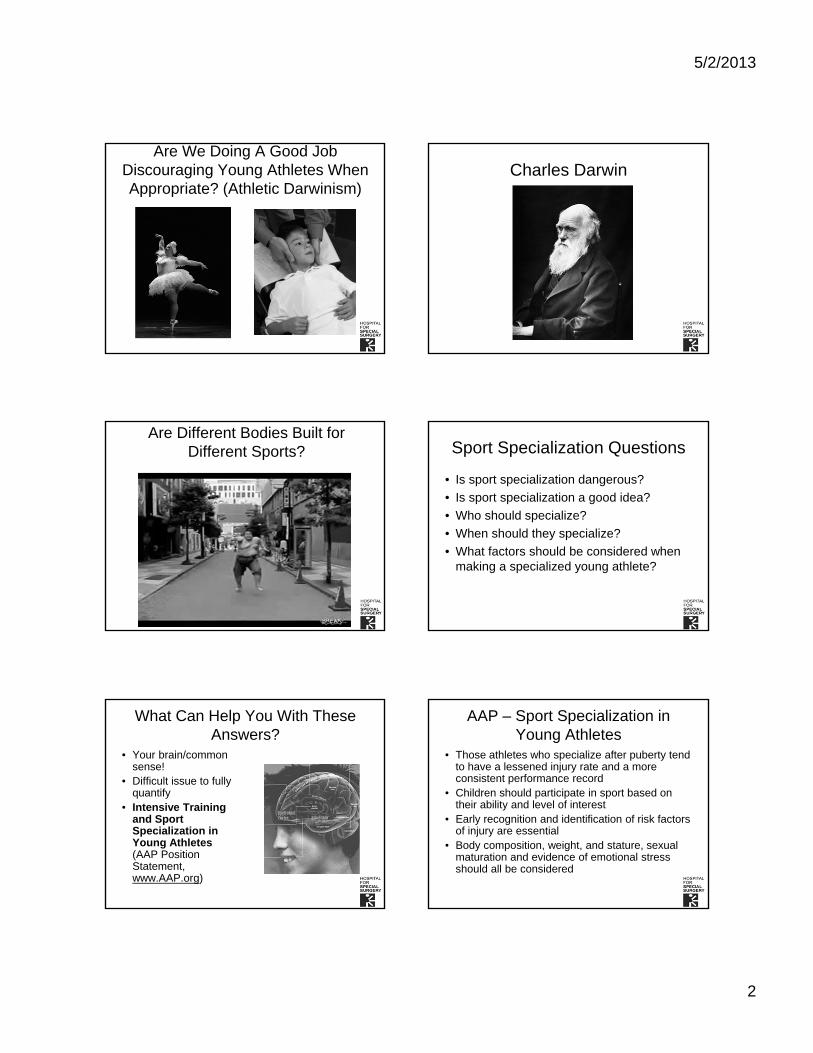
5/2/2013
2
Are We Doing A Good Job Discouraging Young Athletes When Appropriate? (Athletic Darwinism)
Charles Darwin
Are Different Bodies Built for Different Sports? Sport Specialization Questions
• Is sport specialization dangerous?
• Is sport specialization a good idea?
• Who should specialize?
• When should they specialize?
• What factors should be considered when making a specialized young athlete?
What Can Help You With These Answers?
• Your brain/common sense!
• Difficult issue to fully quantify
• Intensive Training and Sport Specialization in Young Athletes(AAP Position Statement, www.AAP.org)
AAP – Sport Specialization in Young Athletes
• Those athletes who specialize after puberty tend to have a lessened injury rate and a more consistent performance record
• Children should participate in sport based on their ability and level of interest
• Early recognition and identification of risk factors of injury are essential
• Body composition, weight, and stature, sexual maturation and evidence of emotional stress should all be considered
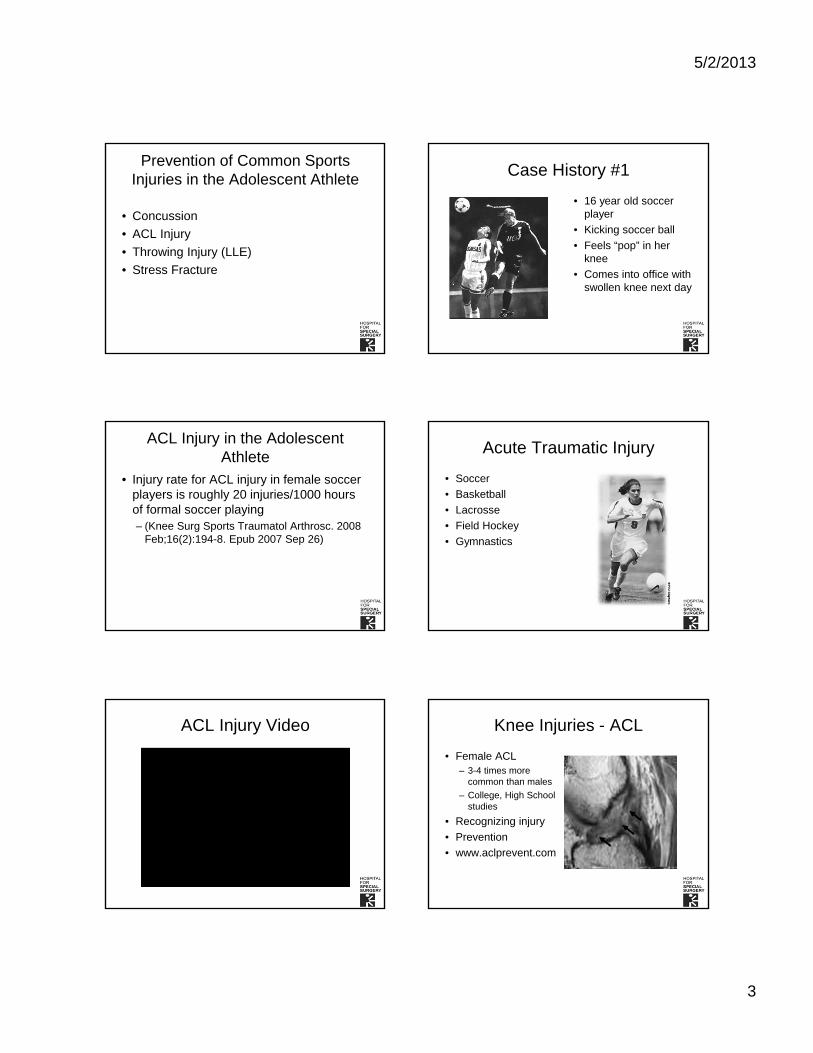
5/2/2013
3
Prevention of Common Sports Injuries in the Adolescent Athlete
• Concussion
• ACL Injury
• Throwing Injury (LLE)
• Stress Fracture
Case History #1
• 16 year old soccer player
• Kicking soccer ball
• Feels “pop” in her knee
• Comes into office with swollen knee next day
ACL Injury in the Adolescent Athlete
• Injury rate for ACL injury in female soccer players is roughly 20 injuries/1000 hours of formal soccer playing– (Knee Surg Sports Traumatol Arthrosc. 2008
Feb;16(2):194-8. Epub 2007 Sep 26)
Acute Traumatic Injury
• Soccer
• Basketball
• Lacrosse
• Field Hockey
• Gymnastics
ACL Injury Video Knee Injuries - ACL
• Female ACL– 3-4 times more
common than males
– College, High School studies
• Recognizing injury
• Prevention
• www.aclprevent.com
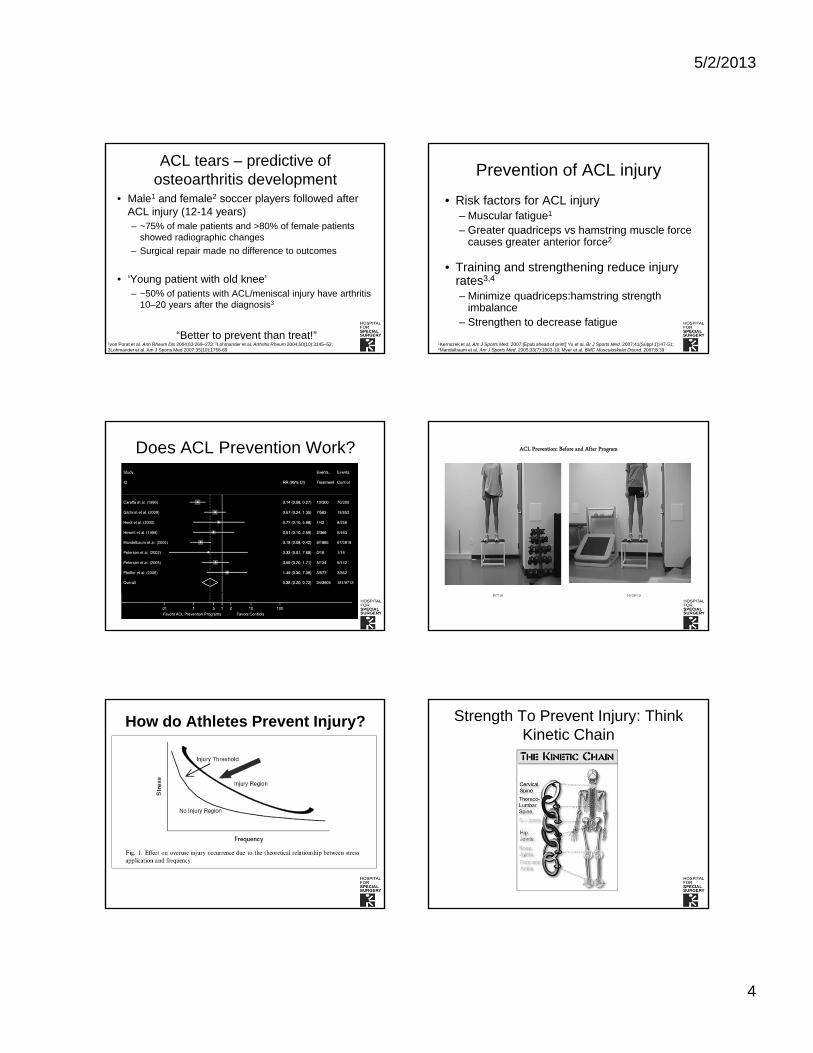
5/2/2013
4
ACL tears – predictive of osteoarthritis development
• Male1 and female2 soccer players followed after ACL injury (12-14 years)– ~75% of male patients and >80% of female patients
showed radiographic changes
– Surgical repair made no difference to outcomes
• ‘Young patient with old knee’– ~50% of patients with ACL/meniscal injury have arthritis
10–20 years after the diagnosis3
“Better to prevent than treat!”1von Porat et al. Ann Rheum Dis 2004;63:269–273; 2Lohmander et al. Arthritis Rheum 2004;50(10):3145–52; 3Lohmander et al. Am J Sports Med 2007:35(10):1756-69
Prevention of ACL injury
• Risk factors for ACL injury– Muscular fatigue1
– Greater quadriceps vs hamstring muscle force causes greater anterior force2
• Training and strengthening reduce injury rates3,4
– Minimize quadriceps:hamstring strength imbalance
– Strengthen to decrease fatigue
1Kernozek et al. Am J Sports Med. 2007:[Epub ahead of print]’ Yu et al. Br J Sports Med. 2007;41(Suppl 1):i47-51;2Mandelbaum et al. Am J Sports Med. 2005;33(7):1003-10; Myer et al. BMC Musculoskelet Disord. 2007;8:39
Does ACL Prevention Work? ACL Prevention: Before and After Program
8/7/10 10/29/10
How do Athletes Prevent Injury? Strength To Prevent Injury: Think Kinetic Chain
5/2/2013
5
Kinetic Chain Needs Strength + Flexibility
Athletes of All Ages Need Their Kinetic Chain to Work!
Today Show on Youth Strength Training
Resources to Encourage Youth Strength Training at Home
AAP with DVD and Flashcard Set
Aap.org/Amazon
I-Tunes $3.99
Take Home Points: ACL Injury
• Prevention is key
• Identification of at risk athletes
• Development of prevention strategies
Common Sports Injuries in the Adolescent Athlete
• ACL Injury
• Throwing Injury (LLE)
• Stress Fracture
Case #2
• 13 year old pitcher
• 4 weeks of worsening shoulder/elbow pain
• Initially only with throwing hard
• Now pain with throwing softly

5/2/2013
6
Longitudinal study of elbow and shoulder pain in youth baseball pitchers
Lyman S. et al, Med. Sci. Sports Exerc., Vol. 33(11)
• The purpose of this study was to evaluate the frequency of elbow and shoulder complaints in young pitchers
• Prospective cohort study of 298 youth pitchers was conducted over two seasons.
• The frequency of elbow pain was 26%; that of shoulder pain, 32%. Risk factors for elbow pain were increased age, increased weight, decreased height, lifting weights during the season, playing baseball outside the league, decreased self-satisfaction, arm fatigue during the game pitched, and throwing fewer than 300 or more than 600 pitches during the season.
• Risk factors for shoulder pain included decreased satisfaction, arm fatigue during the game pitched, throwing more than 75 pitches in a game, and throwing fewer than 300 pitches during the season.
Developmental Phases of Throwing
Facing target – PushFacing target, Cocking, Toss
Age 2
Developmental Phases of Throwing
Facing target, Ipsilateral stepPerpendicular to target, Contralateral step
Age 4
Developmental Phases of Throwing
Wind-up, Cocking, Contralateral stepBody momentum, Follow-thru
Age 6-9
Phases of Throwing
Wind-up Cocking Acceleration DecelerationFollow- thru
E.McFarland ACSM-kinematics
A mature mechanic by age 10?
Age 10 Division 1 collegiate athlete
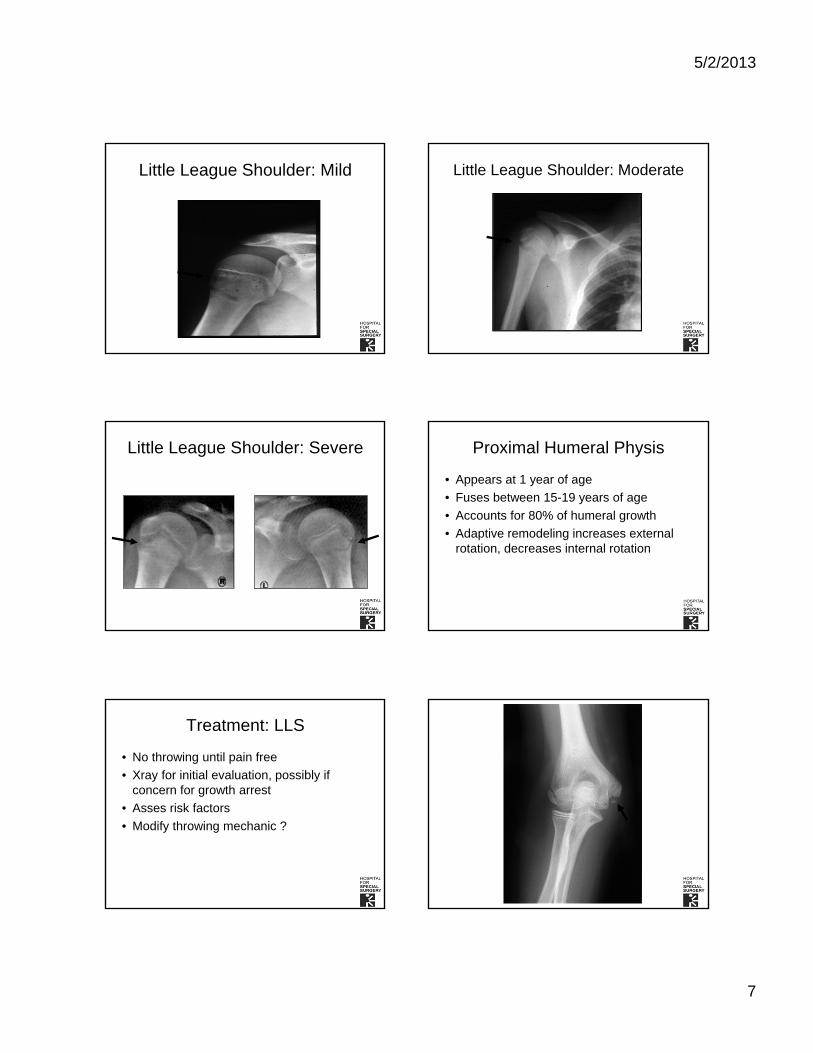
5/2/2013
7
Little League Shoulder: Mild Little League Shoulder: Moderate
Little League Shoulder: Severe Proximal Humeral Physis
• Appears at 1 year of age
• Fuses between 15-19 years of age
• Accounts for 80% of humeral growth
• Adaptive remodeling increases external rotation, decreases internal rotation
Treatment: LLS
• No throwing until pain free
• Xray for initial evaluation, possibly if concern for growth arrest
• Asses risk factors
• Modify throwing mechanic ?
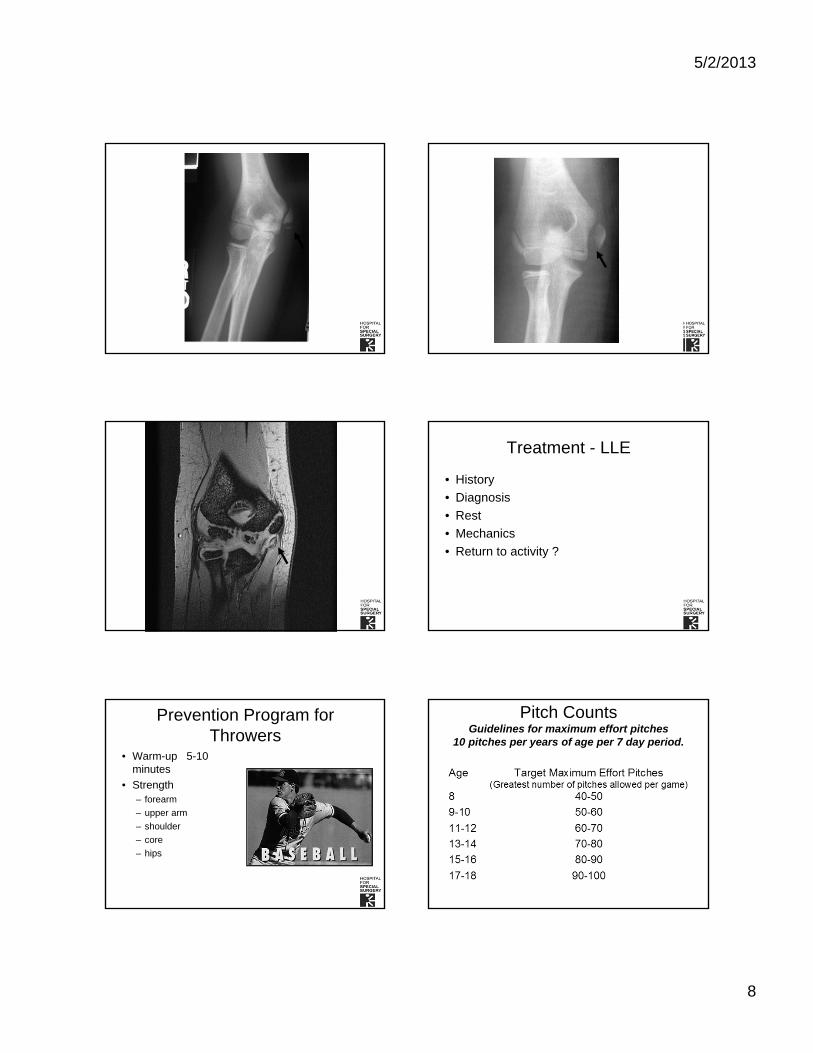
5/2/2013
8
Treatment - LLE
• History
• Diagnosis
• Rest
• Mechanics
• Return to activity ?
Prevention Program for Throwers
• Warm-up 5-10 minutes
• Strength– forearm
– upper arm
– shoulder
– core
– hips
Pitch CountsGuidelines for maximum effort pitches
10 pitches per years of age per 7 day period.
5/2/2013
9
Guidelines for Appropriate Pitch Types
Biomechanics
• Stance
• Windup
• Cocking/acceleration
• Landing
• Follow through
HSS Thrower’s Program
Take Home Points – Throwing Injury
• “Play through the pain”
• Recognition of previous injury patterns
• Prevention programs– Strength
– Biomechanics
FRIDAY, MAY 17, 2013
2:50
P Preventing the Unintended: Contraception News & Evidence
Dr. Norma Jo Waxman
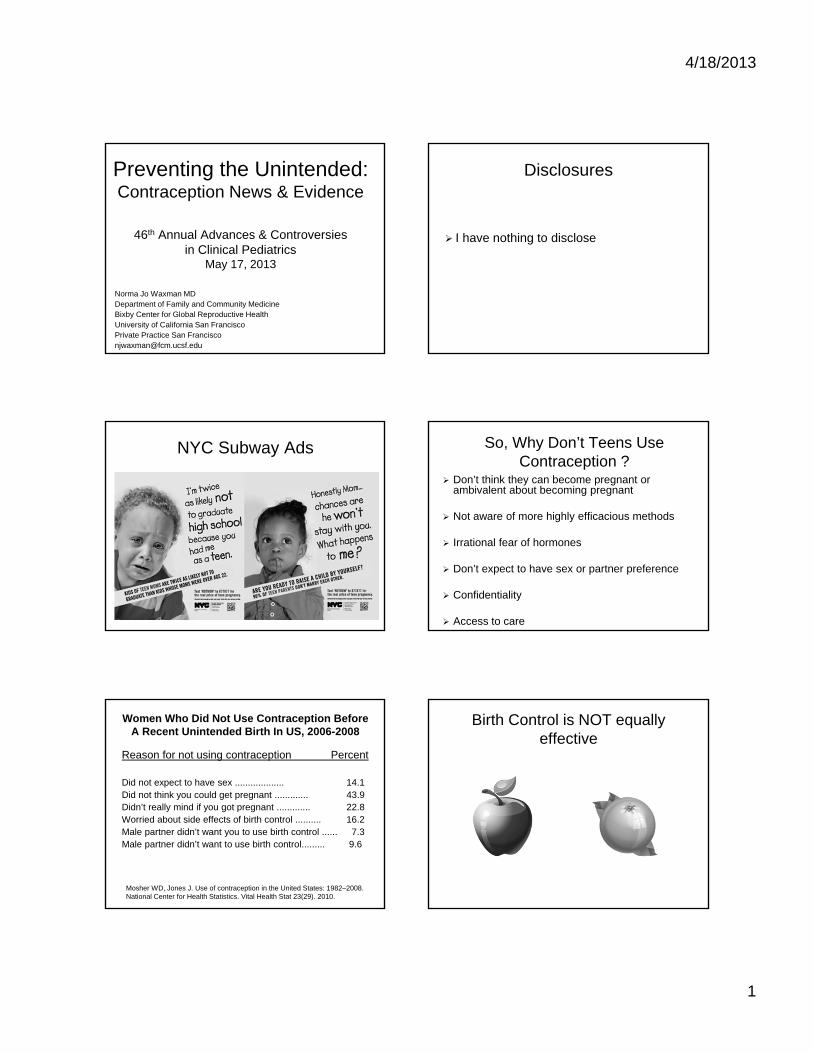
4/18/2013
1
Preventing the Unintended: Contraception News & Evidence
46th Annual Advances & Controversies in Clinical Pediatrics
May 17, 2013
Norma Jo Waxman MDDepartment of Family and Community MedicineBixby Center for Global Reproductive HealthUniversity of California San FranciscoPrivate Practice San Francisco [email protected]
Disclosures
I have nothing to disclose
NYC Subway Ads So, Why Don’t Teens Use Contraception ?
Don’t think they can become pregnant or ambivalent about becoming pregnant
Not aware of more highly efficacious methods
Irrational fear of hormones
Don’t expect to have sex or partner preference
Confidentiality
Access to care
Women Who Did Not Use Contraception Before A Recent Unintended Birth In US, 2006-2008
Reason for not using contraception Percent
Did not expect to have sex ................... 14.1 Did not think you could get pregnant ............. 43.9 Didn’t really mind if you got pregnant ............. 22.8 Worried about side effects of birth control .......... 16.2 Male partner didn’t want you to use birth control ...... 7.3 Male partner didn’t want to use birth control......... 9.6
Mosher WD, Jones J. Use of contraception in the United States: 1982–2008. National Center for Health Statistics. Vital Health Stat 23(29). 2010.
Birth Control is NOT equally effective
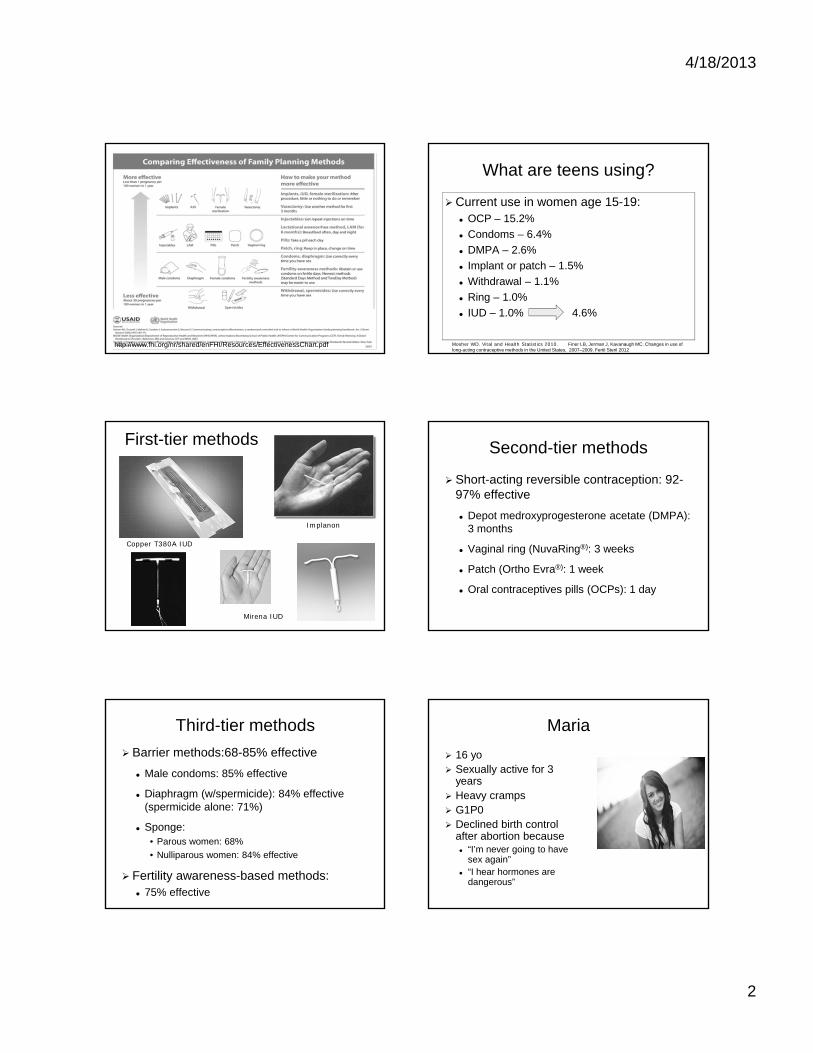
4/18/2013
2
http://www.fhi.org/nr/shared/enFHI/Resources/EffectivenessChart.pdf
What are teens using?
Current use in women age 15-19: OCP – 15.2%
Condoms – 6.4%
DMPA – 2.6%
Implant or patch – 1.5%
Withdrawal – 1.1%
Ring – 1.0%
IUD – 1.0% 4.6%
Mosher WD. Vital and Health Statistics 2010. Finer LB, Jerman J, Kavanaugh MC. Changes in use oflong-acting contraceptive methods in the United States, 2007–2009. Fertil Steril 2012
First-tier methods
Implanon
Copper T380A IUD
Mirena IUD
Second-tier methods
Short-acting reversible contraception: 92-97% effective
Depot medroxyprogesterone acetate (DMPA): 3 months
Vaginal ring (NuvaRing®): 3 weeks
Patch (Ortho Evra®): 1 week
Oral contraceptives pills (OCPs): 1 day
Third-tier methods
Barrier methods:68-85% effective
Male condoms: 85% effective
Diaphragm (w/spermicide): 84% effective (spermicide alone: 71%)
Sponge: • Parous women: 68%
• Nulliparous women: 84% effective
Fertility awareness-based methods: 75% effective
Maria
16 yo Sexually active for 3
years Heavy cramps G1P0 Declined birth control
after abortion because “I’m never going to have
sex again” “I hear hormones are
dangerous”

4/18/2013
3
Medical Benefits of Hormonal Contraception
Combined hormonal contraception (CHC) reduces: Blood loss, PMS, dysmenorrhea, Ovarian cysts, acne, perimenopausal sxs, DUB, PCOS, Endometriosis
OC users reduce risk of ovarian Ca by 40%1, and by 80% after 10 yrs2
OC reduces risk of endometrial CA by up to 40%3
No increase risk of Breast CA in OC users4
1. Vessey et al Br J Cancer 1995. 2. Rosenberg et al Am J Epidmiol 1994
3. JAMA 1987:257(6) 4. Marchbanks et al NEJM 2002;346:2025-2032
Risk Comparisons (slide credit: Association of Reproductive Health Professionals)
Skydiving 100
Driving 20
Pregnancy 11.5
Riding a bicycle 0.8
Airplane crash 0.4
Using OC* 0.06* Nonsmoker, under age 35
Trussell J, Jordan B. Contraception in press. Chang J, et al. MMWR 2003. Harvard Center for Risk Analysis 2006. Bennett P. In: Risk Communication and Public Health 1999.
Annual Risk of Death (per 100,000)
Do women need a “break” or “holiday” from contraception?
NO! they get pregnant
Is it safe to not have periods? Dispel myths around “need to bleed”
Teach our patients that amenorrhea on progestinis safe vs. amenorrhea off hormones
Alissa
16 years oldAfraid of pelvic exam
Interested in the pill
Wants the one “with no period”
What else does she need today?
What is required before starting contraception?
1. Pelvic exam
2. Up to date Pap test
3. Breast Exam
4. STI testing
5. Pregnancy test
6. None of the above
And the evidence says…
Medical History: Required
BP: Helpful
Pelvic exam, Pap, Breast exam, Hemoglobin, pregnancy test, STI testing:
NOT REQUIRED!Stewart F, et al. JAMA. 2001;285:2232-9. Tepper NK, et al. Contraception 2012

4/18/2013
4
Wait Until 21 To Start Pap Tests
ACOG 2009 & USPSTF 2012 screening women < 21 years of age may be
harmful and lacks benefit Don’t start until 21, regardless of age of first
intercourse or number of partners
Over-screening & treatment of teens with CIN Double to triple rate preterm birth after LEEP
Most HPV infections are low-grade, transient and resolve completely without intervention
Why Wait Until 21 To Start Paps?
Spontaneous regression of CIN is common 65% regression of CIN 2 after 18 mo; 75%
after 36 mo
When CIN 3 persists, >10 years are required for the lesion to acquire the capacity to become invasive
UK starts pap screen at 25; some northern European countries start at 30
When can she start contraception?
• The first day of her period?
• The first Sunday after her period?
• Anytime in her cycle, including today?
• All of the above?
“Quick Start”“Quick Start” – start pill1,2 ( patch3, shot, ring4, ) on day of
visit - any time of the month.
EC if unprotected sex in last 5 days
Back up method for 1 week (if not first week of cycle)
Urine HCG if no withdrawal bleed at end of cycle, or 2 weeks after DMPA injection
Reassure - Exposure of embryo to OC not teratogenic
1. Westhoff et al Contraception 2002 2. Westhoff et al Fertil Steril 2003 3. Murthy AS, et al. Contraception. 2005 4. Westhoff CW, et al. Obstet Gynecol. 2005
How many refills can I give her?
One month? 3 months 13 cycles
What if you have never seen her?Can you refill a new patient’s contraception
until you could see her?YES, it is safe to continue her medication
Dispensing 12 months of contraception increases continuation & lowers costs
UCSF Bixby Center evaluated 2003 claims for 82,319 women dispensed OCPs via Fam PACT Outcomes:
Women who received 13 cycles more likely to be receiving pills in 2004 than women who received 1 or 3 cycles.
Women dispensed 13 cycles more likely to receive Pap & Chlamydia tests; less likely to have pregnancy test
Fam PACT saved $99/ year on women who received 13 cycles
Foster, D et al. Obstetrics & Gynecology 108(5):1107-1114, November 2006.
4/18/2013
5
Increasing Teen OCP Adherence
Emphasize the noncontraceptive benefits of oral contraceptives
Demonstrate concretely how to use pills.
Have teens explicitly discuss their concerns about pill use so that they can be addressed
Help the teen plan for crucial logistics such as pill storage and how to remember to take the pills each day
Alissa
16 years oldAfraid of pelvic exam
Interested in the pill
Wants the one “with no period”
What else does she need today?
Traditional prescription flawed
May increase efficacy 47% w/ follicle ready to ovulate by day 7 of placebo week!1
Symptoms w/ OC worse during withdrawal bleed Cyclic vs. extended cycle: less headaches, tiredness,
bloating, menstrual pain 2
Treats anemia, dysmenorrhea, heavy bleeding, PMS, menstrual migraines, endometriosis, PCOS
There is NO NEED TO BLEED3
Extended/ Continuous Cycle Advantages
1. Baerwald, Contraception, 2004 2. Edelman et al Cochrane Review 2006 3. Bachman, Contraception, 2004; Johnson, Contraception, 2007.
Extended Cycle Dedicated Products
2- 4 days of placebo rather than 7Suppresses follicular growth seen during placebo weekSimilar breakthrough bleeding
Loestrin 24 Fe ™ 20 mcg EE/ 1 mg NET 24 days active, 3 days of Fe
Mircette ™ (Kariva generic) 20 mcg EE/ 150 mcg DSG 21 days active, 2 days placebo, 5 days 10 mcg EE
Yaz ™ 20 mcg EE/ 3 mg DRSP 24 active pills/ 3 placebo pills
.
Continuous Cycle Dedicated Products Lybrel ™
20 mcg EE/ 90 mcg LNG Daily continuous use, no placebo, for a year
Seasonale ™ (generic version now available) 30 mcg EE/ 150 mcg LNG 84 active pills/ 7 placebo pills
Seasonique ™ 30 mcg EE/ 150 mcg LNG 84 active pills/ 7 pills 10mcg EE
LoSeasonique ™ 20 mcg EE/ 100 mcg LNG 84 active pills/ 7pills 10mcg EE
Alissa
16 years oldAfraid of pelvic exam
The condom broke 3 days ago
Interested in the pill
Wants the one “with no period”
What else does she need today?
4/18/2013
6
EC Pills Available in the US:
Trussell J, Raymond EG. 2011.
Dedicated products
ParaGard® (Copper-T IUD)
Trussell J, Raymond EG. 2011.
Off label use
Placed within 5 days after intercourse
Effectiveness does not decline with delay
Placed by a trained clinician
Ulipristal Acetate versus Levonorgestrel
Ulipristal acetate more effective than LNgin postponing imminent ovulation
In RCT, all 3 pregnancies with use from 73-120 h were in the LNg group
Significantly more pregnancies prevented in the UPA group (p=0.037)
Glasier AF et al. Lancet 2010; Schwarz and Trussell. Contraceptive Technology 2011.
Emergency Contraception Plan B, Next Choice, Ella
Does not require an exam (or visit)
OTC for all ages as of April 2013
If you write a Rx, teens obtain confidentially and free
Advance Rx does not increase high risk behavior
Does not interrupt or harm established pregnancy
No Evidenced Based Contraindication
Prescription ella ®
Rx required for all ages
May be ordered from online prescription service - https://www.ella-kwikmed.com/ Pill mailed the next day
www.not-2-late.com.
Pregnancies per 1000 Women after Unprotected Intercourse
ParaGard, ella, Plan B/Next Choice, Yuzpe, Nothing
4/18/2013
7
Effectiveness: Obesity
ECP Failure among
obese versus non-obese women
• LNg: OR = 4.41, 95%CI 2.05-9.44
• Ulipristal: OR = 2.62, 95%CI 0.89-7.00
Glasier A et al. Contraception 2011.
ECP Mechanism of Action ?
Strong evidence suggests ECPs primarily work by stopping or delaying ovulation
Inhibits ovulation & luteal function, interferes with sperm migration
The best available evidence indicates that ECPs have no effect post-fertilization
Davidoff F, Trussell J. JAMA 2006; ICEC and FIGO statement. 2008; Novikova N, et al. Contraception 2007; Brache V et al. Hum Reprod 2010; Stratton P et al. Fertil Steril 2010; Gemzel-Danielsson K. Contraception 2010; Trussell J, Raymond E 2011.
What else is known about EC and teens
EC awareness is low: especially in immigrant and low-income communities (Foster, Harper AJOG 2004)
Youth can be embarrassed to ask for EC (Free, BMJ 2002)
Primary Care Providers do not routinely counsel adolescents about EC (Chuang, Contraception 2004)
Consider stocking EC in your office to dispense directly or RX to all as advance prescription
Emergency Contraception And Medical Abortion: What’s The Difference?
Emergency Contraception (EC or Morning After Pill)
Medication Abortion
Mifepristone/RU-486
What Does It Do?
Prevents a pregnancy after intercourse
Ends a pregnancy
When is it Used?
Works within 5 days of unprotected sex
Ends pregnancies in the first 9 weeks
Brand Names Plan B or Next Choice
Ella
Mifeprex
What’s In The Pills?
Levonorgestrel
Ulipristal
mifepristone (taken with misoprostol)
Alissa
16 years oldAfraid of pelvic exam
Interested in the pill
Wants the one “with no period”
What else does she need today?
STI Screening in Teens
Chlamydia - annually and with each new partner Sexually active women and MSM < 25 y.o. Chlamydia most common reportable STI
• ¾ of infections asymptomatic• Causes PID & tubal infertility in women.
Gonorrhea Sexually active women < 25 years old and MSM If practice-site prevalence >1% or diagnose with another STI
HIV 30% of new HIV infections occur in 13 to 25 years old
Any STI is an indication to screen for all other STIs. I.E. if patient has trichomoniasis, screen for Chlamydia, GC,
Hepatitis, Syphilis and HIV.
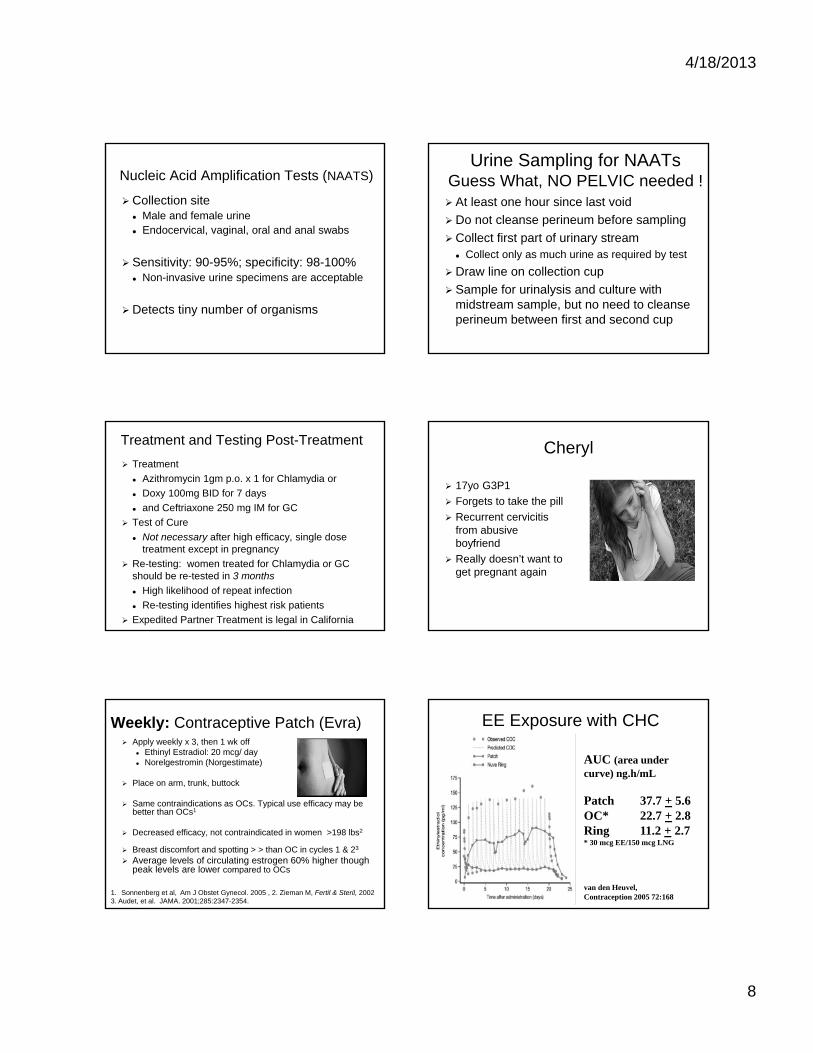
4/18/2013
8
Nucleic Acid Amplification Tests (NAATS)
Collection site Male and female urine Endocervical, vaginal, oral and anal swabs
Sensitivity: 90-95%; specificity: 98-100% Non-invasive urine specimens are acceptable
Detects tiny number of organisms
Urine Sampling for NAATsGuess What, NO PELVIC needed ! At least one hour since last void
Do not cleanse perineum before sampling
Collect first part of urinary stream Collect only as much urine as required by test
Draw line on collection cup
Sample for urinalysis and culture with midstream sample, but no need to cleanse perineum between first and second cup
Treatment and Testing Post-Treatment
Treatment
Azithromycin 1gm p.o. x 1 for Chlamydia or
Doxy 100mg BID for 7 days
and Ceftriaxone 250 mg IM for GC
Test of Cure
Not necessary after high efficacy, single dose treatment except in pregnancy
Re-testing: women treated for Chlamydia or GC should be re-tested in 3 months
High likelihood of repeat infection
Re-testing identifies highest risk patients
Expedited Partner Treatment is legal in California
Cheryl
17yo G3P1
Forgets to take the pill
Recurrent cervicitis from abusive boyfriend
Really doesn’t want to get pregnant again
Weekly: Contraceptive Patch (Evra) Apply weekly x 3, then 1 wk off
Ethinyl Estradiol: 20 mcg/ day Norelgestromin (Norgestimate)
Place on arm, trunk, buttock
Same contraindications as OCs. Typical use efficacy may be better than OCs1
Decreased efficacy, not contraindicated in women >198 lbs2
Breast discomfort and spotting > > than OC in cycles 1 & 23
Average levels of circulating estrogen 60% higher though peak levels are lower compared to OCs
1. Sonnenberg et al, Am J Obstet Gynecol. 2005 , 2. Zieman M, Fertil & Steril, 2002 3. Audet, et al. JAMA. 2001;285:2347-2354.
EE Exposure with CHC
AUC (area under curve) ng.h/mL
Patch 37.7 + 5.6OC* 22.7 + 2.8Ring 11.2 + 2.7* 30 mcg EE/150 mcg LNG
van den Heuvel,Contraception 2005 72:168

4/18/2013
9
Ortho Evra and risk of Venous Thromboembolism (VTE)
Retrospective case-control studies from claims data Jick et al, 2006 Nested case-control design based on
information from PharMetrics; 59K patch, 147K OC users• did not show increased risk of VTE : OR .9 (CI 0.5–1.6)
and OR 1.1 (CI 0.6–2.1) with 2006 data, when compared to OCs containing 35mcg ethinylestradiol (EE) and norgestimate
Cole et al, 2007. United Health Care claims data and chart reviews; 99K patch 257K OC users• did show odds ratio 2.4 (CI 1.1-5.5) for VTE among patch
users compared to OCs with 35 mcg EE and norgestimate• Bias: new patch users vs. new and prior OC user
Jick SS et al. Contraception 2006;73:223-228 and Contraception 2007;76:4-7 Cole JA et al. Obstet Gynecol 2007;109:339-346
Monthly: Vaginal Contraceptive Ring
One ring each month
Failure rate lower than pill
Easily placed and removed
Rarely noticed during sex
Continuation in teens > OCPs
Less spotting compared to pills
Lowest and constant serum estrogen levels of all options
Avoids liver first-pass metabolism
Miller, Obstetrics and Gynecology, 2005
Vaginal Contraceptive Ring: Nuva Ring
Lowest and constant serum estrogen levels of all options
Obesity doesn’t affect efficacy
Improves microflora content1
No GI interference with absorption
Avoids liver first-pass metabolism
1. Archer et al. Fertil Steril 2002
Vaginal Contraceptive Ring:Off label, Alternative use regimens
The Ring is effective for up to 35 days1
Continuous cycling, increases breakthrough bleeding2
“Calendar month” use 1-27th of month, then off for rest of month
1. Mulders & Dieben, Fertil Steril 2001;75:865-70. 2. Miller, et al. 2005
Tiffany
18 y/o G1P0
Has been using depo-provera successfully since her abortion 3 years ago
Plans to start college in the fall
Got headaches on OC’s, and likes not having a period. She wants to stay on depo
Q 3 months: Progestin-Only Injection: Depo Medroxyprogesterone Acetate (DMPA -IM 150mg q12wk)
•Irregular bleeding is expected and Amenorrhea is normal: 50% at 1 year, 80% at 5 years
•Advantages for teens: privacy, adherence, efficacy, decreased PID risk, decreased cramps & anemia
•May decrease seizure frequency and sickle crisis
•Part responsible for decrease in teen birth & abortion
•Calcium & Vit D, and weight bearing exercise
4/18/2013
10
DMPA-IM 150 & Black Box Warning Pregnancy & nursing cause similar or > bone loss than DMPA1
In teens, bone loss reversed w/in 12 months of discontinuation; ultimate BMD may be higher in former DMPA users 2,6
No increased incidence of osteoporosis or fractures w/ DMPA in >30yrs of worldwide use3
No role for BMD evaluation or treatment with bisphosphonates4
Experts feel “FDA's recent additional labeling for DMPA is unnecessary and should be revised or rescinded” 4,5
1. Sowers Obstet Gynecol, 2000;96:189-93 2.Scholes Arch Pedatir Adol Med 2005;159:139-44 3. Westhoff C Contraception. 2003;68:75-87 4.ACOG Bulletin 2005 5. Kaunitz Contraception2005;72:165-167 6. Harel et al Contraception, 2010;81: 281-291
DMPA and Weight Gain
Teens on DMPA gain more weight than teens on COCs1
Teens who gained > 5% of baseline weight at 3 months were at high risk at gaining even more weight at 12 months2
Overweight teens may be more likely to have significant weight gain on DMPA1,2
1. Mangan SA, et al. Overweight Teens at Increased Risk for Weight Gain While Using Depot Medroxyprogesterone Acetate. J Pediatr Adolesc Gynecol 2002;15:79–82. 2. Risser WL, Gefter LR, Barratt MS, Risser JM. Weight change in adolescents who used hormonal contraception. J Adolesc Health 1999;24(6):433–436
Lawonda
16 yo nullip
Sexually active for 2 years
3 lifetime partners partners
h/o Chlamydia
Plays basketball
Goes between 2 homes
Intrauterine Contraception (IUD) in Teens
Safe and effective in nulliparous women and women <20yrs old CDC class 21-4
Higher continuation rates than with OCs in teens1
Progestin IUCs great choice for menorrhagia & dysmenorrhea
Does not affect future fertility
Lower PID risk b/c thicker cervical mucus & thinner endometrium
1. Suhonen S. Contraception 2004 2. Nelson AL. Obstet Gynecol Clin North Am. 2000 3.Dardano KL, Burkman RT. Am J Obstet Gynecol. 1999 4. Li C. Contraception 2004 5.Treiman K Population Reports. 1995. Intrauterine Device and Adolescents. ACOG Committee Opinion December 2007
Do IUDs cause STIs and PID?
Screen for STI and insert IUD at same visit1
Transient PID risk of 1/1000 likely due to contamination at insertion 2,3
Treat STI and PID with IUD in place4,5,6
Do not remove unless treatment failure
Dose and duration does not change
1.Suffrin,C et al, Obstetrics & Gynecology. 120(6):1314-1321, December 2012 2. Grimes, D Lancet 2001; 7358:6-7, 3. Grimes, D Lancet 2000; 356:1013-9 4. CDC MEC 2010 5. Grimes Cochrane Database 2001, revised 2003 6. Tepper NK, et al. Contraception Oct 2012
What about the risk of Infertility?
The evidence shows:
IUDs DO NOT increase risk of infertility or STI1
PID risk with cervicitis similar with & w/o IUD1,2
Tubal infertility linked to presence of Chlamydia antibodies, but NOT history of IUD3
1. Grimes, D. Lancet 2000; 356: 1013-19. 2. 1.Suffrin,C et al, Obstetrics & Gynecology. 2012 120(6):1314-1321 3. Hubacher D, et al. NEJM 2001; 345:561-7.
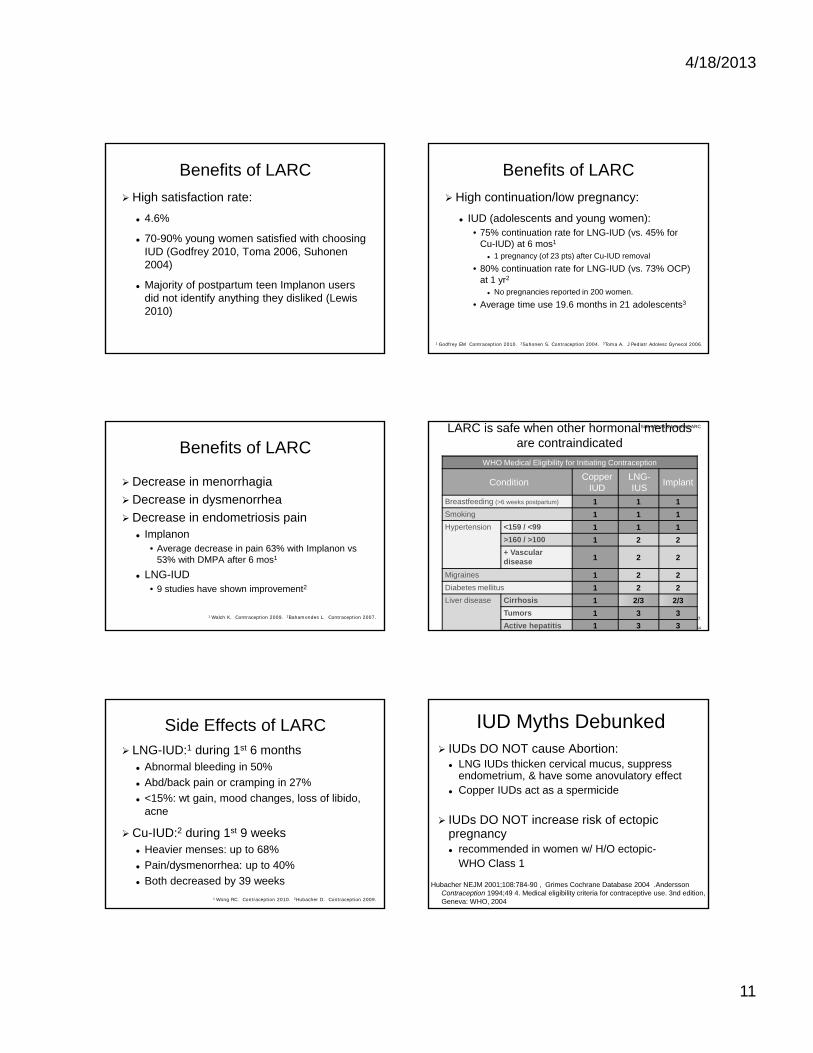
4/18/2013
11
Benefits of LARC
High satisfaction rate:
4.6%
70-90% young women satisfied with choosing IUD (Godfrey 2010, Toma 2006, Suhonen2004)
Majority of postpartum teen Implanon users did not identify anything they disliked (Lewis 2010)
Benefits of LARC
High continuation/low pregnancy:
IUD (adolescents and young women):• 75% continuation rate for LNG-IUD (vs. 45% for
Cu-IUD) at 6 mos1
1 pregnancy (of 23 pts) after Cu-IUD removal
• 80% continuation rate for LNG-IUD (vs. 73% OCP) at 1 yr2
No pregnancies reported in 200 women.
• Average time use 19.6 months in 21 adolescents3
1 Godfrey EM Contraception 2010. 2Suhonen S. Contraception 2004. 3Toma A. J Pediatr Adolesc Gynecol 2006.
Benefits of LARC
Decrease in menorrhagia
Decrease in dysmenorrhea
Decrease in endometriosis pain Implanon
• Average decrease in pain 63% with Implanon vs 53% with DMPA after 6 mos1
LNG-IUD• 9 studies have shown improvement2
1 Walch K. Contraception 2009. 2Bahamondes L. Contraception 2007.
64
LARC is safe when other hormonal methods are contraindicated
Side effects & benefits LARC
WHO Medical Eligibility Criteria for Contraceptive Use. In Family Planning. 2007.
WHO Medical Eligibility for Initiating Contraception
ConditionCopper
IUDLNG-IUS
Implant
Breastfeeding (>6 weeks postpartum) 1 1 1
Smoking 1 1 1
Hypertension <159 / <99 1 1 1
>160 / >100 1 2 2
+ Vascular disease 1 2 2
Migraines 1 2 2
Diabetes mellitus 1 2 2
Liver disease Cirrhosis 1 2/3 2/3
Tumors 1 3 3
Active hepatitis 1 3 3
Side Effects of LARC LNG-IUD:1 during 1st 6 months
Abnormal bleeding in 50%
Abd/back pain or cramping in 27%
<15%: wt gain, mood changes, loss of libido, acne
Cu-IUD:2 during 1st 9 weeks Heavier menses: up to 68%
Pain/dysmenorrhea: up to 40%
Both decreased by 39 weeks1 Wong RC. Contraception 2010. 2Hubacher D. Contraception 2009.
IUD Myths Debunked IUDs DO NOT cause Abortion:
LNG IUDs thicken cervical mucus, suppress endometrium, & have some anovulatory effect
Copper IUDs act as a spermicide
IUDs DO NOT increase risk of ectopicpregnancy recommended in women w/ H/O ectopic-
WHO Class 1
Hubacher NEJM 2001;108:784-90 , Grimes Cochrane Database 2004 .Andersson Contraception 1994;49 4. Medical eligibility criteria for contraceptive use. 3nd edition, Geneva: WHO, 2004
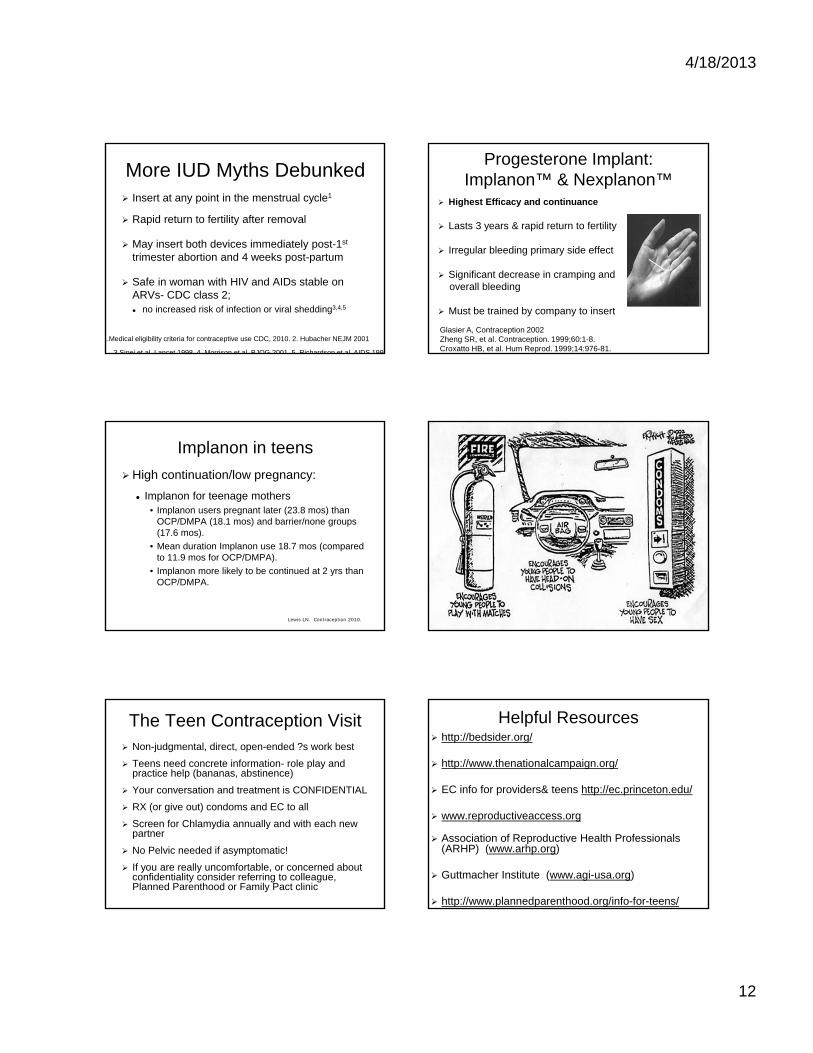
4/18/2013
12
More IUD Myths Debunked Insert at any point in the menstrual cycle1
Rapid return to fertility after removal
May insert both devices immediately post-1st
trimester abortion and 4 weeks post-partum
Safe in woman with HIV and AIDs stable on ARVs- CDC class 2; no increased risk of infection or viral shedding3,4,5
1.Medical eligibility criteria for contraceptive use CDC, 2010. 2. Hubacher NEJM 2001
3 Sinei et al Lancet 1998 4 Morrison et al BJOG 2001 5 Richardson et al AIDS 1999
Progesterone Implant: Implanon™ & Nexplanon™
Highest Efficacy and continuance
Lasts 3 years & rapid return to fertility
Irregular bleeding primary side effect
Significant decrease in cramping and overall bleeding
Must be trained by company to insert
Glasier A, Contraception 2002Zheng SR, et al. Contraception. 1999;60:1-8.Croxatto HB, et al. Hum Reprod. 1999;14:976-81.
Implanon in teens
High continuation/low pregnancy:
Implanon for teenage mothers• Implanon users pregnant later (23.8 mos) than
OCP/DMPA (18.1 mos) and barrier/none groups (17.6 mos).
• Mean duration Implanon use 18.7 mos (compared to 11.9 mos for OCP/DMPA).
• Implanon more likely to be continued at 2 yrs than OCP/DMPA.
Lewis LN. Contraception 2010.
The Teen Contraception Visit Non-judgmental, direct, open-ended ?s work best
Teens need concrete information- role play and practice help (bananas, abstinence)
Your conversation and treatment is CONFIDENTIAL
RX (or give out) condoms and EC to all
Screen for Chlamydia annually and with each new partner
No Pelvic needed if asymptomatic!
If you are really uncomfortable, or concerned about confidentiality consider referring to colleague, Planned Parenthood or Family Pact clinic
Helpful Resources http://bedsider.org/
http://www.thenationalcampaign.org/
EC info for providers& teens http://ec.princeton.edu/
www.reproductiveaccess.org
Association of Reproductive Health Professionals (ARHP) (www.arhp.org)
Guttmacher Institute (www.agi-usa.org)
http://www.plannedparenthood.org/info-for-teens/
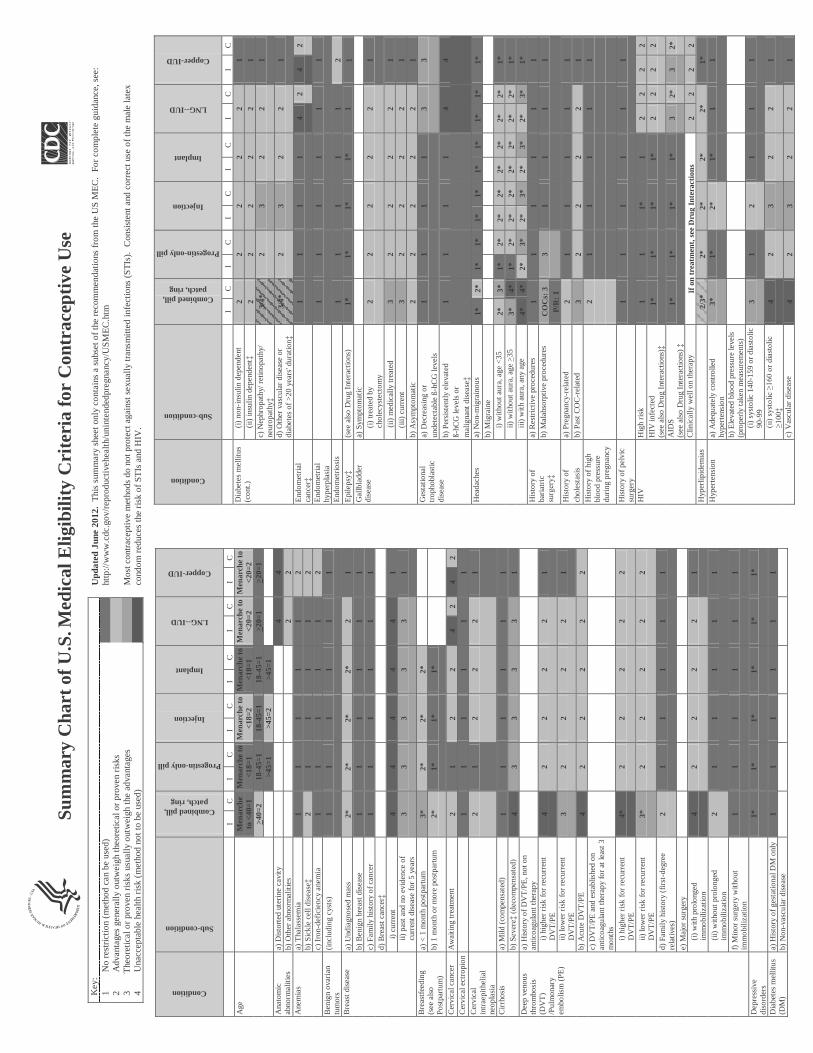
Su
mm
ary
Ch
art
of U
.S.M
edic
al E
ligib
ilit
y C
rite
ria
for
Con
trac
epti
ve U
se
Up
date
d J
une
2012
. T
his
sum
mar
y sh
eet
only
con
tain
s a
subs
et o
f th
e re
com
men
dati
ons
from
the
US
ME
C.
For
com
plet
e gu
idan
ce, s
ee:
http
://w
ww
.cdc
.gov
/rep
rodu
ctiv
ehea
lth/
unin
tend
edpr
egna
ncy/
US
ME
C.h
tm
Mos
t con
trac
epti
ve m
etho
ds d
o no
t pro
tect
aga
inst
sex
ually
tran
smit
ted
infe
ctio
ns (
ST
Is).
C
onsi
sten
t and
cor
rect
use
of
the
mal
e la
tex
cond
om r
educ
es th
e ri
sk o
f ST
Is a
nd H
IV.
Condition
Sub-condition
Combinedpill, patch, ring
Progestin-only pill
Injection
Implant
LNG--IUD
Copper-IUD
IC
IC
IC
IC
IC
IC
Age
M
enar
che
to <
40=
1 M
enar
che
to
<18
=1
Men
arch
e to
<
18=
2 M
enar
che
to
<18
=1
Men
arch
e to
<
20=
2 M
enar
che
to
<20
=2
>40
=2
18-4
5=1
18-4
5=1
18-4
5=1
>20
=1
>20
=1
>45
=1
>45
=2
>45
=1
Ana
tom
ic
abno
rmal
itie
s a)
Dis
tort
ed u
teri
ne c
avit
y 4
4b)
Oth
er a
bnor
mal
itie
s 2
2A
nem
ias
a) T
hala
ssem
ia
11
11
12
b) S
ickl
e ce
ll di
seas
e‡2
11
11
2c)
Iro
n-de
fici
ency
ane
mia
1
11
11
2B
enig
n ov
aria
n tu
mor
s (i
nclu
ding
cys
ts)
11
11
11
Bre
ast
dise
ase
a) U
ndia
gnos
ed m
ass
2*2*
2*2*
21
b) B
enig
n br
east
dis
ease
1
11
11
1c)
Fam
ily
hist
ory
of c
ance
r 1
11
11
1d)
Bre
ast c
ance
r‡
i)
curr
ent
44
44
41
ii) p
ast
and
no e
vide
nce
of
curr
ent
dise
ase
for
5 ye
ars
33
33
31
Bre
astf
eedi
ng
(see
als
o P
ostp
artu
m)
a) <
1 m
onth
pos
tpar
tum
3*
2*2*
2*b)
1 m
onth
or
mor
e po
stpa
rtum
2*
1*1*
1*
Cer
vica
l can
cer
Aw
aiti
ng t
reat
men
t 2
12
24
24
2C
ervi
cal e
ctro
pion
1
11
11
1C
ervi
cal
intr
aepi
thel
ial
neop
lasi
a
21
22
21
Cir
rhos
is
a) M
ild (
com
pens
ated
) 1
11
11
1b)
Sev
ere‡
(dec
ompe
nsat
ed)
43
33
31
Dee
p ve
nous
th
rom
bosi
s (D
VT
) /P
ulm
onar
y
embo
lism
(P
E)
a) H
isto
ry o
f D
VT
/PE
, not
on
anti
coag
ulan
t th
erap
y i)
hig
her
risk
for
rec
urre
nt
DV
T/P
E
42
22
21
ii) lo
wer
ris
k fo
r re
curr
ent
DV
T/P
E
32
22
21
b) A
cute
DV
T/P
E
42
22
22
c) D
VT
/PE
and
est
ablis
hed
on
anti
coag
ulan
t th
erap
y fo
r at
leas
t 3
mon
ths
i) h
ighe
r ri
sk f
or r
ecur
rent
D
VT
/PE
4*
22
22
2
ii) lo
wer
ris
k fo
r re
curr
ent
DV
T/P
E
3*2
22
22
d) F
amil
y hi
stor
y (f
irst
-deg
ree
rela
tive
s)
21
11
11
e) M
ajor
sur
gery
(i)
with
pro
long
ed
imm
obili
zati
on
42
22
21
(ii)
with
out
prol
onge
d im
mob
iliza
tion
2
11
11
1
f) M
inor
sur
gery
wit
hout
im
mob
iliza
tion
1
11
11
1
Dep
ress
ive
diso
rder
s 1*
1*1*
1*1*
1*
Dia
bete
s m
ellit
us
(DM
)
a) H
isto
ry o
f ge
stat
iona
l DM
onl
y 1
11
11
1b)
Non
-vas
cula
r di
seas
e
Condition
Sub-condition
Combinedpill, patch, ring
Progestin-only pill
Injection
Implant
LNG--IUD
Copper-IUD
IC
IC
IC
IC
IC
IC
Dia
bete
s m
ellit
us
(con
t.)(i
) no
n-in
sulin
dep
ende
nt
22
22
21
(ii)
insu
lin d
epen
dent
‡2
22
22
1c)
Nep
hrop
athy
/ ret
inop
athy
/ ne
urop
athy
‡3/
4*2
32
21
d) O
ther
vas
cula
r di
seas
e or
di
abet
es o
f >
20 y
ears
' dur
atio
n‡3/
4*2
32
21
End
omet
rial
ca
ncer
‡1
11
14
24
2
End
omet
rial
hy
perp
lasi
a 1
11
11
1
End
omet
rios
is
11
11
12
Epi
leps
y‡(s
ee a
lso
Dru
g In
tera
ctio
ns)
1*1*
1*1*
11
Gal
lbla
dder
di
seas
ea)
Sym
ptom
atic
(i
) tr
eate
d by
chol
ecys
tect
omy
22
22
21
(
ii) m
edic
ally
tre
ated
3
22
22
1(i
ii) c
urre
nt
32
22
21
b) A
sym
ptom
atic
2
22
22
1G
esta
tiona
l tr
opho
blas
tic
di
seas
e
a) D
ecre
asin
g or
un
dete
ctab
le ß
-hC
G le
vels
1
11
13
3
b) P
ersi
sten
tly
elev
ated
ß-
hCG
leve
ls o
r m
alig
nant
dis
ease
‡
11
11
44
Hea
dach
es
a) N
on-m
igra
inou
s 1*
2*1*
1*1*
1*1*
1*1*
1*1*
b) M
igra
ine
i) w
ithou
t aur
a, a
ge <
35
2*3*
1*2*
2*2*
2*2*
2*2*
1*ii)
wit
hout
aur
a, a
ge >
35
3*4*
1*2*
2*2*
2*2*
2*2*
1*ii
i) w
ith
aura
, any
age
4*
4*2*
3*2*
3*2*
3*2*
3*1*
His
tory
of
bari
atri
c su
rger
y‡
a) R
estr
icti
ve p
roce
dure
s 1
11
11
1b)
Mal
abso
rpti
ve p
roce
dure
s C
OC
s: 3
3
11
11
P/R
: 1
His
tory
of
a)
Pre
gnan
cy-r
elat
ed
21
11
11
chol
esta
sis
b) P
ast
CO
C-r
elat
ed
32
22
21
His
tory
of
high
bl
ood
pres
sure
du
ring
pre
gnan
cy
21
11
11
His
tory
of
pelv
ic
surg
ery
11
11
11
HIV
Hig
h ri
sk
11
1*1
22
22
HIV
infe
cted
(s
ee a
lso
Dru
g In
tera
ctio
ns)‡
1*1*
1*1*
22
22
AID
S
(see
als
o D
rug
Inte
ract
ions
)‡
1*1*
1*1*
32*
32*
Clin
ical
ly w
ell o
n th
erap
y If
on
tre
atm
ent,
see
Dru
g In
tera
ctio
ns
22
22
Hyp
erlip
idem
ias
2/3*
2*2*
2*2*
1*H
yper
tens
ion
a)
Ade
quat
ely
cont
rolle
d hy
pert
ensi
on
3*1*
2*1*
11
b) E
leva
ted
bloo
d pr
essu
re le
vels
(p
rope
rly
take
n m
easu
rem
ents
) (i
) sy
stol
ic 1
40-1
59 o
r di
asto
lic
90-9
9 3
12
11
1
(ii) s
ysto
lic
160
or d
iast
olic
10
0‡4
23
22
1
c) V
ascu
lar
dise
ase
42
32
21
Key
: 1
No
rest
rict
ion
(met
hod
can
be u
sed)
2
Adv
anta
ges
gene
rally
out
wei
gh th
eore
tical
or
prov
en r
isks
3
The
oret
ical
or
prov
en r
isks
usu
ally
out
wei
gh th
e ad
vant
ages
4
Una
ccep
tabl
e he
alth
ris
k (m
etho
d no
t to
be u
sed)
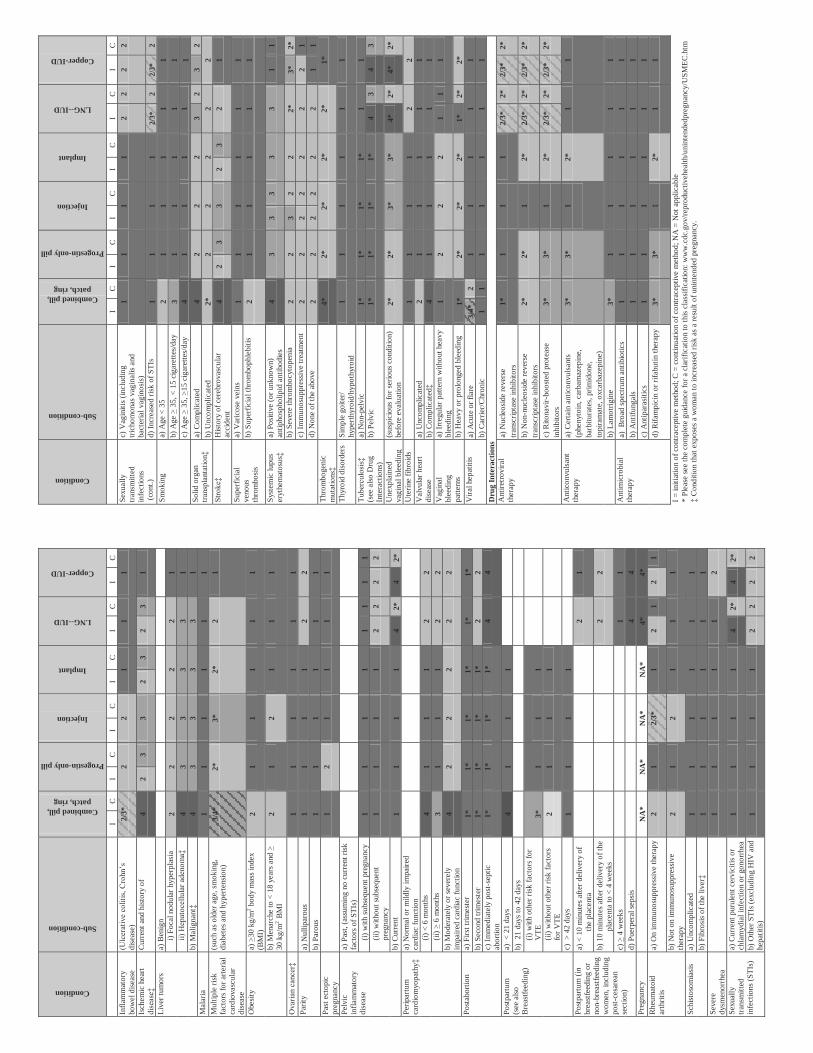
Condition
Sub-condition
Combinedpill, patch, ring
Progestin-only pill
Injection
Implant
LNG--IUD
Copper-IUD
IC
IC
IC
IC
IC
IC
Infl
amm
ator
y bo
wel
dis
ease
(U
lcer
ativ
e co
litis,
Cro
hn’s
di
seas
e)
2/3*
22
11
1
Isch
emic
hea
rt
dise
ase‡
Cur
rent
and
his
tory
of
42
33
23
23
1
Liv
er t
umor
s a)
Ben
ign
i) F
ocal
nod
ular
hyp
erpl
asia
2
22
22
1ii)
Hep
atoc
ellu
lar a
deno
ma‡
43
33
31
b) M
alig
nant
‡4
33
33
1M
alar
ia
11
11
11
Mul
tipl
e ri
sk
fact
ors
for
arte
rial
ca
rdio
vasc
ular
di
seas
e
(suc
h as
old
er a
ge, s
mok
ing,
di
abet
es a
nd h
yper
tens
ion)
3/4*
2*3*
2*2
1
Obe
sity
a)
>30
kg/
m2 b
ody
mas
s in
dex
(BM
I)
21
11
11
b) M
enar
che
to <
18
year
s an
d >
30 k
g/m
2B
MI
21
21
11
Ova
rian
canc
er‡
11
11
11
Par
ity
a) N
ullip
arou
s 1
11
12
2b)
Par
ous
11
11
11
Pas
t ec
topi
c pr
egna
ncy
12
11
11
Pel
vic
infl
amm
ator
y
dise
ase
a) P
ast,
(ass
umin
g no
cur
rent
ris
k fa
ctor
s of
ST
Is)
(i)
with
sub
sequ
ent
preg
nanc
y 1
11
11
11
1(i
i) w
ithou
t su
bseq
uent
pr
egna
ncy
11
11
22
22
b) C
urre
nt
11
11
42*
42*
Per
ipar
tum
ca
rdio
myo
path
y‡a)
Nor
mal
or
mild
ly i
mpa
ired
ca
rdia
c fu
nctio
n (i
) <
6 m
onth
s 4
11
12
2(i
i) >
6 m
onth
s 3
11
12
2b)
Mod
erat
ely
or s
ever
ely
impa
ired
car
diac
fun
ctio
n 4
22
22
2
Pos
tabo
rtio
n a)
Fir
st tr
imes
ter
1*1*
1*1*
1*1*
b) S
econ
d tr
imes
ter
1*1*
1*1*
22
c) I
mm
edia
tely
pos
t-se
ptic
ab
ortio
n 1*
1*1*
1*4
4
Pos
tpar
tum
(s
ee a
lso
Bre
astf
eedi
ng)
a) <
21
days
4
11
1b)
21
days
to 4
2 da
ys
(i)
with
oth
er r
isk
fact
ors
for
VT
E
3*1
11
(ii)
with
out o
ther
ris
k fa
ctor
s fo
r V
TE
2
11
1
c) >
42
days
1
11
1P
ostp
artu
m (
in
brea
stfe
edin
g or
no
n -br
east
feed
ing
wom
en, i
nclu
ding
po
st-c
esar
ean
sect
ion)
a) <
10
min
utes
aft
er d
eliv
ery
of
the
plac
enta
2
1
b) 1
0 m
inut
es a
fter
del
iver
y of
the
pl
acen
ta to
< 4
wee
ks
22
c) >
4 w
eeks
1
1d)
Pue
rper
al s
epsi
s 4
4P
regn
ancy
N
A*
NA
*N
A*
NA
*4*
4*R
heum
atoi
d
arth
riti
s a)
On
imm
unos
uppr
essi
ve t
hera
py
21
2/3*
12
12
1
b) N
ot o
n im
mun
osup
pres
sive
th
erap
y 2
12
11
1
Sch
isto
som
iasi
s a)
Unc
ompl
icat
ed
11
11
11
b) F
ibro
sis
of t
he li
ver‡
11
11
11
Sev
ere
dysm
enor
rhea
1
11
11
2
Sex
uall
y tr
ansm
itted
in
fect
ions
(ST
Is)
a) C
urre
nt p
urul
ent
cerv
icit
is o
r ch
lam
ydia
l inf
ectio
n or
gon
orrh
ea
11
11
42*
42*
b) O
ther
ST
Is (
excl
udin
g H
IV a
nd
hepa
titi
s)
11
11
22
22
Condition
Sub-condition
Combinedpill, patch, ring
Progestin-only pill
Injection
Implant
LNG--IUD
Copper-IUD
IC
IC
IC
IC
IC
IC
Sex
uall
y tr
ansm
itted
in
fect
ions
(co
nt.)
c) V
agin
itis
(in
clud
ing
tric
hom
onas
vag
inal
is a
nd
bact
eria
l vag
inos
is)
11
11
22
22
d) I
ncre
ased
ris
k of
ST
Is
11
11
2/3*
2
2/3*
2S
mok
ing
a) A
ge <
35
21
11
11
b) A
ge >
35,
< 1
5 ci
gare
ttes
/day
3
11
11
1c)
Age
> 3
5, >
15 c
igar
ette
s/da
y 4
11
11
1S
olid
org
an
trans
plan
tatio
n‡a)
Com
plic
ated
4
22
23
23
2b)
Unc
ompl
icat
ed
2*2
22
22
Stro
ke‡
His
tory
of
cere
brov
ascu
lar
acci
dent
4
23
32
32
1
Sup
erfi
cial
ve
nous
thro
mbo
sis
a) V
aric
ose
vein
s 1
11
11
1b)
Sup
erfi
cial
thr
ombo
phle
biti
s 2
11
11
1
Sys
tem
ic lu
pus
eryt
hem
atos
us‡
a) P
ositi
ve (
or u
nkno
wn)
an
tiph
osph
olip
id a
ntib
odie
s 4
33
33
31
1
b) S
ever
e th
rom
bocy
tope
nia
22
32
22*
3*2*
c) I
mm
unos
uppr
essi
ve t
reat
men
t 2
22
22
22
1d)
Non
e of
the
abo
ve
22
22
22
11
Thr
ombo
geni
c m
utat
ions
‡4*
2*2*
2*2*
1*
Thy
roid
dis
orde
rs
Sim
ple
goite
r/
hype
rthy
roid
/hyp
othy
roid
1
11
11
1
Tube
rcul
osis‡
(see
als
o D
rug
Inte
ract
ions
)
a) N
on-p
elvi
c 1*
1*1*
1*1
1b)
Pel
vic
1*1*
1*1*
43
43
Une
xpla
ined
va
gina
l ble
edin
g
(sus
pici
ous
for
seri
ous
cond
ition
) be
fore
eva
luat
ion
2*2*
3*3*
4*2*
4*2*
Ute
rine
fib
roid
s 1
11
12
2V
alvu
lar
hear
t di
seas
e a)
Unc
ompl
icat
ed
21
11
11
b) C
ompl
icat
ed‡
41
11
11
Vag
inal
bl
eedi
ngpa
tter
ns
a) I
rreg
ular
pat
tern
with
out h
eavy
bl
eedi
ng
12
22
11
1
b) H
eavy
or
prol
onge
d bl
eedi
ng
1*2*
2*2*
1*2*
2*V
iral
hep
atit
is
a) A
cute
or
flar
e 3/
4*2
11
11
1b)
Car
rier
/Chr
onic
1
11
11
11
Dru
g In
tera
ctio
ns
Ant
iret
rovi
ral
ther
apy
a) N
ucle
osid
e re
vers
e tr
ansc
ript
ase
inhi
bito
rs
1*1
11
2/3*
2*2/
3*
2*
b) N
on-n
ucle
osid
e re
vers
e tr
ansc
ript
ase
inhi
bito
rs
2*2*
12*
2/3*
2*2/
3*
2*
c) R
itona
vir-
boos
ted
prot
ease
in
hibi
tors
3*
3*1
2*2/
3*2*
2/3*
2*
Ant
icon
vuls
ant
ther
apy
a) C
erta
in a
ntic
onvu
lsan
ts
(phe
nyto
in, c
arba
maz
epin
e,ba
rbitu
rate
s, p
rim
idon
e,to
pira
mat
e, o
xcar
baze
pine
)
3*3*
12*
11
b) L
amot
rigi
ne
3*1
11
11
Ant
imic
robi
al
ther
apy
a) B
road
spe
ctru
m a
ntib
ioti
cs
11
11
11
b) A
ntif
unga
ls
11
11
11
c) A
ntip
aras
itic
s 1
11
11
1d)
Rif
ampi
cin
or r
ifab
utin
the
rapy
3*
3*1
2*1
1
I =
init
iatio
n of
con
trac
epti
ve m
etho
d; C
= c
onti
nuat
ion
of c
ontr
acep
tive
met
hod;
NA
= N
ot a
pplic
able
*
Ple
ase
see
the
com
plet
e gu
idan
ce f
or a
cla
rifi
cati
on to
this
cla
ssif
icat
ion:
ww
w.c
dc.g
ov/r
epro
duct
iveh
ealth
/uni
nten
dedp
regn
ancy
/US
ME
C.h
tm
‡ C
ondi
tion
that
exp
oses
a w
oman
to
incr
ease
d ri
sk a
s a
resu
lt of
uni
nten
ded
preg
nanc
y.
VOL. 120, NO. 4, OCTOBER 2012 OBSTETRICS & GYNECOLOGY 983
Sexual Behavior and Contraceptive Use Among American AdolescentsIn the United States, 42% of adolescents aged 15–19 years have had sexual intercourse (1). Although almost all sexu-ally active adolescents report having used some method of contraception during their lifetimes, they rarely select the most effective methods. Adolescents most commonly use contraceptive methods with relatively high typical use failure rates such as condoms, withdrawal, or oral contra-ceptive (OC) pills (1). Nonuse, inconsistent use, and use of methods with high typical use failure rates are reflected in the high rate of unintended adolescent pregnancies in the United States. Eighty-two percent of adolescent pregnancies are unplanned, accounting for one fifth of all unintended pregnancies in the United States, a statistic that indicates an unmet need for acceptable, reliable, and effective contraceptive methods for adolescents (2).
Long-acting reversible contraception (LARC) meth-ods are increasing in popularity with use increasing from 2.4% of all U.S. women using contraception in 2002 to 8.5% in 2009 (3). Approximately 4.5% of women aged 15–19 years who are currently using a method of con-traception use LARC, with most using an IUD (3). The etonogestrel single-rod contraceptive implant, approved by the U.S. Food and Drug Administration in 2006, is used by less than 1% of U.S. women using contraception and 0.5% of those aged 15–19 years (4).
Short-acting contraceptive methods, including con-doms, OCs, the contraceptive patch, the vaginal ring, and
depot medroxyprogesterone acetate (DMPA) injections, are mainstays of adolescent contraceptive choices, but these contraceptives have lower continuation rates and higher pregnancy rates than LARC methods (5, 6). Of 1,387 females aged 15–24 years who initiated short-acting hormonal methods, only 11% using the contraceptive patch, 16% receiving DMPA injections, and approxi-mately 30% using the vaginal ring and OCs were still using the same method after 12 months (6). In a study of 4,167 females aged 14–45 years that compared con-tinuation rates for LARC and short-acting contraceptive methods, the continuation rate for LARC was 86% at 12 months compared with 55% for short-acting contracep-tive methods (7). In this study, continuation rates for the levonorgestrel intrauterine system and the contraceptive implant in women younger than 20 years were similar to rates for older women at 85% and 80%, respectively, at 1 year. Copper IUD continuation rates were slightly lower for adolescents than for older women, but were still 72% at 1 year. In the same study population, unintended pregnancy rates for short-acting contraceptives were 22 times higher than unintended pregnancy rates for LARC. Women younger than 21 years using short-acting con-traceptives had a risk of unintended pregnancy that was two times the risk among older women using short-acting contraceptives, but the risk was the same if they were using LARC (8). Poor continuation coupled with higher failure rates decrease the efficacy of short-acting contra-ception in young women.
Adolescents and Long-Acting Reversible
Contraception: Implants and Intrauterine Devices
ABSTRACT: Long-acting reversible contraception (LARC)—intrauterine devices and the contraceptive implant—are safe and appropriate contraceptive methods for most women and adolescents. The LARC methods are top-tier contraceptives based on effectiveness, with pregnancy rates of less than 1% per year for perfect use and typical use. These contraceptives have the highest rates of satisfaction and continuation of all reversible contraceptives. Adolescents are at high risk of unintended pregnancy and may benefit from increased access to LARC methods.
COMMITTEE OPINION
The American College of Obstetricians and GynecologistsWOMEN’S HEALTH CARE PHYSICIANS
Committee on Adolescent Health Care Long-Acting Reversible Contraception Working GroupThis document reflects emerging clinical and scientific advances as of the date issued and is subject to change. The information should not be construed as dictating an exclusive course of treatment or procedure to be followed.
(Replaces Committee Opinion No. 392, December 2007)
984 Committee Opinion Long-Acting Reversible Contraception OBSTETRICS & GYNECOLOGY
Barriers to wide use of LARC methods by adolescents include a lack of familiarity with or misperceptions about the methods, the high cost, the lack of access, and health care providers’ concerns about the safety of LARC use in adolescents (9–11). A large study that removed cost and other common barriers to LARC methods, and included counseling on the full range of birth control options, found that more than two thirds of females aged 14–20 years chose LARC methods (12).
Counseling, Consent, Confidentiality, and CostIncreasing adolescent access to LARC is a clinical and pub- lic health opportunity for obstetrician–gynecologists. With top-tier effectiveness, high rates of satisfaction and continuation, and no need for daily adherence, LARC methods should be first-line recommendations for all women and adolescents (13). As with all nonbarrier meth- ods, to decrease the risk of sexually transmitted infections (STIs), including human immunodeficiency virus (HIV), health care providers should advise sexually active ado-lescents to consistently use condoms along with LARC methods.
Like all women seeking reproductive health services, adolescents have the right to decline the use of LARC as well as the right to discontinue LARC without barriers. Coercive insertion of long-acting contraception was used in the past as a means of fertility control in marginalized women (14). In the absence of contraindications, patient choice should be the principal factor in prescribing one method of contraception over another, and adolescents have the right to decline any method of contraception.
Confidentiality is of particular importance to adoles-cents. In many states, adolescents have the right to receive confidential contraceptive services without parental con-sent, and health care providers should be familiar with laws concerning provision of contraception to minors in their own states. Information regarding these laws can be found at: http://www.guttmacher.org/statecenter/adolescents.html.
High up-front costs for LARC methods can be a deterrent to use. Adolescents who have insurance cover-age through their parents may not want to use the benefit because of confidentiality concerns; others may be unin-sured or have insurance that excludes coverage for LARC methods. In all of these cases, referral to a publicly funded clinic may be appropriate. Proposed health care reform provisions to cover all FDA-approved contraceptive methods, including LARC methods, without copayments or deductibles for these preventive health services, may ease this burden.
Guidance for Adolescent Health Care Providers to Address Common MisconceptionsHealth care providers’ concerns about LARC use by ado-lescents are a barrier to access. Health care provider train-
ing and continuing education programs should address common misconceptions and review the key evidence and benefits of adolescent LARC use.
Intrauterine Devices
Intrauterine devices are safe to use among adolescents. Current evidence demonstrates the safety of modern IUDs. Although few studies have focused exclusively on adolescents who use currently available IUDs, good evidence suggests that the relative risk of pelvic inflam-matory disease (PID) is increased only in the first 20 days after IUD insertion and then returns to baseline, while the absolute risk remains small (15–17). Bacterial contamination associated with the insertion process is the likely cause of infection, not the IUD itself. The risk of PID with IUD placement is 0–2% when no cervical infection is present and 0–5% when insertion occurs with an undetected infection (17). Women with positive chla-mydia cultures after IUD insertion are unlikely to develop PID, even with retention of the IUD, if the infection is promptly treated (18, 19). The levonorgestrel intrauter-ine system may lower the risk of PID by thickening cervi-cal mucus and thinning the endometrium (20–22).
Intrauterine devices do not increase an adolescent’s risk of infertility. Infertility is not more likely after discontinuation of IUD use than after discontinuation of other reversible meth-ods of contraception (16). In a large case–control study that examined determinants of tubal infertility, the pres-ence of chlamydial antibodies, not previous IUD use, was associated with infertility (23). Baseline fecundity returns rapidly after IUD removal (24).
Intrauterine devices may be inserted without technical difficulty in most adolescents and nulliparous women.
Little evidence suggests that IUD insertion is techni-cally more difficult in adolescents compared with older women. More than one half of young nulliparous women report discomfort with IUD insertion (21). Anticipatory guidance regarding pain and provision of analgesia dur-ing IUD insertion should be individualized and may include supportive care, nonsteroidal antiinflammatory drugs (NSAIDs), narcotics, anxiolytics, or paracervical blocks. The most effective method of pain control has not yet been established (25). Use of buccal or vaginal misoprostol 2–3 hours before IUD insertion to soften a nulliparous cervix does not appear to reduce insertion pain, and adverse effects are common (26–28).
Adolescents should be routinely screened for STIs (eg, gonor-rhea and chlamydia) at the time of IUD insertion.
Women aged 15–19 years have the second highest rates of chlamydia and the highest rates of gonorrhea of any age group (29). Thus, all adolescents should be screened for STIs at the time of or before IUD insertion. It is reason-able to screen for STIs and place the IUD on the same day (and administer treatment if the test results are positive)
VOL. 120, NO. 4, OCTOBER 2012 Long-Acting Reversible Contraception 985
(43). Other noncontraceptive benefits of the contracep-tive implant include reductions in dysmenorrhea and pelvic pain (44, 45). A prospective study of etonogestrel implant users showed no difference in the change in bone mineral density compared with copper IUD users after 2 years of use (46).
The contraceptive implant has minimal or no effect on weight.Currently, no prospective studies of weight in etonogestrel implant users have been published. A small percentage of women (2.3%) in the clinical trials for the etonogestrel implant discontinued use because of reported weight gain; however, actual weight gain was not documented (37). In contrast, DMPA injections are associated with weight gain, with overweight adolescents more susceptible to weight gain than normal weight adolescents (47).
Postpartum and Postabortal Long-Acting Reversible Contraception Initiation
Postpartum Long-Acting Reversible
Contraception
Adolescent mothers are at high risk of rapid repeat preg-nancy; 20% give birth again within 2 years (48). Insertion of an IUD or implant immediately postpartum ensures reliable contraception for adolescents when they are highly motivated to prevent pregnancy and are already in the health care system. The benefits of postpartum IUD insertion outweigh the risks, although recommen-dations vary depending on the type of device and timing of postpartum insertion (see Table 1) (31). Although the risk of expulsion is higher for immediate insertion compared with delayed insertion, if a delayed insertion presents a significant barrier, immediate insertion should be offered (49). Of adolescents in the postpartum period who received care from a clinic that prioritizes contracep-tive use, the implant was more likely to be placed before resumption of sexual activity than the IUD, thus reducing repeat pregnancy (50).
Postabortal Long-Acting Reversible
Contraception
Almost one half of all abortions performed in the United States are repeat abortions (51). Inserting an IUD or implant immediately after abortion significantly reduces the risk of repeat abortion (52). As is the case with older women, the benefits of providing LARC to adolescents after a spontaneous or induced abortion outweigh the risks (see Table 1). The implant is safe to place after any abortion, including second-trimester or septic abortion (31). Intrauterine devices are safe to place after a first-trimester or second-trimester abortion; however, the adolescent should be counseled about the possibility of IUD expulsion. Data on postabortal etonogestrel implant
or when the test results are available. If an STI is diag-nosed after the IUD is in place, it may be treated without removing the IUD (30–32). Routine antibiotic prophy-laxis is not recommended before IUD insertion (33).
Intrauterine device expulsion is uncommon in adolescents.Intrauterine device expulsion rates range from 3% to 5% for all IUD users and from 5% to 22% in adoles-cents (34, 35). Young age, previous IUD expulsion, and nulliparity may slightly increase the risk of expulsion, but research on current IUDs is limited (34–36). Prior expulsion should not be considered a contraindication for another IUD provided that appropriate counseling is given (36).
Intrauterine devices cause changes in bleeding patterns.Adolescents using either copper IUDs or the levonor-gestrel intrauterine system can expect changes in their menstrual bleeding especially in the first months of use. The copper IUD may cause heavier menses that can be treated with NSAIDs. Women using the levonorgestrel intrauterine system will have a decrease in bleeding over time that will lead to light bleeding, spotting, or amenor-rhea. Health care providers should counsel adolescents so they understand that these changes are expected.
The Contraceptive Implant
The contraceptive implant causes changes in bleeding patterns.Adolescents who use the contraceptive implant can expect changes in menstrual bleeding patterns throughout the duration of use. In an analysis of 11 clinical trials, includ-ing 942 etonogestrel implant users of all ages, the most common bleeding pattern was infrequent bleeding in 33.3% of 90-day cycles, followed by amenorrhea in 21.4% of cycles. Prolonged bleeding occurred in 16.9% of cycles and frequent bleeding occurred in 6.1% of cycles (37). A change in bleeding pattern is the most common rea-son for implant discontinuation. Anticipatory guidance regarding bleeding patterns may improve satisfaction and continuation. The bleeding pattern women experience in the first 3 months is broadly predictive of future bleeding patterns (38).
Common strategies for treating problematic bleed-ing include the use of short courses of combined OCs or NSAIDs; however, there are no published placebo con-trolled trials to support the use of these treatments (39). Limited clinical trial data suggest that, compared with placebo, mefenamic acid, mifepristone in combination with ethinyl estradiol or doxycycline, and doxycycline alone decrease the length of bleeding episodes in implant users (40–42). More research is needed to determine whether these or other interventions affect long-term continuation or acceptability of the implant.
The contraceptive implant has secondary health benefits.High rates of infrequent bleeding or amenorrhea lead to higher hemoglobin levels in etonogestrel implant users
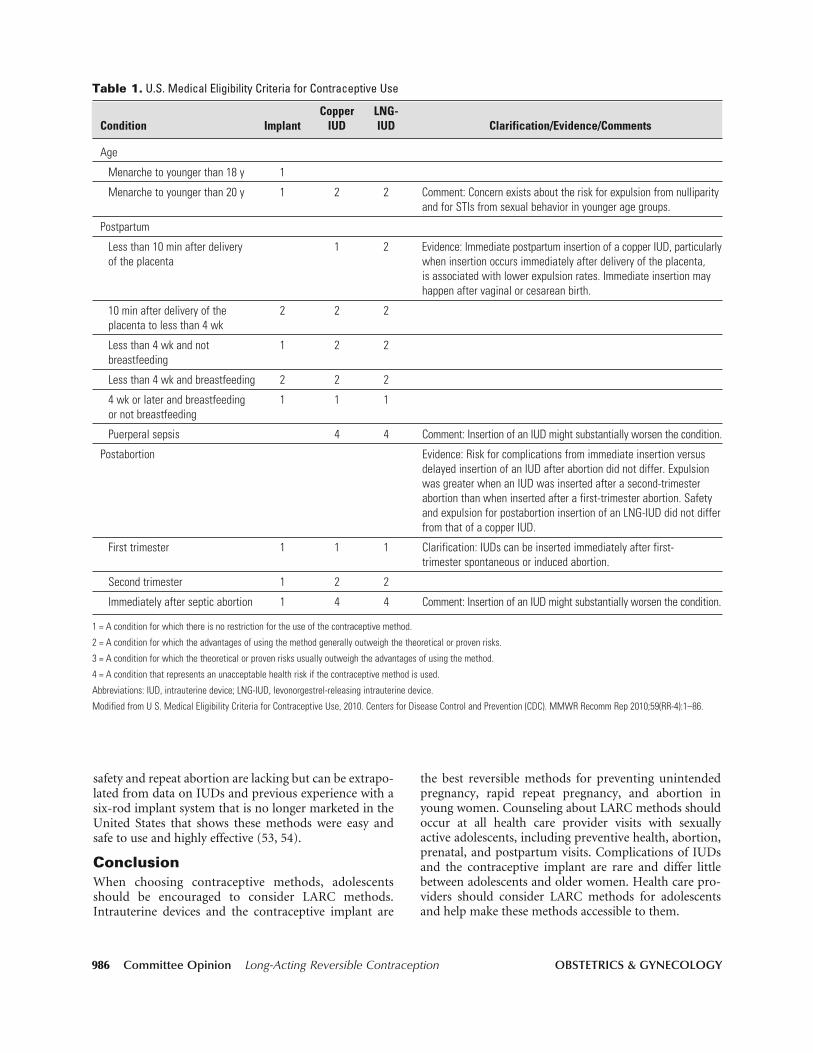
986 Committee Opinion Long-Acting Reversible Contraception OBSTETRICS & GYNECOLOGY
the best reversible methods for preventing unintended pregnancy, rapid repeat pregnancy, and abortion in young women. Counseling about LARC methods should occur at all health care provider visits with sexually active adolescents, including preventive health, abortion, prenatal, and postpartum visits. Complications of IUDs and the contraceptive implant are rare and differ little between adolescents and older women. Health care pro-viders should consider LARC methods for adolescents and help make these methods accessible to them.
safety and repeat abortion are lacking but can be extrapo-lated from data on IUDs and previous experience with a six-rod implant system that is no longer marketed in the United States that shows these methods were easy and safe to use and highly effective (53, 54).
ConclusionWhen choosing contraceptive methods, adolescents should be encouraged to consider LARC methods. Intrauterine devices and the contraceptive implant are
Table 1. U.S. Medical Eligibility Criteria for Contraceptive Use
Copper LNG- Condition Implant IUD IUD Clarification/Evidence/Comments
Age
VOL. 120, NO. 4, OCTOBER 2012 Long-Acting Reversible Contraception 987
transmitted infection? A systematic review. Contraception 2006;73:145–53.
18. Faundes A, Telles E, Cristofoletti ML, Faundes D, Castro S, Hardy E. The risk of inadvertent intrauterine device inser-tion in women carriers of endocervical Chlamydia tracho-matis. Contraception 1998;58:105–9.
19. Skjeldestad FE, Halvorsen LE, Kahn H, Nordbo SA, Saake K. IUD users in Norway are at low risk for genital C. tracho-matis infection. Contraception 1996;54:209–12.
20. Suhonen S, Haukkamaa M, Jakobsson T, Rauramo I. Clini- cal performance of a levonorgestrel-releasing intrauterine system and oral contraceptives in young nulliparous women: a comparative study. Contraception 2004;69:407–12.
21. Andersson K, Odlind V, Rybo G. Levonorgestrel-releasing and copper-releasing (Nova T) IUDs during five years of use: a randomized comparative trial. Contraception 1994; 49:56–72.
22. Toivonen J, Luukkainen T, Allonen H. Protective effect of intrauterine release of levonorgestrel on pelvic infection: three years’ comparative experience of levonorgestrel- and copper-releasing intrauterine devices. Obstet Gynecol 1991; 77:261–4.
23. Hubacher D, Lara-Ricalde R, Taylor DJ, Guerra-Infante F, Guzman-Rodriguez R. Use of copper intrauterine devices and the risk of tubal infertility among nulligravid women. N Engl J Med 2001;345:561–7.
24. Hov GG, Skjeldestad FE, Hilstad T. Use of IUD and subse-quent fertility--follow-up after participation in a random-ized clinical trial. Contraception 2007;75:88–92.
25. Allen RH, Bartz D, Grimes DA, Hubacher D, O’Brien P. Interventions for pain with intrauterine device insertion. Cochrane Database of Systematic Reviews 2009, Issue 3. Art. No.: CD007373. DOI: 10.1002/14651858.CD007373.pub2.
26. Edelman AB, Schaefer E, Olson A, Van Houten L, Bednarek P, Leclair C, et al. Effects of prophylactic misoprostol admin- istration prior to intrauterine device insertion in nullipa-rous women. Contraception 2011;84:234–9.
27. Heikinheimo O, Inki P, Kunz M, Parmhed S, Anttila AM, Olsson SE, et al. Double-blind, randomized, placebo-controlled study on the effect of misoprostol on ease of consecutive insertion of the levonorgestrel-releasing intra-uterine system. Contraception 2010;81:481–6.
28. Swenson C, Turok DK, Ward K, Jacobson JC, Dermish A. Self-administered misoprostol or placebo before intrauter-ine device insertion in nulliparous women: a randomized controlled trial. Obstet Gynecol 2012;120:341–7.
29. Centers for Disease Control and Prevention. Sexually trans-mitted disease surveillance 2010. Atlanta (GA): CDC; 2011. Available at: http://www.cdc.gov/std/stats10/surv2010.pdf. Retrieved June 29, 2012.
30. Workowski KA, Berman S. Sexually transmitted diseases treatment guidelines, 2010. Centers for Disease Control and Prevention (CDC) [published erratum appears in MMWR Morb Mortal Wkly Rep 2011;60:18]. MMWR Recomm Rep 2010(RR-12);59:1–110.
31. U S. Medical Eligibility Criteria for Contraceptive Use, 2010. Centers for Disease Control and Prevention (CDC). MMWR Recomm Rep 2010;59(RR-4):1–86.
References 1. Abma JC, Martinez GM, Copen CE. Teenagers in the
United States: sexual activity, contraceptive use, and child-bearing, National Survey of Family Growth 2006–2008. National Center for Health Statistics. Vital Health Stat 23 2010;(30):1–79.
2. Finer LB, Zolna MR. Unintended pregnancy in the United States: incidence and disparities, 2006. Contraception 2011;84:478–85.
3. Finer LB, Jerman J, Kavanaugh MC. Changes in use of long-acting contraceptive methods in the United States, 2007–2009. Fertil Steril 2012; DOI: 10.1016/j.fertnstert. 2012.06.027.
4. Mosher WD, Jones J. Use of contraception in the United States: 1982–2008. Vital Health Stat 23 2010;(29):1–44.
5. Zibners A, Cromer BA, Hayes J. Comparison of continua-tion rates for hormonal contraception among adolescents. J Pediatr Adolesc Gynecol 1999;12:90–4.
6. Raine TR, Foster-Rosales A, Upadhyay UD, Boyer CB, Brown BA, Sokoloff A, et al. One-year contraceptive con-tinuation and pregnancy in adolescent girls and women initiating hormonal contraceptives. Obstet Gynecol 2011; 117:363–71.
7. Peipert JF, Zhao Q, Allsworth JE, Petrosky E, Madden T, Eisenberg D, et al. Continuation and satisfaction of revers-ible contraception. Obstet Gynecol 2011;117:1105–13.
8. Winner B, Peipert JF, Zhao Q, Buckel C, Madden T, Allsworth JE, et al. Effectiveness of long-acting reversible contraception. N Engl J Med 2012;366:1998–2007.
9. Fleming KL, Sokoloff A, Raine TR. Attitudes and beliefs about the intrauterine device among teenagers and young women. Contraception 2010;82:178–82.
10. Spies EL, Askelson NM, Gelman E, Losch M. Young wom-en’s knowledge, attitudes, and behaviors related to long- acting reversible contraceptives. Womens Health Issues 2010;20:394–9.
11. Harper CC, Blum M, de Bocanegra HT, Darney PD, Speidel JJ, Policar M, et al. Challenges in translating evi-dence to practice: the provision of intrauterine contracep-tion. Obstet Gynecol 2008;111:1359–69.
12. Mestad R, Secura G, Allsworth JE, Madden T, Zhao Q, Peipert JF. Acceptance of long-acting reversible contracep-tive methods by adolescent participants in the Contraceptive CHOICE Project. Contraception 2011;84:493–8.
13. Espey E, Ogburn T. Long-acting reversible contraceptives: intrauterine devices and the contraceptive implant. Obstet Gynecol 2011;117:705–19.
14. Steinbock B. Coercion and long-term contraceptives. Hastings Cent Rep 1995;25:S19–22.
15. Farley TM, Rosenberg MJ, Rowe PJ, Chen JH, Meirik O. Intrauterine devices and pelvic inflammatory disease: an international perspective. Lancet 1992;339:785–8.
16. Grimes DA. Intrauterine device and upper-genital-tract infection. Lancet 2000;356:1013–9.
17. Mohllajee AP, Curtis KM, Peterson HB. Does insertion and use of an intrauterine device increase the risk of pel-vic inflammatory disease among women with sexually
988 Committee Opinion Long-Acting Reversible Contraception OBSTETRICS & GYNECOLOGY
acetate: effects on pain scores in patients with symptom-atic endometriosis--a pilot study. Contraception 2009;79: 29–34.
46. Beerthuizen R, van Beek A, Massai R, Makarainen L, Hout J, Bennink HC. Bone mineral density during long-term use of the progestagen contraceptive implant Implanon com-pared to a non-hormonal method of contraception. Hum Reprod 2000;15:118–22.
47. Bonny AE, Ziegler J, Harvey R, Debanne SM, Secic M, Cromer BA. Weight gain in obese and nonobese adolescent girls initiating depot medroxyprogesterone, oral contra-ceptive pills, or no hormonal contraceptive method. Arch Pediatr Adolesc Med 2006;160:40–5.
48. Schelar E, Franzetta K, Manlove J. Repeat teen childbearing: differences across states and by race and ethnicity. Child Trends Research Brief. Washington, DC: Child Trends; 2007. Available at: http://www.childtrends.org/Files/Child_Trends-2007_10_25_RB_Repeat.pdf. Retrieved June 22, 2012.
49. Chen BA, Reeves MF, Hayes JL, Hohmann HL, Perriera LK, Creinin MD. Postplacental or delayed insertion of the levonorgestrel intrauterine device after vaginal delivery: a randomized controlled trial. Obstet Gynecol 2010;116: 1079–87.
50. Tocce K, Sheeder J, Python J, Teal SB. Long acting reversible contraception in postpartum adolescents: early initiation of etonogestrel implant is superior to IUDs in the outpatient setting. J Pediatr Adolesc Gynecol 2012;25:59–63.
51. Pazol K, Zane SB, Parker WY, Hall LR, Berg C, Cook DA. Abortion surveillance--United States, 2008. Centers for Disease Control and Prevention (CDC). MMWR Surveill Summ 2011;60(SS-15):1–41.
52. Goodman S, Hendlish SK, Reeves MF, Foster-Rosales A. Impact of immediate postabortal insertion of intrauterine contraception on repeat abortion. Contraception 2008;78: 143–8.
53. Ortayli N, Bulut A, Sahin T, Sivin I. Immediate posta-bortal contraception with the levonorgestrel intrauterine device, Norplant, and traditional methods. Contraception 2001;63:309–14.
54. Kurunmaki H. Contraception with levonorgestrel-releasing subdermal capsules, Norplant, after pregnancy termina-tion. Contraception 1983;27:473–82.
32. Long-acting reversible contraception: implants and intra-uterine devices. Practice Bulletin No. 121. American College of Obstetricians and Gynecologists. Obstet Gynecol 2011;118:184–96.
33. Grimes DA, Lopez LM, Schulz KF. Antibiotic prophylaxis for intrauterine contraceptive device insertion. Cochrane Database of Systematic Reviews 1999, Issue 3. Art. No.: CD001327. DOI: 10.1002/14651858.CD001327.
34. Deans EI, Grimes DA. Intrauterine devices for adolescents: a systematic review. Contraception 2009;79:418–23.
35. Lyus R, Lohr P, Prager S. Use of the Mirena LNG-IUS and Paragard CuT380A intrauterine devices in nullipa-rous women. Board of the Society of Family Planning. Contraception 2010;81:367–71.
36. Thonneau P, Almont T, de La Rochebrochard E, Maria B. Risk factors for IUD failure: results of a large multicentre case-control study. Hum Reprod 2006;21:2612–6.
37. Darney P, Patel A, Rosen K, Shapiro LS, Kaunitz AM. Safety and efficacy of a single-rod etonogestrel implant (Implanon): results from 11 international clinical trials. Fertil Steril 2009;91:1646–53.
38. Mansour D, Korver T, Marintcheva-Petrova M, Fraser IS. The effects of Implanon on menstrual bleeding patterns. Eur J Contracept Reprod Health Care 2008;13(suppl 1): 13–28.
39. Mansour D, Bahamondes L, Critchley H, Darney P, Fraser IS. The management of unacceptable bleeding patterns in etonogestrel-releasing contraceptive implant users. Contra-ception 2011;83:202–10.
40. Phaliwong P, Taneepanichskul S. The effect of mefenamic acid on controlling irregular uterine bleeding second to Implanon use. J Med Assoc Thai 2004;87(suppl 3):S64–8.
41. Weisberg E, Hickey M, Palmer D, O’Connor V, Salamonsen LA, Findlay JK, et al. A pilot study to assess the effect of three short-term treatments on frequent and/or prolonged bleeding compared to placebo in women using Implanon. Hum Reprod 2006;21:295–302.
42. Weisberg E, Hickey M, Palmer D, O’Connor V, Salamonsen LA, Findlay JK, et al. A randomized controlled trial of treatment options for troublesome uterine bleeding in Implanon users. Hum Reprod 2009;24:1852–61.
43. Dilbaz B, Ozdegirmenci O, Caliskan E, Dilbaz S, Haberal A. Effect of etonogestrel implant on serum lipids, liver func-tion tests and hemoglobin levels. Contraception 2010;81: 510–4.
44. Shokeir T, Amr M, Abdelshaheed M. The efficacy of Implanon for the treatment of chronic pelvic pain associ-ated with pelvic congestion: 1-year randomized controlled pilot study. Arch Gynecol Obstet 2009;280:437–43.
45. Walch K, Unfried G, Huber J, Kurz C, van Trotsenburg M, Pernicka E, et al. Implanon versus medroxyprogesterone
Copyright October 2012 by the American College of Obstetricians and Gynecologists, 409 12th Street, SW, PO Box 96920, Washington, DC 20090-6920. All rights reserved.
Adolescents and long-acting reversible contraception: implants and intrauterine devices. Committee Opinion No. 539. American College of Obstetricians and Gynecologists. Obstet Gynecol 2012;120:983–8.
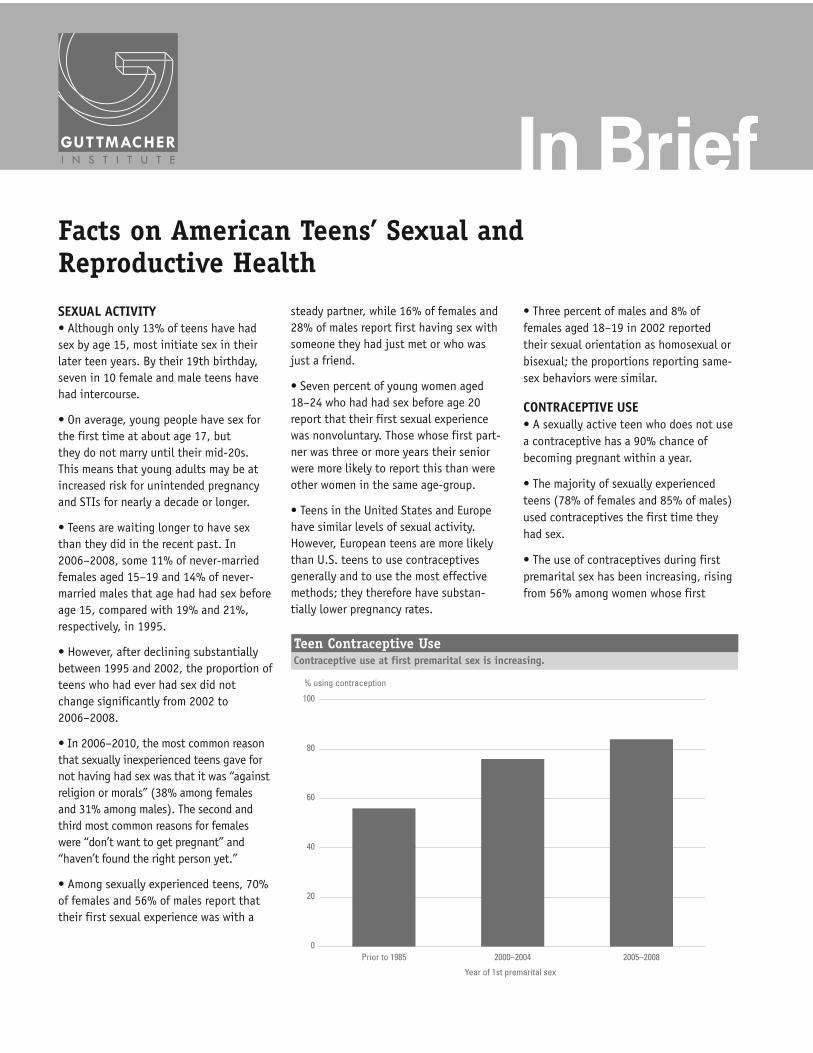
Facts on American Teens’ Sexual andReproductive Health
SEXUAL ACTIVITY• Although only 13% of teens have hadsex by age 15, most initiate sex in theirlater teen years. By their 19th birthday,seven in 10 female and male teens havehad intercourse.
• On average, young people have sex forthe first time at about age 17, butthey do not marry until their mid-20s.This means that young adults may be atincreased risk for unintended pregnancyand STIs for nearly a decade or longer.
• Teens are waiting longer to have sexthan they did in the recent past. In2006–2008, some 11% of never-marriedfemales aged 15–19 and 14% of never-married males that age had had sex beforeage 15, compared with 19% and 21%,respectively, in 1995.
• However, after declining substantiallybetween 1995 and 2002, the proportion ofteens who had ever had sex did notchange significantly from 2002 to2006–2008.
• In 2006–2010, the most common reasonthat sexually inexperienced teens gave fornot having had sex was that it was “againstreligion or morals” (38% among femalesand 31% among males). The second andthird most common reasons for femaleswere “don’t want to get pregnant” and“haven’t found the right person yet.”
• Among sexually experienced teens, 70%of females and 56% of males report thattheir first sexual experience was with a
steady partner, while 16% of females and28% of males report first having sex withsomeone they had just met or who wasjust a friend.
• Seven percent of young women aged18–24 who had had sex before age 20report that their first sexual experiencewas nonvoluntary. Those whose first part-ner was three or more years their seniorwere more likely to report this than wereother women in the same age-group.
• Teens in the United States and Europehave similar levels of sexual activity.However, European teens are more likelythan U.S. teens to use contraceptivesgenerally and to use the most effectivemethods; they therefore have substan-tially lower pregnancy rates.
• Three percent of males and 8% offemales aged 18–19 in 2002 reportedtheir sexual orientation as homosexual orbisexual; the proportions reporting same-sex behaviors were similar.
CONTRACEPTIVE USE• A sexually active teen who does not usea contraceptive has a 90% chance ofbecoming pregnant within a year.
• The majority of sexually experiencedteens (78% of females and 85% of males)used contraceptives the first time theyhad sex.
• The use of contraceptives during firstpremarital sex has been increasing, risingfrom 56% among women whose first
In Brief
Contraceptive use at first premarital sex is increasing.Teen Contraceptive Use
0
20
40
60
80
100
2005–20082000–2004Prior to 1985
Year of 1st premarital sex
% using contraception
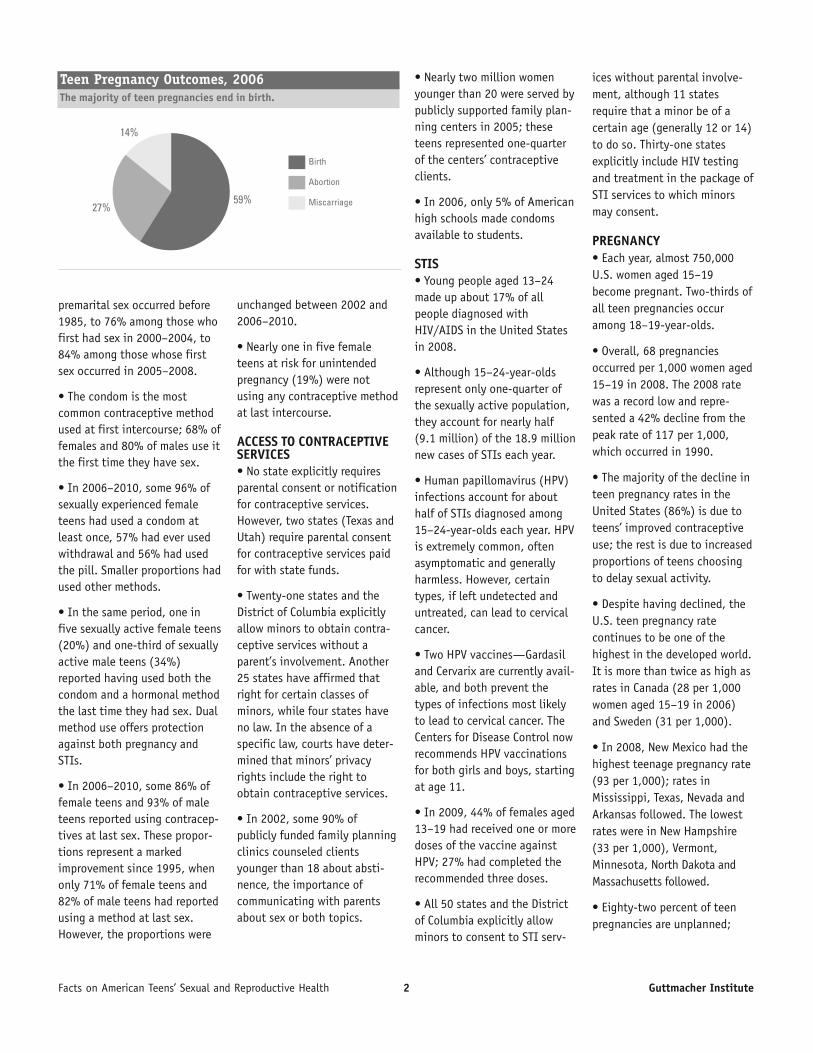
Facts on American Teens’ Sexual and Reproductive Health 2 Guttmacher Institute
premarital sex occurred before1985, to 76% among those whofirst had sex in 2000–2004, to84% among those whose firstsex occurred in 2005–2008.
• The condom is the mostcommon contraceptive methodused at first intercourse; 68% offemales and 80% of males use itthe first time they have sex.
• In 2006–2010, some 96% ofsexually experienced femaleteens had used a condom atleast once, 57% had ever usedwithdrawal and 56% had usedthe pill. Smaller proportions hadused other methods.
• In the same period, one infive sexually active female teens(20%) and one-third of sexuallyactive male teens (34%)reported having used both thecondom and a hormonal methodthe last time they had sex. Dualmethod use offers protectionagainst both pregnancy andSTIs.
• In 2006–2010, some 86% offemale teens and 93% of maleteens reported using contracep-tives at last sex. These propor-tions represent a markedimprovement since 1995, whenonly 71% of female teens and82% of male teens had reportedusing a method at last sex.However, the proportions were
unchanged between 2002 and2006–2010.
• Nearly one in five femaleteens at risk for unintendedpregnancy (19%) were notusing any contraceptive methodat last intercourse.
ACCESS TO CONTRACEPTIVESERVICES• No state explicitly requiresparental consent or notificationfor contraceptive services.However, two states (Texas andUtah) require parental consentfor contraceptive services paidfor with state funds.
• Twenty-one states and theDistrict of Columbia explicitlyallow minors to obtain contra-ceptive services without aparent’s involvement. Another25 states have affirmed thatright for certain classes ofminors, while four states haveno law. In the absence of aspecific law, courts have deter-mined that minors’ privacyrights include the right toobtain contraceptive services.
• In 2002, some 90% ofpublicly funded family planningclinics counseled clientsyounger than 18 about absti-nence, the importance ofcommunicating with parentsabout sex or both topics.
• Nearly two million womenyounger than 20 were served bypublicly supported family plan-ning centers in 2005; theseteens represented one-quarterof the centers’ contraceptiveclients.
• In 2006, only 5% of Americanhigh schools made condomsavailable to students.
STIS• Young people aged 13–24made up about 17% of allpeople diagnosed withHIV/AIDS in the United Statesin 2008.
• Although 15–24-year-oldsrepresent only one-quarter ofthe sexually active population,they account for nearly half(9.1 million) of the 18.9 millionnew cases of STIs each year.
• Human papillomavirus (HPV)infections account for abouthalf of STIs diagnosed among15–24-year-olds each year. HPVis extremely common, oftenasymptomatic and generallyharmless. However, certaintypes, if left undetected anduntreated, can lead to cervicalcancer.
• Two HPV vaccines—Gardasiland Cervarix are currently avail-able, and both prevent thetypes of infections most likelyto lead to cervical cancer. TheCenters for Disease Control nowrecommends HPV vaccinationsfor both girls and boys, startingat age 11.
• In 2009, 44% of females aged13–19 had received one or moredoses of the vaccine againstHPV; 27% had completed therecommended three doses.
• All 50 states and the Districtof Columbia explicitly allowminors to consent to STI serv-
ices without parental involve-ment, although 11 statesrequire that a minor be of acertain age (generally 12 or 14)to do so. Thirty-one statesexplicitly include HIV testingand treatment in the package ofSTI services to which minorsmay consent.
PREGNANCY• Each year, almost 750,000U.S. women aged 15–19become pregnant. Two-thirds ofall teen pregnancies occuramong 18–19-year-olds.
• Overall, 68 pregnanciesoccurred per 1,000 women aged15–19 in 2008. The 2008 ratewas a record low and repre-sented a 42% decline from thepeak rate of 117 per 1,000,which occurred in 1990.
• The majority of the decline inteen pregnancy rates in theUnited States (86%) is due toteens’ improved contraceptiveuse; the rest is due to increasedproportions of teens choosingto delay sexual activity.
• Despite having declined, theU.S. teen pregnancy ratecontinues to be one of thehighest in the developed world.It is more than twice as high asrates in Canada (28 per 1,000women aged 15–19 in 2006)and Sweden (31 per 1,000).
• In 2008, New Mexico had thehighest teenage pregnancy rate(93 per 1,000); rates inMississippi, Texas, Nevada andArkansas followed. The lowestrates were in New Hampshire(33 per 1,000), Vermont,Minnesota, North Dakota andMassachusetts followed.
• Eighty-two percent of teenpregnancies are unplanned;
The majority of teen pregnancies end in birth.
Teen Pregnancy Outcomes, 2006
Birth
Abortion
Miscarriage59%27%
14%
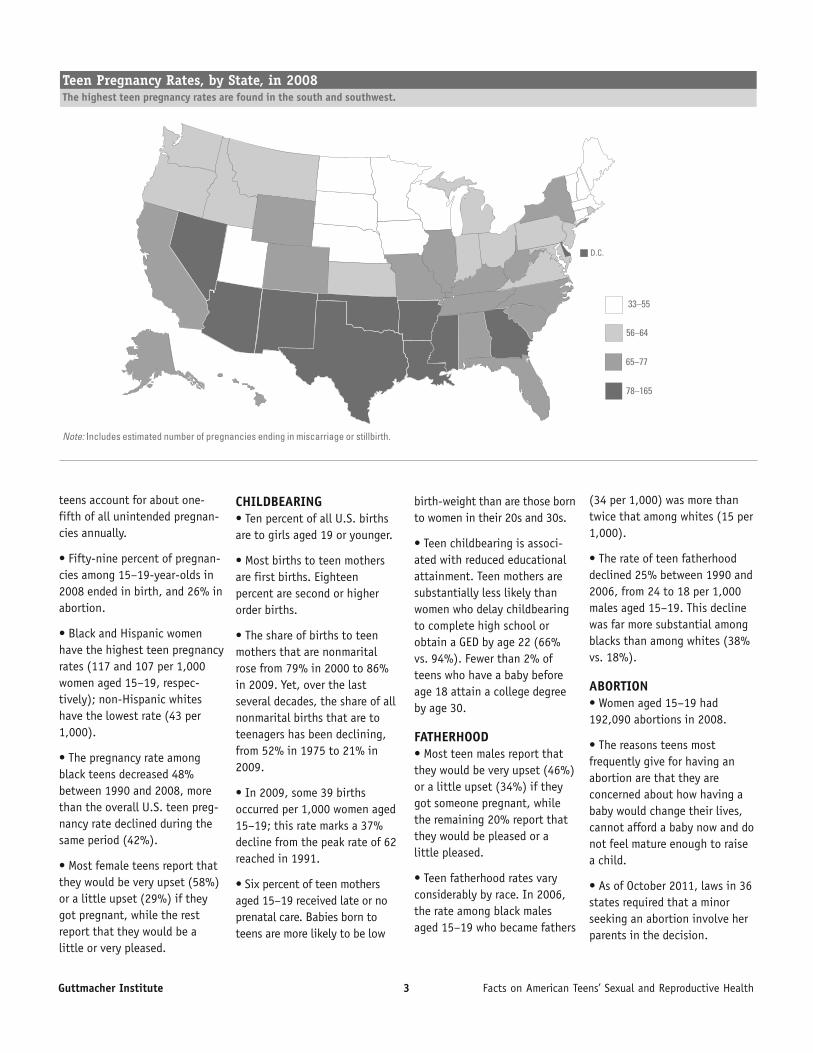
Guttmacher Institute 3 Facts on American Teens’ Sexual and Reproductive Health
teens account for about one-fifth of all unintended pregnan-cies annually.
• Fifty-nine percent of pregnan-cies among 15–19-year-olds in2008 ended in birth, and 26% inabortion.
• Black and Hispanic womenhave the highest teen pregnancyrates (117 and 107 per 1,000women aged 15–19, respec-tively); non-Hispanic whiteshave the lowest rate (43 per1,000).
• The pregnancy rate amongblack teens decreased 48%between 1990 and 2008, morethan the overall U.S. teen preg-nancy rate declined during thesame period (42%).
• Most female teens report thatthey would be very upset (58%)or a little upset (29%) if theygot pregnant, while the restreport that they would be alittle or very pleased.
CHILDBEARING• Ten percent of all U.S. birthsare to girls aged 19 or younger.
• Most births to teen mothersare first births. Eighteenpercent are second or higherorder births.
• The share of births to teenmothers that are nonmaritalrose from 79% in 2000 to 86%in 2009. Yet, over the lastseveral decades, the share of allnonmarital births that are toteenagers has been declining,from 52% in 1975 to 21% in2009.
• In 2009, some 39 birthsoccurred per 1,000 women aged15–19; this rate marks a 37%decline from the peak rate of 62reached in 1991.
• Six percent of teen mothersaged 15–19 received late or noprenatal care. Babies born toteens are more likely to be low
birth-weight than are those bornto women in their 20s and 30s.
• Teen childbearing is associ-ated with reduced educationalattainment. Teen mothers aresubstantially less likely thanwomen who delay childbearingto complete high school orobtain a GED by age 22 (66%vs. 94%). Fewer than 2% ofteens who have a baby beforeage 18 attain a college degreeby age 30.
FATHERHOOD• Most teen males report thatthey would be very upset (46%)or a little upset (34%) if theygot someone pregnant, whilethe remaining 20% report thatthey would be pleased or alittle pleased.
• Teen fatherhood rates varyconsiderably by race. In 2006,the rate among black malesaged 15–19 who became fathers
(34 per 1,000) was more thantwice that among whites (15 per1,000).
• The rate of teen fatherhooddeclined 25% between 1990 and2006, from 24 to 18 per 1,000males aged 15–19. This declinewas far more substantial amongblacks than among whites (38%vs. 18%).
ABORTION• Women aged 15–19 had192,090 abortions in 2008.
• The reasons teens mostfrequently give for having anabortion are that they areconcerned about how having ababy would change their lives,cannot afford a baby now and donot feel mature enough to raisea child.
• As of October 2011, laws in 36states required that a minorseeking an abortion involve herparents in the decision.
The highest teen pregnancy rates are found in the south and southwest.Teen Pregnancy Rates, by State, in 2008
Note: Includes estimated number of pregnancies ending in miscarriage or stillbirth.
33–55
65–77
78–165
56–64
D.C.

Most data in this fact sheet arefrom research conducted by theGuttmacher Institute orpublished in its peer-reviewedjournals. An additional source isthe Centers for Disease Controland Prevention. References areavailable in the HTML version of this factsheet athttp://www.guttmacher.org/pubs/FB-ATSRH.html
February 2013
Advancing sexual and reproductive health worldwidethrough research, policy analysis and public education
New York125 Maiden Lane New York, NY 10038Tel: 212.248.1111Fax: [email protected]
Washington D.C.1301 Connecticut Ave., N.W., Suite 700Washington, DC 20036 Tel: 202.296.4012, Fax: [email protected]
www.guttmacher.org
FRIDAY, MAY 17, 2013
3:20
Influenza in 2013: Continuing Evolution & Challenges
Dr. Andrew Pavia
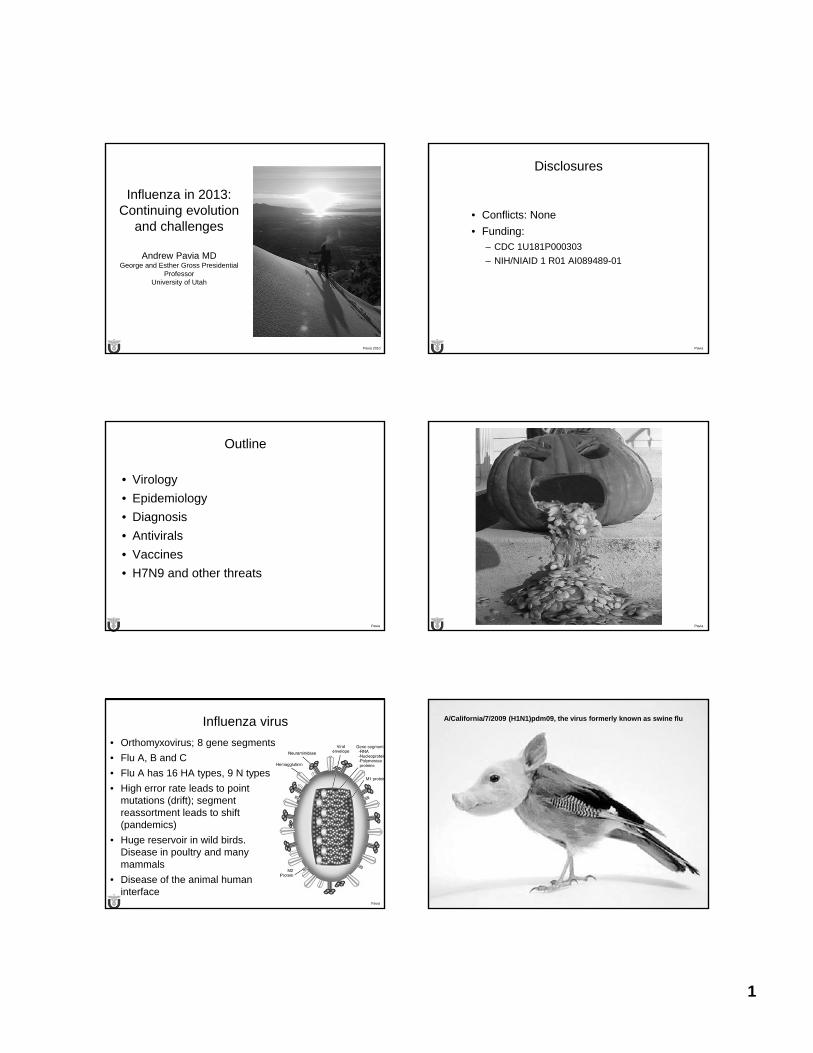
1
Pavia 2010
Influenza in 2013:Continuing evolution
and challenges
Andrew Pavia MDGeorge and Esther Gross Presidential
ProfessorUniversity of Utah
Pavia
Disclosures
• Conflicts: None
• Funding:– CDC 1U181P000303
– NIH/NIAID 1 R01 AI089489-01
Pavia
Outline
• Virology
• Epidemiology
• Diagnosis
• Antivirals
• Vaccines
• H7N9 and other threats
Pavia
Pavia
Influenza virus
• Orthomyxovirus; 8 gene segments
• Flu A, B and C
• Flu A has 16 HA types, 9 N types
• High error rate leads to point mutations (drift); segment reassortment leads to shift (pandemics)
• Huge reservoir in wild birds. Disease in poultry and many mammals
• Disease of the animal human interface
Pavia
A/California/7/2009 (H1N1)pdm09, the virus formerly known as swine flu
2
Pavia Pavia
Key Epidemiologic Factors
• Incubation 1-4 days
• People with influenza shed virus before developing symptoms
• Up to 50% of people with influenza are asymptomatic
• Serologic studies suggest up to 25% of HCWs contract flu in a season
Pavia 9
Influenza-Associated Hospitalizations Among Healthy and High-Risk Persons
0
20
40
60
80
100
120
140
160
180
200
<6 mos 6-23 mos 2-5 yrs 5-17 yrs 18-49 50-64 65+
Ra
te P
er
10
,00
0 P
ers
on
s
Healthy High risk
Glezen WP. Am Rev Respir Dis. 1987;136:550-555.
Hospitalizations for Acute Respiratory Disease in Houston 1978 – 1981 Influenza Epidemics
Pavia 10
Annual Hospitalization Rate for Virologically Confirmed Seasonal Influenza in Children
0
50
100
150
200
250
300
<6 m 6-12 m 1 yr 2 yr 3yr 4 yr 5 yr 6 yr 7 - 15 yrs
Hos
pita
lizat
ions
/100
,000
py
Age Group
Ampofo K. Pediatrics. 2006;118:2409-2417.
Salt Lake County, Utah2001-2004
Pavia Pavia
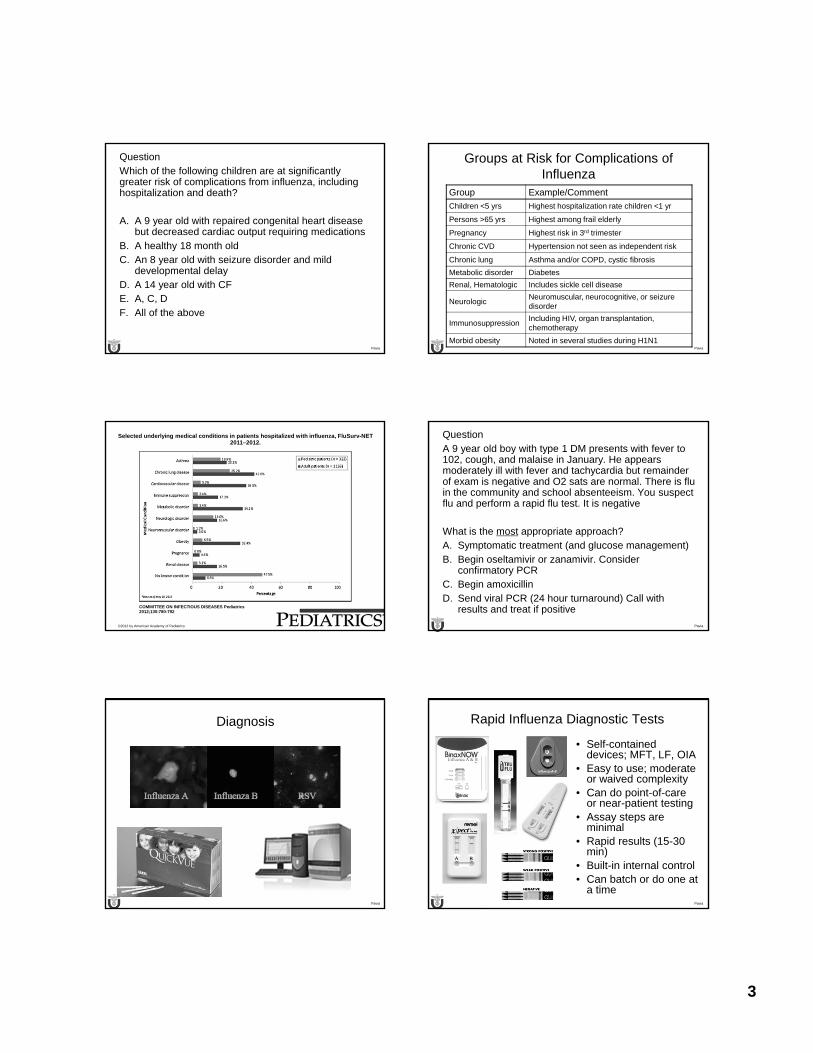
3
Pavia
QuestionWhich of the following children are at significantly greater risk of complications from influenza, including hospitalization and death?
A. A 9 year old with repaired congenital heart disease but decreased cardiac output requiring medications
B. A healthy 18 month oldC. An 8 year old with seizure disorder and mild
developmental delayD. A 14 year old with CFE. A, C, DF. All of the above
Pavia
Groups at Risk for Complications of Influenza
Group Example/Comment
Children <5 yrs Highest hospitalization rate children <1 yr
Persons >65 yrs Highest among frail elderly
Pregnancy Highest risk in 3rd trimester
Chronic CVD Hypertension not seen as independent risk
Chronic lung Asthma and/or COPD, cystic fibrosis
Metabolic disorder Diabetes
Renal, Hematologic Includes sickle cell disease
NeurologicNeuromuscular, neurocognitive, or seizure disorder
ImmunosuppressionIncluding HIV, organ transplantation, chemotherapy
Morbid obesity Noted in several studies during H1N1
Selected underlying medical conditions in patients hospitalized with influenza, FluSurv-NET 2011–2012.
COMMITTEE ON INFECTIOUS DISEASES Pediatrics 2012;130:780-792
©2012 by American Academy of Pediatrics Pavia
QuestionA 9 year old boy with type 1 DM presents with fever to 102, cough, and malaise in January. He appears moderately ill with fever and tachycardia but remainder of exam is negative and O2 sats are normal. There is flu in the community and school absenteeism. You suspect flu and perform a rapid flu test. It is negative
What is the most appropriate approach?A. Symptomatic treatment (and glucose management)B. Begin oseltamivir or zanamivir. Consider
confirmatory PCRC. Begin amoxicillin D. Send viral PCR (24 hour turnaround) Call with
results and treat if positive
Pavia
Diagnosis
Pavia
Rapid Influenza Diagnostic Tests
• Self-contained devices; MFT, LF, OIA
• Easy to use; moderate or waived complexity
• Can do point-of-care or near-patient testing
• Assay steps are minimal
• Rapid results (15-30 min)
• Built-in internal control• Can batch or do one at
a time
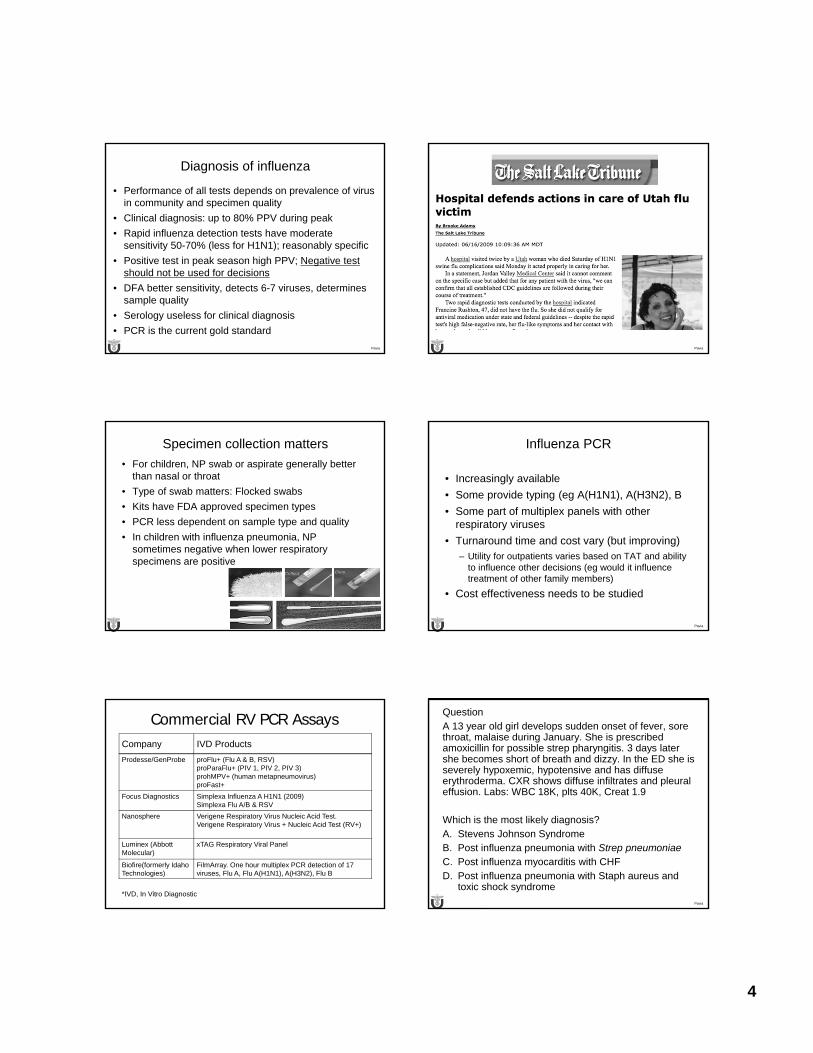
4
Pavia
Diagnosis of influenza
• Performance of all tests depends on prevalence of virus in community and specimen quality
• Clinical diagnosis: up to 80% PPV during peak
• Rapid influenza detection tests have moderate sensitivity 50-70% (less for H1N1); reasonably specific
• Positive test in peak season high PPV; Negative test should not be used for decisions
• DFA better sensitivity, detects 6-7 viruses, determines sample quality
• Serology useless for clinical diagnosis
• PCR is the current gold standard
Pavia
Pavia
Specimen collection matters
• For children, NP swab or aspirate generally better than nasal or throat
• Type of swab matters: Flocked swabs
• Kits have FDA approved specimen types
• PCR less dependent on sample type and quality
• In children with influenza pneumonia, NP sometimes negative when lower respiratory specimens are positive
Pavia
Influenza PCR
• Increasingly available
• Some provide typing (eg A(H1N1), A(H3N2), B
• Some part of multiplex panels with other respiratory viruses
• Turnaround time and cost vary (but improving)– Utility for outpatients varies based on TAT and ability
to influence other decisions (eg would it influence treatment of other family members)
• Cost effectiveness needs to be studied
Commercial RV PCR Assays Company IVD Products
Prodesse/GenProbe proFlu+ (Flu A & B, RSV)proParaFlu+ (PIV 1, PIV 2, PIV 3)prohMPV+ (human metapneumovirus)proFast+
Focus Diagnostics Simplexa Influenza A H1N1 (2009)Simplexa Flu A/B & RSV
Nanosphere Verigene Respiratory Virus Nucleic Acid Test.Verigene Respiratory Virus + Nucleic Acid Test (RV+)
Luminex (Abbott Molecular)
xTAG Respiratory Viral Panel
Biofire(formerly Idaho Technologies)
FilmArray. One hour multiplex PCR detection of 17 viruses, Flu A, Flu A(H1N1), A(H3N2), Flu B
*IVD, In Vitro DiagnosticPavia
QuestionA 13 year old girl develops sudden onset of fever, sore throat, malaise during January. She is prescribed amoxicillin for possible strep pharyngitis. 3 days later she becomes short of breath and dizzy. In the ED she is severely hypoxemic, hypotensive and has diffuse erythroderma. CXR shows diffuse infiltrates and pleural effusion. Labs: WBC 18K, plts 40K, Creat 1.9
Which is the most likely diagnosis?A. Stevens Johnson SyndromeB. Post influenza pneumonia with Strep pneumoniaeC. Post influenza myocarditis with CHFD. Post influenza pneumonia with Staph aureus and
toxic shock syndrome
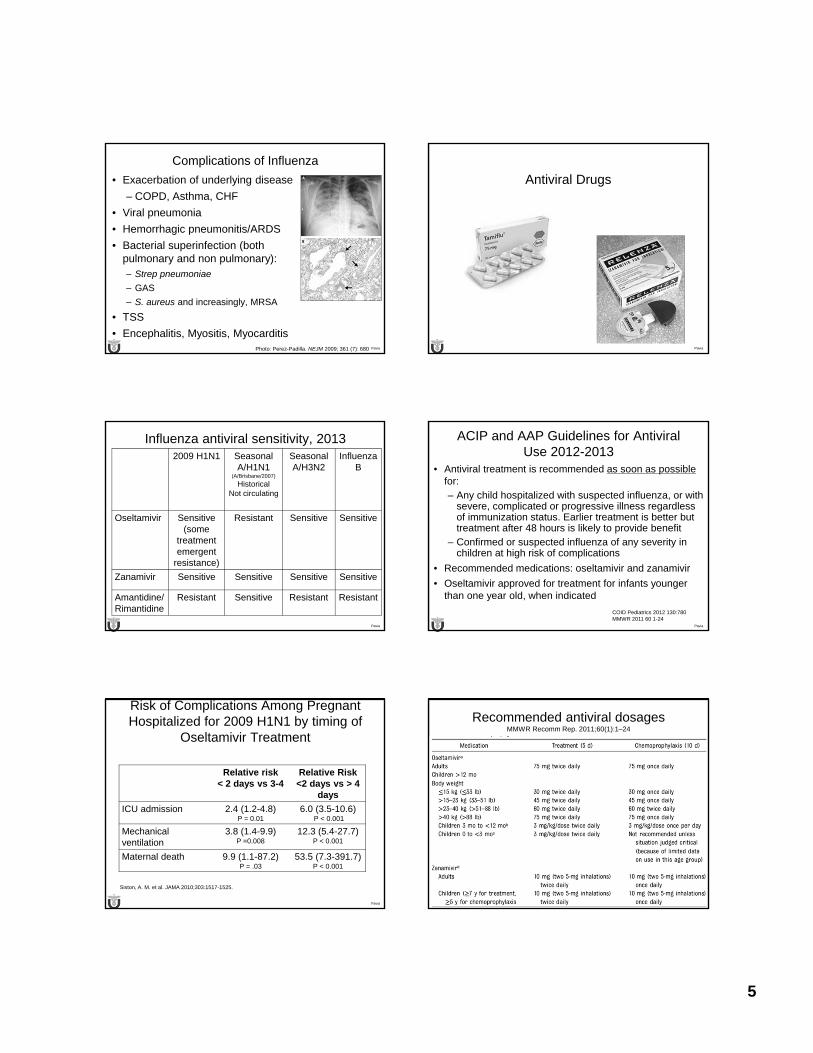
5
Pavia
Complications of Influenza
• Exacerbation of underlying disease
– COPD, Asthma, CHF
• Viral pneumonia
• Hemorrhagic pneumonitis/ARDS
• Bacterial superinfection (both pulmonary and non pulmonary): – Strep pneumoniae
– GAS
– S. aureus and increasingly, MRSA
• TSS
• Encephalitis, Myositis, MyocarditisPhoto: Perez-Padilla. NEJM 2009; 361 (7): 680 Pavia
Antiviral Drugs
Pavia
Influenza antiviral sensitivity, 20132009 H1N1 Seasonal
A/H1N1 (A/Brisbane/2007)
Historical Not circulating
Seasonal A/H3N2
Influenza B
Oseltamivir Sensitive (some
treatment emergent
resistance)
Resistant Sensitive Sensitive
Zanamivir Sensitive Sensitive Sensitive Sensitive
Amantidine/Rimantidine
Resistant Sensitive Resistant Resistant
Pavia
ACIP and AAP Guidelines for Antiviral Use 2012-2013
• Antiviral treatment is recommended as soon as possible for: – Any child hospitalized with suspected influenza, or with
severe, complicated or progressive illness regardless of immunization status. Earlier treatment is better but treatment after 48 hours is likely to provide benefit
– Confirmed or suspected influenza of any severity in children at high risk of complications
• Recommended medications: oseltamivir and zanamivir
• Oseltamivir approved for treatment for infants younger than one year old, when indicated
COID Pediatrics 2012 130:780MMWR 2011 60 1-24
Pavia
Risk of Complications Among Pregnant Hospitalized for 2009 H1N1 by timing of
Oseltamivir Treatment
Relative risk < 2 days vs 3-4
Relative Risk<2 days vs > 4
days
ICU admission 2.4 (1.2-4.8)P = 0.01
6.0 (3.5-10.6)P < 0.001
Mechanical ventilation
3.8 (1.4-9.9)P =0.008
12.3 (5.4-27.7)P < 0.001
Maternal death 9.9 (1.1-87.2)P = .03
53.5 (7.3-391.7)P < 0.001
Siston, A. M. et al. JAMA 2010;303:1517-1525.
Pavia
Recommended antiviral dosagesMMWR Recomm Rep. 2011;60(1):1–24
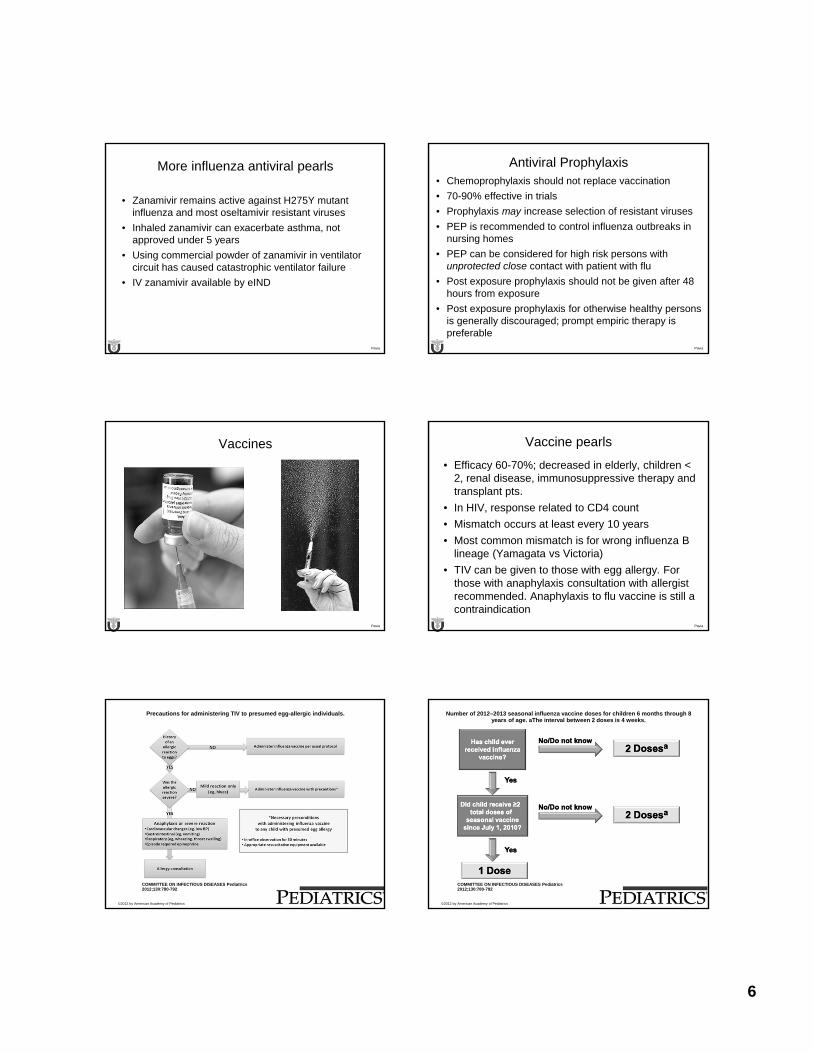
6
Pavia
More influenza antiviral pearls
• Zanamivir remains active against H275Y mutant influenza and most oseltamivir resistant viruses
• Inhaled zanamivir can exacerbate asthma, not approved under 5 years
• Using commercial powder of zanamivir in ventilator circuit has caused catastrophic ventilator failure
• IV zanamivir available by eIND
Pavia
Antiviral Prophylaxis• Chemoprophylaxis should not replace vaccination
• 70-90% effective in trials
• Prophylaxis may increase selection of resistant viruses
• PEP is recommended to control influenza outbreaks in nursing homes
• PEP can be considered for high risk persons with unprotected close contact with patient with flu
• Post exposure prophylaxis should not be given after 48 hours from exposure
• Post exposure prophylaxis for otherwise healthy persons is generally discouraged; prompt empiric therapy is preferable
Pavia
Vaccines
Pavia
Vaccine pearls
• Efficacy 60-70%; decreased in elderly, children < 2, renal disease, immunosuppressive therapy and transplant pts.
• In HIV, response related to CD4 count
• Mismatch occurs at least every 10 years
• Most common mismatch is for wrong influenza B lineage (Yamagata vs Victoria)
• TIV can be given to those with egg allergy. For those with anaphylaxis consultation with allergist recommended. Anaphylaxis to flu vaccine is still a contraindication
Precautions for administering TIV to presumed egg-allergic individuals.
COMMITTEE ON INFECTIOUS DISEASES Pediatrics 2012;130:780-792
©2012 by American Academy of Pediatrics
Number of 2012–2013 seasonal influenza vaccine doses for children 6 months through 8 years of age. aThe interval between 2 doses is 4 weeks.
COMMITTEE ON INFECTIOUS DISEASES Pediatrics 2012;130:780-792
©2012 by American Academy of Pediatrics
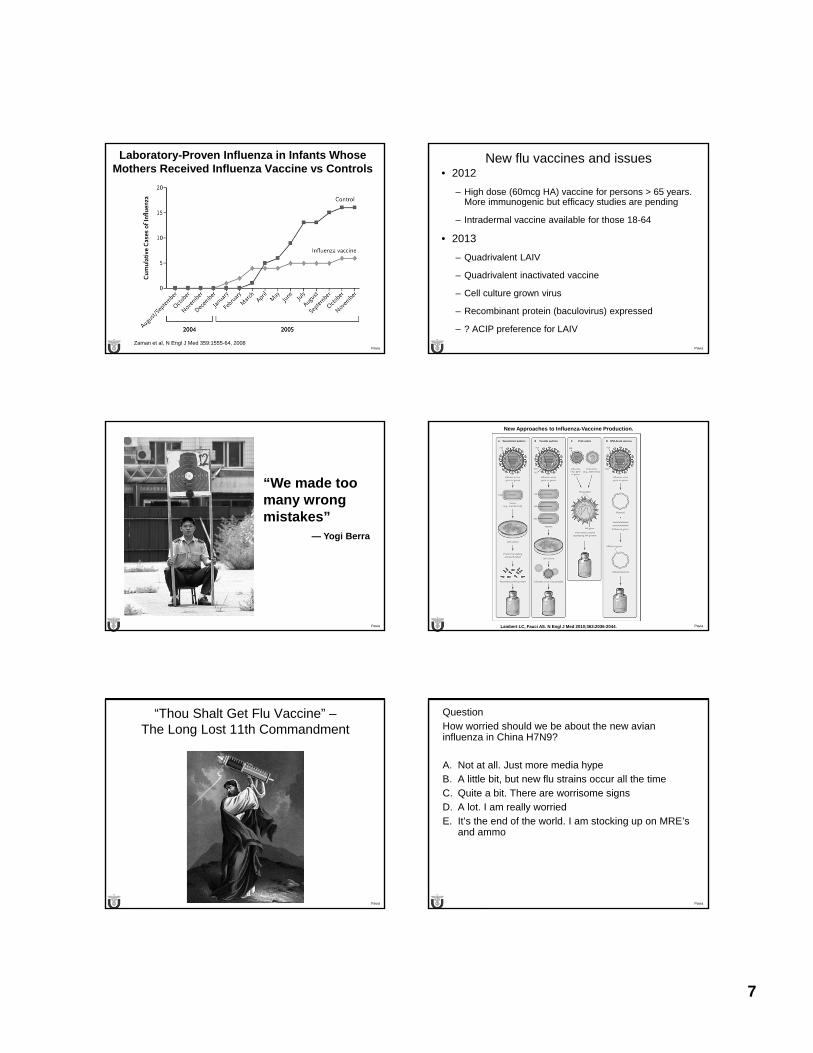
7
Pavia
Laboratory-Proven Influenza in Infants WhoseMothers Received Influenza Vaccine vs Controls
Zaman et al, N Engl J Med 359:1555-64, 2008Pavia
New flu vaccines and issues• 2012
– High dose (60mcg HA) vaccine for persons > 65 years. More immunogenic but efficacy studies are pending
– Intradermal vaccine available for those 18-64
• 2013
– Quadrivalent LAIV
– Quadrivalent inactivated vaccine
– Cell culture grown virus
– Recombinant protein (baculovirus) expressed
– ? ACIP preference for LAIV
Pavia
“We made too many wrongmistakes”
— Yogi Berra
Pavia
New Approaches to Influenza-Vaccine Production.
Lambert LC, Fauci AS. N Engl J Med 2010;363:2036-2044.
Pavia
“Thou Shalt Get Flu Vaccine” –The Long Lost 11th Commandment
Pavia
QuestionHow worried should we be about the new avian influenza in China H7N9?
A. Not at all. Just more media hypeB. A little bit, but new flu strains occur all the timeC. Quite a bit. There are worrisome signsD. A lot. I am really worriedE. It’s the end of the world. I am stocking up on MRE’s
and ammo
8
Influenza A(H7N9)
Pavia
Confirmed influenza A(H7N9) infection (n=126) by date of onset and province China, 19 February - 29 April, 2013
MMWR May 1, 2013 (early release)
Pavia
Geographic Distribution of 82 Confirmed and 2 Suspected Cases of H7N9 Virus Infection in China, as of April 17, 2013.
Li Q et al. N Engl J Med 2013. DOI: 10.1056/NEJMoa1304617
Pavia
Location of confirmed human influenza A(H7N9) infections, China, 19 February – 29 April, 2013
MMWR May 1, 2013 (early release) Pavia
Hypothetical Host and Lineage Origins of the Gene Segments of the Novel Reassortant Human Influenza A (H7N9) Viruses.
Gao R et al. N Engl J Med 2013. DOI: 10.1056/NEJMoa1304459
9
Pavia Liu Lancet May 1, 2013
H7 N9
Pavia
H7N9: The bad news
• Current mortality ~ 18%
• >220 cases in 8 weeks with wide dispersion
• No disease in affected birds
• Virus has features of human adaptation
– Mutation in HA conferring binding to alpha 2-6 SA receptors ( G186V, Q226L,T160K)
– Mutations in PB2 polymerase associated with efficient replication in mammal
– Encodes full length PB1-F2 protein associated with high virulence in 1918 H1N1 and H5N1
– NA stalk deletion associated with virulence in mammals
Pavia
Shinya et al Nature 2006;440:435
2-6 SA receptors abundant in the upper airway of humans, but 2-3 receptors are found in alveoli
Pavia
Summary
• Influenza causes severe disease in young kids, pregnant women and those with underlying medical conditions
• RIDT’s continue to be prone to false negatives
• Empiric treatment for those hospitalized and at high risk of complications
• Vaccines are not completely effective but are not being used optimally. Newer vaccines are needed
• Flu will continue to surprise us. H7N9 is just the latest example.
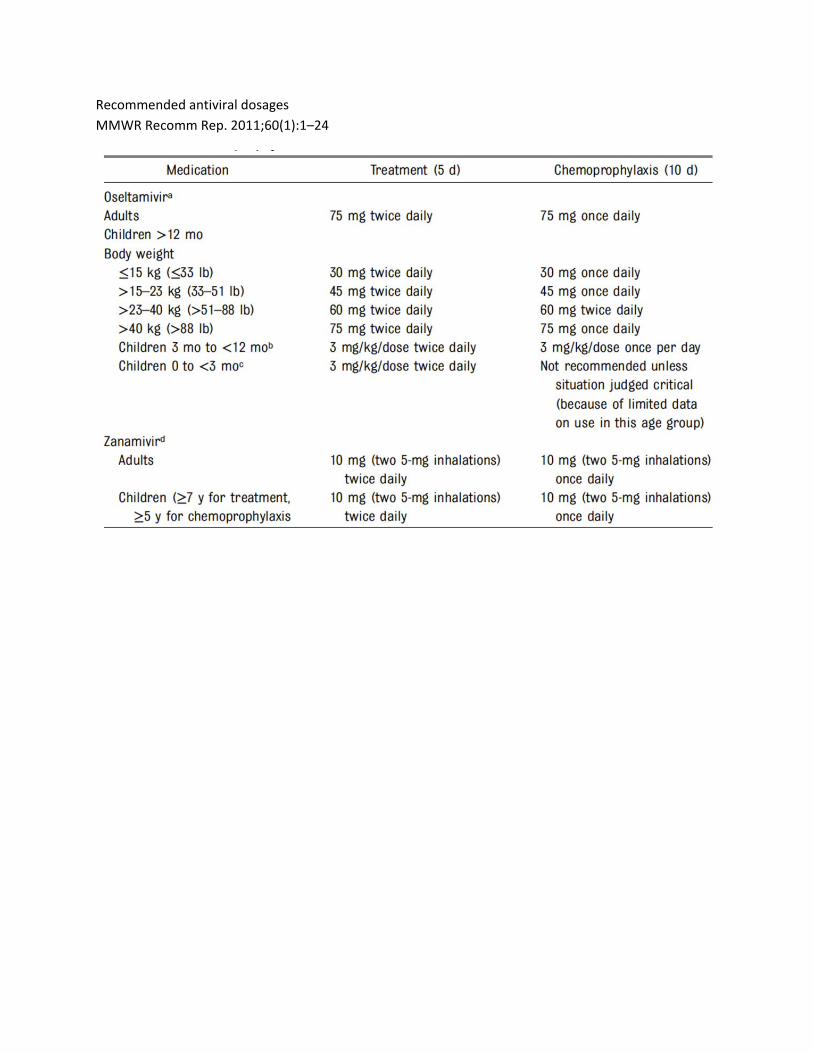
Recommended antiviral dosages
MMWR Recomm Rep. 2011;60(1):1–24
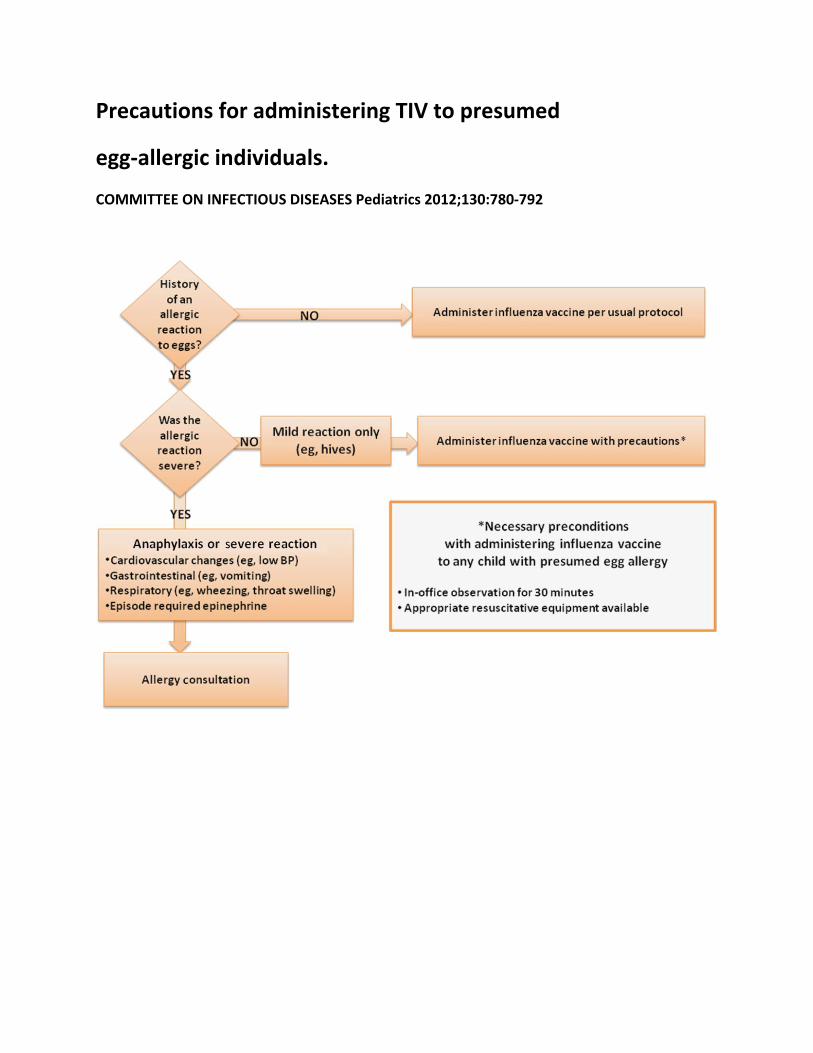
Precautions for administering TIV to presumed
egg‐allergic individuals.
COMMITTEE ON INFECTIOUS DISEASES Pediatrics 2012;130:780‐792
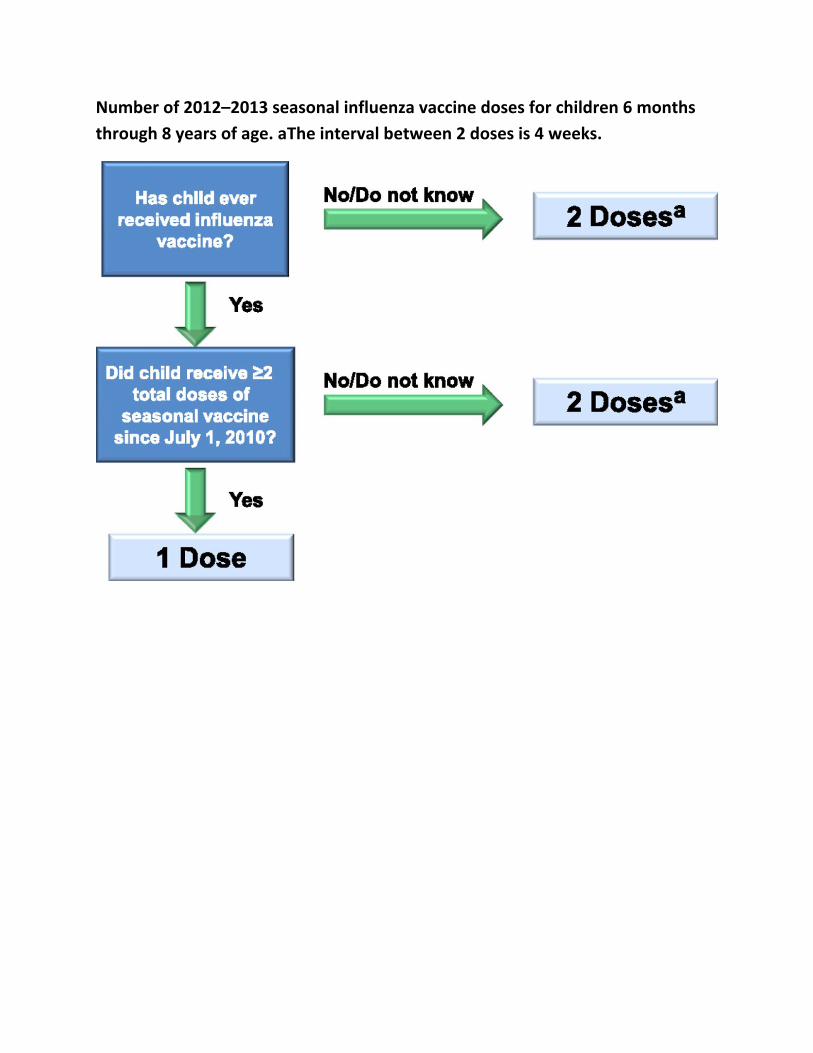
Number of 2012–2013 seasonal influenza vaccine doses for children 6 months
through 8 years of age. aThe interval between 2 doses is 4 weeks.
FRIDAY, MAY 17, 2013
CARING FOR CHILDREN WITH CHRONIC CONDITIONS
Moderator: Dr. Martha Taylor

FRIDAY, MAY 17, 2013
4:25
P Pediatric Foie Gras: Non‐Alcoholic Fatty Liver Disease
Dr. Patrika Tsai
4/18/2013
1
PEDIATRIC FOIE GRAS: NON-ALCOHOLIC FATTY LIVER DISEASE
Patrika Montricul Tsai, MD, MPH
Pediatric Gastroenterology, Hepatology, and Nutrition
University of California, San Francisco
May 17, 2013
Updates on…
• New insights into NAFLD and NASH pathophysiology
• New AASLD/AGA/ACG guidelines for NAFLD and NASH, as pertains to pediatrics
• Evidence-based recommendations for NASH treatment in children
Disclosures
• I have nothing to disclose
Is NAFLD really a problem in kids?
• Most common pediatric chronic liver disease in North America
• 2-9% of all U.S. adolescents• 20% of U.S. obese adolescents• Rates in younger children unknown
Definitions:• NAFLD:
• Hepatic steatosis, by imaging or histology
• DIAGNOSIS OF EXCLUSION: No other causes for secondary hepatic steatosis
• Includes entire disease spectrum:
• NAFL:
• hepatic steatosis
• WITHOUT hepatocellular injury
• WITHOUT fibrosis
• NASH:
• hepatic steatosis
• + inflammation/ballooning
• +/- fibrosis
• Can progress to cirrhosis, ESLD
NAFLD/NASH Progression
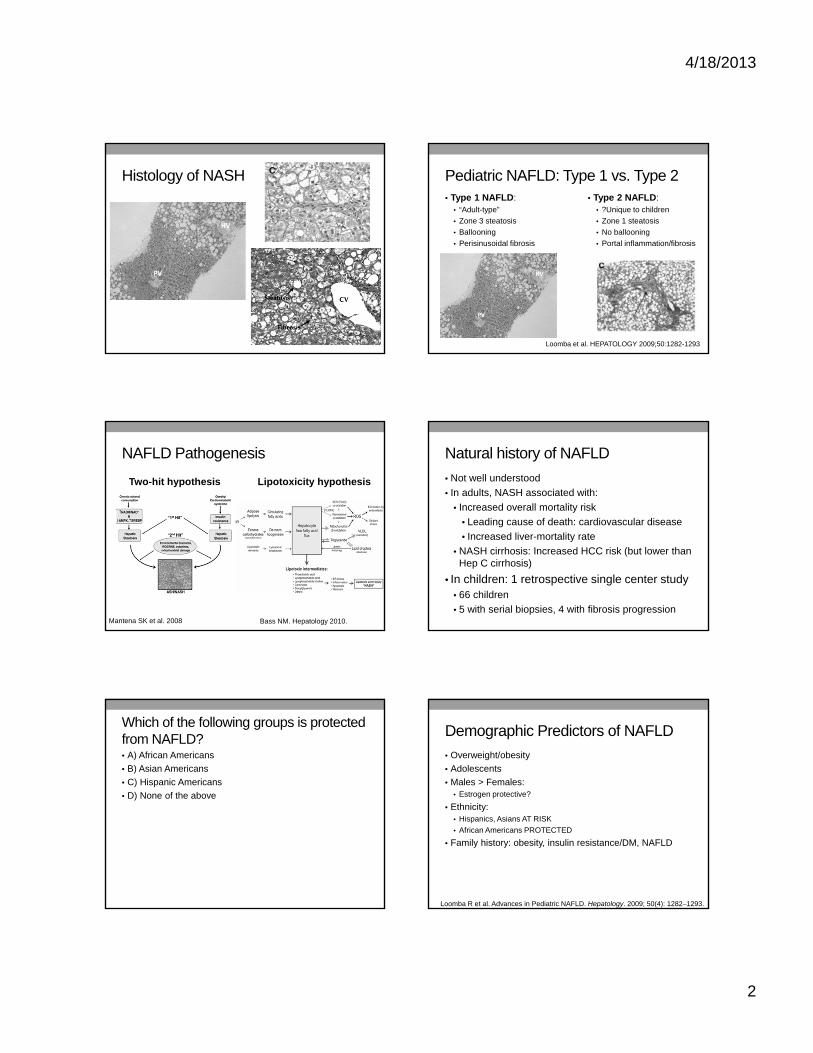
4/18/2013
2
Histology of NASH Pediatric NAFLD: Type 1 vs. Type 2• Type 1 NAFLD:
• “Adult-type”
• Zone 3 steatosis
• Ballooning
• Perisinusoidal fibrosis
• Type 2 NAFLD:• ?Unique to children
• Zone 1 steatosis
• No ballooning
• Portal inflammation/fibrosis
Loomba et al. HEPATOLOGY 2009;50:1282-1293
NAFLD Pathogenesis
Mantena SK et al. 2008 Bass NM. Hepatology 2010.
Two-hit hypothesis Lipotoxicity hypothesis
Natural history of NAFLD
• Not well understood
• In adults, NASH associated with:
• Increased overall mortality risk
• Leading cause of death: cardiovascular disease
• Increased liver-mortality rate
• NASH cirrhosis: Increased HCC risk (but lower than Hep C cirrhosis)
• In children: 1 retrospective single center study• 66 children
• 5 with serial biopsies, 4 with fibrosis progression
Which of the following groups is protected from NAFLD?• A) African Americans
• B) Asian Americans
• C) Hispanic Americans
• D) None of the above
Demographic Predictors of NAFLD
• Overweight/obesity
• Adolescents
• Males > Females:• Estrogen protective?
• Ethnicity:• Hispanics, Asians AT RISK
• African Americans PROTECTED
• Family history: obesity, insulin resistance/DM, NAFLD
Loomba R et al. Advances in Pediatric NAFLD. Hepatology. 2009; 50(4): 1282–1293.
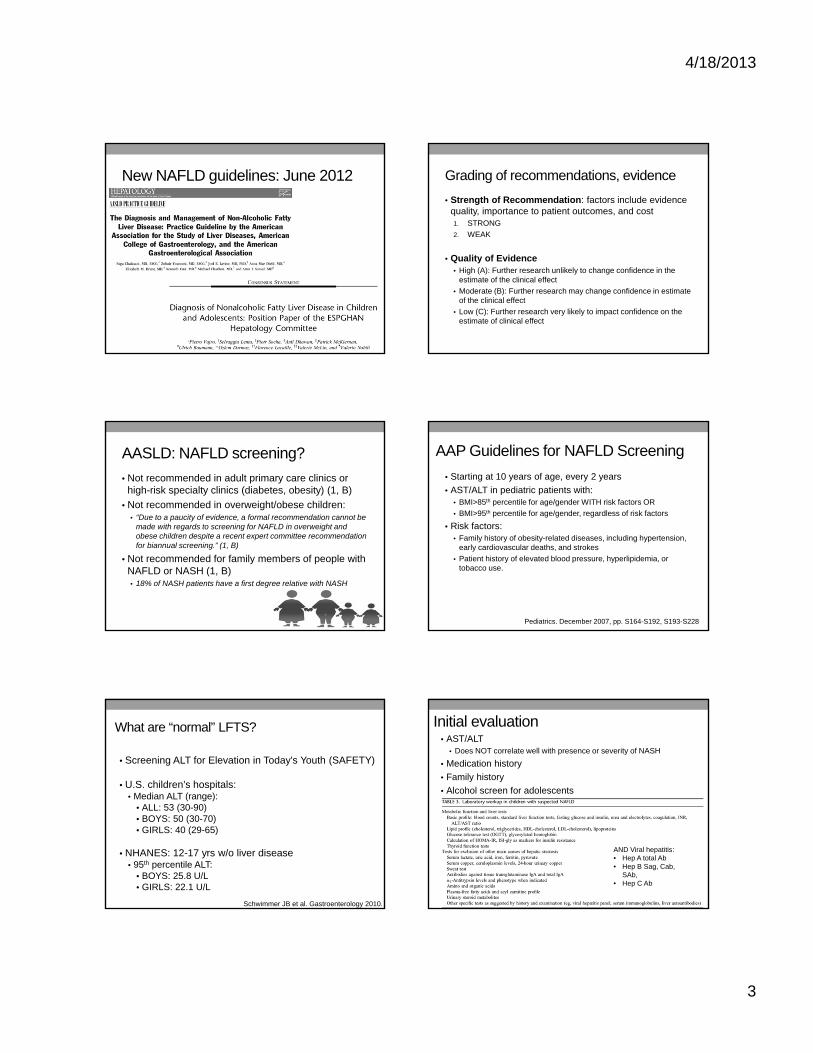
4/18/2013
3
New NAFLD guidelines: June 2012 Grading of recommendations, evidence
• Strength of Recommendation: factors include evidence quality, importance to patient outcomes, and cost1. STRONG
2. WEAK
• Quality of Evidence• High (A): Further research unlikely to change confidence in the
estimate of the clinical effect
• Moderate (B): Further research may change confidence in estimate of the clinical effect
• Low (C): Further research very likely to impact confidence on the estimate of clinical effect
AASLD: NAFLD screening?
• Not recommended in adult primary care clinics or high-risk specialty clinics (diabetes, obesity) (1, B)
• Not recommended in overweight/obese children:• “Due to a paucity of evidence, a formal recommendation cannot be
made with regards to screening for NAFLD in overweight and obese children despite a recent expert committee recommendation for biannual screening.” (1, B)
• Not recommended for family members of people with NAFLD or NASH (1, B)• 18% of NASH patients have a first degree relative with NASH
AAP Guidelines for NAFLD Screening
• Starting at 10 years of age, every 2 years
• AST/ALT in pediatric patients with:• BMI>85th percentile for age/gender WITH risk factors OR
• BMI>95th percentile for age/gender, regardless of risk factors
• Risk factors: • Family history of obesity-related diseases, including hypertension,
early cardiovascular deaths, and strokes
• Patient history of elevated blood pressure, hyperlipidemia, or tobacco use.
Pediatrics. December 2007, pp. S164-S192, S193-S228
What are “normal” LFTS?
• Screening ALT for Elevation in Today’s Youth (SAFETY)
• U.S. children’s hospitals: • Median ALT (range):
• ALL: 53 (30-90)• BOYS: 50 (30-70)• GIRLS: 40 (29-65)
• NHANES: 12-17 yrs w/o liver disease• 95th percentile ALT:
• BOYS: 25.8 U/L• GIRLS: 22.1 U/L
Schwimmer JB et al. Gastroenterology 2010.
Initial evaluation• AST/ALT
• Does NOT correlate well with presence or severity of NASH
• Medication history
• Family history
• Alcohol screen for adolescents
AND Viral hepatitis:• Hep A total Ab• Hep B Sag, Cab,
SAb,• Hep C Ab
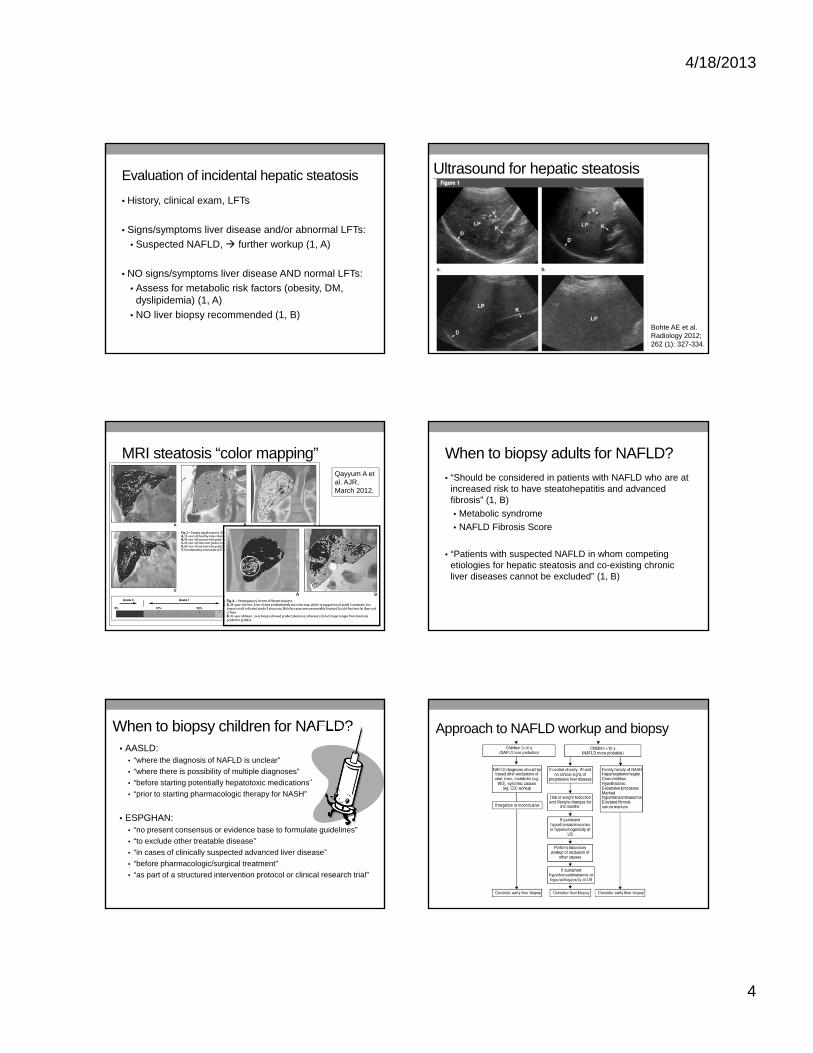
4/18/2013
4
Evaluation of incidental hepatic steatosis
• History, clinical exam, LFTs
• Signs/symptoms liver disease and/or abnormal LFTs:
• Suspected NAFLD, further workup (1, A)
• NO signs/symptoms liver disease AND normal LFTs:
• Assess for metabolic risk factors (obesity, DM, dyslipidemia) (1, A)
• NO liver biopsy recommended (1, B)
Ultrasound for hepatic steatosis
Bohte AE et al. Radiology 2012; 262 (1): 327-334.
MRI steatosis “color mapping”Qayyum A et al. AJR, March 2012.
When to biopsy adults for NAFLD?
• “Should be considered in patients with NAFLD who are at increased risk to have steatohepatitis and advanced fibrosis” (1, B)
• Metabolic syndrome
• NAFLD Fibrosis Score
• “Patients with suspected NAFLD in whom competing etiologies for hepatic steatosis and co-existing chronic liver diseases cannot be excluded” (1, B)
When to biopsy children for NAFLD?• AASLD:
• “where the diagnosis of NAFLD is unclear”
• “where there is possibility of multiple diagnoses”
• “before starting potentially hepatotoxic medications”
• “prior to starting pharmacologic therapy for NASH”
• ESPGHAN:• “no present consensus or evidence base to formulate guidelines”
• “to exclude other treatable disease”
• “in cases of clinically suspected advanced liver disease”
• “before pharmacologic/surgical treatment”
• “as part of a structured intervention protocol or clinical research trial”
Approach to NAFLD workup and biopsy
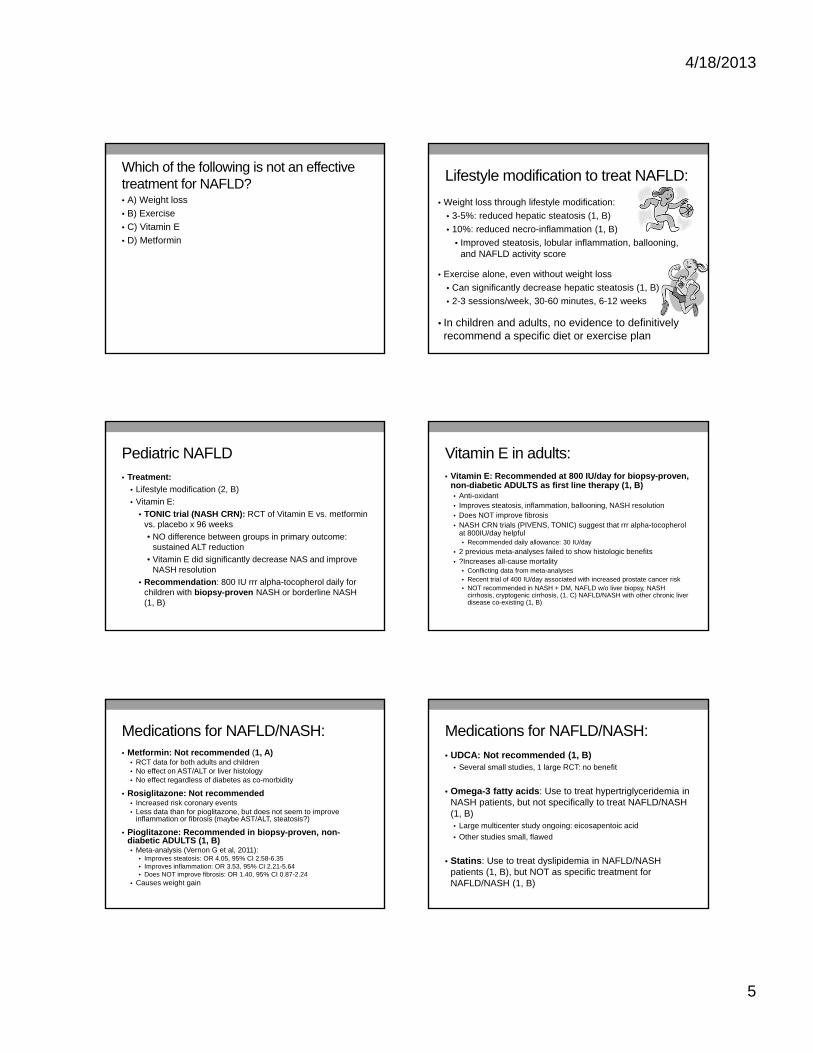
4/18/2013
5
Which of the following is not an effective treatment for NAFLD?• A) Weight loss
• B) Exercise
• C) Vitamin E
• D) Metformin
Lifestyle modification to treat NAFLD:
• Weight loss through lifestyle modification:
• 3-5%: reduced hepatic steatosis (1, B)
• 10%: reduced necro-inflammation (1, B)
• Improved steatosis, lobular inflammation, ballooning, and NAFLD activity score
• Exercise alone, even without weight loss
• Can significantly decrease hepatic steatosis (1, B)
• 2-3 sessions/week, 30-60 minutes, 6-12 weeks
• In children and adults, no evidence to definitively recommend a specific diet or exercise plan
Pediatric NAFLD• Treatment:
• Lifestyle modification (2, B)
• Vitamin E:
• TONIC trial (NASH CRN): RCT of Vitamin E vs. metformin vs. placebo x 96 weeks
• NO difference between groups in primary outcome: sustained ALT reduction
• Vitamin E did significantly decrease NAS and improve NASH resolution
• Recommendation: 800 IU rrr alpha-tocopherol daily for children with biopsy-proven NASH or borderline NASH (1, B)
Vitamin E in adults:• Vitamin E: Recommended at 800 IU/day for biopsy-proven,
non-diabetic ADULTS as first line therapy (1, B)• Anti-oxidant• Improves steatosis, inflammation, ballooning, NASH resolution• Does NOT improve fibrosis• NASH CRN trials (PIVENS, TONIC) suggest that rrr alpha-tocopherol
at 800IU/day helpful• Recommended daily allowance: 30 IU/day
• 2 previous meta-analyses failed to show histologic benefits • ?Increases all-cause mortality
• Conflicting data from meta-analyses• Recent trial of 400 IU/day associated with increased prostate cancer risk• NOT recommended in NASH + DM, NAFLD w/o liver biopsy, NASH
cirrhosis, cryptogenic cirrhosis, (1, C) NAFLD/NASH with other chronic liver disease co-existing (1, B)
Medications for NAFLD/NASH:• Metformin: Not recommended (1, A)
• RCT data for both adults and children• No effect on AST/ALT or liver histology• No effect regardless of diabetes as co-morbidity
• Rosiglitazone: Not recommended• Increased risk coronary events• Less data than for pioglitazone, but does not seem to improve
inflammation or fibrosis (maybe AST/ALT, steatosis?)
• Pioglitazone: Recommended in biopsy-proven, non-diabetic ADULTS (1, B)• Meta-analysis (Vernon G et al, 2011):
• Improves steatosis: OR 4.05, 95% CI 2.58-6.35• Improves inflammation: OR 3.53, 95% CI 2.21-5.64• Does NOT improve fibrosis: OR 1.40, 95% CI 0.87-2.24
• Causes weight gain
Medications for NAFLD/NASH:
• UDCA: Not recommended (1, B)• Several small studies, 1 large RCT: no benefit
• Omega-3 fatty acids: Use to treat hypertriglyceridemia in NASH patients, but not specifically to treat NAFLD/NASH (1, B)• Large multicenter study ongoing: eicosapentoic acid
• Other studies small, flawed
• Statins: Use to treat dyslipidemia in NAFLD/NASH patients (1, B), but NOT as specific treatment for NAFLD/NASH (1, B)
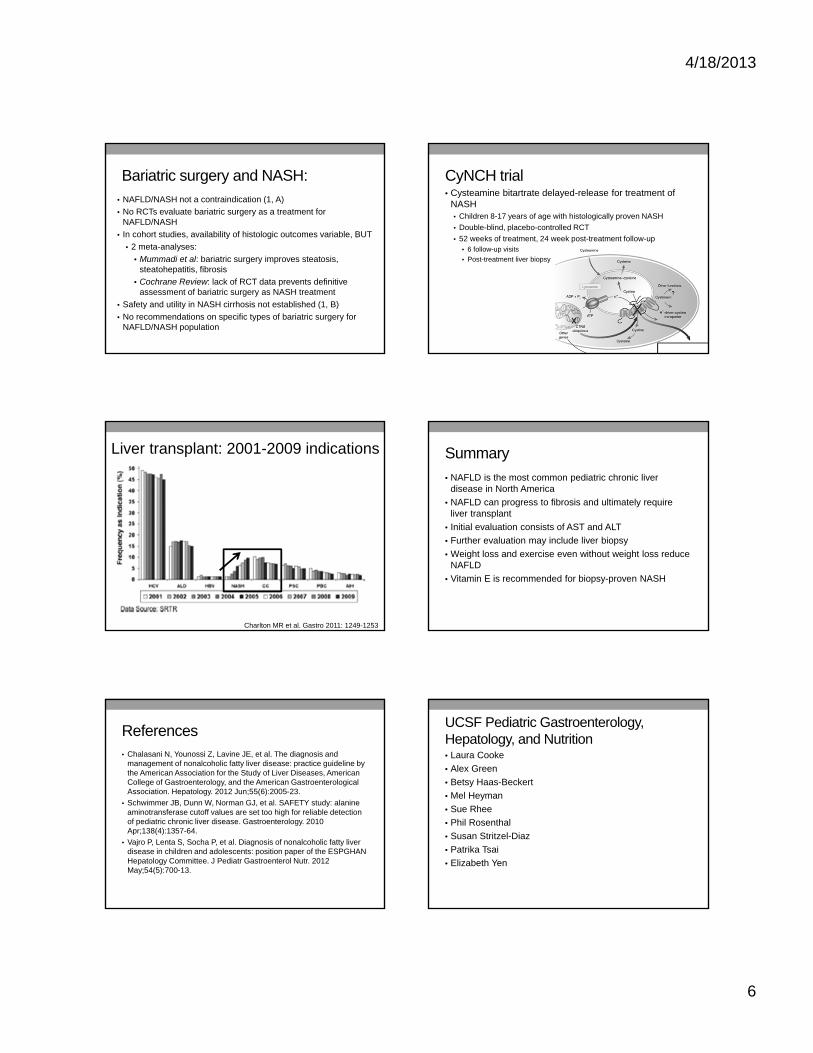
4/18/2013
6
Bariatric surgery and NASH:• NAFLD/NASH not a contraindication (1, A)
• No RCTs evaluate bariatric surgery as a treatment for NAFLD/NASH
• In cohort studies, availability of histologic outcomes variable, BUT
• 2 meta-analyses:
• Mummadi et al: bariatric surgery improves steatosis, steatohepatitis, fibrosis
• Cochrane Review: lack of RCT data prevents definitive assessment of bariatric surgery as NASH treatment
• Safety and utility in NASH cirrhosis not established (1, B)
• No recommendations on specific types of bariatric surgery for NAFLD/NASH population
CyNCH trial• Cysteamine bitartrate delayed-release for treatment of
NASH• Children 8-17 years of age with histologically proven NASH
• Double-blind, placebo-controlled RCT
• 52 weeks of treatment, 24 week post-treatment follow-up• 6 follow-up visits
• Post-treatment liver biopsy
Charlton MR et al. Gastro 2011: 1249-1253
Liver transplant: 2001-2009 indications Summary
• NAFLD is the most common pediatric chronic liver disease in North America
• NAFLD can progress to fibrosis and ultimately require liver transplant
• Initial evaluation consists of AST and ALT
• Further evaluation may include liver biopsy
• Weight loss and exercise even without weight loss reduce NAFLD
• Vitamin E is recommended for biopsy-proven NASH
References• Chalasani N, Younossi Z, Lavine JE, et al. The diagnosis and
management of nonalcoholic fatty liver disease: practice guideline by the American Association for the Study of Liver Diseases, American College of Gastroenterology, and the American Gastroenterological Association. Hepatology. 2012 Jun;55(6):2005-23.
• Schwimmer JB, Dunn W, Norman GJ, et al. SAFETY study: alanine aminotransferase cutoff values are set too high for reliable detection of pediatric chronic liver disease. Gastroenterology. 2010 Apr;138(4):1357-64.
• Vajro P, Lenta S, Socha P, et al. Diagnosis of nonalcoholic fatty liver disease in children and adolescents: position paper of the ESPGHAN Hepatology Committee. J Pediatr Gastroenterol Nutr. 2012 May;54(5):700-13.
UCSF Pediatric Gastroenterology, Hepatology, and Nutrition• Laura Cooke
• Alex Green
• Betsy Haas-Beckert
• Mel Heyman
• Sue Rhee
• Phil Rosenthal
• Susan Stritzel-Diaz
• Patrika Tsai
• Elizabeth Yen
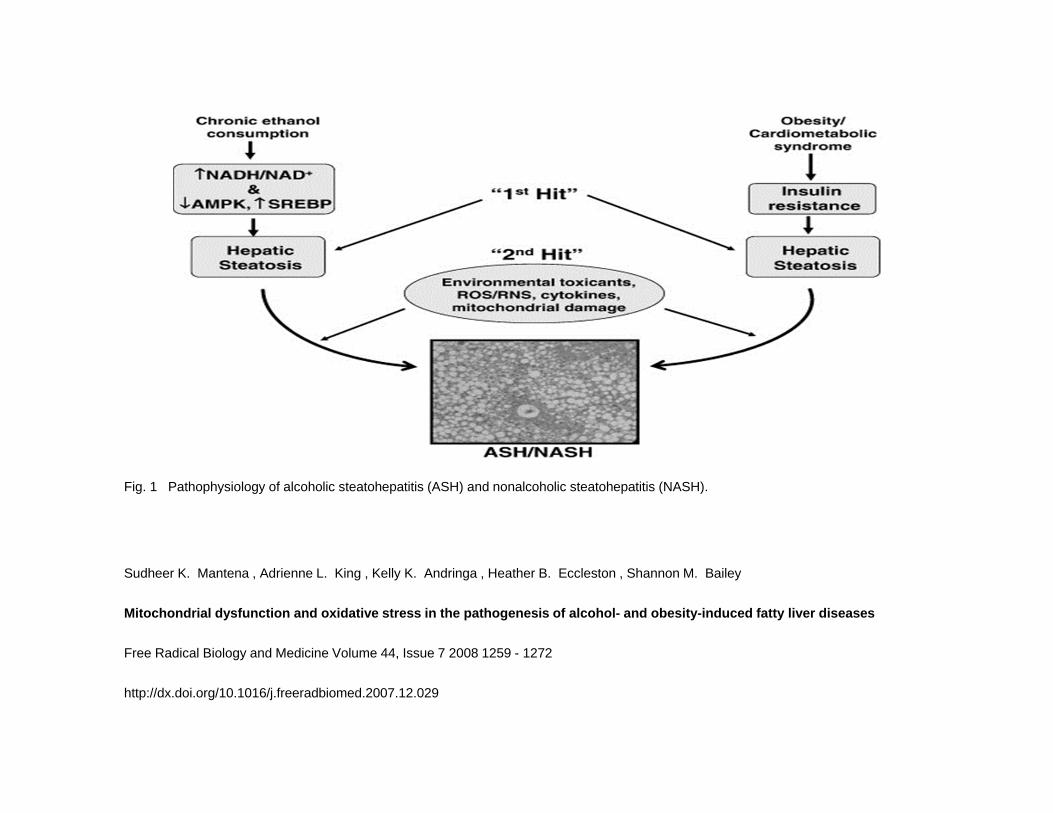
Fig. 1 Pathophysiology of alcoholic steatohepatitis (ASH) and nonalcoholic steatohepatitis (NASH).
Sudheer K. Mantena , Adrienne L. King , Kelly K. Andringa , Heather B. Eccleston , Shannon M. Bailey
Mitochondrial dysfunction and oxidative stress in the pathogenesis of alcohol- and obesity-induced fatty liver diseases
Free Radical Biology and Medicine Volume 44, Issue 7 2008 1259 - 1272
http://dx.doi.org/10.1016/j.freeradbiomed.2007.12.029
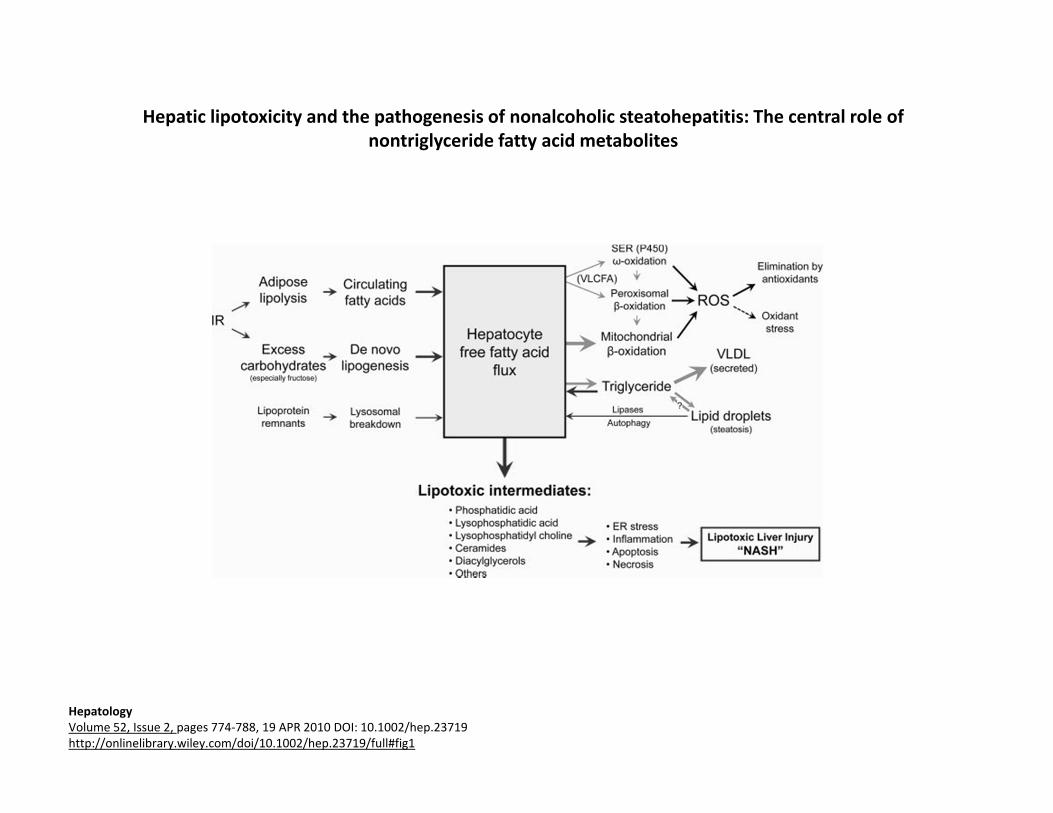
Hepatic lipotoxicity and the pathogenesis of nonalcoholic steatohepatitis: The central role of nontriglyceride fatty acid metabolites
HepatologyVolume 52, Issue 2, pages 774‐788, 19 APR 2010 DOI: 10.1002/hep.23719http://onlinelibrary.wiley.com/doi/10.1002/hep.23719/full#fig1
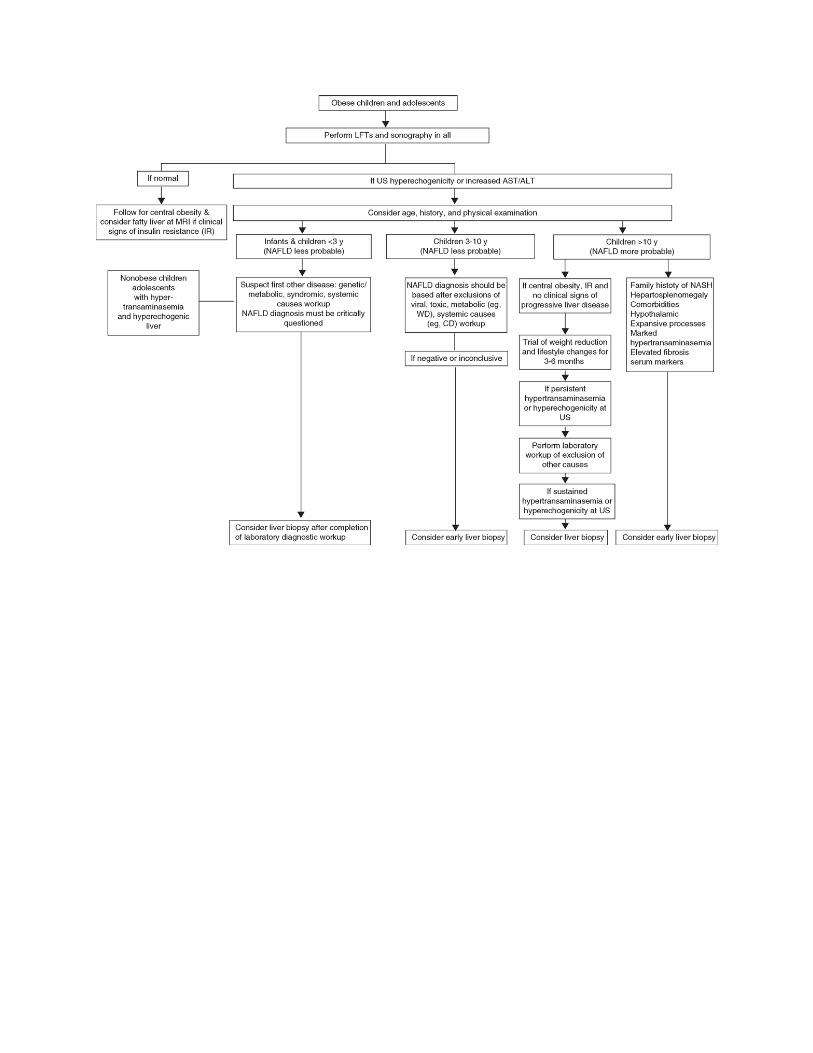
FRIDAY, MAY 17, 2013
4:55
P Type I Diabetes: A Techy Disease
Dr. Saleh Adi
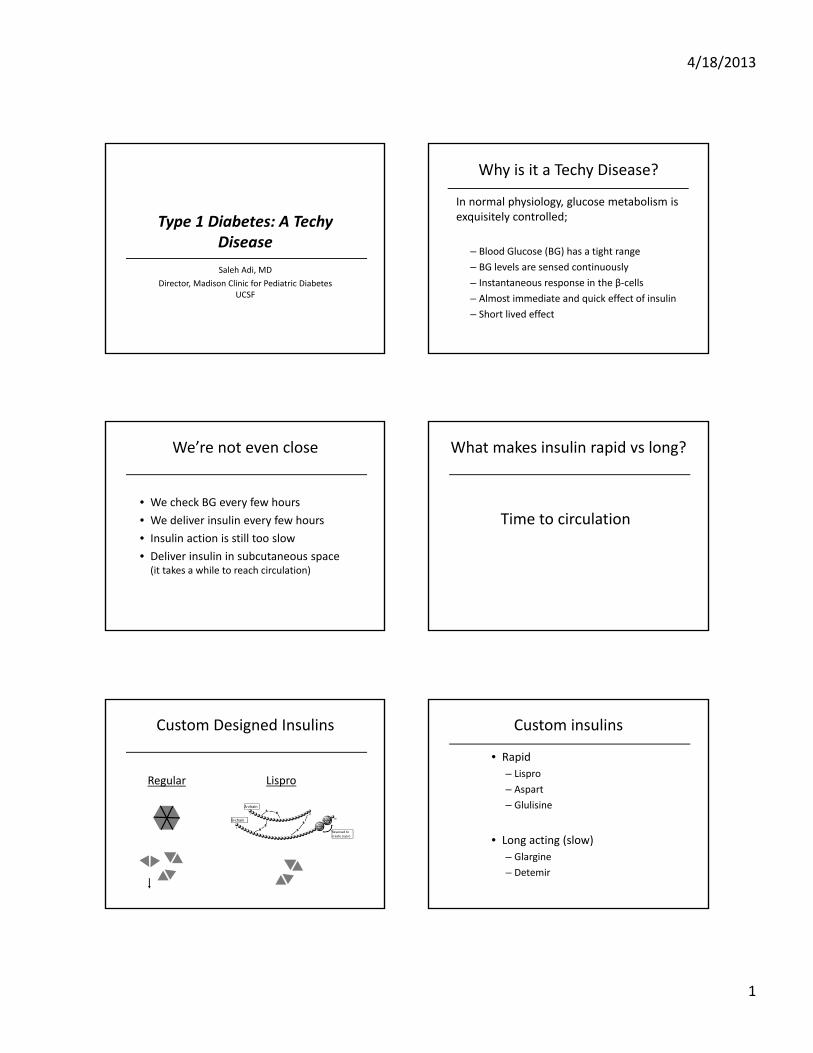
4/18/2013
1
Type 1 Diabetes: A Techy Disease
Saleh Adi, MD
Director, Madison Clinic for Pediatric Diabetes UCSF
Why is it a Techy Disease?
In normal physiology, glucose metabolism is exquisitely controlled;
– Blood Glucose (BG) has a tight range
– BG levels are sensed continuously
– Instantaneous response in the β‐cells
– Almost immediate and quick effect of insulin
– Short lived effect
We’re not even close
• We check BG every few hours
• We deliver insulin every few hours
• Insulin action is still too slow
• Deliver insulin in subcutaneous space (it takes a while to reach circulation)
What makes insulin rapid vs long?
Time to circulation
Custom Designed Insulins
LisproRegular
A‐chain
B‐chain
Reversed to create Lispro
Custom insulins
• Rapid
– Lispro
– Aspart
– Glulisine
• Long acting (slow)
– Glargine
– Detemir
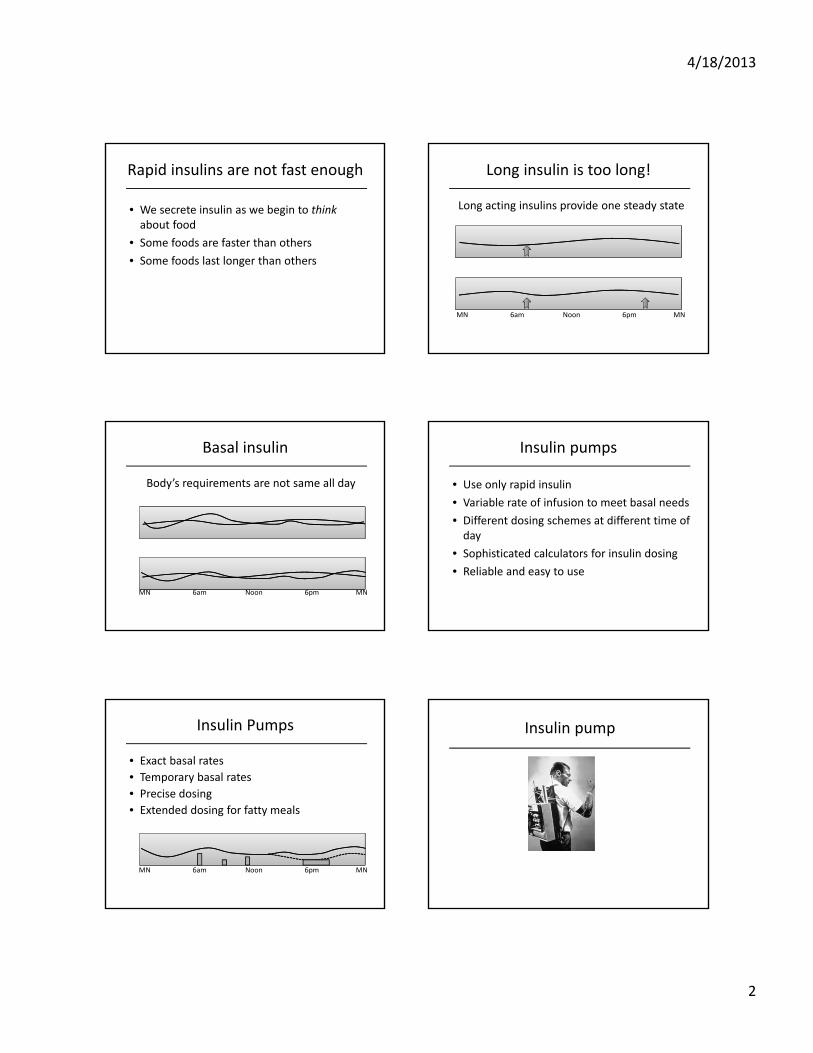
4/18/2013
2
Rapid insulins are not fast enough
• We secrete insulin as we begin to thinkabout food
• Some foods are faster than others
• Some foods last longer than others
Long insulin is too long!
Long acting insulins provide one steady state
MN 6am Noon 6pm MN
Basal insulin
Body’s requirements are not same all day
MN 6am Noon 6pm MN
Insulin pumps
• Use only rapid insulin
• Variable rate of infusion to meet basal needs
• Different dosing schemes at different time of day
• Sophisticated calculators for insulin dosing
• Reliable and easy to use
Insulin Pumps
• Exact basal rates
• Temporary basal rates
• Precise dosing
• Extended dosing for fatty meals
MN 6am Noon 6pm MN
Insulin pump
4/18/2013
3
Insulin pump More Insulin Pumps
Insulin pump Pod Pump
Insulin pump Old Diabetes Logs
4/18/2013
4
Continuous Glucose Monitor (CGM) Pump and sensor (CGM)
A: pumpB: infusion setC: sensorD: transmitter
Pump and CGM download Old Diabetes Logs
Pump and CGM download Implantable Pump
4/18/2013
5
Artificial Pancreas Artificial Pancreas Command Center
Connected Meters The App Era
The App Era
– Logging blood sugar
– Guessing carb content in foods
– Tracking blood sugar trend after eating at certain places
– Social networking
– Motivational apps
– Tracking activity
– Etc…
SATURDAY, MAY 18, 2013
PRACTICING RESPONSIBLY, PROMOTING HEALTHY HABITS
Moderator: Dr. Eileen Aicardi
SATURDAY, MAY 18, 2013
8:15
Antimicrobial Stewardship: Who, What, When, Where, How
Dr. Andrew Pavia
SATURDAY, MAY 18, 2013
8:55
P Performance Sports Athletes: Caring for Gymnasts, Dancers, and Skaters
Dr. Jordan Metzl
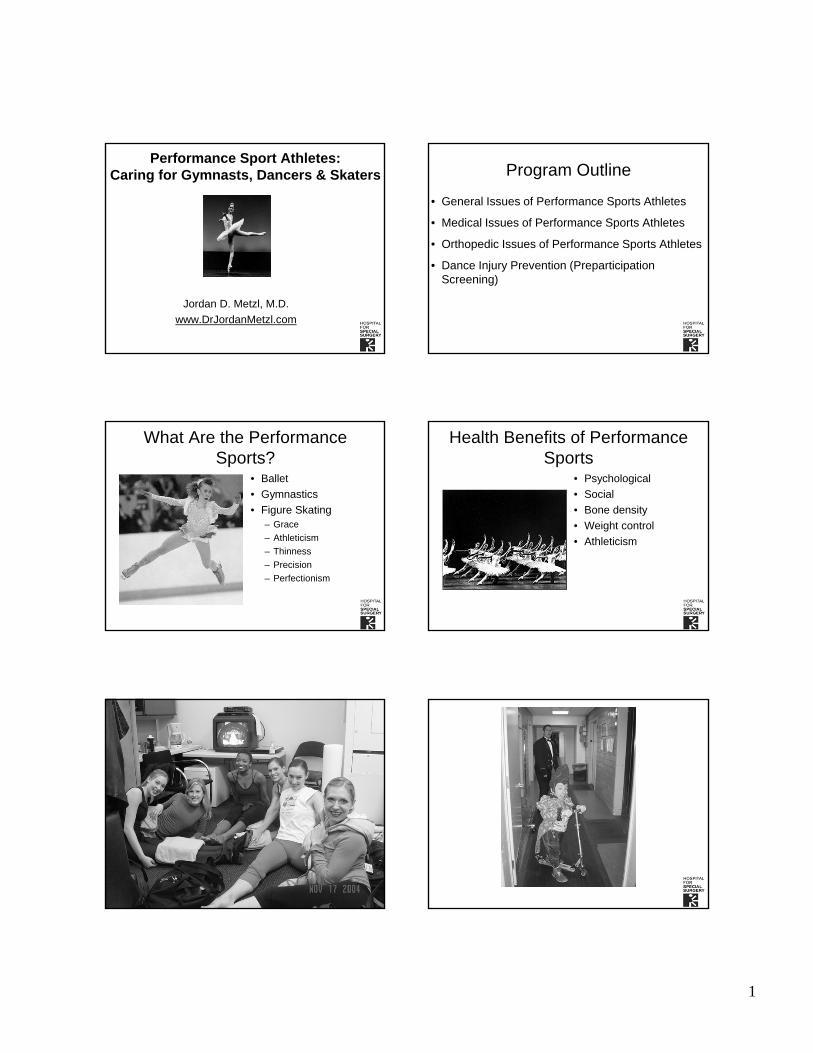
1
Performance Sport Athletes: Caring for Gymnasts, Dancers & Skaters
Jordan D. Metzl, M.D.
www.DrJordanMetzl.com
Program Outline
• General Issues of Performance Sports Athletes
• Medical Issues of Performance Sports Athletes
• Orthopedic Issues of Performance Sports Athletes
• Dance Injury Prevention (Preparticipation Screening)
What Are the Performance Sports?
• Ballet
• Gymnastics
• Figure Skating– Grace
– Athleticism
– Thinness
– Precision
– Perfectionism
Health Benefits of Performance Sports
• Psychological
• Social
• Bone density
• Weight control
• Athleticism
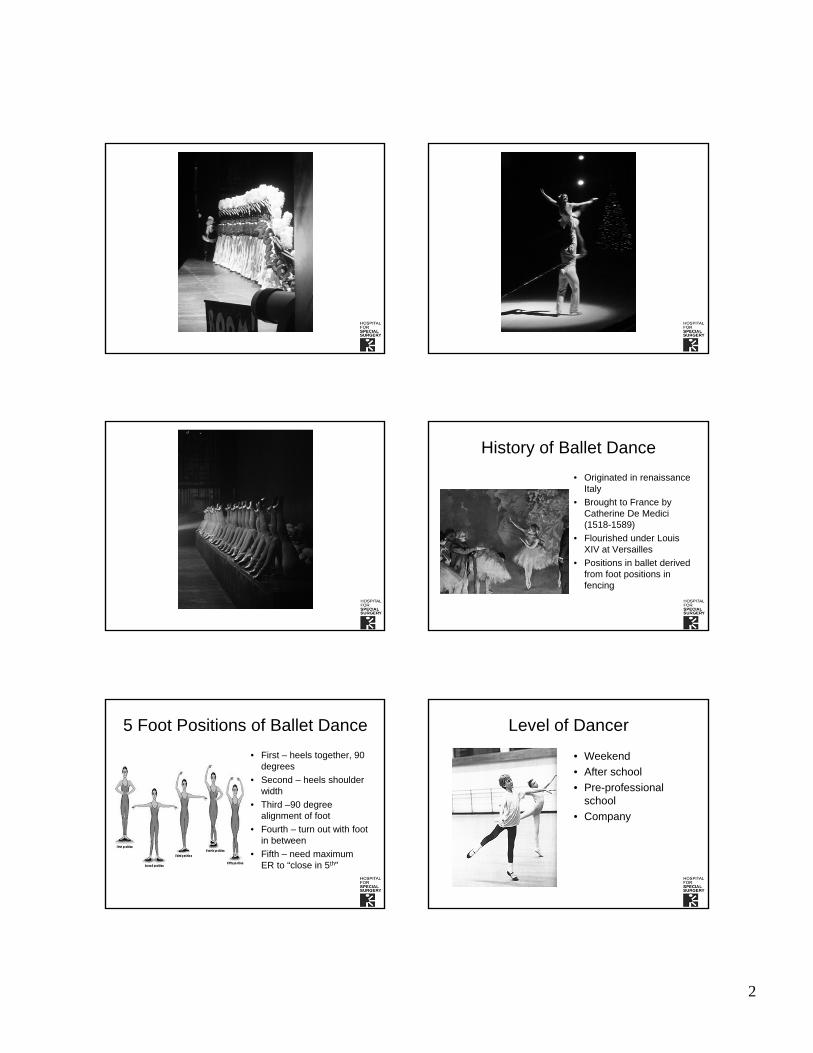
2
History of Ballet Dance
• Originated in renaissance Italy
• Brought to France by Catherine De Medici (1518-1589)
• Flourished under Louis XIV at Versailles
• Positions in ballet derived from foot positions in fencing
5 Foot Positions of Ballet Dance
• First – heels together, 90 degrees
• Second – heels shoulder width
• Third –90 degree alignment of foot
• Fourth – turn out with foot in between
• Fifth – need maximum ER to “close in 5th”
Level of Dancer
• Weekend
• After school
• Pre-professional school
• Company

3
Specialization and Dance
• What are goals/objectives?
• In order to be good, need to start early?
• Exclusion of other sports?
• Varied types of dance?
Performance Enhancement?
• Drugs?
• “Extra” edge?
• Weight issues
• Influence and politics– Boston ballet
experience (Heidi Gunther)
Medical Issues of Female Athletes
• Medical Issues– Bone
– Female Athlete Triad• Anorexia
– Nutritional
• Amenorrhea– Hormonal
• Osteopenia– Future bone health?
Medical Development of the female athlete
• Adolescent Development– Sexual Development
– Skeletal Development
– Physiologic Development
– Psychological Development
Sexual Development in Dancers
• Menarche 2-3 years later than controls
• Primary amenorrhea– Absence of menses by
age 16
• Progression of sexual development correlated with rest
Female Athlete Triad
• Amenorrhea– Primary
– Secondary
• Anorexia– Anorexia athletica
• Osteoporosis– Osteopenia
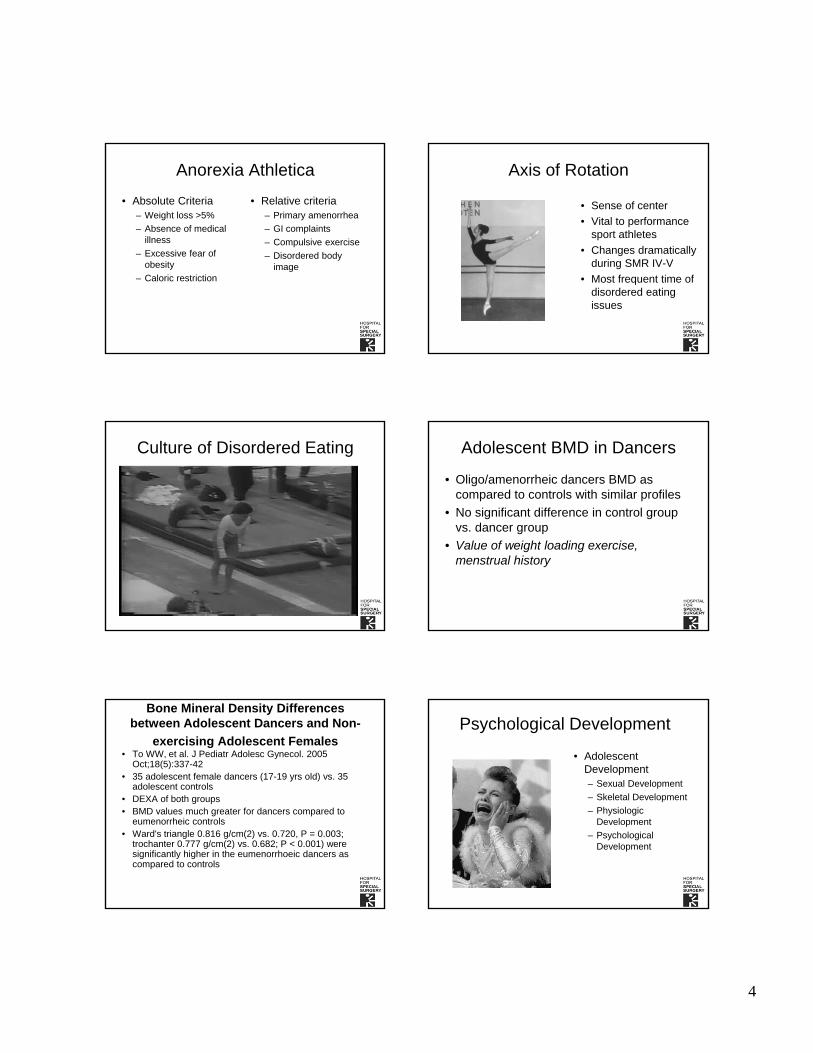
4
Anorexia Athletica
• Absolute Criteria– Weight loss >5%
– Absence of medical illness
– Excessive fear of obesity
– Caloric restriction
• Relative criteria– Primary amenorrhea
– GI complaints
– Compulsive exercise
– Disordered body image
Axis of Rotation
• Sense of center
• Vital to performance sport athletes
• Changes dramatically during SMR IV-V
• Most frequent time of disordered eating issues
Culture of Disordered Eating Adolescent BMD in Dancers
• Oligo/amenorrheic dancers BMD as compared to controls with similar profiles
• No significant difference in control group vs. dancer group
• Value of weight loading exercise, menstrual history
Bone Mineral Density Differences between Adolescent Dancers and Non-
exercising Adolescent Females• To WW, et al. J Pediatr Adolesc Gynecol. 2005
Oct;18(5):337-42 • 35 adolescent female dancers (17-19 yrs old) vs. 35
adolescent controls• DEXA of both groups• BMD values much greater for dancers compared to
eumenorrheic controls• Ward's triangle 0.816 g/cm(2) vs. 0.720, P = 0.003;
trochanter 0.777 g/cm(2) vs. 0.682; P < 0.001) were significantly higher in the eumenorrhoeic dancers as compared to controls
Psychological Development
• Adolescent Development– Sexual Development
– Skeletal Development
– Physiologic Development
– Psychological Development

5
Psychological Considerations
• Only 23% of female and 33% of male professional dancers are satisfied with their bodies
• Adolescent dancers who begin puberty on time (12.9 years) have a lower body image than their peers
Issues to Consider When Counseling for Healthy Bones
• Body Habitus– Disordered eating, anorexia athletica,
anorexia nervosa
• Lifestyle– smoking, drinking, caffeine ingestion
• Diet– calcium, calories (calcium counting sheet)
• Heredity
• Sex Hormone Levels
• Previous Bone Injury (Dexa?)
Keeping Dancers Medically Healthy
• Preventive education
• Recognition of disordered eating, altered body image
• Making sure that health care team and teaching institution are on same page
Orthopedic Issues in Dancers
Common Orthopedic Issues in Dancers
• Scoliosis• Overuse Injury
– Bone• Sesamoid• Tibial• Femoral
– Tendon• Ankle• Iliopsoas
– Apophyseal
• Acute Traumatic Injury– Romeo and Julliet
Scoliosis
• 15% of dancers
• Most common type is
adolescent idiopathic
• Girls>Boys
• Skeletal delay?

6
Forward Flexion Test Injuries in Dancers
Is the School on Board? Which Body Type Is Favored?
• Flexibility• “Natural” turnout• “Normal” Femoral
anteroversion is 15 degrees
• External tibial torsion• Roughly 60% above
knee, 40% below knee (turnout)
• Foot – Type– ROM at 1st MTP
The Ballet Pointe Shoe Correct age to go en pointe?
• Beginning Stage Dancer– 8-12 years of age
– Pre-pointe
• Middle Stage Dancer– 12-16 years of age
– Major health issues
• Apprentice Stage Dancer– 16-older
– Pre-professional stage
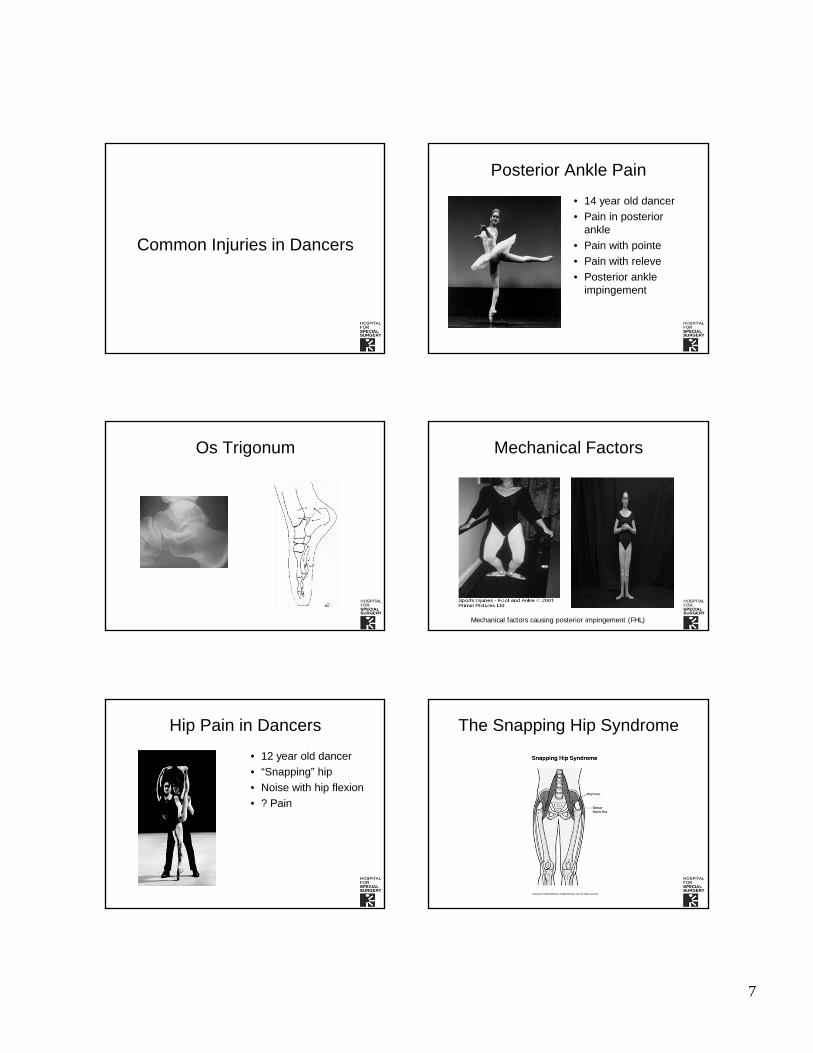
7
Common Injuries in Dancers
Posterior Ankle Pain
• 14 year old dancer
• Pain in posterior ankle
• Pain with pointe
• Pain with releve
• Posterior ankle impingement
Os Trigonum Mechanical Factors
Mechanical factors causing posterior impingement (FHL)
Hip Pain in Dancers
• 12 year old dancer
• “Snapping” hip
• Noise with hip flexion
• ? Pain
The Snapping Hip Syndrome
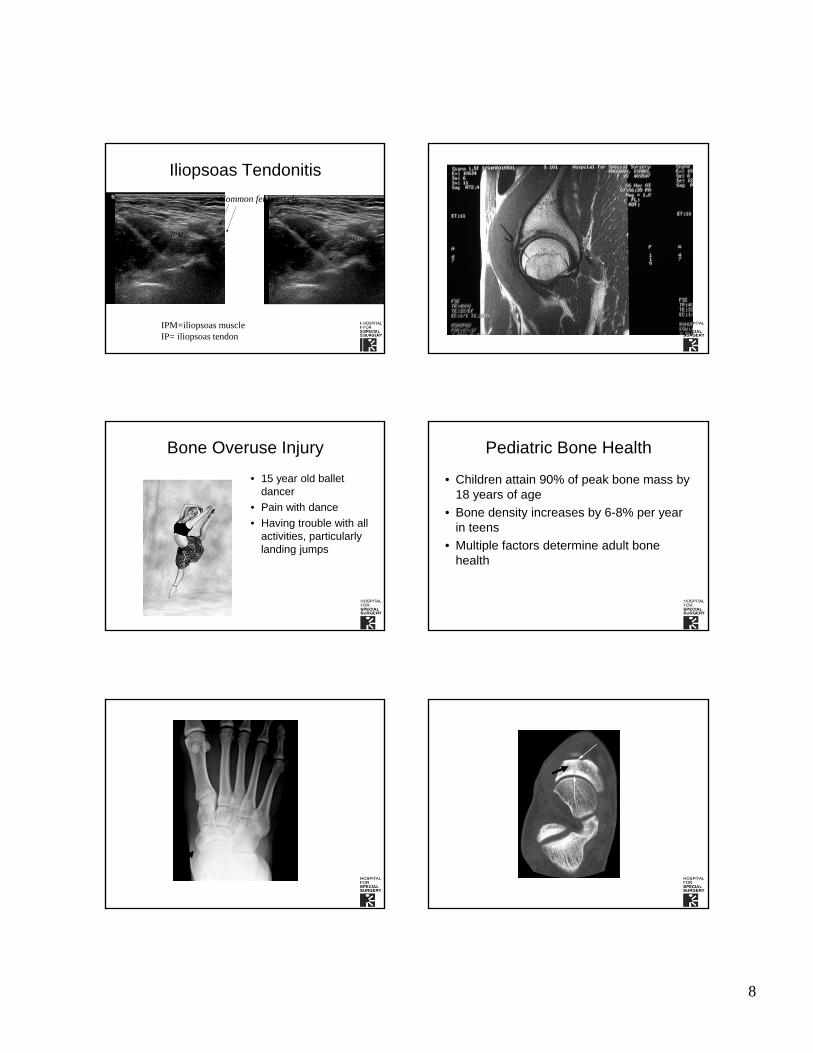
8
Iliopsoas Tendonitis
acet
IPM
IPM=iliopsoas muscleIP= iliopsoas tendon
IP
Needle tip
Common fem vessels
Injection Site
Bone Overuse Injury
• 15 year old ballet dancer
• Pain with dance
• Having trouble with all activities, particularly landing jumps
Pediatric Bone Health
• Children attain 90% of peak bone mass by 18 years of age
• Bone density increases by 6-8% per year in teens
• Multiple factors determine adult bone health
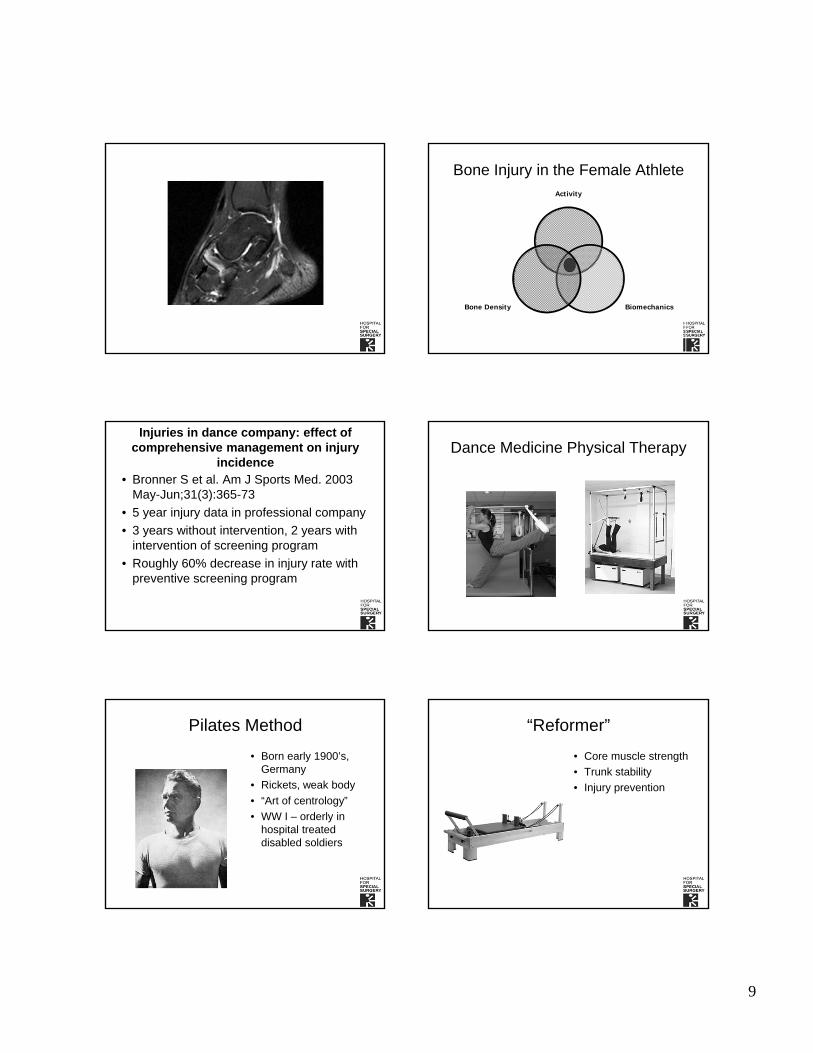
9
Bone Injury in the Female AthleteActivity
BiomechanicsBone Density
Injuries in dance company: effect of comprehensive management on injury
incidence• Bronner S et al. Am J Sports Med. 2003
May-Jun;31(3):365-73
• 5 year injury data in professional company
• 3 years without intervention, 2 years with intervention of screening program
• Roughly 60% decrease in injury rate with preventive screening program
Dance Medicine Physical Therapy
Pilates Method
• Born early 1900’s, Germany
• Rickets, weak body
• “Art of centrology”
• WW I – orderly in hospital treated disabled soldiers
“Reformer”
• Core muscle strength
• Trunk stability
• Injury prevention
10
Conclusions
• Dance is great for health!
• Medical and orthopedic issues
• Parents, teachers can take an active role in health prevention!
• Don’t “dance through the pain”
SATURDAY, MAY 18, 2013
OBESITY & ITS CHALLENGES
Moderator: Dr. Eileen Aicardi

SATURDAY, MAY 18, 2013
10:10
P Cholesterol & Lipids in Kids: It's a Matter of the Heart
Dr. Scott Soifer
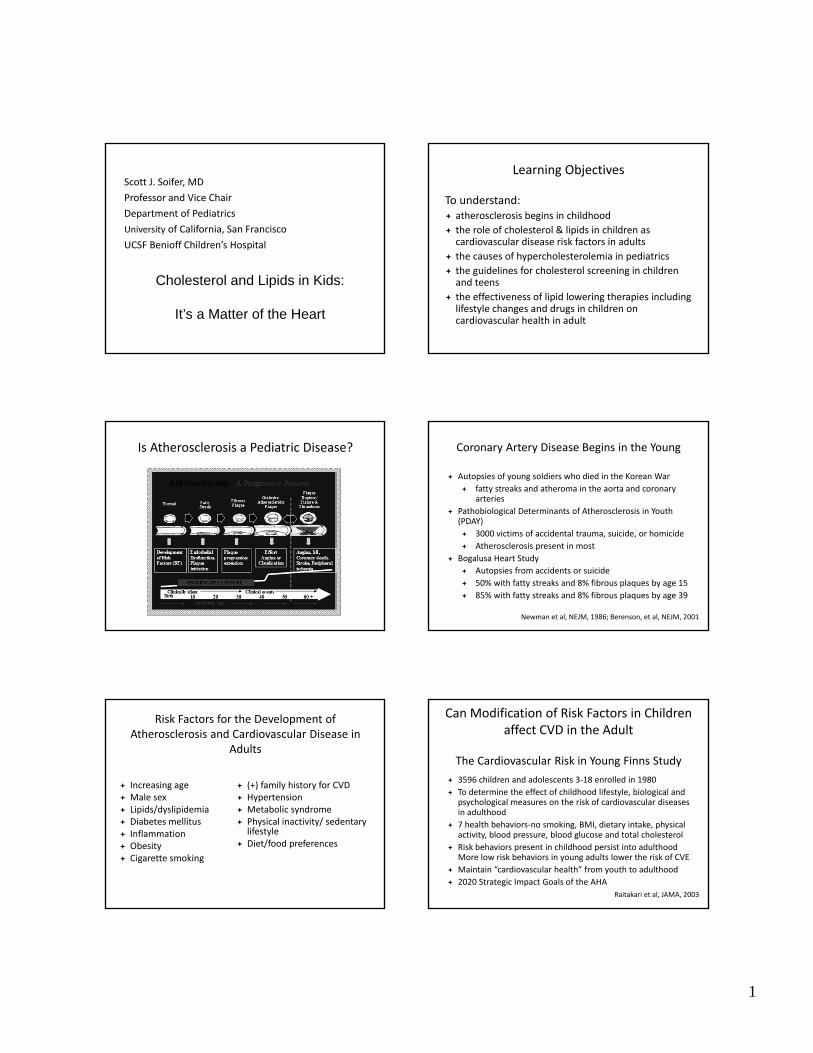
1
Cholesterol and Lipids in Kids:
It’s a Matter of the Heart
Scott J. Soifer, MD
Professor and Vice Chair
Department of Pediatrics
University of California, San Francisco
UCSF Benioff Children’s Hospital
Learning Objectives
To understand: atherosclerosis begins in childhood
the role of cholesterol & lipids in children as cardiovascular disease risk factors in adults
the causes of hypercholesterolemia in pediatrics
the guidelines for cholesterol screening in children and teens
the effectiveness of lipid lowering therapies including lifestyle changes and drugs in children on cardiovascular health in adult
Is Atherosclerosis a Pediatric Disease? Coronary Artery Disease Begins in the Young
Autopsies of young soldiers who died in the Korean War
fatty streaks and atheroma in the aorta and coronary arteries
Pathobiological Determinants of Atherosclerosis in Youth (PDAY)
3000 victims of accidental trauma, suicide, or homicide
Atherosclerosis present in most
Bogalusa Heart Study
Autopsies from accidents or suicide
50% with fatty streaks and 8% fibrous plaques by age 15
85% with fatty streaks and 8% fibrous plaques by age 39
Newman et al, NEJM, 1986; Berenson, et al, NEJM, 2001
Risk Factors for the Development of Atherosclerosis and Cardiovascular Disease in
Adults
Increasing age Male sex Lipids/dyslipidemia Diabetes mellitus Inflammation Obesity Cigarette smoking
(+) family history for CVD Hypertension Metabolic syndrome Physical inactivity/ sedentary
lifestyle Diet/food preferences
Can Modification of Risk Factors in Children affect CVD in the Adult
The Cardiovascular Risk in Young Finns Study
Raitakari et al, JAMA, 2003
3596 children and adolescents 3‐18 enrolled in 1980
To determine the effect of childhood lifestyle, biological and psychological measures on the risk of cardiovascular diseases in adulthood
7 health behaviors‐no smoking, BMI, dietary intake, physical activity, blood pressure, blood glucose and total cholesterol
Risk behaviors present in childhood persist into adulthood More low risk behaviors in young adults lower the risk of CVE
Maintain “cardiovascular health” from youth to adulthood
2020 Strategic Impact Goals of the AHA
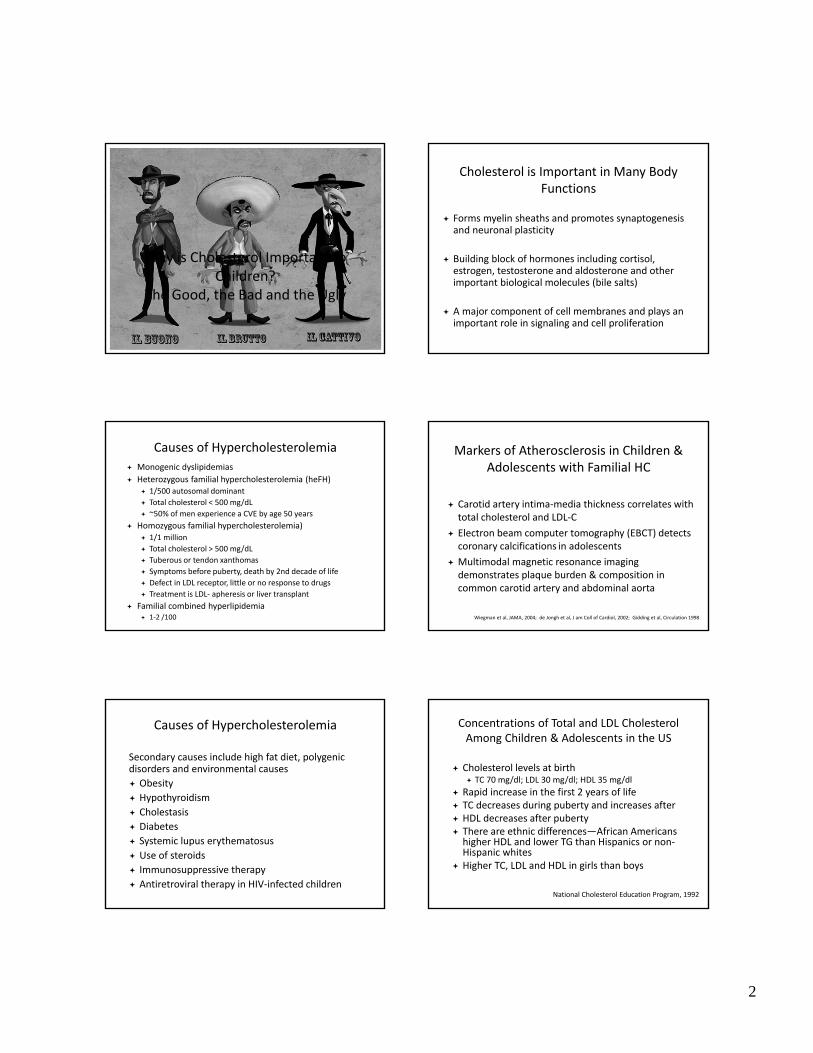
2
Why is Cholesterol Important to Children?
The Good, the Bad and the Ugly
Cholesterol is Important in Many Body Functions
Forms myelin sheaths and promotes synaptogenesis and neuronal plasticity
Building block of hormones including cortisol, estrogen, testosterone and aldosterone and other important biological molecules (bile salts)
A major component of cell membranes and plays an important role in signaling and cell proliferation
Causes of Hypercholesterolemia
Monogenic dyslipidemias
Heterozygous familial hypercholesterolemia (heFH) 1/500 autosomal dominant
Total cholesterol < 500 mg/dL
~50% of men experience a CVE by age 50 years
Homozygous familial hypercholesterolemia) 1/1 million
Total cholesterol > 500 mg/dL
Tuberous or tendon xanthomas
Symptoms before puberty, death by 2nd decade of life
Defect in LDL receptor, little or no response to drugs
Treatment is LDL‐ apheresis or liver transplant
Familial combined hyperlipidemia 1‐2 /100
Markers of Atherosclerosis in Children & Adolescents with Familial HC
Wiegman et al, JAMA, 2004; de Jongh et al, J am Coll of Cardiol, 2002; Gidding et al, Circulation 1998
Carotid artery intima‐media thickness correlates with total cholesterol and LDL‐C
Electron beam computer tomography (EBCT) detects coronary calcifications in adolescents
Multimodal magnetic resonance imaging demonstrates plaque burden & composition in common carotid artery and abdominal aorta
Causes of Hypercholesterolemia
Secondary causes include high fat diet, polygenic disorders and environmental causes
Obesity
Hypothyroidism
Cholestasis
Diabetes
Systemic lupus erythematosus
Use of steroids
Immunosuppressive therapy
Antiretroviral therapy in HIV‐infected children
Concentrations of Total and LDL Cholesterol Among Children & Adolescents in the US
Cholesterol levels at birth TC 70 mg/dl; LDL 30 mg/dl; HDL 35 mg/dl
Rapid increase in the first 2 years of life TC decreases during puberty and increases after HDL decreases after puberty There are ethnic differences—African Americans higher HDL and lower TG than Hispanics or non‐Hispanic whites
Higher TC, LDL and HDL in girls than boys
National Cholesterol Education Program, 1992
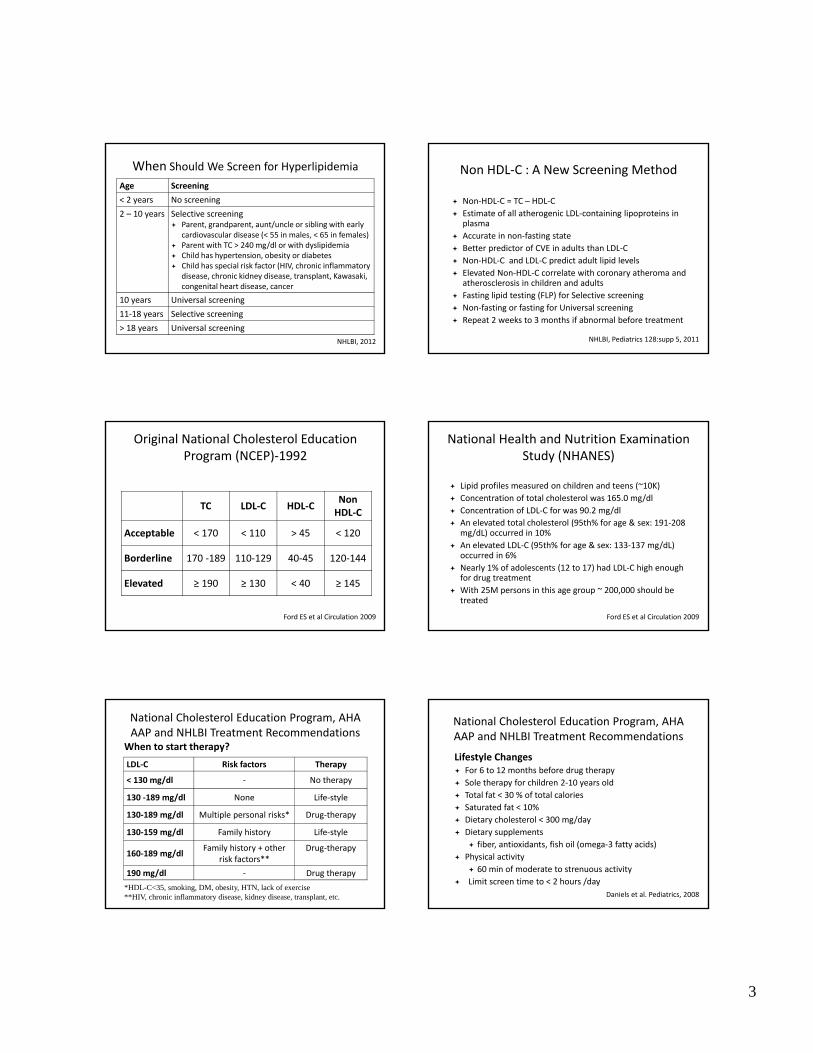
3
When Should We Screen for Hyperlipidemia
NHLBI, 2012
Age Screening
< 2 years No screening
2 – 10 years Selective screening Parent, grandparent, aunt/uncle or sibling with early
cardiovascular disease (< 55 in males, < 65 in females) Parent with TC > 240 mg/dl or with dyslipidemia Child has hypertension, obesity or diabetes Child has special risk factor (HIV, chronic inflammatory
disease, chronic kidney disease, transplant, Kawasaki, congenital heart disease, cancer
10 years Universal screening
11‐18 years Selective screening
> 18 years Universal screening
Non HDL‐C : A New Screening Method
Non‐HDL‐C = TC – HDL‐C
Estimate of all atherogenic LDL‐containing lipoproteins in plasma
Accurate in non‐fasting state
Better predictor of CVE in adults than LDL‐C
Non‐HDL‐C and LDL‐C predict adult lipid levels
Elevated Non‐HDL‐C correlate with coronary atheroma and atherosclerosis in children and adults
Fasting lipid testing (FLP) for Selective screening
Non‐fasting or fasting for Universal screening
Repeat 2 weeks to 3 months if abnormal before treatment
NHLBI, Pediatrics 128:supp 5, 2011
Original National Cholesterol Education Program (NCEP)‐1992
TC LDL‐C HDL‐CNon HDL‐C
Acceptable < 170 < 110 > 45 < 120
Borderline 170 ‐189 110‐129 40‐45 120‐144
Elevated ≥ 190 ≥ 130 < 40 ≥ 145
Ford ES et al Circulation 2009
National Health and Nutrition Examination Study (NHANES)
Lipid profiles measured on children and teens (~10K)
Concentration of total cholesterol was 165.0 mg/dl
Concentration of LDL‐C for was 90.2 mg/dl
An elevated total cholesterol (95th% for age & sex: 191‐208 mg/dL) occurred in 10%
An elevated LDL‐C (95th% for age & sex: 133‐137 mg/dL) occurred in 6%
Nearly 1% of adolescents (12 to 17) had LDL‐C high enough for drug treatment
With 25M persons in this age group ~ 200,000 should be treated
Ford ES et al Circulation 2009
National Cholesterol Education Program, AHA AAP and NHLBI Treatment Recommendations
LDL‐C Risk factors Therapy
< 130 mg/dl ‐ No therapy
130 ‐189 mg/dl None Life‐style
130‐189 mg/dl Multiple personal risks* Drug‐therapy
130‐159 mg/dl Family history Life‐style
160‐189 mg/dlFamily history + other
risk factors**Drug‐therapy
190 mg/dl ‐ Drug therapy
*HDL-C<35, smoking, DM, obesity, HTN, lack of exercise**HIV, chronic inflammatory disease, kidney disease, transplant, etc.
When to start therapy?
National Cholesterol Education Program, AHA AAP and NHLBI Treatment Recommendations
Daniels et al. Pediatrics, 2008
Lifestyle Changes For 6 to 12 months before drug therapy
Sole therapy for children 2‐10 years old
Total fat < 30 % of total calories
Saturated fat < 10%
Dietary cholesterol < 300 mg/day
Dietary supplements
fiber, antioxidants, fish oil (omega‐3 fatty acids)
Physical activity
60 min of moderate to strenuous activity
Limit screen time to < 2 hours /day
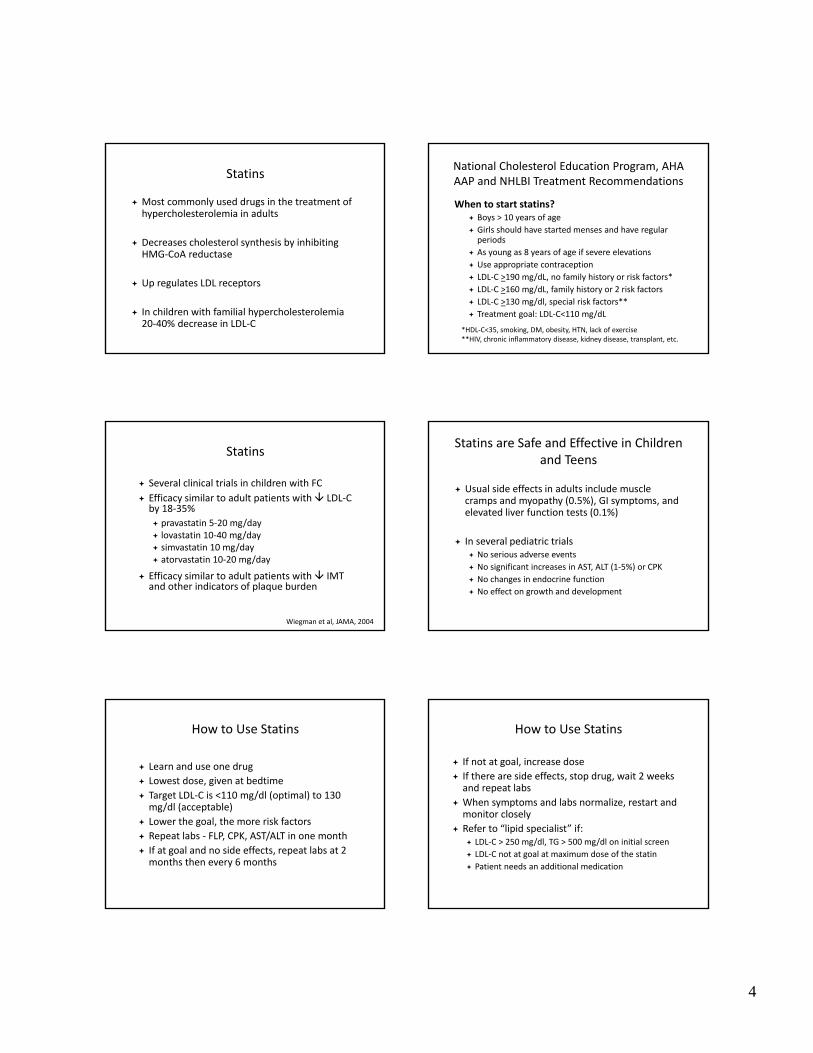
4
Statins
Most commonly used drugs in the treatment of hypercholesterolemia in adults
Decreases cholesterol synthesis by inhibiting HMG‐CoA reductase
Up regulates LDL receptors
In children with familial hypercholesterolemia 20‐40% decrease in LDL‐C
National Cholesterol Education Program, AHA AAP and NHLBI Treatment Recommendations
When to start statins? Boys > 10 years of age
Girls should have started menses and have regular periods
As young as 8 years of age if severe elevations
Use appropriate contraception
LDL‐C >190 mg/dL, no family history or risk factors*
LDL‐C >160 mg/dL, family history or 2 risk factors
LDL‐C >130 mg/dl, special risk factors**
Treatment goal: LDL‐C<110 mg/dL
*HDL‐C<35, smoking, DM, obesity, HTN, lack of exercise**HIV, chronic inflammatory disease, kidney disease, transplant, etc.
Statins
Several clinical trials in children with FC
Efficacy similar to adult patients with LDL‐C by 18‐35%
pravastatin 5‐20 mg/day lovastatin 10‐40 mg/day simvastatin 10 mg/day atorvastatin 10‐20 mg/day
Efficacy similar to adult patients with IMT and other indicators of plaque burden
Wiegman et al, JAMA, 2004
Statins are Safe and Effective in Children and Teens
Usual side effects in adults include muscle cramps and myopathy (0.5%), GI symptoms, and elevated liver function tests (0.1%)
In several pediatric trials No serious adverse events
No significant increases in AST, ALT (1‐5%) or CPK
No changes in endocrine function
No effect on growth and development
How to Use Statins
Learn and use one drug
Lowest dose, given at bedtime
Target LDL‐C is <110 mg/dl (optimal) to 130 mg/dl (acceptable)
Lower the goal, the more risk factors
Repeat labs ‐ FLP, CPK, AST/ALT in one month
If at goal and no side effects, repeat labs at 2 months then every 6 months
How to Use Statins
If not at goal, increase dose
If there are side effects, stop drug, wait 2 weeks and repeat labs
When symptoms and labs normalize, restart and monitor closely
Refer to “lipid specialist” if: LDL‐C > 250 mg/dl, TG > 500 mg/dl on initial screen
LDL‐C not at goal at maximum dose of the statin
Patient needs an additional medication
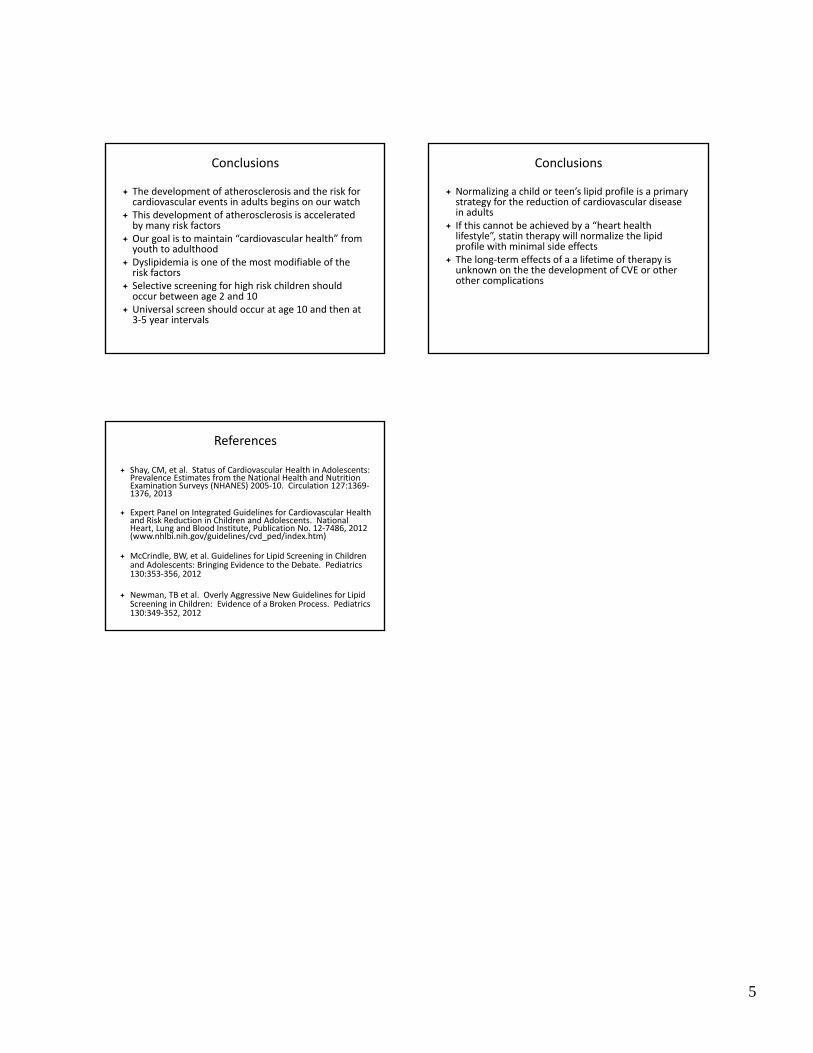
5
Conclusions
The development of atherosclerosis and the risk for cardiovascular events in adults begins on our watch
This development of atherosclerosis is accelerated by many risk factors
Our goal is to maintain “cardiovascular health” from youth to adulthood
Dyslipidemia is one of the most modifiable of the risk factors
Selective screening for high risk children should occur between age 2 and 10
Universal screen should occur at age 10 and then at 3‐5 year intervals
Conclusions
Normalizing a child or teen’s lipid profile is a primary strategy for the reduction of cardiovascular disease in adults
If this cannot be achieved by a “heart health lifestyle”, statin therapy will normalize the lipid profile with minimal side effects
The long‐term effects of a a lifetime of therapy is unknown on the the development of CVE or other other complications
References
Shay, CM, et al. Status of Cardiovascular Health in Adolescents: Prevalence Estimates from the National Health and Nutrition Examination Surveys (NHANES) 2005‐10. Circulation 127:1369‐1376, 2013
Expert Panel on Integrated Guidelines for Cardiovascular Health and Risk Reduction in Children and Adolescents. National Heart, Lung and Blood Institute, Publication No. 12‐7486, 2012 (www.nhlbi.nih.gov/guidelines/cvd_ped/index.htm)
McCrindle, BW, et al. Guidelines for Lipid Screening in Children and Adolescents: Bringing Evidence to the Debate. Pediatrics 130:353‐356, 2012
Newman, TB et al. Overly Aggressive New Guidelines for Lipid Screening in Children: Evidence of a Broken Process. Pediatrics 130:349‐352, 2012
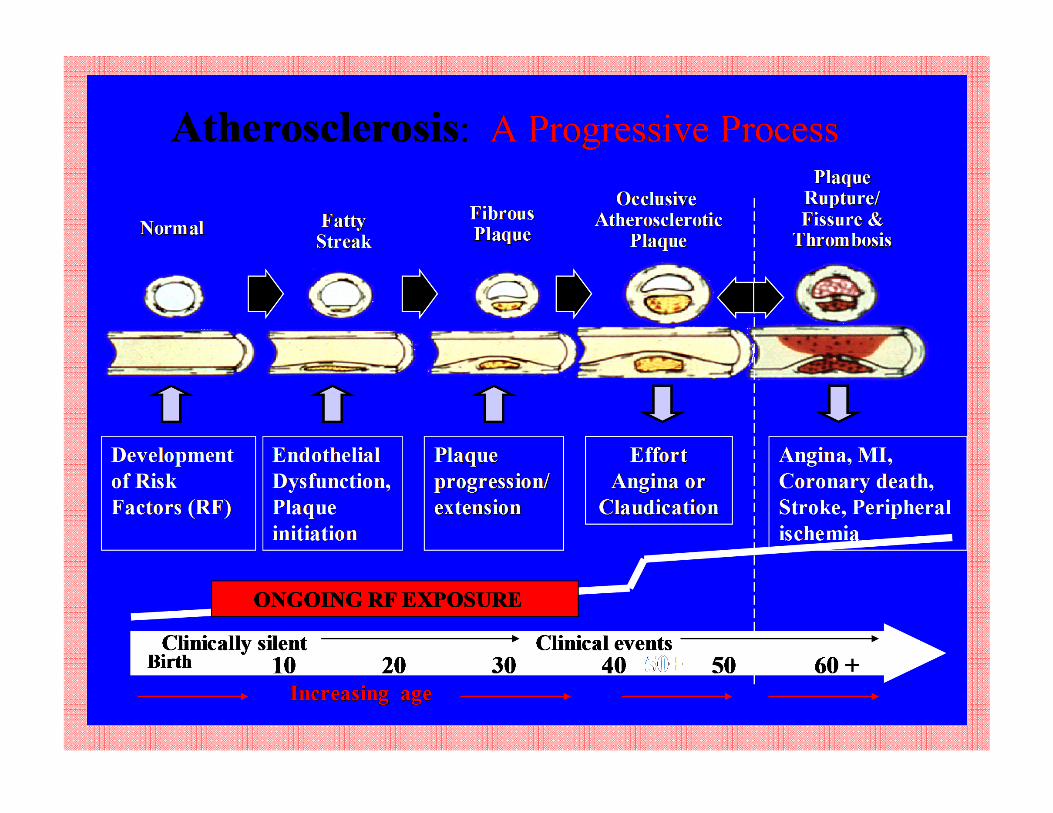
SATURDAY, MAY 18, 2013
10:40
Facts & Fiction about Pediatric Obesity Treatment: Nutrition & Metabolic Health Improvement
Luis Rodríguez, RD
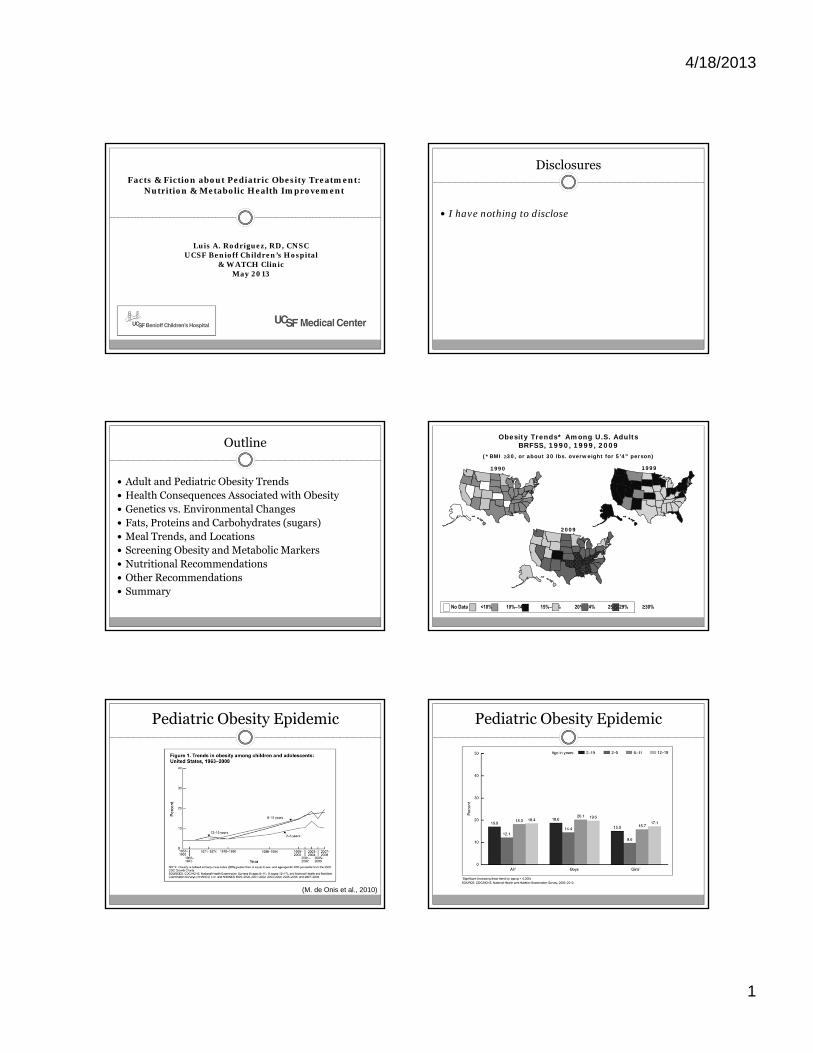
4/18/2013
1
Facts & Fiction about Pediatric Obesity Treatment: Nutrition & Metabolic Health Improvement
Luis A. Rodríguez, RD, CNSCUCSF Benioff Children’s Hospital
& WATCH ClinicMay 2013
Disclosures
I have nothing to disclose
Outline
Adult and Pediatric Obesity Trends Health Consequences Associated with Obesity Genetics vs. Environmental Changes Fats, Proteins and Carbohydrates (sugars) Meal Trends, and Locations Screening Obesity and Metabolic Markers Nutritional Recommendations Other Recommendations Summary
1999
Obesity Trends* Among U.S. AdultsBRFSS, 1990, 1999, 2009
(*BMI 30, or about 30 lbs. overweight for 5’4” person)
2009
1990
No Data <10% 10%–14% 15%–19% 20%–24% 25%–29% ≥30%
Pediatric Obesity Epidemic
(M. de Onis et al., 2010)
Pediatric Obesity Epidemic
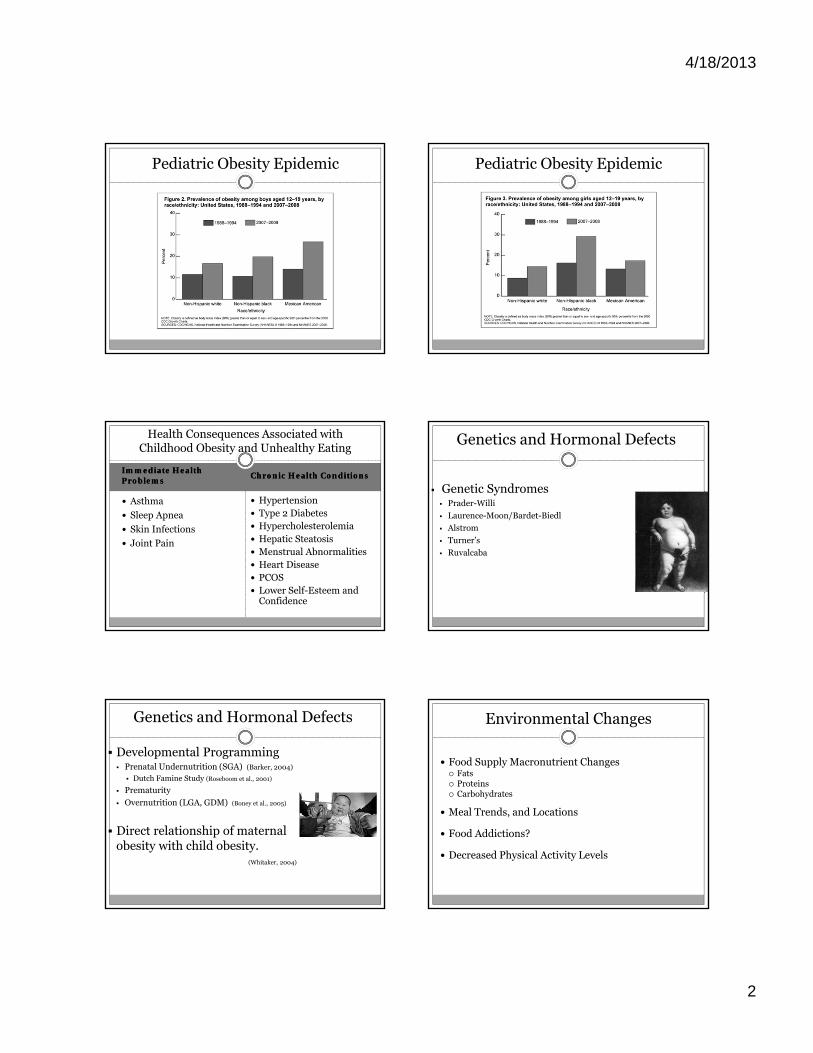
4/18/2013
2
Pediatric Obesity Epidemic Pediatric Obesity Epidemic
Immediate Health ProblemsImmediate Health Problems
Chronic Health ConditionsChronic Health Conditions
Asthma
Sleep Apnea
Skin Infections
Joint Pain
Hypertension Type 2 Diabetes Hypercholesterolemia Hepatic Steatosis Menstrual Abnormalities Heart Disease PCOS Lower Self-Esteem and
Confidence
Health Consequences Associated with Childhood Obesity and Unhealthy Eating
Genetic Syndromes Prader-Willi
Laurence-Moon/Bardet-Biedl
Alstrom
Turner’s
Ruvalcaba
Genetics and Hormonal Defects
Developmental Programming Prenatal Undernutrition (SGA) (Barker, 2004)
Dutch Famine Study (Roseboom et al., 2001)
Prematurity
Overnutrition (LGA, GDM) (Boney et al., 2005)
Direct relationship of maternal obesity with child obesity.
(Whitaker, 2004)
Genetics and Hormonal Defects Environmental Changes
Food Supply Macronutrient Changes Fats Proteins Carbohydrates
Meal Trends, and Locations
Food Addictions?
Decreased Physical Activity Levels
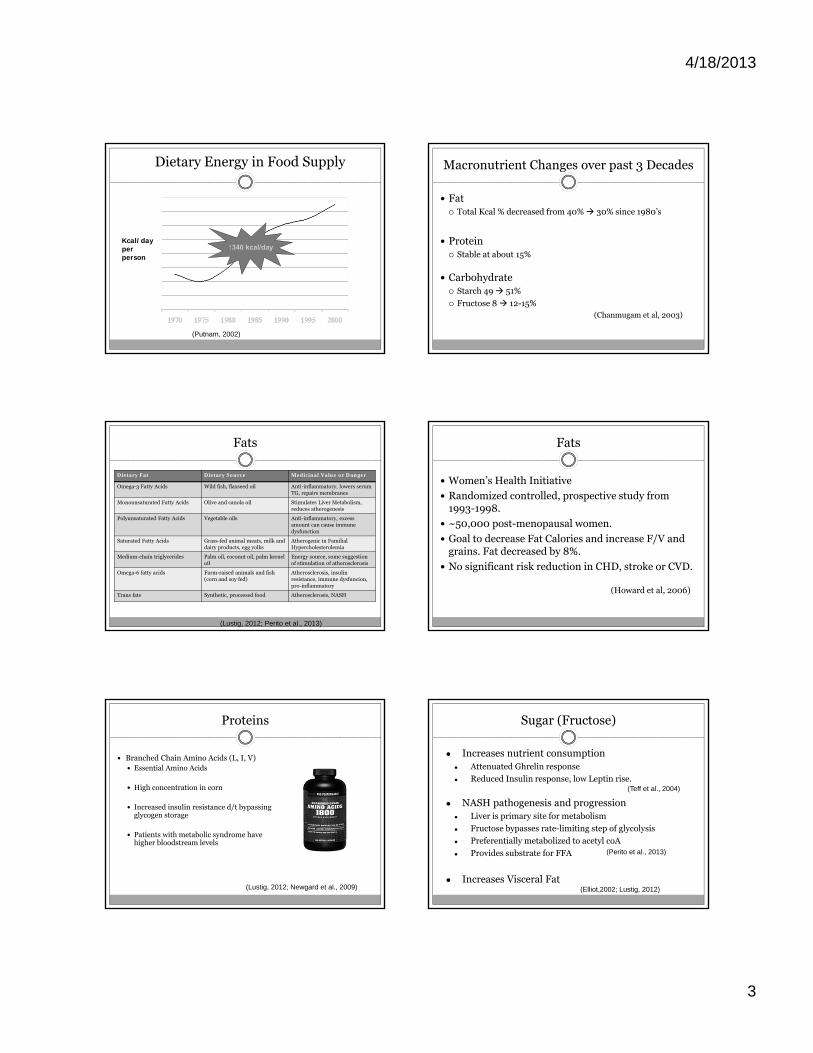
4/18/2013
3
Dietary Energy in Food Supply
Kcal/dayper person
(Putnam, 2002)
↑340 kcal/day
Macronutrient Changes over past 3 Decades
Fat Total Kcal % decreased from 40% 30% since 1980’s
Protein Stable at about 15%
Carbohydrate Starch 49 51%
Fructose 8 12-15%(Chanmugam et al, 2003)
Fats
Dietary Fat Dietary Source Medicinal Value or Danger
Omega-3 Fatty Acids Wild fish, flaxseed oil Anti-inflammatory, lowers serum TG, repairs membranes
Monounsaturated Fatty Acids Olive and canola oil Stimulates Liver Metabolism, reduces atherogenesis
Polyunsaturated Fatty Acids Vegetable oils Anti-inflammatory, excess amount can cause immune dysfunction
Saturated Fatty Acids Grass-fed animal meats, milk and dairy products, egg yolks
Atherogenic in FamilialHypercholesterolemia
Medium-chain triglycerides Palm oil, coconut oil, palm kernel oil
Energy source, some suggestion of stimulation of atherosclerosis
Omega-6 fatty acids Farm-raised animals and fish (corn and soy fed)
Atherosclerosis, insulin resistance, immune dysfuncion,pro-inflammatory
Trans fats Synthetic, processed food Atherosclerosis, NASH
(Lustig, 2012; Perito et al., 2013)
Fats
Women’s Health Initiative
Randomized controlled, prospective study from 1993-1998.
~50,000 post-menopausal women.
Goal to decrease Fat Calories and increase F/V and grains. Fat decreased by 8%.
No significant risk reduction in CHD, stroke or CVD.
(Howard et al, 2006)
Proteins
Branched Chain Amino Acids (L, I, V) Essential Amino Acids
High concentration in corn
Increased insulin resistance d/t bypassing glycogen storage
Patients with metabolic syndrome have higher bloodstream levels
(Lustig, 2012; Newgard et al., 2009)
Sugar (Fructose)
● Increases nutrient consumption● Attenuated Ghrelin response
● Reduced Insulin response, low Leptin rise.
● NASH pathogenesis and progression ● Liver is primary site for metabolism
● Fructose bypasses rate-limiting step of glycolysis
● Preferentially metabolized to acetyl coA
● Provides substrate for FFA
● Increases Visceral Fat
(Teff et al., 2004)
(Perito et al., 2013)
(Elliot,2002; Lustig, 2012)
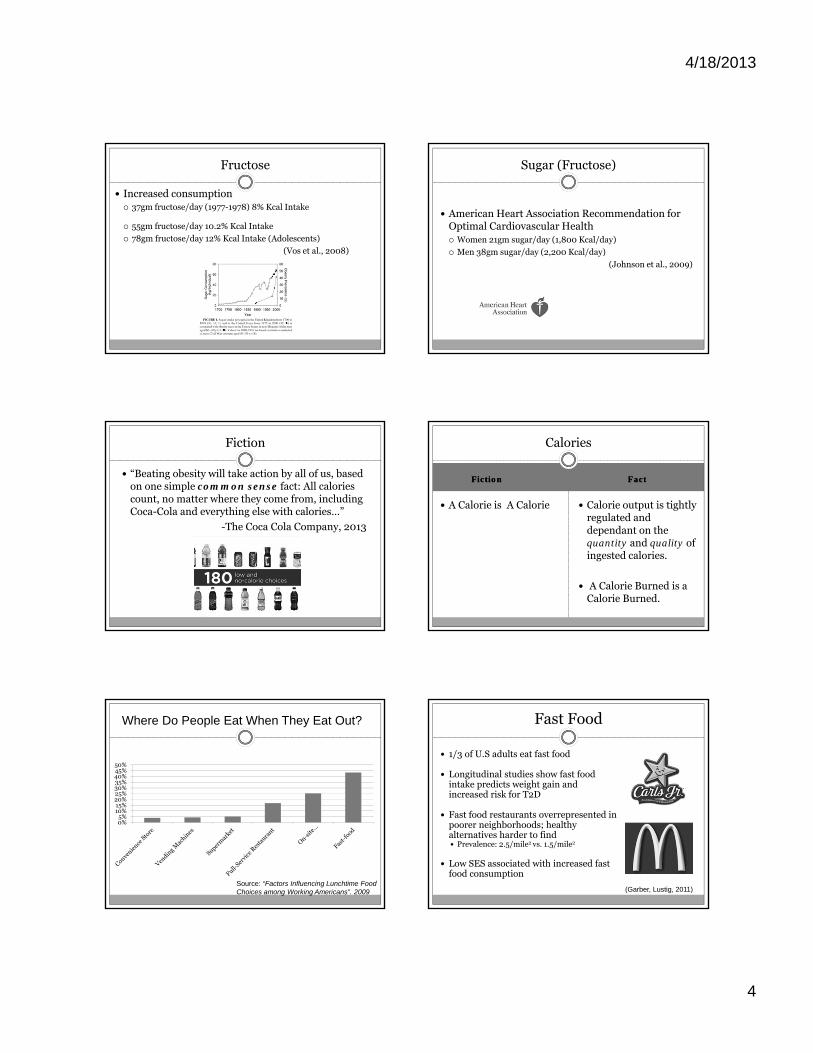
4/18/2013
4
Fructose
Increased consumption 37gm fructose/day (1977-1978) 8% Kcal Intake
55gm fructose/day 10.2% Kcal Intake
78gm fructose/day 12% Kcal Intake (Adolescents)
(Vos et al., 2008)
Sugar (Fructose)
American Heart Association Recommendation for Optimal Cardiovascular Health Women 21gm sugar/day (1,800 Kcal/day)
Men 38gm sugar/day (2,200 Kcal/day)
(Johnson et al., 2009)
Fiction
“Beating obesity will take action by all of us, based on one simple common sense fact: All calories count, no matter where they come from, including Coca-Cola and everything else with calories…”
-The Coca Cola Company, 2013
FictionFiction FactFact
A Calorie is A Calorie Calorie output is tightly regulated and dependant on the quantity and quality of ingested calories.
A Calorie Burned is a Calorie Burned.
Calories
Where Do People Eat When They Eat Out?
0%5%
10%15%20%25%30%35%40%45%50%
Source: “Factors Influencing Lunchtime Food Choices among Working Americans”. 2009
Fast Food
1/3 of U.S adults eat fast food
Longitudinal studies show fast food intake predicts weight gain and increased risk for T2D
Fast food restaurants overrepresented in poorer neighborhoods; healthy alternatives harder to find Prevalence: 2.5/mile2 vs. 1.5/mile2
Low SES associated with increased fast food consumption
(Garber, Lustig, 2011)
4/18/2013
5
Is Fast Food Addictive?
Sugar Rodent Models demonstrate binging,
withdrawal (teeth chattering, tremors, shakes and anxiety)
Seeking and craving
Cross-Sensitization
Human Studies also suggest sugar is addictive with withdrawal
Fructose increases liver and muscle insulin resistance (Sung et al., 2011; Perito et al., 2013)
Blocks leptin’s ability to extinguish mesolimbic dopamine signaling
Photo from cbsnews.com
(Garber, Lustig, 2011)
Caffeine “Flavoring agent”
Increases salience of high rewarding beverage.
Well established psychological & physiological dependence across age spectrum.
Is Fast Food Addictive?
(Garber, Lustig, 2011)
Photo from: http://www.islandcrisis.net
Is Fast Food Addictive?
Environmental Cues Required to create addictive patterns
Powerful external Stimuli trigger reward in animal and human
Vulnerability to environmental cues may explain differences in ability to follow a “diet”
Ads 3-5 per 30 minutes during prime time TV.
(Brown, 2002)
(Garber, Lustig, 2011)
Exercise
33% Percentage of youth who are actual couch
potatoes, engaging in little or no leisure-time physical activity whatsoever
2/3 Proportion of teens that don’t meet the
minimum recommended levels of physical activity of one hour a day of moderate to vigorous activity
>2-3 Daily number of hours children spend
watching TV; more time than on any other single activity except sleeping
<6% Percentage of high schools requiring daily PE
FictionFiction FactsFacts
Exercise alone causes significant weight loss
Exercise—even in absence of weight loss—decreases hepatic steatosis, and other lipotoxicity markers.
Exercise builds muscle and stimulates new mitochondrial development and improves insulin sensitivity
Increases liver’s Krebs cycle speed
Exercise
(Perito et al. 2013)
(Lustig, 2012)
Screening and Identification of Pediatric Obesity
Children 0-24 months use WHO Growth Standards >97th%ile for weight for length
Children >2 years use CDC BMI curves 85-95th%ile: Overweight >95th%ile: Obese
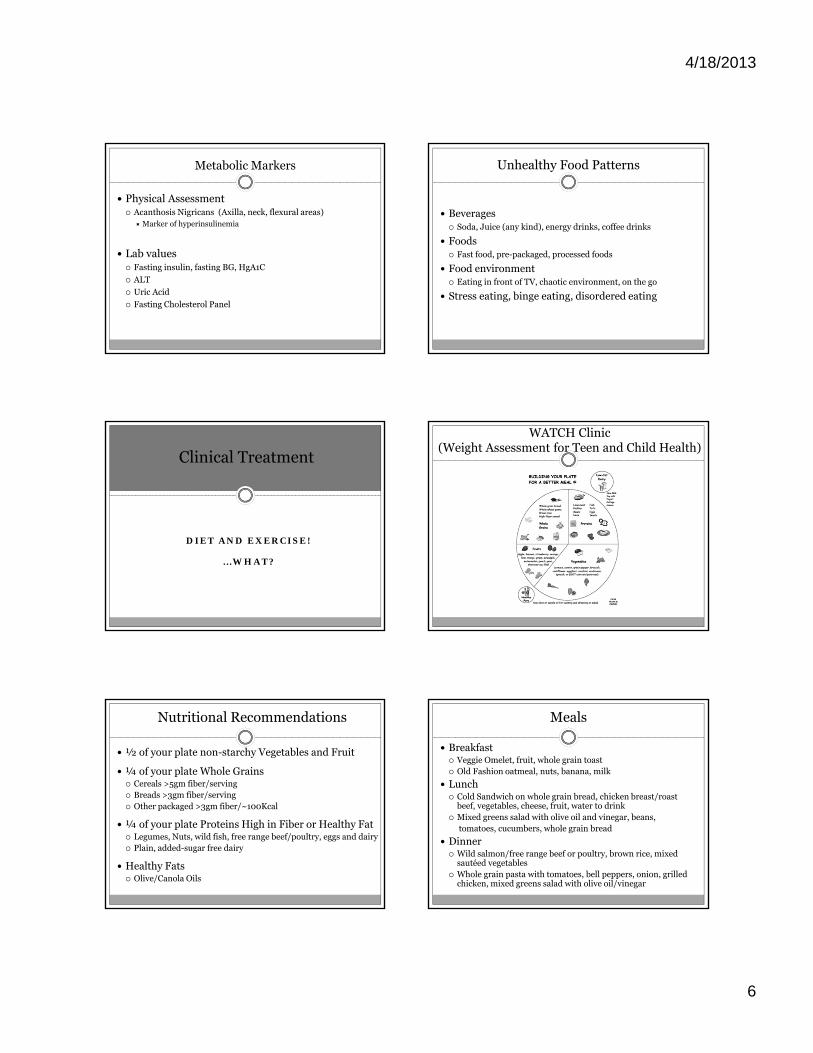
4/18/2013
6
Metabolic Markers
Physical Assessment Acanthosis Nigricans (Axilla, neck, flexural areas)
Marker of hyperinsulinemia
Lab values Fasting insulin, fasting BG, HgA1C
ALT
Uric Acid
Fasting Cholesterol Panel
Unhealthy Food Patterns
Beverages Soda, Juice (any kind), energy drinks, coffee drinks
Foods Fast food, pre-packaged, processed foods
Food environment Eating in front of TV, chaotic environment, on the go
Stress eating, binge eating, disordered eating
DIET AND EXERCISE!
Clinical Treatment
…WHAT?
WATCH Clinic (Weight Assessment for Teen and Child Health)
Nutritional Recommendations
½ of your plate non-starchy Vegetables and Fruit
¼ of your plate Whole Grains Cereals >5gm fiber/serving Breads >3gm fiber/serving Other packaged >3gm fiber/~100Kcal
¼ of your plate Proteins High in Fiber or Healthy Fat Legumes, Nuts, wild fish, free range beef/poultry, eggs and dairy Plain, added-sugar free dairy
Healthy Fats Olive/Canola Oils
Meals
Breakfast Veggie Omelet, fruit, whole grain toast Old Fashion oatmeal, nuts, banana, milk
Lunch Cold Sandwich on whole grain bread, chicken breast/roast
beef, vegetables, cheese, fruit, water to drink Mixed greens salad with olive oil and vinegar, beans,
tomatoes, cucumbers, whole grain bread
Dinner Wild salmon/free range beef or poultry, brown rice, mixed
sautéed vegetables Whole grain pasta with tomatoes, bell peppers, onion, grilled
chicken, mixed greens salad with olive oil/vinegar
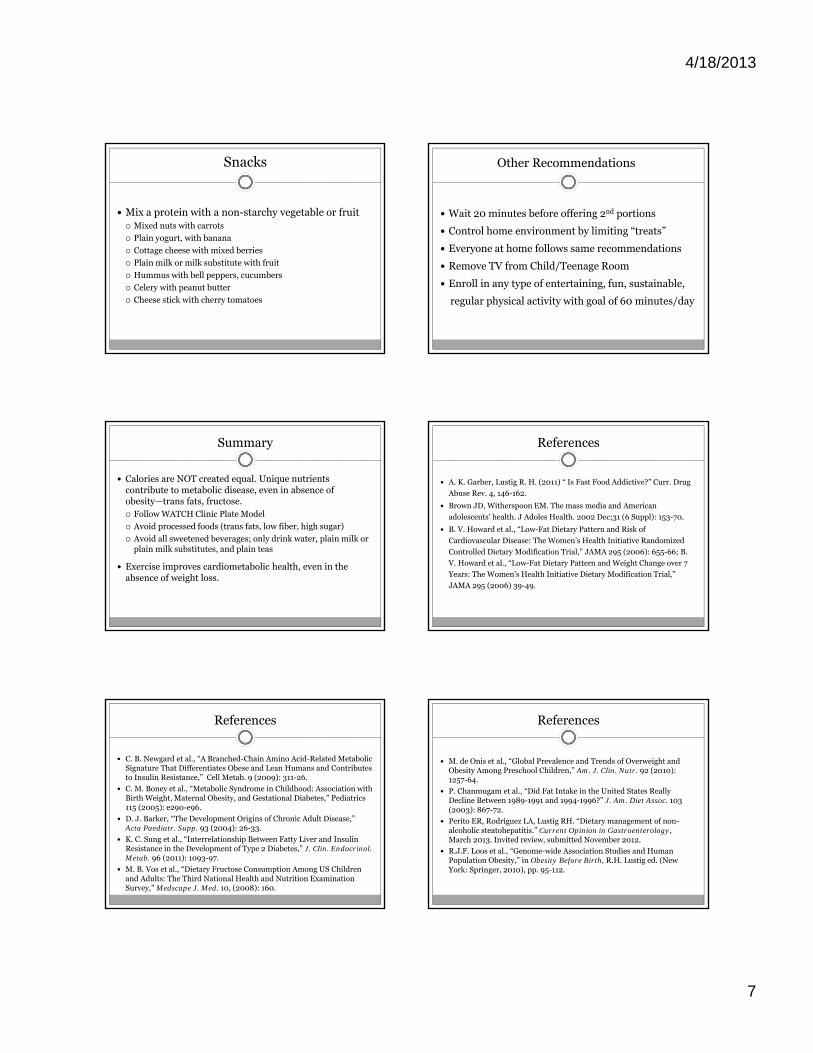
4/18/2013
7
Snacks
Mix a protein with a non-starchy vegetable or fruit Mixed nuts with carrots
Plain yogurt, with banana
Cottage cheese with mixed berries
Plain milk or milk substitute with fruit
Hummus with bell peppers, cucumbers
Celery with peanut butter
Cheese stick with cherry tomatoes
Other Recommendations
Wait 20 minutes before offering 2nd portions
Control home environment by limiting “treats”
Everyone at home follows same recommendations
Remove TV from Child/Teenage Room
Enroll in any type of entertaining, fun, sustainable,
regular physical activity with goal of 60 minutes/day
Summary
Calories are NOT created equal. Unique nutrients contribute to metabolic disease, even in absence of obesity—trans fats, fructose. Follow WATCH Clinic Plate Model
Avoid processed foods (trans fats, low fiber, high sugar)
Avoid all sweetened beverages; only drink water, plain milk or plain milk substitutes, and plain teas
Exercise improves cardiometabolic health, even in the absence of weight loss.
References
A. K. Garber, Lustig R. H. (2011) “ Is Fast Food Addictive?” Curr. Drug
Abuse Rev. 4, 146-162.
Brown JD, Witherspoon EM. The mass media and American
adolescents’ health. J Adoles Health. 2002 Dec;31 (6 Suppl): 153-70.
B. V. Howard et al., “Low-Fat Dietary Pattern and Risk of
Cardiovascular Disease: The Women’s Health Initiative Randomized
Controlled Dietary Modification Trial,” JAMA 295 (2006): 655-66; B.
V. Howard et al., “Low-Fat Dietary Pattern and Weight Change over 7
Years: The Women’s Health Initiative Dietary Modification Trial,”
JAMA 295 (2006) 39-49.
References
C. B. Newgard et al., “A Branched-Chain Amino Acid-Related Metabolic Signature That Differentiates Obese and Lean Humans and Contributes to Insulin Resistance,” Cell Metab. 9 (2009): 311-26.
C. M. Boney et al., “Metabolic Syndrome in Childhood: Association with Birth Weight, Maternal Obesity, and Gestational Diabetes,” Pediatrics 115 (2005): e290-e96.
D. J. Barker, “The Development Origins of Chronic Adult Disease,” Acta Paediatr. Supp. 93 (2004): 26-33.
K. C. Sung et al., “Interrelationship Between Fatty Liver and Insulin Resistance in the Development of Type 2 Diabetes,” J. Clin. Endocrinol. Metab. 96 (2011): 1093-97.
M. B. Vos et al., “Dietary Fructose Consumption Among US Children and Adults: The Third National Health and Nutrition Examination Survey,” Medscape J. Med. 10, (2008): 160.
References
M. de Onis et al., “Global Prevalence and Trends of Overweight and Obesity Among Preschool Children,” Am. J. Clin. Nutr. 92 (2010): 1257-64.
P. Chanmugam et al., “Did Fat Intake in the United States Really Decline Between 1989-1991 and 1994-1996?” J. Am. Diet Assoc. 103 (2003): 867-72.
Perito ER, Rodriguez LA, Lustig RH. “Dietary management of non-alcoholic steatohepatitis.” Current Opinion in Gastroenterology, March 2013. Invited review, submitted November 2012.
R.J.F. Loos et al., “Genome-wide Association Studies and Human Population Obesity,” in Obesity Before Birth, R.H. Lustig ed. (New York: Springer, 2010), pp. 95-112.
4/18/2013
8
References
R.K. Johnson et al., “Dietary Sugars Intake and Cardiovascular Health: A Scientific Statement From the American Heart Association. Circulation.” 2009 Sep 15; 120 (11):1011-20.
Robert H. Lustig, Fat Chance: Beating the Odds Against Sugar, Processed Food, Obesity, and Disease. New York: Penguin, 2012.
S. J. Olshansky et al., “A Potential Decline in Life Expectancy in the United States in the 21st Century,” New Engl. J. Med. 352 (2005): 1138-45.
Teff K, et al. Dietary Fructose Reduces Circulating Insulin and Leptin, Attenuates Posprandial Suppression of Ghrelin, and increases Triglycerides in Women. J Clin Endocr Metab (2004): 89:2963-2972.
T. J. Roseboom et al., “Effects of Prenatal Exposure to the Dutch Famine on Adult Disease in Later Life: An Overview,” Mol. Cell. Endocrinol. 185 (2001): 93-98.
Whitaker, R. “Predicting Preschooler Obesity at Birth: The Role of Maternal Obesity in Early Pregnancy,” Pediatrics. (2004): 114; e29.

Whole Grains
Proteins
Low-fat Dairy
Healthy Fats
Skim Milk Soy milk Yogurt Cottage cheese
Lettuce, carrot, green pepper, broccoli, cauliflower, eggplant, zucchini, mushroom,
spinach, or (NOT corn and potatoes)
Use olive or canola oil for cooking and dressing on salad
Whole grain bread Whole wheat pasta Brown rice High-fiber cereal
Lean meat Fish Poultry Tofu Beans Eggs Nuts Seeds
tofu
BUILDING YOUR PLATE FOR A BETTER MEAL ©
UCSF WATCH CLINIC
Apple, banana, strawberry, orange, kiwi, mango, grape, pineapple,
watermelon, peach, pear, whatever you like!
Fruits
Vegetables

Created by Andrea Garber, PhD, RD and Daphne Drohr, UCSF WATCH clinic Copyright August 2003
KEY CONCEPTS FOR HEALTHY EATING: Switch to whole grain bread, cereal, pasta and rice Get away from “white fluffies”, including white bread, corn, potatoes, rice and cereal with added sugar. Because they don’t contain fiber, they put a lot of sugar into your blood and leave you feeling hungrier sooner.
• Bread: LOOK FOR at least 3 grams fiber/serving Good choices: “100% whole grain” bread, Pumpernickel or rye.
• Cereal: LOOK FOR at least 5 grams fiber/serving Good choices: Post Bran Flakes, Kellogg’s All Bran and Kashi Good Friends
• Pasta: choose whole wheat instead of white noodles • Rice: choose brown or wild instead of white rice
Eat protein with meals Include a protein with every meal and snack. Proteins are low in sugar and keep you feeling full.
• Great sources of protein: tofu, beans, and nuts contain protein, fiber and healthy fats.
• Good sources of protein: lean meats with no visible fat. o Chicken and turkey: choose white meat o Eggs: about 1 per day is OK. Yes, you can eat the yolks!
Eat more vegetables and some fruits Vegetables are low in calories and packed with vitamins, minerals and fiber. Fruit is healthy but it contains lots of sugar so eat a smaller portion.
• Keep them cut-up and ready to go in the refrigerator • Eat them with a protein for a healthy snack • Snack ideas:
o Celery sticks + peanut butter o Strawberries + plain yogurt o Carrot sticks + hummous (bean dip)
Drink water and low-fat milk Cut out regular soda and juice.
• Drink more water or flavored water (no calories). If must have soda, choose a diet soda.
• Low-fat milk is a healthy drink with protein, vitamins, and calcium to keep your bones strong!
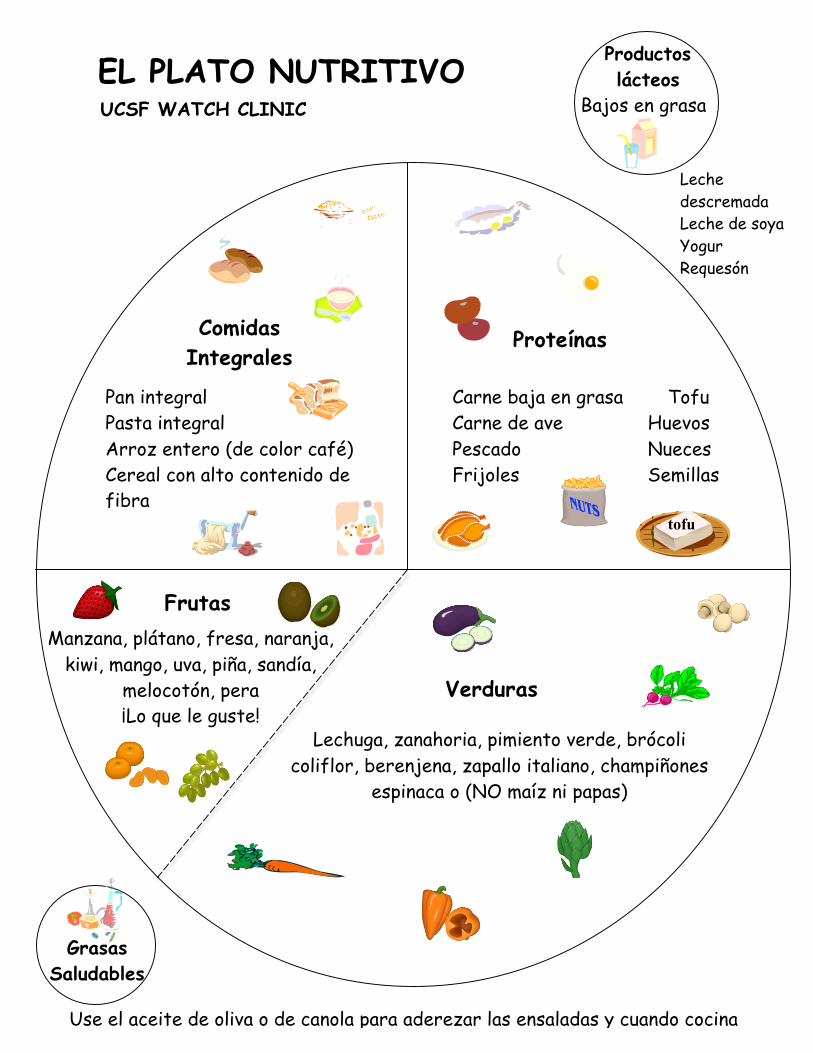
Productos lácteos
Bajos en grasa
Frutas
Comidas Integrales
Proteínas
Grasas Saludables
Leche descremada Leche de soya Yogur Requesón
Use el aceite de oliva o de canola para aderezar las ensaladas y cuando cocina
Pan integral Pasta integral Arroz entero (de color café) Cereal con alto contenido de fibra
Lechuga, zanahoria, pimiento verde, brócoli coliflor, berenjena, zapallo italiano, champiñones
espinaca o (NO maíz ni papas)
Carne baja en grasa Tofu Carne de ave Huevos Pescado Nueces Frijoles Semillas
tofu
EL PLATO NUTRITIVO UCSF WATCH CLINIC
Manzana, plátano, fresa, naranja,
kiwi, mango, uva, piña, sandía, melocotón, pera ¡Lo que le guste!
Verduras
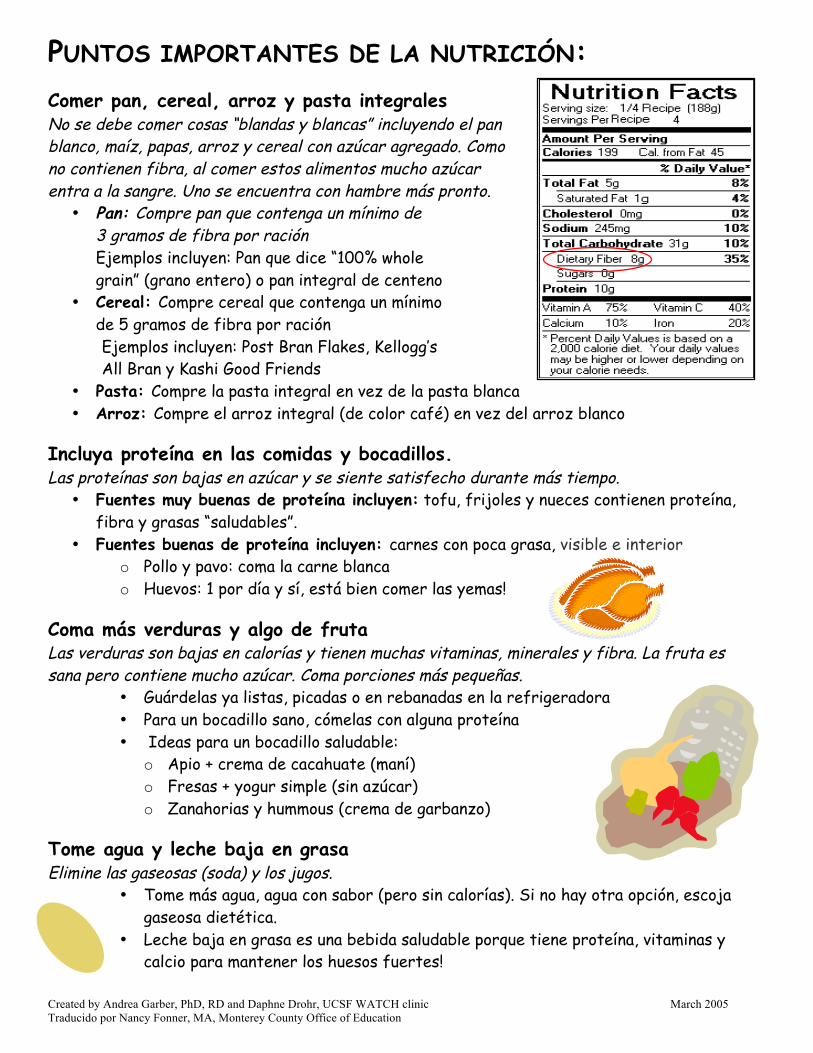
Created by Andrea Garber, PhD, RD and Daphne Drohr, UCSF WATCH clinic March 2005 Traducido por Nancy Fonner, MA, Monterey County Office of Education
PUNTOS IMPORTANTES DE LA NUTRICIÓN: Comer pan, cereal, arroz y pasta integrales No se debe comer cosas “blandas y blancas” incluyendo el pan blanco, maíz, papas, arroz y cereal con azúcar agregado. Como no contienen fibra, al comer estos alimentos mucho azúcar entra a la sangre. Uno se encuentra con hambre más pronto.
• Pan: Compre pan que contenga un mínimo de 3 gramos de fibra por ración Ejemplos incluyen: Pan que dice “100% whole grain” (grano entero) o pan integral de centeno
• Cereal: Compre cereal que contenga un mínimo de 5 gramos de fibra por ración Ejemplos incluyen: Post Bran Flakes, Kellogg’s All Bran y Kashi Good Friends
• Pasta: Compre la pasta integral en vez de la pasta blanca • Arroz: Compre el arroz integral (de color café) en vez del arroz blanco
Incluya proteína en las comidas y bocadillos. Las proteínas son bajas en azúcar y se siente satisfecho durante más tiempo.
• Fuentes muy buenas de proteína incluyen: tofu, frijoles y nueces contienen proteína, fibra y grasas “saludables”.
• Fuentes buenas de proteína incluyen: carnes con poca grasa, visible e interior o Pollo y pavo: coma la carne blanca o Huevos: 1 por día y sí, está bien comer las yemas!
Coma más verduras y algo de fruta Las verduras son bajas en calorías y tienen muchas vitaminas, minerales y fibra. La fruta es sana pero contiene mucho azúcar. Coma porciones más pequeñas.
• Guárdelas ya listas, picadas o en rebanadas en la refrigeradora • Para un bocadillo sano, cómelas con alguna proteína • Ideas para un bocadillo saludable:
o Apio + crema de cacahuate (maní) o Fresas + yogur simple (sin azúcar) o Zanahorias y hummous (crema de garbanzo)
Tome agua y leche baja en grasa Elimine las gaseosas (soda) y los jugos.
• Tome más agua, agua con sabor (pero sin calorías). Si no hay otra opción, escoja gaseosa dietética.
• Leche baja en grasa es una bebida saludable porque tiene proteína, vitaminas y calcio para mantener los huesos fuertes!

WATCH CLINIC SHOPPING LIST ©
These foods are higher in fiber and lower in sugar, starch and unhealthy fats (saturated and trans)
High fiber cereals Steel cut (Irish) oatmeal Rolled oats All Bran Muesli Kashi Whole grain breads Coarse wheat kernel Cracked wheat (bulgur) Coarse barley kernel Coarse rye kernel (pumpernickel) Whole grain pumpernickel Oat bran bread Healthy Choice Hearty 7 Grain Buckwheat bread Whole grains, rice and pasta Protein enriched pasta Wild rice Bulgur wheat Semolina Rye Tortillas Whole wheat tortilla
Eggs Meat Fish Lamb Turkey Chicken Lean ground beef Nuts Almonds Peanuts Walnuts Peanut butter (all natural) Non-meat Veggie/Garden Burger Boca Burger Tofu Dairy Plain low-fat yogurt String cheese Low-fat cottage cheese Mozzarella cheese Farmer’s cheese Queso fresco Beans Garbanzo beans Black beans Lentil beans Kidney beans Black-eyed beas
Fruits Apple Asparagus Banana Bean Sprouts Cantaloupe Watermelon Honey dew Bok Choy Strawberries Tomato Raspberries Broccoli Blueberries Carrots Cauliflower Cherries Apricots Cherry Tomato Cucumber Guava Eggplant Grapes Green Beans Green Bell Peppers Kiwi Green Peas Mango Lettuce Mandarin Orange Mushroom Onion Papaya Peppers Peach Radish Pear Red Bell Peppers Pineapple Spaghetti Squash Plum Spinach Star fruit Squash Yellow Bell Peppers Dried apricots Dried apples Apple sauce (no sugar added) Fruit cocktail (NOT in syrup)
Vegetables Asparagus Bean sprouts Bell peppers Bok choy Broccoli Carrots Cauliflower Tomato Cucumber Eggplant Green beans Lettuce Mushroom Onion Peas Radish Squash Spinach Tomato Zucchini
Water Non-fat milk Crystal Geyser 1% milk Club soda Low-fat Soy Milk (fortified) Sparkling water Rice Milk (fortified) Sugar free flavored waters Coffee (black) Herbal tea
CONDIMENTS
WHOLE GRAINS PROTEINS FRUITS and VEGETABLES
BEVERAGES
Sauces, Dips and Spreads Hummus Spices Salsa Mrs. Dash Mustard Pepper Yogurt sauce Earth Balance buttery spread Spreadable Fruit Salad dressing made with olive and canola oil Olive and canola oil are best for cooking, dipping and salad dressing
These are the healthiest foods Choose most of your foods from this list
Fruits and veggies can be fresh, frozen, or canned. Here are some ideas:
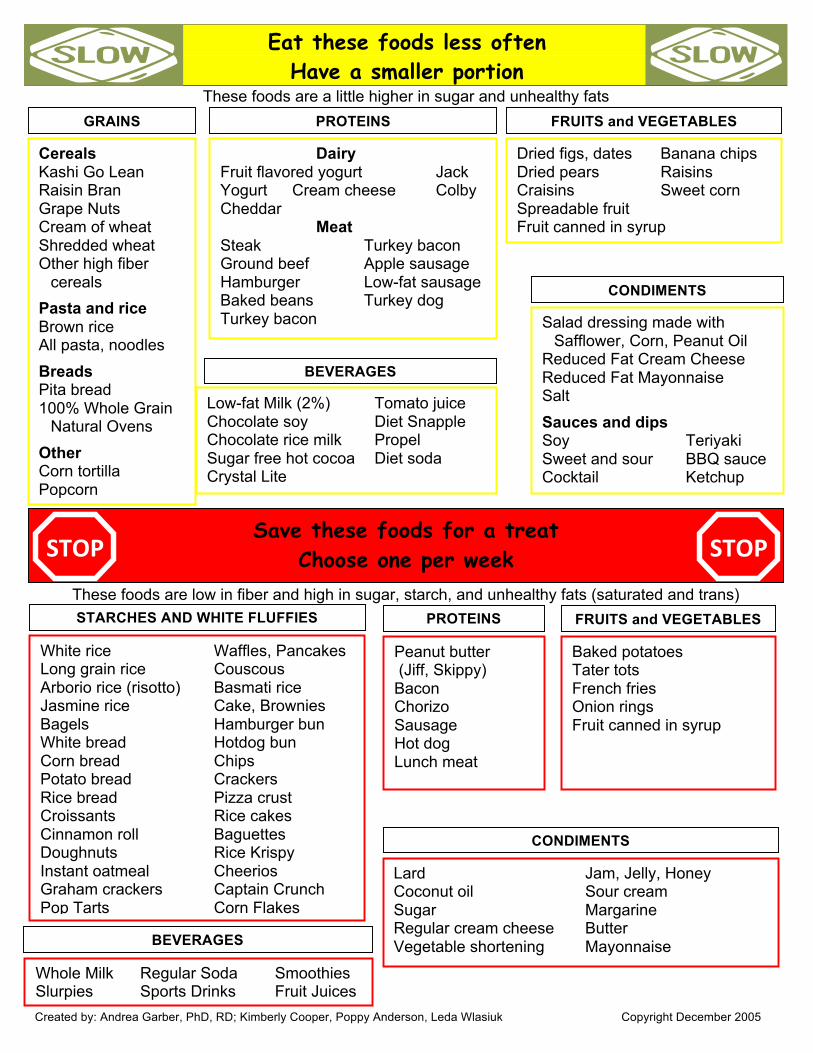
These foods are a little higher in sugar and unhealthy fats
These foods are low in fiber and high in sugar, starch, and unhealthy fats (saturated and trans)
Save these foods for a treat Choose one per week
Eat these foods less often Have a smaller portion
GRAINS PROTEINS FRUITS and VEGETABLES
Cereals Kashi Go Lean Raisin Bran Grape Nuts Cream of wheat Shredded wheat Other high fiber
cereals Pasta and rice Brown rice All pasta, noodles Breads Pita bread 100% Whole Grain
Natural Ovens Other Corn tortilla Popcorn
Dairy Fruit flavored yogurt Jack Yogurt Cream cheese Colby Cheddar Meat Steak Turkey bacon Ground beef Apple sausage Hamburger Low-fat sausage Baked beans Turkey dog Turkey bacon
Dried figs, dates Banana chips Dried pears Raisins Craisins Sweet corn Spreadable fruit Fruit canned in syrup
Low-fat Milk (2%) Tomato juice Chocolate soy Diet Snapple Chocolate rice milk Propel Sugar free hot cocoa Diet soda Crystal Lite
CONDIMENTS
BEVERAGES
Salad dressing made with Safflower, Corn, Peanut Oil
Reduced Fat Cream Cheese Reduced Fat Mayonnaise Salt Sauces and dips Soy Teriyaki Sweet and sour BBQ sauce Cocktail Ketchup
White rice Waffles, Pancakes Long grain rice Couscous Arborio rice (risotto) Basmati rice Jasmine rice Cake, Brownies Granola Bagels Hamburger bun White bread Hotdog bun Corn bread Chips Fruity Pebbles® Potato bread Crackers Rice bread Pizza crust Croissants Rice cakes Cinnamon roll Baguettes Doughnuts Rice Krispy Instant oatmeal Cheerios Graham crackers Captain Crunch Pop Tarts Corn Flakes
Peanut butter (Jiff, Skippy) Bacon Chorizo Sausage Hot dog Lunch meat
STARCHES AND WHITE FLUFFIES PROTEINS
Baked potatoes Tater tots French fries Onion rings Fruit canned in syrup
FRUITS and VEGETABLES
BEVERAGES
CONDIMENTS
Whole Milk Regular Soda Smoothies Slurpies Sports Drinks Fruit Juices
Lard Jam, Jelly, Honey Coconut oil Sour cream Sugar Margarine Regular cream cheese Butter Vegetable shortening Mayonnaise
Created by: Andrea Garber, PhD, RD; Kimberly Cooper, Poppy Anderson, Leda Wlasiuk Copyright December 2005
STOP STOP
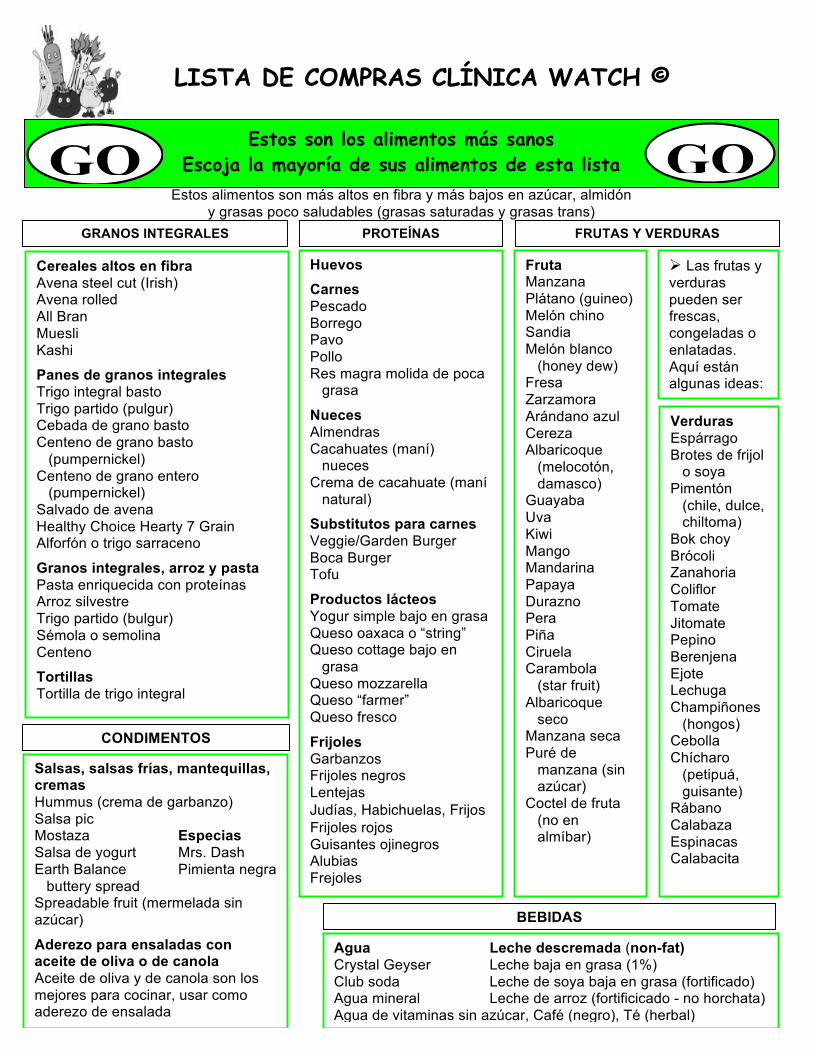
LISTA DE COMPRAS CLÍNICA WATCH ©
Las frutas y verduras pueden ser frescas, congeladas o enlatadas. Aquí están algunas ideas:
Estos alimentos son más altos en fibra y más bajos en azúcar, almidón y grasas poco saludables (grasas saturadas y grasas trans)
Cereales altos en fibra Avena steel cut (Irish) Avena rolled All Bran Muesli Kashi
Panes de granos integrales Trigo integral basto Trigo partido (pulgur) Cebada de grano basto Centeno de grano basto
(pumpernickel) Centeno de grano entero
(pumpernickel) Salvado de avena Healthy Choice Hearty 7 Grain Alforfón o trigo sarraceno
Granos integrales, arroz y pasta Pasta enriquecida con proteínas Arroz silvestre Trigo partido (bulgur) Sémola o semolina Centeno
Tortillas Tortilla de trigo integral
Huevos Carnes Pescado Borrego Pavo Pollo Res magra molida de poca
grasa
Nueces Almendras Cacahuates (maní) nueces Crema de cacahuate (maní
natural)
Substitutos para carnes Veggie/Garden Burger Boca Burger Tofu
Productos lácteos Yogur simple bajo en grasa Queso oaxaca o “string” Queso cottage bajo en
grasa Queso mozzarella Queso “farmer” Queso fresco
Frijoles Garbanzos Frijoles negros Lentejas Judías, Habichuelas, Frijos Frijoles rojos Guisantes ojinegros Alubias Frejoles
Fruta Manzana Asparagus Plátano (guineo) Bean Sprouts Melón chino Sandia Melón blanco
(honey dew) Bok Choy Fresa Tomato Zarzamora Broccoli Arándano azul Carrots Cauliflower Cereza Albaricoque
(melocotón, damasco) Cherry Tomato Cucumber
Guayaba Eggplant Uva Green Beans Green Bell Peppers Kiwi Green Peas Mango Lettuce Mandarina Mushroom Onion Papaya Peppers Durazno Radish Pera Red Bell Peppers Piña Spaghetti Squash Ciruela Spinach Carambola (star fruit) Squash Yellow Bell Peppers Albaricoque
seco Manzana seca Puré de
manzana (sin azúcar)
Coctel de fruta (no en almíbar)
Verduras Espárrago Brotes de frijol
o soya Pimentón
(chile, dulce, chiltoma)
Bok choy Brócoli Zanahoria Coliflor Tomate Jitomate Pepino Berenjena Ejote Lechuga Champiñones
(hongos) Cebolla Chícharo
(petipuá, guisante)
Rábano Calabaza Espinacas Calabacita
Agua Leche descremada (non-fat) Crystal Geyser Leche baja en grasa (1%) Club soda Leche de soya baja en grasa (fortificado) Agua mineral Leche de arroz (fortificicado - no horchata) Agua de vitaminas sin azúcar, Café (negro), Té (herbal)
CONDIMENTOS
GRANOS INTEGRALES PROTEÍNAS FRUTAS Y VERDURAS
BEBIDAS
Salsas, salsas frías, mantequillas, cremas Hummus (crema de garbanzo) Salsa pic Mostaza Especias Salsa de yogurt Mrs. Dash Earth Balance Pimienta negra
buttery spread Spreadable fruit (mermelada sin azúcar)
Aderezo para ensaladas con aceite de oliva o de canola Aceite de oliva y de canola son los mejores para cocinar, usar como aderezo de ensalada
Estos son los alimentos más sanos Escoja la mayoría de sus alimentos de esta lista
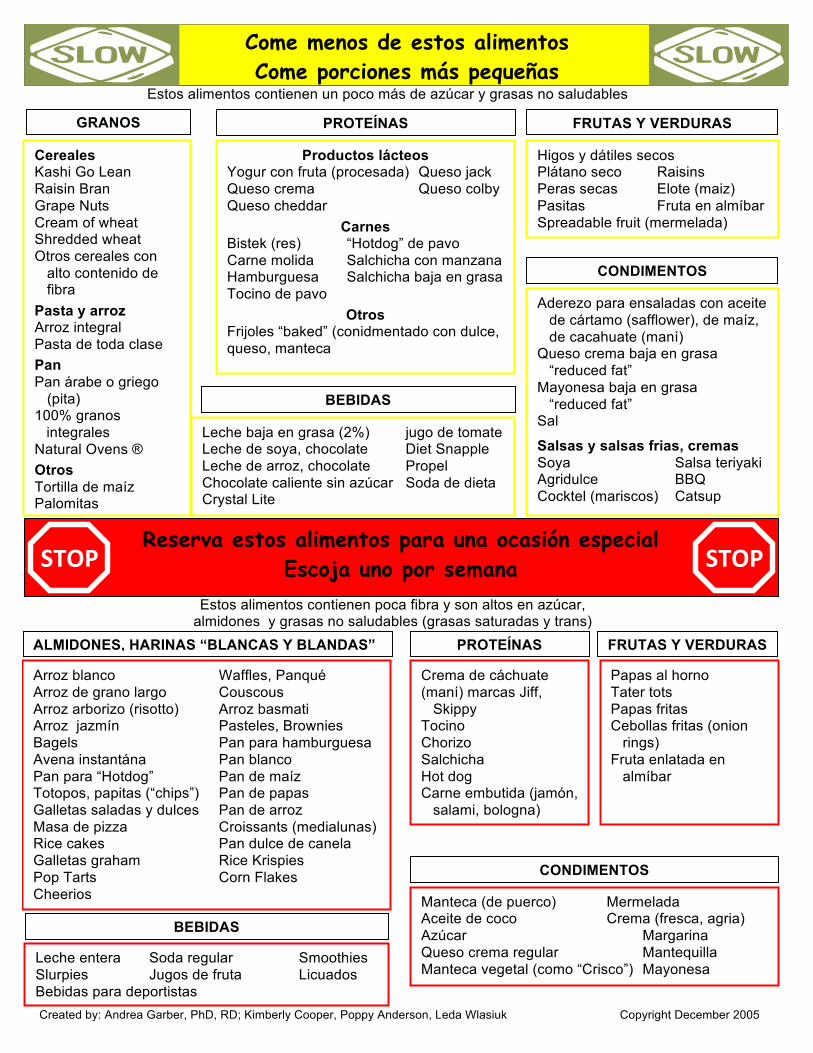
Estos alimentos contienen poca fibra y son altos en azúcar, almidones y grasas no saludables (grasas saturadas y trans)
Estos alimentos contienen un poco más de azúcar y grasas no saludables
Reserva estos alimentos para una ocasión especial Escoja uno por semana
Come menos de estos alimentos Come porciones más pequeñas
Productos lácteos Yogur con fruta (procesada) Queso jack Queso crema Queso colby Queso cheddar
Carnes Bistek (res) “Hotdog” de pavo Carne molida Salchicha con manzana Hamburguesa Salchicha baja en grasa Tocino de pavo
Otros Frijoles “baked” (conidmentado con dulce, queso, manteca
GRANOS PROTEÍNAS FRUTAS Y VERDURAS
Cereales Kashi Go Lean Raisin Bran Grape Nuts Cream of wheat Shredded wheat Otros cereales con
alto contenido de fibra
Pasta y arroz Arroz integral Pasta de toda clase Pan Pan árabe o griego
(pita) 100% granos
integrales Natural Ovens ® Otros Tortilla de maíz Palomitas
Higos y dátiles secos Plátano seco Raisins Peras secas Elote (maiz) Pasitas Fruta en almíbar Spreadable fruit (mermelada)
Leche baja en grasa (2%) jugo de tomate Leche de soya, chocolate Diet Snapple Leche de arroz, chocolate Propel Chocolate caliente sin azúcar Soda de dieta Crystal Lite
CONDIMENTOS
BEBIDAS
Aderezo para ensaladas con aceite de cártamo (safflower), de maíz, de cacahuate (maní)
Queso crema baja en grasa “reduced fat”
Mayonesa baja en grasa “reduced fat” Sal
Salsas y salsas frias, cremas Soya Salsa teriyaki Agridulce BBQ Cocktel (mariscos) Catsup
Created by: Andrea Garber, PhD, RD; Kimberly Cooper, Poppy Anderson, Leda Wlasiuk Copyright December 2005
STOP STOP
Arroz blanco Waffles, Panqué Arroz de grano largo Couscous Arroz arborizo (risotto) Arroz basmati Arroz jazmín Pasteles, Brownies Bagels Pan para hamburguesa Avena instantána Pan blanco Pan para “Hotdog” Pan de maíz Totopos, papitas (“chips”) Pan de papas Galletas saladas y dulces Pan de arroz Masa de pizza Croissants (medialunas) Rice cakes Pan dulce de canela Galletas graham Rice Krispies Pop Tarts Corn Flakes Cheerios
Crema de cáchuate (maní) marcas Jiff, Skippy Tocino Chorizo Salchicha Hot dog Carne embutida (jamón,
salami, bologna)
PROTEÍNAS
Papas al horno Tater tots Papas fritas Cebollas fritas (onion
rings) Fruta enlatada en
almíbar
FRUTAS Y VERDURAS
CONDIMENTOS
BEBIDAS Leche entera Soda regular Smoothies Slurpies Jugos de fruta Licuados Bebidas para deportistas
Manteca (de puerco) Mermelada Aceite de coco Crema (fresca, agria) Azúcar Margarina Queso crema regular Mantequilla Manteca vegetal (como “Crisco”) Mayonesa
ALMIDONES, HARINAS “BLANCAS Y BLANDAS”
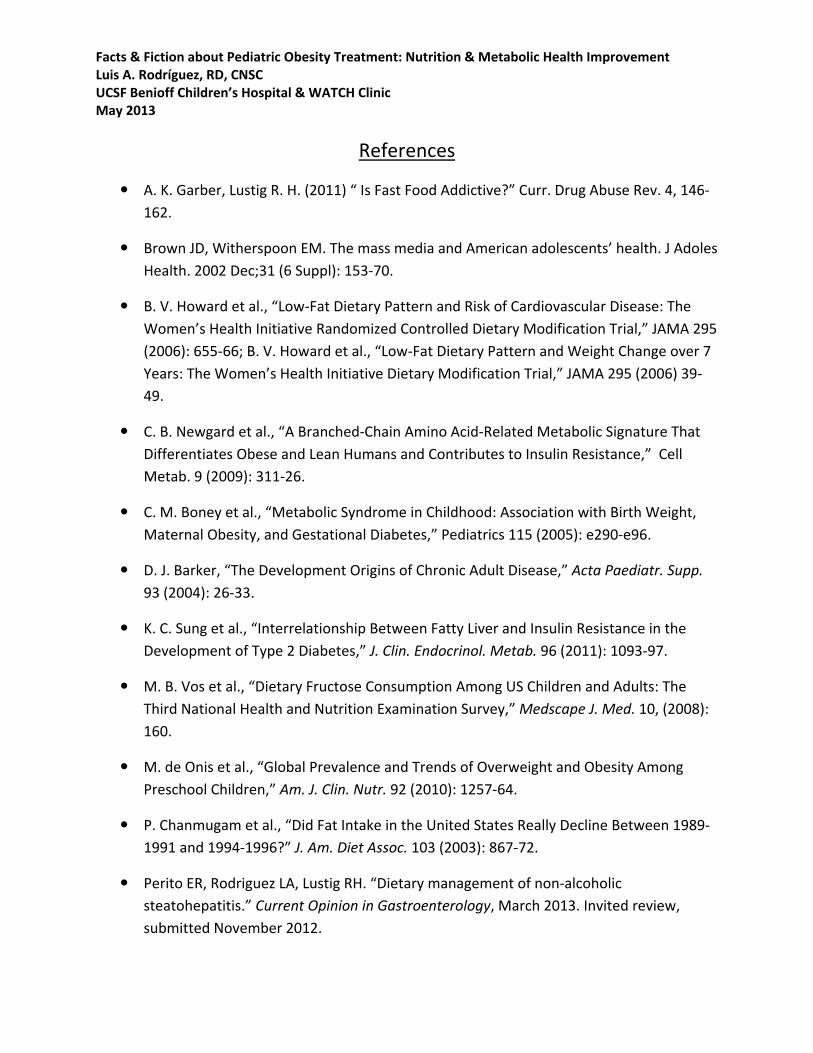
Facts & Fiction about Pediatric Obesity Treatment: Nutrition & Metabolic Health Improvement Luis A. Rodríguez, RD, CNSC UCSF Benioff Children’s Hospital & WATCH Clinic May 2013
References
A. K. Garber, Lustig R. H. (2011) “ Is Fast Food Addictive?” Curr. Drug Abuse Rev. 4, 146‐
162.
Brown JD, Witherspoon EM. The mass media and American adolescents’ health. J Adoles
Health. 2002 Dec;31 (6 Suppl): 153‐70.
B. V. Howard et al., “Low‐Fat Dietary Pattern and Risk of Cardiovascular Disease: The
Women’s Health Initiative Randomized Controlled Dietary Modification Trial,” JAMA 295
(2006): 655‐66; B. V. Howard et al., “Low‐Fat Dietary Pattern and Weight Change over 7
Years: The Women’s Health Initiative Dietary Modification Trial,” JAMA 295 (2006) 39‐
49.
C. B. Newgard et al., “A Branched‐Chain Amino Acid‐Related Metabolic Signature That
Differentiates Obese and Lean Humans and Contributes to Insulin Resistance,” Cell
Metab. 9 (2009): 311‐26.
C. M. Boney et al., “Metabolic Syndrome in Childhood: Association with Birth Weight,
Maternal Obesity, and Gestational Diabetes,” Pediatrics 115 (2005): e290‐e96.
D. J. Barker, “The Development Origins of Chronic Adult Disease,” Acta Paediatr. Supp.
93 (2004): 26‐33.
K. C. Sung et al., “Interrelationship Between Fatty Liver and Insulin Resistance in the
Development of Type 2 Diabetes,” J. Clin. Endocrinol. Metab. 96 (2011): 1093‐97.
M. B. Vos et al., “Dietary Fructose Consumption Among US Children and Adults: The
Third National Health and Nutrition Examination Survey,” Medscape J. Med. 10, (2008):
160.
M. de Onis et al., “Global Prevalence and Trends of Overweight and Obesity Among
Preschool Children,” Am. J. Clin. Nutr. 92 (2010): 1257‐64.
P. Chanmugam et al., “Did Fat Intake in the United States Really Decline Between 1989‐
1991 and 1994‐1996?” J. Am. Diet Assoc. 103 (2003): 867‐72.
Perito ER, Rodriguez LA, Lustig RH. “Dietary management of non‐alcoholic
steatohepatitis.” Current Opinion in Gastroenterology, March 2013. Invited review,
submitted November 2012.
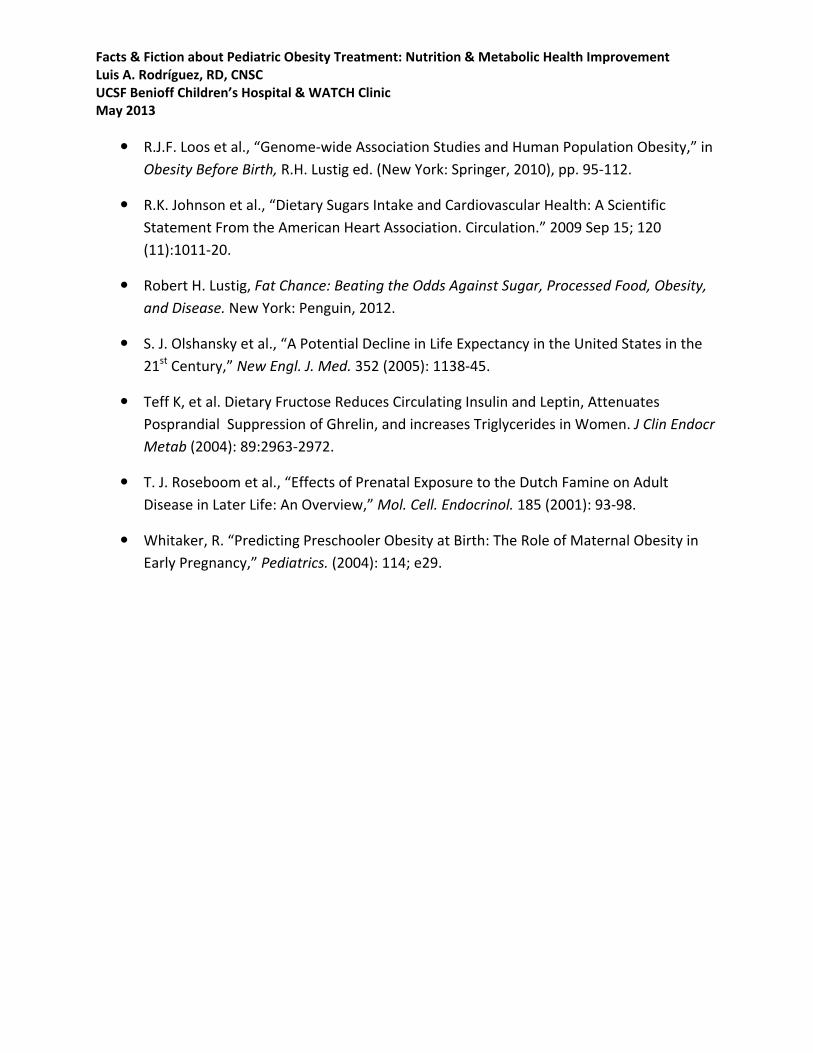
Facts & Fiction about Pediatric Obesity Treatment: Nutrition & Metabolic Health Improvement Luis A. Rodríguez, RD, CNSC UCSF Benioff Children’s Hospital & WATCH Clinic May 2013
R.J.F. Loos et al., “Genome‐wide Association Studies and Human Population Obesity,” in
Obesity Before Birth, R.H. Lustig ed. (New York: Springer, 2010), pp. 95‐112.
R.K. Johnson et al., “Dietary Sugars Intake and Cardiovascular Health: A Scientific
Statement From the American Heart Association. Circulation.” 2009 Sep 15; 120
(11):1011‐20.
Robert H. Lustig, Fat Chance: Beating the Odds Against Sugar, Processed Food, Obesity,
and Disease. New York: Penguin, 2012.
S. J. Olshansky et al., “A Potential Decline in Life Expectancy in the United States in the
21st Century,” New Engl. J. Med. 352 (2005): 1138‐45.
Teff K, et al. Dietary Fructose Reduces Circulating Insulin and Leptin, Attenuates
Posprandial Suppression of Ghrelin, and increases Triglycerides in Women. J Clin Endocr
Metab (2004): 89:2963‐2972.
T. J. Roseboom et al., “Effects of Prenatal Exposure to the Dutch Famine on Adult
Disease in Later Life: An Overview,” Mol. Cell. Endocrinol. 185 (2001): 93‐98.
Whitaker, R. “Predicting Preschooler Obesity at Birth: The Role of Maternal Obesity in
Early Pregnancy,” Pediatrics. (2004): 114; e29.
SATURDAY, MAY 18, 2013
11:10
P Bariatric Surgery: Why or Why Not
Dr. Lan Vu
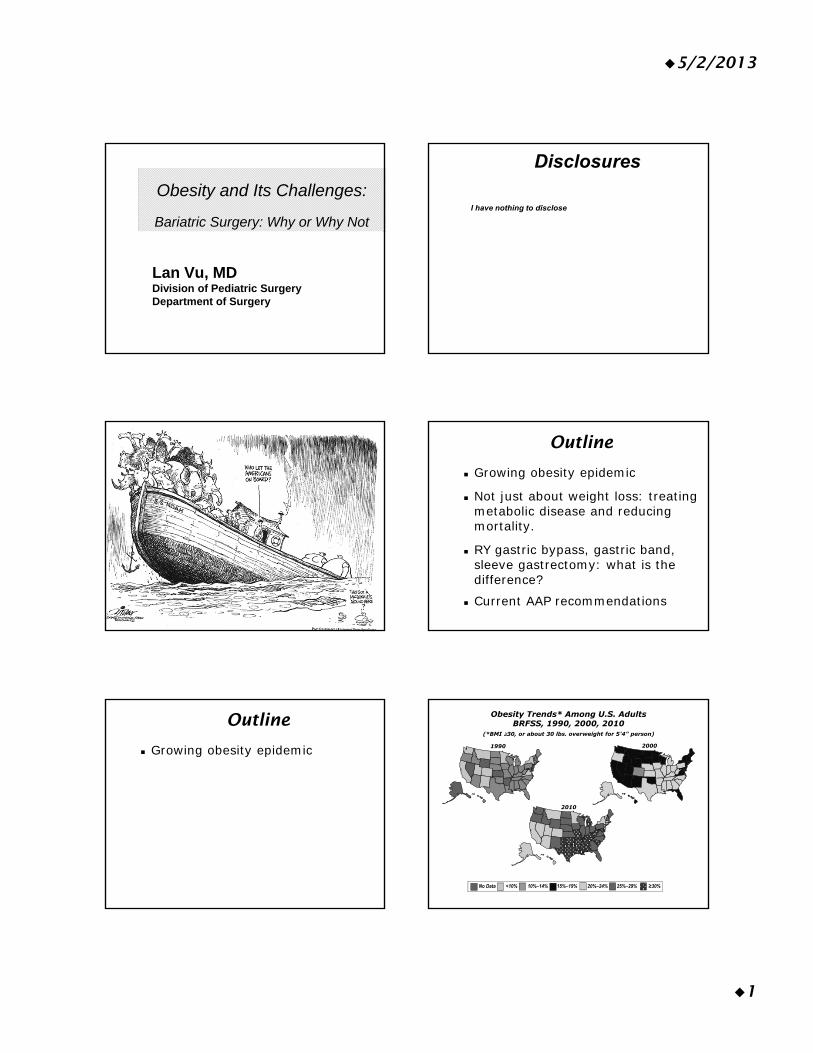
5/2/2013
1
Lan Vu, MDDivision of Pediatric SurgeryDepartment of Surgery
Obesity and Its Challenges:
Bariatric Surgery: Why or Why Not
Disclosures
I have nothing to disclose
Outline
Growing obesity epidemic
Not just about weight loss: treating metabolic disease and reducing mortality.
RY gastric bypass, gastric band, sleeve gastrectomy: what is the difference?
Current AAP recommendations
Outline
Growing obesity epidemic 2000
Obesity Trends* Among U.S. AdultsBRFSS, 1990, 2000, 2010
(*BMI 30, or about 30 lbs. overweight for 5’4” person)
2010
1990
No Data <10% 10%–14% 15%–19% 20%–24% 25%–29% ≥30%
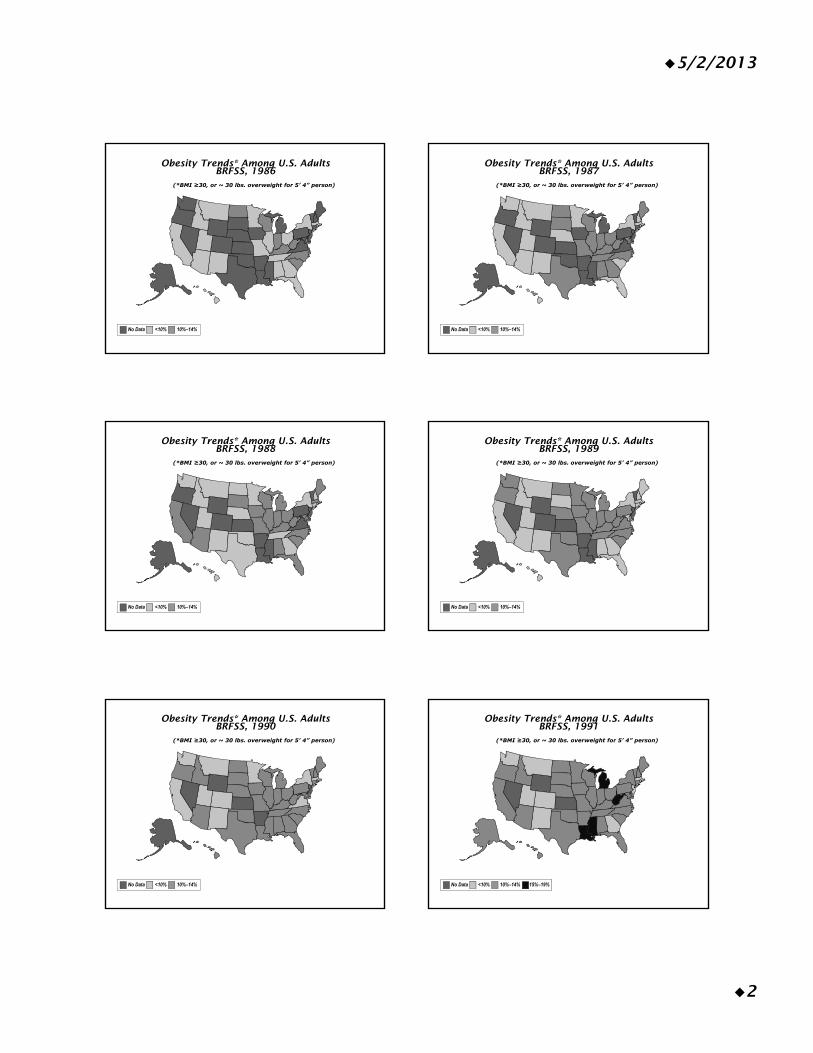
5/2/2013
2
Obesity Trends* Among U.S. AdultsBRFSS, 1986
(*BMI ≥30, or ~ 30 lbs. overweight for 5’ 4” person)
No Data <10% 10%–14%
Obesity Trends* Among U.S. AdultsBRFSS, 1987
(*BMI ≥30, or ~ 30 lbs. overweight for 5’ 4” person)
No Data <10% 10%–14%
Obesity Trends* Among U.S. AdultsBRFSS, 1988
(*BMI ≥30, or ~ 30 lbs. overweight for 5’ 4” person)
No Data <10% 10%–14%
Obesity Trends* Among U.S. AdultsBRFSS, 1989
(*BMI ≥30, or ~ 30 lbs. overweight for 5’ 4” person)
No Data <10% 10%–14%
Obesity Trends* Among U.S. AdultsBRFSS, 1990
(*BMI ≥30, or ~ 30 lbs. overweight for 5’ 4” person)
No Data <10% 10%–14%
Obesity Trends* Among U.S. AdultsBRFSS, 1991
(*BMI ≥30, or ~ 30 lbs. overweight for 5’ 4” person)
No Data <10% 10%–14% 15%–19%
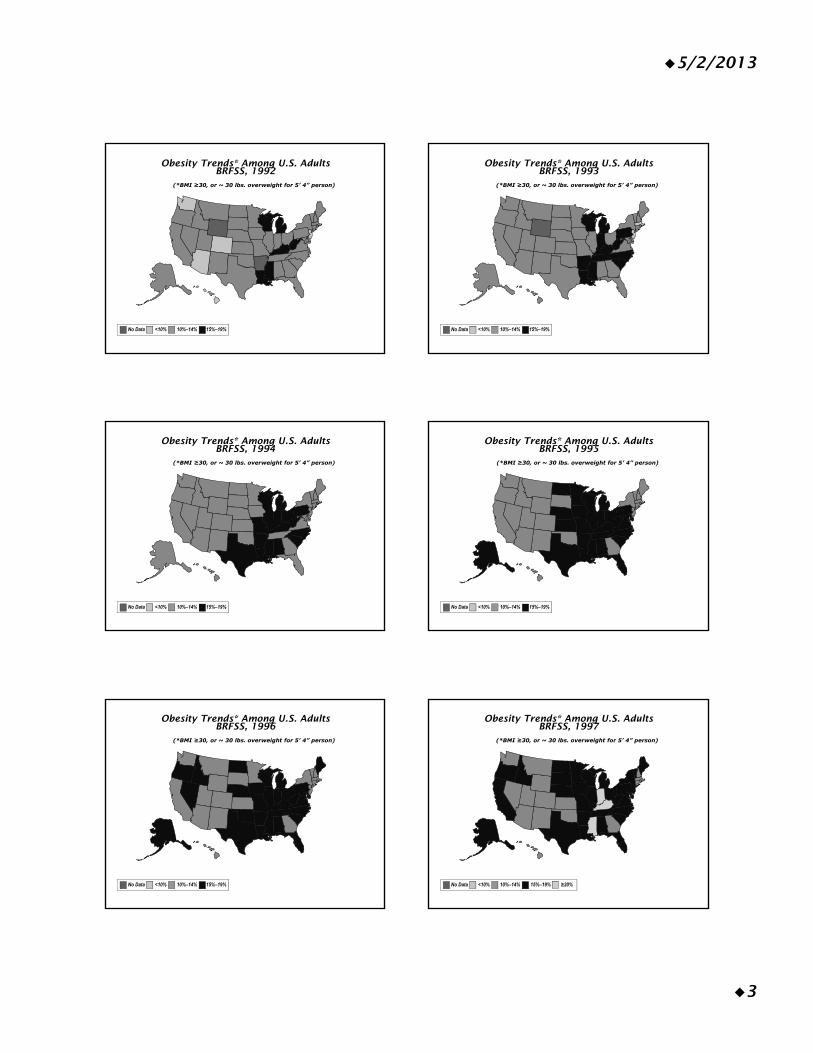
5/2/2013
3
Obesity Trends* Among U.S. AdultsBRFSS, 1992
(*BMI ≥30, or ~ 30 lbs. overweight for 5’ 4” person)
No Data <10% 10%–14% 15%–19%
Obesity Trends* Among U.S. AdultsBRFSS, 1993
(*BMI ≥30, or ~ 30 lbs. overweight for 5’ 4” person)
No Data <10% 10%–14% 15%–19%
Obesity Trends* Among U.S. AdultsBRFSS, 1994
(*BMI ≥30, or ~ 30 lbs. overweight for 5’ 4” person)
No Data <10% 10%–14% 15%–19%
Obesity Trends* Among U.S. AdultsBRFSS, 1995
(*BMI ≥30, or ~ 30 lbs. overweight for 5’ 4” person)
No Data <10% 10%–14% 15%–19%
Obesity Trends* Among U.S. AdultsBRFSS, 1996
(*BMI ≥30, or ~ 30 lbs. overweight for 5’ 4” person)
No Data <10% 10%–14% 15%–19%
Obesity Trends* Among U.S. AdultsBRFSS, 1997
(*BMI ≥30, or ~ 30 lbs. overweight for 5’ 4” person)
No Data <10% 10%–14% 15%–19% ≥20%
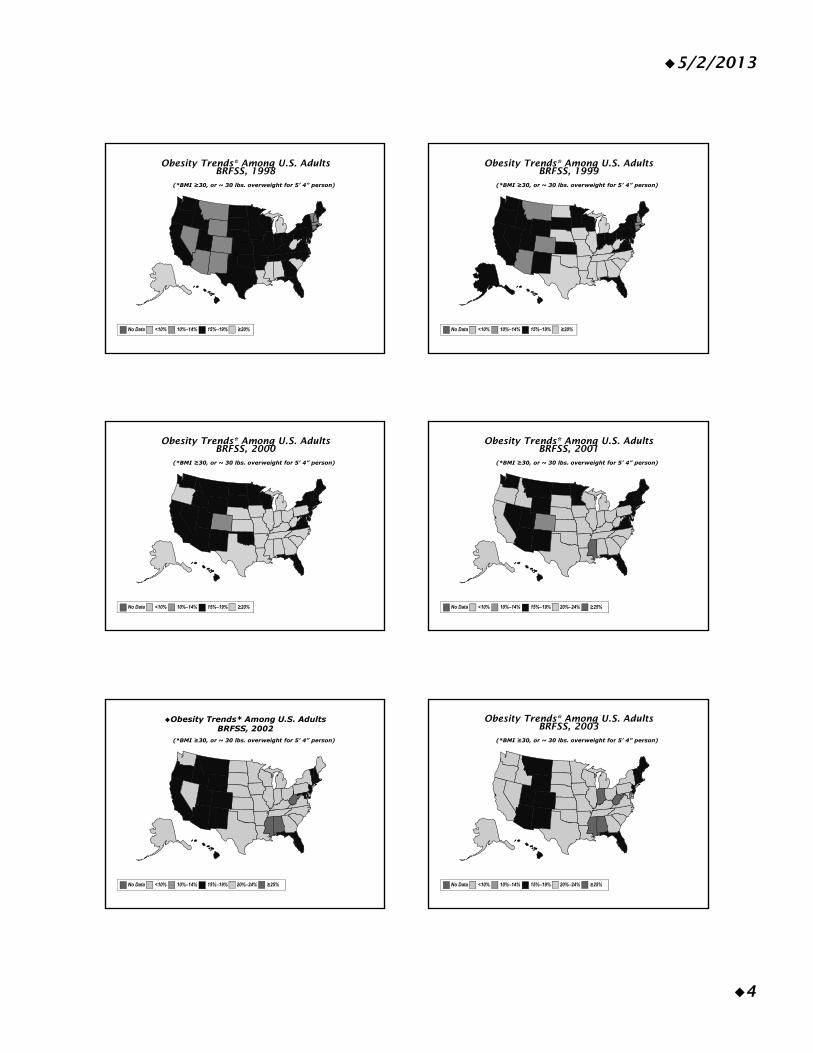
5/2/2013
4
Obesity Trends* Among U.S. AdultsBRFSS, 1998
(*BMI ≥30, or ~ 30 lbs. overweight for 5’ 4” person)
No Data <10% 10%–14% 15%–19% ≥20%
Obesity Trends* Among U.S. AdultsBRFSS, 1999
(*BMI ≥30, or ~ 30 lbs. overweight for 5’ 4” person)
No Data <10% 10%–14% 15%–19% ≥20%
Obesity Trends* Among U.S. AdultsBRFSS, 2000
(*BMI ≥30, or ~ 30 lbs. overweight for 5’ 4” person)
No Data <10% 10%–14% 15%–19% ≥20%
Obesity Trends* Among U.S. AdultsBRFSS, 2001
(*BMI ≥30, or ~ 30 lbs. overweight for 5’ 4” person)
No Data <10% 10%–14% 15%–19% 20%–24% ≥25%
(*BMI ≥30, or ~ 30 lbs. overweight for 5’ 4” person)
Obesity Trends* Among U.S. AdultsBRFSS, 2002
No Data <10% 10%–14% 15%–19% 20%–24% ≥25%
Obesity Trends* Among U.S. AdultsBRFSS, 2003
(*BMI ≥30, or ~ 30 lbs. overweight for 5’ 4” person)
No Data <10% 10%–14% 15%–19% 20%–24% ≥25%
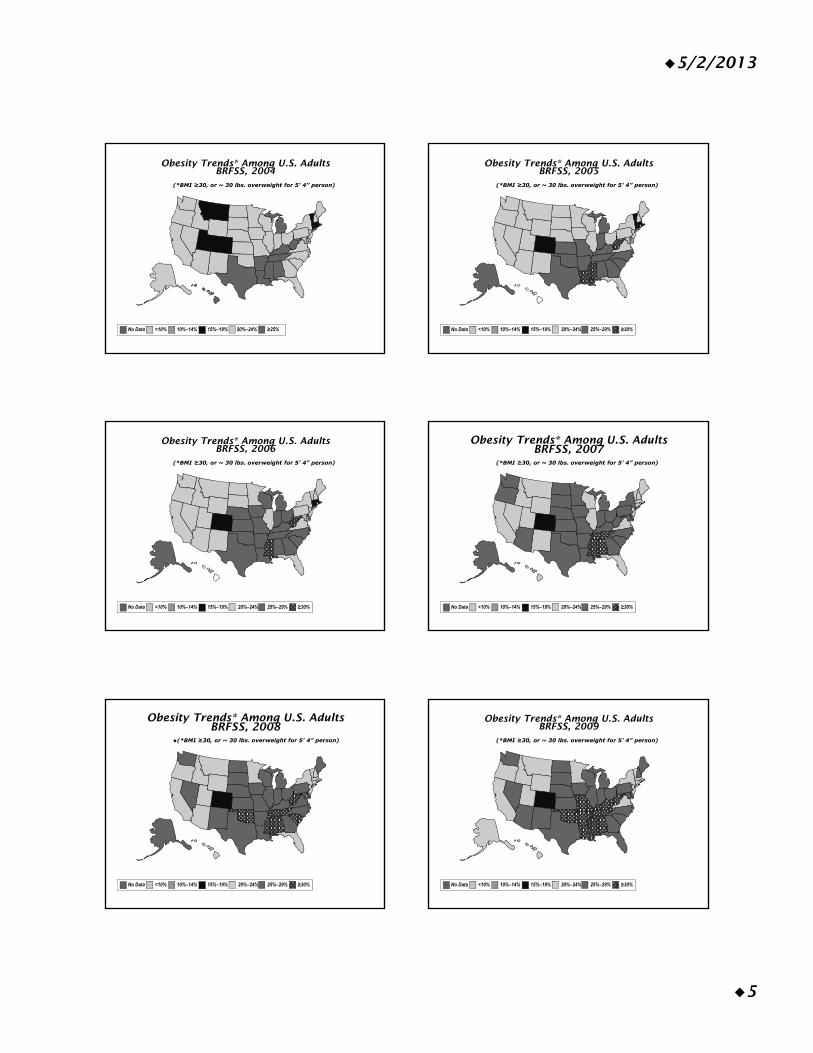
5/2/2013
5
Obesity Trends* Among U.S. AdultsBRFSS, 2004
(*BMI ≥30, or ~ 30 lbs. overweight for 5’ 4” person)
No Data <10% 10%–14% 15%–19% 20%–24% ≥25%
Obesity Trends* Among U.S. AdultsBRFSS, 2005
(*BMI ≥30, or ~ 30 lbs. overweight for 5’ 4” person)
No Data <10% 10%–14% 15%–19% 20%–24% 25%–29% ≥30%
Obesity Trends* Among U.S. AdultsBRFSS, 2006
(*BMI ≥30, or ~ 30 lbs. overweight for 5’ 4” person)
No Data <10% 10%–14% 15%–19% 20%–24% 25%–29% ≥30%
Obesity Trends* Among U.S. AdultsBRFSS, 2007
(*BMI ≥30, or ~ 30 lbs. overweight for 5’ 4” person)
No Data <10% 10%–14% 15%–19% 20%–24% 25%–29% ≥30%
Obesity Trends* Among U.S. AdultsBRFSS, 2008
(*BMI ≥30, or ~ 30 lbs. overweight for 5’ 4” person)
No Data <10% 10%–14% 15%–19% 20%–24% 25%–29% ≥30%
Obesity Trends* Among U.S. AdultsBRFSS, 2009
(*BMI ≥30, or ~ 30 lbs. overweight for 5’ 4” person)
No Data <10% 10%–14% 15%–19% 20%–24% 25%–29% ≥30%
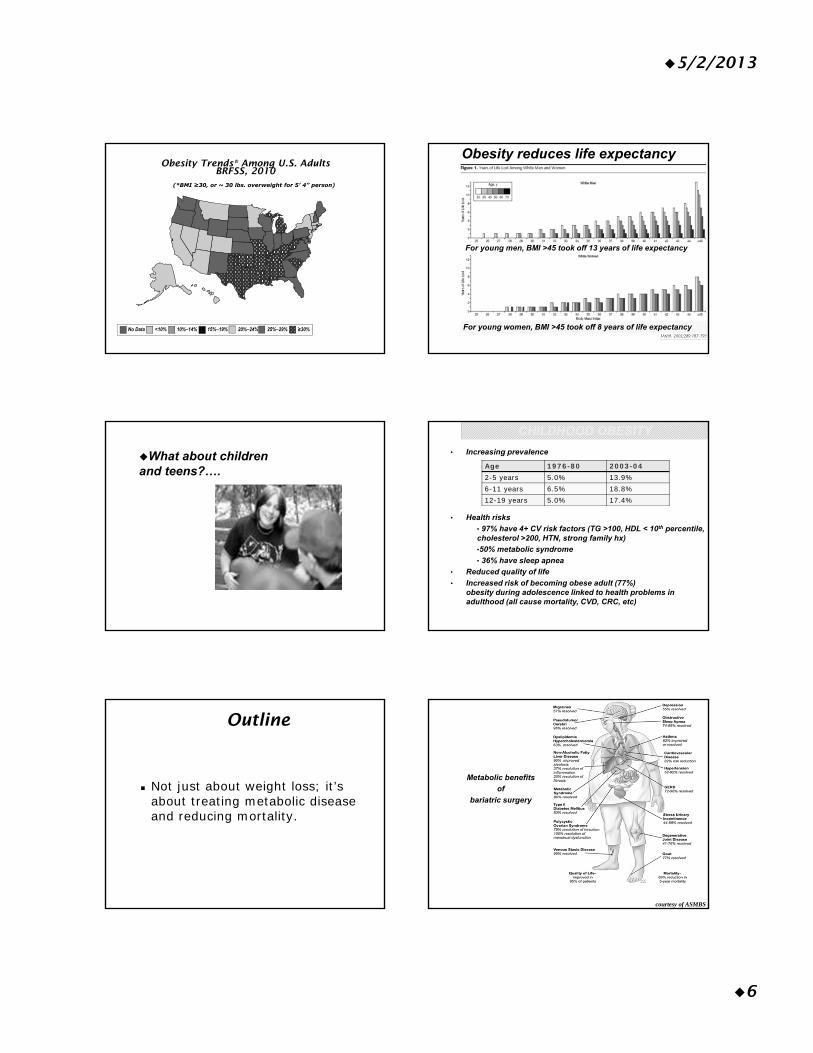
5/2/2013
6
Obesity Trends* Among U.S. AdultsBRFSS, 2010
(*BMI ≥30, or ~ 30 lbs. overweight for 5’ 4” person)
No Data <10% 10%–14% 15%–19% 20%–24% 25%–29% ≥30%
Obesity reduces life expectancy
For young men, BMI >45 took off 13 years of life expectancy
For young women, BMI >45 took off 8 years of life expectancy
What about children and teens?….
• Increasing prevalence
• Health risks
• 97% have 4+ CV risk factors (TG >100, HDL < 10th percentile, cholesterol >200, HTN, strong family hx)
•50% metabolic syndrome
• 36% have sleep apnea
• Reduced quality of life
• Increased risk of becoming obese adult (77%)obesity during adolescence linked to health problems in adulthood (all cause mortality, CVD, CRC, etc)
CHILDHOOD OBESITY
Age 1976-80 2003-042-5 years 5.0% 13.9%6-11 years 6.5% 18.8%12-19 years 5.0% 17.4%
Outline
Not just about weight loss; it’s about treating metabolic disease and reducing mortality.
courtesy of ASMBS
Metabolic benefits
of
bariatric surgery
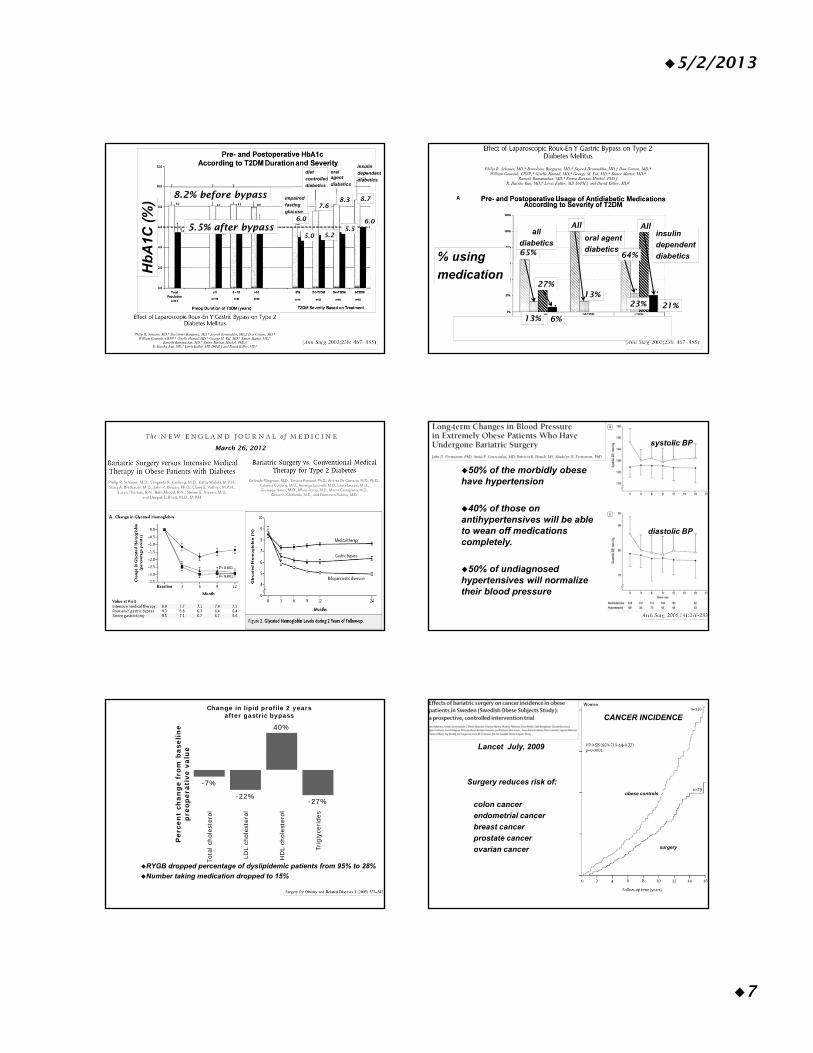
5/2/2013
7
impaired
fasting
glucose
diet
controlled
diabetics
oral agent
diabetics
insulin
dependent
diabetics
Hb
A1C
(%
)
8.2% before bypass
5.5% after bypass6.0
5.0
7.68.3 8.7
5.56.0
5.2 oral agent
diabetics
insulin
dependent
diabetics% using
medication
All
13%
All
64%
23% 21%
65%
27%
all
diabetics
13% 6%
March 26, 2012
50% of the morbidly obese have hypertension
40% of those on antihypertensives will be able to wean off medications completely.
50% of undiagnosed hypertensives will normalize their blood pressure
systolic BP
diastolic BP
RYGB dropped percentage of dyslipidemic patients from 95% to 28%
Number taking medication dropped to 15%
-7%
-22%
40%
-27%
Tota
l cho
lest
erol
LDL
chol
este
rol
HD
L ch
oles
tero
l
Trig
lyce
ride
s
Per
cen
t ch
ang
e fr
om b
asel
ine
pre
oper
ativ
e va
lue
Change in lipid profile 2 years after gastric bypass
surgery
obese controls
Lancet July, 2009
Surgery reduces risk of:
colon cancer
endometrial cancer
breast cancer
prostate cancer
ovarian cancer
CANCER INCIDENCE
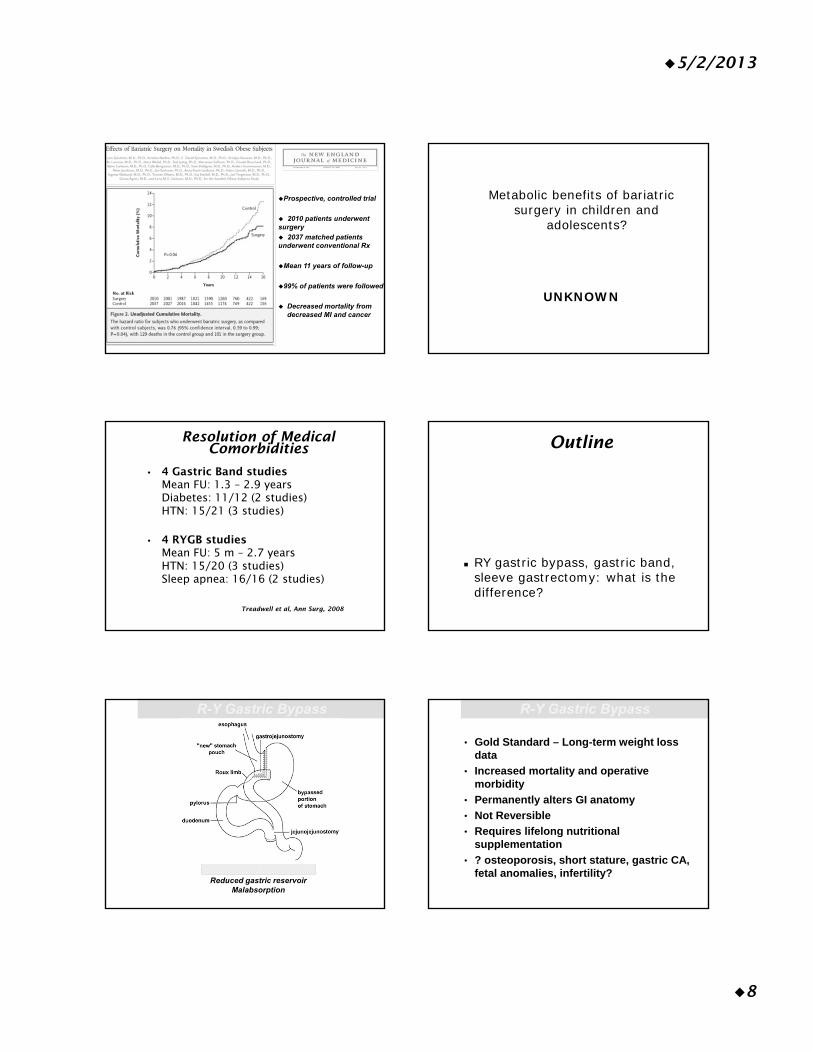
5/2/2013
8
Prospective, controlled trial
2010 patients underwent surgery
2037 matched patients underwent conventional Rx
Mean 11 years of follow-up
99% of patients were followed
Decreased mortality from decreased MI and cancer
Metabolic benefits of bariatric surgery in children and
adolescents?
UNKNOWN
• 4 Gastric Band studiesMean FU: 1.3 – 2.9 yearsDiabetes: 11/12 (2 studies)HTN: 15/21 (3 studies)
• 4 RYGB studiesMean FU: 5 m – 2.7 yearsHTN: 15/20 (3 studies)Sleep apnea: 16/16 (2 studies)
Resolution of Medical Comorbidities
Treadwell et al, Ann Surg, 2008
Outline
RY gastric bypass, gastric band, sleeve gastrectomy: what is the difference?
Weight loss mechanism
Reduced gastric reservoirMalabsorption
R-Y Gastric Bypass
• Gold Standard – Long-term weight loss data
• Increased mortality and operative morbidity
• Permanently alters GI anatomy
• Not Reversible
• Requires lifelong nutritional supplementation
• ? osteoporosis, short stature, gastric CA, fetal anomalies, infertility?
R-Y Gastric Bypass
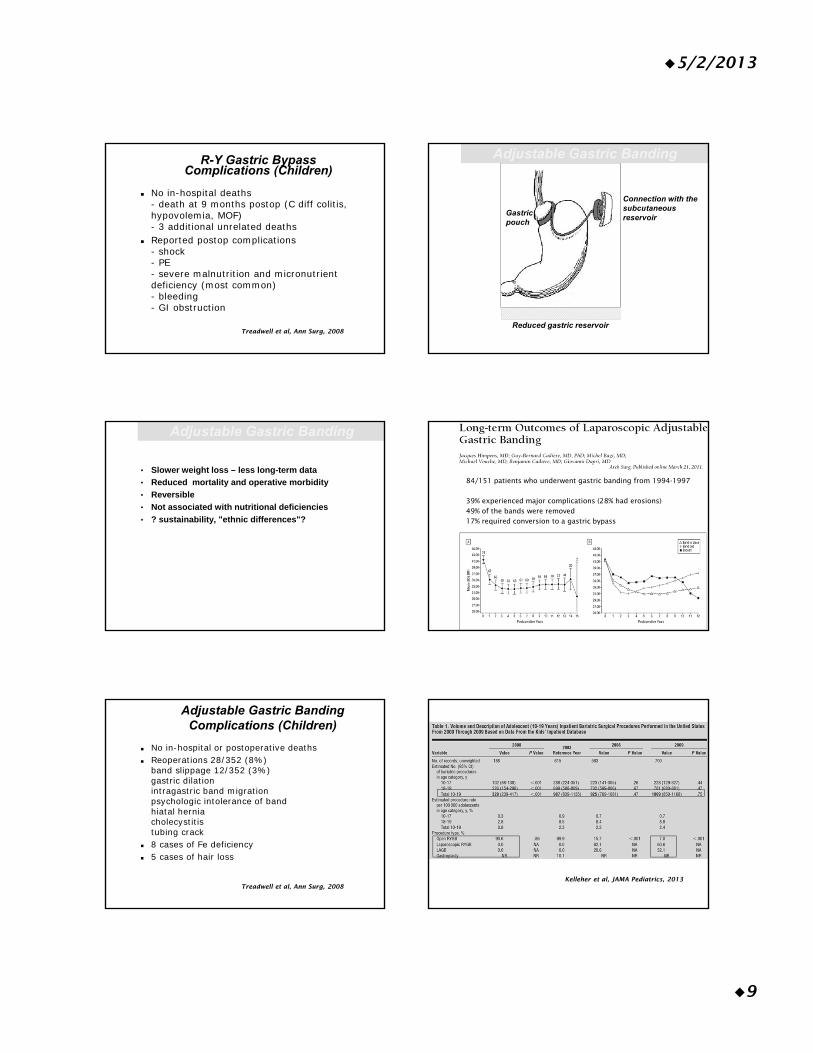
5/2/2013
9
R-Y Gastric Bypass Complications (Children)
No in-hospital deaths- death at 9 months postop (C diff colitis, hypovolemia, MOF)- 3 additional unrelated deaths
Reported postop complications- shock- PE- severe malnutrition and micronutrient deficiency (most common)- bleeding- GI obstruction
Treadwell et al, Ann Surg, 2008
Weight loss mechanism
Reduced gastric reservoir
Connection with the subcutaneous reservoir
Gastric pouch
Adjustable Gastric Banding
• Slower weight loss – less long-term data
• Reduced mortality and operative morbidity
• Reversible
• Not associated with nutritional deficiencies
• ? sustainability, "ethnic differences"?
Adjustable Gastric Banding
84/151 patients who underwent gastric banding from 1994-1997
39% experienced major complications (28% had erosions)49% of the bands were removed17% required conversion to a gastric bypass
No in-hospital or postoperative deaths Reoperations 28/352 (8%)
band slippage 12/352 (3%)gastric dilationintragastric band migrationpsychologic intolerance of bandhiatal herniacholecystitistubing crack
8 cases of Fe deficiency 5 cases of hair loss
Adjustable Gastric Banding Complications (Children)
Treadwell et al, Ann Surg, 2008Kelleher et al, JAMA Pediatrics, 2013
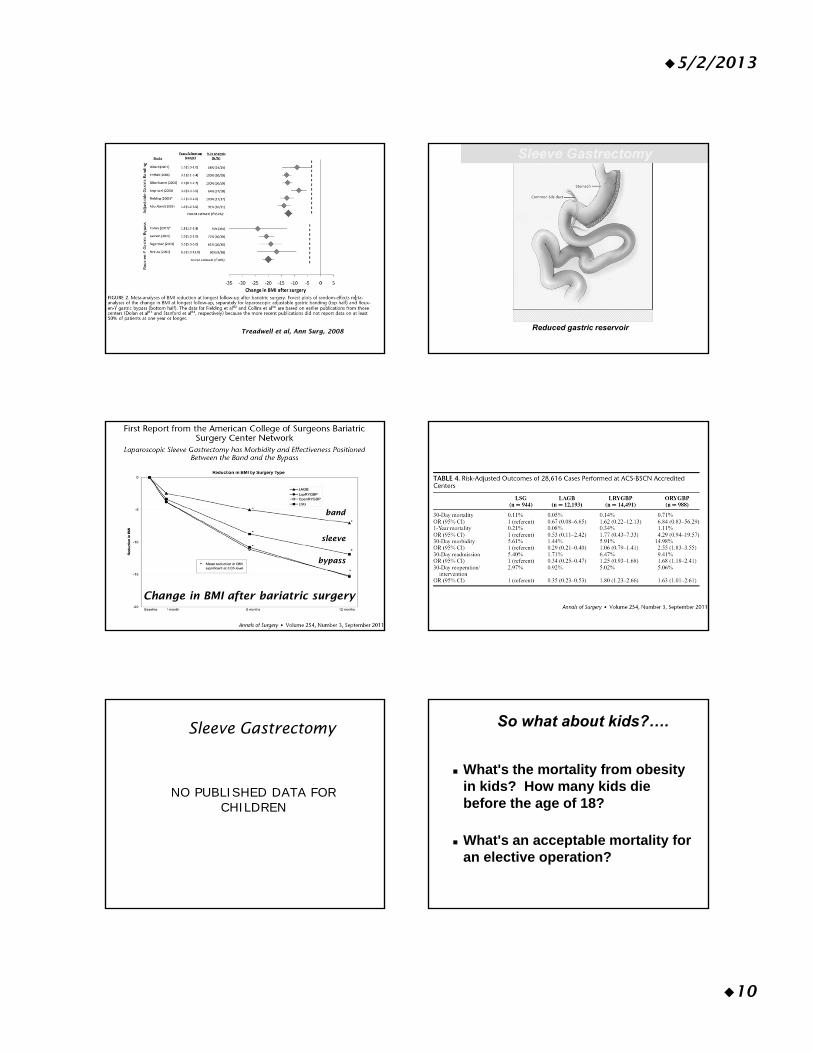
5/2/2013
10
Treadwell et al, Ann Surg, 2008
Weight loss mechanism
Reduced gastric reservoir
Sleeve Gastrectomy
band
sleeve
bypass
Change in BMI after bariatric surgery
Sleeve Gastrectomy
NO PUBLISHED DATA FOR CHILDREN
What's the mortality from obesity in kids? How many kids die before the age of 18?
What's an acceptable mortality for an elective operation?
So what about kids?….
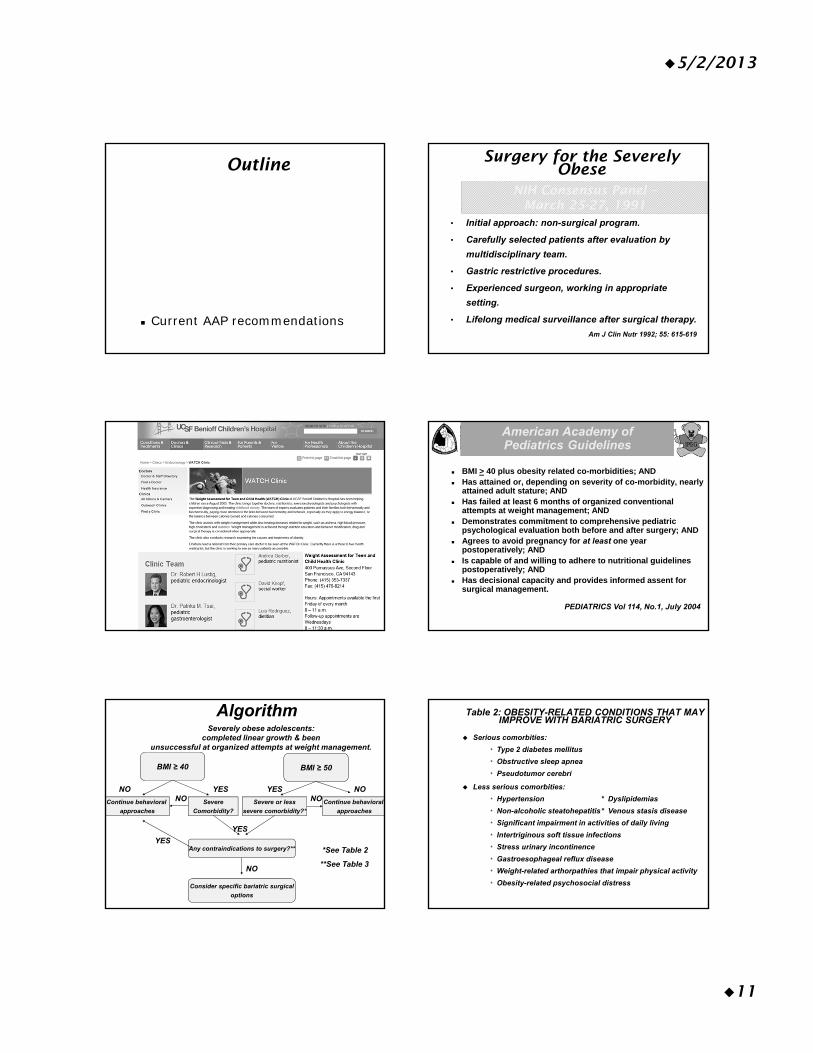
5/2/2013
11
Outline
Current AAP recommendations
• Initial approach: non-surgical program.
• Carefully selected patients after evaluation by
multidisciplinary team.
• Gastric restrictive procedures.
• Experienced surgeon, working in appropriate
setting.
• Lifelong medical surveillance after surgical therapy.
NIH Consensus Panel –March 25-27, 1991
Am J Clin Nutr 1992; 55: 615-619
Surgery for the Severely Obese
American Academy of Pediatrics Guidelines
BMI > 40 plus obesity related co-morbidities; AND Has attained or, depending on severity of co-morbidity, nearly
attained adult stature; AND Has failed at least 6 months of organized conventional
attempts at weight management; AND Demonstrates commitment to comprehensive pediatric
psychological evaluation both before and after surgery; AND Agrees to avoid pregnancy for at least one year
postoperatively; AND Is capable of and willing to adhere to nutritional guidelines
postoperatively; AND Has decisional capacity and provides informed assent for
surgical management.
PEDIATRICS Vol 114, No.1, July 2004
AlgorithmSeverely obese adolescents:
completed linear growth & been unsuccessful at organized attempts at weight management.
BMI ≥ 40 BMI ≥ 50
Continue behavioral
approaches
Severe
Comorbidity?
Severe or less
severe comorbidity?*
Continue behavioral
approaches
Any contraindications to surgery?**
Consider specific bariatric surgical
options
NO
YES
YESYES NO
NO
NO NO
YES
*See Table 2
**See Table 3
Table 2: OBESITY-RELATED CONDITIONS THAT MAY IMPROVE WITH BARIATRIC SURGERY
Serious comorbities:
* Type 2 diabetes mellitus
* Obstructive sleep apnea
* Pseudotumor cerebri
Less serious comorbities:
* Hypertension * Dyslipidemias
* Non-alcoholic steatohepatitis* Venous stasis disease
* Significant impairment in activities of daily living
* Intertriginous soft tissue infections
* Stress urinary incontinence
* Gastroesophageal reflux disease
* Weight-related arthorpathies that impair physical activity
* Obesity-related psychosocial distress
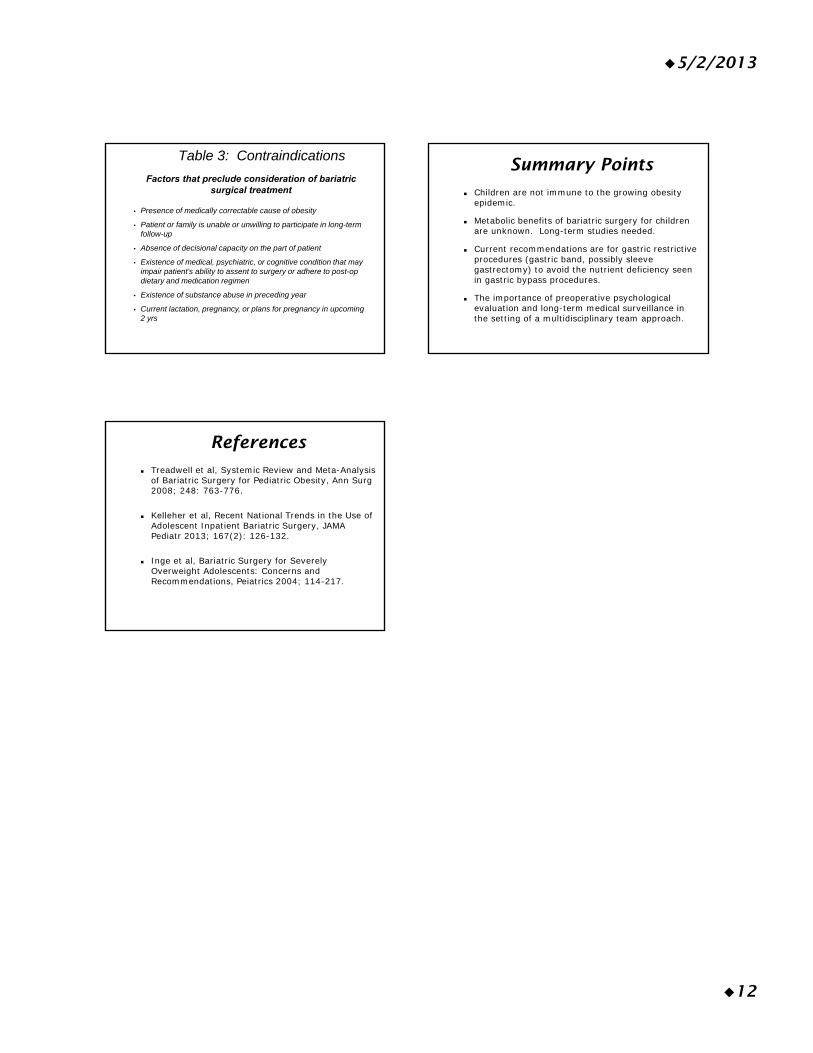
5/2/2013
12
Table 3: Contraindications
Factors that preclude consideration of bariatric surgical treatment
• Presence of medically correctable cause of obesity
• Patient or family is unable or unwilling to participate in long-term follow-up
• Absence of decisional capacity on the part of patient
• Existence of medical, psychiatric, or cognitive condition that may impair patient’s ability to assent to surgery or adhere to post-op dietary and medication regimen
• Existence of substance abuse in preceding year
• Current lactation, pregnancy, or plans for pregnancy in upcoming 2 yrs
Summary Points
Children are not immune to the growing obesity epidemic.
Metabolic benefits of bariatric surgery for children are unknown. Long-term studies needed.
Current recommendations are for gastric restrictive procedures (gastric band, possibly sleeve gastrectomy) to avoid the nutrient deficiency seen in gastric bypass procedures.
The importance of preoperative psychological evaluation and long-term medical surveillance in the setting of a multidisciplinary team approach.
References
Treadwell et al, Systemic Review and Meta-Analysis of Bariatric Surgery for Pediatric Obesity, Ann Surg2008; 248: 763-776.
Kelleher et al, Recent National Trends in the Use of Adolescent Inpatient Bariatric Surgery, JAMA Pediatr 2013; 167(2): 126-132.
Inge et al, Bariatric Surgery for Severely Overweight Adolescents: Concerns and Recommendations, Peiatrics 2004; 114-217.
SATURDAY, MAY 18, 2013
11:40
P Healthy, Wealthy & Wise? How Chronic Metabolic Disease Affects You
Dr. Robert Lustig
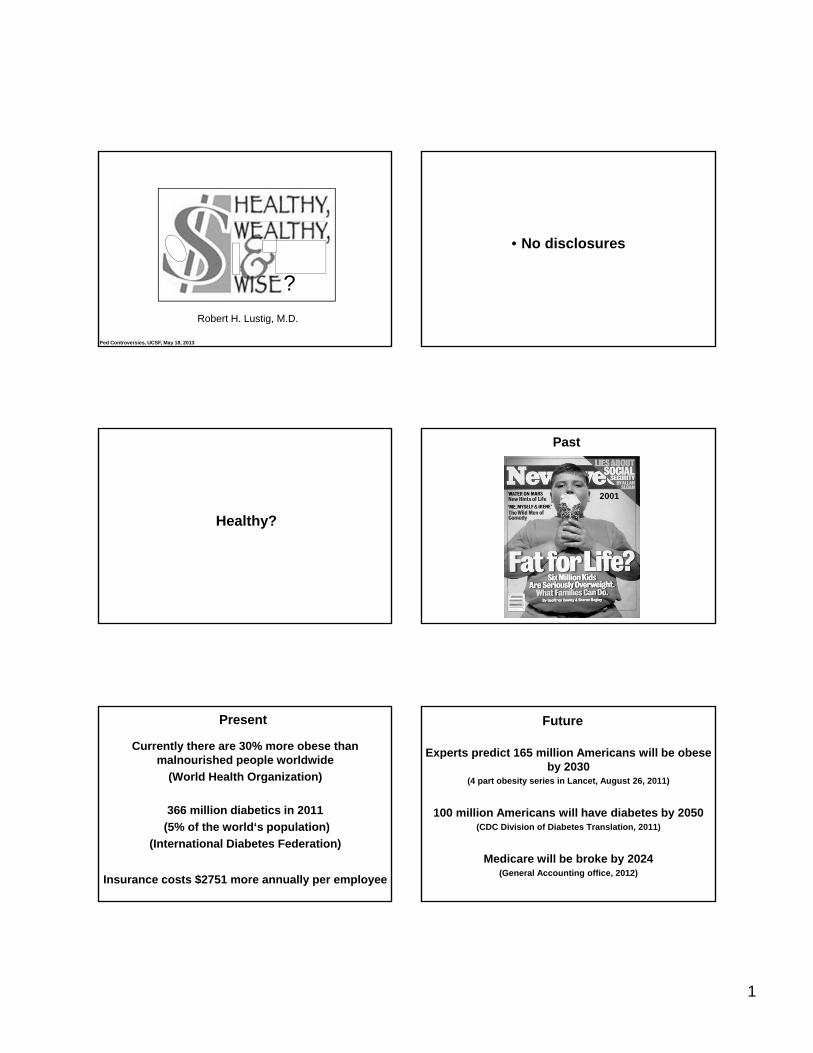
1
Robert H. Lustig, M.D.
Ped Controversies, UCSF, May 18, 2013
?
• No disclosures
Healthy?
2001
Past
Currently there are 30% more obese than malnourished people worldwide
(World Health Organization)
366 million diabetics in 2011
(5% of the world‘s population)
(International Diabetes Federation)
Present
Insurance costs $2751 more annually per employee
Experts predict 165 million Americans will be obeseby 2030
(4 part obesity series in Lancet, August 26, 2011)
100 million Americans will have diabetes by 2050(CDC Division of Diabetes Translation, 2011)
Medicare will be broke by 2024(General Accounting office, 2012)
Future
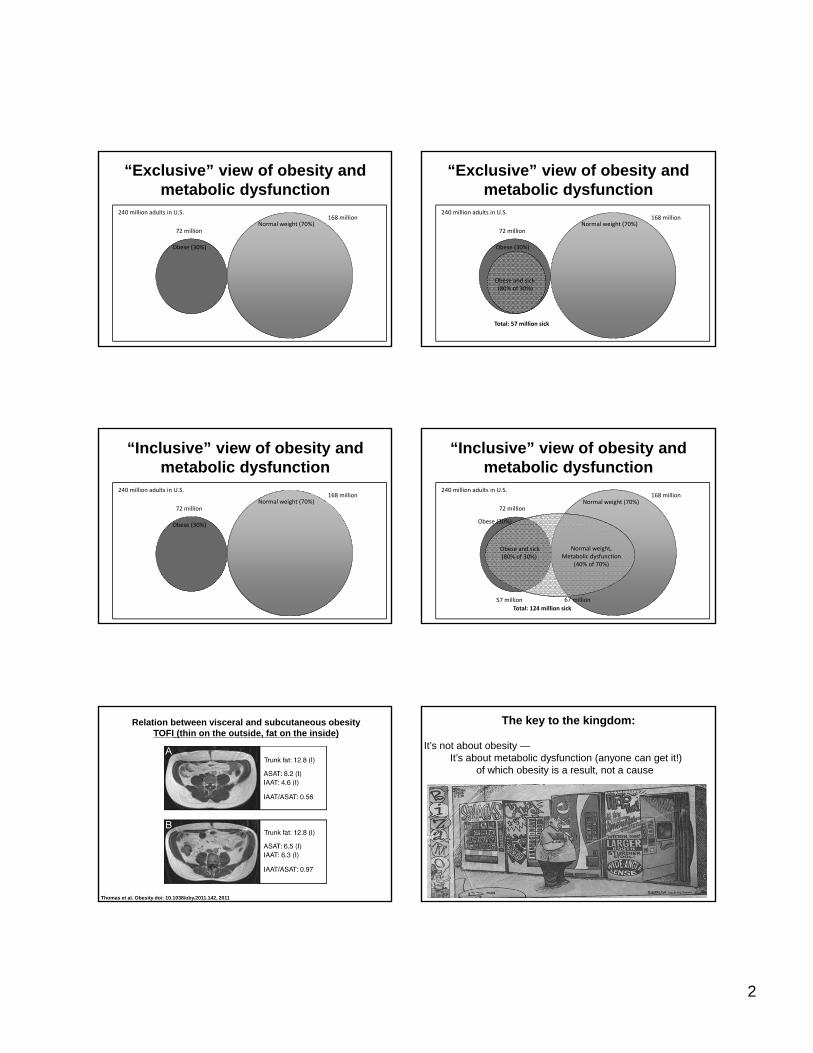
2
“Exclusive” view of obesity and metabolic dysfunction
Obese (30%)
Normal weight (70%)
240 million adults in U.S.
72 million
168 million
Obese (30%)
Obese and sick(80% of 30%)
Normal weight (70%)
240 million adults in U.S.
72 million
168 million
Total: 57 million sick
“Exclusive” view of obesity and metabolic dysfunction
Obese (30%)
Normal weight (70%)
240 million adults in U.S.
72 million
168 million
“Inclusive” view of obesity and metabolic dysfunction
Obese (30%)
Normal weight (70%)
240 million adults in U.S.
Normal weight,Metabolic dysfunction
(40% of 70%)
Obese and sick(80% of 30%)
57 million 67 million
Total: 124 million sick
72 million
168 million
“Inclusive” view of obesity and metabolic dysfunction
Relation between visceral and subcutaneous obesityTOFI (thin on the outside, fat on the inside)
Thomas et al. Obesity doi: 10.1038/oby.2011.142, 201112
The key to the kingdom:
It’s not about obesity —It’s about metabolic dysfunction (anyone can get it!)
of which obesity is a result, not a cause
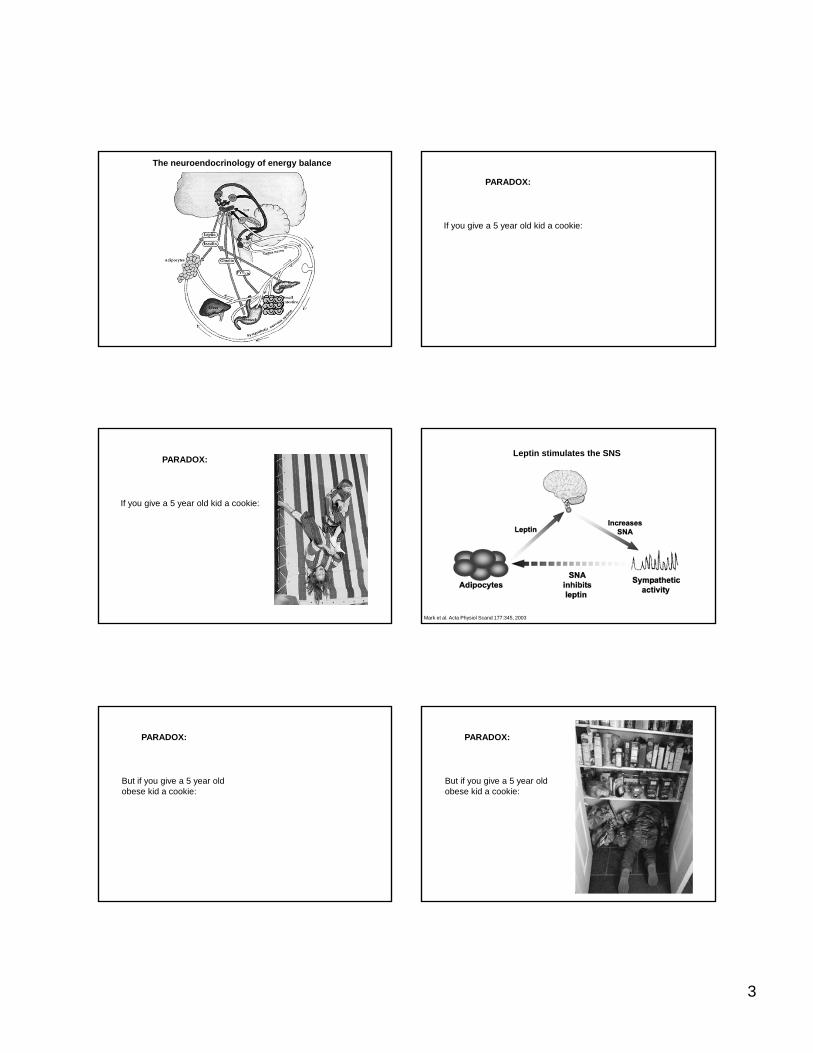
3
The neuroendocrinology of energy balance
If you give a 5 year old kid a cookie:
PARADOX:
PARADOX:
If you give a 5 year old kid a cookie:
Leptin stimulates the SNS
Mark et al. Acta Physiol Scand 177:345, 2003
But if you give a 5 year old obese kid a cookie:
PARADOX:
But if you give a 5 year old obese kid a cookie:
PARADOX:
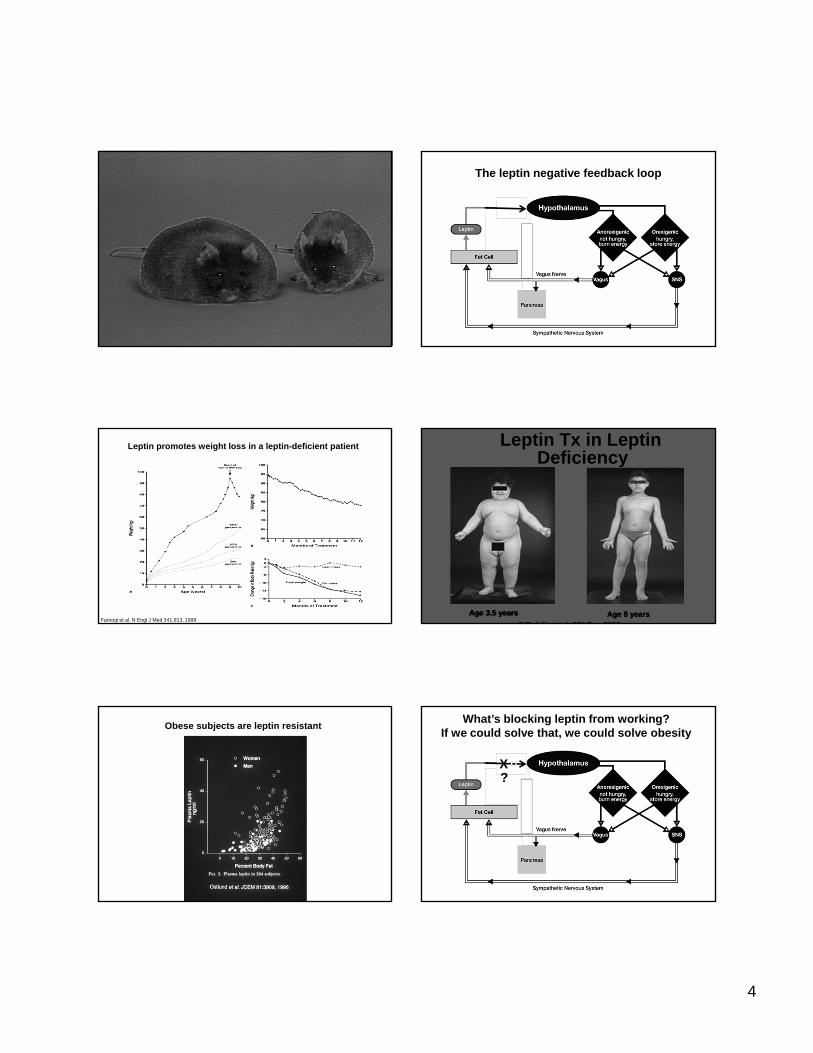
4
The leptin negative feedback loop
Farooqi et al. N Engl J Med 341:913, 1999
Leptin promotes weight loss in a leptin-deficient patient Leptin Tx in LeptinDeficiency
Age 3.5 yearsAge 3.5 years Age 8 yearsAge 8 yearsO’Rahilly et al JCI Oct 2002
Obese subjects are leptin resistantWhat’s blocking leptin from working?
If we could solve that, we could solve obesity
X?
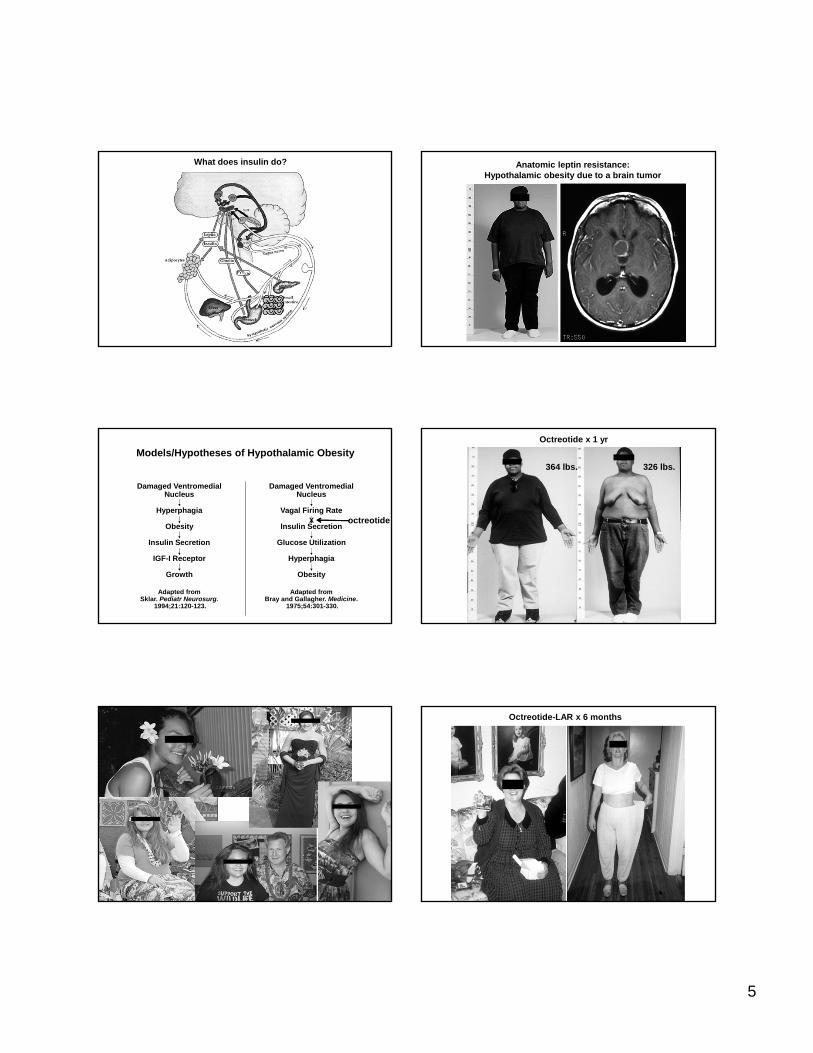
5
What does insulin do? Anatomic leptin resistance:Hypothalamic obesity due to a brain tumor
Models/Hypotheses of Hypothalamic Obesity
Damaged VentromedialNucleus
Hyperphagia
Obesity
Insulin Secretion
IGF-I Receptor
Growth
Adapted fromSklar. Pediatr Neurosurg.
1994;21:120-123.
Damaged VentromedialNucleus
Vagal Firing Rate
Insulin Secretion
Glucose Utilization
Hyperphagia
Obesity
Adapted fromBray and Gallagher. Medicine.
1975;54:301-330.
X octreotide
Octreotide x 1 yr
364 lbs. 326 lbs.
Octreotide-LAR x 6 months
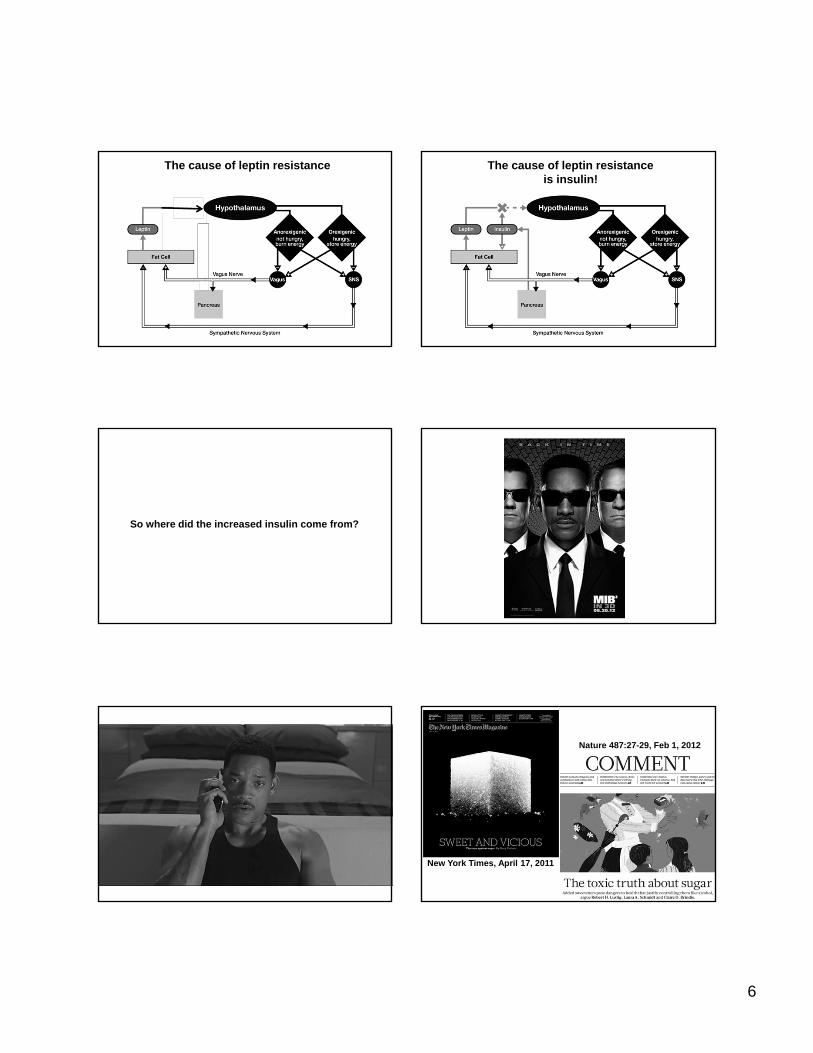
6
The cause of leptin resistance The cause of leptin resistanceis insulin!
So where did the increased insulin come from?
New York Times, April 17, 2011
Nature 487:27-29, Feb 1, 2012
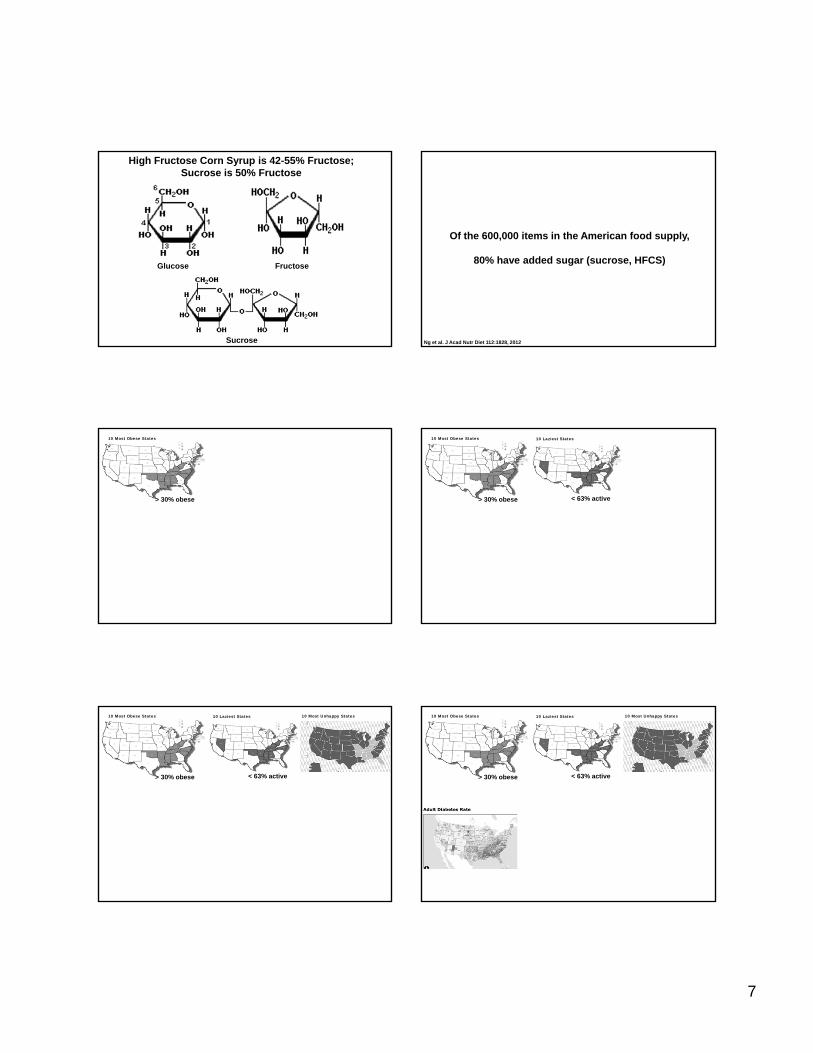
7
High Fructose Corn Syrup is 42-55% Fructose;Sucrose is 50% Fructose
Glucose Fructose
Sucrose
Of the 600,000 items in the American food supply,
80% have added sugar (sucrose, HFCS)
Ng et al. J Acad Nutr Diet 112:1828, 2012
10 Most Obese States
> 30% obese
10 Most Obese States 10 Laziest States
> 30% obese < 63% active
10 Most Obese States 10 Laziest States
> 30% obese < 63% active
10 Most Unhappy States 10 Most Obese States 10 Laziest States
> 30% obese < 63% active
10 Most Unhappy States
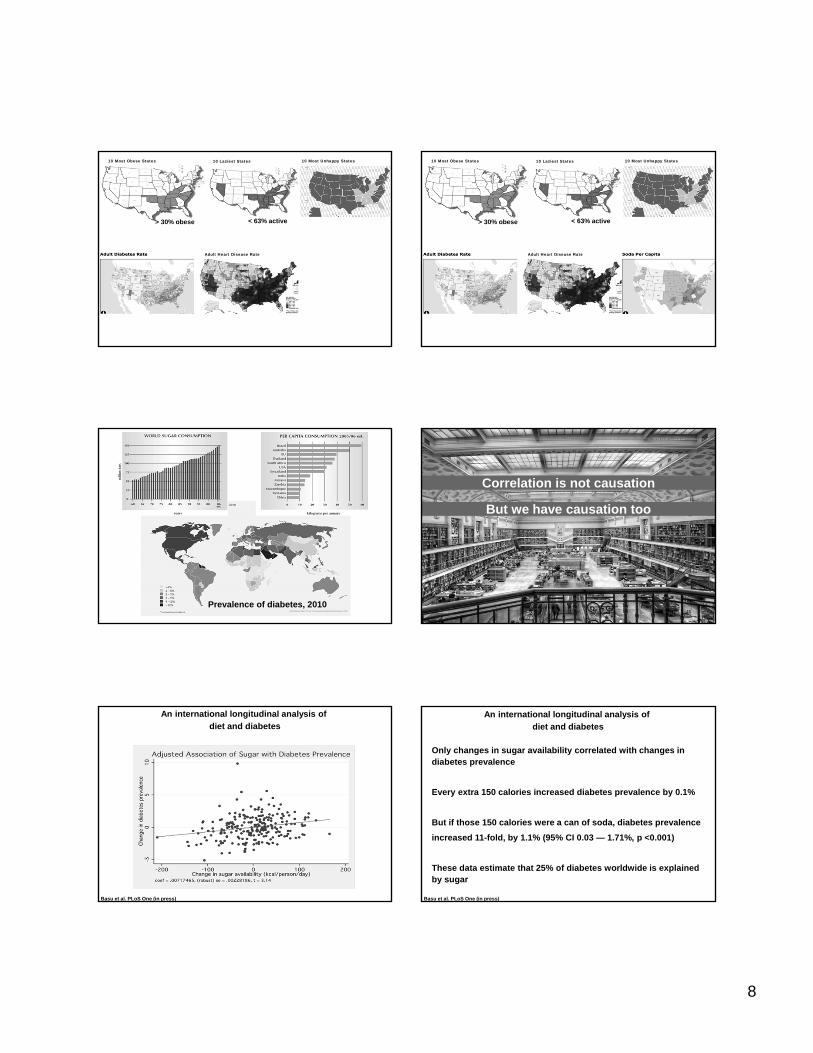
8
10 Most Obese States 10 Laziest States
> 30% obese < 63% active
10 Most Unhappy States
Adult Heart Disease Rate
10 Most Obese States 10 Laziest States
> 30% obese < 63% active
10 Most Unhappy States
Adult Heart Disease Rate
Prevalence of diabetes, 201046
Correlation is not causationCorrelation is not causation
But we have causation tooBut we have causation too
Basu et al. PLoS One (in press)
An international longitudinal analysis of
diet and diabetes
Basu et al. PLoS One (in press)
An international longitudinal analysis of
diet and diabetes
Only changes in sugar availability correlated with changes in diabetes prevalence
Every extra 150 calories increased diabetes prevalence by 0.1%
But if those 150 calories were a can of soda, diabetes prevalence
increased 11-fold, by 1.1% (95% CI 0.03 — 1.71%, p <0.001)
These data estimate that 25% of diabetes worldwide is explained by sugar
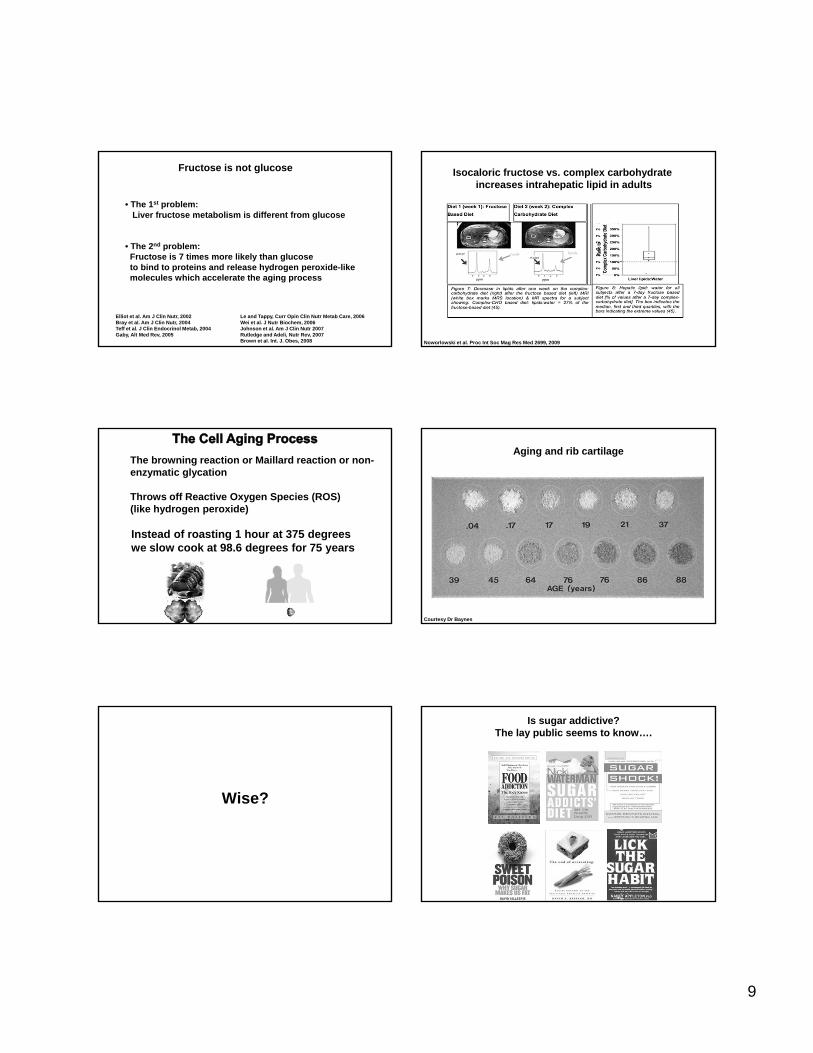
9
Fructose is not glucose
• The 1st problem:Liver fructose metabolism is different from glucose
• The 2nd problem:Fructose is 7 times more likely than glucoseto bind to proteins and release hydrogen peroxide-like molecules which accelerate the aging process
Elliot et al. Am J Clin Nutr, 2002Bray et al. Am J Clin Nutr, 2004Teff et al. J Clin Endocrinol Metab, 2004Gaby, Alt Med Rev, 2005
Le and Tappy, Curr Opin Clin Nutr Metab Care, 2006Wei et al. J Nutr Biochem, 2006Johnson et al. Am J Clin Nutr 2007Rutledge and Adeli, Nutr Rev, 2007Brown et al. Int. J. Obes, 2008 Noworlowski et al. Proc Int Soc Mag Res Med 2699, 2009
Isocaloric fructose vs. complex carbohydrate increases intrahepatic lipid in adults
The browning reaction or Maillard reaction or non-enzymatic glycation
Throws off Reactive Oxygen Species (ROS) (like hydrogen peroxide)
Instead of roasting 1 hour at 375 degreeswe slow cook at 98.6 degrees for 75 years
Aging and rib cartilage
Courtesy Dr Baynes
Wise?
Is sugar addictive?The lay public seems to know….
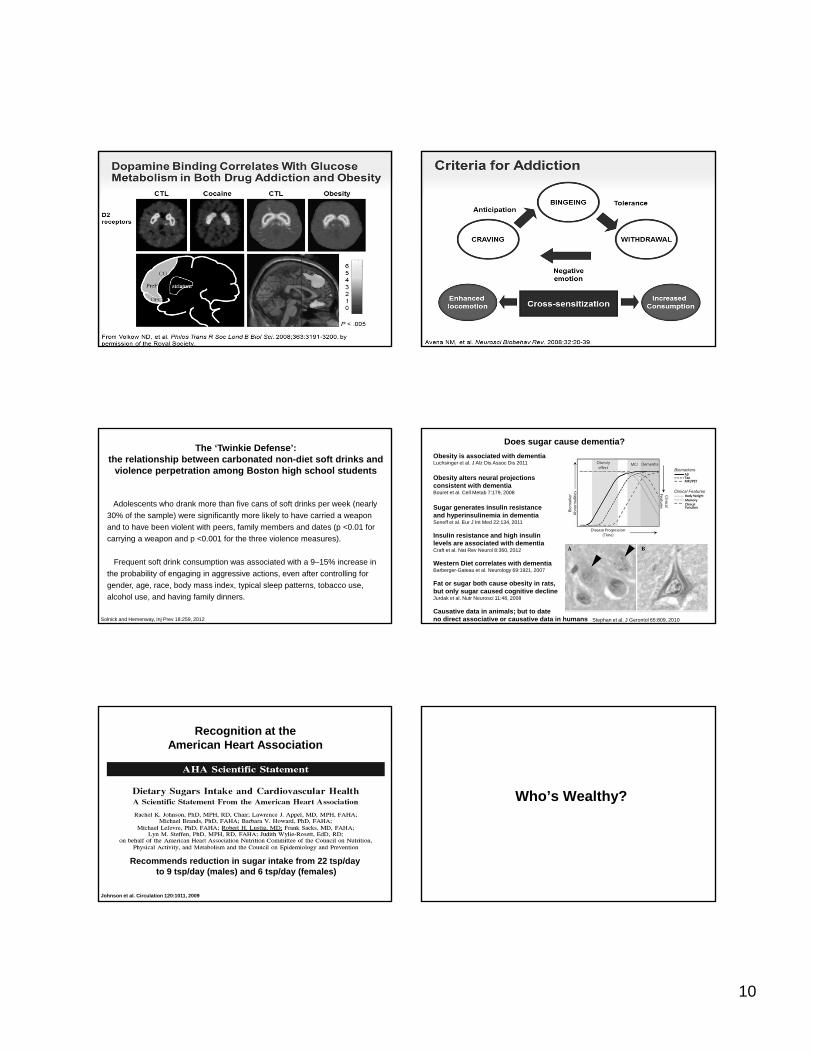
10
The ‘Twinkie Defense’: the relationship between carbonated non-diet soft drinks and
violence perpetration among Boston high school students
Adolescents who drank more than five cans of soft drinks per week (nearly
30% of the sample) were significantly more likely to have carried a weapon
and to have been violent with peers, family members and dates (p <0.01 for
carrying a weapon and p <0.001 for the three violence measures).
Frequent soft drink consumption was associated with a 9–15% increase in
the probability of engaging in aggressive actions, even after controlling for
gender, age, race, body mass index, typical sleep patterns, tobacco use,
alcohol use, and having family dinners.
Solnick and Hemenway, Inj Prev 18:259, 2012
Does sugar cause dementia?
Obesity is associated with dementiaLuchsinger et al. J Alz Dis Assoc Dis 2011
Obesity alters neural projections consistent with dementiaBouret et al. Cell Metab 7:179, 2008
Sugar generates insulin resistance and hyperinsulinemia in dementiaSeneff et al. Eur J Int Med 22:134, 2011
Insulin resistance and high insulinlevels are associated with dementiaCraft et al. Nat Rev Neurol 8:360, 2012
Western Diet correlates with dementiaBarberger-Gateau et al. Neurology 69:1921, 2007
Fat or sugar both cause obesity in rats,but only sugar caused cognitive declineJurdak et al. Nutr Neurosci 11:48, 2008
Causative data in animals; but to dateno direct associative or causative data in humans Stephan et al. J Gerontol 65:809, 2010
Recognition at the American Heart Association
Johnson et al. Circulation 120:1011, 2009
Recommends reduction in sugar intake from 22 tsp/day to 9 tsp/day (males) and 6 tsp/day (females)
Who’s Wealthy?
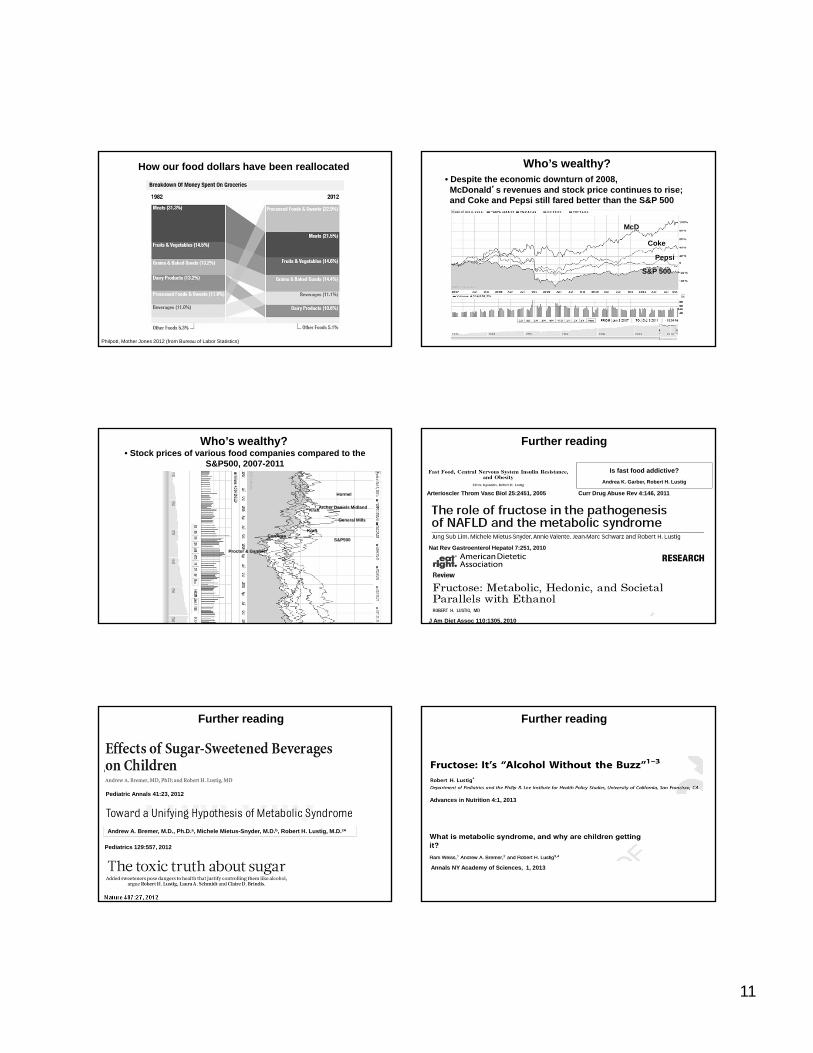
11
Philpott, Mother Jones 2012 (from Bureau of Labor Statistics)
How our food dollars have been reallocated Who’s wealthy?• Despite the economic downturn of 2008,McDonald’s revenues and stock price continues to rise; and Coke and Pepsi still fared better than the S&P 500
Pepsi
McD
Coke
S&P 500
• Stock prices of various food companies compared to the S&P500, 2007-2011
Archer Daniels Midland
Proctor & Gamble/
Kraft
Kraft
General Mills
ConAgra
Hormel
S&P500
Who’s wealthy?
Nat Rev Gastroenterol Hepatol 7:251, 2010
J Am Diet Assoc 110:1305, 2010
Further reading
Arterioscler Throm Vasc Biol 25:2451, 2005
Is fast food addictive?
Andrea K. Garber, Robert H. Lustig
Curr Drug Abuse Rev 4:146, 2011
Pediatric Annals 41:23, 2012
Further reading
Arterioscler Throm Vasc Biol 25:2451, 2005
Andrew A. Bremer, M.D., Ph.D.a, Michele Mietus-Snyder, M.D.b, Robert H. Lustig, M.D.c*
Pediatrics 129:557, 2012
Nature 487:27, 2012
Advances in Nutrition 4:1, 2013
Annals NY Academy of Sciences, 1, 2013
Further reading
12
PLoS One 8:e57873, 2013
Further reading
Current Opinion Gastroenterology, 29:170, 2013
Hudson Street Press(Penguin)
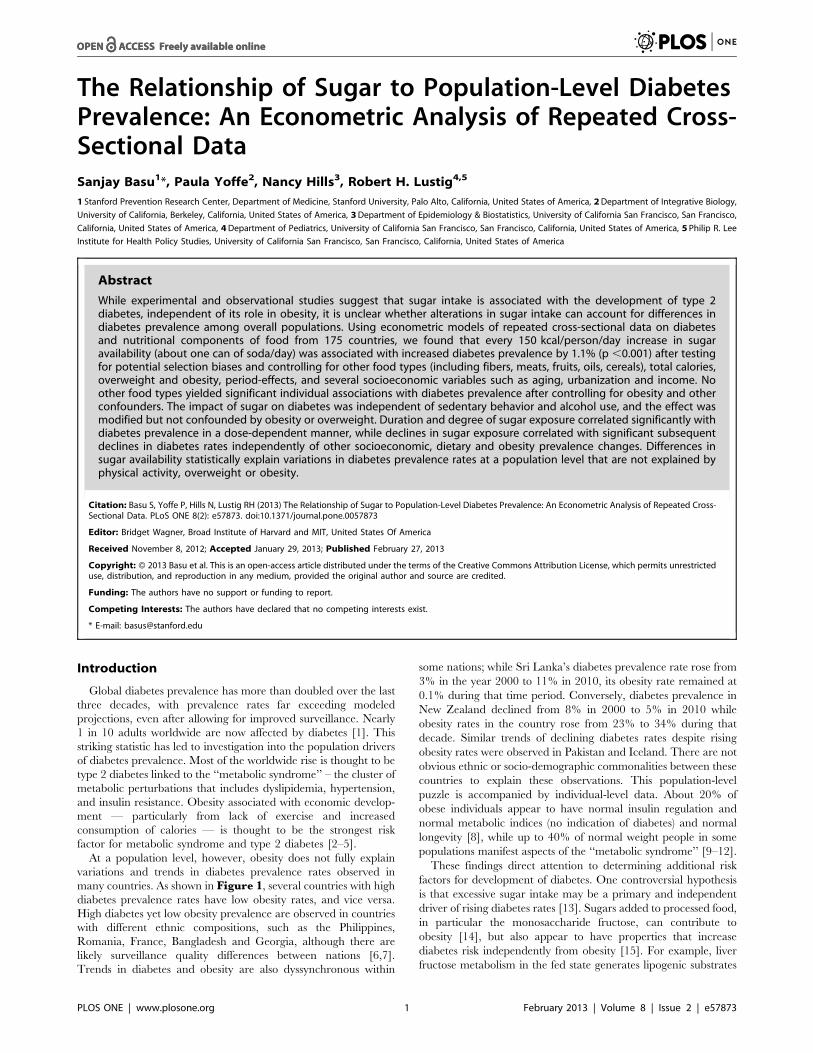
The Relationship of Sugar to Population-Level DiabetesPrevalence: An Econometric Analysis of Repeated Cross-Sectional DataSanjay Basu1*, Paula Yoffe2, Nancy Hills3, Robert H. Lustig4,5
1 Stanford Prevention Research Center, Department of Medicine, Stanford University, Palo Alto, California, United States of America, 2Department of Integrative Biology,
University of California, Berkeley, California, United States of America, 3Department of Epidemiology & Biostatistics, University of California San Francisco, San Francisco,
California, United States of America, 4Department of Pediatrics, University of California San Francisco, San Francisco, California, United States of America, 5 Philip R. Lee
Institute for Health Policy Studies, University of California San Francisco, San Francisco, California, United States of America
Abstract
While experimental and observational studies suggest that sugar intake is associated with the development of type 2diabetes, independent of its role in obesity, it is unclear whether alterations in sugar intake can account for differences indiabetes prevalence among overall populations. Using econometric models of repeated cross-sectional data on diabetesand nutritional components of food from 175 countries, we found that every 150 kcal/person/day increase in sugaravailability (about one can of soda/day) was associated with increased diabetes prevalence by 1.1% (p ,0.001) after testingfor potential selection biases and controlling for other food types (including fibers, meats, fruits, oils, cereals), total calories,overweight and obesity, period-effects, and several socioeconomic variables such as aging, urbanization and income. Noother food types yielded significant individual associations with diabetes prevalence after controlling for obesity and otherconfounders. The impact of sugar on diabetes was independent of sedentary behavior and alcohol use, and the effect wasmodified but not confounded by obesity or overweight. Duration and degree of sugar exposure correlated significantly withdiabetes prevalence in a dose-dependent manner, while declines in sugar exposure correlated with significant subsequentdeclines in diabetes rates independently of other socioeconomic, dietary and obesity prevalence changes. Differences insugar availability statistically explain variations in diabetes prevalence rates at a population level that are not explained byphysical activity, overweight or obesity.
Citation: Basu S, Yoffe P, Hills N, Lustig RH (2013) The Relationship of Sugar to Population-Level Diabetes Prevalence: An Econometric Analysis of Repeated Cross-Sectional Data. PLoS ONE 8(2): e57873. doi:10.1371/journal.pone.0057873
Editor: Bridget Wagner, Broad Institute of Harvard and MIT, United States Of America
Received November 8, 2012; Accepted January 29, 2013; Published February 27, 2013
Copyright: � 2013 Basu et al. This is an open-access article distributed under the terms of the Creative Commons Attribution License, which permits unrestricteduse, distribution, and reproduction in any medium, provided the original author and source are credited.
Funding: The authors have no support or funding to report.
Competing Interests: The authors have declared that no competing interests exist.
* E-mail: [email protected]
Introduction
Global diabetes prevalence has more than doubled over the last
three decades, with prevalence rates far exceeding modeled
projections, even after allowing for improved surveillance. Nearly
1 in 10 adults worldwide are now affected by diabetes [1]. This
striking statistic has led to investigation into the population drivers
of diabetes prevalence. Most of the worldwide rise is thought to be
type 2 diabetes linked to the ‘‘metabolic syndrome’’ – the cluster of
metabolic perturbations that includes dyslipidemia, hypertension,
and insulin resistance. Obesity associated with economic develop-
ment — particularly from lack of exercise and increased
consumption of calories — is thought to be the strongest risk
factor for metabolic syndrome and type 2 diabetes [2–5].
At a population level, however, obesity does not fully explain
variations and trends in diabetes prevalence rates observed in
many countries. As shown in Figure 1, several countries with high
diabetes prevalence rates have low obesity rates, and vice versa.
High diabetes yet low obesity prevalence are observed in countries
with different ethnic compositions, such as the Philippines,
Romania, France, Bangladesh and Georgia, although there are
likely surveillance quality differences between nations [6,7].
Trends in diabetes and obesity are also dyssynchronous within
some nations; while Sri Lanka’s diabetes prevalence rate rose from
3% in the year 2000 to 11% in 2010, its obesity rate remained at
0.1% during that time period. Conversely, diabetes prevalence in
New Zealand declined from 8% in 2000 to 5% in 2010 while
obesity rates in the country rose from 23% to 34% during that
decade. Similar trends of declining diabetes rates despite rising
obesity rates were observed in Pakistan and Iceland. There are not
obvious ethnic or socio-demographic commonalities between these
countries to explain these observations. This population-level
puzzle is accompanied by individual-level data. About 20% of
obese individuals appear to have normal insulin regulation and
normal metabolic indices (no indication of diabetes) and normal
longevity [8], while up to 40% of normal weight people in some
populations manifest aspects of the ‘‘metabolic syndrome’’ [9–12].
These findings direct attention to determining additional risk
factors for development of diabetes. One controversial hypothesis
is that excessive sugar intake may be a primary and independent
driver of rising diabetes rates [13]. Sugars added to processed food,
in particular the monosaccharide fructose, can contribute to
obesity [14], but also appear to have properties that increase
diabetes risk independently from obesity [15]. For example, liver
fructose metabolism in the fed state generates lipogenic substrates
PLOS ONE | www.plosone.org 1 February 2013 | Volume 8 | Issue 2 | e57873
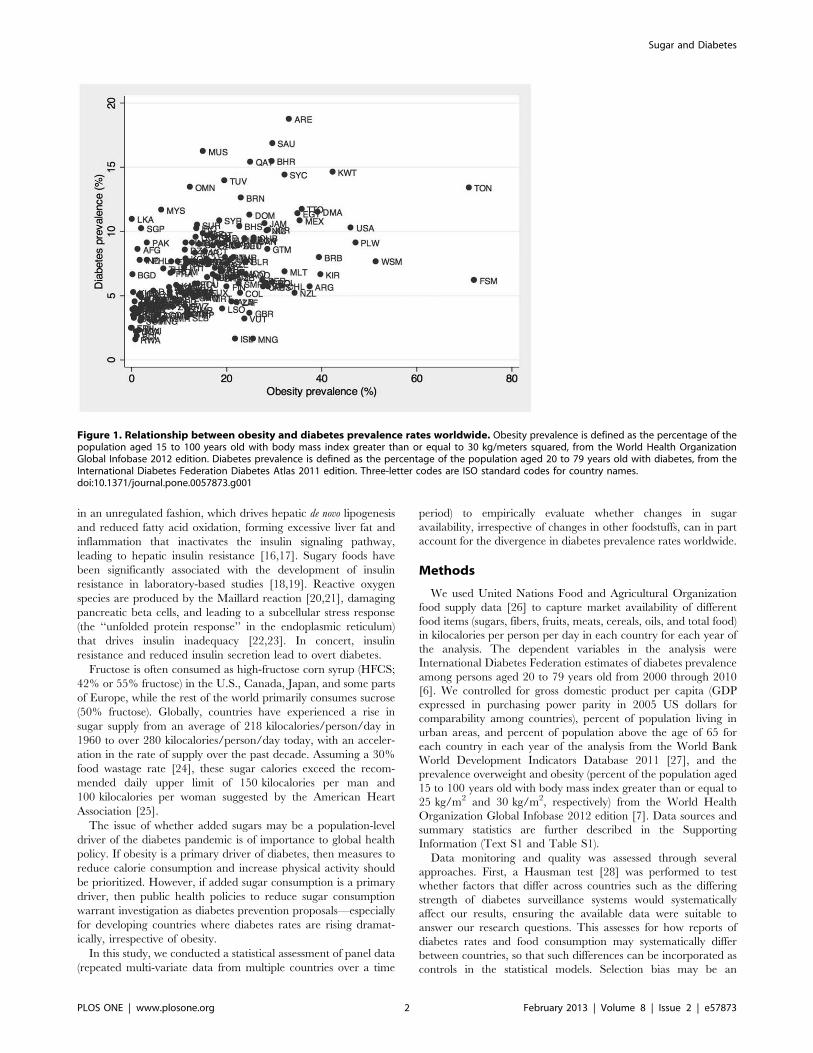
in an unregulated fashion, which drives hepatic de novo lipogenesis
and reduced fatty acid oxidation, forming excessive liver fat and
inflammation that inactivates the insulin signaling pathway,
leading to hepatic insulin resistance [16,17]. Sugary foods have
been significantly associated with the development of insulin
resistance in laboratory-based studies [18,19]. Reactive oxygen
species are produced by the Maillard reaction [20,21], damaging
pancreatic beta cells, and leading to a subcellular stress response
(the ‘‘unfolded protein response’’ in the endoplasmic reticulum)
that drives insulin inadequacy [22,23]. In concert, insulin
resistance and reduced insulin secretion lead to overt diabetes.
Fructose is often consumed as high-fructose corn syrup (HFCS;
42% or 55% fructose) in the U.S., Canada, Japan, and some parts
of Europe, while the rest of the world primarily consumes sucrose
(50% fructose). Globally, countries have experienced a rise in
sugar supply from an average of 218 kilocalories/person/day in
1960 to over 280 kilocalories/person/day today, with an acceler-
ation in the rate of supply over the past decade. Assuming a 30%
food wastage rate [24], these sugar calories exceed the recom-
mended daily upper limit of 150 kilocalories per man and
100 kilocalories per woman suggested by the American Heart
Association [25].
The issue of whether added sugars may be a population-level
driver of the diabetes pandemic is of importance to global health
policy. If obesity is a primary driver of diabetes, then measures to
reduce calorie consumption and increase physical activity should
be prioritized. However, if added sugar consumption is a primary
driver, then public health policies to reduce sugar consumption
warrant investigation as diabetes prevention proposals—especially
for developing countries where diabetes rates are rising dramat-
ically, irrespective of obesity.
In this study, we conducted a statistical assessment of panel data
(repeated multi-variate data from multiple countries over a time
period) to empirically evaluate whether changes in sugar
availability, irrespective of changes in other foodstuffs, can in part
account for the divergence in diabetes prevalence rates worldwide.
Methods
We used United Nations Food and Agricultural Organization
food supply data [26] to capture market availability of different
food items (sugars, fibers, fruits, meats, cereals, oils, and total food)
in kilocalories per person per day in each country for each year of
the analysis. The dependent variables in the analysis were
International Diabetes Federation estimates of diabetes prevalence
among persons aged 20 to 79 years old from 2000 through 2010
[6]. We controlled for gross domestic product per capita (GDP
expressed in purchasing power parity in 2005 US dollars for
comparability among countries), percent of population living in
urban areas, and percent of population above the age of 65 for
each country in each year of the analysis from the World Bank
World Development Indicators Database 2011 [27], and the
prevalence overweight and obesity (percent of the population aged
15 to 100 years old with body mass index greater than or equal to
25 kg/m2 and 30 kg/m2, respectively) from the World Health
Organization Global Infobase 2012 edition [7]. Data sources and
summary statistics are further described in the Supporting
Information (Text S1 and Table S1).
Data monitoring and quality was assessed through several
approaches. First, a Hausman test [28] was performed to test
whether factors that differ across countries such as the differing
strength of diabetes surveillance systems would systematically
affect our results, ensuring the available data were suitable to
answer our research questions. This assesses for how reports of
diabetes rates and food consumption may systematically differ
between countries, so that such differences can be incorporated as
controls in the statistical models. Selection bias may be an
Figure 1. Relationship between obesity and diabetes prevalence rates worldwide. Obesity prevalence is defined as the percentage of thepopulation aged 15 to 100 years old with body mass index greater than or equal to 30 kg/meters squared, from the World Health OrganizationGlobal Infobase 2012 edition. Diabetes prevalence is defined as the percentage of the population aged 20 to 79 years old with diabetes, from theInternational Diabetes Federation Diabetes Atlas 2011 edition. Three-letter codes are ISO standard codes for country names.doi:10.1371/journal.pone.0057873.g001
Sugar and Diabetes
PLOS ONE | www.plosone.org 2 February 2013 | Volume 8 | Issue 2 | e57873
additional issue for assessing the effect of sugar on diabetes
prevalence rates. Having greater sugar available in a country, for
example, may be an artifact of overall economic development and
increased general food importation, which could temporally
overlap with rising diabetes prevalence irrespective of higher
sugar intake (e.g., due to increased sedentary living or higher
calorie intake leading to obesity). We controlled for this possibility
using a lag of the change in log GDP per capita in our models. We
also modeled the hazard of having high sugar availability rates in
each country, and used this constructed hazard variable to
explicitly control for potential unobserved selection bias (a
‘‘Heckman selection model’’, see Text S1) [29]. We also used a
set of period effects to control for secular trends in the diabetes and
sugar data that may have occurred as a result of changes in
countries’ diabetes detection capacity or sugar importation
policies.
We conducted explicit model selection procedures using
Generalized Estimating Equations (see results in Text S1) to
ensure the model was an optimal choice for the given data [30].
The following regression model was specified, incorporating the
leading factors believed to be related to diabetes prevalence, in
addition to the sugar exposure variable:
DiabetesPrevalenceit~azb1GDPitzb2GDPcit{1z
b3SUGARitzb4FIBERitzb5FRUITitzb6MEATitz
b7CEREALSitzb8OILitzb9TOTALitzb10URBANitz
b11ELDERitzb12OBESEitzntzeit
ð1Þ
In Equation 1, i is country and t is year; GDP is logged per
capita gross domestic product; GDPc is the lag of GDP change;
SUGAR is the number of kilocalories per person per day of sugar
availability (the sum of sugar, sugar crops, and sweeteners); FIBER
is the number of kilocalories per person per day of fiber
(constituting pulses, vegetables, nuts, roots and tubers); FRUIT,
CEREALS, MEAT and OIL are the kilocalories per day per
capita availability for each of these food categories; TOTAL is the
total number of kilocalories per person per day of overall food
availability; URBAN is the percentage of the country’s population
living in urban settings; ELDER is the percentage of the
population that is age 65 or above; OBESE is the obesity
prevalence rate; and g is the set of dummy variables which controls
for period-effects, as described above; and epsilon is the error
variable.
We subsequently added additional variables to test the
associations of the percentage of total calories derived from sugar
or other food components with diabetes prevalence, the duration
of exposure to high calorie availability from sugar, and the effect of
reduced sugar availability. We further tested the impact of
introducing a measure of sedentary behavior, the estimated
percentage of the population aged 15 years and older that is
physically inactive from the International Physical Activity
Questionnaire [31](defined as not meeting any of three criteria:
(a) 5630 minutes of moderate-intensity activity per week; (b)
3620 minutes of vigorous-intensity activity per week; (c) an
equivalent combination achieving 600 metabolic equivalent-
minutes per week). Further control variables were the percent of
persons above age 15 years who currently smoke tobacco, from
the WHO Global Infobase [32], and the percent who engage
heavy episodic alcohol drinking (at least 60 grams or more of pure
alcohol on at least one occasion weekly), from the WHO Global
Information System on Alcohol and Health [33].
We also performed Granger-causality tests, which use the
temporal nature of the data to test whether high sugar availability
preceded an increase in diabetes (‘‘precedence’’) or whether high
diabetes prevalence preceded high sugar availability [34] (see Text
S1). Data were analyzed in STATA v10.1. In all analyses, food
availability data were age-adjusted, regressions were population
weighted, and robust standard errors were computed to ensure
stability of the results in the face of heteroskedasticity and
intragroup correlations.
Results
Correlates of diabetes prevalenceTable 1 presents the results of the cross-national model from
2000 to 2010. Each 150 kilocalorie/person/day increase in total
calorie availability related to a 0.1% rise in diabetes prevalence
(not significant), whereas a 150 kilocalories/person/day rise in
sugar availability (one 12 oz. can of soft drink) was associated with
a 1.1% rise in diabetes prevalence (95% CI: 0.48–1.7%; p,0.001)
after all control variables were incorporated into the model. These
controls included current income, changes in income, urbaniza-
tion, aging, obesity, and the consumption of other foods as well as
period effects (secular correlations that may have occurred simply
due to surveillance changes or economic development). Diabetes
prevalence rates rose 27% on average from 2000 to 2010, with just
over one-fourth of the increase explained by a rise in sugar
availability in this model. In countries like the Philippines,
Romania, Sri Lanka, Georgia and Bangladesh, where high and
rising diabetes rates were observed in the context of low obesity
rates, sugar availability rose by over 20% during the study period.
(It is possible that weight gain, rather than overt obesity, might
account for some of the changes in diabetes, hence our models
were repeated with overweight prevalence rather than obesity in
Table S3, and with measures of physical inactivity rather than
BMI in Table S4, but the results did not change).
Several of the main control variables in the model had
important effects. The coefficient of log Gross Domestic Product
(GDP) per capita was 1.07, which means that a 1% increase in
GDP levels corresponded to a 1.07% rise in diabetes prevalence
(p,0.05), consistent with the notion that economic development is
a powerful correlate to diabetes prevalence [35,36]. Similarly,
variables capturing urbanization and aging populations were
associated with diabetes prevalence; however these variables fell
from significance as total food availability and obesity were
incorporated into the model (Table 1), suggesting that calorie
consumption and obesity are among the pathways by which these
other factors may contribute to diabetes, consistent with cross-
sectional studies [37].
A potential criticism of the basic finding is that, given the effect
of obesity on the risk of diabetes and the high prevalence of both
obesity and sugar availability in developed countries, our results
are not due to sugar per se but rather confounded by rising obesity
rates. In Table 1, we see that sugar availability remained a
significant correlate to diabetes prevalence independent of obesity
and total calorie consumption. When obesity was removed from
the model, the effect size of sugar was not significantly amplified
(beta = 0.0081, p,0.001), suggesting that obesity does not appear
to account for the major part of the impact of sugar on diabetes.
We additionally tested whether sugar availability alone was a
significant predictor of obesity rates independent of the other
control variables (total consumption, urbanization, aging, income,
other foods and period effects), and found the expected
relationship between total calories and obesity, but not individually
Sugar and Diabetes
PLOS ONE | www.plosone.org 3 February 2013 | Volume 8 | Issue 2 | e57873
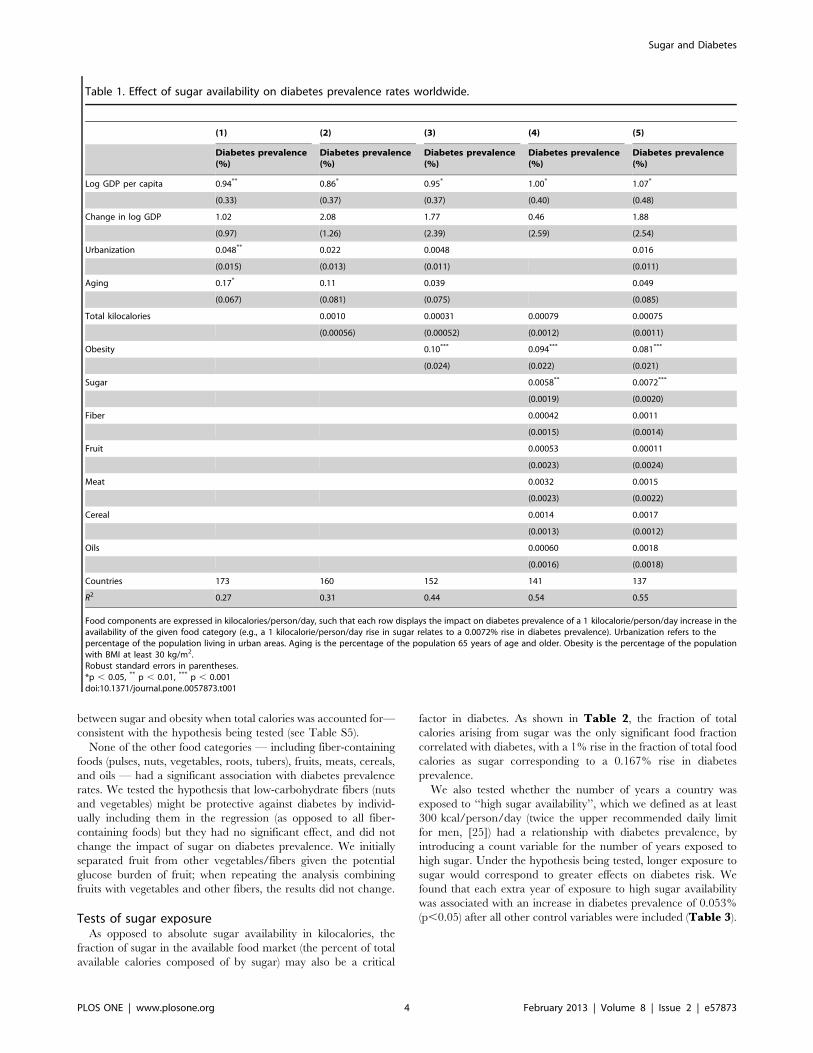
between sugar and obesity when total calories was accounted for—
consistent with the hypothesis being tested (see Table S5).
None of the other food categories — including fiber-containing
foods (pulses, nuts, vegetables, roots, tubers), fruits, meats, cereals,
and oils — had a significant association with diabetes prevalence
rates. We tested the hypothesis that low-carbohydrate fibers (nuts
and vegetables) might be protective against diabetes by individ-
ually including them in the regression (as opposed to all fiber-
containing foods) but they had no significant effect, and did not
change the impact of sugar on diabetes prevalence. We initially
separated fruit from other vegetables/fibers given the potential
glucose burden of fruit; when repeating the analysis combining
fruits with vegetables and other fibers, the results did not change.
Tests of sugar exposureAs opposed to absolute sugar availability in kilocalories, the
fraction of sugar in the available food market (the percent of total
available calories composed of by sugar) may also be a critical
factor in diabetes. As shown in Table 2, the fraction of total
calories arising from sugar was the only significant food fraction
correlated with diabetes, with a 1% rise in the fraction of total food
calories as sugar corresponding to a 0.167% rise in diabetes
prevalence.
We also tested whether the number of years a country was
exposed to ‘‘high sugar availability’’, which we defined as at least
300 kcal/person/day (twice the upper recommended daily limit
for men, [25]) had a relationship with diabetes prevalence, by
introducing a count variable for the number of years exposed to
high sugar. Under the hypothesis being tested, longer exposure to
sugar would correspond to greater effects on diabetes risk. We
found that each extra year of exposure to high sugar availability
was associated with an increase in diabetes prevalence of 0.053%
(p,0.05) after all other control variables were included (Table 3).
Table 1. Effect of sugar availability on diabetes prevalence rates worldwide.
(1) (2) (3) (4) (5)
Diabetes prevalence(%)
Diabetes prevalence(%)
Diabetes prevalence(%)
Diabetes prevalence(%)
Diabetes prevalence(%)
Log GDP per capita 0.94** 0.86* 0.95* 1.00* 1.07*
(0.33) (0.37) (0.37) (0.40) (0.48)
Change in log GDP 1.02 2.08 1.77 0.46 1.88
(0.97) (1.26) (2.39) (2.59) (2.54)
Urbanization 0.048** 0.022 0.0048 0.016
(0.015) (0.013) (0.011) (0.011)
Aging 0.17* 0.11 0.039 0.049
(0.067) (0.081) (0.075) (0.085)
Total kilocalories 0.0010 0.00031 0.00079 0.00075
(0.00056) (0.00052) (0.0012) (0.0011)
Obesity 0.10*** 0.094*** 0.081***
(0.024) (0.022) (0.021)
Sugar 0.0058** 0.0072***
(0.0019) (0.0020)
Fiber 0.00042 0.0011
(0.0015) (0.0014)
Fruit 0.00053 0.00011
(0.0023) (0.0024)
Meat 0.0032 0.0015
(0.0023) (0.0022)
Cereal 0.0014 0.0017
(0.0013) (0.0012)
Oils 0.00060 0.0018
(0.0016) (0.0018)
Countries 173 160 152 141 137
R2 0.27 0.31 0.44 0.54 0.55
Food components are expressed in kilocalories/person/day, such that each row displays the impact on diabetes prevalence of a 1 kilocalorie/person/day increase in theavailability of the given food category (e.g., a 1 kilocalorie/person/day rise in sugar relates to a 0.0072% rise in diabetes prevalence). Urbanization refers to thepercentage of the population living in urban areas. Aging is the percentage of the population 65 years of age and older. Obesity is the percentage of the populationwith BMI at least 30 kg/m2.Robust standard errors in parentheses.*p , 0.05, ** p , 0.01, *** p , 0.001doi:10.1371/journal.pone.0057873.t001
Sugar and Diabetes
PLOS ONE | www.plosone.org 4 February 2013 | Volume 8 | Issue 2 | e57873
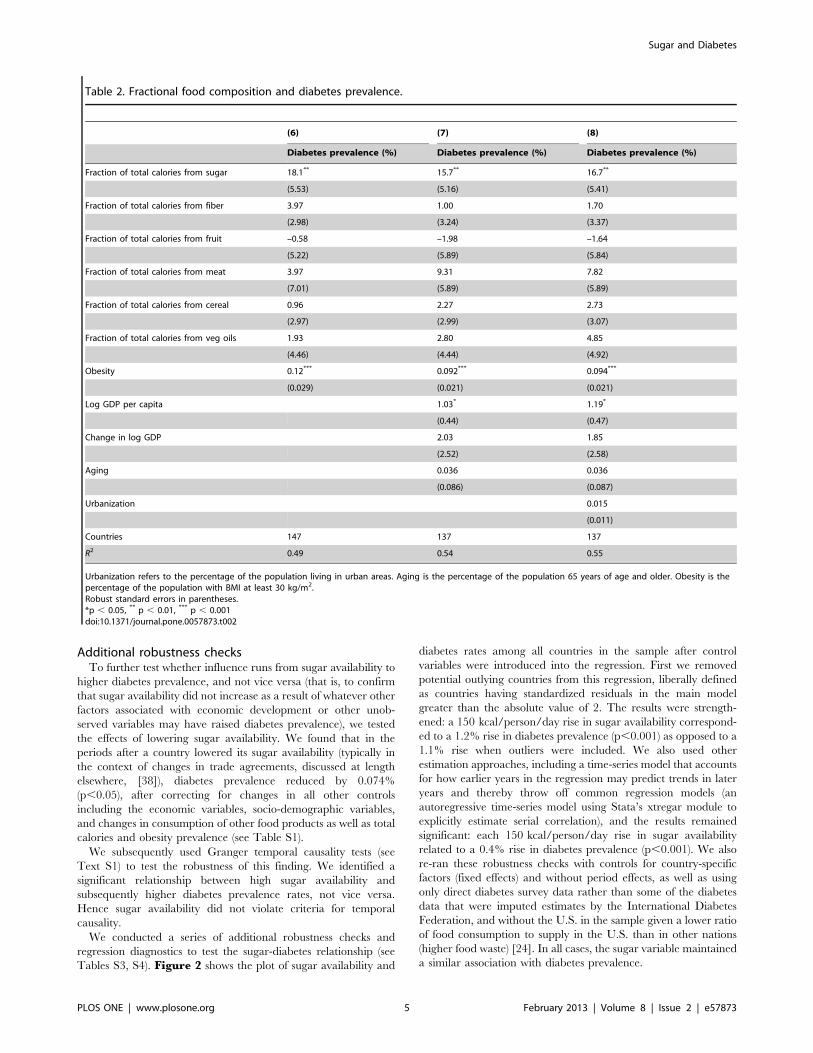
Additional robustness checksTo further test whether influence runs from sugar availability to
higher diabetes prevalence, and not vice versa (that is, to confirm
that sugar availability did not increase as a result of whatever other
factors associated with economic development or other unob-
served variables may have raised diabetes prevalence), we tested
the effects of lowering sugar availability. We found that in the
periods after a country lowered its sugar availability (typically in
the context of changes in trade agreements, discussed at length
elsewhere, [38]), diabetes prevalence reduced by 0.074%
(p,0.05), after correcting for changes in all other controls
including the economic variables, socio-demographic variables,
and changes in consumption of other food products as well as total
calories and obesity prevalence (see Table S1).
We subsequently used Granger temporal causality tests (see
Text S1) to test the robustness of this finding. We identified a
significant relationship between high sugar availability and
subsequently higher diabetes prevalence rates, not vice versa.
Hence sugar availability did not violate criteria for temporal
causality.
We conducted a series of additional robustness checks and
regression diagnostics to test the sugar-diabetes relationship (see
Tables S3, S4). Figure 2 shows the plot of sugar availability and
diabetes rates among all countries in the sample after control
variables were introduced into the regression. First we removed
potential outlying countries from this regression, liberally defined
as countries having standardized residuals in the main model
greater than the absolute value of 2. The results were strength-
ened: a 150 kcal/person/day rise in sugar availability correspond-
ed to a 1.2% rise in diabetes prevalence (p,0.001) as opposed to a
1.1% rise when outliers were included. We also used other
estimation approaches, including a time-series model that accounts
for how earlier years in the regression may predict trends in later
years and thereby throw off common regression models (an
autoregressive time-series model using Stata’s xtregar module to
explicitly estimate serial correlation), and the results remained
significant: each 150 kcal/person/day rise in sugar availability
related to a 0.4% rise in diabetes prevalence (p,0.001). We also
re-ran these robustness checks with controls for country-specific
factors (fixed effects) and without period effects, as well as using
only direct diabetes survey data rather than some of the diabetes
data that were imputed estimates by the International Diabetes
Federation, and without the U.S. in the sample given a lower ratio
of food consumption to supply in the U.S. than in other nations
(higher food waste) [24]. In all cases, the sugar variable maintained
a similar association with diabetes prevalence.
Table 2. Fractional food composition and diabetes prevalence.
(6) (7) (8)
Diabetes prevalence (%) Diabetes prevalence (%) Diabetes prevalence (%)
Fraction of total calories from sugar 18.1** 15.7** 16.7**
(5.53) (5.16) (5.41)
Fraction of total calories from fiber 3.97 1.00 1.70
(2.98) (3.24) (3.37)
Fraction of total calories from fruit –0.58 –1.98 –1.64
(5.22) (5.89) (5.84)
Fraction of total calories from meat 3.97 9.31 7.82
(7.01) (5.89) (5.89)
Fraction of total calories from cereal 0.96 2.27 2.73
(2.97) (2.99) (3.07)
Fraction of total calories from veg oils 1.93 2.80 4.85
(4.46) (4.44) (4.92)
Obesity 0.12*** 0.092*** 0.094***
(0.029) (0.021) (0.021)
Log GDP per capita 1.03* 1.19*
(0.44) (0.47)
Change in log GDP 2.03 1.85
(2.52) (2.58)
Aging 0.036 0.036
(0.086) (0.087)
Urbanization 0.015
(0.011)
Countries 147 137 137
R2 0.49 0.54 0.55
Urbanization refers to the percentage of the population living in urban areas. Aging is the percentage of the population 65 years of age and older. Obesity is thepercentage of the population with BMI at least 30 kg/m2.Robust standard errors in parentheses.*p , 0.05, ** p , 0.01, *** p , 0.001doi:10.1371/journal.pone.0057873.t002
Sugar and Diabetes
PLOS ONE | www.plosone.org 5 February 2013 | Volume 8 | Issue 2 | e57873
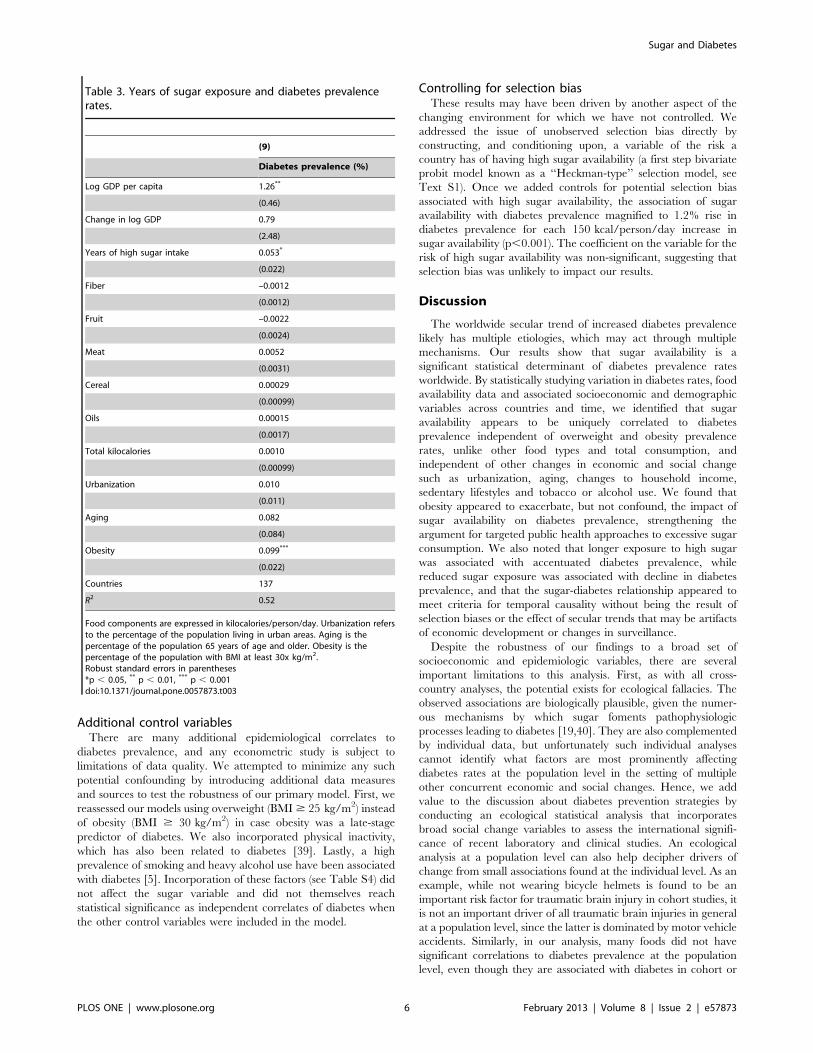
Additional control variablesThere are many additional epidemiological correlates to
diabetes prevalence, and any econometric study is subject to
limitations of data quality. We attempted to minimize any such
potential confounding by introducing additional data measures
and sources to test the robustness of our primary model. First, we
reassessed our models using overweight (BMI$ 25 kg/m2) instead
of obesity (BMI $ 30 kg/m2) in case obesity was a late-stage
predictor of diabetes. We also incorporated physical inactivity,
which has also been related to diabetes [39]. Lastly, a high
prevalence of smoking and heavy alcohol use have been associated
with diabetes [5]. Incorporation of these factors (see Table S4) did
not affect the sugar variable and did not themselves reach
statistical significance as independent correlates of diabetes when
the other control variables were included in the model.
Controlling for selection biasThese results may have been driven by another aspect of the
changing environment for which we have not controlled. We
addressed the issue of unobserved selection bias directly by
constructing, and conditioning upon, a variable of the risk a
country has of having high sugar availability (a first step bivariate
probit model known as a ‘‘Heckman-type’’ selection model, see
Text S1). Once we added controls for potential selection bias
associated with high sugar availability, the association of sugar
availability with diabetes prevalence magnified to 1.2% rise in
diabetes prevalence for each 150 kcal/person/day increase in
sugar availability (p,0.001). The coefficient on the variable for the
risk of high sugar availability was non-significant, suggesting that
selection bias was unlikely to impact our results.
Discussion
The worldwide secular trend of increased diabetes prevalence
likely has multiple etiologies, which may act through multiple
mechanisms. Our results show that sugar availability is a
significant statistical determinant of diabetes prevalence rates
worldwide. By statistically studying variation in diabetes rates, food
availability data and associated socioeconomic and demographic
variables across countries and time, we identified that sugar
availability appears to be uniquely correlated to diabetes
prevalence independent of overweight and obesity prevalence
rates, unlike other food types and total consumption, and
independent of other changes in economic and social change
such as urbanization, aging, changes to household income,
sedentary lifestyles and tobacco or alcohol use. We found that
obesity appeared to exacerbate, but not confound, the impact of
sugar availability on diabetes prevalence, strengthening the
argument for targeted public health approaches to excessive sugar
consumption. We also noted that longer exposure to high sugar
was associated with accentuated diabetes prevalence, while
reduced sugar exposure was associated with decline in diabetes
prevalence, and that the sugar-diabetes relationship appeared to
meet criteria for temporal causality without being the result of
selection biases or the effect of secular trends that may be artifacts
of economic development or changes in surveillance.
Despite the robustness of our findings to a broad set of
socioeconomic and epidemiologic variables, there are several
important limitations to this analysis. First, as with all cross-
country analyses, the potential exists for ecological fallacies. The
observed associations are biologically plausible, given the numer-
ous mechanisms by which sugar foments pathophysiologic
processes leading to diabetes [19,40]. They are also complemented
by individual data, but unfortunately such individual analyses
cannot identify what factors are most prominently affecting
diabetes rates at the population level in the setting of multiple
other concurrent economic and social changes. Hence, we add
value to the discussion about diabetes prevention strategies by
conducting an ecological statistical analysis that incorporates
broad social change variables to assess the international signifi-
cance of recent laboratory and clinical studies. An ecological
analysis at a population level can also help decipher drivers of
change from small associations found at the individual level. As an
example, while not wearing bicycle helmets is found to be an
important risk factor for traumatic brain injury in cohort studies, it
is not an important driver of all traumatic brain injuries in general
at a population level, since the latter is dominated by motor vehicle
accidents. Similarly, in our analysis, many foods did not have
significant correlations to diabetes prevalence at the population
level, even though they are associated with diabetes in cohort or
Table 3. Years of sugar exposure and diabetes prevalencerates.
(9)
Diabetes prevalence (%)
Log GDP per capita 1.26**
(0.46)
Change in log GDP 0.79
(2.48)
Years of high sugar intake 0.053*
(0.022)
Fiber –0.0012
(0.0012)
Fruit –0.0022
(0.0024)
Meat 0.0052
(0.0031)
Cereal 0.00029
(0.00099)
Oils 0.00015
(0.0017)
Total kilocalories 0.0010
(0.00099)
Urbanization 0.010
(0.011)
Aging 0.082
(0.084)
Obesity 0.099***
(0.022)
Countries 137
R2 0.52
Food components are expressed in kilocalories/person/day. Urbanization refersto the percentage of the population living in urban areas. Aging is thepercentage of the population 65 years of age and older. Obesity is thepercentage of the population with BMI at least 30x kg/m2.Robust standard errors in parentheses*p , 0.05, ** p , 0.01, *** p , 0.001doi:10.1371/journal.pone.0057873.t003
Sugar and Diabetes
PLOS ONE | www.plosone.org 6 February 2013 | Volume 8 | Issue 2 | e57873

clinical trial studies. This is because at a population level the
significance of these other foods may be not be driving population-
level diabetes rates. Our population-level data do not allow us to
assert mechanistic understandings of relationships between risk
and outcome, but do afford us a sense that the effect size is large
enough to affect the population rates of disease.
Second, we utilized an international food database that tracks
caloric availability, as there are no direct measures of actual
human consumption that can account for food wastage and
provide precise measures of food consumption internationally.
Exclusion of the United States from the data—an outlier-country
in terms of food wastage—did not change our results. In other
countries, supply and consumption are more closely aligned [41],
and differential wastage among foodstuffs does not appear to occur
[42]. Another potential limitation is that we cannot track specific
foods with accuracy, hence further analyses should investigate and
differentiate different types of sugars, or foods like dairy products,
to which sugars are frequently added, as well as other nutritional
components such as proteins and fats. For instance, a recent
ecological analysis correlated high-fructose corn syrup with
diabetes prevalence [43]. Our assessment was also ecological in
nature and cannot identify specific longitudinal causation among
individuals; however, unlike the prior assessment, the correlations
detected here were subjected to several tests to assess relationships
across time, the potential effects of other foodstuffs, the potential
for selection biases, and a larger number of potential confounding
factors.
Third, while considerable debate exists as to what forms of
sugar may be most relevant to this relationship (for example,
whether high-fructose corn syrup (HFCS) is different than sucrose
[44]), our analysis cannot distinguish between any specific added
sugars, such as HFCS or sucrose, or between any specific vehicle,
such as soda or processed food. Our study merely suggests that the
aggregate indicator of added sugar availability statistically predicts
changes in diabetes prevalence over time.
Fourth, our ecological approach limits statistical power as one
makes inferences about individuals based on aggregates; age, sex,
and racial predictions are lost. Important work at the individual
level suggests that certain populations, such as South Asian groups,
may develop metabolic syndrome and diabetes at lower levels of
obesity as assessed by BMI than other populations such as
Caucasians. Environmental factors such as sugar consumption
should be investigated as potential factors in this interaction. A
BMI . 25 kg/m2 rather than 30 kg/m2 may a more appropriate
indicator of obesity in Asians. Substituting overweight for obesity
in the models did not change the effect size or significance of our
findings with regard to sugar, and high sugars with low obesity
rates were observed in countries outside of East and South Asia,
suggesting that ethnic factors alone are unlikely to explain our
observations. Other societal factors associated with diabetes were
those classically associated with metabolic syndrome; including
income, urbanization and aging. All three of these were associated
with dietary and physical activity changes.
Finally, the International Diabetes Federation database contains
diabetes prevalence data based on multiple surveys of varying
quality; as many diabetics go undiagnosed, these are likely
underestimates, and do not distinguish between Type 1 (approx-
imately 10%) and Type 2 diabetes (90%), which would tend to
produce regression towards the mean (underestimating the
relationship between sugar and diabetes). Furthermore, we used
the best available population-wide international data available to
date for this assessment, but these data are known to be highly
imperfect. It is thought that much of the FAO data on foods and
nutrients in the food supply have limits to their reliability, and that
IDF data and WHO data on obesity prevalence are difficult to
validate independently. Hence, any of the findings we observe here
are meant to be exploratory in nature, helping us to detect broad
population patterns that deserve further testing through prospec-
tive longitudinal cohort studies in international settings, which are
only now coming underway.
The observed relationship between dietary sugar exposure and
diabetes in this statistical assessment was not mitigated by
adjusting for confounders related to socioeconomics, aging,
physical activity, or obesity. This suggests that sugar should be
Figure 2. Adjusted association of sugar availability (kcal/person/day) with diabetes prevalence (% adults 20–79 years old).Regression line is adjusted for all control variables listed in Table 1, including time-trends (period-effects).doi:10.1371/journal.pone.0057873.g002
Sugar and Diabetes
PLOS ONE | www.plosone.org 7 February 2013 | Volume 8 | Issue 2 | e57873
investigated for its role in diabetes pathogenesis apart from its
contributions to obesity.
In summary, population-level variations in diabetes prevalence
that are unexplained by other common variables appear to be
statistically explained by sugar. This finding lends credence to the
notion that further investigations into sugar availability and/or
consumption are warranted to further elucidate the pathogenesis
of diabetes at an individual level and the drivers of diabetes at a
population level [13].
Supporting Information
Table S1 Summary statistics.
(DOCX)
Table S2 Lowered sugar availability and diabetesprevalence.
(DOCX)
Table S3 Replication of results using overweight in-stead of obesity.(DOCX)
Table S4 Incorporating controls for physical inactivity,tobacco and alcohol.(DOCX)
Table S5 Testing sugar as an explanatory variable forobesity.(DOCX)
Text S1 Additional model information.(DOC)
Author Contributions
Conceived and designed the experiments: SB RL. Performed the
experiments: SB PY RL. Analyzed the data: SB PY NH RL. Contributed
reagents/materials/analysis tools: SB PY NH. Wrote the paper: SB RL.
References
1. Danaei G, Finucane MM, Lu Y, Singh GM, Cowan MJ, et al. (2011) National,
regional, and global trends in fasting plasma glucose and diabetes prevalence
since 1980: systematic analysis of health examination surveys and epidemiolog-ical studies with 370 country-years and 2?7 million participants. Lancet 378: 31–
40.2. Villjoen A, Sinclair AJ (2011) Diabetes and insulin resistance in older people.
Med Clin North America 95: 615–629.3. Cecchini M, Sassi F, Lauer JA, Lee YY, Guajardo-Barron V, et al. (2010)
Tackling of unhealthy diets, physical inactivity, and obesity: health effects and
cost-effectiveness. Lancet 376: 1775–1784.4. Popkin BM (1999) Urbanization, lifestyle changes, and the nutrition transition.
World Devel 27: 1905–1916.5. Hu FB (2011) Globalization of diabetes: the role of diet, lifestyle, and genes. Diab
Care 34: 1249–1257.
6. International Diabetes Federation (2011) IDF Diabetes Atlas.7. World Health Organization (2012) Global database on body mass index.
8. Chan JM, Rimm EB, Colditz GA, Stampfer MJ, Willett WC (1994) Obesity, fatdistribution, and weight gain as risk factors for clinical diabetes in men. Diabetes
Care 17: 961–969.9. Sung KC, Seo MH RE, Wilson AM. (2011) Elevated fasting insulin predicts the
future incidence of metabolic syndrome: a 5-year follow-up study. Cardiovasc
Diabetol 10: epub, 108.10. Sung KC, Kim SH (2011) Interrelationship between fatty liver and insulin
resistance in the development of type 2 diabetes. J Clin Endocrinol Metab 96:1093–1097.
11. Abbasi F, Chu JW, Lamendola C, McLaughlin T, Hayden J, et al. (2004)
Discrimination between obesity and insulin resistance in the relationship withadiponectin. Diabetes 53: 585–590.
12. Voulgari C, Tentolouris N, Dilaveris P, Tousoulis D, Katsilambros N, et al.(2011) Increased heart failure risk in normal-weight people with metabolic
syndrome compared with metabolically healthy obese individuals. J Am Coll
Cardiol 58: 1343–1350.13. Lustig RH, Schmidt LA, Brindis CD (2012) The toxic truth about sugar. Nature
487: 27–29.14. Johnson RJ, Segal MS, Sautin Y, Nakagawa T, Feig DI, et al. (2007) Potential
role of sugar (fructose) in the epidemic of hypertension, obesity and themetabolic syndrome, diabetes, kidney disease, and cardiovascular disease. Am J
Clin Nutr 86: 899–906.
15. Malik VS, Hu FB (2012) Sweeteners and risk of obesity and type 2 diabetes: therole of sugar-sweetened beverages. Curr Diab Rep epub Jan 31.
16. Bremer AA, Mietus-Snyder ML, Lustig RH (2012) Toward a unifyinghypothesis of metabolic syndrome. Pediatrics 129: 557–570.
17. Nagai Y, Yonemitsu S, Erion DM, Iwasaki T, Stark R, et al. (2009) The role of
peroxisome proliferator-activated receptor gamma coactivator-1 beta in thepathogenesis of fructose-induced insulin resistance. Cell Metab 9: 252–264.
18. Teff KL, Grudziak J, Townsend RR, Dunn TN, Grant RW, et al. (2009)Endocrine and metabolic effects of consuming fructose- and glucose-sweetened
beverages with meals in obese men and women: influence of insulin resistance onplasma triglyceride responses. J Clin Endocrinol Metab 94: 1562–1569.
19. Bremer AA, Stanhope KL, Graham JL, Cummings BP, Wang W, et al. (2011)
Fructose-fed rhesus monkeys: a nonhuman primate model of insulin resistance,metabolic syndrome, and type 2 diabetes. Clin Transl Sci 4: 243–252.
20. Schalkwijk CG, Stehouwer CD, van Hinsbergh VW (2004) Fructose-mediatednon-enzymatic glycation: sweet coupling or bad modification. Diabetes Metab
Res 20: 369–382.
21. Dills WL (1993) Protein fructosylation: fructose and the Maillard reaction. Am J
Clin Nutr 58: 779S–787S.
22. Santos CX, Tanaka LY, Wosniak J, Laurindo FR (2009) Mechanisms and
implications of reactive oxygen species generation during the unfolded protein
response: roles of endoplasmic reticulum oxidoreductases, mitochondrial
electron transport, and NADPH oxidase. Antioxid Redox Signal 11: 2409–2427.
23. Hummasti S, Hotamisligil GS (2010) Endoplasmic reticulum stress and
inflammation in obesity and diabetes. Circ Res 107: 579–591.
24. Hall KD, Guo J, Dore M, Chow CC (2009) The progressive increase of food
waste in America and Its environmental impact. PLoS One 4: e7940.
25. Johnson RK, Appel LJ, Brands M, Howard BV, Lefevre M, et al. (2009) Dietary
sugars intake and cardiovascular health. A scientific statement from the
American Heart Association Circulation 120: 1011–1020.
26. Food and Agriculture Organization of the United Nations (2011) FAOSTAT.
Rome: FAO.
27. The World Bank (2012) World Development Indicators.
28. Hausman JA (1978) Specification tests in econometrics. Econometrica 46: 1251–
1271.
29. Heckman J, Navarro-Lozano S (2004) Using matching, instrumental variables
and control functions to estimate economic choice models. Rev Econ Stat 86:
30–57.
30. Hardin JW, Hilbe JM (2003) Generalized estimating equations. Boca Raton:
CRC Press.
31. Hallal PC, Andersen LB, Bull FC, Guthold R, Haskell W, et al. (2012) Global
physical activity levels: surveillance progress, pitfalls, and prospects. Lancet 380:
247–257.
32. World Health Organization (2012) WHO Global Infobase.
33. World Health Organization (2012) Global health observatory data repository.
34. Granger CWJ (1969) Investigating causal relations by econometric models and
cross-spectral methods. Econometrica 37: 24–36.
35. Yoon KH, Lee JH, Kim JW, Cho JH, Choi YH, et al. (2006) Epidemic obesity
and type 2 diabetes in Asia. Lancet 368: 1681–1688.
36. Ramachandran A, Ma RC, Snehalatha C (2010) Diabetes in Asia. Lancet 375:
408–418.
37. Siegel KR, Echouffo-Tcheugui JB, Ali MK, Mehta NK, Narayan KM, et al.
(2012) Societal correlates of diabetes prevalence: an analysis across 94 countries.
Diabetes Res Clin Pract 96: 76–83.
38. Elobeid A, Beghin J (2006) Multilateral trade and agricultural policy reforms in
sugar markets. Journal of Agricultural Economics 57: 23–48.
39. Lee DC, Park I, Jun TW, Nam BH, Cho SI, et al. (2012) Physical activity and
body mass index and their associations with the development of type 2 diabetes
in Korean men. Am J Epidemiol doi: 10.1093/aje/kwr471.
40. Lim JS, Mietus-Snyder M, Valente A, Schwarz JM, Lustig RH (2010) The role
of fructose in the pathogenesis of NAFLD and the metabolic syndrome. Nat Rev
Gastroenterol Hepatol 7: 251–264.
41. Gustavsson J, Cederberg C, Sonesson U, van Otterdijk R, Meybeck A (2011)
Global food losses and food waste. Rome: Food and Agriculture Organization.
42. Muth MK, Karns SA, Nielsen SJ, Buzby JC, Wells HF (2011) Consumer-level
food loss estimates and their use in the ERS loss-adjusted food availability data.
Washngton, D.C.: U.S. Dept. of Agriculture.
43. Goran MI, Ulijaszek SJ, Ventura EE (2012) High fructose corn syrup and
diabetes prevalence: A global perspective.
44. Bray GA (2007) How bad is fructose? Am J Clin Nutr 86: 895–896.
Sugar and Diabetes
PLOS ONE | www.plosone.org 8 February 2013 | Volume 8 | Issue 2 | e57873
MPD13001: Advances Clinical Pediatrics
5/2/2013University of California San Francisco
City, StateName
Registrant ListUCSF OCME Page 1 of 9
1 MD Santa Barbara, CAAbbott Stephen L.2 MD Lodi, CAAbillar Irene D.3 MD San Francisco, CAAblin Arthur R.4 MD Antioch, CAAdham Susan 5 MD San Francisco, CAAdi Saleh 6 MD Tucson, AZAdler Albert 7 dohaahmed wessam 8 MD Bakersfield, CAAiylam Parameswaran S.9 MD Tigard, ORAl-Mulla Zaid 10 MD Providence, RIAnderson Angela C.11 MD Fullerton, CAAndreeff Katherine 12 MD Littleton, COArfsten Greg 13 MD Oxnard, CAArmijo Cristina A.14 MD Mandaluyong City, PhilippinesAscutia Alisa 15 MD Burbank, CAAshburn N. Keith 16 MD San Francisco, CAAtkinson-McEvoy Lee 17 MD n/aAyestaran Alejandra 18 MD, MS Berkeley, CABachrach Lela R.19 San FranciscoBaird Carina 20 NP San Francisco, CABaker Ann B.21 MD San Francisco, CABakken Eliza H.22 Edmonton, AB, CanadaBankowski Alicia N.23 MD Burlingame, CABarra-Stevens Debra A.24 MD Placerville, CABarrios Elaine A.25 MD, MPH, MBA Oakland, CABean Gary 26 MD Madison, WIBecker Michael 27 MD Santa Ana, CABendig Donald 28 MD San Francisco, CABernsten Brock D.29 MD, MPH Albany, CABerreman Janet M.30 MD San Francisco, CABojorquez Diana I.31 MD, MPH San Francisco, CABokser Seth J.32 MD Mill Valley, CABolton John C.33 MD San Mateo, CABorovina Rachel 34 MD Berkeley, CABradus Joan L.35 MD Dallas, TXBriner Susan 36 MSN, FNP Alameda, CABrito Nicki 37 MD Alameda, CABrooks Rona 38 MD San Francisco, CABuchholz David
City, StateName
Registrant ListUCSF OCME Page 2 of 9
39 MD San Mateo, CABuchner Stephen J.40 MD Oakland, CABuckelew Sara 41 MD Lake Bluff, ILBurkhart Carol T.42 MD San Angelo, TXCampanini Emir 43 MD Palo Alto, CAChaikind Janet 44 MD San Francisco, CAChan Mabel 45 MD Berkeley, CAChan Sue 46 MD San Francisco, CAChan Wai-Lam 47 MD Newport Coast, CAChang Cecilia 48 MD Davis, CAChen Amy 49 MD Saint Augustine, FLChen Kuo 50 MD San Francisco, CACheung David K.51 MD Baton Rouge, LAChevalier Tiffanny P52 MD El Cerrito, CAChin Catherine A.53 MD Redwood City, CACho Jennifer 54 MD San Bruno, CAChong Roberto 55 MD Altoona, PAChopra Rakesh K.56 MD San Mateo, CAChow Howard 57 Kapolei, HIChristie Carol Lee58 MD Belleville, ON, CanadaCoady John 59 MD Rancho Cucamonga, CACohen Seth A.60 MD Mandaluyong, PhilippinesComuelo Jerusha 61 RN, MSN, CPNP Burlingame, CACooke Laura 62 MD Bayside, NYCorpuz Elsa P.63 MD Bakersfield, CACousin Luis A.64 MD, MPH, FAAP San Francisco, CACrain Lucy S.65 NP, PhD Jamesville, NYCronin Virginia 66 MD Rego Park, NYCruz Elsa 67 MD Oakland, CACunningham Roberta A.68 MD San Francisco, CACzaja Jaclyn 69 MD Petaluma, CADahmen John J.70 MD San Francisco, CADe Jong Katherine 71 MD, MPH Fresno, CADelacruz Dmitri 72 RN, MSN, NNP San Francisco, CADewar Deborah 73 MD Piedmont, CADiller Lawrence H.74 MD San Carlos, CADolgasheva Assol 75 MD Sonoma, CADolislager Donna M.76 MD Berkeley, CADonahue Clem 77 MD Redwood City, CADuh Harry 78 Syracuse, NYDunham Melanie 79 MD Bloomington, INDusleag Dan Liviu80 MD Winnipeg, CanadaDwilow Rachel

City, StateName
Registrant ListUCSF OCME Page 3 of 9
81 NP Foster City, CAEpstein Karen 82 MD San Francisco, CAErnster Martin F.83 MD Redwood City, CAEspinoza Sylvia 84 MD Studio City, CAFalkowski Tanya 85 MD Castro Valley, CAFernandes Dionisio A.86 MD San Francisco, CAFerriero Donna M.87 MD San Francisco, CAFine Carol M.88 MD San Francisco, CAFiore Darren 89 MD Hillsborough, CAFisher Ivy 90 MD Scandia, MNFrank Harvey J.91 MD Fremont, CAFriedkin Stephen 92 MD San Francisco, CAFung Martin A.93 MD Baltimore, MDGaddy Anne 94 PA-C Alameda, CAGee Doris L.95 MD San Francisco, CAGelfand Amy Antman96 Rio De Janeiro, BrazilGenu Daniel Hilario San97 MD Greenbrae, CAGerman Donald F.98 MD San Francisco, CAGhorayeb Maya 99 MD Sacramento, CAGibbons Suzanne Irene100 MD San Francisco, CAGin Gary D.101 MSN Castro Valley, CAGonden Melissa G.102 MD Lubbock, TXGonzales Arnulfo 103 MD San Francisco, CAGoodman Amnon 104 MS Orinda, CAGottfried William G.105 MD Odessa, TXGowda Dinesh N.106 MD Rotorua, New ZealandGrangaard Erik 107 MD Olympia, WAGroseclose Lydia J.108 MD San Francisco, CAGrumbach Kevin 109 MD San Francisco, CAGrumbach Melvin 110 MD Manteca, CAGuevara Anna Lizza 111 MD Elk Grove, CAHall Allen D.112 MD Piedmont, CAHarris Penny 113 D.O. Oklahoma City, OKHarvey Albert Kenneth114 MD, MPH San Francisco, CAHayashida David N.115 MD Swarthmore, PAHayes Darcy 116 MD Berkeley, CAHayes Elizabeth 117 MD Las Vegas, NVHazen Jon 118 MD Anchorage, AKHeimerl John P.119 MD Pasco, WAHenriques John 120 MD San Francisco, CAHirose Shinjiro 121 MD Oakland, CAHo Melvin K.122 MD Los Altos, CAHo Patricia

City, StateName
Registrant ListUCSF OCME Page 4 of 9
123 MD Alameda, CAHong Tina 124 MD Oakland, CAHoward Renee M.125 MD Gilroy, CAHuang John Y.126 MD Calgary, AB, CanadaHumber Ashley 127 MD Duluth, GAHussain Saima 128 MD Santa Rosa, CAIezza Heather 129 MS, BS, RN San Rafael, CAIglesias Lucia 130 MD Albuquerque, NMInigo C. Paulina 131 MD Mandaluyong City, PhilippinesIsidoro Lygia Emily 132 MD San Francisco, CAJain Shonul 133 MD San Francisco, CAJernigan Laura A.134 MD Spartanbug, SCJohns Ralph H.135 MD San Francisco, CAJohnson Alan C.136 MD San Francisco, CAJohnson Kathryn 137 PA Spencer, NCJones Cybil 138 MD Huntington Beach, CAJones Jerome H.139 MD San Mateo, CAKaferly James 140 MD San Francisco, CAKaiser Sunitha 141 RN San Bruno, CAKakita Eugenia 142 MD Ottawa, ON, CanadaKalaichandran Amitha 143 MD Foster City, CAKapgan Galina 144 Yakima, WAKawakami Julie 145 MD San Francisco, CAKelly Timothy W.146 MD San Francisco, CAKim Cynthia D.147 MD Truckee, CAKinman Lynn 148 MD Mountain View, CAKnueppel Sung 149 MD Sacramento, CAKong Bo 150 MD San Francisco, CAKosinski Marta V.151 MD San Francisco, CAKota Aparna 152 MD Oakland, CAKotin Geoffrey R.153 MD Winnemucca, NVKracaw Kurt E.154 MD Fresno, CAKratzer James 155 MD Fremont, CAKrishnan Nalini R.156 MD Fresno, CAKrogstad Judi A.157 MD Campbell, CAKurwa Nurjehan 158 MD San Rafael, CAKwok Grace 159 Salisbury, MDLai Evelyn 160 MD Winnipeg, MB, CanadaLaks Jessica A.161 Oakland, CALangham Margaret 162 MD San Francisco, CALarson Ilse 163 MD Fort Worth, TXLazarus Peter S.164 MD Benicia, CALee Daniel

City, StateName
Registrant ListUCSF OCME Page 5 of 9
165 MD San Ramon, CALee Erin M.166 MD Sacramento, CALee Ronald 167 MD Oakland, CALee Simon 168 PA New Berlin, WILeranth Danielle 169 MD Berkeley, CALewak Norman 170 MD Pleasanton, CALewis Nancy 171 MD Woodside, NYLezcano Lazaro 172 MS Daly City, CALi Shirley 173 MD Davis, CALink Victoria C.174 MD San Francisco, CALitwin Jessica Ruth175 MD Oakland, CALong Dayna Alexis176 MD San Francisco, CALong Michele 177 MD San Ramon, CALong Thomas F.178 MD Albuquerque, NMLongfield Lynn A.179 DO Balboa Island, CALongnecker Joseph 180 MD San Jose, CALopez Ricardo 181 BSN Napa, CALosado Cheryl 182 MD San Francisco, CALowe Stephanie C.183 MD El Paso, TXLoya Amador 184 MD San Francisco, CALu Helen K.185 La Habra, CALum Jessica 186 MD Albuquerque, NMLuna Alice 187 MD San Francisco, CALustig Robert H.188 MD Portland, ORLutfi Eman 189 MD Minneapolis, MNMackey Paula S.190 MD San Francisco, CAMalawa Zea 191 MD Lafayette, CAMalone Michael H.192 Mandaluyong, N/A, PhilippinesManus Marco Elmer B.193 MD Alameda, CAMarbin Jyothi 194 MD Mill Valley, CAMartin Ann Marie195 MD Vallejo, CAMartin Fatma S.196 MD San Francisco, CAMathes Erin 197 MD Sacramento, CAMaulino Perla-Inez 198 MD Woodbridge, CAMayo Abelardo 199 MD Bethel, AKMcClure K. Jane 200 MD Stockton, CAMcCormick Charles R.201 MD Escondido, CAMcCormick Leslie J.202 MD Eugene, ORMcKee M. Christine 203 MD San Francisco, CAMcMahan Tracy D.204 MD Los Gatos, CAMcNabb Mary 205 MD San Francisco, CAMcNamara Meg M.206 MD, MPH West Sacramento, CAMeneses Lisa

City, StateName
Registrant ListUCSF OCME Page 6 of 9
207 MD New York, NYMetzl Jordan D.208 MD, MPH Chico, CAMiller Mark D.209 MD, MPH San Anselmo, CAMiller Peter M.210 BSN, RN Mill Valley, CAMisterio Leticia (Tish) 211 MD Fremont, CAMody Suhani 212 MD Fresno, CAMoemeni Parisa 213 MD San Francisco, CAMonash Bradley J.214 MD Santa Rosa, CAMulligan Marie 215 MS, CPNP San Mateo, CAMurphy Carol M.216 MSN san francisco, CAMuskat Mica 217 MD San Francisco, CANadiv Elizabeth C.218 MD Sacramento, CANakano David 219 MD Quezon City, PhilippinesNatividad, Jr. Graciano 220 PNP Portland, ORNava Jean 221 RN, CPNP Lemoore, CANaylon Stephen 222 MD, MBA Houston, TXNetoskie Mark J.223 MD Santa Rosa, CANewman Aimee 224 San Carlos, CANg Brian 225 MD Sausalito, CANiederer Alison J.226 MD, PhD San Francisco, CANielson Dennis 227 MD, MPH, JD Lafayette, CANolan Robert L.228 MD San Francisco, CANosek Carl 229 MD Elk Grove, CANzerem-Johnson Nkechi 230 Castle Pines, COOakes Tony 231 MD Nashville, TNObremskey Jill C232 MD San Ramon, CAObrinsky Allen D.233 MD Aurora, COOh Jeanne 234 MD Berkeley, CAOken Richard L.235 MD Durham, NCOleniacz Joseph 236 MD St. Paul, MNOmann Nicole M.237 Visalia, CAOngbongan Krischel 238 MD San Bruno, CAOsmena Maria L.239 MD Phoenix, AZPadrez James 240 MD Mandaluyong City, PhilippinesPalanca Amelen 241 MD Melbourne, AustraliaPalit Vikram 242 BSN, RN Dublin, CAPaolozzi Mary 243 MD La Jolla, CAParsons Genevieve 244 MD Pueblo, COParvin Quazi 245 MD Frisco, TXPatel Rima 246 MD Salt Lake City, UTPavia Andrew T.247 Oakland, CAPayne Margaret 248 MSN Wallingford, CTPeccerillo Sandra
City, StateName
Registrant ListUCSF OCME Page 7 of 9
249 MD Sartell, MNPeitso Marilyn J.250 MD Danville, CAPejham Sam 251 MD Templeton, CAPeterson Richard A.252 MD Granada Hills, CAPosner Gary 253 BSN, PhN Napa, CAPrice Debra J.254 MD, MPH Berkeley, CAQuint Richard D.255 RN Calistoga, CAQuiroga Kathryn L.256 MD Winston-Salem, NCRaguraman Ramakrishnan 257 MD Oakland, CARamos Andre M.258 MD College Station, TXRansom Daniel G.259 MD Oakland, CARay Anjana 260 Toronto, ON, CanadaRazik Fathima 261 MD Santa Monica, CARegala Elena R.262 RN, MSN, NNP Millbrae, CAReimer-Brady Jean 263 MD Berkeley, CAResner Jena 264 MS, PNP Berkeley, CARichards Martha J.265 Winston Hills, NSW, AustraliaRobinson Gregory 266 RN Napa, CARobinson Yoke May 267 RD, CNSC San Francisco, CARodriguez Luis A.268 MD San Jose, CARogé Claude 269 MD Pleasanton, CARoitshteyn Misha 270 MD Ramsey, MNRolfe Phillip B.271 MD North Chelmsford, MARoseman Byron D.272 MD San Francisco, CARosenberg Dawn L.273 MD San Francisco, CARosenbluth Glenn 274 MD San Francisco, CARoth Emily J.275 MD Albuquerque, NMRoveto Christopher 276 MD Castro Valley, CARuiz Michael 277 MS, PNP San Francisco, CASan Luis Elizabeth 278 MD Pembroke Pines, FLSanchez Ben-Emir 279 MD Oakland, CASantucci Stephen 280 MD San Diego, CASchneider Stephen D.281 MD Richmond, CASchoen Edgar J.282 MD Red Bluff, CASchultz Lena 283 RN San Francisco, CASchwartz Suzanne 284 MD Brooklyn, NYScott Robin 285 MD San Francisco, CASehring Sally A.286 MD Portland, ORSeitz Kristen M.287 MD San Francisco, CASherer Ilana 288 MD Northborough, MAShields Sara G.289 MD San Mateo, CAShowen Mark H.290 Seattle, WAShutts Jennifer
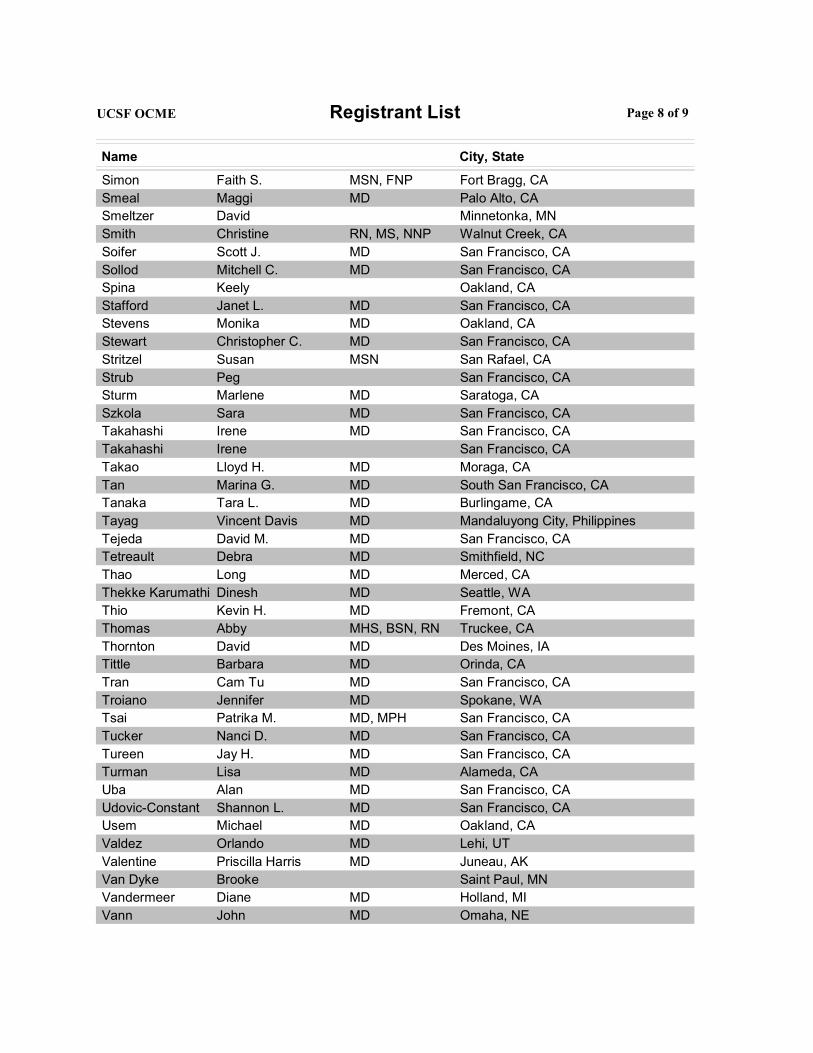
City, StateName
Registrant ListUCSF OCME Page 8 of 9
291 MSN, FNP Fort Bragg, CASimon Faith S.292 MD Palo Alto, CASmeal Maggi 293 Minnetonka, MNSmeltzer David 294 RN, MS, NNP Walnut Creek, CASmith Christine 295 MD San Francisco, CASoifer Scott J.296 MD San Francisco, CASollod Mitchell C.297 Oakland, CASpina Keely 298 MD San Francisco, CAStafford Janet L.299 MD Oakland, CAStevens Monika 300 MD San Francisco, CAStewart Christopher C.301 MSN San Rafael, CAStritzel Susan 302 San Francisco, CAStrub Peg 303 MD Saratoga, CASturm Marlene 304 MD San Francisco, CASzkola Sara 305 MD San Francisco, CATakahashi Irene 306 San Francisco, CATakahashi Irene 307 MD Moraga, CATakao Lloyd H.308 MD South San Francisco, CATan Marina G.309 MD Burlingame, CATanaka Tara L.310 MD Mandaluyong City, PhilippinesTayag Vincent Davis 311 MD San Francisco, CATejeda David M.312 MD Smithfield, NCTetreault Debra 313 MD Merced, CAThao Long 314 MD Seattle, WAThekke Karumathi Dinesh 315 MD Fremont, CAThio Kevin H.316 MHS, BSN, RN Truckee, CAThomas Abby 317 MD Des Moines, IAThornton David 318 MD Orinda, CATittle Barbara 319 MD San Francisco, CATran Cam Tu 320 MD Spokane, WATroiano Jennifer 321 MD, MPH San Francisco, CATsai Patrika M.322 MD San Francisco, CATucker Nanci D.323 MD San Francisco, CATureen Jay H.324 MD Alameda, CATurman Lisa 325 MD San Francisco, CAUba Alan 326 MD San Francisco, CAUdovic-Constant Shannon L.327 MD Oakland, CAUsem Michael 328 MD Lehi, UTValdez Orlando 329 MD Juneau, AKValentine Priscilla Harris330 Saint Paul, MNVan Dyke Brooke 331 MD Holland, MIVandermeer Diane 332 MD Omaha, NEVann John

City, StateName
Registrant ListUCSF OCME Page 9 of 9
333 MD Missoula, MTVannatta Andrea 334 MD Fort Lee, NJVillabona Beatriz 335 MD Mandaluyong City, PhilippinesVillanueva Armando 336 MN Portland, ORWallis Joanne (Jodi) M.337 MD Roseville, CAWarden William R.338 El Dorado Hills, CAWatkins Cristina 339 MD San Francisco, CAWaxman Norma Jo 340 Eugene, ORWeiner Karen 341 MD Portland, ORWeisskirk Maggie 342 MD Castro Valley, CAWells Eric 343 MD Pasadena, CAWhang Stephanie 344 MD San Francisco, CAWong Angela R.345 MD San Francisco, CAWong Irene 346 San Francisco, CAWong Kristin 347 MD, MPH Berkeley, CAWoo Jean 348 RN, FNP San Francisco, CAWoo-Lim Linda W.349 MD San Francisco, CAWright Kara 350 PNP San Rafael, CAWright Pamela M.351 MD Atlanta, GAWyatt Thomas E.352 MD San Francisco, CAYadav Neha 353 MD New City, NYYogananda Shanti 354 MD Castro Valley, CAYoung Sharon 355 MD San Francisco, CAYu Doris M.356 MD Newport Beach, CAYu Michael 357 BSN San Francisco, CAYu Susan 358 MD Calgary, AB, CanadaZaver Shaila 359 Walnut Creek, CAZilius Marie 360 MD Lafayette, CAZwerdling Michael A.
360Total Number of Attendees for MPD13001:
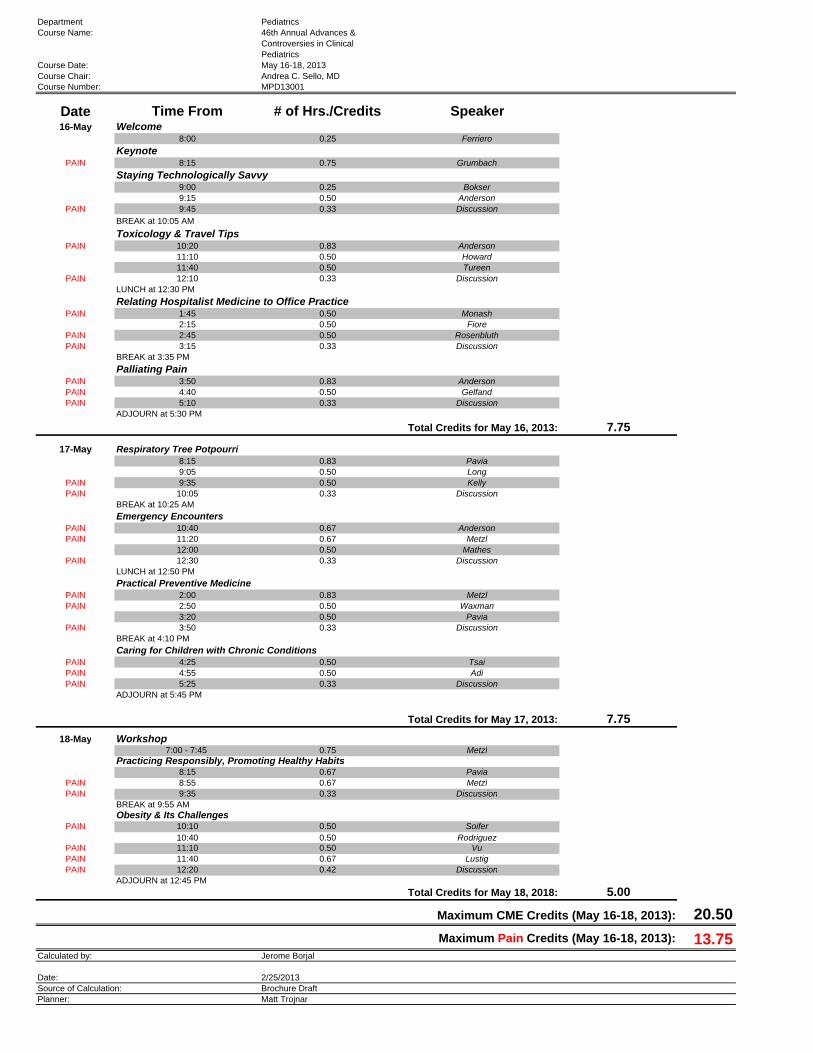
Department PediatricsCourse Name: 46th Annual Advances &
Controversies in ClinicalPediatrics
Course Date: May 16-18, 2013Course Chair: Andrea C. Sello, MDCourse Number: MPD13001
Date Time From # of Hrs./Credits Speaker16-May Welcome
8:00 0.25 Ferriero
KeynotePAIN 8:15 0.75 Grumbach
Staying Technologically Savvy9:00 0.25 Bokser9:15 0.50 Anderson
PAIN 9:45 0.33 Discussion
BREAK at 10:05 AM
Toxicology & Travel TipsPAIN 10:20 0.83 Anderson
11:10 0.50 Howard11:40 0.50 Tureen
PAIN 12:10 0.33 DiscussionLUNCH at 12:30 PM
Relating Hospitalist Medicine to Office PracticePAIN 1:45 0.50 Monash
2:15 0.50 FiorePAIN 2:45 0.50 RosenbluthPAIN 3:15 0.33 Discussion
BREAK at 3:35 PM
Palliating PainPAIN 3:50 0.83 AndersonPAIN 4:40 0.50 GelfandPAIN 5:10 0.33 Discussion
ADJOURN at 5:30 PM
Total Credits for May 16, 2013: 7.75
17-May Respiratory Tree Potpourri8:15 0.83 Pavia9:05 0.50 Long
PAIN 9:35 0.50 KellyPAIN 10:05 0.33 Discussion
BREAK at 10:25 AM
Emergency EncountersPAIN 10:40 0.67 AndersonPAIN 11:20 0.67 Metzl
12:00 0.50 MathesPAIN 12:30 0.33 Discussion
LUNCH at 12:50 PM
Practical Preventive MedicinePAIN 2:00 0.83 MetzlPAIN 2:50 0.50 Waxman
3:20 0.50 PaviaPAIN 3:50 0.33 Discussion
BREAK at 4:10 PM
Caring for Children with Chronic ConditionsPAIN 4:25 0.50 TsaiPAIN 4:55 0.50 AdiPAIN 5:25 0.33 Discussion
ADJOURN at 5:45 PM
Total Credits for May 17, 2013: 7.75
18-May Workshop7:00 - 7:45 0.75 Metzl
Practicing Responsibly, Promoting Healthy Habits8:15 0.67 Pavia
PAIN 8:55 0.67 MetzlPAIN 9:35 0.33 Discussion
BREAK at 9:55 AMObesity & Its Challenges
PAIN 10:10 0.50 Soifer10:40 0.50 Rodriguez
PAIN 11:10 0.50 VuPAIN 11:40 0.67 LustigPAIN 12:20 0.42 Discussion
ADJOURN at 12:45 PM
Total Credits for May 18, 2018: 5.00
Maximum CME Credits (May 16-18, 2013): 20.50
Maximum Pain Credits (May 16-18, 2013): 13.75Calculated by: Jerome Borjal
Date: 2/25/2013Source of Calculation: Brochure DraftPlanner: Matt Trojnar
Related Documents