Proceedings of the Institution of Civil Engineers Transport 156 May 2003 Issue TR2 Pages 103–115 Paper 12656 Received 27/07/2001 Accepted 04/03/2003 Keywords: traffic engineering/transport planning William H. K. Lam Professor, Department of Civil and Structural Engineering, The Hong Kong Polytechnic University W. T. Hung Associate Professor, Department of Civil and Structural Engineering, The Hong Kong Polytechnic University Hong K. Lo Associate Professor, Department of Civil Engineering, The Hong Kong University of Science and Technology H. P. Lo Associate Professor, Department of Management Sciences, City University of Hong Kong C. O. Tong Associate Professor, Department of Civil Engineering, The University of Hong Kong S. C. Wong Associate Professor, Department of Civil Engineering, The University of Hong Kong Hai Yang Associate Professor, Department of Civil Engineering, The Hong Kong University of Science and Technology Advancement of the annual traffic census in Hong Kong W. H. K. Lam, W. T. Hung, H. K. Lo, H. P. Lo, C. O. Tong, S. C. Wong and H. Yang This paper summarises the process, findings and recommendations of a recently completed joint university consultancy project that reviewed the annual traffic census (ATC) in Hong Kong. The results of a survey that assessed the usefulness of the census report are presented, together with an overview of the existing traffic data collection process and traffic detection equipment. Areas for improvement are then identified, including the sampling strategies for the collection of vehicle classification and occupancy data, the procedure for the development of group scaling factors, the method for the selection of core and coverage stations, the approaches to developing growth factors and traffic flow estimation, the presentation method and database structure of the census framework, and the manpower requirements. Based on these identified areas, a new computer program is developed to integrate all of the tasks of the census report and to produce the results in CD-ROM format. Finally, concluding remarks are given together with recommendations for further study. 1. INTRODUCTION Hong Kong is a small city with a total land area of approximately 1100 km 2 . Its topography is hilly and contains many islands. With a population that is approaching 7 million, and with urban development that is concentrated in around 16% of the land area, it has residential densities that are among the highest in the world. 1,2 In the past two decades the government has invested heavily in the highway and railway systems. A high-standard transportation system is provided to ensure the mobility of people and goods. However, owing to environmental concerns a recently published transport green paper recommended giving more priority to railway development. To maximise performance, the highway system must be closely monitored and effectively managed. 3 1.1. Background As the size of a highway network in a city is usually very large, it is generally impractical to measure the traffic flow on every link in the network. Therefore sampling techniques coupled with traffic flow prediction procedures are usually adopted to monitor the highway traffic volumes in the network. Two classes of technique are commonly used for the analysis of traffic volumes in networks: linear regression models 4,5 and time-series models. 6–11 In the United States, the measurement of traffic volume has been conducted in New York, 12 Washington, 13 Delaware 14 and Minnesota. 15 Studies were also conducted in the UK in the 1970s, 16, 17 upon which the proposed methodology in this paper is extended and developed. In Hong Kong, automatic traffic counters for the measurement of traffic volume were first used in 1961. With gradual developments in the subsequent years, a comprehensive system was established in 1971. This system is known as the annual traffic census (ATC). 18 The existing system follows the methodology from the comprehensive review of the census system in 1988. 19 Over 1500 counting stations were used in 1999. 20 Owing to the continuous development and the rapid expansion of the highway system in Hong Kong over the past decade, there was a need to review the existing methodology of the census system and to explore more sophisticated hardware and software technologies for data collection and analysis. 21 Against this background, the Civil and Structural Engineering Department of the Hong Kong Polytechnic University (PolyU), together with the Civil Engineering Departments at the University of Hong Kong (HKU) and the Hong Kong University of Science and Technology (HKUST), and the Department of Management Sciences at the City University of Hong Kong (CityU), were appointed to conduct a study that reviewed the census methodology and to develop new computer programs for all data analyses and the presentation of results. 22 This paper summarises the process, findings and recommendations of that study. The findings will be relevant to other Asian cities that have similar traffic patterns and share the need to monitor their highway systems effectively and efficiently. 1.2. Objectives The objectives of the study were to (a) review the census methodology and identify areas for improvement or formulate a new methodology so that the census could be conducted and reported in a more cost- effective manner (b) develop a comprehensive, user-friendly computer package to perform the data analysis and the presentation of ad hoc and final reports for inquiries and the production of the census Report (c) investigate the possibility of the digital publication of the Report. Transport 156 Issue TR2 Lam et al. 103 Annual Traffic Census in Hong Kong

Welcome message from author
This document is posted to help you gain knowledge. Please leave a comment to let me know what you think about it! Share it to your friends and learn new things together.
Transcript
Proceedings of the Institution ofCivil EngineersTransport 156May 2003 Issue TR2Pages 103–115
Paper 12656
Received 27/07/2001Accepted 04/03/2003
Keywords:traffic engineering/transportplanning
William H. K. LamProfessor,Department of Civiland StructuralEngineering, TheHong KongPolytechnicUniversity
W. T. HungAssociate Professor,Department of Civiland StructuralEngineering, TheHong KongPolytechnicUniversity
Hong K. LoAssociate Professor,Department of CivilEngineering, TheHong KongUniversity ofScience andTechnology
H. P. LoAssociate Professor,Department ofManagementSciences, CityUniversity of HongKong
C. O. TongAssociate Professor,Department of CivilEngineering, TheUniversity of HongKong
S. C. WongAssociate Professor,Department of CivilEngineering, TheUniversity of HongKong
Hai YangAssociate Professor,Department of CivilEngineering, TheHong KongUniversity ofScience andTechnology
Advancement of the annual traffic census in Hong Kong
W. H. K. Lam, W. T. Hung, H. K. Lo, H. P. Lo, C. O. Tong, S. C. Wong and H. Yang
This paper summarises the process, findings and
recommendations of a recently completed joint
university consultancy project that reviewed the annual
traffic census (ATC) in Hong Kong. The results of a
survey that assessed the usefulness of the census report
are presented, together with an overview of the existing
traffic data collection process and traffic detection
equipment. Areas for improvement are then identified,
including the sampling strategies for the collection of
vehicle classification and occupancy data, the procedure
for the development of group scaling factors, the
method for the selection of core and coverage stations,
the approaches to developing growth factors and traffic
flow estimation, the presentation method and database
structure of the census framework, and the manpower
requirements. Based on these identified areas, a new
computer program is developed to integrate all of the
tasks of the census report and to produce the results in
CD-ROM format. Finally, concluding remarks are given
together with recommendations for further study.
1. INTRODUCTION
Hong Kong is a small city with a total land area of
approximately 1100 km2. Its topography is hilly and contains
many islands. With a population that is approaching 7 million,
and with urban development that is concentrated in around
16% of the land area, it has residential densities that are
among the highest in the world.1,2
In the past two decades the
government has invested heavily in the highway and railway
systems. A high-standard transportation system is provided to
ensure the mobility of people and goods. However, owing to
environmental concerns a recently published transport green
paper recommended giving more priority to railway
development. To maximise performance, the highway system
must be closely monitored and effectively managed.3
1.1. Background
As the size of a highway network in a city is usually very
large, it is generally impractical to measure the traffic flow on
every link in the network. Therefore sampling techniques
coupled with traffic flow prediction procedures are usually
adopted to monitor the highway traffic volumes in the
network. Two classes of technique are commonly used for the
analysis of traffic volumes in networks: linear regression
models4,5
and time-series models.6–11
In the United States, the
measurement of traffic volume has been conducted in New
York,12
Washington,13
Delaware14
and Minnesota.15
Studies
were also conducted in the UK in the 1970s,16, 17
upon which
the proposed methodology in this paper is extended and
developed.
In Hong Kong, automatic traffic counters for the measurement
of traffic volume were first used in 1961. With gradual
developments in the subsequent years, a comprehensive
system was established in 1971. This system is known as the
annual traffic census (ATC).18
The existing system follows the
methodology from the comprehensive review of the census
system in 1988.19
Over 1500 counting stations were used in
1999.20
Owing to the continuous development and the rapid
expansion of the highway system in Hong Kong over the past
decade, there was a need to review the existing methodology
of the census system and to explore more sophisticated
hardware and software technologies for data collection and
analysis.21
Against this background, the Civil and Structural Engineering
Department of the Hong Kong Polytechnic University (PolyU),
together with the Civil Engineering Departments at the
University of Hong Kong (HKU) and the Hong Kong University
of Science and Technology (HKUST), and the Department of
Management Sciences at the City University of Hong Kong
(CityU), were appointed to conduct a study that reviewed the
census methodology and to develop new computer programs
for all data analyses and the presentation of results.22
This
paper summarises the process, findings and recommendations
of that study. The findings will be relevant to other Asian cities
that have similar traffic patterns and share the need to monitor
their highway systems effectively and efficiently.
1.2. Objectives
The objectives of the study were to
(a) review the census methodology and identify areas for
improvement or formulate a new methodology so that the
census could be conducted and reported in a more cost-
effective manner
(b) develop a comprehensive, user-friendly computer package
to perform the data analysis and the presentation of ad hoc
and final reports for inquiries and the production of the
census Report
(c) investigate the possibility of the digital publication of the
Report.
Transport 156 Issue TR2 Lam et al. 103Annual Traffic Census in Hong Kong
1.3. Structure of the paper
Section 2 summarises the results of a questionnaire survey. The
data collection techniques and methodology are described in
section 3. The analysis of data is discussed in section 4. Section
5 describes the method of presentation and the development of
a computer program. The manpower requirements and the
likely savings with the enhanced system are discussed in
section 6. Section 7 concludes the findings and suggests topics
for further study.
2. QUESTIONNAIRE SURVEY
To achieve the objectives of the study, it was necessary to
understand the structure of the census data and the users’
requirements. To this end, a questionnaire survey of major
census users was conducted in late December 1999.23
A total
of 133 questionnaires were distributed in both the public and
private sectors, and a high return rate of 52% was achieved.
The response breakdown by different sectors is listed in Table
1. Questions were asked about
(a) the purpose and frequency of using the annual census
Report
(b) the overall easiness of using the Report and suggestions for
improvements
(c) the usefulness of all chapters, tables, figures and
appendices of the Report
(d) the overall content and presentation of the Report.
The census Report was generally used for traffic noise
assessment, pavement design, traffic impact assessment and
model calibration and report writing. The frequencies with
which different organisations used the Report are shown in
Table 2. The usage patterns of government and non-
government organisations were quite similar. The census data
in the current report format were generally easy to use, and the
overall content and presentation of the census Report were
considered satisfactory. However, the assessment of the
usefulness of each data category in the Report was slightly
different for the three groups of respondents
(a) Transport Department/Transport Branch
(b) other government departments
(c) consulting firms/contractors/others.
Overall, about half of the respondents considered most types of
census data to be very useful or useful, and the other half
considered them to be not very useful/not at all useful.
Usefulness may well depend on the purpose of usage.
In light of the survey findings, more detailed statistics should
be provided in the census Report, and more stations should be
installed to cover more areas, especially those with substantial
traffic growth due to the opening of new roads. It is also
strongly suggested that the report be made available in digital
format, on CD-ROM or a website, which will allow the
inclusion of more detailed information such as summary
statistics for each counting station. In terms of presentation,
figures and tables should be included in the Report, and the
statistics of Lantau Island should be separated from those of
the New Territories. All of these findings and recommendations
have been taken into account in the development of the new
methodologies for the census system and the working and
reporting computer programs.
3. DATA COLLECTION
The census data collection processes in Hong Kong and
overseas were reviewed.24
Hong Kong uses the same approach
as the United States in terms of equipment usage: pneumatic
air-tubes are used for temporary counting stations, and
inductive loop detectors are used for permanent counting
Frequency Governmentdepartments
Non-government organisations Total
No. % No. % No. %
> 10 times per year 11 22 7 39 18 266–10 times per year 6 12 4 22 10 153–5 times per year 9 17 3 16 12 171–2 times per year 15 29 1 6 16 23No response 4 8 1 6 5 7Others 6 12 2 11 8 12Total 51 100 18 100 69 100
Table 2. The frequencies of Report usage
User categories Number of questionnairesdistributed
Number of questionnairesreturned
Response rate:%
Transport Department and Transport Bureau 17 17 100Other government departments 53 34 64Consulting firms, contractors and others 63 18 29Overall 133 69 52
Table 1. The breakdown of responses to questionnaire survey by different sectors
Transport 156 Issue TR2 Lam et al.104 Annual Traffic Census in Hong Kong
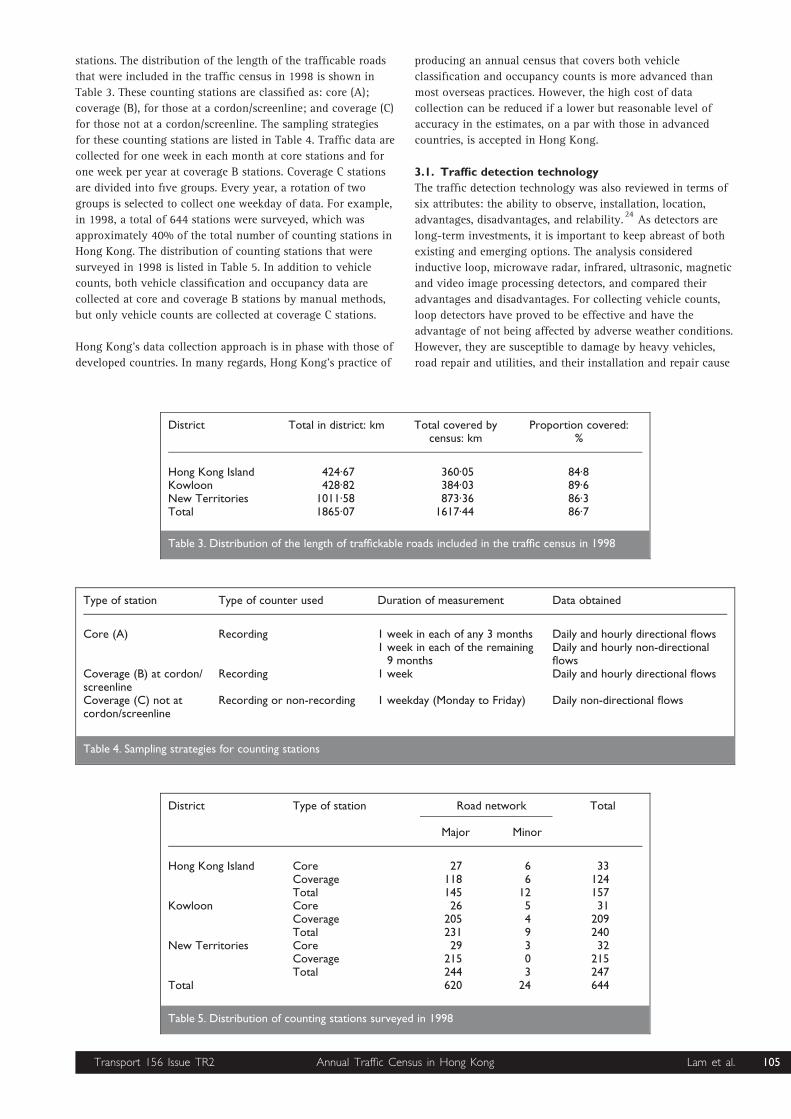
stations. The distribution of the length of the trafficable roads
that were included in the traffic census in 1998 is shown in
Table 3. These counting stations are classified as: core (A);
coverage (B), for those at a cordon/screenline; and coverage (C)
for those not at a cordon/screenline. The sampling strategies
for these counting stations are listed in Table 4. Traffic data are
collected for one week in each month at core stations and for
one week per year at coverage B stations. Coverage C stations
are divided into five groups. Every year, a rotation of two
groups is selected to collect one weekday of data. For example,
in 1998, a total of 644 stations were surveyed, which was
approximately 40% of the total number of counting stations in
Hong Kong. The distribution of counting stations that were
surveyed in 1998 is listed in Table 5. In addition to vehicle
counts, both vehicle classification and occupancy data are
collected at core and coverage B stations by manual methods,
but only vehicle counts are collected at coverage C stations.
Hong Kong’s data collection approach is in phase with those of
developed countries. In many regards, Hong Kong’s practice of
producing an annual census that covers both vehicle
classification and occupancy counts is more advanced than
most overseas practices. However, the high cost of data
collection can be reduced if a lower but reasonable level of
accuracy in the estimates, on a par with those in advanced
countries, is accepted in Hong Kong.
3.1. Traffic detection technology
The traffic detection technology was also reviewed in terms of
six attributes: the ability to observe, installation, location,
advantages, disadvantages, and relability.24
As detectors are
long-term investments, it is important to keep abreast of both
existing and emerging options. The analysis considered
inductive loop, microwave radar, infrared, ultrasonic, magnetic
and video image processing detectors, and compared their
advantages and disadvantages. For collecting vehicle counts,
loop detectors have proved to be effective and have the
advantage of not being affected by adverse weather conditions.
However, they are susceptible to damage by heavy vehicles,
road repair and utilities, and their installation and repair cause
District Total in district: km Total covered bycensus: km
Proportion covered:%
Hong Kong Island 424·67 360·05 84·8Kowloon 428·82 384·03 89·6New Territories 1011·58 873·36 86·3Total 1865·07 1617·44 86·7
Table 3. Distribution of the length of traffickable roads included in the traffic census in 1998
Type of station Type of counter used Duration of measurement Data obtained
Core (A) Recording 1 week in each of any 3 months Daily and hourly directional flows1 week in each of the remaining9 months
Daily and hourly non-directionalflows
Coverage (B) at cordon/screenline
Recording 1 week Daily and hourly directional flows
Coverage (C) not atcordon/screenline
Recording or non-recording 1 weekday (Monday to Friday) Daily non-directional flows
Table 4. Sampling strategies for counting stations
District Type of station Road network Total
Major Minor
Hong Kong Island Core 27 6 33Coverage 118 6 124Total 145 12 157
Kowloon Core 26 5 31Coverage 205 4 209Total 231 9 240
New Territories Core 29 3 32Coverage 215 0 215Total 244 3 247
Total 620 24 644
Table 5. Distribution of counting stations surveyed in 1998
Transport 156 Issue TR2 Lam et al. 105Annual Traffic Census in Hong Kong

traffic disruptions. Magnetic detectors provide an alternative
means of traffic detection, but, like loop detectors, they are also
embedded in the roadway and have similar drawbacks. New
products, such as Nu-metrics detectors, however, can be either
portable or buried to prolong their wear-and-tear period.
A common advantage of video image processing, infrared
detectors and ultrasonic detectors is that they are mounted in
overhead or side positions so that their installation and
maintenance do not disrupt the traffic. However, their accuracy
is susceptible to weather conditions and atmospheric
obscurants. Nevertheless, they can often replace a couple of
loop detectors in proximity, and hence could lead to cost
savings. Moreover, video image processing can provide a live
image of the detected area, which can be used for other
purposes such as incidence validation. Similar to the above
three types of detector, microwave radar detectors are also
mounted at overhead or side positions, but they are less
susceptible to adverse weather or atmospheric conditions.
Of the types of detector mentioned above, magnetic,
microwave and video image detectors deserve a more in-depth
study of their cost and performance. They represent emergent
technologies, and their continuous development should be
closely followed. Recent field experiments in Hong Kong show
that the microwave detector can measure volume, lane
occupancy, speed, highway and classification (long or short
vehicle) information. When set up properly, the traffic counts
were reported to be quite accurate, with a 5% margin for error.
However, the accuracy of the side-fired mode was low at
certain locations. It is believed that high fencing and narrow
shoulders on highways will adversely affect its accuracy. For
video imaging detectors, the measurement results show that,
when compared with the counts obtained from loop detectors,
the difference is around 6–8%. During the peak period from 4
to 7 p.m. the difference is around 6%, whereas the difference of
12-hour counts from noon to midnight is around 8%. One
thing to note is that video imaging detectors seem to have
consistently higher counts than do loop detectors. The above-
mentioned experimental comparison results for magnetic,
microwave and video image detectors are consistent with other
international studies.25, 26
At present, it is premature to choose one technology for large-
scale replacements. It is therefore recommended that a few
operational tests be conducted at various sites to determine the
lifespan, accuracy and ease and cost of installation of these
detectors. It should be emphasised that this technology
assessment is based purely on obtaining vehicle counts for
census purposes. Many of these detectors can obtain data for
other applications. Some provide images that are helpful for
incident detection or traffic condition verification, and others
provide multiple detection zones per detector, which would be
cost-effective for intersection signal control where many
detector zones are within close proximity.
In the nearer term, an examination of the existing traffic count
collection procedure may bring in more immediate cost
savings. Labour costs are a major part of the existing procedure
owing to the extensive use of movable air-tube detectors.
Owing to the relatively short durability of air-tubes (about half
a week on average) and the use of standalone counters that
require on-site data retrieval, the collection of data for one
week from each air-tube station requires the crew to make at
least three trips: one to set up the air-tube and counter, one to
check and retrieve data, and one to dismount the tube. To
reduce the labour costs, the air-tubes could be replaced with
linked loop detectors, or wireless communication modems
could be installed to reduce the number of crew trips. We
conducted a cost analysis to investigate when and where these
alternatives are cost-effective.
In the analysis, we designed a survey to collect the life-cycle
costs of air-tubes and loops, with emphasis on fixed and
material costs, installation costs, and operations and
maintenance costs. Both material and labour costs were
included in this consideration. All of these costs were accrued
on an annual basis for comparison purposes. The fixed costs
were the equipment costs for the expected year of service per
counting station. The material costs were the cost of non-
reusable materials that were associated with the use of air-
tubes. Installation costs comprised mainly labour costs.
Similarly, operations and maintenance costs were mainly
labour costs. Based on the frequency of the service trips and
crew size, we estimated the labour hours that were needed for
each item. Assuming an average wage of HK$100 per hour
(£1 � HK$12), we converted the labour hours to a monetary
amount for comparison purposes.
The cost of loop detectors was the same regardless of the
station type. Air-tubes, however, owing to their short
durability, require frequent checking and reinstallation. Such
costs increase significantly with measurement duration and
frequency.
For the set-up in Hong Kong as described at the beginning of
this section, the cost analysis can be summarised as follows.
For core A stations, though the fixed cost of loops is much
higher than that of air-tubes, their lower installation and
maintenance costs outweigh the difference. The installation of
a loop for a core station amounts to HK$14 000 per year,
whereas the installation of air-tubes requires HK$41 000 per
year. This analysis shows that loop detectors are more cost-
effective for core stations.
For coverage B and C stations, the lower frequency and
duration of data collection cannot justify the use of loop
detectors. Whereas the annual cost of loop detectors remains at
HK$14 000, those of air-tubes for coverage B and C stations
drop to HK$4000 and HK$2000 respectively. However, we
emphasise that this is based on a cost analysis solely for the
purpose of the census. Other factors that are not considered
include the safety of the crew when installing and dismounting
the air-tubes, and the fact that the traffic data that are
collected can be used for other purposes such as area traffic
control, incident detection, or, in the future, real-time traffic
information systems. These factors should have an influence on
the selection of the detector types.
The transmission of data from on-site counters to a central off-
site computer via wireless modems can reduce the need for
trips to check and retrieve data. Such an installation includes a
modem-equipped base unit, to which the user’s office-based
computer is connected through the public telephone switch
Transport 156 Issue TR2 Lam et al.106 Annual Traffic Census in Hong Kong

network. The base unit then serves as a common point of entry
between the user’s management system and the detectors. The
base unit performs as a store and forward data switch for the
required information, and can transmit data in accordance with
the specific period.
Each check requires 2 hours of labour. For standalone loop
detectors, this translates into HK$2400 per core station every
year and HK$200 per coverage B station every year. In the case
of air-tubes, owing to the need for more service trips by the
crew, the savings are much more substantial: HK$10 000 per
core station every year and HK$800 per coverage B station
every year. Coverage C stations are not considered in this
analysis because they collect only one weekday of data, which
does not require much maintenance checking.
This analysis examines the potential benefits of using wireless
communication between the counters and a central computer.
We searched for but could not identify commercial products
that provide this wireless linkage in an independent manner.
Most are bundled with a counter and detectors. An example is
Groundhog Model G-1 from Nu-metrics. Nevertheless, this cost
analysis provides an estimate of the upper bound value for
such a device.
To summarise, in comparing the costs of loop detectors and
air-tube detectors for census purposes only, it was found that
the former were cost-effective for core stations, whereas the
latter were cost-effective for coverage B and C stations.
However, in view of the fact that coverage B stations are also
cordon stations, traffic counts that are collected at such
stations can be used for many other types of study, and
inductive loop detectors should be installed for all core and
coverage B stations and linked to a central computer. A large
number of loop detectors at core stations are already linked.
This effort should be extended to all core and coverage B
stations. The analysis indicated that pneumatic air-tubes are
cost-effective for coverage C stations. However, based on past
records, at stations where air-tubes cannot last throughout the
measurement period, where traffic volume is high or where the
crew has safety concerns while mounting the air-tubes, it is
advisable to install standalone loop detectors. The objective is
to ensure two service trips to each coverage C station—one for
mounting/setting up and one for dismounting/retrieving the
counter.
In view of the emerging detection technologies, several
alternatives should be field-tested to validate their accuracy,
lifespan, portability and cost. These field results will form the
basis for considering the potential of such technologies as
replacements for loops and air-tubes. The alternatives include
the following.
(a) Nu-metrics detectors (e.g. Groundhog or Hi-star). It is
believed that non-contact Nu-metrics detectors will not be
worn out as easily as air-tubes.
(b) Video image processing (e.g. Autoscope 2000). The
Transport Department recently acquired this type of
detector for field-testing. Its performance for Hong Kong
scenarios and cost data should be collected and analysed
for census purposes.
(c) Microwave or ultrasonic detectors mounted on movable
platforms that can be transported to different stations with
relative ease. This set-up would be suitable for coverage C
stations with sufficient shoulders and clearance. To our
knowledge, there is no readily available commercial set-up
for this purpose. This is one concept that should be
explored for the longer-term future.
3.2. Traffic counter technology
The traffic counter technology was also reviewed.24
Recommendations are made as follows. Peek counters can
satisfactorily fulfil the need of the census. Even the low-end
Peek counters should be sufficient. The current Sarasota
counters that are used by the Transport Department of Hong
Kong should be phased out, given their lack of service and
spare parts. Moreover, a set of Nu-metrics detector/counters
with wireless transmission capability should be procured for
evaluation purposes. The evaluation results would be useful in
determining the suitability of this system and its cost-
effectiveness for coverage C stations.
3.3. Vehicle classification and occupancy
The sampling strategies for vehicle classification (motorcycle,
private car, taxi, passenger van, public light bus, light and
heavy goods vehicles, and franchised and non-franchised
buses) and passenger occupancy data that will lead to savings
in labour costs were also studied.24 Three types of station were
considered: high flow (with average annual daily traffic
(AADT) of around 123 000 vehicles), medium flow (with AADT
of around 87 000 vehicles), and low flow (with AADT of
around 11 000 vehicles). The following sampling durations
were examined
(a) franchised buses (FB): 20 min/h, 30 min/h, 60 min/h
(existing scheme)
(b) all but franchised buses (ABFB): 5 min/h, 10 min/h,
15 min/h (existing scheme)
(c) once every two years compared with every year (existing
scheme).
Each of these alternatives offers labour savings at the expense
of larger estimation errors (hereafter, the term ‘error’ refers to
the sampling error in statistical analysis, rather than the data
collection error). Based on an extensive study on statistical
errors, the sampling scheme of 10 min for ABFB and 30 min
for FB has the most potential as a replacement for the existing
scheme. This new scheme could reduce the current labour cost
by one sixth. The resultant statistical errors for both medium-
and high-flow stations are acceptable. However, more field
data should be collected to validate the level of estimation
accuracy of low-flow stations. Furthermore, for stations in
established areas where the annual trends of vehicle
composition and classification have stabilised, cross-year
sampling methods that could cut the labour cost by half should
be considered. Nevertheless, the disadvantage is that a
complete set of vehicle composition and occupancy data is not
available for every year.
4. DATA ANALYSIS
This section outlines the approach to data analysis. Detailed
mathematical formulae and expressions can be found in Lo et
al.27
and Tong et al.28
Transport 156 Issue TR2 Lam et al. 107Annual Traffic Census in Hong Kong

4.1. Group scaling factors
Owing to cost constraints, the traffic flows on coverage stations
are surveyed for a short period, which is usually one or two
days in a year. Hence scaling factors are needed to estimate the
AADT of coverage stations. A total of 84 (7 days by 12
months) scaling factors are defined as
FK,D,M ¼ AADTKxK,D,M
1
where AADTK is the average annual daily traffic at the Kth
road link, and FK, D, M and xK, D, M are the scaling factor and
measured traffic flow for the Dth day of the week in the Mth
month and at the Kth road link.
The current approach of the census to the development of
group scaling factors and the existing clusters of core stations
was reviewed. Using census-1998 survey data and cluster
analysis, new clusters of core stations were formed, based on
geographical locations and road types. The new groupings were
quite similar to the existing census groupings for Hong Kong
Island and Kowloon, but substantially different for the New
Territories. In general, the new groupings improved the
accuracy of the estimates of the group scaling factors. Table 6
shows the group scaling factors of Hong Kong Island (Urban)
for 1998. To obtain better estimates of group scaling factors
and the AADT of coverage stations, the core stations should be
regrouped by cluster analysis once a new set of census survey
data is obtained. The variables to be used by the cluster
analysis should include the 84 AADT ratios, road types and
geographical locations.27
4.2. Growth factors
According to the original census rotation scheme, coverage C
stations are only surveyed twice in every five years. Many
coverage stations do not have survey data for both the current
year and the previous year. Growth factors have to be applied
at least twice to generate the AADT of these stations. This may
lead to large and unacceptable variances of the estimators, and
thus inaccurate AADT of the coverage C stations. Hence a
group of four sets of growth factors should be developed, one
for each of the previous four years. For example, if 1998 is the
current year, then four sets of growth factors should be
developed from the ratios AADT98/AADT97, AADT98/AADT96,
AADT98/AADT95 and AADT98/AADT94. With these four sets
of growth factors, the AADT of coverage C stations with survey
data on any one of the previous four years can be directly
obtained by applying the appropriate growth factor. Hence the
AADT of the past four years together with the AADT of the
current year are used for the development of growth factors.
Not all core stations within a cluster are used in the calculation
of the growth factors for a cluster. A 95% acceptance interval
is used for checking the growth rate of the core and coverage
stations for each cluster. If a station is found to have a growth
factor outside the acceptance interval, then the station is
excluded from the calculation of the growth factor to prevent
this extreme growth rate from affecting the overall growth
factor of the cluster. The 95% acceptance interval is defined as
AADTtAADTt�n
� S 0:025, c � 1ð Þ3 DAADTtAADTt�n
� �2
where t is year 1998, n equals 1–4, c is the number of the core
or coverage stations in the cluster, S(.) is the critical value from
the Student t distribution, and D(.) is the standard derivation of
the random variable.
4.3. Cluster analysis
Cluster analysis is a multivariate technique for classifying
objects into natural groups or clusters so that the objects
within groups are similar in some respects and unlike those in
other groups.29
The proposed methodology makes use of this
technique to group the core stations in terms of their traffic
patterns. The statistical software package SPSS is used to
perform the proposed cluster analysis. Euclidean distance is
used to build the objective function, and Ward’s method is
used to generate the clusters. Ward’s method is widely used in
cluster formation. The performance of several popular methods
in terms of the clusters that are formed has been compared,
and Ward’s method has been found to be the most suitable.
Milligan et al.30
compare several popular agglomerative
algorithms including single link, complete link, group average
and Ward’s method, and conclude that Ward’s method
performs best. The standardisation of variables is performed
before the cluster analysis to reduce the effect of unusual
Sun Mon Tue Wed Thu Fri Sat
Jan 1·221 0·979 0·969 0·983 0·959 0·945 0·962Feb 1·254 1·010 0·987 0·979 0·974 0·959 0·985Mar 1·267 1·003 0·975 0·978 0·965 0·950 0·985Apr 1·250 0·986 0·959 0·954 0·945 0·937 0·974May 1·250 0·984 0·959 0·959 0·952 0·936 0·959June 1·283 0·992 0·972 0·976 0·973 0·960 0·977July 1·240 0·993 0·970 0·965 0·962 0·957 0·959Aug 1·223 0·987 0·976 0·960 0·959 0·950 0·962Sept 1·208 0·970 0·951 0·952 0·954 0·931 0·946Oct 1·217 0·949 0·937 0·950 0·940 0·922 0·964Nov 1·192 0·950 0·940 0·930 0·928 0·907 0·940Dec 1·204 0·943 0·927 0·925 0·920 0·898 0·930
Table 6. Group scaling factors of Hong Kong Island (urban) for 1998
Transport 156 Issue TR2 Lam et al.108 Annual Traffic Census in Hong Kong
fluctuations in particular months of the year or days of the
week, and to make the variables of different units more
compatible. The results that were obtained are compared with
the existing census cluster structures to check the
appropriateness of the groupings of the core stations. Cluster
analysis is applied separately to the core stations in Hong
Kong, Kowloon and the New Territories. Different clusters are
developed for both group scaling factor and growth factors.
4.3.1. Variables used in the cluster analysis. The initial choice
of variables is itself a categorisation of the data with no
mathematical or statistical guidelines, which reflects the
investigator’s judgement of relevance for the purpose of the
classification. Obviously, the input variables determine the
classification. To make the groupings more applicable, proper
variables should be used in the cluster analysis.
4.3.2. Group scaling factors. As the main objective of the
grouping of core stations is to develop group scaling factors,
the applicability of the groupings in terms of group scaling
factors must be considered. This implies that the groupings
should not be too scattered or contain too many road types
within each group so that coverage stations in the area can be
classified accordingly. Dummy variables that represent road
types and geographic locations (as reflected by previous
groupings) are therefore included in the data analysis for group
scaling factors. The road types include Expressway, Urban
Trunk road, Primary Distributor, District Distributor, Local
Distributor, Rural Trunk road and Rural Road A. Based on the
clusters of the core stations, the whole territory is divided into
groups. Within each group, core stations are more or less
similar in traffic pattern, geographical location and/or road
type. Coverage stations are then assigned to the appropriate
groups according to location and/or road type.
4·3·3. Growth factors. As previously mentioned, the existing
procedure of using the clusters that are developed for the group
scaling factors to form groups for the estimation of growth
factors may not be suitable. Thus clusters that are developed
specifically for the development of growth factors are
produced. The variables of the four ratios of AADT (AADT98/
AADT97, AADT98/AADT96, AADT98/AADT95 and AADT98/
AADT94), the K factor, and the location of the station (x, y
coordinates) are used in the cluster analysis.
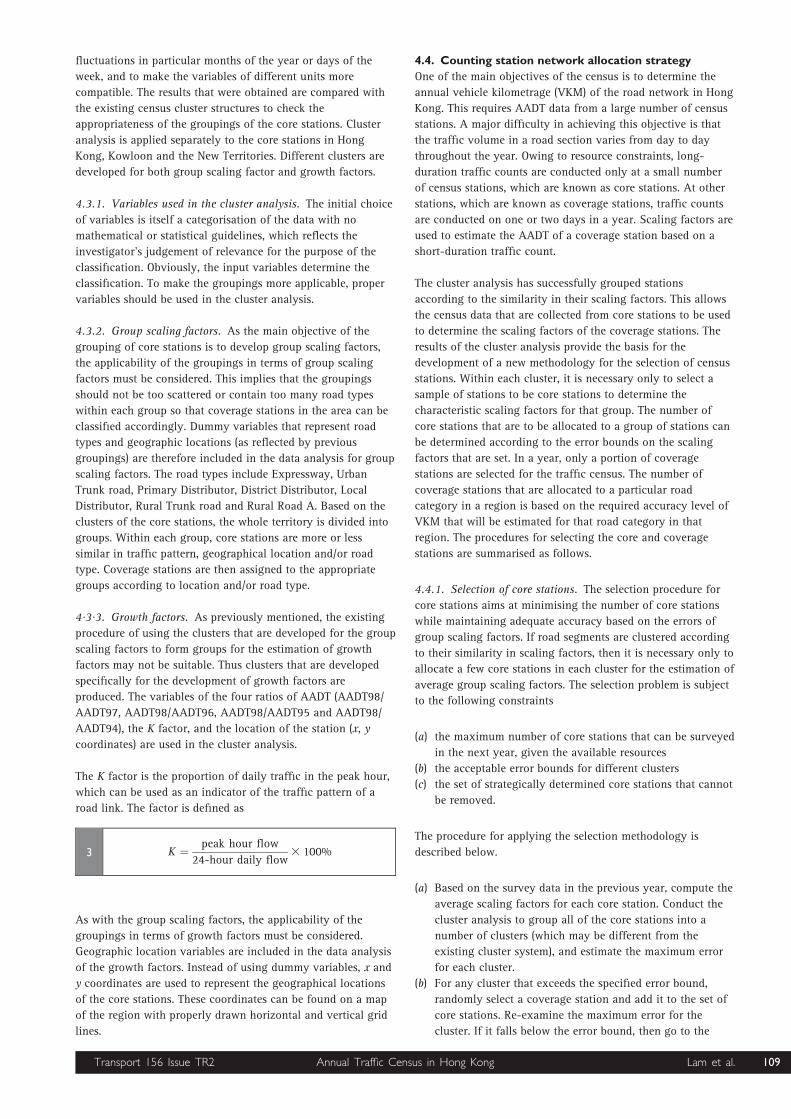
The K factor is the proportion of daily traffic in the peak hour,
which can be used as an indicator of the traffic pattern of a
road link. The factor is defined as
K ¼ peak hour flow
24-hour daily flow3 100%3
As with the group scaling factors, the applicability of the
groupings in terms of growth factors must be considered.
Geographic location variables are included in the data analysis
of the growth factors. Instead of using dummy variables, x and
y coordinates are used to represent the geographical locations
of the core stations. These coordinates can be found on a map
of the region with properly drawn horizontal and vertical grid
lines.
4.4. Counting station network allocation strategy
One of the main objectives of the census is to determine the
annual vehicle kilometrage (VKM) of the road network in Hong
Kong. This requires AADT data from a large number of census
stations. A major difficulty in achieving this objective is that
the traffic volume in a road section varies from day to day
throughout the year. Owing to resource constraints, long-
duration traffic counts are conducted only at a small number
of census stations, which are known as core stations. At other
stations, which are known as coverage stations, traffic counts
are conducted on one or two days in a year. Scaling factors are
used to estimate the AADT of a coverage station based on a
short-duration traffic count.
The cluster analysis has successfully grouped stations
according to the similarity in their scaling factors. This allows
the census data that are collected from core stations to be used
to determine the scaling factors of the coverage stations. The
results of the cluster analysis provide the basis for the
development of a new methodology for the selection of census
stations. Within each cluster, it is necessary only to select a
sample of stations to be core stations to determine the
characteristic scaling factors for that group. The number of
core stations that are to be allocated to a group of stations can
be determined according to the error bounds on the scaling
factors that are set. In a year, only a portion of coverage
stations are selected for the traffic census. The number of
coverage stations that are allocated to a particular road
category in a region is based on the required accuracy level of
VKM that will be estimated for that road category in that
region. The procedures for selecting the core and coverage
stations are summarised as follows.
4.4.1. Selection of core stations. The selection procedure for
core stations aims at minimising the number of core stations
while maintaining adequate accuracy based on the errors of
group scaling factors. If road segments are clustered according
to their similarity in scaling factors, then it is necessary only to
allocate a few core stations in each cluster for the estimation of
average group scaling factors. The selection problem is subject
to the following constraints
(a) the maximum number of core stations that can be surveyed
in the next year, given the available resources
(b) the acceptable error bounds for different clusters
(c) the set of strategically determined core stations that cannot
be removed.
The procedure for applying the selection methodology is
described below.
(a) Based on the survey data in the previous year, compute the
average scaling factors for each core station. Conduct the
cluster analysis to group all of the core stations into a
number of clusters (which may be different from the
existing cluster system), and estimate the maximum error
for each cluster.
(b) For any cluster that exceeds the specified error bound,
randomly select a coverage station and add it to the set of
core stations. Re-examine the maximum error for the
cluster. If it falls below the error bound, then go to the
Transport 156 Issue TR2 Lam et al. 109Annual Traffic Census in Hong Kong
next cluster. Otherwise, repeat the procedure until the error
becomes acceptable.
(c) For any cluster within the specified error bound, randomly
remove a core station (excluding those in the set of
strategically determined stations). Re-estimate the
maximum error for the cluster. If it falls below the error
bound, then repeat the procedure until it exceeds the error
bound. Go to the next cluster.
(d) If, for the sake of continuity, it is not desirable to have a
large sudden change in the allocation scheme for core
stations, the error bounds can be moved upwards or
downwards by 5% to minimise change.
(e) For any new roads that fall within the major road network,
use the existing stratified sampling method to select
additional core stations. The number of core stations that
are to be added is dependent on the total new link length
and the average flows in each road type stratum.
( f ) Set up a core station in each new road link, with the major
road network cut by a cordon/screenline.
(g) All other new links in the major road network that are not
covered by core stations are covered by coverage C
stations. All new coverage C stations are divided randomly
into five groups and appended to the existing five groups
of coverage C stations.
(h) For all new roads that fall within the minor road network,
randomly select additional core and coverage C stations.
The number of new core and coverage C stations that are
to be added is dependent on the total new minor road
length. Divide the new coverage stations randomly into
five groups and append them to the existing five groups of
coverage C stations.
(i) Set up a coverage B station in each new link in the minor
road network, which is cut by a cordon/screenline.
( j) After the allocation of core stations, if the total number
exceeds the maximum allowable number of core stations,
then the specified accuracy level cannot be maintained
with the limited resources. In this case, adjust the error
bounds upward for different clusters.
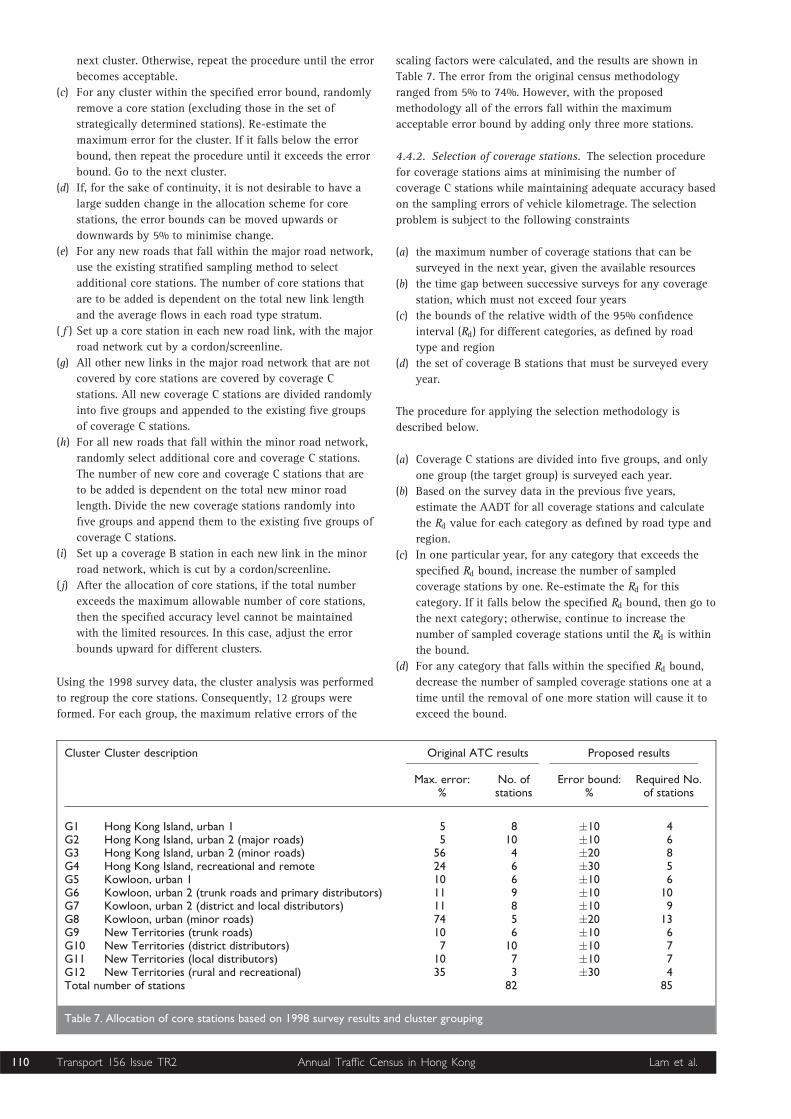
Using the 1998 survey data, the cluster analysis was performed
to regroup the core stations. Consequently, 12 groups were
formed. For each group, the maximum relative errors of the
scaling factors were calculated, and the results are shown in
Table 7. The error from the original census methodology
ranged from 5% to 74%. However, with the proposed
methodology all of the errors fall within the maximum
acceptable error bound by adding only three more stations.
4.4.2. Selection of coverage stations. The selection procedure
for coverage stations aims at minimising the number of
coverage C stations while maintaining adequate accuracy based
on the sampling errors of vehicle kilometrage. The selection
problem is subject to the following constraints
(a) the maximum number of coverage stations that can be
surveyed in the next year, given the available resources
(b) the time gap between successive surveys for any coverage
station, which must not exceed four years
(c) the bounds of the relative width of the 95% confidence
interval (Rd) for different categories, as defined by road
type and region
(d) the set of coverage B stations that must be surveyed every
year.
The procedure for applying the selection methodology is
described below.
(a) Coverage C stations are divided into five groups, and only
one group (the target group) is surveyed each year.
(b) Based on the survey data in the previous five years,
estimate the AADT for all coverage stations and calculate
the Rd value for each category as defined by road type and
region.
(c) In one particular year, for any category that exceeds the
specified Rd bound, increase the number of sampled
coverage stations by one. Re-estimate the Rd for this
category. If it falls below the specified Rd bound, then go to
the next category; otherwise, continue to increase the
number of sampled coverage stations until the Rd is within
the bound.
(d) For any category that falls within the specified Rd bound,
decrease the number of sampled coverage stations one at a
time until the removal of one more station will cause it to
exceed the bound.
Cluster Cluster description Original ATC results Proposed results
Max. error:%
No. ofstations
Error bound:%
Required No.of stations
G1 Hong Kong Island, urban 1 5 8 �10 4G2 Hong Kong Island, urban 2 (major roads) 5 10 �10 6G3 Hong Kong Island, urban 2 (minor roads) 56 4 �20 8G4 Hong Kong Island, recreational and remote 24 6 �30 5G5 Kowloon, urban 1 10 6 �10 6G6 Kowloon, urban 2 (trunk roads and primary distributors) 11 9 �10 10G7 Kowloon, urban 2 (district and local distributors) 11 8 �10 9G8 Kowloon, urban (minor roads) 74 5 �20 13G9 New Territories (trunk roads) 10 6 �10 6G10 New Territories (district distributors) 7 10 �10 7G11 New Territories (local distributors) 10 7 �10 7G12 New Territories (rural and recreational) 35 3 �30 4Total number of stations 82 85
Table 7. Allocation of core stations based on 1998 survey results and cluster grouping
Transport 156 Issue TR2 Lam et al.110 Annual Traffic Census in Hong Kong
(e) From steps (c) and (d), the number of coverage C stations
that are to be sampled for each category in the next survey
year is determined. If stations are to be added, then they
are selected randomly from the remaining four groups of
coverage stations. However, the priority of selection is
based on the survey time gap for each station. If stations
are to be removed, then they cannot be selected from
stations that belong to the target group.
( f ) If the resources that are available in the next year are not
sufficient to survey all of the sampled coverage stations,
then the specified accuracy level for estimating vehicle
kilometrage cannot be maintained. In such cases, adjust the
Rd bounds for different categories and repeat steps (a)–(e).
Using the 1998 survey data, the Rd values for all of the road
categories in Hong Kong are determined. These are then
compared with the following Rd bounds
• major primary distributors: �15%
• major district distributors and remote areas: �15%
• major expressways, and urban and rural trunk roads: �20%
• major local distributors (except New Territories): �30%
• minor roads: �30%
• major local distributors (New Territories): �50%.
Note that the proposed Rd bound for the major local
distributors (New Territories) category is set at 50%, which is
much higher than the rest. This is because the lowest
achievable Rd value for the category is 47% even if all stations
are included in the analysis. For each category, if the Rd value
exceeds the specified Rd bound, then coverage C stations are
added one at a time until the estimated Rd value falls below the
bound. If the Rd value is below the specified bound, then
coverage C stations are removed randomly one at a time until
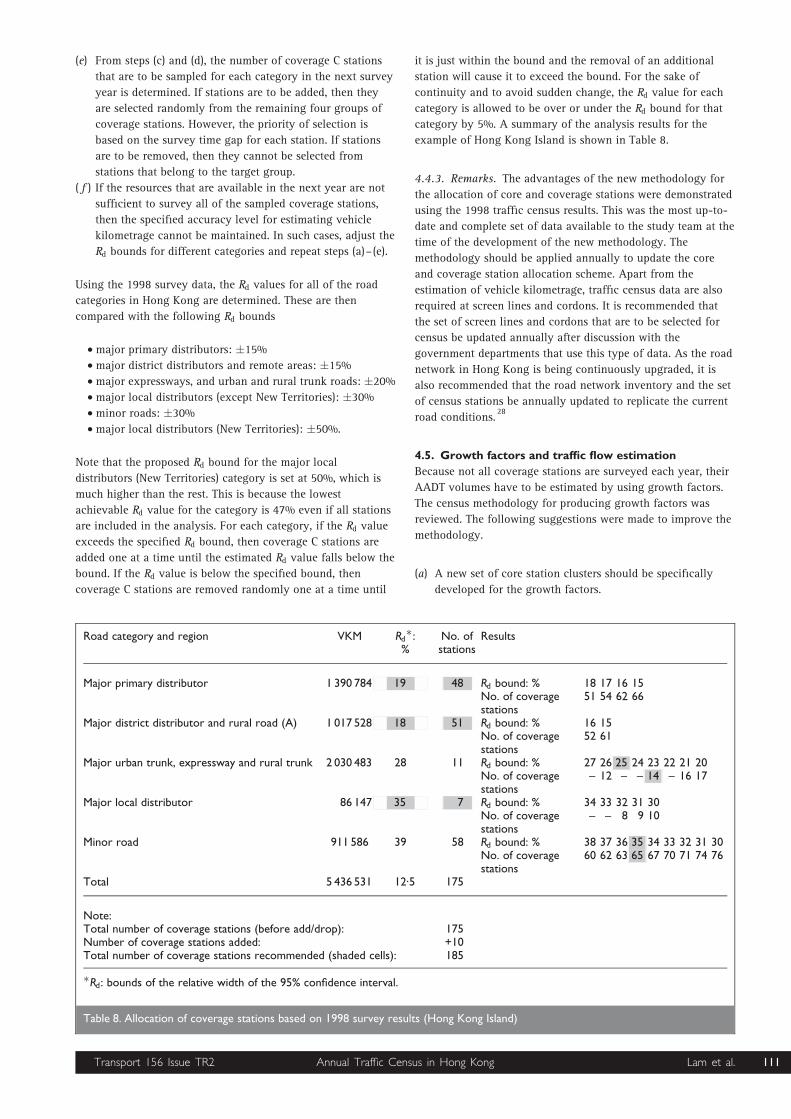
it is just within the bound and the removal of an additional
station will cause it to exceed the bound. For the sake of
continuity and to avoid sudden change, the Rd value for each
category is allowed to be over or under the Rd bound for that
category by 5%. A summary of the analysis results for the
example of Hong Kong Island is shown in Table 8.
4.4.3. Remarks. The advantages of the new methodology for
the allocation of core and coverage stations were demonstrated
using the 1998 traffic census results. This was the most up-to-
date and complete set of data available to the study team at the
time of the development of the new methodology. The
methodology should be applied annually to update the core
and coverage station allocation scheme. Apart from the
estimation of vehicle kilometrage, traffic census data are also
required at screen lines and cordons. It is recommended that
the set of screen lines and cordons that are to be selected for
census be updated annually after discussion with the
government departments that use this type of data. As the road
network in Hong Kong is being continuously upgraded, it is
also recommended that the road network inventory and the set
of census stations be annually updated to replicate the current
road conditions.28
4.5. Growth factors and traffic flow estimation
Because not all coverage stations are surveyed each year, their
AADT volumes have to be estimated by using growth factors.
The census methodology for producing growth factors was
reviewed. The following suggestions were made to improve the
methodology.
(a) A new set of core station clusters should be specifically
developed for the growth factors.
Road category and region VKM Rd�:%
No. ofstations
Results
Major primary distributor 1 390 784 19 48 Rd bound: % 18 17 16 15No. of coveragestations
51 54 62 66
Major district distributor and rural road (A) 1 017 528 18 51 Rd bound: % 16 15No. of coveragestations
52 61
Major urban trunk, expressway and rural trunk 2 030 483 28 11 Rd bound: % 27 26 25 24 23 22 21 20No. of coveragestations
– 12 – – 14 – 16 17
Major local distributor 86 147 35 7 Rd bound: % 34 33 32 31 30No. of coveragestations
– – 8 9 10
Minor road 911 586 39 58 Rd bound: % 38 37 36 35 34 33 32 31 30No. of coveragestations
60 62 63 65 67 70 71 74 76
Total 5 436 531 12·5 175
Note:Total number of coverage stations (before add/drop): 175Number of coverage stations added: +10Total number of coverage stations recommended (shaded cells): 185
�Rd: bounds of the relative width of the 95% confidence interval.
Table 8. Allocation of coverage stations based on 1998 survey results (Hong Kong Island)
Transport 156 Issue TR2 Lam et al. 111Annual Traffic Census in Hong Kong

(b) The rotation scheme for the coverage stations should be
modified.
(c) The new rotation scheme for the coverage stations on the
minor link network should be applied.
(d) Four sets of growth factors should be produced to limit the
number of times that each is used for any coverage station.
The census methodology for estimating the traffic flow and
VKM has also been reviewed. Suggestions are made to amend
the estimation formula for the minor link network so that the
VKM for the core stations and coverage stations on minor
roads can be estimated separately and more accurately. The
proposed methodologies for the development of growth factors
and the estimation of VKM are validated using census-1998
survey data. The results show that the proposed methodologies
generally outperform the existing census approach.27
5. DISSEMINATION OF RESULTS
5.1. Presentation of results
The census Report is currently presented in booklet form. This
not only causes a storage problem due to the large stack of
reports that are printed for many years, but it also means that
the reports are not user-friendly. Data retrieval can be
improved, as indicated by the results of the survey. The data
and information that are presented in the census Report can be
broadly divided into three major categories: documentation
and summary statistics, AADT data and maps, and definitions
and terminology. With the existing presentation, it is rather
difficult and time-consuming to search for the station that
covers a particular road section and its traffic counts.
Moreover, for each ordered attribute for the AADT of counting
stations, such as station numbers and road names, a whole set
of results have to be duplicated. This occupies much space in
the Report.
Based on the findings of the review and the results of the
survey, it is recommended that future census Reports be
documented in digital form, with CD-ROMs as the major
distribution medium. A Windows-based reporting program was
developed for users to retrieve the necessary data and
information from the CD-ROM in a user-friendly environment,
which can either be used alone or installed in the user’s
computer. Fig. 1 shows the layout of the front page of the
reporting program. Six major buttons are available for
accessing the documentation, individual counting station,
cordon/screenline, map information, help menu and printing
pages.
The possibility of exploring geographic information system
(GIS) technology to further enhance the presentation of the
census results was also studied. The use of a GIS for the
presentation of census results would not only be compatible
Fig. 1. Layout of the front page of the reporting program
Transport 156 Issue TR2 Lam et al.112 Annual Traffic Census in Hong Kong
with the future development of the Transport Information
System (TIS), but would also provide an even more user-
friendly and flexible environment. Therefore a GIS should be
considered in the future expansion and enhancement of the
census system.31
5.2. Computer programs
Apart from the reporting program, a new working program was
developed to integrate all of the tasks and analyses for the
census system. Three improvements are achieved in the
working program: a well-organised database, an object-
oriented approach for the integration of all of the tasks for
producing the census results, and user-friendliness (Windows-
based). The census data are stored and manipulated in MS
Access for better protection and management. The object-
oriented modelling is used for encapsulating the data in the
working program so that they are easier to understand.
Windows screens are used to provide a user-friendly
environment for the production of the census results, which are
automatically stored in the Access database. The proposed
database system should be backed up regularly.
A rotation scheme for the backup of the proposed database
system should be adopted to regularly save the data files on
hard disk and CD-ROM (or a high-capacity external hard disk).
For instance, in a three-day rotation the database is backed up
and copied to three daily files for three successive days. Note
that the third-day file includes all of the data that were
recorded in the previous two days and in the current day. On
the fourth day, a new (fourth) file replaces the first-day file,
and so on. The backup process is repeated for the whole month,
and the last-day file of each month (the monthly file) is saved
as a backup file for the up-to-month data. The daily and
monthly files are continuously and regularly saved for the
whole survey year. At the end of the survey year, the yearly
database should also be saved, both on hard disk and CD-ROM
(or a high-capacity external hard disk), to ensure the security
of the data.31
6. MANPOWER REQUIREMENTS
An analysis of the cost components of the manpower
requirements for the existing census revealed that around 60
people were required for carrying out the census exercise. The
manpower cost was approximately HK$11·5 million. The
equipment and direct labour costs for surveys at counting
stations ranged from HK$2·8 million to HK$3·4 million,
depending on the lifespan of the equipment. The annual capital
and running costs of an induction loop station were less than
those of an air-loop station for core stations, but more
expensive for coverage stations. The annual manpower cost of
data collection for the vehicle classification and occupancy
counts was approximately HK$1·4 million. If the
recommendations of the present study are implemented, then
the costs of data collection at all counting stations will rise
from the current range of between HK$2·8 million and 3·4
million to between HK$4·3 million and HK$5·5 million, but a
saving of about HK$0·5 million could be achieved from the
vehicle occupancy and classification surveys. If the data
collection work of the census were contracted out, then a
minimum saving of HK$2·0 million in manpower resources
could be achieved, as reflected in the preliminary quotations of
three consultantcy firms.
7. CONCLUSIONS AND FURTHER STUDIES
7.1. Concluding remarks
This study has achieved the following.
(a) A questionnaire survey has been conducted to collect
important and useful views from users of the census system,
and the results have been incorporated into the establishment
of a newmethodology for the census and the development of
both the reporting and working computer programs.
(b) A critical review of state-of-the-art traffic detection
technology, traffic counter technology and vehicle
classification and occupancy survey methods has been
carried out. Useful surveys have also been conducted to
formulate the most cost-effective methodologies for data
collection, taking full account of Hong Kong’s local
characteristics.
(c) The existing strategy for locating counting stations and the
statistical analysis of collected data has been discussed.
Based on the census data of previous years, new
methodologies have been developed to provide a cost-
effective and efficient solution for the allocation of
counting stations and statistical analyses of traffic data.
With the census-1998 survey data, it has been
demonstrated that a higher accuracy can be achieved
without the need for extra resources.
(d) A new Windows-based and user-friendly working program
has been developed to integrate all of the tasks and
analyses of the census into a unified software suite, which
will allow more efficient handling of the massive amounts
of data that are collected from the various sources in the
census system. In addition, and in response to the
comments from the questionnaire survey, a user-friendly
reporting program has been developed to present the
census Report in digital form, which can be distributed to
end users in
CD-ROM format and accessed in a Windows-based
environment.
(e) An extensive review of the manpower requirements for the
census system has also been carried out to identify room
for a more cost-effective solution. If the recommendations
of the study in relation to upgrading the traffic detection
and counter technologies are implemented, then equipment
costs will increase by between HK$1·5 and HK$2 million
per annum, but this will be partially compensated for by a
reduction in labour costs of around HK$0·5 million per
annum and intangible benefits such as higher accuracy and
the ability to measure other useful traffic data (e.g. speed).
7.2. Further studies
This study draws a rather detailed road map for improving the
current census system in Hong Kong. Nevertheless, there is a
need to further assess the effects of the improvements where
the new census system differs markedly from the existing
system, and where important decisions or commitments need to
be made. To do so, pilot studies should be conducted to test the
recommendations of this study. The following studies are
suggested
(a) a survey of vehicle classification and occupancy counts at
various locations (different road types) to validate the
various data collection schemes
Transport 156 Issue TR2 Lam et al. 113Annual Traffic Census in Hong Kong

(b) a pilot study of a selected area, such as Hong Kong Island,
to validate the proposed methodology while collecting the
required data
(c) a comparison of the proposed and existing approaches in
terms of growth factor development.
In addition, the development of an integrated census and GIS
system for Hong Kong would certainly help to improve the
current data retrieval and data analysis process. Such a system
could be extended to connect with the proposed Transport
Information System (TIS). A complete linkage to a GIS should
be investigated and implemented in a separate study.
8. ACKNOWLEDGEMENTS
This paper is based on a consultancy project for the Hong Kong
Transport Department. The comments that are expressed herein
reflect the views of the authors, who are responsible for the
facts and the accuracy of the data. The contents of this paper
do not necessarily reflect the official views or policy of the
Hong Kong Transport Department. The research that is
described herein was a joint effort of the Hong Kong
Polytechnic University, the University of Hong Kong, the Hong
Kong University of Science and Technology and the City
University of Hong Kong. The assistance of the Traffic and
Transport Survey Division of the Transport Department is
gratefully acknowledged. The research was also supported by a
grant from the Research Committee of the Hong Kong
Polytechnic University (Project No. G-T29A).
REFERENCES
1. TONG C. O. and WONG S. C. The advantages of a high-
density, mixed land use, linear urban development.
Transportation, 1997, 24, 295–307.
2. THOMPSON D., EAGLESTONE A., TONG C. O. and WONG S. C.
Development of a sub-regional forecasting model for the
Comprehensive Traffic Review of East Kowloon, Hong
Kong. Proceedings of the Institution of Civil Engineers—
Transport, 2000, 141, 87–97.
3. TRANSPORT BUREAU. Third Comprehensive Transport Study,
Consultation Document. Government of the Hong Kong
Special Administrative Region, 1998.
4. SHARMA S. C. and OH J. Y. Prediction of design hourly
volume from road users’ perspective. ASCE Journal of
Transportation Engineering, 1989, 115, No. 6, 646–660.
5. KIM G., MOORE J. E. II and XU R. An analysis of seasonality
and long-term trend of Los Angeles highway traffic
volumes. Journal of the Eastern Asia Society for
Transportation Studies, 1999, 3, No. 3, 1–14.
6. AHMED M. S. and COOK A. R. Analysis of freeway traffic
time-series data by using Box–Jenkins techniques.
Transportation Research Record, 1979, 722, 1–9.
7. NIHAN N. L. and HOLMESLAND K. O. Use of the Box and
Jenkins time series techniques in traffic forecasting.
Transportation, 1980, 9, 125–143.
8. BENJAMIN J. A time-series forecast of average daily
traffic volume. Transportation Research, 1986, 20A, No. 1,
51–60.
9. MOORTHY C. K. and RATCLIFFE B. G. Short-term traffic
forecasting using time series methods. Transportation
Planning and Technology, 1988, 12, 45–56.
10. VARIRI M., HUTCHINSON J. and KERMANSHAH M. Short-term
demand for specialized transportation: time-series model.
ASCE Journal of Transportation Engineering, 1990, 116,
No. 1, 105–121.
11. HAMED M. M., AL-MASAEID H. R. and BANI-SAID Z. M.
Short-term prediction of traffic volume in urban arterials.
ASCE Journal of Transportation Engineering, 1995, 121,
No. 3, 249–254.
12. HARTGEN D. T. and LEMMERMAN J. H. Streamlining
collection and processing of traffic count statistics.
Transportation Research Record, 1983, 928, 11–18.
13. RITCHIE S. G. A statistical approach to statewide traffic
counting. Transportation Research Record, 1986, 1090,
14–21.
14. FAGHRI A. and CHAKROBORTY P. Development and
evaluation of a statistically reliable traffic counting
program. Transportation Planning and Technology, 1994,
18, 223–237.
15. SHARMA S. C., GULATI B. M. and RIZAK S. N. Statewide
traffic volume studies and precision of AADT estimates.
ASCE Journal of Transportation Engineering, 1996, 122,
No. 6, 430–439.
16. PHILLIPS G. Accuracy of Annual Traffic Flow Estimates from
Short Period Counts. Transport and Road Research
Laboratory, Crowthorne, 1979, TRRL Report SR 514.
17. PHILLIPS G. Accuracy of Annual Traffic Flow Estimates from
Automatic Counts. Transport and Road Research
Laboratory, Crowthorne, UK, 1979, TRRL Report SR 515.
18. TRANSPORT DEPARTMENT. The Annual Traffic Census. Traffic
and Transport Survey Division, Transport Department,
Government of the Hong Kong Special Administrative
Region, 1965–1999.
19. TRANSPORT DEPARTMENT. The Annual Traffic Census (New
Methodology) in Hong Kong Island. Traffic and Transport
Survey Division, Transport Department, Hong Kong
Government, 1988, Technical Report No. 334.
20. CHAN Y. M., LEE B. S., WONG C. H., KWOK W. S. and KWAN
W. K. Traffic census: today’s practice and tomorrow’s
challenges. Proceedings of the 5th Conference of Hong Kong
Society for Transportation Studies, Hong Kong, 2000,
186–194.
21. MAY A. D. Traffic Flow Fundamentals. Prentice-Hall,
Englewood Cliffs, NJ, 1990.
22. LAM W. H. K., HUNG W. T., LO H. K., LO H. P., TONG C. O.,
WONG S. C. and YANG H. Review of the Annual Traffic
Census: Final Report. Prepared for Traffic and Transport
Survey Division, Transport Department, Government of the
Hong Kong SAR, 2000.
23. YANG H. Questionnaire survey for review of the annual
traffic census. Proceedings of the 5th Conference of Hong
Kong Society for Transportation Studies, Hong Kong, 2000,
195–203.
24. LO H. K., WAN Q. K. H., LAI M. F. and LEE D. S. M. Data
collection methods for the annual traffic census: review
and analysis. Proceedings of the 5th Conference of Hong
Kong Society for Transportation Studies, Hong Kong, 2000,
204–212.
25. TRANSPORT DEPARTMENT. Consultancy Study on the
Provision, Management, and Operation of Traffic Control
and Surveillance Facilities for the Strategic Road Network.
Transport Department, Government of the Hong Kong
Special Administrative Region, 1999.
26. DEPARTMENT OF TRANSPORT. Task A Report for Detection
Technology for IVHS. Department of Transport, USA, 1994.
Transport 156 Issue TR2 Lam et al.114 Annual Traffic Census in Hong Kong

27. LO H. P., CHEUNG K. M., TONG C. O. and WONG S. C. Use of
cluster analysis in the annual traffic census. Proceedings of
the 5th Conference of Hong Kong Society for Transportation
Studies, Hong Kong, 2000, 442–450.
28. TONG C. O., WONG S. C., LO H. P. and CHEUNG K. M.
Estimation of vehicle kilometrage from counting stations.
Proceedings of the 5th Conference of Hong Kong Society for
Transportation Studies, Hong Kong, 2000, 451–460.
29. ARABIE P., HUBERT L. J. and DE SOETE G. Clustering and
Classification. World Scientific, 1996, Singapore.
30. MILLIGAN G. W., SOKOL L. M. and SOON S. C. The effect of
cluster size, dimensionality, and the number of clusters on
recovery of true cluster structure. IEEE Transactions on
Pattern Analysis and Machine Intelligence, 1983, 5, No. 1,
40–47.
31. LAM W. H. K., TANG A. Y. F. and YU J. H. C. A user
friendly computer program for Hong Kong annual traffic
census. Proceedings of the 5th Conference of Hong Kong
Society for Transportation Studies, Hong Kong, 2000,
213–222.
Please email, fax or post your discussion contributions to the secretary by 1 November 2003: email: [email protected];
fax: þ44 (0)20 7799 1325; or post to Emma Holder, Journals Department, Institution of Civil Engineers, 1–7 Great George Street,
London SW1P 3AA.
Transport 156 Issue TR2 Lam et al. 115Annual Traffic Census in Hong Kong
Related Documents