Advanced Color Machine Vision and Applications Ben Dawson Director of Strategic Development Teledyne DALSA 2016 V04 - for tutorial 5/4/2016

Welcome message from author
This document is posted to help you gain knowledge. Please leave a comment to let me know what you think about it! Share it to your friends and learn new things together.
Transcript

Advanced Color Machine Vision and Applications
Ben Dawson Director of Strategic
Development Teledyne DALSA
2016 V04 - for tutorial 5/4/2016
Outline
• What is color vision? Why is it useful? • Comparing human and machine color vision • Physics of color imaging • A model of color image formation • Human color vision and measurement • Color machine vision systems • Basic color machine vision algorithms • Advanced algorithms & applications • Human vision Machine Vision • Case study Important terms
What is Color?
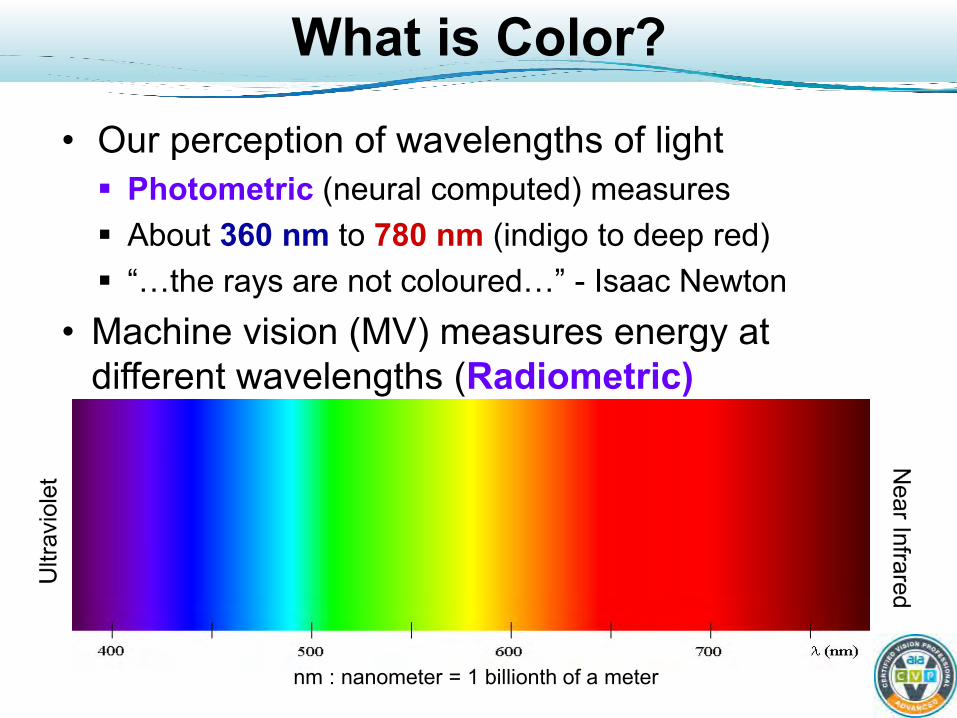
• Our perception of wavelengths of light Photometric (neural computed) measures About 360 nm to 780 nm (indigo to deep red) “…the rays are not coloured…” - Isaac Newton
• Machine vision (MV) measures energy at different wavelengths (Radiometric)
nm : nanometer = 1 billionth of a meter
Color Image
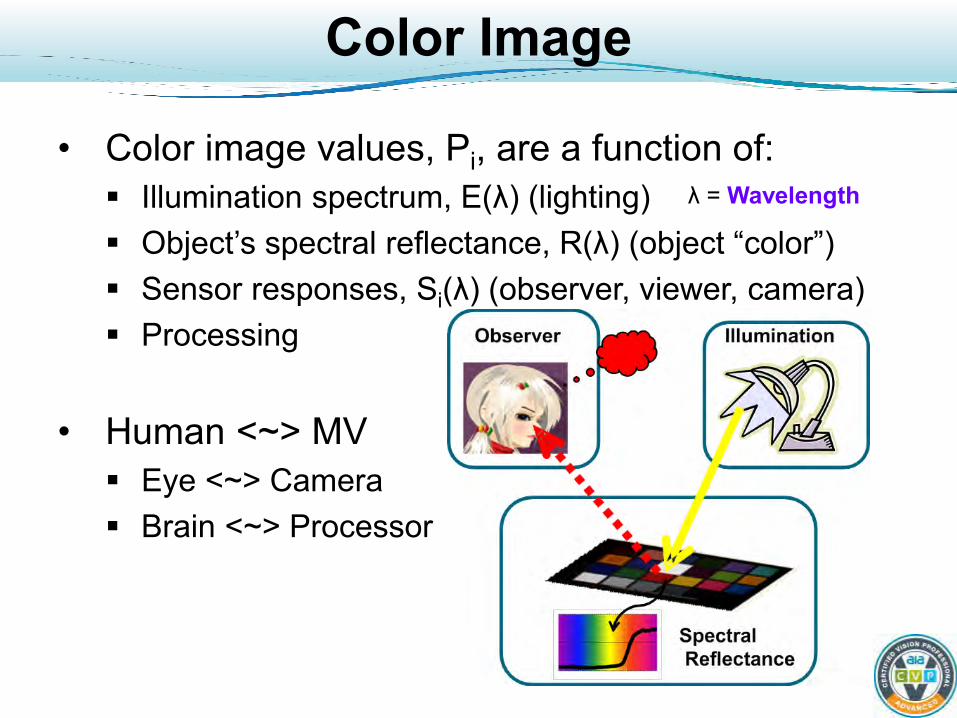
• Color image values, Pi, are a function of: Illumination spectrum, E(λ) (lighting) Object’s spectral reflectance, R(λ) (object “color”) Sensor responses, Si(λ) (observer, viewer, camera) Processing
• Human <~> MV Eye <~> Camera Brain <~> Processor
λ = Wavelength
Color Vision Estimates Object Color
• The formation color image values, Pi, has too many unknowns (E(λ) = lighting spectrum, etc.) to directly estimate object color.
• Hard to “factor out” these unknowns to get an estimate of object color In machine vision, we often don’t bother to!
• Use knowledge, constraints, and computation to solve for object color estimates Not perfect, but usually works…
• If color vision is so hard, why use it?

Material Property
• Color is a material property – it helps tell what an object is made of, its state, etc. Texture is also a material property
Wood and Brass? Bananas or What…?
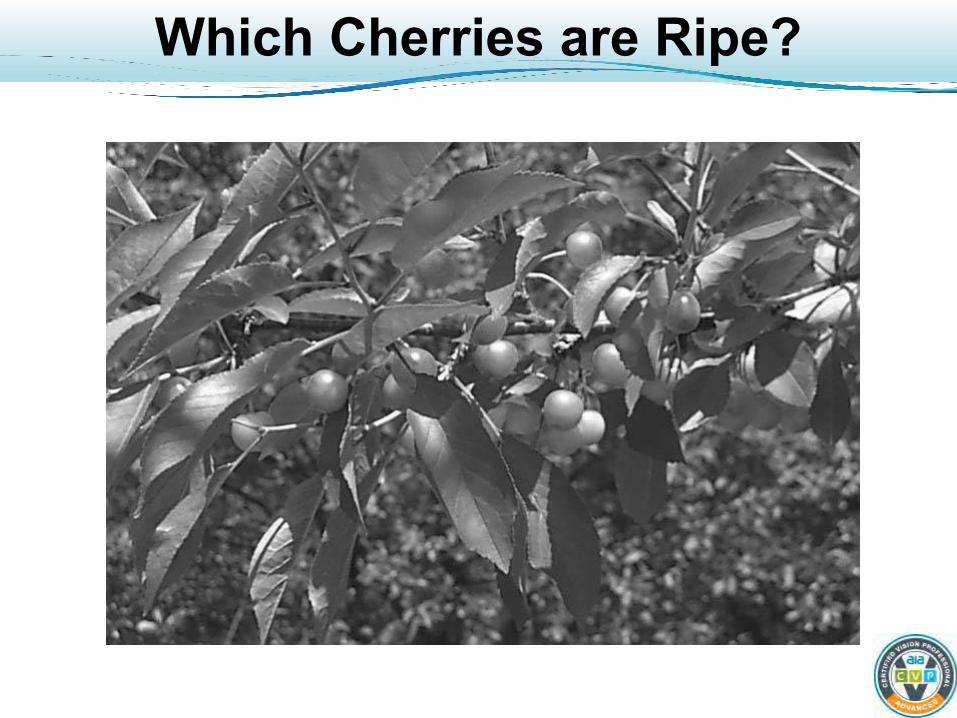
Which Cherries are Ripe?
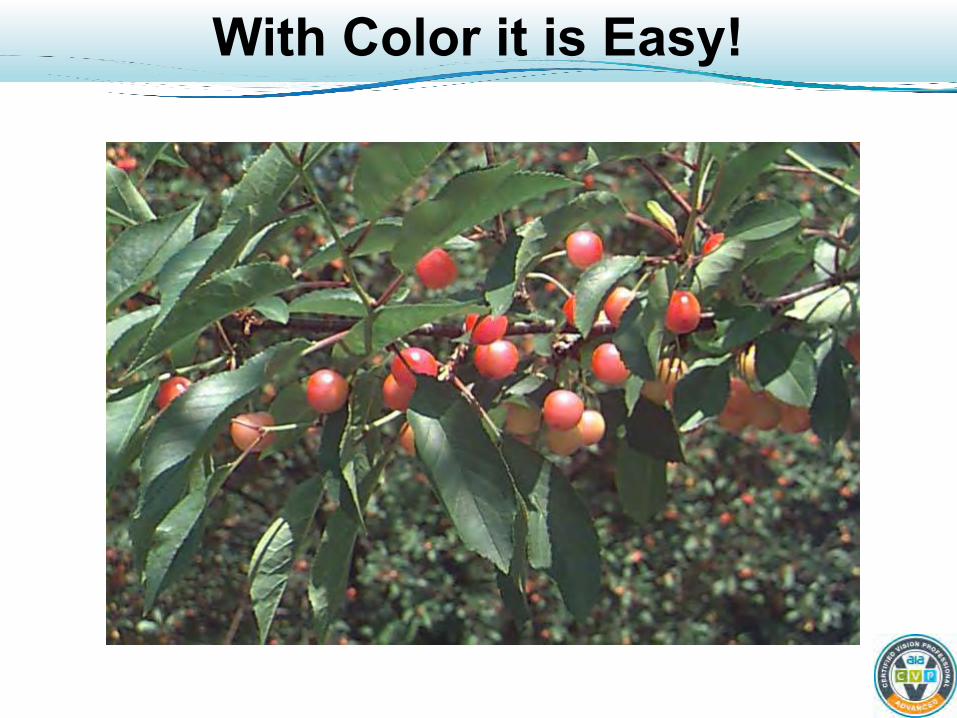
With Color it is Easy!
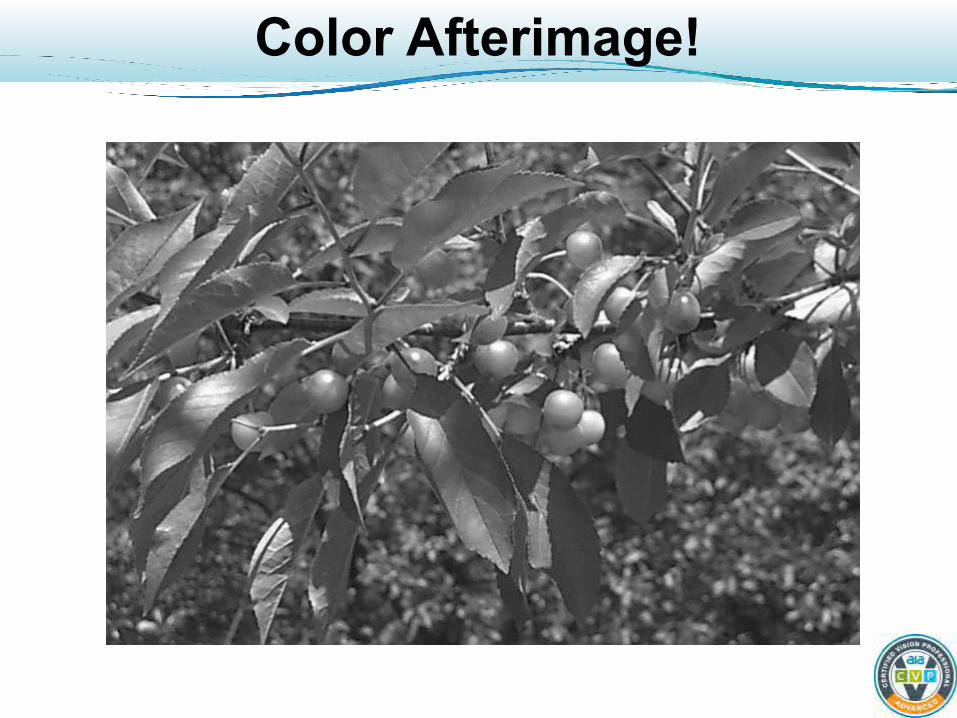
Color Afterimage!
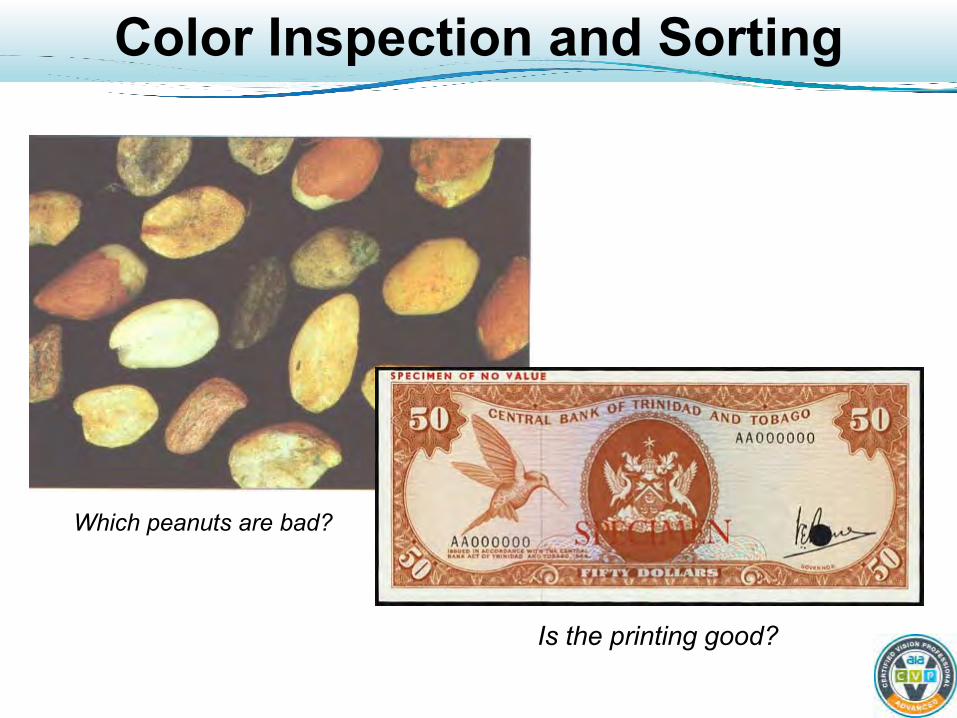
Color Inspection and Sorting
Is the printing good?
Which peanuts are bad?

Searching and Locating
Which Sneakers are Light Blue?

Importance of Fast Color Search
• Quickly identify hazards! • Grab the food!
Milk snake – Batesian (harmless) mimic of poisonous coral snake

Color Measuring and Matching
Medical diagnostics Color matching on car interior
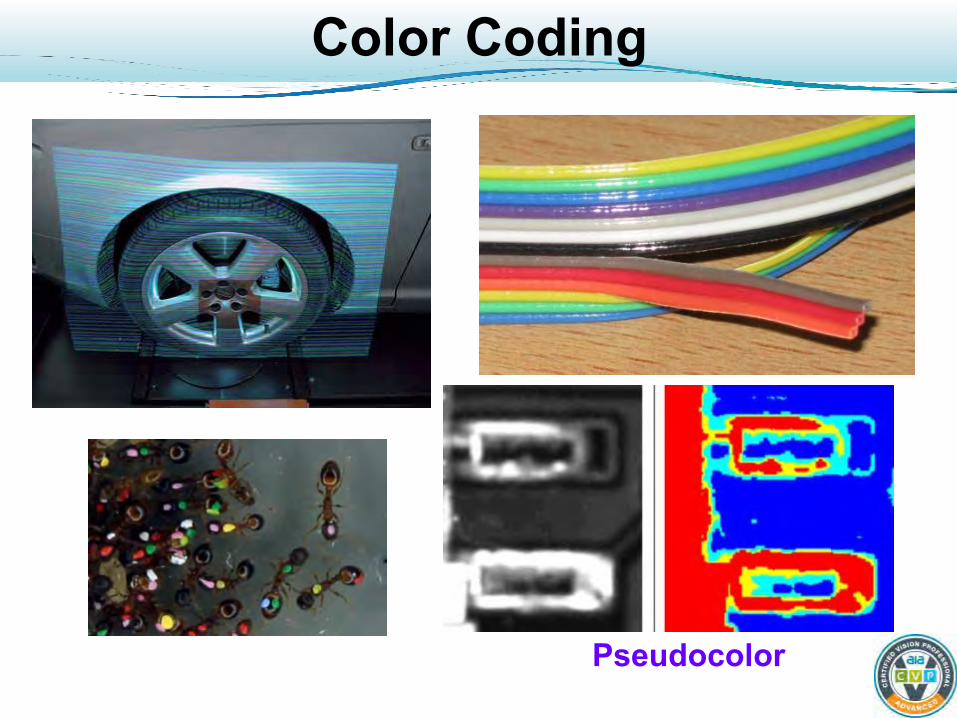
Color Coding
Pseudocolor
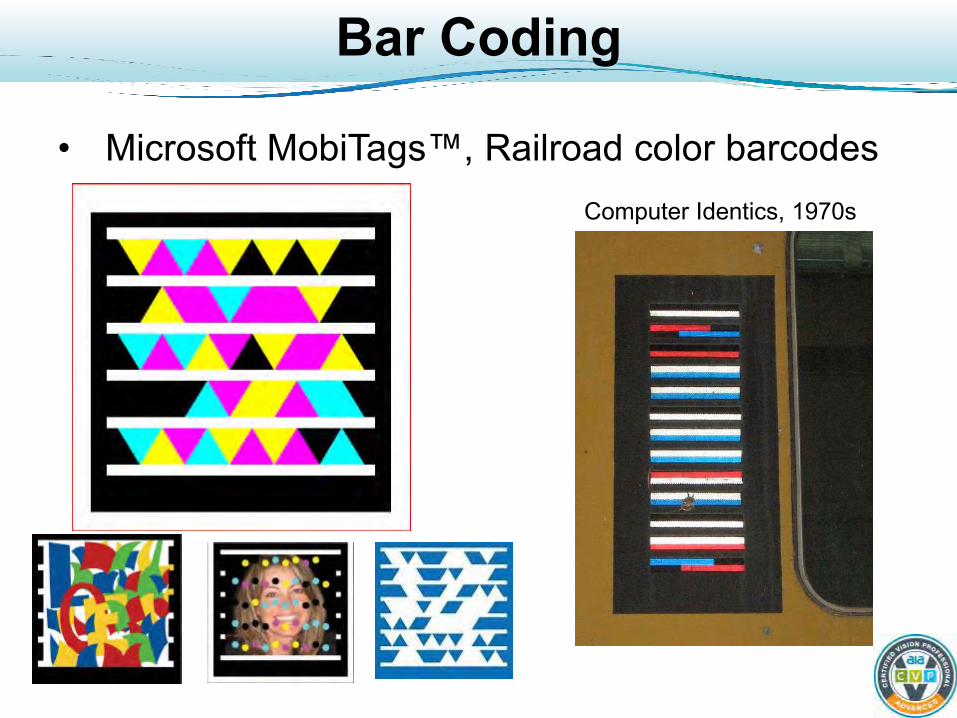
Bar Coding
• Microsoft MobiTags™, Railroad color barcodes Computer Identics, 1970s
Human Color Vision
Stable perceptions of objects despite uncontrolled lighting and imaging geometry
Easy to train, flexible, “understands” images Slow, quickly tires, individuals differ, hard to calibrate, drifts. Color (not intensity!) is low spatial resolution Influenced by surroundings in time and space
• Optical illusions show problems and give us clues as to how biological vision works

Influenced by Surroundings
Dramatic example of color contrast effects “Side effect” of our color constancy abilities?
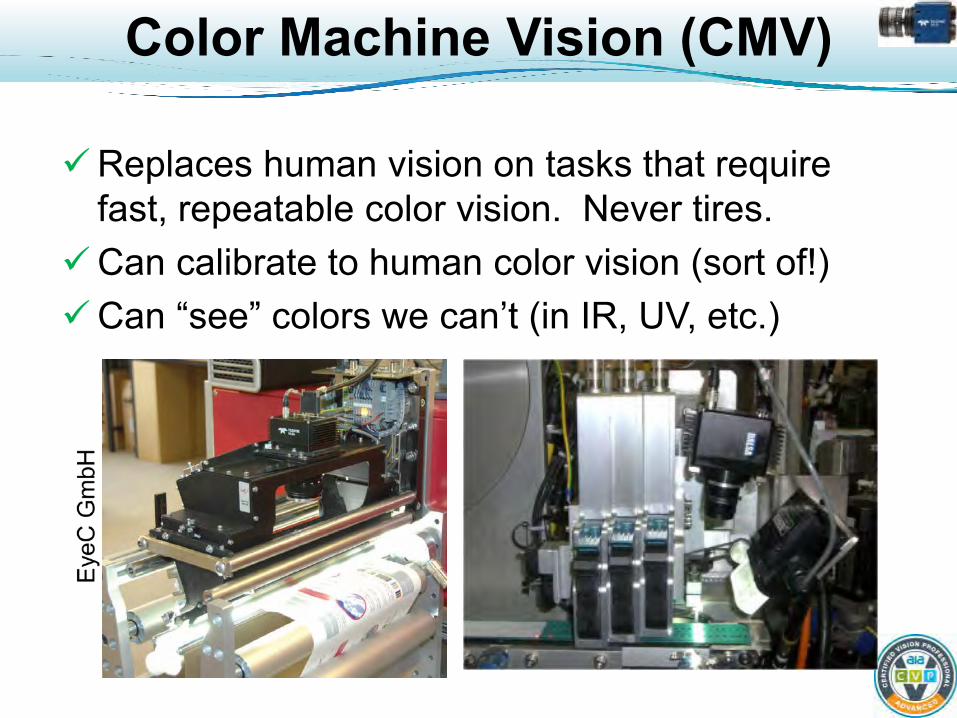
Color Machine Vision (CMV)
Replaces human vision on tasks that require fast, repeatable color vision. Never tires.
Can calibrate to human color vision (sort of!) Can “see” colors we can’t (in IR, UV, etc.)
Color Machine Vision
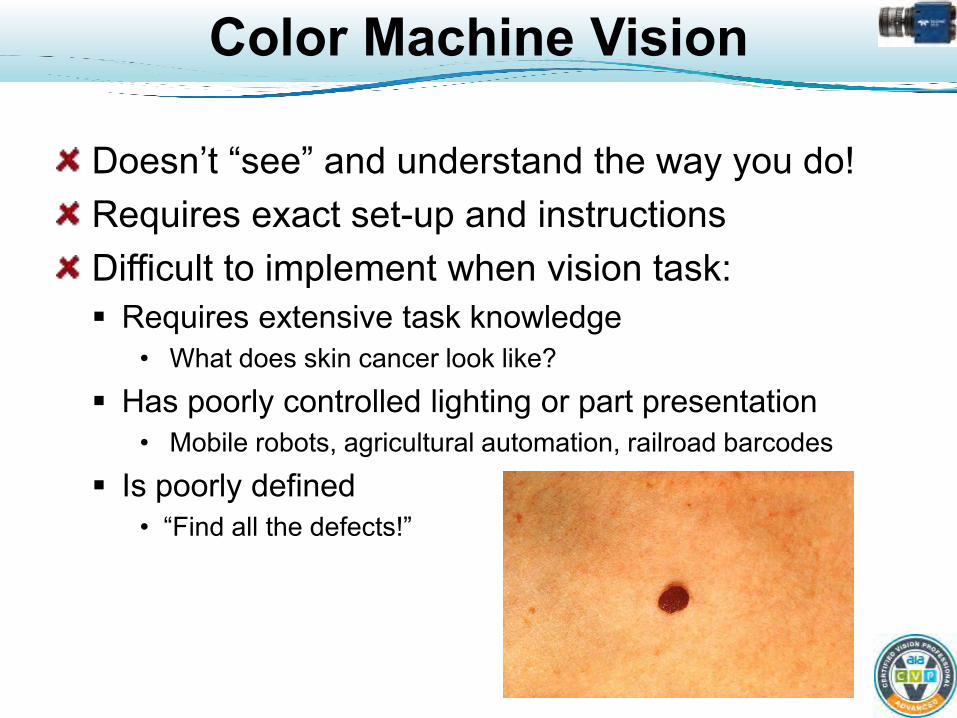
Doesn’t “see” and understand the way you do! Requires exact set-up and instructions Difficult to implement when vision task: Requires extensive task knowledge
• What does skin cancer look like?
Has poorly controlled lighting or part presentation • Mobile robots, agricultural automation, railroad barcodes
Is poorly defined • “Find all the defects!”
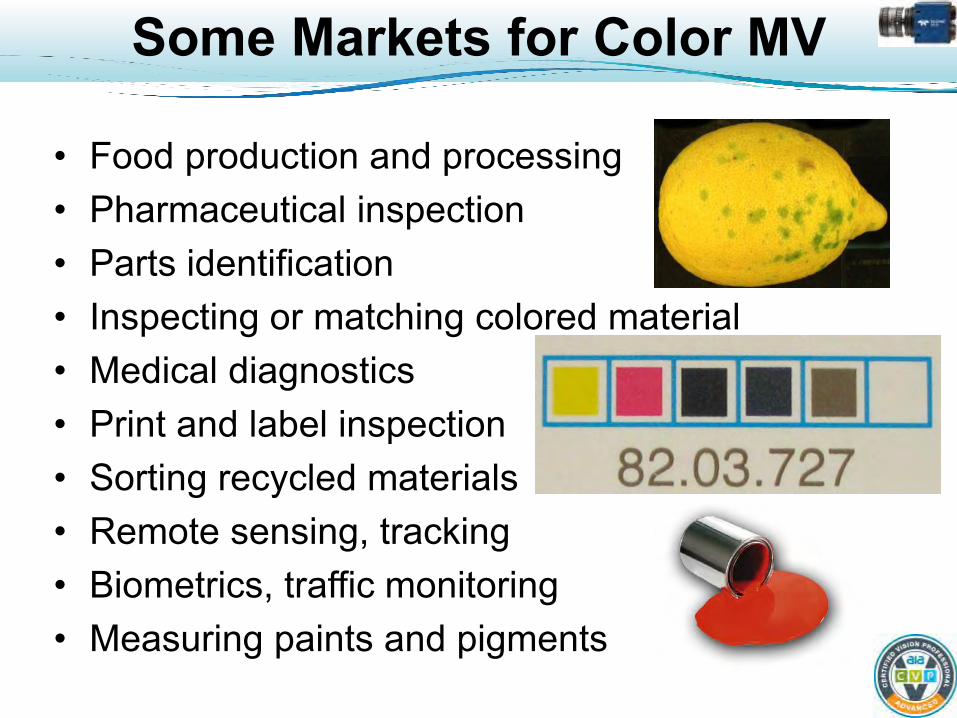
Some Markets for Color MV
• Food production and processing • Pharmaceutical inspection • Parts identification • Inspecting or matching colored material • Medical diagnostics • Print and label inspection • Sorting recycled materials • Remote sensing, tracking • Biometrics, traffic monitoring • Measuring paints and pigments

Physics of Color Imaging
Light
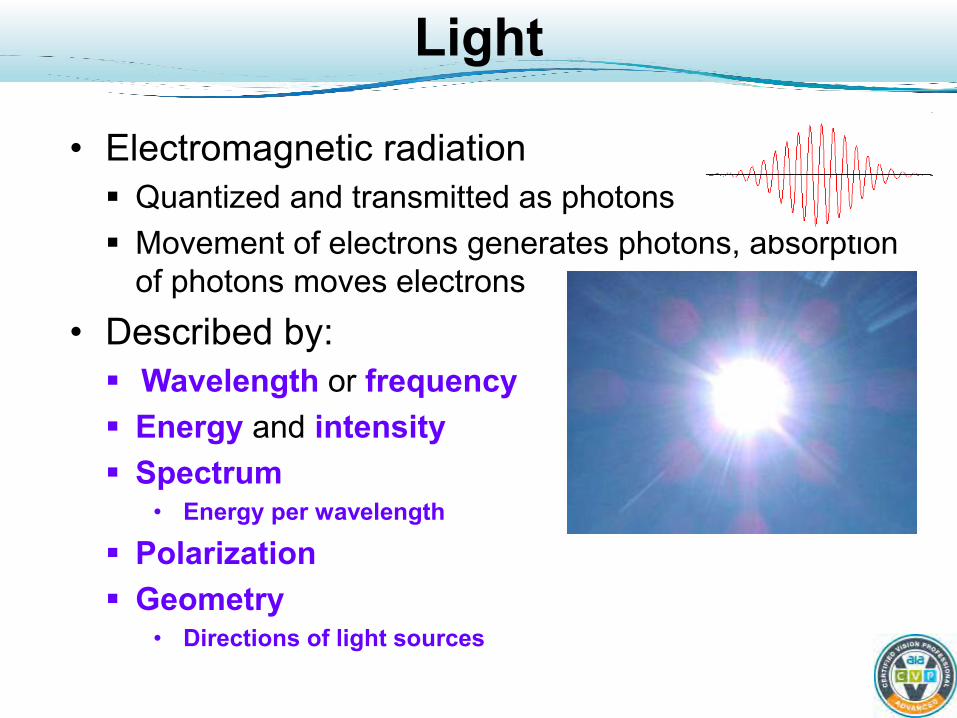
• Electromagnetic radiation Quantized and transmitted as photons Movement of electrons generates photons, absorption
of photons moves electrons • Described by: Wavelength or frequency Energy and intensity Spectrum
• Energy per wavelength
Polarization Geometry
• Directions of light sources
Wavelength or Frequency
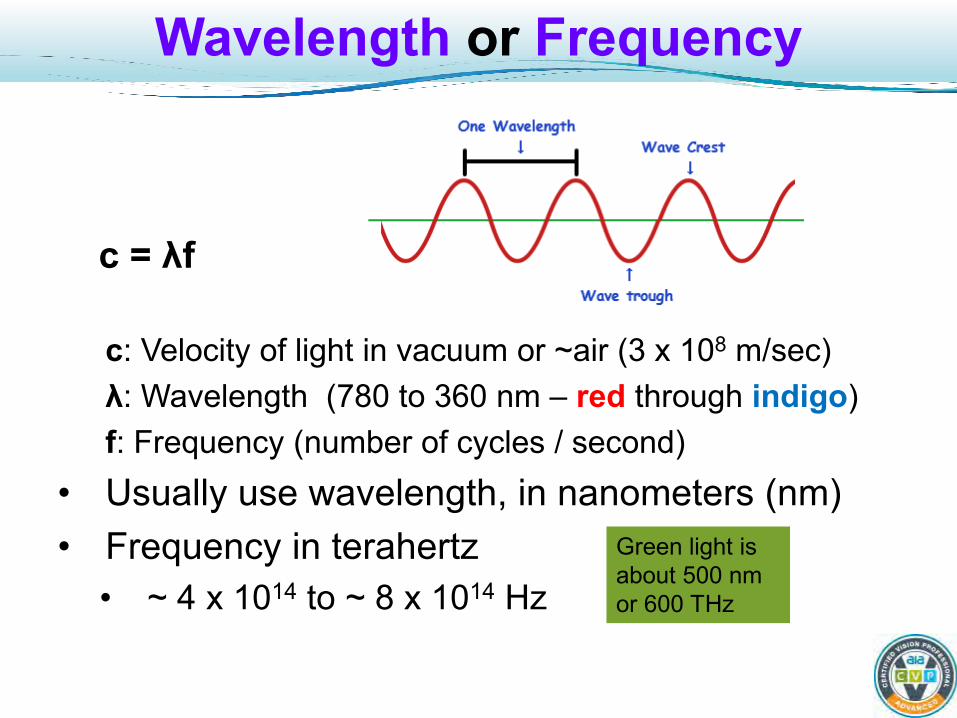
c = λf
c: Velocity of light in vacuum or ~air (3 x 10⁸ m/sec) λ: Wavelength (780 to 360 nm – red through indigo) f: Frequency (number of cycles / second)
• Usually use wavelength, in nanometers (nm) • Frequency in terahertz
• ~ 4 x 10¹⁴ to ~ 8 x 10¹⁴ Hz
Green light is about 500 nm or 600 THz
Energy and Intensity
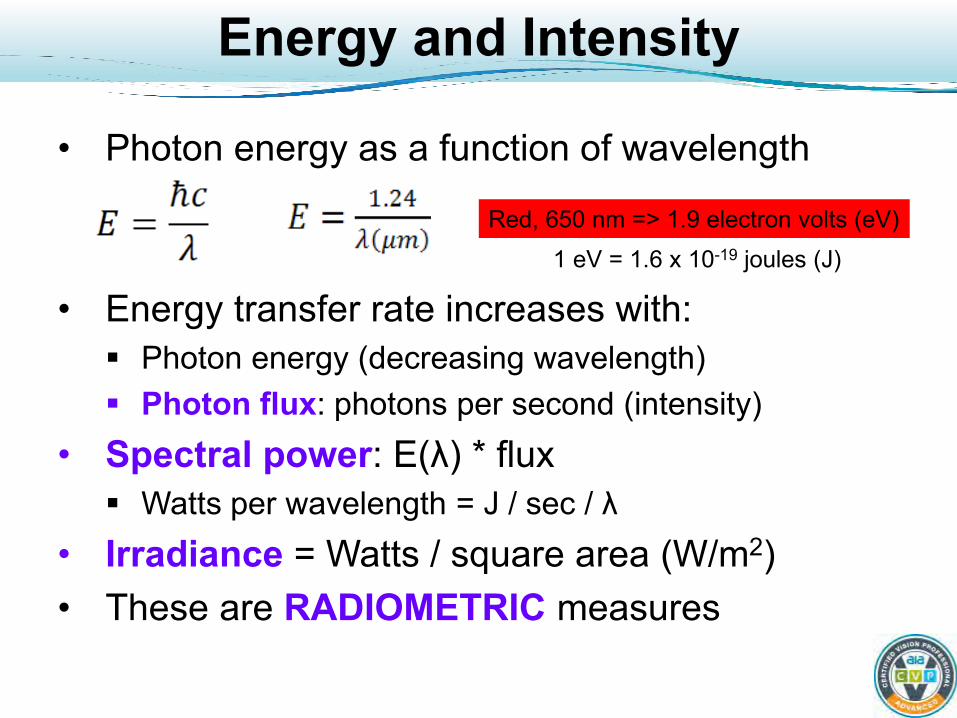
• Photon energy as a function of wavelength • Energy transfer rate increases with: Photon energy (decreasing wavelength) Photon flux: photons per second (intensity)
• Spectral power: E(λ) * flux Watts per wavelength = J / sec / λ
• Irradiance = Watts / square area (W/m2) • These are RADIOMETRIC measures
Red, 650 nm => 1.9 electron volts (eV)
1 eV = 1.6 x 10⁻¹⁹ joules (J)
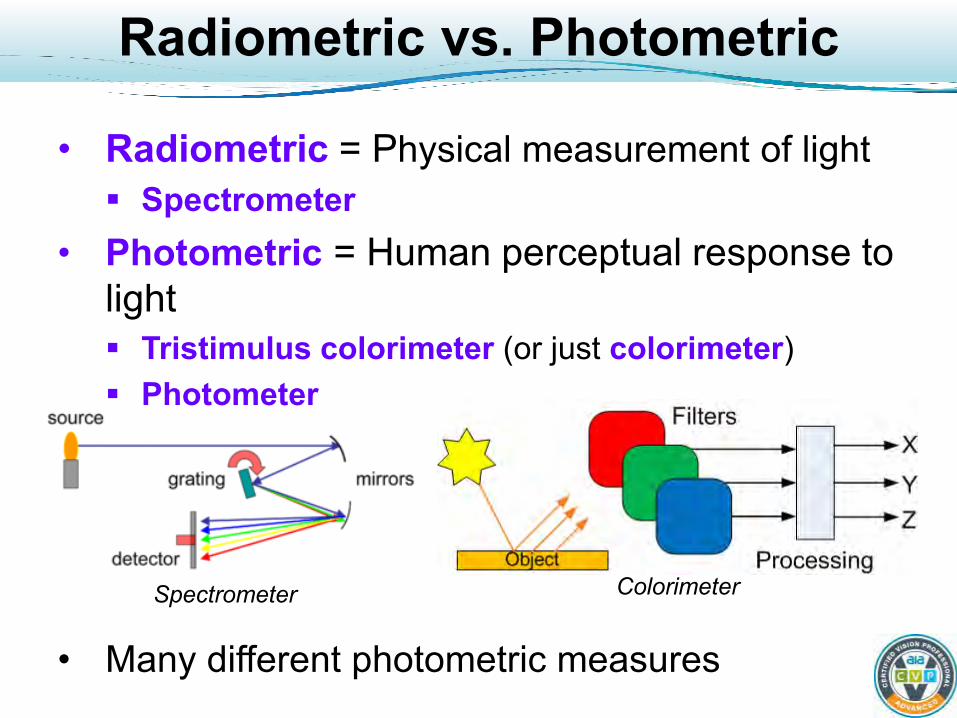
Radiometric vs. Photometric
• Radiometric = Physical measurement of light Spectrometer
• Photometric = Human perceptual response to light Tristimulus colorimeter (or just colorimeter) Photometer
• Many different photometric measures
Spectrometer Colorimeter
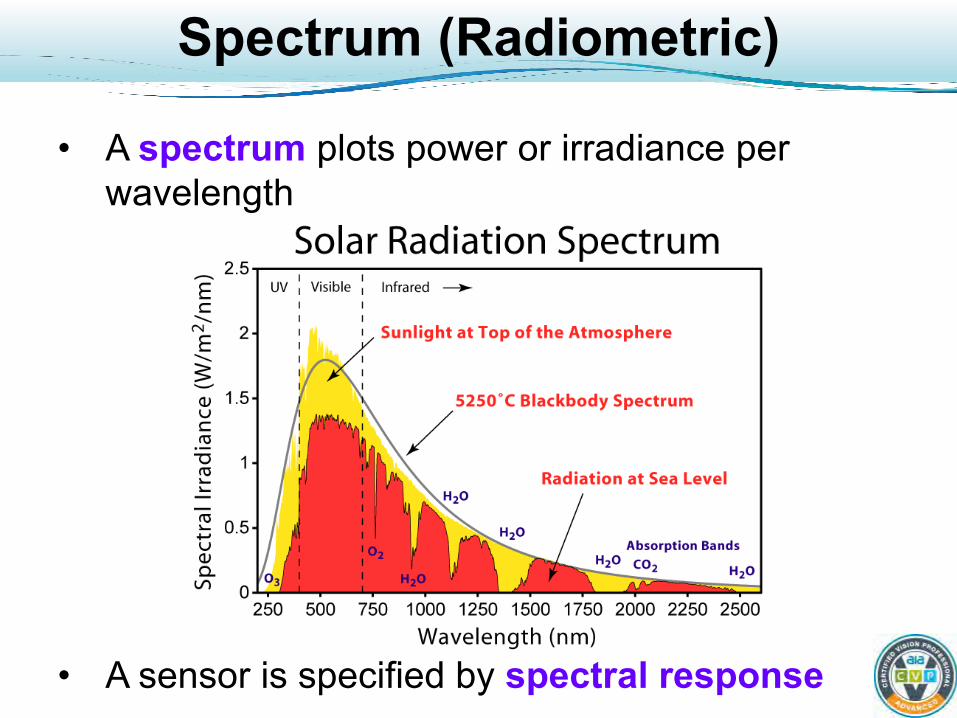
Spectrum (Radiometric)
• A spectrum plots power or irradiance per wavelength
• A sensor is specified by spectral response
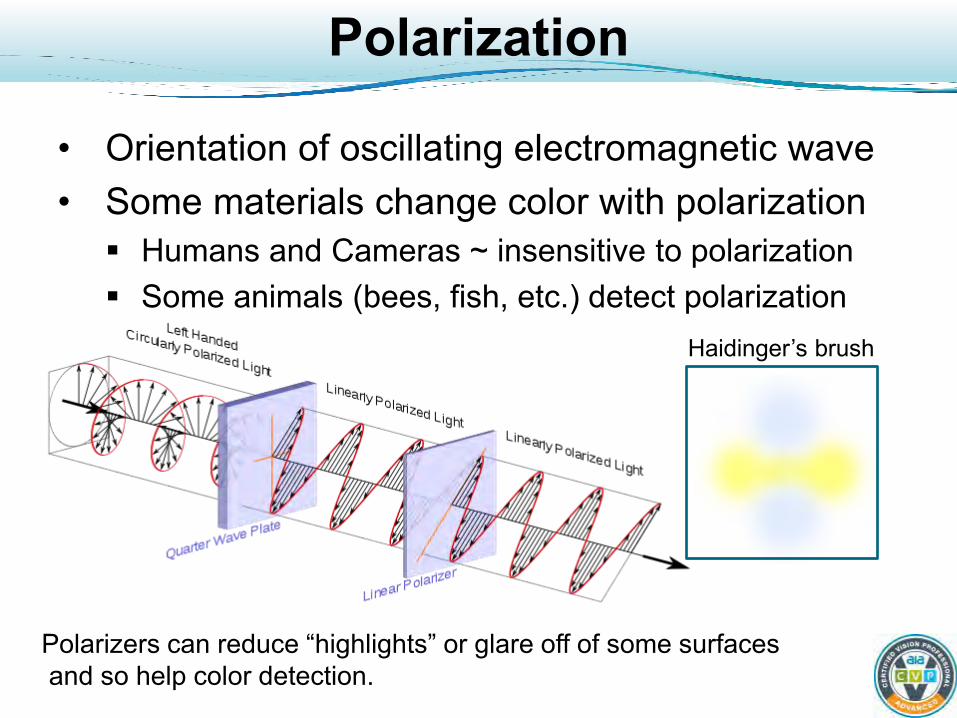
Polarization
• Orientation of oscillating electromagnetic wave • Some materials change color with polarization Humans and Cameras ~ insensitive to polarization Some animals (bees, fish, etc.) detect polarization
Haidinger’s brush
Polarizers can reduce “highlights” or glare off of some surfaces and so help color detection.
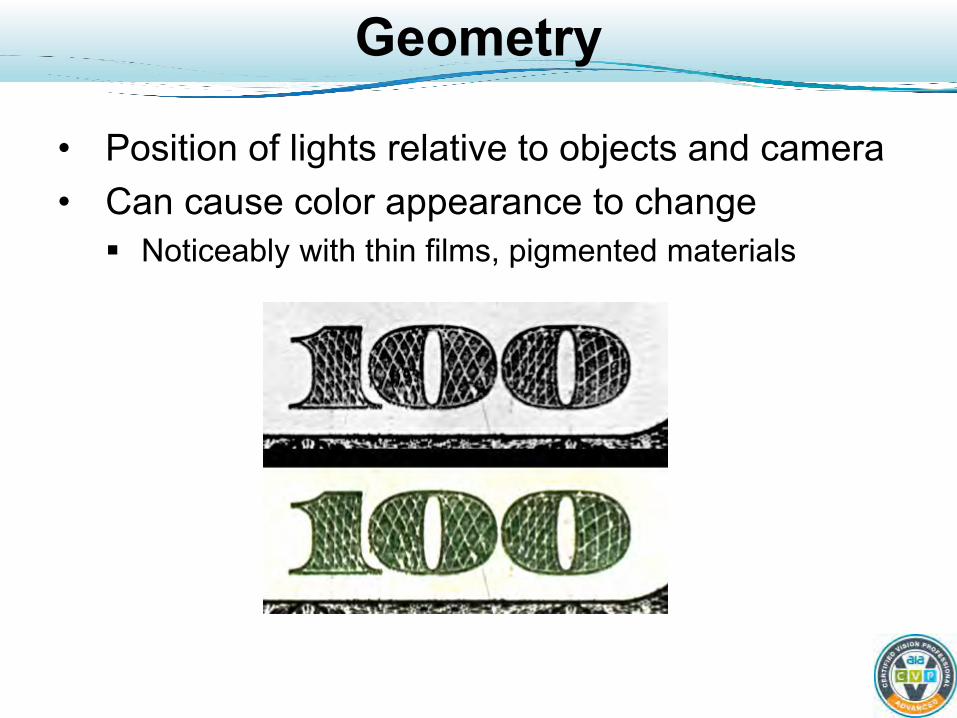
Geometry
• Position of lights relative to objects and camera • Can cause color appearance to change Noticeably with thin films, pigmented materials
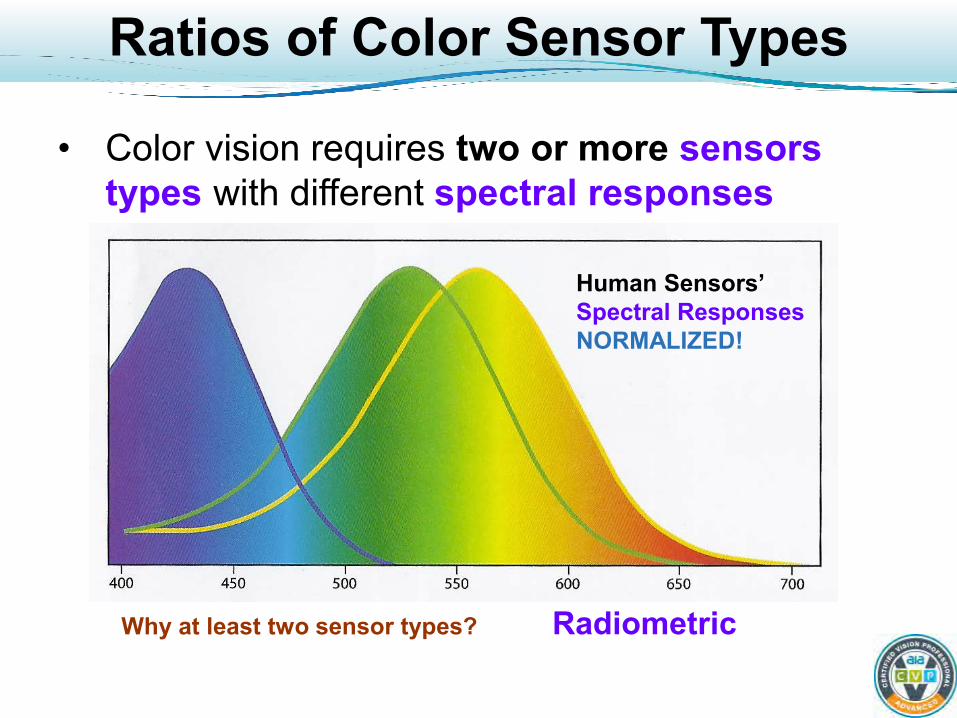
Ratios of Color Sensor Types
• Color vision requires two or more sensors types with different spectral responses
Why at least two sensor types?
Human Sensors’ Spectral Responses NORMALIZED!
Radiometric
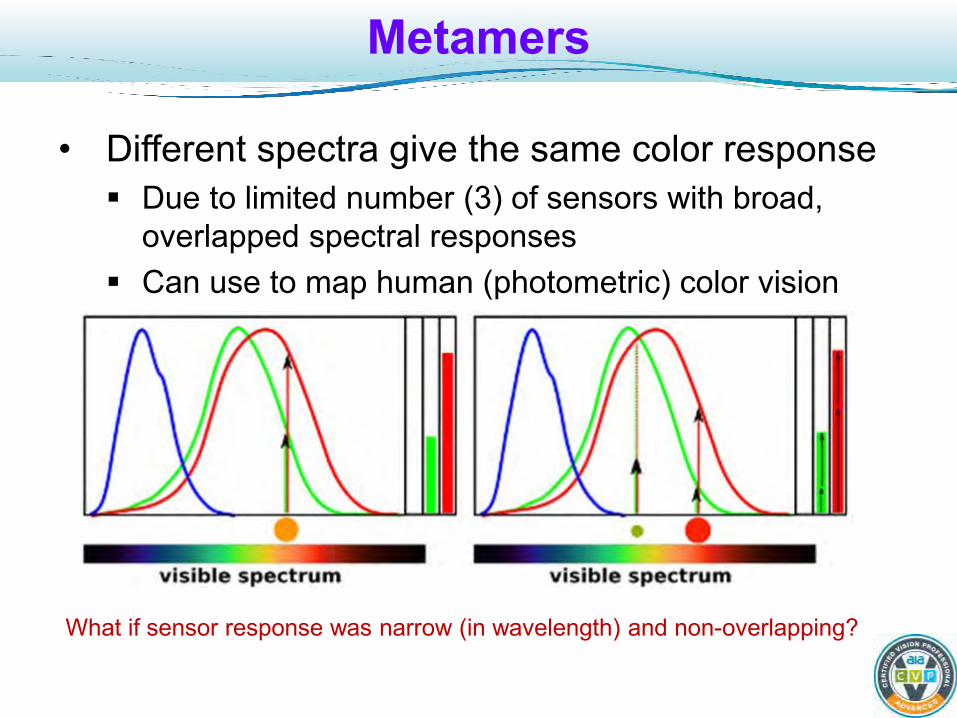
Metamers
• Different spectra give the same color response Due to limited number (3) of sensors with broad,
overlapped spectral responses Can use to map human (photometric) color vision
What if sensor response was narrow (in wavelength) and non-overlapping?

A Model of Color Image Formation
• Modeled as a function of: Illumination spectrum Object transmission or reflection properties
• Spectrum and imaging geometry
Sensors’ spectral responses
Illumination
Object 26 87 451“Color” samples
Spectrum at Sensors
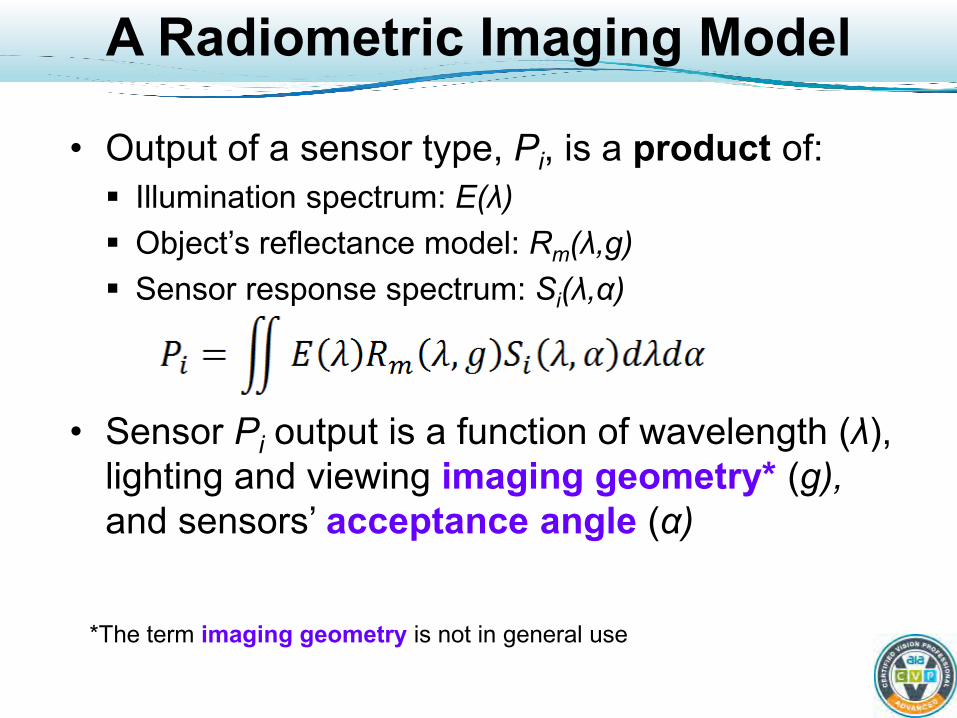
A Radiometric Imaging Model
• Output of a sensor type, Pi, is a product of: Illumination spectrum: E(λ) Object’s reflectance model: Rm(λ,g) Sensor response spectrum: Si(λ,α)
• Sensor Pi output is a function of wavelength (λ), lighting and viewing imaging geometry* (g), and sensors’ acceptance angle (α)
*The term imaging geometry is not in general use
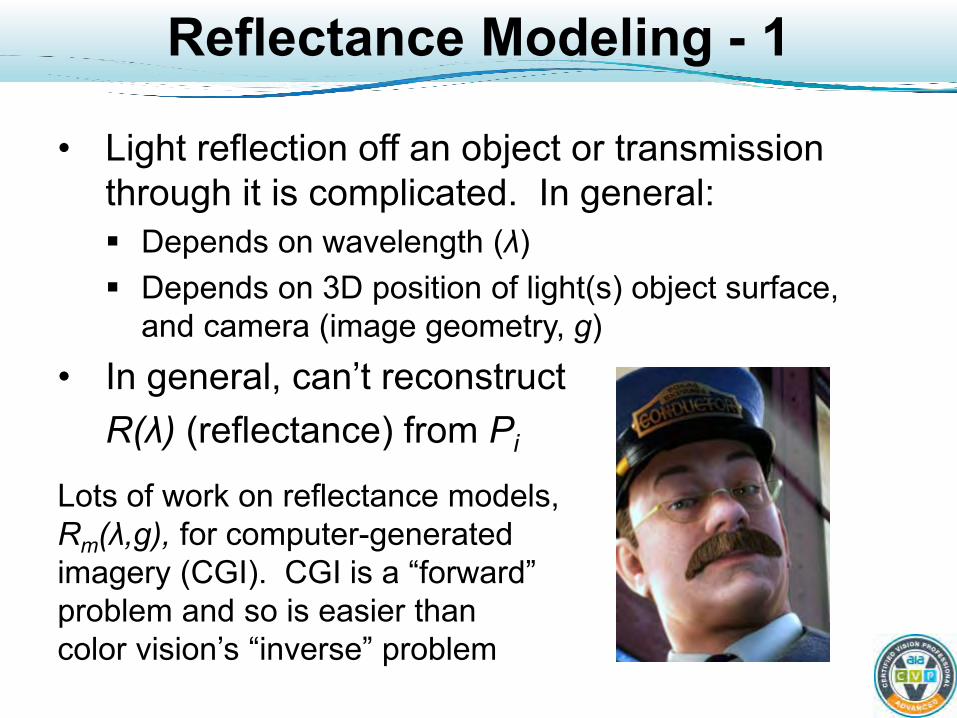
Reflectance Modeling - 1
• Light reflection off an object or transmission through it is complicated. In general: Depends on wavelength (λ) Depends on 3D position of light(s) object surface,
and camera (image geometry, g) • In general, can’t reconstruct R(λ) (reflectance) from Pi
Lots of work on reflectance models, Rm(λ,g), for computer-generated imagery (CGI). CGI is a “forward” problem and so is easier than color vision’s “inverse” problem

Reflectance Modeling - 2
• Function of spectral reflectance as a function of geometry, g : {e,v,b}
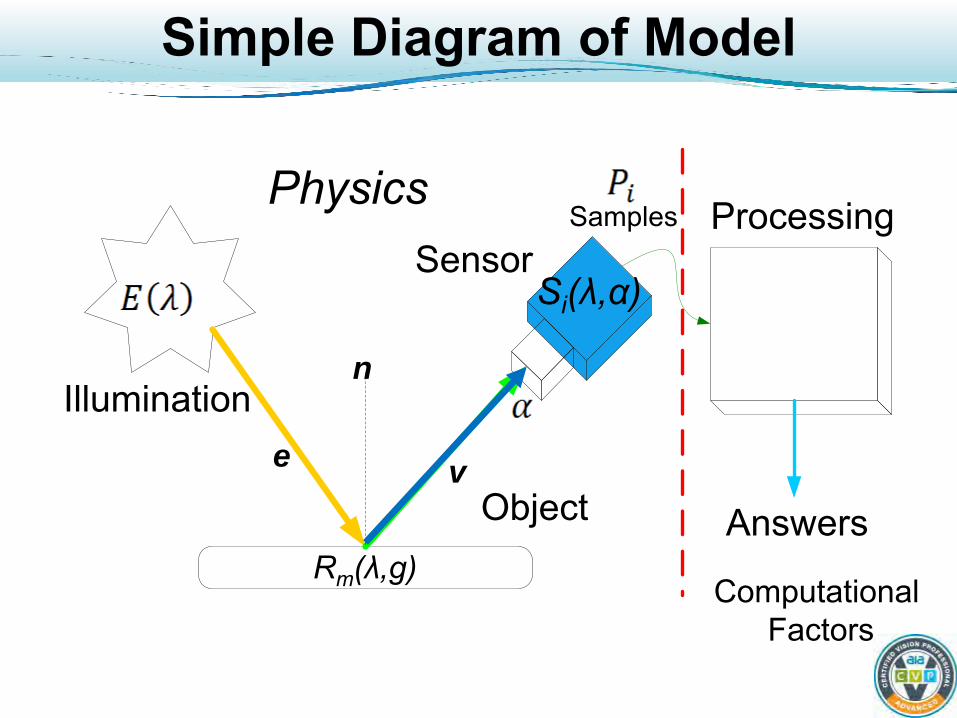
Simple Diagram of Model
Illumination
Object
SensorProcessingSamples
Answers
Physics
Si(λ,α)
Computational Factors
Rm(λ,g)
e v
n
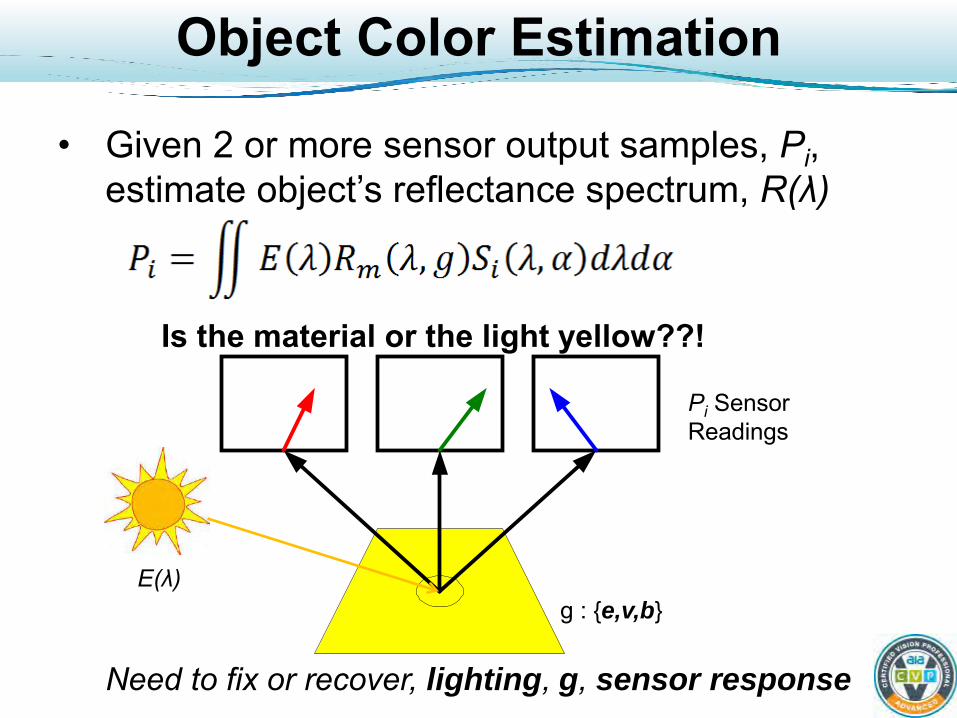
Object Color Estimation
• Given 2 or more sensor output samples, Pi, estimate object’s reflectance spectrum, R(λ)
Is the material or the light yellow??!
Pi Sensor Readings
E(λ) g : {e,v,b}
Need to fix or recover, lighting, g, sensor response
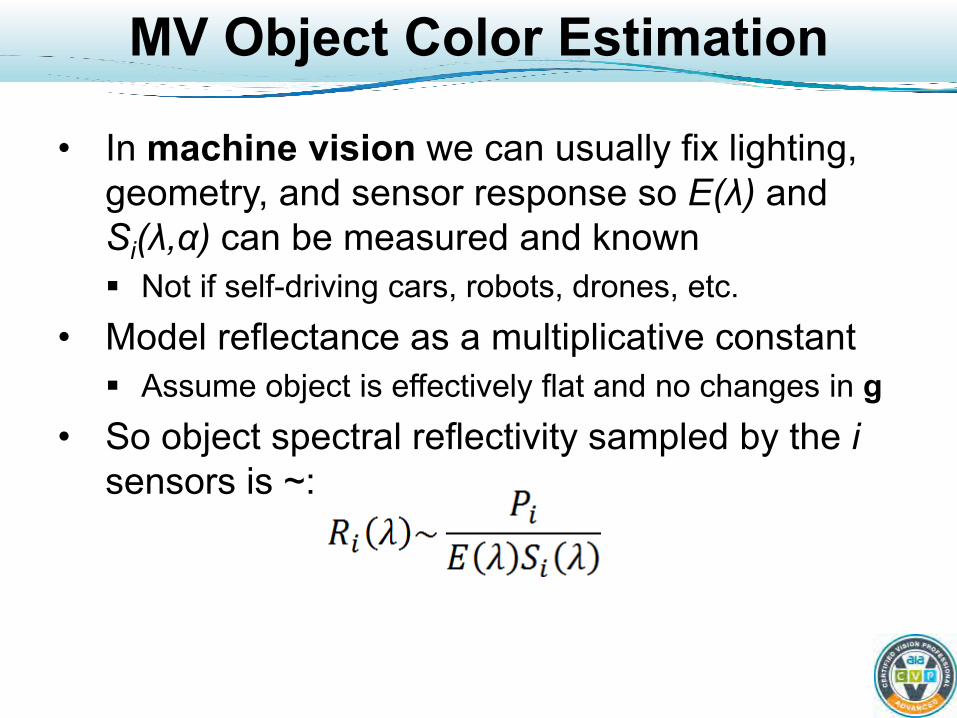
MV Object Color Estimation
• In machine vision we can usually fix lighting, geometry, and sensor response so E(λ) and Si(λ,α) can be measured and known Not if self-driving cars, robots, drones, etc.
• Model reflectance as a multiplicative constant Assume object is effectively flat and no changes in g
• So object spectral reflectivity sampled by the i sensors is ~:
In MV, We Usually Don’t!
• It is difficult to measure E(λ) and Si(λ) and they drift with time and temperature.
• We are usually interested in color changes and colors relative to standard objects’ colors, usually good and bad parts
• Take output samples, Pi, as the samples of the object’s spectrum, and forget the math!
• Use a white reference patch to compensate for illumination changes
• Requires periodic (re)calibration, fixed g
Human Object Color Estimation
• Human vision recovers the illuminant to get E(λ) and knows Si(λ)
• Has to compensate for changes in geometry, g (angle of view, etc.) A difficult computational (processing) task Uses knowledge about the world, e.g. light usually
comes from above to constrain the problem Veridical color perception under changing conditions
is known as color constancy • MV algorithms for color constancy aren’t as
robust
Color Constancy
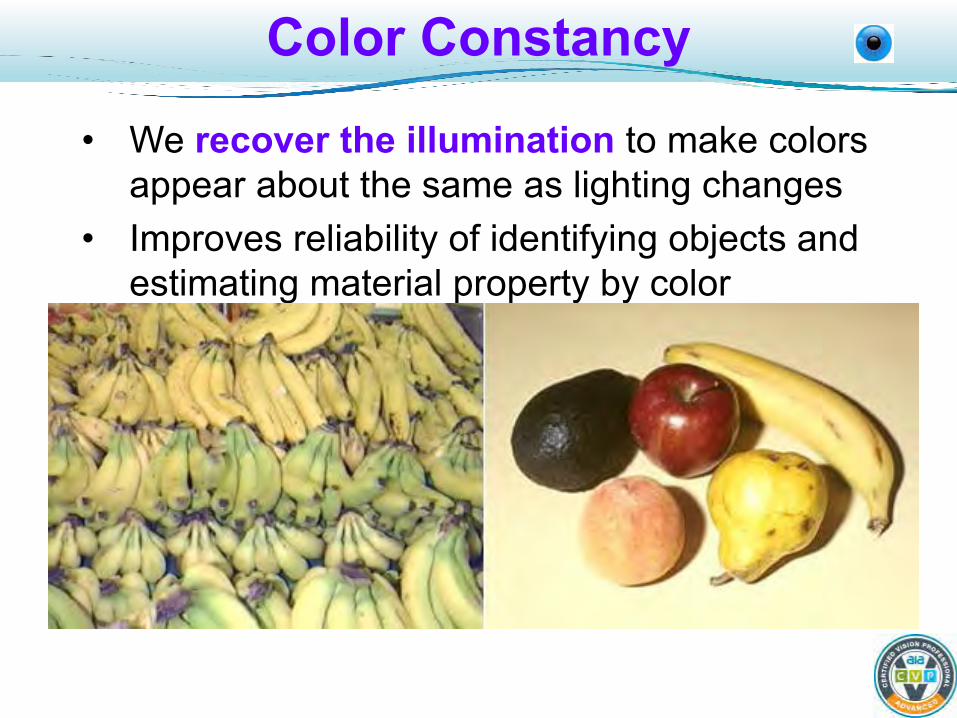
• We recover the illumination to make colors appear about the same as lighting changes
• Improves reliability of identifying objects and estimating material property by color
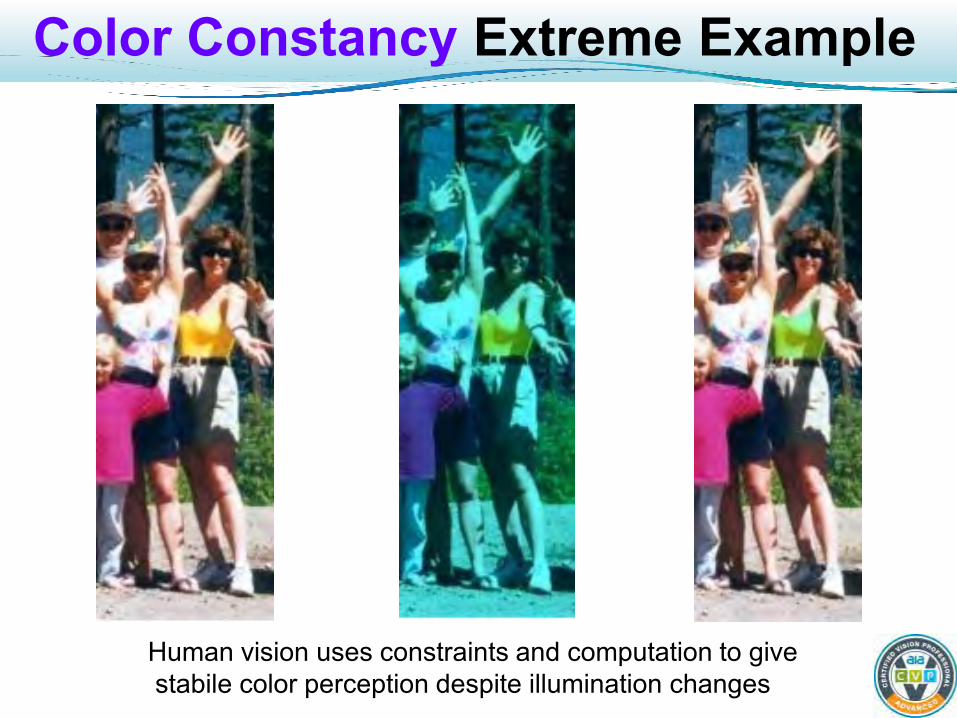
Color Constancy Extreme Example
Human vision uses constraints and computation to give stabile color perception despite illumination changes
Illumination
More details on the elements in color image Formation, starting with illumination

Black Body Radiators
• black body radiators Heat “jiggles” electrons to create broadband radiation The sun, flames, people, incandescent lights
• Visibly glow at ~ 400 C (670 K) (750 F) • Color shifts towards the blue as object heats up:
• Used as an illumination standard Simple to described – function only of temperature
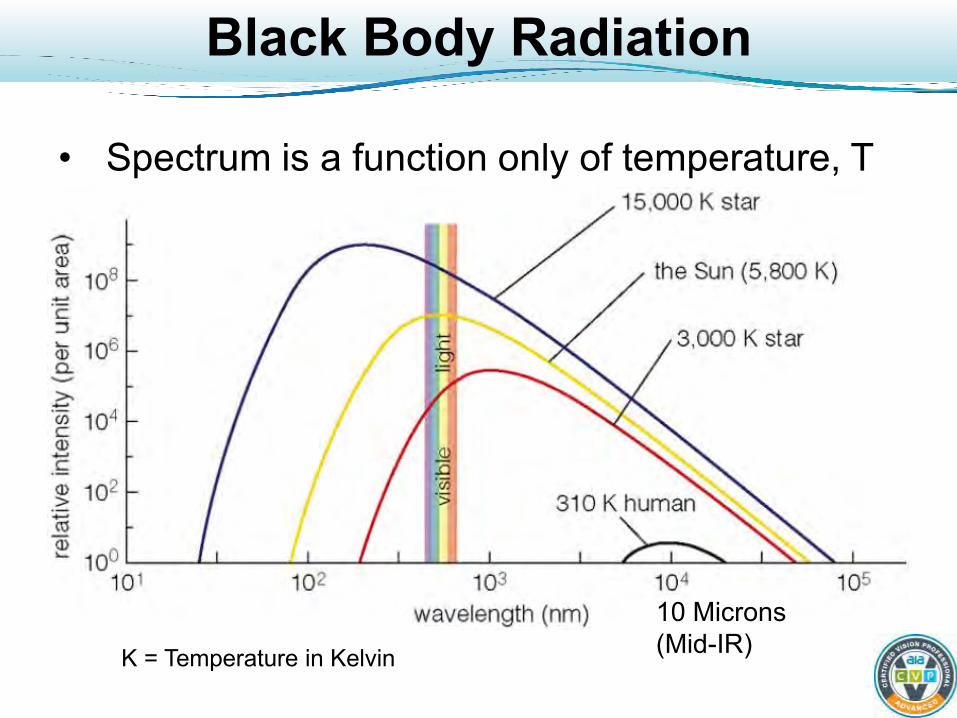
Black Body Radiation
• Spectrum is a function only of temperature, T
10 Microns (Mid-IR) K = Temperature in Kelvin
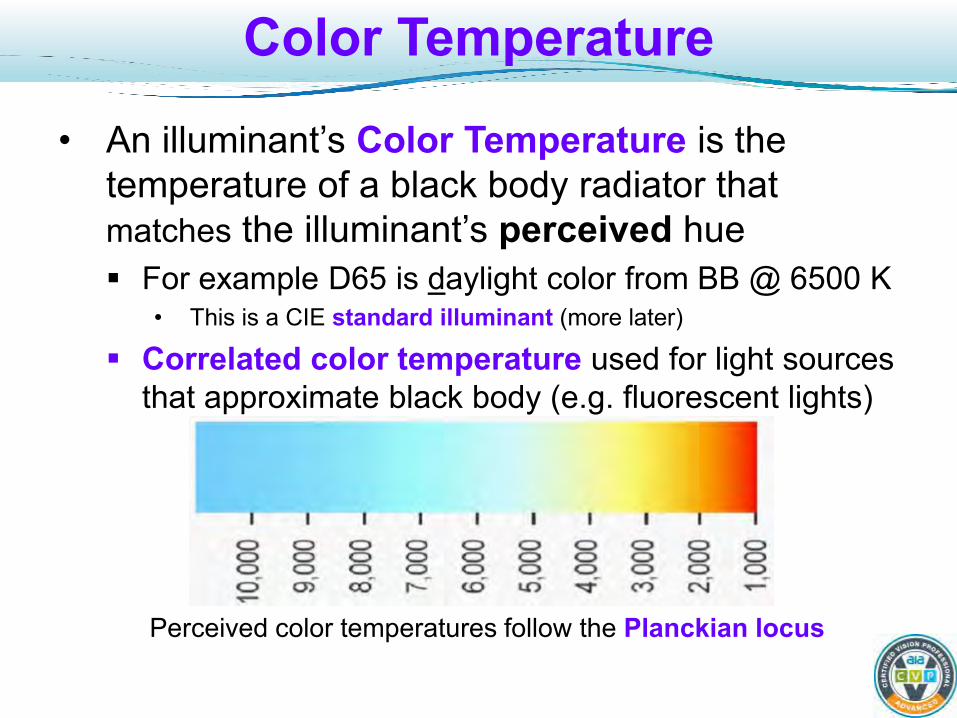
Color Temperature
• An illuminant’s Color Temperature is the temperature of a black body radiator that matches the illuminant’s perceived hue For example D65 is daylight color from BB @ 6500 K
• This is a CIE standard illuminant (more later)
Correlated color temperature used for light sources that approximate black body (e.g. fluorescent lights)
Perceived color temperatures follow the Planckian locus
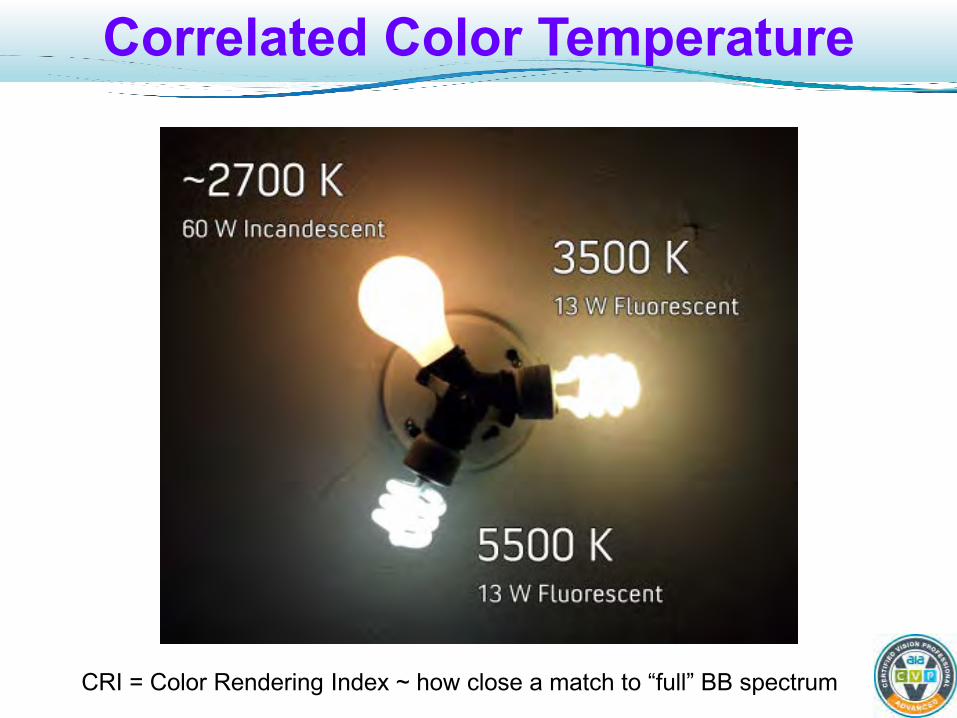
Correlated Color Temperature
CRI = Color Rendering Index ~ how close a match to “full” BB spectrum
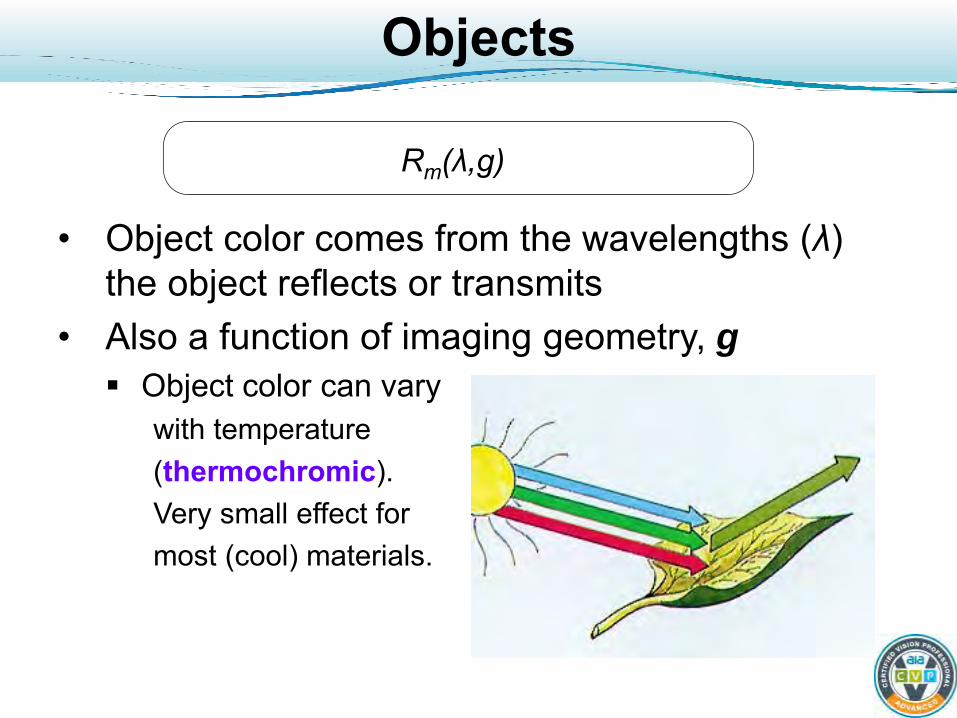
Objects
• Object color comes from the wavelengths (λ)
the object reflects or transmits • Also a function of imaging geometry, g Object color can vary
with temperature (thermochromic). Very small effect for most (cool) materials.
Rm(λ,g)
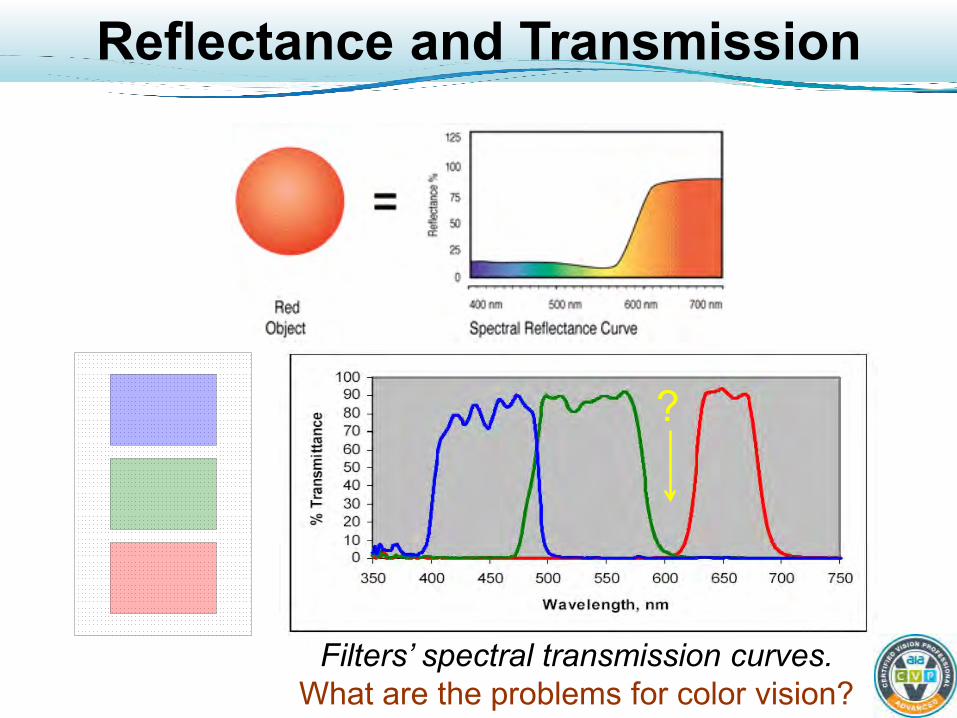
Reflectance and Transmission
Filters’ spectral transmission curves. What are the problems for color vision?
?
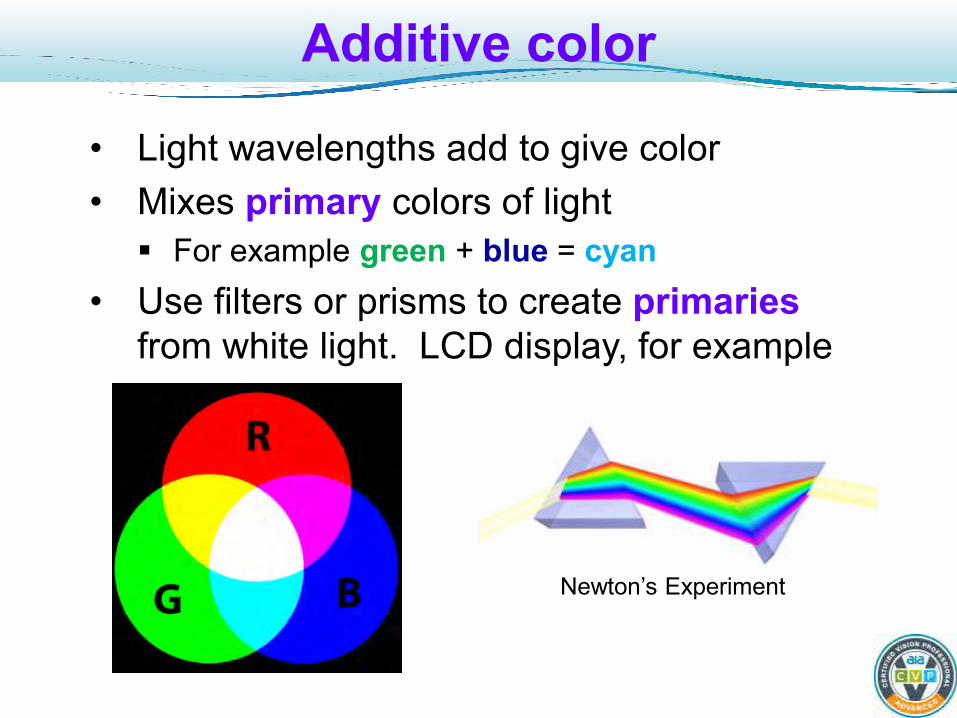
Additive color
• Light wavelengths add to give color • Mixes primary colors of light For example green + blue = cyan
• Use filters or prisms to create primaries from white light. LCD display, for example
Newton’s Experiment
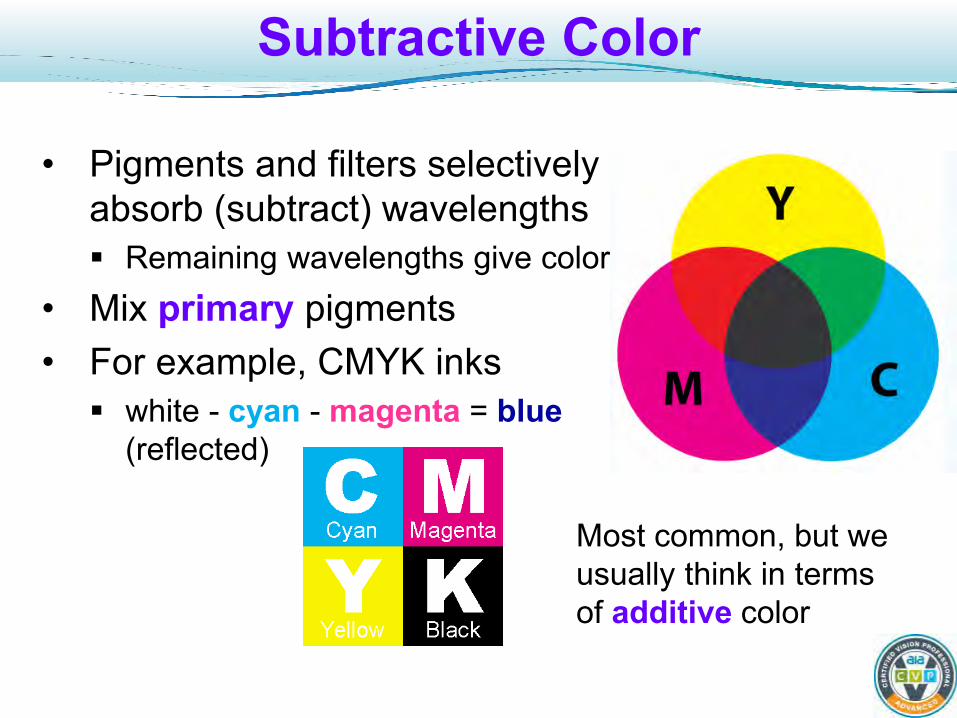
Subtractive Color
• Pigments and filters selectively absorb (subtract) wavelengths Remaining wavelengths give color
• Mix primary pigments • For example, CMYK inks white - cyan - magenta = blue
(reflected)
Most common, but we usually think in terms of additive color
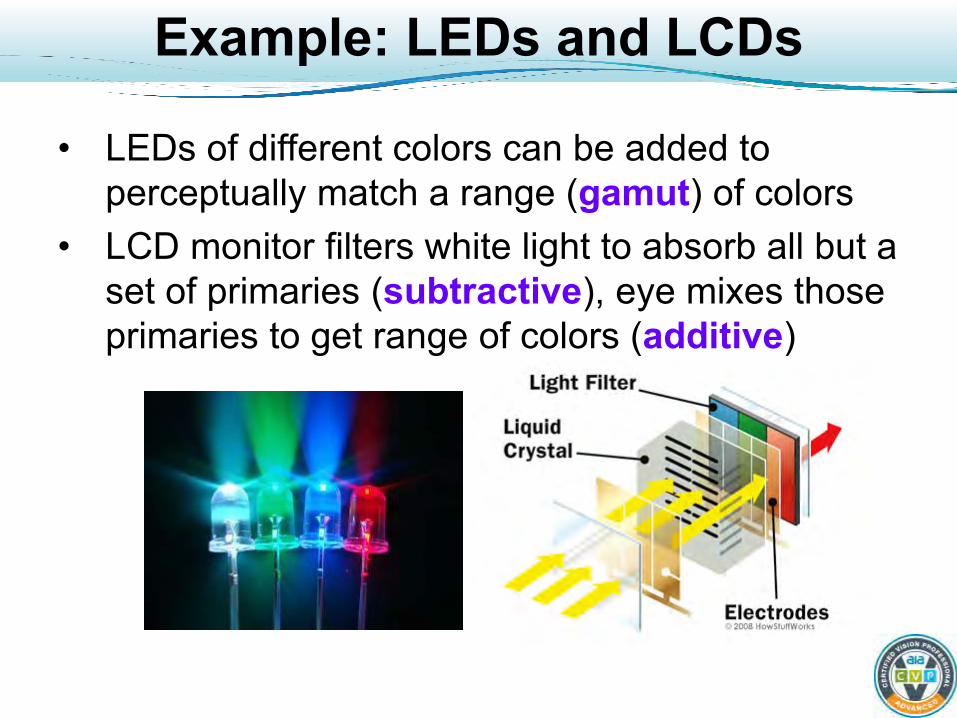
Example: LEDs and LCDs
• LEDs of different colors can be added to perceptually match a range (gamut) of colors
• LCD monitor filters white light to absorb all but a set of primaries (subtractive), eye mixes those primaries to get range of colors (additive)
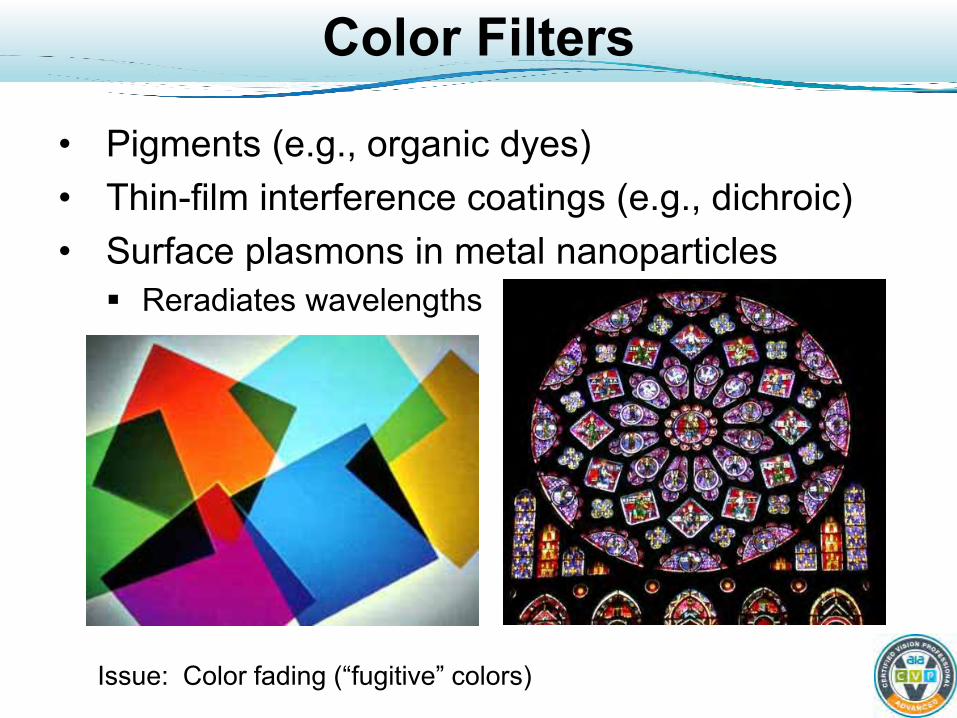
Color Filters
• Pigments (e.g., organic dyes) • Thin-film interference coatings (e.g., dichroic) • Surface plasmons in metal nanoparticles Reradiates wavelengths
Issue: Color fading (“fugitive” colors)
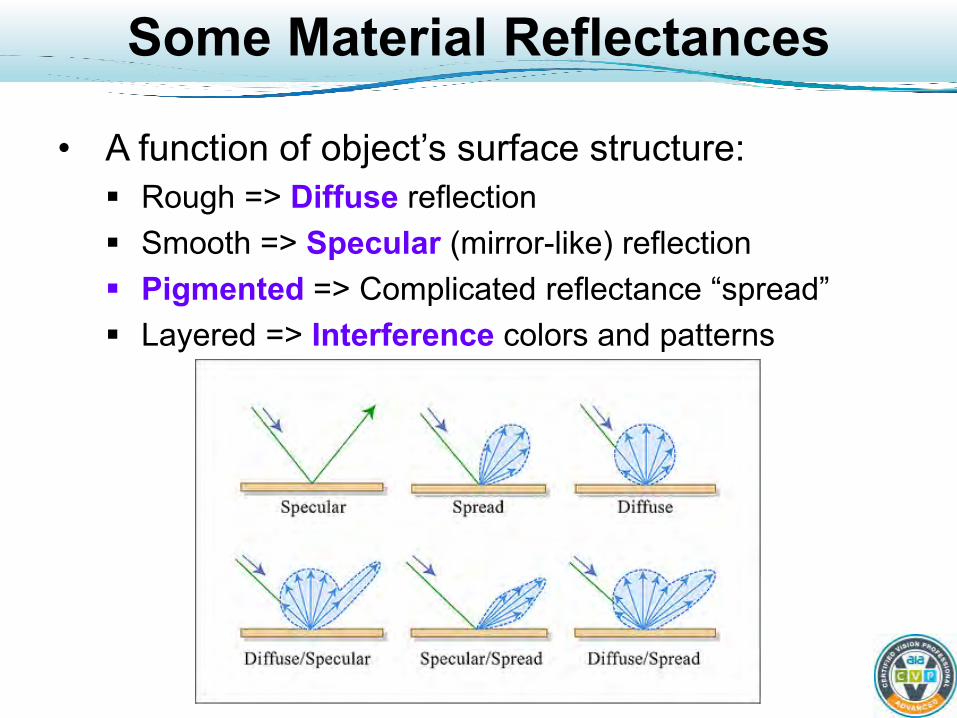
Some Material Reflectances
• A function of object’s surface structure: Rough => Diffuse reflection Smooth => Specular (mirror-like) reflection Pigmented => Complicated reflectance “spread” Layered => Interference colors and patterns
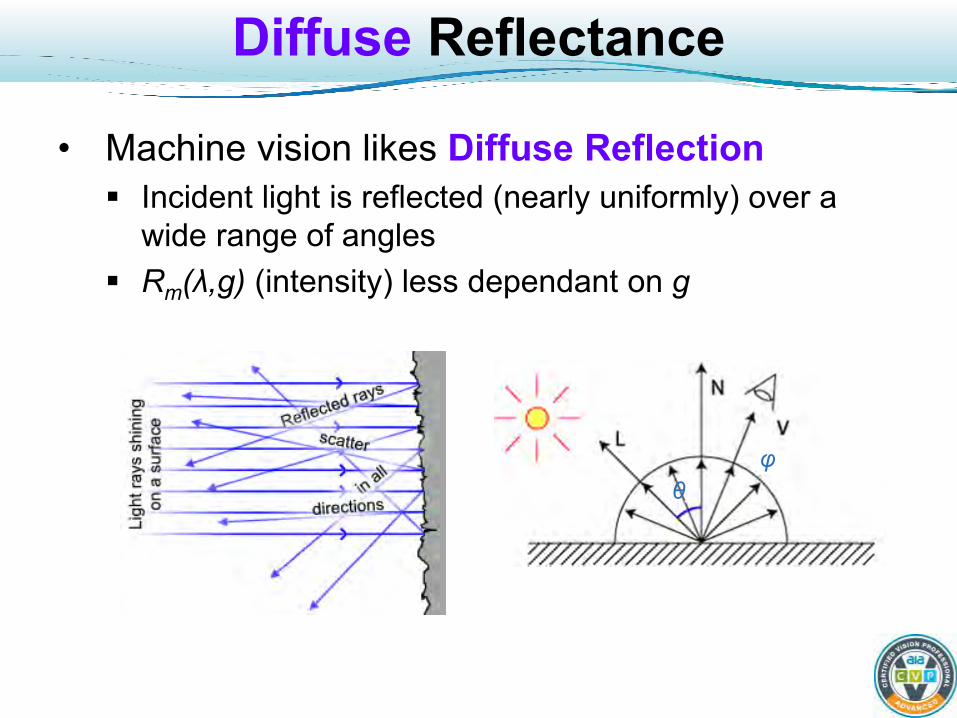
Diffuse Reflectance
• Machine vision likes Diffuse Reflection Incident light is reflected (nearly uniformly) over a
wide range of angles Rm(λ,g) (intensity) less dependant on g
θ φ

Specular Reflection
• MV generally doesn’t like Specular Reflection Angle of incidence = angle of reflection (mirror) Gives “highlights”, “hot-spots”
Shows the illuminant color which can be useful if it is consistent (but usually unstable with angle changes)
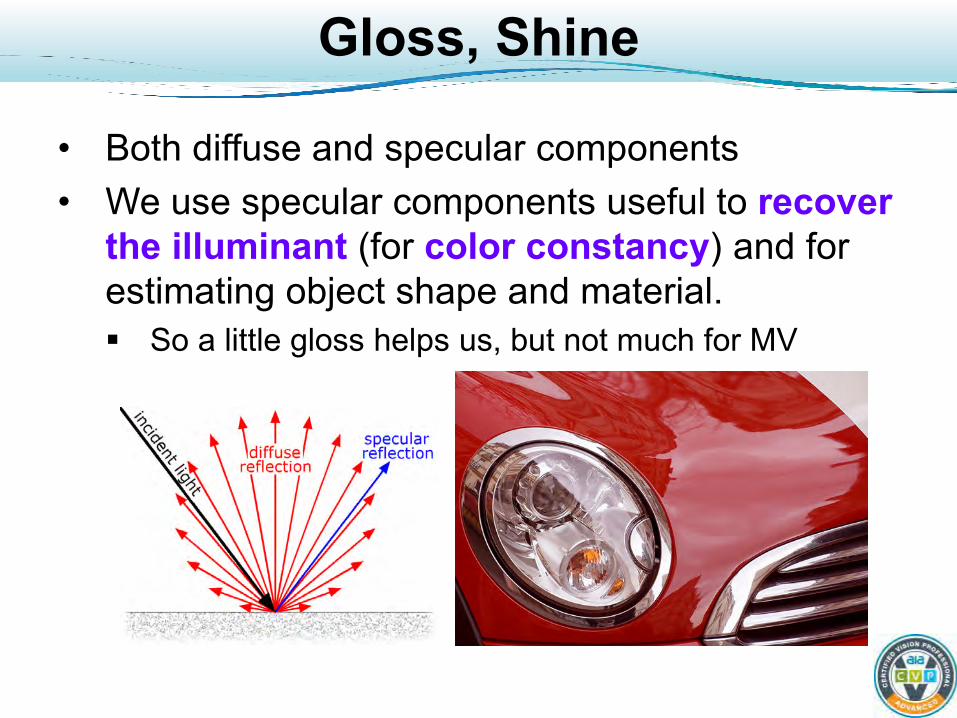
Gloss, Shine
• Both diffuse and specular components • We use specular components useful to recover
the illuminant (for color constancy) and for estimating object shape and material. So a little gloss helps us, but not much for MV
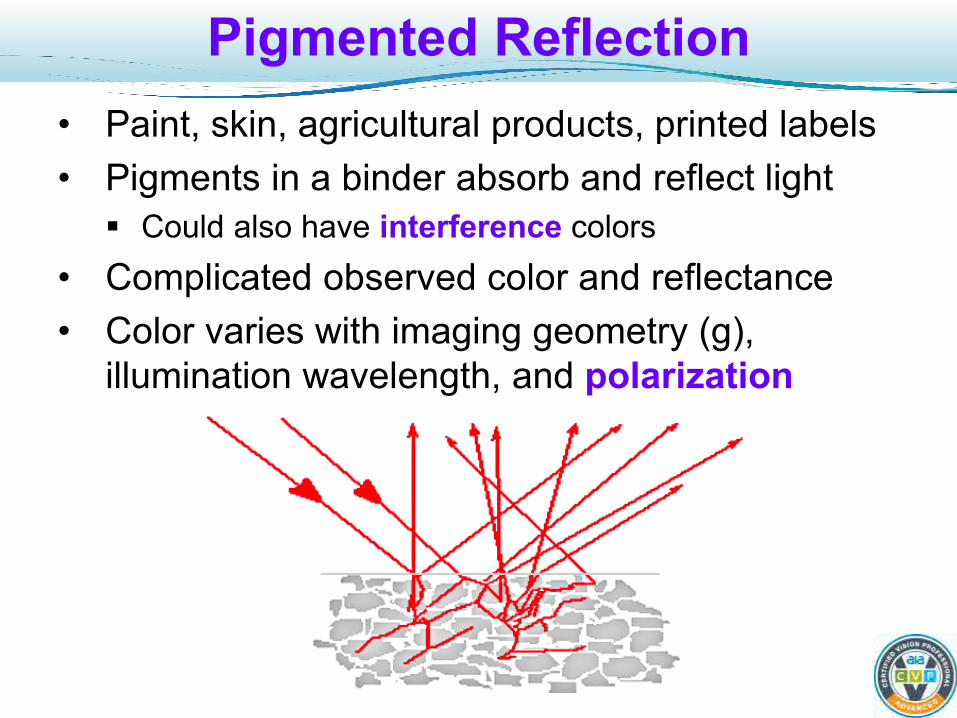
Pigmented Reflection • Paint, skin, agricultural products, printed labels • Pigments in a binder absorb and reflect light Could also have interference colors
• Complicated observed color and reflectance • Color varies with imaging geometry (g),
illumination wavelength, and polarization
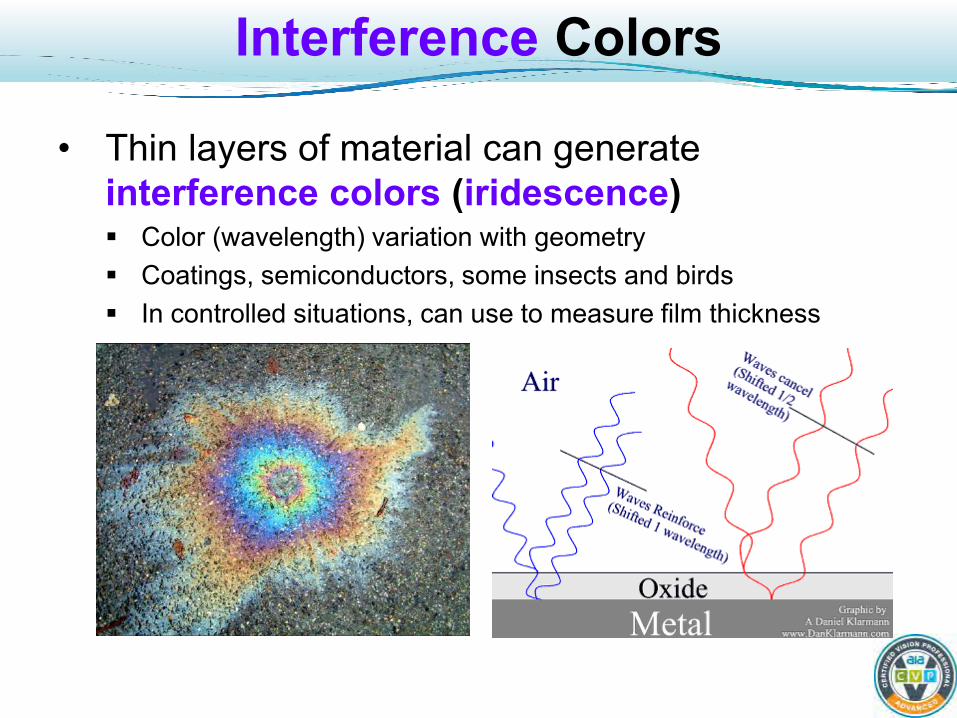
Interference Colors
• Thin layers of material can generate interference colors (iridescence) Color (wavelength) variation with geometry Coatings, semiconductors, some insects and birds In controlled situations, can use to measure film thickness
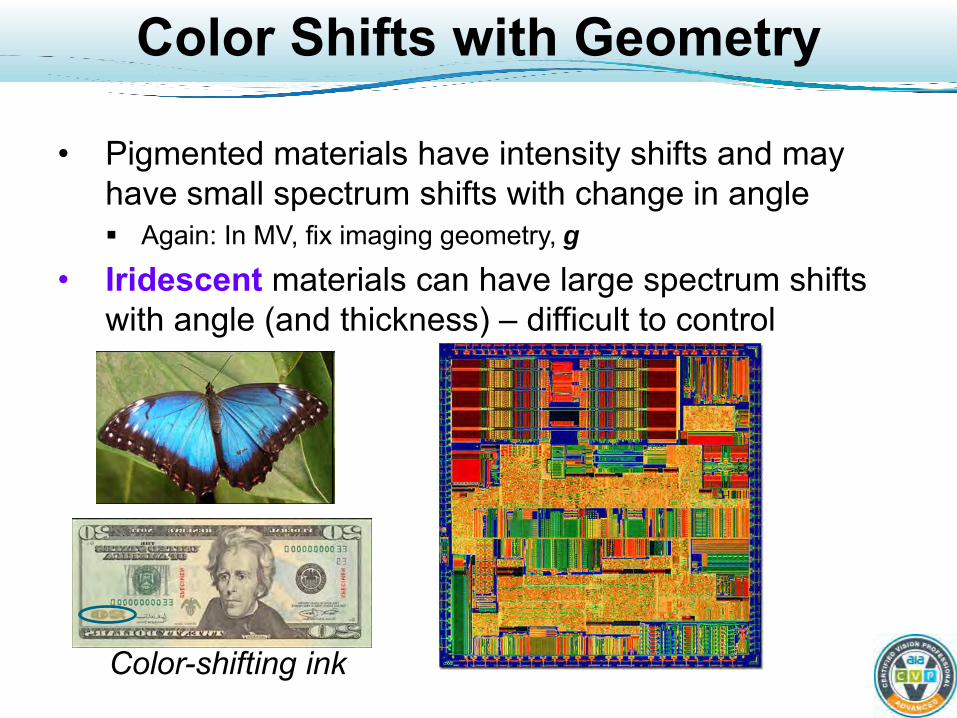
Color Shifts with Geometry
• Pigmented materials have intensity shifts and may have small spectrum shifts with change in angle Again: In MV, fix imaging geometry, g
• Iridescent materials can have large spectrum shifts with angle (and thickness) – difficult to control
Color-shifting ink
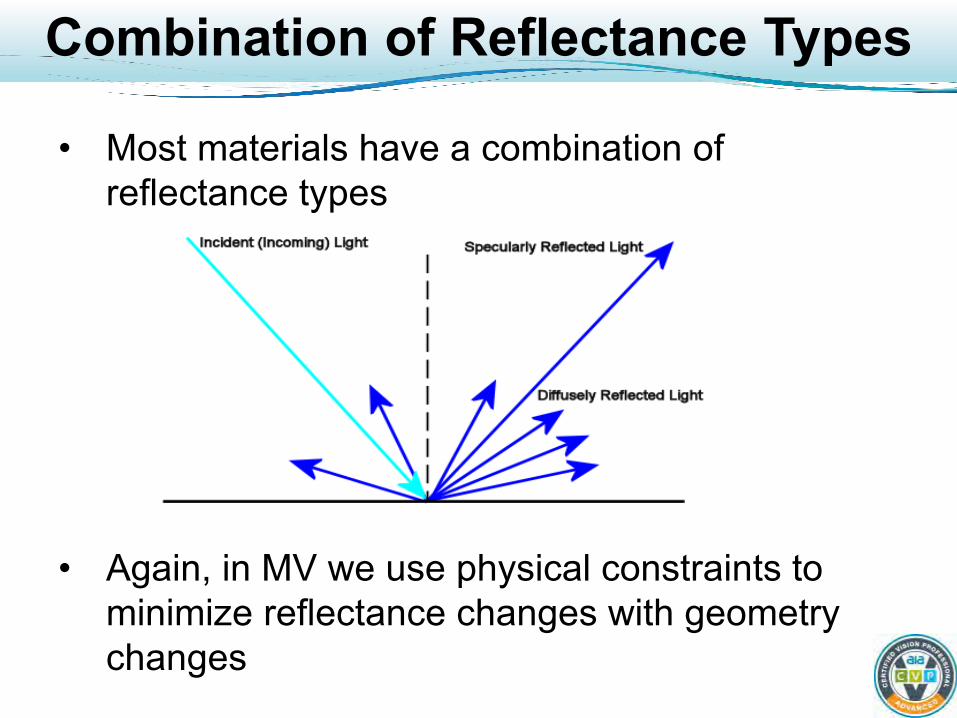
Combination of Reflectance Types
• Most materials have a combination of reflectance types
• Again, in MV we use physical constraints to minimize reflectance changes with geometry changes

Sensor
Si(λ,α)
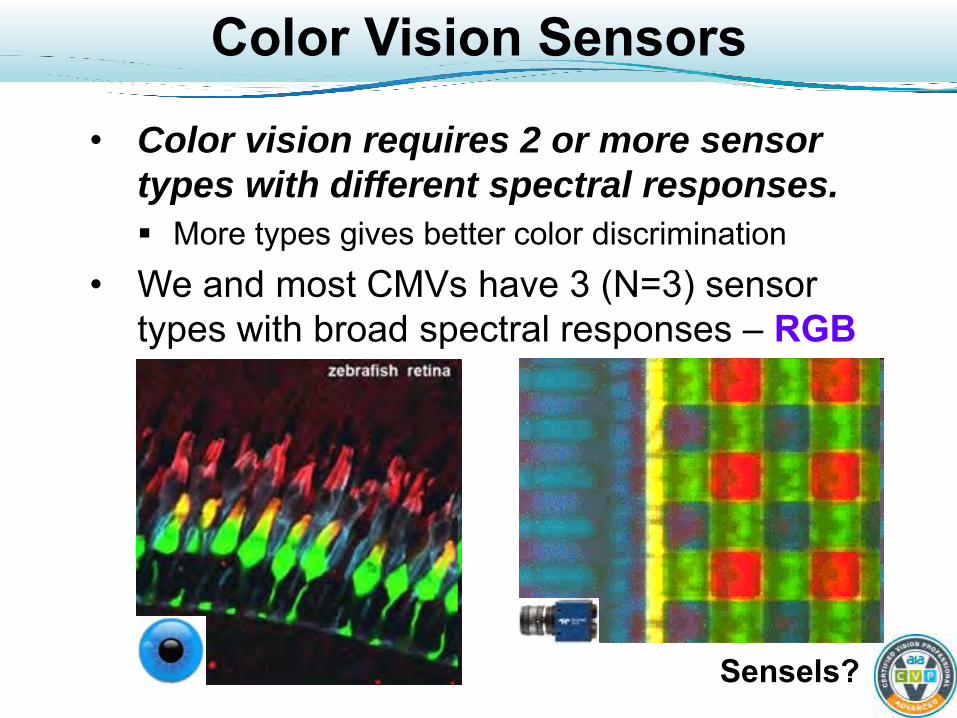
Color Vision Sensors
• Color vision requires 2 or more sensor types with different spectral responses. More types gives better color discrimination
• We and most CMVs have 3 (N=3) sensor types with broad spectral responses – RGB
Sensels?
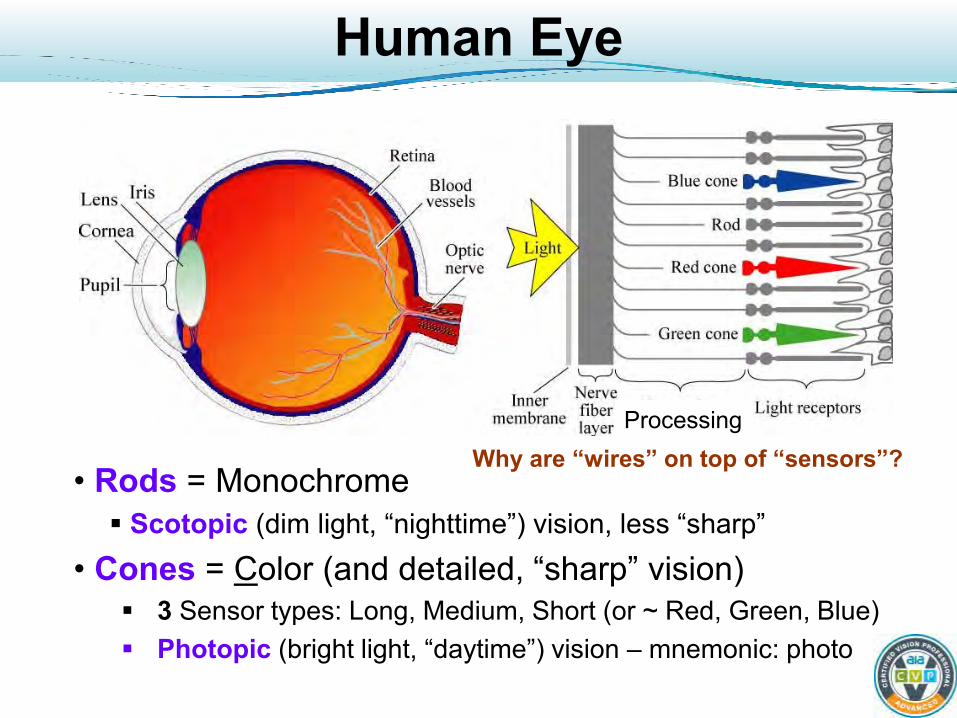
Human Eye
• Rods = Monochrome Scotopic (dim light, “nighttime”) vision, less “sharp”
• Cones = Color (and detailed, “sharp” vision) 3 Sensor types: Long, Medium, Short (or ~ Red, Green, Blue) Photopic (bright light, “daytime”) vision – mnemonic: photo
Why are “wires” on top of “sensors”? Processing
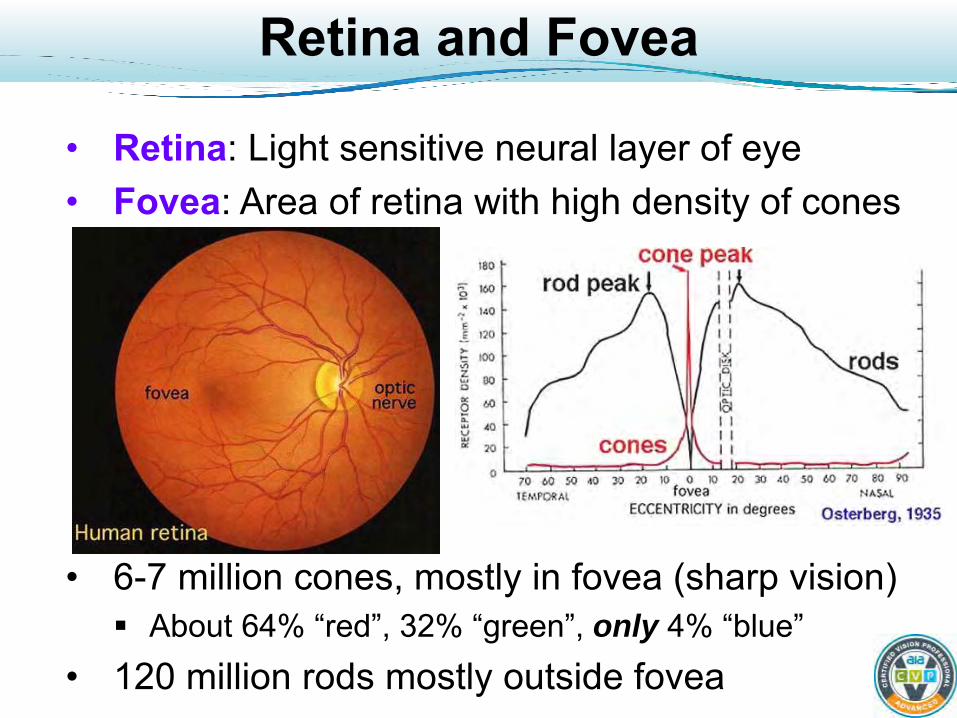
Retina and Fovea
• Retina: Light sensitive neural layer of eye • Fovea: Area of retina with high density of cones
• 6-7 million cones, mostly in fovea (sharp vision) About 64% “red”, 32% “green”, only 4% “blue”
• 120 million rods mostly outside fovea
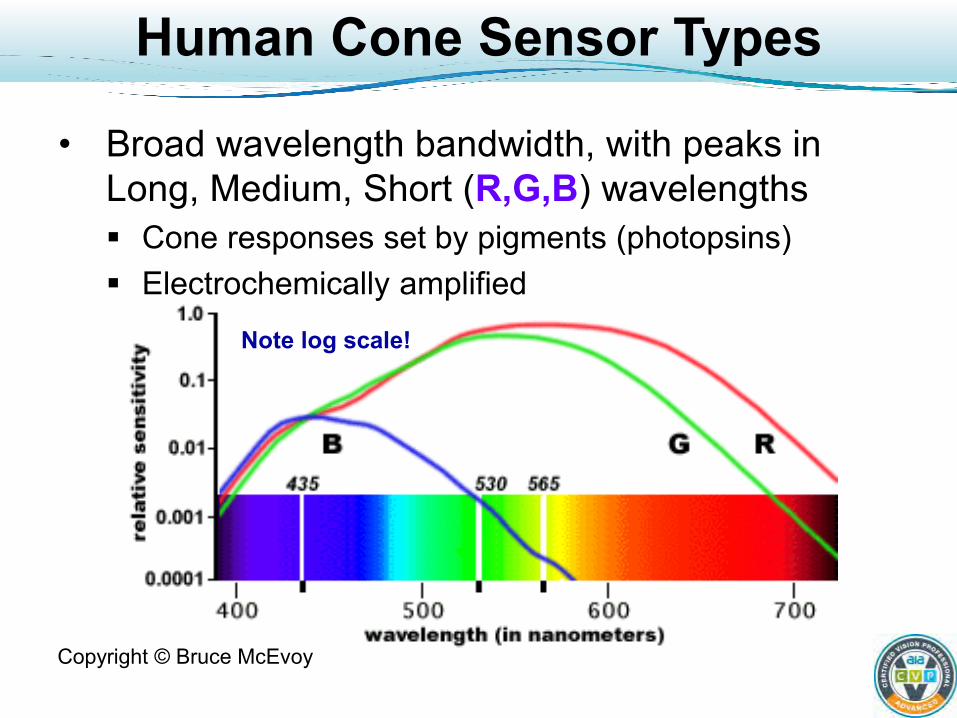
Human Cone Sensor Types
• Broad wavelength bandwidth, with peaks in Long, Medium, Short (R,G,B) wavelengths Cone responses set by pigments (photopsins) Electrochemically amplified
Copyright © Bruce McEvoy
Note log scale!
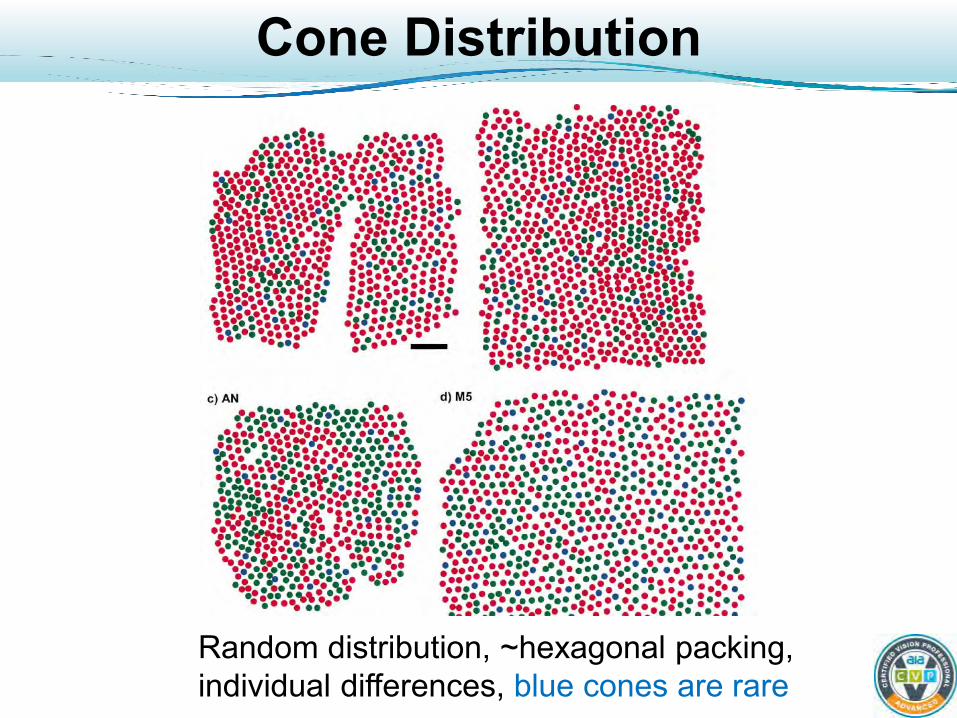
Cone Distribution
Random distribution, ~hexagonal packing, individual differences, blue cones are rare

Camera Color Sensors
• Color sensors use a monochrome sensor overlaid with (typically) R,G,B color filters Bayer pattern of color filters most common Sensor responses are typically to red, green, blue
a.Microlenses b.Color filter mosaic c. Sensor pixels d.Packaging (IC)
Correct lens action->
- Fill Factor - Acceptance angle
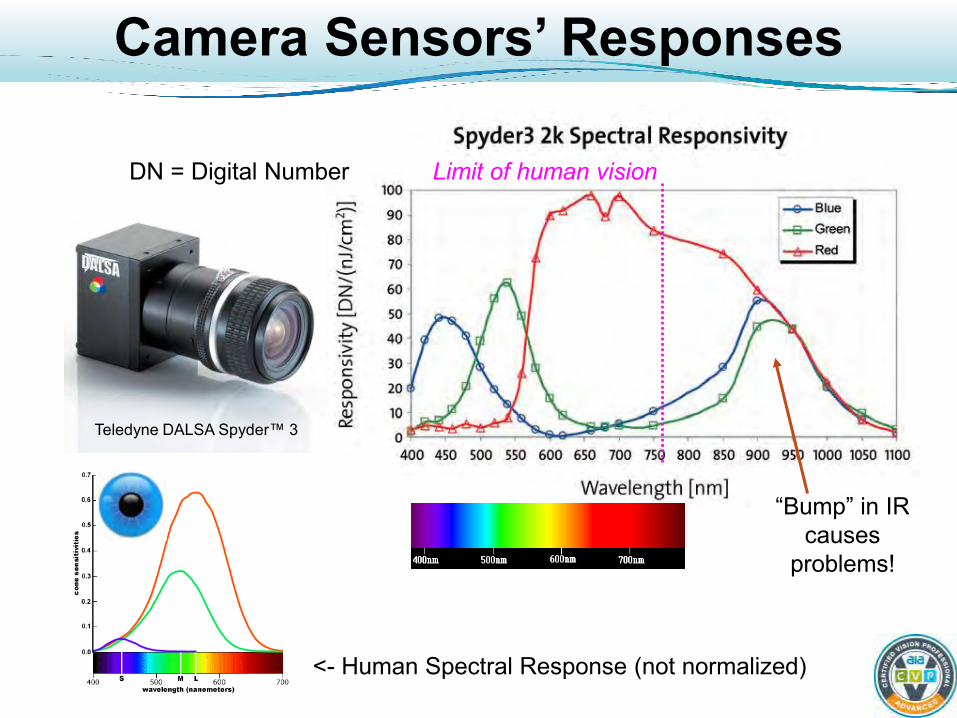
Camera Sensors’ Responses
“Bump” in IR causes
problems!
DN = Digital Number Limit of human vision
Teledyne DALSA Spyder™ 3
<- Human Spectral Response (not normalized)

Human Color Vision
If human vision is to be used as a standard, need to measure it. Also gives us ideas for color machine vision processing.
Review ?
• Define: rods, cones • How many sensor types does the eye have* • Name three (or more) properties of light • What is a metamer? • When we say color is a material property, what
does that mean? • Name some factors in color image formation • Name two (or more) types of reflectance • What is color temperature?
* Trick Question!

As the Sun Goes Down…
• Below are normalized scotopic and photopic brightness spectral responses
• What happens to colors’ brightnesses as it gets darker?
Purkinje Shift
Scotopic Photopic
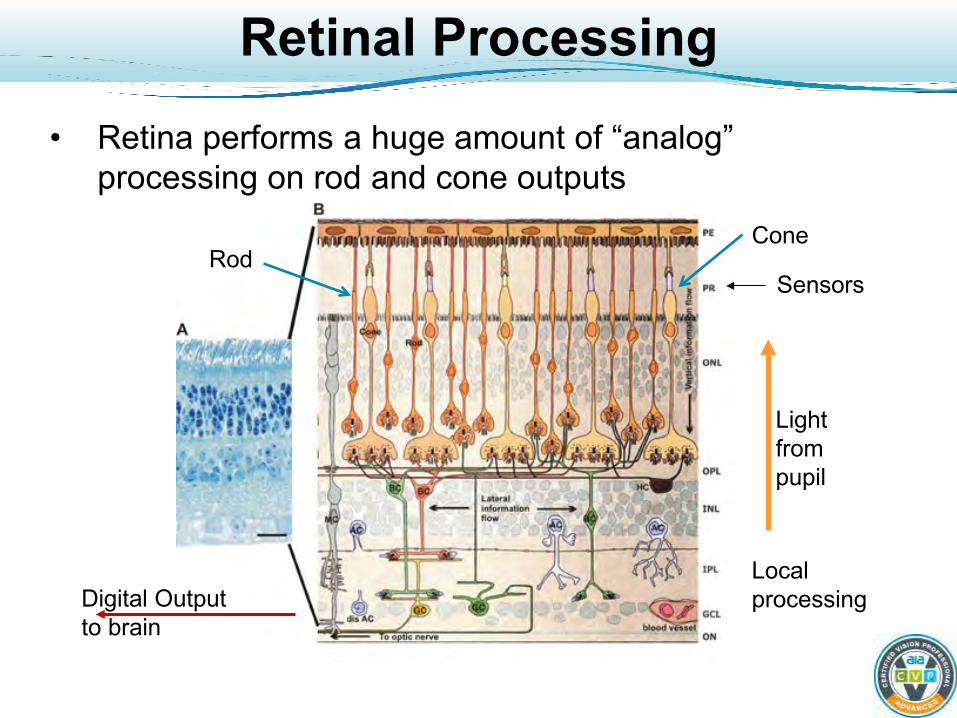
Retinal Processing
• Retina performs a huge amount of “analog” processing on rod and cone outputs
Light from pupil
Digital Output to brain
Sensors
Local processing
Rod Cone
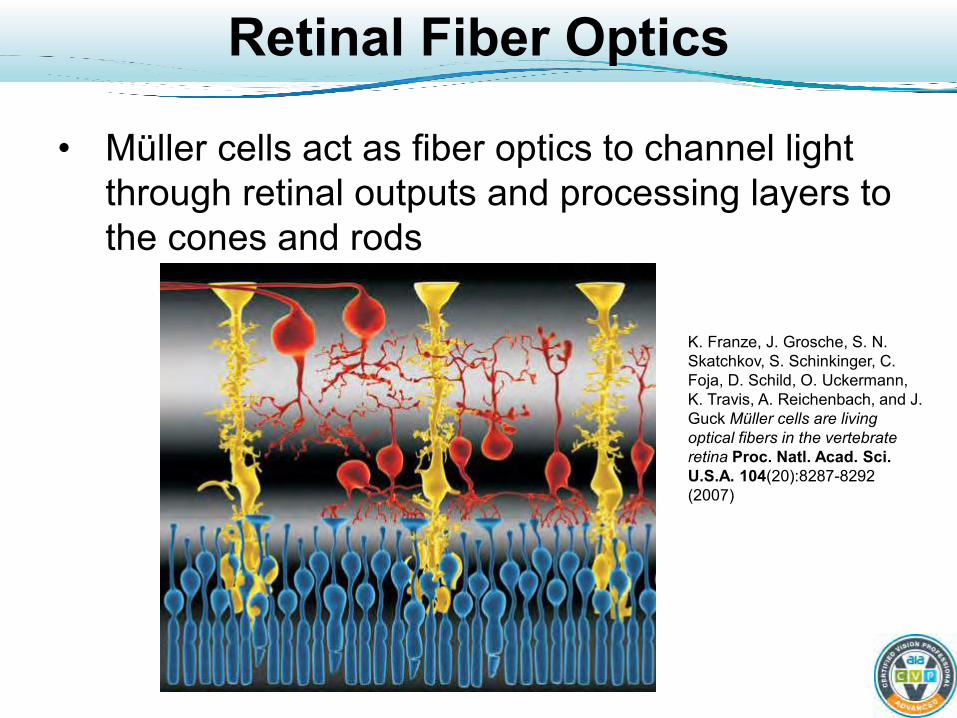
Retinal Fiber Optics
• Müller cells act as fiber optics to channel light through retinal outputs and processing layers to the cones and rods
K. Franze, J. Grosche, S. N. Skatchkov, S. Schinkinger, C. Foja, D. Schild, O. Uckermann, K. Travis, A. Reichenbach, and J. Guck Müller cells are living optical fibers in the vertebrate retina Proc. Natl. Acad. Sci. U.S.A. 104(20):8287-8292 (2007)

Retinal Processing of Colors
Very simplified model: Trichromatic – Young, Helmholtz, from color matching
Color opponents - Hering
Brightness (Luma) is separated from color opponents
Sensors are ~ logarithmic Response, so -,+ become /,*
There is no “reddish-green” or “bluish-yellow”

Color Opponency Demo
Demonstrates color opponency by adapting (fatiguing) trichromatic sensors

How’s Your Hering?

Perceptual Color Terms
• Hue = “pure” color • Saturation = amount of color compared to
white light with similar perceptual intensity
• Brightness or Luma = intensity of light • Unfortunately, these are not consistently used In particular, Chroma usually means saturation but
sometimes Hue+Saturation (short for Chromaticity) • These are photometric terms
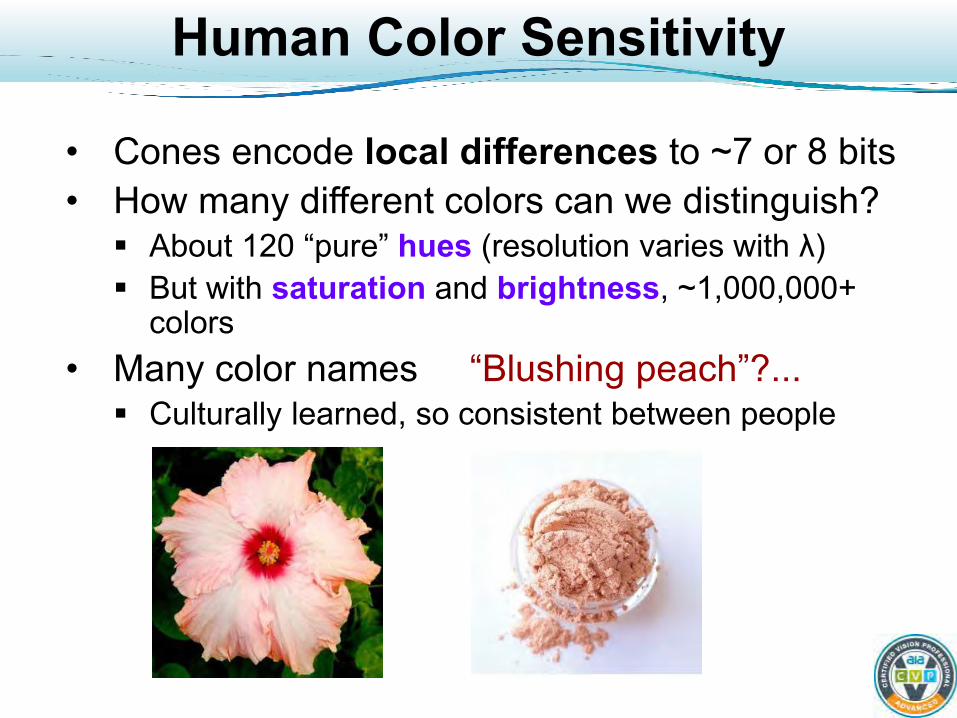
Human Color Sensitivity
• Cones encode local differences to ~7 or 8 bits
• How many different colors can we distinguish? About 120 “pure” hues (resolution varies with λ) But with saturation and brightness, ~1,000,000+
colors • Many color names “Blushing peach”?... Culturally learned, so consistent between people

Some Retinal Processing
• Cone and rod response is ~ logarithmic • RGB separated into R-G, B-Y color and luma • Adjusts to environment (lighting) Adaptation in space and time; cones & rods, etc.
• Encoded into 7 to 8 bits • Extracts information ~100 to 1 sensor to output compression Compression ratio increases away from fovea Local adaptation and balance selects sending
changes in light input (spatial & temporal patterns) Color is sent at lower resolution than luma Luma encodes motion, intensity, detail (edges)
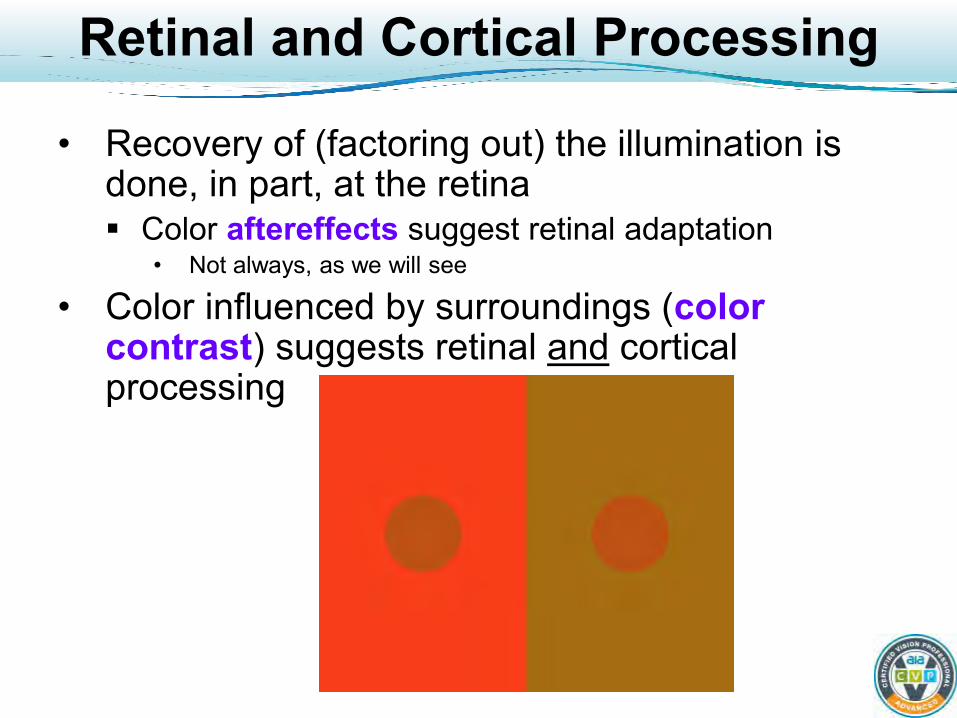
Retinal and Cortical Processing
• Recovery of (factoring out) the illumination is done, in part, at the retina Color aftereffects suggest retinal adaptation
• Not always, as we will see
• Color influenced by surroundings (color contrast) suggests retinal and cortical processing

Color Processing Paths
• Eye -> LGN -> Cortex • Cortical areas specialized for different processing
How do they get unified into our perceptions?
Psychophysics
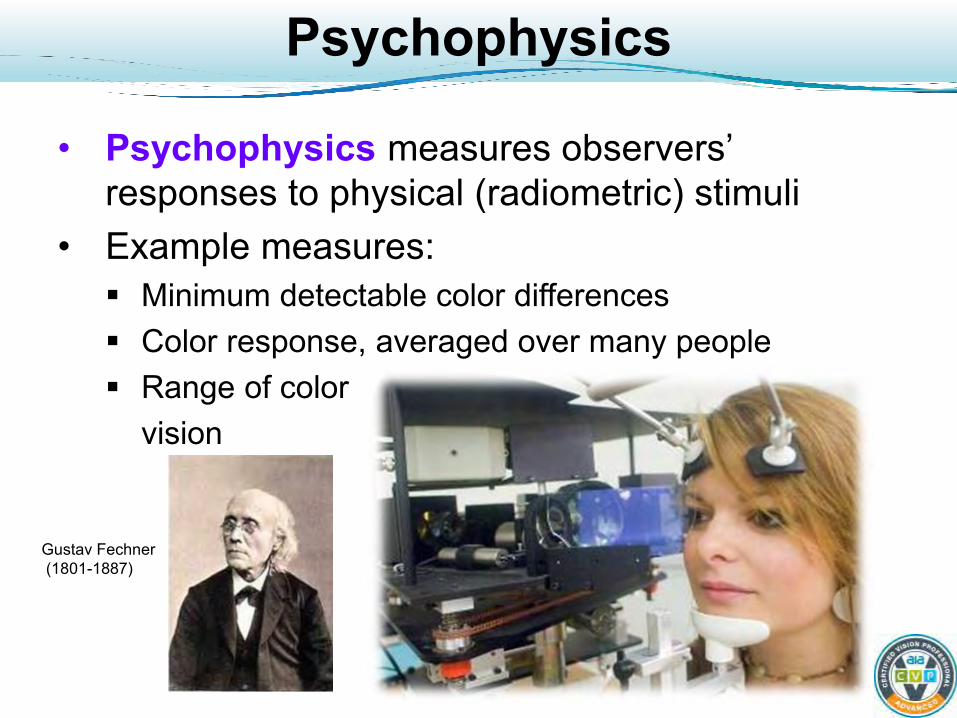
• Psychophysics measures observers’ responses to physical (radiometric) stimuli
• Example measures: Minimum detectable color differences Color response, averaged over many people Range of color vision
Gustav Fechner (1801-1887)
Measuring Human Color Vision
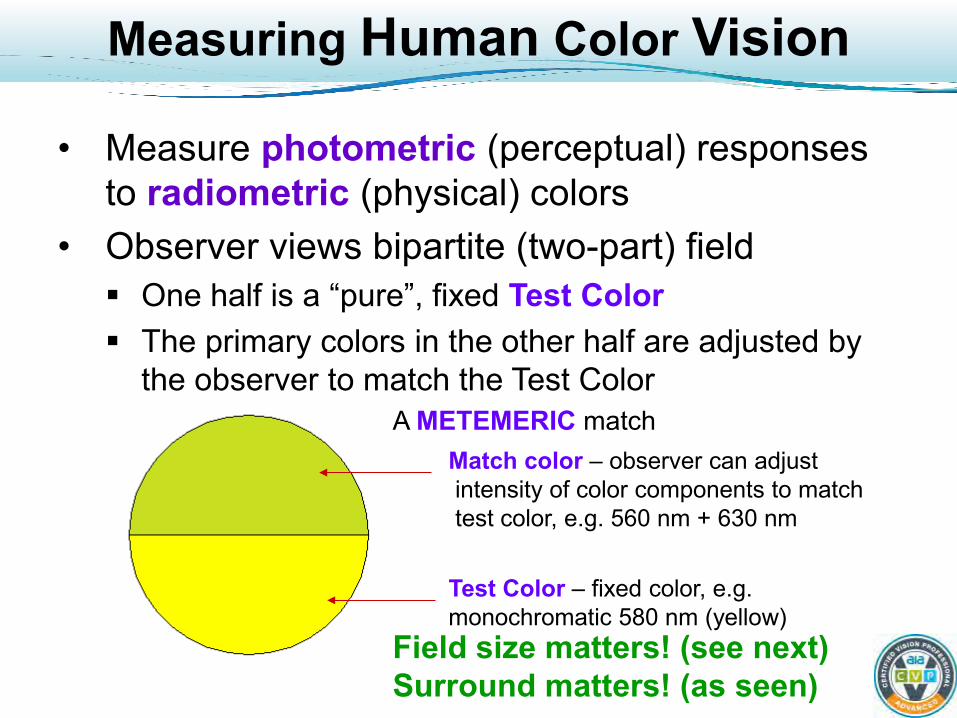
• Measure photometric (perceptual) responses to radiometric (physical) colors
• Observer views bipartite (two-part) field One half is a “pure”, fixed Test Color The primary colors in the other half are adjusted by
the observer to match the Test Color A METEMERIC match
Test Color – fixed color, e.g. monochromatic 580 nm (yellow)
Match color – observer can adjust intensity of color components to match test color, e.g. 560 nm + 630 nm
Field size matters! (see next) Surround matters! (as seen)
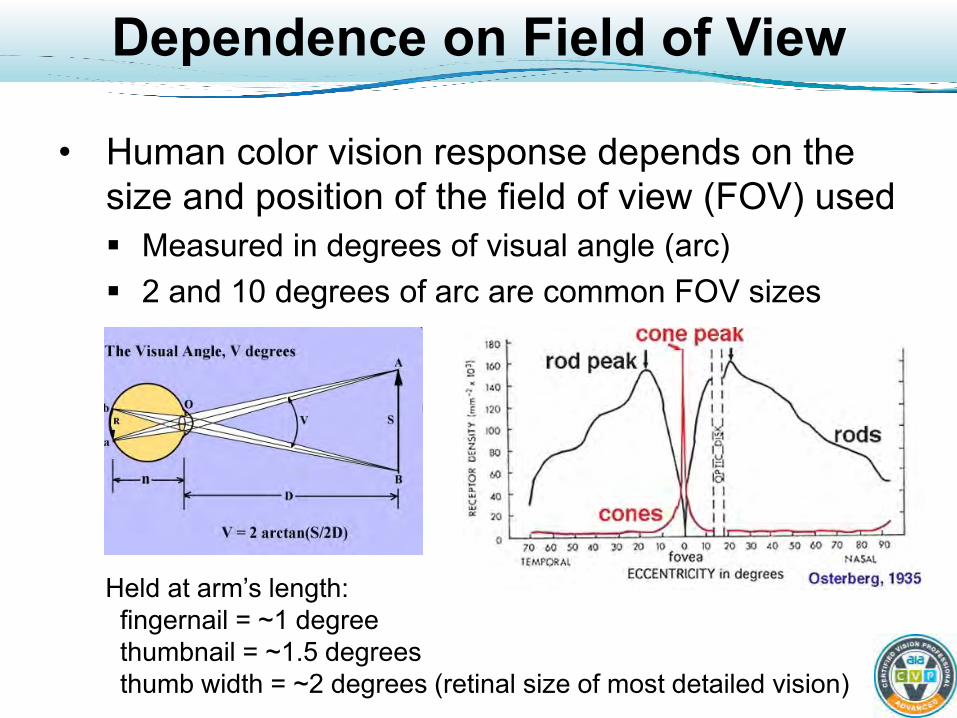
Dependence on Field of View
• Human color vision response depends on the size and position of the field of view (FOV) used Measured in degrees of visual angle (arc) 2 and 10 degrees of arc are common FOV sizes
Held at arm’s length: fingernail = ~1 degree thumbnail = ~1.5 degrees thumb width = ~2 degrees (retinal size of most detailed vision)
CIE Standard Observer Functions
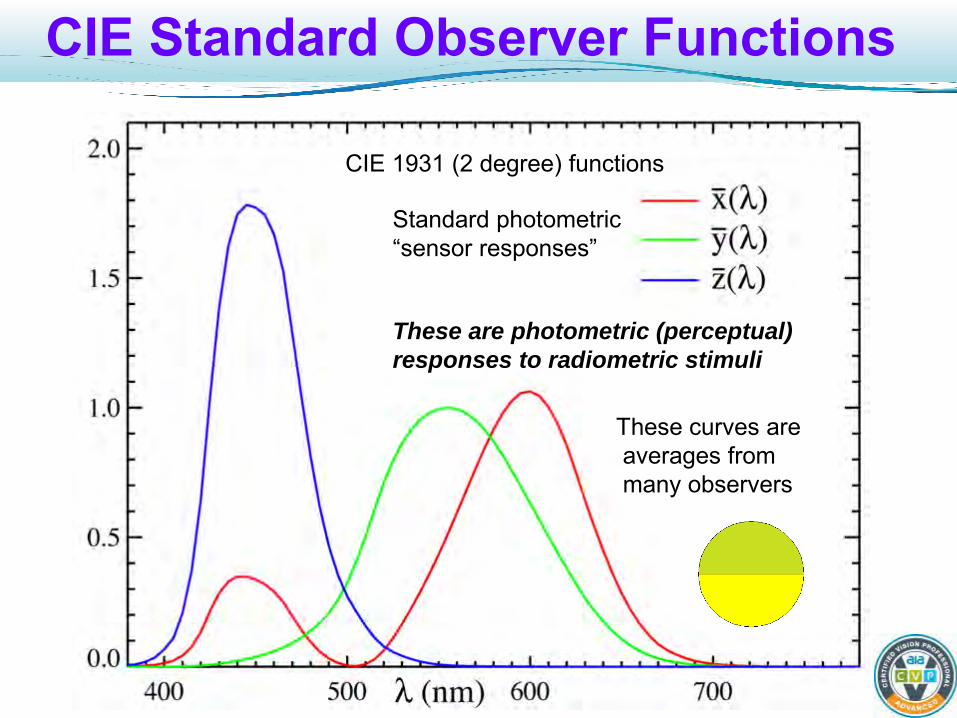
CIE 1931 (2 degree) functions
These are photometric (perceptual) responses to radiometric stimuli
Standard photometric “sensor responses”
These curves are averages from many observers
CIE Color Standards
• CIE = Commission Internationale de l’Eclairage Sets international standards for illumination
• CIE Standard observer functions Are spectral sensitivities for three (tristimulus) linear,
photometric “sensor types”. usually provided as numerical tables
• CIE Standard Illuminants Specifies spectrum of standard illumination Such as the D65 (Daylight at 6500 K) standard.
)(),(),( λλλ zyx
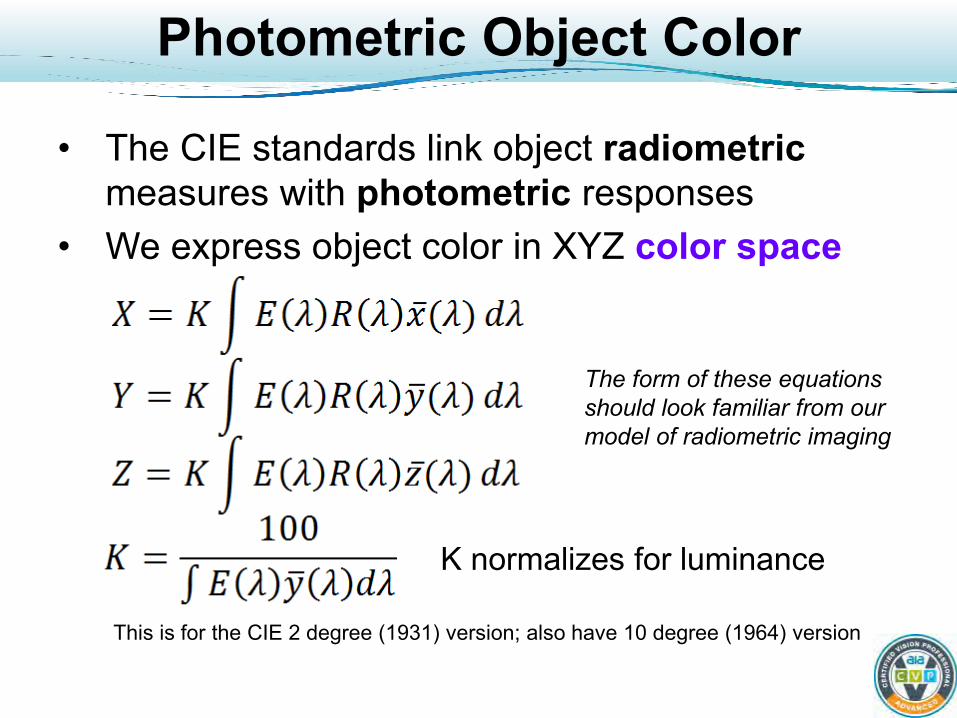
Photometric Object Color
• The CIE standards link object radiometric measures with photometric responses
• We express object color in XYZ color space
K normalizes for luminance
This is for the CIE 2 degree (1931) version; also have 10 degree (1964) version
The form of these equations should look familiar from our model of radiometric imaging
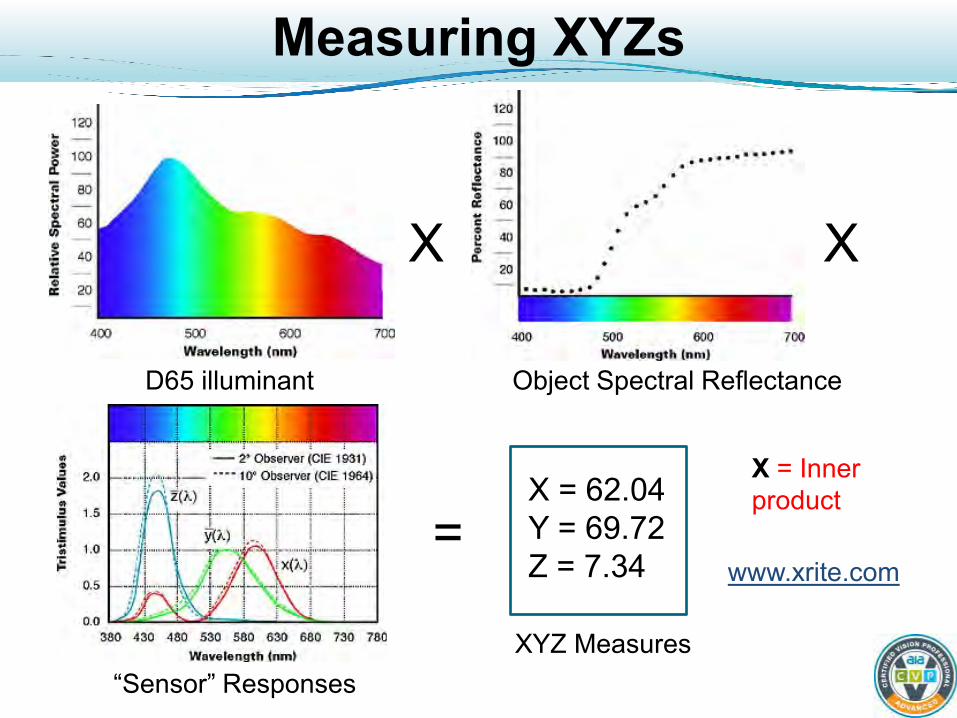
Measuring XYZs
Object Spectral Reflectance
X
D65 illuminant
X
X = 62.04 Y = 69.72 Z = 7.34
“Sensor” Responses
=
XYZ Measures
www.xrite.com
X = Inner product
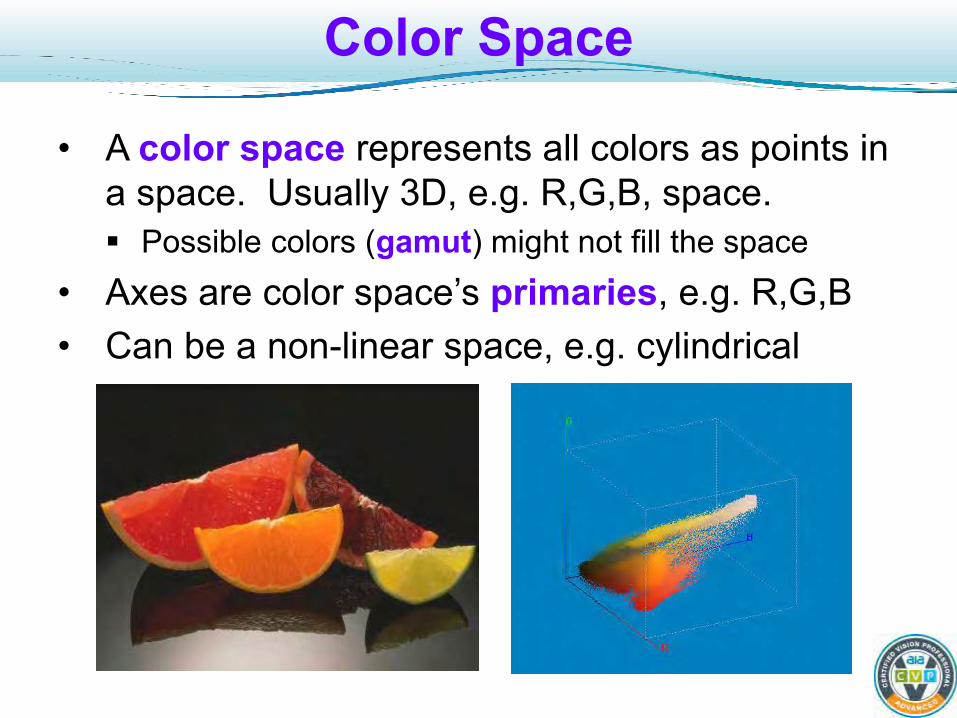
Color Space
• A color space represents all colors as points in a space. Usually 3D, e.g. R,G,B, space. Possible colors (gamut) might not fill the space
• Axes are color space’s primaries, e.g. R,G,B • Can be a non-linear space, e.g. cylindrical
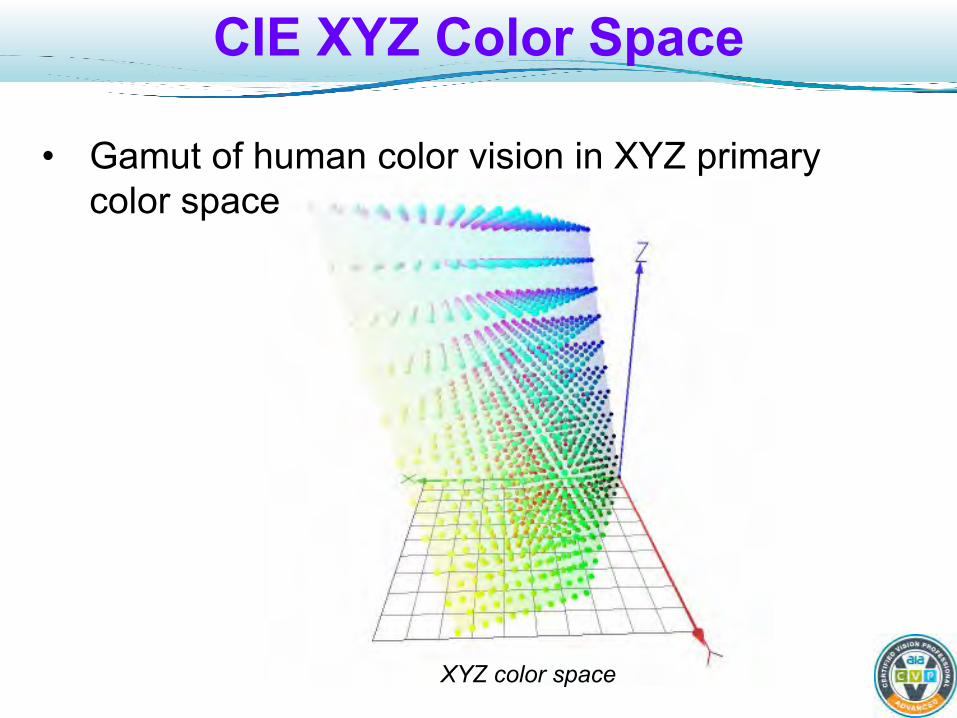
CIE XYZ Color Space
• Gamut of human color vision in XYZ primary color space
XYZ color space
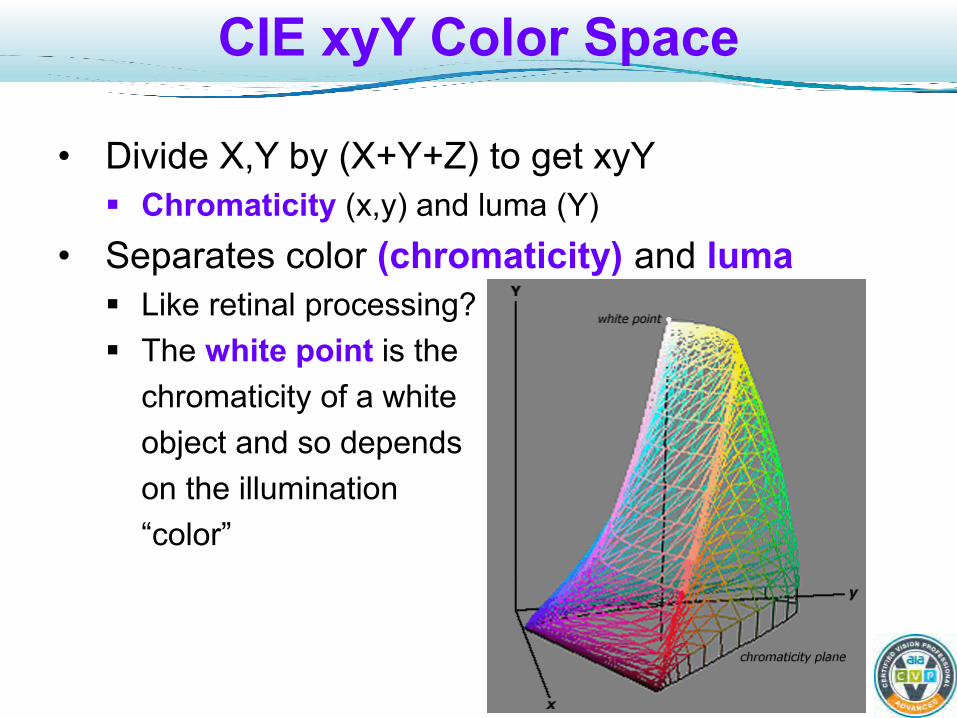
CIE xyY Color Space
• Divide X,Y by (X+Y+Z) to get xyY Chromaticity (x,y) and luma (Y)
• Separates color (chromaticity) and luma Like retinal processing? The white point is the chromaticity of a white object and so depends on the illumination “color”
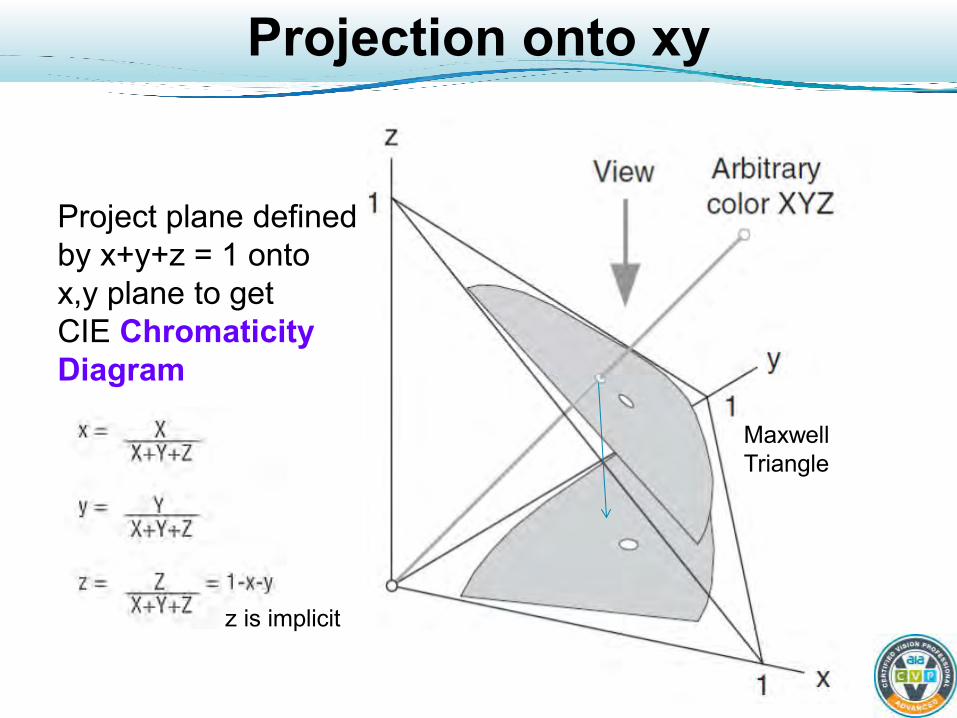
Projection onto xy
Project plane defined by x+y+z = 1 onto x,y plane to get CIE Chromaticity Diagram
Maxwell Triangle
z is implicit
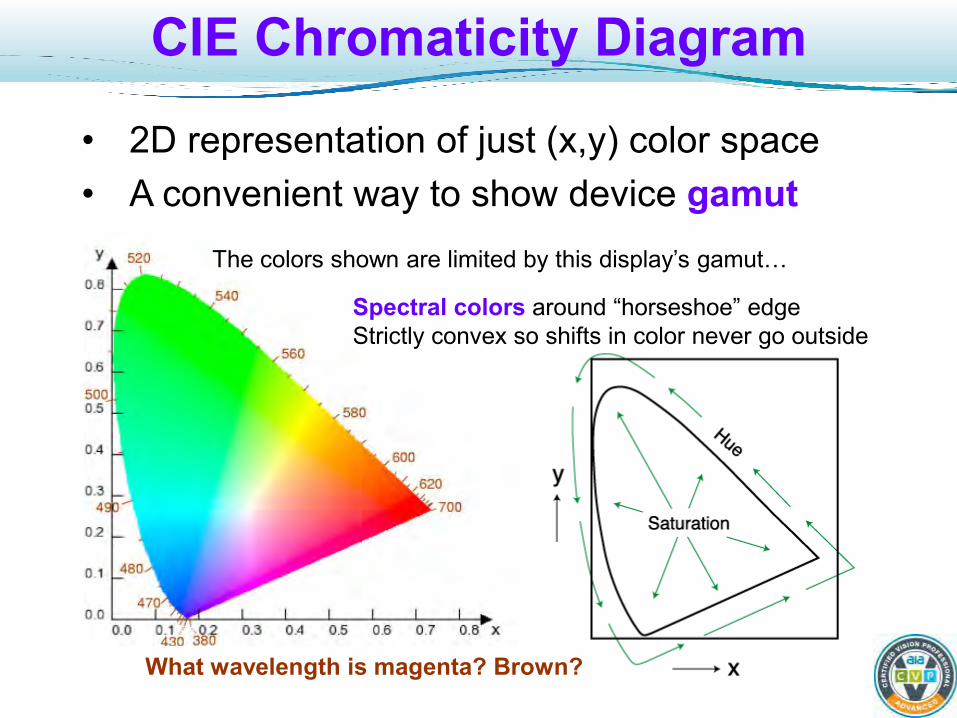
CIE Chromaticity Diagram
• 2D representation of just (x,y) color space • A convenient way to show device gamut
What wavelength is magenta? Brown?
The colors shown are limited by this display’s gamut…
Spectral colors around “horseshoe” edge Strictly convex so shifts in color never go outside
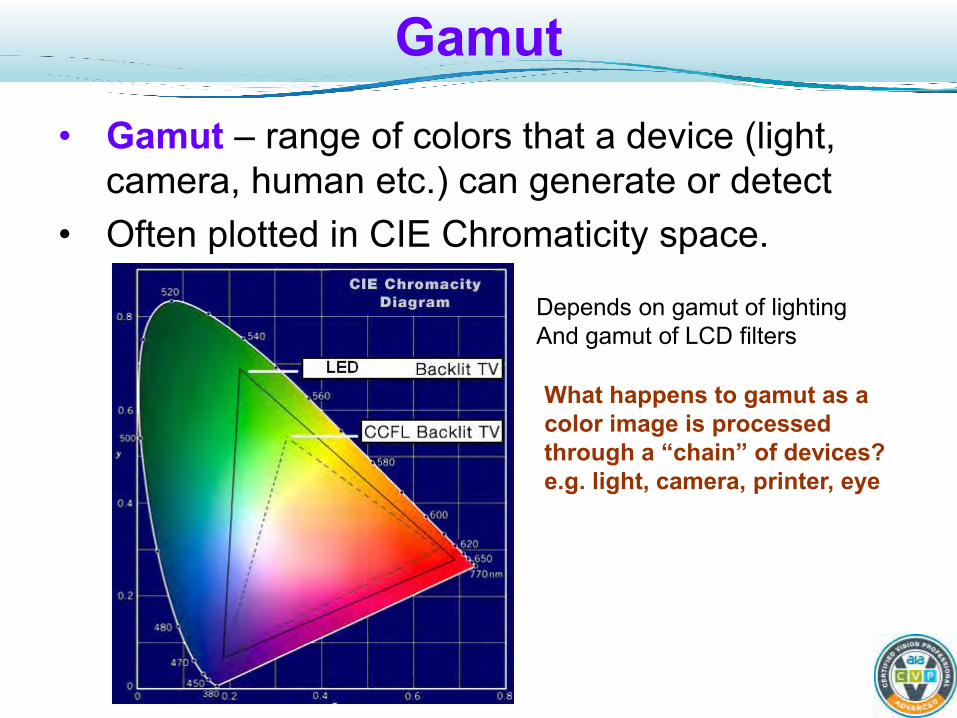
Gamut
• Gamut – range of colors that a device (light, camera, human etc.) can generate or detect
• Often plotted in CIE Chromaticity space.
What happens to gamut as a color image is processed through a “chain” of devices? e.g. light, camera, printer, eye
Depends on gamut of lighting And gamut of LCD filters
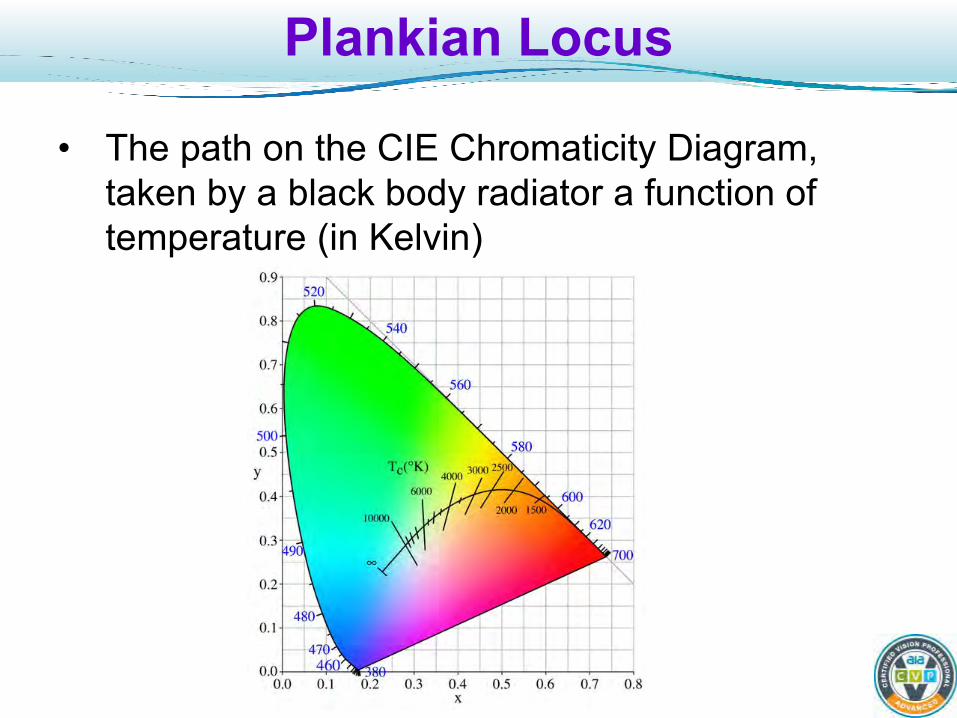
Plankian Locus
• The path on the CIE Chromaticity Diagram, taken by a black body radiator a function of temperature (in Kelvin)
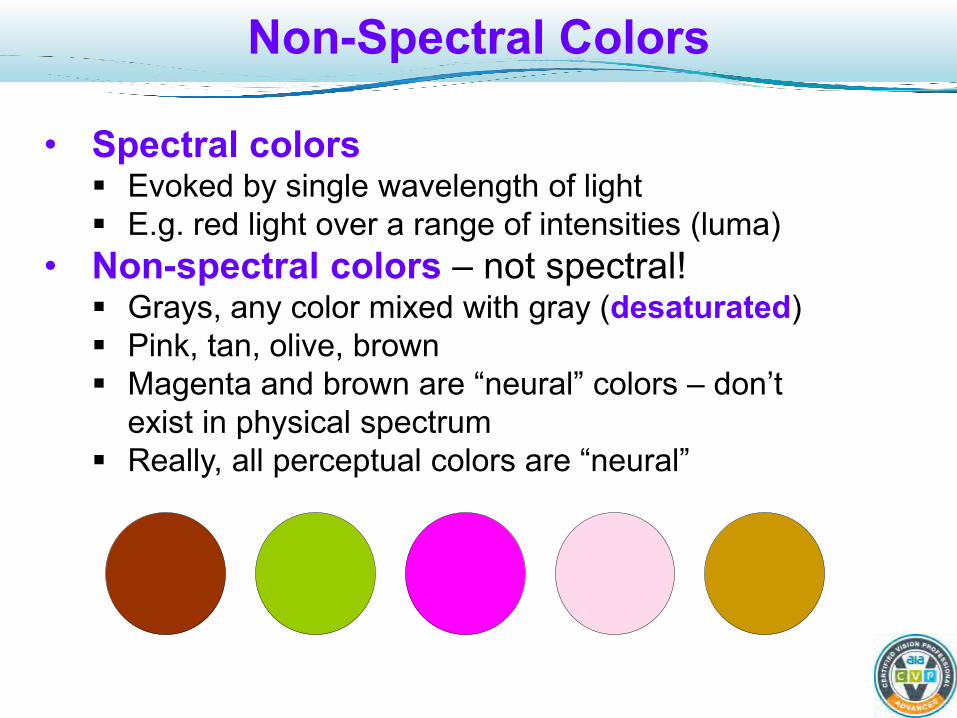
Non-Spectral Colors
• Spectral colors Evoked by single wavelength of light E.g. red light over a range of intensities (luma)
• Non-spectral colors – not spectral! Grays, any color mixed with gray (desaturated) Pink, tan, olive, brown Magenta and brown are “neural” colors – don’t exist in physical spectrum Really, all perceptual colors are “neural”

Why is CIE Color Important?
• Color spaces derived from CIE XYZ give a standard way to specify process colors Colorants, Object colors
• CIE color standards link photometric and radiometric measures, so a colorimeter or MVS can generate photometric measures Standard Observer Illumination standards
• Usually don’t have MV Generate photometric measures
ElektroP
hysik
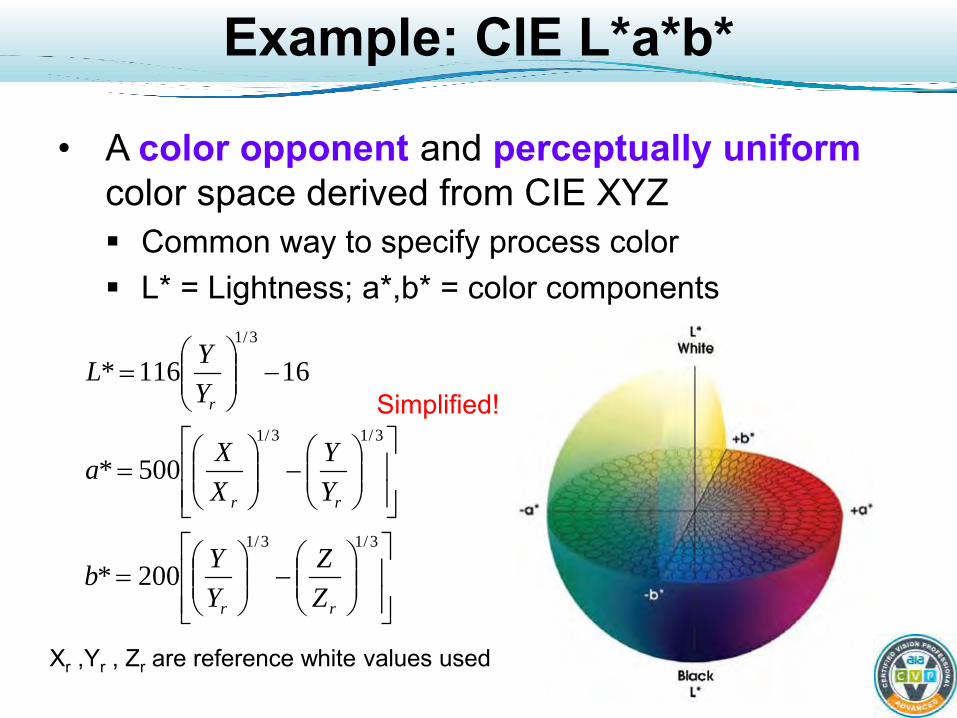
Example: CIE L*a*b*
• A color opponent and perceptually uniform color space derived from CIE XYZ Common way to specify process color L* = Lightness; a*,b* = color components
Xr ,Yr , Zr are reference white values used
−
=
−
=
−
=
3/13/1
3/13/1
3/1
200*
500*
16116*
rr
rr
r
ZZ
YYb
YY
XXa
YYL
Simplified!
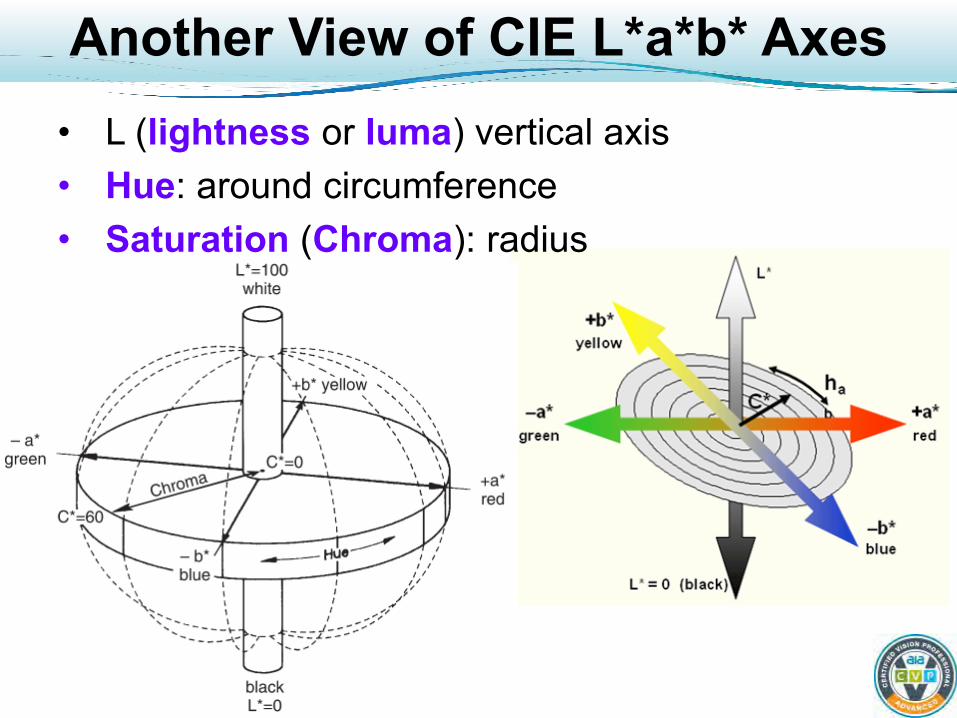
Another View of CIE L*a*b* Axes • L (lightness or luma) vertical axis • Hue: around circumference • Saturation (Chroma): radius

Calibrating MV to CIE
• Generally not done Specific illumination, sensors that match
• If you must, set matches and limits in RGB: Use a colorimeter to measure references (e.g. good
and bad parts) patches Record RGB values for same references, as limits
• To control for lighting changes, use a white reference (a patch of white material) in FOV Shows illumination color, so you can factor it out Sensor responses are also somewhat controlled This is useful even if you are not using CIE
)(),(),( λλλ zyx
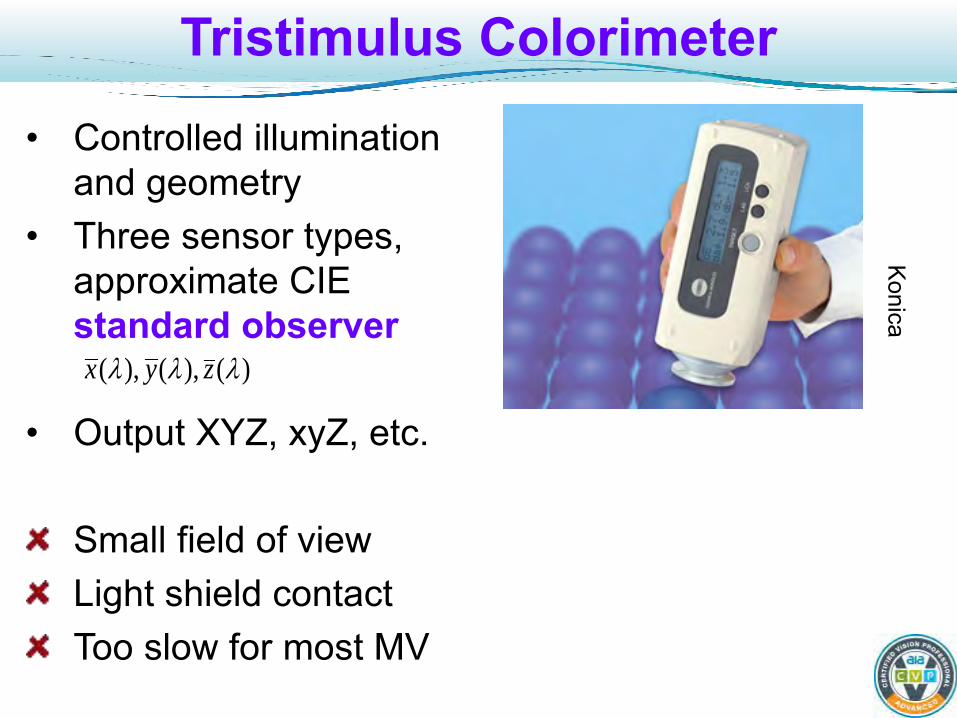
Tristimulus Colorimeter
• Controlled illumination and geometry
• Three sensor types, approximate CIE standard observer
• Output XYZ, xyZ, etc.
Small field of view Light shield contact Too slow for most MV
Konica
)(),(),( λλλ zyx

Wait a Minute!
• Why did we learn about imaging models and CIE color if they are mostly ignored in MV?
• You need this knowledge… for example… • Understand image formation and human vision
to know practical limits of CMV • Your customers will ask for CIE measures Your task is to educate the customer!
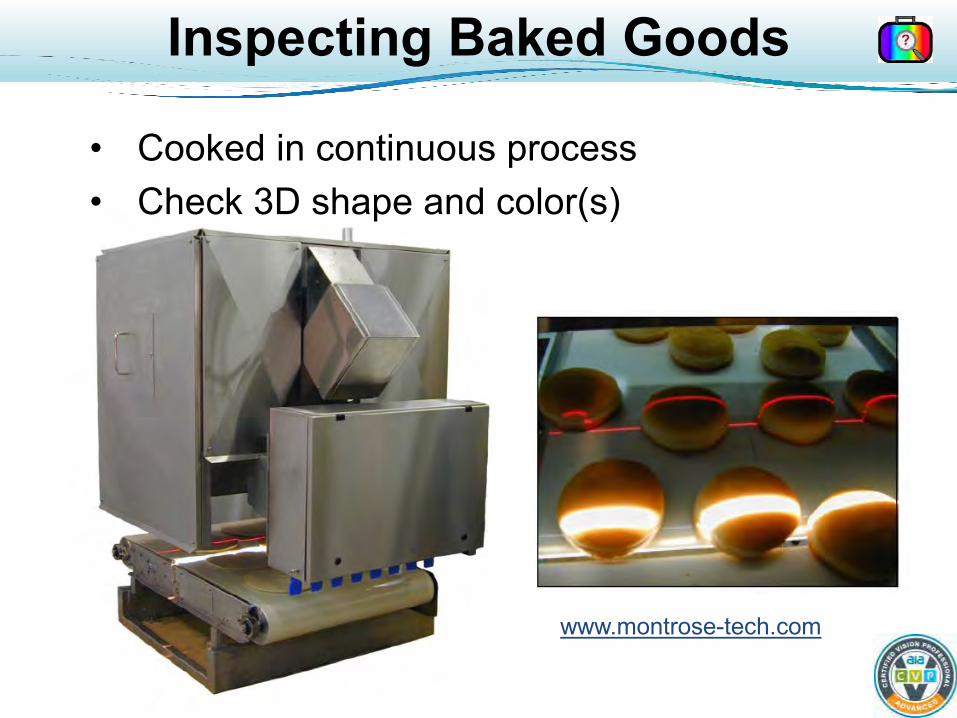
Inspecting Baked Goods
• Cooked in continuous process • Check 3D shape and color(s)
www.montrose-tech.com
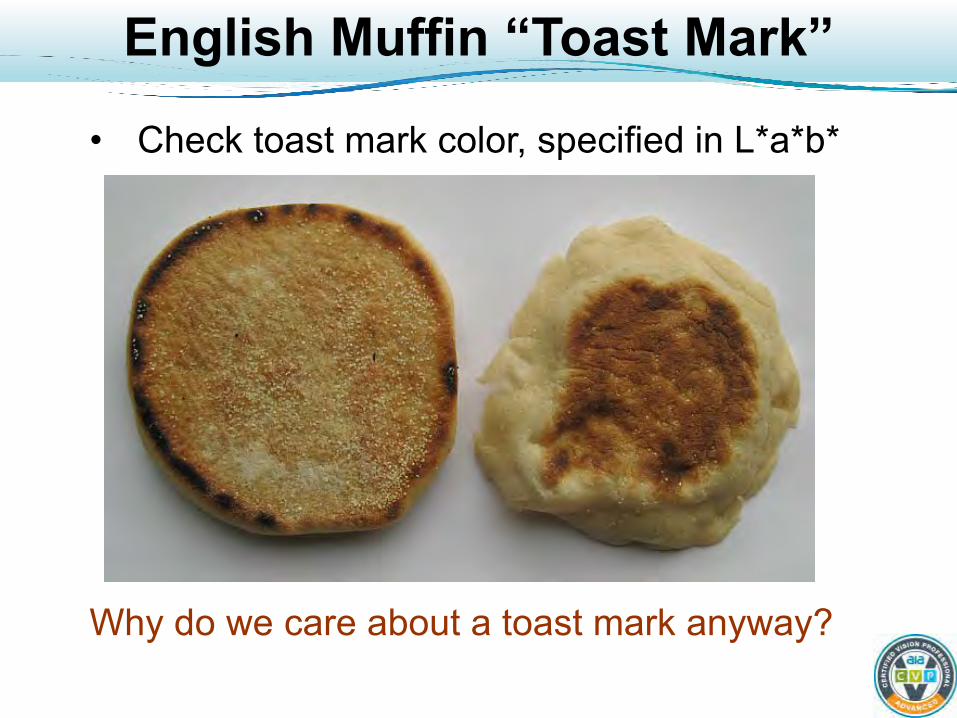
English Muffin “Toast Mark”
• Check toast mark color, specified in L*a*b* Why do we care about a toast mark anyway?
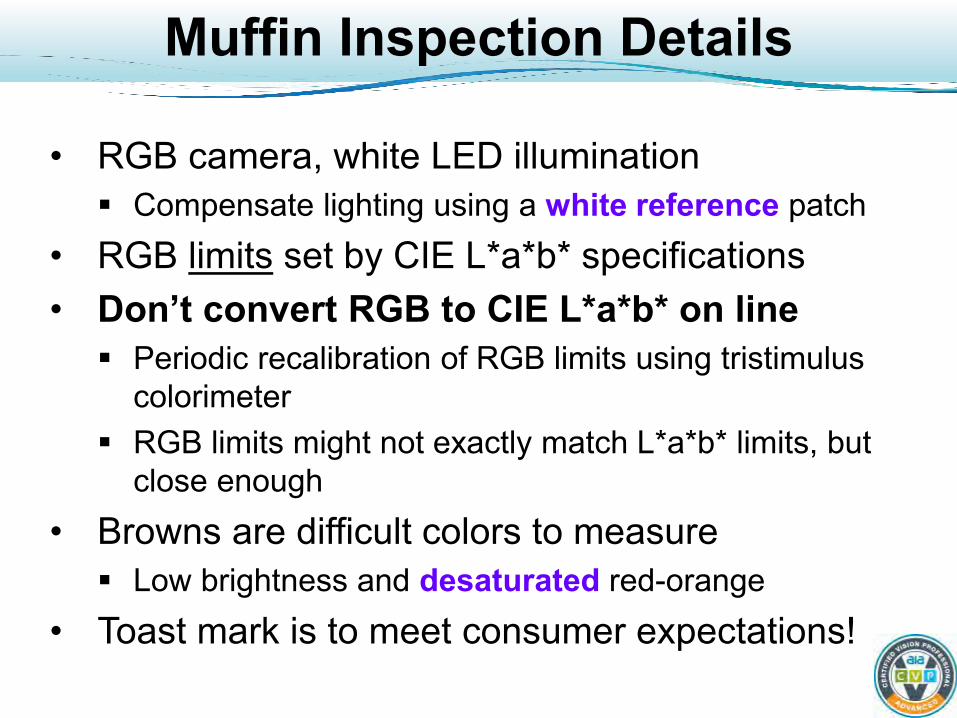
Muffin Inspection Details
• RGB camera, white LED illumination Compensate lighting using a white reference patch
• RGB limits set by CIE L*a*b* specifications • Don’t convert RGB to CIE L*a*b* on line Periodic recalibration of RGB limits using tristimulus
colorimeter RGB limits might not exactly match L*a*b* limits, but
close enough • Browns are difficult colors to measure Low brightness and desaturated red-orange
• Toast mark is to meet consumer expectations!

Perceptually Uniform Color Spaces
• MacAdam Ellipses: how much a color has to change to be seen as different
• Note different sizes -CIE x,y is not a perceptually uniform color space where a Δ change in component gives an equivalent perceptual change. L*a*b* is.
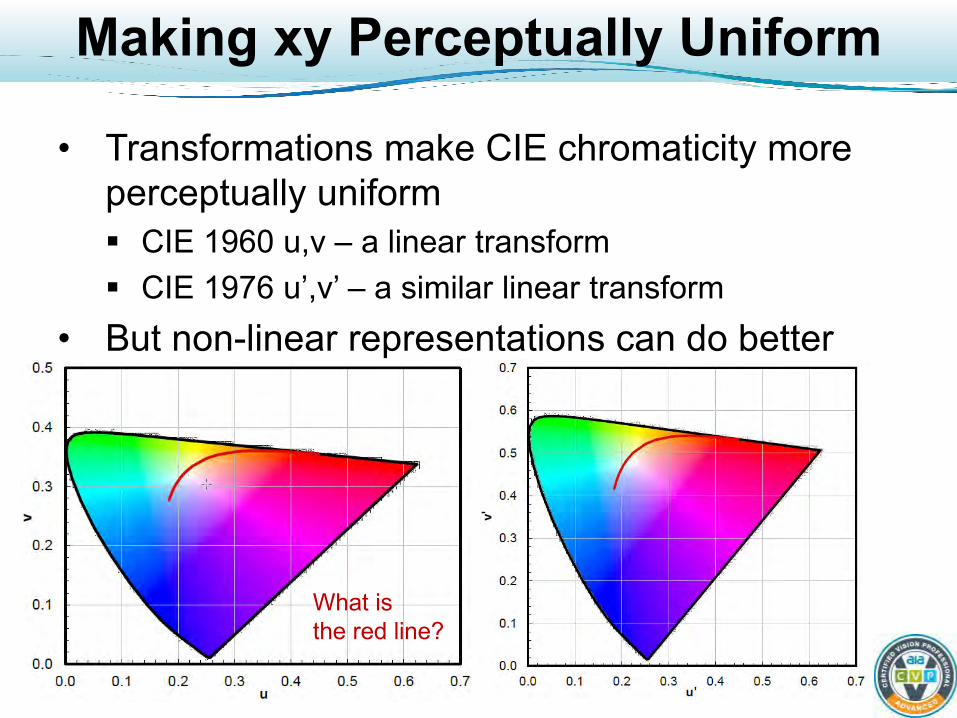
Making xy Perceptually Uniform
• Transformations make CIE chromaticity more perceptually uniform CIE 1960 u,v – a linear transform CIE 1976 u’,v’ – a similar linear transform
• But non-linear representations can do better
What is the red line?
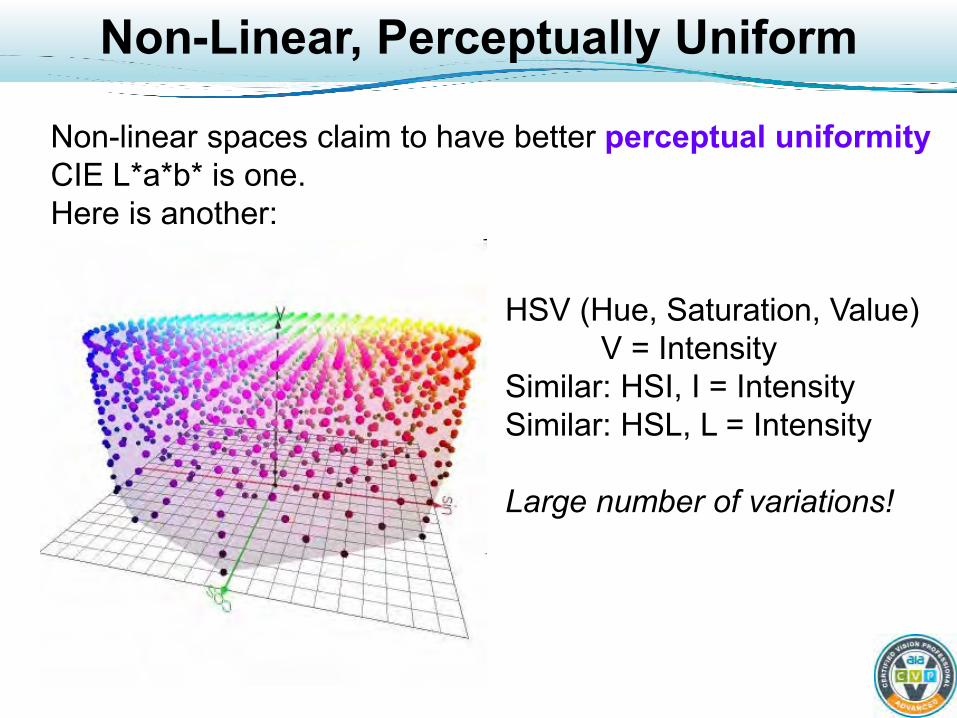
Non-Linear, Perceptually Uniform
HSV (Hue, Saturation, Value) V = Intensity Similar: HSI, I = Intensity Similar: HSL, L = Intensity Large number of variations!
Non-linear spaces claim to have better perceptual uniformity CIE L*a*b* is one. Here is another:
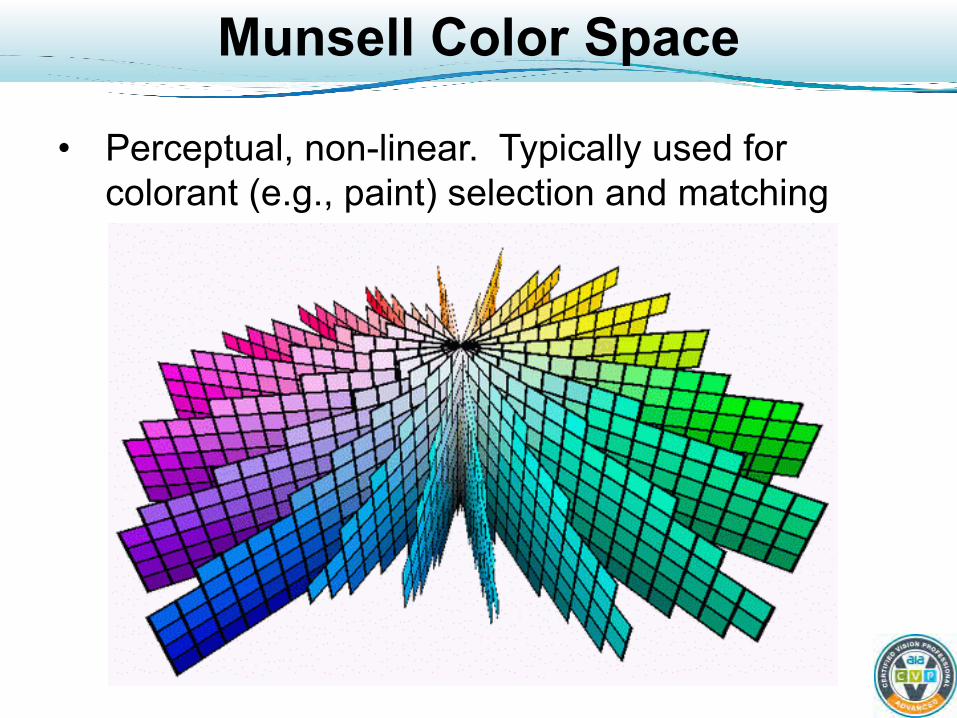
Munsell Color Space
• Perceptual, non-linear. Typically used for colorant (e.g., paint) selection and matching
Converting from MV’s RGB
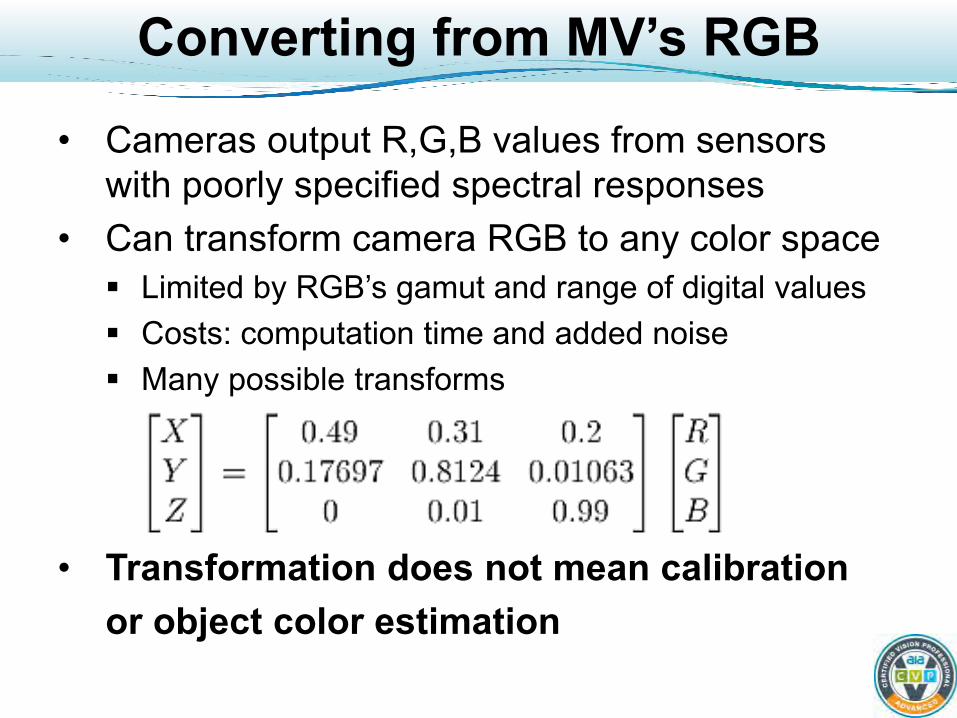
• Cameras output R,G,B values from sensors with poorly specified spectral responses
• Can transform camera RGB to any color space Limited by RGB’s gamut and range of digital values Costs: computation time and added noise Many possible transforms
• Transformation does not mean calibration or object color estimation
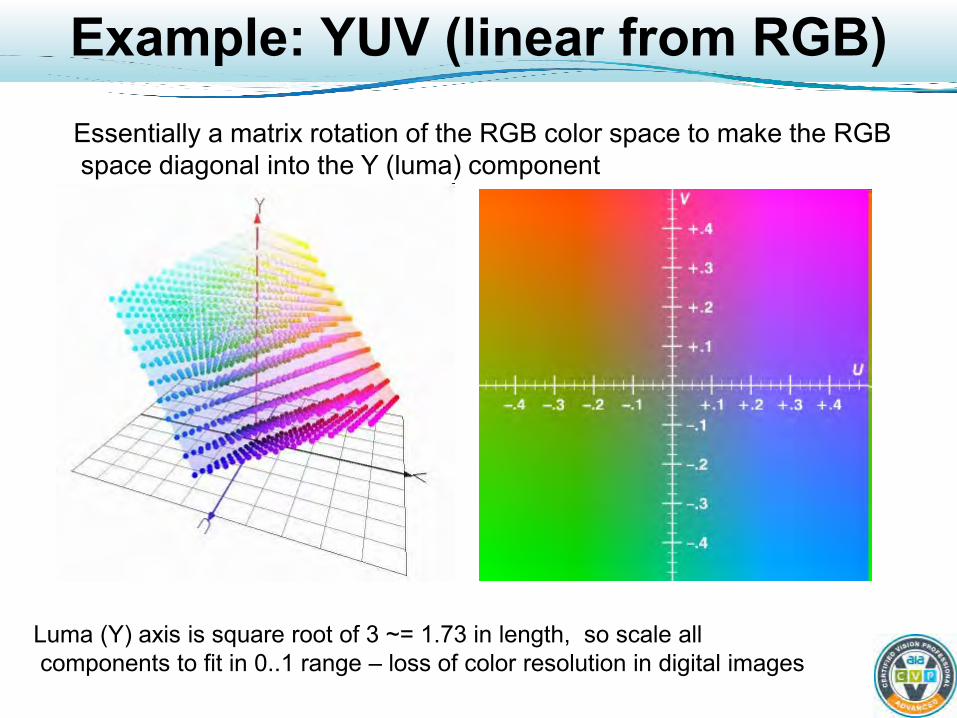
Example: YUV (linear from RGB)
Luma (Y) axis is square root of 3 ~= 1.73 in length, so scale all components to fit in 0..1 range – loss of color resolution in digital images
Essentially a matrix rotation of the RGB color space to make the RGB space diagonal into the Y (luma) component
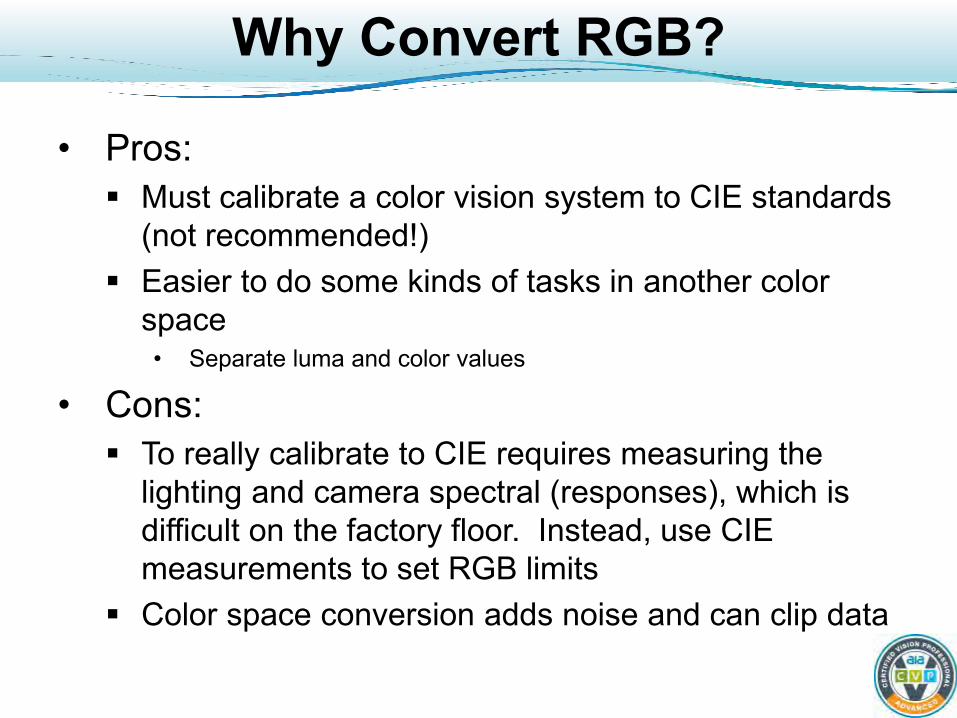
Why Convert RGB?
• Pros: Must calibrate a color vision system to CIE standards
(not recommended!) Easier to do some kinds of tasks in another color
space • Separate luma and color values
• Cons: To really calibrate to CIE requires measuring the
lighting and camera spectral (responses), which is difficult on the factory floor. Instead, use CIE measurements to set RGB limits
Color space conversion adds noise and can clip data
More on Individual Differences
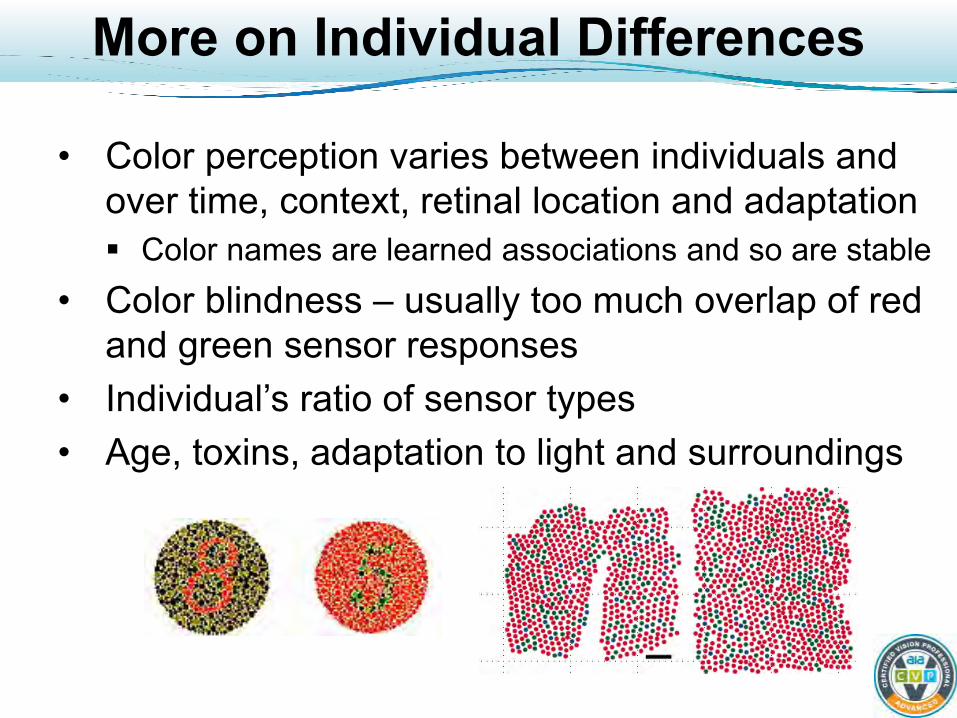
• Color perception varies between individuals and over time, context, retinal location and adaptation Color names are learned associations and so are stable
• Color blindness – usually too much overlap of red and green sensor responses
• Individual’s ratio of sensor types • Age, toxins, adaptation to light and surroundings
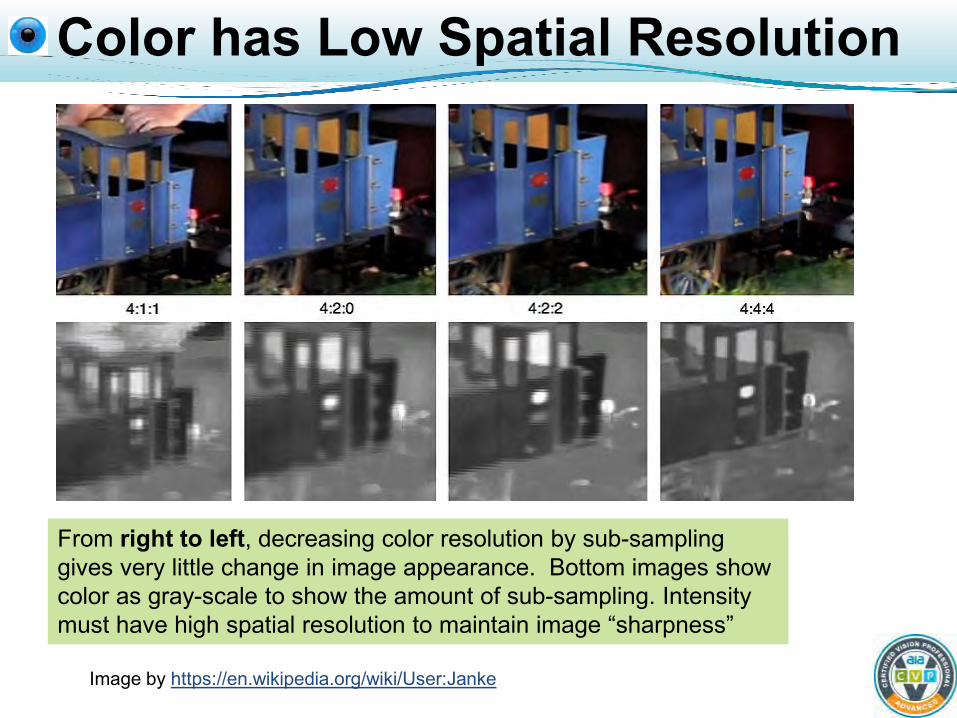
Color has Low Spatial Resolution
From right to left, decreasing color resolution by sub-sampling gives very little change in image appearance. Bottom images show color as gray-scale to show the amount of sub-sampling. Intensity must have high spatial resolution to maintain image “sharpness”
Image by https://en.wikipedia.org/wiki/User:Janke
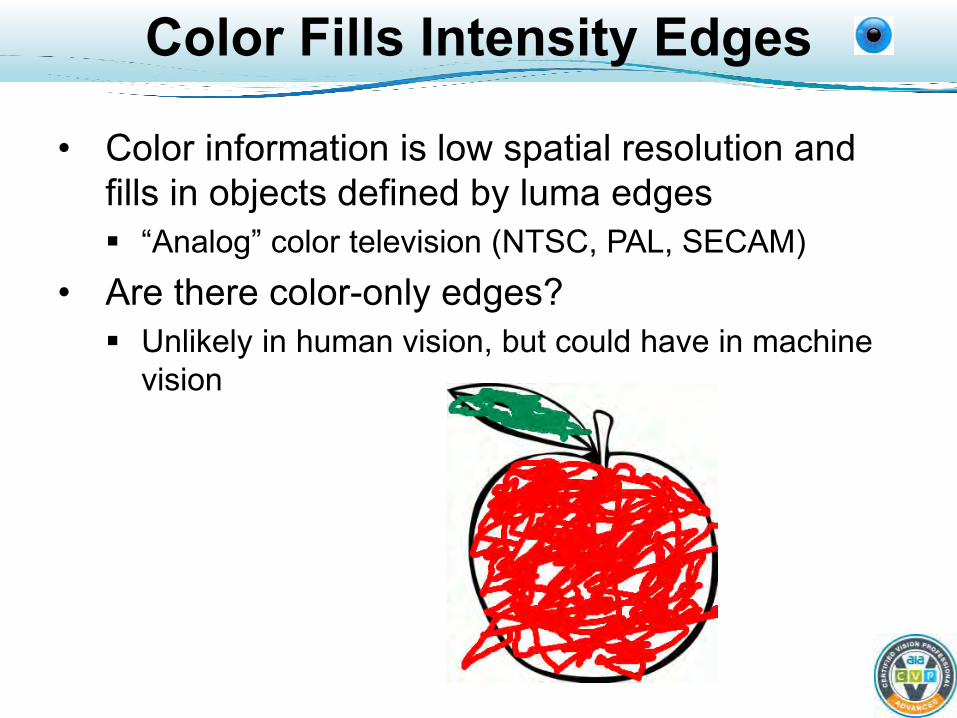
Color Fills Intensity Edges
• Color information is low spatial resolution and fills in objects defined by luma edges “Analog” color television (NTSC, PAL, SECAM)
• Are there color-only edges? Unlikely in human vision, but could have in machine
vision

Let’s Choose a Paint Color…
• (a) Paint on the wall doesn’t look the same as the samples in the store (b) You and your mate disagree on how the colors look
• What could cause these problems? How to fix?

Towards Painting Harmony
• Lighting differences between store and home Color constancy might reduce this
• Individual differences • Color Contrast: influence of surrounding colors Kirshmann’s “laws” of color contrast (1891)
• Smaller the test area, the larger the effect • The larger the surrounding, the larger the effect • Effect decreases with distance between colors • Effect increases as brightness contrast decreases • Effect increases with saturation of the surrounding
Bring large (30 cm or more) samples home! View in expected light and surroundings!

Adaptation
• Human vision constantly adjusts its “operating points” as environment changes
• Short term and long term adaptation Color aftereffects, adaption to light changes
• Attenuates constant colors, amplifies spatial and temporal differences Stabilizes information extraction, e.g. color constancy Compresses visual data by mostly sending changes

Adaptation Example
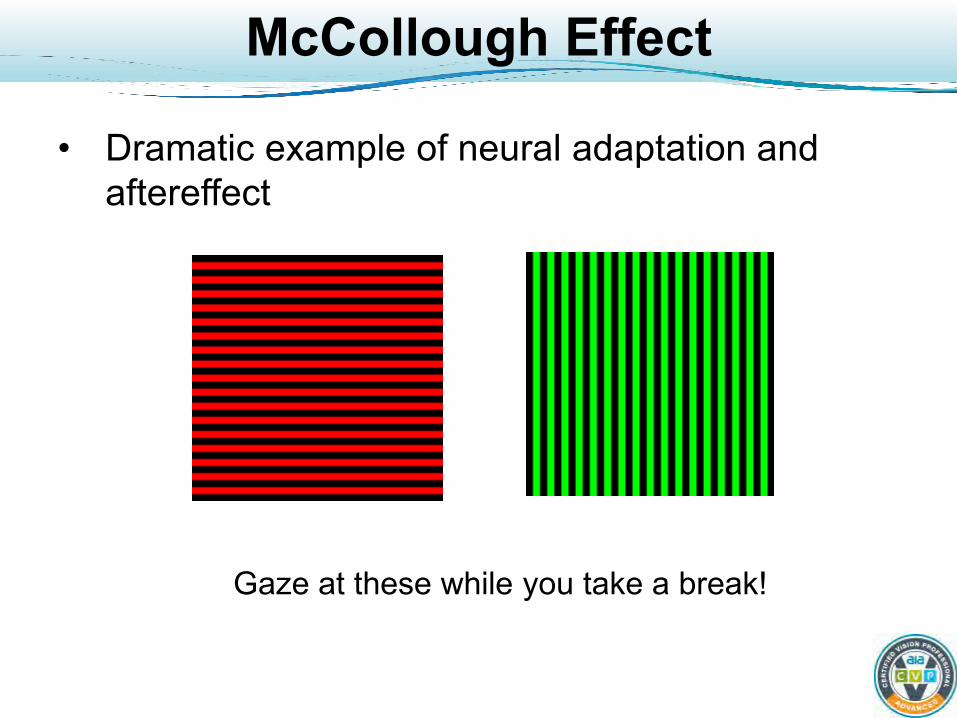
McCollough Effect
• Dramatic example of neural adaptation and aftereffect
Gaze at these while you take a break!
Review ?
• Define gamut • What is a color space? • Name a non-spectral color • What are some retinal processing functions? • Name a perceptually uniform color space • Why is CIE calibration of a MV system difficult? • What is color constancy?

McCollough Effect Test
Induction Result
Color Machine Vision Systems
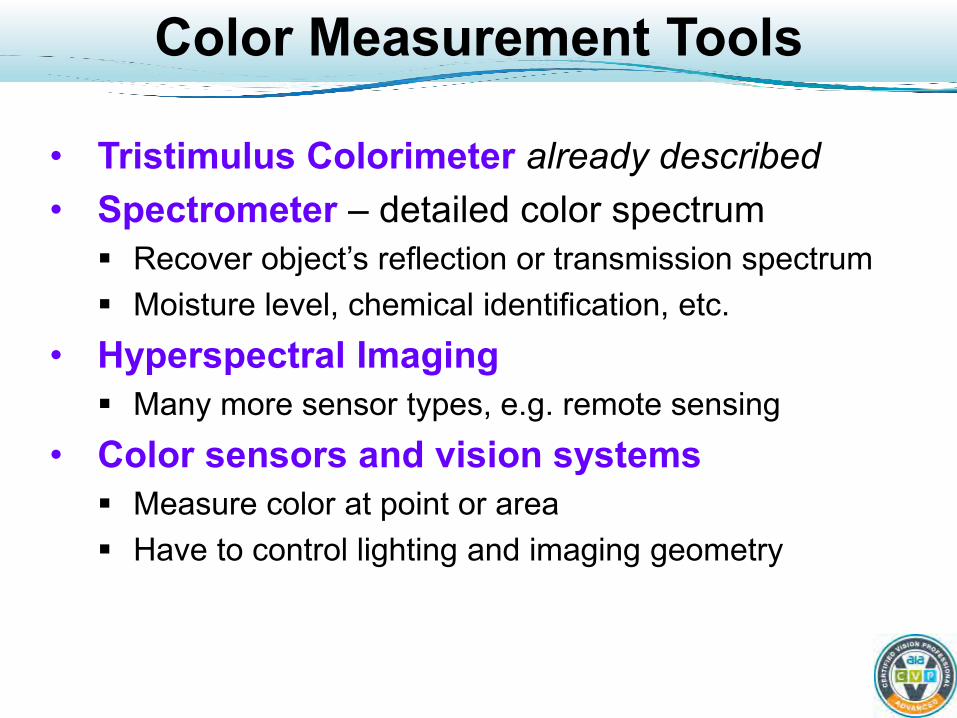
Color Measurement Tools
• Tristimulus Colorimeter already described • Spectrometer – detailed color spectrum Recover object’s reflection or transmission spectrum Moisture level, chemical identification, etc.
• Hyperspectral Imaging Many more sensor types, e.g. remote sensing
• Color sensors and vision systems Measure color at point or area Have to control lighting and imaging geometry
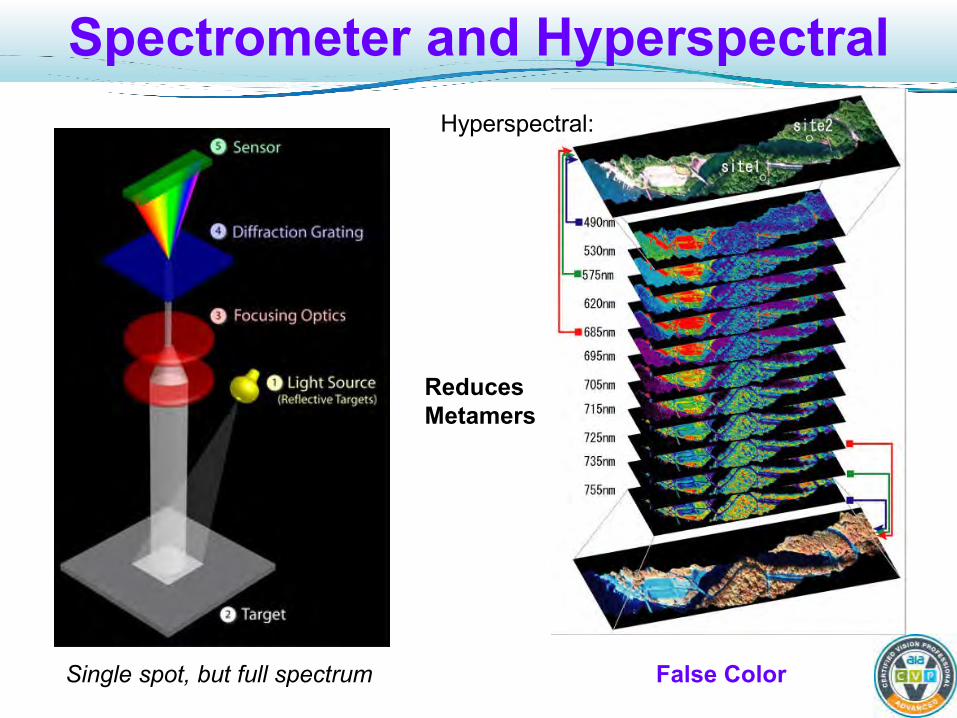
Spectrometer and Hyperspectral Hyperspectral:
False Color Single spot, but full spectrum
Reduces Metamers
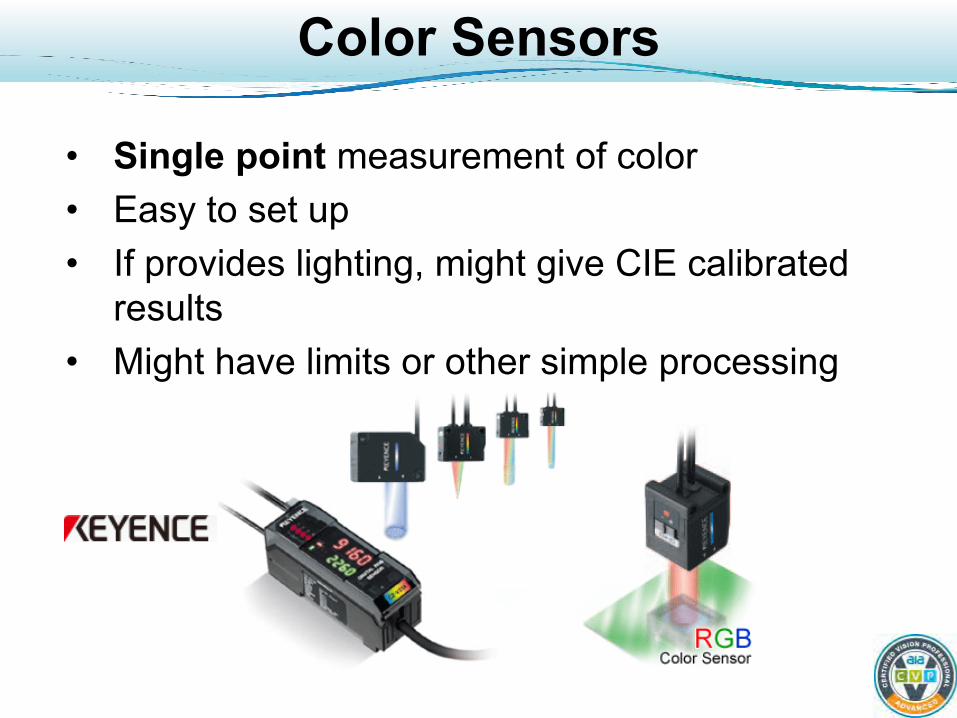
Color Sensors
• Single point measurement of color • Easy to set up • If provides lighting, might give CIE calibrated
results • Might have limits or other simple processing
Color Machine Vision Systems
• Color camera measures RGB color over areas • “Smarts” built in or in an attached processor • Some CMVS components: Part presentation (geometry), environmental control Lighting, filters, lenses Processors, algorithms Software, developer interface, user interface (HMI) Reporting, factory integration (not covered here)
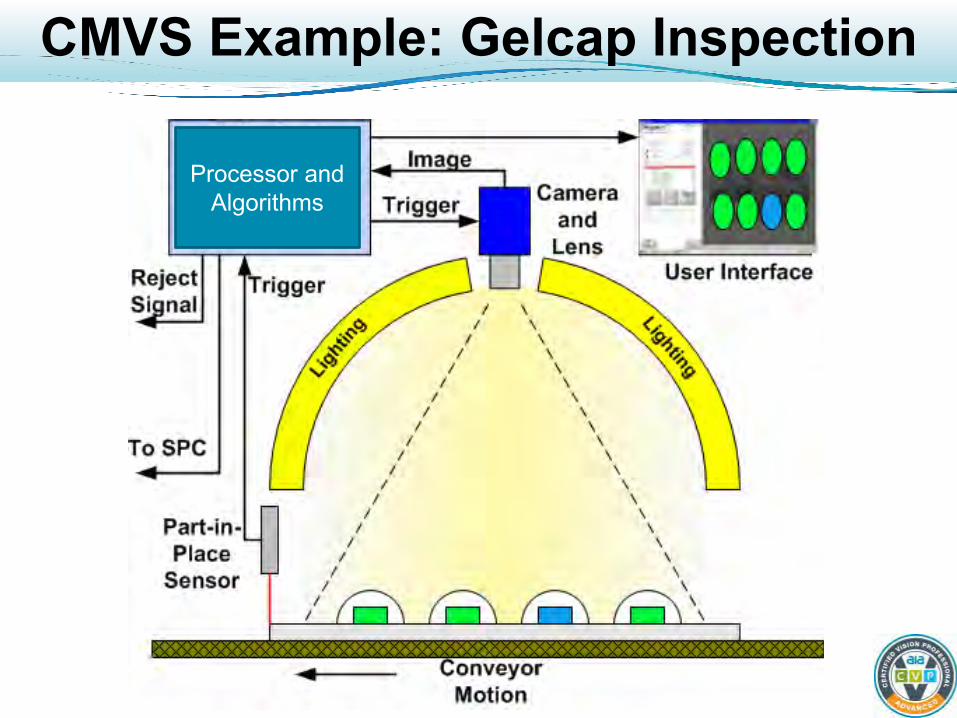
CMVS Example: Gelcap Inspection
Processor and
Algorithms

Part Presentation & Environment
• Positions parts in the camera’s field of view • Fixes viewing geometry Limit color shifts Best view of defects
• Control Environment Light Shield Lighting regulation Cooling, safety, etc.
http://possibility.teledynedalsa.com/rubik-robot/
Rubik’s Cube robotic vision solver. Faber Associates and Liberty Science Center

Desired Illumination for CMV
• “White” light at a specified color temperature Smooth, full spectrum, like a Black Body radiator
• Spectrum covers sensors’ gamuts • Stabile intensity and spectrum
Sunshine would be nice, A cloudy day better
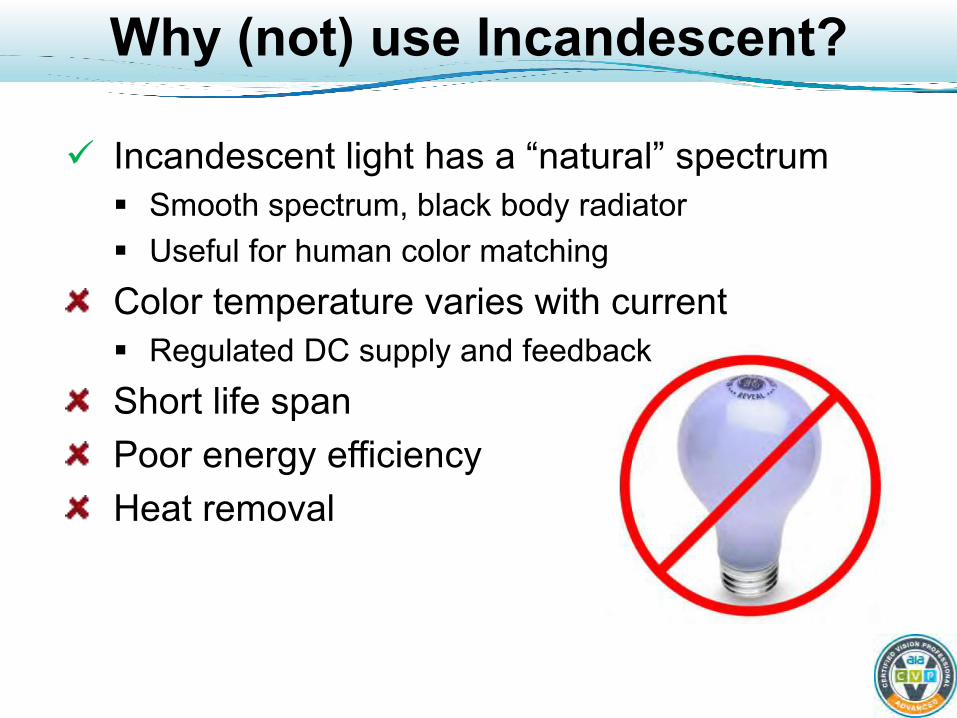
Why (not) use Incandescent?
Incandescent light has a “natural” spectrum Smooth spectrum, black body radiator Useful for human color matching Color temperature varies with current Regulated DC supply and feedback Short life span Poor energy efficiency Heat removal
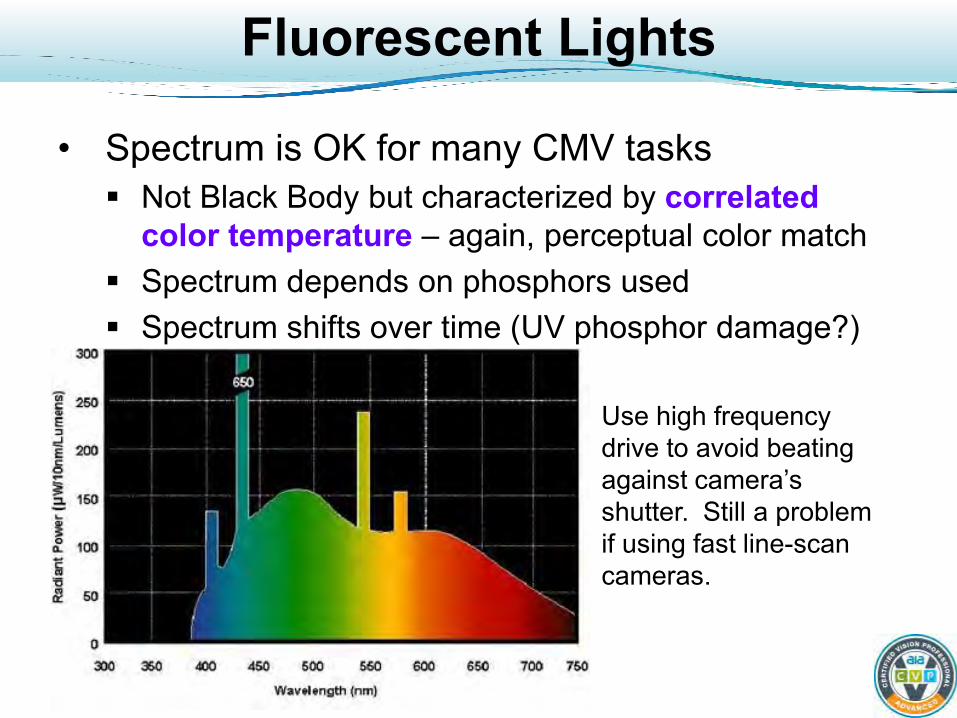
Fluorescent Lights
• Spectrum is OK for many CMV tasks Not Black Body but characterized by correlated
color temperature – again, perceptual color match Spectrum depends on phosphors used Spectrum shifts over time (UV phosphor damage?)
Use high frequency drive to avoid beating against camera’s shutter. Still a problem if using fast line-scan cameras.
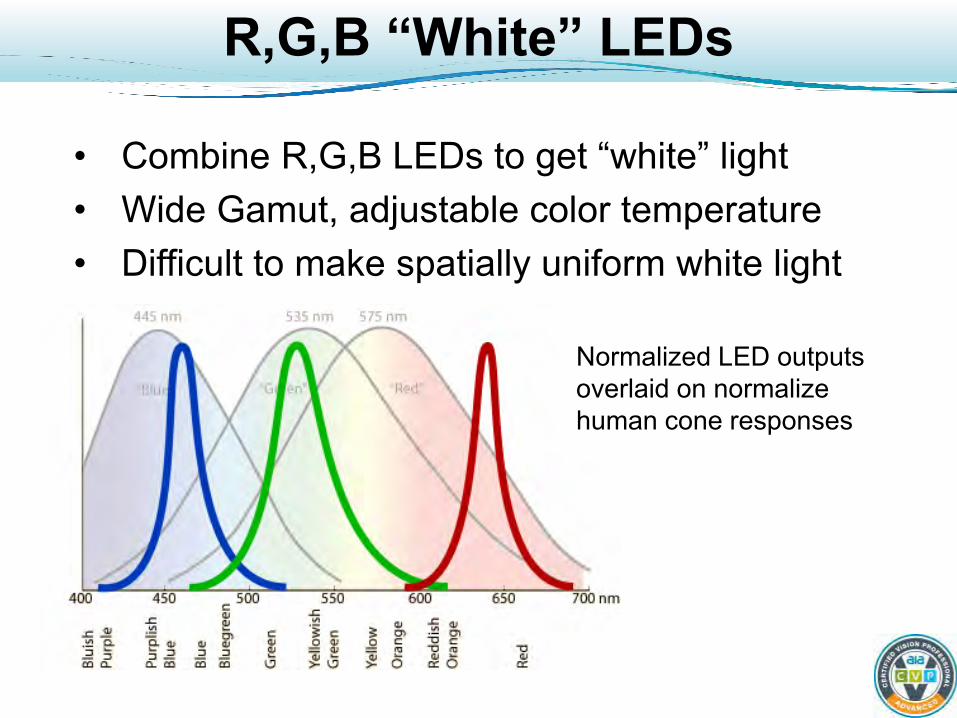
R,G,B “White” LEDs
• Combine R,G,B LEDs to get “white” light • Wide Gamut, adjustable color temperature • Difficult to make spatially uniform white light
Normalized LED outputs overlaid on normalize human cone responses

White Phosphor LEDs
• LED emits at ~ 440 nm, phosphor “down converts” some light to longer wavelengths
• Peaks in blue and yellow; dip in blue-green
Higher color temperature than sun; very different spectrum. Spectrum is OK for many CMV tasks.
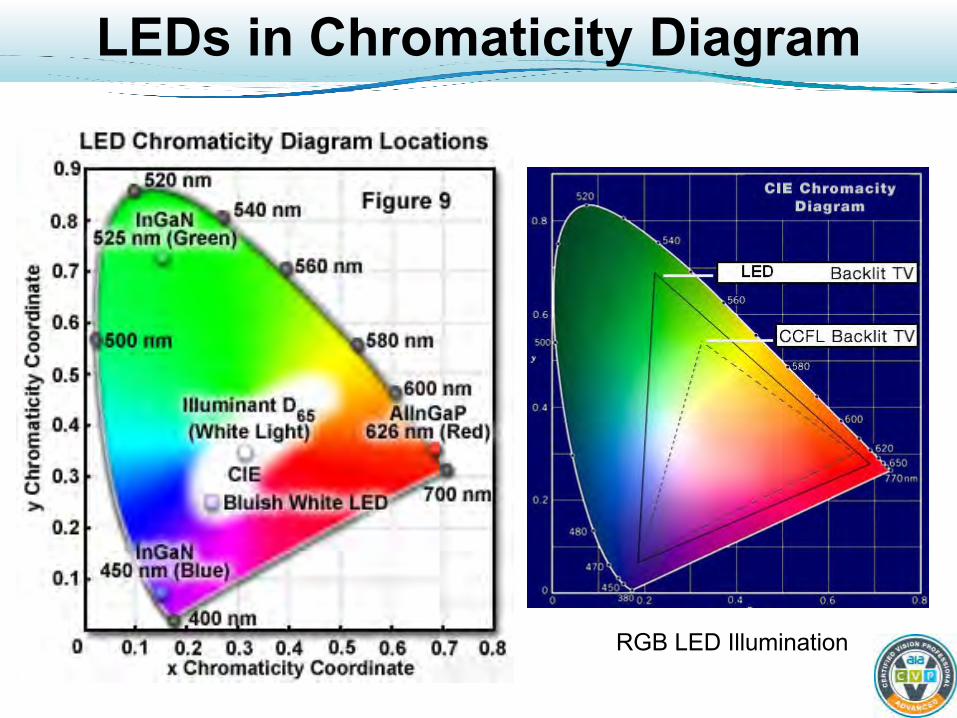
LEDs in Chromaticity Diagram
RGB LED Illumination
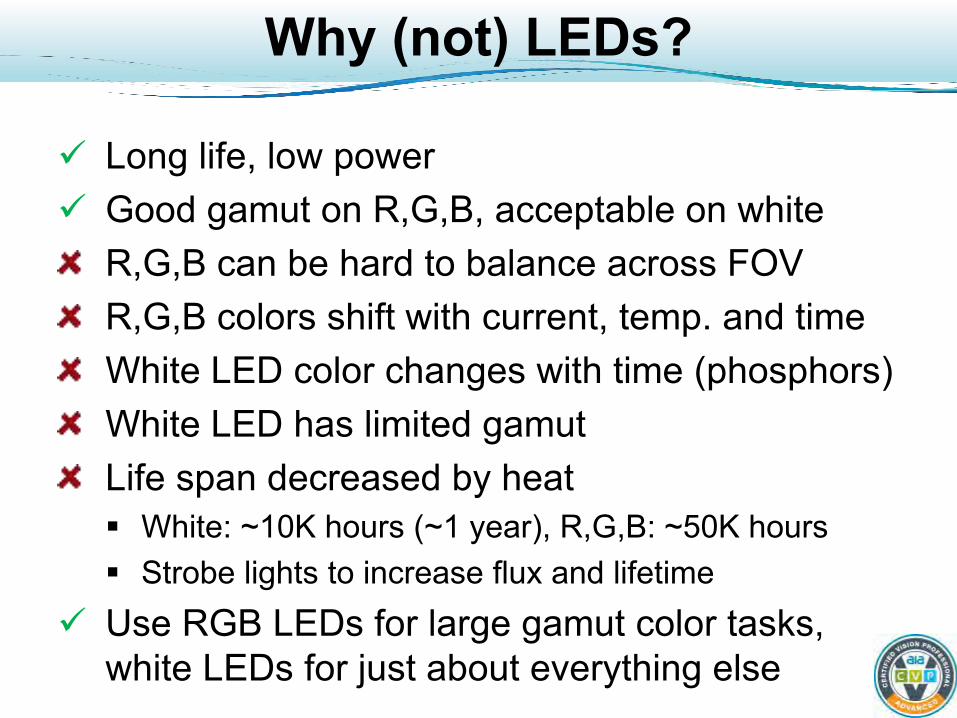
Why (not) LEDs?
Long life, low power Good gamut on R,G,B, acceptable on white
R,G,B can be hard to balance across FOV R,G,B colors shift with current, temp. and time White LED color changes with time (phosphors) White LED has limited gamut Life span decreased by heat White: ~10K hours (~1 year), R,G,B: ~50K hours Strobe lights to increase flux and lifetime
Use RGB LEDs for large gamut color tasks, white LEDs for just about everything else
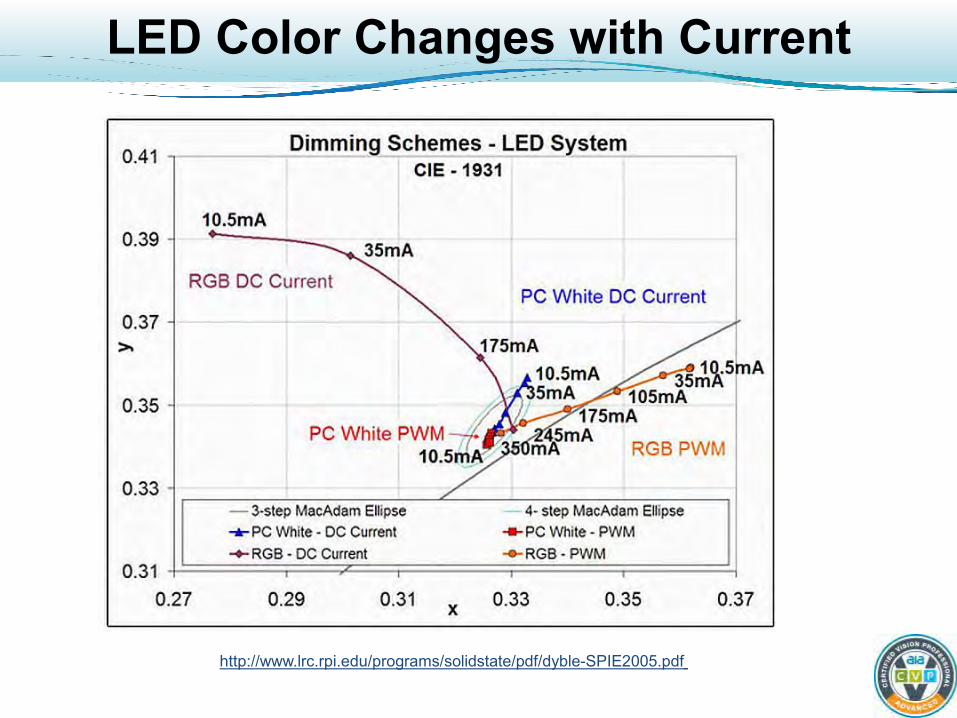
LED Color Changes with Current
http://www.lrc.rpi.edu/programs/solidstate/pdf/dyble-SPIE2005.pdf
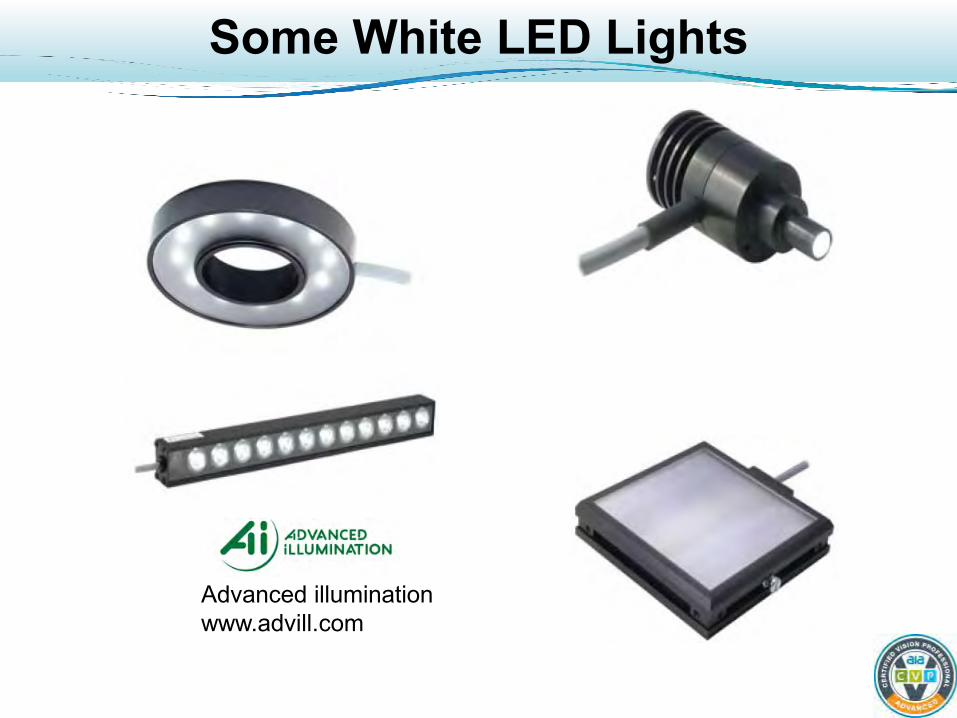
Some White LED Lights
Advanced illumination www.advill.com
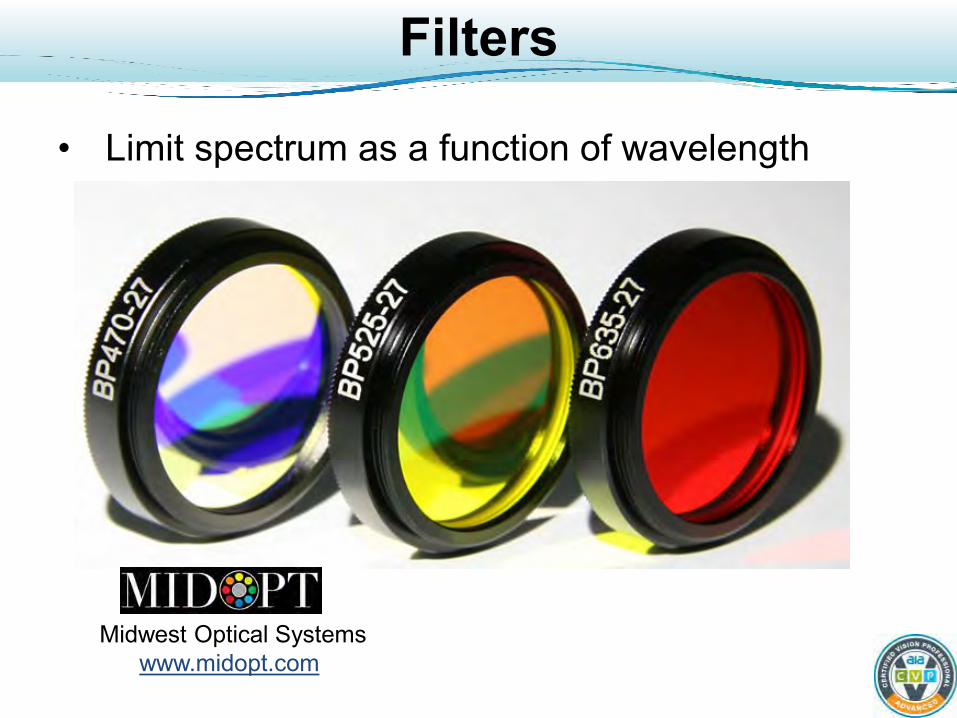
Filters
• Limit spectrum as a function of wavelength
Midwest Optical Systems www.midopt.com
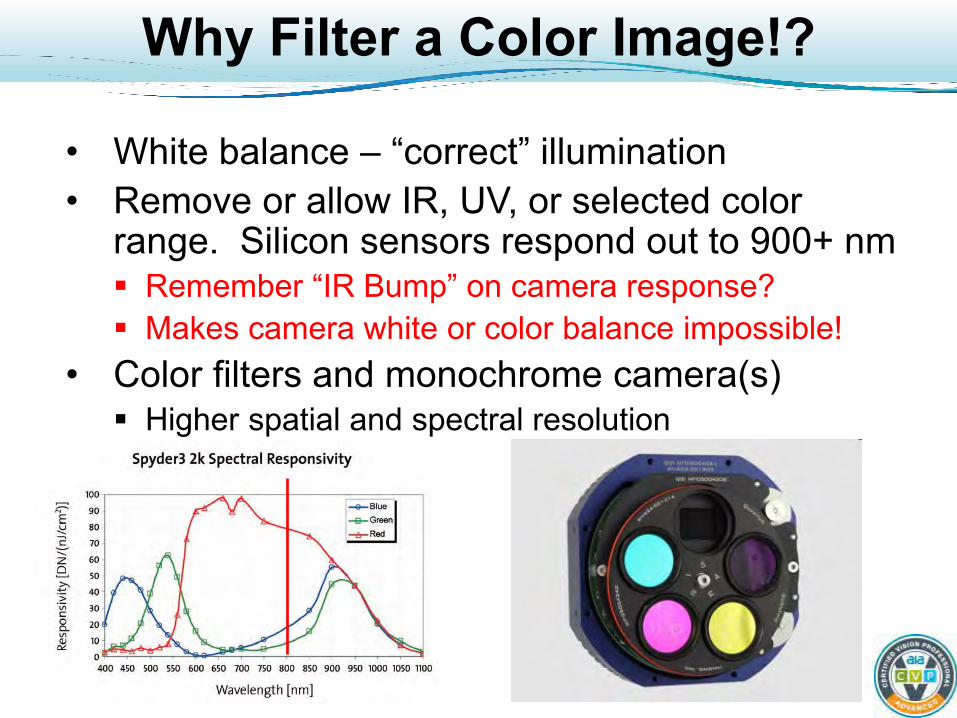
Why Filter a Color Image!?
• White balance – “correct” illumination • Remove or allow IR, UV, or selected color
range. Silicon sensors respond out to 900+ nm Remember “IR Bump” on camera response? Makes camera white or color balance impossible!
• Color filters and monochrome camera(s) Higher spatial and spectral resolution
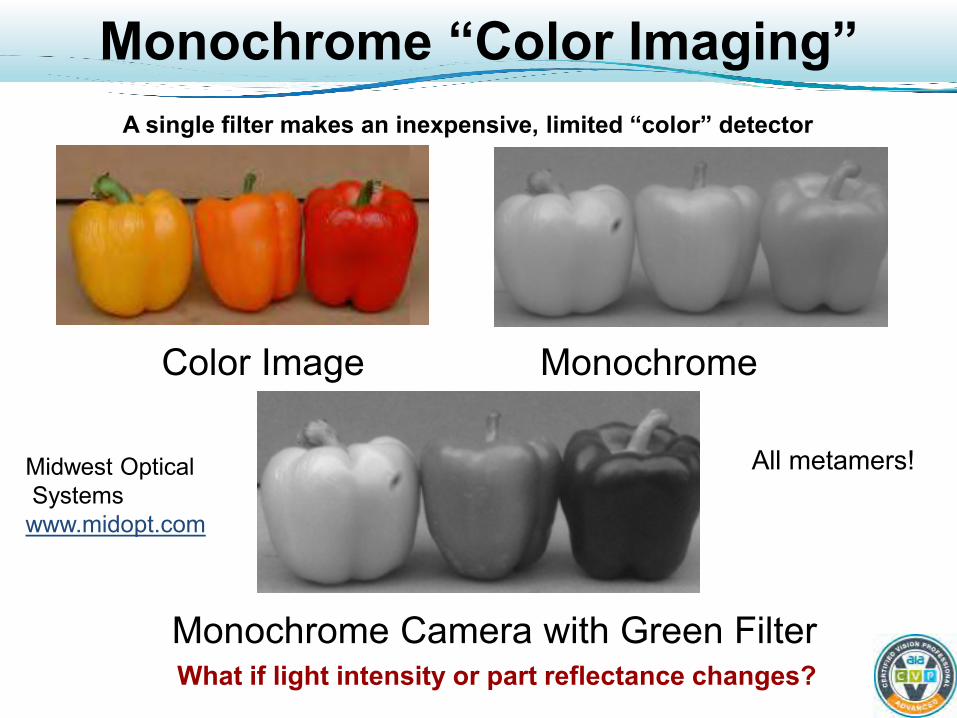
Monochrome “Color Imaging”
Color Image Monochrome Monochrome Camera with Green Filter
A single filter makes an inexpensive, limited “color” detector
What if light intensity or part reflectance changes?
Midwest Optical Systems www.midopt.com
All metamers!

Lenses for CMVS
• Brings object into focus on the sensor plane • Lenses must be color corrected to remove
chromatic aberrations
www.schneideroptics.com
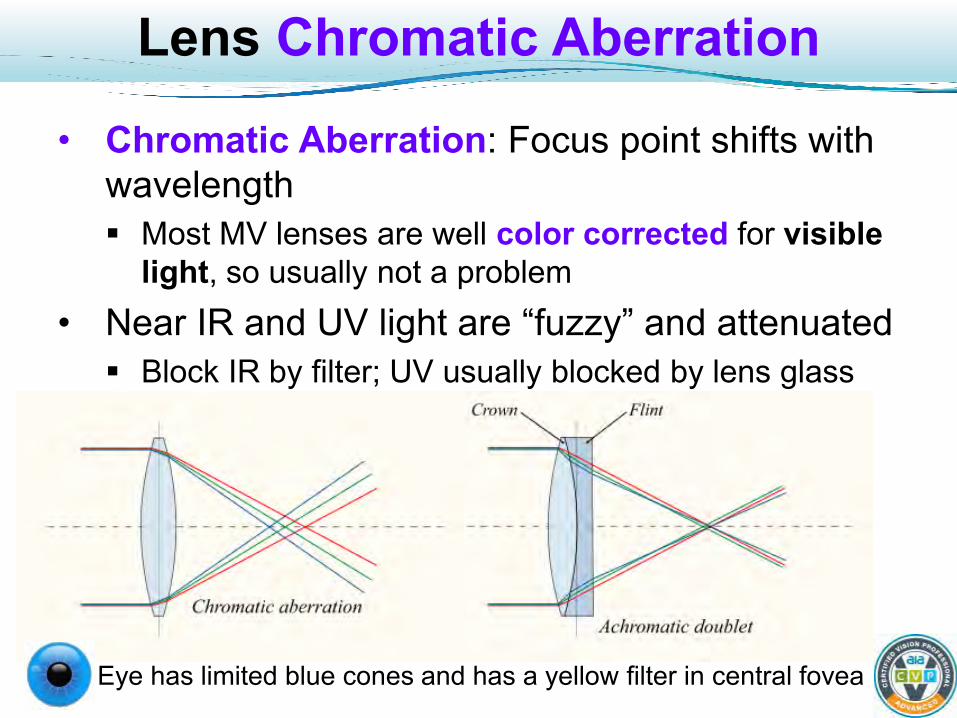
Lens Chromatic Aberration
• Chromatic Aberration: Focus point shifts with wavelength Most MV lenses are well color corrected for visible
light, so usually not a problem • Near IR and UV light are “fuzzy” and attenuated Block IR by filter; UV usually blocked by lens glass
Eye has limited blue cones and has a yellow filter in central fovea
Color Cameras
• Usually three sensor types, usually R,G,B Approximates spectral responses of eye’s sensors Color computed from the relative responses of the
sensor types, as with the eye • Warning: Outputs could shift with temperature
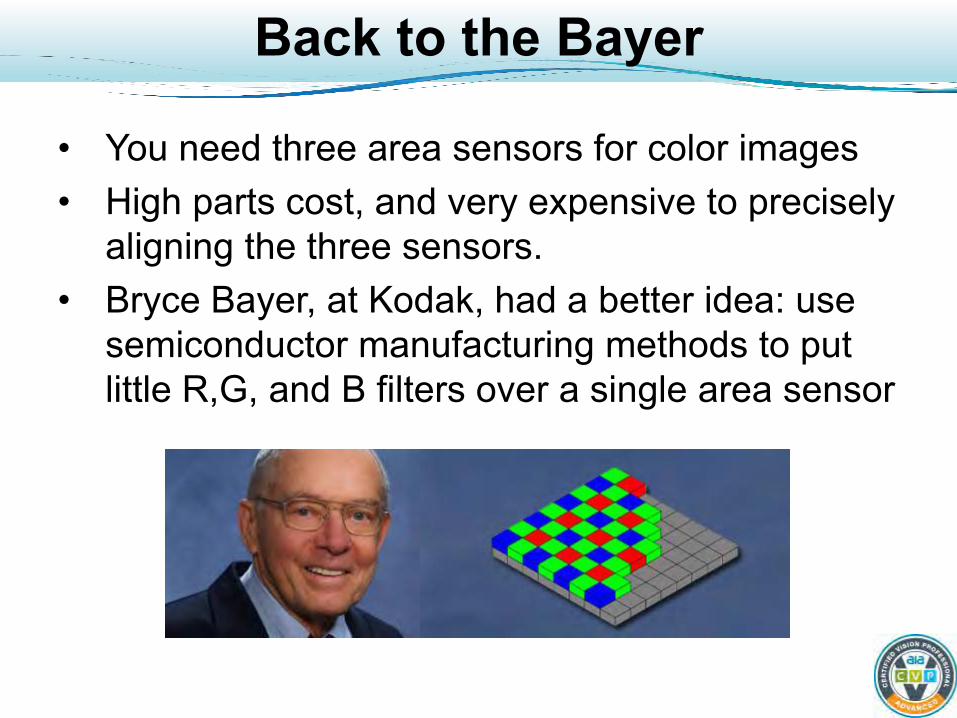
Back to the Bayer
• You need three area sensors for color images • High parts cost, and very expensive to precisely
aligning the three sensors. • Bryce Bayer, at Kodak, had a better idea: use
semiconductor manufacturing methods to put little R,G, and B filters over a single area sensor
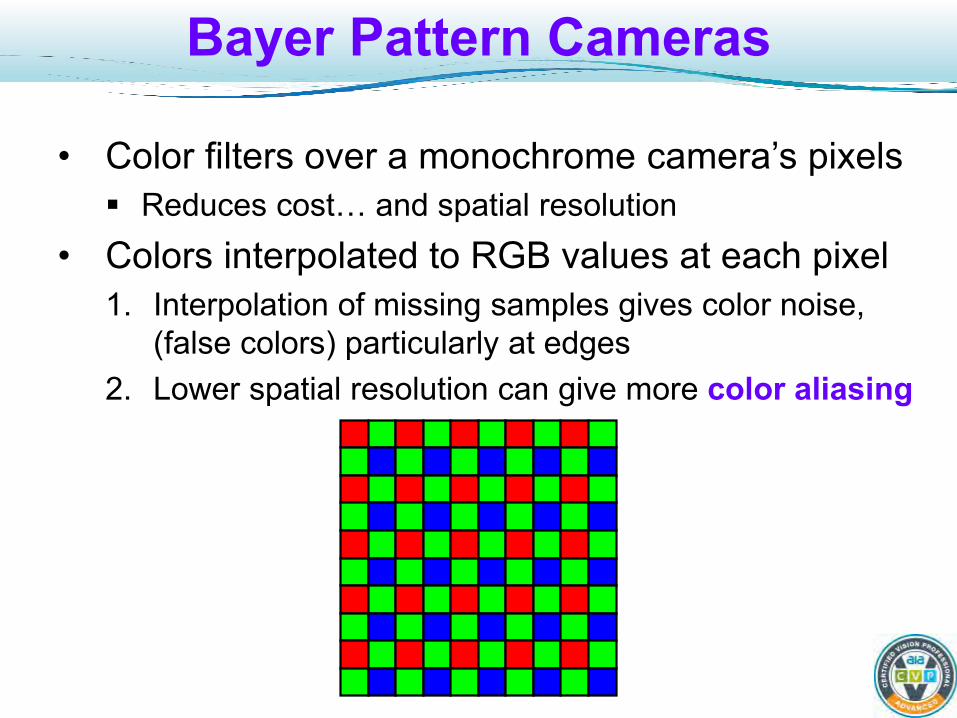
Bayer Pattern Cameras
• Color filters over a monochrome camera’s pixels Reduces cost… and spatial resolution
• Colors interpolated to RGB values at each pixel 1. Interpolation of missing samples gives color noise,
(false colors) particularly at edges 2. Lower spatial resolution can give more color aliasing
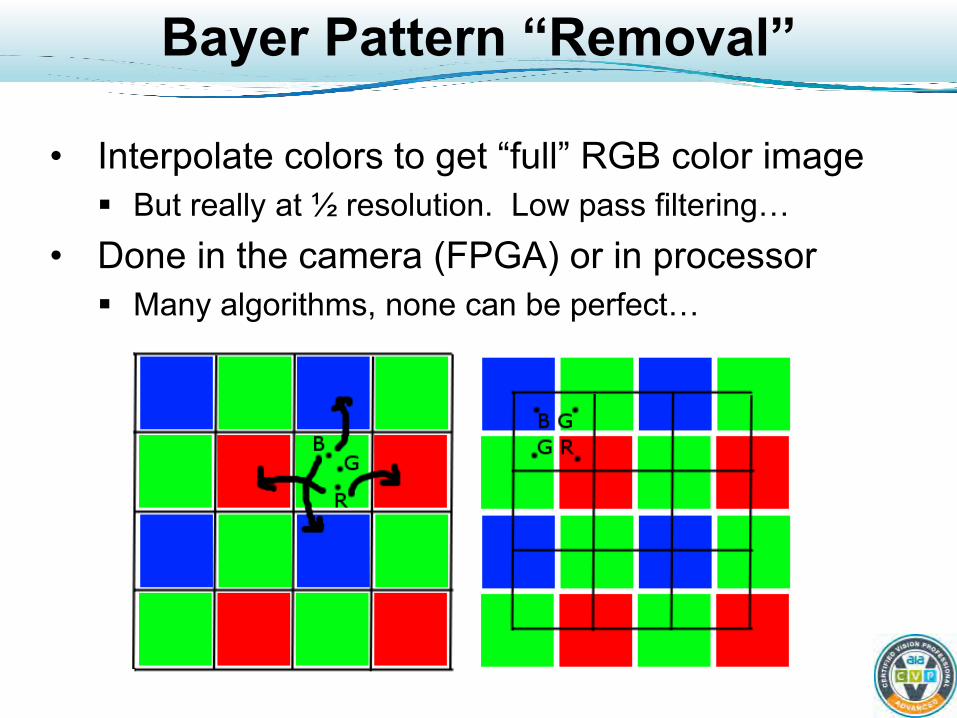
Bayer Pattern “Removal”
• Interpolate colors to get “full” RGB color image But really at ½ resolution. Low pass filtering…
• Done in the camera (FPGA) or in processor Many algorithms, none can be perfect…
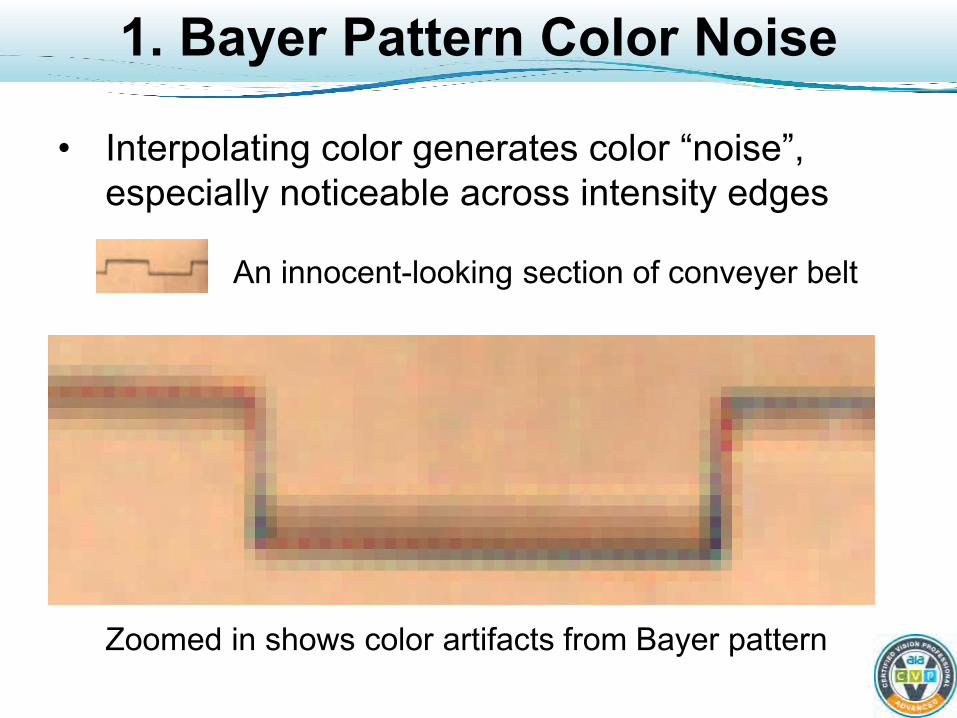
1. Bayer Pattern Color Noise
• Interpolating color generates color “noise”, especially noticeable across intensity edges
An innocent-looking section of conveyer belt
Zoomed in shows color artifacts from Bayer pattern
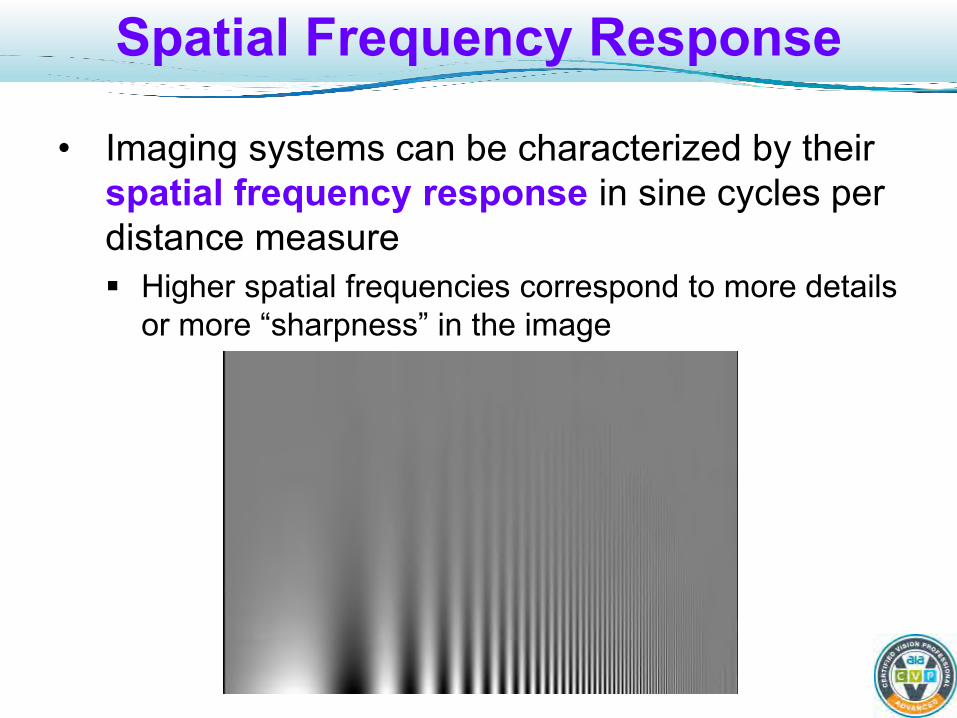
Spatial Frequency Response
• Imaging systems can be characterized by their spatial frequency response in sine cycles per distance measure Higher spatial frequencies correspond to more details
or more “sharpness” in the image
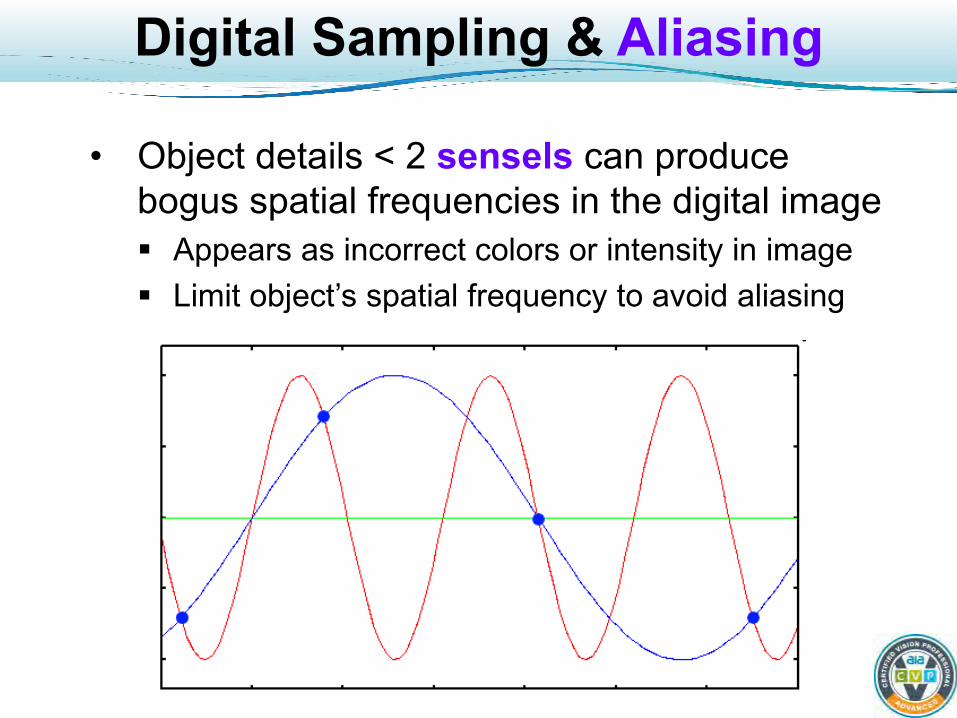
Digital Sampling & Aliasing
• Object details < 2 sensels can produce bogus spatial frequencies in the digital image Appears as incorrect colors or intensity in image Limit object’s spatial frequency to avoid aliasing

2. Color Aliasing
• Bayer filter cameras tend to exhibit aliasing Beat or color moiré patterns on high spatial frequencies
• Some cameras include an optical low-pass filter Spreads light rays into a 2x2 pixel square
Son
y
Color vs. Resolution
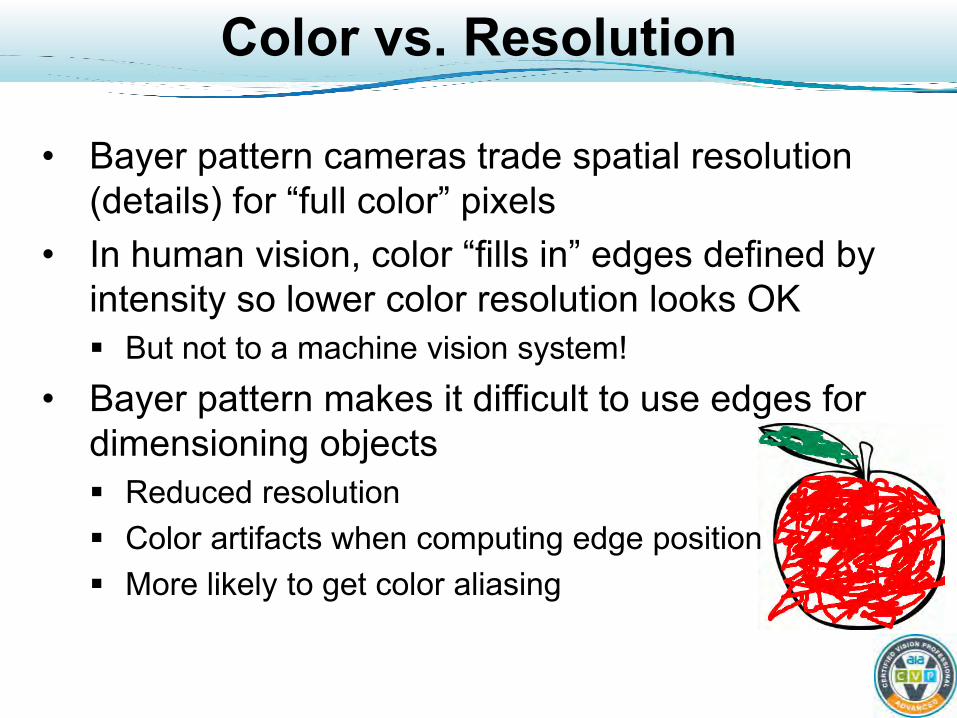
• Bayer pattern cameras trade spatial resolution (details) for “full color” pixels
• In human vision, color “fills in” edges defined by intensity so lower color resolution looks OK But not to a machine vision system!
• Bayer pattern makes it difficult to use edges for dimensioning objects Reduced resolution Color artifacts when computing edge position More likely to get color aliasing
3 CCD Cameras (1)
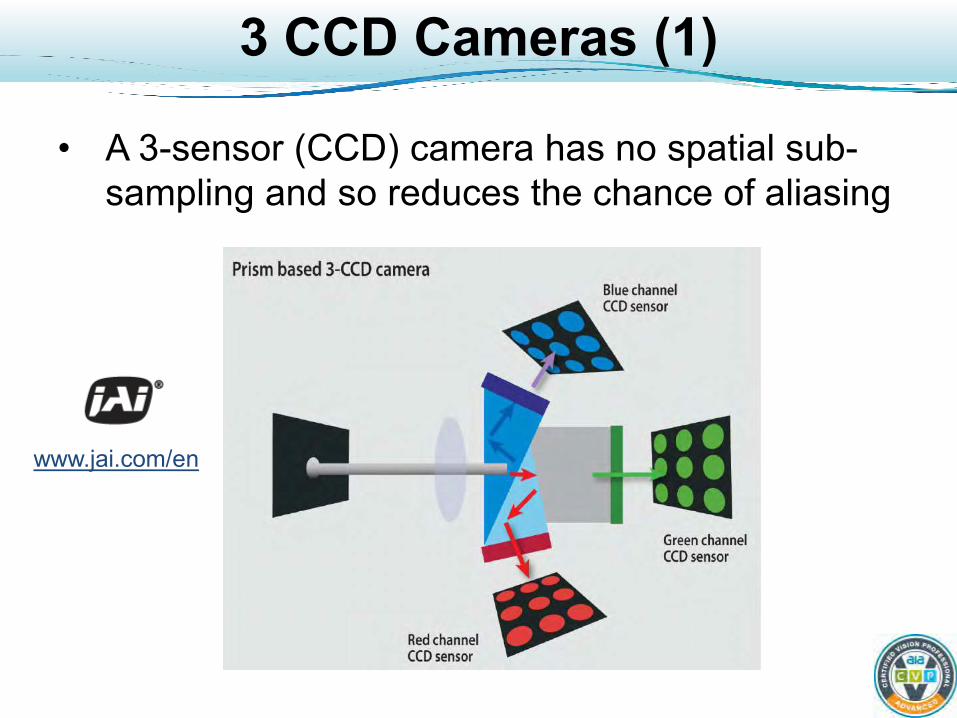
• A 3-sensor (CCD) camera has no spatial sub-sampling and so reduces the chance of aliasing
www.jai.com/en
3 CCD Cameras (2)
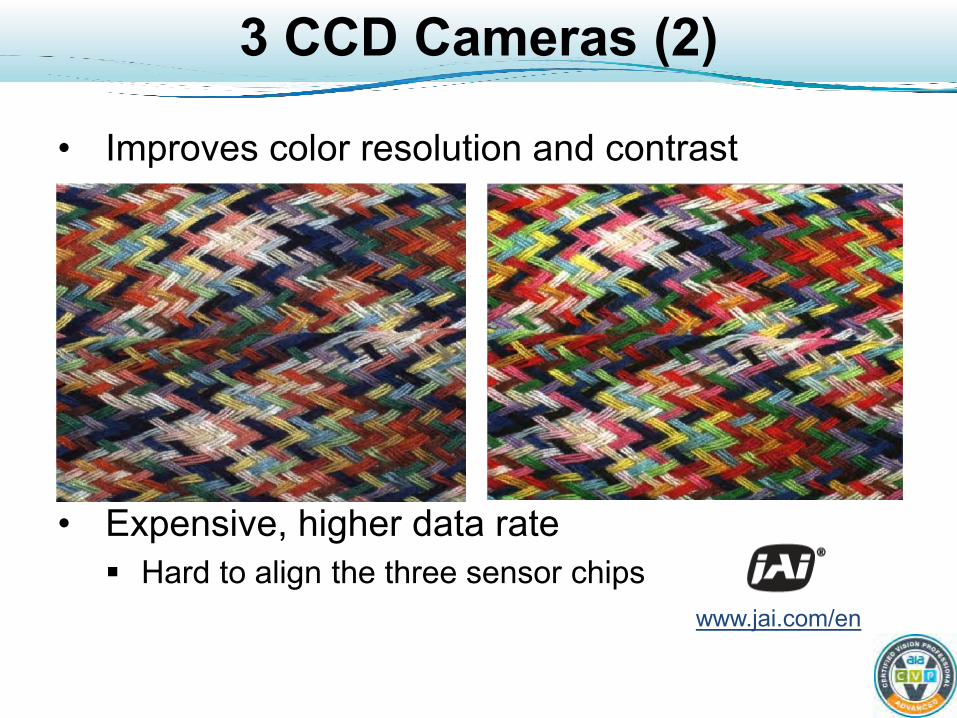
• Improves color resolution and contrast
• Expensive, higher data rate Hard to align the three sensor chips
www.jai.com/en
Color Line Scan Cameras
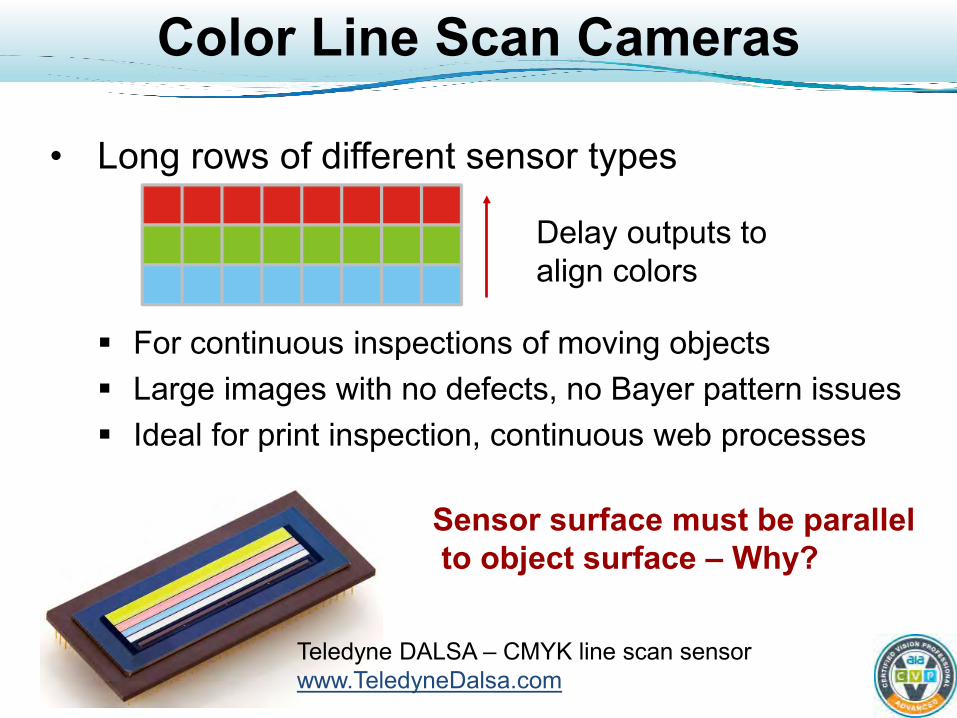
• Long rows of different sensor types
For continuous inspections of moving objects Large images with no defects, no Bayer pattern issues Ideal for print inspection, continuous web processes
Delay outputs to align colors
Sensor surface must be parallel to object surface – Why?
Teledyne DALSA – CMYK line scan sensor www.TeledyneDalsa.com

Living with the Bayer
• It’s low cost • Use a line scan camera if you need edge or
detail measures (e.g. print defect detection) Higher resolution, line-scan, or 3-sensor
• Customized interpolation algorithm to task • Measure areas and averages, not details

In-Camera Processing
= Optional
Gain and Offset, A to D
• Changes gain and offset for each channel Out = gain * input + offset Want to do in analog to before digitizing
• Maximize digital range, minimize digital computation noise
Adjust for maximum output gamut • Used to approximately white balance or color
balance the image (discussed later) • Analog to digital conversion of 10 bits gives you
“headroom” for Bayer pattern removal, etc. Each digital multiply introduce ~0.5 bit of error Digital dynamic range is limited
0000
6
10
567
...
0
10
10
12345
0
78910
...
IN OUT
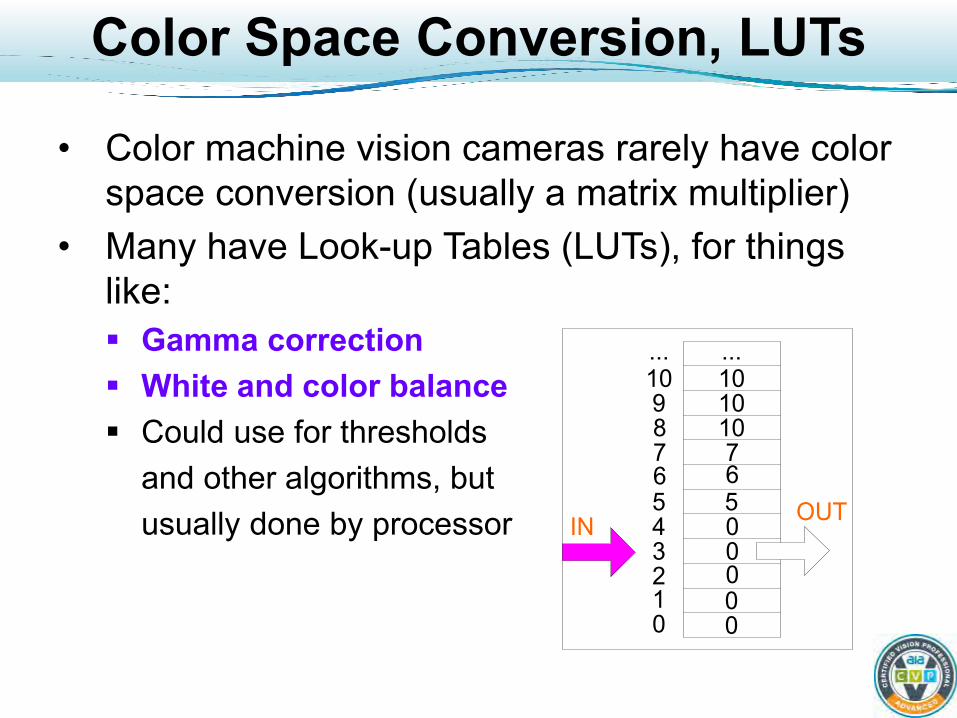
Color Space Conversion, LUTs
• Color machine vision cameras rarely have color space conversion (usually a matrix multiplier)
• Many have Look-up Tables (LUTs), for things like: Gamma correction White and color balance Could use for thresholds and other algorithms, but usually done by processor
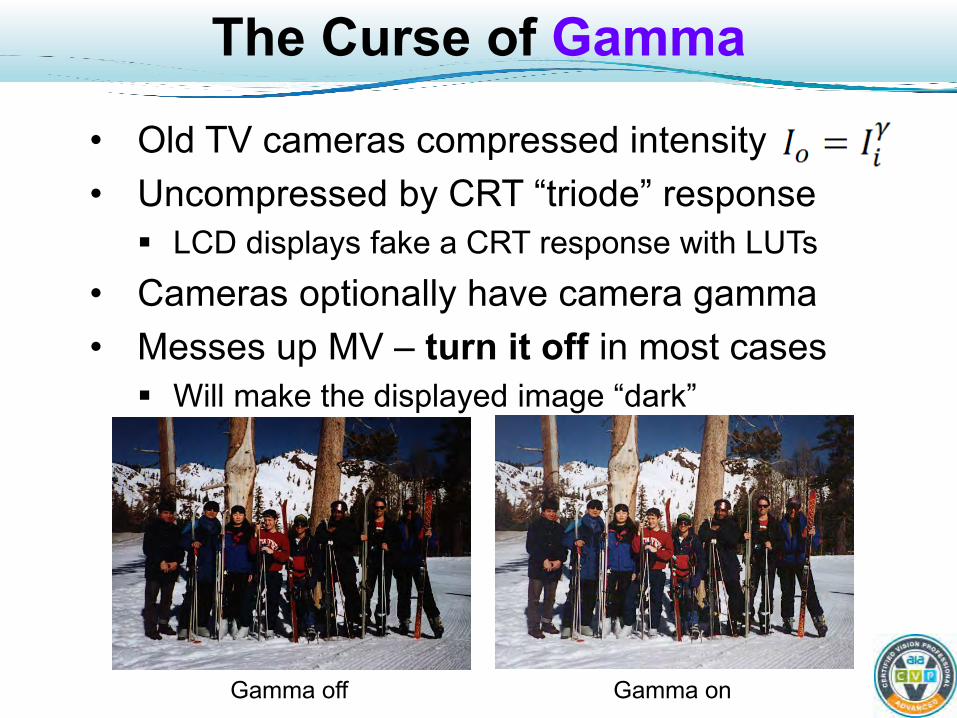
The Curse of Gamma
• Old TV cameras compressed intensity • Uncompressed by CRT “triode” response LCD displays fake a CRT response with LUTs
• Cameras optionally have camera gamma • Messes up MV – turn it off in most cases Will make the displayed image “dark”
Gamma off Gamma on
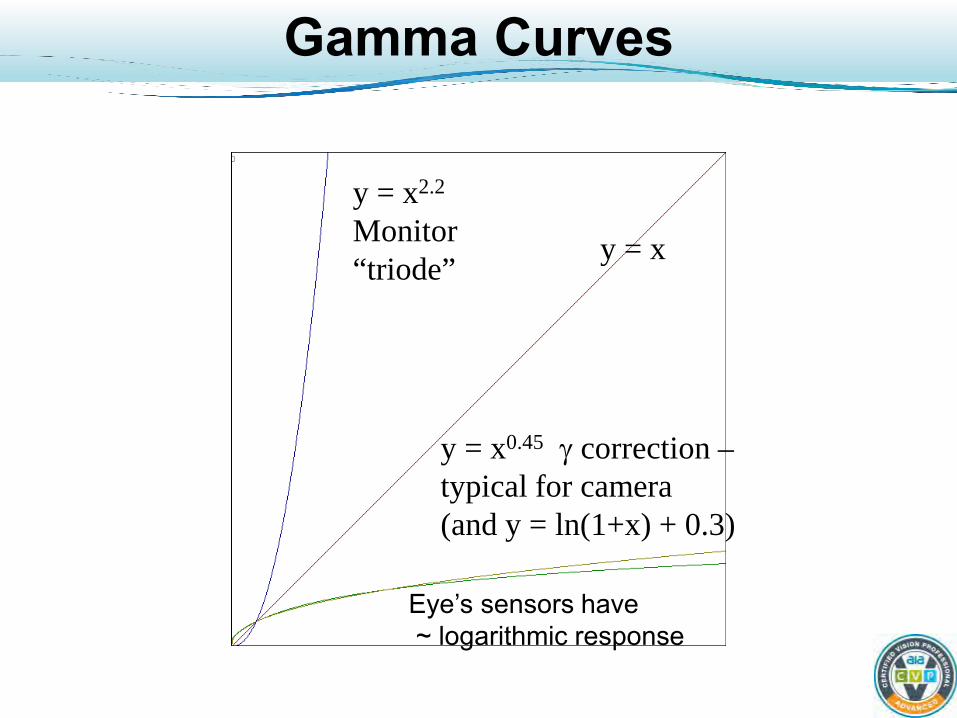
Gamma Curves
y = x
y = x2.2 Monitor “triode”
y = x0.45 γ correction – typical for camera (and y = ln(1+x) + 0.3)
Eye’s sensors have ~ logarithmic response
Oh, Say Can You See?
• Capture and display “snapshots” of high-speed can printing line
• Allow operator to judge color and print quality • Strobe white LEDs • Difficult to get veridical color display Adjusting gain and offset helped
• Gamma correction and a custom LUT to compensate for the bluish cast of LED lighting did the job.

Color MV Processors
• Smart cameras Low cost, good performance, easy to set up
• PC Based Higher performance, familiar work environment
• Attached processor (boards) For high-speed applications such as web inspection FPGAs, large LUTs, parallel processors, etc.
• High-speed, custom processors CT, MRI, remote sensing Huge data rates Not covered in this tutorial…
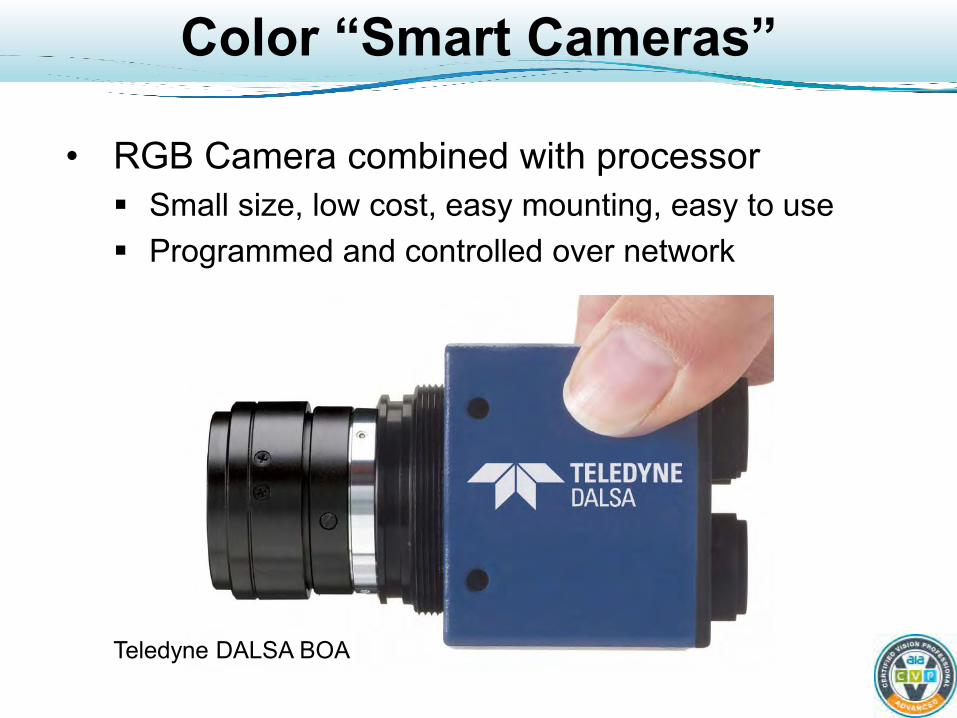
Color “Smart Cameras”
• RGB Camera combined with processor Small size, low cost, easy mounting, easy to use Programmed and controlled over network
Teledyne DALSA BOA
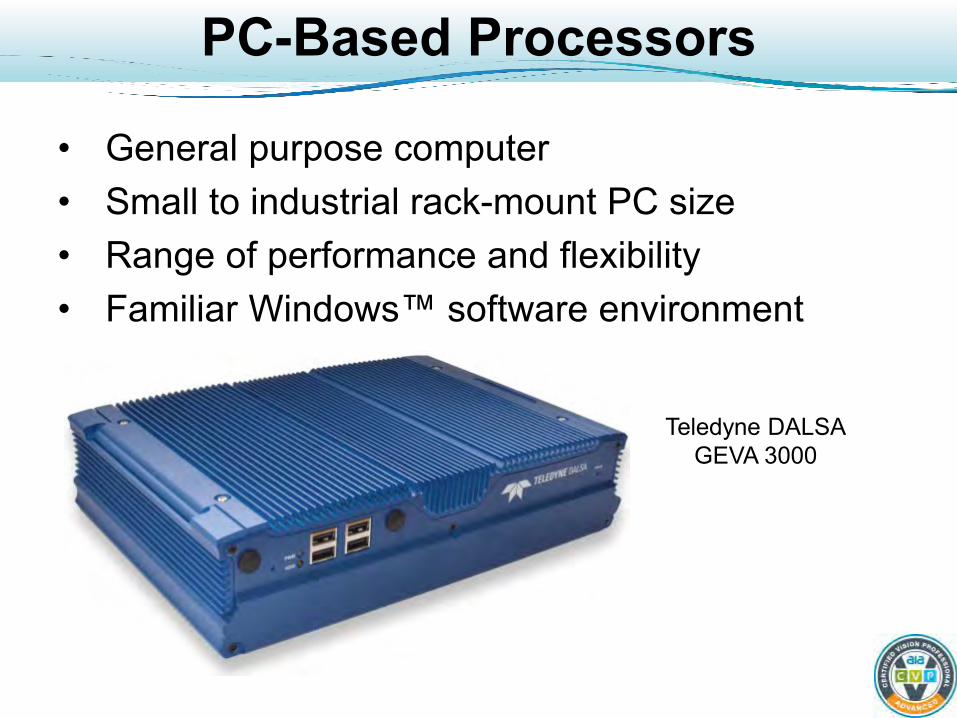
PC-Based Processors
• General purpose computer • Small to industrial rack-mount PC size • Range of performance and flexibility • Familiar Windows™ software environment
Teledyne DALSA GEVA 3000
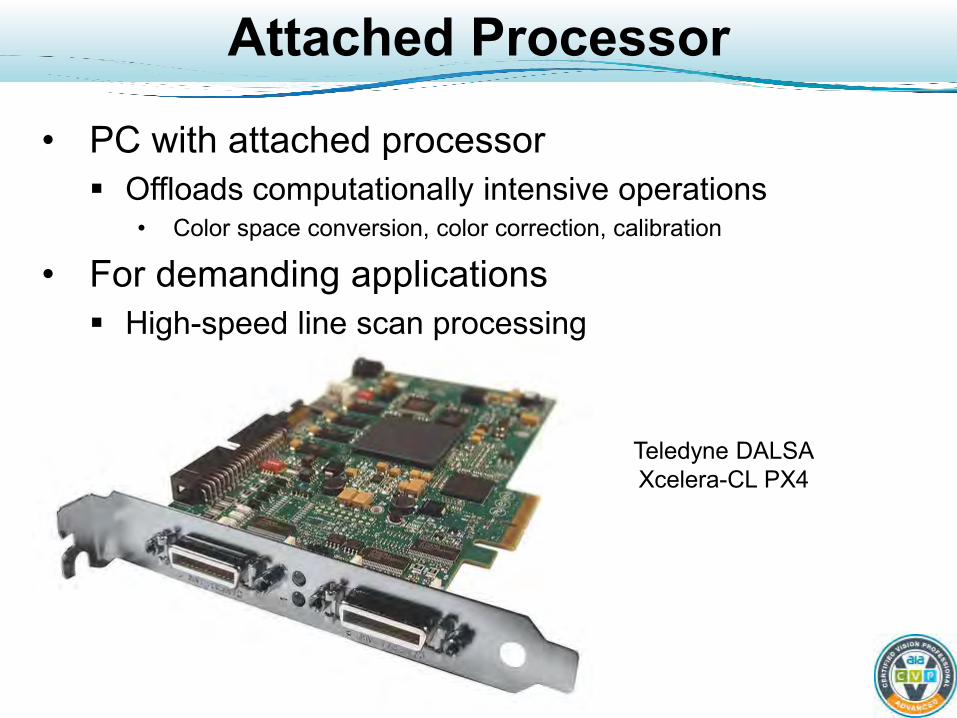
Attached Processor
• PC with attached processor Offloads computationally intensive operations
• Color space conversion, color correction, calibration
• For demanding applications High-speed line scan processing
Teledyne DALSA Xcelera-CL PX4
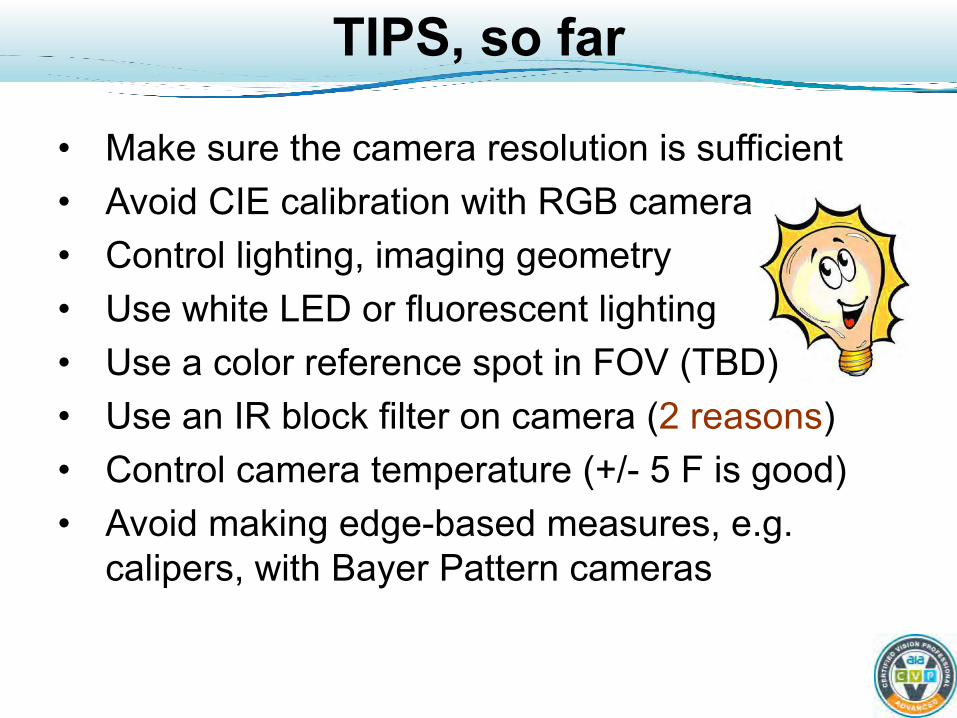
TIPS, so far
• Make sure the camera resolution is sufficient • Avoid CIE calibration with RGB camera • Control lighting, imaging geometry • Use white LED or fluorescent lighting • Use a color reference spot in FOV (TBD) • Use an IR block filter on camera (2 reasons) • Control camera temperature (+/- 5 F is good) • Avoid making edge-based measures, e.g.
calipers, with Bayer Pattern cameras
Basic Color MV Algorithms
• Algorithms are implemented by Lighting, Optics, Hardware and Software
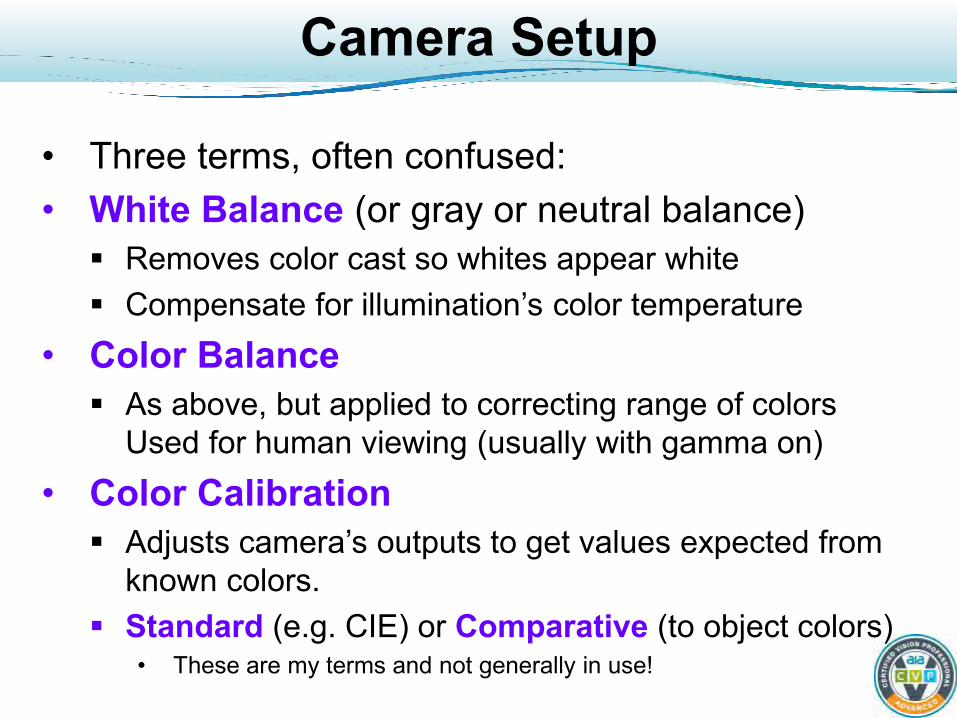
Camera Setup
• Three terms, often confused: • White Balance (or gray or neutral balance) Removes color cast so whites appear white Compensate for illumination’s color temperature
• Color Balance As above, but applied to correcting range of colors
Used for human viewing (usually with gamma on) • Color Calibration Adjusts camera’s outputs to get values expected from
known colors. Standard (e.g. CIE) or Comparative (to object colors)
• These are my terms and not generally in use!
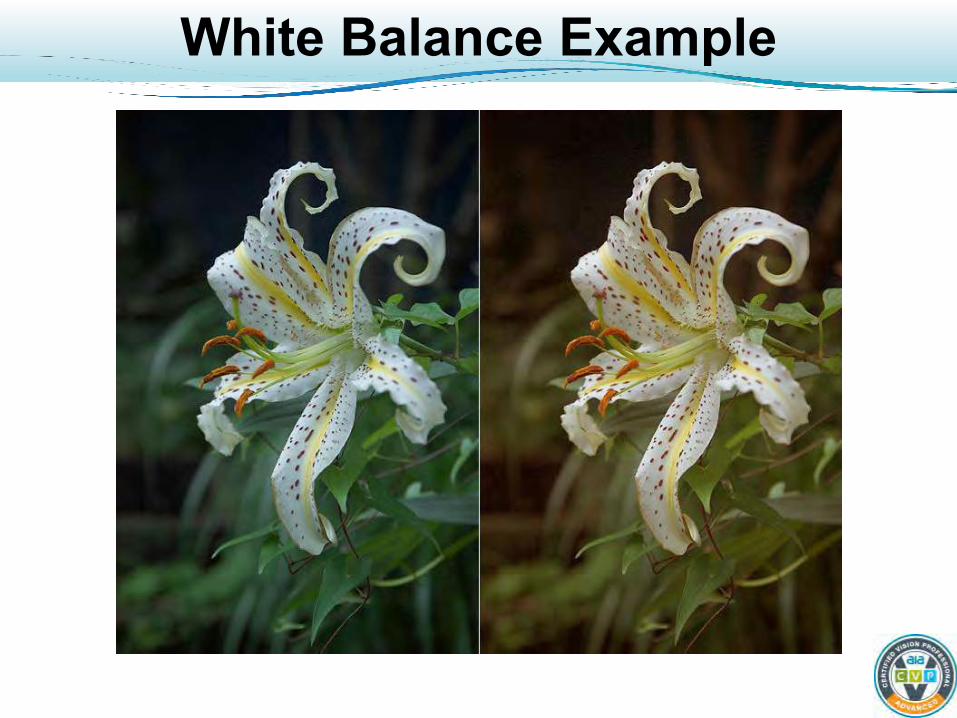
White Balance Example
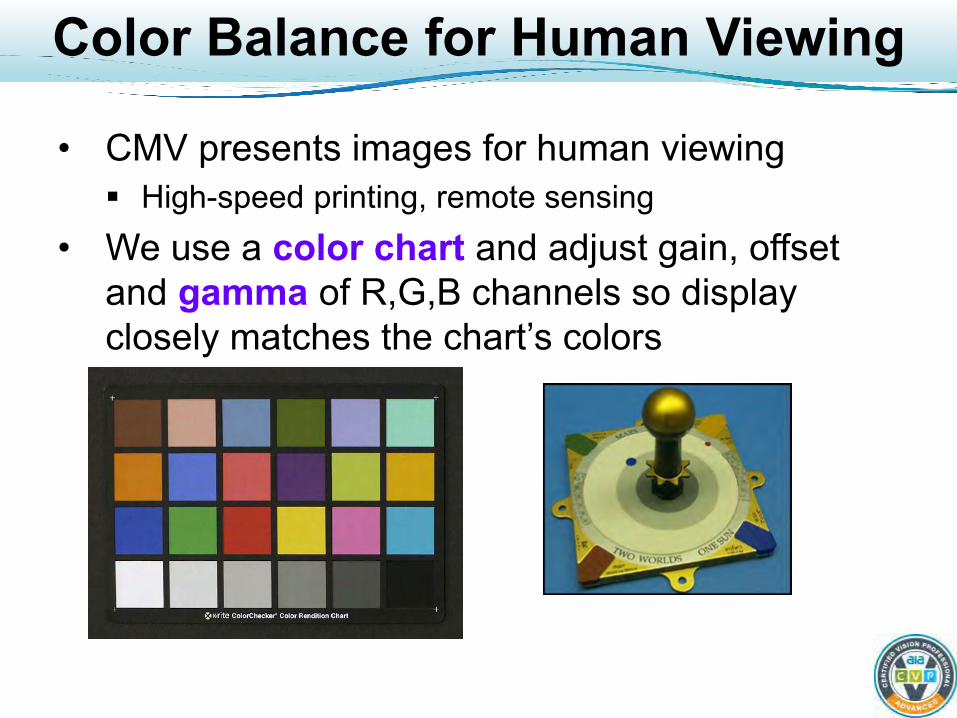
Color Balance for Human Viewing
• CMV presents images for human viewing High-speed printing, remote sensing
• We use a color chart and adjust gain, offset and gamma of R,G,B channels so display closely matches the chart’s colors
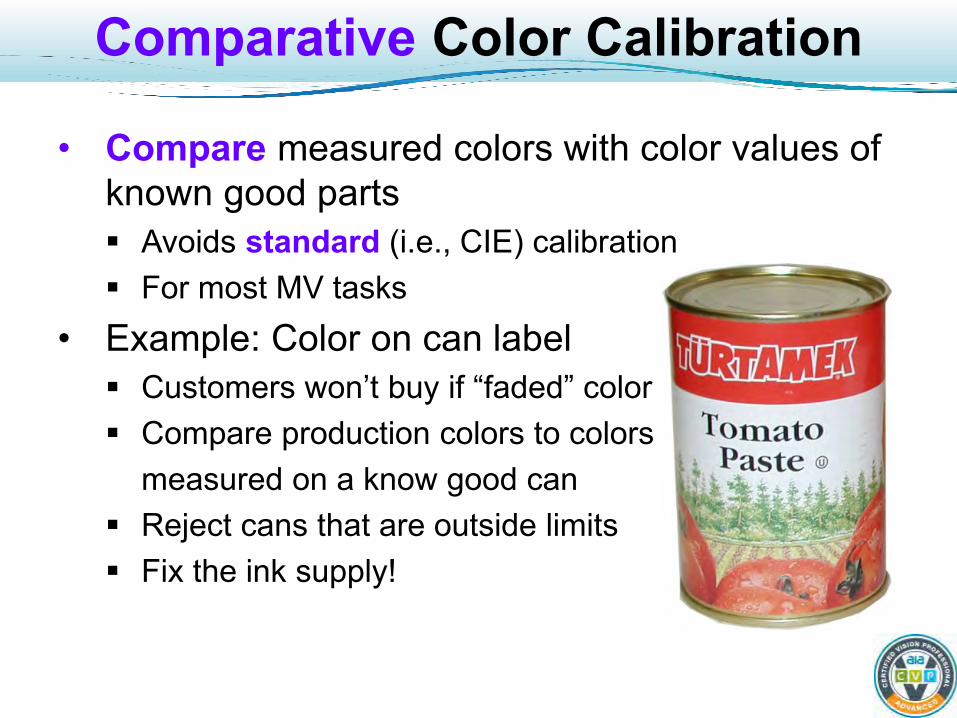
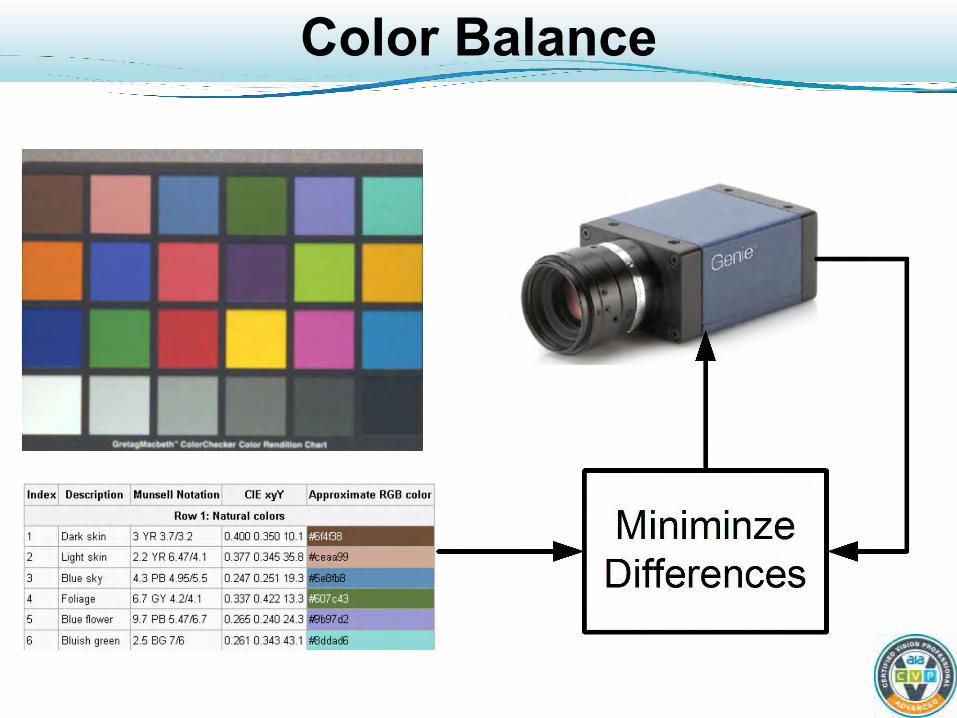
Comparative Color Calibration
• Compare measured colors with color values of known good parts Avoids standard (i.e., CIE) calibration For most MV tasks
• Example: Color on can label Customers won’t buy if “faded” color Compare production colors to colors measured on a know good can Reject cans that are outside limits Fix the ink supply!
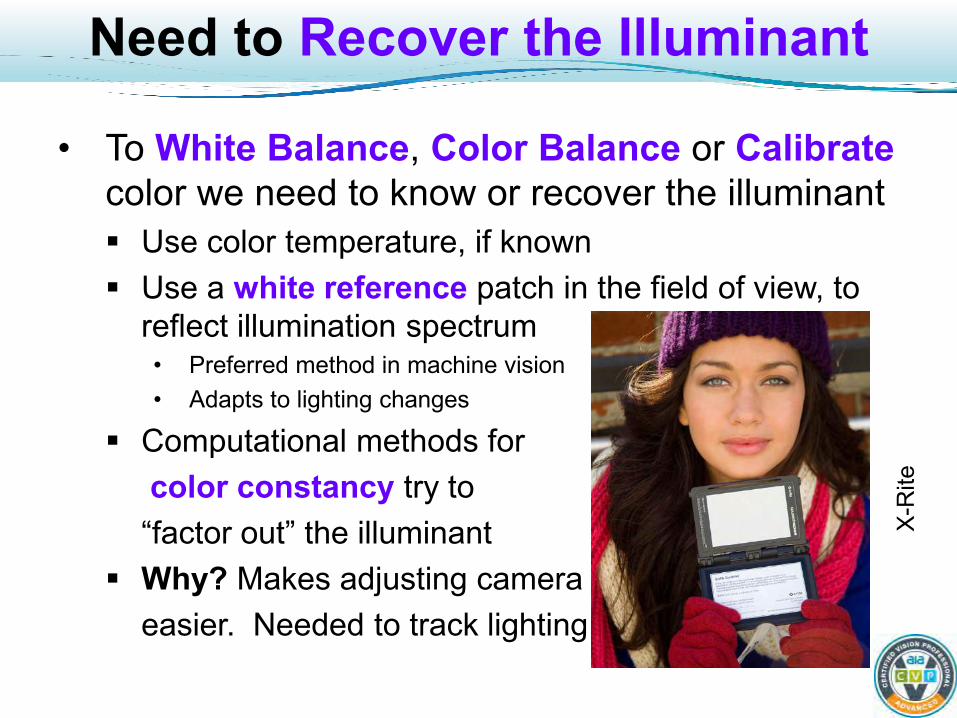
Need to Recover the Illuminant
• To White Balance, Color Balance or Calibrate color we need to know or recover the illuminant Use color temperature, if known Use a white reference patch in the field of view, to
reflect illumination spectrum • Preferred method in machine vision • Adapts to lighting changes
Computational methods for color constancy try to “factor out” the illuminant Why? Makes adjusting camera easier. Needed to track lighting.
X-R
ite
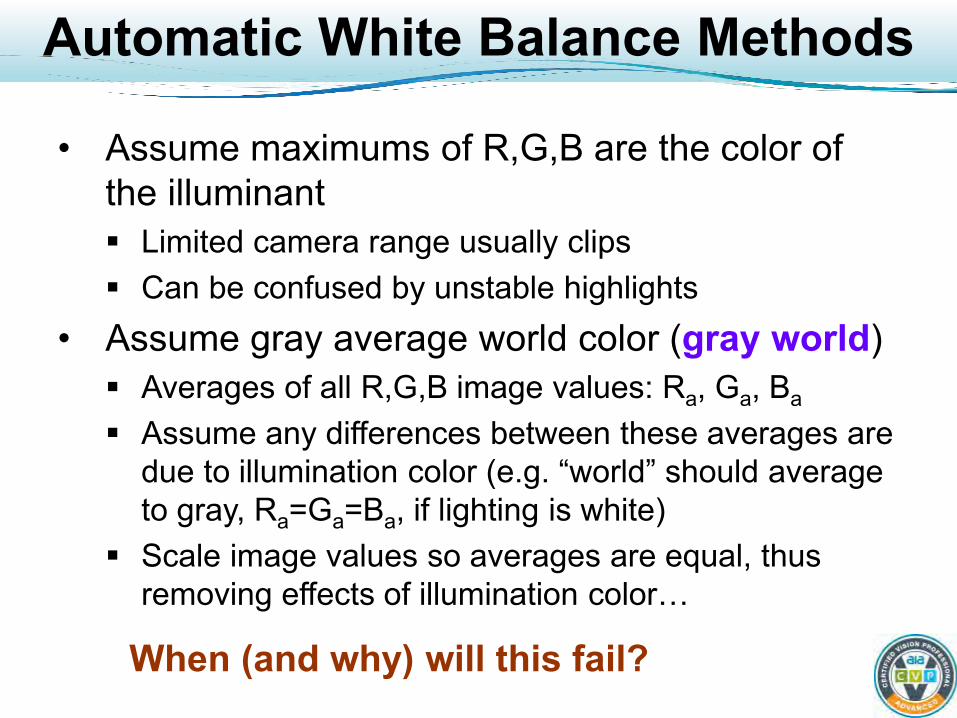
Automatic White Balance Methods
• Assume maximums of R,G,B are the color of the illuminant Limited camera range usually clips Can be confused by unstable highlights
• Assume gray average world color (gray world) Averages of all R,G,B image values: Ra, Ga, Ba Assume any differences between these averages are
due to illumination color (e.g. “world” should average to gray, Ra=Ga=Ba, if lighting is white)
Scale image values so averages are equal, thus removing effects of illumination color…
When (and why) will this fail?

Violating Gray World Assumption
When “average world color” isn’t gray…
Color Balance
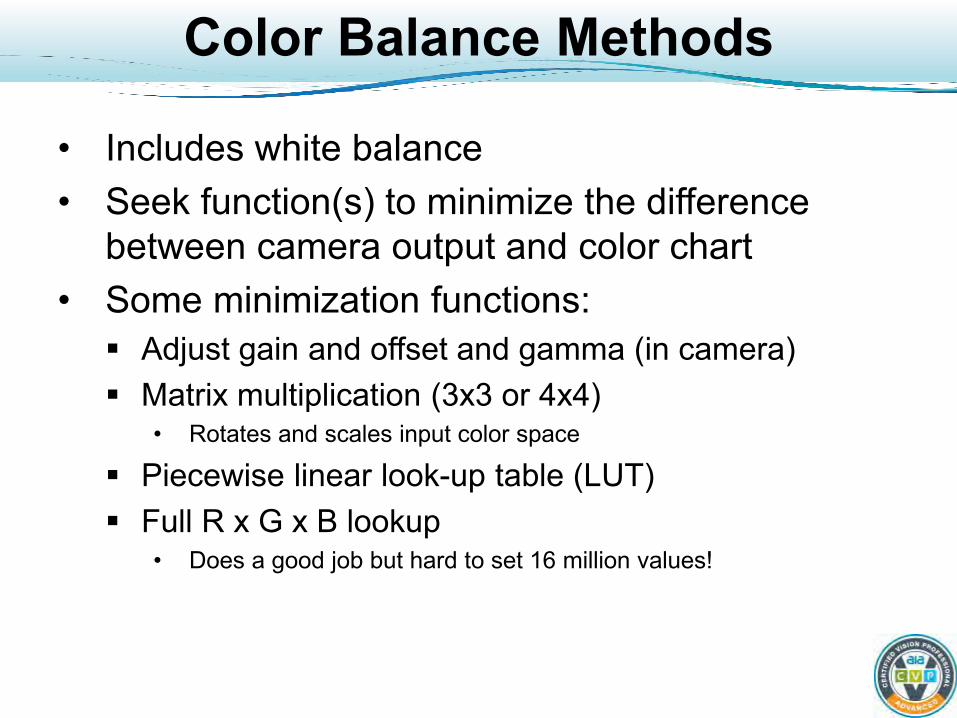
Color Balance Methods
• Includes white balance • Seek function(s) to minimize the difference
between camera output and color chart • Some minimization functions: Adjust gain and offset and gamma (in camera) Matrix multiplication (3x3 or 4x4)
• Rotates and scales input color space
Piecewise linear look-up table (LUT) Full R x G x B lookup
• Does a good job but hard to set 16 million values!

Color Balance Examples
Method 2: Matrix (linear)
Method 1: Gain / Gamma
Original Image
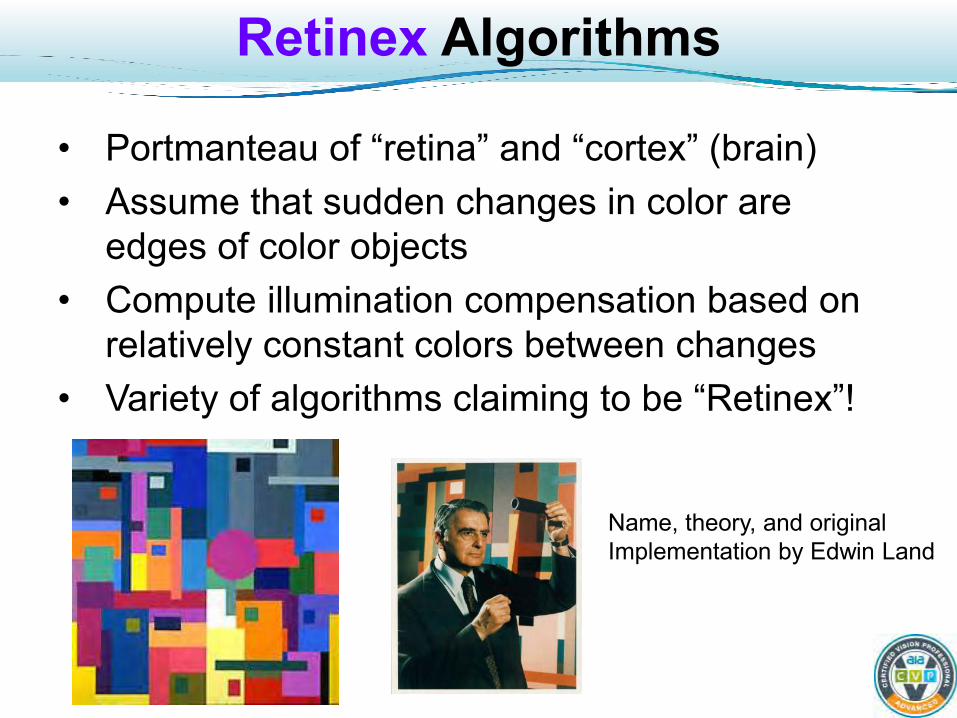
Retinex Algorithms
• Portmanteau of “retina” and “cortex” (brain) • Assume that sudden changes in color are
edges of color objects • Compute illumination compensation based on
relatively constant colors between changes • Variety of algorithms claiming to be “Retinex”!
Name, theory, and original Implementation by Edwin Land
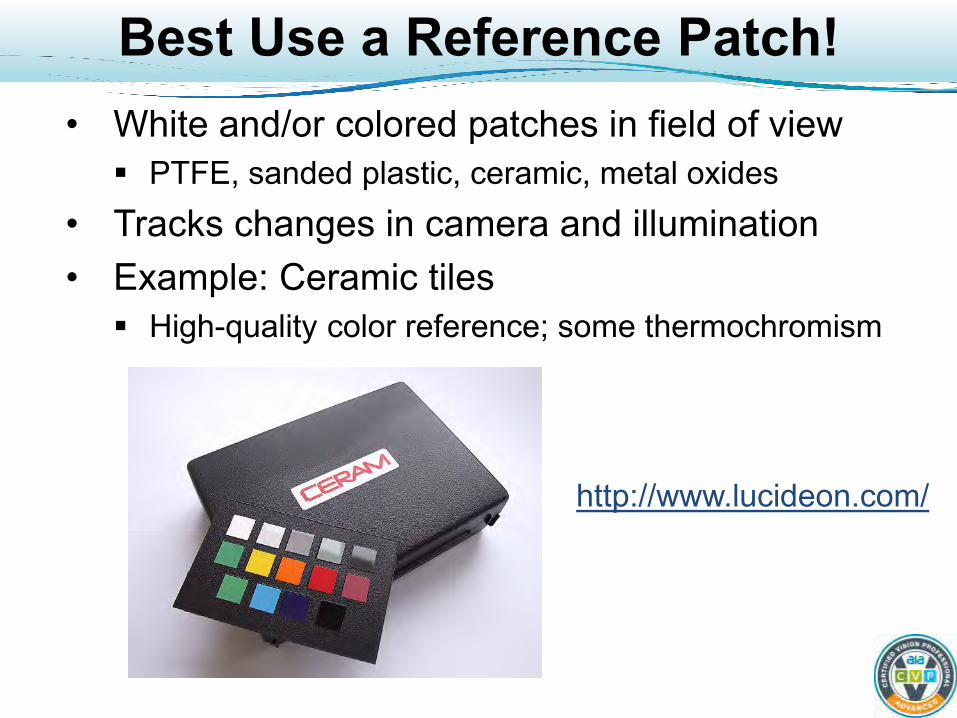
Best Use a Reference Patch! • White and/or colored patches in field of view PTFE, sanded plastic, ceramic, metal oxides
• Tracks changes in camera and illumination • Example: Ceramic tiles High-quality color reference; some thermochromism
http://www.lucideon.com/
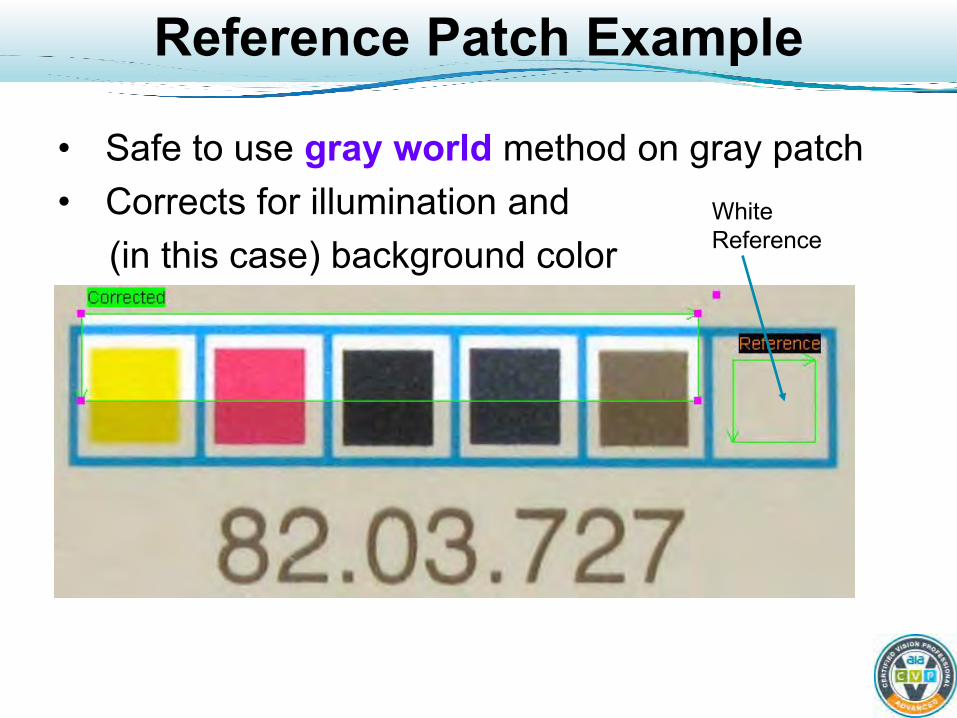
Reference Patch Example
• Safe to use gray world method on gray patch • Corrects for illumination and (in this case) background color
White Reference
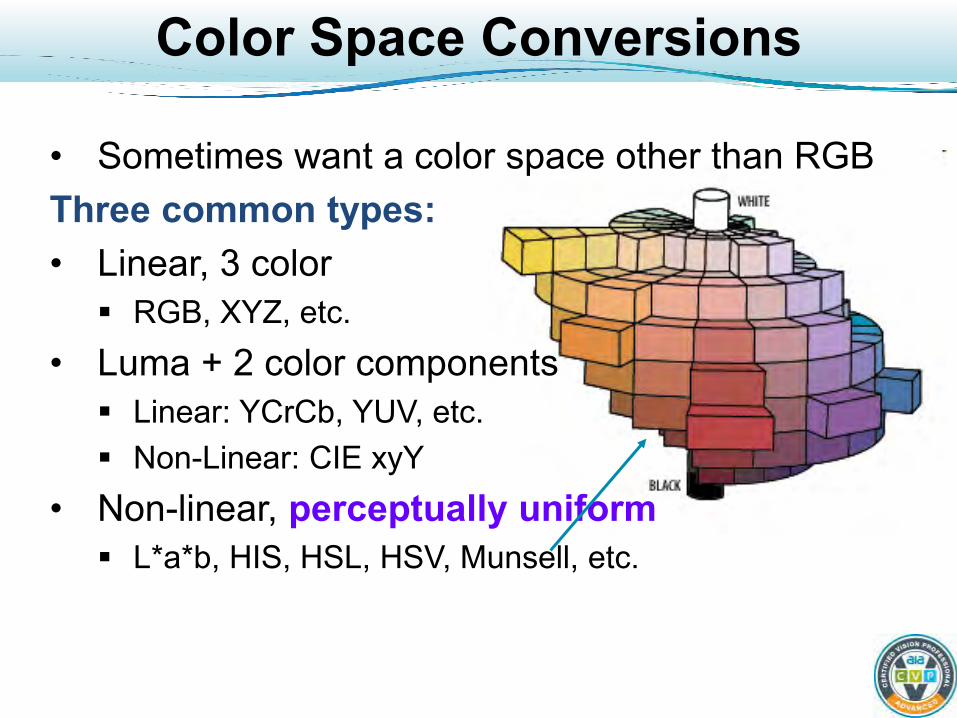
Color Space Conversions
• Sometimes want a color space other than RGB Three common types: • Linear, 3 color RGB, XYZ, etc.
• Luma + 2 color components Linear: YCrCb, YUV, etc. Non-Linear: CIE xyY
• Non-linear, perceptually uniform L*a*b, HIS, HSL, HSV, Munsell, etc.
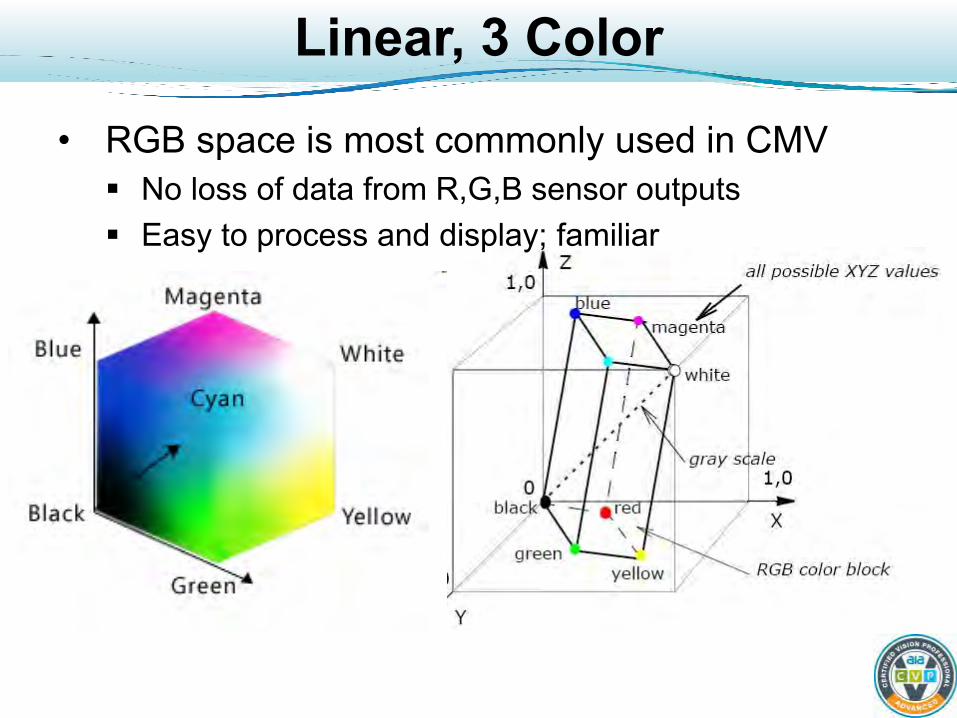
Linear, 3 Color
• RGB space is most commonly used in CMV No loss of data from R,G,B sensor outputs Easy to process and display; familiar
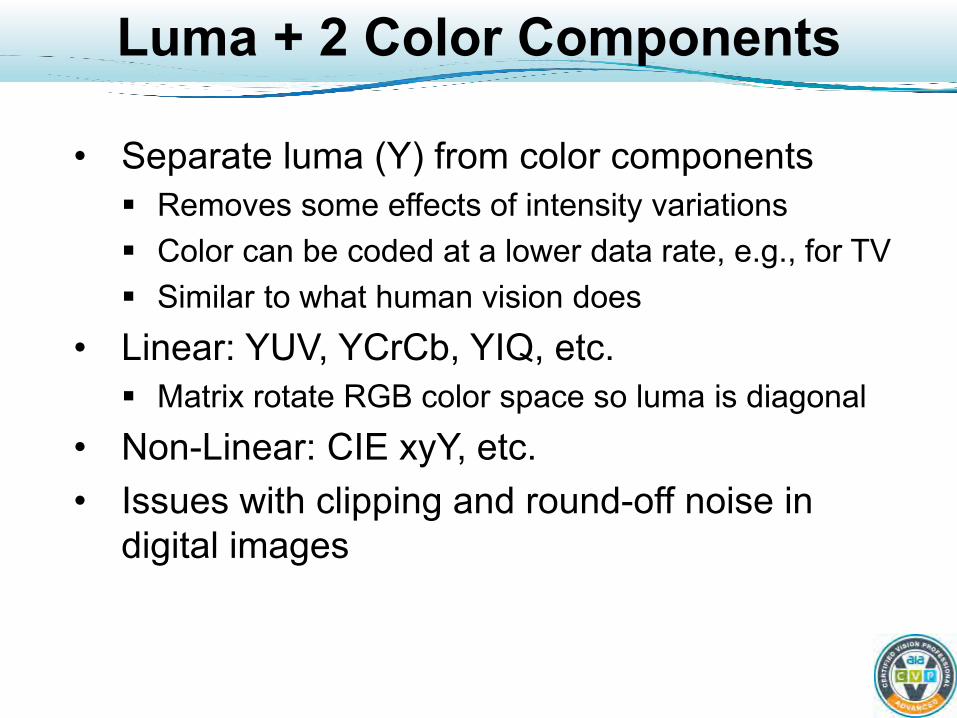
Luma + 2 Color Components
• Separate luma (Y) from color components Removes some effects of intensity variations Color can be coded at a lower data rate, e.g., for TV Similar to what human vision does
• Linear: YUV, YCrCb, YIQ, etc. Matrix rotate RGB color space so luma is diagonal
• Non-Linear: CIE xyY, etc. • Issues with clipping and round-off noise in
digital images
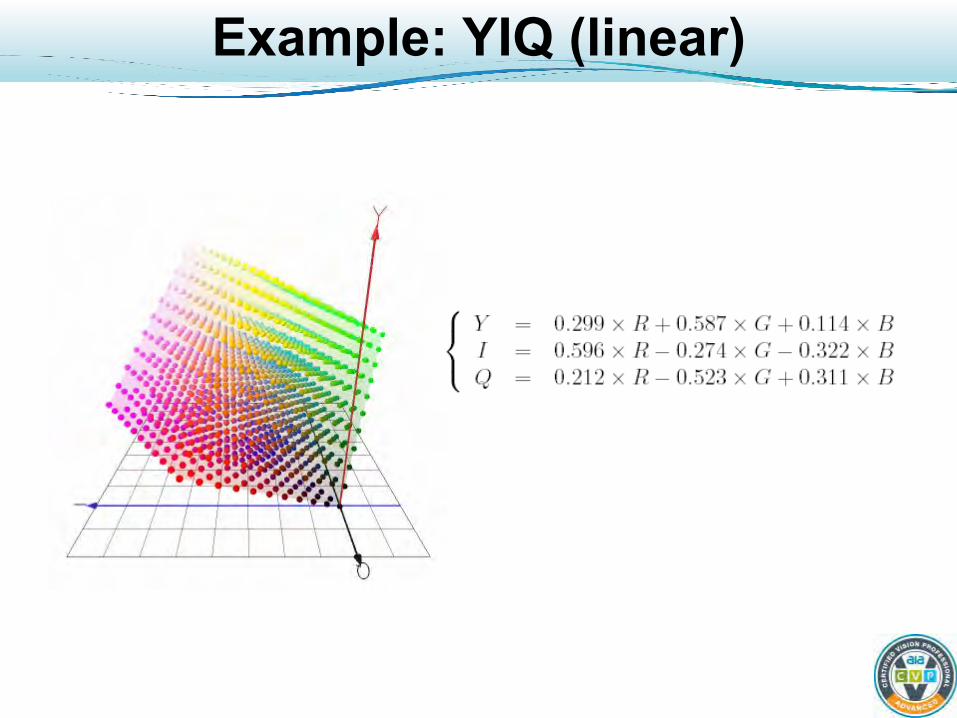
Example: YIQ (linear)
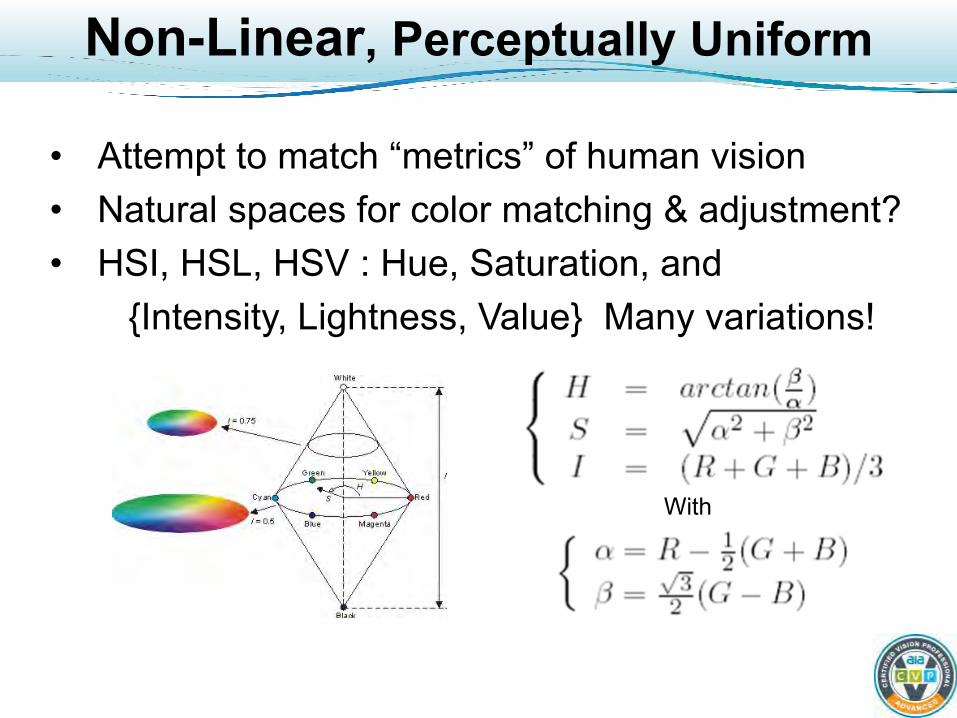
Non-Linear, Perceptually Uniform
• Attempt to match “metrics” of human vision • Natural spaces for color matching & adjustment? • HSI, HSL, HSV : Hue, Saturation, and {Intensity, Lightness, Value} Many variations!
With
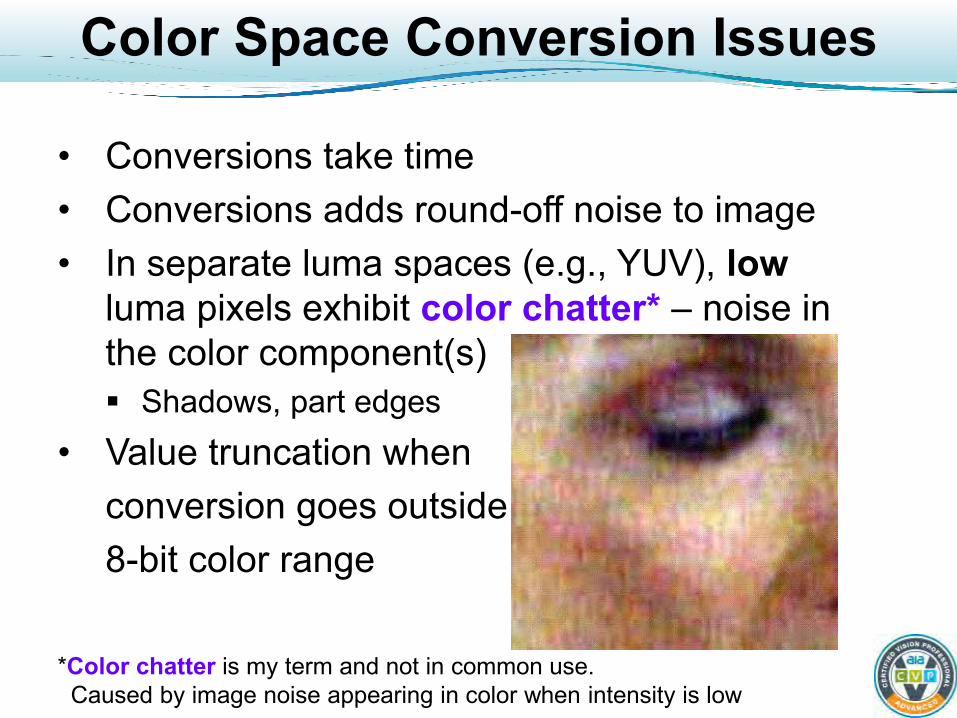
Color Space Conversion Issues
• Conversions take time • Conversions adds round-off noise to image • In separate luma spaces (e.g., YUV), low
luma pixels exhibit color chatter* – noise in the color component(s) Shadows, part edges
• Value truncation when conversion goes outside 8-bit color range
*Color chatter is my term and not in common use. Caused by image noise appearing in color when intensity is low

Example: Gelcaps
• Can you see the incorrect color gelcap?

Remove Luminance
• Divide RGB components by pixel luminance, like CIE XYZ to xyz color space conversion
• Removes luma to better show color differences
Some Bayer pattern noise & color chatter, but improved color detection
More Tips
• Comparative calibration OK for many MV tasks • White balance: Use reference patch in FOV Used to remove lighting and camera variations
• Color balance Generally set up “off line” and with human help
• Use RGB space when possible Color space conversion adds noise and time
• Separate luma + 2 color components Reduces effects of luma change Can introduce color chatter at low luma
Computing Application Answers
(Credit: Photo © Neuron)
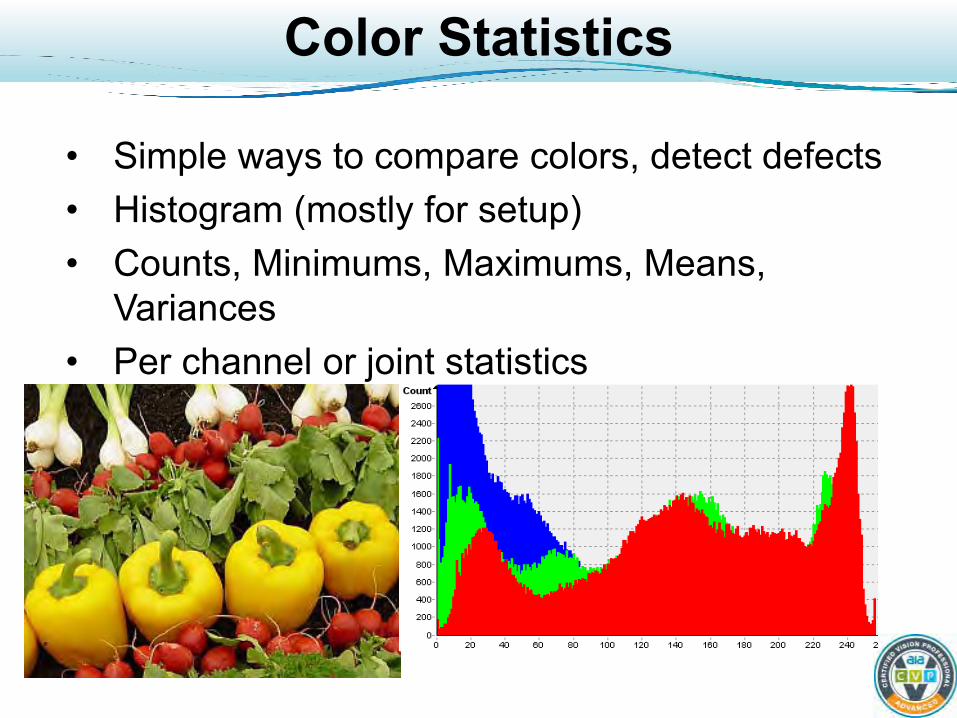
Color Statistics
• Simple ways to compare colors, detect defects • Histogram (mostly for setup) • Counts, Minimums, Maximums, Means,
Variances • Per channel or joint statistics
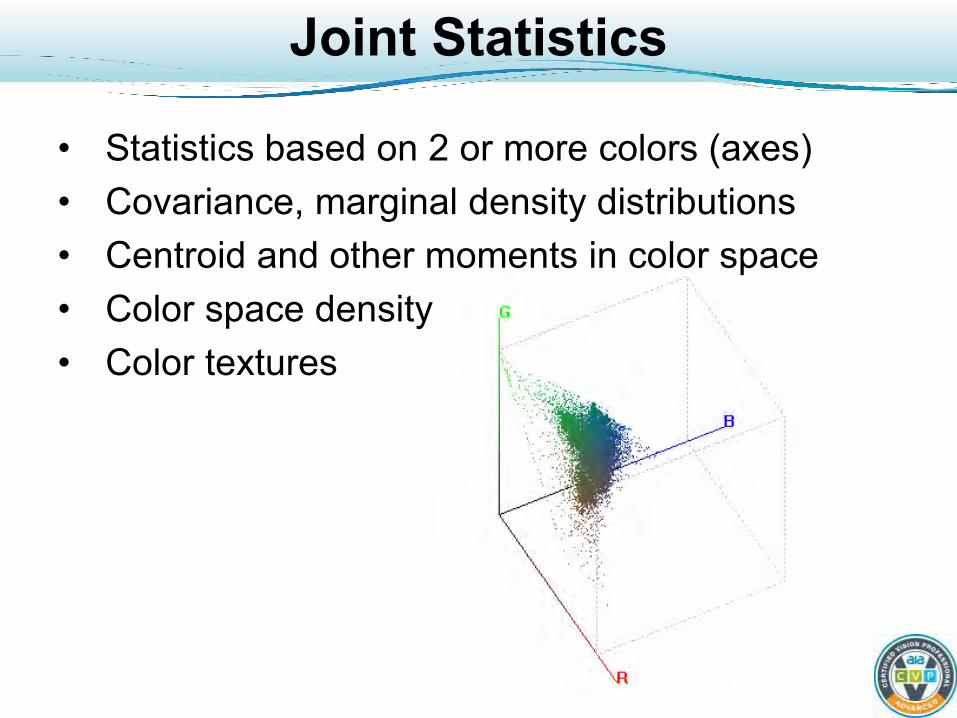
Joint Statistics
• Statistics based on 2 or more colors (axes) • Covariance, marginal density distributions • Centroid and other moments in color space • Color space density • Color textures

Color Spot Meter
• Color statistics over an area of image Computed on a per-component (RGB) basis Measures means, maximums, and variances
• Used for: Checking color range (go / no-go) Correct part present, based on color Matching colors (not very accurate) Checking part orientation by color “swatch” location
• Good When: Parts have uniform color areas at known positions Large color differences between parts’ colors
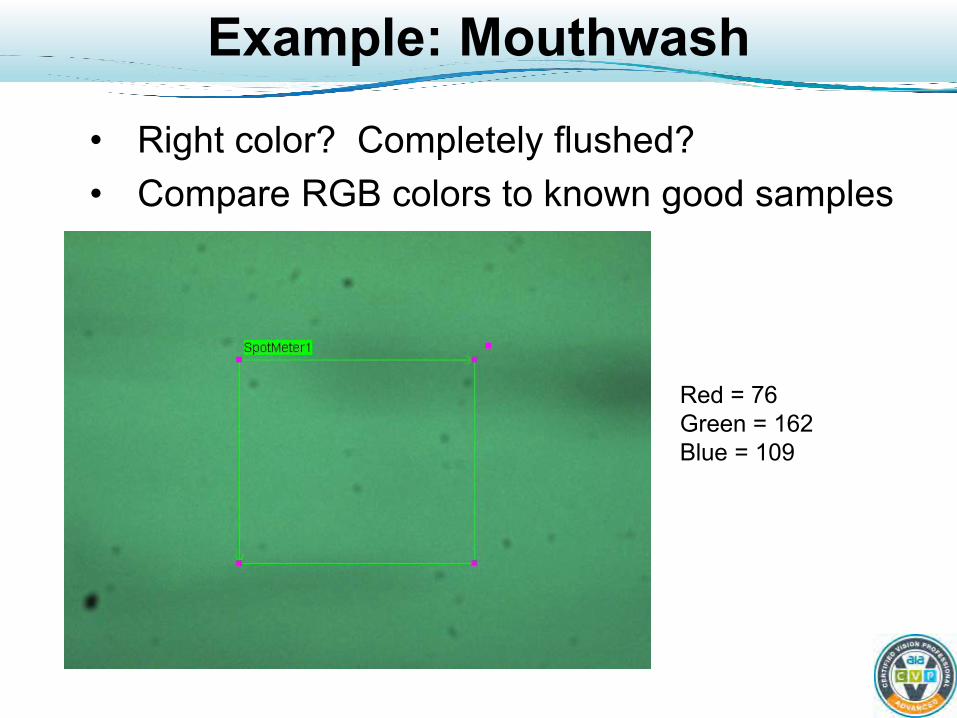
Example: Mouthwash
• Right color? Completely flushed? • Compare RGB colors to known good samples
Red = 76 Green = 162 Blue = 109
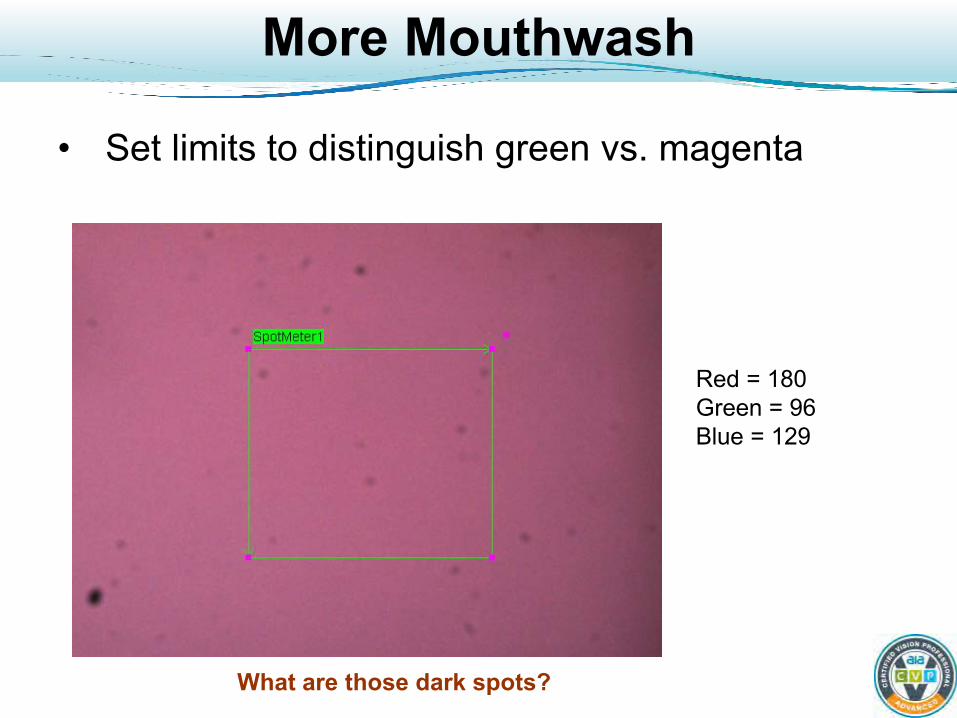
More Mouthwash
• Set limits to distinguish green vs. magenta
Red = 180 Green = 96 Blue = 129
What are those dark spots?
Color Classifiers
• Key algorithm for many CMV applications • Pixels assigned to “classes” based on their color • Class assignment functions* (CAFs) divide a
color space into smaller volumes Each volume represent a color of interest (e.g. “good”)
• CAFs are difficult to specify “by eye”, so the classifier learns the classes “by example”
• Classified pixels can be “tagged” with their class number, to be used for further processing Color Map
* This is my term and not in general use
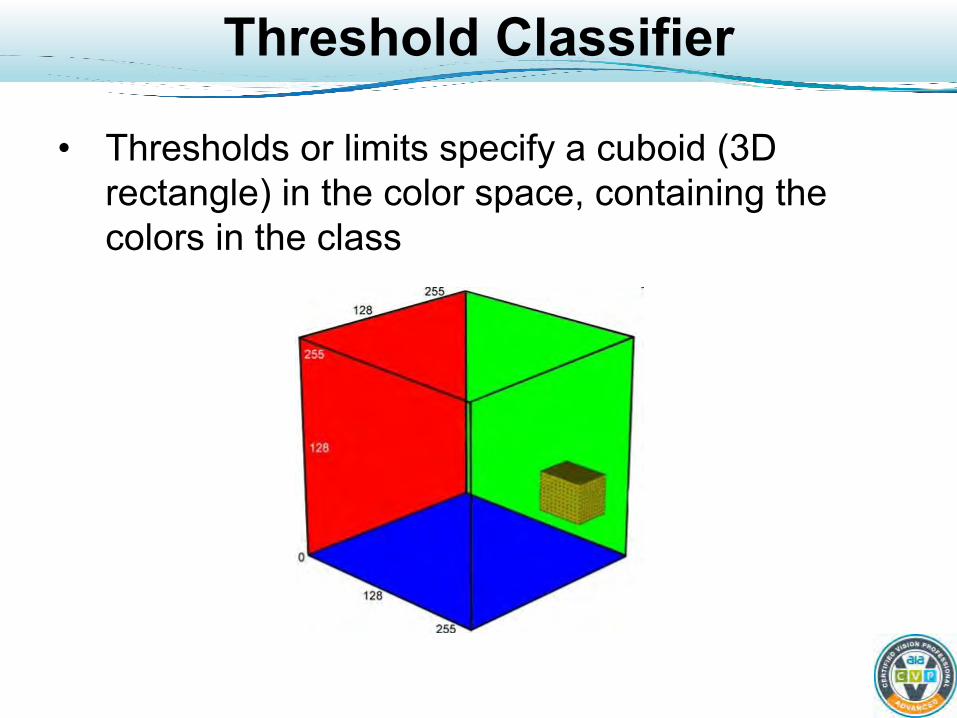
Threshold Classifier
• Thresholds or limits specify a cuboid (3D rectangle) in the color space, containing the colors in the class
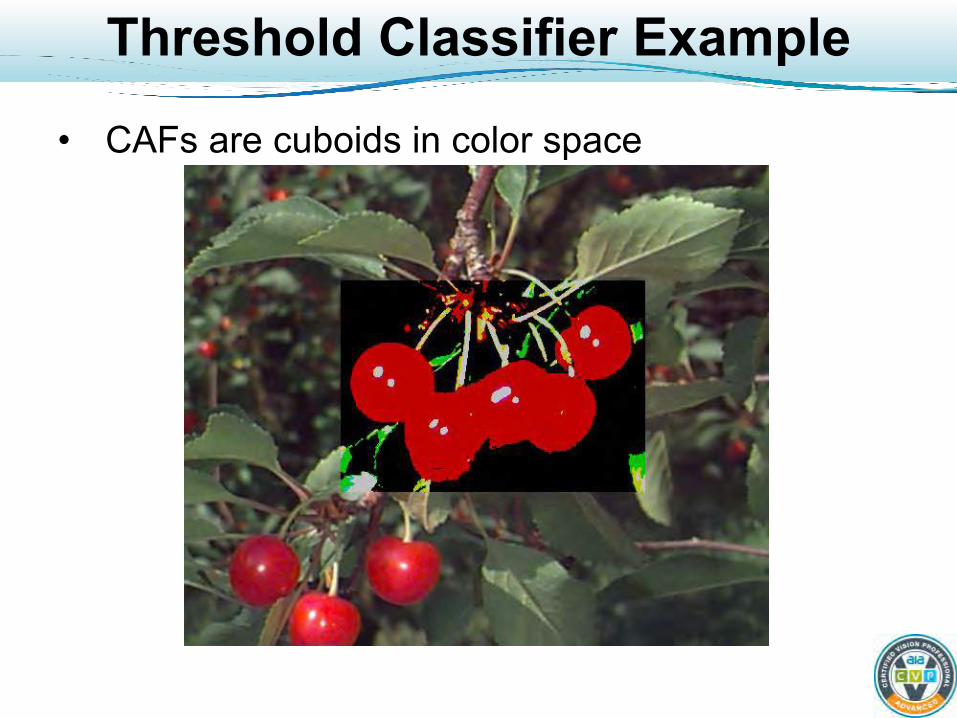
Threshold Classifier Example
• CAFs are cuboids in color space
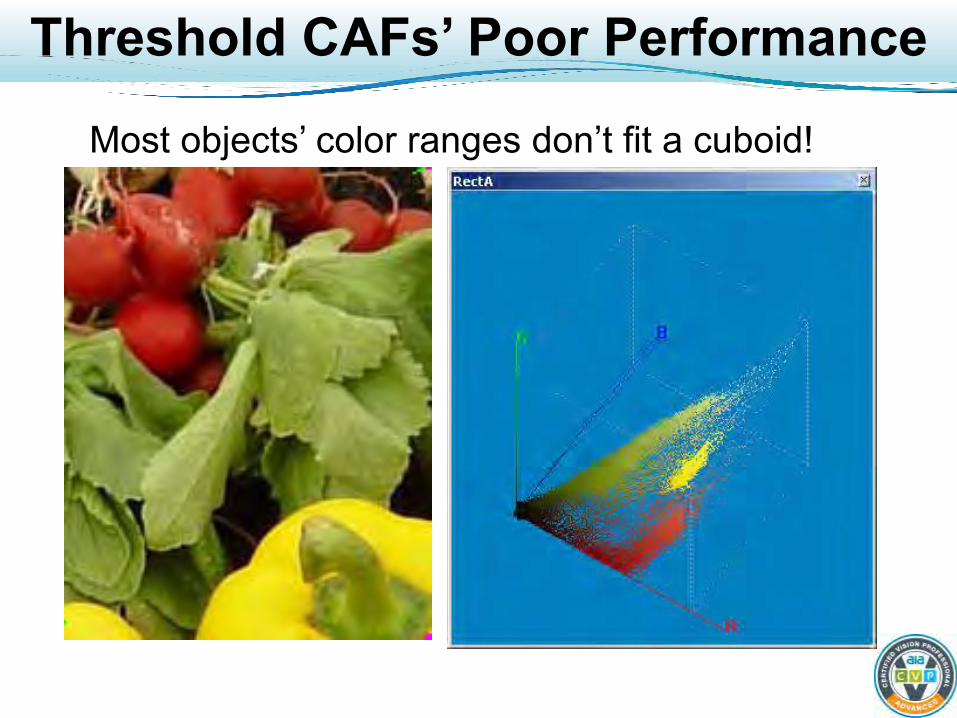
Threshold CAFs’ Poor Performance
Most objects’ color ranges don’t fit a cuboid!

Part Location by Color
• Counting chicken breasts • Threshold CAF works OK because only red
channel drives classification

Gaussian CAFs
• Ellipsoids in 3D color space Defined by center and covariance matrix
• Better color classification than rectangles Closer to how colors distribute in natural images
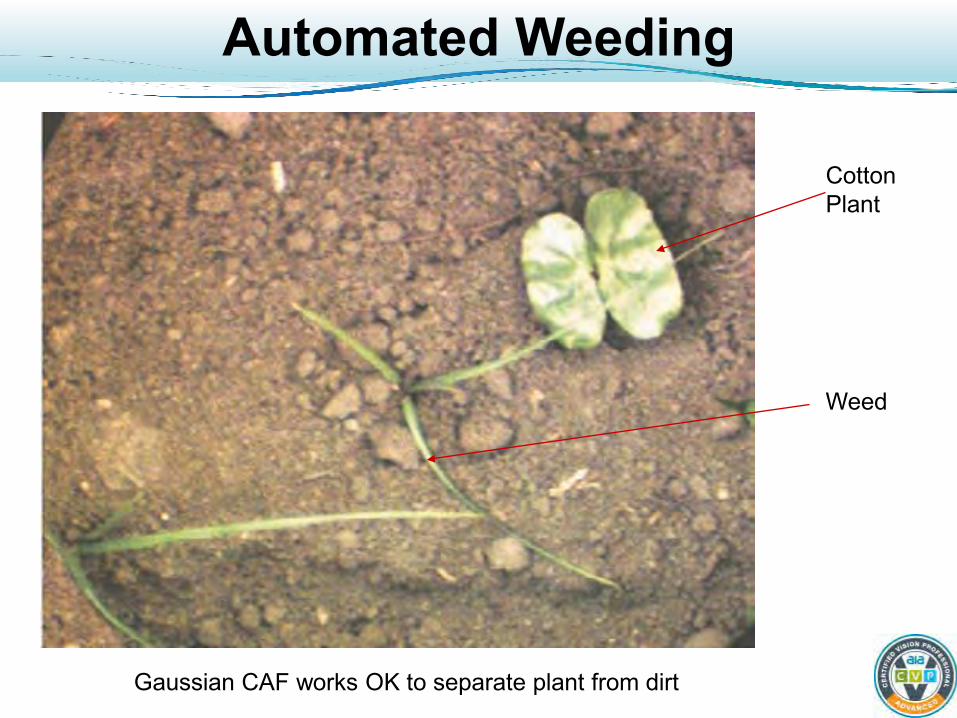
Automated Weeding
Cotton Plant
Weed
Gaussian CAF works OK to separate plant from dirt

Automated Weeding System
Color alone is not sufficient – need shape, etc.

Radial Basis CAFs
• Decision surfaces expand, like balloons, and push against each other to divide up the space
• A form of Artificial Neural Network (ANN)

Support Vector Machines
• CAFs try to maximize the margin (~ distance) between classes
Class Probability
• Some classifiers return probabilities of a color being in a class (e.g. how close is a particular color to the centroid of that class’s volume ).
• Allows you to use prior information (e.g., a Bayesian classifier) and / or “cost functions” to improve classification results
• Example: Sorting oranges and apples, if oranges are expected 80% time then we bias our apple vs. orange decision towards oranges
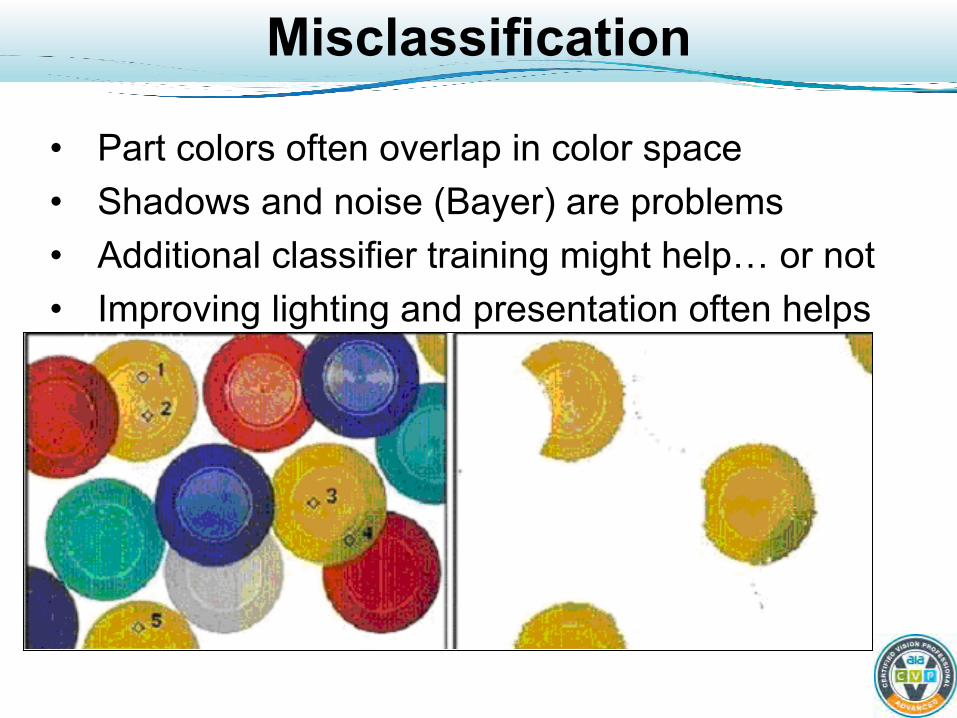
Misclassification
• Part colors often overlap in color space • Shadows and noise (Bayer) are problems • Additional classifier training might help… or not • Improving lighting and presentation often helps

Training a Classifier
• Pick examples of each part color you want to train • Show the classifier each set of examples and give
each set a class name (e.g., “red”, “good”, etc.) • How many examples to use? Too many => “over train” so poor generalization Too few => some wanted colors might not be classified
• Have an “out class” for colors that haven’t been trained (usually provided by algorithm)
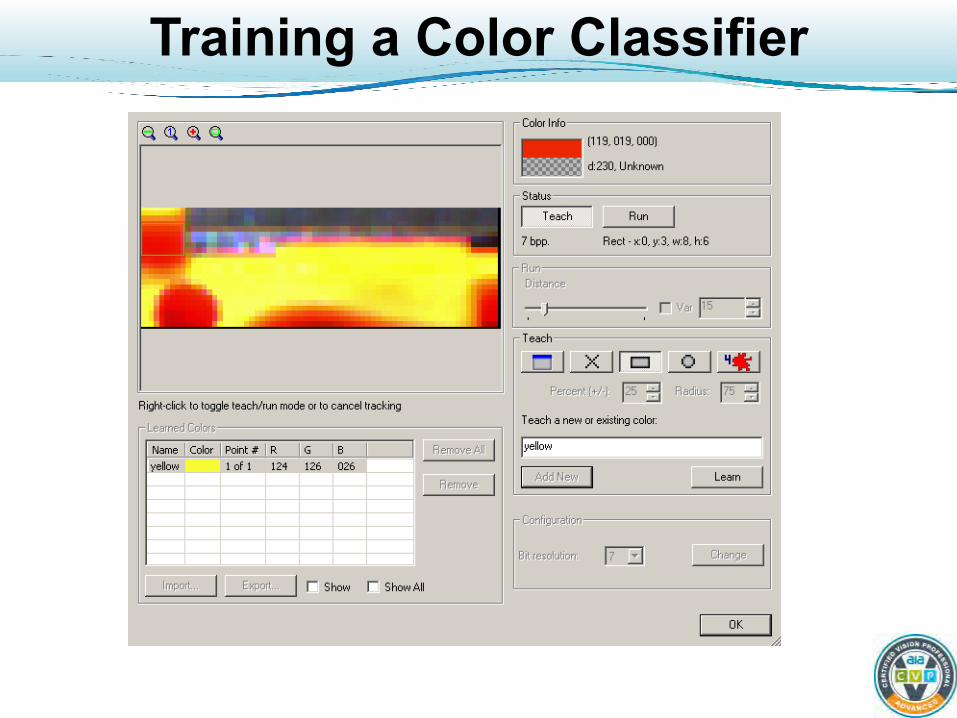
Training a Color Classifier
Thresholds and Error Costs
• A classifier defines decision thresholds (e.g. a surface in color space) for different classes.
• The decision is often not perfect because sample colors might overlap class boundaries
• False Accept (escape) – Classifier says color is “good” but it isn’t
• False Reject (false alarm) – Classifier says color is “bad” but it isn’t
• If you have a measure of classification certainty, you can use it to weight the decision Weighting is called a cost function

Cost Functions
• Example: Cheaper to have falsely reject good food than have a lawsuit. So set to reject even if only a few pixels are classified as “bad”
Obviously bad… How about this?

Example: Grading Seed Corn
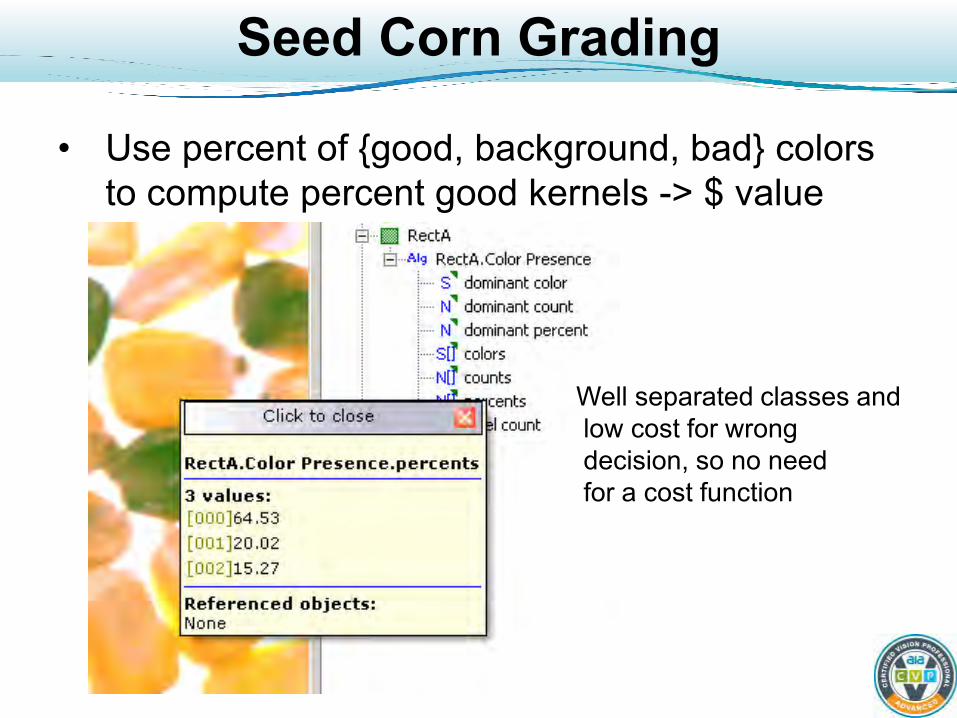
Seed Corn Grading
• Use percent of {good, background, bad} colors to compute percent good kernels -> $ value
Well separated classes and low cost for wrong decision, so no need for a cost function
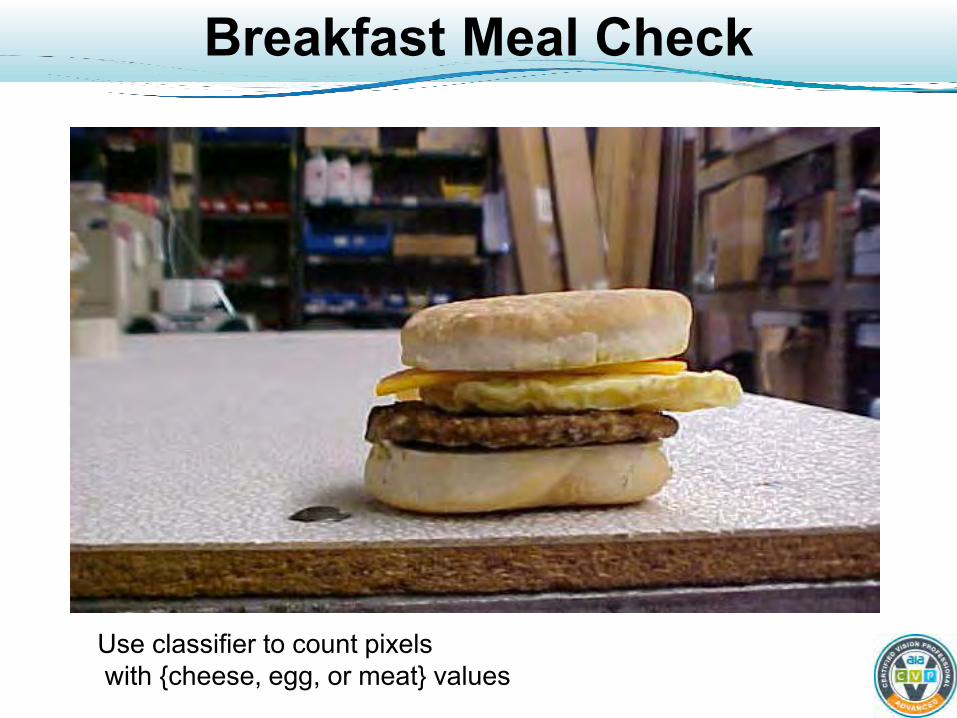
Breakfast Meal Check
Use classifier to count pixels with {cheese, egg, or meat} values

Assembly Checking
Hand assembled, so this is a quality control check. Vision system false alarms require human checking. Greatly reduces human effort.
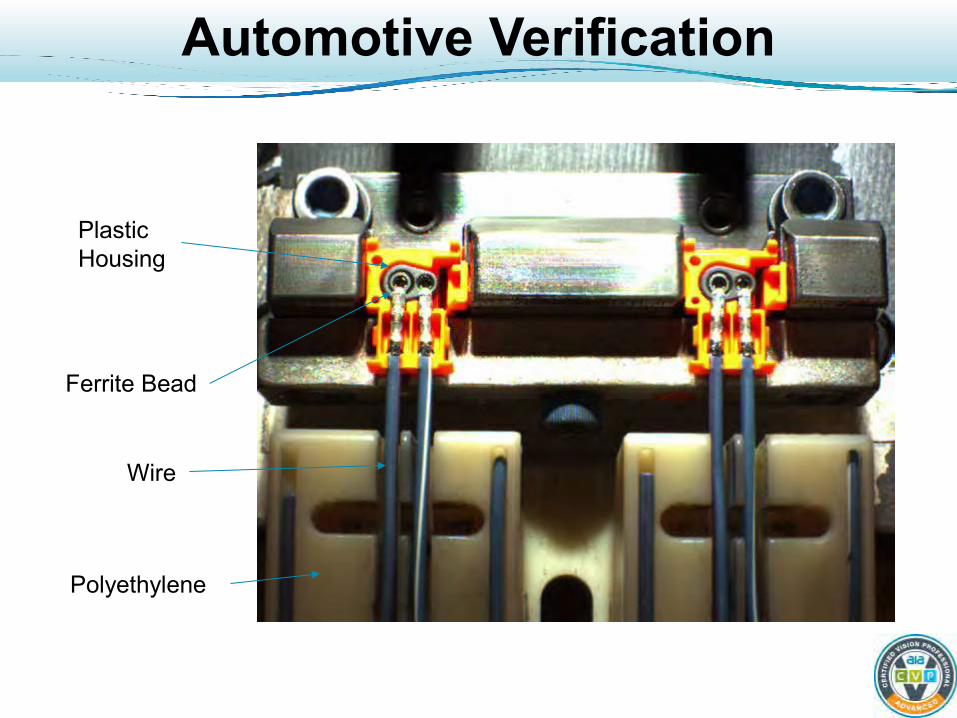
Automotive Verification
Plastic Housing
Ferrite Bead
Wire
Polyethylene
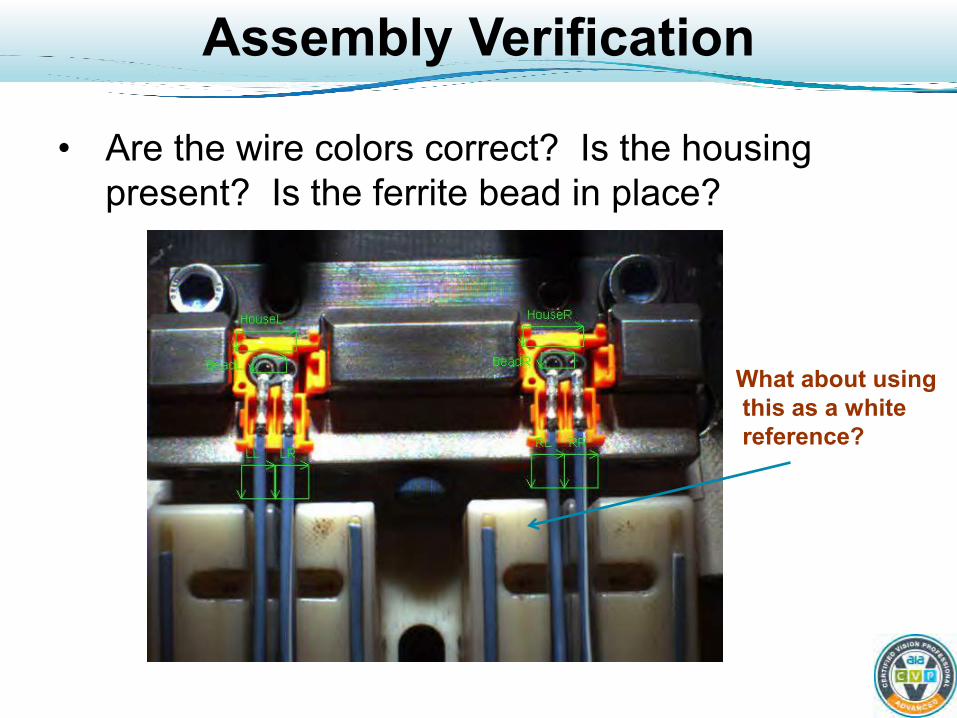
Assembly Verification
• Are the wire colors correct? Is the housing present? Is the ferrite bead in place?
What about using this as a white reference?
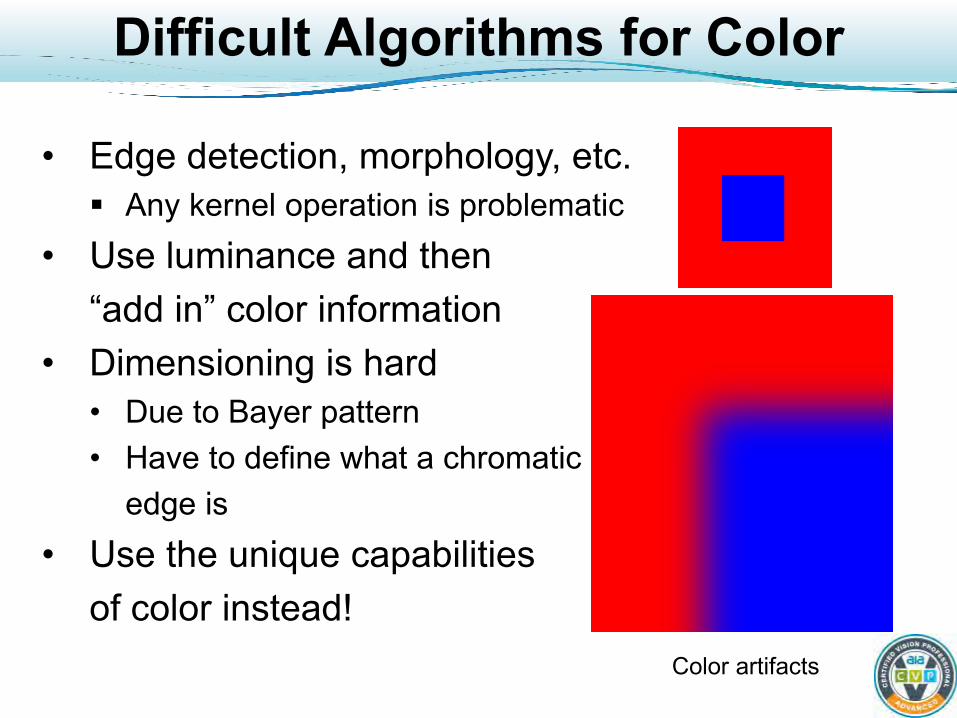
Difficult Algorithms for Color
• Edge detection, morphology, etc. Any kernel operation is problematic
• Use luminance and then “add in” color information • Dimensioning is hard
• Due to Bayer pattern • Have to define what a chromatic edge is
• Use the unique capabilities of color instead!
Color artifacts
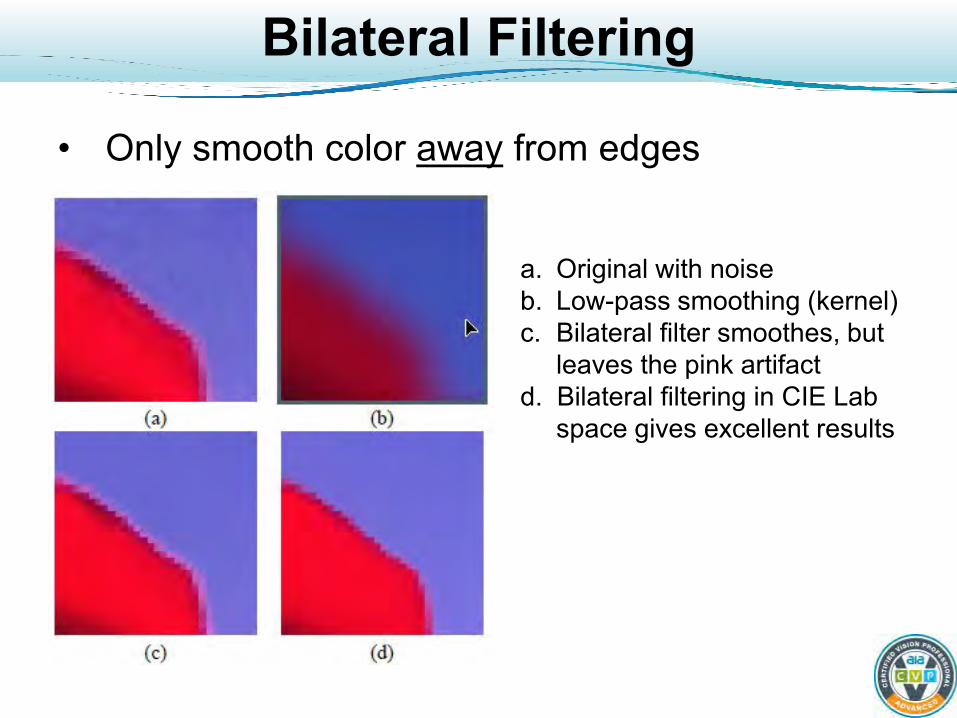
Bilateral Filtering
• Only smooth color away from edges
a. Original with noise b. Low-pass smoothing (kernel) c. Bilateral filter smoothes, but leaves the pink artifact d. Bilateral filtering in CIE Lab space gives excellent results
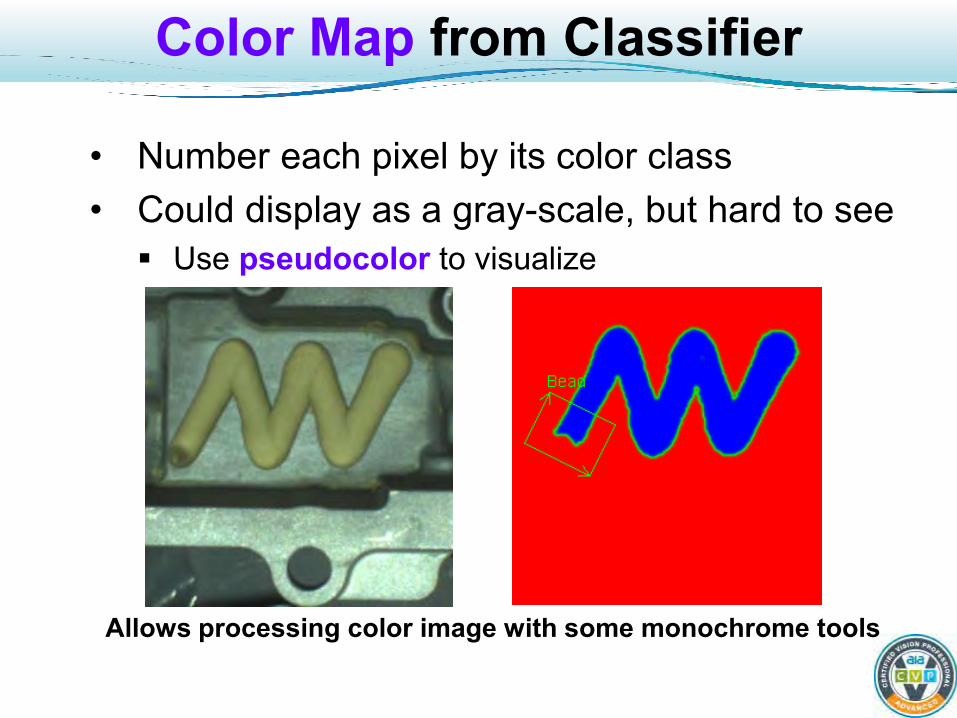
Color Map from Classifier
• Number each pixel by its color class • Could display as a gray-scale, but hard to see Use pseudocolor to visualize
Allows processing color image with some monochrome tools
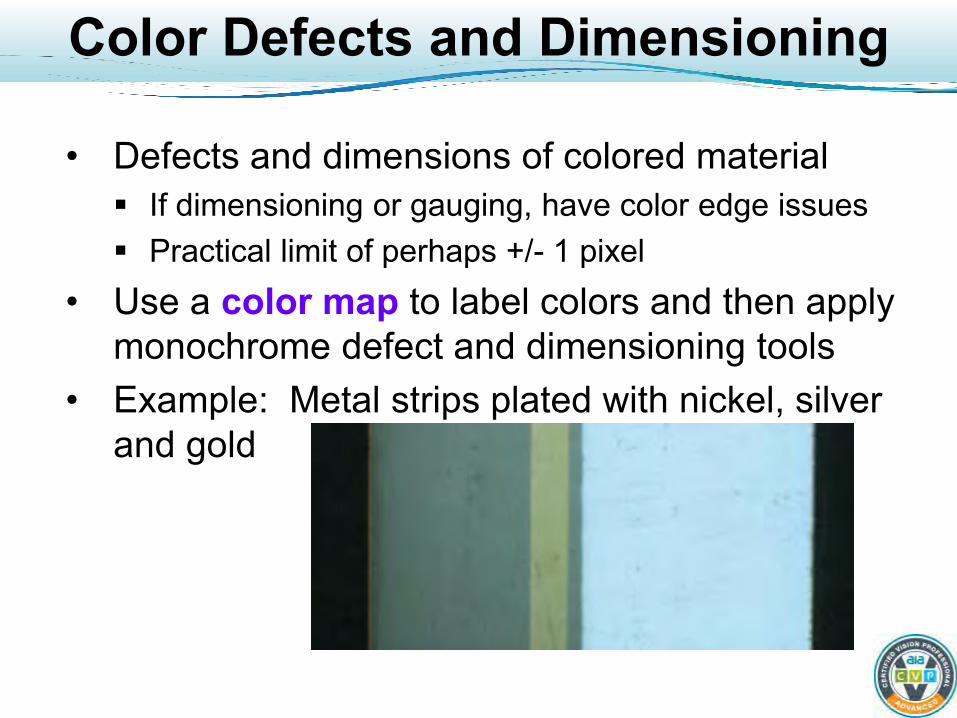
Color Defects and Dimensioning
• Defects and dimensions of colored material If dimensioning or gauging, have color edge issues Practical limit of perhaps +/- 1 pixel
• Use a color map to label colors and then apply monochrome defect and dimensioning tools
• Example: Metal strips plated with nickel, silver and gold
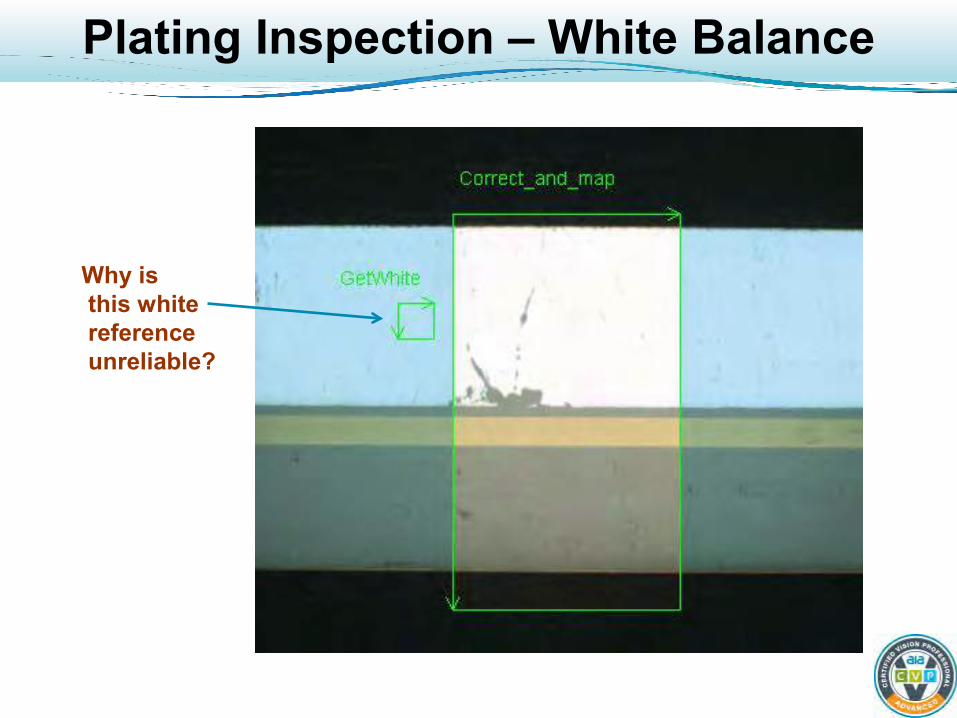
Plating Inspection – White Balance
Why is this white reference unreliable?
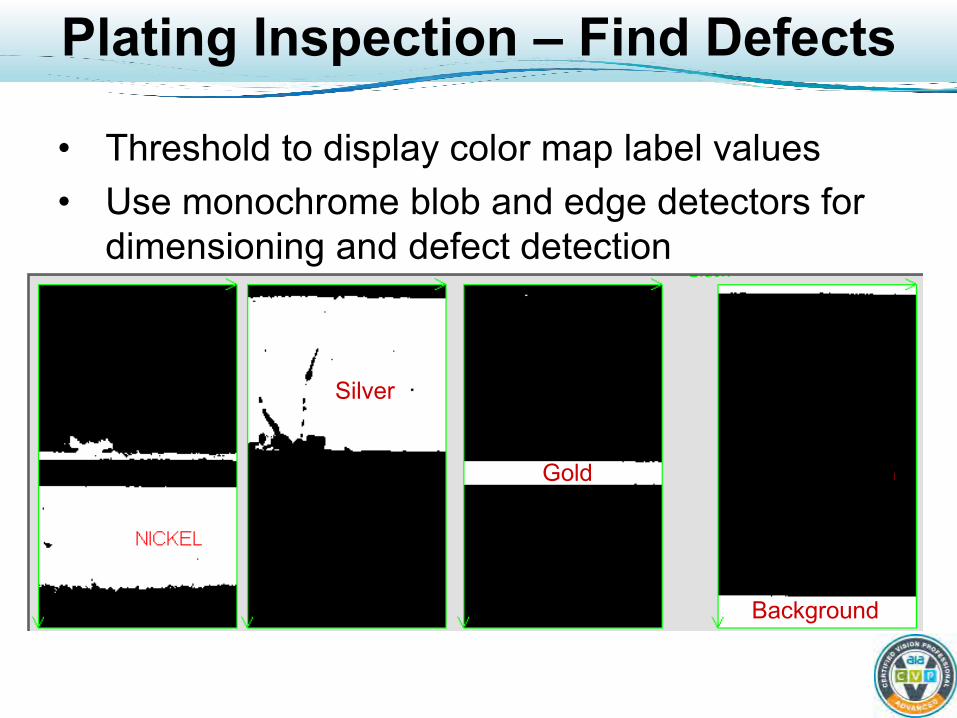
Plating Inspection – Find Defects
• Threshold to display color map label values • Use monochrome blob and edge detectors for
dimensioning and defect detection
Silver
Gold
Background

Sorting Recycled Plastic
Use a Color Map
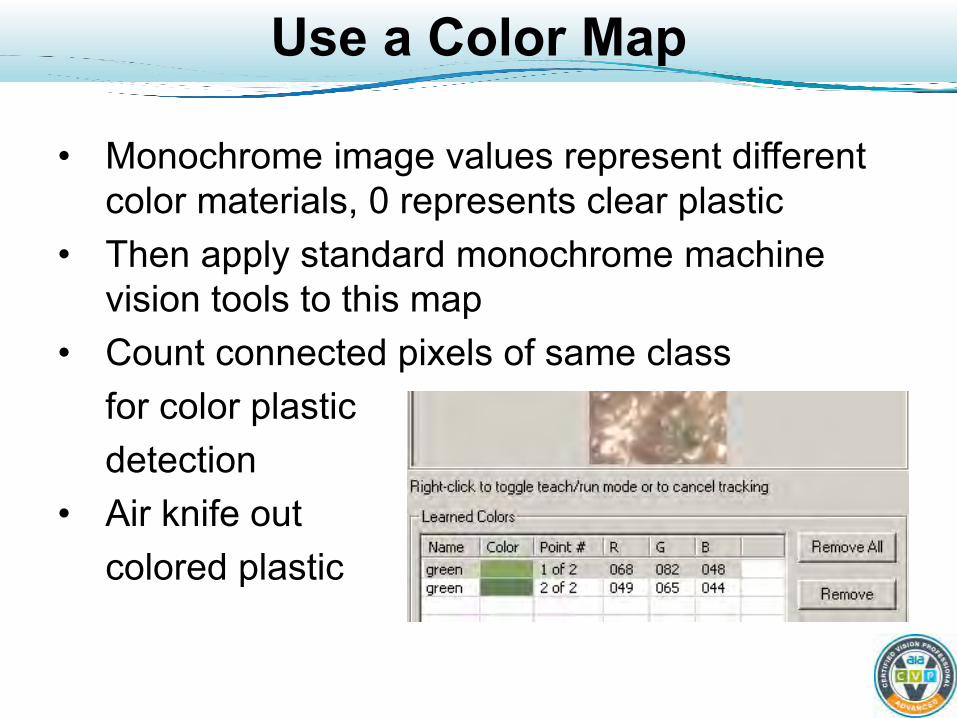
• Monochrome image values represent different color materials, 0 represents clear plastic
• Then apply standard monochrome machine vision tools to this map
• Count connected pixels of same class for color plastic detection • Air knife out colored plastic
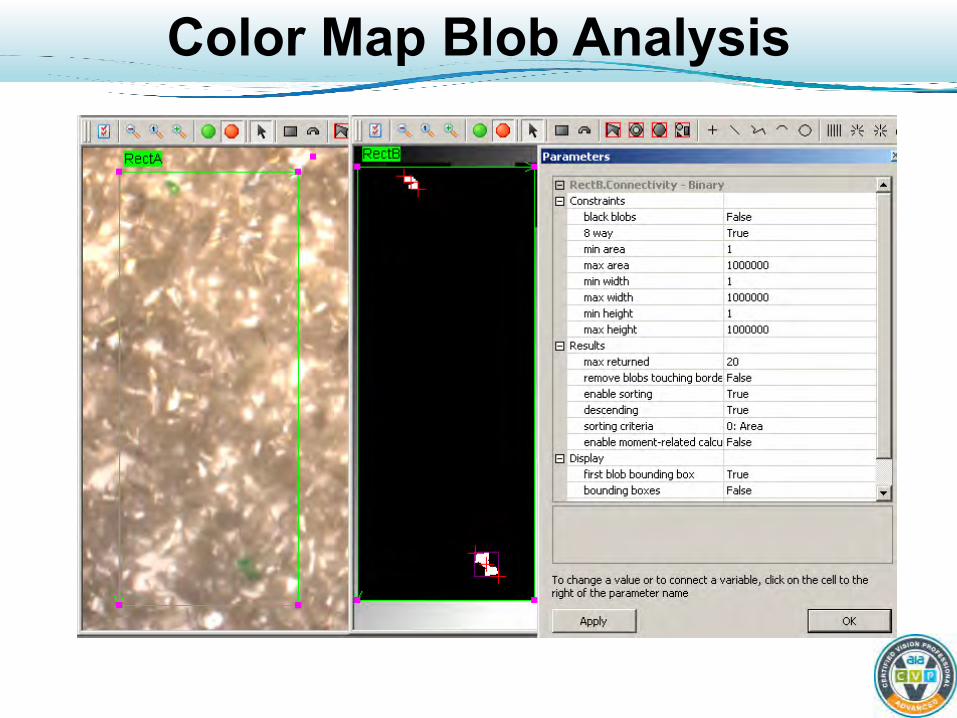
Color Map Blob Analysis
Counting Bows
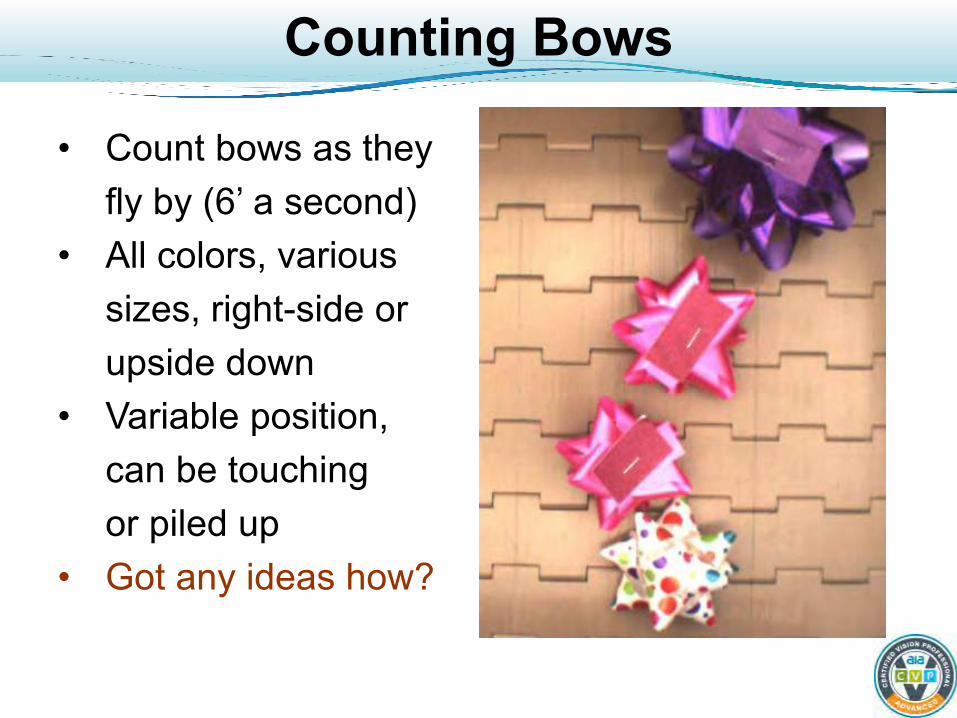
• Count bows as they fly by (6’ a second) • All colors, various sizes, right-side or upside down • Variable position, can be touching or piled up • Got any ideas how?
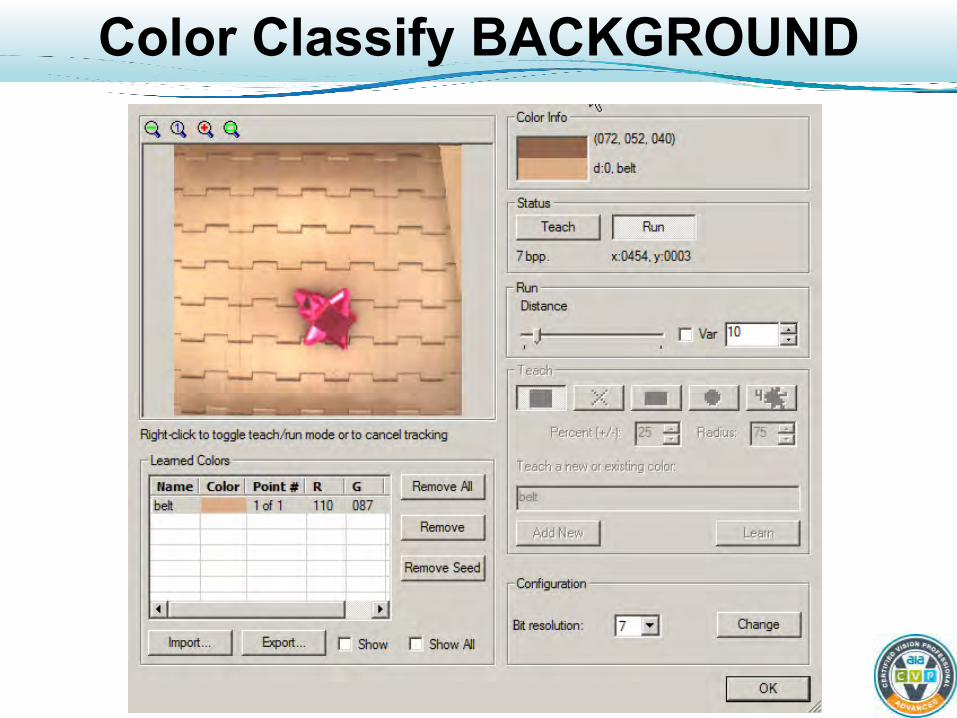
Color Classify BACKGROUND
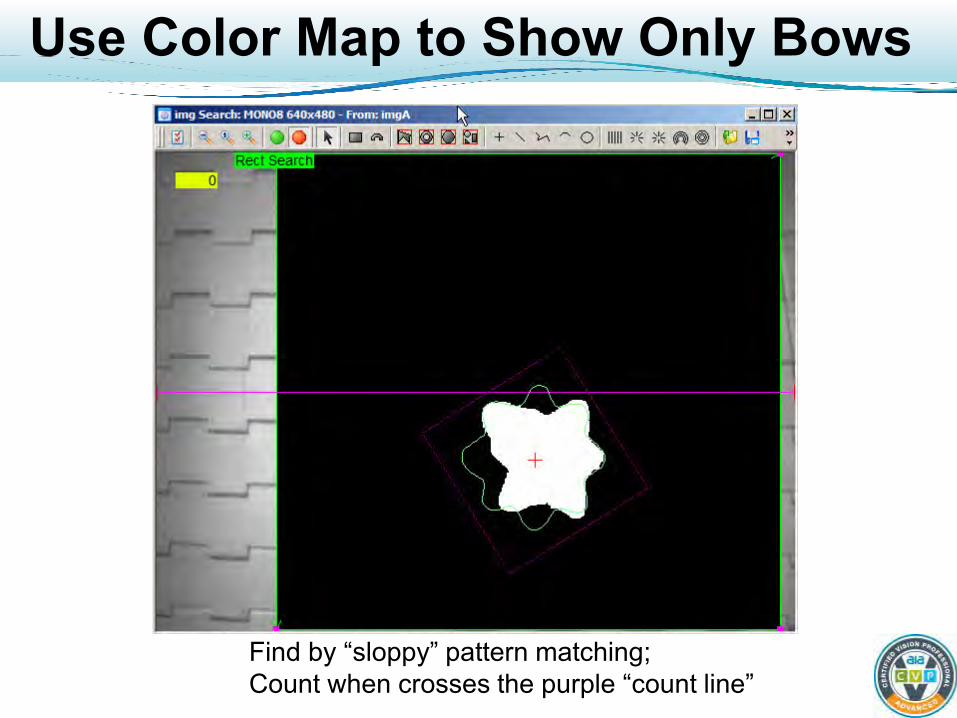
Use Color Map to Show Only Bows
Find by “sloppy” pattern matching; Count when crosses the purple “count line”
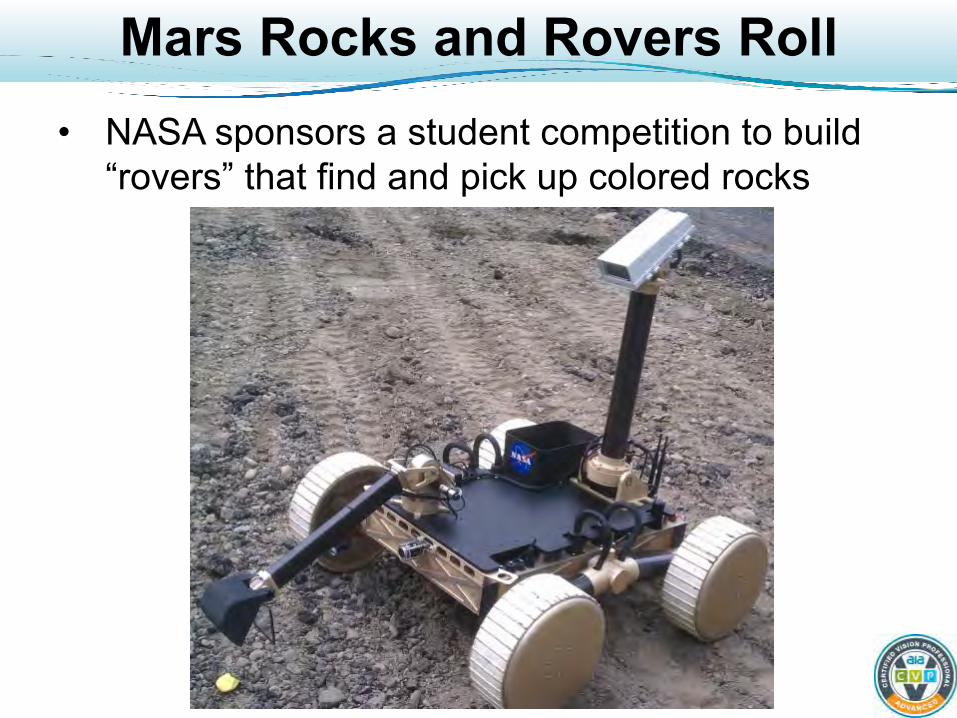
Mars Rocks and Rovers Roll • NASA sponsors a student competition to build
“rovers” that find and pick up colored rocks
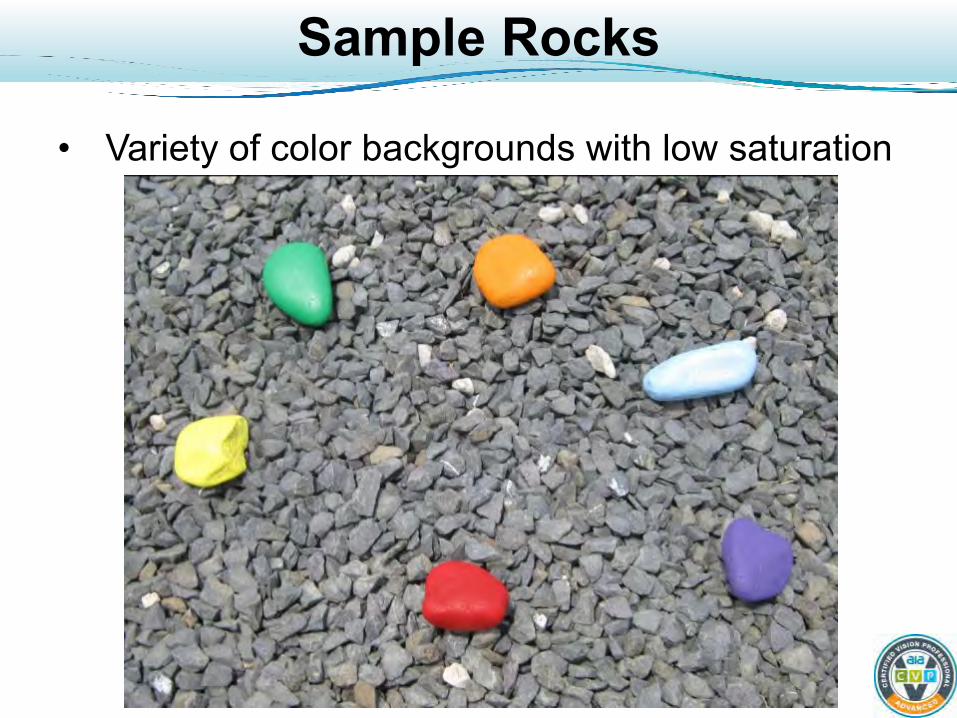
Sample Rocks
• Variety of color backgrounds with low saturation
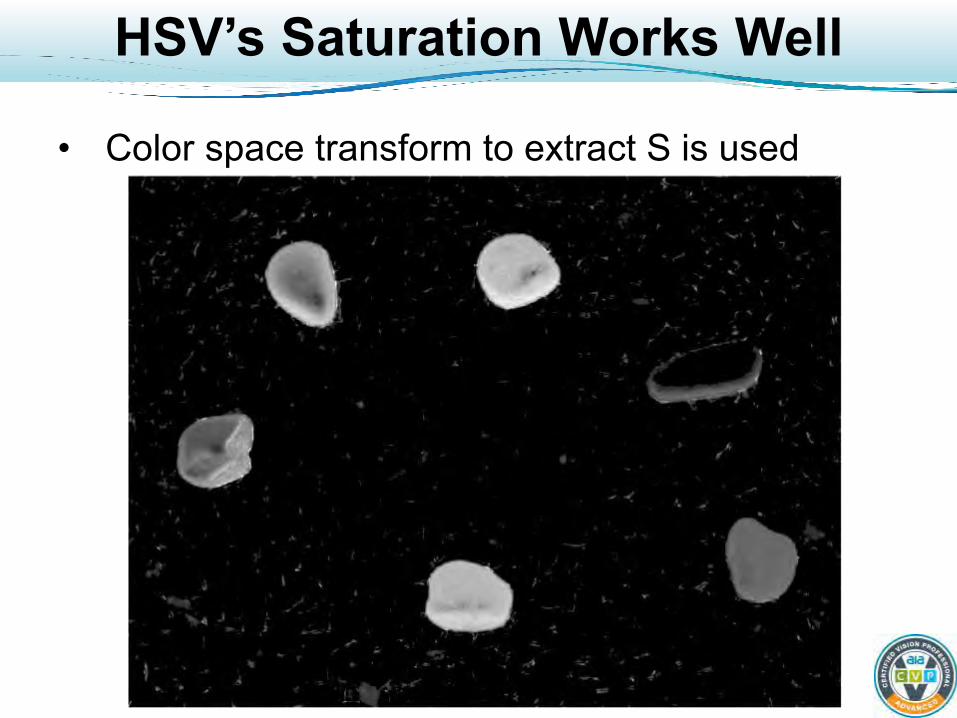
HSV’s Saturation Works Well
• Color space transform to extract S is used
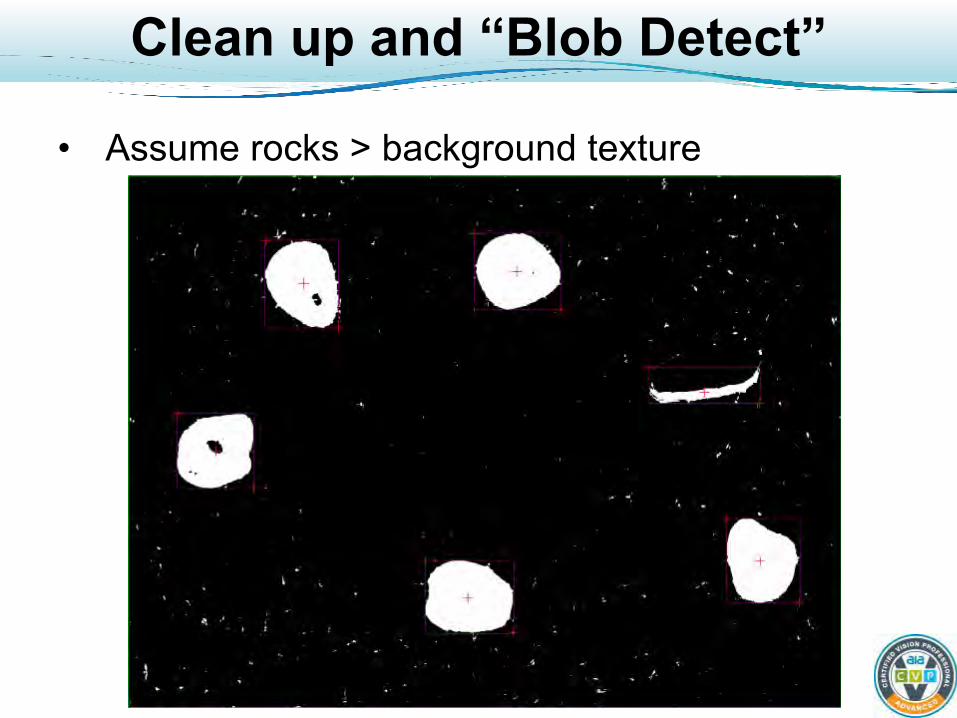
Clean up and “Blob Detect”
• Assume rocks > background texture

A Difficult Color Vision Problem
We can’t say who we helped do this…

Ben Dawson Director of Strategic Development
Teledyne DALSA IPD 700 Technology Park Drive Billerica, Massachusetts 01821 USA
Phone: +1 978-670-2000
Email: [email protected]
www.TeledyneDalsa.com
Related Documents