A UNEP Synthesis Report 2014 THE EMISSIONS GAP REPORT

Welcome message from author
This document is posted to help you gain knowledge. Please leave a comment to let me know what you think about it! Share it to your friends and learn new things together.
Transcript

ADVANCE COPY
A UNEP Synthesis Report2014
United Nations Environment ProgrammeP.O. Box 30552 - 00100 Nairobi, Kenya
Tel.: +254 20 762 1234Fax: +254 20 762 3927
e-mail: [email protected]
www.unep.org
THE EMISSIONS GAP REPORT
978-92-807-3413-3DEW/1833/NA
UNEP promotes environmentally sound practices
globally and in its own activities. This report is printed on paper from sustainable forests including recycled fibre. The paper is chlorine free, and the inks vegetable-based.
Our distribution policy aims to reduce UNEP’s carbon footprint
Published by the United Nations Environment Programme (UNEP), November 2014Copyright © UNEP 2014
ISBN: 978-92-807-3413-3 DEW/1833/NA
This publication may be reproduced in whole or in part and in any form for educational or non-pro�t services without special permission from the copyright holder, provided acknowledgement of the source is made. UNEP would appreciate receiving a copy of any publication that uses this publication as a source.
No use of this publication may be made for resale or any other commercial purpose whatsoever without prior permission in writing from the United Nations Environment Programme. Applications for such permission, with a statement of the purpose and extent of the reproduction, should be addressed to the Director, DCPI, UNEP, P. O. Box 30552, Nairobi 00100, Kenya.
Disclaimers Mention of a commercial company or product in this document does not imply endorsement by UNEP or the authors. The use of information from this document for publicity or advertising is not permitted. Trademark names and symbols are used in an editorial fashion with no intention on infringement of trademark or copyright laws.
The views expressed in this publication are those of the authors and do not necessarily re�ect the views of the United Nations Environment Programme. We regret any errors or omissions that may have been unwittingly made.
© Images and illustrations as speci�ed.
Citation This document may be cited as: UNEP 2014. The Emissions Gap Report 2014. United Nations Environment Programme (UNEP), Nairobi
A digital copy of this report along with supporting appendices are available at http://www.unep.org/emissionsgapreport2014/
This project is part of the International Climate Initiative. The Federal Ministry for the Environment, Nature Conservation, Building and Nuclear Safely supports this initiative on the basis of a decision adopted by the German Bundestag.
Cover Photo Credits© Soloviova Liudmyla/Shutterstock© WDG Photo
THE EMISSIONS GAP REPORT
A UNEP Synthesis Report2014
Published by the United Nations Environment Programme (UNEP), November 2014Copyright © UNEP 2014
ISBN: 978-92-807-3413-3 DEW/1833/NA
This publication may be reproduced in whole or in part and in any form for educational or non-pro�t services without special permission from the copyright holder, provided acknowledgement of the source is made. UNEP would appreciate receiving a copy of any publication that uses this publication as a source.
No use of this publication may be made for resale or any other commercial purpose whatsoever without prior permission in writing from the United Nations Environment Programme. Applications for such permission, with a statement of the purpose and extent of the reproduction, should be addressed to the Director, DCPI, UNEP, P. O. Box 30552, Nairobi 00100, Kenya.
Disclaimers Mention of a commercial company or product in this document does not imply endorsement by UNEP or the authors. The use of information from this document for publicity or advertising is not permitted. Trademark names and symbols are used in an editorial fashion with no intention on infringement of trademark or copyright laws.
The views expressed in this publication are those of the authors and do not necessarily re�ect the views of the United Nations Environment Programme. We regret any errors or omissions that may have been unwittingly made.
© Images and illustrations as speci�ed.
Citation This document may be cited as: UNEP 2014. The Emissions Gap Report 2014. United Nations Environment Programme (UNEP), Nairobi
A digital copy of this report along with supporting appendices are available at http://www.unep.org/emissionsgapreport2014/
This project is part of the International Climate Initiative. The Federal Ministry for the Environment, Nature Conservation, Building and Nuclear Safely supports this initiative on the basis of a decision adopted by the German Bundestag.
Cover Photo Credits© Soloviova Liudmyla/Shutterstock© WDG Photo
ii
EMISSIONS GAP REPORT A UNEP Synthesis
Acknowledgments
The United Nations Environment Programme (UNEP) would like to thank the members of the steering committee, the lead and contributing authors, reviewers and the secretariat for their contribution to the preparation of this assessment report.
Authors and reviewers have contributed to the report in their individual capacities. Their affiliations are only mentioned for identifi-cation purposes.
Project steering committeeJacqueline McGlade (United Nations Environment Programme), Bert Metz (European Climate Foundation), Ji Zou (National Centre for Climate Change Strategy and International Cooperation), John Christensen (United Nations Environment Programme), Katia Simeonova (United Nations Framework Convention on Climate Change), Klaus Müschen (Federal Environment Agency of Germany), María Paz Cigarán (Libélula), Merlyn van Voore (United Nations Environment Programme), Mónica Araya (Nivela), Simon Maxwell (Climate and Development Knowledge Network), Youba Sokona (South Centre)
Chapter 1Lead authors: Joseph Alcamo (University of Kassel), Daniel Puig (UNEP DTU Partnership), Joeri Rogelj (ETH Zurich / International Institute for Applied Systems Analysis)
Chapter 2Lead authors: Joeri Rogelj (ETH Zurich / International Institute for Applied Systems Analysis), David McCollum (International Institute for Applied Systems Analysis), Steven Smith (Pacific Northwest National Laboratory)
Contributing authors: Katherine Calvin (Pacific Northwest National Laboratory), Leon Clarke (Pacific Northwest National Laboratory), Monica Crippa (European Commission’s Joint Research Centre) , Amit Garg (Indian Institute of Management Ahmedabad), Kejun Jiang (Energy Research Institute), Volker Krey (International Institute for Applied Systems Analysis), Jason Lowe (Hadley Centre), Greet Maenhout (European Commission’s Joint Research Centre), Keywan Riahi (International Institute for Applied Systems Analysis), Michiel Schaeffer (Climate Analytics), Detlef van Vuuren (PBL Netherlands), Chen Wenying (Tsinghua University)
Chapter 3Lead authors: Michel den Elzen (PBL Netherlands), Taryn Fransen (World Resources Institute)
Contributing authors: Jusen Asuka (Tohoku University), Thomas Damassa (World Resources Institute), Hanna Fekete (NewClimate Institute), Jørgen Fenhann (UNEP DTU Partnership), Andries Hof (PBL Netherlands), Kejun Jiang (Energy Research Institute), Kelly Levin (World Resources Institute), Ritu Mathur (The Energy and Resources Institute), Mark Roelfsema (PBL Netherlands), Roberto Schaeffer (Federal University of Rio de Janeiro)
Chapter 4Lead authors: Kornelis Blok (Ecofys), Tim Farrell (Copenhagen Centre on Energy Efficiency), Niklas Höhne (NewClimate Institute), Ritu Mathur (The Energy and Resources Institute), Daniel Puig (UNEP DTU Partnership), Lisa Ryan (University College Dublin)
Contributing authors: Andreas Ernst (University of Kassel), Lewis Fulton (University of California at Davis), Kelly Levin (World Resources Institute),
Acknowledgments

iii
EMISSIONS GAP REPORT A UNEP Synthesis
Neha Pahuja (The Energy and Resources Institute), Lynn Price (Lawrence Berkeley National Laboratory), Julia Reinaud (European Climate Foundation), Hans-Paul Siderius (Netherlands Enterprise Energy), Diana Ürge-Vorsatz (Central European University)
ReviewersMónica Araya (Nivela), Jusen Asuka (Tohoku University), Juliane Berger (Federal Environment Agency of Germany), Monica Crippa (European Commission’s Joint Research Centre), Thomas Damassa (World Resources Institute), Rob Dellink (Organisation for Economic Co-operation and Development), Michel den Elzen (PBL Netherlands), Lewis Fulton (University of California at Davis), Tatsuya Hanaoka (National Institute for Environmental Studies), Andries Hof (PBL Netherlands), Lisa Hunsinger (Federal Environment Agency of Germany), Ariane Labat (European Commission), Benoît Lebot (International Partnership for Energy Efficiency Cooperation), Simone Lucatello (Instituto Mora), Greet Maenhout (European Commission’s Joint Research Centre), Simon Maxwell (Climate and Development Knowledge Network), Bert Metz (European Climate Foundation), Axel Michaelowa (Perspectives), Lera Miles (World Conservation Monitoring Centre), Klaus Müschen (Federal Environment Agency of Germany), Elizabeth Sawin (Climate Interactive), Roberto Schaeffer (Federal University of Rio de Janeiro), Katia Simeonova (United Nations Framework Convention on Climate Change), Christopher Taylor (Department of Energy and Climate Change), Zhao Xiusheng (Tsinghua University)
Thanks also toUnnada Chewpeecha (Cambridge Econometrics), Vijay Deshpande (Copenhagen Centre on Energy Efficiency), Philip Drost (United Nations Environment Programme), María Elena Gutiérrez (Libélula), Séraphine Häussling (United Nations Environment Programme), Kimon Keramidas (Enerdata), Tom Kober (ECN Netherlands), Cecilie Larsen (UNEP DTU Partnership), Prakriti Naswa (UNEP DTU Partnership), Ksenia Petrichenko
(Copenhagen Centre on Energy Efficiency), Hector Pollitt (Cambridge Econometrics), Uwe Remme (International Energy Agency), Aristeidis Tsakiris (Copenhagen Centre on Energy Efficiency), Steffi Richter (Federal Environment Agency of Germany)
Chief Scientific EditorJoseph Alcamo (University of Kassel)
Editorial teamDaniel Puig (UNEP DTU Partnership), Bert Metz (European Climate Foundation), Volodymyr Demkine (United Nations Environment Programme)
Project coordinationDaniel Puig (UNEP DTU Partnership), Volodymyr Demkine (United Nations Environment Programme), Emma A. Igual (UNEP DTU Partnership), Anne Olhoff (UNEP DTU Partnership), Lene Thorsted (UNEP DTU Partnership)
Media supportShereen Zorba (United Nations Environment Programme), Mette Annelie Rasmussen (UNEP DTU Partnership), Tamiza Khalid (United Nations Environment Programme), Kelvin Memia (United Nations Environment Programme), Waiganjo Njoroge (United Nations Environment Programme), Surabhi Goswami (UNEP DTU Partnership)
Gap model calculationsJørgen Fenhann (UNEP DTU Partnership)
Emission scenario calculationsJoeri Rogelj (ETH Zurich / International Institute for Applied Systems Analysis)
Copy editingBart Ullstein
Design, layout and printingAudrey Ringler (United Nations Environment Programme), Lene Søjberg (Phoenix Design Aid), UNON Publishing Services (ISO 14001:2004 certified)
Acknowledgments
iv
EMISSIONS GAP REPORT A UNEP Synthesis
Acknowledgments . . . . . . . . . . . . . . . . . . . . . . . . . . . . . . . . . . . . . . . . . . . . . . . . . . . . . . . . . . . . . . . . . . . . . . . . . . ii
Glossary . . . . . . . . . . . . . . . . . . . . . . . . . . . . . . . . . . . . . . . . . . . . . . . . . . . . . . . . . . . . . . . . . . . . . . . . . . . . . . . . . . . v
Acronyms . . . . . . . . . . . . . . . . . . . . . . . . . . . . . . . . . . . . . . . . . . . . . . . . . . . . . . . . . . . . . . . . . . . . . . . . . . . . . . . . viii
Foreword . . . . . . . . . . . . . . . . . . . . . . . . . . . . . . . . . . . . . . . . . . . . . . . . . . . . . . . . . . . . . . . . . . . . . . . . . . . . . . . . . . x
Executive Summary . . . . . . . . . . . . . . . . . . . . . . . . . . . . . . . . . . . . . . . . . . . . . . . . . . . . . . . . . . . . . . . . . . . . . . . .xiii
Chapter 1: Introduction . . . . . . . . . . . . . . . . . . . . . . . . . . . . . . . . . . . . . . . . . . . . . . . . . . . . . . . . . . . . . . . . . . . . . . . . . . . . . . 1
Chapter 2: What emission levels will comply with temperature limits? . . . . . . . . . . . . . . . . . . . . . . . . . . . . . . . . . 3
2.1 Current global emission levels . . . . . . . . . . . . . . . . . . . . . . . . . . . . . . . . . . . . . . . . . . . . . . . . . . . . . . . . . 3
2.2 Business-as-usual emission levels . . . . . . . . . . . . . . . . . . . . . . . . . . . . . . . . . . . . . . . . . . . . . . . . . . . . . . 5
2.3 Global emission levels linked with global warming limits . . . . . . . . . . . . . . . . . . . . . . . . . . . . . . . 6
Chapter 3: Emissions pledges and the emissions gap . . . . . . . . . . . . . . . . . . . . . . . . . . . . . . . . . . . . . . . . . . . . . . . .21
3.1 How big will the emissions gap be in 2020 and 2030? . . . . . . . . . . . . . . . . . . . . . . . . . . . . . . . . .21
3.2 Progress towards pledges: a closer look at major economies . . . . . . . . . . . . . . . . . . . . . . . . . .27
3.3 Summing up . . . . . . . . . . . . . . . . . . . . . . . . . . . . . . . . . . . . . . . . . . . . . . . . . . . . . . . . . . . . . . . . . . . . . . . .31
Chapter 4: Improving energy efficiency and reaping development and climate benefits . . . . . . . . . . . . . .33
4.1 Climate mitigation in a development context . . . . . . . . . . . . . . . . . . . . . . . . . . . . . . . . . . . . . . . . .33
4.2 Spotlight: energy efficiency has benefits for all . . . . . . . . . . . . . . . . . . . . . . . . . . . . . . . . . . . . . . . .37
References . . . . . . . . . . . . . . . . . . . . . . . . . . . . . . . . . . . . . . . . . . . . . . . . . . . . . . . . . . . . . . . . . . . . . . . . . . . . . . . . 49
contents
Contents

v
EMISSIONS GAP REPORT A UNEP Synthesis
The entries in this glossary are adapted from definitions provided by authoritative sources, such as the Intergovernmental Panel on Climate Change.
Additionality: A criterion sometimes applied to projects aimed at reducing greenhouse gas emissions. It stipulates that the emission reductions accomplished by the project must not have happened anyway had the project not taken place.
Aerosols: Airborne solid or liquid particles, with a typical size of between 0.01 and 10 micrometer (a millionth of a meter) that reside in the atmosphere for at least several hours. They may influence the climate directly through scattering and absorbing radiation, and indirectly by modifying the optical properties and lifetime of clouds.
Annex I parties/countries: The group of countries listed in Annex I to the United Nations Framework Convention on Climate Change. Under Articles 4.2 (a) and 4.2 (b) of the convention, Annex I Parties were committed to adopting national policies and measures with the non-legally binding aim to return their greenhouse gas emissions to 1990 levels by 2000. By default, the other countries are referred to as Non-Annex I Parties.
Biomass plus carbon capture and storage (BioCCS or BECCS): Use of energy produced from biomass where the combustion gases are then captured and stored underground or used, for example, in industrial processes. It excludes gases generated through, for example, a fermentation process (as opposed to combustion).
Biomass: The total mass of living organisms in a given area or volume, including products, by-products, and waste of biological origin (plants or animal matter) and excluding material embedded in geological formations and transformed to fossil fuels or peat.
Black carbon: The substance formed through the incomplete combustion of fossil fuels, biofuels, and biomass, which is emitted in both anthropogenic and naturally occurring soot. It consists of pure carbon in several linked forms. Black carbon warms the Earth by absorbing heat in the atmosphere and by reducing albedo – the ability to reflect sunlight – when deposited on snow and ice.
Bottom-up model: In the context of this assessment, a model that represents a system by looking at its detailed underlying parts. Compared to so-called top-down models, which focus on economic inter-linkages, bottom-up models of energy use and emissions can provide greater resolution with regards to sectors or mitigation technologies.
Business-as-usual: A scenario that describes future greenhouse gas emission levels in the absence of additional mitigation efforts and policies (with respect to an agreed set).
Carbon dioxide emissions budget: For a given temperature rise limit, for example a 1.5 or 2 °C long-term limit, the corresponding carbon budget reflects the total amount of carbon emissions that can be emitted to stay within that limit. Stated differently, a carbon budget is the area under a greenhouse gas emissions trajectory that satisfies assumptions about limits on cumulative emissions estimated to avoid a certain level of global mean surface temperature rise.
glossAry
Glossary

vi
EMISSIONS GAP REPORT A UNEP Synthesis
Carbon credits: An entitlement allocated by a government to a legal entity (company or other type of emitter) to emit a specified amount of a substance. These entitlements, which may be transferrable and tradable, can be used to reduce emissions of greenhouse gases (by giving them a monetary value) or can be used for accounting of emissions.
Carbon dioxide equivalent: A way to place emissions of various radiative forcing agents on a common footing by accounting for their effect on climate. It describes, for a given mixture and amount of greenhouse gases, the amount of carbon dioxide that would have the same global warming ability, when measured over a specified time period. For the purpose of this report, greenhouse gas emissions (unless otherwise specified) are the sum of the basket of greenhouse gases listed in Annex A to the Kyoto Protocol, expressed as carbon dioxide equivalents assuming a 100-year global warming potential.
Carbon leakage: Phenomenon whereby the reduction in emissions (relative to a baseline) in a jurisdiction or sector associated with the implementation of mitigation policy is offset to some degree by an increase outside of that jurisdiction or sector which can be causally linked to the aforementioned reduction.
Conditional pledges: Greenhouse gas emissions reduction pledges made by some countries that are contingent on the ability of national legislatures to enact the necessary laws, ambitious action from other countries, realization of finance and technical support, or other factors.
Double counting: In the context of this assessment, double counting refers to a situation in which the same emission reductions are counted towards meeting two countries’ pledges.
Emission pathway: The trajectory of annual global greenhouse gas emissions over time.
Global warming potential: An index, based on the radiative properties of greenhouse gases, measuring the radiative forcing following a pulse emission of a unit mass of a given greenhouse gas in the present-day atmosphere integrated over a chosen time horizon, relative to that of carbon dioxide. The global warming potential represents the combined effect of the differing times these gases remain in the atmosphere and their relative effectiveness in causing radiative forcing.
Greenhouse gases covered by the Kyoto Protocol: The six greenhouse gases listed in Annex A to the Kyoto Protocol: carbon dioxide (CO
2); methane (CH
4); nitrous oxide (N
2O); hydrofluorocarbons (HFCs);
perfluorocarbons (PFCs); and sulphur hexafluoride (SF6)1.
Integrated assessment models: Models that seek to combine knowledge from multiple disciplines in the form of equations and/or algorithms in order to explore complex environmental problems. As such, they describe the full chain of climate change, from production of greenhouse gases to atmospheric responses. This necessarily includes relevant links and feedbacks between socio-economic and bio-physical processes.
International cooperative initiatives: Initiatives outside of the United Nations Framework Convention on Climate Change aimed at reducing emissions of climate forcers by, for example, promoting actions that are less greenhouse gas intensive, compared to prevailing alternatives. Cooperative initiatives also involve national and sub-national partners (they are often referred to as, simply, ‘cooperative initiatives’).
Kyoto Protocol: A protocol to the United Nations Framework Convention on Climate Change that contains legally binding commitments, in addition to those included in the UNFCCC. Countries included in Annex B of the Protocol (most Organisation for Economic Cooperation and Development countries and countries with economies in transition) agreed to reduce their anthropogenic greenhouse gas emissions (carbon dioxide, methane, nitrous oxide, hydrofluorocarbons, perfluorocarbons, and sulphur hexafluoride) by at least five per cent below 1990 levels in the commitment period 2008–2012.
____________________1 Nitrogen trifluoride (NF
3) is not included as it applies only from the beginning of the second commitment period.
Glossary

vii
EMISSIONS GAP REPORT A UNEP Synthesis
Later-action scenarios: Climate change mitigation scenarios in which emission levels in the near term, typically up to 2020 or 2030, are higher than those in the corresponding least-cost scenarios.
Least-cost scenarios: Climate change mitigation scenarios assuming that emission reductions start immediately after the model base year, typically 2010, and are distributed optimally over time, such that aggregate costs of reaching the climate target are minimized.
Lenient rules: Pledge cases with maximum Annex I land use, land-use change and forestry (LULUCF) credits and surplus emissions units, and maximum impact of double counting.
Likely chance: A likelihood greater than 66 per cent. Used in this assessment to convey the probabilities of meeting temperature limits.
Medium chance: A likelihood of 50–66 per cent. Used in this report to convey the probabilities of meeting temperature limits.
Montreal Protocol: The Montreal Protocol on Substances that Deplete the Ozone Layer is an international treaty that was designed to reduce the production and consumption of ozone-depleting substances in order to reduce their abundance in the atmosphere, and thereby protect the Earth’s ozone layer.
Non-Annex I countries/parties: See Annex I countries/parties.
Pledges: For the purpose of this assessment, pledges include Annex I targets and non-Annex I actions, as included in Appendix I and Appendix II to the Copenhagen Accord, and subsequently revised and updated in some instances.
Radiative forcing: Change in the net, downward minus upward, irradiance, expressed in watt per square meter (W/m2), at the tropopause due to a change in an external driver of climate change, such as, for example, a change in the concentration of carbon dioxide or the output of the Sun. For the purposes of this assessment, radiative forcing is further defined as the change relative to the year 1750 and, unless otherwise noted, refers to a global and annual average value.
Scenario: A description of how the future may unfold based on if-then propositions. Scenarios typically include an initial socio-economic situation and a description of the key driving forces and future changes in emissions, temperature or other climate change-related variables.
Strict rules: Pledge cases in which the impact of land use, land-use change and forestry (LULUCF) credits and surplus emissions units are set to zero.
Top-down model: A model that applies macroeconomic theory, econometric and/or optimisation techniques to aggregate economic variables. Using historical data on consumption, prices, incomes, and factor costs, top-down models assess demand and emissions for goods and services from main sectors, such as energy conversion, transportation, buildings, agriculture and industry.
Transient climate response: Measure of the temperature rise that occurs at the time of a doubling of carbon dioxide concentration in the atmosphere.
Transient climate response to cumulative carbon emissions: Measure of temperature rise per unit of cumulative carbon emissions.
Unconditional pledges: Pledges made by countries without conditions attached.
20th–80th percentile range: Results that fall within the 20–80 per cent range of the frequency distribution of results in this assessment.
Glossary

viii
EMISSIONS GAP REPORT A UNEP Synthesis
AR5 fifth Assessment Report of the Intergovernmental Panel on Climate Change
BaU business-as-usual
BC black carbon
BECCS bio-energy with carbon capture and storage
CCS carbon capture and storage
CDM Clean Development Mechanism
CER certified emission reduction
CFC chlorofluorocarbon
CO2e carbon dioxide equivalent
COP Conference of the Parties to the United Nations Framework Convention on Climate Change
EDGAR Emissions Database for Global Atmospheric Research
ERU emission reduction unit
EU-ETS European Union Emissions Trading System
FF&I fossil fuels and industry
GDP gross domestic product
GEA Global Energy Assessment
GHG greenhouse gas
Gt gigatonne
GWP global warming potential
HCFC hydrochlorofluorocarbon
HFC hydrofluorocarbon
IAM integrated assessment model
ICI international cooperative initiative
Acronyms
Acronyms

ix
EMISSIONS GAP REPORT A UNEP Synthesis
IEA International Energy Agency
IPCC Intergovernmental Panel on Climate Change
LED Light-emitting diode
LULUCF Land use, Land-Use Change and Forestry
NAMA Nationally Appropriate Mitigation Action
NGO non-governmental organisation
OC organic carbon
ODS ozone-depleting substances
OECD Organisation for Economic Cooperation and Development
PAM policies and measures
REDD+ reduced emissions from deforestation and forest degradation
SE4ALL Sustainable Energy for All
SO2 sulphur dioxide
SOC soil organic carbon
TCR transient climate response
TCRE transient climate response to cumulative carbon emissions
UNEP United Nations Environment Programme
UNFCCC United Nations Framework Convention on Climate Change
US$ United States dollar
Acronyms

x
EMISSIONS GAP REPORT A UNEP Synthesis
Foreword
Foreword
The Fifth Assessment Report by the Intergovernmental Panel on Climate Change, released earlier this year, is a sobering reminder that climate change is unequivocal, that it is essentially driven by human activity, and that it represents one of the biggest challenges of our time. The risks of inaction are too high to be ignored, and the effects of global warming can already be felt in many aspects of human life.
Further to the Copenhagen Accord of 2009 and the Cancun agreements of 2010, over 90 countries have made voluntary pledges and commitments toward cutting their emission levels. However, despite these and related efforts, current pledges and commitments are not sufficient to keep the average rise in global temperature below 2° Celsius, compared to pre-industrial levels: the associated “gap” in required emission reductions is growing, not closing.
Over the past four years the “emissions gap” series published by the United Nations Environment Programme has analysed the size of the gap and has provided insights on options to close it. This fifth report provides an updated measure of the emissions gap. In addition, this year’s update of

xi
EMISSIONS GAP REPORT A UNEP Synthesis
the analysis calculates an emissions gap relative to expected emission levels in 2030, in recognition of the growing focus that action beyond 2020 is gaining in international climate change negotiations. Not least, the report provides an assessment of the carbon budget that is consistent with the 2° Celsius temperature target.
Consistent with the findings of the 2014 assessment by the Intergovernmental Panel on Climate Change, our analysis reveals a worrisome worsening trend. Continued emissions of greenhouse gases will lead to an even warmer climate and exacerbate the devastating effects of climate change. Failure to curb climate change does not only undermine prosperity for millions of people, most acutely in the developing world: it threatens to roll back decades of development and to hamper the capacity of countries to achieve key societal goals, such as poverty reduction or economic growth.
Against this background, this report explores the multiple benefits of tried and tested development
policies – benefits in terms of, for example, employment creation, economic growth, improved environmental quality and, not least, reduced greenhouse gas emissions. Unlike previous editions of the report, this year’s update does not focus on a specific sector. Instead, we illustrate the multiple benefits of one greenhouse gas mitigation option – energy efficiency improvements – across a wide range of sectors. Our findings show that multiple benefits, including climate change mitigation, can indeed be achieved by implementing fundamentally simple and well-known development policies.
The conclusions of the report are a stark reminder that, to meet the goals of the United Nations Framework Convention on Climate Change, consistent and decisive action is required without any further delay. I hope that the analysis presented in this fifth “emissions gap” report will help parties to the climate change convention negotiate positions that result in increased action. Everyone will gain if the outcome will enable more ambitious actions by more actors – sooner rather than later.
Foreword
Achim SteinerUN Under Secretary General and UNEP Executive Director
xii
EMISSIONS GAP REPORT A UNEP Synthesis
Executive Summary
© WDG Photo/Shutterstock
xiii
EMISSIONS GAP REPORT A UNEP Synthesis
Executive Summary
The world is moving towards a crucial new climate agreement in 2015, which could provide the long-needed global plan to slow down climate change and enable humanity to adapt to the unavoidable part of a changing climate. While recognizing that some climate change is unavoidable, global leaders at the 2010 Cancun Climate Conference1
agreed to limit global warming to 2 °C in this century, relative to the pre-industrial period. They also decided to review this limit to see if it should be further lowered to 1.5 °C.
Given the aim to limit global temperature, the critical question has now become what level of global emissions would make this possible? The United Nations Environment Programme (UNEP) has tackled this question since 2010 by convening a large group of knowledgeable scientists to prepare the Emissions Gap reports. These reports have examined the gap in 2020 between emission levels consistent with the 2 °C limit, and levels expected if country pledges/commitments are met. In earlier reports the scientists conveyed the message that indeed a large gap exists, but also that there were many promising opportunities for bridging the gap.
executive summAry
1 . What is the focus of this year’s report?
The focus of this year’s update is on the emissions budget for staying within the 2°C limit .
This fifth Emissions Gap report has a different focus from previous years. While it updates the 2020 emissions gap analysis, it gives particular attention to the implications of the global carbon dioxide emissions budget for staying within the 2 °C limit beyond 2020. It does so because countries are giving increasing attention to where they need to be in 2025, 2030 and beyond. Furthermore, this year’s update of the report benefits from the findings on the emissions budget from the latest series of Intergovernmental Panel on Climate Change (IPCC) reports2.
As noted by the IPCC, scientists have determined that an increase in global temperature is proportional to the build-up of long-lasting greenhouse gases in the atmosphere, especially carbon dioxide. Based on this finding, they have estimated the maximum amount of carbon dioxide that could be emitted over time to the atmosphere and still stay within the 2 °C limit. This is called the carbon dioxide emissions budget because, if the world stays within this budget, it should be possible to stay within the 2 °C global warming limit. In the hypothetical case that carbon dioxide was the only human-made greenhouse gas, the IPCC estimated a total carbon dioxide budget
____________________1 The 16th Conference of Parties of the United Nations Framework Convention on Climate Change. 2 Another reason for changing the report’s focus is that previous reports have concentrated on findings from least-cost scenarios that begin in 2010 or earlier.
However, these scenarios have become decreasingly useful because emissions in recent years have been consistently higher than, and thus not in line with, these scenarios. Second, it will be increasingly difficult to implement new large-scale emission control measures by 2020. Hence, looking beyond 2020 becomes even more important. Third, the move towards sustainable development goals will directly or indirectly influence climate targets, with countries likely to settle on 2025 and 2030 as the target year for these goals.

xiv
EMISSIONS GAP REPORT A UNEP Synthesis
Executive Summary
of about 3 670 gigatonnes of carbon dioxide (Gt CO
2) for a likely chance of staying within the 2
°C limit3. Since emissions began rapidly growing in the late 19th century, the world has already emitted around 1 900 Gt CO
2 and so has used
up a large part of this budget. Moreover, human activities also result in emissions of a variety of other substances that have an impact on global warming and these substances also reduce the total available budget to about 2 900 Gt CO
2. This
leaves less than about 1 000 Gt CO2 to “spend” in
the future4. The key questions are: how can these emissions best be spread out over time; at what
point in time should net carbon dioxide emissions fall to zero – that is, when should we become budget neutral in the sense that we sequester as much as we emit; and how much can we spend of the budget at different points in the future and still stay within the temperature limit? To tackle these questions this year’s Emissions Gap report analyses the scenarios published in the latest IPCC reports. It also examines the great potential for improving energy efficiency, which would not only reduce greenhouse gas emissions but also meet many other societal goals. Key findings from these analyses are presented in the following sections.
____________________3 A likely chance denotes a greater than 66 per cent chance, as specified by the IPCC.4 The Working Group III contribution to the IPCC AR5 reports that scenarios in its category which is consistent with limiting warming to below 2 °C have carbon
dioxide budgets between 2011 and 2100 of about 630-1 180 Gt CO2. See main text.
2010 2100
2010
0
0
2100
Remaining budget
Remaining budgetSlower exhaustionof emissions budget
Rapid exhaustionof emissions budget
Annual global CO2 emissions
Annual global CO2 emissions
Carbon neutrality
Lower emissionsover next decades
budgetovershoot
budgetovershoot
Later carbon neutrality
Net negativeemissions to compensatefor overshootof budget
Lower level of netnegative emissions
Available CO2 emissions budget
from the 19th century onward
Available CO2 emissions budget
from 2012 onward
2 900 Gt
1 000 Gt
Figure ES .1: Carbon neutrality
xv
EMISSIONS GAP REPORT A UNEP Synthesis
Executive Summary
2 . What does the budget approach say about emission levels and their timing to meet the 2 °C limit?
To stay within the 2 °C limit, global carbon neutrality will need to be achieved sometime between 2055 and 2070 .
Using the carbon budget approach and information from integrated assessment models it is possible to estimate when or if global carbon neutrality will need to be reached during the 21st century in order to have a likely chance of staying within the 2 °C limit.
Here global carbon neutrality means that annual anthropogenic carbon dioxide emissions5 are net zero on the global scale (Figure ES.1). Net zero implies that some remaining carbon dioxide emissions could be compensated by the same amount of carbon dioxide uptake (negative emissions) so long as the net input of carbon dioxide to the atmosphere due to human activities is zero.
The fact that global emissions will continue to be larger than zero in the immediate future means that at some point we will exhaust the carbon dioxide emissions budget and annual net emissions will have to drop to zero to avoid exceeding the budget. If we do exceed the budget, then negative emissions will be required to stay within the 2 °C limit (Figure ES.1).
Based on a subset of scenarios from the IPCC Fifth Assessment Report (AR5) scenario database6, the best estimate is that global carbon neutrality is reached between 2055 and 2070 in order to have a likely chance of staying within the 2 °C limit. This same subset of scenarios is used throughout this Summary for calculating emissions consistent with the 2 °C limit, with the exception of the calculation of the 2020 gap, as explained in Section 5 of the Summary.
To stay within the 2 °C limit, total global greenhouse gas emissions need to shrink to net zero some time between 2080 and 2100 .
An important point about carbon neutrality is that it only refers to carbon dioxide emissions. Nonetheless, it is well known that other greenhouse gases also cause global temperature increases. Among these are methane, nitrous oxide and hydrofluorocarbons. Current and likely future emissions of these and other non-carbon dioxide greenhouse gases have been taken into account in the above estimation of when carbon neutrality should be reached. The next question is, when must total greenhouse gas emissions (carbon dioxide plus non-carbon dioxide)7 reach net zero in order to stay within the emissions budget?
Based on additional assumptions about non-carbon dioxide emissions8, it has been estimated that global total greenhouse gas emissions will need to reach net zero sometime between
____________________5 In this Summary emissions always refer to anthropogenic emissions.6 This subset (called Least-cost 2020 scenarios in this report) consists of scenarios that begin in 2010, have a likely chance of staying within the 2 °C limit, have modest
emission reductions up to 2020, assume country pledges are fully implemented in 2020, and follow least-cost emission pathways leading to rapid reductions after 2020. Modest here means that the pace of emission reductions up to 2020 is significantly slower than in scenarios that have a likely chance of staying within the 2 °C limit and follow a least-cost emission pathway beginning in 2010. A least-cost emission pathway is an emissions pathway that takes advantage of lowest cost options for emission reductions and minimizes total costs of reduction up to 2100. These scenarios are often called delayed action or later action scenarios because they begin their least-cost pathway in 2020 rather than 2010.
This subset of scenarios is used for three main reasons. First, because actual emissions since 2010 have been higher than in other types of scenarios in the IPCC scenarios database, particularly those that meet the 2 oC target and have a least-cost pathway beginning in 2010 rather than 2020. (These are called Least-cost 2010 scenarios in this report. These scenarios have lower global emissions up to 2020 than the Least-cost 2020 scenarios because they follow a least-cost pathway from 2010 rather than 2020.) Second, because the Least-cost 2020 scenarios seem to be more in accord with current projections of emissions for 2020. Global emissions in 2020 under various pledge cases are estimated to be about 52–54 Gt CO
2e. The Least-cost 2020 scenarios used here have global emissions close to this range
(50–53 Gt CO2e). The Least-cost 2010 scenarios have much lower global emissions in 2020 (41–47 Gt CO
2e). Third, the Least-cost 2020 scenarios are consistent with
negotiations to deliver a new climate agreement, which provides a framework for higher ambition beginning in 2020. (Current negotiations aim to “further raise the existing level of ... action and stated ambition to bring greenhouse gas emissions down.”) For these reasons, the Least-cost 2020 scenarios are used for calculating emissions consistent with the 2 °C limit, with the exception of the 2020 gap, as explained in Section 5 of the Summary.
7 Total greenhouse gas emissions here and elsewhere in the report refer to the sum of the six greenhouse gases covered by the Kyoto Protocol (carbon dioxide, methane, nitrous oxide, hydrofluorocarbons, perfluorinated compounds and sulphur hexaflouride).
8 Since most scenarios assume that it will be difficult to remove 100 per cent of non-carbon dioxide emissions (for example, all of methane from agriculture) the scenarios assume that these residual emissions will be compensated for by net negative carbon dioxide emissions after total net zero greenhouse gas emissions are achieved. Under these circumstances, it is logical that first carbon neutrality is reached, and then net zero total greenhouse gas emissions.

xvi
EMISSIONS GAP REPORT A UNEP Synthesis
Executive Summary
2080 and 2100. Although this is somewhat later than the timing for carbon neutrality it does not assume slower reductions of non-carbon dioxide emissions. On the contrary, non-carbon dioxide and carbon dioxide emissions are assumed to be reduced with about the same level of effort9.
The estimates here are again based on a subset of scenarios that have a likely chance of staying within the 2 °C limit10. As in the case of carbon neutrality, the net part of net zero emissions means that any global residual emissions from society could be compensated by enough uptake of carbon dioxide and other greenhouse gases from the atmosphere (negative emissions) to make sure that the net input of total greenhouse gases to the atmosphere is zero.
Bringing global emissions down to below the pledge range in 2020 allows us to postpone the timing of carbon neutrality and net zero total emissions .
An important consequence of the carbon budget is that the lower the annual emissions in the immediate future, including in the years up to 2020, the relatively higher they can be later, and
the longer the time we have before exhausting the emissions budget. This would allow us to push back the timing of carbon neutrality and net-zero total emissions. Hence taking more action now reduces the need for taking more extreme action later to stay within the 2 °C limit.
Following the budget approach, the levels of annual global emissions consistent with the 2 °C limit have been estimated. Under these circumstances, global emissions in 2050 are around 55 per cent below 2010 levels . By 2030 global emissions have already turned the corner and are more than 10 per cent below 2010 levels after earlier peaking .
Countries took the important decision at the Durban Climate Conference11 to pursue a new climate agreement, expected to enter into effect in 2020. This raises the crucial question about which global emission levels after 2020 are consistent with staying within the 2 °C limit. The estimates in the following table (Table ES.1) were made with this question in mind12.
These estimates are based on the same subset of scenarios from the IPCC AR5 database as used
____________________9 “About the same level of effort” means that both non-carbon dioxide and carbon dioxide emissions are assumed to be reduced in the scenarios if they have similar
costs (per carbon-equivalent) of reduction. The reason for the later timing of net zero total greenhouse gas emissions is explained in Footnote 8.10 The same scenarios described in Footnote 6.11 The 17th Conference of the Parties of the United Nations Framework Convention on Climate Change.12 Emission levels in this table are higher than those reported in the Emissions Gap report 2013. The reason is that the 2013 report used scenarios that assumed least-
cost emission pathways (with stringent reductions of global emissions) beginning in 2010. Hence, emission levels in that report for the time frame up to 2050 were lower than in this report. It is worth noting, that because the scenarios used in this report have higher emissions over the next few years, they also assume that a much higher level of negative emissions will be needed to compensate for them later in the 21st century (see Section 3 of the Summary).
Year Median (Gt CO
2e)
Relative to 1990 emissions
Relative to 2010 emissions
Range (Gt CO
2e)
Relative to 1990 emissions
Relative to 2010 emissions
2025 47 +27% -4% 40 to 48 +8 to +30% - 2 to -18%2030 42 +14% -14% 30 to 44 -19 to +19% -10 to -39%2050 22 -40% -55% 18 to 25 -32 to -51% - 49 to -63%
Notes: Since current emissions are 54 Gt CO2e and rising (see Section 4 of the Summary), substantial emission reductions will be needed
to reach these levels.
Table ES .1: Required greenhouse gas emission levels (Gt CO2e) for a likely chance of staying within the 2 °C limit

xvii
EMISSIONS GAP REPORT A UNEP Synthesis
Executive Summary
1990 2010 2012 2025 2030 2050
55
50
45
4037
49
54
4847
42
22
40
44
30
25
18
35
30
25
20
15
10
5
0
Emiss
ions
(Gt C
O2e
/yr)
HistoricalEstimated emission levelsMedian
____________________13 These are the scenarios described in Footnote 6.14 These are the scenarios described in Footnote 6.
Figure ES .2: Emission levels consistent with the 2 °C target
above. They have a likely chance of staying within the 2 °C limit, assume pledge implementation in 2020, and then follow a least-cost emissions pathway after 202013.
3 . What are the consequences of delayed action?
The consequences of postponing stringent emission reductions will be additional costs and higher risks to society .
The current pathway of global emissions is consistent with scenarios that assume only modest emission reductions up to 2020 and then stringent mitigation thereafter14. By postponing rigorous
action until 2020, this pathway will save on costs of mitigation in the near term. But it will bring much higher costs and risks later on, such as:
i: much higher rates of global emission reductions in the medium term;
ii: greater lock-in of carbon-intensive infrastructure; iii: greater dependence on using all available
mitigation technologies in the medium-term;iv: greater costs of mitigation in the medium-
and long-term, and greater risks of economic disruption;
v: greater reliance on negative emissions; and vi: greater risks of failing to meet the 2 °C target,
which would lead to substantially higher adaptation challenges and costs.
xviii
EMISSIONS GAP REPORT A UNEP Synthesis
Executive Summary
Delaying stringent action till 2030 will further aggravate these risks and reduce the likelihood of meeting the 2 °C target to 50 per cent or less. Conversely, putting greater effort into reducing emissions over the next few years would reduce all of these risks and would bring many co-benefits along with climate mitigation (see Section 7 of the Summary).
The higher the emissions level in the near term, the higher the level of negative emissions needed later in the century as compensation . Although scenarios routinely assume a substantial amount of global negative emissions, the feasibility of these assumptions still needs to be explored .
Another consequence of the current pathway of emissions (see Section 2 of the Summary) is that it implies that net negative emissions are needed to stay within the 2 °C limit, to compensate for higher emissions in 2020 and following decades. Theoretically, carbon uptake or net negative emissions could be achieved by extensive reforestation and forest growth, or by schemes that combine bioenergy use with carbon capture and storage15. But the feasibility of such large-scale schemes is still uncertain. Even though they seem feasible on a small scale, the question remains as to how much they can be scaled up without having unacceptable social, economic or environmental consequences. As noted above, the quicker emissions are reduced now, the less society will be dependent on negative emissions later.
4 . Where are we headed under business-as-usual conditions?
Although it is clear from the science that emissions soon need to peak to stay within the 2 °C target16, global greenhouse gas emissions continue to rise . Without additional climate
policies global emissions will increase hugely up to at least 2050 .
Since 1990, global emissions have grown by more than 45 per cent and were approximately 54 Gt CO
2e in 2012. Looking to the future, scientists
have produced business-as-usual scenarios as benchmarks to see what emission levels would be like in the absence of additional climate policies, also assuming country pledges would not be implemented. Under these scenarios, global greenhouse gas emissions would rise to about 59 Gt CO2e in 2020, 68 Gt CO2e in 2030 and 87 Gt CO2e in 2050. It is clear that global emissions are not expected to peak unless additional emission reduction policies are introduced.
5 . What about the 2020 emissions gap?
The 2020 gap is not becoming smaller . Country pledges and commitments for 2020 result in only a moderate reduction in global emissions below business-as-usual levels .
As an update of previous Emissions Gap reports, we have again estimated the expected level of global greenhouse gas emissions in 2020 under five pledge cases, which cover a range of variants for complying with country pledges and commitments. The range of median estimates is 52–54 Gt CO2
e, about the same as in the 2013 report. It is 6–12 per cent above 2010 emissions of 49 Gt CO2e and about 7–12 per cent lower than the business-as-usual level in 2020.
The 2020 emissions gap has been updated in this report. The gap in 2020 is defined as the difference between global emission levels consistent with the 2 °C target and the emission levels expected if country pledge cases are implemented. Global emissions in 2020 should not be higher than 44 Gt CO
2e to have a likely chance of staying within
____________________15 Here and elsewhere in this Summary we refer to net negative emissions, meaning that on a global level, the sum of negative emissions exceeds any residual positive
emissions to the atmosphere. Also, these are anthropogenic negative emissions and would have to be additional to any natural uptake of greenhouse gases by the biosphere or oceans.
16 About 85 per cent of scenarios in the IPCC scenario database with a likely chance of staying within the 2 °C limit have peak global greenhouse gas emissions in 2020 or before.
xix
EMISSIONS GAP REPORT A UNEP Synthesis
Executive Summary
the 2 °C target17. However, the range of expected global emissions (median estimates) from the pledge cases is 52–54 Gt CO
2e in 2020, as noted
above. The gap in 2020 is therefore 8–10 Gt CO2e (52 minus 44 and 54 minus 44). This is of the same magnitude as given in the 2013 report.
For continuity, we base these estimates on the same kind of scenarios used in previous reports18. But these scenarios were computed some years ago and assume that a least-cost pathway with stringent emission reductions begins in 2010, whereas actual global emissions in recent years have been consistently higher. Hence, the 2020 gap estimate is becoming increasingly uncertain.
Previous Emissions Gap reports pointed out that the potential exists to reduce emissions and narrow the gap in 2020, although this is becoming increasingly difficult as we get closer to that year. Nevertheless, the lower the emissions between now and 2020, the lower the risks caused by delaying emission reductions, as noted above.
Without further action current pledges will not be met by a number of countries and global emissions could be above the top end of the pledge range .
Above we saw that the current implementation level of pledges is not adequate for bridging the 2020 emissions gap, but it does slow down the growth in emissions. A further important question is whether countries are on track to realize the pledges.
After reviewing available evidence from the G20 (with the EU 28 taken as a group) it appears that five parties to the United Nations Framework Convention on Climate Change – Brazil, China, the EU28, India and the Russian Federation – are
on track to meet their pledges. Four parties – Australia, Canada, Mexico and the USA – are likely to require further action and/or purchased offsets to meet their pledges, according to government and independent estimates of projected national emissions in 2020. Conclusions are not drawn for Japan, the Republic of Korea, Indonesia and South Africa because of various uncertainties, nor for Argentina, Turkey and Saudi Arabia because they have not proposed pledges.
On the global scale, this report estimates that emissions will rise to 55 (rounded from 54.5) Gt CO2
e in 2020 if countries do not go beyond their current climate policies. This is above the top of the pledge range of 54 Gt CO
2e (rounded median estimate).
6 . What about the emissions gap in 2030?
The emissions gap in 2030 is estimated to be about 14–17 Gt CO2e but can be closed if the available global emissions reduction potential is exploited .
As countries discuss the contours of a new climate agreement for the period after 2020, the question arises whether an emissions gap will occur in 2030. The gap in 2030 is defined as the difference between global emission levels consistent with the 2 °C target versus the emissions levels expected if the pledge cases are extrapolated to 2030.
This report estimates that global emissions in 2030 consistent with having a likely chance of staying within the 2 °C target are about 42 Gt CO2e19.
As for expected emissions in 2030, the range of the pledge cases in 2020 (52–54 Gt CO
2e)
was extrapolated to give median estimates of 56–59 Gt CO
2e in 2030.
____________________17 This estimate is based on the subset of emission scenarios from the IPCC AR5 database (called Least-cost 2010 scenarios in this report). These are the same type of
scenarios used in previous Emissions Gap reports to compute the 2020 emissions gap. These scenarios begin in 2010, have a likely chance of staying within the 2 °C limit, and follow a least-cost emissions pathway with stringent reductions (exceeding current pledges and commitments) after 2010. Least-cost emission pathway is defined in Footnote 6.
18 See Footnote 17.19 This estimate is based on the subset of emission scenarios from the IPCC AR5 database described in Footnote 6. A different subset of scenarios was used for
estimating the 2020 gap in order to be consistent with previous reports.
xx
EMISSIONS GAP REPORT A UNEP Synthesis
Executive Summary
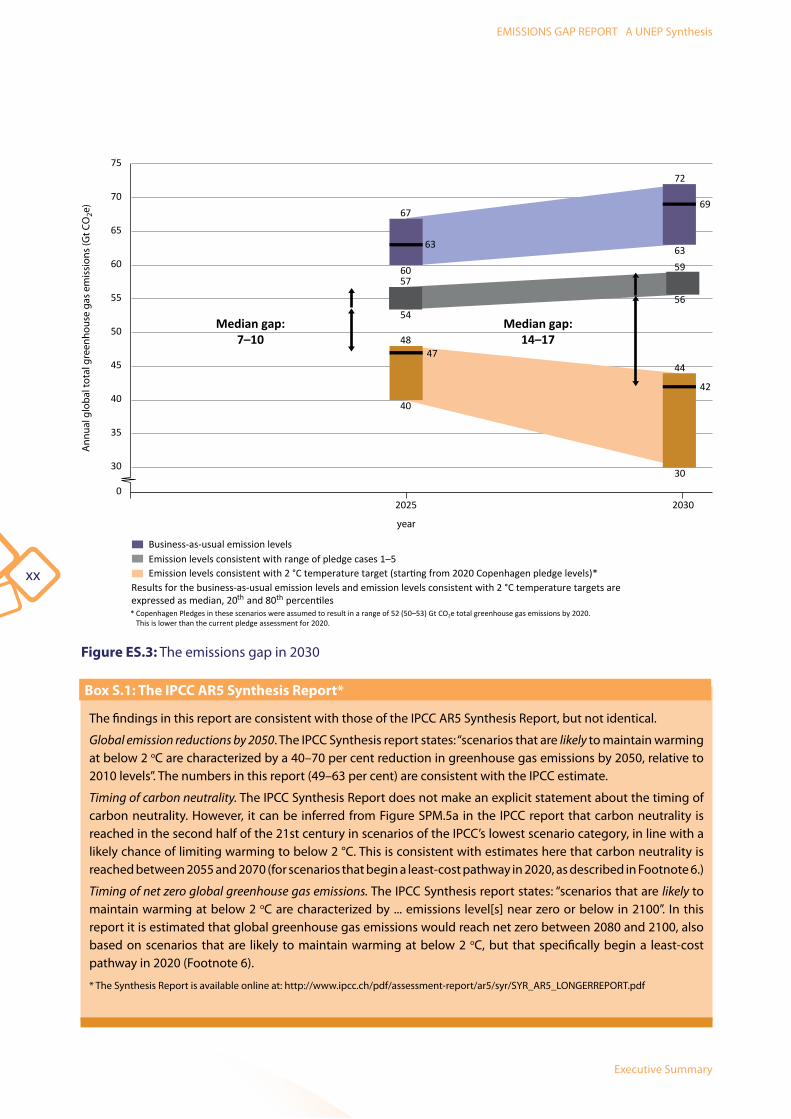
Figure ES .3: The emissions gap in 2030
Box S .1: The IPCC AR5 Synthesis Report*
The findings in this report are consistent with those of the IPCC AR5 Synthesis Report, but not identical.
Global emission reductions by 2050. The IPCC Synthesis report states: “scenarios that are likely to maintain warming at below 2 oC are characterized by a 40–70 per cent reduction in greenhouse gas emissions by 2050, relative to 2010 levels”. The numbers in this report (49–63 per cent) are consistent with the IPCC estimate.
Timing of carbon neutrality. The IPCC Synthesis Report does not make an explicit statement about the timing of carbon neutrality. However, it can be inferred from Figure SPM.5a in the IPCC report that carbon neutrality is reached in the second half of the 21st century in scenarios of the IPCC’s lowest scenario category, in line with a likely chance of limiting warming to below 2 °C. This is consistent with estimates here that carbon neutrality is reached between 2055 and 2070 (for scenarios that begin a least-cost pathway in 2020, as described in Footnote 6.)
Timing of net zero global greenhouse gas emissions. The IPCC Synthesis report states: “scenarios that are likely to maintain warming at below 2 oC are characterized by ... emissions level[s] near zero or below in 2100”. In this report it is estimated that global greenhouse gas emissions would reach net zero between 2080 and 2100, also based on scenarios that are likely to maintain warming at below 2 oC, but that specifically begin a least-cost pathway in 2020 (Footnote 6).
* The Synthesis Report is available online at: http://www.ipcc.ch/pdf/assessment-report/ar5/syr/SYR_AR5_LONGERREPORT.pdf
Median gap:7–10
30
35
40
45
50
55
60
65
70
75
year
2025 20300
30
44
42
4847
40
72
67
60
63
69
6359
56
57
54Median gap:
14–17
* Copenhagen Pledges in these scenarios were assumed to result in a range of 52 (50–53) Gt CO2e total greenhouse gas emissions by 2020. This is lower than the current pledge assessment for 2020.
Emission levels consistent with range of pledge cases 1–5Emission levels consistent with 2 °C temperature target (starting from 2020 Copenhagen pledge levels)*
Results for the business-as-usual emission levels and emission levels consistent with 2 °C temperature targets areexpressed as median, 20 and 80 percentiles
Business-as-usual emission levels
Ann
ual g
loba
l tot
al g
reen
hous
e ga
s em
issi
ons
(Gt C
O2e
)
th th
xxi
EMISSIONS GAP REPORT A UNEP Synthesis
Executive Summary
The emissions gap in 2030 is therefore estimated to be 14–17 Gt CO
2e (56 minus 42 and 59 minus
42). This is equivalent to about a third of current global greenhouse emissions (or 26–32 per cent of 2012 emission levels).
As a reference point, the gap in 2030 relative to business-as-usual emissions in that year (68 Gt CO
2e) is 26 Gt CO
2e. The good news is that
the potential to reduce global emissions relative to the baseline is estimated to be 29 Gt CO
2e, that is,
larger than this gap. This means that it is feasible to close the 2030 gap and stay within the 2 °C limit.
7 . How can climate change mitigation be linked with actions to promote sustainable development?
There is a strong case for integrating climate change mitigation in a policy framework that can deliver economic growth, social development and climate and environmental protection .
Actions to mitigate climate change often have close synergies with policies that countries need for achieving domestic goals of improved energy access and energy security, or reduction in air pollution. The Sustainable Development Goals presented in the report of the Open Working Group20 underscore the many synergies between development goals and climate change mitigation goals. For example, efforts to eradicate energy poverty, promote universal access to cleaner forms of energy, and double energy efficiency, if fully realised, would go a long way towards bringing the world back to a path consistent with the temperature target set by the United Nations Framework Convention on Climate Change. Linking development with climate mitigation also helps countries build energy efficient and low-emissions infrastructure for the coming decades, and achieve deep transformational changes in the economy and society worldwide.
Policies and measures are being applied worldwide that promote both sustainable development and reduce greenhouse gas emissions .
The good news is that countries and other actors are already widely applying policies that are very beneficial to both sustainable development and climate mitigation. About half the countries in the world have national policies for promoting more efficient use of energy in buildings, such as heating and/or cooling. About half are working on raising the efficiency of appliances and lighting. Other national policies and measures are promoting electricity generation with renewable energy, reducing transport demand and shifting transport modes, reducing process-related emissions from industry, and advancing sustainable agriculture. Significant public and private investments are flowing into energy efficiency (US$ 310–360 billion in 2012) and renewable energy (US$ 244 billion in the same year).
Non-state actors such as regions, cities and companies are also promoting policies that advance both sustainable development and emission reductions. Some of these non-state actors have come together (in some cases with governments) to form international cooperative initiatives (ICIs) for pursuing specific sustainable development, energy, environmental and climate mitigation objectives. These ICIs have the potential to significantly reduce greenhouse gas emissions in support of, and potentially beyond, national emission reduction pledges. The interest and importance of these initiatives is increasing and a plethora of new such initiatives were proposed at the UN Secretary General’s Climate Summit in New York in September 201421.
____________________ 20 The report is available online at: http://sustainabledevelopment.un.org/focussdgs.html21 Further details are available online at: http://sustainabledevelopment.un.org/index.html

xxii
EMISSIONS GAP REPORT A UNEP Synthesis
Executive Summary
If climate mitigation actions already taking place were to be replicated and scaled up, they would provide a huge potential to reduce greenhouse gas emissions .
Experience shows that countries can make rapid progress in climate mitigation when they integrate climate policy into their core development strategy, lay out a long-term strategic vision, and build wide-ranging political support for those changes. Scaling up the many feasible actions that reduce emissions and promote sustainable development yields a large potential for reducing global emissions. In 2030 this potential adds up to no less than 29 Gt CO
2e. As a reference point,
this is equivalent to nearly 60 per cent of global emissions in 2010.
New polices and measures based on proven approaches can provide the necessary incentives to achieve the full potential of climate mitigation and the associated short-term development benefits .
New government policies are needed to overcome barriers and create the right incentives for climate mitigation. One approach is to adjust fuel prices, through carbon taxes or emissions trading systems, so that they incorporate the costs of climate change and other environmental damages. Another is to reduce or abolish subsidies on fossil fuels, estimated to be more than US$ 600 billion annually, and thereby avoid this huge annual governmental expenditure. To make investments in low-carbon and resource-efficient assets attractive, risks need to be reduced, the general investment climate improved, financing costs lowered and government budget support made available. New policies are needed to promote the diffusion of innovative technologies in order to overcome the risk aversion of potential users, and other obstacles. But the transition to a low-carbon future may create losers in some companies and
segments of the population. The impact of new policies on these groups needs to be considered and enterprises and society need to be given time to adjust to the new paradigm.
8 . How can energy efficiency help to promote development while contributing to emission reductions?
Energy efficiency has multiple social, economic and environmental benefits .
Past Emissions Gap reports have focused on good practices in different sectors and their ability to stimulate economic activity and development, while reducing emissions. Following this tradition, this report focuses on the vast potential to improve energy efficiency across many different sectors.
Globally the energy intensity between 2002 and 2012 was estimated to have improved on average by 1.6 per cent annually22. Improvements in energy efficiency in 18 Organisation of Economic Co-operation and Development (OECD) countries over the period 2001–2011 have resulted in cumulative energy savings of 1 731 million tonnes of oil equivalent (Mtoe) – more than the equivalent of the total energy demand of the EU in 2011. As a result, energy efficiency is increasingly called the ‘first fuel’.
Improving energy efficiency comes with substantial multiple benefits. Not only does it reduce or avoid greenhouse emissions, but it has long been considered a main way to increase productivity and sustainability, primarily through the delivery of energy savings. Moreover, energy efficiency measures can contribute to economic growth and social development by increasing economic output, employment and energy security. In a scenario with carbon prices of US$ 70 per tonne, for example, improvements in energy efficiency are estimated to result in a
____________________22 Energy intensity and energy efficiency are not exactly equivalent since energy intensity is a function of both the economic structure and energy efficiency of an
economy. However, as is often the case, if the economic structure does not change significantly over time, then the changes in energy intensity can be used as a proxy for changes in energy efficiency.

xxiii
EMISSIONS GAP REPORT A UNEP Synthesis
Executive Summary
0.2–0.5 per cent increase in gross domestic product (GDP) in 2030, relative to a baseline level23.
Improving energy efficiency also has important positive social impacts. It reduces, for example, air pollution and its public health risks: nearly 100 000 premature deaths related to air pollution in six regions – Brazil, China, the EU, India, Mexico and the USA – could be avoided annually by 2030 through energy efficiency measures in the transport, buildings and industrial sectors. In many cases these benefits have a higher priority for governments than climate change mitigation. Hence improving energy efficiency can be seen as an excellent opportunity for linking sustainable development with climate mitigation.
Improving energy efficiency has a high potential for reducing global emissions, and in a very cost effective way .
Between 2015 and 2030, energy efficiency improvements worldwide could avoid 22–24 Gt CO
2e (or 2.5–3.3 Gt CO
2e annually in 2030)
relative to a baseline scenario and assuming a carbon price of US$ 70 per tonne. This corresponds to a reduction in primary energy demand of about 5–7 per cent over the same 15-year period and relative to the same baseline scenario. Improvements in energy efficiency represent about one-fifth of all cost-effective emission reduction measures over the same 15-year period24. Depending on the assumptions, estimates are higher. For example, the International Energy Agency reports that end-use fuel and electricity efficiency could save 6.8 Gt CO
2e
in 2030, and power generation efficiency and fossil fuel switching could save 0.3 Gt CO
2e, also in 2030.
An assessment by the German Aerospace Centre estimates that 13 Gt CO
2e could be saved in 2030
through energy efficiency improvements alone.
Many energy efficiency measures can be implemented with negative or very low long-term
costs due to reduced energy bills that offset the sometimes higher upfront costs, compared to less efficient technologies, not even considering positive economic effects and multiple societal benefits.
There are great opportunities for improving the energy efficiency of heating, cooling, appliances and lighting in the buildings sector .
There is tremendous potential for improving energy efficiency in the buildings sector. Because of advances in materials and know-how, new energy efficient buildings use 60–90 per cent less energy than conventional buildings of a similar type and configuration, and are cost-effective in all countries and climate zones.
As compared to developed countries, the rate of new building construction in developing countries is much higher, which means that energy efficiency in buildings can best be achieved through regulations for building energy performance or codes for new construction. Several developing countries, and virtually all OECD countries, have some form of building code in place. Because they have an older building stock with a low rate of turnover, most developed countries also need to pay special attention to renovating their existing buildings in an energy efficient manner.
The provision of heating, cooling and hot water is estimated to account for roughly half the global energy consumption in buildings. Some cities are providing both thermal and electrical energy to buildings in a very efficient manner through district energy systems. Although these systems have been used mostly in cooler climates in the northern hemisphere, they are also becoming a popular way to cool buildings efficiently, for example in Dubai, Kuwait and Singapore.
Appliances and lighting also account for a significant amount of energy use in buildings, and
____________________23 These improvements correspond to a reduction in primary energy demand of nearly 10 per cent and a reduction in final energy consumption of 6–8 per cent,
compared with a baseline scenario in 2030. 24 These emission reduction estimates relate to abatement costs that would be economically efficient to incur in the period to 2030 (on average, worldwide) if carbon
emissions were priced at US$ 70 per tonne over that same period.

xxiv
EMISSIONS GAP REPORT A UNEP Synthesis
Executive Summary
great progress has been made in improving their energy efficiency through national standards and labelling programmes. The number of countries with these programmes has grown rapidly from 50–81 between 2004 and 2013. The two key policy measures used to improve energy efficiency of appliances and lighting include:
i: mandating the energy performance of equipment through standards and regulation; and
ii: labelling their energy performance.
An important task is to acknowledge and tackle the many barriers to saving energy in buildings, including uneven dissemination of information, limited access to capital, high discount rates and market fragmentation. To overcome these and other barriers there are many successful and time-tested policies that can be drawn upon, including energy and carbon taxes, energy performance standards and regulations, investment grants, soft loans, mandatory energy audits, energy efficiency obligations (for example, for utilities) and energy labelling and certification schemes.
Rather than applying standardized policies, the industrial sector uses a wide variety of country- and subsector-specific approaches to improve its energy efficiency .
There is substantial potential for reducing energy use in the industrial sector. But due to its diverse nature, it has proven impractical to implement standardized policies and measures. Most policy packages are very country-, subsector- and size-specific.
A typical approach is for governments to assist companies in identifying cost-effective investments, often through energy audits or in-depth energy reviews. Governments also provide incentives for making these investments by reducing the payback time of these investments, through subsidies and loans; by mandating, through energy-saving targets and emissions trading; or by
encouraging implementation through voluntary agreements and differentiated electricity pricing.
Three particularly promising policies and measures are worth highlighting:
i: Corporate energy saving programmes lay down comprehensive requirements to reduce energy use in the industrial sector. China has one of the most extensive of these programmes, the Top-10,000 Energy-Consuming Enterprises.
ii: Energy consumption targets are company-specific targets for energy-intensive sectors, such as aluminium or cement. India’s Perform, Achieve and Trade, with its 478 target companies, is a major example.
iii: Energy performance standards are common for three-phase electric motors – standards are now mandatory in 44 countries, including Brazil, China, the Republic of Korea and the USA. Another example is that China has applied specific energy efficiency standards to the production of 39 industrial commodities.
Improving energy efficiency in the transport sector can slow down growing fuel consumption . Effective policies are available to make that happen .
Worldwide, more than half of oil consumption is for transport; three-quarters of transport energy is consumed on roads. Without strong new policies, fuel use for road transport is projected to double between 2010 and 2050. Nevertheless, a huge amount of energy can be saved in the transport sector now and in the future through efficiency improvements.
The principal means for improving energy efficiency in the transport sector is through mandatory fuel economy standards for road vehicles. Governments often supplement standards with other measures such as labelling, taxes and incentives, which aim to boost vehicle

xxv
EMISSIONS GAP REPORT A UNEP Synthesis
Executive Summary
efficiency and accelerate the market penetration of new efficient vehicle technologies. Vehicle fuel efficiency can also be increased by making the air conditioning, lighting and other non-engine components of vehicles more efficient or by modifying driving habits, which can reduce average fuel use by 10 per cent or more.
An important approach to improving energy efficiency in the transport sector is to promote the use of more efficient transportation modes, especially by shifting from private vehicles to public transportation or bicycling. This shift in mode of transportation is being encouraged in many cities, especially in Europe, through local zoning policies that limit the use of private vehicles in certain areas. More broadly, land-use planning and management can play a critical role in reducing energy use related to mobility by reducing the need for motorized transport and enabling full capacity public transport.
The overall efficiency by which electricity is produced, transmitted and distributed can be greatly increased .
Great potential exists for saving energy in the power sector. A key factor for improving energy efficiency is maintaining competition through appropriate legislation, regulations and policies with respect to open access, restructuring and deregulation. Another important approach is to support the retirement of inefficient and emissions-intensive production facilities as well as improving operating practices to make the production
facilities, especially coal-based facilities, operate near their design heat-rate values.
Improving energy efficiency in this sector also involves reducing transmission and distribution losses which amount to an annual global economic loss of more than US$ 61 billion and generate annual greenhouse gas emissions of more than 700 million tonnes. One-third of network losses occur in transformers and as a response Australia, Canada, China and the USA have adopted energy performance standards to reduce these losses.
Actions to improve energy efficiency sometimes have a rebound effect, in that they might stimulate further growth in energy demand and thus lower the greenhouse emissions reductions that are aimed for .
The rebound effect, as applied to energy consumption, refers to the situation in which an efficiency improvement is counteracted by additional energy consumption. This could arise for various reasons, ranging from human behaviour to stimulated economic activity. The question arises whether some of the rebound effect can be viewed as an acceptable price for society to pay in order to get the multiple benefits described above. Considering the potential impact of this effect on the expectations of energy efficiency policies and measures, it is important to better understand its effects, and to take it into account when charting strategies for mitigating climate change.
xxvi
EMISSIONS GAP REPORT A UNEP Synthesis
© Mediagram/Shutterstock

1
EMISSIONS GAP REPORT A UNEP Synthesis Chapter 1
Introduction
chApter 1:
Authors: Joseph Alcamo (University of Kassel), Daniel Puig (UNEP DTU Partnership), Joeri Rogelj (ETH Zurich / International Institute for Applied Systems Analysis)
The road to a pivotal new climate treaty was laid out in Durban at the 17th Conference of the Parties to the United Nations Framework Convention on Climate Change (UNFCCC) in 2011, where countries agreed to work towards a “new protocol, ... another legal instrument, or an agreed outcome with legal force”. Now countries are moving along this road with the aim of adopting a new climate agreement in Paris at the 21st Conference of the Parties to UNFCCC, scheduled for December 2015.
Although the time to the Paris Conference is short, the list of issues to be decided is long. Most are political, but some have an important scientific aspect. Among these are: “will current pledges and commitments in 2020 be enough to stay within temperature targets?” and “what long-term emissions are consistent with a 2 oC temperature limit?” Since 2010 the United Nations Environment Programme (UNEP) has produced an annual Emissions Gap Report to address these and other science-related issues of critical importance to the climate change negotiations. These reports have shown that an emissions gap is expected in 2020 between the level of global emissions consistent with the 2 oC limit and the level of ambition of countries. Nonetheless, they have also shown that the gap can be bridged through a wide range of policies and measures that will not only reduce emissions but also advance the sustainable development agenda.
Since the publication of the first report in 2010, many parties to the UNFCCC and other stakeholders have asked for annual updates. This year the report not only updates the estimate of the emissions gap, but also has a new focus in response to the changing context of the climate
Introduction
negotiations, as governments look beyond 2020. Moreover, previous reports have concentrated on findings from least-cost scenarios that begin in 2010 or earlier. Using these, however, has become problematic because they do not take account of recent emission levels, which have been consistently higher than the scenarios. In preparing this report scientists have also been able to benefit from the work of the Intergovernmental Panel on Climate Change (IPCC), which has just published its Fifth Assessment Report (AR5; IPCC, 2014).
The focus of this year’s report is on the implications of the global emissions budget for staying within the 2 oC limit, a concept explored in the IPCC’s AR5 (IPCC, 2014). As noted by the IPCC, scientists have found that an increase in global temperature is proportional to the accumulation of carbon dioxide and other greenhouse gases that persist in the atmosphere. Building on this insight the IPCC has assessed the maximum amount of carbon dioxide that could be emitted to the atmosphere over time while keeping global warming below 2 oC. This is termed the “carbon dioxide emissions budget” because if the world manages to stay within it, it should be possible to stay within the 2 oC global warming limit.
Considering a theoretical situation in which carbon dioxide is the only anthropogenic greenhouse gas, the IPCC (IPCC, 2013) estimated a maximum total carbon budget of 3 670 gigatonnes (Gt) of carbon dioxide for a “likely chance” of staying within the 2 oC limit1. However, since emissions began growing rapidly in the late 19th century, we have already emitted about 1 900 Gt carbon dioxide (IPCC, 2013). In addition, a variety of other substances that have an impact on global
____________________1 A “likely” chance denotes a greater than 66% chance, as specified by the IPCC.

2
EMISSIONS GAP REPORT A UNEP SynthesischApter 1
Introduction
warming are also emitted and further reduce the remaining budget to about 2 900 Gt CO
2, leaving
less than about 1 000 Gt carbon dioxide to emit in the future2. The key questions are: how can these emissions be best spread out over time; by which year should we target to be budget-neutral, that is, sequester as much as we emit; and, what is the maximum we can emit at different points in the future to stay on track?
To tackle these questions, this year’s report takes an emissions budget approach and analyses the scenarios published in the latest IPCC reports. Estimates are presented for future years in which carbon neutrality and net zero total emissions need to be reached to stay within the 2 oC temperature limit3. Here global carbon neutrality means that, globally, anthropogenic carbon dioxide emissions are net zero. Net zero implies that some remaining carbon dioxide emissions could be compensated by the same amount of carbon dioxide uptake (negative emissions), as long as the net input of carbon dioxide to the atmosphere due to human activities is zero.
The report is organised into four chapters, including this introduction. Chapter 2 presents an update of current global emissions and business-as-usual projections, introduces the budget approach and presents emission levels consistent with temperature limits, as well as estimates of the timing of carbon neutrality and net zero emissions. Chapter 3 presents global emission projections under various cases of implementation of pledges
and commitments. An update of the 2020 emissions gap is given, as well as a first estimate of the 2030 gap.
While reporting on targets and gaps is useful, it is also important to provide guidance on how they can be reached or bridged. With this in mind, previous ‘emissions gap’ reports have given great attention to policies and measures that have the dual effect of reducing emissions of greenhouse gases and promoting sustainable development. Chapter 4 in this year’s report continues in this tradition and reviews a cross-cutting approach to mitigation that has clear, positive impacts on development. Chapter 4 shows that energy efficiency improvements not only reduce greenhouse gas emissions and energy consumption, but also deliver multiple benefits, such as increased economic growth and job creation; improved health, by reducing air pollution; higher disposable income, by saving on energy costs; and other payoffs. Improving energy efficiency in combination with the many other mitigation approaches reviewed in previous reports can move the sustainable development agenda forward while reducing emissions and protecting the climate system.
As in previous editions, this year’s report has been put together by an international team of top scientists. This year 38 scientists from 22 scientific groups in 14 countries have contributed to the report.
____________________2 Working Group III of IPCC AR5 indicated that scenarios that have a likely chance of staying within the 2 °C limit have remaining carbon dioxide budgets between
the years 2011 and 2100 of about 630 –1180 Gt CO2. The IPCC AR5 Synthesis Report highlights that limiting total human-induced warming to less than 2 °C relative
to the period 1861–1880 with a probability greater than 66% would require cumulative CO2 emissions from all anthropogenic sources since 1870 to remain below
about 2 900 Gt CO2.
3 The results in this report are fully consistent with those from the IPCC’s AR5. However, the two reports give different types of projections. This report presents estimates of the timing of carbon neutrality and net zero total emissions, as well as emission levels consistent with temperature targets. Meanwhile the IPCC report focuses on estimates of cumulative carbon dioxide emissions for the periods 2011–2050 and 2011–2100. As a result, the estimates from the two reports are consistent, but not identical.

3
EMISSIONS GAP REPORT A UNEP Synthesis Chapter 2
What emission levels will comply with temperature limits?
____________________1 For consistency with reporting practices of the UNFCCC and data from the scientific literature, estimates of different greenhouse gas emissions in this report are
weighted using Global Warming Potentials (GWPs) from the IPCC Second Assessment Report (Schimel et al., 1996). GWPs have been regularly updated in successive IPCC assessment reports and in the scientific literature.
2 Updated greenhouse gas emissions estimates as shown in Figure 2.1, based on Olivier et al. (2013), JRC/PBL (2012) as described in Appendix 2-A.
chApter 2: What emission levels will comply with temperature limits?Lead authors: Joeri Rogelj (ETH Zurich / International Institute for Applied Systems Analysis), David McCollum (International Institute for Applied Systems Analysis), Steven Smith (Pacific Northwest National Laboratory)Contributing authors: Katherine Calvin (Pacific Northwest National Laboratory), Leon Clarke (Pacific Northwest National Laboratory), Monica Crippa (European Commission’s Joint Research Centre), Amit Garg (Indian Institute of Management Ahmedabad), Kejun Jiang (Energy Research Institute), Volker Krey (International Institute for Applied Systems Analysis), Jason Lowe (Hadley Centre), Greet Maenhout (European Commission’s Joint Research Centre), Keywan Riahi (International Institute for Applied Systems Analysis), Michiel Schaeffer (Climate Analytics), Detlef van Vuuren (PBL Netherlands), Chen Wenying (Tsinghua University)
Over the past few years rapid progress has been made in understanding the impacts of greenhouse gas emissions on global warming. This understanding has also made it possible to better estimate the levels of global emissions consistent with global temperature increase limits, such as 1.5 °C and 2 °C.
This chapter first reviews estimates of recent global emission levels and trends; then examines business-as-usual emission levels that would theoretically be reached if no further action were taken to reduce emissions. Finally, it presents the levels of emissions that are consistent with limits to global temperature increases.
2 .1 Current global emission levels
Different data sources give different estimates of global greenhouse gas emissions for 2010 (JRC/PBL, 2012; Blanco et al. 2014). The IPCC’s AR5 gives a median estimate of 49 gigatonnes of carbon dioxide equivalent (Gt CO
2e; 49±4.5 range, with a
5–95 per cent confidence interval)1. A recent update
of trends in global emission levels (Figure 2.1) gives a median estimate of 51 Gt CO
2e2. In this report
(specifically, in Chapters 2 and 3) the AR5 value of 49 Gt CO
2e is used.
Figure 2.1 shows emission levels by major economic groupings for the period 1970–2012. Note that, due to different methodologies and data sources, these values may differ from data derived from national inventory submissions and communications. The general regional trends over recent years were described in last year’s report. For 2010–2012, these preliminary estimates indicate that global emissions grew by an average of 3 per cent per year, to 53 and 54 Gt CO
2e in 2011
and 2012, respectively (JRC/PBL, 2012; Olivier et al., 2013; Appendix 2-A). Trends varied from an increase of 6 per cent in the G20 countries that are not members of the Organization for Economic Co-operation and Development (OECD), to a decline of 1 and 2 per cent, respectively, in OECD Europe and OECD North America. Over the last decade, per person emissions also increased in non-OECD G20 countries and decreased in OECD Europe and OECD North America.
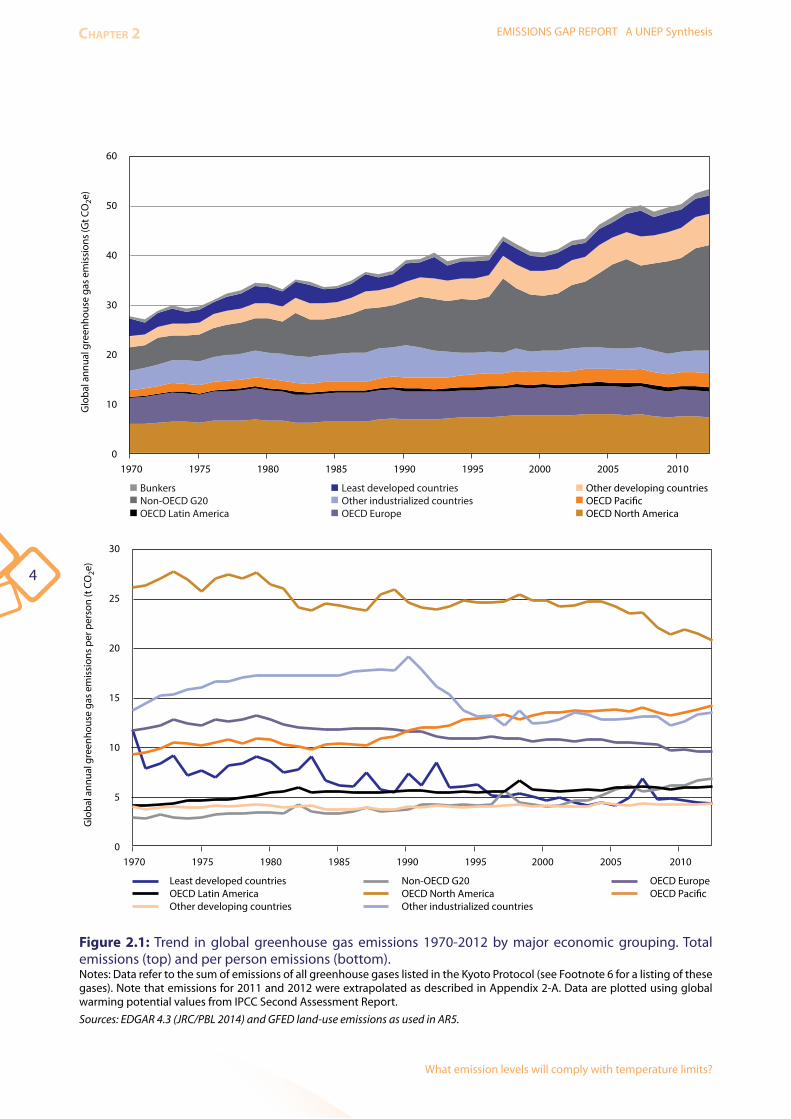
4
EMISSIONS GAP REPORT A UNEP SynthesischApter 2
What emission levels will comply with temperature limits?
Least developed countriesOther industrialized countriesOECD Europe
Other developing countriesOECD PacificOECD North America
BunkersNon-OECD G20OECD Latin America
40
20
10
0
30
60
50
Glo
bal a
nnua
l gre
enho
use
gas e
mis
sion
s (G
t CO
2e)
1970 1975 1980 1985 1990 1995 2000 2005 2010
Non-OECD G20OECD North AmericaOther industrialized countries
OECD EuropeOECD Pacific
Least developed countriesOECD Latin AmericaOther developing countries
20
10
5
0
15
30
25
Glo
bal a
nnua
l gre
enho
use
gas e
mis
sion
s per
per
son
(t C
O2e
)
1970 1975 1980 1985 1990 1995 2000 2005 2010
Figure 2 .1: Trend in global greenhouse gas emissions 1970-2012 by major economic grouping. Total emissions (top) and per person emissions (bottom).Notes: Data refer to the sum of emissions of all greenhouse gases listed in the Kyoto Protocol (see Footnote 6 for a listing of these gases). Note that emissions for 2011 and 2012 were extrapolated as described in Appendix 2-A. Data are plotted using global warming potential values from IPCC Second Assessment Report.
Sources: EDGAR 4.3 (JRC/PBL 2014) and GFED land-use emissions as used in AR5.
5
EMISSIONS GAP REPORT A UNEP Synthesis Chapter 2
What emission levels will comply with temperature limits?
Carbon dioxide from fossil fuel combustion and cement production is the largest contributor to total greenhouse gas emissions. These emissions grew by about 2.4 per cent per year averaged over 2011 and 2012, and by 2.0 per cent in 20133. This represents a slowing of the 2.7 per cent per year rate of growth experienced over the preceding decade. At the global level, these emissions are fairly well estimated, within a range of ±8 per cent (5–95 per cent confidence interval; Andres et al., 2012). Cumulative carbon dioxide emissions are also a useful indicator of climate impact and the most recent trends, to 2010, are reviewed in AR5 (Blanco et al., 2014).
Methane is the second largest greenhouse gas, and its apparent importance has increased because estimates of its global warming potential have increased from 21 to 284. Methane’s share of total greenhouse gas emissions increases from 16 per cent to 20 per cent if the higher estimate of GWP is used (Edenhofer et al., 2014). The absolute value and trends in methane emissions are more uncertain (around ±20 per cent) than estimates of carbon dioxide emissions from fossil fuel combustion and cement production (Blanco et al., 2014). This uncertainty is apparent in the discrepancy between emission estimates based on emission inventories versus atmospheric measurements. While global (anthropogenic) methane emission levels have been steadily increasing over the last three decades according to global emission inventories, they have been stable ssor decreasing based on an inversion analysis of methane concentration trends in the atmosphere (Kirschke et al., 2013). Since 2006, however, both ways of estimating anthropogenic methane
emissions indicate that global emissions have been increasing.
2 .2 Business-as-usual emission levels
To track the progress of additional targeted climate policies, it is useful to have a reference point for estimating emission levels in the absence of additional policies. When these reference points are presented over a series of future years, they are called business-as-usual (BaU) scenarios. This part of the report presents BaU scenarios of global greenhouse gas emissions5 up to 2050.
The BaU scenarios shown here are based on an extrapolation of current economic, social and technological trends. They only take into account climate policies implemented up to around 2005–20106 (i.e. recent country pledges and policies are not considered) and therefore serve as a reference point for what would happen to emissions if planned climate mitigation policies were not implemented.
The BaU scenarios presented here draw on a much larger and more diverse ensemble of scenarios than previously available. Since the 2013 report, a number of model inter-comparison projects have reported their findings7, on which the recently published AR5 drew heavily. In fact, a novel product of the AR5 exercise is an interactive scenario database containing all pathways that were reviewed, both BaU and greenhouse gas mitigation scenarios, including thorough explanations of their scenario designs and policy assumptions8. Nearly 1 200 scenarios populate the AR5 Database, and about 250 of these can be
____________________ 3 The average of estimates from JRC/PBL (2014) and Le Quéré et al. (2014).4 This is the 10-year global warming potential (please refer to the glossary for a definition). The earlier estimate of 21 is from Schimel et al. (1996) and the new
estimate of 28 is from the IPCC AR5 based on new physical science understanding from Myhre et al. (2013).5 Unless otherwise noted, greenhouse gas emissions or total greenhouse gas emissions refers to the sum of the six greenhouse gases included in the Kyoto Protocol
(CO2, CH
4, N
2O, HFCs, PFCs and SF
6). It includes emissions from fossil fuel combustion in the energy and industry sectors, as well as from land use, land-use change
and forestry (LULUCF).6 Different models use different base years for their internal calibration.7 Examples include AMPERE (Riahi et al., 2014; Kriegler et al., 2014a), EMF27 (Kriegler et al., 2014b), LIMITS (Kriegler et al., 2013; Tavoni et al., 2013), and RoSE (Luderer
et al., 2013a).8 The IPCC WG III AR5 Scenario Database can be accessed at: https://secure.iiasa.ac.at/web-apps/ene/AR5DB/
6
EMISSIONS GAP REPORT A UNEP SynthesischApter 2
What emission levels will comply with temperature limits?
considered BaU ones according to the definition applied here9. This section of the report focuses on a subset of 191 scenarios, produced by 31 different models that take emissions of all Kyoto gases10 into account and have full global and sectoral coverage.
According to this large ensemble of scenarios, in the absence of additional policies to reduce greenhouse gases, global emissions are projected to rise to 59 Gt CO
2e per year (range:
57–61 Gt CO2e/yr)11 by 2020. They are likely
to continue climbing to 87 Gt CO2e per year
(range: 75–92 Gt CO2e/yr) by 2050, equivalent
to a 70 per cent increase relative to 2010 (Figure 2.2). Such steep upward trajectories are consistent with global average temperature levels that are around 4 °C warmer in the year 2100 than the period 1850–1900. The likelihood of staying below 2 °C warming is extremely small in this case (Table 6.3 of IPCC WGIII AR5).
The uncertainty ranges of the BaU emissions projections shown in Figure 2.2 reflect different interpretations of economic, social and tech-nological trends. For example, scenarios that are optimistic about fossils fuels and/or are pessimistic about renewable or nuclear energy tend to have emissions near the top of the range. By contrast, scenarios that assume slower growth of the economy and/or energy demand, relative to economic activity, tend to have emissions at the lower part of the range. Although the differences between scenarios are fairly minor in the short- term (2020), they become more pronounced by 2030.
2 .3 Global emission levels linked with global warming limits
2 .3 .1 Introduction
As noted above, countries have agreed to limit global warming to 2 °C relative to pre-industrial levels, and to consider lowering that limit to 1.5 °C (UNFCCC, 2010). Findings reported here and elsewhere, have made it clear that society must limit emissions if it is to stay within its own global warming limits. This raises some important questions which are dealt with in this section:
- What is the level of cumulative greenhouse gas emissions consistent with limiting warming to below 1.5 °C or 2 °C?
- How can this budget of cumulative emissions be distributed over time? Under these budgetary constraints, when are global carbon dioxide emissions expected to reach zero? And how does this translate into a path for total greenhouse gases over time?
- What are the implications of not increasing climate mitigation efforts significantly beyond their current levels?
To address these and other questions, this section draws on the scenarios compiled by AR5 grouped according to their temperature outcomes (Appendix 2-D)12.
____________________9 Because the different scenarios have different base year (2010) estimates for emissions (most likely resulting from non-standardized data sources and conversion
methodologies across models), the current analysis normalizes all 2010 emissions to the same value. An estimate of 49 Gt CO2e per year is used for doing this
because that was the best available value at the time the models were running scenarios for the IPCC AR5 process. Future emissions growth in each scenario is then indexed to this common base-year value. The emission pathways reported in this section have all been indexed in this way. For the non-indexed emission pathways, including the 2010 ranges, see Appendix 2-B. It should be noted, however, that these adjustments via base-year indexing have only a small effect on the spread of future emissions: a variety of other factors are at play. To be sure, the indexing methodology, as applied here, leads to slight increases in emissions levels in 2020, 2030, 2040 and 2050 relative to the raw scenario data, primarily because the majority of models/scenarios in the IPCC AR5-assessed literature use lower values for 2010 emissions. Note that previous studies of baseline emissions projections, for example Blanford et al. (2012), have utilized similar normalizing/indexing methodologies to control for different base-year starting points across models.
10 For list of Kyoto gases, see Footnote 5.11 Unless otherwise stated, all ranges in this and other sections of the report are expressed as 20th–80th percentiles.12 The IPCC AR5 Working Group III Contribution grouped scenarios based on their resulting carbon dioxide-equivalent concentrations in 2100. This choice allows for
a direct comparison with the four representative concentration pathways (RCPs) that were used by the other working groups of the IPCC AR5. In contrast, the main focus of this report is the temperature outcome of emission scenarios. Therefore, the IPCC scenarios are re-grouped based on their probabilities of limiting warming to below specific temperature levels. Appendix 2-D provides a detailed comparison of the results of this report and the findings of the IPCC AR5.
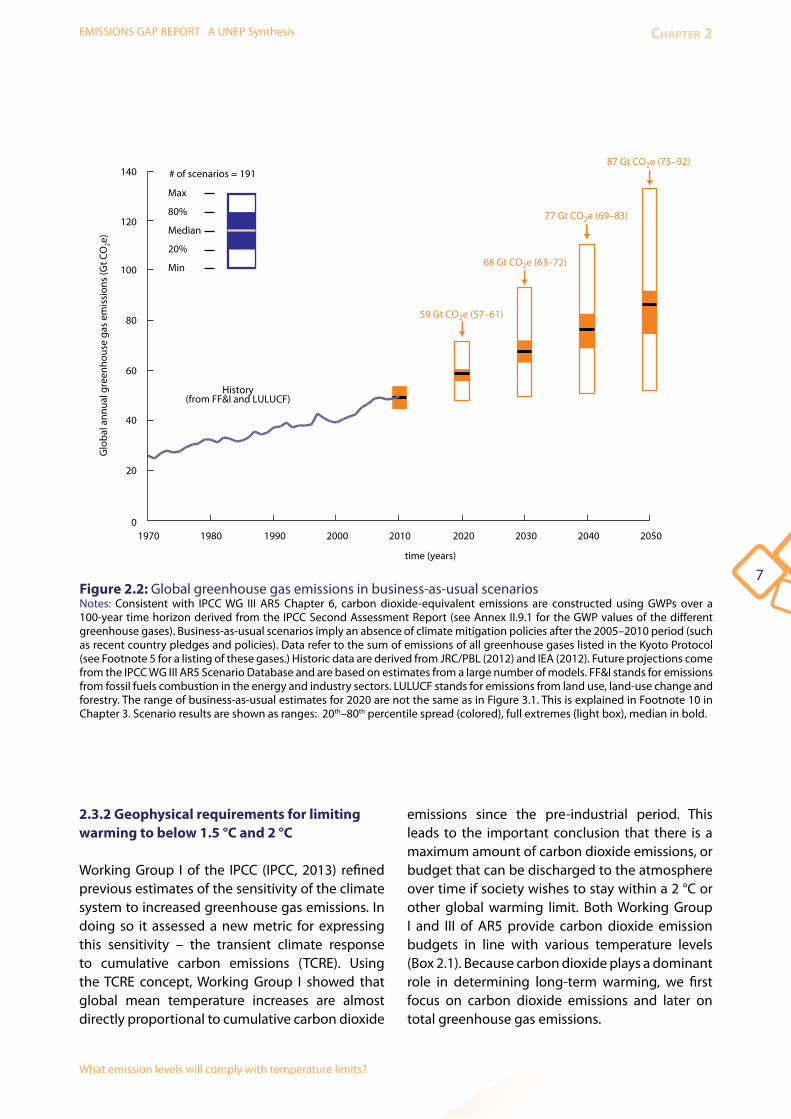
7
EMISSIONS GAP REPORT A UNEP Synthesis Chapter 2
What emission levels will comply with temperature limits?
Max
80%
Median
20%
Min
# of scenarios = 191
1970 1980 1990 2000 2010 2020 2030 2040 20500
20
40
60
80
100
120
140
time (years)
Glo
bal a
nnua
l gre
enho
use
gas
emis
sion
s (G
t CO
2e)
59 Gt CO2e (57–61)
68 Gt CO2e (63–72)
77 Gt CO2e (69–83)
87 Gt CO2e (75–92)
History(from FF&I and LULUCF)
Figure 2 .2: Global greenhouse gas emissions in business-as-usual scenarios
Notes: Consistent with IPCC WG III AR5 Chapter 6, carbon dioxide-equivalent emissions are constructed using GWPs over a 100-year time horizon derived from the IPCC Second Assessment Report (see Annex II.9.1 for the GWP values of the different greenhouse gases). Business-as-usual scenarios imply an absence of climate mitigation policies after the 2005–2010 period (such as recent country pledges and policies). Data refer to the sum of emissions of all greenhouse gases listed in the Kyoto Protocol (see Footnote 5 for a listing of these gases.) Historic data are derived from JRC/PBL (2012) and IEA (2012). Future projections come from the IPCC WG III AR5 Scenario Database and are based on estimates from a large number of models. FF&I stands for emissions from fossil fuels combustion in the energy and industry sectors. LULUCF stands for emissions from land use, land-use change and forestry. The range of business-as-usual estimates for 2020 are not the same as in Figure 3.1. This is explained in Footnote 10 in Chapter 3. Scenario results are shown as ranges: 20th–80th percentile spread (colored), full extremes (light box), median in bold.
2 .3 .2 Geophysical requirements for limiting warming to below 1 .5 °C and 2 °C
Working Group I of the IPCC (IPCC, 2013) refined previous estimates of the sensitivity of the climate system to increased greenhouse gas emissions. In doing so it assessed a new metric for expressing this sensitivity – the transient climate response to cumulative carbon emissions (TCRE). Using the TCRE concept, Working Group I showed that global mean temperature increases are almost directly proportional to cumulative carbon dioxide
emissions since the pre-industrial period. This leads to the important conclusion that there is a maximum amount of carbon dioxide emissions, or budget that can be discharged to the atmosphere over time if society wishes to stay within a 2 °C or other global warming limit. Both Working Group I and III of AR5 provide carbon dioxide emission budgets in line with various temperature levels (Box 2.1). Because carbon dioxide plays a dominant role in determining long-term warming, we first focus on carbon dioxide emissions and later on total greenhouse gas emissions.

8
EMISSIONS GAP REPORT A UNEP SynthesischApter 2
What emission levels will comply with temperature limits?
Box 2 .1: IPCC AR5 and carbon dioxide emission budgets
Figure B.2.1 (based on Figure SPM.10 of (IPCC, 2013) illustrates how cumulative carbon dioxide emissions are influenced by various factors. If we hypothetically assume that carbon dioxide is the only greenhouse gas affecting global temperature and the response of temperature to cumulative carbon dioxide emissions is constant and well known, then the relationship between global warming and emissions would be represented by a straight line (Panel A). However, since the response is not perfectly known, it has an uncertainty range as illustrated by the grey areas in Panels B, C, and D. Staying below a given temperature limit with a higher probability – for example very likely compared to likely – implies a smaller carbon dioxide budget (Panel B). Furthermore, lowering the temperature limit, say, from 2 °C to 1.5 °C, also implies a smaller budget (panel C). Finally, taking into account the additional global warming caused by non-carbon dioxide emissions at the time when global temperature peaks also reduces the emissions budget, and adds additional uncertainties as expressed by the larger light-orange area in Panel D.
Figure B .2 .1: How the transient climate response is influenced by various factors Source: adapted from Knutti and Rogelj (in review).
cumulative carbon emissions
T limit2°C
CO2 only
CO2 only CO2 only
CO2 only
tem
pera
ture
incr
ease
cumulative carbon emissions
2°C
tem
pera
ture
incr
ease
smaller carbon budgetcumulative carbon emissions
2°C
lowertemperature
limit
tem
pera
ture
incr
ease
cumulative carbon emissions
2°C
tem
pera
ture
incr
ease
higherprobability
A
C
B
D
smaller carbon budget
smaller carbon budget
carbon budget
in�uence of netnon CO2 warmingat time of global
temperature peak
likely
likely
very
likel
y
9
EMISSIONS GAP REPORT A UNEP Synthesis Chapter 2
What emission levels will comply with temperature limits?
within the budget of cumulative emissions (Figure 2.3, right-hand panel, where linearly declining emissions become zero between 2045 and 2075). All in all, this means that annual emissions must ultimately decline, and if they are high now they will have to decline faster later to stay within the budget. Conversely, if annual emissions are lower at the beginning of the budget period, they can be somewhat higher at a later time. This, however, implies a trade-off between earlier and later mitigation costs, and between risks linked to the different strategies (Section 2.3.4).
At present, there is still uncertainty around the TCRE estimates which needs to be factored into discussions of future emission pathways. Here this uncertainty is taken into account by grouping scenarios according to their probability to limit warming to below a given temperature limit. A likely chance as used here denotes a greater than 66 per cent probability (Mastrandrea et al., 2010) and a medium chance a probability of 50–66 per cent.
The idea of a carbon dioxide emissions budget implies that annual emissions at some point in time become zero or negative in order to stay
As to the size of the carbon dioxide emissions budget, Working Group I of the IPCC indicated – again for the hypothetical case that carbon dioxide would be the only anthropogenic greenhouse gas – that there was a greater than 66 per cent chance that the 2 °C limit could be maintained if cumulative carbon dioxide emissions from around 1860–1880 to some point in the future could be held to 3 670 Gt CO
2 or less. For a greater than
50 per cent chance, this figure is 4 440 Gt CO2 and for a 33 per cent chance it is 5 760 Gt CO
2. Taking into account
non-carbon dioxide emissions, these budgets are smaller.
As a reference point, by year 2011 a total of 1 890 Gt CO2 (1 630–2 150, 95 per cent confidence range) had already
been emitted into the atmosphere by human activities. Hence a large share of the carbon dioxide emissions budget for limiting global warming to 2 °C has already been used up.
IPCC Working Group III also provided information on carbon dioxide emission budgets as part of their analyses of mitigation scenarios (Clarke et al., 2014). For scenarios with a likely chance of staying within the 2 °C limit, they found that cumulative carbon dioxide emissions from 2011 until 2050 are in the range of 550–1 300 Gt CO
2
and from 2011 until 2100 in the range of 630–1 180 Gt CO2. These figures are broadly consistent with the results
from Working Group I. However, the IPCC WGIII assessment, by further exploring the uncertainty in pathways and including a wide range of non-carbon dioxide forcing, has consistently lowered the estimates of carbon dioxide emission budgets in line with 2 °C as compared to those from WGI, which were based on the hypothetical assumption that carbon dioxide is the only anthropogenic greenhouse gas.
Finally, based on multi-model results, the IPCC Synthesis Report stated that likely limiting total human-induced warming (accounting for both CO
2 and other human influences on climate) to less than 2 °C relative to the period
1861–1880 would require total CO2 emissions from all anthropogenic sources since 1870 to be limited to about
2 900 Gt CO2 when accounting for non-CO
2 forcing as in the RCP2.6 scenario, with a range of 2 550–3 150 Gt CO
2
arising from variations in non-CO2 climate drivers. About 1 900 (1 650 to 2 150, 90 per cent range) Gt CO
2 were
emitted by 2011, leaving about 1 000 Gt CO2 to be consistent with the 2°C objective.
Importantly, some non-carbon dioxide greenhouse gases such as methane and tropospheric ozone have a much shorter residence time in the atmosphere than carbon dioxide or nitrous oxide, and are therefore sometimes called short-lived climate pollutants/forcers. Because of their shorter time in the atmosphere, the annual emissions of these substances have a bigger impact on temperature than their cumulative emissions (Solomon et al., 2010; Smith et al., 2012).

10
EMISSIONS GAP REPORT A UNEP SynthesischApter 2
What emission levels will comply with temperature limits?
Over a longer period of time the carbon dioxide emissions budget cannot be exhausted if the goal is to stay within a particular temperature limit. It can be temporarily exhausted but then the accumulation of carbon dioxide in the atmosphere must be compensated by net negative carbon dioxide emissions – emissions that are actively removed from the atmosphere and sequestered. Note, the feasibility of achieving global negative emissions is uncertain and associated with a host of other risks (Fuss et al., 2014).
The left-hand panels of Figure 2.3 illustrate the temporal trade-offs in carbon dioxide emission mitigation. In all three examples emissions decline
Ann
ual g
loba
l tot
al C
O2 e
mis
sion
s
Ann
ual g
loba
l tot
al C
O2 e
mis
sion
s (G
t CO
2/yr
)
time [years] time [years]2100
0
2100
0
2100
0
Example A Example B Example C
start emission level
net negativeCO2 emissions
cum
ulative CO 2
emiss
ions
in baselin
e scenario
s
from
2010-2100
1950 2000 2050 21000
10
20
30
40
50
60
70
80
remaining 2°C CO2 budget
Figure 2 .3: Illustration of carbon dioxide emission budgets in line with limiting warming to 2°CThe left hand panels show three conceptual examples that distribute the remaining emissions budget over the 21st century. Note that while Example C requires net negative global emissions to stay within the budget, scenarios in the other examples might also make use of negative emissions to a lesser extent if it helps facilitate the required emissions reductions. The examples are explained in the text. The right hand panel shows annual carbon dioxide emissions (black line) over time from Le Quéré et al. (2013). The coloured areas under the curves show the cumulative carbon dioxide emissions from 2010 onwards. The purple-coloured area denotes cumulative carbon dioxide emissions with a likely (66 per cent) chance of limiting warming to below 2 °C, including uncertainty. In this report, these cumulative emissions are called the carbon dioxide emissions budget. The grey-coloured area denotes the cumulative carbon dioxide emissions projected under business-as-usual scenarios which assume no climate policies (likewise including uncertainty). The grey area, cumulative emissions under business-as-usual, is clearly larger than the blue area, the carbon dioxide emissions budget for staying within 2 °C. Cumulative emissions are taken from the WGIII assessment of the IPCC AR5 (Clarke et al., 2014).
significantly during the first half of this century, but with important variations. In Example B, action is taken early to reduce emissions, which means that emissions are lower in the first period as compared to Example A. Since the carbon dioxide emissions budget is not used up as quickly in Example B, it has higher emissions in the second half of the century than Example A. Meanwhile, in Example C, action is delayed at the beginning of the period and initial emissions are higher than in Examples A or B. To stay within the carbon dioxide emissions budget, Example C requires sharp emission reductions immediately afterwards and net negative emissions in the second half of this century.

11
EMISSIONS GAP REPORT A UNEP Synthesis Chapter 2
What emission levels will comply with temperature limits?
____________________13 Hosted at the International Institute for Applied Systems Analysis (IIASA) and available at: https://secure.iiasa.ac.at/web-apps/ene/AR5DB/14 These are cost optimal scenarios in that they take advantage of the lowest cost mitigation options available.
These and other trade-offs related to staying within the emissions budget are discussed in Section 2.3.4.
2 .3 .3 Carbon dioxide emissions budgets, greenhouse gas emissions and temperature limits
We have seen above that it is necessary to stay within a specific carbon dioxide emissions budget to keep warming below 2 °C or some other global warming limit. How then can these budgets be spread out over time? To answer this question, the following sections examine scenarios from integrated assessment models. These models take into account changes in the energy system and other important societal processes, and therefore help identify economically and technologically feasible emission reduction rates and emission pathways. The scenarios are taken from the IPCC WGIII AR5 scenario database13 (Box 2.2).
As mentioned above, science has convincingly established the proportional relationship between global temperature increases and cumulative carbon dioxide emissions. Hence we first focus on carbon dioxide emissions and then report findings on carbon dioxide plus non-carbon dioxide emissions.
The discussion of carbon dioxide emission budgets is structured according to two dimensions. The first divides scenarios according to the year in which concerted emission reductions14 begin – either 2010 or 2020:
- Least-cost 2010 scenarios: the scenarios in this subset are of the same kind analysed in previous gap reports. These are scenarios with a likely chance of staying within the 2 °C limit and that follow a least-cost emissions pathway with stringent reductions after 2010. A least-cost emission pathway is one that takes advantage of
lowest cost options for emission reductions and minimizes total costs of reduction up to 2100.
- Least-cost 2020 scenarios: this subset of scenarios also has a likely chance of staying within the 2 °C limit. But they depart from the least-cost 2010 scenarios by assuming that emission reductions are only modest up to 2020, that pledges are fully implemented in 2020, and that a least-cost emissions pathway with rapid reductions is only followed after 2020. These are often called delayed action or later action scenarios because they begin their least-cost pathway in 2020 rather than 2010. (Modest here means that the speed of emission reductions up to 2020 is significantly slower than in the least-cost 2010 scenarios, and emissions actually increase until 2020).
It is important to note that the current pathway of global emissions is so far more consistent with the least-cost 2020 scenarios than the least-cost 2010 scenarios. First of all, emissions in recent years have been higher than in the least-cost 2010 scenarios (Friedlingstein et al., 2014). Second, the least-cost 2020 scenarios seem to be more in accord with current projections of emissions for 2020. Global emissions in 2020 are projected to be 52–54 Gt CO2
e under various pledge cases (Chapter 3). Least- cost 2020 scenarios are close to this range with 50–53 Gt CO
2e in 2020, while least-
cost 2010 scenarios are much lower with a range of 41-47 Gt CO
2e in 2020.
The second dimension by which the discussion is structured divides scenarios according to whether or not they rely on net negative carbon dioxide emissions from the energy and industrial sectors in order to stay within the emissions budget. As noted earlier, net negative global emissions are required in some scenarios to compensate for having temporarily exceeded the emissions budget or to facilitate a peak and decline in global

12
EMISSIONS GAP REPORT A UNEP SynthesischApter 2
What emission levels will comply with temperature limits?
Box 2 .2: Data and methodology
Findings in this report are based on an analysis of emission scenarios available in the IPCC AR5 Working Group III scenario database, hosted at the International Institute for Applied Systems Analysis and available at: https://secure.iiasa.ac.at/web-apps/ene/AR5DB/. We use the original data for carbon dioxide emissions from fossil fuel and industry, total carbon dioxide emissions, and total global greenhouse gas emissions, defined in this report as the gases covered by the Kyoto Protocol. Non-carbon dioxide gases are reported in units of billion tonnes of carbon dioxide equivalent per year (Gt CO
2e/yr), and are computed from the 100-year global warming potentials
as specified by UNFCCC (2002).
Not included in the analysis is the recently added greenhouse gas, nitrogen trifluoride (NF3). Contributions to
global temperature increase of the air pollutants sulphur dioxide, black carbon, organic carbon and tropospheric ozone with its precursors are included in the same way as in the IPCC AR5 WGIII assessment. Many air-pollutant species have a common source, and some cool the atmosphere while others warm it. Hence, the cooling or warming effect of reducing these pollutants will depend on the precise mixture that is being reduced. While the Copenhagen Accord pledges do not target these species, integrated assessment models provide trends of air-pollutant emissions consistent with the overall changes in the energy system. In the scenarios analysed in this chapter, air pollutants thus are assumed to change in accordance with changes in carbon dioxide emissions.
Data for determining the probability of scenarios staying within 1.5 °C and 2 °C limits were taken from the IPCC AR5 scenario database. These data were computed with the probabilistic carbon-cycle and climate model MAGICC (Meinshausen et al., 2011a; Meinshausen et al., 2011b) in a setup that closely simulates the global temperature response to greenhouse gas emissions of the most complex climate models (Rogelj et al., 2012). This setup is in line with the most recent Working Group I assessment (Jones et al., 2013) and takes into account recent conjectures about a lower climate sensitivity (Rogelj et al., 2014). While this approach provides a single consistent framework for the assessment of temperature outcomes, the probabilities reported here depend on this particular framework and do not take into account uncertainty about the model structure. Temperature increase is computed relative to the 1850–1900 period, which is referred to as pre-industrial levels.
For the analyses in this chapter, we focus on scenarios that limit warming to below 2 °C by the end of the 21st century; and scenarios that limit warming below 1.5 °C by the end of the 21st century. Note that scenarios that stay within the 2 °C limit up to 2100, but also have increasing temperatures during that year, might still exceed 2 °C in the next century. This analysis further uses methodologies described in the literature (Rogelj et al., 2011).
warming. Also as noted above, the feasibility of deploying large-scale technologies for global net negative carbon dioxide emissions is uncertain (Fuss et al., 2014; Box 2.3). Hence, it is important to investigate if negative emissions can be avoided15.
Constraints on global carbon dioxide emissions for limiting warming to below 2 °C
The analysis of scenarios has led to the following findings:
____________________15 It is worth noting that even some scenarios that do not achieve net negative global carbon dioxide emissions do assume that negative emissions technologies
(such as bio-energy in combination with carbon-capture and storage (BECCS)) are used to partly offset positive emissions. Furthermore, the land-use and forestry sector (not accounted for in energy and industry-related carbon dioxide emissions) can also contribute to reaching global net negative carbon dioxide emissions, for example, through afforestation. Scenarios are grouped based on their energy and industry-related emissions only, because the main technological uncertainties surrounding negative emissions (related to BECCS) are reflected most in these sectors.

13
EMISSIONS GAP REPORT A UNEP Synthesis Chapter 2
What emission levels will comply with temperature limits?
1. Carbon neutrality is reached around 2065 (range: 2055–2070) under the subset of least-cost 2020 scenarios, which – as noted above – may be more consistent with the current pathway of emissions up to 2020 than other scenario subsets. Here carbon neutrality means that carbon dioxide emissions16 from society are net zero on the global scale. Net zero implies that any remaining carbon dioxide emissions are simultaneously compensated by the same amount of carbon dioxide uptake (negative emissions) so that the net input of carbon dioxide to the atmosphere due to human activities is zero.
2. Almost all scenarios in the IPCC AR5 scenario database with a likely chance of limiting warming to below 2 °C reach carbon neutrality at some point in the second half of this century (Figure 2.4, panels a–d).
____________________16 Carbon dioxide emissions refers to the sum of carbon dioxide emissions from energy, industry, and land use/land cover change.
3. If emissions up to 2020 would be lower than in the least-cost 2020 scenarios, the carbon dioxide emissions budget would be used up less quickly, and the timing of carbon neutrality could be postponed by about 5–15 years. Hence, increasing ambition over the next few years would postpone by several years the difficult challenge of reaching net zero emissions.
4. In the scenario database from the IPCC, all least-cost 2020 scenarios assume that net negative carbon dioxide emissions are needed at some point during this century to stay within the 2 °C limit. These scenarios further assume that carbon dioxide removal technologies such as bio-energy with carbon capture and storage (BECCS) will be implemented. The uncertainty around these technologies is discussed in
Box 2.3. The scenarios also indicate that the higher the emissions in the near term, the
Box 2 .3: Negative emissions
Negative carbon dioxide emissions, the active removal of carbon dioxide from the atmosphere, can be achieved by several means. These include afforestation or reforestation, carbon dioxide storage in combination with direct-air-capture, and BECCS (Tavoni and Socolow, 2013). BECCS is a measure that is applied often in model-based studies because of its attractive costs and high potential.
However, the viability of large-scale BECCS deployment depends on overcoming some critical barriers. Fuss et al. (2014) identified four:
1: physical and resource constraints (such as water availability), including the sustainability of large-scale deployment relative to other land- and biomass-related needs such as food security and biodiversity conservation, and the presence of safe, long term storage capacity for the captured carbon dioxide;
2: the response of natural land and ocean carbon sinks to negative emissions; 3: the costs and financing of an untested technology; and 4: socio-institutional barriers, such as public acceptance of large-scale carbon capture and storage and large-
scale bioenergy production (UNEP, 2012; van Vuuren et al., 2013 ), and the related deployment policies.
Furthermore, the real-world availability of bioenergy is limited by many factors which are not fully represented in models (Creutzig et al., 2012) and current estimates from integrated assessment models of total mitigation potential vary greatly, sometimes by a factor of three (Tavoni and Socolow, 2013). Importantly, integrated assessment models also show that stringent climate targets can be achieved without BECCS (Riahi et al., 2012), or with just enough BECCS such that carbon dioxide emissions from energy and industry are net zero.

14
EMISSIONS GAP REPORT A UNEP SynthesischApter 2
What emission levels will comply with temperature limits?
larger the negative emissions required later in the century to stay within the carbon dioxide emissions budget (Table 2.1).
5. Scenarios with higher emissions in the near term, least-cost 2020 scenarios, exhaust the carbon dioxide emissions budget more quickly than scenarios with lower emissions in the first few years of the scenario period (least-cost 2010 scenarios). Therefore, scenarios with higher initial emissions must reduce their emissions more rapidly later to stay within the 2 °C limit and/or rely more strongly on negative emission technologies.
Data underlying these findings are provided in Table 2.1. Aiming for only a medium rather than
likely chance of staying within the 2 °C limit does not affect the above conclusions (Appendix 2-C).
To sum up, there is a trade-off between postponing near term emissions reductions and having to reduce emissions more rapidly and stringently later. The more that action is delayed in the near term and the greater the reliance on negative emissions later, the earlier the timing of net zero global total carbon dioxide emissions.
Constraints on total greenhouse gas emissions for limiting warming to below 2 °C
The previous section describes the carbon dioxide emission budgets consistent with a 2 °C limit.
2020 2040 2060 2080 2100−20
−10
0
10
20
30
40
2020 2040 2060 2080 2100 2020 2040 2060 2080 2100
0
2020 2040 2060 2080 2100
0
2020 2040 2060 2080 2100−10
0
10
20
30
40
50
60
2020 2040 2060 2080 2100 2020 2040 2060 2080 2100
0
0
0
2020 2040 2060 2080 2100
0
2065
2085 2095
2070 2080
timing of annualglobal total CO2 emissionsbecoming zero
timing of annualglobal total KyotoGHG emissionsbecoming zero
number of scenarios: 19 number of scenarios: 0
no dataavailable
no dataavailable
number of scenarios: 58 number of scenarios: 23
number of scenarios: 18 number of scenarios: 0 number of scenarios: 50 number of scenarios: 22
Ann
ual g
loba
l tot
alCO
2 em
issi
ons
(Gt C
O2
/yr)
Ann
ual g
loba
l tot
al K
yoto
GH
G e
mis
sion
s (G
t CO
2e/yr
)
total CO2
Kyoto-GHG
Least-cost 2020 scenarios: limited action until 2020 andcost-optimal mitigation afterward
Scenarios relying on netnegative CO2 emissions
from energy and industry
Scenarios NOT relying on netnegative CO2 emissions
from energy and industry
Scenarios relying on netnegative CO2 emissions
from energy and industry
Scenarios NOT relying on netnegative CO2 emissions
from energy and industry
Least-cost 2010 scenarios: cost-optimal mitigation from 2010 onward
a b c d
e f g h
IPCC AR5 WGIIIcategory 1 range
Figure 2 .4: Overview of global total carbon dioxide emissions (top row) and global total greenhouse gas emissions – the sum of emissions of all greenhouse gases listed in the Kyoto Protocol See Footnote 5 for a listing of these gases. The figure shows scenarios that assume limited emissions reductions until 2020 and least-cost emission pathways thereafter (least-cost 2020 scenarios panels a, b, e, and f ) and scenarios that assume least-cost emission pathways from 2010 onwards (least-cost 2010 scenarios panels c, d, g, and h). Scenarios with negative levels of global energy and industry-related carbon dioxide emissions are shown in panels a, c, e, and g, and without in panels b, d, f, and h. More details are provided in the text. For each case, the median (solid lines) and the 20th–80th percentile range (shaded areas) are provided. Additionally, for comparison, the range of scenarios included in Category 1 of the IPCC AR5 WGIII assessment is shown in light blue shaded ranges in panels e-h.
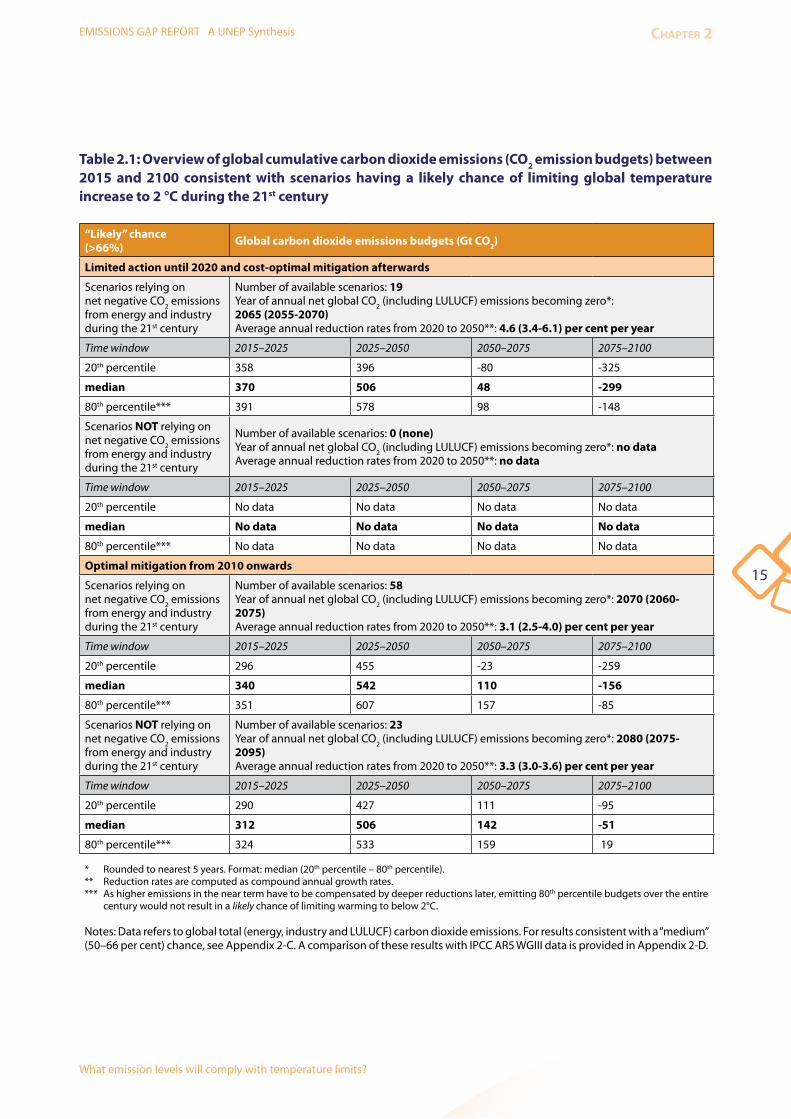
15
EMISSIONS GAP REPORT A UNEP Synthesis Chapter 2
What emission levels will comply with temperature limits?
Table 2 .1: Overview of global cumulative carbon dioxide emissions (CO2 emission budgets) between 2015 and 2100 consistent with scenarios having a likely chance of limiting global temperature increase to 2 °C during the 21st century
“Likely” chance(>66%)
Global carbon dioxide emissions budgets (Gt CO2)
Limited action until 2020 and cost-optimal mitigation afterwards
Scenarios relying on net negative CO
2 emissions
from energy and industry during the 21st century
Number of available scenarios: 19 Year of annual net global CO
2 (including LULUCF) emissions becoming zero*:
2065 (2055-2070) Average annual reduction rates from 2020 to 2050**: 4 .6 (3 .4-6 .1) per cent per year
Time window 2015–2025 2025–2050 2050–2075 2075–2100
20th percentile 358 396 -80 -325
median 370 506 48 -299
80th percentile*** 391 578 98 -148
Scenarios NOT relying on net negative CO
2 emissions
from energy and industry during the 21st century
Number of available scenarios: 0 (none) Year of annual net global CO
2 (including LULUCF) emissions becoming zero*: no data
Average annual reduction rates from 2020 to 2050**: no data
Time window 2015–2025 2025–2050 2050–2075 2075–2100
20th percentile No data No data No data No data
median No data No data No data No data
80th percentile*** No data No data No data No data
Optimal mitigation from 2010 onwards
Scenarios relying on net negative CO
2 emissions
from energy and industry during the 21st century
Number of available scenarios: 58 Year of annual net global CO
2 (including LULUCF) emissions becoming zero*: 2070 (2060-
2075)Average annual reduction rates from 2020 to 2050**: 3 .1 (2 .5-4 .0) per cent per year
Time window 2015–2025 2025–2050 2050–2075 2075–2100
20th percentile 296 455 -23 -259
median 340 542 110 -156
80th percentile*** 351 607 157 -85
Scenarios NOT relying on net negative CO
2 emissions
from energy and industry during the 21st century
Number of available scenarios: 23 Year of annual net global CO
2 (including LULUCF) emissions becoming zero*: 2080 (2075-
2095)Average annual reduction rates from 2020 to 2050**: 3 .3 (3 .0-3 .6) per cent per year
Time window 2015–2025 2025–2050 2050–2075 2075–2100
20th percentile 290 427 111 -95
median 312 506 142 -51
80th percentile*** 324 533 159 19
* Rounded to nearest 5 years. Format: median (20th percentile – 80th percentile).** Reduction rates are computed as compound annual growth rates.*** As higher emissions in the near term have to be compensated by deeper reductions later, emitting 80th percentile budgets over the entire
century would not result in a likely chance of limiting warming to below 2°C.
Notes: Data refers to global total (energy, industry and LULUCF) carbon dioxide emissions. For results consistent with a “medium” (50–66 per cent) chance, see Appendix 2-C. A comparison of these results with IPCC AR5 WGIII data is provided in Appendix 2-D.

16
EMISSIONS GAP REPORT A UNEP SynthesischApter 2
What emission levels will comply with temperature limits?
Table 2 .2: Overview of global emissions of total greenhouse gases in 2020, 2025, 2030, 2050 and 2100 consistent with scenarios with a likely (greater than 66 per cent) chance of limiting global temperature increase to below 2 °C during the 21st century, respectively
“Likely” chance(>66%)
Annual emission of global total greehouse gases (Gt CO2e/yr)
Limited action until 2020 and cost-optimal mitigation afterwards
Scenarios relying on net negative CO
2 emissions
from energy and industry during the 21st century
Number of available scenarios: 18 Year of annual net global Kyoto-greenhouse gas emissions becoming zero†: 2085 (2080-2100) Average annual reduction rates from 2020 to 2050‡: 2 .8 (2 .4-3 .6) per cent per year
Year 2020 2025 2030 2050 2100
median* 52 47 42 22 -3
range and spread** 49(50/53)55 39(40/48)50 29(30/44)44 17(18/25)29 -11(-10/0)0
Scenarios NOT relying on net negative CO
2 emissions
from energy and industry during the 21st century
Number of available scenarios: 0 (none) Year of annual net global Kyoto-greenhouse gas emissions becoming zero†: no dataAverage annual reduction rates from 2020 to 2050‡: no data
Year 2020 2025 2030 2050 2100
median* no data no data no data no data no data
range and spread** no data no data no data no data no data
Optimal mitigation from 2010 onwards
Scenarios relying on net negative CO
2 emissions
from energy and industry during the 21st century
Number of available scenarios: 50 Year of annual net global Kyoto-greenhouse gas emissions becoming zero†: 2095 (2090-after 2100)Average annual reduction rates from 2020 to 2050‡: 2 .1 (1 .4-2 .6) per cent per year
Year 2020 2025 2030 2050 2100
median* 46 43 40 24 -1
range and spread** 22(41/47)49 23(38/45)47 23(34/44)46 14(20/27)33 -10(-4/3)7
Scenarios NOT relying on net negative CO
2 emissions
from energy and industry during the 21st century
Number of available scenarios: 22 Year of annual net global Kyoto-GHG emissions becoming zero†: after 2100 (after 2100-after 2100)Average annual reduction rates from 2020 to 2050‡: 2 .1 (1 .9-2 .4) per cent per year
Year 2020 2025 2030 2050 2100
median* 43 39 36 23 5
range and spread** 36(41/45)48 27(37/42)44 18(32/38)41 13(20/24)25 3(4/9)13
* Rounded to the nearest 1 Gt CO2e/yr.
** Rounded to the nearest 1 Gt CO2e/yr. Format: minimum value (20th percentile/80th percentile) maximum value.
† Rounded to nearest 5 years. Format: median (20th percentile – 80th percentile).‡ Reduction rates are computed as compound annual growth rates.
Notes: Data refer to the sum of emissions of all greenhouse gases listed in the Kyoto Protocol (see footnote 5 for a listing of these gases). For results consistent with a “medium” (50–66 per cent) chance, see Appendix 2-C. A comparison of these results with IPCC AR5 WGIII data is provided in Appendix 2-D.
However, society produces not only carbon dioxide emissions but also substantial amounts of non-carbon dioxide greenhouse gas emissions such as methane, nitrous oxide and hydrofluorocarbons, and these also make an important contribution
____________________ 17 See footnote 5 for a listing of these gases.
to global warming. Indeed, many of the scenarios from the IPCC scenario database take account of both carbon dioxide and the non-carbon dioxide gases listed in the Kyoto Protocol17. Hence, to get a more comprehensive picture of the emission

17
EMISSIONS GAP REPORT A UNEP Synthesis Chapter 2
What emission levels will comply with temperature limits?
pathways consistent with climate targets we consider what total18 greenhouse gas emission pathways – carbon dioxide plus non-carbon dioxide – stay below the 2 °C limit. The following conclusions can be drawn from the analysis of total greenhouse gas emissions scenarios that have a likely chance of staying within the 2 °C limit:
1. More than half of the scenarios in the IPCC AR5 scenario database that limit warming to below 2 °C with a likely chance reach net zero global total greenhouse gas emissions in the second half of this century.
2. All scenarios in the subset of least-cost 2020 scenarios, which, as noted above, may be more consistent with the current pathway of emissions up to 2020, reach net zero total greenhouse gas emissions some time between 2080 and 2100, or have nearly net zero total greenhouse gas emissions in 210019.
3. The timing of net zero global total emissions does not change much for the least cost 2010 scenarios. In that case the timing of net zero emissions would only be pushed back by about 10 years.
4. Least-cost 2010 scenarios show a median emissions level of 44 Gt CO
2e per year in 2020
(range: 41–47).5. Least-cost 2020 scenarios show a median
emissions level of 52 Gt CO2e per year in 2020
(range: 50–53). While this figure is much higher than in scenarios that begin stringent emission reductions in 2010 – least-cost 2010 scenarios – it is still exceeded by the expected level of emissions under almost all the pledge cases (Chapter 3).
6. Looking further into the future, global emissions decline in all scenario groupings considered. In the least-cost 2020 scenarios, median global emissions of total greenhouse gases for 2025, 2030 and 2050 are 47, 42, and 22 Gt CO
2e per
year respectively (Table 2.2).
____________________ 18 Total greenhouse gas emissions is used here to mean the global emissions of the Kyoto gases as listed in Footnote 5. 19 Four scenarios in this subset show total greenhouse gas emissions in 2100 which are below 0.25 Gt CO
2e per year, but still above zero.
20 For example, van Vliet et al. (2012); Rogelj et al. (2013a,b); Riahi et al. (2013); Luderer et al., (2013a,b); Kriegler et al. (2014a) and the IPCC AR5 WGIII report (Clarke et al., 2014).
Constraints for limiting warming to below 1 .5 °C
Working Group III of the IPCC AR5 indicated that only a small number of studies have identified feasible total greenhouse gas emission pathways that are consistent with staying below a 1.5 °C limit up to 2100 with at least a 50 per cent chance. This small group of studies agree that staying within 1.5 °C requires:
1: immediate and strong mitigation action; 2: the rapid upscaling of the full portfolio of
mitigation technologies; and 3: development along a low-energy demand
trajectory (IPCC, 2014).
Within these studies, only a small number of scenarios meet the 1.5 oC target with at least a 50 per cent chance, and have least-cost pathways beginning in 2010. Emission levels in one set of these scenarios are 37–41 Gt CO
2e in 2020,
27–31 Gt CO2e in 2030, and 13–17 Gt CO
2e in 2050
(Rogelj et al., 2013b). Emissions levels in another set are 39–43 Gt CO
2e in 2020, 27–35 in 2030, and
6–10 Gt CO2e in 2050 (Luderer et al., 2013b).
An even smaller number of scenarios meet the 1.5 oC target with at least a 50 per cent chance and have least-cost emissions pathways beginning in 2020 – and therefore, have higher emissions up to 2020.
2 .3 .4 Implications of later action
As noted above, recent trends in global emissions imply that the world is not following a least-cost pathway of early mitigation action for limiting global temperature increase to either 1.5 °C or 2 °C (Friedlingstein et al., 2014). An obvious advantage of delaying mitigation action is that costs are not incurred today. On the other hand, many recent studies20, including the IPCC AR5, have shown that delaying mitigation actions will intensify

18
EMISSIONS GAP REPORT A UNEP SynthesischApter 2
What emission levels will comply with temperature limits?
the challenges to limit global warming to 1.5 °C or 2 °C21. In general, IPCC AR5 found (with high confidence) that postponing further mitigation efforts to 2030 beyond current country pledges would substantially hinder the transition to lower long-term emissions levels and highlights that this postponement would narrow the range of options for staying within the 2 °C limit with a likely chance. The IPCC highlighted that many models were unable to produce scenarios that keep warming to below 2 °C with about 50 per cent chance, when starting from emissions in 2030 that are greaterthan 55 Gt CO
2e.
Higher near term emission levels require very fast medium term emission reductions
Delaying mitigation action and allowing higher emission levels in the near term means that faster emission reductions are required later to stay within the same carbon dioxide emissions budget. For example, scenarios that delay stringent action until 2020 (least-cost 2020 scenarios) reduce their carbon dioxide emissions by around 4.6 per cent per year22 after 2020 as compared to scenarios with earlier action (least-cost 2010 scenarios) which fall by 3.1–3.3 per cent per year during the same period (Table 2.1). Furthermore, the IPCC showed that scenarios with stringent mitigation delayed until 2030 required twice as rapid a reduction in carbon dioxide emissions after 2030 as compared to those that had begun stringent reductions in 2010 – for the case of staying within the 2 °C limit (IPCC, 2014). In addition, the AMPERE study found that scenarios with modest emission reductions until 2030 used up about 70 per cent of the carbon dioxide emissions budget consistent with the 2 °C limit by that date (Bertram et al., 2013; Riahi et al., 2013). Furthermore, it was noted that immediate and stringent emission reductions are essential in scenarios that stay below the 1.5 °C limit by 2100 (Luderer et al., 2013b; Rogelj et al., 2013a; IPCC, 2014).
Delay in mitigation causes lock-in of carbon intensive infrastructure
Scenarios with limited near term action have fewer options for reducing emissions if concerted action is delayed until after 2020 or 2030. This is because of carbon lock-in – the continued construction of high-emissions fossil-fuel infrastructure unconstrained by climate policies (Bertram et al., 2013; Luderer et al., 2013a; Rogelj et al., 2013a; Johnson et al., 2014). Unless comprehensive and ambitious climate policies are put into place, the world will continue to expand its carbon- and energy-intensive infrastructure, and will not sufficiently incentivize the development and scale-up of climate-friendly technologies. As an example, the capacity of coal-fired power plants grows by 50 per cent by 2030, relative to current levels, under some later action scenarios in the AMPERE study (Bertram et al., 2013).
Other studies have shown that a large fraction of carbon-intensive infrastructure, particularly coal power plants, will need to be shut down prematurely if the 2 °C target is to be achieved (Johnson et al., 2014) – an example of stranded assets. Delaying stringent reductions until 2030 will result in such stranded assets in the order of hundreds of billions of dollars (Bertram et al., 2013; Johnson et al., 2014). For example, a recent study (Johnson et al., 2014) estimates that, over the period 2011−2050, global investments associated with stranded coal-fired power plant capacity could more than triple (from US$ 165 to US$ 550 billion) if stringent mitigation is not achieved by 2030 (and the 2 °C target is met through later, drastic mitigation efforts). This happens because weak restrictions on emissions over the next few years are assumed to encourage/allow the expansion of conventional coal-fired power plants. As a result, a larger number of coal-fired power plants might be faced with stringent emission restrictions later and be forced to close before the end of their usual life.
____________________ 21 These paragraphs update the discussion of this topic in UNEP (2013) .22 Emission reduction rates are typically computed as compound annual growth rates. However, such an approach cannot deal with emissions becoming negative
at some point during the assessed time period.
19
EMISSIONS GAP REPORT A UNEP Synthesis Chapter 2
What emission levels will comply with temperature limits?
The same lock-in effect applies to lost opportunities for energy efficiency (Chapter 4). The Global Energy Assessment (GEA23; Riahi et al.,2012) shows the critical importance of energy efficiency measures for limiting warming to below 2 °C, and similar findings are valid for returning warming to below 1.5 °C (Luderer et al., 2013b; Rogelj et al., 2013a; Rogelj et al., 2013b). Later-action scenarios tend to further lock-in power plants, buildings and other infrastructure with low levels of energy efficiency. This makes the transition to a high-energy-efficiency future more difficult, and puts a greater burden on alternative emission reduction measures.
Delay in mitigation can slow the transformation of the energy system
Recent research has shown that the share of zero- and low-carbon energy sources24 in the world’s energy economy has to substantially increase in order to stay within atmospheric levels of greenhouse gases consistent with the 2 °C limit. One estimate is that a 3–4-fold increase is needed between 2010 and 2050 (Riahi et al., 2013; IPCC, 2014). The question is how fast this growth has to take place. On one hand, least-cost scenarios, beginning in 2010, achieve this share through a smooth transition and roughly a doubling of the low-carbon energy share every 20 years. On the other hand, scenarios delaying action until later need to achieve this objective at a much faster pace. For example, scenarios with delays up to 2030, need to scale up the low-carbon share of the energy economy at twice the pace of least-cost scenarios beginning in 2010 (Riahi et al., 2013; IPCC, 2014). Moreover, the lack of near term climate policies is also assumed to hinder the scaling up of low-emission, green-energy technologies (Eom et al., 2013), and hinder technological learning and development as well.
Early policy signals are needed to plan for later action
Even if near term mitigation actions are delayed, it is important to begin sending strong and reliable policy signals to industry, municipalities and other sectors of society that stringent emissions reductions will be necessary over the medium term – for example, laws or regulations that call for specific emission reductions or ceilings at some future date. Without clear signals, industry will lock-in carbon- and energy-intensive infrastructure as explained above.
Delay in mitigation leads to higher overall costs and economic challenges
Scenarios with later action have lower mitigation costs in the near term and this implies a lower burden on current economic growth but larger overall mitigation costs. These scenarios also have larger economic challenges during the transition towards a comprehensive climate policy regime, including substantial impacts on global economic growth and energy prices (Clarke et al., 2009; Jakob et al., 2012; OECD, 2012; Kriegler et al., 2014a; Luderer et al., 2013a; Luderer et al., 2013b; Riahi et al., 2013; Rogelj et al., 2013a; Rogelj et al., 2013b; Clarke et al., 2014). The longer the delay, the higher costs become. The IPCC indicates that delaying stringent reductions to 2030 would increase mitigation costs during the period 2030–2050 by around 40 per cent compared to scenarios without delays (Clarke et al., 2014). The cost penalty of later action depends on:
1: when comprehensive mitigation actions finally begin;
2: the magnitude of emission reductions up to that point; and
3: the future availability of technologies.
Furthermore, delaying emission reductions in the near term shifts the burden of mitigation costs
____________________ 23 The full report is available at: http://www.globalenergyassessment.org/24 Renewables, nuclear energy, fossil fuel energy with carbon capture and storage, or biofuels with carbon capture and storage.

20
EMISSIONS GAP REPORT A UNEP SynthesischApter 2
What emission levels will comply with temperature limits?
to later generations (OECD, 2012; Luderer et al., 2013b; Rogelj et al., 2013a; Clarke et al., 2014).
Finally, later-action scenarios also have higher economic costs, exclusive of mitigation costs, during the transition from modest early action to later more comprehensive action (Kriegler et al., 2014a; Luderer et al., 2013a; Luderer et al., 2013b). These transitional costs increase strongly with further delay.
Delay in mitigation reduces societal choices
The more emission reductions are delayed, the greater society’s dependence on future unproven technologies25, reducing its options and choices for the future (Luderer et al., 2013b; Riahi et al., 2013; Rogelj et al., 2013a). Many later-action scenarios assume that the full portfolio of mitigation options represented in the models is available, including unproven negative emissions technologies such as BECCS (Box 2.3). However, costs will increase if it turns out that anticipated technologies are not available, because of technology failure or because society chooses not to deploy them (Kriegler et al., 2014b; Luderer et al., 2013b; Rogelj et al., 2013b; Clarke et al., 2014).
Delay in mitigation leads to higher climate risks
Scenarios with later action increase the risks of climate impacts in the following ways:
First, the risk of temporarily exceeding climate limits is higher because of higher initial emission levels (Clarke et al., 2009; den Elzen et al., 2010; van Vliet et al., 2012; Kriegler et al., 2013; Luderer et al., 2013a; Rogelj et al., 2013a; Schaeffer et al., 2013). Overshooting temperature limits, or prolonging the overshoot period, implies a greater risk of large-scale and possibly irreversible changes in the climate system – see Lenton et al. (2008) for examples of such changes. The extent to which
such overshooting increases the risk of these impacts is very uncertain.
Second, the pace of temperature increase in the near to medium term is higher (den Elzen et al., 2010; van Vliet et al., 2012; Schaeffer et al., 2013) and this can imply more rapid climate impacts and require quicker adaptation. For example, based on results from 11 integrated assessment models, Schaeffer et al. (2013) found that later-action scenarios meeting the 2 °C limit have, on average, a 50 per cent higher rate of decadal temperature increase in the 2040s compared with least-cost scenarios beginning in 2010 – 0.3 °C instead of 0.2 °C per decade.
Third, postponing stringent mitigation increases the risk of exhausting carbon dioxide emission budgets. The risk comes from the fact that the steep reductions required to compensate for higher near-term emissions may not materialise. This may happen because of unanticipated technology failures (Riahi et al., 2013; Clarke et al., 2014) or the unwillingness of future policymakers to take on the required high costs of mitigation.
Fourth, when action is delayed, various options to achieve stringent levels of climate protection are increasingly lost (Luderer et al., 2013b; Rogelj et al., 2013a; Rogelj et al., 2013b). One sign of this is that a declining number of models are able to identify feasible emission pathways that stay within a 1.5 °C or 2 °C limit with increasing delays (IPCC, 2014).
Delay in mitigation forgoes co-benefits
The IPCC AR5 WGIII report (IPCC, 2014) identified a large number of co-benefits of greenhouse gas mitigation, such as reduced costs for achieving air quality and energy security objectives, improved human health, reduced crop yield losses, and lower adverse impacts on ecosystems. Delaying mitigation action also implies that these co-benefits will be forgone while emissions remain high.____________________
25 As an example of technological dependency, it was found that only two out of nine models in the AMPERE study could reach a long-term 450 parts per million (ppm) carbon dioxide concentration target (and therefore could comply with the 2 °C target) without scaling up carbon capture and storage (Riahi et al., 2013). A similar dependency is found for other mitigation technologies (ibid, Rogelj et al., 2013b).

21
EMISSIONS GAP REPORT A UNEP Synthesis Chapter 3
Emissions pledges and the emissions gap
____________________1 At the Conference of the Parties to the UNFCCC in Doha, in 2012, a group of developed countries (Australia, Belarus, the EU and its Member States, Kazakhstan,
Monaco, Norway, Switzerland and Ukraine) also made reduction commitments for the 2013–2020 period under the Kyoto Protocol (UNFCCC, 2012b). 2 China and India have expressed their mitigation goals in terms of emission reductions per unit of GDP; Brazil, Indonesia, Mexico, South Africa and South Korea, in
terms of deviations below their respective business-as-usual emission scenarios; Antigua and Barbuda, Marshall Islands and the Republic of Moldova, in terms of absolute greenhouse gas emission reductions; and Costa Rica and the Maldives, in terms of a carbon neutrality goal (UNFCCC, 2013). Most of the non-economy-wide NAMAs have not been quantified, and it is difficult to estimate their impact with much certainty. In order to approximate their impact, the following steps were taken. First, non-Annex I countries that have developed or are developing non-economy-wide NAMAs were identified on the basis of the UNEP and Ecofys NAMA databases. Second, these countries’ baseline 2020 emissions were estimated on the basis of an assumed 27 per cent growth from 2010, for a total of 2 553 Mt CO
2e (including LULUCF). Third, an average percentage reduction on economy-wide emissions was calculated at –19 per cent, based on the NAMAs
of Chile, Dominica, Dominican Republic, Kenya, and Mongolia, the only countries to have quantified all their NAMAs. Finally, this reduction was applied to the economy-wide emissions of the countries with non-economy-wide NAMAs. If all NAMAs were completely additional to baseline emissions, this would generate a total impact of -482 Mt CO
2e. However, as there is no basis to assume a high level of additionality, this impact is not included in the cases described in this chapter.
National greenhouse gas reduction pledges provide an important indication of the collective global ambition to limit greenhouse gas emissions. Under the UNFCCC, 42 developed country parties (Annex I) have submitted quantified economy-wide emission reduction pledges for 20201. Likewise, more than 55 developing country parties (non-Annex I) have submitted nationally appropriate mitigation actions (NAMAs), of which 16 are framed in terms of expected economy-wide greenhouse gas emission reductions2. Together, the developed country parties plus the 16 developing countries with pledges account for about 75 per cent of global emissions as of 2010 (UNEP, 2013).
Since 2010, UNEP’s ‘emissions gap’ reports have examined whether these pledges and commitments are enough to stay within the 2 °C target, or whether a gap exists between temperature limits and the level of ambition. Here we present an update of gap estimates for 2020 and new estimates for 2025 and 2030. The chapter begins with an analysis of expected global emissions by 2020 under several cases of pledge implementation. Estimates from 2020 are then
used to project 2025 and 2030 emission levels, and from these the 2025 and 2030 emissions gaps have been estimated. Finally, the chapter evaluates the progress of major economies in achieving their 2020 pledges.
3 .1 How big will the emissionsgap be in 2020 and 2030?
3 .1 .1 The role of emission reduction pledges
Since the 2013 update of UNEP’s Emissions Gap Report, three Parties have revised or clarified their pledges. First, Japan has revised its pledge due to the Fukushima disaster and the consequent uncertainty regarding the future role of nuclear power. Japan’s tentative new 2020 target is to reduce emissions 3.8 per cent from 2005 levels (UNFCCC, 2014a). This equates to an increase of about 3.1 per cent from 1990 levels, as compared to the previous conditional target of reducing emissions by 25 per cent from 1990 levels. In addition, the Russian Federation has indicated it will limit its emissions to 75 per cent of 1990 levels; its initial pledge had promised a 15–25 per cent
chApter 3: Emissions pledges and the emissions gap
Lead authors: Michel den Elzen (PBL Netherlands) and Taryn Fransen (World Resources Institute)
Contributing authors: Jusen Asuka (Tohoku University), Thomas Damassa (World Resources Institute), Hanna Fekete (NewClimate Institute), Jørgen Fenhann (UNEP DTU Partnership), Andries Hof (PBL Netherlands), Kejun Jiang (Energy Research Institute), Kelly Levin (World Resources Institute), Ritu Mathur (The Energy and Resources Institute), Mark Roelfsema (PBL Netherlands), Roberto Schaeffer (Federal University of Rio de Janeiro).
22
EMISSIONS GAP REPORT A UNEP SynthesischApter 3
Emissions pledges and the emissions gap
reduction from 1990 levels (Biennial Report, UNFCCC, 2014a). Finally, the USA has clarified that
its pledge to reduce emissions 17 per cent from 2005 levels is unconditional (UNFCCC, 2014b).
Box 3 .1: Factors affecting the greenhouse gas impact of the pledges
The collective impact of the pledges on global greenhouse gas emissions will depend on:
1: accounting rules for credits or debits from land-use change and forestry (LULUCF), surplus emission units, and double counting and additionality of offsets; and
2: whether parties adopt the more ambitious (conditional) or less ambitious (unconditional) variant of their pledges.
Accounting rulesAccounting rules govern a number of issues that affect global emissions. These rules dictate whether and how LULUCF and surplus emission credits can be applied towards pledges, the extent to which offsets applied towards pledges actually represent additional greenhouse gas reductions, and whether offsets can be double-counted towards pledges by both buyers and sellers. Relative to a strict application of accounting rules, a lenient application of these rules increases global emissions by 0.7 Gt CO
2e under unconditional pledges and by
1.6 Gt CO2e under conditional pledges. This effect is slightly smaller than was estimated in 2013 (0.9 Gt CO
2e
and 1.9 Gt CO2e, respectively); we assume less non-additionality of offsets this year relative to last year due to
improved governance of offset programmes.
LULUCF: under the Kyoto Protocol, whether Annex I parties may receive credits or debits from LULUCF activities depends on a set of complex accounting rules that contribute to the achievement of their pledges. However, except for the case of New Zealand, it is unclear if countries not part of the Protocol’s second commitment period will adhere to its LULUCF rules (UNFCCC, 2012a). If all Annex I countries followed the rules, the credits from afforestation/reforestation, deforestation and forest management activities would be 0.35 Gt CO
2e per year,
based on the Parties’ latest submissions3 (Grassi et al., 2012; Grassi, 2013). In other words, lenient LULUCF rules would push global emissions 0.35 Gt CO
2e higher in 2020 relative to strict LULUCF rules4.
Use of surplus emissions units: accounting rules also govern the use of surplus emission units from the Kyoto Protocol’s first commitment periods to meet 2020 pledges. These units include assigned amount units, emission reduction units (ERUs) from Joint Implementation, and certified emission reductions (CERs) from the Clean Development Mechanism. Relative to strict accounting rules, which would prohibit the use of such surplus units to meet 2020 pledges, lenient rules on surplus units would increase global 2020 emissions by 0.25 Gt CO
2e in the
case of unconditional pledges and by 0.75 Gt CO2e for conditional pledges. These figures are the same as in the
2013 update of UNEP’s Emissions Gap Report.
Double-counting and non-additionality: relative to strict accounting rules, which would prohibit double-counting offsets towards more than one pledge, lenient rules on double-counting would increase global 2020 emissions
____________________ 3 For the USA, the estimated potential contribution from LULUCF credits is about 0.15 Gt CO
2e per year (UNEP, 2013).
4 The first ‘emissions gap’ report used a maximum value of 0.8 Gt CO2e, since at that time no rules had been agreed.
23
EMISSIONS GAP REPORT A UNEP Synthesis Chapter 3
Emissions pledges and the emissions gap
by 0.3 Gt CO2e in the unconditional pledge case and 0.5 Gt CO
2e in the conditional pledge case5,6. This effect is
slightly lower than estimated in the 2013 update (UNEP, 2013), because:
1: Japan’s lower target leads to a lower demand for offsets; and 2: measures to ensure the additionality of offsets have led to a reduced estimate of the impact of non-
additionality in the lenient rules case.
Specifically, improvements concerning the additionality of offsets include a more rigorous regulatory review, increased standardization for assessing baseline emissions and better oversight of third-party auditors. It is generally accepted that such improvements have addressed earlier concerns that offset credits did not represent actual or additional reductions7. Furthermore, any estimates of over-crediting must be weighed against countervailing factors that result in under-crediting, such as the use of conservative default factors and time-limited crediting periods. The impact of this risk is likely to be negligible overall compared to 0.15 Gt CO
2e in
UNEP 2013 Emission Gap Report.
Conditionality of emission reduction pledgesSome countries have made all or part of their pledge conditional on factors such as national legislation, action from other countries or the provision of finance or technical support from other countries. Other countries did not attach conditions to their pledges. As in previous updates of UNEP’s Emissions Gap Report, these types of pledges are described here as conditional and unconditional pledges, respectively. Where countries have made only a conditional pledge, their pledge in the unconditional case is assumed in this analysis to be a zero reduction relative to the business-as-usual case.
3 .1 .2 Scenarios of global emissions in 2020
Assumptions of pledge cases
We present five projections of 2020 global emission levels, based on varying assumptions about accounting rules and pledge conditionality. The cases are as follows:
• Unconditionalpledges,lenientrules: all parties implement their unconditional pledges. (Business-as-usual is assumed for those parties that have only conditional pledges.) The use of LULUCF credits, offset double counting and surplus emission units is allowed.
• Unconditionalpledges,strictrules: all parties implement their unconditional pledges. (Business-as-usual is assumed for those parties that have only conditional pledges.) The use of LULUCF credits, offset double counting, and surplus emission units is not allowed.
• Conditional pledges, lenient rules: all parties implement their conditional pledges. The use of LULUCF credits, offset double counting, and surplus emission units is allowed.
• Conditional pledges, strict rules: all parties implement their conditional pledges. The use of LULUCF credits, offset double counting, and surplus emission units is not allowed.
____________________ 5 Consistent with the analysis in the 2013 update of the report, for the pledge cases it is assumed that international emission offsets could account for 33 per cent
of the difference between business-as-usual and pledged emission levels by 2020 for all Annex I countries, except for Canada and the USA, where no offset use is assumed. This is an arbitrary, conservative estimate, as many parties have yet to specify any limits to the use of transferable units.
6 This estimate is based on the offset mechanisms currently in most widespread use. If bilateral approaches to offsets proliferate, without adequately addressing double counting, the impact of double counting could become more pronounced.
7 For example, a recent report by the Australian Climate Change Authority (2014) found that the “CDM has detailed rules and governance arrangements to ensure credited emissions reductions are genuine. Its operation has improved over time, and its Executive Board has made a concerted effort to identify and address environmental concerns”.
24
EMISSIONS GAP REPORT A UNEP SynthesischApter 3
Emissions pledges and the emissions gap
• Current pledges, current rules: all parties implement the pledges they are currently pursuing8. The use of LULUCF credits, offset double counting, and surplus emission units is allowed.
All of these cases are based on the findings from 12 modeling groups, which have estimated national, regional and global emissions under conditional and unconditional pledges, and under different accounting assumptions9. Five modeling groups have updated their analyses, and for all modeling groups the updates of Japan, Russia, and the USA have been included.
Assumptions of current trajectory case
This case assumes that no additional action is taken beyond current policies – even if it results in pledges not being achieved or being over-achieved. For G20 countries, estimates are taken from the current trajectory, official data column of Table 3.1. If official data are not available, then estimates are taken from the current trajectory, independent estimates column. For other coun-tries the business-as-usual estimates from the modelling groups are used. Due to a limited number of estimates for each country we do not present a range of outcomes. More information on the current trajectory case as it applies to the G20 countries is given in Section 3.2.
Scenario results
Figure 3.1 shows global emissions in 2020 for the pledge cases, the current trajectory case,
business-as-usual and historical emissions. For the unconditional pledges, lenient rules case, the estimate for 2020 emissions is 54 Gt CO2
e (range 53–55 Gt CO
2e) and for the conditional pledges,
strict rules case, 52 Gt CO2e (range 50–53 Gt CO
2e).
Under current pledges, current rules, the resulting projected emission level is 53 Gt CO
2e (range
51–54 Gt CO2e). For reference, the business-as-usual
level in 2020 is 59 Gt CO2e (range 56–60 Gt CO
2e).
The current trajectory case has global emissions of 55 Gt CO
2e (rounded from 54.5 Gt CO
2e) in 2020,
which is above the upper end of the range of pledge cases of 54 Gt CO
2e (median and rounded estimate).
Compared to UNEP’s Emissions Gap Report 2013, 2020 emissions under the conditional cases have not changed significantly. The conditional pledge, strict rules case has increased by about 0.2 Gt CO
2e due to Japan’s new tentative, less
ambitious pledge. Under the conditional pledge, lenient rules case, these higher emissions are partly compensated by a lower impact of double counting relative to last year. The estimate of the unconditional pledge, strict rule case is 1 Gt CO
2e
lower than in 2013 due to the clarification that the USA pledge is unconditional. The unconditional pledge, lenient rules case is 1.2 Gt CO
2e lower, due
to both the revision of the USA pledge and the lower impact of accounting rules. The impact of Japan’s new pledge is limited for the unconditional pledge cases, as it is close to Japan’s business-as-usual estimate that was used for the unconditional case in 2013.
____________________ 8 Each country is categorized as implementing its conditional or unconditional pledge according to official documents and public statements. Conditional pledges
are applied for Canada, Mexico and South Africa. Unconditional pledges are applied for Australia, Brazil, China, the EU, India, Indonesia, Japan, the Republic of Korea, the Russian Federation, and the USA. Sources for official statements are detailed in Table 3.1.
9 These are the same groups as for UNEP (2013) and include (i) the Climate Action Tracker by Ecofys, Climate Analytics and Potsdam Institute for Climate Impact Research–PIK, www.climateactiontracker.org (Fekete et al., 2013); (ii) Climate Interactive (C-ROADS) (Sterman et al., 2012); (iii) Fondazione Eni Enrico Mattei (Tavoni et al., 2013); (iv) Grantham Research Institute, London School of Economics (updated based on Stern and Taylor, 2010); (v) OECD Environmental Outlook to 2050 (OECD, 2012); (vi) PBL Netherlands (den Elzen et al., 2013; Hof et al., 2013) and (vii) UNEP DTU Partnership (UNEP, 2014). In addition, the five model groups that participate in the LIMITS project (Kriegler et al., 2013): (viii) Energy Research Centre of the Netherlands, (ix) International Institute for Applied Systems Analysis, (x) National Institute for Environmental Studies, (xi) Pacific Northwest National Laboratory and (xii) Potsdam Institute for Climate Impact Research. See Table B.1 in Appendix 4.B to the UNEP Emissions Gap Report 2013 (UNEP, 2013) for more information on the contributing modeling groups.
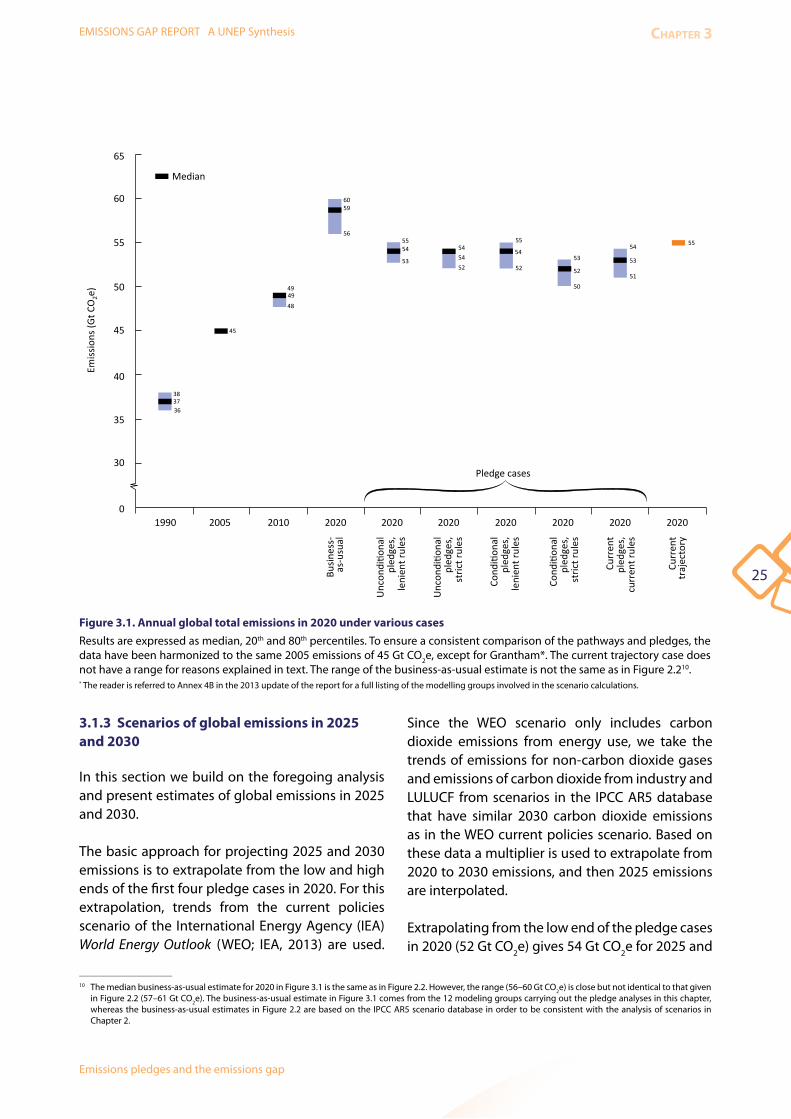
25
EMISSIONS GAP REPORT A UNEP Synthesis Chapter 3
Emissions pledges and the emissions gap
3 .1 .3 Scenarios of global emissions in 2025 and 2030
In this section we build on the foregoing analysis and present estimates of global emissions in 2025 and 2030.
The basic approach for projecting 2025 and 2030 emissions is to extrapolate from the low and high ends of the first four pledge cases in 2020. For this extrapolation, trends from the current policies scenario of the International Energy Agency (IEA) World Energy Outlook (WEO; IEA, 2013) are used.
Since the WEO scenario only includes carbon dioxide emissions from energy use, we take the trends of emissions for non-carbon dioxide gases and emissions of carbon dioxide from industry and LULUCF from scenarios in the IPCC AR5 database that have similar 2030 carbon dioxide emissions as in the WEO current policies scenario. Based on these data a multiplier is used to extrapolate from 2020 to 2030 emissions, and then 2025 emissions are interpolated.
Extrapolating from the low end of the pledge cases in 2020 (52 Gt CO2
e) gives 54 Gt CO2e for 2025 and
Figure 3 .1 . Annual global total emissions in 2020 under various cases
Results are expressed as median, 20th and 80th percentiles. To ensure a consistent comparison of the pathways and pledges, the data have been harmonized to the same 2005 emissions of 45 Gt CO
2e, except for Grantham*. The current trajectory case does
not have a range for reasons explained in text. The range of the business-as-usual estimate is not the same as in Figure 2.210.* The reader is referred to Annex 4B in the 2013 update of the report for a full listing of the modelling groups involved in the scenario calculations.
____________________ 10 The median business-as-usual estimate for 2020 in Figure 3.1 is the same as in Figure 2.2. However, the range (56–60 Gt CO
2e) is close but not identical to that given
in Figure 2.2 (57–61 Gt CO2e). The business-as-usual estimate in Figure 3.1 comes from the 12 modeling groups carrying out the pledge analyses in this chapter,
whereas the business-as-usual estimates in Figure 2.2 are based on the IPCC AR5 scenario database in order to be consistent with the analysis of scenarios in Chapter 2.
1990 2005 2010 2020 20202020 2020 2020 2020 20200
30
35
40
45
50
55
60
65
Pledge cases
Median
Busin
ess-
as-u
sual
Uncon
ditio
nal
pled
ges,
leni
ent r
ules
Uncon
ditio
nal
pled
ges,
stric
t rul
es
Cond
ition
alpl
edge
s,le
nien
t rul
es
Cond
ition
alpl
edge
s,st
rict r
ules
Curr
ent
pled
ges,
curr
ent r
ules
Curr
ent
traj
ecto
ry
Emiss
ions
(Gt C
O2e
)
383736
45
494948
6059
565554
53
5455
54
5253
52
50
54
53
51
55
5452
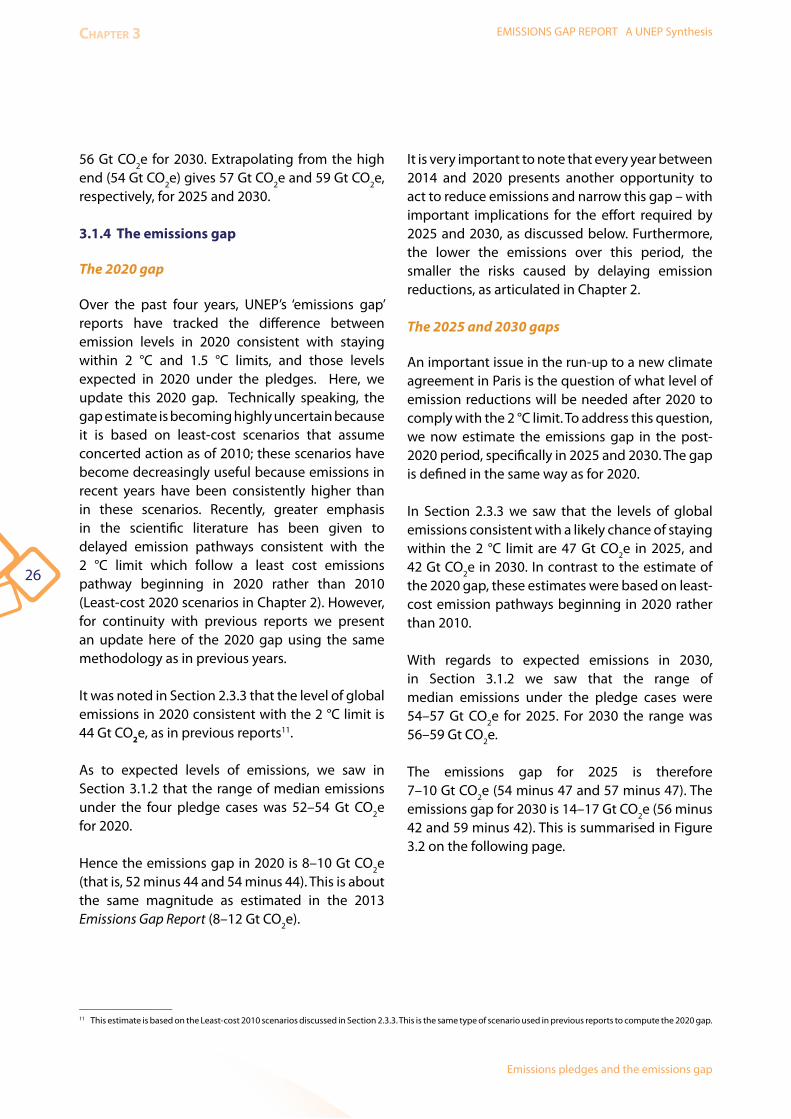
26
EMISSIONS GAP REPORT A UNEP SynthesischApter 3
Emissions pledges and the emissions gap
56 Gt CO2e for 2030. Extrapolating from the high
end (54 Gt CO2e) gives 57 Gt CO
2e and 59 Gt CO
2e,
respectively, for 2025 and 2030.
3 .1 .4 The emissions gap
The 2020 gap
Over the past four years, UNEP’s ‘emissions gap’ reports have tracked the difference between emission levels in 2020 consistent with staying within 2 °C and 1.5 °C limits, and those levels expected in 2020 under the pledges. Here, we update this 2020 gap. Technically speaking, the gap estimate is becoming highly uncertain because it is based on least-cost scenarios that assume concerted action as of 2010; these scenarios have become decreasingly useful because emissions in recent years have been consistently higher than in these scenarios. Recently, greater emphasis in the scientific literature has been given to delayed emission pathways consistent with the 2 °C limit which follow a least cost emissions pathway beginning in 2020 rather than 2010 (Least-cost 2020 scenarios in Chapter 2). However, for continuity with previous reports we present an update here of the 2020 gap using the same methodology as in previous years.
It was noted in Section 2.3.3 that the level of global emissions in 2020 consistent with the 2 °C limit is 44 Gt CO2e, as in previous reports11.
As to expected levels of emissions, we saw in Section 3.1.2 that the range of median emissions under the four pledge cases was 52–54 Gt CO
2e
for 2020.
Hence the emissions gap in 2020 is 8–10 Gt CO2e
(that is, 52 minus 44 and 54 minus 44). This is about the same magnitude as estimated in the 2013 Emissions Gap Report (8–12 Gt CO
2e).
It is very important to note that every year between 2014 and 2020 presents another opportunity to act to reduce emissions and narrow this gap – with important implications for the effort required by 2025 and 2030, as discussed below. Furthermore, the lower the emissions over this period, the smaller the risks caused by delaying emission reductions, as articulated in Chapter 2.
The 2025 and 2030 gaps
An important issue in the run-up to a new climate agreement in Paris is the question of what level of emission reductions will be needed after 2020 to comply with the 2 °C limit. To address this question, we now estimate the emissions gap in the post-2020 period, specifically in 2025 and 2030. The gap is defined in the same way as for 2020.
In Section 2.3.3 we saw that the levels of global emissions consistent with a likely chance of staying within the 2 °C limit are 47 Gt CO2
e in 2025, and 42 Gt CO
2e in 2030. In contrast to the estimate of
the 2020 gap, these estimates were based on least-cost emission pathways beginning in 2020 rather than 2010.
With regards to expected emissions in 2030, in Section 3.1.2 we saw that the range of median emissions under the pledge cases were 54–57 Gt CO
2e for 2025. For 2030 the range was
56–59 Gt CO2e.
The emissions gap for 2025 is therefore 7–10 Gt CO
2e (54 minus 47 and 57 minus 47). The
emissions gap for 2030 is 14–17 Gt CO2e (56 minus
42 and 59 minus 42). This is summarised in Figure 3.2 on the following page.
____________________11 This estimate is based on the Least-cost 2010 scenarios discussed in Section 2.3.3. This is the same type of scenario used in previous reports to compute the 2020 gap.
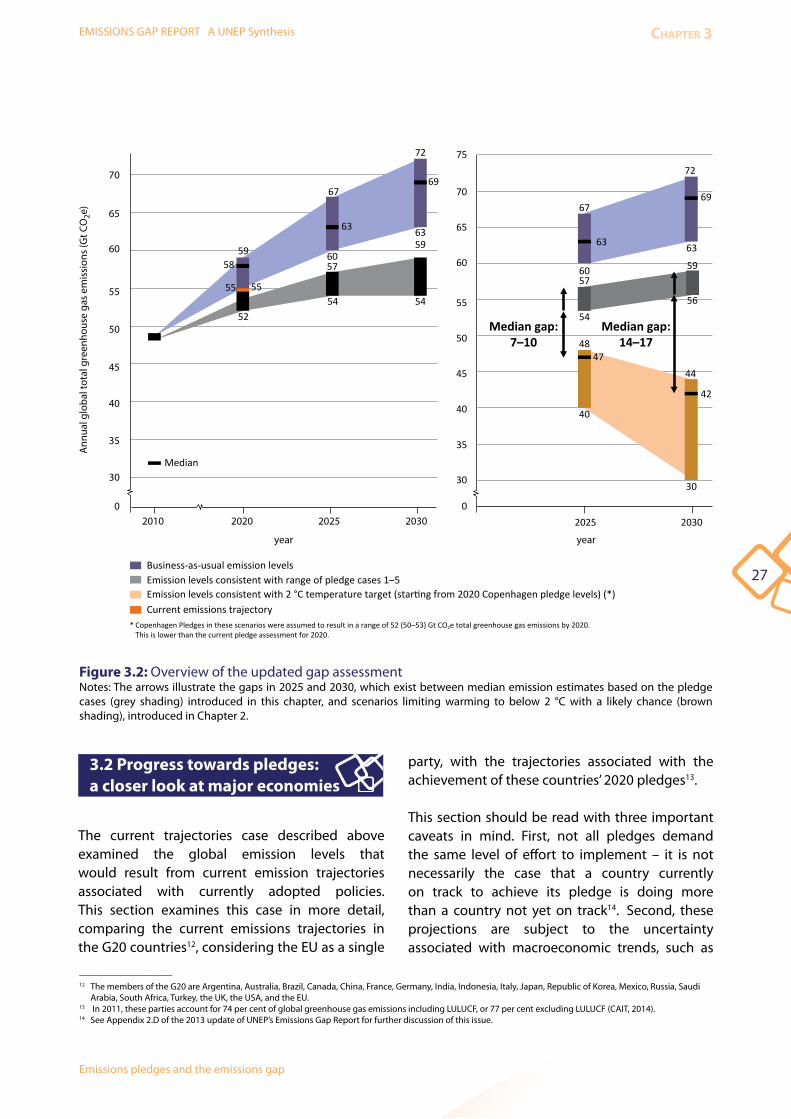
27
EMISSIONS GAP REPORT A UNEP Synthesis Chapter 3
Emissions pledges and the emissions gap
Figure 3 .2: Overview of the updated gap assessmentNotes: The arrows illustrate the gaps in 2025 and 2030, which exist between median emission estimates based on the pledge cases (grey shading) introduced in this chapter, and scenarios limiting warming to below 2 °C with a likely chance (brown shading), introduced in Chapter 2.
3 .2 Progress towards pledges: a closer look at major economies
The current trajectories case described above examined the global emission levels that would result from current emission trajectories associated with currently adopted policies. This section examines this case in more detail, comparing the current emissions trajectories in the G20 countries12, considering the EU as a single
party, with the trajectories associated with the achievement of these countries’ 2020 pledges13.
This section should be read with three important caveats in mind. First, not all pledges demand the same level of effort to implement – it is not necessarily the case that a country currently on track to achieve its pledge is doing more than a country not yet on track14. Second, these projections are subject to the uncertainty associated with macroeconomic trends, such as
____________________12 The members of the G20 are Argentina, Australia, Brazil, Canada, China, France, Germany, India, Indonesia, Italy, Japan, Republic of Korea, Mexico, Russia, Saudi
Arabia, South Africa, Turkey, the UK, the USA, and the EU.13 In 2011, these parties account for 74 per cent of global greenhouse gas emissions including LULUCF, or 77 per cent excluding LULUCF (CAIT, 2014).14 See Appendix 2.D of the 2013 update of UNEP’s Emissions Gap Report for further discussion of this issue.
2010 2020 2025 20300
40
35
30
45
50
55
60
65
70
Median gap:7–10
yearyear
Ann
ual g
loba
l tot
al g
reen
hous
e ga
s em
issi
ons
(Gt C
O2e
)
2025 2030
30
35
40
45
50
55
60
65
70
75
* Copenhagen Pledges in these scenarios were assumed to result in a range of 52 (50–53) Gt CO2e total greenhouse gas emissions by 2020. This is lower than the current pledge assessment for 2020.
Emission levels consistent with range of pledge cases 1–5Emission levels consistent with 2 °C temperature target (starting from 2020 Copenhagen pledge levels) (*)Current emissions trajectory
Business-as-usual emission levels
Median
0
30
44
42
4847
40
72
67
72
6359
54
57
54
59
52
58
5555
6969
63
59
56
57
54Median gap:
14–17
60
63
67
60
63
28
EMISSIONS GAP REPORT A UNEP SynthesischApter 3
Emissions pledges and the emissions gap
gross domestic product (GDP) and population growth, as well as with the impact of policies. Third, this analysis does not consider the potential use of offsets to achieve pledges; it considers only national emission trends.
Table 1 compares 2020 emissions under three cases: a pledge case, based on official data; a current trajectory case, based on official data; and a current trajectory case, based on independent analysis. These cases are described in Box 3.2.
____________________15 For China, GDP is assumed to reach 61.6 trillion yuan in 2020, consistent with China’s National Communication. For India, GDP is assumed to reach 120.41 trillion
rupees (’06–‘07 rupee value) in 2020, consistent with the average of the scenarios presented in Planning Commission (2014). 16 The Australian official estimate is taken from DoE (2013), which, in contrast to the Biennial Report, presents a scenario without a carbon pricing mechanism, which
reflects the current policy situation. The Mexican official estimate is based on Government of Mexico (2012), adjusted based on updated figures from the National Climate Change Strategy (2013).
Box 3 .2: Assumptions of analysis of progress towards pledges
For each UNFCCC party, Table 3.1 compares 2020 emissions under three cases:
1: Pledge case (official data): this case identifies the maximum amount of greenhouse gas emissions that each country or party could emit in 2020 and still meet its pledge – not considering the use of offsets. If a pledge is presented as a range, we adopted the less ambitious end as the official pledge estimate. For countries whose pledges are framed relative to a baseline scenario, we assume that baselines are not adjusted in the future. For countries whose pledges are framed as greenhouse gas intensity targets, we assume economic growth consistent with official projections15. Where available, we use the 2020 emissions level described by the country or party as the pledge level; alternatively, we calculate this level working from official base-year or baseline data.
2: Current trajectory (official data): this case identifies official estimates of 2020 emissions considering projected economic trends and current policy approaches, including policies at least through 2012. Unless otherwise noted, figures are sourced from biennial reports to the UNFCCC (UNFCCC, 2014a)16.
3: Current trajectory (independent analysis): this case similarly identifies estimates of 2020 emissions considering projected economic trends and current policy approaches, but is based on independent analysis rather than official data. Figures are drawn from the Climate Action Tracker (2013) and PBL (Roelfsema et al., 2014), as well as LaRovere et al. (2013) in the case of Brazil and RHG (2014) in the case of the USA. Projections considering only a limited subset of sectors and gases, for example carbon dioxide from fossil fuels, are omitted, as they cannot be compared to economy-wide projections.

29
EMISSIONS GAP REPORT A UNEP Synthesis Chapter 3
Emissions pledges and the emissions gap
Pledge case(based on official data)
Current trajectory (based on official data)
Current trajectory (based on independent estimates)
Recent policy developments Notes and sources
Base Year PledgesAustralia 555 685 710
(710–710) New government replaced carbon-pricing mechanism with Emission Reduction Fund. This results in an increase in projected emissions for 2020.
Department of Environment (2013), Roelfsema et al. (2014).
Canada 610 735 720 (710–735)
Adopted greenhouse gas regulations on heavy-duty vehicles (GLOBE International, 2014).
Environment Canada 2013a, Climate Action Tracker (2013), Roelfsema et al. (2014; updated), adjusted to include LULUCF based on Environment Canada 2013a. Official pledge estimate based on 2005 emissions as reported in Environment Canada (2013b).
European Union
4 500 4 370 4 185 (4 150–4 210)
2030 framework for climate and energy policies proposed in January 2014; binding emission targets for new car and van fleets; regulation of fluorinated gases; various Member State policies. (European Environment Agency, 2014a)
Official pledge from EEA (2014a), official trajectory from EEA (2014b). Independent estimate from Climate Action Tracker (2013). Figures exclude LULUCF. Official trajectory does not fully reflect all policies adopted past mid-2012.
Japan 1 300 1 320 1 225 (1 165–1 285)
Japan revised its conditional target in November 2013 to a less ambitious one. Official estimates indicate it is close, but not yet on track to achieve the new pledge with current policies, which may necessitate the purchase of the international offsets; international acceptance, quality, and quantity of Japan’s Joint Crediting Mechanism (JCM) under the UNFCCC is not yet clear. New pledge does not reflect potential reductions from nuclear power, which is still under consideration. Firm pledge will be set following further review of energy policy.
Biennial Report (UNFCCC, 2014a), Climate Action Tracker (2013), Roelfsema et al. (2014; updated). Range of independent estimates due to different assumptions regarding nuclear energy.
Russian Federation
2 515 2 400 2 340 (2 085–2 540)
With Decree 752 of Sept 2013, Russia has moved to a target of “not more than 75% of 1990 levels by 2020”.
Excludes LULUCF.
United States of America
5 145 5 920 5 830 (5 440–6 145)
The US EPA has drafted regulations to restrict emissions from existing power plants.
Biennial Report (UNFCCC, 2014a), RHG (2014), Climate Action Tracker (2013), Roelfsema et al. (2014; updated). Figures do not include impact of proposed regulations of existing power plants. Independent estimate of current trajectory considers full range of possible LULUCF credit per Biennial Report (-898 MtCO
2e to -614 MtCO
2e).
Baseline Scenario PledgesBrazil 2 070 N/A 1 640
(1 440–1 900)Range of independent 2020 projections has narrowed considerably since last report. Status change is due to improved estimates rather than new policies, though Brazil has continued to make progress implementing sectoral plans, and passed Law No. 12805 on Establishing the National Policy on Farming-Livestock-Forest Integration (GLOBE International, 2014).
Brazilian Government (2010), Climate Action Tracker (2013), Roelfsema et al. (2014), LaRovere et al. 2013.
Table 3 .1 Emissions in 2020 under pledge case and current trajectory cases for G20 members (Mt CO2e )17
____________________17 Not considering purchase or sale of offsets. Figures include all gases and sectors, including LULUCF, unless otherwise noted.
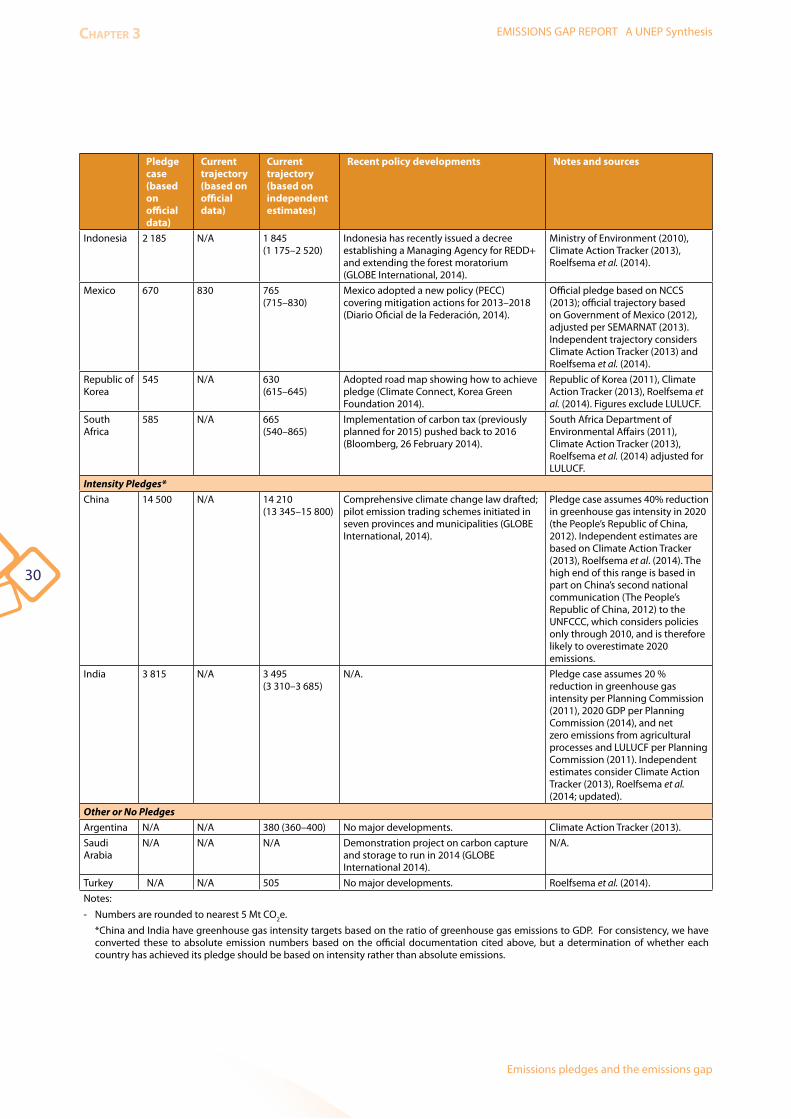
30
EMISSIONS GAP REPORT A UNEP SynthesischApter 3
Emissions pledges and the emissions gap
Pledge case(based on official data)
Current trajectory (based on official data)
Current trajectory (based on independent estimates)
Recent policy developments Notes and sources
Indonesia 2 185 N/A 1 845 (1 175–2 520)
Indonesia has recently issued a decree establishing a Managing Agency for REDD+ and extending the forest moratorium (GLOBE International, 2014).
Ministry of Environment (2010), Climate Action Tracker (2013), Roelfsema et al. (2014).
Mexico 670 830 765 (715–830)
Mexico adopted a new policy (PECC) covering mitigation actions for 2013–2018 (Diario Oficial de la Federación, 2014).
Official pledge based on NCCS (2013); official trajectory based on Government of Mexico (2012), adjusted per SEMARNAT (2013). Independent trajectory considers Climate Action Tracker (2013) and Roelfsema et al. (2014).
Republic of Korea
545 N/A 630 (615–645)
Adopted road map showing how to achieve pledge (Climate Connect, Korea Green Foundation 2014).
Republic of Korea (2011), Climate Action Tracker (2013), Roelfsema et al. (2014). Figures exclude LULUCF.
South Africa
585 N/A 665 (540–865)
Implementation of carbon tax (previously planned for 2015) pushed back to 2016 (Bloomberg, 26 February 2014).
South Africa Department of Environmental Affairs (2011), Climate Action Tracker (2013), Roelfsema et al. (2014) adjusted for LULUCF.
Intensity Pledges*China 14 500 N/A 14 210
(13 345–15 800)Comprehensive climate change law drafted; pilot emission trading schemes initiated in seven provinces and municipalities (GLOBE International, 2014).
Pledge case assumes 40% reduction in greenhouse gas intensity in 2020 (the People’s Republic of China, 2012). Independent estimates are based on Climate Action Tracker (2013), Roelfsema et al. (2014). The high end of this range is based in part on China’s second national communication (The People’s Republic of China, 2012) to the UNFCCC, which considers policies only through 2010, and is therefore likely to overestimate 2020 emissions.
India 3 815 N/A 3 495 (3 310–3 685)
N/A. Pledge case assumes 20 % reduction in greenhouse gas intensity per Planning Commission (2011), 2020 GDP per Planning Commission (2014), and net zero emissions from agricultural processes and LULUCF per Planning Commission (2011). Independent estimates consider Climate Action Tracker (2013), Roelfsema et al. (2014; updated).
Other or No PledgesArgentina N/A N/A 380 (360–400) No major developments. Climate Action Tracker (2013).
Saudi Arabia
N/A N/A N/A Demonstration project on carbon capture and storage to run in 2014 (GLOBE International 2014).
N/A.
Turkey N/A N/A 505 No major developments. Roelfsema et al. (2014).
Notes:
- Numbers are rounded to nearest 5 Mt CO2e.
*China and India have greenhouse gas intensity targets based on the ratio of greenhouse gas emissions to GDP. For consistency, we have converted these to absolute emission numbers based on the official documentation cited above, but a determination of whether each country has achieved its pledge should be based on intensity rather than absolute emissions.

31
EMISSIONS GAP REPORT A UNEP Synthesis Chapter 3
Emissions pledges and the emissions gap
Based on this analysis, five of the parties considered here – Brazil, China, the EU28, India and the Russian Federation – appear to be on track to meet their pledges. These parties all have adopted new policies since putting forward their pledges in 2009. However, some observers have called into question the ambition of some of these pledges relative to historic trends: Russia’s 2013 pledge to limit 2020 emissions to 75 per cent of 1990 levels is roughly in line with existing trends and scenarios (Kokorin and Korppoo 2014). Similarly, India’s pledge is higher than some estimates of business-as-usual trends (Pew Center on Global Climate Change, 2011; Climate Action Tracker, 2013). Brazil’s pledge assumed a baseline in which LULUCF emissions would grow at the rates they did for 1995–2005, when in reality these emissions had already dropped significantly by the time the pledge was put forward in 2009 (SEEG, 2014).
China’s and India’s pledges are framed in terms of greenhouse gas intensity reductions from 2005 levels, and several sources indicate that both countries are currently on track to achieve them. For China, the IEA Current Policies Scenario shows a 43 per cent reduction, and the Climate Action Tracker shows a 42 per cent reduction, compared to a pledged reduction of 40–45 per cent. For India, Garg et al. (2014) show that by 2012 India had already reduced intensity by 17 per cent out of a pledged reduction of 20–25 per cent by 2020, and the Climate Action Tracker shows India on track for a 36 per cent reduction by 2020.
Japan announced an adjustment to its pledge in November 2013 from a 25 per cent reduction from 1990 levels to a 3.8 per cent reduction from 2005 levels. While this adjustment makes it much easier for Japan to achieve its pledge, current official projections still place Japan’s 2020 emissions slightly above its pledge threshold (UNFCCC, 2014a). Independent projections, on the other hand, estimate that Japan is now on track to meet its revised pledge (Climate Action Tracker, 2013; Roelfsema et al. 2014). Japan’s actual trajectory, however, will depend significantly on the fate of nuclear and coal to meet power needs.
Four parties – Australia, Canada, Mexico, and the USA – are likely to require further action and/or purchased offsets in order to meet their pledges, according to government and independent estimates. Australia had been on track to meet its pledge in part through its carbon pricing mechanism, but this mechanism was abolished on 1 July 2014. Recent policy developments in Mexico (the Special Program on Climate Change (PECC) for 2013–2018) and the USA (draft emission standards for existing power plants) bring each country nearer to meeting its pledge, but further action will be necessary in both cases (see, for example, Climate Action Tracker, 2013; RHG, 2014; World Resources Institute, 2014.) The USA has published an analysis suggesting that it will meet its pledge if it successfully implements the President’s Climate Action Plan (Executive Office of the President, 2013).
The Republic of Korea may also require further action to meet its pledge, but this could not be verified based on publicly available official projections. Korea did release a road map in early 2014 outlining a pathway to achieving its 2020 pledge (Climate Connect, 2014; Korea Green Foundation, 2014).
In the case of Indonesia and South Africa, insufficient information is currently available to determine whether they are on track. Official projections to 2020 do not reflect recently adopted and implemented policies, and independent estimates vary widely, from well below the pledge level to well above it.
Finally, Argentina, Saudi Arabia and Turkey have not proposed greenhouse gas reduction pledges.
3 .3 Summing up
This chapter finds that global 2020 emissions range from 52 Gt CO
2e, if all countries were to achieve their
conditional pledges and apply strict accounting rules, to 54 Gt CO
2e, if all countries were to achieve
only their unconditional pledges and apply lenient accounting rules. If each country were to achieve the pledge it is currently pursuing – conditional for

32
EMISSIONS GAP REPORT A UNEP SynthesischApter 3
Emissions pledges and the emissions gap
some countries and unconditional for others – and apply the current set of accounting rules, which are lenient, 2020 emissions would reach 53 Gt CO
2e.
This is 8 per cent above 2010 emissions and 10 per cent below business-as-usual in 2020.
Relative to the previous update of the Emissions Gap Report (UNEP, 2013), this year’s unconditional pledge cases result in slightly lower 2020 emissions, due primarily to the fact that the USA has recently clarified that its pledge should be considered unconditional. Revisions in accounting assumptions also play a minor role (the remaining 2020 cases, and 2030 emissions, were not considered in the 2013 update of the Emissions Gap Report).
Several studies now indicate that Brazil, China, the EU, India, and the Russian Federation are on track to achieve their pledges. Conversely, Australia is no longer on track, due to the abolition of its carbon
pricing mechanism. Japan is closer to achieving its pledge than estimated last year, but this is due primarily to the fact that its tentative new pledge is less ambitious. Japan’s 2020 emissions will also depend on the future of its nuclear energy production. Recent policy developments in Mexico and the USA bring them closer to achieving their pledges, but further efforts will be necessary. Likewise, further efforts are still needed in Canada. Available data for Indonesia and South Africa are inconclusive and Argentina, Saudi Arabia, and Turkey have not made pledges.
Finally, extrapolating trends from the pledge cases in 2020 out to 2030 leads to an emissions gap of 14–17 Gt CO2
e in 2030, which is about a third of current global emissions. These estimates assume emission pathways with delayed action until 2020 and follow cost-optimal paths afterwards (Section 2.3.3).

33
EMISSIONS GAP REPORT A UNEP Synthesis Chapter 4
Improving energy efficiency and reaping development and climate benefits
4 .1 Climate mitigation in a development context
4 .1 .1 Sustainable development and addressing climate change
Sustainable development continues to be an over-riding priority for developing countries, where poverty is a major issue and 1.3 billion people still do not have access to basic energy services. While sustainable development is the aim, the reality is that another model is steering world development, bringing the unintended impacts of climate change, resource scarcity, air pollution, water pollution and other large-scale types of environmental degradation.
An alternative model of sustainable economic and societal development has been proposed which emphasizes non-polluting and resource-efficient management and technologies, and which would help decouple economic growth and an increase in well-being from the build-up of greenhouse gas emissions, the depletion of resources and the degradation of land. This model has been articulated by a range of international organi-sations, such as UNEP in its report Towards a Green Economy: Pathways to Sustainable Development and Poverty Eradication (UNEP, 2011), the African Development Bank in its African Development Report 2012: Towards Green Growth in Africa (AfDB, 2012), the World Bank in Inclusive Green Growth:
the Pathway to Sustainable Development (World Bank, 2012), and OECD in its Green Growth Strategy (OECD, 2011). They all make a strong case for integrating climate change mitigation in a policy framework that can deliver economic growth, development and stringent climate action.
Most recently Better Growth, Better Climate: The New Climate Economy Report from the Global Commission on the Economy and Climate (NCE, 2014) made the case for a new economic model in relation to the urgent need to deal with climate change. Key messages from the report are:
1: countries at all levels of income can have lasting economic growth, while effectively dealing with the risks of climate change;
2: the next 15 years of investment in the world’s urban, energy and land use systems will determine the future climate; if climate
change is not tackled, economic growth itself will be at risk;
3: future economic growth does not have to replicate the high-carbon, unevenly distributed model of the past: there are now enough efficient and low-carbon solutions available;
4: stimulating innovation and making it attractive to invest in low-carbon infrastructure can drive a greater resource efficiency that will lead to economic growth, many social and environmental benefits, and lower emissions; and
5: additional investments needed for this
chApter 4: Improving energy efficiency and reaping development and climate benefits
Lead authors: Kornelis Blok (Ecofys), Tim Farrell (Copenhagen Centre on Energy Efficiency), Niklas Höhne (NewClimate Institute), Ritu Mathur (The Energy and Resources Institute), Daniel Puig (UNEP DTU Partnership), Lisa Ryan (University College Dublin)
Contributing authors: Andreas Ernst (University of Kassel), Lewis Fulton (University of California at Davis), Kelly Levin (World Resources Institute), Neha Pahuja (The Energy and Resources Institute), Lynn Price (Lawrence Berkeley National Laboratory), Julia Reinaud (European Climate Foundation), Hans-Paul Siderius (Netherlands Enterprise Energy), Diana Ürge-Vorsatz (Central European University)
34
EMISSIONS GAP REPORT A UNEP SynthesischApter 4
Improving energy efficiency and reaping development and climate benefits
transformation will be modest compared to the basic investments needed to raise the level of well-being worldwide.
4 .1 .2 Sustainable development goals can deliver strong climate benefits
The UN Sustainable Development Goals (SDGs)1
aim to build on economic, social and environmental links in achieving sustainable development. The proposed SDGs, to be realized by 2030, provide a concrete opportunity to achieve climate co-benefits while mitigating climate risks. One of the proposed goals is to ensure access to affordable sustainable, and reliable modern energy services for all, building on the Sustainable Energy for All (SE4ALL) initiative (UN, 2012). The 2030 goals of the SE4ALL initiative are to:
1: ensure universal access to sustainable modern energy services for all;
2: double the share of renewable energy in the global energy mix; and
3: double the global rate of improvement in energy efficiency.
Studies on the SE4ALL initiative (Rogelj et al., 2013; IRENA, 2014) suggest that achieving these objectives could provide a major contribution to putting the world on an emissions pathway that
stays within the 2 °C limit, assuming other actions are taken such as stopping deforestation and expanding sustainable agriculture. Other SDGs can also contribute to addressing climate change, not only by reducing emissions, but also by improving resilience against climate change impacts.
4 .1 .3 Climate change mitigation has multiple benefits
While the previous section argues that sustainable development can lead to climate mitigation, the reverse is also true – actions to reduce greenhouse gas emissions yield many important benefits to development. Comprehensive overviews of the benefits of many climate policies are included in the IPCC’s AR5 (Clarke et al., 2014) and in a UNFCCC technical paper (UNFCCC, 2014). Table 4.1 lists these mitigation actions and Appendix 4-A presents a short overview of their economic, social, environmental and other benefits. These options include: introducing more renewable energy in the energy supply system, improving energy efficiency across all sectors and expanding sustainable agriculture and forestry. In Section 4.2 we look more closely at one of these promising options – improving energy efficiency – which effectively reduces emissions and brings multiple benefits to development. The overall conclusion is that actions to mitigate
Box 4 .1: Energy and climate scenarios for India
Comparison of energy-security driven scenarios and climate-specific scenarios for India by The Energy and Resources Institute indicate strong convergence in the direction of changes required to achieve both energy security and climate change mitigation. These scenarios highlight that there are several technological options that could help meet the twin objectives of reducing emissions and enhancing energy access, and through these, support sustainable development. For example, energy efficiency often brings economic gains in addition to reducing energy use and emissions (Section 4.2.2). Moreover, decentralized power generation through renewables could lead to additional benefits in the form of improved livelihoods, and better health of women and children, in addition to helping achieve a low carbon development path. Some of the important areas where clear synergies exist are improving energy efficiency, increasing the deployment of renewable energy technologies and increasing the efficiency of transport systems (TERI, 2009).
____________________ 1 For details on each sustainable development goal see: http://sustainabledevelopment.un.org/focussdgs.html

35
EMISSIONS GAP REPORT A UNEP Synthesis Chapter 4
Improving energy efficiency and reaping development and climate benefits
climate change often have close synergies with policies that countries pursue to fulfil their own priorities; this includes domestic goals such as energy security, reduction in local air pollution, reduced congestion on roads, and improved access to electricity and modern fuels (Box 4.1).
An important point is that the emission reduction potentials of the various options in Table 4.1 add up to a substantial global potential for reducing greenhouse gas emissions (about 28.5 Gt CO
2e
relative to a baseline in 2030). This is equivalent to nearly 60 per cent of the global greenhouse gas emissions released in 2010.
4 .1 .4 Barriers
Even though the arguments for a transformation to a low carbon, climate resilient and resource efficient economy are compelling, there will be trade-offs to be made and barriers to be overcome. The most important barriers are those that provide
Selected thematic areas Approximate emission reductions potential (Gt CO2e)
Level of co-benefits a
Level of barriers a Level of coverage by:
National pledges and policies b
(per cent)
International cooperative initiatives c
Energy supply – renewable energy, including increased energy access
5 * High Medium50
High
Energy supply – fuel switch, combined heat-and-power, nuclear, carbon capture and storage
3 * Low High10
Low
Energy supply: energy industry 2 ** Medium Low 10 Low
Manufacturing industry – energy efficiency3 *
High High 30 Medium
Manufacturing industry – renewable energy
Medium Medium30
Medium
Manufacturing industry – process emissions
1.5 ** Medium Low10
Low
Buildings – energy efficient heating and cooling
2 *
High High50
High
Buildings – renewable energy heating High Medium 30 Medium
Buildings – appliances and lighting High Medium 50 High
Transport – energy efficiency, incl. electrification
3 *
High Medium20
High
Transport – renewable energy Medium Medium 50 Medium
Transport – demand reduction and modal shift
High Medium10
Medium
Sustainable waste management 2 ** Low Low 30 Medium
Sustainable and efficient agriculture 3 ** Medium Medium 10 High
Sustainable forestry 4 *** Medium Medium 30 High
* “Manufacturing industry” includes also carbon capture and storage and fuel and feedstock switching (IEA, 2014a).** Non-energy emissions are not covered by the Energy Technology Perspectives 2014 (IEA, 2014a). Therefore we used the IPCC RCP scenarios
to derive the order of magnitude of the potential. We used the difference between a reference scenario (RCP 8.5) and a 2 °C compatible scenario (RCP 2.6) as a measure of potential. The analysis in the IPCC AR5 on the full IPCC scenario dataset does not include the sectoral split that was chosen in this report.
*** Estimates of mitigation potential from forestry are very diverse. For a simple estimate of potential we assumed that total current net emissions from forests (as in RCP 2.6) can be reduced to zero by 2030. The resulting emissions reduction potential estimate is in line with the range from the full IPCC scenario analysis of about 1 to 8 Gt CO2
(Figure 6.35).a Summary rating based on IPCC AR5, WGIII Table 6.7.b Coverage adapted from Braun et al., 2014. Includes the 38 largest emitters, rounded to 10 per cent (100 per cent represent coverage of all
sub-areas in one thematic area – for example, fuel economy standards in passenger and freight transport).c Number of initiatives: counted from 197 initiatives included in: www.climateinitiativesdatabase.org.
Table 4 .1: Overview of emission reduction potential, co-benefits, barriers, and coverage by national actions and international cooperative initiatives
36
EMISSIONS GAP REPORT A UNEP SynthesischApter 4
Improving energy efficiency and reaping development and climate benefits
a motivation for sticking with the current high-carbon economic model: for example, prices that do not factor in damage caused by climate change, air pollution or other negative consequences of current economic practices; subsidies that encourage the use of fossil fuel, water and other scarce resources; investments that are driven by short-term returns in traditional high-carbon sectors and practices; and lack of investment in low-carbon, resource efficient solutions (NCE, 2014).
The scale of these up-front investments can be a real obstacle, as in the case of smaller manufacturing units that do not have the capital or the borrowing power to undertake such investments. In some cases the lack of appropriate and affordable technologies becomes an additional barrier. In another case, a study by the Energy and Resources Institute of India and the World Wildlife Fund (WWF/TERI, 2013) examined the technical feasibility of a 100 per cent renewable energy scenario for India. The study found that although the country had the technical potential to run on renewable energy sources, significant technological gaps made it difficult to realize.
Also, barriers to innovation must be overcome. The diffusion of innovative technologies is hampered by current pricing systems, risk aversion of potential users, regulations that favour existing products and lack of supporting networks – for example, infrastructure for electric vehicles (NCE, 2014).
In most cases a transition will also create losers in that some economic sectors, companies and segments of the population may see their business or incomes being affected. Hence, it is important to carefully consider the impact of new policies on these groups and to give them time to adjust.
4 .1 .5 Policies and international collaboration that support sustainable development and reduce greenhouse gas emissions
To overcome the above barriers, new government policies are needed to create the right incentives.
One approach is to incorporate the costs of climate change into the price of fuels through carbon taxes or emissions trading systems. A complimentary approach is to reduce or abolish subsidies on fossil fuels and thereby avoid annual government expenditure of more than US$ 600 billion (IEA 2013a; OECD 2013). At the same time, it is important to provide financial assistance to poor households that may not be able to afford more efficient fuels and technologies.
The good news is that countries are already widely applying policies that are overcoming barriers, reducing greenhouse gas emissions and promoting sustainable development. This is confirmed in Table 4.1 which shows that about half the countries in the world have national policies for promoting more efficient heating and/or cooling in buildings, and that about half are working on raising the efficiency of appliances and lighting. About 30 per cent of countries have programmes for sustainable waste management and sustainable forestry. Moreover, Bhutan, Costa Rica, Maldives, Norway and Sweden have carbon neutrality targets. By 2050 Denmark aims to be independent from fossil fuels and to have 100 per cent of its energy demand covered by renewable energy. Already 144 countries have set renewable energy targets (REN21, 2014). Some aim to cover 100 per cent of their electricity supply by renewable energy, such as the Cook Islands, Fiji, Niue, Tokelau, Tuvalu and Scotland. Germany’s Renewable Energy Sources Act provides for “constantly and cost effectively” increasing the share of renewable energy sources in electricity supply, to reach 80 per cent by 2050. Experience shows that countries have made rapid progress when they integrate climate policy into their core development strategy, lay out a long-term strategic vision, and build wide-ranging political support for a new approach. More details on policies are provided in section 4.2.3.
Not only are countries active, but also regions, cities and companies have joined together to launch international cooperative initiatives (ICIs) to pursue sustainable development, environmental protection and climate change mitigation

37
EMISSIONS GAP REPORT A UNEP Synthesis Chapter 4
Improving energy efficiency and reaping development and climate benefits
objectives. These initiatives, which in some cases include national governments, have the potential to significantly reduce greenhouse gas emissions in support of, and potentially beyond, national emission reduction pledges (UNEP, 2013). Interest is increasing in these efforts, as was noted at the UN Secretary General’s Climate Change Summit in New York, in September 20142 and in the UNFCCC negotiations3. Over the last year, some estimates have become available on the possible impact of the targets of a few ICIs (Appendix 4-B). The collective impact of these initiatives could add up to a substantial global emissions reduction. But further research has to determine whether these reductions are additional to current government action.
4 .1 .6 Investment Requirements
Scaling up the many efforts described above in order to reach emission targets will take consider-able investment – one estimate is US$ 44 trillion over 40 years to limit global warming to 2 oC4 (IEA, 2014a). Although a significant amount of public and private investment is already flowing into energy efficiency and renewable energy, it is far below what is needed. Investment in energy efficiency was estimated to be between US$ 310 and US$ 360 billion in 2012 (IEA, 2014b) and in renewable energy about US$ 244 billion in 2012 (IEA, 2014b), with the latter figure estimated to be US$ 250 billion in 2013 (IEA, 2014g). Therefore a greater policy push is required to enhance investment in this direction. To make it attractive for investors to invest in low-carbon and resource-efficient assets, the financial, policy and technological risks need to be reduced, general investment conditions need to be improved, financing costs need to be lowered and government budget support made available (GGGI, 2014; NCE, 2014).
4 .2 Spotlight: energy efficiency has benefits for all
4 .2 .1 Introduction
As in past emission gap reports, this chapter reviews successful policies and measures that reduce greenhouse gas emissions and at the same time support development. This year’s focus is on improving energy efficiency.
Energy efficiency improvements are defined here as a reduction of energy use per unit of energy services delivered, for example, a reduction of the energy used to heat 1 m2 of a home, or to drive 1 km with a car. This could also mean delivering more services with the same amount of energy. These improvements could be technical, as in replacing existing equipment with more energy efficient equipment (for example, energy efficient light bulbs), or behavioural, in which people use equipment more efficiently (for example, adjusting the thermostat setting on heating and cooling appliances).
Table 4.1 shows the substantial potential of energy efficiency improvements as part of a package of approaches to reduce global emissions. More specific estimates are presented in Section 4.2.2, which also reviews the multiple benefits to be garnered from energy efficiency improvements, beyond energy savings alone. Section 4.2.3 summarises policies and measures to improve energy efficiency in key sectors.
4 .2 .2 The multiple benefits of improving energy efficiency
The impacts of energy efficiency measures go far beyond energy savings and bring multiple benefits in line with the SDGs. An understanding of these could improve the benefit-cost assessment of energy efficiency outcomes and also show that it is unnecessary to trade environmental goals off against economic and social development ones.
____________________ 2 The Chair’s summary is available online at: http://www.un.org/climatechange/summit/2014/09/2014-climate-change-summary-chairs-summary/3 The Ad-hoc Working Group on the Durban Platform for Enhanced Action’s draft text on Accelerating the implementation of enhanced pre-2020 climate action is
available online at: http://unfccc.int/resource/docs/2014/adp2/eng/8drafttext.pdf4 However, these investment costs are offset by nearly US$ 115 trillion in fuel savings in a scenario that lowers emissions enough to stay within the 2 ˚C limit.

38
EMISSIONS GAP REPORT A UNEP SynthesischApter 4
Improving energy efficiency and reaping development and climate benefits
Many of the benefits are derived from two effects:
a: lower energy use which increases environ-mental performance, disposable income, and/or productivity, or
b: investments in energy efficiency goods and services which increase spending in the economy5 (IEA, 2014e).
One way to look at the multiple advantages of improving energy efficiency is to divide them into environmental, social and economic benefits, as in the following paragraphs.
Environmental benefits
Reducing greenhouse gas emissions
Energy efficiency represents one of the most important pillars in efforts to decarbonize the global energy system and achieve the world’s climate protection objectives. Improving energy efficiency is prominently featured in government strategies for reducing greenhouse gas emissions because of its significant potential to do so. Compared to other measures, improving energy efficiency is generally one of the most cost-effective options and can be implemented quickly (IIASA, 2012; IEA 2013a, 2013b; UNFCCC, 2014).
Some ongoing improvement of energy efficiency is indicated by the 1.6 per cent per year worldwide decline of energy intensity between 2002 and 20126 (IEA, 2014b). These improvements of course come at a price, with the annual investment in energy efficiency noted above to be US$ 310–360 billion in 2012 (IEA, 2014b).
While there has been steady progress over the past decade, there is great potential to further increase the rate of energy efficiency improvements (IEA,
2014c) and reduce greenhouse gas emissions. The extent to which greenhouse gas emissions can be reduced depends on both the emissions intensity of energy supply and use, and the effectiveness of those energy efficiency measures in reducing energy consumption. Improvements in the energy efficiency of energy consuming technologies and practices in 11 OECD countries over the past four decades saved 1 336 million tonnes of oil equivalents (Mtoe) in 2012, an amount larger than total final consumption of any other single source of fuel (IEA, 2014b).
A recent assessment (UDP, in preparation) provides world and G20 national- and sector-specific estimates of the emissions reduction potential associated with energy efficiency measures. The findings of this assessment, which are consistent with related studies (Appendix 4-C), highlight a significant emissions reduction potential through energy efficiency improvements, in particular in the power generation and industry sectors.
By this estimate, energy efficiency improvements worldwide could abate 22–24 Gt CO2
e in the period 2015–2030 (or 2.5–3.3 Gt CO
2e annually in 2030)
relative to a baseline scenario. This corresponds to a reduction in primary energy demand of about 5-7 per cent over the same fifteen-year period. Cumulative emission reductions attributable to improvements in energy efficiency over the period 2015-2030 represent about one-fifth of all cost effective emission reductions.7
Depending on the assumptions, estimates are higher (Appendix 4-C). For example, the International Energy Agency (IEA, 2014a) reports that end-use fuel and electricity efficiency could save 6.8 Gt CO
2e in 2030, and power generation
efficiency and fossil fuel switching could save 0.3 Gt CO
2e, also in 2030. An assessment by the
____________________ 5 Much of the research material for this section is sourced from the IEA’s Multiple Benefits of Energy Efficiency (IEA, 2014c). More details on the subject can be found
there (see http://www.iea.org/W/bookshop/475-Capturing_the_Multiple_Benefits_of_Energy_Efficiency )6 Energy intensity is an indicator of the energy efficiency of a country and is defined as the amount of primary energy used per unit of GDP of a country. But energy
intensity does not only reflect an economy’s energy efficiency; it also reflects the mix and type of economic activity. However, if the structure and level of economic activity remains relatively stable, then trends in energy intensity can serve as a proxy for changes in energy efficiency.
7 These emission reduction estimates relate to abatement costs that would be economically efficient to incur in the period to 2030 (on average, worldwide) if carbon emissions were priced at US$ 70 per tonne over that same period.

39
EMISSIONS GAP REPORT A UNEP Synthesis Chapter 4
Improving energy efficiency and reaping development and climate benefits
German Aerospace Centre (EREC, 2012) estimates that 13 Gt CO
2e could be saved in 2030 through
energy efficiency improvements alone.
Reducing air pollution
Emissions from fossil-fuels and biomass burning account for the majority of energy-related air pollution. The emitted substances include particulate matter (PM), precursors of tropospheric (the lower layer of the atmosphere) ozone (O
3),
nitrogen oxides (NOX), sulphur dioxide (SO
2),
carbon monoxide (CO) and organic compounds and metals. These compounds have a range of harmful impacts. The most recent global burden of disease report (Lim et al., 2012) estimated that in 2010 there were 3.5 million premature deaths from indoor smoke from solid fuels and another 3 million premature deaths from urban air pollution (ClimateWorks and World Bank, 2014). In addition, air pollution causes major crop losses. It was estimated that one pollutant alone, ozone, causes annual crop losses of around 79–121 million tonnes (reference year 2000), equivalent to about US$ 11–18 billion (Avnery et al., 2011).
Energy efficiency improvements can reduce air pollutant impacts by lowering the burning of fossil fuels and hence their air-polluting emissions, leading to health benefits in addition to those described in the health and well-being section below. A recent study showed that nearly 100 000 premature deaths could be avoided annually in Brazil, China the EU, India, Mexico and the USA by 2030 through energy efficiency measures in the transport, buildings and industrial sectors (ClimateWorks and World Bank, 2014).
Economic benefits
Improvements in energy efficiency can produce significant positive macroeconomic impacts such as increases in GDP, public budgets, employment,
and national competitiveness, as well as improved trade balances and reduced energy prices.
Economic output and public budget impacts
Investment in energy efficiency implies a transfer of capital from energy supply to less energy-intensive activities. This can have significant impacts on the wider economy if the transfer involves a restructuring of the economy to more labour-intensive activities. Both energy cost savings and increased investment in energy efficiency goods and services can lead to spending throughout the economy and increased economic activity.
Policy makers tend to think of energy efficiency policies in terms of their costs to the public budget such as costs for implementing regulations, information and enforcement measures. For financial incentives using public funds, the costs include the value of the subsidy8 and administrative costs. Moreover, in countries with substantial levels of energy taxes, energy efficiency programmes also trigger reductions in energy tax revenues which must be compensated for elsewhere.
However, the more positive effects on the public budget are often overlooked. These include:
1: direct effects such as reductions in operational expenditure and capital expenditure for the public sector itself; and
2: indirect effects such as increases in tax revenues from the sales of energy efficiency-related goods and services; or reductions in unemployment because of stimulated spending and economic activity.
A few studies have confirmed that energy efficiency programmes have positive benefits to the public sector in that around 50 per cent to 75 per cent of the total investment in energy efficiency is returned to the public budget9 (Lehr and Lutz, et al., 2012; Kuckshinrichs et al., 2013).
____________________ 8 Financial incentives can also be funded through user charges and other private sources, which would not be counted as public budget expenditure.9 In terms of the public investment alone rather than total investment in energy efficiency; in Germany, Kuckshinrichs et al. (2013) estimated that the return on
investment for the public budget is up to 7:1.

40
EMISSIONS GAP REPORT A UNEP SynthesischApter 4
Improving energy efficiency and reaping development and climate benefits
Employment effects
Investment in energy efficiency programmes has significant potential to create jobs, both directly through action that requires firms to carry out the work, and indirectly because of the boost in economic output caused by investment and energy cost reductions, as noted above10. However, it is important to clarify whether there is a net or gross job creation, since the employment produced may only shift jobs between sectors. Research shows a wide range of estimates for changes to employment, from zero net jobs across all sectors in G20 countries per million euros spent on energy efficiency11 (UDP, in preparation), to 19 jobs per million euros invested in energy efficiency in the buildings sector in Europe12 (Janssen and Staniaszek, 2012).
Not only is the number of jobs created important, but also the value of those jobs. This depends on various factors such as labour intensity, local content, wage rates and temporal durability. In the USA, it is estimated that US$ 1 million spent on energy efficiency in retrofitting buildings and mass transit generates 2.5–4 times more jobs than the same amount spent on oil and natural gas because of the higher labour intensity associated with energy efficiency work (Pollin et al., 2009). The effectiveness of an energy efficiency programme in creating jobs will also depend on the size and structure of financing and the type of energy savings intervention.
Benefits to industrial productivity
Energy efficiency measures in industry have been shown to provide a range of direct and indirect non-energy benefits for businesses (Lilly and Pearson, 1999; Pearson and Skumatz, 2002). These include reduced environmental compliance costs, enhanced
productivity and competitiveness, decreased maintenance costs, extended life of equipment, reduced waste-disposal costs, and improved process and product quality (IEA, 2014b). Worrell et al. (2003) analysed 72 case studies and found that the non-energy benefits can also extend to improvement in individual working conditions, such as less noise, and higher levels of safety and worker morale. However, these impacts are very difficult to quantify. The implementation of energy efficiency measures has also been associated with the generation of business opportunities and access to new markets, as new energy-efficient technologies are manufactured and traded (Mundaca et al., 2010). Although it is difficult to compare studies, since every industrial plant is different, there is evidence to suggest that the value of the benefits related to improved industrial productivity and operation could be up to 2.5 times the value of energy cost savings (IEA, 2014e).
Social benefits
Health and well-being from more comfortable buildings
There is a growing body of evidence that energy efficiency measures contribute to public health. As mentioned above, there are significant health benefits due to reduced air pollution. Energy-efficiency improvements in buildings (improved insulation, heating and ventilation systems and increased efficiency of other energy using devices) can also lead to a warmer, drier, more comfortable indoor environment (Milne and Boardman, 2000). Studies show that this improved indoor environment reduces respiratory and cardiovascular disease, allergies, arthritis and rheu-matism and creates feedback loops generating improved mental health. Health improvements in turn generate wider social and economic impacts, including lower spending on public health.
____________________ 10 Causal links are difficult to establish but the indirect jobs appear to be more durable with potential to last the period of the energy efficiency improvement itself,
i.e. the 20 year lifetime of an improved heating system, rather than the shorter lifetime of an energy efficiency programme.11 While the study shows nearly no change to global employment as a result of energy efficiency improvements, this result obscures the significant differences
between regions. For most regions there are net employment increases but employment falls in some regions where “the domestic economy is affected by higher prices and trade relationships with the rest of the world” (UDP, in preparation).
12 The Janssen and Staniaszek (2012) estimate of 19 jobs per Euro 1 million invested in upgrading the energy efficiency of the building stock represents an arithmetic average of the results of 35 data points from 20 sources.
41
EMISSIONS GAP REPORT A UNEP Synthesis Chapter 4
Improving energy efficiency and reaping development and climate benefits
Often the health and well-being impacts alone outweigh the benefits of energy savings and emission reductions, not only in societal value, but also in financial terms. In fact, health benefits of energy efficiency measures in buildings are estimated to account for up to 75 per cent of overall benefits (IEA, 2014e). However, it is difficult to determine the causal link between energy efficiency and health outcomes due to the complex nature of human health and the complex interactions of different physical, social and economic drivers (Evans et al., 2003).
Access to energy
The alleviation of poverty in both developed and developing countries is a central concern to society. Access to modern energy services is fundamental to pulling communities out of poverty by providing the energy required for social and economic development.
It is estimated that nearly 1.3 billion people in developing countries do not have access to electricity. More than 95 per cent of them are either in sub-Saharan Africa or developing countries in Asia (IEA, 2013a). In other countries with better access to electricity, fuel shortages sometimes lead to disruptions in fuel supply and temporary interruptions in access to energy. Another important issue is that the expansion of energy infrastructure in developing countries sometimes does not extend to the poorest households, so special programmes are needed to reach these people. Cook-stove improvements are an example of an energy efficiency initiative that can yield better energy services while providing other social benefits such as reduced indoor air pollution13. Improving the energy efficiency of energy infrastructure can also be interpreted as providing more people with access to energy services for the same primary inputs and costs.
Alleviating fuel poverty
Energy affordability issues are both a cause and a symptom of poverty. Fuel or energy poverty describes a situation in which energy services are not affordable enough to maintain healthy living conditions. In OECD countries, fuel poverty is often defined as a situation in which households need to spend more than 10 per cent of their income on achieving adequate levels of energy services in the home. By this definition, just under 20 per cent of the UK’s population is in fuel poverty and around 15 per cent in the USA. European studies estimate that 50–125 million Europeans are fuel poor14.
In general, the poor are more likely to live in inefficient housing, have less access to energy subsidies and therefore face higher relative energy costs. Energy saving measures in buildings can contribute to improving this situation by reducing heating energy bills. Several OECD countries, including Australia, Ireland, New Zealand, the USA and the UK have used energy efficiency policies to address fuel poverty with positive results (IEA, 2014e).
Barriers to energy efficiency
Given the significant benefits associated with improvements in energy efficiency, it seems surprising that there is an energy efficiency gap in that the technical potential remains unfulfilled. The reason for this is that certain barriers, what economists call market failures, prevent energy efficiency measures from being carried out, even when their costs can be recovered quickly through energy savings.
The main market failures and barriers are:
- Imperfect information: this is probably the most common barrier. Energy consumers may not understand the benefits of improved efficiency because they lack sufficient information about the energy performance of equipment or the trend of future energy prices.
____________________ 13 See the Global Alliance for Clean Cookstoves for more details (http://carbonfinanceforcookstoves.org/).14 European fuel Poverty and Energy Efficiency (EPEE) project: www.fuel-poverty.org/
42
EMISSIONS GAP REPORT A UNEP SynthesischApter 4
Improving energy efficiency and reaping development and climate benefits
- Split incentives: this is sometimes known as the landlord-tenant problem where the benefits of investing in energy efficiency do not accrue to the investor. For example when a house is built, the upfront costs of better energy performance are borne by the builder but may not be recouped from the house renter who benefits from lower energy bills.
- Externalities: in the context of energy efficiency this refers to a situation in which the full costs of energy use are not paid by the user, who is therefore not motivated to invest in energy efficiency and save energy. This is important in countries where energy is subsidised and energy prices are low.
Other important market barriers are the higher upfront costs often associated with better energy efficiency and the lack of access to finance for covering these costs. Resistance to change and human inertia are also powerful deterrents to taking action.
Another possible obstacle to obtaining the full benefits of energy efficiency improvements is the so-called rebound effect that some experts believe can undermine energy savings expected from efficiency projects (Box 4.2).
Policy intervention is needed to overcome these obstacles, market failures and barriers, to encou-rage greater improvements in energy efficiency. These are further discussed in the section 4.2.3.
Key points about benefits
Improvements in energy efficiency are among the most cost-effective measures for reducing greenhouse gas emissions. In addition, the economic, social, and environmental benefits of energy efficiency measures other than energy demand reduction could significantly outweigh energy cost savings in terms of value and level of priority for governments.
The benefits of energy efficiency can affect all levels of society – from individual benefits of increased health, well-being, disposable income and access to energy services and employment, through increasing industrial productivity and profits, and on to national-level macroeconomic benefits such as increases to GDP, trade and public budgets, and reduced air pollution and greenhouse gas emissions.
The benefits of energy efficiency improvements are generated from:
1: energy cost reductions, leading to increased disposable income, wellbeing, environmental performance, and competitiveness; and
2: increased investment and spending on energy efficiency.
Ultimately both types of effects can lead to an increase in economic activity, justifying the inclusion of energy efficiency measures in mainstream economic policy. In addition, the social and environmental benefits from improvements in energy efficiency suggest that energy saving measures should be embedded in strategies to achieve the SDGs.
Although the benefits of energy efficiency measures are large, there remain many barriers to implementing them. Policy intervention is clearly needed to realize these benefits.
4 .2 .3 Policies and measures to improve energy efficiency in key sectors
There are many examples of energy efficiency policies and measures adopted in various regions, countries, states and cities that are transferable. There are also various measures and targets that can help accelerate energy efficiency in economies (Box 4.3). Rather than providing an inventory of such measures, this chapter aims to give specific examples of successful action that has made a difference in key sectors. We focus on three sectors that comprise 95 per cent of world energy use: buildings, including lighting and appliances
43
EMISSIONS GAP REPORT A UNEP Synthesis Chapter 4
Improving energy efficiency and reaping development and climate benefits
Box 4 .2: The rebound effect
The rebound effect, as applied to energy consumption, refers to a situation in which an efficiency improvement is counteracted by additional energy consumption (IPCC, 2014; Santarius, 2012). One classic example is the increase in fuel efficiency of passenger cars which some authors claim has led to an increase in the kilometers driven per person (Sorrell et al., 2009).
On one hand, it can be argued that an increase in consumption enhances welfare and therefore is a good thing. On the other hand, if the aim is to reduce overall energy use and greenhouse gas and other emissions as far as possible, then the rebound effect makes this strategy less effective.
Three classes of rebound have been identified (Santarius, 2012). Financial rebound means that cost savings of energy efficiency measures stimulate higher energy consumption, for example, when households invest energy savings in further consumption. Material rebound means that the act of improving energy efficiency also involves some energy costs (for example, that it takes energy to produce the wall insulation used for reducing household heating). Finally, psychological rebound has to do with consciously or unconsciously consuming more, just because it is assumed that, with some new, efficient appliance, it does not matter anymore.
The limited number of studies makes it impossible to generalize about the impact of rebound in a typical energy efficiency project. Some authors estimate the rebound effect to be 10–30 per cent for household energy use and buildings, and as large as 60 per cent for mobility and it can be higher in developing countries where energy demand is unsaturated (Sorrell et al., 2009; Thomas and Azevedo, 2013).
A limited amount of work has been devoted to solutions to the rebound effect. One proposal is to tax profits arising from efficiency improvements (von Weizsacker et al., 2009); another is to introduce a carbon price in combination with energy efficiency measures to reduce increased spending on carbon-intensive activities. But the question remains whether some of the rebound effect can be viewed as an acceptable price for society to pay to get the multiple benefits described in this chapter. For example, energy efficiency measures have been known to provide benefits such as stimulating jobs and economic activity, but these in turn stimulate further energy use. Is some lessening of the climate mitigation effectiveness of energy efficiency projects an acceptable trade-off for societal welfare gains?
Considering the potential impact of the rebound effect on energy efficiency policies and measures, it is important to better understand its impacts and to take it into account when charting strategies for mitigating climate change.
(38 per cent), industry (33 per cent), and transport (24 per cent)15. In addition, we look at the electricity production sector.
Buildings
The scope for improving the efficiency with which energy is used in building design, construction and operation is large. Recent advances in materials and know-how mean that new energy
efficient buildings can use 60 to 90 per cent less energy than conventional buildings of a similar type and configuration, suggesting they would be cost-effective in all countries and climate zones (GEA 2012). Energy use in buildings represents a complex interaction between physical, economic and human systems. Many policies have focused on addressing individual components within these systems. Although this approach has been successful up to now in improving
____________________ 15 Data for 2010 are calculated in terms of primary energy, taking into account global energy conversion efficiencies for power plants. Use of energy for non-energy
purposes is not taken into account. The calculation is based on data from the IEA energy balances from both OECD and non-OECD countries.

44
EMISSIONS GAP REPORT A UNEP SynthesischApter 4
Improving energy efficiency and reaping development and climate benefits
energy efficiency, a more integrated approach is required to drive further improvements – that is, an approach covering the building shell, fixed and plug-in appliances, energy generation and enabling technologies, and occupant behaviour (Box 4.4). For new structures, buildings codes stipulating minimum energy performance standards (MEPS) have become the most popular policy instrument for reducing energy demand. If stringent building codes are not universally introduced, high energy use and emissions risk being locked in for decades, leading to a 33 per cent increase in global energy use for buildings by 2050 instead of a decrease of 46 per cent (GEA, 2012). To achieve real energy savings, these codes need to be enforced, reviewed and regularly strengthened (IEA, 2011a). Virtually all OECD countries and several developing countries have building codes in place (IEA 2008)16,
Box 4 .3: Cross-cutting measures that support energy efficiency
Box 4 .4: Energy for heating, cooling and hot water
A number of measures can be used to improve energy efficiency across the economy. The main measures include:
• puttingapriceoncarbone.g.carbontrading,carbontax;• energyefficiencytargets;• energyintensityreductiontargets-decouplinggrossdomesticproductfromenergyuse/emissions;• emissionreductiontargets;• settingcarbon-neutraltargets;and• removingfuelsubsidiestoreflectthetruepriceofenergy.
Naturally, not all measures are suitable for all countries. In addition, success depends on regular monitoring, verification and enforcement.
The provision of heating, cooling and hot water is estimated to account for roughly half of global energy consumption in buildings (IEA, 2012c). Some cities are adopting district energy systems to supply thermal energy (heat, cooling and hot water) and in some cases electricity to buildings. District energy systems coordinate the supply of heating, cooling and power and in so doing optimize energy use and maximize energy efficiency. While district energy systems are appropriate for different climate zones (IPCC, 2014), up to now they have been used mostly to provide heating in cooler climates – in Europe and the USA. Nonetheless there are now a growing number of district energy systems providing cooling in warmer climates such as in Dubai, Kuwait and Singapore.
which require a level of insulation that substantially reduces energy demand. For example, standards in place in Japan, in the EU and in selected states of the USA (HSBC, 2014) typically call for a level of energy consumption that is only one-quarter the level of non-insulated buildings.
Although, energy performance standards have primarily been applied to new buildings, the UK’s 2011 Energy Act has banned the rental or sale of buildings in the worst performing energy classes from 2018 onwards. To achieve significant energy and emissions reductions in the building sector, there is a growing consensus that new buildings must have net-zero energy or nearly zero-energy performance. Net-zero energy buildings are those with on-site renewable energy systems, such as photovoltaics, wind turbines or solar thermal that, over the year or for a stated period, generate
____________________ 16 A key factor in the success of building codes is their ambition level. With this in mind, it is important to note that many countries have adopted very ambitious codes.
45
EMISSIONS GAP REPORT A UNEP Synthesis Chapter 4
Improving energy efficiency and reaping development and climate benefits
as much energy as they consume (IPCC, 2014). Increased construction of low-energy and efficient buildings can be encouraged mainly through the establishment of targets for market share in new constructions, updates of building codes and demonstration projects17.
Energy-plus buildings – buildings that produce more energy than they consume – represent a relatively recent concept that is being applied to pilot and demonstration projects (Wang et al., 2009; Miller and Buys 2010). There have been a handful of commercial and residential buildings that have demonstrated they are energy-plus buildings. Some cities, such as Boston in the USA, have developed an Energy Plus green building programme to promote energy efficient buildings throughout the city.
There are other measures that can improve the energy efficiency of existing buildings, including energy audits, energy rating schemes, incentives to encourage investment, as well as education and awareness programmes (IEA, 2014d). Some important energy efficiency measures target specific building components such as:
1: performance requirements and labelling of windows and other glazed areas;
2: reduced energy demand from heating, ventilation and air conditioning systems through, for example, increased efficiency, labelling and correct sizing; and
3: promoting energy management and controls to reduce energy use and capture energy efficiency opportunities (IEA, 2014d).
____________________ 17 The European Performance Buildings Directive requires that all new buildings in European Union member states are nearly-zero energy buildings by 2020, with
all new buildings occupied and owned by public authorities being nearly zero-energy buildings by 2018 (European Union 2010). Some European member states have already moved to ambitious performance goals of low- or zero-emissions buildings (Hermelink et al. 2013). California has set a target that all new residential constructions are to be net-zero energy by 2020 and all new commercial constructions will be net-zero energy by 2030 (CA, 2013).
18 For some devices, such as game consoles, up to 80 per cent of the energy consumption is used just to maintain a network connection. Policy measures mandating minimum performance standards could reverse this situation (IEA, 2014f ).
19 Detailed assessments of energy performance standards can be found in Ürge-Vorsatz et al., (2007); Koeppel and Ürge-Vorsatz, (2007); Boza-Kiss et al., (2013); Siderius and Nakagami, (2013); and Molenbroek et al., (2014).
20 The success of any standards and labelling programme depends on an effective strategy for monitoring, verification and enforcement (Ellis et al., 2010; IEA, 2010) to ensure the delivery of energy, financial and climate benefits.
Appliances and lighting
Appliances include all types of equipment used in buildings – refrigerators, air conditioners, televisions, equipment for water heating, etc. Electrical appliances, excluding heating and cooling systems and lighting, typically account for 20 per cent or more of residential energy consumption18 (IPCC, 2014).
It is now technically possible to substantially reduce the energy use of appliances, equipment and lighting without diminishing their service levels or working effectiveness. Two key measures are typically used to this end:
- Energy performance standards which encourage rapid adoption of higher efficiency products19. The number of different products subject to energy performance standards has grown from 42 to 55 between 2004 and 2013 (EES, 2013); and
- Labelling which informs consumers about the comparative energy consumption of products and provides an incentive for manufacturers to innovate in order to gain a market advantage. Mandatory energy labelling has been applied to many appliances and lighting products (Ellis et al., 2010; IEA, 2010).
The combination of energy performance standards and labelling in its various forms are often complementary tools applied to the same product type20. The number of countries with a standards and labelling programme has grown rapidly, from 50 to 81 between 2004 and 2013 (EES, 2013). Among other challenges, these

46
EMISSIONS GAP REPORT A UNEP SynthesischApter 4
Improving energy efficiency and reaping development and climate benefits
programmes must keep up with technological developments that continuously produce new equipment of higher energy efficiency. This means that standards setting and labelling must be a flexible and responsive process.
There is also large potential to save energy in lighting applications. This includes residential lighting, replaceable by LEDs and controls; commercial and industrial lighting, replaceable by linear fluorescent lamps and LEDs; and outdoor lighting, replaceable by high intensity discharge lamps – LEDs – and controls. One of the most concerted efforts to reduce energy use in lighting is UNEP’s En.lighten Initiative21.
Industry
There is substantial potential for reducing energy use in the industrial sector. Fuel use for process heating can be reduced through heat recovery and better insulation, as well as by modifying the production process. The electricity requirements of driving equipment such as compressors, fans, and pumps can be reduced by optimising motor systems. Not least, energy efficiency can also be substantially improved by low- or no-cost changes to management practices in industrial facilities (Reinaud and Goldberg, 2013).
Implementing these and other measures requires effective policies, but no single approach dominates in the industrial sector. Governments seldom implement isolated policies: they prefer policy packages that address several energy efficiency improvements at the same time22. In addition, governments often try to avoid the application of stringent and costly measures that reduce the competitiveness of their industries.
Governments promote industrial energy efficiency by helping companies identify the most cost effective efficiency investments, mainly through energy audits or in-depth energy reviews. They also encourage industries to make efficiency investments by reducing the payback time of these investments, typically through subsidies and loans; by mandating, mostly through energy-saving targets and emissions trading; or by encouraging implementation, for example through voluntary agreements and differentiated electricity pricing.
Governments generally adopt policies that allow flexibility as to how their industries achieve energy savings (Reinaud and MacNulty, 2014). This flexibility is needed because policies have to be applicable to industries that encompass a wide variety of sub-sectors, all with different energy consumption profiles (World Energy Council and Ademe, 2013). The following policies and measures have proved to be particularly promising:
- Energy management programmes that require or encourage companies to adopt energy management guidelines such as ISO 50001 have been introduced in several countries23 (IEA & IIP, 2012). Experience has shown that government-led energy management programmes are most effective when they are part of a broader government programme or a voluntary agreement between industry and government, coupled with a mix of incentives, supports and the threat of regulation (IEA & IIP, 2012; Reinaud and Goldberg, 2013).
- A corporate energy-saving programme is a comprehensive effort to reduce energy use in the industrial sector and is usually country-specific24. China has one of the most extensive of these, the Top-10,000 Energy-Consuming
____________________ 21 En.lighten is a partnership of more than 60 countries committed to phasing out the use of inefficient incandescent lamps and replacing them with energy efficient
lighting sources by 2016 (http://www.enlighten-initiative.org/). 22 Most policy packages are very country-, sector- and size-specific.23 Energy management systems establish a framework for industrial facilities to manage their energy use, and require companies to adopt a suite of procedures and
practices to ensure systematic tracking, analysis and planning of energy use in industry.24 For more details on energy management programmes, see: http://www.iipnetwork.org/databases/programs

47
EMISSIONS GAP REPORT A UNEP Synthesis Chapter 4
Improving energy efficiency and reaping development and climate benefits
____________________ 25 This is a package of policies and measures including a specific energy-saving target assigned to each of around 15 000 Chinese enterprises, and the requirement to
adopt the Chinese energy management system standard. Each company’s 5-year energy-saving target has to be reached by the end of the current Five Year Plan (2011–2015; Ke et al., 2012).
26 Included are energy-intensive sectors such as aluminium, cement, chlor-alkali, fertilizer, iron and steel and pulp and paper. Certificates are issued to companies that can verify their energy savings and these certificates can be traded between the companies. This programme sets a plant-specific energy reduction target compared to its baseline, with the average reduction target being 4.8 per cent between 2012 and 2015 (CDKN, 2013).
27 In the EU, the standard for electric motors is combined with an obligation to install equipment for power-speed control (Reinaud and MacNulty, 2014).28 ETS are operational in the EU, California, several provinces in Canada, several cities and provinces in China (with plans to extend it to the entire country in the
coming three years), South-Korea, Kazakhstan and New Zealand (Höhne et al., 2014).29 Canada, Japan and the USA have emission standards for heavy-duty vehicles. China has plans to introduce them (EC, 2014).30 Harmonizing test methods and ensuring appropriate monitoring, verification and evaluation are among the most problematic issues.31 The Global Fuel Economy Initiative (GFEI) sponsored by, among others, the IEA and UNEP is promoting improvements in global average automotive fuel economy.
The target is a 50 per cent reduction in litres per 100 km (L/100km) between 2005 and 2030, from about 8 L/100 km to 4 L/100 km. This would result in about a 50 per cent reduction in the fuel use of all cars on the road by 2050 (IEA, 2012b).
32 For example, Korea has implemented a tyre labelling programme to promote reduced rolling-resistant tyres.
Enterprises25, and another example is India’s Perform, Achieve and Trade programme, which sets a specific energy consumption targets for 478 companies26.
- Energy performance standards contribute to energy savings in industry but are usually only applied to specific equipment or technologies. The most popular application of these standards is to electric motors. Up to now, 44 countries have such standards, including Brazil, China, South Korea, and the USA (EES 2013)27. China has applied specific energy efficiency standards to the production of 39 industrial commodities.
- Emissions trading systems (ETS) are proliferating across the globe and are now in place or scheduled for implementation in many regions28. Although current low price levels limit their impact, future higher prices could change this situation.
Transport
Worldwide, more than half of oil consumption is for transport. Three-quarters of the energy used in this sector is consumed on roads (IEA, 2012a). Without strong new mitigation policies, fuel use for road transport is projected to double between 2010 and 2050 (IEA, 2012b).
Currently, the principal measure used to improve energy efficiency in the transport sector is to impose mandatory fuel economy standards on road vehicles – these are in place in most
OECD member countries and China (IEA, 2012a). For freight transport, the development of fuel economy standards is less advanced29, as the wide variety of freight transport modes makes them challenging to set30.
In addition to fuel economy standards, measures such as labelling, taxes and incentives can help increase vehicle efficiency and accelerate the market penetration of more efficient vehicles31 (IEA, 2012b). Vehicle fuel efficiency can also be boosted by improving the efficiency of non-fuel related components, such as tyres, air conditioning and lighting (IEA, 2012a). For example, reducing the rolling-resistance of tyres and promoting optimal inflation levels are effective measures for reducing energy use32.
Ecodriving provides a further means of improving the efficiency with which energy is used in the transport sector. It involves the modification of driving habits to conserve fuel use (for example, by paying special attention to driving at steady speeds and low rpm), which can reduce average fuel use by 10 per cent or more (IEA, 2012b).
Land use planning and management also plays an important role in improving the energy efficiency of transport by encouraging the greater use of public transport and reducing the overall need for motorized transport. It can do so by increasing density, so that public transportation can work at capacity. It can also reduce the distances between

48
EMISSIONS GAP REPORT A UNEP SynthesischApter 4
Improving energy efficiency and reaping development and climate benefits
residences, commercial areas and work places, so that it is easier and more convenient to travel by foot or bicycle. Zoning can also be used to discourage private vehicles and encourage more energy efficient modes of travel33.
Electricity production, transmission and distribution
In 2005, the overall efficiency of the energy system from primary energy to useful energy was only about 34 per cent (GEA, 2012). It is, however, possible to raise this level by saving energy at power plants and reducing losses during electricity distribution.
Despite the rapid expansion of renewable energy production in many countries, fossil fuel facilities will continue to play a significant role in energy production. Therefore legislation and incentives are needed to boost the energy efficiency of fossil fuel-based energy generation. At a technical level, energy can be saved by replacing conventional turbines with super- or ultra-super critical boilers or combined-cycle gas turbines. Energy can also be saved by improving
____________________ 33 For example, drivers in many German cities have to obtain a special sticker to drive in the green zone of these cities.34 Network losses produce more than 700 million tonnes of greenhouse gas emissions each year.35 Australia, Canada, China and the USA, among other countries, have introduced energy performance standards for distribution transformers.36 These schemes have various names such as energy efficiency obligation schemes, energy saving initiatives or white certificate schemes.37 In the USA, 25 states have utilities with such obligations (ACEEE, 2014). In the EU, eight member states have introduced these obligations, and eight more are
planning to do so (Bean et al., 2014).
operating practices at electrical generation facilities, such that they operate near their design heat-rate values.
Electrical transmission and distribution networks are other areas with high potential for efficiency improvements. Worldwide, the cost of energylosses in networks amounts to more than US$ 61 billion annually34 (Leonardo Energy, 2005). Most of these losses occur in the distribution system, and of those, one-third occur in transformers – the majority in distribution transformers (SEAD, 2013). Energy per-formance standards for distribution trans-formers can help reduce these losses35.
Some governments have created regulatory and other policies to ensure that energy utilities carry out energy efficiency improvements36. These schemes enable utilities to trade energy-saving obligations and encourage competition in delivering energy services and meeting energy savings targets. Some schemes allow utilities to recover their costs while maintaining revenues and profits by sharing the costs and benefits with consumers37 (IEA, 2011b).

49
EMISSIONS GAP REPORT A UNEP Synthesis
References
Chapter 1IPCC. 2013. Summary for Policymakers. In Climate Change 2013: The Physical Science Basis. Contribution of Working Group I to the
Fifth Assessment Report of the Intergovernmental Panel on Climate Change. Stocker, T.F., Qin, D., Plattner, G.-K., Tignor, M., Allen, S.K., Boschung, J., Nauels, A., Xia, Y., Bex V. and Midgley P.M. (eds.). Cambridge University Press, Cambridge, UK.
IPCC. 2014. Climate Change 2014: Mitigation of Climate Change. Contribution of Working Group III to the Fifth Assessment Report of the Intergovernmental Panel on Climate Change. Edenhofer, O., Pichs-Madruga, R., Sokona, Y., Farahani, E., Kadner, S., Seyboth, K., Adler, A., Baum, I., Brunner, S., Eickemeier, P., Kriemann, B., Savolainen, J., Schlömer, S., von Stechow, C., Zwickel, T. and Minx, J.C. (eds.). Cambridge University Press, Cambridge, UK.
Chapter 2Andres, R.J., Boden, T.A., Bréon, F.- M., Ciais, P., Davis, S., Erickson, D., Gregg, J.S., Jacobson, A., Marland, G., Miller, J., Oda, T., Olivier,
J.G.J., Raupach, M.R., Rayner, P. and Treanton K. (2012) ‘A synthesis of carbon dioxide emissions from fossil-fuel combustion’. Biogeosciences, 9:1845-1871.
Bertram, C., Johnson, N., Luderer, G., Riahi, K., Isaac, M. and Eom, J. (2013) ‘Carbon lock-in through capital stock inertia associated with weak near-term climate policies’. Technological Forecasting and Social Change (in press).
Blanco, G., Gerlagh, R., Suh, S., Barrett, J., de Coninck, H.C., Diaz Morejon, C.F., Mathur, R., Nakicenovic, N., Ofosu Ahenkora, A., Pan, J., Pathak, H., Rice, J., Richels, R., Smith, S.J., Stern, D.I., Toth, F.L. and Zhou, P. (2014) ‘Drivers, Trends and Mitigation’. In Edenhofer, O., Pichs-Madruga, R., Sokona, Y., Farahani, E., Kadner, S., Seyboth, K., Adler, A., Baum, I., Brunner, S., Eickemeier, P., Kriemann, B., Savolainen, J., Schlömer, S., von Stechow, C., Zwickel, T. and. Minx, J.C (Eds.), Climate Change 2014: Mitigation of Climate Change. Contribution of Working Group III to the Fifth Assessment Report of the Intergovernmental Panel on Climate Change. Cambridge, UK and New York, USA: Cambridge University Press.
Blanford, G.J., Rose, S.K. and Tavoni M. (2012) ‘Baseline projections of energy and emissions in Asia’. Energy Economics, 34:S284-S292.
Clarke, L., Edmonds, J., Krey, V., Richels, R., Rose, S. and Tavoni, M. (2009) ‘International climate policy architectures: Overview of the EMF 22 International Scenarios’. Energy Economics 31: S64-S81.
Clarke, L., Jiang, K., Akimoto, K., Babiker, M., Blanford, G., Fisher-Vanden, K., Hourcade, J.-C., Krey, V., Kriegler, E., Löschel, A., McCollum, D., Paltsev, S., Rose, S., Shukla, P.R., Tavoni, M., Zwaan, B.V.D. and van Vuuren, D.P., (2014) ‘Assessing Transformation Pathways’ in Edenhofer, O., Pichs-Madruga, R., Sokona, Y., Farahani, E., Kadner, S., Seyboth, K., Adler, A., Baum, I., Brunner, S., Eickemeier, P., Kriemann, B., Savolainen, J., Schlömer, S., Stechow, C.V., Zwickel, T. and Minx, J.C. (Eds.), Climate Change 2014: Mitigation of Climate Change. Contribution of Working Group III to the Fifth Assessment Report of the Intergovernmental Panel on Climate Change. Cambridge, UK and New York, USA: Cambridge University Press.
Creutzig, F., Popp, A., Plevin, R., Luderer, G., Minx, J. and Edenhofer, O. (2012) ‘Reconciling top-down and bottom-up modelling on future bioenergy deployment’. Nature Climate Change, 2:320-327.
den Elzen, M.G.J., van Vuuren, D.P. and van Vliet, J. (2010) ‘Postponing emission reductions from 2020 to 2030 increases climate risks and long-term costs’. Climatic Change, 99(1-2): 313-320.
Edenhofer, O., Pichs-Madruga, R., Sokona, Y., Kadner, S., Minx, J.C., Brunner, S., Agrawala, S., Baiocchi, G., Bashmakov, I.A., Blanco, G., Broome, J., Bruckner, T., Bustamante, M., Clarke, L., Conte Grand, M., Creutzig, F., Cruz-Núñez, X., Dhakal, S., Dubash, N.K., Eickemeier, P., Farahani, E., Fischedick, M., Fleurbaey, M., Gerlagh, R., Gómez-Echeverri, L., Gupta, S., Harnisch, J., Jiang, K., Jotzo, F., Kartha, S., Klasen, S., Kolstad, C., Krey, V., Kunreuther, H., Lucon, O., Masera, O., Mulugetta, Y., Norgaard, R.B., Patt, A., Ravindranath, N.H., Riahi, K., Roy, J., Sagar, A., Schaeffer, R., Schlömer, S., Seto, K.C., Seyboth, K., Sims, R., Smith, P., Somanathan, E., Stavins, R., von Stechow, C., Sterner, T., Sugiyama, T., Suh, S., Ürge-Vorsatz, D., Urama, K., Venables, A., Victor, D.G., Weber, E., Zhou, D., Zou, J. and Zwickel, T. (2014) ‘Technical Summary’ in Edenhofer, O., Pichs-Madruga, R., Sokona, Y., Farahani, E., Kadner, S., Seyboth, K., Adler, A., Baum, I., Brunner, S., Eickemeier, P., Kriemann, B., Savolainen, J., Schlömer, S., von Stechow, C., Zwickel, T. and Minx, J.C. (Eds.), Climate Change 2014: Mitigation of Climate Change. Contribution of Working Group III to the Fifth Assessment Report of the Intergovernmental Panel on Climate Change. Cambridge, UK and New York, USA: Cambridge University Press.
reFerences

50
EMISSIONS GAP REPORT A UNEP Synthesis
References
Eom, J., Edmonds, J., Krey, V., Johnson, N., Longden, T., Luderer, G., Riahi, K.and van Vuuren, D.P. (2013) ‘The impact of near-term climate policy choices on technology and emissions transformation pathways’. Technological Forecasting and Social Change (in press).
Friedlingstein, P., Andrew, R.M., Rogelj, J., Peters, G.P., Canadell, J.G., Knutti, R., Luderer, G., Raupach, M.R., Schaeffer, M., van Vuuren, D.P. and Le Quere, C. (2014) ‘Persistent growth of CO
2 emissions and implications for reaching climate targets’. Nature
Geoscience, 7(10):709-715.
Fuss, S., Canadell, J.G., Peters, G.P., Tavoni, M., Andrew, R.M., Ciais, P., Jackson, R.B., Jones, C.D., Kraxner, F., Nakicenovic, N., Le Quere, C., Raupach, M.R., Sharifi, A., Smith, P. and Yamagata, Y. (2014). ‘Betting on negative emissions’. Nature Climate Change, 4(10): 850-853.
IEA (2012) CO2 Emissions from Fuel Combustion. Beyond 2020 Online Database. 2012 Edition. Paris: International Energy Agency, pp.
138. Available at: http://data.iea.org
IPCC (2013) ‘Summary for Policymakers’ in Stocker, T.F., Qin, D., Plattner, G.-K., Tignor, M., Allen, S.K., Boschung, J., Nauels, A., Xia, Y., Bex V. and Midgley P.M. (Eds.), Climate Change 2013: The Physical Science Basis. Contribution of Working Group I to the Fifth Assessment Report of the Intergovernmental Panel on Climate Change. Cambridge, UK and New York, USA: Cambridge University Press, pp. 1-29.
IPCC (2014) ‘Mitigation of Climate Change. Working Group III Contribution to the Intergovernmental Panel on Climate Change Fifth Assessment Report’, Edenhofer, O., Pichs-Madruga, R., Sokona, Y., Farahani, E. , Kadner,S. , Seyboth, K., Adler, A. , Baum,I. , Brunner, S. , Eickemeier,P., Kriemann, B. , Savolainen, J., Schlömer,S., von Stechow,C., Zwickel, T. and Minx, J.C. (Eds.). Cambridge, UK and New York, USA: Cambridge University Press.
Jakob, M., Luderer, G., Steckel, J., Tavoni, M. and Monjon, S. (2012) ‘Time to act now? Assessing the costs of delaying climate measures and benefits of early action’. Climatic Change, 114(1):79-99.
Johnson, N., Krey, V., McCollum, D.L., Rao, S., Riahi, K. and Rogelj, J. (2014) ‘Stranded on a low-carbon planet: Implications of climate policy for the phase-out of coal-based power plants’. Technological Forecasting and Social Change (in press).
Jones, C., Robertson, E., Arora, V., Friedlingstein, P., Shevliakova, E., Bopp, L., Brovkin, V., Hajima, T., Kato, E., Kawamiya, M., Liddicoat, S., Lindsay, K., Reick, C.H., Roelandt, C., Segschneider, J. and Tjiputra, J. (2013) ‘Twenty-First-Century Compatible CO
2 Emissions
and Airborne Fraction Simulated by CMIP5 Earth System Models under Four Representative Concentration Pathways’. Journal of Climate, 26: 4398-4413.
JRC/PBL (2012) Emission Database for Global Atmospheric Research (EDGAR) - Release Version 4.2 FT2010. Bilthoven, Netherlands: European Commission, Joint Research Centre (JRC)/PBL Netherlands Environmental Assessment Agency. Available at: http://edgar.jrc.ec.europa.eu
JRC/PBL (2014) Emission Database for Global Atmospheric Research (EDGAR) - Release Version 4.2 FT2012. Bilthoven, Netherlands: European Commission, Joint Research Centre (JRC)/PBL Netherlands Environmental Assessment Agency. Available at: http://edgar.jrc.ec.europa.eu
Knutti, R. and Rogelj, J. (in review) ‘The legacy of our CO2 emissions: a clash of scientific facts, politics and ethics’. Climatic Change.
Kirschke, S., Bousquet, P., Ciais, P., Saunois, M., Canadell, J.G., Dlugokencky, E.J., Bergamaschi, P., Bergmann, D., Blake, D.R., Bruhwiler, L., Cameron-Smith, P., Castaldi, S., Chevallier, F., Feng, L., Fraser, A., Heimann, M., Hodson, E.L., Houweling, S., Josse, B., Fraser, P.J., Krummel, P.B., Lamarque, J. F., Langenfelds, R.L., Quéré, C. L., Naik, V., O’Doherty, S., Palmer, P.I., Pison, I., Plummer, D., Poulter, B., Prinn, R.G., Rigby, M., Ringeval, B., Santini, M., Schmidt, M., Shindell, D.T., Simpson, I.J., Spahni, R., Steele, L.P., Strode, S.A., Sudo, K., Szopa, S., van der Werf, G.R., Voulgarakis, A., van Weele, M., Weiss, R.F., Williams, J.E. and Zeng G. (2013) ‘Three decades of global methane sources and sinks’. Nature Geoscience, 6(10):813–823.
Kriegler, E., Riahi, K., Bauer, N., Schwanitz, V.J., Petermann, N., Bosetti, V., Marcucci, A., Otto, S., Paroussos, L., Rao, S., Arroyo Currás, T., Ashina, S., Bollen, J., Eom, J., Hamdi-Cherif, M., Longden, T., Kitous, A., Méjean, A., Sano, F., Schaeffer, M., Wada, K., Capros, P., van Vuuren, D.P. and Edenhofer, O. (2014a) ‘Making or breaking climate targets: The AMPERE study on staged accession scenarios for climate policy’. Technological Forecasting and Social Change (in press).
Kriegler, E., Weyant, J.P.,Blanford, G.J., Krey, V., Clarke, L., Edmonds, J., Fawcett, A., Luderer, G., Riahi, K., Richels, R., Rose, S.K., Tavoni, M. and van Vuuren, D.P. (2014b) ‘The Role of Technology for Achieving Climate Policy Objectives: Overview of the EMF 27 Study on Global Technology and Climate Policy Strategies’. Climatic Change, 123(3-4):353-367.
Kriegler, E., Tavoni, M., Aboumahboub, T., Luderer, G., Calvin, K., Demaere, G., Krey, V., Riahi, K., Rösler, H., Schaeffer, M. and van Vuuren, D.P. (2013) ‘What does the 2°C target imply for a global climate agreement in 2020? The LIMITS study on Durban Platform scenarios’. Climate Change Economics, 4(4): 1340008.
Le Quéré, C., Andres, R.J., Boden, T., Conway, T., Houghton, R.A., House, J.I., Marland, G., Peters, G.P., van der Werf, G.R., Ahlström, A., Andrew, R.M., Bopp, L., Canadell, J.G., Ciais, P., Doney, S.C., Enright, C., Friedlingstein, P., Huntingford, C., Jain, A.K., Jourdain, C., Kato, E., Keeling, R.F., Klein Goldewijk, K., Levis, S., Levy, P., Lomas, M., Poulter, B., Raupach, M.R., Schwinger, J., Sitch, S., Stocker, B.D., Viovy, N., Zaehle, S. and Zeng, N. (2013) ‘The global carbon budget 1959–2011’. Earth System Science Data Discussions, 5:165-185.
51
EMISSIONS GAP REPORT A UNEP Synthesis
References
Le Quéré, C., Moriarty, R., Andrew, R. M., Peters, G. P., Ciais, P., Friedlingstein, P., Jones, S. D., Sitch, S., Tans, P., Arneth, A., Boden, T. A., Bopp, L., Bozec, Y., Canadell, J. G., Chevallier, F., Cosca, C. E., Harris, I., Hoppema, M., Houghton, R. A., House, J. I., Jain, A., Johannessen, T., Kato, E., Keeling, R. F., Kitidis, V., Klein Goldewijk, K., Koven, C., Landa, C. S., Landschützer, P., Lenton, A., Lima, I. D., Marland, G., Mathis, J. T., Metzl, N., Nojiri, Y., Olsen, A., Ono, T., Peters, W., Pfeil, B., Poulter, B., Raupach, M. R., Regnier, P., Rödenbeck, C., Saito, S., Salisbury, J. E., Schuster, U., Schwinger, J., Séférian, R., Segschneider, J., Steinhoff, T., Stocker, B. D., Sutton, A. J., Takahashi, T., Tilbrook, B., van der Werf, G. R., Viovy, N., Wang, Y.-P., Wanninkhof, R., Wiltshire, A. and Zeng, N. (2014) ‘Global carbon budget 2014’. Earth System Science Data Discussions, 7:521-610.
Lenton, T.M., Held, H., Kriegler, E., Hall, J.W., Lucht, W., Rahmstorf, S. and Schellnhuber, H.J. (2008) ‘Tipping elements in the Earth’s climate system’. Proceedings Of The National Academy Of Sciences Of The United States Of America, 105:1786-1793.
Luderer, G., Bertram, C., Calvin, K., De Cian, E. and Kriegler, E. (2013a) ‘Implications of weak near term climate policies on long-term mitigation pathways’. Climatic Change (in press).
Luderer, G., Pietzcker, R.C., Bertram, C., Kriegler, E., Meinshausen, M. and Edenhofer, O. (2013b) ‘Economic mitigation challenges: how further delay closes the door for achieving climate targets’. Environmental Research Letters 8(3):1-8.
Mastrandrea, M.D., Field, C.B., Stocker, T.F., Edenhofer, O., Ebi, K.L., Frame, D.J., Held, H., Kriegler, E., Mach, K.J., Matschoss, P.R., Plattner, G.-K., Yohe, G.W. and Zwiers, F.W. (2010) ‘Guidance Notes for Lead Authors of the IPCC Fifth Assessment Report on Consistent Treatment of Uncertainties’. IPCC, pp. 5. Available at: http://www.ipcc.ch/pdf/supporting-material/uncertainty-guidance-note.pdf
Meinshausen, M., Raper, S.C.B. and Wigley, T.M.L. (2011a) ‘Emulating coupled atmosphere-ocean and carbon cycle models with a simpler model, MAGICC6 – Part 1: Model description and calibration’. Atmospheric Chemistry and Physics, 11:1417-1456.
Meinshausen, M., Wigley, T.M.L. and Raper, S.C.B. (2011b) ‘Emulating atmosphere-ocean and carbon cycle models with a simpler model, MAGICC6 – Part 2: Applications’. Atmospheric Chemistry and Physics, 11:1457-1471.
Myhre, G., Shindell, D., Bréon, F.-M., Collins, W., Fuglestvedt, J., Huang, J., Koch, D., Lamarque, J.F., Lee, D., Mendoza, B., Nakajima, T., Robock, A., Stephens, G., Takemura, T. and Zhang, H. (2013) ‘Anthropogenic and Natural Radiative Forcing’ in Stocker, T.F., Qin, D., Plattner, G. K., Tignor, M., Allen, S.K., Boschung, J., Nauels, A., Xia, Y., Bex, V. and Midgley, P.M. (Eds.), Climate Change 2013: The Physical Science Basis. Contribution of Working Group I to the Fifth Assessment Report of the Intergovernmental Panel on Climate Change. Cambridge, UK and New York, USA: Cambridge University Press, pp. 659-740.
OECD (2012) OECD Environmental Outlook to 2050. Paris: OECD, pp. 353.
Olivier, Jos GJ. et al. (2013) ‘Trends in global CO2
emissions: 2013 report’. PBL Netherlands Environmental Assessment Agency, 2013.
Riahi, K., Dentener, F., Gielen, D., Grubler, A., Jewell, J., Klimont, Z., Krey, V., McCollum, D., Pachauri, S., Rao, S., van Ruijven, B., van Vuuren, D.P. and Wilson, C. (2012) ‘Chapter 17 - Energy Pathways for Sustainable Development, Global Energy Assessment - Toward a Sustainable Future’. Cambridge, UK and New York, USA: Cambridge University Press and Laxenburg, Austria: International Institute for Applied Systems Analysis, pp. 1203-1306.
Riahi, K., Mima, S., Criqui, P., Longden, T., Edenhofer, O., den Elzen, M., Isaac, M., Bosetti, V., Kriegler, E., Bertram, C., Luderer, G., van Vuuren, D.P., Schaeffer, M., McCollum, D.L., Krey, V., Johnson, N., Turton, H., Capros, P., Wada, K., Kainuma, M., Eom, J., Edmonds, J., Méjean, A. and Hamdi-Cherif, M. (2013) ‘Locked into Copenhagen Pledges - Implications of short-term emission targets for the cost and feasibility of long-term climate goals’. Technological Forecasting and Social Change (in press).
Rogelj, J., Hare, W., Lowe, J., van Vuuren, D.P., Riahi, K., Matthews, B., Hanaoka, T., Jiang, K. and Meinshausen, M. (2011) ‘Emission pathways consistent with a 2°C global temperature limit’. Nature Climate Change, 1:413-418.
Rogelj, J., Meinshausen, M. and Knutti, R. (2012) ‘Global warming under old and new scenarios using IPCC climate sensitivity range estimates’. Nature Climate Change, 2:248-253.
Rogelj, J., McCollum, D.L., O’Neill, B.C. and Riahi, K. (2013a) ‘2020 emissions levels required to limit warming to below 2°C’. Nature Climate Change, 3:405-412.
Rogelj, J., McCollum, D.L., Reisinger, A., Meinshausen, M. and Riahi, K. (2013b) ‘Probabilistic cost estimates for climate change mitigation’. Nature, 493:79-83.
Rogelj, J., Meinshausen, M., Sedláček, J. and Knutti, R. (2014) ‘Implications of potentially lower climate sensitivity on climate projections and policy’. Environmental Research Letters, 9:031003.
Schaeffer, M., Gohar, L.K., Kriegler, E., Lowe, J.A., Riahi, K. and van Vuuren, D.P. (2013) ‘Mid- and long-term climate projections for fragmented and delayed-action scenarios’. Technological Forecasting & Social Change (in press).
Schimel, D., Alves, D., Enting, I., Heimann, M., Joos, R., Raynaud, D., Wigley, T., Prather, M., Derwent, R., Ehhalt, D., Eraser, R., Sanhueza, E., Zhou, X., Jonas, R., Charlson, R., Rohde, H., Sadasivan, S., Shine, K.R., Fouquart, Y., Ramaswamy, V., Solomon, S. and Srinivasan J. (1996) ‘Radiative forcing of climate change’ in Houghton, J.T., Meira Filho, L.G., Callander, B.A., Harris, N., Kattenberg, A. and Maskell K. (Eds.), Climate Change 1995: The Science of Climate Change. Cambridge, UK and New York, USA: Cambridge University Press, pp.65–131.
Smith, S.M., Lowe, J.A., Bowerman, N.H.A., Gohar, L.K., Huntingford, C. and Allen, M.R. (2012) ‘Equivalence of greenhouse-gas emissions for peak temperature limits’. Nature Climate Change, 2:535-538.

52
EMISSIONS GAP REPORT A UNEP Synthesis
References
Solomon, S., Daniel, J.S., Sanford, T.J., Murphy, D.M., Plattner, G.-K., Knutti, R. and Friedlingstein, P. (2010) ‘Persistence of climate changes due to a range of greenhouse gases’. Proceedings of the National Academy of Sciences, 107:18354-18359.
Tavoni, M., Kriegler, E., Aboumahboub, T., Calvin, K., De Maere, G., Jewell, J., Kober, T., Lucas, P., Luderer, G., McCollum, D., Marangoni, G., Riahi, K. and van Vuuren, D.P. (2013) ‘The distribution of the major economies’ effort in the Durban platform scenarios’. Climate Change Economics 4(4): 1340009.
Tavoni, M. and Socolow, R. (2013) ‘Modeling meets science and technology: an introduction to a special issue on negative emissions’. Climatic Change 118(1):1-14.
UNEP (2012) The Emissions Gap Report 2012. Nairobi, Kenya: UNEP, pp. 62.
UNEP (2013) The Emissions Gap Report 2013. Nairobi, Kenya: UNEP, pp. 64.
UNFCCC (2002) ‘Guidelines for the preparation of national communications by Parties included in Annex I to the Convention, Part I: UNFCCC guidelines on annual inventories’, pp. 92.
UNFCCC (2010) FCCC/CP/2010/7/Add.1 Decision 1/CP.16 - ‘The Cancun Agreements: Outcome of the work of the Ad Hoc Working Group on Long-term Cooperative Action under the Convention’, pp. 31.
van Vliet, J., van den Berg, M., Schaeffer, M., van Vuuren, D.P., den Elzen, M., Hof, A., Mendoza Beltran, A. and Meinshausen, M. (2012) ‘Copenhagen Accord Pledges imply higher costs for staying below 2°C warming: A Letter’. Climatic Change, 113(2):551-561.
van Vuuren, D.P., Deetman, S., Vliet, J., Berg, M., Ruijven, B. and Koelbl, B. (2013) ‘The role of negative CO2 emissions for reaching
2 °C—insights from integrated assessment modelling’. Climatic Change, 118(1): 15-27.
Chapter 3Australian Climate Change Authority (2014) Reducing Australia’s Greenhouse Gas Emissions: Targets and Progress Review—Final
Report. Available at: http://climatechangeauthority.gov.au/reviews/targets-and-progress-review-3
Bloomberg (2014) South Africa Delays Carbon Tax, Plans Levies on Acid Mine Water. Available at: http://www.bloomberg.com/news/2014-02-26/south-africa-delays-carbon-tax-plans-levies-on-acid-mine-water.html
Brazilian Government (2010) Decreto No. 7.390, de 9 de dezembro de 2010. Available at: http://www.planalto.gov.br/ccivil_03/_Ato2007-2010/2010/Decreto/D7390.htm
CAIT (2014) Climate Analysis Indicators Tool. Available at: http://www.cait2.wri.org
Climate Action Tracker (2013) Analysis of current greenhouse gas emission trend, CAT report. Available at: http://climateactiontracker.org/assets/publications/publications/CAT_Trend_Report.pdf
Climate Connect (2014) South Korea defines roadmap for 30% GHG emission reduction by 2020. Available at: http://www.climate-connect.co.uk/Home/?q=%20South%20Korea%20defines%20roadmap%20for%2030%25%20GHG%20emission%20reduction%20by%202020 (Retrieved May 27, 2014)
den Elzen, M.G.J., Hof, A.F. and Roelfsema, M. (2013) ‘Analysing the greenhouse gas emission reductions of the mitigation action plans by non-Annex I countries by 2020’. Energy Policy 56:633–643.
Department of the Environment (DoE) (2013) Australia’s abatement task and 2013 emissions projections, DoE, Canberra, ACT. Available at: http://www.environment.gov.au/resource/australias-abatement-task-and-2013-emissions-projections
Fekete, H., Vieweg, M., Rocha, M., Braun, N., Lindberg, M., Gütschow, J., Jefferey, L., Höhne, N., Hare, B., Schaeffer, M., Macey, K. and Larkin, J. (2013) Analysis of Current Greenhouse Gas Emission Trends. Climate Action Tracker, Climate Analytics, Ecofys and the Potsdam Institute for Climate Impact Research (PIK). Available at: http://climateactiontracker.org/assets/publications/publications/CAT_Trend_Report.pdf
Environment Canada (2013a) Canada’s Emissions Trends. Available at http://www.ec.gc.ca/ges-ghg/985F05FB-4744-4269-8C1A-D443F8A86814/1001-Canada’s%20Emissions%20Trends%202013_e.pdf
Environment Canada (2013b) National Inventory Report: Greenhouse Gas Sources and Sinks in Canada. Available at: http://unfccc.int/files/national_reports/annex_i_ghg_inventories/national_inventories_submissions/application/zip/can-2013-nir-15apr.zip
EEA (2014a) Annual European Union greenhouse gas inventory 1990–2012 and inventory report 2014. European Environment Agency. Available at: http://www.eea.europa.eu/publications/european-union-greenhouse-gas-inventory-2014
EEA (2014b) Trends and projections in Europe 2014 - Tracking progress towards Europe’s climate and energy targets until 2020. European Environment Agency. Available at: http://www.eea.europa.eu/themes/climate#tab-publications
Executive Office of the President (2013) The President’s Climate Action Plan. Available at: http://www.whitehouse.gov/sites/default/files/image/president27sclimateactionplan.pdf
Garg, A., Shukla, P.R. and Bhushan K. (2014) Low Climate Impact Scenarios and the Implications of Required Tight Emission Control Strategies: India Report on Alternate Development Pathways for India; Aligning Copenhagen Climate Change Commitments with National Energy Security and Economic Development. Ahmedabad: Indian Institute of Management-Ahmedabad

53
EMISSIONS GAP REPORT A UNEP Synthesis
References
GLOBE International (2014) ‘The GLOBE Climate Legislation Study: A Review of Climate Change Legislation in 66 Countries (4th ed.)’. Nachmany, M., Fankhauser, S., Townshend, T., Collins, M., Landesman, T., Matthews, A., Pavese, C., Rietig, K., Schleifer, P. and Seltzer, J. (Eds.) Available at: http://www.globeinternational.org
Government of Mexico (2012) Fifth National Communication to the United Nations Framework Convention on Climate Change. Available at: http://www2.inecc.gob.mx/publicaciones/libros/685/programas2.pdf
Grassi, G., den Elzen, M.G.J., Hof, A.F., Pilli, R. and Federici, S. (2012) ‘The role of the land use, land use change and forestry sector in achieving Annex I reduction pledges’. Climatic Change, 115(3-4):873–881.
Grassi G. (2013) JRC LULUCF tool. Joint Research Centre (JRC), European Commission. http://afoludata.jrc.ec.europa.eu/index.php/models/JRC_LULUCF_TOOL (Retrieved May 27, 2014).
Hof, A.F., den Elzen, M.G.J. and Roelfsema, M. (2013) ‘The effect of updated pledges and business-as-usual projections, and new agreed rules on expected global greenhouse gas emissions in 2020’. Environmental Science and Policy, 33:308-319.
IEA (2013) IEA World Energy Outlook 2013. Paris: International Energy Agency. Available at: http://www.worldenergyoutlook.org/publications/weo-2013/
Kokorin, A. and Korppoo, A. (2014) Russia’s Greenhouse Gas Target 2020: Projections, Trends, and Risks. Berlin: Friedrich-Ebert-Stiftung.
Korea Green Foundation (2014) [Statement] 2020 Roadmap for Reducing GHG Emissions. Available at: http://www.greenfund.org/greenfund_eng/inform/notice_eng_view.jsp?pBBSCode=182 (Retrieved November 3, 2014).
Kriegler, E., Tavoni, M., Aboumahboub, T., Luderer, G., Calvin, K., Demaere, G., Krey, V., Riahi, K., Rösler, H., Schaeffer, M. and van Vuuren, D.P. (2013) ‘What does the 2°C target imply for a global climate agreement in 2020? The LIMITS study on Durban Platform scenarios’. Climate Change Economics, 4(4): 1340008.
LaRovere, E.L., Dubeux, C.B., Pereira (Jr.), A.O. and Wills, W. (2013) ‘Brazil beyond 2020: from deforestation to the energy challenge’. Climate Policy, 13(1):70-86.
Mexico Diario Oficial de la Federación (2014) Programa Especial de Cambio Climatico (PECC) 2014-2018. Available at: http://dof.gob.mx/nota_detalle.php?codigo=5342492&fecha=28/04/2014
Ministry of Environment (2010) Indonesia Second National Communication Under the United Nations Framework Convention on Climate Change. Available at: http://unfccc.int/files/national_reports/non-annex_i_natcom/submitted_natcom/application/pdf/indonesia_snc.pdf
NCCS (2013) National Climate Change Strategy. 10-20-40 Vision. Mexico: Federal Government of Mexico. Available at: http://mitigationpartnership.net/sites/default/files/encc_englishversion.pdf
OECD (2012) OECD Environmental Outlook to 2050. Paris: OECD.
Pew Center on Global Climate Change (2011) Common metrics: Comparing countries’ climate pledges. Arlington, VA: Pew Center on Global Climate Change. Available at: http://www.c2es.org/docUploads/country-pledge-brief.pdf
The People’s Republic of China (2012) The Second National Communication of the People’s Republic of China. Available at: http://unfccc.int/resource/docs/natc/chnnc2e.pdf
Planning Commission (2011) Interim report of the Expert Group on Low Carbon Strategies for Inclusive Growth. Available at http://www.moef.nic.in/downloads/public-information/Interim%20Report%20of%20the%20Expert%20Group.pdf
Planning Commission (2014) The Final Report of the Expert Group on Low Carbon Strategies for Inclusive Growth. Available at http://planningcommission.nic.in/reports/genrep/rep_carbon2005.pdf
Republic of Korea (2011) Korea’s Third National Communication under the United Nations Framework Convention on Climate Change: Low Carbon, Green Growth. Available at: http://unfccc.int/resource/docs/natc/kornc3.pdf
RHG (2014) Is the US on Track? EPA’s Clean Power Plan and the US 2020 Climate Goal. Available at: http://rhg.com/notes/is-the-us-on-track-epas-clean-power-plan-and-the-us-2020-climate-goal
Roelfsema, M., den Elzen, M.G.J., Höhne, N., Hof, A.F., Braun, N.,Fekete, H., Brandsma, R., Larkin, J. and Böttcher, H. (2014) ‘Are major economies on track to achieve their pledges for 2020? An assessment of domestic climate and energy policies‘. Energy Policy, 67:781-796.
SEEG 2014 Sistema de Estimativa de Emissão de Gases de Efeito Estufa. Available at: http://seeg.observatoriodoclima.eco.br/
SEMARNAT (2013) Estrategia Nacional de Cambio Climático: visión 10-20-40. Secretaría de Medio Ambiente y Recursos Naturales, México. Available at: http://www.inmujeres.gob.mx/inmujeres/images/stories/medioambiente/2014/09_SEPTIEMBRE/estrategia_nacional_cambio_climatico.pdf
South Africa Department of Environmental Affairs (2011) Explanatory note: Defining South Africa’s Peak, Plateau and Decline Greenhouse Gas Emission Trajectory. Available at: http://www.climateaction.org.za/cop17-cmp7/sa-government-position-on-climate-change
Sterman, J., Fiddaman, T., Franck, T., Jones, A., McCauley, S., Rice, P., Sawin, E. and Siegel L. (2012) ‚Climate interactive: The C-ROADS climate policy model‘. System Dynamics Review, 28(3):295-305.
54
EMISSIONS GAP REPORT A UNEP Synthesis
References
Stern, N. and Taylor, C. (2010) ‘What do the Appendices to the Copenhagen Accord tell us about global greenhouse gas emissions and the prospects for avoiding a rise in global average temperature of more than 2°C?’. Policy paper - Centre for Climate Change Economics and Policy Grantham Research Institute on Climate Change and the Environment in collaboration with the United Nations Environment Programme. Available at: http://www.unep.org/PDF/PressReleases/Accord_targets_paper.pdf
Tavoni, M., Kriegler, E., Aboumahboub, T., Calvin, K., De Maere, G., Jewell, J., Kober, T., Lucas, P., Luderer, G., McCollum, D., Marangoni, G., Riahi, K. and van Vuuren, D.P. (2013) ‚The distribution of the major economies’ effort in the Durban platform scenarios’. Climate Change Economics (in press).
United States Department of State (2010) U.S. Climate Action Report 2010: Fifth National Communication of the United States of America under the United Nations Framework Convention on Climate Change. Washington: Global Publishing Services. Available at: http://www.state.gov/documents/organization/140636.pdf
UNEP (2014) Pledge Pipeline. UNEP. Available at: http://www.unep.org/climatechange/pledgepipeline/ (Retrieved May 27, 2014).
UNEP (2013) The Emissions Gap Report 2013: A UNEP Synthesis Report. Nairobi, Kenya: UNEP. Available at: www.unep.org/pdf/UNEPEmissionsGapReport2013.pdf
UNFCCC (2012a) Decision 2/CMP.7 Land use, land-use change and forestry. UNFCCC document FCCC/KP/CMP/2011/10. Available at: http://unfccc.int/resource/docs/2011/cmp7/eng/10a01.pdf#page=11
UNFCCC (2012b) Outcome of the work of the Ad Hoc Working Group on Further Commitments for Annex I Parties under the Kyoto Protocol. UNFCCC document FCCC/KP/CMP/2012/L.9. Available at: http://unfccc.int/resource/docs/2012/cmp8/eng/l09.pdf
UNFCCC (2013) Compilation of information on nationally appropriate mitigation actions to be implemented by developing country Parties. UNFCCC document FCCC/SBI/2013/INF.12. Available at: http://unfccc.int/resource/docs/2013/sbi/eng/inf12r02.pdf
UNFCCC (2014a) Submitted Biennial Reports. Available at: http://unfccc.int/national_reports/biennial_reports_and_iar/submitted_biennial_reports/items/7550.php
UNFCCC (2014b) Report of the technical review of the first biennial report of the United States of America. UNFCCC document FCCC/TRR.1/USA. Available at: http://unfccc.int/resource/docs/2014/trr/usa01.pdf
World Resources Institute (2014) What Does the Clean Power Plan Mean for Meeting U.S. Climate Goals? Available at: http://www.wri.org/blog/2014/06/what-does-clean-power-plan-mean-meeting-us-climate-goals
Chapter 4ACEEE (2014) State Energy Efficiency Resource Standards. Policy Brief. Washington DC: American Council for an Energy-Efficient
Economy. Available at: http://www.aceee.org/policy-brief/state-energy-efficiency-resource-standard-activity
AfDB (2012) African Development Report 2012- Towards Green Growth in Africa. Tunis-Belvedere, Tunisia: African Development Bank. Available at: http://www.afdb.org/fileadmin/uploads/afdb/Documents/Publications/African_Development_Report_2012.pdf
Avnery, S., Mauzerall, D.L., Liu, J. and Horowitz, L.W. (2011) ‘Global crop yield reductions due to surface ozone exposure: 1. Year 2000 crop production losses and economic damage’. Atmospheric Environment, 45(13):2284-2296.
Bean, F., Bruel, R., Scheuer, S. and Walczak A. (2014) Implementing the EU Energy Efficiency Directives – Analysis of Article 7 Member States reports. Brussels: Coalition for Energy Saving. Available at: http://energycoalition.eu/sites/default/files/20140422%20Coalition%20for%20Energy%20Savings%20Art%207%20Report%20FINAL.pdf
Boza-Kiss, B., Moles, S., and Urge-Vorsatz, B. (2013) Evaluating policy instruments to foster energy efficiency for the sustainable transformation of buildings. Current Opinion in Environmental Sustainability. 5(2): 163–176.
Braun, N., Höhne, N., Hagemann, M., Day, T., Healy, S., Schumacher, K., Duscha, V., (2014) Instruments to increase climate policy ambition before 2020 – economic and political implications in selected industry and emerging countries. Ökoinstitut. Freiburg.
CA (2011) CA Energy Efficiency Strategic Plan – January 2011 update. San Francisco: California Energy Commission. Available at: http://www.energy.ca.gov/ab758/documents/CAEnergyEfficiencyStrategicPlan_Jan2011.pdf
CDKN (2013) Creating Market Support for Energy Efficiency – India’s perform, achieve and trade scheme. London: Climate Development and Knowledge Network. Available at: http://cdkn.org/resource/creating-market-support-for-energy-efficiency-indias-perform-achieve-and-trade-scheme/?loclang=en_gb
Clarke, L., Jiang, K., Akimoto, K., Babiker, M., Blanford, G., Fisher-Vanden, K., Hourcade, J.-C., Krey, V., Kriegler, E., Löschel, A., McCollum, D., Paltsev, S., Rose, S., Shukla, P.R., Tavoni, M., Zwaan, B.V.D. and van Vuuren, D.P., (2014) ‘Assessing Transformation Pathways’ in Edenhofer, O., Pichs-Madruga, R., Sokona, Y., Farahani, E., Kadner, S., Seyboth, K., Adler, A., Baum, I., Brunner, S., Eickemeier, P., Kriemann, B., Savolainen, J., Schlömer, S., Stechow, C.V., Zwickel, T. and Minx, J.C. (Eds.), Climate Change 2014: Mitigation of Climate Change. Contribution of Working Group III to the Fifth Assessment Report of the Intergovernmental Panel on Climate Change. Cambridge, UK and New York, USA: Cambridge University Press.
ClimateWorks and the World Bank (2014) Climate-Smart Development - Adding up the benefits of actions that help build prosperity, end poverty and combat climate change. (http://www-wds.worldbank.org/external/default/WDSContentServer/WDSP/IB/2014/06/20/000456286_20140620100846/Rendered/PDF/889080WP0v10RE0Smart0Development0Ma.pdf)
55
EMISSIONS GAP REPORT A UNEP Synthesis
References
EC (2014) Action Plan Concerning EU-China customs cooperation on IPR (2014-2017) (http://eeas.europa.eu/delegations/china/documents/news/201405161_3_action_plan_on_ipr_2014-2017_en.pdf)
EES (2013) Energy standards and labelling programs throughout the world in 2013. Energy Efficient Strategies, Australia and Maia Consulting, Australia. Available at: http://www.iea-4e.org/files/otherfiles/0000/0317/Int-Label-2013-desktop-v7b.pdf
Ellis, M., Pilven, Z., Evans, C. and McAndrew L. (2010) Compliance Counts: A Practitioners Guidebook on Best Practice Monitoring, Verification and Enforcement for Appliances Standards and Labelling. Washington DC: CLASP. Available at: http://www.clasponline.org/Resources/MVEResources/MVEGuidebook
EREC/Greenpeace/GWEC (2012) Energy [r]evolution: a sustainable world energy outlook. European Renewable Energy Council, Brussels. Greenpeace International, Amsterdam. Global Wind Energy Council, Brussels.
European Union (2010) Directive 2010/31/EU of the European Parliament and of the Council of 19 May 2010 on the energy performance of buildings. Available at: http://eur-lex.europa.eu/LexUriServ/LexUriServ.do?uri=OJ:L:2010:153:0013:0035:EN:PDF
Evans, G., Wells , N. and Moch A. (2003) ‘Housing and Mental Health: A Review of the Evidence and a Methodological and Conceptual Critique’. Journal of Social Issues. 59(3):475-500.
GEA (2012): Global Energy Assessment - Toward a Sustainable Future. Cambridge, UK; New York, USA and Laxenburg, Austria: Cambridge University Press and the International Institute for Applied Systems Analysis.
GGGI (2014): Green Growth in Practice: Lessons from Country Experiences. Green Growth Best Practice Initiative. Seoul: Global Green Growth Institute. Available at: http://www.ggbp.org/sites/all/themes/ggbp/uploads/Green-Growth-in-Practice-062014-Full.pdf
Hermelink, A., Schimschar, S., Boermans, T., Pagliano, L., Zangheri, P., Armani, R., Voss, K. and Musall E. (2013) Towards nearly zero-energy buildings - Definition of common principles under the EPBD. Cologne, Germany: Ecofys. Available at: http://ec.europa.eu/energy/efficiency/buildings/doc/nzeb_full_report.pdf
Höhne, N., Klein, N., Gilber, A., Lam, L., Toop, G., Wu, Q., Hagemann, M., Casanova-Allende, C., Li, L., Borkent, B., Warnecke, C. and Wong, L. (2014) State and Trends of Carbon Pricing 2014. Washington DC: The World Bank. Available at: http://documents.worldbank.org/curated/en/2014/05/19572833/state-trends-carbon-pricing-2014
HSBC (2014) Sizing energy efficiency investment. HSBC Global Research, London, UK.
IEA (2008) Energy efficiency requirements in building codes, energy efficiency policies for new buildings. Paris: International Energy Agency. Available at: http://www.iea.org/publications/freepublications/publication/Building_Codes.pdf
IEA (2010) IEA Policy Pathways - Energy Performance Certification of Buildings. Paris: International Energy Agency. Available at: http://www.iea.org/publications/freepublications/publication/buildings_certification.pdf
IEA (2011a) Policy Pathways: Monitoring, Verification and Enforcement of Equipment Programmes. OECD/IEA, Paris.
IEA (2011b) Technology Roadmap- Smart Grids. Paris: International Energy Agency. Available at: http://www.iea.org/publications/freepublications/publication/smartgrids_roadmap.pdf
IEA (2012a) Improving the Fuel Economy of Road Vehicles – A policy package. Paris: International Energy Agency. Available at: http://www.iea.org/publications/freepublications/publication/policy-pathways-improving-the-fuel-economy-of-road-vehicles---a-policy-package.html
IEA (2012b) Technology Roadmap: Fuel Economy of Road Vehicles. Paris: International Energy Agency. Available at: http://www.iea.org/publications/fueleconomy_2012_final_web.pdf
IEA (2012c) Technology Roadmap: Energy-efficient Buildings: Heating and Cooling Equipment. Paris: International Energy Agency. Available at: http://www.iea.org/publications/freepublications/publication/buildings_roadmap.pdf
IEA & IIP (2012) IEA Policy Pathways – Energy Management Programmes for Industry. Paris: International Energy Agency. Available at: http://www.iea.org/publications/freepublications/publication/policy-pathways-energy-management-programmes-for-industry.html
IEA (2013a) Redrawing the Energy-Climate Map. World Energy Outlook Special Report. Paris: International Energy Agency. Available at: http://www.iea.org/publications/freepublications/publication/WEO_Special_Report_2013_Redrawing_the_Energy_Climate_Map.pdf
IEA (2013b) IEA World Energy Outlook 2013. Paris: International Energy Agency. Available at: http://www.worldenergyoutlook.org/publications/weo-2013/
IEA (2014a) Energy technology perspectives 2014 – Harnessing electricity’s potential. Paris: International Energy Agency.
IEA (2014b) Energy Efficiency Market Report 2014 - Market Trends and Medium-Term Prospects. Paris: International Energy Agency.
IEA (2014c) Multiple Benefits of Energy Efficiency: A guide to quantifying the value added. Paris: OECD/IEA Publishing.
IEA (2014d) Transition to Sustainable Buildings - Strategies and Opportunities to 2050. Paris: International Energy Agency. Available at: http://www.iea.org/media/training/presentations/etw2014/publications/Sustainable_Buildings_2013.pdf
IEA (2014e) Capturing the Multiple Benefits of Energy Efficiency: Roundtable on Industrial Productivity and Competitiveness Discussion Paper, 27 January 2014. Available at: http://www.iea.org/workshop/industrial-productivity-and-competitive-benefits.html

56
EMISSIONS GAP REPORT A UNEP Synthesis
References
IEA (2014f ) More Data, Less Energy: Making Network Standby More Efficient in Billions of Connected Devices. Paris: International Energy Agency. Available at: http://www.iea.org/publications/freepublications/publication/moredata_lessenergy.pdf
IEA (2014g) Renewable Energy Medium-Term Market Report 2014. Paris: International Energy Agency.
IIP (2014). Perform Achieve Trade Scheme (PAT Scheme). Industrial Efficiency Policy Database, Institute for Industrial Productivity. Available at: http://iepd.iipnetwork.org/policy/perform-achieve-trade-scheme-pat-scheme (Retrieved July 27, 2014).
IIASA (2012) Global Energy Assessment: Toward a more Sustainable Future. Laxenburg, Austria: International Institute for Applied Systems Analysis. Available at: http://www.iiasa.ac.at/web/home/research/Flagship-Projects/Global-Energy-Assessment/GEA-Summary-web.pdf
IRENA (2014) Remap 2030 – a renewable energy roadmap. Abu Dhabi: International Renewable Energy Agency. Available at: http://irena.org/remap/REmap_Report_June_2014.pdf
IPCC (2014) Climate Change 2014: Mitigation of Climate Change. Contribution of Working Group III to the Fifth Assessment Report of the Intergovernmental Panel on Climate Change [Edenhofer, O., R. Pichs-Madruga, Y. Sokona, E. Farahani, S. Kadner, K. Seyboth, A. Adler, I. Baum, S. Brunner, P. Eickemeier, B. Kriemann, J. Savolainen, S. Schlömer, C. von Stechow, T. Zwickel and J.C. Minx (eds.)]. Cambridge University Press, Cambridge, United Kingdom and New York, NY, USA.
Janssen, R. and Staniaszek, D. (2012) How Many Jobs?: A Survey of the Employment Effects of Investment in Energy Efficiency of Buildings.
Ke, J., Price, L., Ohshita, S., Fridley, D., Khanna, N.Z., Zhou, N., Levine, M. (2012) China’s industrial energy consumption trends and impacts of the Top-1000 enterprises Energy Saving Program and the Ten Key Energy-Saving Projects. Energy Policy 50: 562-569.
Koeppel, S. and Ürge-Vorsatz D. (2007) Assessment of policy instruments for reducing greenhouse gas emissions from buildings. Report for the UNEP-Sustainable Buildings and Construction Initiative. Budapest, Hungary: UNEP and Central European University.
Kuckshinrichs, W., Kronenberg, T. and Hansen, P (2013) Impact on public budgets of the KfW promotional programmes “Energy-efficiet construction”, “Energy-efficient refurbishment” and “Energy-efficient infrastructure” in 2011. STE Research Report, Forschungszentrum Juelick, commissioned by KfW Bankengruppe. Frankfurt: KFW Research. Available at: https://www.kfw.de/Download-Center/Konzernthemen/Research/Research-englisch/PDF-Dateien-STE-Reports/STE-Research-Report-April-2013-EN.pdf
Lehr, U., C. Lutz, and M. Pehnt (2012) Volkswirtschaftliche Effekte der Energiewende: Erneubare Energien und Energieeffizienz. Heidelberg, Germany: Gesellschaft für Wirtschaftliche Strukturforschung and Institut für Energie-und Umweltforschung.
Leonardo Energy (2005) The Potential for Global Energy Savings from High Efficiency Distribution Transformers. Brussels: European Copper Institute.
Lilly, P. and Pearson D. (1999) Determining the Full Value of Industrial Efficiency Programs. Proceedings from the 1999 ACEEE Summer Study on Energy Efficiency in Industry. Washington DC: American Council for an Energy Efficient Economy, pp.349-362. Available at: http://www.seattle.gov/light/Conserve/Reports/paper_7.pdf
Miller, W. and Buys, L. (2010) Post-occupancy Analysis of a Zero Energy Hojme (ZEH). Solar 2010 Conference Proceedings, Australian Solar Energy Society. Canberra: Australian National University. Available at: http://eprints.qut.edu.au/38552/1/c38552.pdf
Milne, G. and Boardman, B. (2000) Making cold homes warmer: the effect of energy efficiency improvements in low-income homes. A report to the EAGA Charitable Trust. Energy Policy 28 (6-7): 411-424.
Molenbroek, E., Smith, M., Groenenberg, H., Waide, P., Attali, S., Fischer, C., Krivošik, J., Fonseca, P., Santos, B. and Fong, J. (2014) Evaluation of the Energy Labelling Directive and specific aspects of the Ecodesign Directive. Utrecht, The Netherlands: Ecofys. Available at: http://www.energylabelevaluation.eu/tmce/Final_technical_report-Evaluation_ELD_ED_June_2014.pdf
Mundaca, L., Neij, L., Worrel, E. and McNeil M. (2010) ‘Evaluating Energy Efficiency Policies with Energy-Economy Models’. Annual Review of Environment and Resources, 35 (1):305-344.
NCE (2014) Better Growth, Better Climate: The New Climate Economy Report. Global Commission on the Economy and Climate. Available at: http://newclimateeconomy.report/misc/downloads/
OECD (2011) Towards Green Growth. Paris: Organisation for Economic Cooperation and Development. Available at: http://www.oecd.org/greengrowth/48224539.pdf
OECD (2013): Inventory of Estimated Budget Support and Tax Expenditures for Fossil Fuels. Paris: Organisation for Economic Cooperation and Development.
Pearson, D. and Skumatz L.A. (2002) Non-energy Benefits Including Productivity, Liability, Tenant Satisfaction, and Others – What Participant Surveys Tell Us About Designing and Marketing Commercial Programs. Proceedings of the 2002 Summer Study on Energy Efficiency in Buildings. Washington DC: American Council for an Energy Efficient Economy. Available at: http://www.seattle.gov/light/Conserve/Reports/paper_8.pdf
Pollin, R., Heintz J. and Garrett-Peltier H. (2009) The Economic Benefits of Investing in Clean Energy: How the Economic Stimulus Program and New Legislation can boost US Economic Growth and Employment. Political Economy Research Institute. Available at: http://www.peri.umass.edu/economic_benefits/
57
EMISSIONS GAP REPORT A UNEP Synthesis
References
Reinaud, J. and Goldberg, A. (2012) Ten Key Messages for Effective Policy Packages. Sharing best practices in industrial energy efficiency policies. Institute for Industrial Productivity. Available at: http://www.iipnetwork.org/Tenkey_policy_IIP.pdf
Reinaud, J. and MacNulty, H. (2013) Energy Efficiency: the Win-Win Opportunity in the Iron and Steel Sector. http://www.oecd.org/sti/ind/Item%209.1%20IIP.pdf
REN21 (2014) Global Status Report 2014. Renewable Energy Policy Network for the 21st Century. Paris: Renewable Energy Policy Network for the 21st century. Available at: http://www.ren21.net/ren21activities/globalstatusreport.aspx
Rogelj, J., McCollum, D. L., and Riahi, K. (2013). ‘The UN’s “Sustainable Energy for All” initiative is compatible with a warming limit of 2 °C’. Nature Climate Change, 3(6), 545-551.
Santarius, T. (2012) Der Rebound-Effekt: Über die unerwünschten Folgen der erwünschten Energieeffizienz. Wuppertal: Wuppertal-Institut für Klima, Umwelt, Energie.
SEAD (2013) SEAD Distribution Transformers Collaboration. Part 1: Comparison of Efficiency Programmes for Distribution Transformers. Standard and Labelling Working Group. Washington DC: Super-efficient Equipment and Appliance Deployment. Available at: http://www.superefficient.org/~/media/Files/Distribution%20Transformers%20Project/SEAD%20Distribution%20Transformers%20Report%20-%20Part%201%20-%20Comparison%20of%20Efficiency%20Programs.pdf
Siderius, H.-P. and H. Nakagami (2013) ‘MEPS is a MEPS is a MEPS: Comparing Ecodesign and Top Runner schemes for setting product efficiency standards’. Energy Efficiency, 6 (1): 1-19.
Sorrell, S., Dimitropoulos, J., and Sommerville, M. (2009) ’Empirical estimates of the direct rebound 34 effect: A review’. Energy Policy 37(4):1356–1371.
TERI (2009) India’s energy security: new opportunities for a sustainable future. New Delhi: The Energy & Resources Institute. Available at: http://www.teriin.org/events/CoP16/India_Energy_Security.pdf
Thomas, B.A., and Azevedo, I.L. (2013) ‘Estimating direct and indirect rebound effects for U.S. households with input–output analysis Part 1: Theoretical framework’. Ecological Economics, 86: 199–210.
UDP (in preparation) The multiple benefits of measures to improve energy efficiency. UNEP DTU Partnership. Copenhagen.
UN (2012) Sustainable Energy for All: A framework for action. The Secretary General’s High-level Group on Sustainable Energy for All. New York: United Nations. Available at: http://www.un.org/wcm/webdav/site/sustainableenergyforall/shared/Documents/SE%20for%20All%20-%20Framework%20for%20Action%20FINAL.pdf
UNEP (2011) Towards a Green Economy: Pathways to Sustainable Development and Poverty Eradication. Nairobi: United Nations Environment Programme. Available at: http://www.unep.org/greeneconomy/Portals/88/documents/ger/ger_final_dec_2011/Green%20EconomyReport_Final_Dec2011.pdf
UNEP (2013) The Emissions Gap Report 2013. Nairobi, Kenya: UNEP.
UNFCCC (2014) Updated compilation of information on mitigation benefits of actions, initiatives and options to enhance mitigation ambition. Technical paper. UNFCCC document FCCC/TP/2014/3. Available at: http://unfccc.int/resource/docs/2013/tp/08.pdf
Ürge-Vorsatz, D., Koeppel, S. and Mirasgedis, S. (2007) ‘An appraisal of policy instruments for reducing buildings’ CO2 emissions’.
Building Research and Information, 35(4):458-477.
Ürge-Vorsatz, D., Eyre, N., Graham, P., Harvey, D., Hertwich, E., Jiang, Y., Kornevall, C., Majumdar, M., McMahon, J. E., Mirasgedis, S., Murakami, S. and Novikova A. (2012) ‘Energy End-Use: Buildings’, Chapter 10. In Johansson, T.B., Patwardhan, A., Nakicenovic, N. and Gomez-Echeverri L. (Eds.), Global Energy Assessment - Toward a Sustainable Future. Cambridge, UK; New York, USA and Laxenburg, Austria: Cambridge University Press and the International Institute for Applied Systems Analysis.
von Weizsacker, E. U., Hargroves, C., Smith, M. H., Desha, C. and Stasinopoulos, P. (2009) Factor Five: Transforming the global economy through 80% improvements in resource productivity. London: Routledge.
Wang, L., Gwilliam, J. and Jones, P. (2009) ‘Case study of zero energy house design in UK’. Energy and Buildings, 41(11):1215-1222.
Worrell, E., Laitner, J. A., Ruth, M. and Finman, H. (2003) ‘Productivity benefits of industrial energy efficiency measures’. Energy, 28(11):1081-1098.
World Bank (2012) Inclusive Green Growth: the Pathway to Sustainable Development. Washington DC: The World Bank. Available at: http://siteresources.worldbank.org/EXTSDNET/Resources/Inclusive_Green_Growth_May_2012.pdf
World Energy Council and ADEME (2013) World Energy Perspective Energy Efficiency Policies – What works and what does not. London.
WWF/TERI (2013) The Energy Report – India - 100% renewable energy by 2050. New Delhi: WWF India and The Energy and Resources Institute. Available at: http://www.wwfindia.org/?10261/100-Renewable-Energy-by-2050-for-India

© alphaspirit/Shutterstock


A UNEP Synthesis Report2014
United Nations Environment ProgrammeP.O. Box 30552 - 00100 Nairobi, Kenya
Tel.: +254 20 762 1234Fax: +254 20 762 3927
e-mail: [email protected]
www.unep.org
THE EMISSIONS GAP REPORT
978-92-807-3413-3DEW/1833/NA
Related Documents