Desalination 225 (2008) 13–28 0011-9164/08/$– See front matter © 2008 Elsevier B.V. All rights reserved *Corresponding author. Adsorption of basic dye using activated carbon prepared from oil palm shell: batch and fixed bed studies I.A.W. Tan, A.L. Ahmad, B.H. Hameed* School of Chemical Engineering, University Science Malaysia, Engineering Campus, 14300 Nibong Tebal, Penang, Malaysia Tel. +60 (4) 599-6422; Fax +60 (4) 594-1013; email: [email protected] Received 7 December 2006; accepted 29 July 2007 Abstract The feasibility of activated carbon prepared from oil palm shell to remove methylene blue from aqueous solutions was investigated through batch and column studies. Batch experiments were carried out to study the adsorption isotherm and kinetics at 30°C, with the initial concentration of 50–500 mg/l and solution pH of 6.5. Equilibrium data were fitted to Langmuir, Freundlich, Temkin and Dubinin-Radushkevich isotherm models. The equilibrium data were best represented by the Langmuir isotherm model, with maximum monolayer adsorption capacity of 243.90 mg/g at 30°C. The adsorption process was found to be exothermic in nature. The kinetic data were fitted to pseudo-first-order, pseudo-second-order and intraparticle diffusion models, and it was found to follow closely the pseudo-second-order model. In column experiments, the effects of the initial dye concentration, bed height and flow rate on methylene blue adsorption were studied. The highest bed capacity of 40.86 mg/g was obtained using 100 mg/l initial dye concentration, 6 cm bed height and 20 ml/min flow rate. Keywords: Adsorption; Oil palm shell; Methylene blue; Equilibrium; Kinetics 1. Introduction The discharge of dyes in the environment is worrying for both toxicological and esthetical rea- sons as dyes impede light penetration, damage the quality of the receiving streams and are toxic to food chain organisms [1]. Industries such as tex- tile, leather, paper, plastics, etc., are some of the sources for dye effluents [2]. Methylene blue (MB), a cationic dye, is the most commonly used substance for colouring among all other dyes of its category. MB can cause eye burns, and if swal- lowed, it causes irritation to the gastrointestinal tract with symptoms of nausea, vomiting and di- arrhea. It may also cause methemoglobinemia, cy- anosis, convulsions and dyspnea if inhaled [3]. Hence, the treatment of effluents containing such doi:10.1016/j.desal.2007.07.005

Welcome message from author
This document is posted to help you gain knowledge. Please leave a comment to let me know what you think about it! Share it to your friends and learn new things together.
Transcript
Desalination 225 (2008) 13–28
0011-9164/08/$– See front matter © 2008 Elsevier B.V. All rights reserved
*Corresponding author.
Adsorption of basic dye using activated carbon prepared fromoil palm shell: batch and fixed bed studies
I.A.W. Tan, A.L. Ahmad, B.H. Hameed*School of Chemical Engineering, University Science Malaysia, Engineering Campus,
14300 Nibong Tebal, Penang, MalaysiaTel. +60 (4) 599-6422; Fax +60 (4) 594-1013; email: [email protected]
Received 7 December 2006; accepted 29 July 2007
Abstract
The feasibility of activated carbon prepared from oil palm shell to remove methylene blue from aqueous solutionswas investigated through batch and column studies. Batch experiments were carried out to study the adsorptionisotherm and kinetics at 30°C, with the initial concentration of 50–500 mg/l and solution pH of 6.5. Equilibriumdata were fitted to Langmuir, Freundlich, Temkin and Dubinin-Radushkevich isotherm models. The equilibriumdata were best represented by the Langmuir isotherm model, with maximum monolayer adsorption capacity of243.90 mg/g at 30°C. The adsorption process was found to be exothermic in nature. The kinetic data were fitted topseudo-first-order, pseudo-second-order and intraparticle diffusion models, and it was found to follow closely thepseudo-second-order model. In column experiments, the effects of the initial dye concentration, bed height andflow rate on methylene blue adsorption were studied. The highest bed capacity of 40.86 mg/g was obtained using100 mg/l initial dye concentration, 6 cm bed height and 20 ml/min flow rate.
Keywords: Adsorption; Oil palm shell; Methylene blue; Equilibrium; Kinetics
1. Introduction
The discharge of dyes in the environment isworrying for both toxicological and esthetical rea-sons as dyes impede light penetration, damage thequality of the receiving streams and are toxic tofood chain organisms [1]. Industries such as tex-tile, leather, paper, plastics, etc., are some of the
sources for dye effluents [2]. Methylene blue(MB), a cationic dye, is the most commonly usedsubstance for colouring among all other dyes ofits category. MB can cause eye burns, and if swal-lowed, it causes irritation to the gastrointestinaltract with symptoms of nausea, vomiting and di-arrhea. It may also cause methemoglobinemia, cy-anosis, convulsions and dyspnea if inhaled [3].Hence, the treatment of effluents containing such
doi:10.1016/j.desal.2007.07.005
14 I.A.W. Tan et al. / Desalination 225 (2008) 13–28
dye is of interest due to its harmful impacts onreceiving waters.
Adsorption onto activated carbon has beenfound to be superior for wastewater treatmentcompared to other physical and chemical tech-niques, such as flocculation, coagulation, precipi-tation and ozonation as they possess inherent limi-tations such as high cost, formation of hazardousby-products and intensive energy requirements[1]. However, commercially available activatedcarbons are still considered expensive [4]. This isdue to the use of non-renewable and relativelyexpensive starting material such as coal, which isunjustified in pollution control applications [5].Therefore, in recent years, this has prompted agrowing research interest in the production ofactivated carbons from renewable and cheaperprecursors which are mainly industrial and agri-cultural by-products, such as date pits [6], silkcotton hull and maize [7], jute fiber [3], ground-nut shell [8], corncob [9], bamboo [10], rattan saw-dust [11] and oil palm fibre [12].
Malaysia is the largest exporter of palm oil inthe international market. One of the significantproblems in the palm fruit processing is manag-ing of the wastes generated during the processes.Palm oil mills in Malaysia produce about 4.3 mil-lion tonnes of shell annually [13]. In practice, thisbiomass is burned in incinerators by palm oil millswhich creates environmental pollution problemsin nearby localities and also offers a limited valueto the industry. In order to make better use of thischeap and abundant agricultural waste, it is pro-posed to convert oil palm shell into activated car-bon. Furthermore, very few papers have reportedthe dye adsorption using continuous flow condi-tions, which are more useful in a large-scale tex-tile wastewater treatment. Therefore, in this study,the adsorption of MB on oil palm shell-based ac-tivated carbon was conducted in both batch andcontinuous conditions using a laboratory scalefixed bed column.
The focus of this research was to evaluate theadsorption potential of the oil palm shell-based
activated carbon in removing MB from aqueoussolutions through batch and fixed bed experi-ments. The equilibrium, kinetic and dynamicbehaviours of the adsorption process were thenevaluated to study the adsorption mechanism ofMB molecules onto the prepared activated car-bon.
2. Materials and methods
2.1. Methylene blue
Methylene blue (MB) supplied by Sigma-Aldrich (M) Sdn Bhd, Malaysia was used as anadsorbate and was not purified prior to use. MBwas chosen for this study because of its knownstrong adsorption onto solids. Deionized waterwas used to prepare all the solutions and reagents.Some properties of the MB dye, together with itschemical structure, are listed in Table 1.
2.2. Preparation and characterization of activatedcarbon
Oil palm shell used for preparation of activatedcarbon was obtained from United Oil Palm In-dustries Sdn Bhd, Malaysia. The precursor wasfirst washed to remove dirt from its surface andthen dried overnight at 105°C. The dried shell wascrushed and sieved to desired mesh size of 1–
Table 1Some properties of the MB used
Properties Chemical structure
Chemical formula C16H18ClN3S.3H2O Molecular weight 373.9 g/mol Type Basic dye Solubility Soluble in water Solution pH 6.5 Wave length 668 nm
I.A.W. Tan et al. / Desalination 225 (2008) 13–28 15
2 mm, then carbonized in a stainless steel verti-cal tubular reactor placed in a tube furnace underpurified nitrogen (99.995%) flow of 150 cm3/minat 700°C, with a heating rate of 10°C/min. Thesample was held at the carbonization temperaturefor 2 h. The char produced was soaked in a potas-sium hydroxide (KOH) solution with an impreg-nation ratio of 1:1. The mixture was then dehy-drated in an oven overnight at 105°C to removemoisture and then activated under the same con-ditions as carbonization, but to a final tempera-ture of 850°C. Once the final temperature wasreached, the nitrogen gas flow was switched tocarbon dioxide and activation was held for 2 h.The activated product was then cooled to roomtemperature under nitrogen flow and washed withhot deionized water and 0.1 molar hydrochloricacid until the pH of the washing solution reached6–7.
Textural characterization of the prepared acti-vated carbon was carried out by N2 adsorption at77 K using Autosorb I (Quantachrome Corpora-tion, USA). The Brunauer-Emmett-Teller (BET)surface area and total pore volume of the preparedactivated carbon were then determined [14,15].Scanning electron microscopy (SEM) analysiswas carried out for the precursor and the preparedactivated carbon to study their surface texturesand the development of porosity. In addition, thesurface functional groups of the prepared activatedcarbon were detected by Fourier Transform In-frared (FTIR) spectroscope (FTIR-2000, PerkinElmer). The spectra were recorded from 4000 to400 cm–1.
2.3. Batch equilibrium studies
Adsorption tests were performed in a set of 43Erlenmeyer flasks (250 ml) where 100 ml of MBsolutions with initial concentrations of 50–500 mg/l were placed in these flasks. Equal massof 0.1 g of the prepared activated carbon with theparticle size of 200 μm was added to each flaskand kept in an isothermal shaker of 120 rpm at30°C for 30 h to reach equilibrium. The pH of the
solutions was natural (pH 6.5). Aqueous sampleswere taken from the solution and the concentra-tions were analyzed. All samples were filteredprior to the analysis in order to minimize the in-terference of the carbon fines with the analysis.The concentrations of MB in the supernatant so-lution before and after adsorption were determinedusing a double beam UV-visible spectrophotom-eter (Shimadzu, Japan) at 668 nm. Each experi-ment was duplicated under identical conditions.The amount of adsorption at equilibrium, qe (mg/g),was calculated by:
( )0 ee
C C Vq
W−
= (1)
where C0 and Ce (mg/l) are the liquid phase con-centrations of dye at the initial and equilibriumconditions, respectively. V is the volume of thesolution (l) and W is the mass of dry adsorbentused (g).
2.4. Batch kinetic studies
The procedure of kinetic tests was identical tothat of the equilibrium tests. The aqueous sampleswere taken at preset time intervals and the con-centrations of MB were similarly measured. Theamount of adsorption at time t, qt (mg/g), wascalculated by:
( )0 tt
C C Vq
W−
= (2)
where C0 and Ct (mg/l) are the liquid-phase con-centrations of dye at the initial time and at anytime t, respectively. V is the volume of the solu-tion (l) and W is the mass of dry adsorbent used(g).
2.5. Column studies
Continuous flow adsorption studies were con-ducted in a glass column made of Pyrex glass tubeof 1.2 cm inner diameter and 19.5 cm height. Atthe bottom of the column, a stainless sieve was
16 I.A.W. Tan et al. / Desalination 225 (2008) 13–28
attached followed by a layer of glass wool. Aknown quantity of the prepared activated carbonwas packed in the column to yield the desired bedheight of the adsorbent (3 and 6 cm). The columnwas then filled up with 5 mm size glass beads inorder to provide a uniform flow of the solutionthrough the column. Dye solution of known con-centrations (50, 100 and 150 mg/l) at pH 6.5 waspumped upward through the column at a desiredflow rate (20 and 30 ml/min) controlled by a peri-staltic pump (Masterflex, Cole-Parmer InstrumentCo.). The MB solutions at the outlet of the col-umn were collected at regular time intervals andthe concentration was measured using a doublebeam UV-visible spectrophotometer (Shimadzu,Japan) at 668 nm. All the experiments were car-ried out at room temperature (28 ± 1°C).
3. Results and discussion
3.1. Characterization of prepared activated car-bon
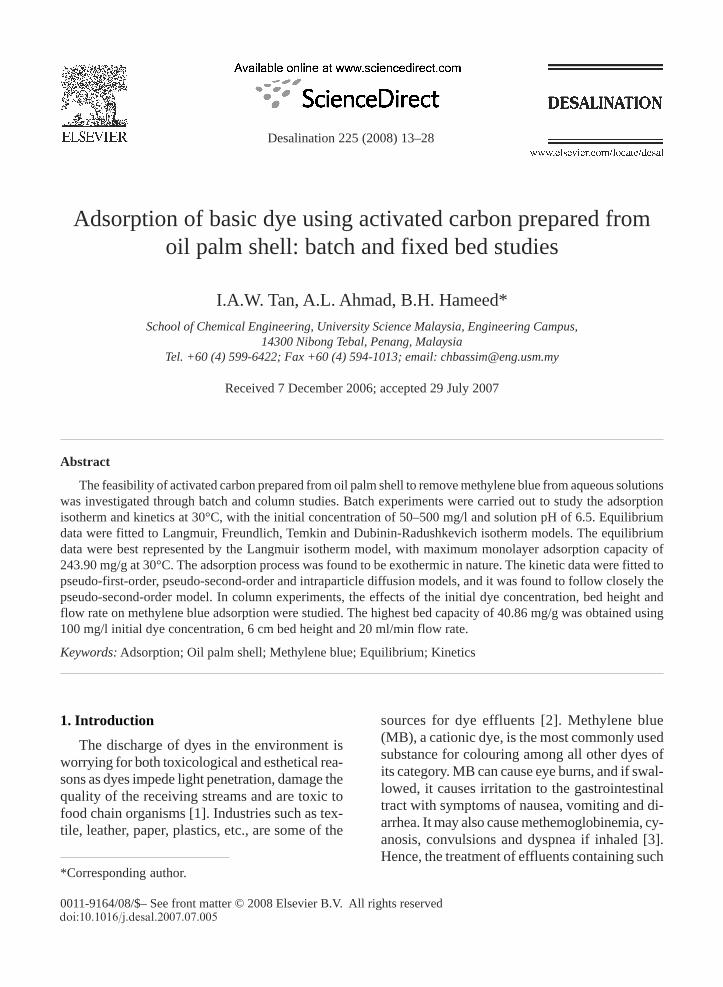
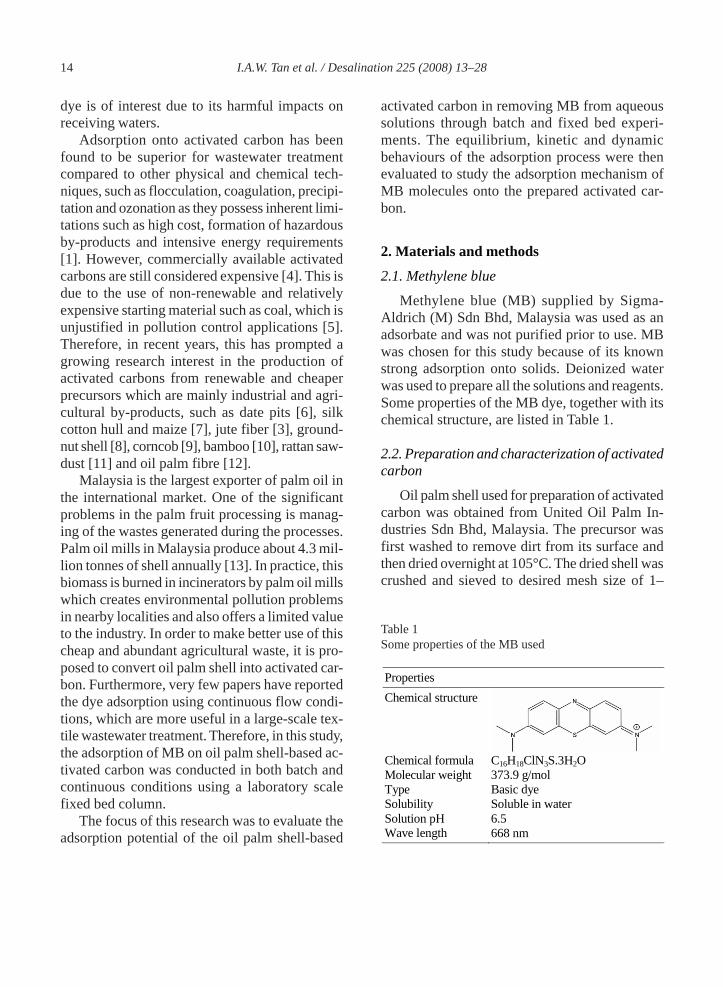
The BET surface area of the prepared activatedcarbon was found to be 596.20 m2/g, with the to-tal pore volume of 0.34 cm3/g. Figs. 1a and 1bshow the SEM images of the precursor and thederived activated carbon, respectively. Large andwell-developed pores were clearly found on thesurface of the activated carbon, compared to theoriginal precursor. This might be due to the acti-vation process used, which involved both chemi-cal and physical activating agents of KOH andCO2. Pore development in the char during pyroly-sis was also important as this would enhance thesurface area and pore volume of the activated car-bon by promoting the diffusion of KOH and CO2molecules into the pores and thereby increasingthe KOH-carbon and CO2-carbon reactions, whichwould then create more pores in the activated car-bon. Stavropoulos and Zabaniotou [15] stated thatKOH is dehydrated to K2O, which reacts with CO2produced by the water-shift reaction, to giveK2CO3. Intercalation of metallic potassium ap-
(a)
(b)
Fig. 1. SEM micrographs: (a) raw oil palm shell (1000×);(b) oil palm shell-based activated carbon (1000×).
peared to be responsible for the drastic expansionof the carbon material and hence the creation of alarge surface area and high pore volume.
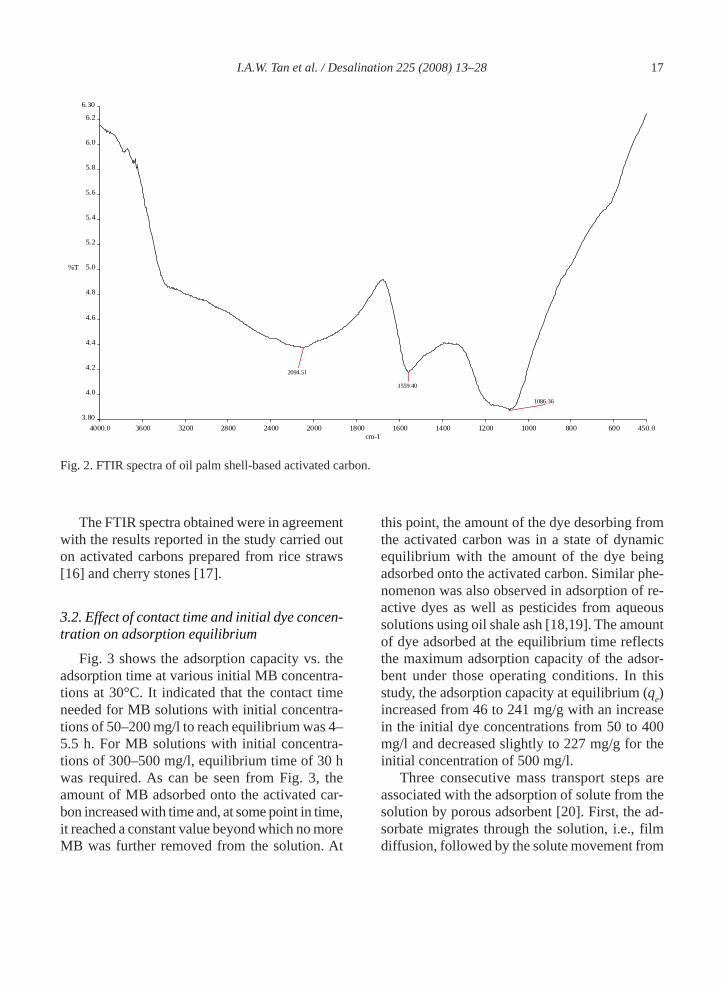
Fig. 2 displays the FTIR spectra obtained forthe prepared activated carbon. The spectra dis-played the following bands:
3400 cm–1: O–H stretching vibrations2095 cm–1: C≡C stretching vibrations1559 cm–1: C=C stretching vibration in aroma-tic rings1086 cm–1: C–OH stretching vibrations
I.A.W. Tan et al. / Desalination 225 (2008) 13–28 17
The FTIR spectra obtained were in agreementwith the results reported in the study carried outon activated carbons prepared from rice straws[16] and cherry stones [17].
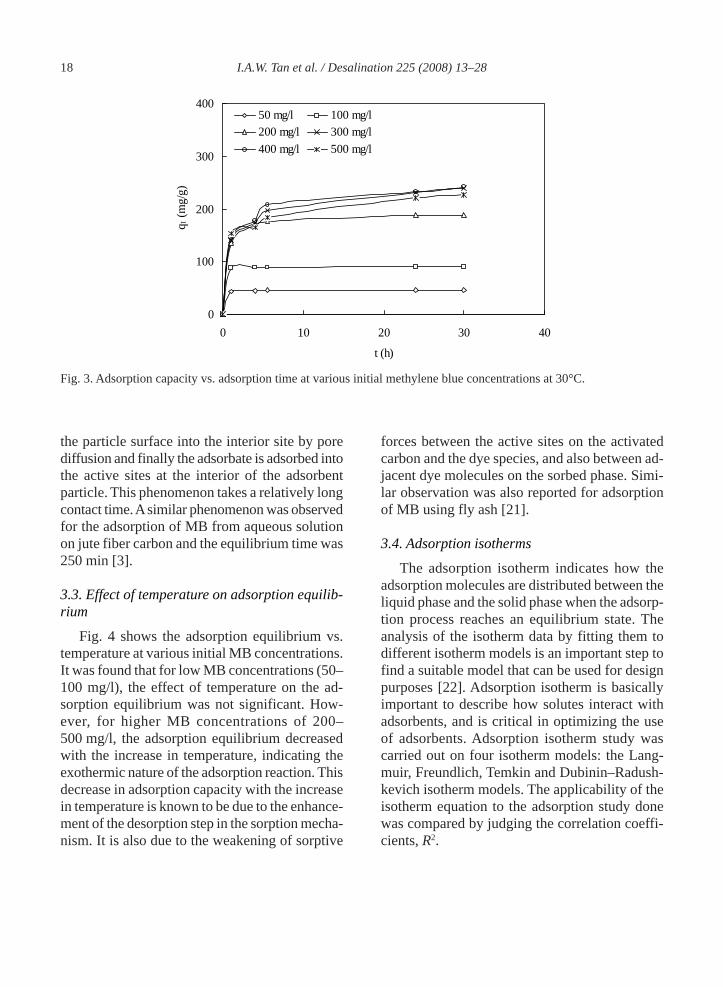
3.2. Effect of contact time and initial dye concen-tration on adsorption equilibrium
Fig. 3 shows the adsorption capacity vs. theadsorption time at various initial MB concentra-tions at 30°C. It indicated that the contact timeneeded for MB solutions with initial concentra-tions of 50–200 mg/l to reach equilibrium was 4–5.5 h. For MB solutions with initial concentra-tions of 300–500 mg/l, equilibrium time of 30 hwas required. As can be seen from Fig. 3, theamount of MB adsorbed onto the activated car-bon increased with time and, at some point in time,it reached a constant value beyond which no moreMB was further removed from the solution. At
4000.0 3600 3200 2800 2400 2000 1800 1600 1400 1200 1000 800 600 450.03.80
4.0
4.2
4.4
4.6
4.8
5.0
5.2
5.4
5.6
5.8
6.0
6.2
6.30
cm-1
%T
2094.51
1559.40
1086.36
Fig. 2. FTIR spectra of oil palm shell-based activated carbon.
this point, the amount of the dye desorbing fromthe activated carbon was in a state of dynamicequilibrium with the amount of the dye beingadsorbed onto the activated carbon. Similar phe-nomenon was also observed in adsorption of re-active dyes as well as pesticides from aqueoussolutions using oil shale ash [18,19]. The amountof dye adsorbed at the equilibrium time reflectsthe maximum adsorption capacity of the adsor-bent under those operating conditions. In thisstudy, the adsorption capacity at equilibrium (qe)increased from 46 to 241 mg/g with an increasein the initial dye concentrations from 50 to 400mg/l and decreased slightly to 227 mg/g for theinitial concentration of 500 mg/l.
Three consecutive mass transport steps areassociated with the adsorption of solute from thesolution by porous adsorbent [20]. First, the ad-sorbate migrates through the solution, i.e., filmdiffusion, followed by the solute movement from
18 I.A.W. Tan et al. / Desalination 225 (2008) 13–28
the particle surface into the interior site by porediffusion and finally the adsorbate is adsorbed intothe active sites at the interior of the adsorbentparticle. This phenomenon takes a relatively longcontact time. A similar phenomenon was observedfor the adsorption of MB from aqueous solutionon jute fiber carbon and the equilibrium time was250 min [3].
3.3. Effect of temperature on adsorption equilib-rium
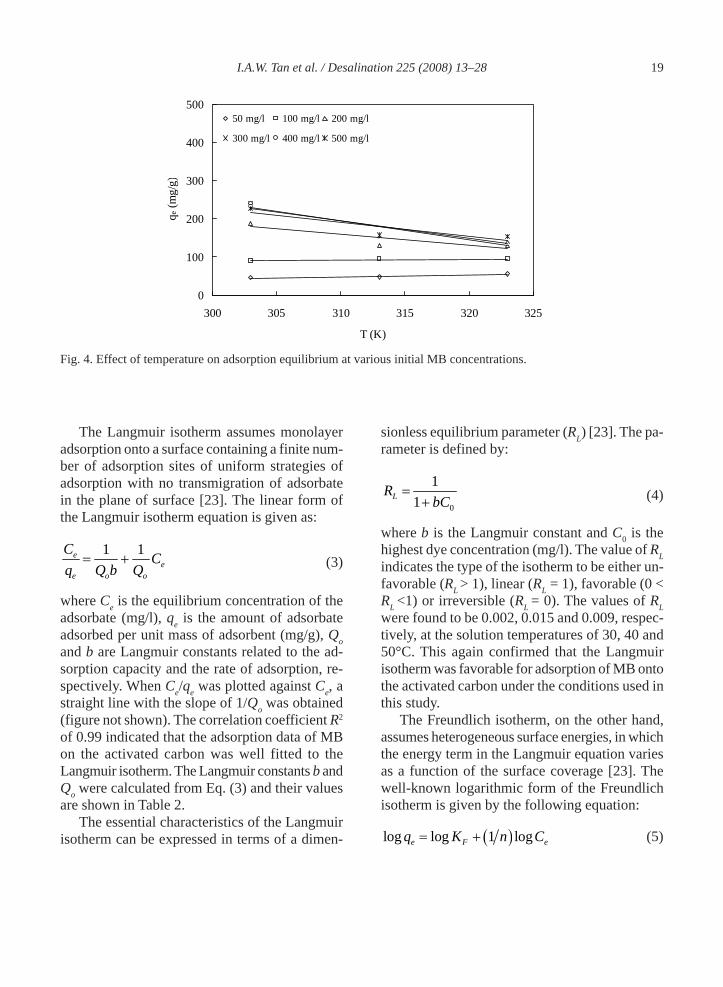
Fig. 4 shows the adsorption equilibrium vs.temperature at various initial MB concentrations.It was found that for low MB concentrations (50–100 mg/l), the effect of temperature on the ad-sorption equilibrium was not significant. How-ever, for higher MB concentrations of 200–500 mg/l, the adsorption equilibrium decreasedwith the increase in temperature, indicating theexothermic nature of the adsorption reaction. Thisdecrease in adsorption capacity with the increasein temperature is known to be due to the enhance-ment of the desorption step in the sorption mecha-nism. It is also due to the weakening of sorptive
0
100
200
300
400
0 10 20 30 40
t (h)
q t (m
g/g)
50 mg/l 100 mg/l200 mg/l 300 mg/l400 mg/l 500 mg/l
Fig. 3. Adsorption capacity vs. adsorption time at various initial methylene blue concentrations at 30°C.
forces between the active sites on the activatedcarbon and the dye species, and also between ad-jacent dye molecules on the sorbed phase. Simi-lar observation was also reported for adsorptionof MB using fly ash [21].
3.4. Adsorption isotherms
The adsorption isotherm indicates how theadsorption molecules are distributed between theliquid phase and the solid phase when the adsorp-tion process reaches an equilibrium state. Theanalysis of the isotherm data by fitting them todifferent isotherm models is an important step tofind a suitable model that can be used for designpurposes [22]. Adsorption isotherm is basicallyimportant to describe how solutes interact withadsorbents, and is critical in optimizing the useof adsorbents. Adsorption isotherm study wascarried out on four isotherm models: the Lang-muir, Freundlich, Temkin and Dubinin–Radush-kevich isotherm models. The applicability of theisotherm equation to the adsorption study donewas compared by judging the correlation coeffi-cients, R2.
I.A.W. Tan et al. / Desalination 225 (2008) 13–28 19
The Langmuir isotherm assumes monolayeradsorption onto a surface containing a finite num-ber of adsorption sites of uniform strategies ofadsorption with no transmigration of adsorbatein the plane of surface [23]. The linear form ofthe Langmuir isotherm equation is given as:
1 1ee
e o o
C Cq Q b Q
= + (3)
where Ce is the equilibrium concentration of theadsorbate (mg/l), qe is the amount of adsorbateadsorbed per unit mass of adsorbent (mg/g), Qoand b are Langmuir constants related to the ad-sorption capacity and the rate of adsorption, re-spectively. When Ce/qe was plotted against Ce, astraight line with the slope of 1/Qo was obtained(figure not shown). The correlation coefficient R2
of 0.99 indicated that the adsorption data of MBon the activated carbon was well fitted to theLangmuir isotherm. The Langmuir constants b andQo were calculated from Eq. (3) and their valuesare shown in Table 2.
The essential characteristics of the Langmuirisotherm can be expressed in terms of a dimen-
0
100
200
300
400
500
300 305 310 315 320 325
T (K)
qe (m
g/g)
50 mg/l 100 mg/l 200 mg/l
300 mg/l 400 mg/l 500 mg/l
Fig. 4. Effect of temperature on adsorption equilibrium at various initial MB concentrations.
sionless equilibrium parameter (RL) [23]. The pa-rameter is defined by:
0
11LR
bC=
+ (4)
where b is the Langmuir constant and C0 is thehighest dye concentration (mg/l). The value of RLindicates the type of the isotherm to be either un-favorable (RL > 1), linear (RL = 1), favorable (0 <RL <1) or irreversible (RL = 0). The values of RLwere found to be 0.002, 0.015 and 0.009, respec-tively, at the solution temperatures of 30, 40 and50°C. This again confirmed that the Langmuirisotherm was favorable for adsorption of MB ontothe activated carbon under the conditions used inthis study.
The Freundlich isotherm, on the other hand,assumes heterogeneous surface energies, in whichthe energy term in the Langmuir equation variesas a function of the surface coverage [23]. Thewell-known logarithmic form of the Freundlichisotherm is given by the following equation:
( )log log 1 loge F eq K n C= + (5)
20 I.A.W. Tan et al. / Desalination 225 (2008) 13–28
where Ce is the equilibrium concentration of theadsorbate (mg/l), qe is the amount of adsorbateadsorbed per unit mass of adsorbent (mg/g), KFand n are Freundlich constants with n giving anindication of how favorable the adsorption pro-cess is. KF (mg/g (l/mg)1/n) is the adsorption ca-pacity of the adsorbent which can be defined asthe adsorption or distribution coefficient and rep-resents the quantity of dye adsorbed onto acti-vated carbon for a unit equilibrium concentration.The slope of 1/n ranging between 0 and 1 is ameasure of the adsorption intensity or surface het-erogeneity, becoming more heterogeneous as itsvalue gets closer to zero [24]. A value for 1/n be-low one indicates a normal Langmuir isothermwhile 1/n above one is indicative of cooperativeadsorption [25]. The plot of log qe vs. log Ce (fig-ure not shown) gave a straight line with the slopeof 1/n with the value of 0.19, which showed thatthe adsorption of MB on the activated carbon was
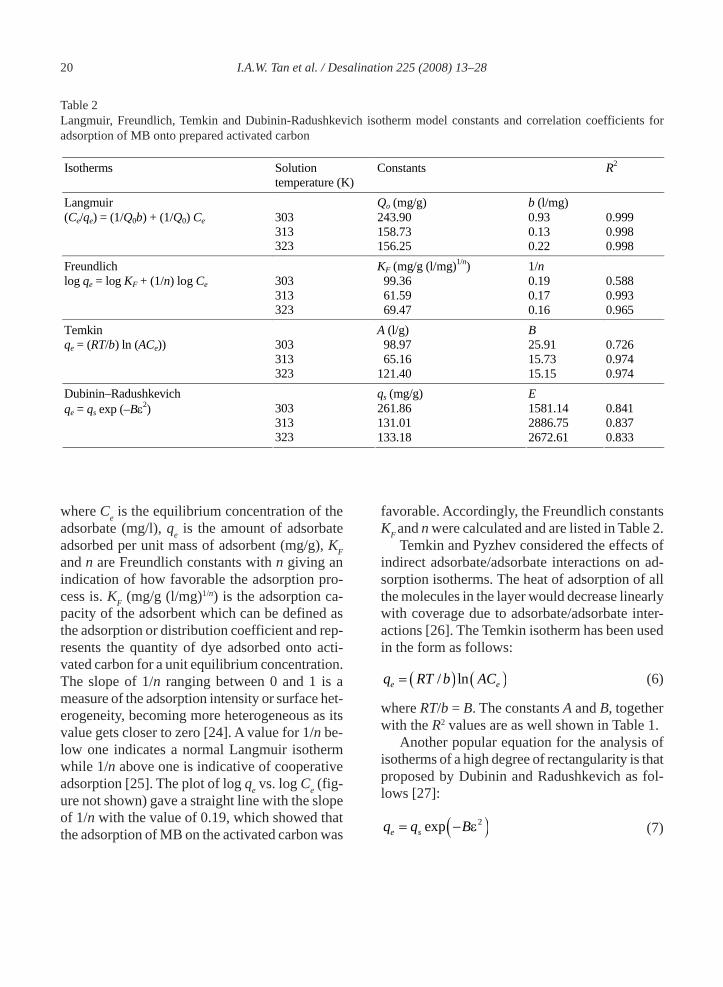
Table 2Langmuir, Freundlich, Temkin and Dubinin-Radushkevich isotherm model constants and correlation coefficients foradsorption of MB onto prepared activated carbon
Isotherms Solution temperature (K)
Constants R2
Langmuir Qo (mg/g) b (l/mg) 303 243.90 0.93 0.999 313 158.73 0.13 0.998
(Ce/qe) = (1/Q0b) + (1/Q0) Ce
323 156.25 0.22 0.998 Freundlich KF (mg/g (l/mg)1/n) 1/n
303 99.36 0.19 0.588 313 61.59 0.17 0.993
log qe = log KF + (1/n) log Ce
323 69.47 0.16 0.965 Temkin A (l/g) B
303 98.97 25.91 0.726 313 65.16 15.73 0.974
qe = (RT/b) ln (ACe))
323 121.40 15.15 0.974 Dubinin–Radushkevich qs (mg/g) E
303 261.86 1581.14 0.841 313 131.01 2886.75 0.837
qe = qs exp (–Bε2)
323 133.18 2672.61 0.833
favorable. Accordingly, the Freundlich constantsKF and n were calculated and are listed in Table 2.
Temkin and Pyzhev considered the effects ofindirect adsorbate/adsorbate interactions on ad-sorption isotherms. The heat of adsorption of allthe molecules in the layer would decrease linearlywith coverage due to adsorbate/adsorbate inter-actions [26]. The Temkin isotherm has been usedin the form as follows:
( ) ( )/ lne eq RT b AC= (6)
where RT/b = B. The constants A and B, togetherwith the R2 values are as well shown in Table 1.
Another popular equation for the analysis ofisotherms of a high degree of rectangularity is thatproposed by Dubinin and Radushkevich as fol-lows [27]:
( )2expe sq q B= − ε (7)
I.A.W. Tan et al. / Desalination 225 (2008) 13–28 21
where ε can be correlated:
1ln 1e
RTC
⎡ ⎤ε = +⎢ ⎥
⎣ ⎦(8)
The constant B gives the mean free energy Eof sorption per molecule of the sorbate when it istransferred to the surface of the solid from infin-ity in the solution and can be computed by usingthe relationship:
12
EB
⎡ ⎤= ⎢ ⎥⎣ ⎦(9)
where R is the gas constant (8.314 J/mol K) and Tis the absolute temperature. A plot of ln qe vs. ε2
(figure not shown) enables the constants qs and Eto be determined.
Table 2 summarizes all the constants and cor-relation coefficients, R2 of the four isotherm mod-els at the three temperatures studied. The Lang-muir model yielded the best fit with R2 which werehigher than 0.99 at all the three temperatures.Conformation of the experimental data into theLangmuir isotherm equation indicated the homo-geneous nature of oil palm shell-based activatedcarbon surface, i.e., each dye molecule/oil palmshell carbon adsorption had equal adsorption ac-tivation energy. The results also demonstrated theformation of monolayer coverage of dye mol-ecules at the outer surface of the oil palm shell-based activated carbon. Similar observation wasreported by the adsorption of MB onto activatedcarbons prepared from jute fiber [3], corncob [9],rattan sawdust [11] and oil palm fibre [12].
3.5. Adsorption kinetics
The rate constant of adsorption is determinedfrom the pseudo-first-order equation given byLangergren and Svenska [28] as:
( ) 1ln lne t eq q q k t− = − (10)
where qe and qt are the amounts of MB adsorbed
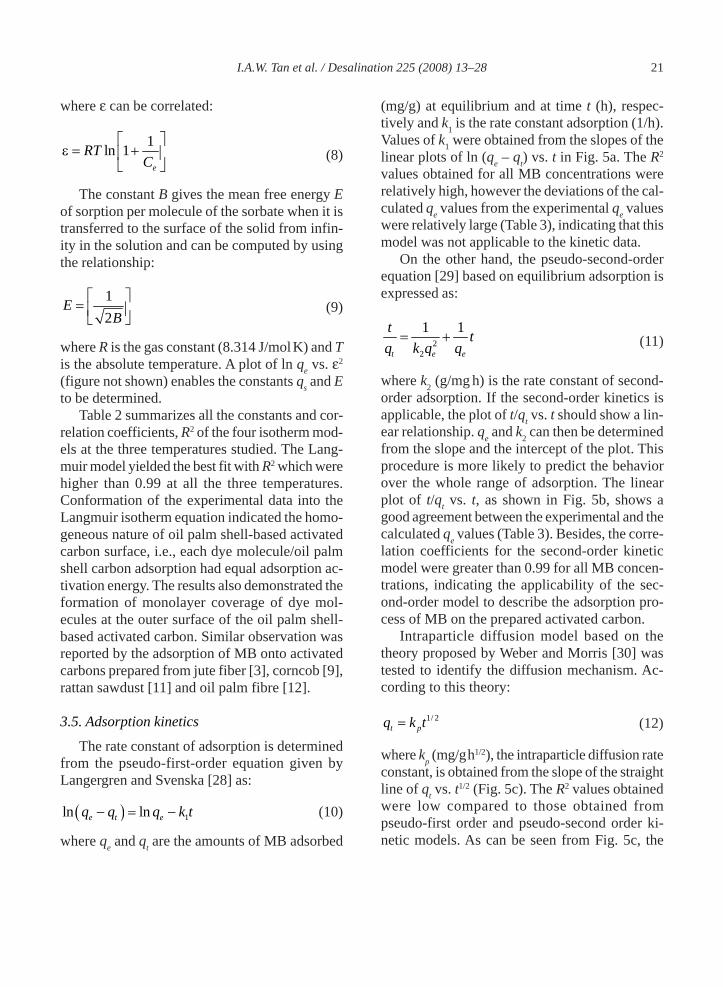
(mg/g) at equilibrium and at time t (h), respec-tively and k1 is the rate constant adsorption (1/h).Values of k1 were obtained from the slopes of thelinear plots of ln (qe – qt) vs. t in Fig. 5a. The R2
values obtained for all MB concentrations wererelatively high, however the deviations of the cal-culated qe values from the experimental qe valueswere relatively large (Table 3), indicating that thismodel was not applicable to the kinetic data.
On the other hand, the pseudo-second-orderequation [29] based on equilibrium adsorption isexpressed as:
22
1 1
t e e
t tq k q q= + (11)
where k2 (g/mg h) is the rate constant of second-order adsorption. If the second-order kinetics isapplicable, the plot of t/qt vs. t should show a lin-ear relationship. qe and k2 can then be determinedfrom the slope and the intercept of the plot. Thisprocedure is more likely to predict the behaviorover the whole range of adsorption. The linearplot of t/qt vs. t, as shown in Fig. 5b, shows agood agreement between the experimental and thecalculated qe values (Table 3). Besides, the corre-lation coefficients for the second-order kineticmodel were greater than 0.99 for all MB concen-trations, indicating the applicability of the sec-ond-order model to describe the adsorption pro-cess of MB on the prepared activated carbon.
Intraparticle diffusion model based on thetheory proposed by Weber and Morris [30] wastested to identify the diffusion mechanism. Ac-cording to this theory:
1/ 2t pq k t= (12)
where kp (mg/g h1/2), the intraparticle diffusion rateconstant, is obtained from the slope of the straightline of qt vs. t1/2 (Fig. 5c). The R2 values obtainedwere low compared to those obtained frompseudo-first order and pseudo-second order ki-netic models. As can be seen from Fig. 5c, the
22 I.A.W. Tan et al. / Desalination 225 (2008) 13–28
-20
-15
-10
-5
0
5
10
15
20
0 5 10 15 20 25 30
t (h)
ln (q
e-qt)
50 mg/l 100 mg/l200 mg/l 300 mg/l400 mg/l 500 mg/l
0.0
0.2
0.4
0.6
0.8
1.0
0 10 20 30 40
t (h)
t/qt (
h g/
mg)
50 mg/l 100 mg/l200 mg/l 300 mg/l400 mg/l 500 mg/l
Fig. 5. Kinetics for adsorption of methylene blue onto prepared activated carbon at 30°C: (a) pseudo-first-order; (b)pseudo-second-order; (c) intraparticle diffusion model.
(a)
(b)
(c)
0
200
400
600
800
0 1 2 3 4 5 6
t1/2 (h1/2)
q t (m
g/g)
50 mg/l 100 mg/l200 mg/l 300 mg/l400 mg/l 500 mg/l
I.A.W. Tan et al. / Desalination 225 (2008) 13–28 23
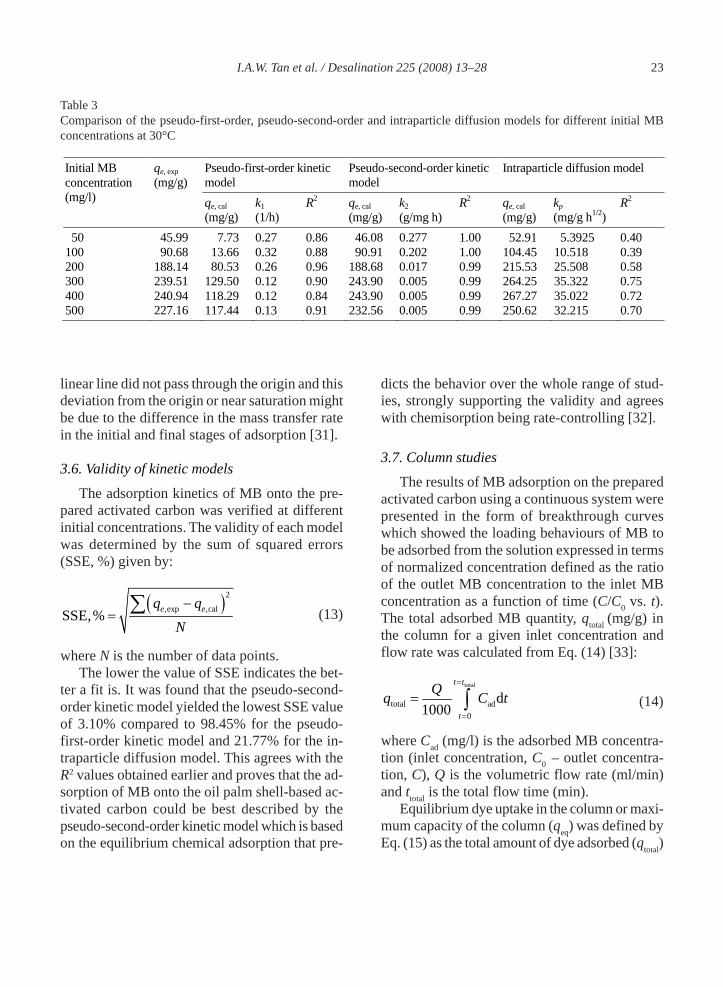
Table 3Comparison of the pseudo-first-order, pseudo-second-order and intraparticle diffusion models for different initial MBconcentrations at 30°C
Pseudo-first-order kinetic model
Pseudo-second-order kinetic model
Intraparticle diffusion model Initial MB concentration (mg/l)
qe, exp (mg/g)
qe, cal (mg/g)
k1 (1/h)
R2 qe, cal (mg/g)
k2 (g/mg h)
R2 qe, cal (mg/g)
kp (mg/g h1/2)
R2
50 45.99 7.73 0.27 0.86 46.08 0.277 1.00 52.91 5.3925 0.40 100 90.68 13.66 0.32 0.88 90.91 0.202 1.00 104.45 10.518 0.39 200 188.14 80.53 0.26 0.96 188.68 0.017 0.99 215.53 25.508 0.58 300 239.51 129.50 0.12 0.90 243.90 0.005 0.99 264.25 35.322 0.75 400 240.94 118.29 0.12 0.84 243.90 0.005 0.99 267.27 35.022 0.72 500 227.16 117.44 0.13 0.91 232.56 0.005 0.99 250.62 32.215 0.70
linear line did not pass through the origin and thisdeviation from the origin or near saturation mightbe due to the difference in the mass transfer ratein the initial and final stages of adsorption [31].
3.6. Validity of kinetic models
The adsorption kinetics of MB onto the pre-pared activated carbon was verified at differentinitial concentrations. The validity of each modelwas determined by the sum of squared errors(SSE, %) given by:
( )2
,exp ,calSSE,% e eq qN−
= ∑ (13)
where N is the number of data points.The lower the value of SSE indicates the bet-
ter a fit is. It was found that the pseudo-second-order kinetic model yielded the lowest SSE valueof 3.10% compared to 98.45% for the pseudo-first-order kinetic model and 21.77% for the in-traparticle diffusion model. This agrees with theR2 values obtained earlier and proves that the ad-sorption of MB onto the oil palm shell-based ac-tivated carbon could be best described by thepseudo-second-order kinetic model which is basedon the equilibrium chemical adsorption that pre-
dicts the behavior over the whole range of stud-ies, strongly supporting the validity and agreeswith chemisorption being rate-controlling [32].
3.7. Column studies
The results of MB adsorption on the preparedactivated carbon using a continuous system werepresented in the form of breakthrough curveswhich showed the loading behaviours of MB tobe adsorbed from the solution expressed in termsof normalized concentration defined as the ratioof the outlet MB concentration to the inlet MBconcentration as a function of time (C/C0 vs. t).The total adsorbed MB quantity, qtotal (mg/g) inthe column for a given inlet concentration andflow rate was calculated from Eq. (14) [33]:
total
total ad0
d1000
t t
t
Qq C t=
=
= ∫ (14)
where Cad (mg/l) is the adsorbed MB concentra-tion (inlet concentration, C0 – outlet concentra-tion, C), Q is the volumetric flow rate (ml/min)and ttotal is the total flow time (min).
Equilibrium dye uptake in the column or maxi-mum capacity of the column (qeq) was defined byEq. (15) as the total amount of dye adsorbed (qtotal)
24 I.A.W. Tan et al. / Desalination 225 (2008) 13–28
per g of the adsorbent (X) at the end of the totalflow time [33].
totaleq
qqX
= (15)
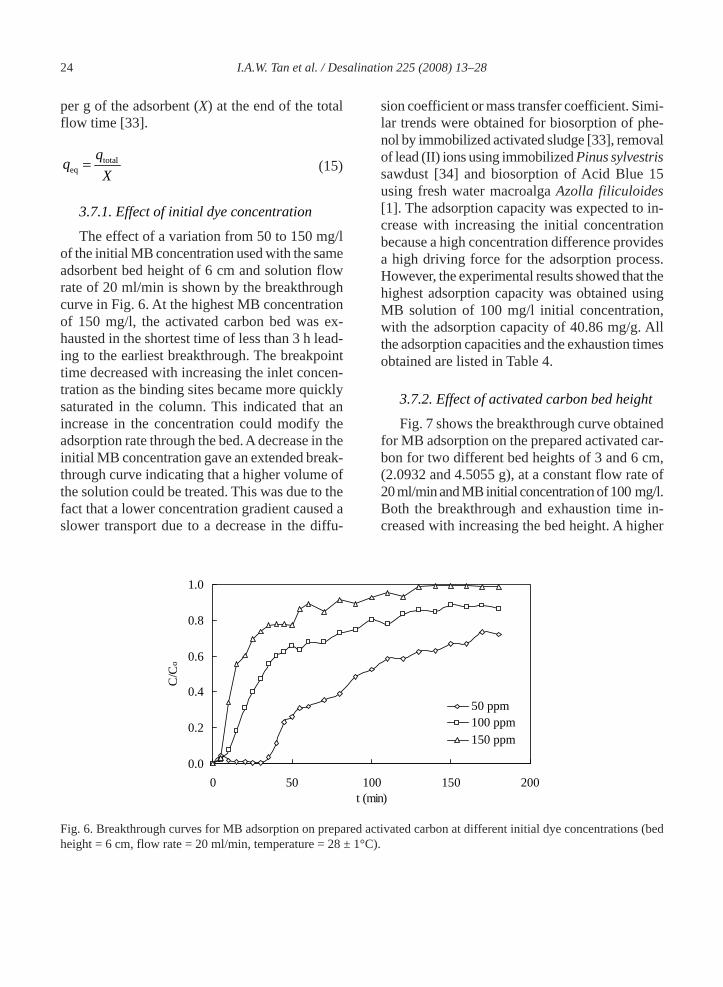
3.7.1. Effect of initial dye concentration
The effect of a variation from 50 to 150 mg/lof the initial MB concentration used with the sameadsorbent bed height of 6 cm and solution flowrate of 20 ml/min is shown by the breakthroughcurve in Fig. 6. At the highest MB concentrationof 150 mg/l, the activated carbon bed was ex-hausted in the shortest time of less than 3 h lead-ing to the earliest breakthrough. The breakpointtime decreased with increasing the inlet concen-tration as the binding sites became more quicklysaturated in the column. This indicated that anincrease in the concentration could modify theadsorption rate through the bed. A decrease in theinitial MB concentration gave an extended break-through curve indicating that a higher volume ofthe solution could be treated. This was due to thefact that a lower concentration gradient caused aslower transport due to a decrease in the diffu-
0.0
0.2
0.4
0.6
0.8
1.0
0 50 100 150 200t (min)
C/C
o
50 ppm100 ppm150 ppm
Fig. 6. Breakthrough curves for MB adsorption on prepared activated carbon at different initial dye concentrations (bedheight = 6 cm, flow rate = 20 ml/min, temperature = 28 ± 1°C).
sion coefficient or mass transfer coefficient. Simi-lar trends were obtained for biosorption of phe-nol by immobilized activated sludge [33], removalof lead (II) ions using immobilized Pinus sylvestrissawdust [34] and biosorption of Acid Blue 15using fresh water macroalga Azolla filiculoides[1]. The adsorption capacity was expected to in-crease with increasing the initial concentrationbecause a high concentration difference providesa high driving force for the adsorption process.However, the experimental results showed that thehighest adsorption capacity was obtained usingMB solution of 100 mg/l initial concentration,with the adsorption capacity of 40.86 mg/g. Allthe adsorption capacities and the exhaustion timesobtained are listed in Table 4.
3.7.2. Effect of activated carbon bed height
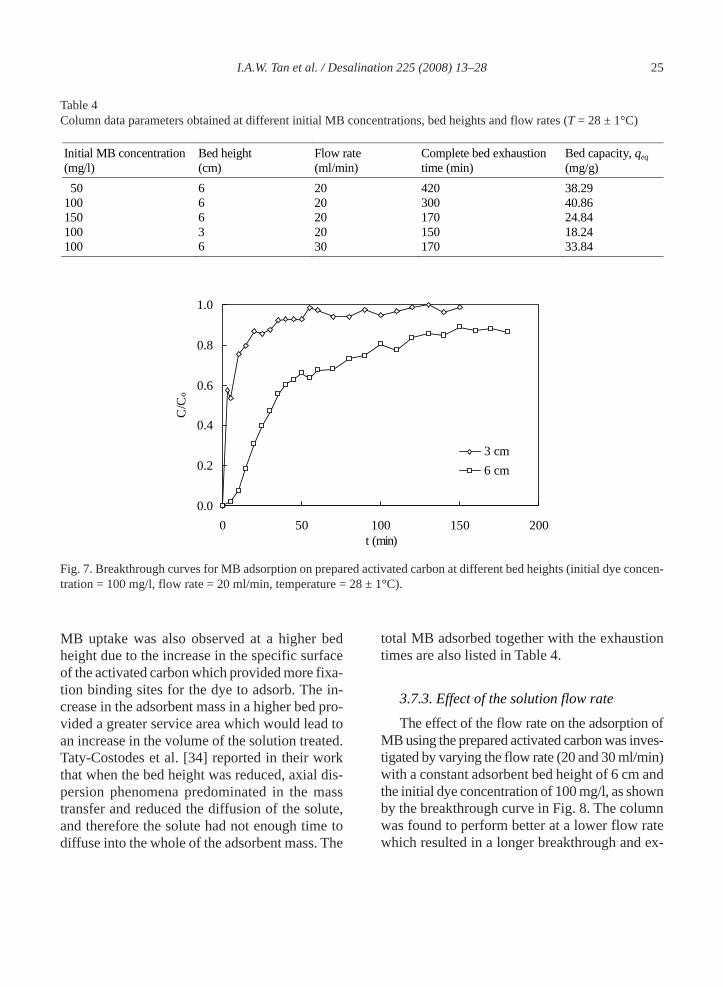
Fig. 7 shows the breakthrough curve obtainedfor MB adsorption on the prepared activated car-bon for two different bed heights of 3 and 6 cm,(2.0932 and 4.5055 g), at a constant flow rate of20 ml/min and MB initial concentration of 100 mg/l.Both the breakthrough and exhaustion time in-creased with increasing the bed height. A higher
I.A.W. Tan et al. / Desalination 225 (2008) 13–28 25
Table 4Column data parameters obtained at different initial MB concentrations, bed heights and flow rates (T = 28 ± 1°C)
Initial MB concentration (mg/l)
Bed height (cm)
Flow rate (ml/min)
Complete bed exhaustion time (min)
Bed capacity, qeq (mg/g)
50 6 20 420 38.29 100 6 20 300 40.86 150 6 20 170 24.84 100 3 20 150 18.24 100 6 30 170 33.84
0.0
0.2
0.4
0.6
0.8
1.0
0 50 100 150 200t (min)
C/C
o
3 cm6 cm
Fig. 7. Breakthrough curves for MB adsorption on prepared activated carbon at different bed heights (initial dye concen-tration = 100 mg/l, flow rate = 20 ml/min, temperature = 28 ± 1°C).
MB uptake was also observed at a higher bedheight due to the increase in the specific surfaceof the activated carbon which provided more fixa-tion binding sites for the dye to adsorb. The in-crease in the adsorbent mass in a higher bed pro-vided a greater service area which would lead toan increase in the volume of the solution treated.Taty-Costodes et al. [34] reported in their workthat when the bed height was reduced, axial dis-persion phenomena predominated in the masstransfer and reduced the diffusion of the solute,and therefore the solute had not enough time todiffuse into the whole of the adsorbent mass. The
total MB adsorbed together with the exhaustiontimes are also listed in Table 4.
3.7.3. Effect of the solution flow rate
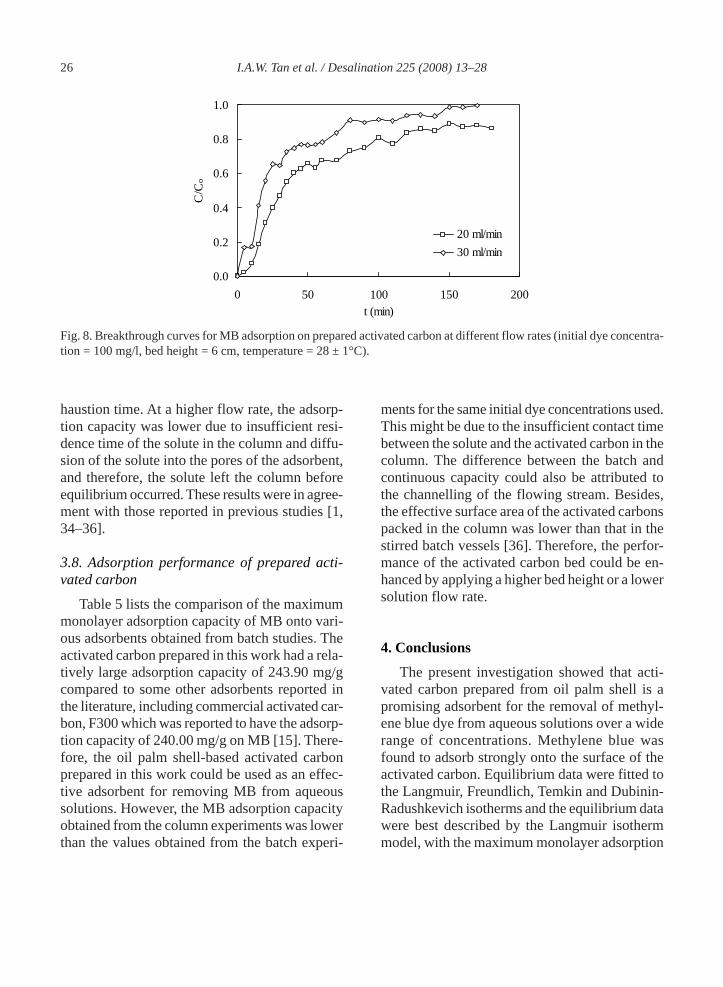
The effect of the flow rate on the adsorption ofMB using the prepared activated carbon was inves-tigated by varying the flow rate (20 and 30 ml/min)with a constant adsorbent bed height of 6 cm andthe initial dye concentration of 100 mg/l, as shownby the breakthrough curve in Fig. 8. The columnwas found to perform better at a lower flow ratewhich resulted in a longer breakthrough and ex-
26 I.A.W. Tan et al. / Desalination 225 (2008) 13–28
haustion time. At a higher flow rate, the adsorp-tion capacity was lower due to insufficient resi-dence time of the solute in the column and diffu-sion of the solute into the pores of the adsorbent,and therefore, the solute left the column beforeequilibrium occurred. These results were in agree-ment with those reported in previous studies [1,34–36].
3.8. Adsorption performance of prepared acti-vated carbon
Table 5 lists the comparison of the maximummonolayer adsorption capacity of MB onto vari-ous adsorbents obtained from batch studies. Theactivated carbon prepared in this work had a rela-tively large adsorption capacity of 243.90 mg/gcompared to some other adsorbents reported inthe literature, including commercial activated car-bon, F300 which was reported to have the adsorp-tion capacity of 240.00 mg/g on MB [15]. There-fore, the oil palm shell-based activated carbonprepared in this work could be used as an effec-tive adsorbent for removing MB from aqueoussolutions. However, the MB adsorption capacityobtained from the column experiments was lowerthan the values obtained from the batch experi-
0.0
0.2
0.4
0.6
0.8
1.0
0 50 100 150 200t (min)
C/C
o
20 ml/min30 ml/min
Fig. 8. Breakthrough curves for MB adsorption on prepared activated carbon at different flow rates (initial dye concentra-tion = 100 mg/l, bed height = 6 cm, temperature = 28 ± 1°C).
ments for the same initial dye concentrations used.This might be due to the insufficient contact timebetween the solute and the activated carbon in thecolumn. The difference between the batch andcontinuous capacity could also be attributed tothe channelling of the flowing stream. Besides,the effective surface area of the activated carbonspacked in the column was lower than that in thestirred batch vessels [36]. Therefore, the perfor-mance of the activated carbon bed could be en-hanced by applying a higher bed height or a lowersolution flow rate.
4. Conclusions
The present investigation showed that acti-vated carbon prepared from oil palm shell is apromising adsorbent for the removal of methyl-ene blue dye from aqueous solutions over a widerange of concentrations. Methylene blue wasfound to adsorb strongly onto the surface of theactivated carbon. Equilibrium data were fitted tothe Langmuir, Freundlich, Temkin and Dubinin-Radushkevich isotherms and the equilibrium datawere best described by the Langmuir isothermmodel, with the maximum monolayer adsorption
I.A.W. Tan et al. / Desalination 225 (2008) 13–28 27
Table 5Comparison of the maximum monolayer adsorption of MB onto various adsorbents
* Commercial activated carbon
Adsorbents Maximum monolayer adsorption capacity (mg/g)
References
Oil palm shell-based activated carbon Bamboo dust-based activated carbon Groundnut shell-based activated carbon Jute fiber-based activated carbon Jute processing wastes Olive-seed waste residue-based activated carbon Rattan sawdust-based activated carbon Oil palm fibre *Filtrasorb F300
243.90 143.20 164.90 225.64 22.47
190.00–263.00 294.14 277.78 240.00
This work [8] [8] [3]
[37] [15] [11] [12] [15]
capacity of 243.90 mg/g at 30°C. The adsorptionprocess was found to be exothermic in nature. Theadsorption performance of the oil palm shell-basedactivated carbon was comparable to the commer-cial activated carbon and some other adsorbentsreported in earlier studies. A series of column ex-periments revealed that the continuous adsorptionsystem represented by the breakthrough curveswas dependent on the initial dye concentration,activated carbon bed height and the solution flowrate used.
Acknowledgments
The authors acknowledge the research grantprovided by the Ministry of Science, Technologyand Innovation (MOSTI), Malaysia under a long-term IRPA grant (Project No: 08-02-05-1021EA001) that resulted in this article.
References[1] T.V.N. Padmesh, K. Vijayaraghavan, G. Sekaran and
M. Velan, Dyes Pigments, 71 (2006) 77–82.[2] K. Ravikumar, B. Deebika and K. Balu, J. Hazard.
Mater., B122 (2005) 75–83.[3] S. Senthilkumaar, P.R. Varadarajan, K. Porkodi and
C.V. Subbhuraam, J. Colloid Interface Sci., 284(2005) 78–82.
[4] C. Sourja, D. Sirshendu, D. Sunando and K.B.Jayanta, Chemosphere, 58 (2005) 1079–1086.
[5] M.J. Martin, A. Artola, M.D. Balaguer and M.Rigola, Chem. Eng. J., 94 (2003) 231–239.
[6] B.S. Girgis and A.A. El-Hendawy, Micropor.Mesopor. Mater., 52 (2002) 105–117.
[7] K. Kadirvelu, M. Kavipriya, C. Karthika, M.Radhika, N. Vennilamani and S. Pattabhi, Bioresour.Technol., 87 (2003) 129–132.
[8] N. Kannan and M.M. Sundaram, Dyes Pigments,51 (2001) 25–40.
[9] R.L. Tseng, S.K. Tseng and F.C. Wu, Colloids Surf.A: Physicochem. Eng. Aspects, 279 (2006) 69–78.
[10] B.H. Hameed, A.T.M. Din and A.L. Ahmad, J. Haz-ard. Mater., 141 (2007) 819–825.
[11] B.H. Hameed, A.L. Ahmad and K.N.A. Latiff, DyesPigments, 75 (2007) 143–149.
[12] I.A.W. Tan, B.H. Hameed and A.L. Ahmad, Chem.Eng. J., 127 (2007) 111–119.
[13] Z. Husain, Z. A. Zainal and M. Z. Abdullah, Biom-ass Bioenergy, 24 (2003) 117–124.
[14] S. Wang, Z.H. Zhu, A. Coomes, F. Haghseresht andG.Q. Lu, J. Colloid Interface Sci., 284 (2005) 440–446.
[15] G.G. Stavropoulos and A.A. Zabaniotou, Micropor.Mesopor. Mater., 82 (2005) 79–85.
[16] G.H. Oh, C.H. Yun and C.R. Park, Carbon Sci., 4(4)(2003) 180–184.
[17] M. Olivares-Marín, C. Fernández-González, A.Macías-García and V. Gómez-Serrano, Appl. Surf.Sci., 252 (2006) 5980–5983.
28 I.A.W. Tan et al. / Desalination 225 (2008) 13–28
[18] Z. Al-Qodah, Water Res., 34(17) (2000) 4295–4303.[19] Z. Al-Qodah, A.T. Shawaqfeh and W.K. Lafi, De-
salination, 208 (2007) 294–305.[20] D.S. Faust and M.O. Aly, Chemistry of Wastewater
Treatment. Butterworths, Boston, 1983.[21] V.V. Basava Rao and S. Ram Mohan Rao, Chem.
Eng. J., 116 (2006) 77–84.[22] M. El-Guendi, Adsorpt. Sci. Technol., 8(2) (1991)
217–225.[23] T.W. Weber and R.K. Chakkravorti, AIChE J., 20
(1974) 228.[24] F. Haghseresht and G. Lu, Energy Fuels, 12 (1998)
1100–1107.[25] K. Fytianos, E. Voudrias and E. Kokkalis, Chemo-
sphere, 40 (2000) 3–6.[26] M. Hosseini, S.F.L. Mertens, M. Ghorbani and M.R.
Arshadi, Mater. Chem. Phys., 78 (2003) 800.[27] S. Rengaraj, Y. Kim, C.K. Joo, K. Choi and J. Yi,
Korean J. Chem. Eng., 21(1) (2004) 187–194.[28] S. Langergren and B.K. Svenska, Veternskapsakad
Handlingar, 24(4) (1898) 1–39.[29] Y.S. Ho and G. McKay, Chem. Eng. J., 70 (1998)
115–124.[30] W.J. Weber and J.C. Morris, Proc. Int. Water Pollu-
tion Symposium, Pergamon, Oxford, 2 (1962) 231–266.
[31] K. Mohanty, D. Das and M.N. Biswas, Chem. Eng.J., 115 (2005) 121–131.
[32] R.L. Tseng and S.K. Tseng, J. Colloid Interface Sci.,287 (2005) 428–437.
[33] Z. Aksu and F. Gönen, Process Biochem., 39 (2004)599–613.
[34] V.C. Taty-Costodes, H. Fauduet, C. Porte and Y.S.Ho, J. Hazard. Mater., B123 (2005) 135–144.
[35] E. Malkoc, Y. Nuhoglu and Y. Abali, Chem. Eng. J.,119 (2006) 61–68.
[36] Z. Al-Qodah and W. Lafi, J. Water Supply: Res.Technol., 52(3) (2003) 189–198.
[37] S. Banerjee and M.G. Dastidar, Bioresour. Technol.,96 (2005) 1919–1928.
Related Documents


