PREBIOTIC CHEMISTRY Adsorption of Adenine, Cytosine, Thymine, and Uracil on Sulfide-Modified Montmorillonite: FT-IR, Mössbauer and EPR Spectroscopy and X-Ray Diffractometry Studies Cristine E. A. Carneiro & Graciele Berndt & Ivan G. de Souza Junior & Cláudio M. D. de Souza & Andrea Paesano Jr & Antonio C. S. da Costa & Eduardo di Mauro & Henrique de Santana & Cássia T. B. V . Zaia & Dimas A. M. Zaia Received: 7 March 2011 /Accepted: 18 June 2011 # Springer Science+Business Media B.V . 2011 Abstract In the present work the interactions of nucleic acid bases with and adsorption on clays were studied at two pHs (2.00, 7.00) using different techniques. As shown by Mössbauer and EPR spectroscopies and X-ray diffractometry, the most important finding of this work is that nucleic acid bases penetrate into the interlayer of the clays and oxidize Fe 2+ to Fe 3+ , thus, this interaction cannot be regarded as a simple physical adsorption. For the two pHs the order of the adsorption of nucleic acid bases on the clays was: adenine ≈ cytosine>thymine>uracil. The adsorption of adenine and cytosine on clays increased with decreasing of the pH. For unaltered montmorillonite this result could be explained by electrostatic forces between adenine/cytosine positively charged and clay negatively charged. However for montmorillonite modified with Na 2 S, probably van der Waals forces also play an important role since both adenine/cytosine and clay were positively charged. FT-IR spectra showed that the interaction between nucleic acid bases and clays was through NH + or NH 2 + groups. X-ray diffractograms showed that nucleic acid bases adsorbed on clays were distributed into the interlayer surface, edge sites and external surface functional groups (aluminol, silanol) EPR spectra showed that the intensity of the line Orig Life Evol Biosph DOI 10.1007/s11084-011-9244-3 C. E. A. Carneiro : C. M. D. de Souza : H. de Santana : D. A. M. Zaia (*) Laboratório de Química Prebiótica, Departamento de Química-CCE, Universidade Estadual de Londrina, 86051-990 Londrina, PR, Brazil e-mail: [email protected] G. Berndt : A. Paesano Jr Departamento de Física-CCE, Universidade Estadual de Maringá, 87020-900 Maringá, PR, Brazil I. G. de Souza Junior : A. C. S. da Costa Departamento de Agronomia-CCA, Universidade Estadual de Maringá, 87020-900 Maringá, PR, Brazil E. di Mauro Laboratório de Fluorescência e Ressonância Paramagnética Eletrônica (LAFLURPE)-CCE, Universidade Estadual de Londrina, 86051-990 Londrina, PR, Brazil C. T. B. V . Zaia Departamento de Ciências Fisiológicas-CCB, Universidade Estadual de Londrina, 86051-990 Londrina, PR, Brazil

Welcome message from author
This document is posted to help you gain knowledge. Please leave a comment to let me know what you think about it! Share it to your friends and learn new things together.
Transcript
PREBIOTIC CHEMISTRY
Adsorption of Adenine, Cytosine, Thymine, and Uracilon Sulfide-Modified Montmorillonite: FT-IR, Mössbauerand EPR Spectroscopy and X-Ray Diffractometry Studies
Cristine E. A. Carneiro & Graciele Berndt & Ivan G. de Souza Junior &
Cláudio M. D. de Souza & Andrea Paesano Jr & Antonio C. S. da Costa &
Eduardo di Mauro & Henrique de Santana & Cássia T. B. V. Zaia & Dimas A. M. Zaia
Received: 7 March 2011 /Accepted: 18 June 2011# Springer Science+Business Media B.V. 2011
Abstract In the present work the interactions of nucleic acid bases with and adsorption onclays were studied at two pHs (2.00, 7.00) using different techniques. As shown by Mössbauerand EPR spectroscopies and X-ray diffractometry, the most important finding of this work isthat nucleic acid bases penetrate into the interlayer of the clays and oxidize Fe2+ to Fe3+, thus,this interaction cannot be regarded as a simple physical adsorption. For the two pHs the orderof the adsorption of nucleic acid bases on the clays was: adenine≈cytosine>thymine>uracil.The adsorption of adenine and cytosine on clays increased with decreasing of the pH.For unaltered montmorillonite this result could be explained by electrostatic forcesbetween adenine/cytosine positively charged and clay negatively charged. However formontmorillonite modified with Na2S, probably van der Waals forces also play animportant role since both adenine/cytosine and clay were positively charged. FT-IRspectra showed that the interaction between nucleic acid bases and clays was throughNH+ or NH2
+ groups. X-ray diffractograms showed that nucleic acid bases adsorbed onclays were distributed into the interlayer surface, edge sites and external surfacefunctional groups (aluminol, silanol) EPR spectra showed that the intensity of the line
Orig Life Evol BiosphDOI 10.1007/s11084-011-9244-3
C. E. A. Carneiro : C. M. D. de Souza : H. de Santana : D. A. M. Zaia (*)Laboratório de Química Prebiótica, Departamento de Química-CCE,Universidade Estadual de Londrina, 86051-990 Londrina, PR, Brazile-mail: [email protected]
G. Berndt : A. Paesano JrDepartamento de Física-CCE, Universidade Estadual de Maringá, 87020-900 Maringá, PR, Brazil
I. G. de Souza Junior :A. C. S. da CostaDepartamento de Agronomia-CCA, Universidade Estadual de Maringá, 87020-900 Maringá, PR, Brazil
E. di MauroLaboratório de Fluorescência e Ressonância Paramagnética Eletrônica (LAFLURPE)-CCE,Universidade Estadual de Londrina, 86051-990 Londrina, PR, Brazil
C. T. B. V. ZaiaDepartamento de Ciências Fisiológicas-CCB, Universidade Estadual de Londrina,86051-990 Londrina, PR, Brazil
g≈2 increased probably because the oxidation of Fe2+ to Fe3+ by nucleic acid bases andintensity of the line g=4.1 increased due to the interaction of Fe3+ with nucleic acid bases.Mössbauer spectra showed a large decreased on the Fe2+ doublet area of the clays due tothe reaction of nucleic acid bases with Fe2+.
Keywords Nucleic acid bases . Montmorillonite . Adsorption . Mössbauer spectroscopy.
EPR spectroscopy. Prebiotic chemistry
Introduction
Clays are among the oldest minerals synthesized on our planet and they are widelydistributed around the world and they were also detected on Mars surface (Ehlmann et al.2008; Hazen et al. 2008). Nucleic acid bases have been found in meteorites and have beensynthesized in experiments resembling environments on the prebiotic Earth (Hua et al.1995; Borquez et al. 2005; LaRowe and Regnier 2008; Martins et al. 2008). Comets andsubmarines volcanoes could be sources for hydrogen sulfide. (Aloisi et al. 2004; Llorca2005). Thus, nucleic acid bases, clay minerals and hydrogen sulfide could be easily foundin the prebiotic Earth and interactions among them could have occurred.
In the literature there are several articles describing the adsorption of nucleic acid baseson minerals/metals. The adsorption of nucleic acid bases was studied in the followingminerals: clays (Lailach et al. 1968; Lailach and Brindley 1969; StrašáK 1991; Weckhuysenet al. 1999; Perezgasga et al. 2005; Hashizume and Theng 2007; Benetoli et al. 2008;Hashizume et al. 2010; Negrón-Mendoza et al. 2010; Pucci et al. 2010), apatite (Winter andZubay 1995), silicon dioxide (Plekan et al. 2007), graphite (Sowerby et al. 2001a, b),metals sulfide compounds (Sowerby et al. 1998; Bebié and Schoonen 2000; Plekan et al.2007; Hatton and Rickard 2008) and rutile (Cleaves et al. 2010).
In general, it was observed that adenine and/or cytosine are more adsorbed on mineralsthan thymine and/or uracil (Lailach and Brindley 1969; Perezgasga et al. 2005; Benetoli etal. 2008; Cleaves et al. 2010; Hashizume et al. 2010). The higher adsorption of adeninewhen compared to the lower adsorption of thymine or uracil raises some questions aboutthe role played by minerals such as pre concentrator of nucleic acid bases from dilutesolution as well as the possibility of genetic code being based on unique nucleic acid bases(Sowerby et al. 2001b; Benetoli et al. 2008).
For adenine and cytosine, in most of the studies, the adsorption depends on the pHand could be explained as interaction of charged minerals with charged nucleic acidbases or ion exchange process (Lailach and Brindley 1969; Winter and Zubay 1995;Weckhuysen et al. 1999; Perezgasga et al. 2005; Hashizume and Theng 2007; Benetoli etal. 2008; Cleaves et al. 2010; Negrón-Mendoza et al. 2010; Pucci et al. 2010). However,the adsorption of uracil and thymine was not pH dependent (Benetoli et al. 2008; Cleaveset al. 2010).
It also should be pointed out that there is one report about the reaction forminghypoxanthine after adenine was adsorbed on Cu-montmorillonite (Strašák 1991).
In the present work the adsorption of adenine, cytosine, uracil and thymine onunmodified and sulfide-modified montmorillonites was studied at two different pHs (2.00,7.00) in artificial seawater. The modification of montmorillonite was carried out with aNa2S solution. The amount of nucleic acid bases adsorbed on clays was measured and theirinteractions were studied by FT-IR, EPR and Mössbauer spectroscopies and X-raydiffractometry.
C.E.A. Carneiro et al.
Materials and Methods
Materials
All reagents were analytical grade. Montmorillonite KSF, (CAS 1318-93-0) was purchasedfrom Acros Organics-NJ, USA and was used as received. Chemical composition ofmontmorillonite: SiO2 54%, Al2O3 17%, Fe2O3 5.2%, CaO 1.5%, MgO 2.5%, Na2O 0.4%,K2O 1.5% and specific surface area 10 m2/g.
Seawater
The following substances were weighed and dissolved in 1.0 L of distilled water: 28.57 g ofsodium chloride, 3.88 g of magnesium chloride, 1.787 g of magnesium sulfate, 1.308 g ofcalcium sulfate, 0.832 g of potassium sulfate, 0.103 g of potassium bromide and 0.0282 gof boric acid.
Modified Montmorillonite
Montmorillonite was modified as follows: a solution of Na2S (0.10 mol L−1) was added tomontmorillonite in the proportion of 1:10 m/v. Then the sample was spun for 15 min at2,000 rpm and solid was dried in oven at 60°C for 24 h (Carneiro et al. 2011).
Sample Preparation
Unmodified and modified montmorillonites were processed as follows: to two different setsof duplicated tubes (15 ml) containing 50 mg of clay were added 5.00 ml of seawater plusnucleic acid bases in 120, 240, 480 and 720 μg mL−1 The pH was adjusted to 2.00 or 7.00with HCl or NaOH. The tubes were mixed for 3 h, after which they were spun for 15 min at2,000 rpm. The aqueous phase was used for determination of the concentration of nucleicacid base by UV method. The clays mixed with 720 μg mL−1 of nucleic acid bases weredried overnight at 60°C and used for FT-IR, EPR and Mössbauer and X-ray diffractometryanalysis.
Methods
UV Spectrophotometric
Absorbance was read with a spectrophotometer, Spectronic Genesys. The nucleic acid baseswere determined by reading the absorbance in the UV region (260–265 nm). The followingequation was used for the calculation of the amount of base adsorbed on clays.Cadsorbed=2g ¼ Cinitial � Csolutionð Þ, where Csolution=[(Cinitial) (Abssample/Absinitial)].
Infrared Spectroscopic
The IR spectra were recorded with a FT-IR 8300 Shimadzu using pressed KBr disks and aspectral resolution of 4 cm−1, and each spectrum was obtained after acquiring 85 spectra.FT-IR analysis was carried out with unmodified and modified montmorillonite samples,mixed with seawater at two different pHs. About 10 mg of unmodified or modifiedmontmorillonite samples plus 200 mg of KBr were weighed and ground in an agate mortar
Adsorption of Nucleic Acid Bases on Sulfide-Modified Montmorillonite
with a pestle until a homogeneous mixture was obtained. Disc pellets were prepared andspectra were recorded from 400 to 4,000 cm−1. FT-IR spectra were analyzed by the Originsoftware (5.0, 2001).
Electron Paramagnetic Resonance (EPR) Spectroscopy
The samples were submitted to EPR experiment at X-band (ca. 9 GHz) with 20 Gmodulation amplitude and magnetic field modulation 100 kHz using a JEOL (JES-PE- 3X)spectrometer at room temperature. Mn2+:MgO was used as g-marker and standard of lineintensity, using its fourth spectrum line (g=1.981).
Mössbauer Spectroscopy
Mössbauer spectroscopy characterizations were performed in transmission geometry, usinga conventional Mössbauer spectrometer, in a constant acceleration mode. The γ-rays wereprovided by a 57Co(Rh) source, with initial nominal activity of 50 mCi. The Mössbauerspectra were analyzed with a nonlinear least-square routine, with Lorentzian line shapes.All isomer shift (IS) data given are relative to α-Fe throughout this paper.
X-Ray Diffractometry
The X-ray diffractograms were obtained in an XRD-6000 Shimadzu, using Cu K α, amonochromator, and the scanning parameters were set at 0.02°2θ, step width, count time0.6 s and a measurement range from 2 to 30°2θ. The powder samples were placed on aglass slide. X-ray diffractograms were analyzed by Grams/386 v 4.0 (Galactic Ind. Corp.)software.
Statistical Analysis
Comparisons among means were assessed by using: ANOVA and Student-Newman-Keulstest (SNK test) at a significance level of p<0.05.
Results and Discussion
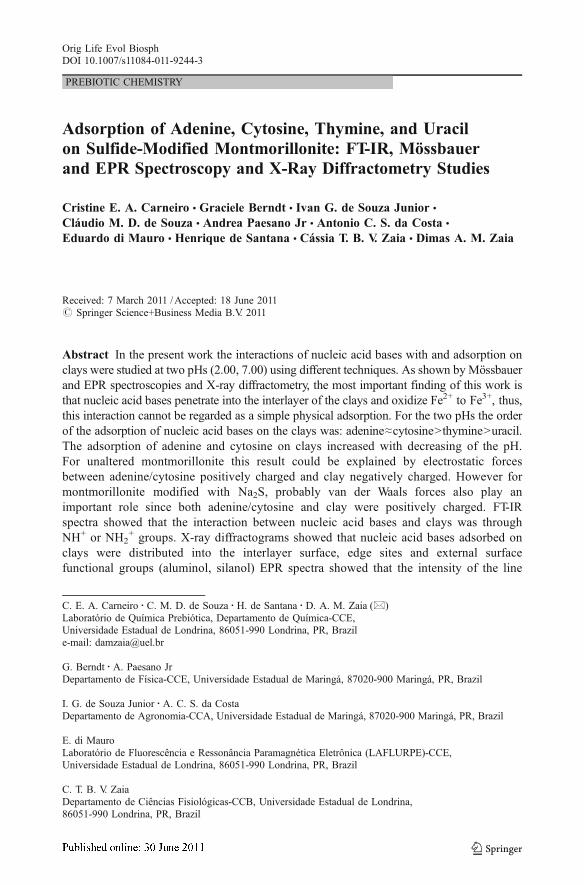
Figure 1 shows the amount of nucleic acid bases adsorbed on clays in two different pHs(2.00, 7.00). In general, for the two pHs the adsorption order of nucleic acid bases on theclays was: adenine ≈ cytosine > thymine > uracil (Fig. 1). This adsorption order was alsoobserved by other authors on clays (Lailach et al. 1968; Lailach and Brindley 1969; Winterand Zubay 1995; Perezgasga et al. 2005; Benetoli et al. 2008; Hashizume et al. 2010).
The adsorption of adenine and cytosine on clays decreased and were statisticallydifferent (SNK test p<0.05) when the pH was higher (Fig. 1). In the acidic (2.00) and basic(7.00) pHs adenine and cytosine had positive and zero net charge, respectively (Table 1).Since the pHpzc of unmodified montmorillonite was 1.42, it had negative net charge balancein the two pHs (2.00, 7.00) (Table 1). Thus, electrostatic forces between unmodifiedmontmorillonite (negative) and nucleic acid bases (positive) increased adsorption at acidicpH. However, for modified montmorillonite the pHpzc was 5.26 (Carneiro et al. 2011) and atpH 2.00 both montmorillonite and adenine and cytosine had positive net charge (Table 1).In this case electrostatic force could be not used to explain the higher adsorption of these
C.E.A. Carneiro et al.
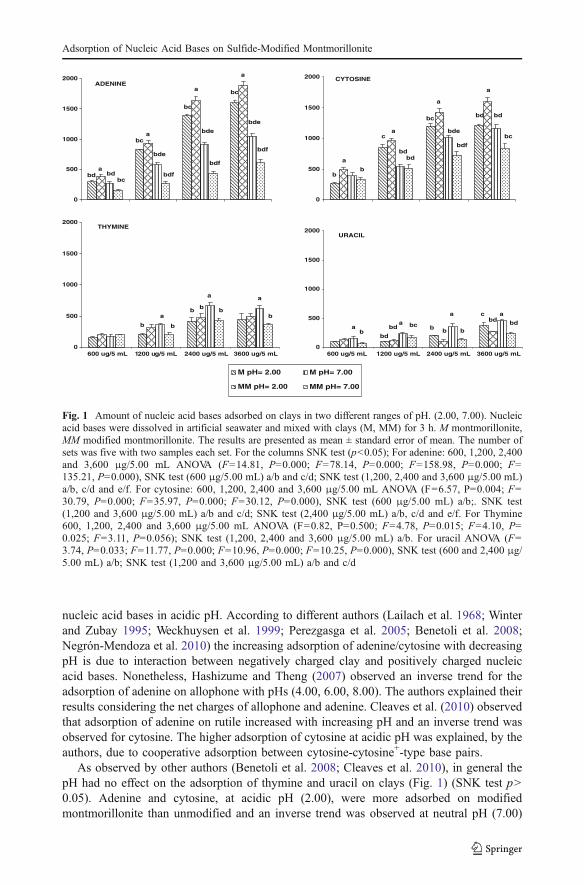
nucleic acid bases in acidic pH. According to different authors (Lailach et al. 1968; Winterand Zubay 1995; Weckhuysen et al. 1999; Perezgasga et al. 2005; Benetoli et al. 2008;Negrón-Mendoza et al. 2010) the increasing adsorption of adenine/cytosine with decreasingpH is due to interaction between negatively charged clay and positively charged nucleicacid bases. Nonetheless, Hashizume and Theng (2007) observed an inverse trend for theadsorption of adenine on allophone with pHs (4.00, 6.00, 8.00). The authors explained theirresults considering the net charges of allophone and adenine. Cleaves et al. (2010) observedthat adsorption of adenine on rutile increased with increasing pH and an inverse trend wasobserved for cytosine. The higher adsorption of cytosine at acidic pH was explained, by theauthors, due to cooperative adsorption between cytosine-cytosine+-type base pairs.
As observed by other authors (Benetoli et al. 2008; Cleaves et al. 2010), in general thepH had no effect on the adsorption of thymine and uracil on clays (Fig. 1) (SNK test p>0.05). Adenine and cytosine, at acidic pH (2.00), were more adsorbed on modifiedmontmorillonite than unmodified and an inverse trend was observed at neutral pH (7.00)
0
500
1000
1500
2000
abd bd
bc
ADENINE
bca
bde
bdf
bc
a
bde
bdf
bc
a
bde
bdf
0
500
1000
1500
2000
M pH= 2.00
MM pH= 2.00
M pH= 7.00
MM pH= 7.00
CYTOSINE
b
a
b
ca
bdbd
bc
a
bde
bdf
bd
a
bd
bc
0
500
1000
1500
2000THYMINE
b
a
b
b b
a
b
a
b
0
500
1000
1500
2000
600 ug/5 mL 1200 ug/5 mL 2400 ug/5 mL 3600 ug/5 mL 600 ug/5 mL 1200 ug/5 mL 2400 ug/5 mL 3600 ug/5 mL
ab
URACIL
bd
bda bc b b
a
b
cbd
a
bd
Fig. 1 Amount of nucleic acid bases adsorbed on clays in two different ranges of pH. (2.00, 7.00). Nucleicacid bases were dissolved in artificial seawater and mixed with clays (M, MM) for 3 h. M montmorillonite,MM modified montmorillonite. The results are presented as mean ± standard error of mean. The number ofsets was five with two samples each set. For the columns SNK test (p<0.05); For adenine: 600, 1,200, 2,400and 3,600 μg/5.00 mL ANOVA (F=14.81, P=0.000; F=78.14, P=0.000; F=158.98, P=0.000; F=135.21, P=0.000), SNK test (600 μg/5.00 mL) a/b and c/d; SNK test (1,200, 2,400 and 3,600 μg/5.00 mL)a/b, c/d and e/f. For cytosine: 600, 1,200, 2,400 and 3,600 μg/5.00 mL ANOVA (F=6.57, P=0.004; F=30.79, P=0.000; F=35.97, P=0.000; F=30.12, P=0.000), SNK test (600 μg/5.00 mL) a/b;. SNK test(1,200 and 3,600 μg/5.00 mL) a/b and c/d; SNK test (2,400 μg/5.00 mL) a/b, c/d and e/f. For Thymine600, 1,200, 2,400 and 3,600 μg/5.00 mL ANOVA (F=0.82, P=0.500; F=4.78, P=0.015; F=4.10, P=0.025; F=3.11, P=0.056); SNK test (1,200, 2,400 and 3,600 μg/5.00 mL) a/b. For uracil ANOVA (F=3.74, P=0.033; F=11.77, P=0.000; F=10.96, P=0.000; F=10.25, P=0.000), SNK test (600 and 2,400 μg/5.00 mL) a/b; SNK test (1,200 and 3,600 μg/5.00 mL) a/b and c/d
Adsorption of Nucleic Acid Bases on Sulfide-Modified Montmorillonite
(Fig. 1) (SNK test p<0.05). This behavior on pH 2.00 could be an indication that otherinteractions than electrostatic forces are playing an important role in the adsorption of thenucleic acid bases.
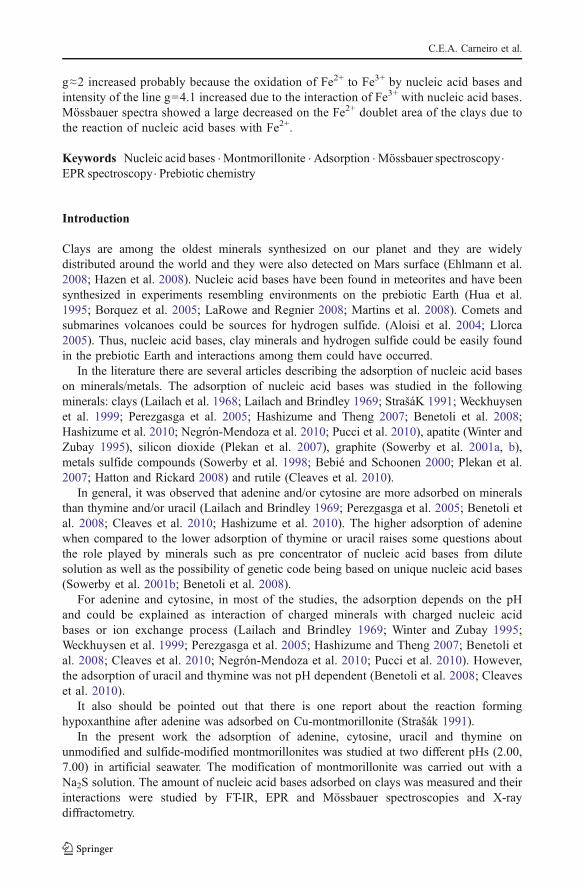
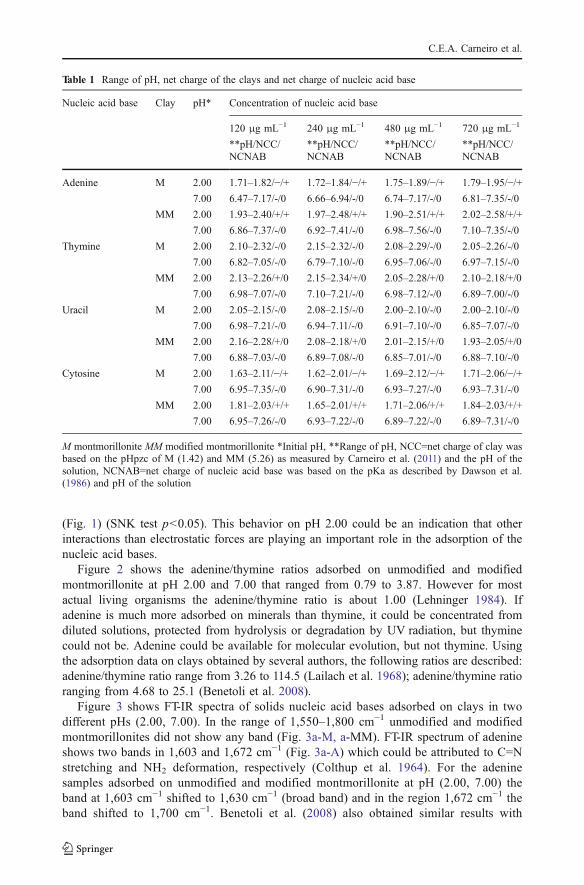
Figure 2 shows the adenine/thymine ratios adsorbed on unmodified and modifiedmontmorillonite at pH 2.00 and 7.00 that ranged from 0.79 to 3.87. However for mostactual living organisms the adenine/thymine ratio is about 1.00 (Lehninger 1984). Ifadenine is much more adsorbed on minerals than thymine, it could be concentrated fromdiluted solutions, protected from hydrolysis or degradation by UV radiation, but thyminecould not be. Adenine could be available for molecular evolution, but not thymine. Usingthe adsorption data on clays obtained by several authors, the following ratios are described:adenine/thymine ratio range from 3.26 to 114.5 (Lailach et al. 1968); adenine/thymine ratioranging from 4.68 to 25.1 (Benetoli et al. 2008).
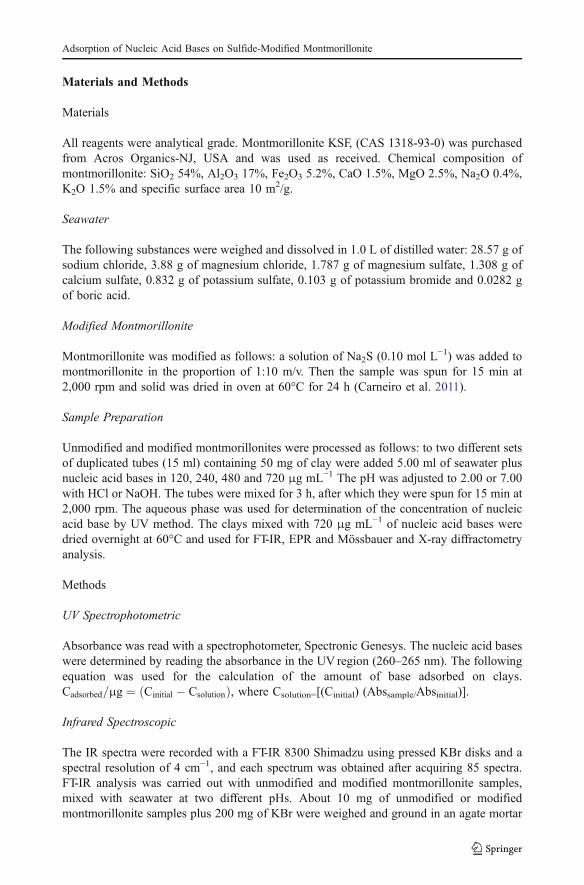
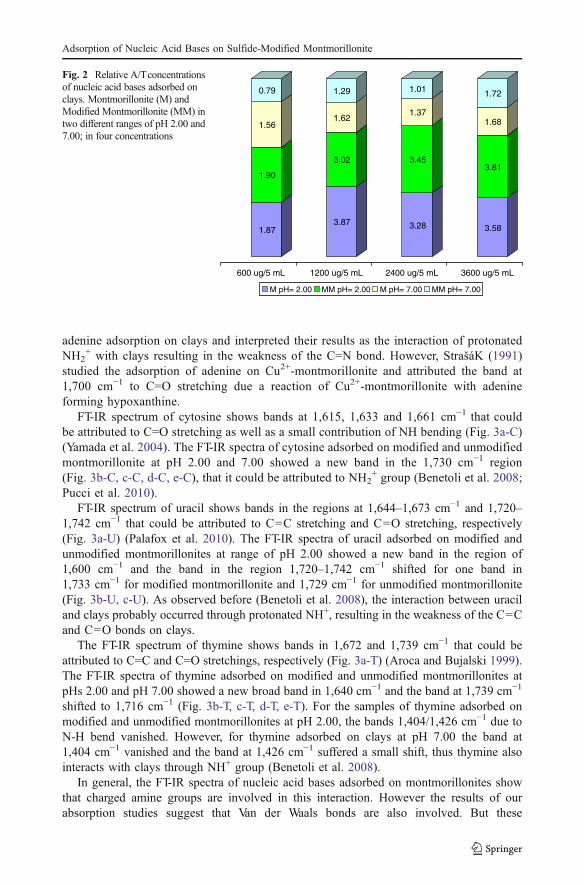
Figure 3 shows FT-IR spectra of solids nucleic acid bases adsorbed on clays in twodifferent pHs (2.00, 7.00). In the range of 1,550–1,800 cm−1 unmodified and modifiedmontmorillonites did not show any band (Fig. 3a-M, a-MM). FT-IR spectrum of adenineshows two bands in 1,603 and 1,672 cm−1 (Fig. 3a-A) which could be attributed to C=Nstretching and NH2 deformation, respectively (Colthup et al. 1964). For the adeninesamples adsorbed on unmodified and modified montmorillonite at pH (2.00, 7.00) theband at 1,603 cm−1 shifted to 1,630 cm−1 (broad band) and in the region 1,672 cm−1 theband shifted to 1,700 cm−1. Benetoli et al. (2008) also obtained similar results with
Table 1 Range of pH, net charge of the clays and net charge of nucleic acid base
Nucleic acid base Clay pH* Concentration of nucleic acid base
120 μg mL−1 240 μg mL−1 480 μg mL−1 720 μg mL−1
**pH/NCC/NCNAB
**pH/NCC/NCNAB
**pH/NCC/NCNAB
**pH/NCC/NCNAB
Adenine M 2.00 1.71–1.82/−/+ 1.72–1.84/−/+ 1.75–1.89/−/+ 1.79–1.95/−/+7.00 6.47–7.17/-/0 6.66–6.94/-/0 6.74–7.17/-/0 6.81–7.35/-/0
MM 2.00 1.93–2.40/+/+ 1.97–2.48/+/+ 1.90–2.51/+/+ 2.02–2.58/+/+
7.00 6.86–7.37/-/0 6.92–7.41/-/0 6.98–7.56/-/0 7.10–7.35/-/0
Thymine M 2.00 2.10–2.32/-/0 2.15–2.32/-/0 2.08–2.29/-/0 2.05–2.26/-/0
7.00 6.82–7.05/-/0 6.79–7.10/-/0 6.95–7.06/-/0 6.97–7.15/-/0
MM 2.00 2.13–2.26/+/0 2.15–2.34/+/0 2.05–2.28/+/0 2.10–2.18/+/0
7.00 6.98–7.07/-/0 7.10–7.21/-/0 6.98–7.12/-/0 6.89–7.00/-/0
Uracil M 2.00 2.05–2.15/-/0 2.08–2.15/-/0 2.00–2.10/-/0 2.00–2.10/-/0
7.00 6.98–7.21/-/0 6.94–7.11/-/0 6.91–7.10/-/0 6.85–7.07/-/0
MM 2.00 2.16–2.28/+/0 2.08–2.18/+/0 2.01–2.15/+/0 1.93–2.05/+/0
7.00 6.88–7.03/-/0 6.89–7.08/-/0 6.85–7.01/-/0 6.88–7.10/-/0
Cytosine M 2.00 1.63–2.11/−/+ 1.62–2.01/−/+ 1.69–2.12/−/+ 1.71–2.06/−/+7.00 6.95–7.35/-/0 6.90–7.31/-/0 6.93–7.27/-/0 6.93–7.31/-/0
MM 2.00 1.81–2.03/+/+ 1.65–2.01/+/+ 1.71–2.06/+/+ 1.84–2.03/+/+
7.00 6.95–7.26/-/0 6.93–7.22/-/0 6.89–7.22/-/0 6.89–7.31/-/0
M montmorillonite MM modified montmorillonite *Initial pH, **Range of pH, NCC=net charge of clay wasbased on the pHpzc of M (1.42) and MM (5.26) as measured by Carneiro et al. (2011) and the pH of thesolution, NCNAB=net charge of nucleic acid base was based on the pKa as described by Dawson et al.(1986) and pH of the solution
C.E.A. Carneiro et al.
adenine adsorption on clays and interpreted their results as the interaction of protonatedNH2
+ with clays resulting in the weakness of the C=N bond. However, StrašáK (1991)studied the adsorption of adenine on Cu2+-montmorillonite and attributed the band at1,700 cm−1 to C=O stretching due a reaction of Cu2+-montmorillonite with adenineforming hypoxanthine.
FT-IR spectrum of cytosine shows bands at 1,615, 1,633 and 1,661 cm−1 that couldbe attributed to C=O stretching as well as a small contribution of NH bending (Fig. 3a-C)(Yamada et al. 2004). The FT-IR spectra of cytosine adsorbed on modified and unmodifiedmontmorillonite at pH 2.00 and 7.00 showed a new band in the 1,730 cm−1 region(Fig. 3b-C, c-C, d-C, e-C), that it could be attributed to NH2
+ group (Benetoli et al. 2008;Pucci et al. 2010).
FT-IR spectrum of uracil shows bands in the regions at 1,644–1,673 cm−1 and 1,720–1,742 cm−1 that could be attributed to C=C stretching and C=O stretching, respectively(Fig. 3a-U) (Palafox et al. 2010). The FT-IR spectra of uracil adsorbed on modified andunmodified montmorillonites at range of pH 2.00 showed a new band in the region of1,600 cm−1 and the band in the region 1,720–1,742 cm−1 shifted for one band in1,733 cm−1 for modified montmorillonite and 1,729 cm−1 for unmodified montmorillonite(Fig. 3b-U, c-U). As observed before (Benetoli et al. 2008), the interaction between uraciland clays probably occurred through protonated NH+, resulting in the weakness of the C=Cand C=O bonds on clays.
The FT-IR spectrum of thymine shows bands in 1,672 and 1,739 cm−1 that could beattributed to C=C and C=O stretchings, respectively (Fig. 3a-T) (Aroca and Bujalski 1999).The FT-IR spectra of thymine adsorbed on modified and unmodified montmorillonites atpHs 2.00 and pH 7.00 showed a new broad band in 1,640 cm−1 and the band at 1,739 cm−1
shifted to 1,716 cm−1 (Fig. 3b-T, c-T, d-T, e-T). For the samples of thymine adsorbed onmodified and unmodified montmorillonites at pH 2.00, the bands 1,404/1,426 cm−1 due toN-H bend vanished. However, for thymine adsorbed on clays at pH 7.00 the band at1,404 cm−1 vanished and the band at 1,426 cm−1 suffered a small shift, thus thymine alsointeracts with clays through NH+ group (Benetoli et al. 2008).
In general, the FT-IR spectra of nucleic acid bases adsorbed on montmorillonites showthat charged amine groups are involved in this interaction. However the results of ourabsorption studies suggest that Van der Waals bonds are also involved. But these
1.87
1.90
1.56
0.79
3.87
3.02
1.62
1.29
3.28
3.45
1.37
1.01
3.58
3.81
1.68
1.72
600 ug/5 mL
M pH= 2.00 MM pH= 2.00 M pH= 7.00 MM pH= 7.00
1200 ug/5 mL 2400 ug/5 mL 3600 ug/5 mL
Fig. 2 Relative A/Tconcentrationsof nucleic acid bases adsorbed onclays. Montmorillonite (M) andModified Montmorillonite (MM) intwo different ranges of pH 2.00 and7.00; in four concentrations
Adsorption of Nucleic Acid Bases on Sulfide-Modified Montmorillonite
0.00.20.40.60.81.01.2
1657
1715
1670
1729
1700
1637
0.00.20.40.60.81.01.2
1622
1670
1715
1700
1652
(b)
(c)
Abs
orba
nce
(a.u
.)
-0.50.00.51.01.52.02.53.0
U A C T M MM
(a)
1733
1739
1677
1740
1720
1661
167216
03
0081007100610.0
0.1
0.2
0.3
0.4
0.5
1731
1657
171716
74
1731
1700
1637
Wavenumber (cm-1)
0.0
0.1
0.2
0.3
0.4
0.5
1637 16
74
1700
1717
(d)
(e)
Fig. 3 FT-IR spectra: U-solid uracil, (a)-U; A-solid adenine, (a)-A; C-solid cytosine, (a)-C; T-solid thymine,(a)-T; M-solid montmorillonite, (a)-M; MM-solid modified montmorillonite, (a)-MM; U adsorbed on MM atpH 2.00, (b)-U; A adsorbed on MM at pH 2.00, (b)-A; C adsorbed on MM at pH 2.00, (b)-C; T adsorbed onMM at pH 2.00, (b)-T; U adsorbed on M at pH 2.00, (c)-U; A adsorbed on M at pH 2.00, (c)-A; C adsorbedon M at pH 2.00, (c)-C; T adsorbed on M at pH 2.00, (c)-T; U adsorbed on MM at pH 7.00, (d)-U; Aadsorbed on MM at pH 7.00, (d)-A; C adsorbed on MM at pH 7.00, (d)-C; T adsorbed on MM at pH 7.00,(d)-T; U adsorbed on M at pH 7.00, (e)-U; A adsorbed on M at pH 7.00, (e)-A; C adsorbed on M at pH 7.00,(e)-C; T adsorbed on M at pH 7.00, (e)-T. The nucleic acid bases (720 μg mL−1) were dissolved in artificialseawater and mixed with the clays (M, MM) for 3 h, after the samples were spun for 15 min. at 2,000 r.p.m.and the solids were dried overnight at 60°C
C.E.A. Carneiro et al.
interactions are not observed in the FT-IR spectra, probably because they are too weak,meaning it is not strong enough to make structural changes affecting the dipole moment ofthe adsorbed nucleic acid bases (or parts of nucleic acid bases such as amine, carboxylicgroup) compared to solid nucleic acid bases.
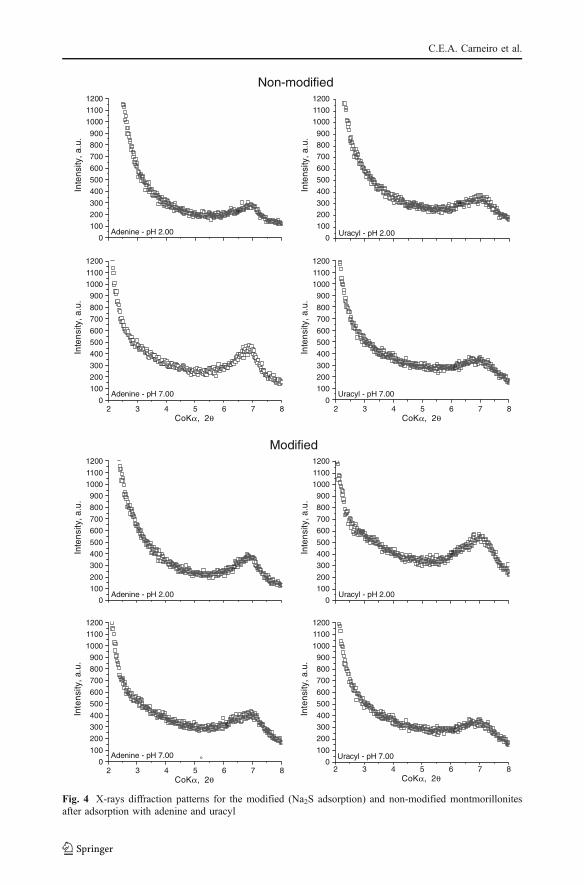
X-ray diffraction studies indicate that bases distribute into the interlayer surface, edgesites and external surface, neutralizing permanent charges and complexing functionalgroups such as aluminol ([]Al-OH) and silanol ([]-SiOH), respectively (Sposito 1989). Twomajor factors might influence the adsorption trend: pH of the solution and pKa of theadsortives.
As the pH changes, relative proportions of the ionic species of the adsorbate moleculealso changes according to their pKa (Table 1). At pH 2.00, for example, uracil has nocharge (Table 1) and is sparingly adsorbed (Fig. 1) by weak attractive van der Waals forces,while adenine has a net positive charge (Table 1), and the main adsorption mechanism isionic exchange with a positive cation present in the negatively charged interlayer space. For2:1 clay minerals, adsorption of organic molecules in the interlayer region might beenhanced through partition (Sposito 1989) of a new adsortive into the existent adsorbate(Perezgasga et al. 2005).
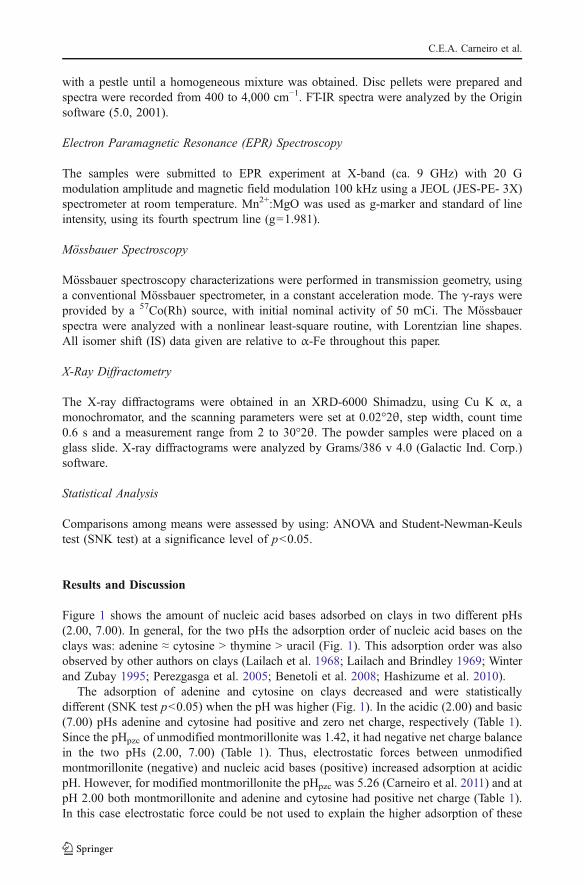
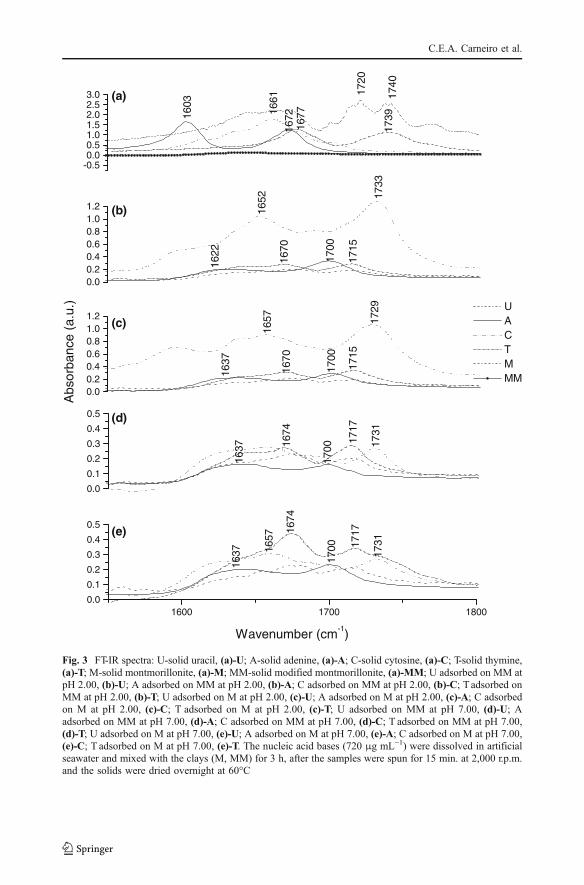
Average expansion of the d001 diffraction plane for montmorillonite was greater at pH=7.00 (13.04, 13.41Å) when compared to the pH 2.00 (12.72, 12.87Å) for the unmodifiedand modified montmorillonites, respectively (Table 2) due to greater total negative charge,affinity for positive cations present in solution (Grim 1968; Perezgasga et al. 2005) andprotonated surface functional groups in the bases, at higher pHs.
Modification of clay minerals with Na2S is a surface phenomena (Carneiro et al. 2011)and little effect was observed on the expansion of montmorillonite (Table 2). Average valuesfor d001 expansion after adsorption of the bases was very small at pH 2.00 and it was notpossible to differentiate the adsorption behavior among the bases, at this pH value, from theuntreated mineral (Table 2, Fig. 4). At pH 7.00, the average d001 value in the presence ofbases was smaller for the untreated clay.
At pH 2.00 the highest d001 expansion was observed for adenine adsorption in theunmodified and modified montmorillonite, showing that this bases has strong affinity fromthe internal surfaces charges to its net negative charge. The average d001 value at pH 7.00(Table 2) was smaller for the modified montmorillonites after the adsorption of the bases(12.89Å) than in their absence (13.14Å). This behavior shows a certain degree ofpenetration of the bases compensating part of the internal charges of the mineral insubstitution of the Na+ cation and holding more tightly the silica sheets. Perezgasga et al.(2005) observed that uracil expands the d001 spacing of Na+-montmorillonite to 12.56Å.
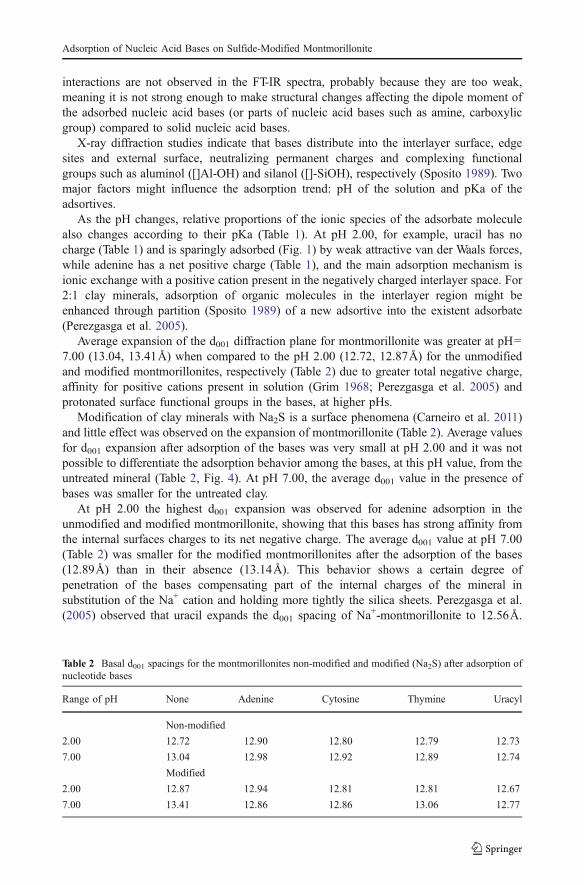
Table 2 Basal d001 spacings for the montmorillonites non-modified and modified (Na2S) after adsorption ofnucleotide bases
Range of pH None Adenine Cytosine Thymine Uracyl
Non-modified
2.00 12.72 12.90 12.80 12.79 12.73
7.00 13.04 12.98 12.92 12.89 12.74
Modified
2.00 12.87 12.94 12.81 12.81 12.67
7.00 13.41 12.86 12.86 13.06 12.77
Adsorption of Nucleic Acid Bases on Sulfide-Modified Montmorillonite
Non-modified
Modified
0
100
200
300
400
500
600
700
800
900
1000
1100
1200
Adenine - pH 2.00
Inte
nsity
,a.u
.
Uracyl - pH 2.00
02 3 4 5 6 7 8
100
200
300
400
500
600
700
800
900
1000
1100
1200
Adenine - pH 7.00
Inte
nsity
,a.u
.
Uracyl - pH 7.00
0
100
200
300
400
500
600
700
800
900
1000
1100
1200
Adenine - pH 2.00
Inte
nsity
,a.u
.
Uracyl - pH 2.00
0
100
200
300
400
500
600
700
800
900
1000
1100
1200
Adenine - pH 7.00
Inte
nsity
,a.u
.
0
100
200
300
400
500
600
700
800
900
1000
1100
1200
Inte
nsity
,a.u
.
0
100
200
300
400
500
600
700
800
900
1000
1100
1200
Inte
nsity
,a.u
.
0
100
200
300
400
500
600
700
800
900
1000
1100
1200
Inte
nsity
,a.u
.
0
100
200
300
400
500
600
700
800
900
1000
1100
1200
Inte
nsity
,a.u
.
CoKα, 2θ2 3 4 5 6 7 8
CoKα, 2θ
2 3 4 5 6 7 8CoKα, 2θ
2 3 4 5 6 7 8CoKα, 2θ
Uracyl - pH 7.00
Fig. 4 X-rays diffraction patterns for the modified (Na2S adsorption) and non-modified montmorillonitesafter adsorption with adenine and uracyl
C.E.A. Carneiro et al.
Robinson et al. (2007) concluded that the formation of hydrogen bonds accounts for thestabilization of thymine and uracil on the mineral surface. These authors also observed thatthymine and uracil are less stable on the tetrahedral surface than on the octahedral surface,i.e., the most energetically favorable adsorption, for these bases, is predicted in the case ofthe system containing hydrated octahedral mineral surfaces. Montmorillonites, unmodifiedor modified, showed the following decreasing order on the adsorption of bases: adenine ≈cytosine > thymine > uracil.
Expandable clays are known for their affinity for organic compounds, and in theprebiotic environment they might have provided protection to adsorbed moleculesagainst high-energy radiation (Guzmán et al. 2002). In the case of adsorption of organicmolecules between silicate layers, variations of d001 are associated to size and geometryof the organic molecule. For example, HDTMA adsorbed on the clay changed the d001basal reflection to 14.21Å (Perezgasga et al. 2005) and with further adsorption it wasdisplaced to 18.11Å. For adenine, the same authors observed expansion of the d001 to11.5Å, but addition of adenine to HDTMA-Na+-montmorillonite further expanded to abroad maximum around 15Å the basal reflection, by occupying available sites and/orpartition within the HDTMA molecules. Perezgasga et al. (2005) observed that uracil-HDTMA-Na+ montmorillonite basal spacing was displaced to 14.09Å a similar expansionto HDTMA-montmorillonite alone, which might indicate some interaction of uracil andHDTMAwithin the interlamelar spacing.
Table 3 shows intensity lines of EPR of the samples of nucleic acid bases adsorbed onclays in two different pHs (2.00, 7.00). The resonance line g≈2 is due to hydroxides andoxides of Fe3+ (Guskos et al. 2002; Carbone et al. 2005; Mota et al. 2009). The intensities
Table 3 Resonance line intensities of Fe3+
Nucleic Acid Base Clay Range of pH Line 1 Fe3+ (g≈7–8) Line 2 Fe3+ (g=4.1) Line 3 Fe3+ (g≈2)
Adenine M 1.79–1.95 0.04±0.02 2.01±0.23 2.85±0.05
6.81–7.35 0.15±0.02 6.45±4.72 5.75±1.50
MM 2.02–2.58 0.16±0.03 6.39±2.43 5.99±0.99
7.10–7.35 0.26±0.11 12.24±8.61 10.70±7.80
Cytosine M 1.71–2.06 0.15±0.10 4.53±2.31 6.56±1.63
6.93–7.31 0.06±0.02 3.50±1.31 4.65±0.27
MM 1.84–2.03 0.12±0.06 4.09±0.02 3.45±0.21
6.89–7.31 0.25±0.09 9.74±6.25 7.74±4.75
Thymine M 2.05–2.26 0.05±0.01 2.52±0.38 4.39±1.71
6.97–7.15 0.09±0.07 1.52±0.59 3.09±2.08
MM 2.10–2.18 0.19±0.12 4.03±0.17 3.93±0.46
6.89–7.00 0.09±0.05 2.94±0.26 2.56±0.55
Uracil M 2.00–2.10 0.65±0.52 11.3±8.95 11.13±4.06
6.85–7.07 0.41±0.27 14.2±12.22 15.60±10.67
MM 1.93–2.05 0.09±0.02 4.36±1.90 4.09±1.50
6.88–7.10 0.12±0.06 4.49±0.99 4.88±0.87
M montmorillonite and MM modified montmorillonite. The results are presented as mean ± standard error ofmean. Each result is a mean of two analysis. For all samples 50 mg of M or MM plus 5.0 mL of seawaterwith nucleic acid bases (720 μg mL−1 ) were mixed for 3 h, after the samples were spun for 15 min at4,000 rpm and the solids were dried overnight at 60°C
Adsorption of Nucleic Acid Bases on Sulfide-Modified Montmorillonite
line g≈2 obtained for unmodified and modified montmorillonite were 5.63 and 2.68,respectively (Carneiro et al. 2011), and after these clays were mixed with artificial seawaterin two different pHs, the intensities showed a variation from 2.04 to 3.36 (De Santana et al.2010; Carneiro et al. 2011). The decrease in the intensities of the line g≈2 was due to theextraction of Fe by artificial seawater or Na2S solution (De Santana et al. 2010; Carneiro etal. 2011). In general, when nucleic acid bases were adsorbed on clays an increase on theintensity of this line was observed (Table 3). However, an inverse trend was observed whencysteine was adsorbed on clays and on iron oxides (De Santana et al. 2010; Vieira et al.2011). The resonance line g=4.1 could be due to Fe3+ with rhombic symmetry as well asthe interaction of Fe3+ with organic matter (Guskos et al. 2002; Carbone et al. 2005; Motaet al. 2009). The intensities line g=4.1 obtained for unmodified and modifiedmontmorillonite were 2.73 and 3.27 respectively (Carneiro et al. 2011), and after theseclays were mixed with artificial seawater in two different pHs, the intensities showed avariation from 1.33 to 3.28 (De Santana et al. 2010; Carneiro et al. 2011). In general asexpected the interaction of nucleic acid bases with clays increased this line (Table 3). DeSantana et al. (2010) and Vieira et al. (2011) also observed an increase of this when cysteinewas adsorbed on clays and iron oxides, respectively.
The resonance line g≈7–8 could be attributed to Fe3+ rhombohedral distortedsymmetry (Budziak et al. 2007). The intensity of this line for montmorillonite withoutfurther preparations is 1.28 and a decrease was observed when montmorillonite wasmodified with Na2S (0.13) (Carneiro et al. 2011). For all nucleic acid bases samplesadsorbed on clays, Table 3 shows a decrease of this line when compared to themontmorillonite without further preparation. A large decrease of this line was alsoobserved when montmorillonite was mixed with artificial seawater or articial seawaterplus cysteine (De Santana et al. 2010). This decrease could due to the withdrawn of Fe3+
by the solutions of sodium sulfide or artificial sea water (Carneiro et al. 2011). Theintensities of this line did not depend on the nucleic acid base adsorbed on clays (Table 3).The adsorption of cysteine on clays and iron oxides had also no effect on this resonanceline (De Santana et al. 2010; Vieira et al. 2011).
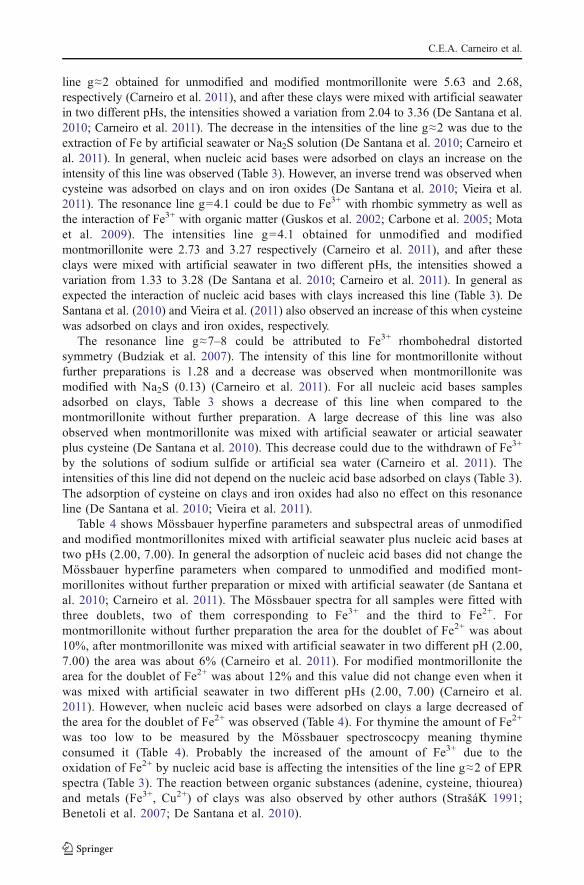
Table 4 shows Mössbauer hyperfine parameters and subspectral areas of unmodifiedand modified montmorillonites mixed with artificial seawater plus nucleic acid bases attwo pHs (2.00, 7.00). In general the adsorption of nucleic acid bases did not change theMössbauer hyperfine parameters when compared to unmodified and modified mont-morillonites without further preparation or mixed with artificial seawater (de Santana etal. 2010; Carneiro et al. 2011). The Mössbauer spectra for all samples were fitted withthree doublets, two of them corresponding to Fe3+ and the third to Fe2+. Formontmorillonite without further preparation the area for the doublet of Fe2+ was about10%, after montmorillonite was mixed with artificial seawater in two different pH (2.00,7.00) the area was about 6% (Carneiro et al. 2011). For modified montmorillonite thearea for the doublet of Fe2+ was about 12% and this value did not change even when itwas mixed with artificial seawater in two different pHs (2.00, 7.00) (Carneiro et al.2011). However, when nucleic acid bases were adsorbed on clays a large decreased ofthe area for the doublet of Fe2+ was observed (Table 4). For thymine the amount of Fe2+
was too low to be measured by the Mössbauer spectroscocpy meaning thymineconsumed it (Table 4). Probably the increased of the amount of Fe3+ due to theoxidation of Fe2+ by nucleic acid base is affecting the intensities of the line g≈2 of EPRspectra (Table 3). The reaction between organic substances (adenine, cysteine, thiourea)and metals (Fe3+, Cu2+) of clays was also observed by other authors (StrašáK 1991;Benetoli et al. 2007; De Santana et al. 2010).
C.E.A. Carneiro et al.
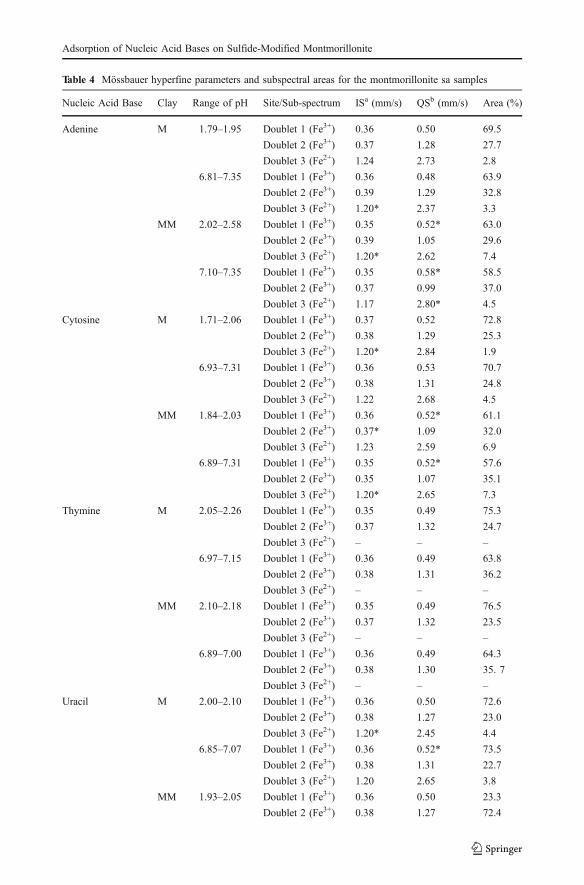
Table 4 Mössbauer hyperfine parameters and subspectral areas for the montmorillonite sa samples
Nucleic Acid Base Clay Range of pH Site/Sub-spectrum ISa (mm/s) QSb (mm/s) Area (%)
Adenine M 1.79–1.95 Doublet 1 (Fe3+) 0.36 0.50 69.5
Doublet 2 (Fe3+) 0.37 1.28 27.7
Doublet 3 (Fe2+) 1.24 2.73 2.8
6.81–7.35 Doublet 1 (Fe3+) 0.36 0.48 63.9
Doublet 2 (Fe3+) 0.39 1.29 32.8
Doublet 3 (Fe2+) 1.20* 2.37 3.3
MM 2.02–2.58 Doublet 1 (Fe3+) 0.35 0.52* 63.0
Doublet 2 (Fe3+) 0.39 1.05 29.6
Doublet 3 (Fe2+) 1.20* 2.62 7.4
7.10–7.35 Doublet 1 (Fe3+) 0.35 0.58* 58.5
Doublet 2 (Fe3+) 0.37 0.99 37.0
Doublet 3 (Fe2+) 1.17 2.80* 4.5
Cytosine M 1.71–2.06 Doublet 1 (Fe3+) 0.37 0.52 72.8
Doublet 2 (Fe3+) 0.38 1.29 25.3
Doublet 3 (Fe2+) 1.20* 2.84 1.9
6.93–7.31 Doublet 1 (Fe3+) 0.36 0.53 70.7
Doublet 2 (Fe3+) 0.38 1.31 24.8
Doublet 3 (Fe2+) 1.22 2.68 4.5
MM 1.84–2.03 Doublet 1 (Fe3+) 0.36 0.52* 61.1
Doublet 2 (Fe3+) 0.37* 1.09 32.0
Doublet 3 (Fe2+) 1.23 2.59 6.9
6.89–7.31 Doublet 1 (Fe3+) 0.35 0.52* 57.6
Doublet 2 (Fe3+) 0.35 1.07 35.1
Doublet 3 (Fe2+) 1.20* 2.65 7.3
Thymine M 2.05–2.26 Doublet 1 (Fe3+) 0.35 0.49 75.3
Doublet 2 (Fe3+) 0.37 1.32 24.7
Doublet 3 (Fe2+) – – –
6.97–7.15 Doublet 1 (Fe3+) 0.36 0.49 63.8
Doublet 2 (Fe3+) 0.38 1.31 36.2
Doublet 3 (Fe2+) – – –
MM 2.10–2.18 Doublet 1 (Fe3+) 0.35 0.49 76.5
Doublet 2 (Fe3+) 0.37 1.32 23.5
Doublet 3 (Fe2+) – – –
6.89–7.00 Doublet 1 (Fe3+) 0.36 0.49 64.3
Doublet 2 (Fe3+) 0.38 1.30 35. 7
Doublet 3 (Fe2+) – – –
Uracil M 2.00–2.10 Doublet 1 (Fe3+) 0.36 0.50 72.6
Doublet 2 (Fe3+) 0.38 1.27 23.0
Doublet 3 (Fe2+) 1.20* 2.45 4.4
6.85–7.07 Doublet 1 (Fe3+) 0.36 0.52* 73.5
Doublet 2 (Fe3+) 0.38 1.31 22.7
Doublet 3 (Fe2+) 1.20 2.65 3.8
MM 1.93–2.05 Doublet 1 (Fe3+) 0.36 0.50 23.3
Doublet 2 (Fe3+) 0.38 1.27 72.4
Adsorption of Nucleic Acid Bases on Sulfide-Modified Montmorillonite
Conclusion
Adenine and cytosine were more adsorbed on clays than thymine and uracil. A decreasingpH increased the adsorption of adenine and cytosine on clays (SNK test p<0.05). Theincreasing adsorption of adenine and cytosine on unmodified montmorillonite associated toa lower pH could be related to electrostatic forces between nucleic acid bases andunmodified montmorillonite. However, for modified montmorillonite (Na2S) other forces(van der Waals) should be considered. In general the pH had no effect on the adsorption ofthymine and uracil on clays (SNK test p>0.05).
FT-IR spectra showed that the interaction between nucleic acid bases and clays was throughNH+ or NH2
+ groups. Others bonds were also affected such as: C=O, C=C, C=N and C-H.X-ray diffractograms showed that nucleic acid bases adsorbed on clays distribute into the
interlayer surface, edge sites and external surface complexing functional groups such asaluminol ([]Al-OH) e silanol ([]-SiOH). For both clay the expansion depend on the pH.
For all samples, after adsorption of nucleic acid bases the intensities of the resonancelines g≈2 and g=4.1 increased when compared to the samples without nucleic acid basesadsorbed. The intensity of the line g≈2 increased probably because the oxidation of Fe2+ toFe3+ by nucleic acid base and intensity of the line g=4.1 increased because the interactionof Fe3+ with nucleic acid bases.
When nucleic acid bases were adsorbed on clays a large decrease of the area for thedoublet of Fe2+ was observed. These results show that nucleic acid bases are reacting withFe2+ of the clays.
The results show that the interaction of nucleic acid bases with clays is not only a simpleprocess of physical adsorption, but complex reactions can also occur.
Acknowledgments CMDS and CEAC acknowledge the fellowships from Capes. This research wassupported by grants from CNPq (474985/2010-5) and Fundação Araucária (15279/2009). The authors aregrateful to Dr. Alan W. Schwartz for the suggestions and reviewing the text. The authors also are grateful totwo anonymous reviewers for the suggestions.
References
Aloisi G, Drews M, Wallmann K, Bohrmann G (2004) Fluid expulsion from the Dvurechenskii mud volcano(Black Sea): Part I. Fluid sources and relevance to Li, B, Sr, I and dissolved inorganic nitrogen cyclesEarth Planet. Sci Lett 225:347–363
Table 4 (continued)
Nucleic Acid Base Clay Range of pH Site/Sub-spectrum ISa (mm/s) QSb (mm/s) Area (%)
Doublet 3 (Fe2+) 1.20* 2.46 4.3
6.88–7.10 Doublet 1 (Fe3+) 0.35 0.52* 55.6
Doublet 2 (Fe3+) 0.36 1.05 39.6
Doublet 3 (Fe2+) 1.18 2.82 4.8
M montmorillonite, MM modified montmorillonite *The composition of artificial seawater is described inMaterials and Methods. **Montmorillonite was modified with Na2S as described in Materials and Methods;a Isomer Shift, relative to α-Fe foil at room temperature; b Quadrupole Splitting; c Line width For all samples50 mg of M or MM plus 5.0 mL of seawater with nucleic acid bases (720 μg mL−1 ) were mixed for 3 h, afterthe samples were spun for 15 min at 4,000 rpm and the solids were dried overnight at 60°C
C.E.A. Carneiro et al.
Aroca R, Bujalski R (1999) Surface enhanced vibrational spectra of thymine. Vib Spectrosc 19:11–21Bebié J, Schoonen MAA (2000) Pyrite surface interaction with selected organic aqueous species under
anoxic conditions. Geochem Trans. doi:10.1039/b005581fBenetoli LOB, de Souza CMD, da Silva KL, de Souza IG Jr, de Santana H, Paesano A Jr, da Costa ACS,
Zaia CTBV, Zaia DAM (2007) Amino acid interaction with and adsorption on clays: FT-IR andMössbauer spectroscopy and X-ray diffractometry investigations. Orig Life Evol Biosph 37:479–493
Benetoli LOB, de Santana H, Zaia CTBV, Zaia DAM (2008) Adsorption of nucleic acid bases on clays: aninvestigation using Langmuir and Freundlich isotherms and FT-IR spectroscopy. Monatsh Chem139:753–761
Borquez E, Cleaves HJ, Lazcano A, Miller SL (2005) An investigation of prebiotic purine synthesis from thehydrolysis of HCN polymers. Orig Life Evol Biosph 35:79–90
Budziak CRF, Wypych F, Mangrich AS (2007) Use of Fe3+ ion probe to study the stability of urea-intercalated kaolinite by electron paramagnetic resonance. J Coll Inter Sci 313:537–541
Carbone C, di Benedetto F, Marescotti P, Sangregorio C, Sorace L, Lima N, Romanelli M, Luchetti G,Cipriani C (2005) Natural Fe-oxide and -oxyhydroxide nanoparticles: an EPR and SQUID investigation.Mineral Petrol 85:19–32
Carneiro CEA, Machado CFC, de Souza Junior IG, Paesano A Jr, Di Mauro E, da Costa ACS, deSantana H, Zaia DAM (2011) Modification of montmorillonite with sodium sulfide for prebioticchemistry studies: characterization using spectroscopy methods and x-ray diffractometry. J ServChem Soc Submitted
Cleaves HJ, Jonsson CM, Jonsson CL, Sverjensky DA, Hazen RM (2010) Adsorption of nucleic acidcomponents on rutile (TiO2) surfaces. Astrobiology 10:311–323
Colthup NB, Daly LH, Wiberly SE (1964) Introduction to infrared and raman spectroscopy. Academic, NewYork
Dawson RMC, Elliott DC, Elliott WH, Jones KM (1986) Data for biochemical research, 3rd edn. Clarendon,Oxford
De Santana H, Paesano A Jr, da Costa ACS, di Mauro E, de Souza Junior IG, Ivashita FF, de Souza CMD,Zaia CTB, Zaia DAM (2010) Cysteine, thiourea and thiocyanate interactions with clays: FT-IR,Mössbauer and EPR spectroscopy and X-ray diffractometry studies. Amino Acids 38:1089–1099
Ehlmann BL, Mustard JF, Swayze GA, Wray JJ, Barnouin-Jha OS, Bishop JL, Des Marais DJ, Poulet F,Roach LH, Milliken RE, Clark RN, Murchie SL, MRO CRISM Team (2008) Phyllosilicates, zeolites andcarbonate near nili fossae Mars: evidence for distinct environments of aqueous alteration. Workshop onmartian phyllosilicates recorders of aqueous processes? Held October 21–23, 2008 in Paris-France, LPIContribution number 1441 pp 33–34
Grim RE (1968) Clay minerology. McGraw-Hill, New YorkGuskos N, Papadopoulos GJ, Likodimos V, Patapis S, Yarmis D, Przepiera A, Przepiera K, Majszczyk J,
Typek J, Wabia M, Aidinis K, Drazek Z (2002) Photoacoustic, EPR and electrical conductivityinvestigations of three synthetic mineral pigments: hematite, goethite and magnetite. Mater Res Bull37:1051–1106
Guzmán A, Negrón-Mendoza A, Ramos-Bernal S (2002) Behavior of adenine in Na-montmorilloniteexposed to gamma radiation: implications to chemical evolution studies. Cell Mol Biol 48:525–528
Hashizume H, Theng BKG (2007) Adenine, adenosine, ribose and 5′-AMP adsorption to allophane. ClaysClay Miner 55:599–605
Hashizume H, Van der Gaast S, Theng BKG (2010) Adsorption of adenine, cytosine, uracil, ribose, andphosphate by Mg-exchanged montmorillonite. Clays Clay Miner 45:469–475
Hatton B, Rickard D (2008) Nucleic acid binds to nanoparticulate iron (II) monosulphide in aqueoussolutions. Orig Life Evol Biosph 38:257–270
Hazen RM, Papineau D, Bleeke W, Downs RT, Ferry JM, McCoy TJ, Sverjensky DA, Yang H (2008) Mineralevolution. Am Miner 93:1693–1720
Hua LL, Kobayashi K, Ochiai EI, Gehrke CW, Gerhardt KO, Ponnamperuma C (1995) Identificationand quantification of nucleic acid bases in carbonaceous chondrites. Orig Life Evol Biosph 16:226–227
Lailach GE, Brindley GW (1969) Specific co-absorption of purines and pyrimidines by montmorillonite(Clay-organic studies XV). Clays Clay Miner 17:95–100
Lailach GE, Thompson TD, Brindley GW (1968) Adsorption of pyrimidines, purines and nucleosides by Co,Ni, Cu, and Fe (III)-montmorillonite (Clay-organic studies XIII). Clays Clay Miner 16:295–301
LaRowe DE, Regnier P (2008) Thermodynamic potential for the abiotic synthesis of adenine, cytosine,guanine, thymine, uracil, ribose and deoxyribose in hydrothermal sytems. Orig Life Evol Biosph38:383–397
Lehninger AL (1984) Princípios de Bioquímica. Sarvier Editora de Livro Técnicos Ltda, São Paulo, p 574Llorca J (2005) Organic matter in comets and cometary dust. Internat Microbiol 8:5–12
Adsorption of Nucleic Acid Bases on Sulfide-Modified Montmorillonite
Martins Z, Botta O, Fogel MI, Sephton MA, Glavin DP, Watson JS, Dworkin JP, Schwartz AW, Ehrenfreund P(2008) Extraterrestrial nucleobases in the Murchison meteorite. Earth Planet Sci Lett 270:130–136
Mota L, Toledo R, Faria RT Jr, da Silva EC, Vargas H, Deladillo-Hotfort I (2009) Thermally treated soli claysas ceramic raw materials: characterization by x-ray diffraction, photoacoustic spectroscopy and electronspin resonance. Appl Clay Sci 43:243–247
Negrón-Mendoza A, Ramos-Bernal S, de Buen IG (2010) A thermoluminescence study of bio-organiccompounds adsorbed in a clay mineral. IEEE Trans Nucl Sci 57:1223–1227
Palafox MA, Tardajos G, Guerrero-Martinez A, Vats JK, Joe H, Rastogi VK (2010) Relationships observed inthe structure and spectra uracil and its 5-substituted derivative. Spectrochim Acta A 75:1261–1269
Perezgasga L, Serrato-Díaz A, Negrón-Mendonza A, de Pablo GL, Mosqueira FG (2005) Sites of adsorptionof adenine, uracil, and their corresponding derivatives on sodium montmorillonite. Orig Life EvolBiosph 35:91–110
Plekan O, Feyer V, Šutara F, Skála T, Švec M, Cháb V, Matolín V, Prince KC (2007) The adsorption ofadenine on mineral surfaces: iron pyrite and silicon dioxide. Surf Sci 601:1973–1980
Pucci A, Branciamore S, Casarosa M, D’Acqui LP, Gallori E (2010) Implications for an RNA-clay world:interaction of cytosine with clays minerals. J Cosmol 10:3398–3407
Robinson TL, Michalkova A, Gorb L, Leszczynski J (2007) Hydrogen bonding of thymine and uracil withsurface of dickite: an ab initio study. J Mol Struct 844/855:48–58
Sowerby SJ, Edelwirth M, Reiter M, Heckl WM (1998) Scanning tunneling microscopy image contrast as afunction of scan angle in hydrogen bonded self assembled monolayers. Langmuir 14:5195–5202
Sowerby SJ, Mörth CM, Holm NG (2001a) Effect of temperature on the adsorption of adenine. Astrobiology1:481–487
Sowerby SJ, Cohn CA, Heckl WM, Holm NG (2001b) Differential adsorption of nucleic acid bases:relevance to the origin of life. Proc Natl Acad Sci USA 98:820–822
Sposito G (1989) The chemistry of soil. Oxford University Press, New York, p 277StrašáK M (1991) An unsual reaction of adenine and adenosine on montmorillonite. Naturwissenschaften
78:121–122Vieira AP, Berndt G, de Souza Junior IG, Di Mauro E, Paesano A Jr, de Santana H, da Costa ACS, Zaia
CTBV, Zaia DAM (2011) Adsorption of cysteine on hematite, magnetite and ferrihydrite: FT-IR,Mössbauer. EPR spectroscopy and X-ray diffractometry. Studies. Amino Acids 40:205–214
Weckhuysen BM, Leeman H, Schoonheydt RA (1999) Synthesis and spectroscopy of clay intercalated Cu(II) bio-monomer complexes: coordination of Cu (II) with purines and nucleotides. Phys Chem ChemPhys 1:2875–2880
Winter D, Zubay G (1995) Binding of adenine and adenine related compounds to the clay montmorilloniteand the mineral hydroylapatite. Orig Life Evol Biosph 25:61–81
Yamada T, Shirasaka K, Takano A, Kawai M (2004) Adsorption of cytosine, thymine, guanine and adenineon Cu(1 1 0) studied by infrared reflection absorption spectroscopy. Surf Sci 561:233–247
C.E.A. Carneiro et al.
Related Documents