Adsorption-based Treatment Systems for Removing Chemical Vapors from Indoor Air TABLE OF CONTENTS 1. PURPOSE AND SUMMARY 1 2. INTRODUCTION 2 3. AIR TREATMENT SYSTEM BASICS 3 3.1 Classes of Commercially Available Treatment Units 3 3.2 Adsorption Principles and Performance 3 3.3 Photocatalytic Oxidation 7 3.4 Other Air Treatment Unit Types 8 3.5 Multiple Technology Air Treatment Units 9 3.6 System Sizes and Geometries 9 4. PERFORMANCE DATA AND SPECIFICATIONS 10 4.1 Laboratory and Chamber Tests for Efficiency and Capacity 11 4.2 Controlled (Unoccupied) Building-scale Demonstrations of Air Treatment Units 14 4.3 Practical (Occupied) Field Applications to VI Cases 16 5. SELECTING AN AIR TREATMENT UNIT, DESIGNING AND IMPLEMENTING AN AIR TREATMENT UNIT APPLICATION 21 5.1 Chemical and Physical Characteristics of the Air Stream to be Treated 21 5.2 Building Characteristics 25 5.3 Design Process—Standalone Units 27 5.4 Design Process—Differences for Duct- Mounted Systems 32 5.5 Air Treatment Unit Deployment 33 5.6 Communication and Instructions for Occupants During Air Treatment Unit Deployment and Operation 36 6. MONITORING AND VERIFYING AIR TREATMENT UNIT PERFORMANCE 36 7. CURRENT CHALLENGES, LIMITATIONS, AND RESEARCH AND DEVELOPMENT NEEDS 37 7.1 Technology Development and Chamber Verification Needs 38 7.2 Field-Scale Testing, Verification, and Tech Transfer Recommendations 39 8. REFERENCES 40 ATTACHMENT A. AVAILABLE VOC AIR CLEANER EQUIPMENT 45 ATTACHMENT B. AIR CLEANER EQUIPMENT 101 The U.S. Environmental Protection Agency (EPA) Engineering Issue Papers (EIPs) are a series of technology transfer documents that summarize the latest information on selected waste treatment and site remediation technologies and related issues. EIPs are designed to help remedial project managers, on- scene coordinators, contractors and other site managers understand the type of data and site characteristics needed to evaluate a technology for a particular application at their sites. This EIP may also be useful for building owners/operators and home owners who may have a concern about the indoor air quality at their location(s). Each EPA EIP is developed in conjunction with a small group of engineers and scientists from inside EPA and outside consultants, with a reliance on peer-reviewed literature, EPA reports, Web sources, current ongoing research, and other pertinent information. As such, this EIP assembles, organizes, and summarizes the current knowledge on air treatment technologies that are available for removing volatile organic compounds (VOCs) from indoor air. VOCs are one group of chemicals that can easily become gases, or chemical vapors, which can migrate through soil and enter buildings. Well-known examples of VOCs are petroleum products (e.g., gasoline or diesel fuel), dry cleaning solvents (e.g., perchloroethylene, aka perc) and industrial degreasers (e.g., trichloroethylene, TCE). This EIP does not represent EPA policy or guidance. 1. PURPOSE AND SUMMARY This EIP summarizes the state of the science on selecting and using indoor treatment technology for VOCs, also known as air treatment units (ATUs). When selected and operated correctly, ATUs remove VOCs from indoor air to keep their concentrations below specified limits. This paper describes the

Welcome message from author
This document is posted to help you gain knowledge. Please leave a comment to let me know what you think about it! Share it to your friends and learn new things together.
Transcript

Adsorption-based Treatment Systems for Removing Chemical Vapors from Indoor Air
TABLE OF CONTENTS
1. PURPOSE AND SUMMARY 1 2. INTRODUCTION 2 3. AIR TREATMENT SYSTEM BASICS 3
3.1 Classes of Commercially Available Treatment Units 3
3.2 Adsorption Principles and Performance 3 3.3 Photocatalytic Oxidation 7 3.4 Other Air Treatment Unit Types 8 3.5 Multiple Technology Air Treatment Units 9 3.6 System Sizes and Geometries 9
4. PERFORMANCE DATA AND SPECIFICATIONS 10 4.1 Laboratory and Chamber Tests for
Efficiency and Capacity 11 4.2 Controlled (Unoccupied) Building-scale
Demonstrations of Air Treatment Units 14 4.3 Practical (Occupied) Field Applications to
VI Cases 16 5. SELECTING AN AIR TREATMENT UNIT,
DESIGNING AND IMPLEMENTING AN AIR TREATMENT UNIT APPLICATION 21 5.1 Chemical and Physical Characteristics of
the Air Stream to be Treated 21 5.2 Building Characteristics 25 5.3 Design Process—Standalone Units 27 5.4 Design Process—Differences for Duct-
Mounted Systems 32 5.5 Air Treatment Unit Deployment 33 5.6 Communication and Instructions for
Occupants During Air Treatment Unit Deployment and Operation 36
6. MONITORING AND VERIFYING AIR TREATMENT UNIT PERFORMANCE 36
7. CURRENT CHALLENGES, LIMITATIONS, AND RESEARCH AND DEVELOPMENT NEEDS 37 7.1 Technology Development and Chamber
Verification Needs 38 7.2 Field-Scale Testing, Verification, and
Tech Transfer Recommendations 39 8. REFERENCES 40
ATTACHMENT A. AVAILABLE VOC AIR CLEANER EQUIPMENT 45
ATTACHMENT B. AIR CLEANER EQUIPMENT 101
The U.S. Environmental Protection Agency (EPA)
Engineering Issue Papers (EIPs) are a series of
technology transfer documents that summarize the
latest information on selected waste treatment and
site remediation technologies and related issues. EIPs
are designed to help remedial project managers, on-
scene coordinators, contractors and other site
managers understand the type of data and site
characteristics needed to evaluate a technology for a
particular application at their sites. This EIP may also
be useful for building owners/operators and home
owners who may have a concern about the indoor air
quality at their location(s). Each EPA EIP is
developed in conjunction with a small group of
engineers and scientists from inside EPA and outside
consultants, with a reliance on peer-reviewed
literature, EPA reports, Web sources, current ongoing
research, and other pertinent information. As such,
this EIP assembles, organizes, and summarizes the
current knowledge on air treatment technologies that
are available for removing volatile organic
compounds (VOCs) from indoor air. VOCs are one
group of chemicals that can easily become gases, or
chemical vapors, which can migrate through soil and
enter buildings. Well-known examples of VOCs are
petroleum products (e.g., gasoline or diesel fuel), dry
cleaning solvents (e.g., perchloroethylene, aka perc)
and industrial degreasers (e.g., trichloroethylene,
TCE). This EIP does not represent EPA policy or
guidance.
1. PURPOSE AND SUMMARY
This EIP summarizes the state of the science on
selecting and using indoor treatment technology for
VOCs, also known as air treatment units (ATUs).
When selected and operated correctly, ATUs remove
VOCs from indoor air to keep their concentrations
below specified limits. This paper describes the
2 Adsorption-based Treatment Systems
different types of commercially available VOC ATUs,
how they work, and what factors influence their
effectiveness. This EIP also provides information on
how to select, install, operate, and monitor VOC
ATUs to meet indoor air quality objectives.
2. INTRODUCTION
The focus of this EIP is Comprehensive
Environmental Response, Compensation, and
Liability Act (CERCLA), known also as Superfund,
and Resource Conservation and Recovery Act
(RCRA) sites with VOCs in indoor air as the
contaminants of concern. The ATU technologies
described in this EIP can be applied when indoor air
VOC concentrations exceed specified limits, including
sites where VOCs are entering a building from a
subsurface source, commonly known as vapor
intrusion (VI). The technology can also be applied
when the VOCs are entering the building from
groundwater, for example in sumps.
One of the more common applications of VOC
ATUs is when a temporary reduction of indoor air
VOC concentrations is needed while a longer-term
solution is put in place. One example of this situation
would be using an ATU while a subslab
depressurization mitigation system is installed at a VI
site (and ultimately soil and groundwater remediation
is implemented to eliminate the need for indoor air
mitigation). In these cases, portable ATUs can be
deployed for weeks or months while the longer-term
solution is designed, permitted, and constructed.
Similarly, VOC ATUs can be used to reduce indoor
air VOC concentrations while possible sources of the
VOCs of concern are investigated.
This EIP surveys the available literature to address
five aspects of VOC ATU use: (1) What research has
been conducted on VOC ATUs that demonstrate
their effectiveness in removing chlorinated VOCs
from indoor air? (2) What VOC ATUs are
commercially available, how do they work, and what
are the recommended protocols, performance goals,
and monitoring for their use? (3) Based on available
ACRONYMS AND ABBREVIATIONS
ACH air exchanges per hour
ATU air treatment unit
AHAM Association of Home Appliance Manufacturers
AIC acid-impregnated carbon
AS air sparging
ASHRAE American Society of Heating, Refrigerating and Air-Conditioning Engineers
BIC base-impregnated carbon
CADR Clean Air Delivery Rate (from AHAM room air cleaner test)
CARB California Air Resource Board
CERCLA Comprehensive Environmental Response, Compensation, and Liability Act
CFM cubic feet per minute
DQO data quality objective
EIP Engineering Issue Paper
EPA U.S. Environmental Protection Agency
GAC granular activated carbon
HEPA high-efficiency particle air filter
HVAC heating, ventilation, and air conditioning
IH imminent hazard
ISO International Standards Organization
MEK methyl ethyl ketone
NIST National Institute of Standards and Technology
PCE perchloroethylene, tetrachloroethylene, or tetrachloroethene, also PERC
PCO photocatalytic oxidation
PPB parts per billion
PPIA potassium permanganate impregnated alumina
PPM parts per million
RH relative humidity
RCRA Resource Conservation and Recovery Act
SSD subslab depressurization
SVE soil vapor extraction
TCE trichloroethylene or trichloroethene
TCLP EPA’s Toxicity Characteristic Leachate Procedure
UV ultraviolet light
VI vapor intrusion
VOC volatile organic compound
Adsorption-based Treatment Systems 3
test results, how effective are commercially available
VOC ATU technologies at removing or destroying
chlorinated VOCs from indoor air? (4) What are the
building- and unit (device)-specific factors that
influence VOC ATU performance? and (5) How
should VOC ATUs be selected, installed, and
maintained in a particular building? The paper also
identifies knowledge gaps that interfere with the
ability to answer these questions and recommends
research needs to fill these gaps.
3. AIR TREATMENT SYSTEM BASICS
3.1 Classes of Commercially Available Treatment Units
ATUs for removing gas phase contaminants from
indoor air use many different technologies and come
in designs intended for standalone operation (as
portable, wall-mounted, or ceiling-mounted units) or
for installation in heating, ventilation, and air
conditioning (HVAC) ducts. The most common
VOC air cleaning technology in either design employs
a sorbent bed, or sorbent layer, usually composed of
carbon, to remove gas phase contaminants from the
air. Reactive ATUs, which use various chemical
reactions to change or breakdown the contaminants
into other compounds, are also commercially
available.
For the removal of the VOCs that are important for
VI (i.e., chlorinated compounds like trichloroethylene
and perchloroethylene), the most-demonstrated
technology at this time—and the primary focus of
this document—is carbon sorption, preferably with a
large amount of carbon relative to the air flowrate
needed. The principles and performance of other
commercially available technologies (e.g.,
photocatalytic oxidation) that may be proposed for
VOC control will also be briefly discussed.
Standalone devices use fans to pull room air into the
unit, through a sorbent bed, and back into the same
room after the air is “cleaned.” Portable versions of
standalone devices are plugged into wall outlets and
can be easily moved. Wall- and ceiling-mounted units
that can be hard wired for power are also available.
HVAC ATUs, also called in-duct systems, are
normally installed in existing HVAC ducts or outside
the duct system but connect to it. The air from the
contaminated room enters the HVAC duct, possibly
after passing through other rooms on the way to the
return air duct inlet, and is decontaminated by the in-
duct ATU before being redistributed throughout the
building. In-duct devices often do not require a
dedicated power supply because the HVAC fan forces
the air through the device.
Each class of ATU has its advantages and
disadvantages, so it is important to understand your
situation, contaminants, humidity variability and
range, temperature, airflow needs, and other related
factors before choosing an ATU. Many devices are
sold without full unit test data and some are sold
without any test data. The lack of test data requires
the user to understand the principles of operation to
evaluate how well the technology, in the configuration
being sold, is likely to function for their needs.
Without test data, the person selecting the ATU and
designing its installation must be knowledgeable of
indoor air quality assessment and maintenance. A
professional engineer can assist in assessing unit
selection.
3.2 Adsorption Principles and Performance
3.2.1 Adsorption Principles
Two types of adsorption occur in ATUs:
physisorption and chemisorption. In physisorption,
compounds collect on the sorbent surface due to van
der Waals forces and other relatively weak binding
forces, and remain there until they are desorbed. Both
the sorbed compound and the sorbing surface remain
the same—no irreversible chemical changes occur.
Physisorption systems can have single use or
regenerable sorbents. Desorption (i.e., release of the
chemical) can be intentional in a regeneration process
or may occur because of significant changes in
conditions (such as temperature, humidity, or
4 Adsorption-based Treatment Systems
chemicals adsorbed) that prevailed after the original
adsorption. In chemisorption, the adsorbed
compound collects on the surface but reacts with the
surface irreversibly so that desorption is not possible.
This permanently removes the contaminant from the
airstream but also consumes the surface of the
sorbent (American Society of Heating, Refrigerating
and Air-Conditioning Engineers [ASHRAE], 1994).
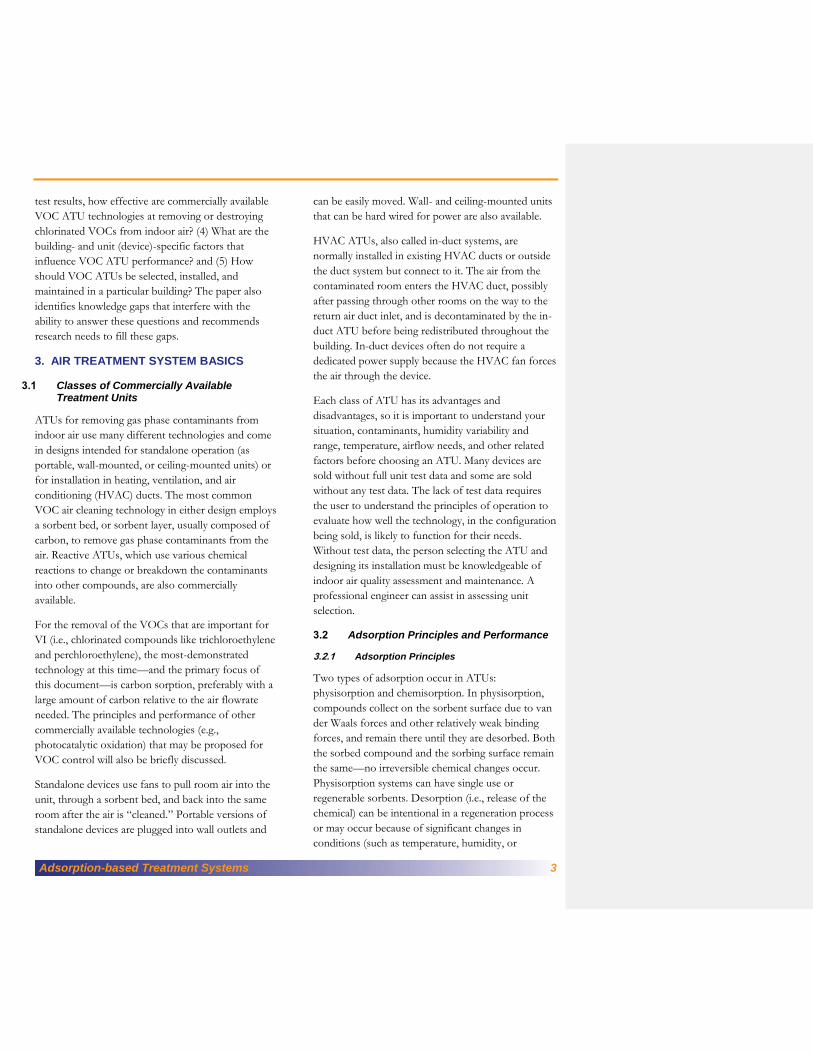
Sorption occurs at a molecular level when VOC
molecules contact the sorbent surface due to
Brownian (or random) motion, as energetic molecules
move from a higher concentration in the air near the
sorbents to the relatively low concentration air in the
boundary layer at the surface of the sorbent (Figure
1). Advective currents (i.e., airflow), whether natural
or fan induced, bring contaminants into range where
this Brownian motion can become important.
Effective sorbents tend to have large surface areas
due to the presence of micropores. According to
ASHRAE (1994), “one gram of 1.5 mm diameter
carbon spheres would have an external surface area of
about 0.01 m2, which is only a small fraction of the
total adsorption surface of 1,000 to 1,500 m2/g.”
Figure 1. Diagram illustrating sorption of VOCs by solid, porous sorbent granules
The most common sorbent in use for air cleaning is
granular activated carbon (GAC). For VOCs,
including the chlorinated hydrocarbons most
frequently encountered at VI sites, carbon acts as a
physisorbent. When the concentration of a
compound in the air goes down, the sorbed
contaminant may desorb due to the concentration
gradient driving force.
Carbon sorbents are usually placed in beds, or layers,
where small granules of carbon are held in place in a
confined space with mesh to allow airflow and
contact with the sorbent surface. Within these beds,
the sorbents are often described by their particle size.
The particle size is often expressed in “mesh” units
that refer to the sieves that pass or retain a given
particle size. For example, in 8×30 mesh GAC, at
least 96% of the granules by weight are larger than 30
mesh (0.60 mm) and at least 85% of the granules by
weight are smaller than 8 mesh (2.36 mm). Other
GAC sizes include 12×40 US mesh (0.42 to 1.70 mm)
and 6×16 US mesh (1.18 to 3.35 mm).
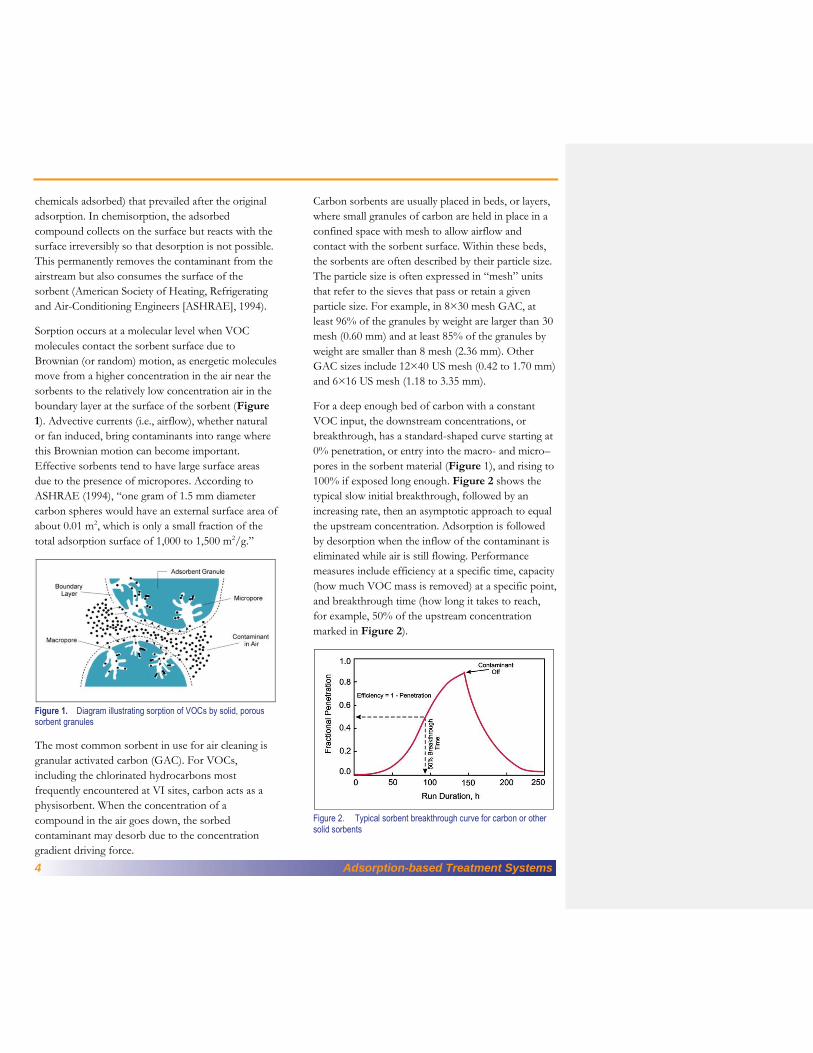
For a deep enough bed of carbon with a constant
VOC input, the downstream concentrations, or
breakthrough, has a standard-shaped curve starting at
0% penetration, or entry into the macro- and micro–
pores in the sorbent material (Figure 1), and rising to
100% if exposed long enough. Figure 2 shows the
typical slow initial breakthrough, followed by an
increasing rate, then an asymptotic approach to equal
the upstream concentration. Adsorption is followed
by desorption when the inflow of the contaminant is
eliminated while air is still flowing. Performance
measures include efficiency at a specific time, capacity
(how much VOC mass is removed) at a specific point,
and breakthrough time (how long it takes to reach,
for example, 50% of the upstream concentration
marked in Figure 2).
Figure 2. Typical sorbent breakthrough curve for carbon or other solid sorbents
Adsorption-based Treatment Systems 5
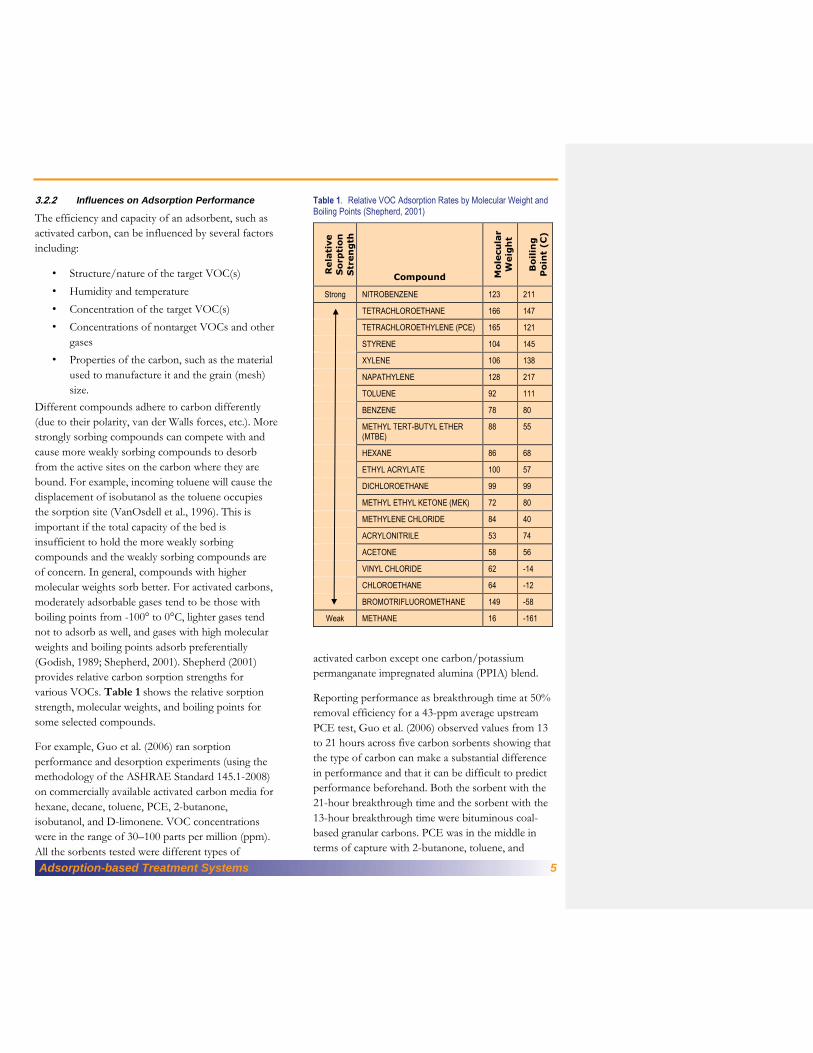
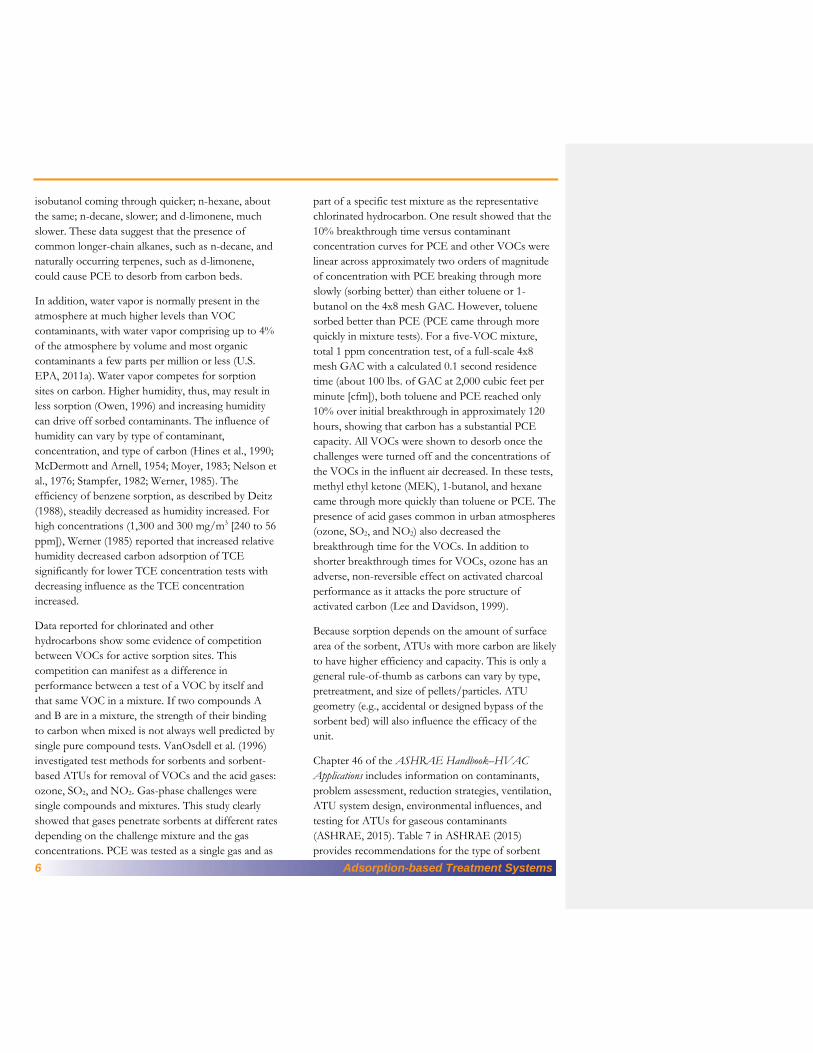
3.2.2 Influences on Adsorption Performance
The efficiency and capacity of an adsorbent, such as
activated carbon, can be influenced by several factors
including:
• Structure/nature of the target VOC(s)
• Humidity and temperature
• Concentration of the target VOC(s)
• Concentrations of nontarget VOCs and other
gases
• Properties of the carbon, such as the material
used to manufacture it and the grain (mesh)
size.
Different compounds adhere to carbon differently
(due to their polarity, van der Walls forces, etc.). More
strongly sorbing compounds can compete with and
cause more weakly sorbing compounds to desorb
from the active sites on the carbon where they are
bound. For example, incoming toluene will cause the
displacement of isobutanol as the toluene occupies
the sorption site (VanOsdell et al., 1996). This is
important if the total capacity of the bed is
insufficient to hold the more weakly sorbing
compounds and the weakly sorbing compounds are
of concern. In general, compounds with higher
molecular weights sorb better. For activated carbons,
moderately adsorbable gases tend to be those with
boiling points from -100° to 0°C, lighter gases tend
not to adsorb as well, and gases with high molecular
weights and boiling points adsorb preferentially
(Godish, 1989; Shepherd, 2001). Shepherd (2001)
provides relative carbon sorption strengths for
various VOCs. Table 1 shows the relative sorption
strength, molecular weights, and boiling points for
some selected compounds.
For example, Guo et al. (2006) ran sorption
performance and desorption experiments (using the
methodology of the ASHRAE Standard 145.1-2008)
on commercially available activated carbon media for
hexane, decane, toluene, PCE, 2-butanone,
isobutanol, and D-limonene. VOC concentrations
were in the range of 30–100 parts per million (ppm).
All the sorbents tested were different types of
Table 1. Relative VOC Adsorption Rates by Molecular Weight and Boiling Points (Shepherd, 2001)
Rela
tive
Sorp
tion
Str
en
gth
Compound Mole
cu
lar
Weig
ht
Boil
ing
Poin
t (C
)
Strong NITROBENZENE 123 211
TETRACHLOROETHANE 166 147
TETRACHLOROETHYLENE (PCE) 165 121
STYRENE 104 145
XYLENE 106 138
NAPATHYLENE 128 217
TOLUENE 92 111
BENZENE 78 80
METHYL TERT-BUTYL ETHER (MTBE)
88 55
HEXANE 86 68
ETHYL ACRYLATE 100 57
DICHLOROETHANE 99 99
METHYL ETHYL KETONE (MEK) 72 80
METHYLENE CHLORIDE 84 40
ACRYLONITRILE 53 74
ACETONE 58 56
VINYL CHLORIDE 62 -14
CHLOROETHANE 64 -12
BROMOTRIFLUOROMETHANE 149 -58
Weak METHANE 16 -161
activated carbon except one carbon/potassium
permanganate impregnated alumina (PPIA) blend.
Reporting performance as breakthrough time at 50%
removal efficiency for a 43-ppm average upstream
PCE test, Guo et al. (2006) observed values from 13
to 21 hours across five carbon sorbents showing that
the type of carbon can make a substantial difference
in performance and that it can be difficult to predict
performance beforehand. Both the sorbent with the
21-hour breakthrough time and the sorbent with the
13-hour breakthrough time were bituminous coal-
based granular carbons. PCE was in the middle in
terms of capture with 2-butanone, toluene, and
6 Adsorption-based Treatment Systems
isobutanol coming through quicker; n-hexane, about
the same; n-decane, slower; and d-limonene, much
slower. These data suggest that the presence of
common longer-chain alkanes, such as n-decane, and
naturally occurring terpenes, such as d-limonene,
could cause PCE to desorb from carbon beds.
In addition, water vapor is normally present in the
atmosphere at much higher levels than VOC
contaminants, with water vapor comprising up to 4%
of the atmosphere by volume and most organic
contaminants a few parts per million or less (U.S.
EPA, 2011a). Water vapor competes for sorption
sites on carbon. Higher humidity, thus, may result in
less sorption (Owen, 1996) and increasing humidity
can drive off sorbed contaminants. The influence of
humidity can vary by type of contaminant,
concentration, and type of carbon (Hines et al., 1990;
McDermott and Arnell, 1954; Moyer, 1983; Nelson et
al., 1976; Stampfer, 1982; Werner, 1985). The
efficiency of benzene sorption, as described by Deitz
(1988), steadily decreased as humidity increased. For
high concentrations (1,300 and 300 mg/m3 [240 to 56
ppm]), Werner (1985) reported that increased relative
humidity decreased carbon adsorption of TCE
significantly for lower TCE concentration tests with
decreasing influence as the TCE concentration
increased.
Data reported for chlorinated and other
hydrocarbons show some evidence of competition
between VOCs for active sorption sites. This
competition can manifest as a difference in
performance between a test of a VOC by itself and
that same VOC in a mixture. If two compounds A
and B are in a mixture, the strength of their binding
to carbon when mixed is not always well predicted by
single pure compound tests. VanOsdell et al. (1996)
investigated test methods for sorbents and sorbent-
based ATUs for removal of VOCs and the acid gases:
ozone, SO2, and NO2. Gas-phase challenges were
single compounds and mixtures. This study clearly
showed that gases penetrate sorbents at different rates
depending on the challenge mixture and the gas
concentrations. PCE was tested as a single gas and as
part of a specific test mixture as the representative
chlorinated hydrocarbon. One result showed that the
10% breakthrough time versus contaminant
concentration curves for PCE and other VOCs were
linear across approximately two orders of magnitude
of concentration with PCE breaking through more
slowly (sorbing better) than either toluene or 1-
butanol on the 4x8 mesh GAC. However, toluene
sorbed better than PCE (PCE came through more
quickly in mixture tests). For a five-VOC mixture,
total 1 ppm concentration test, of a full-scale 4x8
mesh GAC with a calculated 0.1 second residence
time (about 100 lbs. of GAC at 2,000 cubic feet per
minute [cfm]), both toluene and PCE reached only
10% over initial breakthrough in approximately 120
hours, showing that carbon has a substantial PCE
capacity. All VOCs were shown to desorb once the
challenges were turned off and the concentrations of
the VOCs in the influent air decreased. In these tests,
methyl ethyl ketone (MEK), 1-butanol, and hexane
came through more quickly than toluene or PCE. The
presence of acid gases common in urban atmospheres
(ozone, SO2, and NO2) also decreased the
breakthrough time for the VOCs. In addition to
shorter breakthrough times for VOCs, ozone has an
adverse, non-reversible effect on activated charcoal
performance as it attacks the pore structure of
activated carbon (Lee and Davidson, 1999).
Because sorption depends on the amount of surface
area of the sorbent, ATUs with more carbon are likely
to have higher efficiency and capacity. This is only a
general rule-of-thumb as carbons can vary by type,
pretreatment, and size of pellets/particles. ATU
geometry (e.g., accidental or designed bypass of the
sorbent bed) will also influence the efficacy of the
unit.
Chapter 46 of the ASHRAE Handbook–HVAC
Applications includes information on contaminants,
problem assessment, reduction strategies, ventilation,
ATU system design, environmental influences, and
testing for ATUs for gaseous contaminants
(ASHRAE, 2015). Table 7 in ASHRAE (2015)
provides recommendations for the type of sorbent
Adsorption-based Treatment Systems 7
media to use for different VOCs. Sorbents included
are GAC, PPIA, acid-impregnated carbon (AIC), and
base-impregnated carbon (BIC). GAC is the first
choice for dichlorobenzene, dichlorofluoromethane,
PCE, and 1,1,1 trichloroethane. PPIA is listed second
for TCE and as an alternate first for 1,1,1
trichloroethane. However, recent (June and July 2016)
contacts with manufacturers by e-mail and at the June
2016 ASHRAE meeting gave only GAC as the
recommended sorbent for chlorinated hydrocarbons.
3.3 Photocatalytic Oxidation
Photocatalytic oxidation (PCO) refers to a type of
reactive ATU that uses light and catalysts to react
VOCs in the air into other species. Typically, these
devices are called UV-PCO for the ultraviolet light
used with photocatalytic oxidation. Specific devices
may be designed for different specific wavelengths
and this could influence performance. The usual
catalyst is titanium dioxide (TiO2).
PCO technology has been studied extensively at the
lab scale and to some extent at full scale (room sized
and up to units designed to treat a full building).
Although some studies show that—given enough air
passes (recirculation) through the devices—many
contaminants can be broken down to CO2 and water,
most studies show that intermediate oxidation
byproducts are formed, including aldehydes (such as
formaldehyde), acetone, and even phosgene. The
current commercial implementations of this
technology achieve multiple passes by discharge to
the room air where the byproducts may be breathed
in before re-entrainment to the device of some of the
room air (Hodgson et al., 2005; Jo and Park, 2004;
Mo et al., 2009).
In real-world situations, it is impossible to know
ahead of time exactly what VOCs and other gases will
be present in the indoor air to be treated. Reactions in
the PCO devices may result from compounds in the
air other than the targeted VI compounds. VOCs like
chlorinated solvents, benzene, and other petroleum
hydrocarbons are always present in the indoor and
ambient atmosphere even in rural areas and remote
sites (Kesselmeier and Staudt, 1999; Weisel et al.,
2008). Thus, it is nearly impossible to predict which
intermediaries will be formed without sampling and
analyzing the indoor air. Because intermediate
products become part of the breathing air in the
room or building being treated, and may have low
indoor-air screening levels, they must be considered
potentially as dangerous or more dangerous than the
original contaminants of concern (Alberici et al.,
1998; Hodgson et al., 2005, 2007; Kropp, 2014). In
short, there have not been enough field
demonstrations in complex real indoor atmospheres
to fully evaluate whether any observed destruction of
target VOCs outweighs the formation of undesirable
reaction byproducts by PCO devices.
Some PCO devices are ineffective or produce
excessive ozone. California maintains lists of ATUs
that are “potentially hazardous” because of ozone
generation along with the devices that they certify.
Kropp (2014) studied on-the-market PCO devices in
a small (580 L) chamber. Of the five devices studied,
three did not appreciably reduce the concentration of
the target contaminant. The fourth removed
contaminants, but the sorbent bed it contained
performed similarly with the UV light function turned
off. The fifth device destroyed dichlorobenzene over
time and did not make phosgene. Byproducts formed
by these devices included acetone, acetaldehyde, and
formaldehyde.
A lab-scale study by Alberici et al. (1998) also showed
destruction of compounds and creation of
intermediate byproducts. They examined byproducts
of UV-PCO (TiO2/UV) degradation of TCE, PCE,
chloroform, and dichloromethane at various humidity
levels. Among the byproducts they detected were
phosgene for TCE, PCE, and chloroform;
dichloroacetyl chloride for TCE; and trichloroacetyl
chloride for PCE. Chlorine gas (Cl2) was also detected
as a final product. Alberici et al. (1998) also showed
that increasing the relative humidity (RH) from 20%
to 80% decreased the destruction from close to 100%
to 70% for a 30-minute exposure.

8 Adsorption-based Treatment Systems
Hodgson et al. (2005) generated extensive data on the
destruction of low concentration multicomponent
VOC mixtures by UV-PCO in a 20 m3 chamber.
Byproducts found included formaldehyde,
acetaldehyde, acetone, formic acid, and acetic acid.
These compounds were found at low levels, given
that the inlet concentrations were also low level. In a
study with a gas mixture intended to be similar to the
Hodgson et al. (2005) study, but done in an HVAC
test duct, RTI (2009) tested a different UV-PCO unit
and showed very small statistically significant
differences between upstream and downstream VOC
concentrations with some removal of several
compounds. In a follow-on study, Hodgson et al.
(2007) looked at chemisorbent scrubbers downstream
of the UVPCO device to reduce the production of
formaldehyde and acetaldehyde and found that the
combination “effectively counteracted the generation
of formaldehyde and acetaldehyde due to incomplete
oxidation of VOCs in the UVPCO reactor.”
UV-PCO units are often not tested for efficacy or
byproduct formation, in part due to the lack of
standard test methods. Devices may be sold based on
lab-scale or similar device testing, or performance
expectations may simply be based on the presence of
the catalyst and UV light. Therefore, a UV-PCO
device should not be used for VI remediation in
occupied spaces unless test results are available that
demonstrate efficiency and the lack of toxic
byproduct formation for the conditions in the indoor
spaces being treated. Other reactive devices (such as
bipolar ionization and plasma-based units) have
essentially the same positives and negatives as the
UV-PCO units discussed above.
3.4 Other Air Treatment Unit Types
Other types of ATUs based on ozone generation,
chemisorption, or biofiltration are available for use
for indoor air VOC mitigation but further testing is
required because they are mechanistically unsuitable,
lack reliable performance data, or may have negative
1 https://www.arb.ca.gov/research/indoor/o3g-list.htm
effects. They are presented in short form in this
section to cover devices that might be proposed or
considered for use at sites with VI applications. As
described below, these technologies have not been
adequately tested for VOCs nor for the applications
described in this document.
Although ozone generators may remove
contaminants by oxidation, they are concerns with
their use because of the dangers of ozone itself. As
stated in a previous EPA EIP (U.S. EPA, 2008):
“regulatory agencies have taken strong positions to
warn of potential problems with air cleaners
dependent on ozone generation…Methods that inject
ozone into the breathing space of the indoor
environment cannot be recommended as an air
cleaning technique, as ozone is a criteria pollutant.
The state of California has banned the sale of
residential ozone producing air cleaners effective in
2009.” The California Air Resource Board (CARB)
has a long list of devices under the heading
“Potentially Hazardous Ozone Generators Sold as Air
Purifiers.”1 CARB also certifies other air cleaning
devices as being electrically safe and having low
ozone generation (CARB, 2016).2
Some ATUs are marketed as “ion generators.” The
most common application of the ion generator
concept is particulate removal (Shaughnessy et al.,
1994), which is beyond the scope of this document.
Chemisorbent beds of permanganate, usually in the
form of PPIA, oxidize some airborne contaminants.
However, PPIA is not recommended for use with
chlorinated hydrocarbons, in part, because of
potential byproducts including hydrochloric acid
(Aguado et al., 2004; ASHRAE, 1994; VanOsdell et
al., 1996).
Biofiltration works by having plants or microbes
digest contaminants. These devices need to be
specifically planned for the specific compounds to be
removed from air, usually need stabilizing time for
2 https://www.arb.ca.gov/research/indoor/aircleaners/certified.htm

Adsorption-based Treatment Systems 9
microbes to self-select for ones that thrive on
particular contaminants, and may be slow working
(Guieysse et al., 2008). They have not been tested for
the applications discussed in this document.
3.5 Multiple Technology Air Treatment Units
Many commercially available ATUs include multiple
technologies and address both particulates and gases.
Frequently, a gas-phase device will add a particle filter
before and/or after a sorbent bed. Sorbent media may
also be affixed to fibers in combination gas-particle
filters. Multiple technology systems should be
evaluated based on an understanding of the effects of
their component parts. ATUs with particle filtration
before a carbon bed would be expected to behave for
VOCs as well or better as systems with carbon beds
alone, as the filters can prevent the carbon bed from
being fouled by particulate matter. Technologies that
use particle filtration ahead of UV-PCO would be
expected to be subject to most of the same
weaknesses as UV-PCO–only systems in VOC
removal applications because background VOCs
would be not be filtered out and could form reaction
byproducts in the UV-PCO unit. A unit with a
reaction chamber, such as UV-PCO, ahead of a
carbon bed is likely to be acceptable if there is
sufficient carbon or other sorbent(s) to adsorb the
reaction byproducts (e.g., formaldehyde, acetone,
acetic acid, and acetaldehyde).
3.6 System Sizes and Geometries
Air treatment units are available in a wide variety of
capacities and configurations. Treatment capacity is
typically rated as the airflow rate in cubic feet per
minute. However, units with similar airflow ratings
may differ in air treatment capacity due to different
treatment efficiencies resulting from such factors as
the type of sorbent material and air-sorbent contact
time within the units. At present, manufacturers do
not publish information on treatment efficiency using
a standardized method so comparisons are difficult.
For comparison within this EIP, treatment capacity is
assessed as airflow through the device.
Attachment A summarizes information about a wide
range of ATU equipment. The listed ATUs fall into
the following main categories: portable units and
built-in units intended for permanent or
semipermanent installation. Built-in units are
connected to existing HVAC duct work while
portable units are generally freestanding units that
withdraw air from the room, treat it, and discharge it
into the same room. Various systems are available
within each of these categories.
3.6.1 Sizing an Air Treatment Unit
The size of an ATU needs to be understood in the
context of the air exchange rate of the room, zone, or
building into which it is being installed. The air
exchange rate is the ratio of the airflow through the
building to the building volume, and is generally
expressed in units per hour, the number of air
exchanges per hour (ACH). EPA gives a 50th
percentile air exchange rate for residences of 0.45
ACH (U.S. EPA, 2011b). Commercial and
institutional buildings have design requirements for
air exchange that are expressed per person or per unit
area of building (International Code Council, 2009).
Those requirements typically result in air exchange
rates above four for many types of commercial and
institutional buildings (Engineering Toolbox, n.d.).
Larger buildings are typically divided into multiple
zones for heating or cooling, often defined as areas in
which temperature can be separately controlled often
by a single thermostat (Grondzik and Furst, 2000).
Building mechanical system designers generally seek
to create a “well-mixed” condition within each zone
for thermal comfort, which also plays an important
role in determining the effectiveness of a localized
ATU device within the zone (Howard-Reed et al.,
2008a, b; Int-Hout, 2015).
3.6.2 Portable Air Treatment Units
Most of the portable units listed in Attachment A are
smaller types weighing less than 100 pounds. These
units run off 110-volt current and have wall plugs.
Airflows range from less than 100 cfm up to

10 Adsorption-based Treatment Systems
approximately 600 cfm. Assuming a residential
example, with a normal air exchange rate of one
exchange per hour or less, a targeted treatment air
exchange rate through the ATU of four
exchanges/hour might be selected if significant
subslab or indoor sources of VOCs are expected to
be present. Thus, in a 10-ft ceiling space up to 900 ft2,
a 600-cfm unit could be used (see Section 5.3 for
further information on these types of calculations).
When selecting air flows, attention should also be
paid to a comfortable air velocity through the room
(ASHRAE, 2009) as well as the need for complete
mixing within the zone if the entire zone is to be
treated by a portable unit. This estimate will differ
from the treatment area estimates provided by the
manufacturers, but currently there are no standard
methods by which manufacturers estimate and report
this information.
Some larger portable units are listed in Attachment A.
These wheel- or cart-mounted units also run off 110-
volt current and have wall plugs. The listed airflows
are up to 2,000 cfm. Using the assumption applied
above, a 2,000-cfm unit could treat up to 3,000 ft2 in a
single well-mixed zone with a normal air exchange
rate of one per hour or less. One of the larger
portable units is optionally ductable, allowing
placement of the unit outside of the space being
treated. Alternatively, a large space could be treated
with multiple smaller units.
3.6.3 Built-in Air (Ducted) Air Treatment Units
Many types of built-in units are commercially
available (Attachment B). These devices are intended
for placement outside the space being treated, for
example in a drop-ceiling space or utility room, and
connected to an HVAC duct system or separately
ducted for outdoor discharge. The units with separate
ducts are hard-wired into the building’s electrical
system and run off 110- or 220-volt current
depending on the model. Airflows range from less
than 100 cfm up to 10,000 cfm. HVAC-mounted
units are approximately the cross section of the
ductwork and 1–12 inches in depth. The airflow will
depend on the fan in the HVAC system and, thus, no
separate power source is required.
4. PERFORMANCE DATA AND
SPECIFICATIONS
Information that a user should consider for ATU
design includes airflow (for portable units), pressure
drop (for duct-mounted units), VOC removal
efficiency, sorbent capacity/lifetime, reliability and
uptime, noise levels, power usage, physical
dimensions, and weight. Many of these details are
cited on sales Websites and on the product’s
packaging. Care is needed in interpreting data that
may not have been measured in the same way.
Available specification data for the reviewed devices
are summarized in Attachments A and B. Key testing
criteria include:
Total Airflow: For portable and many wall-mounted
devices, total air flow is the volumetric flow rate (in
cubic feet per minute) at which air is pulled from,
treated, and returned to the room. For duct-
connected devices with their own fan, this is the
volumetric flow rate at which air is treated. For
HVAC-mounted devices that do not have their own
fan, the airflow is usually determined at the air
handler of the HVAC system that the device is
installed in. Total airflow information should be
available for any portable device in any standard
catalog listing, from the packaging, and from
distributors. Important considerations for the user
include being sure that the flow configuration of a
device fits the needs of the project and that device
inlets and outlets are not obstructed.
Clean Air Delivery Rate (CADR): For portable
devices, CADR is the amount of 100% clean air that
is delivered by an ATU when tested using the
Association of Home Appliance Manufacturers
(AHAM, 2015) test method for specific types of
particles. An ATU with an airflow of 100 cfm and an
efficiency of 50% would have a CADR of 50 cfm.
The particulate CADR does not indicate whether a
unit can clean VOCs from the air. However, unit
Adsorption-based Treatment Systems 11
testing for VOC removal can provide a VOC
CADR-like value based on similar measurements
and calculations.
Pressure Drop (or Resistance): For HVAC-
mounted devices, this is a measure of how difficult it
is to push or pull air through the device. A higher-
pressure drop may reduce airflow and increase energy
costs. Pressure drop is usually reported in inches of
water (in. H2O) in the United States. HVAC devices
intended for commercial buildings will have rated
airflow and pressure drop. These are usually on the
product label and will be available from the
distributor or manufacturer.
Removal Efficiency: Removal efficiency is the
percentage of a contaminant that is removed by the
device (outlet inlet 100). Removal efficiency may
change over time, with temperature and humidity
changes, and for different concentrations of VOCs in
the inlet air. Penetration is the inverse of efficiency:
efficiency = 100% (1 penetration). Removal
efficiency across the unit is not the same as the
achieved change in concentration in the indoor
environment in which the unit is operating.
Capacity: The mass of a compound that a device can
remove under specific conditions.
Reliability and Uptime: A typical metric of
reliability is the mean time between failures (Myrefelt,
2004) or availability as a percentage as uptime divided
by total time (Murphy and Morgan, 2006).
Noise Level: How loud a device will be, usually
reported for the highest airflow setting in decibels.
Power Usage: How much power the device requires,
often measured in watts or kilowatt hours. Some
devices report this as likely annual usage.
Dimensions: How wide, deep, and tall a device is.
Weight: For portable units, this could be the unit
without the filters, with filter weight reported
separately.
4.1 Laboratory and Chamber Tests for Efficiency and Capacity
Standardized laboratory test methods for ATUs fall
into two main categories: HVAC/in-duct and room.
ASHRAE 145.2-2011 Laboratory Test Method for
Assessing the Performance of Gas-Phase Air-Cleaning
Systems: Air-Cleaning Devices (ASHRAE, 2011) specifies
how to test HVAC/in-duct sorbent devices. Each test
uses a single contaminant in otherwise clean air as the
challenge. The initial efficiency, 1-hour, low
concentration, section is followed by the 4-hr, high
concentration, capacity test. After the challenge gas is
turned off, potential desorption is monitored for up
to 30 minutes. This test is performed at one
temperature/RH combination. This test allows
comparison of ATUs under controlled conditions for
pressure drop (resistance), clean filter efficiency,
capacity, and presence of desorption (ASHRAE,
2011). This test has recommended compounds for
many chemical categories. ASHRAE 145.2 does not
have a suggested gas mixture test, and it does not
require testing for reaction products. Standing
Standard Project Committee 145, the committee
responsible for ASHRAE 145.2, is currently
considering changes to add reactive devices and
reaction product analysis. However, this is likely to
take years to incorporate and get approved as a new
version of the method. International Standards
Organization (ISO) 10121 is a similar test to the
current ASHRAE 145.2 with somewhat different
concentration levels suggested (ISO, 2014). These
tests are performed at the manufacturer’s stated
airflow, so the airflow for a given pressure drop is
reported. In addition, a description of the device,
including dimensions, is required.
For portable and wall- or ceiling-mounted room
ATUs, the U.S. standard for particle removal is
usually the AHAM standard (AHAM, 2015). A room
unit is placed in a closed chamber with no airflow
through the chamber. The change in concentration
(the decay rate) is determined with the device on and
off (as a control). Comparison of these values and
12 Adsorption-based Treatment Systems
accounting for the size of the room, leads to a CADR
as the output.
The methodology used in this test can be used to test
gas-phase filters if a gaseous contaminant and
analyzer are substituted in place of the particles and
particle analyzer. The National Research Council
Canada: NRCC-54013 Method for Testing Portable Air
Cleaners (NRCC, 2011) and the Professional Standard
of the Republic of China: Test of Pollutant Cleaning
Performance of Air Cleaners (PRC, 2010) implement this
approach. Some of the specifics are different, but the
essence of on/off decay rate comparisons is the basis
for this method. Other than the inclusion of ozone
testing in the Chinese method, these methods do not
call for testing reaction byproducts. However, it is
simple to add analysis for expected reaction
byproducts (although it may be difficult to predict
which compounds to look for). As an example of this
approach to testing, Chen et al. (2005) used this
approach in addition to single-pass efficiency
reporting. Output from tests of these types can be
used in modeling, as discussed later in this document,
either as the amount of clean air entering the room or
by separating the information into a device airflow
amount and a removal efficiency. Note that the clean
air rate and the efficiency will change over time in
long-term operations even if this is not observed in a
short-term laboratory test.
Filter/technology combinations from room ATUs
may also be tested for single-pass efficiency in a test
duct. This can be done by removing the
filter/technology from the housing and fan assembly
or by installing the whole device in a duct and
matching the duct airflow to the device’s airflow rate.
This would be a non-standard use of a test method,
but can give useful data on the device. Some devices
can use different filters, so it is a good idea to be sure
that any test or in situ data that are reported are based
on the filters that will be installed.
In a laboratory study of five on-the-market gas-phase
ATUs, Owen et al. (2014a and b) ran ASHRAE
Method 145.2 tests on HVAC ATUs with sorbent
amounts ranging from under an ounce to 48 pounds.
Table 2 gives descriptions of the devices. These
ATUs were chosen with the expectation that they
would show a variety of results from low to high
removal efficiency across different test VOCs. The
VOC challenge gases in this study (toluene, hexane,
and formaldehyde) were tested separately as required
by the method. Also as required by the test method,
the initial efficiency portion of the tests was
performed at a gas concentration of 400 parts per
billion (ppb) for 1 hour. The capacity portion of the
test has the challenge level at 50 ppm for toluene and
25 ppm for hexane and exposure for up to 4 hours.
Formaldehyde was tested for only the initial efficiency
portion at 100 ppb.
The test results show that the different ATUs have
significantly different performance when compared to
each other and for different compounds. For most
ATUs, the efficiency was stable over the initial
efficiency test period; however, the efficiency
dropped for some. The reported initial efficiency
percentage is the average over the hour of the test.
For the capacity test, the efficiency is reported at
intervals over the course of the test, which runs for 4
hours or to less than 5% efficiency, whichever comes
first. The capacity is the calculated amount of the
challenge gas that the ATU captures during this test;
it is not adjusted by any desorption seen after the
challenge gas is turned off.
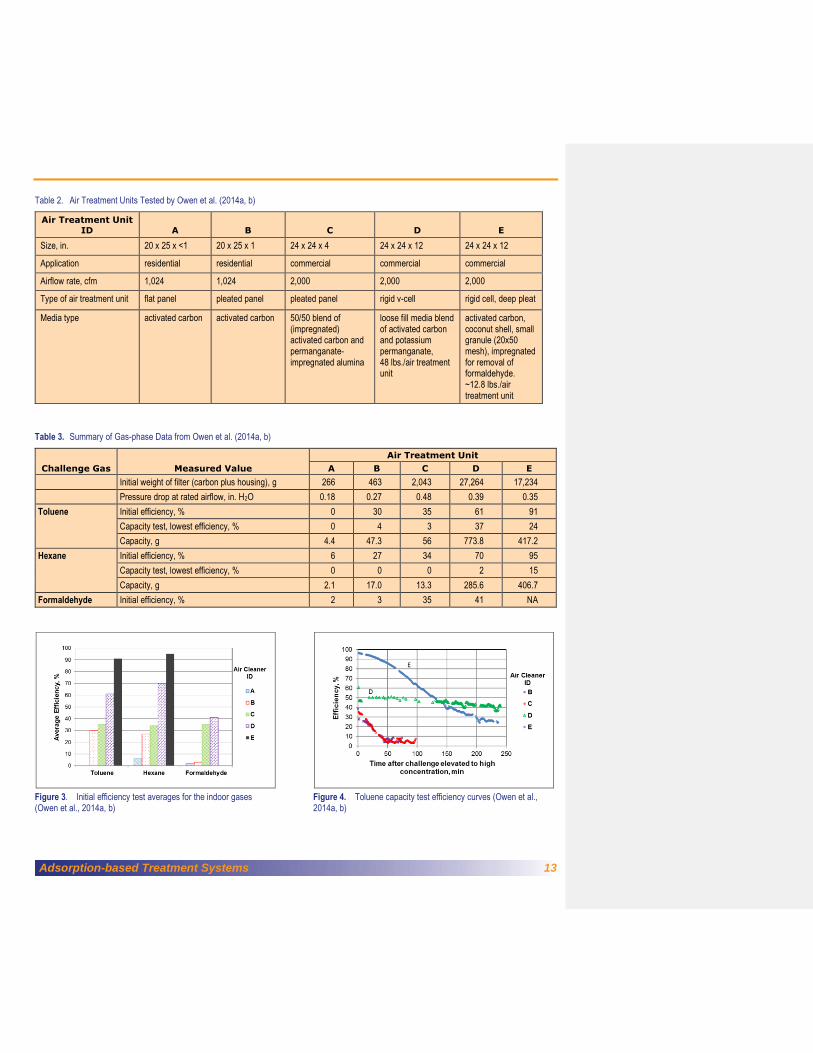
Table 3 summarizes the gas phase data for all five
filters. The initial efficiencies are graphed in Figure 3.
To show how the efficiency can change with loading,
Figure 4 plots the toluene efficiency curves over the
capacity tests (ATU A did not remove toluene). Note
that the capacity tests were performed at a very high
concentration relative to normal room air and are
intended to rank the relative performance of the
equipment, not to measure how long a filter will
function in an actual installation (i.e., not to estimate
filter lifetime).
Adsorption-based Treatment Systems 13
Table 2. Air Treatment Units Tested by Owen et al. (2014a, b)
Air Treatment Unit ID A B C D E
Size, in. 20 x 25 x <1 20 x 25 x 1 24 x 24 x 4 24 x 24 x 12 24 x 24 x 12
Application residential residential commercial commercial commercial
Airflow rate, cfm 1,024 1,024 2,000 2,000 2,000
Type of air treatment unit flat panel pleated panel pleated panel rigid v-cell rigid cell, deep pleat
Media type activated carbon activated carbon 50/50 blend of (impregnated) activated carbon and permanganate-impregnated alumina
loose fill media blend of activated carbon and potassium permanganate, 48 lbs./air treatment unit
activated carbon, coconut shell, small granule (20x50 mesh), impregnated for removal of formaldehyde. ~12.8 lbs./air treatment unit
Table 3. Summary of Gas-phase Data from Owen et al. (2014a, b)
Challenge Gas Measured Value
Air Treatment Unit
A B C D E
Initial weight of filter (carbon plus housing), g 266 463 2,043 27,264 17,234
Pressure drop at rated airflow, in. H2O 0.18 0.27 0.48 0.39 0.35
Toluene Initial efficiency, % 0 30 35 61 91
Capacity test, lowest efficiency, % 0 4 3 37 24
Capacity, g 4.4 47.3 56 773.8 417.2
Hexane Initial efficiency, % 6 27 34 70 95
Capacity test, lowest efficiency, % 0 0 0 2 15
Capacity, g 2.1 17.0 13.3 285.6 406.7
Formaldehyde Initial efficiency, % 2 3 35 41 NA
Figure 3. Initial efficiency test averages for the indoor gases (Owen et al., 2014a, b)
Figure 4. Toluene capacity test efficiency curves (Owen et al., 2014a, b)

14 Adsorption-based Treatment Systems
4.2 Controlled (Unoccupied) Building-scale Demonstrations of Air Treatment Units
An extensive series of well-controlled, factorial
studies of ATU performance have been conducted by
the National Institute of Standards and Technology
(NIST) and reported by Howard-Reed et al. (2005,
2007, 2008a, 2008b) and Persily et al. (2003). There
are several features of these studies that make them
somewhat different from common ATU VI
applications:
• The contaminant tested was decane
introduced at a constant controlled rate from
a permeation oven directly into the indoor
environment. Decane is very nonpolar and
should adsorb quite well to GAC.
• The studied structure was apparently a
research structure not actually occupied by
residents, which would tend to limit the
number of indoor sources of VOCs.
However, ambient air VOCs would be
expected to be present.
• The studied structure was a double-wide
manufactured home with an unusual
crawlspace—one divided vertically by an
“insulated plastic belly” which contained the
HVAC ductwork (Persily et al., 2003).
However, the house was otherwise fairly
typical for modern U.S. residential
construction, consisting of three bedrooms,
two bathrooms, a utility room, and a
continuous living/dining/kitchen/family
room.
• The test durations were relatively short—
typically 1 to 3 days. The ATU devices tested
had modest masses of sorbent, such as a duct
ATU with 0.75 kg of activated carbon or a
portable ATU with 500 g of carbon,
potassium permanganate, and zeolite
(Howard-Reed et al., 2007, 2008b).
Nevertheless, important insights and findings were
generated from this series of tests that should be
applicable to residential-scale implementations of
ATUs for VI:
• The 140 m2 structure (1,506 feet2) was
operated either as a single ventilation zone,
using the forced-air HVAC system to provide
recirculation, or as multiple zones by turning
off the HVAC system and closing bedroom
doors. This had a dramatic influence on
contaminant distribution in tests of a single
portable ATU:
◦ When the source and ATU were in the
same isolated bedroom, with the HVAC
off, concentrations in other rooms of the
house were “almost unaffected” by the
contaminant release and remained low
(Howard-Reed et al., 2007).
◦ When the source and ATU were in the
same bedroom with the door closed but
with air distributed throughout the house
by the HVAC, the ATU in the closed
bedroom had the most effect on the
bedroom concentration but also had some
beneficial effects on VOC concentrations
in other rooms.
◦ When the source and the ATU were in
different rooms, with the HVAC off, “the
tests showed limited ability of the portable
ATU…to remove decane from the entire
house” regardless of whether the doors
were open or closed (Howard-Reed et al.,
2007, 2008a).
• The average “direct removal efficiency”
(outlet concentration divided by the inlet
concentration) for the portable ATU tested
was 54%. The duct-mounted device had an
average removal efficiency of 42%.
• New media was used in each test. When the
HVAC system was operated to mix the air in
the 140 m2 structure, the reduction in VOC
concentration in the whole structure was
approximately the same (within 15% for the
portable systems) as would have been
Adsorption-based Treatment Systems 15
mathematically predicted based on
measurements at the outlet of the ATU for
both the portable and duct-mounted systems
(Howard-Reed et al., 2007, 2008a). The
authors interpret this result to mean that “a
single zone was achieved in the test house and
that the ATU was operating without
significant short-circuiting” (Howard-Reed et
al., 2007). Thus, the mathematical approaches
that were used by Howard-Reed to predict
changes in indoor air concentrations based on
the single pass removal efficiency of the ATU
were validated.
• Although the authors define ATU
effectiveness as “the fractional reduction in
pollutant concentration that results from
application of a control device” (Howard-
Reed et al., 2007), they do not report their
results in these practical units. However,
effectiveness can be estimated from the
figures presented. In test 48 with the portable
ATU in use, HVAC on, and the ATU in a
bedroom with the door closed, the decane
concentration was reduced from 0.86 to
0.31 mg/m3 in that bedroom, which would be
an effectiveness of 64%. A similar
effectiveness (58%) can be estimated from the
kitchen/family room dataset. These effects
were observed over approximately 1 day of
operation after the ATU was turned on. The
reported air exchange rate for that test was
0.21 per hour. The portable ATU flow rate
was 340 m3/hour and the volume of the
house was reported as 340 m3. Thus, the ATU
was operating at 4.8 times the natural air
exchange rate of the structure.
• When the house was operated as multiple
zones, with the contaminant injected into a
different room/zone than the portable ATU,
ATU effectiveness dropped to between 14
and 23% of the optimal predicted benefit
(Howard-Reed et al., 2007).
Howard-Reed et al. (2008a) summarize their results
stating, “When a building does not have a uniform
concentration of contaminants, an in-duct ATU may
not be as effective at reducing the whole-building
mass. Likewise, a portable will also not be as effective
at removing total mass when operated in rooms
different from the contaminant source, but it can also
effectively exceed predicted performance when the
source and ATU are in the same room isolated from
the remainder of the house.” One practical
conclusion of this study for VI sites is that it is
advantageous to locate an ATU in the lowest level of
a building, close to the presumed VOC entry points,
or both.
Howard-Reed et al. (2008b) tested a small (37 m2;
398 ft2) unfurnished single-room house with wood-
frame construction and an attic. Decane was directly
injected into indoor air from a permeation oven. The
in-duct system tested in this house contained 0.6 kg
of activated carbon, alumina, and potassium
permanganate in a filter housing. The portable ATU
contained 2.7 kg of charcoal, potassium
permanganate, and zeolite. The portable ATU
operated on its highest airflow setting and delivered
an average flow rate of 350 m3/hour (206 cfm) versus
a manufacturer reported air flow rate of 510 m3/hour
(300 cfm). The average direct measurement of ATU
efficiency based on inlet and outlet concentrations
was 38% for the duct-mounted unit and 43% for the
portable ATU. Efficiencies calculated based on
measurements in the center of the room and either
transient or steady state mass balance were somewhat
less. The effectiveness defined as “the fractional
reduction in pollutant concentration that results from
application of a control device” was always greater
than 80%. Both ATUs were used for repeated short-
term challenge tests (8 for the duct mounted unit and
16 for the portable unit) and showed decreasing
decane removal efficiency as the total mass of decane
treated increased (without changing the sorbent).

16 Adsorption-based Treatment Systems
4.3 Practical (Occupied) Field Applications to VI Cases
A review of publicly available literature was
completed for sites where ATUs have been used to
reduce indoor air VOC concentrations in occupied
buildings. The documents reviewed are listed in
Table 4. A full summary of the parameters of the
treated space (e.g., volume, potential indoor sources,
HVAC operational parameters) was not consistently
available. These case studies include ATU
deployments in commercial, industrial, and residential
buildings. In some cases, multiple buildings were
included in the deployments. In these cases, one or
two representative buildings are discussed below.
4.3.1 Naval Weapons Industrial Reserve Plant, Bethpage New York (TetraTech, 2010)
Site 1 of the Former Drum Marshalling Area was
impacted by historic releases of chlorinated solvents
to soil and groundwater. Site impacts were remediated
by an air sparging/soil vapor extraction (AS/SVE)
system between 1998 and 2002. Soil gas testing
conducted in 2008 indicated elevated concentrations
of VOCs along the eastern boundary of Site 1,
affecting the adjacent residential neighborhood. Soil
gas, indoor air, outdoor air, and subslab soil vapor
samples were collected from January through April
2009 at 18 residences. As an interim measure, ATUs
were placed in homes. Following additional sampling,
subslab depressurization (SSD) systems were installed
in a subset of the homes.
The available reports did not provide information on
the size of each of the residences, the flow rate of the
ATUs, or ATU run time. For this discussion, we
assume that the residences were constructed similarly
and that most contain basements. Available analytical
data included indoor air concentration prior to
installation of the ATUs, indoor air concentration
after ATU installation, subslab soil vapor
concentrations, and indoor ATU post-SSD system
installation (where applicable). A summary of key
parameters is provided in Table 5.
In Homes 1, 4, 6, 7, 10, 12, 13, and 14, the ATUs
reduced indoor air concentrations of TCE to levels
below the New York State health screening levels
when initial concentrations were above the indoor air
screening levels (Table 5). Similar reductions in
indoor air concentrations for PCE (82–87%) and
1,1,1-trichloroethane (33–72%) were also found at the
site (see referenced report in Table 4 for full
information). However, the ATUs did not appear to
adequately reduce indoor air concentrations in Homes
2 and 3 and SSD systems were subsequently installed
at those locations. SSD systems were also installed in
Homes 4, 6, 13, and 14 as a precautionary measure.
Across all cases, an average TCE concentration
reduction of approximately 80% was observed in the
post-ATU installation samples.
Assuming that the ATUs were operating in similar
home volumes and at similar flow rates, there appears
to be a correlation between elevated subslab and
indoor concentrations (i.e., orders of magnitude
above screening levels) and the ability of the ATU to
reduce concentrations and maintain acceptable indoor
air concentrations (refer to the basements of Homes 2
and 3). In the two cases with subslab concentrations
greater than 10,000 g/m3, although reductions in
indoor concentrations of 67–81% were achieved in
indoor air, those reductions were insufficient to reach
the New York State screening level. This is consistent
with the mathematical design approaches outlined in
Section 5.3.2, which show that the needed ATU
capacity/number of ATU devices required increases
sharply with increasing baseline subslab and indoor
air concentrations.
A complete dataset was not available for review, and,
thus, the data are not conclusive. For example, the
run time for each system is not provided. Some
residences may not have operated specific units
during the entire time between samples. However, the
apparent correlation between subslab soil vapor
concentration and ATU effectiveness should be given
further consideration as it is discussed based on the
theory in Section 5.

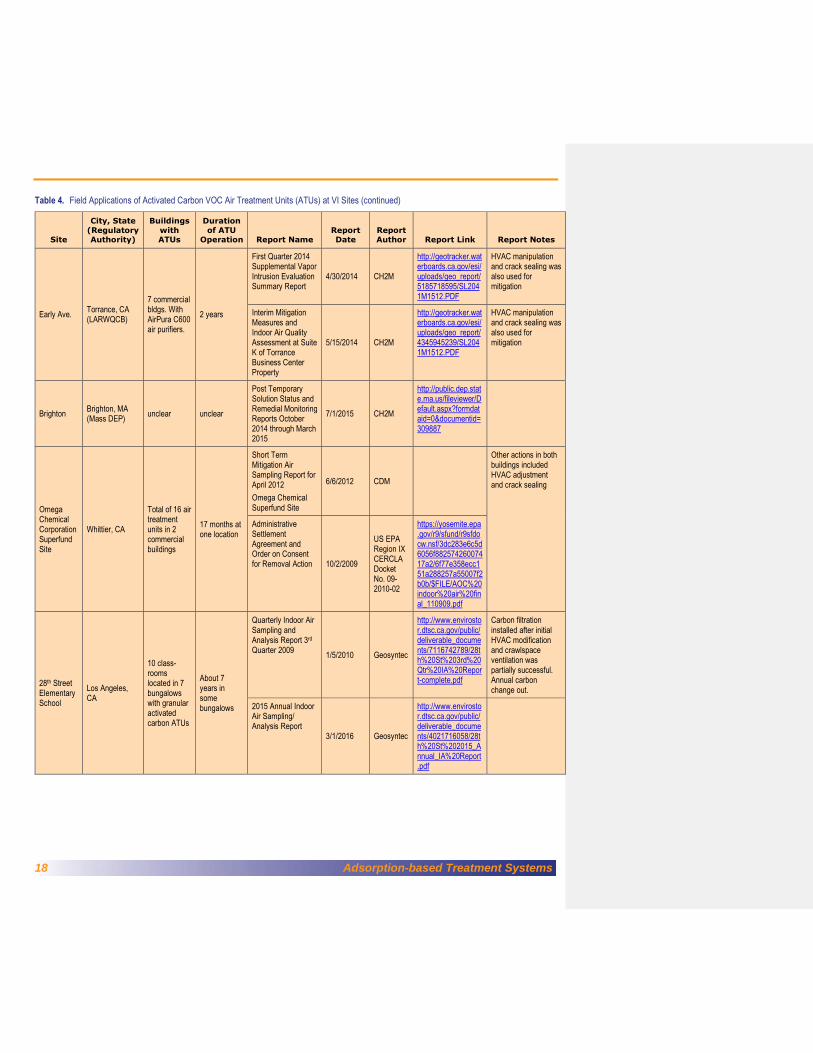
Adsorption-based Treatment Systems 17
Table 4. Field Applications of Activated Carbon VOC Air Treatment Units (ATUs) at VI Sites
Site
City, State (Regulatory Authority)
Buildings with ATUs
Duration of ATU
Operation Report Name Report Date
Report Author Report Link Report Notes
Bethpage Naval Weapons Industrial Reserve Plant
Bethpage, NY (NY DOH)
2 residences with granular activated carbon ATUs.
8 months
Final Quarterly Data Summary Report for Soil Vapor Intrusion Monitoring (May–August 2010) NWIRP Bethpage, NY
11/1/2010 TetraTech
http://www.navfac.navy.mil/niris/MID_ATLANTIC/BETHPA.GE_NWIRP/N90845_001199.pdf
Addresses only one residence (#3). Has a description of ATU/SSD history.
Gardena Marketplace
Gardena, CA (CA DTSC)
3 residences with granular activated carbon ATUs
4 months
Supplemental Vapor Intrusion Assessment Summary Report #2, Former Honeywell Gardena Site, 1711-1735 West Artesia Boulevard, Gardena, CA
3/25/2016 CH2M
http://www.envirostor.dtsc.ca.gov/regulators/deliverable_documents/6357958734/Gardena%20Marketplace_Supp_VI%20Assessment_Report_No%202_32516.pdf
Documents concentrations before installation of air treatment units at 3 residential locations
Second Quarter
2016 Vapor
Intrusion Monitoring
Event Report,
Honeywell Gardena
Site, West Artesia
Boulevard,
Gardena, California
7/29/2016 CH2M
Not yet posted. But
will appear here
http://www.envirosto
r.dtsc.ca.gov/public/
profile_report.asp?gl
obal_id=19360536
Documents
concentrations after
installation of air
treatment units at 3
residential locations
9 commercial
bldgs. with
granular
activated
carbon ATUs
2.5 years
First Quarter 2016
Vapor Intrusion
Monitoring Event
Report, Honeywell
Gardena Site, 1711-
1735 West Artesia
Boulevard Gardena
CA
4/29/2016 CH2M
http://www.envirosto
r.dtsc.ca.gov/public/
deliverable_docume
nts/6771593987/Gar
dena%20Marketplac
e_1Q16_VI_Monitori
ng_Report_42916.p
df
HVAC manipulation
and crack sealing was
also used for
mitigation
CRREL Hanover, NH (NH DES)
1 industrial research facility
not specified
The Value of an Iterative Approach to VI Evaluation and Mitigation: Lessons Learned at the CRREL Facility in Hanover, NH
Geosyntec
Not available online (2016 conference presentation)
Bruscoe Property
Belmont, CA (SFRWQCB)
1 commercial bldg. with AirPura c600 ATU.
8 months
Vapor Intrusion Summary Report, Former Brusco Property
10/31/2013 CH2M
http://geotracker.waterboards.ca.gov/esi/uploads/geo_report/3363481044/T10000002681.PDF
Pre-cleaner investigation
Completion Report - Interim Remedial Measure and SVE Construction
10/10/2014 CH2M
http://geotracker.waterboards.ca.gov/esi/uploads/geo_report/2903016567/T10000002681.PDF
(continued)
18 Adsorption-based Treatment Systems
Table 4. Field Applications of Activated Carbon VOC Air Treatment Units (ATUs) at VI Sites (continued)
Site
City, State (Regulatory Authority)
Buildings with ATUs
Duration of ATU
Operation Report Name Report Date
Report Author Report Link Report Notes
Early Ave. Torrance, CA (LARWQCB)
7 commercial bldgs. With AirPura C600 air purifiers.
2 years
First Quarter 2014 Supplemental Vapor Intrusion Evaluation Summary Report
4/30/2014 CH2M
http://geotracker.waterboards.ca.gov/esi/uploads/geo_report/5185718595/SL2041M1512.PDF
HVAC manipulation and crack sealing was also used for mitigation
Interim Mitigation Measures and Indoor Air Quality Assessment at Suite K of Torrance Business Center Property
5/15/2014 CH2M
http://geotracker.waterboards.ca.gov/esi/uploads/geo_report/4345945239/SL2041M1512.PDF
HVAC manipulation and crack sealing was also used for mitigation
Brighton Brighton, MA (Mass DEP)
unclear unclear
Post Temporary Solution Status and Remedial Monitoring Reports October 2014 through March 2015
7/1/2015 CH2M
http://public.dep.state.ma.us/fileviewer/Default.aspx?formdataid=0&documentid=309887
Omega Chemical Corporation Superfund Site
Whittier, CA
Total of 16 air treatment units in 2 commercial buildings
17 months at one location
Short Term Mitigation Air Sampling Report for April 2012
Omega Chemical Superfund Site
6/6/2012 CDM
Other actions in both buildings included HVAC adjustment and crack sealing
Administrative Settlement Agreement and Order on Consent for Removal Action 10/2/2009
US EPA Region IX CERCLA Docket No. 09-2010-02
https://yosemite.epa.gov/r9/sfund/r9sfdocw.nsf/3dc283e6c5d6056f88257426007417a2/6f77e358ecc151a288257a55007f2b0b/$FILE/AOC%20indoor%20air%20final_110909.pdf
28th Street Elementary School
Los Angeles, CA
10 class-rooms located in 7 bungalows with granular activated carbon ATUs
About 7 years in some bungalows
Quarterly Indoor Air Sampling and Analysis Report 3rd Quarter 2009
1/5/2010 Geosyntec
http://www.envirostor.dtsc.ca.gov/public/deliverable_documents/7116742789/28th%20St%203rd%20Qtr%20IA%20Report-complete.pdf
Carbon filtration installed after initial HVAC modification and crawlspace ventilation was partially successful. Annual carbon change out.
2015 Annual Indoor Air Sampling/ Analysis Report
3/1/2016 Geosyntec
http://www.envirostor.dtsc.ca.gov/public/deliverable_documents/4021716058/28th%20St%202015_Annual_IA%20Report.pdf

Adsorption-based Treatment Systems 19
Table 5. Summary of Bethpage Data1
Home #
Su
bsla
b S
oil
Vap
or T
CE
Con
cen
trati
on
(µ
g/
m3)
In
door A
ir T
CE
Con
cen
trati
on
Prio
r t
o A
ir
Treatm
en
t U
nit
In
sta
llati
on
(µ
g/
m3)
Sam
ple
Locati
on
In
door A
ir T
CE
Con
cen
trati
on
Post-
Air
Treatm
en
t U
nit
In
sta
llati
on
(µ
g/
m3)
Percen
t
Red
ucti
on
In
door A
ir T
CE
Con
cen
trati
on
~4
Mon
ths
Post-
Air
Treatm
en
t U
nit
In
sta
llati
on
(µ
g/
m3)
SS
D S
yste
m
In
sta
lled
Pri
or
to 4
-Mon
th
Even
t?
1 160 2.2 Living Space 0.44 80 0.93 N
2 16,000 100 Living Space 3.1 97 9.2 Y
16,000 140 Basement 46 67 61 Y
3 13,000 110 Living Space 2.8 97 16 Y
13,000 180 Basement 34 81 79 Y
4 1,400 6.1 Living Space 1.1 82 NS Y
1,400 6.8 Basement 1.2 82 3 Y
6 740 6.6 Living Space 1.2 82 NS Y
740 43 Basement 2.1 95 13 Y
7 170 0.40 Living Space NS NS NS N
170 0.75 Basement 0.2 J 73 0.4 J N
10 300 ND Living Space NS NS NS N
300 2.9 Basement 1.5 48 2.1 N
12 94 ND Living Space NS NS NS N
94 0.55 Basement 0.21 J 62 0.22 J N
13 230 ND Living Space NS NS NS Y
230 1.5 Basement 0.50 67 1.9 Y
14 290 0.73 Living Space NS NS NS Y
290 1.9 Basement ND NS NS Y
1 Only select data shown; refer to the administrative record for the full data set.
Gray shading indicates exceedance of a New York State Department of Health Screening Level (5 µg/m3 for indoor air and 250 µg/m3 for subslab).
NS = Not Sampled; ND = Not Detected; J = estimated
4.3.2 Gardena Marketplace, Gardena, California (CH2M 2014b, 2016a, 2016b)
This site is a commercial development consisting of a
grocery store and a strip mall over contaminated soil
and groundwater. ATUs were installed as an interim
VI mitigation measure to reduce indoor-air
concentrations of PCE and TCE. Information for
each affected space is as follows:
• Space Number 1
◦ Commercial strip mall space with
independent HVAC unit.
◦ Single story, approximately 1,700 ft2.
◦ Premitigation subslab concentrations:
PCE = 130,000 µg/m3; TCE = 4,600
µg/m3.
◦ Temporary mitigation measures included
(1) HVAC adjustment to increase outdoor
air ventilation and change from
intermittent to continuous operation and
(2) installation of one portable ATU with
a flow rate of approximately 500 cfm.
◦ Indoor PCE decreased from 4.9 µg/m3 to
1.4 µg/m3 (71% reduction). Indoor TCE
decreased from 0.36 µg/m3 to 0.11 µg/m3
(69% reduction).
20 Adsorption-based Treatment Systems
◦ Reductions sustained for at least 1 year
prior to startup of a SVE pilot test, which
further reduced indoor-air concentrations.
Final PCE and TCE concentrations prior
to SVE startup were 1.8 and 0.13 µg/m3,
respectively with concentration ranges
varying from 1.1–1.8 µg/m3 and
nondetect–0.17 µg/m3, respectively.
• Space Number 2
◦ Commercial strip mall space with
independent HVAC unit.
◦ Single story, approximately 1,700 ft2.
◦ Premitigation subslab concentrations:
PCE = 55,000 µg/m3; TCE = 2,700
µg/m3.
◦ Temporary mitigation measures included
(1) HVAC adjustment to increase outdoor
air ventilation and change from
intermittent to continuous operation,
(2) sealing of slab cracks and utility line
entry points through the slab, and
(3) installation of two portable ATUs each
with a flow rate of approximately 500 cfm.
◦ Indoor PCE decreased from 87 µg/m3 to
0.73 µg/m3 (99% reduction). Indoor TCE
decreased from 7 µg/m3 to 0.079 µg/m3
(99% reduction).
◦ Reductions sustained for at least 1 year
prior to startup of a SVE pilot test, which
further reduced indoor-air concentrations.
Final PCE and TCE concentrations prior
to SVE startup were 0.25 µg/m3 and
0.083 µg/m3, respectively with
concentration ranges varying from 0.25–
1.2 µg/m3 and nondetect–0.15 µg/m3,
respectively.
3 http://www.newtonma.gov/gov/health_n_human_servi
ces/enviro/environmental_health_information.asp
4.3.3 U.S. Army Corps of Engineers, Cold Regions Research and Engineering Laboratory, Hanover, NH (Calicchio and Malinowski, 2016; Clausen and Shoop, 2015; Folkes and Tripp, 2016)
This site is a large, multistory research building with
industrial operation overlies multiple soil and
groundwater VOC sources. ATUs were installed to
reduce indoor air concentrations of TCE.
Information for the site is as follows:
• 200 ATUs with an approximate maximum
flow rate of 300 cfm (per unit) were
distributed throughout the building.
• Subslab concentrations: TCE = 12,000–
3,000,000 µg/m3.
• Pretreatment indoor air concentrations: TCE
= 2–84 µg/m3.
• No other concurrent mitigation measures
reported with treatment unit deployment.
• Indoor air TCE was reduced 25–75%.
4.3.4 Nonantum West Street Area, Newton, MA (Newton Environmental Health,3 2016; Mass DEP,4 2016)
This site, a former auto-salvage parts facility, is
underlain by TCE contaminated groundwater. To
screen the area for the existence and elimination of
imminent hazard (IH) conditions, 39 groundwater
monitoring wells were installed and sampled; and 157
indoor air grab samples from 57 residences were
initially analyzed. For residences with TCE
concentrations above the IH limits, air
cleaning/purifying units were installed. Site
information and results were as follows:
• ATUs contained 12.5 pounds of activated
carbon plus a layer of zeolite (for moisture
removal) and potassium iodide (KI) to
enhance chemisorption of certain organic
compounds.
• Flow rate was 125 cfm (per unit).
4 http://public.dep.state.ma.us/fileviewer/Default.aspx?formdataid=0&documentid=368843

Adsorption-based Treatment Systems 21
• Indoor air concentrations of TCE were <1–
180 µg/m3.
• TCE concentrations were reduced by 50–75%
within 1 week of operation when initial TCE
concentrations were 60–120 µg/m3.
• TCE concentrations were reduced by 50–75%
within 2 weeks of operation when initial TCE
concentrations were 6–20 µg/m3.
4.3.5 Field Study Summary
Comparison of these field studies highlights some of
the challenges in using this type of information to
assess ATU performance:
• It may not be possible to distinguish the effect
of VOC ATUs from other concurrent
measures such as sealing and HVAC
modifications. Because ATUs are generally
employed in situations perceived as urgent,
the natural inclination of the project team is to
implement multiple measures to best ensure
reductions in indoor air concentrations.
• Building size (especially volume) and ATU
operating flow rate are not adequately
reported to allow calculating a normalized air
exchange rate through the ATUs. It is
possible that a more extensive information-
gathering effort could develop this
information for the sites in question.
• Building-specific indoor/outdoor air
exchange rates through natural ventilation and
HVAC operation are not available. This
makes it more difficult to accurately estimate
the VOC mass flux into the building at a
specific time. However, data are sometimes
available on VOC mass accumulated in an
ATU carbon bed over a long operational
period, which could be used to estimate VOC
mass flux into the structure. Air exchange
rates could potentially be established through
field measurements as the implementations
are ongoing.
• Multiple ATUs may be needed to achieve
mitigation goals within given timeframes.
Without the normalized parameters mentioned above,
it is difficult to draw generalized conclusions about
ATU performance from the available case studies.
However, the case studies suggest that ATUs can be
part of a multimeasure effort to reduce indoor VOC
concentrations.
5. SELECTING AN AIR TREATMENT UNIT,
DESIGNING AND IMPLEMENTING AN AIR
TREATMENT UNIT APPLICATION
This section provides detailed information on
designing and implementing a successful ATU
installation for reducing indoor air VOC
concentrations in a variety of buildings, including
important factors for selecting an ATU and how to
design, install, and operate an ATU system.
5.1 Chemical and Physical Characteristics of the Air Stream to be Treated
Air in buildings, even within a single HVAC zone, is
not uniform. The contaminants of concern and
background VOCs can both vary in concentration
spatially and temporally. Humidity and temperature
also vary across time in the same room, by location in
a building, and across climate zones. Outdoor air
conditions can also affect VOC ATU performance
because outdoor air can influence indoor air VOC
concentrations.
5.1.1 Humidity
The relative humidity (RH) level is important in
choosing and maintaining an ATU because the
humidity can change the performance of some types
of ATUs (see Section 3). In general, indoor air in
controlled spaces is likely to be in the 30–65% RH
range in the breathing space. For GAC, higher
humidity (>80% RH) will reduce sorbent
effectiveness (ASHRAE, 2015).
22 Adsorption-based Treatment Systems
While the effects of humidity will vary among GACs
and contaminants, Owen (1996) showed much better
VOC removal efficiency below 65% RH than above
80% RH for 4x8 mesh coconut shell carbon. Keener
and Zhou (1990) reported on the influence of
humidity for one type of pelletized carbon over a
range of 54–92% RH for toluene, carbon
tetrachloride, ethylbenzene, methylene chloride, and
ethyl alcohol at VOC concentrations of 300–900
ppm. They found a decrease by as much as 65% in
VOC capacity over this RH range with great
variability across the compounds. They also report a
decrease in toluene capacity of 75% when humidity
rises from 5% to 92% based, apparently, on calculated
values. However, because these concentrations are so
much higher than those found in indoor air, it is
difficult to know whether the relationship can be
easily extrapolated to low concentration VOCs.
For reactive ATUs such as photocatalytic systems, the
presence of humidity may change the reaction rate,
reaction products, or both depending on the specifics
of technology and the other contaminants in the air.
It may also change the reaction byproducts. Alberici
et al. (1998) showed that for TCE and the test
devices, increasing the RH from 20% to 80%
decreased the destruction from nearly 100% to 70%.
Similarly, Lee et al. (2016) saw a decrease in air
cleaning efficiency with increasing RH, ranging from
20% to 55% for benzene, toluene, and xylene. In
contrast, Jo and Park (2004) showed no variability in
VOC destruction due to RH. Mo et al. (2013) showed
water vapor has a significant effect not only on the
photocatalytic decomposition rate of toluene, but also
its byproducts due to the competitive adsorption
among water vapor, toluene, and its breakdown
byproducts. If photocatalytic devices are employed at
field scale, the designer should understand the device-
specific humidity effects that could apply.
5 https://www.epa.gov/indoor-air-quality-iaq/indoor-
particulate-matter#indoor_pm
In summary, increases in humidity are well-known to
drive sorbed contaminants off GAC. This effect is
seen most often at very high humidity (>80% RH)
and would result in the ATU temporarily emitting
more VOCs than are present in the inlet air. This
desorption, while highly undesirable for short-term
indoor air quality, actually allows the carbon to sorb
additional contaminants once the humidity is lower
again, which means that the ATU should return to
functionality after a temporary humidity increase.
However, for best use of carbon-based ATUs,
humidity control, at least to prevent surges of high
humidity, is useful. This control could take the form
of a separate dehumidifier or operation of an air
conditioning system.
5.1.2 Temperature
Most occupied buildings in the United States are
conditioned to keep the air temperature at
comfortable levels, usually in the low to mid 70s (°F).
However, some residences either do not have air
conditioning or allow the temperature to decrease
into the 50s or low 60s in the winter to reduce heating
costs. Temperatures in the summer can rise into the
90s or higher in unconditioned structures in some
parts of the United States. With lower temperatures,
RH increases, and vice versa for higher temperatures.
High temperatures, given a constant RH, will decrease
sorption capacity and efficiency (ASHRAE, 2015).
This decrease may be similar across carbon types and
devices such that relative ranking of sorbents or
ATUs may be the same.
5.1.3 Particles
Indoor air contains particles. The concentration and
sizes of the particles will depend on the sources in the
structure and the filtration system, if any, in use.
Sources of indoor particulates include ambient air
infiltration, cooking, combustion heating systems,
cigarette smoking, and some hobbies.5 While sorbent
Adsorption-based Treatment Systems 23
beds will not catch many particles, those that are
caught can hinder the performance by blocking active
sorption sites or increasing pressure drop by
obstructing air flow. It is common to include a
particulate filter upstream of carbon bed type ATUs.
Some units, especially room units, come with
standard particle filters upstream of the carbon beds.
Sorbent beds also shed particles with use, which can
constitute at least a nuisance. To avoid having these
particles emitted into the air, a particle filter may also
be used downstream of the sorbent bed. In either
case, the particle filters that are present in a VOC
ATU should be checked regularly and changed
according to the manufacturer’s recommendations.
Air filters that include sorbents within or attached to
fibrous media are intended to provide particle
filtration and gas-phase filtration in one unit. Note
that when particles are captured and lead to a pressure
drop increase, the entire filter must be replaced.
However, for many existing buildings, this type of
filter will fit into the existing HVAC filter housing
and can provide a simple and quick-to-install
adaptation to including VOC filtration in an existing
building. If a sorbent-containing media is introduced,
it should continue to provide adequate particle
filtration (ASHRAE, 2009). The expected particle
loading on the filter based on the indoor air
particulate load would then be an additional control
on the frequency with which such a dual-purpose
filter would need to be replaced.
5.1.4 Target Organics
Target VOC compounds for VI situations are most
frequently chlorinated hydrocarbons, such as PCE
and TCE, that enter the residence or commercial
building in soil gas, primarily advectively (U.S. EPA,
2012). Thus, differential pressure across the building
envelope will strongly influence the mass flux into the
structure as the contaminants can enter with airflow.
The differential pressure across the building envelope
is in turn affected by the differential temperature
between the building interior and exterior as well as
wind loads (U.S. EPA, 2012). These factors influence
the air exchange rate of the structure (U.S. EPA,
2011b). These two effects can offset to some extent,
so the percentage increase in indoor concentration
due to increased entry rate can be lower than the
percentage increase in the mass flux.
However, even in the absence of a differential
pressure driving force, contaminants can enter
diffusively following concentration gradients (U.S.
EPA, 2012). Due to this method of entry, it is
possible that air treatment could increase the mass
flux of entry as the ATU lowers the indoor
concentration.
5.1.5 Nontarget Organics and Other Air Contaminants
As with the target organics, other organics (both
anthropogenic contaminants and naturally occurring
VOCs) will enter the building at variable mass flux
rates, dependent in general on whether the area
around the building is urban, suburban, or rural, as
well as how well the building is weatherized.
Inorganic constituents such as ozone, SO2, and NO2
that can also interact with sorbents are present in all
urban atmospheres. Differential pressure,
concentration gradients, and outdoor environmental
conditions will influence the rate of entry of these
contaminants into the building. Opening of windows,
mostly in homes, may result in increased air exchange
and allow outdoor contaminants to more easily enter
the building. Increasing outdoor inlet air to HVACs
(for example, when outdoor temperatures yield
heating/cooling energy savings) will cause outdoor air
pollutants to enter the building. Some outdoor
contaminants (e.g., ozone) will enter the building and
can react with other compounds including those that
enter through VI, potentially forming different
contaminants.
However, for many buildings, most indoor air organic
contamination comes from indoor sources. These
sources include off-gassing from furniture, carpets or
equipment, cooking, pesticides, paint, cosmetics,

24 Adsorption-based Treatment Systems
personal care products, personal hygiene products,
smoking, air fresheners, and others. The nontarget
compounds compete for sorption sites and may
deactivate photocatalytic technologies (Hay et al.,
2010). The best method for lowering concentrations
of nontarget organics is source removal or reduction
(ASHRAE 2009; U.S. EPA 2011a, 2012). Reducing
these compounds will help any ATU function more
effectively. It is important to realize that an ATU will
treat the air, to the extent possible, for both the target
compounds and the nontarget compounds.
Depending on the sorption properties of the target
compounds and the nontarget compounds, the ATU
may take up the intended compounds better or worse
than the unintended compounds.
Although the authors were not able to find systematic
tabulated information about the relative strength of
carbon adsorption for various VOCs in indoor air
applications, the literature on gas phase carbon
efficiency for air pollution control devices could be a
useful alternative in evaluating interactions between
VOCs. Example sources of tabulated information
include U.S. EPA (1998) and Shephard (2001).
Sorption for a given compound will change
depending on the other compounds in the same
atmosphere. In a test of HVAC-insertable carbon
beds (a 24x24x24” housing filled with 100-pounds of
carbon in 1” deep trays in a zigzag format inserted
into the test rig’s HVAC duct section), VanOsdell et
al. (1996) tested a five-VOC mixture (Figure 5). The
test concentrations were 0.2 ppm per VOC for a total
of 1 ppm VOC. The efficiency curves in the figure are
shown as trend lines based on the observed data. The
graph shows differences among the compounds in
how well the carbon bed removed them from the air
(toluene is the most strongly sorbed, followed by
PCE). This test was run long enough that the less
well-sorbed compounds (isobutanol and MEK) were
pushed through the bed when the more strongly
sorbing compounds displaced them from active
sorption sites. This result can be shown since the
Figure 5. Efficiency curves for a five-compound VOC test mixture from VanOsdell et al. (1996)
Figure 6. Efficiency curves for a five-compound VOC test mixture with three additional inorganic gases from VanOsdell et al. (1996)
outlet concentrations were above the inlet
concentration (where efficiency is thus less than 0%)
after the 200-hour mark.
A separate test with the same five-VOC mixture,
same RH, and same airflow rate but with acid gases
(ozone, SO2, and NO2 at National Ambient Air
Quality Standard maximum levels) added to the
challenge gas mixture is shown in Figure 6 (also
reported in VanOsdell et al., 1996). This second test
was run for just over 100 hours.
Comparing Figures 5 and 6 shows that the presence
of the acid gases caused the VOC compounds to
break through the active charcoal bed much quicker
(VanOsdell et al., 1996). There is also less apparent
separation in efficiency between strongly and weakly
Adsorption-based Treatment Systems 25
adsorbing VOCs. In the later stages of the test, all the
challenge gases were turned off, as shown by the red
line, such that only clean air passed through the
carbon bed. The efficiencies then had an increase due
to a calculation artifact in which the data were still
presented in this period, relative to the upstream
concentration during the challenge on portion. Thus,
the graph shows that all the challenge gases continued
to be present in the treated air after they were no
longer present in the influent, showing desorption.
PCE desorbed the least of the five VOCs.
5.2 Building Characteristics
Characteristics of the building requiring treatment
play a large roll in selection, deployment, and
monitoring of an ATU for a particular space. Some of
these characteristics include:
• Occupancy
• Size of the space requiring treatment
• Operation of HVAC systems and the target
air exchange rate
• Existing air circulation patterns
• ATU power requirements
• Security requirements
• Space requirements.
Each of the listed characteristics influences the
necessary air exchange rate and is discussed further in
the following subsections. Determining these
characteristics will generally require a combination of:
• Review of plans and building energy audits/
HVAC balancing reports
• Discussions with building managers who have
knowledge of HVAC systems operation,
tenant activities, and other factors that can
affect indoor VOC levels
• A field survey, using standard forms generally
found in VI guidance documents and is often
called an “Indoor Air Sampling
Questionnaire” or “Building Evaluation
Form.”
5.2.1 Type of Occupancy
The use of the treated space should be considered
during selection and sizing of the ATU. Specific
considerations are as follows:
• Target indoor air concentrations: Target
indoor air concentrations should be based on
the occupancy of the space (commercial vs.
residential) and specific exposure durations. If
very low target air concentrations are required,
a higher level of ATU efficiency will be
needed for the same level of contaminant
flux.
• Products in use: Products in use within the
treated space can have significant impact on
recommended air exchange rates (fresh air
supply requirements) and carbon use in air
cleaning applications. For example, if the
space being treated has frequent use of
products that emit VOCs, the presence of
these VOCs, rather than target compound
concentrations may drive the rate of carbon
consumption and breakthrough times. Note
that these products include intentionally used
items such as deodorant and bug spray and
always-present items such as furniture and
carpet. Particular attention should be paid to
any situation where a liquid source of VOCs
may be in equilibrium with indoor air because
they can provide a large source as the ATU
removes VOCs from indoor air. Possible
examples of such sources include a loosely
covered jar of paint thinner, a gasoline can
with the air vent open, or air fresheners
designed to continuously emit a fragrance.
When a volatilizing substance is at equilibrium
with the overlying air, and the concentration
in the overlying air is reduced, the rate of
volatilization increases (Le Chatelier’s
Principle; Oxtoby et al., 1990).
• Noise tolerance: The noise tolerance of the
occupants should be considered when
selecting the specific ATU and number of
26 Adsorption-based Treatment Systems
units required. Most ATUs are well tolerated
by occupants, with noise as the primary
complaint. In a residential or office setting,
units are often too noisy to be operated at the
highest level (Lawrence Berkley National
Laboratory, 2016). The background (ambient)
noise level of the space should be considered;
for example, bedrooms would typically have a
low acceptable noise level.
5.2.2 Size of Treated Space—Volume Requiring Treatment and Space Needed for Portable Unit
The volume of air to be treated within the target
space is a critical element for ATU selection. The
volume of the space is used—along with the
estimated number of air exchanges per hour—to
select the size, operating speed, and number of units
needed. This selection process requires an
understanding of not just square footage, but also
ceiling height and the degree of interconnectedness of
airflow between rooms and floors. As discussed in the
following sections, this will also require an
understanding of the zones in the building in which
air is mixed (either naturally through air currents or by
a forced air system).
Once the required volume of air treatment has been
determined, an evaluation is conducted to determine
the number of air cleaning units required. Residential
portable units are typically small (Attachment A) and
can often be placed in an unobtrusive location;
however, free flow of air in and out of the unit and
good mixing of the room air should be ensured. If a
larger treatment volume is needed, several units may
be required to meet the target air exchange rate and
multiple small units may become difficult to locate.
5.2.3 HVAC Systems and Air Exchange Rate
Existing HVAC system operating parameters (e.g.,
flow rate, on-off cycling) and connectivity between
6 http://www.engineeringtoolbox.com/air-change-rate-
room-d_867.html
the treated space and the remainder of the building
need to be considered during ATU selection. HVAC
systems often recirculate some portion of the air
within the building as well as provide some fresh
outdoor air (Althouse et al., 1988). Most residences
only recirculate air through the HVAC system and
rely on air infiltration through the building envelope
to provide outdoor air exchanges. The portion of
outdoor air introduced through the HVAC system is
typically higher and more variable in commercial
buildings. In these buildings, the percentage of
outdoor air provided by the HVAC system may be
varied by occupancy or temperature (Althouse et al.,
1988). Thus, the rate of air exchange within the target
space (both designed and actual) as well as the source
and portions of recirculated air and outdoor makeup
air should be considered in selecting the ATU to be
used.
The volume of outdoor air (makeup air) required for
proper space conditioning is determined by the size
and use of the space (e.g., number of occupants,
background indoor air sources, whether smoking is
allowed). In general, a minimum exchange rate of
four air changes per hour is recommended; however,
as noted the recommended exchanges vary dependent
upon the use of the target space.6
When calculating the volume of treated space,
connectivity to other portions of the building through
the HVAC system should be considered. Additional
contaminant mass could be delivered to the target
space through the HVAC system and additional air
changes could be necessary. Additional mass could be
in the form of products used within the building or
from subsurface contamination extending beyond the
initially considered space. Mass contributions from
other portions of the building connected by the
HVAC must be considered as part of carbon
consumption rates.
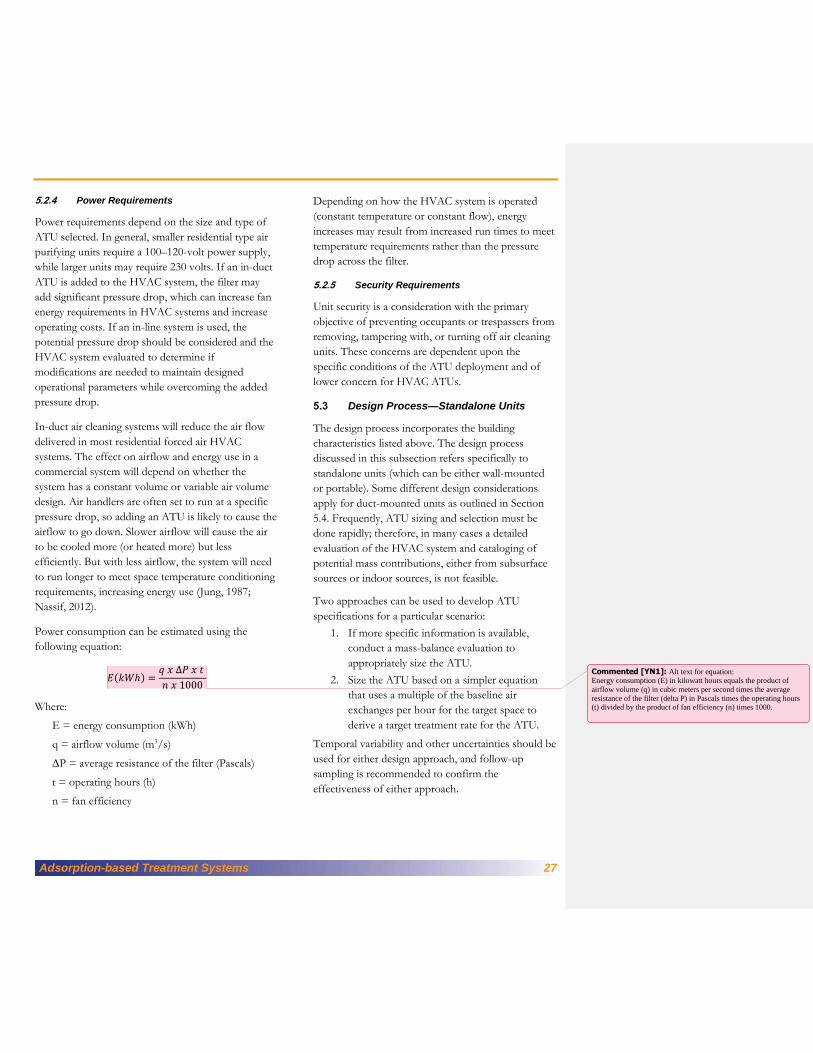
Adsorption-based Treatment Systems 27
5.2.4 Power Requirements
Power requirements depend on the size and type of
ATU selected. In general, smaller residential type air
purifying units require a 100–120-volt power supply,
while larger units may require 230 volts. If an in-duct
ATU is added to the HVAC system, the filter may
add significant pressure drop, which can increase fan
energy requirements in HVAC systems and increase
operating costs. If an in-line system is used, the
potential pressure drop should be considered and the
HVAC system evaluated to determine if
modifications are needed to maintain designed
operational parameters while overcoming the added
pressure drop.
In-duct air cleaning systems will reduce the air flow
delivered in most residential forced air HVAC
systems. The effect on airflow and energy use in a
commercial system will depend on whether the
system has a constant volume or variable air volume
design. Air handlers are often set to run at a specific
pressure drop, so adding an ATU is likely to cause the
airflow to go down. Slower airflow will cause the air
to be cooled more (or heated more) but less
efficiently. But with less airflow, the system will need
to run longer to meet space temperature conditioning
requirements, increasing energy use (Jung, 1987;
Nassif, 2012).
Power consumption can be estimated using the
following equation:
𝐸(𝑘𝑊ℎ) =𝑞 𝑥 ∆𝑃 𝑥 𝑡
𝑛 𝑥 1000
Where:
E = energy consumption (kWh)
q = airflow volume (m3/s)
∆P = average resistance of the filter (Pascals)
t = operating hours (h)
n = fan efficiency
Depending on how the HVAC system is operated
(constant temperature or constant flow), energy
increases may result from increased run times to meet
temperature requirements rather than the pressure
drop across the filter.
5.2.5 Security Requirements
Unit security is a consideration with the primary
objective of preventing occupants or trespassers from
removing, tampering with, or turning off air cleaning
units. These concerns are dependent upon the
specific conditions of the ATU deployment and of
lower concern for HVAC ATUs.
5.3 Design Process—Standalone Units
The design process incorporates the building
characteristics listed above. The design process
discussed in this subsection refers specifically to
standalone units (which can be either wall-mounted
or portable). Some different design considerations
apply for duct-mounted units as outlined in Section
5.4. Frequently, ATU sizing and selection must be
done rapidly; therefore, in many cases a detailed
evaluation of the HVAC system and cataloging of
potential mass contributions, either from subsurface
sources or indoor sources, is not feasible.
Two approaches can be used to develop ATU
specifications for a particular scenario:
1. If more specific information is available,
conduct a mass-balance evaluation to
appropriately size the ATU.
2. Size the ATU based on a simpler equation
that uses a multiple of the baseline air
exchanges per hour for the target space to
derive a target treatment rate for the ATU.
Temporal variability and other uncertainties should be
used for either design approach, and follow-up
sampling is recommended to confirm the
effectiveness of either approach.
Commented [YN1]: Alt text for equation: Energy consumption (E) in kilowatt hours equals the product of
airflow volume (q) in cubic meters per second times the average
resistance of the filter (delta P) in Pascals times the operating hours
(t) divided by the product of fan efficiency (n) times 1000.
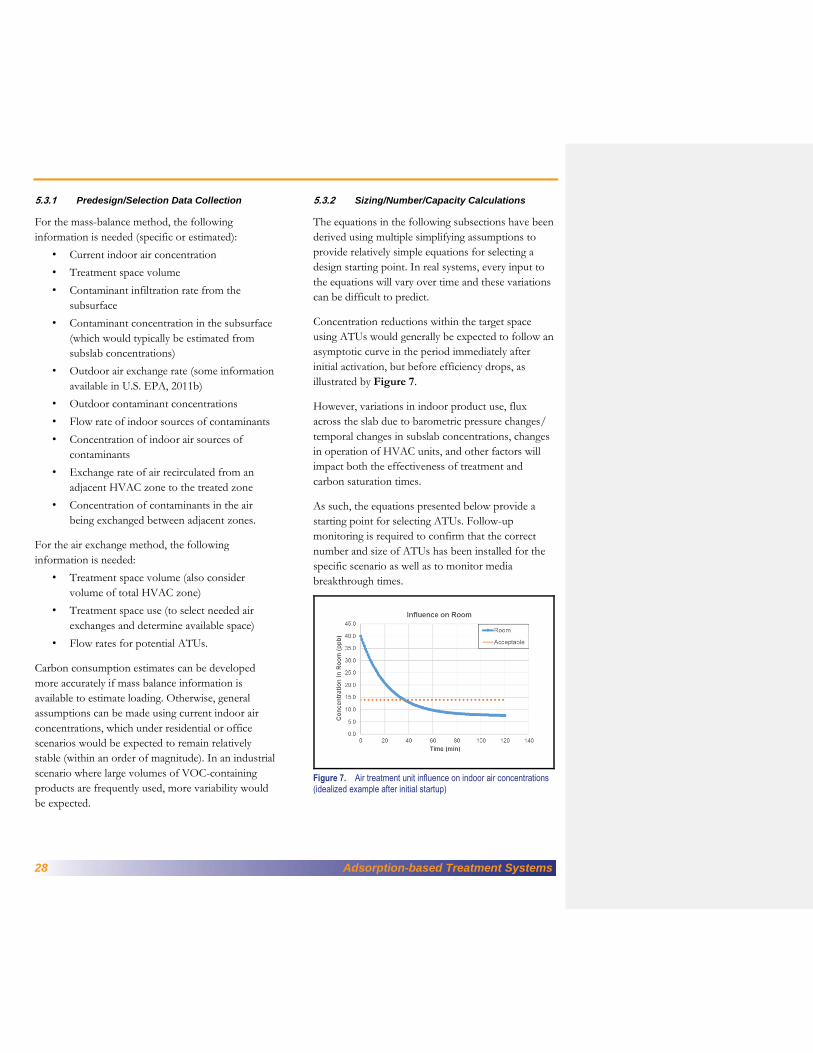
28 Adsorption-based Treatment Systems
5.3.1 Predesign/Selection Data Collection
For the mass-balance method, the following
information is needed (specific or estimated):
• Current indoor air concentration
• Treatment space volume
• Contaminant infiltration rate from the
subsurface
• Contaminant concentration in the subsurface
(which would typically be estimated from
subslab concentrations)
• Outdoor air exchange rate (some information
available in U.S. EPA, 2011b)
• Outdoor contaminant concentrations
• Flow rate of indoor sources of contaminants
• Concentration of indoor air sources of
contaminants
• Exchange rate of air recirculated from an
adjacent HVAC zone to the treated zone
• Concentration of contaminants in the air
being exchanged between adjacent zones.
For the air exchange method, the following
information is needed:
• Treatment space volume (also consider
volume of total HVAC zone)
• Treatment space use (to select needed air
exchanges and determine available space)
• Flow rates for potential ATUs.
Carbon consumption estimates can be developed
more accurately if mass balance information is
available to estimate loading. Otherwise, general
assumptions can be made using current indoor air
concentrations, which under residential or office
scenarios would be expected to remain relatively
stable (within an order of magnitude). In an industrial
scenario where large volumes of VOC-containing
products are frequently used, more variability would
be expected.
5.3.2 Sizing/Number/Capacity Calculations
The equations in the following subsections have been
derived using multiple simplifying assumptions to
provide relatively simple equations for selecting a
design starting point. In real systems, every input to
the equations will vary over time and these variations
can be difficult to predict.
Concentration reductions within the target space
using ATUs would generally be expected to follow an
asymptotic curve in the period immediately after
initial activation, but before efficiency drops, as
illustrated by Figure 7.
However, variations in indoor product use, flux
across the slab due to barometric pressure changes/
temporal changes in subslab concentrations, changes
in operation of HVAC units, and other factors will
impact both the effectiveness of treatment and
carbon saturation times.
As such, the equations presented below provide a
starting point for selecting ATUs. Follow-up
monitoring is required to confirm that the correct
number and size of ATUs has been installed for the
specific scenario as well as to monitor media
breakthrough times.
Figure 7. Air treatment unit influence on indoor air concentrations (idealized example after initial startup)

Adsorption-based Treatment Systems 29
Mass Balance Sizing Method
The overall mass balance can be generalized as
follows:
𝑀𝑎𝑠𝑠 𝑒𝑛𝑡𝑒𝑟𝑖𝑛𝑔 𝑡ℎ𝑒 𝑠𝑝𝑎𝑐𝑒
= 𝑚𝑎𝑠𝑠 𝑎𝑑𝑠𝑜𝑟𝑏𝑒𝑑
+ 𝑚𝑎𝑠𝑠 𝑒𝑥𝑖𝑡𝑖𝑛𝑔 𝑡ℎ𝑒 𝑠𝑝𝑎𝑐𝑒
Contaminant mass enters a space from several
primary locations:
• Outdoor air.
• Air recirculated from other zones within the
building.
• Soil gas entry points.
• VOC-containing products in use within the
target space or other VOC generating
processes, such as cooking (Huang et al.,
2011) or combustion appliances.
• The flow rates of outdoor air exchange and
recirculated air depend on HVAC operation
and are based on the use of the space and the
number of people generally occupying the
space. Information on typical background
concentrations of many VOCs of concern in
VI is available from U.S. EPA (2011a). Data
on indoor air concentrations of a longer list of
VOCs are summarized in Appendix C of the
New York State VI guidance (New York State
Department of Health, 2006).
• Mass generally enters a space from the
subsurface through specific entry points (e.g.,
cracks, utility lines entry points) and to a lesser
extent as diffusive flux across a slab. This
term can be estimated using subsurface
concentrations and a default soil gas entry rate
(Qs) or by direct measurements of mass flux.
Methods for mass flux estimation from VI are
discussed in Dawson and Wertz (2016) and
Guo et al. (2015).
• Product use within a space may contribute
significant mass to the space dependent upon
use and may be more difficult to estimate.
However, if the air exchange rate is known
and a long-term integrated VOC sample is
acquired for a full list of VOCs, an estimate
may be obtained.
It should be recognized that concentrations and flow
rates change temporally. However, in the following
equations, pseudo-steady state conditions are assumed
as a simple way to make initial estimates. This
approach uses a constant removal rate for the air
cleaner based on the value it would have at the initial
room concentration, 𝑄𝑓𝑛𝑓𝐶𝑖. This estimate allows us
to avoid the complicated equations that describe the
actual non-steady state situation, while providing an
acceptable estimate for an initial assessment.
Figure 8 is a representative depiction of the mass
balance inputs used in the following equation:
𝑄𝑜𝐶𝑜 + 𝑄𝑟1𝐶𝑟1 + 𝑄𝑠𝐶𝑠 + 𝑄𝑝𝐶𝑝
= 𝑄𝑓𝑛𝑓𝐶𝑖 + 𝑄𝑟2𝐶𝑟2 + 𝑄𝑒𝐶𝑒
Where:
Qo = outdoor air flow rate
Co = outdoor air concentration
Qr1 = air flow rate from target space to adjacent
space
Cr1 = air concentration in air moving from target
space to adjacent space
Qr2 = air flow rate from adjacent space to target
space
Cr2 = air concentration in air moving from adjacent
space to target space
Qs = subsurface soil gas infiltration rate
Cs = subsurface soil gas concentration
Qp = product flow rate
Cp = product concentration
Qf = air filter flow rate
nf = air filter efficiency
Ci = starting indoor air concentration
Qe = flow rate of air exiting target space through
the building envelope
Ce = concentration of air exiting target space (i.e.,
after filtration).
Commented [YN2]: Alt text for equation:
This equation is related to the model depicted in Figure 8. Outdoor
air flow rate times the outdoor air concentration plus the air flow rate
from the target space to the adjacent space times the air concentration in air moving from the target space to the adjacent
space plus the subsurface soil gas infiltration rate times the
subsurface soil gas concentration plus the product flow rate times the
product concentration equals the air filter flow rate times the air
filter efficiency times the starting indoor air concentration plus air
flow rate from adjacent space to target space times air flow rate from adjacent space to target space plus flow rate of air exiting target
space through the building envelope times concentration of air
exiting target space (i.e., after filtration).
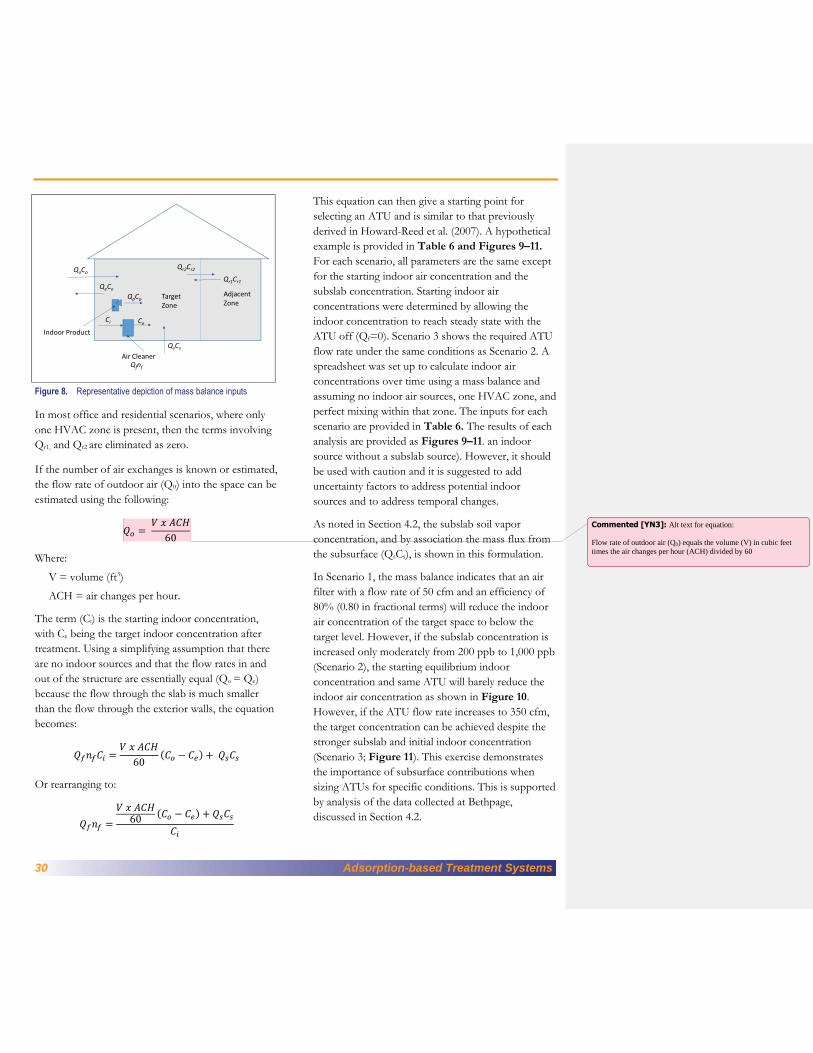
30 Adsorption-based Treatment Systems
Figure 8. Representative depiction of mass balance inputs
In most office and residential scenarios, where only
one HVAC zone is present, then the terms involving
Qr1, and Qr2 are eliminated as zero.
If the number of air exchanges is known or estimated,
the flow rate of outdoor air (Q0) into the space can be
estimated using the following:
𝑄𝑜 = 𝑉 𝑥 𝐴𝐶𝐻
60
Where:
V = volume (ft3)
ACH = air changes per hour.
The term (Ci) is the starting indoor concentration,
with Ce being the target indoor concentration after
treatment. Using a simplifying assumption that there
are no indoor sources and that the flow rates in and
out of the structure are essentially equal (Qo = Qe)
because the flow through the slab is much smaller
than the flow through the exterior walls, the equation
becomes:
𝑄𝑓𝑛𝑓𝐶𝑖 =𝑉 𝑥 𝐴𝐶𝐻
60(𝐶𝑜 − 𝐶𝑒) + 𝑄𝑠𝐶𝑠
Or rearranging to:
𝑄𝑓𝑛𝑓 =
𝑉 𝑥 𝐴𝐶𝐻60
(𝐶𝑜 − 𝐶𝑒) + 𝑄𝑠𝐶𝑠
𝐶𝑖
This equation can then give a starting point for
selecting an ATU and is similar to that previously
derived in Howard-Reed et al. (2007). A hypothetical
example is provided in Table 6 and Figures 9–11.
For each scenario, all parameters are the same except
for the starting indoor air concentration and the
subslab concentration. Starting indoor air
concentrations were determined by allowing the
indoor concentration to reach steady state with the
ATU off (Qf=0). Scenario 3 shows the required ATU
flow rate under the same conditions as Scenario 2. A
spreadsheet was set up to calculate indoor air
concentrations over time using a mass balance and
assuming no indoor air sources, one HVAC zone, and
perfect mixing within that zone. The inputs for each
scenario are provided in Table 6. The results of each
analysis are provided as Figures 9–11. an indoor
source without a subslab source). However, it should
be used with caution and it is suggested to add
uncertainty factors to address potential indoor
sources and to address temporal changes.
As noted in Section 4.2, the subslab soil vapor
concentration, and by association the mass flux from
the subsurface (QsCs), is shown in this formulation.
In Scenario 1, the mass balance indicates that an air
filter with a flow rate of 50 cfm and an efficiency of
80% (0.80 in fractional terms) will reduce the indoor
air concentration of the target space to below the
target level. However, if the subslab concentration is
increased only moderately from 200 ppb to 1,000 ppb
(Scenario 2), the starting equilibrium indoor
concentration and same ATU will barely reduce the
indoor air concentration as shown in Figure 10.
However, if the ATU flow rate increases to 350 cfm,
the target concentration can be achieved despite the
stronger subslab and initial indoor concentration
(Scenario 3; Figure 11). This exercise demonstrates
the importance of subsurface contributions when
sizing ATUs for specific conditions. This is supported
by analysis of the data collected at Bethpage,
discussed in Section 4.2.
QoCo
QsCs
Air Cleaner
QpCp
Qfnf
Ci Ce
QeCe
Qr2Cr2
Qr1Cr1
Indoor Product
Target Zone
Adjacent Zone
Commented [YN3]: Alt text for equation:
Flow rate of outdoor air (Q0) equals the volume (V) in cubic feet
times the air changes per hour (ACH) divided by 60
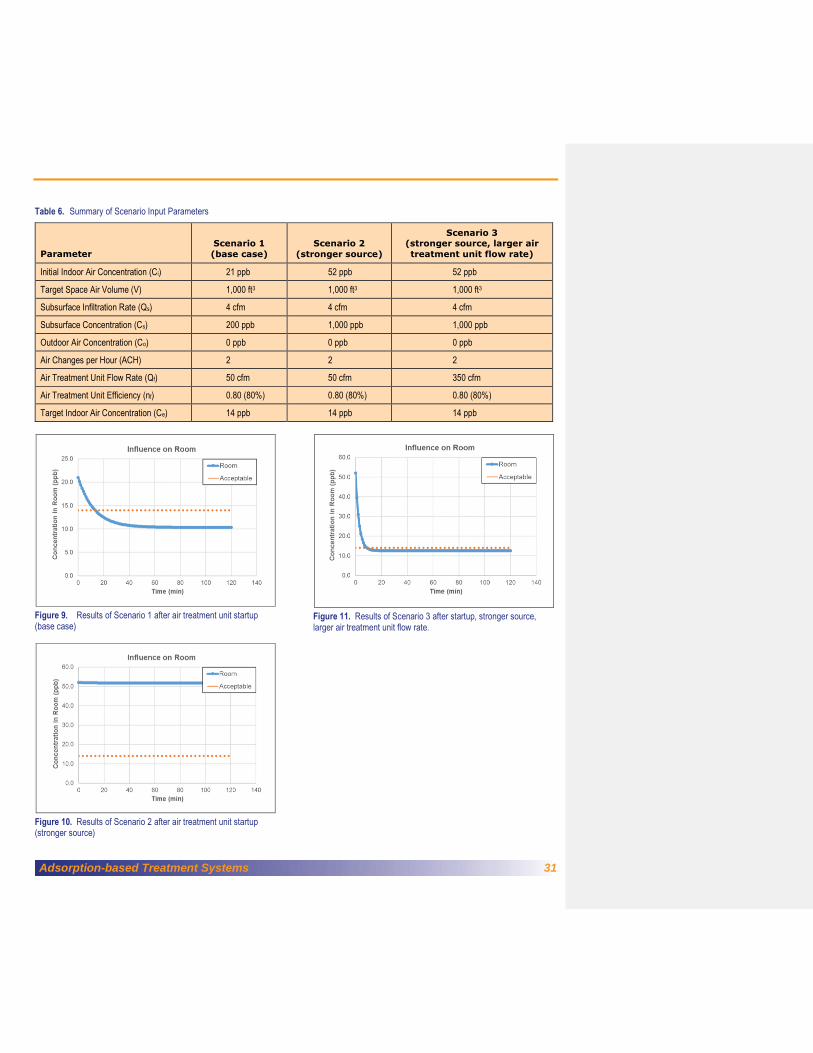
Adsorption-based Treatment Systems 31
Table 6. Summary of Scenario Input Parameters
Parameter
Scenario 1
(base case)
Scenario 2
(stronger source)
Scenario 3 (stronger source, larger air
treatment unit flow rate)
Initial Indoor Air Concentration (Ci) 21 ppb 52 ppb 52 ppb
Target Space Air Volume (V) 1,000 ft3 1,000 ft3 1,000 ft3
Subsurface Infiltration Rate (Qs) 4 cfm 4 cfm 4 cfm
Subsurface Concentration (Cs) 200 ppb 1,000 ppb 1,000 ppb
Outdoor Air Concentration (Co) 0 ppb 0 ppb 0 ppb
Air Changes per Hour (ACH) 2 2 2
Air Treatment Unit Flow Rate (Qf) 50 cfm 50 cfm 350 cfm
Air Treatment Unit Efficiency (nf) 0.80 (80%) 0.80 (80%) 0.80 (80%)
Target Indoor Air Concentration (Ce) 14 ppb 14 ppb 14 ppb
Figure 9. Results of Scenario 1 after air treatment unit startup (base case)
Figure 10. Results of Scenario 2 after air treatment unit startup (stronger source)
Figure 11. Results of Scenario 3 after startup, stronger source, larger air treatment unit flow rate.
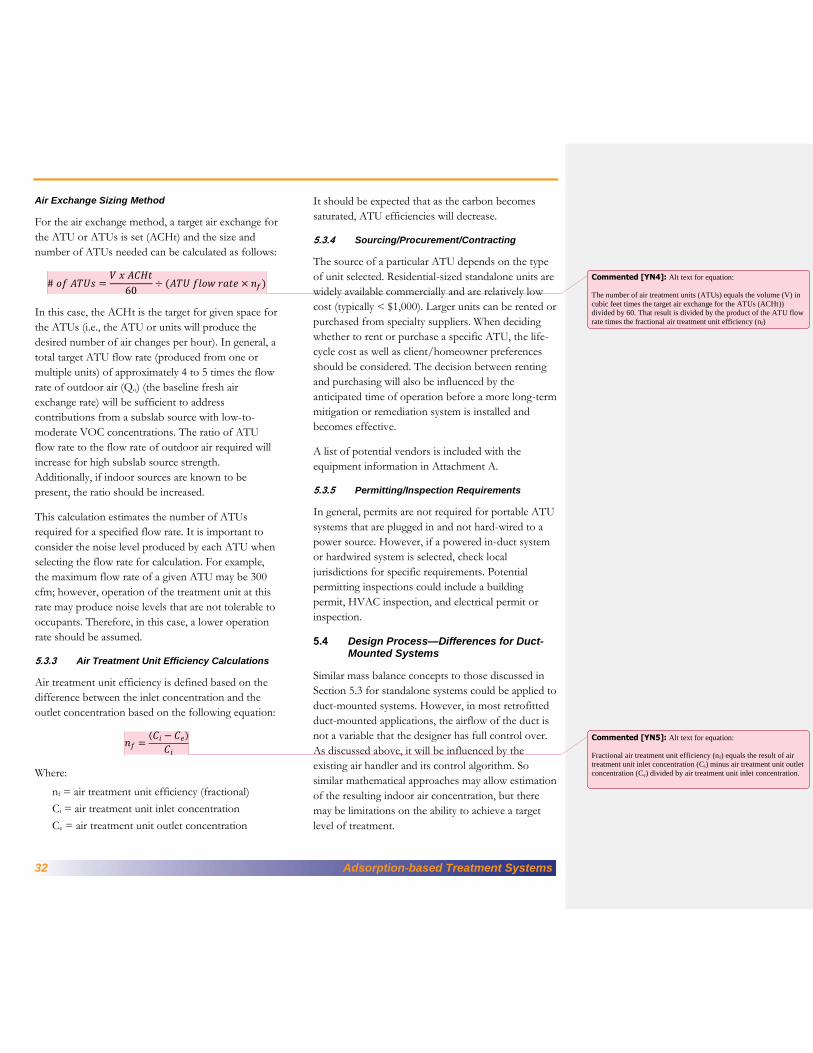
32 Adsorption-based Treatment Systems
Air Exchange Sizing Method
For the air exchange method, a target air exchange for
the ATU or ATUs is set (ACHt) and the size and
number of ATUs needed can be calculated as follows:
# 𝑜𝑓 𝐴𝑇𝑈𝑠 =𝑉 𝑥 𝐴𝐶𝐻𝑡
60÷ (𝐴𝑇𝑈 𝑓𝑙𝑜𝑤 𝑟𝑎𝑡𝑒 × 𝑛𝑓)
In this case, the ACHt is the target for given space for
the ATUs (i.e., the ATU or units will produce the
desired number of air changes per hour). In general, a
total target ATU flow rate (produced from one or
multiple units) of approximately 4 to 5 times the flow
rate of outdoor air (Qo) (the baseline fresh air
exchange rate) will be sufficient to address
contributions from a subslab source with low-to-
moderate VOC concentrations. The ratio of ATU
flow rate to the flow rate of outdoor air required will
increase for high subslab source strength.
Additionally, if indoor sources are known to be
present, the ratio should be increased.
This calculation estimates the number of ATUs
required for a specified flow rate. It is important to
consider the noise level produced by each ATU when
selecting the flow rate for calculation. For example,
the maximum flow rate of a given ATU may be 300
cfm; however, operation of the treatment unit at this
rate may produce noise levels that are not tolerable to
occupants. Therefore, in this case, a lower operation
rate should be assumed.
5.3.3 Air Treatment Unit Efficiency Calculations
Air treatment unit efficiency is defined based on the
difference between the inlet concentration and the
outlet concentration based on the following equation:
𝑛𝑓 =(𝐶𝑖 − 𝐶𝑒)
𝐶𝑖
Where:
nf = air treatment unit efficiency (fractional)
Ci = air treatment unit inlet concentration
Ce = air treatment unit outlet concentration
It should be expected that as the carbon becomes
saturated, ATU efficiencies will decrease.
5.3.4 Sourcing/Procurement/Contracting
The source of a particular ATU depends on the type
of unit selected. Residential-sized standalone units are
widely available commercially and are relatively low
cost (typically < $1,000). Larger units can be rented or
purchased from specialty suppliers. When deciding
whether to rent or purchase a specific ATU, the life-
cycle cost as well as client/homeowner preferences
should be considered. The decision between renting
and purchasing will also be influenced by the
anticipated time of operation before a more long-term
mitigation or remediation system is installed and
becomes effective.
A list of potential vendors is included with the
equipment information in Attachment A.
5.3.5 Permitting/Inspection Requirements
In general, permits are not required for portable ATU
systems that are plugged in and not hard-wired to a
power source. However, if a powered in-duct system
or hardwired system is selected, check local
jurisdictions for specific requirements. Potential
permitting inspections could include a building
permit, HVAC inspection, and electrical permit or
inspection.
5.4 Design Process—Differences for Duct-Mounted Systems
Similar mass balance concepts to those discussed in
Section 5.3 for standalone systems could be applied to
duct-mounted systems. However, in most retrofitted
duct-mounted applications, the airflow of the duct is
not a variable that the designer has full control over.
As discussed above, it will be influenced by the
existing air handler and its control algorithm. So
similar mathematical approaches may allow estimation
of the resulting indoor air concentration, but there
may be limitations on the ability to achieve a target
level of treatment.
Commented [YN4]: Alt text for equation:
The number of air treatment units (ATUs) equals the volume (V) in
cubic feet times the target air exchange for the ATUs (ACHt)) divided by 60. That result is divided by the product of the ATU flow
rate times the fractional air treatment unit efficiency (nf)
Commented [YN5]: Alt text for equation:
Fractional air treatment unit efficiency (nf) equals the result of air
treatment unit inlet concentration (Ci) minus air treatment unit outlet
concentration (Ce) divided by air treatment unit inlet concentration.
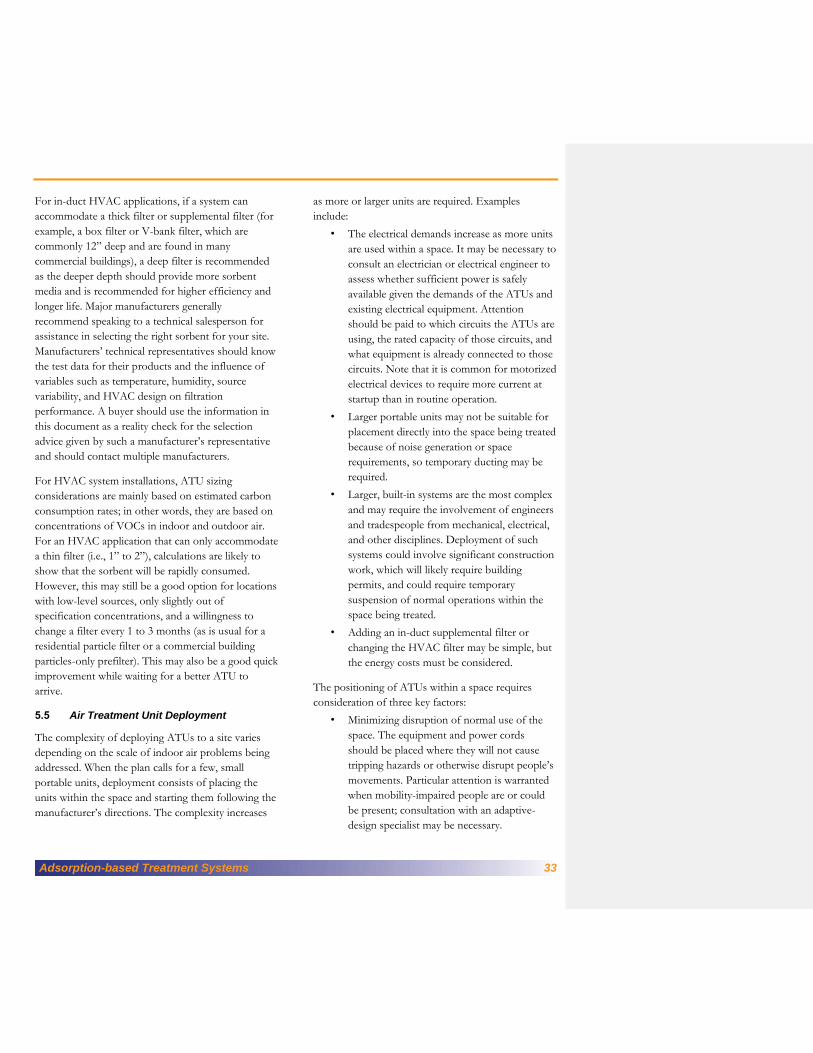
Adsorption-based Treatment Systems 33
For in-duct HVAC applications, if a system can
accommodate a thick filter or supplemental filter (for
example, a box filter or V-bank filter, which are
commonly 12” deep and are found in many
commercial buildings), a deep filter is recommended
as the deeper depth should provide more sorbent
media and is recommended for higher efficiency and
longer life. Major manufacturers generally
recommend speaking to a technical salesperson for
assistance in selecting the right sorbent for your site.
Manufacturers’ technical representatives should know
the test data for their products and the influence of
variables such as temperature, humidity, source
variability, and HVAC design on filtration
performance. A buyer should use the information in
this document as a reality check for the selection
advice given by such a manufacturer’s representative
and should contact multiple manufacturers.
For HVAC system installations, ATU sizing
considerations are mainly based on estimated carbon
consumption rates; in other words, they are based on
concentrations of VOCs in indoor and outdoor air.
For an HVAC application that can only accommodate
a thin filter (i.e., 1” to 2”), calculations are likely to
show that the sorbent will be rapidly consumed.
However, this may still be a good option for locations
with low-level sources, only slightly out of
specification concentrations, and a willingness to
change a filter every 1 to 3 months (as is usual for a
residential particle filter or a commercial building
particles-only prefilter). This may also be a good quick
improvement while waiting for a better ATU to
arrive.
5.5 Air Treatment Unit Deployment
The complexity of deploying ATUs to a site varies
depending on the scale of indoor air problems being
addressed. When the plan calls for a few, small
portable units, deployment consists of placing the
units within the space and starting them following the
manufacturer’s directions. The complexity increases
as more or larger units are required. Examples
include:
• The electrical demands increase as more units
are used within a space. It may be necessary to
consult an electrician or electrical engineer to
assess whether sufficient power is safely
available given the demands of the ATUs and
existing electrical equipment. Attention
should be paid to which circuits the ATUs are
using, the rated capacity of those circuits, and
what equipment is already connected to those
circuits. Note that it is common for motorized
electrical devices to require more current at
startup than in routine operation.
• Larger portable units may not be suitable for
placement directly into the space being treated
because of noise generation or space
requirements, so temporary ducting may be
required.
• Larger, built-in systems are the most complex
and may require the involvement of engineers
and tradespeople from mechanical, electrical,
and other disciplines. Deployment of such
systems could involve significant construction
work, which will likely require building
permits, and could require temporary
suspension of normal operations within the
space being treated.
• Adding an in-duct supplemental filter or
changing the HVAC filter may be simple, but
the energy costs must be considered.
The positioning of ATUs within a space requires
consideration of three key factors:
• Minimizing disruption of normal use of the
space. The equipment and power cords
should be placed where they will not cause
tripping hazards or otherwise disrupt people’s
movements. Particular attention is warranted
when mobility-impaired people are or could
be present; consultation with an adaptive-
design specialist may be necessary.
34 Adsorption-based Treatment Systems
• To minimize occupants’ discomfort due to
noise, the units should be placed as far as
practical from locations where occupants
spend large amounts of time. In occupational
settings, this could include being away from
desks or other workstations. In a residential
setting, this could include avoiding proximity
to dining tables, kitchen work areas, sofas,
chairs, and beds.
• As discussed previously, the results from the
testing conducted by Howard-Reed et al.
(2007, 2008a) imply that it is beneficial to
locate the unit in the same room that soil gas
is entering. It is also necessary to place the
unit so it has free air circulation, and the
treated air is rapidly mixed with the bulk of
the air in the targeted zone.
Startup of small portable units can be as simple as
turning the fan on to the desired speed setting and
confirming that air if flowing through the unit.
Startup of larger and built-in units will be more
complex, especially if the air is to be ducted into
existing ductwork or if a supplemental filter is to be
introduced into the existing ductwork that markedly
changes the flow. In that case, startup will likely
involve rebalancing of airflow, requiring the expertise
of a knowledgeable mechanical engineer or technician
(National Environmental Balancing Bureau, 2005).
5.5.1 Verification Testing and Performance
Monitoring
Verification and ongoing performance testing is a
requirement following ATU deployment and startup.
Although the ATU mitigation may have been
specified with a conservatively high airflow rate, no
system can be assumed to be operating as intended
without collecting and analyzing indoor air VOC
samples. Also, as the system operates and the sorbent
gets loaded with VOCs, the potential for VOC
breakthrough and desorption increases. Therefore,
some type of ongoing performance monitoring is
required.
The sampling and analytical methods for verification
and operational monitoring typically consist of time-
weighted samples collected in the breathing zone, that
is, 3 to 5 feet above the floor within the space of
interest. The sampling location should be selected to
be well away from the air cleaning device. Sample
durations can vary from hours to days. Some current
sampling strategies may include the following:
• Collecting 8-hour indoor air samples in
occupational settings using U.S. EPA Method
TO-15
• Collecting 24-hour air indoor air samples in
residential settings using U.S. EPA Method
TO-15
• Collecting 7-day or longer indoor air samples
using passive-diffusion samplers and U.S.
EPA Method TO-17.
Selection of a sample duration and methods is a
project-specific decision. Initial verification samples
typically match the duration and methods used to
collect the investigation samples that led to the need
for mitigation. The strategy may be changed as the
goal changes to long-term monitoring.
Initial verification samples are collected after an
equilibration period of 24 to 48 hours following ATU
startup. If the initial verification samples show indoor
air VOC concentrations below applicable thresholds,
such as project action levels, then the monitoring
program transitions to operational monitoring. If the
VOC concentration exceed thresholds, then
modification to the system may be required followed
by additional verification sampling.
The frequency of operational indoor air monitoring is
a function of two main factors: the anticipated time
for VOC breakthrough and the presence of other
indoor air contaminants that may influence ATU
performance. An example of the latter, as discussed in
Section 5.1, is nontarget VOCs present in indoor air,
which may consume sorption capacity and reduce the
lifetime of the sorbent. Another example is airborne
Adsorption-based Treatment Systems 35
particles. Most ATUs include some type of prefilter to
remove particulates prior to the sorbent material.
Often high-efficiency particle air (HEPA) filters or
other fine-particulate filtration media is used. Such
filter media may become clogged resulting in
decreased airflow and air-cleaning efficiency over
time. Due to these factors, it is prudent to include a
margin of safety when selecting a sampling frequency.
For example, if breakthrough is calculated to take 1
year, then quarterly monitoring could provide
sufficient resolution to see breakthrough in advance
of the expected time. The monitoring frequency could
be reduced once the breakthrough period is
understood through two or more cycles of sorption
media change out with site-specific data collection.
5.5.2 Operation and Maintenance
ATU equipment requires ongoing routine
maintenance. The user manuals will provide detailed
information for a specific unit. General operations
and maintenance procedures include:
• Inspections to verify that the equipment is in
place and running at the intended air flow.
While this may seem like a simple procedure,
experience has shown that it may be the most
critical inspection criterion. Building
occupants may turn off, move, or unplug
portable ATUs for various reasons including
noise (Lawrence Berkley National Lab, 2016),
access of areas for cleaning, or lack of
understanding of the equipment’s purpose.
With more permanent, built-in systems, data
loggers and telemetry may be incorporated to
verify system uptime.
• Checking the seating of the filters. Many
portable units have filters that are loosely
mounted. It is important that they be in the
correct place so that the air does not
inadvertently bypass the filter.
• Replacing prefilters at the frequency
recommended by the manufacturer or more
frequently if airflow is reduced due to high
concentrations of particulates.
• Replacing the VOC filtration media. The
operational air monitoring data will provide
information on trends of the target analytes.
Media change out can be specified for when
the monitoring data shows concentrations of
target analytes at some fraction, say 50% or
75%, of the site-specific action level. This will
minimize the potential for breakthrough prior
to the subsequent monitoring event.
• Cleaning. Keeping the exterior of the ATU
clean will improve its aesthetic appeal.
Because VOC filtration media will accumulate VOC
mass, it is possible that spent media could meet state
or federal criteria for characterization as hazardous
waste. Testing, such as EPA’s Toxicity Characteristic
Leachate Procedure (TCLP), may be necessary to
support waste characterization. A waste management
specialist should be consulted to evaluate this
possibility and develop waste characterization and
management plan. Prefilter media will typically be
managed as non-hazardous waste and disposed of as
municipal solid waste.
The need for ATUs may end for reasons such as the
following:
• A longer-term mitigation system has been
installed. For example, a subslab
depressurization system may be installed
when VI is the cause of indoor air
contamination.
• Environmental remediation has diminished
the source of VOCs to the point where
mitigation is no longer required.
When portable equipment is used, demobilization
may be as simple as removing the equipment from
the building and managing spent media appropriately.
Removal of a built-in system may be as significant an
effort as the original installation. Building owners or
operators may prefer to leave the equipment in place
36 Adsorption-based Treatment Systems
to improve indoor air quality issues unrelated to
environmental contamination. In such cases,
ownership and responsibility for operations and
maintenance will typically be transferred to the owner
or operator.
5.6 Communication and Instructions for Occupants During Air Treatment Unit Deployment and Operation
Communication with building owners, operators, and
occupants is key to successful deployment and
operation of ATUs. For environmental clean-up
projects, this will likely take place as part of a larger
property access and stakeholder-communication
effort. Some examples of needed communication
regarding ATUs include the following:
• Informing stakeholders that use of ATUs may
be implemented if results from planned
indoor air VOC samples exceed applicable
thresholds. This is particularly important if the
need for a rapid response is a possibility (rapid
responses were performed in many of the
applications discussed previously in Section
4.3). In such cases, it may be most efficient to
include the potential deployment of ATUs
into the agreement used to gain access to the
property for sampling. Including pictures and
other information about the units may ease
communication with stakeholders.
• If portable ATUs are being deployed,
outreach to building occupants, maintenance
staff, and others with access to the units is
important. As noted in Section 5.5, people
turning the units off, unplugging them, or
removing them is a common problem.
Regular inspections can help minimize such
events, but educated occupants are the first
line of defense. Direct, face-to-face education,
wall signs, and other methods can be used to
educate occupants about the purpose of the
ATUs and the importance of their continuous
operation to maintaining indoor air quality.
• If deployment of built-in or in-duct ATUs is a
possibility, it will be important to identify
decision makers early in the process. In
commercial settings in particular, the decision-
making authority may be complex and could
involve owners, property managers, and the
businesses leasing the property. Workers’
unions may also require notification in
commercial and industrial setting.
• Establishing a clear line of communication for
occupants to report problems with the ATUs
during operations is important. This can take
the form of stickers or wall notices placed on
or near the units. It may also be beneficial to
place property tags on the equipment that
clearly identify the equipment owner with
contact phone numbers. Portable ATUs have
gone missing during deployment and property
tags could aid in recovering the equipment.
Identifying these and other communications needs
and establishing a communications plan early in the
project planning process will facilitate a more
successful project.
6. MONITORING AND VERIFYING AIR
TREATMENT UNIT PERFORMANCE
Since the performance of VOC ATUs can decline
over time for various reasons, including saturation of
the sorbent media, increases in VOC sources, and
changes in building flow regimes, a monitoring
program is needed to verify that performance
objectives are met. Performance objectives for a VOC
ATU installation can be specified in several ways, but
the primary ones are:
• Maintenance of indoor air concentrations
below pre-specified standards
• ATU efficiency (concentration out over
concentration in)
• ATU placement and continued operation
Adsorption-based Treatment Systems 37
• Reduction of indoor air concentration while a
longer-term mitigation solution is being
installed.
As detailed in Section 5.5.1, the desired performance
objectives can be monitored in several ways including:
• Regular VOC monitoring by measuring
indoor air VOC concentrations (to check for
exceedances of the specified standards), or
VOC concentrations at the ATU inlet and
outlet (to check on VOC removal efficiency).
• Scheduled check-ins (visits and calls) before
and after installation to ensure that the system
is and remains correctly installed and
operated. For example, for residential
installations, it may be prudent to contact the
homeowner within a few days of installation
to ensure that the ATU is still operational
(e.g., is it plugged in? Is air coming out of the
discharge?) and has not caused issues such as
excessive noise. Check-in visits can also
inspect the premises to help identify changes
in HVAC operations or building
modifications that could adversely affect
treatment unit operation and performance.
• Contacts for the building occupants in case of
problems with the units.
When developing a monitoring plan, performance
objectives should also be expressed in terms of data
quality objectives (DQOs) that specify the type,
amount, and quality of indoor air quality data that
needs to be collected to verify performance at the
specific location of interest, including how samples
will be collected and analyzed. For example, DQOs
for a commercial building might specify 8-hour
summa canister (Method TO-15) samples for short-
term VOC concentration checks while DQOs for a
residential setting may specify 24-hour samples to
accommodate the longer exposure period.
An ATU monitoring plan should be consistent with
the indoor air sampling plan that was used to identify
the indoor air problem and select VOC ATUs as part
of the solution, with the original indoor air sampling
establishing the baseline that will be compared to the
ATU monitoring results. This monitoring plan can
include sampling frequency and locations (for
comparability), although ATU placement will
influence sampling locations (for example inlet and
outlet samples for efficiency measurements).
In addition, the monitoring plan should specify an
end date for sampling, based on site-specific estimates
or measurements of when VOC concentrations may
fall below concentrations of concern. This may
involve different sampling frequencies during
treatment system operation, such as specifying 2-week
or 1-month passive samplers (U.S. EPA, 2015) for
longer operations with TO-15 samples at the
beginning and end of operation, or when
concentration increases are identified from passive
samplers or field VOC sensor measurements.
Although they do not provide compound-specific
data, field VOC sensors (e.g., photo- or flame-
ionization detectors) may also be useful in identifying
VOC sources associated with VOC increases
identified during routine VOC monitoring.
Finally, specifications of sampling and analysis
techniques should be appropriate for the problem and
consistent with what is being used by the regional or
state regulatory authorities.
7. CURRENT CHALLENGES, LIMITATIONS,
AND RESEARCH AND DEVELOPMENT
NEEDS
As shown in the examples and data presented in
Section 4.3, there has been considerable variability in
the effectiveness of the practical applications of
ATUs to vapor intrusion. Most field applications have
been to rapid action cases and have relied on rules of
thumb rather than computational engineering design
approaches.

38 Adsorption-based Treatment Systems
The best field-scale, measurement-based testing
program results found reported in Section 4.2 were
for decane, not the chlorinated or aromatic
hydrocarbons that drive the vast majority of U.S.
vapor intrusion sites. That test program employed a
constant indoor source of the test VOC, and; thus,
did not test the complex set of geologic and
meteorological factors that control VI behavior in
buildings (U.S. EPA, 2012).
As exemplified by the publications of the California
Air Resources Board (2016), not all currently
marketed ATUs can be recommended for use. Some
of the devices are ineffective or produce excessive
ozone. There have not been adequate field
demonstrations of photocatalytic ATUs in complex
real indoor atmospheres with trace VOCs, such as are
found at VI sites, to fully evaluate whether any
observed destruction of target VOCs outweighs the
formation of undesirable reaction byproducts in some
designs. Therefore, the use of sorbent-based VOC
ATUs in current applications is preferred and
suggest that the photocatalytic devices merit
additional testing.
7.1 Technology Development and Chamber Verification Needs
7.1.1 Future Technology Development
Although carbon filtration for VI contamination
removal is most effective at this point, there are many
technologies that could eventually be developed to
successfully remove VOCs from indoor air.
Specifically treated sorbents designed for chlorinated
hydrocarbons could be developed. Systems using
currently available sorbents could be designed to
allow periodic stripping of sorbed compounds to
increase lifetime and yield better prediction of
performance. Reactive ATU technologies are still
relatively new and newer designs could lead to units
with predictable byproducts or extremely short half-
life intermediates that are not problematic.
7.1.2 Potential Duct-Testing Programs
Duct-testing apparatuses can be used to directly test
replacement filters and similar devices that are directly
installed in existing HVAC systems. These
apparatuses can also be used to test the filter or
sorbent components of portable or wall-mounted
ATUs (dismounted from the portable equipment).
Single-pass efficiency and capacity information is
extremely useful in ranking devices for performance.
Testing of units based on the ASHRAE 145.2 test
should be done. Simply testing more commercially
available units with a VI-relevant chlorinated
hydrocarbon would increase our knowledge of how
these units work relative to each other. These data
used in modeling would allow improved calculations
of the likely effectiveness of the devices.
Another useful approach using duct testing would be
to use a mixture of VOCs typically found in VI
situations, considering both soil gas and indoor air
background VOCs. This testing could be conducted
at typical concentrations observed in the field, but as
low as needed to include regulatory limits. Testing
could also be conducted at standard and high
humidity, to include conditions common to
basements and crawlspaces, low income communities
where air conditioning may not be universal, and high
humidity spaces such as bathrooms and kitchens.
Although this approach would not give exact
information for every situation, it could provide very
different answers than provided by the single-
compound, typical condition testing. A measurement-
based pilot study of representative units could
determine whether all units should be tested this way.
7.1.3 Potential Chamber-Testing Programs
Chamber testing is used for portable and wall-
mounted units. Chamber testing specifically allows
multiple passes of air through the ATUs. HVAC
units should be scaled to the size of the room.
Chamber testing is needed, especially for small
Adsorption-based Treatment Systems 39
devices with low airflow that cannot be tested using
the duct-testing method.
A chamber test could start with a single injection of a
contaminant or set of contaminants, continuous
injection, pulsed injection, or even injection with
changing characteristics over time, which could be
helpful in emulating VI situations. Chamber testing
using high sensitivity analysis could detect byproduct
compounds that might not be seen in duct testing as
they may be concentrated over time in the chamber.
Conditions such as humidity and various
concentrations of mixed VOCs and inorganic gases
can be tested.
For the future development of reactive devices,
chamber testing allows for the multiple passes and
time for reactions to occur and be completed. Testing
can then determine both reaction intermediaries that
might be unacceptable and capability to actually
destroy contaminants.
7.2 Field-Scale Testing, Verification, and Tech Transfer Recommendations
7.2.1 Quantitative Reviews of Existing Field
Applications
Existing applications are generally managed only to
meet the human health protection, regulatory
compliance, and economic needs of a situation.
Therefore, data that may be helpful in designing
future applications of the devices are generally not
systematically gathered, reported, or analyzed.
However, more analysis using the mathematical
approaches outlined in this paper (and in Howard-
Reed et al., 2008a, b) is possible. Information on
building volumes while not frequently reported could
be easily gathered. Records of operational runtime as
well as concentrations found on sorbent beds prior to
disposal are other valuable information that may be
gathered. Comparison of existing subslab
concentration data to indoor air performance would
be valuable. Applications funded by government
potentially responsible parties or EPA Regions, and
data already in the public record, may be amenable to
additional systematic analysis.
Buildings with ongoing applications could be
approached to allow the measurement of key
parameters such as air exchange rates and indoor
humidity. Indoor source surveys might also be
undertaken with field instruments, such as the
HAPSITE gas chromatograph/mass spectrometer
system, to understand performance differences
between buildings. In government-funded or
controlled cases, collection of additional indoor air
quality data to provide more time resolution or source
strength information may be feasible.
Such applications have the benefit of realism with
varying weather conditions and VOC-generating
indoor activities. However, with that realism also
comes more potentially confounding variables to
analyze. Additionally, systems in occupied buildings
cannot be run to breakthrough or other failure
modes.
7.2.2 Field-Scale Demonstrations
Studies in normally constructed, but currently
unoccupied structures, have been informative to the
VI field. Tests of ATU performance in such
structures have been previously performed by
Howard-Reed for indoor sources. Ideally a building
that has concentrations of VOCs from vapor
intrusion that might require rapid response in an
occupied building could be selected. Such a structure
could be carefully instrumented to observe air
exchange rate, soil gas entry rate (i.e., with radon
tracer), time-resolved VOC concentrations, humidity,
and other factors. Tests could be done initially
without indoor sources. Later, indoor sources (i.e., air
fresheners, loosely capped solvent containers, shower
water) could be introduced in a controlled manner.
Testing could be conducted with and without air
conditioning or dehumidification.
Multiple ATUs or multiple flow settings could be
tested to validate the mathematical design approaches

40 Adsorption-based Treatment Systems
presented in this EIP. Additional spreadsheet
scenarios, such as those presented in Table 6, could
be developed as a technology transfer/training tool.
The ability of such a simple spreadsheet model to
provide useful design guidance could be explored by
comparison to results of more complex models. More
complex models, such as the NIST multizone indoor
air quality model CONTAM7 or a three-dimensional
or transient VI model, could provide the ability to
explore the sensitivity of ATU performance to
variations in environmental conditions.
NOTICE
The information in this document has been funded
wholly by the United States Environmental
Protection Agency under contract number EP-C-11-
036 to RTI International. It has been subjected to the
Agency’s peer and administrative review and has been
approved for publication as an EPA document.
Mention of trade names or commercial products does
not constitute endorsement or recommendation
for use.
8. REFERENCES
Aguado, S., A.C. Polo, M.P. Bernal, J. Coronas, and J. Santamaría. 2004. Removal of pollutants from indoor air using zeolite membranes. Journal of Membrane Science 240:159–166. http://www.sciencedirect.com/science/article/pii/S0376738804003035
Alberici, R.M., M.A. Mendes, W.F. Jardim, and M.N. Eberlin. 1998. Mass spectrometry on-line monitoring and MS2 product characterization of TiO2/UV photocatalytic degradation of chlorinated volatile organic compounds. Journal of the American Society for Mass Spectrometry 9:1321–1327.
Althouse, A.D., C.H. Turnquist. and A.F. Bracciano. 1988. Modern Refrigeration and Air Conditioning. Goodheart-Willcox Company, South Holland, IL.
7 https://www.nist.gov/services-
resources/software/contam
AHAM (Association of Home Appliance Manufacturers). 2015. ANSI/AHAM AC-1-2015: Method for Measuring the Performance of Portable Household Electric Room Air Cleaners.
ASHRAE (American Society of Heating, Refrigerating and Air-Conditioning Engineers). 1994. Evaluation of Test Methods for Determining the Effectiveness and Capacity of Gas Phase Air Filtration Equipment for Indoor Air Applications. Phase I: Literature review. Final Report for Phase 1 of 674-RP. American Society of Heating, Refrigerating and Air-Conditioning Engineers, Inc. Atlanta, GA.
ASHRAE (American Society of Heating, Refrigerating and Air-Conditioning Engineers). 2008. Standard 145.1 2008. Laboratory Test Method for Assessing the Performance of Gas-Phase Air-Cleaning Systems: Loose Granular Media (ANSI/ASHRAE Approved). ASHRAE, Atlanta, GA. http://www.madcad.com/store/subscription/ASHRAE-145.1-08/
ASHRAE (American Society of Heating, Refrigerating and Air-Conditioning Engineers). 2009. Indoor Air Quality Guide Best Practices for Design Construction and Commissioning. http://cms.ashrae.biz/iaqguide/pdf/IAQGuide.pdf?bcsi_scan_C17DAEAF2505A29E=0&bcsi_scan_filename=IAQGuide.pdf
ASHRAE (American Society of Heating, Refrigerating and Air-Conditioning Engineers). 2011. Standard 145.2-2011 -- Laboratory Test Method for Assessing the Performance of Gas-Phase Air Cleaning Systems: Air Cleaning Devices (ANSI approved). ASHRAE, Atlanta, GA. http://www.techstreet.com/standards/ashrae-145-2-2011?product_id=1804729
ASHRAE (American Society of Heating, Refrigerating and Air-Conditioning Engineers). 2015. ASHRAE Handbook-Applications. Chapter 46: Air Cleaners Gaseous Indoor Air Contaminants. ASHRAE, Atlanta, GA.
Calicchio, W. and K. Malinowski. 2016. Utilizing HAPSITE GC/MS as a vapor intrusion investigation tool for defining trichloroethene impacts in indoor air. Presented at Tenth International Conference on Remediation of Chlorinated and Recalcitrant Compounds.

Adsorption-based Treatment Systems 41
CARB (California Air Resource Board). 2016, October 13. Consumer’s Air Cleaner Portal. https://www.arb.ca.gov/research/indoor/aircleaners/consumers.htm, accessed October 14, 2016.
Chen, W., J.S. Zhang, and Z. Zhang. 2005. Performance of air cleaners for removing multiple volatile organic compounds in indoor air. ASHRAE Transactions. 111(1):1101–1114.
CH2M. 2014a. Completion Report - Interim Remedial Measure and SVE Construction. http://geotracker.waterboards.ca.gov/esi/uploads/geo_report/2903016567/T10000002681.PDF, accessed October 2016.
CH2M. 2014b. Vapor Intrusion Evaluation Summary Report for Honeywell Gardena Site, 1711–1735 West Artesia Boulevard, Gardena, California.
CH2M. 2014c. First Quarter 2014 Supplemental Vapor Intrusion Evaluation Summary Report. http://geotracker.waterboards.ca.gov/esi/uploads/geo_report/5185718595/SL2041M1512.PDF, accessed October 2016.
CH2M. 2014d. Interim Mitigation Measures and Indoor Air Quality Assessment at Suite K of Torrance Business Center Property. http://geotracker.waterboards.ca.gov/esi/uploads/geo_report/4345945239/SL2041M1512.PDF, accessed October 2016.
CH2M. 2015. Post–Temporary Solution Status and Remedial Monitoring Reports October 2014 through March 2015, Former Bull HN Information Systems Inc. Facility, RTN 3-00158.
CH2M. 2016a. Supplemental Vapor Intrusion Assessment Summary Report #2, Former Honeywell Gardena Site, 1711-1735 West Artesia Boulevard, Gardena, CA http://www.envirostor.dtsc.ca.gov/regulators/deliverable_documents/6357958734/Gardena%20Marketplace_Supp_VI%20Assessment_Report_No%202_32516.pdf, accessed October 2016.
CH2M. 2016b. Second Quarter 2016 Vapor Intrusion Monitoring Event Report, Honeywell Gardena Site, West Artesia Boulevard, Gardena, California.
Clausen, J. and S. Shoop. 2015, April. CRREL TCE External Review Panel Summary. http://www.nae.usace.army.mil/Portals/74/docs/Topics/CRREL/Presentation8April2015.pdf
Dawson, H., and W. Wertz. 2016. Mass flux characterization for vapor intrusion assessment. Presented at EPA Vapor Intrusion Technical Workshop, March 22, 2016 San Diego CA https://iavi.rti.org/attachments/WorkshopsAndConferences/12_Dawson%20AEHS%20March%202016%20Mass%20Flux.pdf, accessed October 2016.
Deitz, V. R. 1988, March. Activated carbon performance in removing toxic waste. Proceedings of the Symposium on Gaseous and Vaporous Removal Equipment Test Methods, P. E. McNall (Ed.) NBSIR 88/3716, National Bureau of Standards, pp. 4–11.
Engineering Toolbox. n.d. Air change rates for typical rooms and buildings. http://www.engineeringtoolbox.com/air-change-rate-room-d_867.html, accessed October 2016.
Folkes, D. and D. Tripp. 2016. The value of an iterative approach to VI evaluation and mitigation: Lessons learned at the CRREL facility in Hanover, NH Presented at Tenth International Conference on Remediation of Chlorinated and Recalcitrant Compounds.
Godish, T. 1989. Indoor Air Pollution Control. Lewis Publishers, Inc., Chelsea, MI. pp. 282-306.
Grondzik, W. and R. Furst. 2000. HVAC components and systems. Vital Signs Project. http://www.okohausger.com/media/books/hvac-sml_opt.pdf, accessed October 10, 2016.
Guieysse, B., C. Hort, V. Platel, R. Munoz, M. Ondarts, and S. Revah. 2008. Biological treatment of indoor air for VOC removal: Potential and challenges. Biotechnology Advances 26:398–410.
Guo, B., Chen, W., Zhang, J.S., Smith, J., and Nair, S. 2006. VOC removal performance of pellet/granular type sorbent media - experimental results. ASHRAE Transactions 112:430-440.
Guo, Y., C. Holton, H. Luo, P. Dahlen, K. Gorder, E. Dettenmaier, and P.C. Johnson. 2015. Identification of alternative vapor intrusion pathways using controlled pressure testing, soil gas monitoring, and screening model calculations. Environmental Science & Technology 49(22):13472–13482.
Hay, S.O., T.N. Obee, and C. Thibaud-Erkey. 2010. The deactivation of photocatalytic based air purifiers by ambient siloxanes. Applied Catalysis B—Environmental 99:435–441.
42 Adsorption-based Treatment Systems
Hines, A.L., T.K. Ghosh, S.K. Loyalka, and R.C. Warder, Jr. 1990. Investigation of co-sorption of gases and vapors as a means to enhance indoor air quality. GRI-90/0194 (NTIS PB91-178806), Gas Research Insti-tute, Chicago, IL.
Hodgson, A.T., H. Destaillats, T. Hotchi, and W.J. Fisk. 2007. Evaluation of a combined ultraviolet photocatalytic oxidation (UVPCO)/chemisorbent air cleaner for indoor air applications. LBNL-62202. https://eetd.lbl.gov/node/49375.
Hodgson, A.T., D.P. Sullivan, and W.J. Fisk. 2005. Evaluation of Ultra-Violet Photocatalytic Oxidation (UVPCO) for Indoor Air Applications: Conversion of Volatile Organic Compounds at Low Part-per-Billion Concentrations. Lawrence Berkeley National Laboratory. Paper LBNL-58936.
Howard-Reed, C., V. Henzel, S.J. Nabinger, and A.K. Persily. 2008a. Development of a field test method to evaluate gaseous air cleaner performance in a multizone building. Journal of the Air & Waste Management Association 58(7):919–927.
Howard-Reed, C., S.J. Nabinger, and S.J. Emmerich. 2008b. Characterizing gaseous air cleaner performance in the field. Building and Environment 43(3):368–377.
Howard-Reed, C., V. Henzel, S.J. Nabinger, and A.K. Persily. 2007. Development of a field test method to measure gaseous air cleaner performance in a multizone building, Paper #265. Presented at the 2007 (100th) AWMA Annual conference, Pittsburgh, PA.
Howard-Reed, C., S.J. Nabinger, and S.J. Emmerich. 2005. Predicting gaseous air cleaner performance in the field. Proceedings Indoor Air 2005, p. 1335–1339.
Huang, Y., S.S.H. Ho, K.F. Ho, S.C. Lee, J.Z. Yu, and P.K.K. Louie. 2011. Characteristics and health impacts of VOCs and carbonyls associated with residential cooking activities in Hong Kong. Journal of Hazardous Materials 186(1):344–351.
International Code Council, 2009. International Mechanical Code, February 2009, Section 403 Mechanical Ventilation. https://law.resource.org/pub/us/code/ibr/icc.imc.2009.pdf
Int-Hout, D. 2015. Basics of well-mixed room air distribution. ASHRAE Journal 57(7):12–19.
ISO (International Standards Organization). 2014. Test method for assessing the performance of gas-phase air cleaning media and devices for general ventilation -- Part 1: Gas-phase air cleaning media. ISO 10121-1:2014.
Jo, W-K., and K-H. Park. 2004. Heterogeneous photocatalysis of aromatic and chlorinated volatile organic compounds (VOCs) for non-occupational indoor air application. Chemosphere 57:555–565.
Jung, L. 1987. Impact of Air-Filter Condition on HVAC Equipment. No. ORNL/TM-9894. Oak Ridge National Laboratory.
Keener, T.C., and D. Zhou. 1990. Prediction of activated carbon adsorption performance under high relative humidity conditions. Environmental Progress 9(1):40–46.
Kesselmeier, J., and M. Staudt. 1999. Biogenic volatile organic compounds (VOC): An overview on emission, physiology and ecology. Journal of Atmospheric Chemistry 33(1):23–88.
Kropp, R. 2014. Applications of Photo-Active Thin Film Semiconductors in Environmental Remediation. PhD Dissertation. University of Wisconsin-Madison.
Lawrence Berkley National Laboratory. 2016. Indoor Environment Group, Scientific Finding Resource Bank, Frequently Asked Questions, https://iaqscience.lbl.gov/faq, accessed October 14, 2016.
Lee, P. and J. Davidson. 1999. Evaluation of activated carbon filters for removal of ozone at the ppb level. American Industrial Hygiene Association Journal 60(5):589–600.
Lee, C.S., F. Haghighat, and A. Bahloul. 2016. What are the hurdles in effective implementation of PCO systems in AHU? IAQVEC 2016, 9th International Conference on Indoor Air Quality Ventilation & Energy Conservation in Buildings. Seoul, Korea.
McDermott, H.L., and J.C. Arnell. 1954. Charcoal sorption studies II. The sorption of water by hydrogen-treated charcoal. Journal of Physical Chemistry 58:492–498.
Mo, J., Y. Zhang, Q. Xu, J.J. Lamson, and R. Zhao. 2009. Photocatalytic purification of volatile organic compounds in indoor air: A literature review, Atmospheric Environment 43:2229–2246.
Mo, J., Y. Zhang, and Q. Xu. 2013. Effect of water vapor on the by-products and decomposition rate of ppb-level toluene by photocatalytic oxidation. Applied Catalysis B: Environmental 132–133:212–218.
Moyer, E.S. 1983. Review of influential factors affecting the performance of organic vapor air-purifying respirator cartridges. American Industrial Hygiene Association Journal 44:46–51.
Adsorption-based Treatment Systems 43
Murphy, J., and T.W. Morgan. 2006. Availability, reliability, and survivability: An introduction and some contractual implications. CrossTalk: The Journal of Defense Software Engineering
Myrefelt, S. 2004, October. Reliability and functional availability of HVAC systems. Proceedings of the Fourth International Conference for Enhanced Building Operations, Paris, http://oaktrust.library.tamu.edu/bitstream/handle/1969.1/5031/ESL-IC-04-10-07.pdf?sequence=4&isAllowed=y, accessed October 10, 2016.
Nassif, N. 2012. The impact of air filter pressure drop on the performance of typical air-conditioning systems. Building Simulation 5(4):345–350.
National Environmental Balancing Bureau. 2005. Procedural Standards for Testing and Adjusting and Balancing of Environmental Systems, 7th Edition Gaithersburg, MD.
Nelson, G.O., A.N. Correia, and C.A. Harder. 1976. Respirator cartridge efficiency studies: VII, Effect of relative humidity and temperature. American Industrial Hygiene Association Journal 37:280–288.
New York State Department of Health. 2006. Final: Guidance for Evaluating Soil Vapor Intrusion in the State of New York, October. https://www.health.ny.gov/environmental/indoors/vapor_intrusion/, accessed October 13, 2016.
NRCC (National Resource Council of Canada). 2011. Method for Testing Portable Air Cleaners. NRCC-54013. Prepared for Government of Canada, Clean Air Agenda, Indoor Air Initiative. Evaluation of IAQ Solutions in Support of Industry Innovation, pp. 1-43, March. http://nparc.cisti-icist.nrc-cnrc.gc.ca/eng/view/fulltext/?id=cc1570e0-53cc-476d-b2ee-3e252d8bd739
Owen, M.K. 1996. The Effect of Relative Humidity on Toluene Adsorption by Activated Carbon. Masters of Science Technical Report, the University of North Carolina at Chapel Hill, Chapel Hill, NC.
Owen, K., R. Pope, and J. Hanley. 2014a. ASHRAE 145.2 Efficiency and capacity test results for five gas-phase air cleaners. Conference Proceedings for the ASHRAE Annual Conference, New York, NY.
Owen, K., R.H. Pope, and J.T. Hanley, J. T. 2014b. Gas-phase air cleaners for use in HVAC systems. Proceedings of AFS Next Generation Filter Media Conference, p. 1–13. Chicago.
Oxtoby, D.W., N.H. Nachtrieb, and W.A Freeman. 1990. Chemistry: Science of Change. Saunders College Publishing, Philadelphia.
PRC (Peoples Republic of China). 2010. Professional Standard of the Republic of China: Test of Pollutant Cleaning Performance of Air Cleaners. Issued by the Ministry of Housing and Urban-Rural Development of the People's Republic of China. December 20.
Persily, A., J. Crum, S. Nabinger, and M. Lubliner. 2003. Ventilation characterization of a new manufactured house. Proceedings of 24th AIVC & BETEC Conference, Ventilation, Humidity Control and Energy, pp. 295-300.
RTI. 2009. Office VOC Mixture Test Report, prepared for Genesis Air. Downloaded from the Genesis Air Website on July 20, 2016.
Shaughnessy, R.J., E. Levetin, J. Blocker, and K.L. Sublette. 1994. Effectiveness of portable indoor air cleaners: Sensory testing results. Indoor Air 4(3):179–188.
Shepherd, A. 2001, May. Activated carbon adsorption for treatment of VOC emissions. 13th Annual EnviroExpo, Boston, MA. http://www.carbtrol.com/images/white-papers/voc.pdf
Stampfer, J.F. 1982. Respirator canister evaluation for nine selected organic vapors. American Industrial Hygiene Association Journal 43:319–328.
TetraTech. 2010, November. Final Quarterly Data Summary Report for Soil Vapor Intrusion Monitoring (May-August 2010) NWIRP Bethpage, NY. http://www.navfac.navy.mil/niris/MID_ATLANTIC/BETHPAGE_NWIRP/N90845_001199.pdf
U.S. EPA. 1998, June. Carbon Adsorption for Control of VOC Emissions: Theory and Full Scale Performance, EPA-450/3-88-012.
U.S. EPA. 2008, October. Indoor Air Vapor Intrusion Mitigation Approaches, EPA/600/R-08-115.
U.S. EPA. 2011a, June. Background Indoor Air Concentrations of Volatile Organic Compounds in North American Residences (1990–2005): A Compilation of Statistics for Assessing Vapor Intrusion, EPA 530-R-10-0111.
U.S. EPA. 2011b, September. Exposure Factors Handbook: 2011 Edition, EPA/600/R-090/052F.
U.S. EPA. 2012, February. Conceptual Model Scenarios for the Vapor Intrusion Pathway, EPA 530-R-10-003. Office of Solid Waste and Emergency Response, Washington, DC.
44 Adsorption-based Treatment Systems
U.S. EPA. 2015. OSWER Technical Guide for Assessing and Mitigating the Vapor Intrusion Pathway from Subsurface Vapor Sources to Indoor Air. OSWER Publication 9200.2-154. Office of Solid Waste and Emergency Response, Washington, DC.
VanOsdell, D.W., Owen, M.K., and L.B. Jaffe. 1996, July. Evaluation of Test Methods for Determining the Effectiveness and Capacity of Gas-Phase Air Filtration Equipment for Indoor Air Applications. Phase II: A Laboratory Study to Support the Development of Standard Test Methods. Final Report 792-RP. American Society of Heating, Refrigerating, and Air-Conditioning Engineers, Atlanta, GA. 63 pages.
Weisel, C.P., Alimokhtari, S., & Sanders, P.F. (2008). Indoor air VOC concentrations in suburban and rural New Jersey. Environmental Science & Technology, 42(22):8231–8238.
Werner, M.D. 1985. The effects of relative humidity on the vapor phase adsorption of trichloroethylene by activated carbon. American Industrial Hygiene Association Journal 46:585–590.

Adsorption-based Treatment Systems 45
ATTACHMENT A
AVAILABLE VOC AIR CLEANER EQUIPMENT

46
A
dso
rptio
n-b
ased
Tre
atm
en
t Syste
ms
Image Brand Name
Model Installation Type Manufacturer Manufacture
Country Website
Aerus Sanctuairy by Aerus In-Duct Whole House Air Purifier
Built in. Ducted Aerus http://www.aerushome.com/Site/Air
Air Oasis Large commercial models
Portable. Not ducted Air Oasis USA http://www.airoasis.com/shop/air-oasis-5000pro
Air Quality Engineering
M66 R&L Built in. Ductable or not ducted.
Air Quality Engineering
http://www.air-quality-eng.com/
Air Quality Engineering
M73 Portable. Not ducted Air Quality Engineering
http://www.air-quality-eng.com/
Airgle AG950 PurePal Multigas Air Purifier
Portable. Not ducted Airgle China http://www.airgle.com/
AirPura C600 DLX Air Purifier
Portable. Not ducted Airpura Industries Canada http://airpura.com/index.html

Ad
so
rptio
n-b
as
ed
Tre
atm
en
t Syste
ms
47
Image Brand Name
Model Installation Type Manufacturer Manufacture
Country Website
Airpura R600 All Purpose Portable. Not ducted Airpura Industries Canada http://www.airpura.com/
Alen Breathesmart-HEPA-FreshPlus
Portable. Not ducted Alen https://www.alencorp.com/collections/air-purifiers-for-chemicals-and-cooking-odors/products/breathesmart-air-purifier-w-hepa-freshplus-filter?variant=890004515
Amaircare 3000 HEPA Air Purifier
Portable. Not ducted Amaircare Canada http://amaircare.com/
Amaircare 7500 Airwash Cart
Portable. Ductable or freestanding.
Amaircare Canada http://amaircare.com/
Amaircare Air Wash 10000 Built in. Ducted Amaircare Canada http://www.airpurifiersandcleaners.com/amaircare-10000-hvac-air-cleaner
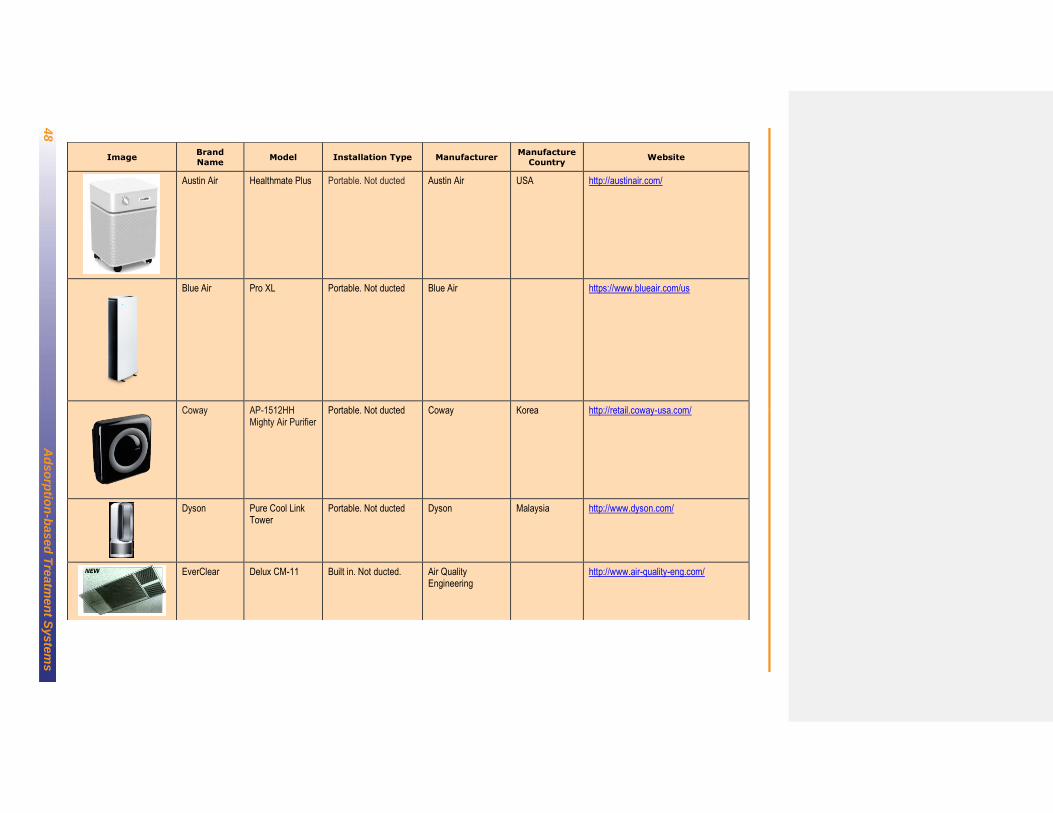
48
A
dso
rptio
n-b
ased
Tre
atm
en
t Syste
ms
Image Brand
Name Model Installation Type Manufacturer
Manufacture
Country Website
Austin Air Healthmate Plus Portable. Not ducted Austin Air USA http://austinair.com/
Blue Air Pro XL Portable. Not ducted Blue Air https://www.blueair.com/us
Coway AP-1512HH Mighty Air Purifier
Portable. Not ducted Coway Korea http://retail.coway-usa.com/
Dyson Pure Cool Link Tower
Portable. Not ducted Dyson Malaysia http://www.dyson.com/
EverClear Delux CM-11 Built in. Not ducted. Air Quality Engineering
http://www.air-quality-eng.com/
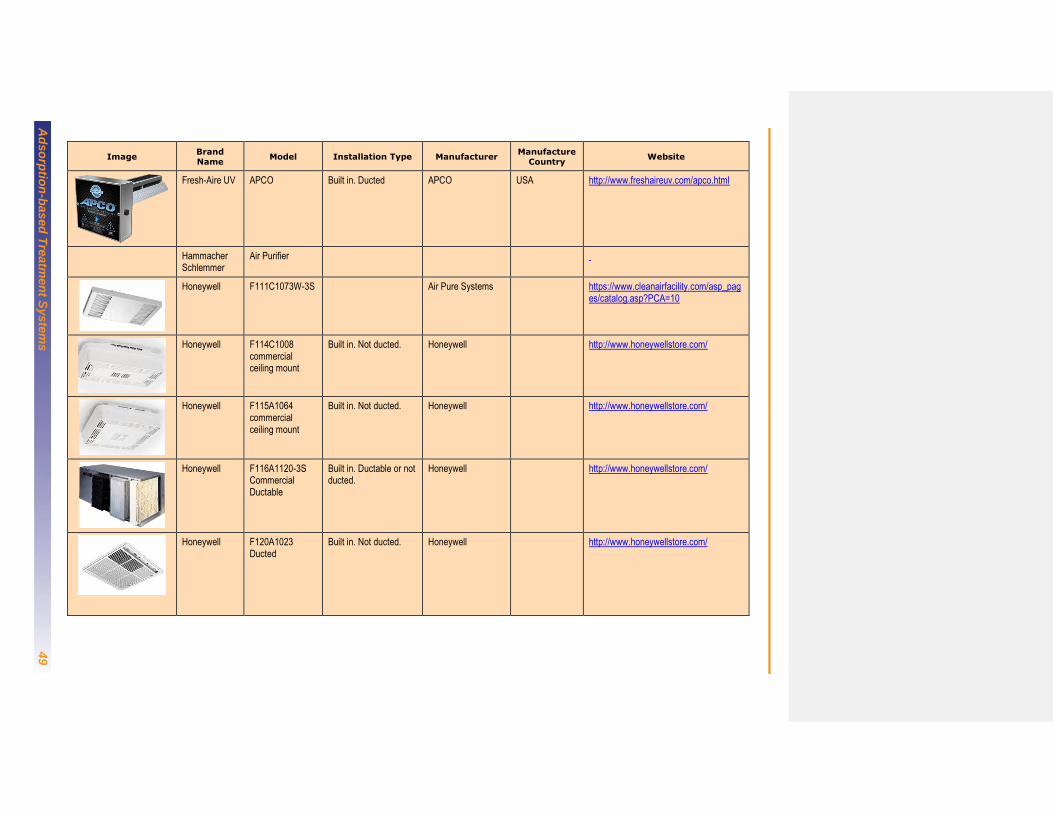
Ad
so
rptio
n-b
as
ed
Tre
atm
en
t Syste
ms
49
Image Brand Name
Model Installation Type Manufacturer Manufacture
Country Website
Fresh-Aire UV APCO Built in. Ducted APCO USA http://www.freshaireuv.com/apco.html
Hammacher Schlemmer
Air Purifier
Honeywell F111C1073W-3S Air Pure Systems https://www.cleanairfacility.com/asp_pages/catalog.asp?PCA=10
Honeywell F114C1008 commercial ceiling mount
Built in. Not ducted. Honeywell http://www.honeywellstore.com/
Honeywell F115A1064 commercial ceiling mount
Built in. Not ducted. Honeywell http://www.honeywellstore.com/
Honeywell F116A1120-3S Commercial Ductable
Built in. Ductable or not ducted.
Honeywell http://www.honeywellstore.com/
Honeywell F120A1023 Ducted
Built in. Not ducted. Honeywell http://www.honeywellstore.com/
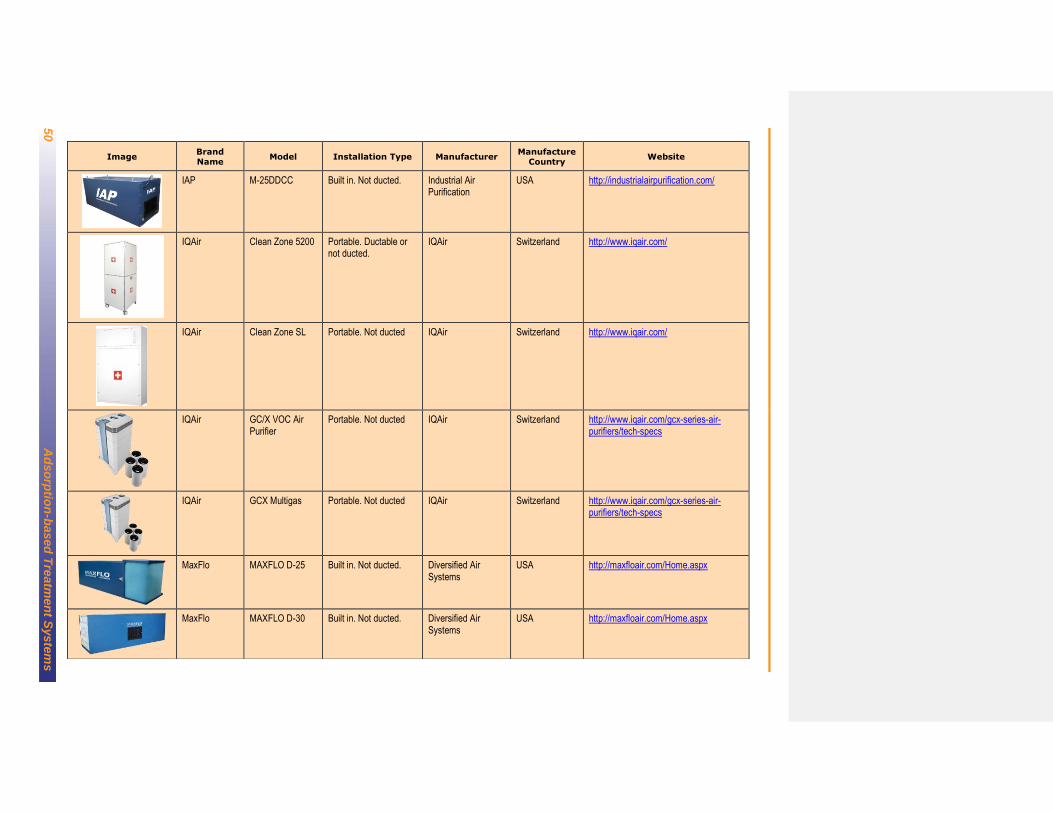
50
A
dso
rptio
n-b
ased
Tre
atm
en
t Syste
ms
Image Brand Name
Model Installation Type Manufacturer Manufacture
Country Website
IAP M-25DDCC Built in. Not ducted. Industrial Air Purification
USA http://industrialairpurification.com/
IQAir Clean Zone 5200 Portable. Ductable or not ducted.
IQAir Switzerland http://www.iqair.com/
IQAir Clean Zone SL Portable. Not ducted IQAir Switzerland http://www.iqair.com/
IQAir GC/X VOC Air Purifier
Portable. Not ducted IQAir Switzerland http://www.iqair.com/gcx-series-air-purifiers/tech-specs
IQAir GCX Multigas Portable. Not ducted IQAir Switzerland http://www.iqair.com/gcx-series-air-purifiers/tech-specs
MaxFlo MAXFLO D-25 Built in. Not ducted. Diversified Air Systems
USA http://maxfloair.com/Home.aspx
MaxFlo MAXFLO D-30 Built in. Not ducted. Diversified Air Systems
USA http://maxfloair.com/Home.aspx

Ad
so
rptio
n-b
as
ed
Tre
atm
en
t Syste
ms
51
Image Brand
Name Model Installation Type Manufacturer
Manufacture
Country Website
NQ Clarifier Air Purifier Portable. Not ducted NQ clarifier USA http://www.nqinc.com/
RabbitAir BIOGS 2.0 - 625A
Portable. Not ducted RabbitAir https://www.rabbitair.com/?utm_source=bing&utm_medium=cpc&utm_campaign=Search%20%7C%20US%20%7C%20ALPHA%20%7C%20Brand&utm_term=RabbitAir&utm_content=Rabbit%20Air
Sentry Air Systems
SS-700-FH Built in. Not ducted. Sentry Air Systems USA http://www.sentryair.com/index.htm
Sun Pure SP-20C Portable. Not ducted Field Controls http://www.fieldcontrols.com/sun-pure
Temp Air C2000 Portable. Ductable or not ducted.
Temp air Rental http://temp-air.com/

52
A
dso
rptio
n-b
ased
Tre
atm
en
t Syste
ms
Image Brand Name
Model Installation Type Manufacturer Manufacture
Country Website
Trion Air Boss ATS Built in. Ducted. Trion USA https://www.trioniaq.com/index.aspx
Winix U450 Portable. Not ducted Winix USA https://winixamerica.com/

Ad
so
rptio
n-b
as
ed
Tre
atm
en
t Syste
ms
53
Image Brand Name Model
Power Noise
Voltage Current
(amperes)
Decibels
(Maximum)
Decibels
(Minimum)
Noise Measurement
Notes
Aerus Sanctuairy by Aerus In-Duct Whole House Air Purifier
100-240V 0.4
Air Oasis Large commercial models
24 VDC No noise measurements recorded
Air Quality Engineering
M66 R&L 110-480 12-4.4 73-70 70 at 15 ft. 73 at 9 ft., no minimum measurement
Air Quality Engineering
M73 208-480 V No noise measurements
Airgle AG950 PurePal Multigas Air Purifier
110V 32
AirPura C600 DLX Air Purifier 115-220V 62 28 Measured at 6 ft. distance
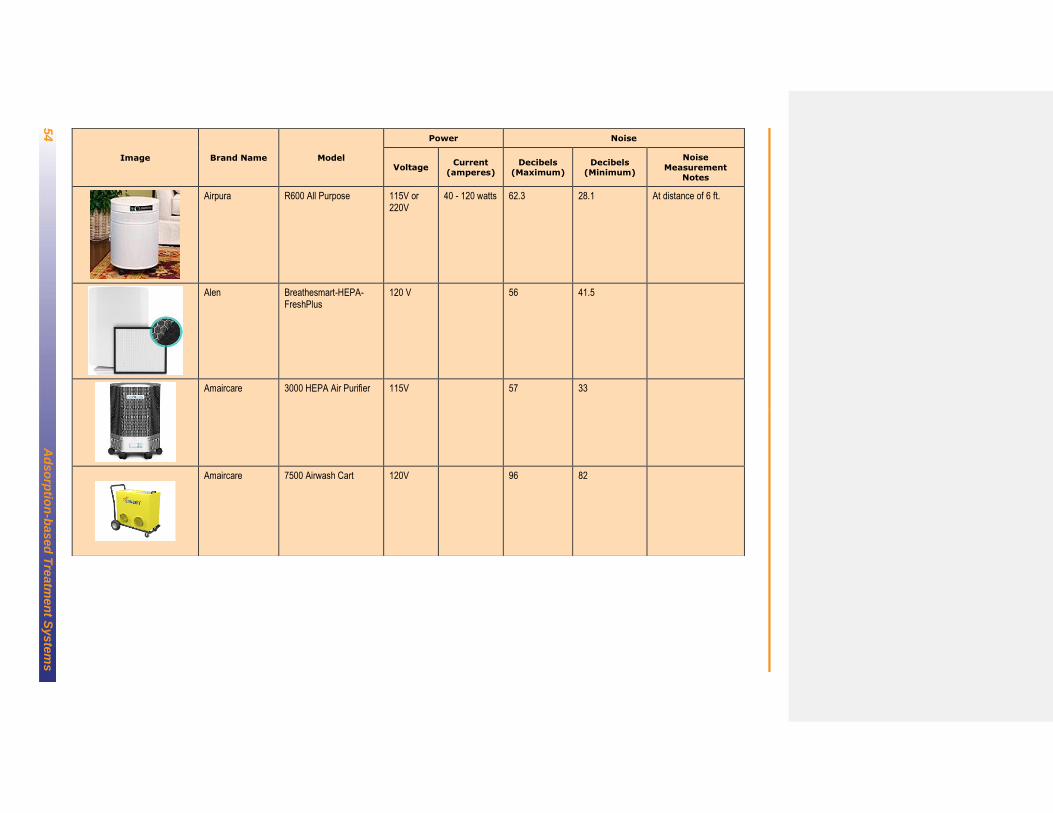
54
A
dso
rptio
n-b
ased
Tre
atm
en
t Syste
ms
Image Brand Name Model
Power Noise
Voltage Current
(amperes) Decibels
(Maximum) Decibels
(Minimum)
Noise
Measurement Notes
Airpura R600 All Purpose 115V or 220V
40 - 120 watts 62.3 28.1 At distance of 6 ft.
Alen Breathesmart-HEPA-FreshPlus
120 V 56 41.5
Amaircare 3000 HEPA Air Purifier 115V 57 33
Amaircare 7500 Airwash Cart 120V 96 82
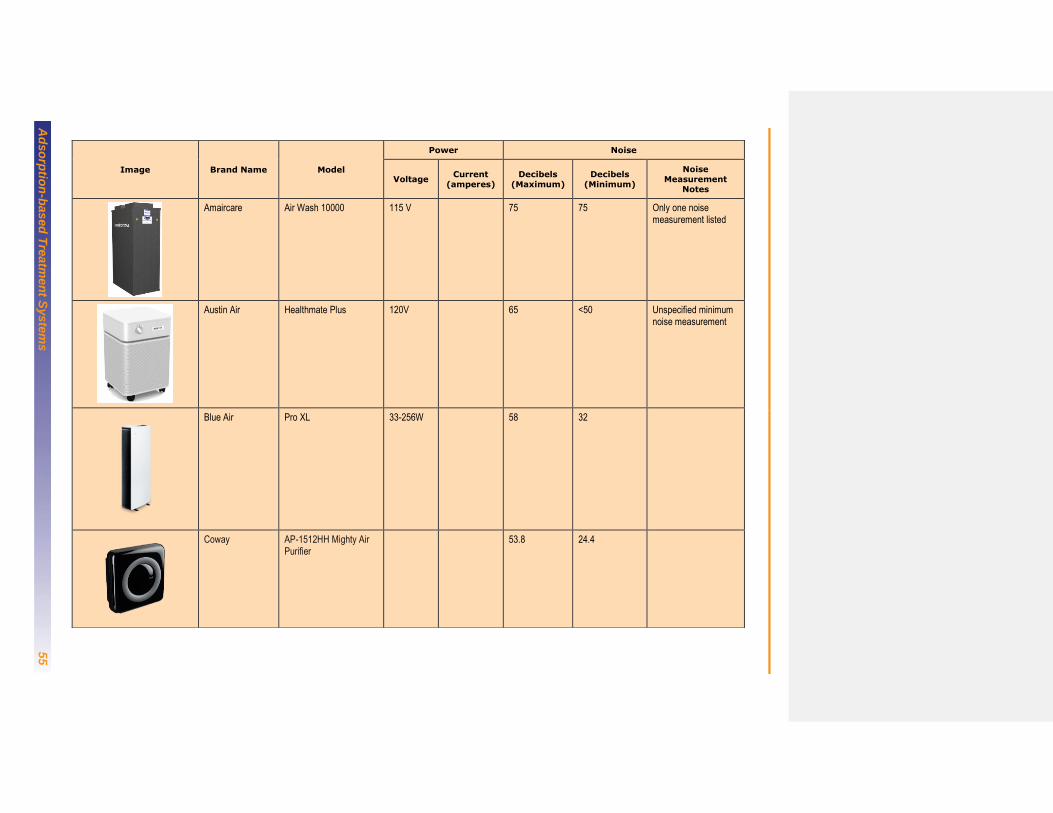
Ad
so
rptio
n-b
as
ed
Tre
atm
en
t Syste
ms
55
Image Brand Name Model
Power Noise
Voltage Current
(amperes) Decibels
(Maximum) Decibels
(Minimum)
Noise Measurement
Notes
Amaircare Air Wash 10000 115 V 75 75 Only one noise measurement listed
Austin Air Healthmate Plus 120V 65 <50 Unspecified minimum noise measurement
Blue Air Pro XL 33-256W 58 32
Coway AP-1512HH Mighty Air Purifier
53.8 24.4
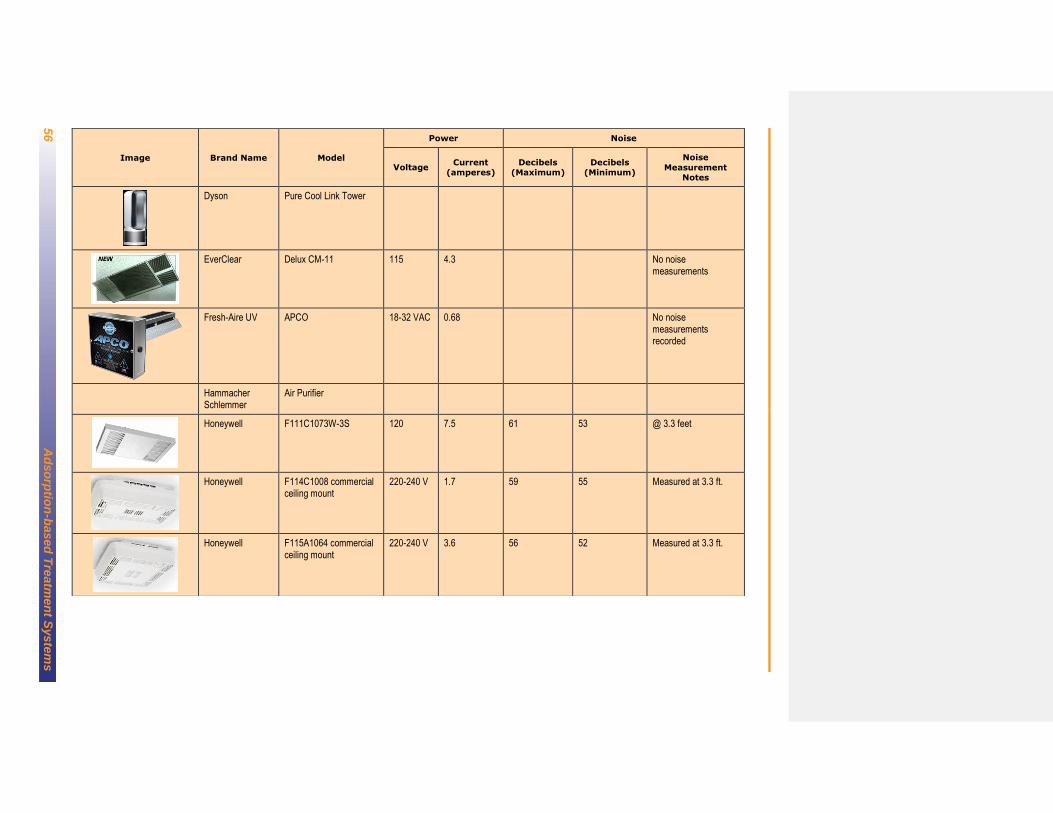
56
A
dso
rptio
n-b
ased
Tre
atm
en
t Syste
ms
Image Brand Name Model
Power Noise
Voltage Current
(amperes) Decibels
(Maximum) Decibels
(Minimum)
Noise
Measurement Notes
Dyson Pure Cool Link Tower
EverClear Delux CM-11 115 4.3 No noise measurements
Fresh-Aire UV APCO 18-32 VAC 0.68 No noise measurements recorded
Hammacher Schlemmer
Air Purifier
Honeywell F111C1073W-3S 120 7.5 61 53 @ 3.3 feet
Honeywell F114C1008 commercial ceiling mount
220-240 V 1.7 59 55 Measured at 3.3 ft.
Honeywell F115A1064 commercial ceiling mount
220-240 V 3.6 56 52 Measured at 3.3 ft.
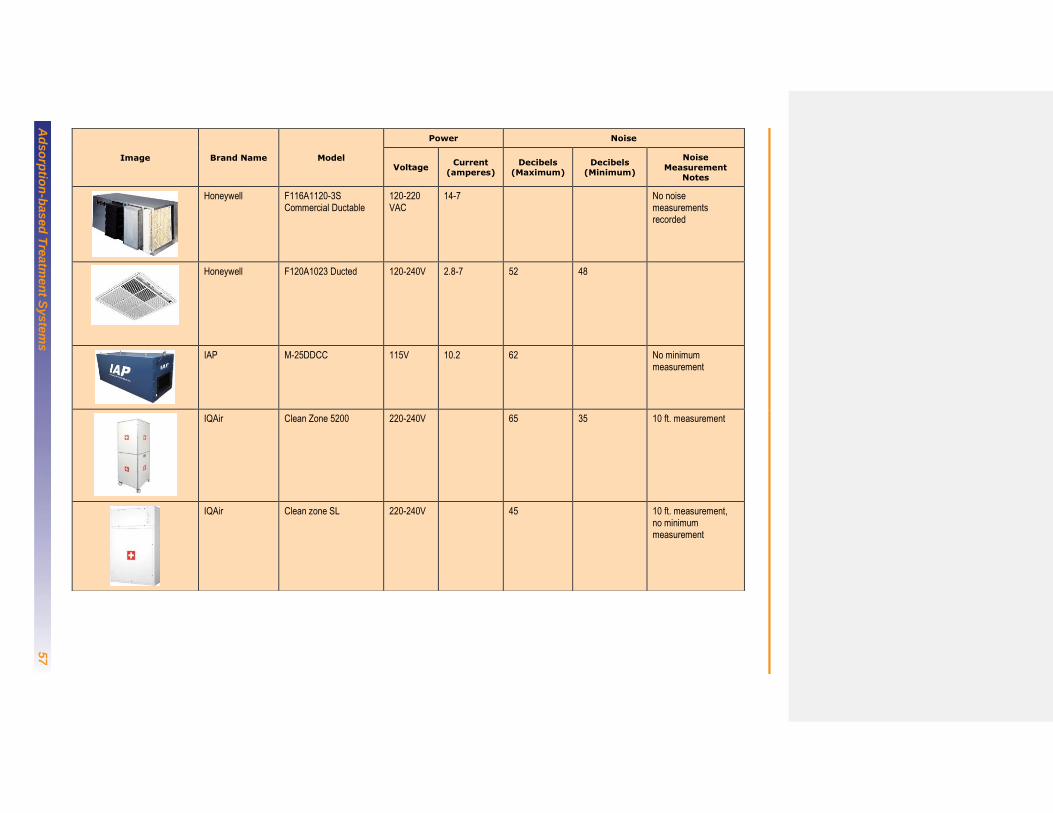
Ad
so
rptio
n-b
as
ed
Tre
atm
en
t Syste
ms
57
Image Brand Name Model
Power Noise
Voltage Current
(amperes) Decibels
(Maximum) Decibels
(Minimum)
Noise
Measurement Notes
Honeywell F116A1120-3S Commercial Ductable
120-220 VAC
14-7 No noise measurements recorded
Honeywell F120A1023 Ducted 120-240V 2.8-7 52 48
IAP M-25DDCC 115V 10.2 62 No minimum measurement
IQAir Clean Zone 5200 220-240V 65 35 10 ft. measurement
IQAir Clean zone SL 220-240V 45 10 ft. measurement, no minimum measurement
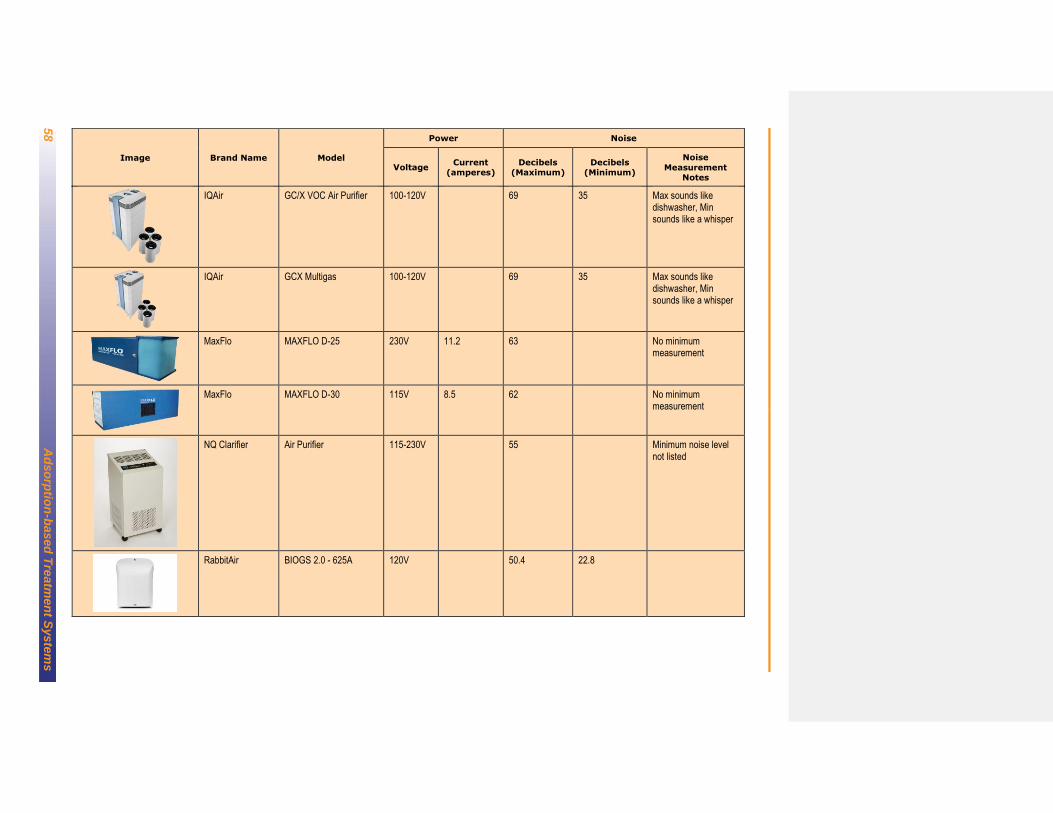
58
A
dso
rptio
n-b
ased
Tre
atm
en
t Syste
ms
Image Brand Name Model
Power Noise
Voltage Current
(amperes) Decibels
(Maximum) Decibels
(Minimum)
Noise
Measurement Notes
IQAir GC/X VOC Air Purifier 100-120V 69 35 Max sounds like dishwasher, Min sounds like a whisper
IQAir GCX Multigas 100-120V 69 35 Max sounds like dishwasher, Min sounds like a whisper
MaxFlo MAXFLO D-25 230V 11.2 63 No minimum measurement
MaxFlo MAXFLO D-30 115V 8.5 62 No minimum measurement
NQ Clarifier Air Purifier 115-230V 55 Minimum noise level not listed
RabbitAir BIOGS 2.0 - 625A 120V 50.4 22.8
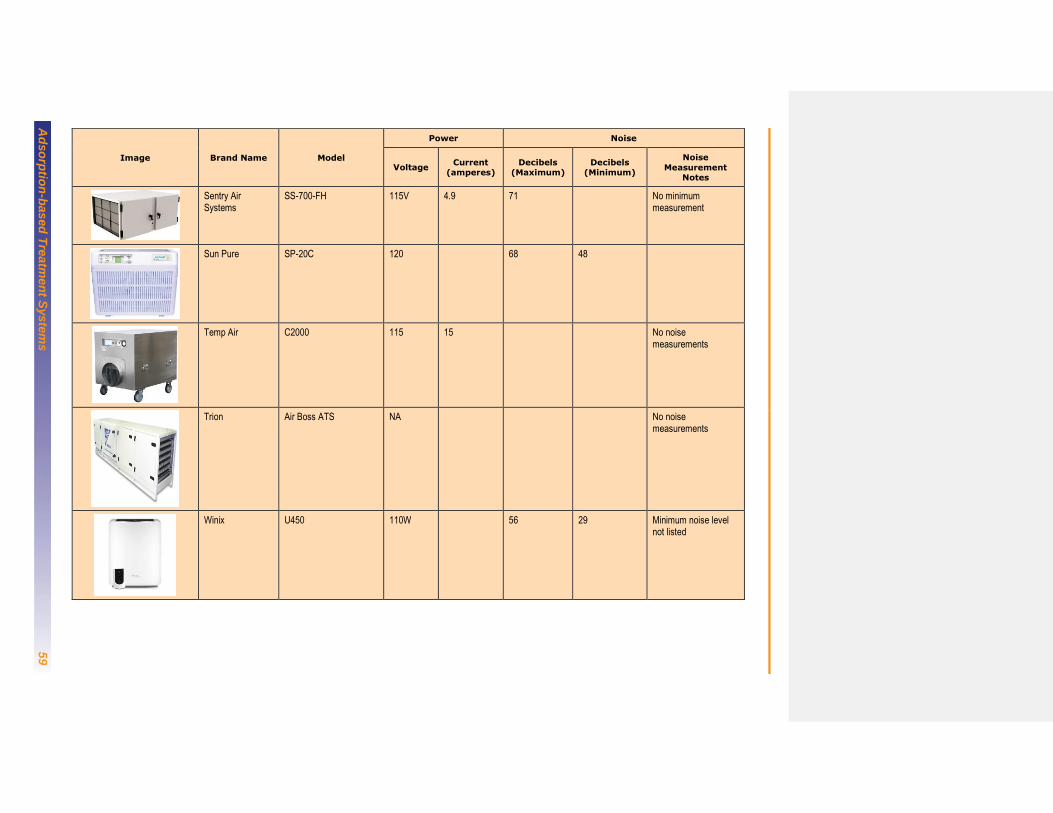
Ad
so
rptio
n-b
as
ed
Tre
atm
en
t Syste
ms
59
Image Brand Name Model
Power Noise
Voltage Current
(amperes) Decibels
(Maximum) Decibels
(Minimum)
Noise
Measurement Notes
Sentry Air Systems
SS-700-FH 115V 4.9 71 No minimum measurement
Sun Pure SP-20C 120 68 48
Temp Air C2000 115 15 No noise measurements
Trion Air Boss ATS NA No noise measurements
Winix U450 110W 56 29 Minimum noise level not listed
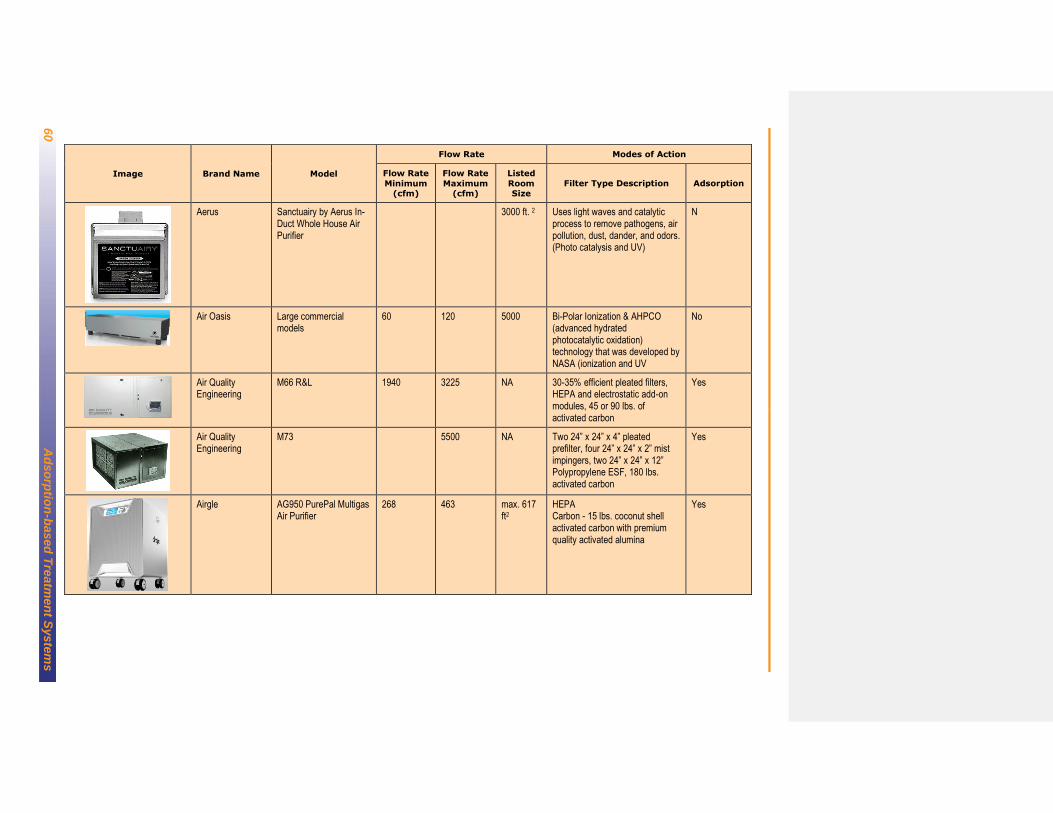
60
A
dso
rptio
n-b
ased
Tre
atm
en
t Syste
ms
Image Brand Name Model
Flow Rate Modes of Action
Flow Rate
Minimum (cfm)
Flow Rate
Maximum (cfm)
Listed
Room Size
Filter Type Description Adsorption
Aerus Sanctuairy by Aerus In-Duct Whole House Air Purifier
3000 ft. 2 Uses light waves and catalytic process to remove pathogens, air pollution, dust, dander, and odors. (Photo catalysis and UV)
N
Air Oasis Large commercial models
60 120 5000 Bi-Polar Ionization & AHPCO (advanced hydrated photocatalytic oxidation) technology that was developed by NASA (ionization and UV
No
Air Quality Engineering
M66 R&L 1940 3225 NA 30-35% efficient pleated filters, HEPA and electrostatic add-on modules, 45 or 90 lbs. of activated carbon
Yes
Air Quality Engineering
M73 5500 NA Two 24” x 24” x 4” pleated prefilter, four 24” x 24” x 2” mist impingers, two 24” x 24” x 12” Polypropylene ESF, 180 lbs. activated carbon
Yes
Airgle AG950 PurePal Multigas Air Purifier
268 463 max. 617 ft2
HEPA Carbon - 15 lbs. coconut shell activated carbon with premium quality activated alumina
Yes
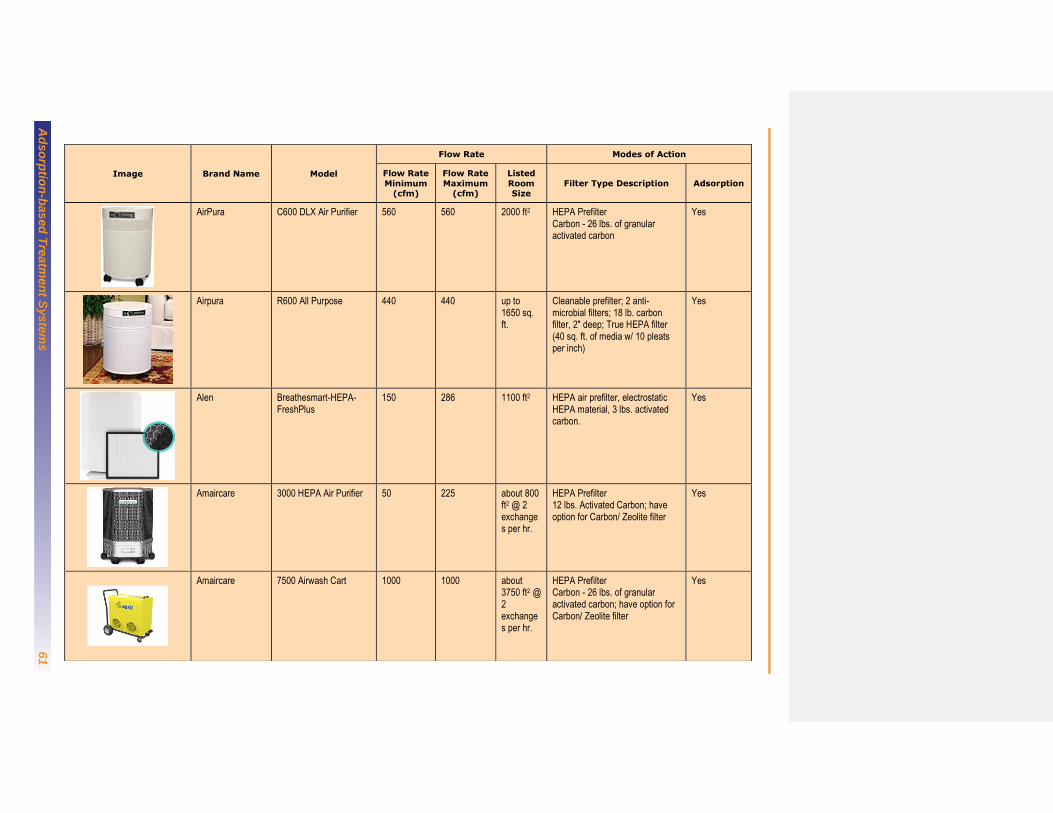
Ad
so
rptio
n-b
as
ed
Tre
atm
en
t Syste
ms
61
Image Brand Name Model
Flow Rate Modes of Action
Flow Rate
Minimum (cfm)
Flow Rate
Maximum (cfm)
Listed
Room Size
Filter Type Description Adsorption
AirPura C600 DLX Air Purifier 560 560 2000 ft2 HEPA Prefilter Carbon - 26 lbs. of granular activated carbon
Yes
Airpura R600 All Purpose 440 440 up to 1650 sq. ft.
Cleanable prefilter; 2 anti-microbial filters; 18 lb. carbon filter, 2" deep; True HEPA filter (40 sq. ft. of media w/ 10 pleats per inch)
Yes
Alen Breathesmart-HEPA-FreshPlus
150 286 1100 ft2 HEPA air prefilter, electrostatic HEPA material, 3 lbs. activated carbon.
Yes
Amaircare 3000 HEPA Air Purifier 50 225 about 800 ft2 @ 2 exchanges per hr.
HEPA Prefilter 12 lbs. Activated Carbon; have option for Carbon/ Zeolite filter
Yes
Amaircare 7500 Airwash Cart 1000 1000 about 3750 ft2 @ 2 exchanges per hr.
HEPA Prefilter Carbon - 26 lbs. of granular activated carbon; have option for Carbon/ Zeolite filter
Yes

62
A
dso
rptio
n-b
ased
Tre
atm
en
t Syste
ms
Image Brand Name Model
Flow Rate Modes of Action
Flow Rate
Minimum (cfm)
Flow Rate
Maximum (cfm)
Listed
Room Size
Filter Type Description Adsorption
Amaircare Air Wash 10000 1980 1980 11250 ft2 Triple cylindrical perfect seal 3-stage cartridges (each: 13″ diameter x 16” height); stage one: 1/8” foam prefilter sleeve x3; stage two: 100 sq. Ft. Pleated easy twist HEPA cartridge x3; stage three: ½” non-woven polyester filter media imbued 200% with activated carbon (164 g = 180,400 m2adsorption surface area) x3; optional stage three canister: Granulated carbon pellets encased in steel mesh canister (1550 g = 1,705,000 m2 adsorption surface area) x3
Yes
Austin Air Healthmate Plus 75 400 up to 875 ft2 @ 2 exchanges per hr.
HEPA Prefilter 15 lbs. Activated Carbon / Zeolite filter impregnated with potassium iodide
Yes
Blue Air Pro XL 800 950 1180 Activated carbon pellets and thermally bonded fibers containing polypropylene and polyethylene free of chemicals and binders.
Yes

Ad
so
rptio
n-b
as
ed
Tre
atm
en
t Syste
ms
63
Image Brand Name Model
Flow Rate Modes of Action
Flow Rate
Minimum (cfm)
Flow Rate
Maximum (cfm)
Listed
Room Size
Filter Type Description Adsorption
Coway AP-1512HH Mighty Air Purifier
269 up to 326 ft2
HEPA prefilter Carbon - 26 lbs. of granular activated carbon
Yes
Dyson Pure Cool Link Tower 190 190 unspecified
HEPA prefilter Carbon at unspecified quantity
Yes
EverClear Delux CM-11 400 850 NA 95% efficient (at .3 micron) HEPA type filters, 44 lbs. of activated carbon
Yes
Fresh-Aire UV APCO Combination of UV-C light and activated carbon
Yes
Hammacher Schlemmer
Air Purifier up to 150 ft2
HEPA Nano confined catalytic oxidation
No
Honeywell F111C1073W-3S 1150 825 n/s Model selected is for a 95% ASHRAE particulate filter. HEPA available in different model. 43 pounds of carbon, permanganate (Note: equipment catalog list zeolite also but replacement filter page includes only charcoal/permanganate).
Yes

64
A
dso
rptio
n-b
ased
Tre
atm
en
t Syste
ms
Image Brand Name Model
Flow Rate Modes of Action
Flow Rate
Minimum (cfm)
Flow Rate
Maximum (cfm)
Listed
Room Size
Filter Type Description Adsorption
Honeywell F114C1008 commercial ceiling mount
180 325 400 95% DOP (Di-octyl phthalate) Efficient Filter at 0.3 Micron, 8+ lbs. CPZ Filter
Yes
Honeywell F115A1064 commercial ceiling mount
600 750 99.97% HEPA Filter, 16+ lbs. CPZ Filter
Yes
Honeywell F116A1120-3S Commercial Ductable
1400 1675 not listed First stage is a prefilter rated 30-40% ASHRAE dust spot efficiency, second stage is a set of 40 plus pounds of CPZ filters (charcoal, permanganate, potassium, and zeolite), The third stage includes a set of CPZ filters
Yes
Honeywell F120A1023 Ducted 900 1050 1200 95% DOP Efficient Filter at 0.3 Micron, 22+ lbs. CPZ Filters for gas, odor, and volatile organic compounds (VOC) control
Yes
IAP M-25DDCC 300 2500 NA Pleated prefilter, 95% bag filter, 36 lb. charcoal canister filter
Yes
IQAir Clean Zone 5200 600 HEPA filter, activated carbon Yes
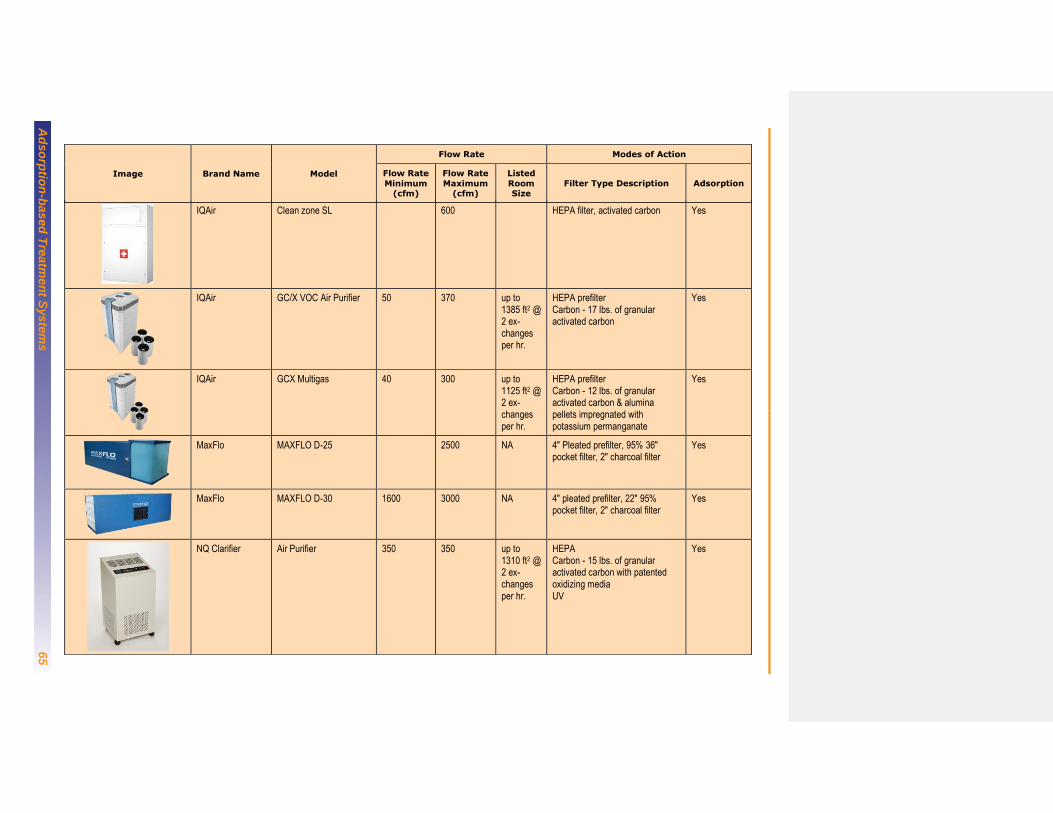
Ad
so
rptio
n-b
as
ed
Tre
atm
en
t Syste
ms
65
IQAir Clean zone SL 600 HEPA filter, activated carbon Yes
IQAir GC/X VOC Air Purifier 50 370 up to 1385 ft2 @ 2 ex-changes per hr.
HEPA prefilter Carbon - 17 lbs. of granular activated carbon
Yes
IQAir GCX Multigas 40 300 up to 1125 ft2 @ 2 ex-changes per hr.
HEPA prefilter Carbon - 12 lbs. of granular activated carbon & alumina pellets impregnated with potassium permanganate
Yes
MaxFlo MAXFLO D-25 2500 NA 4" Pleated prefilter, 95% 36" pocket filter, 2" charcoal filter
Yes
MaxFlo MAXFLO D-30 1600 3000 NA 4" pleated prefilter, 22" 95% pocket filter, 2" charcoal filter
Yes
NQ Clarifier Air Purifier 350 350 up to 1310 ft2 @ 2 ex-changes per hr.
HEPA Carbon - 15 lbs. of granular activated carbon with patented oxidizing media UV
Yes
Image Brand Name Model
Flow Rate Modes of Action
Flow Rate
Minimum (cfm)
Flow Rate
Maximum (cfm)
Listed
Room Size
Filter Type Description Adsorption
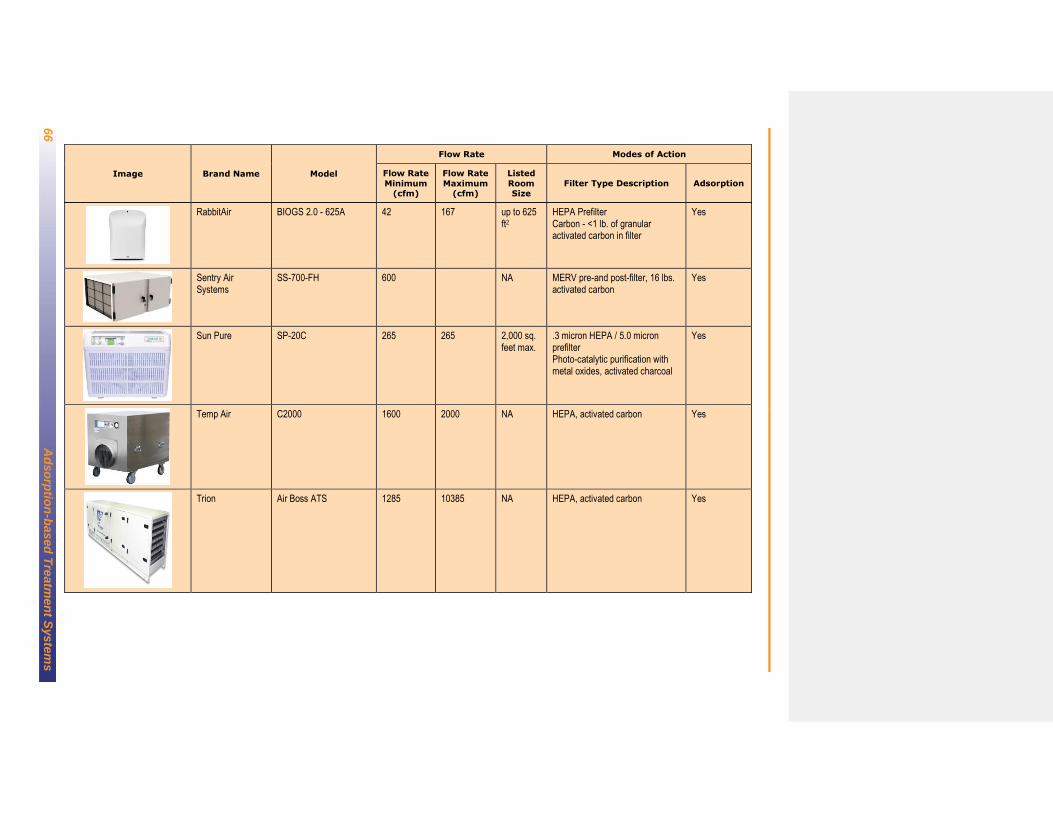
66
A
dso
rptio
n-b
ased
Tre
atm
en
t Syste
ms
Image Brand Name Model
Flow Rate Modes of Action
Flow Rate
Minimum (cfm)
Flow Rate
Maximum (cfm)
Listed
Room Size
Filter Type Description Adsorption
RabbitAir BIOGS 2.0 - 625A 42 167 up to 625 ft2
HEPA Prefilter Carbon - <1 lb. of granular activated carbon in filter
Yes
Sentry Air Systems
SS-700-FH 600 NA MERV pre-and post-filter, 16 lbs. activated carbon
Yes
Sun Pure SP-20C 265 265 2,000 sq. feet max.
.3 micron HEPA / 5.0 micron prefilter Photo-catalytic purification with metal oxides, activated charcoal
Yes
Temp Air C2000 1600 2000 NA HEPA, activated carbon Yes
Trion Air Boss ATS 1285 10385 NA HEPA, activated carbon Yes
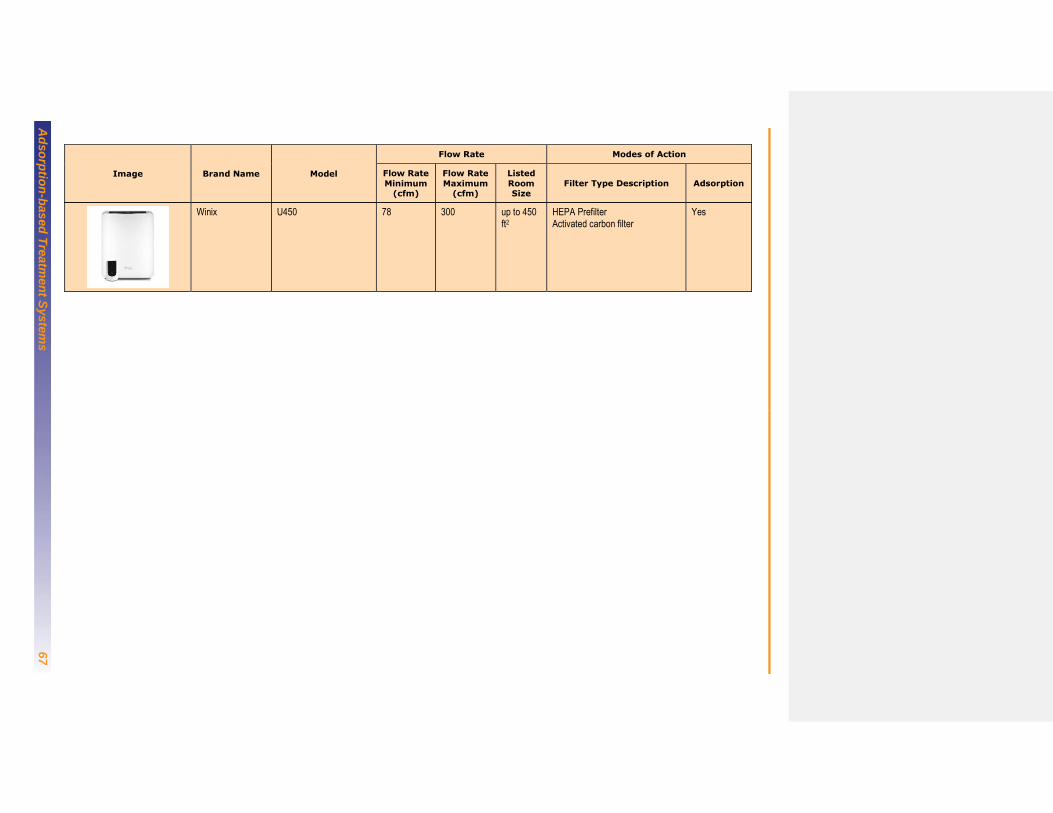
Ad
so
rptio
n-b
as
ed
Tre
atm
en
t Syste
ms
67
Image Brand Name Model
Flow Rate Modes of Action
Flow Rate
Minimum (cfm)
Flow Rate
Maximum (cfm)
Listed
Room Size
Filter Type Description Adsorption
Winix U450 78 300 up to 450 ft2
HEPA Prefilter Activated carbon filter
Yes
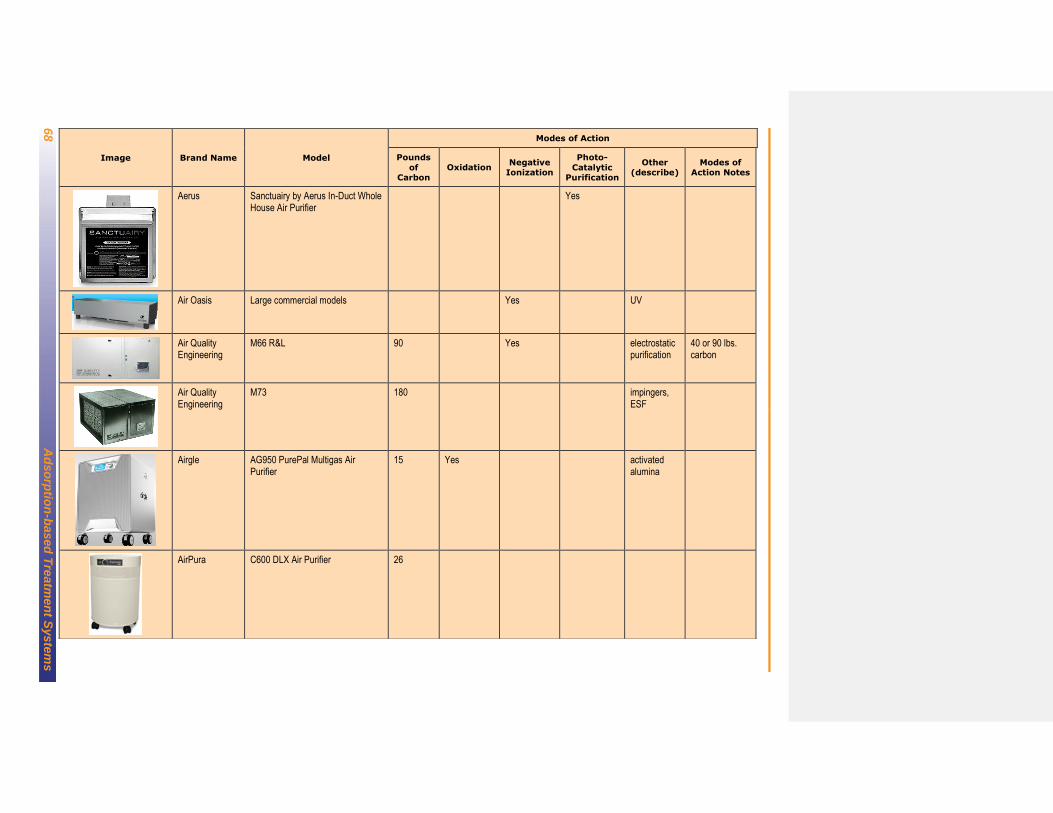
68
A
dso
rptio
n-b
ased
Tre
atm
en
t Syste
ms
Image Brand Name Model
Modes of Action
Pounds
of Carbon
Oxidation Negative
Ionization
Photo-
Catalytic Purification
Other (describe)
Modes of Action Notes
Aerus Sanctuairy by Aerus In-Duct Whole House Air Purifier
Yes
Air Oasis Large commercial models Yes UV
Air Quality Engineering
M66 R&L 90 Yes electrostatic purification
40 or 90 lbs. carbon
Air Quality Engineering
M73 180 impingers, ESF
Airgle AG950 PurePal Multigas Air Purifier
15 Yes activated alumina
AirPura C600 DLX Air Purifier 26
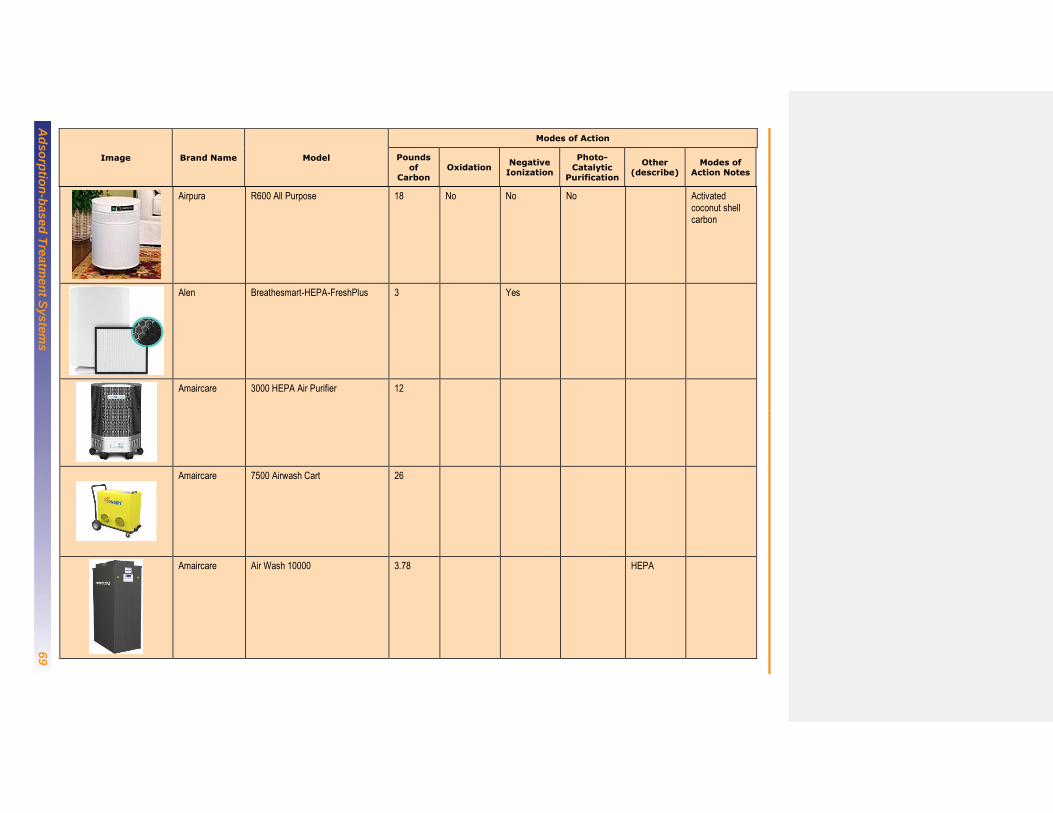
Ad
so
rptio
n-b
as
ed
Tre
atm
en
t Syste
ms
69
Image Brand Name Model
Modes of Action
Pounds
of Carbon
Oxidation Negative
Ionization
Photo-
Catalytic Purification
Other (describe)
Modes of Action Notes
Airpura R600 All Purpose 18 No No No Activated coconut shell carbon
Alen Breathesmart-HEPA-FreshPlus 3 Yes
Amaircare 3000 HEPA Air Purifier 12
Amaircare 7500 Airwash Cart 26
Amaircare Air Wash 10000 3.78 HEPA

70
A
dso
rptio
n-b
ased
Tre
atm
en
t Syste
ms
Image Brand Name Model
Modes of Action
Pounds
of Carbon
Oxidation Negative
Ionization
Photo-
Catalytic Purification
Other (describe)
Modes of Action Notes
Austin Air Healthmate Plus 15 Yes
Blue Air Pro XL Yes
Coway AP-1512HH Mighty Air Purifier 26 Yes
Dyson Pure Cool Link Tower
EverClear Delux CM-11 44 HEPA

Ad
so
rptio
n-b
as
ed
Tre
atm
en
t Syste
ms
71
Image Brand Name Model
Modes of Action
Pounds
of Carbon
Oxidation Negative
Ionization
Photo-
Catalytic Purification
Other (describe)
Modes of Action Notes
Fresh-Aire UV APCO UV
Hammacher Schlemmer
Air Purifier Yes
Honeywell F111C1073W-3S 43 Yes
Honeywell F114C1008 commercial ceiling mount
8 8+ lbs. of CPZ
Honeywell F115A1064 commercial ceiling mount
16 16+ lbs. of CPZ
Honeywell F116A1120-3S Commercial Ductable
40 Yes 40 lbs. of CPZ (carbon, permanganate, potassium, zeolite)
Honeywell F120A1023 Ducted 22 22+ lbs. of CPZ

72
A
dso
rptio
n-b
ased
Tre
atm
en
t Syste
ms
Image Brand Name Model
Modes of Action
Pounds
of Carbon
Oxidation Negative
Ionization
Photo-
Catalytic Purification
Other (describe)
Modes of Action Notes
IAP M-25DDCC 36 bag filter
IQAir Clean Zone 5200
IQAir Clean zone SL
IQAir GC/X VOC Air Purifier 17 No
IQAir GCX Multigas 12 Yes
MaxFlo MAXFLO D-25 2" charcoal filter
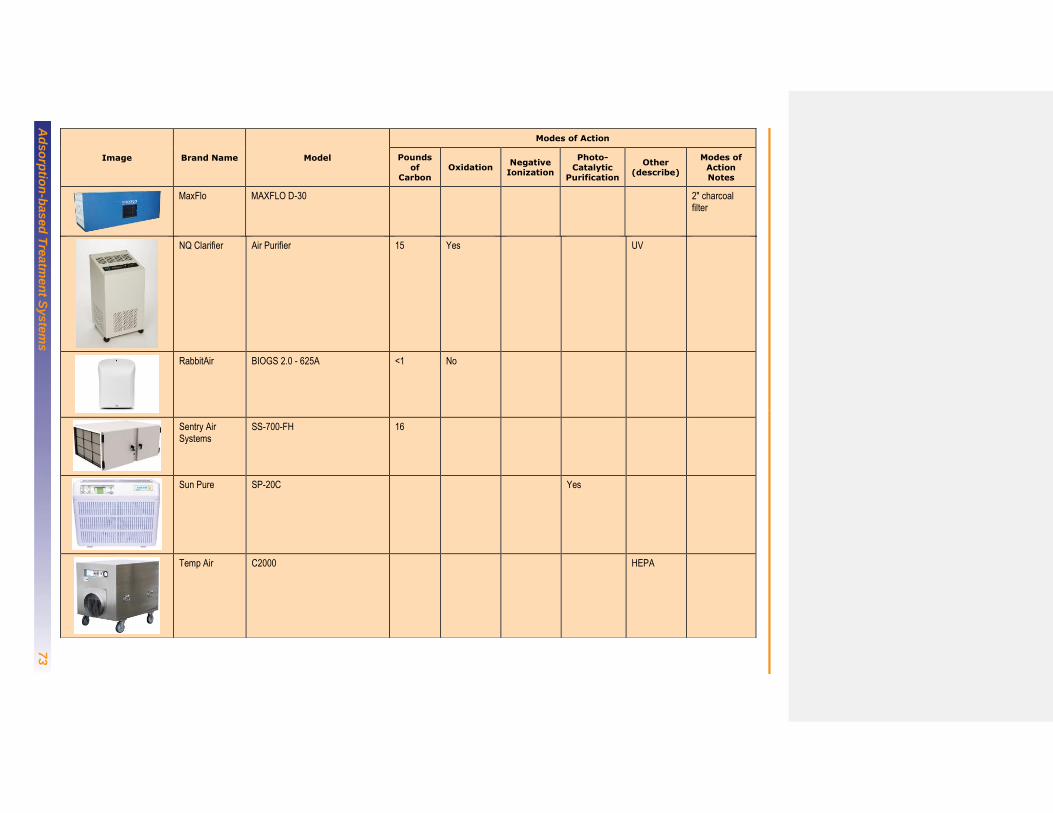
Ad
so
rptio
n-b
as
ed
Tre
atm
en
t Syste
ms
73
Image Brand Name Model
Modes of Action
Pounds
of Carbon
Oxidation Negative
Ionization
Photo-
Catalytic Purification
Other (describe)
Modes of
Action Notes
MaxFlo MAXFLO D-30 2" charcoal filter
NQ Clarifier Air Purifier 15 Yes UV
RabbitAir BIOGS 2.0 - 625A <1 No
Sentry Air Systems
SS-700-FH 16
Sun Pure SP-20C Yes
Temp Air C2000 HEPA
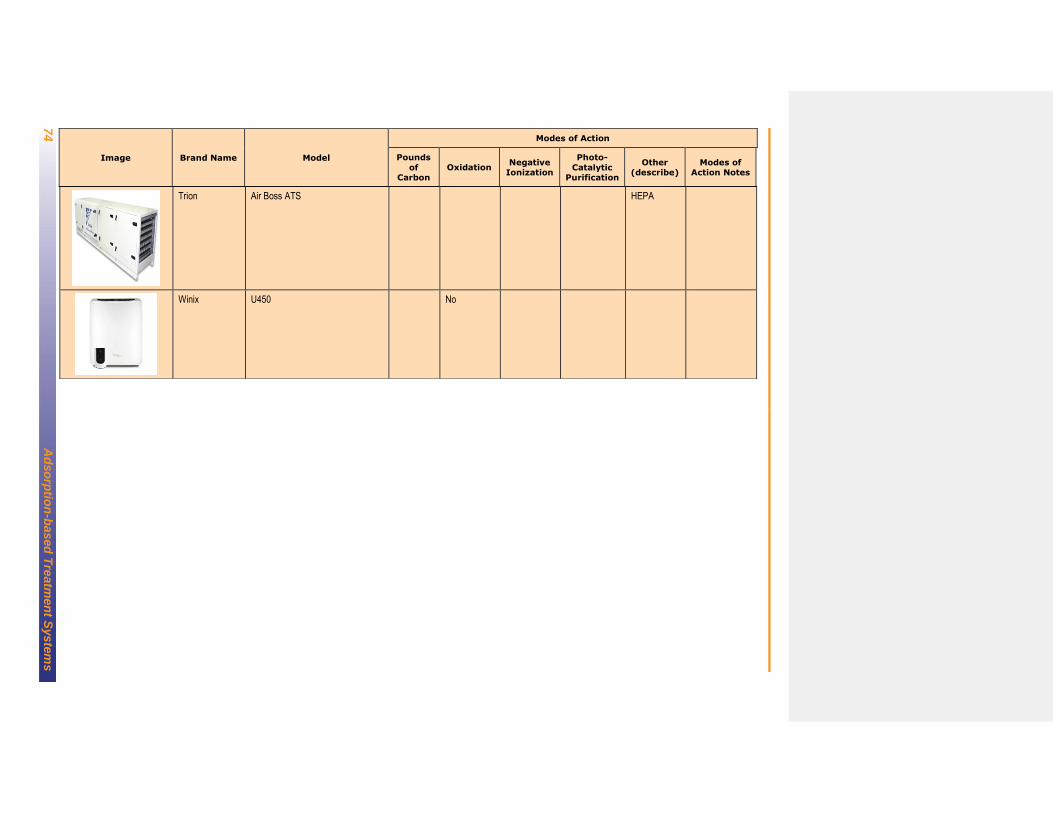
74
A
dso
rptio
n-b
ased
Tre
atm
en
t Syste
ms
Image Brand Name Model
Modes of Action
Pounds
of Carbon
Oxidation Negative
Ionization
Photo-
Catalytic Purification
Other (describe)
Modes of Action Notes
Trion Air Boss ATS HEPA
Winix U450 No
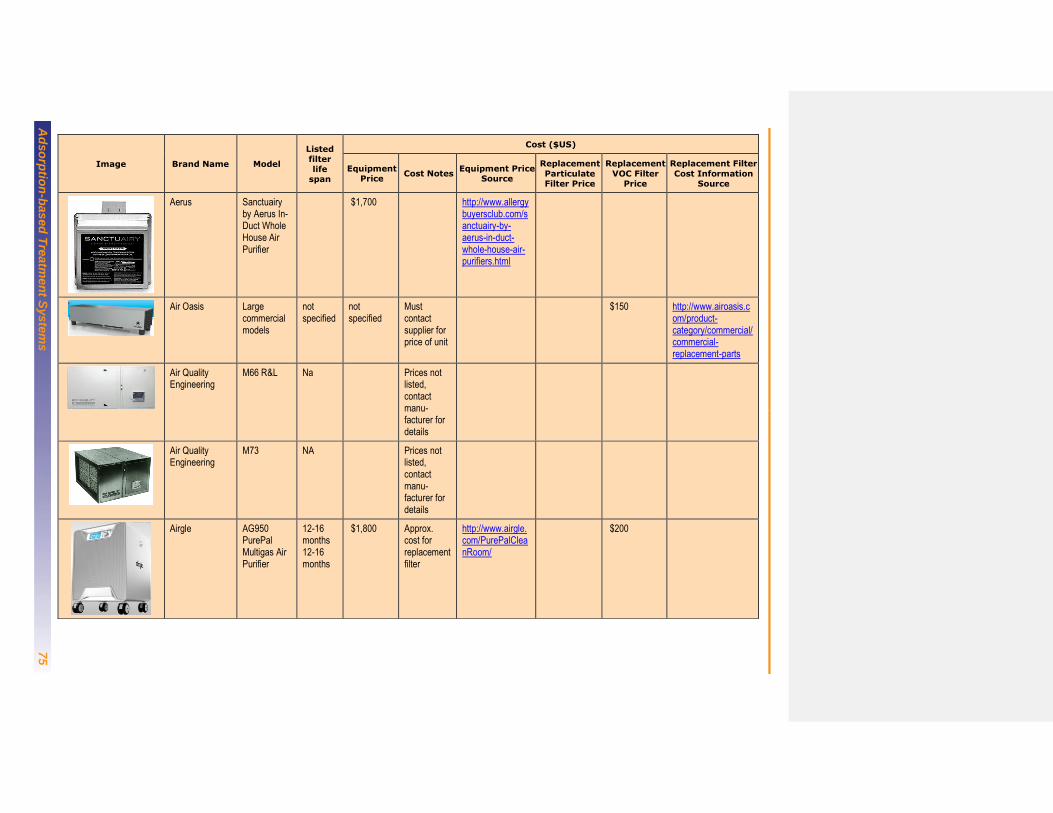
Ad
so
rptio
n-b
as
ed
Tre
atm
en
t Syste
ms
75
Image Brand Name Model
Listed filter life
span
Cost ($US)
Equipment Price
Cost Notes Equipment Price
Source
Replacement
Particulate Filter Price
Replacement
VOC Filter Price
Replacement Filter
Cost Information Source
Aerus Sanctuairy by Aerus In-Duct Whole House Air Purifier
$1,700 http://www.allergybuyersclub.com/sanctuairy-by-aerus-in-duct-whole-house-air-purifiers.html
Air Oasis Large commercial models
not specified
not specified
Must contact supplier for price of unit
$150 http://www.airoasis.com/product-category/commercial/commercial-replacement-parts
Air Quality Engineering
M66 R&L Na Prices not listed, contact manu-facturer for details
Air Quality Engineering
M73 NA Prices not listed, contact manu-facturer for details
Airgle AG950 PurePal Multigas Air Purifier
12-16 months 12-16 months
$1,800 Approx. cost for replacement filter
http://www.airgle.com/PurePalCleanRoom/
$200
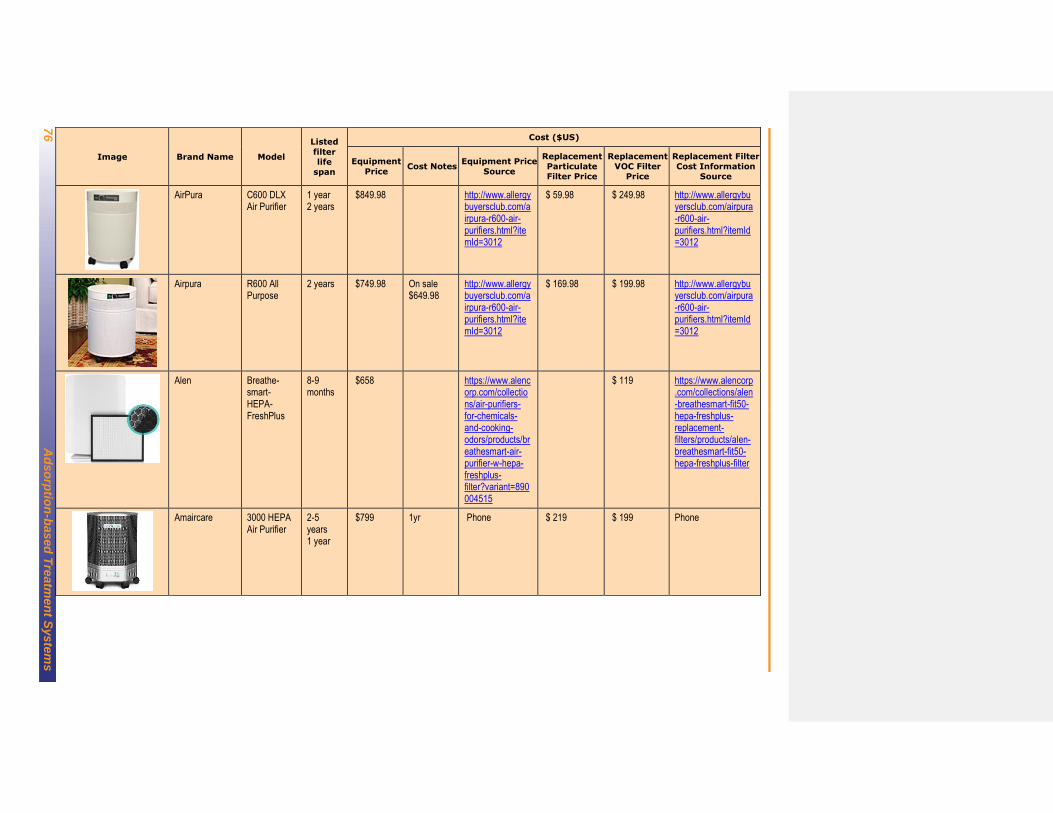
76
A
dso
rptio
n-b
ased
Tre
atm
en
t Syste
ms
Image Brand Name Model
Listed
filter life
span
Cost ($US)
Equipment
Price Cost Notes
Equipment Price
Source
Replacement Particulate Filter Price
Replacement VOC Filter
Price
Replacement Filter Cost Information
Source
AirPura C600 DLX Air Purifier
1 year 2 years
$849.98 http://www.allergybuyersclub.com/airpura-r600-air-purifiers.html?itemId=3012
$ 59.98 $ 249.98 http://www.allergybuyersclub.com/airpura-r600-air-purifiers.html?itemId=3012
Airpura R600 All Purpose
2 years $749.98 On sale $649.98
http://www.allergybuyersclub.com/airpura-r600-air-purifiers.html?itemId=3012
$ 169.98 $ 199.98 http://www.allergybuyersclub.com/airpura-r600-air-purifiers.html?itemId=3012
Alen Breathe-smart-HEPA-FreshPlus
8-9 months
$658 https://www.alencorp.com/collections/air-purifiers-for-chemicals-and-cooking-odors/products/breathesmart-air-purifier-w-hepa-freshplus-filter?variant=890004515
$ 119 https://www.alencorp.com/collections/alen-breathesmart-fit50-hepa-freshplus-replacement-filters/products/alen-breathesmart-fit50-hepa-freshplus-filter
Amaircare 3000 HEPA Air Purifier
2-5 years 1 year
$799 1yr Phone $ 219 $ 199 Phone

Ad
so
rptio
n-b
as
ed
Tre
atm
en
t Syste
ms
77
Image Brand Name Model
Listed filter life
span
Cost ($US)
Equipment Price
Cost Notes Equipment Price
Source
Replacement
Particulate Filter Price
Replacement
VOC Filter Price
Replacement Filter
Cost Information Source
AirPura C600 DLX Air Purifier
1 year 2 years
$849.98 http://www.allergybuyersclub.com/airpura-r600-air-purifiers.html?itemId=3012
$59.98 $249.98 http://www.allergybuyersclub.com/airpura-r600-air-purifiers.html?itemId=3012
Amaircare 7500 Airwash Cart
2-5 years 6-12 months
$3,699 3-5 yrs., contains 2 HEPA filters
Phone $ 219 $199 Phone
Amaircare Air Wash 10000
Prefilter: 1 yr.; HEPA: 3-5 yrs.; Carbon: 6 months
$4,000 Replace-ment filter costs not found
http://www.airpurifiersandcleaners.com/amaircare-10000-hvac-air-cleaner
Austin Air Healthmate Plus
3-5 years
$649 Did not specify cost of HEPA prefilter
http://austinair.com/healthmate-2/
$325 http://austinair.com/healthmate-2/

78
A
dso
rptio
n-b
ased
Tre
atm
en
t Syste
ms
Image Brand Name Model
Listed filter life
span
Cost ($US)
Equipment Price
Cost Notes Equipment Price
Source
Replacement Particulate Filter Price
Replacement VOC Filter
Price
Replacement Filter Cost Information
Source
Blue Air Pro XL 6 months $2,500 https://www.blueair.com/us/air-purifiers/pro-xl
$360 https://www.blueair.com/us/%E2%80%8B%E2%80%8Bair-purifier-filters/pro-xl-smokestop
Coway AP-1512HH Mighty Air Purifier
1 year 6 months
$300 no replace-ment filter costs found
http://www.allergybuyersclub.com/coway-mighty-air-purifiers.html
Dyson Pure Cool Link Tower
Too new to tell but claim sensor will let you know
$500
EverClear Delux CM-11
NA Prices not listed, contact manu-facturer for details
Fresh-Aire UV APCO Lifetime Prices not listed
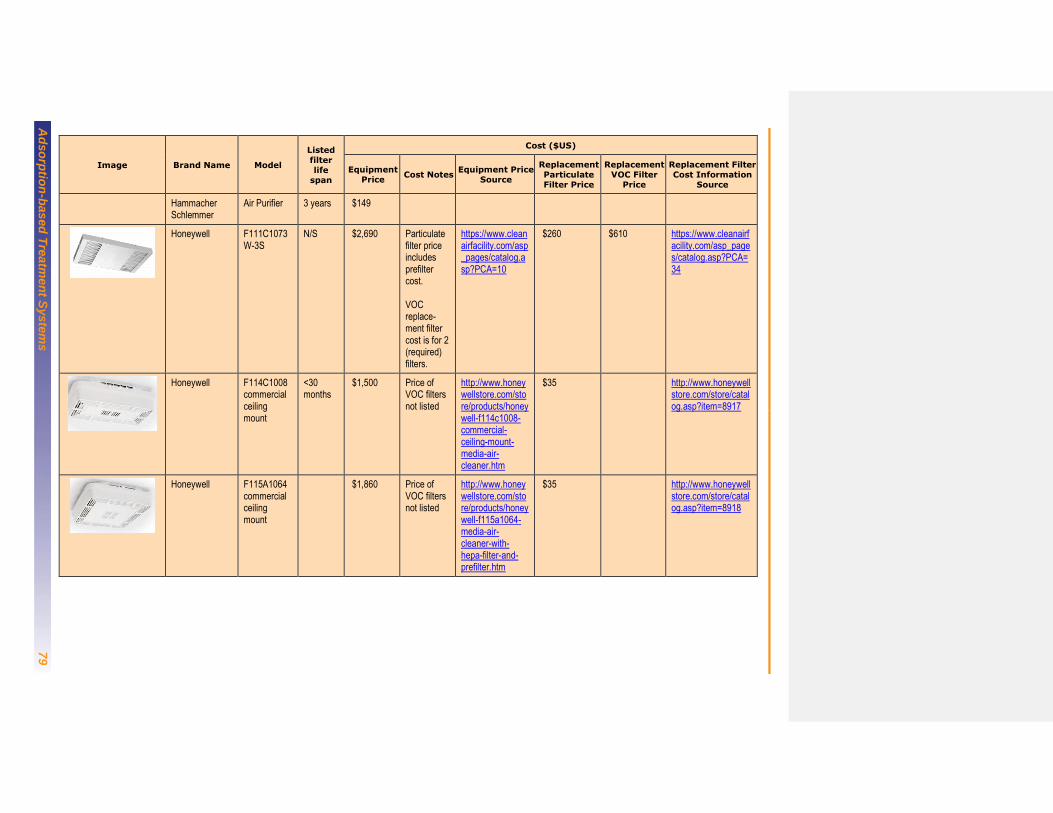
Ad
so
rptio
n-b
as
ed
Tre
atm
en
t Syste
ms
79
Image Brand Name Model
Listed filter life
span
Cost ($US)
Equipment Price
Cost Notes Equipment Price
Source
Replacement Particulate Filter Price
Replacement VOC Filter
Price
Replacement Filter Cost Information
Source
Hammacher Schlemmer
Air Purifier 3 years $149
Honeywell F111C1073W-3S
N/S $2,690 Particulate filter price includes prefilter cost. VOC replace-ment filter cost is for 2 (required) filters.
https://www.cleanairfacility.com/asp_pages/catalog.asp?PCA=10
$260 $610 https://www.cleanairfacility.com/asp_pages/catalog.asp?PCA=34
Honeywell F114C1008 commercial ceiling mount
<30 months
$1,500 Price of VOC filters not listed
http://www.honeywellstore.com/store/products/honeywell-f114c1008-commercial-ceiling-mount-media-air-cleaner.htm
$35 http://www.honeywellstore.com/store/catalog.asp?item=8917
Honeywell F115A1064 commercial ceiling mount
$1,860 Price of VOC filters not listed
http://www.honeywellstore.com/store/products/honeywell-f115a1064-media-air-cleaner-with-hepa-filter-and-prefilter.htm
$35 http://www.honeywellstore.com/store/catalog.asp?item=8918
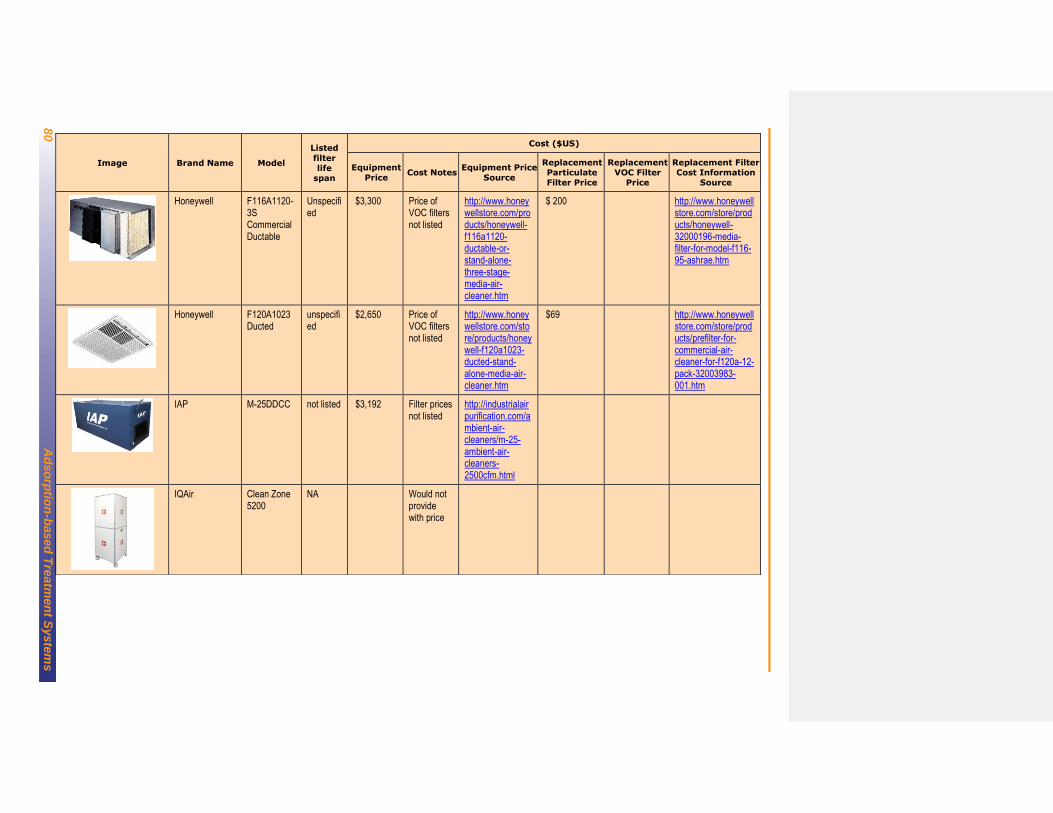
80
A
dso
rptio
n-b
ased
Tre
atm
en
t Syste
ms
Image Brand Name Model
Listed
filter life
span
Cost ($US)
Equipment
Price Cost Notes
Equipment Price
Source
Replacement Particulate Filter Price
Replacement VOC Filter
Price
Replacement Filter Cost Information
Source
Honeywell F116A1120-3S Commercial Ductable
Unspecified
$3,300 Price of VOC filters not listed
http://www.honeywellstore.com/products/honeywell-f116a1120-ductable-or-stand-alone-three-stage-media-air-cleaner.htm
$ 200 http://www.honeywellstore.com/store/products/honeywell-32000196-media-filter-for-model-f116-95-ashrae.htm
Honeywell F120A1023 Ducted
unspecified
$2,650 Price of VOC filters not listed
http://www.honeywellstore.com/store/products/honeywell-f120a1023-ducted-stand-alone-media-air-cleaner.htm
$69 http://www.honeywellstore.com/store/products/prefilter-for-commercial-air-cleaner-for-f120a-12-pack-32003983-001.htm
IAP M-25DDCC not listed $3,192 Filter prices not listed
http://industrialairpurification.com/ambient-air-cleaners/m-25-ambient-air-cleaners-2500cfm.html
IQAir Clean Zone 5200
NA Would not provide with price

Ad
so
rptio
n-b
as
ed
Tre
atm
en
t Syste
ms
81
Image Brand Name Model
Listed
filter life
span
Cost ($US)
Equipment
Price Cost Notes
Equipment Price
Source
Replacement Particulate Filter Price
Replacement VOC Filter
Price
Replacement Filter Cost Information
Source
IQAir Clean zone SL
NA Would not provide with price
IQAir GC/X VOC Air Purifier
18 mos. 2-4 yrs.
$2,199 http://www.iqair.com/gcx-series-air-purifiers/buy
139/HEPA prefilter 169/postfilter sleeves (4 count)
495/GCX cartridge (4count)
http://www.iqair.com/commercial/support/replacementfilters
IQAir GCX Multigas
1 yr. 2.5 yrs.
$2,199 http://www.iqair.com/gcx-series-air-purifiers/buy
139/HEPA prefilter 169/postfilter sleeves (4 count)
495/GCX cartridge (4count)
http://www.iqair.com/commercial/support/replacementfilters
MaxFlo MAXFLO D-25
NA Prices not listed, contact manu-facturer for details
http://maxfloair.com/Products/AirCleaners.aspx
MaxFlo MAXFLO D-30
NA Prices not listed, contact manu-facturer for details
http://maxfloair.com/Products/AirCleaners.aspx
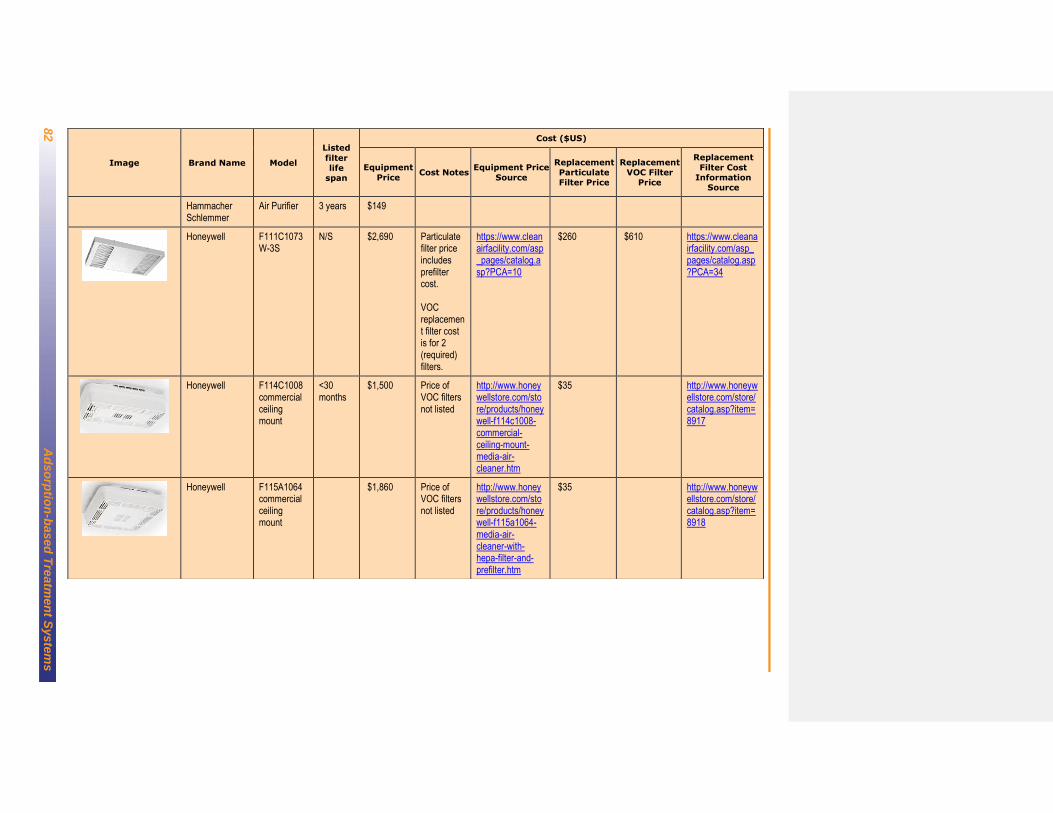
82
A
dso
rptio
n-b
ased
Tre
atm
en
t Syste
ms
Image Brand Name Model
Listed
filter life
span
Cost ($US)
Equipment
Price Cost Notes
Equipment Price
Source
Replacement Particulate Filter Price
Replacement VOC Filter
Price
Replacement
Filter Cost Information
Source
Hammacher Schlemmer
Air Purifier 3 years $149
Honeywell F111C1073W-3S
N/S $2,690 Particulate filter price includes prefilter cost. VOC replacement filter cost is for 2 (required) filters.
https://www.cleanairfacility.com/asp_pages/catalog.asp?PCA=10
$260 $610 https://www.cleanairfacility.com/asp_pages/catalog.asp?PCA=34
Honeywell F114C1008 commercial ceiling mount
<30 months
$1,500 Price of VOC filters not listed
http://www.honeywellstore.com/store/products/honeywell-f114c1008-commercial-ceiling-mount-media-air-cleaner.htm
$35 http://www.honeywellstore.com/store/catalog.asp?item=8917
Honeywell F115A1064 commercial ceiling mount
$1,860 Price of VOC filters not listed
http://www.honeywellstore.com/store/products/honeywell-f115a1064-media-air-cleaner-with-hepa-filter-and-prefilter.htm
$35 http://www.honeywellstore.com/store/catalog.asp?item=8918
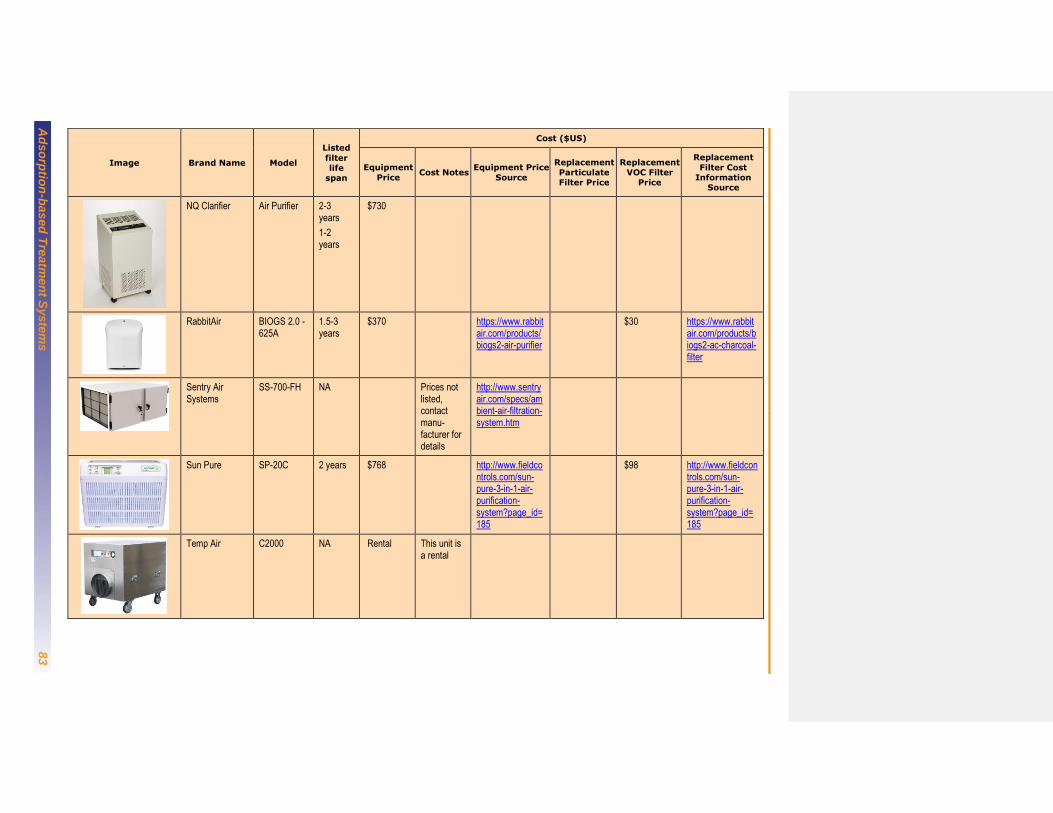
Ad
so
rptio
n-b
as
ed
Tre
atm
en
t Syste
ms
83
Image Brand Name Model
Listed
filter life
span
Cost ($US)
Equipment
Price Cost Notes
Equipment Price
Source
Replacement Particulate Filter Price
Replacement VOC Filter
Price
Replacement
Filter Cost Information
Source
NQ Clarifier Air Purifier 2-3 years
1-2 years
$730
RabbitAir BIOGS 2.0 - 625A
1.5-3 years
$370 https://www.rabbitair.com/products/biogs2-air-purifier
$30 https://www.rabbitair.com/products/biogs2-ac-charcoal-filter
Sentry Air Systems
SS-700-FH NA Prices not listed, contact manu-facturer for details
http://www.sentryair.com/specs/ambient-air-filtration-system.htm
Sun Pure SP-20C 2 years $768 http://www.fieldcontrols.com/sun-pure-3-in-1-air-purification-system?page_id=185
$98 http://www.fieldcontrols.com/sun-pure-3-in-1-air-purification-system?page_id=185
Temp Air C2000 NA Rental This unit is a rental
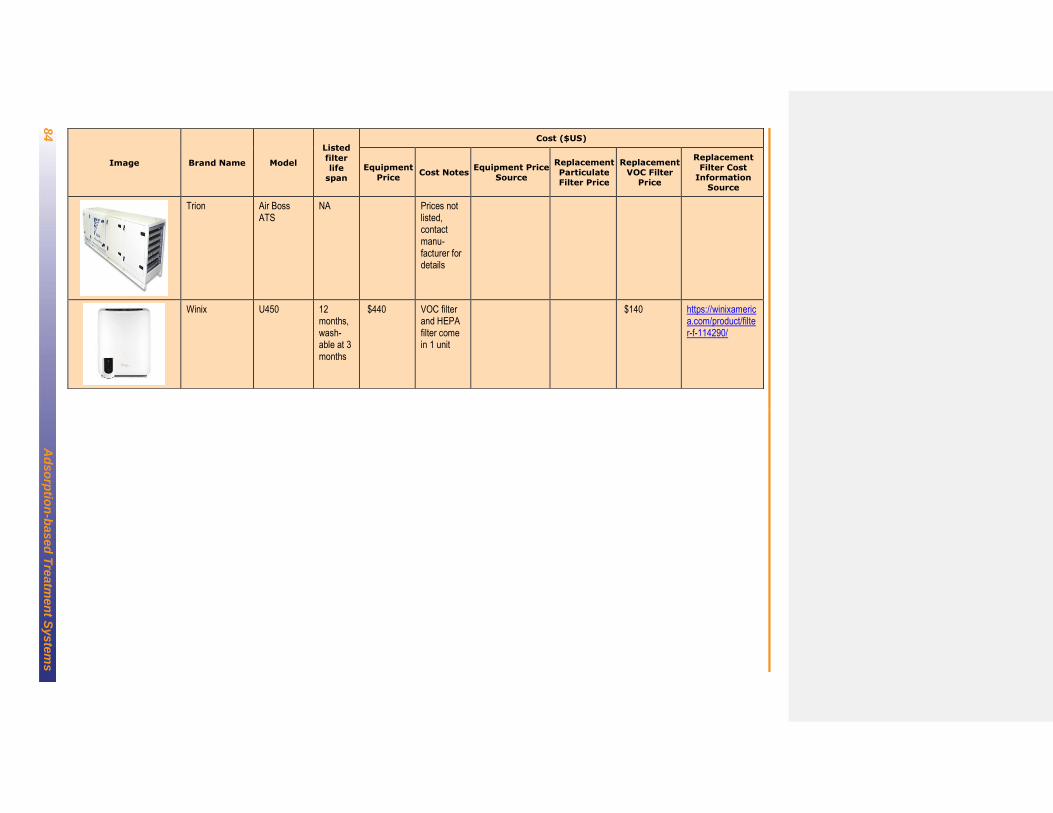
84
A
dso
rptio
n-b
ased
Tre
atm
en
t Syste
ms
Image Brand Name Model
Listed
filter life
span
Cost ($US)
Equipment
Price Cost Notes
Equipment Price
Source
Replacement Particulate Filter Price
Replacement VOC Filter
Price
Replacement
Filter Cost Information
Source
Trion Air Boss ATS
NA Prices not listed, contact manu-facturer for details
Winix U450 12 months, wash-able at 3 months
$440 VOC filter and HEPA filter come in 1 unit
$140 https://winixamerica.com/product/filter-f-114290/
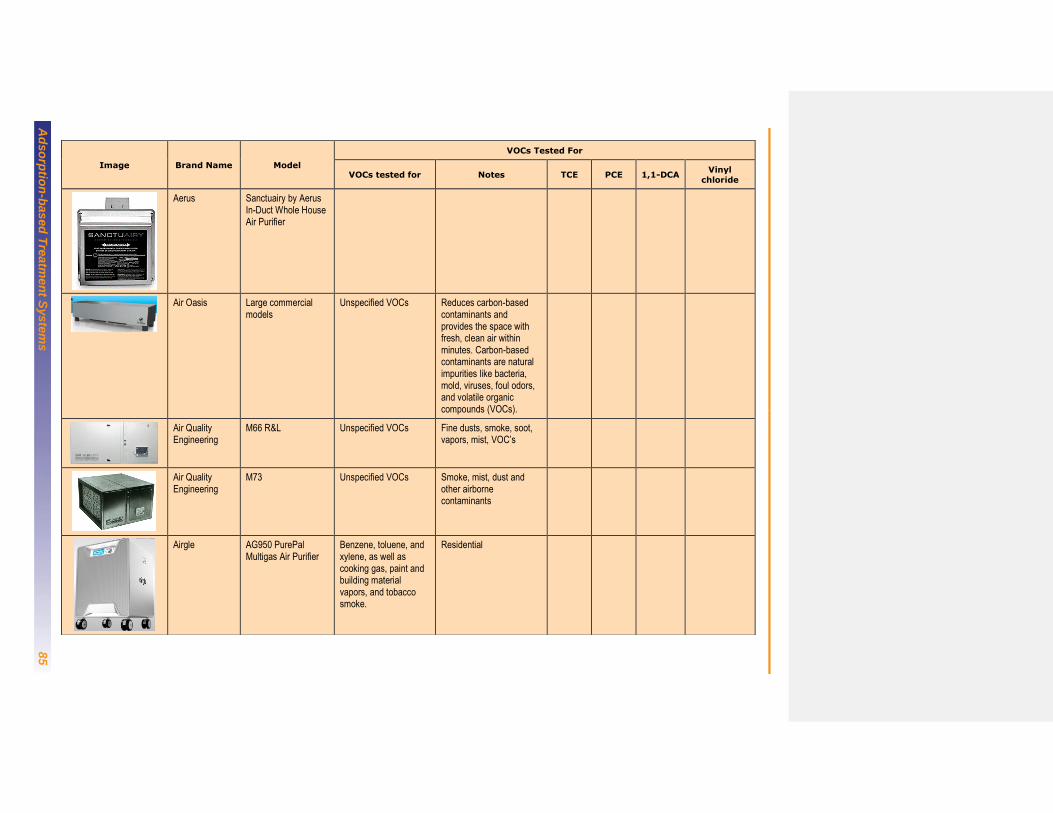
Ad
so
rptio
n-b
as
ed
Tre
atm
en
t Syste
ms
85
Image Brand Name Model
VOCs Tested For
VOCs tested for Notes TCE PCE 1,1-DCA Vinyl
chloride
Aerus Sanctuairy by Aerus In-Duct Whole House Air Purifier
Air Oasis Large commercial models
Unspecified VOCs Reduces carbon-based contaminants and provides the space with fresh, clean air within minutes. Carbon-based contaminants are natural impurities like bacteria, mold, viruses, foul odors, and volatile organic compounds (VOCs).
Air Quality Engineering
M66 R&L Unspecified VOCs Fine dusts, smoke, soot, vapors, mist, VOC’s
Air Quality Engineering
M73 Unspecified VOCs Smoke, mist, dust and other airborne contaminants
Airgle AG950 PurePal Multigas Air Purifier
Benzene, toluene, and xylene, as well as cooking gas, paint and building material vapors, and tobacco smoke.
Residential
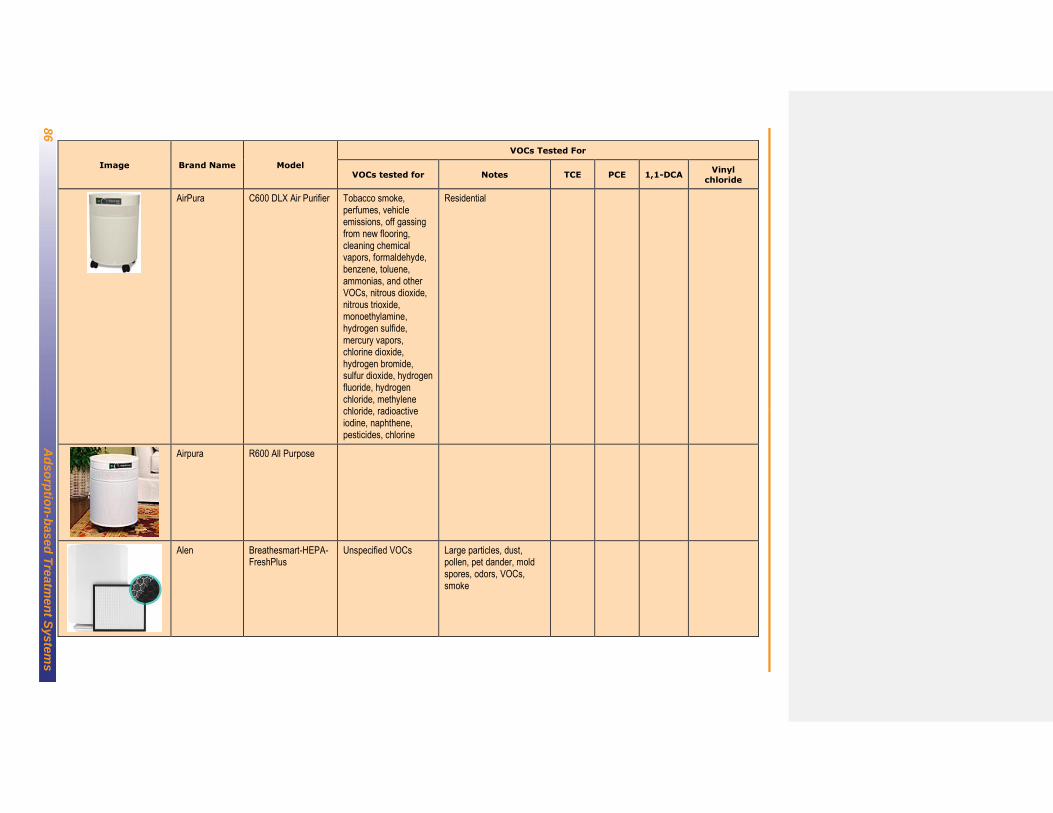
86
A
dso
rptio
n-b
ased
Tre
atm
en
t Syste
ms
Image Brand Name Model
VOCs Tested For
VOCs tested for Notes TCE PCE 1,1-DCA Vinyl
chloride
AirPura C600 DLX Air Purifier Tobacco smoke, perfumes, vehicle emissions, off gassing from new flooring, cleaning chemical vapors, formaldehyde, benzene, toluene, ammonias, and other VOCs, nitrous dioxide, nitrous trioxide, monoethylamine, hydrogen sulfide, mercury vapors, chlorine dioxide, hydrogen bromide, sulfur dioxide, hydrogen fluoride, hydrogen chloride, methylene chloride, radioactive iodine, naphthene, pesticides, chlorine
Residential
Airpura R600 All Purpose
Alen Breathesmart-HEPA-FreshPlus
Unspecified VOCs Large particles, dust, pollen, pet dander, mold spores, odors, VOCs, smoke
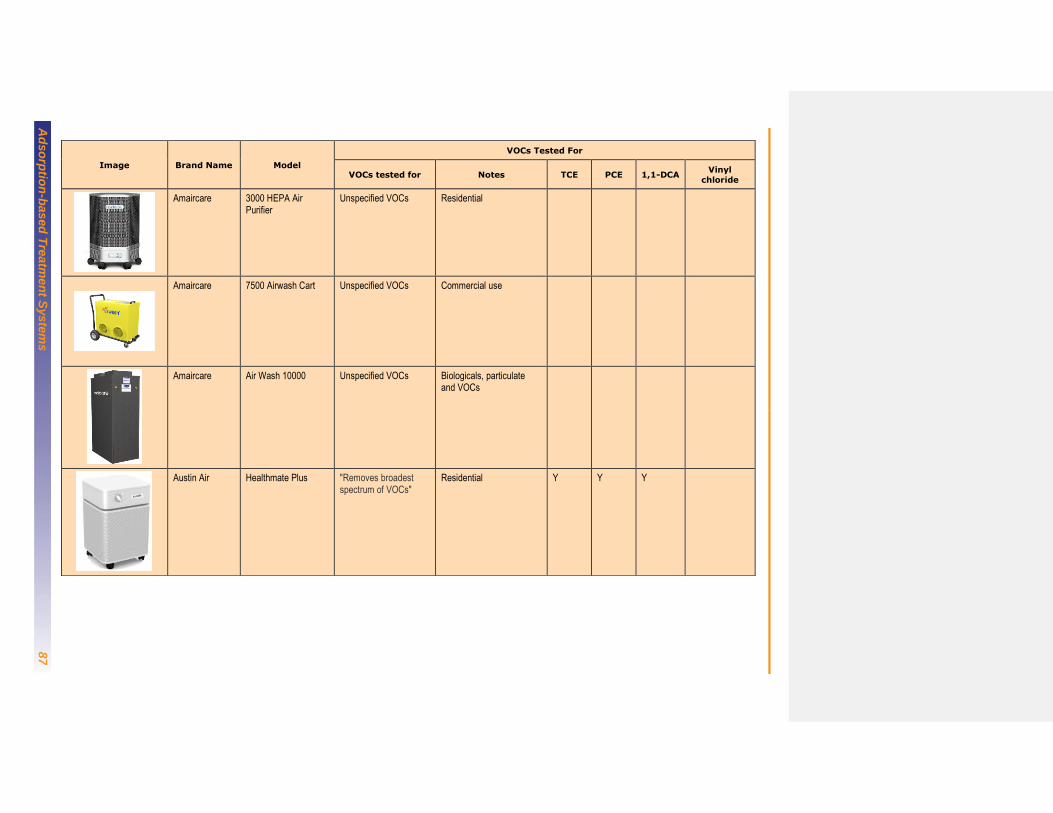
Ad
so
rptio
n-b
as
ed
Tre
atm
en
t Syste
ms
87
Image Brand Name Model
VOCs Tested For
VOCs tested for Notes TCE PCE 1,1-DCA Vinyl
chloride
Amaircare 3000 HEPA Air Purifier
Unspecified VOCs Residential
Amaircare 7500 Airwash Cart Unspecified VOCs Commercial use
Amaircare Air Wash 10000 Unspecified VOCs Biologicals, particulate and VOCs
Austin Air Healthmate Plus "Removes broadest spectrum of VOCs"
Residential Y Y Y

88
A
dso
rptio
n-b
ased
Tre
atm
en
t Syste
ms
Image Brand Name Model
VOCs Tested For
VOCs tested for Notes TCE PCE 1,1-DCA Vinyl
chloride
Blue Air Pro XL Unspecified VOCs Large particles, dust, pollen, pet dander, mold spores, odors, VOCs, smoke
Coway AP-1512HH Mighty Air Purifier
Unspecified VOCs Residential
Dyson Pure Cool Link Tower A layer of activated carbon granules eliminates odors and potentially harmful toxins such as paint fumes. No specified VOCs
Residential
EverClear Delux CM-11 Unspecified VOCs Odors, tobacco smoke, pollen, dust, vapors and many other irritants.
Fresh-Aire UV APCO Unspecified VOCs Y
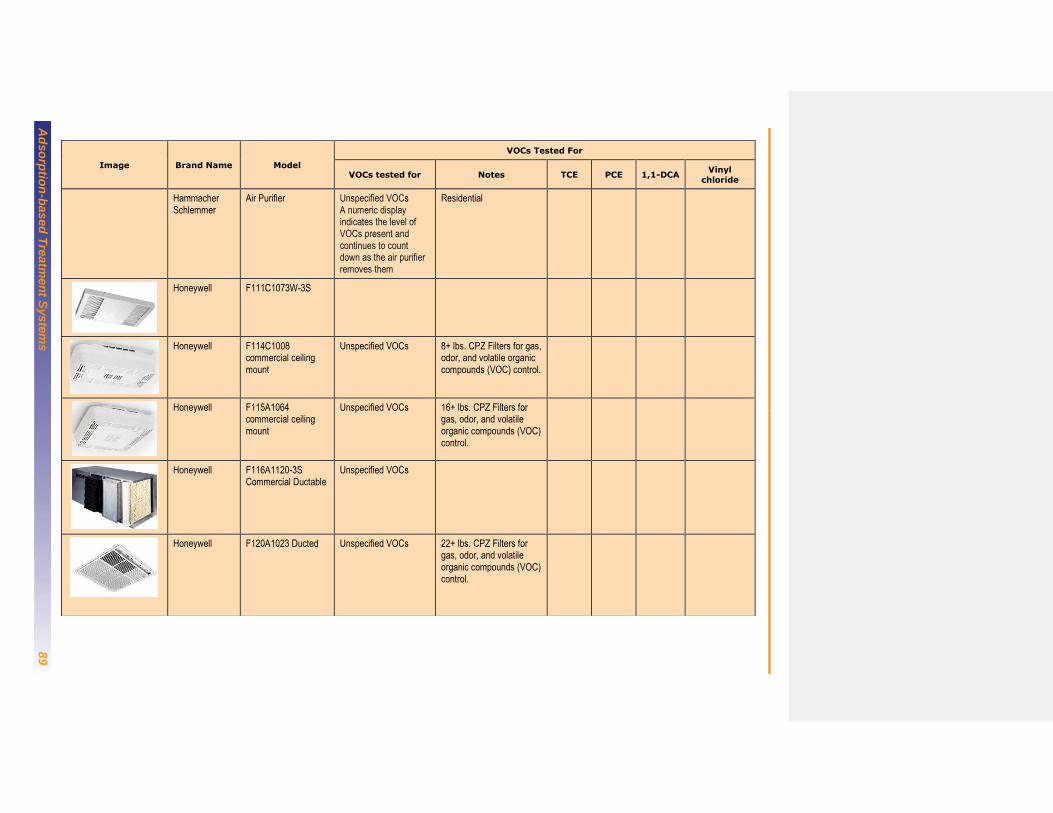
Ad
so
rptio
n-b
as
ed
Tre
atm
en
t Syste
ms
89
Image Brand Name Model
VOCs Tested For
VOCs tested for Notes TCE PCE 1,1-DCA Vinyl
chloride
Hammacher Schlemmer
Air Purifier Unspecified VOCs A numeric display indicates the level of VOCs present and continues to count down as the air purifier removes them
Residential
Honeywell F111C1073W-3S
Honeywell F114C1008 commercial ceiling mount
Unspecified VOCs 8+ lbs. CPZ Filters for gas, odor, and volatile organic compounds (VOC) control.
Honeywell F115A1064 commercial ceiling mount
Unspecified VOCs 16+ lbs. CPZ Filters for gas, odor, and volatile organic compounds (VOC) control.
Honeywell F116A1120-3S Commercial Ductable
Unspecified VOCs
Honeywell F120A1023 Ducted Unspecified VOCs 22+ lbs. CPZ Filters for gas, odor, and volatile organic compounds (VOC) control.
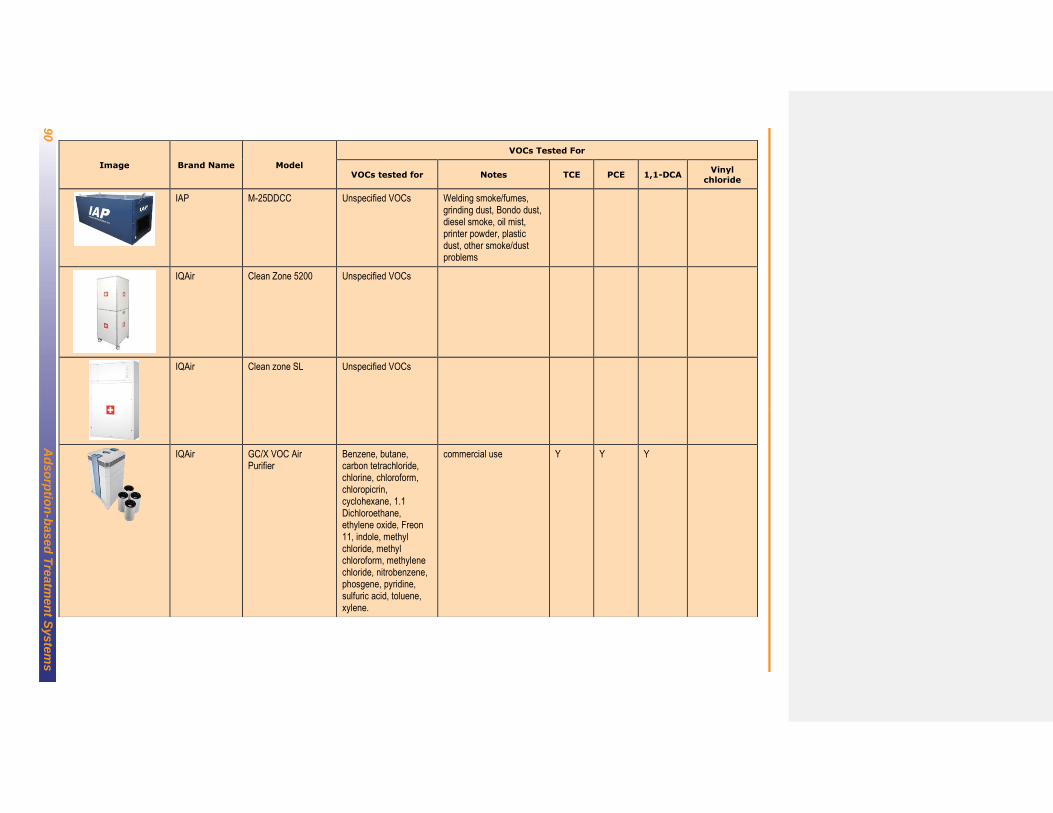
90
A
dso
rptio
n-b
ased
Tre
atm
en
t Syste
ms
Image Brand Name Model
VOCs Tested For
VOCs tested for Notes TCE PCE 1,1-DCA Vinyl
chloride
IAP M-25DDCC Unspecified VOCs Welding smoke/fumes, grinding dust, Bondo dust, diesel smoke, oil mist, printer powder, plastic dust, other smoke/dust problems
IQAir Clean Zone 5200 Unspecified VOCs
IQAir Clean zone SL Unspecified VOCs
IQAir GC/X VOC Air Purifier
Benzene, butane, carbon tetrachloride, chlorine, chloroform, chloropicrin, cyclohexane, 1.1 Dichloroethane, ethylene oxide, Freon 11, indole, methyl chloride, methyl chloroform, methylene chloride, nitrobenzene, phosgene, pyridine, sulfuric acid, toluene, xylene.
commercial use Y Y Y
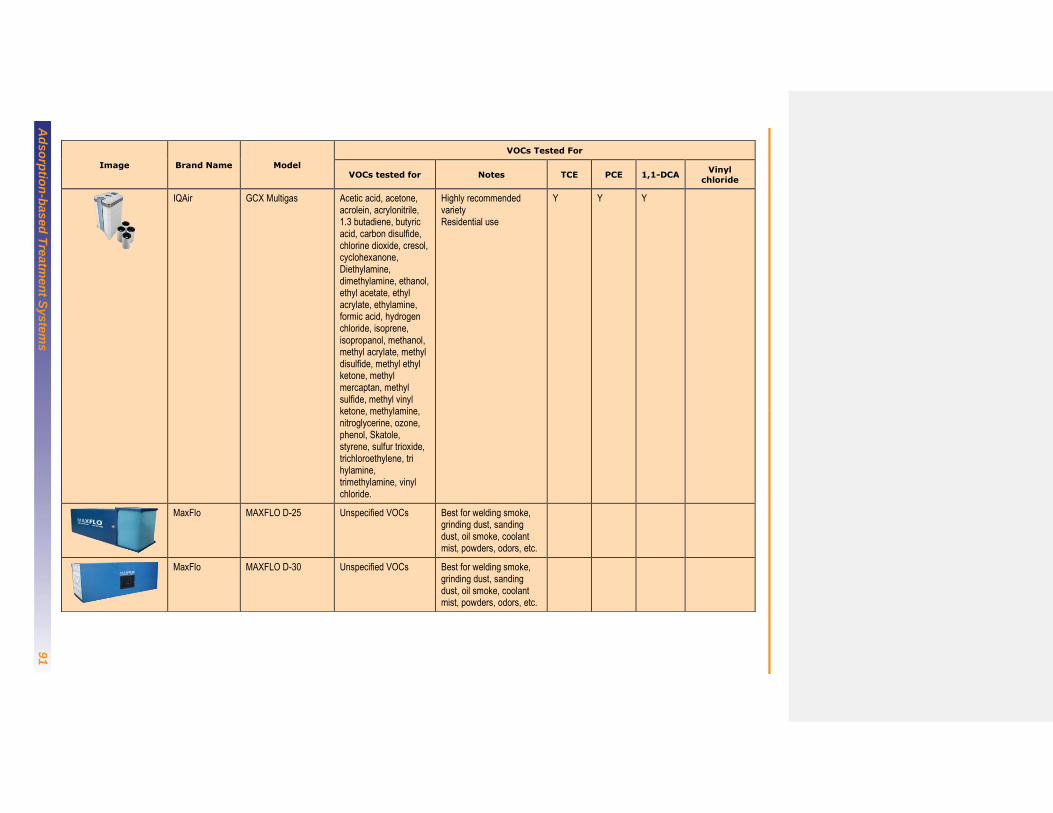
Ad
so
rptio
n-b
as
ed
Tre
atm
en
t Syste
ms
91
Image Brand Name Model
VOCs Tested For
VOCs tested for Notes TCE PCE 1,1-DCA Vinyl
chloride
IQAir GCX Multigas Acetic acid, acetone, acrolein, acrylonitrile, 1.3 butadiene, butyric acid, carbon disulfide, chlorine dioxide, cresol, cyclohexanone, Diethylamine, dimethylamine, ethanol, ethyl acetate, ethyl acrylate, ethylamine, formic acid, hydrogen chloride, isoprene, isopropanol, methanol, methyl acrylate, methyl disulfide, methyl ethyl ketone, methyl mercaptan, methyl sulfide, methyl vinyl ketone, methylamine, nitroglycerine, ozone, phenol, Skatole, styrene, sulfur trioxide, trichloroethylene, tri hylamine, trimethylamine, vinyl chloride.
Highly recommended variety Residential use
Y Y Y
MaxFlo MAXFLO D-25 Unspecified VOCs Best for welding smoke, grinding dust, sanding dust, oil smoke, coolant mist, powders, odors, etc.
MaxFlo MAXFLO D-30 Unspecified VOCs Best for welding smoke, grinding dust, sanding dust, oil smoke, coolant mist, powders, odors, etc.
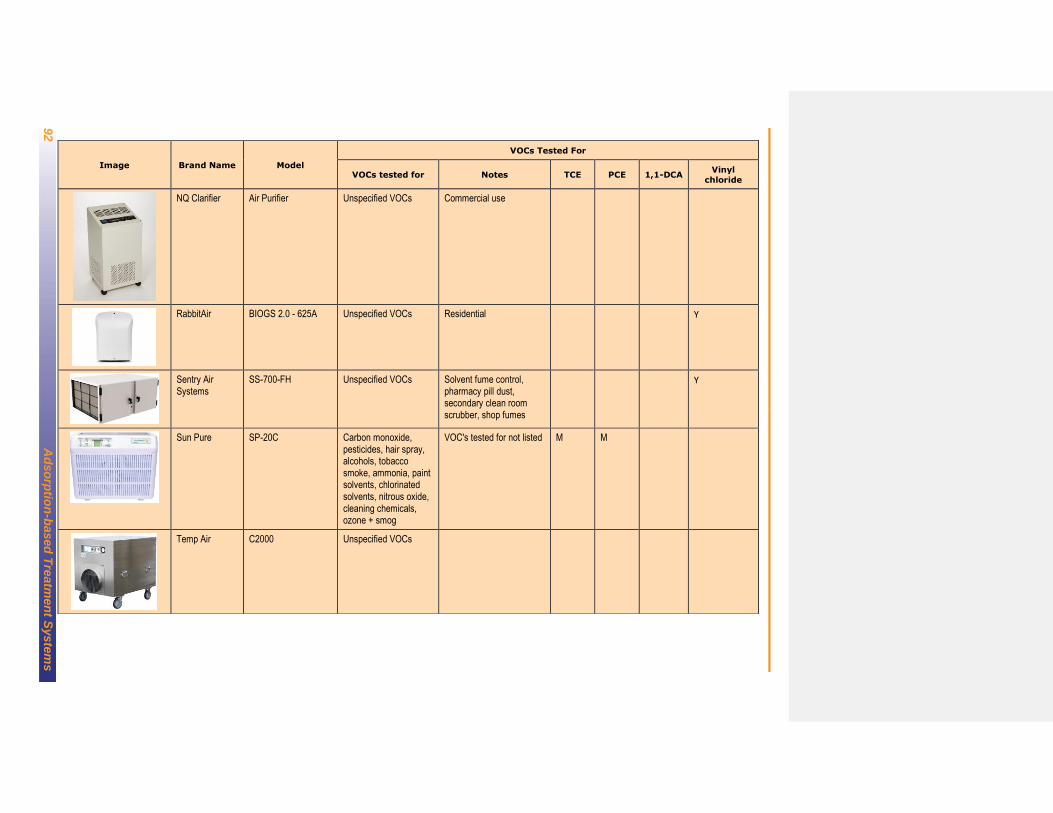
92
A
dso
rptio
n-b
ased
Tre
atm
en
t Syste
ms
Image Brand Name Model
VOCs Tested For
VOCs tested for Notes TCE PCE 1,1-DCA Vinyl
chloride
NQ Clarifier Air Purifier Unspecified VOCs Commercial use
RabbitAir BIOGS 2.0 - 625A Unspecified VOCs Residential Y
Sentry Air Systems
SS-700-FH Unspecified VOCs Solvent fume control, pharmacy pill dust, secondary clean room scrubber, shop fumes
Y
Sun Pure SP-20C Carbon monoxide, pesticides, hair spray, alcohols, tobacco smoke, ammonia, paint solvents, chlorinated solvents, nitrous oxide, cleaning chemicals, ozone + smog
VOC's tested for not listed M M
Temp Air C2000 Unspecified VOCs

Ad
so
rptio
n-b
as
ed
Tre
atm
en
t Syste
ms
93
Image Brand Name Model
VOCs Tested For
VOCs tested for Notes TCE PCE 1,1-DCA Vinyl
chloride
Trion Air Boss ATS Unspecified VOCs Smoke, fumes, and oil/coolant mists, nuisance odors
Winix U450 Not published Residential

94
A
dso
rptio
n-b
ased
Tre
atm
en
t Syste
ms
Image Brand Name Model VOCs Tested For
General Notes Others
Aerus Sanctuairy by Aerus In-Duct Whole House Air Purifier
Air Oasis Large commercial models
Air Quality Engineering
M66 R&L This company used to be the supplier and manufacturer for Honeywell industrial air cleaners until they decided to start making their own. There are a huge range of add-ons, configurations, and motor types for this specific model, for details see http://www.air-quality-eng.com/specs/m66-media-air-filtration-systems/ or http://www.breathepureair.com/aqe_m66.html
Air Quality Engineering
M73 There are a huge range of add-ons, configurations, and motor types for this specific model, for details see http://www.air-quality-eng.com/specs/m73-industrial-air-filter/ or http://www.breathepureair.com/aqe_m73.html
Airgle AG950 PurePal Multigas Air Purifier
AG950 PurePal Multigas Air Purifier discontinued, AG900 PurePal Clean Room closest model found

Ad
so
rptio
n-b
as
ed
Tre
atm
en
t Syste
ms
95
Image Brand Name Model VOCs Tested For
General Notes Others
AirPura C600 DLX Air Purifier
Airpura R600 All Purpose
Alen Breathesmart-HEPA-FreshPlus
Amaircare 3000 HEPA Air Purifier
Amaircare 7500 Airwash Cart

96
A
dso
rptio
n-b
ased
Tre
atm
en
t Syste
ms
Image Brand Name Model VOCs Tested For
General Notes Others
Amaircare Air Wash 10000 This model not listed on official Website
Austin Air Healthmate Plus
Blue Air Pro XL
Coway AP-1512HH Mighty Air Purifier
Unclear where the amount of GAC was found, as unit only weighs 15 lbs.
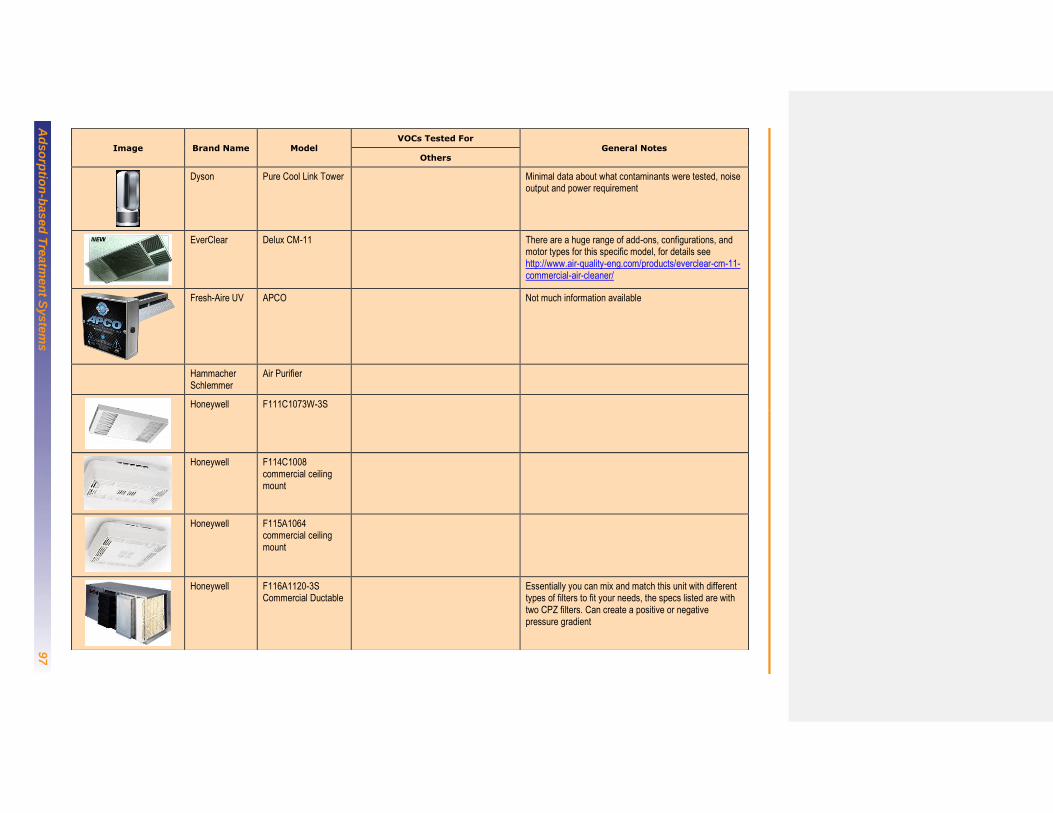
Ad
so
rptio
n-b
as
ed
Tre
atm
en
t Syste
ms
97
Image Brand Name Model VOCs Tested For
General Notes Others
Dyson Pure Cool Link Tower Minimal data about what contaminants were tested, noise output and power requirement
EverClear Delux CM-11 There are a huge range of add-ons, configurations, and motor types for this specific model, for details see http://www.air-quality-eng.com/products/everclear-cm-11-commercial-air-cleaner/
Fresh-Aire UV APCO Not much information available
Hammacher Schlemmer
Air Purifier
Honeywell F111C1073W-3S
Honeywell F114C1008 commercial ceiling mount
Honeywell F115A1064 commercial ceiling mount
Honeywell F116A1120-3S Commercial Ductable
Essentially you can mix and match this unit with different types of filters to fit your needs, the specs listed are with two CPZ filters. Can create a positive or negative pressure gradient

98
A
dso
rptio
n-b
ased
Tre
atm
en
t Syste
ms
Image Brand Name Model VOCs Tested For
General Notes Others
Honeywell F120A1023 Ducted
IAP M-25DDCC
IQAir Clean Zone 5200
IQAir Clean zone SL
IQAir GC/X VOC Air Purifier

Ad
so
rptio
n-b
as
ed
Tre
atm
en
t Syste
ms
99
Image Brand Name Model VOCs Tested For
General Notes Others
IQAir GCX Multigas Acetic acid, acetone, acrolein, acrylonitrile, 1.3 butadiene, butyric acid, carbon disulfide, chlorine dioxide, cresol, cyclohexanone, Diethylamine, dimethylamine, ethanol, ethyl acetate, ethyl acrylate, ethylamine, formic acid, hydrogen chloride, isoprene, isopropanol, methanol, methyl acrylate, methyl disulfide, methyl ethyl ketone, methyl mercaptan, methyl sulfide, methyl vinyl ketone, methylamine, nitroglycerine, ozone, phenol, Skatole, styrene, sulfur trioxide, tri hylamine, trimethylamine
MaxFlo MAXFLO D-25 Charcoal filter can be interchanged with HEPA filter
MaxFlo MAXFLO D-30
NQ Clarifier Air Purifier
RabbitAir BIOGS 2.0 - 625A

10
0
Ad
so
rptio
n-b
ased
Tre
atm
en
t Syste
ms
Image Brand Name Model VOCs Tested For
General Notes Others
Sentry Air Systems
SS-700-FH
Sun Pure SP-20C
Temp Air C2000 Rental unit that uses carbon for various applications
Trion Air Boss ATS
Winix U450

Adsorption-based Treatment Systems 101
ATTACHMENT B
AIR CLEANER EQUIPMENT

10
2
Ad
so
rptio
n-b
ased
Tre
atm
en
t Syste
ms
Manufacturer Filtration Group Filtration Group Filtration Group
Website www.filtrationgroup.com www.filtrationgroup.com www.filtrationgroup.com
Image
Brand Name Filtration Group Filtration Group Aerostar
Model Series 750 Carbon Pleat Series 550 Carbon Pleat HEGA filters: Grade 653 for VOCs.
Height (in.) 24 24 24
Width (in.) 24 24 24
Depth (in.) 2 2 12
Dimension Notes many sizes many sizes many sizes include 2”, 4”, 12” deep
Weight (Pounds) depends on size
Description
Carbon pleated filters that provide particle and gas-phase filtration. Self-supportive media of 100% synthetic pre-filtration layer laminated to a chemically enhanced activated carbon filtration layer. MERV 11 for particles.
Carbon pleated filters designed for control of intermittent odors and common indoor air pollutants.
Specifications • 500 g/m2 media loading • High Activity Carbon (85% CTC) Gas-phase units allow choice of sorbent (Series 653 is carbon), frames, and dimensions • Works on physisorption and catalysis
Listed filter life span
Price $125 $25 $490
Price Source
http://www.filtrationgroup.com/WFS/FGCBusiness/en_US/-/USD/HVAC/hvac-pleated-air-filters/hvac-pleated-air-filters-series-750-carbon-pleat-4/PLEAT-24x24x4-Nominal-Size-24-in-x-24-in-x-4-in--zid173444
http://www.filtrationgroup.com/WFS/FGCBusiness/en_US/-/USD/HVAC/hvac-pleated-air-filters/hvac-pleated-air-filters-series-550-carbon-pleat-1/PLEAT-24x24x1-Nominal-Size-24-in-x-24-in-x-1-in--zid15842
http://www.filtrationgroup.com/WFS/FGCBusiness/en_US/-/USD/HVAC/hvac-gas-phase-filters/hvac-gas-phase-filters-hega-3653-series/HEGA-3653-SERIES-Nominal-Size-24-in-x-24-in-x-12-in--zid17982
Price Notes Price depends on size and quantity Price depends on size and quantity Price depends on size and type of frame

Pas
siv
e S
am
ple
rs fo
r Inve
stig
atio
ns o
f Air Q
uality
10
3
Ad
so
rptio
n-b
ased
Tre
atm
en
t Syste
ms
10
3
Manufacturer Filtration Group Dafco Filtration Group AAF Intl.
Website www.filtrationgroup.com dafcofiltrationgroup.com aafintl.com
Image
Brand Name Aerostar Aerostar AAF
Model FP Gas-phase Filter Side Access - Carbon Sorb Housing AmAir/C family of filters
Height (in.) 24 24
Width (in.) 24 24
Depth (in.) 12 2
Dimension Notes many sizes from 0.5x0.5 to 2.5x5 ft. cross section, various
depths many sizes avail; 1", 2", 4" depths
Weight (Pounds) 24 for carbon; 28 for blend (media only)
Description
removes wide range of odors and common indoor air pollutants at high air flows. Constructed of heavy-duty galvanized steel and plastic, with 3/4" honeycomb media packs. Blend of 60% CTC activated carbon and potassium permanganate on zeolite is recommended for TCE; carbon version for PCE.
This is a filter housing. Holds 2" or 4" pleated prefilters and 3/4" refillable carbon trays. Recommends 12 trays per 24" of height to achieve low-pressure drop. Standard housing depth is 36" for 2" prefilters and 38" for 4" prefilters; other depths are available upon request. Various sorbents available (carbon, PPIS, blends)
Directly interchangeable with standard air filters. Options: panels, pads, and 1”, 2”, and 4” pleated filters. long-lasting gas-phase and particle filters, with AAF’s SAAFWeb™ technology chemical media. High chemical media density yields superior odor control. Carbon version more recommended for chlorinated hydrocarbons.
Listed filter life span
Price
Price Source
Price Notes

10
4
Ad
so
rptio
n-b
ased
Tre
atm
en
t Syste
ms
Manufacturer AAF Intl. 3M Accumulair
Website aafintl.com http://www.filtrete.com/3M/en_US/filtrete/products www.accumulair.com
Image
Brand Name AAF Filtrete Accumulair
Model VariCel RF/C Allergen Defense Odor Reduction Filter Carbon
Height (in.) 24 20 20
Width (in.) 24 25 25
Depth (in.) 11.5 1 6
Dimension Notes many sizes many sizes, intended for residences many sizes
Weight (Pounds) 7.8 1.3
Description
60% granular activated carbon; high-efficiency removal of multiple contaminants. The media is pleated and housed in a rigid metal frame. The frame is available in either the standard box style, no-header version, or with a single 13/16" thick header.
Lightly pleated particle and gas filter, MERV 11, activated carbon
Carbon-impregnated disposable pleated panel filter
Listed filter life span
up to 3 months up to 3 months
Price $10 $30
Price Source
https://www.amazon.com/dp/B006EI5V7O/ref=twister_B00O4TYSUG?_encoding=UTF8&psc=1
https://jet.com/product/detail/3fb52c1e5d6846d7b6136935c98e4994?jcmp=pla:ggl:gen_hardware_a2:heating_ventilation_air_conditioning_a2_other:na:PLA_348828540_24713608260_pla-161719582140:na:na:na:2&code=PLA15&ds_c=gen_hardware_a2&ds_cid=&ds_ag=heating_ventilation_air_conditioning_a2_other&product_id=3fb52c1e5d6846d7b6136935c98e4994&product_partition_id=161719582140&gclid=CN_ylenEj84CFQMLaQod9bsFIg&gclsrc=aw.ds
Price Notes
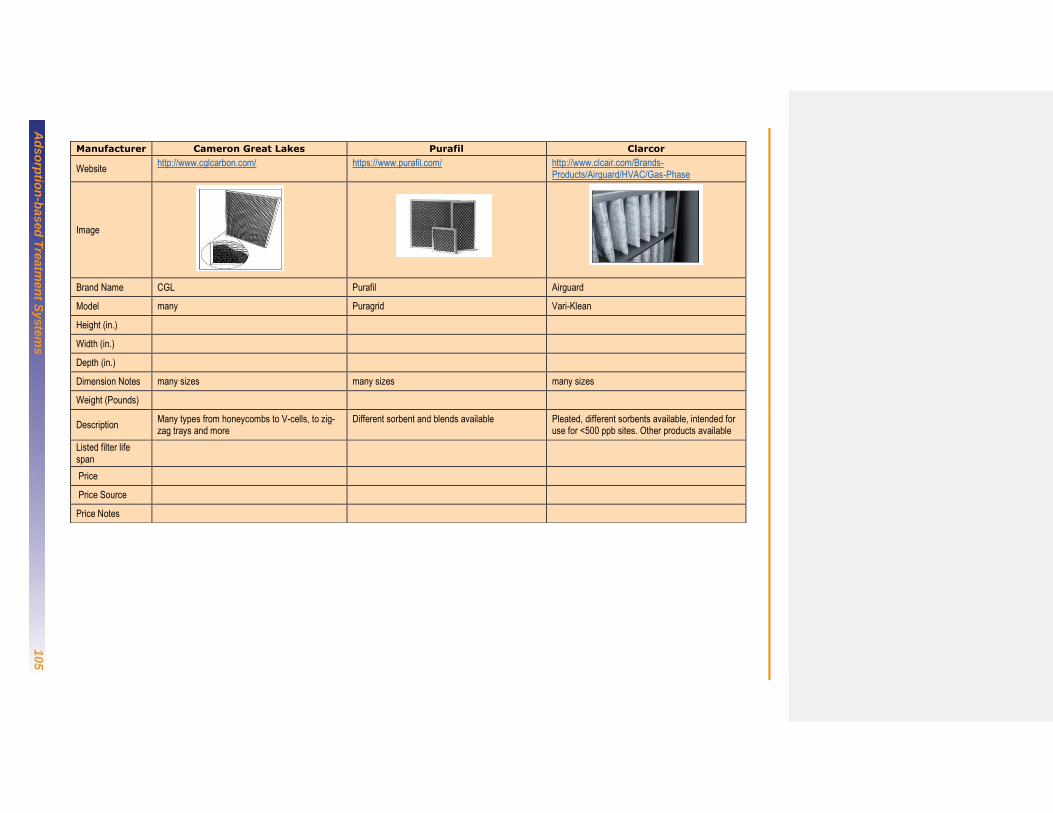
Pas
siv
e S
am
ple
rs fo
r Inve
stig
atio
ns o
f Air Q
uality
10
5
Ad
so
rptio
n-b
ased
Tre
atm
en
t Syste
ms
10
5
Manufacturer Cameron Great Lakes Purafil Clarcor
Website http://www.cglcarbon.com/ https://www.purafil.com/ http://www.clcair.com/Brands-
Products/Airguard/HVAC/Gas-Phase
Image
Brand Name CGL Purafil Airguard
Model many Puragrid Vari-Klean
Height (in.)
Width (in.)
Depth (in.)
Dimension Notes many sizes many sizes many sizes
Weight (Pounds)
Description Many types from honeycombs to V-cells, to zig-zag trays and more
Different sorbent and blends available Pleated, different sorbents available, intended for use for <500 ppb sites. Other products available
Listed filter life span
Price
Price Source
Price Notes

10
6
Ad
so
rptio
n-b
ased
Tre
atm
en
t Syste
ms
Manufacturer Clarcor
Website http://www.clcair.com/Brands-Products/Airguard/HVAC/Gas-Phase
Image
Brand Name Clarcor
Model Carbon filter housings with refillable or replacement trays
Height (in.)
Width (in.)
Depth (in.)
Dimension Notes Various sizes
Weight (Pounds)
Description Different sorbents and differing weights up to 90 pounds for the AG-2000
Listed filter life span
Price
Price Source
Price Notes
Adsorption-based Treatment Systems
Office of Research and Development
National Risk Management
Research Laboratory
Cincinnati, OH 45268
Official Business
Penalty for Private Use
$300
EPA/600/R-17/276 August 2017 www.epa.gov
Related Documents