sustainability Article Adsorption and Desorption Behaviors of Four Endocrine Disrupting Chemicals in Soils from the Water-Level Fluctuation Zone of the Three Gorges Reservoir, China Ying Hu 1 , Qingwei Yang 2 ID , Jiaoxia Sun 2, *, Qingkong Chen 2 , Jianxin Fan 2 and Xiaoxing Mei 2 1 Key Laboratory of Hydraulic and Waterway Engineering of the Ministry of Education, Chongqing Jiaotong University, Chongqing 400074, China; [email protected] 2 Chongqing Engineering Laboratory of Environmental Hydraulic Engineering, Chongqing Municipal Development and Reform Commission, Chongqing Jiaotong University, Chongqing 400074, China; [email protected] (Q.Y.); [email protected] (Q.C.); [email protected] (J.F.); [email protected] (X.M.) * Correspondence: [email protected]; Tel./Fax: +86-23-6265-2714 Received: 16 June 2018; Accepted: 16 July 2018; Published: 19 July 2018 Abstract: As a special zone of periodic impoundment and flooding in the Three Gorges Reservoir (TGR), the water-level fluctuation zone (WLFZ) of TGR acts as a short-term ‘sink’ for hydrophobic endocrine disrupting compounds (EDCs). This study was conducted on the adsorption/desorption kinetics and equilibriums of four target EDCs (i.e., estrone (E1), 17β-estradiol (E2), 17α-ethynylestradiol (EE2), and bisphenol A (BPA)) in soil samples (i.e., S1, S2, S3, and S4), which were collected from different elevation gradients of the WLFZ at Qingxi Town of Fulin in TGR. Under the influence of the water-level fluctuation, S1 and S2 from the frequent inundation area had smaller particle sizes with more organic matter (OM) and total nitrogen (TN) content, whereas soils S3 and S4 from the long-term exposed area had a higher fraction of sand with lower OM and TN. All four target EDCs could achieve an adsorption equilibrium within 24 h, and the kinetics of the adsorption/desorption fitted the pseudo-second-order model excellently. The adsorption/desorption isotherms of the EDCs were better described by the Freundlich equation. The adsorption capacity decreased, as 17α-ethynylestradiol (EE2) > 17β-estradiol (E2) > estrone (E1) > bisphenol A (BPA), in each tested soil. S1 and S2 exhibited a greater capacity but a lower degree of nonlinearity to adsorb the target EDCs than S3 and S4. The values of the Gibbs free energy suggested that the EDCs adsorption in the tested soils was dominated by unstable physical adsorption. The desorption hysteresis of E1, E2, and EE2 were stronger in S1 and S2, whereas the BPA exhibited weak or almost no hysteresis in all of the tested soils. The substantial water-level fluctuation imposed on the TGR would have a continuous influence on the EDCs adsorption/desorption by altering the soil properties. Thus, long-term monitoring and further research of EDCs in this region are urgent. Keywords: adsorption; desorption; soil; endocrine-disrupting chemicals; Three Gorges Reservoir 1. Introduction Endocrine disrupting compounds (EDCs), which could mostly influence the endocrine system through mimicking or disrupting the functions of hormones, have drawn considerable social and scientific concern in recent years [1]. Studies suggest that exposure to EDCs is associated with male fish feminization, reproductive abnormalities, obesity, autism, cancer, cardiovascular risk, and other neurobehavioral deficits [2,3]. What deserves greater attention is its wide distribution around the Sustainability 2018, 10, 2531; doi:10.3390/su10072531 www.mdpi.com/journal/sustainability

Welcome message from author
This document is posted to help you gain knowledge. Please leave a comment to let me know what you think about it! Share it to your friends and learn new things together.
Transcript
sustainability
Article
Adsorption and Desorption Behaviors of FourEndocrine Disrupting Chemicals in Soils from theWater-Level Fluctuation Zone of the Three GorgesReservoir, China
Ying Hu 1, Qingwei Yang 2 ID , Jiaoxia Sun 2,*, Qingkong Chen 2, Jianxin Fan 2 and Xiaoxing Mei 2
1 Key Laboratory of Hydraulic and Waterway Engineering of the Ministry of Education,Chongqing Jiaotong University, Chongqing 400074, China; [email protected]
2 Chongqing Engineering Laboratory of Environmental Hydraulic Engineering, Chongqing MunicipalDevelopment and Reform Commission, Chongqing Jiaotong University, Chongqing 400074, China;[email protected] (Q.Y.); [email protected] (Q.C.); [email protected] (J.F.);[email protected] (X.M.)
* Correspondence: [email protected]; Tel./Fax: +86-23-6265-2714
Received: 16 June 2018; Accepted: 16 July 2018; Published: 19 July 2018
Abstract: As a special zone of periodic impoundment and flooding in the Three GorgesReservoir (TGR), the water-level fluctuation zone (WLFZ) of TGR acts as a short-term ‘sink’for hydrophobic endocrine disrupting compounds (EDCs). This study was conducted on theadsorption/desorption kinetics and equilibriums of four target EDCs (i.e., estrone (E1), 17β-estradiol(E2), 17α-ethynylestradiol (EE2), and bisphenol A (BPA)) in soil samples (i.e., S1, S2, S3, and S4),which were collected from different elevation gradients of the WLFZ at Qingxi Town of Fulin in TGR.Under the influence of the water-level fluctuation, S1 and S2 from the frequent inundation area hadsmaller particle sizes with more organic matter (OM) and total nitrogen (TN) content, whereas soilsS3 and S4 from the long-term exposed area had a higher fraction of sand with lower OM and TN.All four target EDCs could achieve an adsorption equilibrium within 24 h, and the kinetics of theadsorption/desorption fitted the pseudo-second-order model excellently. The adsorption/desorptionisotherms of the EDCs were better described by the Freundlich equation. The adsorption capacitydecreased, as 17α-ethynylestradiol (EE2) > 17β-estradiol (E2) > estrone (E1) > bisphenol A (BPA),in each tested soil. S1 and S2 exhibited a greater capacity but a lower degree of nonlinearity toadsorb the target EDCs than S3 and S4. The values of the Gibbs free energy suggested that theEDCs adsorption in the tested soils was dominated by unstable physical adsorption. The desorptionhysteresis of E1, E2, and EE2 were stronger in S1 and S2, whereas the BPA exhibited weak or almostno hysteresis in all of the tested soils. The substantial water-level fluctuation imposed on the TGRwould have a continuous influence on the EDCs adsorption/desorption by altering the soil properties.Thus, long-term monitoring and further research of EDCs in this region are urgent.
Keywords: adsorption; desorption; soil; endocrine-disrupting chemicals; Three Gorges Reservoir
1. Introduction
Endocrine disrupting compounds (EDCs), which could mostly influence the endocrine systemthrough mimicking or disrupting the functions of hormones, have drawn considerable social andscientific concern in recent years [1]. Studies suggest that exposure to EDCs is associated with malefish feminization, reproductive abnormalities, obesity, autism, cancer, cardiovascular risk, and otherneurobehavioral deficits [2,3]. What deserves greater attention is its wide distribution around the
Sustainability 2018, 10, 2531; doi:10.3390/su10072531 www.mdpi.com/journal/sustainability
Sustainability 2018, 10, 2531 2 of 15
world, including wastewater, surface water and sediment, groundwater, drinking water, indoor andoutdoor air, soils, and foods [4–7]. Estrone (E1) and 17β-estradiol (E2), which are the major metabolitesof the female sex hormone; 17α-ethynylestradiol (EE2), which is the ovulation-inhibiting synthetichormone; and bisphenol A (BPA), which is the monomer used in the manufacture of epoxy resins andpolycarbonate plastics, are examples of important environmental EDCs because of their high potenciesand discharge.
E1, E2, EE2, and BPA are generally hydrophobic (low solubility and high hydrophobicity–lipophilicity);thus, they can easily accumulate in soil and sediment, and their fate and bioavailability mainly dependon interactions at solid–water interfaces [8]. Therefore, the water-level fluctuation zone (WLFZ) is aneffective sink for EDCs because of the complicated material exchange and transformation processesbetween terrestrial and aquatic environments. With the operation of the Three Gorges Reservoir(TGR), a unique WLFZ, which has been created with a total area of 349 km2 and annual fluctuationof up to 30 m, has received considerable attention [9]. Besides the economic importance of the TGR,there are also widespread environmental concerns. Thus far, numerous research works on the WLFZof the TGR have been conducted, mainly in terms of the loss of biodiversity and vegetation [10];the background value and migration of heavy metals [11]; the dynamics of soil nitrogen, phosphorus,and sulfur [12,13]; and greenhouse gas emissions [14]. However, research on the distribution andmigration of EDCs in the WLFZ of the TGR is lacking. Limited studies have prompted the existence ofEDCs in the overlying water, soil, and sediment of the TGR [15–17]. Although the EDCs occur at lowtrace-level concentrations, such low concentrations may lead to a direct or indirect hazard to humans.The hydrological alternation between wet and dry environments implies a strong interaction betweenthe WLFZ soil EDCs and aquatic surface water EDCs. Nevertheless, few studies have reported on theadsorption/desorption of EDCs in the WLFZ, and the effect of the WLFZ on the fate and ecologicalsafety of EDCs in the TGR are poorly understood. The WLFZ plays a significant role in reducingthe bioavailability and toxicity of many contaminations by soil buffering and filtration [18]. On theother hand, the desorption of the adsorbed EDCs from the soil can increase the bioavailability of thechemicals, thereby causing hazards to the environment and human health. Therefore, the researchon EDC adsorption and desorption in the WLFZ are particularly important for the assessment andcontrol of the health risk of EDCs in the TGR. Meanwhile, as water transfer between regions has beenwidely used to mitigate the crisis of water resource shortage, lots of artificial WLFZ were created inmany countries. The adsorption/desorption behavior of the EDCs in the WLFZ was also essential fordetermining the fate of EDCs and quantifying the risk of contamination in these regions.
Thus far, the adsorption/desorption of EDCs in soil has been widely studied, and thecharacteristics of EDC behavior varies considerably in different cases [19–22]. According to theseexperimental studies, soil properties, including the particle size, specific surface area, cation exchangecapacity, minerals, and organic matters (OM), all affect the adsorption/desorption of EDCs. Particularly,soil OM is one of the most important factors that affect their adsorption/desorption properties, such asthe adsorption capacity and nonlinearity and desorption hysteresis. As the cohesion zone betweenwater and land areas, frequent interactions at soil–water interfaces occur in the WLFZ of the TGRalong with the water-level fluctuation pattern; thus, the adsorption and desorption of EDCs in theWLFZ may have different characteristics compared with those found in previous studies. However,very little is known about the adsorption/desorption of EDCs in soils of the WLFZ, as well asthe influences of water-level fluctuation on these processes. The impoundment and dischargingof the Three Gorges Dam have profound effects on the WLFZ, including inundation and drying,erosion and sedimentation processes, growth and death of plants, and redistribution of sediment,thereby ultimately changing the physical and chemical soil properties in the WLFZ [23] and furtheraffecting the EDC adsorption/desorption and bioavailability. Recent studies have suggested thatthe concentrations of hydrophobic organic contaminants (HOCs), for example, polycyclic aromatichydrocarbons in natural waters, increase when soils or sediments undergo dry–wet cycles [24]. Thus,water-level fluctuation patterns will have a continuous influence on the WLFZ, making the absorption
Sustainability 2018, 10, 2531 3 of 15
and desorption behaviors of the EDCs in this region special and complicated, which will eventuallyinfluence the fate and transport of EDCs.
Considering the absence of data on the adsorption/desorption of EDCs in the WLFZ, we selectedsoils collected from different elevation gradients of a typical WLFZ of TGR as the object of this study.The present study aims to characterize periodically submerged soil samples of the WLFZ of TGR andto investigate the adsorption/desorption behaviors of E1, E2, EE2, and BPA as representatives of EDCsin the tested soils subjected to different drying and wetting cycles. This study is a further step inunderstanding the migration of EDCs in the WLFZ of TGR.
2. Materials and Methods
2.1. Chemicals
The standards of E1, E2, EE2, and BPA were obtained from J&K Scientific (J&K ScientificLtd., Peking, China). HPLC grade methanol (MeOH) and acetonitrile were purchased from Fisher(Fisher Scientific Ltd., Waltham, MA, USA). Ultra-pure water (resistance = 18.2 Ω) was produced witha Milli-Q unit (Diect-Q5 UV, Millipore, Billerica, MA, USA). Stock solutions (0.5 g/L) of individualEDCs were prepared in MeOH and stored at −20 C in the dark. The stock solutions were dilutedusing MeOH as a solvent to obtain standard curve with different concentrations before use.
2.2. Sampling Site and Soil Samples
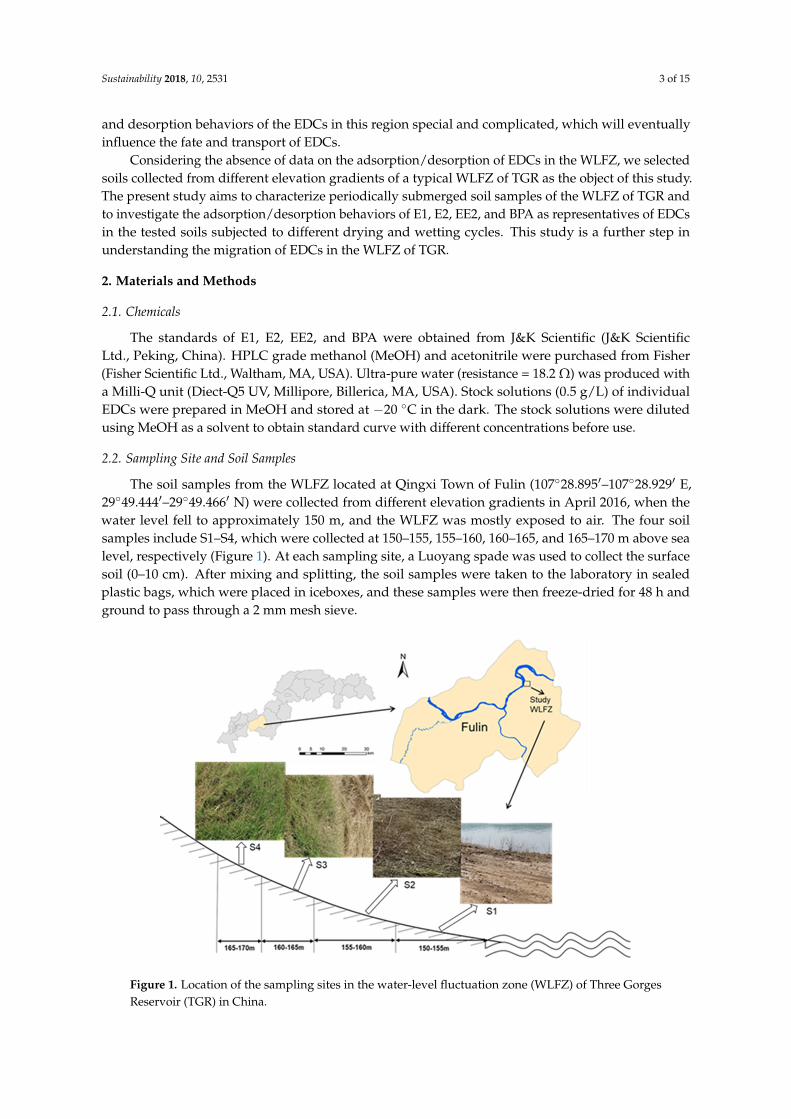
The soil samples from the WLFZ located at Qingxi Town of Fulin (10728.895′–10728.929′ E,2949.444′–2949.466′ N) were collected from different elevation gradients in April 2016, when thewater level fell to approximately 150 m, and the WLFZ was mostly exposed to air. The four soilsamples include S1–S4, which were collected at 150–155, 155–160, 160–165, and 165–170 m above sealevel, respectively (Figure 1). At each sampling site, a Luoyang spade was used to collect the surfacesoil (0–10 cm). After mixing and splitting, the soil samples were taken to the laboratory in sealedplastic bags, which were placed in iceboxes, and these samples were then freeze-dried for 48 h andground to pass through a 2 mm mesh sieve.
Sustainability 2018, 10, x FOR PEER REVIEW 3 of 15
when soils or sediments undergo dry–wet cycles [24]. Thus, water-level fluctuation patterns will have a continuous influence on the WLFZ, making the absorption and desorption behaviors of the EDCs in this region special and complicated, which will eventually influence the fate and transport of EDCs.
Considering the absence of data on the adsorption/desorption of EDCs in the WLFZ, we selected soils collected from different elevation gradients of a typical WLFZ of TGR as the object of this study. The present study aims to characterize periodically submerged soil samples of the WLFZ of TGR and to investigate the adsorption/desorption behaviors of E1, E2, EE2, and BPA as representatives of EDCs in the tested soils subjected to different drying and wetting cycles. This study is a further step in understanding the migration of EDCs in the WLFZ of TGR.
2. Materials and Methods
2.1. Chemicals
The standards of E1, E2, EE2, and BPA were obtained from J&K Scientific (J&K Scientific Ltd., Peking, China). HPLC grade methanol (MeOH) and acetonitrile were purchased from Fisher (Fisher Scientific Ltd., Waltham, MA, USA). Ultra-pure water (resistance = 18.2 Ω) was produced with a Milli-Q unit (Diect-Q5 UV, Millipore, Billerica, MA, USA). Stock solutions (0.5 g/L) of individual EDCs were prepared in MeOH and stored at −20 °C in the dark. The stock solutions were diluted using MeOH as a solvent to obtain standard curve with different concentrations before use.
2.2. Sampling Site and Soil Samples
The soil samples from the WLFZ located at Qingxi Town of Fulin (107°28.895′–107°28.929′ E, 29°49.444′–29°49.466′ N) were collected from different elevation gradients in April 2016, when the water level fell to approximately 150 m, and the WLFZ was mostly exposed to air. The four soil samples include S1–S4, which were collected at 150–155, 155–160, 160–165, and 165–170 m above sea level, respectively (Figure 1). At each sampling site, a Luoyang spade was used to collect the surface soil (0–10 cm). After mixing and splitting, the soil samples were taken to the laboratory in sealed plastic bags, which were placed in iceboxes, and these samples were then freeze-dried for 48 h and ground to pass through a 2 mm mesh sieve.
Figure 1. Location of the sampling sites in the water-level fluctuation zone (WLFZ) of Three Gorges Reservoir (TGR) in China. Figure 1. Location of the sampling sites in the water-level fluctuation zone (WLFZ) of Three GorgesReservoir (TGR) in China.
Sustainability 2018, 10, 2531 4 of 15
The pH of the soil samples was measured by an in situ soil pH meter (Veinasa-PH, Veinasa,Mianyang, China) during the collecting processes. The total nitrogen (TN) and total organic carbon(TOC) were measured using the Kjeldahl method and potassium dichromate-external heating method,respectively. The grain-size distribution of the soil samples was measured by a laser diffractionparticle size analyzer (SALD-3101, SHIMADZU, Kyoto, Japan). The Fourier transform infrared spectra(FTIR) of the soils were obtained using a FT-IR Spectrometer (PerkinElmer Spectrum RX, PerkinElmer,Waltham, MA, USA).
2.3. Adsorption and Desorption Experiments
All of the adsorption/desorption kinetics and isotherms were executed in glass vials. Accordingto the results from the preliminary experiments, the soil/solution ratios were set to be 1:16. The EDCaqueous solutions of the different concentrations were obtained by diluting the stock solution with abackground solution, which contained 200 mg/L NaN3 as bioinhibitor and 0.01 M CaCl2 in ultra-purewater, to maintain a constant ionic strength. The MeOH content in the solution was controlled under0.1% during dilution to minimize the co-solvent effect.
The adsorption kinetics was conducted by adding the EDC solution with an initial concentrationof 2.0 mg/L into the vials with soils, according to the previous soil/solution ratio. Thereafter, all ofthe vials were immediately sealed and then shaken in the dark at 120 r/min and 25 C for 0.5, 1, 2, 4,8, 12, 16, 24, 48, and 72 h. The suspensions were then centrifuged at 5000 r/min for 5 min to obtainthe supernatants.
All of the adsorption isotherms were obtained in single-solute systems using batch equilibration at25 C. The initial concentrations were in the range of 0.5–5.0 mg/L for E1, E2, and EE2, and 0.5–40 mg/Lfor BPA. On the basis of the results of the adsorption kinetics, the vials for obtaining the adsorptionisotherms were shaken for 2 d, and the suspensions were then centrifuged at 5000 r/min for 5 min toobtain the supernatants.
After the adsorption experiments, the desorption experiments were immediately conductedby replacing the supernatant with an EDC-free background solution. The vials for the desorptionisotherms were agitated (150 r/min) at 25 C for 2 day and then centrifuged at 5000 r/min for 5 min.Sampling times of 2, 5, 12, 16, 24, 48, and 72 h were used to analyze the desorption kinetics.
After centrifuge, the supernatants were filtered through 0.45 µm syringe filters and thenmeasured by an HPLC (SHIMADZU LC-2010C) with a C18 column for separation, as well as aUV spectrophotometry for detection and quantification. The operating conditions were as follows:45/55 (v/v) mobile phase of methanol/water, 0.7 mL/min flow rate, 35 C oven temperature, 10 µLinjection volume, and 205 nm detector wavelength. The retention time for BPA, E2, EE2, and E1 were9.2, 10.2, 13.2, and 14.8 min, respectively. All of the adsorption and desorption data points were run induplicate or more, and the reference samples were set without soil.
2.4. Data Analysis
The amount of EDCs adsorbed in the soil at different times (Qt) and under equilibrium conditions(Qe) were calculated using Equations (1) and (2), respectively.
Qe =(C0 −Ct)×V
m, (1)
Qe =(C0 −Ce)×V
m, (2)
where Qt (mg/kg) and Qe (mg/kg) are the amount of EDC adsorbed at time t (h) and under theequilibrium conditions, respectively; C0 (mg/L) and Ce (mg/L) are the initial and equilibrium aqueousconcentrations, respectively; Ct (mg/L) is the liquid-phase concentration of EDC at time t; V (mL) isthe solution volume; and m (g) is the mass of soil in the vials.
Sustainability 2018, 10, 2531 5 of 15
The pseudo-first-order model (Equation (3)), pseudo-second-order model (Equation (4)),and Elovich model (Equation (5)) were used to stimulate the adsorption kinetics.
Qt = Qe
(1− e−K1t
), (3)
tQt
=1
K2Q2e+
tQe
, (4)
Qt = a + blnt, (5)
where Qt (mg/kg) and Qe (mg/kg) are the amount of EDC adsorbed at time t (h) and under theequilibrium conditions, respectively; k1 (1/h) is the pseudo-first-order model rate constant for theadsorption; k2 (kg/(mg·h)) is the pseudo-second-order model rate constant for adsorption; and a andb are the Elovich model constants.
The isotherm data of the adsorption and desorption were arranged to fit for typicaladsorption models, including the linear partition model, Langmuir model, and Freundlich model(Equations (6)–(8)).
Qe = KdCe, (6)
Ce
Qe=
1QmKL
+Ce
Qm, (7)
Qe = KFCen, (8)
where Ce (mg/L) and Qe (mg/kg) are the equilibrium concentrations of EDC in the aqueous phaseand soil, respectively; Kd is the partition coefficient in the linear model; KF ((mg/kg)/(mg/L)n) and nare the affinity coefficient and isotherm linearity index in the Freundlich equation, respectively; and KL
(L/mg) and Qm (mg/kg) are the equilibration parameter and the maximum adsorption capacity forthe Langmuir model, respectively.
The hysteresis index (HI) was calculated for the adsorption/desorption isotherms, shown as follows:
HI =ndesnads
, (9)
where ndes and nads are the Freundlich exponents for the desorption and adsorption isotherms,respectively.
Based on the Gibbs equation, the standard molar Gibbs free energy change for the adsorptionprocesses was calculated as Equation (10).
∆G = −RT lnKF, (10)
where ∆G (kJ/mol) is the standard Gibbs free energy, KF((mg/kg)/(mg/L)n) is the Freundlich constantdefined by the Freundlich model (Equation (8)), T (K) is the absolute temperature, and R is the gasconstant (8.314 J/(mol·K)).
3. Results and Discussion
3.1. Characterization of Soils
The soils of the studied WLFZ are the purple soils developed from purple gritstone, which areparticularly susceptible to erosion and weathering [25]. The physiochemical properties of the soilsamples from different elevation gradients of the studied WLFZ are analyzed and presented in Table 1.The results showed that the soil properties varied among the samples with different flooding–dryingconditions. The pH values, which varied from 7.79 to 8.30, were all alkalescent. The silt fraction wasthe major fraction in the soils, which accounted for 57.29–79.68% of the total. The clay fraction was theminor fraction, accounting for 15.33–19.79% of the total, whereas the sand fraction varied apparently
Sustainability 2018, 10, 2531 6 of 15
from 0.53% for S1 to 26.93% for S4. In total, the soils from the lower altitudes held more clay fractions,whereas the soils from the higher altitudes showed coarser fractions. The sedimentation of minorparticles increased the clay fraction of soils during the long-term impoundment, whereas a loss offine particles as a result of water and wind erosion would cause a decrease in the clay fraction uponexposure to air [26]. The significant variation of the particle size distribution among the four testedsoils may be related to the difference in alternation of wetting and drying, along with the elevation.
Table 1. Physical and chemical characteristics of the tested soils from the water-level fluctuation zone(WLFZ). TOC—total organic carbon; (TOC) TN—total nitrogen (TN).
PropertySoil Sample
S1 S2 S3 S4
Elevation gradient/m 150–155 155–160 160–165 165–170Average slope 15 20 25 30
Vegetation none Cynodon dactylon Cynodon dactylon Cynodon dactylon, XanthiumpH 7.79 7.60 8.13 8.30
TOC/(g/kg) 18.50 16.84 9.33 8.26TN/(g/kg) 2.32 2.05 1.09 0.86
Sand (≥0.05 mm)/% 0.53 4.59 25.01 26.93Silt (0.002–0.05 mm)/% 79.68 78.01 59.66 57.29Clay (≤0.002 mm)/% 19.79 17.40 15.33 15.78
The variability of the TOC and TN concentrations among the four tested soils was high, and theTOC and TN followed similar change trends, that is, S1 > S2 > S3 > S4. Studies have shown that thelong-term waterlogged condition is beneficial to the accumulation of OM, whereas the frequentlydry and wet alternating can accelerate the degradation of soil OM, mainly via continuous microbialbiodegradation [23,27]. Meanwhile, the fine soil particles usually have higher OM content than thecoarse particles; thus, the loss of fine particles during long-term exposure also contributes to theOM loss in soils. Moreover, water-level fluctuation not only stimulates the soil OM loss, but it alsoconsiderably promotes the soil nitrogen attenuation due to improved denitrification [28]. In this study,the TOC and TN content of the soils from the frequent flooding areas (i.e., S1 and S2) were found to behigher than the contrasting long-term exposed areas (i.e., S3 and S4). Furthermore, the TOC/TN inthe soils could reflect the source of OM as the TOC/TN of advanced plants, aquatic life, zooplanktonand phytoplankton, and algae were 14–23, 2.8–3.4, 6–13, and 5–14, respectively [29]. The values ofTOC/TN in the tested soils were all lower than 10, indicating that the OM in the tested soils mainlycame from the biological settlement in the overlying water during the flood season.
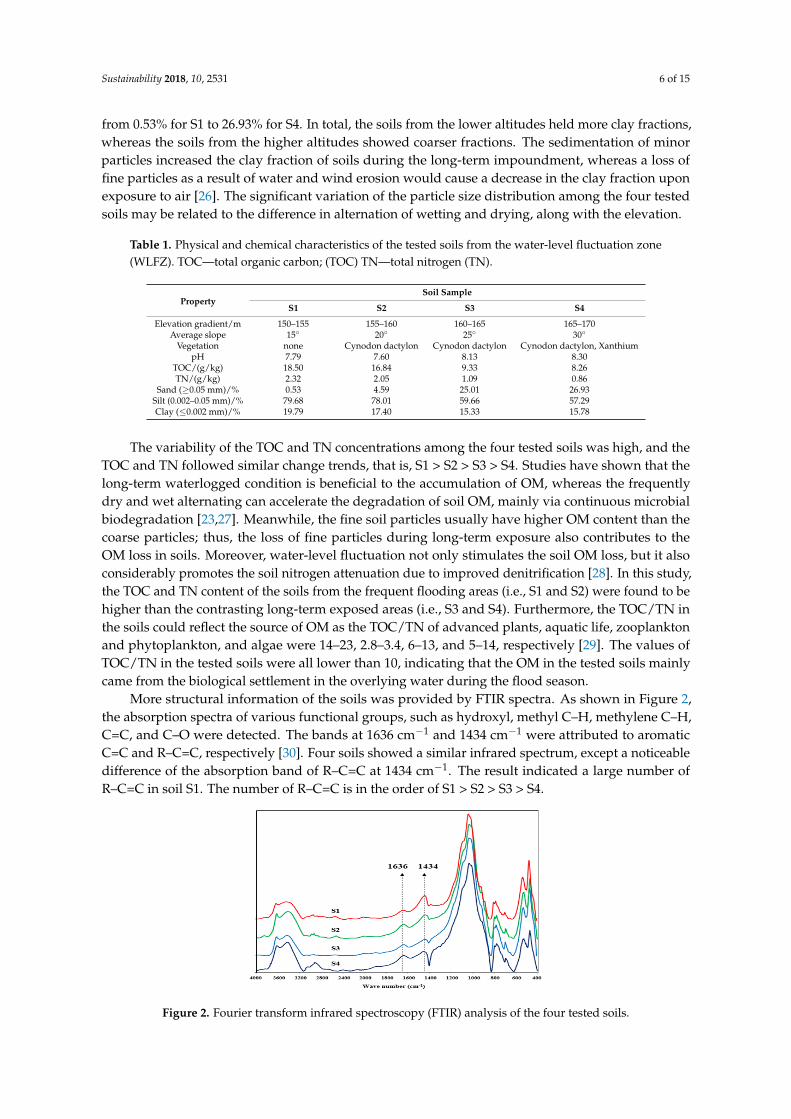
More structural information of the soils was provided by FTIR spectra. As shown in Figure 2,the absorption spectra of various functional groups, such as hydroxyl, methyl C–H, methylene C–H,C=C, and C–O were detected. The bands at 1636 cm−1 and 1434 cm−1 were attributed to aromaticC=C and R–C=C, respectively [30]. Four soils showed a similar infrared spectrum, except a noticeabledifference of the absorption band of R–C=C at 1434 cm−1. The result indicated a large number ofR–C=C in soil S1. The number of R–C=C is in the order of S1 > S2 > S3 > S4.
Sustainability 2018, 10, x FOR PEER REVIEW 6 of 15
The variability of the TOC and TN concentrations among the four tested soils was high, and the TOC and TN followed similar change trends, that is, S1 > S2 > S3 > S4. Studies have shown that the long-term waterlogged condition is beneficial to the accumulation of OM, whereas the frequently dry and wet alternating can accelerate the degradation of soil OM, mainly via continuous microbial biodegradation [23,27]. Meanwhile, the fine soil particles usually have higher OM content than the coarse particles; thus, the loss of fine particles during long-term exposure also contributes to the OM loss in soils. Moreover, water-level fluctuation not only stimulates the soil OM loss, but it also considerably promotes the soil nitrogen attenuation due to improved denitrification [28]. In this study, the TOC and TN content of the soils from the frequent flooding areas (i.e., S1 and S2) were found to be higher than the contrasting long-term exposed areas (i.e., S3 and S4). Furthermore, the TOC/TN in the soils could reflect the source of OM as the TOC/TN of advanced plants, aquatic life, zooplankton and phytoplankton, and algae were 14–23, 2.8–3.4, 6–13, and 5–14, respectively [29]. The values of TOC/TN in the tested soils were all lower than 10, indicating that the OM in the tested soils mainly came from the biological settlement in the overlying water during the flood season.
Table 1. Physical and chemical characteristics of the tested soils from the water-level fluctuation zone (WLFZ). TOC—total organic carbon; (TOC) TN—total nitrogen (TN).
Property Soil Sample
S1 S2 S3 S4 Elevation gradient/m 150–155 155–160 160–165 165–170
Average slope 15° 20° 25° 30° Vegetation none Cynodon dactylon Cynodon dactylon Cynodon dactylon, Xanthium
pH 7.79 7.60 8.13 8.30 TOC/(g/kg) 18.50 16.84 9.33 8.26 TN/(g/kg) 2.32 2.05 1.09 0.86
Sand (≥0.05 mm)/% 0.53 4.59 25.01 26.93 Silt (0.002–0.05 mm)/% 79.68 78.01 59.66 57.29
Clay (≤0.002 mm)/% 19.79 17.40 15.33 15.78
More structural information of the soils was provided by FTIR spectra. As shown in Figure 2, the absorption spectra of various functional groups, such as hydroxyl, methyl C–H, methylene C–H, C=C, and C–O were detected. The bands at 1636 cm−1 and 1434 cm−1 were attributed to aromatic C=C and R–C=C, respectively [30]. Four soils showed a similar infrared spectrum, except a noticeable difference of the absorption band of R–C=C at 1434 cm−1. The result indicated a large number of R–C=C in soil S1. The number of R–C=C is in the order of S1 > S2 > S3 > S4.
Figure 2. Fourier transform infrared spectroscopy (FTIR) analysis of the four tested soils.
3.2. Adsorption and Desorption Kinetics Figure 2. Fourier transform infrared spectroscopy (FTIR) analysis of the four tested soils.
Sustainability 2018, 10, 2531 7 of 15
3.2. Adsorption and Desorption Kinetics
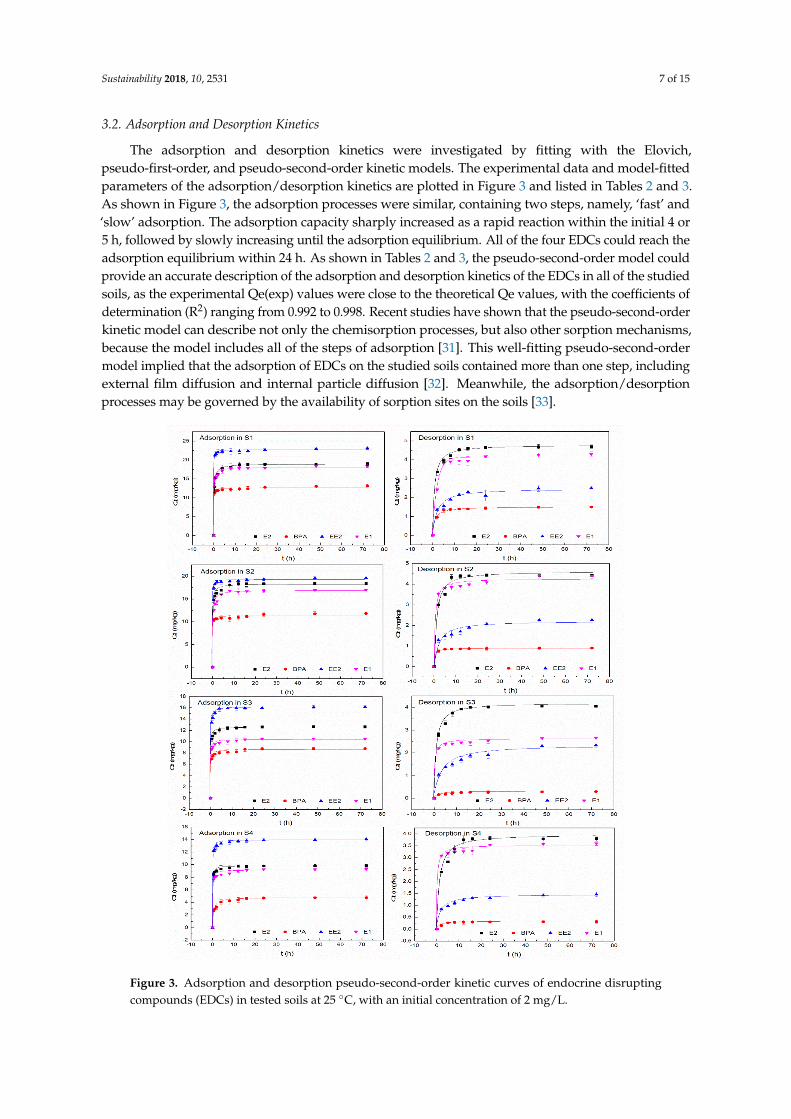
The adsorption and desorption kinetics were investigated by fitting with the Elovich,pseudo-first-order, and pseudo-second-order kinetic models. The experimental data and model-fittedparameters of the adsorption/desorption kinetics are plotted in Figure 3 and listed in Tables 2 and 3.As shown in Figure 3, the adsorption processes were similar, containing two steps, namely, ‘fast’ and‘slow’ adsorption. The adsorption capacity sharply increased as a rapid reaction within the initial 4 or5 h, followed by slowly increasing until the adsorption equilibrium. All of the four EDCs could reach theadsorption equilibrium within 24 h. As shown in Tables 2 and 3, the pseudo-second-order model couldprovide an accurate description of the adsorption and desorption kinetics of the EDCs in all of the studiedsoils, as the experimental Qe(exp) values were close to the theoretical Qe values, with the coefficients ofdetermination (R2) ranging from 0.992 to 0.998. Recent studies have shown that the pseudo-second-orderkinetic model can describe not only the chemisorption processes, but also other sorption mechanisms,because the model includes all of the steps of adsorption [31]. This well-fitting pseudo-second-ordermodel implied that the adsorption of EDCs on the studied soils contained more than one step, includingexternal film diffusion and internal particle diffusion [32]. Meanwhile, the adsorption/desorptionprocesses may be governed by the availability of sorption sites on the soils [33].
Sustainability 2018, 10, x FOR PEER REVIEW 7 of 15
The adsorption and desorption kinetics were investigated by fitting with the Elovich, pseudo-first-order, and pseudo-second-order kinetic models. The experimental data and model-fitted parameters of the adsorption/desorption kinetics are plotted in Figure 3 and listed in Tables 2 and 3. As shown in Figure 3, the adsorption processes were similar, containing two steps, namely, ‘fast’ and ‘slow’ adsorption. The adsorption capacity sharply increased as a rapid reaction within the initial 4 or 5 h, followed by slowly increasing until the adsorption equilibrium. All of the four EDCs could reach the adsorption equilibrium within 24 h. As shown in Tables 2 and 3, the pseudo-second-order model could provide an accurate description of the adsorption and desorption kinetics of the EDCs in all of the studied soils, as the experimental Qe(exp) values were close to the theoretical Qe values, with the coefficients of determination (R2) ranging from 0.992 to 0.998. Recent studies have shown that the pseudo-second-order kinetic model can describe not only the chemisorption processes, but also other sorption mechanisms, because the model includes all of the steps of adsorption [31]. This well-fitting pseudo-second-order model implied that the adsorption of EDCs on the studied soils contained more than one step, including external film diffusion and internal particle diffusion [32]. Meanwhile, the adsorption/desorption processes may be governed by the availability of sorption sites on the soils [33].
Figure 3. Adsorption and desorption pseudo-second-order kinetic curves of endocrine disrupting compounds (EDCs) in tested soils at 25 °C, with an initial concentration of 2 mg/L.
Figure 3. Adsorption and desorption pseudo-second-order kinetic curves of endocrine disruptingcompounds (EDCs) in tested soils at 25 C, with an initial concentration of 2 mg/L.
Sustainability 2018, 10, 2531 8 of 15
Table 2. Constants and coefficients of determination of adsorption kinetics models. EDC—endocrinedisrupting compounds; EE2—17α-ethynylestradiol; E2—17β-estradiol (E2); E1—estrone;BPA—bisphenol A; Qe—equilibrium conditions, K—absolute temperature; R—gas constant.
EDCSoil
SampleQe (exp)mg/kg
Elovich Equation Pseudo-First-Order Pseudo-Second-Order
a b R2 K11/h
Qemg/kg R2 K2
kg/(mg·h)Qe
mg/kg R2
EE2
S1 23.10 21.6 0.339 0.947 5.64 22.42 0.996 0.180 23.09 0.997S2 19.60 18.1 0.377 0.911 4.80 19.07 0.995 0.238 19.65 0.996S3 16.16 14.4 0.513 0.792 3.46 15.79 0.989 0.411 16.18 0.998S4 14.08 12.6 0.388 0.932 4.22 13.60 0.987 0.321 14.08 0.998
E2
S1 18.90 15.2 1.126 0.828 2.13 18.33 0.977 0.224 18.97 0.998S2 18.40 15.8 0.781 0.884 3.16 17.78 0.973 0.288 18.45 0.997S3 12.64 11.1 0.449 0.889 3.49 12.26 0.982 0.438 12.67 0.999S4 9.84 8.84 0.285 0.920 4.07 9.55 0.987 0.571 9.86 0.997
E1
S1 18.36 15.7 0.725 0.928 3.38 17.53 0.975 0.164 18.42 0.994S2 16.99 14.0 0.883 0.853 2.52 16.35 0.971 0.215 17.04 0.996S3 10.50 9.17 0.378 0.942 3.61 10.12 0.980 0.398 10.55 0.997S4 9.30 7.96 0.357 0.955 3.63 8.84 0.974 0.316 9.34 0.994
BPA
S1 13.20 11.6 0.334 0.941 4.68 12.44 0.986 0.152 13.21 0.993S2 11.80 10.4 0.304 0.901 5.09 11.13 0.982 0.177 11.85 0.993S3 8.80 7.40 0.376 0.942 3.20 8.35 0.974 0.282 8.85 0.995S4 4.77 3.10 0.469 0.925 1.14 4.45 0.917 0.268 4.82 0.998
Table 3. Constants and coefficients of determination of desorption kinetics models.
EDCSoil
SampleQe (exp)mg/kg
Elovich Equation Pseudo-First-Order Pseudo-Second-Order
a b R2 K11/h
Qemg/kg R2 K2
kg/(mg·h)Qe
mg/kg R2
EE2
S1 2.49 1.16 0.334 0.887 0.289 2.29 0.928 0.504 2.52 0.993S2 2.26 1.00 0.308 0.960 0.298 2.02 0.874 0.416 2.34 0.995S3 2.33 0.77 0.377 0.985 0.194 2.10 0.906 0.306 2.40 0.988S4 1.46 0.72 0.183 0.960 0.334 1.32 0.931 0.891 1.48 0.997
E2
S1 4.70 3.37 0.369 0.804 0.602 4.53 0.981 0.968 4.74 0.998S2 4.42 3.10 0.383 0.628 0.491 4.36 0.979 1.487 4.45 0.992S3 4.04 2.84 0.342 0.746 0.535 3.94 0.980 1.274 4.08 0.997S4 3.79 2.38 0.402 0.726 0.397 3.72 0.968 1.085 3.85 0.994
E1
S1 4.30 2.70 0.435 0.675 0.451 4.12 0.989 0.606 4.34 0.994S2 4.40 3.34 0.249 0.960 0.972 4.07 0.973 0.545 4.43 0.994S3 2.66 2.14 0.123 0.965 1.031 2.51 0.985 1.250 2.67 0.997S4 3.60 2.92 0.162 0.900 1.172 3.39 0.978 0.904 3.63 0.993
BPA
S1 1.50 1.03 0.127 0.689 0.537 1.43 0.992 2.008 1.51 0.998S2 0.90 0.76 0.035 0.819 0.997 0.87 0.996 6.975 0.90 0.998S3 0.30 0.15 0.037 0.915 0.321 0.27 0.938 4.292 0.30 0.998S4 0.31 0.18 0.036 0.659 0.381 0.30 0.995 9.602 0.31 0.998
According to the pseudo-second-order constants in Table 2, EE2 (0.180–0.411 kg/(mg·h)) andE2 (0.224–0.571 kg/(mg·h)) showed the higher K2, followed by E1 (0152–0.398 kg/(mg·h)), whereasBPA exhibited the lowest Qe (4.77–13.2 mg/kg) and K2 (0.152–0.282 kg/(mg·h)). The adsorption ofEE2, E2, and E1 in the four tested soils could reach the equilibrium within 10 h, and it continuedto increase slightly until ultimately reaching the equilibrium for the adsorption of BPA (Figure 3).The slower adsorption rate of the BPA compared with the other target EDCs may be related to itsweaker hydrophobicity and higher solubility in water. At the equilibrium, the adsorption rates ofthe tested soils for EE2, E2, E1, and BPA were 44.0–72.2%, 30.7–59.1%, 29.1–57.4%, and 14.9–41.2%,respectively. Meanwhile, the adsorbed Qe for each EDC followed the same order, S1 > S2 > S3 > S4,which was consistent with the order of the soil TOC content.
Among the four soils, the adsorption rate constant K2 of the target EDCs in S3 and S4 werenotably higher compared with the K2 values for S1 and S2. This phenomenon could be explained bythe difference in physical and chemical properties among the tested soils. Several mechanisms wereinvolved during the sorption process. The fast adsorption of organic compounds may be attributed tothe adsorption of organic compounds to mineral surfaces or partitioning into a ‘rubbery’ fraction of the
Sustainability 2018, 10, 2531 9 of 15
soil OM, whereas the slow adsorption could be related to the gradual diffusion of organic compoundsinto soil micropores or into highly cross-linked regions of the soil OM [34,35]. As previously discussed,S3 and S4 from long-term exposed areas had considerably coarser fractions and a lower OM content,which resulted in less micropores in the soils and, consequently, faster pore filling and diffusionof EDCs.
As shown in Figure 3, compared with the adsorption process, the desorption of the four EDCsneeded more time to reach equilibrium, and the trend of delay was apparent especially for EE2.Contrary to the adsorption process, the desorption in the tested soils was considerably easier for BPAto reach equilibrium than the other three EDCs, because the K2 values for the BPA desorption weremarkedly higher than the others (Table 3). Moreover, the amount of desorbed EDCs was less thanthe total amount of adsorbed EDCs, suggesting that some amount of EDC was tightly bound to thesoil and did not readily desorb. This phenomenon of desorption hysteresis is discussed further indesorption isotherms.
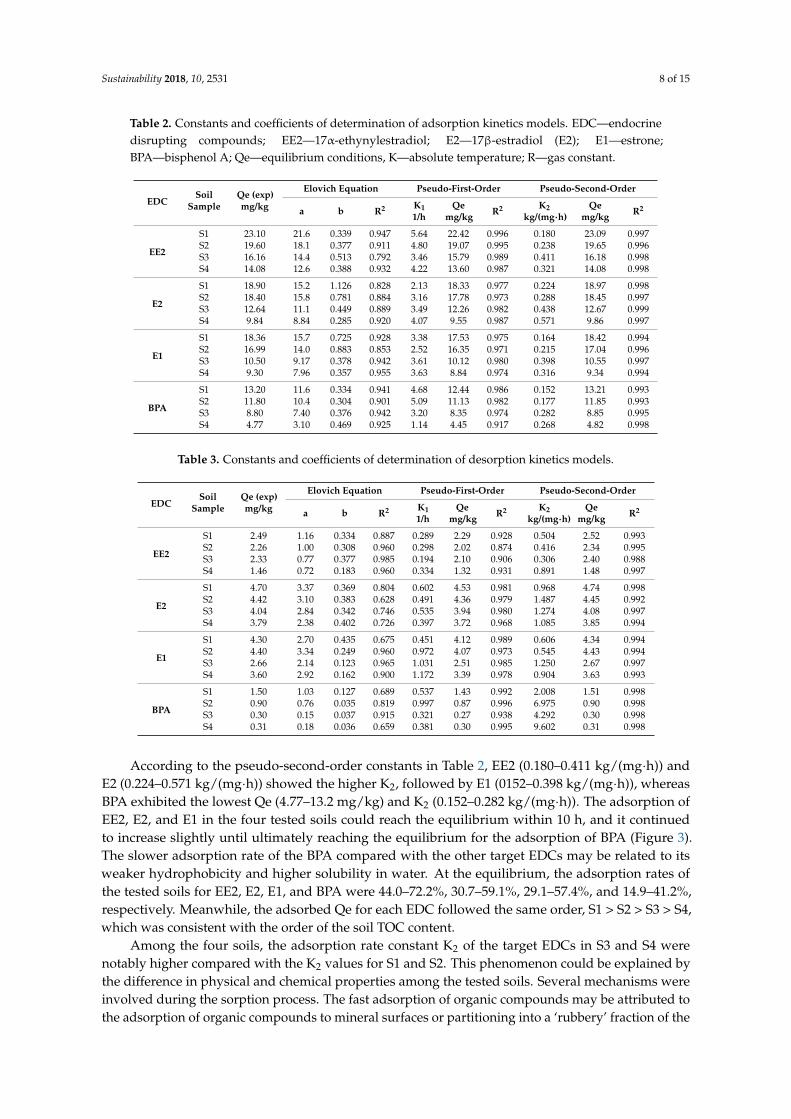
3.3. Adsorption Isotherms and Nonlinearity
The adsorption isotherms for the EDCs in the tested soils are presented in Figure 4, and theparameters of the model fittings are summarized in Table 4. According to the comparison amongthe R2 values, the isotherms of the EDC adsorption in the concentration range tested on the soilscould be better fitted by the Freundlich model, which assumes that EDC adsorption occurs on aheterogeneous surface with the possibility of adsorption being multi-layered [36]. For each studiedsoil, the four target EDCs exhibited the following trend of adsorption capacity (KF): EE2 > E2 > E1> BPA, which was consistent with the order of their hydrophobicity (KOW). Three intermolecularinteractions, including hydrophobic interaction, hydrogen bonding, and π–π bonding, are involved inEDC adsorption mechanisms [30]. In comparison with EE2, E2, and E1, BPA had a considerably lowerKOW and higher Sw value, which possibly caused its weak affinity with soil organics and its lowestamount of adsorption by the tested soils. In addition, E2 and EE2 had one more hydroxyl group thanE1, which could result in stronger hydrogen bonding and a corresponding higher KF.
Sustainability 2018, 10, x FOR PEER REVIEW 9 of 15
to the adsorption of organic compounds to mineral surfaces or partitioning into a ‘rubbery’ fraction of the soil OM, whereas the slow adsorption could be related to the gradual diffusion of organic compounds into soil micropores or into highly cross-linked regions of the soil OM [34,35]. As previously discussed, S3 and S4 from long-term exposed areas had considerably coarser fractions and a lower OM content, which resulted in less micropores in the soils and, consequently, faster pore filling and diffusion of EDCs.
As shown in Figure 3, compared with the adsorption process, the desorption of the four EDCs needed more time to reach equilibrium, and the trend of delay was apparent especially for EE2. Contrary to the adsorption process, the desorption in the tested soils was considerably easier for BPA to reach equilibrium than the other three EDCs, because the K2 values for the BPA desorption were markedly higher than the others (Table 3). Moreover, the amount of desorbed EDCs was less than the total amount of adsorbed EDCs, suggesting that some amount of EDC was tightly bound to the soil and did not readily desorb. This phenomenon of desorption hysteresis is discussed further in desorption isotherms.
3.3. Adsorption Isotherms and Nonlinearity
The adsorption isotherms for the EDCs in the tested soils are presented in Figure 4, and the parameters of the model fittings are summarized in Table 4. According to the comparison among the R2 values, the isotherms of the EDC adsorption in the concentration range tested on the soils could be better fitted by the Freundlich model, which assumes that EDC adsorption occurs on a heterogeneous surface with the possibility of adsorption being multi-layered [36]. For each studied soil, the four target EDCs exhibited the following trend of adsorption capacity (KF): EE2 > E2 > E1 > BPA, which was consistent with the order of their hydrophobicity (KOW). Three intermolecular interactions, including hydrophobic interaction, hydrogen bonding, and π–π bonding, are involved in EDC adsorption mechanisms [30]. In comparison with EE2, E2, and E1, BPA had a considerably lower KOW and higher Sw value, which possibly caused its weak affinity with soil organics and its lowest amount of adsorption by the tested soils. In addition, E2 and EE2 had one more hydroxyl group than E1, which could result in stronger hydrogen bonding and a corresponding higher KF.
Figure 4. Freundlich equation adsorption isotherms of target EDCs in tested soils (25 °C). Figure 4. Freundlich equation adsorption isotherms of target EDCs in tested soils (25 C).
Sustainability 2018, 10, 2531 10 of 15
Table 4. Parameters of model fitting of EDC adsorption in tested soils (25 C).
Sample EDCsLinear Model Langmuir Model Freundlich Model
KdL/kg R2 KL
L/kgQm
mg/kg R2 logKF nads R2 ∆GKJ/mol
S1
EE2 23.60 0.975 0.545 95.30 0.994 1.508 0.714 0.996 −8.603E2 23.71 0.999 0.120 217.4 0.995 1.374 0.976 0.997 −7.838E1 11.47 0.936 0.484 61.75 0.980 1.269 0.696 0.984 −7.239
BPA 3.54 0.979 0.036 215.2 0.991 1.061 0.672 0.998 −6.054
S2
EE2 19.45 0.993 0.224 136.6 0.994 1.391 0.774 0.998 −7.938E2 19.46 0.999 0.269 99.01 0.989 1.322 0.906 0.996 −7.542E1 10.56 0.960 0.380 63.94 0.986 1.222 0.696 0.992 −6.971
BPA 2.70 0.965 0.047 150.6 0.977 0.980 0.672 0.993 −5.603
S3
EE2 9.67 0.965 0.438 56.50 0.993 1.213 0.661 0.997 −6.910E2 10.28 0.995 0.079 151.5 0.998 1.036 0.953 0.999 −5.910E1 3.70 0.953 0.525 25.51 0.990 0.919 0.574 0.995 −5.243
BPA 1.43 0.954 0.053 80.90 0.985 0.811 0.603 0.995 −4.627
S4
EE2 7.09 0.970 0.358 48.11 0.989 1.083 0.678 0.996 −6.178E2 7.32 0.996 0.131 74.62 0.996 0.922 0.903 0.997 −5.262E1 3.22 0.963 0.451 23.49 0.971 0.846 0.588 0.993 −4.826
BPA 0.98 0.961 0.040 62.71 0.983 0.594 0.632 0.994 −3.389
As shown in Table 4, the Freundlich adsorption isotherms had a curvature index (n) that varied inthe range of 0.661–0.774, 0.574–0.696, and 0.603–0.672 for EE2, E1, and BPA, respectively, exhibiting theapparent adsorption nonlinearity in the soils where high-energy sites were occupied first, followedby adsorption at lower-energy sites [37]. This phenomenon may also suggest that the adsorption forEE2, E1, and BPA would become saturated when the aqueous concentration of these EDCs increased.By contrast, all of the values of the isotherm linearity index (n, 0.903–0.976) for E2 were close to 1,indicating that the absorption of E2 on the tested soils was nearly linear and the adsorption capacitycould continually increase with the aqueous concentration increasing.
A higher soil OM content usually results in a higher adsorption affinity [19]. In this study, the KF
for each target EDC was in the same order, that is, S1 > S2 > S3 > S4, which was consistent with the orderof the soil TOC content. This result was in general agreement with previous studies, and demonstratedagain that OM was one of the most important properties of soil that affect their sorption capacity.In addition, the smaller fractions of soil generally exhibited the stronger adsorption capacity forHOCs [38]. The high adsorption capacity of S1 and S2 was also relevant to their clay fractions.
Moreover, not only the abundance but also the sources and properties of the soil OM affect theadsorption behavior of EDCs, such as the adsorption nonlinearity [39]. According to the n values inTable 4, the adsorption of each target EDCs on S3 and S4 exhibited a lower nonlinearity coefficient,and thus a stronger nonlinearity compared with S1 and S2. Previous studies have suggested that thesorption on hard carbon, especially the black carbon (BC), is dominated by nonlinear adsorption witha high adsorption affinity but limited capacity, whereas the adsorption on the soft carbon follows apartition mechanism and exhibits linear adsorption [40]. The dry and wet alternating can acceleratethe degradation of soil OM; however, the water-level fluctuation condition has an advantageous rolein preventing BC decomposition, and the BC in the WLFZ contained high amounts of carbon andlow amounts of oxygen [41]. S3 and S4 had been exposed to air considerably longer than S1 and S2at the sampling time, because of the operation of the TGR. Accordingly, the OM in S3 and S4 hadbeen decayed to a further degree, with the BC remaining accumulated under the non-flood condition.The water-level fluctuation condition imposed on the TGR altered the soil organic decomposition andchanged the degree of aromaticity, C/N, and H/C ratios of the OM [39,41], thereby fundamentallyaffecting the adsorption behavior, including the adsorption nonlinearity, of the soil. The high degreesof OM decay while retaining BC in S3 and S4 may have a close relation to their high degree of EDCadsorption nonlinearity.
Sustainability 2018, 10, 2531 11 of 15
Meanwhile, the obtained values of ∆G (Table 4) were all negative and considerably less than40 kJ/mol. The EDC adsorption in the tested soils was dominated by unstable physical adsorption [42],with possible subsequent desorption back into the aquatic environment. Thus, the soil of the WLFZshould be considered as a long-term ‘source’, as well as a potential short-term ‘sink’ for EDCs.
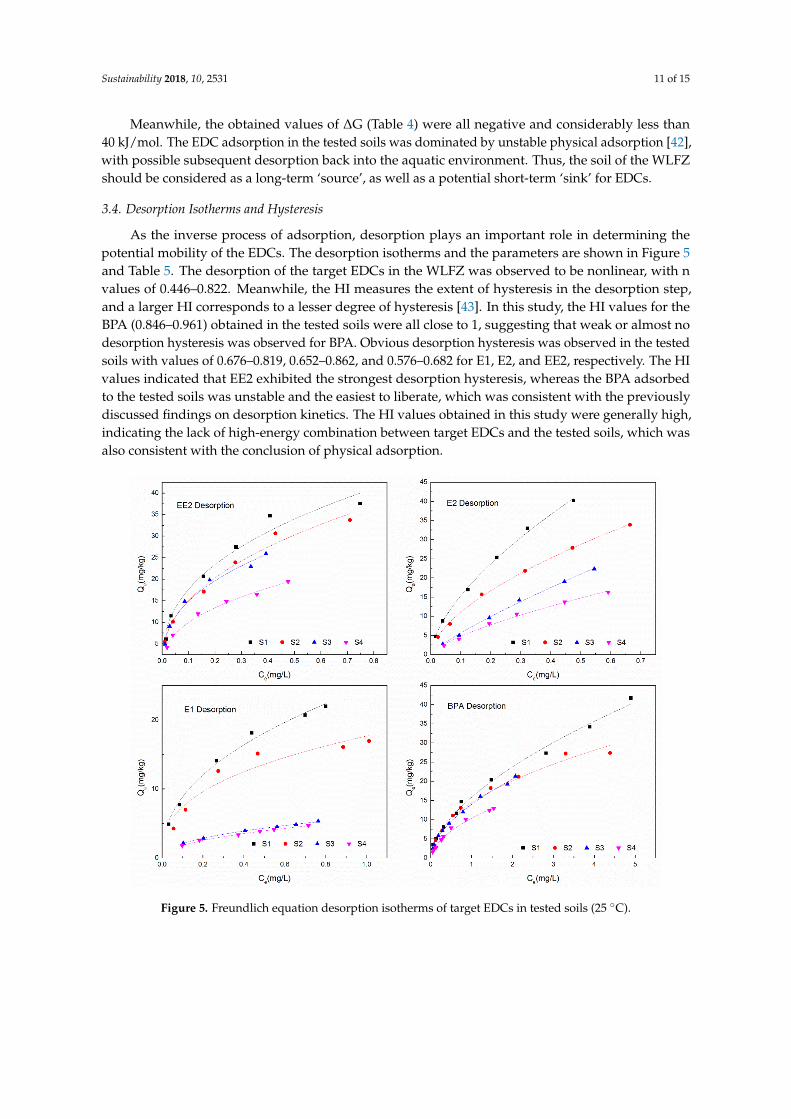
3.4. Desorption Isotherms and Hysteresis
As the inverse process of adsorption, desorption plays an important role in determining thepotential mobility of the EDCs. The desorption isotherms and the parameters are shown in Figure 5and Table 5. The desorption of the target EDCs in the WLFZ was observed to be nonlinear, with nvalues of 0.446–0.822. Meanwhile, the HI measures the extent of hysteresis in the desorption step,and a larger HI corresponds to a lesser degree of hysteresis [43]. In this study, the HI values for theBPA (0.846–0.961) obtained in the tested soils were all close to 1, suggesting that weak or almost nodesorption hysteresis was observed for BPA. Obvious desorption hysteresis was observed in the testedsoils with values of 0.676–0.819, 0.652–0.862, and 0.576–0.682 for E1, E2, and EE2, respectively. The HIvalues indicated that EE2 exhibited the strongest desorption hysteresis, whereas the BPA adsorbedto the tested soils was unstable and the easiest to liberate, which was consistent with the previouslydiscussed findings on desorption kinetics. The HI values obtained in this study were generally high,indicating the lack of high-energy combination between target EDCs and the tested soils, which wasalso consistent with the conclusion of physical adsorption.
Sustainability 2018, 10, x FOR PEER REVIEW 11 of 15
S4
EE2 7.09 0.970 0.358 48.11 0.989 1.083 0.678 0.996 −6.178 E2 7.32 0.996 0.131 74.62 0.996 0.922 0.903 0.997 −5.262 E1 3.22 0.963 0.451 23.49 0.971 0.846 0.588 0.993 −4.826
BPA 0.98 0.961 0.040 62.71 0.983 0.594 0.632 0.994 −3.389
3.4. Desorption Isotherms and Hysteresis
As the inverse process of adsorption, desorption plays an important role in determining the potential mobility of the EDCs. The desorption isotherms and the parameters are shown in Figure 5 and Table 5. The desorption of the target EDCs in the WLFZ was observed to be nonlinear, with n values of 0.446–0.822. Meanwhile, the HI measures the extent of hysteresis in the desorption step, and a larger HI corresponds to a lesser degree of hysteresis [43]. In this study, the HI values for the BPA (0.846–0.961) obtained in the tested soils were all close to 1, suggesting that weak or almost no desorption hysteresis was observed for BPA. Obvious desorption hysteresis was observed in the tested soils with values of 0.676–0.819, 0.652–0.862, and 0.576–0.682 for E1, E2, and EE2, respectively. The HI values indicated that EE2 exhibited the strongest desorption hysteresis, whereas the BPA adsorbed to the tested soils was unstable and the easiest to liberate, which was consistent with the previously discussed findings on desorption kinetics. The HI values obtained in this study were generally high, indicating the lack of high-energy combination between target EDCs and the tested soils, which was also consistent with the conclusion of physical adsorption.
Moreover, the HI values of the four EDCs were relatively lower in S1 and S2 compared with the values for the other two soils (Table 5). Pore deformation caused by the solute-diffusion through soil OM matrixes (especially in hard carbon) and porosities were suggested to be responsible for the hysteresis [44], which resulted in the pathway of desorption being different from the pathway of adsorption, and leading to entrapment of some sorbate during desorption. The difference in the degree of hysteresis among the tested soils may be attributed to the fact that S1 and S2 were of smaller particle sizes with more OM, whereas S3 and S4 were of higher fraction of sand and lower OM content.
Figure 5. Freundlich equation desorption isotherms of target EDCs in tested soils (25 °C). Figure 5. Freundlich equation desorption isotherms of target EDCs in tested soils (25 C).
Sustainability 2018, 10, 2531 12 of 15
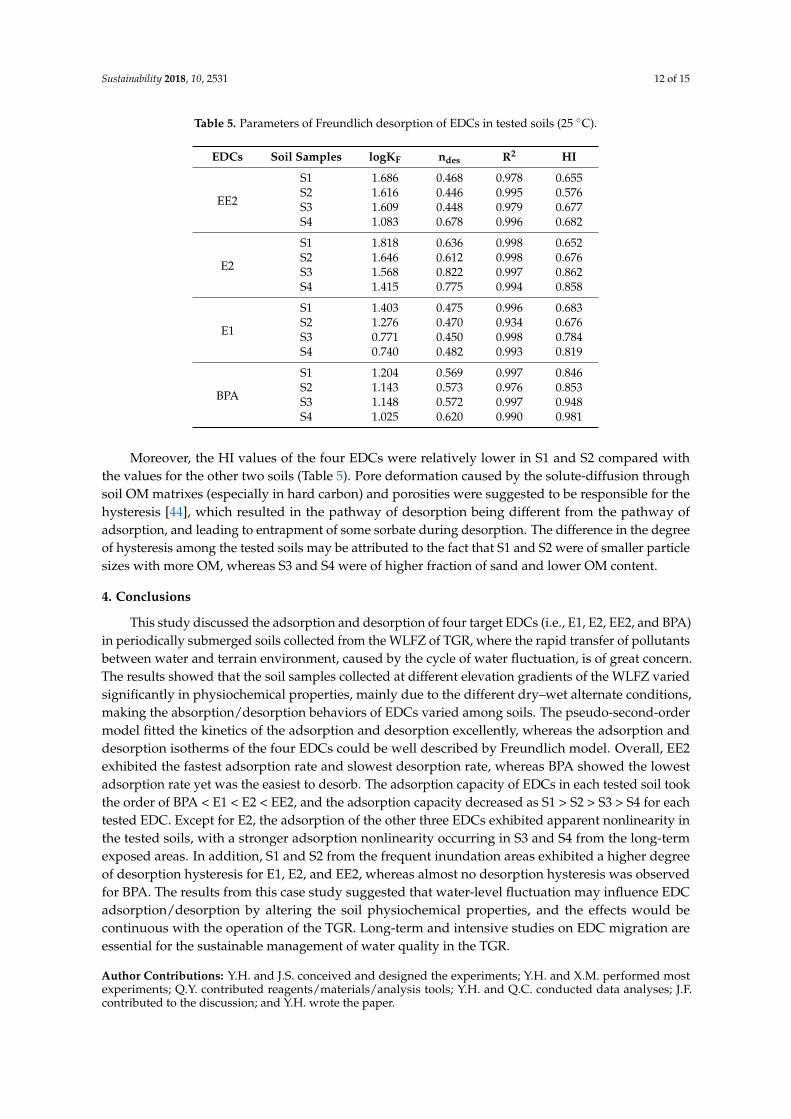
Table 5. Parameters of Freundlich desorption of EDCs in tested soils (25 C).
EDCs Soil Samples logKF ndes R2 HI
EE2
S1 1.686 0.468 0.978 0.655S2 1.616 0.446 0.995 0.576S3 1.609 0.448 0.979 0.677S4 1.083 0.678 0.996 0.682
E2
S1 1.818 0.636 0.998 0.652S2 1.646 0.612 0.998 0.676S3 1.568 0.822 0.997 0.862S4 1.415 0.775 0.994 0.858
E1
S1 1.403 0.475 0.996 0.683S2 1.276 0.470 0.934 0.676S3 0.771 0.450 0.998 0.784S4 0.740 0.482 0.993 0.819
BPA
S1 1.204 0.569 0.997 0.846S2 1.143 0.573 0.976 0.853S3 1.148 0.572 0.997 0.948S4 1.025 0.620 0.990 0.981
Moreover, the HI values of the four EDCs were relatively lower in S1 and S2 compared withthe values for the other two soils (Table 5). Pore deformation caused by the solute-diffusion throughsoil OM matrixes (especially in hard carbon) and porosities were suggested to be responsible for thehysteresis [44], which resulted in the pathway of desorption being different from the pathway ofadsorption, and leading to entrapment of some sorbate during desorption. The difference in the degreeof hysteresis among the tested soils may be attributed to the fact that S1 and S2 were of smaller particlesizes with more OM, whereas S3 and S4 were of higher fraction of sand and lower OM content.
4. Conclusions
This study discussed the adsorption and desorption of four target EDCs (i.e., E1, E2, EE2, and BPA)in periodically submerged soils collected from the WLFZ of TGR, where the rapid transfer of pollutantsbetween water and terrain environment, caused by the cycle of water fluctuation, is of great concern.The results showed that the soil samples collected at different elevation gradients of the WLFZ variedsignificantly in physiochemical properties, mainly due to the different dry–wet alternate conditions,making the absorption/desorption behaviors of EDCs varied among soils. The pseudo-second-ordermodel fitted the kinetics of the adsorption and desorption excellently, whereas the adsorption anddesorption isotherms of the four EDCs could be well described by Freundlich model. Overall, EE2exhibited the fastest adsorption rate and slowest desorption rate, whereas BPA showed the lowestadsorption rate yet was the easiest to desorb. The adsorption capacity of EDCs in each tested soil tookthe order of BPA < E1 < E2 < EE2, and the adsorption capacity decreased as S1 > S2 > S3 > S4 for eachtested EDC. Except for E2, the adsorption of the other three EDCs exhibited apparent nonlinearity inthe tested soils, with a stronger adsorption nonlinearity occurring in S3 and S4 from the long-termexposed areas. In addition, S1 and S2 from the frequent inundation areas exhibited a higher degreeof desorption hysteresis for E1, E2, and EE2, whereas almost no desorption hysteresis was observedfor BPA. The results from this case study suggested that water-level fluctuation may influence EDCadsorption/desorption by altering the soil physiochemical properties, and the effects would becontinuous with the operation of the TGR. Long-term and intensive studies on EDC migration areessential for the sustainable management of water quality in the TGR.
Author Contributions: Y.H. and J.S. conceived and designed the experiments; Y.H. and X.M. performed mostexperiments; Q.Y. contributed reagents/materials/analysis tools; Y.H. and Q.C. conducted data analyses; J.F.contributed to the discussion; and Y.H. wrote the paper.
Sustainability 2018, 10, 2531 13 of 15
Funding: This research was funded by [the National Natural Science Foundation of China] grant number[51508056 and 51508057], [the Key Laboratory of Hydraulic and Waterway Engineering of the Ministry ofEducation Foundation] grant number [SLK2017B04], [the Natural Science Foundation of Chongqing of China]grant number [cstc2018jcyjAX0054], and [the Supporting Program of the Scientific Foundation Project ofChongqing Sci & Tech Committee] grant number [cstc2015jcyjBX0041].
Conflicts of Interest: The authors declare no conflict of interest.
References
1. Giulivo, M.; De Alda, M.L.; Capri, E.; Barceló, D. Human exposure to endocrine disrupting compounds:Their role in reproductive systems, metabolic syndrome and breast cancer. A review. Environ. Res. 2016, 151,251–264. [CrossRef] [PubMed]
2. Hauser, R.; Skakkebaek, N.E.; Hass, U.; Toppari, J.; Juul, A.; Andersson, A.M. Male reproductive disorders,diseases, and costs of exposure to endocrine-disrupting chemicals in the European Union. J. Clin. Endocrinol.Metab. 2015, 100, 1267–1277. [CrossRef] [PubMed]
3. Choi, J.; Eom, J.; Kim, J.; Lee, S.; Kim, Y. Association between some endocrine-disrupting chemicals andchildhood obesity in biological samples of young girls: A cross-sectional study. Environ. Toxicol. Pharmacol.2014, 38, 51–57. [CrossRef] [PubMed]
4. Gorga, M.; Insa, S.; Petrovic, M.; Barceló, D. Occurrence and spatial distribution of EDCs and related compoundsin waters and sediments of Iberian rivers. Sci. Total Environ. 2015, 503, 69–86. [CrossRef] [PubMed]
5. Thomson, B.M.; Grounds, P.R. Bisphenol A in canned foods in New Zealand: An exposure assessment.Food Addit. Contam. 2005, 22, 65–72. [CrossRef] [PubMed]
6. Rudel, R.A.; Perovich, L.J. Endocrine disrupting chemicals in indoor and outdoor air. Atmos. Environ. 2009,43, 170–181. [CrossRef] [PubMed]
7. Duong, C.N.; Jinsung, R.; Jaeweon, C.; Kim, S.D.; Choi, H.K. Estrogenic chemicals and estrogenicity in riverwaters of South Korea and seven Asian countries. Chemosphere 2010, 78, 286–293. [CrossRef] [PubMed]
8. Weber, J.W., Jr.; Mcginley, P.M.; Katz, L.E. Sorption phenomena in subsurface systems: Concepts, models andeffects on contaminant fate and transport. Water Res. 1991, 25, 499–528. [CrossRef]
9. Bao, Y.; Gao, P.; He, X. The water-level fluctuation zone of Three Gorges Reservoir—A uniquegeomorphological unit. Earth Sci. Rev. 2015, 150, 14–24. [CrossRef]
10. Peng, C.R.; Lang, Z.; Qin, H.J.; Li, D.H. Revegetation in the water level fluctuation zone of a reservoir: Anideal measure to reduce the input of nutrients and sediment. Ecol. Eng. 2014, 71, 574–577. [CrossRef]
11. Ye, C.; Li, S.; Zhang, Y.; Zhang, Q. Assessing soil heavy metal pollution in the water-level-fluctuation zone ofthe Three Gorges Reservoir, China. J. Hazard. Mater. 2011, 191, 366–372. [CrossRef] [PubMed]
12. Liu, J.; Jiang, T.; Huang, R.; Wang, D.; Zhang, J.; Qian, S.; Yin, D.; Chen, H. A simulation study of inorganicsulfur cycling in the water level fluctuation zone of the Three Gorges Reservoir, China and the implicationsfor mercury methylation. Chemosphere 2017, 166, 31–40. [CrossRef] [PubMed]
13. Zhang, B.; Fang, F.; Guo, J.; Chen, Y.; Li, Z.; Guo, S. Phosphorus fractions and phosphate sorption-releasecharacteristics relevant to the soil composition of water-level-fluctuating zone of Three Gorges Reservoir.Ecol. Eng. 2012, 40, 153–159. [CrossRef]
14. Zhao, Y.; Wu, B.F.; Zeng, Y. Spatial and temporal aspects of greenhouse gas emissions from Three GorgesReservoir, China. Biogeosci. Discuss. 2012, 9, 14503–14535. [CrossRef]
15. Tang, Y.M.; Junaid, M.; Niu, A.; Deng, S.; Pei, D.S. Diverse toxicological risks of PAHs in surface water withan impounding level of 175 m in the Three Gorges Reservoir Area, China. Sci. Total Environ. 2016, 580,1085–1096. [CrossRef] [PubMed]
16. Floehr, T.; Scholz-Starke, B.; Xiao, H.; Koch, J.; Wu, L.; Hou, J.; Wolf, A.; Bergmann, A.; Bluhm, K.; Yuan, X.;et al. Yangtze Three Gorges Reservoir, China: A holistic assessment of organic pollution, mutagenic effectsof sediments and genotoxic impacts on fish. J. Environ. Sci. 2015, 38, 63–82. [CrossRef] [PubMed]
17. Hu, T.; Zhang, J.; Ye, C.; Zhang, L.; Xing, X.; Zhang, Y.; Wang, Y.; Sun, W.; Qi, S.; Zhang, Q. Status, source andhealth risk assessment of polycyclic aromatic hydrocarbons (PAHs) in soil from the water-level-fluctuationzone of the Three Gorges Reservoir, China. J. Geochem. Explor. 2017, 172, 20–28. [CrossRef]
18. Loffredo, E. Fate of anthropogenic organic pollutants in soils with emphasis on adsorption/desorptionprocesses of endocrine disruptor compounds. Pure Appl. Chem. 2006, 78, 947–961. [CrossRef]
Sustainability 2018, 10, 2531 14 of 15
19. Sun, K.; Gao, B.; Zhang, Z.Y.; Zhang, G.X.; Liu, X.T. Sorption of endocrine disrupting chemicals by condensedorganic matter in soils and sediments. Chemosphere 2010, 80, 709–715. [CrossRef] [PubMed]
20. Lima, D.L.; Schneider, R.J.; Esteves, V.I. Sorption behavior of EE2 on soils subjected to different long-termorganic amendments. Sci. Total Environ. 2012, 423, 120–124. [CrossRef] [PubMed]
21. Bonin, J.L.; Simpson, M.J. Sorption of steroid estrogens to soil and soil constituents in single- andmulti-sorbate systems. Environ. Toxicol. Chem. 2007, 26, 2604–2610. [CrossRef] [PubMed]
22. Stumpe, B.; Marschner, B. Dissolved organic carbon from sewage sludge and manure can affect estrogensorption and mineralization in soils. Environ. Pollut. 2010, 158, 148–154. [CrossRef] [PubMed]
23. Jia, G.; Liu, X. Soil microbial biomass and metabolic quotient across a gradient of the duration of annuallycyclic drainage of hillslope riparian zone in the three gorges reservoir area. Ecol. Eng. 2017, 99, 366–373.[CrossRef]
24. Reoyo-Prats, B.; Aubert, D.; Menniti, C.; Ludwig, W.; Sola, J.; Pujo-Pay, M.; Conan, P.; Verneau, O.; Palacios, C.Multicontamination phenomena occur more often than expected in Mediterranean coastal watercourses:Study case of the Têt River (France). Sci. Total Environ. 2017, 579, 10–21. [CrossRef] [PubMed]
25. Li, Q.; Luo, Y.; Wang, C.; Li, B.; Zhang, X.; Yuan, D.; Gao, X.; Zhang, H. Spatiotemporal variations and factorsaffecting soil nitrogen in the purple hilly area of Southwest China during the 1980s and the 2010s. Sci. TotalEnviron. 2016, 547, 173–181. [CrossRef] [PubMed]
26. Defersha, M.B.; Melesse, A.M. Effect of rainfall intensity, slope and antecedent moisture content on sedimentconcentration and sediment enrichment ratio. Catena 2012, 90, 47–52. [CrossRef]
27. Zeng, F.Y.; Jia, G.M.; Chen, F.Q.; Cao, L. The Effect of Different Flooding Duration on Soil Organic Carbonand its Labile Fraction in the Riparian Zone of Three Gorges Reservoir Area. Adv. Mater. Res. 2013, 726,3757–3761. [CrossRef]
28. Tang, X.; Wu, M.; Li, Q.; Lin, L.; Zhao, W. Impacts of water level regulation on sediment physic-chemicalproperties and phosphorus adsorption–desorption behaviors. Ecol. Eng. 2014, 70, 450–458. [CrossRef]
29. Zhang, B.; Guo, J.S.; Fang, F.; Li, Z.; Fu, C. Concentration of nutrients in the soil in water-level-fluctuatingzone of three gorges reservoir. Ecohydrol. Hydrobiol. 2012, 12, 105–114. [CrossRef]
30. Li, J.; Jiang, L.; Liu, X.; Lv, J. Adsorption and aerobic biodegradation of four selected endocrine disruptingchemicals in soil–water system. Int. Biodeterior. Biodegrad. 2013, 76, 3–7. [CrossRef]
31. Martínezhernández, V.; Meffe, R.; Herrera, L.S.; De, B.I. The role of sorption and biodegradation in theremoval of acetaminophen, carbamazepine, caffeine, naproxen and sulfamethoxazole during soil contact: Akinetics study. Sci. Total Environ. 2016, 559, 232–241. [CrossRef] [PubMed]
32. Shen, D.Z.; Fan, J.X.; Zhou, W.Z.; Gao, B.Y.; Yue, Q.Y.; Qi, K. Adsorption kinetics and isotherm of anionic dyesonto organo-bentonite from single and multisolute systems. J. Hazard. Mater. 2009, 172, 99–107. [CrossRef][PubMed]
33. Apul, O.G.; Karanfil, T. Adsorption of synthetic organic contaminants by carbon nanotubes: A critical review.Water Res. 2015, 68, 34–55. [CrossRef] [PubMed]
34. Huang, W.; Thomas, M.Y.; Mark, A.S.; Yu, H., Jr.; Weber, W.J. A Distributed Reactivity Model for Sorptionby Soils and Sediments. 9. General Isotherm Nonlinearity and Applicability of the Dual Reactive DomainModel. Environ. Sci. Technol. 1996, 26, 3549–3555. [CrossRef]
35. And, J.J.P.; Xing, B. Mechanisms of Slow Sorption of Organic Chemicals to Natural Particles. Environ. Sci.Technol. 1996, 30, 1–11.
36. Fuentes, B.; de la Luz Mora, M.; Bol, R.; San Martin, F.; Pérez, E.; Cartes, P. Sorption of inositol hexaphosphateon desert soils. Geoderma 2014, 232–234, 573–580. [CrossRef]
37. Sukul, P.; Lamshöft, M.; Zühlke, S.; Spiteller, M. Sorption and desorption of sulfadiazine in soil andsoil-manure systems. Chemosphere 2008, 73, 1344–1350. [CrossRef] [PubMed]
38. Thielebruhn, S.; Seibicke, T.; Schulten, H.R.; Leinweber, P. Sorption of sulfonamide pharmaceutical antibioticson whole soils and particle-size fractions. J. Environ. Qual. 2004, 33, 1331–1342. [CrossRef]
39. Fei, Y.; Xing, B.; Li, X. Changes in the adsorption of bisphenol A, 17 α-ethinyl estradiol, and phenanthreneon marine sediment in Hong Kong in relation to the simulated sediment organic matter decomposition.Environ. Pollut. 2014, 192, 139–146. [CrossRef] [PubMed]
40. Pan, B.; Ning, P.; Xing, B. Part IV—sorption of hydrophobic organic contaminants. Environ. Sci. Pollut.Res. Int. 2008, 15, 554–564. [CrossRef] [PubMed]
Sustainability 2018, 10, 2531 15 of 15
41. Hao, R.; Wang, P.; Wu, Y.; Hu, R.; Zhang, J.; Song, Y. Impacts of water level fluctuations on thephysicochemical properties of black carbon and its phenanthrene adsorption-desorption behaviors. Ecol. Eng.2017, 100, 130–137. [CrossRef]
42. Oepen, B.V.; Kördel, W.; Klein, W. Sorption of nonpolar and polar compounds to soils: Processes,measurements and experience with the applicability of the modified OECD-Guideline 106. Chemosphere1991, 22, 285–304. [CrossRef]
43. Yuan, G.S.; Xing, B.S. Effects of metal cations on sorption and desorption of organic compounds in humicacids. Soil Sci. 2001, 166, 205–208. [CrossRef]
44. Lesan, H.M.; Bhandari, A. Atrazine sorption on surface soils: Time-dependent phase distribution andapparent desorption hysteresis. Water Res. 2003, 37, 1644–1654. [CrossRef]
© 2018 by the authors. Licensee MDPI, Basel, Switzerland. This article is an open accessarticle distributed under the terms and conditions of the Creative Commons Attribution(CC BY) license (http://creativecommons.org/licenses/by/4.0/).
Related Documents