Draft ADOPTION AND TERMINATION OF EMPLOYEE INVOLVEMENT POLICIES Wei Chi Tsinghua Univeresity and Kansas State University Richard Freeman Harvard University and NBER Morris Kleiner University of Minnesota and NBER July 2006 Abstract Employee Involvement (EI) programs in American manufacturing have been increasing, but these policies have not been universally successful. Many of these high performance workplace practices are not implemented properly or are abandoned. Yet the vast majority of research focuses on the adoption of these policies with little attention to those that are eliminated. Using a 10-year longitudinal database on U.S. manufacturing in union and nonunion establishments obtained through detailed plant visits, the study examines the trends and determinants of the adoption and termination of EI policies. The study develops an anatomy of employee involvement policies in the establishments of the most and least used elements of the overall policy. In addition, we compare the anatomy of EI in our sample to those in other similar studies. We find that the plants that have a high EI use are more likely to adopt another EI policy and more likely to abandon them as well; and that a set of other policies that are potentially complementary with employee involvement also affect the rate of adoption and decline of EI policies. Finally, we find that firms with higher levels of EI utilization have lower turnover rates.

Welcome message from author
This document is posted to help you gain knowledge. Please leave a comment to let me know what you think about it! Share it to your friends and learn new things together.
Transcript

Draft
ADOPTION AND TERMINATION OF EMPLOYEE INVOLVEMENT POLICIES
Wei Chi Tsinghua Univeresity and Kansas State University
Richard Freeman Harvard University and NBER
Morris Kleiner University of Minnesota and NBER
July 2006 Abstract
Employee Involvement (EI) programs in American manufacturing have been increasing, but these policies have not been universally successful. Many of these high performance workplace practices are not implemented properly or are abandoned. Yet the vast majority of research focuses on the adoption of these policies with little attention to those that are eliminated. Using a 10-year longitudinal database on U.S. manufacturing in union and nonunion establishments obtained through detailed plant visits, the study examines the trends and determinants of the adoption and termination of EI policies. The study develops an anatomy of employee involvement policies in the establishments of the most and least used elements of the overall policy. In addition, we compare the anatomy of EI in our sample to those in other similar studies. We find that the plants that have a high EI use are more likely to adopt another EI policy and more likely to abandon them as well; and that a set of other policies that are potentially complementary with employee involvement also affect the rate of adoption and decline of EI policies. Finally, we find that firms with higher levels of EI utilization have lower turnover rates.
cbeck
PPL 7/27/06 1:15 PM
1
I. Introduction
One of the most visible and widely discussed human resources policies in
American business has been the development of employee involvement (EI) programs –a
diverse set of personnel and human resources management (HRM) practices that give
workers more authority at workplaces and promote their involvement in business
decision-making processes. These practices include, for example, total quality
management (TQM), self-directed work teams, and suggestion systems.
The major findings by Freeman and Rogers (1999) showed that voice through
employee involvement programs is the most sought-after policy by American workers.
The Presidential Commission on the Future of Worker Management Relations, often
referred to as the Dunlop Commission, lists employee involvement as one of its main
recommendations for improving the quality of work life and U.S. productivity
(Commission on the Future of Worker Management Relations, 1993-1994).
Previous studies have mainly focused on two issues: who adopted EI policies and
the impact of EI on organizational level outcomes. The findings showed that EI adopters
are often organizations that operate in competitive product markets. They also have to
respond to the market quickly and flexibly, and use new technology that requires highly
skilled workers. They tend to follow business strategies that emphasize quality and
innovation rather than low cost, and have adopted complementary human resources (HR)
practices, such as high levels of training and incentive compensation plans (Osterman,
1994, 2000; Arthur, 1992; Ichniowski et al., 1995; Pil and MacDuffie, 1996; Dunlop and
Weil, 1996; Gittleman et al., 1998).
Studies on the impact of EI on organizational performance are conflicting. Some
studies find that EI promotes higher productivity, improved quality, higher customer
satisfaction, lower quit rates, and greater sales (Arthur, 1994; Ichniowski et al., 1997;

2
MacDuffie, 1995; Huselid, 1995; Banker et al., 1996; Berg et al., 1996; Dunlop and Weil
1996; Batt, 2002; Batt et al., 2002; Bartel, 2004). Other studies emphasize the
intermediating effect of business strategy on the relationship between EI and financial
performance (Huselid, 1995; Youndt et al., 1996). However, other analyses on the
benefits of EI on performance show that the impacts are generally small and that the high
cost of implementing EI practices often offsets the benefits (Freeman and Kleiner, 2000;
Cappelli and Neumark, 2001). Nevertheless, EI has undoubtedly increased employees’
morale and satisfaction, which may explain their association with lower quit rates
(Freeman and Kleiner, 2000; Hunter et al., 2002).
Although EI programs have been increasing, these policies have clearly not been
universally successful. For example, case study evidence shows that firms have chosen
to abandon these policies when they have not performed well (Kleiner et al., 2002).
Unlike most other studies, we examine the adoption as well as the decline of EI. We use
data that cover 10 years of information on human resource and business strategy from
manufacturing establishments. Consistent with other analysis, our data show that EI use
has been rapidly increasing in establishments during this period. However, EI use has
also declined in some establishments suggesting that estimates of the impact of human
resource polices on performance should also take into account the decline of these
policies in order to present less statistically biased evaluations of these programs.
While many studies have examined why firms adopt EI policies, fewer have
examined why firms abandon them. Among the latter, several studies have noticed the
high failure rates of Quality of Work Life (QWL) and Quality Circles (QC) (Goodman,
1980; Rankin, 1986; Drago, 1988; Eaton, 1994). Eaton (1994) finds that the failure rate
of employee involvement practices is about 20 percent in union establishments, and she
investigates the role of unions and labor-management relations in causing terminations.
3
Our study examines not only the role of union and nonunion establishments, but also the
impact of business strategy, management style, and complementarity between different
human resources programs on the decline in EI use. In addition, our study calls further
attention to the termination of employee voice policies in manufacturing plants. This is
particularly important in the estimation of the importance of high performance workplace
practices on firm performance, because almost all studies focus only on the adoption of
these policies. This flaw in the research design is likely to bias upwards the estimates of
the importance of EI and related policies on firm performance.
The rest of the paper is organized as follows. Section II describes data used in the
analysis collected by the National Bureau of Economic Research Human Resources
Management Survey (NBER HRM). Section III describes patterns of EI diffusion and
decline. Section IV provides the rationale for the adoption and termination of EI. Section
V presents empirical methods and results. A summary and conclusion are contained in
Section VI.
II. Data
In 1994, the NBER HRM survey was generated from more than a hundred plants
randomly selected from the complete list of manufacturing establishments at the U.S.
Census Bureau’s Census of Manufactures. The survey was conducted on-site. To save
the cost of field trips, establishments in the Midwest area, close to the University of
Minnesota where the survey team was assembled, were over sampled. After initial
contact, 51 plants agreed to participate in the survey and allowed researchers to visit the
plant and conduct interviews. The researchers asked for and received written documents
on policies within the plants from plant managers and first-line supervisors or other
officials, and follow-up visits to the plants resulted in greater verification of the data than
4
that obtained in other short-term data collection efforts such as mail surveys or phone
calls.
From 1995 through 1997, the survey team paid on-site visits to the plants. During
the visits, which often included multiple return trips, the survey team collected written
documents that the plant was willing to share to obtain knowledge about business
environment, technology, and production of the plants, and interviewed managers,
workers, and union representatives to conduct the survey. The NBER HRM survey
provided more detailed and accurate longitudinal information than the large-scale surveys
conducted via phone or mail since it obtained written documentation on the policies.
However, one disadvantage is the data’s relatively small sample size, given the costly
nature of the data collection effort.
The survey asked questions about the plants’ recruiting and selection, training,
performance evaluation, employee involvement, and financial participation practices, as
well as business strategy, management style, and basic information about the plant. For
HR programs, managers were asked whether the plant has adopted a certain program
since 1986, if yes, which year, whether the program was still in use and, if no, which year
the program was terminated. Specifically, selection and staffing programs include
whether the company had a detailed screening process, personal interview, aptitude test,
physical exam, reference check, and probationary period. Training programs include
whether the company offered on-the-job training, training in team building, on-site
training, and tuition reimbursement. Performance appraisal policies include whether the
company used assessment centers, formal review sessions, and a standardized form to
evaluate their employees periodically. Employee involvement and communication
practices include whether the company adopted job rotation, suggestion system, Quality
of Work Life (QWL), Quality Circles (QC), total quality management (TQM), self-

5
managed work teams, job redesign, joint labor-management committee, and employee
representation on the board of directors. Finally, financial participation programs include
whether the company adopted an Individual Incentive Plan, Employee Stock Ownership
(ESOP), Cash or Deferred Profit Sharing, Gain Sharing, Skill-Based Pay, Employee
Stock Purchase Plan, and Group Bonus.
Managers interviewed were also asked whether there had been changes in the
plant manager/production leader since 1986 and, if yes, how many. Then the
management style of each manager was rated on a 1 to 5 scale with 1 representing “Close
Monitoring” and 5 representing “Gives Employee Autonomy.” Four categories of
business strategy were included in the survey: Growth of the Market Share of the Firm,
Obtain a Specific Market Niche, Short-Term Profit Maximization, and Maximizing
Shareholder Value of the Firm. The emphasis of the current manager on each of the four
strategies was rated on a 1 to 5 scale with 1 indicating “a little” and 5 being “a great
deal.” Managers were also asked whether the plant had undergone major restructuring
since 1986 and, if yes, which year. All of the above responses were converted to yearly
observations. The basic information about plants was time-constant. The questions
included which year the plant was built, whether the company had union representation,
and the average yearly turnover rate. Unlike the data gathered and analyzed by Eaton, our
sample had 54 percent- unionized establishments.
III. Trends in EI Use As can be seen in Table 1, in 1986, at the beginning of the period covered by the
survey, 76 percent of the plants in our sample had adopted some EI programs. By 1995,
this number had increased to 96 percent. The number of companies using a “bundle of
programs” also greatly increased. Even in 1986, the percentage of plants that adopted
two or more programs was 55 percent, and this percentage increased to over 90 percent

6
by 1995. As Figure 1 suggests, by 1995, job rotation was the most frequently used EI
policy. A little over 75% of plants in the sample adopted it. The second most popular
program is joint labor-management committee followed by suggestion system and TQM.
Table 2 shows the anatomy or structure of EI policies for the establishments in
our sample (Freeman et al., 2000). The table shows that the most common form of EI are
joint labor-management committees along with suggestion systems, but that worker
participation on corporate boards is the highest form or least used form of EI. Moreover,
policies such as self-managed teams suggest that a small percentage of establishments
have evolved to a high level of employee involvement.
Although the trend was toward increasing EI, during some periods the percentage
of companies and the extent of EI use declined. The downward trend was caused by the
termination of programs. In Table 3, we show the number of companies adopting or
terminating programs by year. The diffusion of EI sped up after 1990. An exception was
employee representation on the board of directors. At the beginning of the period, only
two companies had adopted the policy of having employees on the boards of the
company. In the 10-year period, one additional company adopted the program; however,
another company later abandoned the program. At the end of the time period, only two
companies still had the policy of giving employees a voice at the top-level decisions of
management.
In general, termination of EI programs is less frequent than adopting the programs.
QC and TQM are the two programs that have most frequently been terminated,
suggesting that these two programs may be less effective or that other programs may be
substituting for them. A substantial number of terminations occurred between 1988 and
1991, which was a downturn in the business cycle, suggesting that financial difficulties
may lead companies to abandon some EI programs to cut costs. In Table 4, we show the

7
number of years the program is used before it is terminated. For most programs that are
terminated, the average time a program is in existence is four to five years. For
suggestion systems and employee representation on the board of directors, the average
time to termination is six years. Figure 2 shows the anatomy of the adoption and
termination of EI policies. The adoption and termination seem to be negatively correlated.
As the number of programs adopted increases, the number of termination declines. This
may be explained by the learning effect: companies learn to implement EI policies more
effectively as they adopt more programs, and thus the probability of failing declines.
However, more probing of the firms in our sample is needed to discover the most
important determinants of EI adoption and termination.
IV. Rationale for the Rise and Fall in EI
One of the central issues in the EI literature is, what leads firms to adopt or
terminate EI? Interviews with plant managers, first-line supervisors, and plant tours
provided us with firsthand knowledge (Helper, 2000). In addition, previous research
suggested additional factors that may impact the adoption and termination of EI.
Business Strategy
Companies emphasizing service, quality, variety, and employee commitment are
more likely to adopt EI than those focusing only on low costs (Arthur, 1992; Osterman,
1994). The performance effect of EI is also conditional on the type of strategy adopted by
companies (Youndt et al., 1996). If the switch was from a low-cost policy to
emphasizing service and quality, then it led companies to adopt EI. Conversely, a change
in the strategy in the opposite direction may cause companies to terminate EI.
The NBER survey did not ask about the emphasis on low-cost production. Of the
four types of strategies asked in the survey, short-term profit maximization may be the

8
closest to the low-cost strategy because companies that pursue maximizing short-term
profit may be most likely to resort to cost cutting to increase profits. On the other hand,
companies targeted at the growth of market share will be more likely to adopt and least
likely to terminate EI because these companies need to rely on employees’ commitment
and innovation to attract potential new customers. Companies focusing on a niche market
have loyal customers and face less cost pressure, and thus may not need to cut programs
to save costs. Nevertheless, they may be less likely to adopt EI because their emphasis is
on task specialization and greater output. Whether companies that pursue shareholder-
value maximization are more or less likely to terminate EI depends on shareholders’
interests and whether these interests are short term or long term.
Complementarity
In the EI literature, considerable evidence has suggested that a complementary
bundle of EI practices generate greater performance effects than a single program
(Ichniowski et al., 1995, 1997; Delery and Doty, 1996). This is because some programs
add to the impact of each of the others. As our data show, the percentage of plants using
multiple programs has increased remarkably over the 10-year period, suggesting that
companies also have comprehended complementarity between programs.
Since there is complementarity between EI programs, if a firm adopted an EI program,
it would be more likely to adopt another complementary program later. Moreover, firms
that have had experience implementing EI, have better knowledge of the problems that
may arise during implementation. They are consequently better equipped to deal with
these problems and their implementation costs will be lower. Moreover, adopting a
bundle of programs and past experience implementing EI increase the potential that the
companies will succeed in adopting a new program and cause companies to be less likely
to abandon EI.

9
EI and other HR practices are also complementary. For example, firms that have
extensive training and incentive pay programs are more likely to adopt EI (Osterman,
1994; Pil and MacDuffie, 1996; Whitfield, 2000; Gittleman et al., 1998). Therefore,
companies that have adopted other complementary HR programs would also be more
likely to adopt an EI program. As companies succeed in implementing EI and other
supportive HR policies, they will be less likely to terminate EI.
Unions
Unionization is sometimes associated with low EI use. Unions sometimes see EI
as a substitute for their function in the organization and may prevent companies from
adopting EI practices. In addition, nonunion firms see EI as a policy to keep union out of
their establishments (Freeman and Rogers,1999). If companies have adopted EI, unions
may oppose the program in order to terminate it as a competitor for the services that
unions may provide within the organization. Furthermore, employees may want EI, and
firms may see EI as a substitute for unions. Yet, if properly implemented, EI can increase
the voice of employees and result in more autonomy. Under these conditions, unions may
support EI policies (Eaton, 1994).
Establishment Age and Restructuring
The plant’s age can also impact the adoption of the EI practice. New plants have
an advantage in adopting EI because they face less transition cost and resistance from
employees than plants that have existed for a long time (Ichniowski et al., 1995). If older
plants facing greater transition costs and employee resistance are more likely to fail in
implementing EI, then older plants are also more likely to terminate EI.
For older plants, restructuring is like resetting the age clock of the plant. During
restructuring, old organizational routine, structure, and culture undergo dramatic changes.

10
If firms introduce EI at this time, they deal with the transition cost and resistance all at
once and save the cost of having to deal with them again if EI is implemented at a later
date. Moreover, if EI is introduced after a recent restructuring, both organizational
structure and culture change to fit with EI. As a consequence, EI implementation may
encounter less resistance, and the performance effect of EI may be greater; thus firms will
be less likely to terminate these programs.
In addition to firm characteristics discussed above, size, technology, and product
market conditions also affect the adoption decision. Large firms are more able to afford
the costs of implementing EI than small firms since this is a fixed cost that can be spread
over a large number of workers with lower costs per employee. Consequently, large firms
are more likely to adopt EI. However, size may not affect termination because if both
large and small firms have invested in EI, the investment cost is a sunk cost and should
not affect the firm’s decision to end the program. The introduction of new technology and
the increased market competition both drive companies to adopt EI. Many of the
interviewed companies cited increased competition and new technology as the reasons
why the companies adopted EI. However, technology and market conditions have hardly
reversed, so none of the companies indicated that changes in technology or market
conditions are responsible for their terminating EI.
V. Empirical Methods and Results
Rasch Measure of EI Use To investigate the rise and fall in EI, we developed a measure of EI use in
organizations. In the literature, many studies used a composite index of EI, which is
calculated based on the adoption and score of several specific EI programs (Ichniowski et
al., 1995; Pil and MacDuffie, 1996). The measure we developed is based on the estimates
of the Rasch model. The advantage of the Rasch model is that it allows us to estimate the

11
extent of EI use in companies while taking into account differences across programs in
the difficulty level of the programs. The Rasch model regards the probability that a plant
has a certain program as a function of plant and EI policy characteristics:
( 1) ( , )ij i jP X θ γ= = Φ , i, establishment, j, EI practice, (1)
where θ denotes the degree of employee involvement in an establishment, which is
considered a latent characteristic of the establishment, and γ also denotes a latent
variable indicating the difficulty or higher level of an EI program. The probability that an
establishment had a certain EI policy depends on an establishment’s degree of EI use (θ )
and the difficulty level of an EI program (γ ). The function Φ is specified to have a
logistic form, and equation (1) becomes
exp( )
( 1)1 exp( )
i jij
i j
P Xθ γθ γ−
= =− −
, i, establishment, j, EI practice. (2)
Then, the maximizing likelihood estimation (MLE) method is used to estimate the
establishment parameter (θ ) and the EI policy parameter (γ )1. The estimates of θ are
used as the measure of EI use in plants. Its value ranges from –1 to 1.
Estimating the Models
Using the Rasch estimate as the dependent variable, we first estimate an OLS
model to examine the determinants of the level of EI use in plants. The model is
estimated by pooling observations from all years. We then examine the impact of degree
of EI use on the employees’ turnover rate. Finally, we examine the determinants of
adoption and termination of EI in organizations. EI adoption equals one if a company
adopted any EI program in a year. EI termination equals one if a company ends using one

12
or more EI policies in a year. Using these variables as the dependent variables, we
estimate the following two models:
it it i t itA X β α γ ε= + + + ,
it it i t itT X β α γ ε= + + + . Ait indicates EI adoption in year t, and Tit indicates EI termination in year t. Xit are a set
of time-varying explanatory variables, such as age of plant, management granting
autonomy, the current EI use denoted by the Rasch value, whether the firm has
undergone a major restructuring, other HR practices, and time-constant variables such as
union representation. The business strategy of only current managers was asked in the
survey. Current managers may start in 1986 or before, or may have been in the position
for only a few years. Therefore, some values for business strategy variables are missing.
Definition and descriptive statistics of explanatory variables are reported in Appendix
Table. Furthermore, iα denotes individual plant dummy variables, which are included to
control for the plant fixed effect, and tγ indicates year dummy variables to control for the
year fixed effect.
The two equations are specified as the linear probability model with White Robust
standard errors to make the interpretation coefficient estimates straightforward. The
estimates of linear probability model indicate marginal effect. In order to check for the
robustness of results, we have also estimated Probit and Logit specifications and calculate
marginal effects at the means of explanatory variables. The results are similar, but not
reported in the paper.
Estimates of the Level of EI Use
1 The estimation algorithm is provided by Quest, a computer software package. Using Quest, we calculate the Rasch measure of EI system for each establishment and the Rasch measure for jγ indicating the

13
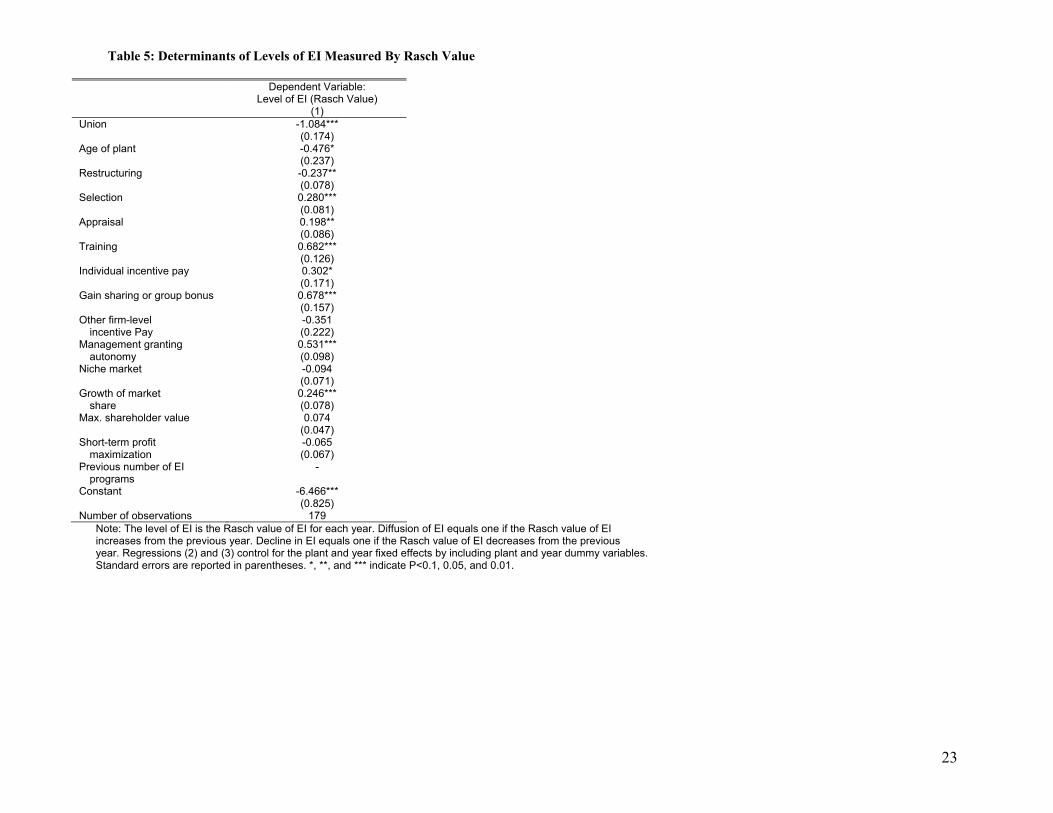
As can be seen in column (3) of Table 5, companies with other HR programs,
such as training, selection, performance appraisal, and the group- or firm-level incentive
pay, had a higher level of EI use than companies without these HR programs. Moreover,
a higher level of EI use was also found in companies following a strategy that emphasizes
growth of market share and in companies whose managers emphasize giving employees
autonomy. On the other hand, companies with union representationand that recently
experienced restructuring had a lower level of EI use. Most of these results are consistent
with findings of the previous research in the literature.
Determinants of the Adoption and Termination of EI
In Table 6 we give the change in EI use over time, specifically, the adoption and
termination of EI. Initially, the results show that, a higher Rasch value of EI increases
the probability of adopting EI policies. This may be explained by the learning effect and
the complementarities between EI policies. Companies that have adopted other EI
programs are more likely to adopt a new program. The greater EI use did not reduce the
probability of terminating EI policies. On the contrary, the result in Table 6 shows that
the higher Rasch value of EI use is associated with a higher probability of ending an EI
program. An explanation for this result is that companies may have adopted the more-
than-optimal number of policies. As the result of trial and error, some policies are
eliminated.
Second, companies emphasizing market growth are those that are most likely to
rely on employees’ commitment and innovation, which explains why they are more likely
to adopt EI and less likely to end EI use. The appendix table shows the mean and
standard deviation of company’s emphasis on growth of market shares. In the scale of
one to five, the average score is 3.63 and standard deviation is 1.33. The estimate shows
difficulty level of each EI practice in each year.

14
that a one-standard deviation change in the focus on market share is associated with 26-
percentage point higher EI adoption rate and 14-percentage point lower rate of
abandoning EI. Thus, an emphasis on a product market strategy of growth of market
shares has a somewhat larger impact on a company’s decision to adopt EI than abandon
EI.
Finally, some factors are found to affect the adoption decision but not termination,
or vice versa. For instance, Table 6 shows that the strategy of maximizing shareholders’
value and management granting autonomy are associated with a lower probability of
terminating EI policies. Companies that emphasize employee performance appraisal are
more likely to end EI programs. This may be because monitoring employees and
motivating them are two methods to reduce employees’ shirking and agency problem,
and performance evaluation can be regarded as a mechanism to monitor employees, and
this is a substitute for EI policies. A greater use of performance evaluation is therefore
accompanied by terminating EI. Apart from the above factors, financial incentive
programs, specifically gainsharing or group bonus, are positively associated with EI
adoption. This result suggests further that companies may have realized the importance of
complementarity between EI programs and other human resource policies. As many EI
policies are implemented on work groups, group-level financial incentives would make
the implementation of EI more robust.
The Level of EI Use and Turnover Rates
Table 7 shows that the greater EI use, as indicated by the larger Rasch value of EI,
reduces employee turnover rates. This result supports many previous studies that found
reduced turnover rates as being associated with the use of EI policies (Batt, 2002; Batt et
al., 2002; Bartel, 2004). In fact, decreasing turnover rates is commonly found as one of
the main benefits of utilizing EI in a company. In addition, we also found that average

15
turnover rate declines with the age of plant. The turnover rate also decreases as
companies use more financial incentive plans such as the individual- and firm-level
incentive programs. Turnover rates also are lower in companies that target a niche market.
The results also show that lower turnover rates are associated with restructuring and
management granting greater autonomy.
VI. Summary and Conclusion
Using 10-year longitudinal data of establishments, we show that EI use is not
necessarily a stable phenomenon. It has spurts of growth and decline, as do other labor
market institutions within firms. We find evidence of symmetry for some explanatory
variables included in the analysis, and the evidence is particularly strong for the impact of
market growth strategy. However, some factors appear to affect only adoption or
termination but not the other, e.g. the degree of current EI use. Although other studies
have investigated the determinants of EI adoption, few studies have examined the
determinants of the termination of these programs, and even fewer studies have examined
the interactions between adoption and termination of EI programs. The lack of a focus on
the termination of EI programs may bias upward estimates of the impact of human
resources on productivity and other measures of firm performance. Our study develops
the relationship between the level of EI and changes in the adoption and termination of
these employee voice policies. These results suggest a rethinking of the stability and
long-term impact of employee involvement as one of the most often proposed human
resource policies by managers, industrial relations specialists, and public policy makers.

16
References
Arthur, Jeffrey. 1992. “The Link between Business Strategy and Industrial Relations Systems in American Steel Minimills.” Industrial and Labor Relations Review, Vol. 45, No. 3: 488–506. Arthur, Jeffrey. 1994. “Effects of Human Resource Systems on Manufacturing Performance and Turnover.” Academy of Management Journal, Vol. 37, No. 3: 670–687. Banker, Rajiv, Field, Joy M., Schroeder, Roger G., and Sinha, Kingshuk K. 1996. “Impact of Work Teams on Manufacturing Performance: A Longitudinal Field Study.” Academy of Management Journal, Vol. 39, No. 4: 867–890. Bartel, Ann P. 2004. “Human Resource Management and Organizational Performance: Evidence from Retail Banking.” Industrial and Labor Relations Review, Vol. 57, No. 2: 181–203. Batt, Rosemary. 2002. “Managing Customer Services: Human Resource Practices, Quit Rates, and Sales Growth.” Academy of Management Journal, Vol. 45, No. 3: 587–597. Batt, Rosemary, Colvin, Alexander J. S., and Keefe, Jeffrey. 2002. “Employee Voice, Human Resource Practices, and Quit Rates: Evidence from the Telecommunications Industry.” Industrial and Labor Relations Review, Vol. 55, No. 4: 573–594. Berg, Peter, Appelbaum, Eileen, Bailey, Thomas, and Kalleberg, Arne. 1996. “The Performance Effects of Modular Production in the Apparel Industry.” Industrial Relations, Vol. 35, No. 3: 356–373. Cappelli, Peter, and Neumark, David. 2001. “Do ‘High-Performance’ Work Practices Improve Establishment-Level Outcomes?” Industrial and Labor Relations Review, Vol. 54, No. 4: 737–775. Commission on the Future of Worker-Management Relations (Dunlop Commission) (1993–1994) http://digitalcommons.ilr.cornell.edu/key_workplace/2/ Delery, John, E., and Doty, D. Harold. 1996. “Modes of Theorizing in Strategic Human Resource Management: Tests of Universalistic, Contingency, and Configurational Performance Predictions.” Academy of Management Journal, Vol. 39, No. 4: 802–835. Delery, John, E., Gupta, Nina, Shaw, Jason D., Jenkins, Douglas G. Jr., Ganster, Margot. 2000. “Unionization, Compensation, and Voice Effects on Quits and Retention.” Industrial Relations, Vol. 39, No. 4: 625–645. Drago, Robert. 1988. “Quality Circle Survival: An Exploratory Analysis.” Industrial Relations, Vol. 27, No. 3: 336–351. Dunlop, John T. and Weil, David. 1996. “Diffusion and Performance of Modular Production in the U.S. Apparel Industry.” Industrial Relations, Vol. 35, No. 3: 334–355.
17
Eaton, Adrienne E. 1994. “The Survival of Employee Participation Programs in Unionized Settings.” Industrial and Labor Relations Review, Vol. 47, No. 3: 371–389. . Freeman, Richard B., and Kleiner, Morris M. 2000. “Who Benefits Most from Employee Involvement: Firms or Workers?” American Economic Review, Vol. 90, No. 2: 219–223. Freeman, Richard B., Kleiner, Morris M., and Ostroff, Cheri. 2000, “The Anatomy of Employee Involvement and Its Effects on Firms and Workers.” NBER Working Paper 8050, December. Freeman, Richard B., and Rogers, Joel. 1999. What Workers Want. Ithaca, N.Y.: Cornell University Press. Gittleman, Maury, Horrigan, Michael, and Joyce, Mary. 1998. “‘Flexible’ Workplace Practices: Evidence from a Nationally Representative Survey.” Industrial and Labor Relations Review, Vol. 52, No. 1: 99–115. Goodman, Paul S. 1980. “Realities of Improving the Quality of Work Life: Quality of Work Life Projects in 1980.” Proceedings of the Spring IRRA Meetings, Labor Law Journal, August, 487–494. Helper, Susan. 2000 “Economists and Field Research: ‘You Can Observe a Lot Just by Watching’.” American Economic Review, Vol. 90, No. 2: 228–232. Hunter, Larry W., MacDuffie, John Paul, and Doucet, Lorna. 2002. “What Makes Teams Take? Employee Reactions to Work Reforms.” Industrial and Labor Relations Review, Vol. 55, No. 3: 448–472. Huselid, Mark A. 1995. “The Impact of Human Resource Management Practices on Turnover, Productivity, and Corporate Financial Performance.” Academy of Management Journal, Vol. 38, No. 3: 635–672. Ichniowski, Casey, and Shaw, Kathryn. 1995. “Old Dogs and New Tricks: Determinants of the Adoption of Productivity-Enhancing Work Practices.” Brookings Papers on Economic Activity, Social Issue Microeconomics 1–65. Ichniowski, Casey, and Shaw, Kathryn. 1997. “The Effects of Human Resource Management Practices on Productivity: A Study of Steel Finishing Lines.” American Economic Review, Vol. 87, No. 3: 291–313. Kleiner, Morris M., Leonard, Jonathan S., and Pilarski, Adam M. 2002, “How Industrial Relations Affects Plant Performance: The Case of Commercial Aircraft Manufacturing.” Industrial and Labor Relations Review, Vol. 55, No. 2: 195–218. MacDuffie, John Paul. 1995. “Human Resource Bundles and Manufacturing Performance: Organizational Logic and Flexible Production Systems in the World Auto Industry.” Industrial and Labor Relations Review, Vol. 48, No. 2: 197–221.
18
Osterman, Paul. 1994. “How Common Is Workplace Transformation and Who Adopts It?” Industrial and Labor Relations Review, Vol. 47, No. 2: 173–188. Osterman, Paul. 2000. “Work Reorganization in an Era of Restructuring: Trends in Diffusion and Effects on Employee Welfare.” Industrial and Labor Relations Review, Vol. 53, No. 2: 179–196. Pil, Frits K., and MacDuffie, John Paul. 1996. “The Adoption of High-Involvement Work Practices.” Industrial Relations, Vol. 35, No. 3: 423–455. Rankin, Tom. 1986. “Integrating QWL and Collective Bargaining.” QWL Force, Vol. 5, No. 1: 3–6. Whitfield, K. 2000. “High-Performance Workplaces, Training, and the Distribution of Skills.” Industrial Relations, Vol. 39, No. 1: 1–25. Youndt, Mark A., Snell, Scott A., Dean, James W. Jr., and Lepak, David P. 1996. “Human Resource Management, Manufacturing Strategy, and Firm Performance.” Academy of Management Journal, Vol. 39, No. 4: 836–866.

19
Table 1: Diffusion of EI: Percentage of Establishments Using Multiple Programs
Note: The table shows the percentage of establishments that used zero to nine EI programs in a year. These EI programs include job rotation, joint labor-management committee, suggestion system, TQM, quality circles, self-managed work team, job redesign, quality of work life, and employee representation on the board of directors.
EI programs in use 1986 1987 1988 1989 1990 1991 1992 1993 1994 1995 0 23.53 23.53 21.57 21.57 17.65 15.69 11.76 11.76 5.88 3.92 1 21.57 19.61 17.65 17.65 13.73 7.84 9.8 7.84 7.84 3.92 2 9.8 7.84 11.76 13.73 15.69 13.73 13.73 11.76 15.69 17.65 3 13.73 17.65 17.65 19.61 19.61 19.61 17.65 17.65 21.57 21.57 4 9.8 9.8 9.8 7.84 7.84 13.73 19.61 13.73 9.8 13.73 5 1.96 1.96 3.92 3.92 9.8 9.8 9.8 15.69 15.69 15.69 6 11.76 11.76 9.8 9.8 11.76 9.8 7.84 11.76 11.76 11.76 7 3.92 3.92 3.92 1.96 0 5.88 3.92 3.92 5.88 1.96 8 1.96 1.96 1.96 1.96 1.96 1.96 5.88 5.88 5.88 9.8 9 1.96 1.96 1.96 1.96 1.96 1.96 0 0 0 0

20
Table 2: The Anatomy of EI Programs: Percentage of establishments that have the combination of programs at the end of the period Job
rotation (%)
Joint committee (%)
Suggestion system (%)
TQM (%)
Quality of work life (%)
Job redesign (%)
Self-managed work team (%)
Quality circles (%)
Joint committee 51 Suggestion system 43 39 TQM 35 35 24 Quality of work
life 35
29
27
22
Job redesign 33 35 20 24 22 Self-managed
work team 24
22
18
20
22
22
Quality circles 22 20 22 16 12 8 10 Employee
representation on the board of directors
2
4
2
2
2
0
2
2

21
Table 3: Number of Establishments Adopting or Terminating Program by Year
Adopting
1986 (left-
censored) 1987 1988 1989 1990 1991 1992 1993 1994 1995 Employee Representation on
Board of Directors 2
1
Joint Committee 20 3 3 2 2 3 2 Job Redesign 10 1 2 2 2 2 3 1 Self-Managed Work Team 4 1 3 3 5 3 1 1 TQM 16 1 3 6 1 2 2 Quality Circles 16 2 1 3 1 2 1 Quality of Work Life 14 1 2 2 1 2 2 Suggestion System 19 1 2 2 3 2 1 3 Job Rotation 23 1 3 5 4 2 2 Total Number of Adoptions 4 3 5 18 22 18 14 16 10
Terminating 1986 1987 1988 1989 1990 1991 1992 1993 1994
1995 (right-
censored) Employee Representation on
Board of Directors 1
Joint Committee 1 1 1 Job Redesign 1 1 Self-Managed Work Team 1 1 3 TQM 2 2 2 1 1 Quality Circles 1 3 2 2 4 Quality of Work Life 2 1 1 Suggestion System 1 2 2 Job Rotation 1 1 Total Number of Terminations 1 1 11 4 2 14 2 8

22
Table 4: Number of Years of Individual EI Policy Use Until Termination Average 1–3 years (%) 4–5 years (%) 6–8 years (%)Employee Representation on
Board of Directors 6 100 Joint Committee 3.7 67 33 Job Redesign 4.5 50 50 Self-Managed Work Team 4.3 33 33 33 TQM 5.0 43 15 42 Quality Circles 4.5 33 33 34 Quality of Work Life 4.3 50 25 25 Suggestion System 6.2 20 80 Job Rotation 4.5 50 50
23
Table 5: Determinants of Levels of EI Measured By Rasch Value
Dependent Variable: Level of EI (Rasch Value)
(1) Union
-1.084*** (0.174)
Age of plant
-0.476* (0.237)
Restructuring
-0.237** (0.078)
Selection
0.280*** (0.081)
Appraisal
0.198** (0.086)
Training
0.682*** (0.126)
Individual incentive pay
0.302* (0.171)
Gain sharing or group bonus
0.678*** (0.157)
Other firm-level incentive Pay
-0.351 (0.222)
Management granting autonomy
0.531*** (0.098)
Niche market
-0.094 (0.071)
Growth of market share
0.246*** (0.078)
Max. shareholder value
0.074 (0.047)
Short-term profit maximization
-0.065 (0.067)
Previous number of EI programs
-
Constant
-6.466*** (0.825)
Number of observations 179 Note: The level of EI is the Rasch value of EI for each year. Diffusion of EI equals one if the Rasch value of EI increases from the previous year. Decline in EI equals one if the Rasch value of EI decreases from the previous year. Regressions (2) and (3) control for the plant and year fixed effects by including plant and year dummy variables. Standard errors are reported in parentheses. *, **, and *** indicate P<0.1, 0.05, and 0.01.

24
Table 6: Adoption or Termination of EI as a function of Rasch EI value
Dependent Variable: Adoption of EI
Dependent Variable: Termination of EI
Rasch EI value 0.191*** (0.064)
0.088** (0.041)
Union
-0.341 (0.276)
0.215 (0.186)
Age of plant
-0.004 (0.003)
0.003 (0.002)
Restructuring
0.120 (0.123)
-0.035 (0.129)
Selection
0.071 (0.080)
-0.002 (0.022)
Appraisal
-0.165 (0.112)
0.097* (0.058)
Training
0.092 (0.064)
-0.053 (0.048)
Individual incentive pay
-0.046 (0.162)
-0.163 (0.101)
Gain sharing or group bonus
0.438** (0.171)
-0.005 (0.121)
Other firm-level incentive Pay
0.192 (0.167)
0.059 (0.132)
Management granting autonomy
0.074 (0.082)
-0.079* (0.047)
Niche market
-0.143 (0.092)
-0.063 (0.041)
Growth of market share
0.263** (0.127)
-0.138* (0.081)
Max. shareholder value
0.081 (0.052)
-0.045* (0.024)
Short-term profit maximization
-0.017 (0.114)
0.132 (0.085)
Constant
-0.217 (0.914)
0.375 (0.440)
Number of observations 179 179

25
Table 7: The Impact of EI on Turnover
Dependent Variable: Turnover Rate (%)
Rasch EI value -0.565* (0.312)
Union
0.341 (0.773)
Age of plant
-0.046*** (0.011)
Restructuring
-3.039*** (0.878))
Selection
1.350*** (0.085)
Appraisal
-0.126 (0.348)
Training
0.985* (0.546)
Individual incentive pay
-1.511** (0.690)
Gain sharing or group bonus
0.636 (0.663)
Other firm-level incentive Pay
-1.689* (0.892)
Management granting autonomy
1.771*** (0.425)
Niche market
-1.224*** (0.286)
Growth of market share
0.567* (0.304)
Max. shareholder value
-0.027 (0.190)
Short-term profit maximization
-0.115 (0.268)
Constant
-5.826 (3.859)
Number of observations 179

26
Figure 1: Anatomy of EI Programs: Percentage of Compani es Usi ng t he Fol l owi ng Pr ogr ams (1995)
0
0. 1
0. 2
0. 3
0. 4
0. 5
0. 6
0. 7
0. 8
Empl
oyee
Repr
esen
tati
onon
Boa
rd o
fDi
rect
ors
Join
t Co
mmit
tee
Job
Rede
sign
Self
-Man
aged
Work
Tea
m TQM
Qual
ity
Circ
les
Qual
ity
of W
ork
Life
Sugg
esti
onSy
stem
Job
Rota
tion

27
Figure 2: Anatomy of EI Adoptions and Terminations
0
1
2
3
4
5
6
7
8
9
10
0 1 2 3 4 5 6 7 8Number of Programs Adopt ed by 1995
Num
ber
of p
rogr
ams
term
inat
ed b
y 19
95

28
Appendix Table: Descriptive Statistics of Explanatory Variables
Variable name Variable Definition Mean Standard Deviation
Union
=1 if a plant has a union representation; =0 otherwise; 0.54
Annual average turnover rate
Average yearly turnover rate 4.49
5.40
Age of plant
Age of plant in years 37.32
29.71
Restructuring
=1 if a plant has recently been restructured; =0 otherwise; 0.17
Selection
=the total number of selection programs used in a plant including a detailed screening process, personal interview, aptitude test, physical exam, reference check, and probationary period; takes a value from 0-6;
4.88
1.23
Appraisal
=the total number of performance appraisal programs used in a plant including assessment centers, formal review sessions, and a standardized evaluation form; takes a value from 0-3;
1.52
0.92
Training
=the total number of training programs used in a plant including on-the-job training, team building training, on-site training, and tuition reimbursement; takes a value from 0-4;
3.36
0.65
Ind. incentive pay
=1 if a plant has adopted the individual incentive pay plan; =0 otherwise; 0.55
Gain sharing or group bonus
=1 if a plant has adopted a gainsharing plan or group bonus program; =0 otherwise;
0.40
Other firm-level incentive Pay
=1 if a plant has adopted an ESOP, cash or deferred profit sharing, or employee stock purchase plan; =0 otherwise.
0.74
Management granting autonomy
The degree of manager giving employees autonomy in the scale of 1-5; 3.51
0.93
Niche market
The degree of a plant’s focusing on niche market in the scale of 1-5; 3.20
1.38
Growth of market share
The degree of a plant’s focusing on growth of market shares in the scale of 1-5;
3.63
1.33
Maximizing shareholder value
The degree of a plant’s focusing on maximizing shareholder value in the scale of 1-5;
3.67
1.57
Short-term profit maximization
The degree of a plant’s focusing on short-term profit maximization in the scale of 1-5;
3.51
1.14
EI
Previous number of EI programs adopted 3.65
2.07
Related Documents