Quarterly Journal of International Agriculture 54 (2015), No. 2: 133-161 Quarterly Journal of International Agriculture 54 (2015), No. 2; DLG-Verlag Frankfurt/M. Adoption and Impact of Black Pepper Certification in India Priyanka Parvathi and Herman Waibel Leibniz University of Hannover, Germany Abstract This paper analyses the adoption of organic farming under fair trade marketing practices and its impact on household income of black pepper (piper nigrum) farmers in India. We use a set of panel data, collected from 300 smallholder farmers who plant black pepper as their main crop in 2010 and 2011.The aim of the paper is to investigate the use of panel data for adoption models using the case of organic and fair trade certified black pepper in Idukki district, Kerala, India. We compare two adoption models: (i) a multinomial cross-section logit applied for both survey years separately and (ii) a panel multinomial random effects logit model. The panel adoption model which allows capturing unobserved heterogeneity in adoption decisions was found to be superior over the cross section models. We find that farm size and market distance are the major factors that influence adoption. To measure the differential gain of adop- tion, we applied propensity score matching with multiple treatment effects accompanied by sensitivity analysis to test robustness of impact results. Results show that certified organic farmers have a significantly higher income but participation in fair trade regimes does not generate additional monetary benefits. Keywords: organic agriculture, fair trade, panel multinomial logit using gllamm, propensity score matching, Kerala JEL: Q1, Q120, Q160, Q180, Q550 1 Introduction The Indian spices sector is an important part of the agricultural sector and its export value was US$ 2,037.76 million in 2011-2012 (SBI, 2012). Currently in India, 60 out of the 109 spices recognized by the International Organization for Standardization (ISO) are grown. India’s share in the international market for spices is 25% and black pepper (piper nigrum) amounts to 8% of Indian exports in value terms (PARTHASARATHY et al., 2011). While until 1999 India was the leading black pepper producer in the world with 76,000 metric tons (MT), by 2010 its production had declined to 51,000 MT (FAO, 2010).

Welcome message from author
This document is posted to help you gain knowledge. Please leave a comment to let me know what you think about it! Share it to your friends and learn new things together.
Transcript
Quarterly Journal of International Agriculture 54 (2015), No. 2: 133-161
Quarterly Journal of International Agriculture 54 (2015), No. 2; DLG-Verlag Frankfurt/M.
Adoption and Impact of Black Pepper Certification
in India
Priyanka Parvathi and Herman Waibel
Leibniz University of Hannover, Germany
Abstract
This paper analyses the adoption of organic farming under fair trade marketing
practices and its impact on household income of black pepper (piper nigrum) farmers
in India. We use a set of panel data, collected from 300 smallholder farmers who plant
black pepper as their main crop in 2010 and 2011.The aim of the paper is to
investigate the use of panel data for adoption models using the case of organic and fair
trade certified black pepper in Idukki district, Kerala, India. We compare two adoption
models: (i) a multinomial cross-section logit applied for both survey years separately
and (ii) a panel multinomial random effects logit model. The panel adoption model
which allows capturing unobserved heterogeneity in adoption decisions was found to
be superior over the cross section models. We find that farm size and market distance
are the major factors that influence adoption. To measure the differential gain of adop-
tion, we applied propensity score matching with multiple treatment effects accompanied
by sensitivity analysis to test robustness of impact results. Results show that certified
organic farmers have a significantly higher income but participation in fair trade
regimes does not generate additional monetary benefits.
Keywords: organic agriculture, fair trade, panel multinomial logit using gllamm,
propensity score matching, Kerala
JEL: Q1, Q120, Q160, Q180, Q550
1 Introduction
The Indian spices sector is an important part of the agricultural sector and its export
value was US$ 2,037.76 million in 2011-2012 (SBI, 2012). Currently in India, 60 out
of the 109 spices recognized by the International Organization for Standardization (ISO)
are grown. India’s share in the international market for spices is 25% and black pepper
(piper nigrum) amounts to 8% of Indian exports in value terms (PARTHASARATHY et
al., 2011).
While until 1999 India was the leading black pepper producer in the world with 76,000
metric tons (MT), by 2010 its production had declined to 51,000 MT (FAO, 2010).
134 Priyanka Parvathi and Herman Waibel
Quarterly Journal of International Agriculture 54 (2015), No. 2; DLG-Verlag Frankfurt/M.
From being a leading exporter of black pepper in the world, India became a net
importer (JEROMI, 2007). Productivity of black pepper in India is also low. Hence, it
only contributes 25% to global production even though more than 50% of the world´s
area of black pepper is in India. The decline in production in India is due to poor farm
management, depletion of soil fertility, natural calamity and outbreaks of diseases and
pests coupled with increasing input costs (HEMA et al., 2007, and GAFOOR et al.,
2007).
The production and profitability of black pepper is highly influenced by its international
price. This makes the revenues from black pepper highly volatile (HEMA et al., 2007).
The domestic price in India is further influenced by the instabilities in international
prices. This has made black pepper a risky crop. As a consequence, many black pepper
smallholder farmers in India have shifted to organic farming practices and have
adopted fair trade marketing.
While fair trade marketing practices have been introduced in India at least three decades
ago, organic farming is more recent and was officially recognized by the Indian Govern-
ment in 2000 only. The adoption of organic farming practices and the participation in
fair trade certification regimes provides access to global markets for smallholder
farmers (ADB, 2012). For the black pepper industry in India, organic black pepper
marketed under fair trade regimes, provides an opportunity to diversify agricultural
export markets. This can contribute to increased and a more stable income from agri-
culture. While certification improves production standards and labeling generates
economic and environmental benefits (WAIBEL and ZILBERMAN, 2007), conversion to
organic farming and entering fair trade marketing arrangements is not without costs to
farmers. To meet required production and product quality standards can be demanding,
especially for resource poor, less educated farmers. Nevertheless, as hypothesized by
PARVATHI and WAIBEL (2013) adopting both innovations can be mutually reinforcing.
Hence, this paper examines the factors that influence the adoption and impact of such
alternative farming systems.
While there are many papers that have analyzed adoption and impact of organic and
fair trade certification separately, so far there is no study that has examined the
combined effects of both certification schemes. Hence this research studies to what
extent black pepper produced organically and marketed under fair trade managements,
can improve income of smallholder farmers in India. Moreover, most of the adoption
studies do not explicitly examine the counterfactual analysis and the differential gain
of adoption. Therefore, we analyze the causal impact of adopting organic and both
organic and fair trade certification on smallholder livelihoods and welfare in terms of
total household income (JENA et al., 2012, and AMARE et al., 2012). In this context, the
objective of the paper is to answer the following questions:
Adoption and Impact of Black Pepper Certification in India 135
Quarterly Journal of International Agriculture 54 (2015), No. 2; DLG-Verlag Frankfurt/M.
1. What are the drivers that influence the adoption of organic and fair trade certifica-
tion systems by rural smallholder black pepper farmers?
2. What is the impact of organic and fair trade certified black pepper on household
welfare in terms of total income of the household?
Another contribution of this paper is to explore the value of panel analysis in identifying
adoption determinates in comparison to cross section analysis which is the common
approach followed in literature. The advantage of using panel data with random effects
in adoption analysis is that it helps to account for unobserved heterogeneity in adop-
tion decisions. For measuring welfare impact, we employ propensity score matching
with multiple treatment effects. Results show that organic farming does have a positive
impact on income but fair trade certification does not seem to add additional benefits.
The remainder of this paper is organized as follows. In the next section, the organic
and fair trade certification regarding black pepper are described followed by a literature
review in section three. Section four details conceptual framework and methodology
followed by a description of the data collection procedure and descriptive statistics in
section five. The results of the econometric analysis are discussed in section six. Section
seven concludes the paper.
2 Organic and Fair Trade Certified Black Pepper
Organic and fair trade standards are a recent phenomenon as far as the black pepper crop
is concerned. The problems of soil fertility in conventional black pepper production
popularized organic methods of production in India. Under organic standards, certified
black pepper farmers have to follow production methods that enhance soil fertility and
promote biodiversity. Moreover, organic certification systems are rigorous and require
a conversion period of a minimum three years (COULIBALY and LIU, 2006). During
this conversion period, the yields are low and smallholders may require additional
sources of income to meet their livelihood needs. However, certified organic farmers
can sell their black pepper at organic premium prices which are higher than conventional
market prices.
The international decline of black pepper prices in 2003-04 (HEMA et al., 2007)
prompted the introduction of fair trade standards for black pepper by the Fairtrade
Labeling Organization (FLO). Unlike coffee, in which fair trade standards and certifica-
tion was launched in 1988; it was only introduced for black pepper in 2005 by FLO
(FAIRTRADE INTERNATIONAL, 2014). A fair trade certificate offers black pepper
farmers certain advantages. In terms of price, it offers a minimum price and a price
premium. The minimum price protects farmers against fluctuating market prices by
136 Priyanka Parvathi and Herman Waibel
Quarterly Journal of International Agriculture 54 (2015), No. 2; DLG-Verlag Frankfurt/M.
providing a floor price. The price premium is a pro-poor social premium that is given
to the cooperative in which the smallholders are members. The cooperative can only use
this premium to improve the social conditions of the smallholders like building infra-
structure or educational institutions. This premium is not for the smallholder directly
and hence does not form a part of their income from black pepper. In addition to this,
an organic price differential is offered under fair trade certification systems for organic
black pepper farmers. This price differential is added to the minimum price. Hence,
organic farmers under fair trade have a higher minimum price as it includes the organic
price differential. In effect, an organic farmer under fair trade schemes would get the
organic market prices or the minimum fair trade organic price whichever is higher.
The primary difference between the two systems is pricing. Organic certification does
not offer any floor pricing. The minimum price offered by fair trade is intended to
protect farmers from downside risk. However, this is not the case for conventional
black pepper. As per FLO, the minimum fair trade price for conventional pepper does
not exist and is equivalent to its commercial price. With regard to organic pepper,
1.13€/kg (approximately INR 75/kg) is set as a floor price in 2005 (FAIRTRADE INTER-
NATIONAL, 2014a). Therefore, fair trade certification systems for black pepper seem to
protect only organic farmers from organic market price shocks. Hence, the benefit of a
fair trade certificate becomes significant for organic farmers only when the organic
black pepper prices falls below the minimum organic fair trade price for black pepper.
3 Literature Review
Most of the organic adoption studies in literature are based on cross section data and
apply a logit or a probit analysis (e.g. BURTON et al., 1999; KHALEDI et al., 2010, and
KOESLINGet al., 2008). Some studies like BURTON et al. (2003) use duration analysis
to explore the timing of adoption in a dynamic framework. Very few studies explore
panel adoption model. For example, PIETOLA and LANDINK (2001) use time series data
to identify determinants of organic farming. As they their data set is binary, they apply
a switching type probit model and find that decreasing output prices and increasing
direct subsidies for organic farming leads to its adoption in Finland. However, hardly
any study is available that uses a multinomial panel model.
Most of the organic and fair trade impact studies analyze welfare outcomes like house-
hold income or consumption expenditures using propensity score matching (PSM)
techniques (e.g. JENA et al., 2012; RUBEN and FORT, 2012, and ARNOULD et al., 2009).
JENA et al., 2012, find that although certification increases per capita income, it does
not contribute to poverty reduction among Ethiopian organic and fair trade certified
coffee farmers. However, in Peru, RUBEN and FORT, 2012, do not find any significant
Adoption and Impact of Black Pepper Certification in India 137
Quarterly Journal of International Agriculture 54 (2015), No. 2; DLG-Verlag Frankfurt/M.
income gains. Similarly only small household welfare impacts were found among fair
trade certified farmers in Peru, Nicaragua and Guatemala by ARNOULD et al. (2009).
Few studies like CHIPUTWA et al. (2015) compare three sustainability oriented standards
namely; fair trade, organic and UTZ using PSM with multiple treatment effects and
find that in general all categories of certified farmers have higher living standards than
conventional farmers. Though, in particular fair trade improves household living
standards more significantly than organic and UTZ in Uganda. However, most of the
fair trade impact studies pertain to coffee and find that certification increases well-
being of smallholders (e.g. VALKILA, 2009; VALKILA and NYGREN, 2010; BACON,
2005; BACON, 2010; RAYNOLDS, 2002). Some studies like KLEEMAN and ABUDALAI
(2013) analyze welfare outcomes in terms of return on investment (ROI) and find that
organic farmers have a higher ROI than conventional pineapple farmers in Ghana.
However, so far little is known on organic and fair trade black pepper adoption and its
impact. Hence, we contribute to this literature by applying a panel model to analyze
adoption determinants. We also apply propensity score matching with multiple treat-
ment effects drawing from LECHER (2002) to analyze the effect of adoption on house-
hold welfare measured in terms of household income.
4 Conceptual Framework and Methodology
4.1 Panel Model for Adoption Studies
Though economists regard technology adoption as a dynamic process, most of the
adoption studies use cross-section data. However, studies that are based on cross-
section data and compare adopters to non-adopters cannot be used to analyze the
characteristics of farmers at the time of adoption. This is because some variables might
be endogenous. For example, if in a cross-section adoption study farm size is found to
be a significant factor influencing adoption this does not necessarily imply that farmers
with larger landholdings are more likely to adopt because larger landholdings might be
a consequence of earlier adoption decisions. Also, static adoption models based on
cross-section data assume values of time varying variables as constant (BESLEY and
CASE, 1993). Using current household, farm and individual characteristics as explanatory
variables to describe adoption of an agricultural technology using cross-section data
can lead to a misinterpretation of results. While cross-section adoption regressions
may provide evidence on correlation, it does not necessarily prove causality.
Moreover, it could also be the case that unobserved variables (e.g. farm management
skills) influence farm size and certification status leading to spurious correlations.
138 Priyanka Parvathi and Herman Waibel
Quarterly Journal of International Agriculture 54 (2015), No. 2; DLG-Verlag Frankfurt/M.
Hence, adoption studies based on cross-section data can result in biased coefficients
with inconsistent estimates.
To overcome the problem of endogeneity due to unobserved heterogeneity, past and
recent research (BESLEY and CASE, 1993, and BARHAM et al., 2004) points out the
advantage of using panel data for adoption studies. The advantage of a panel model is
that it can account for spurious causality in adoption decisions and also establish
direction of causality in adoption analysis (BESLEY and CASE, 1993).
Though a perfect experimental design would be ideal, i.e. to follow adopters and non-
adopters of a technology before and after introduction with randomized treatments, a
second best solution is to have panel data after adoption. As pointed out by DOSS
(2006), to understand adoption, farmer’s decision needs to be followed over a period
of time. Also, panel data allow for controlling heterogeneity across households and
thereby accounts for endogenous regressors. Hence, the robustness of adoption models
can be improved using panel data, even if no dis-adoption or late adoption is observed
in the sample and the variability is only captured by the explanatory variables. The
classic adoption model of ROGERS (1995) assumes that adoption follows an S shaped
diffusion path in which the adoption dynamics depends on the differences across
farmer categories. We explore this facet by applying a panel adoption analysis and
compare it with a cross section analysis applied to two consecutive years. Hence, on
the basis of this foundation, we draw our first hypothesis that (a) panel model is more
precise to identify adoption determinants as compared to a cross section model. Also
based on the literature review in section 3, we hypothesize (b) adoption increases
household welfare measured in terms of household income.
4.2 Adoption Decision
In the literature numerous approaches to model farm technology adoption behavior of
farmers and to identify the key factors that facilitate such a decision have been
proposed. From an economic perspective final adoption of an agricultural innovation is
defined at the farm level as “the degree of use of a new technology in long-run
equilibrium when the farmer has full information about the new technology and its
potential” (FEDER et al., 1985: 256). The theoretical foundation of adoption is utility
theory, i.e. farmers make decisions in order to maximize their utility under uncertainty
(FEDER, 1980). Farmers choose an agricultural technology that maximizes their
expected utility of profits (DORFMAN, 1996).
In this paper, the farmer is faced with two agricultural innovations, organic agriculture
(A1) and both organic and fair trade certified farming (A2). Farmers may also choose
not to adopt either of the innovations and remain conventional farmers. This is
Adoption and Impact of Black Pepper Certification in India 139
Quarterly Journal of International Agriculture 54 (2015), No. 2; DLG-Verlag Frankfurt/M.
represented as A0. Therefore drawing from GREENE (2003), a farmer will adopt an
innovation only if:
V (q(i,j)
, X) ≥ V (q0, X); ε , where i = 1 and j = 2 (1)
where, V (q2, X, ε2), V (q
1, X, ε1) and V (q
0, X, ε0) are utility functions with each
technology adoption and no adoption respectively and ε2, ε1 and ε0 are assumed to be
independent and identically distributed with zero mean.
Based on PICKLES et al. (2006), we decompose the utilities presented in Equation (1)
for the three alternatives:
V0 = X0 + ε0 (2)
V1 = X1 + ε1 (3)
V2 = X2 + ε2 (4)
Assuming (ε1 - ε0) and (ε2 - ε0) follow independent logistic distributions, a multinomial
logit model (MNL) can be presented as:
Pr (𝑐ℎ𝑜𝑖𝑐𝑒 = 𝑖) = ʃ𝛿1ʃ𝛿2𝑒𝑥𝑝 (𝛽𝑖𝑋)
1+exp(𝛽𝑖𝑋)+exp(𝛽𝑗𝑋) , where i = 1 and j = 2 (5)
However, the assumption that the errors are independent gives rise to the independence
of irrelevant alternatives (IIA) property, which is seen as a limitation (MCFADDEN et
al., 1977). To overcome this limitation, we use generalized linear latent and mixed
models (gllamm) following RABE-HESKETH et al. (2004). The gllamm model allows
for the correlation between random components by introducing shared random effects, u:
V0 = X0 + u0 + ε0 (6)
V1 = X1 + u1 + ε1 (7)
V2 = X2 + u2 + ε2 (8)
But there could also be latent variables like farming skills that affect adoption
decisions. These latent variables are specified as 𝛿1 = (u1 – u0) and 𝛿2 = (u2 – u0) and
are assumed to follow a bivariate normal distribution. The correlations between
random components capture unobserved heterogeneity and hence lead to unbiased
parameter estimates of adoption determinants. Taking the first alternative, con-
ventional farming as the reference category; the two latent variables, 𝛿𝑗1 and 𝛿𝑗
2 are for
the other two categories, namely organic certified and both organic and fair trade
140 Priyanka Parvathi and Herman Waibel
Quarterly Journal of International Agriculture 54 (2015), No. 2; DLG-Verlag Frankfurt/M.
certified farming respectively. Therefore, MNL gllamm can be defined with the
inclusion of latent variables as:
Pr (𝑐ℎ𝑜𝑖𝑐𝑒, 𝑥 = 𝑖) = ʃ𝛿1ʃ𝛿2𝑒𝑥𝑝 (𝛽𝑖𝑋+𝛿1)
1+exp(𝛽𝑖𝑋+𝛿1)+exp(𝛽𝑗𝑋+𝛿2) d𝛿1𝛿2 , where i = 1 and j = 2 (9)
Integration is used as the individual values of the latent variable are not known. We
only know that they are distributed bivariate normal. Adaptive quadrature and a
modified Newton-Raphson procedure as implemented in RABE-HESKETH et al. (2002)
are used for the estimation of multinomial logit using gllamm. In this algorithm, the
probabilities associated with the possible values of the latent variables are computed.
These are then weighted by their likelihood of occurrence given the distributional
assumptions for the latent variables. Moreover, we expand the data in gllamm which
enables to include alternative specific covariates or random effects.
To sum up, there are specific advantages in using a panel multinomial logit with
random effects. First it allows to capture unobserved heterogeneity at the individual
level by introducing alternative specific random effects (𝛿𝑗1 and 𝛿𝑗
2 ). This helps to
account for heterogeneity in adoption decisions as a farmer´s decision to choose a
particular certification strategy might be partly related to unobserved farm and
individual characteristics. Second, it effectively captures individual choices that may
not likely be independent. This is made possible by capturing repeated observations
for the same household sharing the same unobserved random effects. Hence, panel
multinomial logit analysis using gllamm allows adoption determinates to be identified
while accounting for unobserved heterogeneity.
4.3 Differential Gain of Adoption
We use the impact evaluation approach to measure the differential gains of adoption.
Impact evaluation includes ex ante and ex post methods. In this paper, we employ an
ex post impact evaluation, wherein data is gathered after technology adoption, to
measure the actual benefit accrued to the farmers in terms of income from organic and
fair trade adoption. Impact assessment requires identifying a valid counterfactual. In
an ex post analysis, we cannot observe the outcome of adopters before adoption.
Hence we are faced with a potential self-selection bias. To overcome this problem a
counterfactual group has to be generated. There are several methods to correct such a
self-selection bias. These include propensity score matching (PSM) (ROSENBAUM and
RUBIN, 1983; PEARL, 2009), instrumental variable models (HECKMAN, 1997; IMBENS
and ANGRIST, 1994), Heckman selection model (HECKMAN, 1979; LEE, 2001) and
endogenous switching regression models (LOKSHIN and SAJAIA, 2004). In this study, a
Adoption and Impact of Black Pepper Certification in India 141
Quarterly Journal of International Agriculture 54 (2015), No. 2; DLG-Verlag Frankfurt/M.
stratified sampling technique with random sampling at the Taluk1 level was applied to
have adequate representation of the three farmer groups, namely conventional, organic
and both organic and fair trade certified smallholder farmers. This could inherently
lead to sample selection bias induced by non-random program enrollment. But PSM
helps to generate valid counterfactuals from a non-random sample (MEZZATESTA et
al., 2013). Hence, PSM is used to select reliable counterfactuals from a large pool of
conventional farmers in an area with similar conditions.
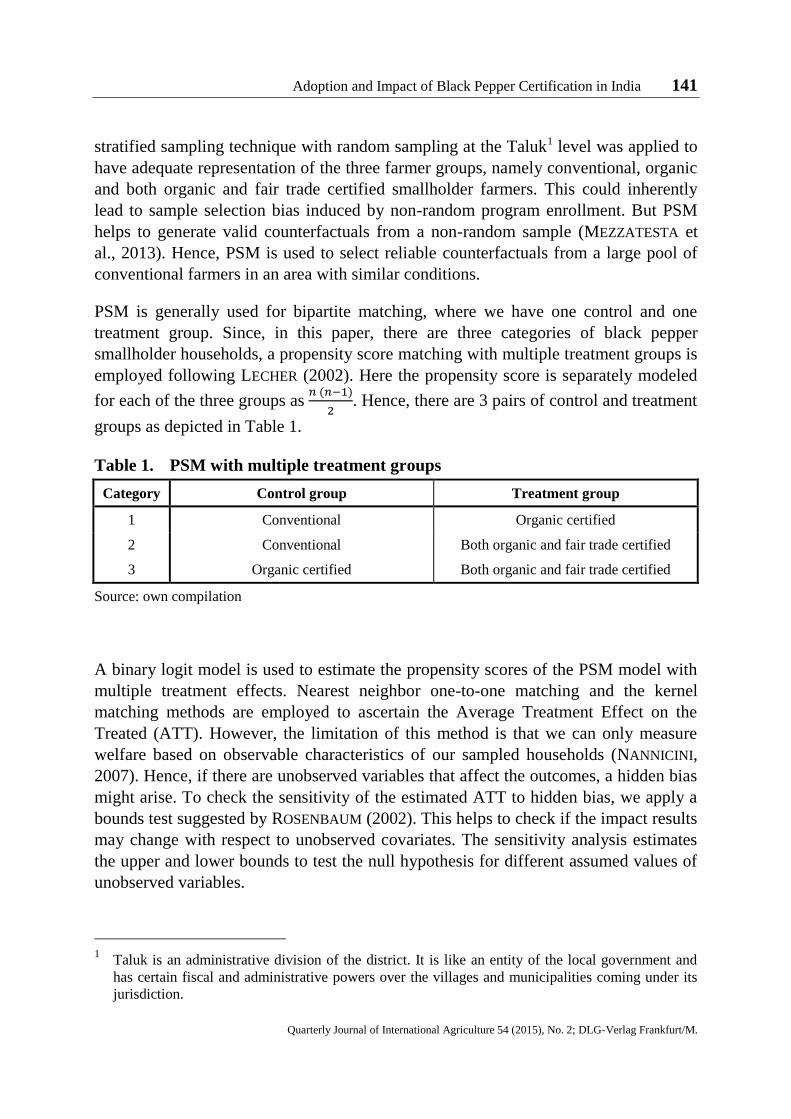
PSM is generally used for bipartite matching, where we have one control and one
treatment group. Since, in this paper, there are three categories of black pepper
smallholder households, a propensity score matching with multiple treatment groups is
employed following LECHER (2002). Here the propensity score is separately modeled
for each of the three groups as 𝑛 (𝑛−1)
2. Hence, there are 3 pairs of control and treatment
groups as depicted in Table 1.
Table 1. PSM with multiple treatment groups
Category Control group Treatment group
1 Conventional Organic certified
2 Conventional Both organic and fair trade certified
3 Organic certified Both organic and fair trade certified
Source: own compilation
A binary logit model is used to estimate the propensity scores of the PSM model with
multiple treatment effects. Nearest neighbor one-to-one matching and the kernel
matching methods are employed to ascertain the Average Treatment Effect on the
Treated (ATT). However, the limitation of this method is that we can only measure
welfare based on observable characteristics of our sampled households (NANNICINI,
2007). Hence, if there are unobserved variables that affect the outcomes, a hidden bias
might arise. To check the sensitivity of the estimated ATT to hidden bias, we apply a
bounds test suggested by ROSENBAUM (2002). This helps to check if the impact results
may change with respect to unobserved covariates. The sensitivity analysis estimates
the upper and lower bounds to test the null hypothesis for different assumed values of
unobserved variables.
1 Taluk is an administrative division of the district. It is like an entity of the local government and
has certain fiscal and administrative powers over the villages and municipalities coming under its
jurisdiction.
142 Priyanka Parvathi and Herman Waibel
Quarterly Journal of International Agriculture 54 (2015), No. 2; DLG-Verlag Frankfurt/M.
4.4 Choice of Explanatory Variables
In their seminal paper, FEDER et al. (1985) propose a wide range of explanatory
variables like household characteristics, socioeconomic and physical factors. These
same variables are also used in organic adoption studies both in developed and
developing countries (e.g. BURTON et al., 1999; BURTON et al., 2003; GENIUS et al.,
2006; BOLWIG et al., 2009). We represent household characteristics by including age,
level of education and farm experience of the household head. Availability of family
labor, farm size and access to irrigation are included in farm characteristics. Today
agricultural extension agencies play a significant role in information dissipation. Thus,
support received from extension agencies is also included as one of the independent
variables. Farmers may be more motivated to adopt advancement of new products or
technologies if market access is easy. Hence, distance to market is included as a
variable. In terms of income, farmers having additional sources of income, apart from
agriculture, may be better equipped to diversify the risk of adoption. To capture this,
access to non-farm income is included. An easy credit access is useful to invest in
agricultural advancements like organic and fair trade certified agriculture. This is
captured in terms of the variable, access to credit. The wealth effects are represented
through owning livestock assets.
5 Data and Descriptive Statistics
Black pepper in India is primarily cultivated in the Malabar Coast, state of Kerala.
This state accounts for nearly 97% of the total black pepper production in India (HEMA
et al., 2007). It is the major source of income and employment for the rural households
in Kerala, wherein two million farm households are involved in black pepper culti-
vation. Idukki is the largest black pepper producing district in Kerala and, therefore, it
is chosen as our study area.
Idukki is situated in the top Western Ghats surrounded by mountains. Around 86% of
the population in Idukki is involved in agricultural activities. The major sources of
income are from black pepper, cardamom, tea, rubber and coffee production (DISTRICT
ADMINISTRATION, 2011). Idukki has 37.92% of the total black pepper area of Kerala
and the contribution of black pepper to total agricultural income is around 20% (SBI,
2008, and ESD, 2011).
In Idukki, the taluks of Udumbanchola and Peerumedu were non-randomly selected as
they grow majority of black pepper in the district. Udumbanchola is the largest taluk in
Idukki and has 23 villages in total. Peerumedu has 10 villages. Both these taluks share
the same topography and are covered by rugged mountains and forests. They experience
moderate rainfall and minimum seasonal variation.
Adoption and Impact of Black Pepper Certification in India 143
Quarterly Journal of International Agriculture 54 (2015), No. 2; DLG-Verlag Frankfurt/M.
A list of smallholder conventional black pepper farmers were obtained from the agri-
cultural office of Idukki district for these two taluks. With regard to certified farmers,
the details were collected from a local Non-Government Organisation (NGO), called
Peermade Development Society (PDS). It is the largest NGO operating in the district
and is a promoter of organic cultivation and fair trade marketing practices. Details of
smallholder farmers who are organic certified and both organic and fair trade certified
were obtained from PDS. Hence, in terms of management regimes, we have three
groups of smallholder black pepper farmers namely: (a) conventional (b) organic and
(c) both organic and fair trade certified. We do not have an “only fair trade” certified
category. This is because in Idukki, farmers with conventional practices but who
practice fair trade certified black pepper are usually large scale tea planters who grow
some black pepper as an intercrop. Their minimum landholding is 10 hectares.
However, this study was focussed on smallholders, i.e. farmers with less than five
hectares of farm land.
It was seen from both lists that all the conventional farmers were concentrated in
Udumbanchola. But the organic and both organic and fair trade certified farmers were
spread out in both of these taluks, though more than 50% were from Peerumedu. There
was no village in these taluks that represented all the three categories of farmers in the
lists provided. As the NGO is situated in Peerumedu, it is more active in that region
and is only in the process of expanding in other areas of Idukki.
From these obtained lists, a sample of 100 farmers was randomly chosen for each
category. Hence, a total of 300 farmers were chosen. These 300 farmers come from
9 villages in Udumbanchola and 5 villages in Peerumedu. Thereby, a total of 300 farmers
were surveyed in 2011 from 14 villages in Idukki. In 2012, due to attrition of 3 con-
ventional famers, data was collected from a total of 297 farmers. Also, there was no
dis-adoption or late-adoption observed in the sample in 2012.
In such a sampling scenario, applying a panel model is better to control for unobserved
heterogeneity in the adoption decision regression. Moreover, employing PSM for
impact analysis is credible as it helps to select a valid counterfactual from an area
where organic and organic fair trade is still not widely introduced. Furthermore, as
both the taluks where these 14 villages are located share similar topographical and
climatic conditions, they can provide an effective counterfactual group for the PSM
analysis.
In the surveys, farmers were asked about prior production year, i.e. 2010 and 2011,
respectively. Panel data was collected for two consecutive years in order to measure
changes from production decisions that go beyond one year. This also helped to
account for endogenous explanatory variables. A household survey questionnaire was
144 Priyanka Parvathi and Herman Waibel
Quarterly Journal of International Agriculture 54 (2015), No. 2; DLG-Verlag Frankfurt/M.
used to elicit information about household characteristics, agricultural activities, off-
farm employment, asset endowments, credit access and consumption expenditure.
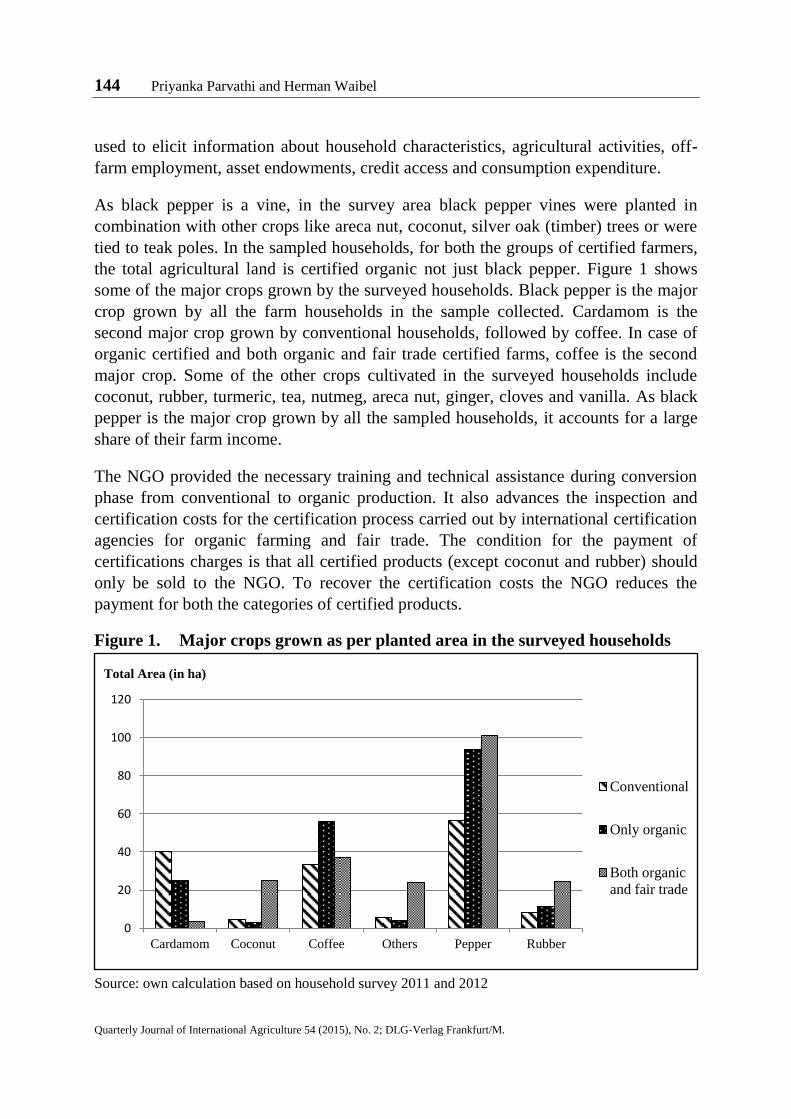
As black pepper is a vine, in the survey area black pepper vines were planted in
combination with other crops like areca nut, coconut, silver oak (timber) trees or were
tied to teak poles. In the sampled households, for both the groups of certified farmers,
the total agricultural land is certified organic not just black pepper. Figure 1 shows
some of the major crops grown by the surveyed households. Black pepper is the major
crop grown by all the farm households in the sample collected. Cardamom is the
second major crop grown by conventional households, followed by coffee. In case of
organic certified and both organic and fair trade certified farms, coffee is the second
major crop. Some of the other crops cultivated in the surveyed households include
coconut, rubber, turmeric, tea, nutmeg, areca nut, ginger, cloves and vanilla. As black
pepper is the major crop grown by all the sampled households, it accounts for a large
share of their farm income.
The NGO provided the necessary training and technical assistance during conversion
phase from conventional to organic production. It also advances the inspection and
certification costs for the certification process carried out by international certification
agencies for organic farming and fair trade. The condition for the payment of
certifications charges is that all certified products (except coconut and rubber) should
only be sold to the NGO. To recover the certification costs the NGO reduces the
payment for both the categories of certified products.
Figure 1. Major crops grown as per planted area in the surveyed households
Source: own calculation based on household survey 2011 and 2012
0
20
40
60
80
100
120
Cardamom Coconut Coffee Others Pepper Rubber
Conventional
Only organic
Both organic
and fair trade
Total Area (in ha)
Adoption and Impact of Black Pepper Certification in India 145
Quarterly Journal of International Agriculture 54 (2015), No. 2; DLG-Verlag Frankfurt/M.
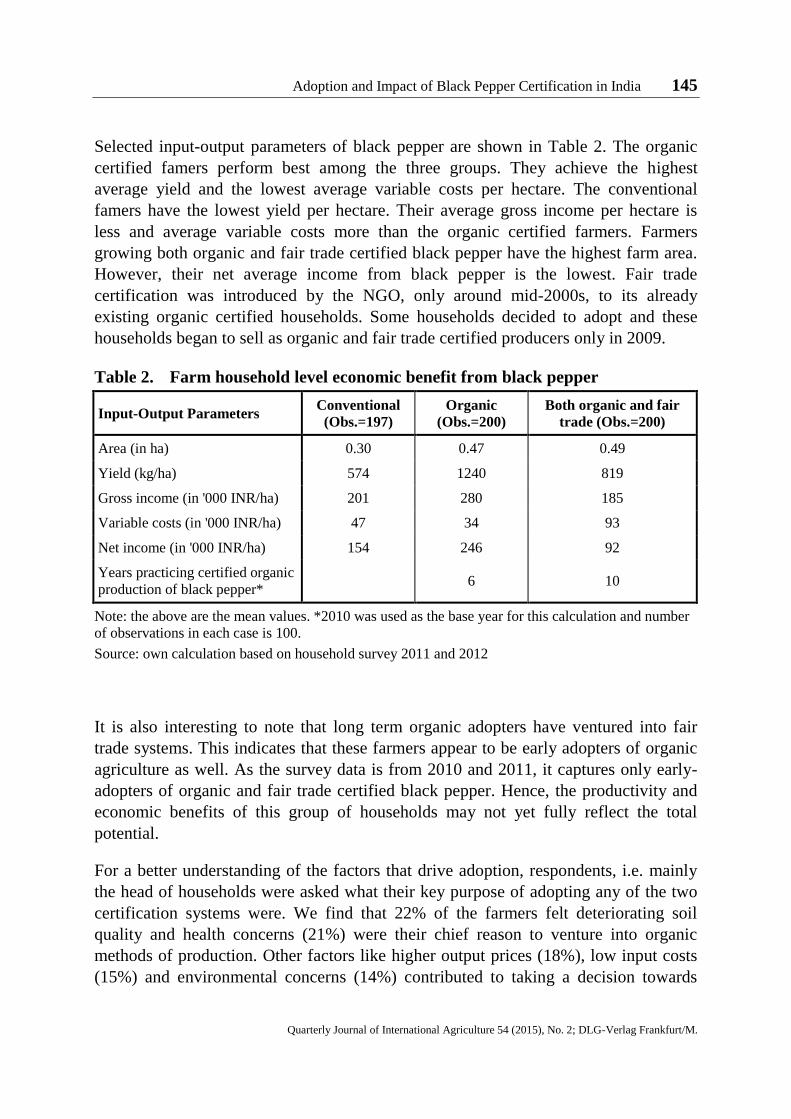
Selected input-output parameters of black pepper are shown in Table 2. The organic
certified famers perform best among the three groups. They achieve the highest
average yield and the lowest average variable costs per hectare. The conventional
famers have the lowest yield per hectare. Their average gross income per hectare is
less and average variable costs more than the organic certified farmers. Farmers
growing both organic and fair trade certified black pepper have the highest farm area.
However, their net average income from black pepper is the lowest. Fair trade
certification was introduced by the NGO, only around mid-2000s, to its already
existing organic certified households. Some households decided to adopt and these
households began to sell as organic and fair trade certified producers only in 2009.
Table 2. Farm household level economic benefit from black pepper
Input-Output Parameters Conventional
(Obs.=197)
Organic
(Obs.=200)
Both organic and fair
trade (Obs.=200)
Area (in ha) 0.30 0.47 0.49
Yield (kg/ha) 574 1240 819
Gross income (in '000 INR/ha) 201 280 185
Variable costs (in '000 INR/ha) 47 34 93
Net income (in '000 INR/ha) 154 246 92
Years practicing certified organic
production of black pepper* 6 10
Note: the above are the mean values. *2010 was used as the base year for this calculation and number
of observations in each case is 100.
Source: own calculation based on household survey 2011 and 2012
It is also interesting to note that long term organic adopters have ventured into fair
trade systems. This indicates that these farmers appear to be early adopters of organic
agriculture as well. As the survey data is from 2010 and 2011, it captures only early-
adopters of organic and fair trade certified black pepper. Hence, the productivity and
economic benefits of this group of households may not yet fully reflect the total
potential.
For a better understanding of the factors that drive adoption, respondents, i.e. mainly
the head of households were asked what their key purpose of adopting any of the two
certification systems were. We find that 22% of the farmers felt deteriorating soil
quality and health concerns (21%) were their chief reason to venture into organic
methods of production. Other factors like higher output prices (18%), low input costs
(15%) and environmental concerns (14%) contributed to taking a decision towards
146 Priyanka Parvathi and Herman Waibel
Quarterly Journal of International Agriculture 54 (2015), No. 2; DLG-Verlag Frankfurt/M.
converting to organic cultivation. The possibility of an assurance of a minimum price
(65%) was one of the chief drivers that made organic certified farmers also enter fair
trade marketing practices.
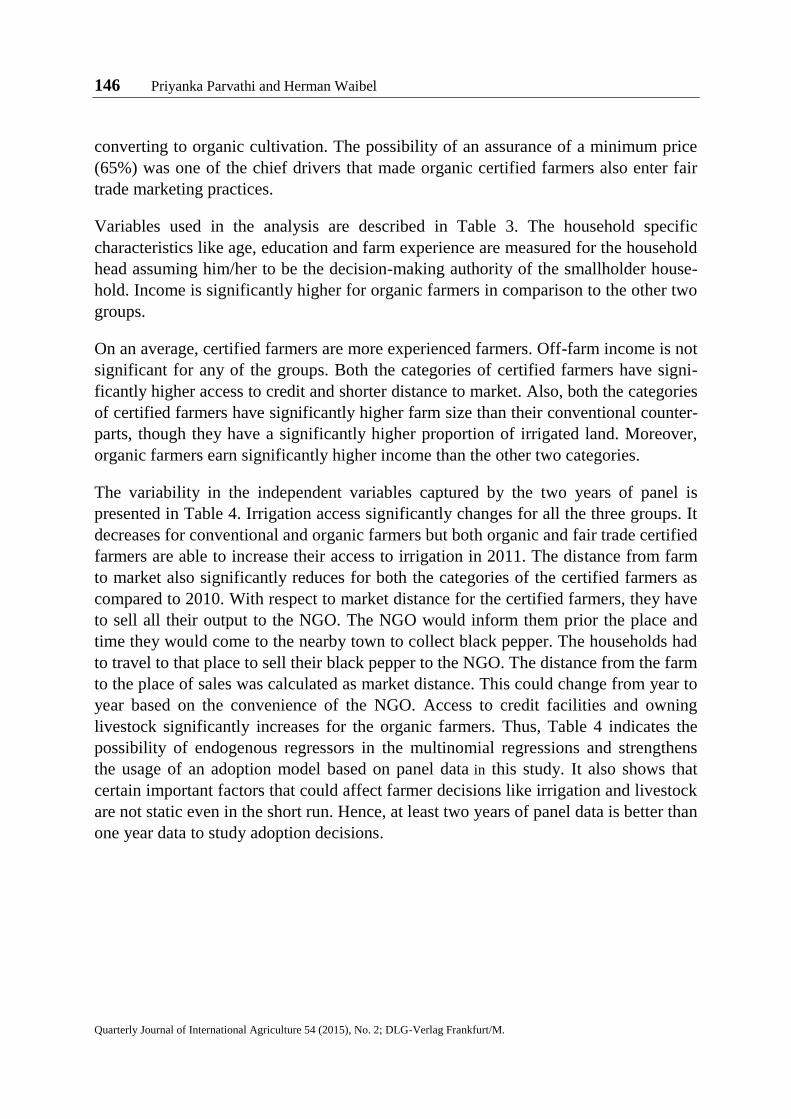
Variables used in the analysis are described in Table 3. The household specific
characteristics like age, education and farm experience are measured for the household
head assuming him/her to be the decision-making authority of the smallholder house-
hold. Income is significantly higher for organic farmers in comparison to the other two
groups.
On an average, certified farmers are more experienced farmers. Off-farm income is not
significant for any of the groups. Both the categories of certified farmers have signi-
ficantly higher access to credit and shorter distance to market. Also, both the categories
of certified farmers have significantly higher farm size than their conventional counter-
parts, though they have a significantly higher proportion of irrigated land. Moreover,
organic farmers earn significantly higher income than the other two categories.
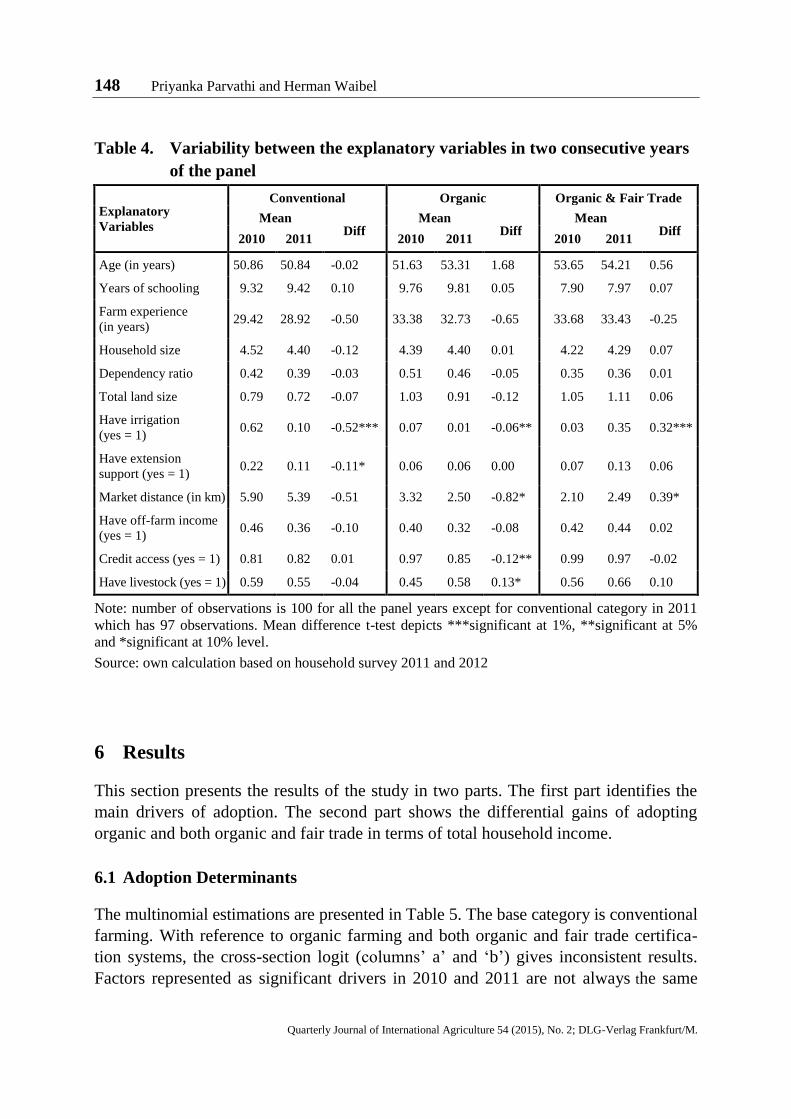
The variability in the independent variables captured by the two years of panel is
presented in Table 4. Irrigation access significantly changes for all the three groups. It
decreases for conventional and organic farmers but both organic and fair trade certified
farmers are able to increase their access to irrigation in 2011. The distance from farm
to market also significantly reduces for both the categories of the certified farmers as
compared to 2010. With respect to market distance for the certified farmers, they have
to sell all their output to the NGO. The NGO would inform them prior the place and
time they would come to the nearby town to collect black pepper. The households had
to travel to that place to sell their black pepper to the NGO. The distance from the farm
to the place of sales was calculated as market distance. This could change from year to
year based on the convenience of the NGO. Access to credit facilities and owning
livestock significantly increases for the organic farmers. Thus, Table 4 indicates the
possibility of endogenous regressors in the multinomial regressions and strengthens
the usage of an adoption model based on panel data in this study. It also shows that
certain important factors that could affect farmer decisions like irrigation and livestock
are not static even in the short run. Hence, at least two years of panel data is better than
one year data to study adoption decisions.
Quarterly Journal of International Agriculture 54 (2015), No. 2; DLG-Verlag Frankfurt/M.
Table 3. Description and summary statistics of variables
Variable Description Mean
Con Org
T test
Mean Diff OFT
T test
Mean Diff
T test
Mean Diff
Mean Mean (Con - Org) Mean (Con - OFT) (Org - OFT)
Age Age of the household head in years 52.26 50.85 51.97 -1.12 53.93 -3.08 ** -1.96 *
Years of
schooling
Education of the household head in
years
9.03 9.37 9.79 -0.41 7.94 1.44 *** 1.85 ***
Farm
experience
The farming experience of the
household head in years
31.94 29.17 33.06 -3.88 ** 33.56 -4.38 *** -0.50
Household
size
Total number of members in the
household
4.37 4.46 4.40 0.07 4.26 0.21 0.14
Dependency
ratio
The total household members below
15 and above 65 divided by the rest
of the household members
0.41 0.40 0.49 -0.09 * 0.35 0.05 0.14 **
Total
Landsize
Total size of the farm in hectares 0.94 0.76 0.97 -0.22 *** 1.08 -0.33 *** -0.11
Have
irrigation
If the household has irrigation
facility (yes = 1 and no = 0)
0.2 0.37 0.04 0.33 *** 0.19 0.18 *** -0.15 ***
Extension
support
If the household had access to exten-
sion support (yes = 1 and no = 0)
0.11 0.17 0.06 0.11 *** 0.10 0.07 ** -0.04
Market
distance
The distance from farm to market in
kilometers
3.61 5.65 2.91 2.73 ** 2.29 3.35 *** 0.62 **
Have Off-
farm access
If the household has off-farm
income (yes = 1 and no = 0)
0.4 0.41 0.36 0.05 0.43 -0.02 -0.07
Credit
access
If the household had access to credit
(yes = 1 and no = 0)
0.9 0.82 0.91 -0.09 *** 0.98 -0.16 *** -0.07 ***
Have
livestock
If the household has livestock
(yes = 1 and no = 0)
0.57 0.57 0.52 0.06 0.61 -0.04 -0.10 *
Dependent Variable
Income per
capita
Total income of the household
divided by the total household size
17741 40542 -22801 *** 27461 -9720 ** 13081 *
Number of Observations 597 197 200 200
Note: average exchange rate during the panel survey years was 1US$ = 50 INR. Con: Conventional, Org: Organic and OFT: Organic and Fair Trade
Source: own compilation based on household survey 2011 and 2012
148 Priyanka Parvathi and Herman Waibel
Quarterly Journal of International Agriculture 54 (2015), No. 2; DLG-Verlag Frankfurt/M.
Table 4. Variability between the explanatory variables in two consecutive years
of the panel
Explanatory
Variables
Conventional Organic Organic & Fair Trade
Mean Diff
Mean Diff
Mean Diff
2010 2011 2010 2011 2010 2011
Age (in years) 50.86 50.84 -0.02 51.63 53.31 1.68 53.65 54.21 0.56
Years of schooling 9.32 9.42 0.10 9.76 9.81 0.05 7.90 7.97 0.07
Farm experience
(in years) 29.42 28.92 -0.50 33.38 32.73 -0.65 33.68 33.43 -0.25
Household size 4.52 4.40 -0.12 4.39 4.40 0.01 4.22 4.29 0.07
Dependency ratio 0.42 0.39 -0.03 0.51 0.46 -0.05 0.35 0.36 0.01
Total land size 0.79 0.72 -0.07 1.03 0.91 -0.12 1.05 1.11 0.06
Have irrigation
(yes = 1) 0.62 0.10 -0.52*** 0.07 0.01 -0.06** 0.03 0.35 0.32***
Have extension
support (yes = 1) 0.22 0.11 -0.11* 0.06 0.06 0.00 0.07 0.13 0.06
Market distance (in km) 5.90 5.39 -0.51 3.32 2.50 -0.82* 2.10 2.49 0.39*
Have off-farm income
(yes = 1) 0.46 0.36 -0.10 0.40 0.32 -0.08 0.42 0.44 0.02
Credit access (yes = 1) 0.81 0.82 0.01 0.97 0.85 -0.12** 0.99 0.97 -0.02
Have livestock (yes = 1) 0.59 0.55 -0.04 0.45 0.58 0.13* 0.56 0.66 0.10
Note: number of observations is 100 for all the panel years except for conventional category in 2011
which has 97 observations. Mean difference t-test depicts ***significant at 1%, **significant at 5%
and *significant at 10% level.
Source: own calculation based on household survey 2011 and 2012
6 Results
This section presents the results of the study in two parts. The first part identifies the
main drivers of adoption. The second part shows the differential gains of adopting
organic and both organic and fair trade in terms of total household income.
6.1 Adoption Determinants
The multinomial estimations are presented in Table 5. The base category is conventional
farming. With reference to organic farming and both organic and fair trade certifica-
tion systems, the cross-section logit (columns’ a’ and ‘b’) gives inconsistent results.
Factors represented as significant drivers in 2010 and 2011 are not always the same
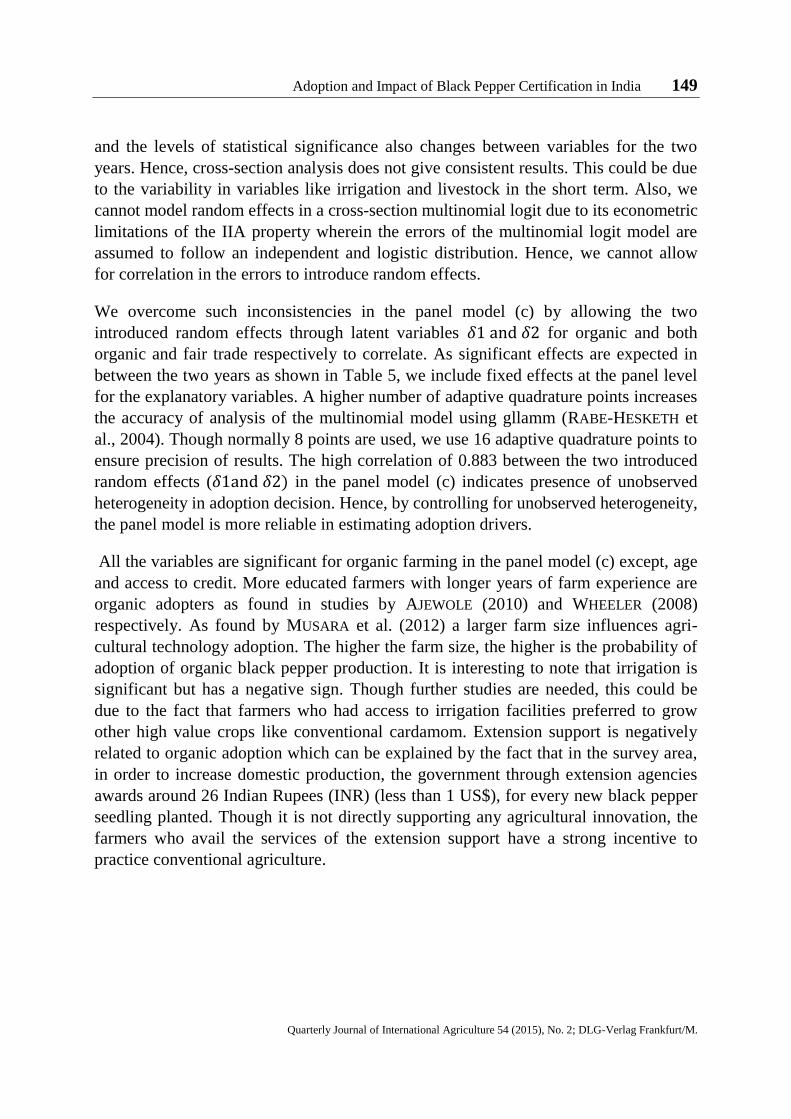
Adoption and Impact of Black Pepper Certification in India 149
Quarterly Journal of International Agriculture 54 (2015), No. 2; DLG-Verlag Frankfurt/M.
and the levels of statistical significance also changes between variables for the two
years. Hence, cross-section analysis does not give consistent results. This could be due
to the variability in variables like irrigation and livestock in the short term. Also, we
cannot model random effects in a cross-section multinomial logit due to its econometric
limitations of the IIA property wherein the errors of the multinomial logit model are
assumed to follow an independent and logistic distribution. Hence, we cannot allow
for correlation in the errors to introduce random effects.
We overcome such inconsistencies in the panel model (c) by allowing the two
introduced random effects through latent variables 𝛿1 and 𝛿2 for organic and both
organic and fair trade respectively to correlate. As significant effects are expected in
between the two years as shown in Table 5, we include fixed effects at the panel level
for the explanatory variables. A higher number of adaptive quadrature points increases
the accuracy of analysis of the multinomial model using gllamm (RABE-HESKETH et
al., 2004). Though normally 8 points are used, we use 16 adaptive quadrature points to
ensure precision of results. The high correlation of 0.883 between the two introduced
random effects (𝛿1and 𝛿2) in the panel model (c) indicates presence of unobserved
heterogeneity in adoption decision. Hence, by controlling for unobserved heterogeneity,
the panel model is more reliable in estimating adoption drivers.
All the variables are significant for organic farming in the panel model (c) except, age
and access to credit. More educated farmers with longer years of farm experience are
organic adopters as found in studies by AJEWOLE (2010) and WHEELER (2008)
respectively. As found by MUSARA et al. (2012) a larger farm size influences agri-
cultural technology adoption. The higher the farm size, the higher is the probability of
adoption of organic black pepper production. It is interesting to note that irrigation is
significant but has a negative sign. Though further studies are needed, this could be
due to the fact that farmers who had access to irrigation facilities preferred to grow
other high value crops like conventional cardamom. Extension support is negatively
related to organic adoption which can be explained by the fact that in the survey area,
in order to increase domestic production, the government through extension agencies
awards around 26 Indian Rupees (INR) (less than 1 US$), for every new black pepper
seedling planted. Though it is not directly supporting any agricultural innovation, the
farmers who avail the services of the extension support have a strong incentive to
practice conventional agriculture.
150 Priyanka Parvathi and Herman Waibel
Quarterly Journal of International Agriculture 54 (2015), No. 2; DLG-Verlag Frankfurt/M.
Table 5. MNL cross section (a) and (b) and MNL panel gllamm (c) results
Base Category - Conventional (a)
2010
(b)
2011
(c)
Panel
Organic
Variables Coef. Coef. Coef.
Age (years) -0.097 *** -0.019 -0.048
(0.037) (0.029) (0.034)
Years of schooling 0.040 0.048 0.047 ***
(0.090) (0.062) (0.004)
Farm experience (years) 0.127 *** 0.043 * 0.072 **
(0.032) (0.023) (0.034)
Household size -0.174 -0.104 -0.127 ***
(0.222) (0.155) (0.033)
Dependency ratio 0.102 0.532 0.410 **
(0.587) (0.430) (0.189)
Total land size (log) 1.524 *** 0.698 *** 0.955 ***
(0.399) (0.215) (0.342)
Have irrigation (yes = 1) -4.492 *** -2.574 ** -3.102 ***
(0.722) (1.110) (0.664)
Have extension support (yes = 1) -1.131 * -0.337 -0.820 ***
(0.681) (0.747) (0.311)
Market distance in km (log) -0.707 *** -1.028 *** -0.649 ***
(0.270) (0.276) (0.176)
Have off-farm income (yes = 1) -0.060 0.233 0.221 **
(0.552) (0.338) (0.086)
credit access (yes = 1) 2.070 *** -0.073 0.555
(0.700) (0.454) (0.800)
have livestock (yes = 1) -0.742 -0.295 -0.501 ***
(0.458) (0.310) (0.178)
_Cons 2.334 -1.109 1.406 **
(2.127) (1.498) (0.664)

Adoption and Impact of Black Pepper Certification in India 151
Quarterly Journal of International Agriculture 54 (2015), No. 2; DLG-Verlag Frankfurt/M.
Table 5. MNL cross section (a) and (b) and MNL panel gllamm (c) results (cont.)
Base Category - Conventional
(a)
2010
(b)
2011
(c)
Panel
Organic and Fair Trade
Variables Coef. Coef. Coef.
Age (years) -0.087 ** -0.014 -0.028
(0.041) (0.031) (0.033)
Years of schooling -0.204 ** -0.164 ** -0.189 ***
(0.097) (0.068) (0.017)
Farm experience (years) 0.106 *** 0.008 0.031
(0.036) (0.024) (0.041)
Household size -0.329 -0.229 -0.297 ***
(0.222) (0.172) (0.032)
Dependency ratio -0.123 0.356 0.272
(0.612) (0.481) (0.227)
Total land size (log) 1.676 *** 1.139 *** 1.249 ***
(0.424) (0.261) (0.176)
Have irrigation (yes = 1) -5.350 *** 1.363 *** -1.342
(0.773) (0.509) (2.369)
Have extension support (yes = 1) -1.173 * 0.545 -0.521
(0.670) (0.546) (0.706)
Market distance in km (log) -1.183 *** -1.217 *** -0.899 ***
(0.283) (0.315) (0.028)
Have off-farm income (yes = 1) -0.397 0.424 0.264
(0.549) (0.354) (0.330)
credit access (yes = 1) 4.411 *** 1.406 ** 2.326 **
(1.365) (0.681) (1.118)
have livestock (yes = 1) -0.223 0.182 -0.043
(0.476) (0.355) (0.141)
_Cons 3.369 2.472 2.654 ***
(2.512) (1.617) (0.603)
Log Likelihood -204.596 -253.258 -515.158
Condition number 1263.431
Correlation of random effects
Cor (𝛿1𝛿2)
0.883
Observations 300 297 1791
Note: robust standard errors in parenthesis. Panel analysis using gllamm is with 16 adaptive quadrature
points. ***significant at 1%, **significant at 5% and *significant at 10% level. The number of
observations in panel (c) is 1791 as to incorporate random effects the MNL gllamm model expands the
dataset so that there is one record for each alternative for each observation (i.e. (300+297)*3).
Source: own calculation based on household survey 2011 and 2012
152 Priyanka Parvathi and Herman Waibel
Quarterly Journal of International Agriculture 54 (2015), No. 2; DLG-Verlag Frankfurt/M.
A shorter distance to market and having access to off-farm income increases organic
adoption. Owning livestock is used as an asset indicator in this study. Contrary to other
findings (FEDER et al., 1985; SARKER et al., 2009; SHARIFI et al., 2010; OELOFSE et al.,
2010), it is noted that it is negatively related to organic adoption. But, since in this
study most of the support for adoption including organic manure is provided by the
NGO, even farmers who do not own many assets appear to be motivated to adopt
organic black pepper. Also, though more studies are required, multi-cropping increases
soil fertility as pointed out by DADAL et al. (1991) and perhaps this reduces the need
for manure and fertilizers.
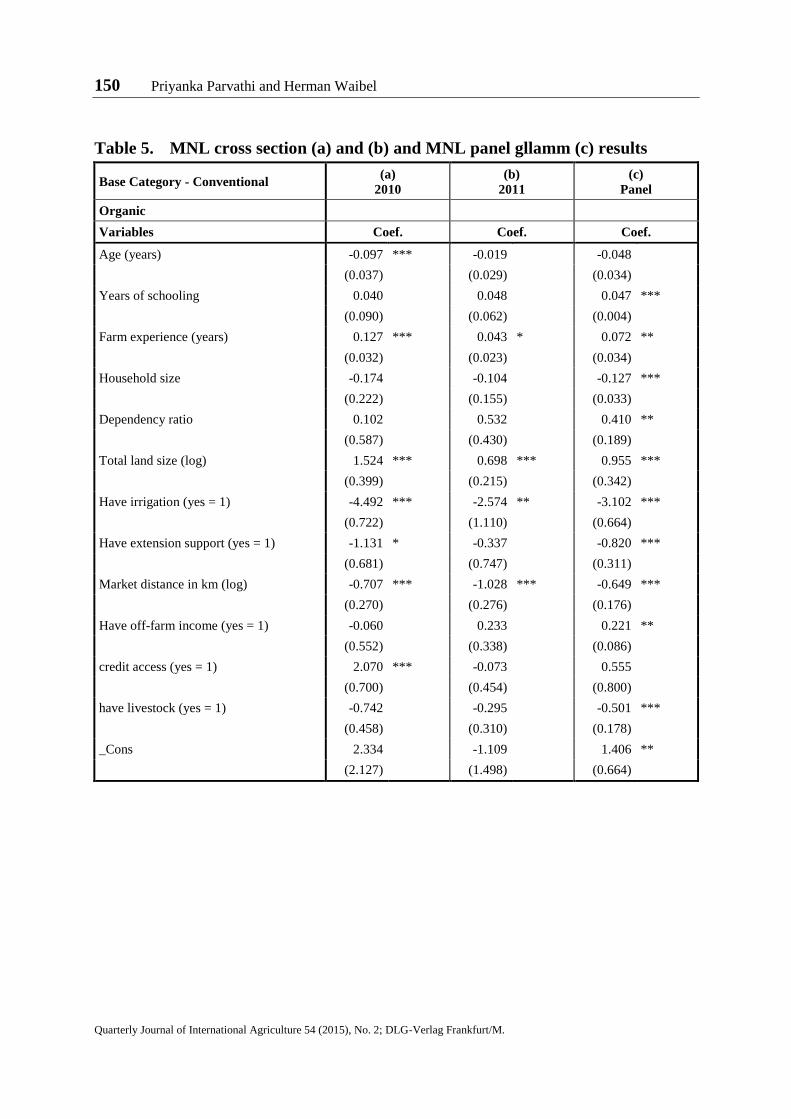
The variables education, household and farm size, distance to market and credit access
are significant with regard to both organic and fair trade adoption in the panel model.
The less educated farmers are adopters of organic fair trade. This could be because of
the awareness programs conducted by the NGO in the survey area. The higher the
farm size, the more driven the farmers are to adopt organic fair trade. A shorter
distance to market proves an impetus to smallholders to explore organic and fair trade
agriculture. This could be probably attributed to reduced transportation costs. Having
an easy access to credit stimulates its adoption.
The panel adoption model (model c) accounts for endogenous regressors due to
unobserved heterogeneity and thereby gives more reliable parameter estimates and
determinants of organic and both organic and fair trade certified black pepper. Hence,
these results do not reject our first hypothesis that a panel model provides a better
identification of adoption determinants. As can be seen from the results, in the
presence of unobserved heterogeneity, the panel model is more robust. The
determinants for adoption of organic black pepper and for both organic and fair trade
are not the same. For example, education is positively related to organic adoption and
negatively with both organic and fair trade adoption. This could be specific to black
pepper in Idukki because though education helps farmers understand the food safety,
environmental and health aspects of organic black pepper farming, the awareness
programs conducted by the NGO seems to have played a major role in driving the less
educated organic farmers to sell under fair trade marketing schemes. Credit access is
observed to be more important for organic farmers to venture into fair trade
certifications though it did not play a determining role when adopting organic
certification.
Overall, total farm size plays a critical role in adoption. It is highly significant at 1% in
all the models (a, b and c) for organic and both organic and fair trade adoption. Having
accounted for unobserved heterogeneity in the panel model (c), we find that these
innovations are tend to be favored by farmers with a larger farm size. This is consistent
with other findings in literature (MUSARA et al., 2012, and CHOUICHOM and YAMAO,
Adoption and Impact of Black Pepper Certification in India 153
Quarterly Journal of International Agriculture 54 (2015), No. 2; DLG-Verlag Frankfurt/M.
2010). Also, farmers with a larger area have easier access to credit (WEIL, 1970). The
variable, distance from farm to market is also highly significant at 1% for both the
farming alternatives as found in other studies like DADI et al. (2004).
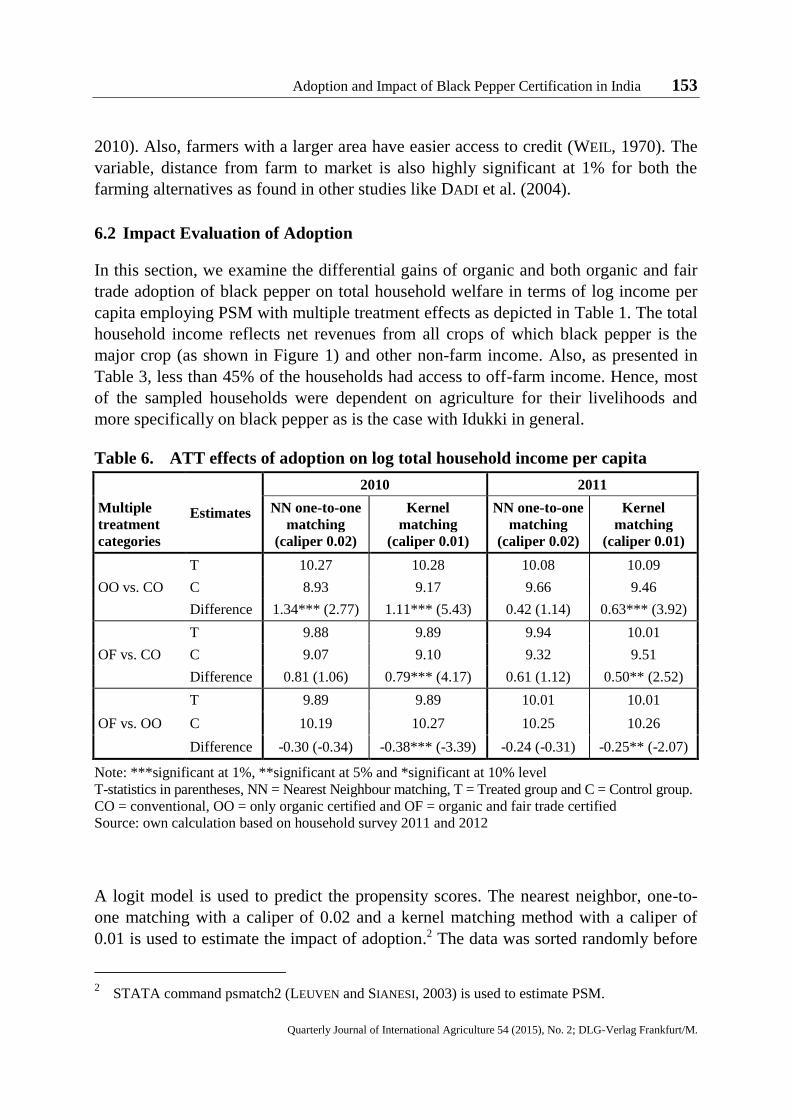
6.2 Impact Evaluation of Adoption
In this section, we examine the differential gains of organic and both organic and fair
trade adoption of black pepper on total household welfare in terms of log income per
capita employing PSM with multiple treatment effects as depicted in Table 1. The total
household income reflects net revenues from all crops of which black pepper is the
major crop (as shown in Figure 1) and other non-farm income. Also, as presented in
Table 3, less than 45% of the households had access to off-farm income. Hence, most
of the sampled households were dependent on agriculture for their livelihoods and
more specifically on black pepper as is the case with Idukki in general.
Table 6. ATT effects of adoption on log total household income per capita
Multiple
treatment
categories
Estimates
2010 2011
NN one-to-one
matching
(caliper 0.02)
Kernel
matching
(caliper 0.01)
NN one-to-one
matching
(caliper 0.02)
Kernel
matching
(caliper 0.01)
OO vs. CO
T 10.27 10.28 10.08 10.09
C 8.93 9.17 9.66 9.46
Difference 1.34*** (2.77) 1.11*** (5.43) 0.42 (1.14) 0.63*** (3.92)
OF vs. CO
T 9.88 9.89 9.94 10.01
C 9.07 9.10 9.32 9.51
Difference 0.81 (1.06) 0.79*** (4.17) 0.61 (1.12) 0.50** (2.52)
OF vs. OO
T 9.89 9.89 10.01 10.01
C 10.19 10.27 10.25 10.26
Difference -0.30 (-0.34) -0.38*** (-3.39) -0.24 (-0.31) -0.25** (-2.07)
Note: ***significant at 1%, **significant at 5% and *significant at 10% level
T-statistics in parentheses, NN = Nearest Neighbour matching, T = Treated group and C = Control group.
CO = conventional, OO = only organic certified and OF = organic and fair trade certified
Source: own calculation based on household survey 2011 and 2012
A logit model is used to predict the propensity scores. The nearest neighbor, one-to-
one matching with a caliper of 0.02 and a kernel matching method with a caliper of
0.01 is used to estimate the impact of adoption.2 The data was sorted randomly before
2 STATA command psmatch2 (LEUVEN and SIANESI, 2003) is used to estimate PSM.
154 Priyanka Parvathi and Herman Waibel
Quarterly Journal of International Agriculture 54 (2015), No. 2; DLG-Verlag Frankfurt/M.
matching to reduce potential bias. The evaluation is separate for each cross-section
year, as we do not have data before and after adoption for the same households to
employ the double difference PSM approach. Nonetheless, applying PSM to each year
separately enables us to establish consistency of results. All the 200 observations in
each category for both the years are retained in kernel matching but only around 75%
is retained after one-to-one nearest neighbor matching. The adoption effect on total log
income per capita is presented in Table 6 for the year 2010 and 2011, respectively.
The kernel matching shows that adopters of organic black pepper have a significantly
higher per capita income in both 2010 and 2011 when compared to non-adopters.
Since income per capita is expressed in terms of logarithm, we can interpret the results
in percentages. The income effect is quite remarkable in 2010 where organic farmers
earn 111% more household income than conventional growers based on the Kernel
matching method. A possible reason for this result is that organic pepper farmers
perform very well in terms of yield as they have become more professional in pepper
farming while conventional might pay less attention to pepper. The change in income
per capita is also positive and significant for farmers who adopt both certification
schemes with respect to conventional farmers, again based on the kernel matching
method. However, the income effect is much lower than for the former group. No
positive income effect can be shown for organic black pepper farmers who
additionally adopt fair trade regimes. To the contrary, two matching methods yield a
significant negative income effect. This is due to additional certification costs.
Besides, fair trade will only yield economic benefits if the market price falls below the
minimum fair trade price which was not the case in the observation years. Though
these PSM results are based on logit models run on each cross-section data, as both
years in the kernel matching method show consistently that certified farmers in both
categories have significantly higher income than convention growers, our second
hypothesis cannot be rejected.
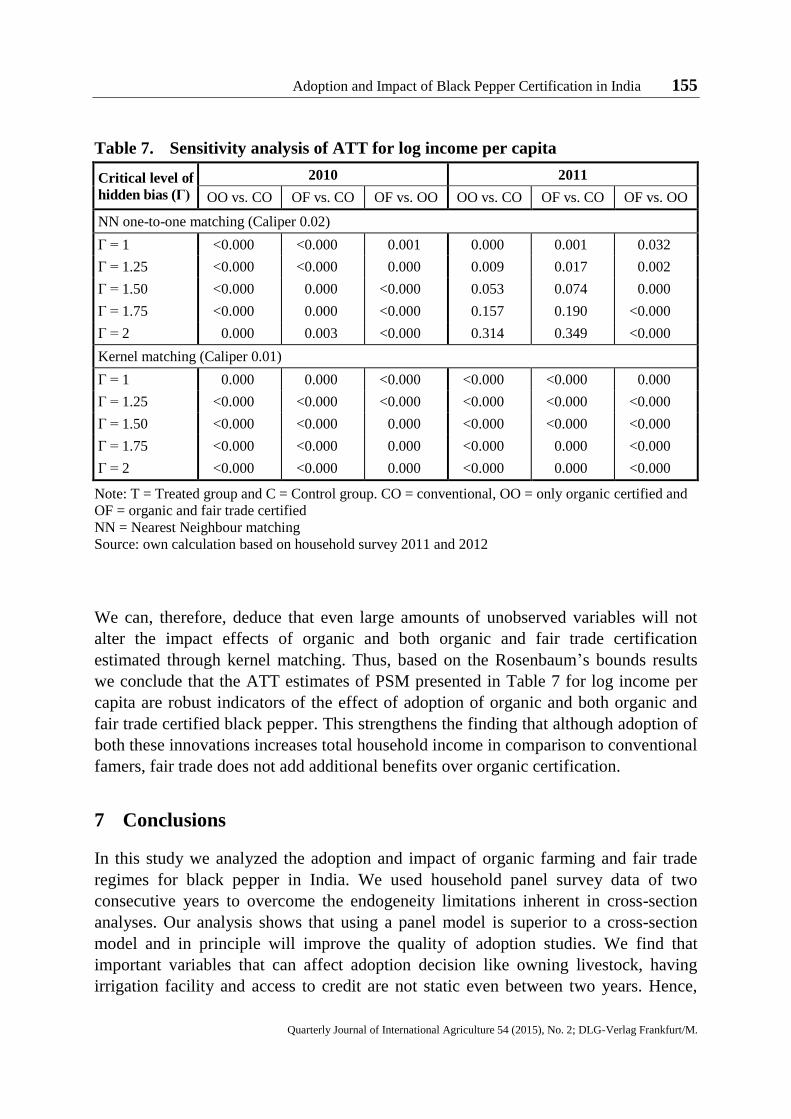
To check the robustness of the PSM results to unobservable factors, the ROSENBAUM
(2002) sensitivity analysis is employed and its results are presented in Table 73.
Results show that our results from the PSM are insensitive to hidden bias. The kernel
based matching method provides the best results that are insensitive with reference to
assumed hidden bias (Г) levels (1, 1.25, 1.50, 1.75 and 2). To overcome the
assumption of no hidden bias (Г = 1), the hidden bias will need to increase by more
than a factor of Г=2 for the kernel matching of log income per capita.
3 We use STATA command rbounds (GANGL, 2004) to perform the sensitivity analysis.
Adoption and Impact of Black Pepper Certification in India 155
Quarterly Journal of International Agriculture 54 (2015), No. 2; DLG-Verlag Frankfurt/M.
Table 7. Sensitivity analysis of ATT for log income per capita
Critical level of
hidden bias (Г)
2010 2011
OO vs. CO OF vs. CO OF vs. OO OO vs. CO OF vs. CO OF vs. OO
NN one-to-one matching (Caliper 0.02)
Г = 1 <0.000 <0.000 0.001 0.000 0.001 0.032
Г = 1.25 <0.000 <0.000 0.000 0.009 0.017 0.002
Г = 1.50 <0.000 0.000 <0.000 0.053 0.074 0.000
Г = 1.75 <0.000 0.000 <0.000 0.157 0.190 <0.000
Г = 2 0.000 0.003 <0.000 0.314 0.349 <0.000
Kernel matching (Caliper 0.01)
Г = 1 0.000 0.000 <0.000 <0.000 <0.000 0.000
Г = 1.25 <0.000 <0.000 <0.000 <0.000 <0.000 <0.000
Г = 1.50 <0.000 <0.000 0.000 <0.000 <0.000 <0.000
Г = 1.75 <0.000 <0.000 0.000 <0.000 0.000 <0.000
Г = 2 <0.000 <0.000 0.000 <0.000 0.000 <0.000
Note: T = Treated group and C = Control group. CO = conventional, OO = only organic certified and
OF = organic and fair trade certified
NN = Nearest Neighbour matching
Source: own calculation based on household survey 2011 and 2012
We can, therefore, deduce that even large amounts of unobserved variables will not
alter the impact effects of organic and both organic and fair trade certification
estimated through kernel matching. Thus, based on the Rosenbaum’s bounds results
we conclude that the ATT estimates of PSM presented in Table 7 for log income per
capita are robust indicators of the effect of adoption of organic and both organic and
fair trade certified black pepper. This strengthens the finding that although adoption of
both these innovations increases total household income in comparison to conventional
famers, fair trade does not add additional benefits over organic certification.
7 Conclusions
In this study we analyzed the adoption and impact of organic farming and fair trade
regimes for black pepper in India. We used household panel survey data of two
consecutive years to overcome the endogeneity limitations inherent in cross-section
analyses. Our analysis shows that using a panel model is superior to a cross-section
model and in principle will improve the quality of adoption studies. We find that
important variables that can affect adoption decision like owning livestock, having
irrigation facility and access to credit are not static even between two years. Hence,
156 Priyanka Parvathi and Herman Waibel
Quarterly Journal of International Agriculture 54 (2015), No. 2; DLG-Verlag Frankfurt/M.
having a panel data of just two consecutive years are sufficient to control for such
short-term variability in identifying adoption determinants. Also, due to omitted
variable bias and the IIA limitation, the cross-section analysis applied to both years
separately did not give consistent results. However, when random effects are
introduced through the panel gllamm model, unobserved heterogeneity is accounted
for and robust adoption determinants are identified.
The main drivers to adopt organic black pepper are business motives rather than health
or environmental concerns of decision makers. This is in line with other adoption studies
in conventional agriculture in developing countries (e.g. ASFAW et al., 2009; EVENSON
and GOLLIN, 2003). Also, larger farmers and those better connected to markets tend to
adopt fair trade certified black pepper in addition to organic production. On the other
hand the study suggests that non-adopters can also shift to other high value crops such
as cardamom provided they have adequate irrigation.
To estimate the differential gains of organic and both organic and fair trade adoption,
the effect on the per capita income of the farm household was estimated. The causal
impact analysis using three Propensity Score Matching methods (PSM) with multiple
treatment effects reveals that farmers who adopted organic as well as organic and fair
trade certification schemes achieve higher income than conventional black pepper
growers. However, a critical finding of this study is that in the case of black pepper in
India fair trade does not add any additional benefit over organic certification. This can
be due to the fact that for both organic and fair trade farmers, the additional costs of
certification are high which are not sufficiently rewarded by higher market prices in
the observed year. Moreover, for a smallholder black pepper farmer in both regimes
the advantage of fair trade prices only comes into play if market prices fall below the
minimum organic black pepper price. Hence, the major benefit of fair trade is reducing
price risk in markets which is less so for organic black pepper. The fair trade price
premium above the organic market prices is also a social premium aimed to develop
the socio economic conditions of a farming community, for example, in terms of
education and infrastructure and has other benefits than farm household income. Since
fair trade regimes were only recently implemented in the study region, additional
adoption of fair trade certified black pepper is likely to generate benefits the longer
farmers are engaged in the fair trade regime as found by BECCHETTI et al. (2011) in the
case of Thai Jasmine rice.
More studies are needed to better understand social-based and environmentally-friendly
innovations in agriculture in developing countries. As pointed out by JENA et al. (2012),
one remaining question is the integration of the different institutions and players
involved in fair trade and organic systems.
Adoption and Impact of Black Pepper Certification in India 157
Quarterly Journal of International Agriculture 54 (2015), No. 2; DLG-Verlag Frankfurt/M.
Acknowledgements
The authors would like to thank the two anonymous reviewers for their valuable
comments which helped us to significantly improve the paper. We would also like to
thank the Graduate Academy, Leibniz Universität Hannover for providing funding for
the survey in 2011.
References
ADB (Asian Development Bank) (2012): Case studies on cross-border eco trade. Available at:
http://www.adb.org/sites/default/files/pub/2012/case-studies-cross-border-
ecotrade.pdf.
AJEWOLE, O.C. (2010): Farmer’s response to adoption of commercially available organic
fertilizers in Oyo state, Nigeria. In: African Journal of Agricultural Research 5 (10):
2497-2503.
AMARE, M., S. ASFAW and B. SHIFERAW (2012): Welfare impacts of maize-pigeonpea inten-
sification in Tanzania. In: Agricultural Economics 43 (1): 27-43.
ARNOULD, E.J., A. PLASTINA and D. BALL (2009): Does Fair Trade deliver on its core value
proposition? Effects on income, educational attainment, and health in three countries.
In: Journal of Public Pollicy Marketing 28 (2): 186-201.
ASFAW, S., D. MITHÖFER and H. WAIBEL (2009): EU Food Safety Standards, Pesticide Use
and Farm-level Productivity: The Case of High-value Crops in Kenya. In: Journal of
Agricultural Economics 60 (3): 645-667.
BACON, C. (2005): Confronting the coffee crisis: Can fair trade, organic, and specialty coffee
reduce small-scale farmer vulnerability in Northern Nicaragua? In: World Develop-
ment 33 (3): 497-511.
– (2010): Who decides what is fair in fair trade? The agri-environmental governance of
standards, access, and price. In: The journal of peasant studies 37 (1): 111-147.
BARHAM, B.L., J.D. FOLTZ, D. JACKSON-SMITH and S. MOON (2004): The dynamics of
agricultural biotechnology adoption: Lessons from series rBST use in Wisconsin,
1994-2001. In: American Journal of Agricultural Economics 86 (1): 61-72.
BECCHETTI, L., P. CONZO and G. GIANFREDA (2012): Market access, organic farming and
productivity: the effects of Fair Trade affiliation on Thai farmer producer groups*. In:
Australian Journal of Agricultural and Resource Economics 56 (1): 117-140.
BESLEY, T. and A. CASE (1993): Modeling technology adoption in developing countries. In:
The American Economic Review 83 (2): 396-402.
BOLWIG, S., P. GIBBON and S. JONES (2009): The economics of smallholder organic contract
farming in tropical Africa. In: World Development 37 (6): 1094-1104.
BURTON, M., D. RIGBY and T. YOUNG (1999): Analysis of the determinants of adoption of
organic horticultural techniques in the UK. In: Journal of Agricultural Economics 50
(1): 47-63.
158 Priyanka Parvathi and Herman Waibel
Quarterly Journal of International Agriculture 54 (2015), No. 2; DLG-Verlag Frankfurt/M.
– (2003): Modelling the adoption of organic horticultural technology in the UK using duration
analysis. In: Australian Journal of Agricultural and Resource Economics 47 (1): 29-
54.
CHIPUTWA, B., D.J. SPIELMAN and M. QAIM (2015): Food Standards, Certification, and
Poverty among Coffee Farmers in Uganda. In: World Development 66: 400-412.
doi:10.1016/j.worlddev.2014.09.006.
CHOUICHOM, S. and M. YAMAO (2010): Comparing opinions and attitudes of organic and
non-organic farmers towards organic rice farming system in North-Eastern Thailand.
In: Journal of Organic System 5 (1): 25-35.
COULIBALY, A.L. and P. LIU (2006): Regulations, Standards and Certification for Agricultural
Exports. A Practical Manual for Producers and Exporters in East Africa. Food and
Agricultural Organization of the United Nations, Rome.
DADI, L., M. BURTON and A. OZANNE (2004): Duration analysis of technological adoption in
Ethiopian agriculture. In: Journal of Agricultural Economics 55 (3): 613-631.
DALAL, R.C., W.M. STRONG, E.J. WESTON and J. GAFFNEY (1991): Sustaining multiple
production systems. 2. Soil fertility decline and restoration of cropping lands in
subtropical Queensland. In: Tropical Grasslands 25 (173): 80.
DISTRICT ADMINISTRATION (2011): Idukki:Location. Available at: http//idukki.gov.in/loca
tion.htm.
DORFMAN, J.H. (1996): Modeling multiple adoption decisions in a joint framework. In:
American Journal of Agricultural Economics 78 (3): 547-557.
DOSS, C.R. (2006): Analyzing technology adoption using microstudies: limitations, challenges,
and opportunities for improvement. In: Agricultural economics 34 (3): 207-219.
ESD (Economic and Statistics Department, Government of Kerala State) (2011): Agricultural
Statistics 2008 - 2009; A Brief analysis of the area under important crops. Available
at: www.escostat.kerala.gov.in/docs/pdf/reports/agristat/agc0809briefarea.pdf.
EVENSON, R.R.E. and D. GOLLIN (eds.) (2003): Crop variety improvement and its effect on
productivity: the impact of international agricultural research. CABI, London, UK.
FAIRTRADE INTERNATIONAL (2014): Fairtrade International / Products / Spices and herbs.
Available at: http://www.fairtrade.net/spices_and_herbs.html. Accessed on November
11, 2014.
– (2014a): Fairtrade minimum price and fair trade premium Table. Available at:
http://www.fairtrade.net/fileadmin/user_upload/content/2009/standards/documents/20
14-10-27_EN_Fairtrade_Minimum_Price_and_Premium_Table.pdf. Accessed on
November 11, 2014.
FAO (2010): Top production – Black pepper (Piper spp). Available at: http://faostat.fao. org/
site/339/default.aspx.
FEDER, G. (1980): Farm size, risk aversion and the adoption of new technology under
uncertainty. In: Oxford Economic Papers 32 (2): 263-283.
FEDER, G., R.E. JUST and D. ZILBERMAN (1985): Adoption of agricultural innovations in
developing countries: A survey. In: Economic Development and Cultural Change 33
(2): 255-298.
Adoption and Impact of Black Pepper Certification in India 159
Quarterly Journal of International Agriculture 54 (2015), No. 2; DLG-Verlag Frankfurt/M.
GAFOOR, A., M.J. JACOB, M.K. BHASKARAN, S. KOKERI and N.C. NAIR (2007): The Kerala
state farmers’ debt relief commission, Thiruvananthapuram. Recommendations made
to Government of Kerala to Declare Cardamom, Coffee and Tea Distress Affected
Crops, India. Available at: http://ksfdrc.kerala.gov.in/pdf/recom_idu.pdf.
GANGL, M. (2004): RBOUNDS: Stata module to perform Rosenbaum sensitivity analysis for
average treatment effects on the treated. Statistical Software Components. Available
at: http://ideas.repec.org/c/boc/bocode/s438301.html#author.
GENIUS, M., C.J. PANTZIOS and V. TZOUVELEKAS (2006): Information acquisition and
adoption of organic farming practices. In: Journal of Agricultural and Resource
economics 31 (1): 93-113.
GREENE, W.H (2003): Econometric analysis. Pearson Education, New Jersey.
HECKMAN, J.J. (1979): Sample selection bias as a specification error. In: Econometrica:
Journal of the econometric society 47 (1): 153-161.
– (1997): Instrumental variables: A study of implicit behavioral assumptions used in making
program evaluations. In: The Journal of Human Resources 32 (3): 441-462.
HEMA, M., R. KUMAR and N.P. SINGH (2007): Volatile price and declining profitability of
black pepper in India: Disquieting future. In: Agricultural Economics Research
Review 20 (1): 61-76.
IMBENS, G.W. and J.D. ANGRIST (1994): Identification and estimation of local average
treatment effects. In: Econometrica 62 (2): 467-475.
JENA, P.R., B.B. CHICHAIBELU, T. STELLMACHER and U. GROTE (2012): The impact of coffee
certification on small‐scale producers’ livelihoods: a case study from the Jimma Zone,
Ethiopia. In: Agricultural Economics 43 (4): 429-440.
JEROMI, P.D. (2007): Farmers' Indebtedness and Suicides: Impact of Agricultural Trade
Liberalization in Kerala. In: Economic and Political Weekly 42 (31): 3241-3247.
KLEEMANN, L. and A. ABDULAI (2013): Organic certification, agro-ecological practices and
return on investment: Evidence from pineapple producers in Ghana. In: Ecological
Economics 93: 330-341. doi:10.1016/j.ecolecon.2013.06.017.
KHALEDI, M., S. WESEEN, E. SAWYER, S. FERGUSON and R. GRAY (2010): Factors influencing
partial and complete adoption of organic farming practices in Saskatchewan, Canada.
In: Canadian Journal of Agricultural Economics/Revue canadienne d'agroeconomie 58
(1): 37-56.
KOESLING, M., O. FLATEN and G. LIEN (2008): Factors influencing the conversion to organic
farming in Norway. In: International Journal of Agricultural Resources, Governance
and Ecology 7 (1): 78-95.
LECHNER, M. (2002): Program heterogeneity and propensity score matching: An application
to the evaluation of active labor market policies. In: Review of Economics and
Statistics 84 (2): 205-220.
LEE, M.J. (2001): First-difference estimator for panel censored-selection models. In: Economics
Letters 70 (1): 43-49.
LEUVEN, E. and B. SIANESI (2012): PSMATCH2: Stata module to perform full Mahalanobis
and propensity score matching, common support graphing, and covariate imbalance
160 Priyanka Parvathi and Herman Waibel
Quarterly Journal of International Agriculture 54 (2015), No. 2; DLG-Verlag Frankfurt/M.
testing. Statistical Software Components. Available at: http://ideas.repec.org/c/boc/
bocode/s432001.html.
LOKSHIN, M. and Z. SAJAIA (2004): Maximum likelihood estimation of endogenous switching
regression models. In: Stata Journal 4 (3): 282-289.
MCFADDEN, D., W.B. TYE and K. TRAIN (1977): An application of diagnostic tests for the
independence from irrelevant alternatives property of the multinomial logit model.
Institute of Transportation Studies, University of California, Charles River Associates,
Cambridge, Massachusetts.
MEZZATESTA, M., D.A. NEWBURN and R.T. WOODWARD (2013): Additionality and the
Adoption of Farm Conservation Practices. In: Land Economics 89 (4): 722-742.
MUSARA, J.P., J. CHIMVURAMAHWE and R. BORERWE (2012): Adoption and Efficiency of
Selected Conservation Farming Technologies in Madziva Communal Area,
Zimbabwe: A Transcendental Production Function Approach. In: Bulletin of
Environment, Pharmacology and Life Sciences 1 (4): 27-38.
NANNICINI, T. (2007): Simulation-based sensitivity analysis for matching estimators. In: Stata
Journal 7 (3): 334-350.
OELOFSE, M., H. HØGH-JENSEN, L.S. ABREU, G.F. ALMEIDA, Q.Y. HUI, T. SULTAN and A. DE
NEERGAARD (2010): Certified organic agriculture in China and Brazil: Market
accessibility and outcomes following adoption. In: Ecological Economics 69 (9):
1785-1793.
PARTHASARATHY, V.A., M. ANANDARAJ, V. SRIVINASAN, R. DINESH and K.N. BABU (2011):
Vision 2030. Indian Institute of Spices Research, Calicut. Available at:
http://www.spices.res.in/IISRVision2030.pdf.
PEARL, J. (2009): Causal inference in statistics: An overview. In: Statistics Surveys 3: 96-146.
doi:10.1214/09-55057.
PARVATHI, P. and H. WAIBEL (2013) Fair Trade and Organic Agriculture in Developing
Countries: A Review. In: Journal of International Food and Agribusiness Marketing
25 (4): 311-323.
PICKLES, A., N. SHRYANE, J. JOHNSON and K. PURDAM (2006): Modeling Multiparty Elections,
Preference Classes and Strategic Voting. Cathie Marsh Centre for Census and Survey
Research, Manchester.
PIETOLA, K.S. and A.O. LANSINK (2001): Farmer response to policies promoting ornanic
farming technologiess in Finland. In: European Review of Agricultural Economics 18
(1): 1-15.
RABE-HESKETH, S., A. SKRONDAL and A. PICKLES (2002): Reliable estimation of generalized
linear mixed models using adaptive quadrature. In: The Stata Journal 2 (1): 1-21.
– (2004): GLLAMM manual. Available at http://hbanaszak.mjr.uw.edu.pl/TempTxt/Rabe
HeskethEtAl_2004_GLLAMMManual.pdf.
RAYNOLDS, L.T. (2002): Poverty alleviation through participation in Fair Trade coffee
networks: Existing research and critical issues. Ford Foundation, New York, NY.
ROGERS, E.M. (1995): Diffusion of Innovations (4th
Edition). The Free Press, New York.
ROSENBAUM, P.R. and D.B. RUBIN (1983): The central role of the propensity score in
observational studies for causal effects. In: Biometrika 70 (1): 41-55.
Adoption and Impact of Black Pepper Certification in India 161
Quarterly Journal of International Agriculture 54 (2015), No. 2; DLG-Verlag Frankfurt/M.
ROSENBAUM, P.R. (2002): Observational studies. Springer, New York: 1-17.
RUBEN, R. and R. FORT (2012): The impact of Fair Trade certification for coffee farmers in
Peru. In: World Development 40 (3): 570-582.
SARKER, M., Y. ITOHARA and M. HOQUE (2009): Determinants of adoption decisions: The
case of organic farming (OF) in Bangladesh. In: Extension Farming Systems Journal 5
(2) – Research Forum.
SBI (Spices Board of India) (2008): Spices Board. Government of India. Project on black
pepper production in Idukki district of Kerala. Under National horticulture mission.
Available at: http://commerce.nic.in/trade/SB_Black pepper_Production_In_Under_
NHM_English.pdf.
– (2012): Spices Board. Government of India. Spice India. Available at: http://www.indian-
spices.com/php/downloadfile.php?file=/magazine/Spice-English-July12.pdf.
SHARIFI, O., S.A. SADATI, F.R. GHOBADI, Y. MOHAMADI and P.T.T. DEL (2010): Barriers to
conversion to organic farming: A case study in Babol Country in Iran. In: African
Journal of Agricultural Research 5 (16): 2260-2267.
VALKILA, J. (2009): Fair trade organic coffee production in Nicaragua: Sustainable
development or a poverty trap? In: Ecological Economics 68 (12): 3018-3025. doi:
10.1016/j.ecolecon.2009.07.002.
VALKILA, J. and A. NYGREN (2010): Impacts of Fair Trade certification on coffee farmers,
cooperatives, and laborers in Nicaragua. In: Agriculture and Human Values 27 (3):
321-333.
WAIBEL, H. and D. ZILBERMAN (eds.) (2007): International Research on Natural Resources
Management: Advances in Impact Assessment. CABI, Wallingford.
WEIL, P.M. (1970): The introduction of the ox plow in Central Gambia. African food
production systems: Cases and theory. Johns Hopkins University Press, Baltimore and
London.
WHEELER, S.A. (2008): What influences agricultural professionals’ views towards organic
agriculture? In: Ecological Economics 65 (1): 145-154.
Contact author:
Hermann Waibel
Institute of Development and Agricultural Economics, Faculty of Economics and Management,
Leibniz University of Hannover, Koenigsworther Platz 1, 30167 Hannover, Germany
e-mail: [email protected]
Related Documents