Adopted Operating Budget Fiscal Year 2020

Welcome message from author
This document is posted to help you gain knowledge. Please leave a comment to let me know what you think about it! Share it to your friends and learn new things together.
Transcript
Adopted Operating Budget Fiscal Year 2020
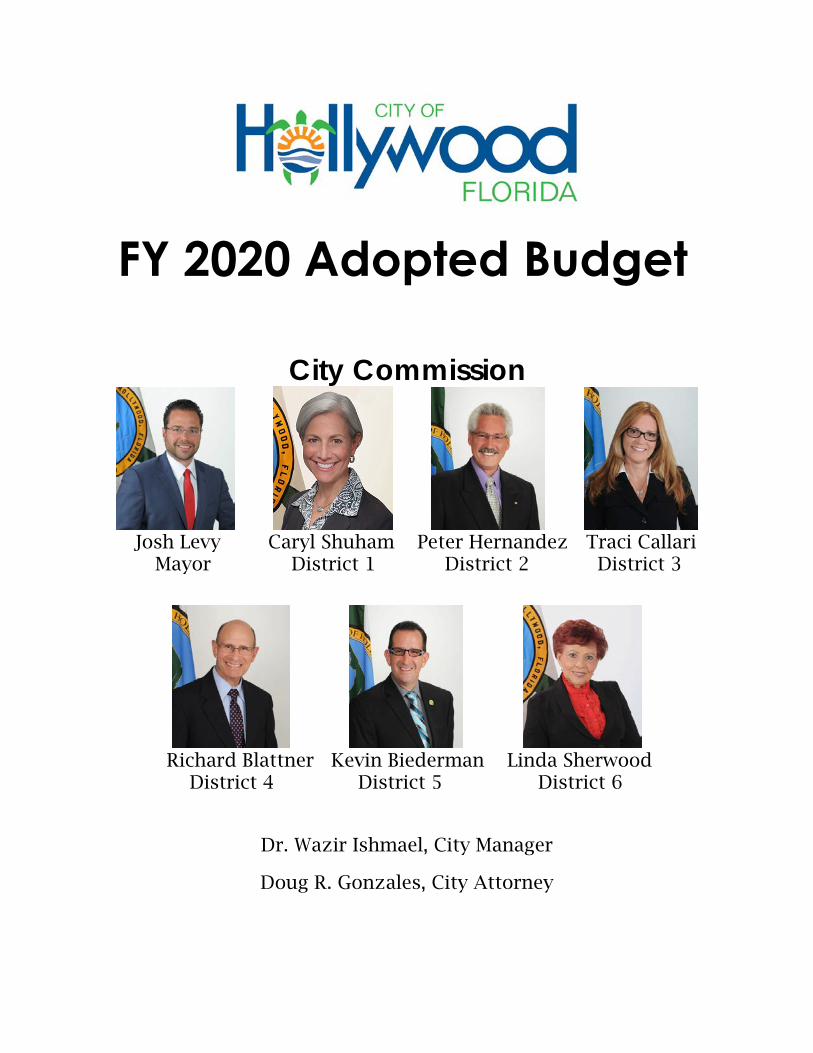
FY 2020 Adopted Budget
City Commission
Josh Levy Caryl Shuham Peter Hernandez Traci Callari Mayor District 1 District 2 District 3
Richard Blattner Kevin Biederman Linda Sherwood District 4 District 5 District 6
Dr. Wazir Ishmael, City Manager
Doug R. Gonzales, City Attorney
Office of Budget & Performance Management
Laurette Jean Director
Madonna Dell Olio Assistant Director
Neesha Bajere Budget Officer
Angela Stanley Budget Support Technician
City of Hollywood, Florida Office of Budget & Performance Management
P.O. Box 229045 Hollywood, Florida 33022-9045
Telephone: (954) 921-3206 Fax: (954) 921-3343
Persons with disabilities who require reasonable accommodation to participate in City programs and/or services may call the Office of Human Resources at (954) 921-3218.
If an individual is hearing or speech impaired, please contact the Florida Relay Service at 1-800-955-8770 (information) or 1-800-955-8771 (TDD).
The City of Hollywood has received 23 GFOA Distinguished Budget
Presentation Awards.
This award is presented to state and local governments that have prepared
budget documents of the very highest quality that reflect both the guidelines
established by the National Advisory Council on State and Local Budgeting and
the GFOA’s best practices on budgeting
Table of ContentsSECTION PAGE
HOW TO READ THE OPERATING BUDGET ........................................................... vi CITY MANAGER’S LETTER ......................................................................................... viii
Operating Budget Summary By Fund (Table) ...................................................... ix
Community Profile ........................................................................................................... xii Service Data. ................................................................................................................... xiii
INTRODUCTION The City of Hollywood, Florida ......................................................................................... 1 Budget Overview .............................................................................................................. 6
Operating Budget Summary By Category (Table) .............................................. 7 Staffing Overview ............................................................................................................ 11
Summary of Staffing Changes by Fund (Table) ................................................. 11 FY 2018-2020 Full-time Staffing Summary (Table) ............................................... 12
Assessed Value & Millage Data .................................................................................... 14 Taxable Assessed Value History (Chart) .............................................................. 14 Assessed Taxable Value Comparison – FY 2019 vs. FY 2020 (Table) ............... 14 Value of New Construction – Since 2000 (Chart) .............................................. 15 Ad Valorem Property Tax Millage Rates – 20 Year History(Chart) ................... 16
Impact on Homeowners ................................................................................................ 17 Budget Calendar ............................................................................................................. 18 Operating Budget Policies & Procedures. ................................................................... 19 Financial Policies. ............................................................................................................ 22 Citywide Goals & Objectives. ....................................................................................... 26 Long-Term Planning. ....................................................................................................... 28
General Fund Five Year Forecast (FY 2020 through FY 2024) (Table) ............. 31
SUMMARY OF FUNDS Overview of Funds .......................................................................................................... 32
Fund Structure – FY 2020 Budget (Chart) ............................................................ 35 All Funds Summary ( FY 2018 – FY 2020) (Table) ................................................. 36 FY 2020 Operating Budget – All Funds Summary (Table) ................................ 37 FY 2020 Citywide Revenues (Chart) ..................................................................... 39
FY 2020 Citywide Expenditures – by Fund Type (Chart) .................................... 39 General Fund Overview ................................................................................................. 40
Net Property Tax Revenue (Chart) ....................................................................... 40 Utility Service Tax Revenue (Chart) ...................................................................... 41 Franchise Tax Revenue (Chart) ............................................................................ 41 Simplified Communications Tax Revenue (Chart)............................................. 42
FY 2020 Adopted Budget i Table of Contents
HOLLYWOOD AT A GLANCE
Building Permits Revenue (Chart) ......................................................................... 42 Other User Charges/Fees Revenue (Chart) ........................................................ 43 State Shared Revenue (Chart) ............................................................................. 43 Fire-Rescue Assessment Fee Revenue (Chart) ................................................... 44 Local Business Tax Revenue (Chart) .................................................................... 44 General Fund Expense Summary by Category (Table) .................................... 48 How the General Fund Dollar is Spent (Chart) ................................................... 48
General Fund (001) – Summary (FY 2018 – FY 2020) (Table)............................. 49 FY 2020 General Fund Revenues (Chart) ............................................................ 50 FY 2020 General Fund Expenditures (Chart) ....................................................... 50 Debt Service Fund Overview ......................................................................................... 51 Debt Service Fund (223) – Summary (FY 2018 – FY 2020) (Table) .................... 51 General Obligation Bond (GOB) Fund Overview ....................................................... 53 Debt Service GOB Fund (226) – Summary (FY 2018 – FY 2020) (Table) ........... 53 Gas Tax Fund Overview ................................................................................................. 54
Gas Tax Revenues Ten-Year History (Chart) ...................................................... 54 Gas Tax Fund (336) - Summary (FY 2018 – FY 2020) (Table) .............................. 54 Water & Sewer Utility Fund Overview ........................................................................... 55
Water Revenues Ten-Year History (Chart) .......................................................... 55 Wastewater Revenues Ten-Year History (Chart) ............................................... 56
Water & Sewer Utility Fund (442)- Summary (FY 2018 – FY 2020) (Table) ........ 58 Stormwater Utility Fund Overview ................................................................................. 59
Stormwater Revenues Ten-Year History (Chart) ................................................ 59 Stormwater Utility Fund (443)- Summary (FY 2018 – FY 2020) (Table) .............. 60 Golf Enterprise Fund Overview ...................................................................................... 61
Orangebrook Revenues Ten-Year History (Chart) ............................................ 61 Other Courses Revenues Ten-Year History (Chart) ........................................... 62 Concession Revenues Ten-Year History (Chart) ................................................ 62
Golf Enterprise Fund (444) - Summary (FY 2018 – FY 2020) (Table) .................. 63 Sanitation Enterprise Fund Overview............................................................................ 64
Sanitation Fee Revenues Ten-Year History (Chart) ........................................... 64 Recycling Revenues Ten-Year History (Chart) ................................................... 65
Sanitation Enterprise Fund (445)- Summary (FY 2018 – FY 2020) (Table) ......... 66 Parking Enterprise Fund Overview ................................................................................ 67
User Fee Revenues Ten-Year History (Chart) ...................................................... 67 Citation Revenues Ten-Year History (Chart) ....................................................... 68 Parking Permit Revenues Ten-Year History (Chart) ........................................... 68
Parking Enterprise Fund (446)- Summary (FY 2018 – FY 2020) (Table) .............. 69 Central Services Fund Overview ................................................................................... 70 Central Services Fund (557) - Summary (FY 2018 – FY 2020) (Table) ............... 72 Insurance Fund Overview .............................................................................................. 73
Insurance Fund - Summary (FY 2018 – FY 2020) (Table) .................................... 73
FY 2020 Adopted Budget ii Table of Contents
REVENUE SOURCES General Fund (Table) ............................................................................................. 74 Special Revenue Funds (Table) ............................................................................ 78 Debt Service Fund (Table) ..................................................................................... 79 General Obligation Bond Fund (Table) ............................................................... 79 General Capital Outlay Fund (Table).................................................................. 80 Gas Tax Fund (Table).............................................................................................. 80 Water & Sewer Utility Fund (Table) ....................................................................... 81 Stormwater Utility Fund (Table) ............................................................................. 82 Golf Enterprise Fund (Table) .................................................................................. 82 Sanitation Enterprise Fund (Table) ........................................................................ 83 Records Preservation Trust Fund (Table) .............................................................. 83 Parking Enterprise Fund (Table) ............................................................................ 84 Central Services Fund (Table) ............................................................................... 85 Self-Insurance Fund (Table) ................................................................................... 86
DEPARTMENT/OFFICE BUDGETS Office of the City Commission ...................................................................................... 87
Citywide Organizational Chart ............................................................................ 87 City Commission Expenditure Summary by Program (Table) ......................... 89
Office of the City Manager ............................................................................................ 91 City Manager Organizational Chart ................................................................... 91 City Manager Staffing by Division (Table) ........................................................... 92 City Manager Expenditure Summary by Program (Table) ............................... 92
Office of the City Attorney ............................................................................................. 95 City Attorney Organizational Chart .................................................................... 95 City Attorney Expenditure Summary by Program (Table) ................................ 96
Office of the City Clerk ................................................................................................... 98 City Clerk Organizational Chart .......................................................................... 98 City Clerk Performance Measures (Table) ....................................................... 102 City Clerk Staffing by Division (Table) ................................................................ 102 City Clerk Expenditure Summary by Program (Table) .................................... 102
Office of Procurement Services .................................................................................. 106 Procurement Services Organizational Chart ................................................... 106 Procurement Services Performance Measures (Table) .................................. 109 Procurement Services Expenditure Summary by Program (Table) ............... 109
Office of Human Resources ......................................................................................... 111 Human Resources Organizational Chart ......................................................... 111 Human Resources Performance Measures (Table) ......................................... 117 Human Resources Staffing by Division (Table) ................................................. 117 Human Resources Expenditure Summary by Program (Table)...................... 117
Office of Communications, Marketing & Economic Development (CMED) ........ 126 CMED Organizational Chart .............................................................................. 126 CMED Performance Measures (Table) .............................................................. 131
FY 2020 Adopted Budget iii Table of Contents
CMED Staffing by Division (Table) ...................................................................... 132 CMED Expenditure Summary by Program (Table) .......................................... 132
Department of Financial Services .............................................................................. 142 Financial Services Organizational Chart .......................................................... 142 Financial Services Performance Measures (Table) ......................................... 144 Financial Services Staffing by Division (Table) .................................................. 144 Financial Services Expenditure Summary by Program (Table) ...................... 145
Department of Information Technology .................................................................... 152 Information Technology Organizational Chart .............................................. 152 Information Technology Performance Measures (Table) .............................. 155 Information Technology Staffing by Division (Table) ....................................... 155 Information Technology Expenditure Summary by Program (Table) ........... 156
Department of Development Services ...................................................................... 161 Development Services Organizational Chart ................................................. 161 Development Services Performance Measures (Table) ................................. 167 Development Services Staffing by Division (Table) ......................................... 168 Development Services Expenditure Summary by Program (Table) ............. 168
Police Department ........................................................................................................ 188 Police Organizational Chart .............................................................................. 188 Police Performance Measures (Table) .............................................................. 193 Police Staffing by Division (Table) ...................................................................... 194 Police Expenditure Summary by Program (Table) ........................................... 194
Department of Fire-Rescue & Beach Safety ............................................................. 228 Fire-Rescue & Beach Safety Organizational Chart ........................................ 228 Fire-Rescue & Beach Safety Performance Measures (Table) ........................ 232 Fire-Rescue & Beach Safety Staffing by Division (Table) ................................ 232 Fire-Rescue & Beach Safety Expenditure Summary by Program (Table) .... 233
Department of Parks, Recreation & Cultural Arts (PRCA) ........................................ 239 PRCA Organizational Chart ............................................................................... 239 PRCA Performance Measures (Table) ............................................................... 243 PRCA Staffing by Division (Table) ....................................................................... 243 PRCA Expenditure Summary by Program (Table) ........................................... 244
Department of Public Utilities ...................................................................................... 258 Public Utilities Organizational Chart .................................................................. 258 Public Utilities Performance Measures (Table) ................................................. 263 Public Utilities Staffing by Division (Table) .......................................................... 263 Public Utilities Expenditure Summary by Program (Table) .............................. 264
Department of Public Works ........................................................................................ 285 Public Works Organizational Chart ................................................................... 285 Public Works Performance Measures (Table) ................................................... 289 Public Works Staffing by Division (Table) ........................................................... 290 Public Works Expenditure Summary by Program (Table) ............................... 290
FY 2020 Adopted Budget iv Table of Contents
Department of Design and Construction Management (DCM) ............................ 304
DCM Organizational Chart ................................................................................ 304 DCM Performance Measures (Table) ................................................................ 306 DCM Expenditure Summary by Program (Table) ............................................ 306
Non-Departmental ........................................................................................................ 328 Non-Departmental Expenditure Summary by Program (Table) .................... 309 Emerald Hills Safety Enhancement District ....................................................... 310
CAPITAL IMPROVEMENT PLAN (CIP) General Capital Information ....................................................................................... 311 CIP Development Process. .......................................................................................... 314 Sources of Funds ........................................................................................................... 315
FY 2020 Capital Funding Sources (Chart) ........................................................ 316 FY 2020 - 24 Capital Funding Sources (Chart) .................................................. 316 General Obligation Bond Projects by Category (Table) ................................ 319 Transportation Surtax Projects (Table) ................................................................ 320 Outstanding Principal Balances (Table)............................................................ 321
Use of Funds ................................................................................................................... 322 FY 2020 Capital Projects by Type (Chart) ......................................................... 323 FY 2020 - 24 Capital Projects by Type (Chart) .................................................. 323
Major Capital Improvement Projects ......................................................................... 324 Impact of Capital Improvement Projects on Operating Budget ........................... 325 Capital Improvement Projects by Fund ..................................................................... 326
General Capital Outlay ....................................................................................... 326 Gas Tax Fund ......................................................................................................... 352 Parking Enterprise Fund ........................................................................................ 357 Water and Sewer Enterprise Fund ...................................................................... 361 Stormwater Enterprise Fund ............................................................................... 384 Fleet Replacement – Internal Services .............................................................. 388
DEBT SERVICE FUNDS Debt Service Funds Overview. .................................................................................... 397
Long-Term Debt Obligations (Table) .................................................................. 398
APPENDIX Statistical & Supplemental Data ................................................................................. 400 Assessed Value of Taxable Property and Direct Property Rates (Table) ...... 400 Demographic & Economic Statistics (Table) .................................................... 401 Population Age Distribution (Table) ................................................................... 401 Principal Taxpayers (Table) ................................................................................. 402 Glossary of Terms .......................................................................................................... 403
FY 2020 Adopted Budget v Table of Contents
How to Read the Adopted Fiscal Year 2020 Operating Budget
The Adopted Fiscal Year 2020 Operating Budget serves as a communication tool for defining strategic priorities and organizational structures; identifying sources of City revenues; and analyzing Department and Office operating expenditures, program objectives, and performance measures. It also shows how economic and financial forecasting affects decisions in the areas of long-term financing, capital investment, program organization and services offered. These elements are essential for sound management of public resources.
This section describes the structure and components of the Adopted Fiscal Year 2020 Operating Budget to enhance reader understanding and facilitate use of the document. The Budget has been organized in a manner that is consistent with the National Advisory Council on State and Local Budgeting and the Recommended Budget Practices which requires that reader be presented with a guide to government programs and organizational structure. These sections are consistent with the Government Finance Officers Association’s standards for the Distinguished Budget Presentation Award.
Special Chapters
The special chapters provide general budget information at a high level to inform the reader of the City’s policies, organizational structure, budget process, component funds and staffing. This section is composed of the City Manager’s Letter, Hollywood at a Glance, Introduction, and Summary of Funds.
IntroductionThis chapter contains the following information:
• City Profile• Budget Overview• Staffing Overview• Assessed Value & Millage Data• Impact on Homeowners• Budget Calendar
• Operating Budget Policies & Procedures
• Financial Policies• Citywide Goals & Objectives• Long-Term Planning
Summary of Funds The Summary chapter provides an overview of the FY 2020 Operating Budget by
fund. Each fund is identified according to category and purpose. Charts and tables illustrate fund structure, revenue sources, and history and appropriations by fund.
FY 2020 Adopted Budget How to Read the Adopted Budgetvi
Department / Office Chapters
Each Department and Office chapter contains Department / Office and Program level descriptions, appropriations, and staffing. In addition, each Department and Office summary contains accomplishments, goals, performance measures, and appropriations by Fund and Division.
A Non-Departmental chapter is included to identify and describe the functions of each non-departmental program. These programs do not contain staffing, objectives or performance measures.
Revenue Sources
This section details all City revenues, separated by fund and revenue type.
Capital Improvement Plan
The Capital Improvement Plan (CIP) section defines and describes the sources and uses of funds for capital improvements, as well as the process for approving projects and appropriating funds. Narrative and charts are provided to inform the reader on the following related topics:
• General Capital Information• CIP Development Process• Sources of Funds• Use of Funds• Major Capital Improvement
Projects
• Capital Improvement Projects byFund
• Impact of Capital ImprovementProjects on Operating Budget
Appendix
The Appendix contains the following charts and tables which provide detailed information about the City:
• Statistical & Supplemental Data • Glossary of Terms
FY 2020 Adopted Budget How to Read the Adopted Budgetvii
City Manager's Letter
Office of the City Manager Wazir A. Ishmael, Ph.D. City Manager
tel: 954.921.3201
2600 Hollywood Boulevard P.O. Box 229045
Hollywood, Florida 33022-9045
hollywoodfl.org
October 29, 2019
City of Hollywood, Florida Honorable Mayor, Vice Mayor and City Commissioners
Re: Fiscal Year 2020 Adopted Operating Budget & Capital Improvement Program
Dear Mayor, Vice Mayor and City Commissioners:
During the course of the budget development process, robust discussions with City staff, City Commission, and input from residents during public meetings provided valuable guidance in the development of the Fiscal Year (FY) 2020 Adopted Budget. It is with great pleasure that I present the FY 2020 Adopted Budget which is a representation of our commitment to providing the highest quality services to our residents and constituents in a cost-effective and operationally efficient manner.
Economic Outlook
The overall economic outlook of the City of Hollywood remains strong which is evidenced by the growth in the tax base of 43% over the past 5 years, growth in population by approximately 6% from 140,711 to 149,028 over the same time period, and recent credit rating of Aa3 with a positive outlook by Moody’s and AA- with a stable outlook by Fitch. Additionally, the City has experienced record levels of development activities in the residential/hotel, marina, and manufacturing industries. The 2019 certified taxable value is $17.43 billion which is 6.68% or $1.09 billion higher than the 2018 adjusted value of $16.34 billion.
From a regional perspective, Broward County’s unemployment rate remains below the national average of 3.5%. The Fort Lauderdale-Hollywood International Airport is ranked 21st in the U.S. and continues to show considerable growth with over 35 million passengers traveling through the airport annually. Port Everglades is the number one revenue generating seaport in Florida and will continue to grow as it seeks to deepen and widen its navigational channels. Also, the recent voter-approved Transportation Surtax will invest significant funding to enhance on-time transit services, improve roadways and alleyways, and update traffic signalization. These investments in Broward County’s transportation network will further strengthen the economic outlook of the County.
viii
October 29, 2019 Mayor, Vice Mayor and City Commissioners Page 2
Nationally, the immediate term outlook of the U.S. economy is healthy with this year marking the longest continuous growth in the history of the nation. Other key economic indicators such as a nearly full employment market, low housing stock, and low mortgage rates further substantiates the strength of the US economy. However, recent volatility in the stock market, job losses in the manufacturing industry and consumer fears of the U.S.-China trade wars have triggered concerns amongst economists regarding a potential upcoming recession.
Budget Overview
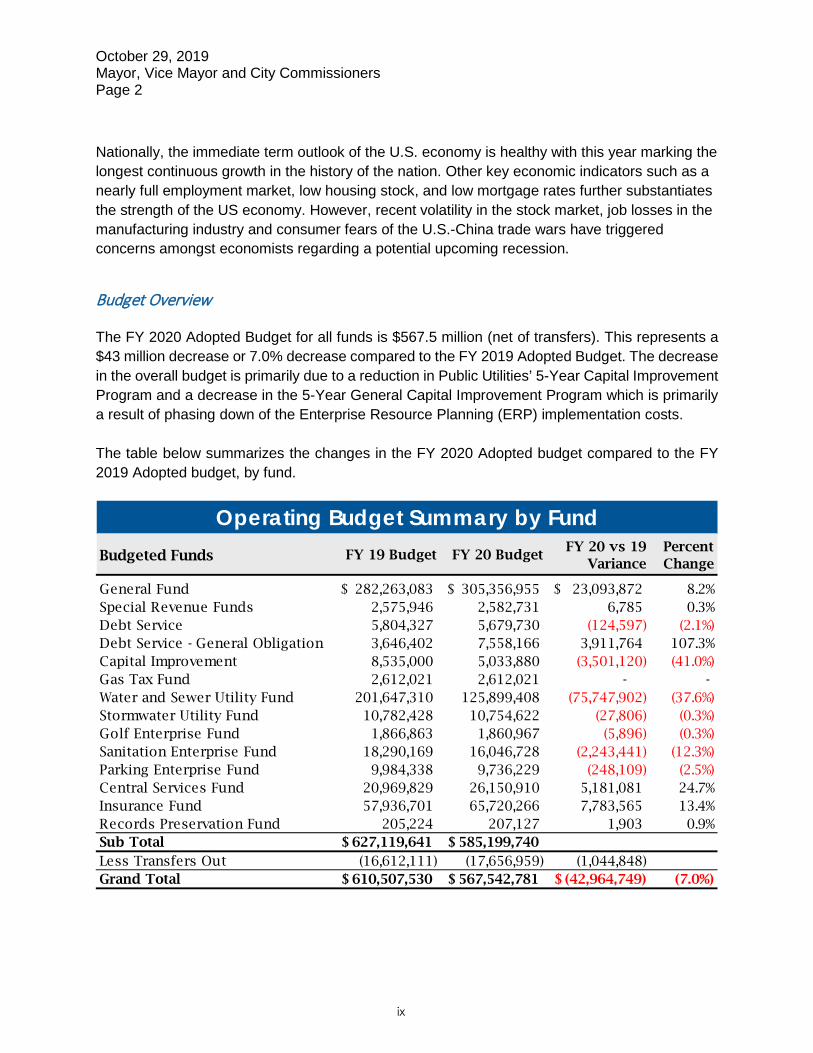
The FY 2020 Adopted Budget for all funds is $567.5 million (net of transfers). This represents a $43 million decrease or 7.0% decrease compared to the FY 2019 Adopted Budget. The decrease in the overall budget is primarily due to a reduction in Public Utilities’ 5-Year Capital Improvement Program and a decrease in the 5-Year General Capital Improvement Program which is primarily a result of phasing down of the Enterprise Resource Planning (ERP) implementation costs.
The table below summarizes the changes in the FY 2020 Adopted budget compared to the FY 2019 Adopted budget, by fund.
Budgeted Funds FY 19 Budget FY 20 BudgetFY 20 vs 19
VariancePercent Change
General Fund 282,263,083$ 305,356,955$ 23,093,872$ 8.2%Special Revenue Funds 2,575,946 2,582,731 6,785 0.3%Debt Service 5,804,327 5,679,730 (124,597) (2.1%)Debt Service - General Obligation 3,646,402 7,558,166 3,911,764 107.3%Capital Improvement 8,535,000 5,033,880 (3,501,120) (41.0%)Gas Tax Fund 2,612,021 2,612,021 - - Water and Sewer Utility Fund 201,647,310 125,899,408 (75,747,902) (37.6%)Stormwater Utility Fund 10,782,428 10,754,622 (27,806) (0.3%)Golf Enterprise Fund 1,866,863 1,860,967 (5,896) (0.3%)Sanitation Enterprise Fund 18,290,169 16,046,728 (2,243,441) (12.3%)Parking Enterprise Fund 9,984,338 9,736,229 (248,109) (2.5%)Central Services Fund 20,969,829 26,150,910 5,181,081 24.7%Insurance Fund 57,936,701 65,720,266 7,783,565 13.4%Records Preservation Fund 205,224 207,127 1,903 0.9%Sub Total 627,119,641$ 585,199,740$ Less Transfers Out (16,612,111) (17,656,959) (1,044,848) Grand Total 610,507,530$ 567,542,781$ (42,964,749)$ (7.0%)
Operating Budget Summary by Fund
ix
October 29, 2019 Mayor, Vice Mayor and City Commissioners Page 3
The total adopted budget of $567.5 million includes investments in the following citywide initiatives:
Funding for administrative and project management support of the Department of Designand Construction Management for General Obligation Bond activities;
Restoration of pension benefits that were frozen during the economic downturn whichpositively impacts employee morale;
Investment in talent recruitment and retention to provide more efficient, high-qualityservice delivery to our residents and constituencies;
Funding to secure and harden information technology systems and infrastructures; Continued focus on code and zoning compliance to maintain the aesthetics of the City; Initial investment to address environmental concerns such as seaweed removal; One-time and recurring operating funding for the new Nevada Garage; Funding for a 9-week summer swim program at Attucks Middle School; Additional grant funding for the programming at the Arts & Culture Center; Grant match for Metropolitan Planning Organization projects; and Funding for various capital needs such as fleet replacement, purchase of fire equipment,
transportation improvements, and building maintenance.
The FY 2020 General Fund Adopted Budget is $305.3 million, a $23.1 million or 8.2% increase over the FY 2019 General Fund Adopted Budget. The overall increase in the General Fund budget is supported by the growth in property tax revenues, increased collection of fire assessment revenues (with no increase to the fees), and increase in the collection of various user fees (such as permitting fees).
The overall increases in the General Fund expenditure budget is primarily driven by pension restoration, increase in debt service payments, increase in the transfer to the Community Redevelopment Agency (CRA) as a direct result of an anticipated increase of property tax collections in the CRA districts, and increase in the 17% target reserves. The expenditure budget also includes several organizational changes to better align with the future organizational needs of the City. The reorganization includes the transfer of Code Compliance from the Public Works Department to the Development Services Department, the transfer of the Parking Division from the Development Services Department to the Police Department, and the transfer of the Budget Division from the Financial Services Department to a Special Office of the City Manager’s Office.
Based on projected revenue growth and stable expenditures, we were able to recommend a flat operating millage of 7.4665 mills and a decrease in the 2005 voted debt service millage from 0.2327 to 0.2200. With the successful passage of the General Obligation Bonds by voter referendum, the FY 2020 total millage includes the addition of a voted debt service millage for the Series 2019 General Obligation Bond of 0.2361 mills. This results in a total adopted millage for FY 2020 of 7.9226 mills.
x
October 29, 2019 Mayor, Vice Mayor and City Commissioners Page 4
Future Outlook
Although the City has experienced record growth over the past five years, the risk of an economic slow-down is ever present. As a proactive measure, Staff will continue to monitor economic activities both nationally and locally. Moreover, Staff will continue to update fiscal policies and procedures, create tools to assist departments to better manage their operating budgets through the utilization of the new ERP system, continue to monitor the impact of proposed legislation, and continue to work with departments to identify revenue generating and cost containment innovations. To conclude, the Adopted FY 2020 Budget addresses critical operating needs throughout the City while investing in various initiatives to improve overall service delivery to our residents.
xi

Hollywood at a Glance
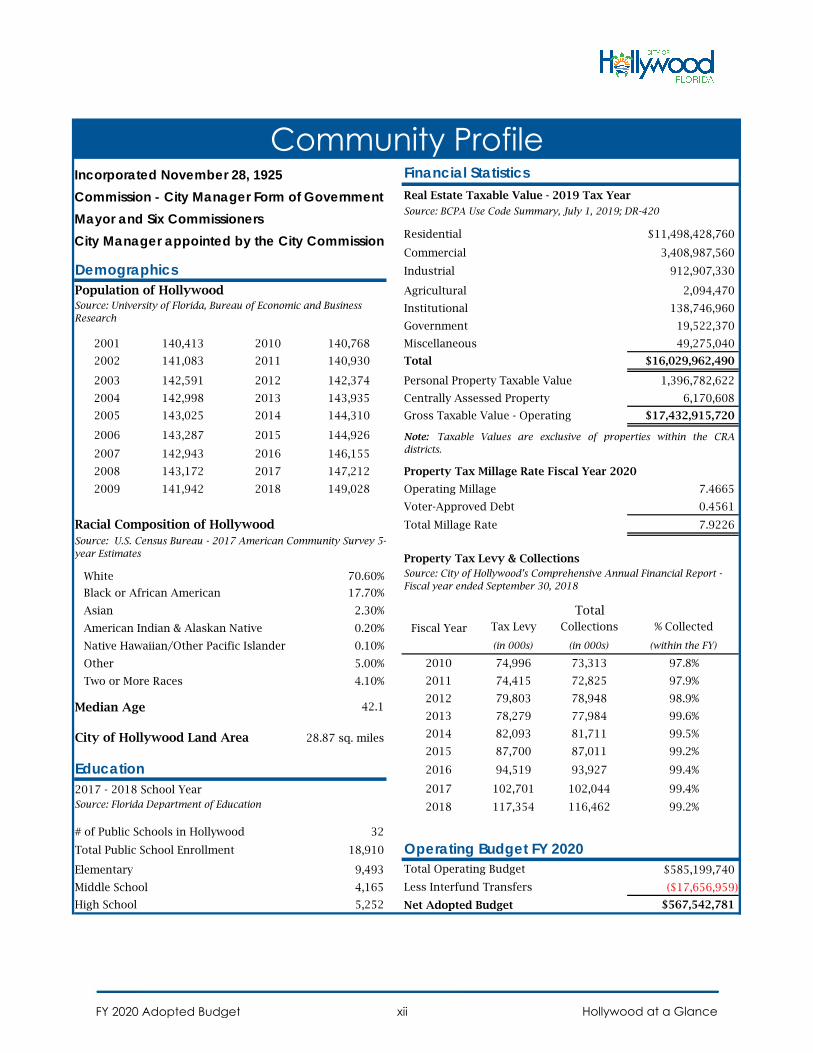
Financial StatisticsIncorporated November 28, 1925Commission - City Manager Form of Government Mayor and Six CommissionersCity Manager appointed by the City Commission Residential $11,498,428,760
Commercial 3,408,987,560
Demographics Industrial 912,907,330
Population of Hollywood Agricultural 2,094,470
Institutional 138,746,960
Government 19,522,370
2001 140,413 2010 140,768 Miscellaneous 49,275,040
2002 141,083 2011 140,930 Total $16,029,962,490
2003 142,591 2012 142,374 Personal Property Taxable Value 1,396,782,622
2004 142,998 2013 143,935 Centrally Assessed Property 6,170,608
2005 143,025 2014 144,310 Gross Taxable Value - Operating $17,432,915,720
2006 143,287 2015 144,926
2007 142,943 2016 146,155
2008 143,172 2017 147,212 Property Tax Millage Rate Fiscal Year 2020
2009 141,942 2018 149,028 Operating Millage 7.4665
Voter-Approved Debt 0.4561
Racial Composition of Hollywood Total Millage Rate 7.9226
Property Tax Levy & Collections
White 70.60%
Black or African American 17.70%
Asian 2.30% Total
American Indian & Alaskan Native 0.20% Fiscal Year Tax Levy Collections % Collected
Native Hawaiian/Other Pacific Islander 0.10% (in 000s) (in 000s) (within the FY)
Other 5.00% 2010 74,996 73,313 97.8%
Two or More Races 4.10% 2011 74,415 72,825 97.9%
Median Age 42.12012 79,803 78,948 98.9%
2013 78,279 77,984 99.6%
City of Hollywood Land Area 28.87 sq. miles 2014 82,093 81,711 99.5%
2015 87,700 87,011 99.2%
Education 2016 94,519 93,927 99.4%
2017 - 2018 School Year 2017 102,701 102,044 99.4%Source: Florida Department of Education 2018 117,354 116,462 99.2%
# of Public Schools in Hollywood 32
Total Public School Enrollment 18,910 Operating Budget FY 2020Elementary 9,493 Total Operating Budget $585,199,740
Middle School 4,165 Less Interfund Transfers ($17,656,959)
High School 5,252 Net Adopted Budget $567,542,781
Community Profile
Source: BCPA Use Code Summary, July 1, 2019; DR-420
Real Estate Taxable Value - 2019 Tax Year
Source: U.S. Census Bureau - 2017 American Community Survey 5-year Estimates
Note: Taxable Values are exclusive of properties within the CRA districts.
Source: City of Hollywood’s Comprehensive Annual Financial Report - Fiscal year ended September 30, 2018
Source: University of Florida, Bureau of Economic and Business Research
FY 2020 Adopted Budget Hollywood at a Glancexii
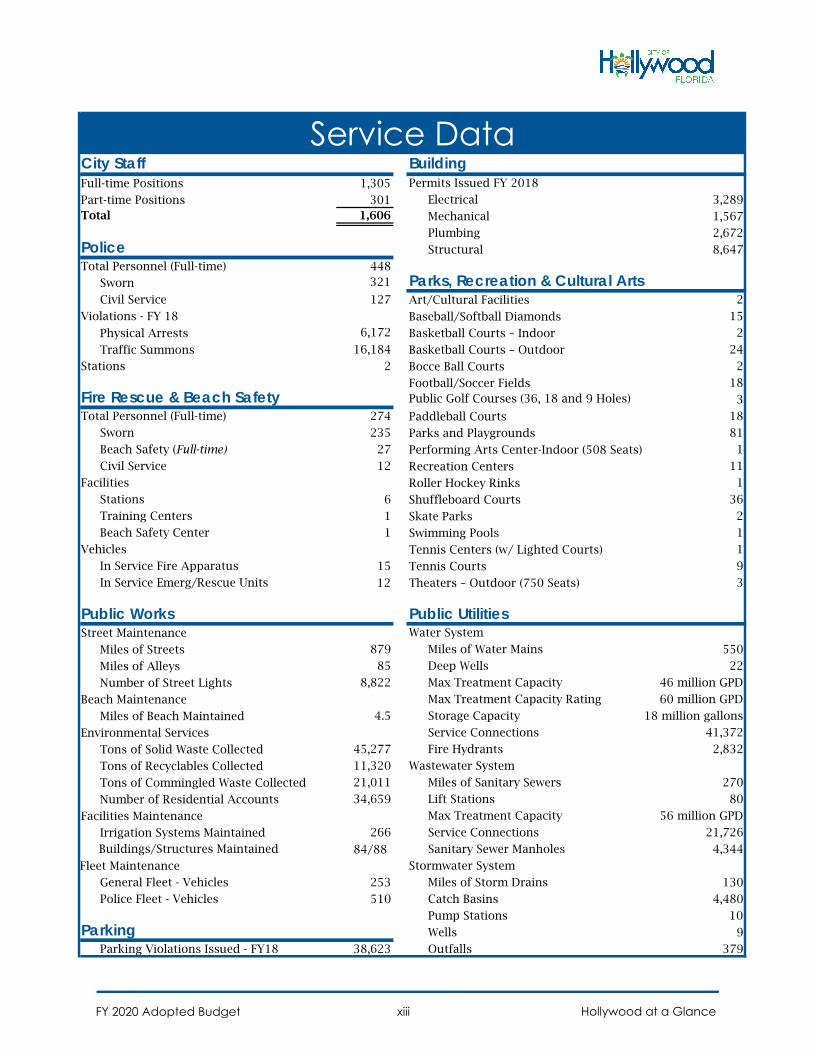
City Staff BuildingFull-time Positions 1,305 Permits Issued FY 2018
Part-time Positions 301 Electrical 3,289 Total 1,606 Mechanical 1,567
Plumbing 2,672 Police Structural 8,647
Total Personnel (Full-time) 448
Sworn 321 Parks, Recreation & Cultural ArtsCivil Service 127 Art/Cultural Facilities 2
Violations - FY 18 Baseball/Softball Diamonds 15
Physical Arrests 6,172 Basketball Courts – Indoor 2
Traffic Summons 16,184 Basketball Courts – Outdoor 24
Stations 2 Bocce Ball Courts 2
Football/Soccer Fields 18Fire Rescue & Beach Safety Public Golf Courses (36, 18 and 9 Holes) 3
Total Personnel (Full-time) 274 Paddleball Courts 18
Sworn 235 Parks and Playgrounds 81
Beach Safety (Full-time) 27 Performing Arts Center-Indoor (508 Seats) 1
Civil Service 12 Recreation Centers 11
Facilities Roller Hockey Rinks 1
Stations 6 Shuffleboard Courts 36
Training Centers 1 Skate Parks 2
Beach Safety Center 1 Swimming Pools 1
Vehicles Tennis Centers (w/ Lighted Courts) 1
In Service Fire Apparatus 15 Tennis Courts 9
In Service Emerg/Rescue Units 12 Theaters – Outdoor (750 Seats) 3
Public Works Public UtilitiesStreet Maintenance Water System
Miles of Streets 879 Miles of Water Mains 550
Miles of Alleys 85 Deep Wells 22
Number of Street Lights 8,822 Max Treatment Capacity 46 million GPD
Beach Maintenance Max Treatment Capacity Rating 60 million GPD
Miles of Beach Maintained 4.5 Storage Capacity 18 million gallons
Environmental Services Service Connections 41,372
Tons of Solid Waste Collected 45,277 Fire Hydrants 2,832
Tons of Recyclables Collected 11,320 Wastewater System
Tons of Commingled Waste Collected 21,011 Miles of Sanitary Sewers 270
Number of Residential Accounts 34,659 Lift Stations 80
Facilities Maintenance Max Treatment Capacity 56 million GPD
Irrigation Systems Maintained 266 Service Connections 21,726
Buildings/Structures Maintained 84/88 Sanitary Sewer Manholes 4,344
Fleet Maintenance Stormwater System
General Fleet - Vehicles 253 Miles of Storm Drains 130
Police Fleet - Vehicles 510 Catch Basins 4,480
Pump Stations 10Parking Wells 9
Parking Violations Issued - FY18 38,623 Outfalls 379
Service Data
FY 2020 Adopted Budget Hollywood at a Glancexiii

Introduction
The City of Hollywood, Florida It’s all about location and Hollywood has it – in the heart of South Florida between
Fort Lauderdale and Miami. As the 3rd largest city in Broward County, it’s easy to understand why Hollywood is both a sought-after tourist destination and a perfect spot for doing business. The City’s founder came to Florida in the 1920s to create a “dream city” where people could “make a living and live while making it.”
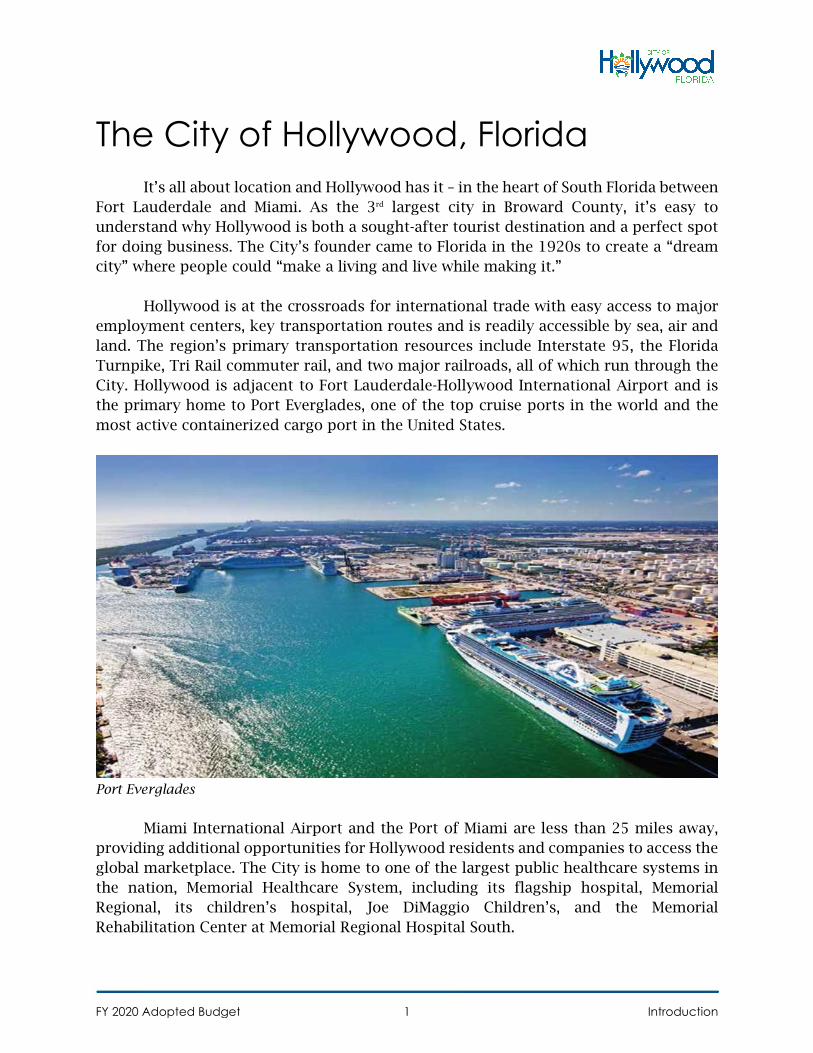
Hollywood is at the crossroads for international trade with easy access to major employment centers, key transportation routes and is readily accessible by sea, air and land. The region’s primary transportation resources include Interstate 95, the Florida Turnpike, Tri Rail commuter rail, and two major railroads, all of which run through the City. Hollywood is adjacent to Fort Lauderdale-Hollywood International Airport and is the primary home to Port Everglades, one of the top cruise ports in the world and the most active containerized cargo port in the United States.
Port Everglades
Miami International Airport and the Port of Miami are less than 25 miles away, providing additional opportunities for Hollywood residents and companies to access the global marketplace. The City is home to one of the largest public healthcare systems in the nation, Memorial Healthcare System, including its flagship hospital, Memorial Regional, its children’s hospital, Joe DiMaggio Children’s, and the Memorial Rehabilitation Center at Memorial Regional Hospital South.
FY 2020 Adopted Budget 1 Introduction
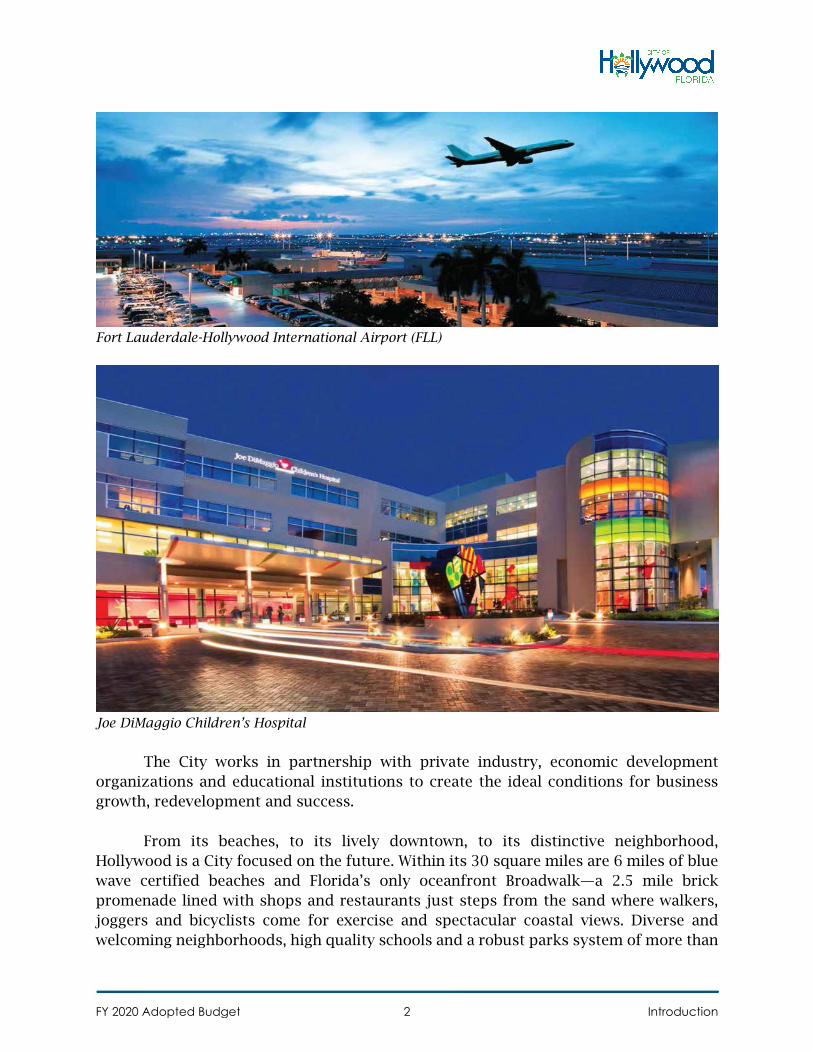
Fort Lauderdale-Hollywood International Airport (FLL)
Joe DiMaggio Children’s Hospital
The City works in partnership with private industry, economic development organizations and educational institutions to create the ideal conditions for business growth, redevelopment and success.
From its beaches, to its lively downtown, to its distinctive neighborhood, Hollywood is a City focused on the future. Within its 30 square miles are 6 miles of blue wave certified beaches and Florida’s only oceanfront Broadwalk—a 2.5 mile brick promenade lined with shops and restaurants just steps from the sand where walkers, joggers and bicyclists come for exercise and spectacular coastal views. Diverse and welcoming neighborhoods, high quality schools and a robust parks system of more than
FY 2020 Adopted Budget 2 Introduction
70 parks and community centers, make Hollywood a great place to work, live and raise a family.
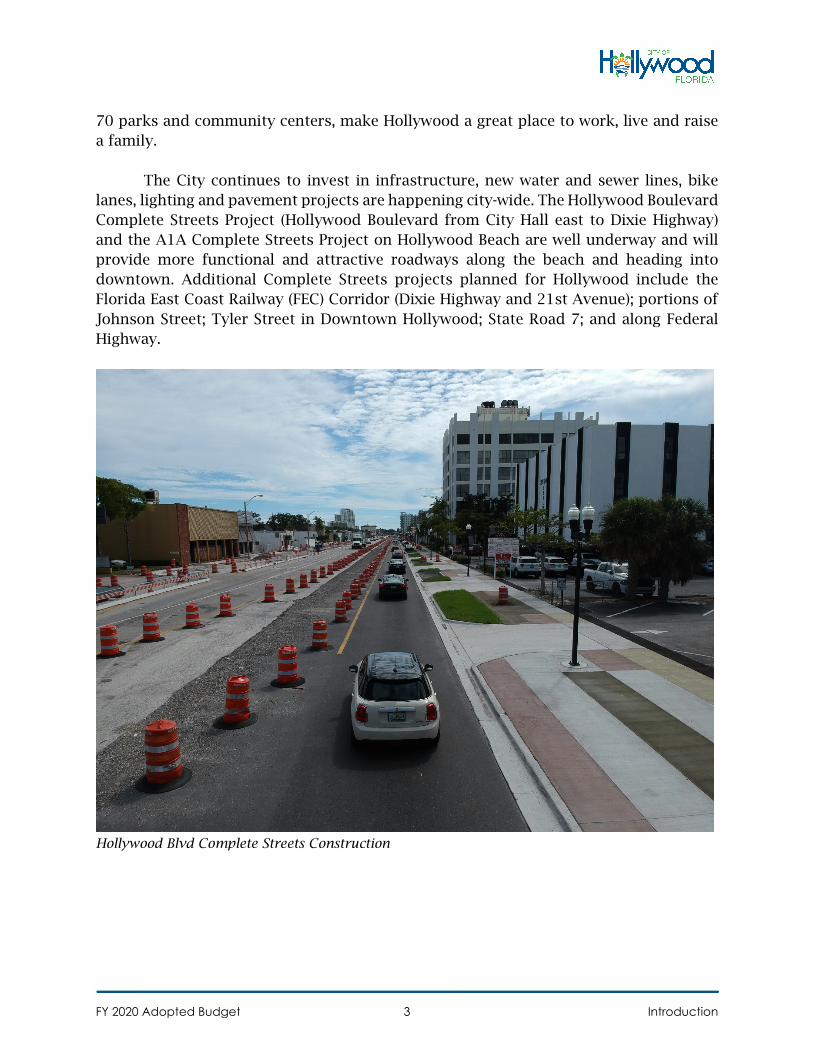
The City continues to invest in infrastructure, new water and sewer lines, bike lanes, lighting and pavement projects are happening city-wide. The Hollywood Boulevard Complete Streets Project (Hollywood Boulevard from City Hall east to Dixie Highway) and the A1A Complete Streets Project on Hollywood Beach are well underway and will provide more functional and attractive roadways along the beach and heading into downtown. Additional Complete Streets projects planned for Hollywood include the Florida East Coast Railway (FEC) Corridor (Dixie Highway and 21st Avenue); portions of Johnson Street; Tyler Street in Downtown Hollywood; State Road 7; and along Federal Highway.
Hollywood Blvd Complete Streets Construction
FY 2020 Adopted Budget 3 Introduction
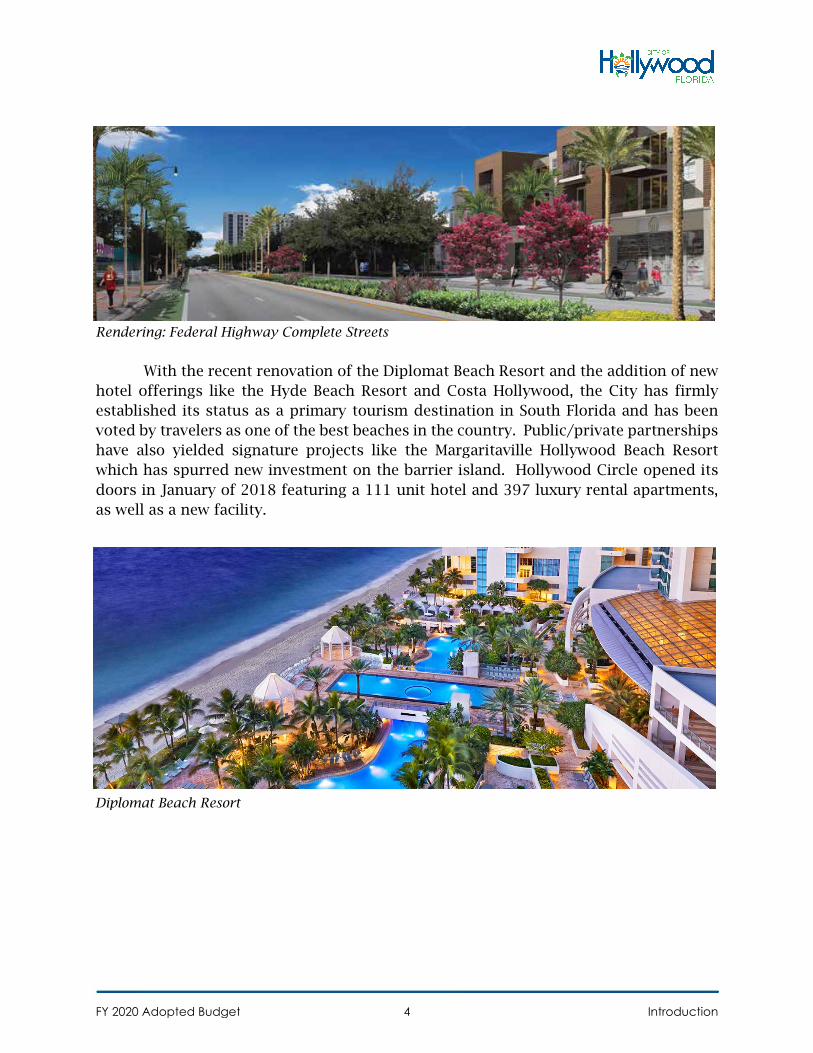
Rendering: Federal Highway Complete Streets
With the recent renovation of the Diplomat Beach Resort and the addition of new hotel offerings like the Hyde Beach Resort and Costa Hollywood, the City has firmly established its status as a primary tourism destination in South Florida and has been voted by travelers as one of the best beaches in the country. Public/private partnerships have also yielded signature projects like the Margaritaville Hollywood Beach Resort which has spurred new investment on the barrier island. Hollywood Circle opened its doors in January of 2018 featuring a 111 unit hotel and 397 luxury rental apartments, as well as a new facility.
FY 2020 Adopted Budget 4 Introduction
Diplomat Beach Resort
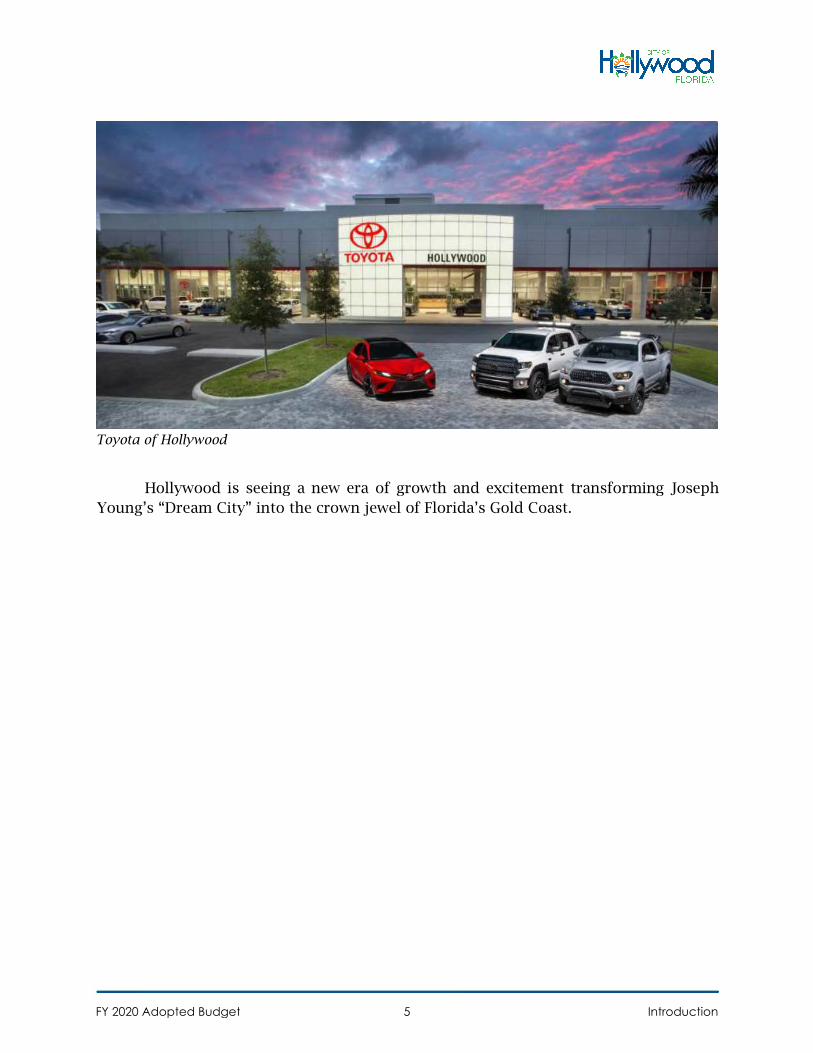
Toyota of Hollywood
Hollywood is seeing a new era of growth and excitement transforming Joseph Young’s “Dream City” into the crown jewel of Florida’s Gold Coast.
FY 2020 Adopted Budget 5 Introduction
Budget Overview
Budget Process
• The budget development process kicked-off on January 7, 2019. The BudgetAdministration Division distributed the pre-core budget package to the variousCity departments and offices for the preparation of the FY 2020 OperatingBudget. The individual department and office budget proposals were to bereturned by January 24, 2019.
• Individual meetings were conducted in March 2019 with representatives from theCity’s departments and offices with Budget Administration Division staff, the CityManager, and the Assistant City Managers to review, discuss, and prioritizeindividual budget submissions.
• The City Manager’s Fiscal Planning Retreat was held on April 17, 2019 with theMayor, City Commissioners and key members of the City’s executive andmanagement staff. During the retreat, City staff provided an overview of thenational economic conditions, fiscal health of the City, reviewed financialchallenges currently faced by the City and discussed Commission priorities.
• On July 3, 2019, City staff presented a Resolution to set the Not-To-Exceed Millagerate for Fiscal Year 2020. The proposed maximum millage recommended by staffwas 7.4665 mills (operating) and 0.5085 mills (voted debt service) for a total Not-To-Exceed Millage Rate of 7.975 mills. The City Commission adopted the Not-To-Exceed Millage Rate during its regular City Commission meeting.
• Public Hearings were held on September 12, 2019 and September 26, 2019 toformally approve and adopt the FY 2020 Budget.
Budget Summary
The Adopted FY 2020 Budget for all funds totals $567,542,781 (net of transfers) which represents a decrease of (7.0%) or approximately $43.1 million below the Adopted FY 2019 Budget of $610,507,530 for all funds (net of transfers). The FY 2020 Adopted General Fund Operating Budget of $305,356,955 increased by approximately $23.1 million or 8.2% above the FY 2019 Adopted General Fund Operating Budget of $282,263,083.
The total number of full-time positions increased from 1,273 positions in FY 2019 to 1,305 positions in FY 2020. Additionally, all contractual salary adjustments for employees have been funded in the FY 2020 budget.
FY 2020 Adopted Budget Introduction6
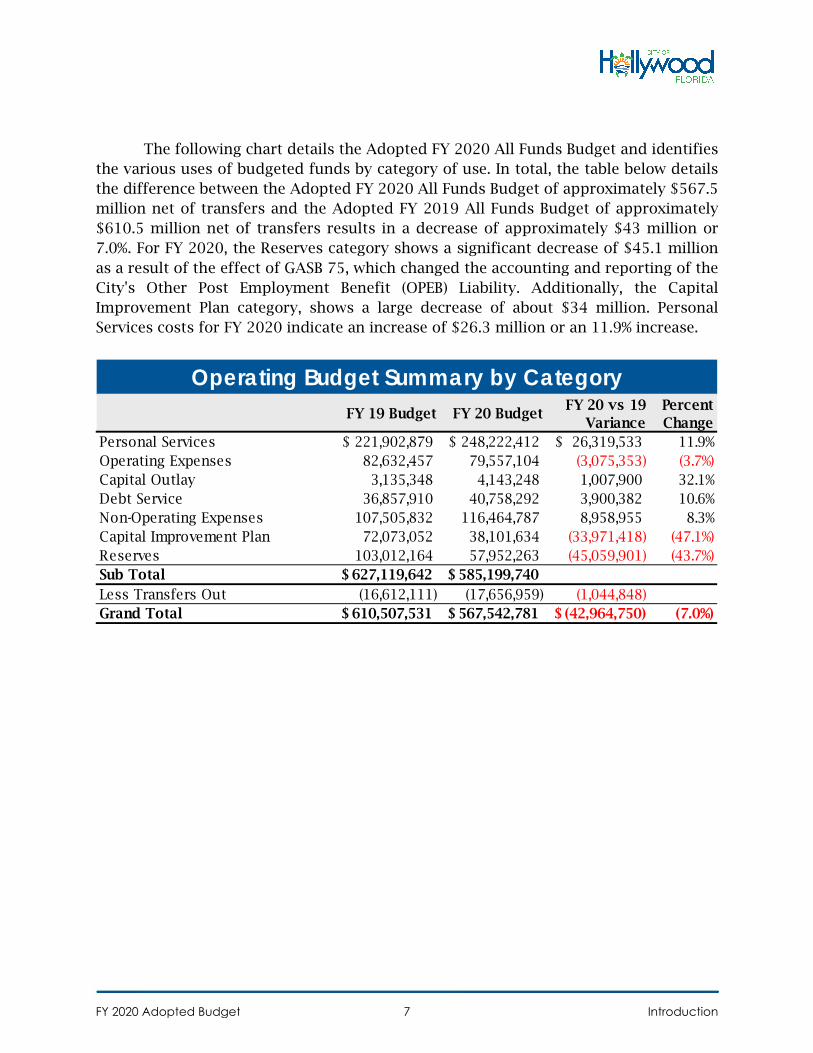
The following chart details the Adopted FY 2020 All Funds Budget and identifies the various uses of budgeted funds by category of use. In total, the table below details the difference between the Adopted FY 2020 All Funds Budget of approximately $567.5 million net of transfers and the Adopted FY 2019 All Funds Budget of approximately $610.5 million net of transfers results in a decrease of approximately $43 million or 7.0%. For FY 2020, the Reserves category shows a significant decrease of $45.1 million as a result of the effect of GASB 75, which changed the accounting and reporting of the City's Other Post Employment Benefit (OPEB) Liability. Additionally, the Capital Improvement Plan category, shows a large decrease of about $34 million. Personal Services costs for FY 2020 indicate an increase of $26.3 million or an 11.9% increase.
FY 19 Budget FY 20 BudgetFY 20 vs 19
VariancePercent Change
Personal Services 221,902,879$ 248,222,412$ 26,319,533$ 11.9%Operating Expenses 82,632,457 79,557,104 (3,075,353) (3.7%)Capital Outlay 3,135,348 4,143,248 1,007,900 32.1%Debt Service 36,857,910 40,758,292 3,900,382 10.6%Non-Operating Expenses 107,505,832 116,464,787 8,958,955 8.3%Capital Improvement Plan 72,073,052 38,101,634 (33,971,418) (47.1%)Reserves 103,012,164 57,952,263 (45,059,901) (43.7%)Sub Total 627,119,642$ 585,199,740$ Less Transfers Out (16,612,111) (17,656,959) (1,044,848) Grand Total 610,507,531$ 567,542,781$ (42,964,750)$ (7.0%)
Operating Budget Summary by Category
FY 2020 Adopted Budget Introduction7
FY 2020 Operating Budget Initiatives
The City of Hollywood’s operating budget initiatives provide an immediate short-term focus to guide the development of the FY 2020 Operating Budget. Given the City’s success to date in meeting and exceeding the recommended fund balance target, the Adopted FY 2020 budget contemplates the continuation of sustainable financial decision making.
The following is a listing of selected initiatives and areas of note for FY 2020:
Revenue Initiatives
The City has certain policies and procedures in place to ensure that revenue projections will provide realistic and conservative revenue estimates upon which a balanced operating budget can be constructed. Included in the policies/procedures that have been implemented are:
• Formalized revenue estimates generated by a revenue estimating committee,chaired by the Director of Financial Services with representatives from several keydepartments/divisions; and
• Quarterly revenue and expenditure reports
Property Tax Revenues
On July 1, 2019, the Broward County Property Appraiser’s Office certified the City’s taxable property value at $17,432,915,720 which is $1,092,012,512 or 6.7% above that of the previous tax year’s final gross taxable value of $16,340,903,208 after corrections. For FY 2020, the City adopted an operating millage rate of 7.4665 mills which maintains previous year’s millage rate. This operating millage rate is projected to generate $124,956,351 in net property tax revenues for FY 2020, inclusive of statutory discounts and uncollectible taxes.
Fire Rescue Assessment Revenues
The Fire Rescue Assessment Fee will remain unchanged at $285 per residential unit. The FY 2020 assessment covers 97.5% of the assessable cost of fire rescue services provided to City residents and businesses, generating net revenues of approximately $27.2 million.
FY 2020 Adopted Budget Introduction8
Fire Inspection Fee Revenues
The Fire Inspection Fee will remain at $28 for inspected residential units and is expected to generate approximately $2.4 million.
Community Redevelopment Agency (CRA)
In FY 2020, the reimbursement to the City for enhanced services and benefits from both districts of the CRA remains unchanged at approximately $5.5 million.
Capital Improvement Plan (CIP)
For FY 2020, capital improvement project spending has been budgeted for projects totaling approximately $40.8 million. The requested citywide capital improvement projects being prioritized include grant matching dollars for Street and Right-of-Way Improvements and the implementation of an Enterprise Resources System.
Funding will continue for the “Pay-As-You-Go” program which was first established in FY 2012. The “Pay-As-You-Go” approach is recommended as the most prudent way of financing capital projects due to the unstable short term financial environment faced by the City. This program also enables the City to address current small capital needs immediately without having to wait for funding from debt financing.
General Obligation Bond (G.O.B.) Capital Improvement Projects
In November 2004, voters approved a two-part referendum supporting the issuance of a General Obligation Bond for Public Safety and Parks & Recreation capital improvements. Prioritization and scheduling of projects, along with the initial selection of design and engineering agencies for larger projects began in FY 2005.
In March 2019, voters approved three questions for the Hollywood on the GO Bond which will provide funding to improve public safety facilities, purchase technology and equipment and improve the City’s parks and cultural facilities. The first tranche of debt in the amount of $70 million was issued in the fall of 2019.
The required debt payments for both bond issuances total roughly $7.6 million for FY 2020 and will be funded by the voted debt service millage rate of 0.4561 mills, an increase of 0.2234 mills from the FY 2019 voted debt service millage rate of 0.2327 mills.
FY 2020 Adopted Budget Introduction9
GASB 75 - Other Post-Employment Benefits (OPEB) Requirement
The line item for “OPEB Cost” was first included in the budgets of a number of departments for FY 2010 after the implementation of GASB 45. It remains of importance for FY 2020 since the budgetary impact is extensive. Each Enterprise Fund (Water and Sewer, Stormwater, Golf, Sanitation, and Parking Enterprise) and Central Service Fund includes an expense line that represents the anticipated cost of post-employment benefits other than pension costs, as determined by an independent actuary. This change was initiated by the Government Accounting Standards Board (GASB), the national organization that sets standards for governmental accounting and reporting, in order to provide more complete information on obligations incurred by state and local governments. The City offers healthcare as a post-employment benefit. Until GASB 45 was adopted, City contributions to post-employment healthcare were on a “Pay-As-You-Go” approach, in which the cost of post-employment healthcare benefits were reported only on actual claims from retired employees.
The implementation of GASB 75 required the City to record total OPEB liability, which eliminated the previously reported net OPEB obligation (GASB 45). Due to the adoption of this statement, beginning net position of governmental and business-type activities have been restated and reduced. City contributions to post-employment healthcare for the City’s General Fund remain on a “Pay-As-You-Go” basis.
FY 2020 Adopted Budget Introduction10
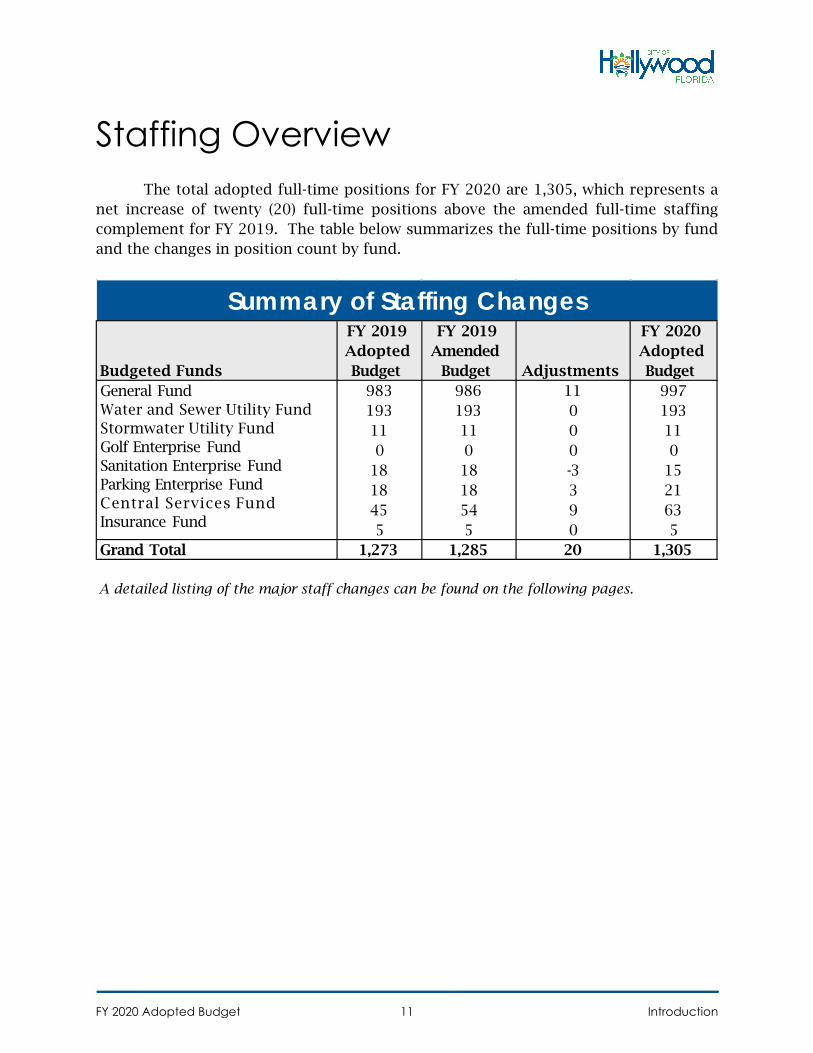
Staffing Overview The total adopted full-time positions for FY 2020 are 1,305, which represents a
net increase of twenty (20) full-time positions above the amended full-time staffing complement for FY 2019. The table below summarizes the full-time positions by fund and the changes in position count by fund.
Budgeted Funds
FY 2019 Adopted Budget
FY 2019 Amended
Budget Adjustments
FY 2020 Adopted Budget
983 986 11 997193 193 0 19311 11 0 110 0 0 0
18 18 -3 1518 18 3 2145 54 9 63
General FundWater and Sewer Utility Fund Stormwater Utility Fund Golf Enterprise Fund Sanitation Enterprise FundParking Enterprise FundCentral Services Fund Insurance Fund 5 5 0 5Grand Total 1,273 1,285 20 1,305
Summary of Staffing Changes
A detailed listing of the major staff changes can be found on the following pages.
FY 2020 Adopted Budget Introduction11
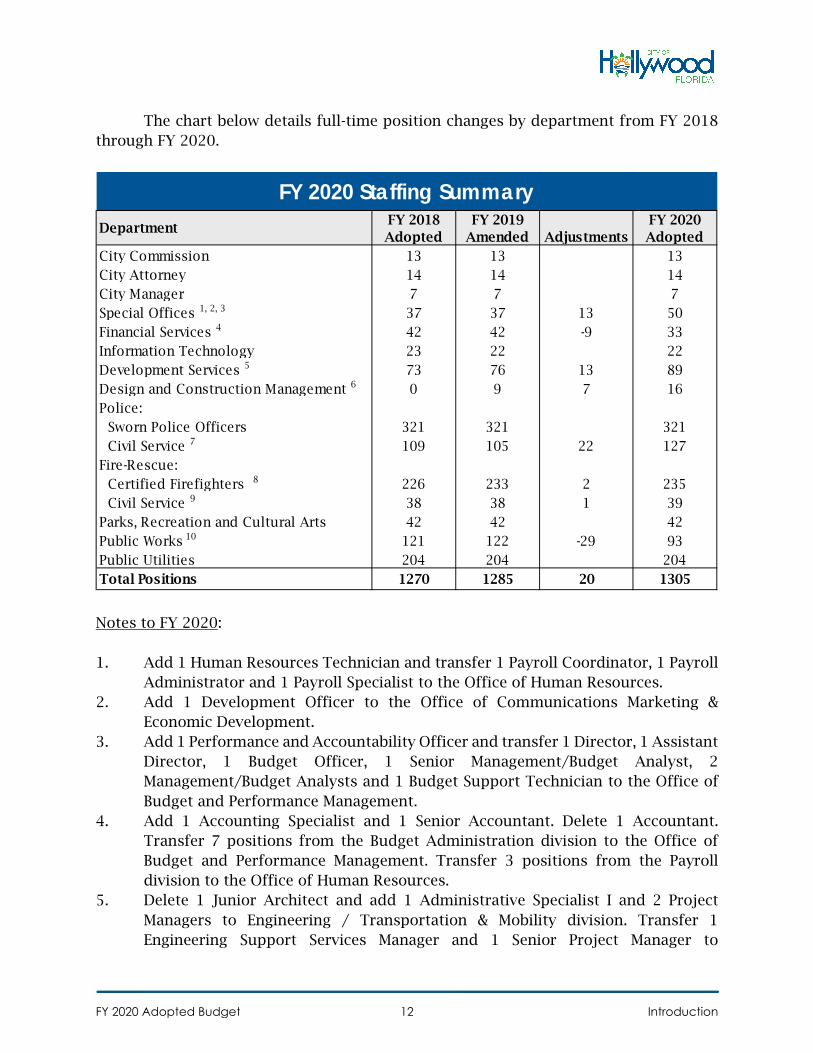
The chart below details full-time position changes by department from FY 2018 through FY 2020.
Notes to FY 2020:
1. Add 1 Human Resources Technician and transfer 1 Payroll Coordinator, 1 PayrollAdministrator and 1 Payroll Specialist to the Office of Human Resources.
2. Add 1 Development Officer to the Office of Communications Marketing &Economic Development.
3. Add 1 Performance and Accountability Officer and transfer 1 Director, 1 AssistantDirector, 1 Budget Officer, 1 Senior Management/Budget Analyst, 2Management/Budget Analysts and 1 Budget Support Technician to the Office ofBudget and Performance Management.
4. Add 1 Accounting Specialist and 1 Senior Accountant. Delete 1 Accountant.Transfer 7 positions from the Budget Administration division to the Office ofBudget and Performance Management. Transfer 3 positions from the Payrolldivision to the Office of Human Resources.
5. Delete 1 Junior Architect and add 1 Administrative Specialist I and 2 ProjectManagers to Engineering / Transportation & Mobility division. Transfer 1Engineering Support Services Manager and 1 Senior Project Manager to
FY 2018 FY 2019 FY 2020Adopted Amended Adjustments Adopted
13 13 1314 14 147 7 737 37 13 5042 42 -9 3323 22 2273 76 13 890 9 7 16
321 321 321109 105 22 127
226 233 2 23538 38 1 3942 42 42
121 122 -29 93204 204 2041270 1285 20 1305
Public Utilities Total Positions
FY 2020 Staffing SummaryDepartment
City CommissionCity Attorney City ManagerSpecial Offices 1, 2, 3
Public Works 10
Financial Services 4
Development Services 5
Design and Construction Management 6
Police: Sworn Police Officers
Fire-Rescue: Certified Firefighters 8
Civil Service 9
Parks, Recreation and Cultural Arts
Civil Service 7
Information Technology
FY 2020 Adopted Budget Introduction12
Department of Design & Construction Management. Delete Chief Development Officer from Building division. Add 1 Zoning and Compliance Inspector to Planning and Urban Design division. Add 1 Special Projects Manager to ILA division. Add 1 Administrative Specialist I, 4 Administrative Specialist II, 1 Code Compliance Manager, 1 Code Compliance Specialist, 3 Code Compliance Supervisors, 17 Code Compliance Officers and 1 Animal Control Officer to the Code Compliance division. Transfer 18 Parking Services positions to the Police Department.
6. Add 1 Architect, 1 Engineer, 1 Project Manager, 3 Senior Project Managers, 1Engineering Support Services Manager, 1 Grants Planner and 1 Senior CADDOperator.
7. Add 1 Deputy City Manager and delete 1 Assistant City Manager - Public Safety.Add 1 Grants and Special Projects Manager. Add the following positions toParking Services: 1 Administrative Assistant I, 1 Financial Analyst, 1 ParkingAdministrator, 1 Parking Collections and Accounting Clerk, 5 ParkingEnforcement Officers, 1 Parking Operations Manager, 1 Parking OperationSuperintendent, 5 Parking Operations Supervisors, 2 Parking OperationsTechnicians, 1 Parking Technology Specialist, 1 Senior, Parking OperationsTechnician and 1 Parking Garage Technician.
8. Add 2 Firefighters9. Add 1 Marine Safety Officer10. Add 2 Custodians. Delete 1 Heavy Equipment Operator and 2 Maintenance
Technicians. Transfer 28 positions from Code Compliance division to Departmentof Development Services.
FY 2020 Adopted Budget Introduction13
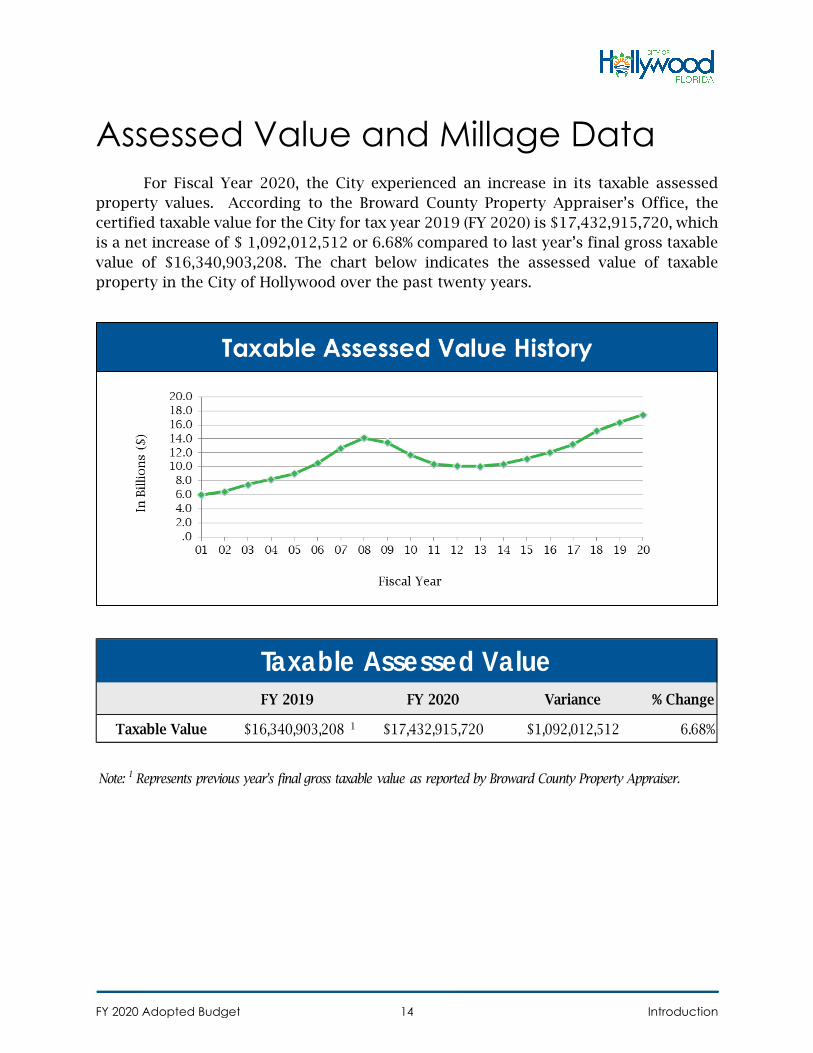
Assessed Value and Millage Data For Fiscal Year 2020, the City experienced an increase in its taxable assessed
property values. According to the Broward County Property Appraiser’s Office, the certified taxable value for the City for tax year 2019 (FY 2020) is $17,432,915,720, which is a net increase of $ 1,092,012,512 or 6.68% compared to last year’s final gross taxable value of $16,340,903,208. The chart below indicates the assessed value of taxable property in the City of Hollywood over the past twenty years.
FY 2019 FY 2020 Variance % Change
Taxable Value $16,340,903,208 1 $17,432,915,720 $1,092,012,512 6.68%
Note: 1 Represents previous year's final gross taxable value as reported by Broward County Property Appraiser.
Taxable Assessed Value
FY 2020 Adopted Budget Introduction14
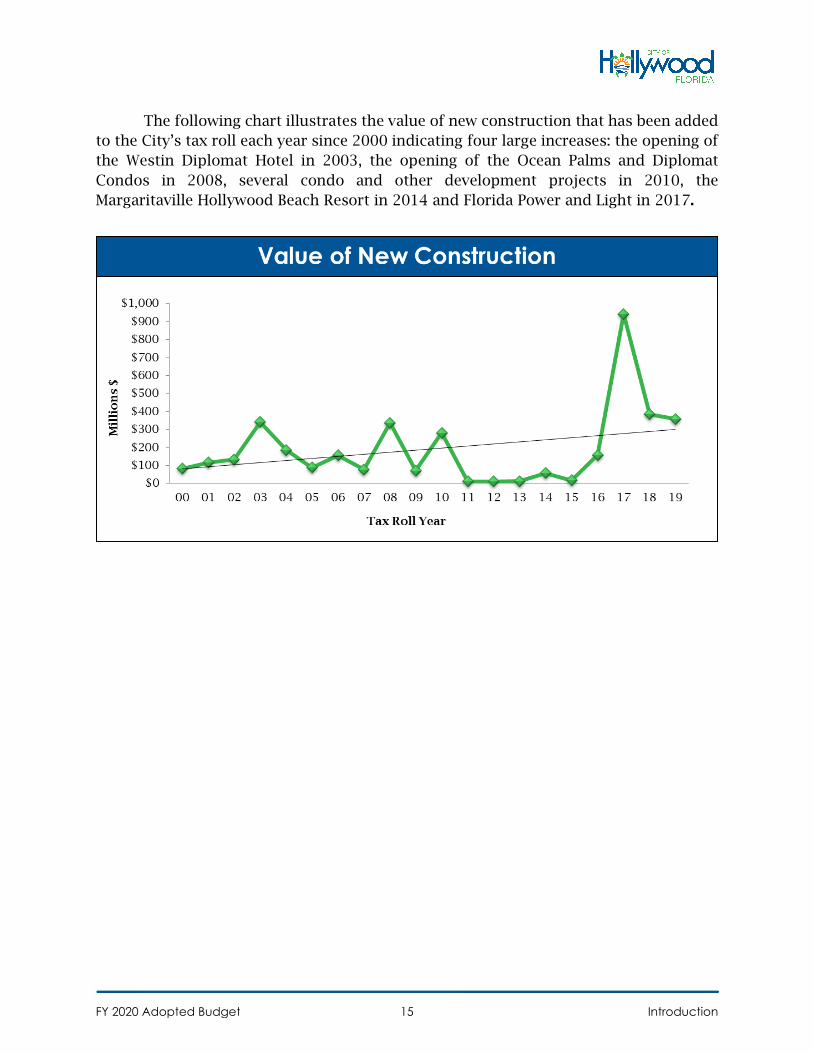
The following chart illustrates the value of new construction that has been added to the City’s tax roll each year since 2000 indicating four large increases: the opening of the Westin Diplomat Hotel in 2003, the opening of the Ocean Palms and Diplomat Condos in 2008, several condo and other development projects in 2010, the Margaritaville Hollywood Beach Resort in 2014 and Florida Power and Light in 2017.
FY 2020 Adopted Budget Introduction15
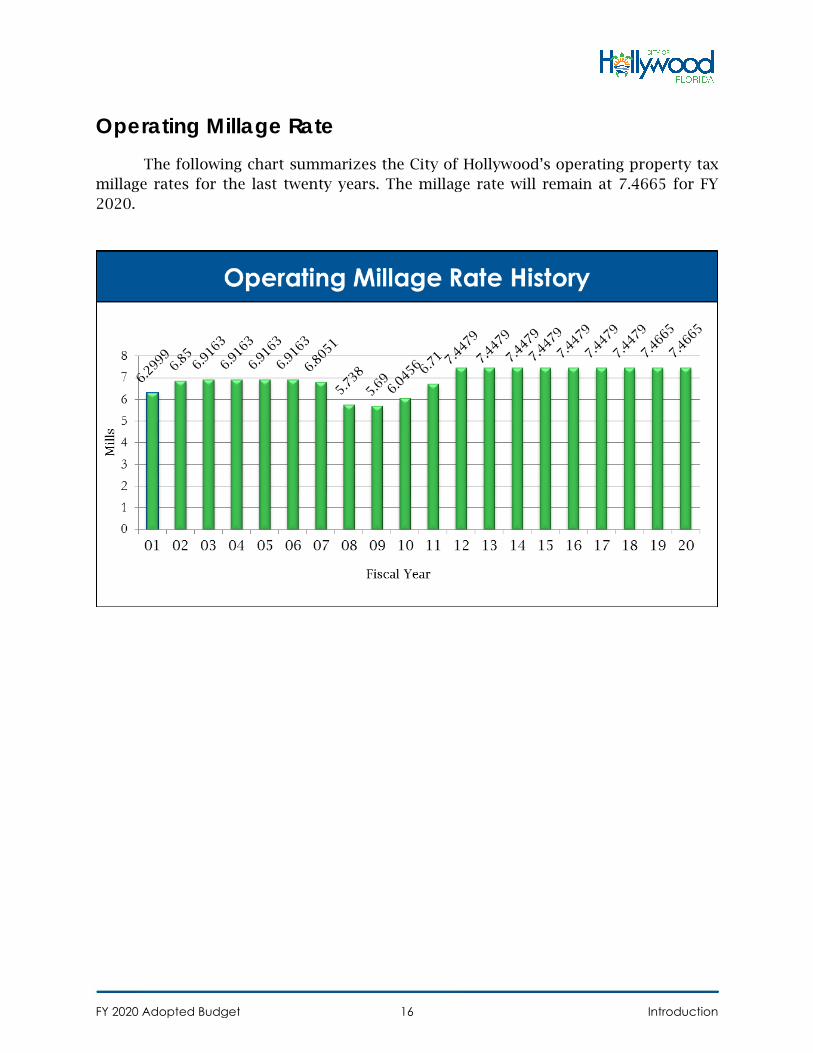
Operating Millage Rate The following chart summarizes the City of Hollywood’s operating property tax
millage rates for the last twenty years. The millage rate will remain at 7.4665 for FY 2020.
FY 2020 Adopted Budget Introduction16
Value of Home $50,000 $75,000 $100,000 $125,000 $150,000 $175,000
Homestead Exemption 25,000 50,000 50,000 50,000 50,000 50,000Taxable Value $25,000 $25,000 $50,000 $75,000 $100,000 $125,000
2019 City Costs to HomeownerCity Ad Valorem Taxes - 7.4665 mills $187 $187 $373 $560 $747 $933Voted Debt Service - 0.2327 mills 6 6 12 17 23 29Non-Ad Valorem Assessment 285 285 285 285 285 285Total Costs $478 $478 $670 $862 $1,055 $1,247
2020 City Costs to HomeownerCity Ad Valorem Taxes - 7.4665 mills $187 $187 $373 $560 $747 $933Voted Debt Service - 0.4561 mills 11 11 23 34 46 57Non-Ad Valorem Assessment 285 285 285 285 285 285Total Costs $483 $483 $681 $879 $1,078 $1,275
Overall Annual Change in Costs $5 $5 $11 $17 $23 $28Percentage Change in Costs 1.0% 1.0% 1.6% 2.0% 2.2% 2.2%Change in Monthly Cost $0.42 $0.42 $0.92 $1.42 $1.92 $2.33
Value of Home $200,000 $250,000 $300,000 $350,000 $400,000 $500,000
Homestead Exemption 50,000 50,000 50,000 50,000 50,000 50,000Taxable Value $150,000 $200,000 $250,000 $300,000 $350,000 $450,000
2019 City Costs to HomeownerCity Ad Valorem Taxes - 7.4665 mills $1,120 $1,493 $1,867 $2,240 $2,613 $3,360Voted Debt Service - 0.2327 mills 35 47 58 70 81 105Non-Ad Valorem Assessment 285 285 285 285 285 285Total Costs $1,440 $1,825 $2,210 $2,595 $2,979 $3,750
2020 City Costs to HomeownerCity Ad Valorem Taxes - 7.4665 mills $1,120 $1,493 $1,867 $2,240 $2,613 $3,360Voted Debt Service - 0.4561 mills 68 91 114 137 160 205Non-Ad Valorem Assessment 285 285 285 285 285 285Total Costs $1,473 $1,869 $2,266 $2,662 $3,058 $3,850
Overall Annual Change in Costs $33 $44 $56 $67 $79 $100Percentage Change in Costs 2.3% 2.4% 2.5% 2.6% 2.7% 2.7%Change in Monthly Cost $2.75 $3.67 $4.67 $5.58 $6.58 $8.33
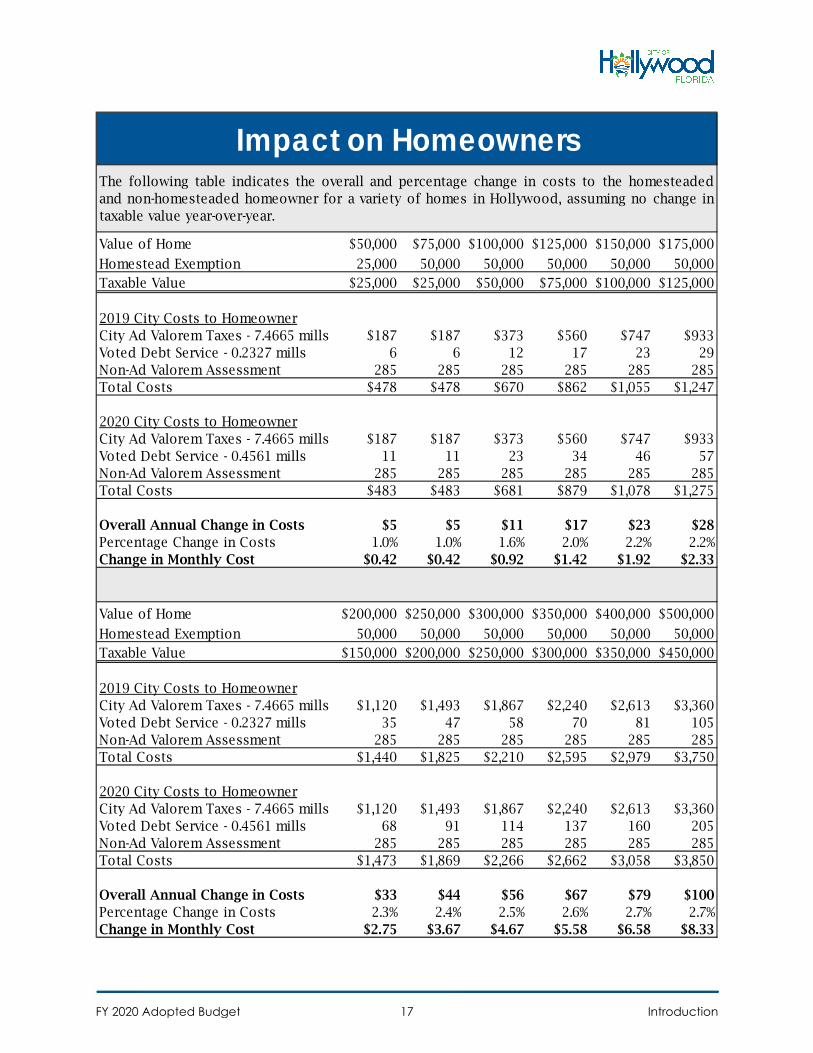
Impact on HomeownersThe following table indicates the overall and percentage change in costs to the homesteadedand non-homesteaded homeowner for a variety of homes in Hollywood, assuming no change intaxable value year-over-year.
FY 2020 Adopted Budget Introduction17
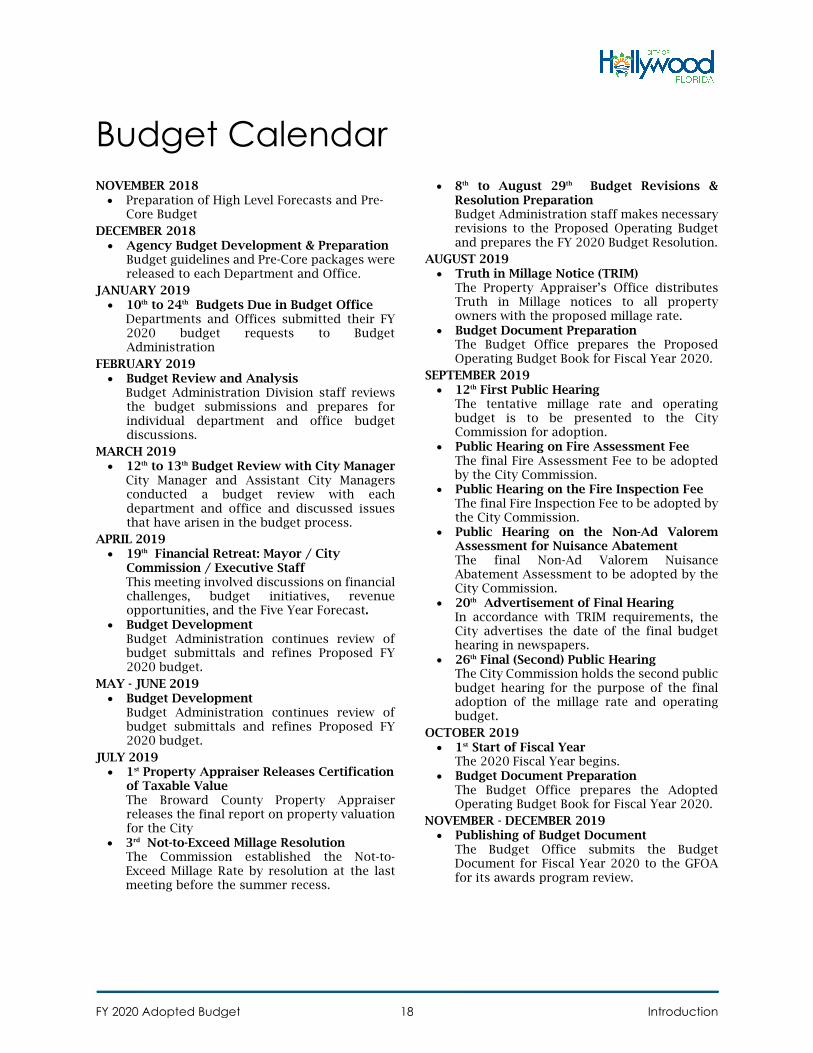
Budget CalendarNOVEMBER 2018 • Preparation of High Level Forecasts and Pre-
Core BudgetDECEMBER 2018 • Agency Budget Development & Preparation
Budget guidelines and Pre-Core packages werereleased to each Department and Office.
JANUARY 2019 • 10th to 24th Budgets Due in Budget Office
Departments and Offices submitted their FY2020 budget requests to Budget Administration
FEBRUARY 2019• Budget Review and Analysis
Budget Administration Division staff reviewsthe budget submissions and prepares forindividual department and office budgetdiscussions.
MARCH 2019 • 12th to 13th Budget Review with City Manager
City Manager and Assistant City Managersconducted a budget review with eachdepartment and office and discussed issuesthat have arisen in the budget process.
APRIL 2019 • 19th Financial Retreat: Mayor / City
Commission / Executive StaffThis meeting involved discussions on financialchallenges, budget initiatives, revenueopportunities, and the Five Year Forecast.
• Budget DevelopmentBudget Administration continues review ofbudget submittals and refines Proposed FY2020 budget.
MAY - JUNE 2019 • Budget Development
Budget Administration continues review ofbudget submittals and refines Proposed FY2020 budget.
JULY 2019 • 1st Property Appraiser Releases Certification
of Taxable ValueThe Broward County Property Appraiserreleases the final report on property valuationfor the City
• 3rd Not-to-Exceed Millage ResolutionThe Commission established the Not-to-Exceed Millage Rate by resolution at the lastmeeting before the summer recess.
• 8th to August 29th Budget Revisions &Resolution PreparationBudget Administration staff makes necessaryrevisions to the Proposed Operating Budgetand prepares the FY 2020 Budget Resolution.
AUGUST 2019 • Truth in Millage Notice (TRIM)
The Property Appraiser’s Office distributesTruth in Millage notices to all propertyowners with the proposed millage rate.
• Budget Document PreparationThe Budget Office prepares the ProposedOperating Budget Book for Fiscal Year 2020.
SEPTEMBER 2019 • 12th First Public Hearing
The tentative millage rate and operatingbudget is to be presented to the CityCommission for adoption.
• Public Hearing on Fire Assessment FeeThe final Fire Assessment Fee to be adoptedby the City Commission.
• Public Hearing on the Fire Inspection FeeThe final Fire Inspection Fee to be adopted bythe City Commission.
• Public Hearing on the Non-Ad ValoremAssessment for Nuisance AbatementThe final Non-Ad Valorem NuisanceAbatement Assessment to be adopted by theCity Commission.
• 20th Advertisement of Final HearingIn accordance with TRIM requirements, theCity advertises the date of the final budgethearing in newspapers.
• 26th Final (Second) Public HearingThe City Commission holds the second publicbudget hearing for the purpose of the finaladoption of the millage rate and operatingbudget.
OCTOBER 2019 • 1st Start of Fiscal Year
The 2020 Fiscal Year begins.• Budget Document Preparation
The Budget Office prepares the AdoptedOperating Budget Book for Fiscal Year 2020.
NOVEMBER - DECEMBER 2019 • Publishing of Budget Document
The Budget Office submits the BudgetDocument for Fiscal Year 2020 to the GFOAfor its awards program review.
FY 2020 Adopted Budget Introduction18
Operating Budget Policies & Procedures Budget Policies
The development of the City’s Operating Budget is guided by the following policies:
• The primary budgetary objective is to provide the highest possible level of serviceto the residents of Hollywood without impairing the City’s financial condition.
• The budget must be balanced for each fund; total projected revenues must equaltotal anticipated expenditures.
• The City will avoid budgetary procedures that balance the current year’s budgetat the expense of meeting future years’ obligations.
• The City will maintain a budgetary control system to ensure adherence to thebudget and will prepare regular reports comparing actual revenues andexpenditures to budgeted amounts.
• Annual budgets are legally adopted for the general fund, proprietary funds andcertain special revenue funds.
• Laws and policies on limitations to revenue sources must be explicitly addressedin the budget process.
Basis of Budgeting and Accounting
The annual budget, which represents departmental appropriations, is prepared on the modified accrual basis utilizing encumbrance accounting. Encumbrances are used to indicate the “intent to purchase goods or services,” which does not need to be received for liabilities and expenditures to be recorded.
In brief, the modified accrual basis of accounting allows for revenues to be recognized when susceptible to accrual (measurable and available). Measurable means the amount of the transaction can be scientifically determined. Available means collectible within the fiscal period or subsequently to be used to pay liabilities of the current period.
The Enterprise Funds (Water & Sewer, Sanitation, etc.) on the other hand, are budgeted on a full accrual basis. Expenses are recognized when incurred. Revenues are recognized when they are obligated to the City. For example, water and sewer fees are recognized as revenue when bills are issued.
FY 2020 Adopted Budget Introduction19
Budget Adoption
The City and its component units’ fiscal year begins on October 1st of each year and ends on September 30th the following year. Annually, the City Manager submits to the City Commission a proposed budget for the upcoming fiscal year based upon Commission established priorities, which are included as part of a detailed financial plan prepared by the leaders of the City’s departments and offices. Upon receipt of the proposed budget, a series of workshops are held with the City Commission. The Commission may make modifications by consensus of its members; however, no votes are taken at a Commission workshop. Before the adoption of the budget, the Commission holds two public hearings where the public is given an opportunity to make comments. During these hearings the Commission may again make revisions to the budget by majority vote. On or before the thirtieth day of September, the City Commission adopts the budget and property tax rate by the affirmative vote of at least a majority of its members. Upon final adoption, the budget is in effect for the ensuing fiscal year and becomes the authority for the various departments and offices to expend funds subject to controls established by the City Code of Ordinances and Florida Statutes.
Budget Amendments
From time to time, it becomes necessary to modify the adopted budget. The procedure for amending the budget depends on the type of change that is needed.
If expenditure will cause the object level to exceed its budget, a budget transfer request must be submitted to the Office of Budget and Performance Management for approval. These changes do not affect the bottom line total for a department. These changes include transfers from one line item to another within a department’s operating budget, or changes between divisions within a department. All budget transfer requests must state to and from accounts. It must also explain the reason for the available funds in the transferring account and the need for the funds in the receiving account.
• Budget transfer requests of $5,000 or less require approval by the departmenthead and authorization by the Director of Budget & Performance Managementand the Director of Financial Services.
• Budget transfers between $5,001 and $50,000 require the City Manager’sapproval and may be done without approval of the City Commission. Thetransfers however, must be made within the same office or department within adistinct fund, including but not limited to the reallocation of funding for aposition reclassification. Where the budget transfer is the result of the creationof accounts and transfer of funds necessitated by the creation or amendment of
FY 2020 Adopted Budget Introduction20
a division within a department or the creation or amendment of a special office within the Office of the City Manager, the City Manager may approve the budget transfer without Commission action. All administrative budget transfers are documented and tracked in the City’s financial management system.
• All budget transfers over $50,000 must be approved by the City Commission.
The second type of budget amendment changes the total appropriation for a department or fund. The five types of changes that require legislative approval by the City Commission prior to modifying the adopted budget are:
• The acceptance of an award of grant funding;• The appropriation of additional funding if expenditures are projected to exceed
budgeted amounts;• Any necessary budget transfers and adjustments within a sixty (60) day period
following the close of the fiscal year, in accordance with Florida Statute 166.241;• Adjustments to reflect unanticipated revenues or receipts; and• Re-appropriation of monies from one fund to another when deemed necessary.
Budget Control
The budget is developed on a programmatic basis and depicts the various services that are provided by the City and the resources that are allocated for the provision of these services. The programs outlined in the budget are implemented by the various departments and offices within the City.
Normally there are a number of levels of detail in an appropriated budget. Consider, for example, the following level of detail:
Although budgets normally are prepared at all of these levels of detail, the City of Hollywood has designated the Department as the “legal level of control.” This level of control is the lowest level at which management may not reassign resources without legislative approval of the City Commission.
In all cases, annual operating appropriations lapse at the fiscal year end to the extent that they have not been expended, lawfully encumbered, or appropriated to ongoing capital improvement projects. Additionally, expenditures should not exceed appropriations at the departmental level.
Fund General Fund Department Fire-Rescue & Beach Safety Program Fire Prevention Function Public Safety Object Personal Services – Salaries & Wages - Full Time
FY 2020 Adopted Budget Introduction21
Financial Policies The City of Hollywood financial policies set forth the basic framework for the
overall fiscal management of the City. Operating independently of changing circumstances and conditions, these policies assist the decision-making process used in developing this operating budget. The financial policies are reviewed periodically to incorporate applicable best practices and adhere to legal mandates.
Financial Planning Policies
Financial Planning policies address the need for a long-term view and the fundamental principle of a balanced budget.
Balanced Budget
• The Operating Budget is balanced with current resources equal to currentexpenditures using strategies in the following order of priority: improveproductivity, shift the service or payment burden away from the City, improverevenues, create new service fees or raise existing fees based on the cost ofservices, increase property taxes, and reduce or eliminate programs.
• New programs are not budgeted or implemented until the full annual cost andthe financial impact can be reasonably projected. Typically, new or expandedservices are implemented simultaneously with their related off-setting revenueincrease or expense reduction. This applies to personnel, equipment and anyother peripheral expense associated with the service.
• The tax rate is comparable to that of other cities of similar size and conditionsand must be adequate to produce sufficient revenues to cover City servicesapproved by the City Commission.
Long-Range Planning
• The City supports investments designed to reduce future operating costs andenhance property values.
• The City’s multi-year Capital Improvement Plan is updated annually. Approvalis given only to capital improvements that coincide with the plan.
Asset Inventory
• An inventory and condition assessment is conducted for all major capital assetson a yearly basis.
FY 2020 Adopted Budget Introduction
• The City maintains the condition of physical assets at an adequate level to protectthe City’s capital investment and minimize future repair and replacement costs.
22
Cash Management
• All investments are assessed relative to the following objectives in the statedorder: safety, liquidity, and yield.
• Interest earned from investments of available funds is distributed to fundsaccording to ownership of the invested funds through the City’s pooled cashprogram.
Revenue Policies
The City follows revenue policies that seek stability and avoid potential service disruptions caused by revenue shortfalls.
Revenue Diversification
• The City shall maintain a diversified and stable revenue system to shelter it fromshort-term fluctuations in any one revenue source.
• The City shall seek additional major revenue sources as a way of ensuring abalanced budget.
Fees and Charges
• The City shall establish all user charges and fees at a level related to full cost(operating, direct, indirect and capital) of providing the service.
• The City shall consider market rates and charges levied by other public andprivate organizations for similar services in establishing rates, fees and charges.
• The General Fund shall be compensated by Enterprise Funds for general andadministrative services provided, such as management, finance, and personnel.
• The City shall adopt annual utility rates that generate sufficient revenues to coveroperating expenses and to meet the legal obligations of bond covenants.
• The City shall aggressively collect revenues including all types of past due bills.
Use of One-Time Revenues
• The City shall not use one-time revenues to finance ongoing programs. To theextent feasible, one-time revenues shall be applied toward one-time expendituresor are to be used to enhance fund balance.
FY 2020 Adopted Budget Introduction23
Use of Unpredictable Revenues
• The City’s budget document shall identify major revenue sources that areconsidered unpredictable and shall define how these revenues may be used. Foreach major unpredictable revenue source, the document shall indicate its degreeof volatility and shall project a minimum base.
• During the budgeting process, the City shall identify a set of tentative actions tobe taken if one or more of these sources generate revenues substantially higheror lower than predicted.
• The City’s compensation plan shall be tied to revenue growth.• The Revenue Estimating Committee meets periodically to formalize revenue
estimates and projection methodologies.
Expenditure Policies
The City follows expenditure policies that define its commitment to ongoing public service with the underlying belief that prudent expenditure planning and accountability ensure fiscal stability.
Debt Capacity, Issuance, and Management
• The City of Hollywood has no legal debt limit requirement.• The City shall assess its total indebtedness in relation to its overall debt capacity
on an annual basis and prior to issuance of new debt.• The City shall not issue notes to finance operating deficits.• General Obligation debt shall be issued only for capital improvement projects
approved by the voters.• The City will provide annual disclosure information for its debt obligations.
Reserve/Fund Balance
The General Fund balance should be adequate to handle unexpected decreases in revenues plus a reasonable level of extraordinary unbudgeted expenditures.
• Compliance with GASB No. 54, which establishes a hierarchy of fund balance classifications based primarily on the extent to which governments are bound by constraints placed on resources, etc.
• Establishes a target of two (2) months of General Fund operatingexpenditures in reserves (approximately 17%)
• Limits use of reserves for recurring expenditures• Sets standards for use and replenishment of reserves
FY 2020 Adopted Budget Introduction24
•
• Establishes a disaster reserve equal to 5% of General Fund expenditures
Cash Management/Investment Policies
• All investments will address the following objectives in the stated order: safety,liquidity, and yield.
• Interest earned from investments of available funds will be distributed to fundsaccording to ownership of the invested funds.
• The City will collect revenues aggressively, including past due bills of any type.
Operating/Capital Expenditure Accountability
• Adjustments to the Operating Budget shall be presented to the City Commissionfor approval, as needed, at the mid-year point.
Accounting, Auditing and Financial Reporting Policies
• Operating Budgets for governmental funds shall be prepared on a modifiedaccrual basis of accounting except that encumbrances are treated as theequivalent of expenditures.
• Operating Budgets for enterprise funds shall be prepared on a full accrual basis.Expenses shall be recognized when incurred and revenues are recognized whenthey are obligated to the City.
• An independent audit will be performed annually.• The City will produce annual financial reports in accordance with Generally
Accepted Accounting Principles (GAAP) as outlined by the GovernmentalAccounting Standards Board.
Legal Debt Limitations
• The City has no legal debt limit requirement.
FY 2020 Adopted Budget Introduction25
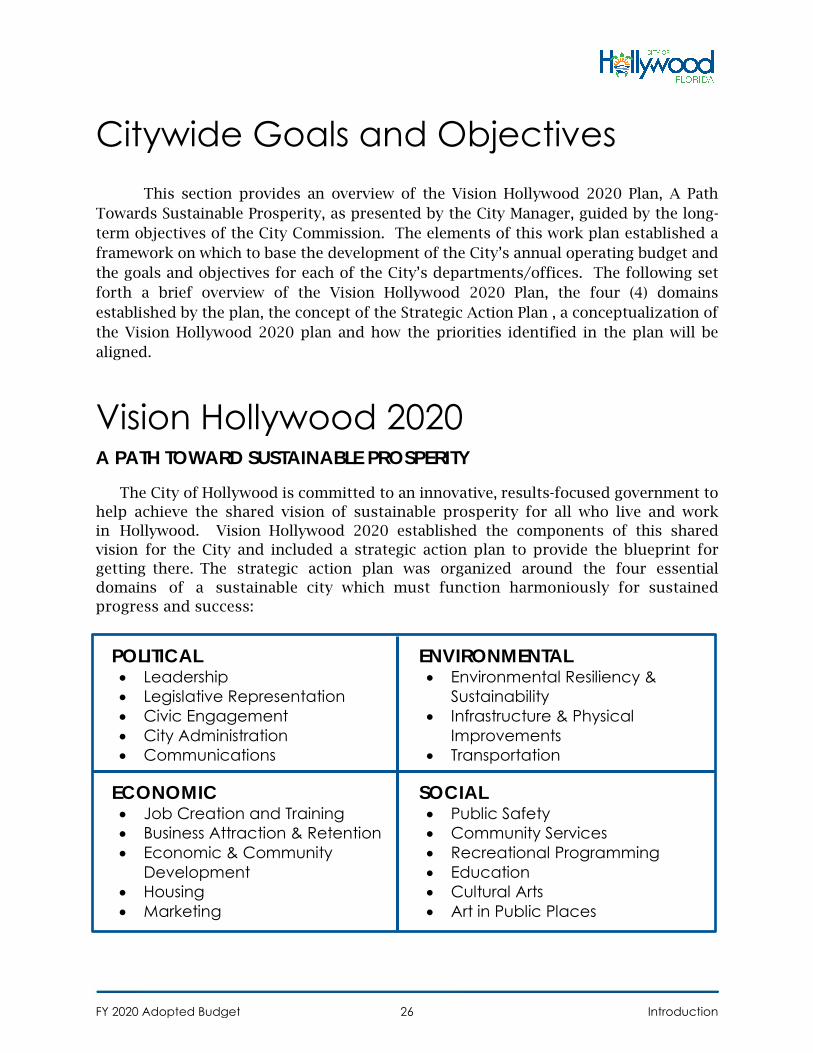
Citywide Goals and Objectives This section provides an overview of the Vision Hollywood 2020 Plan, A Path
Towards Sustainable Prosperity, as presented by the City Manager, guided by the long-term objectives of the City Commission. The elements of this work plan established a framework on which to base the development of the City’s annual operating budget and the goals and objectives for each of the City’s departments/offices. The following set forth a brief overview of the Vision Hollywood 2020 Plan, the four (4) domains established by the plan, the concept of the Strategic Action Plan , a conceptualization of the Vision Hollywood 2020 plan and how the priorities identified in the plan will be aligned.
Vision Hollywood 2020 A PATH TOWARD SUSTAINABLE PROSPERITY
The City of Hollywood is committed to an innovative, results-focused government to help achieve the shared vision of sustainable prosperity for all who live and work in Hollywood. Vision Hollywood 2020 established the components of this shared vision for the City and included a strategic action plan to provide the blueprint for getting there. The strategic action plan was organized around the four essential domains of a sustainable city which must function harmoniously for sustained progress and success:
POLITICAL • Leadership• Legislative Representation• Civic Engagement• City Administration• Communications
ECONOMIC • Job Creation and Training• Business Attraction & Retention• Economic & Community
Development• Housing• Marketing
ENVIRONMENTAL • Environmental Resiliency &
Sustainability • Infrastructure & Physical
Improvements • Transportation
SOCIAL • Public Safety• Community Services• Recreational Programming• Education• Cultural Arts• Art in Public Places
FY 2020 Adopted Budget Introduction26
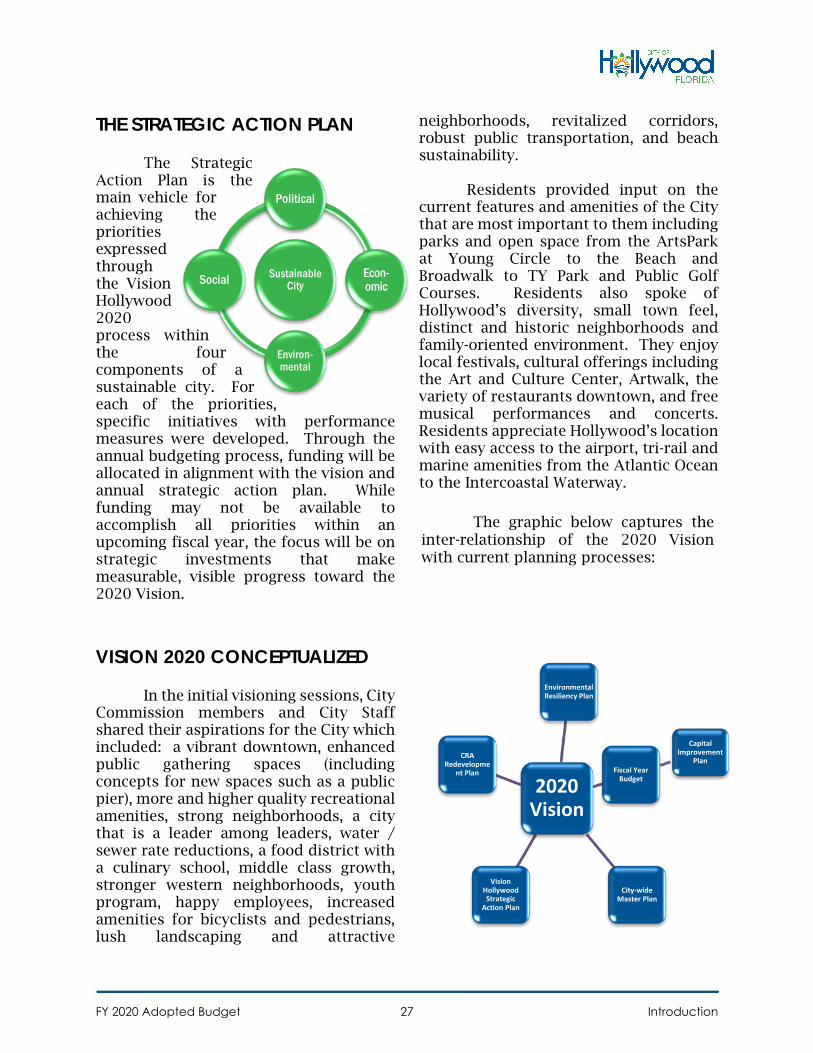
THE STRATEGIC ACTION PLAN
The Strategic Action Plan is the main vehicle for achieving the priorities expressed through the Vision Hollywood 2020 process within the four components of a sustainable city. For each of the priorities, specific initiatives with performance measures were developed. Through the annual budgeting process, funding will be allocated in alignment with the vision and annual strategic action plan. While funding may not be available to accomplish all priorities within an upcoming fiscal year, the focus will be on strategic investments that makemeasurable, visible progress toward the 2020 Vision.
VISION 2020 CONCEPTUALIZED
In the initial visioning sessions, City Commission members and City Staff shared their aspirations for the City which included: a vibrant downtown, enhanced public gathering spaces (including concepts for new spaces such as a public pier), more and higher quality recreational amenities, strong neighborhoods, a city that is a leader among leaders, water / sewer rate reductions, a food district with a culinary school, middle class growth, stronger western neighborhoods, youth program, happy employees, increased amenities for bicyclists and pedestrians, lush landscaping and attractive
neighborhoods, revitalized corridors, robust public transportation, and beach sustainability.
Residents provided input on the current features and amenities of the City that are most important to them including parks and open space from the ArtsPark at Young Circle to the Beach and Broadwalk to TY Park and Public Golf Courses. Residents also spoke of Hollywood’s diversity, small town feel, distinct and historic neighborhoods and family-oriented environment. They enjoy local festivals, cultural offerings including the Art and Culture Center, Artwalk, the variety of restaurants downtown, and free musical performances and concerts. Residents appreciate Hollywood’s location with easy access to the airport, tri-rail and marine amenities from the Atlantic Ocean to the Intercoastal Waterway.
Sustainable City
Political
Econ-omic
Environ-mental
Social
2020 Vision
EnvironmentalResiliency Plan
Fiscal Year Budget
Capital Improvement
Plan
City-wide Master Plan
Vision Hollywood Strategic
Action Plan
CRA Redevelopme
nt Plan
FY 2020 Adopted Budget Introduction27
The graphic below captures the inter-relationship of the 2020 Vision with current planning processes:
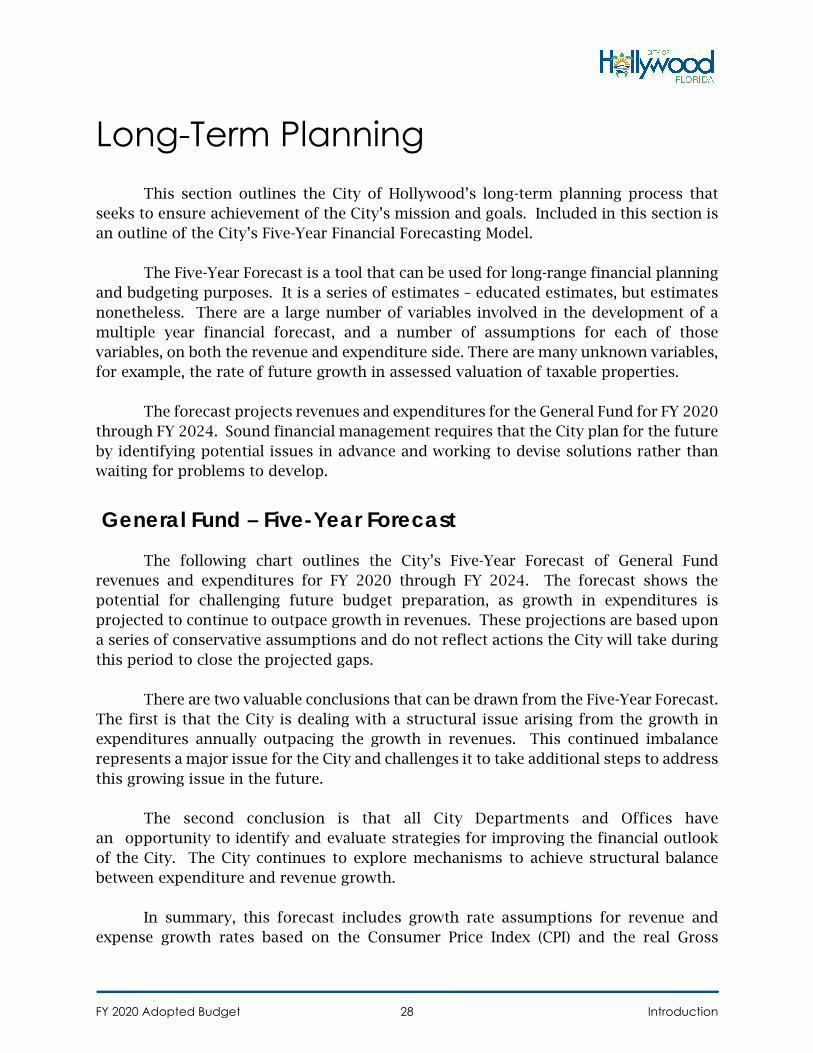
Long-Term Planning This section outlines the City of Hollywood’s long-term planning process that
seeks to ensure achievement of the City’s mission and goals. Included in this section is an outline of the City’s Five-Year Financial Forecasting Model.
The Five-Year Forecast is a tool that can be used for long-range financial planning and budgeting purposes. It is a series of estimates – educated estimates, but estimates nonetheless. There are a large number of variables involved in the development of a multiple year financial forecast, and a number of assumptions for each of those variables, on both the revenue and expenditure side. There are many unknown variables, for example, the rate of future growth in assessed valuation of taxable properties.
The forecast projects revenues and expenditures for the General Fund for FY 2020 through FY 2024. Sound financial management requires that the City plan for the future by identifying potential issues in advance and working to devise solutions rather than waiting for problems to develop.
General Fund – Five-Year Forecast
The following chart outlines the City’s Five-Year Forecast of General Fund revenues and expenditures for FY 2020 through FY 2024. The forecast shows the potential for challenging future budget preparation, as growth in expenditures is projected to continue to outpace growth in revenues. These projections are based upon a series of conservative assumptions and do not reflect actions the City will take during this period to close the projected gaps.
There are two valuable conclusions that can be drawn from the Five-Year Forecast. The first is that the City is dealing with a structural issue arising from the growth in expenditures annually outpacing the growth in revenues. This continued imbalance represents a major issue for the City and challenges it to take additional steps to address this growing issue in the future.
The second conclusion is that all City Departments and Offices have an opportunity to identify and evaluate strategies for improving the financial outlook of the City. The City continues to explore mechanisms to achieve structural balance between expenditure and revenue growth.
In summary, this forecast includes growth rate assumptions for revenue and expense growth rates based on the Consumer Price Index (CPI) and the real Gross
FY 2020 Adopted Budget Introduction28
Domestic Product (GDP) as projected by the Congressional Budget Office (CBO) for the period FY 2020 through FY 2024. Two primary goals are targeted: (1) eliminate the structural budget gap and (2) maintain reserves in the General Fund at the target level of seventeen percent (17%) of total expenditures. The following list shows some of the main assumption categories:
Revenues
Property Taxes
• In FY 2020, property tax revenues experienced a net increase of approximately$6.7 million (5.7%) due to the growth in property values
• For FY 2021 the growth rate is assumed at 5%• For FY 2022 through FY 2024, the growth rate is assumed conservatively at 3%• The millage rate is projected to remain constant at 7.4665 throughout the five-
year forecast
Other Revenue Growth Rates
The following revenues are projected to grow with inflation:
• Franchise Taxes• Utility Service Taxes• Intergovernmental Revenue• Fees (other than Fire Assessment)
Expenditures
Personnel Costs
• Headcounts are projected to remain flat over the five-year period• For Wages and social security the City assumes annual across the board
increases to all employees of 2.0% in addition to any contractual step/merit increases allowed by the various collective bargaining agreements
• Pension costs are projected to grow at an average 5% annually over the next five years
• Group insurance is projected to grow annually by 8%
FY 2020 Adopted Budget Introduction29
Non-personnel Costs
• Purchased services and supplies are projected to be flat in 2020 and to follow inflation from FY 2021-2024
• Other expenditure items are projected to grow at an estimated rate of 2%
Debt Service
• Debt service is projected to increase by approximately $250,000 each year from FY 2021-2024
Transfers
• Increment transfers to both the Downtown and Beach CRA are projected to grow by 3% each year for FY 2021 - 2024
FY 2020 Adopted Budget Introduction30
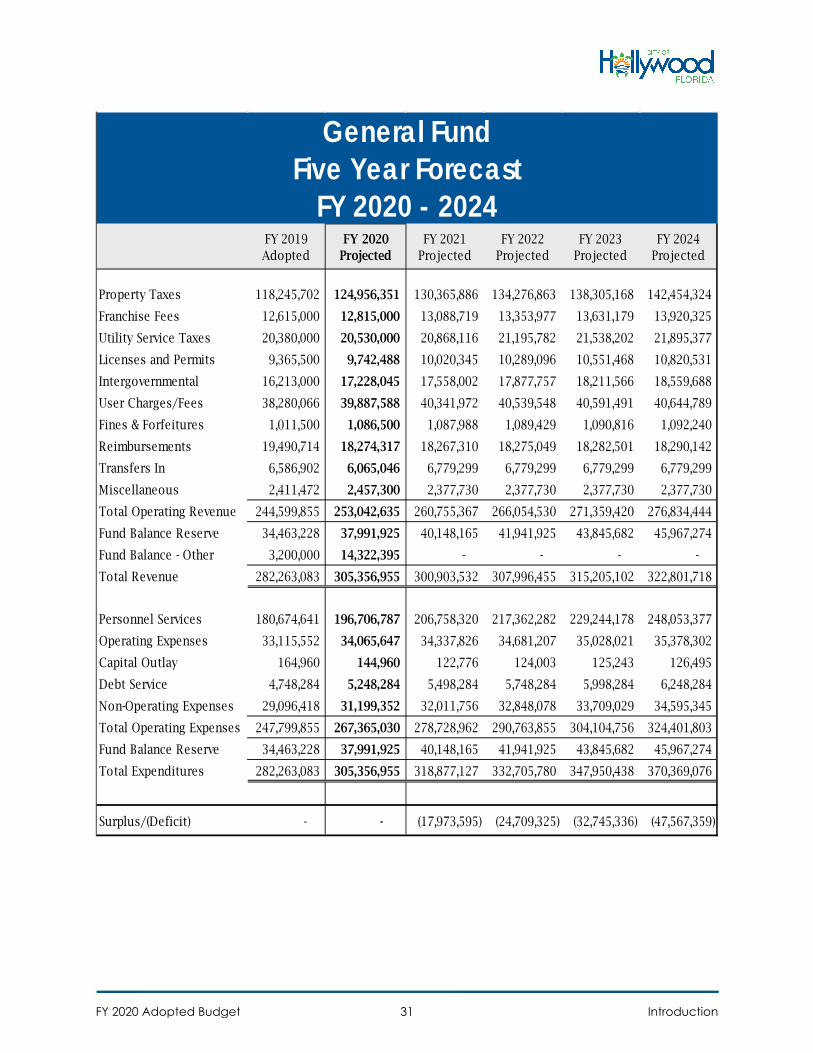
FY 2019 Adopted
FY 2020 Projected
FY 2021 Projected
FY 2022 Projected
FY 2023 Projected
FY 2024 Projected
Property Taxes 118,245,702 124,956,351 130,365,886 134,276,863 138,305,168 142,454,324
Franchise Fees 12,615,000 12,815,000 13,088,719 13,353,977 13,631,179 13,920,325
Utility Service Taxes 20,380,000 20,530,000 20,868,116 21,195,782 21,538,202 21,895,377
Licenses and Permits 9,365,500 9,742,488 10,020,345 10,289,096 10,551,468 10,820,531
Intergovernmental 16,213,000 17,228,045 17,558,002 17,877,757 18,211,566 18,559,688
User Charges/Fees 38,280,066 39,887,588 40,341,972 40,539,548 40,591,491 40,644,789
Fines & Forfeitures 1,011,500 1,086,500 1,087,988 1,089,429 1,090,816 1,092,240
Reimbursements 19,490,714 18,274,317 18,267,310 18,275,049 18,282,501 18,290,142
Transfers In 6,586,902 6,065,046 6,779,299 6,779,299 6,779,299 6,779,299
Miscellaneous 2,411,472 2,457,300 2,377,730 2,377,730 2,377,730 2,377,730
Total Operating Revenue 244,599,855 253,042,635 260,755,367 266,054,530 271,359,420 276,834,444
Fund Balance Reserve 34,463,228 37,991,925 40,148,165 41,941,925 43,845,682 45,967,274
Fund Balance - Other 3,200,000 14,322,395 - - - -
Total Revenue 282,263,083 305,356,955 300,903,532 307,996,455 315,205,102 322,801,718
Personnel Services 180,674,641 196,706,787 206,758,320 217,362,282 229,244,178 248,053,377
Operating Expenses 33,115,552 34,065,647 34,337,826 34,681,207 35,028,021 35,378,302
Capital Outlay 164,960 144,960 122,776 124,003 125,243 126,495
Debt Service 4,748,284 5,248,284 5,498,284 5,748,284 5,998,284 6,248,284
Non-Operating Expenses 29,096,418 31,199,352 32,011,756 32,848,078 33,709,029 34,595,345
Total Operating Expenses 247,799,855 267,365,030 278,728,962 290,763,855 304,104,756 324,401,803
Fund Balance Reserve 34,463,228 37,991,925 40,148,165 41,941,925 43,845,682 45,967,274
Total Expenditures 282,263,083 305,356,955 318,877,127 332,705,780 347,950,438 370,369,076
Surplus/(Deficit) - - (17,973,595) (24,709,325) (32,745,336) (47,567,359)
General FundFive Year Forecast
FY 2020 - 2024
FY 2020 Adopted Budget Introduction31
Summary of Funds
Overview of Funds The City follows Generally Accepted Accounting Principles in preparing its budget
and accounting for its operations. These principles require that the City use separate accounting entities called funds to keep track of the resources used for different purposes. There are two (2) different classes of funds, Governmental Funds and Proprietary Funds. The Governmental Funds include the General Fund, Debt Service Fund, General Capital Projects Fund, Gas Tax Fund and Special Revenue Funds. The City maintains two types of Proprietary Funds: (a) Enterprise Funds, which include the Water & Sewer Utility Fund, Stormwater Utility Fund, Golf Enterprise Fund, Sanitation Enterprise Fund, Parking Enterprise Fund and the Records Preservation Fund; and (b) Internal Services Funds, which include the Central Services Fund and the Insurance Fund. A fund balance or reserve reflects an accumulation of unexpended revenues. This reserve is maintained to cover unanticipated decreases in revenues plus a reasonable level of extraordinary unbudgeted expenditures.
Governmental Funds This category includes those individual funds through which most governmental
functions are typically financed.
General Fund (001) – The fund used to account for all financial resources, exceptthose that are required to be accounted for in another fund. Most governmental operations such as police and fire protection, recreation activities, and planning and zoning administration are accounted for in this fund. Ad Valorem property taxes are budgeted in this fund.
Special Revenue Funds (111 and 164) – The City uses special revenue funds,considered non-major governmental funds, to account for specific revenues that are legally restricted to expenditure for particular purposes. These funds relate primarily to revenues and expenditures associated with federal, state and local government grant programs. Expenditures for these purposes are dependent upon receipt of related revenues.
Debt Service Fund (223) – Funds used to track the payment of principal andinterest related to long-term debt used by the City of Hollywood. These instruments of debt may include special obligation bonds, bond anticipation notes and tax anticipation notes.
FY 2020 Adopted Budget Summary of Funds32
General Obligation Bond Fund (226) – This fund accounts for revenues fromad valorem taxes and payment of principal and interest on the City’s general obligation bond issue.
Capital Projects Funds (333 and 334) – Funds created to account for financial resources to be used for the acquisition or construction of major capital facilities such as public safety facilities, new parks, and new streets (other than those financed by proprietary funds or trust funds). Because the City finances capital projects, the associated operating expenditures appear in their respective Debt Service Funds. Fund 333 is used for the voted general obligation bond projects and Fund 334 is used for General Fund capital improvement projects.
Gas Tax Fund (336) – The Gas Tax Fund is a Special Revenue Fund that accountsfor the City’s share of Local Option Gas Tax revenues levied by Broward County. The use of this revenue is restricted to street related maintenance, construction and repairs.
Enterprise Funds These funds are used to account for the City’s ongoing activities that are similar
to those often found in the private sector. These funds use the same accounting principles used by commercial business activities.
Water & Sewer Utility Fund (442) – The Water & Sewer Utility Fund is anenterprise fund which is used to account for all financial activity associated with the operation of the City’s water and sewer utilities. This fund is totally self-sufficient, with its primary source of revenue being user charges levied on all utility customers.
Stormwater Utility Fund (443) – The Stormwater Utility Fund was established asa funding mechanism for the maintenance, repair and improvements to the City’s stormwater maintenance system. Funding for these activities is provided by user charges based on an equivalent residential unit service charge.
Golf Enterprise Fund (444) – The Golf Enterprise Fund accounts for all financialactivity associated with the City’s golf operations. Included in this fund are the total operations of the Orangebrook Golf Course and the payments made to the City by the operators of the Hollywood Beach and Eco Grande golf courses. The primary sources of revenue for this fund are golf greens fees and memberships.
Sanitation Enterprise Fund (445) – The Sanitation Fund was established toaccount for municipal environmental services operations. This fund is supported by a combination of user fees and the sale of recyclable materials.
FY 2020 Adopted Budget Summary of Funds33
Parking Enterprise Fund (446) – The Parking Fund accounts for the operation ofmunicipal parking facilities. The primary revenue sources for this fund are parking fines, parking meter revenue and parking permits.
Records Preservation Enterprise Fund (460) – The Records Preservation Fundaccounts for resources accumulated to defray the cost of maintaining City-wide records management and preservation activities.
Internal Services Funds Central Service Fund (557) – The Central Service Fund allocates the cost of
providing certain centralized services (Information Technology, Central Fleet) among user agencies. The chief aim of this fund is full cost reimbursement for providing these services.
Insurance Fund (558) – The Insurance Fund provides a central risk financingmechanism and self-insurance reserve for the payment of claims relating to workers’ compensation, general liability and employee health. The chief aim of this fund is full cost reimbursement for providing these services.
Other Funds The City of Hollywood’s audited Comprehensive Annual Financial Report (CAFR)
includes several funds, which are not specifically included as part of the City’s operating budget.
Community Redevelopment Agency (CRA) District Funds – The CRA is legallyseparate from the City of Hollywood and prepares its own detailed operating budget. The CRA relies on Tax Increment Financing (TIF) for revenues, which flow into the City’s operating budget as Property Tax Revenue and out of the City’s operating budget as Non-Departmental Interfund Operating Transfers.
Emergency Disaster Fund – This governmental fund reflects extraordinaryactivities that are conducted in preparation for, and for recovery from, hurricane, fire, flood or other major disasters. Extraordinary activities are not included in the City’s operating budget, but this fund’s balance is considered in the overall budgetary short-term and long-term strategy.
FY 2020 Adopted Budget Summary of Funds34
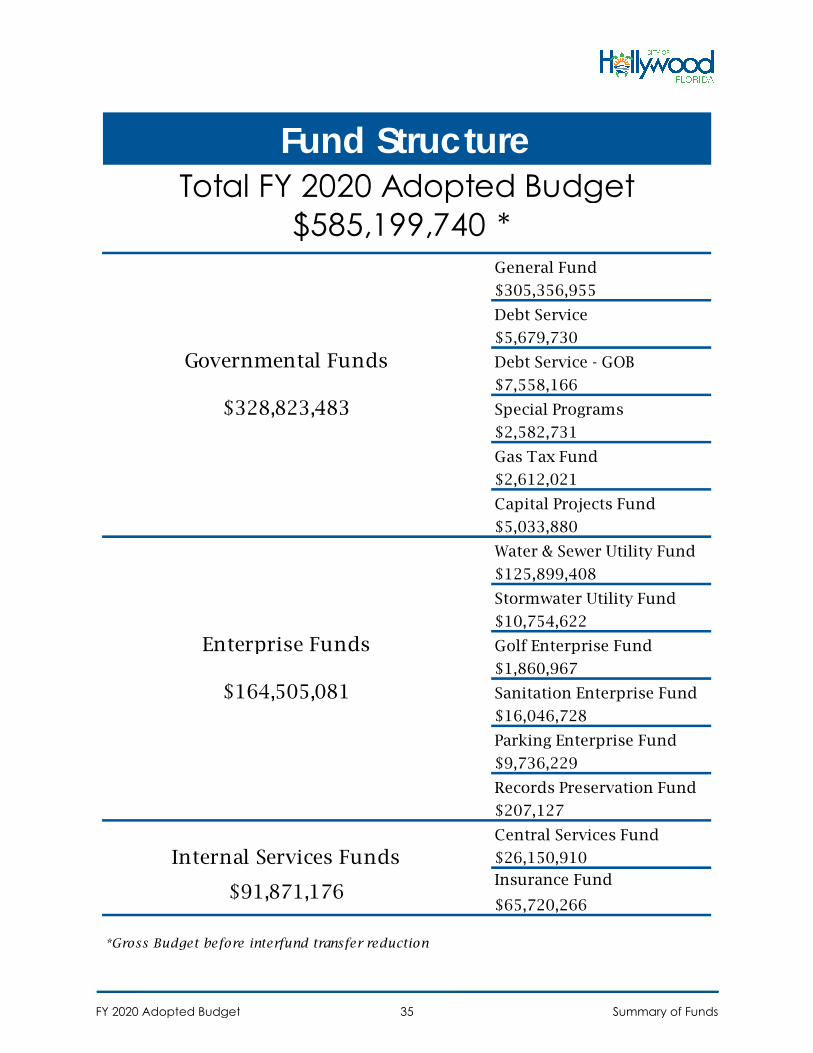
*General Fund
$305,356,955
Debt Service
$5,679,730
Debt Service - GOB
$7,558,166
$328,823,483 Special Programs
$2,582,731
Gas Tax Fund
$2,612,021
Capital Projects Fund
$5,033,880
Water & Sewer Utility Fund
$125,899,408
Stormwater Utility Fund
$10,754,622
Golf Enterprise Fund
$1,860,967
$164,505,081 Sanitation Enterprise Fund
$16,046,728
Parking Enterprise Fund
$9,736,229
Records Preservation Fund
$207,127
Central Services Fund
$26,150,910
Insurance Fund
$65,720,266
*Gross Budget before interfund transfer reduction
Enterprise Funds
$91,871,176
Internal Services Funds
Governmental Funds
Fund StructureTotal FY 2020 Adopted Budget
$585,199,740
FY 2020 Adopted Budget Summary of Funds35
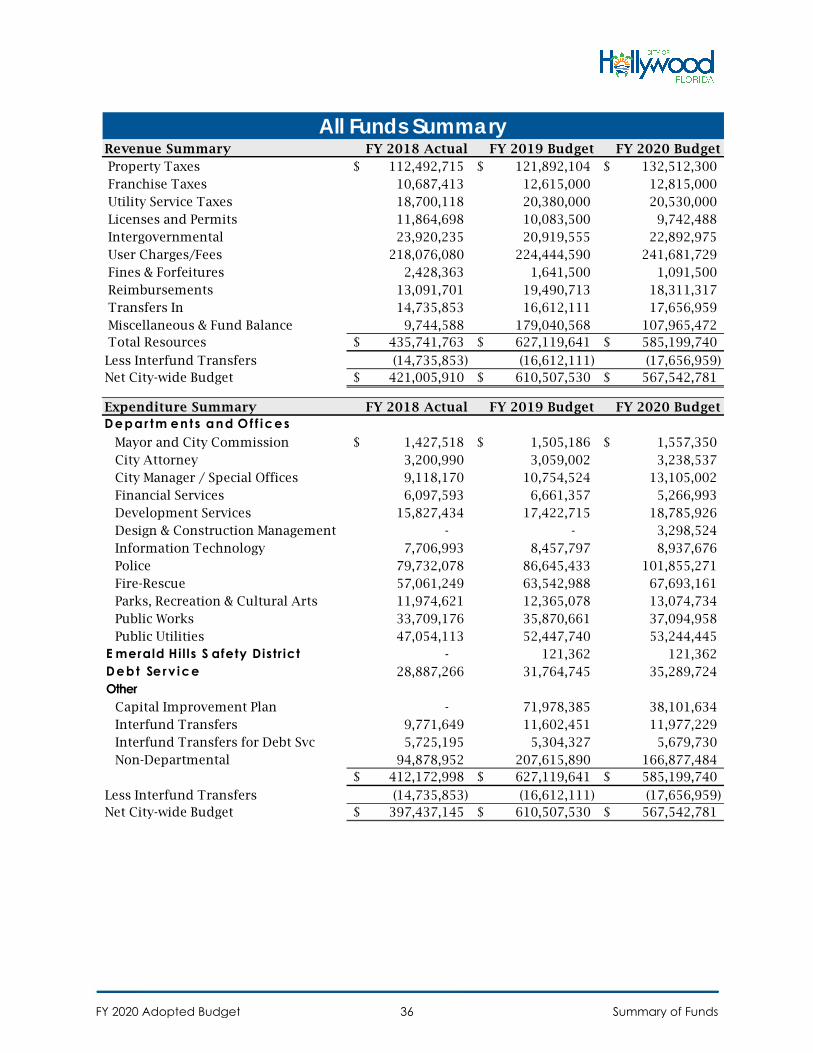
Revenue Summary FY 2018 Actual FY 2019 Budget FY 2020 BudgetProperty Taxes 112,492,715$ 121,892,104$ 132,512,300$ Franchise Taxes 10,687,413 12,615,000 12,815,000 Utility Service Taxes 18,700,118 20,380,000 20,530,000 Licenses and Permits 11,864,698 10,083,500 9,742,488 Intergovernmental 23,920,235 20,919,555 22,892,975 User Charges/Fees 218,076,080 224,444,590 241,681,729 Fines & Forfeitures 2,428,363 1,641,500 1,091,500 Reimbursements 13,091,701 19,490,713 18,311,317 Transfers In 14,735,853 16,612,111 17,656,959 Miscellaneous & Fund Balance 9,744,588 179,040,568 107,965,472 Total Resources 435,741,763$ 627,119,641$ 585,199,740$
Less Interfund Transfers (14,735,853) (16,612,111) (17,656,959) Net City-wide Budget 421,005,910$ 610,507,530$ 567,542,781$
Expenditure Summary FY 2018 Actual FY 2019 Budget FY 2020 BudgetDepar tm en t s and Of f ices
Mayor and City Commission 1,427,518$ 1,505,186$ 1,557,350$ City Attorney 3,200,990 3,059,002 3,238,537 City Manager / Special Offices 9,118,170 10,754,524 13,105,002 Financial Services 6,097,593 6,661,357 5,266,993 Development Services 15,827,434 17,422,715 18,785,926 Design & Construction Management - - 3,298,524 Information Technology 7,706,993 8,457,797 8,937,676 Police 79,732,078 86,645,433 101,855,271 Fire-Rescue 57,061,249 63,542,988 67,693,161 Parks, Recreation & Cultural Arts 11,974,621 12,365,078 13,074,734 Public Works 33,709,176 35,870,661 37,094,958 Public Utilities 47,054,113 52,447,740 53,244,445
- 121,362 121,362 28,887,266 31,764,745 35,289,724
E merald Hil ls S afety Distr ict Debt Se rv iceOther
Capital Improvement Plan - 71,978,385 38,101,634 Interfund Transfers 9,771,649 11,602,451 11,977,229 Interfund Transfers for Debt Svc 5,725,195 5,304,327 5,679,730 Non-Departmental 94,878,952 207,615,890 166,877,484
412,172,998$ 627,119,641$ 585,199,740$
Less Interfund Transfers (14,735,853) (16,612,111) (17,656,959) Net City-wide Budget 397,437,145$ 610,507,530$ 567,542,781$
All Funds Summary
FY 2020 Adopted Budget Summary of Funds36
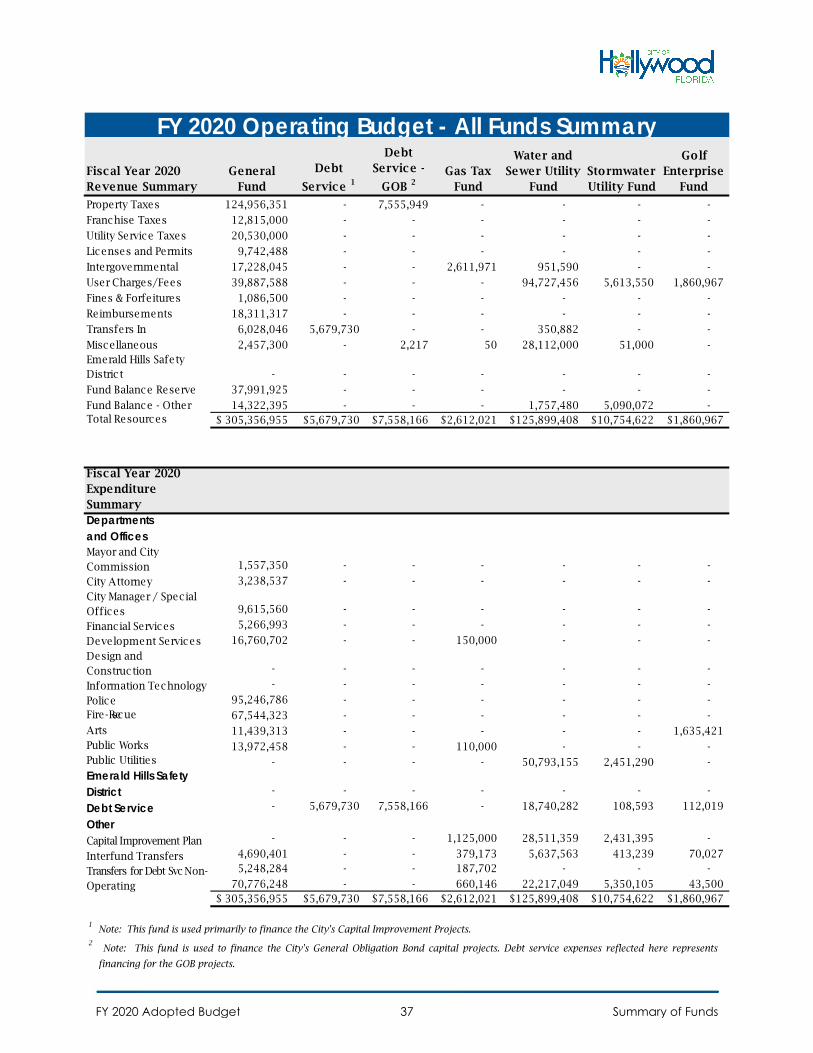
Fiscal Year 2020 Revenue Summary
General Fund
Debt
Service 1
Debt Service -
GOB 2Gas Tax
Fund
Water and Sewer Utility
FundStormwater Utility Fund
Golf Enterprise
Fund
Property Taxes 124,956,351 - 7,555,949 - - - -
Franchise Taxes 12,815,000 - - - - - -
Utility Service Taxes 20,530,000 - - - - - -
Licenses and Permits 9,742,488 - - - - - -
Intergovernmental 17,228,045 - - 2,611,971 951,590 - -
User Charges/Fees 39,887,588 - - - 94,727,456 5,613,550 1,860,967
Fines & Forfeitures 1,086,500 - - - - - -
Reimbursements 18,311,317 - - - - - -
Transfers In 6,028,046 5,679,730 - - 350,882 - -
Miscellaneous 2,457,300 - 2,217 50 28,112,000 51,000 - Emerald Hills Safety Distric t - - - - - - -
Fund Balance Reserve 37,991,925 - - - - - -
Fund Balance - Other 14,322,395 - - - 1,757,480 5,090,072 - Total Resources 305,356,955$ $5,679,730 $7,558,166 $2,612,021 $125,899,408 $10,754,622 $1,860,967
Fiscal Year 2020 Expenditure Summary
1,557,350 - - - - - -
3,238,537 - - - - - -
9,615,560 - - - - - -
5,266,993 - - - - - -
16,760,702 - - 150,000 - - -
- - - - - - -
- - - - - - -
95,246,786 - - - - - -
67,544,323 - - - - - -
11,439,313 - - - - - 1,635,421
13,972,458 - - 110,000 - - -
- - - - 50,793,155 2,451,290 -
- - - - - - -
- 5,679,730 7,558,166 - 18,740,282 108,593 112,019
- - - 1,125,000 28,511,359 2,431,395 -
4,690,401 - - 379,173 5,637,563 413,239 70,027 5,248,284 - - 187,702 - - -
Departmentsand OfficesMayor and City CommissionCity AttorneyCity Manager / Spec ial OfficesFinancial Services Development Services Design and Construction Information Technology PoliceFire-Re scue
ArtsPublic Works Public Utilities
Emerald Hills Safety DistrictDebt ServiceOtherCapital Improvement Plan
Interfund Transfers Transfers for Debt Svc Non-Operating 70,776,248 - - 660,146 22,217,049 5,350,105 43,500
305,356,955$ $5,679,730 $7,558,166 $2,612,021 $125,899,408 $10,754,622 $1,860,967
1 Note: This fund is used primarily to finance the City's Capital Improvement Projects.
2 Note: This fund is used to finance the City's General Obligation Bond capital projects. Debt service expenses reflected here represents
financing for the GOB projects.
FY 2020 Operating Budget - All Funds Summary
FY 2020 Adopted Budget Summary of Funds37
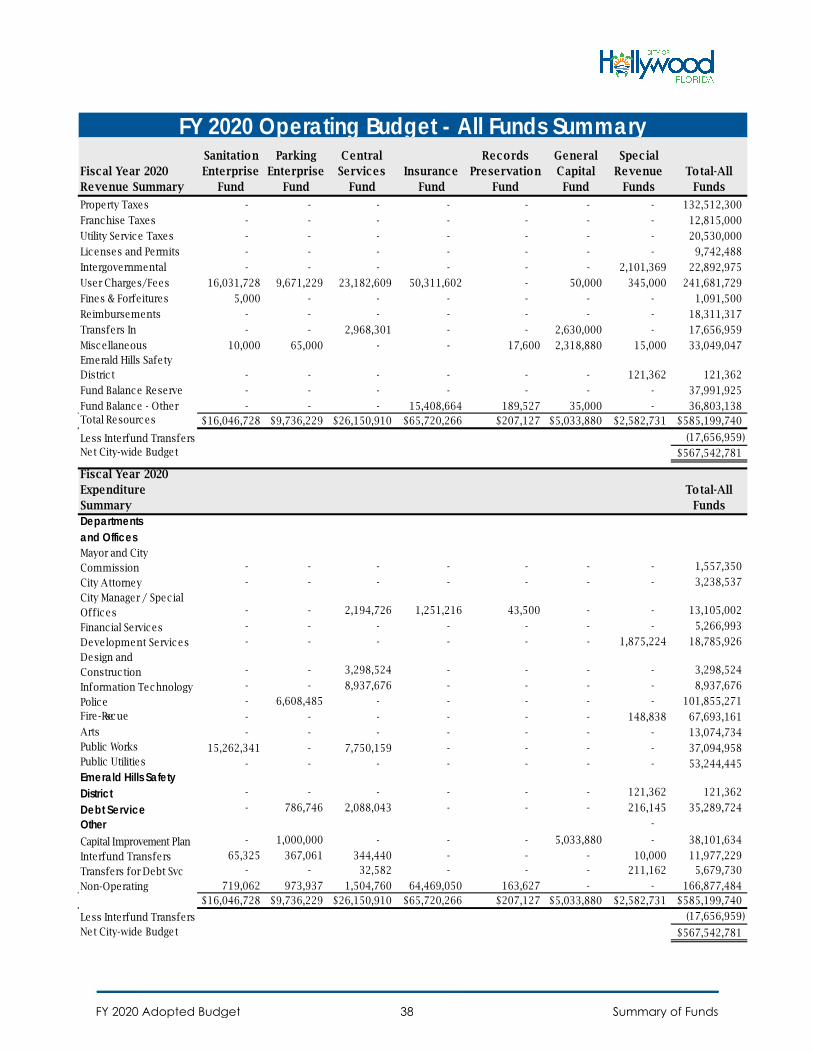
Fiscal Year 2020 Revenue Summary
Sanitation Enterprise
Fund
Parking Enterprise
Fund
Central Services
FundInsurance
Fund
Records Preservation
Fund
General Capital Fund
Special Revenue
FundsTotal-All
Funds
Property Taxes - - - - - - - 132,512,300
Franchise Taxes - - - - - - - 12,815,000
Utility Service Taxes - - - - - - - 20,530,000
Licenses and Permits - - - - - - - 9,742,488
Intergovernmental - - - - - - 2,101,369 22,892,975
User Charges/Fees 16,031,728 9,671,229 23,182,609 50,311,602 - 50,000 345,000 241,681,729
Fines & Forfeitures 5,000 - - - - - - 1,091,500
Reimbursements - - - - - - - 18,311,317
Transfers In - - 2,968,301 - - 2,630,000 - 17,656,959
Miscellaneous 10,000 65,000 - - 17,600 2,318,880 15,000 33,049,047 Emerald Hills Safety Distric t - - - - - - 121,362 121,362
Fund Balance Reserve - - - - - - - 37,991,925
Fund Balance - Other - - - 15,408,664 189,527 35,000 - 36,803,138 Total Resources $16,046,728 $9,736,229 $26,150,910 $65,720,266 $207,127 $5,033,880 $2,582,731 $585,199,740
Less Interfund Transfers (17,656,959) Net City-wide Budget $567,542,781
Fiscal Year 2020 Expenditure Summary
Total-All Funds
- - - - - - - 1,557,350
- - - - - - - 3,238,537
- - 2,194,726 1,251,216 43,500 - - 13,105,002
- - - - - - - 5,266,993
- - - - - - 1,875,224 18,785,926
- - 3,298,524 - - - - 3,298,524
- - 8,937,676 - - - - 8,937,676
- 6,608,485 - - - - - 101,855,271
- - - - - - 148,838 67,693,161
- - - - - - - 13,074,734
15,262,341 - 7,750,159 - - - - 37,094,958
- - - - - - - 53,244,445
- - - - - - 121,362 121,362
- 786,746 2,088,043 - - - 216,145 35,289,724
-
- 1,000,000 - - - 5,033,880 - 38,101,634
65,325 367,061 344,440 - - - 10,000 11,977,229 - - 32,582 - - - 211,162 5,679,730
Departmentsand OfficesMayor and City CommissionCity AttorneyCity Manager / Spec ial OfficesFinancial Services Development Services Design and Construction Information Technology PoliceFire -Re scue
ArtsPublic Works Public Utilities
Emerald Hills Safety DistrictDebt ServiceOtherCapital Improvement PlanInterfund Transfers Transfers for Debt Svc Non-Operating 719,062 973,937 1,504,760 64,469,050 163,627 - - 166,877,484
$16,046,728 $9,736,229 $26,150,910 $65,720,266 $207,127 $5,033,880 $2,582,731 $585,199,740
Less Interfund Transfers (17,656,959)
Net City-wide Budget $567,542,781
FY 2020 Operating Budget - All Funds Summary
FY 2020 Adopted Budget Summary of Funds38
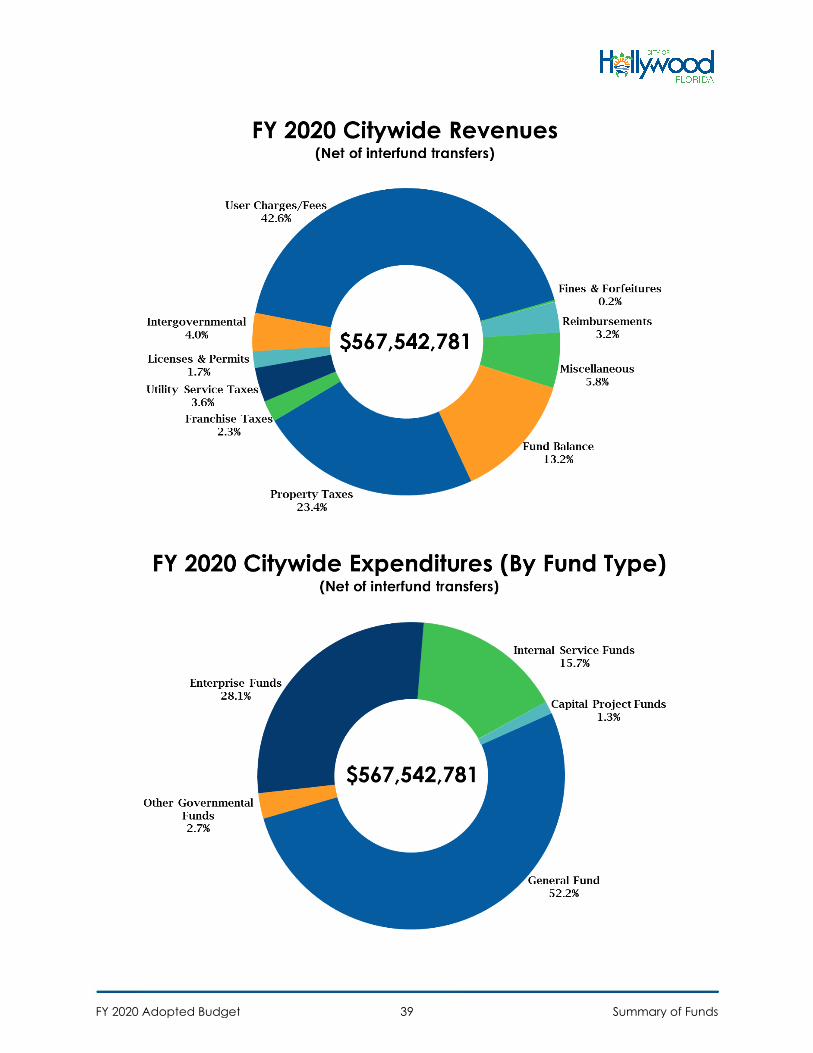
FY 2020 Adopted Budget Summary of Funds39
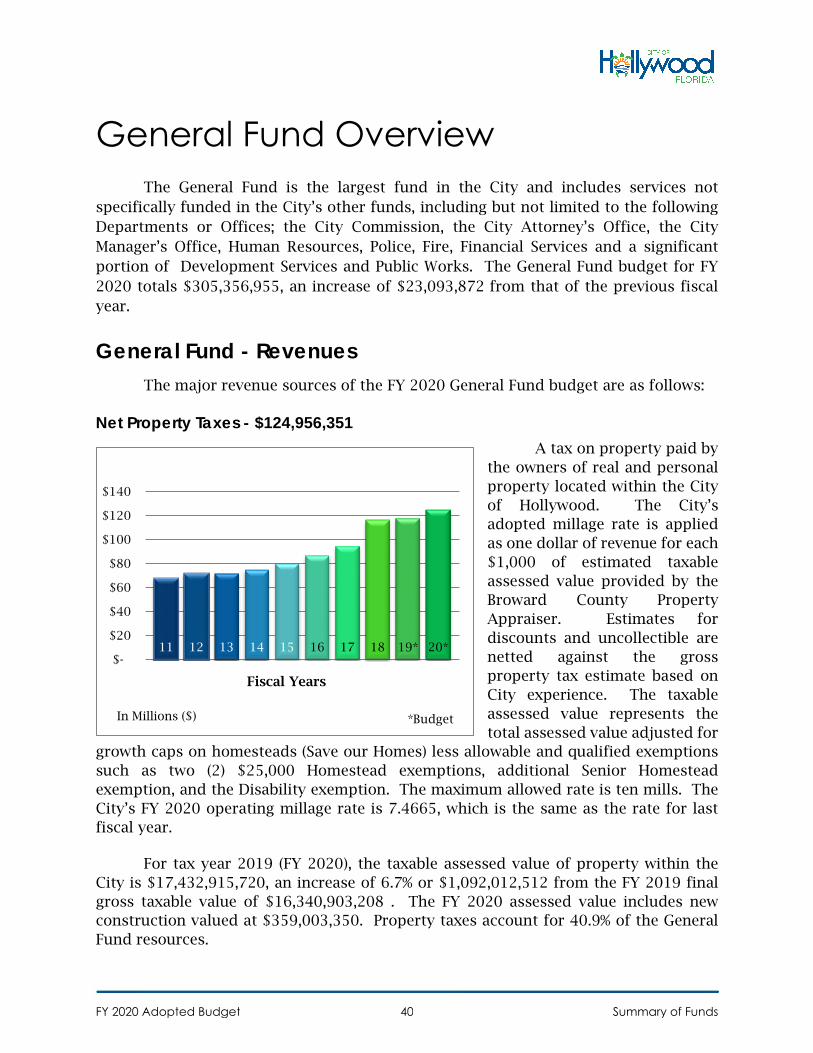
General Fund Overview The General Fund is the largest fund in the City and includes services not
specifically funded in the City’s other funds, including but not limited to the following Departments or Offices; the City Commission, the City Attorney’s Office, the City Manager’s Office, Human Resources, Police, Fire, Financial Services and a significant portion of Development Services and Public Works. The General Fund budget for FY 2020 totals $305,356,955, an increase of $23,093,872 from that of the previous fiscal year.
General Fund - Revenues The major revenue sources of the FY 2020 General Fund budget are as follows:
Net Property Taxes - $124,956,351 A tax on property paid by
the owners of real and personal property located within the City of Hollywood. The City’s adopted millage rate is applied as one dollar of revenue for each $1,000 of estimated taxable assessed value provided by the Broward County Property Appraiser. Estimates for discounts and uncollectible are netted against the gross property tax estimate based onCity experience. The taxable assessed value represents the total assessed value adjusted for
growth caps on homesteads (Save our Homes) less allowable and qualified exemptions such as two (2) $25,000 Homestead exemptions, additional Senior Homestead exemption, and the Disability exemption. The maximum allowed rate is ten mills. The City’s FY 2020 operating millage rate is 7.4665, which is the same as the rate for last fiscal year.
For tax year 2019 (FY 2020), the taxable assessed value of property within the City is $17,432,915,720, an increase of 6.7% or $1,092,012,512 from the FY 2019 final gross taxable value of $16,340,903,208 . The FY 2020 assessed value includes new construction valued at $359,003,350. Property taxes account for 40.9% of the General Fund resources.
11 12 13 14 15 16 17 18 19* 20* $-
$20
$40
$60
$80
$100
$120
$140
*BudgetIn Millions ($)
Fiscal Years
FY 2020 Adopted Budget Summary of Funds40
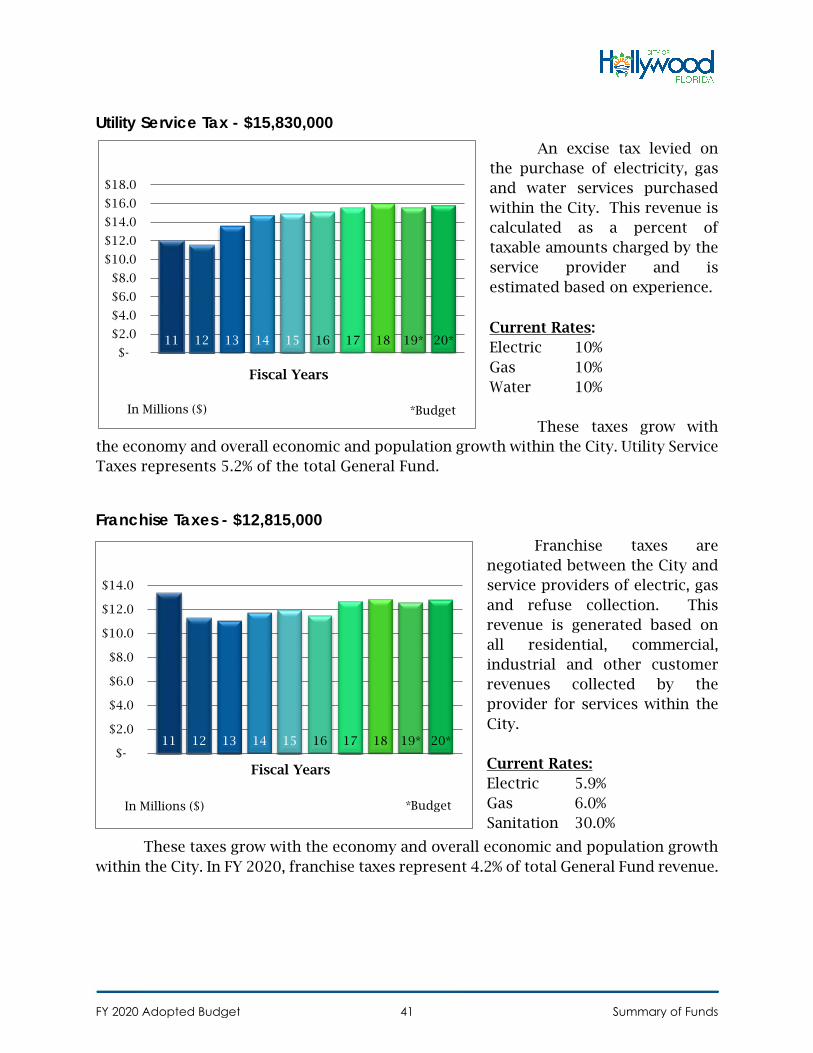
Utility Service Tax - $15,830,000 An excise tax levied on
the purchase of electricity, gas and water services purchased within the City. This revenue is calculated as a percent of taxable amounts charged by the service provider and is estimated based on experience.
Current Rates: Electric 10% Gas 10% Water 10%
These taxes grow with the economy and overall economic and population growth within the City. Utility Service Taxes represents 5.2% of the total General Fund.
Franchise Taxes - $12,815,000 Franchise taxes are
negotiated between the City and service providers of electric, gas and refuse collection. This revenue is generated based on all residential, commercial, industrial and other customer revenues collected by the provider for services within the City.
Current Rates: Electric 5.9% Gas 6.0% Sanitation 30.0%
These taxes grow with the economy and overall economic and population growth within the City. In FY 2020, franchise taxes represent 4.2% of total General Fund revenue.
11 12 13 14 15 16 17 18 19* 20* $-
$2.0
$4.0
$6.0
$8.0
$10.0
$12.0
$14.0
$16.0
$18.0
*BudgetIn Millions ($)
Fiscal Years
11 12 13 14 15 16 17 18 19* 20* $-
$2.0
$4.0
$6.0
$8.0
$10.0
$12.0
$14.0
*BudgetIn Millions ($)
Fiscal Years
FY 2020 Adopted Budget Summary of Funds41
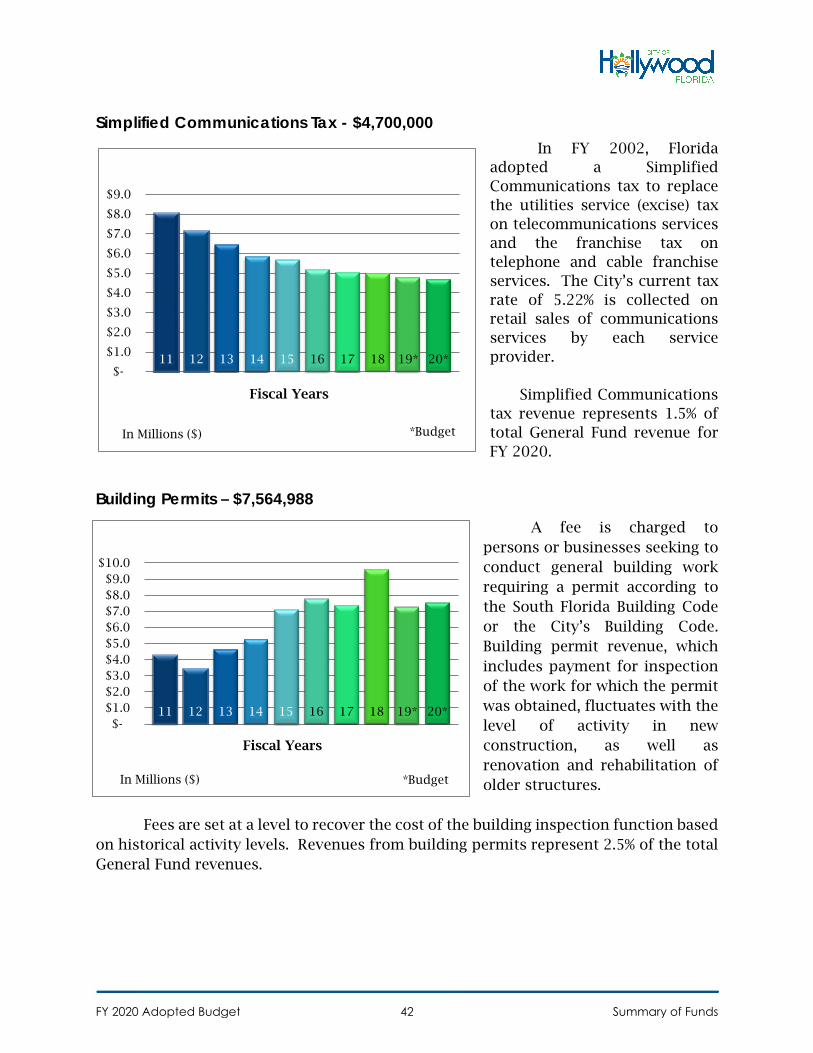
Simplified Communications Tax - $4,700,000 In FY 2002, Florida
adopted a Simplified Communications tax to replace the utilities service (excise) tax on telecommunications services and the franchise tax on telephone and cable franchise services. The City’s current tax rate of 5.22% is collected on retail sales of communications services by each service provider.
Simplified Communications tax revenue represents 1.5% of total General Fund revenue for FY 2020.
Building Permits – $7,564,988 A fee is charged to
persons or businesses seeking to conduct general building work requiring a permit according to the South Florida Building Code or the City’s Building Code. Building permit revenue, which includes payment for inspection of the work for which the permit was obtained, fluctuates with the level of activity in new construction, as well as renovation and rehabilitation of older structures.
Fees are set at a level to recover the cost of the building inspection function based on historical activity levels. Revenues from building permits represent 2.5% of the total General Fund revenues.
11 12 13 14 15 16 17 18 19* 20* $-
$1.0
$2.0
$3.0
$4.0
$5.0
$6.0
$7.0
$8.0
$9.0
*BudgetIn Millions ($)
Fiscal Years
11 12 13 14 15 16 17 18 19* 20* $-
$1.0 $2.0 $3.0 $4.0 $5.0 $6.0 $7.0 $8.0 $9.0
$10.0
*BudgetIn Millions ($)
Fiscal Years
FY 2020 Adopted Budget Summary of Funds42
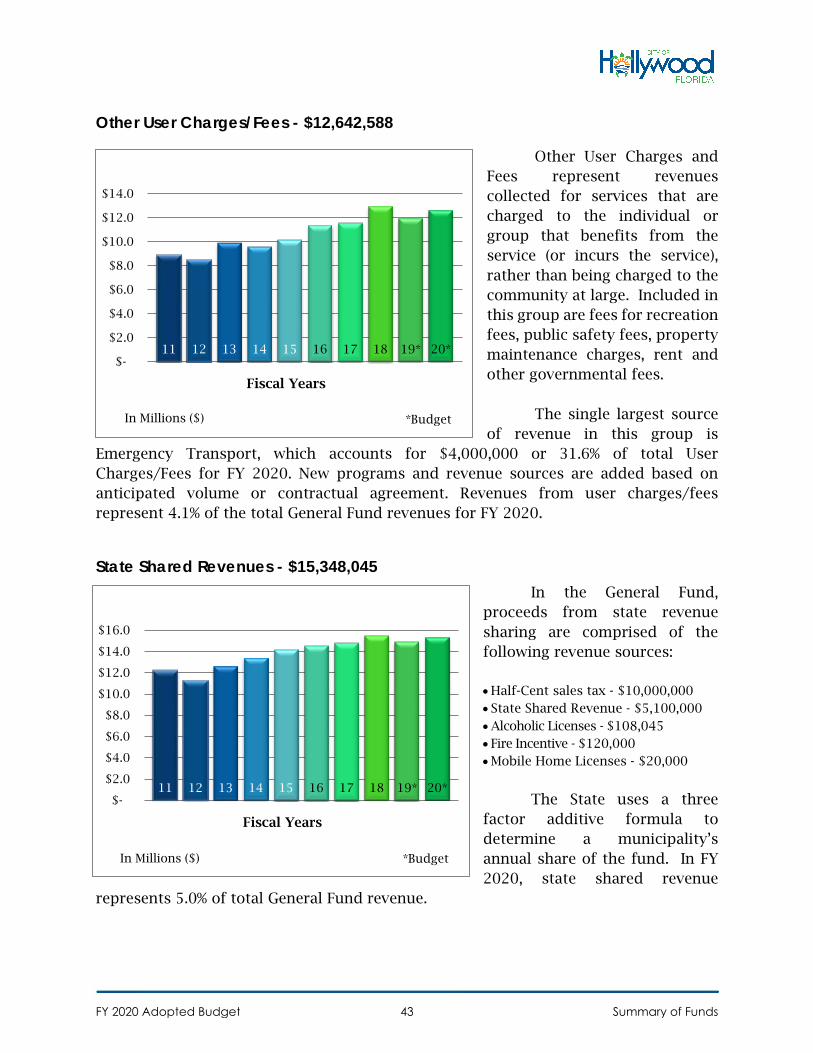
Other User Charges/Fees - $12,642,588
Other User Charges and Fees represent revenues collected for services that are charged to the individual or group that benefits from the service (or incurs the service), rather than being charged to the community at large. Included in this group are fees for recreation fees, public safety fees, property maintenance charges, rent and other governmental fees.
The single largest source of revenue in this group is
Emergency Transport, which accounts for $4,000,000 or 31.6% of total User Charges/Fees for FY 2020. New programs and revenue sources are added based on anticipated volume or contractual agreement. Revenues from user charges/fees represent 4.1% of the total General Fund revenues for FY 2020.
State Shared Revenues - $15,348,045 In the General Fund,
proceeds from state revenue sharing are comprised of the following revenue sources:
• Half-Cent sales tax - $10,000,000• State Shared Revenue - $5,100,000• Alcoholic Licenses - $108,045• Fire Incentive - $120,000• Mobile Home Licenses - $20,000
The State uses a three factor additive formula to determine a municipality’s annual share of the fund. In FY 2020, state shared revenue
represents 5.0% of total General Fund revenue.
11 12 13 14 15 16 17 18 19* 20* $-
$2.0
$4.0
$6.0
$8.0
$10.0
$12.0
$14.0
$16.0
*BudgetIn Millions ($)
Fiscal Years
11 12 13 14 15 16 17 18 19* 20* $-
$2.0
$4.0
$6.0
$8.0
$10.0
$12.0
$14.0
*BudgetIn Millions ($)
Fiscal Years
FY 2020 Adopted Budget Summary of Funds43
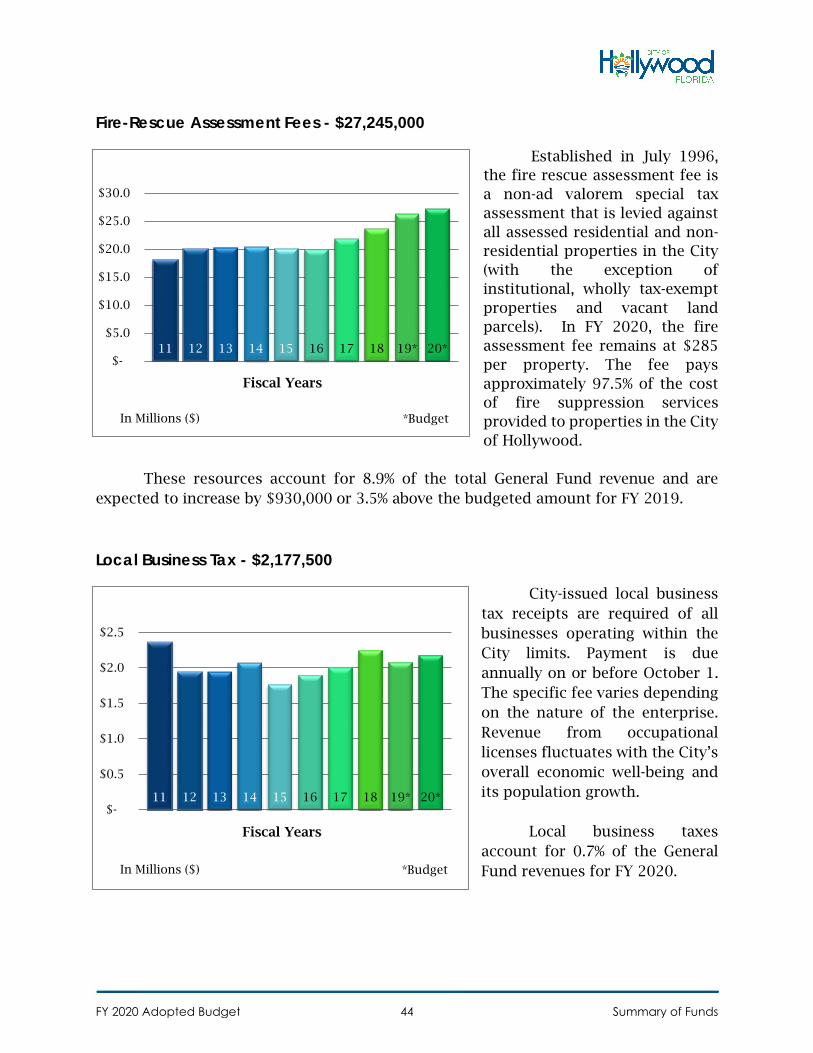
Fire-Rescue Assessment Fees - $27,245,000
Established in July 1996, the fire rescue assessment fee is a non-ad valorem special tax assessment that is levied against all assessed residential and non-residential properties in the City (with the exception of institutional, wholly tax-exempt properties and vacant land parcels). In FY 2020, the fire assessment fee remains at $285 per property. The fee pays approximately 97.5% of the cost of fire suppression services provided to properties in the City of Hollywood.
These resources account for 8.9% of the total General Fund revenue and are expected to increase by $930,000 or 3.5% above the budgeted amount for FY 2019.
Local Business Tax - $2,177,500
City-issued local business tax receipts are required of all businesses operating within the City limits. Payment is due annually on or before October 1. The specific fee varies depending on the nature of the enterprise. Revenue from occupational licenses fluctuates with the City’s overall economic well-being and its population growth.
Local business taxes account for 0.7% of the General Fund revenues for FY 2020.
11 12 13 14 15 16 17 18 19* 20* $-
$0.5
$1.0
$1.5
$2.0
$2.5
*BudgetIn Millions ($)
Fiscal Years
11 12 13 14 15 16 17 18 19* 20* $-
$5.0
$10.0
$15.0
$20.0
$25.0
$30.0
*BudgetIn Millions ($)
Fiscal Years
FY 2020 Adopted Budget Summary of Funds44
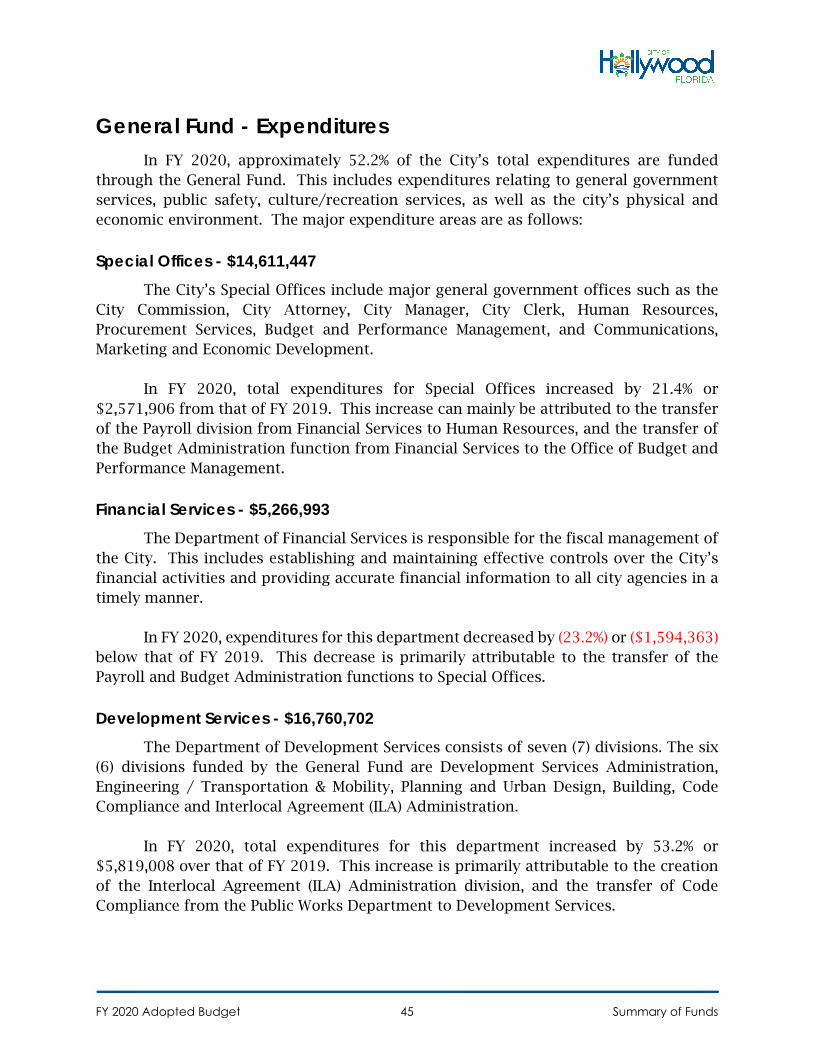
General Fund - Expenditures
In FY 2020, approximately 52.2% of the City’s total expenditures are funded through the General Fund. This includes expenditures relating to general government services, public safety, culture/recreation services, as well as the city’s physical and economic environment. The major expenditure areas are as follows:
Special Offices - $14,611,447 The City’s Special Offices include major general government offices such as the
City Commission, City Attorney, City Manager, City Clerk, Human Resources, Procurement Services, Budget and Performance Management, and Communications, Marketing and Economic Development.
In FY 2020, total expenditures for Special Offices increased by 21.4% or $2,571,906 from that of FY 2019. This increase can mainly be attributed to the transfer of the Payroll division from Financial Services to Human Resources, and the transfer of the Budget Administration function from Financial Services to the Office of Budget and Performance Management.
Financial Services - $5,266,993 The Department of Financial Services is responsible for the fiscal management of
the City. This includes establishing and maintaining effective controls over the City’s financial activities and providing accurate financial information to all city agencies in a timely manner.
In FY 2020, expenditures for this department decreased by (23.2%) or ($1,594,363) below that of FY 2019. This decrease is primarily attributable to the transfer of the Payroll and Budget Administration functions to Special Offices.
Development Services - $16,760,702 The Department of Development Services consists of seven (7) divisions. The six
(6) divisions funded by the General Fund are Development Services Administration, Engineering / Transportation & Mobility, Planning and Urban Design, Building, Code Compliance and Interlocal Agreement (ILA) Administration.
In FY 2020, total expenditures for this department increased by 53.2% or $5,819,008 over that of FY 2019. This increase is primarily attributable to the creation of the Interlocal Agreement (ILA) Administration division, and the transfer of Code Compliance from the Public Works Department to Development Services.
FY 2020 Adopted Budget Summary of Funds45
Parks, Recreation & Cultural Arts - $11,439,313 The Department of Parks, Recreation & Cultural Arts (PRCA) provides a wide range
of special events, cultural arts and recreation related services.
In FY 2020 total expenditures for this department increased by 6.7% or $716,318 above that of FY 2019. This increase in expenses is attributable to growth in personal services costs and additional funding for cultural arts programming at the Hollywood Central Performing Arts Center.
Police Department - $95,246,786 The Police Department is a full service law enforcement agency that provides a
wide range of services to the citizens of Hollywood.
In FY 2020, expenditures for this department increased by 9.9% or $8,601,341 over FY 2019. This change is mainly related to increases in personal service costs.
Fire, Rescue & Beach Safety - $68,959,323 The Department of Fire-Rescue and Beach Safety provides public safety services
to the citizens of Hollywood in the areas of fire suppression, emergency medical care, fire prevention and public education, hazardous materials mitigation, beach safety and other emergency needs.
In FY 2020, expenditures for this department increased by 4.1% or $2,745,174above that of FY 2019. This change is primarily attributable to increases in personal services costs.
Public Works - $13,972,458 The Public Works Department is responsible for the operation and maintenance
of City property and the effective management of resources at its disposal. Six (6) divisions exist within the Public Works Department. Four (4) of these are funded through the General Fund.
In FY 2020 expenditures for this department decreased by ($2,422,312) below that of FY 2019. This decrease is primarily attributable to the transfer of Code Compliance to Development Services.
FY 2020 Adopted Budget Summary of Funds46
Debt Service - $5,248,284 Debt Service shows the appropriations for principal, interest and finance charges
on those City-wide projects for which the City has borrowed funds. The appropriation reflected above represents a transfer from the General Fund to the Debt Service Fund (Fund 223). In FY 2020, this appropriation increased by 10.5% or $500,000 above that of FY 2019.
Non-Departmental – $73,851,649 This appropriation includes those resources which the City has committed to
City-wide appropriations that are not necessarily attributable to an individual department. In FY 2020, funding levels increased by $6,156,800 above that of FY 2019. Included in this grouping are the following:
Retiree Benefits - $250,000 This funding is related to the administration of benefits for retired City employees.
Capital Improvement – $1,550,000 This category represents the transfer to the Capital Improvement Plan.
CRA Obligation - $26,300,476 This includes the City’s increment contribution to the Community Redevelopment Agency Downtown and Beach districts. In FY 2020, the contribution will increase by $1,108,039for the Downtown District and by $874,494 for the Beach District.
Central Services – $1,725,401 This allocation represents the transfer to the Central Services Fund.
Contingencies – $44,025,772 This funding represents fund balance reserves, contingencies for operating expenses, accrued leave payments, wages for unresolved labor-related issues, City-wide consulting services, and other miscellaneous contingencies. In FY 2020, this amount will increase by $2,453,866 above that of FY 2019. This is due primarily to an increase in reserves.
FY 2020 Adopted Budget Summary of Funds47
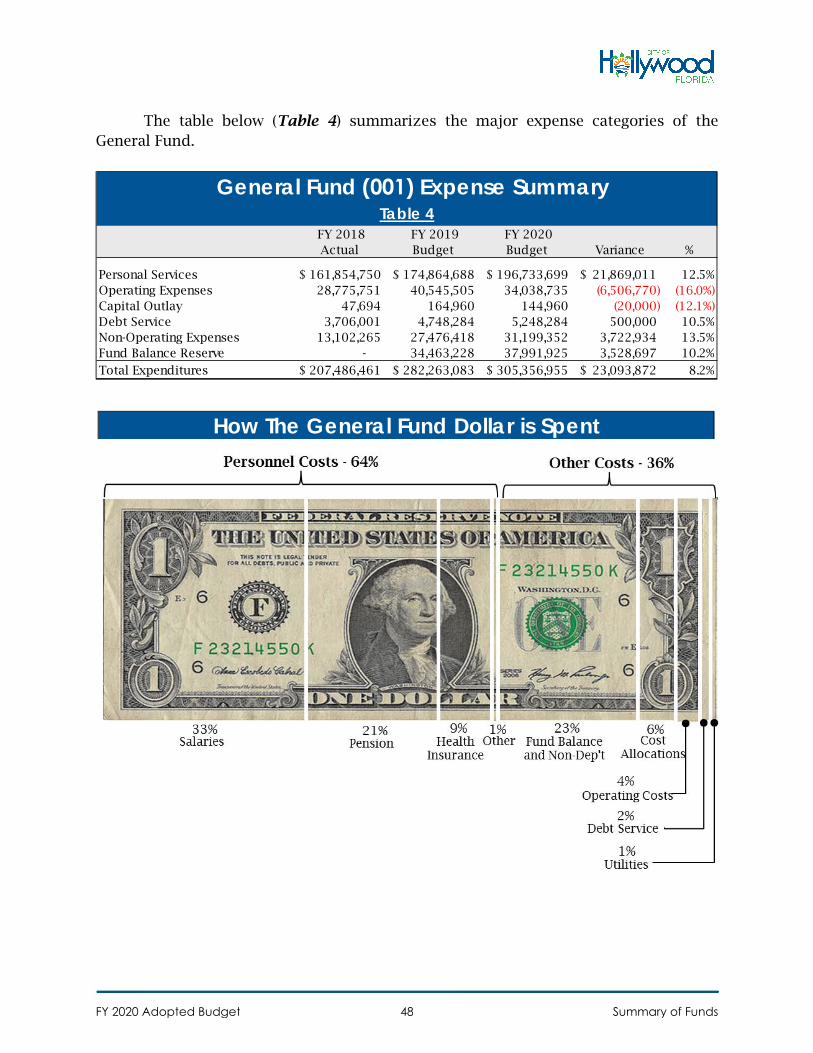
The table below (Table 4) summarizes the major expense categories of the General Fund.
FY 2018 Actual
FY 2019 Budget
FY 2020 Budget Variance %
Personal Services 161,854,750$ 174,864,688$ 196,733,699$ 21,869,011$ 12.5%Operating Expenses 28,775,751 40,545,505 34,038,735 (6,506,770) (16.0%)Capital Outlay 47,694 164,960 144,960 (20,000) (12.1%)Debt Service 3,706,001 4,748,284 5,248,284 500,000 10.5%Non-Operating Expenses 13,102,265 27,476,418 31,199,352 3,722,934 13.5%Fund Balance Reserve - 34,463,228 37,991,925 3,528,697 10.2%
Total Expenditures 207,486,461$ 282,263,083$ 305,356,955$ 23,093,872$ 8.2%
General Fund (001) Expense SummaryTable 4
How The General Fund Dollar is Spent
FY 2020 Adopted Budget Summary of Funds48
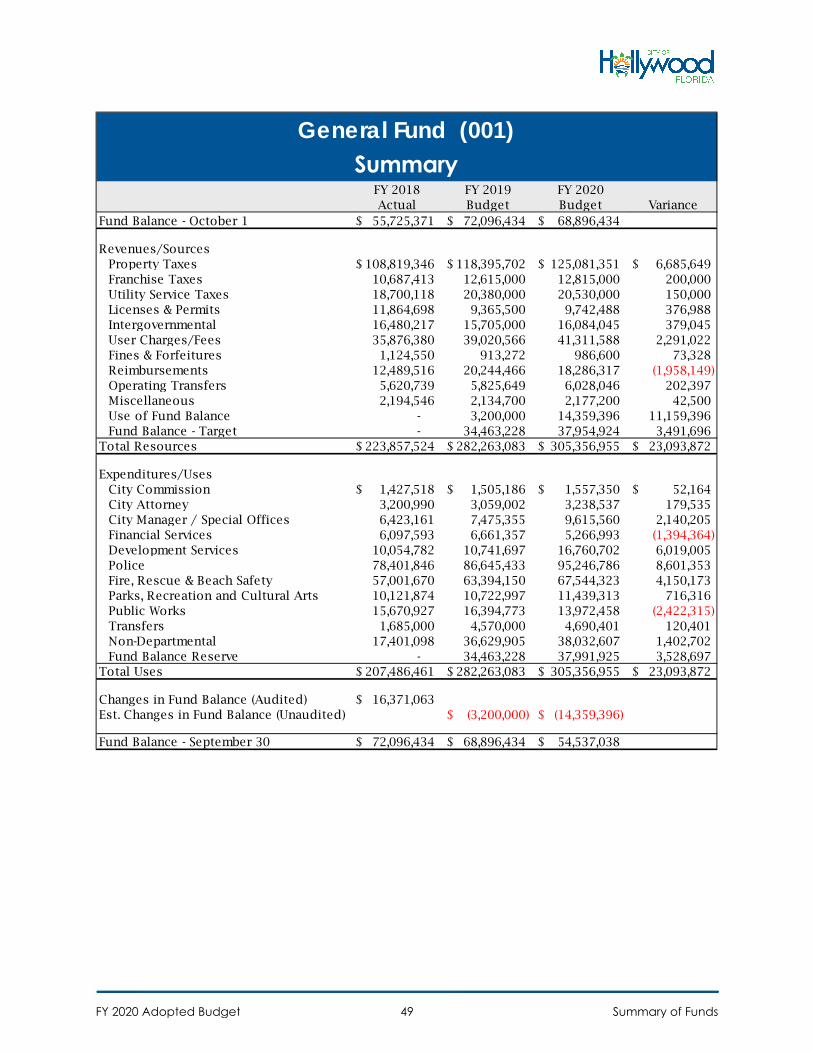
FY 2018 FY 2019 FY 2020 Actual Budget Budget Variance
Fund Balance - October 1 55,725,371$ 72,096,434$ 68,896,434$
Revenues/SourcesProperty Taxes 108,819,346$ 118,395,702$ 125,081,351$ 6,685,649$ Franchise Taxes 10,687,413 12,615,000 12,815,000 200,000Utility Service Taxes 18,700,118 20,380,000 20,530,000 150,000Licenses & Permits 11,864,698 9,365,500 9,742,488 376,988Intergovernmental 16,480,217 15,705,000 16,084,045 379,045User Charges/Fees 35,876,380 39,020,566 41,311,588 2,291,022Fines & Forfeitures 1,124,550 913,272 986,600 73,328Reimbursements 12,489,516 20,244,466 18,286,317 (1,958,149)Operating Transfers 5,620,739 5,825,649 6,028,046 202,397Miscellaneous 2,194,546 2,134,700 2,177,200 42,500Use of Fund Balance - 3,200,000 14,359,396 11,159,396Fund Balance - Target - 34,463,228 37,954,924 3,491,696
Total Resources 223,857,524$ 282,263,083$ 305,356,955$ 23,093,872$
Expenditures/UsesCity Commission 1,427,518$ 1,505,186$ 1,557,350$ 52,164$ City Attorney 3,200,990 3,059,002 3,238,537 179,535City Manager / Special Offices 6,423,161 7,475,355 9,615,560 2,140,205Financial Services 6,097,593 6,661,357 5,266,993 (1,394,364)Development Services 10,054,782 10,741,697 16,760,702 6,019,005Police 78,401,846 86,645,433 95,246,786 8,601,353Fire, Rescue & Beach Safety 57,001,670 63,394,150 67,544,323 4,150,173Parks, Recreation and Cultural Arts 10,121,874 10,722,997 11,439,313 716,316Public Works 15,670,927 16,394,773 13,972,458 (2,422,315)Transfers 1,685,000 4,570,000 4,690,401 120,401Non-Departmental 17,401,098 36,629,905 38,032,607 1,402,702Fund Balance Reserve - 34,463,228 37,991,925 3,528,697
Total Uses 207,486,461$ 282,263,083$ 305,356,955$ 23,093,872$
Changes in Fund Balance (Audited) 16,371,063$ Est. Changes in Fund Balance (Unaudited) (3,200,000)$ (14,359,396)$
Fund Balance - September 30 72,096,434$ 68,896,434$ 54,537,038$
General Fund (001) Summary
FY 2020 Adopted Budget Summary of Funds49
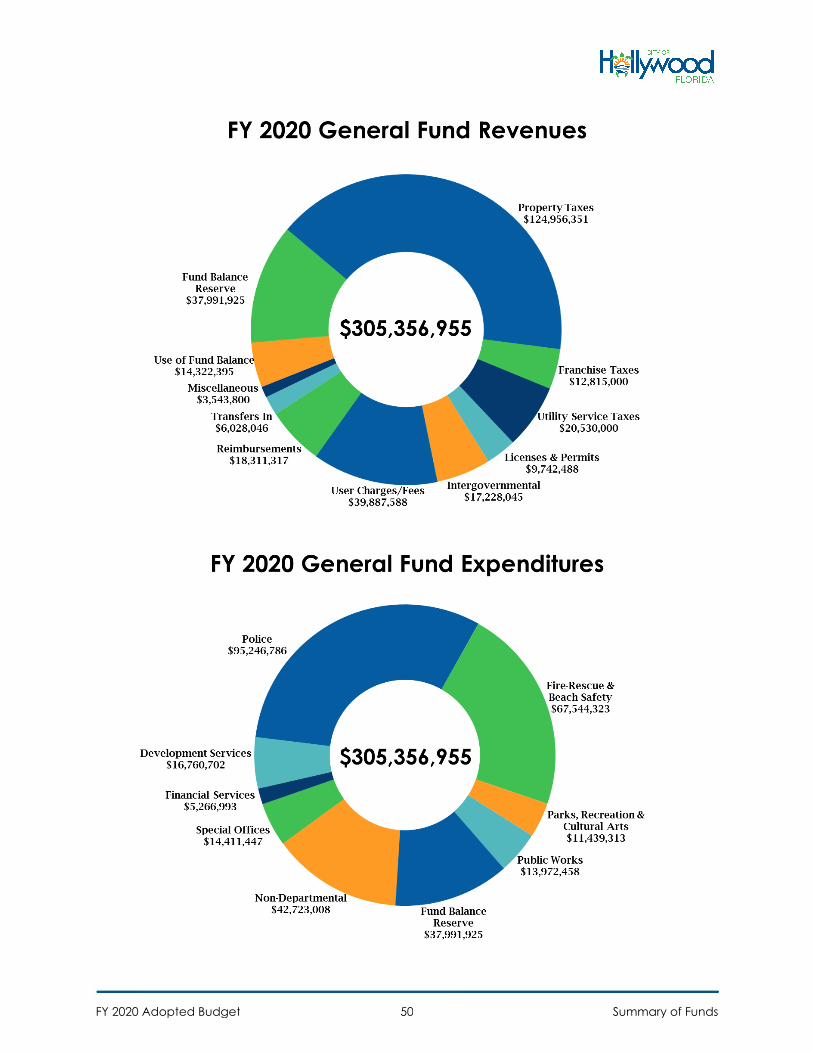
FY 2020 Adopted Budget Summary of Funds50
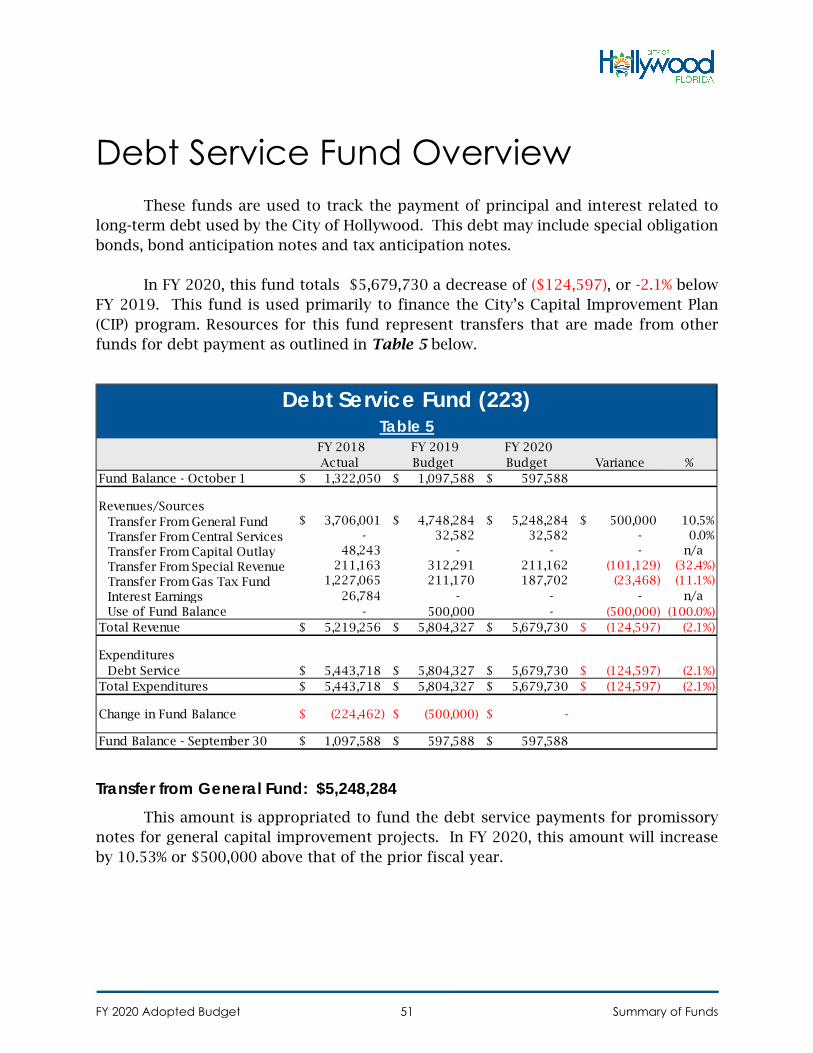
Debt Service Fund Overview These funds are used to track the payment of principal and interest related to
long-term debt used by the City of Hollywood. This debt may include special obligation bonds, bond anticipation notes and tax anticipation notes.
In FY 2020, this fund totals $5,679,730 a decrease of ($124,597), or -2.1% below FY 2019. This fund is used primarily to finance the City’s Capital Improvement Plan (CIP) program. Resources for this fund represent transfers that are made from other funds for debt payment as outlined in Table 5 below.
Transfer from General Fund: $5,248,284 This amount is appropriated to fund the debt service payments for promissory
notes for general capital improvement projects. In FY 2020, this amount will increase by 10.53% or $500,000 above that of the prior fiscal year.
FY 2018 Actual
FY 2019 Budget
FY 2020 Budget Variance %
Fund Balance - October 1 1,322,050$ 1,097,588$ 597,588$
Revenues/SourcesTransfer From General Fund 3,706,001$ 4,748,284$ 5,248,284$ 500,000$ 10.5%Transfer From Central Services - 32,582 32,582 - 0.0%Transfer From Capital Outlay 48,243 - - - n/a Transfer From Special Revenue 211,163 312,291 211,162 (101,129) (32.4%)Transfer From Gas Tax Fund 1,227,065 211,170 187,702 (23,468) (11.1%)Interest Earnings 26,784 - - - n/a Use of Fund Balance - 500,000 - (500,000) (100.0%)
Total Revenue 5,219,256$ 5,804,327$ 5,679,730$ (124,597)$ (2.1%)
ExpendituresDebt Service 5,443,718$ 5,804,327$ 5,679,730$ (124,597)$ (2.1%)
Total Expenditures 5,443,718$ 5,804,327$ 5,679,730$ (124,597)$ (2.1%)
Change in Fund Balance (224,462)$ (500,000)$ -$
Fund Balance - September 30 1,097,588$ 597,588$ 597,588$
Table 5Debt Service Fund (223)
FY 2020 Adopted Budget Summary of Funds51
Transfer from Central Services Fund: $32,582 This amount primarily reflects debt service payments for the City’s annual vehicle
lease/purchase program, as well as payments for the City computer lease program. In FY 2020, this amount will remain the same as that of the prior fiscal year.
Transfer from Special Revenue Fund: $211,162 This amount reflects debt service payments for the Fire equipment
lease/purchase program. In FY 2020, this amount will decrease by ($101,129) or (32.4%) below that of the prior fiscal year.
Transfer from Gas Tax Fund: $ 187,702 This amount reflects debt service payments for the City’s capital improvement
initiatives that are funded with gas tax proceeds. This amount is projected to decrease by ($23,468), or (11.1%) below that of the prior fiscal year.
Use of Fund Balance: $0 This amount reflects debt service payments for the City’s capital improvement
initiatives that will be funded with proceeds from Fund Balance.
FY 2020 Adopted Budget Summary of Funds52
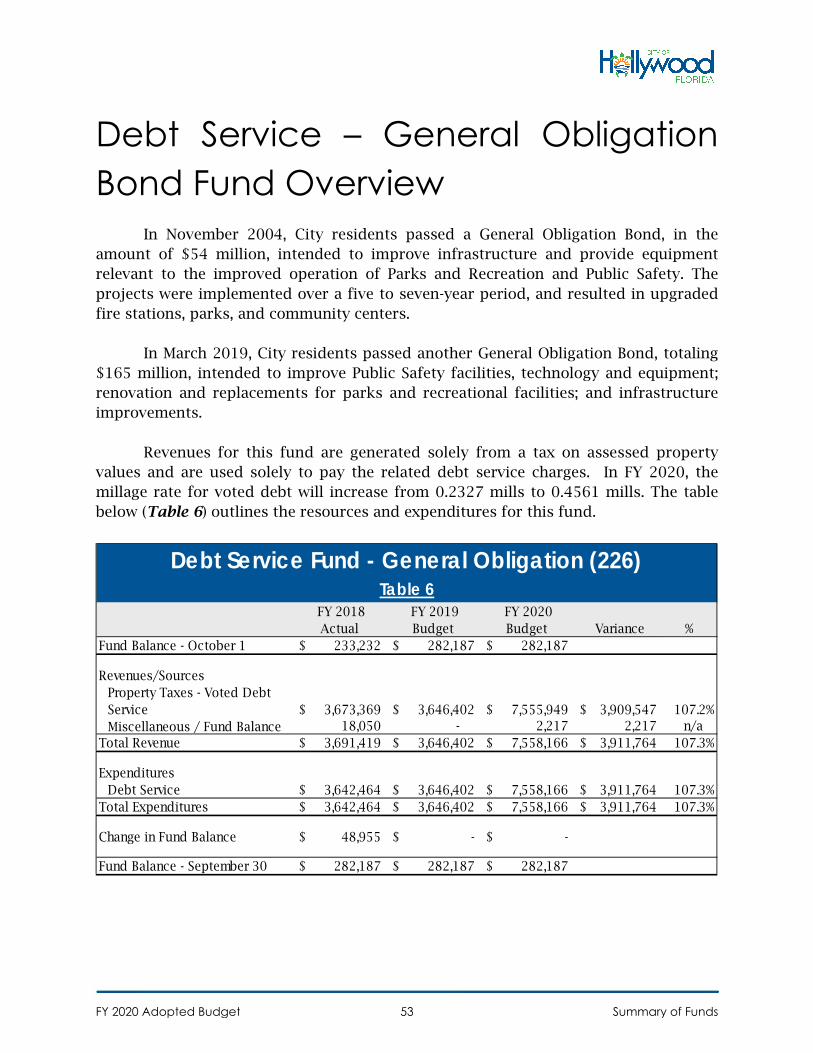
Debt Service – General Obligation Bond Fund Overview
In November 2004, City residents passed a General Obligation Bond, in the amount of $54 million, intended to improve infrastructure and provide equipment relevant to the improved operation of Parks and Recreation and Public Safety. The projects were implemented over a five to seven-year period, and resulted in upgraded fire stations, parks, and community centers.
In March 2019, City residents passed another General Obligation Bond, totaling $165 million, intended to improve Public Safety facilities, technology and equipment; renovation and replacements for parks and recreational facilities; and infrastructure improvements.
Revenues for this fund are generated solely from a tax on assessed property values and are used solely to pay the related debt service charges. In FY 2020, the millage rate for voted debt will increase from 0.2327 mills to 0.4561 mills. The table below (Table 6) outlines the resources and expenditures for this fund.
FY 2018 Actual
FY 2019 Budget
FY 2020 Budget Variance %
Fund Balance - October 1 233,232$ 282,187$ 282,187$
Revenues/SourcesProperty Taxes - Voted Debt Service 3,673,369$ 3,646,402$ 7,555,949$ 3,909,547$ 107.2%Miscellaneous / Fund Balance 18,050 - 2,217 2,217 n/a
Total Revenue 3,691,419$ 3,646,402$ 7,558,166$ 3,911,764$ 107.3%
ExpendituresDebt Service 3,642,464$ 3,646,402$ 7,558,166$ 3,911,764$ 107.3%
Total Expenditures 3,642,464$ 3,646,402$ 7,558,166$ 3,911,764$ 107.3%
Change in Fund Balance 48,955$ -$ -$
Fund Balance - September 30 282,187$ 282,187$ 282,187$
Table 6Debt Service Fund - General Obligation (226)
FY 2020 Adopted Budget Summary of Funds53
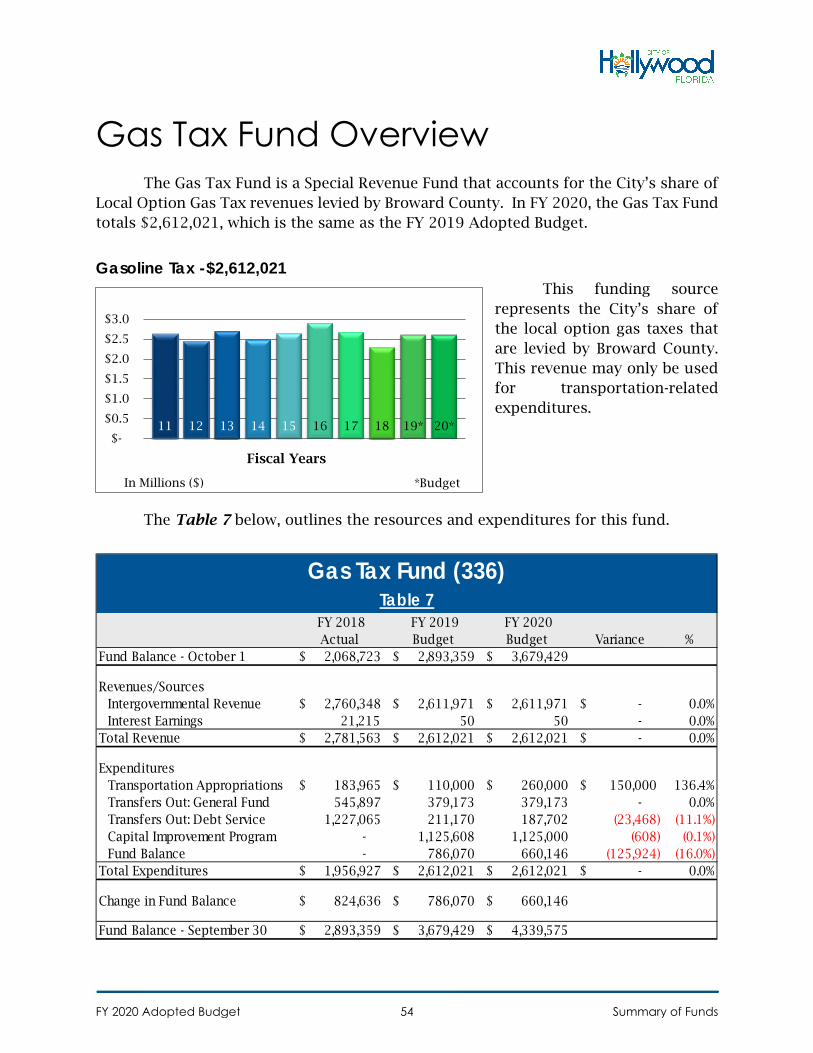
Gas Tax Fund Overview The Gas Tax Fund is a Special Revenue Fund that accounts for the City’s share of
Local Option Gas Tax revenues levied by Broward County. In FY 2020, the Gas Tax Fund totals $2,612,021, which is the same as the FY 2019 Adopted Budget.
Gasoline Tax -$2,612,021This funding source
represents the City’s share of the local option gas taxes that are levied by Broward County. This revenue may only be used for transportation-related expenditures.
The Table 7 below, outlines the resources and expenditures for this fund.
FY 2018 Actual
FY 2019 Budget
FY 2020 Budget Variance %
Fund Balance - October 1 2,068,723$ 2,893,359$ 3,679,429$
Revenues/SourcesIntergovernmental Revenue 2,760,348$ 2,611,971$ 2,611,971$ -$ 0.0%Interest Earnings 21,215 50 50 - 0.0%
Total Revenue 2,781,563$ 2,612,021$ 2,612,021$ -$ 0.0%
ExpendituresTransportation Appropriations 183,965$ 110,000$ 260,000$ 150,000$ 136.4%Transfers Out: General Fund 545,897 379,173 379,173 - 0.0%Transfers Out: Debt Service 1,227,065 211,170 187,702 (23,468) (11.1%)Capital Improvement Program - 1,125,608 1,125,000 (608) (0.1%)Fund Balance - 786,070 660,146 (125,924) (16.0%)
Total Expenditures 1,956,927$ 2,612,021$ 2,612,021$ -$ 0.0%
Change in Fund Balance 824,636$ 786,070$ 660,146$
Fund Balance - September 30 2,893,359$ 3,679,429$ 4,339,575$
Gas Tax Fund (336)Table 7
11 12 13 14 15 16 17 18 19* 20* $-
$0.5
$1.0
$1.5
$2.0
$2.5
$3.0
*BudgetIn Millions ($)
Fiscal Years
FY 2020 Adopted Budget Summary of Funds54
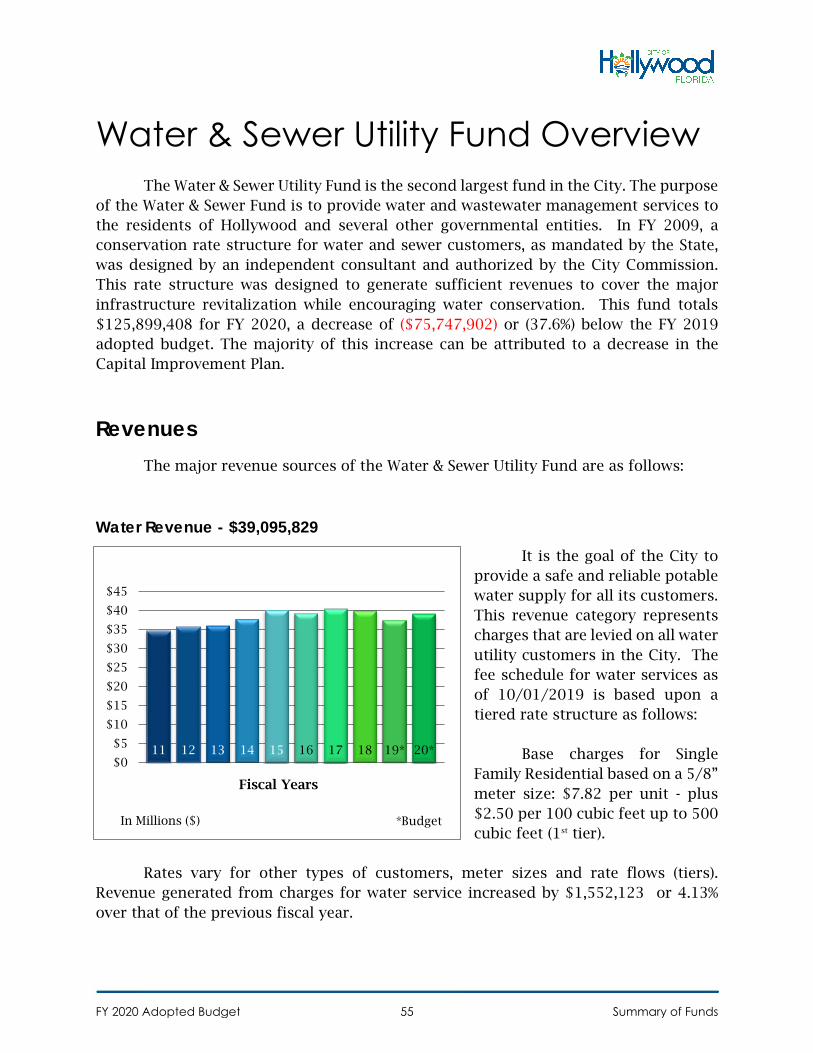
Water & Sewer Utility Fund Overview The Water & Sewer Utility Fund is the second largest fund in the City. The purpose
of the Water & Sewer Fund is to provide water and wastewater management services to the residents of Hollywood and several other governmental entities. In FY 2009, a conservation rate structure for water and sewer customers, as mandated by the State, was designed by an independent consultant and authorized by the City Commission. This rate structure was designed to generate sufficient revenues to cover the major infrastructure revitalization while encouraging water conservation. This fund totals $125,899,408 for FY 2020, a decrease of ($75,747,902) or (37.6%) below the FY 2019 adopted budget. The majority of this increase can be attributed to a decrease in the Capital Improvement Plan.
Revenues The major revenue sources of the Water & Sewer Utility Fund are as follows:
Water Revenue - $39,095,829 It is the goal of the City to
provide a safe and reliable potable water supply for all its customers. This revenue category represents charges that are levied on all water utility customers in the City. The fee schedule for water services as of 10/01/2019 is based upon a tiered rate structure as follows:
Base charges for Single Family Residential based on a 5/8” meter size: $7.82 per unit - plus $2.50 per 100 cubic feet up to 500 cubic feet (1st tier).
Rates vary for other types of customers, meter sizes and rate flows (tiers). Revenue generated from charges for water service increased by $1,552,123 or 4.13% over that of the previous fiscal year.
11 12 13 14 15 16 17 18 19* 20*$0
$5
$10
$15
$20
$25
$30
$35
$40
$45
*BudgetIn Millions ($)
Fiscal Years
FY 2020 Adopted Budget Summary of Funds55
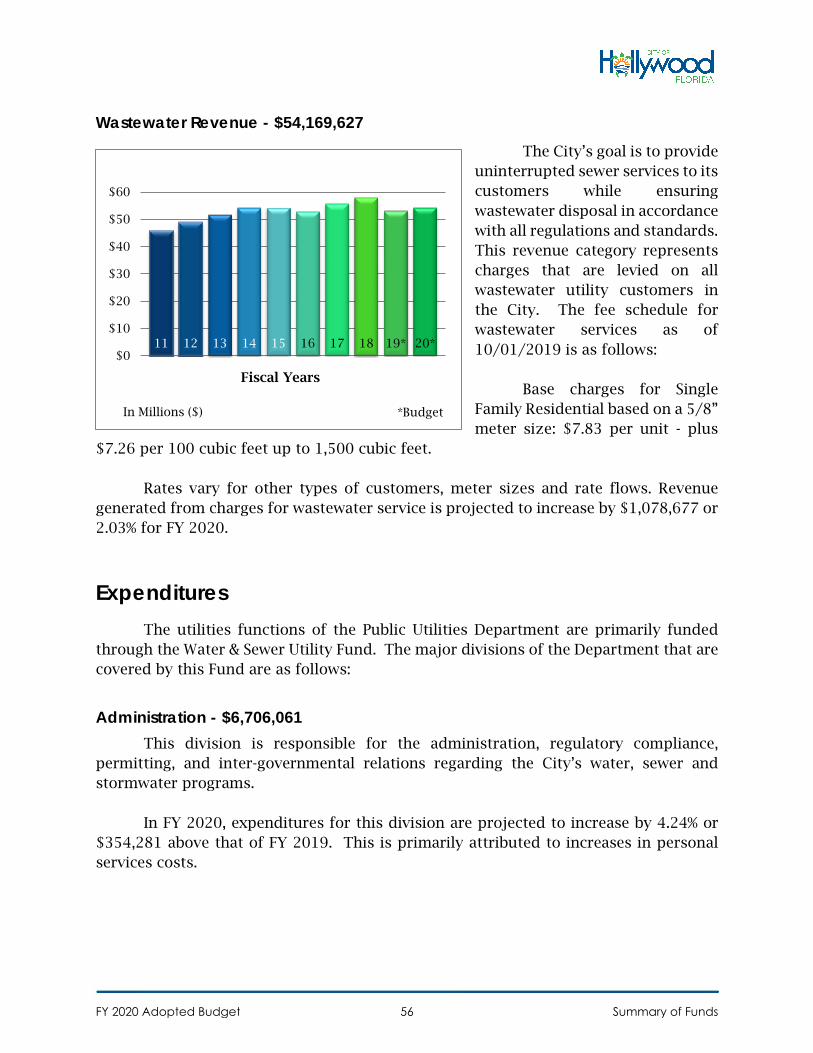
Wastewater Revenue - $54,169,627 The City’s goal is to provide
uninterrupted sewer services to its customers while ensuring wastewater disposal in accordance with all regulations and standards. This revenue category represents charges that are levied on all wastewater utility customers in the City. The fee schedule for wastewater services as of 10/01/2019 is as follows:
Base charges for Single Family Residential based on a 5/8” meter size: $7.83 per unit - plus
$7.26 per 100 cubic feet up to 1,500 cubic feet.
Rates vary for other types of customers, meter sizes and rate flows. Revenue generated from charges for wastewater service is projected to increase by $1,078,677 or 2.03% for FY 2020.
Expenditures The utilities functions of the Public Utilities Department are primarily funded
through the Water & Sewer Utility Fund. The major divisions of the Department that are covered by this Fund are as follows:
Administration - $6,706,061 This division is responsible for the administration, regulatory compliance,
permitting, and inter-governmental relations regarding the City’s water, sewer and stormwater programs.
In FY 2020, expenditures for this division are projected to increase by 4.24% or $354,281 above that of FY 2019. This is primarily attributed to increases in personal services costs.
11 12 13 14 15 16 17 18 19* 20*$0
$10
$20
$30
$40
$50
$60
*BudgetIn Millions ($)
Fiscal Years
FY 2020 Adopted Budget Summary of Funds56
Water Treatment Plant - $8,628,442 This division is responsible for producing a plentiful supply of potable water,
which is safe, attractive, and meets all regulatory requirements for health and fire safety needs. Expenditures for this division are expected to decrease by (0.4%) or ($31,495) in FY 2020. This is attributed to a reduction in personal services costs.
Wastewater Treatment - $17,209,401 This division is responsible for operating the City’s Wastewater Treatment Plant.
In FY 2020, total expenditures for this division will increase by 1.24% or $210,129 above the previous fiscal year. This is attributed to increases in personal services costs.
Engineering Services - $4,281,755 This division provides professional in-house engineering services under the
Utilities Engineering Support program. Expenditures for the program are expected to increase by 0.62% or $26,433 in FY 2020 above that of the previous fiscal year.
Underground Utilities - $9,416,160 This division is responsible for ensuring uninterrupted flow of quality potable
water and wastewater via the various distribution systems, as well as the operation of the Stormwater Management program. In FY 2020, total expenditures for this division will increase by 1.12% or $103,842 above that of the previous fiscal year. This is a result of increases in personal services costs.
Utility Billing - $4,551,336 This division is responsible for meter reading and utility customer and billing
services for the City’s utility system. These services include billing, collection, customer service, service termination and service reinstatement. In FY 2020, total expenditures for this division will decrease by (0.3%) or ($14,679) below that of the previous fiscal year.
FY 2020 Adopted Budget Summary of Funds57
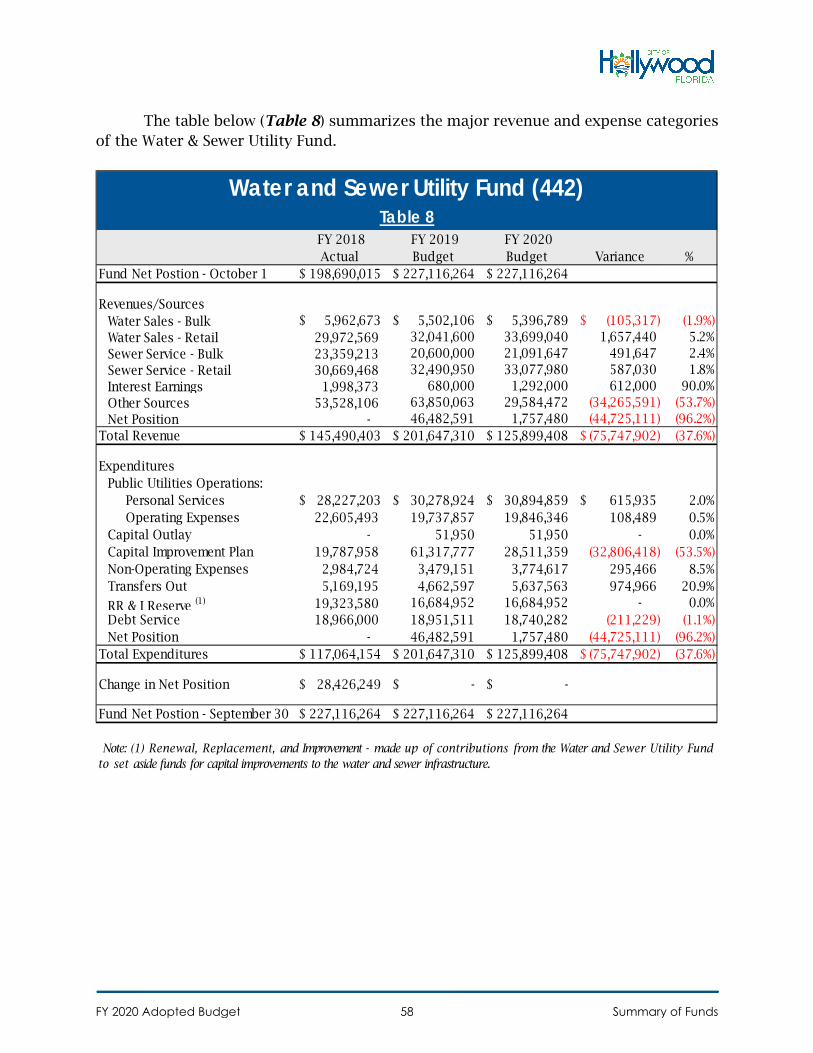
The table below (Table 8) summarizes the major revenue and expense categories of the Water & Sewer Utility Fund.
FY 2018 Actual
FY 2019 Budget
FY 2020 Budget Variance %
Fund Net Postion - October 1 198,690,015$ 227,116,264$ 227,116,264$
Revenues/SourcesWater Sales - Bulk 5,962,673$ 5,502,106$ 5,396,789$ (105,317)$ (1.9%)Water Sales - Retail 29,972,569 32,041,600 33,699,040 1,657,440 5.2%Sewer Service - Bulk 23,359,213 20,600,000 21,091,647 491,647 2.4%Sewer Service - Retail 30,669,468 32,490,950 33,077,980 587,030 1.8%Interest Earnings 1,998,373 680,000 1,292,000 612,000 90.0%Other Sources 53,528,106 63,850,063 29,584,472 (34,265,591) (53.7%)Net Position - 46,482,591 1,757,480 (44,725,111) (96.2%)
Total Revenue 145,490,403$ 201,647,310$ 125,899,408$ (75,747,902)$ (37.6%)
ExpendituresPublic Utilities Operations:
Personal Services 28,227,203$ 30,278,924$ 30,894,859$ 615,935$ 2.0%Operating Expenses 22,605,493 19,737,857 19,846,346 108,489 0.5%
Capital Outlay - 51,950 51,950 - 0.0%Capital Improvement Plan 19,787,958 61,317,777 28,511,359 (32,806,418) (53.5%)Non-Operating Expenses 2,984,724 3,479,151 3,774,617 295,466 8.5%Transfers Out 5,169,195 4,662,597 5,637,563 974,966 20.9%
RR & I Reserve (1) 19,323,580 16,684,952 16,684,952 - 0.0%Debt Service 18,966,000 18,951,511 18,740,282 (211,229) (1.1%)Net Position - 46,482,591 1,757,480 (44,725,111) (96.2%)
Total Expenditures 117,064,154$ 201,647,310$ 125,899,408$ (75,747,902)$ (37.6%)
Change in Net Position 28,426,249$ -$ -$
Fund Net Postion - September 30 227,116,264$ 227,116,264$ 227,116,264$
Water and Sewer Utility Fund (442)Table 8
Note: (1) Renewal, Replacement, and Improvement - made up of contributions from the Water and Sewer Utility Fund to set aside funds for capital improvements to the water and sewer infrastructure.
FY 2020 Adopted Budget Summary of Funds58
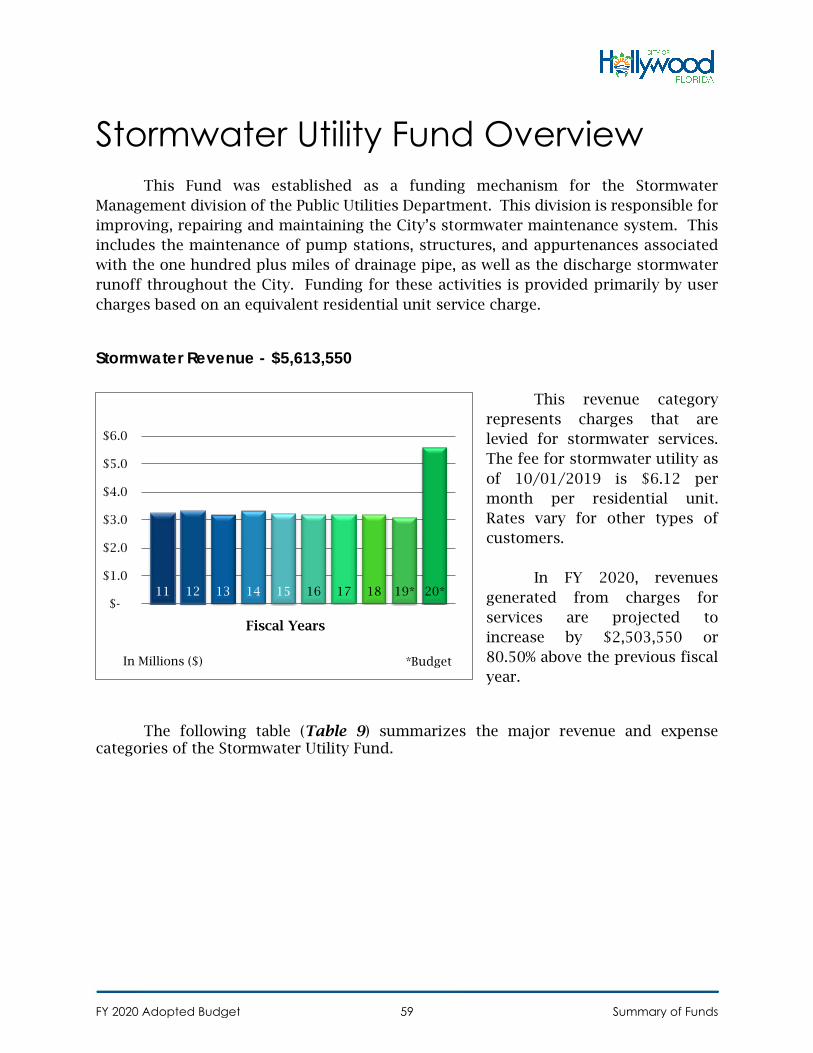
Stormwater Utility Fund Overview This Fund was established as a funding mechanism for the Stormwater
Management division of the Public Utilities Department. This division is responsible for improving, repairing and maintaining the City’s stormwater maintenance system. This includes the maintenance of pump stations, structures, and appurtenances associated with the one hundred plus miles of drainage pipe, as well as the discharge stormwater runoff throughout the City. Funding for these activities is provided primarily by user charges based on an equivalent residential unit service charge.
Stormwater Revenue - $5,613,550
This revenue category represents charges that are levied for stormwater services. The fee for stormwater utility as of 10/01/2019 is $6.12 per month per residential unit. Rates vary for other types of customers.
In FY 2020, revenues generated from charges for services are projected to increase by $2,503,550 or 80.50% above the previous fiscal year.
The following table (Table 9) summarizes the major revenue and expense categories of the Stormwater Utility Fund.
11 12 13 14 15 16 17 18 19* 20* $-
$1.0
$2.0
$3.0
$4.0
$5.0
$6.0
*BudgetIn Millions ($)
Fiscal Years
FY 2020 Adopted Budget Summary of Funds59
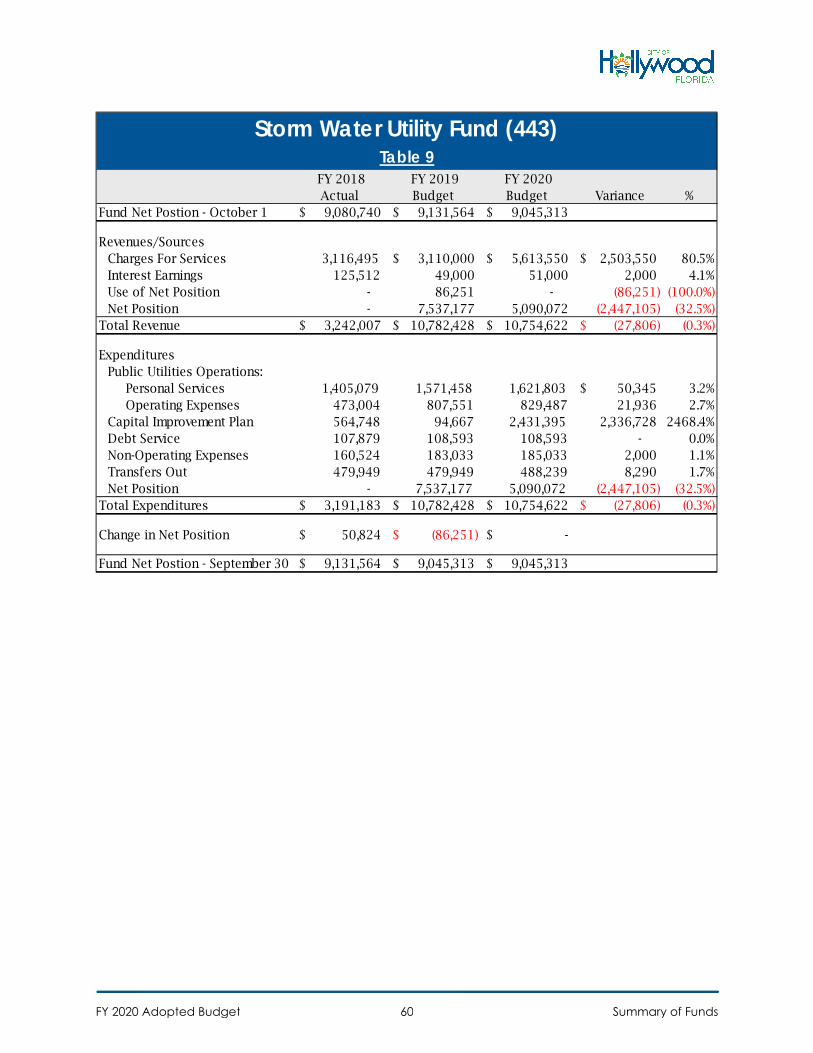
FY 2018 Actual
FY 2019 Budget
FY 2020 Budget Variance %
Fund Net Postion - October 1 9,080,740$ 9,131,564$ 9,045,313$
Revenues/SourcesCharges For Services 3,116,495 3,110,000$ 5,613,550$ 2,503,550$ 80.5%Interest Earnings 125,512 49,000 51,000 2,000 4.1%Use of Net Position - 86,251 - (86,251) (100.0%)Net Position - 7,537,177 5,090,072 (2,447,105) (32.5%)
Total Revenue 3,242,007$ 10,782,428$ 10,754,622$ (27,806)$ (0.3%)
ExpendituresPublic Utilities Operations:
Personal Services 1,405,079 1,571,458 1,621,803 50,345$ 3.2%Operating Expenses 473,004 807,551 829,487 21,936 2.7%
Capital Improvement Plan 564,748 94,667 2,431,395 2,336,728 2468.4%Debt Service 107,879 108,593 108,593 - 0.0%Non-Operating Expenses 160,524 183,033 185,033 2,000 1.1%Transfers Out 479,949 479,949 488,239 8,290 1.7%Net Position - 7,537,177 5,090,072 (2,447,105) (32.5%)
Total Expenditures 3,191,183$ 10,782,428$ 10,754,622$ (27,806)$ (0.3%)
Change in Net Position 50,824$ (86,251)$ -$
Fund Net Postion - September 30 9,131,564$ 9,045,313$ 9,045,313$
Storm Water Utility Fund (443)Table 9
FY 2020 Adopted Budget Summary of Funds60
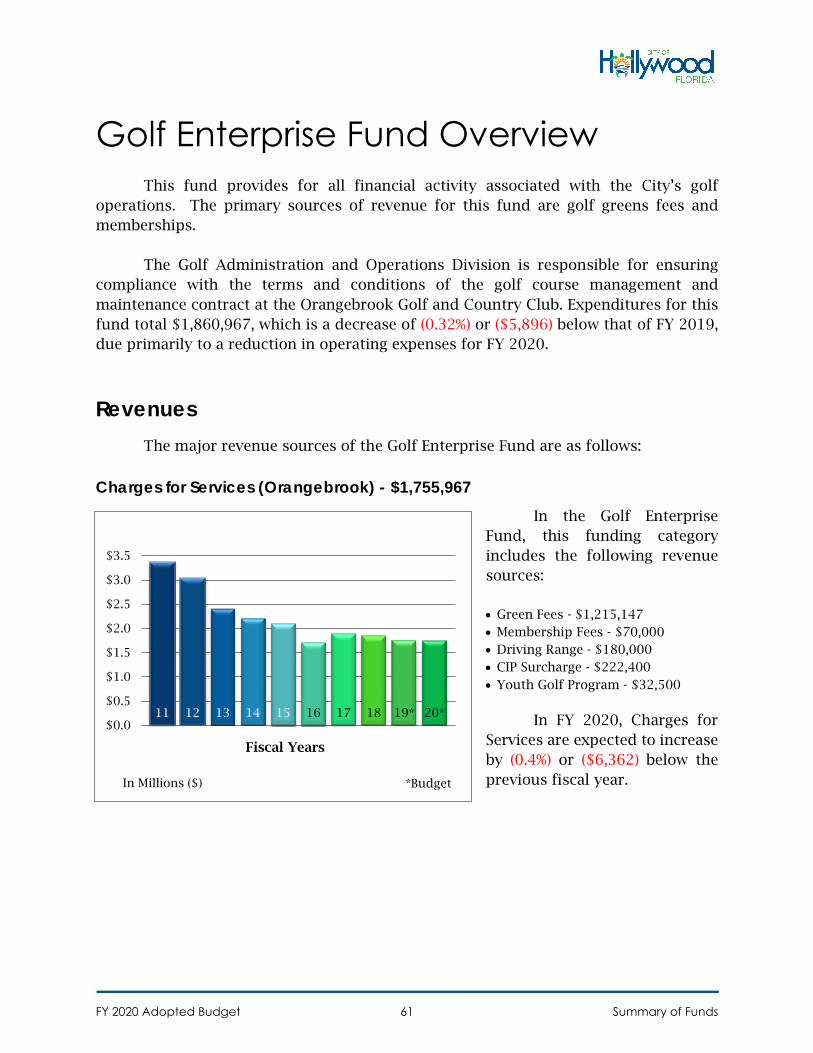
Golf Enterprise Fund Overview This fund provides for all financial activity associated with the City’s golf
operations. The primary sources of revenue for this fund are golf greens fees and memberships.
The Golf Administration and Operations Division is responsible for ensuring compliance with the terms and conditions of the golf course management and maintenance contract at the Orangebrook Golf and Country Club. Expenditures for this fund total $1,860,967, which is a decrease of (0.32%) or ($5,896) below that of FY 2019, due primarily to a reduction in operating expenses for FY 2020.
Revenues The major revenue sources of the Golf Enterprise Fund are as follows:
Charges for Services (Orangebrook) - $1,755,967 In the Golf Enterprise
Fund, this funding category includes the following revenue sources:
• Green Fees - $1,215,147• Membership Fees - $70,000• Driving Range - $180,000• CIP Surcharge - $222,400• Youth Golf Program - $32,500
In FY 2020, Charges for Services are expected to increase by (0.4%) or ($6,362) below the previous fiscal year.
11 12 13 14 15 16 17 18 19* 20*$0.0
$0.5
$1.0
$1.5
$2.0
$2.5
$3.0
$3.5
*BudgetIn Millions ($)
Fiscal Years
FY 2020 Adopted Budget Summary of Funds61
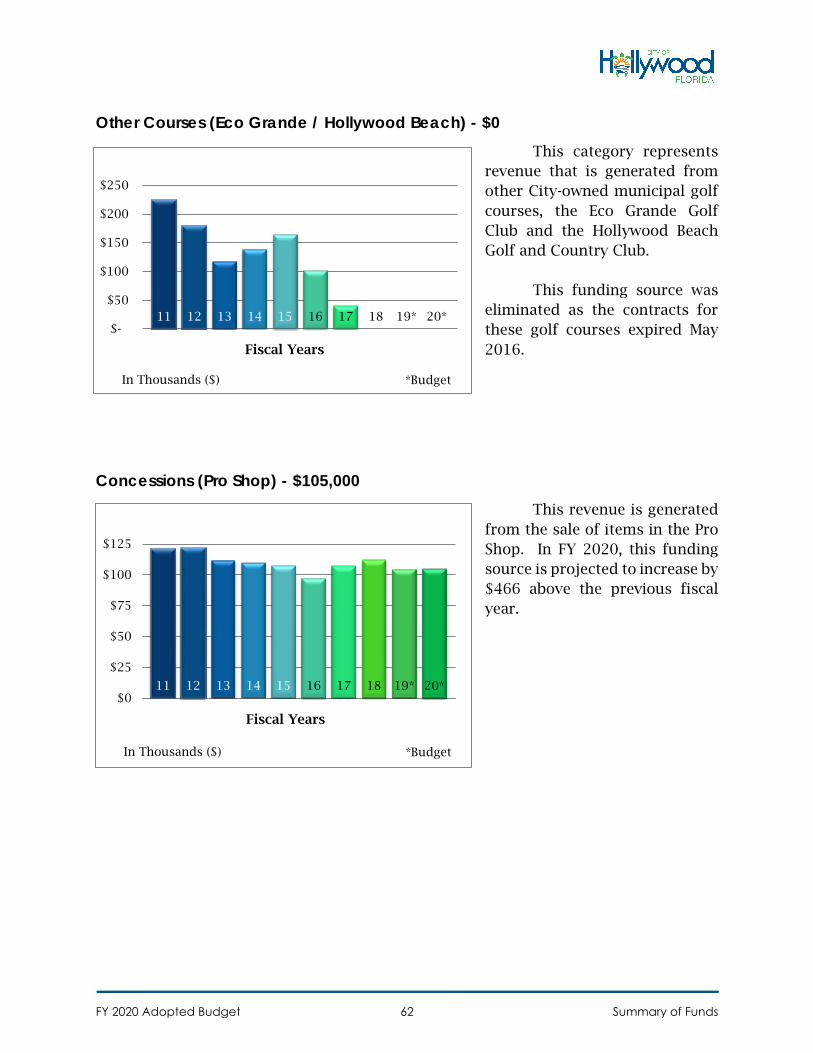
Other Courses (Eco Grande / Hollywood Beach) - $0 This category represents
revenue that is generated from other City-owned municipal golf courses, the Eco Grande Golf Club and the Hollywood Beach Golf and Country Club.
This funding source was eliminated as the contracts for these golf courses expired May 2016.
Concessions (Pro Shop) - $105,000 This revenue is generated
from the sale of items in the Pro Shop. In FY 2020, this funding source is projected to increase by $466 above the previous fiscal year.
11 12 13 14 15 16 17 18 19* 20* $-
$50
$100
$150
$200
$250
*BudgetIn Thousands ($)
Fiscal Years
11 12 13 14 15 16 17 18 19* 20*$0
$25
$50
$75
$100
$125
*BudgetIn Thousands ($)
Fiscal Years
FY 2020 Adopted Budget Summary of Funds62
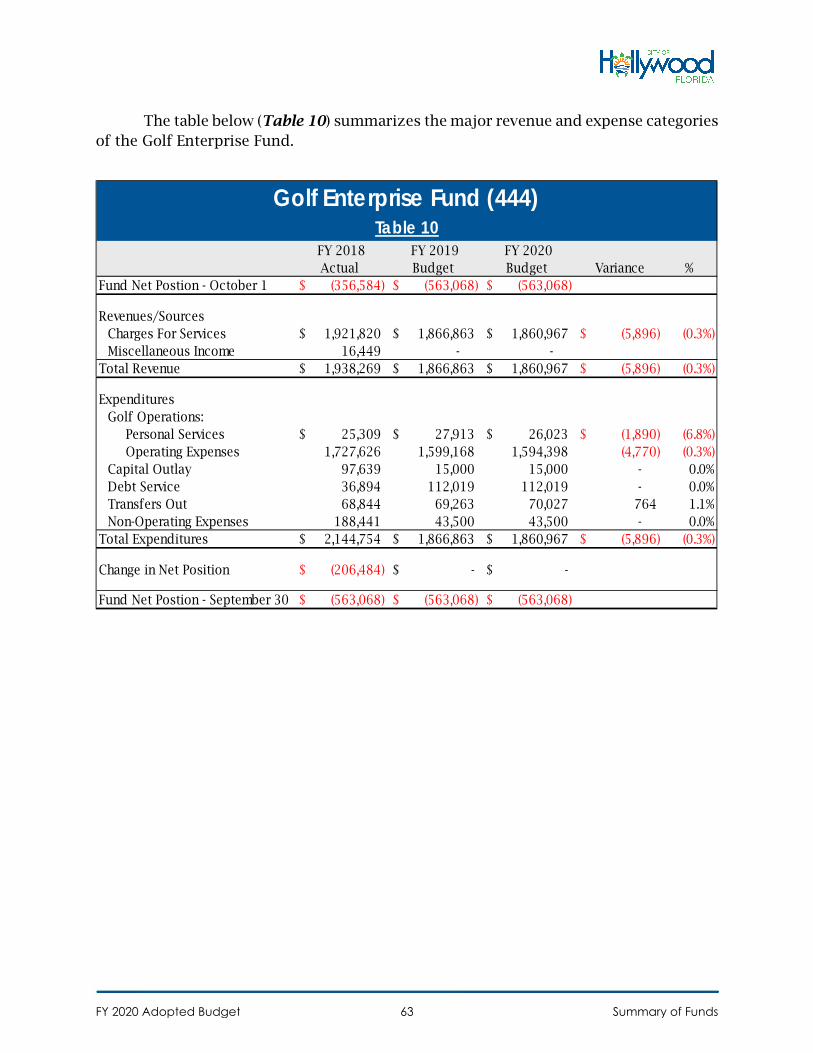
The table below (Table 10) summarizes the major revenue and expense categories of the Golf Enterprise Fund.
FY 2018 Actual
FY 2019 Budget
FY 2020 Budget Variance %
Fund Net Postion - October 1 (356,584)$ (563,068)$ (563,068)$
Revenues/SourcesCharges For Services 1,921,820$ 1,866,863$ 1,860,967$ (5,896)$ (0.3%)Miscellaneous Income 16,449 - -
Total Revenue 1,938,269$ 1,866,863$ 1,860,967$ (5,896)$ (0.3%)
ExpendituresGolf Operations:
Personal Services 25,309$ 27,913$ 26,023$ (1,890)$ (6.8%)Operating Expenses 1,727,626 1,599,168 1,594,398 (4,770) (0.3%)
Capital Outlay 97,639 15,000 15,000 - 0.0%Debt Service 36,894 112,019 112,019 - 0.0%Transfers Out 68,844 69,263 70,027 764 1.1%Non-Operating Expenses 188,441 43,500 43,500 - 0.0%
Total Expenditures 2,144,754$ 1,866,863$ 1,860,967$ (5,896)$ (0.3%)
Change in Net Position (206,484)$ -$ -$
Fund Net Postion - September 30 (563,068)$ (563,068)$ (563,068)$
Golf Enterprise Fund (444)Table 10
FY 2020 Adopted Budget Summary of Funds63
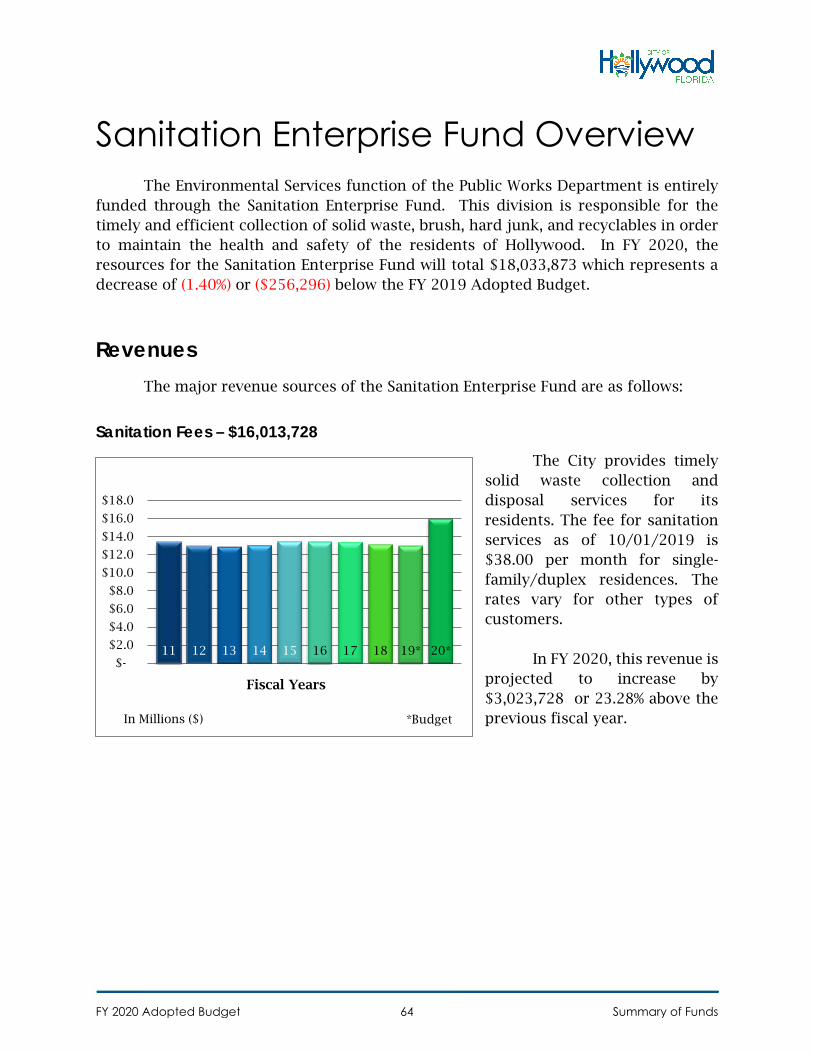
Sanitation Enterprise Fund Overview The Environmental Services function of the Public Works Department is entirely
funded through the Sanitation Enterprise Fund. This division is responsible for the timely and efficient collection of solid waste, brush, hard junk, and recyclables in order to maintain the health and safety of the residents of Hollywood. In FY 2020, the resources for the Sanitation Enterprise Fund will total $18,033,873 which represents a decrease of (1.40%) or ($256,296) below the FY 2019 Adopted Budget.
Revenues The major revenue sources of the Sanitation Enterprise Fund are as follows:
Sanitation Fees – $16,013,728 The City provides timely
solid waste collection and disposal services for its residents. The fee for sanitation services as of 10/01/2019 is $38.00 per month for single-family/duplex residences. The rates vary for other types of customers.
In FY 2020, this revenue is projected to increase by $3,023,728 or 23.28% above the previous fiscal year.
11 12 13 14 15 16 17 18 19* 20* $-
$2.0
$4.0
$6.0
$8.0
$10.0
$12.0
$14.0
$16.0
$18.0
*BudgetIn Millions ($)
Fiscal Years
FY 2020 Adopted Budget Summary of Funds64
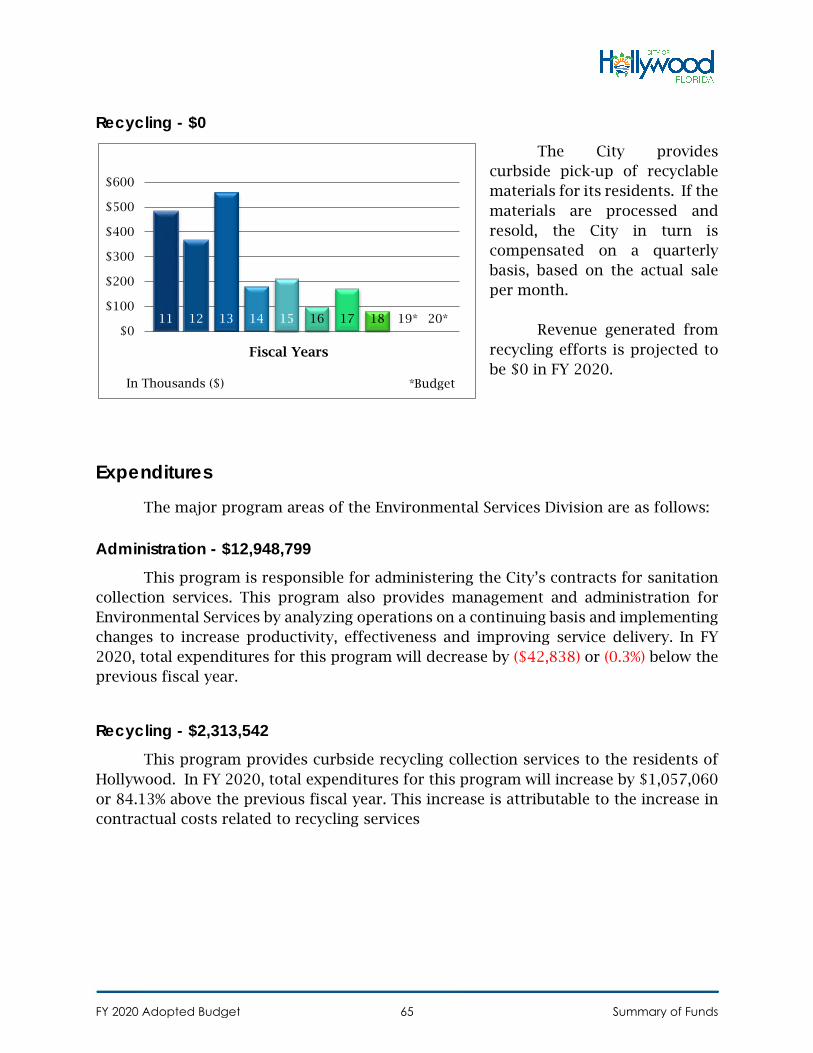
Recycling - $0 The City provides
curbside pick-up of recyclable materials for its residents. If the materials are processed and resold, the City in turn is compensated on a quarterly basis, based on the actual sale per month.
Revenue generated from recycling efforts is projected to be $0 in FY 2020.
Expenditures
The major program areas of the Environmental Services Division are as follows:
Administration - $12,948,799 This program is responsible for administering the City’s contracts for sanitation
collection services. This program also provides management and administration for Environmental Services by analyzing operations on a continuing basis and implementing changes to increase productivity, effectiveness and improving service delivery. In FY 2020, total expenditures for this program will decrease by ($42,838) or (0.3%) below the previous fiscal year.
Recycling - $2,313,542 This program provides curbside recycling collection services to the residents of
Hollywood. In FY 2020, total expenditures for this program will increase by $1,057,060 or 84.13% above the previous fiscal year. This increase is attributable to the increase in contractual costs related to recycling services
11 12 13 14 15 16 17 18 19* 20*$0
$100
$200
$300
$400
$500
$600
*BudgetIn Thousands ($)
Fiscal Years
FY 2020 Adopted Budget Summary of Funds65
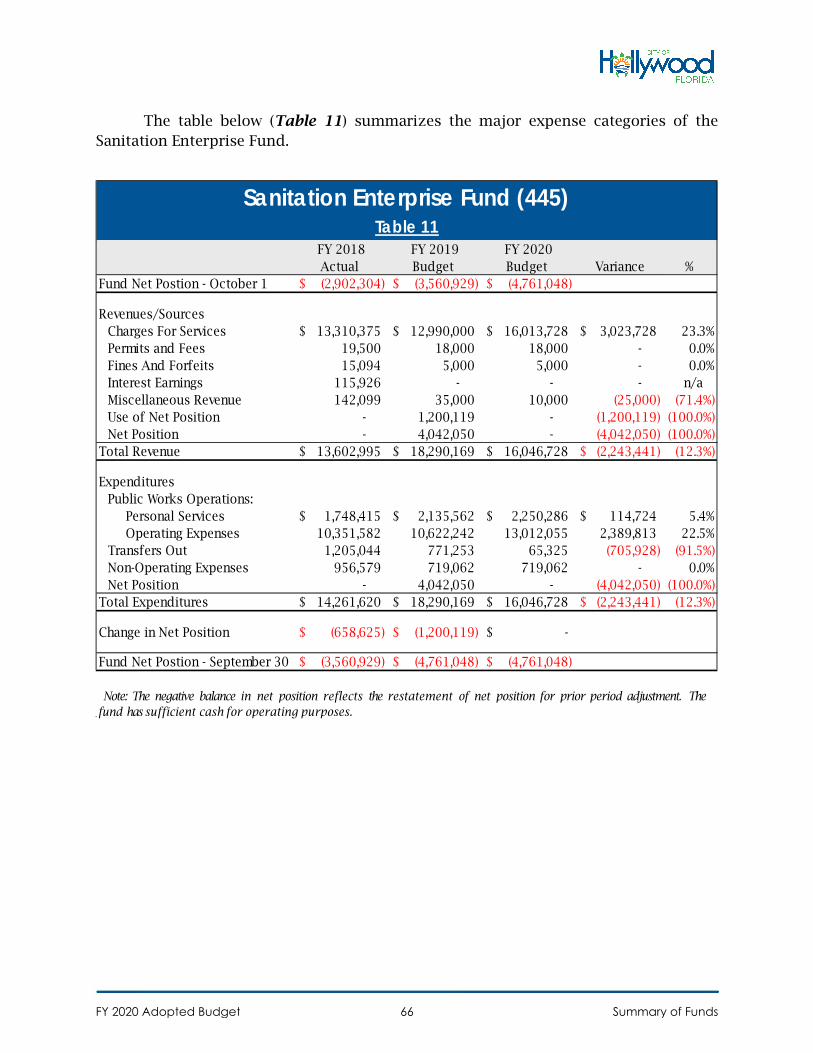
The table below (Table 11) summarizes the major expense categories of the Sanitation Enterprise Fund.
FY 2018 Actual
FY 2019 Budget
FY 2020 Budget Variance %
Fund Net Postion - October 1 (2,902,304)$ (3,560,929)$ (4,761,048)$
Revenues/SourcesCharges For Services 13,310,375$ 12,990,000$ 16,013,728$ 3,023,728$ 23.3%Permits and Fees 19,500 18,000 18,000 - 0.0%Fines And Forfeits 15,094 5,000 5,000 - 0.0%Interest Earnings 115,926 - - - n/a Miscellaneous Revenue 142,099 35,000 10,000 (25,000) (71.4%)Use of Net Position - 1,200,119 - (1,200,119) (100.0%)Net Position - 4,042,050 - (4,042,050) (100.0%)
Total Revenue 13,602,995$ 18,290,169$ 16,046,728$ (2,243,441)$ (12.3%)
ExpendituresPublic Works Operations:
Personal Services 1,748,415$ 2,135,562$ 2,250,286$ 114,724$ 5.4%Operating Expenses 10,351,582 10,622,242 13,012,055 2,389,813 22.5%
Transfers Out 1,205,044 771,253 65,325 (705,928) (91.5%)Non-Operating Expenses 956,579 719,062 719,062 - 0.0%Net Position - 4,042,050 - (4,042,050) (100.0%)
Total Expenditures 14,261,620$ 18,290,169$ 16,046,728$ (2,243,441)$ (12.3%)
Change in Net Position (658,625)$ (1,200,119)$ -$
Fund Net Postion - September 30 (3,560,929)$ (4,761,048)$ (4,761,048)$
Note: The negative balance in net position reflects the restatement of net position for prior period adjustment. The fund has sufficient cash for operating purposes.
Sanitation Enterprise Fund (445)Table 11
FY 2020 Adopted Budget Summary of Funds66
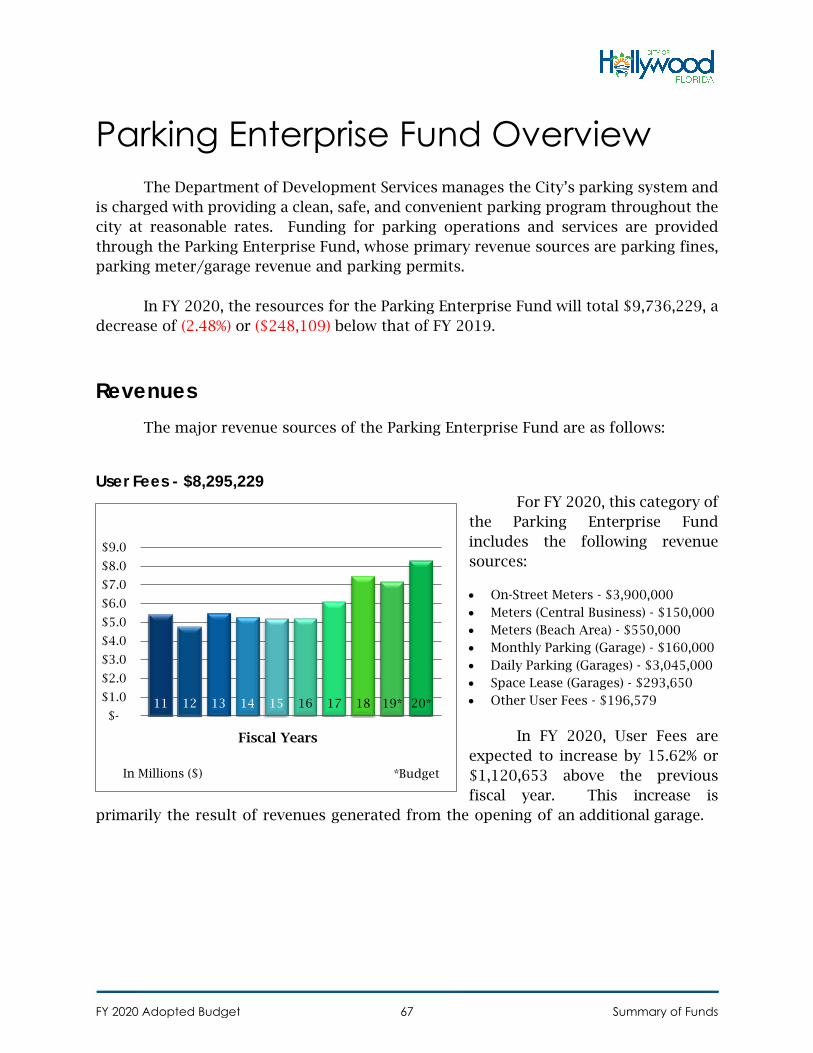
Parking Enterprise Fund Overview The Department of Development Services manages the City’s parking system and
is charged with providing a clean, safe, and convenient parking program throughout the city at reasonable rates. Funding for parking operations and services are provided through the Parking Enterprise Fund, whose primary revenue sources are parking fines, parking meter/garage revenue and parking permits.
In FY 2020, the resources for the Parking Enterprise Fund will total $9,736,229, a decrease of (2.48%) or ($248,109) below that of FY 2019.
Revenues The major revenue sources of the Parking Enterprise Fund are as follows:
User Fees - $8,295,229 For FY 2020, this category of
the Parking Enterprise Fund includes the following revenue sources:
• On-Street Meters - $3,900,000• Meters (Central Business) - $150,000• Meters (Beach Area) - $550,000• Monthly Parking (Garage) - $160,000• Daily Parking (Garages) - $3,045,000• Space Lease (Garages) - $293,650• Other User Fees - $196,579
In FY 2020, User Fees are expected to increase by 15.62% or $1,120,653 above the previous fiscal year. This increase is
primarily the result of revenues generated from the opening of an additional garage.
11 12 13 14 15 16 17 18 19* 20* $-
$1.0
$2.0
$3.0
$4.0
$5.0
$6.0
$7.0
$8.0
$9.0
*BudgetIn Millions ($)
Fiscal Years
FY 2020 Adopted Budget Summary of Funds67
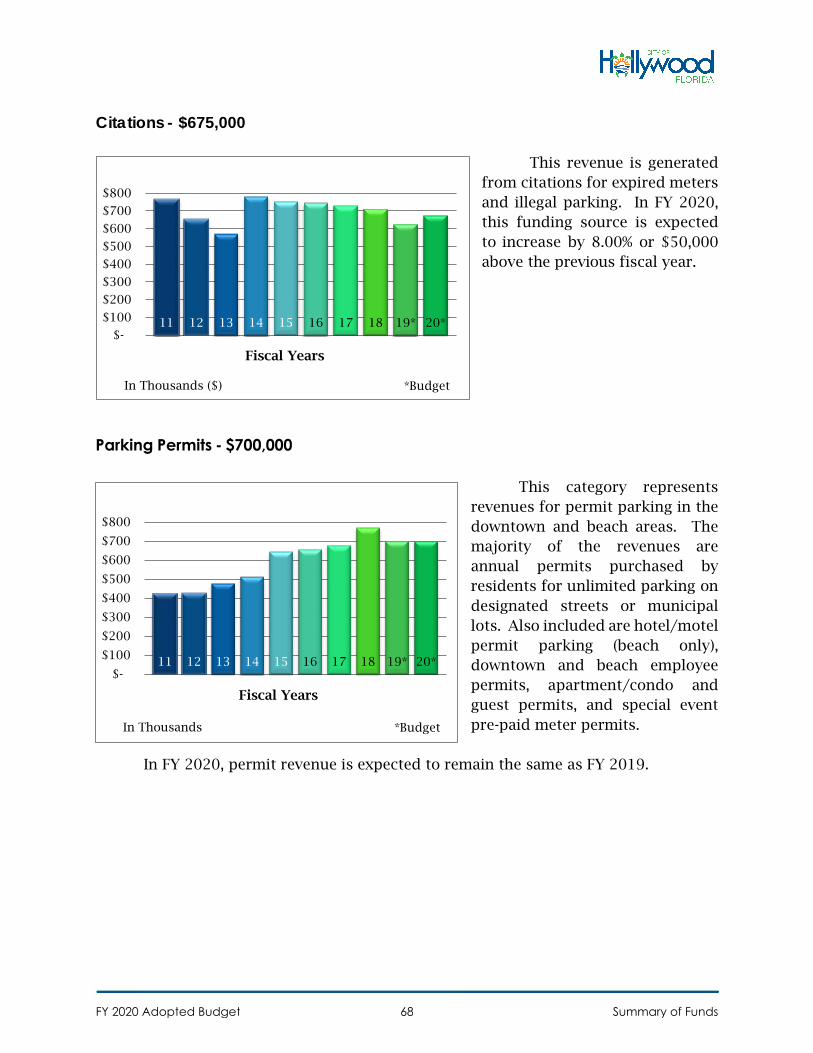
Citations - $675,000
This revenue is generated from citations for expired meters and illegal parking. In FY 2020, this funding source is expected to increase by 8.00% or $50,000 above the previous fiscal year.
Parking Permits - $700,000
This category represents revenues for permit parking in the downtown and beach areas. The majority of the revenues are annual permits purchased by residents for unlimited parking on designated streets or municipal lots. Also included are hotel/motel permit parking (beach only), downtown and beach employee permits, apartment/condo and guest permits, and special event pre-paid meter permits.
In FY 2020, permit revenue is expected to remain the same as FY 2019.
11 12 13 14 15 16 17 18 19* 20* $-
$100
$200
$300
$400
$500
$600
$700
$800
*BudgetIn Thousands ($)
Fiscal Years
11 12 13 14 15 16 17 18 19* 20* $-
$100
$200
$300
$400
$500
$600
$700
$800
*BudgetIn Thousands
Fiscal Years
FY 2020 Adopted Budget Summary of Funds68
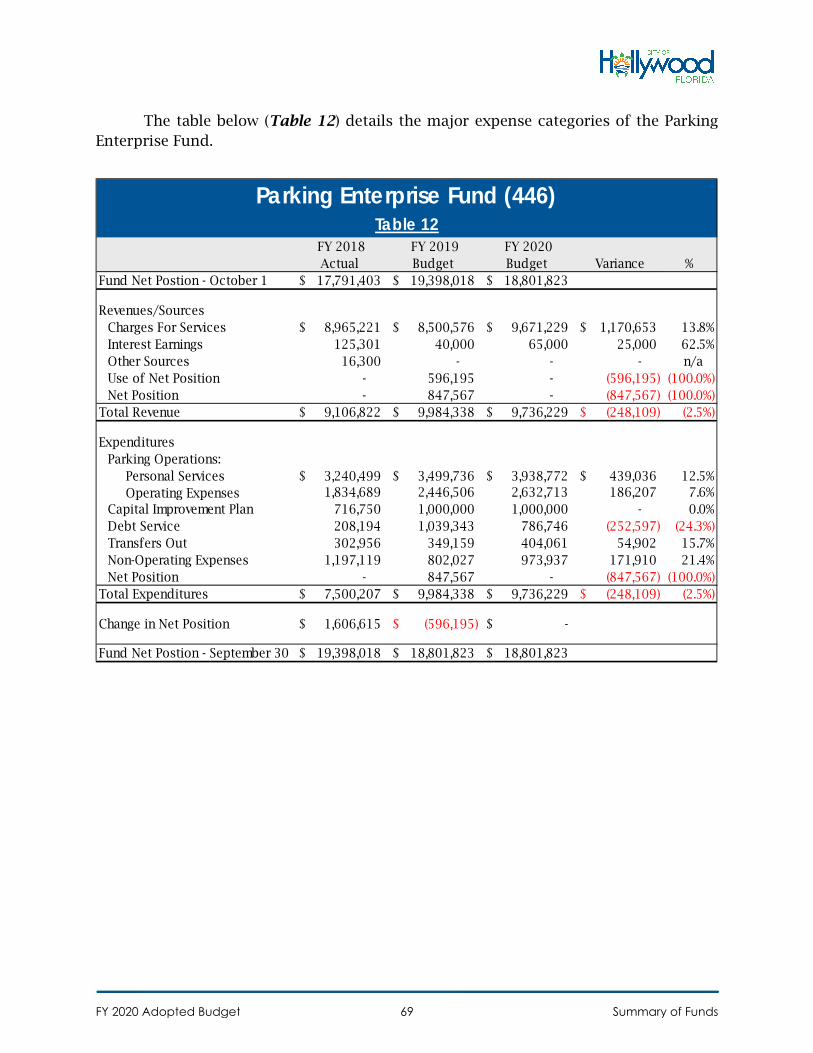
The table below (Table 12) details the major expense categories of the Parking Enterprise Fund.
FY 2018 Actual
FY 2019 Budget
FY 2020 Budget Variance %
Fund Net Postion - October 1 17,791,403$ 19,398,018$ 18,801,823$
Revenues/SourcesCharges For Services 8,965,221$ 8,500,576$ 9,671,229$ 1,170,653$ 13.8%Interest Earnings 125,301 40,000 65,000 25,000 62.5%Other Sources 16,300 - - - n/a Use of Net Position - 596,195 - (596,195) (100.0%)Net Position - 847,567 - (847,567) (100.0%)
Total Revenue 9,106,822$ 9,984,338$ 9,736,229$ (248,109)$ (2.5%)
ExpendituresParking Operations:
Personal Services 3,240,499$ 3,499,736$ 3,938,772$ 439,036$ 12.5%Operating Expenses 1,834,689 2,446,506 2,632,713 186,207 7.6%
Capital Improvement Plan 716,750 1,000,000 1,000,000 - 0.0%Debt Service 208,194 1,039,343 786,746 (252,597) (24.3%)Transfers Out 302,956 349,159 404,061 54,902 15.7%Non-Operating Expenses 1,197,119 802,027 973,937 171,910 21.4%Net Position - 847,567 - (847,567) (100.0%)
Total Expenditures 7,500,207$ 9,984,338$ 9,736,229$ (248,109)$ (2.5%)
Change in Net Position 1,606,615$ (596,195)$ -$
Fund Net Postion - September 30 19,398,018$ 18,801,823$ 18,801,823$
Parking Enterprise Fund (446)Table 12
FY 2020 Adopted Budget Summary of Funds69
Central Services Fund Overview The Central Service Fund allocates the cost of providing certain centralized
services among user agencies. This fund accounts for the operations of the City’s central garage, archiving services, public relations services and information technology services. In FY 2020, the budget for the Central Services fund totals $26,150,910, which represents an increase of 24.7% or $5,181,081 above that of FY 2019.
The following departments/divisions are funded through the Central Services fund. The budget for each department/office represents total funding for personal services, operating expenses, debt service, capital outlay, and non-operating expenses such as transfers out.
Expenditures
Records & Archives Management - $612,803 The Records & Archives Management Division of the Office of the City Clerk
coordinates and manages all active, inactive and archival records of the City. The Division functions as the City’s central records management office, and collects, preserves, and makes available vital municipal and historically significant documents and photographs of Hollywood.
In FY 2020, appropriations for this division are projected to increase by $20,054 or 3.38% above those for the previous fiscal year. This is attributed to an increase in personal services expenses.
Communications and Marketing - $1,707,506 The Communications and Marketing Division of the Office of Communications,
Marketing and Economic Development is responsible for responding to the information needs of both the professional media and the public, and works with other City departments and offices to coordinate the dissemination of information relating to special events, City services, programs and projects.
The FY 2020 budget for the Communications Division is expected to increase by $112,123 or 7.03% above the previous fiscal year.
FY 2020 Adopted Budget Summary of Funds70
Information Technology - $10,888,591 The Department of Information Technology oversees the City’s information
technology programs and functions. This department is responsible for setting the tone and direction of all IT related activities throughout the City and ensuring compliance with adopted standards and procedures.
In FY 2020, appropriations for this department are projected to increase by 3.99% or $417,493 above that of FY 2019.
Fleet Management - $9,434,787 The Environmental, Fleet, Grounds & Beach Division of the Public Works
Department provides for the preventative and corrective maintenance of the City’s general fleet. The preventative maintenance program provides for the scheduled inspection and servicing of vehicles and equipment, while the corrective program is involved with the diagnosis, repair, modification and upgrade of City-owned vehicles, equipment, tools and machinery. This division is also responsible for all fuel management activities and the City’s debt service payments for the Vehicle/Equipment Replacement program.
In FY 2020, funding for this division will increase by 14.77% or $1,214,520 above that of the previous fiscal year.
Design and Construction Management - $3,298,524 The Department of Design and Construction Management was re-established in
FY 2019 and is responsible for implementing the General Obligation (GO) Bond projects for the City of Hollywood.
FY 2020 Adopted Budget Summary of Funds71
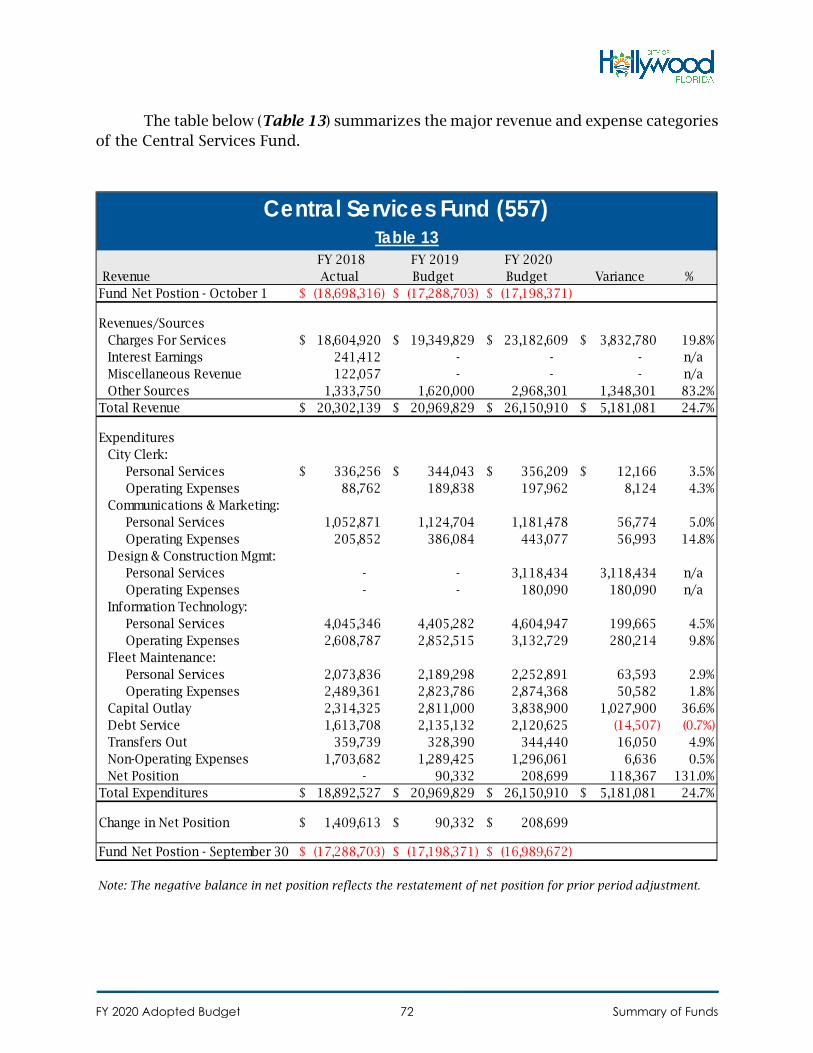
The table below (Table 13) summarizes the major revenue and expense categories of the Central Services Fund.
Revenue FY 2018 Actual
FY 2019 Budget
FY 2020 Budget Variance %
Fund Net Postion - October 1 (18,698,316)$ (17,288,703)$ (17,198,371)$
Revenues/SourcesCharges For Services 18,604,920$ 19,349,829$ 23,182,609$ 3,832,780$ 19.8%Interest Earnings 241,412 - - - n/a Miscellaneous Revenue 122,057 - - - n/a Other Sources 1,333,750 1,620,000 2,968,301 1,348,301 83.2%
Total Revenue 20,302,139$ 20,969,829$ 26,150,910$ 5,181,081$ 24.7%
ExpendituresCity Clerk:
Personal Services 336,256$ 344,043$ 356,209$ 12,166$ 3.5%Operating Expenses 88,762 189,838 197,962 8,124 4.3%
Communications & Marketing:Personal Services 1,052,871 1,124,704 1,181,478 56,774 5.0%Operating Expenses 205,852 386,084 443,077 56,993 14.8%
Design & Construction Mgmt:Personal Services - - 3,118,434 3,118,434 n/a Operating Expenses - - 180,090 180,090 n/a
Information Technology:Personal Services 4,045,346 4,405,282 4,604,947 199,665 4.5%Operating Expenses 2,608,787 2,852,515 3,132,729 280,214 9.8%
Fleet Maintenance:Personal Services 2,073,836 2,189,298 2,252,891 63,593 2.9%Operating Expenses 2,489,361 2,823,786 2,874,368 50,582 1.8%
Capital Outlay 2,314,325 2,811,000 3,838,900 1,027,900 36.6%Debt Service 1,613,708 2,135,132 2,120,625 (14,507) (0.7%)Transfers Out 359,739 328,390 344,440 16,050 4.9%Non-Operating Expenses 1,703,682 1,289,425 1,296,061 6,636 0.5%Net Position - 90,332 208,699 118,367 131.0%
Total Expenditures 18,892,527$ 20,969,829$ 26,150,910$ 5,181,081$ 24.7%
Change in Net Position 1,409,613$ 90,332$ 208,699$
Fund Net Postion - September 30 (17,288,703)$ (17,198,371)$ (16,989,672)$
Central Services Fund (557)Table 13
Note: The negative balance in net position reflects the restatement of net position for prior period adjustment.
FY 2020 Adopted Budget Summary of Funds72
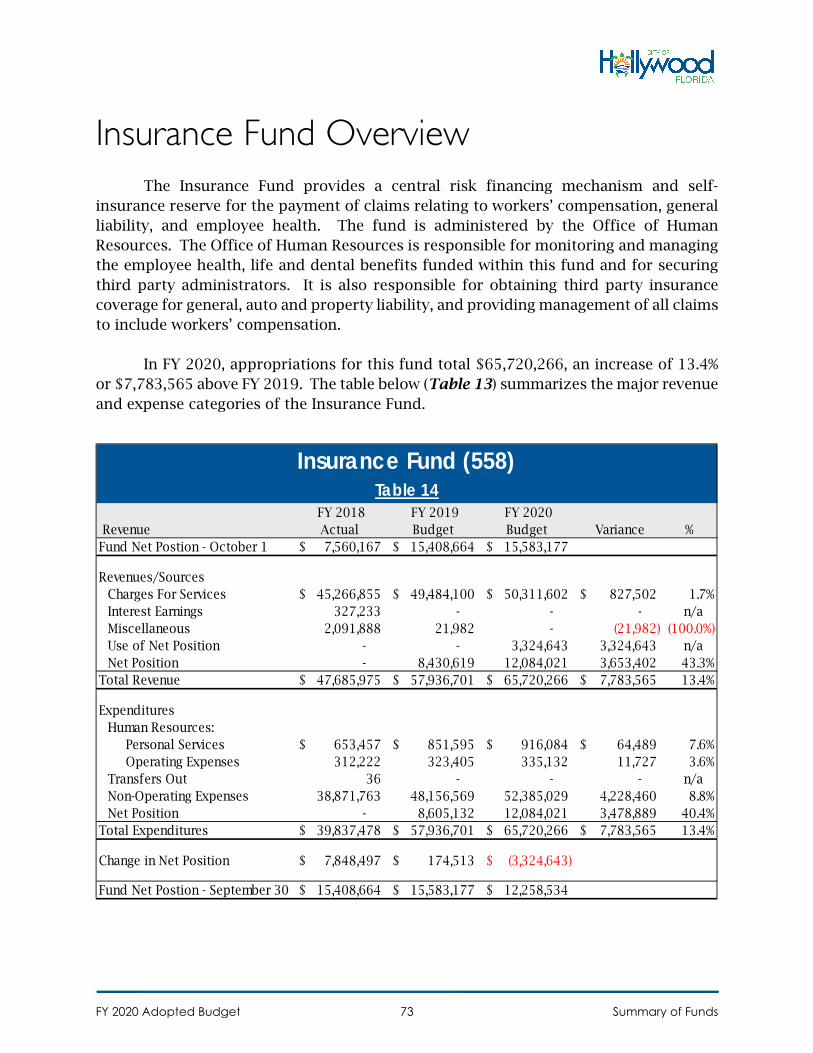
Insurance Fund OverviewThe Insurance Fund provides a central risk financing mechanism and self-
insurance reserve for the payment of claims relating to workers’ compensation, general liability, and employee health. The fund is administered by the Office of Human Resources. The Office of Human Resources is responsible for monitoring and managing the employee health, life and dental benefits funded within this fund and for securing third party administrators. It is also responsible for obtaining third party insurance coverage for general, auto and property liability, and providing management of all claims to include workers’ compensation.
In FY 2020, appropriations for this fund total $65,720,266, an increase of 13.4% or $7,783,565 above FY 2019. The table below (Table 13) summarizes the major revenue and expense categories of the Insurance Fund.
Revenue FY 2018 Actual
FY 2019 Budget
FY 2020 Budget Variance %
Fund Net Postion - October 1 7,560,167$ 15,408,664$ 15,583,177$
Revenues/SourcesCharges For Services 45,266,855$ 49,484,100$ 50,311,602$ 827,502$ 1.7%Interest Earnings 327,233 - - - n/a Miscellaneous 2,091,888 21,982 - (21,982) (100.0%)Use of Net Position - - 3,324,643 3,324,643 n/a Net Position - 8,430,619 12,084,021 3,653,402 43.3%
Total Revenue 47,685,975$ 57,936,701$ 65,720,266$ 7,783,565$ 13.4%
ExpendituresHuman Resources:
Personal Services 653,457$ 851,595$ 916,084$ 64,489$ 7.6%Operating Expenses 312,222 323,405 335,132 11,727 3.6%
Transfers Out 36 - - - n/a Non-Operating Expenses 38,871,763 48,156,569 52,385,029 4,228,460 8.8%Net Position - 8,605,132 12,084,021 3,478,889 40.4%
Total Expenditures 39,837,478$ 57,936,701$ 65,720,266$ 7,783,565$ 13.4%
Change in Net Position 7,848,497$ 174,513$ (3,324,643)$
Fund Net Postion - September 30 15,408,664$ 15,583,177$ 12,258,534$
Table 14Insurance Fund (558)
FY 2020 Adopted Budget Summary of Funds73
Revenue Sources
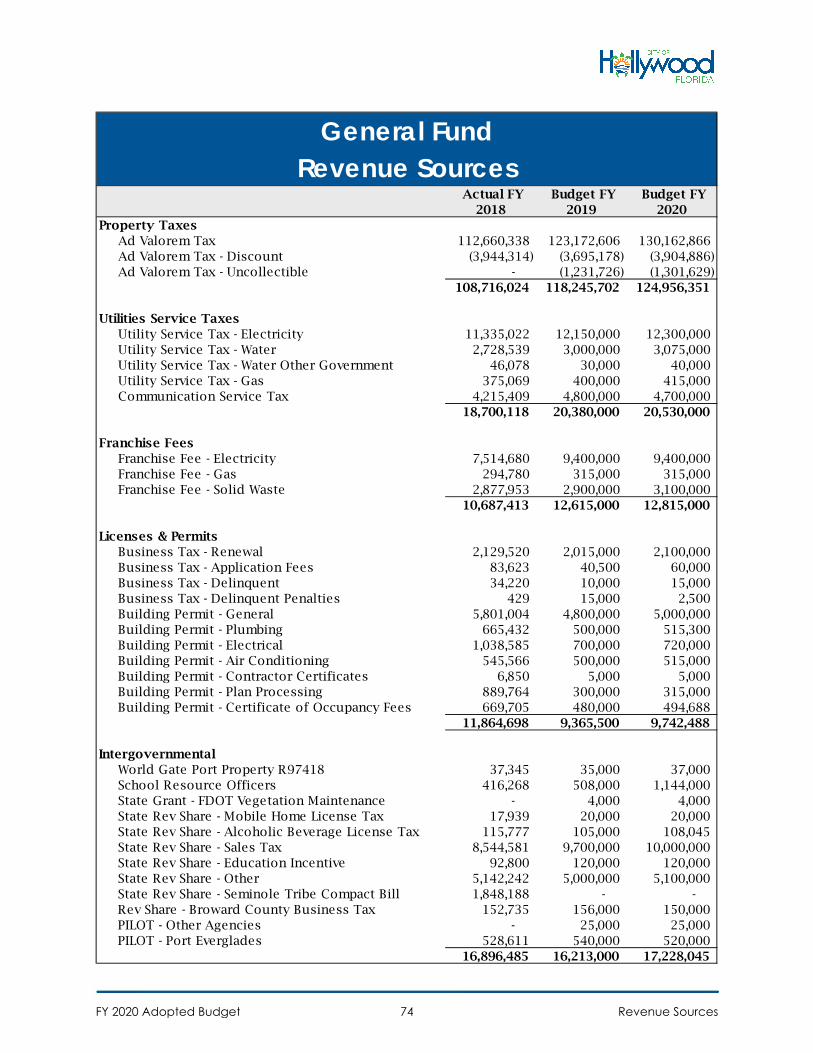
Actual FY 2018
Budget FY 2019
Budget FY 2020
Property TaxesAd Valorem Tax 112,660,338 123,172,606 130,162,866 Ad Valorem Tax - Discount (3,944,314) (3,695,178) (3,904,886) Ad Valorem Tax - Uncollectible - (1,231,726) (1,301,629)
108,716,024 118,245,702 124,956,351
Utilities Service TaxesUtility Service Tax - Electricity 11,335,022 12,150,000 12,300,000 Utility Service Tax - Water 2,728,539 3,000,000 3,075,000 Utility Service Tax - Water Other Government 46,078 30,000 40,000 Utility Service Tax - Gas 375,069 400,000 415,000 Communication Service Tax 4,215,409 4,800,000 4,700,000
18,700,118 20,380,000 20,530,000
Franchise FeesFranchise Fee - Electricity 7,514,680 9,400,000 9,400,000 Franchise Fee - Gas 294,780 315,000 315,000 Franchise Fee - Solid Waste 2,877,953 2,900,000 3,100,000
10,687,413 12,615,000 12,815,000
Licenses & PermitsBusiness Tax - Renewal 2,129,520 2,015,000 2,100,000 Business Tax - Application Fees 83,623 40,500 60,000 Business Tax - Delinquent 34,220 10,000 15,000 Business Tax - Delinquent Penalties 429 15,000 2,500 Building Permit - General 5,801,004 4,800,000 5,000,000 Building Permit - Plumbing 665,432 500,000 515,300 Building Permit - Electrical 1,038,585 700,000 720,000 Building Permit - Air Conditioning 545,566 500,000 515,000 Building Permit - Contractor Certificates 6,850 5,000 5,000 Building Permit - Plan Processing 889,764 300,000 315,000 Building Permit - Certificate of Occupancy Fees 669,705 480,000 494,688
11,864,698 9,365,500 9,742,488
IntergovernmentalWorld Gate Port Property R97418 37,345 35,000 37,000 School Resource Officers 416,268 508,000 1,144,000 State Grant - FDOT Vegetation Maintenance - 4,000 4,000 State Rev Share - Mobile Home License Tax 17,939 20,000 20,000 State Rev Share - Alcoholic Beverage License Tax 115,777 105,000 108,045 State Rev Share - Sales Tax 8,544,581 9,700,000 10,000,000 State Rev Share - Education Incentive 92,800 120,000 120,000 State Rev Share - Other 5,142,242 5,000,000 5,100,000 State Rev Share - Seminole Tribe Compact Bill 1,848,188 - - Rev Share - Broward County Business Tax 152,735 156,000 150,000 PILOT - Other Agencies - 25,000 25,000 PILOT - Port Everglades 528,611 540,000 520,000
16,896,485 16,213,000 17,228,045
General FundRevenue Sources
FY 2020 Adopted Budget Revenue Sources74
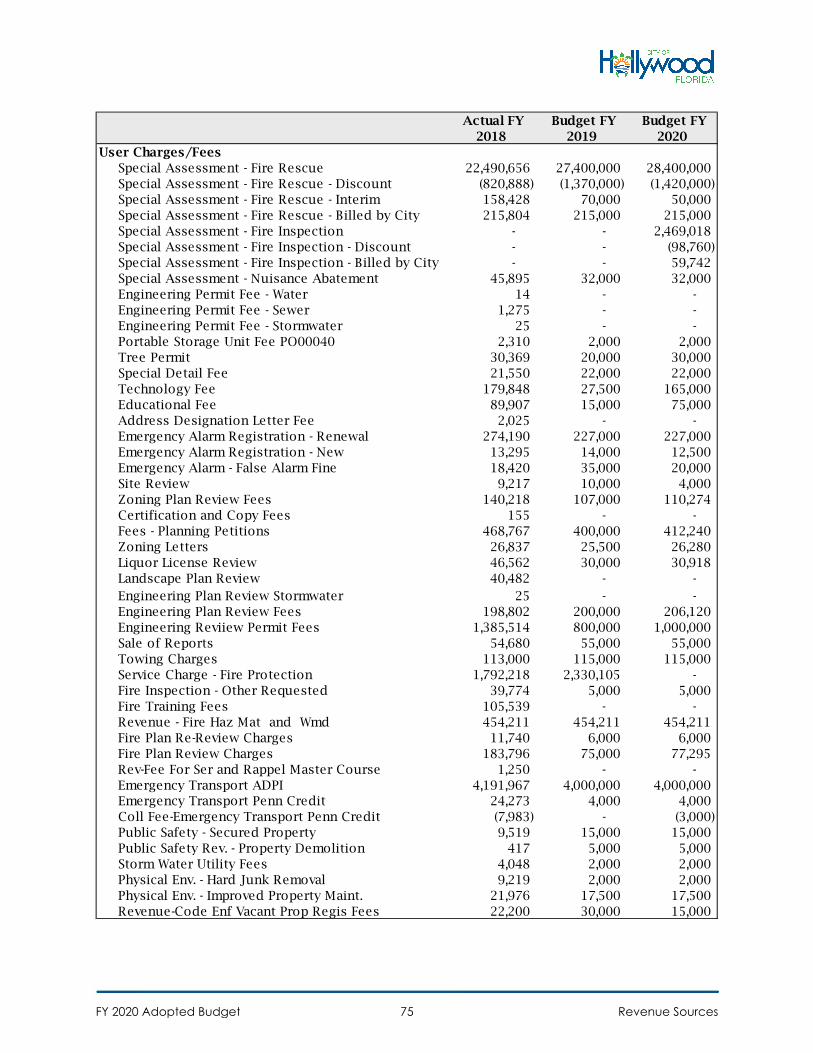
Actual FY 2018
Budget FY 2019
Budget FY 2020
User Charges/FeesSpecial Assessment - Fire Rescue 22,490,656 27,400,000 28,400,000 Special Assessment - Fire Rescue - Discount (820,888) (1,370,000) (1,420,000) Special Assessment - Fire Rescue - Interim 158,428 70,000 50,000 Special Assessment - Fire Rescue - Billed by City 215,804 215,000 215,000 Special Assessment - Fire Inspection - - 2,469,018 Special Assessment - Fire Inspection - Discount - - (98,760) Special Assessment - Fire Inspection - Billed by City - - 59,742 Special Assessment - Nuisance Abatement 45,895 32,000 32,000 Engineering Permit Fee - Water 14 - - Engineering Permit Fee - Sewer 1,275 - - Engineering Permit Fee - Stormwater 25 - - Portable Storage Unit Fee PO00040 2,310 2,000 2,000 Tree Permit 30,369 20,000 30,000 Special Detail Fee 21,550 22,000 22,000 Technology Fee 179,848 27,500 165,000 Educational Fee 89,907 15,000 75,000 Address Designation Letter Fee 2,025 - - Emergency Alarm Registration - Renewal 274,190 227,000 227,000 Emergency Alarm Registration - New 13,295 14,000 12,500 Emergency Alarm - False Alarm Fine 18,420 35,000 20,000 Site Review 9,217 10,000 4,000 Zoning Plan Review Fees 140,218 107,000 110,274 Certification and Copy Fees 155 - - Fees - Planning Petitions 468,767 400,000 412,240 Zoning Letters 26,837 25,500 26,280 Liquor License Review 46,562 30,000 30,918 Landscape Plan Review 40,482 - - Engineering Plan Review Stormwater 25 - - Engineering Plan Review Fees 198,802 200,000 206,120 Engineering Reviiew Permit Fees 1,385,514 800,000 1,000,000 Sale of Reports 54,680 55,000 55,000 Towing Charges 113,000 115,000 115,000 Service Charge - Fire Protection 1,792,218 2,330,105 - Fire Inspection - Other Requested 39,774 5,000 5,000 Fire Training Fees 105,539 - - Revenue - Fire Haz Mat and Wmd 454,211 454,211 454,211 Fire Plan Re-Review Charges 11,740 6,000 6,000 Fire Plan Review Charges 183,796 75,000 77,295 Rev-Fee For Ser and Rappel Master Course 1,250 - - Emergency Transport ADPI 4,191,967 4,000,000 4,000,000 Emergency Transport Penn Credit 24,273 4,000 4,000 Coll Fee-Emergency Transport Penn Credit (7,983) - (3,000) Public Safety - Secured Property 9,519 15,000 15,000 Public Safety Rev. - Property Demolition 417 5,000 5,000 Storm Water Utility Fees 4,048 2,000 2,000 Physical Env. - Hard Junk Removal 9,219 2,000 2,000 Physical Env. - Improved Property Maint. 21,976 17,500 17,500 Revenue-Code Enf Vacant Prop Regis Fees 22,200 30,000 15,000
FY 2020 Adopted Budget Revenue Sources75
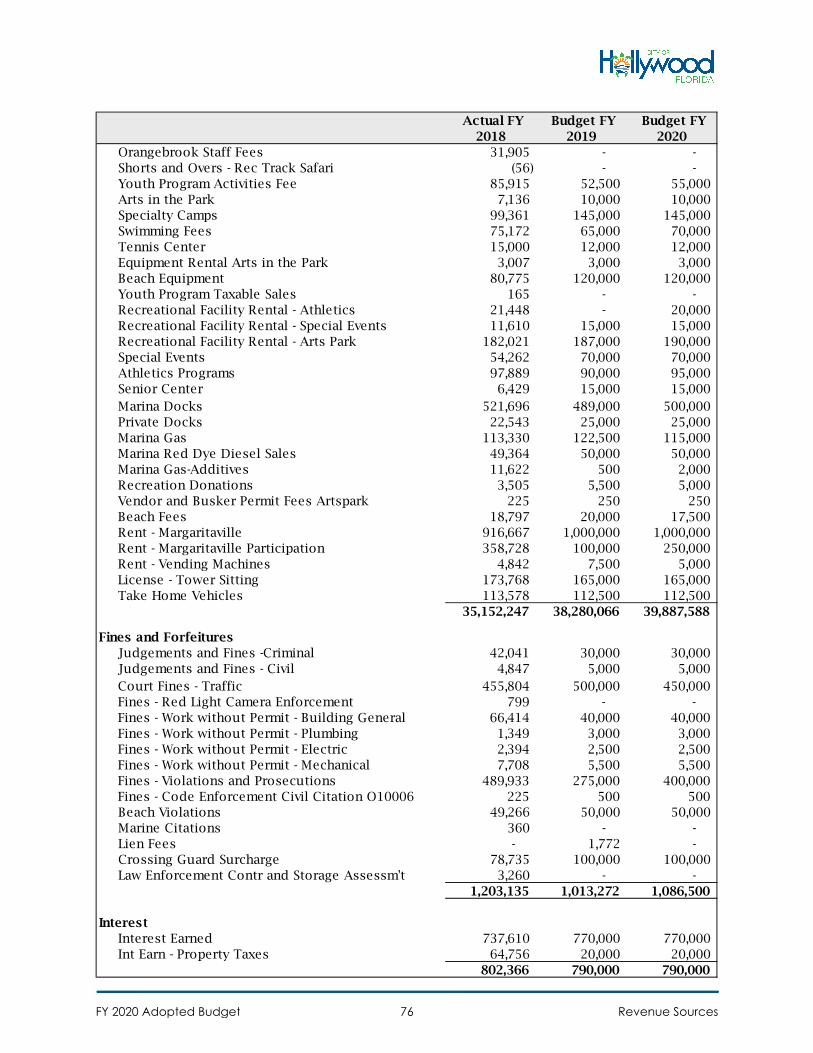
Actual FY 2018
Budget FY 2019
Budget FY 2020
Orangebrook Staff Fees 31,905 - - Shorts and Overs - Rec Track Safari (56) - - Youth Program Activities Fee 85,915 52,500 55,000 Arts in the Park 7,136 10,000 10,000 Specialty Camps 99,361 145,000 145,000 Swimming Fees 75,172 65,000 70,000 Tennis Center 15,000 12,000 12,000 Equipment Rental Arts in the Park 3,007 3,000 3,000 Beach Equipment 80,775 120,000 120,000 Youth Program Taxable Sales 165 - - Recreational Facility Rental - Athletics 21,448 - 20,000 Recreational Facility Rental - Special Events 11,610 15,000 15,000 Recreational Facility Rental - Arts Park 182,021 187,000 190,000 Special Events 54,262 70,000 70,000 Athletics Programs 97,889 90,000 95,000 Senior Center 6,429 15,000 15,000 Marina Docks 521,696 489,000 500,000 Private Docks 22,543 25,000 25,000 Marina Gas 113,330 122,500 115,000 Marina Red Dye Diesel Sales 49,364 50,000 50,000 Marina Gas-Additives 11,622 500 2,000 Recreation Donations 3,505 5,500 5,000 Vendor and Busker Permit Fees Artspark 225 250 250 Beach Fees 18,797 20,000 17,500 Rent - Margaritaville 916,667 1,000,000 1,000,000 Rent - Margaritaville Participation 358,728 100,000 250,000 Rent - Vending Machines 4,842 7,500 5,000 License - Tower Sitting 173,768 165,000 165,000 Take Home Vehicles 113,578 112,500 112,500
35,152,247 38,280,066 39,887,588
Fines and ForfeituresJudgements and Fines -Criminal 42,041 30,000 30,000 Judgements and Fines - Civil 4,847 5,000 5,000 Court Fines - Traffic 455,804 500,000 450,000 Fines - Red Light Camera Enforcement 799 - - Fines - Work without Permit - Building General 66,414 40,000 40,000 Fines - Work without Permit - Plumbing 1,349 3,000 3,000 Fines - Work without Permit - Electric 2,394 2,500 2,500 Fines - Work without Permit - Mechanical 7,708 5,500 5,500 Fines - Violations and Prosecutions 489,933 275,000 400,000 Fines - Code Enforcement Civil Citation O10006 225 500 500 Beach Violations 49,266 50,000 50,000 Marine Citations 360 - - Lien Fees - 1,772 - Crossing Guard Surcharge 78,735 100,000 100,000 Law Enforcement Contr and Storage Assessm't 3,260 - -
1,203,135 1,013,272 1,086,500
InterestInterest Earned 737,610 770,000 770,000 Int Earn - Property Taxes 64,756 20,000 20,000
802,366 790,000 790,000
FY 2020 Adopted Budget Revenue Sources76
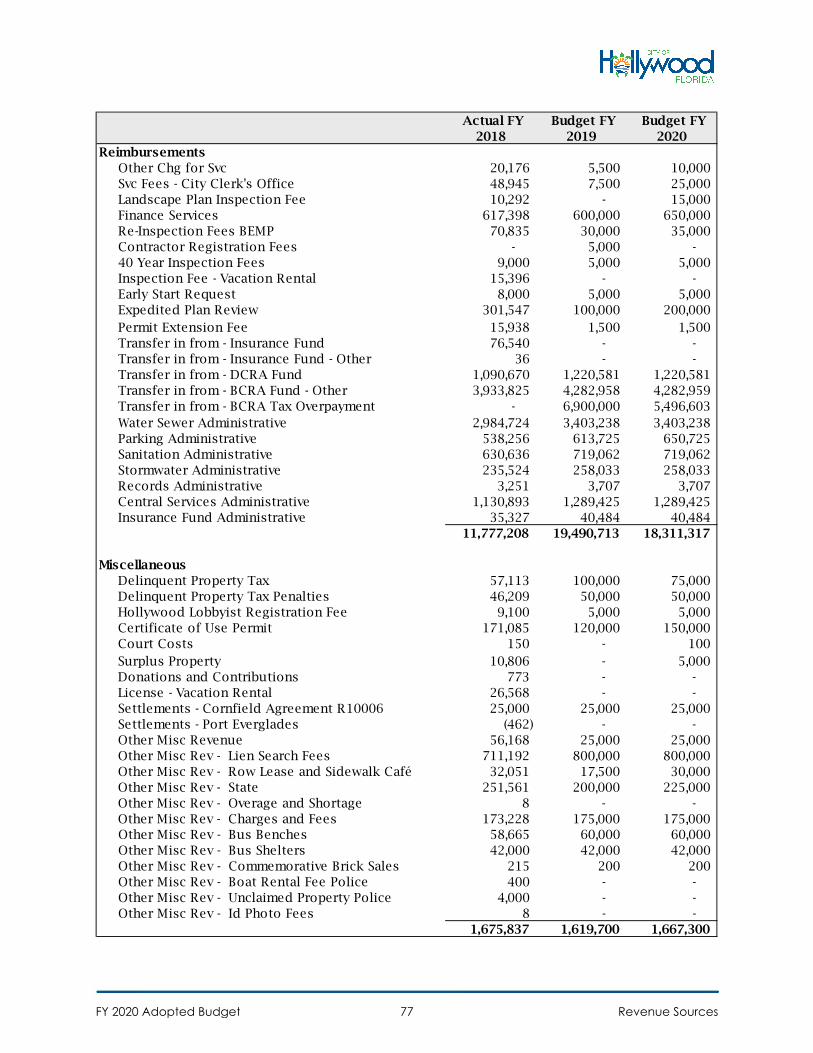
Actual FY 2018
Budget FY 2019
Budget FY 2020
ReimbursementsOther Chg for Svc 20,176 5,500 10,000 Svc Fees - City Clerk's Office 48,945 7,500 25,000 Landscape Plan Inspection Fee 10,292 - 15,000 Finance Services 617,398 600,000 650,000 Re-Inspection Fees BEMP 70,835 30,000 35,000 Contractor Registration Fees - 5,000 - 40 Year Inspection Fees 9,000 5,000 5,000 Inspection Fee - Vacation Rental 15,396 - - Early Start Request 8,000 5,000 5,000 Expedited Plan Review 301,547 100,000 200,000 Permit Extension Fee 15,938 1,500 1,500 Transfer in from - Insurance Fund 76,540 - - Transfer in from - Insurance Fund - Other 36 - - Transfer in from - DCRA Fund 1,090,670 1,220,581 1,220,581 Transfer in from - BCRA Fund - Other 3,933,825 4,282,958 4,282,959 Transfer in from - BCRA Tax Overpayment - 6,900,000 5,496,603 Water Sewer Administrative 2,984,724 3,403,238 3,403,238 Parking Administrative 538,256 613,725 650,725 Sanitation Administrative 630,636 719,062 719,062 Stormwater Administrative 235,524 258,033 258,033 Records Administrative 3,251 3,707 3,707 Central Services Administrative 1,130,893 1,289,425 1,289,425 Insurance Fund Administrative 35,327 40,484 40,484
11,777,208 19,490,713 18,311,317
MiscellaneousDelinquent Property Tax 57,113 100,000 75,000 Delinquent Property Tax Penalties 46,209 50,000 50,000 Hollywood Lobbyist Registration Fee 9,100 5,000 5,000 Certificate of Use Permit 171,085 120,000 150,000 Court Costs 150 - 100 Surplus Property 10,806 - 5,000 Donations and Contributions 773 - - License - Vacation Rental 26,568 - - Settlements - Cornfield Agreement R10006 25,000 25,000 25,000 Settlements - Port Everglades (462) - - Other Misc Revenue 56,168 25,000 25,000 Other Misc Rev - Lien Search Fees 711,192 800,000 800,000 Other Misc Rev - Row Lease and Sidewalk Café 32,051 17,500 30,000 Other Misc Rev - State 251,561 200,000 225,000 Other Misc Rev - Overage and Shortage 8 - - Other Misc Rev - Charges and Fees 173,228 175,000 175,000 Other Misc Rev - Bus Benches 58,665 60,000 60,000 Other Misc Rev - Bus Shelters 42,000 42,000 42,000 Other Misc Rev - Commemorative Brick Sales 215 200 200 Other Misc Rev - Boat Rental Fee Police 400 - - Other Misc Rev - Unclaimed Property Police 4,000 - - Other Misc Rev - Id Photo Fees 8 - -
1,675,837 1,619,700 1,667,300
FY 2020 Adopted Budget Revenue Sources77
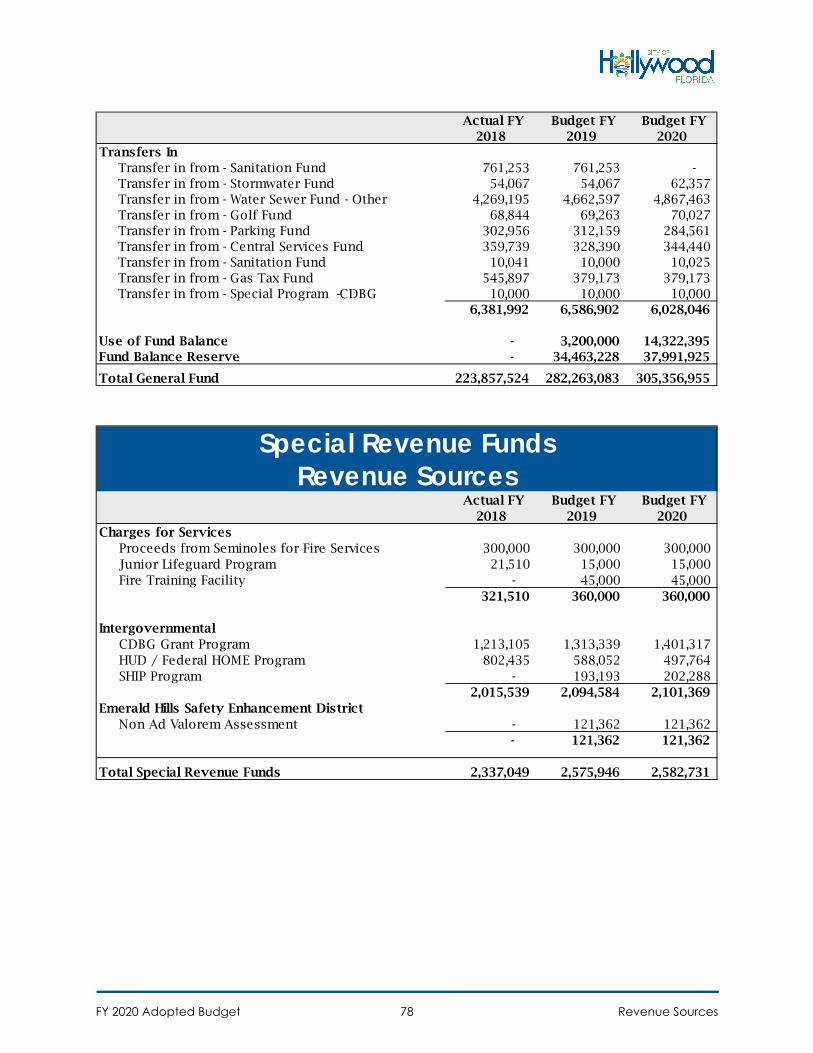
Actual FY 2018
Budget FY 2019
Budget FY 2020
Charges for ServicesProceeds from Seminoles for Fire Services 300,000 300,000 300,000 Junior Lifeguard Program 21,510 15,000 15,000 Fire Training Facility - 45,000 45,000
321,510 360,000 360,000
IntergovernmentalCDBG Grant Program 1,213,105 1,313,339 1,401,317 HUD / Federal HOME Program 802,435 588,052 497,764 SHIP Program - 193,193 202,288
2,015,539 2,094,584 2,101,369 Emerald Hills Safety Enhancement District
Non Ad Valorem Assessment - 121,362 121,362 - 121,362 121,362
Total Special Revenue Funds 2,337,049 2,575,946 2,582,731
Special Revenue FundsRevenue Sources
Actual FY 2018
Budget FY 2019
Budget FY 2020
Transfers InTransfer in from - Sanitation Fund 761,253 761,253 - Transfer in from - Stormwater Fund 54,067 54,067 62,357 Transfer in from - Water Sewer Fund - Other 4,269,195 4,662,597 4,867,463 Transfer in from - Golf Fund 68,844 69,263 70,027 Transfer in from - Parking Fund 302,956 312,159 284,561 Transfer in from - Central Services Fund 359,739 328,390 344,440 Transfer in from - Sanitation Fund 10,041 10,000 10,025 Transfer in from - Gas Tax Fund 545,897 379,173 379,173 Transfer in from - Special Program -CDBG 10,000 10,000 10,000
6,381,992 6,586,902 6,028,046
Use of Fund Balance - 3,200,000 14,322,395 Fund Balance Reserve - 34,463,228 37,991,925
Total General Fund 223,857,524 282,263,083 305,356,955
FY 2020 Adopted Budget Revenue Sources78
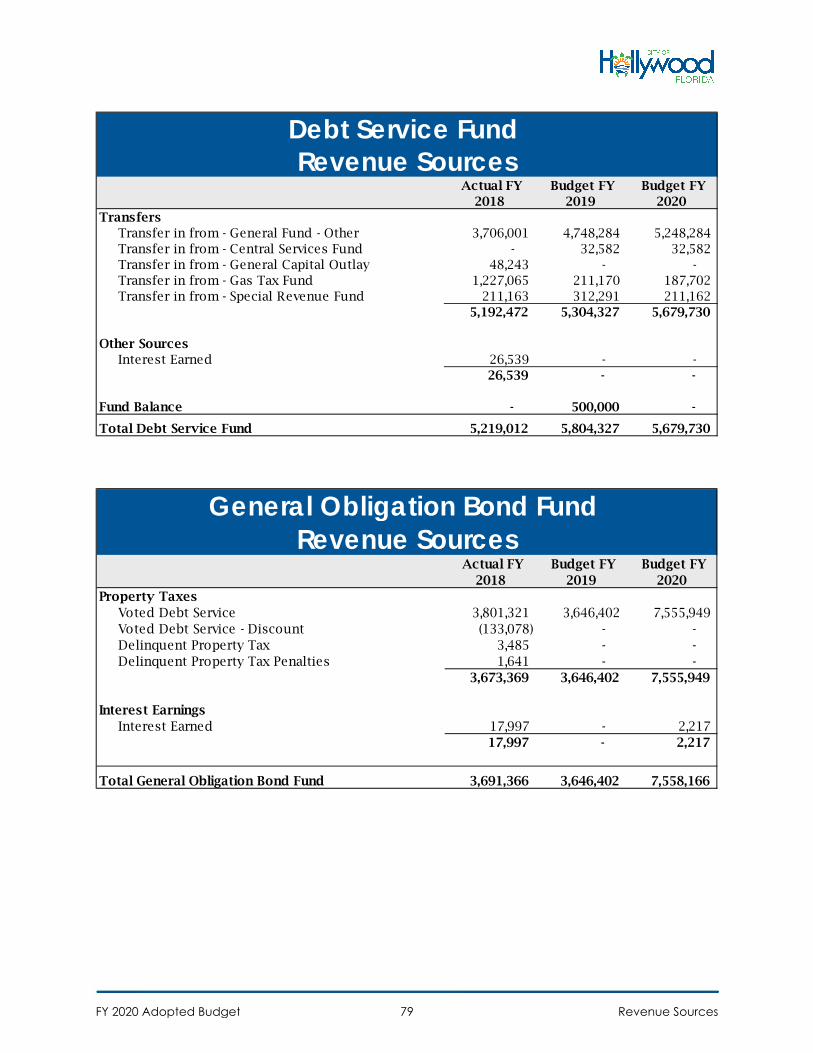
Actual FY 2018
Budget FY 2019
Budget FY 2020
TransfersTransfer in from - General Fund - Other 3,706,001 4,748,284 5,248,284 Transfer in from - Central Services Fund - 32,582 32,582 Transfer in from - General Capital Outlay 48,243 - - Transfer in from - Gas Tax Fund 1,227,065 211,170 187,702 Transfer in from - Special Revenue Fund 211,163 312,291 211,162
5,192,472 5,304,327 5,679,730
Other SourcesInterest Earned 26,539 - -
26,539 - -
Fund Balance - 500,000 -
Total Debt Service Fund 5,219,012 5,804,327 5,679,730
Debt Service Fund Revenue Sources
Actual FY 2018
Budget FY 2019
Budget FY 2020
Property TaxesVoted Debt Service 3,801,321 3,646,402 7,555,949 Voted Debt Service - Discount (133,078) - - Delinquent Property Tax 3,485 - - Delinquent Property Tax Penalties 1,641 - -
3,673,369 3,646,402 7,555,949
Interest EarningsInterest Earned 17,997 - 2,217
17,997 - 2,217
Total General Obligation Bond Fund 3,691,366 3,646,402 7,558,166
General Obligation Bond Fund Revenue Sources
FY 2020 Adopted Budget Revenue Sources79
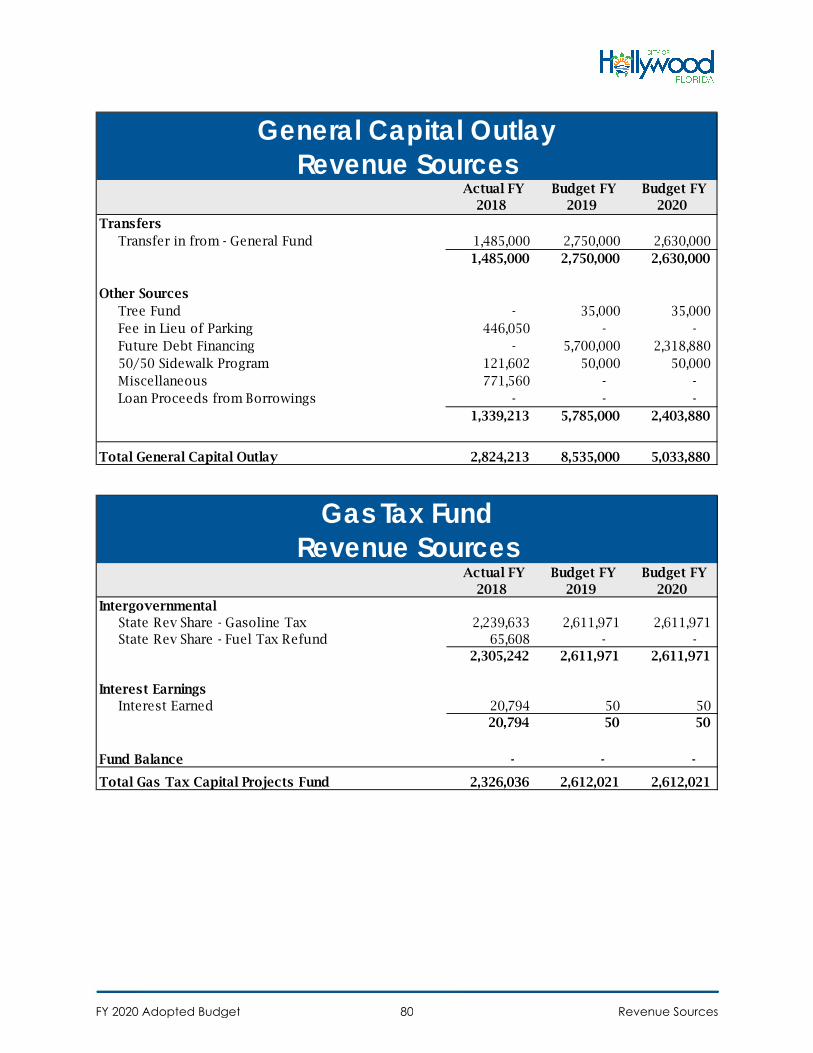
Actual FY 2018
Budget FY 2019
Budget FY 2020
TransfersTransfer in from - General Fund 1,485,000 2,750,000 2,630,000
1,485,000 2,750,000 2,630,000
Other SourcesTree Fund - 35,000 35,000 Fee in Lieu of Parking 446,050 - - Future Debt Financing - 5,700,000 2,318,880 50/50 Sidewalk Program 121,602 50,000 50,000 Miscellaneous 771,560 - - Loan Proceeds from Borrowings - - -
1,339,213 5,785,000 2,403,880
Total General Capital Outlay 2,824,213 8,535,000 5,033,880
General Capital OutlayRevenue Sources
Actual FY 2018
Budget FY 2019
Budget FY 2020
IntergovernmentalState Rev Share - Gasoline Tax 2,239,633 2,611,971 2,611,971 State Rev Share - Fuel Tax Refund 65,608 - -
2,305,242 2,611,971 2,611,971
Interest EarningsInterest Earned 20,794 50 50
20,794 50 50
Fund Balance - - -
Total Gas Tax Capital Projects Fund 2,326,036 2,612,021 2,612,021
Gas Tax FundRevenue Sources
FY 2020 Adopted Budget Revenue Sources80
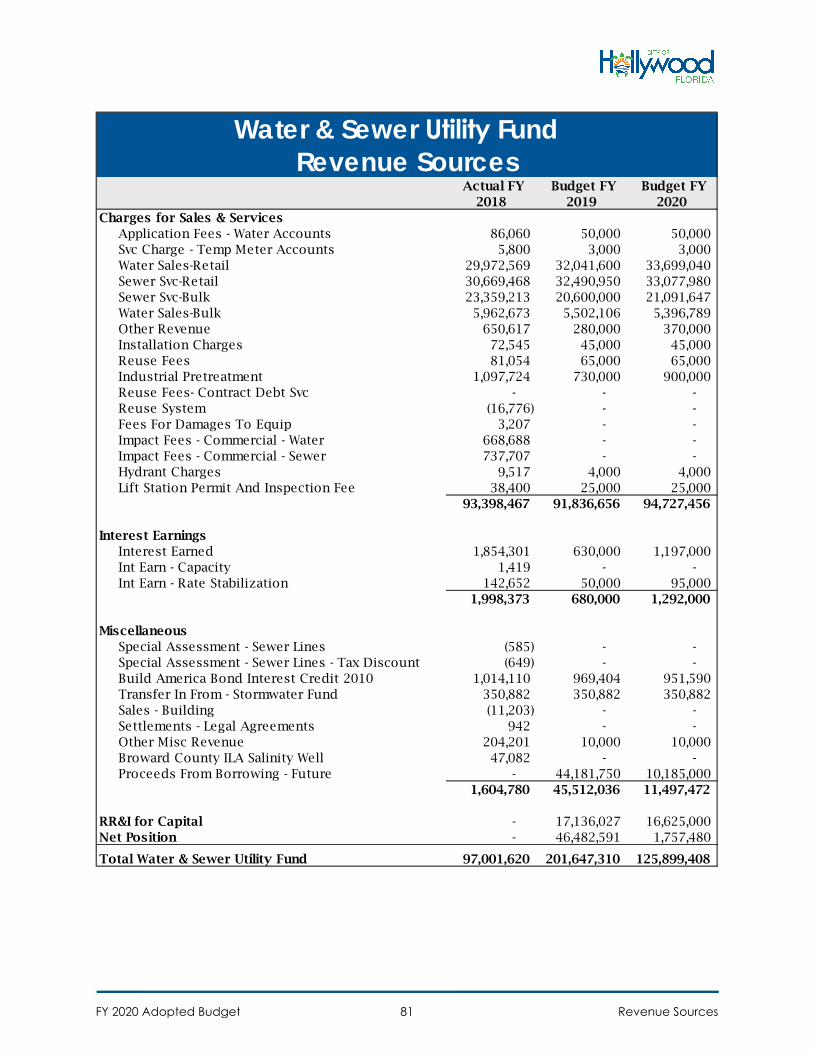
Actual FY 2018
Budget FY 2019
Budget FY 2020
Charges for Sales & ServicesApplication Fees - Water Accounts 86,060 50,000 50,000 Svc Charge - Temp Meter Accounts 5,800 3,000 3,000 Water Sales-Retail 29,972,569 32,041,600 33,699,040 Sewer Svc-Retail 30,669,468 32,490,950 33,077,980 Sewer Svc-Bulk 23,359,213 20,600,000 21,091,647 Water Sales-Bulk 5,962,673 5,502,106 5,396,789 Other Revenue 650,617 280,000 370,000 Installation Charges 72,545 45,000 45,000 Reuse Fees 81,054 65,000 65,000 Industrial Pretreatment 1,097,724 730,000 900,000 Reuse Fees- Contract Debt Svc - - - Reuse System (16,776) - - Fees For Damages To Equip 3,207 - - Impact Fees - Commercial - Water 668,688 - - Impact Fees - Commercial - Sewer 737,707 - - Hydrant Charges 9,517 4,000 4,000 Lift Station Permit And Inspection Fee 38,400 25,000 25,000
93,398,467 91,836,656 94,727,456
Interest EarningsInterest Earned 1,854,301 630,000 1,197,000 Int Earn - Capacity 1,419 - - Int Earn - Rate Stabilization 142,652 50,000 95,000
1,998,373 680,000 1,292,000
MiscellaneousSpecial Assessment - Sewer Lines (585) - - Special Assessment - Sewer Lines - Tax Discount (649) - - Build America Bond Interest Credit 2010 1,014,110 969,404 951,590 Transfer In From - Stormwater Fund 350,882 350,882 350,882 Sales - Building (11,203) - - Settlements - Legal Agreements 942 - - Other Misc Revenue 204,201 10,000 10,000 Broward County ILA Salinity Well 47,082 - - Proceeds From Borrowing - Future - 44,181,750 10,185,000
1,604,780 45,512,036 11,497,472
RR&I for Capital - 17,136,027 16,625,000 Net Position - 46,482,591 1,757,480
Total Water & Sewer Utility Fund 97,001,620 201,647,310 125,899,408
Water & Sewer Utility Fund Revenue Sources
FY 2020 Adopted Budget Revenue Sources81
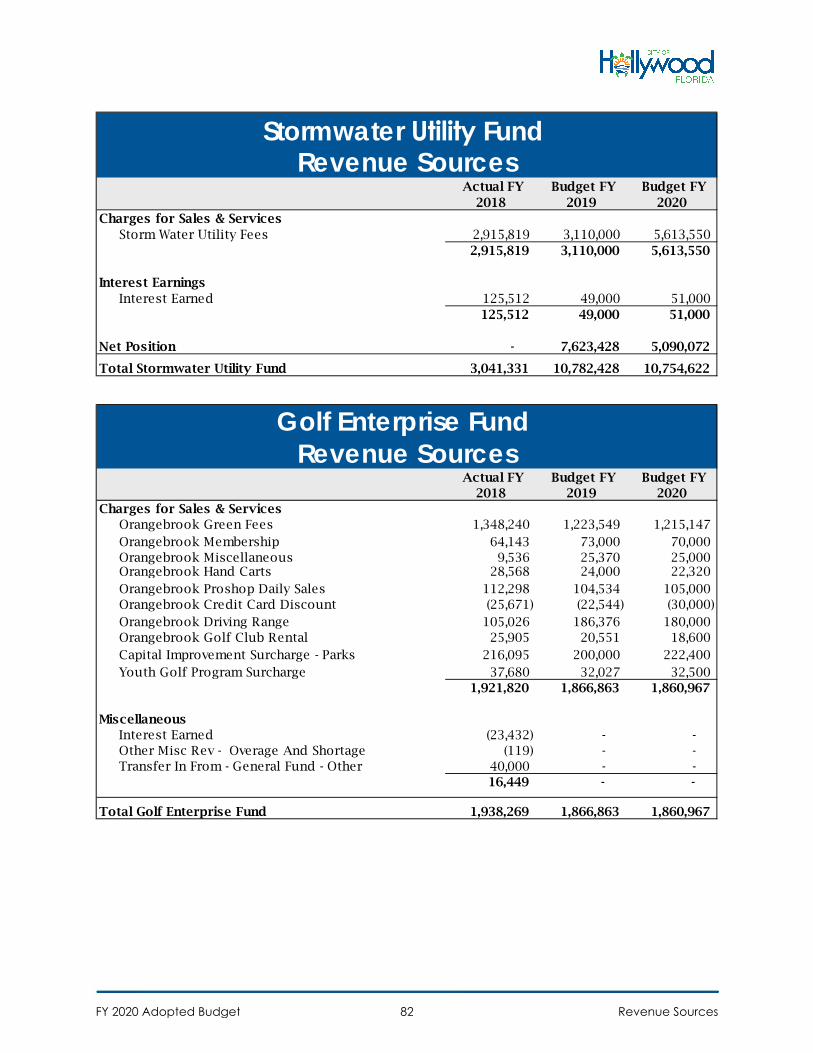
Actual FY 2018
Budget FY 2019
Budget FY 2020
Charges for Sales & ServicesStorm Water Utility Fees 2,915,819 3,110,000 5,613,550
2,915,819 3,110,000 5,613,550
Interest EarningsInterest Earned 125,512 49,000 51,000
125,512 49,000 51,000
Net Position - 7,623,428 5,090,072
Total Stormwater Utility Fund 3,041,331 10,782,428 10,754,622
Stormwater Utility Fund Revenue Sources
Actual FY 2018
Budget FY 2019
Budget FY 2020
Charges for Sales & ServicesOrangebrook Green Fees 1,348,240 1,223,549 1,215,147 Orangebrook Membership 64,143 73,000 70,000 Orangebrook Miscellaneous 9,536 25,370 25,000 Orangebrook Hand Carts 28,568 24,000 22,320 Orangebrook Proshop Daily Sales 112,298 104,534 105,000 Orangebrook Credit Card Discount (25,671) (22,544) (30,000) Orangebrook Driving Range 105,026 186,376 180,000 Orangebrook Golf Club Rental 25,905 20,551 18,600 Capital Improvement Surcharge - Parks 216,095 200,000 222,400 Youth Golf Program Surcharge 37,680 32,027 32,500
1,921,820 1,866,863 1,860,967
MiscellaneousInterest Earned (23,432) - - Other Misc Rev - Overage And Shortage (119) - - Transfer In From - General Fund - Other 40,000 - -
16,449 - -
Total Golf Enterprise Fund 1,938,269 1,866,863 1,860,967
Golf Enterprise Fund Revenue Sources
FY 2020 Adopted Budget Revenue Sources82
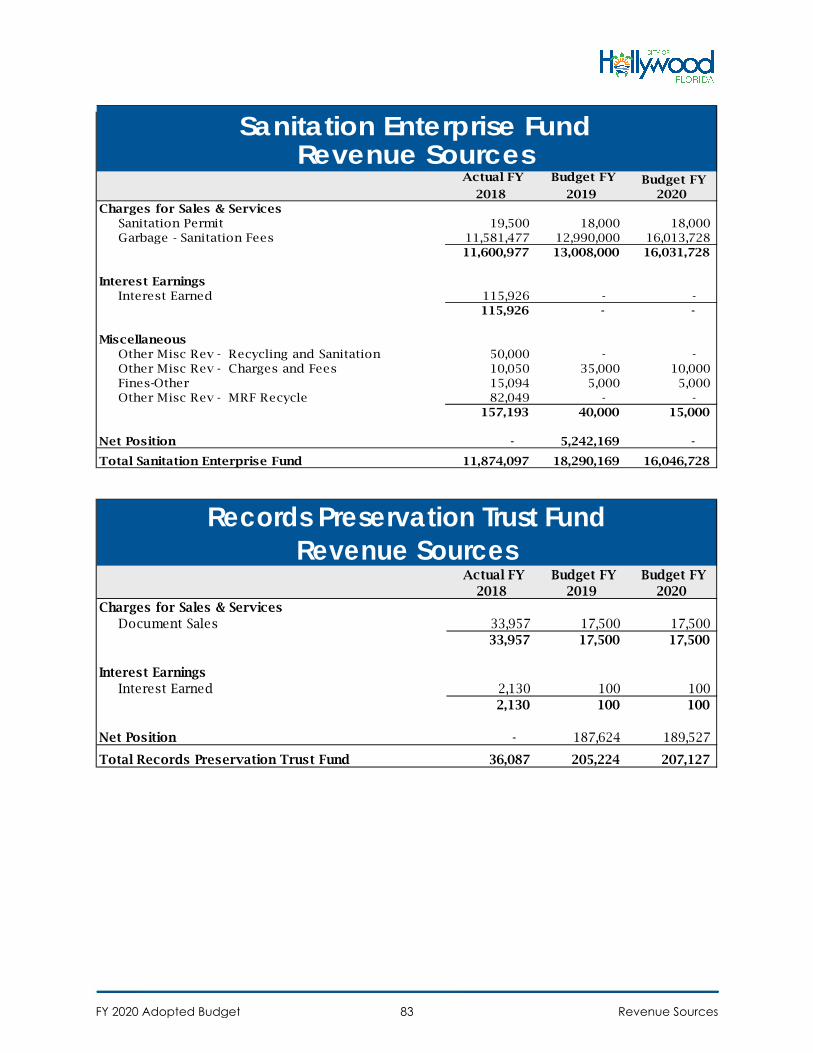
Actual FY
2018
Budget FY
2019 Budget FY
2020 Charges for Sales & Services
Sanitation Permit 19,500 18,000 18,000 Garbage - Sanitation Fees 11,581,477 12,990,000 16,013,728
11,600,977 13,008,000 16,031,728
Interest EarningsInterest Earned 115,926 - -
115,926 - -
MiscellaneousOther Misc Rev - Recycling and Sanitation 50,000 - - Other Misc Rev - Charges and Fees 10,050 35,000 10,000 Fines-Other 15,094 5,000 5,000 Other Misc Rev - MRF Recycle 82,049 - -
157,193 40,000 15,000
Net Position - 5,242,169 -
Total Sanitation Enterprise Fund 11,874,097 18,290,169 16,046,728
Sanitation Enterprise Fund Revenue Sources
Actual FY 2018
Budget FY 2019
Budget FY 2020
Charges for Sales & ServicesDocument Sales 33,957 17,500 17,500
33,957 17,500 17,500
Interest EarningsInterest Earned 2,130 100 100
2,130 100 100
Net Position - 187,624 189,527
Total Records Preservation Trust Fund 36,087 205,224 207,127
Records Preservation Trust FundRevenue Sources
FY 2020 Adopted Budget Revenue Sources83
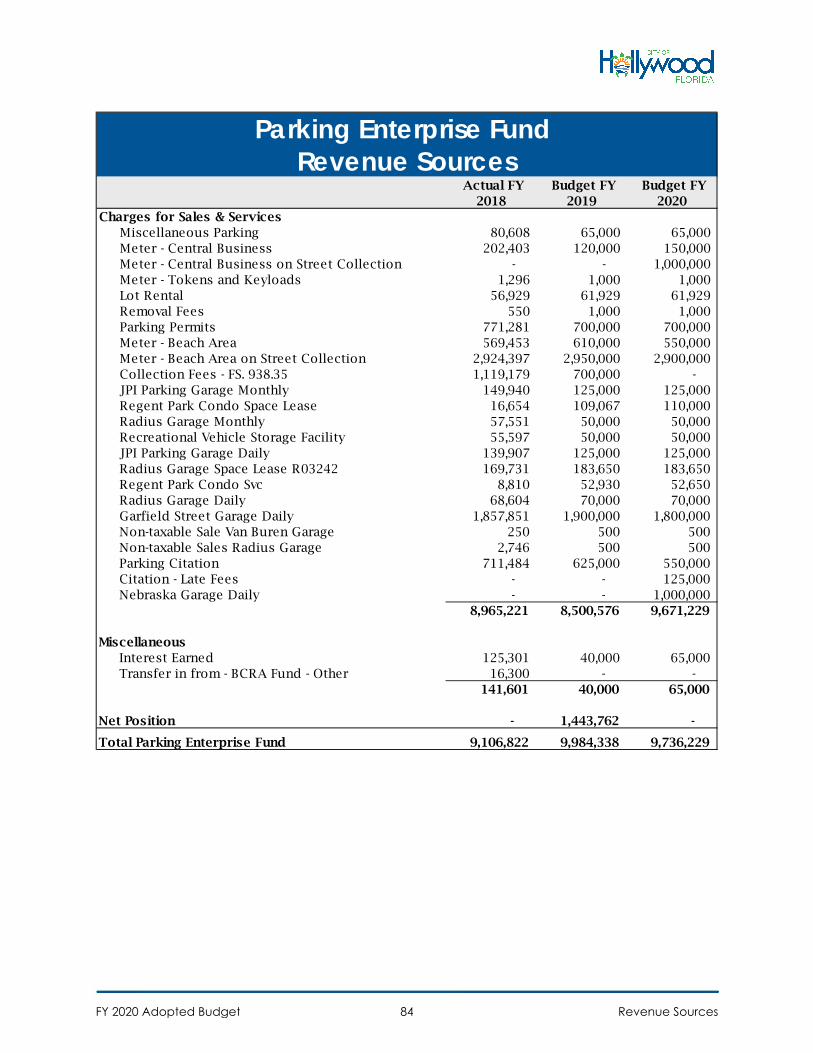
Actual FY 2018
Budget FY 2019
Budget FY 2020
Charges for Sales & ServicesMiscellaneous Parking 80,608 65,000 65,000 Meter - Central Business 202,403 120,000 150,000 Meter - Central Business on Street Collection - - 1,000,000 Meter - Tokens and Keyloads 1,296 1,000 1,000 Lot Rental 56,929 61,929 61,929 Removal Fees 550 1,000 1,000 Parking Permits 771,281 700,000 700,000 Meter - Beach Area 569,453 610,000 550,000 Meter - Beach Area on Street Collection 2,924,397 2,950,000 2,900,000 Collection Fees - FS. 938.35 1,119,179 700,000 - JPI Parking Garage Monthly 149,940 125,000 125,000 Regent Park Condo Space Lease 16,654 109,067 110,000 Radius Garage Monthly 57,551 50,000 50,000 Recreational Vehicle Storage Facility 55,597 50,000 50,000 JPI Parking Garage Daily 139,907 125,000 125,000 Radius Garage Space Lease R03242 169,731 183,650 183,650 Regent Park Condo Svc 8,810 52,930 52,650 Radius Garage Daily 68,604 70,000 70,000 Garfield Street Garage Daily 1,857,851 1,900,000 1,800,000 Non-taxable Sale Van Buren Garage 250 500 500 Non-taxable Sales Radius Garage 2,746 500 500 Parking Citation 711,484 625,000 550,000 Citation - Late Fees - - 125,000 Nebraska Garage Daily - - 1,000,000
8,965,221 8,500,576 9,671,229
MiscellaneousInterest Earned 125,301 40,000 65,000 Transfer in from - BCRA Fund - Other 16,300 - -
141,601 40,000 65,000
Net Position - 1,443,762 -
Total Parking Enterprise Fund 9,106,822 9,984,338 9,736,229
Parking Enterprise Fund Revenue Sources
FY 2020 Adopted Budget Revenue Sources84
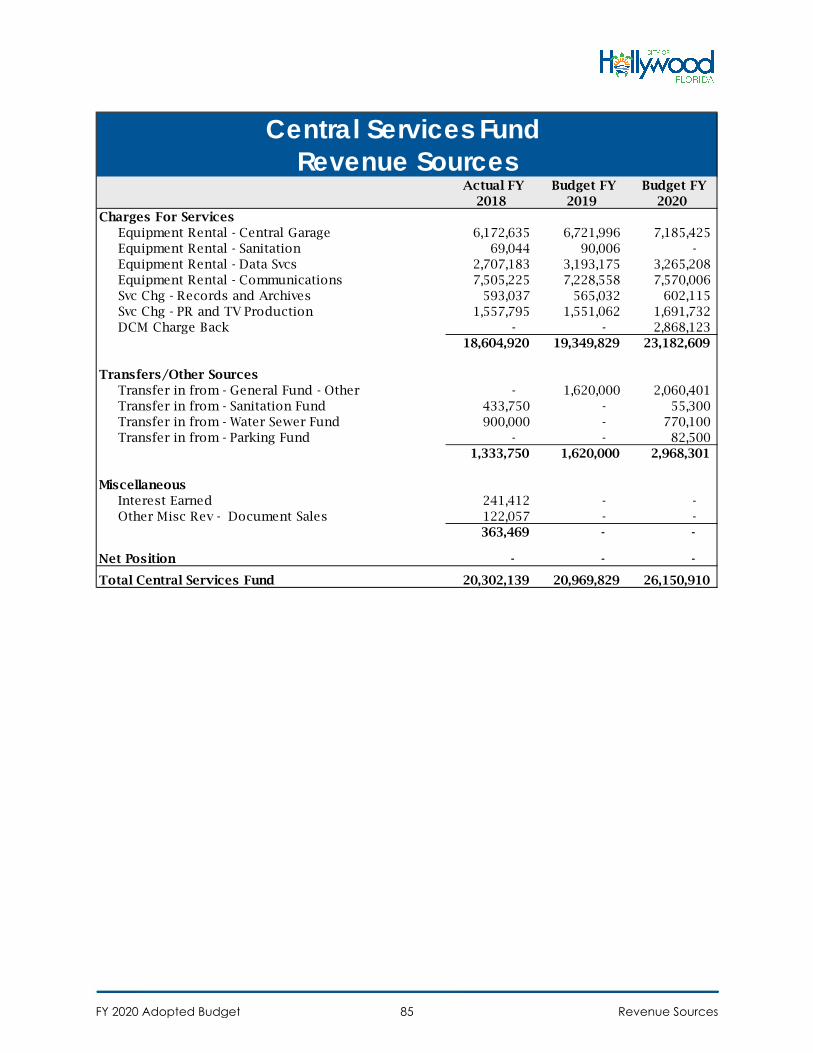
Actual FY 2018
Budget FY 2019
Budget FY 2020
Charges For ServicesEquipment Rental - Central Garage 6,172,635 6,721,996 7,185,425 Equipment Rental - Sanitation 69,044 90,006 - Equipment Rental - Data Svcs 2,707,183 3,193,175 3,265,208 Equipment Rental - Communications 7,505,225 7,228,558 7,570,006 Svc Chg - Records and Archives 593,037 565,032 602,115 Svc Chg - PR and TV Production 1,557,795 1,551,062 1,691,732 DCM Charge Back - - 2,868,123
18,604,920 19,349,829 23,182,609
Transfers/Other SourcesTransfer in from - General Fund - Other - 1,620,000 2,060,401 Transfer in from - Sanitation Fund 433,750 - 55,300 Transfer in from - Water Sewer Fund 900,000 - 770,100 Transfer in from - Parking Fund - - 82,500
1,333,750 1,620,000 2,968,301
MiscellaneousInterest Earned 241,412 - - Other Misc Rev - Document Sales 122,057 - -
363,469 - -
Net Position - - -
Total Central Services Fund 20,302,139 20,969,829 26,150,910
Central Services Fund Revenue Sources
FY 2020 Adopted Budget Revenue Sources85
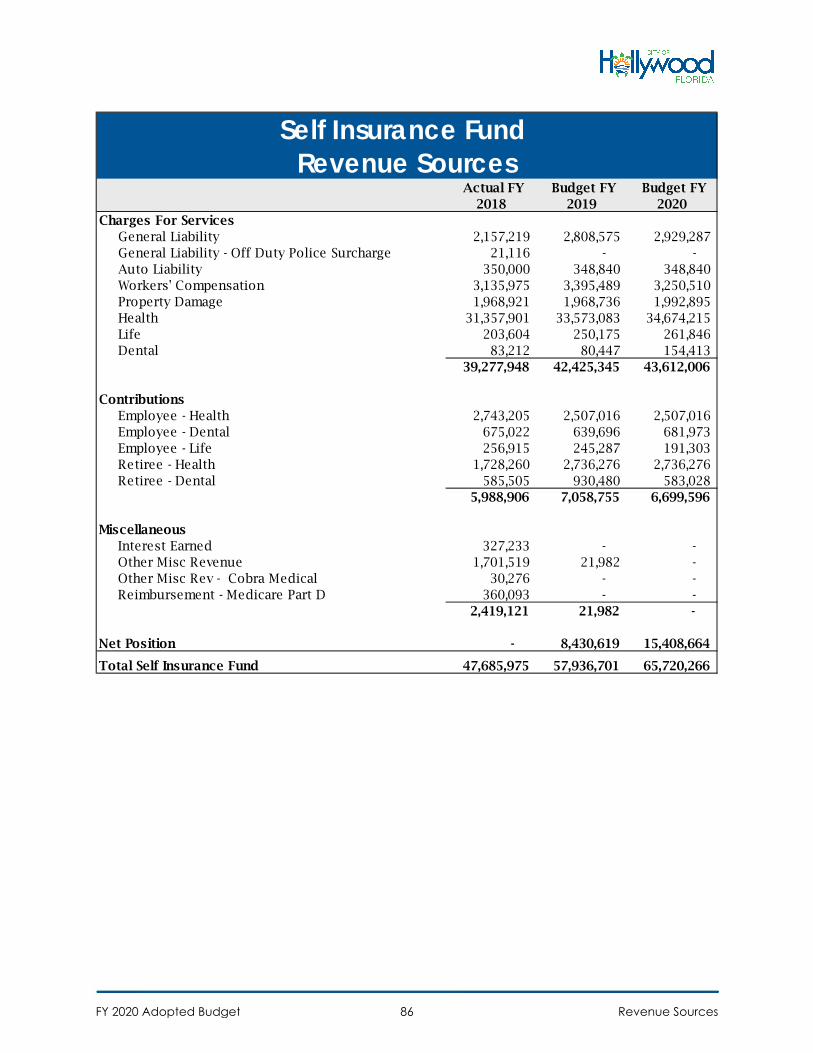
Actual FY 2018
Budget FY 2019
Budget FY 2020
Charges For ServicesGeneral Liability 2,157,219 2,808,575 2,929,287 General Liability - Off Duty Police Surcharge 21,116 - - Auto Liability 350,000 348,840 348,840 Workers' Compensation 3,135,975 3,395,489 3,250,510 Property Damage 1,968,921 1,968,736 1,992,895 Health 31,357,901 33,573,083 34,674,215 Life 203,604 250,175 261,846 Dental 83,212 80,447 154,413
39,277,948 42,425,345 43,612,006
ContributionsEmployee - Health 2,743,205 2,507,016 2,507,016 Employee - Dental 675,022 639,696 681,973 Employee - Life 256,915 245,287 191,303 Retiree - Health 1,728,260 2,736,276 2,736,276 Retiree - Dental 585,505 930,480 583,028
5,988,906 7,058,755 6,699,596
MiscellaneousInterest Earned 327,233 - - Other Misc Revenue 1,701,519 21,982 - Other Misc Rev - Cobra Medical 30,276 - - Reimbursement - Medicare Part D 360,093 - -
2,419,121 21,982 -
Net Position - 8,430,619 15,408,664
Total Self Insurance Fund 47,685,975 57,936,701 65,720,266
Self Insurance Fund Revenue Sources
FY 2020 Adopted Budget Revenue Sources86
Departments /Offices
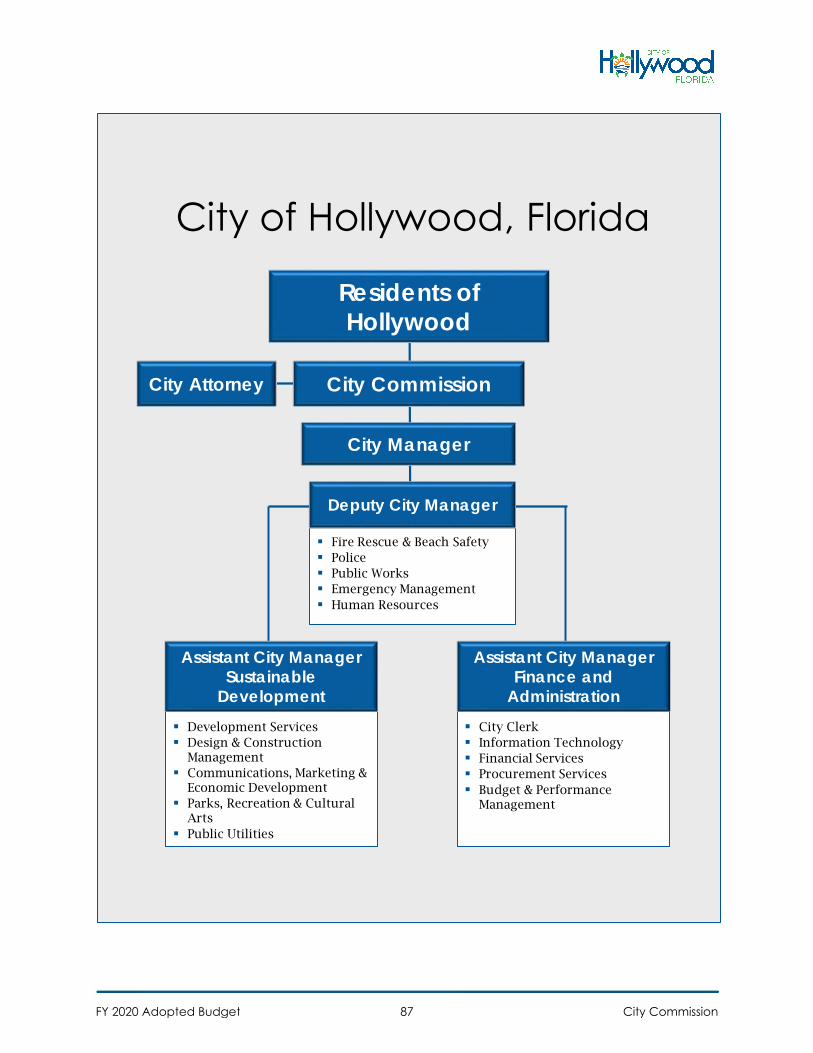
City of Hollywood, Florida
Development Services Design & Construction
Management Communications, Marketing &
Economic Development Parks, Recreation & Cultural
Arts Public Utilities
Fire Rescue & Beach Safety Police Public Works Emergency Management Human Resources
City Clerk Information Technology Financial Services Procurement Services Budget & Performance
Management
City CommissionCity Attorney
City Manager
Deputy City Manager
Assistant City Manager Sustainable
Development
Assistant City Manager Finance and
Administration
Residents of Hollywood
FY 2020 Adopted Budget City Commission87
Office of the City Commission
Summary The City Commission is the legislative body that governs the City and has a
fiduciary responsibility to the citizens. As set by the City Charter, the Commission is comprised of the Mayor and six Commissioners. The Mayor is elected at-large, and each of the six Commissioners is elected from a single-member geographical district. The Commission appoints the City Manager, City Attorney and the members of City boards. The Commission is primarily responsible for setting City policies, adopting an annual budget, approving all employee bargaining unit contracts, setting municipal service levels, and approving ordinances (laws) and resolutions to maintain or enhance the quality of life and community standards. The City Commission serves as the Board of Commissioners for the Community Redevelopment Agency (CRA) and appoints the Executive Director for the Downtown and Beach CRA districts and the General Counsel. The Mayor and Commissioners represent the City on various national, state, and regional agencies, organizations, and boards.
Highlights• Sets priorities, budget, service levels, salaries, and benefits of the City Manager,
City Attorney, CRA Executive Directors, CRA General Counsel, and employees bycategory and through collective bargaining agreements
• Sets priorities, budget, programming, and salaries and benefits for the CRAExecutive Directors and CRA General Counsel
• Passes ordinances (laws) and resolutions• Initiates programs to improve the quality of life, business climate, fiscal stability,
and attractiveness to tourists and residents• Responds to citizen requests and assists in resolving problems through
correspondence, individual meetings, community forums, and referral• Commission members interface with other elected officials to represent the
concerns of the City and its residents to other governmental bodies, agencies, andorganizations
FY 2020 Adopted Budget City Commission88
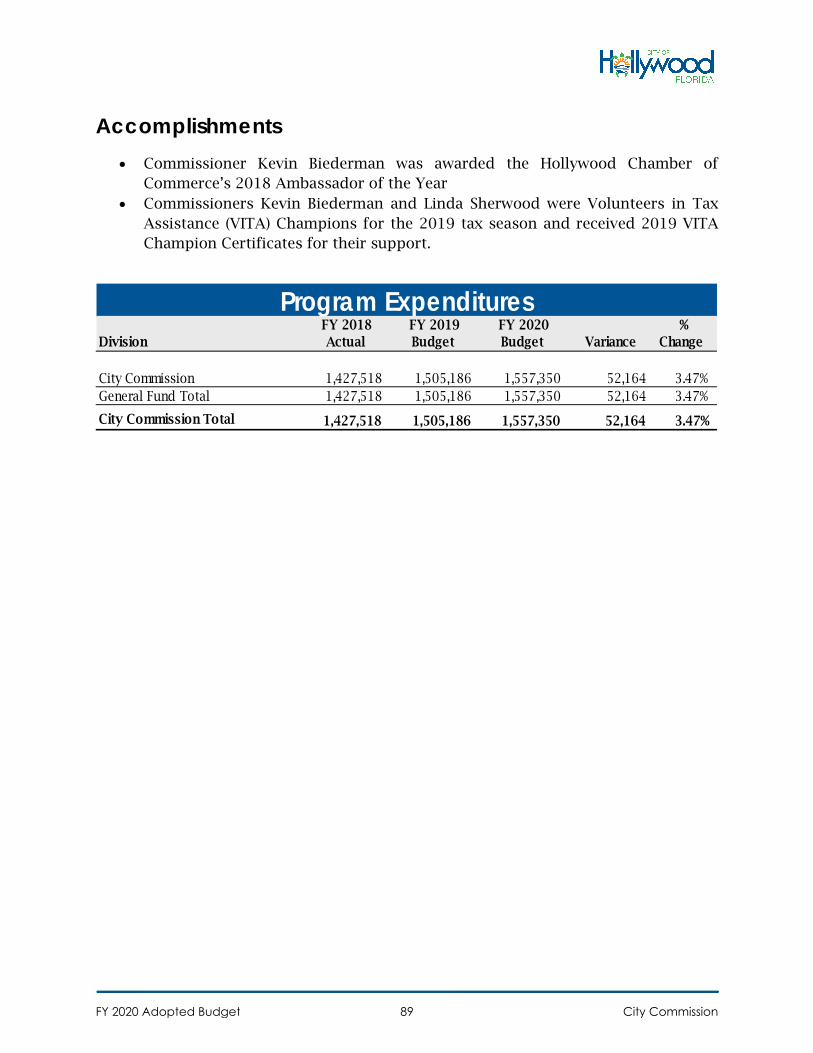
Accomplishments• Commissioner Kevin Biederman was awarded the Hollywood Chamber of
Commerce’s 2018 Ambassador of the Year• Commissioners Kevin Biederman and Linda Sherwood were Volunteers in Tax
Assistance (VITA) Champions for the 2019 tax season and received 2019 VITAChampion Certificates for their support.
Division FY 2018
Actual FY 2019 Budget
FY 2020 Budget Variance
% Change
City Commission 1,427,518 1,505,186 1,557,350 52,164 3.47%General Fund Total 1,427,518 1,505,186 1,557,350 52,164 3.47%
City Commission Total 1,427,518 1,505,186 1,557,350 52,164 3.47%
Program Expenditures
FY 2020 Adopted Budget City Commission89
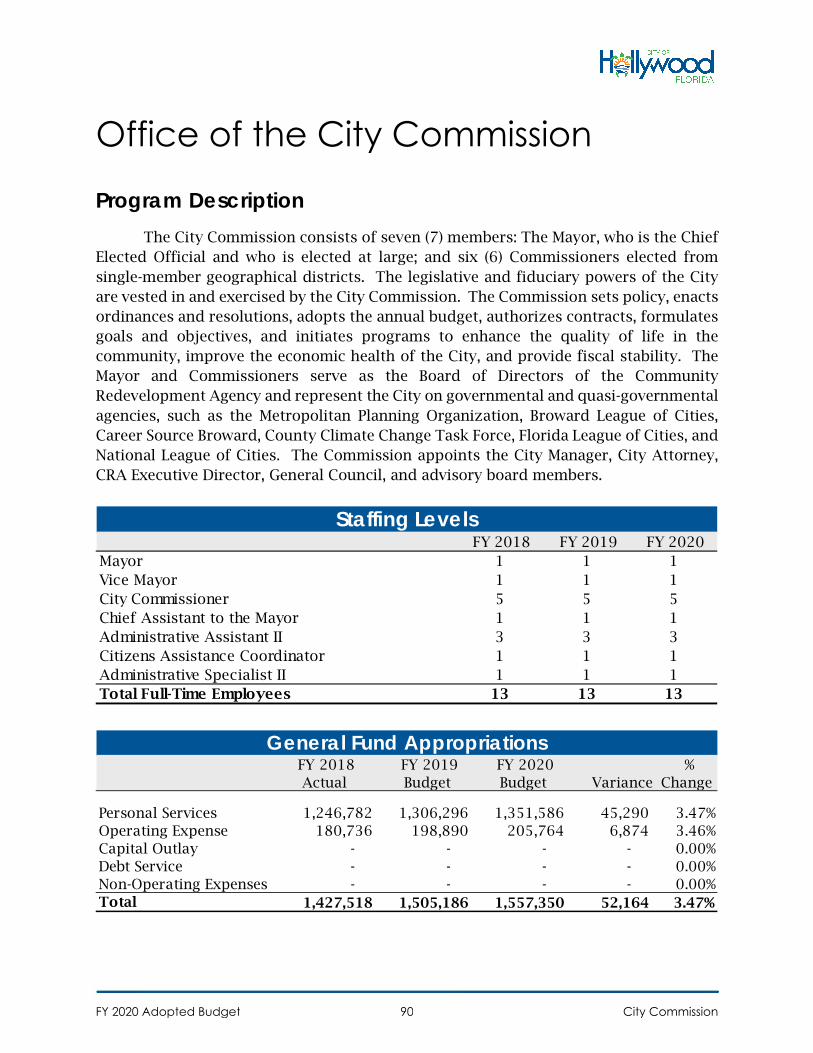
Office of the City Commission
Program DescriptionThe City Commission consists of seven (7) members: The Mayor, who is the Chief
Elected Official and who is elected at large; and six (6) Commissioners elected from single-member geographical districts. The legislative and fiduciary powers of the City are vested in and exercised by the City Commission. The Commission sets policy, enacts ordinances and resolutions, adopts the annual budget, authorizes contracts, formulates goals and objectives, and initiates programs to enhance the quality of life in the community, improve the economic health of the City, and provide fiscal stability. The Mayor and Commissioners serve as the Board of Directors of the Community Redevelopment Agency and represent the City on governmental and quasi-governmental agencies, such as the Metropolitan Planning Organization, Broward League of Cities, Career Source Broward, County Climate Change Task Force, Florida League of Cities, and National League of Cities. The Commission appoints the City Manager, City Attorney, CRA Executive Director, General Council, and advisory board members.
FY 2018 FY 2019 FY 2020 Mayor 1 1 1Vice Mayor 1 1 1City Commissioner 5 5 5Chief Assistant to the Mayor 1 1 1Administrative Assistant II 3 3 3Citizens Assistance Coordinator 1 1 1Administrative Specialist II 1 1 1Total Full-Time Employees 13 13 13
Staffing Levels
FY 2018 Actual
FY 2019 Budget
FY 2020 Budget Variance
% Change
Personal Services 1,246,782 1,306,296 1,351,586 45,290 3.47%Operating Expense 180,736 198,890 205,764 6,874 3.46%Capital Outlay - - - - 0.00%Debt Service - - - - 0.00%Non-Operating Expenses - - - - 0.00% Total 1,427,518 1,505,186 1,557,350 52,164 3.47%
General Fund Appropriations
FY 2020 Adopted Budget City Commission90
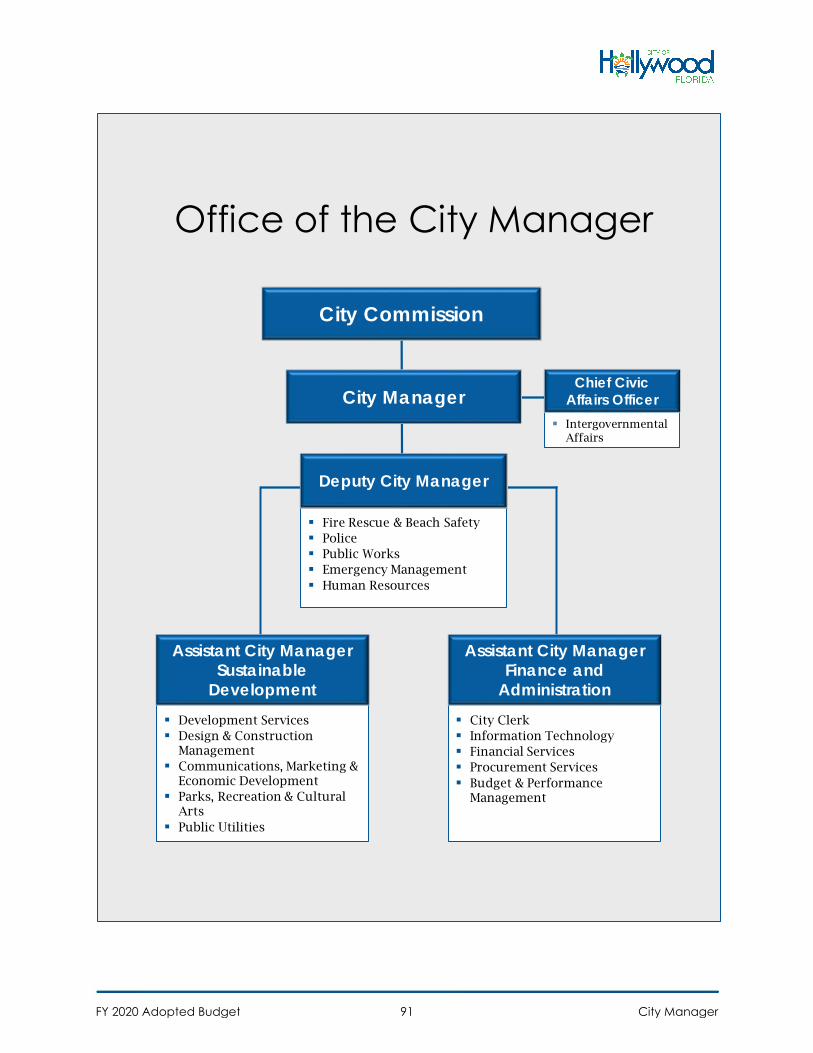
Office of the City Manager
Development Services Design & Construction
Management Communications, Marketing &
Economic Development Parks, Recreation & Cultural
Arts Public Utilities
Fire Rescue & Beach Safety Police Public Works Emergency Management Human Resources
City Clerk Information Technology Financial Services Procurement Services Budget & Performance
Management
City Commission
City Manager
Deputy City Manager
Assistant City Manager Sustainable
Development
Assistant City Manager Finance and
Administration
IntergovernmentalAffairs
Chief Civic Affairs Officer
FY 2020 Adopted Budget City Manager91
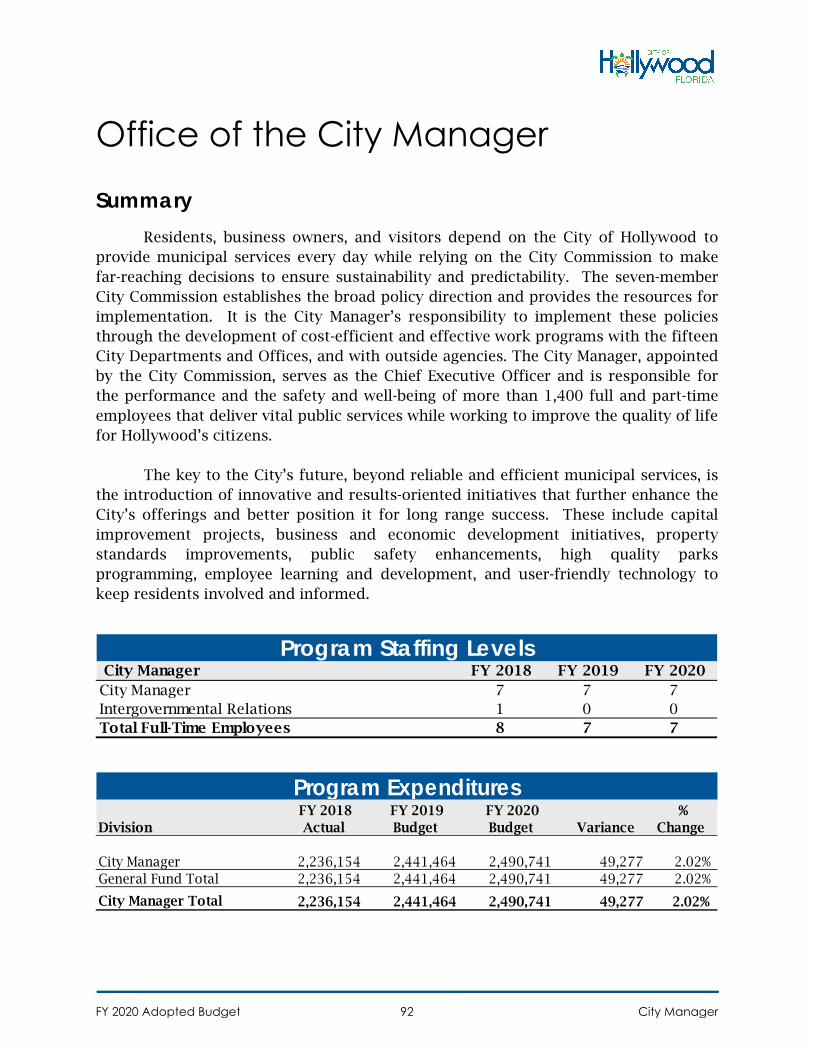
Office of the City Manager
Summary Residents, business owners, and visitors depend on the City of Hollywood to
provide municipal services every day while relying on the City Commission to make far-reaching decisions to ensure sustainability and predictability. The seven-member City Commission establishes the broad policy direction and provides the resources for implementation. It is the City Manager’s responsibility to implement these policies through the development of cost-efficient and effective work programs with the fifteen City Departments and Offices, and with outside agencies. The City Manager, appointed by the City Commission, serves as the Chief Executive Officer and is responsible for the performance and the safety and well-being of more than 1,400 full and part-time employees that deliver vital public services while working to improve the quality of life for Hollywood’s citizens.
The key to the City’s future, beyond reliable and efficient municipal services, is the introduction of innovative and results-oriented initiatives that further enhance the City’s offerings and better position it for long range success. These include capital improvement projects, business and economic development initiatives, property standards improvements, public safety enhancements, high quality parks programming, employee learning and development, and user-friendly technology to keep residents involved and informed.
City Manager FY 2018 FY 2019 FY 2020 City Manager 7 7 7Intergovernmental Relations 1 0 0Total Full-Time Employees 8 7 7
Program Staffing Levels
Division FY 2018
Actual FY 2019 Budget
FY 2020 Budget Variance
% Change
City Manager 2,236,154 2,441,464 2,490,741 49,277 2.02%General Fund Total 2,236,154 2,441,464 2,490,741 49,277 2.02%
City Manager Total 2,236,154 2,441,464 2,490,741 49,277 2.02%
Program Expenditures
FY 2020 Adopted Budget City Manager92
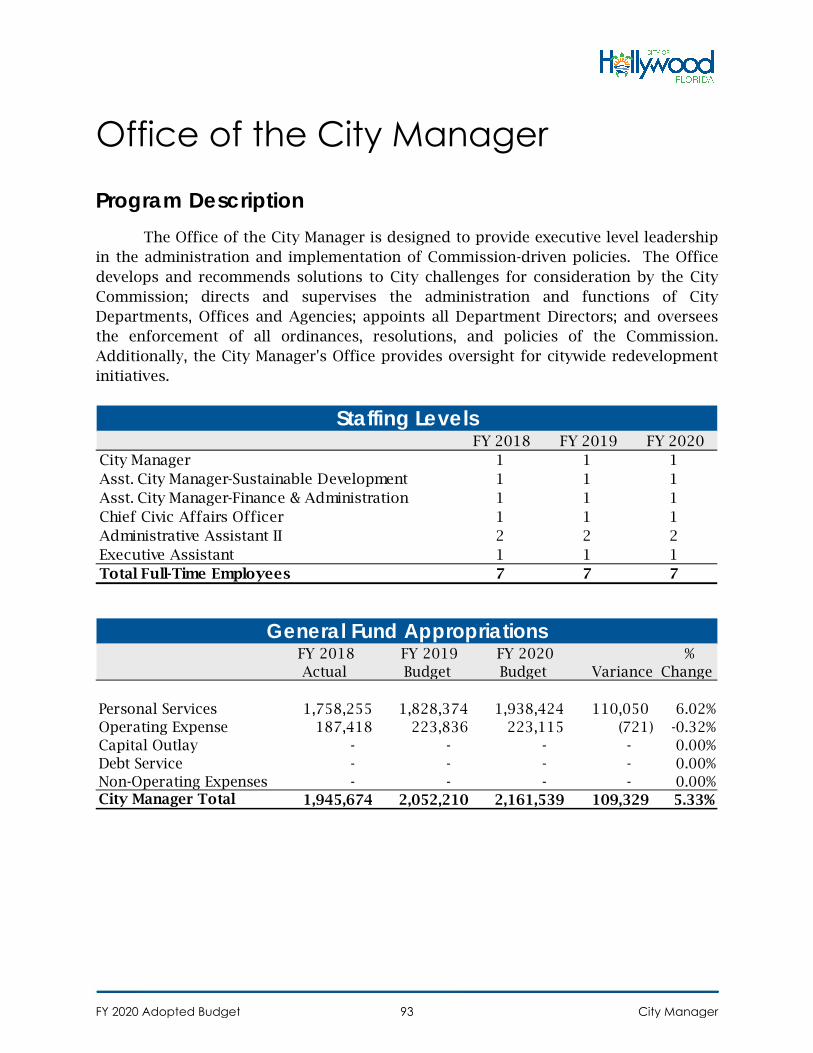
Office of the City Manager
Program Description The Office of the City Manager is designed to provide executive level leadership
in the administration and implementation of Commission-driven policies. The Office develops and recommends solutions to City challenges for consideration by the City Commission; directs and supervises the administration and functions of City Departments, Offices and Agencies; appoints all Department Directors; and oversees the enforcement of all ordinances, resolutions, and policies of the Commission. Additionally, the City Manager's Office provides oversight for citywide redevelopment initiatives.
FY 2018 FY 2019 FY 2020 City Manager 1 1 1Asst. City Manager-Sustainable Development 1 1 1Asst. City Manager-Finance & Administration 1 1 1Chief Civic Affairs Officer 1 1 1Administrative Assistant II 2 2 2Executive Assistant 1 1 1Total Full-Time Employees 7 7 7
Staffing Levels
FY 2018 Actual
FY 2019 Budget
FY 2020 Budget Variance
% Change
Personal Services 1,758,255 1,828,374 1,938,424 110,050 6.02%Operating Expense 187,418 223,836 223,115 (721) -0.32%Capital Outlay - - - - 0.00%Debt Service - - - - 0.00%Non-Operating Expenses - - - - 0.00%City Manager Total 1,945,674 2,052,210 2,161,539 109,329 5.33%
General Fund Appropriations
FY 2020 Adopted Budget City Manager93
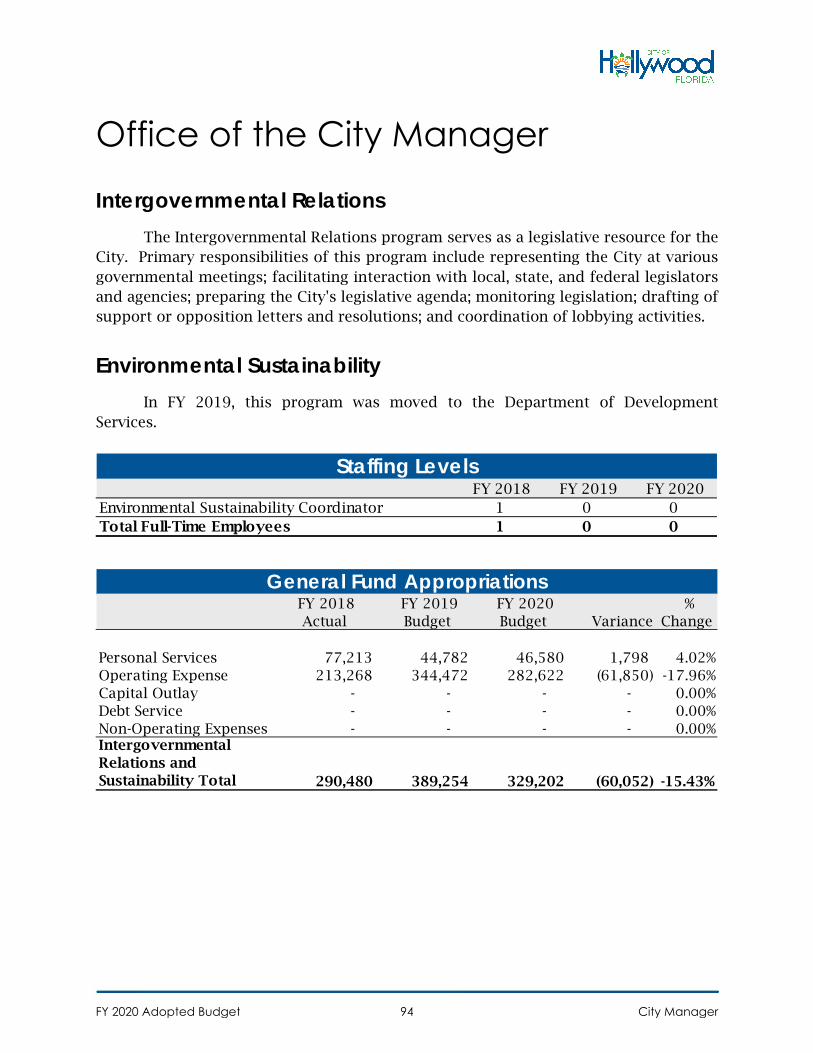
Office of the City Manager
Intergovernmental RelationsThe Intergovernmental Relations program serves as a legislative resource for the
City. Primary responsibilities of this program include representing the City at various governmental meetings; facilitating interaction with local, state, and federal legislators and agencies; preparing the City's legislative agenda; monitoring legislation; drafting of support or opposition letters and resolutions; and coordination of lobbying activities.
Environmental Sustainability In FY 2019, this program was moved to the Department of Development
Services.
FY 2018 FY 2019 FY 2020 Environmental Sustainability Coordinator 1 0 0Total Full-Time Employees 1 0 0
Staffing Levels
FY 2018 Actual
FY 2019 Budget
FY 2020 Budget Variance
% Change
Personal Services 77,213 44,782 46,580 1,798 4.02%Operating Expense 213,268 344,472 282,622 (61,850) -17.96%Capital Outlay - - - - 0.00%Debt Service - - - - 0.00%Non-Operating Expenses - - - - 0.00%Intergovernmental Relations and Sustainability Total 290,480 389,254 329,202 (60,052) -15.43%
General Fund Appropriations
FY 2020 Adopted Budget City Manager94
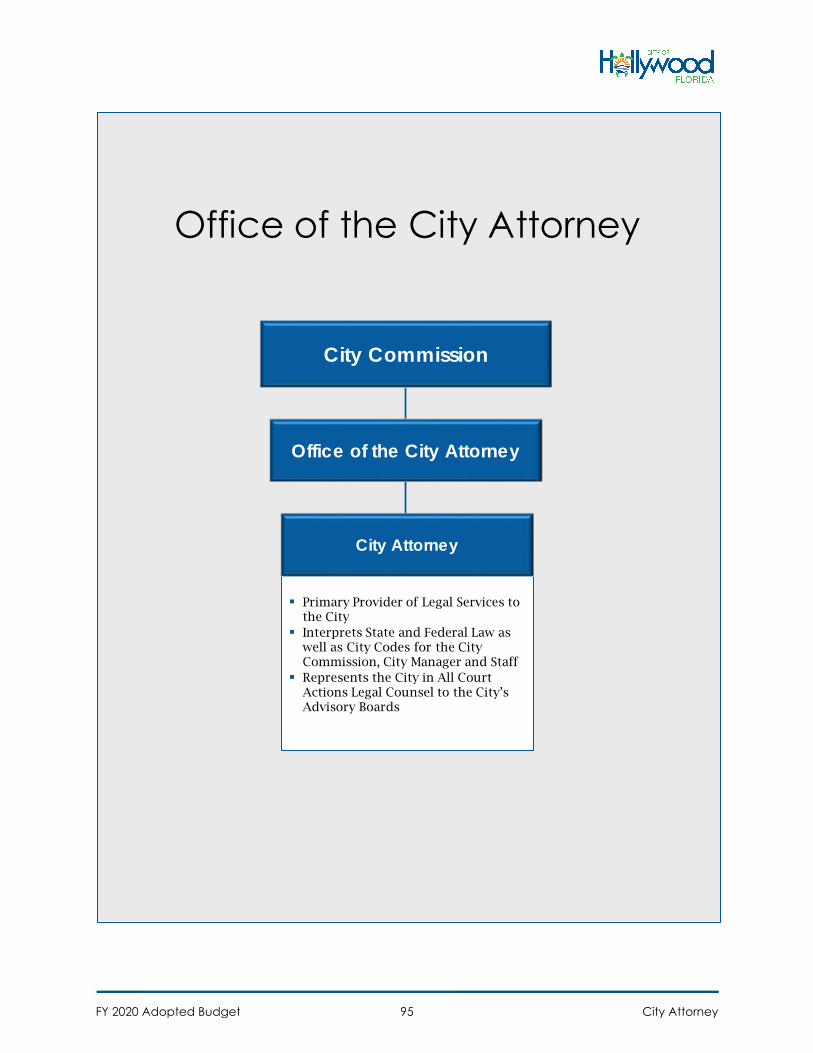
Office of the City Attorney
Primary Provider of Legal Services tothe City
Interprets State and Federal Law aswell as City Codes for the CityCommission, City Manager and Staff
Represents the City in All CourtActions Legal Counsel to the City’sAdvisory Boards
City Attorney
City Commission
Office of the City Attorney
FY 2020 Adopted Budget City Attorney95
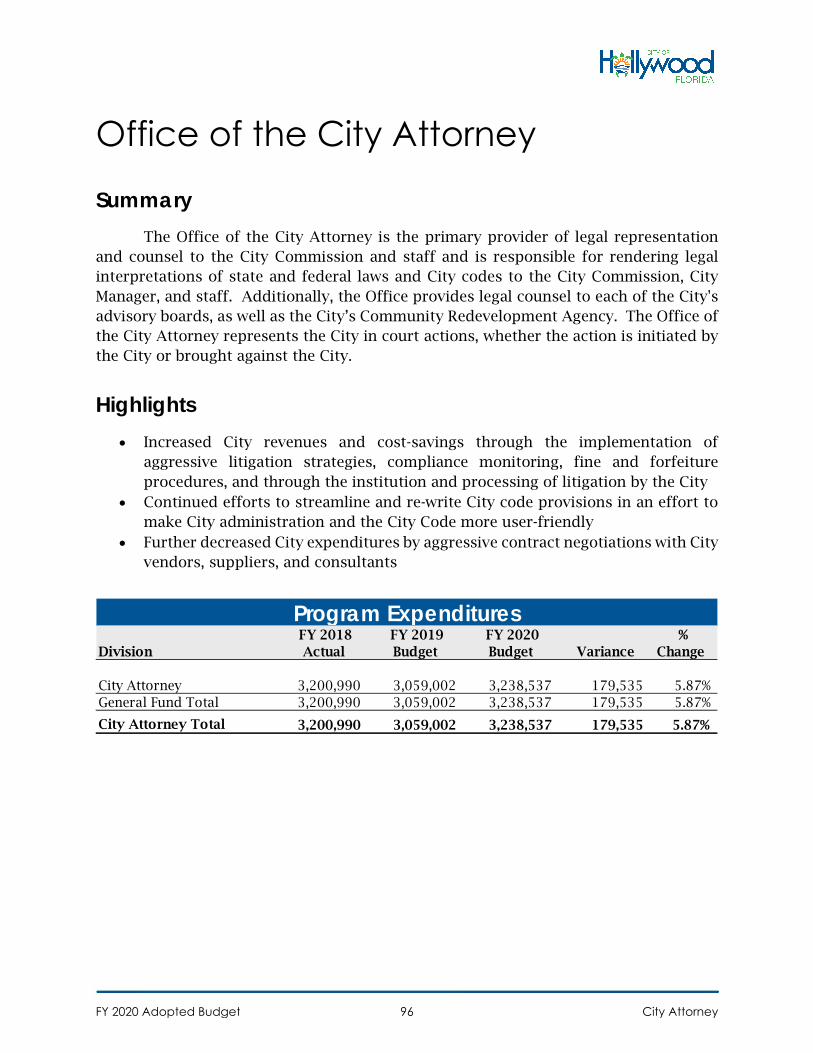
Office of the City Attorney
SummaryThe Office of the City Attorney is the primary provider of legal representation
and counsel to the City Commission and staff and is responsible for rendering legal interpretations of state and federal laws and City codes to the City Commission, City Manager, and staff. Additionally, the Office provides legal counsel to each of the City's advisory boards, as well as the City’s Community Redevelopment Agency. The Office of the City Attorney represents the City in court actions, whether the action is initiated by the City or brought against the City.
Highlights• Increased City revenues and cost-savings through the implementation of
aggressive litigation strategies, compliance monitoring, fine and forfeitureprocedures, and through the institution and processing of litigation by the City
• Continued efforts to streamline and re-write City code provisions in an effort tomake City administration and the City Code more user-friendly
• Further decreased City expenditures by aggressive contract negotiations with Cityvendors, suppliers, and consultants
Division FY 2018
Actual FY 2019 Budget
FY 2020 Budget Variance
% Change
City Attorney 3,200,990 3,059,002 3,238,537 179,535 5.87%General Fund Total 3,200,990 3,059,002 3,238,537 179,535 5.87%
City Attorney Total 3,200,990 3,059,002 3,238,537 179,535 5.87%
Program Expenditures
FY 2020 Adopted Budget City Attorney96
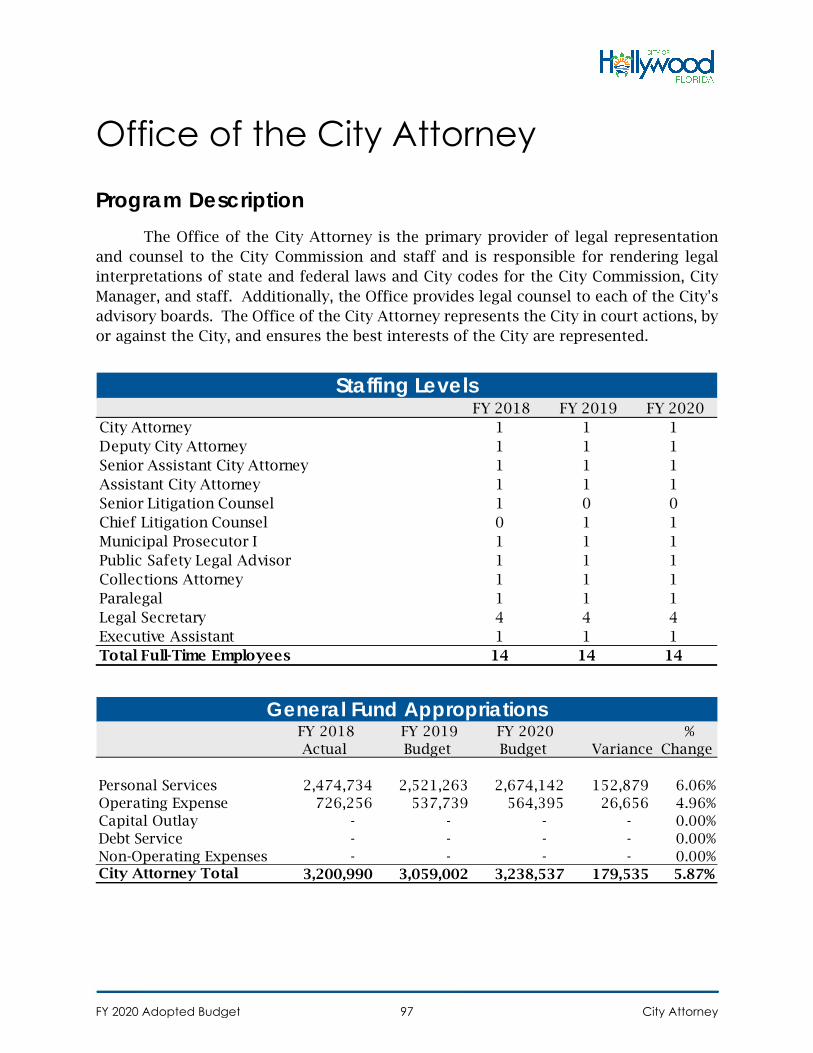
Office of the City Attorney
Program DescriptionThe Office of the City Attorney is the primary provider of legal representation
and counsel to the City Commission and staff and is responsible for rendering legal interpretations of state and federal laws and City codes for the City Commission, City Manager, and staff. Additionally, the Office provides legal counsel to each of the City's advisory boards. The Office of the City Attorney represents the City in court actions, by or against the City, and ensures the best interests of the City are represented.
FY 2018 FY 2019 FY 2020 City Attorney 1 1 1Deputy City Attorney 1 1 1Senior Assistant City Attorney 1 1 1Assistant City Attorney 1 1 1Senior Litigation Counsel 1 0 0Chief Litigation Counsel 0 1 1Municipal Prosecutor I 1 1 1Public Safety Legal Advisor 1 1 1Collections Attorney 1 1 1Paralegal 1 1 1Legal Secretary 4 4 4Executive Assistant 1 1 1Total Full-Time Employees 14 14 14
Staffing Levels
FY 2018 Actual
FY 2019 Budget
FY 2020 Budget Variance
% Change
Personal Services 2,474,734 2,521,263 2,674,142 152,879 6.06%Operating Expense 726,256 537,739 564,395 26,656 4.96%Capital Outlay - - - - 0.00%Debt Service - - - - 0.00%Non-Operating Expenses - - - - 0.00%City Attorney Total 3,200,990 3,059,002 3,238,537 179,535 5.87%
General Fund Appropriations
FY 2020 Adopted Budget City Attorney97
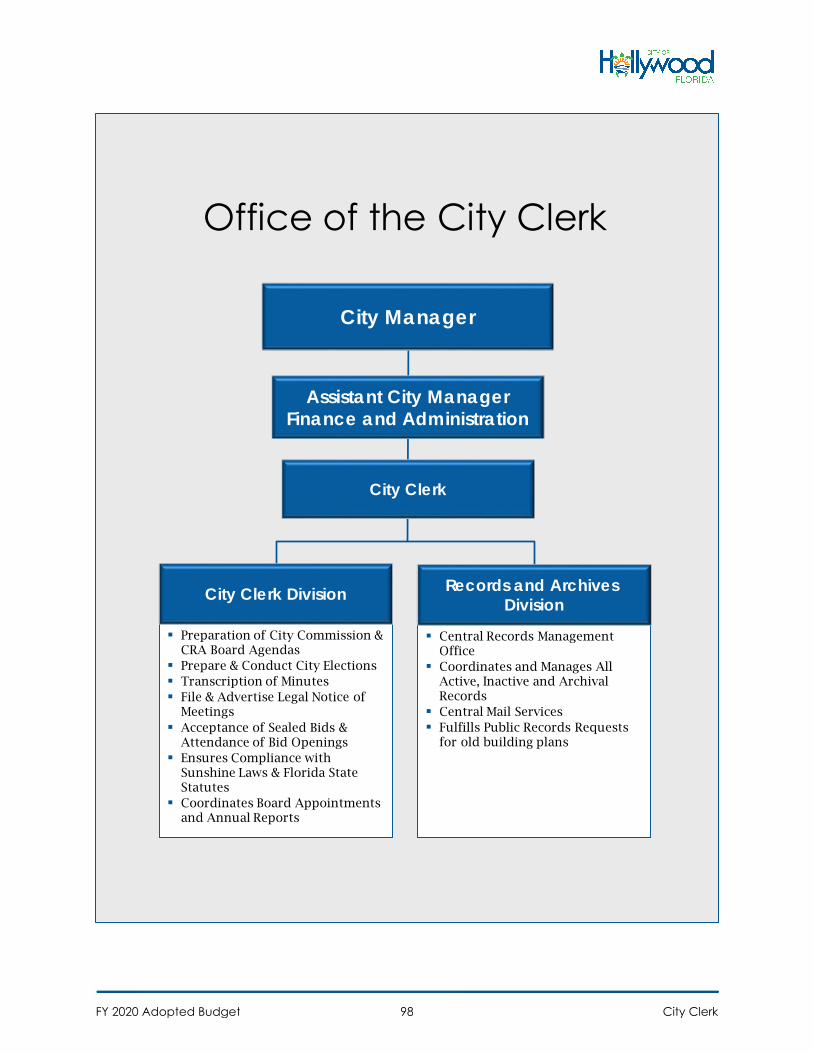
Office of the City Clerk
City Manager
City Clerk
Preparation of City Commission &CRA Board Agendas
Prepare & Conduct City Elections Transcription of Minutes File & Advertise Legal Notice of
Meetings Acceptance of Sealed Bids &
Attendance of Bid Openings Ensures Compliance with
Sunshine Laws & Florida StateStatutes
Coordinates Board Appointmentsand Annual Reports
City Clerk Division
Central Records ManagementOffice
Coordinates and Manages AllActive, Inactive and ArchivalRecords
Central Mail Services Fulfills Public Records Requests
for old building plans
Records and Archives Division
Assistant City ManagerFinance and Administration
FY 2020 Adopted Budget City Clerk98
Office of the City Clerk
Summary The Office of the City Clerk is comprised of two divisions: City Clerk and
Records and Archives. The City Clerk division is a centralized reference center, maintaining a thorough understanding of all City procedures, organizational functions, and the City’s Code of Ordinances as well as outside issues relating to municipal government, legal guidelines, and the Florida State Statutes. The Records and Archives Division coordinates and manages active, inactive, and archival records of the City. The Division’s mission is to collect, preserve, and make available vital municipal and historically significant documents and photographs of Hollywood.
FY 2019 Accomplishments • Participated in the Downtown Hollywood Vintage South Florida event in
February 2019 with historical photographs, maps and documents
• Displayed two photographic exhibits on the first floor of City Hall, “BuildingHollywood: The 1920s” and the “Post Card” Collection
• Held the November 2018 City General Election which included 10 candidates forDistricts 1, 3, and 5 and nine Charter referendum questions
• Coordinated with the Broward County Supervisor of Elections and various Citydepartments to ensure that during Early Voting for the general (November 2018)election, at the City Hall Library, issues such as parking, signage, lighting andlitter were addressed
• Held the Swearing-in Ceremony for the Newly Elected City Commissionmembers from the November 2018 election
• Prepared and held the March 12, 2019 Special Election for the three GeneralObligation Bond (GO Bond) questions and three questions related to the sale ofCity timeshare property
• Worked with the Supervisor of Elections on the selection of polling locationsand other various issues
• Worked with staff and provided educational information to the residentsregarding the GO Bond questions
• Served as liaison for the Emerald Hills Safety Enhancement District Board andstaff regarding any issues
• Scanned current resolutions, ordinances, minutes, and city deeds intoLaserfiche, reducing paper copies
FY 2020 Adopted Budget City Clerk99
• Monitored and provided continuous staff training of Legistar by Granicus, theagenda management program
• Processed 398 Resolutions, 54 Ordinances and 85 Presentations for placementon Commission meeting agendas
• Monitored GovQA, a public records management program, for compliance with3,209 requests submitted, of which 2,424 were handled by this office. Providedtechnical support for users on the operations of the software
• Updated and revised the Citywide Records Management policy to align with theState’s regulations and the City’s operational needs. Provided annual recordsmanagement training for records law compliance by holding individual stafftraining
• Improved upon the current historic collection system to allow for greatermanageability, research ability and retrieval of historical documents by creatinga spreadsheet in which collections were organized by department
• Destroyed 785 boxes, which equals 1,178 cubic feet, of eligible records from ourinventory list which have met the retention period as required by State Statute.This aids in reducing our storage fees
• Assisted various departments with their inventory and internal recordmanagement processes. Processed submission of 1,230 boxes for transmittal ofrecords
• Processed requests from departments for retrieval of 657 boxes from off-sitestorage
• Reviewed 1,387 boxes in storage, updating the inventory in accordance withState Statutes
• Began the conversion of microfilm to digital records; to date 93 reels ofmicrofilm have been converted
• Coordinated with the City's 20-advisory boards and committees forappointments and reporting requirements. There were 147 board applicationsfor 93 vacant/expiring positions
• Placed 70 legal advertisements in the newspaper to comply with State Statutesand City Codes
• Posted 501 Sunshine Notices for the City to hold various meetings and events
• Staffed 27 Commission meetings and 28 special/workshops and communitymeetings
• Processed 22 Commission meeting minutes and 12 sets of workshop minutes
• Processed 12 CRA agendas with 101 items
• Accepted bid proposals and attended 46 bid openings
• Processed and collected funds for 99 lobbyist client registrations
• Processed the routing for execution of 220 contracts
FY 2020 Adopted Budget City Clerk100
• The Records and Archives Division took on the task of moving approximately500 boxes that were stored in the “block house” at the Van Buren Street parkinglot. This project was large in nature requiring the coordination of adequatetransportation and laborers to complete the job. The end result is that therecords are now properly inventoried and stored within State Statutesrequirements.
• Prepared two years of Building Permit records (approximately 400 boxes
• Prepared and scanned three years of Personnel and Payroll records(approximately 100 boxes)
FY 2020 Goals • Prepare for the November 2020 City General Election (Mayor and Districts 2 , 4 ,
and 6 )
• Coordinate with the Broward County Supervisor of Election and various Citydepartments to ensure that during Early Voting for the Presidential Preference,and primary election , at the City Hall Library, issues such as parking,appropriate signs, lighting and trash cans will be addressed
• Continue to monitor GovQA, a public records management program forcompliance, and provide refresher training
• Provide refresher training on Legistar agenda management program forcompliance
• Continue to provide records management training for City employees forrecords law compliance; including the assistance to departments/divisions withtheir inventory and internal records management processes
• Continue to improve upon the current historic collection system to allow forgreater manageability, research ability and retrieval of historical documents
• Review boxes in storage, updating the inventory and destroy eligible records inaccordance with State Statute
FY 2020 Adopted Budget City Clerk101
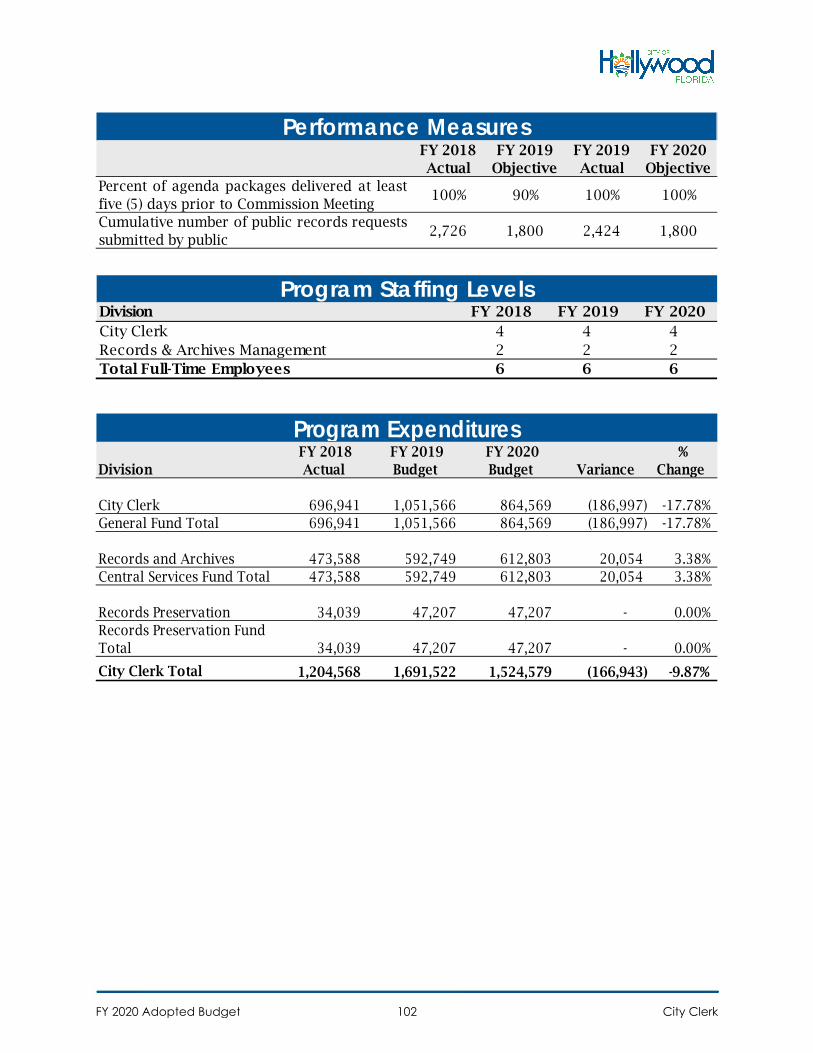
FY 2018 Actual
FY 2019 Objective
FY 2019 Actual
FY 2020 Objective
Percent of agenda packages delivered at leastfive (5) days prior to Commission Meeting
100% 90% 100% 100%
Cumulative number of public records requestssubmitted by public
2,726 1,800 2,424 1,800
Performance Measures
Division FY 2018 FY 2019 FY 2020 City Clerk 4 4 4Records & Archives Management 2 2 2Total Full-Time Employees 6 6 6
Program Staffing Levels
Division FY 2018
Actual FY 2019 Budget
FY 2020 Budget Variance
% Change
City Clerk 696,941 1,051,566 864,569 (186,997) -17.78%General Fund Total 696,941 1,051,566 864,569 (186,997) -17.78%
Records and Archives 473,588 592,749 612,803 20,054 3.38%Central Services Fund Total 473,588 592,749 612,803 20,054 3.38%
Records Preservation 34,039 47,207 47,207 - 0.00%Records Preservation Fund Total 34,039 47,207 47,207 - 0.00%
City Clerk Total 1,204,568 1,691,522 1,524,579 (166,943) -9.87%
Program Expenditures
FY 2020 Adopted Budget City Clerk102
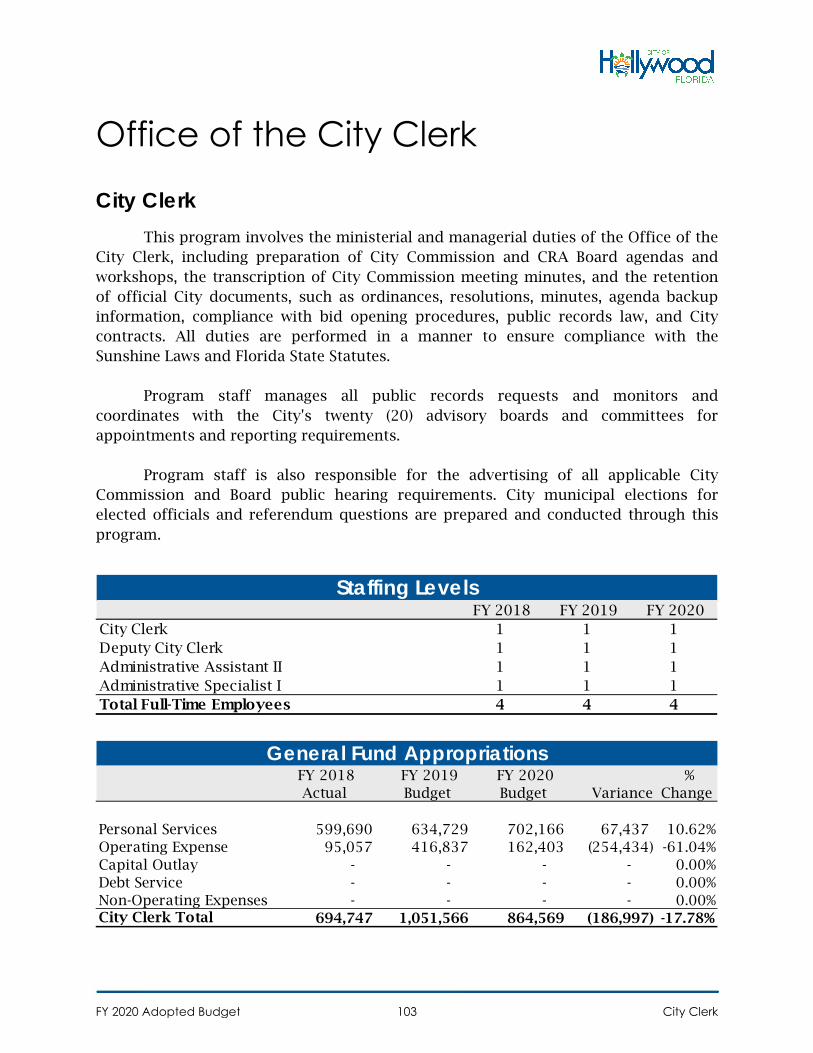
Office of the City Clerk
City ClerkThis program involves the ministerial and managerial duties of the Office of the
City Clerk, including preparation of City Commission and CRA Board agendas and workshops, the transcription of City Commission meeting minutes, and the retention of official City documents, such as ordinances, resolutions, minutes, agenda backup information, compliance with bid opening procedures, public records law, and City contracts. All duties are performed in a manner to ensure compliance with the Sunshine Laws and Florida State Statutes.
Program staff manages all public records requests and monitors and coordinates with the City's twenty (20) advisory boards and committees for appointments and reporting requirements.
Program staff is also responsible for the advertising of all applicable City Commission and Board public hearing requirements. City municipal elections for elected officials and referendum questions are prepared and conducted through this program.
FY 2018 FY 2019 FY 2020 City Clerk 1 1 1Deputy City Clerk 1 1 1Administrative Assistant II 1 1 1Administrative Specialist I 1 1 1Total Full-Time Employees 4 4 4
Staffing Levels
FY 2018 Actual
FY 2019 Budget
FY 2020 Budget Variance
% Change
Personal Services 599,690 634,729 702,166 67,437 10.62%Operating Expense 95,057 416,837 162,403 (254,434) -61.04%Capital Outlay - - - - 0.00%Debt Service - - - - 0.00%Non-Operating Expenses - - - - 0.00%City Clerk Total 694,747 1,051,566 864,569 (186,997) -17.78%
General Fund Appropriations
FY 2020 Adopted Budget City Clerk103
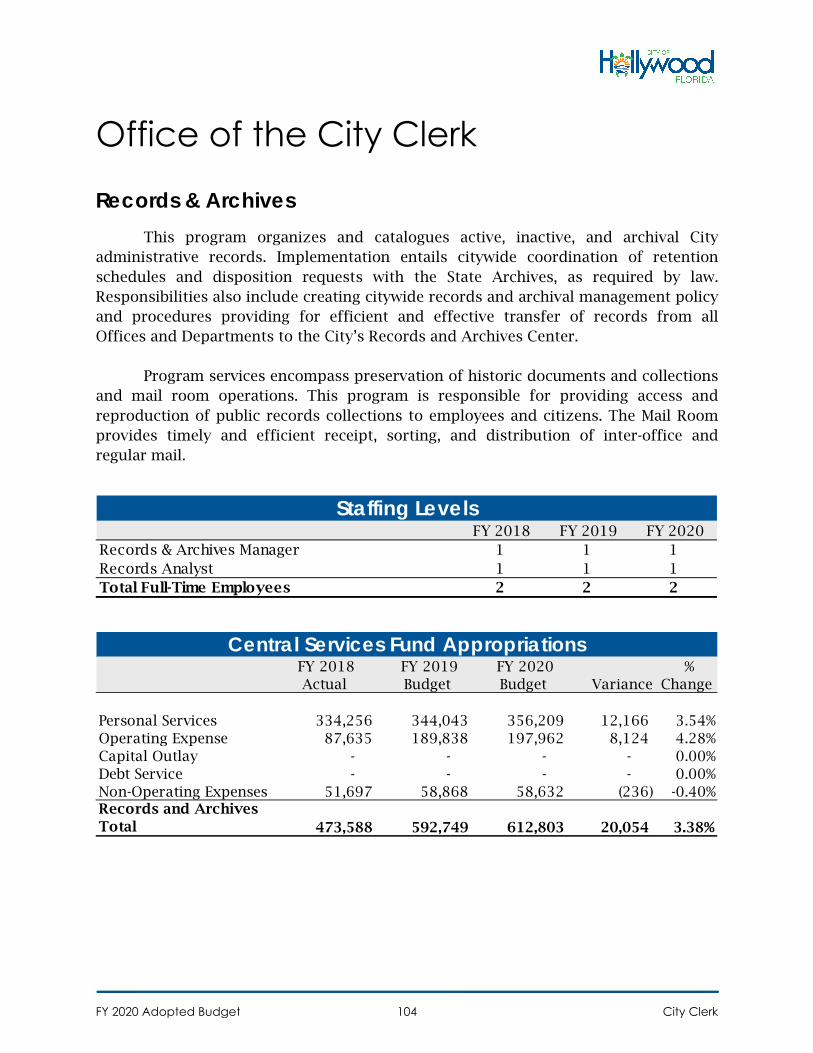
Office of the City Clerk
Records & Archives This program organizes and catalogues active, inactive, and archival City
administrative records. Implementation entails citywide coordination of retention schedules and disposition requests with the State Archives, as required by law. Responsibilities also include creating citywide records and archival management policy and procedures providing for efficient and effective transfer of records from all Offices and Departments to the City’s Records and Archives Center.
Program services encompass preservation of historic documents and collections
and mail room operations. This program is responsible for providing access and reproduction of public records collections to employees and citizens. The Mail Room provides timely and efficient receipt, sorting, and distribution of inter-office and regular mail.
FY 2018 FY 2019 FY 2020 Records & Archives Manager 1 1 1Records Analyst 1 1 1Total Full-Time Employees 2 2 2
Staffing Levels
FY 2018 Actual
FY 2019 Budget
FY 2020 Budget Variance
% Change
Personal Services 334,256 344,043 356,209 12,166 3.54%Operating Expense 87,635 189,838 197,962 8,124 4.28%Capital Outlay - - - - 0.00%Debt Service - - - - 0.00%Non-Operating Expenses 51,697 58,868 58,632 (236) -0.40%Records and Archives Total 473,588 592,749 612,803 20,054 3.38%
Central Services Fund Appropriations
FY 2020 Adopted Budget City Clerk104
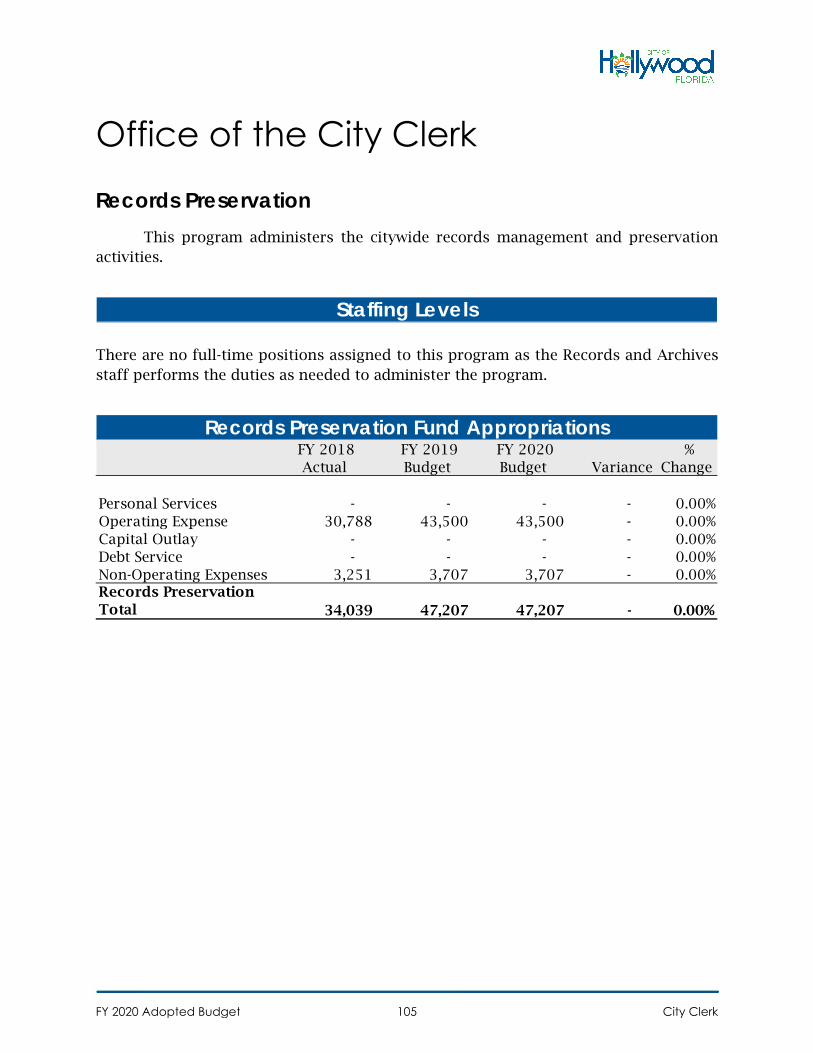
Office of the City Clerk
Records Preservation This program administers the citywide records management and preservation
activities.
There are no full-time positions assigned to this program as the Records and Archives staff performs the duties as needed to administer the program.
Staffing Levels
FY 2018 Actual
FY 2019 Budget
FY 2020 Budget Variance
% Change
Personal Services - - - - 0.00%Operating Expense 30,788 43,500 43,500 - 0.00%Capital Outlay - - - - 0.00%Debt Service - - - - 0.00%Non-Operating Expenses 3,251 3,707 3,707 - 0.00%Records Preservation Total 34,039 47,207 47,207 - 0.00%
Records Preservation Fund Appropriations
FY 2020 Adopted Budget City Clerk105
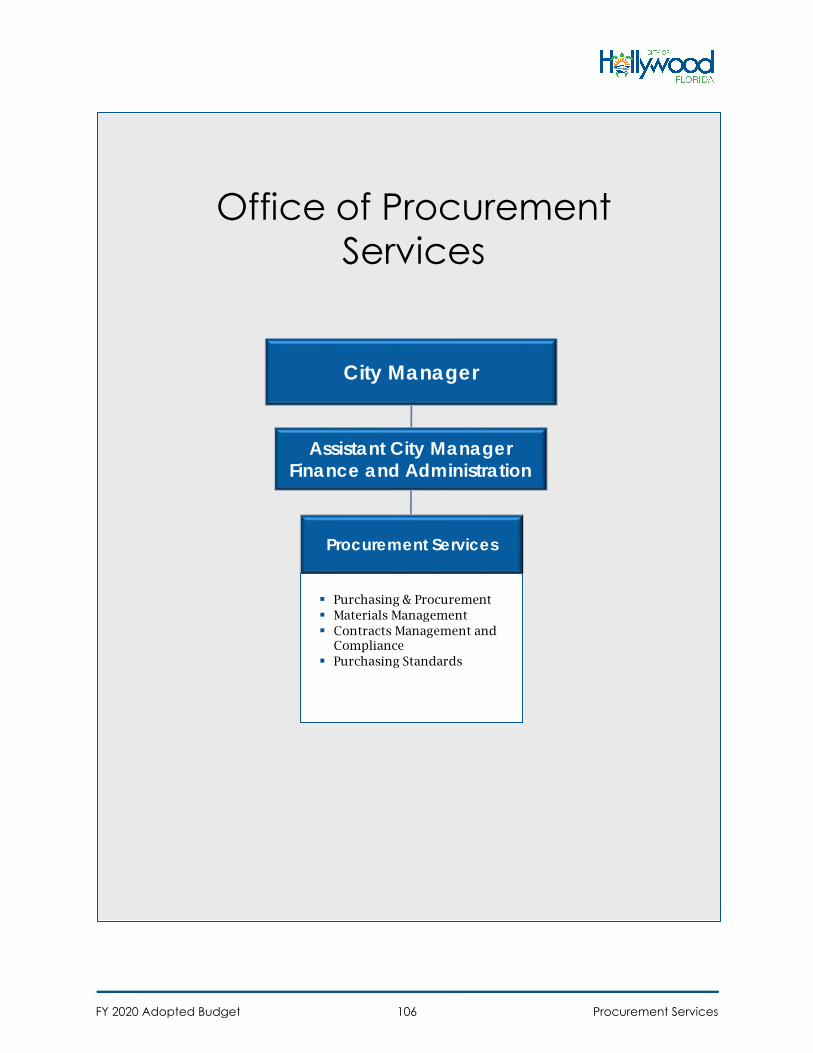
Office of Procurement Services
City Manager
Procurement Services
Assistant City ManagerFinance and Administration
Purchasing & Procurement Materials Management Contracts Management and
Compliance Purchasing Standards
FY 2020 Adopted Budget Procurement Services106
Office of Procurement Services
Summary The Office of Procurement Services procures supplies, materials, and equipment
in a manner that maximizes the purchasing value of the public funds while ensuring an open, fair, and equitable competitive process to acquire the best product consistent with operational needs.
FY 2019 Accomplishments • Refined the GEMS supplier list from over 36,000 suppliers down to 6,000 • Completed on schedule Phase II Advance Procurement, which included Sourcing
and Supplier Portal. Sourcing will allows the City to standardize the bid process/documents and has the capabilities of making critical decision electronically (within Oracle), such as finalizing scores from an evaluation committee. Supplier Portal allows for suppliers to manage their contract portfolio for the City including the ability to review orders and invoices, check payment status, and make administrative changes.
• Processed over 1,000 purchase orders (average of 192 Purchase Orders a week) with a value of $53M
• Processed over 1,200 Supplier Requests (an average of 23 supplier requests a week). Supplier requests include adding a new vendor or making administrative changes such as address change, updating W9s, and adding a new point of contact
• Purchase card transactions amounted to approximately $2M (the highest amount to date), of which approximately $900K was expended with Hollywood vendors
• Held two vehicle auctions resulting in the sale of 140 vehicles and revenues of $170k
FY 2020 Adopted Budget Procurement Services107
FY 2020 Goals • Continue improving contract management within Oracle particularly the flow
chart approvals for the various threshold levels. • Explore the cost benefit of having Oracle as a one solution platform for the
sourcing of the City Bids/RFPs. • Update procurement code and polices to reflect current functionality and best
practices • Standardize procurement documents including resolution templates,
solicitation documents, standard contracts for solicitations, and a checklist for all solicitation types.
• Continue improving contract management within Oracle particularly the flow chart approvals for the various threshold levels.
• Expand the supplier portal to allow suppliers to update administrative data at a time and place of their choosing—when fully implemented the ability to manage contract data, invoices, uploading W9s or making administrative data will be handled by the supplier. This portal will reduce the number of phone calls inquiring about a payment status of an address change or asking for a copy of their contract/mods—as suppliers will be able to obtain this information through the portal. Once all the security measures are addressed, suppliers will be able to submit invoices and receive ACH payments through this portal
• Have quarterly auctions for the sale of vehicles • Provide semi-annual procurement refresher training for City Staff. • Outreach events for the Business Community—how to do business with the City • Internal training on new procedures/best practices—FY closing out of POs • Explore the feasibility of creating an Acquisition Forecast Plan—vendors having
the ability to see a two year forecast of contracts that will be expiring
FY 2020 Adopted Budget Procurement Services108
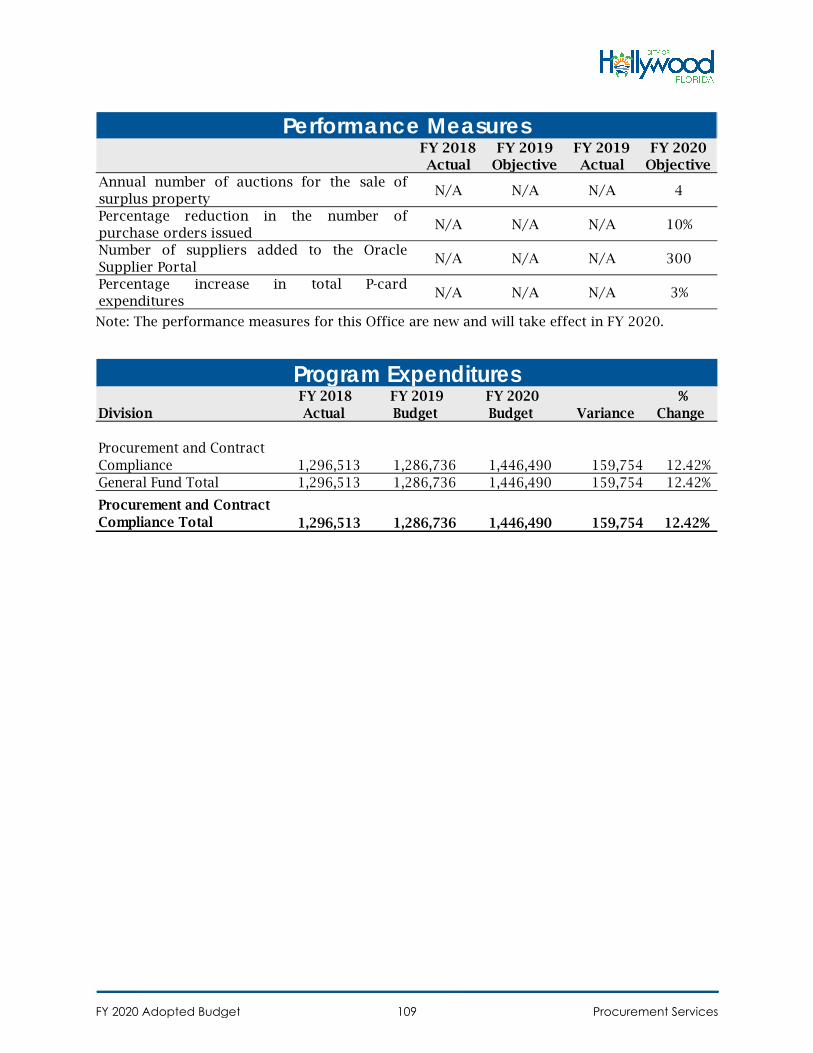
Note: The performance measures for this Office are new and will take effect in FY 2020.
FY 2018 Actual
FY 2019 Objective
FY 2019 Actual
FY 2020 Objective
Annual number of auctions for the sale ofsurplus property
N/A N/A N/A 4
Percentage reduction in the number ofpurchase orders issued
N/A N/A N/A 10%
Number of suppliers added to the OracleSupplier Portal
N/A N/A N/A 300
Percentage increase in total P-cardexpenditures
N/A N/A N/A 3%
Performance Measures
Division FY 2018
Actual FY 2019 Budget
FY 2020 Budget Variance
% Change
Procurement and Contract Compliance 1,296,513 1,286,736 1,446,490 159,754 12.42%General Fund Total 1,296,513 1,286,736 1,446,490 159,754 12.42%
Procurement and Contract Compliance Total 1,296,513 1,286,736 1,446,490 159,754 12.42%
Program Expenditures
FY 2020 Adopted Budget Procurement Services109
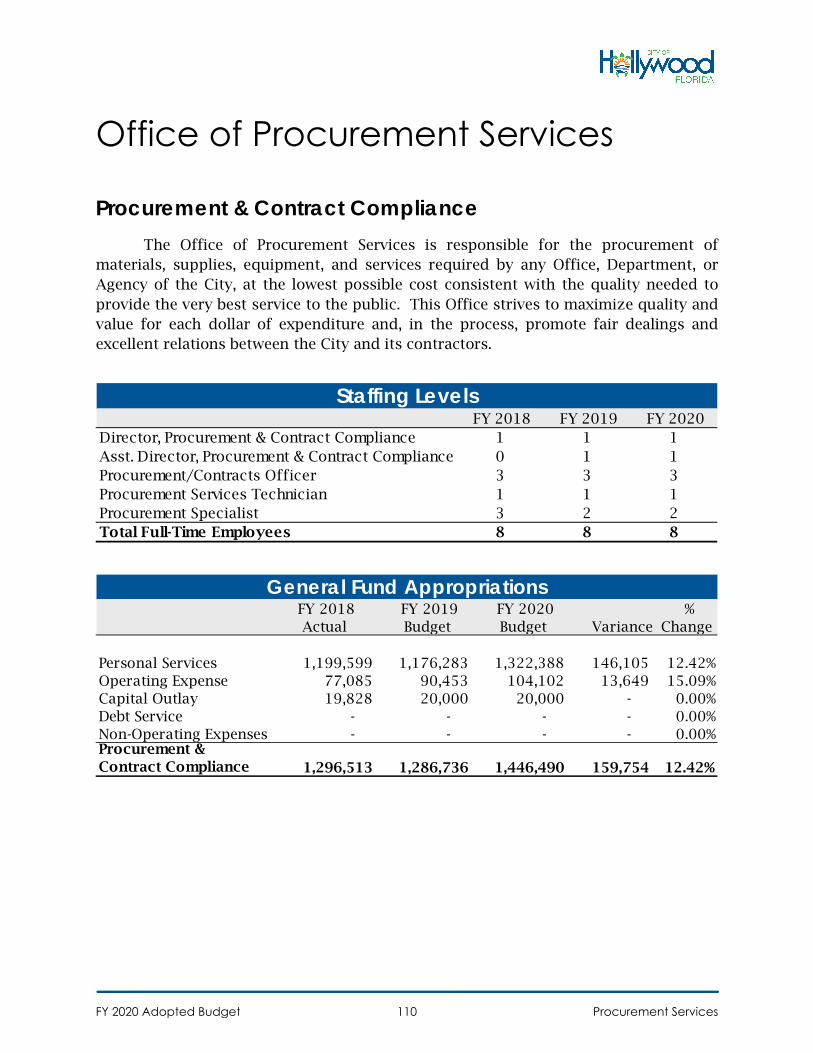
Office of Procurement Services
Procurement & Contract Compliance The Office of Procurement Services is responsible for the procurement of
materials, supplies, equipment, and services required by any Office, Department, or Agency of the City, at the lowest possible cost consistent with the quality needed to provide the very best service to the public. This Office strives to maximize quality and value for each dollar of expenditure and, in the process, promote fair dealings and excellent relations between the City and its contractors.
FY 2018 FY 2019 FY 2020 Director, Procurement & Contract Compliance 1 1 1Asst. Director, Procurement & Contract Compliance 0 1 1Procurement/Contracts Officer 3 3 3Procurement Services Technician 1 1 1Procurement Specialist 3 2 2Total Full-Time Employees 8 8 8
Staffing Levels
FY 2018 Actual
FY 2019 Budget
FY 2020 Budget Variance
% Change
Personal Services 1,199,599 1,176,283 1,322,388 146,105 12.42%Operating Expense 77,085 90,453 104,102 13,649 15.09%Capital Outlay 19,828 20,000 20,000 - 0.00%Debt Service - - - - 0.00%Non-Operating Expenses - - - - 0.00%Procurement & Contract Compliance 1,296,513 1,286,736 1,446,490 159,754 12.42%
General Fund Appropriations
FY 2020 Adopted Budget Procurement Services110
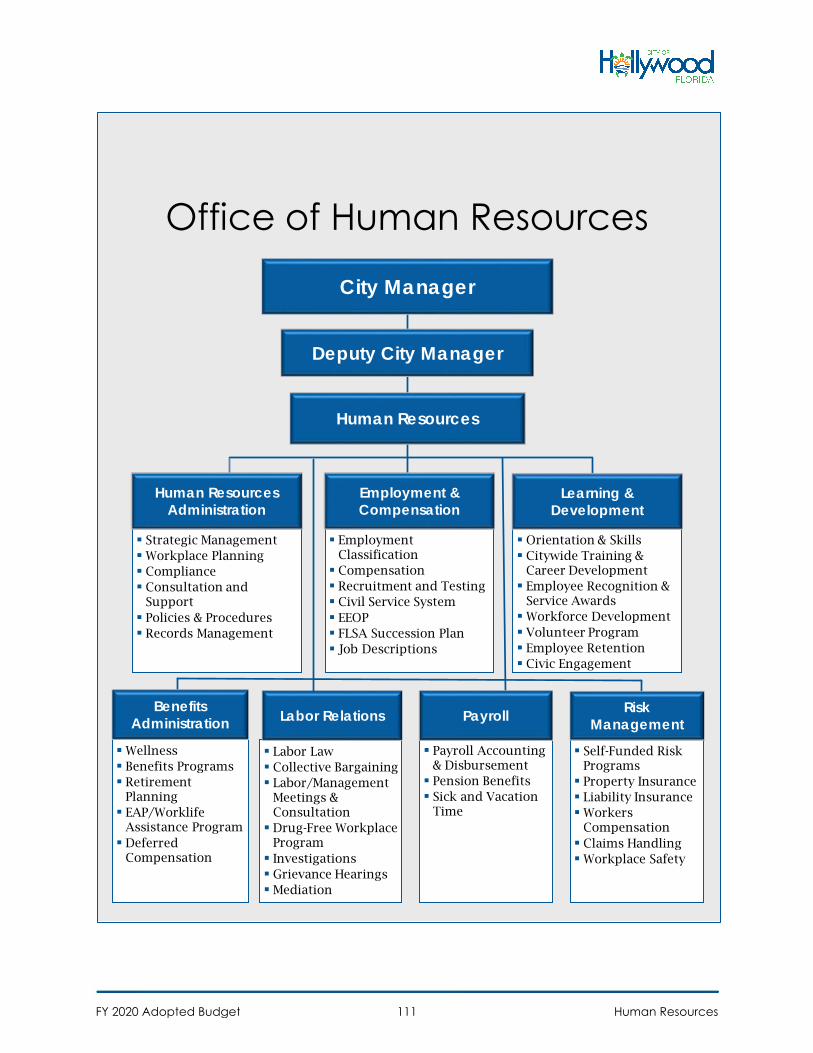
Self-Funded RiskPrograms Property Insurance Liability InsuranceWorkers
Compensation Claims HandlingWorkplace Safety
Risk Management
Office of Human Resources
City Manager
Human Resources
Wellness Benefits Programs Retirement
Planning EAP/Worklife
Assistance Program Deferred
Compensation
Benefits Administration
Labor Law Collective Bargaining Labor/Management
Meetings &Consultation Drug-Free Workplace
Program Investigations Grievance HearingsMediation
Labor Relations
Orientation & Skills Citywide Training &
Career Development Employee Recognition &
Service AwardsWorkforce Development Volunteer Program Employee Retention Civic Engagement
Learning & Development
EmploymentClassification Compensation Recruitment and Testing Civil Service System EEOP FLSA Succession Plan Job Descriptions
Employment & Compensation
Strategic ManagementWorkplace Planning Compliance Consultation and
Support Policies & Procedures Records Management
Human Resources Administration
Deputy City Manager
Payroll Accounting& Disbursement Pension Benefits Sick and Vacation
Time
Payroll
FY 2020 Adopted Budget Human Resources111
Office of Human Resources
Summary The Office of Human Resources is responsible for recruiting, selecting,
retaining, and developing the most important resource of the City – our employees. This Office provides support services and consultation in the areas of Strategic Management, Workforce Planning and Employment, Human Resource Development, Payroll Administration, Compensation and Benefits Administration, and Total Rewards. This Office ensures consistent practices are followed in compliance with State and Federal laws, collective bargaining agreements, City policies, rules, and regulations so that all employees are afforded equal opportunity. It serves all City Departments and Offices in their efforts to recruit, train, and retain a diverse and competent workforce that enables the Departments and Offices to carry out their operations more efficiently and effectively.
In addition, this office is responsible for creating and promoting a productive work environment that fosters an efficient and effective relationship between labor and management. This Office negotiates and administers responsible and cost effective collective bargaining agreements between the City and the City’s five bargaining units, which cover 90% of the City’s workforce.
In addition to providing centralized human resources functions, the Office of
Human Resources is responsible for the administration of the Self Insurance Fund (which covers the City’s self-insured risk) and the development, implementation, and maintenance of the Citywide employee health and benefits programs and handles the City’s workers’ compensation, general liability and property damage claims. The Office is also responsible for the Equal Employment Opportunity (EEO) Program, which includes regulatory functions and compliance with federal, state, and local laws pertaining to equal opportunity in employment. This Office also oversees the City’s Safety Program, is responsible for administering the City’s Drug-Free Workplace Program, and handles all requests for FMLA leave and for reasonable accommodations under the Americans with Disabilities Act.
FY 2020 Adopted Budget Human Resources112
FY 2019 Accomplishments
Administration • Successfully implemented the transition to Oracle Human Capital Management
module meeting the go live date of July 1. • Created and provided Oracle Human Capital Management training both in
person and on-line to over 400 users prior to go live. • Reviewed, revised and received approval to implement revisions to three human
resources policies. • Compiled an EEOP report for applicable Departments/Offices to submit with
their federal grant requirements. • Facilitated four Sick Leave Pool Meetings. • Scanned 1,493 hard copy employment files into Laserfiche. • Received and responded to 9,889 phone calls and walk-in inquiries. • Responded to 145 Public Records Requests for information. • Employees continued their training/education and attended five conferences
related to Labor, Benefits, and Risk Management and one employee is attending classes to obtain the Society of Human Resources SPHR certification.
Labor Relations • Held 19 AFSCME contract negation meetings, 14 IAFF contract negotiation
meetings and 12 PBA contract negotiation meetings which resulted in reaching agreement and entering into five successor collective bargaining agreements, which included health care reform and pension restoration as the main focus
• Processed 28 written reprimands, 20 discipline notices, and responded to two EEOC charges
• Responded to 29 grievances with zero of the grievances advancing to arbitration • Processed 85 FMLA requests • Investigated seven internal complaints • Processed 30 CDL Random/Reasonable/Follow-up Drug Tests and 12 Alcohol
Tests
Learning & Development • Provided 110 Learning and Development classes including but not limited to
Customer Service, New Hire Orientation, Anti-Harassment/Diversity, CPR/AED, EAP/Wellness, Supervisory (New Supervisors & Coaching), Technical/Software and other professional development trainings to more than 1,300 employees
• Provided customer service training to 70 employees • Partnered with City Departments/Offices to provide training on internal topics
including enhanced Legistar/Agenda training, PowerPoint Best Practices and
FY 2020 Adopted Budget Human Resources113
ADA Compliance for Website Liaisons (CMED), Respect/Teamwork (Code Compliance), ERP (Procurement/Finance), and Coaching Employee Performance (Fire)
• Organized various awareness campaigns and fundraising events for causes such as Breast Cancer Awareness, Relay for Life, and Women and Men’s Health Week, raising $6,403.19 dollars
• Facilitated and hosted the annual Public Service Recognition Week activities aimed at focusing on employee recognition and improving morale
• Facilitated and hosted two recognition ceremonies where two Diamond Service award recipients and 220 employees who achieved 5, 10, 15, 20, 25 and 30 years of service were recognized
• Hosted the Annual Volunteer Recognition Reception for 227 people; an increase of 35 volunteers from FY 2018
• Hosted the annual KAPOW (Kids and the Power of Work) program to bring City employees into local schools
• Processed 122 online volunteer applications, background checks and assisted with placement for 20 volunteers
• Completed online Anti-Harassment training with an 80% on-time completion rate
Employment & Compensation • Provided department/offices with qualified personnel within 90 days from
posting the positions (86% of the time) • Assisted departments/offices with the development or revision of 33 job
descriptions and conducted the review of 15 reclassification requests • Conducted 163 unique recruitments, received and reviewed 14,864 applications,
hired 155 new employees and promoted 58 employees • Maintained the turnaround time of 2 days for processing new hire and
promotional personnel action forms within the Human Resources office
Benefits Administration • Processed 9,561 benefit changes including Births, Divorces, Marriages, Domestic
Partnerships, and Dropping Coverage due to Medicare Acquisition and Qualifying Events
• Processed 198 New Hire Benefit enrollments • Processed 159 terminations • Kicked off a new Preventive Incentive Program for employees • Extended AFLAC products to 10 new part time (15-29 hour) classified employees • Hosted 9 Individual Estate Planning Consultations with the Preferred Legal Plan
vendor
FY 2020 Adopted Budget Human Resources114
• Held three Health Insurance Committee Meetings • Increased participation in the City’s fitness facility by adding 68 registrants,
bringing the total number to 333 employees and dependents with access • Implemented/Hosted over 12 wellness initiatives (Life Scans, On-Site
Mammogram Screenings, Wellness/Awareness Lunch-N-Learn Seminars, Beach Boot Camp Series, and a subsidy program with Orange Theory Hollywood) which garnered the participation of 272 participants
• Hosted an annual Biometric Screening which included advanced A1c hemoglobin testing in which 125 employees attended the on-site event
• Held a Flu Shot clinic through Quest where 80 employees received their flu shot • Produced 2,594 Form 1095-C’s that were mailed to all eligible full time
employees, retirees and COBRA participants as well as submitted Form 1095-C to the IRS electronically for mandatory Affordable Care Act reporting
• Conducted 16 Open Enrollment meetings, 13 BenTek Assistance Workshops and processed 1,014 open enrollment changes for a January 1, 2019 effective date
• Sent 1,199 (Open Enrollment Packets), 1,199 (BCBS & Medicare Part D Notices) Retiree Mailings for Open Enrollment and Cigna Changes
Risk Management • Received reimbursement of $708,714 for Hurricane Irma claims • Reduced the number of workers compensation claims by more than 2% (FY18
total claims were 104 and as of 7/30/19, total claims are 68) • Processed 87 new workers compensation claims and closed out 162 workers
compensation cases • Processed 131 new general liability claims and closed out 100 liability cases • Received $31,304 in subrogation funds • Increased EMT Professional Liability insurance limits from $250,00 to
$1,000,000 • Reviewed 1,520 Certificates of Insurances • Conducted checks of all 35 AED’s Citywide • Conducted a physical appraisal of City properties • Conducted 10 safety training classes with 95 employees attending • Purchased four safety training videos for use by Public Utilities and Public
Works
FY 2020 Adopted Budget Human Resources115
FY 2020 Goals
• Provide departments/offices with qualified personnel within 90 days from position posting (80% of the time)
• Develop and revise 12 HR policies annually to ensure consistency with the civil service rules, collective bargaining agreements, and employment laws
• Maintain Employee turnover rate of no more than 5% • Resolve 80% of grievances prior to arbitration • Reduce the number of workers’ compensation claims filed by 2% • Engage employees and improve the overall skills of the workforce to support
the City’s priorities by: o Offering 10 supervisory training classes o Offering 6 administrative training classes o Offering 4 ERP refresher training classes o Offering 2 web-based training classes to leverage the new Oracle learning
module • Facilitate 2 award recognition ceremonies per year • Host the annual Public Service Recognition Week activities • Train 300 employees annually on customer service, conflict resolution and/or
coaching (managers). • Provide annual online refresher training to 1,400 employees on anti-
discrimination and harassment regulations. • Improve the health and well-being of the City’s employees by offering 12
wellness classes/activities annually. • Engage at least 15% of employees to participate in the City’s wellness programs. • Ensure a safe work environment and implement safety programs to reduce
accidents, workers’ compensation claims and lost work days by offering at least 6 safety training sessions.
• Engage at least 120 employees to participate in safety trainings. • Increase the limit for Cyber Liability from $2,000,000 to $5,000,000. • Conduct driver training classes for City employees who drive City vehicles. • Conduct a City Hall fire drill. • Conduct required AED inspections on all units.
FY 2020 Adopted Budget Human Resources116
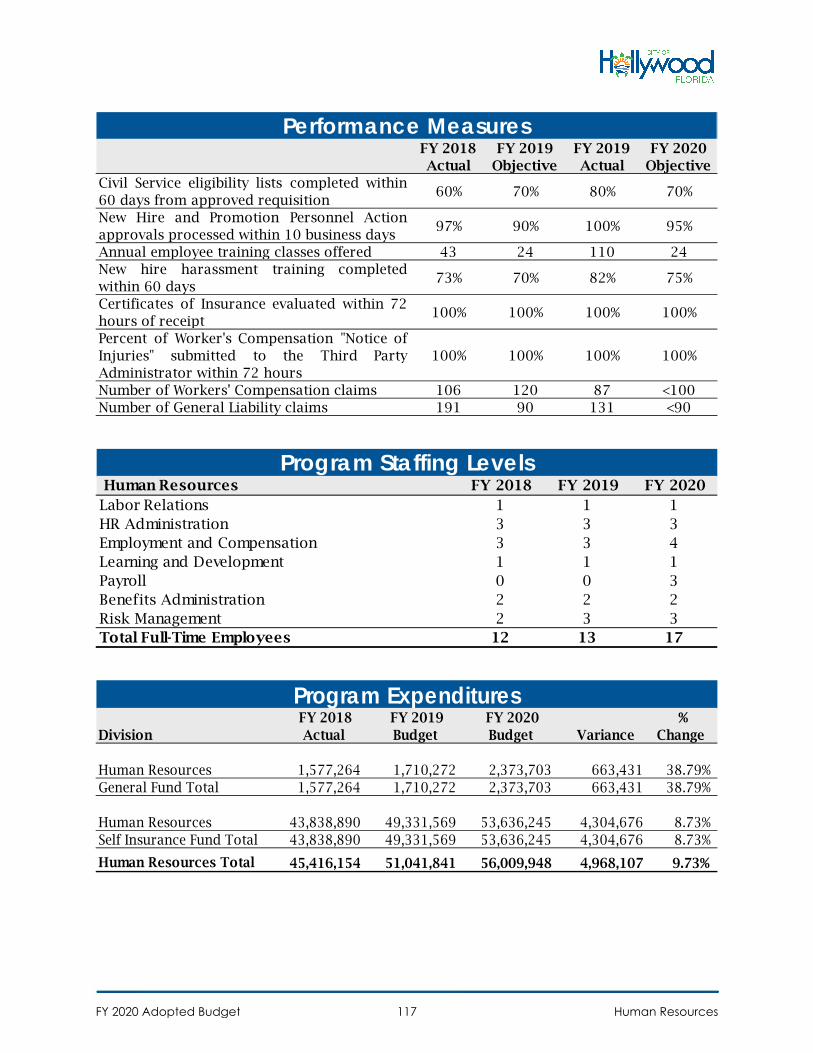
FY 2018 Actual
FY 2019 Objective
FY 2019 Actual
FY 2020 Objective
Civil Service eligibility lists completed within60 days from approved requisition
60% 70% 80% 70%
New Hire and Promotion Personnel Actionapprovals processed within 10 business days
97% 90% 100% 95%
Annual employee training classes offered 43 24 110 24New hire harassment training completedwithin 60 days
73% 70% 82% 75%
Certificates of Insurance evaluated within 72hours of receipt
100% 100% 100% 100%
Percent of Worker's Compensation "Notice ofInjuries" submitted to the Third PartyAdministrator within 72 hours
100% 100% 100% 100%
Number of Workers' Compensation claims 106 120 87 <100Number of General Liability claims 191 90 131 <90
Performance Measures
Human Resources FY 2018 FY 2019 FY 2020 Labor Relations 1 1 1HR Administration 3 3 3Employment and Compensation 3 3 4Learning and Development 1 1 1Payroll 0 0 3Benefits Administration 2 2 2Risk Management 2 3 3Total Full-Time Employees 12 13 17
Program Staffing Levels
Division FY 2018
Actual FY 2019 Budget
FY 2020 Budget Variance
% Change
Human Resources 1,577,264 1,710,272 2,373,703 663,431 38.79%General Fund Total 1,577,264 1,710,272 2,373,703 663,431 38.79%
Human Resources 43,838,890 49,331,569 53,636,245 4,304,676 8.73%Self Insurance Fund Total 43,838,890 49,331,569 53,636,245 4,304,676 8.73%
Human Resources Total 45,416,154 51,041,841 56,009,948 4,968,107 9.73%
Program Expenditures
FY 2020 Adopted Budget Human Resources117
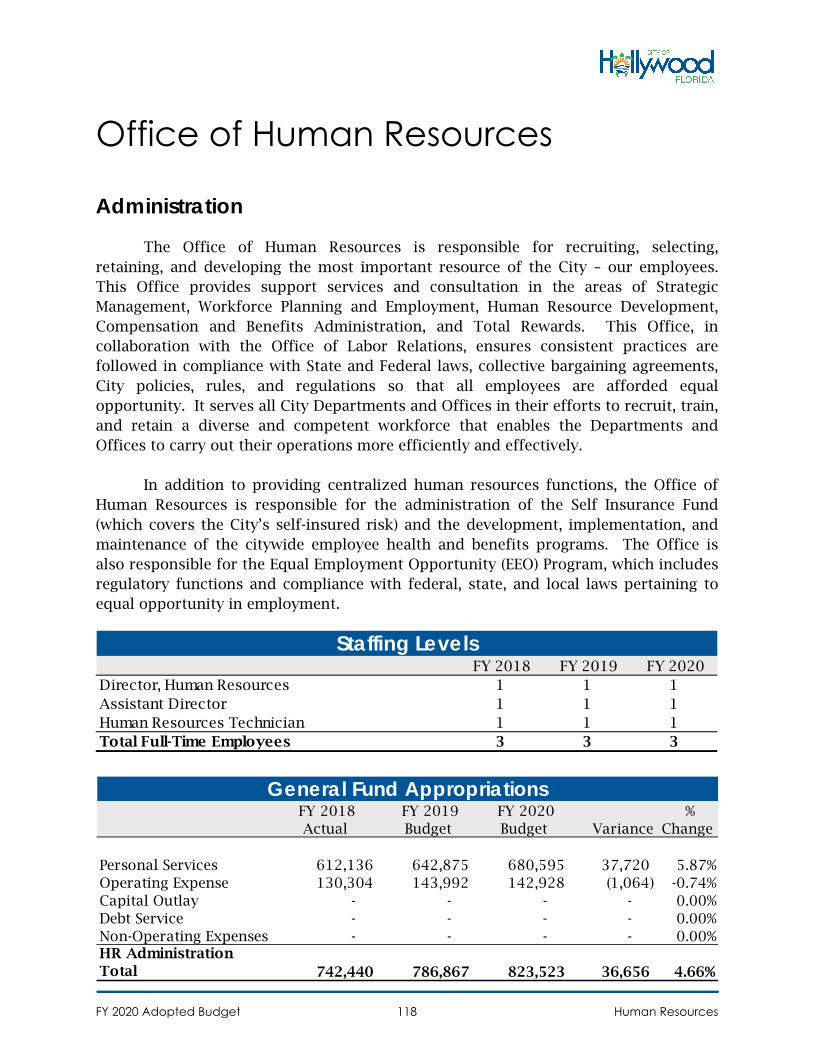
Office of Human Resources
Administration
The Office of Human Resources is responsible for recruiting, selecting, retaining, and developing the most important resource of the City – our employees. This Office provides support services and consultation in the areas of Strategic Management, Workforce Planning and Employment, Human Resource Development, Compensation and Benefits Administration, and Total Rewards. This Office, in collaboration with the Office of Labor Relations, ensures consistent practices are followed in compliance with State and Federal laws, collective bargaining agreements, City policies, rules, and regulations so that all employees are afforded equal opportunity. It serves all City Departments and Offices in their efforts to recruit, train, and retain a diverse and competent workforce that enables the Departments and Offices to carry out their operations more efficiently and effectively.
In addition to providing centralized human resources functions, the Office of Human Resources is responsible for the administration of the Self Insurance Fund (which covers the City’s self-insured risk) and the development, implementation, and maintenance of the citywide employee health and benefits programs. The Office is also responsible for the Equal Employment Opportunity (EEO) Program, which includes regulatory functions and compliance with federal, state, and local laws pertaining to equal opportunity in employment.
FY 2018 FY 2019 FY 2020 Director, Human Resources 1 1 1Assistant Director 1 1 1Human Resources Technician 1 1 1Total Full-Time Employees 3 3 3
Staffing Levels
FY 2018 Actual
FY 2019 Budget
FY 2020 Budget Variance
% Change
612,136 642,875 680,595 37,720 5.87% 130,304 143,992 142,928 (1,064) -0.74%
- - - - 0.00% - - - 0.00%
Personal ServicesOperating ExpenseCapital OutlayDebt ServiceNon-Operating Expenses - - -
- - 0.00%
HR Administration Total 742,440 786,867 823,523 36,656 4.66%
General Fund Appropriations
FY 2020 Adopted Budget Human Resources118
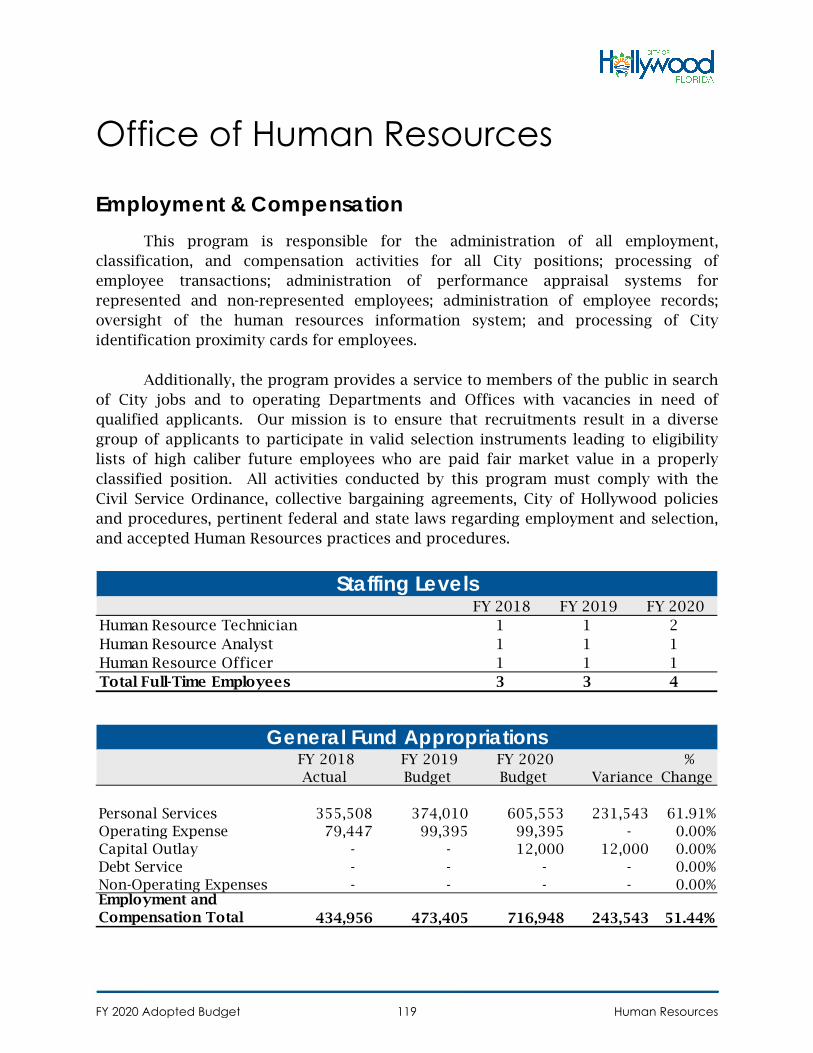
Office of Human Resources
Employment & CompensationThis program is responsible for the administration of all employment,
classification, and compensation activities for all City positions; processing of employee transactions; administration of performance appraisal systems for represented and non-represented employees; administration of employee records; oversight of the human resources information system; and processing of City identification proximity cards for employees.
Additionally, the program provides a service to members of the public in search of City jobs and to operating Departments and Offices with vacancies in need of qualified applicants. Our mission is to ensure that recruitments result in a diverse group of applicants to participate in valid selection instruments leading to eligibility lists of high caliber future employees who are paid fair market value in a properly classified position. All activities conducted by this program must comply with the Civil Service Ordinance, collective bargaining agreements, City of Hollywood policies and procedures, pertinent federal and state laws regarding employment and selection, and accepted Human Resources practices and procedures.
FY 2018 FY 2019 FY 2020 Human Resource Technician 1 1 2Human Resource Analyst 1 1 1Human Resource Officer 1 1 1Total Full-Time Employees 3 3 4
Staffing Levels
FY 2018 Actual
FY 2019 Budget
FY 2020 Budget Variance
% Change
Personal Services 355,508 374,010 605,553 231,543 61.91%Operating Expense 79,447 99,395 99,395 - 0.00%Capital Outlay - - 12,000 12,000 0.00%Debt Service - - - - 0.00%Non-Operating Expenses - - - - 0.00%Employment and Compensation Total 434,956 473,405 716,948 243,543 51.44%
General Fund Appropriations
FY 2020 Adopted Budget Human Resources119
Office of Human Resources
Learning & Development The Learning and Development program provides workforce development which
is carefully designed and strategically aligned to organizational objectives. The program represents an integral component of a systematic process to achieve organizational success by recognizing and addressing the association between the achievement of organizational objectives and the development of employees’ competence.
This program focuses on the following:
• Implementing onboarding, through which new employees acquire the necessary knowledge, skills, and behaviors to become effective organizational members and insiders;
• Evaluating skill level of the workforce to identify learning needs that directly align with City and departmental objectives;
• Targeted development of the workforce through structured and unstructured learning activities;
• Sharing and incorporating best practices in an effort to mitigate the loss of organizational knowledge as a consequence of the departure of experienced individuals; and
• Evaluating learning effectiveness to gauge the impact on performance delivered. The City of Hollywood realizes how important personal and career development
and the work-life balance are to maintaining the productivity and creativity of our employees. The Learning and Development program coordinates activities that develop employee talents and potential, facilitate employability, and enhance the quality of work life.
Finally, the City of Hollywood is focused on increasing employee morale by
offering a variety of engagement activities. A part of this plan includes placing an emphasis on employee recognition which is one of the most effective ways to reduce turnover, curb absenteeism, and increase productivity. The Learning and Development program coordinates service award ceremonies and other programs that focus on employee recognition and improving morale.
FY 2020 Adopted Budget Human Resources120
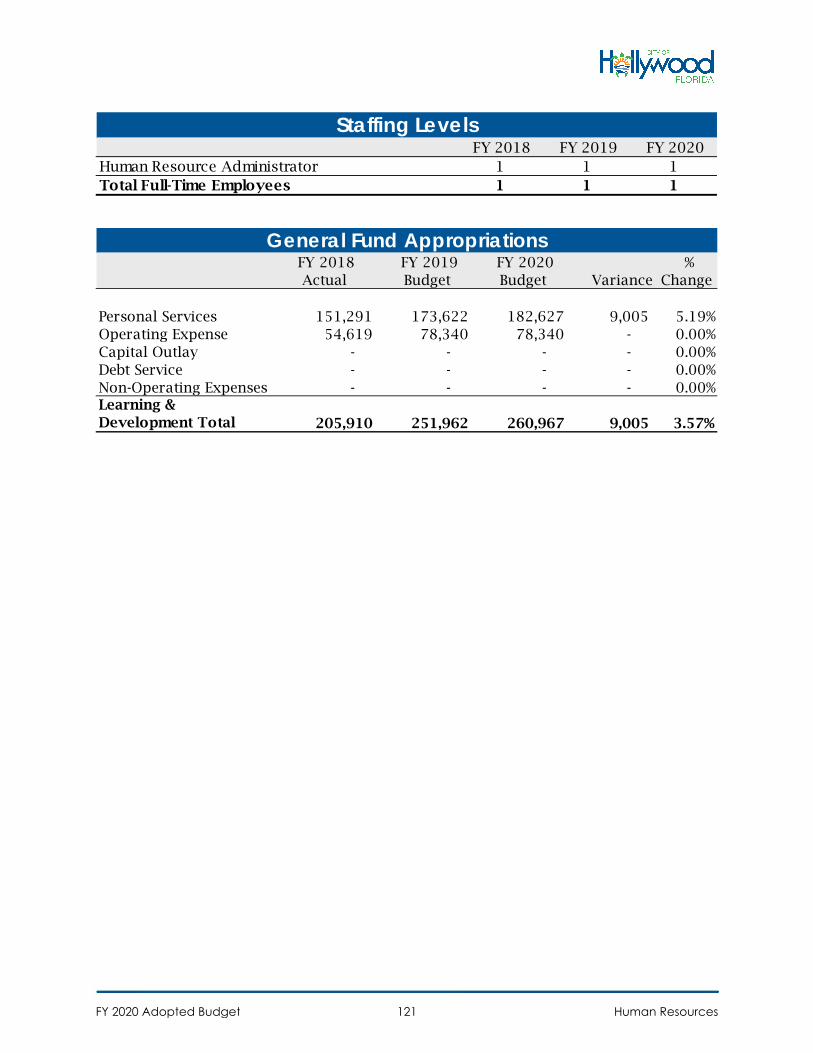
FY 2018 FY 2019 FY 2020 Human Resource Administrator 1 1 1Total Full-Time Employees 1 1 1
Staffing Levels
FY 2018 Actual
FY 2019 Budget
FY 2020 Budget Variance
% Change
Personal Services 151,291 173,622 182,627 9,005 5.19%Operating Expense 54,619 78,340 78,340 - 0.00%Capital Outlay - - - - 0.00%Debt Service - - - - 0.00%Non-Operating Expenses - - - - 0.00%Learning & Development Total 205,910 251,962 260,967 9,005 3.57%
General Fund Appropriations
FY 2020 Adopted Budget Human Resources121
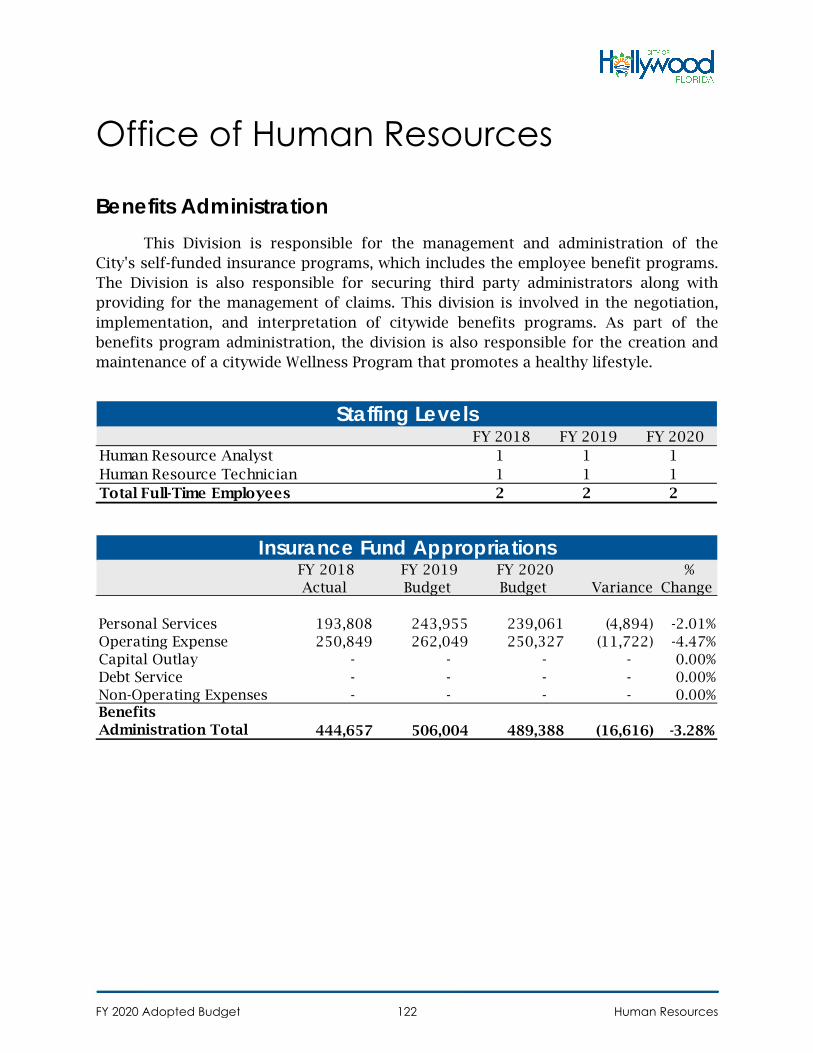
Office of Human Resources
Benefits Administration This Division is responsible for the management and administration of the
City's self-funded insurance programs, which includes the employee benefit programs. The Division is also responsible for securing third party administrators along with providing for the management of claims. This division is involved in the negotiation, implementation, and interpretation of citywide benefits programs. As part of the benefits program administration, the division is also responsible for the creation and maintenance of a citywide Wellness Program that promotes a healthy lifestyle.
FY 2018 FY 2019 FY 2020 Human Resource Analyst 1 1 1Human Resource Technician 1 1 1Total Full-Time Employees 2 2 2
Staffing Levels
FY 2018 Actual
FY 2019 Budget
FY 2020 Budget Variance
% Change
Personal Services 193,808 243,955 239,061 (4,894) -2.01%Operating Expense 250,849 262,049 250,327 (11,722) -4.47%Capital Outlay - - - - 0.00%Debt Service - - - - 0.00%Non-Operating Expenses - - - - 0.00%Benefits Administration Total 444,657 506,004 489,388 (16,616) -3.28%
Insurance Fund Appropriations
FY 2020 Adopted Budget Human Resources122
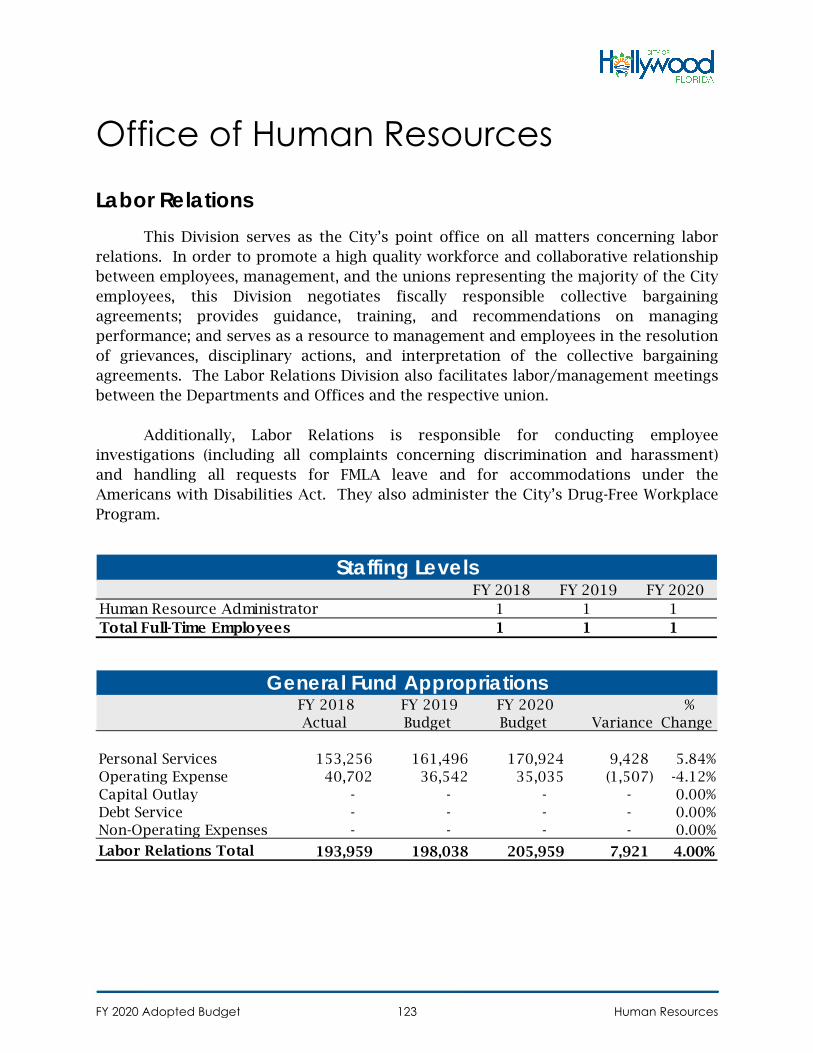
Office of Human Resources
Labor Relations
This Division serves as the City’s point office on all matters concerning labor relations. In order to promote a high quality workforce and collaborative relationship between employees, management, and the unions representing the majority of the City employees, this Division negotiates fiscally responsible collective bargaining agreements; provides guidance, training, and recommendations on managing performance; and serves as a resource to management and employees in the resolution of grievances, disciplinary actions, and interpretation of the collective bargaining agreements. The Labor Relations Division also facilitates labor/management meetings between the Departments and Offices and the respective union.
Additionally, Labor Relations is responsible for conducting employee
investigations (including all complaints concerning discrimination and harassment) and handling all requests for FMLA leave and for accommodations under the Americans with Disabilities Act. They also administer the City’s Drug-Free Workplace Program.
FY 2018 FY 2019 FY 2020 Human Resource Administrator 1 1 1Total Full-Time Employees 1 1 1
Staffing Levels
FY 2018 Actual
FY 2019 Budget
FY 2020 Budget Variance
% Change
Personal Services 153,256 161,496 170,924 9,428 5.84%Operating Expense 40,702 36,542 35,035 (1,507) -4.12%Capital Outlay - - - - 0.00%Debt Service - - - - 0.00%Non-Operating Expenses - - - - 0.00%
Labor Relations Total 193,959 198,038 205,959 7,921 4.00%
General Fund Appropriations
FY 2020 Adopted Budget Human Resources123
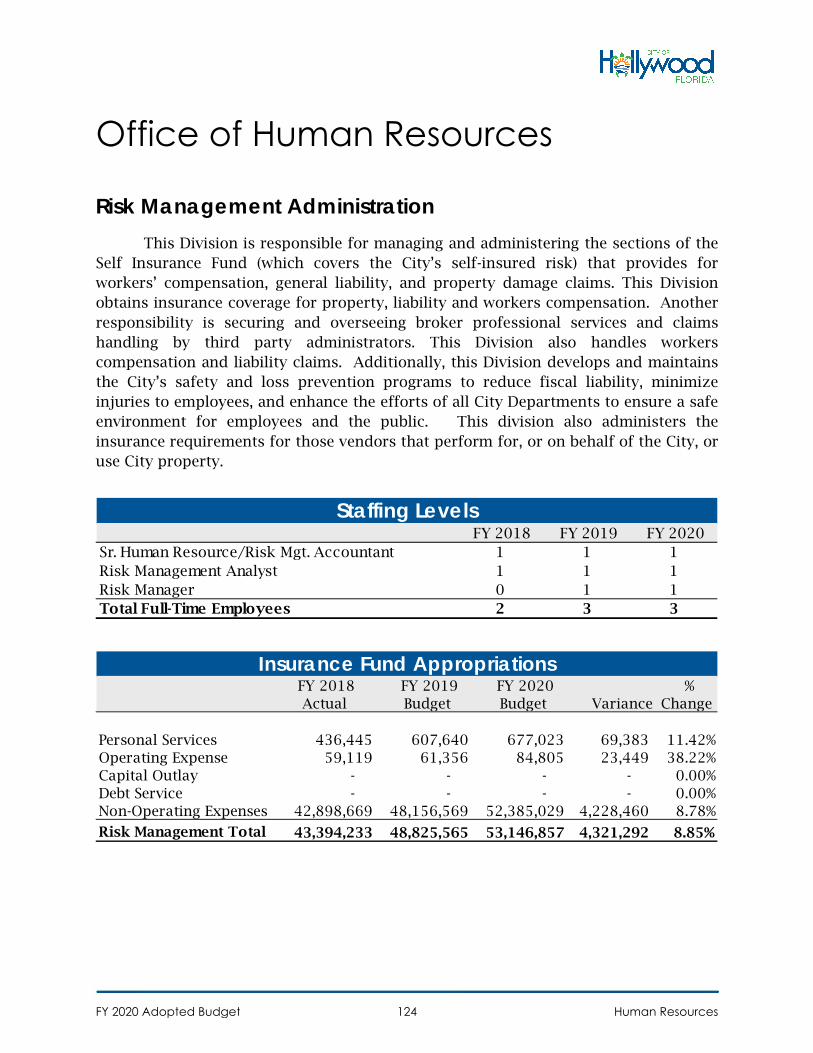
Office of Human Resources
Risk Management Administration This Division is responsible for managing and administering the sections of the
Self Insurance Fund (which covers the City’s self-insured risk) that provides for workers’ compensation, general liability, and property damage claims. This Division obtains insurance coverage for property, liability and workers compensation. Another responsibility is securing and overseeing broker professional services and claims handling by third party administrators. This Division also handles workers compensation and liability claims. Additionally, this Division develops and maintains the City’s safety and loss prevention programs to reduce fiscal liability, minimize injuries to employees, and enhance the efforts of all City Departments to ensure a safe environment for employees and the public. This division also administers the insurance requirements for those vendors that perform for, or on behalf of the City, or use City property.
FY 2018 FY 2019 FY 2020 Sr. Human Resource/Risk Mgt. Accountant 1 1 1Risk Management Analyst 1 1 1Risk Manager 0 1 1Total Full-Time Employees 2 3 3
Staffing Levels
FY 2018 Actual
FY 2019 Budget
FY 2020 Budget Variance
% Change
Personal Services 436,445 607,640 677,023 69,383 11.42%Operating Expense 59,119 61,356 84,805 23,449 38.22%Capital Outlay - - - - 0.00%Debt Service - - - - 0.00%Non-Operating Expenses 42,898,669 48,156,569 52,385,029 4,228,460 8.78%
Risk Management Total 43,394,233 48,825,565 53,146,857 4,321,292 8.85%
Insurance Fund Appropriations
FY 2020 Adopted Budget Human Resources124
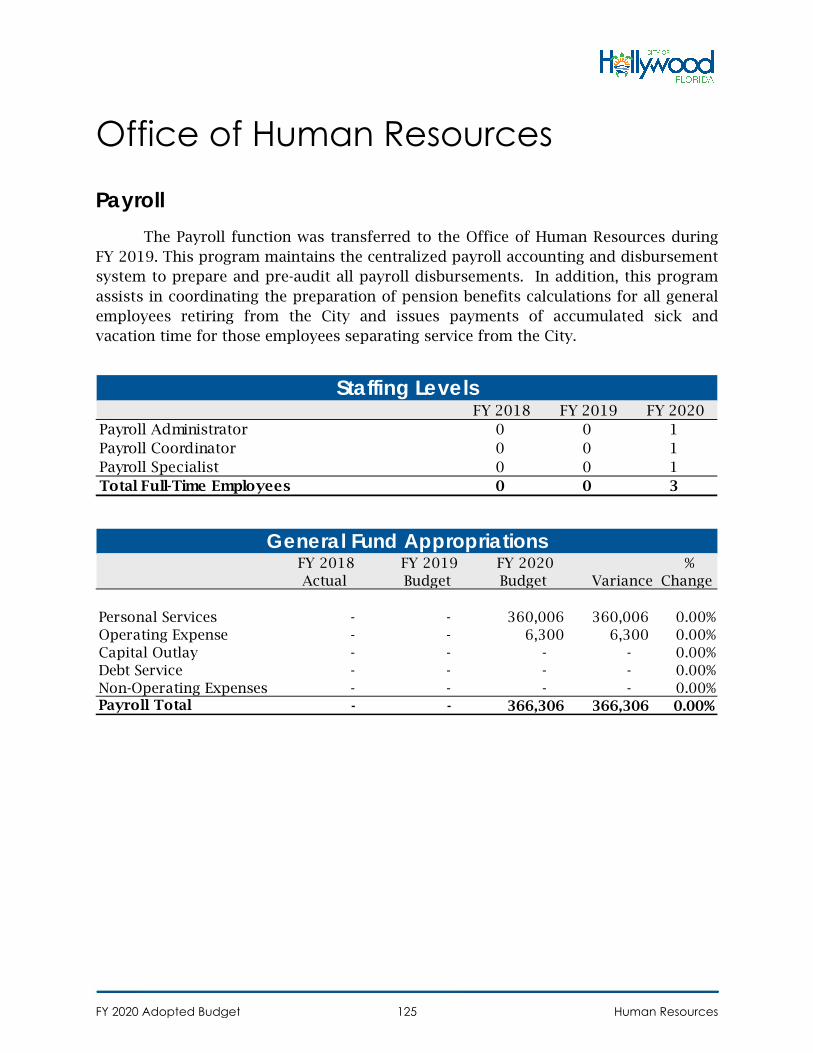
Office of Human Resources
Payroll The Payroll function was transferred to the Office of Human Resources during
FY 2019. This program maintains the centralized payroll accounting and disbursement system to prepare and pre-audit all payroll disbursements. In addition, this program assists in coordinating the preparation of pension benefits calculations for all general employees retiring from the City and issues payments of accumulated sick and vacation time for those employees separating service from the City.
FY 2018 FY 2019 FY 2020 Payroll Administrator 0 0 1Payroll Coordinator 0 0 1Payroll Specialist 0 0 1Total Full-Time Employees 0 0 3
Staffing Levels
FY 2018 Actual
FY 2019 Budget
FY 2020 Budget Variance
% Change
Personal Services - - 360,006 360,006 0.00%Operating Expense - - 6,300 6,300 0.00%Capital Outlay - - - - 0.00%Debt Service - - - - 0.00%Non-Operating Expenses - - - - 0.00%Payroll Total - - 366,306 366,306 0.00%
General Fund Appropriations
FY 2020 Adopted Budget Human Resources125
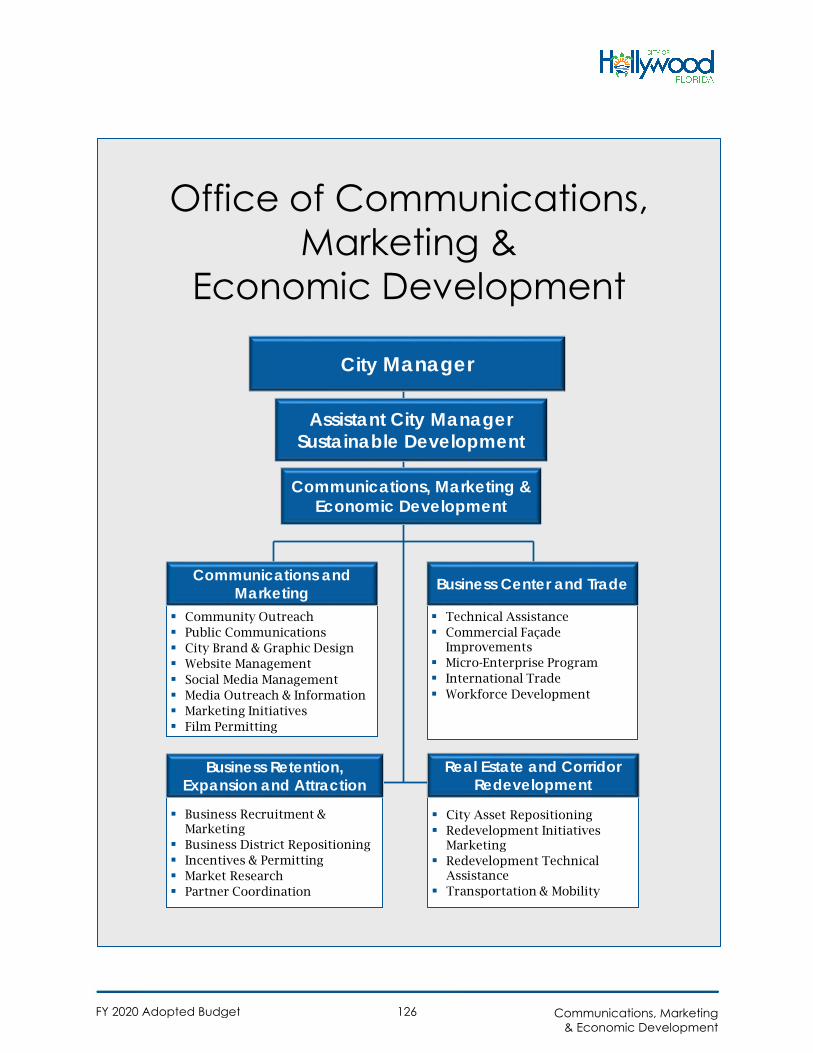
Office of Communications, Marketing &
Economic Development
Technical Assistance Commercial Façade
Improvements Micro-Enterprise Program International Trade Workforce Development
Business Center and Trade
Community Outreach Public Communications City Brand & Graphic Design Website Management Social Media Management Media Outreach & Information Marketing Initiatives Film Permitting
Communications and Marketing
City Manager
Communications, Marketing & Economic Development
Business Recruitment &Marketing
Business District Repositioning Incentives & Permitting Market Research Partner Coordination
Business Retention, Expansion and Attraction
City Asset Repositioning Redevelopment Initiatives
Marketing Redevelopment Technical
Assistance Transportation & Mobility
Real Estate and Corridor Redevelopment
Assistant City ManagerSustainable Development
FY 2020 Adopted Budget Communications, Marketing& Economic Development
126
Office of Communications, Marketing & Economic Development
Summary The Office of Communications, Marketing and Economic Development is
comprised of two divisions: Communications/Marketing and Economic Development. These two divisions work in concert to promote and support the City’s vision to be a welcoming, vibrant, sustainable destination city.
The Office oversees the City’s online presence coordinating with all offices and departments to support ongoing enhancements to the City’s websites and online services. The Communications and Marketing Division provides oversight of the content management of the website and training to all departmental website liaisons. In FY 2016, the City’s online presence was expanded to include a website devoted to promoting the City’s Economic Development initiatives, www.choosehollywoodfl.com. The Communications Division now manages the City’s websites and social media sites including Facebook, Twitter, LinkedIn and YouTube.
FY 2019 Accomplishments• Managed the successful “Let’s Go Hollywood” public education and outreach
campaign for the general obligation bond vote providing communitypresentations, addressing media inquiries, working with communitystakeholders, preparing commission agenda and workshop materials, producingwebsite content, social media content, publications, and online and outdooradvertising to secure voter approval of up to $165 million in bond fundedcapital improvements
• Completed the office reorganization, which combined economic developmentand communications/marketing staff into new office space within City Hall
• Completed the hiring of an Economic Development Manager, EconomicDevelopment Representative and Economic Development Marketing Coordinator
• Re-classified one Video Production Specialist position to a Multimedia DesignCoordinator to better align with office goals
• Enhanced marketing of Hollywood’s two Opportunity Zones by connectingfunding opportunities with projects, prioritizing reviews of opportunity zoneprojects, developing a database of market information and promoting zonesthrough industry marketing events and advertising
FY 2020 Adopted Budget Communications, Marketing& Economic Development
127
• Launched an Entrepreneurship Program offering workshops and trainings inentrepreneur development through the City’s affiliation with KauffmanFastTrac® and partnerships with organizations such as Broward SCORE to equipentrepreneurs with the business skills and insights, tools, resources, and peernetworks necessary to start and grow successful businesses
• Entered into a partnership with Broward College to provide community-basedwork skills training programs as part of the Broward Up
• Sponsored a series of “Tech Talks” and the “Tech Awards” with the SouthFlorida Business Journal and participated in SUPx as part of the City’s EconomicDevelopment strategic marketing program in support of technology basedbusiness development and growth in Hollywood
• Expanded the Commercial Property Improvement Program (CPIP) to strategicbusiness corridors throughout Hollywood and increased program marketingwith community meetings, direct mail, social media and e-mail outreach
• Continued engagement with organized industry networks including NAIOP,International Economic Development Council, Florida Economic DevelopmentCouncil, Greater Fort Lauderdale Alliance and its various councils, Greater FortLauderdale Realtors Association, South Florida Office Brokers Association, andthe International Council of Shopping Centers, to promote businessdevelopment and redevelopment opportunities in the City
• Provided business and permitting assistance as part of expansion and retentioninitiatives with existing companies and recruitment initiatives with companieslooking to relocate to the City
• Collaborated with the Greater Hollywood Chamber of Commerce and LeadershipHollywood to increase SPARK|Hollywood participation and events including the3rd annual SPARK|Hollywood pitching contests and the SPARK three-partSpeaker Series, which focused on “How to Get Funded,” “Speed Branding,” and“Owning Your Pitch”
• Worked in partnership with the Johnson Street Business Association andDepartment of Public Utilities to provide assistance to businesses adverselyaffected by roadway construction on Hollywood Boulevard and Johnson Street
• Hosted multiple familiarization tours of the City providing potential investors,site selectors and real estate consultants with information on new opportunitiesrelated to zoning changes and opportunity zones, planned and current publicimprovement projects, as well as current real estate development taking placewithin the City
• Coordinated, in partnership with the Office of the City Manager and Departmentof Financial Services, presentations and tours with bond ratings agencies tosecure strong bond ratings for the City’s General Obligation Bonds Series 2019
• Partnered with a group of local business leaders, the Chamber of Commerce andLeadership Broward to plan and coordinate the second TEDx Young Circle Parkevent slated for November 2019
FY 2020 Adopted Budget Communications, Marketing& Economic Development
128
• Continued phased implementation of the City’s new brand image and logofeaturing a colorful sea turtle embedded within the Hollywood logo along withthe tag line, “See Life,” updating marketing materials in alignment with theCity’s brand image
• Provided oversight and coordination of the more than 1,000 web content pagesand dozens of applications on the City’s main website, www.hollywoodfl.organd economic development website, www.choosehollywoodfl.com includinggraphic design, writing and editing web pages, calendar listings, news updatesand web liaison training
• Responded to hundreds of media requests on news stories such as the generalobligation bond, seaweed removal, Hollywood Hills Rehabilitation Centerarrests, and septic to sewer conversions. Media support was given to promoteCity events such as the Candy Cane and St. Patrick’s Day Parades
• Provided special event promotion and support through print advertising, freeand paid social media and video production services to support City, CRA andcommunity events and initiatives such as SPARK Hollywood, Veterans DayBarbecue, Spring Marshmallow Drop, and Hollywood Happy Day, St. Patrick’sDay Parade, Candy Parade and the USS Paul Ignatius Ship Commissioning
• Increased ADA compliance of City’s broadcast and website presence bycompleting the final phase of a project with Comcast to transition to adedicated fiber connection for full closed captioning availability of City’sgovernment access channel broadcasts. Provided ADA compliance training forwebsite pages and documents
• Assisted with the planning and implementation of several ribbon cutting andgroundbreaking ceremonies, workshops and community events such as QuietZones, Tu B’ Shavt, and Arbor Day Celebrations
• Produced four issues of the City’s quarterly New Horizons magazine facilitatinga return to a direct mail printed publication, in addition to the onlinepublication, that is mailed to more than 60,000 households and emailed to26,000 NotifyMe subscribers
• Continued to grow the City’s social media presence enhancing publiccommunication through the administration of the City’s Facebook, YouTube,LinkedIn, Twitter and Instagram accounts. As of September 30, 2019, Facebookhas earned more than 15,500 followers, Twitter has more than 6,000 followers,YouTube has more than 800 subscribers, LinkedIn has more than 2,000followers and the newly launched Instagram account has more than 1,500followers
• Coordinated, in conjunction with the City Manager’s Office and the CRA, thelaunch of a new micro-transit transportation circulator service for downtownHollywood, Federal Highway and Hollywood Beach
• Coordinated economic development marketing through ads and advertorialcontent in publications and websites such as Corenet Global’s The Leader,
FY 2020 Adopted Budget Communications, Marketing & Economic Development
129
Business Facilities, Florida Trend, The South Florida Business Journal, Jet Trader, Trade & Industry, Hollywood Chamber Guide and Chief Executive, poBiznow, ULI, Building Broward, Hispanic Unity Entrepreneur Summit, Chamber Guide, and Port Everglades Association
• Provided special event promotion through online and print advertising includingBroward family life, sponsorship of the USS Paul Ignatius Ship Commissioning,St. Patrick’s Parade, and Candy Cane Parade
• Procured, created and designed the new Open Gov “Hollywood on the Go” webportal to provide easily accessible updates or “stories” for Capital Improvement,GOB, ILA and Surtax projects
FY 2020 Goals
• Complete and implement the Economic Development Strategic Plan ensuringintegration into the City’s overall Strategic Plan and new Comprehensive Plan
• Expand SPARK|Hollywood to include more events, meet-ups, and learningsessions in support of small business start-ups and entrepreneurs
• Participate and host local real estate and development forums promotingdevelopment/redevelopment opportunities within the City
• Enhance outreach and assistance to businesses focusing on target industries,improving industrial districts and key commercial corridors
• Promote redevelopment along commercial corridors, within the RegionalActivity Center and Transit Oriented Corridor (TOC), and federal OpportunityZones
• Develop and execute workshops and forum opportunities for the local businesscommunity aimed at providing relevant and practical content for networkingand business advancement
• Continue coordination with Broward MPO, FDOT, and CRA on corridortransportation and mobility projects
• Maximize value of the City’s real estate assets by positioning City's surplus andunderutilized property for redevelopment
• Continue brand implementation with the oversight of the design and location ofnew wayfinding and gateway signage as part of the City’s General ObligationBond and Complete Streets corridor projects
• Finalize and implement a new street banner and electronic billboard program tomaximize outdoor advertising opportunities
• Complete the ADA assessment of website and develop a phased plan forwebsite liaisons to ensure ADA accessibility on the City’s primary and economicdevelopment websites
• Explore new technologies to support community awareness of the services,programs and events offered by the City of Hollywood
FY 2020 Adopted Budget Communications, Marketing & Economic Development
130
• Coordinate with external media partners to seek promotional support for Cityof Hollywood events and programs
• Expand City’s Economic Development media buy to reach a broader audience.• Update the City-wide Communication Plan to reinforce brand messaging and
logo implementation• Finalize upgrade to Comcast broadcast transmitters• Continue to enhance public safety awareness across all public communications
platforms, including publications (New Homeowner’s Guide, Landlord TenantHandbook, New Horizons, Crime Prevention Brochures), social media, the City’swebsites (www.hollywoodfl.org & choosehollywoodfl.com) and governmentaccess cable channels (Hollywood Community Television)
• Maintain and enhance the “Hollywood On the Go” Open Gov web portal foreasily accessible and transparent information related to the City’s CapitalImprovement, GOB, ILA and Surtax projects
• Finalize a comprehensive film ordinance to facilitate commercial, feature film,and national and international episodic television production in Hollywoodthrough the permitting process operated in partnership with the Greater FortLauderdale Office of Film and Entertainment
• Increase Government Access Channel and web-based video programming tocreate greater exposure for special events and programs
• Continue to produce four editions of the City’s quarterly New Horizonsmagazine highlighting programs and services for residents includinginformation on recreation, child care, summer camps, public safety issues,public utility and public works services
• Work in partnership with Community Development to increase work skillstraining programs focused on ensuring a qualified workforce for targetindustries
FY 2018 Actual
FY 2019 Objective
FY 2019 Actual
FY 2020 Objective
Annual hours of Creative Services provided 1,168 1,200 1,555 1,200Annual number of Social Media Posts 17,419 600 9,579 6,000
Annual number of Public Relations Projects(News Releases, Media Inquiries, Film Permits)
257 200 164 200
Annual number of Multi Media Projects (Video,Internet)
511 200 452 200
Annual # of targeted marketing campaigns 11 4 70 4Annual number of businesses assisted 84 25 114 25Annual number of jobs created or retained 5,700 100 3,811 100Annual number of business outreach andassistance provided to property owners anddevelopers
62 25 87 25
Performance Measures
FY 2020 Adopted Budget Communications, Marketing& Economic Development
131
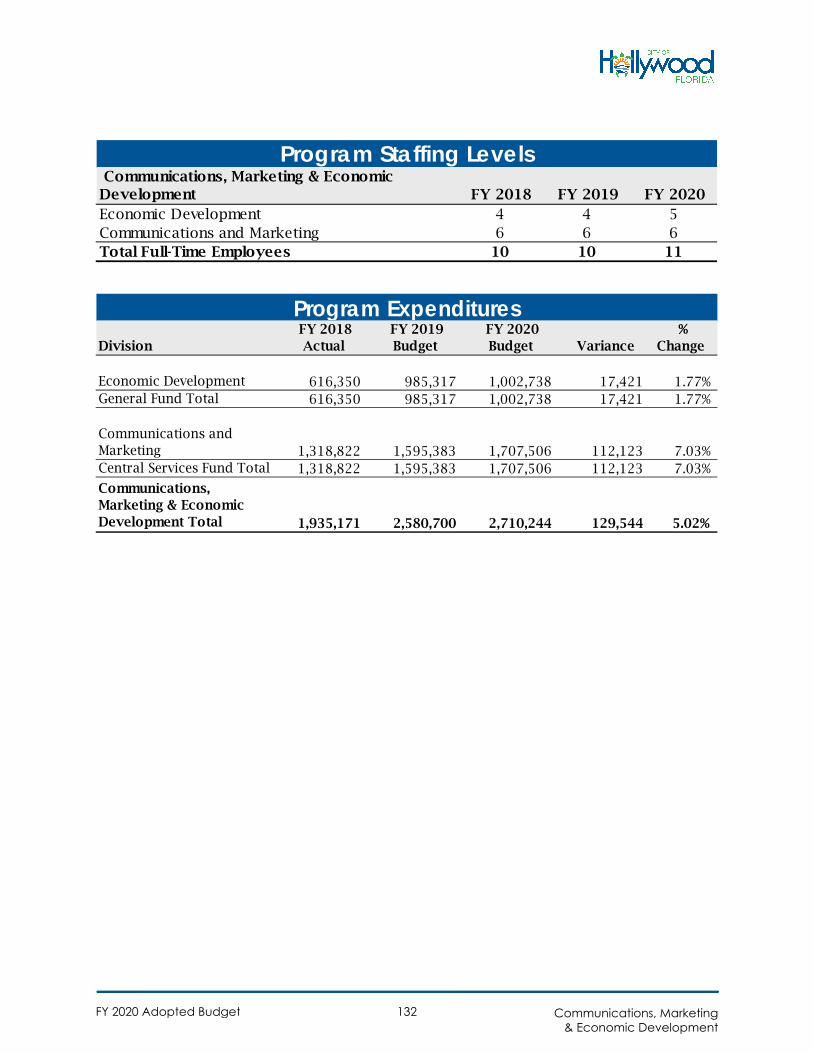
Communications, Marketing & Economic Development FY 2018 FY 2019 FY 2020 Economic Development 4 4 5Communications and Marketing 6 6 6Total Full-Time Employees 10 10 11
Program Staffing Levels
Division FY 2018
Actual FY 2019 Budget
FY 2020 Budget Variance
% Change
Economic Development 616,350 985,317 1,002,738 17,421 1.77%General Fund Total 616,350 985,317 1,002,738 17,421 1.77%
Communications and Marketing 1,318,822 1,595,383 1,707,506 112,123 7.03%Central Services Fund Total 1,318,822 1,595,383 1,707,506 112,123 7.03%
Communications, Marketing & Economic Development Total 1,935,171 2,580,700 2,710,244 129,544 5.02%
Program Expenditures
FY 2020 Adopted Budget Communications, Marketing& Economic Development
132
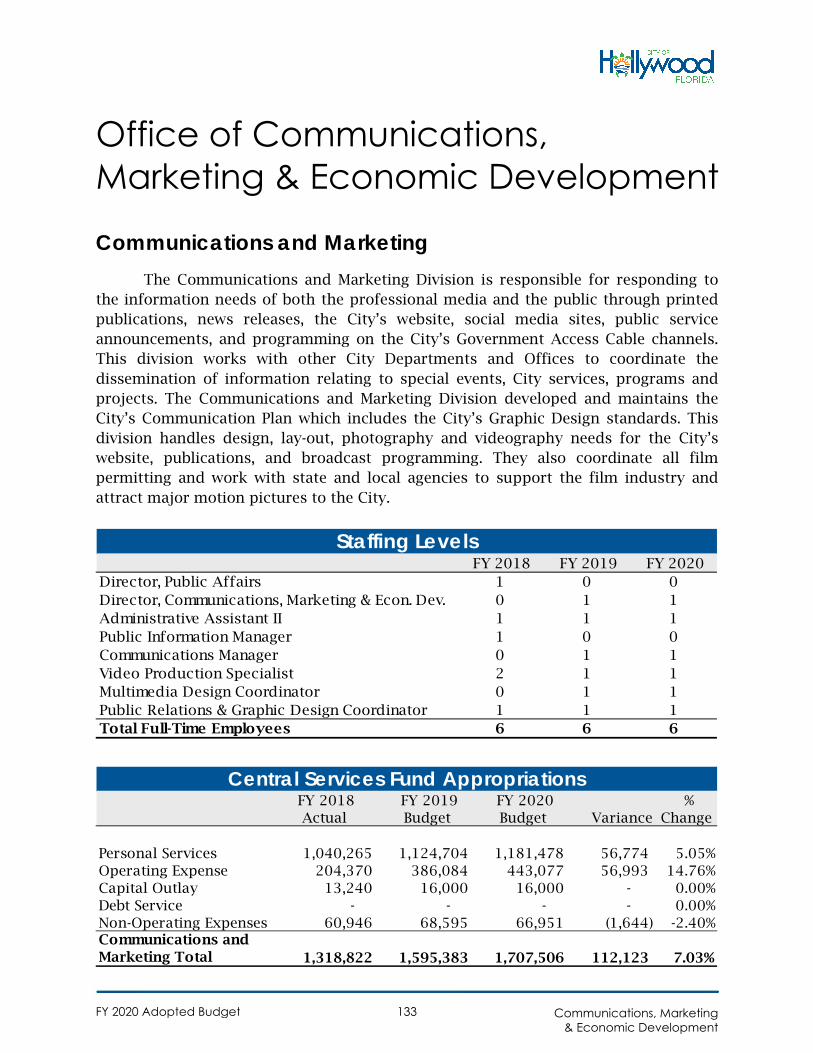
Office of Communications, Marketing & Economic Development
Communications and MarketingThe Communications and Marketing Division is responsible for responding to
the information needs of both the professional media and the public through printed publications, news releases, the City’s website, social media sites, public service announcements, and programming on the City’s Government Access Cable channels. This division works with other City Departments and Offices to coordinate the dissemination of information relating to special events, City services, programs and projects. The Communications and Marketing Division developed and maintains the City’s Communication Plan which includes the City’s Graphic Design standards. This division handles design, lay-out, photography and videography needs for the City’s website, publications, and broadcast programming. They also coordinate all film permitting and work with state and local agencies to support the film industry and attract major motion pictures to the City.
FY 2018 FY 2019 FY 2020 Director, Public Affairs 1 0 0Director, Communications, Marketing & Econ. Dev. 0 1 1Administrative Assistant II 1 1 1Public Information Manager 1 0 0Communications Manager 0 1 1Video Production Specialist 2 1 1Multimedia Design Coordinator 0 1 1Public Relations & Graphic Design Coordinator 1 1 1Total Full-Time Employees 6 6 6
Staffing Levels
FY 2018 Actual
FY 2019 Budget
FY 2020 Budget Variance
% Change
Personal Services 1,040,265 1,124,704 1,181,478 56,774 5.05%Operating Expense 204,370 386,084 443,077 56,993 14.76%Capital Outlay 13,240 16,000 16,000 - 0.00%Debt Service - - - - 0.00%Non-Operating Expenses 60,946 68,595 66,951 (1,644) -2.40%Communications and Marketing Total 1,318,822 1,595,383 1,707,506 112,123 7.03%
Central Services Fund Appropriations
FY 2020 Adopted Budget Communications, Marketing& Economic Development
133
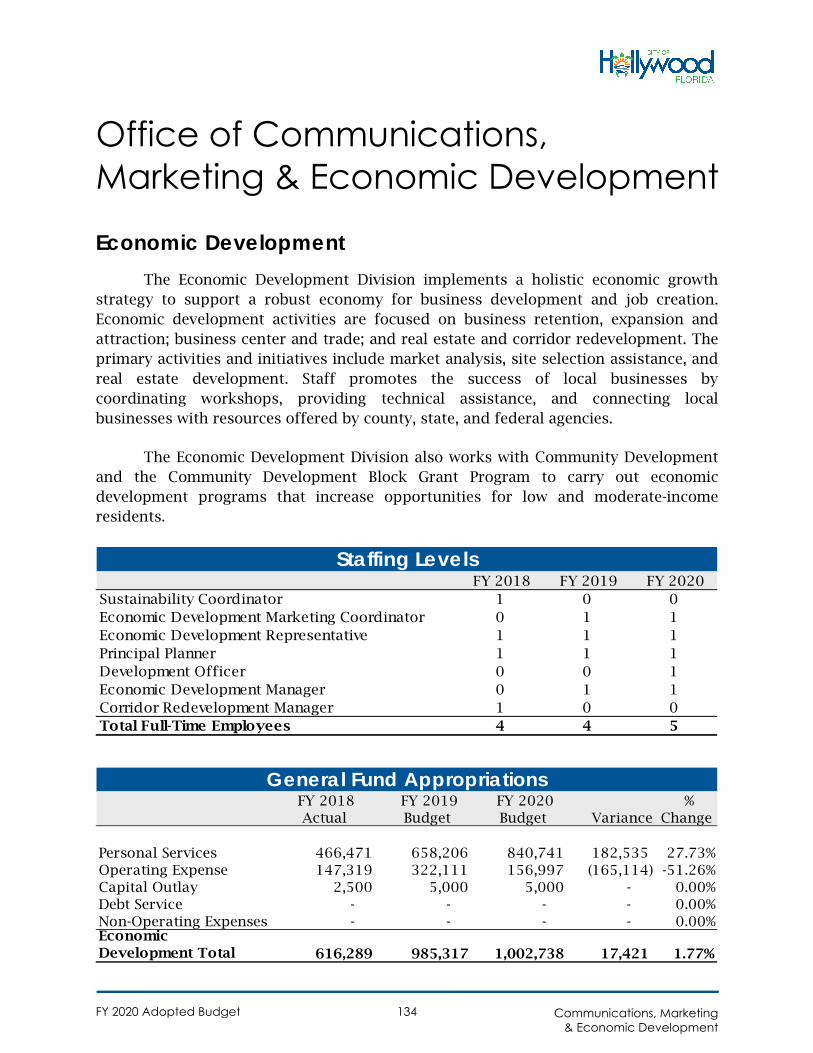
Office of Communications, Marketing & Economic Development
Economic Development The Economic Development Division implements a holistic economic growth
strategy to support a robust economy for business development and job creation. Economic development activities are focused on business retention, expansion and attraction; business center and trade; and real estate and corridor redevelopment. The primary activities and initiatives include market analysis, site selection assistance, and real estate development. Staff promotes the success of local businesses by coordinating workshops, providing technical assistance, and connecting local businesses with resources offered by county, state, and federal agencies.
The Economic Development Division also works with Community Development and the Community Development Block Grant Program to carry out economic development programs that increase opportunities for low and moderate-income residents.
FY 2018 FY 2019 FY 2020 Sustainability Coordinator 1 0 0Economic Development Marketing Coordinator 0 1 1Economic Development Representative 1 1 1Principal Planner 1 1 1Development Officer 0 0 1Economic Development Manager 0 1 1Corridor Redevelopment Manager 1 0 0Total Full-Time Employees 4 4 5
Staffing Levels
FY 2018 Actual
FY 2019 Budget
FY 2020 Budget Variance
% Change
Personal Services 466,471 658,206 840,741 182,535 27.73%Operating Expense 147,319 322,111 156,997 (165,114) -51.26%Capital Outlay 2,500 5,000 5,000 - 0.00%Debt Service - - - - 0.00%Non-Operating Expenses - - - - 0.00%Economic Development Total 616,289 985,317 1,002,738 17,421 1.77%
General Fund Appropriations
FY 2020 Adopted Budget Communications, Marketing & Economic Development
134
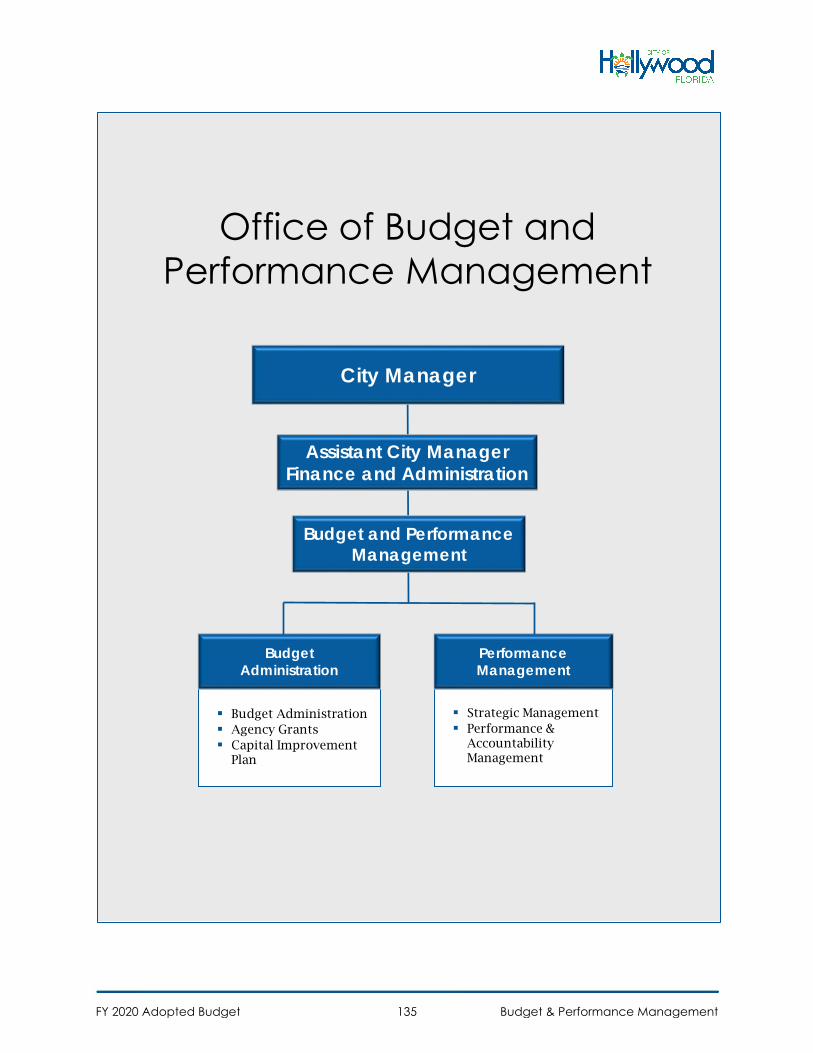
Office of Budget and Performance Management
City Manager
Assistant City ManagerFinance and Administration
Strategic Management Performance &
Accountability Management
Performance Management
Budget and Performance Management
Budget Administration Agency Grants Capital Improvement
Plan
Budget Administration
FY 2020 Adopted Budget Budget & Performance Management135
Office of Budget and Performance Management
Summary
The Office of Budget and Performance Management, formerly the Budget Administration Division, is the epicenter of the City's administrative operations. The Office formulates fiscal policies and procedures via ongoing analyses of City functions to ensure public funds are appropriated, monitored, and modified to successfully facilitate the overall mission of the City of Hollywood, while providing a high level of customer service to other City Departments and the public.
The Office of Budget and Performance Management is responsible for preparing and managing the annual operating budget for the City. This process includes revenue forecasting, expenditure analysis and salary forecasting. In addition to preparing the budget, the Office prepares and presents periodic financial reports to the Commission; initiates management studies within the City for improved efficiency and effectiveness; assists in the development and implementation of administrative policies; coordinates Citywide performance and strategic management activities; and monitors the City's budget condition throughout the year.
FY 2019 Accomplishments • Successfully implemented a new ERP budget planning system which will enhance
the annual operating and capital budget development process and provide budget staff with advance forecasting tools.
• Streamlined the budget development process to allow for a more efficient process and improve communication with the departments.
• Enhanced the office’s external website to translate complex budgetary information in a simplistic, user-friendly manner for the general public.
• Coordinated all administrative activities and conducted annual site visits for the General Fund Agency Grant Program which awarded $180,000 to 14 non-profit organizations throughout the City.
• Assisted with activities related to the issuance of the General Obligation Bond through collaboration with city management and various city departments.
FY 2020 Adopted Budget Budget & Performance Management136
FY 2020 Goals
• Develop a Citywide Revenue Handbook which is a comprehensive tool that can be used to identify revenue trends, potential revenue enhancement opportunities, and assist departments operationally
• Create usable financial reports that may be utilized by departments to make operational and management decisions regarding resources needed throughout the year
• Establish the Performance and Accountability function within the Budget Office which will primarily be responsible for reviewing and improving internal policies and processes to ensure operational efficiency and effectiveness
• Continue to improve the capital development process and develop procedures for capital submissions through collaboration with the Capital Action Committee
• Incorporate the results of the strategic plan into the budget process and assist City Departments with revising and developing meaningful performance measures that align with the strategic plan and goals of the City Commission
• Strengthen the City’s financial position by developing fiscal policies that promote long-term strategic thinking, manages risk, complies with established public management best practices, and clearly defines boundaries and sets a framework for policy makers
• Reduce costs and eliminate duplication of effort in the General Fund Agency Grant process by moving from a heavily paper-driven process to a paperless process
• Continue to conduct annual site visits of the non-profit organizations, funded by the General Fund Agency Grant, to ensure that the objectives of the grant award are utilized accordingly
• Implement a new budget development process for the FY 2021 budget cycle
FY 2020 Adopted Budget Budget & Performance Management137
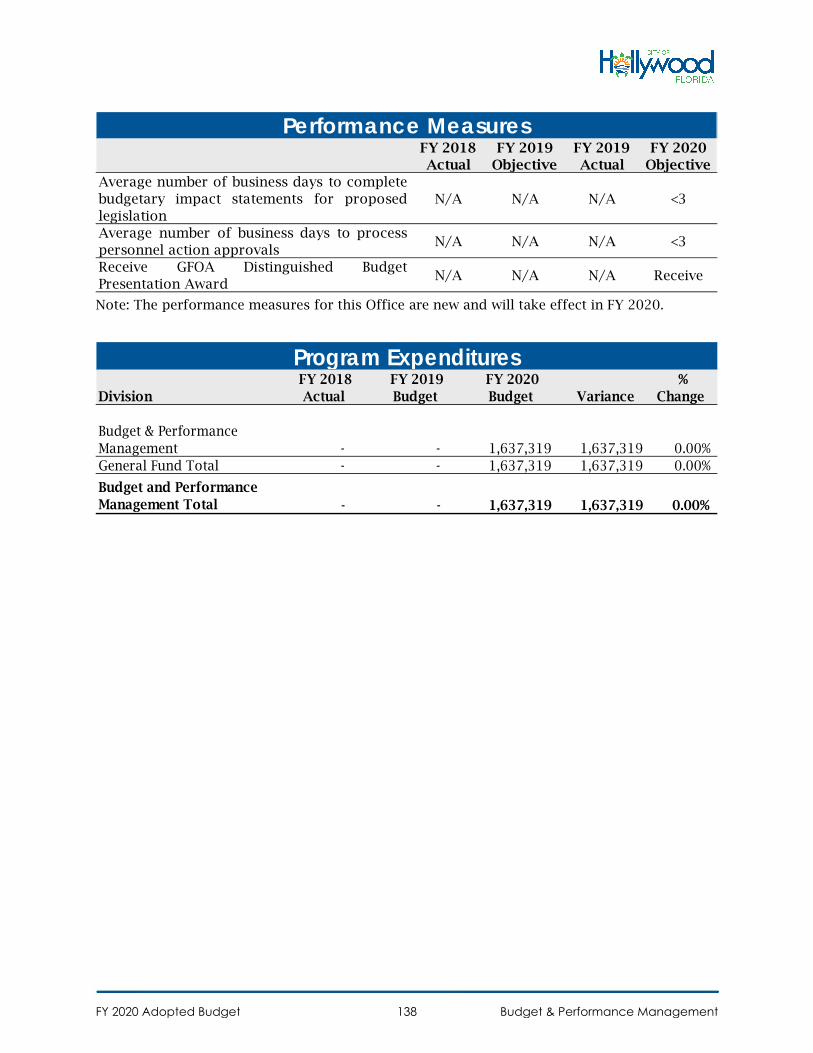
Note: The performance measures for this Office are new and will take effect in FY 2020.
FY 2018 Actual
FY 2019 Objective
FY 2019 Actual
FY 2020 Objective
Average number of business days to completebudgetary impact statements for proposedlegislation
N/A N/A N/A <3
Average number of business days to processpersonnel action approvals
N/A N/A N/A <3
Receive GFOA Distinguished BudgetPresentation Award
N/A N/A N/A Receive
Performance Measures
Division FY 2018
Actual FY 2019 Budget
FY 2020 Budget Variance
% Change
Budget & Performance Management - - 1,637,319 1,637,319 0.00%General Fund Total - - 1,637,319 1,637,319 0.00%
Budget and Performance Management Total - - 1,637,319 1,637,319 0.00%
Program Expenditures
FY 2020 Adopted Budget Budget & Performance Management138
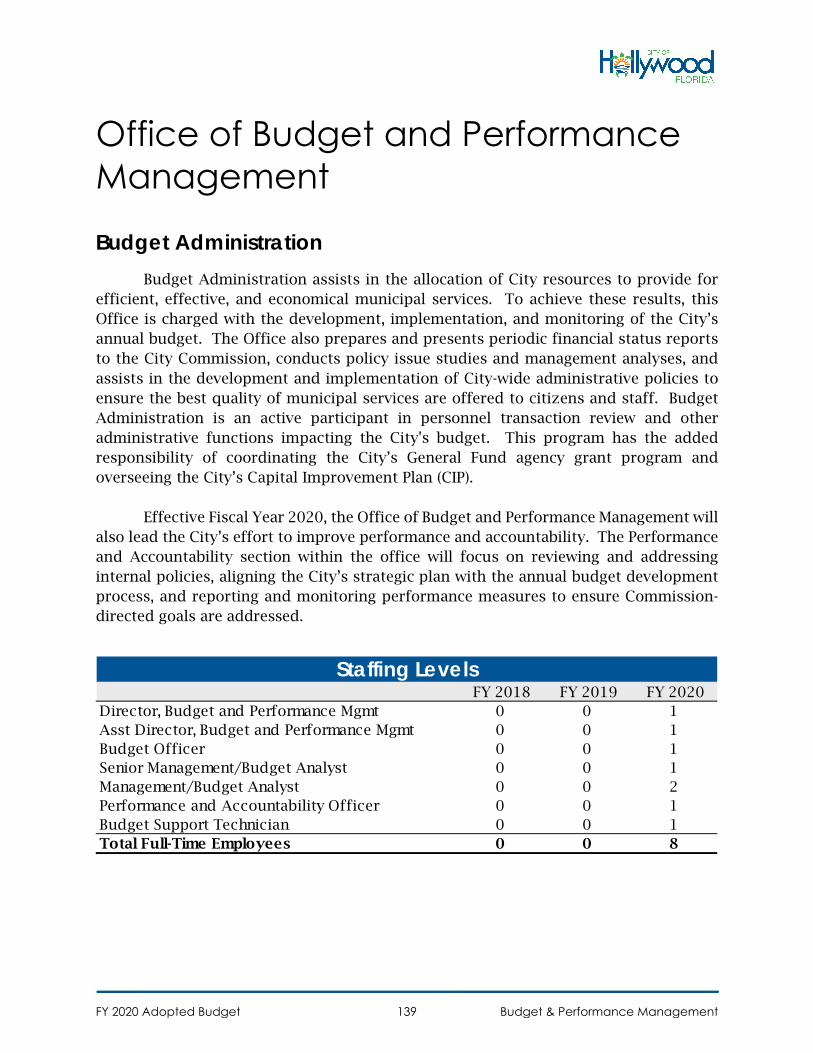
Office of Budget and Performance Management
Budget Administration Budget Administration assists in the allocation of City resources to provide for
efficient, effective, and economical municipal services. To achieve these results, this Office is charged with the development, implementation, and monitoring of the City’s annual budget. The Office also prepares and presents periodic financial status reports to the City Commission, conducts policy issue studies and management analyses, and assists in the development and implementation of City-wide administrative policies to ensure the best quality of municipal services are offered to citizens and staff. Budget Administration is an active participant in personnel transaction review and other administrative functions impacting the City's budget. This program has the added responsibility of coordinating the City’s General Fund agency grant program and overseeing the City’s Capital Improvement Plan (CIP).
Effective Fiscal Year 2020, the Office of Budget and Performance Management will
also lead the City’s effort to improve performance and accountability. The Performance and Accountability section within the office will focus on reviewing and addressing internal policies, aligning the City’s strategic plan with the annual budget development process, and reporting and monitoring performance measures to ensure Commission-directed goals are addressed.
FY 2018 FY 2019 FY 2020 Director, Budget and Performance Mgmt 0 0 1Asst Director, Budget and Performance Mgmt 0 0 1Budget Officer 0 0 1Senior Management/Budget Analyst 0 0 1Management/Budget Analyst 0 0 2Performance and Accountability Officer 0 0 1Budget Support Technician 0 0 1Total Full-Time Employees 0 0 8
Staffing Levels
FY 2020 Adopted Budget Budget & Performance Management139
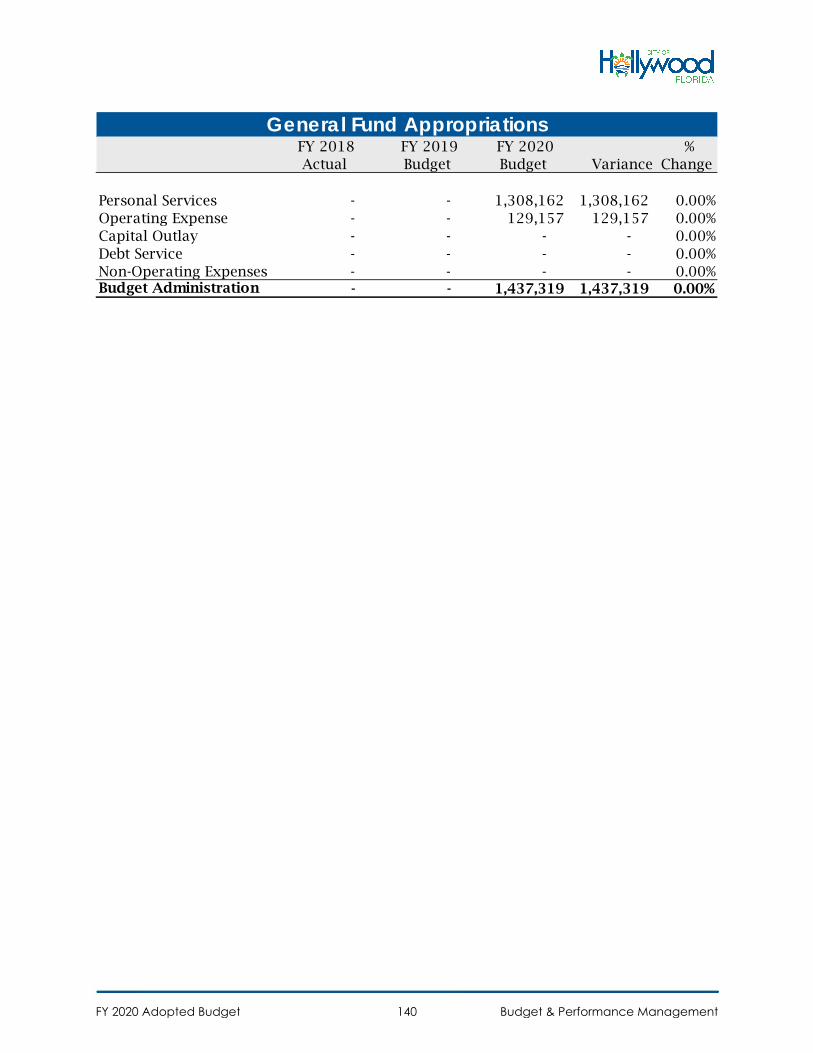
FY 2018 Actual
FY 2019 Budget
FY 2020 Budget Variance
% Change
Personal Services - - 1,308,162 1,308,162 0.00%Operating Expense - - 129,157 129,157 0.00%Capital Outlay - - - - 0.00%Debt Service - - - - 0.00%Non-Operating Expenses - - - - 0.00%Budget Administration - - 1,437,319 1,437,319 0.00%
General Fund Appropriations
FY 2020 Adopted Budget Budget & Performance Management140
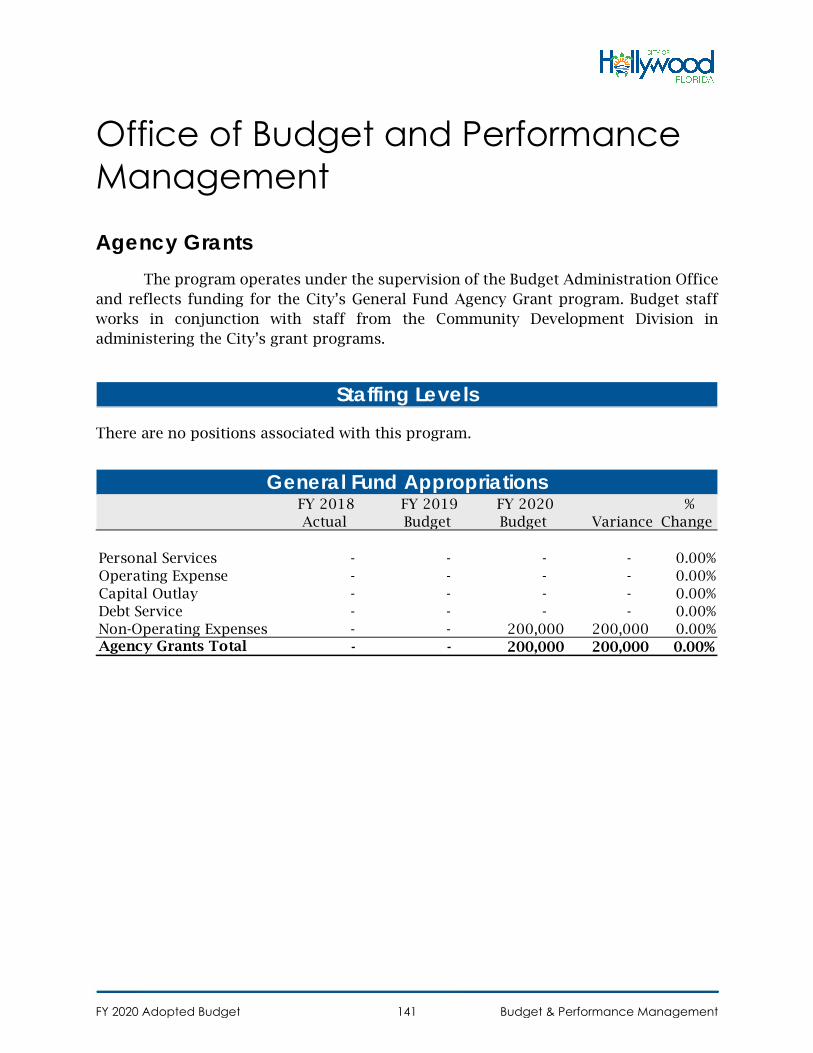
Office of Budget and Performance Management
Agency Grants The program operates under the supervision of the Budget Administration Office
and reflects funding for the City’s General Fund Agency Grant program. Budget staff works in conjunction with staff from the Community Development Division in administering the City’s grant programs.
There are no positions associated with this program.
Staffing Levels
FY 2018 Actual
FY 2019 Budget
FY 2020 Budget Variance
% Change
Personal Services - - - - 0.00%Operating Expense - - - - 0.00%Capital Outlay - - - - 0.00%Debt Service - - - - 0.00%Non-Operating Expenses - - 200,000 200,000 0.00%Agency Grants Total - - 200,000 200,000 0.00%
General Fund Appropriations
FY 2020 Adopted Budget Budget & Performance Management141
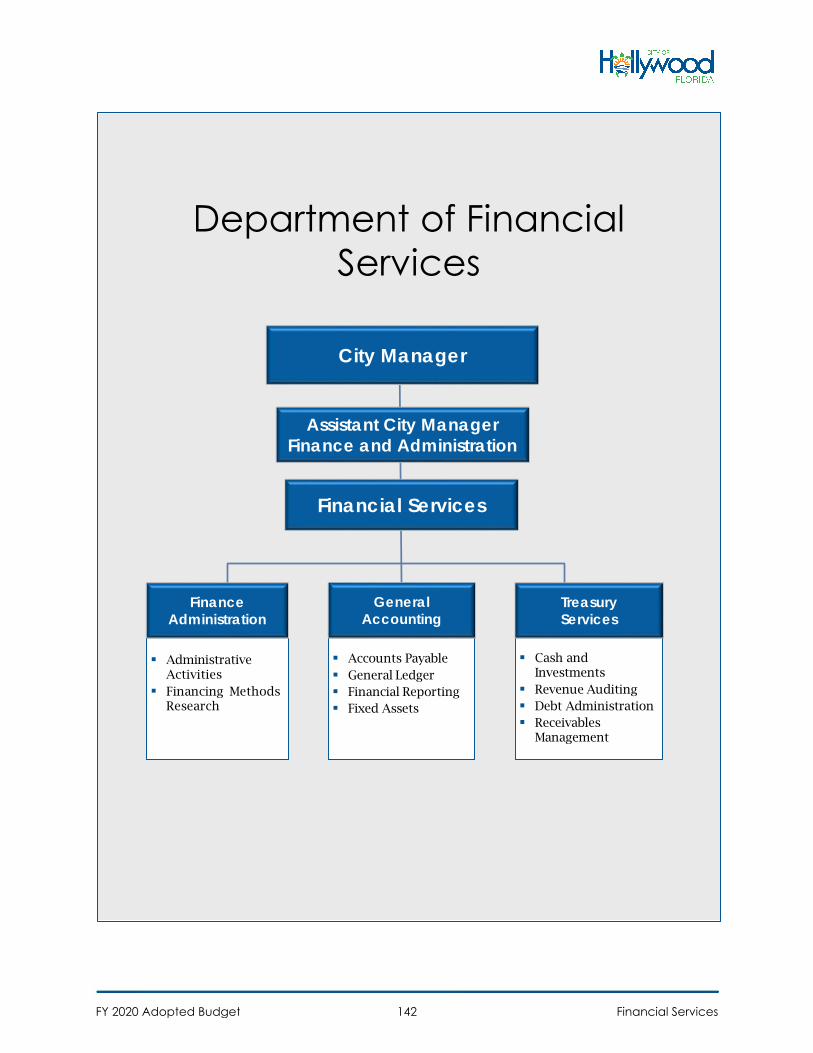
Department of Financial Services
City Manager
Financial Services
Assistant City ManagerFinance and Administration
Accounts Payable General Ledger Financial Reporting Fixed Assets
Cash and Investments
Revenue Auditing Debt Administration Receivables
Management
General Accounting
TreasuryServices
AdministrativeActivities
Financing MethodsResearch
Finance Administration
FY 2020 Adopted Budget Financial Services142
Department of Financial Services
Summary The Department of Financial Services establishes and maintains effective
controls over the City’s financial activities and provides accurate financial information to all City agencies in a timely manner. The Department performs analysis of financial conditions including interim and annual financial reports and recommends financial policies to the City Manager and City Commission.
FY 2019 Accomplishments Treasury Services
• By conducting a series of internal business tax audits, Treasury has increased business tax registration by 20%, increasing business tax revenues by over $225k this year. FY 2019 business tax revenue has exceeded projections and budget for the current year and will continue to enhance revenue through ongoing internal audit initiatives
• As part of the new ERP system, successfully implemented the Oracle Cash Management Module increasing automation in transaction processing and significantly improving the bank reconciliation process by reducing the turnaround time down from over 2 weeks to 2 days
• Improved turnaround time for lien searches reports reducing time down to 3-5 business days for standard service and 1 business day for expedited requests, one of the fastest turnaround times in the County
General Accounting
• Successfully implemented a new ERP system for the General Ledger, Accounts Payable, Fixed Assets, Expense Reporting modules
• Successfully completed the annual external audit with no material weaknesses identified or repeated from the previous year
• Published the City’s FY 2018 Comprehensive Annual Financial Report by the required deadline
• Timely filing of all continuing disclosures for State and Debt reporting requirements
• Obtained the GFOA Certificate of Achievement for Excellence in Financial Reporting Award
FY 2020 Adopted Budget Financial Services143
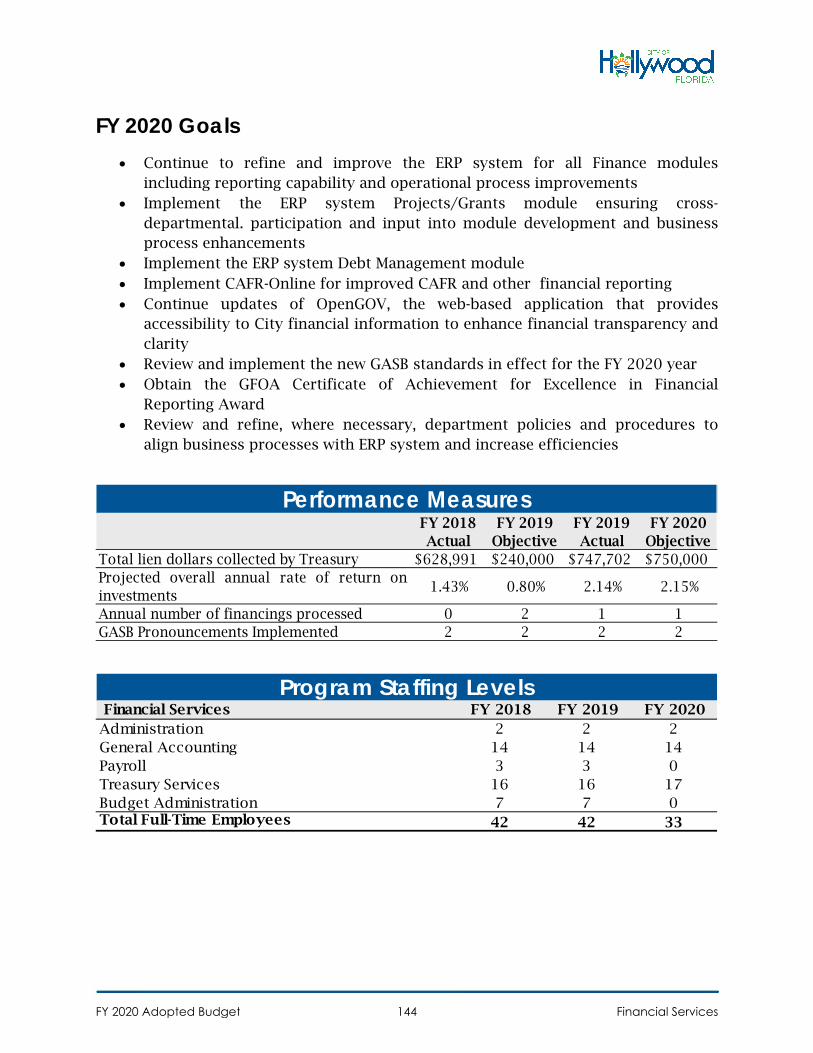
FY 2020 Goals • Continue to refine and improve the ERP system for all Finance modules
including reporting capability and operational process improvements • Implement the ERP system Projects/Grants module ensuring cross-
departmental. participation and input into module development and business process enhancements
• Implement the ERP system Debt Management module • Implement CAFR-Online for improved CAFR and other financial reporting • Continue updates of OpenGOV, the web-based application that provides
accessibility to City financial information to enhance financial transparency and clarity
• Review and implement the new GASB standards in effect for the FY 2020 year • Obtain the GFOA Certificate of Achievement for Excellence in Financial
Reporting Award • Review and refine, where necessary, department policies and procedures to
align business processes with ERP system and increase efficiencies
FY 2018 Actual
FY 2019 Objective
FY 2019 Actual
FY 2020 Objective
Total lien dollars collected by Treasury $628,991 $240,000 $747,702 $750,000Projected overall annual rate of return oninvestments
1.43% 0.80% 2.14% 2.15%
Annual number of financings processed 0 2 1 1GASB Pronouncements Implemented 2 2 2 2
Performance Measures
Financial Services FY 2018 FY 2019 FY 2020 Administration 2 2 2General Accounting 14 14 14Payroll 3 3 0Treasury Services 16 16 17Budget Administration 7 7 0Total Full-Time Employees 42 42 33
Program Staffing Levels
FY 2020 Adopted Budget Financial Services144
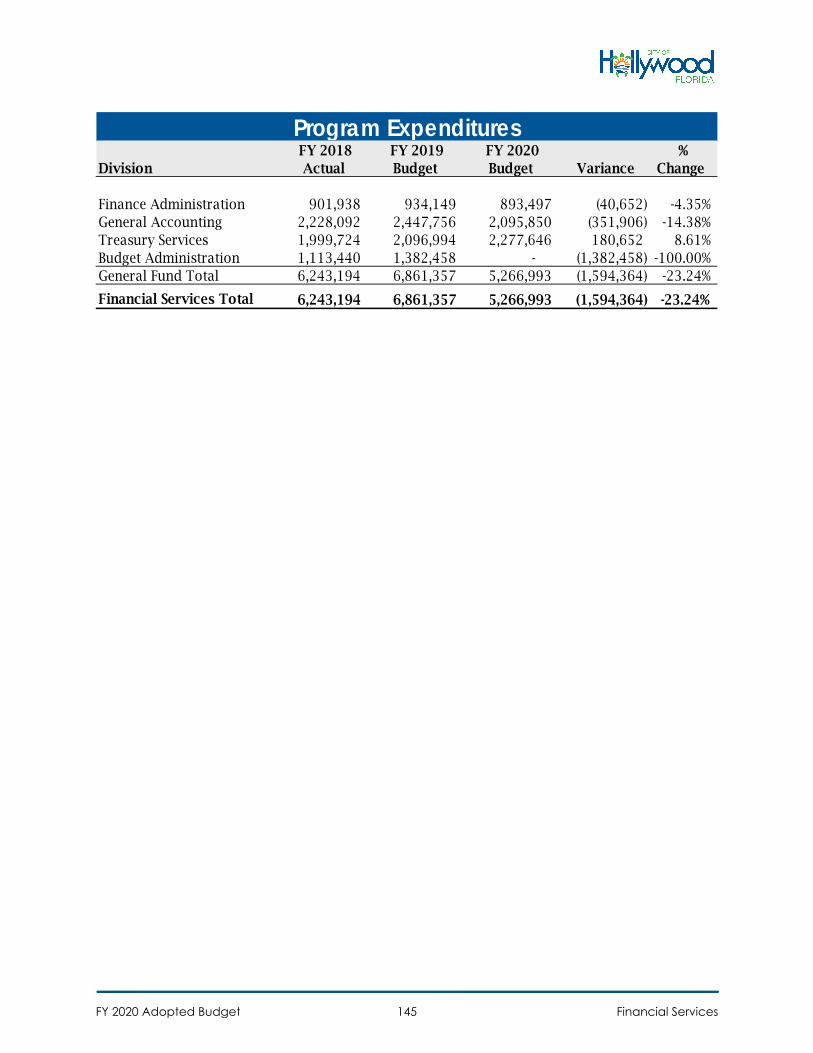
Division FY 2018
Actual FY 2019 Budget
FY 2020 Budget Variance
% Change
Finance Administration 901,938 934,149 893,497 (40,652) -4.35%General Accounting 2,228,092 2,447,756 2,095,850 (351,906) -14.38%Treasury Services 1,999,724 2,096,994 2,277,646 180,652 8.61%Budget Administration 1,113,440 1,382,458 - (1,382,458) -100.00%General Fund Total 6,243,194 6,861,357 5,266,993 (1,594,364) -23.24%
Financial Services Total 6,243,194 6,861,357 5,266,993 (1,594,364) -23.24%
Program Expenditures
FY 2020 Adopted Budget Financial Services145
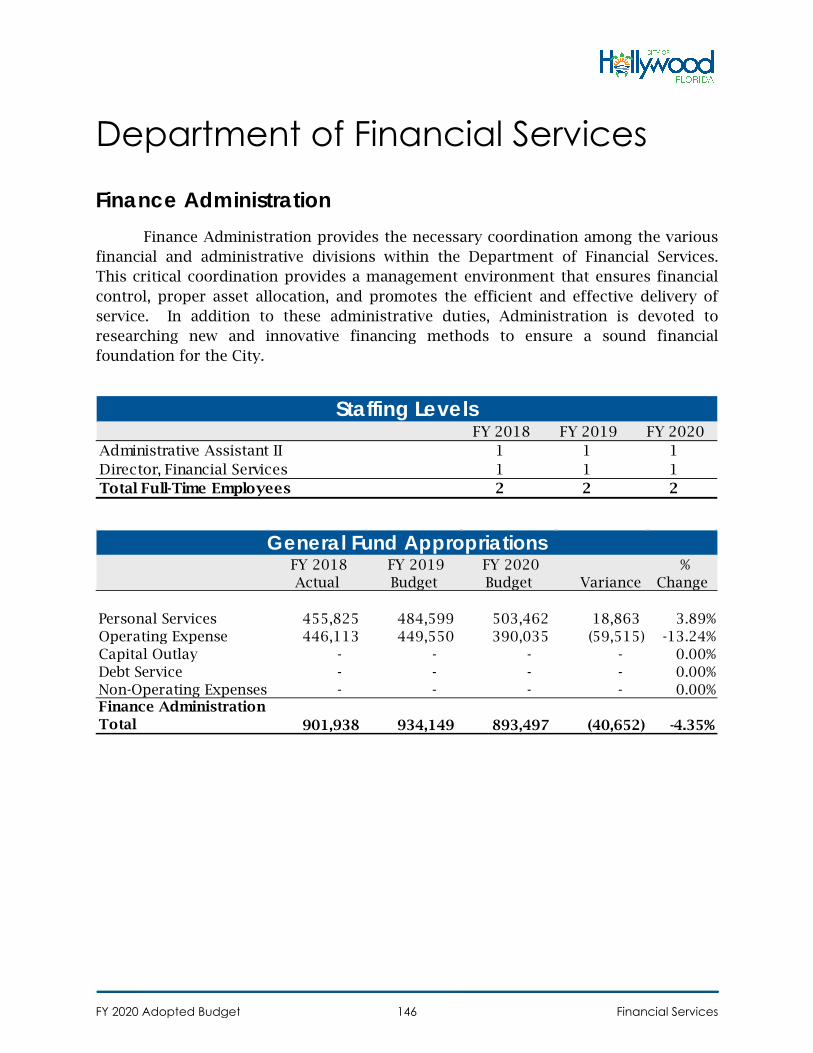
Department of Financial Services
Finance Administration Finance Administration provides the necessary coordination among the various
financial and administrative divisions within the Department of Financial Services. This critical coordination provides a management environment that ensures financial control, proper asset allocation, and promotes the efficient and effective delivery of service. In addition to these administrative duties, Administration is devoted to researching new and innovative financing methods to ensure a sound financial foundation for the City.
FY 2018 FY 2019 FY 2020 Administrative Assistant II 1 1 1Director, Financial Services 1 1 1Total Full-Time Employees 2 2 2
Staffing Levels
FY 2018 Actual
FY 2019 Budget
FY 2020 Budget Variance
% Change
Personal Services 455,825 484,599 503,462 18,863 3.89%Operating Expense 446,113 449,550 390,035 (59,515) -13.24%Capital Outlay - - - - 0.00%Debt Service - - - - 0.00%Non-Operating Expenses - - - - 0.00%Finance Administration Total 901,938 934,149 893,497 (40,652) -4.35%
General Fund Appropriations
FY 2020 Adopted Budget Financial Services146
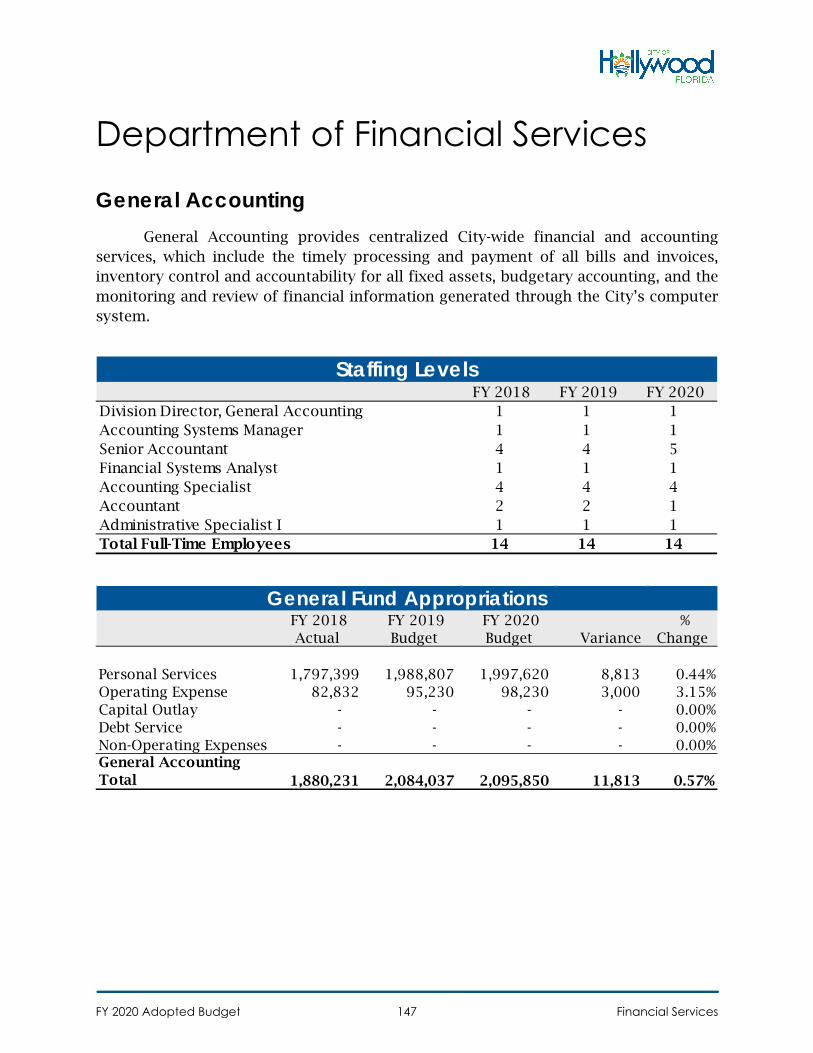
Department of Financial Services
General Accounting General Accounting provides centralized City-wide financial and accounting
services, which include the timely processing and payment of all bills and invoices, inventory control and accountability for all fixed assets, budgetary accounting, and the monitoring and review of financial information generated through the City’s computer system.
FY 2018 FY 2019 FY 2020 Division Director, General Accounting 1 1 1Accounting Systems Manager 1 1 1Senior Accountant 4 4 5Financial Systems Analyst 1 1 1Accounting Specialist 4 4 4Accountant 2 2 1Administrative Specialist I 1 1 1Total Full-Time Employees 14 14 14
Staffing Levels
FY 2018 Actual
FY 2019 Budget
FY 2020 Budget Variance
% Change
Personal Services 1,797,399 1,988,807 1,997,620 8,813 0.44%Operating Expense 82,832 95,230 98,230 3,000 3.15%Capital Outlay - - - - 0.00%Debt Service - - - - 0.00%Non-Operating Expenses - - - - 0.00%General Accounting Total 1,880,231 2,084,037 2,095,850 11,813 0.57%
General Fund Appropriations
FY 2020 Adopted Budget Financial Services147
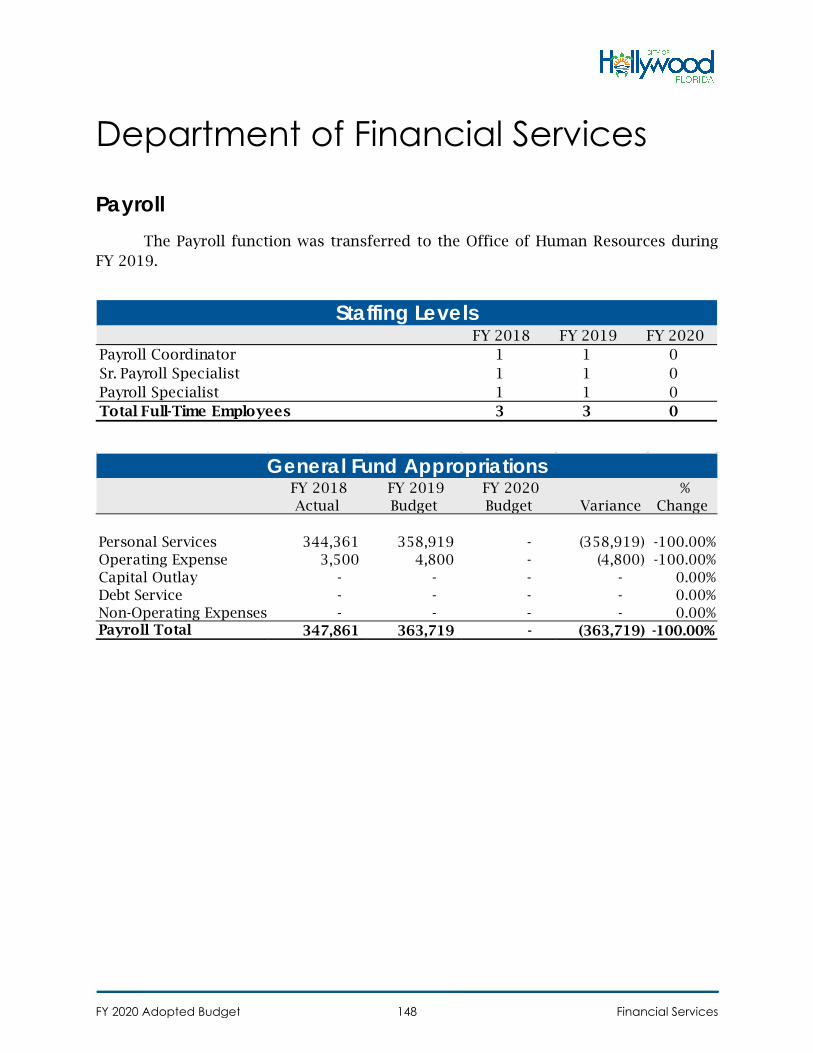
Department of Financial Services
Payroll The Payroll function was transferred to the Office of Human Resources during
FY 2019.
FY 2018 FY 2019 FY 2020 Payroll Coordinator 1 1 0Sr. Payroll Specialist 1 1 0Payroll Specialist 1 1 0Total Full-Time Employees 3 3 0
Staffing Levels
FY 2018 Actual
FY 2019 Budget
FY 2020 Budget Variance
% Change
Personal Services 344,361 358,919 - (358,919) -100.00%Operating Expense 3,500 4,800 - (4,800) -100.00%Capital Outlay - - - - 0.00%Debt Service - - - - 0.00%Non-Operating Expenses - - - - 0.00%Payroll Total 347,861 363,719 - (363,719) -100.00%
General Fund Appropriations
FY 2020 Adopted Budget Financial Services148
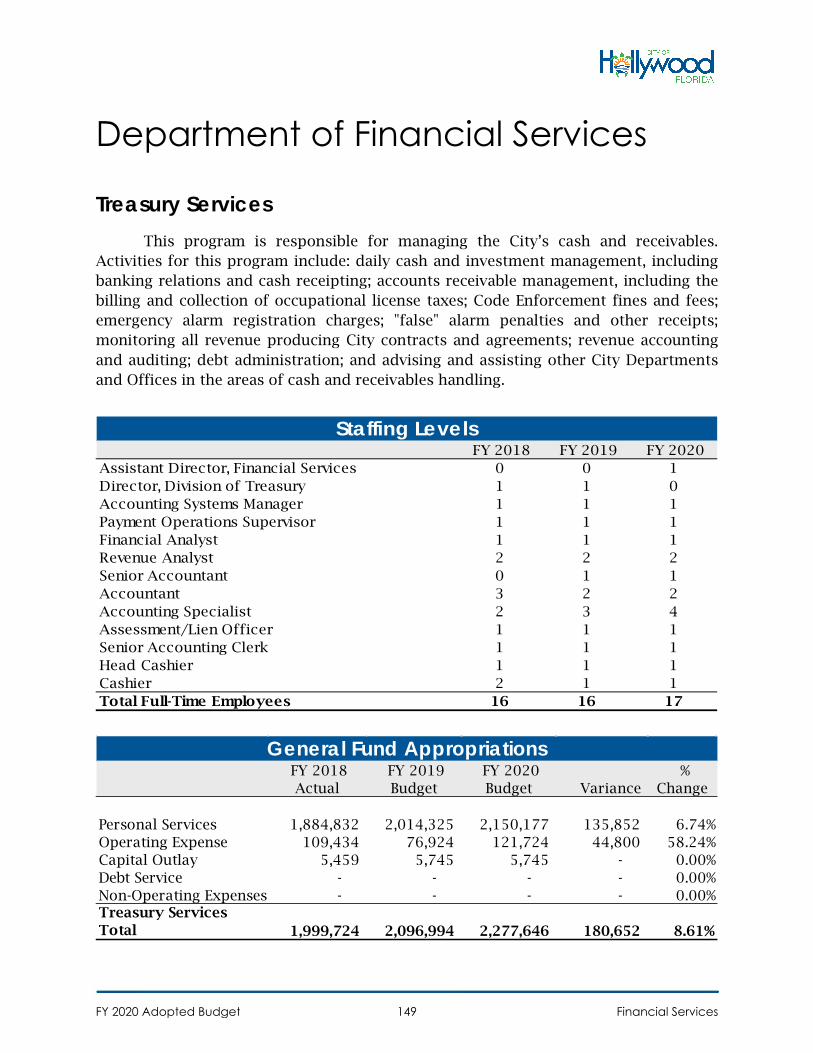
Department of Financial Services
Treasury Services This program is responsible for managing the City’s cash and receivables.
Activities for this program include: daily cash and investment management, including banking relations and cash receipting; accounts receivable management, including the billing and collection of occupational license taxes; Code Enforcement fines and fees; emergency alarm registration charges; "false" alarm penalties and other receipts; monitoring all revenue producing City contracts and agreements; revenue accounting and auditing; debt administration; and advising and assisting other City Departments and Offices in the areas of cash and receivables handling.
FY 2018 FY 2019 FY 2020 Assistant Director, Financial Services 0 0 1Director, Division of Treasury 1 1 0Accounting Systems Manager 1 1 1Payment Operations Supervisor 1 1 1Financial Analyst 1 1 1Revenue Analyst 2 2 2Senior Accountant 0 1 1Accountant 3 2 2Accounting Specialist 2 3 4Assessment/Lien Officer 1 1 1Senior Accounting Clerk 1 1 1Head Cashier 1 1 1Cashier 2 1 1Total Full-Time Employees 16 16 17
Staffing Levels
FY 2018 Actual
FY 2019 Budget
FY 2020 Budget Variance
% Change
Personal Services 1,884,832 2,014,325 2,150,177 135,852 6.74%Operating Expense 109,434 76,924 121,724 44,800 58.24%Capital Outlay 5,459 5,745 5,745 - 0.00%Debt Service - - - - 0.00%Non-Operating Expenses - - - - 0.00%Treasury Services Total 1,999,724 2,096,994 2,277,646 180,652 8.61%
General Fund Appropriations
FY 2020 Adopted Budget Financial Services149
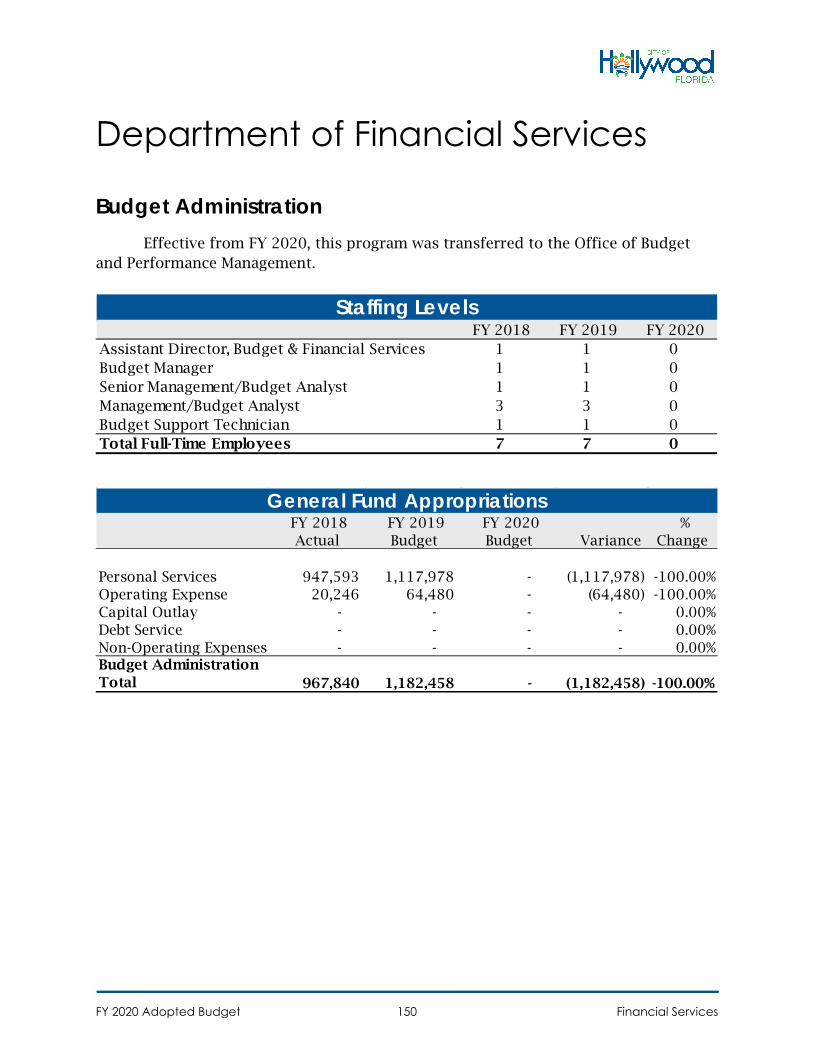
Department of Financial Services
Budget Administration Effective from FY 2020, this program was transferred to the Office of Budget
and Performance Management.
FY 2018 FY 2019 FY 2020 Assistant Director, Budget & Financial Services 1 1 0Budget Manager 1 1 0Senior Management/Budget Analyst 1 1 0Management/Budget Analyst 3 3 0Budget Support Technician 1 1 0Total Full-Time Employees 7 7 0
Staffing Levels
FY 2018 Actual
FY 2019 Budget
FY 2020 Budget Variance
% Change
Personal Services 947,593 1,117,978 - (1,117,978) -100.00%Operating Expense 20,246 64,480 - (64,480) -100.00%Capital Outlay - - - - 0.00%Debt Service - - - - 0.00%Non-Operating Expenses - - - - 0.00%Budget Administration Total 967,840 1,182,458 - (1,182,458) -100.00%
General Fund Appropriations
FY 2020 Adopted Budget Financial Services150
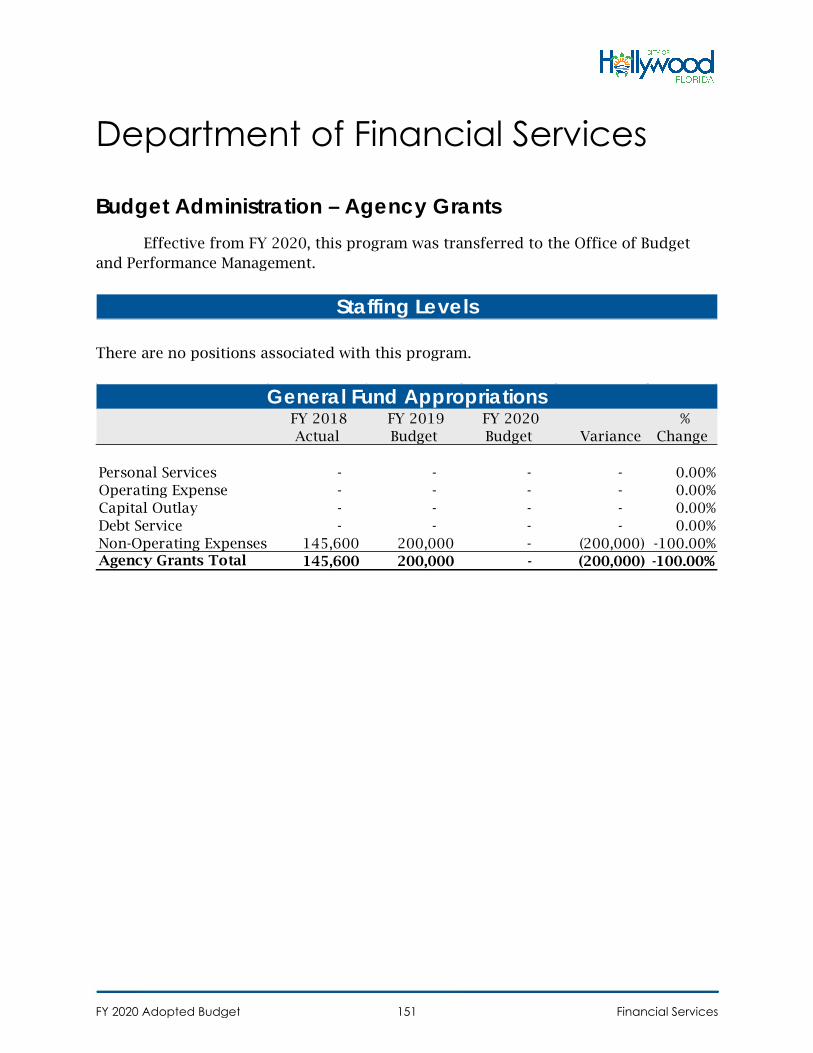
Department of Financial Services
Budget Administration – Agency Grants Effective from FY 2020, this program was transferred to the Office of Budget
and Performance Management.
There are no positions associated with this program.
Staffing Levels
FY 2018 Actual
FY 2019 Budget
FY 2020 Budget Variance
% Change
Personal Services - - - - 0.00%Operating Expense - - - - 0.00%Capital Outlay - - - - 0.00%Debt Service - - - - 0.00%Non-Operating Expenses 145,600 200,000 - (200,000) -100.00%Agency Grants Total 145,600 200,000 - (200,000) -100.00%
General Fund Appropriations
FY 2020 Adopted Budget Financial Services151
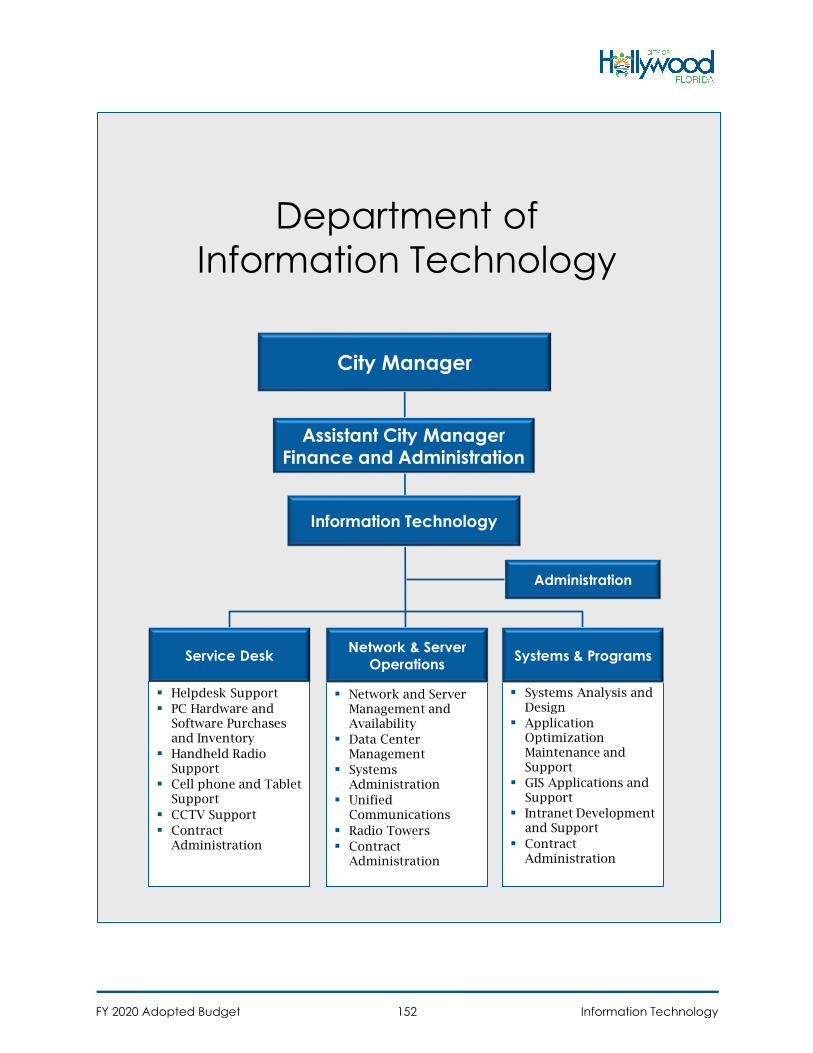
Department of
Information Technology
Network and Server Management and Availability
Data Center Management
Systems Administration
Unified Communications
Radio Towers
Contract Administration
Network & Server
Operations
Systems Analysis and Design
Application Optimization Maintenance and Support
GIS Applications and Support
Intranet Development and Support
Contract Administration
Systems & Programs
City Manager
Information Technology
Administration
Service Desk
Helpdesk Support
PC Hardware and Software Purchases and Inventory
Handheld Radio Support
Cell phone and Tablet Support
CCTV Support
Contract Administration
Assistant City Manager
Finance and Administration
FY 2020 Adopted Budget Information Technology152
Department of
Information Technology
Summary
The Department of Information Technology provides comprehensive technology
services and support to all City Agencies. This includes maintaining and supporting a
fiber optic network connecting over forty (40) City facilities, supporting the City’s data
and voice environment, providing support for approximately 1100 PCs, 1200
telephones, 350 mobile phones, and 400 laptops, maintaining the City’s email system,
providing systems analysis and design, applications development and support, and
radio system support to all local government and public safety users. The Department
of Information Technology is comprised of the Administration, Service Desk, Network
and server Operations and the Systems and Programs divisions.
FY 2019 Accomplishments
Detected and coordinated Security Incident Response for multiple incidents
Provided significant assistance to Human Resources, Finance and Procurement
services in Extracting/Validating/Correcting data from legacy systems
Detected and mitigated 85 risks and mitigated (Trojans, Hacking tools, etc.) on
end point systems
Provided weekly bandwidth management for all City Employees including:
o Intercepting 44,000 Malware
o Intercepting 4,600 Spyware/Adware
o Intercepting 1,000 Phishing attacks
o Providing 150 Gigabytes of Internet content every work day
o Blocking 200,000 attempts at accessing banned content by the City
Continued Support of Station 33 Zetron Fire Alerting IP based communications
throughout FY 2019
Provided continued support for implementation of Fire Station 45, including
fiber optics, alarms, internal wiring and data closet and proposed alerting
system
Continued facilitating LUCA by reviewing and commenting on the U.S. Census
Bureau’s residential address list for the city prior to the 2020 Census. The
Census Bureau relies on a complete and accurate address list to reach every
living quarters and associated population for inclusion in the census
Upgraded VMware Environment from 6.0 to 6.5
FY 2020 Adopted Budget Information Technology153
Maintained High level of Data Center operations and availability
o Backup/Restore Success rate: 100%
o Percentage Uptime Servers: 99%
o Total network uptime: 99%
Core network uptime: 99.95%
o Internet uptime: 99.95% (Internet not functional for about 4 hours / year)
Re-negotiated Contracts with Comcast resulting in over $50K savings in FY 2019
Resolved 3,700 requests for service from October 1, 2018 – June 3, 2019
Facilitated completion of Phase 2 and initiation of Phase 3 for CCTV and
Automated License Plate Reader systems
Implemented additional Compliance Policies and Actions resulting in no Auditor
Issues with Information Technology Department
Continued city-wide security training initiatives
Development Services Department Enhancements
o ePermit Process
o Digital Friday Permit
o Email notification to contractors
o Modified Hard Card and Updated Bluebeam software
o BCLA Code
o Building Permit Search
Implemented GIS Enhancements including:
o Fire Department
Fire Pre-Plan Inspection web map & mobile applications
Premise Report Inspection web map & mobile applications
o Building, Code Enforcement, Public Works, and EOC
Post Hurricane Assessment and Recovery Efforts web map &
mobile applications
o GOB
GOB Taxable Value (calculator) web map application
GOB Projects Location Map web map application
o Census Bureau New Construction Program
o Public Works
County Signage Inventory
o Development Services
Sidewalk Inventory
Initiated Purchase of new City Firewall Infrastructure and revised DMZ network
design
Implemented Hyper converged Virtual Data Center to allow for consolidation of
physical servers and replace existing system
Initiated migration of unified communications system from legacy PRI circuits
to SIP to allow for better business continuity
FY 2020 Adopted Budget Information Technology154
FY 2020 Goals
Assist in the conversion and acquisition new, E.D.G.E , ERP software including:
Building Department, Public Works, LaserFiche
Upgrade GIS system infrastructure continuing the development of spatial
enabled tools to assist city department make better informed decisions and
assisting departments during the planning, development, and implementation
of GIS projects
Update Service Desk Software and ticketing system
Implement security Enhancements including:
o Improve computer imaging and patching deployments
o Improve email security
o Improve Security and Vulnerability assessment and handling
Address legacy Operating Systems
Revise and improve plan to address business continuity and fail over in server
and systems infrastructure
FY 2018
Actual
FY 2019
Objective
FY 2019
Actual
FY 2020
Objective
Percent of Systems & Programming user
requests completed and problems resolved
within ten (10) days of assignment
60% 80% 74% 80%
Percent of Network Computer Services' Help
Desk calls closed within four days90% 80% 85% 80%
Percent of Communications' Help Desk calls
closed within ten days84% 90% 85% 90%
Percent of time servers are available 99% 99% 99% 99%
Performance Measures
Information Technology FY 2018 FY 2019 FY 2020
Information Tech. Administration 3 2 2
Network and Server Operations 7 7 8
Systems & Programs 7 6 6
Service Desk 6 7 6
Total Full-Time Employees 23 22 22
Program Staffing Levels
FY 2020 Adopted Budget Information Technology155
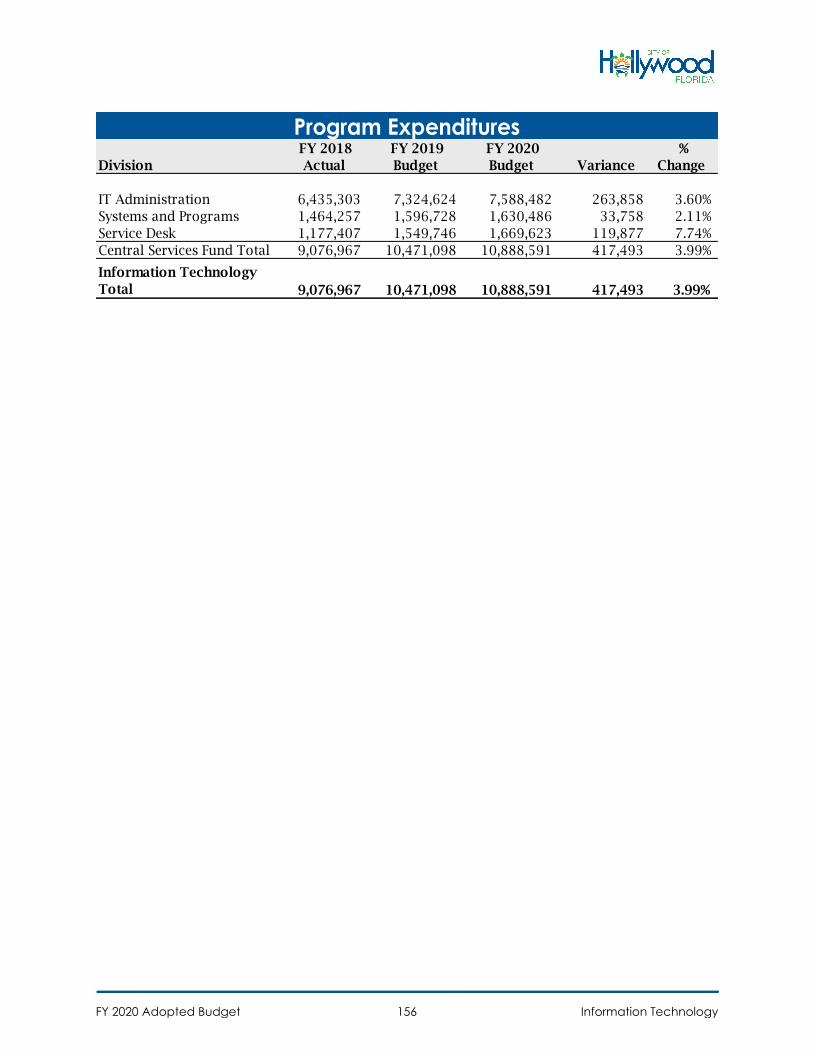
Division
FY 2018
Actual
FY 2019
Budget
FY 2020
Budget Variance
%
Change
IT Administration 6,435,303 7,324,624 7,588,482 263,858 3.60%
Systems and Programs 1,464,257 1,596,728 1,630,486 33,758 2.11%
Service Desk 1,177,407 1,549,746 1,669,623 119,877 7.74%
Central Services Fund Total 9,076,967 10,471,098 10,888,591 417,493 3.99%
Information Technology
Total 9,076,967 10,471,098 10,888,591 417,493 3.99%
Program Expenditures
FY 2020 Adopted Budget Information Technology156
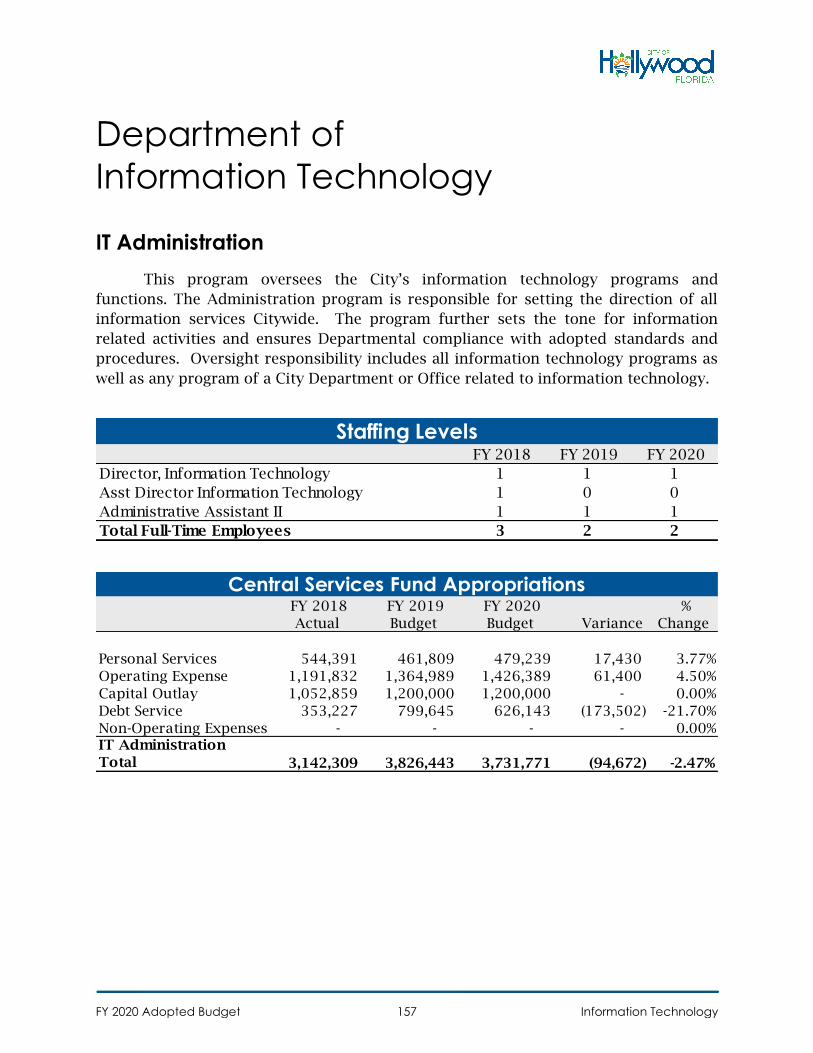
Department of
Information Technology
IT Administration
This program oversees the City’s information technology programs and
functions. The Administration program is responsible for setting the direction of all
information services Citywide. The program further sets the tone for information
related activities and ensures Departmental compliance with adopted standards and
procedures. Oversight responsibility includes all information technology programs as
well as any program of a City Department or Office related to information technology.
FY 2018 FY 2019 FY 2020
Director, Information Technology 1 1 1
Asst Director Information Technology 1 0 0
Administrative Assistant II 1 1 1
Total Full-Time Employees 3 2 2
Staffing Levels
FY 2018
Actual
FY 2019
Budget
FY 2020
Budget Variance
%
Change
Personal Services 544,391 461,809 479,239 17,430 3.77%
Operating Expense 1,191,832 1,364,989 1,426,389 61,400 4.50%
Capital Outlay 1,052,859 1,200,000 1,200,000 - 0.00%
Debt Service 353,227 799,645 626,143 (173,502) -21.70%
Non-Operating Expenses - - - - 0.00%IT Administration
Total 3,142,309 3,826,443 3,731,771 (94,672) -2.47%
Central Services Fund Appropriations
FY 2020 Adopted Budget Information Technology157
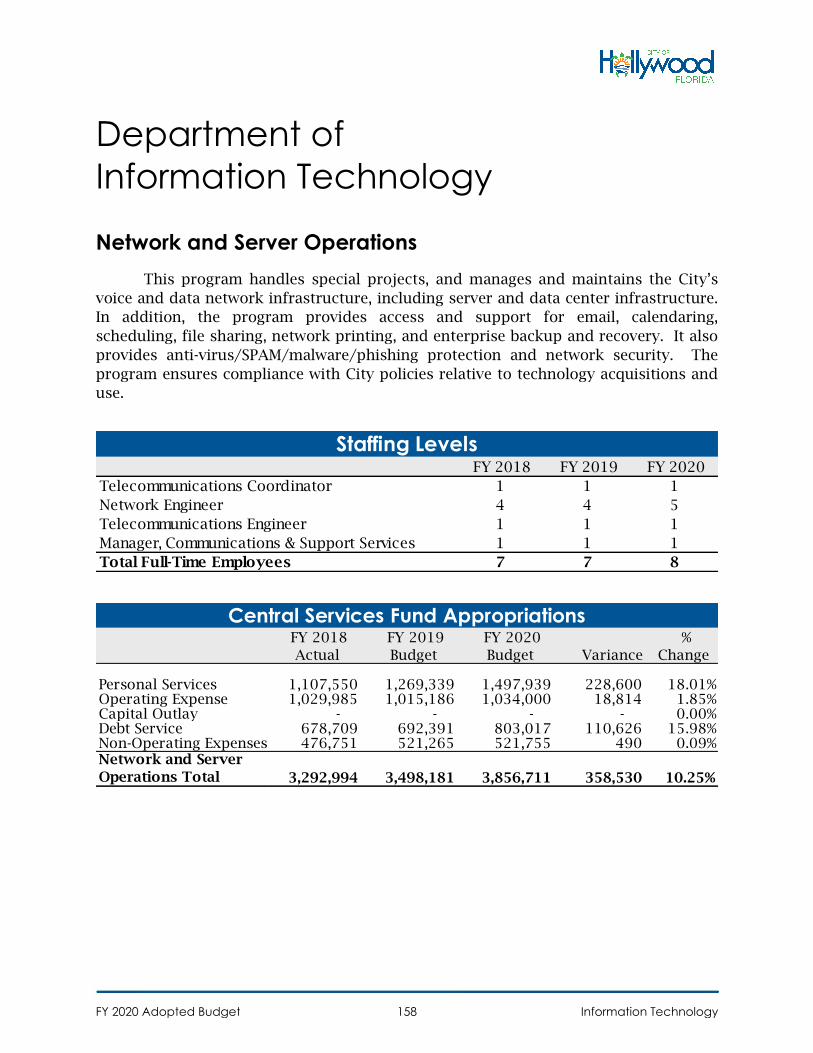
Department of
Information Technology
Network and Server Operations
This program handles special projects, and manages and maintains the City’s
voice and data network infrastructure, including server and data center infrastructure.
In addition, the program provides access and support for email, calendaring,
scheduling, file sharing, network printing, and enterprise backup and recovery. It also
provides anti-virus/SPAM/malware/phishing protection and network security. The
program ensures compliance with City policies relative to technology acquisitions and
use.
FY 2018 FY 2019 FY 2020
Telecommunications Coordinator 1 1 1
Network Engineer 4 4 5
Telecommunications Engineer 1 1 1
Manager, Communications & Support Services 1 1 1
Total Full-Time Employees 7 7 8
Staffing Levels
FY 2018
Actual
FY 2019
Budget
FY 2020
Budget Variance
%
Change
Personal Services 1,107,550 1,269,339 1,497,939 228,600 18.01%Operating Expense 1,029,985 1,015,186 1,034,000 18,814 1.85%Capital Outlay - - - - 0.00%Debt Service 678,709 692,391 803,017 110,626 15.98%Non-Operating Expenses 476,751 521,265 521,755 490 0.09%Network and Server
Operations Total 3,292,994 3,498,181 3,856,711 358,530 10.25%
Central Services Fund Appropriations
FY 2020 Adopted Budget Information Technology158
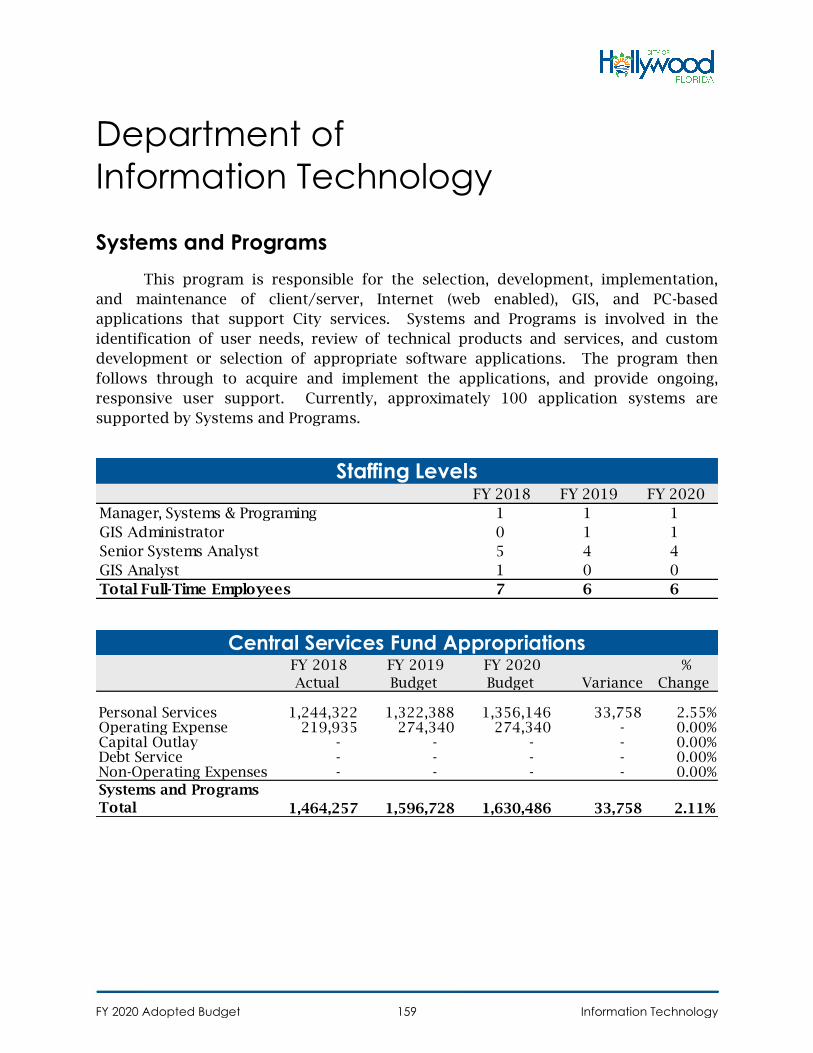
Department of
Information Technology
Systems and Programs
This program is responsible for the selection, development, implementation,
and maintenance of client/server, Internet (web enabled), GIS, and PC-based
applications that support City services. Systems and Programs is involved in the
identification of user needs, review of technical products and services, and custom
development or selection of appropriate software applications. The program then
follows through to acquire and implement the applications, and provide ongoing,
responsive user support. Currently, approximately 100 application systems are
supported by Systems and Programs.
FY 2018 FY 2019 FY 2020
Manager, Systems & Programing 1 1 1
GIS Administrator 0 1 1
Senior Systems Analyst 5 4 4
GIS Analyst 1 0 0
Total Full-Time Employees 7 6 6
Staffing Levels
FY 2018
Actual
FY 2019
Budget
FY 2020
Budget Variance
%
Change
Personal Services 1,244,322 1,322,388 1,356,146 33,758 2.55%Operating Expense 219,935 274,340 274,340 - 0.00%Capital Outlay - - - - 0.00%Debt Service - - - - 0.00%Non-Operating Expenses - - - - 0.00%
Systems and Programs
Total 1,464,257 1,596,728 1,630,486 33,758 2.11%
Central Services Fund Appropriations
FY 2020 Adopted Budget Information Technology159
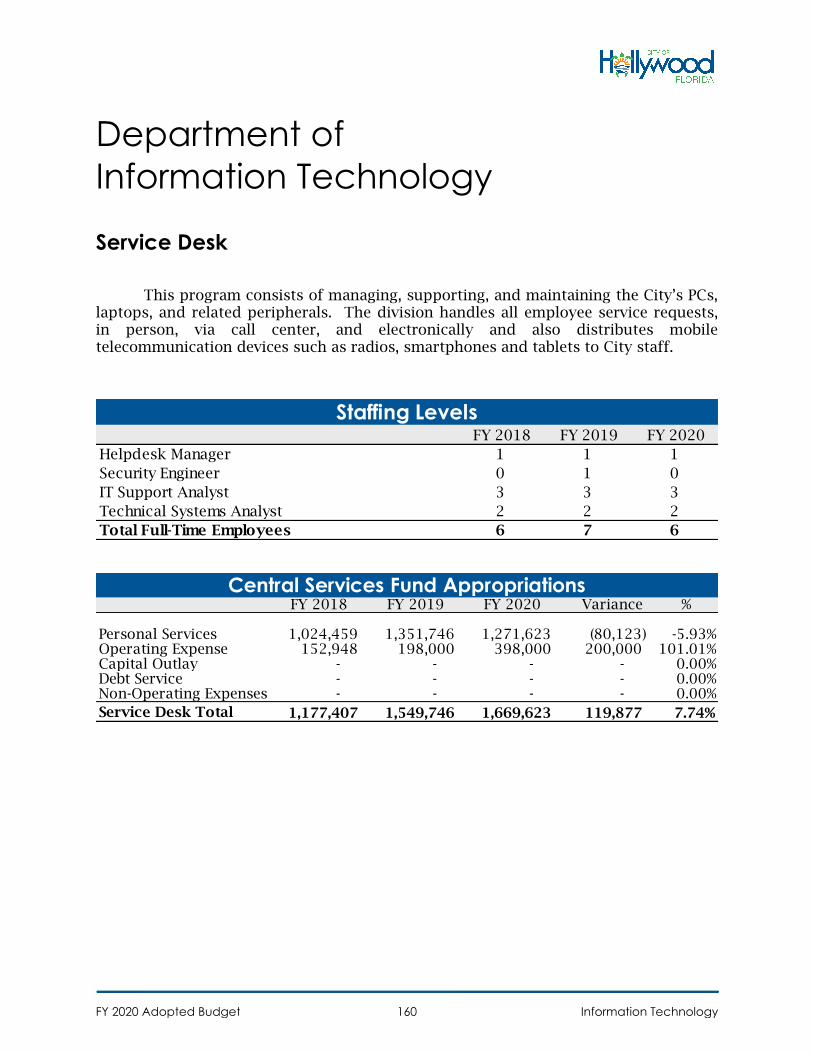
Department of
Information Technology
Service Desk
This program consists of managing, supporting, and maintaining the City’s PCs, laptops, and related peripherals. The division handles all employee service requests, in person, via call center, and electronically and also distributes mobile telecommunication devices such as radios, smartphones and tablets to City staff.
FY 2018 FY 2019 FY 2020
Helpdesk Manager 1 1 1
Security Engineer 0 1 0
IT Support Analyst 3 3 3
Technical Systems Analyst 2 2 2
Total Full-Time Employees 6 7 6
Staffing Levels
FY 2018 FY 2019 FY 2020 Variance %
Personal Services 1,024,459 1,351,746 1,271,623 (80,123) -5.93%Operating Expense 152,948 198,000 398,000 200,000 101.01%Capital Outlay - - - - 0.00%Debt Service - - - - 0.00%Non-Operating Expenses - - - - 0.00%
Service Desk Total 1,177,407 1,549,746 1,669,623 119,877 7.74%
Central Services Fund Appropriations
FY 2020 Adopted Budget Information Technology160
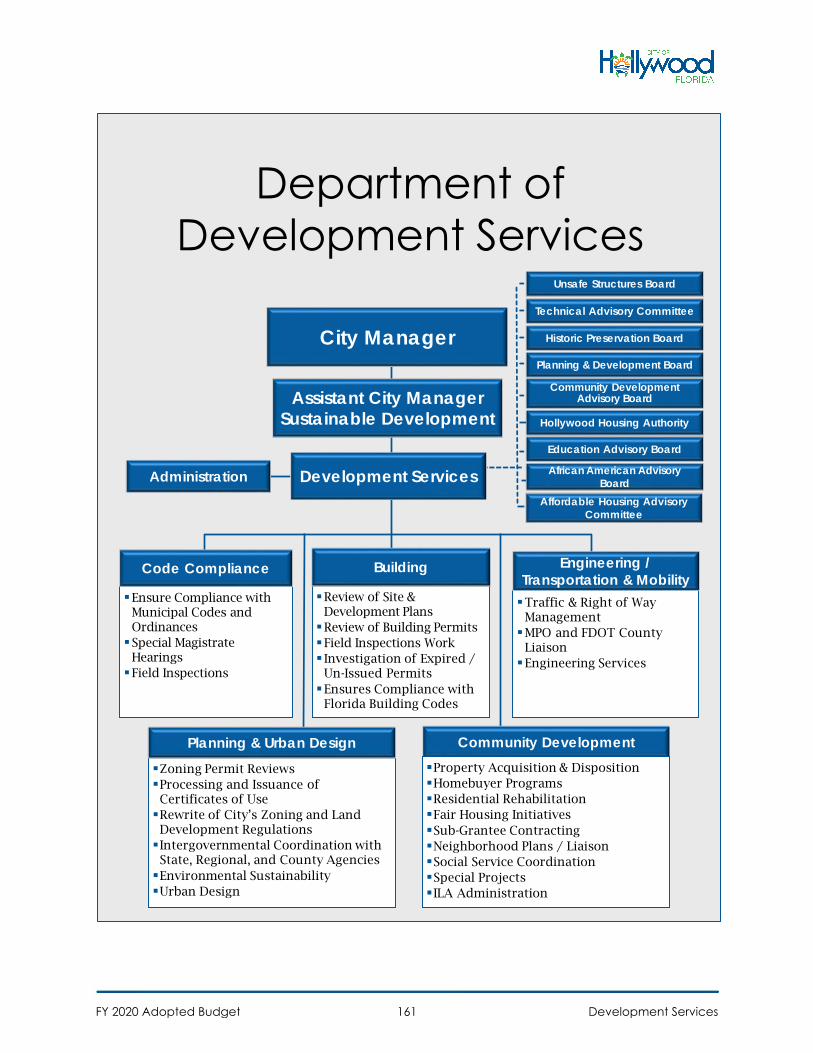
Department ofDevelopment Services
City Manager
Development Services
Assistant City ManagerSustainable Development
Review of Site & Development PlansReview of Building PermitsField Inspections Work Investigation of Expired /
Un-Issued PermitsEnsures Compliance with
Florida Building Codes
Building
Ensure Compliance with Municipal Codes and OrdinancesSpecial Magistrate
HearingsField Inspections
Code Compliance
Administration
Traffic & Right of Way ManagementMPO and FDOT County
LiaisonEngineering Services
Hollywood Housing Authority
Education Advisory Board
African American Advisory Board
Community Development Advisory Board
Technical Advisory Committee
Historic Preservation Board
Planning & Development Board
Unsafe Structures Board
Affordable Housing Advisory Committee
Engineering / Transportation & Mobility
Zoning Permit ReviewsProcessing and Issuance of Certificates of UseRewrite of City’s Zoning and Land Development RegulationsIntergovernmental Coordination with State, Regional, and County AgenciesEnvironmental SustainabilityUrban Design
Planning & Urban Design Community DevelopmentProperty Acquisition & DispositionHomebuyer ProgramsResidential RehabilitationFair Housing InitiativesSub-Grantee ContractingNeighborhood Plans / LiaisonSocial Service CoordinationSpecial ProjectsILA Administration
FY 2020 Adopted Budget Development Services161
Department of Development Services
Summary The Department of Development Services is comprised of the Building, Planning
and Urban Design, Community Development, Engineering /Transportation and Mobility, and Code Compliance divisions. In FY 2020, Code Compliance was transferred from the Department of Public Works, and Parking Services was transferred from the Department of Development Services to the Police Department.
FY 2019 Accomplishments Building
• Implemented new policy for overtime utilizing an incentive based on efficient plan review and customer oriented service
• Instituted an outreach policy concerning HOA’s with Building Official attending regular associations meetings
• Incorporated Green Building Principles into new construction from building design to building operation to ensure all parties were using natural resources efficiently while decreasing waste and pollution
• Entered into an Interlocal Agreement with Broward County for Unsafe Structures Board
• Developed a GIS based Emergency Operational Center hurricane plan • Created preliminary concept for consolidated Development Services Center • Revamped the routing system to make plan review more efficient • Implemented Digital Fridays for same day permits for Mechanical, Electrical,
Plumbing and Structure (M.E.P.S) and electronic plan reviews (e-permit) • Purchased new vehicles for Inspectors
Community Development • Obtained approval for and implemented new housing programs supported by
funding derived from the Interlocal Agreement for affordable housing among Broward County, the City and the CRA
• Provided financial support and technical assistance for social service and workforce development programs administered by non-profit
• Made approximately 900 social service referrals for individuals including but not limited to persons with special needs or at risk of homelessness
• Completed construction on two new, affordable homes in conjunction with the Housing Rehabilitation/Replacement Program
FY 2020 Adopted Budget Development Services162
• Completed 16 housing rehabilitation projects • Completed extensive rehabilitation of two City-owned homes to prepare them
for conveyance to low- to moderate-income households • Consummated sale of City-owned parcels to make way for construction of
Pinnacle at Peacefield affordable rental apartments for seniors, resulting in net proceeds of $1,575,000
• Generated approximately $640,000 in program income as a result of the Division’s housing activities
• With the Office of Communications, Marketing & Economic Development, provided financial assistance to the Commercial Façade Improvement Pilot Program in Low to Moderate Income areas
• Collaborated with elected officials and federal and state legislators to advocate for the preservation of CDBG and HOME programs and full funding of Florida’s Housing Trust funds
• Implemented First-Time Homebuyer Purchase Assistance Program in partnership with the Broward County Housing Finance and Community Redevelopment Division
• Coordinated the Education Advisory Committee’s evaluation of eight candidates for the Hollywood Police Department’s Youth Ambassador Program
• Coordinated the Education Advisory Committee’s evaluation of grant proposals submitted by local educators and assisted with disbursement of financial assistance totaling $20,000
Planning and Urban Design • Honored with the 2018 Smart Growth Partnership Excellence Award for the
Regional Activity Center Rezoning project • Recognized by the Florida Department of State for continued efforts to preserve
Florida’s historic resources and for the Division’s active participation in the Certified Local Government program
• Implemented a fully digital submittal, routing, review, and publishing process for the Planning and Development and Historic Preservation Boards; which:
o Introduced electronic applications, submittals, and review for the Development Review Process
o Promoted economic development o Supported and promoted the City’s sustainability efforts by eliminating
costly and paper intensive submittals o Eliminated the need to physically route packages to Board members on a
monthly basis o Eliminated the Division’s need for a City vehicle
• Incorporated the Environmental Sustainability Coordinator position into the Division; and continued to ensure green practices are incorporated in early stages of the design process
FY 2020 Adopted Budget Development Services163
• Performed permit plan review for major economic development projects, such as, the Joe DiMaggio Children’s Hospital Expansion and Great Southern (Block 40)
• Completed amendments and enhancements to the City’s sign regulations in accordance with content neutrality requirements as mandated by Federal Law; and to fit the City’s vision and aesthetics
• Completed text amendments to Articles 2, 4, 5, 7, and 8 to clarify the intent of regulations, better respond to industry trends, promote the City’s vision, accommodate transitional development, and enhance usability
• Coordinated rewrite of the Comprehensive Plan in conformance to Broward County’s new Comprehensive Plan and Hollywood’s vision
Engineering / Transportation & Mobility • Began construction phase of Colbert Elementary Safe Routes to School Sidewalk
project which will add 5.07 miles of new sidewalk • Design and construction drawings completed for East-West Streetscape phase III
from Oklahoma Street to New Mexico Street • Received Grant funding in the amount of $4M from BMPO CSLIP • Reviewed and determine fees and/or mitigation for a total of 161 tree permits
city wide, reviewed, communicated and approved a total of 437 Landscape Plan Reviews for commercial and residential building permit projects
• Assisted in Citywide CIP projects, streetscape enhancements, landscape designs, and compliance efforts
Parking Services • Wrote amendments for City Code of Ordinances Chapter 72. • Redesigned City Hall parking layout for early voting. • Executed new contract with Broward County to enforce parking regulations at
North Beach pocket parks.
FY 2020 Goals Building
• Dedicate a Permitting Concierge for City and priority projects. • Implement a hybrid digital plan review and inspection services for large projects
under development like Block 58, Hillcrest and 441 Roc. • Enhance educational and certification levels for Permit Services Representatives,
Field Inspectors, and Plan Reviewers. • Commence buildout of Development Services Center • Develop a tracking service for 40 year inspections and unsafe structures.
FY 2020 Adopted Budget Development Services164
• Develop a process for expired permits.• Upgrade technology for permitting process to become fully digital.• Implement procedures to address the new four state statutes.
Community Development • Fully implement housing, infrastructure and work skills initiatives supported by
funds derived from the Interlocal Agreement for affordable housing amongBroward County, the City and the CRA
• Identify and cultivate case management services for vulnerable Hollywoodresidents
• Identify and promote additional civic association capacity-building initiatives• Collaborate with Broward County Human Services Division to host a
Neighborhood Resource Fair in Hollywood• Collaborate with neighborhood associations representing LMI areas to refine the
Division’s Neighborhood Capital Improvement Plan program• Increase technical capacity of neighborhood civic associations• Explore opportunities to facilitate development of affordable housing on
available publicly- and privately-owned parcels• Continue financial support of workforce development initiatives i.e., CPIP, the
Bridge Program, LIVE Hope Program and Hand-Up Program to improve economicopportunity for low- and moderate-income individuals and households
Planning and Urban Design • Improve and expand the features of the interactive GIS based map• Expand and promote Historic Preservation efforts, including increasing the
awareness of realtors and prospective buyers• Work towards sustainability and resiliency goals• Ensure green practices are incorporated in early stages of the design process• Extend the fully digital submittal, routing, and review process to all aspects of
the Development Review Process, including the Pre-Application ConceptualOverview (PACO) and Technical Advisory Committee (TAC)
• Coordinate rewrite of the Comprehensive Plan in conformance to BrowardCounty’s new Comprehensive Plan and Hollywood’s vision
• Work with Building and Code Compliance on permitting and in resolvingproperty violations, globally through an interdepartmental approach
• Enhance and streamline the Development Review Process to support economicdevelopment while balancing and incorporating community priorities
• Continue to evaluate how the Certificate of Use Process could be enhanced tobetter suit the needs of the City
• Work with internal and external resources to evaluate the Zoning & LandDevelopment Regulations for opportunities to enhance zoning regulations
FY 2020 Adopted Budget Development Services165
particularly relative to commercial and residential property standards
Engineering / Transportation and Mobility • Complete the 50/50 Sidewalk Reconstruction Program. • Complete construction of the Colbert Elementary Safe Routes to School Sidewalk
project. • Continue to perform overall Site Plan Review, Integrating Landscape, Traffic and
Civil Engineering with Complete Streets Design Concepts. • Conduct a Study to develop Impact Fees for The following categories:
o Mobility and Transportation o General Government Buildings o Law Enforcement o Fire Rescue o Affordable Housing
• Complete design work on East-West Streetscape Phase IV from Harrison Street to Magnolia Terrace for the CRA.
• Secure and administer Transportation Surtax, Broward MPO and FDOT grant funding for varied transportation improvements.
• Restructure the Division to enhance the development review and ROW permit process.
• Design the landscape and irrigation improvements relative to the various federally funded bike lane projects.
• Develop a “Right of Way Urban Design Guideline” for the CRA and RAC areas. • Develop a “Bike Lane Master Plan.” • Develop a “Citywide Traffic Calming Program.” • Complete design and begin Surf Road reconstruction.
Code Compliance • Submit properties to Broward County’s Unsafe Structure Board to be
demolished • Review and submit properties for City to foreclose on due to high liens • Work on specifications and find location to begin construction of the new
H.A.R.T facility for Pooches and Kitties in Hollywood • Continue to utilize the Administrative Citation process which would allow
quicker compliance and avoid the lengthy Special Magistrate process • Increase zone blitzes by 5% for the reduction in complaints and for cleaner,
more compliant neighborhoods
FY 2020 Adopted Budget Development Services166
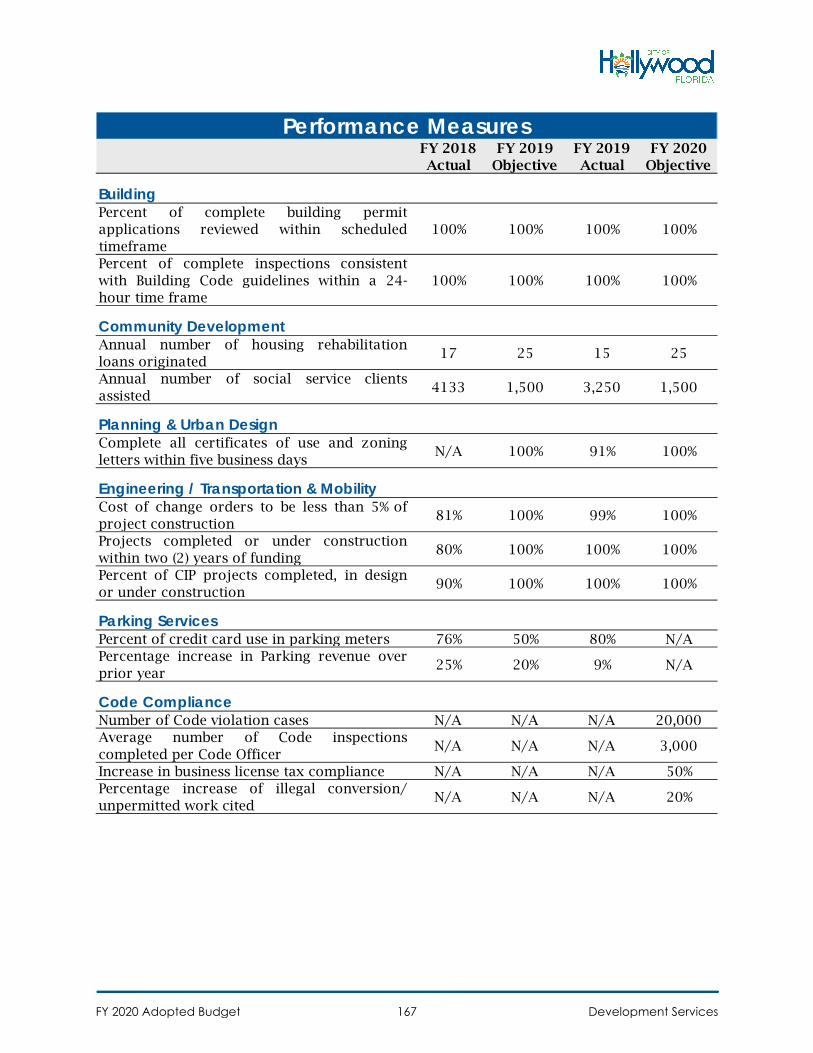
FY 2018 Actual
FY 2019 Objective
FY 2019 Actual
FY 2020 Objective
BuildingPercent of complete building permitapplications reviewed within scheduledtimeframe
100% 100% 100% 100%
Percent of complete inspections consistentwith Building Code guidelines within a 24-hour time frame
100% 100% 100% 100%
Community DevelopmentAnnual number of housing rehabilitationloans originated
17 25 15 25
Annual number of social service clientsassisted
4133 1,500 3,250 1,500
Planning & Urban DesignComplete all certificates of use and zoningletters within five business days
N/A 100% 91% 100%
Engineering / Transportation & MobilityCost of change orders to be less than 5% ofproject construction
81% 100% 99% 100%
Projects completed or under constructionwithin two (2) years of funding
80% 100% 100% 100%
Percent of CIP projects completed, in designor under construction
90% 100% 100% 100%
Parking ServicesPercent of credit card use in parking meters 76% 50% 80% N/APercentage increase in Parking revenue overprior year
25% 20% 9% N/A
Code ComplianceNumber of Code violation cases N/A N/A N/A 20,000 Average number of Code inspectionscompleted per Code Officer
N/A N/A N/A 3,000
Increase in business license tax compliance N/A N/A N/A 50%Percentage increase of illegal conversion/unpermitted work cited
N/A N/A N/A 20%
Performance Measures
FY 2020 Adopted Budget Development Services167
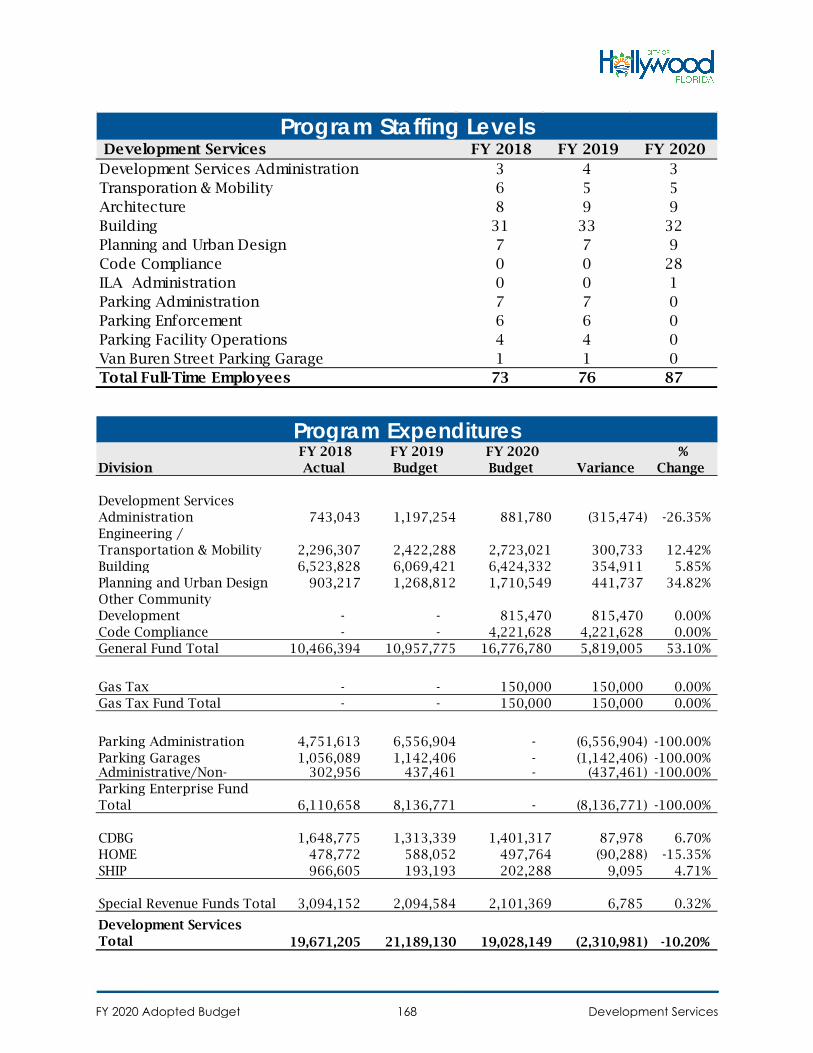
Development Services FY 2018 FY 2019 FY 2020 Development Services Administration 3 4 3Transporation & Mobility 6 5 5Architecture 8 9 9Building 31 33 32Planning and Urban Design 7 7 9Code Compliance 0 0 28ILA Administration 0 0 1Parking Administration 7 7 0Parking Enforcement 6 6 0Parking Facility Operations 4 4 0Van Buren Street Parking Garage 1 1 0Total Full-Time Employees 73 76 87
Program Staffing Levels
Division FY 2018
Actual FY 2019 Budget
FY 2020 Budget Variance
% Change
Development Services Administration 743,043 1,197,254 881,780 (315,474) -26.35%Engineering / Transportation & Mobility 2,296,307 2,422,288 2,723,021 300,733 12.42%Building 6,523,828 6,069,421 6,424,332 354,911 5.85%Planning and Urban Design 903,217 1,268,812 1,710,549 441,737 34.82%Other Community Development - - 815,470 815,470 0.00%Code Compliance - - 4,221,628 4,221,628 0.00%General Fund Total 10,466,394 10,957,775 16,776,780 5,819,005 53.10%
Gas Tax - - 150,000 150,000 0.00%Gas Tax Fund Total - - 150,000 150,000 0.00%
Parking Administration 4,751,613 6,556,904 - (6,556,904) -100.00%Parking Garages 1,056,089 1,142,406 - (1,142,406) -100.00%Administrative/Non- 302,956 437,461 - (437,461) -100.00%Parking Enterprise Fund Total 6,110,658 8,136,771 - (8,136,771) -100.00%
CDBG 1,648,775 1,313,339 1,401,317 87,978 6.70%HOME 478,772 588,052 497,764 (90,288) -15.35%SHIP 966,605 193,193 202,288 9,095 4.71%
Special Revenue Funds Total 3,094,152 2,094,584 2,101,369 6,785 0.32%
Development Services Total 19,671,205 21,189,130 19,028,149 (2,310,981) -10.20%
Program Expenditures
FY 2020 Adopted Budget Development Services168
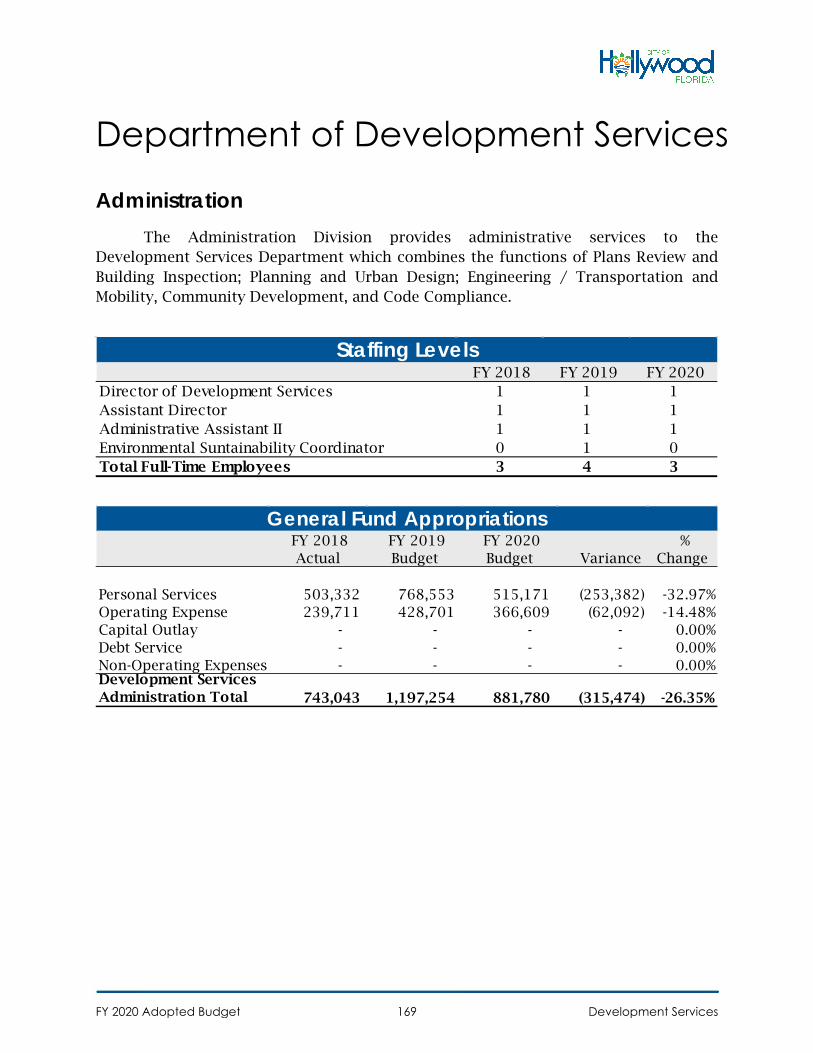
Department of Development Services
Administration The Administration Division provides administrative services to the
Development Services Department which combines the functions of Plans Review and Building Inspection; Planning and Urban Design; Engineering / Transportation and Mobility, Community Development, and Code Compliance.
FY 2018 FY 2019 FY 2020 Director of Development Services 1 1 1Assistant Director 1 1 1Administrative Assistant II 1 1 1Environmental Suntainability Coordinator 0 1 0Total Full-Time Employees 3 4 3
Staffing Levels
FY 2018 Actual
FY 2019 Budget
FY 2020 Budget Variance
% Change
Personal Services 503,332 768,553 515,171 (253,382) -32.97%Operating Expense 239,711 428,701 366,609 (62,092) -14.48%Capital Outlay - - - - 0.00%Debt Service - - - - 0.00%Non-Operating Expenses - - - - 0.00%Development Services Administration Total 743,043 1,197,254 881,780 (315,474) -26.35%
General Fund Appropriations
FY 2020 Adopted Budget Development Services169
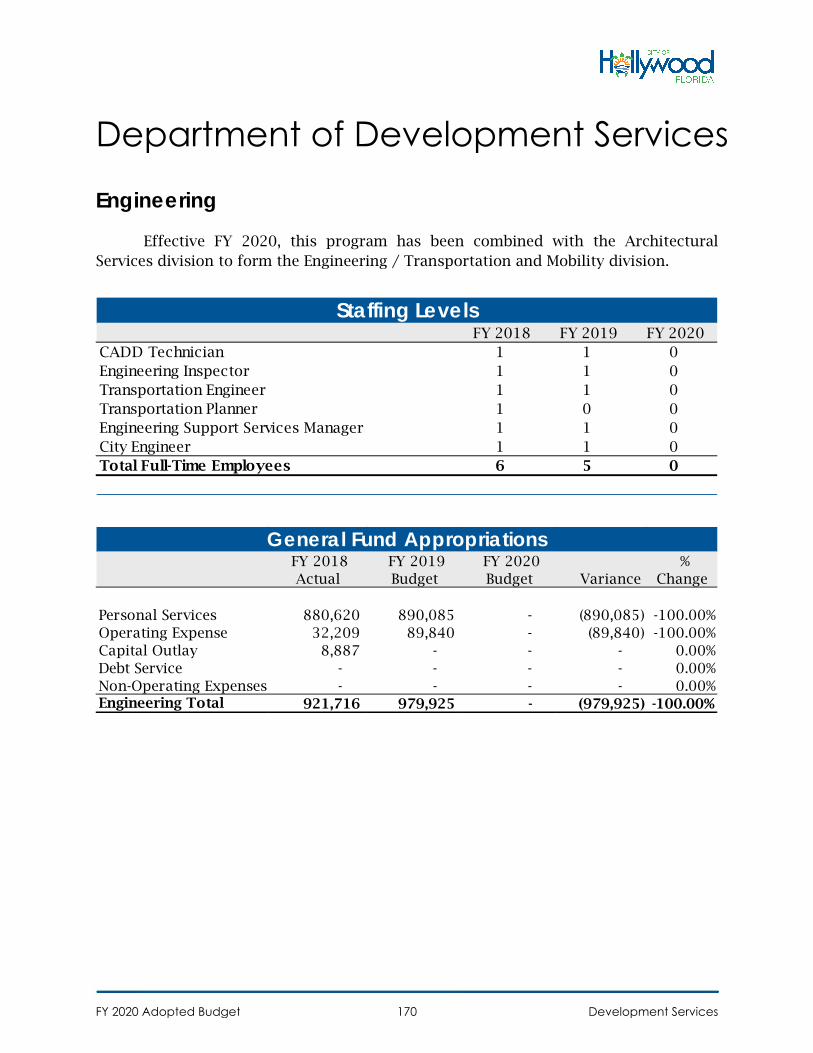
Department of Development Services
Engineering
Effective FY 2020, this program has been combined with the Architectural Services division to form the Engineering / Transportation and Mobility division.
FY 2018 FY 2019 FY 2020 CADD Technician 1 1 0Engineering Inspector 1 1 0Transportation Engineer 1 1 0Transportation Planner 1 0 0Engineering Support Services Manager 1 1 0City Engineer 1 1 0Total Full-Time Employees 6 5 0
Staffing Levels
FY 2018 Actual
FY 2019 Budget
FY 2020 Budget Variance
% Change
Personal Services 880,620 890,085 - (890,085) -100.00%Operating Expense 32,209 89,840 - (89,840) -100.00%Capital Outlay 8,887 - - - 0.00%Debt Service - - - - 0.00%Non-Operating Expenses - - - - 0.00%Engineering Total 921,716 979,925 - (979,925) -100.00%
General Fund Appropriations
FY 2020 Adopted Budget Development Services170
Department of Development Services
Engineering / Transportation & Mobility
Under the direction of the City Engineer, the Engineering, Transportation and Mobility Division provides for the planning, design, development, regulatory permitting, and construction management of City roadway infrastructure improvements. This includes sidewalk program, alley reconstruction, street resurfacing, street lighting improvements, intersection improvements, and bridge repairs.
Staff conducts the engineering review of development plans and reviews site
and building plans for compliance with engineering requirements of the City’s building code. Progress inspections are performed to ensure compliance with permit conditions. Staff also ensures compliance with the City’s right-of-way ordinances, including plan review and inspection of all private utility work in the right-of-way, the placement of news racks, public right-of-way phones, sidewalk cafes, bus benches, bus shelters, and portable storage units.
In addition, this Division is responsible for traffic engineering, right-of-way
rehabilitation, and the procurement and management of survey records for City properties and right-of-ways. Staff also coordinates applications for utility easements, right-of-way vacations or dedications, and assigns street names and property addresses.
This division also implements the five-year Capital Improvement Plan (CIP) in a
timely and efficient manner. To achieve this result, staff assists other Departments and Offices with programming and defining scopes of work for capital projects City-wide, as well as providing cost estimates and preparing project budgets; performing engineering calculations; and preparing architectural and engineering designs, including renderings and design concepts for proposed improvements. Staff prepares bid packages, negotiates consultant and construction management fees, performs cost analysis and value engineering, and is intimately involved in the permitting and construction administration of projects. The Department is responsible for monitoring and implementing changes to City facilities to comply with the Americans with Disabilities Act (ADA). Staff also provides extensive engineering, architectural and project administration support to the Downtown and Beach districts of the Community Redevelopment Agency (CRA).
FY 2020 Adopted Budget Development Services171
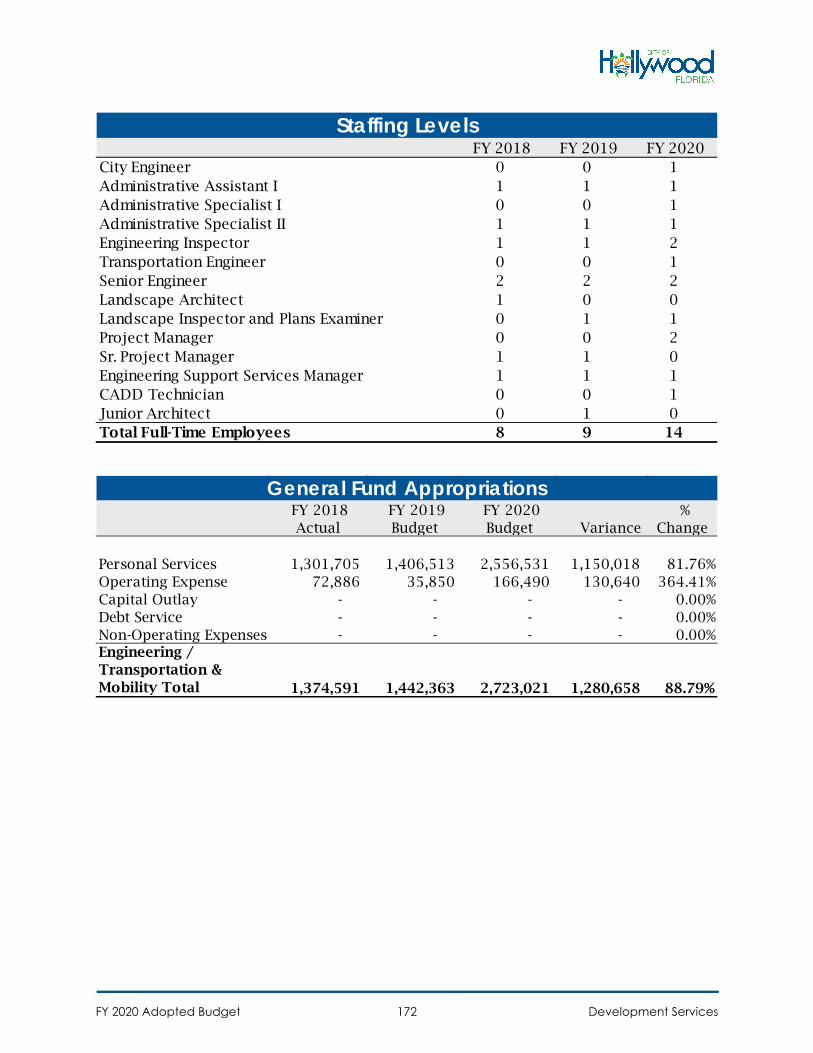
FY 2018 FY 2019 FY 2020 City Engineer 0 0 1Administrative Assistant I 1 1 1Administrative Specialist I 0 0 1Administrative Specialist II 1 1 1Engineering Inspector 1 1 2Transportation Engineer 0 0 1Senior Engineer 2 2 2Landscape Architect 1 0 0Landscape Inspector and Plans Examiner 0 1 1Project Manager 0 0 2Sr. Project Manager 1 1 0Engineering Support Services Manager 1 1 1CADD Technician 0 0 1Junior Architect 0 1 0Total Full-Time Employees 8 9 14
Staffing Levels
FY 2018 Actual
FY 2019 Budget
FY 2020 Budget Variance
% Change
Personal Services 1,301,705 1,406,513 2,556,531 1,150,018 81.76%Operating Expense 72,886 35,850 166,490 130,640 364.41%Capital Outlay - - - - 0.00%Debt Service - - - - 0.00%Non-Operating Expenses - - - - 0.00%Engineering / Transportation & Mobility Total 1,374,591 1,442,363 2,723,021 1,280,658 88.79%
General Fund Appropriations
FY 2020 Adopted Budget Development Services172
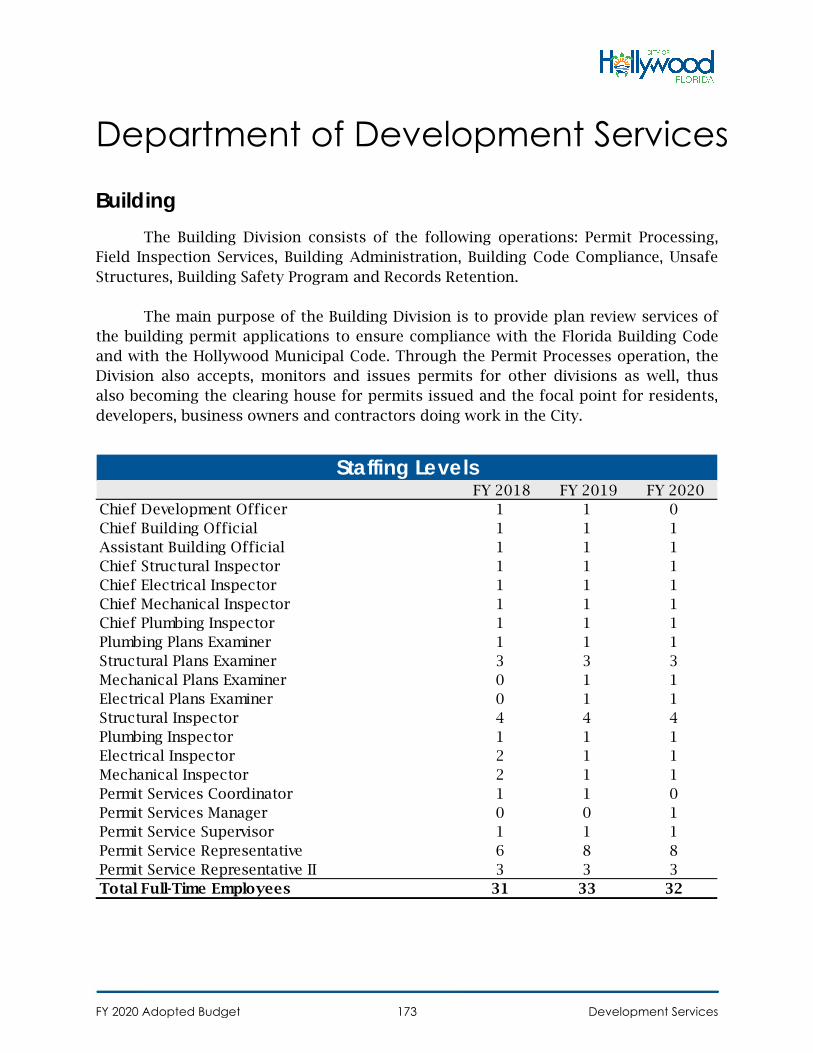
Department of Development Services
Building The Building Division consists of the following operations: Permit Processing,
Field Inspection Services, Building Administration, Building Code Compliance, Unsafe Structures, Building Safety Program and Records Retention.
The main purpose of the Building Division is to provide plan review services of
the building permit applications to ensure compliance with the Florida Building Code and with the Hollywood Municipal Code. Through the Permit Processes operation, the Division also accepts, monitors and issues permits for other divisions as well, thus also becoming the clearing house for permits issued and the focal point for residents, developers, business owners and contractors doing work in the City.
FY 2018 FY 2019 FY 2020 Chief Development Officer 1 1 0Chief Building Official 1 1 1Assistant Building Official 1 1 1Chief Structural Inspector 1 1 1Chief Electrical Inspector 1 1 1Chief Mechanical Inspector 1 1 1Chief Plumbing Inspector 1 1 1Plumbing Plans Examiner 1 1 1Structural Plans Examiner 3 3 3Mechanical Plans Examiner 0 1 1Electrical Plans Examiner 0 1 1Structural Inspector 4 4 4Plumbing Inspector 1 1 1Electrical Inspector 2 1 1Mechanical Inspector 2 1 1Permit Services Coordinator 1 1 0Permit Services Manager 0 0 1Permit Service Supervisor 1 1 1Permit Service Representative 6 8 8Permit Service Representative II 3 3 3Total Full-Time Employees 31 33 32
Staffing Levels
FY 2020 Adopted Budget Development Services173
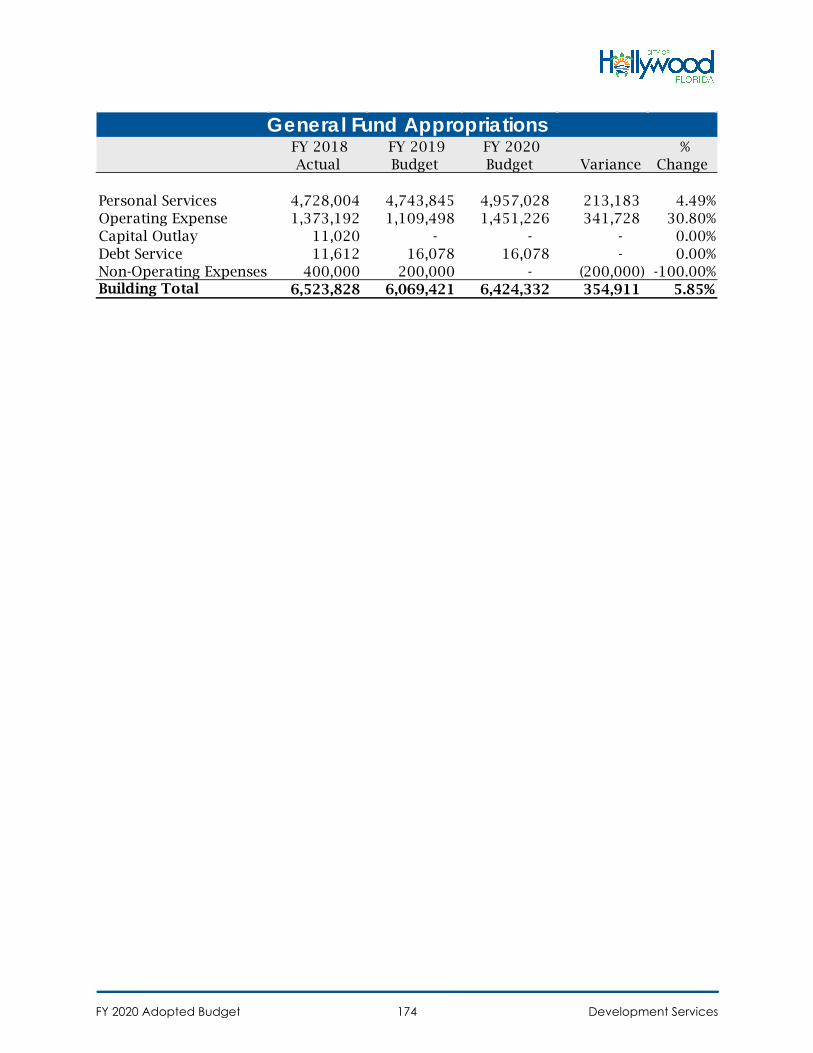
FY 2018 Actual
FY 2019 Budget
FY 2020 Budget Variance
% Change
Personal Services 4,728,004 4,743,845 4,957,028 213,183 4.49%Operating Expense 1,373,192 1,109,498 1,451,226 341,728 30.80%Capital Outlay 11,020 - - - 0.00%Debt Service 11,612 16,078 16,078 - 0.00%Non-Operating Expenses 400,000 200,000 - (200,000) -100.00%Building Total 6,523,828 6,069,421 6,424,332 354,911 5.85%
General Fund Appropriations
FY 2020 Adopted Budget Development Services174
Department of Development Services
Planning & Urban Design Responsible for implementing and administering the City’s Comprehensive Plan,
Citywide Master Plan and Zoning and Land Development Regulations, the Planning & Urban Design Division establishes the City’s vision and coordinates all stages of the Development Review Process within the City including Historic and Overlay Districts. In this capacity, it functions as liaison and administrative support to the City’s Technical Advisory Committee (TAC), Planning and Development Board, and Historic Preservation Board. Striving to provide the highest level of customer service and convenience, the Division also serves the as the public and industry liaison providing technical assistance and support for zoning and land development matters; performs permit review; process and issues Certificates of Use, Extended Hours Licenses, Temporary Sign Permits, Zoning letters, etc.; and oversees special projects.
Planning & Urban Design is also responsible for maintaining and amending the
City’s Zoning and Land Development Regulations in response to Citywide Master Plan recommendations, changing Federal and State statues, and to implement the vision for various areas of the City; as well as updating the Citywide Design Guidelines and Design Guidelines for Historic Properties and Districts.
Additionally, the Division manages intergovernmental coordination with State,
Regional, and County agencies regarding development in the City through representation at Broward County Planning Council, County Commission, South Florida Regional Planning Council meetings, etc. Major projects and processes requiring intergovernmental coordination include: annual updates of the Capital Improvements Element of the Comprehensive Plan; periodic State mandated Evaluation & Appraisal Report (EAR) of the Comprehensive Plan’s; development and monitoring of Interlocal Agreement between the Broward County School Board and City regarding school facilities; adoption and implementation of the ten-year Water Supply Facilities Work Plan, implementation of Transit Oriented Corridor (TOC) Land Use Designation along State Road 7/US 441 Corridor; coordination of Florida Department of Transportation widening/improvements of the State Road 7/US 441 Corridor; and all functions legislatively required to maintain the City’s status as a Certified Local Government of Historic Preservation.
As development trends appear to be stabilizing and the level of development
activity in the City continues to show signs of improvement, the Planning Division is experiencing an increase in the overall number of projects and Planning applications. As such, the Planning Division’s goals continue to evolve in response to the changing
FY 2020 Adopted Budget Development Services175
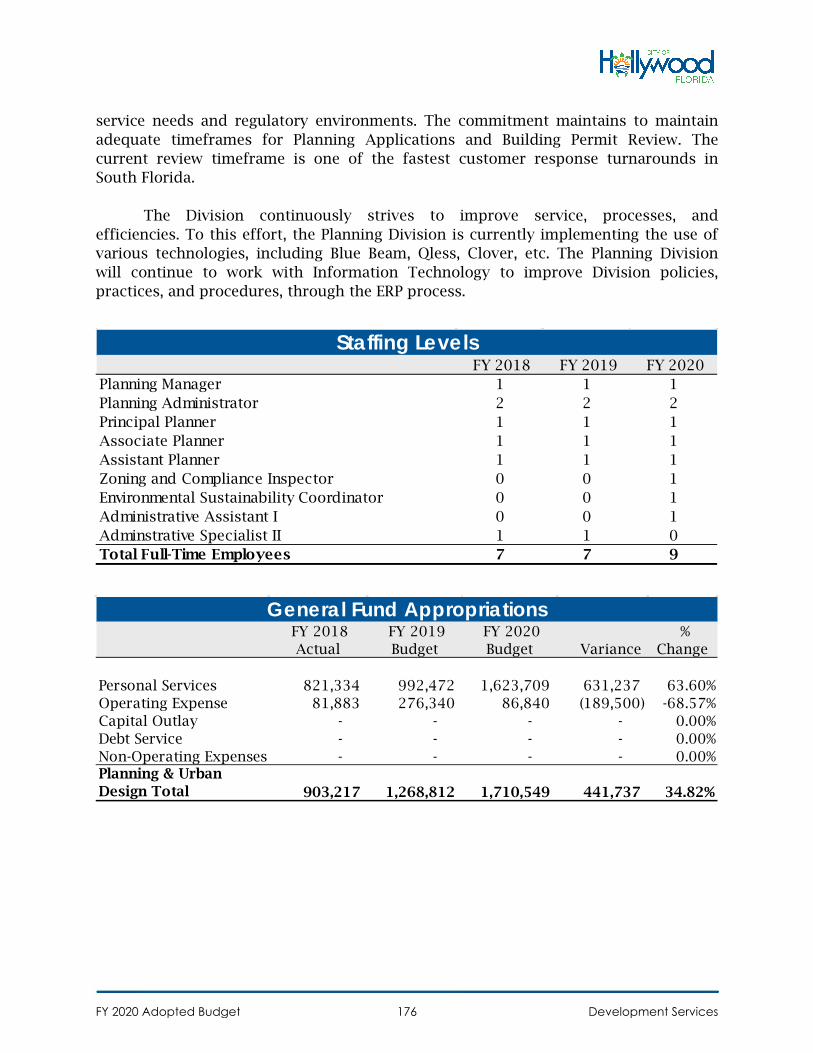
service needs and regulatory environments. The commitment maintains to maintain adequate timeframes for Planning Applications and Building Permit Review. The current review timeframe is one of the fastest customer response turnarounds in South Florida.
The Division continuously strives to improve service, processes, and
efficiencies. To this effort, the Planning Division is currently implementing the use of various technologies, including Blue Beam, Qless, Clover, etc. The Planning Division will continue to work with Information Technology to improve Division policies, practices, and procedures, through the ERP process.
FY 2018 FY 2019 FY 2020 Planning Manager 1 1 1Planning Administrator 2 2 2Principal Planner 1 1 1Associate Planner 1 1 1Assistant Planner 1 1 1Zoning and Compliance Inspector 0 0 1Environmental Sustainability Coordinator 0 0 1Administrative Assistant I 0 0 1Adminstrative Specialist II 1 1 0Total Full-Time Employees 7 7 9
Staffing Levels
FY 2018 Actual
FY 2019 Budget
FY 2020 Budget Variance
% Change
Personal Services 821,334 992,472 1,623,709 631,237 63.60%Operating Expense 81,883 276,340 86,840 (189,500) -68.57%Capital Outlay - - - - 0.00%Debt Service - - - - 0.00%Non-Operating Expenses - - - - 0.00%Planning & Urban Design Total 903,217 1,268,812 1,710,549 441,737 34.82%
General Fund Appropriations
FY 2020 Adopted Budget Development Services176
Department of Development Services
Community Development The Community Development Division uses funds from various public and
private sources to address priority needs and specific objectives established in the Five-Year Consolidated Community Development Plan and Citywide Master Plan.
Community development activities include the development or rehabilitation of
affordable housing, homeownership counseling and financial assistance, community events and programs, neighborhood association partnerships, social service referrals, and the promotion of economic opportunity within underserved areas. In addition, staff monitors outside agencies receiving federal and state grant funding and provides program reporting, accounting and technical assistance. Neighborhoods are assisted to strengthen technical capacity with the assistance of appropriate City staff. Funding for the Division is provided by federal and state grant programs and Program Income, including the U.S. Department of Housing and Urban Development (HUD) Community Development Block Grant (CDBG) program, Home Investment Partnership (HOME) program and Neighborhood Stabilization Program (NSP-1/NSP-3). Grant funding is also received via the State of Florida’s State Housing Initiatives Partnership (SHIP) program.
Grant funding is directed into the following program categories: Housing, Public
Services, Capital Improvements, Program Administration and Economic Development. The primary focus for housing funds is to preserve, upgrade and expand existing affordable housing stock; provide decent, safe and sanitary housing; demolish and clear unsafe structures; assist homeowners with rehabilitation of their home; acquire and rehabilitate homes as appropriate; and encourage new housing development. Public service funds provide supportive services for special needs populations and complement the physical and economic development investment provided through the CDBG program. Economic development activities increase employment opportunities for low- and moderate-income residents.
All full-time employees assigned to this program are partially grant funded.
Staffing Levels
FY 2020 Adopted Budget Development Services177
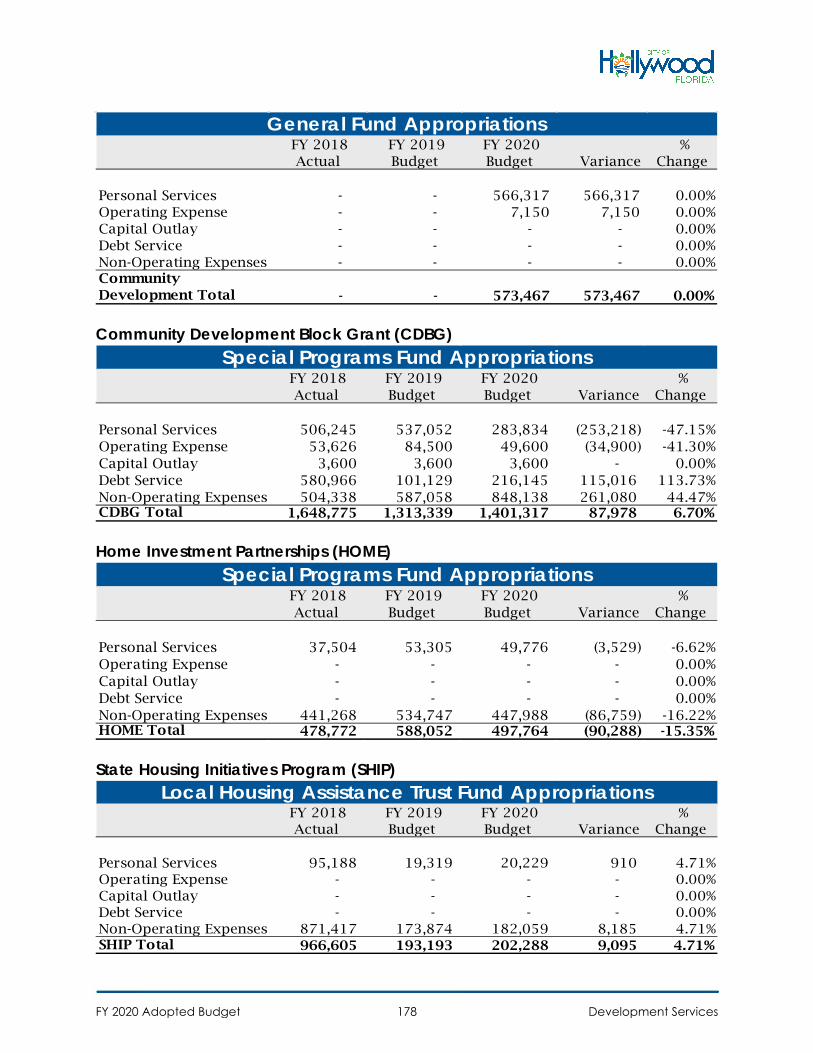
Community Development Block Grant (CDBG)
Home Investment Partnerships (HOME)
State Housing Initiatives Program (SHIP)
FY 2018 Actual
FY 2019 Budget
FY 2020 Budget Variance
% Change
Personal Services - - 566,317 566,317 0.00%Operating Expense - - 7,150 7,150 0.00%Capital Outlay - - - - 0.00%Debt Service - - - - 0.00%Non-Operating Expenses - - - - 0.00%Community Development Total - - 573,467 573,467 0.00%
General Fund Appropriations
FY 2018 Actual
FY 2019 Budget
FY 2020 Budget Variance
% Change
Personal Services 506,245 537,052 283,834 (253,218) -47.15%Operating Expense 53,626 84,500 49,600 (34,900) -41.30%Capital Outlay 3,600 3,600 3,600 - 0.00%Debt Service 580,966 101,129 216,145 115,016 113.73%Non-Operating Expenses 504,338 587,058 848,138 261,080 44.47%CDBG Total 1,648,775 1,313,339 1,401,317 87,978 6.70%
Special Programs Fund Appropriations
FY 2018 Actual
FY 2019 Budget
FY 2020 Budget Variance
% Change
Personal Services 37,504 53,305 49,776 (3,529) -6.62%Operating Expense - - - - 0.00%Capital Outlay - - - - 0.00%Debt Service - - - - 0.00%Non-Operating Expenses 441,268 534,747 447,988 (86,759) -16.22%HOME Total 478,772 588,052 497,764 (90,288) -15.35%
Special Programs Fund Appropriations
FY 2018 Actual
FY 2019 Budget
FY 2020 Budget Variance
% Change
Personal Services 95,188 19,319 20,229 910 4.71%Operating Expense - - - - 0.00%Capital Outlay - - - - 0.00%Debt Service - - - - 0.00%Non-Operating Expenses 871,417 173,874 182,059 8,185 4.71%SHIP Total 966,605 193,193 202,288 9,095 4.71%
Local Housing Assistance Trust Fund Appropriations
FY 2020 Adopted Budget Development Services178
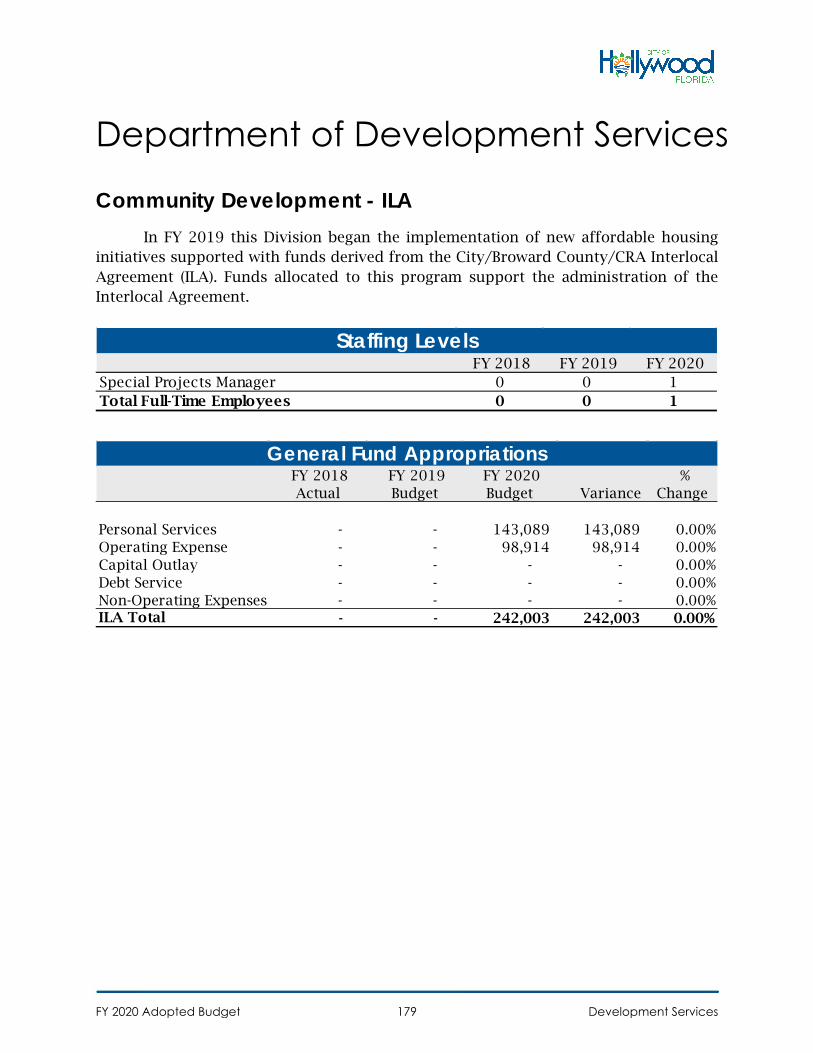
Department of Development Services
Community Development - ILA In FY 2019 this Division began the implementation of new affordable housing
initiatives supported with funds derived from the City/Broward County/CRA Interlocal Agreement (ILA). Funds allocated to this program support the administration of the Interlocal Agreement.
FY 2018 FY 2019 FY 2020 Special Projects Manager 0 0 1Total Full-Time Employees 0 0 1
Staffing Levels
FY 2018 Actual
FY 2019 Budget
FY 2020 Budget Variance
% Change
Personal Services - - 143,089 143,089 0.00%Operating Expense - - 98,914 98,914 0.00%Capital Outlay - - - - 0.00%Debt Service - - - - 0.00%Non-Operating Expenses - - - - 0.00%ILA Total - - 242,003 242,003 0.00%
General Fund Appropriations
FY 2020 Adopted Budget Development Services179
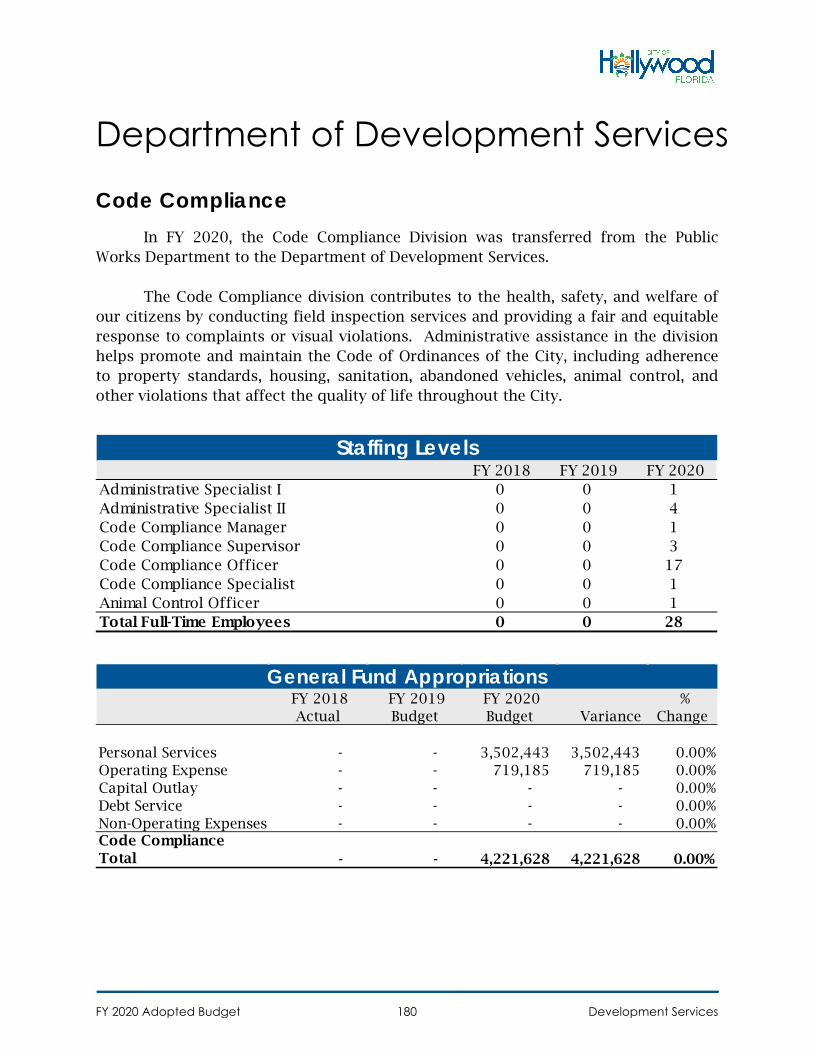
Department of Development Services
Code Compliance In FY 2020, the Code Compliance Division was transferred from the Public
Works Department to the Department of Development Services.
The Code Compliance division contributes to the health, safety, and welfare of our citizens by conducting field inspection services and providing a fair and equitable response to complaints or visual violations. Administrative assistance in the division helps promote and maintain the Code of Ordinances of the City, including adherence to property standards, housing, sanitation, abandoned vehicles, animal control, and other violations that affect the quality of life throughout the City.
FY 2018 FY 2019 FY 2020 Administrative Specialist I 0 0 1Administrative Specialist II 0 0 4Code Compliance Manager 0 0 1Code Compliance Supervisor 0 0 3Code Compliance Officer 0 0 17Code Compliance Specialist 0 0 1Animal Control Officer 0 0 1Total Full-Time Employees 0 0 28
Staffing Levels
FY 2018 Actual
FY 2019 Budget
FY 2020 Budget Variance
% Change
Personal Services - - 3,502,443 3,502,443 0.00%Operating Expense - - 719,185 719,185 0.00%Capital Outlay - - - - 0.00%Debt Service - - - - 0.00%Non-Operating Expenses - - - - 0.00%Code Compliance Total - - 4,221,628 4,221,628 0.00%
General Fund Appropriations
FY 2020 Adopted Budget Development Services180
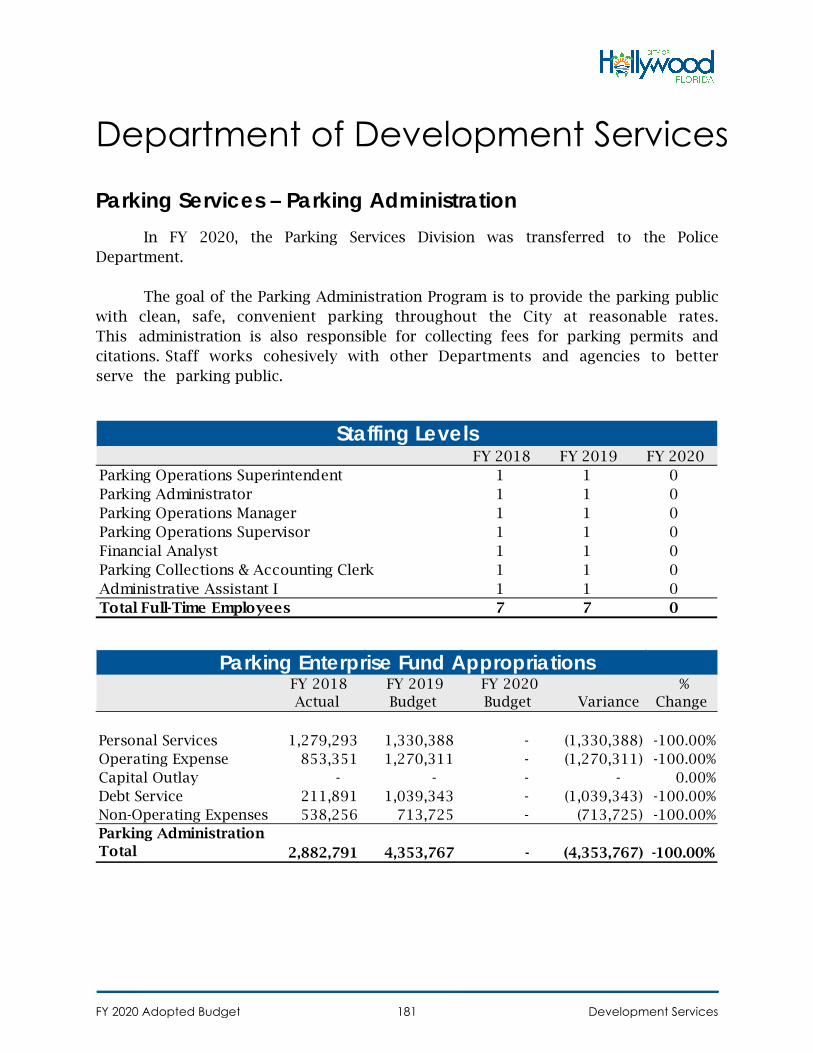
Department of Development Services
Parking Services – Parking Administration In FY 2020, the Parking Services Division was transferred to the Police
Department.
The goal of the Parking Administration Program is to provide the parking public with clean, safe, convenient parking throughout the City at reasonable rates. This administration is also responsible for collecting fees for parking permits and citations. Staff works cohesively with other Departments and agencies to better serve the parking public.
FY 2018 FY 2019 FY 2020 Parking Operations Superintendent 1 1 0Parking Administrator 1 1 0Parking Operations Manager 1 1 0Parking Operations Supervisor 1 1 0Financial Analyst 1 1 0Parking Collections & Accounting Clerk 1 1 0Administrative Assistant I 1 1 0Total Full-Time Employees 7 7 0
Staffing Levels
FY 2018 Actual
FY 2019 Budget
FY 2020 Budget Variance
% Change
Personal Services 1,279,293 1,330,388 - (1,330,388) -100.00%Operating Expense 853,351 1,270,311 - (1,270,311) -100.00%Capital Outlay - - - - 0.00%Debt Service 211,891 1,039,343 - (1,039,343) -100.00%Non-Operating Expenses 538,256 713,725 - (713,725) -100.00%Parking Administration Total 2,882,791 4,353,767 - (4,353,767) -100.00%
Parking Enterprise Fund Appropriations
FY 2020 Adopted Budget Development Services181
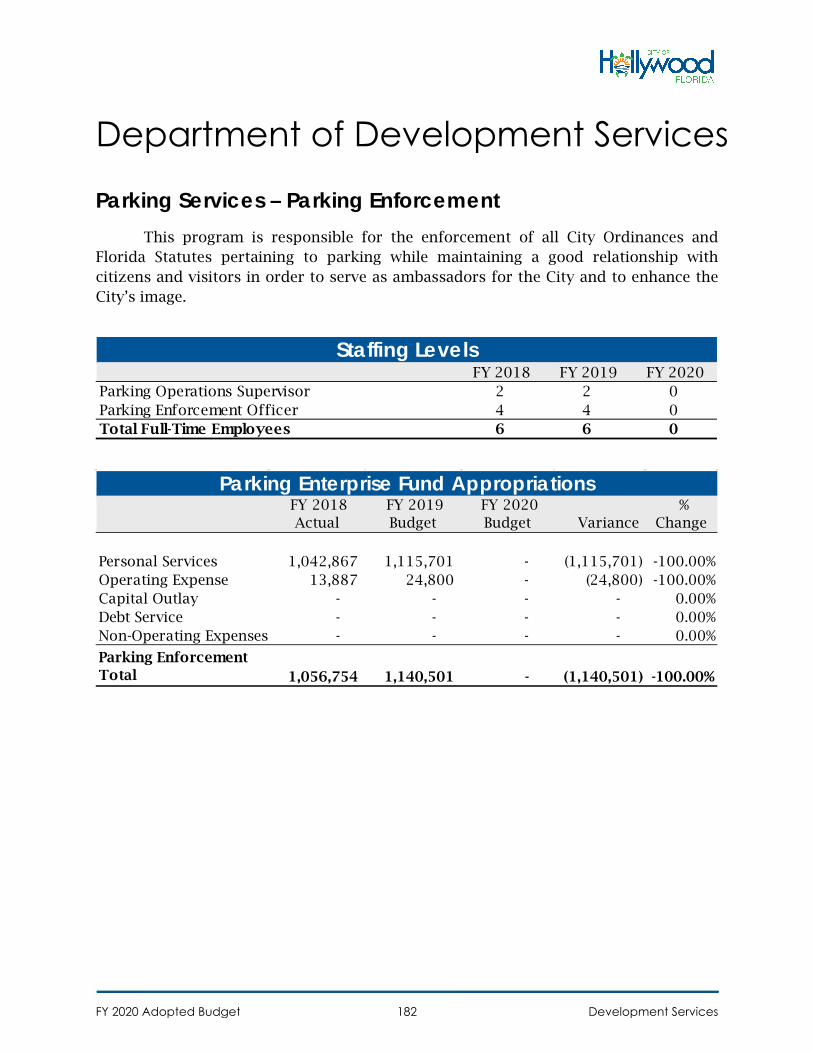
Department of Development Services
Parking Services – Parking Enforcement This program is responsible for the enforcement of all City Ordinances and
Florida Statutes pertaining to parking while maintaining a good relationship with citizens and visitors in order to serve as ambassadors for the City and to enhance the City’s image.
FY 2018 FY 2019 FY 2020 Parking Operations Supervisor 2 2 0Parking Enforcement Officer 4 4 0Total Full-Time Employees 6 6 0
Staffing Levels
FY 2018 Actual
FY 2019 Budget
FY 2020 Budget Variance
% Change
Personal Services 1,042,867 1,115,701 - (1,115,701) -100.00%Operating Expense 13,887 24,800 - (24,800) -100.00%Capital Outlay - - - - 0.00%Debt Service - - - - 0.00%Non-Operating Expenses - - - - 0.00%
Parking Enforcement Total 1,056,754 1,140,501 - (1,140,501) -100.00%
Parking Enterprise Fund Appropriations
FY 2020 Adopted Budget Development Services182
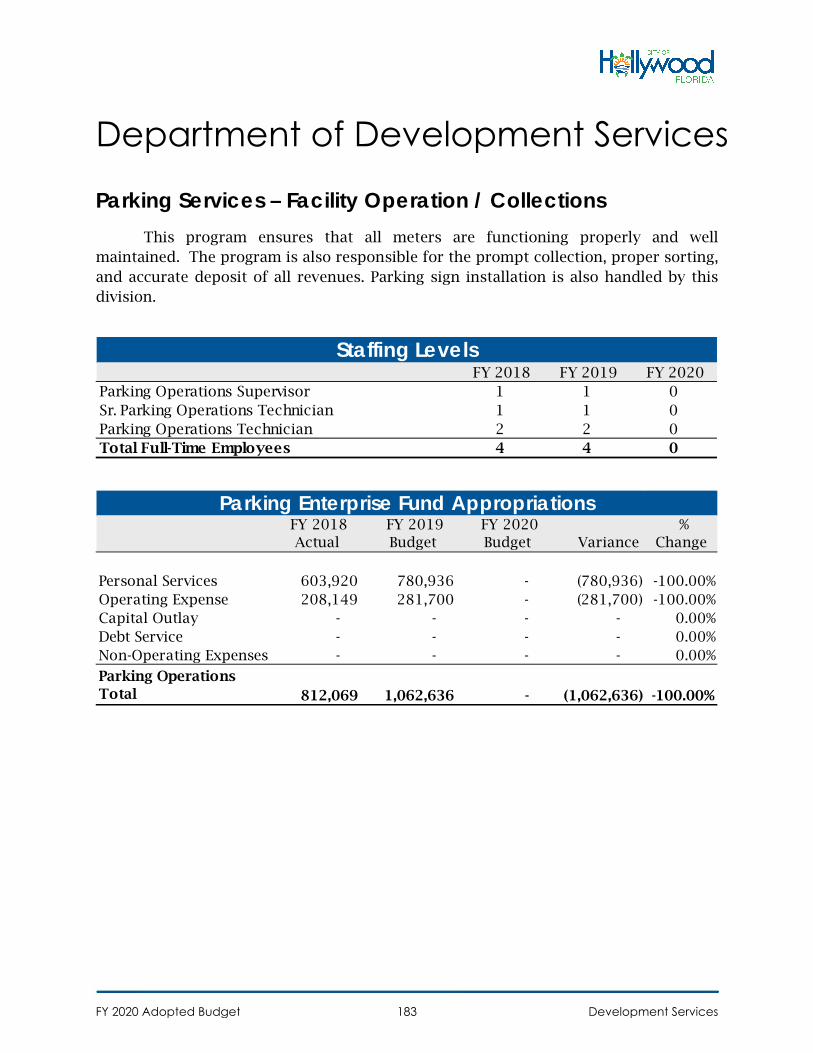
Department of Development Services
Parking Services – Facility Operation / Collections This program ensures that all meters are functioning properly and well
maintained. The program is also responsible for the prompt collection, proper sorting, and accurate deposit of all revenues. Parking sign installation is also handled by this division.
FY 2018 FY 2019 FY 2020 Parking Operations Supervisor 1 1 0Sr. Parking Operations Technician 1 1 0Parking Operations Technician 2 2 0Total Full-Time Employees 4 4 0
Staffing Levels
FY 2018 Actual
FY 2019 Budget
FY 2020 Budget Variance
% Change
Personal Services 603,920 780,936 - (780,936) -100.00%Operating Expense 208,149 281,700 - (281,700) -100.00%Capital Outlay - - - - 0.00%Debt Service - - - - 0.00%Non-Operating Expenses - - - - 0.00%
Parking Operations Total 812,069 1,062,636 - (1,062,636) -100.00%
Parking Enterprise Fund Appropriations
FY 2020 Adopted Budget Development Services183
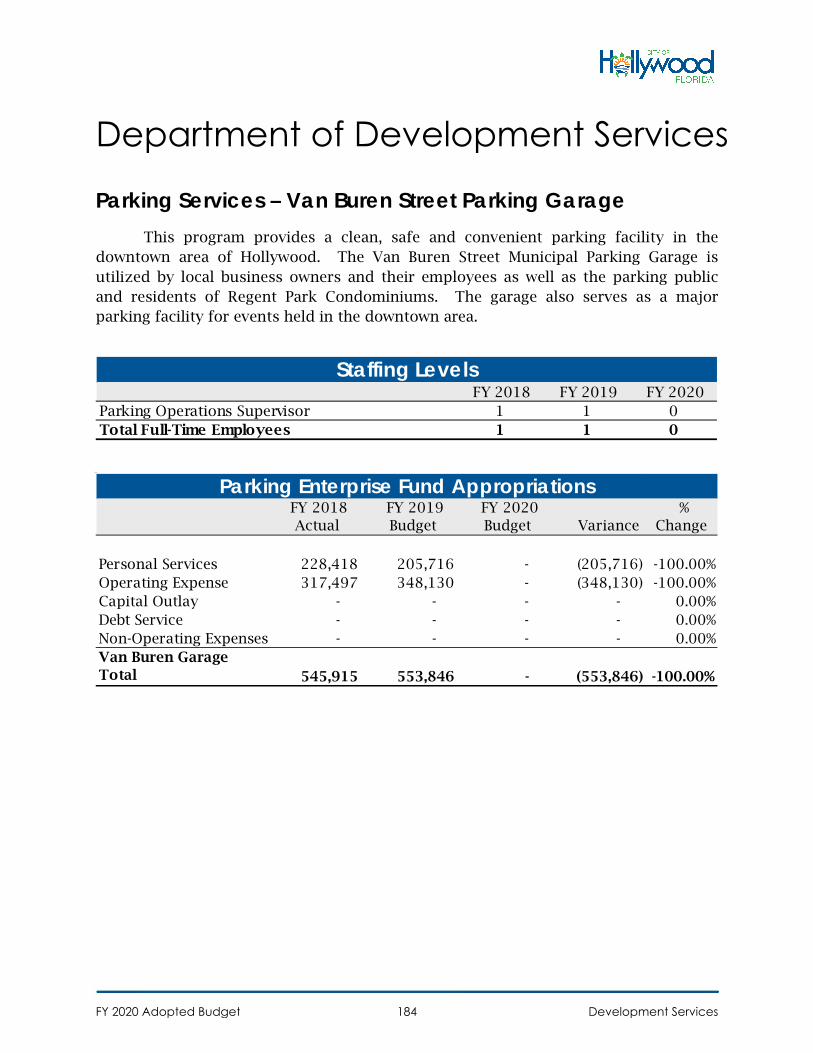
Department of Development Services
Parking Services – Van Buren Street Parking Garage
This program provides a clean, safe and convenient parking facility in the downtown area of Hollywood. The Van Buren Street Municipal Parking Garage is utilized by local business owners and their employees as well as the parking public and residents of Regent Park Condominiums. The garage also serves as a major parking facility for events held in the downtown area.
FY 2018 FY 2019 FY 2020 Parking Operations Supervisor 1 1 0Total Full-Time Employees 1 1 0
Staffing Levels
FY 2018 Actual
FY 2019 Budget
FY 2020 Budget Variance
% Change
Personal Services 228,418 205,716 - (205,716) -100.00%Operating Expense 317,497 348,130 - (348,130) -100.00%Capital Outlay - - - - 0.00%Debt Service - - - - 0.00%Non-Operating Expenses - - - - 0.00%Van Buren Garage Total 545,915 553,846 - (553,846) -100.00%
Parking Enterprise Fund Appropriations
FY 2020 Adopted Budget Development Services184
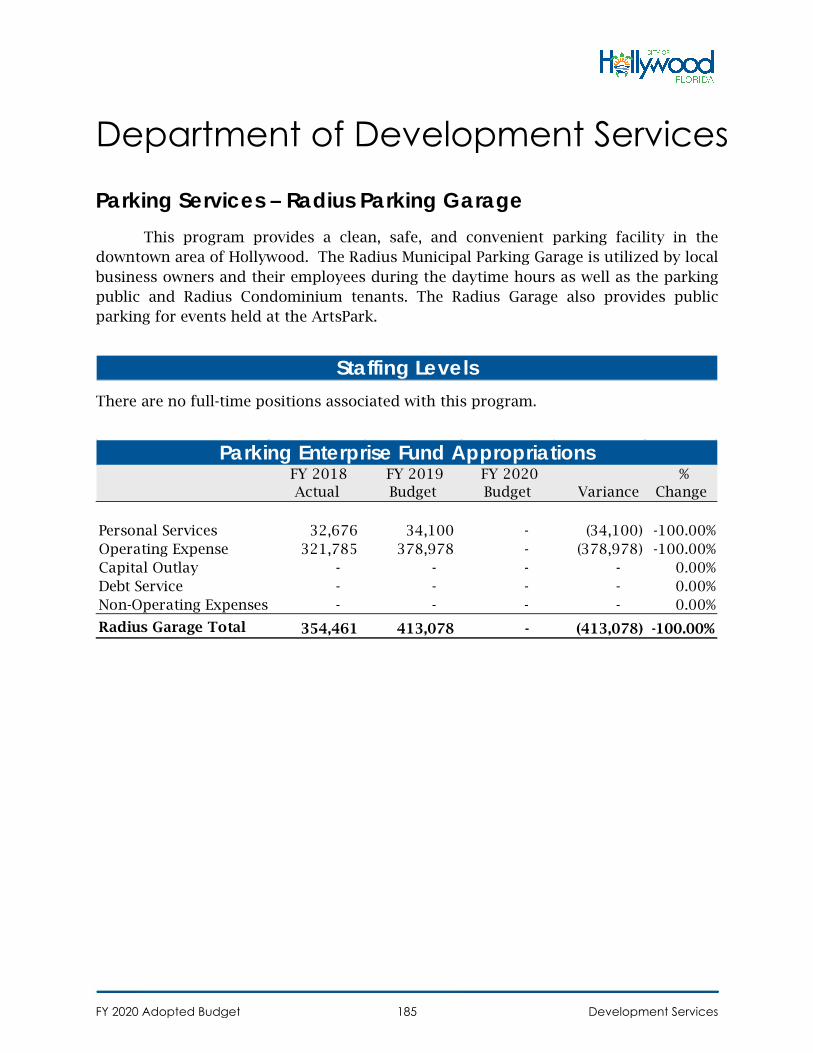
Department of Development Services
Parking Services – Radius Parking GarageThis program provides a clean, safe, and convenient parking facility in the
downtown area of Hollywood. The Radius Municipal Parking Garage is utilized by local business owners and their employees during the daytime hours as well as the parking public and Radius Condominium tenants. The Radius Garage also provides public parking for events held at the ArtsPark.
There are no full-time positions associated with this program.
Staffing Levels
FY 2018 Actual
FY 2019 Budget
FY 2020 Budget Variance
% Change
Personal Services 32,676 34,100 - (34,100) -100.00%Operating Expense 321,785 378,978 - (378,978) -100.00%Capital Outlay - - - - 0.00%Debt Service - - - - 0.00%Non-Operating Expenses - - - - 0.00%
Radius Garage Total 354,461 413,078 - (413,078) -100.00%
Parking Enterprise Fund Appropriations
FY 2020 Adopted Budget Development Services185
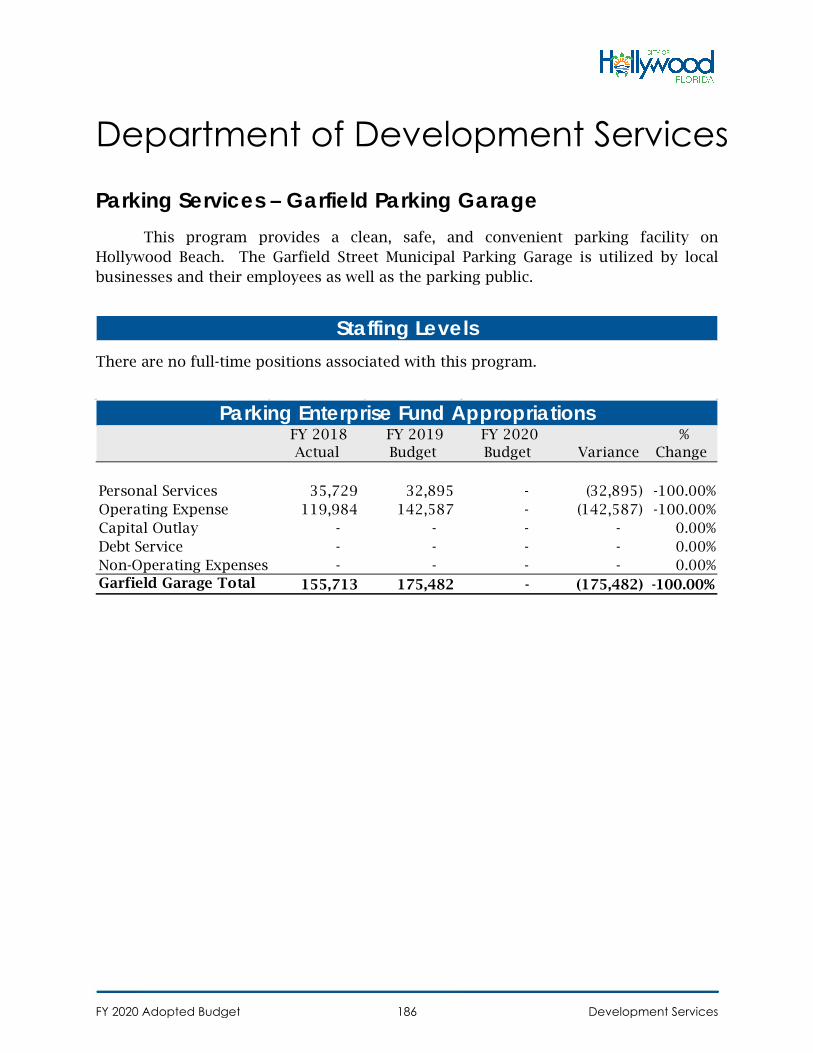
Department of Development Services
Parking Services – Garfield Parking Garage
This program provides a clean, safe, and convenient parking facility on Hollywood Beach. The Garfield Street Municipal Parking Garage is utilized by local businesses and their employees as well as the parking public.
There are no full-time positions associated with this program.
Staffing Levels
FY 2018 Actual
FY 2019 Budget
FY 2020 Budget Variance
% Change
Personal Services 35,729 32,895 - (32,895) -100.00%Operating Expense 119,984 142,587 - (142,587) -100.00%Capital Outlay - - - - 0.00%Debt Service - - - - 0.00%Non-Operating Expenses - - - - 0.00%Garfield Garage Total 155,713 175,482 - (175,482) -100.00%
Parking Enterprise Fund Appropriations
FY 2020 Adopted Budget Development Services186
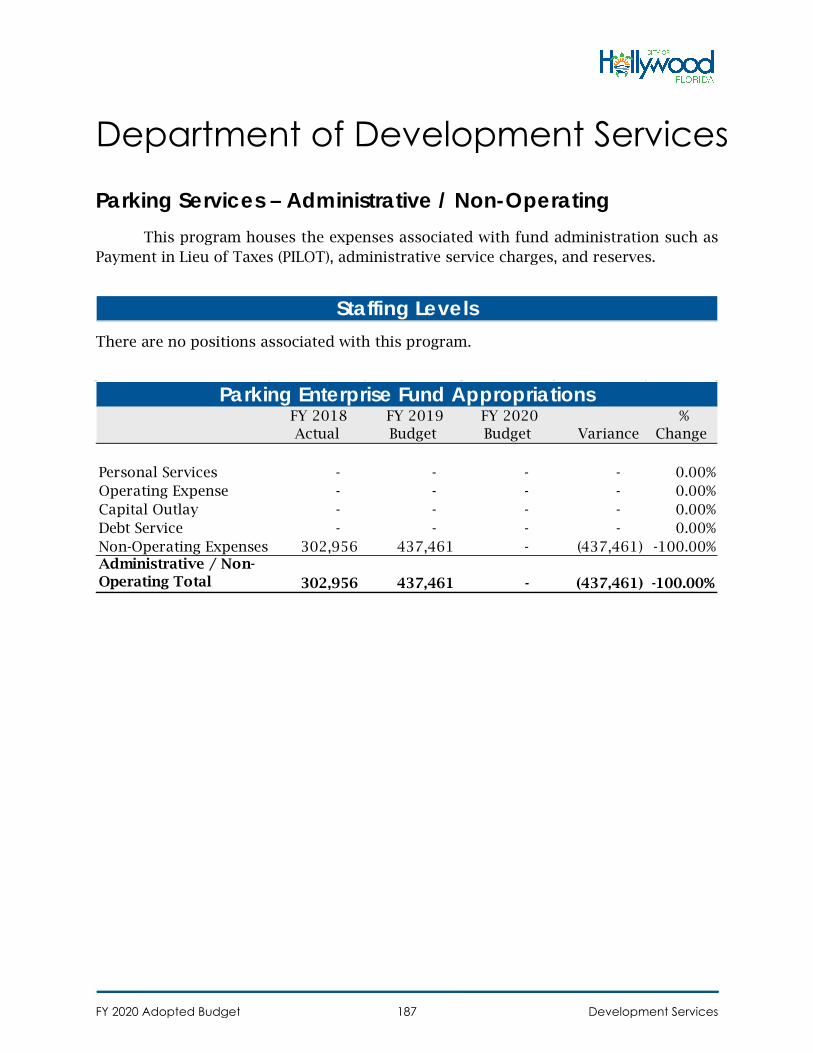
Department of Development Services
Parking Services – Administrative / Non-Operating This program houses the expenses associated with fund administration such as
Payment in Lieu of Taxes (PILOT), administrative service charges, and reserves.
There are no positions associated with this program.
Staffing Levels
FY 2018 Actual
FY 2019 Budget
FY 2020 Budget Variance
% Change
Personal Services - - - - 0.00%Operating Expense - - - - 0.00%Capital Outlay - - - - 0.00%Debt Service - - - - 0.00%Non-Operating Expenses 302,956 437,461 - (437,461) -100.00%Administrative / Non-Operating Total 302,956 437,461 - (437,461) -100.00%
Parking Enterprise Fund Appropriations
FY 2020 Adopted Budget Development Services187
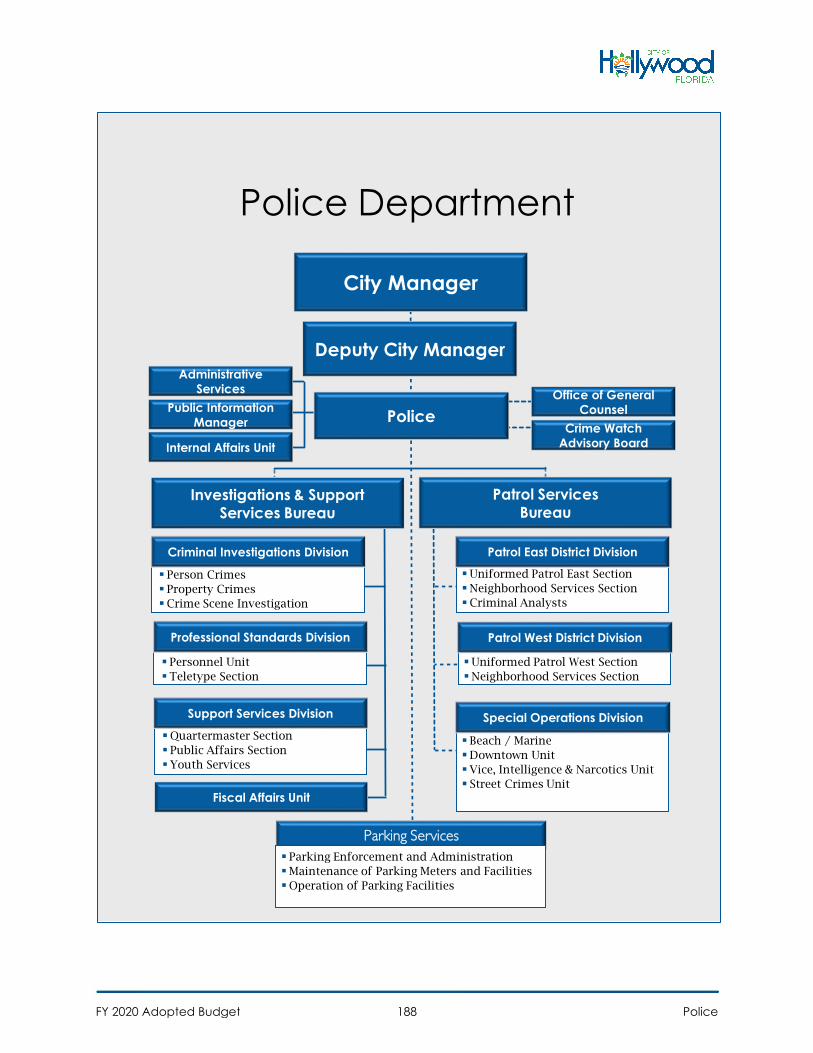
Person Crimes
Property Crimes
Crime Scene Investigation
Criminal Investigations Division
Personnel Unit
Teletype Section
Professional Standards Division
Police Department
City Manager
Deputy City Manager
Office of General
Counsel
Fiscal Affairs Unit
Public Information
Manager
Internal Affairs Unit
Administrative
Services
PoliceCrime Watch
Advisory Board
Investigations & Support Services Bureau
Patrol ServicesBureau
Uniformed Patrol East Section
Neighborhood Services Section
Criminal Analysts
Patrol East District Division
Uniformed Patrol West Section
Neighborhood Services Section
Patrol West District Division
Beach / Marine
Downtown Unit
Vice, Intelligence & Narcotics Unit
Street Crimes Unit
Special Operations Division
Parking Services
Parking Enforcement and Administration
Maintenance of Parking Meters and Facilities
Operation of Parking Facilities
Quartermaster Section
Public Affairs Section
Youth Services
Support Services Division
FY 2020 Adopted Budget Police188
Police Department
Summary
The Hollywood Police Department is a full-service Law Enforcement Agency
providing a wide range of services to approximately 150,000 Hollywood residents and
over 100,000 annual visitors.
The Office of the Chief provides executive services in the form of administrative
support for the Department through the following programs: Internal Affairs, Staff
Inspection/Accreditation Manager’s position and Public Information Officer’s position.
The Investigations and Support Services Bureau is composed of three (3)
Divisions. The Support Services Division, the Professional Standards Division and the
Criminal Investigations Division
The Patrol Services Bureau is comprised of three (3) Divisions. Patrol Divisions
East and West Districts and Special Operations. The Patrol Divisions East and West
include Uniformed Patrol Services, Neighborhood Team Leaders, SWAT, Field Force,
Downtown Citizen Resource Officers and Canines. Both Patrol Divisions respond to all
calls for service and aggressively initiate activities with a strong commitment to
Community Policing. The Special Operations Division includes the Marine Unit, Dive
Team, Traffic Unit, Crisis Negotiations, Downtown Unit, Detail Office, Special Events,
Street Crimes and Vice, Intelligence, and Narcotics (VIN) Unit.
Effective Fiscal Year 2020, the Parking Services Division moves into the Police
Department from the Development Services Department. This division manages the
City’s parking system and is funded through the Parking Enterprise Fund. This
Division provides oversight and development of the City’s parking system and
programs ensuring that everyone has access to safe convenient, and affordable public
parking.
FY 2020 Adopted Budget Police189
FY 2019 Accomplishments
Awarded Reaccreditation status from the Commission for Florida Law
Enforcement Accreditation. Hollywood is one of 166 law enforcement agencies
with this accreditation – out of nearly 400 agencies in Florida
Reduction of calls for service by addressing nuisance locations that incur large
volumes of calls for service
Reduction in nonviolent crimes year to date to include motor vehicle thefts and
vehicle burglaries
Implemented several initiatives targeting burglary and quality of life issues
Obtained and implemented new FTO software
Initiated training and distribution of NARCAN throughout the Patrol Division
Implemented “Talk with a COP” meetings between Neighborhood Team Leader
Officers (NTL’s) and the youth of Hollywood
Replaced aged Department issued handguns
Purchased handgun holster and lighting systems for all sworn personnel
Maintained the Hollywood Youth Ambassador program at 11 students
representing Hollywood area high schools
Streamlined the structure of the Neighborhood Problem Solving Teams
Increased Officers’ abilities and knowledge regarding DUI Investigations
Utilized social media platforms to improve the Hollywood Police Department’s
image and provide information to the public
Implemented the Trip Wire Program that was modeled after an FBI program that
partners with local businesses to combat terror threats
External partnership with faith based organizations to assist community
outreach programs such as the Police Athletic League
Partnered with the Special Olympics Torch Run and raised $9,511 in donations
Coordinated youth programming initiatives to include National Walk to School
with a Cop and Chief for a Day programs
Maintained assignment of one Officer to the Joint Terrorism Task Force (JTTF)
Conducted license plate reader operations Citywide to enhance crime reduction.
Participated in the Florida Department of Highway Safety and Motor Vehicle
Arrive Alive traffic education and enforcement campaign
Coordinated outside speakers to teach tactical leadership for supervisory
personnel
Replaced aging motorcycle helmets and communication system
Established an Auxiliary Officers Program for the Motors and Traffic Homicide
Investigation units to increase staffing levels
Leads OnLine Investigative program implementation for the Criminal
Investigation Division (CID)
FY 2020 Adopted Budget Police190
Tracking reported Lewd and Lascivious incidents to develop patterns in an
effort to mitigate sex crimes through actionable data
Combined the CCTV/Fusion center with the TEC Unit in CID to create an
investigative force multiplier which will play an integral role in the technology
aspect in a variety of investigations
Completed Phase 2 of the CCTV Program in the Downtown area
Additional coverage of CCTV Program to the central beach area (Charnow Park)
Crime View Dashboard software has been implemented for Supervisors and
Officers assigned to Specialized Units
The Criminal Investigations Division interview rooms have had upgraded
videotaping and technology installed
Installed new Uninterrupted Power Source (UPS) for Police Radio Antennas
Completed installation of internal and external cameras at Police Headquarters
Partnered Hollywood Youth Ambassadors with city leaders for insight into
democratic, legislative and leadership practices
Hollywood Youth Ambassadors attended the Florida League of Cities
Conference to encourage civic engagement and leadership
Hollywood Youth Ambassadors participated in the Broward Youth Policy
Summit Program
Family Reunification Program, since inception, has reunified 68 individuals with
supportive family members
Approval of 2019 EMLEG Grant (Enhanced Marine Law Enforcement Grant)
The Crime Scene Unit has increased DNA recovery to successfully identify
subjects related to crimes throughout the City
Maintained focused deterrence with our Criminal Investigations Division,
Violent Crimes Unit
Partnered with Memorial Regional Hospital and Kindred Hospital to address
drug overdoses
Emergency Management
Coordinated the Hollywood Police Department’s successful transition from
MIR3 to CodeRED for daily internal All Page alerts that are sent to the City
Administration, Command Staff and Lieutenants
Developed, implemented and tested the City’s first Family Assistance Center
Operations Plan for use during mass casualty incidents
Enhanced the Hollywood Emergency Operations Center with the addition of an
additional monitor and creation (with IT and other Departments) of a new
Geographic Information System program that monitors all threats and City
operations in real time
Spearheaded the City’s efforts to address the County’s attempt to tie land use
plan amendment application approvals to city assistance with emergency
sheltering
FY 2020 Adopted Budget Police191
FY 2020 Goals
Continue reduction of calls for service by addressing nuisance locations that
incur large volumes of calls for service
Continue hosting of specialized internal and external training for Departmental
Members
Maintain a professional, intelligence-led, lawful approach to Law Enforcement
Create the Hollywood Homeless Task Force and participate in Community Court
Reduction of all Part 1 crimes citywide
Obtain and implement modernized timekeeping software (Kronos)
Expand external partnerships to assist with Community Outreach programming.
Implementation of initiatives aimed at Burglary deterrence, traffic concerns, and
Quality of Life violations
Continue participation in the Florida Department of Highway Safety and Motor
Vehicle Arrive Alive traffic education and enforcement campaign
Increase DUI enforcement citywide
Continue participation in the Task Force “Community Action Team” which
addresses the national issue of drug overdoses
Police drone program implementation
Reduce City-wide auto thefts through a comprehensive strategic operation plan.
Increase joint partnerships with Faith Based Community representatives
Continue involvement with the organizers of the Special Olympics Torch Run
Complete Phase 3 of CCTV Project and expand westward throughout the City
Crime View Dashboard software department wide implementation
Additional CCTV coverage of the Broadwalk
Purchase and installation of a Radio Frequency Identification System (RFID) to
process and document property and evidence items
Identify abandoned, sunk or derelict vessels for removal
Design and approval of Phases IV & V of the CCTV/LPR initiative
Implement an autism awareness program
Instruct all Officers on the newly required Autism Awareness Training as
mandated by Florida State Statute.
Approval of 2020 EMLEG Grant (Enhanced Marine Law Enforcement Grant)
Expand Hollywood Youth Ambassador programming to include the National
League of Cities Congressional City Conference in Washington, D.C.
Expansion of our Computer Crimes/Technology Unit
FY 2020 Adopted Budget Police192
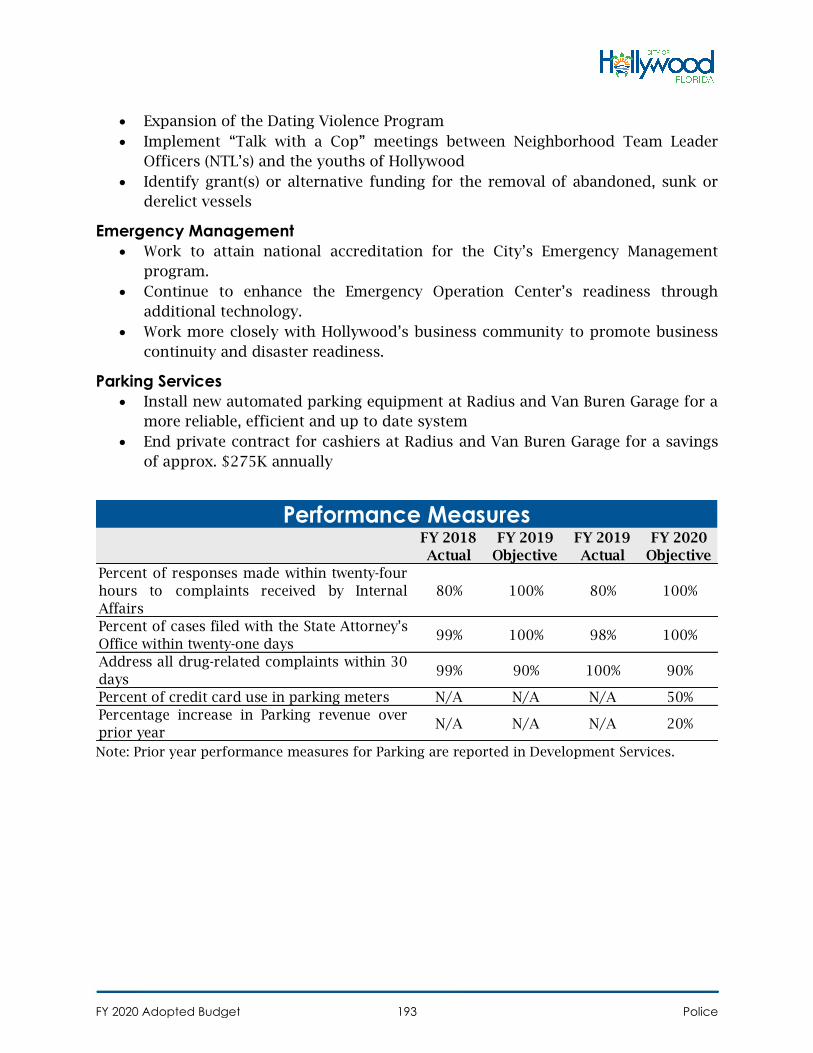
Expansion of the Dating Violence Program
Implement “Talk with a Cop” meetings between Neighborhood Team Leader
Officers (NTL’s) and the youths of Hollywood
Identify grant(s) or alternative funding for the removal of abandoned, sunk or
derelict vessels
Emergency Management
Work to attain national accreditation for the City’s Emergency Management
program.
Continue to enhance the Emergency Operation Center’s readiness through
additional technology.
Work more closely with Hollywood’s business community to promote business
continuity and disaster readiness.
Parking Services
Install new automated parking equipment at Radius and Van Buren Garage for a
more reliable, efficient and up to date system
End private contract for cashiers at Radius and Van Buren Garage for a savings
of approx. $275K annually
Note: Prior year performance measures for Parking are reported in Development Services.
FY 2018
Actual
FY 2019
Objective
FY 2019
Actual
FY 2020
Objective
Percent of responses made within twenty-four
hours to complaints received by Internal
Affairs
80% 100% 80% 100%
Percent of cases filed with the State Attorney’s
Office within twenty-one days99% 100% 98% 100%
Address all drug-related complaints within 30
days99% 90% 100% 90%
Percent of credit card use in parking meters N/A N/A N/A 50%
Percentage increase in Parking revenue over
prior yearN/A N/A N/A 20%
Performance Measures
FY 2020 Adopted Budget Police193
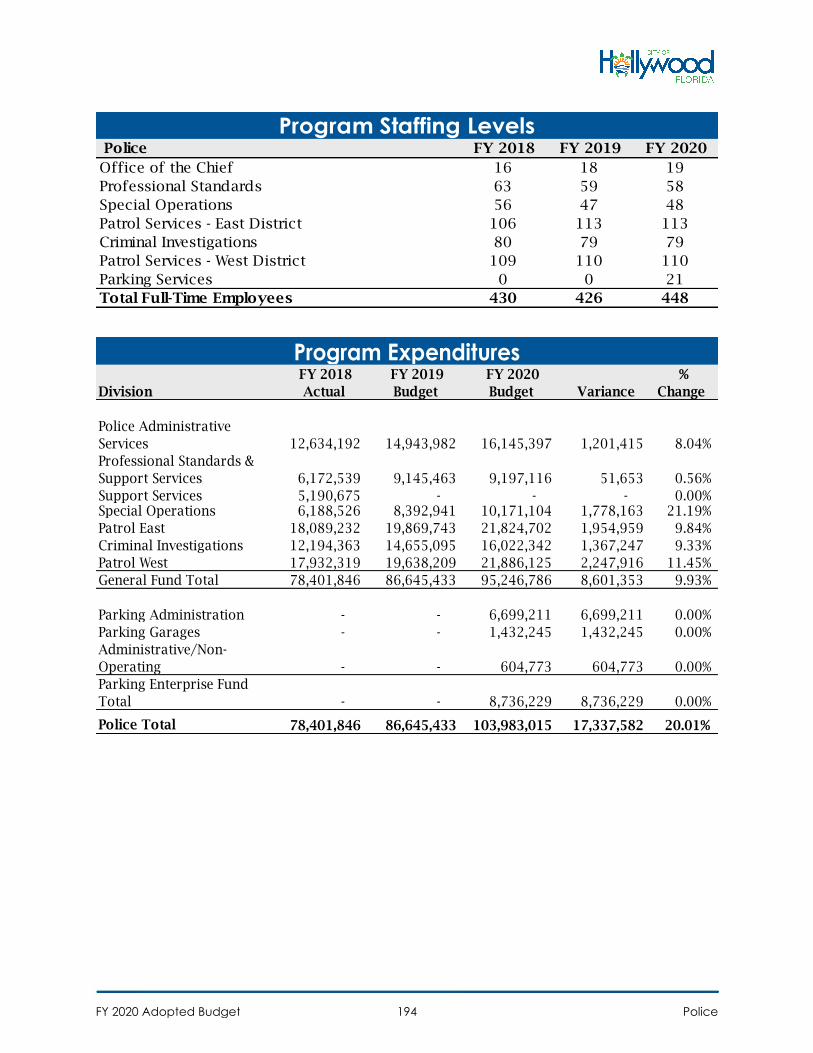
Police FY 2018 FY 2019 FY 2020
Office of the Chief 16 18 19
Professional Standards 63 59 58
Special Operations 56 47 48
Patrol Services - East District 106 113 113
Criminal Investigations 80 79 79
Patrol Services - West District 109 110 110
Parking Services 0 0 21
Total Full-Time Employees 430 426 448
Program Staffing Levels
Division
FY 2018
Actual
FY 2019
Budget
FY 2020
Budget Variance
%
Change
Police Administrative
Services 12,634,192 14,943,982 16,145,397 1,201,415 8.04%
Professional Standards &
Support Services 6,172,539 9,145,463 9,197,116 51,653 0.56%
Support Services 5,190,675 - - - 0.00%Special Operations 6,188,526 8,392,941 10,171,104 1,778,163 21.19%
Patrol East 18,089,232 19,869,743 21,824,702 1,954,959 9.84%
Criminal Investigations 12,194,363 14,655,095 16,022,342 1,367,247 9.33%
Patrol West 17,932,319 19,638,209 21,886,125 2,247,916 11.45%
General Fund Total 78,401,846 86,645,433 95,246,786 8,601,353 9.93%
Parking Administration - - 6,699,211 6,699,211 0.00%
Parking Garages - - 1,432,245 1,432,245 0.00%
Administrative/Non-
Operating - - 604,773 604,773 0.00%
Parking Enterprise Fund
Total - - 8,736,229 8,736,229 0.00%
Police Total 78,401,846 86,645,433 103,983,015 17,337,582 20.01%
Program Expenditures
FY 2020 Adopted Budget Police194
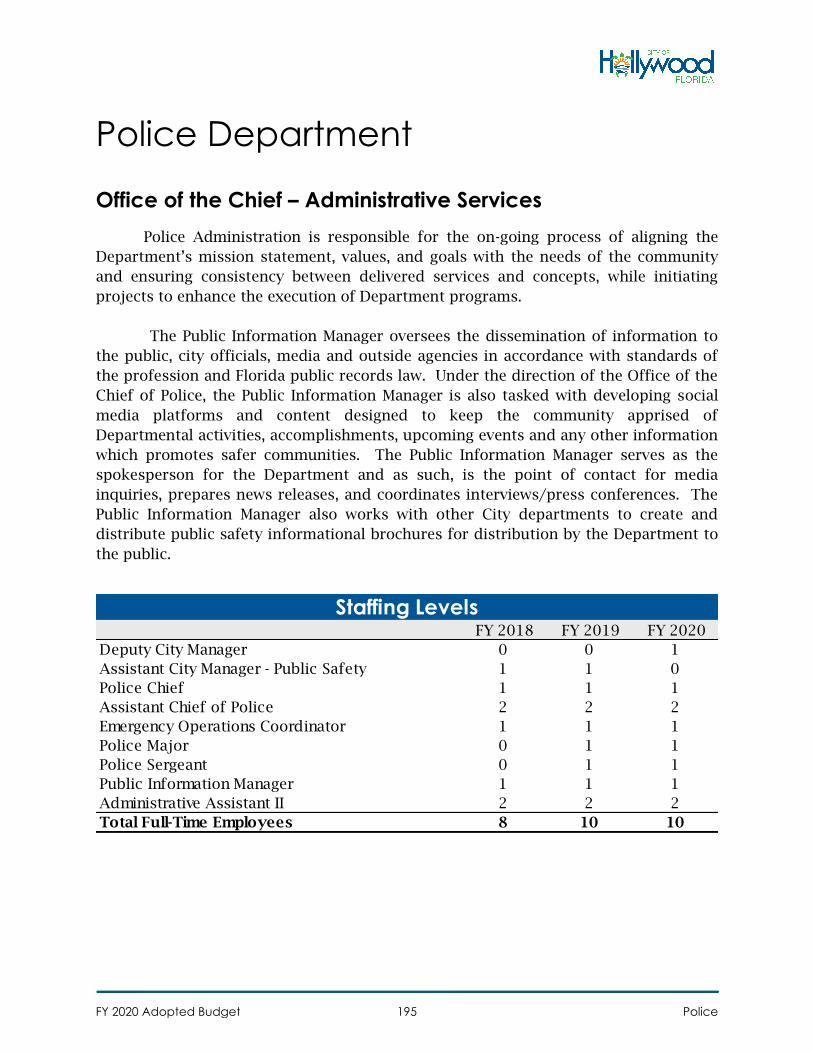
Police Department
Office of the Chief – Administrative Services
Police Administration is responsible for the on-going process of aligning the
Department’s mission statement, values, and goals with the needs of the community
and ensuring consistency between delivered services and concepts, while initiating
projects to enhance the execution of Department programs.
The Public Information Manager oversees the dissemination of information to
the public, city officials, media and outside agencies in accordance with standards of
the profession and Florida public records law. Under the direction of the Office of the
Chief of Police, the Public Information Manager is also tasked with developing social
media platforms and content designed to keep the community apprised of
Departmental activities, accomplishments, upcoming events and any other information
which promotes safer communities. The Public Information Manager serves as the
spokesperson for the Department and as such, is the point of contact for media
inquiries, prepares news releases, and coordinates interviews/press conferences. The
Public Information Manager also works with other City departments to create and
distribute public safety informational brochures for distribution by the Department to
the public.
FY 2018 FY 2019 FY 2020
Deputy City Manager 0 0 1
Assistant City Manager - Public Safety 1 1 0
Police Chief 1 1 1
Assistant Chief of Police 2 2 2
Emergency Operations Coordinator 1 1 1
Police Major 0 1 1
Police Sergeant 0 1 1
Public Information Manager 1 1 1
Administrative Assistant II 2 2 2
Total Full-Time Employees 8 10 10
Staffing Levels
FY 2020 Adopted Budget Police195
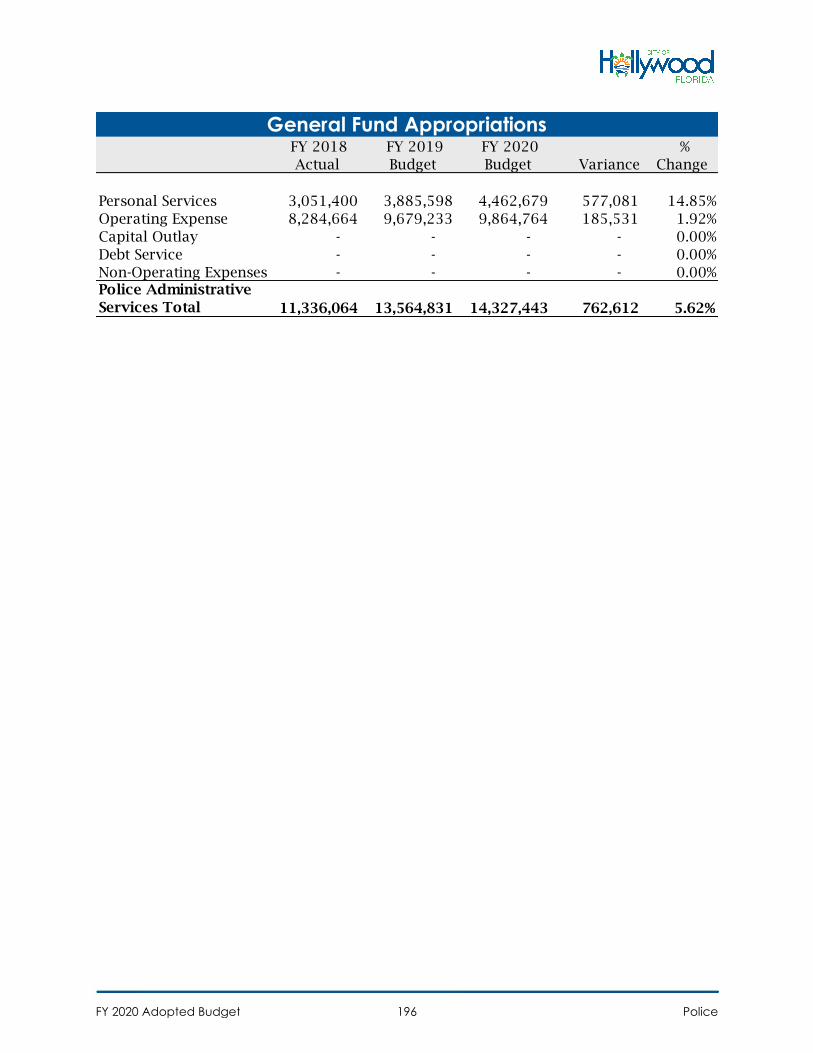
FY 2018
Actual
FY 2019
Budget
FY 2020
Budget Variance
%
Change
Personal Services 3,051,400 3,885,598 4,462,679 577,081 14.85%
Operating Expense 8,284,664 9,679,233 9,864,764 185,531 1.92%
Capital Outlay - - - - 0.00%
Debt Service - - - - 0.00%
Non-Operating Expenses - - - - 0.00%Police Administrative
Services Total 11,336,064 13,564,831 14,327,443 762,612 5.62%
General Fund Appropriations
FY 2020 Adopted Budget Police196
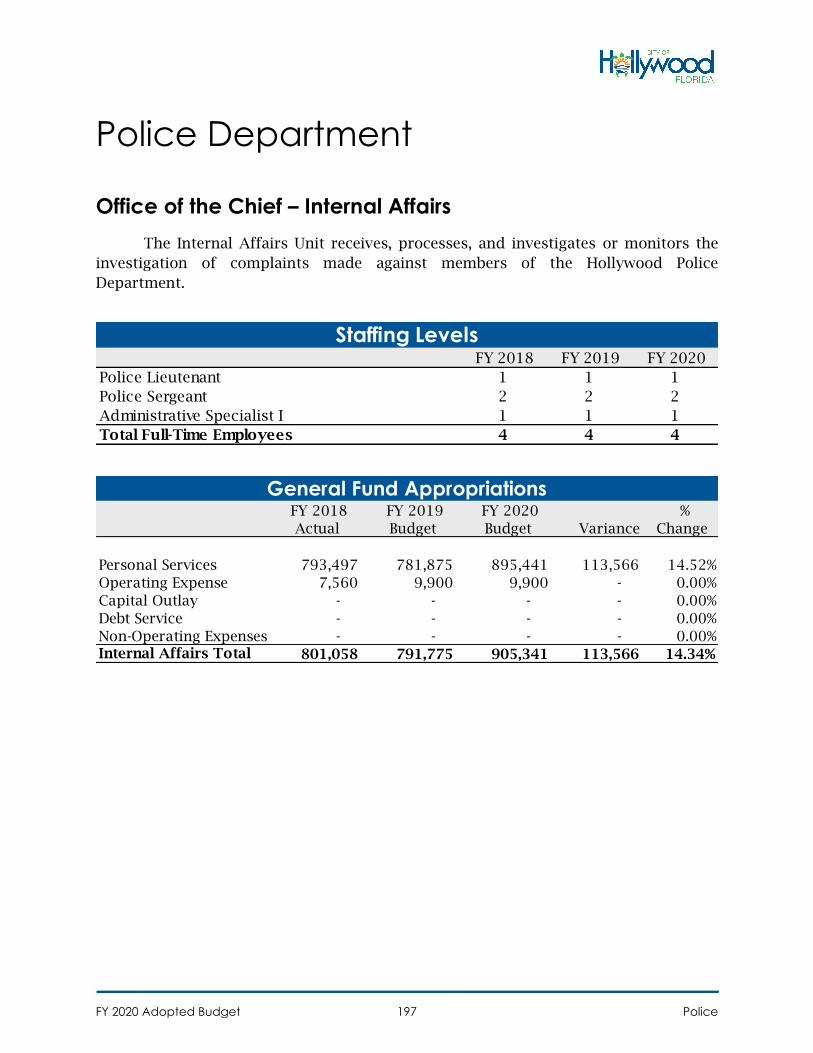
Police Department
Office of the Chief – Internal Affairs
The Internal Affairs Unit receives, processes, and investigates or monitors the
investigation of complaints made against members of the Hollywood Police
Department.
FY 2018 FY 2019 FY 2020
Police Lieutenant 1 1 1
Police Sergeant 2 2 2
Administrative Specialist I 1 1 1
Total Full-Time Employees 4 4 4
Staffing Levels
FY 2018
Actual
FY 2019
Budget
FY 2020
Budget Variance
%
Change
Personal Services 793,497 781,875 895,441 113,566 14.52%
Operating Expense 7,560 9,900 9,900 - 0.00%
Capital Outlay - - - - 0.00%
Debt Service - - - - 0.00%
Non-Operating Expenses - - - - 0.00%Internal Affairs Total 801,058 791,775 905,341 113,566 14.34%
General Fund Appropriations
FY 2020 Adopted Budget Police197
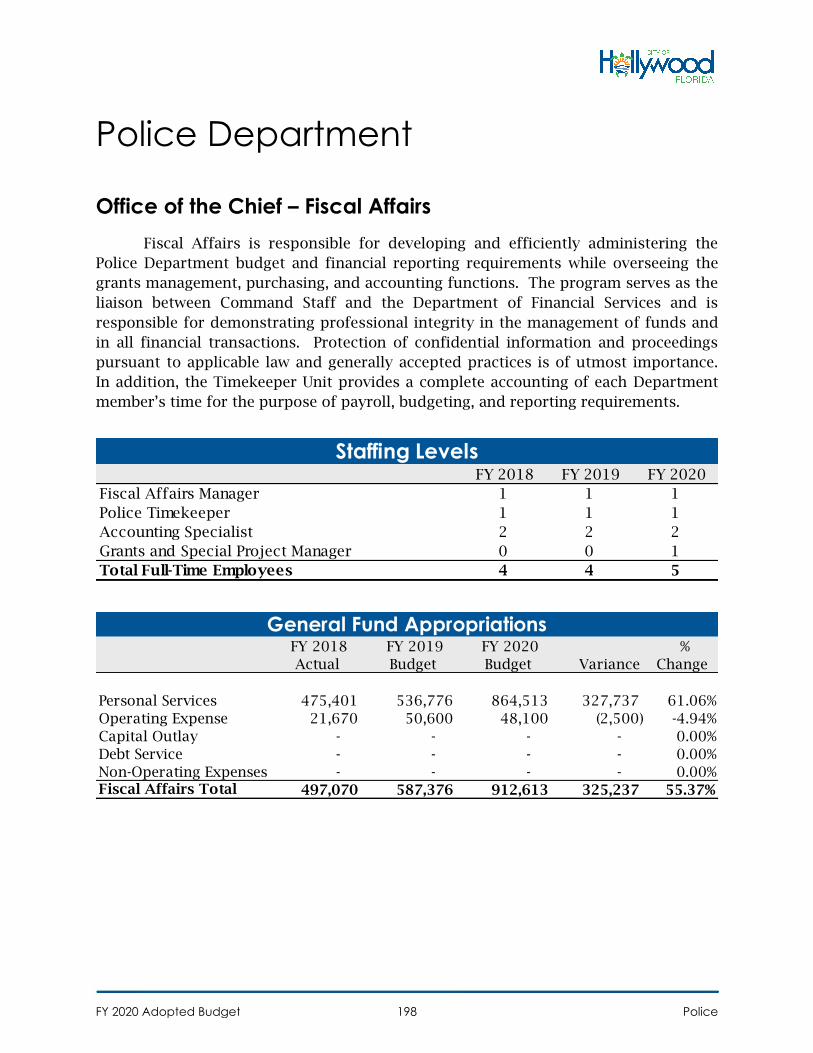
Police Department
Office of the Chief – Fiscal Affairs
Fiscal Affairs is responsible for developing and efficiently administering the
Police Department budget and financial reporting requirements while overseeing the
grants management, purchasing, and accounting functions. The program serves as the
liaison between Command Staff and the Department of Financial Services and is
responsible for demonstrating professional integrity in the management of funds and
in all financial transactions. Protection of confidential information and proceedings
pursuant to applicable law and generally accepted practices is of utmost importance.
In addition, the Timekeeper Unit provides a complete accounting of each Department
member’s time for the purpose of payroll, budgeting, and reporting requirements.
FY 2018 FY 2019 FY 2020
Fiscal Affairs Manager 1 1 1
Police Timekeeper 1 1 1
Accounting Specialist 2 2 2
Grants and Special Project Manager 0 0 1
Total Full-Time Employees 4 4 5
Staffing Levels
FY 2018
Actual
FY 2019
Budget
FY 2020
Budget Variance
%
Change
Personal Services 475,401 536,776 864,513 327,737 61.06%
Operating Expense 21,670 50,600 48,100 (2,500) -4.94%
Capital Outlay - - - - 0.00%
Debt Service - - - - 0.00%
Non-Operating Expenses - - - - 0.00%Fiscal Affairs Total 497,070 587,376 912,613 325,237 55.37%
General Fund Appropriations
FY 2020 Adopted Budget Police198
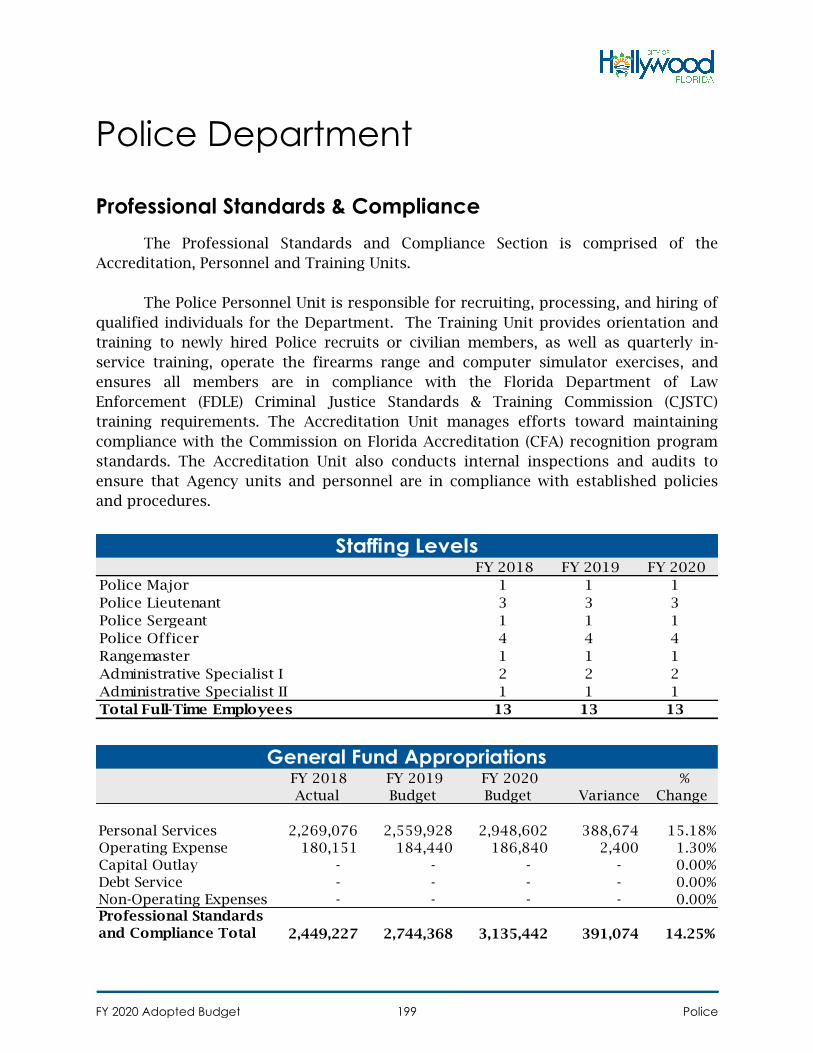
Police Department
Professional Standards & Compliance
The Professional Standards and Compliance Section is comprised of the
Accreditation, Personnel and Training Units.
The Police Personnel Unit is responsible for recruiting, processing, and hiring of
qualified individuals for the Department. The Training Unit provides orientation and
training to newly hired Police recruits or civilian members, as well as quarterly in-
service training, operate the firearms range and computer simulator exercises, and
ensures all members are in compliance with the Florida Department of Law
Enforcement (FDLE) Criminal Justice Standards & Training Commission (CJSTC)
training requirements. The Accreditation Unit manages efforts toward maintaining
compliance with the Commission on Florida Accreditation (CFA) recognition program
standards. The Accreditation Unit also conducts internal inspections and audits to
ensure that Agency units and personnel are in compliance with established policies
and procedures.
FY 2018 FY 2019 FY 2020
Police Major 1 1 1
Police Lieutenant 3 3 3
Police Sergeant 1 1 1
Police Officer 4 4 4
Rangemaster 1 1 1
Administrative Specialist I 2 2 2
Administrative Specialist II 1 1 1
Total Full-Time Employees 13 13 13
Staffing Levels
FY 2018
Actual
FY 2019
Budget
FY 2020
Budget Variance
%
Change
Personal Services 2,269,076 2,559,928 2,948,602 388,674 15.18%
Operating Expense 180,151 184,440 186,840 2,400 1.30%
Capital Outlay - - - - 0.00%
Debt Service - - - - 0.00%
Non-Operating Expenses - - - - 0.00%Professional Standards
and Compliance Total 2,449,227 2,744,368 3,135,442 391,074 14.25%
General Fund Appropriations
FY 2020 Adopted Budget Police199
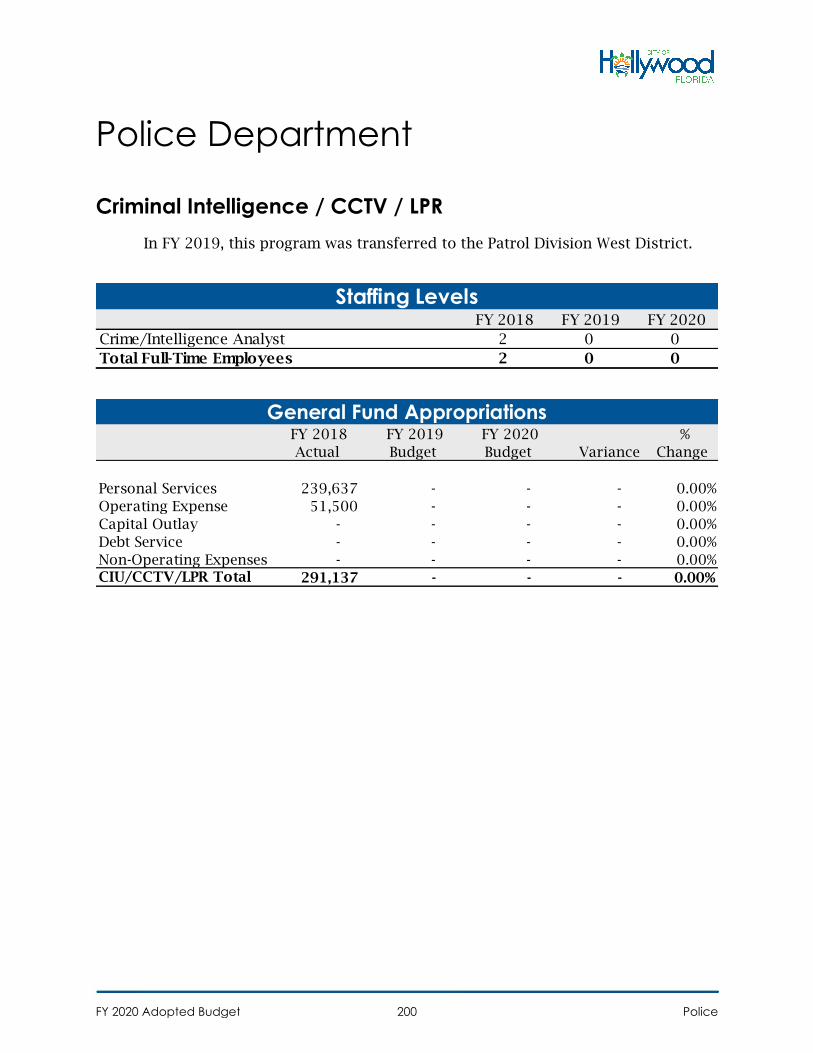
Police Department
Criminal Intelligence / CCTV / LPR
In FY 2019, this program was transferred to the Patrol Division West District.
FY 2018 FY 2019 FY 2020
Crime/Intelligence Analyst 2 0 0
Total Full-Time Employees 2 0 0
Staffing Levels
FY 2018
Actual
FY 2019
Budget
FY 2020
Budget Variance
%
Change
Personal Services 239,637 - - - 0.00%
Operating Expense 51,500 - - - 0.00%
Capital Outlay - - - - 0.00%
Debt Service - - - - 0.00%
Non-Operating Expenses - - - - 0.00%CIU/CCTV/LPR Total 291,137 - - - 0.00%
General Fund Appropriations
FY 2020 Adopted Budget Police200
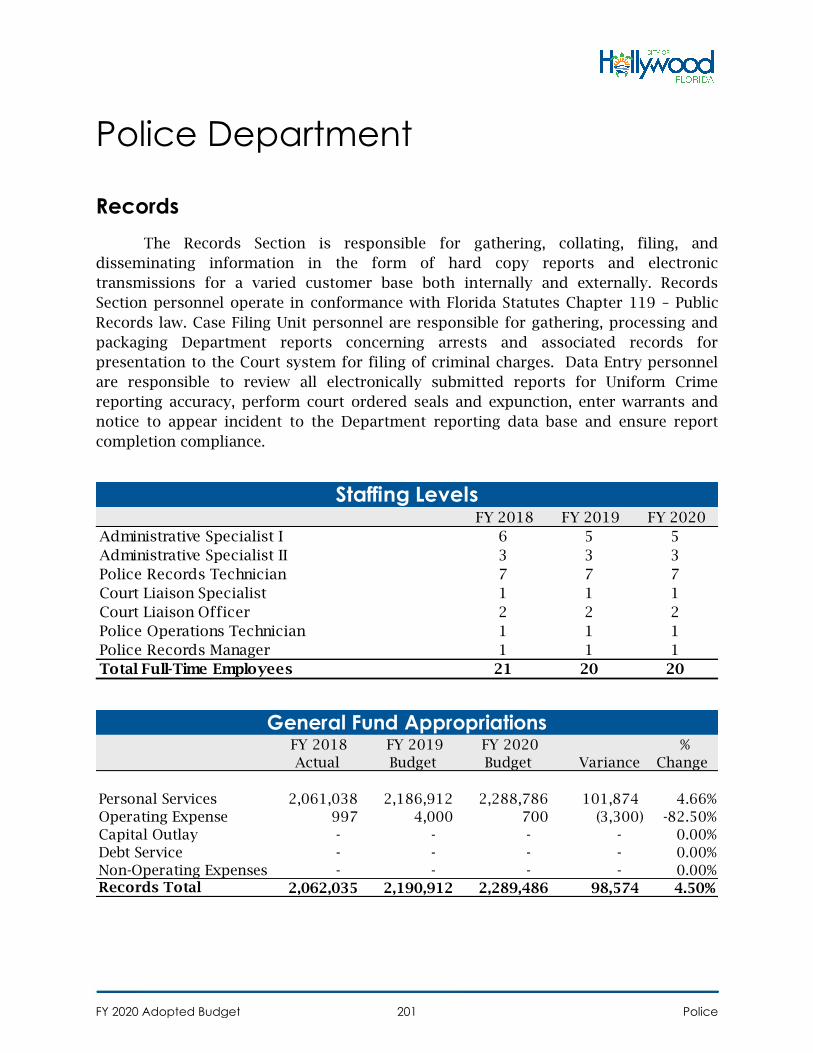
Police Department
Records
The Records Section is responsible for gathering, collating, filing, and
disseminating information in the form of hard copy reports and electronic
transmissions for a varied customer base both internally and externally. Records
Section personnel operate in conformance with Florida Statutes Chapter 119 – Public
Records law. Case Filing Unit personnel are responsible for gathering, processing and
packaging Department reports concerning arrests and associated records for
presentation to the Court system for filing of criminal charges. Data Entry personnel
are responsible to review all electronically submitted reports for Uniform Crime
reporting accuracy, perform court ordered seals and expunction, enter warrants and
notice to appear incident to the Department reporting data base and ensure report
completion compliance.
FY 2018 FY 2019 FY 2020
Administrative Specialist I 6 5 5
Administrative Specialist II 3 3 3
Police Records Technician 7 7 7
Court Liaison Specialist 1 1 1
Court Liaison Officer 2 2 2
Police Operations Technician 1 1 1
Police Records Manager 1 1 1
Total Full-Time Employees 21 20 20
Staffing Levels
FY 2018
Actual
FY 2019
Budget
FY 2020
Budget Variance
%
Change
Personal Services 2,061,038 2,186,912 2,288,786 101,874 4.66%
Operating Expense 997 4,000 700 (3,300) -82.50%
Capital Outlay - - - - 0.00%
Debt Service - - - - 0.00%
Non-Operating Expenses - - - - 0.00%Records Total 2,062,035 2,190,912 2,289,486 98,574 4.50%
General Fund Appropriations
FY 2020 Adopted Budget Police201
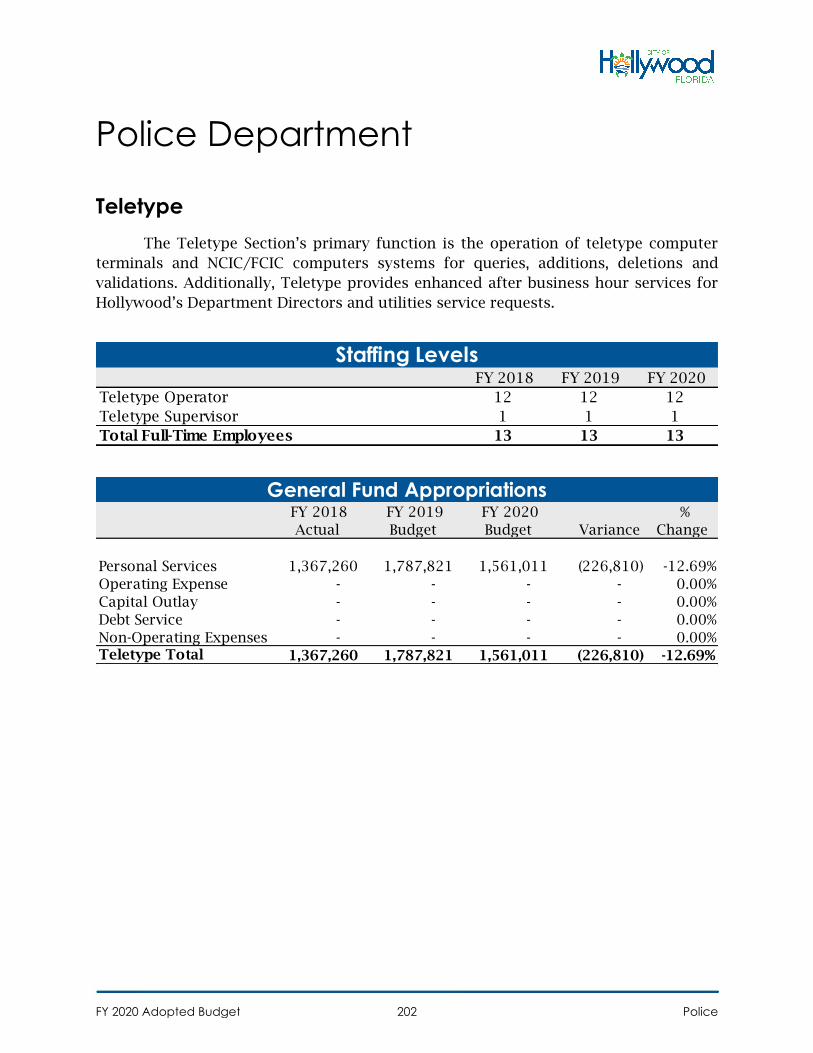
Police Department
Teletype
The Teletype Section’s primary function is the operation of teletype computer
terminals and NCIC/FCIC computers systems for queries, additions, deletions and
validations. Additionally, Teletype provides enhanced after business hour services for
Hollywood’s Department Directors and utilities service requests.
FY 2018 FY 2019 FY 2020
Teletype Operator 12 12 12
Teletype Supervisor 1 1 1
Total Full-Time Employees 13 13 13
Staffing Levels
FY 2018
Actual
FY 2019
Budget
FY 2020
Budget Variance
%
Change
Personal Services 1,367,260 1,787,821 1,561,011 (226,810) -12.69%
Operating Expense - - - - 0.00%
Capital Outlay - - - - 0.00%
Debt Service - - - - 0.00%
Non-Operating Expenses - - - - 0.00%Teletype Total 1,367,260 1,787,821 1,561,011 (226,810) -12.69%
General Fund Appropriations
FY 2020 Adopted Budget Police202
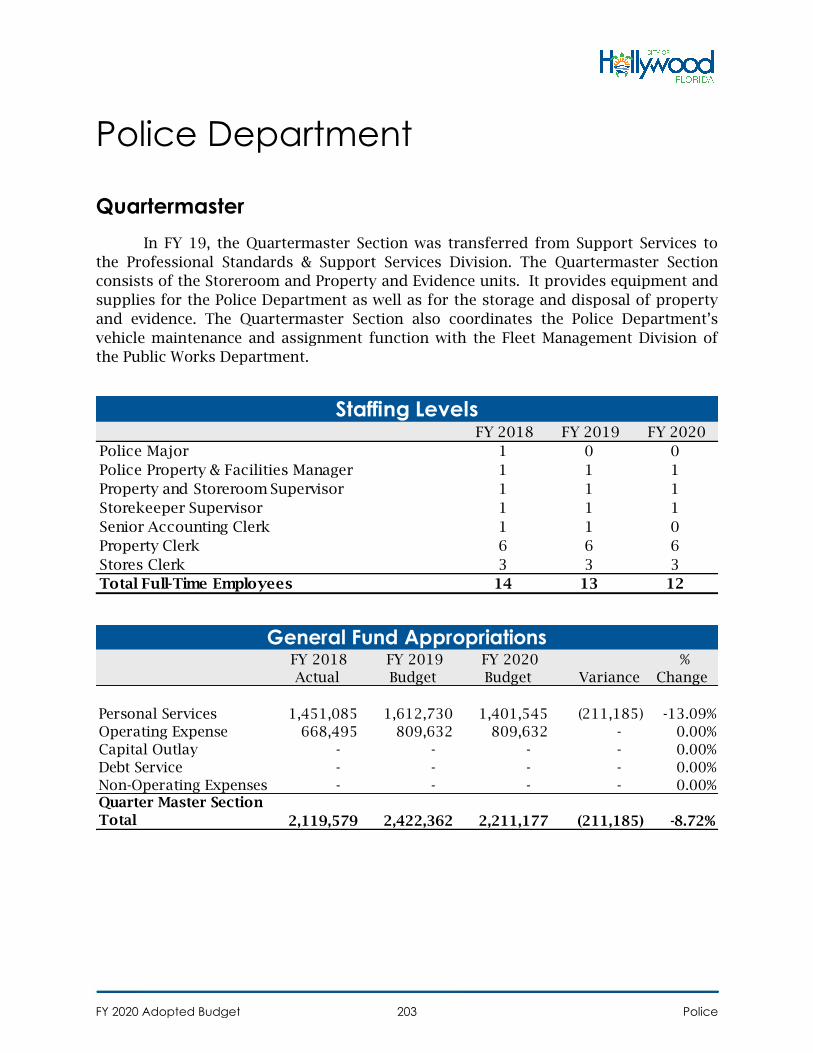
Police Department
Quartermaster
In FY 19, the Quartermaster Section was transferred from Support Services to
the Professional Standards & Support Services Division. The Quartermaster Section
consists of the Storeroom and Property and Evidence units. It provides equipment and
supplies for the Police Department as well as for the storage and disposal of property
and evidence. The Quartermaster Section also coordinates the Police Department’s
vehicle maintenance and assignment function with the Fleet Management Division of
the Public Works Department.
FY 2018 FY 2019 FY 2020
Police Major 1 0 0
Police Property & Facilities Manager 1 1 1
Property and Storeroom Supervisor 1 1 1
Storekeeper Supervisor 1 1 1
Senior Accounting Clerk 1 1 0
Property Clerk 6 6 6
Stores Clerk 3 3 3
Total Full-Time Employees 14 13 12
Staffing Levels
FY 2018
Actual
FY 2019
Budget
FY 2020
Budget Variance
%
Change
Personal Services 1,451,085 1,612,730 1,401,545 (211,185) -13.09%
Operating Expense 668,495 809,632 809,632 - 0.00%
Capital Outlay - - - - 0.00%
Debt Service - - - - 0.00%
Non-Operating Expenses - - - - 0.00%Quarter Master Section
Total 2,119,579 2,422,362 2,211,177 (211,185) -8.72%
General Fund Appropriations
FY 2020 Adopted Budget Police203
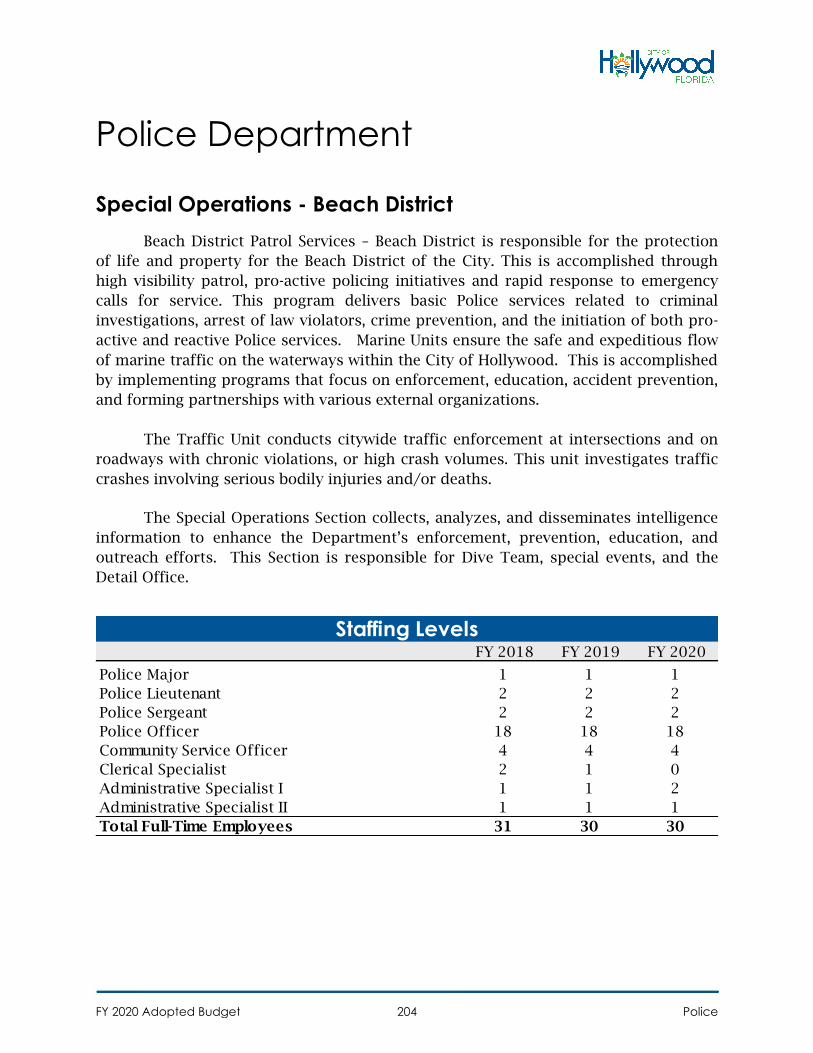
Police Department
Special Operations - Beach District
Beach District Patrol Services – Beach District is responsible for the protection
of life and property for the Beach District of the City. This is accomplished through
high visibility patrol, pro-active policing initiatives and rapid response to emergency
calls for service. This program delivers basic Police services related to criminal
investigations, arrest of law violators, crime prevention, and the initiation of both pro-
active and reactive Police services. Marine Units ensure the safe and expeditious flow
of marine traffic on the waterways within the City of Hollywood. This is accomplished
by implementing programs that focus on enforcement, education, accident prevention,
and forming partnerships with various external organizations.
The Traffic Unit conducts citywide traffic enforcement at intersections and on
roadways with chronic violations, or high crash volumes. This unit investigates traffic
crashes involving serious bodily injuries and/or deaths.
The Special Operations Section collects, analyzes, and disseminates intelligence
information to enhance the Department’s enforcement, prevention, education, and
outreach efforts. This Section is responsible for Dive Team, special events, and the
Detail Office.
FY 2018 FY 2019 FY 2020
Police Major 1 1 1
Police Lieutenant 2 2 2
Police Sergeant 2 2 2
Police Officer 18 18 18
Community Service Officer 4 4 4
Clerical Specialist 2 1 0
Administrative Specialist I 1 1 2
Administrative Specialist II 1 1 1
Total Full-Time Employees 31 30 30
Staffing Levels
FY 2020 Adopted Budget Police204

FY 2018
Actual
FY 2019
Budget
FY 2020
Budget Variance
%
Change
Personal Services 4,790,604 5,049,762 5,697,031 647,269 12.82%
Operating Expense 423,725 55,595 53,795 (1,800) -3.24%
Capital Outlay - - - - 0.00%
Debt Service - - - - 0.00%
Non-Operating Expenses - - - - 0.00%Special Operations
Beach District Total 5,214,329 5,105,357 5,750,826 645,469 12.64%
General Fund Appropriations
FY 2020 Adopted Budget Police205
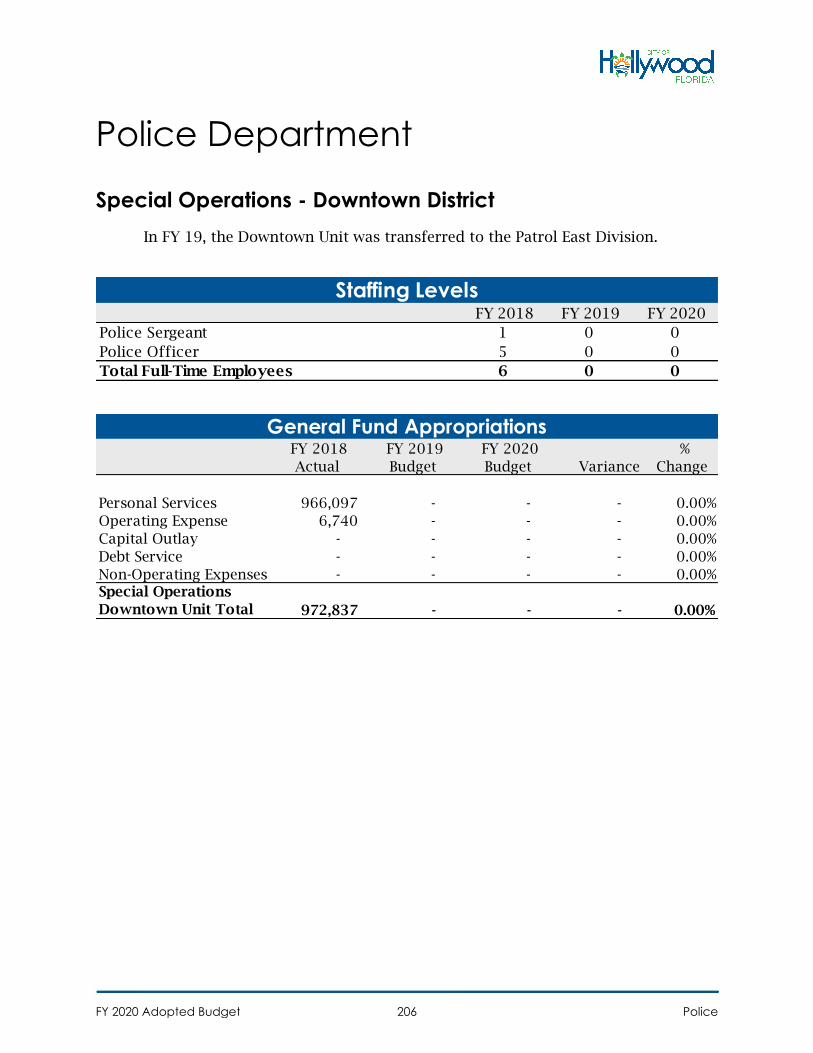
Police Department
Special Operations - Downtown District
In FY 19, the Downtown Unit was transferred to the Patrol East Division.
FY 2018 FY 2019 FY 2020
Police Sergeant 1 0 0
Police Officer 5 0 0
Total Full-Time Employees 6 0 0
Staffing Levels
FY 2018
Actual
FY 2019
Budget
FY 2020
Budget Variance
%
Change
Personal Services 966,097 - - - 0.00%
Operating Expense 6,740 - - - 0.00%
Capital Outlay - - - - 0.00%
Debt Service - - - - 0.00%
Non-Operating Expenses - - - - 0.00%Special Operations
Downtown Unit Total 972,837 - - - 0.00%
General Fund Appropriations
FY 2020 Adopted Budget Police206
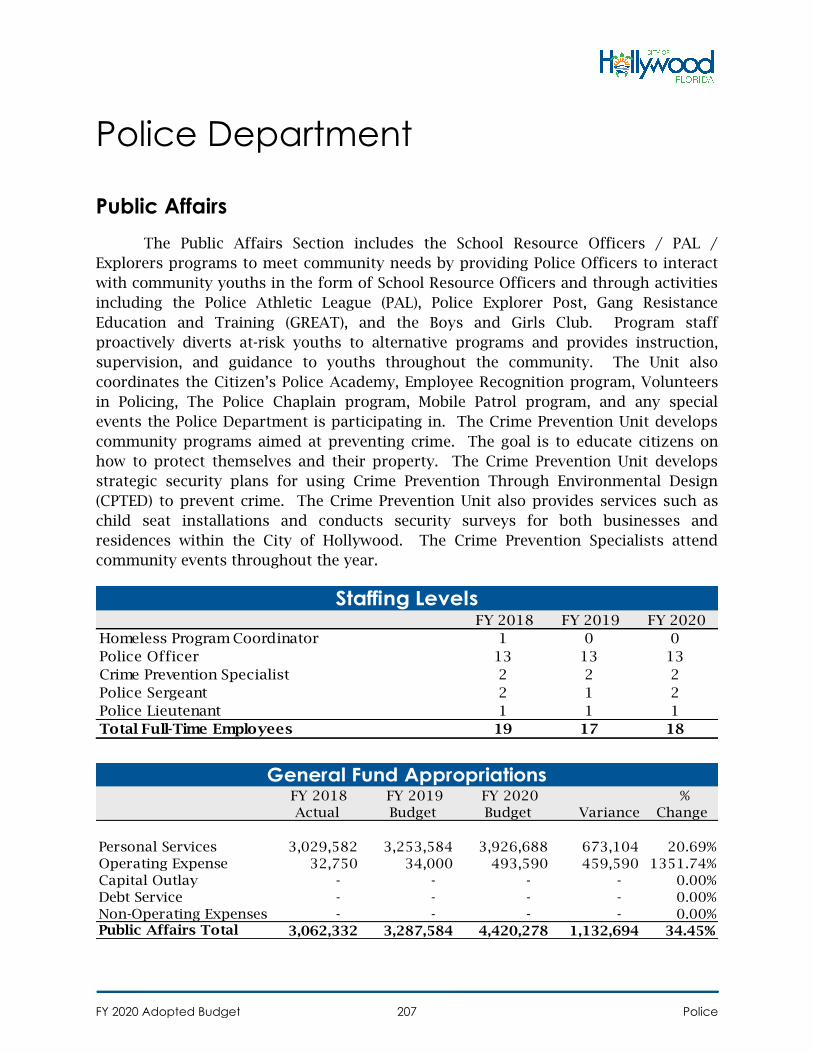
Police Department
Public Affairs
The Public Affairs Section includes the School Resource Officers / PAL /
Explorers programs to meet community needs by providing Police Officers to interact
with community youths in the form of School Resource Officers and through activities
including the Police Athletic League (PAL), Police Explorer Post, Gang Resistance
Education and Training (GREAT), and the Boys and Girls Club. Program staff
proactively diverts at-risk youths to alternative programs and provides instruction,
supervision, and guidance to youths throughout the community. The Unit also
coordinates the Citizen’s Police Academy, Employee Recognition program, Volunteers
in Policing, The Police Chaplain program, Mobile Patrol program, and any special
events the Police Department is participating in. The Crime Prevention Unit develops
community programs aimed at preventing crime. The goal is to educate citizens on
how to protect themselves and their property. The Crime Prevention Unit develops
strategic security plans for using Crime Prevention Through Environmental Design
(CPTED) to prevent crime. The Crime Prevention Unit also provides services such as
child seat installations and conducts security surveys for both businesses and
residences within the City of Hollywood. The Crime Prevention Specialists attend
community events throughout the year.
FY 2018 FY 2019 FY 2020
Homeless Program Coordinator 1 0 0
Police Officer 13 13 13
Crime Prevention Specialist 2 2 2
Police Sergeant 2 1 2
Police Lieutenant 1 1 1
Total Full-Time Employees 19 17 18
Staffing Levels
FY 2018
Actual
FY 2019
Budget
FY 2020
Budget Variance
%
Change
Personal Services 3,029,582 3,253,584 3,926,688 673,104 20.69%
Operating Expense 32,750 34,000 493,590 459,590 1351.74%
Capital Outlay - - - - 0.00%
Debt Service - - - - 0.00%
Non-Operating Expenses - - - - 0.00%Public Affairs Total 3,062,332 3,287,584 4,420,278 1,132,694 34.45%
General Fund Appropriations
FY 2020 Adopted Budget Police207
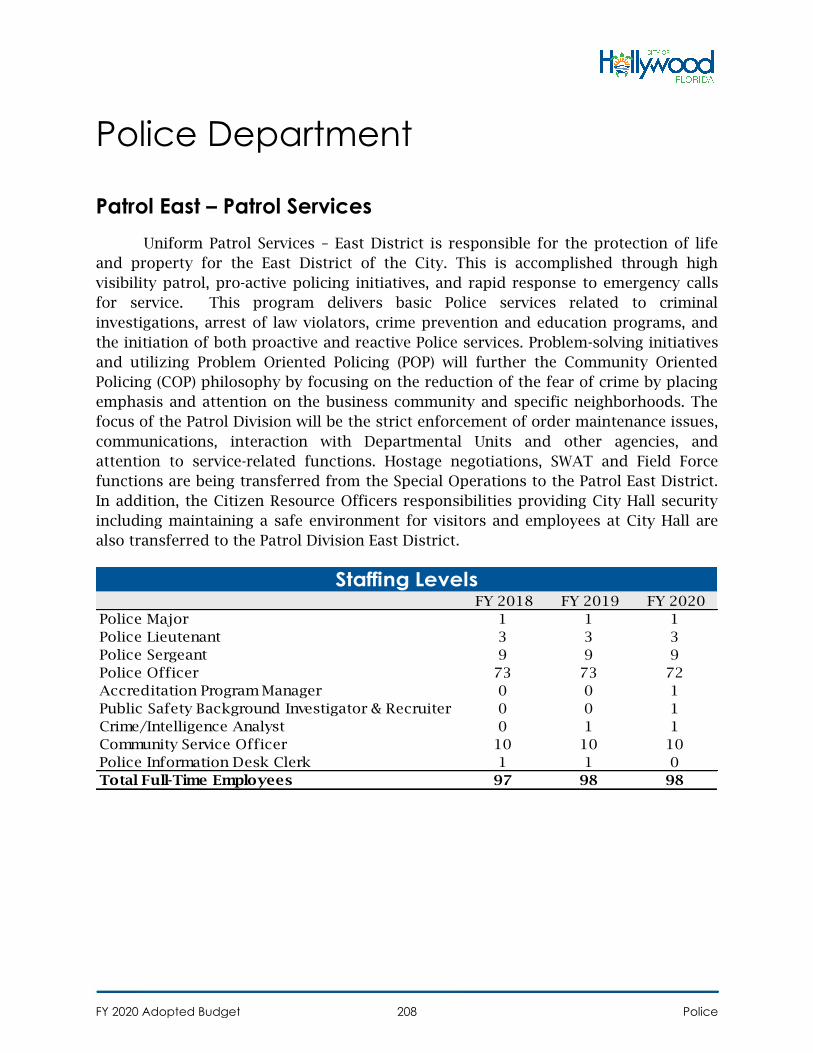
Police Department
Patrol East – Patrol Services
Uniform Patrol Services – East District is responsible for the protection of life
and property for the East District of the City. This is accomplished through high
visibility patrol, pro-active policing initiatives, and rapid response to emergency calls
for service. This program delivers basic Police services related to criminal
investigations, arrest of law violators, crime prevention and education programs, and
the initiation of both proactive and reactive Police services. Problem-solving initiatives
and utilizing Problem Oriented Policing (POP) will further the Community Oriented
Policing (COP) philosophy by focusing on the reduction of the fear of crime by placing
emphasis and attention on the business community and specific neighborhoods. The
focus of the Patrol Division will be the strict enforcement of order maintenance issues,
communications, interaction with Departmental Units and other agencies, and
attention to service-related functions. Hostage negotiations, SWAT and Field Force
functions are being transferred from the Special Operations to the Patrol East District.
In addition, the Citizen Resource Officers responsibilities providing City Hall security
including maintaining a safe environment for visitors and employees at City Hall are
also transferred to the Patrol Division East District.
FY 2018 FY 2019 FY 2020
Police Major 1 1 1
Police Lieutenant 3 3 3
Police Sergeant 9 9 9
Police Officer 73 73 72
Accreditation Program Manager 0 0 1
Public Safety Background Investigator & Recruiter 0 0 1
Crime/Intelligence Analyst 0 1 1
Community Service Officer 10 10 10
Police Information Desk Clerk 1 1 0
Total Full-Time Employees 97 98 98
Staffing Levels
FY 2020 Adopted Budget Police208
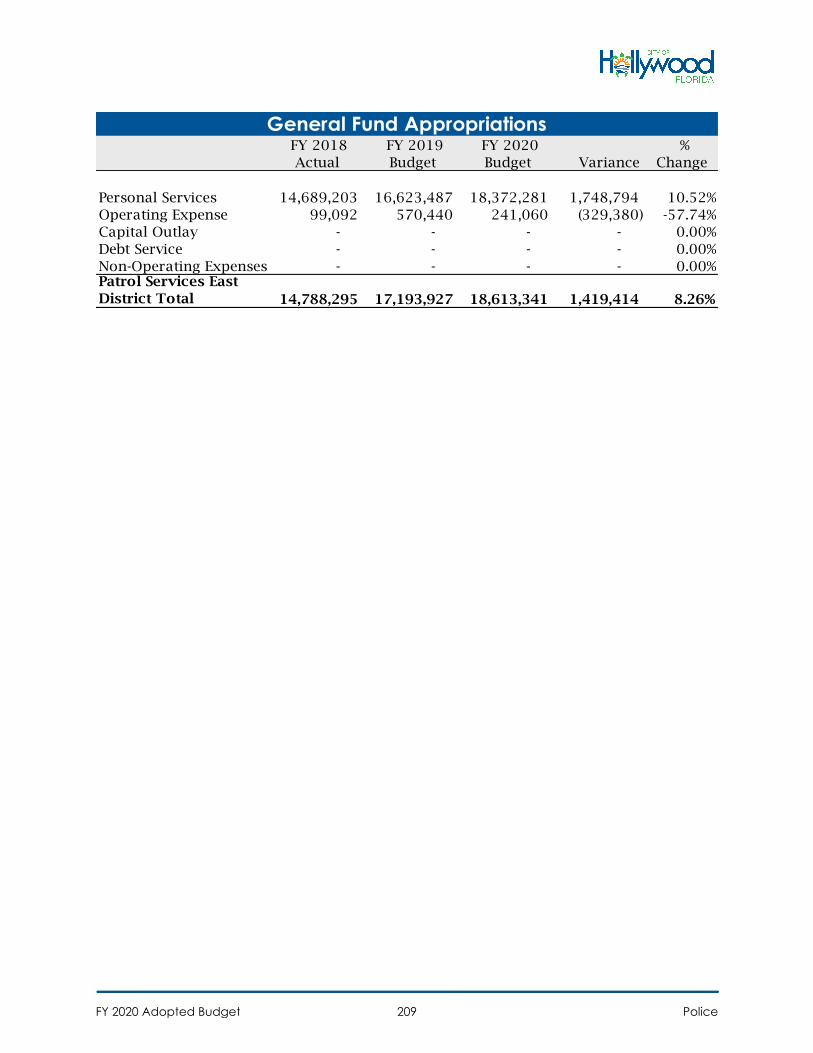
FY 2018
Actual
FY 2019
Budget
FY 2020
Budget Variance
%
Change
Personal Services 14,689,203 16,623,487 18,372,281 1,748,794 10.52%
Operating Expense 99,092 570,440 241,060 (329,380) -57.74%
Capital Outlay - - - - 0.00%
Debt Service - - - - 0.00%
Non-Operating Expenses - - - - 0.00%Patrol Services East
District Total 14,788,295 17,193,927 18,613,341 1,419,414 8.26%
General Fund Appropriations
FY 2020 Adopted Budget Police209
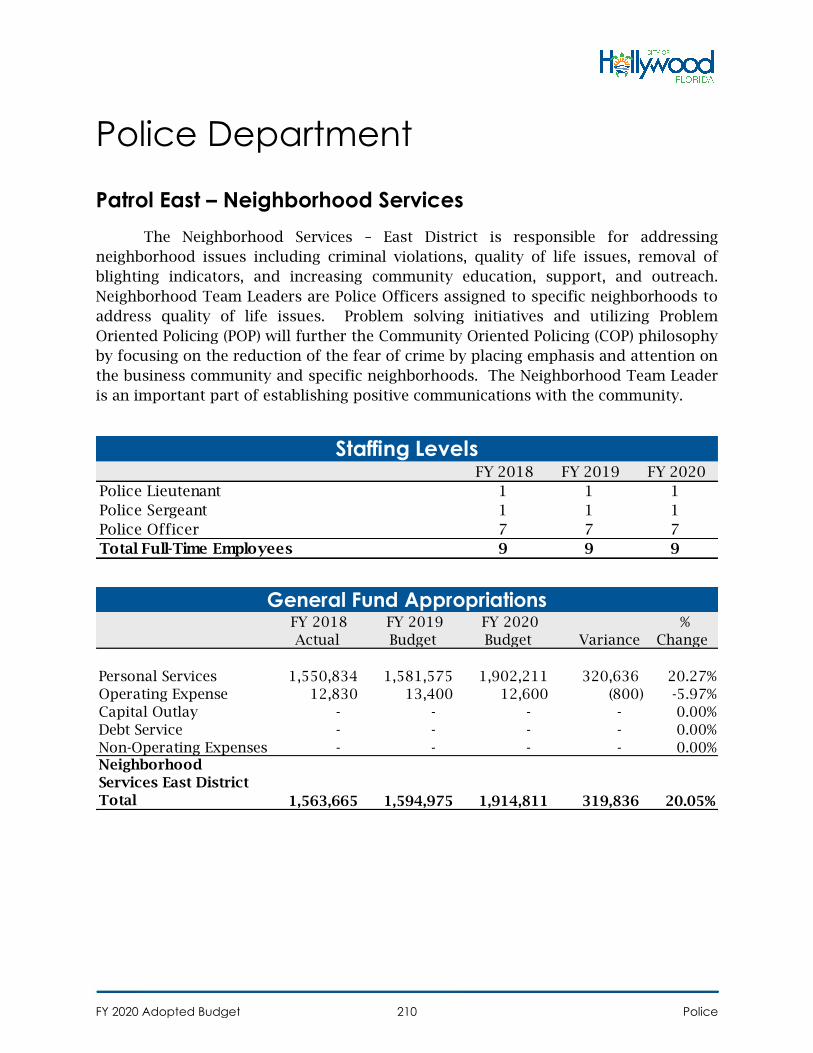
Police Department
Patrol East – Neighborhood Services
The Neighborhood Services – East District is responsible for addressing
neighborhood issues including criminal violations, quality of life issues, removal of
blighting indicators, and increasing community education, support, and outreach.
Neighborhood Team Leaders are Police Officers assigned to specific neighborhoods to
address quality of life issues. Problem solving initiatives and utilizing Problem
Oriented Policing (POP) will further the Community Oriented Policing (COP) philosophy
by focusing on the reduction of the fear of crime by placing emphasis and attention on
the business community and specific neighborhoods. The Neighborhood Team Leader
is an important part of establishing positive communications with the community.
FY 2018 FY 2019 FY 2020
Police Lieutenant 1 1 1
Police Sergeant 1 1 1
Police Officer 7 7 7
Total Full-Time Employees 9 9 9
Staffing Levels
FY 2018
Actual
FY 2019
Budget
FY 2020
Budget Variance
%
Change
Personal Services 1,550,834 1,581,575 1,902,211 320,636 20.27%
Operating Expense 12,830 13,400 12,600 (800) -5.97%
Capital Outlay - - - - 0.00%
Debt Service - - - - 0.00%
Non-Operating Expenses - - - - 0.00%Neighborhood
Services East District
Total 1,563,665 1,594,975 1,914,811 319,836 20.05%
General Fund Appropriations
FY 2020 Adopted Budget Police210
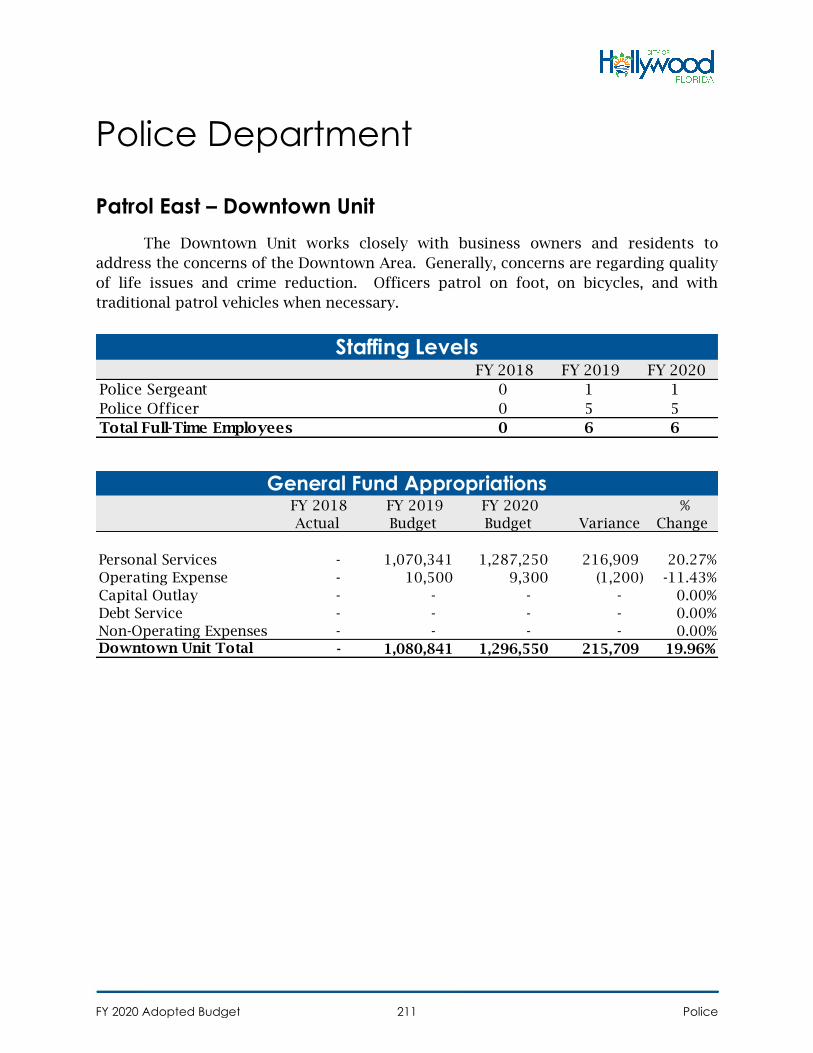
Police Department
Patrol East – Downtown Unit
The Downtown Unit works closely with business owners and residents to
address the concerns of the Downtown Area. Generally, concerns are regarding quality
of life issues and crime reduction. Officers patrol on foot, on bicycles, and with
traditional patrol vehicles when necessary.
FY 2018 FY 2019 FY 2020
Police Sergeant 0 1 1
Police Officer 0 5 5
Total Full-Time Employees 0 6 6
Staffing Levels
FY 2018
Actual
FY 2019
Budget
FY 2020
Budget Variance
%
Change
Personal Services - 1,070,341 1,287,250 216,909 20.27%
Operating Expense - 10,500 9,300 (1,200) -11.43%
Capital Outlay - - - - 0.00%
Debt Service - - - - 0.00%
Non-Operating Expenses - - - - 0.00%Downtown Unit Total - 1,080,841 1,296,550 215,709 19.96%
General Fund Appropriations
FY 2020 Adopted Budget Police211
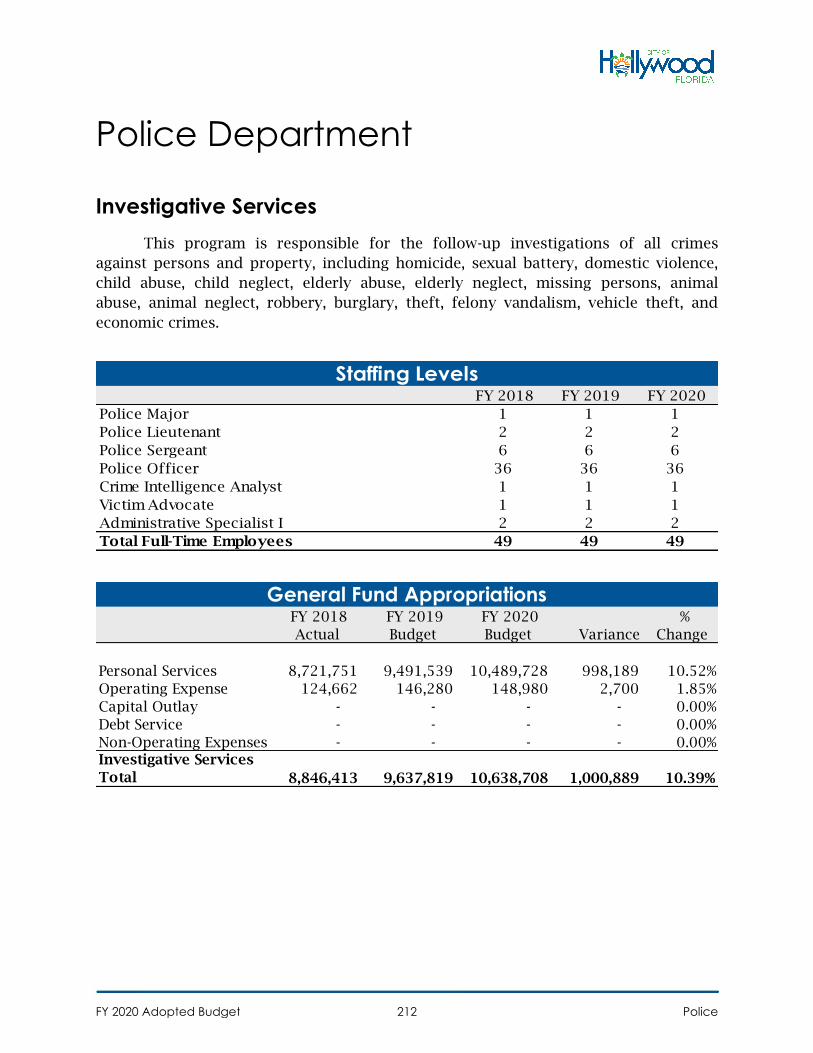
Police Department
Investigative Services
This program is responsible for the follow-up investigations of all crimes
against persons and property, including homicide, sexual battery, domestic violence,
child abuse, child neglect, elderly abuse, elderly neglect, missing persons, animal
abuse, animal neglect, robbery, burglary, theft, felony vandalism, vehicle theft, and
economic crimes.
FY 2018 FY 2019 FY 2020
Police Major 1 1 1
Police Lieutenant 2 2 2
Police Sergeant 6 6 6
Police Officer 36 36 36
Crime Intelligence Analyst 1 1 1
Victim Advocate 1 1 1
Administrative Specialist I 2 2 2
Total Full-Time Employees 49 49 49
Staffing Levels
FY 2018
Actual
FY 2019
Budget
FY 2020
Budget Variance
%
Change
Personal Services 8,721,751 9,491,539 10,489,728 998,189 10.52%
Operating Expense 124,662 146,280 148,980 2,700 1.85%
Capital Outlay - - - - 0.00%
Debt Service - - - - 0.00%
Non-Operating Expenses - - - - 0.00%Investigative Services
Total 8,846,413 9,637,819 10,638,708 1,000,889 10.39%
General Fund Appropriations
FY 2020 Adopted Budget Police212
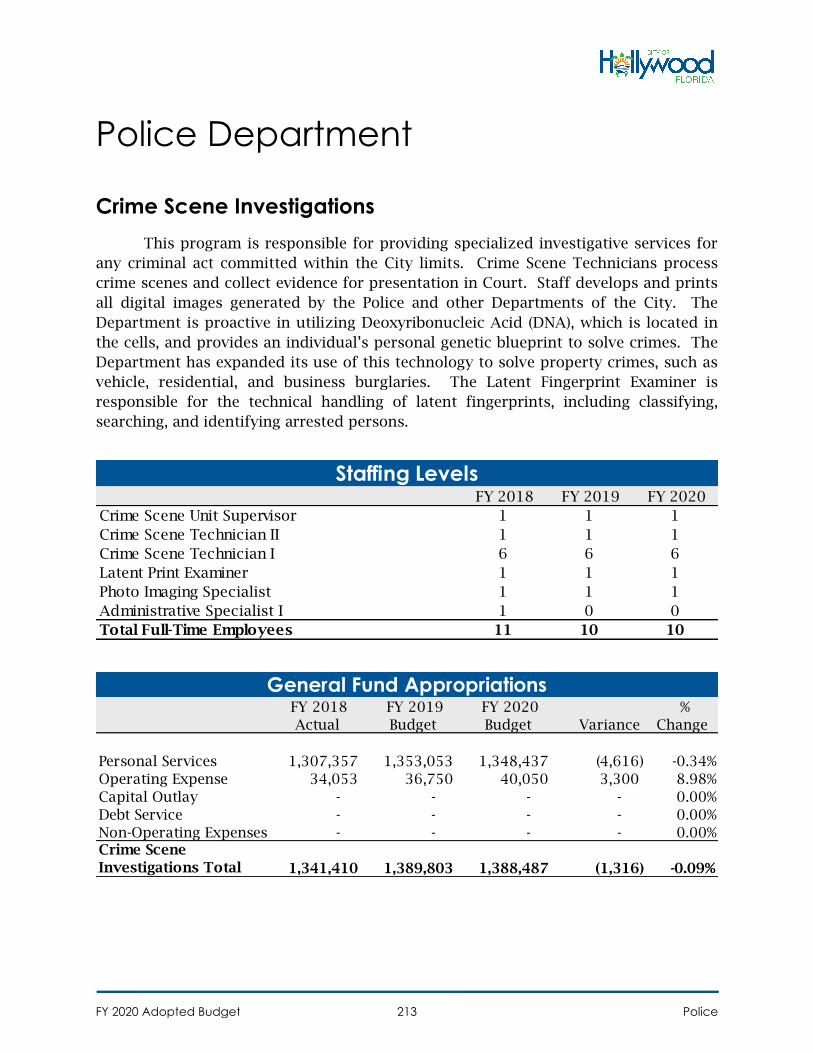
Police Department
Crime Scene Investigations
This program is responsible for providing specialized investigative services for
any criminal act committed within the City limits. Crime Scene Technicians process
crime scenes and collect evidence for presentation in Court. Staff develops and prints
all digital images generated by the Police and other Departments of the City. The
Department is proactive in utilizing Deoxyribonucleic Acid (DNA), which is located in
the cells, and provides an individual’s personal genetic blueprint to solve crimes. The
Department has expanded its use of this technology to solve property crimes, such as
vehicle, residential, and business burglaries. The Latent Fingerprint Examiner is
responsible for the technical handling of latent fingerprints, including classifying,
searching, and identifying arrested persons.
FY 2018 FY 2019 FY 2020
Crime Scene Unit Supervisor 1 1 1
Crime Scene Technician II 1 1 1
Crime Scene Technician I 6 6 6
Latent Print Examiner 1 1 1
Photo Imaging Specialist 1 1 1
Administrative Specialist I 1 0 0
Total Full-Time Employees 11 10 10
Staffing Levels
FY 2018
Actual
FY 2019
Budget
FY 2020
Budget Variance
%
Change
Personal Services 1,307,357 1,353,053 1,348,437 (4,616) -0.34%
Operating Expense 34,053 36,750 40,050 3,300 8.98%
Capital Outlay - - - - 0.00%
Debt Service - - - - 0.00%
Non-Operating Expenses - - - - 0.00%Crime Scene
Investigations Total 1,341,410 1,389,803 1,388,487 (1,316) -0.09%
General Fund Appropriations
FY 2020 Adopted Budget Police213
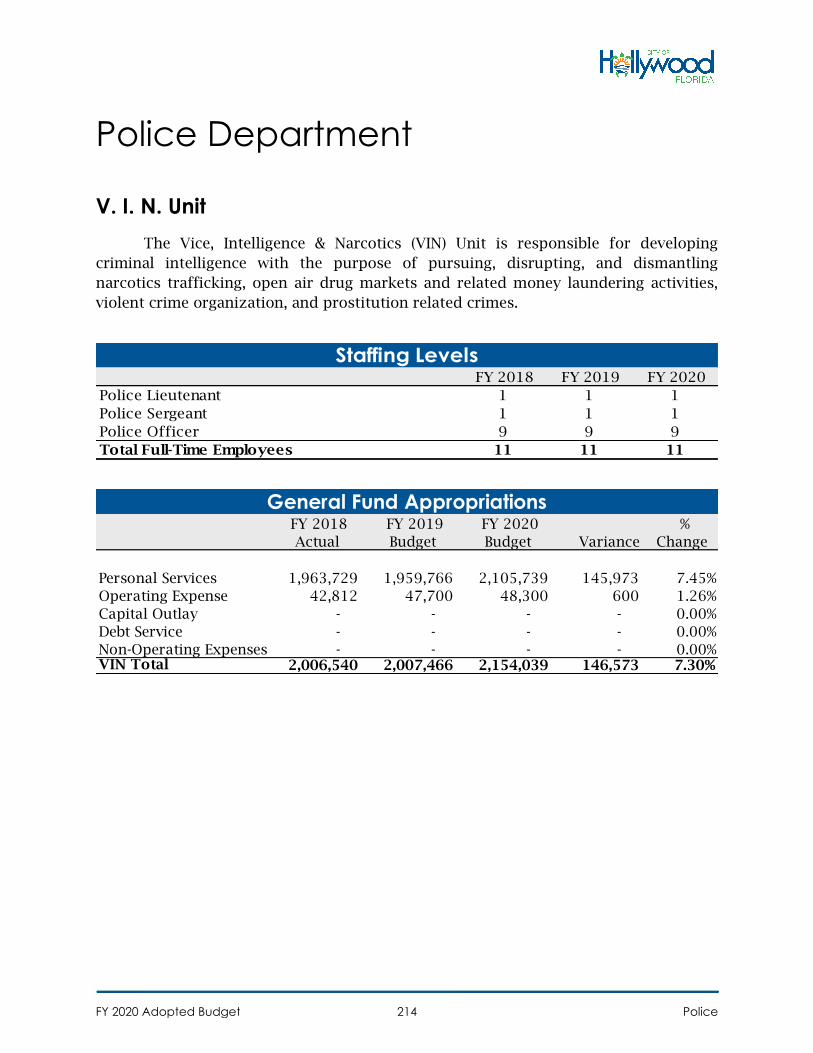
Police Department
V. I. N. Unit
The Vice, Intelligence & Narcotics (VIN) Unit is responsible for developing
criminal intelligence with the purpose of pursuing, disrupting, and dismantling
narcotics trafficking, open air drug markets and related money laundering activities,
violent crime organization, and prostitution related crimes.
FY 2018 FY 2019 FY 2020
Police Lieutenant 1 1 1
Police Sergeant 1 1 1
Police Officer 9 9 9
Total Full-Time Employees 11 11 11
Staffing Levels
FY 2018
Actual
FY 2019
Budget
FY 2020
Budget Variance
%
Change
Personal Services 1,963,729 1,959,766 2,105,739 145,973 7.45%
Operating Expense 42,812 47,700 48,300 600 1.26%
Capital Outlay - - - - 0.00%
Debt Service - - - - 0.00%
Non-Operating Expenses - - - - 0.00%VIN Total 2,006,540 2,007,466 2,154,039 146,573 7.30%
General Fund Appropriations
FY 2020 Adopted Budget Police214
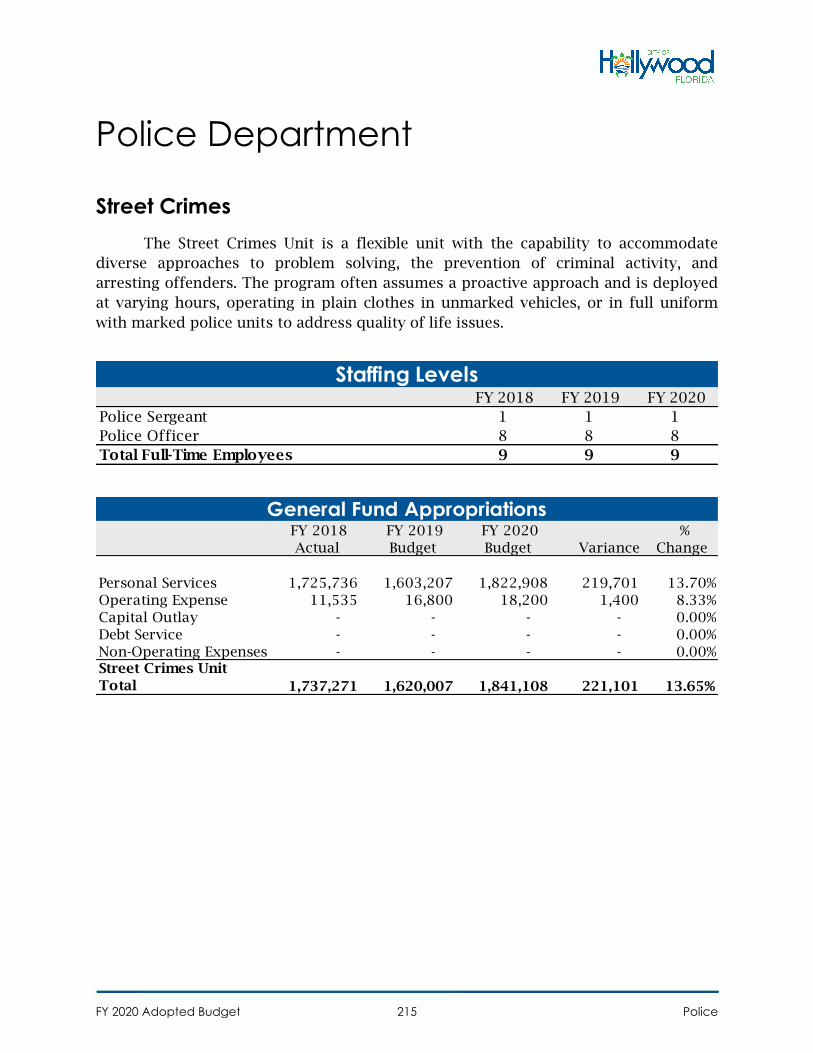
Police Department
Street Crimes
The Street Crimes Unit is a flexible unit with the capability to accommodate
diverse approaches to problem solving, the prevention of criminal activity, and
arresting offenders. The program often assumes a proactive approach and is deployed
at varying hours, operating in plain clothes in unmarked vehicles, or in full uniform
with marked police units to address quality of life issues.
FY 2018 FY 2019 FY 2020
Police Sergeant 1 1 1
Police Officer 8 8 8
Total Full-Time Employees 9 9 9
Staffing Levels
FY 2018
Actual
FY 2019
Budget
FY 2020
Budget Variance
%
Change
Personal Services 1,725,736 1,603,207 1,822,908 219,701 13.70%
Operating Expense 11,535 16,800 18,200 1,400 8.33%
Capital Outlay - - - - 0.00%
Debt Service - - - - 0.00%
Non-Operating Expenses - - - - 0.00%Street Crimes Unit
Total 1,737,271 1,620,007 1,841,108 221,101 13.65%
General Fund Appropriations
FY 2020 Adopted Budget Police215
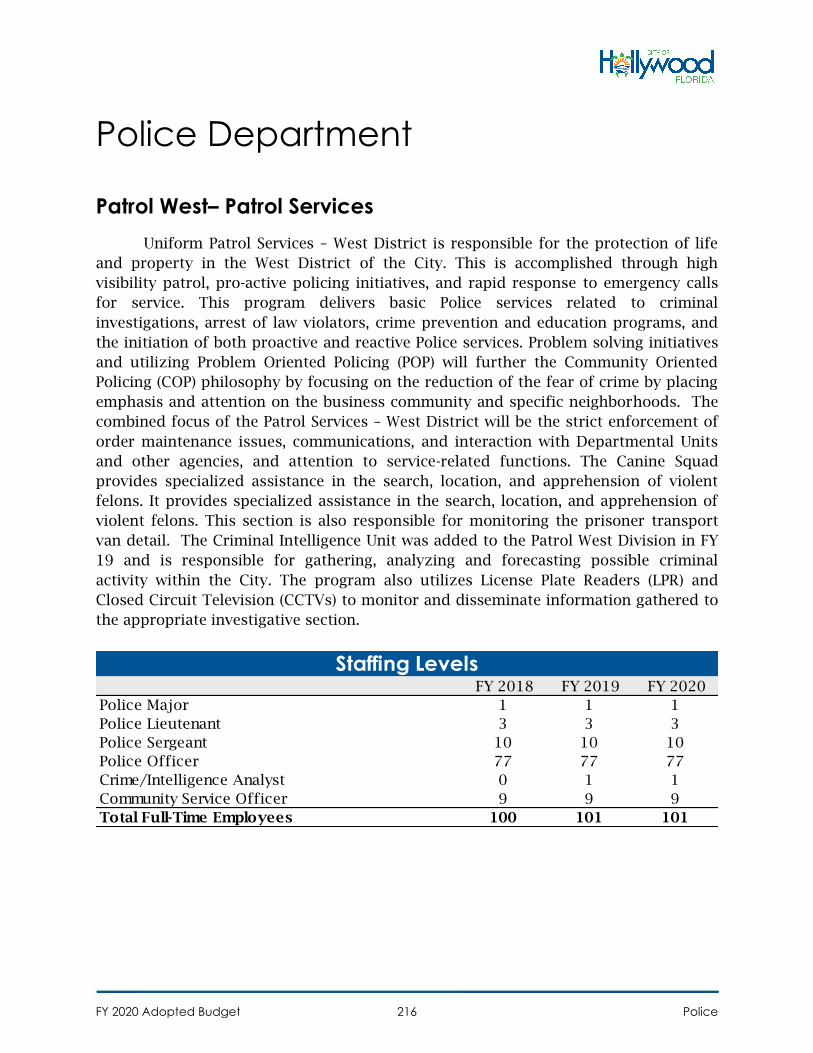
Police Department
Patrol West– Patrol Services
Uniform Patrol Services – West District is responsible for the protection of life
and property in the West District of the City. This is accomplished through high
visibility patrol, pro-active policing initiatives, and rapid response to emergency calls
for service. This program delivers basic Police services related to criminal
investigations, arrest of law violators, crime prevention and education programs, and
the initiation of both proactive and reactive Police services. Problem solving initiatives
and utilizing Problem Oriented Policing (POP) will further the Community Oriented
Policing (COP) philosophy by focusing on the reduction of the fear of crime by placing
emphasis and attention on the business community and specific neighborhoods. The
combined focus of the Patrol Services – West District will be the strict enforcement of
order maintenance issues, communications, and interaction with Departmental Units
and other agencies, and attention to service-related functions. The Canine Squad
provides specialized assistance in the search, location, and apprehension of violent
felons. It provides specialized assistance in the search, location, and apprehension of
violent felons. This section is also responsible for monitoring the prisoner transport
van detail. The Criminal Intelligence Unit was added to the Patrol West Division in FY
19 and is responsible for gathering, analyzing and forecasting possible criminal
activity within the City. The program also utilizes License Plate Readers (LPR) and
Closed Circuit Television (CCTVs) to monitor and disseminate information gathered to
the appropriate investigative section.
FY 2018 FY 2019 FY 2020
Police Major 1 1 1
Police Lieutenant 3 3 3
Police Sergeant 10 10 10
Police Officer 77 77 77
Crime/Intelligence Analyst 0 1 1
Community Service Officer 9 9 9
Total Full-Time Employees 100 101 101
Staffing Levels
FY 2020 Adopted Budget Police216
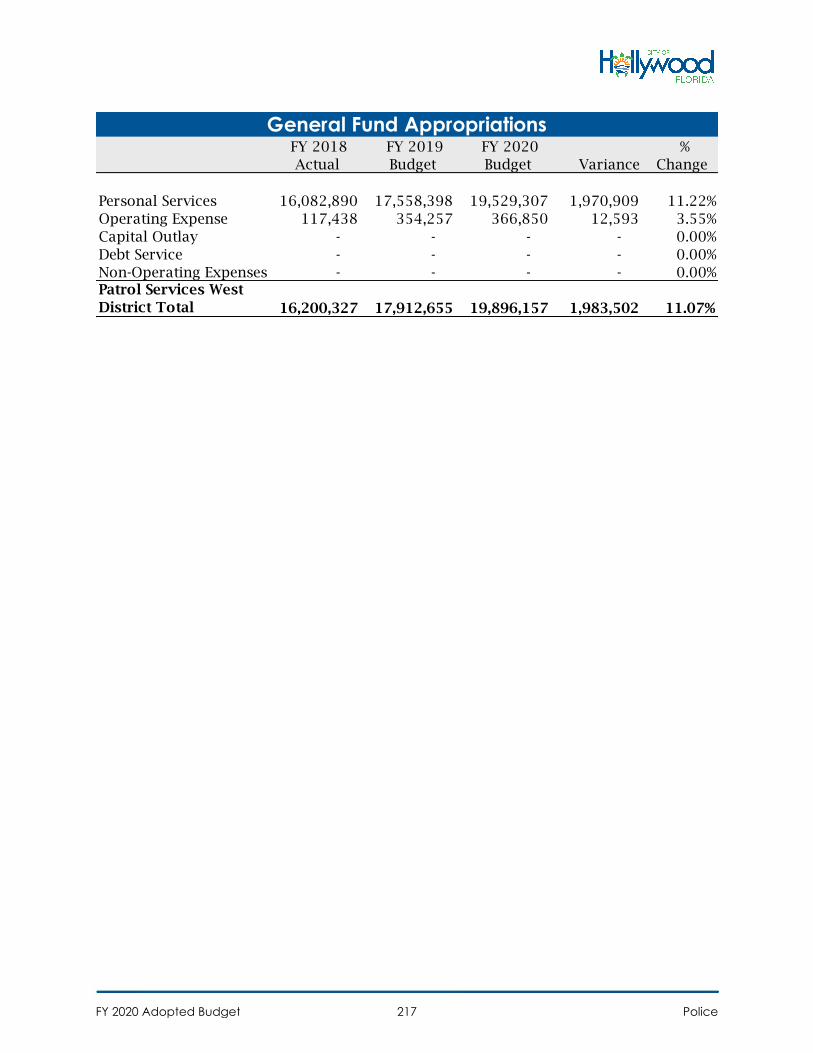
FY 2018
Actual
FY 2019
Budget
FY 2020
Budget Variance
%
Change
Personal Services 16,082,890 17,558,398 19,529,307 1,970,909 11.22%
Operating Expense 117,438 354,257 366,850 12,593 3.55%
Capital Outlay - - - - 0.00%
Debt Service - - - - 0.00%
Non-Operating Expenses - - - - 0.00%Patrol Services West
District Total 16,200,327 17,912,655 19,896,157 1,983,502 11.07%
General Fund Appropriations
FY 2020 Adopted Budget Police217
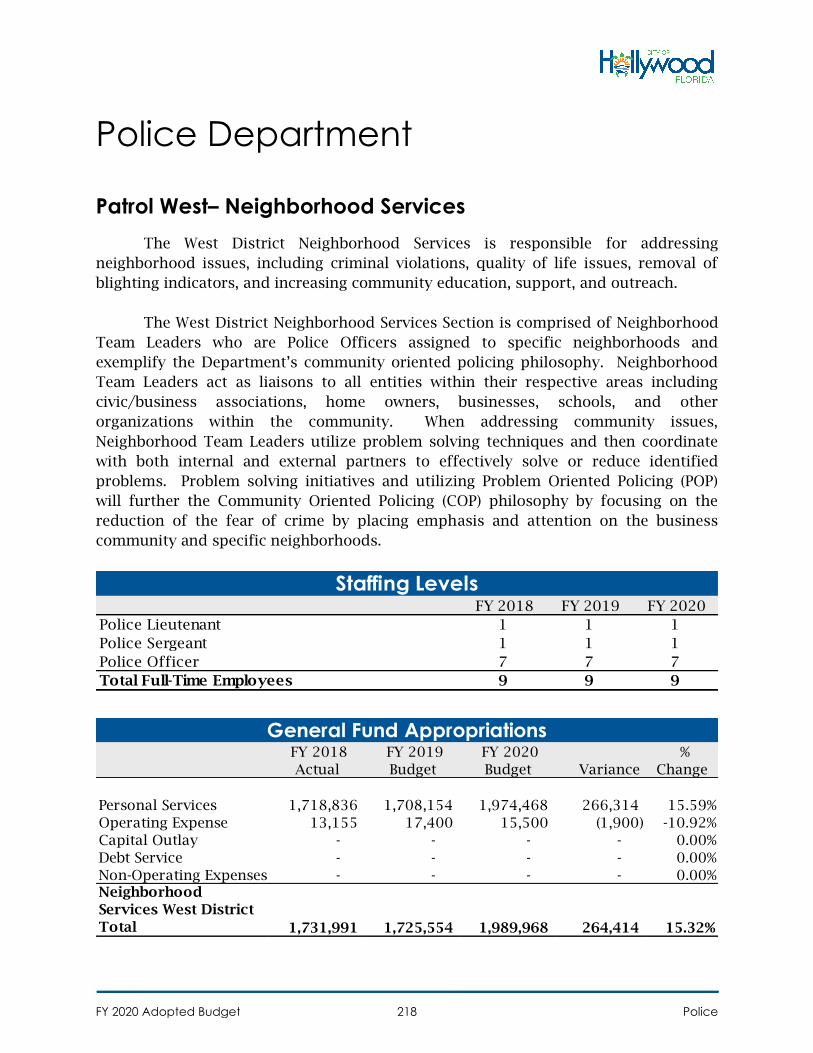
Police Department
Patrol West– Neighborhood Services
The West District Neighborhood Services is responsible for addressing
neighborhood issues, including criminal violations, quality of life issues, removal of
blighting indicators, and increasing community education, support, and outreach.
The West District Neighborhood Services Section is comprised of Neighborhood
Team Leaders who are Police Officers assigned to specific neighborhoods and
exemplify the Department’s community oriented policing philosophy. Neighborhood
Team Leaders act as liaisons to all entities within their respective areas including
civic/business associations, home owners, businesses, schools, and other
organizations within the community. When addressing community issues,
Neighborhood Team Leaders utilize problem solving techniques and then coordinate
with both internal and external partners to effectively solve or reduce identified
problems. Problem solving initiatives and utilizing Problem Oriented Policing (POP)
will further the Community Oriented Policing (COP) philosophy by focusing on the
reduction of the fear of crime by placing emphasis and attention on the business
community and specific neighborhoods.
FY 2018 FY 2019 FY 2020
Police Lieutenant 1 1 1
Police Sergeant 1 1 1
Police Officer 7 7 7
Total Full-Time Employees 9 9 9
Staffing Levels
FY 2018
Actual
FY 2019
Budget
FY 2020
Budget Variance
%
Change
Personal Services 1,718,836 1,708,154 1,974,468 266,314 15.59%
Operating Expense 13,155 17,400 15,500 (1,900) -10.92%
Capital Outlay - - - - 0.00%
Debt Service - - - - 0.00%
Non-Operating Expenses - - - - 0.00%Neighborhood
Services West District
Total 1,731,991 1,725,554 1,989,968 264,414 15.32%
General Fund Appropriations
FY 2020 Adopted Budget Police218
Police Department
Parking Services
In FY 2020, Parking Services was transferred from the Department of
Development Services to the Police Department. This Division manages the City's
parking system which is funded through the Parking Enterprise Fund. It is composed
of an Administration unit and three operating units: Parking Enforcement, Meter
Repair & Collections, and Garage Operations. This Division provides oversight and
development of the City’s parking system and programs ensuring that everyone living,
working, or visiting in the City of Hollywood has access to safe, convenient, and
affordable public parking.
The Division’s primary objectives are to provide effective, efficient parking
programs and clean, safe, and convenient facilities throughout the City at reasonable
rates, as well as to work cohesively with residents, the business community, and other
City Departments and Offices to better serve community needs. Parking Enforcement
Officers enforce all City ordinances and State Statutes, as they pertain to parking,
throughout the City of Hollywood, in a fair and equitable manner while maintaining a
good relationship with the public. Meter Technicians and Collectors are responsible
for on-street parking spaces and public parking lots. Their duties include collection of
coins and currency from the meters, repair and maintenance of equipment, and
installation of signage. Staff also manages four public parking garages.
FY 2020 Adopted Budget Police219
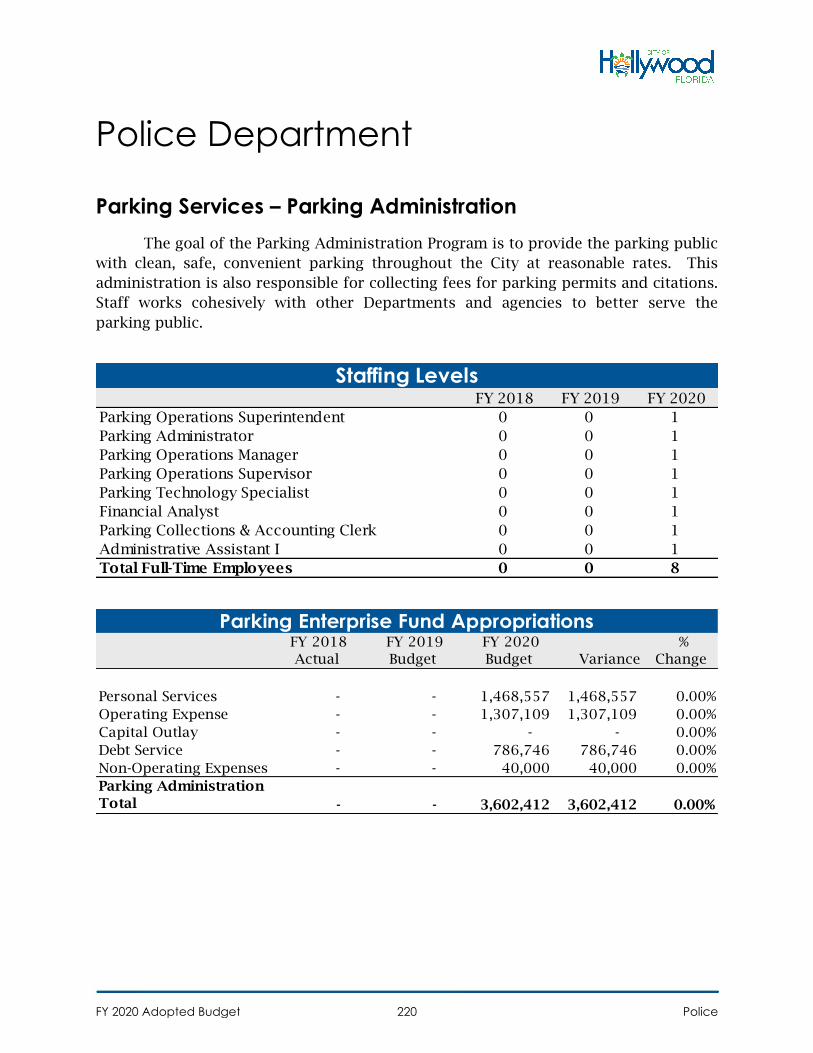
Police Department
Parking Services – Parking Administration
The goal of the Parking Administration Program is to provide the parking public
with clean, safe, convenient parking throughout the City at reasonable rates. This
administration is also responsible for collecting fees for parking permits and citations.
Staff works cohesively with other Departments and agencies to better serve the
parking public.
FY 2018 FY 2019 FY 2020
Parking Operations Superintendent 0 0 1
Parking Administrator 0 0 1
Parking Operations Manager 0 0 1
Parking Operations Supervisor 0 0 1
Parking Technology Specialist 0 0 1
Financial Analyst 0 0 1
Parking Collections & Accounting Clerk 0 0 1
Administrative Assistant I 0 0 1
Total Full-Time Employees 0 0 8
Staffing Levels
FY 2018
Actual
FY 2019
Budget
FY 2020
Budget Variance
%
Change
Personal Services - - 1,468,557 1,468,557 0.00%
Operating Expense - - 1,307,109 1,307,109 0.00%
Capital Outlay - - - - 0.00%
Debt Service - - 786,746 786,746 0.00%
Non-Operating Expenses - - 40,000 40,000 0.00%
Parking Administration
Total - - 3,602,412 3,602,412 0.00%
Parking Enterprise Fund Appropriations
FY 2020 Adopted Budget Police220
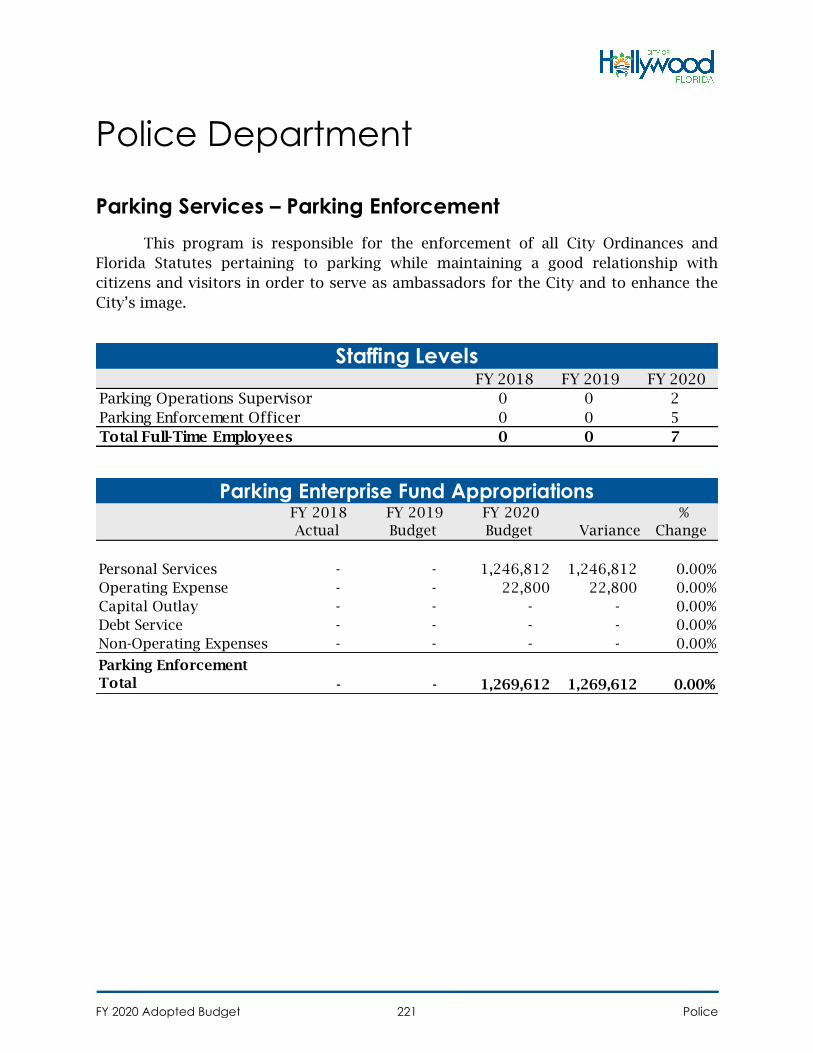
Police Department
Parking Services – Parking Enforcement
This program is responsible for the enforcement of all City Ordinances and
Florida Statutes pertaining to parking while maintaining a good relationship with
citizens and visitors in order to serve as ambassadors for the City and to enhance the
City’s image.
FY 2018 FY 2019 FY 2020
Parking Operations Supervisor 0 0 2
Parking Enforcement Officer 0 0 5
Total Full-Time Employees 0 0 7
Staffing Levels
FY 2018
Actual
FY 2019
Budget
FY 2020
Budget Variance
%
Change
Personal Services - - 1,246,812 1,246,812 0.00%
Operating Expense - - 22,800 22,800 0.00%
Capital Outlay - - - - 0.00%
Debt Service - - - - 0.00%
Non-Operating Expenses - - - - 0.00%
Parking Enforcement
Total - - 1,269,612 1,269,612 0.00%
Parking Enterprise Fund Appropriations
FY 2020 Adopted Budget Police221
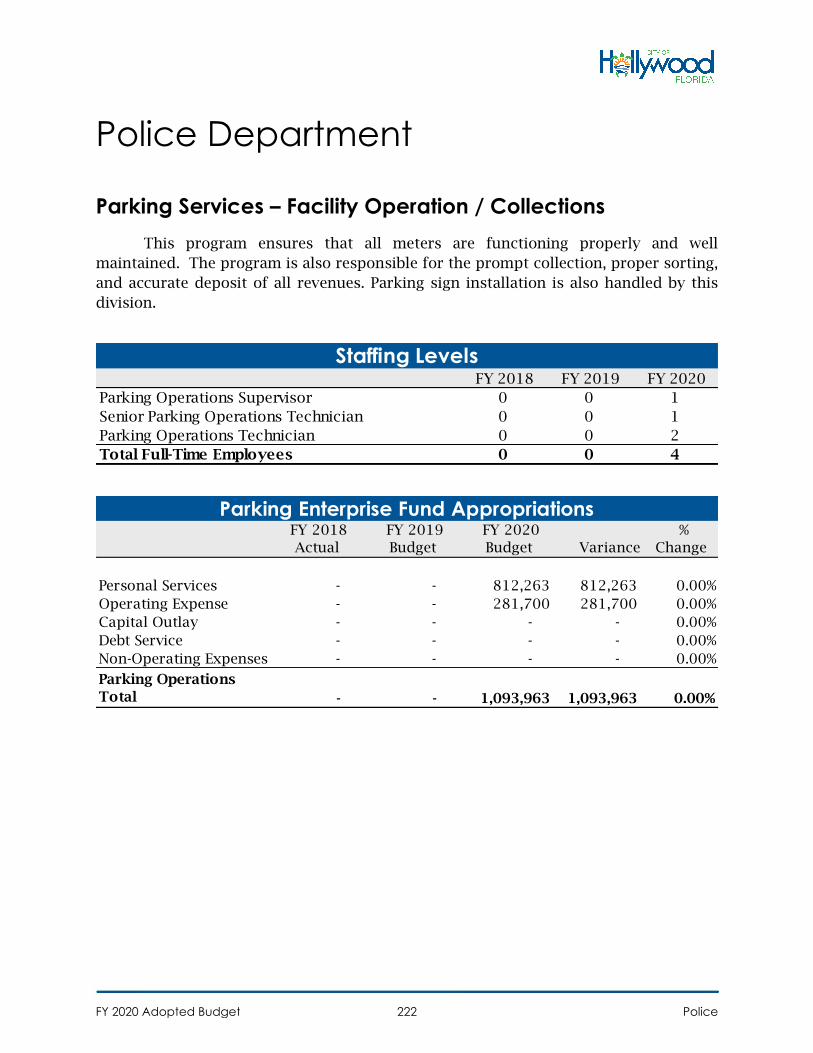
Police Department
Parking Services – Facility Operation / Collections
This program ensures that all meters are functioning properly and well
maintained. The program is also responsible for the prompt collection, proper sorting,
and accurate deposit of all revenues. Parking sign installation is also handled by this
division.
FY 2018 FY 2019 FY 2020
Parking Operations Supervisor 0 0 1
Senior Parking Operations Technician 0 0 1
Parking Operations Technician 0 0 2
Total Full-Time Employees 0 0 4
Staffing Levels
FY 2018
Actual
FY 2019
Budget
FY 2020
Budget Variance
%
Change
Personal Services - - 812,263 812,263 0.00%
Operating Expense - - 281,700 281,700 0.00%
Capital Outlay - - - - 0.00%
Debt Service - - - - 0.00%
Non-Operating Expenses - - - - 0.00%
Parking Operations
Total - - 1,093,963 1,093,963 0.00%
Parking Enterprise Fund Appropriations
FY 2020 Adopted Budget Police222
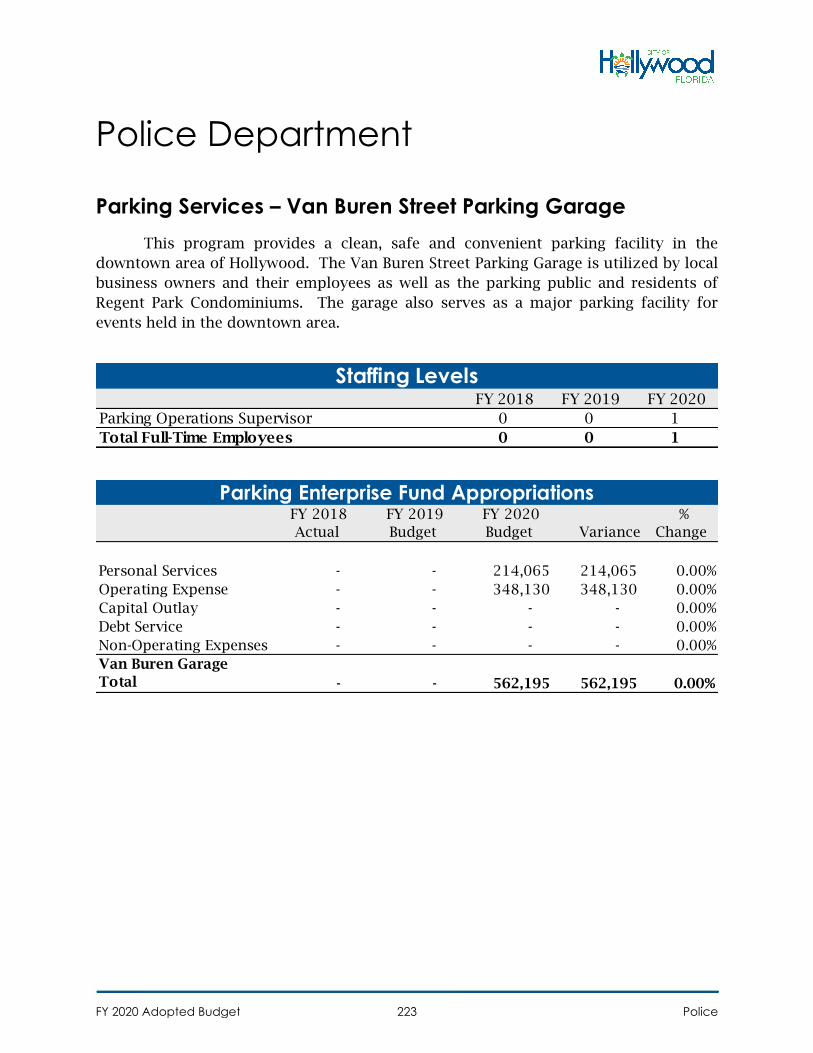
Police Department
Parking Services – Van Buren Street Parking Garage
This program provides a clean, safe and convenient parking facility in the
downtown area of Hollywood. The Van Buren Street Parking Garage is utilized by local
business owners and their employees as well as the parking public and residents of
Regent Park Condominiums. The garage also serves as a major parking facility for
events held in the downtown area.
FY 2018 FY 2019 FY 2020
Parking Operations Supervisor 0 0 1
Total Full-Time Employees 0 0 1
Staffing Levels
FY 2018
Actual
FY 2019
Budget
FY 2020
Budget Variance
%
Change
Personal Services - - 214,065 214,065 0.00%
Operating Expense - - 348,130 348,130 0.00%
Capital Outlay - - - - 0.00%
Debt Service - - - - 0.00%
Non-Operating Expenses - - - - 0.00%
Van Buren Garage
Total - - 562,195 562,195 0.00%
Parking Enterprise Fund Appropriations
FY 2020 Adopted Budget Police223
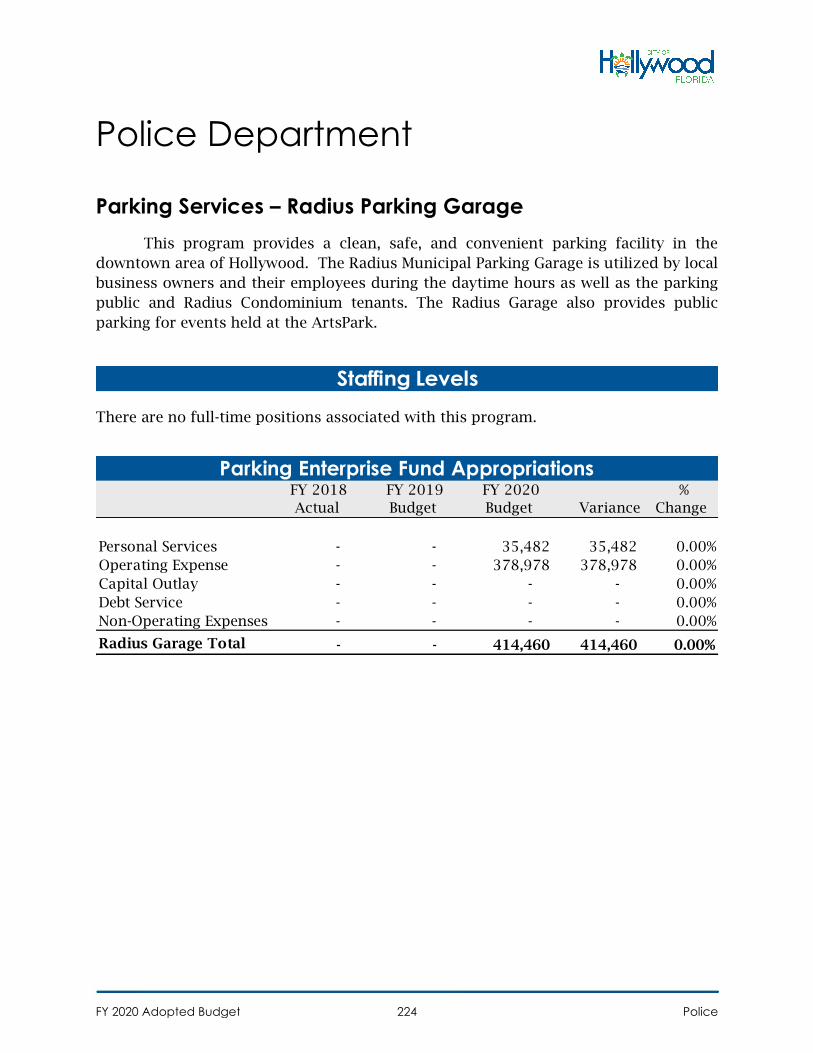
Police Department
Parking Services – Radius Parking Garage
This program provides a clean, safe, and convenient parking facility in the
downtown area of Hollywood. The Radius Municipal Parking Garage is utilized by local
business owners and their employees during the daytime hours as well as the parking
public and Radius Condominium tenants. The Radius Garage also provides public
parking for events held at the ArtsPark.
There are no full-time positions associated with this program.
Staffing Levels
FY 2018
Actual
FY 2019
Budget
FY 2020
Budget Variance
%
Change
Personal Services - - 35,482 35,482 0.00%
Operating Expense - - 378,978 378,978 0.00%
Capital Outlay - - - - 0.00%
Debt Service - - - - 0.00%
Non-Operating Expenses - - - - 0.00%
Radius Garage Total - - 414,460 414,460 0.00%
Parking Enterprise Fund Appropriations
FY 2020 Adopted Budget Police224
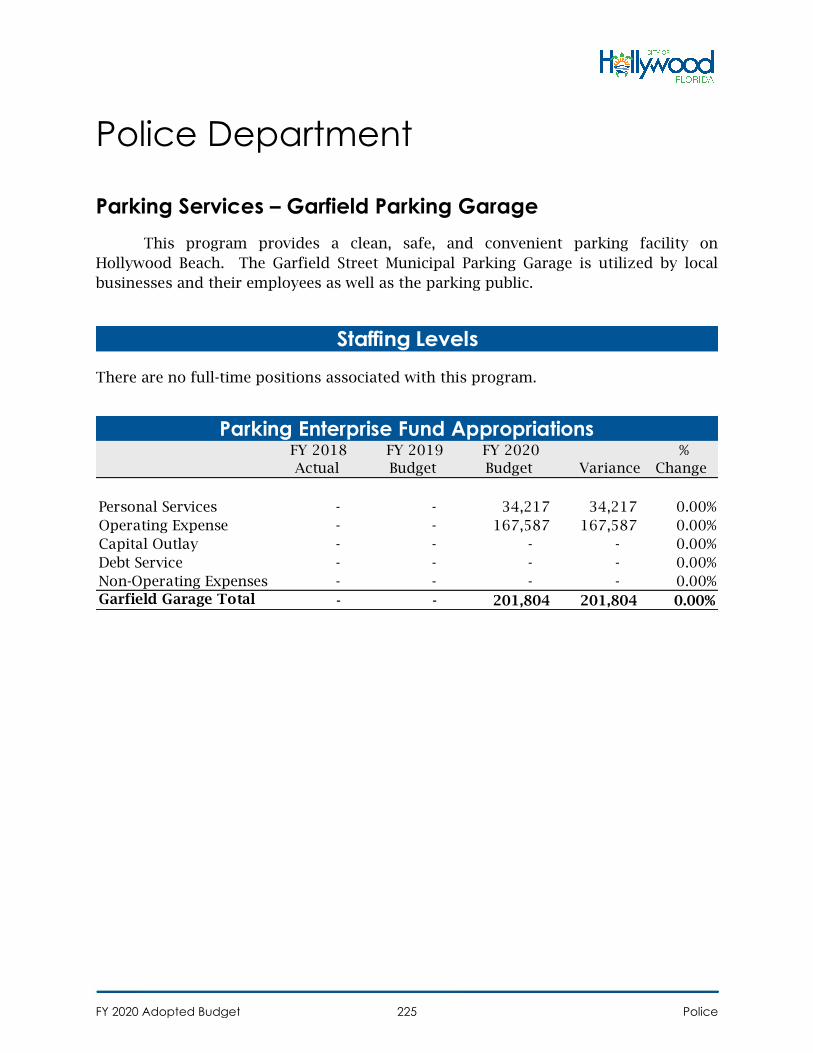
Police Department
Parking Services – Garfield Parking Garage
This program provides a clean, safe, and convenient parking facility on
Hollywood Beach. The Garfield Street Municipal Parking Garage is utilized by local
businesses and their employees as well as the parking public.
There are no full-time positions associated with this program.
Staffing Levels
FY 2018
Actual
FY 2019
Budget
FY 2020
Budget Variance
%
Change
Personal Services - - 34,217 34,217 0.00%
Operating Expense - - 167,587 167,587 0.00%
Capital Outlay - - - - 0.00%
Debt Service - - - - 0.00%
Non-Operating Expenses - - - - 0.00%
Garfield Garage Total - - 201,804 201,804 0.00%
Parking Enterprise Fund Appropriations
FY 2020 Adopted Budget Police225
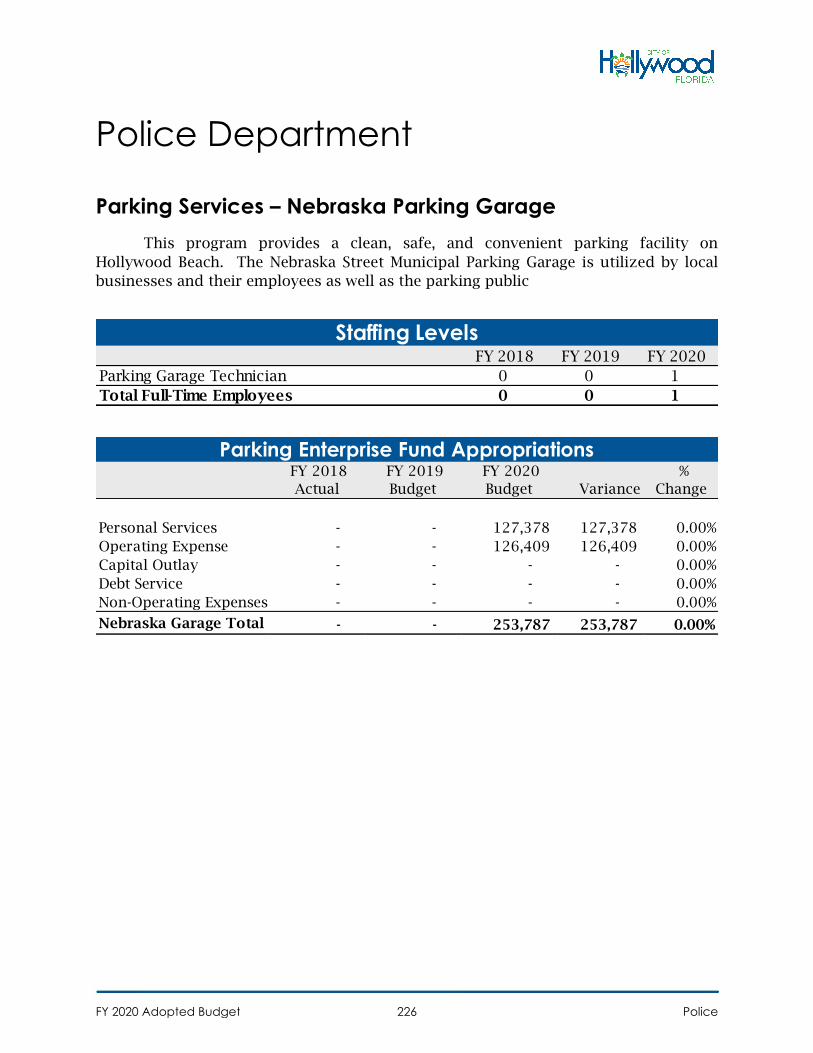
Police Department
Parking Services – Nebraska Parking Garage
This program provides a clean, safe, and convenient parking facility on
Hollywood Beach. The Nebraska Street Municipal Parking Garage is utilized by local
businesses and their employees as well as the parking public
FY 2018 FY 2019 FY 2020
Parking Garage Technician 0 0 1
Total Full-Time Employees 0 0 1
Staffing Levels
FY 2018
Actual
FY 2019
Budget
FY 2020
Budget Variance
%
Change
Personal Services - - 127,378 127,378 0.00%
Operating Expense - - 126,409 126,409 0.00%
Capital Outlay - - - - 0.00%
Debt Service - - - - 0.00%
Non-Operating Expenses - - - - 0.00%
Nebraska Garage Total - - 253,787 253,787 0.00%
Parking Enterprise Fund Appropriations
FY 2020 Adopted Budget Police226
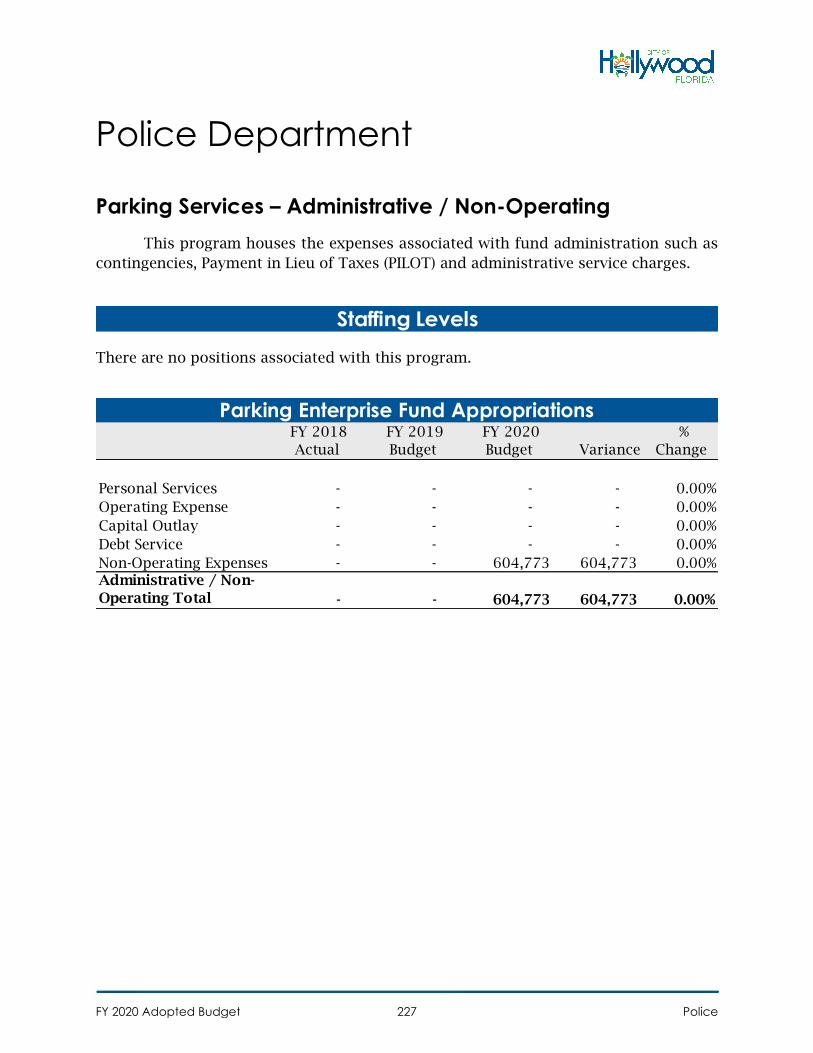
Police Department
Parking Services – Administrative / Non-Operating
This program houses the expenses associated with fund administration such as
contingencies, Payment in Lieu of Taxes (PILOT) and administrative service charges.
There are no positions associated with this program.
Staffing Levels
FY 2018
Actual
FY 2019
Budget
FY 2020
Budget Variance
%
Change
Personal Services - - - - 0.00%
Operating Expense - - - - 0.00%
Capital Outlay - - - - 0.00%
Debt Service - - - - 0.00%
Non-Operating Expenses - - 604,773 604,773 0.00%Administrative / Non-
Operating Total - - 604,773 604,773 0.00%
Parking Enterprise Fund Appropriations
FY 2020 Adopted Budget Police227
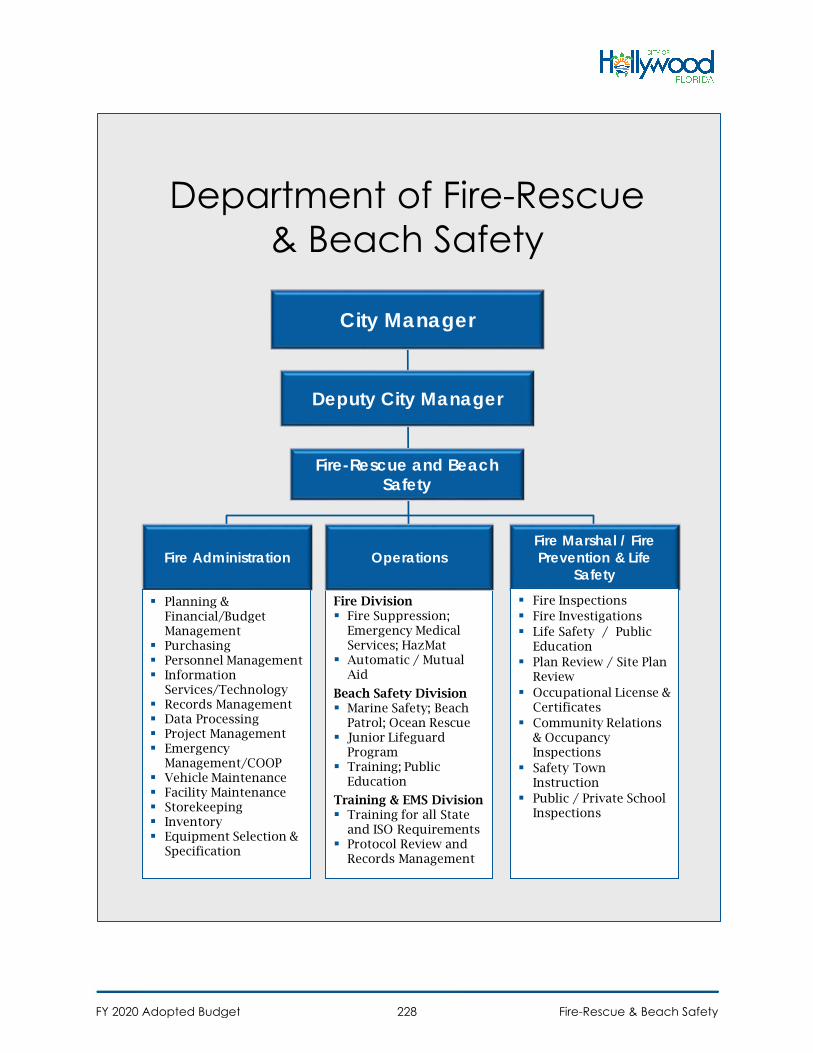
Department of Fire-Rescue& Beach Safety
Fire Administration
Planning & Financial/Budget Management
Purchasing Personnel Management Information
Services/Technology Records Management Data Processing Project Management Emergency
Management/COOP Vehicle Maintenance Facility Maintenance Storekeeping Inventory Equipment Selection &
Specification
Fire Marshal / Fire Prevention & Life
Safety Fire Inspections Fire Investigations Life Safety / Public
Education Plan Review / Site Plan
Review Occupational License &
Certificates Community Relations
& Occupancy Inspections
Safety Town Instruction
Public / Private School Inspections
City Manager
Fire-Rescue and Beach Safety
Fire Division Fire Suppression;
Emergency Medical Services; HazMat
Automatic / Mutual Aid
Beach Safety Division Marine Safety; Beach
Patrol; Ocean Rescue Junior Lifeguard
Program Training; Public
Education
Training & EMS Division Training for all State
and ISO Requirements Protocol Review and
Records Management
Operations
Deputy City Manager
FY 2020 Adopted Budget Fire-Rescue & Beach Safety228
Department of Fire-Rescue & Beach Safety
Summary The mission of the Department of Fire Rescue & Beach Safety is to develop,
implement, and administer programs which enhance the public’s safety within the City of Hollywood in the areas of fire suppression, emergency medical care, fire prevention, fire investigations, public education, hazardous materials mitigation, beach safety, and other emergency needs. This is accomplished through four separate programs including Administration, Fire Rescue Operations, Beach Safety and the Fire Marshal’s office.
FY 2019 Accomplishments • Responded to nearly 28,000 Fire and EMS emergency calls and 13,000
transports • Rescued over 220 swimmers, treated over 1,200 first aids, responded to over
130 medical emergencies, and reunited over 120 with family members • Provided safety for almost 7.5 million visitors to our beach • Held successful Junior Lifeguard program with over 300 children participating • Maintained the ISO Class 1 ranking for the 18th consecutive year. Hollywood is
one of 38 cities rated Class 1 out of 348 nationally • Maintained 8th rescue full-time in-service and 9th rescue in service as a peak
truck • Completed construction of Station 45 • Visited several area schools and gave presentations about water safety,
including ocean conditions, respective warning flags and how to stay safe when visiting the beach
• Held two recruit classes, training twenty-two new firefighters • Partnered with Memorial Regional Hospital in providing ride times with nurses
and medical students • Continued the Firefighter Friday program with Memorial Regional Hospital’s Joe
DiMaggio Children’s Hospital which include visits to children battling various life threating illness
• Held another successful Fire Cadet program at our training facility • Beach safety personnel participated in the United States Lifesaving Association
National Championships in Virginia Beach, Virginia and the United States Lifesaving Association Regional Championships in New Smyrna Beach, Florida
FY 2020 Adopted Budget Fire-Rescue & Beach Safety229
• Participated in County-wide Automatic/Mutual Aid Committee, Premier One Cad Implementation Committee and FireRMS Governance Board Committee
• Installed five Bunker Gear Washer/Dryers Extractors to reduce firefighter exposure to harmful contaminants, which was funded through a $115,000 grant from the 2017 FEMA Assistance to Firefighters (AFG) Grant program
• Completed the second year of the 2015 Staffing for Adequate Fire and Emergency Response (SAFER) grant program which funded six firefighters over a two-year period to enhance fire safety and suppression capabilities
• Received a grant from the Florida Department of Health for 300 doses of Narcan to combat opioid overdoses
• Participated in several active killer drills and seminars, implemented specialized training on opioid use and distributed opioid use reduction kits to the public
• Negotiated new contract with the International Associations of Firefighters • Received a $69,800 regional grant from the Broward County EMS Grant to
purchase “Stop the bleed” kits to be distributed throughout the County • Evaluated replacement of Self-Contained Breathing Apparatus (SCBA’s) due to
age. This equipment provides clean air to firefighters to breathe during firefighting operations
• Replaced one command vehicle, seven administrative vehicles and eleven Fire Inspector vehicles due to the age and conditions
• Placed orders for two Advanced Life Support (ALS) rescues and two Pierce Pumpers utilizing funds from the General Obligation Bond (GOB)
• Coordinated with vendor to design new Platform unit to be funded from the General Obligation Bond (GOB)
• Implemented a new gross decontamination procedure for bunker gear to reduce exposure to carcinogens
• Replaced All-Terrain Vehicles (ATV’s) and rescue watercraft at Beach safety • Replaced the 20 year old analog Zetron Fire Alerting system with the new digital
Phoenix G2 Fire Alerting System • Implemented a new training records management program (Target Solutions)
which is an on-line training platform that will assist with the documentation process needed to maintain an ISO Class 1 rating
• Implemented a new fire inspection software program “Fireworks’ to enhance inspection efficiency and streamline processes
• Underwent a state inspection and maintained status as a State Certified Training Facility (with zero deficiencies)
• Hosted and participated in a Fire Service Cancer Awareness class by the Firefighter Cancer Support network
• Participated in several educational events focusing on Post Traumatic Stress Disorder
• Provided classes for public safety personnel regarding the safe administration of Narcan for overdose cases
• Deployed ballistic equipment on engines and rescues to protect our members in the event of active shooter incidents
FY 2020 Adopted Budget Fire-Rescue & Beach Safety230
• Assisted Broward Healthcare Coalition in distributing grant funded Cyanokits to neighboring EMS agencies to combat cyanide exposure
• Participated in the national program, “Cardiac Arrest Registry to Enhance Survival”, to increase survivability and positive outcomes for our patients
• Collaborated with the University of Miami (UM) Cancer Research Team to track firefighter carcinogen exposures and utilize tumor banks for future study
FY 2020 Goals • Increase Staffing to ensure Fire Rescue and Beach Safety Service reliability for
the patients, residents and visitors of the City of Hollywood • Hold New Recruit Class(es) to fill vacancies and maintain minimum staffing
levels • Complete the Zoll RMS interface with TeleStaff to automatically populate
personnel unit assignments • Receive emergency apparatuses funded through the General Obligation Bond • Issue a 2nd set of bunker gear to all firefighters. This will reduce exposures to
carcinogens and contaminants after firefighting activities. • Replace all existing firefighting hoods for all firefighters. This personal
protective equipment (PPE) will reduce the exposure to carcinogens and contaminants during firefighting activities.
• Complete the Zoll RMS interface with TeleStaff to automatically populate personnel unit assignments
• Continue oversight of deployment of new lifeguard towers and first aid stations • Acquire additional pulse oximeters, glucometers and automatic external
defibrillators to be used by Beach Safety staff to enhance patient care • Extend Beach Safety’s 4-10 schedule so that it starts earlier in the year and we
can provide extended coverage during the early spring break time • Hire additional part time lifeguards to staff on the beach • Deploy an additional Rescue PWC (Jet Ski) to provide better response and
coverage • Completion of the Broward County mandate to replace the existing Zetron Fire
Alerting system in the Fire Stations with the new Phoenix G2 Fire Alerting System
• Complete implementation of Target Solutions program for the Training Division • Replace air breathing compressor at Station 5. This is utilized to fill SCBA
bottles after firefighting activities. • Institute the community risk reduction program “Close the Door” • Complete the in-house Fire Inspector training program to increase the number
of certified inspectors available within the Department • Continue to provide emergency incident response to protect the lives and
property of the residents and visitors of the City by mitigating emergencies and to reduce the impact of natural and other disasters
FY 2020 Adopted Budget Fire-Rescue & Beach Safety231
• Continue to respond to all beach and water emergencies and enforce all city codes and ordinances relating to the beach
• Host regional hazardous material, radiological response and technical rescue drills and a 160 hour state certified Haz-Mat certification course
• Continue to conduct Mass Casualty Incident preplanning, Triage and Treatment, and participate in joint active killer response drills
• Improve medical care of patients through new diagnostic aides and improved training
• Participate in the United States Lifesaving Association National Championships in Daytona Beach, Florida
• Maintain United States Lifesaving Association Advanced Lifesaving Agency certification
• Upgrade fire station alerting/toning systems in line with the new Broward County E911 system upgrade.
• Complete the Broward County P25 radio upgrade • Apply for Assistance to Firefighters (AFG) Grant. • Apply for Florida Department of Health EMS Matching Grant • Apply for the Broward County EMS Grant • Implement Electronic Payroll through Kronos Telestaff to reduce redundancy
FY 2018 Actual
FY 2019 Objective
FY 2019 Actual
FY 2020 Objective
Percent of emergency equipment meeting ISOrequirements
100% 100% 100% 100%
Average out-of-station response time for allemergency incidents at less than two minutes
100% 100% 100% 100%
Percent attainment of goal of fire inspectionof commercial properties
28% 100% 54% 100%
Percent of preventative actions to beachattendance
1.28% 1.37% 1.30% 1.37%
Performance Measures
Fire-Rescue & Beach Safety FY 2018 FY 2019 FY 2020 Fire Administration 12 12 14Operations 214 220 220Operations: Beach Safety 26 26 27Fire Prevention and Life Safety 12 13 13Total Full-Time Employees 264 271 274
Program Staffing Levels
FY 2020 Adopted Budget Fire-Rescue & Beach Safety232
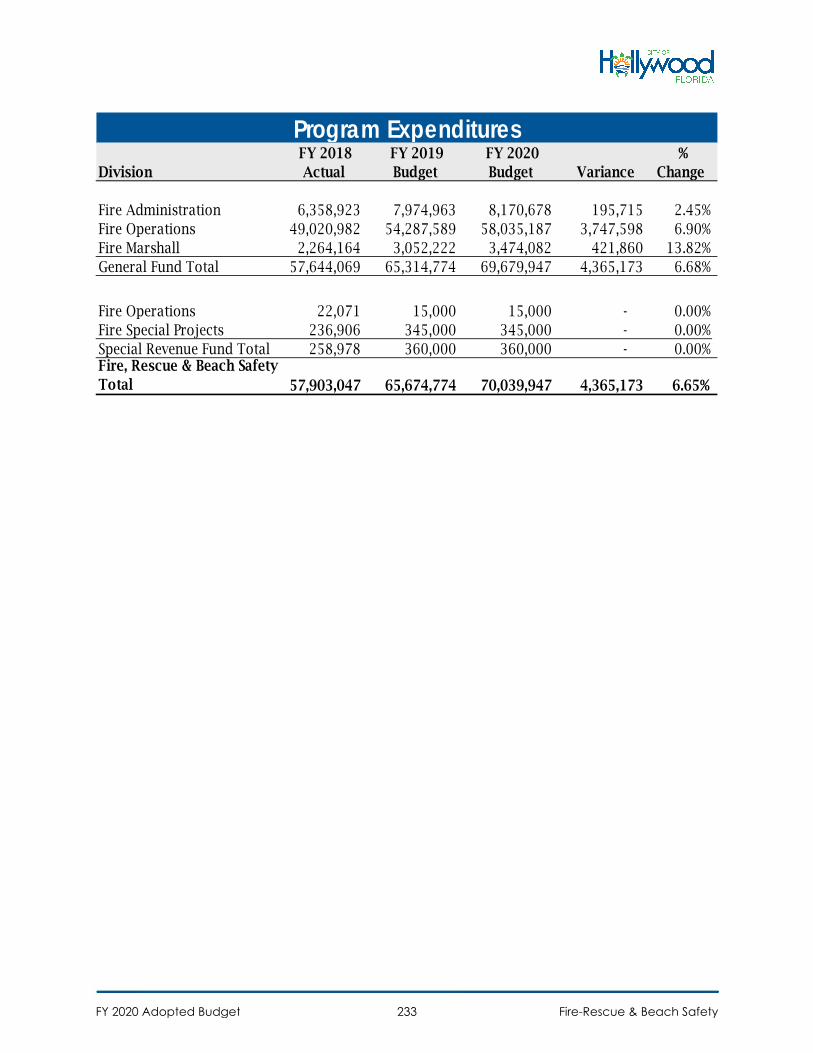
Division FY 2018
Actual FY 2019 Budget
FY 2020 Budget Variance
% Change
Fire Administration 6,358,923 7,974,963 8,170,678 195,715 2.45%Fire Operations 49,020,982 54,287,589 58,035,187 3,747,598 6.90%Fire Marshall 2,264,164 3,052,222 3,474,082 421,860 13.82%General Fund Total 57,644,069 65,314,774 69,679,947 4,365,173 6.68%
Fire Operations 22,071 15,000 15,000 - 0.00%Fire Special Projects 236,906 345,000 345,000 - 0.00%Special Revenue Fund Total 258,978 360,000 360,000 - 0.00%Fire, Rescue & Beach Safety Total 57,903,047 65,674,774 70,039,947 4,365,173 6.65%
Program Expenditures
FY 2020 Adopted Budget Fire-Rescue & Beach Safety233
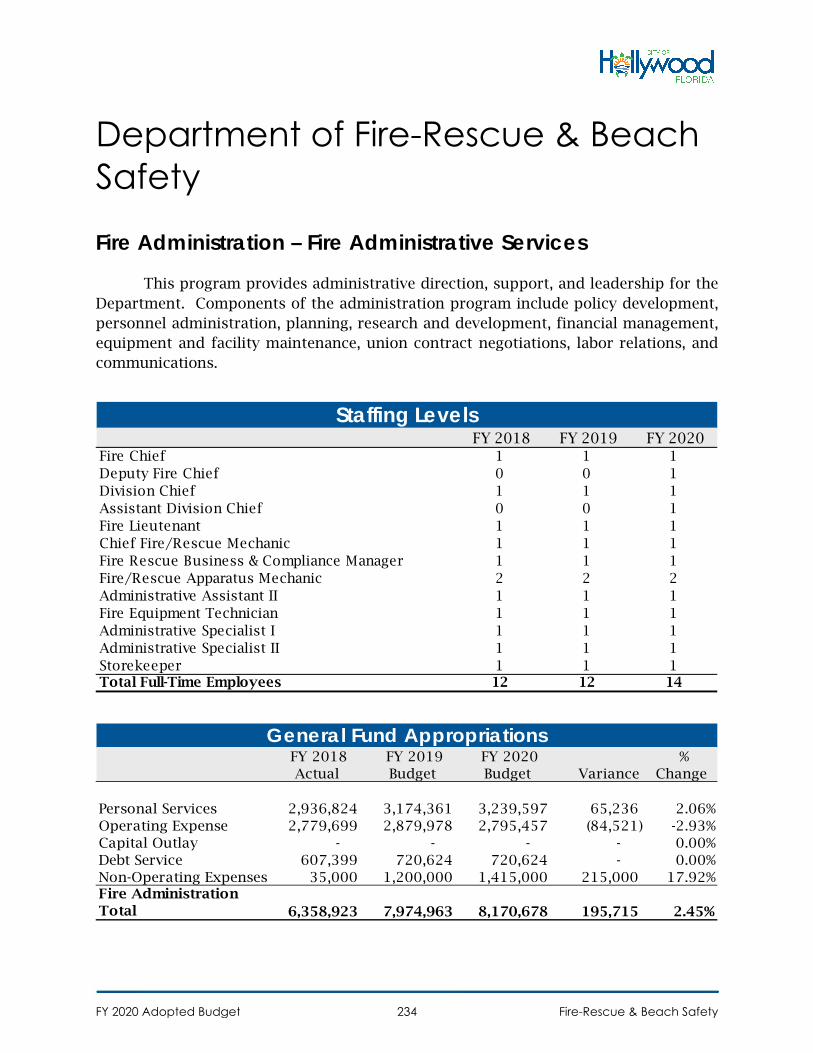
Department of Fire-Rescue & Beach Safety
Fire Administration – Fire Administrative Services
This program provides administrative direction, support, and leadership for the Department. Components of the administration program include policy development, personnel administration, planning, research and development, financial management, equipment and facility maintenance, union contract negotiations, labor relations, and communications.
FY 2018 FY 2019 FY 2020 Fire Chief 1 1 1Deputy Fire Chief 0 0 1Division Chief 1 1 1Assistant Division Chief 0 0 1Fire Lieutenant 1 1 1Chief Fire/Rescue Mechanic 1 1 1Fire Rescue Business & Compliance Manager 1 1 1Fire/Rescue Apparatus Mechanic 2 2 2Administrative Assistant II 1 1 1Fire Equipment Technician 1 1 1Administrative Specialist I 1 1 1Administrative Specialist II 1 1 1Storekeeper 1 1 1Total Full-Time Employees 12 12 14
Staffing Levels
FY 2018 Actual
FY 2019 Budget
FY 2020 Budget Variance
% Change
Personal Services 2,936,824 3,174,361 3,239,597 65,236 2.06%Operating Expense 2,779,699 2,879,978 2,795,457 (84,521) -2.93%Capital Outlay - - - - 0.00%Debt Service 607,399 720,624 720,624 - 0.00%Non-Operating Expenses 35,000 1,200,000 1,415,000 215,000 17.92%Fire Administration Total 6,358,923 7,974,963 8,170,678 195,715 2.45%
General Fund Appropriations
FY 2020 Adopted Budget Fire-Rescue & Beach Safety234
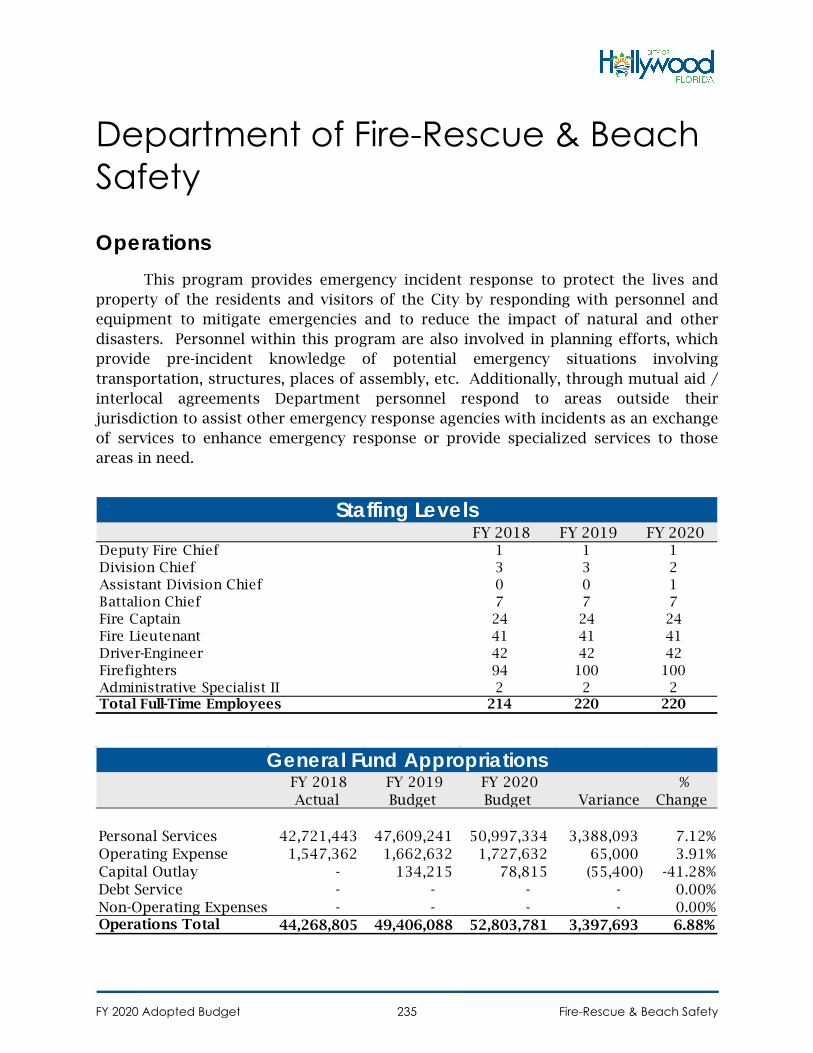
Department of Fire-Rescue & Beach Safety
Operations This program provides emergency incident response to protect the lives and
property of the residents and visitors of the City by responding with personnel and equipment to mitigate emergencies and to reduce the impact of natural and other disasters. Personnel within this program are also involved in planning efforts, which provide pre-incident knowledge of potential emergency situations involving transportation, structures, places of assembly, etc. Additionally, through mutual aid / interlocal agreements Department personnel respond to areas outside their jurisdiction to assist other emergency response agencies with incidents as an exchange of services to enhance emergency response or provide specialized services to those areas in need.
FY 2018 FY 2019 FY 2020 Deputy Fire Chief 1 1 1Division Chief 3 3 2Assistant Division Chief 0 0 1Battalion Chief 7 7 7Fire Captain 24 24 24Fire Lieutenant 41 41 41Driver-Engineer 42 42 42Firefighters 94 100 100Administrative Specialist II 2 2 2Total Full-Time Employees 214 220 220
Staffing Levels
FY 2018 Actual
FY 2019 Budget
FY 2020 Budget Variance
% Change
Personal Services 42,721,443 47,609,241 50,997,334 3,388,093 7.12%Operating Expense 1,547,362 1,662,632 1,727,632 65,000 3.91%Capital Outlay - 134,215 78,815 (55,400) -41.28%Debt Service - - - - 0.00%Non-Operating Expenses - - - - 0.00%Operations Total 44,268,805 49,406,088 52,803,781 3,397,693 6.88%
General Fund Appropriations
FY 2020 Adopted Budget Fire-Rescue & Beach Safety235
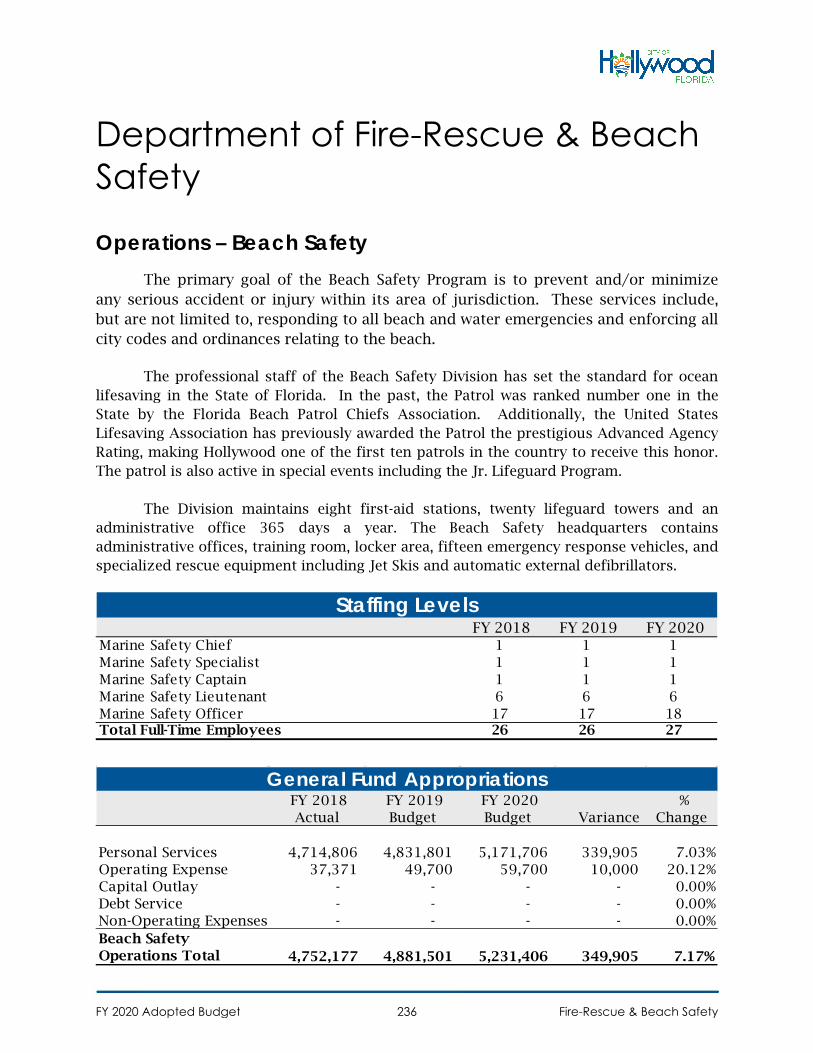
Department of Fire-Rescue & Beach Safety
Operations – Beach Safety The primary goal of the Beach Safety Program is to prevent and/or minimize
any serious accident or injury within its area of jurisdiction. These services include, but are not limited to, responding to all beach and water emergencies and enforcing all city codes and ordinances relating to the beach.
The professional staff of the Beach Safety Division has set the standard for ocean lifesaving in the State of Florida. In the past, the Patrol was ranked number one in the State by the Florida Beach Patrol Chiefs Association. Additionally, the United States Lifesaving Association has previously awarded the Patrol the prestigious Advanced Agency Rating, making Hollywood one of the first ten patrols in the country to receive this honor. The patrol is also active in special events including the Jr. Lifeguard Program.
The Division maintains eight first-aid stations, twenty lifeguard towers and an administrative office 365 days a year. The Beach Safety headquarters contains administrative offices, training room, locker area, fifteen emergency response vehicles, and specialized rescue equipment including Jet Skis and automatic external defibrillators.
FY 2018 FY 2019 FY 2020 Marine Safety Chief 1 1 1Marine Safety Specialist 1 1 1Marine Safety Captain 1 1 1Marine Safety Lieutenant 6 6 6Marine Safety Officer 17 17 18Total Full-Time Employees 26 26 27
Staffing Levels
FY 2018 Actual
FY 2019 Budget
FY 2020 Budget Variance
% Change
Personal Services 4,714,806 4,831,801 5,171,706 339,905 7.03%Operating Expense 37,371 49,700 59,700 10,000 20.12%Capital Outlay - - - - 0.00%Debt Service - - - - 0.00%Non-Operating Expenses - - - - 0.00%Beach Safety Operations Total 4,752,177 4,881,501 5,231,406 349,905 7.17%
General Fund Appropriations
FY 2020 Adopted Budget Fire-Rescue & Beach Safety236
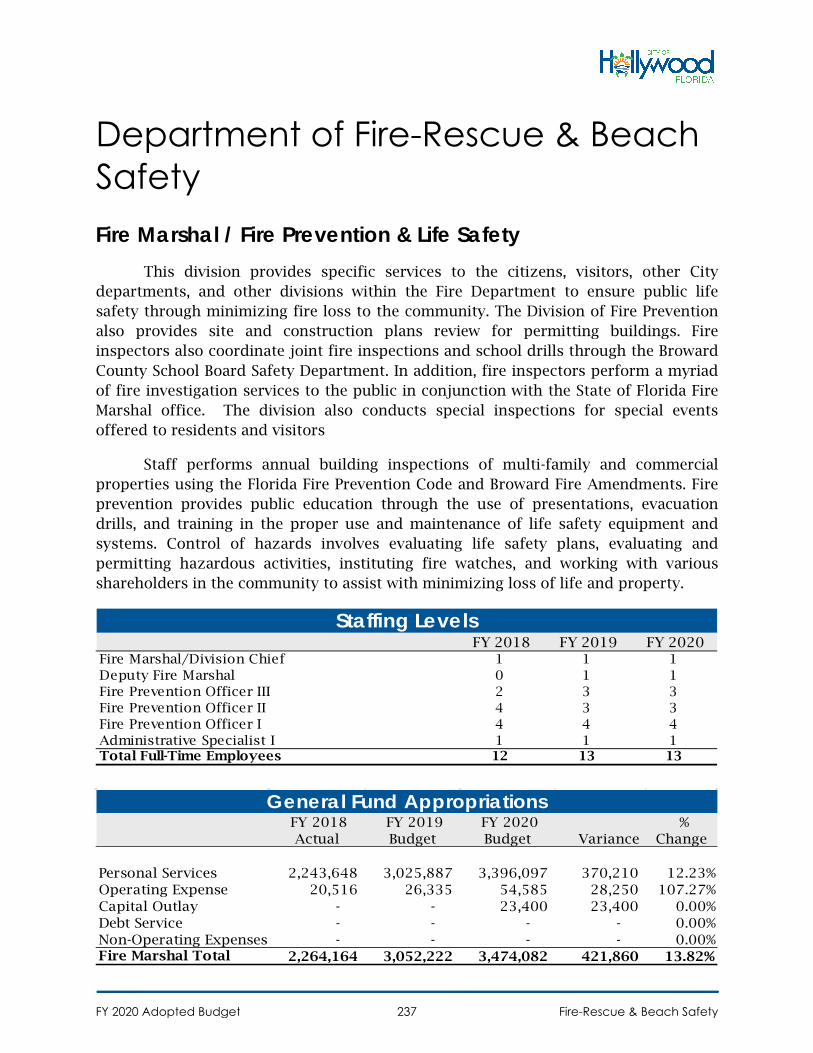
Department of Fire-Rescue & Beach Safety Fire Marshal / Fire Prevention & Life Safety
This division provides specific services to the citizens, visitors, other City departments, and other divisions within the Fire Department to ensure public life safety through minimizing fire loss to the community. The Division of Fire Prevention also provides site and construction plans review for permitting buildings. Fire inspectors also coordinate joint fire inspections and school drills through the Broward County School Board Safety Department. In addition, fire inspectors perform a myriad of fire investigation services to the public in conjunction with the State of Florida Fire Marshal office. The division also conducts special inspections for special events offered to residents and visitors
Staff performs annual building inspections of multi-family and commercial properties using the Florida Fire Prevention Code and Broward Fire Amendments. Fire prevention provides public education through the use of presentations, evacuation drills, and training in the proper use and maintenance of life safety equipment and systems. Control of hazards involves evaluating life safety plans, evaluating and permitting hazardous activities, instituting fire watches, and working with various shareholders in the community to assist with minimizing loss of life and property.
FY 2018 FY 2019 FY 2020 Fire Marshal/Division Chief 1 1 1Deputy Fire Marshal 0 1 1Fire Prevention Officer III 2 3 3Fire Prevention Officer II 4 3 3Fire Prevention Officer I 4 4 4Administrative Specialist I 1 1 1Total Full-Time Employees 12 13 13
Staffing Levels
FY 2018 Actual
FY 2019 Budget
FY 2020 Budget Variance
% Change
Personal Services 2,243,648 3,025,887 3,396,097 370,210 12.23%Operating Expense 20,516 26,335 54,585 28,250 107.27%Capital Outlay - - 23,400 23,400 0.00%Debt Service - - - - 0.00%Non-Operating Expenses - - - - 0.00%Fire Marshal Total 2,264,164 3,052,222 3,474,082 421,860 13.82%
General Fund Appropriations
FY 2020 Adopted Budget Fire-Rescue & Beach Safety237
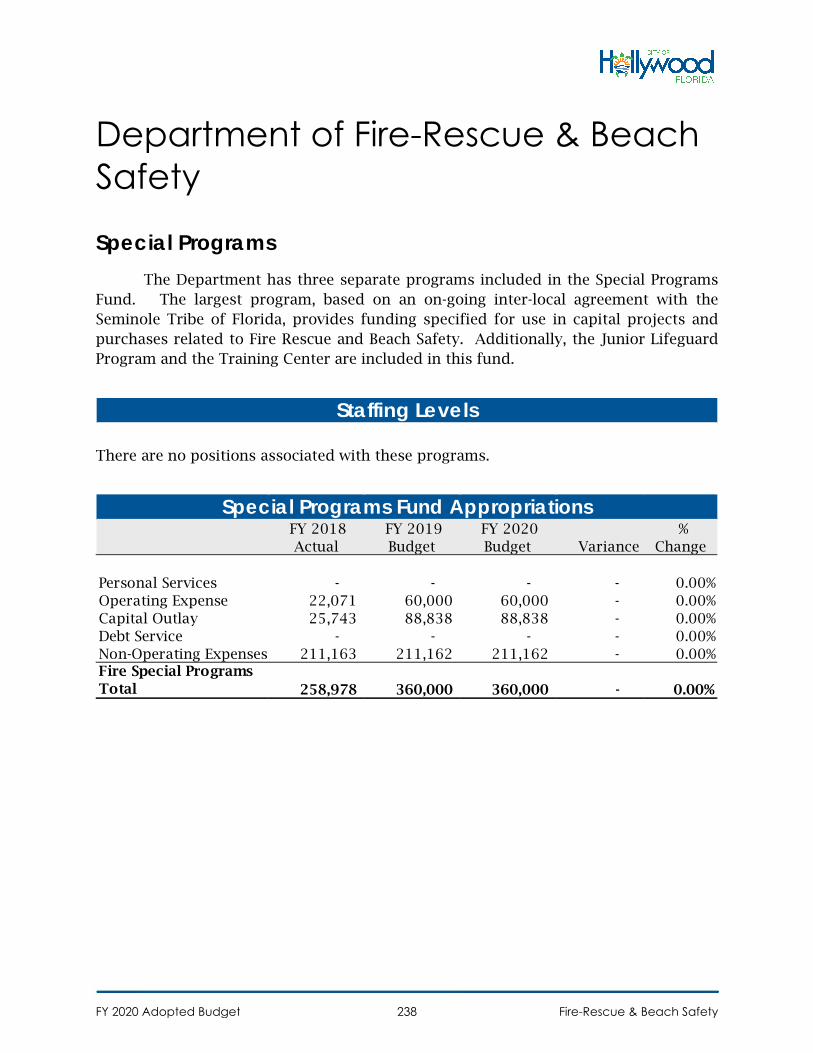
Department of Fire-Rescue & Beach Safety
Special Programs The Department has three separate programs included in the Special Programs
Fund. The largest program, based on an on-going inter-local agreement with the Seminole Tribe of Florida, provides funding specified for use in capital projects and purchases related to Fire Rescue and Beach Safety. Additionally, the Junior Lifeguard Program and the Training Center are included in this fund.
There are no positions associated with these programs.
Staffing Levels
FY 2018 Actual
FY 2019 Budget
FY 2020 Budget Variance
% Change
Personal Services - - - - 0.00%Operating Expense 22,071 60,000 60,000 - 0.00%Capital Outlay 25,743 88,838 88,838 - 0.00%Debt Service - - - - 0.00%Non-Operating Expenses 211,163 211,162 211,162 - 0.00%Fire Special Programs Total 258,978 360,000 360,000 - 0.00%
Special Programs Fund Appropriations
FY 2020 Adopted Budget Fire-Rescue & Beach Safety238
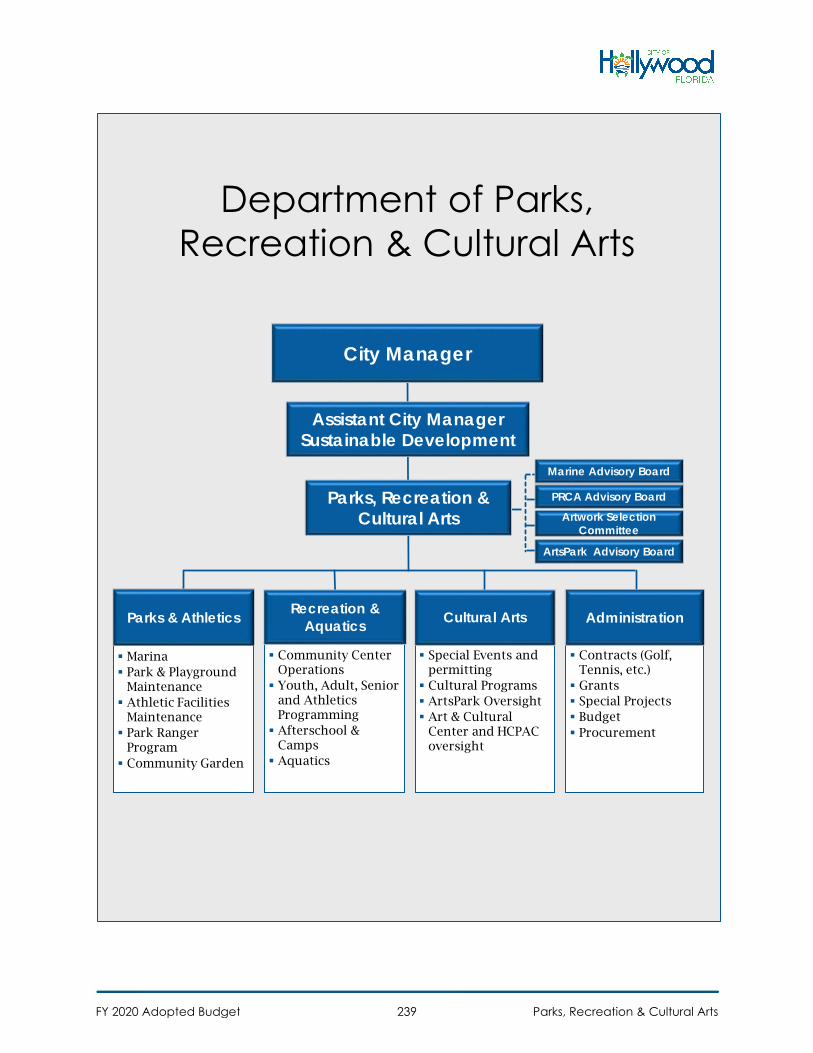
Department of Parks, Recreation & Cultural Arts
Assistant City ManagerSustainable Development
City Manager
Marina Park & Playground
Maintenance Athletic Facilities
Maintenance Park Ranger
Program Community Garden
Parks & Athletics
Special Events andpermitting Cultural Programs ArtsPark Oversight Art & Cultural
Center and HCPACoversight
Cultural Arts
Contracts (Golf,Tennis, etc.) Grants Special Projects Budget Procurement
Administration
Community CenterOperations Youth, Adult, Senior
and AthleticsProgramming Afterschool &
Camps Aquatics
Recreation & Aquatics
Parks, Recreation & Cultural Arts
PRCA Advisory Board
Artwork Selection Committee
ArtsPark Advisory Board
Marine Advisory Board
FY 2020 Adopted Budget Parks, Recreation & Cultural Arts239
Department of Parks, Recreation & Cultural Arts
Summary The Department of Parks, Recreation and Cultural Arts’ (PRCA) purpose is to
assess, develop, program, and maintain City parks and facilities. PRCA also plans, coordinates, and implements a multitude of programs and events. The Department’s philosophy is reflected in its mission statement – "To enrich the quality of life for our residents and guests through memorable recreational experiences."
PRCA is comprised of four Divisions: Parks & Athletics, Recreation & Aquatics, Cultural Arts and Administration. Other important focus areas within these divisions are Golf, Marina, Artspark, Capital Projects and Grants Management.
Departmental staff consists of 42 full-time and 98 part-time employees. Several of our staff are certified through the Florida Recreation and Parks Association and hold degrees in Parks, Recreation, Physical Education, Public Administration, or other related fields. Staff at licensed afterschool sites possess the educational requirements mandated by Broward County Childcare Licensing. The Department offers extensive staff training in a variety of areas throughout the year.
The City of Hollywood has over 785 acres of recreational and open space offering a diverse range of facilities, activities, and amenities for residents and guests. The City’s park system is comprised of 41 playgrounds, 39 parks, 11 community centers, 6 athletic facilities, 3 golf courses, 3 amphitheaters, 1 tennis center, 1 community pool, and a marina. Annual department programs offered include: fitness, dance, martial arts, camps, youth and adult sports, sailing, aquatics, senior trips and programming, clubs, computer labs, special events, cultural arts, culturally diverse programs, and marina dockage.
FY 2020 Adopted Budget Parks, Recreation & Cultural Arts240
FY 2019 Accomplishments • Selected Barth and Associates to produce a new Parks Master Plan.
• Received $232,000 funding from Community Development Block Grant (CDBG)program to purchase pool equipment, park amenities and gymnasium upgrades
• Received $582,977 from Broward County Children’s Services Council for theFY19-20 afterschool programming at Kay Gaither and McNicol CommunityCenters and summer camp programming at Kay Gaither, McNicol, Dr. MartinLuther King Jr., and Washington Park Community Centers serving over 400community youth
• Negotiated a $58,000 Safe Park grant to restore the gymnasium floors atWashington Park and Dr. Martin Luther King Jr. Community Centers
• Hosted the Department of Agriculture at Kay Gaither Community Center torecognize the site for the years of providing summer food program to thecommunity
• Hosted Cardboard Boat Race at Marina Boat Ramps in October 2018 after a twoyear hiatus
• Hosted youth flag football practices and games for 50 children at the HollywoodPolice Athletic League in spring 2019 (Feb – May) after a two year hiatus
• Staff successfully completed the National Recreation and Park AssociationCertified Playground Safety Inspector Exam
• Partnered with MIAMI Association of REALTORS® and conducted a volunteerproject at Oak Lake Park Community Garden site. Approximately 20 volunteersremoved weeds and installed weed barrier and stakes on July 10, 2019
• Partnered with Kiwanis Club of Hollywood to steward and install first of eightfree neighborhood lending library cabinets at Kiwanis Park
• Completed 573 youth sports volunteer background checks FY2019 (Oct – July),which is a 43% increase over the same time period in FY 2018
• Produced the Solar Blast concert series featuring six live tribute bands. Concertswere presented on Saturday evenings with each averaging an attendance of 1,000.Featured “tribute” artist included: Billy Joel, Tina Turner, Aerosmith, Katy Perry,Styx & Journey and the Beatles
• Partnered with the CRA and Rhythm Foundation for a multi-year contract bringinginternational concerts (4x year) to the ArtsPark. Through this agreement, theArtsPark hosted a minimum of 5,000 attendees for each concert the RhythmFoundation scheduled.
• Added a social media presence for the ArtsPark by using Facebook and Instagram
• Special Event application and other forms moved from a PDF format to ADAcompliant format. Special Event applications also made available to fill out andsubmit online
FY 2020 Adopted Budget Parks, Recreation & Cultural Arts241
• Staff attended drone certification classes so that future events can be filmed anddocumented
• Upgraded all ArtsPark lighting to LED and installed 10 new LED lighting fixturesin ArtsPark playground
• Candy Cane Parade waste and post-parade clean up reduced. This wasaccomplished by having parade participants distribute candy by hand toattendees instead of throwing candy from floats. This change significantlyreduced the amount of waste on the Broadwalk
• Increased family involvement nights to three per year for after care sites
• Hosted events at our various Community Centers such as:
o MLK: MLK Fun Day, Workshop for Mothers and their Daughters on SelfLove, Senior Mother’s Day Karaoke, Teen Games Night, Senior JewelryMaking, Senior Fitness/ Chair Exercise, Comic Book Day.
o David Park: Free Throw Contest, One Mic Night, Quit Smoking, SummerFamily Fun Night.
o FLMPC: Musical Percussion Experience Program, Art of Weaving class.
o McNicol: Painting with Faith, Ginger Bread House Holiday Event, FamilyFeud Family Game.
o WP: Basketball skills improvement program averaged 10 kids from 5-12year olds in the spring. Soccer program has averaged 16 kids.
o KG: Men’s Mentoring program was started.
o BH: Valentine’s Day Dance had 90 participants. Brain Stimulation Programfor the elderly averaged 15 participants. Spanish Theater Drama Showaveraged 15 participants while drawing an audience of 40 people.
• 5% increase in Water Safety Educational Courses provided to summer camps.
• 50% increase in Open Swim Camps served.
• 50% increase in Party Pool Rentals.
FY 2020 Goals • Partner with local organizations to steward and install six free neighborhood
lending library cabinets at community centers and other City facilities• Schedule four in-service training sessions for Athletic Maintenance staff. Topics
may include but are not limited to: landscaping, defensive driving, first aid, safeequipment and power tool operation, proper chemical application, sustainability,computer skills, and plant identification
• Schedule three in-service training sessions for Park Rangers. Topics mayinclude: patrolling, interaction with special populations, defensive driving, CPR/AED, first aid, cultural sensitivity, time management, and business writing
FY 2020 Adopted Budget Parks, Recreation & Cultural Arts242
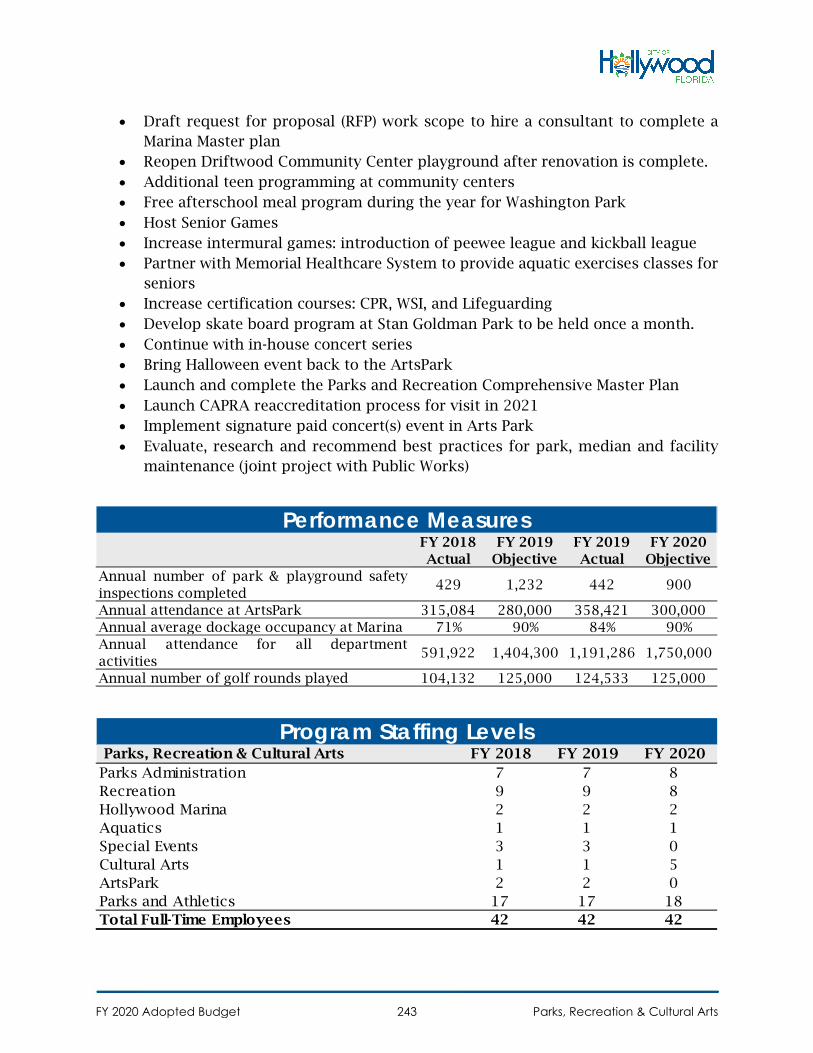
• Draft request for proposal (RFP) work scope to hire a consultant to complete aMarina Master plan
• Reopen Driftwood Community Center playground after renovation is complete.• Additional teen programming at community centers• Free afterschool meal program during the year for Washington Park• Host Senior Games• Increase intermural games: introduction of peewee league and kickball league• Partner with Memorial Healthcare System to provide aquatic exercises classes for
seniors• Increase certification courses: CPR, WSI, and Lifeguarding• Develop skate board program at Stan Goldman Park to be held once a month.• Continue with in-house concert series• Bring Halloween event back to the ArtsPark• Launch and complete the Parks and Recreation Comprehensive Master Plan• Launch CAPRA reaccreditation process for visit in 2021• Implement signature paid concert(s) event in Arts Park• Evaluate, research and recommend best practices for park, median and facility
maintenance (joint project with Public Works)
FY 2018 Actual
FY 2019 Objective
FY 2019 Actual
FY 2020 Objective
Annual number of park & playground safetyinspections completed
429 1,232 442 900
Annual attendance at ArtsPark 315,084 280,000 358,421 300,000Annual average dockage occupancy at Marina 71% 90% 84% 90%Annual attendance for all departmentactivities
591,922 1,404,300 1,191,286 1,750,000
Annual number of golf rounds played 104,132 125,000 124,533 125,000
Performance Measures
Parks, Recreation & Cultural Arts FY 2018 FY 2019 FY 2020 Parks Administration 7 7 8Recreation 9 9 8Hollywood Marina 2 2 2Aquatics 1 1 1Special Events 3 3 0Cultural Arts 1 1 5ArtsPark 2 2 0Parks and Athletics 17 17 18Total Full-Time Employees 42 42 42
Program Staffing Levels
FY 2020 Adopted Budget Parks, Recreation & Cultural Arts243
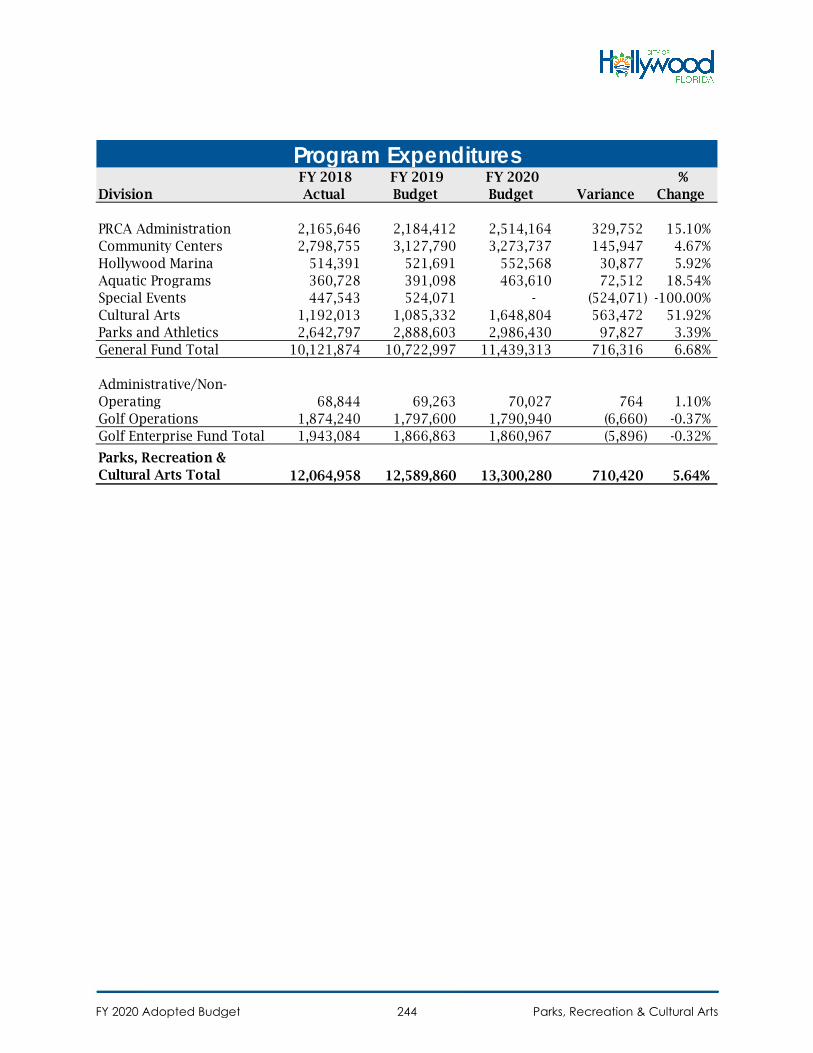
Division FY 2018
Actual FY 2019 Budget
FY 2020 Budget Variance
% Change
PRCA Administration 2,165,646 2,184,412 2,514,164 329,752 15.10%Community Centers 2,798,755 3,127,790 3,273,737 145,947 4.67%Hollywood Marina 514,391 521,691 552,568 30,877 5.92%Aquatic Programs 360,728 391,098 463,610 72,512 18.54%Special Events 447,543 524,071 - (524,071) -100.00%Cultural Arts 1,192,013 1,085,332 1,648,804 563,472 51.92%Parks and Athletics 2,642,797 2,888,603 2,986,430 97,827 3.39%General Fund Total 10,121,874 10,722,997 11,439,313 716,316 6.68%
Administrative/Non-Operating 68,844 69,263 70,027 764 1.10%Golf Operations 1,874,240 1,797,600 1,790,940 (6,660) -0.37%Golf Enterprise Fund Total 1,943,084 1,866,863 1,860,967 (5,896) -0.32%
Parks, Recreation & Cultural Arts Total 12,064,958 12,589,860 13,300,280 710,420 5.64%
Program Expenditures
FY 2020 Adopted Budget Parks, Recreation & Cultural Arts244
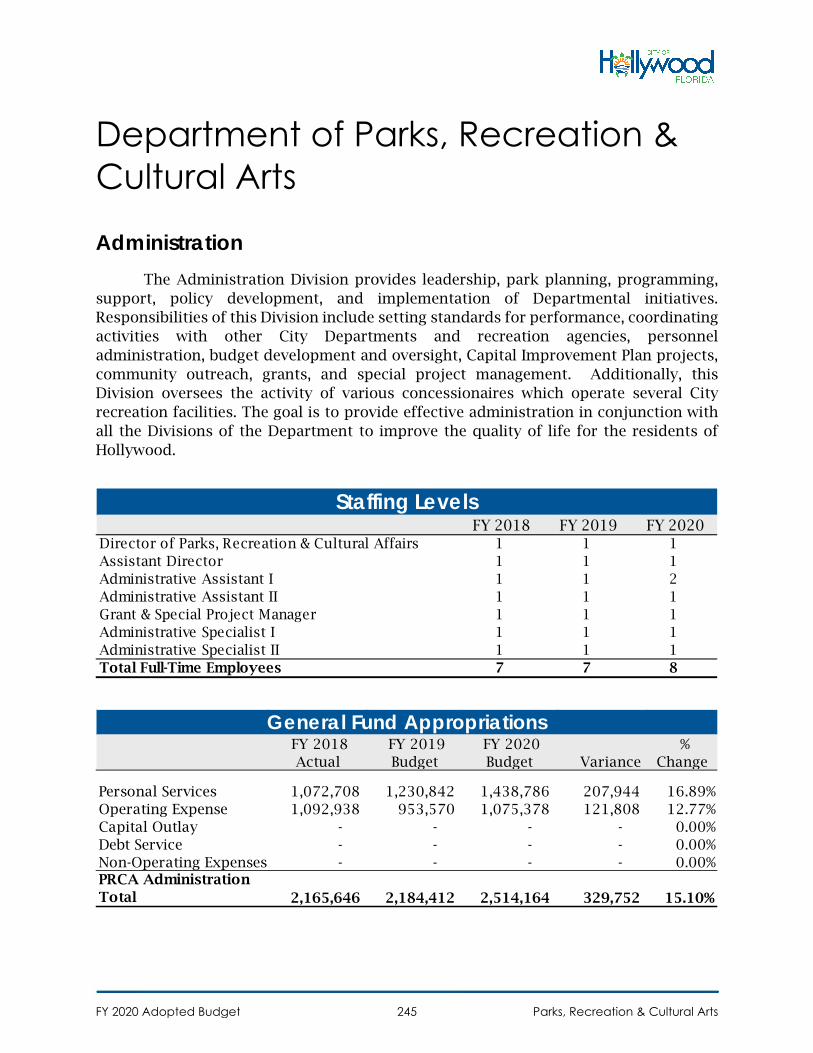
Department of Parks, Recreation & Cultural Arts
Administration The Administration Division provides leadership, park planning, programming,
support, policy development, and implementation of Departmental initiatives. Responsibilities of this Division include setting standards for performance, coordinating activities with other City Departments and recreation agencies, personnel administration, budget development and oversight, Capital Improvement Plan projects, community outreach, grants, and special project management. Additionally, this Division oversees the activity of various concessionaires which operate several City recreation facilities. The goal is to provide effective administration in conjunction with all the Divisions of the Department to improve the quality of life for the residents of Hollywood.
FY 2018 FY 2019 FY 2020 Director of Parks, Recreation & Cultural Affairs 1 1 1Assistant Director 1 1 1Administrative Assistant I 1 1 2Administrative Assistant II 1 1 1Grant & Special Project Manager 1 1 1Administrative Specialist I 1 1 1Administrative Specialist II 1 1 1Total Full-Time Employees 7 7 8
Staffing Levels
FY 2018 Actual
FY 2019 Budget
FY 2020 Budget Variance
% Change
Personal Services 1,072,708 1,230,842 1,438,786 207,944 16.89%Operating Expense 1,092,938 953,570 1,075,378 121,808 12.77%Capital Outlay - - - - 0.00%Debt Service - - - - 0.00%Non-Operating Expenses - - - - 0.00%PRCA Administration Total 2,165,646 2,184,412 2,514,164 329,752 15.10%
General Fund Appropriations
FY 2020 Adopted Budget Parks, Recreation & Cultural Arts245
Department of Parks, Recreation & Cultural Arts
Recreation & Aquatics - Recreation The Recreation Division operates Community Center Operations, Youth & Adult
Programming, Afterschool, Camps, Senior Health & Wellness and Aquatics.
The Division coordinates community center-based recreation programs and events at eleven (11) community centers. Each community center provides a variety of recreation opportunities based on the needs of our diverse neighborhoods. These programs offer children a chance to learn life lessons, experience success early, and to dream big. A strong emphasis is placed on youth-oriented programs such as:
• afterschool programs,• tutorial sessions,• camps,• youth sports,• teen programs,• cultural arts, and• enrichment programs such as martial arts, dance and baton.
Diverse adult/senior opportunities provide a chance for adults/seniors toconnect, form lifetime friendships, and remain active. The programs include:
• fitness activities,• cultural programs,• computer classes,• volunteer opportunities,• trips, and life-long learning activities.
The Division also provides activities through partnerships with civic associations,non-profit organizations, the Broward County School Board, Children Services Council, and numerous community groups. Additionally, the Division has entered into an agreement with Sunshine Child Care Programs to provide aftercare and camps at non-grant funded community centers.
FY 2020 Adopted Budget Parks, Recreation & Cultural Arts246
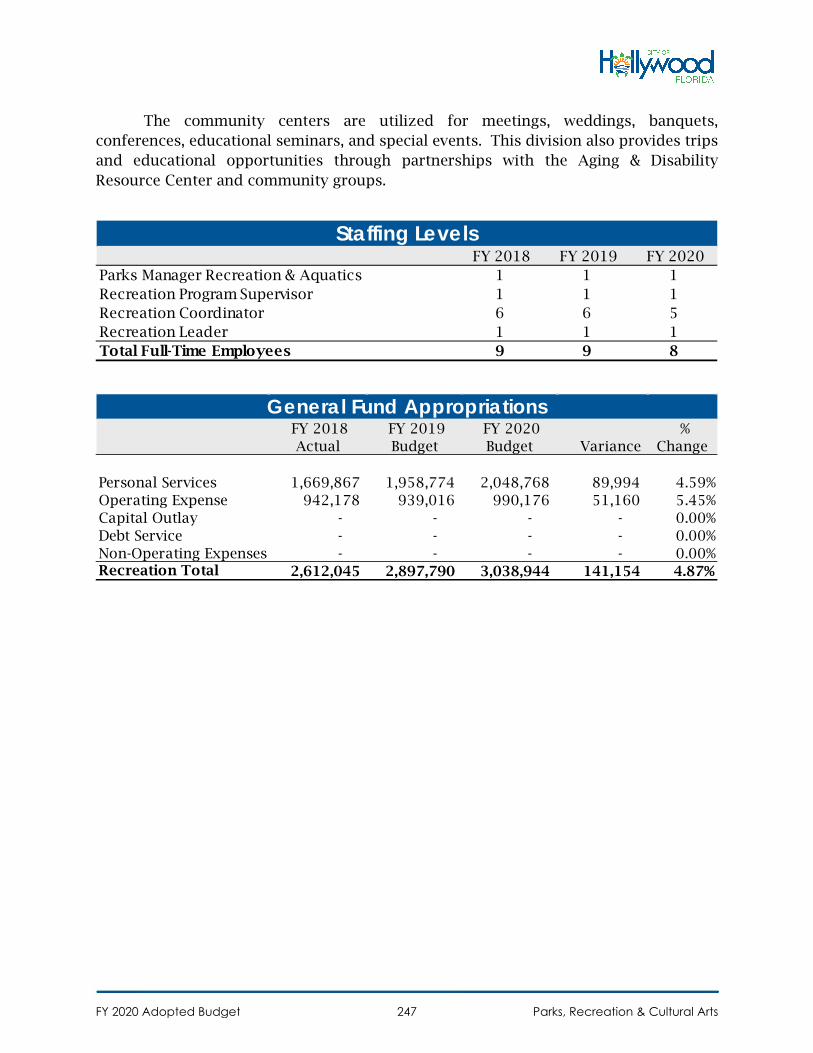
The community centers are utilized for meetings, weddings, banquets, conferences, educational seminars, and special events. This division also provides trips and educational opportunities through partnerships with the Aging & Disability Resource Center and community groups.
FY 2018 FY 2019 FY 2020 Parks Manager Recreation & Aquatics 1 1 1Recreation Program Supervisor 1 1 1Recreation Coordinator 6 6 5Recreation Leader 1 1 1Total Full-Time Employees 9 9 8
Staffing Levels
FY 2018 Actual
FY 2019 Budget
FY 2020 Budget Variance
% Change
Personal Services 1,669,867 1,958,774 2,048,768 89,994 4.59%Operating Expense 942,178 939,016 990,176 51,160 5.45%Capital Outlay - - - - 0.00%Debt Service - - - - 0.00%Non-Operating Expenses - - - - 0.00%Recreation Total 2,612,045 2,897,790 3,038,944 141,154 4.87%
General Fund Appropriations
FY 2020 Adopted Budget Parks, Recreation & Cultural Arts247
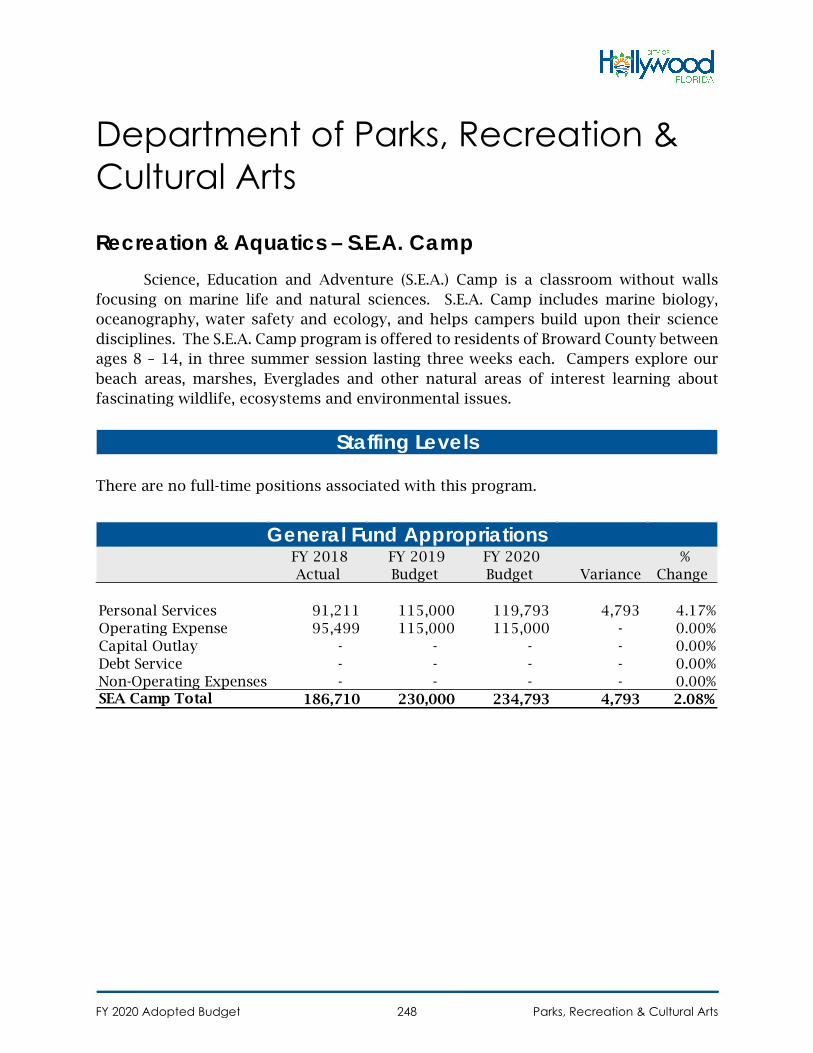
Department of Parks, Recreation & Cultural Arts
Recreation & Aquatics – S.E.A. Camp Science, Education and Adventure (S.E.A.) Camp is a classroom without walls
focusing on marine life and natural sciences. S.E.A. Camp includes marine biology, oceanography, water safety and ecology, and helps campers build upon their science disciplines. The S.E.A. Camp program is offered to residents of Broward County between ages 8 – 14, in three summer session lasting three weeks each. Campers explore our beach areas, marshes, Everglades and other natural areas of interest learning about fascinating wildlife, ecosystems and environmental issues.
There are no full-time positions associated with this program.
Staffing Levels
FY 2018 Actual
FY 2019 Budget
FY 2020 Budget Variance
% Change
Personal Services 91,211 115,000 119,793 4,793 4.17%Operating Expense 95,499 115,000 115,000 - 0.00%Capital Outlay - - - - 0.00%Debt Service - - - - 0.00%Non-Operating Expenses - - - - 0.00%SEA Camp Total 186,710 230,000 234,793 4,793 2.08%
General Fund Appropriations
FY 2020 Adopted Budget Parks, Recreation & Cultural Arts248
Department of Parks, Recreation & Cultural Arts
Recreation & Aquatics – Aquatics The Aquatic Division offers water based programs for participants of all ages and
abilities throughout the year at Driftwood Community Pool. Our core beliefs reside on promoting water safety and developing participant’s swimming ability through American Red Cross curriculums. Aquatic programs and courses are represented in five categories of function: recreational swim, learn-to-swim, competitive swim, water fitness, and professional training. The following is a list of programs being offered:
• Open Swim- (Recreational)• Learn-to-Swim (American Red Cross)
o Swim Lessonso Private Adaptive Swim Lessons
• Competitive Swim Team• Water Fitness Programs:
o Aqua Zumbao Water Arthritiso Aqua Aerobicso Master Swimming- (lap swimming)
• Professional Training (American Red Cross Certifications)o Lifeguard Courseo Water Safety Instructor Courseo Community & Professional CPR/AED Courses
The Aquatic Division also works in tandem with Swim Central, which is a coordinating agency for water-safety instruction and drowning awareness in Broward County. Broward County children receive water-safety instruction and education through public and private schools, day-care centers, and summer camps. Through this cooperative agreement with the Broward County School Board and Swim Central, Driftwood Community Pool services learn-to-swim, water safety, and physical education programming for Driftwood Middle School, Driftwood Elementary, and Sheridan Park Elementary. The Aquatics Division also extends the Swim Central program on a need and seasonal basis at the Quest Center, Attucks Middle School, McArthur High School, and Apollo Middle School. The Aquatics division is committed to fostering healthy lifestyles by enhancing enjoyment in a safe water environment.
FY 2020 Adopted Budget Parks, Recreation & Cultural Arts249
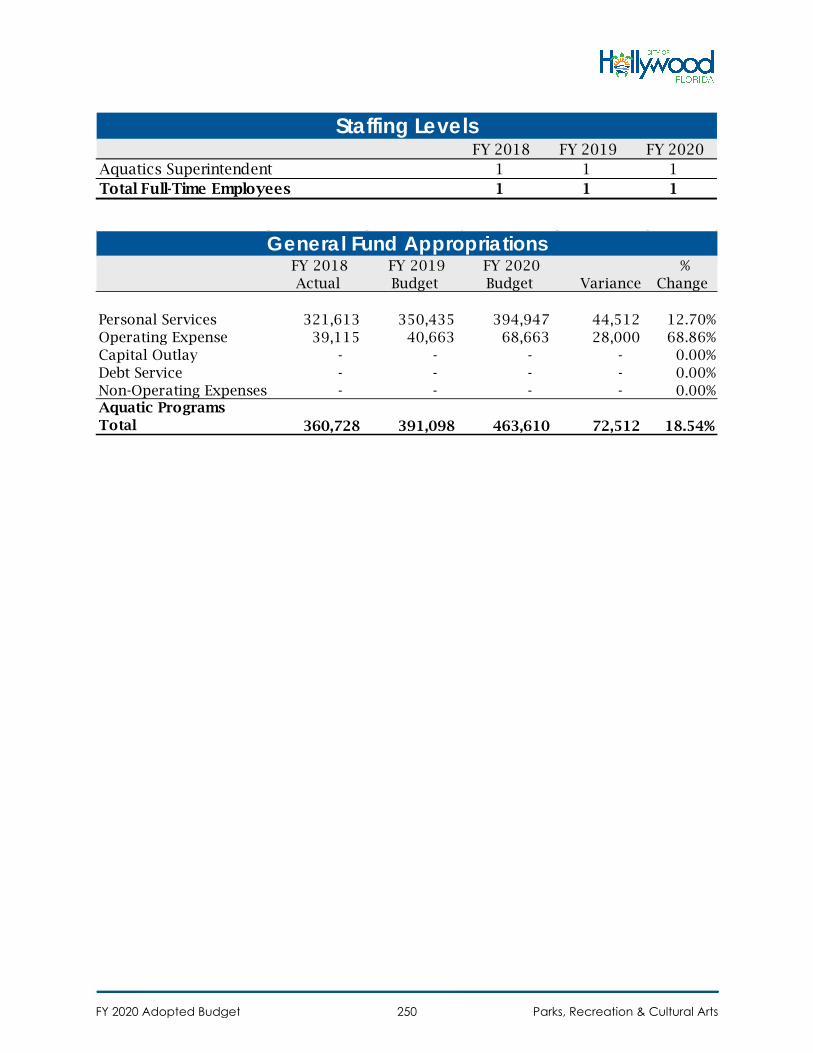
FY 2018 FY 2019 FY 2020 Aquatics Superintendent 1 1 1Total Full-Time Employees 1 1 1
Staffing Levels
FY 2018 Actual
FY 2019 Budget
FY 2020 Budget Variance
% Change
Personal Services 321,613 350,435 394,947 44,512 12.70%Operating Expense 39,115 40,663 68,663 28,000 68.86%Capital Outlay - - - - 0.00%Debt Service - - - - 0.00%Non-Operating Expenses - - - - 0.00%Aquatic Programs Total 360,728 391,098 463,610 72,512 18.54%
General Fund Appropriations
FY 2020 Adopted Budget Parks, Recreation & Cultural Arts250
Department of Parks, Recreation & Cultural Arts
Cultural Arts – Special EventsThe Special Events Division produces signature events that are currently funded
by the Hollywood Community Redevelopment Agency including the Candy Cane Parade, 4th of July Star Spangled Spectacular Celebration and in part, the St. Patrick’s Day & Festival in partnership with the Hibernians of Hollywood. Staff continues to work toward the establishment of sponsor opportunities to facilitate events that have been placed on hold.
Special Events reviews and permits beach weddings, Mobile Food Vending applications and, in concert with stakeholder city departments, Special Events operates as the permitting agency for events by private promoters and non-profit groups. Activities including walks /runs, beach volleyball, footvolley and stand up paddle boarding, Hollywood’s community has many opportunities to participate in health lifestyle activities. The current Beach Resort Food and Beverage Pilot Program applications are also reviewed and permitted through Special Events.
Effective FY 2020, Special Events staff and programming have been transferred to various other programs within the Department.
FY 2018 FY 2019 FY 2020 Program & Events Manager 1 1 0Special Events Coordinator 1 1 0Technical Coordinator 1 1 0Total Full-Time Employees 3 3 0
Staffing Levels
FY 2018 Actual
FY 2019 Budget
FY 2020 Budget Variance
% Change
Personal Services 420,758 477,904 - (477,904) -100.00%Operating Expense 26,785 46,167 - (46,167) -100.00%Capital Outlay - - - - 0.00%Debt Service - - - - 0.00%Non-Operating Expenses - - - - 0.00%Special Events Total 447,543 524,071 - (524,071) -100.00%
General Fund Appropriations
FY 2020 Adopted Budget Parks, Recreation & Cultural Arts251
Department of Parks, Recreation & Cultural Arts
Cultural ArtsCultural Arts staff supports citywide cultural programming by providing
technical assistance to special events, concerts and other year-round, programming at the ArtsPark and Boulevard Heights Amphitheater. Technical assistance to all city departments is provided when requested for groundbreakings, ribbon cutting, meetings, and other ceremonies. In addition, funding is provided to the Art & Culture Center for management of the Hollywood Central Performing Arts Center, and to assist in the implementation of programs that are affordable and accessible to the entire community.
FY 2018 FY 2019 FY 2020 ArtsPark & Cult. Affairs Division Administrator 1 1 1Recreation Coordinator 0 0 1Technical Coordinator 0 0 1Special Events Coordinator 0 0 1Program & Events Manager 0 0 1Total Full-Time Employees 1 1 5
Staffing Levels
FY 2018 Actual
FY 2019 Budget
FY 2020 Budget Variance
% Change
Personal Services 172,532 175,905 909,867 733,962 417.25%Operating Expense 182,586 183,301 331,628 148,327 80.92%Capital Outlay - - - - 0.00%Debt Service - - - - 0.00%Non-Operating Expenses - - - - 0.00%Cultural Arts Total 355,118 359,206 1,241,495 882,289 245.62%
General Fund Appropriations
FY 2020 Adopted Budget Parks, Recreation & Cultural Arts252
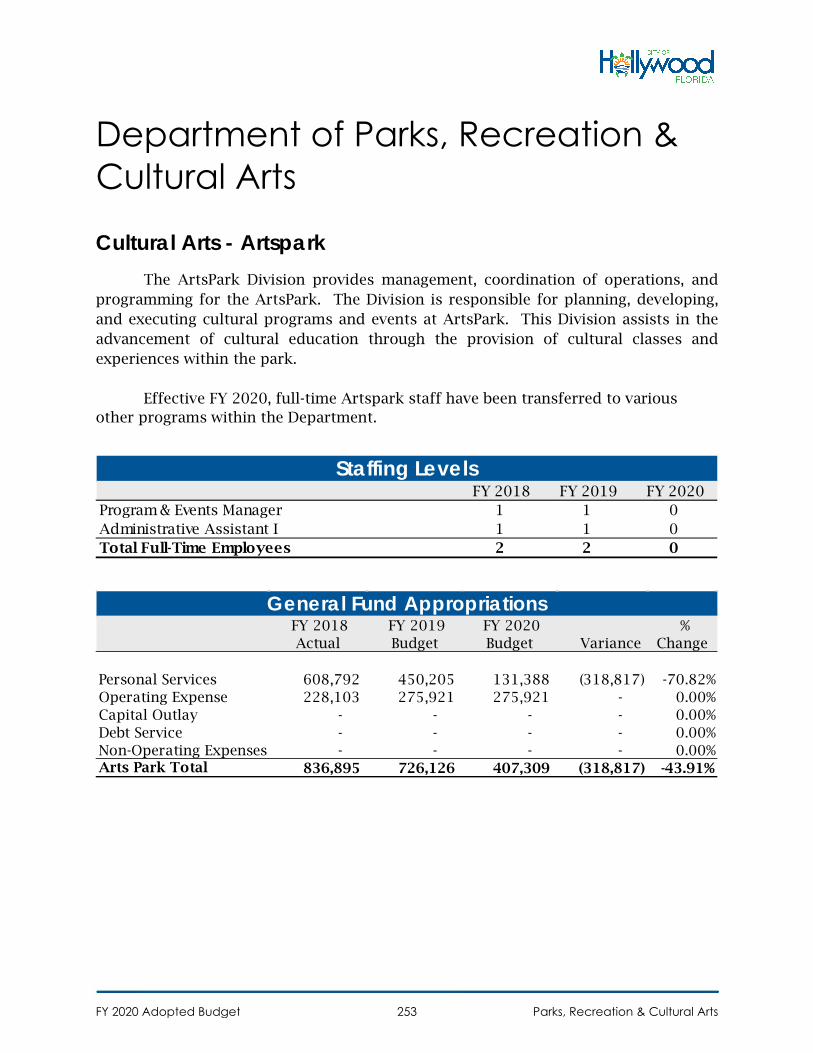
Department of Parks, Recreation & Cultural Arts
Cultural Arts - ArtsparkThe ArtsPark Division provides management, coordination of operations, and
programming for the ArtsPark. The Division is responsible for planning, developing, and executing cultural programs and events at ArtsPark. This Division assists in the advancement of cultural education through the provision of cultural classes and experiences within the park.
Effective FY 2020, full-time Artspark staff have been transferred to various other programs within the Department.
FY 2018 FY 2019 FY 2020 Program & Events Manager 1 1 0Administrative Assistant I 1 1 0Total Full-Time Employees 2 2 0
Staffing Levels
FY 2018 Actual
FY 2019 Budget
FY 2020 Budget Variance
% Change
Personal Services 608,792 450,205 131,388 (318,817) -70.82%Operating Expense 228,103 275,921 275,921 - 0.00%Capital Outlay - - - - 0.00%Debt Service - - - - 0.00%Non-Operating Expenses - - - - 0.00%Arts Park Total 836,895 726,126 407,309 (318,817) -43.91%
General Fund Appropriations
FY 2020 Adopted Budget Parks, Recreation & Cultural Arts253
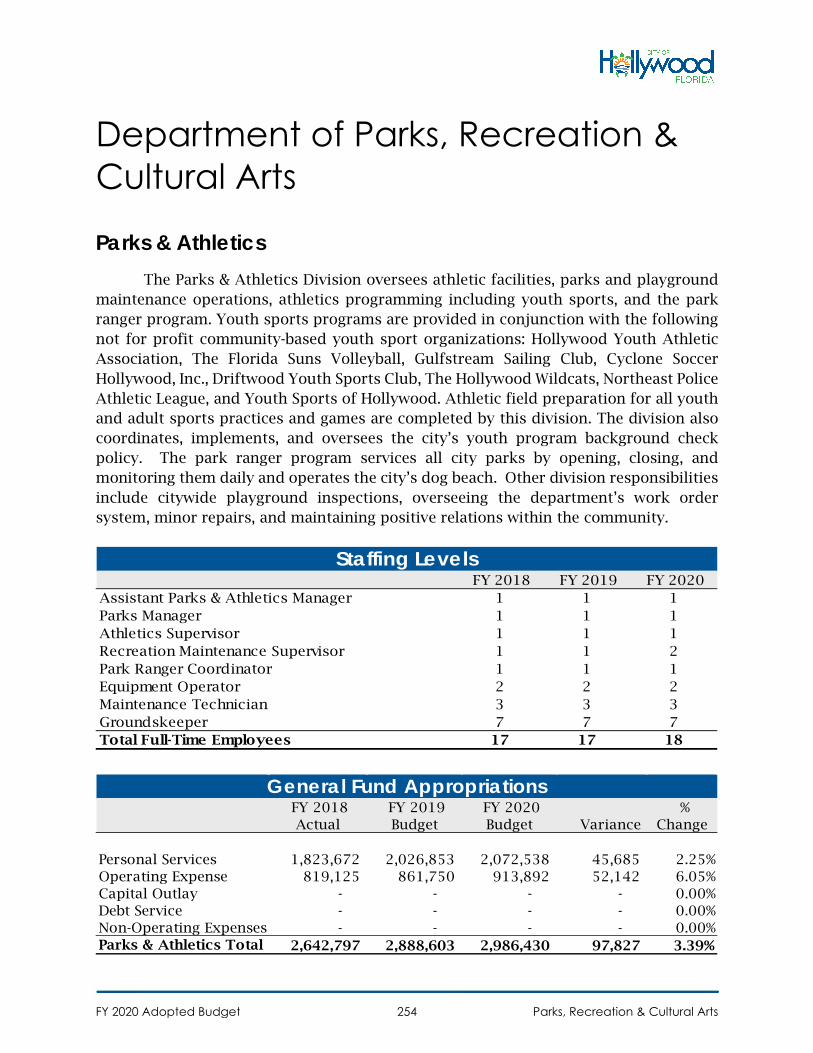
Department of Parks, Recreation & Cultural Arts
Parks & AthleticsThe Parks & Athletics Division oversees athletic facilities, parks and playground
maintenance operations, athletics programming including youth sports, and the park ranger program. Youth sports programs are provided in conjunction with the following not for profit community-based youth sport organizations: Hollywood Youth Athletic Association, The Florida Suns Volleyball, Gulfstream Sailing Club, Cyclone Soccer Hollywood, Inc., Driftwood Youth Sports Club, The Hollywood Wildcats, Northeast Police Athletic League, and Youth Sports of Hollywood. Athletic field preparation for all youth and adult sports practices and games are completed by this division. The division also coordinates, implements, and oversees the city’s youth program background check policy. The park ranger program services all city parks by opening, closing, and monitoring them daily and operates the city’s dog beach. Other division responsibilities include citywide playground inspections, overseeing the department’s work order system, minor repairs, and maintaining positive relations within the community.
FY 2018 FY 2019 FY 2020 Assistant Parks & Athletics Manager 1 1 1Parks Manager 1 1 1Athletics Supervisor 1 1 1Recreation Maintenance Supervisor 1 1 2Park Ranger Coordinator 1 1 1Equipment Operator 2 2 2Maintenance Technician 3 3 3Groundskeeper 7 7 7Total Full-Time Employees 17 17 18
Staffing Levels
FY 2018 Actual
FY 2019 Budget
FY 2020 Budget Variance
% Change
Personal Services 1,823,672 2,026,853 2,072,538 45,685 2.25%Operating Expense 819,125 861,750 913,892 52,142 6.05%Capital Outlay - - - - 0.00%Debt Service - - - - 0.00%Non-Operating Expenses - - - - 0.00%Parks & Athletics Total 2,642,797 2,888,603 2,986,430 97,827 3.39%
General Fund Appropriations
FY 2020 Adopted Budget Parks, Recreation & Cultural Arts254
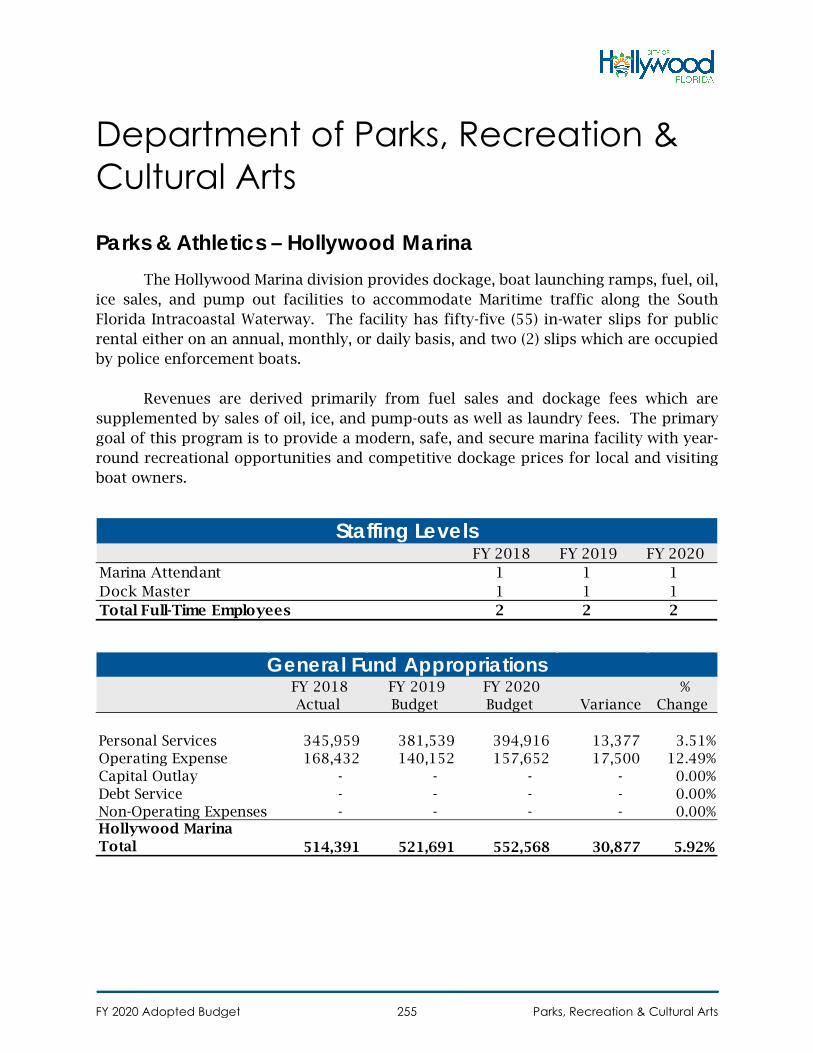
Department of Parks, Recreation & Cultural Arts
Parks & Athletics – Hollywood MarinaThe Hollywood Marina division provides dockage, boat launching ramps, fuel, oil,
ice sales, and pump out facilities to accommodate Maritime traffic along the South Florida Intracoastal Waterway. The facility has fifty-five (55) in-water slips for public rental either on an annual, monthly, or daily basis, and two (2) slips which are occupied by police enforcement boats.
Revenues are derived primarily from fuel sales and dockage fees which are supplemented by sales of oil, ice, and pump-outs as well as laundry fees. The primary goal of this program is to provide a modern, safe, and secure marina facility with year-round recreational opportunities and competitive dockage prices for local and visiting boat owners.
FY 2018 FY 2019 FY 2020 Marina Attendant 1 1 1Dock Master 1 1 1Total Full-Time Employees 2 2 2
Staffing Levels
FY 2018 Actual
FY 2019 Budget
FY 2020 Budget Variance
% Change
Personal Services 345,959 381,539 394,916 13,377 3.51%Operating Expense 168,432 140,152 157,652 17,500 12.49%Capital Outlay - - - - 0.00%Debt Service - - - - 0.00%Non-Operating Expenses - - - - 0.00%Hollywood Marina Total 514,391 521,691 552,568 30,877 5.92%
General Fund Appropriations
FY 2020 Adopted Budget Parks, Recreation & Cultural Arts255
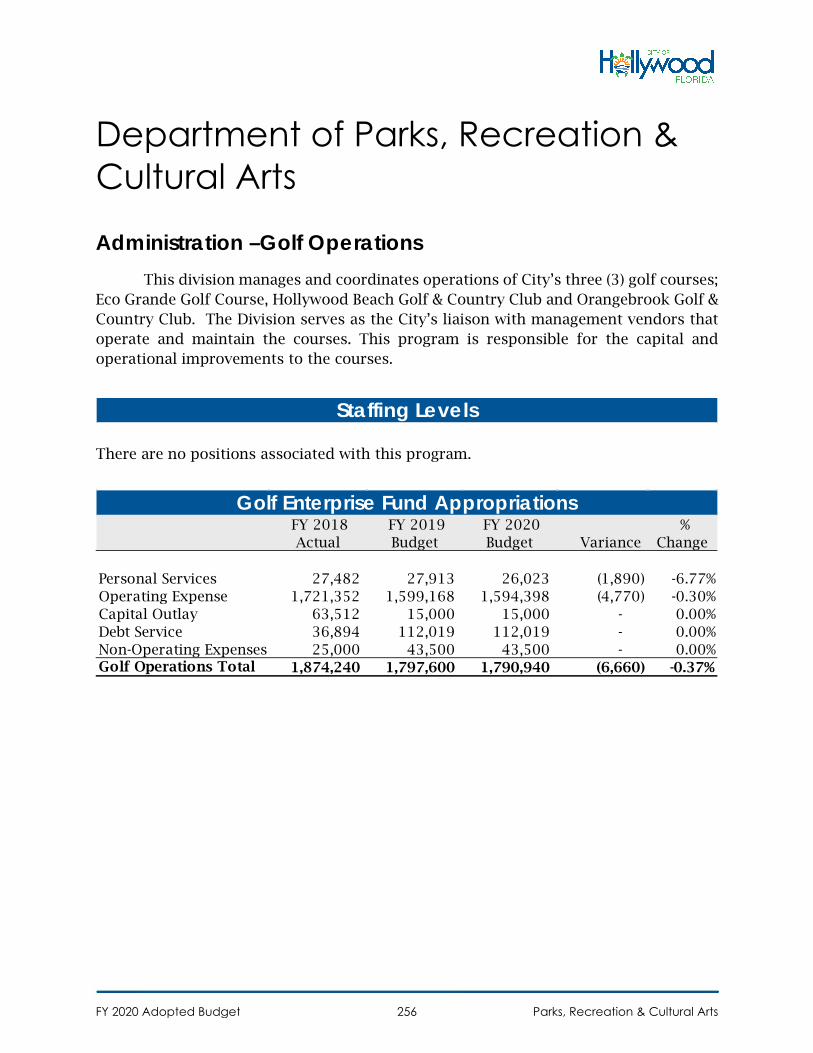
Department of Parks, Recreation & Cultural Arts
Administration –Golf OperationsThis division manages and coordinates operations of City’s three (3) golf courses;
Eco Grande Golf Course, Hollywood Beach Golf & Country Club and Orangebrook Golf & Country Club. The Division serves as the City’s liaison with management vendors that operate and maintain the courses. This program is responsible for the capital and operational improvements to the courses.
There are no positions associated with this program.
Staffing Levels
FY 2018 Actual
FY 2019 Budget
FY 2020 Budget Variance
% Change
Personal Services 27,482 27,913 26,023 (1,890) -6.77%Operating Expense 1,721,352 1,599,168 1,594,398 (4,770) -0.30%Capital Outlay 63,512 15,000 15,000 - 0.00%Debt Service 36,894 112,019 112,019 - 0.00%Non-Operating Expenses 25,000 43,500 43,500 - 0.00%Golf Operations Total 1,874,240 1,797,600 1,790,940 (6,660) -0.37%
Golf Enterprise Fund Appropriations
FY 2020 Adopted Budget Parks, Recreation & Cultural Arts256
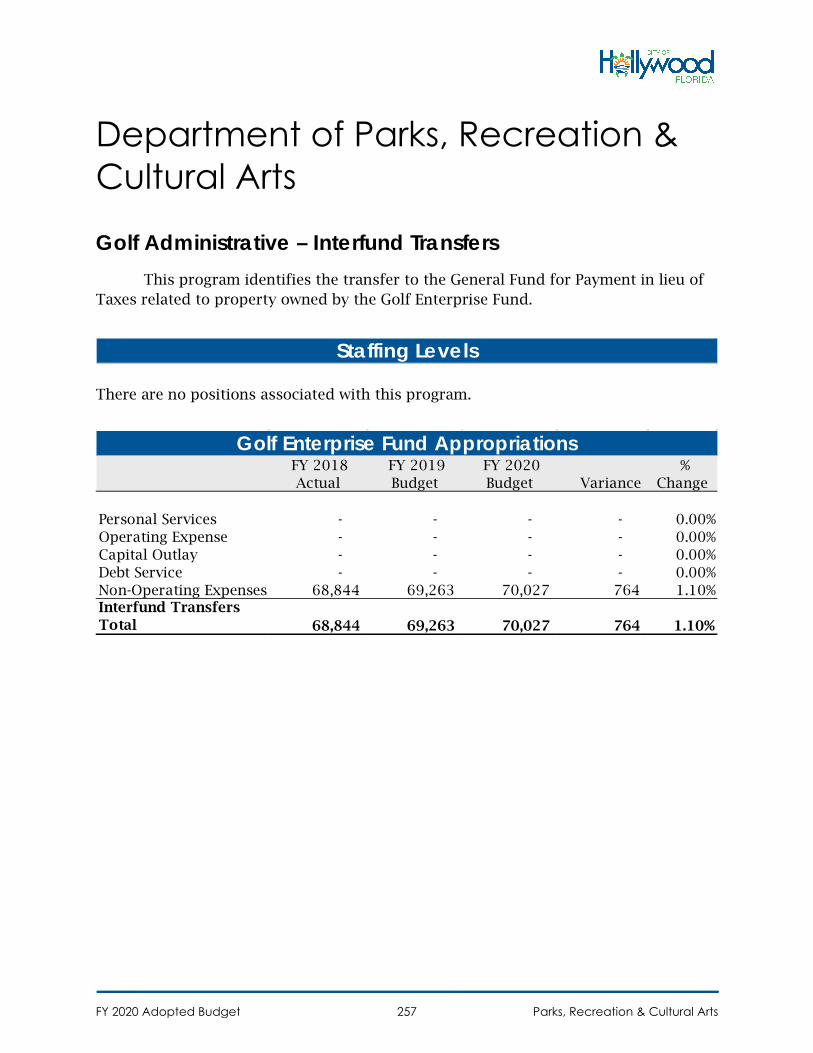
Department of Parks, Recreation & Cultural Arts
Golf Administrative – Interfund TransfersThis program identifies the transfer to the General Fund for Payment in lieu of
Taxes related to property owned by the Golf Enterprise Fund.
There are no positions associated with this program.
Staffing Levels
FY 2018 Actual
FY 2019 Budget
FY 2020 Budget Variance
% Change
Personal Services - - - - 0.00%Operating Expense - - - - 0.00%Capital Outlay - - - - 0.00%Debt Service - - - - 0.00%Non-Operating Expenses 68,844 69,263 70,027 764 1.10%Interfund Transfers Total 68,844 69,263 70,027 764 1.10%
Golf Enterprise Fund Appropriations
FY 2020 Adopted Budget Parks, Recreation & Cultural Arts257
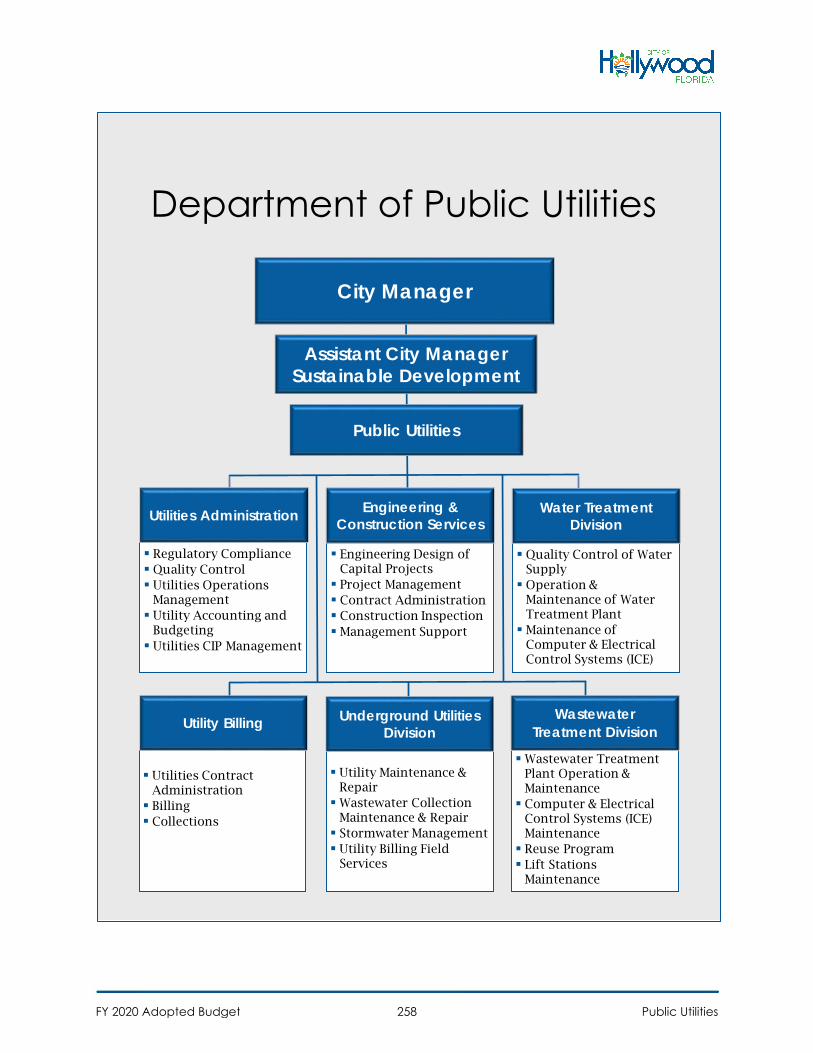
Department of Public Utilities
City Manager
Public Utilities
Regulatory Compliance Quality Control Utilities Operations
Management Utility Accounting and
Budgeting Utilities CIP Management
Utilities Administration
Utility Maintenance &RepairWastewater Collection
Maintenance & Repair Stormwater Management Utility Billing Field
Services
Underground Utilities Division
Wastewater TreatmentPlant Operation &Maintenance Computer & Electrical
Control Systems (ICE)Maintenance Reuse Program Lift Stations
Maintenance
WastewaterTreatment Division
Quality Control of WaterSupply Operation &
Maintenance of WaterTreatment PlantMaintenance of
Computer & ElectricalControl Systems (ICE)
Water Treatment Division
Engineering Design of Capital Projects Project Management Contract Administration Construction InspectionManagement Support
Engineering & Construction Services
Utilities ContractAdministration Billing Collections
Utility Billing
Assistant City ManagerSustainable Development
FY 2020 Adopted Budget Public Utilities258
Department of Public Utilities
Summary The Department of Public Utilities provides water, wastewater and stormwater
management services to the citizens of Hollywood and several other Governmental entities referred to as “Large Users”. The Department consists of six (6) Divisions divided into three (3) Funds. The Divisions are Utilities Administration, Engineering & Construction Services, Utility Billing, Water Treatment, Wastewater Treatment and Underground Utilities. The Underground Utilities Division includes programs in both the Water & Sewer Fund and the Stormwater Fund.
FY 2019 Accomplishments Water Distribution / Water Treatment Plant
• Rehabilitated ten (10) Spiractors in the Lime-Softening process at the WTP • Started the replacement of all pumps and motors and associated piping at the
High Service Pump Room at the WTP for pumping potable drinking water to the distribution system
• Replaced and installed two (2) new Lime Slakers for supplying lime for the water softening process at the WTP
• Continued with the residential meter replacement program • Promoted and implemented the Water Conservation Program (Toilet Rebates) • Continued with the upkeep of the Treatment Plants and infrastructure to reduce
the likelihood of water main breaks and catastrophic treatment failures • Replaced two existing de-gasifiers, which were beyond their useful lives, at the
WTP with new ones to remove hydrogen sulfide from raw water • Continued enforcing the backflow compliance program • Completed the design of new water mains for the Royal Poinciana neighborhood • In coordination and partnership with FDOT, continued with the installation of
new water mains system on SR7
Wastewater Collection / Southern Regional Wastewater Treatment Plant • Painted structures at Public Utilities, including clarifiers, deep injection well
pump stations, chlorine odor scrubber and piping, to improve the appearance of the facilities and help with civic pride
• Completed the replacement of the reuse pumps with new more powerful ones to provide greater volume and pressure in the reuse distribution system
FY 2020 Adopted Budget Public Utilities259
• Completed Phase I of new operating protocols and PLC programming upgradesfor WWTP processes as part of a plan to completely automate the running of theWWTP to gain efficiencies and reduce costs
• Discussed with the City of Miramar possibility to enter into an Inter LocalAgreement for contractual reuse credits to meet reuse requirements of theOcean Outfall legislation
• Applied to FDEP for the permits to install two new Deep Injection Wells to diverteffluent flows for the Ocean Outfall closure in March 2018
• Continued with the upkeep of the Treatment Plants and infrastructure to reducethe likelihood of sewer breaks and catastrophic treatment failures
• Replaced 40-ton A/C unit for the Influent pump station electrical controlbuilding at the WWTP
• Rehabilitated the return activated sludge #2 pumping facility at the WWTP• Construction of new Utilities project for Johnson Street commercial corridor
began and is substantially completed• In coordination and partnership with FDOT, continued with the installation of
new sanitary sewer system along SR7• Completed the design of limited sanitary sewers for the Royal Poinciana
neighborhood• Purchase new Vactor truck for sewer collection cleaning
Stormwater Pumping / Treatment / Collection • Purchased six new auxiliary pumps for stormwater to address North and South
Lake flooding• Rehabilitated large capacity pumps at stormwater pump stations No. 1 and No.
8 in the Lakes area• Installed new drainage infrastructure on 11th Avenue, from North Southlake
Drive to Harrison Street in South Lake and on 15th Avenue, from Grant Street toArthur Street in North Lake
• Purchase new auxiliary pumps for flooding mitigation in the Lakes area
Utility Billing • Implemented new Munis CUBE reporting to facilitate auditing the Utility Billing
processes• Worked with Aclara to replace 34 Data Collection Units (DCU) to allow new type
of Meter Transmitting Units (MTUs) to transmit data to Utility Billing and toreduce the number of failing MTUs
• Fifth year in a row that retail water and sewer rates remained the same forHollywood residents
• Improved water & sewer collections process and lowered total amountoutstanding
FY 2020 Adopted Budget Public Utilities260
Capital Improvement / Grants / Miscellaneous • Applied for Hazard Mitigation grants for backup generators for stormwater
pump stations and sanitary sewer pump stations that could have a positive benefit on the quality of life of our residents
• Sought grant funding to convert septic to sewer systems to reduce impact to groundwater
• Obtained low interest financing (State Revolving Funding – SRF) for water and sewer capital projects
• Continued the water main, and the stormwater infrastructure replacement programs throughout the City
• Purchased a new Asset Management Software system (Cityworks) and working on implementation phase
• Detected and coordinated Security Incident Response for multiple incidents
FY 2020 Goals • Apply for various grants for water, wastewater, and stormwater-related projects
that could have a positive benefit on the quality of life of our residents • Continue construction of Royal Poinciana limited sewer expansion and water
main replacement project • Implement Hazard Mitigation Grant Program (HMGP) for permanent backup
generators for Stormwater pump station and sanitary sewer lift stations that could have a positive benefit on the quality of life of our residents
• Begin construction of the Deep Injection Wells No. 3 & No. 4 to divert effluent flows per the Ocean Outfall Regulatory Rule change
• Purchase additional pumps for flooding mitigation • Paint various building and facilities at the waste water treatment plant (WWTP)
and the water treatment plant (WTP) to improve the appearance and help with civic pride
• Replace the roofs of the Dewatering, Influent and Deep Irrigation Well buildings. • Installation and start-up of new High Service Pumps at WTP to replace existing
antiquated ones to improve reliability • Continue to provide safe, abundant, high quality drinking water following all
regulatory requirements • Explore funding options for the implementation of citywide septic-to-sewer
conversion program • Continue targeted citywide Water Main Replacement Program • Continue to implement the Inflow & Infiltration (I&I) program • Integrate the Autoscribe Laboratory Information Management System (LIMS) lab
data into the Waste Information Management System (WIMS) to provide timely laboratory data for WWTP and WTP processes
FY 2020 Adopted Budget Public Utilities261
• Renovate and upgrade fixtures and equipment in the laboratory • Evaluate drainage infrastructure between Moffet Street and Harrison Street from
17th Avenue to 12th Avenue • Continue to promote and implement the Water Conservation Program (Toilet
Rebates) • Rehabilitate Return Activated Sludge (RAS) pump Station 1 at the WWTP • Rehabilitate Clarifiers 5 and 6 (Phase 2) at the WWTP • Evaluate and Develop a Water Treatment Plant master plan • Strive to become more efficient to keep our operating costs down • Continue to work with Aclara to come up with a permanent solution to the issue
of the failing Meter Transmission Unit (MTUs) in the Automatic Meter Reading (AMR) system
• Attempt to engage more contract reuse partners to comply with the Ocean Outfall reuse requirement
• Address parking needs of employees of the Underground Utilities Division on Wilson Street.
• Continue to increase compliance with the city’s cross-connection program • Implement the recommended rate study findings to support the capital
improvement program for FY2020 to FY2024 • Continue with the upgrade of Program Logical Controller (PLC) programs,
Supervisory Control and Data Acquisition (SCADA) controls, and other improvements needed to completely automate the WWTP processes and gain efficiencies
• Continue to seek low interest financing for capital projects (SRF) • Continue to replace existing aging water meters with new ultrasonic ones to
address the stuck meter issue • Reevaluate the current organizational structure for the Instrumentation Control
and Electrical (ICE) Division to streamline responsibilities • Continue implementation of the new Asset Management Software System
(Cityworks)
FY 2020 Adopted Budget Public Utilities262
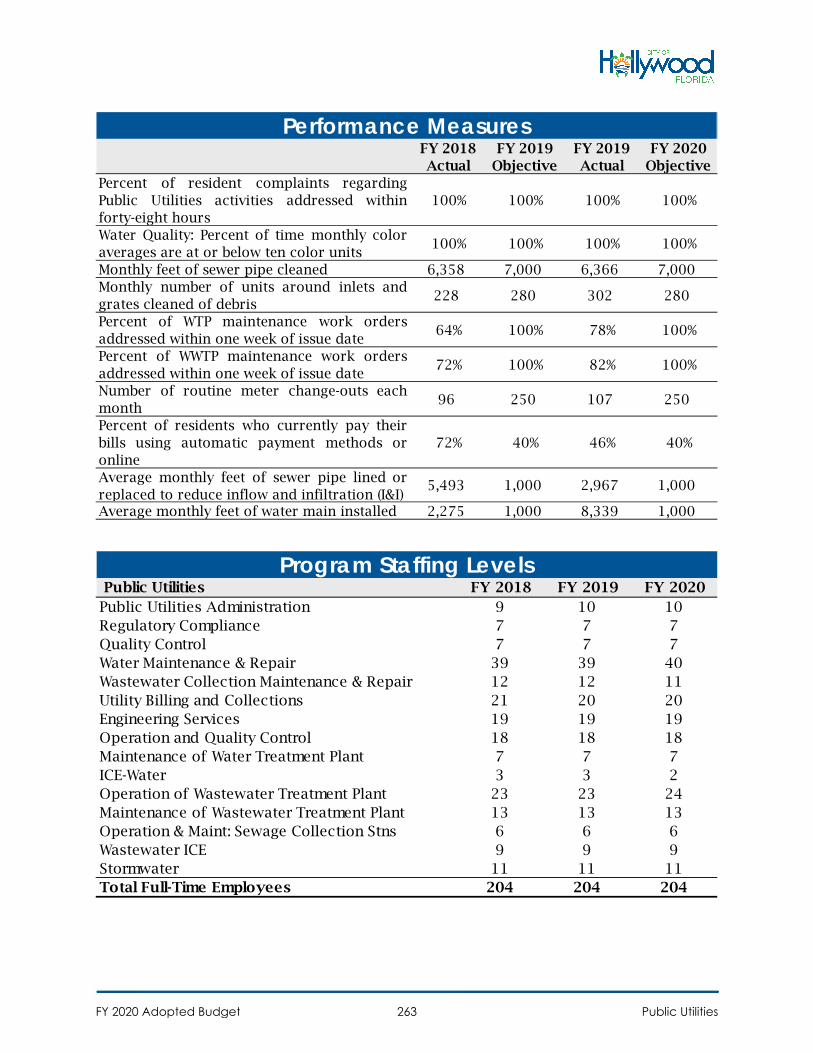
FY 2018 Actual
FY 2019 Objective
FY 2019 Actual
FY 2020 Objective
Percent of resident complaints regardingPublic Utilities activities addressed withinforty-eight hours
100% 100% 100% 100%
Water Quality: Percent of time monthly coloraverages are at or below ten color units
100% 100% 100% 100%
Monthly feet of sewer pipe cleaned 6,358 7,000 6,366 7,000Monthly number of units around inlets andgrates cleaned of debris
228 280 302 280
Percent of WTP maintenance work ordersaddressed within one week of issue date
64% 100% 78% 100%
Percent of WWTP maintenance work ordersaddressed within one week of issue date
72% 100% 82% 100%
Number of routine meter change-outs eachmonth
96 250 107 250
Percent of residents who currently pay theirbills using automatic payment methods oronline
72% 40% 46% 40%
Average monthly feet of sewer pipe lined orreplaced to reduce inflow and infiltration (I&I)
5,493 1,000 2,967 1,000
Average monthly feet of water main installed 2,275 1,000 8,339 1,000
Performance Measures
Public Utilities FY 2018 FY 2019 FY 2020 Public Utilities Administration 9 10 10Regulatory Compliance 7 7 7Quality Control 7 7 7Water Maintenance & Repair 39 39 40Wastewater Collection Maintenance & Repair 12 12 11Utility Billing and Collections 21 20 20Engineering Services 19 19 19Operation and Quality Control 18 18 18Maintenance of Water Treatment Plant 7 7 7ICE-Water 3 3 2Operation of Wastewater Treatment Plant 23 23 24Maintenance of Wastewater Treatment Plant 13 13 13Operation & Maint: Sewage Collection Stns 6 6 6Wastewater ICE 9 9 9Stormwater 11 11 11Total Full-Time Employees 204 204 204
Program Staffing Levels
FY 2020 Adopted Budget Public Utilities263
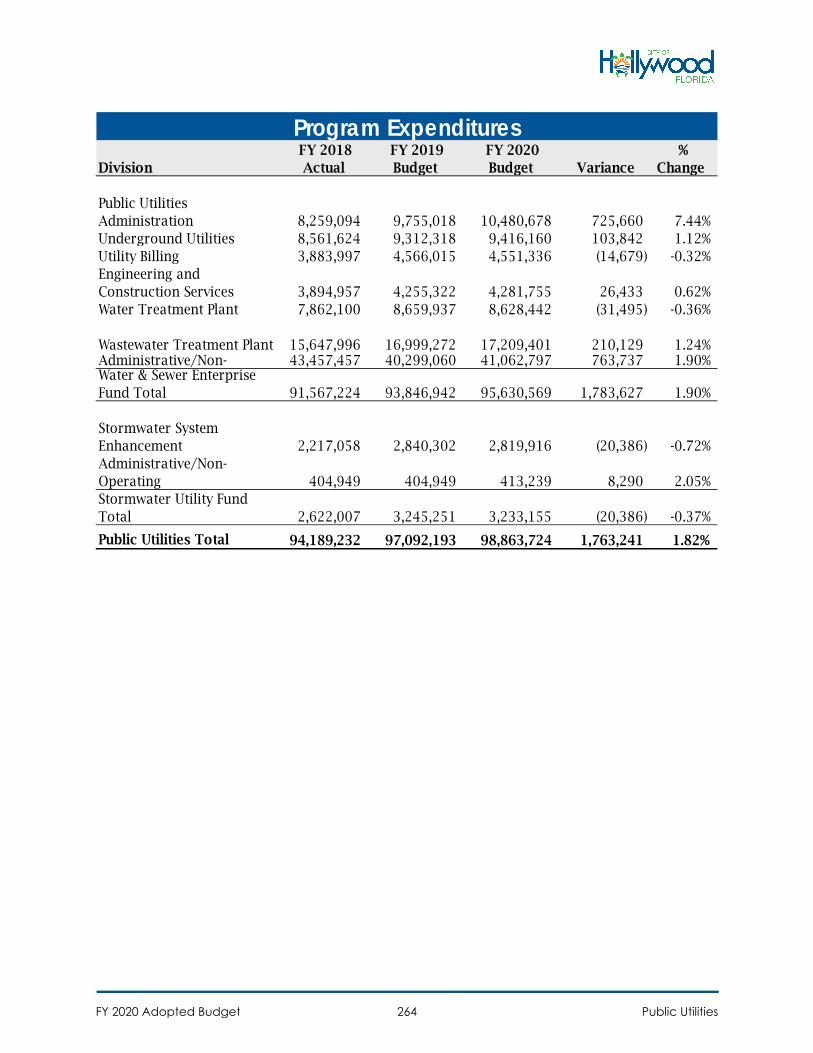
Division FY 2018
Actual FY 2019 Budget
FY 2020 Budget Variance
% Change
Public Utilities Administration 8,259,094 9,755,018 10,480,678 725,660 7.44%Underground Utilities 8,561,624 9,312,318 9,416,160 103,842 1.12%Utility Billing 3,883,997 4,566,015 4,551,336 (14,679) -0.32%Engineering and Construction Services 3,894,957 4,255,322 4,281,755 26,433 0.62%Water Treatment Plant 7,862,100 8,659,937 8,628,442 (31,495) -0.36%
Wastewater Treatment Plant 15,647,996 16,999,272 17,209,401 210,129 1.24%Administrative/Non- 43,457,457 40,299,060 41,062,797 763,737 1.90%Water & Sewer Enterprise Fund Total 91,567,224 93,846,942 95,630,569 1,783,627 1.90%
Stormwater System Enhancement 2,217,058 2,840,302 2,819,916 (20,386) -0.72%Administrative/Non-Operating 404,949 404,949 413,239 8,290 2.05%Stormwater Utility Fund Total 2,622,007 3,245,251 3,233,155 (20,386) -0.37%
Public Utilities Total 94,189,232 97,092,193 98,863,724 1,763,241 1.82%
Program Expenditures
FY 2020 Adopted Budget Public Utilities264
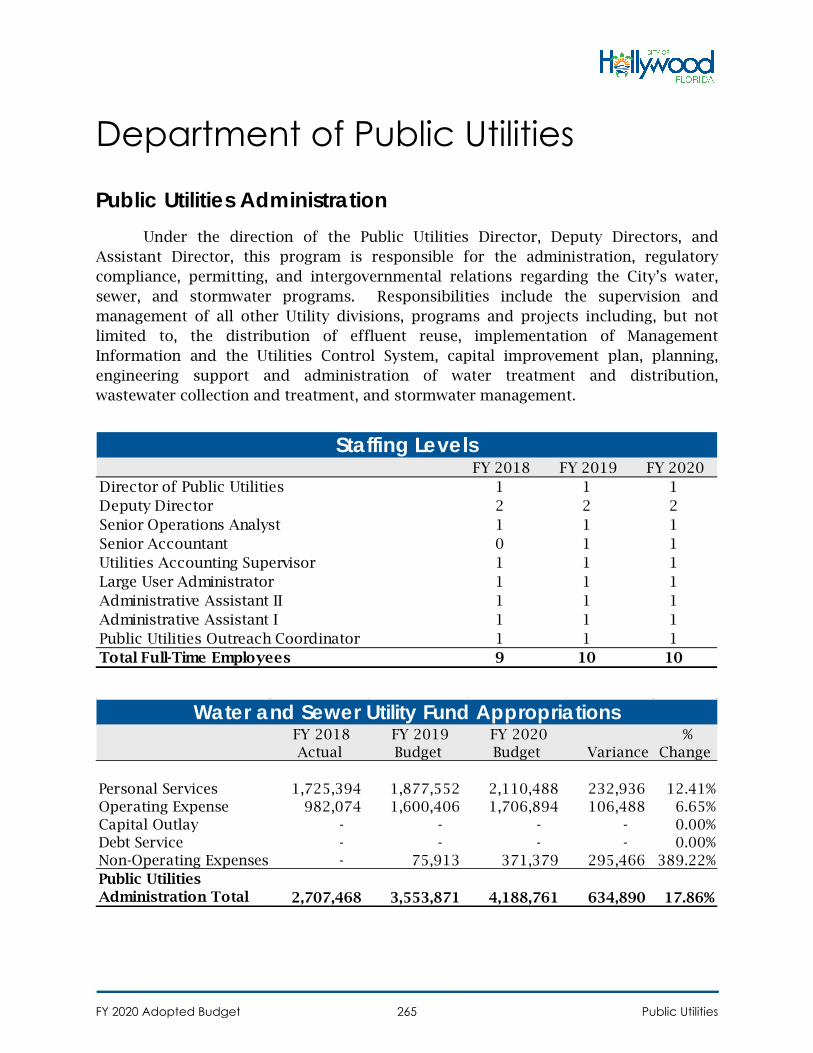
Department of Public Utilities
Public Utilities Administration Under the direction of the Public Utilities Director, Deputy Directors, and
Assistant Director, this program is responsible for the administration, regulatory compliance, permitting, and intergovernmental relations regarding the City’s water, sewer, and stormwater programs. Responsibilities include the supervision and management of all other Utility divisions, programs and projects including, but not limited to, the distribution of effluent reuse, implementation of Management Information and the Utilities Control System, capital improvement plan, planning, engineering support and administration of water treatment and distribution, wastewater collection and treatment, and stormwater management.
FY 2018 FY 2019 FY 2020 Director of Public Utilities 1 1 1Deputy Director 2 2 2Senior Operations Analyst 1 1 1Senior Accountant 0 1 1Utilities Accounting Supervisor 1 1 1Large User Administrator 1 1 1Administrative Assistant II 1 1 1Administrative Assistant I 1 1 1Public Utilities Outreach Coordinator 1 1 1Total Full-Time Employees 9 10 10
Staffing Levels
FY 2018 Actual
FY 2019 Budget
FY 2020 Budget Variance
% Change
Personal Services 1,725,394 1,877,552 2,110,488 232,936 12.41%Operating Expense 982,074 1,600,406 1,706,894 106,488 6.65%Capital Outlay - - - - 0.00%Debt Service - - - - 0.00%Non-Operating Expenses - 75,913 371,379 295,466 389.22%Public Utilities Administration Total 2,707,468 3,553,871 4,188,761 634,890 17.86%
Water and Sewer Utility Fund Appropriations
FY 2020 Adopted Budget Public Utilities265
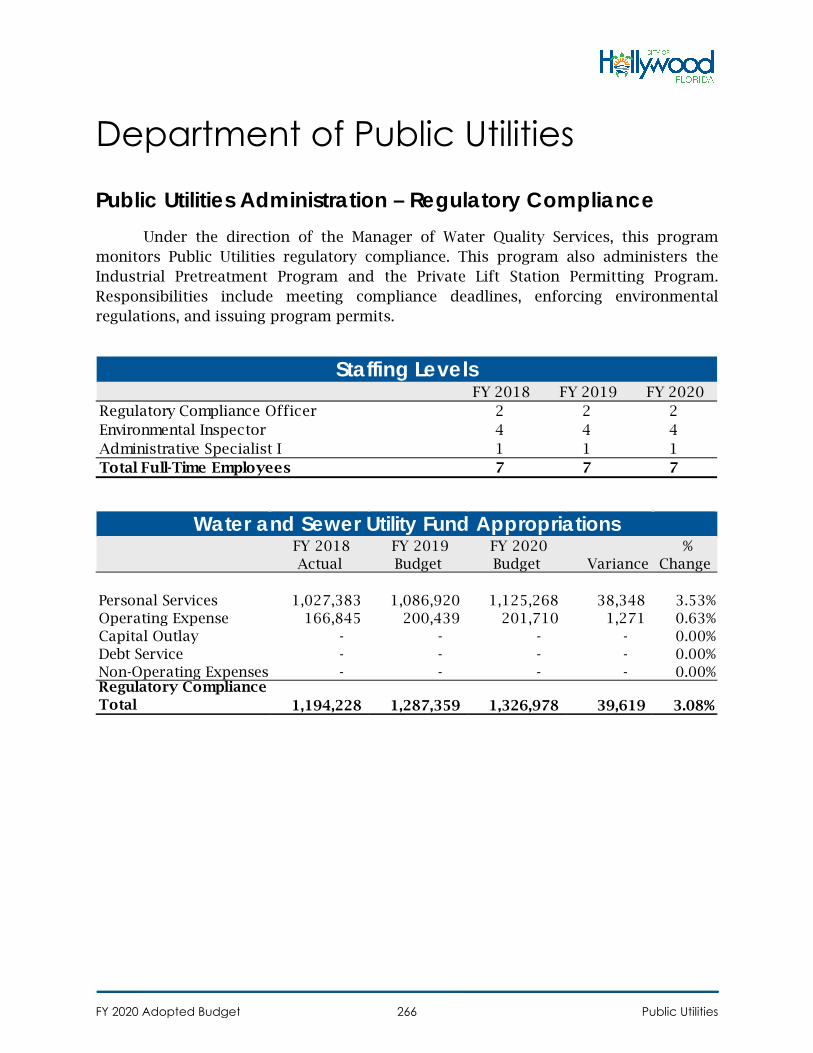
Department of Public Utilities
Public Utilities Administration – Regulatory Compliance Under the direction of the Manager of Water Quality Services, this program
monitors Public Utilities regulatory compliance. This program also administers the Industrial Pretreatment Program and the Private Lift Station Permitting Program. Responsibilities include meeting compliance deadlines, enforcing environmental regulations, and issuing program permits.
FY 2018 FY 2019 FY 2020 Regulatory Compliance Officer 2 2 2Environmental Inspector 4 4 4Administrative Specialist I 1 1 1Total Full-Time Employees 7 7 7
Staffing Levels
FY 2018 Actual
FY 2019 Budget
FY 2020 Budget Variance
% Change
Personal Services 1,027,383 1,086,920 1,125,268 38,348 3.53%Operating Expense 166,845 200,439 201,710 1,271 0.63%Capital Outlay - - - - 0.00%Debt Service - - - - 0.00%Non-Operating Expenses - - - - 0.00%Regulatory Compliance Total 1,194,228 1,287,359 1,326,978 39,619 3.08%
Water and Sewer Utility Fund Appropriations
FY 2020 Adopted Budget Public Utilities266
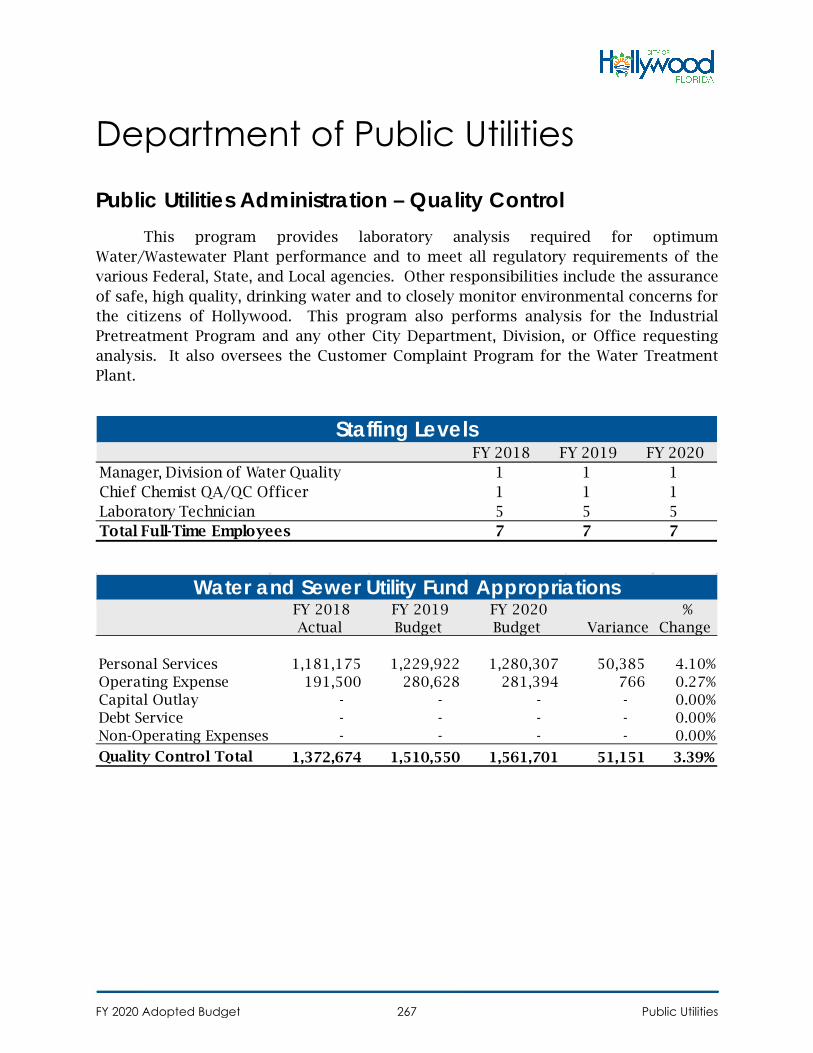
Department of Public Utilities
Public Utilities Administration – Quality Control This program provides laboratory analysis required for optimum
Water/Wastewater Plant performance and to meet all regulatory requirements of the various Federal, State, and Local agencies. Other responsibilities include the assurance of safe, high quality, drinking water and to closely monitor environmental concerns for the citizens of Hollywood. This program also performs analysis for the Industrial Pretreatment Program and any other City Department, Division, or Office requesting analysis. It also oversees the Customer Complaint Program for the Water Treatment Plant.
FY 2018 FY 2019 FY 2020 Manager, Division of Water Quality 1 1 1Chief Chemist QA/QC Officer 1 1 1Laboratory Technician 5 5 5Total Full-Time Employees 7 7 7
Staffing Levels
FY 2018 Actual
FY 2019 Budget
FY 2020 Budget Variance
% Change
Personal Services 1,181,175 1,229,922 1,280,307 50,385 4.10%Operating Expense 191,500 280,628 281,394 766 0.27%Capital Outlay - - - - 0.00%Debt Service - - - - 0.00%Non-Operating Expenses - - - - 0.00%
Quality Control Total 1,372,674 1,510,550 1,561,701 51,151 3.39%
Water and Sewer Utility Fund Appropriations
FY 2020 Adopted Budget Public Utilities267
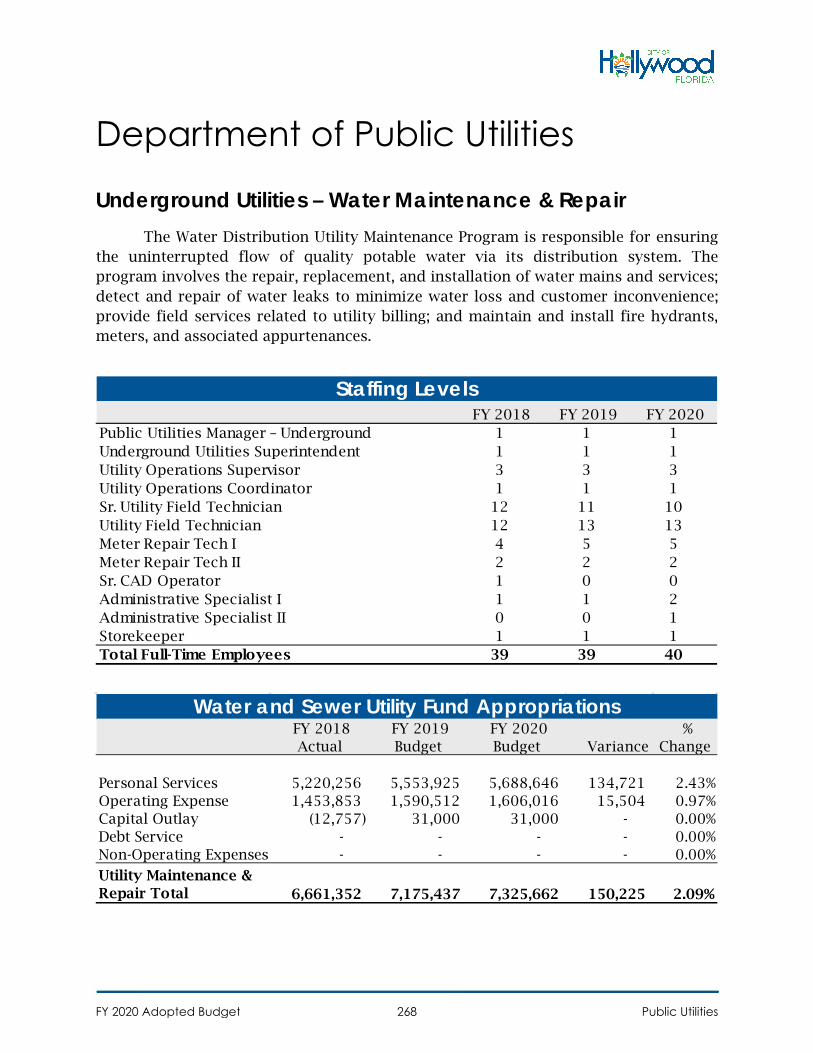
Department of Public Utilities
Underground Utilities – Water Maintenance & Repair The Water Distribution Utility Maintenance Program is responsible for ensuring
the uninterrupted flow of quality potable water via its distribution system. The program involves the repair, replacement, and installation of water mains and services; detect and repair of water leaks to minimize water loss and customer inconvenience; provide field services related to utility billing; and maintain and install fire hydrants, meters, and associated appurtenances.
FY 2018 FY 2019 FY 2020 Public Utilities Manager – Underground 1 1 1Underground Utilities Superintendent 1 1 1Utility Operations Supervisor 3 3 3Utility Operations Coordinator 1 1 1Sr. Utility Field Technician 12 11 10Utility Field Technician 12 13 13Meter Repair Tech I 4 5 5Meter Repair Tech II 2 2 2Sr. CAD Operator 1 0 0Administrative Specialist I 1 1 2Administrative Specialist II 0 0 1Storekeeper 1 1 1Total Full-Time Employees 39 39 40
Staffing Levels
FY 2018 Actual
FY 2019 Budget
FY 2020 Budget Variance
% Change
Personal Services 5,220,256 5,553,925 5,688,646 134,721 2.43%Operating Expense 1,453,853 1,590,512 1,606,016 15,504 0.97%Capital Outlay (12,757) 31,000 31,000 - 0.00%Debt Service - - - - 0.00%Non-Operating Expenses - - - - 0.00%
Utility Maintenance & Repair Total 6,661,352 7,175,437 7,325,662 150,225 2.09%
Water and Sewer Utility Fund Appropriations
FY 2020 Adopted Budget Public Utilities268
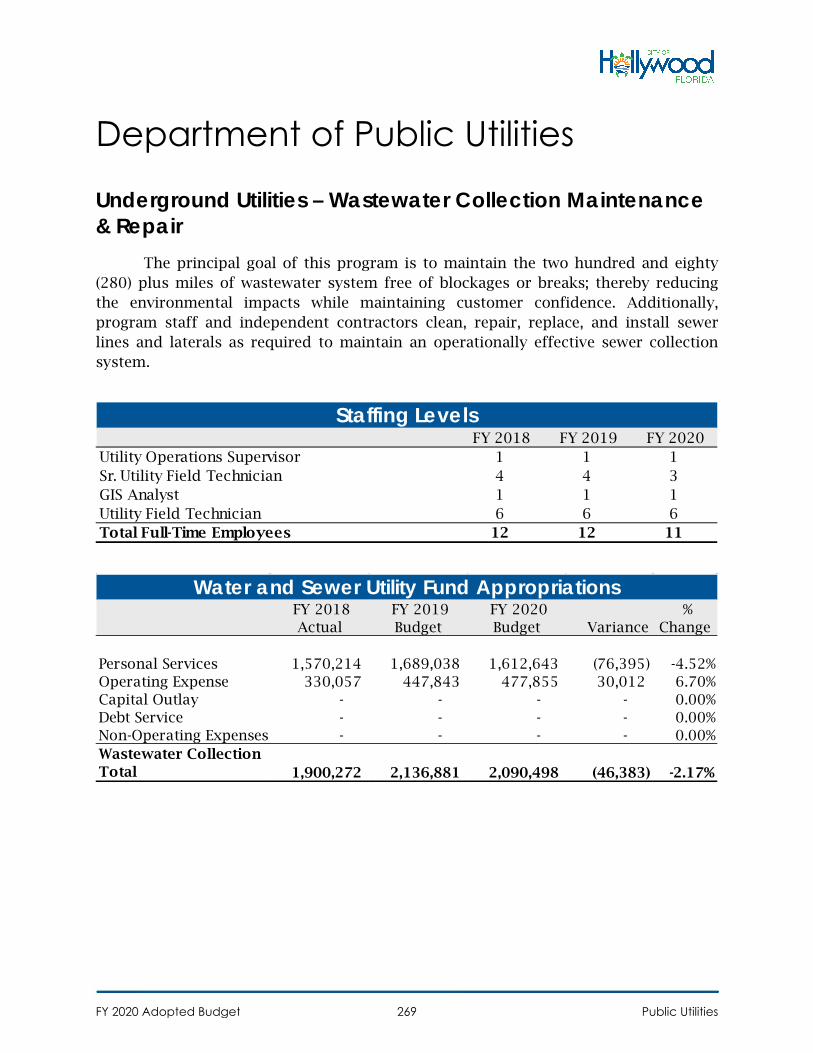
Department of Public Utilities
Underground Utilities – Wastewater Collection Maintenance & Repair
The principal goal of this program is to maintain the two hundred and eighty (280) plus miles of wastewater system free of blockages or breaks; thereby reducing the environmental impacts while maintaining customer confidence. Additionally, program staff and independent contractors clean, repair, replace, and install sewer lines and laterals as required to maintain an operationally effective sewer collection system.
FY 2018 FY 2019 FY 2020 Utility Operations Supervisor 1 1 1Sr. Utility Field Technician 4 4 3GIS Analyst 1 1 1Utility Field Technician 6 6 6Total Full-Time Employees 12 12 11
Staffing Levels
FY 2018 Actual
FY 2019 Budget
FY 2020 Budget Variance
% Change
Personal Services 1,570,214 1,689,038 1,612,643 (76,395) -4.52%Operating Expense 330,057 447,843 477,855 30,012 6.70%Capital Outlay - - - - 0.00%Debt Service - - - - 0.00%Non-Operating Expenses - - - - 0.00%Wastewater Collection Total 1,900,272 2,136,881 2,090,498 (46,383) -2.17%
Water and Sewer Utility Fund Appropriations
FY 2020 Adopted Budget Public Utilities269
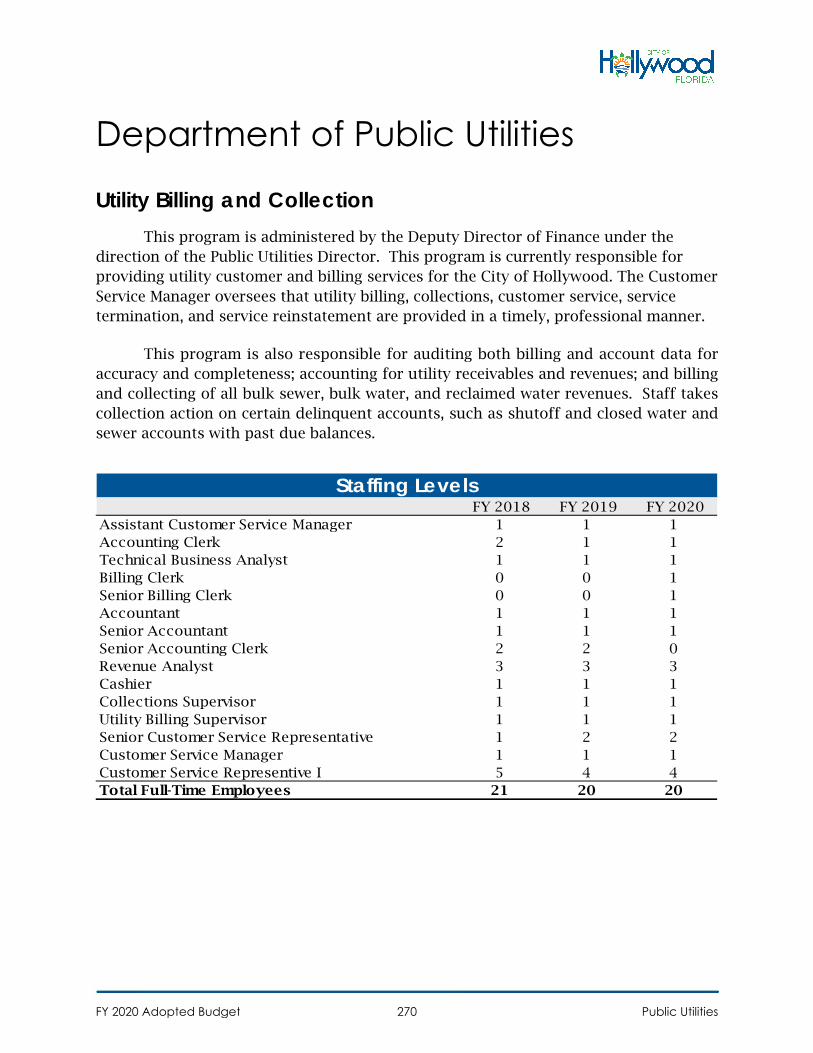
Department of Public Utilities
Utility Billing and Collection This program is administered by the Deputy Director of Finance under the
direction of the Public Utilities Director. This program is currently responsible for providing utility customer and billing services for the City of Hollywood. The Customer Service Manager oversees that utility billing, collections, customer service, service termination, and service reinstatement are provided in a timely, professional manner.
This program is also responsible for auditing both billing and account data for accuracy and completeness; accounting for utility receivables and revenues; and billing and collecting of all bulk sewer, bulk water, and reclaimed water revenues. Staff takes collection action on certain delinquent accounts, such as shutoff and closed water and sewer accounts with past due balances.
FY 2018 FY 2019 FY 2020 Assistant Customer Service Manager 1 1 1Accounting Clerk 2 1 1Technical Business Analyst 1 1 1Billing Clerk 0 0 1Senior Billing Clerk 0 0 1Accountant 1 1 1Senior Accountant 1 1 1Senior Accounting Clerk 2 2 0Revenue Analyst 3 3 3Cashier 1 1 1Collections Supervisor 1 1 1Utility Billing Supervisor 1 1 1Senior Customer Service Representative 1 2 2Customer Service Manager 1 1 1Customer Service Representive I 5 4 4Total Full-Time Employees 21 20 20
Staffing Levels
FY 2020 Adopted Budget Public Utilities270
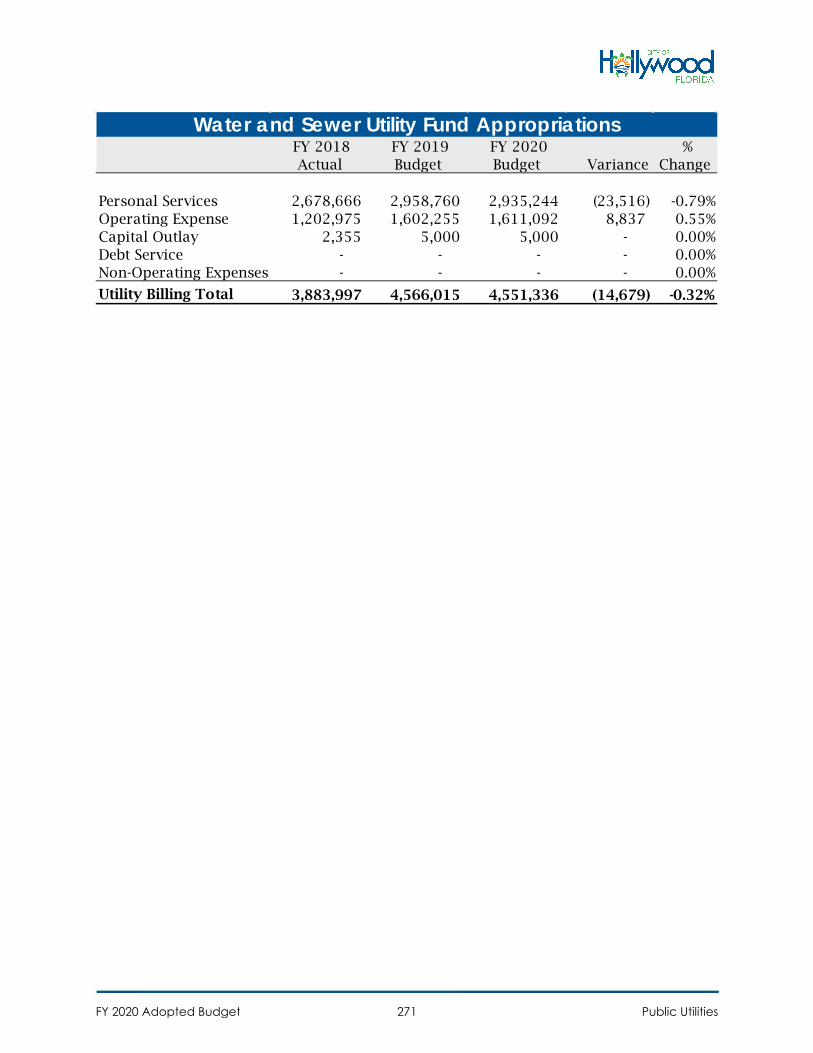
FY 2018 Actual
FY 2019 Budget
FY 2020 Budget Variance
% Change
Personal Services 2,678,666 2,958,760 2,935,244 (23,516) -0.79%Operating Expense 1,202,975 1,602,255 1,611,092 8,837 0.55%Capital Outlay 2,355 5,000 5,000 - 0.00%Debt Service - - - - 0.00%Non-Operating Expenses - - - - 0.00%
Utility Billing Total 3,883,997 4,566,015 4,551,336 (14,679) -0.32%
Water and Sewer Utility Fund Appropriations
FY 2020 Adopted Budget Public Utilities271
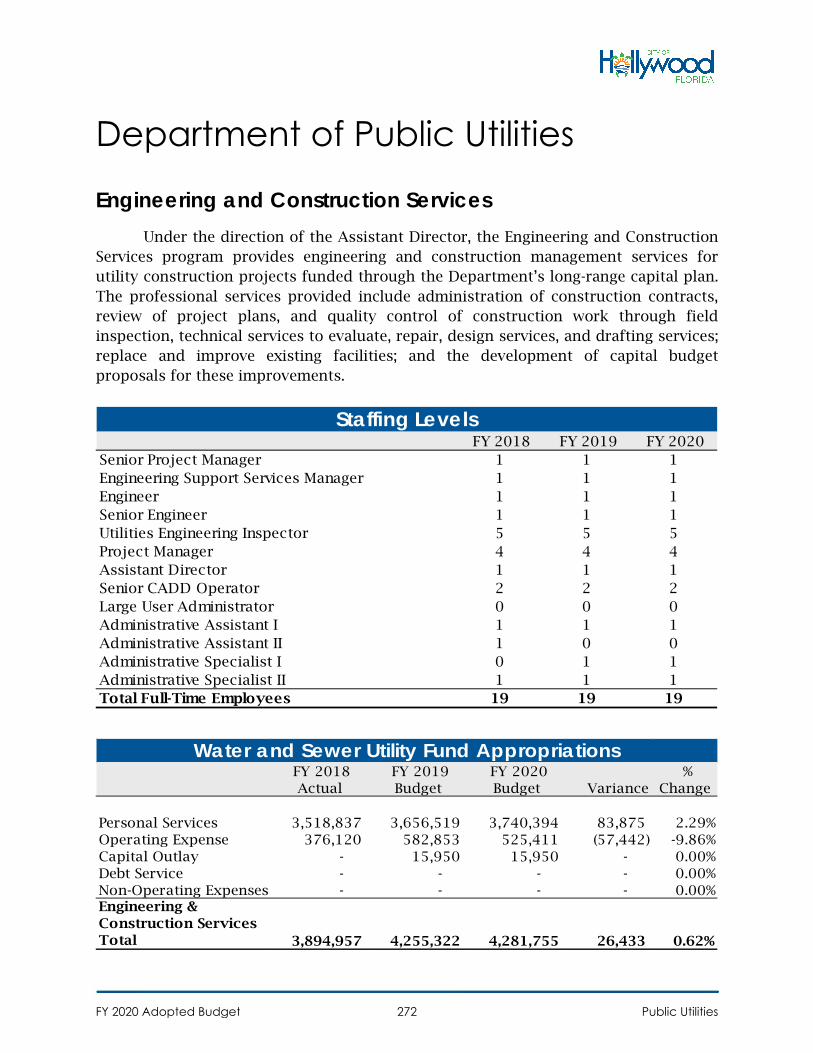
Department of Public Utilities
Engineering and Construction Services Under the direction of the Assistant Director, the Engineering and Construction
Services program provides engineering and construction management services for utility construction projects funded through the Department’s long-range capital plan. The professional services provided include administration of construction contracts, review of project plans, and quality control of construction work through field inspection, technical services to evaluate, repair, design services, and drafting services; replace and improve existing facilities; and the development of capital budget proposals for these improvements.
FY 2018 FY 2019 FY 2020 Senior Project Manager 1 1 1Engineering Support Services Manager 1 1 1Engineer 1 1 1Senior Engineer 1 1 1Utilities Engineering Inspector 5 5 5Project Manager 4 4 4Assistant Director 1 1 1Senior CADD Operator 2 2 2Large User Administrator 0 0 0Administrative Assistant I 1 1 1Administrative Assistant II 1 0 0Administrative Specialist I 0 1 1Administrative Specialist II 1 1 1Total Full-Time Employees 19 19 19
Staffing Levels
FY 2018 Actual
FY 2019 Budget
FY 2020 Budget Variance
% Change
Personal Services 3,518,837 3,656,519 3,740,394 83,875 2.29%Operating Expense 376,120 582,853 525,411 (57,442) -9.86%Capital Outlay - 15,950 15,950 - 0.00%Debt Service - - - - 0.00%Non-Operating Expenses - - - - 0.00%Engineering & Construction Services Total 3,894,957 4,255,322 4,281,755 26,433 0.62%
Water and Sewer Utility Fund Appropriations
FY 2020 Adopted Budget Public Utilities272
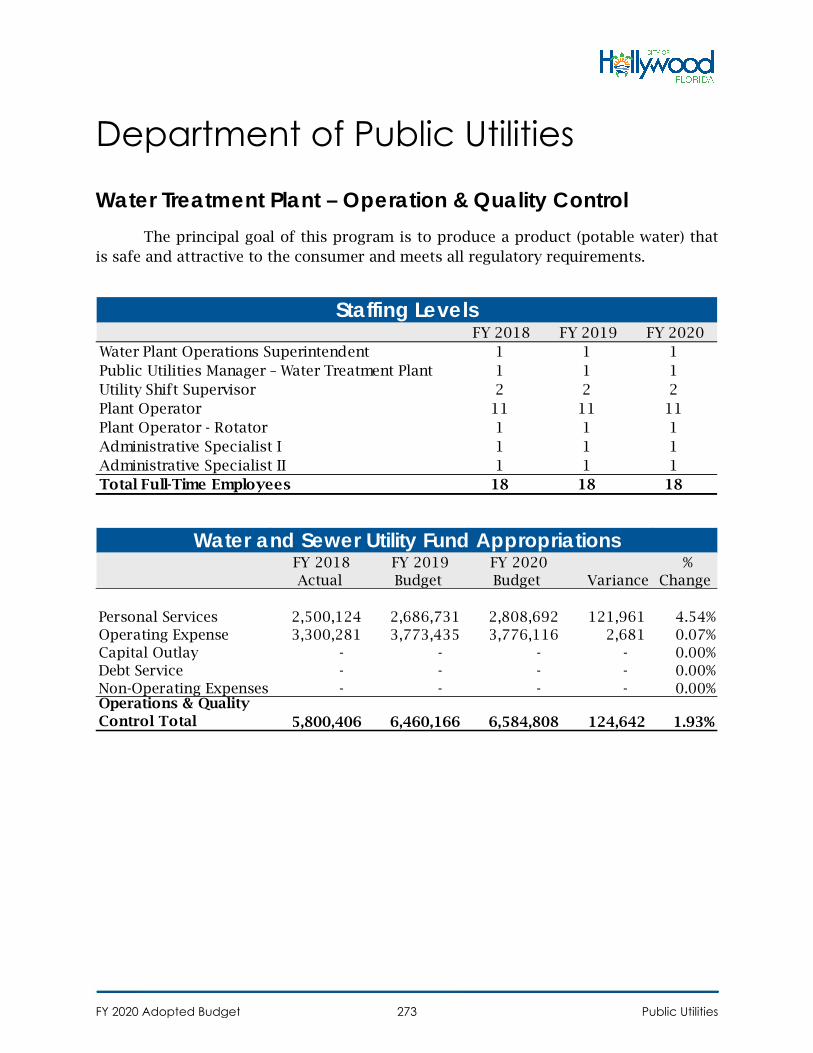
Department of Public Utilities
Water Treatment Plant – Operation & Quality Control The principal goal of this program is to produce a product (potable water) that
is safe and attractive to the consumer and meets all regulatory requirements.
FY 2018 FY 2019 FY 2020 Water Plant Operations Superintendent 1 1 1Public Utilities Manager – Water Treatment Plant 1 1 1Utility Shift Supervisor 2 2 2Plant Operator 11 11 11Plant Operator - Rotator 1 1 1Administrative Specialist I 1 1 1Administrative Specialist II 1 1 1Total Full-Time Employees 18 18 18
Staffing Levels
FY 2018 Actual
FY 2019 Budget
FY 2020 Budget Variance
% Change
Personal Services 2,500,124 2,686,731 2,808,692 121,961 4.54%Operating Expense 3,300,281 3,773,435 3,776,116 2,681 0.07%Capital Outlay - - - - 0.00%Debt Service - - - - 0.00%Non-Operating Expenses - - - - 0.00%Operations & Quality Control Total 5,800,406 6,460,166 6,584,808 124,642 1.93%
Water and Sewer Utility Fund Appropriations
FY 2020 Adopted Budget Public Utilities273
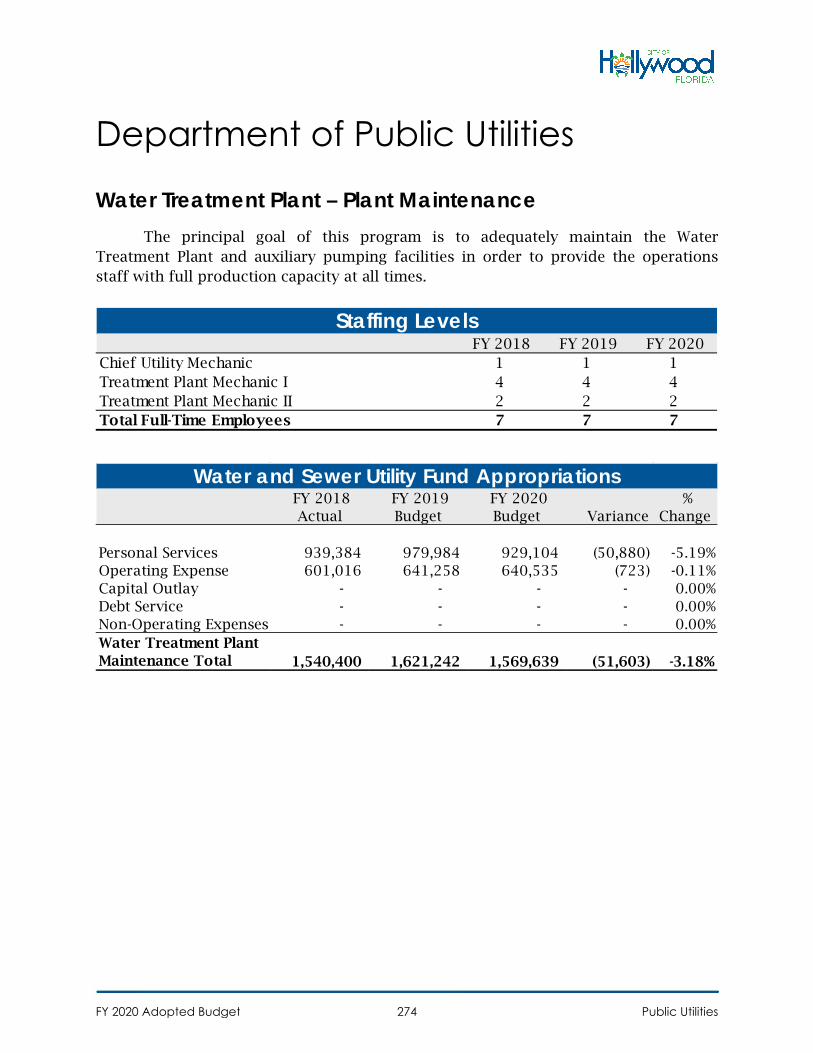
Department of Public Utilities
Water Treatment Plant – Plant Maintenance The principal goal of this program is to adequately maintain the Water
Treatment Plant and auxiliary pumping facilities in order to provide the operations staff with full production capacity at all times.
FY 2018 FY 2019 FY 2020 Chief Utility Mechanic 1 1 1Treatment Plant Mechanic I 4 4 4Treatment Plant Mechanic II 2 2 2Total Full-Time Employees 7 7 7
Staffing Levels
FY 2018 Actual
FY 2019 Budget
FY 2020 Budget Variance
% Change
Personal Services 939,384 979,984 929,104 (50,880) -5.19%Operating Expense 601,016 641,258 640,535 (723) -0.11%Capital Outlay - - - - 0.00%Debt Service - - - - 0.00%Non-Operating Expenses - - - - 0.00%Water Treatment Plant Maintenance Total 1,540,400 1,621,242 1,569,639 (51,603) -3.18%
Water and Sewer Utility Fund Appropriations
FY 2020 Adopted Budget Public Utilities274
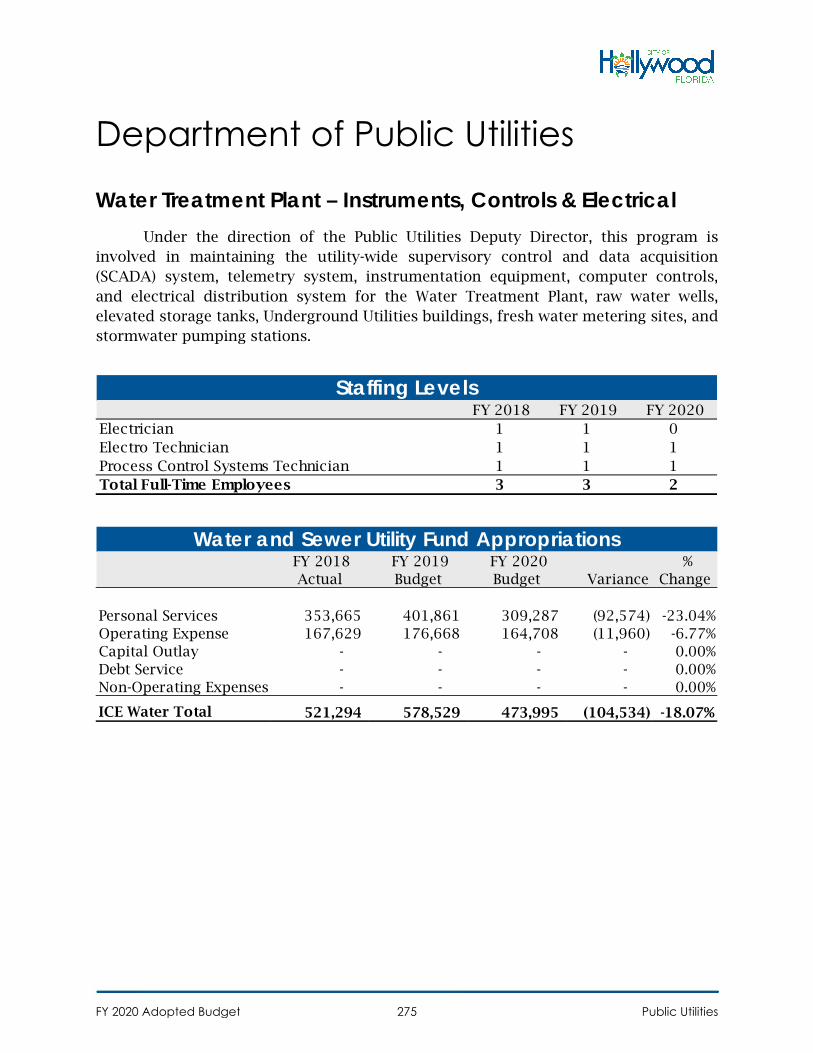
Department of Public Utilities
Water Treatment Plant – Instruments, Controls & Electrical Under the direction of the Public Utilities Deputy Director, this program is
involved in maintaining the utility-wide supervisory control and data acquisition (SCADA) system, telemetry system, instrumentation equipment, computer controls, and electrical distribution system for the Water Treatment Plant, raw water wells, elevated storage tanks, Underground Utilities buildings, fresh water metering sites, and stormwater pumping stations.
FY 2018 FY 2019 FY 2020 Electrician 1 1 0Electro Technician 1 1 1Process Control Systems Technician 1 1 1Total Full-Time Employees 3 3 2
Staffing Levels
FY 2018 Actual
FY 2019 Budget
FY 2020 Budget Variance
% Change
Personal Services 353,665 401,861 309,287 (92,574) -23.04%Operating Expense 167,629 176,668 164,708 (11,960) -6.77%Capital Outlay - - - - 0.00%Debt Service - - - - 0.00%Non-Operating Expenses - - - - 0.00%
ICE Water Total 521,294 578,529 473,995 (104,534) -18.07%
Water and Sewer Utility Fund Appropriations
FY 2020 Adopted Budget Public Utilities275
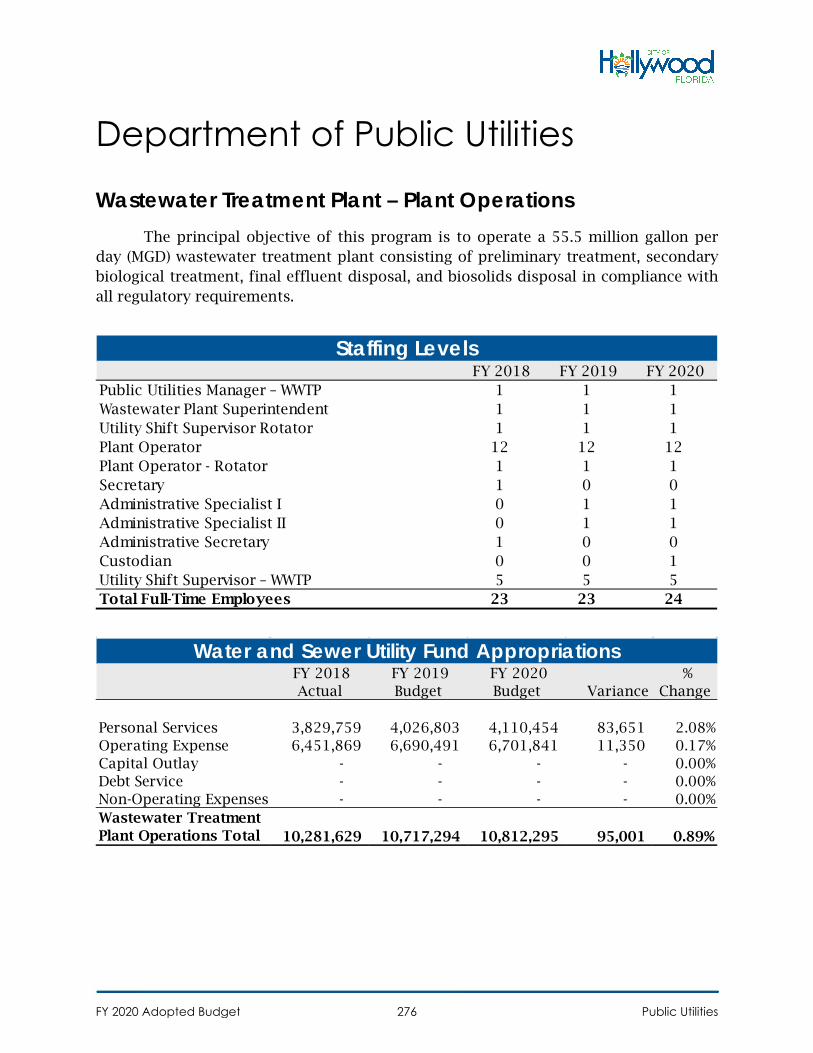
Department of Public Utilities
Wastewater Treatment Plant – Plant OperationsThe principal objective of this program is to operate a 55.5 million gallon per
day (MGD) wastewater treatment plant consisting of preliminary treatment, secondary biological treatment, final effluent disposal, and biosolids disposal in compliance with all regulatory requirements.
FY 2018 FY 2019 FY 2020 Public Utilities Manager – WWTP 1 1 1Wastewater Plant Superintendent 1 1 1Utility Shift Supervisor Rotator 1 1 1Plant Operator 12 12 12Plant Operator - Rotator 1 1 1Secretary 1 0 0Administrative Specialist I 0 1 1Administrative Specialist II 0 1 1Administrative Secretary 1 0 0Custodian 0 0 1Utility Shift Supervisor – WWTP 5 5 5Total Full-Time Employees 23 23 24
Staffing Levels
FY 2018 Actual
FY 2019 Budget
FY 2020 Budget Variance
% Change
Personal Services 3,829,759 4,026,803 4,110,454 83,651 2.08%Operating Expense 6,451,869 6,690,491 6,701,841 11,350 0.17%Capital Outlay - - - - 0.00%Debt Service - - - - 0.00%Non-Operating Expenses - - - - 0.00%Wastewater Treatment Plant Operations Total 10,281,629 10,717,294 10,812,295 95,001 0.89%
Water and Sewer Utility Fund Appropriations
FY 2020 Adopted Budget Public Utilities276
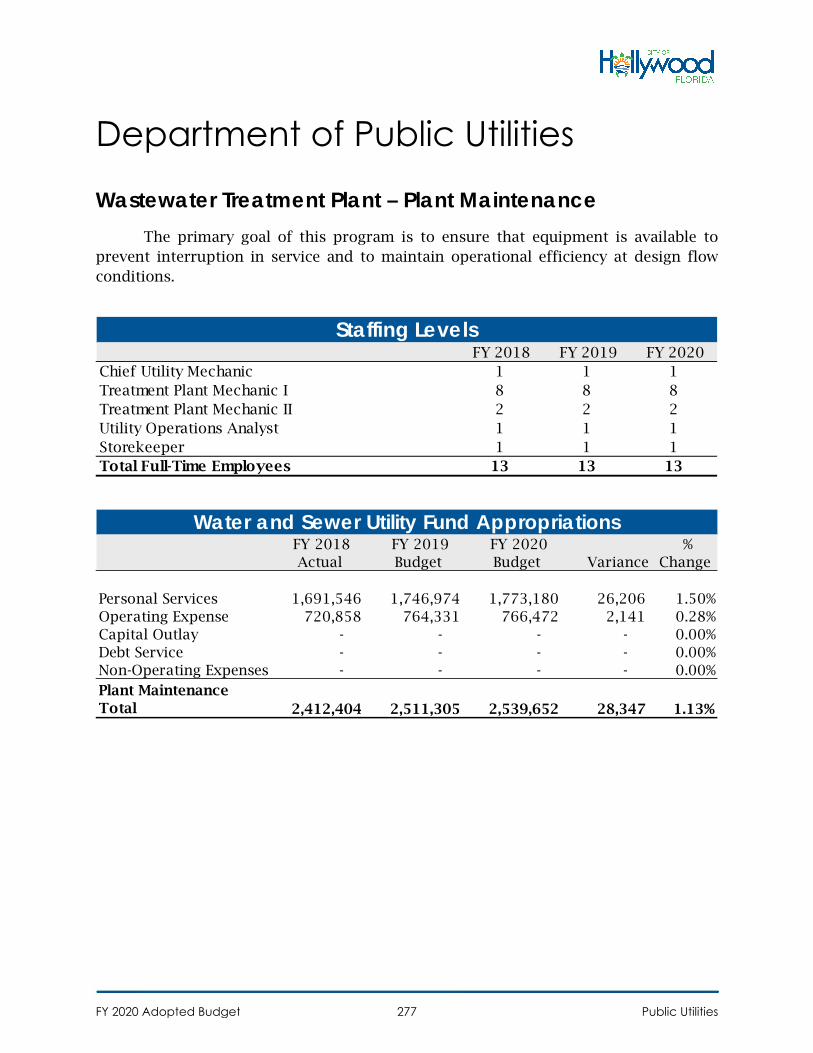
Department of Public Utilities
Wastewater Treatment Plant – Plant MaintenanceThe primary goal of this program is to ensure that equipment is available to
prevent interruption in service and to maintain operational efficiency at design flow conditions.
FY 2018 FY 2019 FY 2020 Chief Utility Mechanic 1 1 1Treatment Plant Mechanic I 8 8 8Treatment Plant Mechanic II 2 2 2Utility Operations Analyst 1 1 1Storekeeper 1 1 1Total Full-Time Employees 13 13 13
Staffing Levels
FY 2018 Actual
FY 2019 Budget
FY 2020 Budget Variance
% Change
Personal Services 1,691,546 1,746,974 1,773,180 26,206 1.50%Operating Expense 720,858 764,331 766,472 2,141 0.28%Capital Outlay - - - - 0.00%Debt Service - - - - 0.00%Non-Operating Expenses - - - - 0.00%Plant Maintenance Total 2,412,404 2,511,305 2,539,652 28,347 1.13%
Water and Sewer Utility Fund Appropriations
FY 2020 Adopted Budget Public Utilities277
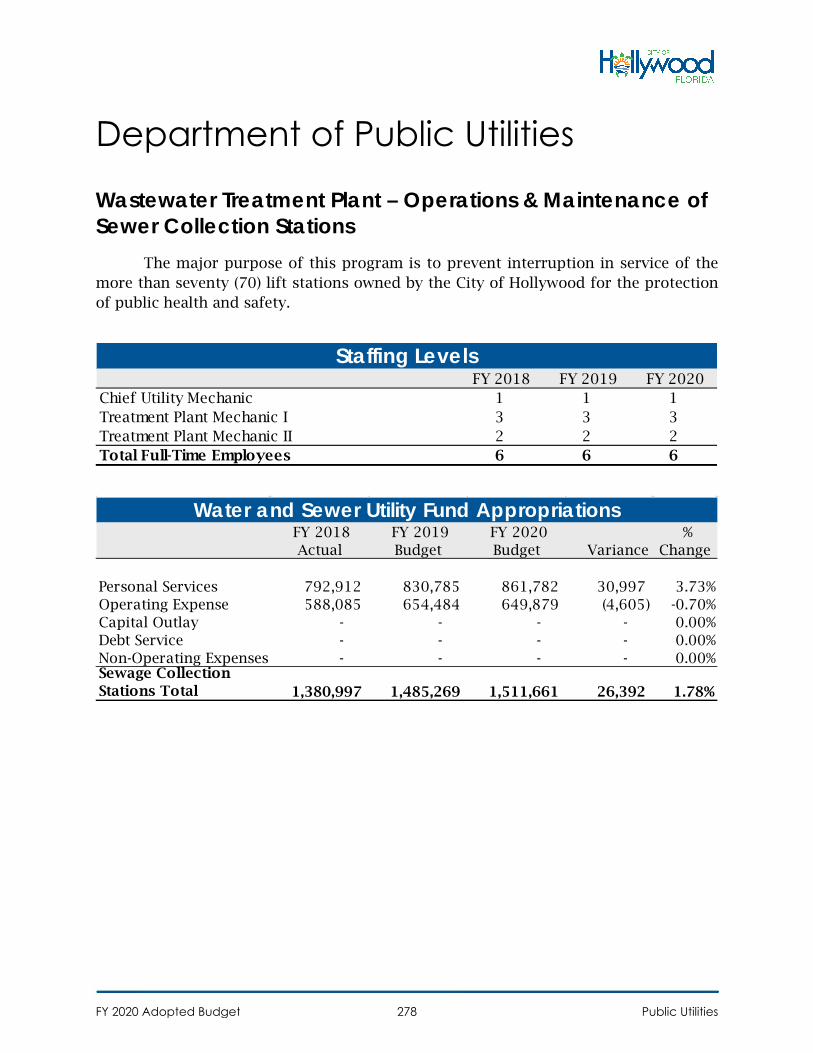
Department of Public Utilities
Wastewater Treatment Plant – Operations & Maintenance of Sewer Collection Stations
The major purpose of this program is to prevent interruption in service of the more than seventy (70) lift stations owned by the City of Hollywood for the protection of public health and safety.
FY 2018 FY 2019 FY 2020 Chief Utility Mechanic 1 1 1Treatment Plant Mechanic I 3 3 3Treatment Plant Mechanic II 2 2 2Total Full-Time Employees 6 6 6
Staffing Levels
FY 2018 Actual
FY 2019 Budget
FY 2020 Budget Variance
% Change
Personal Services 792,912 830,785 861,782 30,997 3.73%Operating Expense 588,085 654,484 649,879 (4,605) -0.70%Capital Outlay - - - - 0.00%Debt Service - - - - 0.00%Non-Operating Expenses - - - - 0.00%Sewage Collection Stations Total 1,380,997 1,485,269 1,511,661 26,392 1.78%
Water and Sewer Utility Fund Appropriations
FY 2020 Adopted Budget Public Utilities278
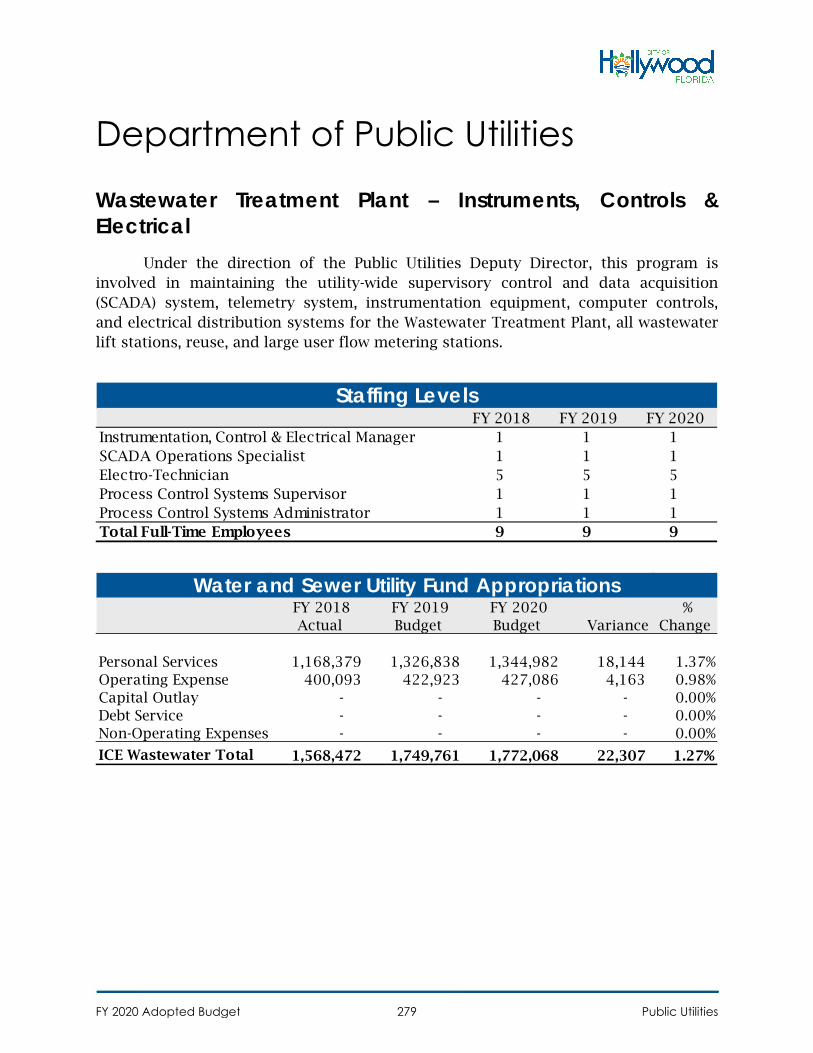
Department of Public Utilities
Wastewater Treatment Plant – Instruments, Controls & Electrical
Under the direction of the Public Utilities Deputy Director, this program is involved in maintaining the utility-wide supervisory control and data acquisition (SCADA) system, telemetry system, instrumentation equipment, computer controls, and electrical distribution systems for the Wastewater Treatment Plant, all wastewater lift stations, reuse, and large user flow metering stations.
FY 2018 FY 2019 FY 2020 Instrumentation, Control & Electrical Manager 1 1 1SCADA Operations Specialist 1 1 1Electro-Technician 5 5 5Process Control Systems Supervisor 1 1 1Process Control Systems Administrator 1 1 1Total Full-Time Employees 9 9 9
Staffing Levels
FY 2018 Actual
FY 2019 Budget
FY 2020 Budget Variance
% Change
Personal Services 1,168,379 1,326,838 1,344,982 18,144 1.37%Operating Expense 400,093 422,923 427,086 4,163 0.98%Capital Outlay - - - - 0.00%Debt Service - - - - 0.00%Non-Operating Expenses - - - - 0.00%
ICE Wastewater Total 1,568,472 1,749,761 1,772,068 22,307 1.27%
Water and Sewer Utility Fund Appropriations
FY 2020 Adopted Budget Public Utilities279
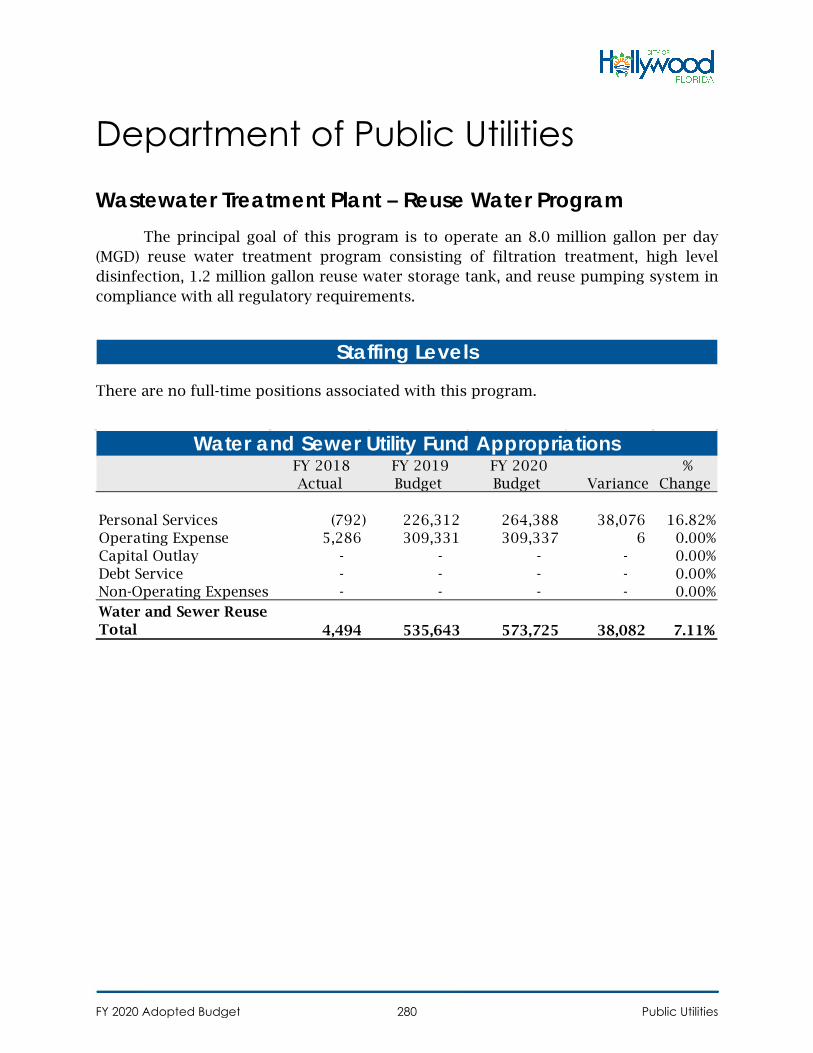
Department of Public Utilities
Wastewater Treatment Plant – Reuse Water ProgramThe principal goal of this program is to operate an 8.0 million gallon per day
(MGD) reuse water treatment program consisting of filtration treatment, high level disinfection, 1.2 million gallon reuse water storage tank, and reuse pumping system in compliance with all regulatory requirements.
There are no full-time positions associated with this program.
Staffing Levels
FY 2018 Actual
FY 2019 Budget
FY 2020 Budget Variance
% Change
Personal Services (792) 226,312 264,388 38,076 16.82%Operating Expense 5,286 309,331 309,337 6 0.00%Capital Outlay - - - - 0.00%Debt Service - - - - 0.00%Non-Operating Expenses - - - - 0.00%Water and Sewer Reuse Total 4,494 535,643 573,725 38,082 7.11%
Water and Sewer Utility Fund Appropriations
FY 2020 Adopted Budget Public Utilities280
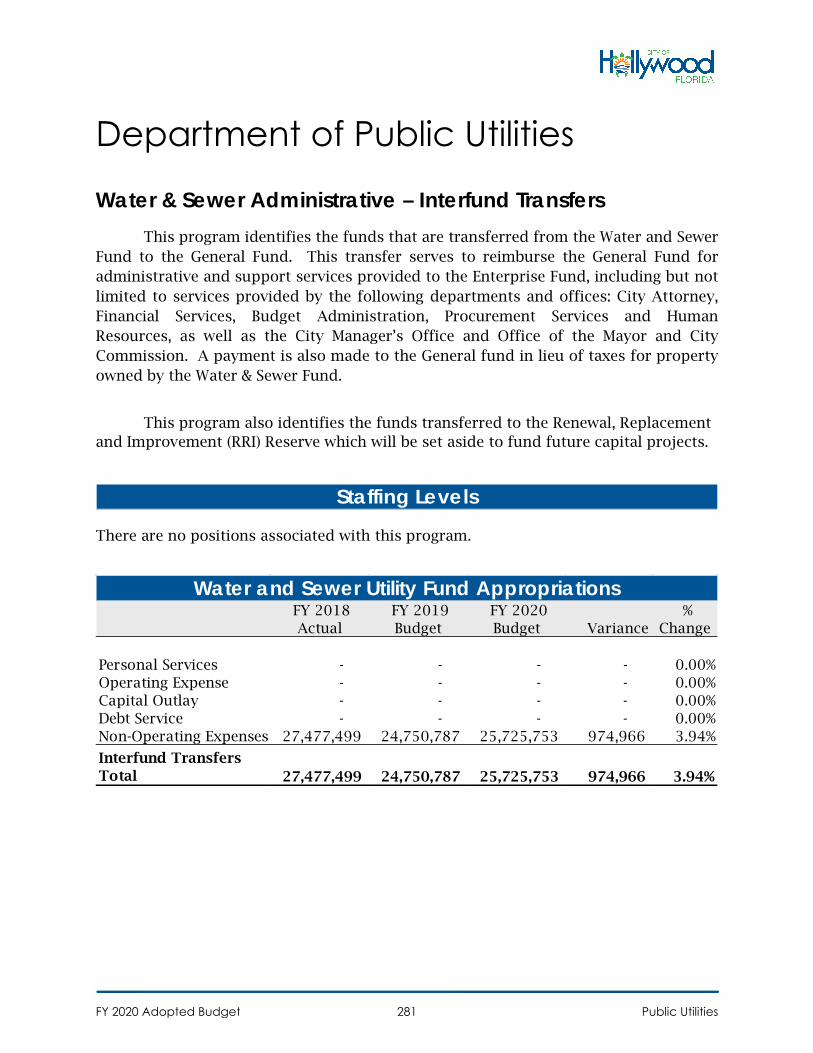
Department of Public Utilities
Water & Sewer Administrative – Interfund TransfersThis program identifies the funds that are transferred from the Water and Sewer
Fund to the General Fund. This transfer serves to reimburse the General Fund for administrative and support services provided to the Enterprise Fund, including but not limited to services provided by the following departments and offices: City Attorney, Financial Services, Budget Administration, Procurement Services and Human Resources, as well as the City Manager’s Office and Office of the Mayor and City Commission. A payment is also made to the General fund in lieu of taxes for property owned by the Water & Sewer Fund.
This program also identifies the funds transferred to the Renewal, Replacement and Improvement (RRI) Reserve which will be set aside to fund future capital projects.
There are no positions associated with this program.
Staffing Levels
FY 2018 Actual
FY 2019 Budget
FY 2020 Budget Variance
% Change
Personal Services - - - - 0.00%Operating Expense - - - - 0.00%Capital Outlay - - - - 0.00%Debt Service - - - - 0.00%Non-Operating Expenses 27,477,499 24,750,787 25,725,753 974,966 3.94%
Interfund Transfers Total 27,477,499 24,750,787 25,725,753 974,966 3.94%
Water and Sewer Utility Fund Appropriations
FY 2020 Adopted Budget Public Utilities281
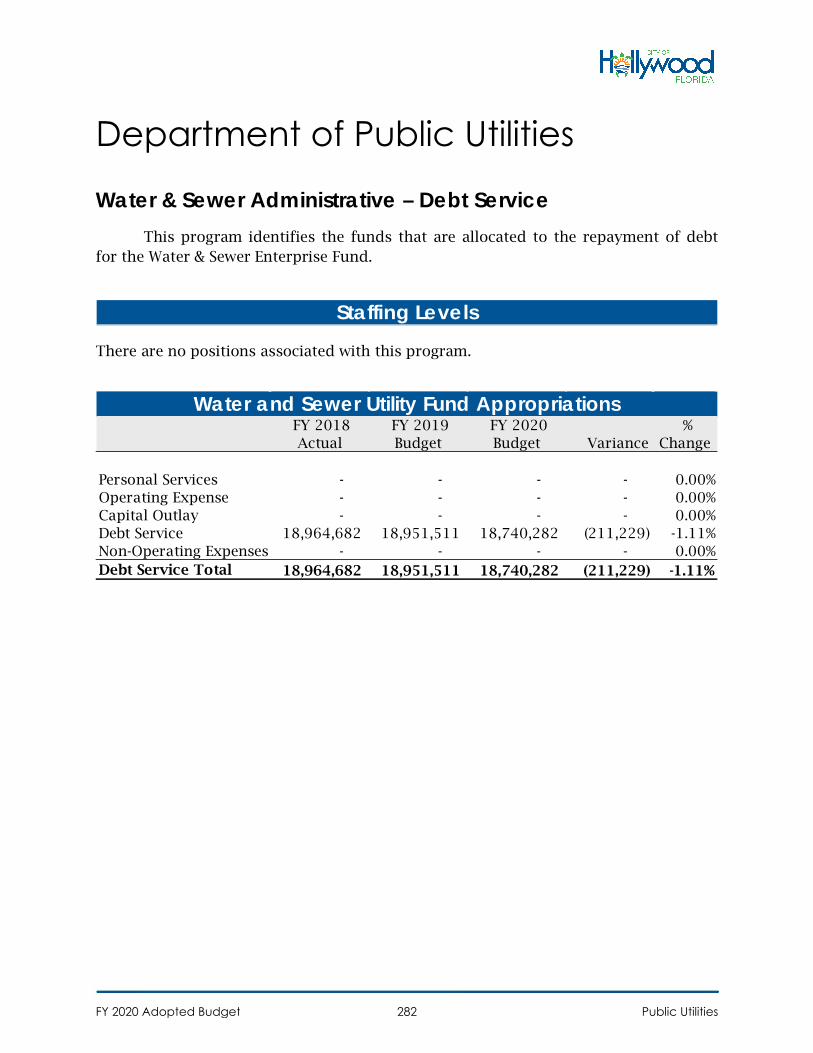
Department of Public Utilities
Water & Sewer Administrative – Debt ServiceThis program identifies the funds that are allocated to the repayment of debt
for the Water & Sewer Enterprise Fund.
There are no positions associated with this program.
Staffing Levels
FY 2018 Actual
FY 2019 Budget
FY 2020 Budget Variance
% Change
Personal Services - - - - 0.00%Operating Expense - - - - 0.00%Capital Outlay - - - - 0.00%Debt Service 18,964,682 18,951,511 18,740,282 (211,229) -1.11%Non-Operating Expenses - - - - 0.00%Debt Service Total 18,964,682 18,951,511 18,740,282 (211,229) -1.11%
Water and Sewer Utility Fund Appropriations
FY 2020 Adopted Budget Public Utilities282
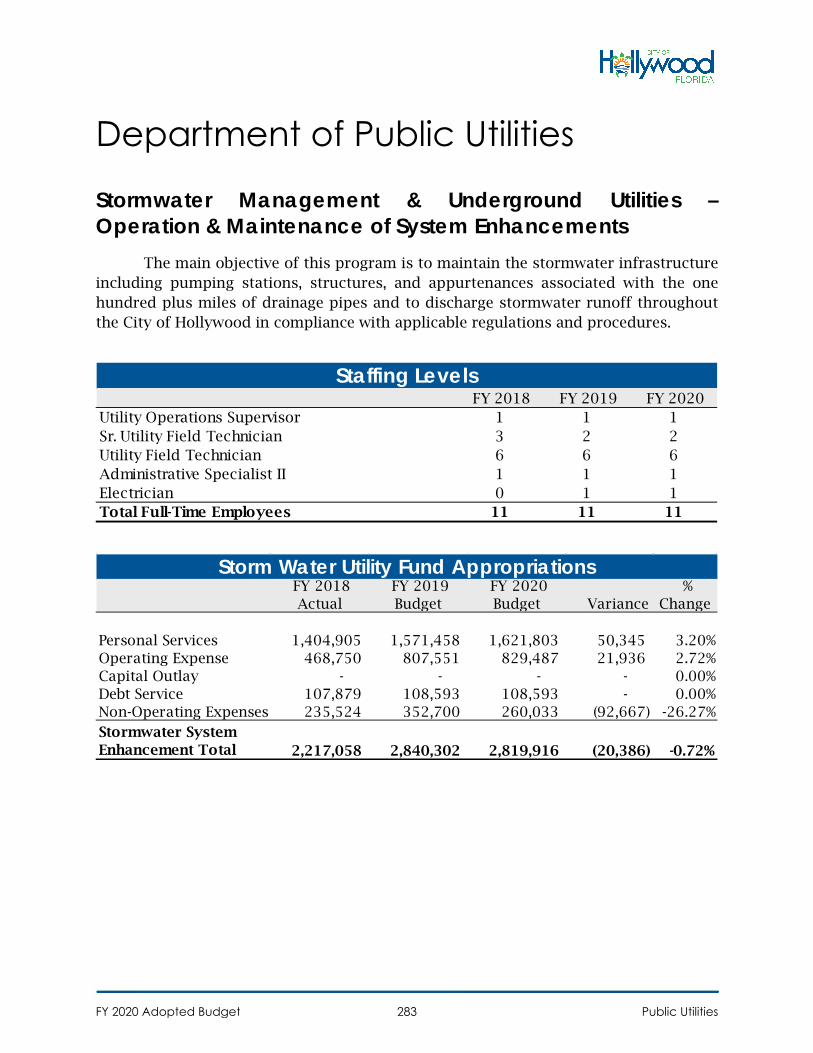
Department of Public Utilities
Stormwater Management & Underground Utilities – Operation & Maintenance of System Enhancements
The main objective of this program is to maintain the stormwater infrastructure including pumping stations, structures, and appurtenances associated with the one hundred plus miles of drainage pipes and to discharge stormwater runoff throughout the City of Hollywood in compliance with applicable regulations and procedures.
FY 2018 FY 2019 FY 2020 Utility Operations Supervisor 1 1 1Sr. Utility Field Technician 3 2 2Utility Field Technician 6 6 6Administrative Specialist II 1 1 1Electrician 0 1 1Total Full-Time Employees 11 11 11
Staffing Levels
FY 2018 Actual
FY 2019 Budget
FY 2020 Budget Variance
% Change
Personal Services 1,404,905 1,571,458 1,621,803 50,345 3.20%Operating Expense 468,750 807,551 829,487 21,936 2.72%Capital Outlay - - - - 0.00%Debt Service 107,879 108,593 108,593 - 0.00%Non-Operating Expenses 235,524 352,700 260,033 (92,667) -26.27%Stormwater System Enhancement Total 2,217,058 2,840,302 2,819,916 (20,386) -0.72%
Storm Water Utility Fund Appropriations
FY 2020 Adopted Budget Public Utilities283
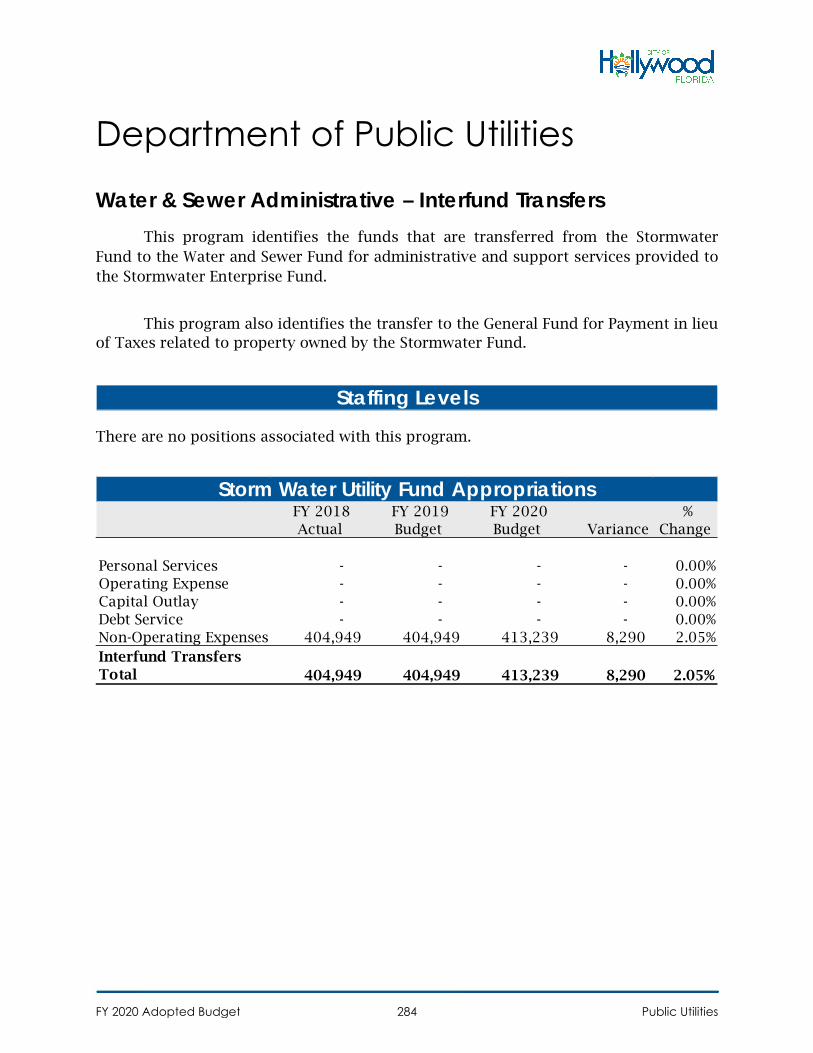
Department of Public Utilities
Water & Sewer Administrative – Interfund TransfersThis program identifies the funds that are transferred from the Stormwater
Fund to the Water and Sewer Fund for administrative and support services provided to the Stormwater Enterprise Fund.
This program also identifies the transfer to the General Fund for Payment in lieu of Taxes related to property owned by the Stormwater Fund.
There are no positions associated with this program.
Staffing Levels
FY 2018 Actual
FY 2019 Budget
FY 2020 Budget Variance
% Change
Personal Services - - - - 0.00%Operating Expense - - - - 0.00%Capital Outlay - - - - 0.00%Debt Service - - - - 0.00%Non-Operating Expenses 404,949 404,949 413,239 8,290 2.05%Interfund Transfers Total 404,949 404,949 413,239 8,290 2.05%
Storm Water Utility Fund Appropriations
FY 2020 Adopted Budget Public Utilities284
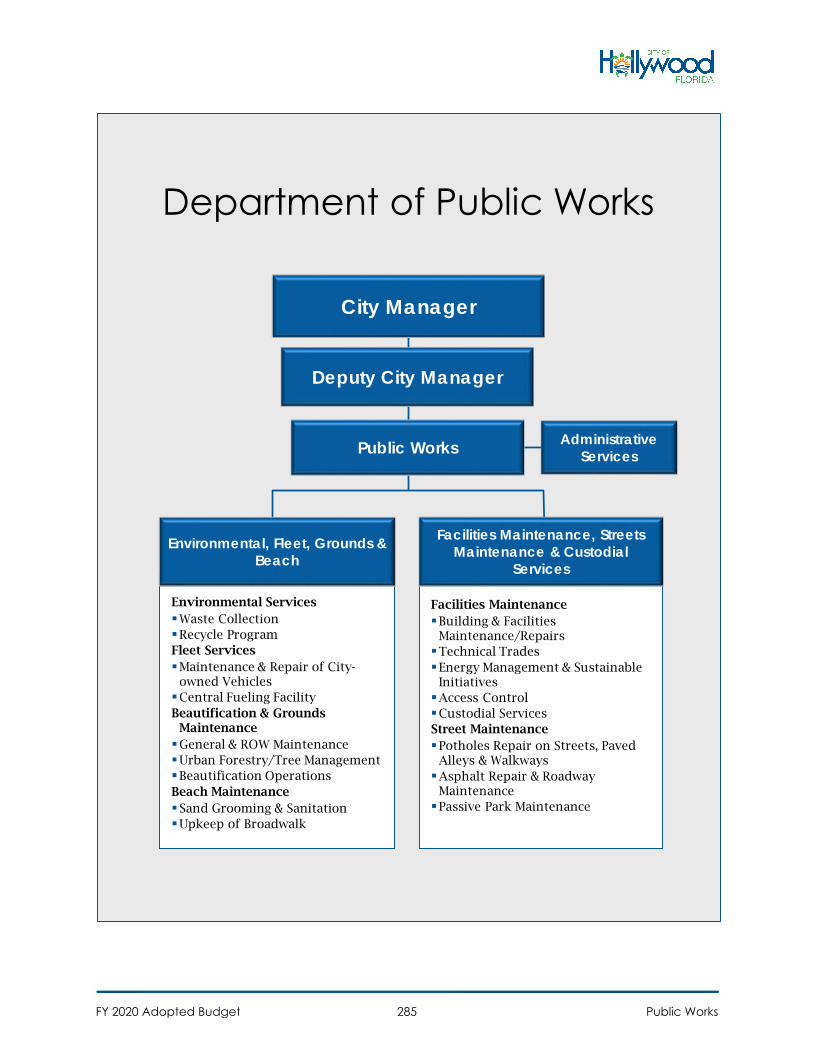
Department of Public Works
City Manager
Public Works
Facilities MaintenanceBuilding & Facilities
Maintenance/RepairsTechnical TradesEnergy Management & Sustainable
InitiativesAccess ControlCustodial ServicesStreet MaintenancePotholes Repair on Streets, Paved
Alleys & WalkwaysAsphalt Repair & Roadway
MaintenancePassive Park Maintenance
Deputy City Manager
Facilities Maintenance, Streets Maintenance & Custodial
Services
Environmental ServicesWaste CollectionRecycle ProgramFleet ServicesMaintenance & Repair of City-
owned VehiclesCentral Fueling FacilityBeautification & Grounds
MaintenanceGeneral & ROW MaintenanceUrban Forestry/Tree ManagementBeautification OperationsBeach MaintenanceSand Grooming & SanitationUpkeep of Broadwalk
Environmental, Fleet, Grounds & Beach
Administrative Services
FY 2020 Adopted Budget Public Works285
Department of Public Works
Summary The purpose of the Public Works Department is to improve and maintain the
City’s assets, infrastructure and facilities, and provide quality, efficient municipal services for residents, businesses, and visitors while responding to changing needs of the community.
FY 2019 Accomplishments • Partnered with Florida Power & Light to substantially complete a project that
will provide for City wide retrofit of Florida Power & Light-owned streetlights to an LED platform, and also created an audit protocol to track project status
• Hired Kessler Consulting Inc. (KCI), solid waste consultant, to evaluate solid waste program. Kessler, along with staff, developed proposed solid waste bids/RFP scheduled, reviewed current solid waste contracts, evaluated collection and contracting options, conducted a program review, and evaluated fees charged
• Received $51,091.59 in rebate revenue for FY19 from the Equity Lease program established in FY17
• 501c3 Hollywood Animal Rescue Team established and approved by City Commission
• Worked with Development Services/Design/Architectural Services/Engineering and the CRA completed the successful design, construction and relocation of the Beach Maintenance facilities.
• Installed additional lighting at Stan Goldman Park to illuminate the area immediately adjacent to the concession stand/restrooms and the adjacent parking area
• Completed repairs and/or refurbishment for 11 monument signs City-wide • Provided maintenance and environmental services support for St Patrick’s Day
event in the downtown CRA district and Fourth of July event in the beach CRA district
• Utilized approximately 147.90 tons of asphalt for pothole and asphalt repairs for City roadways and sidewalks
• Recycled approximately 8,000 lamps/light fixtures for City-wide facilities and City-owned street lights
• Completed the reinstallation of 28 street light poles that were knocked down due to traffic accidents
• Performed more than 6,000 maintenance hours of street lighting repairs
FY 2020 Adopted Budget Public Works286
• Replaced an aging flagpole and installed new LED lighting to illuminate a new flag and flagpole at the entrance to Charles Vollman Park
• Coordinated with Hollywood Police Department to remove 12 homeless camps that were identified within the City
• Participated in a cross-functional team to evaluate and provide recommendations for the redevelopment of the Public Works site (Park Road Redevelopment)
• Worked with Public Utilities and Procurement staff and developed specifications and successfully bid out 13 vehicles and pieces of equipment for Public Utilities.
• Participated in a steering committee to identify potential projects for the General Obligation Bond
• $1M in landscape capital projects are currently underway in varying stages of completion.
• Obtained an additional tree crew to clear trees and shrubs from blocking rights-of-way, alleys, streets etc.
• Distributed over 2,000 gallons of free paint to residents through the quarterly Operation Paintbrush program
• Organized the monthly Beach Sweep event, and with the assistance of over 1,020 volunteers, 2,885 lbs of trash was collected and removed from our Blue Wave Beach.
• 40 streets were adopted in the Adopt-A-Street program which equals to over 25.95 miles
• Completed the Annual Arbor Day event and celebrated the City’s 40th year as a Tree City USA
• Distributed over 391,873 gallons of alternative fuel • Implemented additional alternative fueled vehicles • Installed native Florida friendly landscape designs and efficient irrigation
systems in our parks, medians and facilities • Increased Administrative Citations by 94%. This increase resulted in a $7,000
revenue and also a faster compliance on minor property maintenance violations • Conducted sweeps of Yellow Green Farmers Market, Dixie Highway Corridor,
and 441 Corridor to ensure safety and compliance of City ordinances • Improved relationship with the City’s Building Division, where both Code
Officers (Building & Code) conducted joint inspections on properties, testified at Magistrates and are continuing to expand knowledge/expertise
FY 2020 Adopted Budget Public Works287
FY 2020 Goals • Coordinate with other City departments and Florida Power & Light to identify a
conversion strategy that would allow Florida Power & Light to assume the ownership and maintenance responsibility for City-owned street
• Assist with the administration and execution of capital restoration project(s) recommended with specifications detailed by the forensic engineering analysis of the Hollywood Beach Cultural & Community Center
• Coordinate with other City departments to determine the feasibility and make recommendations regarding Florida Power & Light’s Solar Together initiative
• Accomplish one maintenance project for the refurbishment and/or repair of one monument sign within each City Commission district
• Determine feasibility and make recommendations regarding assuming the operations and maintenance responsibility for City of Hollywood fire stations.
• Continue to participate in a cross-functional team to evaluate and provide recommendations for the redevelopment of the Public Works site (Park Road Redevelopment)
• Participate in a steering committee to execute identified projects for the General Obligation Bond
• Reduce landscape maintenance costs and improve appearance by replacing shrubs with sod and trees and native and other plantings in selected City medians
• Oversee the design and implementation of various citywide landscape improvement projects, dependent upon available resources
• Implement additional alternative fueled vehicles • Install native Florida friendly landscape designs and efficient irrigation systems
in our parks, medians and facilities • Address maintenance and improvements to existing dune features, and
construct new dunes/vegetation on Hollywood Beach • Continue with the Equity Lease program • Work with CRA to develop a solution for trash/garbage collection in the
downtown business district and Hollywood Beach, Surf Road area • Acquire new equipment to be used for clearing trees/shrubs from blocking
right-of-ways, alleys, streets etc. • Expand services to include a concrete repair crew and slowly sunset the 50/50
Sidewalk Program • Re-organize the Department to improve operations and gain efficiencies
FY 2020 Adopted Budget Public Works288
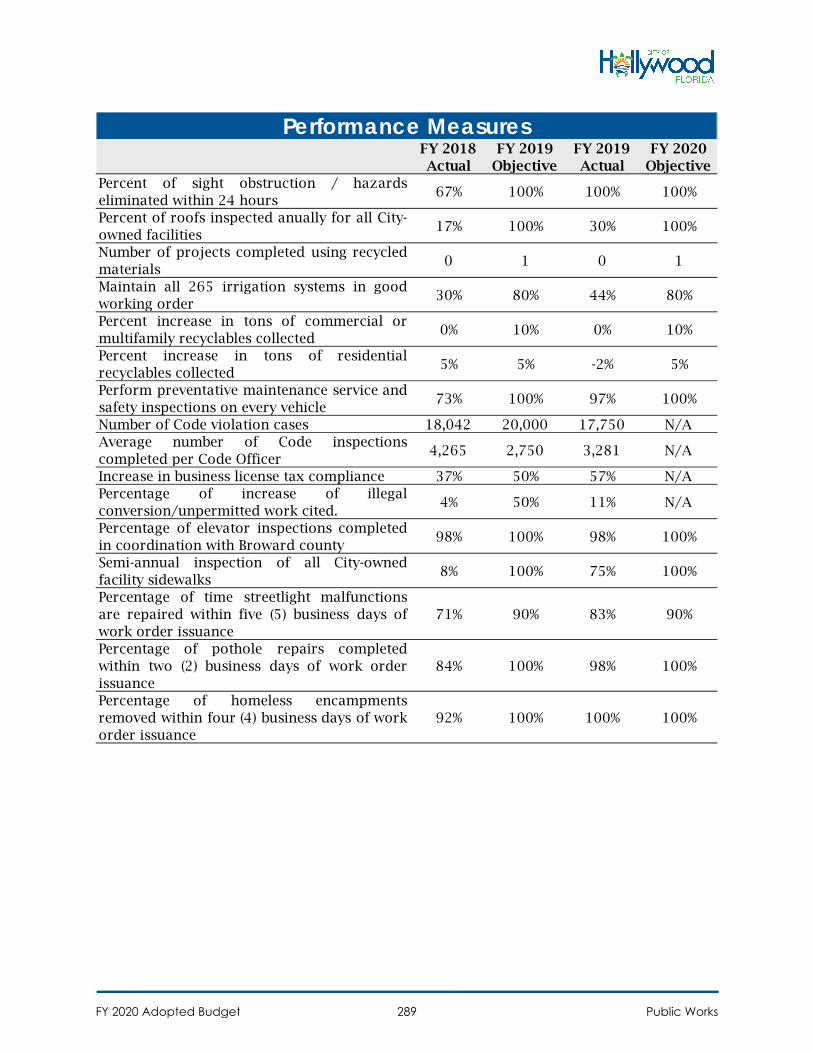
FY 2018 Actual
FY 2019 Objective
FY 2019 Actual
FY 2020 Objective
Percent of sight obstruction / hazardseliminated within 24 hours
67% 100% 100% 100%
Percent of roofs inspected anually for all City-owned facilities
17% 100% 30% 100%
Number of projects completed using recycledmaterials
0 1 0 1
Maintain all 265 irrigation systems in goodworking order
30% 80% 44% 80%
Percent increase in tons of commercial ormultifamily recyclables collected
0% 10% 0% 10%
Percent increase in tons of residentialrecyclables collected
5% 5% -2% 5%
Perform preventative maintenance service andsafety inspections on every vehicle
73% 100% 97% 100%
Number of Code violation cases 18,042 20,000 17,750 N/AAverage number of Code inspectionscompleted per Code Officer
4,265 2,750 3,281 N/A
Increase in business license tax compliance 37% 50% 57% N/APercentage of increase of illegalconversion/unpermitted work cited.
4% 50% 11% N/A
Percentage of elevator inspections completedin coordination with Broward county
98% 100% 98% 100%
Semi-annual inspection of all City-ownedfacility sidewalks
8% 100% 75% 100%
Percentage of time streetlight malfunctionsare repaired within five (5) business days ofwork order issuance
71% 90% 83% 90%
Percentage of pothole repairs completedwithin two (2) business days of work orderissuance
84% 100% 98% 100%
Percentage of homeless encampmentsremoved within four (4) business days of workorder issuance
92% 100% 100% 100%
Performance Measures
FY 2020 Adopted Budget Public Works289
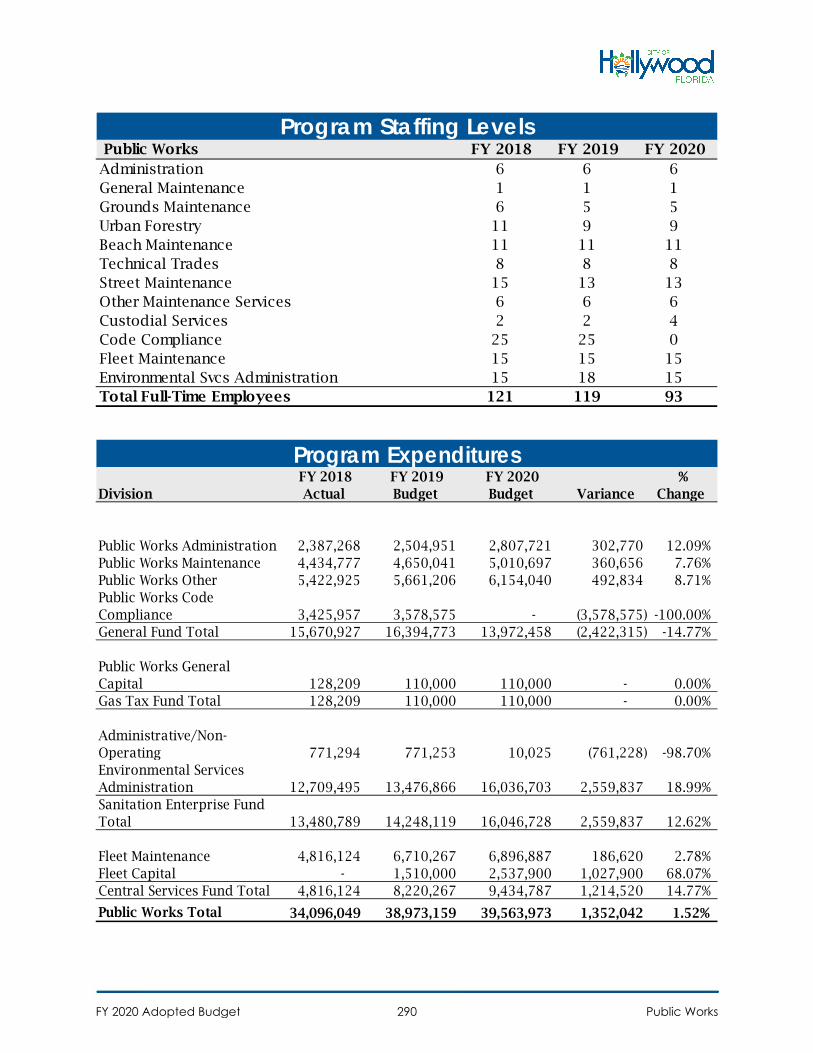
Public Works FY 2018 FY 2019 FY 2020 Administration 6 6 6General Maintenance 1 1 1Grounds Maintenance 6 5 5Urban Forestry 11 9 9Beach Maintenance 11 11 11Technical Trades 8 8 8Street Maintenance 15 13 13Other Maintenance Services 6 6 6Custodial Services 2 2 4Code Compliance 25 25 0Fleet Maintenance 15 15 15Environmental Svcs Administration 15 18 15Total Full-Time Employees 121 119 93
Program Staffing Levels
Division FY 2018
Actual FY 2019 Budget
FY 2020 Budget Variance
% Change
Public Works Administration 2,387,268 2,504,951 2,807,721 302,770 12.09%Public Works Maintenance 4,434,777 4,650,041 5,010,697 360,656 7.76%Public Works Other 5,422,925 5,661,206 6,154,040 492,834 8.71%Public Works Code Compliance 3,425,957 3,578,575 - (3,578,575) -100.00%General Fund Total 15,670,927 16,394,773 13,972,458 (2,422,315) -14.77%
Public Works General Capital 128,209 110,000 110,000 - 0.00%Gas Tax Fund Total 128,209 110,000 110,000 - 0.00%
Administrative/Non-Operating 771,294 771,253 10,025 (761,228) -98.70%Environmental Services Administration 12,709,495 13,476,866 16,036,703 2,559,837 18.99%Sanitation Enterprise Fund Total 13,480,789 14,248,119 16,046,728 2,559,837 12.62%
Fleet Maintenance 4,816,124 6,710,267 6,896,887 186,620 2.78%Fleet Capital - 1,510,000 2,537,900 1,027,900 68.07%Central Services Fund Total 4,816,124 8,220,267 9,434,787 1,214,520 14.77%
Public Works Total 34,096,049 38,973,159 39,563,973 1,352,042 1.52%
Program Expenditures
FY 2020 Adopted Budget Public Works290
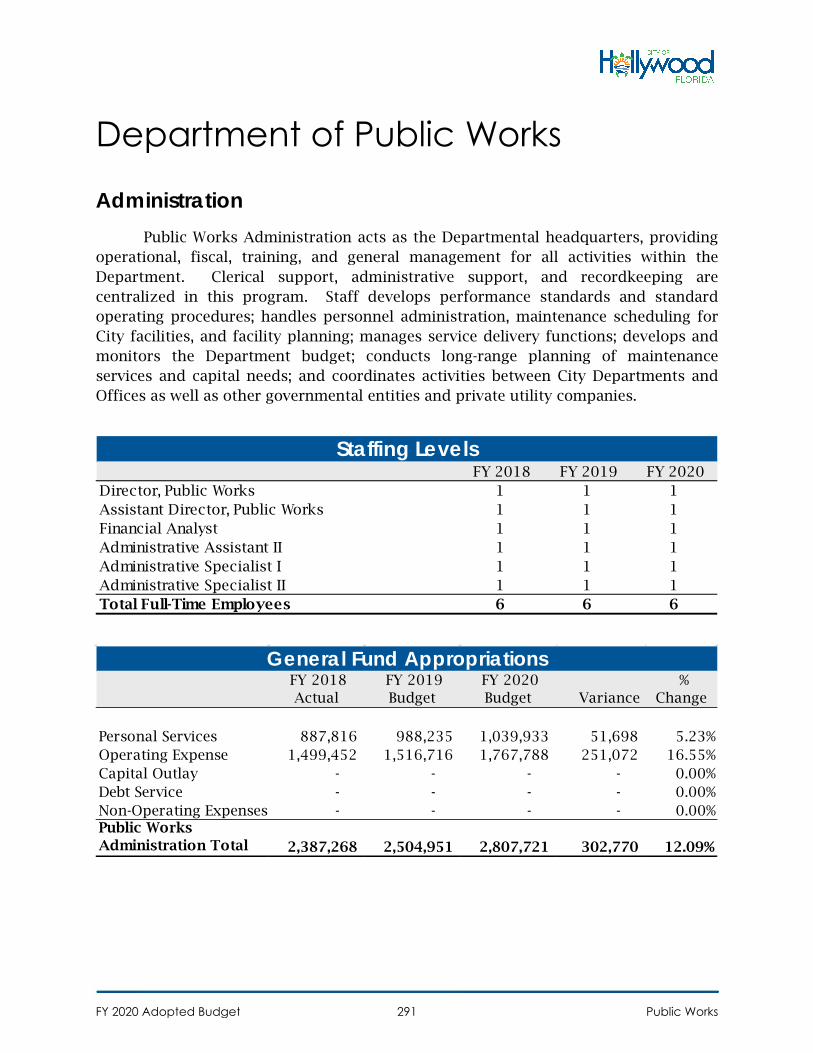
Department of Public Works
Administration Public Works Administration acts as the Departmental headquarters, providing
operational, fiscal, training, and general management for all activities within the Department. Clerical support, administrative support, and recordkeeping are centralized in this program. Staff develops performance standards and standard operating procedures; handles personnel administration, maintenance scheduling for City facilities, and facility planning; manages service delivery functions; develops and monitors the Department budget; conducts long-range planning of maintenance services and capital needs; and coordinates activities between City Departments and Offices as well as other governmental entities and private utility companies.
FY 2018 FY 2019 FY 2020 Director, Public Works 1 1 1Assistant Director, Public Works 1 1 1Financial Analyst 1 1 1Administrative Assistant II 1 1 1Administrative Specialist I 1 1 1Administrative Specialist II 1 1 1Total Full-Time Employees 6 6 6
Staffing Levels
FY 2018 Actual
FY 2019 Budget
FY 2020 Budget Variance
% Change
Personal Services 887,816 988,235 1,039,933 51,698 5.23%Operating Expense 1,499,452 1,516,716 1,767,788 251,072 16.55%Capital Outlay - - - - 0.00%Debt Service - - - - 0.00%Non-Operating Expenses - - - - 0.00%Public Works Administration Total 2,387,268 2,504,951 2,807,721 302,770 12.09%
General Fund Appropriations
FY 2020 Adopted Budget Public Works291
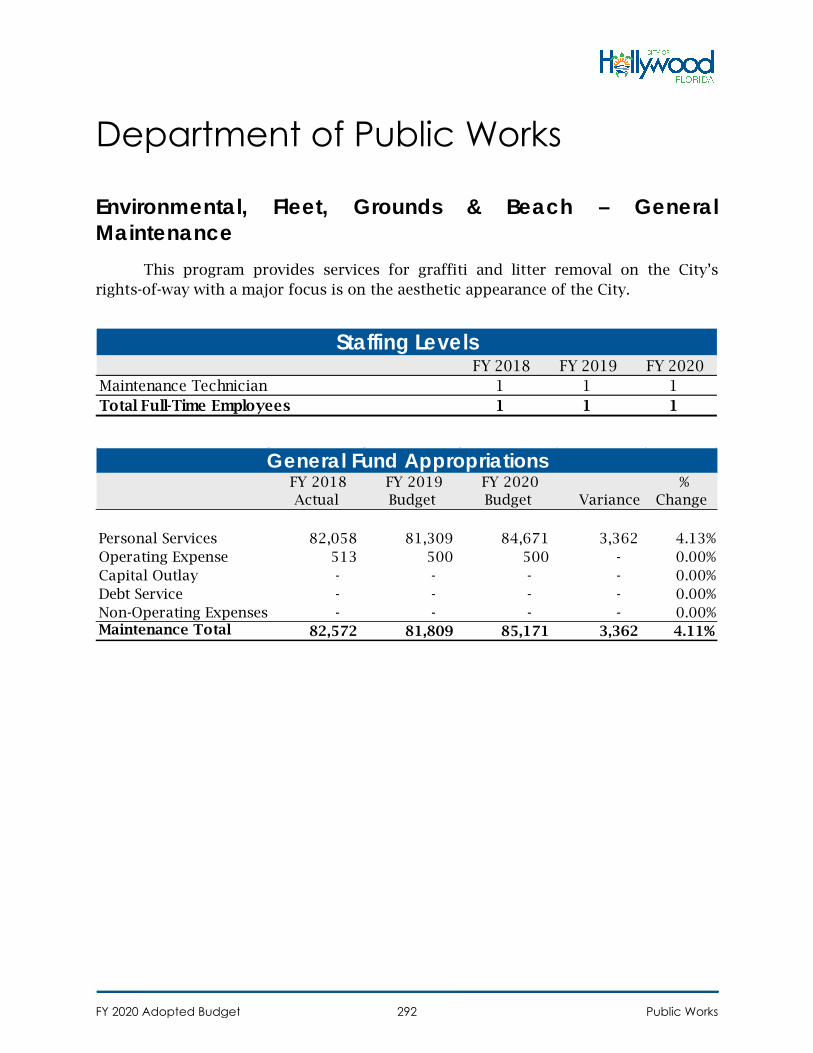
Department of Public Works
Environmental, Fleet, Grounds & Beach – General Maintenance
This program provides services for graffiti and litter removal on the City’s rights-of-way with a major focus is on the aesthetic appearance of the City.
FY 2018 FY 2019 FY 2020 Maintenance Technician 1 1 1Total Full-Time Employees 1 1 1
Staffing Levels
FY 2018 Actual
FY 2019 Budget
FY 2020 Budget Variance
% Change
Personal Services 82,058 81,309 84,671 3,362 4.13%Operating Expense 513 500 500 - 0.00%Capital Outlay - - - - 0.00%Debt Service - - - - 0.00%Non-Operating Expenses - - - - 0.00%Maintenance Total 82,572 81,809 85,171 3,362 4.11%
General Fund Appropriations
FY 2020 Adopted Budget Public Works292
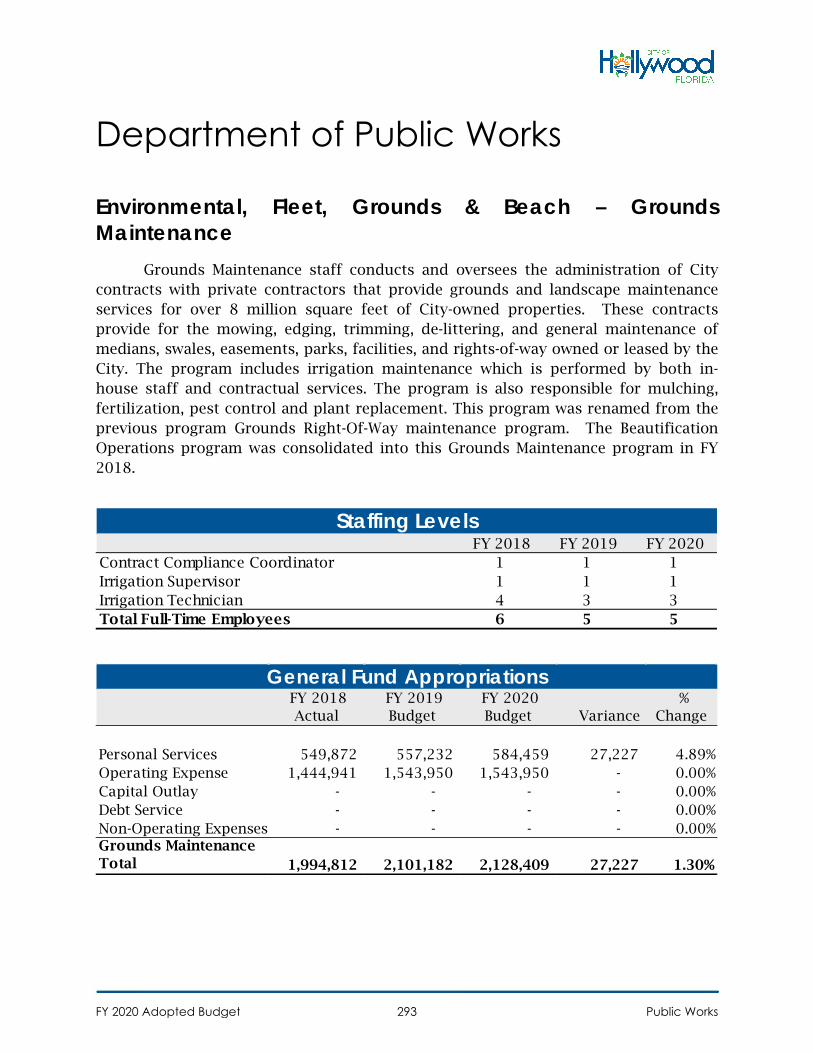
Department of Public Works
Environmental, Fleet, Grounds & Beach – Grounds Maintenance
Grounds Maintenance staff conducts and oversees the administration of City contracts with private contractors that provide grounds and landscape maintenance services for over 8 million square feet of City-owned properties. These contracts provide for the mowing, edging, trimming, de-littering, and general maintenance of medians, swales, easements, parks, facilities, and rights-of-way owned or leased by the City. The program includes irrigation maintenance which is performed by both in-house staff and contractual services. The program is also responsible for mulching, fertilization, pest control and plant replacement. This program was renamed from the previous program Grounds Right-Of-Way maintenance program. The Beautification Operations program was consolidated into this Grounds Maintenance program in FY 2018.
FY 2018 FY 2019 FY 2020 Contract Compliance Coordinator 1 1 1Irrigation Supervisor 1 1 1Irrigation Technician 4 3 3Total Full-Time Employees 6 5 5
Staffing Levels
FY 2018 Actual
FY 2019 Budget
FY 2020 Budget Variance
% Change
Personal Services 549,872 557,232 584,459 27,227 4.89%Operating Expense 1,444,941 1,543,950 1,543,950 - 0.00%Capital Outlay - - - - 0.00%Debt Service - - - - 0.00%Non-Operating Expenses - - - - 0.00%Grounds Maintenance Total 1,994,812 2,101,182 2,128,409 27,227 1.30%
General Fund Appropriations
FY 2020 Adopted Budget Public Works293
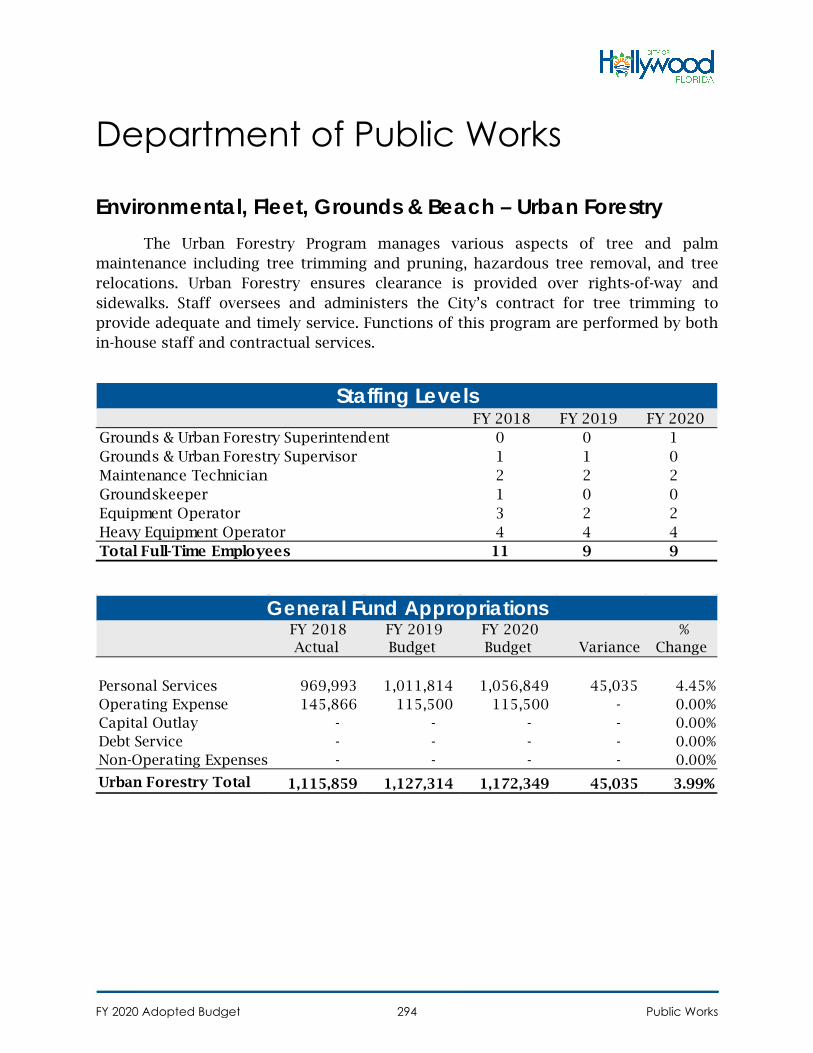
Department of Public Works
Environmental, Fleet, Grounds & Beach – Urban Forestry The Urban Forestry Program manages various aspects of tree and palm
maintenance including tree trimming and pruning, hazardous tree removal, and tree relocations. Urban Forestry ensures clearance is provided over rights-of-way and sidewalks. Staff oversees and administers the City’s contract for tree trimming to provide adequate and timely service. Functions of this program are performed by both in-house staff and contractual services.
FY 2018 FY 2019 FY 2020 Grounds & Urban Forestry Superintendent 0 0 1Grounds & Urban Forestry Supervisor 1 1 0Maintenance Technician 2 2 2Groundskeeper 1 0 0Equipment Operator 3 2 2Heavy Equipment Operator 4 4 4Total Full-Time Employees 11 9 9
Staffing Levels
FY 2018 Actual
FY 2019 Budget
FY 2020 Budget Variance
% Change
Personal Services 969,993 1,011,814 1,056,849 45,035 4.45%Operating Expense 145,866 115,500 115,500 - 0.00%Capital Outlay - - - - 0.00%Debt Service - - - - 0.00%Non-Operating Expenses - - - - 0.00%
Urban Forestry Total 1,115,859 1,127,314 1,172,349 45,035 3.99%
General Fund Appropriations
FY 2020 Adopted Budget Public Works294
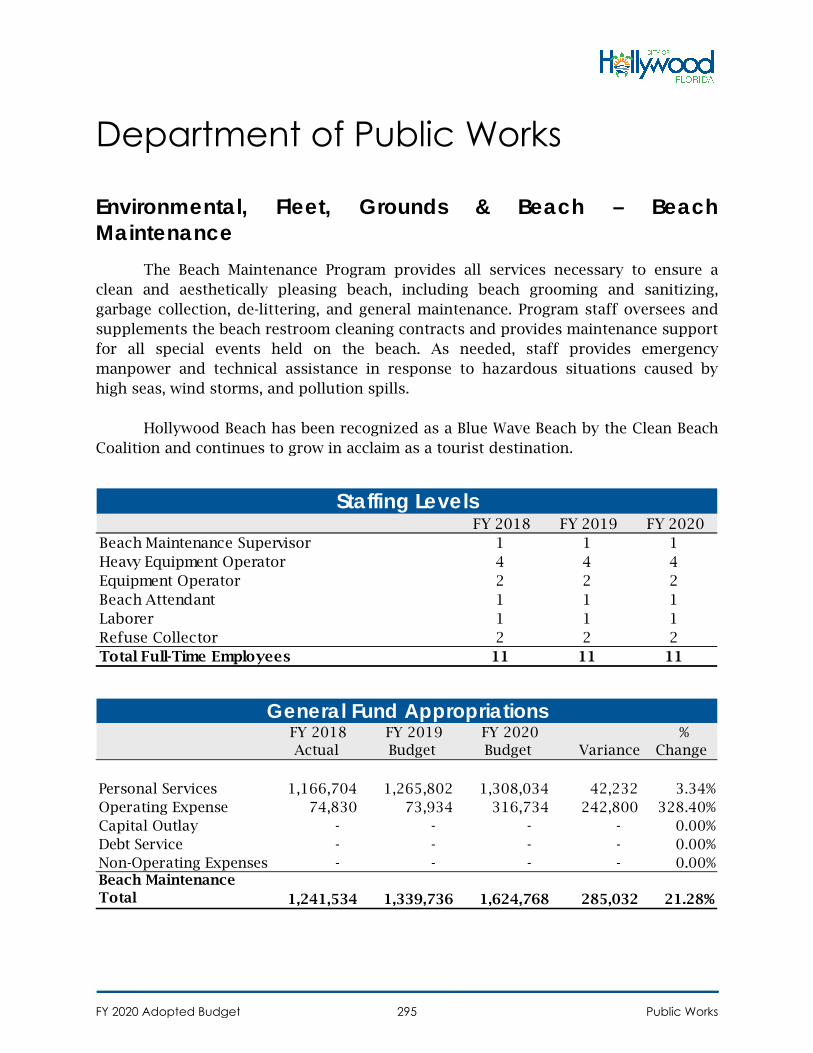
Department of Public Works
Environmental, Fleet, Grounds & Beach – Beach Maintenance
The Beach Maintenance Program provides all services necessary to ensure a clean and aesthetically pleasing beach, including beach grooming and sanitizing, garbage collection, de-littering, and general maintenance. Program staff oversees and supplements the beach restroom cleaning contracts and provides maintenance support for all special events held on the beach. As needed, staff provides emergency manpower and technical assistance in response to hazardous situations caused by high seas, wind storms, and pollution spills.
Hollywood Beach has been recognized as a Blue Wave Beach by the Clean Beach Coalition and continues to grow in acclaim as a tourist destination.
FY 2018 FY 2019 FY 2020 Beach Maintenance Supervisor 1 1 1Heavy Equipment Operator 4 4 4Equipment Operator 2 2 2Beach Attendant 1 1 1Laborer 1 1 1Refuse Collector 2 2 2Total Full-Time Employees 11 11 11
Staffing Levels
FY 2018 Actual
FY 2019 Budget
FY 2020 Budget Variance
% Change
Personal Services 1,166,704 1,265,802 1,308,034 42,232 3.34%Operating Expense 74,830 73,934 316,734 242,800 328.40%Capital Outlay - - - - 0.00%Debt Service - - - - 0.00%Non-Operating Expenses - - - - 0.00%Beach Maintenance Total 1,241,534 1,339,736 1,624,768 285,032 21.28%
General Fund Appropriations
FY 2020 Adopted Budget Public Works295
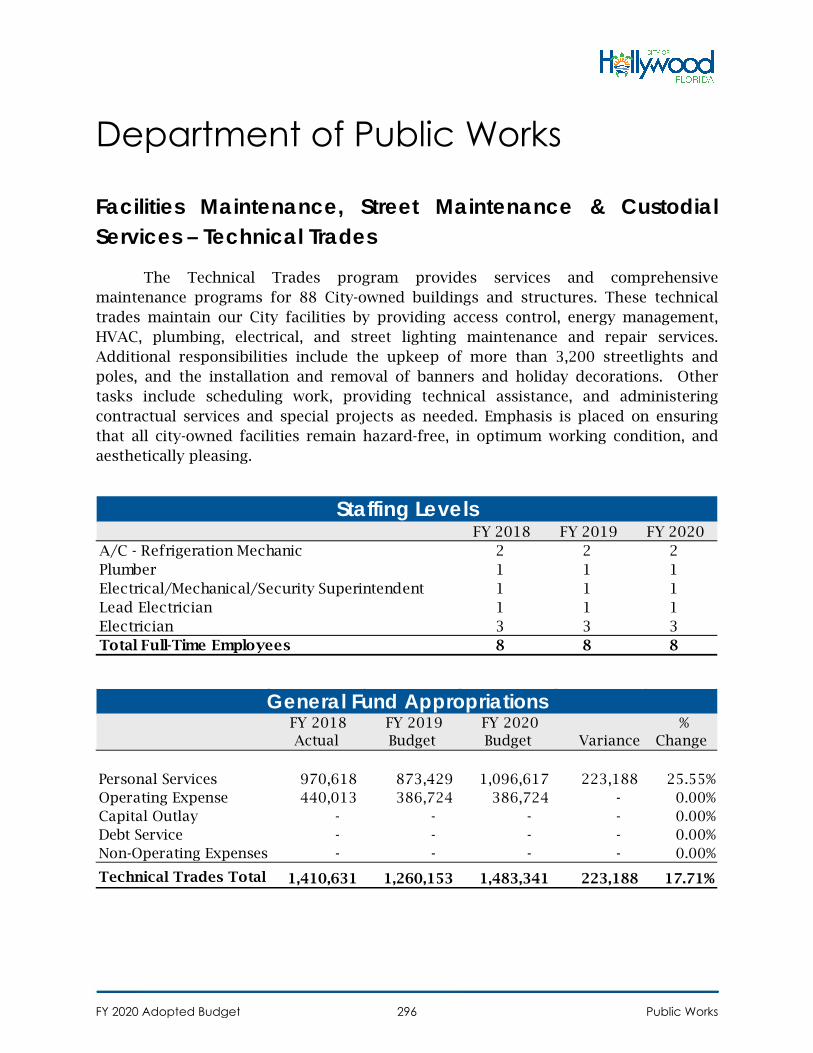
Department of Public Works
Facilities Maintenance, Street Maintenance & Custodial Services – Technical Trades
The Technical Trades program provides services and comprehensive maintenance programs for 88 City-owned buildings and structures. These technical trades maintain our City facilities by providing access control, energy management, HVAC, plumbing, electrical, and street lighting maintenance and repair services. Additional responsibilities include the upkeep of more than 3,200 streetlights and poles, and the installation and removal of banners and holiday decorations. Other tasks include scheduling work, providing technical assistance, and administering contractual services and special projects as needed. Emphasis is placed on ensuring that all city-owned facilities remain hazard-free, in optimum working condition, and aesthetically pleasing.
FY 2018 FY 2019 FY 2020 A/C - Refrigeration Mechanic 2 2 2Plumber 1 1 1Electrical/Mechanical/Security Superintendent 1 1 1Lead Electrician 1 1 1Electrician 3 3 3Total Full-Time Employees 8 8 8
Staffing Levels
FY 2018 Actual
FY 2019 Budget
FY 2020 Budget Variance
% Change
Personal Services 970,618 873,429 1,096,617 223,188 25.55%Operating Expense 440,013 386,724 386,724 - 0.00%Capital Outlay - - - - 0.00%Debt Service - - - - 0.00%Non-Operating Expenses - - - - 0.00%
Technical Trades Total 1,410,631 1,260,153 1,483,341 223,188 17.71%
General Fund Appropriations
FY 2020 Adopted Budget Public Works296
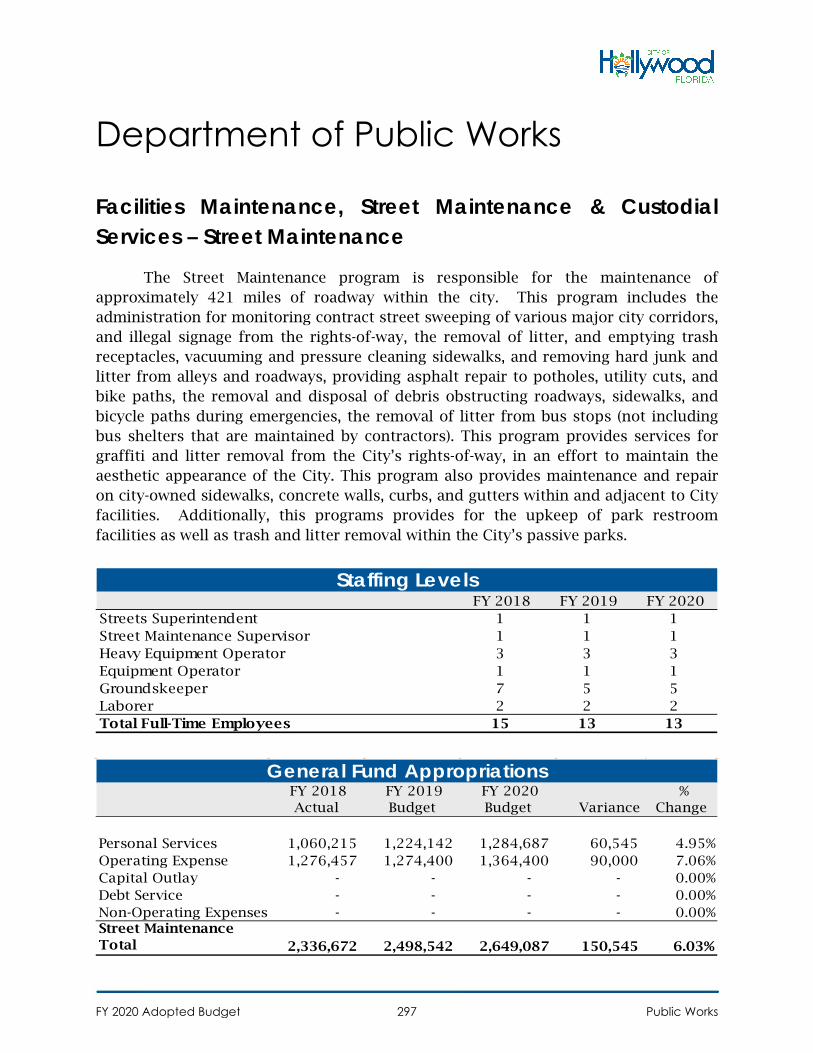
Department of Public Works
Facilities Maintenance, Street Maintenance & Custodial Services – Street Maintenance
The Street Maintenance program is responsible for the maintenance of approximately 421 miles of roadway within the city. This program includes the administration for monitoring contract street sweeping of various major city corridors, and illegal signage from the rights-of-way, the removal of litter, and emptying trash receptacles, vacuuming and pressure cleaning sidewalks, and removing hard junk and litter from alleys and roadways, providing asphalt repair to potholes, utility cuts, and bike paths, the removal and disposal of debris obstructing roadways, sidewalks, and bicycle paths during emergencies, the removal of litter from bus stops (not including bus shelters that are maintained by contractors). This program provides services for graffiti and litter removal from the City’s rights-of-way, in an effort to maintain the aesthetic appearance of the City. This program also provides maintenance and repair on city-owned sidewalks, concrete walls, curbs, and gutters within and adjacent to City facilities. Additionally, this programs provides for the upkeep of park restroom facilities as well as trash and litter removal within the City’s passive parks.
FY 2018 FY 2019 FY 2020 Streets Superintendent 1 1 1Street Maintenance Supervisor 1 1 1Heavy Equipment Operator 3 3 3Equipment Operator 1 1 1Groundskeeper 7 5 5Laborer 2 2 2Total Full-Time Employees 15 13 13
Staffing Levels
FY 2018 Actual
FY 2019 Budget
FY 2020 Budget Variance
% Change
Personal Services 1,060,215 1,224,142 1,284,687 60,545 4.95%Operating Expense 1,276,457 1,274,400 1,364,400 90,000 7.06%Capital Outlay - - - - 0.00%Debt Service - - - - 0.00%Non-Operating Expenses - - - - 0.00%Street Maintenance Total 2,336,672 2,498,542 2,649,087 150,545 6.03%
General Fund Appropriations
FY 2020 Adopted Budget Public Works297
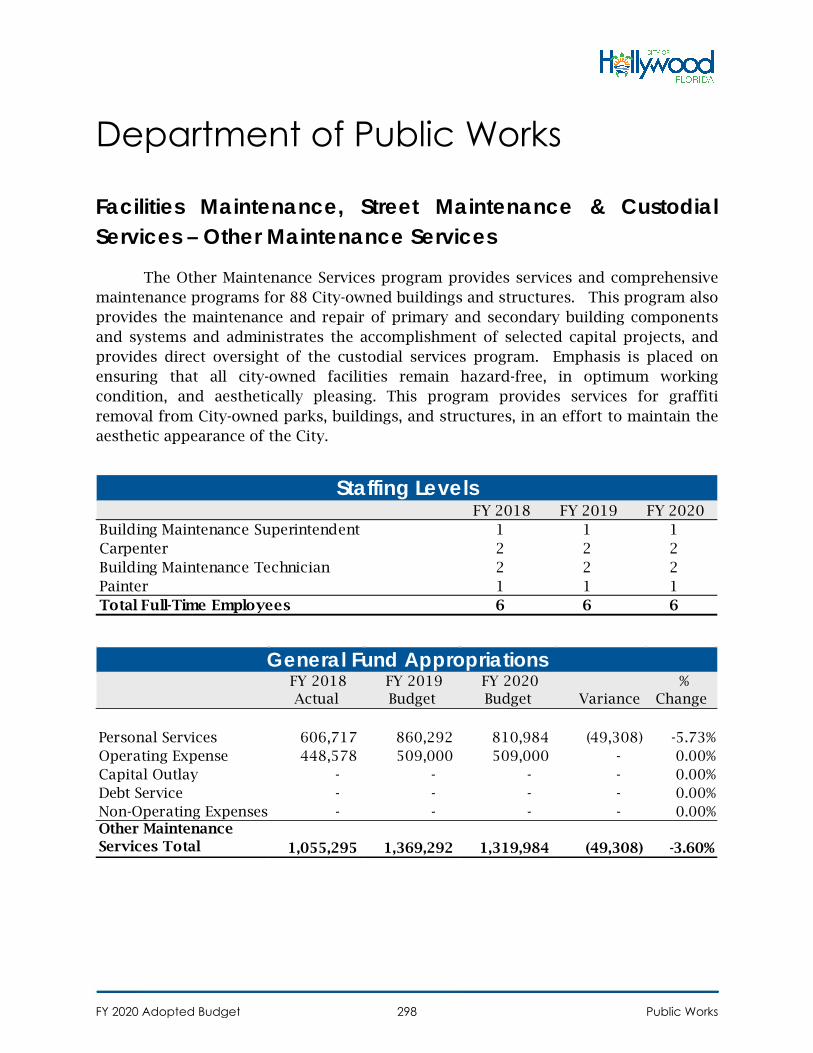
Department of Public Works
Facilities Maintenance, Street Maintenance & Custodial Services – Other Maintenance Services
The Other Maintenance Services program provides services and comprehensive maintenance programs for 88 City-owned buildings and structures. This program also provides the maintenance and repair of primary and secondary building components and systems and administrates the accomplishment of selected capital projects, and provides direct oversight of the custodial services program. Emphasis is placed on ensuring that all city-owned facilities remain hazard-free, in optimum working condition, and aesthetically pleasing. This program provides services for graffiti removal from City-owned parks, buildings, and structures, in an effort to maintain the aesthetic appearance of the City.
FY 2018 FY 2019 FY 2020 Building Maintenance Superintendent 1 1 1Carpenter 2 2 2Building Maintenance Technician 2 2 2Painter 1 1 1Total Full-Time Employees 6 6 6
Staffing Levels
FY 2018 Actual
FY 2019 Budget
FY 2020 Budget Variance
% Change
Personal Services 606,717 860,292 810,984 (49,308) -5.73%Operating Expense 448,578 509,000 509,000 - 0.00%Capital Outlay - - - - 0.00%Debt Service - - - - 0.00%Non-Operating Expenses - - - - 0.00%Other Maintenance Services Total 1,055,295 1,369,292 1,319,984 (49,308) -3.60%
General Fund Appropriations
FY 2020 Adopted Budget Public Works298
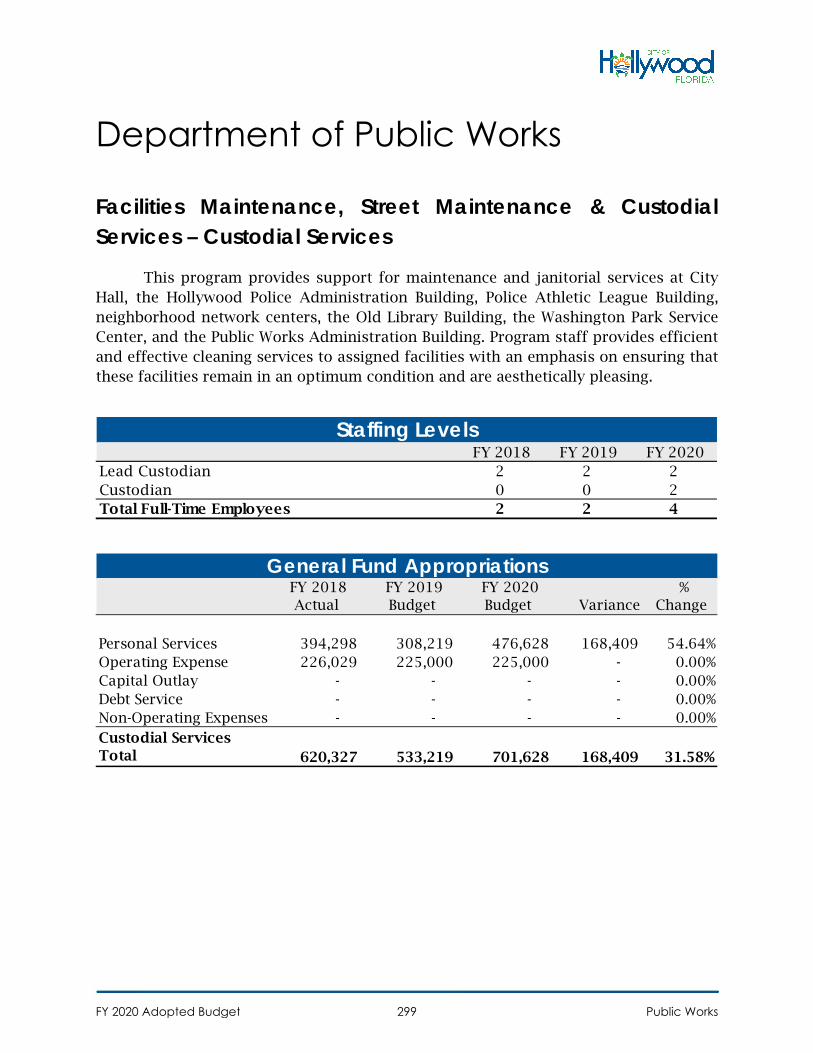
Department of Public Works
Facilities Maintenance, Street Maintenance & Custodial Services – Custodial Services
This program provides support for maintenance and janitorial services at City Hall, the Hollywood Police Administration Building, Police Athletic League Building, neighborhood network centers, the Old Library Building, the Washington Park Service Center, and the Public Works Administration Building. Program staff provides efficient and effective cleaning services to assigned facilities with an emphasis on ensuring that these facilities remain in an optimum condition and are aesthetically pleasing.
FY 2018 FY 2019 FY 2020 Lead Custodian 2 2 2Custodian 0 0 2Total Full-Time Employees 2 2 4
Staffing Levels
FY 2018 Actual
FY 2019 Budget
FY 2020 Budget Variance
% Change
Personal Services 394,298 308,219 476,628 168,409 54.64%Operating Expense 226,029 225,000 225,000 - 0.00%Capital Outlay - - - - 0.00%Debt Service - - - - 0.00%Non-Operating Expenses - - - - 0.00%Custodial Services Total 620,327 533,219 701,628 168,409 31.58%
General Fund Appropriations
FY 2020 Adopted Budget Public Works299
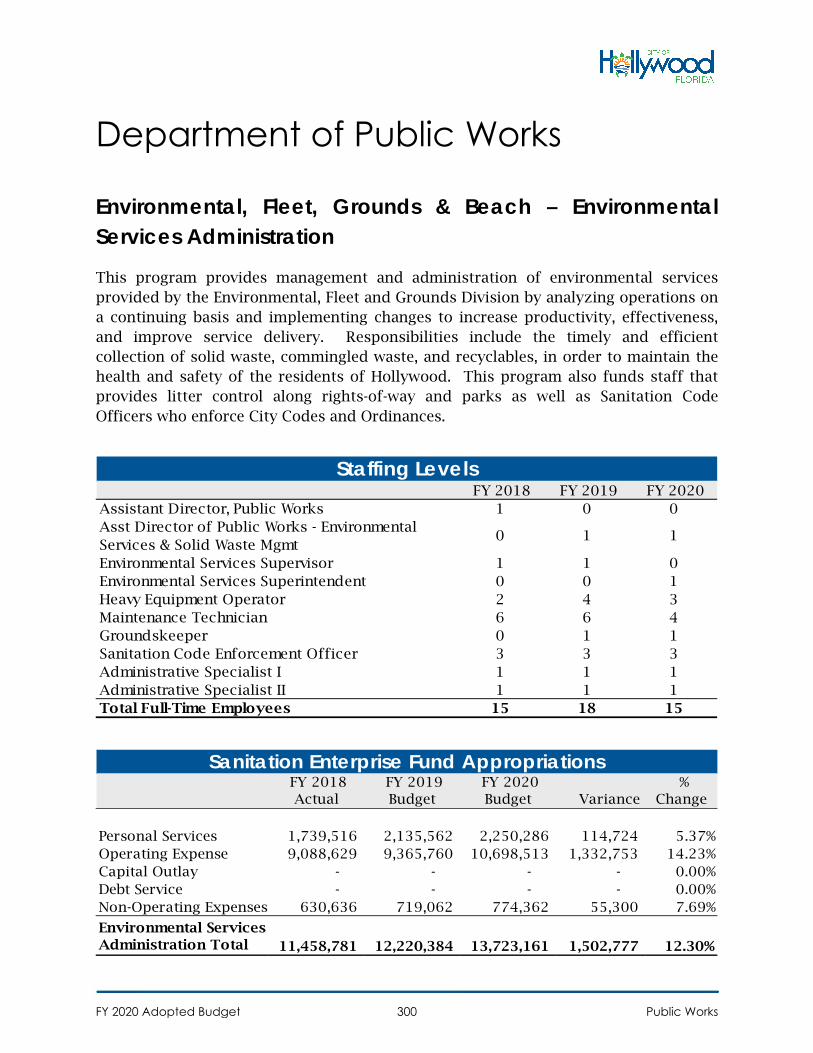
Department of Public Works
Environmental, Fleet, Grounds & Beach – Environmental Services Administration
This program provides management and administration of environmental services provided by the Environmental, Fleet and Grounds Division by analyzing operations on a continuing basis and implementing changes to increase productivity, effectiveness, and improve service delivery. Responsibilities include the timely and efficient collection of solid waste, commingled waste, and recyclables, in order to maintain the health and safety of the residents of Hollywood. This program also funds staff that provides litter control along rights-of-way and parks as well as Sanitation Code Officers who enforce City Codes and Ordinances.
FY 2018 FY 2019 FY 2020 Assistant Director, Public Works 1 0 0Asst Director of Public Works - Environmental Services & Solid Waste Mgmt
0 1 1
Environmental Services Supervisor 1 1 0Environmental Services Superintendent 0 0 1Heavy Equipment Operator 2 4 3Maintenance Technician 6 6 4Groundskeeper 0 1 1Sanitation Code Enforcement Officer 3 3 3Administrative Specialist I 1 1 1Administrative Specialist II 1 1 1Total Full-Time Employees 15 18 15
Staffing Levels
FY 2018 Actual
FY 2019 Budget
FY 2020 Budget Variance
% Change
Personal Services 1,739,516 2,135,562 2,250,286 114,724 5.37%Operating Expense 9,088,629 9,365,760 10,698,513 1,332,753 14.23%Capital Outlay - - - - 0.00%Debt Service - - - - 0.00%Non-Operating Expenses 630,636 719,062 774,362 55,300 7.69%
Environmental Services Administration Total 11,458,781 12,220,384 13,723,161 1,502,777 12.30%
Sanitation Enterprise Fund Appropriations
FY 2020 Adopted Budget Public Works300
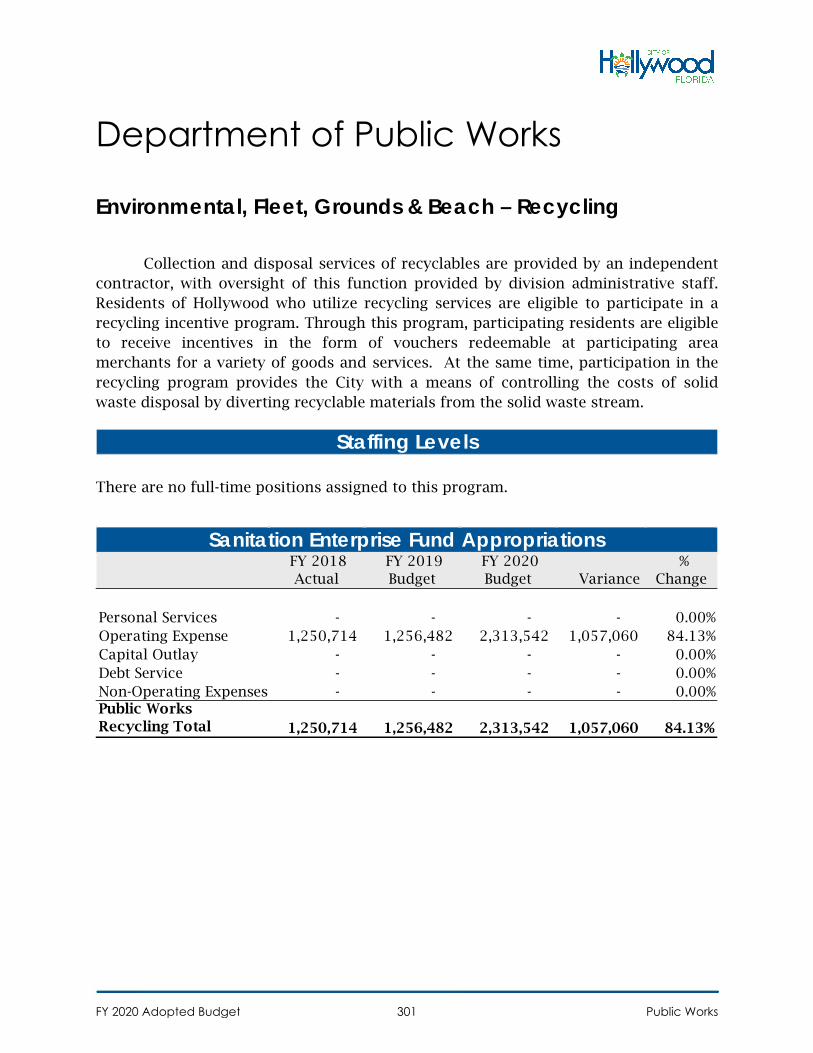
Department of Public Works
Environmental, Fleet, Grounds & Beach – Recycling
Collection and disposal services of recyclables are provided by an independent contractor, with oversight of this function provided by division administrative staff. Residents of Hollywood who utilize recycling services are eligible to participate in a recycling incentive program. Through this program, participating residents are eligible to receive incentives in the form of vouchers redeemable at participating area merchants for a variety of goods and services. At the same time, participation in the recycling program provides the City with a means of controlling the costs of solid waste disposal by diverting recyclable materials from the solid waste stream.
There are no full-time positions assigned to this program.
Staffing Levels
FY 2018 Actual
FY 2019 Budget
FY 2020 Budget Variance
% Change
Personal Services - - - - 0.00%Operating Expense 1,250,714 1,256,482 2,313,542 1,057,060 84.13%Capital Outlay - - - - 0.00%Debt Service - - - - 0.00%Non-Operating Expenses - - - - 0.00%Public Works Recycling Total 1,250,714 1,256,482 2,313,542 1,057,060 84.13%
Sanitation Enterprise Fund Appropriations
FY 2020 Adopted Budget Public Works301
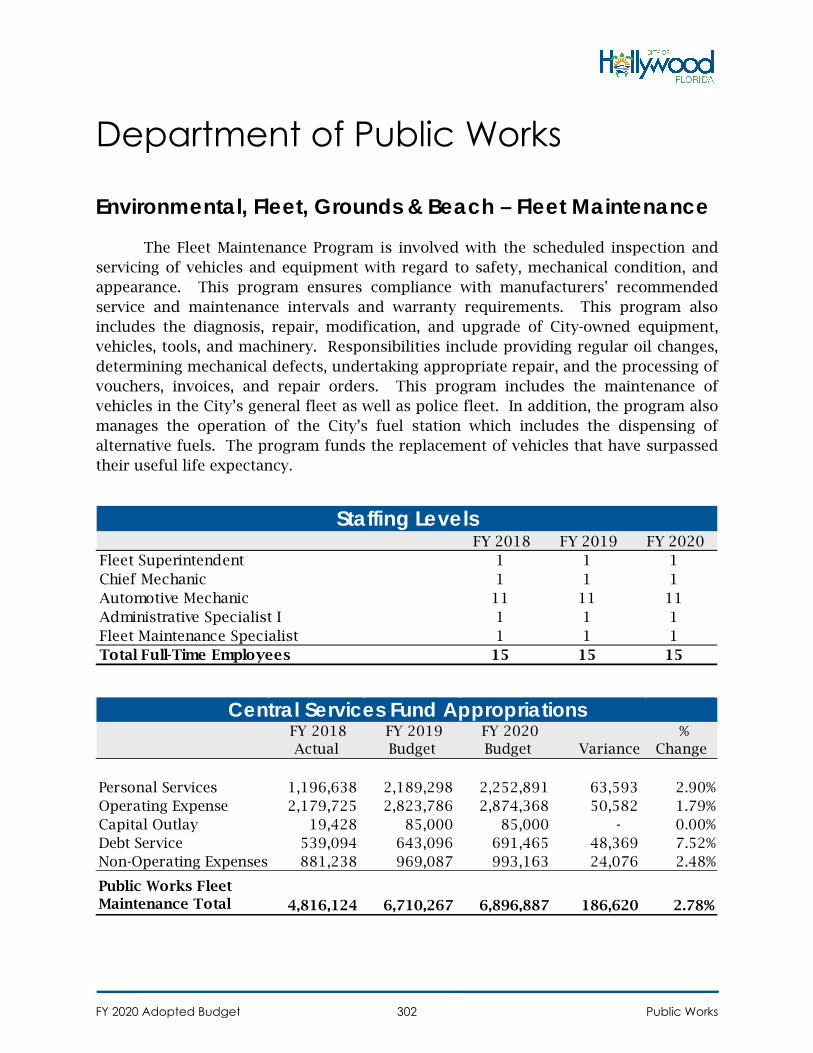
Department of Public Works
Environmental, Fleet, Grounds & Beach – Fleet Maintenance
The Fleet Maintenance Program is involved with the scheduled inspection and servicing of vehicles and equipment with regard to safety, mechanical condition, and appearance. This program ensures compliance with manufacturers' recommended service and maintenance intervals and warranty requirements. This program also includes the diagnosis, repair, modification, and upgrade of City-owned equipment, vehicles, tools, and machinery. Responsibilities include providing regular oil changes, determining mechanical defects, undertaking appropriate repair, and the processing of vouchers, invoices, and repair orders. This program includes the maintenance of vehicles in the City’s general fleet as well as police fleet. In addition, the program also manages the operation of the City’s fuel station which includes the dispensing of alternative fuels. The program funds the replacement of vehicles that have surpassed their useful life expectancy.
FY 2018 FY 2019 FY 2020 Fleet Superintendent 1 1 1Chief Mechanic 1 1 1Automotive Mechanic 11 11 11Administrative Specialist I 1 1 1Fleet Maintenance Specialist 1 1 1Total Full-Time Employees 15 15 15
Staffing Levels
FY 2018 Actual
FY 2019 Budget
FY 2020 Budget Variance
% Change
Personal Services 1,196,638 2,189,298 2,252,891 63,593 2.90%Operating Expense 2,179,725 2,823,786 2,874,368 50,582 1.79%Capital Outlay 19,428 85,000 85,000 - 0.00%Debt Service 539,094 643,096 691,465 48,369 7.52%Non-Operating Expenses 881,238 969,087 993,163 24,076 2.48%
Public Works Fleet Maintenance Total 4,816,124 6,710,267 6,896,887 186,620 2.78%
Central Services Fund Appropriations
FY 2020 Adopted Budget Public Works302
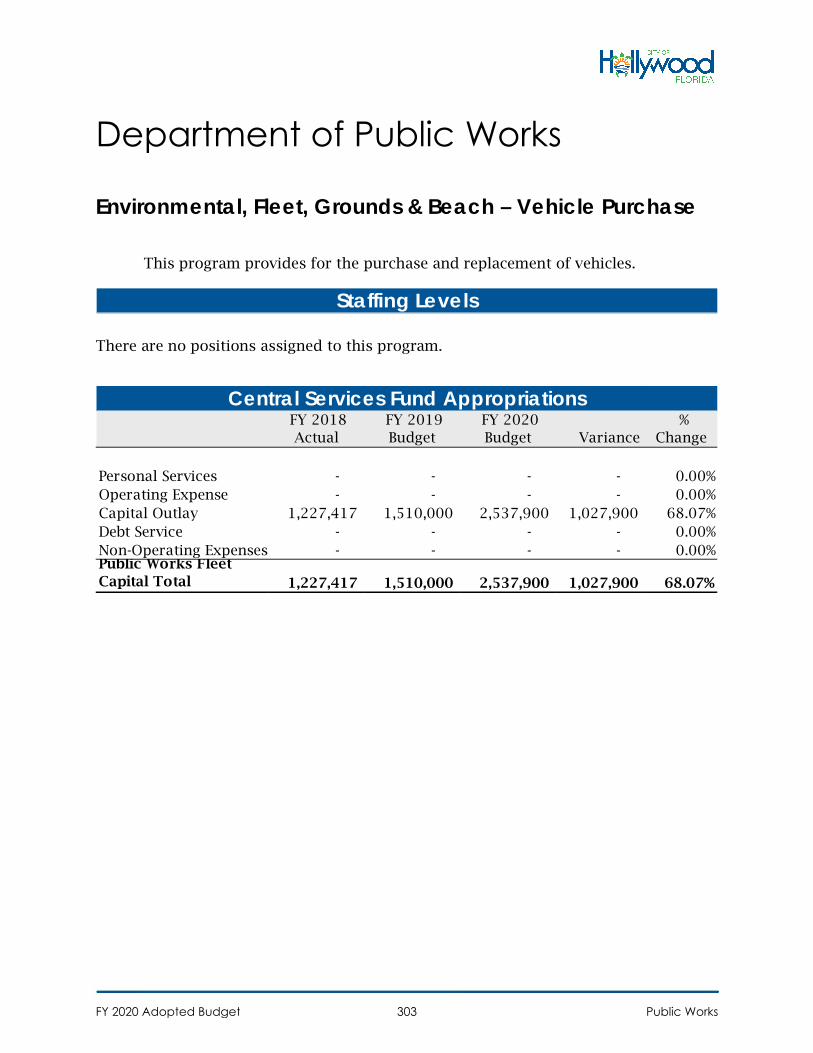
Department of Public Works
Environmental, Fleet, Grounds & Beach – Vehicle Purchase
This program provides for the purchase and replacement of vehicles.
There are no positions assigned to this program.
Staffing Levels
FY 2018 Actual
FY 2019 Budget
FY 2020 Budget Variance
% Change
Personal Services - - - - 0.00%Operating Expense - - - - 0.00%Capital Outlay 1,227,417 1,510,000 2,537,900 1,027,900 68.07%Debt Service - - - - 0.00%Non-Operating Expenses - - - - 0.00%Public Works FleetCapital Total 1,227,417 1,510,000 2,537,900 1,027,900 68.07%
Central Services Fund Appropriations
FY 2020 Adopted Budget Public Works303
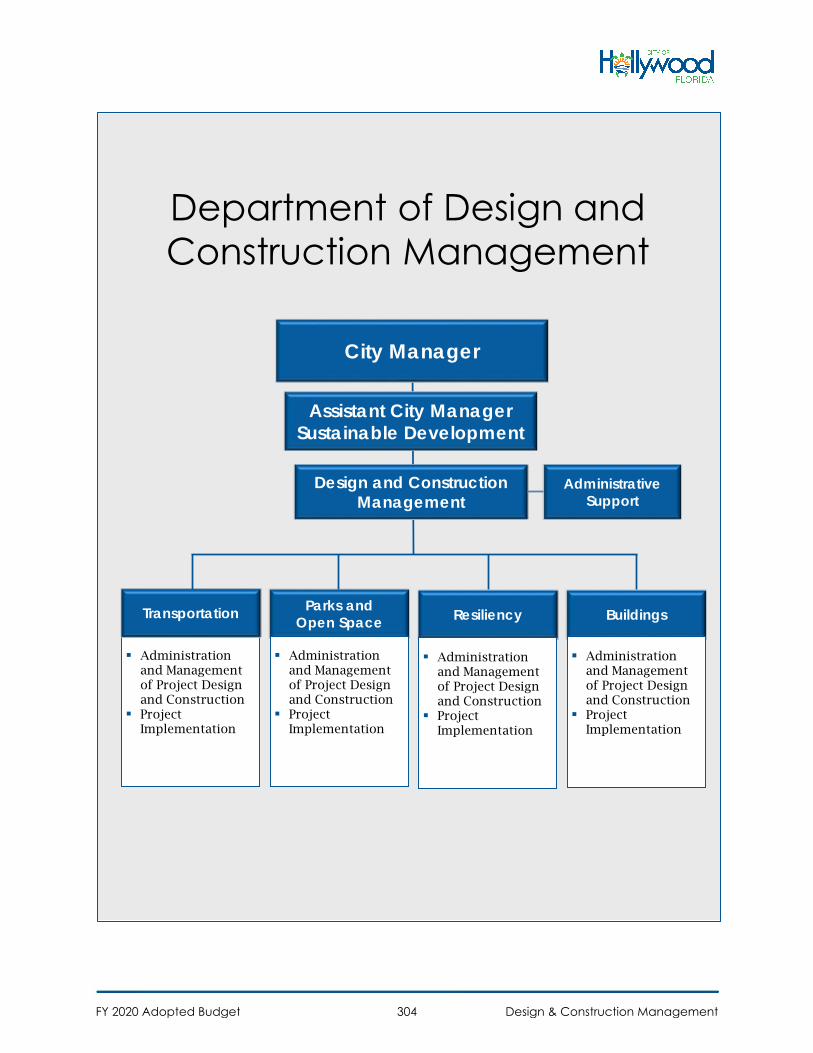
Department of Design and Construction Management
City Manager
Design and Construction Management
Assistant City ManagerSustainable Development
Administrative Support
BuildingsParks and Open Space Resiliency
Administrationand Managementof Project Designand Construction
ProjectImplementation
Transportation
Administrationand Managementof Project Designand Construction
ProjectImplementation
Administrationand Managementof Project Designand Construction
ProjectImplementation
Administrationand Managementof Project Designand Construction
ProjectImplementation
FY 2020 Adopted Budget Design & Construction Management304
Department of Design and Construction Management
Summary
The Department of Design and Construction Management was re-established in FY 2019 and is responsible for implementing the General Obligation (GO) Bond projects for the City of Hollywood. The Department provides the City with a variety of professional, architectural and engineering services.
FY 2019 Accomplishments • Developed GOB projects scope, concept plans and estimates, and attended
community meetings to relay information• Developed a plan to start and fund the projects upon approval by voters and
initiated consultant selection for major projects• Increased community outreach events and other communication prior to vote to
inform the citizens of GO Bond project facts• Identified resiliency projects for inclusion on the GOB project list and other
initiatives
FY 2020 Goals • Provide Community with regular updates on the progress and budget of
Hollywood on the Go projects • Continuously update web based project status and other information for central
distribution of reports• Promote a fair process for selection and award of all contracts related to the GOB• Incorporate sustainability and resiliency components on a project by project basis• Develop project schedule for implementation of design and/or construction
contracts for $70M GOB Phase 1 and other Capital Improvement Projects• Select design consultants for GOB Phase 1 projects and Non GOB funded Capital
Improvement Projects• Select construction vendors to commence construction for smaller, local
permitting GOB Phase 1 projects and Non GOB Funded Capital ImprovementsProjects
FY 2020 Adopted Budget Design & Construction Management305
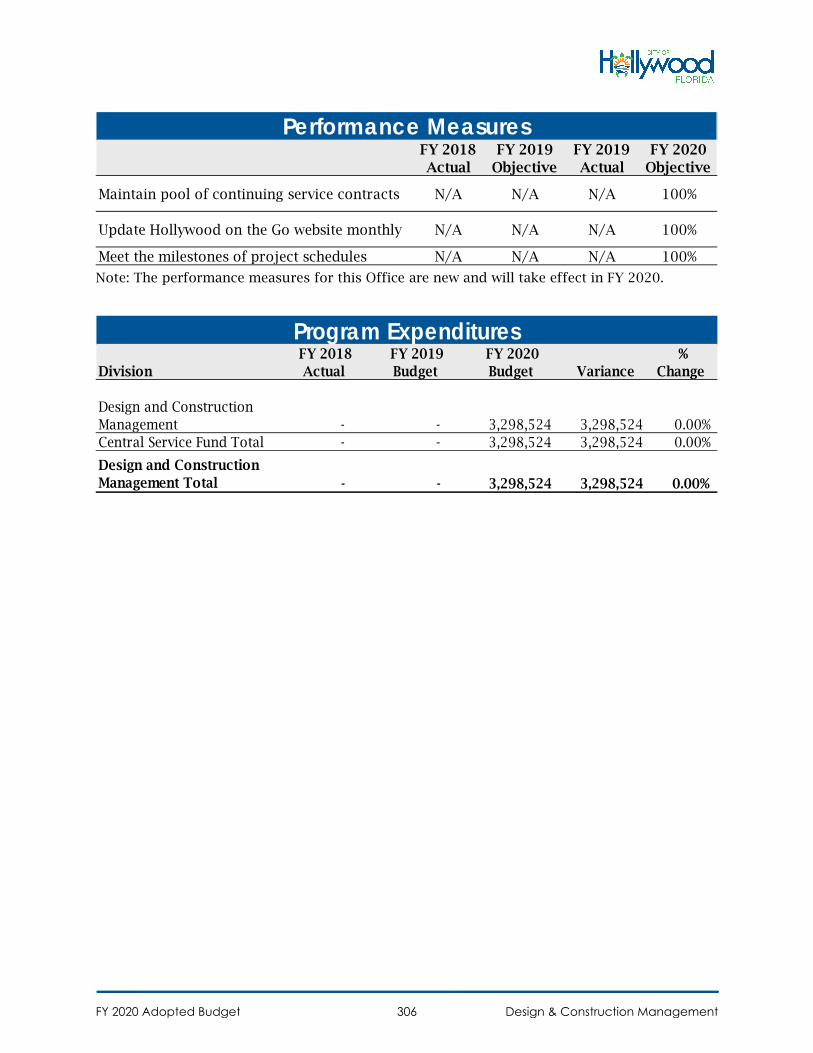
Note: The performance measures for this Office are new and will take effect in FY 2020.
FY 2018 Actual
FY 2019 Objective
FY 2019 Actual
FY 2020 Objective
Maintain pool of continuing service contracts N/A N/A N/A 100%
Update Hollywood on the Go website monthly N/A N/A N/A 100%
Meet the milestones of project schedules N/A N/A N/A 100%
Performance Measures
Division FY 2018
Actual FY 2019 Budget
FY 2020 Budget Variance
% Change
Design and Construction Management - - 3,298,524 3,298,524 0.00%Central Service Fund Total - - 3,298,524 3,298,524 0.00%
Design and Construction Management Total - - 3,298,524 3,298,524 0.00%
Program Expenditures
FY 2020 Adopted Budget Design & Construction Management306
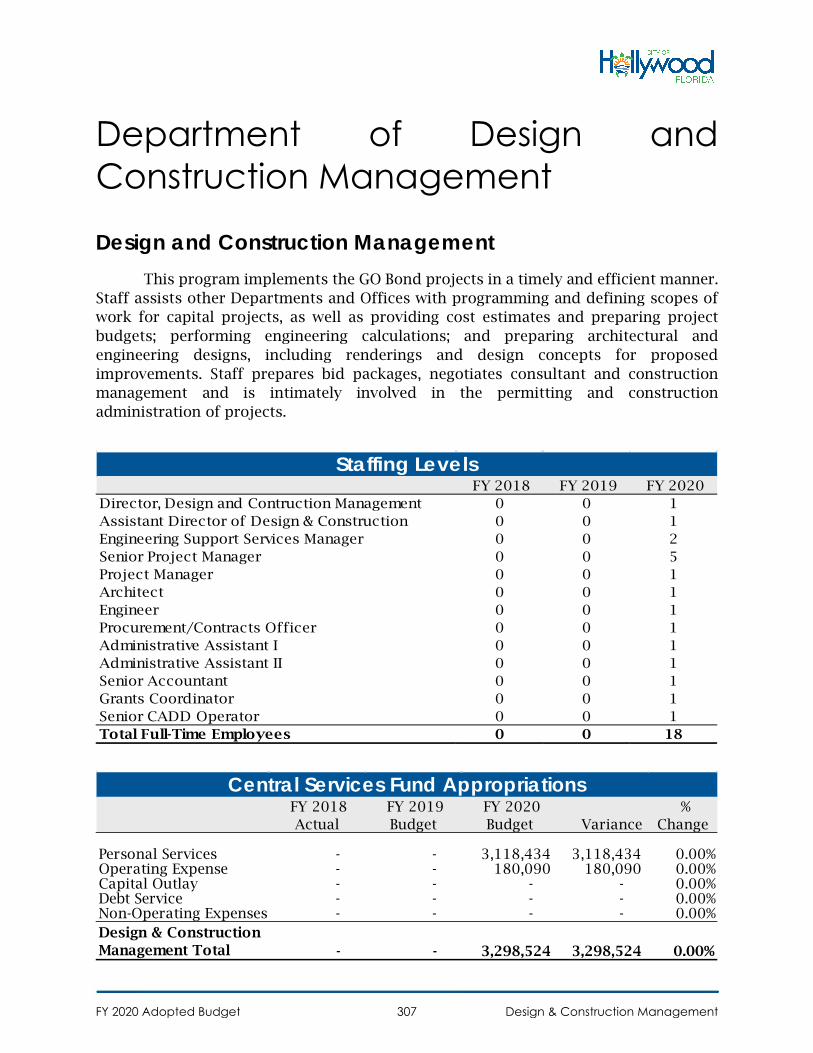
Department of Design and Construction Management
Design and Construction Management This program implements the GO Bond projects in a timely and efficient manner.
Staff assists other Departments and Offices with programming and defining scopes of work for capital projects, as well as providing cost estimates and preparing project budgets; performing engineering calculations; and preparing architectural and engineering designs, including renderings and design concepts for proposed improvements. Staff prepares bid packages, negotiates consultant and construction management and is intimately involved in the permitting and construction administration of projects.
FY 2018 FY 2019 FY 2020 Director, Design and Contruction Management 0 0 1Assistant Director of Design & Construction 0 0 1Engineering Support Services Manager 0 0 2Senior Project Manager 0 0 5Project Manager 0 0 1Architect 0 0 1Engineer 0 0 1Procurement/Contracts Officer 0 0 1Administrative Assistant I 0 0 1Administrative Assistant II 0 0 1Senior Accountant 0 0 1Grants Coordinator 0 0 1Senior CADD Operator 0 0 1Total Full-Time Employees 0 0 18
Staffing Levels
FY 2018 Actual
FY 2019 Budget
FY 2020 Budget Variance
% Change
Personal Services - - 3,118,434 3,118,434 0.00%Operating Expense - - 180,090
180,090 0.00%
Capital Outlay - - -
-
0.00%Debt Service - - - - 0.00%Non-Operating Expenses - - - - 0.00%Design & Construction Management Total - - 3,298,524 3,298,524 0.00%
Central Services Fund Appropriations
FY 2020 Adopted Budget Design & Construction Management307
Non-Departmental
Summary The Non-Departmental allocations includes those resources that the City has
committed to City-wide appropriations which are not necessarily attributable to an individual Department. Included in this section are appropriations for retirement (pension) administration, debt service, interfund transfers, and certain Gas Tax Fund appropriations. This section was established to make it easier for users of this document to track selected appropriations.
Interfund Transfers account for the City’s increment contribution to the Community Redevelopment Agency Downtown and Beach Districts, as well as transfers related to capital improvement and reimbursements.
Debt Service includes appropriations for principal, interest, and financing charges for those citywide projects for which the City has borrowed funding. Debt service on the General Obligation Bonds (G.O.B.) authorized in November 2004 and March 2019, and debt service on Public Utilities Department debt are tracked separately from other City borrowing. Debt service attributable to individual Departments is reflected in those Departments. The debt service appropriations included in Fund 001, the General Fund, represent transfers from that fund to Fund 223, which is the Debt Service Fund.
Contingencies represent funds that are set aside for unexpected and unpredictable costs.
The Gas Tax Fund appropriations shown here include funding for certain capital expenditures, Gas Tax reimbursements to the General Fund, and a transfer from the Gas Tax fund for debt service.
FY 2020 Adopted Budget Non-Departmental308
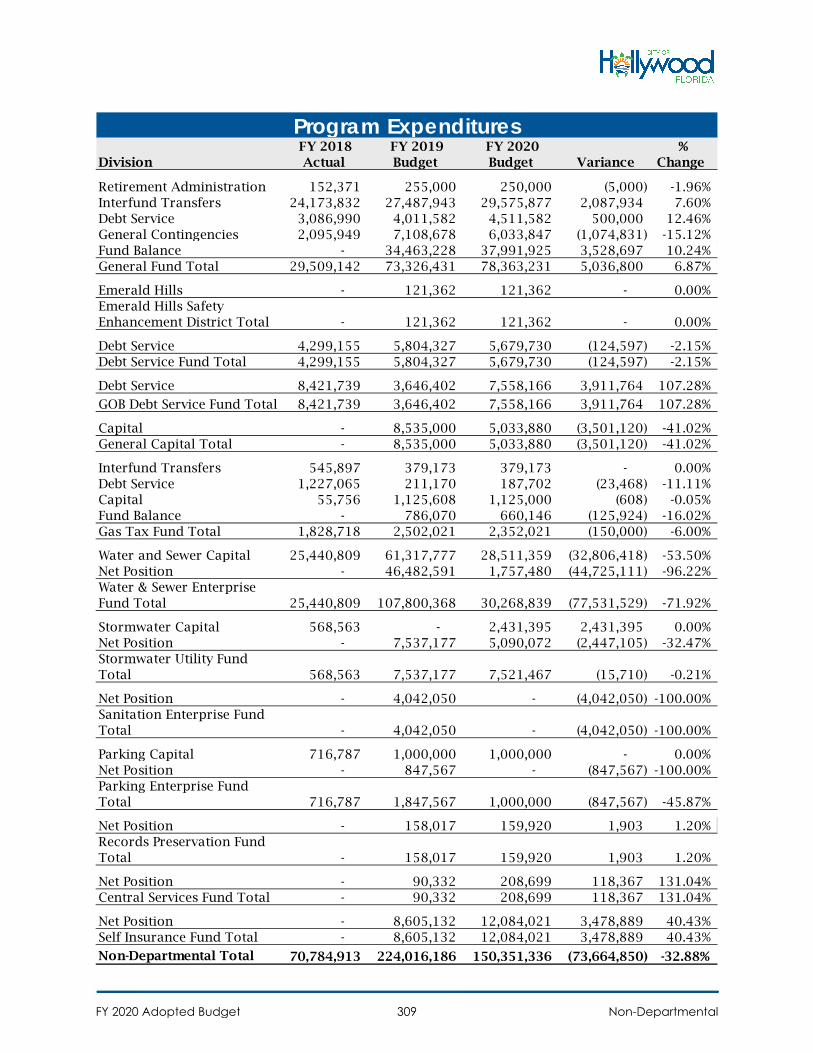
Division FY 2018
Actual FY 2019 Budget
FY 2020 Budget Variance
% Change
Retirement Administration 152,371 255,000 250,000 (5,000) -1.96%Interfund Transfers 24,173,832 27,487,943 29,575,877 2,087,934 7.60%Debt Service 3,086,990 4,011,582 4,511,582 500,000 12.46%General Contingencies 2,095,949 7,108,678 6,033,847 (1,074,831) -15.12%Fund Balance - 34,463,228 37,991,925 3,528,697 10.24%General Fund Total 29,509,142 73,326,431 78,363,231 5,036,800 6.87%
Emerald Hills - 121,362 121,362 - 0.00%Emerald Hills Safety Enhancement District Total - 121,362 121,362 - 0.00%
Debt Service 4,299,155 5,804,327 5,679,730 (124,597) -2.15%Debt Service Fund Total 4,299,155 5,804,327 5,679,730 (124,597) -2.15%
Debt Service 8,421,739 3,646,402 7,558,166 3,911,764 107.28%
GOB Debt Service Fund Total 8,421,739 3,646,402 7,558,166 3,911,764 107.28%
Capital - 8,535,000 5,033,880 (3,501,120) -41.02%General Capital Total - 8,535,000 5,033,880 (3,501,120) -41.02%
Interfund Transfers 545,897 379,173 379,173 - 0.00%Debt Service 1,227,065 211,170 187,702 (23,468) -11.11%Capital 55,756 1,125,608 1,125,000 (608) -0.05%Fund Balance - 786,070 660,146 (125,924) -16.02%Gas Tax Fund Total 1,828,718 2,502,021 2,352,021 (150,000) -6.00%
Water and Sewer Capital 25,440,809 61,317,777 28,511,359 (32,806,418) -53.50%Net Position - 46,482,591 1,757,480 (44,725,111) -96.22%Water & Sewer Enterprise Fund Total 25,440,809 107,800,368 30,268,839 (77,531,529) -71.92%
Stormwater Capital 568,563 - 2,431,395 2,431,395 0.00%Net Position - 7,537,177 5,090,072 (2,447,105) -32.47%Stormwater Utility Fund Total 568,563 7,537,177 7,521,467 (15,710) -0.21%
Net Position - 4,042,050 - (4,042,050) -100.00%Sanitation Enterprise Fund Total - 4,042,050 - (4,042,050) -100.00%
Parking Capital 716,787 1,000,000 1,000,000 - 0.00%Net Position - 847,567 - (847,567) -100.00%Parking Enterprise Fund Total 716,787 1,847,567 1,000,000 (847,567) -45.87%
Net Position - 158,017 159,920 1,903 1.20%Records Preservation Fund Total - 158,017 159,920 1,903 1.20%
Net Position - 90,332 208,699 118,367 131.04%Central Services Fund Total - 90,332 208,699 118,367 131.04%
Net Position - 8,605,132 12,084,021 3,478,889 40.43%Self Insurance Fund Total - 8,605,132 12,084,021 3,478,889 40.43%
Non-Departmental Total 70,784,913 224,016,186 150,351,336 (73,664,850) -32.88%
Program Expenditures
FY 2020 Adopted Budget Non-Departmental309
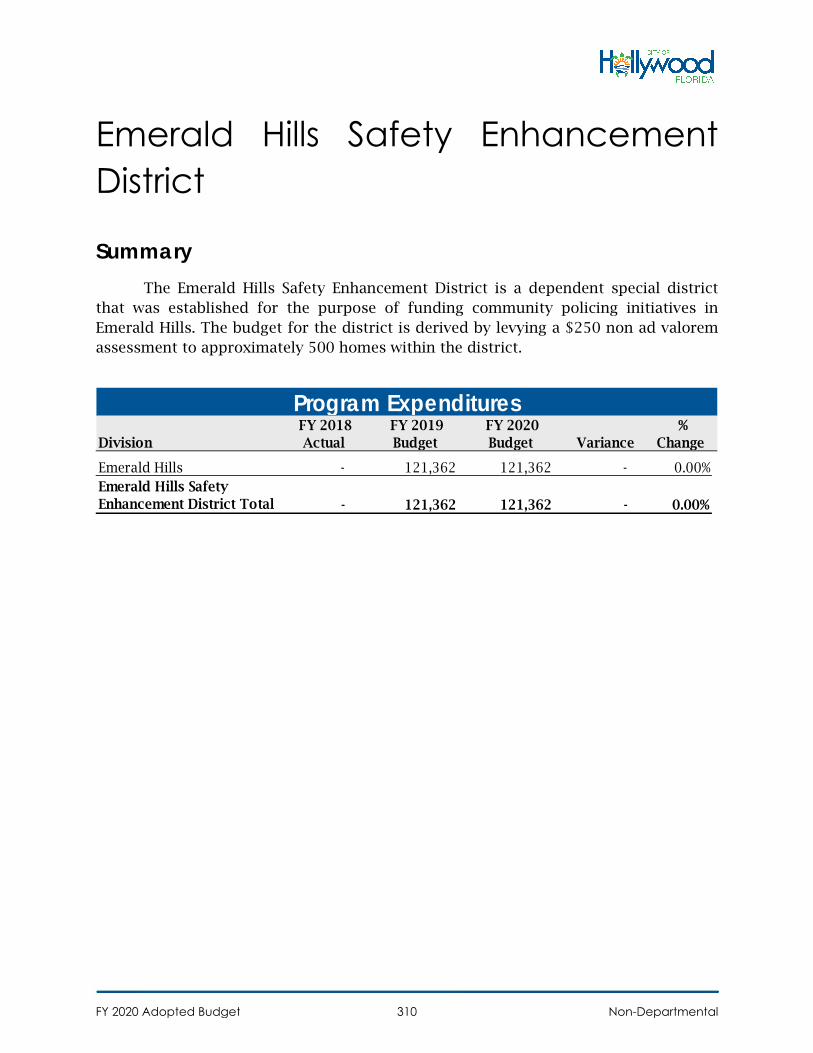
Emerald Hills Safety Enhancement District
Summary The Emerald Hills Safety Enhancement District is a dependent special district
that was established for the purpose of funding community policing initiatives in Emerald Hills. The budget for the district is derived by levying a $250 non ad valorem assessment to approximately 500 homes within the district.
Division FY 2018
Actual FY 2019 Budget
FY 2020 Budget Variance
% Change
Emerald Hills - 121,362 121,362 - 0.00%Emerald Hills Safety Enhancement District Total - 121,362 121,362 - 0.00%
Program Expenditures
FY 2020 Adopted Budget Non-Departmental310
Capital Improvement
Plan
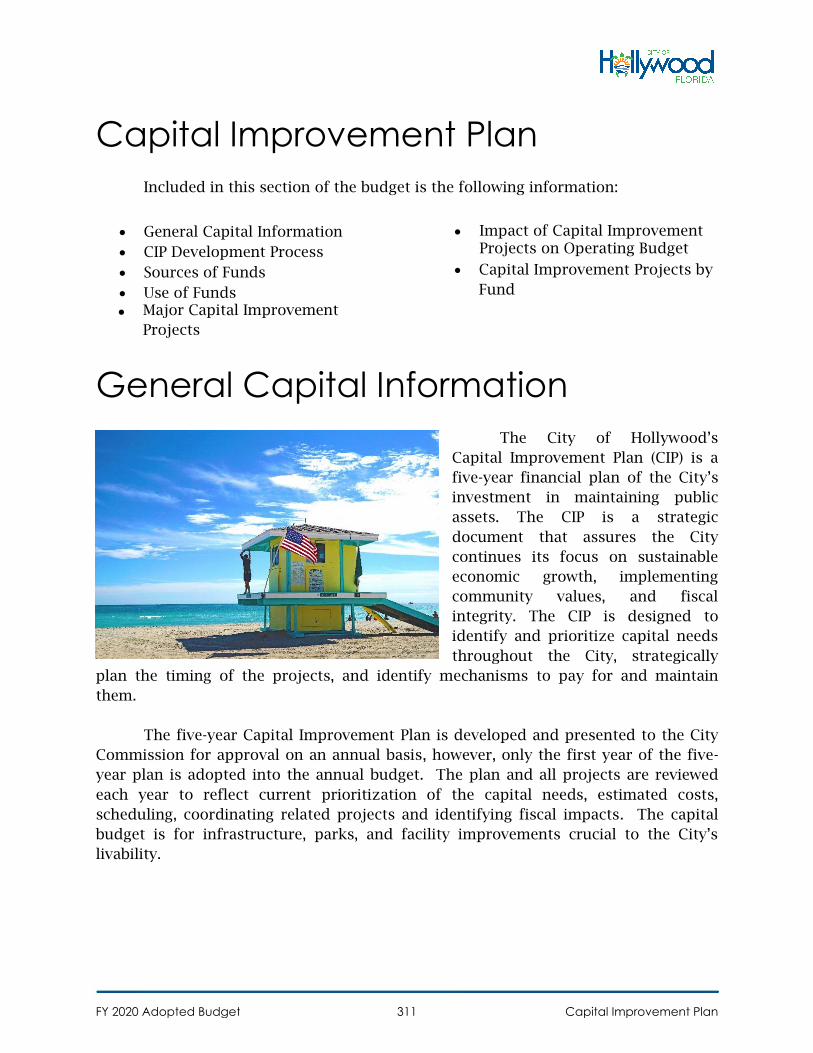
Capital Improvement Plan
Included in this section of the budget is the following information:
General Capital Information
CIP Development Process
Sources of Funds
Use of Funds
• Major Capital Improvement
Projects
Impact of Capital ImprovementProjects on Operating Budget
Capital Improvement Projects by
Fund
General Capital Information
The City of Hollywood’s
Capital Improvement Plan (CIP) is a
five-year financial plan of the City’s
investment in maintaining public
assets. The CIP is a strategic
document that assures the City
continues its focus on sustainable
economic growth, implementing
community values, and fiscal
integrity. The CIP is designed to
identify and prioritize capital needs
throughout the City, strategically
plan the timing of the projects, and identify mechanisms to pay for and maintain
them.
The five-year Capital Improvement Plan is developed and presented to the City
Commission for approval on an annual basis, however, only the first year of the five-
year plan is adopted into the annual budget. The plan and all projects are reviewed
each year to reflect current prioritization of the capital needs, estimated costs,
scheduling, coordinating related projects and identifying fiscal impacts. The capital
budget is for infrastructure, parks, and facility improvements crucial to the City’s
livability.
FY 2020 Adopted Budget Capital Improvement Plan311
The City of Hollywood is
committed to implementing a holistic
and sustainable economic growth
strategy that results in a robust
economy and healthy neighborhoods.
The focus on sustainable economic
growth is particularly relevant with
capital planning and budgeting. The
five-year capital plan supports
responsible development and
redevelopment while focusing on
enhancing residential quality of live,
the preservation of open space and a quality, city-wide community aesthetic. Each
year, as the CIP is updated, the City considers technical, environmental, and financial
challenges that could limit the ability of the city to fund its priority projects.
Challenges identified in the 2020-2024 CIP include, continued impact of sea level rise,
construction cost inflation, and operational funding.
For the past several years, the City has avoided issuing large amounts of debt to
fund capital projects but instead focused available funding on small scale Pay-As-You-
Go capital projects. This strategy contributed to the City’s goal in remaining fiscally
responsible but delayed necessary infrastructure maintenance and improvements.
In FY 2019, the City was able
to take advantage of historically low
interest rates and make a large scale
investment in the City infrastructure
and economic development through
the issuance of the GO Bond. The
GO Bond and the associated projects
are described in more detail in this
plan.
FY 2020 Adopted Budget Capital Improvement Plan312
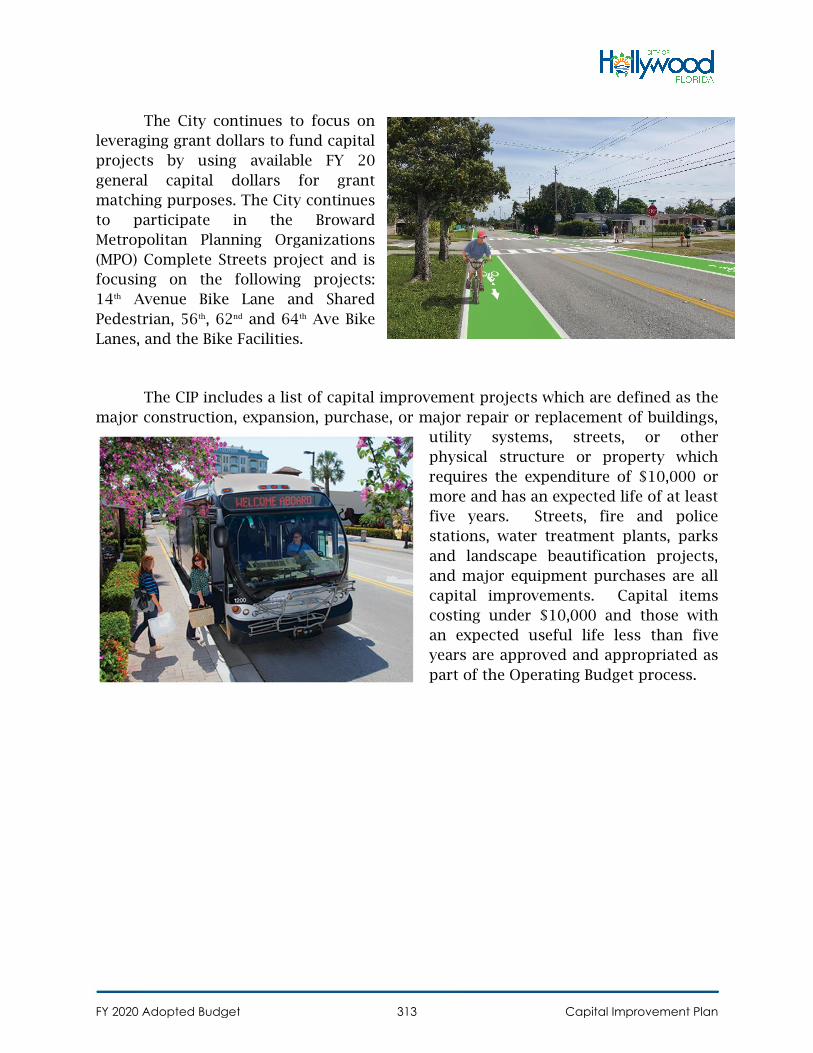
The City continues to focus on
leveraging grant dollars to fund capital
projects by using available FY 20
general capital dollars for grant
matching purposes. The City continues
to participate in the Broward
Metropolitan Planning Organizations
(MPO) Complete Streets project and is
focusing on the following projects:
14th Avenue Bike Lane and Shared
Pedestrian, 56th, 62nd and 64th Ave Bike
Lanes, and the Bike Facilities.
The CIP includes a list of capital improvement projects which are defined as the
major construction, expansion, purchase, or major repair or replacement of buildings,
utility systems, streets, or other
physical structure or property which
requires the expenditure of $10,000 or
more and has an expected life of at least
five years. Streets, fire and police
stations, water treatment plants, parks
and landscape beautification projects,
and major equipment purchases are all
capital improvements. Capital items
costing under $10,000 and those with
an expected useful life less than five
years are approved and appropriated as
part of the Operating Budget process.
FY 2020 Adopted Budget Capital Improvement Plan313
CIP Development Process
The City of Hollywood develops a Capital Improvement Plan (CIP) that
addresses the major capital needs; maintenance and repair of city assets as well as
enhancements and expansion.
Planning for capital improvements is an ongoing process. In conjunction with
the annual operating budgeting process, the Office of Budget and Performance
Management manages the citywide process of revising and updating the city’s capital
plan. Department heads are required to submit capital requests when they submit
their annual budget requests. City staff from all departments participate in review of
existing projects and identification of new projects.
The City uses the below established criteria for evaluating and prioritizing capital
projects:
Mandated/Contractual – Project meets mandates or contractual obligations
Safe Environment – Project addresses a safety hazard to the public or employees
Economic Outcome – Project helps to grow the local economy or revitalize
neighborhoods
Funding Source – Funding available to pay for the project, can borrowed funds
be repaid, can project construction be funded without City Revenue
Operating Budget Impact – Sufficient funds are available to operate and
maintain the project
Impact on Citywide Themes – Extent to which a project aids in achieving the
City’s initiatives.
As the City's infrastructure ages and as needs change, capital programs and
priorities must be adjusted. New construction may be required to accommodate
increased demand or replace aging facilities while existing infrastructure requires
periodic rehabilitation, replacement, or other improvements to protect the City's
previous investments. Financial and legal constraints make it impossible for the city
to fund every project on its list. Given that the CIP is a planning document, it includes
both funded and unfunded projects. If it is determined that the unfunded projects
are priorities, then alternative cans be identified for their inclusion in the CIP.
The adopted FY 2020-2024 Capital Improvement Plan totals $401,417,989 which
includes $38,635,159 of unfunded projects. The FY 2020 capital plan totals
$40,754,534. The 5-year CIP has been formulated with input from all stakeholders and
has been shaped by the needs identified by City staff. The City’s resources are being
used to provide for sensible development opportunities and reliable infrastructure.
FY 2020 Adopted Budget Capital Improvement Plan314
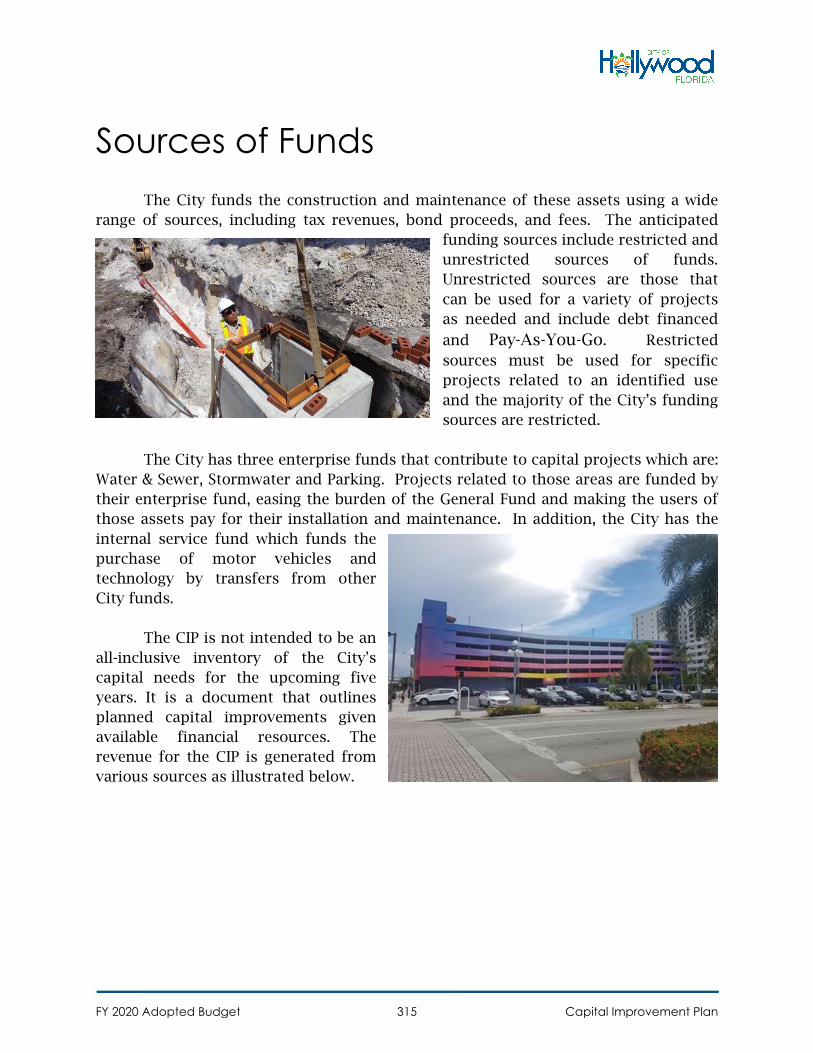
Sources of Funds
The City funds the construction and maintenance of these assets using a wide
range of sources, including tax revenues, bond proceeds, and fees. The anticipated
funding sources include restricted and
unrestricted sources of funds.
Unrestricted sources are those that
can be used for a variety of projects
as needed and include debt financed
and Pay-As-You-Go. Restricted
sources must be used for specific
projects related to an identified use
and the majority of the City’s funding
sources are restricted.
The City has three enterprise funds that contribute to capital projects which are:
Water & Sewer, Stormwater and Parking. Projects related to those areas are funded by
their enterprise fund, easing the burden of the General Fund and making the users of
those assets pay for their installation and maintenance. In addition, the City has the
internal service fund which funds the
purchase of motor vehicles and
technology by transfers from other
City funds.
The CIP is not intended to be an
all-inclusive inventory of the City's
capital needs for the upcoming five
years. It is a document that outlines
planned capital improvements given
available financial resources. The
revenue for the CIP is generated from
various sources as illustrated below.
FY 2020 Adopted Budget Capital Improvement Plan315
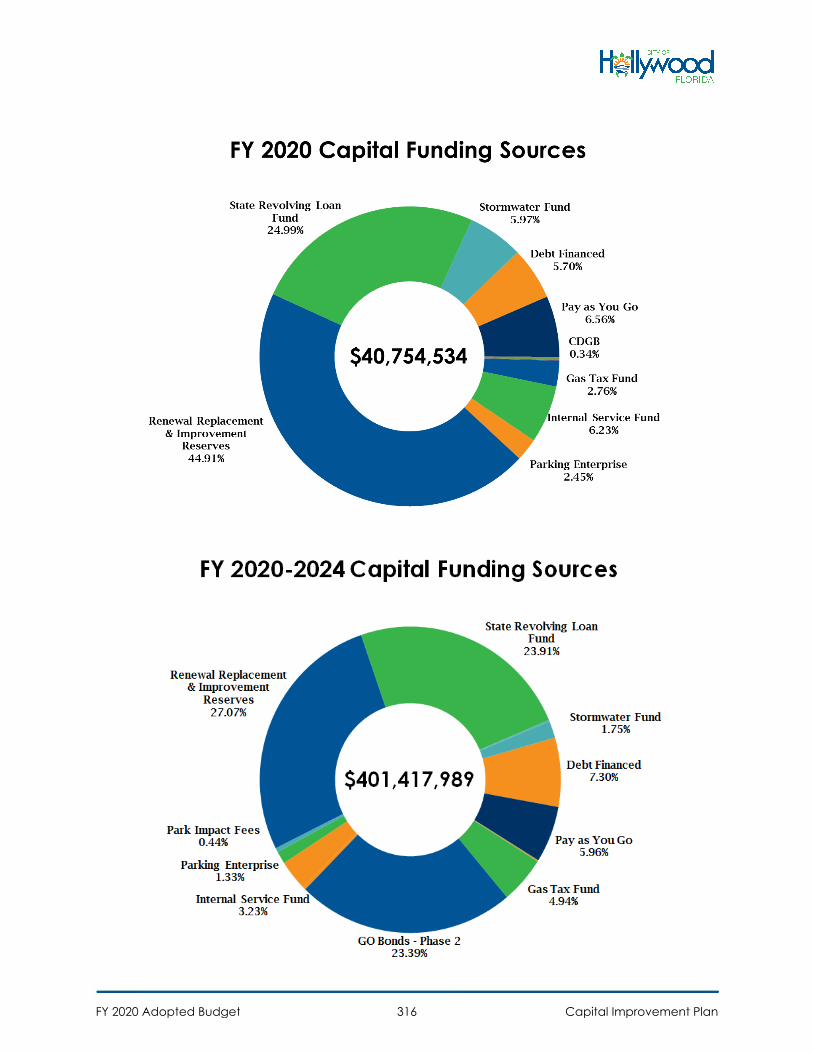
FY 2020 Adopted Budget Capital Improvement Plan316
Funding Sources
Pay-As-You-Go (PAYGO) – Eligible PAYGO projects are typically small scale projects
with current revenues, such as tax revenue, user fees, etc.
Debt Financing- Primary source of funds available is long-term financing, typically abond issue. The repayment of the cost of construction is spread over many yearswith an interest cost making acquisition affordable. This option is typically usedwhen the anticipated life of the asset is greater than the life of the debt.
Gas Tax – Pays for Transportation capital projects related to Streets and Right of
Ways may be paid with Gasoline Tax dollars.
General Obligation Bond (G.O. Bonds) –Municipal projects funded through the
issuance of G.O. Bonds that will be repaid through the imposition of a dedicated ad
valorem property tax.
Transportation Surtax Funds – Additional one-percent sales tax dedicated for
maintenance and mobility transportation related projects.
Parking Enterprise Fund - Capital projects paid with an accumulation of prior year
parking revenues that are reinvested for specific parking related capital.
Public Utilities Water Reserve or Storm Reserve Capacity fees – Capital projects paid
with current user fees, specifically Water Reserve or Storm Reserve Capacity Fees.
Stormwater Enterprise Fund - Capital projects with an accumulation of prior year
stormwater revenues that are reinvested for specific stormwater related capital.
Utilities State Revolving Fund (SRF) loans - Financing provided through the State for
clean water and drinking water related projects.
Water & Sewer Utility Fund Renewal, Replacement and Improvement (RRI) Reserves
– RRI reserves are funds set aside annually to ensure that capital assets and
equipment can be replacement and improvement as needed.
FY 2020 Adopted Budget Capital Improvement Plan317
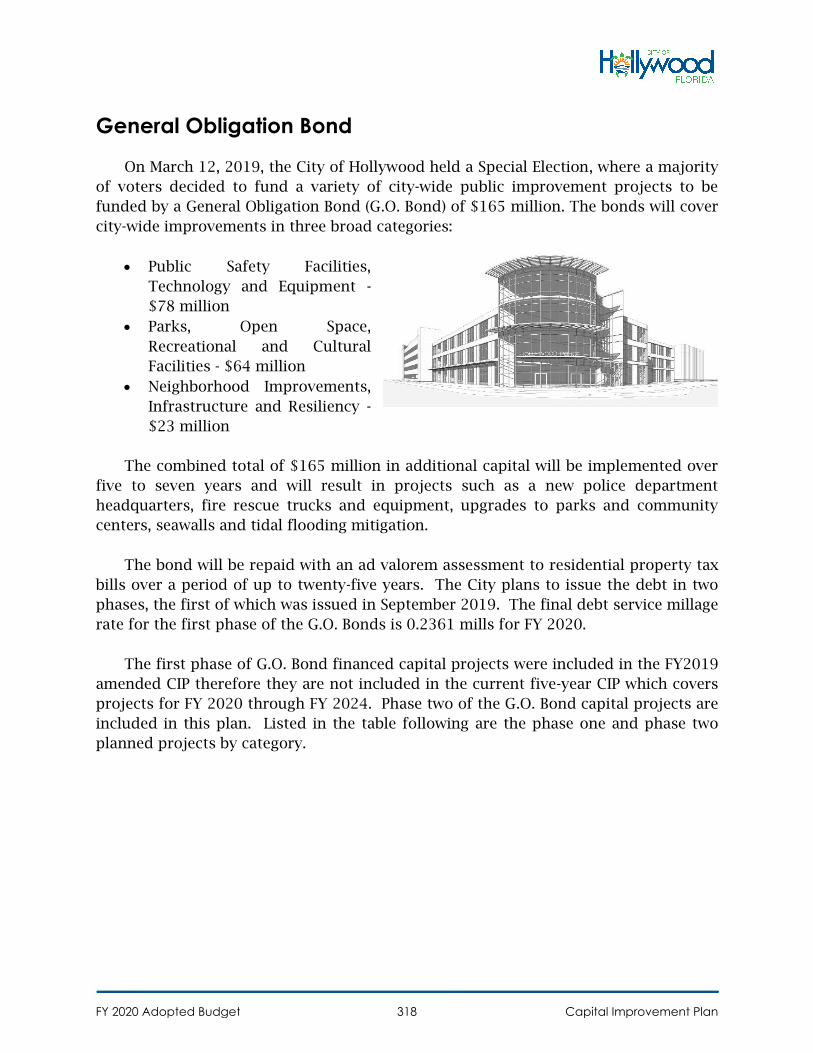
General Obligation Bond
On March 12, 2019, the City of Hollywood held a Special Election, where a majority
of voters decided to fund a variety of city-wide public improvement projects to be
funded by a General Obligation Bond (G.O. Bond) of $165 million. The bonds will cover
city-wide improvements in three broad categories:
Public Safety Facilities,
Technology and Equipment -
$78 million
Parks, Open Space,
Recreational and Cultural
Facilities - $64 million
Neighborhood Improvements,
Infrastructure and Resiliency -
$23 million
The combined total of $165 million in additional capital will be implemented over
five to seven years and will result in projects such as a new police department
headquarters, fire rescue trucks and equipment, upgrades to parks and community
centers, seawalls and tidal flooding mitigation.
The bond will be repaid with an ad valorem assessment to residential property tax
bills over a period of up to twenty-five years. The City plans to issue the debt in two
phases, the first of which was issued in September 2019. The final debt service millage
rate for the first phase of the G.O. Bonds is 0.2361 mills for FY 2020.
The first phase of G.O. Bond financed capital projects were included in the FY2019
amended CIP therefore they are not included in the current five-year CIP which covers
projects for FY 2020 through FY 2024. Phase two of the G.O. Bond capital projects are
included in this plan. Listed in the table following are the phase one and phase two
planned projects by category.
FY 2020 Adopted Budget Capital Improvement Plan318
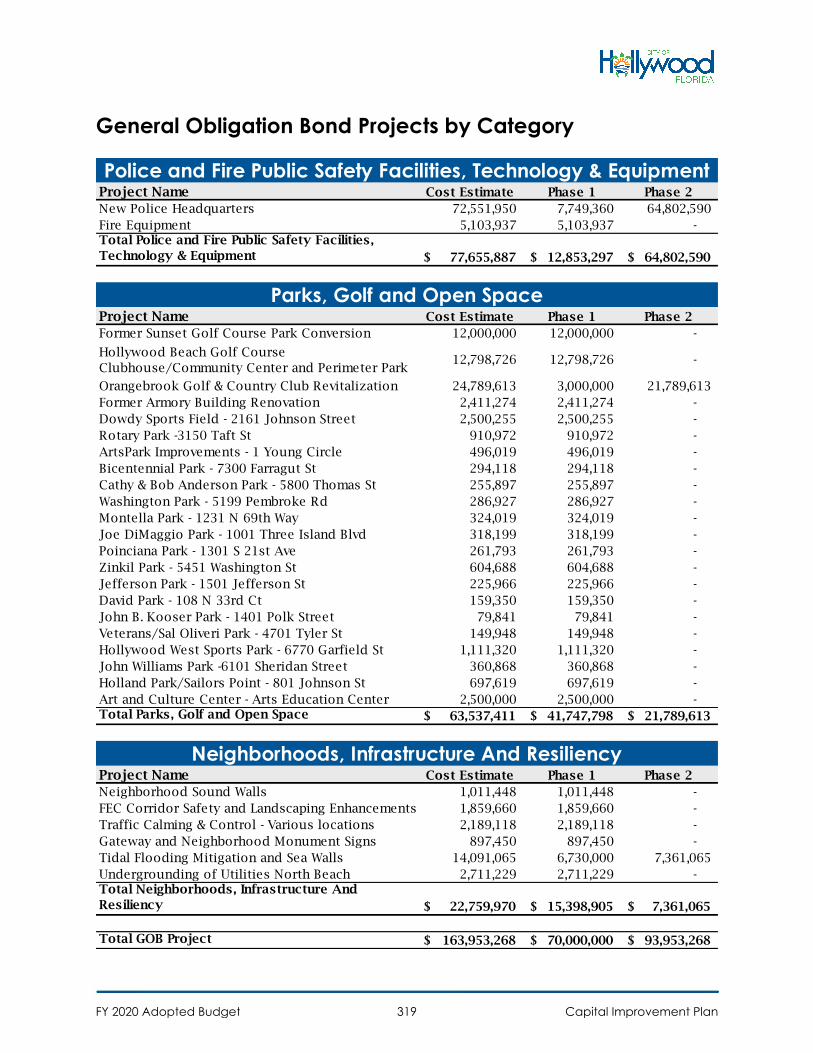
General Obligation Bond Projects by Category
Project Name Cost Estimate Phase 1 Phase 2
New Police Headquarters 72,551,950 7,749,360 64,802,590
Fire Equipment 5,103,937 5,103,937 - Total Police and Fire Public Safety Facilities,
Technology & Equipment 77,655,887$ 12,853,297$ 64,802,590$
Project Name Cost Estimate Phase 1 Phase 2
Former Sunset Golf Course Park Conversion 12,000,000 12,000,000 -
Hollywood Beach Golf Course
Clubhouse/Community Center and Perimeter Park12,798,726 12,798,726 -
Orangebrook Golf & Country Club Revitalization 24,789,613 3,000,000 21,789,613
Former Armory Building Renovation 2,411,274 2,411,274 -
Dowdy Sports Field - 2161 Johnson Street 2,500,255 2,500,255 -
Rotary Park -3150 Taft St 910,972 910,972 -
ArtsPark Improvements - 1 Young Circle 496,019 496,019 -
Bicentennial Park - 7300 Farragut St 294,118 294,118 -
Cathy & Bob Anderson Park - 5800 Thomas St 255,897 255,897 -
Washington Park - 5199 Pembroke Rd 286,927 286,927 -
Montella Park - 1231 N 69th Way 324,019 324,019 -
Joe DiMaggio Park - 1001 Three Island Blvd 318,199 318,199 -
Poinciana Park - 1301 S 21st Ave 261,793 261,793 -
Zinkil Park - 5451 Washington St 604,688 604,688 -
Jefferson Park - 1501 Jefferson St 225,966 225,966 -
David Park - 108 N 33rd Ct 159,350 159,350 -
John B. Kooser Park - 1401 Polk Street 79,841 79,841 -
Veterans/Sal Oliveri Park - 4701 Tyler St 149,948 149,948 -
Hollywood West Sports Park - 6770 Garfield St 1,111,320 1,111,320 -
John Williams Park -6101 Sheridan Street 360,868 360,868 -
Holland Park/Sailors Point - 801 Johnson St 697,619 697,619 -
Art and Culture Center - Arts Education Center 2,500,000 2,500,000 - Total Parks, Golf and Open Space 63,537,411$ 41,747,798$ 21,789,613$
Project Name Cost Estimate Phase 1 Phase 2
Neighborhood Sound Walls 1,011,448 1,011,448 -
FEC Corridor Safety and Landscaping Enhancements 1,859,660 1,859,660 -
Traffic Calming & Control - Various locations 2,189,118 2,189,118 -
Gateway and Neighborhood Monument Signs 897,450 897,450 -
Tidal Flooding Mitigation and Sea Walls 14,091,065 6,730,000 7,361,065
Undergrounding of Utilities North Beach 2,711,229 2,711,229 - Total Neighborhoods, Infrastructure And
Resiliency 22,759,970$ 15,398,905$ 7,361,065$
Total GOB Project 163,953,268$ 70,000,000$ 93,953,268$
Police and Fire Public Safety Facilities, Technology & Equipment
Parks, Golf and Open Space
Neighborhoods, Infrastructure And Resiliency
FY 2020 Adopted Budget Capital Improvement Plan319
Transportation Surtax
In November 2018, Broward County voters approved a 30 year, one-cent surtax
for transportation that took effect on January 1, 2019. Over the next 30 years, revenue
from the penny surtax is planned for significant transportation projects that are
intended to improve every community in
Broward County. This ongoing revenue
source will be used by the City for
projects such as intersections
improvements, complete streets, safe
school zones and other transportation
related projects.
As of October 2019, the structure of the program had not yet been finalized by
the County. Below are a list of projects the City is considering to submit for funding
through the Surtax. Additional funding opportunities may exist for maintenance type
projects.
Project Name Design Construction
Garfield Street and FEC railroad crossing widening and
signalization75,000 1,500,000
Reconstruct south bound Park Road at Sheridan St to allow two
south bound left turn lanes25,000 800,000
Add Bike Lake along Park Road 30,000 4,000,000
Reconstruct north bound 46th Ave at Hollywood Blvd to increase
left turn storage capacity add right turn lane45,000 900,000
Reconstruct north bound 56th Ave at Hollywood Blvd to increase
left turn storage capacity, improve right turn lane, widen south
bound right turn radius
50,000 850,000
Reconstruct west bound Taft St at SR7, add west/right turn lane 50,000 1,500,000
Reconstruct North bound 68th at Stirling, add storage capacity;
lengthen turn lanes50,000 1,200,000
Transportation Surtax
FY 2020 Adopted Budget Capital Improvement Plan320
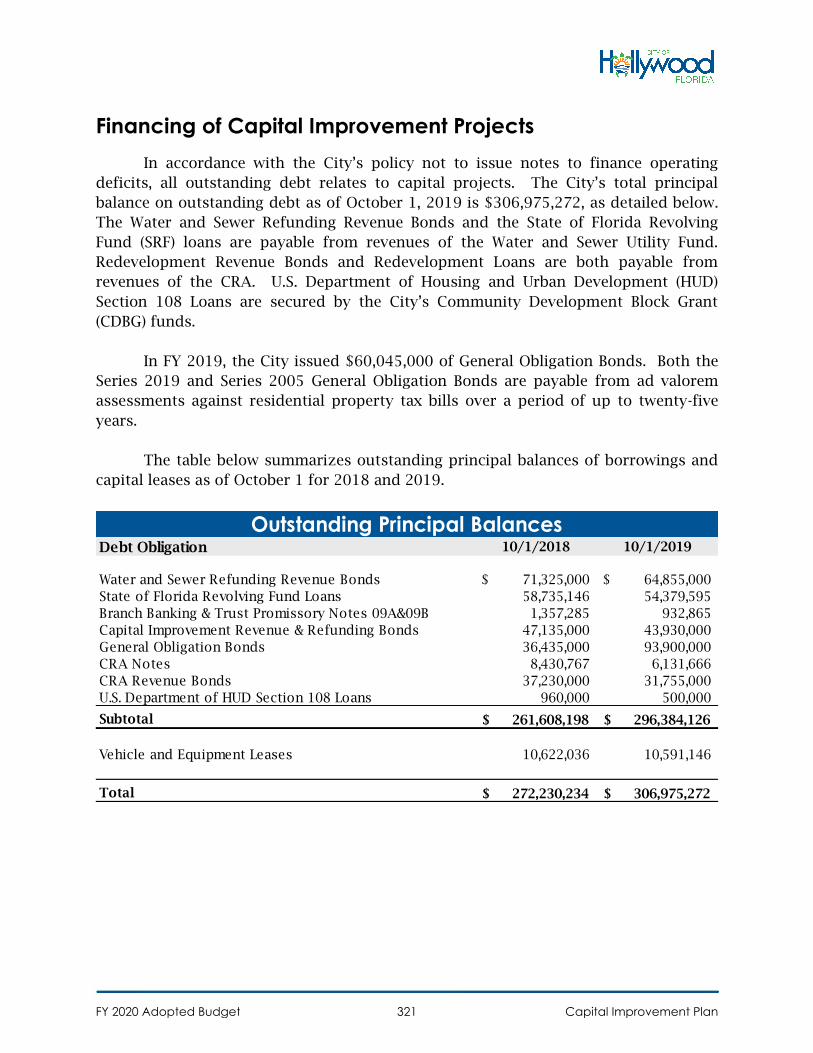
Financing of Capital Improvement Projects
In accordance with the City’s policy not to issue notes to finance operating
deficits, all outstanding debt relates to capital projects. The City’s total principal
balance on outstanding debt as of October 1, 2019 is $306,975,272, as detailed below.
The Water and Sewer Refunding Revenue Bonds and the State of Florida Revolving
Fund (SRF) loans are payable from revenues of the Water and Sewer Utility Fund.
Redevelopment Revenue Bonds and Redevelopment Loans are both payable from
revenues of the CRA. U.S. Department of Housing and Urban Development (HUD)
Section 108 Loans are secured by the City’s Community Development Block Grant
(CDBG) funds.
In FY 2019, the City issued $60,045,000 of General Obligation Bonds. Both the
Series 2019 and Series 2005 General Obligation Bonds are payable from ad valorem
assessments against residential property tax bills over a period of up to twenty-five
years.
The table below summarizes outstanding principal balances of borrowings and
capital leases as of October 1 for 2018 and 2019.
Debt Obligation 10/1/2018 10/1/2019
Water and Sewer Refunding Revenue Bonds 71,325,000$ 64,855,000$
State of Florida Revolving Fund Loans 58,735,146 54,379,595
Branch Banking & Trust Promissory Notes 09A&09B 1,357,285 932,865
Capital Improvement Revenue & Refunding Bonds 47,135,000 43,930,000
General Obligation Bonds 36,435,000 93,900,000
CRA Notes 8,430,767 6,131,666
CRA Revenue Bonds 37,230,000 31,755,000
U.S. Department of HUD Section 108 Loans 960,000 500,000
Subtotal 261,608,198$ 296,384,126$
Vehicle and Equipment Leases 10,622,036 10,591,146
Total 272,230,234$ 306,975,272$
Outstanding Principal Balances
FY 2020 Adopted Budget Capital Improvement Plan321
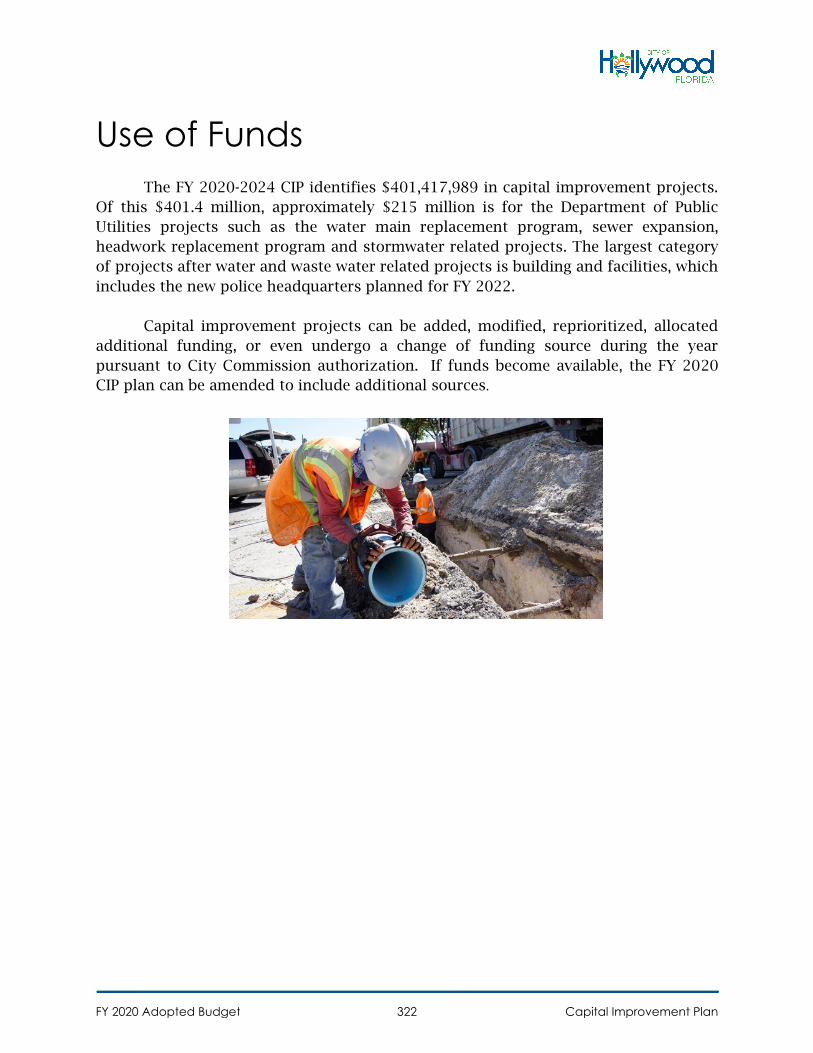
Use of Funds
The FY 2020-2024 CIP identifies $401,417,989 in capital improvement projects.
Of this $401.4 million, approximately $215 million is for the Department of Public
Utilities projects such as the water main replacement program, sewer expansion,
headwork replacement program and stormwater related projects. The largest category
of projects after water and waste water related projects is building and facilities, which
includes the new police headquarters planned for FY 2022.
Capital improvement projects can be added, modified, reprioritized, allocated
additional funding, or even undergo a change of funding source during the year
pursuant to City Commission authorization. If funds become available, the FY 2020
CIP plan can be amended to include additional sources.
FY 2020 Adopted Budget Capital Improvement Plan322
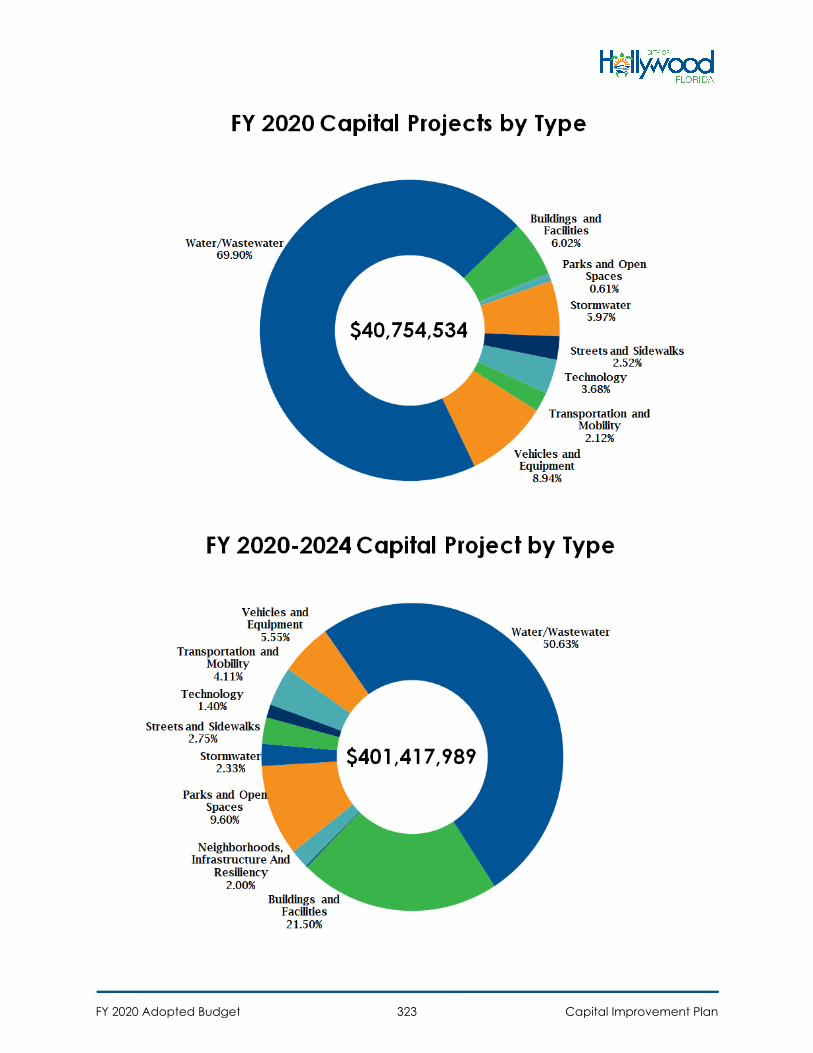
FY 2020 Adopted Budget Capital Improvement Plan323
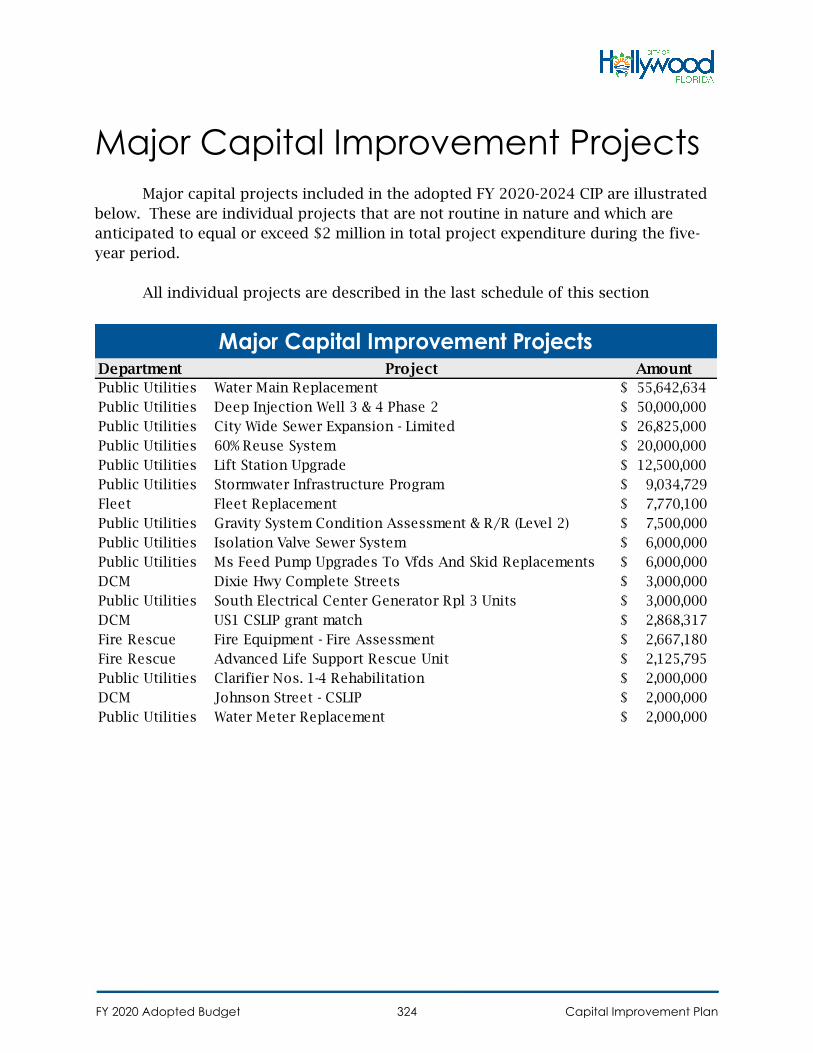
Replacement
FY 2020 Adopted Budget Capital Improvement Plan324
Major Capital Improvement Projects
Major capital projects included in the adopted FY 2020-2024 CIP are illustrated
below. These are individual projects that are not routine in nature and which are
anticipated to equal or exceed $2 million in total project expenditure during the five-
year period.
All individual projects are described in the last schedule of this section
Department Project Amount
Public Utilities Water Main Replacement
Public Utilities Deep Injection Well 3 & 4 Phase 2
Public Utilities City Wide Sewer Expansion - Limited
Public Utilities 60% Reuse System
Public Utilities Lift Station Upgrade
Public Utilities Stormwater Infrastructure Program
Fleet Fleet Replacement
Public Utilities Gravity System Condition Assessment & R/R (Level 2)
Public Utilities Isolation Valve Sewer System
Public Utilities Ms Feed Pump Upgrades To Vfds And Skid Replacements
DCM Dixie Hwy Complete Streets
Public Utilities South Electrical Center Generator Rpl 3 Units
US1 CSLIP grant matchDCM
Fire Rescue
Fire Rescue
Fire Equipment - Fire Assessment
Advanced Life Support Rescue Unit
Public Utilities Clarifier Nos. 1-4 Rehabilitation
DCM Johnson Street - CSLIP
Public Utilities Water Meter Replacement
$ 55,642,634
$ 50,000,000
$ 26,825,000
$ 20,000,000
$ 12,500,000
$ 9,034,729
$ 7,770,100
$ 7,500,000
$ 6,000,000
$ 6,000,000
$ 3,000,000
$ 3,000,000
$ 2,868,317
$ 2,667,180
$ 2,125,795
$ 2,000,000
$ 2,000,000
$ 2,000,000
Major Capital Improvement Projects
Impact of Capital Improvement
Projects on Operating Budget
The CIP impacts the operating budget through debt service and any additional
expenses to operate facilities. The operation of a new facility or improvement
represents an on-going cost to the City. Many of the City’s capital improvement
projects involve the replacement of, or improvement to, existing infrastructure and
facilities. As such, these CIP projects create only minimal operating budget impact
beyond the repayment of debt. Efficiencies realized by improvements to our
infrastructure are redirected to ongoing operating maintenance needs.
In the Fiscal Years 2020-2024 Capital Improvement Plan, the individual projects
include an estimated future operating budget impact, if it is possible to identify the
cost at this time in the project’s lifecycle. The City carefully considers these operating
costs when deciding which projects move forward in the CIP.
FY 2020 Adopted Budget Capital Improvement Plan325
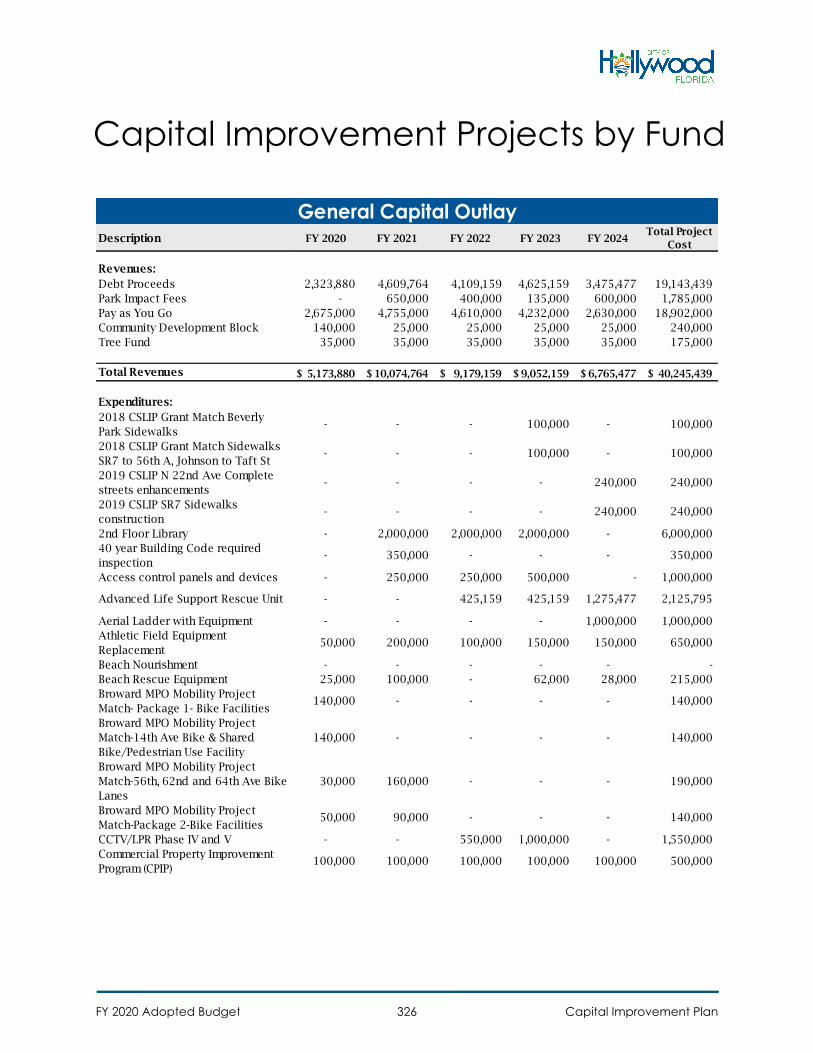
Capital Improvement Projects by Fund
Description FY 2020 FY 2021 FY 2022 FY 2023 FY 2024Total Project
Cost
Revenues:
Debt Proceeds 2,323,880 4,609,764 4,109,159 4,625,159 3,475,477 19,143,439
Park Impact Fees - 650,000 400,000 135,000 600,000 1,785,000
Pay as You Go 2,675,000 4,755,000 4,610,000 4,232,000 2,630,000 18,902,000
Community Development Block 140,000 25,000 25,000 25,000 25,000 240,000
Tree Fund 35,000 35,000 35,000 35,000 35,000 175,000
Total Revenues 5,173,880$ 10,074,764$ 9,179,159$ 9,052,159$ 6,765,477$ 40,245,439$
Expenditures:
2018 CSLIP Grant Match Beverly
Park Sidewalks- - - 100,000 - 100,000
2018 CSLIP Grant Match Sidewalks
SR7 to 56th A, Johnson to Taft St- - - 100,000 - 100,000
2019 CSLIP N 22nd Ave Complete
streets enhancements- - - - 240,000 240,000
2019 CSLIP SR7 Sidewalks
construction- - - - 240,000 240,000
2nd Floor Library - 2,000,000 2,000,000 2,000,000 - 6,000,000
40 year Building Code required
inspection- 350,000 - - - 350,000
Access control panels and devices - 250,000 250,000 500,000 - 1,000,000
Advanced Life Support Rescue Unit - - 425,159 425,159 1,275,477 2,125,795
Aerial Ladder with Equipment - - - - 1,000,000 1,000,000
Athletic Field Equipment
Replacement50,000 200,000 100,000 150,000 150,000 650,000
Beach Nourishment - - - - - -
Beach Rescue Equipment 25,000 100,000 - 62,000 28,000 215,000
Broward MPO Mobility Project
Match- Package 1- Bike Facilities140,000 - - - - 140,000
Broward MPO Mobility Project
Match-14th Ave Bike & Shared
Bike/Pedestrian Use Facility
140,000 - - - - 140,000
Broward MPO Mobility Project
Match-56th, 62nd and 64th Ave Bike
Lanes
30,000 160,000 - - - 190,000
Broward MPO Mobility Project
Match-Package 2-Bike Facilities50,000 90,000 - - - 140,000
CCTV/LPR Phase IV and V - - 550,000 1,000,000 - 1,550,000
Commercial Property Improvement
Program (CPIP)100,000 100,000 100,000 100,000 100,000 500,000
General Capital Outlay
FY 2020 Adopted Budget Capital Improvement Plan326
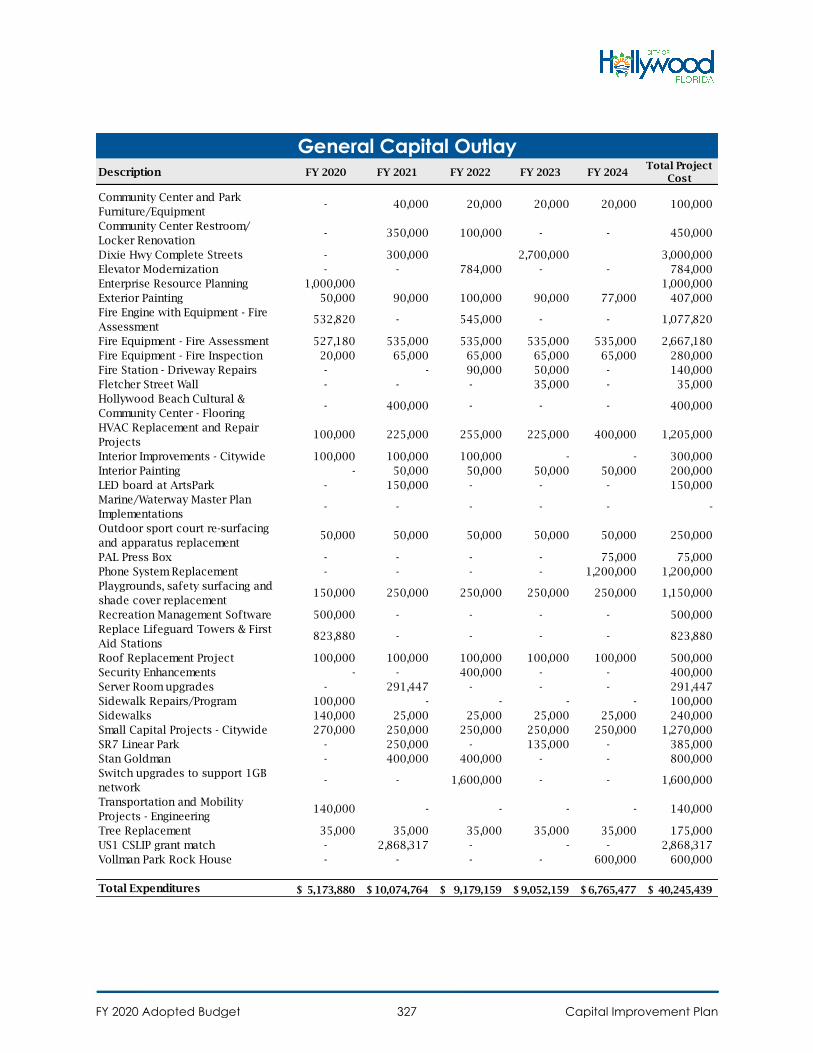
Description FY 2020 FY 2021 FY 2022 FY 2023 FY 2024Total Project
Cost
General Capital Outlay
Community Center and Park
Furniture/Equipment- 40,000 20,000 20,000 20,000 100,000
Community Center Restroom/
Locker Renovation- 350,000 100,000 - - 450,000
Dixie Hwy Complete Streets - 300,000 2,700,000 3,000,000
Elevator Modernization - - 784,000 - - 784,000
Enterprise Resource Planning 1,000,000 1,000,000
Exterior Painting 50,000 90,000 100,000 90,000 77,000 407,000
Fire Engine with Equipment - Fire
Assessment532,820 - 545,000 - - 1,077,820
Fire Equipment - Fire Assessment 527,180 535,000 535,000 535,000 535,000 2,667,180
Fire Equipment - Fire Inspection 20,000 65,000 65,000 65,000 65,000 280,000
Fire Station - Driveway Repairs - - 90,000 50,000 - 140,000
Fletcher Street Wall - - - 35,000 - 35,000
Hollywood Beach Cultural &
Community Center - Flooring- 400,000 - - - 400,000
HVAC Replacement and Repair
Projects100,000 225,000 255,000 225,000 400,000 1,205,000
Interior Improvements - Citywide 100,000 100,000 100,000 - - 300,000
Interior Painting - 50,000 50,000 50,000 50,000 200,000
LED board at ArtsPark - 150,000 - - - 150,000
Marine/Waterway Master Plan
Implementations- - - - - -
Outdoor sport court re-surfacing
and apparatus replacement50,000 50,000 50,000 50,000 50,000 250,000
PAL Press Box - - - - 75,000 75,000
Phone System Replacement - - - - 1,200,000 1,200,000
Playgrounds, safety surfacing and
shade cover replacement150,000 250,000 250,000 250,000 250,000 1,150,000
Recreation Management Software 500,000 - - - - 500,000
Replace Lifeguard Towers & First
Aid Stations823,880 - - - - 823,880
Roof Replacement Project 100,000 100,000 100,000 100,000 100,000 500,000
Security Enhancements - - 400,000 - - 400,000
Server Room upgrades - 291,447 - - - 291,447
Sidewalk Repairs/Program 100,000 - - - - 100,000
Sidewalks 140,000 25,000 25,000 25,000 25,000 240,000
Small Capital Projects - Citywide 270,000 250,000 250,000 250,000 250,000 1,270,000
SR7 Linear Park - 250,000 - 135,000 - 385,000
Stan Goldman - 400,000 400,000 - - 800,000
Switch upgrades to support 1GB
network- - 1,600,000 - - 1,600,000
Transportation and Mobility
Projects - Engineering140,000 - - - - 140,000
Tree Replacement 35,000 35,000 35,000 35,000 35,000 175,000
US1 CSLIP grant match - 2,868,317 - - - 2,868,317
Vollman Park Rock House - - - - 600,000 600,000
Total Expenditures 5,173,880$ 10,074,764$ 9,179,159$ 9,052,159$ 6,765,477$ 40,245,439$
FY 2020 Adopted Budget Capital Improvement Plan327

Project Description
This funds the replacement of field equipment used for the maintenance of the 6 city sports fields. Maintenance equipment such as mowers, sand pros, tractors and utility vehicles will be purchased to maintain sports fields at Rotary Park, Dowdy Field, Boggs Fields, Washington Park, Hollywood West and Driftwood.
Justification This project is considered a routine capital maintenance project.
Ongoing Operating Cost
No measurable impact
Funding Source Pay as You go
Project Type Parks and Open Spaces
Project Cost $650,000
Five-Year Project Funding Summary
FY 20 Cost FY 21 Cost FY 22 Cost FY 23 Cost FY 24 Cost 5 Year Cost
Capital Cost
$50,000 $200,000 $100,000 $150,000 $150,000 $650,000
Operating Impact
$0 $0 $0 $0 $0 $0
General Capital Outlay
Capital Project: Athletic Field Equipment Replacement
Department: Parks, Recreation and Cultural Arts
FY 2020 Adopted Budget Capital Improvement Plan328

Project Description Replacement program for beach rescue equipment such as ATV's and Jet Skis.
Justification Replace ATV's and other Beach Safety equipment to increase Beach Safety patrolling and responsiveness to emergencies.
Ongoing Operating Cost
No measurable impact
Funding Source Pay as You go
Project Type Vehicles and Equipment
Project Cost $215,000
Five-Year Project Funding Summary
FY 20 Cost FY 21 Cost FY 22 Cost FY 23 Cost FY 24 Cost 5 Year Cost
Capital Cost
$25,000 $100,000 $0 $62,000 $28,000 $215,000
Operating Impact
$0 $0 $0 $0 $0 $0
General Capital Outlay
Capital Project: Beach Rescue Equipment
Department: Fire Rescue and Beach Safety
FY 2020 Adopted Budget Capital Improvement Plan329
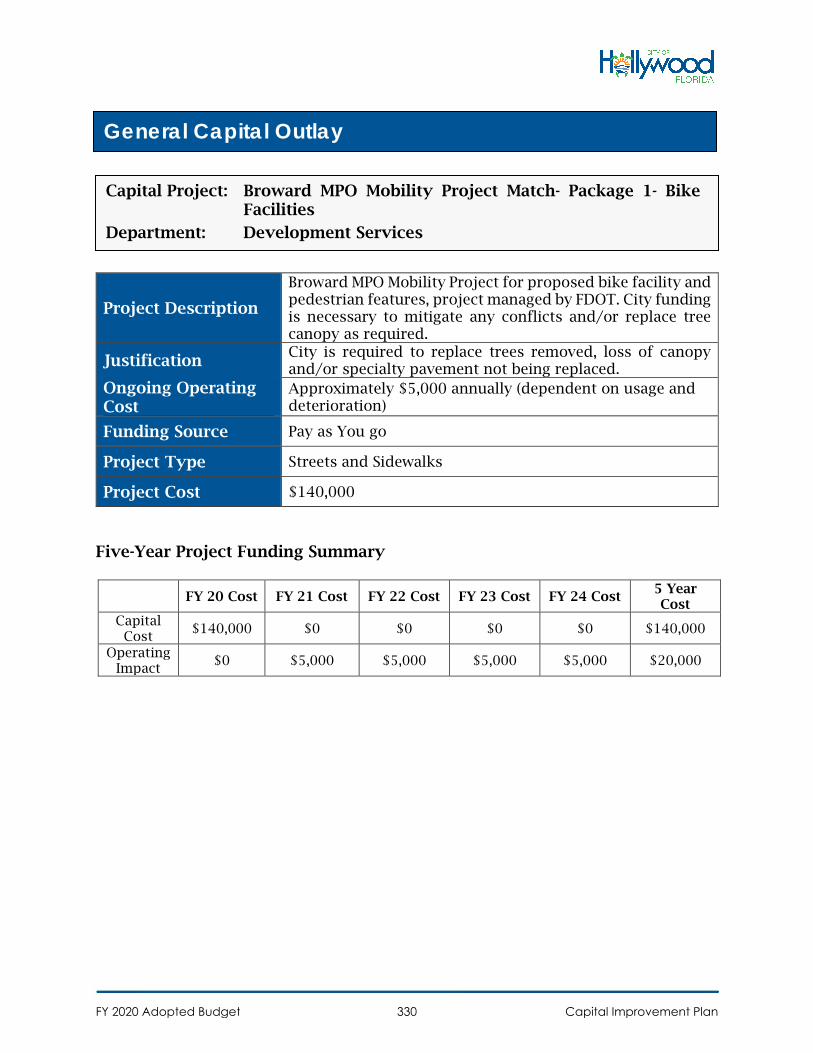
Project Description
Broward MPO Mobility Project for proposed bike facility and pedestrian features, project managed by FDOT. City funding is necessary to mitigate any conflicts and/or replace tree canopy as required.
Justification City is required to replace trees removed, loss of canopy and/or specialty pavement not being replaced.
Ongoing Operating Cost
Approximately $5,000 annually (dependent on usage and deterioration)
Funding Source Pay as You go
Project Type Streets and Sidewalks
Project Cost $140,000
Five-Year Project Funding Summary
FY 20 Cost FY 21 Cost FY 22 Cost FY 23 Cost FY 24 Cost 5 Year Cost
Capital Cost
$140,000 $0 $0 $0 $0 $140,000
Operating Impact
$0 $5,000 $5,000 $5,000 $5,000 $20,000
General Capital Outlay
Capital Project: Broward MPO Mobility Project Match- Package 1- Bike Facilities
Department: Development Services
FY 2020 Adopted Budget Capital Improvement Plan330

Project Description
Broward MPO Mobility Project for proposed bike facility (S 14 Avenue from Moffett Street to Sheridan Street) and shared bike/pedestrian facility (Polk Street from 14 Avenue to 17 Avenue), project managed by FDOT. City funding is necessary to mitigate any conflicts and/or replace tree canopy as required.
Justification City is required to replace trees removed, loss of canopy and/or specialty pavement not being replaced.
Ongoing Operating Cost
Approximately $5,000 annually (dependent on usage and deterioration)
Funding Source Pay as You go
Project Type Streets and Sidewalks
Project Cost $140,000
Five-Year Project Funding Summary
FY 20 Cost FY 21 Cost FY 22 Cost FY 23 Cost FY 24 Cost 5 Year Cost
Capital Cost
$140,000 $0 $0 $0 $0 $140,000
Operating Impact
$0 $5,000 $5,000 $5,000 $5,000 $20,000
General Capital Outlay
Capital Project: Broward MPO Mobility Project Match-14th Ave Bike & Shared Bike/Pedestrian Use Facility
Department: Development Services
FY 2020 Adopted Budget Capital Improvement Plan331
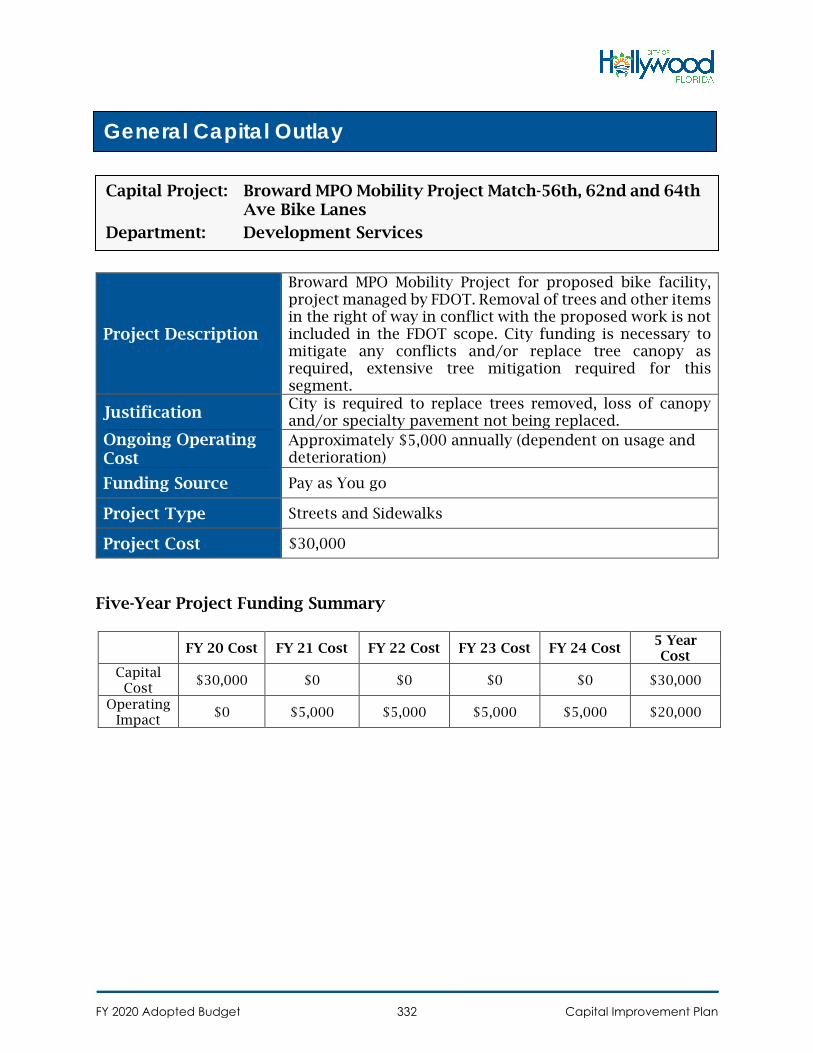
Project Description
Broward MPO Mobility Project for proposed bike facility, project managed by FDOT. Removal of trees and other items in the right of way in conflict with the proposed work is not included in the FDOT scope. City funding is necessary to mitigate any conflicts and/or replace tree canopy as required, extensive tree mitigation required for this segment.
Justification City is required to replace trees removed, loss of canopy and/or specialty pavement not being replaced.
Ongoing Operating Cost
Approximately $5,000 annually (dependent on usage and deterioration)
Funding Source Pay as You go
Project Type Streets and Sidewalks
Project Cost $30,000
Five-Year Project Funding Summary
FY 20 Cost FY 21 Cost FY 22 Cost FY 23 Cost FY 24 Cost 5 Year Cost
Capital Cost
$30,000 $0 $0 $0 $0 $30,000
Operating Impact
$0 $5,000 $5,000 $5,000 $5,000 $20,000
General Capital Outlay
Capital Project: Broward MPO Mobility Project Match-56th, 62nd and 64th Ave Bike Lanes
Department: Development Services
FY 2020 Adopted Budget Capital Improvement Plan332

Project Description
Broward MPO Mobility Project for proposed bike facility and pedestrian features, project managed by FDOT. City funding is necessary to mitigate any conflicts and/or replace tree canopy as required.
Justification City is required to replace trees removed, loss of canopy and/or specialty pavement not being replaced.
Ongoing Operating Cost
Approximately $5,000 annually (dependent on usage and deterioration)
Funding Source Pay as You go
Project Type Streets and Sidewalks
Project Cost $50,000
Five-Year Project Funding Summary
FY 20 Cost FY 21 Cost FY 22 Cost FY 23 Cost FY 24 Cost 5 Year Cost
Capital Cost
$50,000 $0 $0 $0 $0 $50,000
Operating Impact
$0 $5,000 $5,000 $5,000 $5,000 $20,000
General Capital Outlay
Capital Project: Broward MPO Mobility Project Match-Package 2-Bike Facilities
Department: Development Services
FY 2020 Adopted Budget Capital Improvement Plan333
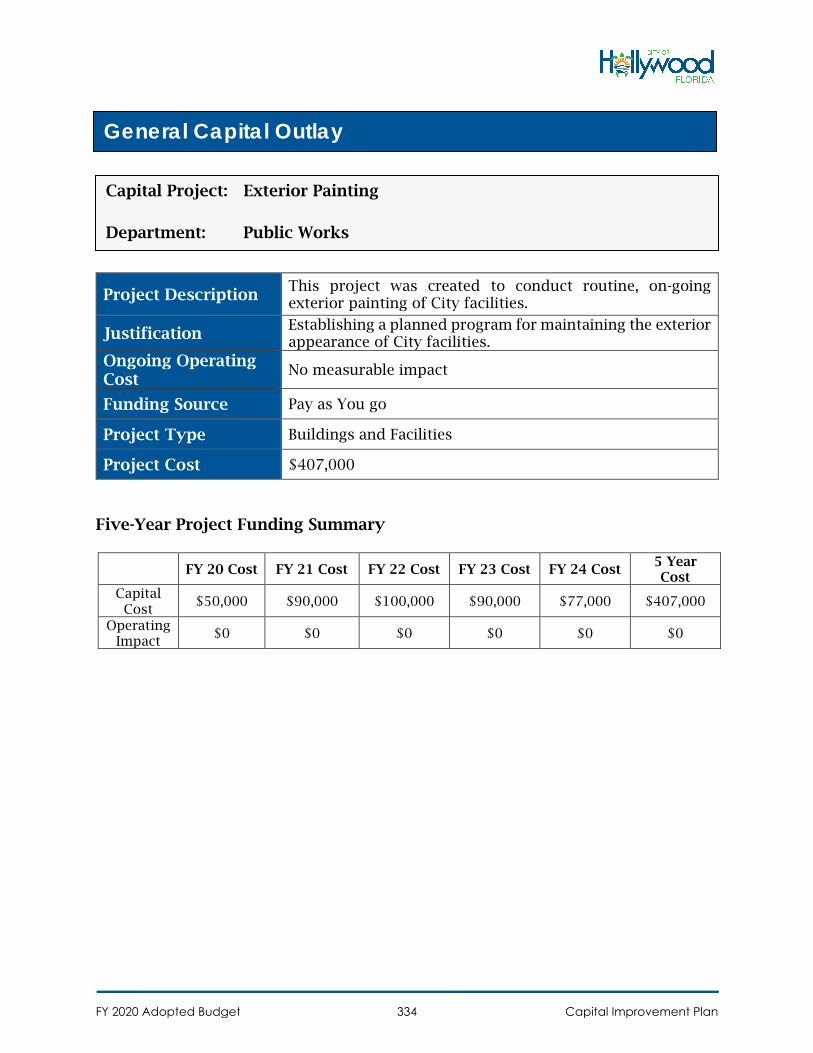
Project Description This project was created to conduct routine, on-going exterior painting of City facilities.
Justification Establishing a planned program for maintaining the exterior appearance of City facilities.
Ongoing Operating Cost
No measurable impact
Funding Source Pay as You go
Project Type Buildings and Facilities
Project Cost $407,000
Five-Year Project Funding Summary
FY 20 Cost FY 21 Cost FY 22 Cost FY 23 Cost FY 24 Cost 5 Year Cost
Capital Cost
$50,000 $90,000 $100,000 $90,000 $77,000 $407,000
Operating Impact
$0 $0 $0 $0 $0 $0
General Capital Outlay
Capital Project: Exterior Painting
Department: Public Works
FY 2020 Adopted Budget Capital Improvement Plan334
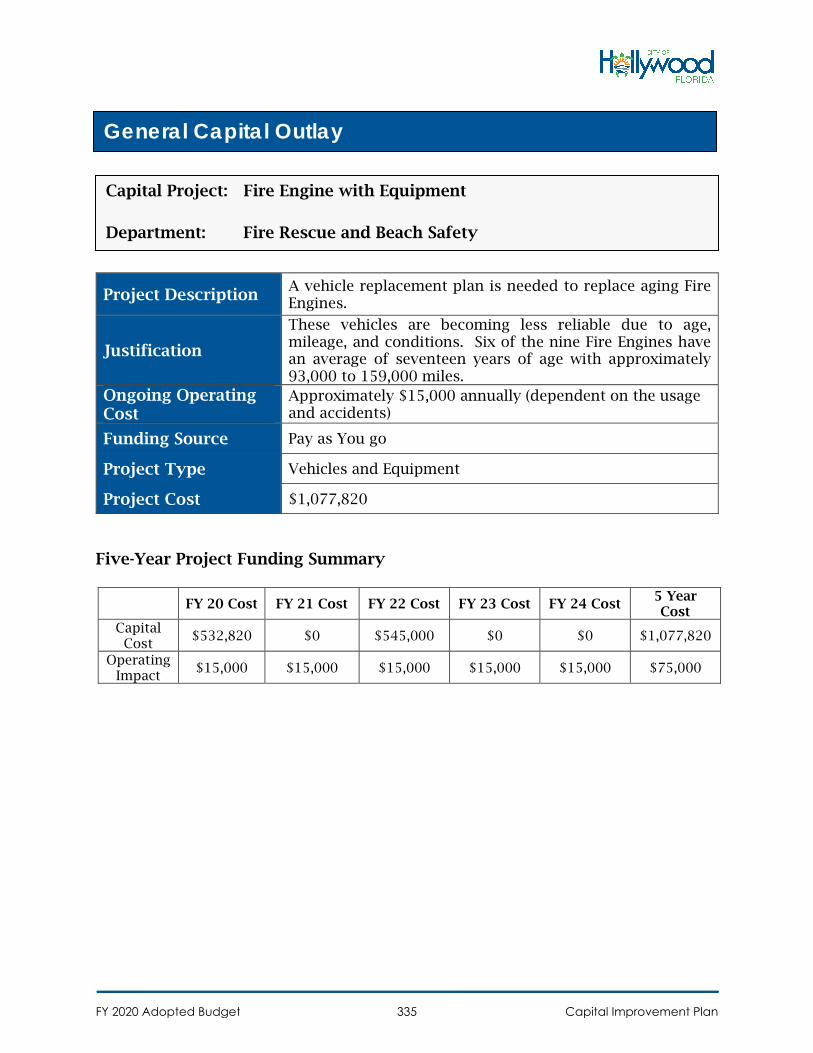
Project Description A vehicle replacement plan is needed to replace aging Fire Engines.
Justification
These vehicles are becoming less reliable due to age, mileage, and conditions. Six of the nine Fire Engines have an average of seventeen years of age with approximately 93,000 to 159,000 miles.
Ongoing Operating Cost
Approximately $15,000 annually (dependent on the usage and accidents)
Funding Source Pay as You go
Project Type Vehicles and Equipment
Project Cost $1,077,820
Five-Year Project Funding Summary
FY 20 Cost FY 21 Cost FY 22 Cost FY 23 Cost FY 24 Cost 5 Year Cost
Capital Cost
$532,820 $0 $545,000 $0 $0 $1,077,820
Operating Impact
$15,000 $15,000 $15,000 $15,000 $15,000 $75,000
General Capital Outlay
Capital Project: Fire Engine with Equipment
Department: Fire Rescue and Beach Safety
FY 2020 Adopted Budget Capital Improvement Plan335
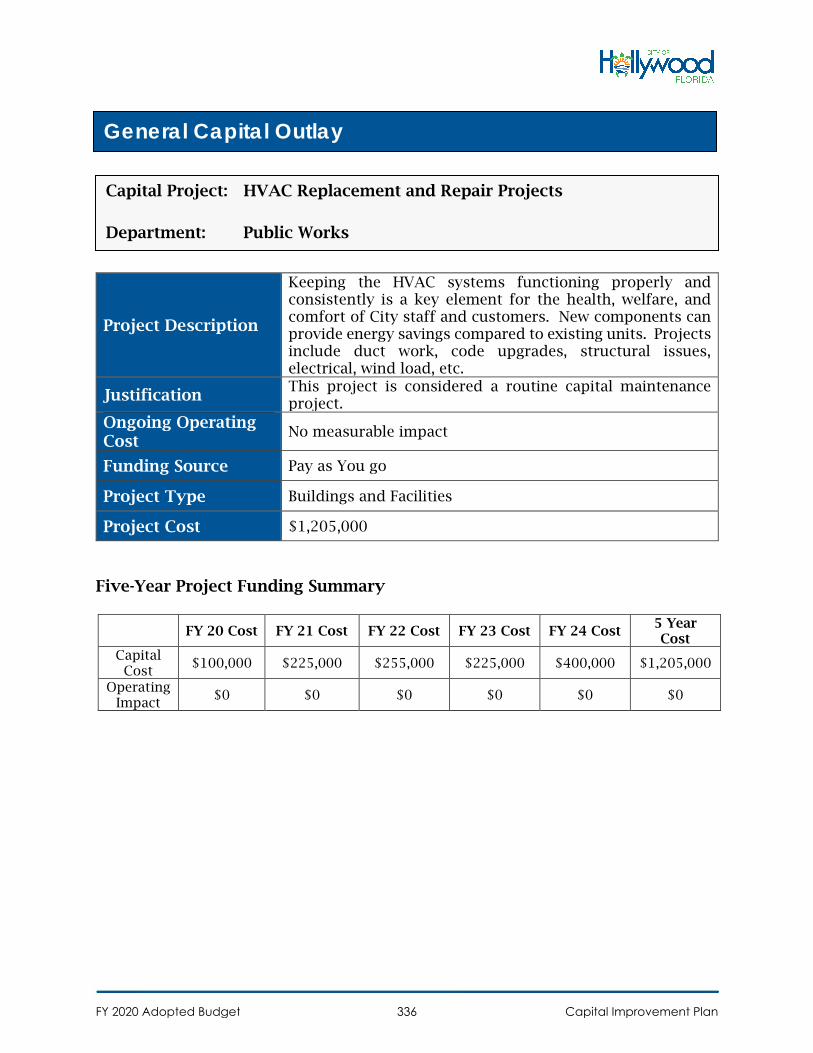
Project Description
Keeping the HVAC systems functioning properly and consistently is a key element for the health, welfare, and comfort of City staff and customers. New components can provide energy savings compared to existing units. Projects include duct work, code upgrades, structural issues, electrical, wind load, etc.
Justification This project is considered a routine capital maintenance project.
Ongoing Operating Cost
No measurable impact
Funding Source Pay as You go
Project Type Buildings and Facilities
Project Cost $1,205,000
Five-Year Project Funding Summary
FY 20 Cost FY 21 Cost FY 22 Cost FY 23 Cost FY 24 Cost 5 Year Cost
Capital Cost
$100,000 $225,000 $255,000 $225,000 $400,000 $1,205,000
Operating Impact
$0 $0 $0 $0 $0 $0
General Capital Outlay
Capital Project: HVAC Replacement and Repair Projects
Department: Public Works
FY 2020 Adopted Budget Capital Improvement Plan336

Project Description
Improvements to City facilities as required. Improvements may include elevator upgrades, leak repairs, accessibility upgrades, security improvements, structural repairs, renovations to floor plans, painting and other miscellaneous building improvements and repairs.
Justification This project is considered a routine capital maintenance project.
Ongoing Operating Cost
No measurable impact
Funding Source Pay as You go
Project Type Buildings and Facilities
Project Cost $300,000
Five-Year Project Funding Summary
FY 20 Cost FY 21 Cost FY 22 Cost FY 23 Cost FY 24 Cost 5 Year Cost
Capital Cost
$100,000 $100,000 $100,000 $0 $0 $300,000
Operating Impact
$0 $0 $0 $0 $0 $0
General Capital Outlay
Capital Project: Interior Improvements - Citywide
Department: Public Works
FY 2020 Adopted Budget Capital Improvement Plan337
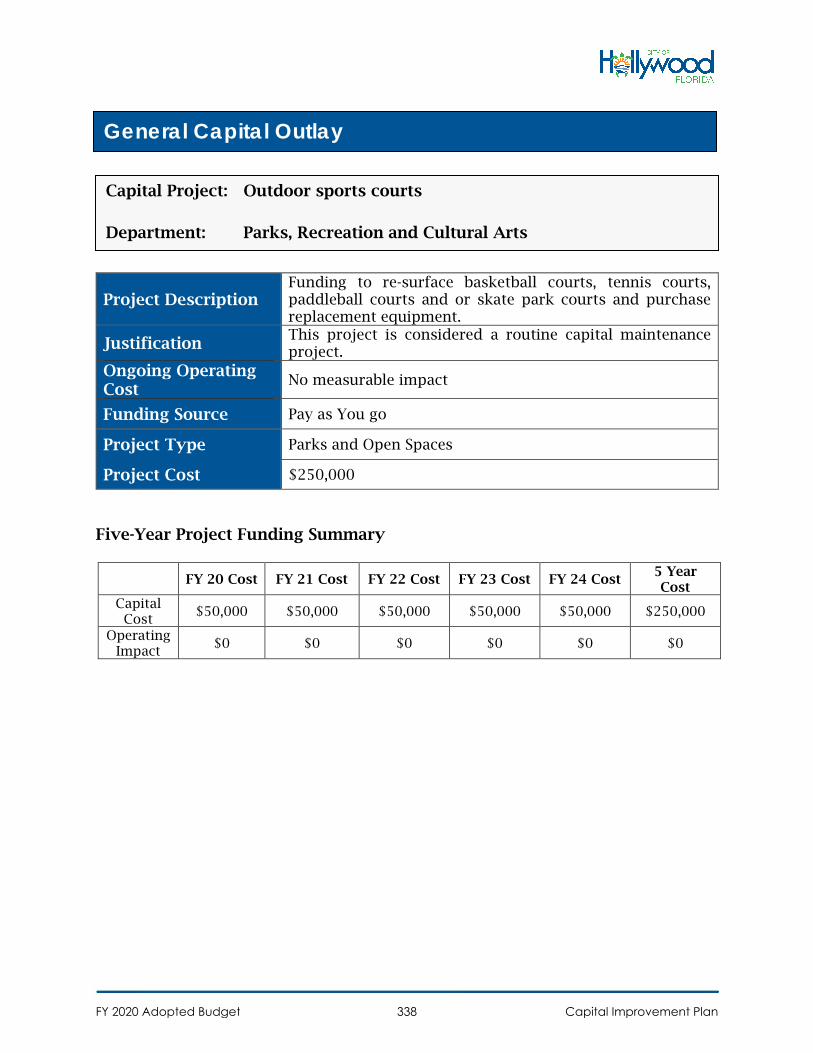
Project Description Funding to re-surface basketball courts, tennis courts, paddleball courts and or skate park courts and purchase replacement equipment.
Justification This project is considered a routine capital maintenance project.
Ongoing Operating Cost
No measurable impact
Funding Source Pay as You go
Project Type Parks and Open Spaces
Project Cost $250,000
Five-Year Project Funding Summary
FY 20 Cost FY 21 Cost FY 22 Cost FY 23 Cost FY 24 Cost 5 Year Cost
Capital Cost
$50,000 $50,000 $50,000 $50,000 $50,000 $250,000
Operating Impact
$0 $0 $0 $0 $0 $0
General Capital Outlay
Capital Project: Outdoor sports courts
Department: Parks, Recreation and Cultural Arts
FY 2020 Adopted Budget Capital Improvement Plan338
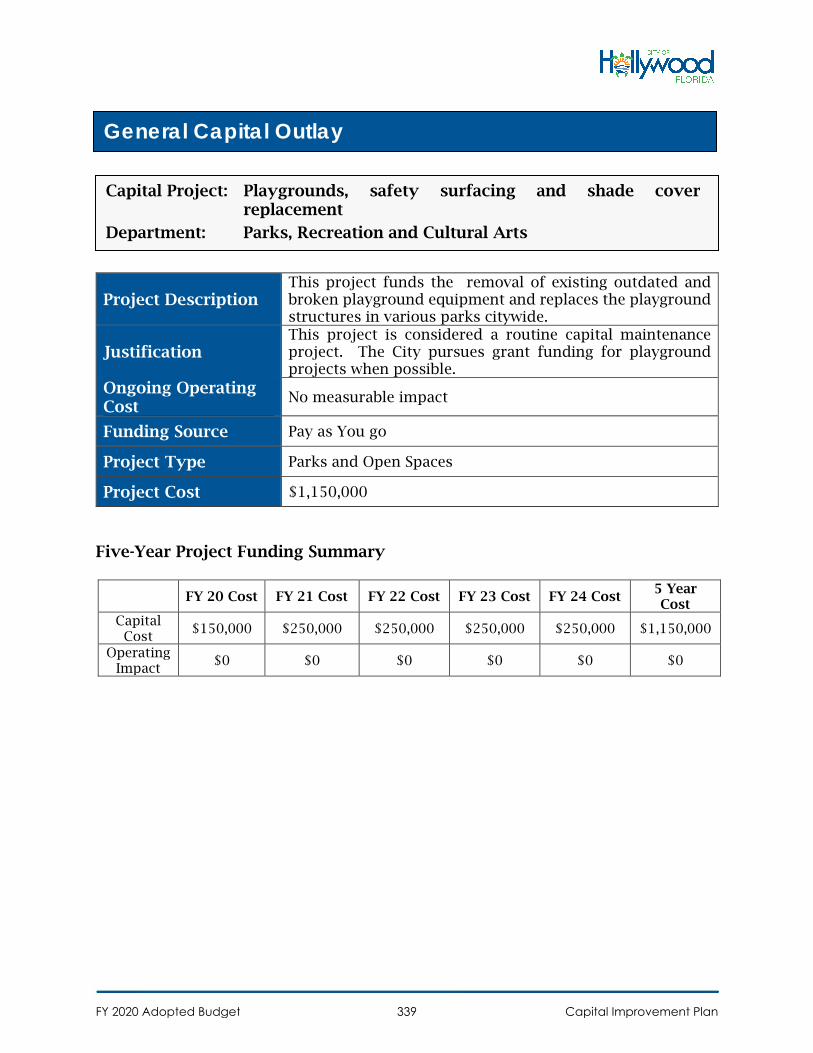
Project Description This project funds the removal of existing outdated and broken playground equipment and replaces the playground structures in various parks citywide.
Justification This project is considered a routine capital maintenance project. The City pursues grant funding for playground projects when possible.
Ongoing Operating Cost
No measurable impact
Funding Source Pay as You go
Project Type Parks and Open Spaces
Project Cost $1,150,000
Five-Year Project Funding Summary
FY 20 Cost FY 21 Cost FY 22 Cost FY 23 Cost FY 24 Cost 5 Year Cost
Capital Cost
$150,000 $250,000 $250,000 $250,000 $250,000 $1,150,000
Operating Impact
$0 $0 $0 $0 $0 $0
General Capital Outlay
Capital Project: Playgrounds, safety surfacing and shade cover replacement
Department: Parks, Recreation and Cultural Arts
FY 2020 Adopted Budget Capital Improvement Plan339
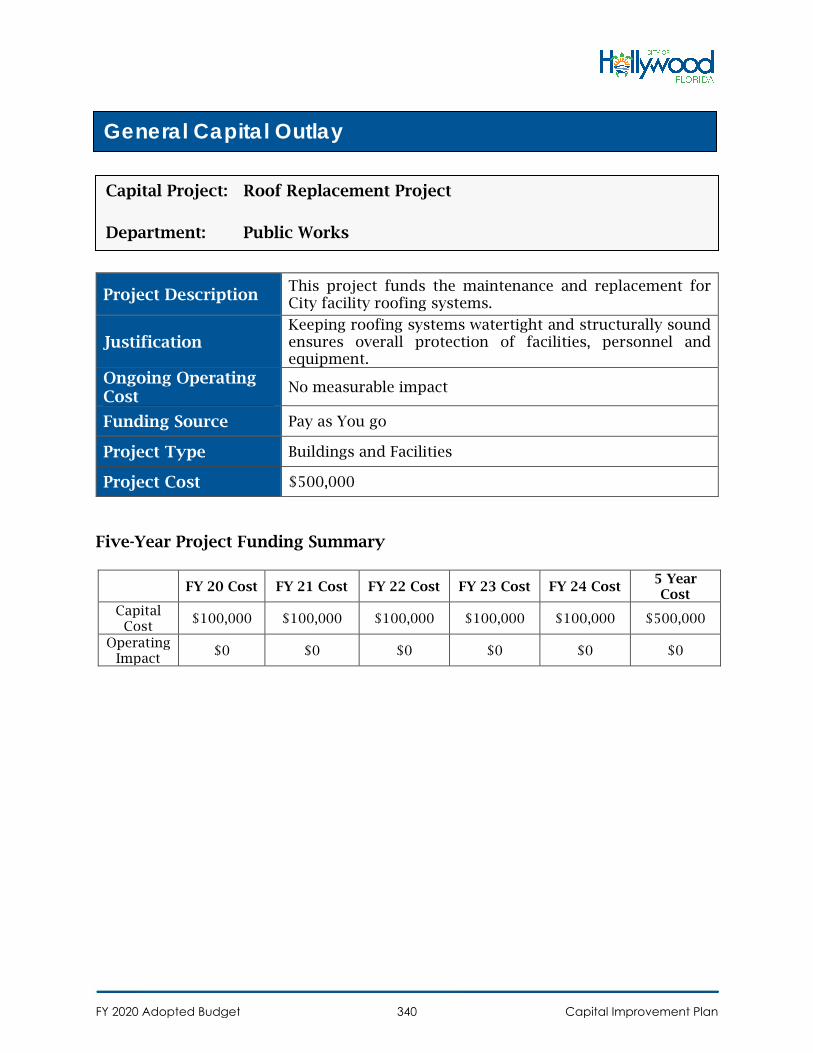
Project Description This project funds the maintenance and replacement for City facility roofing systems.
Justification Keeping roofing systems watertight and structurally sound ensures overall protection of facilities, personnel and equipment.
Ongoing Operating Cost
No measurable impact
Funding Source Pay as You go
Project Type Buildings and Facilities
Project Cost $500,000
Five-Year Project Funding Summary
FY 20 Cost FY 21 Cost FY 22 Cost FY 23 Cost FY 24 Cost 5 Year Cost
Capital Cost
$100,000 $100,000 $100,000 $100,000 $100,000 $500,000
Operating Impact
$0 $0 $0 $0 $0 $0
General Capital Outlay
Capital Project: Roof Replacement Project
Department: Public Works
FY 2020 Adopted Budget Capital Improvement Plan340
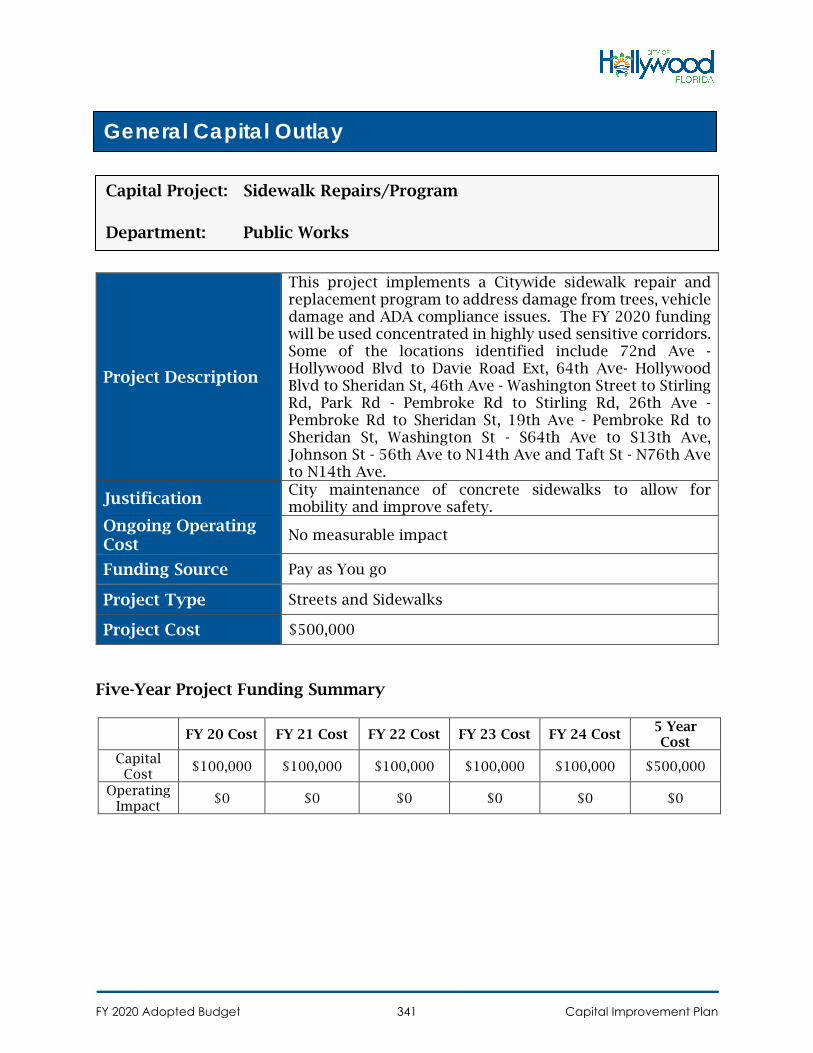
Project Description
This project implements a Citywide sidewalk repair and replacement program to address damage from trees, vehicle damage and ADA compliance issues. The FY 2020 funding will be used concentrated in highly used sensitive corridors. Some of the locations identified include 72nd Ave - Hollywood Blvd to Davie Road Ext, 64th Ave- Hollywood Blvd to Sheridan St, 46th Ave - Washington Street to Stirling Rd, Park Rd - Pembroke Rd to Stirling Rd, 26th Ave - Pembroke Rd to Sheridan St, 19th Ave - Pembroke Rd to Sheridan St, Washington St - S64th Ave to S13th Ave, Johnson St - 56th Ave to N14th Ave and Taft St - N76th Ave to N14th Ave.
Justification City maintenance of concrete sidewalks to allow for mobility and improve safety.
Ongoing Operating Cost
No measurable impact
Funding Source Pay as You go
Project Type Streets and Sidewalks
Project Cost $500,000
Five-Year Project Funding Summary
FY 20 Cost FY 21 Cost FY 22 Cost FY 23 Cost FY 24 Cost 5 Year Cost
Capital Cost
$100,000 $100,000 $100,000 $100,000 $100,000 $500,000
Operating Impact
$0 $0 $0 $0 $0 $0
General Capital Outlay
Capital Project: Sidewalk Repairs/Program
Department: Public Works
FY 2020 Adopted Budget Capital Improvement Plan341
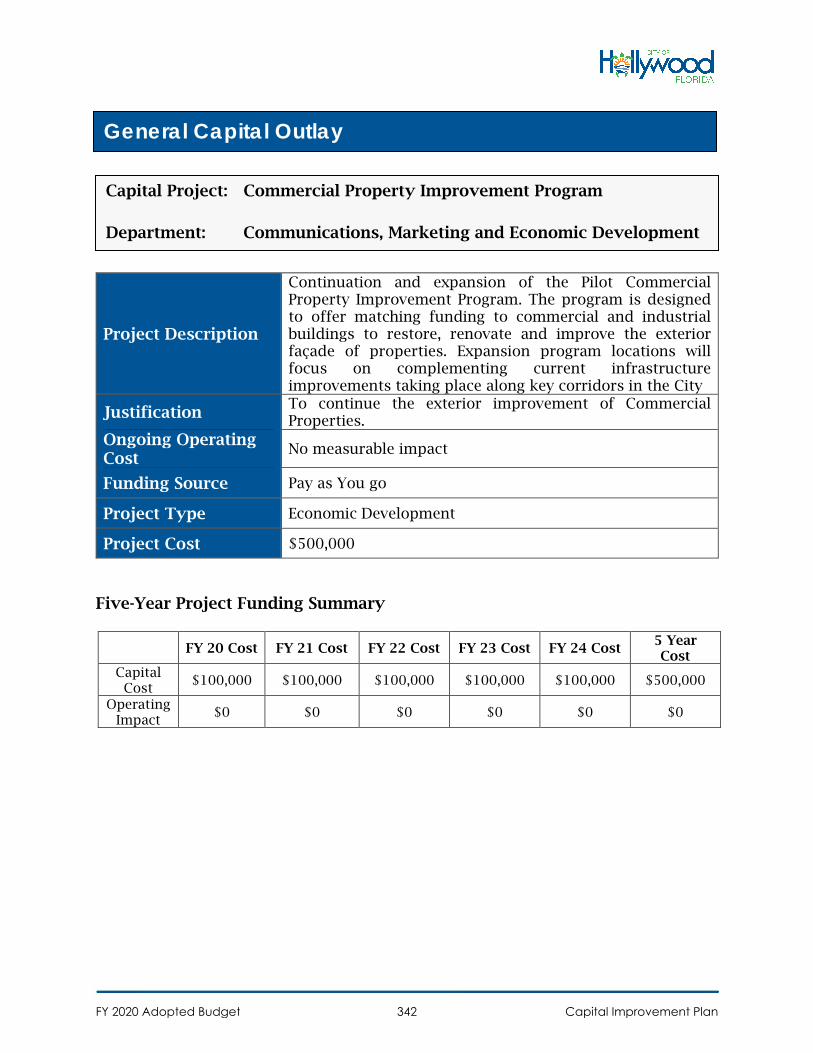
Project Description
Continuation and expansion of the Pilot Commercial Property Improvement Program. The program is designed to offer matching funding to commercial and industrial buildings to restore, renovate and improve the exterior façade of properties. Expansion program locations will focus on complementing current infrastructure improvements taking place along key corridors in the City
Justification To continue the exterior improvement of Commercial Properties.
Ongoing Operating Cost
No measurable impact
Funding Source Pay as You go
Project Type Economic Development
Project Cost $500,000
Five-Year Project Funding Summary
FY 20 Cost FY 21 Cost FY 22 Cost FY 23 Cost FY 24 Cost 5 Year Cost
Capital Cost
$100,000 $100,000 $100,000 $100,000 $100,000 $500,000
Operating Impact
$0 $0 $0 $0 $0 $0
General Capital Outlay
Capital Project: Commercial Property Improvement Program
Department: Communications, Marketing and Economic Development
FY 2020 Adopted Budget Capital Improvement Plan342
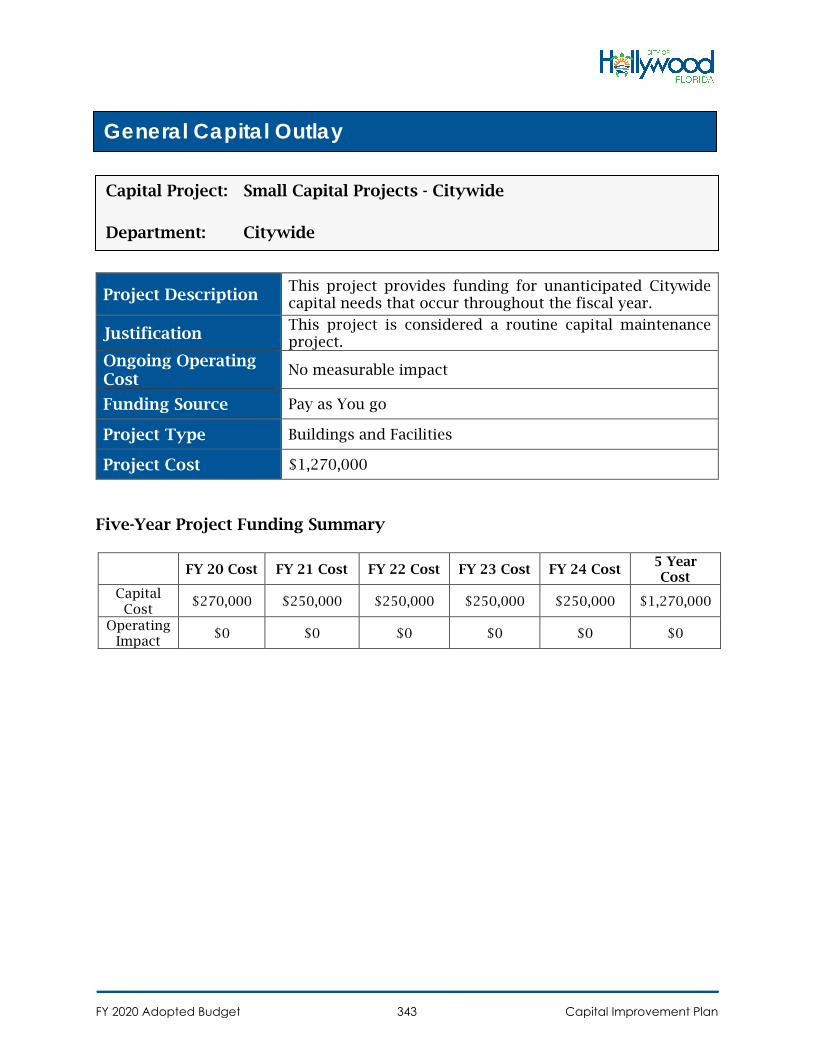
Project Description This project provides funding for unanticipated Citywide capital needs that occur throughout the fiscal year.
Justification This project is considered a routine capital maintenance project.
Ongoing Operating Cost
No measurable impact
Funding Source Pay as You go
Project Type Buildings and Facilities
Project Cost $1,270,000
Five-Year Project Funding Summary
FY 20 Cost FY 21 Cost FY 22 Cost FY 23 Cost FY 24 Cost 5 Year Cost
Capital Cost
$270,000 $250,000 $250,000 $250,000 $250,000 $1,270,000
Operating Impact
$0 $0 $0 $0 $0 $0
General Capital Outlay
Capital Project: Small Capital Projects - Citywide
Department: Citywide
FY 2020 Adopted Budget Capital Improvement Plan343
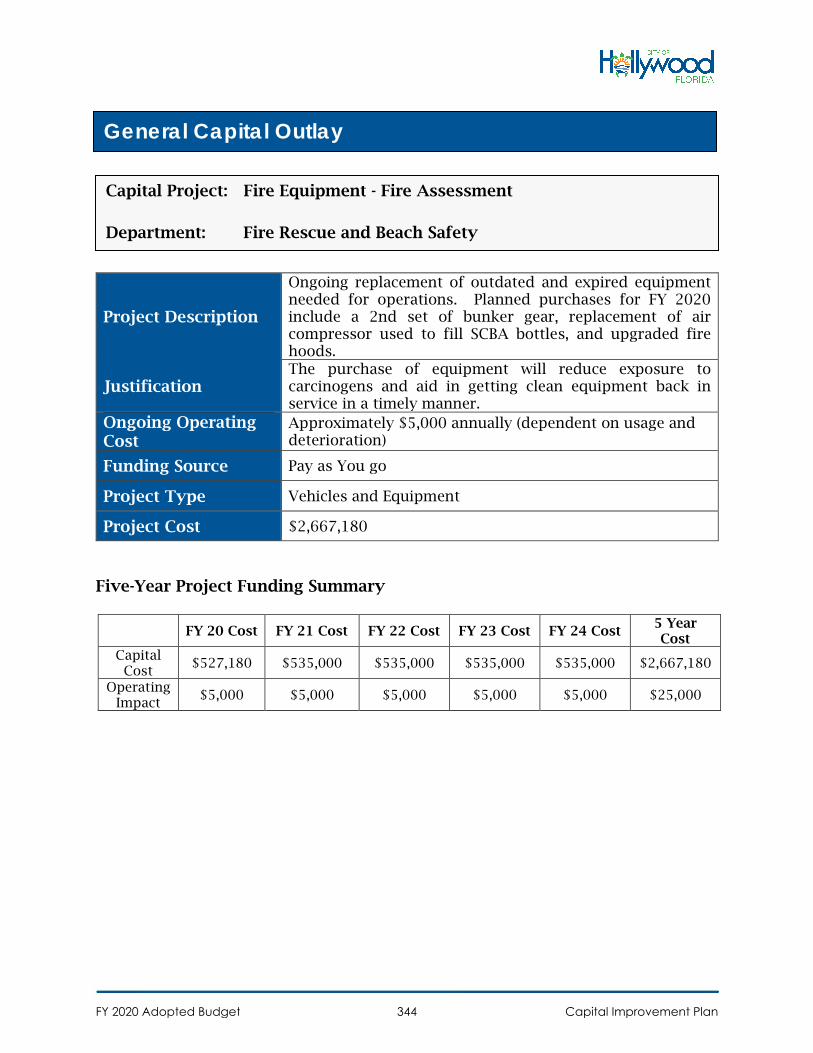
Project Description
Ongoing replacement of outdated and expired equipment needed for operations. Planned purchases for FY 2020 include a 2nd set of bunker gear, replacement of air compressor used to fill SCBA bottles, and upgraded fire hoods.
Justification The purchase of equipment will reduce exposure to carcinogens and aid in getting clean equipment back in service in a timely manner.
Ongoing Operating Cost
Approximately $5,000 annually (dependent on usage and deterioration)
Funding Source Pay as You go
Project Type Vehicles and Equipment
Project Cost $2,667,180
Five-Year Project Funding Summary
FY 20 Cost FY 21 Cost FY 22 Cost FY 23 Cost FY 24 Cost 5 Year Cost
Capital Cost
$527,180 $535,000 $535,000 $535,000 $535,000 $2,667,180
Operating Impact
$5,000 $5,000 $5,000 $5,000 $5,000 $25,000
General Capital Outlay
Capital Project: Fire Equipment - Fire Assessment
Department: Fire Rescue and Beach Safety
FY 2020 Adopted Budget Capital Improvement Plan344
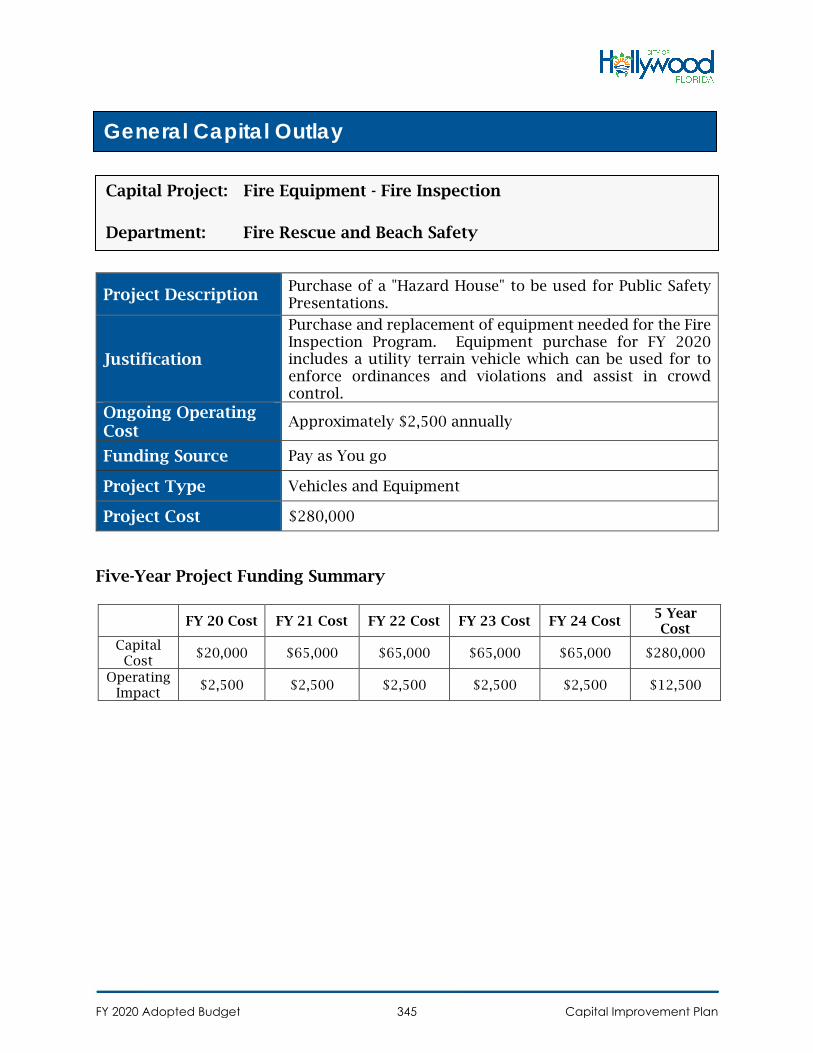
Project Description Purchase of a "Hazard House" to be used for Public Safety Presentations.
Justification
Purchase and replacement of equipment needed for the Fire Inspection Program. Equipment purchase for FY 2020 includes a utility terrain vehicle which can be used for to enforce ordinances and violations and assist in crowd control.
Ongoing Operating Cost
Approximately $2,500 annually
Funding Source Pay as You go
Project Type Vehicles and Equipment
Project Cost $280,000
Five-Year Project Funding Summary
FY 20 Cost FY 21 Cost FY 22 Cost FY 23 Cost FY 24 Cost 5 Year Cost
Capital Cost
$20,000 $65,000 $65,000 $65,000 $65,000 $280,000
Operating Impact
$2,500 $2,500 $2,500 $2,500 $2,500 $12,500
General Capital Outlay
Capital Project: Fire Equipment - Fire Inspection
Department: Fire Rescue and Beach Safety
FY 2020 Adopted Budget Capital Improvement Plan345
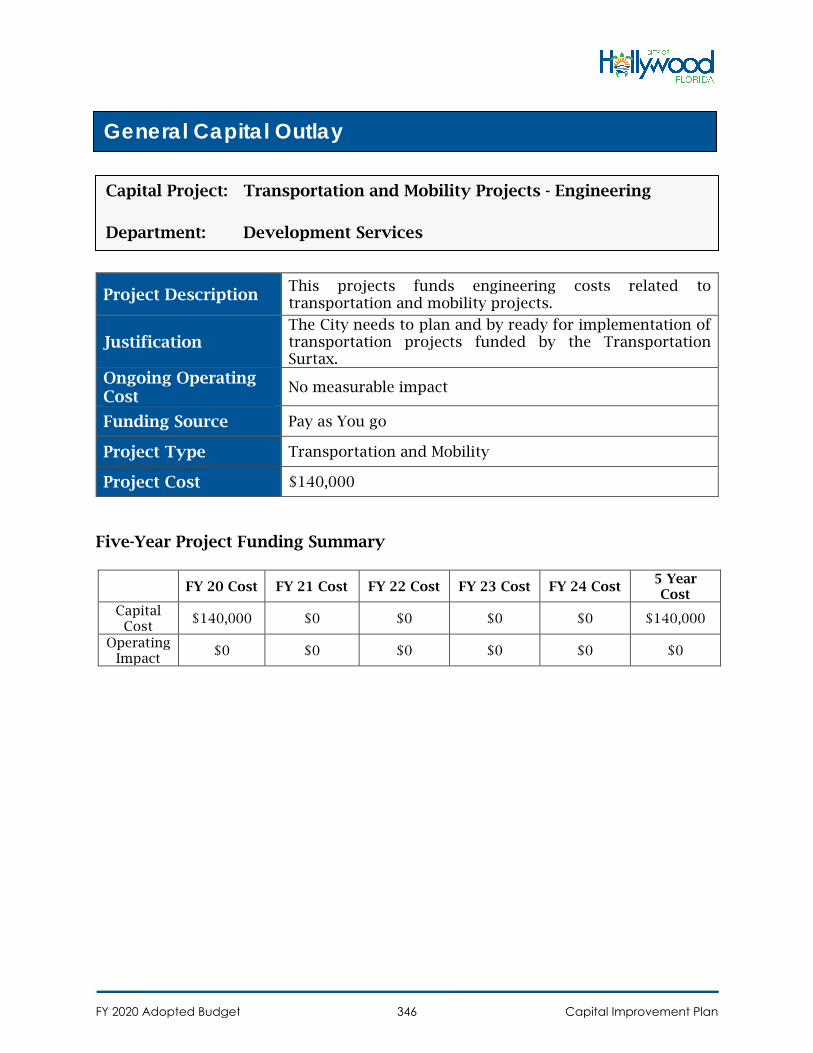
Project Description This projects funds engineering costs related to transportation and mobility projects.
Justification The City needs to plan and by ready for implementation of transportation projects funded by the Transportation Surtax.
Ongoing Operating Cost
No measurable impact
Funding Source Pay as You go
Project Type Transportation and Mobility
Project Cost $140,000
Five-Year Project Funding Summary
FY 20 Cost FY 21 Cost FY 22 Cost FY 23 Cost FY 24 Cost 5 Year Cost
Capital Cost
$140,000 $0 $0 $0 $0 $140,000
Operating Impact
$0 $0 $0 $0 $0 $0
General Capital Outlay
Capital Project: Transportation and Mobility Projects - Engineering
Department: Development Services
FY 2020 Adopted Budget Capital Improvement Plan346
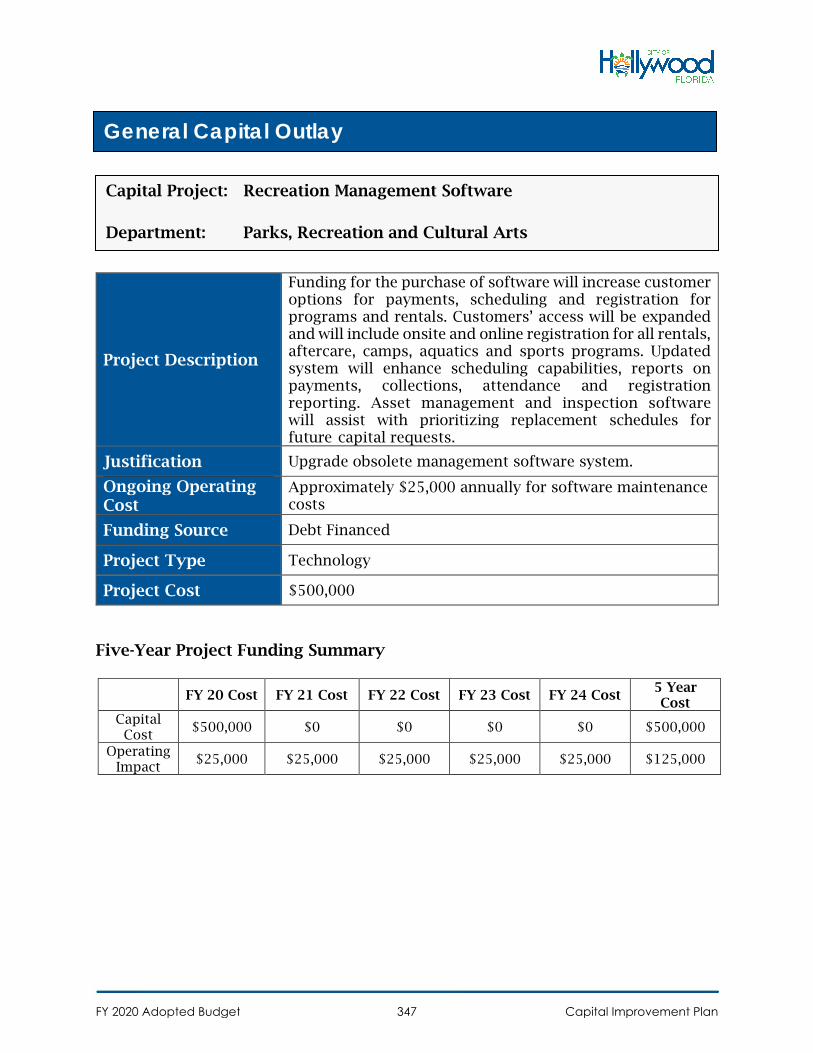
Project Description
Funding for the purchase of software will increase customer options for payments, scheduling and registration for programs and rentals. Customers’ access will be expanded and will include onsite and online registration for all rentals, aftercare, camps, aquatics and sports programs. Updated system will enhance scheduling capabilities, reports on payments, collections, attendance and registration reporting. Asset management and inspection software will assist with prioritizing replacement schedules for future capital requests.
Justification Upgrade obsolete management software system.
Ongoing Operating Cost
Approximately $25,000 annually for software maintenance costs
Funding Source Debt Financed
Project Type Technology
Project Cost $500,000
Five-Year Project Funding Summary
FY 20 Cost FY 21 Cost FY 22 Cost FY 23 Cost FY 24 Cost 5 Year Cost
Capital Cost
$500,000 $0 $0 $0 $0 $500,000
Operating Impact
$25,000 $25,000 $25,000 $25,000 $25,000 $125,000
General Capital Outlay
Capital Project: Recreation Management Software
Department: Parks, Recreation and Cultural Arts
FY 2020 Adopted Budget Capital Improvement Plan347
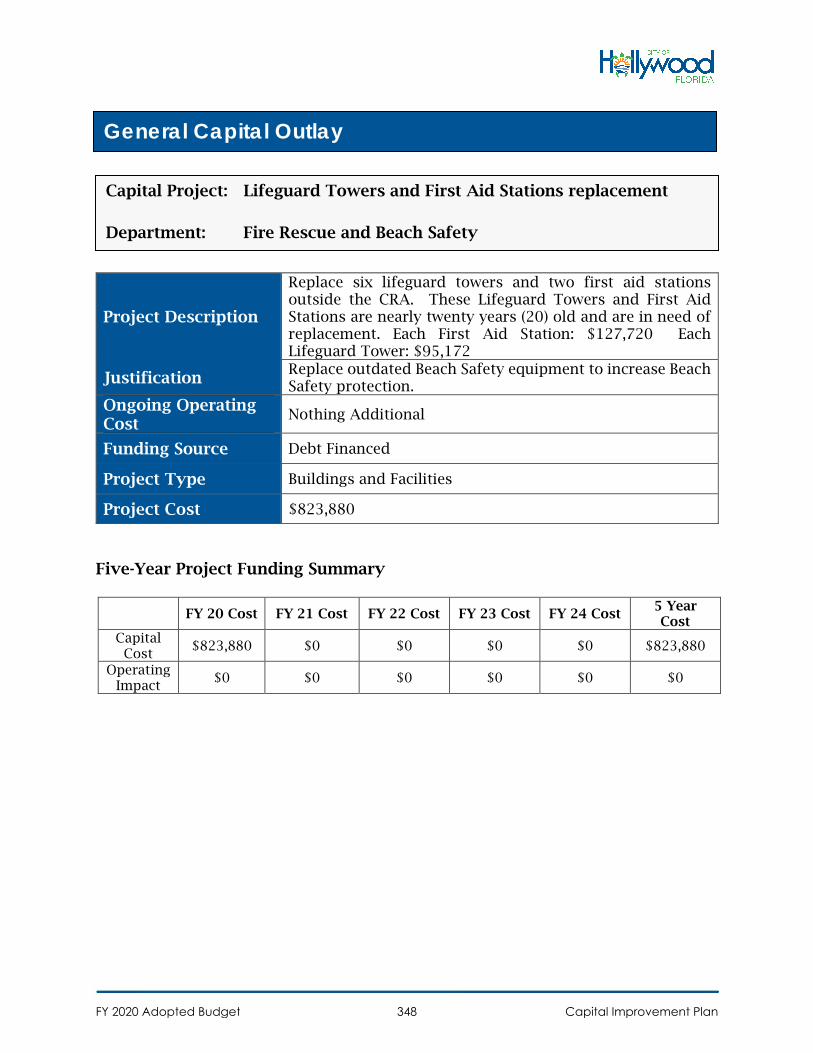
Project Description
Replace six lifeguard towers and two first aid stations outside the CRA. These Lifeguard Towers and First Aid Stations are nearly twenty years (20) old and are in need of replacement. Each First Aid Station: $127,720 Each Lifeguard Tower: $95,172
Justification Replace outdated Beach Safety equipment to increase Beach Safety protection.
Ongoing Operating Cost
Nothing Additional
Funding Source Debt Financed
Project Type Buildings and Facilities
Project Cost $823,880
Five-Year Project Funding Summary
FY 20 Cost FY 21 Cost FY 22 Cost FY 23 Cost FY 24 Cost 5 Year Cost
Capital Cost
$823,880 $0 $0 $0 $0 $823,880
Operating Impact
$0 $0 $0 $0 $0 $0
General Capital Outlay
Capital Project: Lifeguard Towers and First Aid Stations replacement
Department: Fire Rescue and Beach Safety
FY 2020 Adopted Budget Capital Improvement Plan348
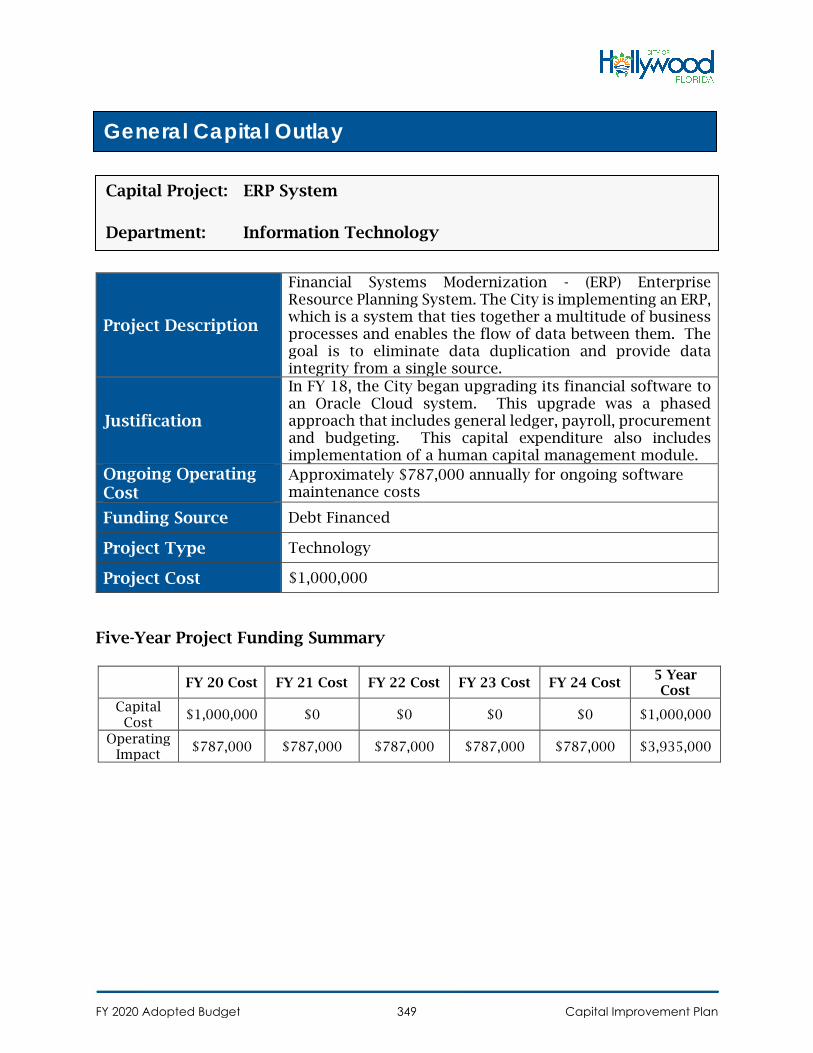
Project Description
Financial Systems Modernization - (ERP) Enterprise Resource Planning System. The City is implementing an ERP, which is a system that ties together a multitude of business processes and enables the flow of data between them. The goal is to eliminate data duplication and provide data integrity from a single source.
Justification
In FY 18, the City began upgrading its financial software to an Oracle Cloud system. This upgrade was a phased approach that includes general ledger, payroll, procurement and budgeting. This capital expenditure also includes implementation of a human capital management module.
Ongoing Operating Cost
Approximately $787,000 annually for ongoing software maintenance costs
Funding Source Debt Financed
Project Type Technology
Project Cost $1,000,000
Five-Year Project Funding Summary
FY 20 Cost FY 21 Cost FY 22 Cost FY 23 Cost FY 24 Cost 5 Year Cost
Capital Cost
$1,000,000 $0 $0 $0 $0 $1,000,000
Operating Impact
$787,000 $787,000 $787,000 $787,000 $787,000 $3,935,000
General Capital Outlay
Capital Project: ERP System
Department: Information Technology
FY 2020 Adopted Budget Capital Improvement Plan349
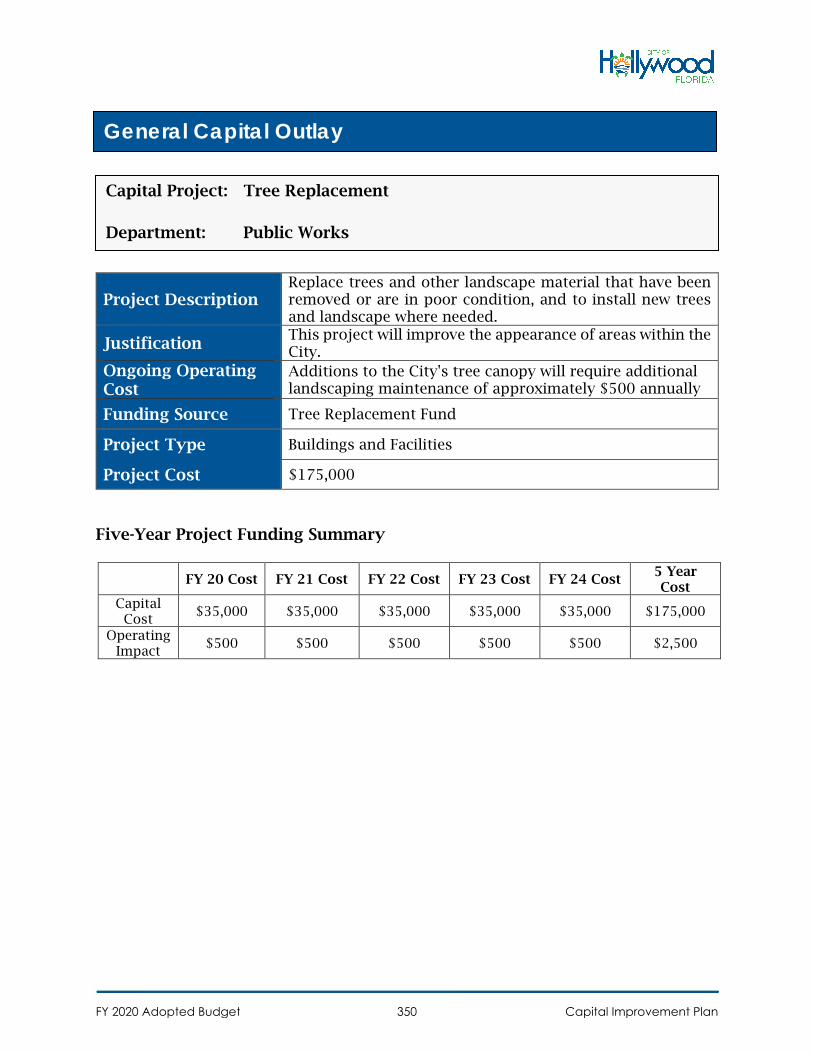
Project Description Replace trees and other landscape material that have been removed or are in poor condition, and to install new trees and landscape where needed.
Justification This project will improve the appearance of areas within the City.
Ongoing Operating Cost
Additions to the City's tree canopy will require additional landscaping maintenance of approximately $500 annually
Funding Source Tree Replacement Fund
Project Type Buildings and Facilities
Project Cost $175,000
Five-Year Project Funding Summary
FY 20 Cost FY 21 Cost FY 22 Cost FY 23 Cost FY 24 Cost 5 Year Cost
Capital Cost
$35,000 $35,000 $35,000 $35,000 $35,000 $175,000
Operating Impact
$500 $500 $500 $500 $500 $2,500
General Capital Outlay
Capital Project: Tree Replacement
Department: Public Works
FY 2020 Adopted Budget Capital Improvement Plan350

Project Description
This project implements a Citywide sidewalk repair and replacement program to address damage from trees, vehicle damage and ADA compliance issues. This funding is being provided by CDBG funds and will used in LMI areas.
Justification This project is considered a routine capital maintenance project.
Ongoing Operating Cost
No measurable impact
Funding Source Community Development Block Grant
Project Type Streets and Sidewalks
Project Cost $240,000
Five-Year Project Funding Summary
FY 20 Cost FY 21 Cost FY 22 Cost FY 23 Cost FY 24 Cost 5 Year Cost
Capital Cost
$140,000 $25,000 $25,000 $25,000 $25,000 $240,000
Operating Impact
$0 $0 $0 $0 $0 $0
General Capital Outlay
Capital Project: Sidewalk Repairs/Program
Department: Public Works
FY 2020 Adopted Budget Capital Improvement Plan351
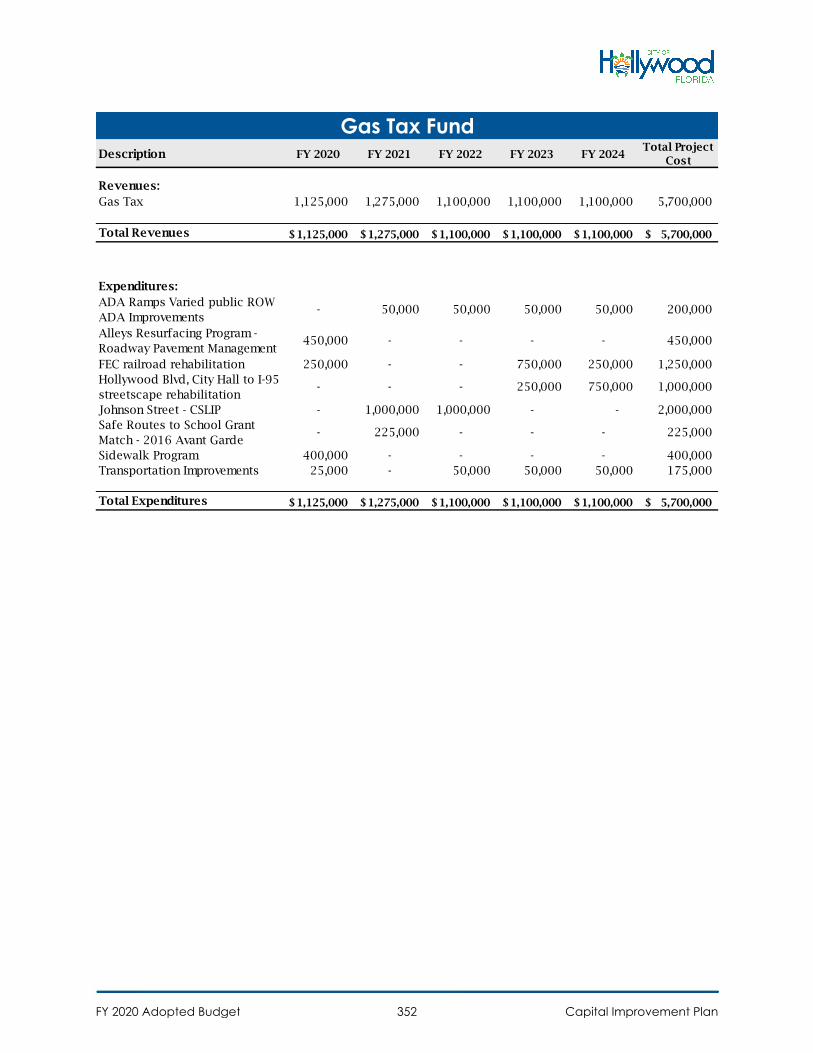
Description FY 2020 FY 2021 FY 2022 FY 2023 FY 2024Total Project
Cost
Revenues:
Gas Tax 1,125,000 1,275,000 1,100,000 1,100,000 1,100,000 5,700,000
Total Revenues 1,125,000$ 1,275,000$ 1,100,000$ 1,100,000$ 1,100,000$ 5,700,000$
Expenditures:
ADA Ramps Varied public ROW
ADA Improvements - 50,000 50,000 50,000 50,000 200,000
Alleys Resurfacing Program -
Roadway Pavement Management450,000 - - - - 450,000
FEC railroad rehabilitation 250,000 - - 750,000 250,000 1,250,000
Hollywood Blvd, City Hall to I-95
streetscape rehabilitation- - - 250,000 750,000 1,000,000
Johnson Street - CSLIP - 1,000,000 1,000,000 - - 2,000,000
Safe Routes to School Grant
Match - 2016 Avant Garde- 225,000 - - - 225,000
Sidewalk Program 400,000 - - - - 400,000
Transportation Improvements 25,000 - 50,000 50,000 50,000 175,000
Total Expenditures 1,125,000$ 1,275,000$ 1,100,000$ 1,100,000$ 1,100,000$ 5,700,000$
Gas Tax Fund
FY 2020 Adopted Budget Capital Improvement Plan352
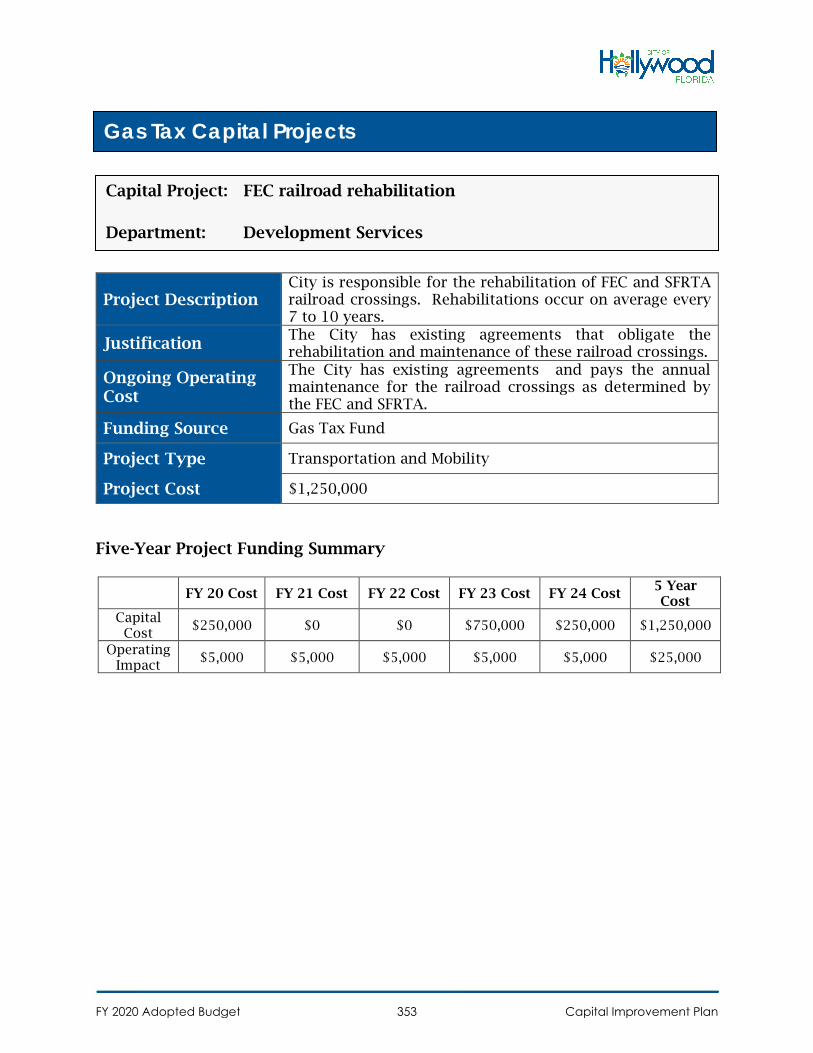
Project Description City is responsible for the rehabilitation of FEC and SFRTA railroad crossings. Rehabilitations occur on average every 7 to 10 years.
Justification The City has existing agreements that obligate the rehabilitation and maintenance of these railroad crossings.
Ongoing Operating Cost
The City has existing agreements and pays the annual maintenance for the railroad crossings as determined by the FEC and SFRTA.
Funding Source Gas Tax Fund
Project Type Transportation and Mobility
Project Cost $1,250,000
Five-Year Project Funding Summary
FY 20 Cost FY 21 Cost FY 22 Cost FY 23 Cost FY 24 Cost 5 Year Cost
Capital Cost
$250,000 $0 $0 $750,000 $250,000 $1,250,000
Operating Impact
$5,000 $5,000 $5,000 $5,000 $5,000 $25,000
Gas Tax Capital Projects
Capital Project: FEC railroad rehabilitation
Department: Development Services
FY 2020 Adopted Budget Capital Improvement Plan353
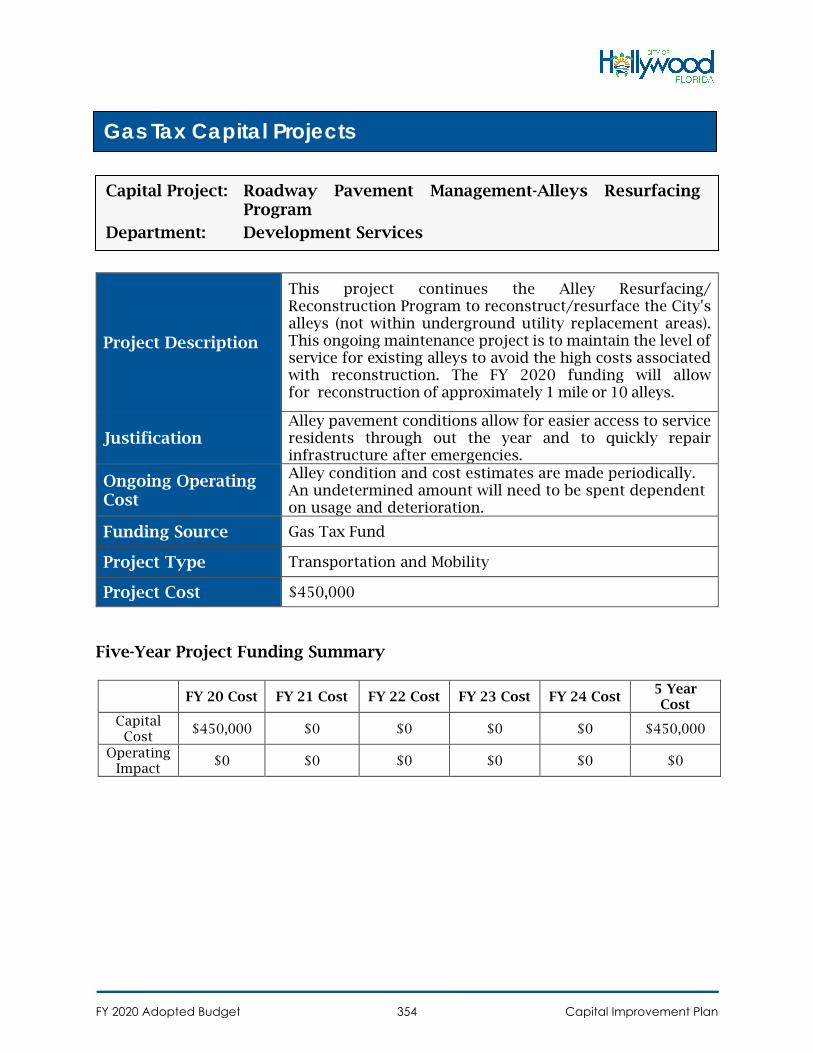
Project Description
This project continues the Alley Resurfacing/ Reconstruction Program to reconstruct/resurface the City's alleys (not within underground utility replacement areas). This ongoing maintenance project is to maintain the level of service for existing alleys to avoid the high costs associated with reconstruction. The FY 2020 funding will allow for reconstruction of approximately 1 mile or 10 alleys.
Justification Alley pavement conditions allow for easier access to service residents through out the year and to quickly repair infrastructure after emergencies.
Ongoing Operating Cost
Alley condition and cost estimates are made periodically. An undetermined amount will need to be spent dependent on usage and deterioration.
Funding Source Gas Tax Fund
Project Type Transportation and Mobility
Project Cost $450,000
Five-Year Project Funding Summary
FY 20 Cost FY 21 Cost FY 22 Cost FY 23 Cost FY 24 Cost 5 Year Cost
Capital Cost
$450,000 $0 $0 $0 $0 $450,000
Operating Impact
$0 $0 $0 $0 $0 $0
Gas Tax Capital Projects
Capital Project: Roadway Pavement Management-Alleys Resurfacing Program
Department: Development Services
FY 2020 Adopted Budget Capital Improvement Plan354

Project Description
This project implements a Citywide sidewalk repair and replacement program to address damage from trees, vehicle damage and ADA compliance issues. The FY 2020 funding will be used concentrated in highly used sensitive corridors. Some of the locations identified include 72nd Ave - Hollywood Blvd to Davie Road Ext, 64th Ave- Hollywood Blvd to Sheridan St, 46th Ave - Washington Street to Stirling Rd, Park Rd - Pembroke Rd to Stirling Rd, 26th Ave - Pembroke Rd to Sheridan St, 19th Ave - Pembroke Rd to Sheridan St, Washington St - S64th Ave to S13th Ave, Johnson St - 56th Ave to N14th Ave and Taft St - N76th Ave to N14th Ave.
Justification City maintenance of concrete sidewalks to allow for mobility and improve safety.
Ongoing Operating Cost
No measurable impact
Funding Source Gas Tax Fund
Project Type Streets and Sidewalks
Project Cost $400,000
Five-Year Project Funding Summary
FY 20 Cost FY 21 Cost FY 22 Cost FY 23 Cost FY 24 Cost 5 Year Cost
Capital Cost
$400,000 $0 $0 $0 $0 $400,000
Operating Impact
$0 $0 $0 $0 $0 $0
Gas Tax Capital Projects
Capital Project: Sidewalk Repairs/Program
Department: Public Works
FY 2020 Adopted Budget Capital Improvement Plan355
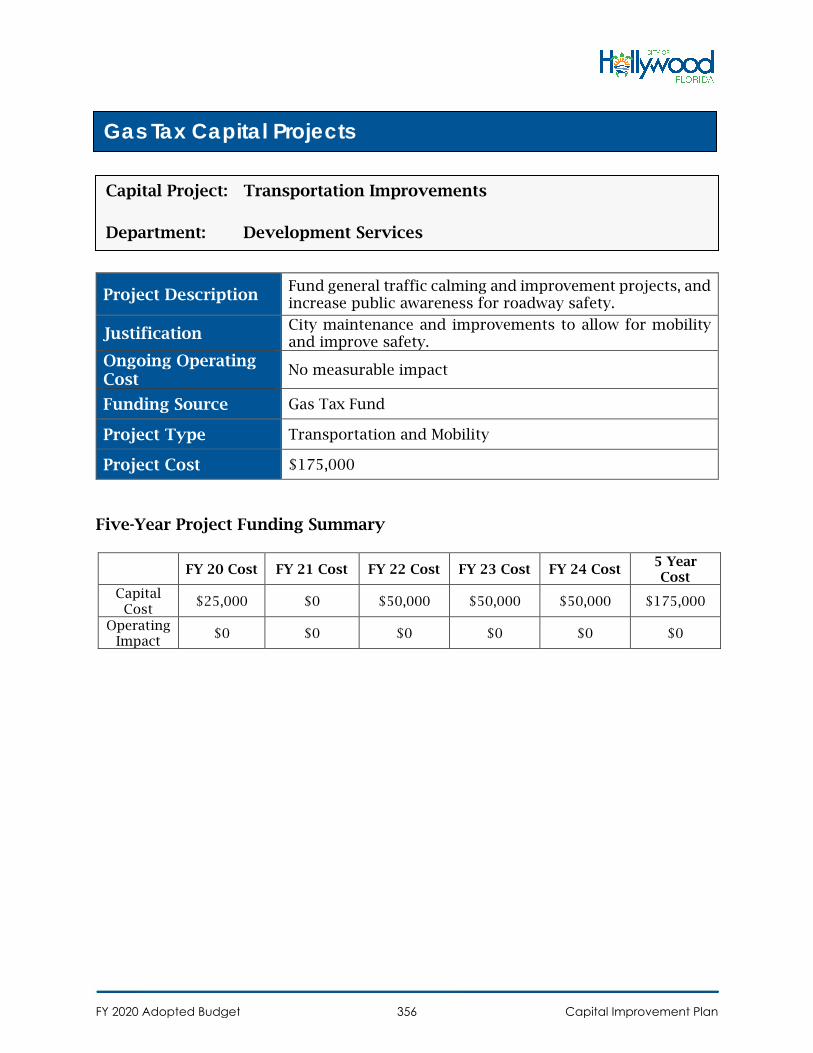
Project Description Fund general traffic calming and improvement projects, and increase public awareness for roadway safety.
Justification City maintenance and improvements to allow for mobility and improve safety.
Ongoing Operating Cost
No measurable impact
Funding Source Gas Tax Fund
Project Type Transportation and Mobility
Project Cost $175,000
Five-Year Project Funding Summary
FY 20 Cost FY 21 Cost FY 22 Cost FY 23 Cost FY 24 Cost 5 Year Cost
Capital Cost
$25,000 $0 $50,000 $50,000 $50,000 $175,000
Operating Impact
$0 $0 $0 $0 $0 $0
Gas Tax Capital Projects
Capital Project: Transportation Improvements
Department: Development Services
FY 2020 Adopted Budget Capital Improvement Plan356
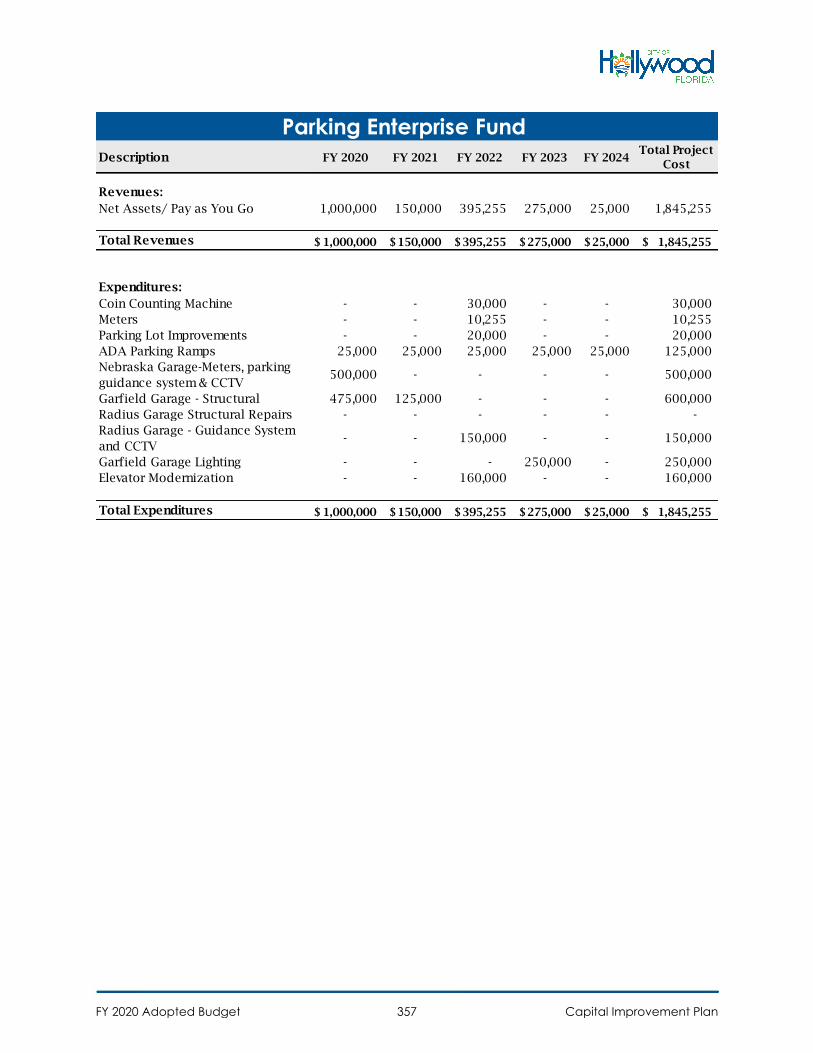
Description FY 2020 FY 2021 FY 2022 FY 2023 FY 2024Total Project
Cost
Revenues:
Net Assets/ Pay as You Go 1,000,000 150,000 395,255 275,000 25,000 1,845,255
Total Revenues 1,000,000$ 150,000$ 395,255$ 275,000$ 25,000$ 1,845,255$
Expenditures:
Coin Counting Machine - - 30,000 - - 30,000
Meters - - 10,255 - - 10,255
Parking Lot Improvements - - 20,000 - - 20,000
ADA Parking Ramps 25,000 25,000 25,000 25,000 25,000 125,000
Nebraska Garage-Meters, parking
guidance system & CCTV500,000 - - - - 500,000
Garfield Garage - Structural 475,000 125,000 - - - 600,000
Radius Garage Structural Repairs - - - - - -
Radius Garage - Guidance System
and CCTV- - 150,000 - - 150,000
Garfield Garage Lighting - - - 250,000 - 250,000
Elevator Modernization - - 160,000 - - 160,000
Total Expenditures 1,000,000$ 150,000$ 395,255$ 275,000$ 25,000$ 1,845,255$
Parking Enterprise Fund
FY 2020 Adopted Budget Capital Improvement Plan357

Project Description This project is for the upgrading and installation of sidewalk connectors throughout the City.
Justification
City staff has identified numerous existing crosswalks and sidewalk connectors through the City that need to be upgraded or installed to make the City's neighborhoods more walkable.
Ongoing Operating Cost
Asphalt condition and cost estimates are made periodically. An undetermined amount will need to be spent dependent on usage and deterioration.
Funding Source Parking Net Assets
Project Type Streets and Sidewalks
Project Cost $125,000
Five-Year Project Funding Summary
FY 20 Cost FY 21 Cost FY 22 Cost FY 23 Cost FY 24 Cost 5 Year Cost
Capital Cost
$25,000 $25,000 $25,000 $25,000 $25,000 $125,000
Operating Impact
$0 $0 $0 $0 $0 $0
Parking Enterprise Fund
Capital Project: ADA Parking Ramps
Department: Development Services
FY 2020 Adopted Budget Capital Improvement Plan358

Project Description This project is for the structural repairs for the Garfield Garage.
Justification It is the City's duty to provide a structurally sound garage for the public.
Ongoing Operating Cost
The operating impact is unknown at this time, however, it is believed that there will be scheduled maintenance once the structural repairs are completed.
Funding Source Parking Net Assets
Project Type Buildings and Facilities
Project Cost $600,000
Five-Year Project Funding Summary
FY 20 Cost FY 21 Cost FY 22 Cost FY 23 Cost FY 24 Cost 5 Year Cost
Capital Cost
$475,000 $125,000 $0 $0 $0 $600,000
Operating Impact
$0 $0 $0 $0 $0 $0
Parking Enterprise Fund
Capital Project: Garfield Garage - Structural Repairs
Department: Parking Division
FY 2020 Adopted Budget Capital Improvement Plan359
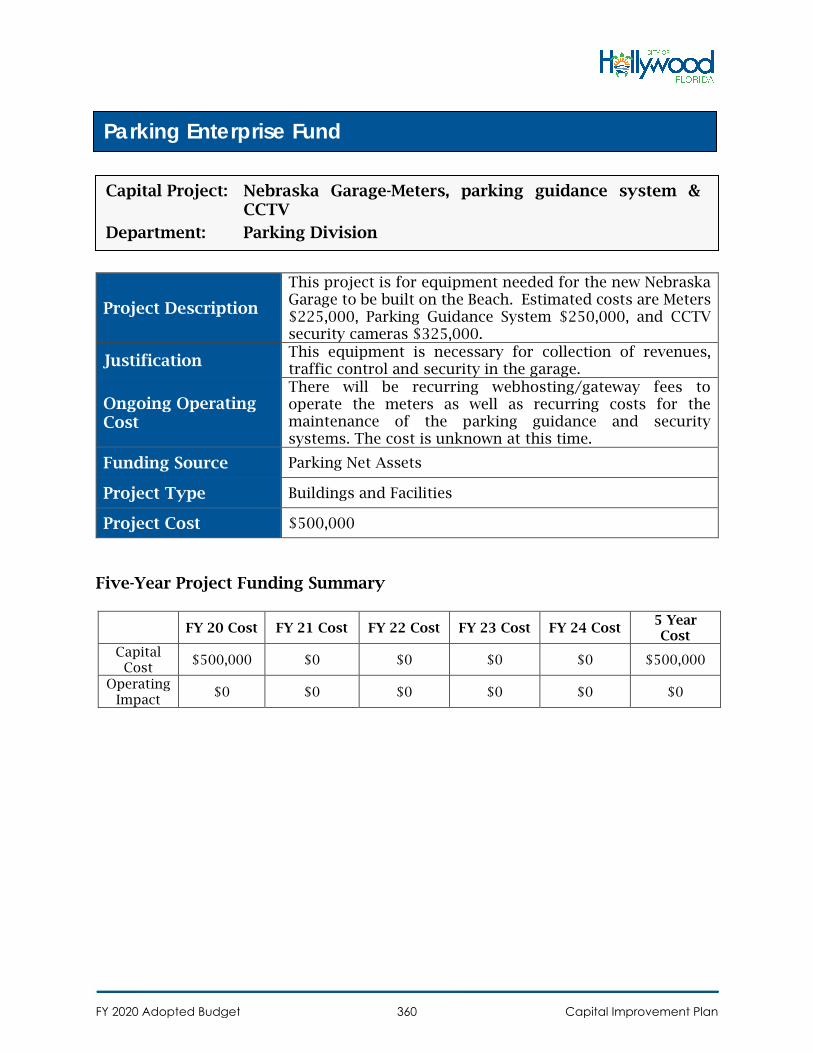
Project Description
This project is for equipment needed for the new Nebraska Garage to be built on the Beach. Estimated costs are Meters $225,000, Parking Guidance System $250,000, and CCTV security cameras $325,000.
Justification This equipment is necessary for collection of revenues, traffic control and security in the garage.
Ongoing Operating Cost
There will be recurring webhosting/gateway fees to operate the meters as well as recurring costs for the maintenance of the parking guidance and security systems. The cost is unknown at this time.
Funding Source Parking Net Assets
Project Type Buildings and Facilities
Project Cost $500,000
Five-Year Project Funding Summary
FY 20 Cost FY 21 Cost FY 22 Cost FY 23 Cost FY 24 Cost 5 Year Cost
Capital Cost
$500,000 $0 $0 $0 $0 $500,000
Operating Impact
$0 $0 $0 $0 $0 $0
Parking Enterprise Fund
Capital Project: Nebraska Garage-Meters, parking guidance system & CCTV
Department: Parking Division
FY 2020 Adopted Budget Capital Improvement Plan360
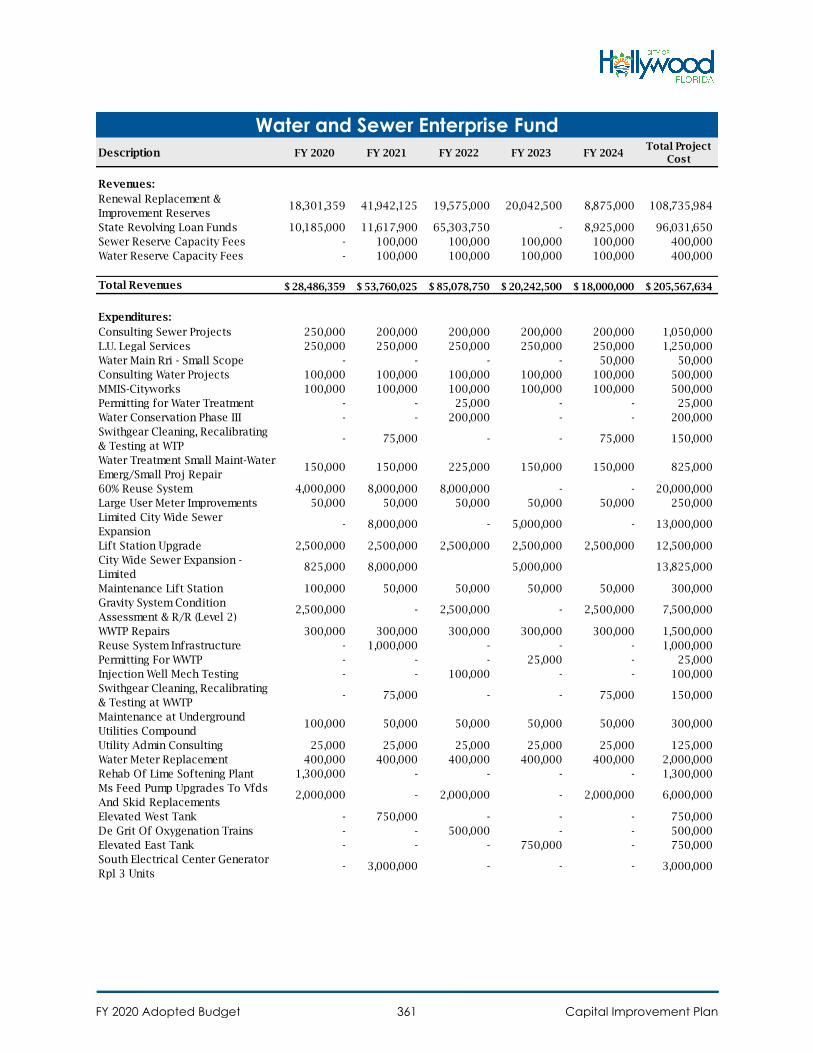
Description FY 2020 FY 2021 FY 2022 FY 2023 FY 2024Total Project
Cost
Revenues:
Renewal Replacement &
Improvement Reserves18,301,359 41,942,125 19,575,000 20,042,500 8,875,000 108,735,984
State Revolving Loan Funds 10,185,000 11,617,900 65,303,750 - 8,925,000 96,031,650
Sewer Reserve Capacity Fees - 100,000 100,000 100,000 100,000 400,000
Water Reserve Capacity Fees - 100,000 100,000 100,000 100,000 400,000
Total Revenues 28,486,359$ 53,760,025$ 85,078,750$ 20,242,500$ 18,000,000$ 205,567,634$
Expenditures:
Consulting Sewer Projects 250,000 200,000 200,000 200,000 200,000 1,050,000
L.U. Legal Services 250,000 250,000 250,000 250,000 250,000 1,250,000
Water Main Rri - Small Scope - - - - 50,000 50,000
Consulting Water Projects 100,000 100,000 100,000 100,000 100,000 500,000
MMIS-Cityworks 100,000 100,000 100,000 100,000 100,000 500,000
Permitting for Water Treatment - - 25,000 - - 25,000
Water Conservation Phase III - - 200,000 - - 200,000
Swithgear Cleaning, Recalibrating
& Testing at WTP- 75,000 - - 75,000 150,000
Water Treatment Small Maint-Water
Emerg/Small Proj Repair150,000 150,000 225,000 150,000 150,000 825,000
60% Reuse System 4,000,000 8,000,000 8,000,000 - - 20,000,000
Large User Meter Improvements 50,000 50,000 50,000 50,000 50,000 250,000
Limited City Wide Sewer
Expansion- 8,000,000 - 5,000,000 - 13,000,000
Lift Station Upgrade 2,500,000 2,500,000 2,500,000 2,500,000 2,500,000 12,500,000
City Wide Sewer Expansion -
Limited825,000 8,000,000 5,000,000 13,825,000
Maintenance Lift Station 100,000 50,000 50,000 50,000 50,000 300,000
Gravity System Condition
Assessment & R/R (Level 2)2,500,000 - 2,500,000 - 2,500,000 7,500,000
WWTP Repairs 300,000 300,000 300,000 300,000 300,000 1,500,000
Reuse System Infrastructure - 1,000,000 - - - 1,000,000
Permitting For WWTP - - - 25,000 - 25,000
Injection Well Mech Testing - - 100,000 - - 100,000
Swithgear Cleaning, Recalibrating
& Testing at WWTP- 75,000 - - 75,000 150,000
Maintenance at Underground
Utilities Compound100,000 50,000 50,000 50,000 50,000 300,000
Utility Admin Consulting 25,000 25,000 25,000 25,000 25,000 125,000
Water Meter Replacement 400,000 400,000 400,000 400,000 400,000 2,000,000
Rehab Of Lime Softening Plant 1,300,000 - - - - 1,300,000
Ms Feed Pump Upgrades To Vfds
And Skid Replacements2,000,000 - 2,000,000 - 2,000,000 6,000,000
Elevated West Tank - 750,000 - - - 750,000
De Grit Of Oxygenation Trains - - 500,000 - - 500,000
Elevated East Tank - - - 750,000 - 750,000
South Electrical Center Generator
Rpl 3 Units- 3,000,000 - - - 3,000,000
Water and Sewer Enterprise Fund
FY 2020 Adopted Budget Capital Improvement Plan361
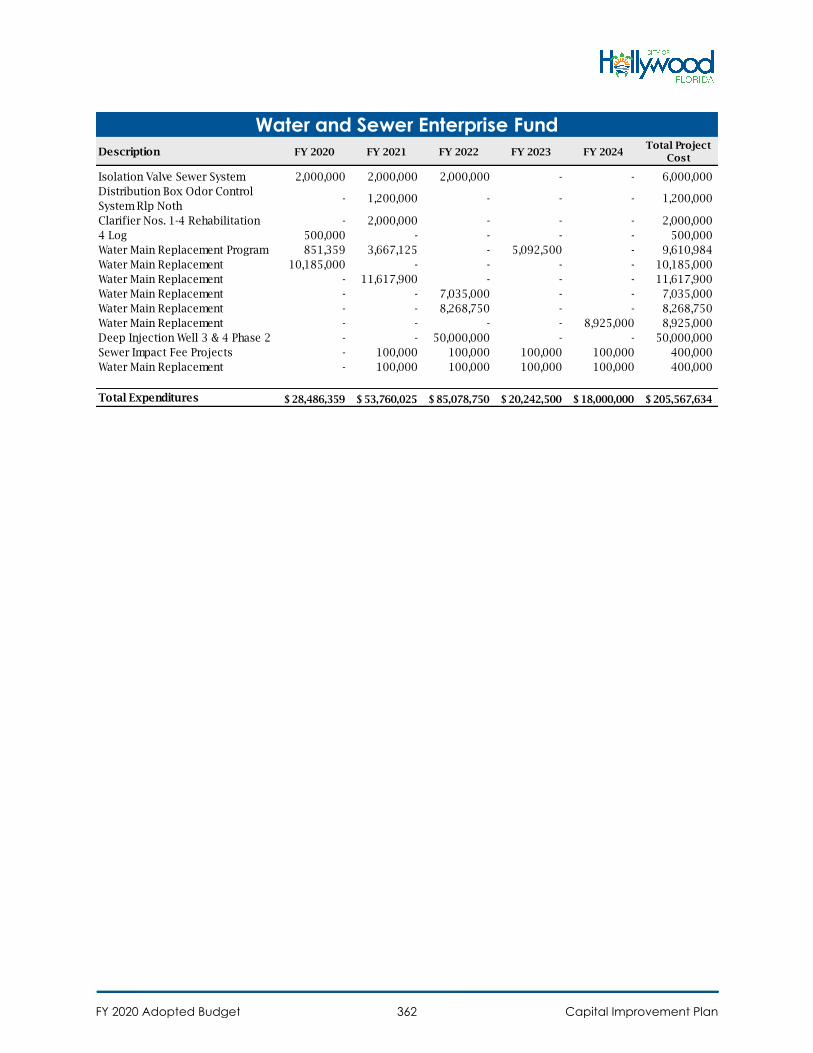
Description FY 2020 FY 2021 FY 2022 FY 2023 FY 2024Total Project
Cost
Water and Sewer Enterprise Fund
Isolation Valve Sewer System 2,000,000 2,000,000 2,000,000 - - 6,000,000
Distribution Box Odor Control
System Rlp Noth- 1,200,000 - - - 1,200,000
Clarifier Nos. 1-4 Rehabilitation - 2,000,000 - - - 2,000,000
4 Log 500,000 - - - - 500,000
Water Main Replacement Program 851,359 3,667,125 - 5,092,500 - 9,610,984
Water Main Replacement 10,185,000 - - - - 10,185,000
Water Main Replacement - 11,617,900 - - - 11,617,900
Water Main Replacement - - 7,035,000 - - 7,035,000
Water Main Replacement - - 8,268,750 - - 8,268,750
Water Main Replacement - - - - 8,925,000 8,925,000
Deep Injection Well 3 & 4 Phase 2 - - 50,000,000 - - 50,000,000
Sewer Impact Fee Projects - 100,000 100,000 100,000 100,000 400,000
Water Main Replacement - 100,000 100,000 100,000 100,000 400,000
Total Expenditures 28,486,359$ 53,760,025$ 85,078,750$ 20,242,500$ 18,000,000$ 205,567,634$
FY 2020 Adopted Budget Capital Improvement Plan362
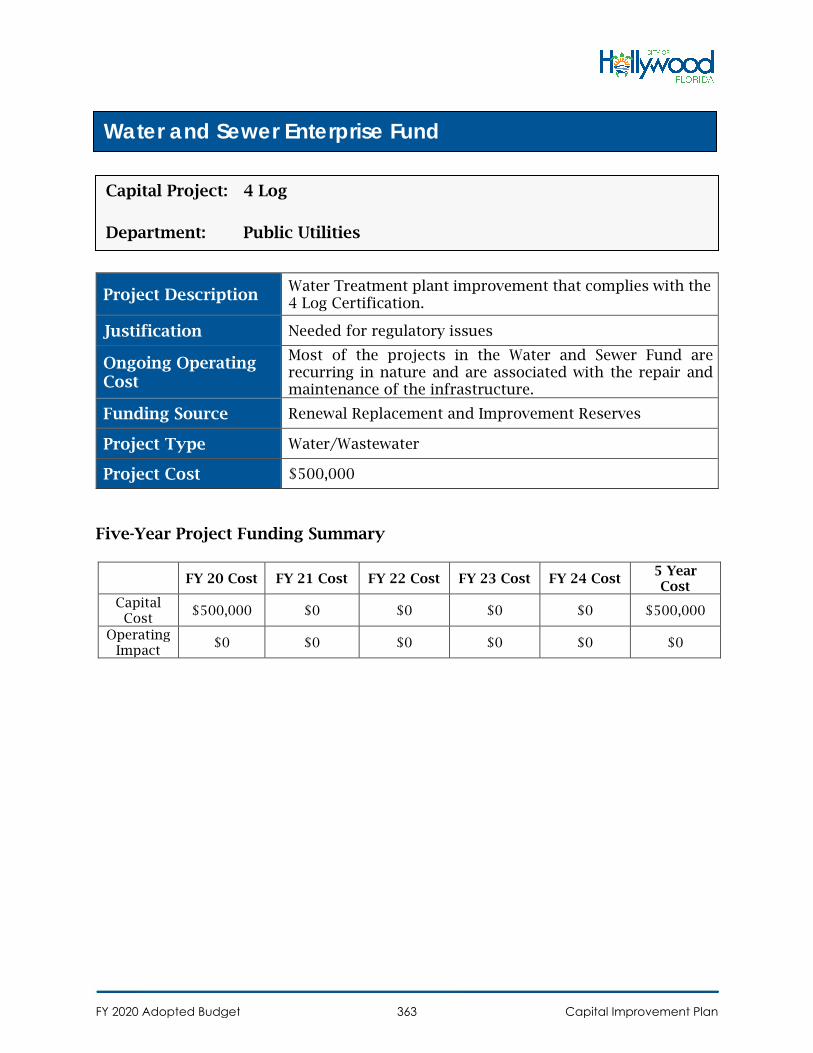
Project Description Water Treatment plant improvement that complies with the 4 Log Certification.
Justification Needed for regulatory issues
Ongoing Operating Cost
Most of the projects in the Water and Sewer Fund are recurring in nature and are associated with the repair and maintenance of the infrastructure.
Funding Source Renewal Replacement and Improvement Reserves
Project Type Water/Wastewater
Project Cost $500,000
Five-Year Project Funding Summary
FY 20 Cost FY 21 Cost FY 22 Cost FY 23 Cost FY 24 Cost 5 Year Cost
Capital Cost
$500,000 $0 $0 $0 $0 $500,000
Operating Impact
$0 $0 $0 $0 $0 $0
Water and Sewer Enterprise Fund
Capital Project: 4 Log
Department: Public Utilities
FY 2020 Adopted Budget Capital Improvement Plan363

Project Description
Costs involved: New facilities and improvements/contract reuse to address 10 MGD of reuse mandated by State legislature and by administrative order under the Wastewater Treatment Plant's operating permit.
Justification Per Approved Water and Sewer Master Plans
Ongoing Operating Cost
Most of the projects in the Water and Sewer Fund are recurring in nature and are associated with the repair and maintenance of the infrastructure.
Funding Source Renewal Replacement and Improvement Reserves
Project Type Water/Wastewater
Project Cost $20,000,000
Five-Year Project Funding Summary
FY 20 Cost FY 21 Cost FY 22 Cost FY 23 Cost FY 24 Cost 5 Year Cost
Capital Cost
$4,000,000 $8,000,000 $8,000,000 $0 $0 $20,000,00
0 Operating
Impact $0 $0 $0 $0 $0 $0
Water and Sewer Enterprise Fund
Capital Project: 60% Reuse System
Department: Public Utilities
FY 2020 Adopted Budget Capital Improvement Plan364
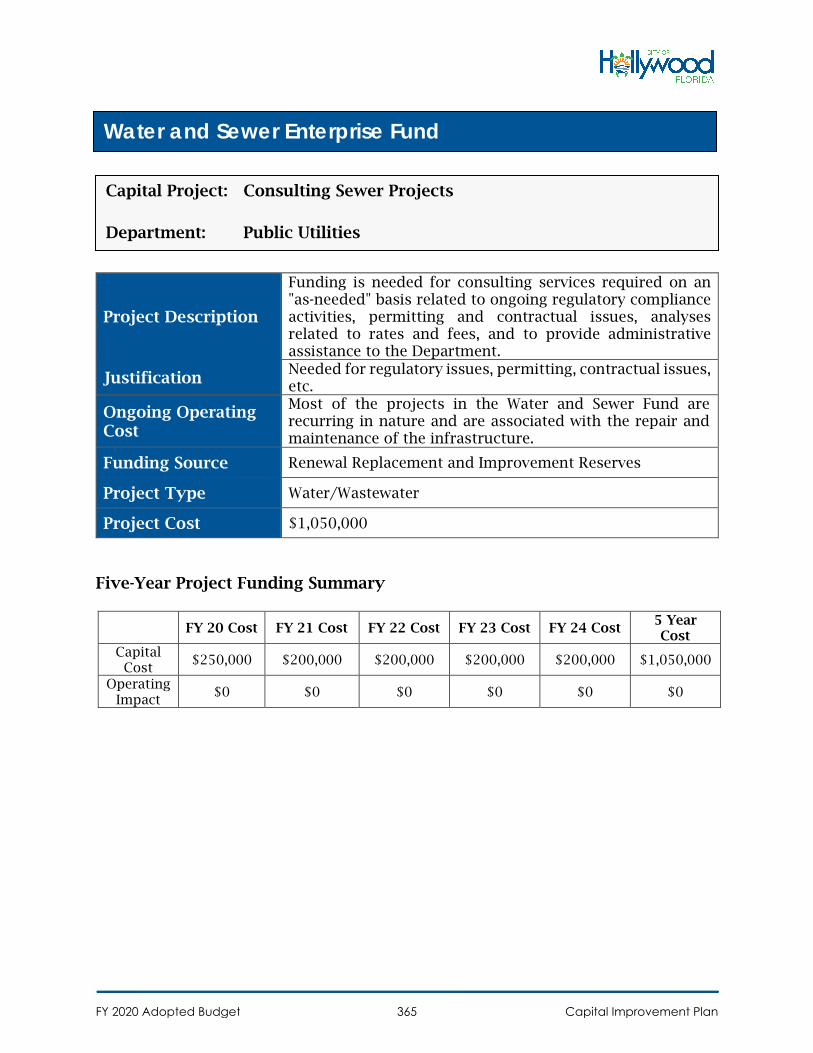
Project Description
Funding is needed for consulting services required on an "as-needed" basis related to ongoing regulatory compliance activities, permitting and contractual issues, analyses related to rates and fees, and to provide administrative assistance to the Department.
Justification Needed for regulatory issues, permitting, contractual issues, etc.
Ongoing Operating Cost
Most of the projects in the Water and Sewer Fund are recurring in nature and are associated with the repair and maintenance of the infrastructure.
Funding Source Renewal Replacement and Improvement Reserves
Project Type Water/Wastewater
Project Cost $1,050,000
Five-Year Project Funding Summary
FY 20 Cost FY 21 Cost FY 22 Cost FY 23 Cost FY 24 Cost 5 Year Cost
Capital Cost
$250,000 $200,000 $200,000 $200,000 $200,000 $1,050,000
Operating Impact
$0 $0 $0 $0 $0 $0
Water and Sewer Enterprise Fund
Capital Project: Consulting Sewer Projects
Department: Public Utilities
FY 2020 Adopted Budget Capital Improvement Plan365

Project Description
Funding is needed for consulting services required on an "as-needed" basis related to ongoing regulatory compliance activities, permitting and contractual issues, analyses related to rates and fees, and to provide administrative assistance to the Department.
Justification Needed for regulatory issues, permitting, contractual issues, etc.
Ongoing Operating Cost
Most of the projects in the Water and Sewer Fund are recurring in nature and are associated with the repair and maintenance of the infrastructure.
Funding Source Renewal Replacement and Improvement Reserves
Project Type Water/Wastewater
Project Cost $500,000
Five-Year Project Funding Summary
FY 20 Cost FY 21 Cost FY 22 Cost FY 23 Cost FY 24 Cost 5 Year Cost
Capital Cost
$100,000 $100,000 $100,000 $100,000 $100,000 $500,000
Operating Impact
$0 $0 $0 $0 $0 $0
Water and Sewer Enterprise Fund
Capital Project: Consulting Water Projects
Department: Public Utilities
FY 2020 Adopted Budget Capital Improvement Plan366

Project Description
Assess the existing gravity sewer basins and perform the following processes on the basins: Sewer line cleaning, joint sealing, lateral sealing, crack sealing, pipe lining, manhole sealing, manhole rehabilitation, and point repairs.
Justification Per Approved Water and Sewer Master Plans
Ongoing Operating Cost
Most of the projects in the Water and Sewer Fund are recurring in nature and are associated with the repair and maintenance of the infrastructure.
Funding Source Renewal Replacement and Improvement Reserves
Project Type Water/Wastewater
Project Cost $7,500,000
Five-Year Project Funding Summary
FY 20 Cost FY 21 Cost FY 22 Cost FY 23 Cost FY 24 Cost 5 Year Cost
Capital Cost
$2,500,000 $0 $2,500,000 $0 $2,500,000 $7,500,000
Operating Impact
$0 $0 $0 $0 $0 $0
Water and Sewer Enterprise Fund
Capital Project: Gravity System Condition Assessment & R/R (Level 2)
Department: Public Utilities
FY 2020 Adopted Budget Capital Improvement Plan367
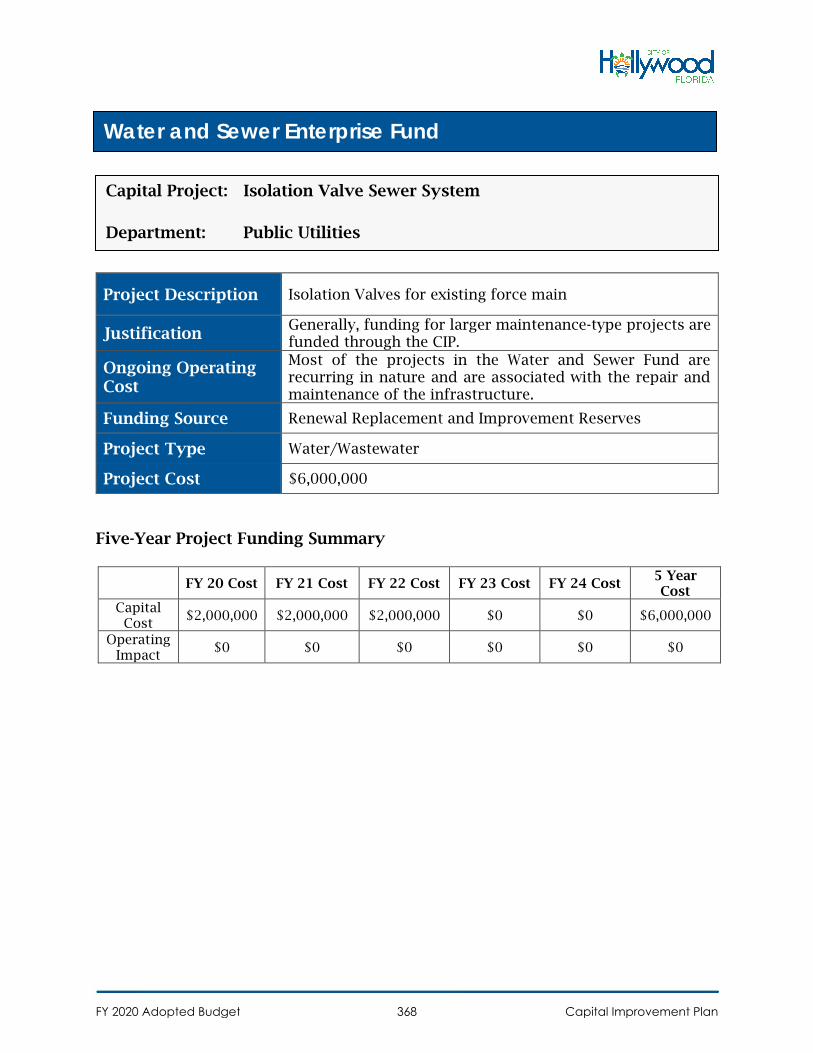
Project Description Isolation Valves for existing force main
Justification Generally, funding for larger maintenance-type projects are funded through the CIP.
Ongoing Operating Cost
Most of the projects in the Water and Sewer Fund are recurring in nature and are associated with the repair and maintenance of the infrastructure.
Funding Source Renewal Replacement and Improvement Reserves
Project Type Water/Wastewater
Project Cost $6,000,000
Five-Year Project Funding Summary
FY 20 Cost FY 21 Cost FY 22 Cost FY 23 Cost FY 24 Cost 5 Year Cost
Capital Cost
$2,000,000 $2,000,000 $2,000,000 $0 $0 $6,000,000
Operating Impact
$0 $0 $0 $0 $0 $0
Water and Sewer Enterprise Fund
Capital Project: Isolation Valve Sewer System
Department: Public Utilities
FY 2020 Adopted Budget Capital Improvement Plan368

Project Description Funding is needed for the Large Users Legal defense related to ongoing Large User matters
Justification Needed for Large User legal issues
Ongoing Operating Cost
Most of the projects in the Water and Sewer Fund are recurring in nature and are associated with the repair and maintenance of the infrastructure.
Funding Source Renewal Replacement and Improvement Reserves
Project Type Water/Wastewater
Project Cost $1,250,000
Five-Year Project Funding Summary
FY 20 Cost FY 21 Cost FY 22 Cost FY 23 Cost FY 24 Cost 5 Year Cost
Capital Cost
$250,000 $250,000 $250,000 $250,000 $250,000 $1,250,000
Operating Impact
$0 $0 $0 $0 $0 $0
Water and Sewer Enterprise Fund
Capital Project: L.U. Legal Services
Department: Public Utilities
FY 2020 Adopted Budget Capital Improvement Plan369

Project Description Replacement of Large User meters. Work is performed by the ICE Division.
Justification To provide accurate readings.
Ongoing Operating Cost
Most of the projects in the Water and Sewer Fund are recurring in nature and are associated with the repair and maintenance of the infrastructure.
Funding Source Renewal Replacement and Improvement Reserves
Project Type Water/Wastewater
Project Cost $250,000
Five-Year Project Funding Summary
FY 20 Cost FY 21 Cost FY 22 Cost FY 23 Cost FY 24 Cost 5 Year Cost
Capital Cost
$50,000 $50,000 $50,000 $50,000 $50,000 $250,000
Operating Impact
$0 $0 $0 $0 $0 $0
Water and Sewer Enterprise Fund
Capital Project: Large User Meter Improvements
Department: Public Utilities
FY 2020 Adopted Budget Capital Improvement Plan370
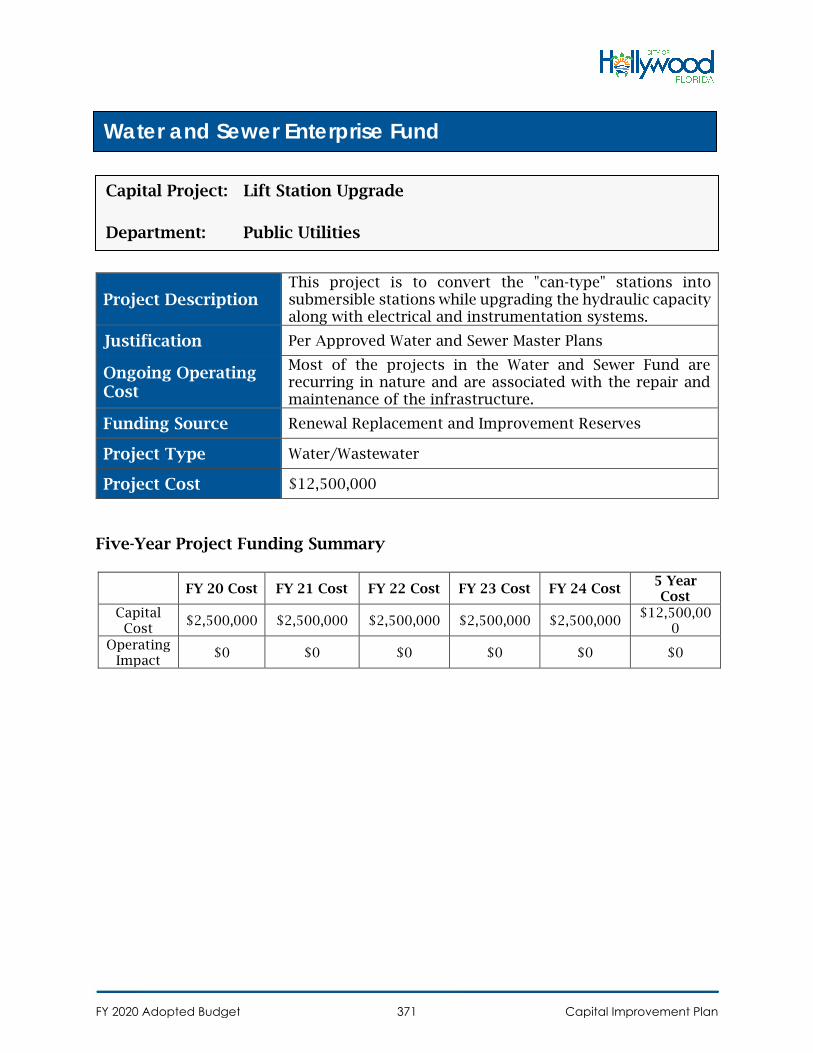
Project Description This project is to convert the "can-type" stations into submersible stations while upgrading the hydraulic capacity along with electrical and instrumentation systems.
Justification Per Approved Water and Sewer Master Plans
Ongoing Operating Cost
Most of the projects in the Water and Sewer Fund are recurring in nature and are associated with the repair and maintenance of the infrastructure.
Funding Source Renewal Replacement and Improvement Reserves
Project Type Water/Wastewater
Project Cost $12,500,000
Five-Year Project Funding Summary
FY 20 Cost FY 21 Cost FY 22 Cost FY 23 Cost FY 24 Cost 5 Year Cost
Capital Cost
$2,500,000 $2,500,000 $2,500,000 $2,500,000 $2,500,000 $12,500,00
0 Operating
Impact $0 $0 $0 $0 $0 $0
Water and Sewer Enterprise Fund
Capital Project: Lift Station Upgrade
Department: Public Utilities
FY 2020 Adopted Budget Capital Improvement Plan371
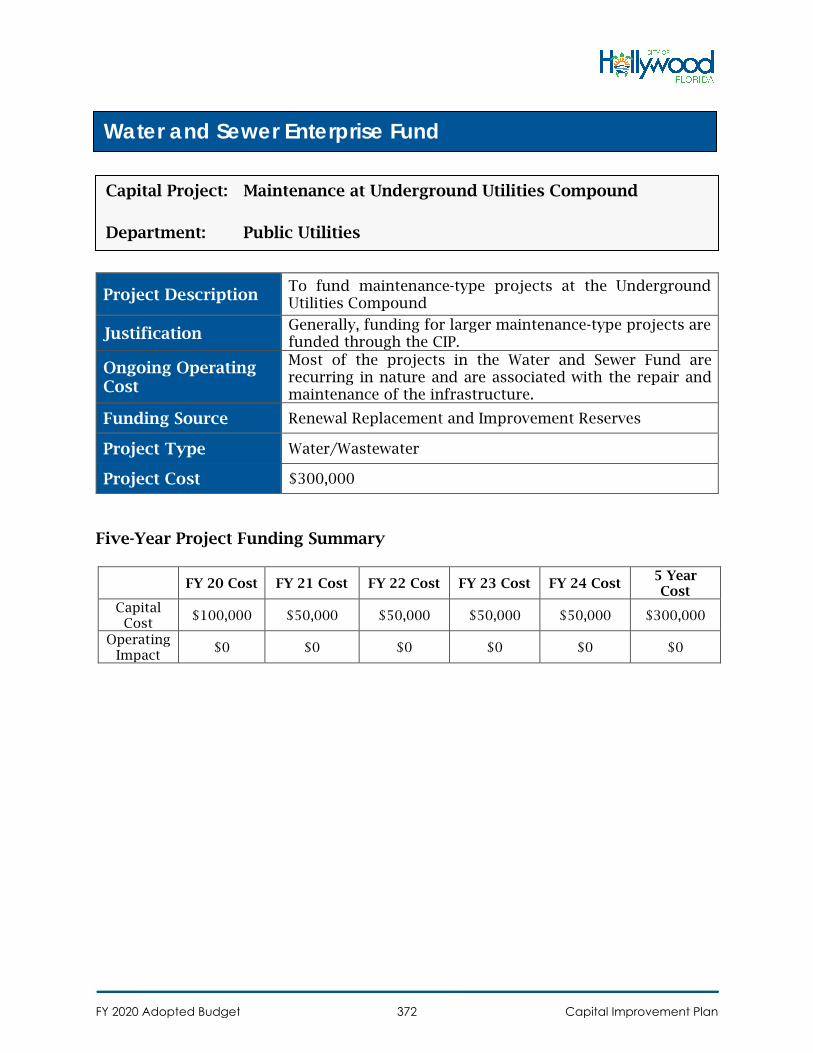
Project Description To fund maintenance-type projects at the Underground Utilities Compound
Justification Generally, funding for larger maintenance-type projects are funded through the CIP.
Ongoing Operating Cost
Most of the projects in the Water and Sewer Fund are recurring in nature and are associated with the repair and maintenance of the infrastructure.
Funding Source Renewal Replacement and Improvement Reserves
Project Type Water/Wastewater
Project Cost $300,000
Five-Year Project Funding Summary
FY 20 Cost FY 21 Cost FY 22 Cost FY 23 Cost FY 24 Cost 5 Year Cost
Capital Cost
$100,000 $50,000 $50,000 $50,000 $50,000 $300,000
Operating Impact
$0 $0 $0 $0 $0 $0
Water and Sewer Enterprise Fund
Capital Project: Maintenance at Underground Utilities Compound
Department: Public Utilities
FY 2020 Adopted Budget Capital Improvement Plan372
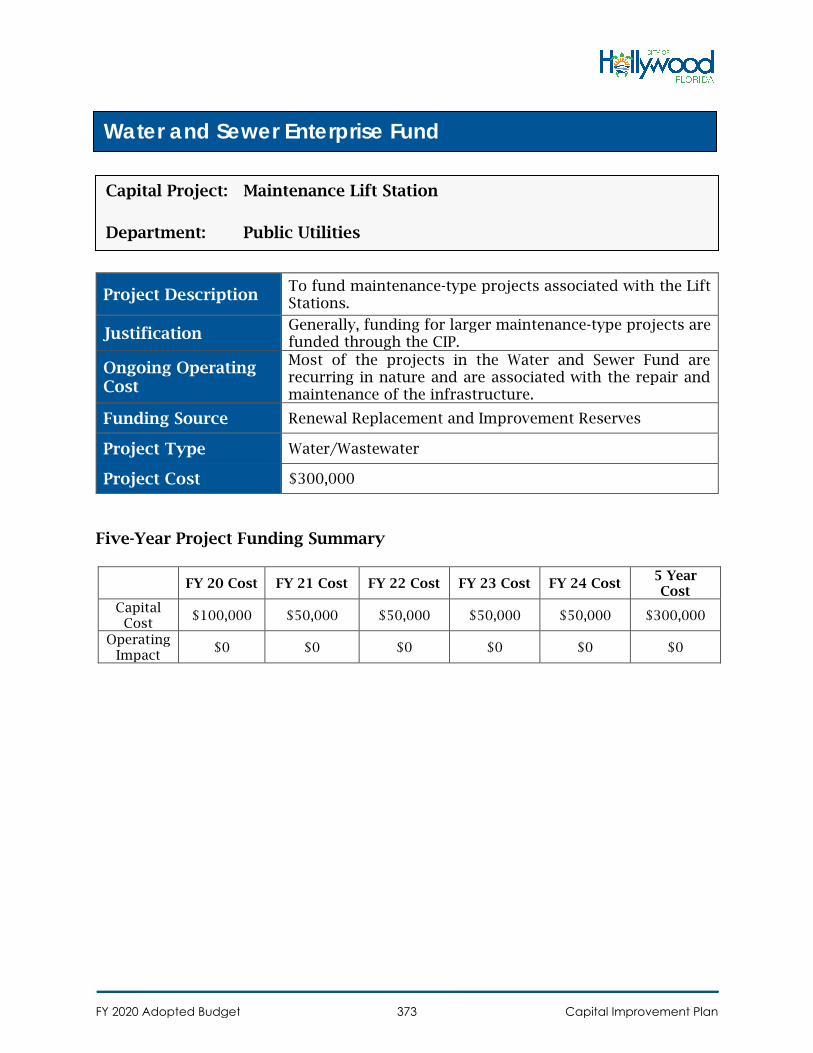
Project Description To fund maintenance-type projects associated with the Lift Stations.
Justification Generally, funding for larger maintenance-type projects are funded through the CIP.
Ongoing Operating Cost
Most of the projects in the Water and Sewer Fund are recurring in nature and are associated with the repair and maintenance of the infrastructure.
Funding Source Renewal Replacement and Improvement Reserves
Project Type Water/Wastewater
Project Cost $300,000
Five-Year Project Funding Summary
FY 20 Cost FY 21 Cost FY 22 Cost FY 23 Cost FY 24 Cost 5 Year Cost
Capital Cost
$100,000 $50,000 $50,000 $50,000 $50,000 $300,000
Operating Impact
$0 $0 $0 $0 $0 $0
Water and Sewer Enterprise Fund
Capital Project: Maintenance Lift Station
Department: Public Utilities
FY 2020 Adopted Budget Capital Improvement Plan373
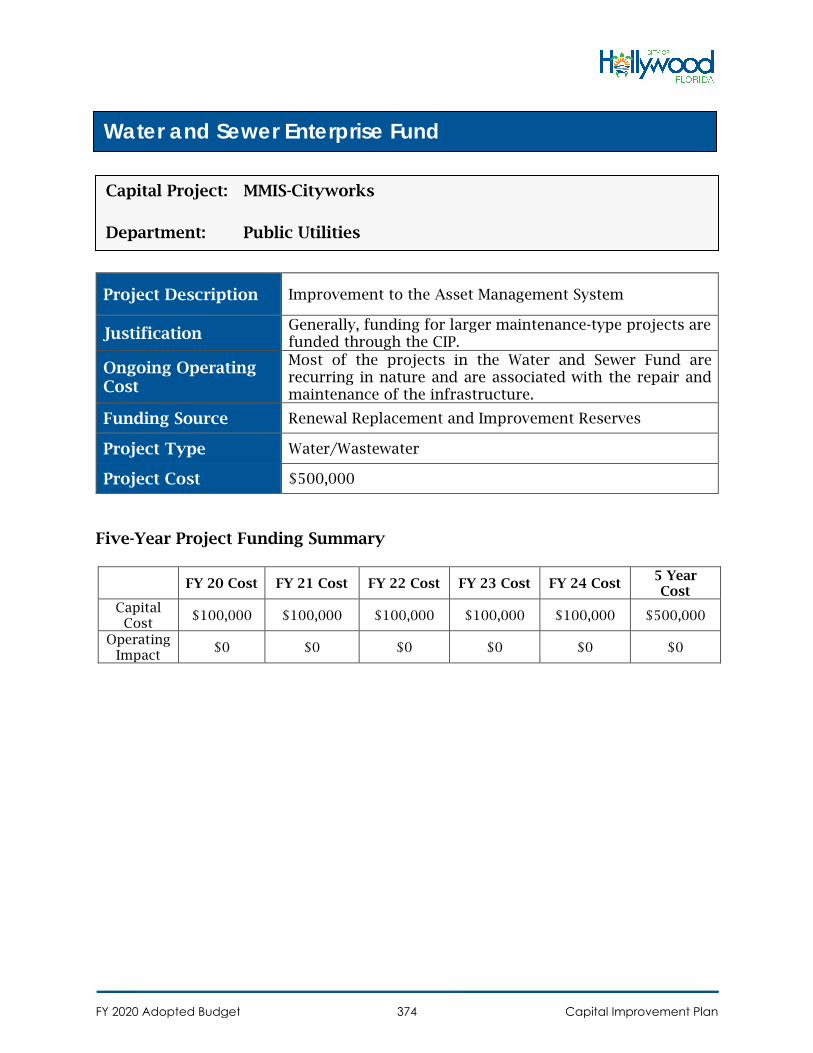
Project Description Improvement to the Asset Management System
Justification Generally, funding for larger maintenance-type projects are funded through the CIP.
Ongoing Operating Cost
Most of the projects in the Water and Sewer Fund are recurring in nature and are associated with the repair and maintenance of the infrastructure.
Funding Source Renewal Replacement and Improvement Reserves
Project Type Water/Wastewater
Project Cost $500,000
Five-Year Project Funding Summary
FY 20 Cost FY 21 Cost FY 22 Cost FY 23 Cost FY 24 Cost 5 Year Cost
Capital Cost
$100,000 $100,000 $100,000 $100,000 $100,000 $500,000
Operating Impact
$0 $0 $0 $0 $0 $0
Water and Sewer Enterprise Fund
Capital Project: MMIS-Cityworks
Department: Public Utilities
FY 2020 Adopted Budget Capital Improvement Plan374

Project Description
This project will convert the membrane softening feed pump electrical motor drives from constant speed controllers to variable frequency drives. This is for the seven existing membrane skids. All new skids will be installed with VFDs.
Justification Per Approved Water and Sewer Master Plans
Ongoing Operating Cost
Most of the projects in the Water and Sewer Fund are recurring in nature and are associated with the repair and maintenance of the infrastructure.
Funding Source Renewal Replacement and Improvement Reserves
Project Type Water/Wastewater
Project Cost $6,000,000
Five-Year Project Funding Summary
FY 20 Cost FY 21 Cost FY 22 Cost FY 23 Cost FY 24 Cost 5 Year Cost
Capital Cost
$2,000,000 $0 $2,000,000 $0 $2,000,000 $6,000,000
Operating Impact
$0 $0 $0 $0 $0 $0
Water and Sewer Enterprise Fund
Capital Project: Ms Feed Pump Upgrades To Vfds And Skid Replacements
Department: Public Utilities
FY 2020 Adopted Budget Capital Improvement Plan375

Project Description Rehabilitating and maintenance of the lime softening plant
Justification Per Approved Water and Sewer Master Plans
Ongoing Operating Cost
Most of the projects in the Water and Sewer Fund are recurring in nature and are associated with the repair and maintenance of the infrastructure.
Funding Source Renewal Replacement and Improvement Reserves
Project Type Water/Wastewater
Project Cost $1,300,000
Five-Year Project Funding Summary
FY 20 Cost FY 21 Cost FY 22 Cost FY 23 Cost FY 24 Cost 5 Year Cost
Capital Cost
$1,300,000 $0 $0 $0 $0 $1,300,000
Operating Impact
$0 $0 $0 $0 $0 $0
Water and Sewer Enterprise Fund
Capital Project: Rehab Of Lime Softening Plant
Department: Public Utilities
FY 2020 Adopted Budget Capital Improvement Plan376

Project Description
Funding is needed for Utility Miscellaneous Administration Consulting services required on an "as-needed" basis related to ongoing ERP, and to provide administrative assistance to the Department.
Justification Needed for contractual issues, etc.
Ongoing Operating Cost
Most of the projects in the Water and Sewer Fund are recurring in nature and are associated with the repair and maintenance of the infrastructure.
Funding Source Renewal Replacement and Improvement Reserves
Project Type Water/Wastewater
Project Cost $125,000
Five-Year Project Funding Summary
FY 20 Cost FY 21 Cost FY 22 Cost FY 23 Cost FY 24 Cost 5 Year Cost
Capital Cost
$25,000 $25,000 $25,000 $25,000 $25,000 $125,000
Operating Impact
$0 $0 $0 $0 $0 $0
Water and Sewer Enterprise Fund
Capital Project: Utility Miscellaneous Administration Consulting
Department: Public Utilities
FY 2020 Adopted Budget Capital Improvement Plan377

Project Description To fund maintenance-type projects at the Wastewater Treatment Plant.
Justification Generally, funding for larger maintenance-type projects are funded through the CIP.
Ongoing Operating Cost
Most of the projects in the Water and Sewer Fund are recurring in nature and are associated with the repair and maintenance of the infrastructure.
Funding Source Renewal Replacement and Improvement Reserves
Project Type Water/Wastewater
Project Cost $1,500,000
Five-Year Project Funding Summary
FY 20 Cost FY 21 Cost FY 22 Cost FY 23 Cost FY 24 Cost 5 Year Cost
Capital Cost
$300,000 $300,000 $300,000 $300,000 $300,000 $1,500,000
Operating Impact
$0 $0 $0 $0 $0 $0
Water and Sewer Enterprise Fund
Capital Project: Waste Water Treatment Plant Miscellaneous Repairs
Department: Public Utilities
FY 2020 Adopted Budget Capital Improvement Plan378
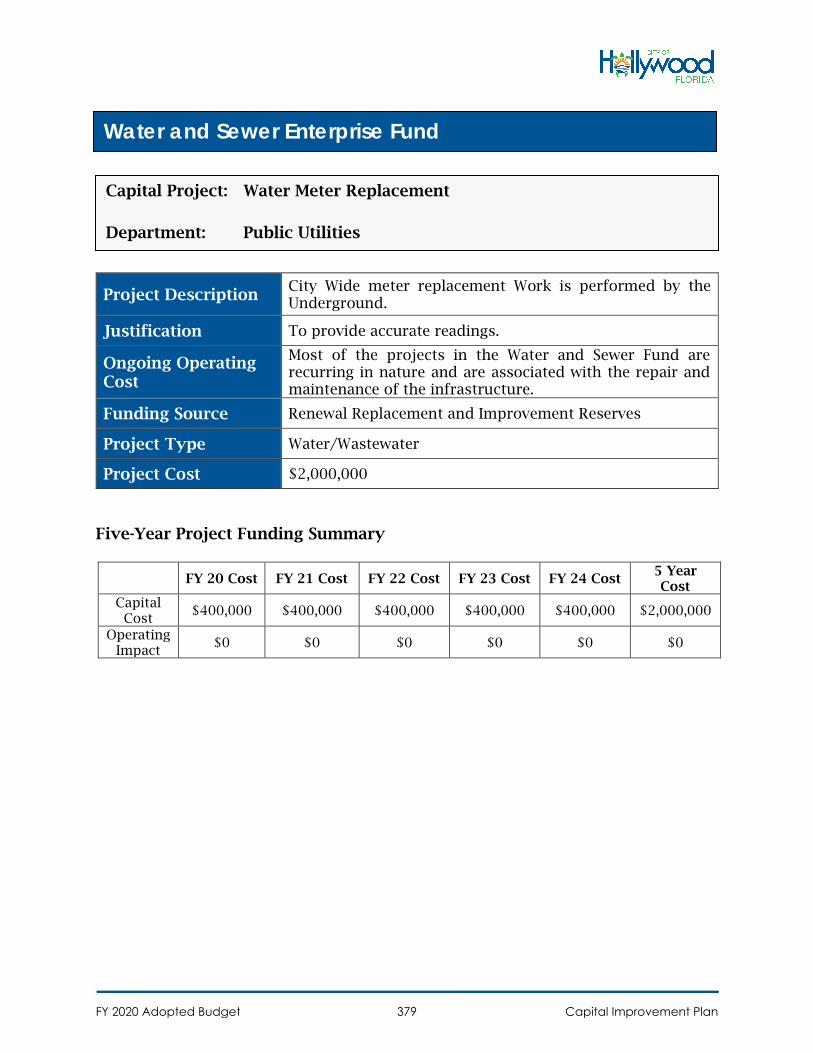
Project Description City Wide meter replacement Work is performed by the Underground.
Justification To provide accurate readings.
Ongoing Operating Cost
Most of the projects in the Water and Sewer Fund are recurring in nature and are associated with the repair and maintenance of the infrastructure.
Funding Source Renewal Replacement and Improvement Reserves
Project Type Water/Wastewater
Project Cost $2,000,000
Five-Year Project Funding Summary
FY 20 Cost FY 21 Cost FY 22 Cost FY 23 Cost FY 24 Cost 5 Year Cost
Capital Cost
$400,000 $400,000 $400,000 $400,000 $400,000 $2,000,000
Operating Impact
$0 $0 $0 $0 $0 $0
Water and Sewer Enterprise Fund
Capital Project: Water Meter Replacement
Department: Public Utilities
FY 2020 Adopted Budget Capital Improvement Plan379
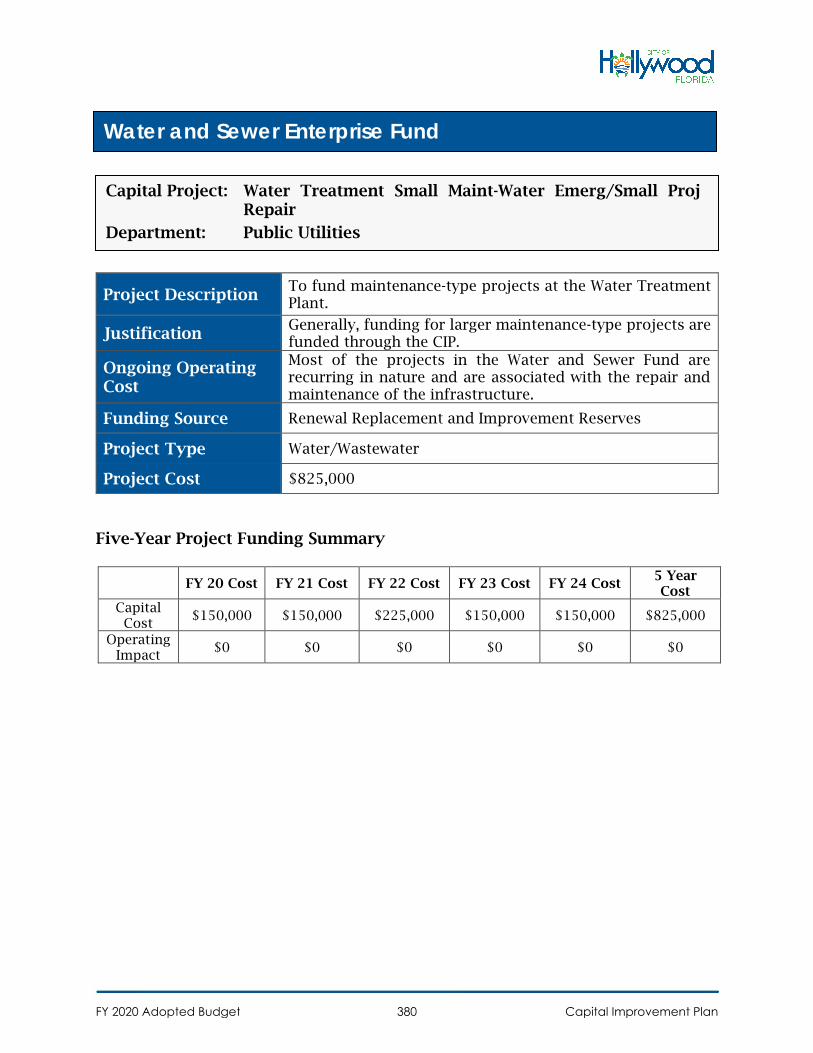
Project Description To fund maintenance-type projects at the Water Treatment Plant.
Justification Generally, funding for larger maintenance-type projects are funded through the CIP.
Ongoing Operating Cost
Most of the projects in the Water and Sewer Fund are recurring in nature and are associated with the repair and maintenance of the infrastructure.
Funding Source Renewal Replacement and Improvement Reserves
Project Type Water/Wastewater
Project Cost $825,000
Five-Year Project Funding Summary
FY 20 Cost FY 21 Cost FY 22 Cost FY 23 Cost FY 24 Cost 5 Year Cost
Capital Cost
$150,000 $150,000 $225,000 $150,000 $150,000 $825,000
Operating Impact
$0 $0 $0 $0 $0 $0
Water and Sewer Enterprise Fund
Capital Project: Water Treatment Small Maint-Water Emerg/Small Proj Repair
Department: Public Utilities
FY 2020 Adopted Budget Capital Improvement Plan380
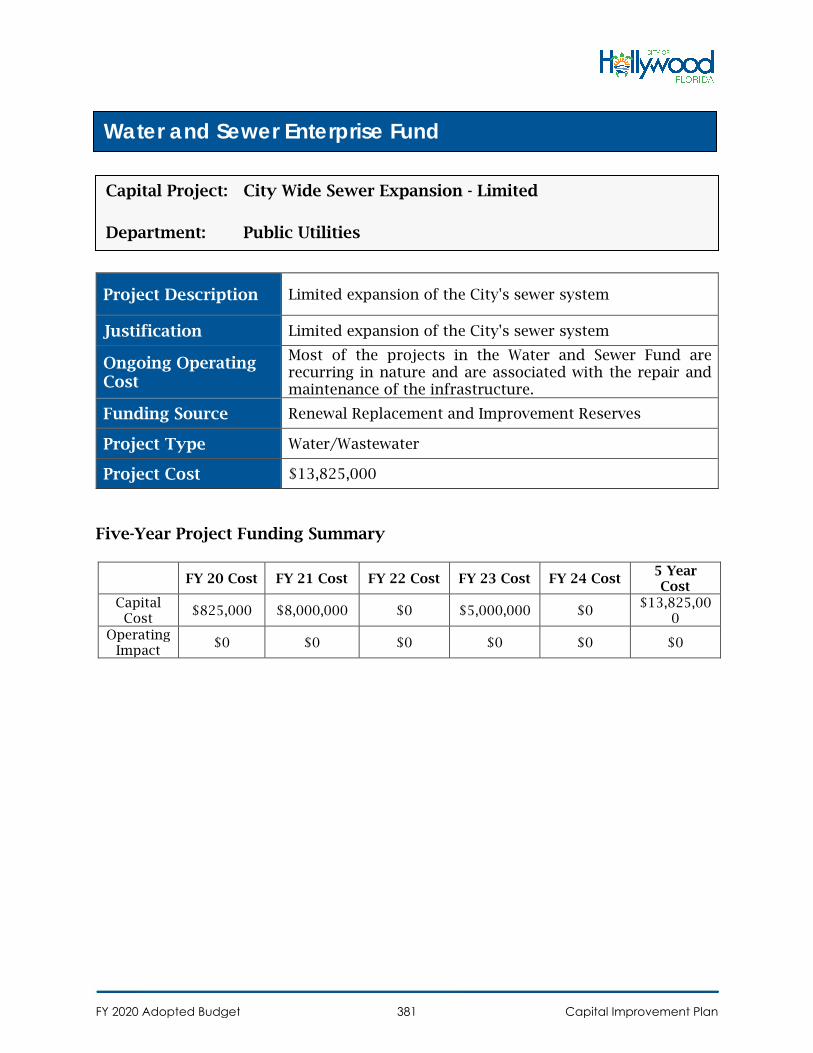
Project Description Limited expansion of the City's sewer system
Justification Limited expansion of the City's sewer system
Ongoing Operating Cost
Most of the projects in the Water and Sewer Fund are recurring in nature and are associated with the repair and maintenance of the infrastructure.
Funding Source Renewal Replacement and Improvement Reserves
Project Type Water/Wastewater
Project Cost $13,825,000
Five-Year Project Funding Summary
FY 20 Cost FY 21 Cost FY 22 Cost FY 23 Cost FY 24 Cost 5 Year Cost
Capital Cost
$825,000 $8,000,000 $0 $5,000,000 $0 $13,825,00
0 Operating
Impact $0 $0 $0 $0 $0 $0
Water and Sewer Enterprise Fund
Capital Project: City Wide Sewer Expansion - Limited
Department: Public Utilities
FY 2020 Adopted Budget Capital Improvement Plan381

Project Description Water Main Replacement Program
Justification Per Approved Water and Sewer Master Plans
Ongoing Operating Cost
Most of the projects in the Water and Sewer Fund are recurring in nature and are associated with the repair and maintenance of the infrastructure.
Funding Source Renewal Replacement and Improvement Reserves
Project Type Water/Wastewater
Project Cost $9,610,984
Five-Year Project Funding Summary
FY 20 Cost FY 21 Cost FY 22 Cost FY 23 Cost FY 24 Cost 5 Year Cost
Capital Cost
$851,359 $3,667,125 $0 $5,092,500 $0 $9,610,984
Operating Impact
$0 $0 $0 $0 $0 $0
Water and Sewer Enterprise Fund
Capital Project: Water Main Replacement Program
Department: Public Utilities
FY 2020 Adopted Budget Capital Improvement Plan382

Project Description Water Main Replacement Program
Justification Per Approved Water and Sewer Master Plans
Ongoing Operating Cost
Most of the projects in the Water and Sewer Fund are recurring in nature and are associated with the repair and maintenance of the infrastructure.
Funding Source State Revolving Loan Funds
Project Type Water/Wastewater
Project Cost $10,185,000
Five-Year Project Funding Summary
FY 20 Cost FY 21 Cost FY 22 Cost FY 23 Cost FY 24 Cost 5 Year Cost
Capital Cost
$10,185,000
$0 $0 $0 $0 $10,185,00
0 Operating
Impact $0 $0 $0 $0 $0 $0
Water and Sewer Enterprise Fund
Capital Project: Water Main Replacement Program
Department: Public Utilities
FY 2020 Adopted Budget Capital Improvement Plan383
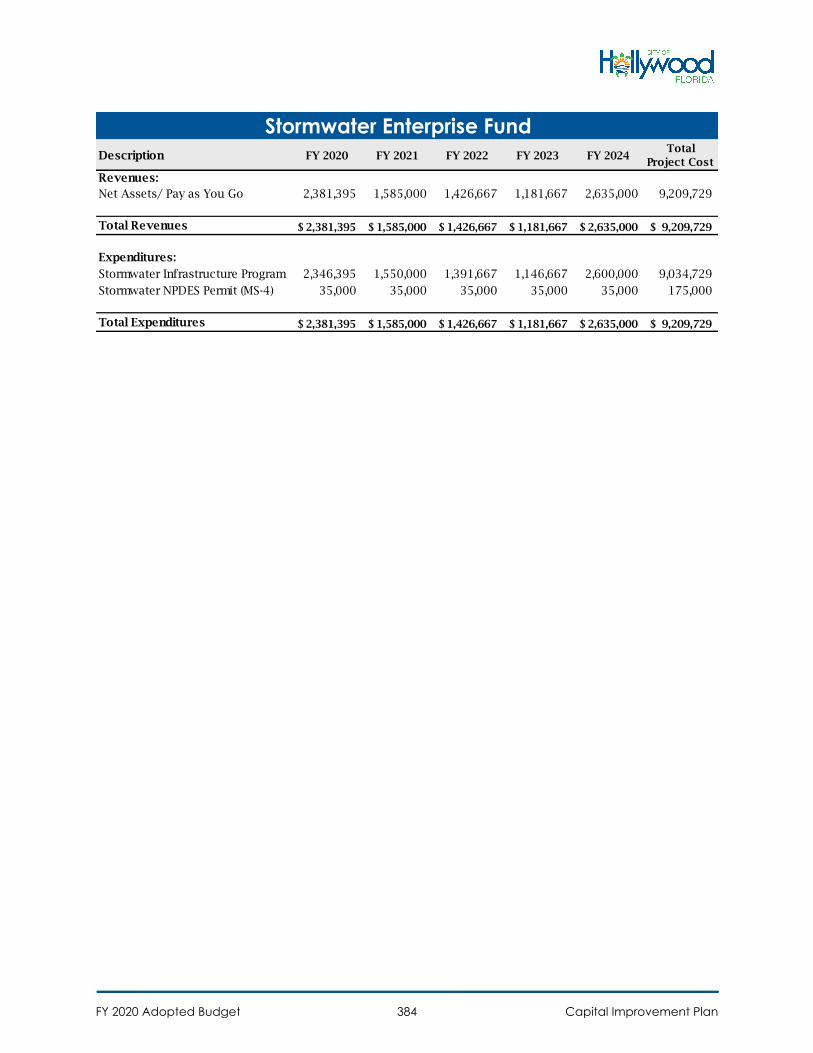
Description FY 2020 FY 2021 FY 2022 FY 2023 FY 2024Total
Project Cost
Revenues:
Net Assets/ Pay as You Go 2,381,395 1,585,000 1,426,667 1,181,667 2,635,000 9,209,729
Total Revenues 2,381,395$ 1,585,000$ 1,426,667$ 1,181,667$ 2,635,000$ 9,209,729$
Expenditures:
Stormwater Infrastructure Program 2,346,395 1,550,000 1,391,667 1,146,667 2,600,000 9,034,729
Stormwater NPDES Permit (MS-4) 35,000 35,000 35,000 35,000 35,000 175,000
Total Expenditures 2,381,395$ 1,585,000$ 1,426,667$ 1,181,667$ 2,635,000$ 9,209,729$
Stormwater Enterprise Fund
FY 2020 Adopted Budget Capital Improvement Plan384
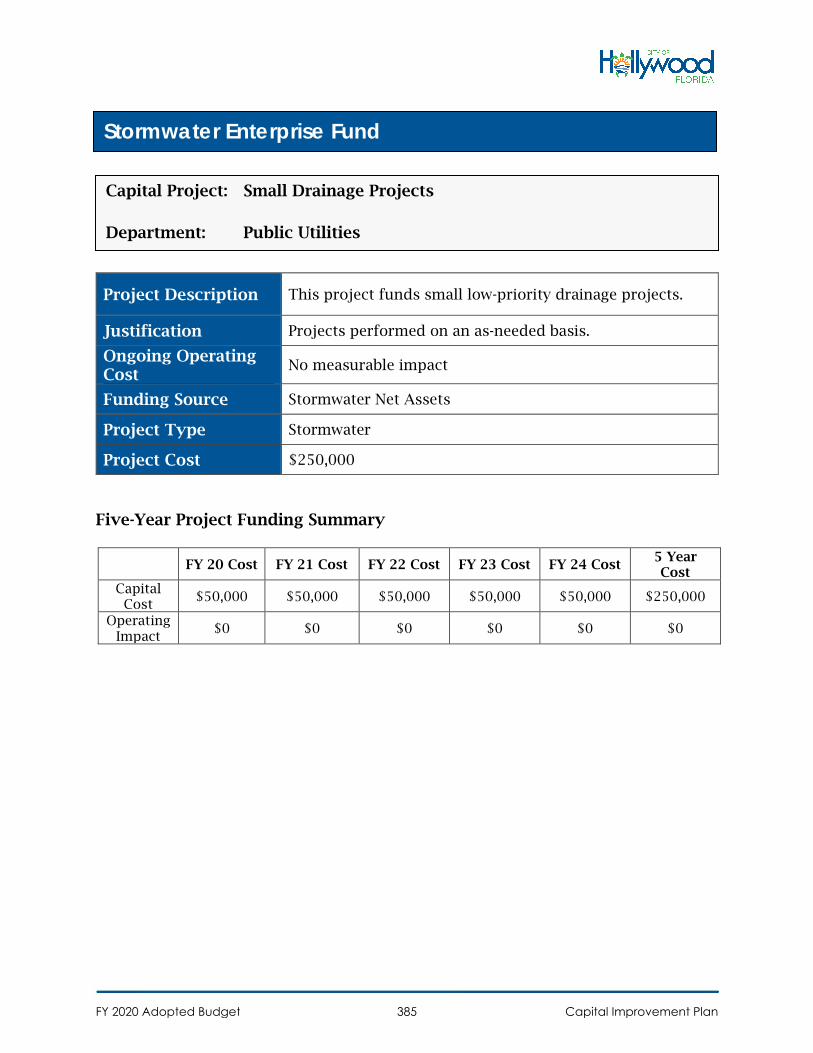
Project Description This project funds small low-priority drainage projects.
Justification Projects performed on an as-needed basis.
Ongoing Operating Cost
No measurable impact
Funding Source Stormwater Net Assets
Project Type Stormwater
Project Cost $250,000
Five-Year Project Funding Summary
FY 20 Cost FY 21 Cost FY 22 Cost FY 23 Cost FY 24 Cost 5 Year Cost
Capital Cost
$50,000 $50,000 $50,000 $50,000 $50,000 $250,000
Operating Impact
$0 $0 $0 $0 $0 $0
Stormwater Enterprise Fund
Capital Project: Small Drainage Projects
Department: Public Utilities
FY 2020 Adopted Budget Capital Improvement Plan385
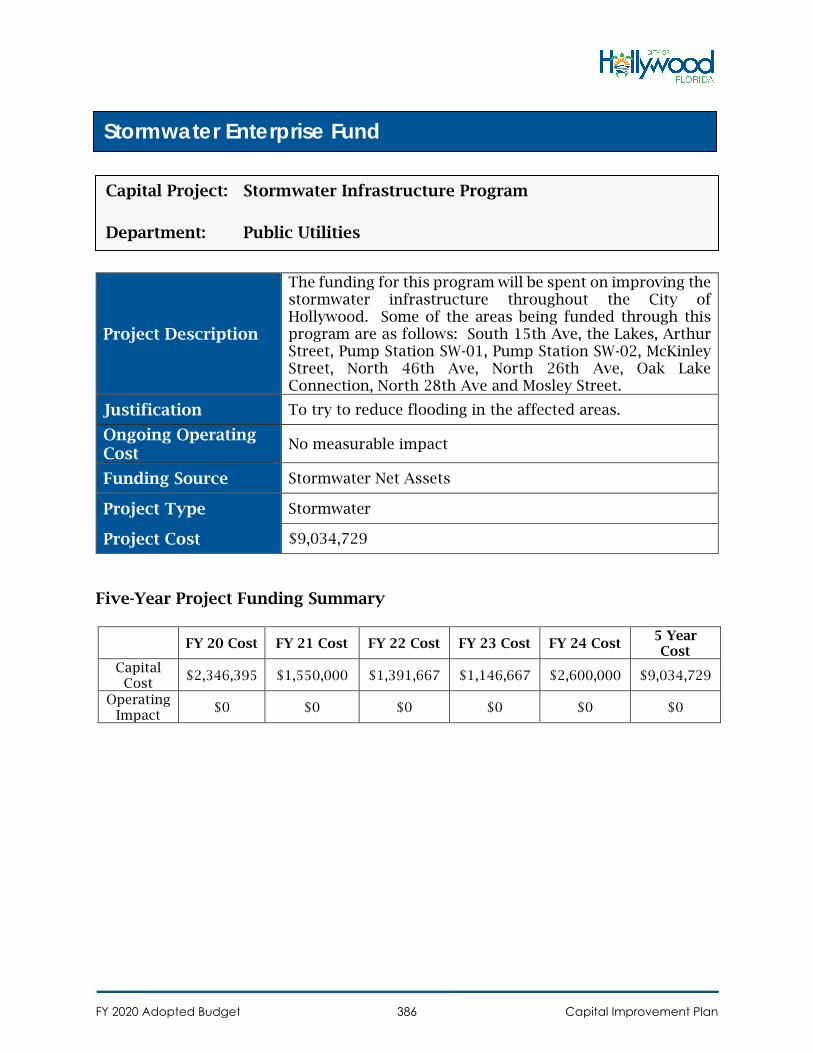
Project Description
The funding for this program will be spent on improving the stormwater infrastructure throughout the City of Hollywood. Some of the areas being funded through this program are as follows: South 15th Ave, the Lakes, Arthur Street, Pump Station SW-01, Pump Station SW-02, McKinley Street, North 46th Ave, North 26th Ave, Oak Lake Connection, North 28th Ave and Mosley Street.
Justification To try to reduce flooding in the affected areas.
Ongoing Operating Cost
No measurable impact
Funding Source Stormwater Net Assets
Project Type Stormwater
Project Cost $9,034,729
Five-Year Project Funding Summary
FY 20 Cost FY 21 Cost FY 22 Cost FY 23 Cost FY 24 Cost 5 Year Cost
Capital Cost
$2,346,395 $1,550,000 $1,391,667 $1,146,667 $2,600,000 $9,034,729
Operating Impact
$0 $0 $0 $0 $0 $0
Stormwater Enterprise Fund
Capital Project: Stormwater Infrastructure Program
Department: Public Utilities
FY 2020 Adopted Budget Capital Improvement Plan386
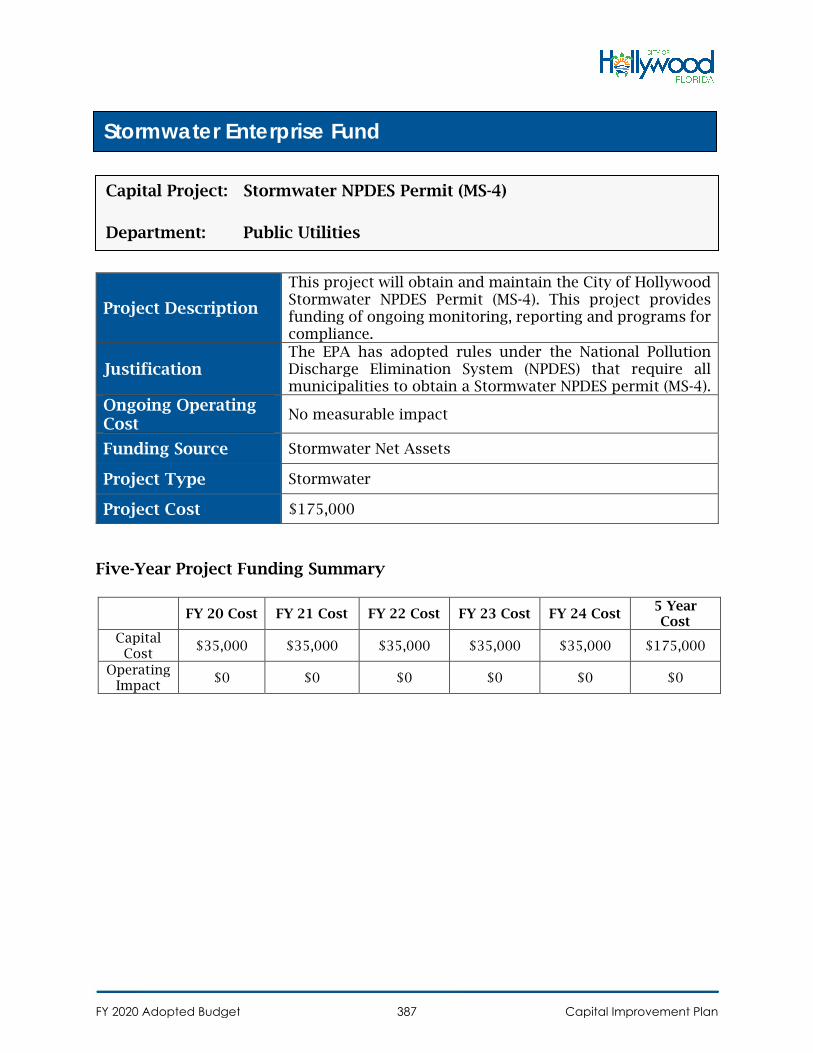
Project Description
This project will obtain and maintain the City of Hollywood Stormwater NPDES Permit (MS-4). This project provides funding of ongoing monitoring, reporting and programs for compliance.
Justification The EPA has adopted rules under the National Pollution Discharge Elimination System (NPDES) that require all municipalities to obtain a Stormwater NPDES permit (MS-4).
Ongoing Operating Cost
No measurable impact
Funding Source Stormwater Net Assets
Project Type Stormwater
Project Cost $175,000
Five-Year Project Funding Summary
FY 20 Cost FY 21 Cost FY 22 Cost FY 23 Cost FY 24 Cost 5 Year Cost
Capital Cost
$35,000 $35,000 $35,000 $35,000 $35,000 $175,000
Operating Impact
$0 $0 $0 $0 $0 $0
Stormwater Enterprise Fund
Capital Project: Stormwater NPDES Permit (MS-4)
Department: Public Utilities
FY 2020 Adopted Budget Capital Improvement Plan387
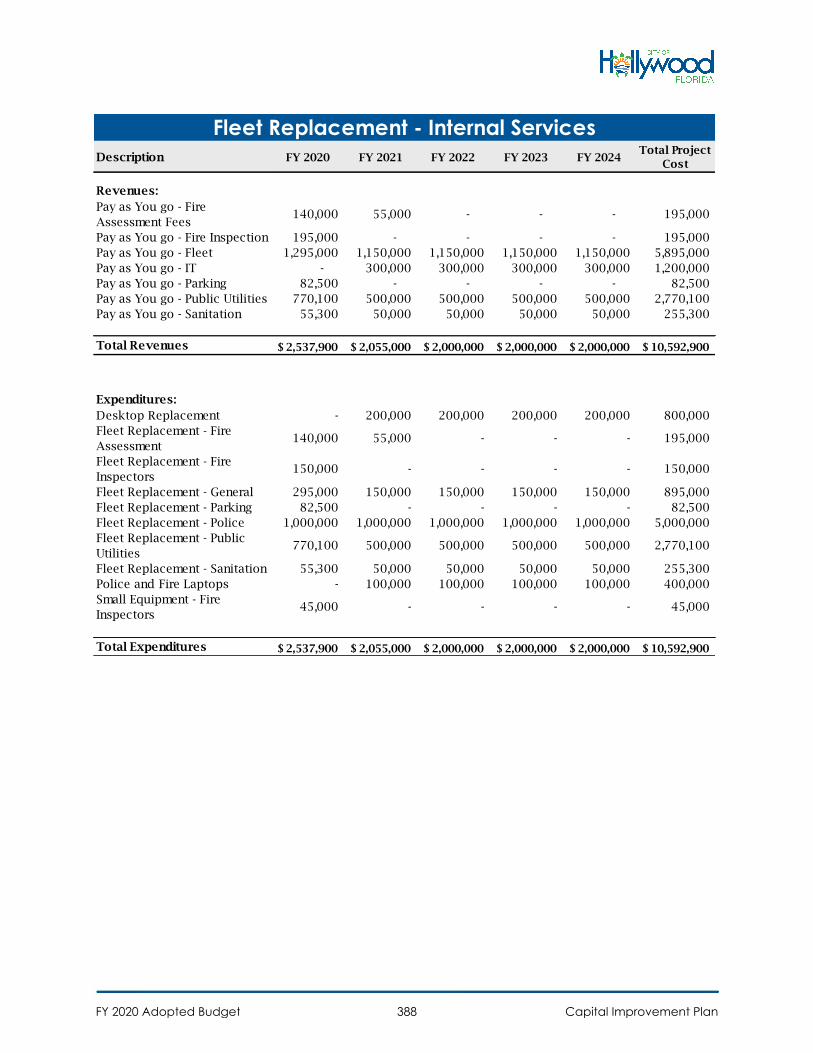
FY 2020 Adopted Budget Capital Improvement Plan388
Description FY 2020 FY 2021 FY 2022 FY 2023 FY 2024Total Project
Cost
140,000 55,000 - - - 195,000
195,000 - - - - 195,000
1,295,000 1,150,000 1,150,000 1,150,000 1,150,000 5,895,000
- 300,000 300,000 300,000 300,000 1,200,000
82,500 - - - - 82,500
770,100 500,000 500,000 500,000 500,000 2,770,100
Revenues:
Pay as You go - Fire
Assessment Fees
Pay as You go - Fire Inspection
Pay as You go - Fleet
Pay as You go - IT
Pay as You go - Parking
Pay as You go - Public Utilities
Pay as You go - Sanitation 55,300 50,000 50,000 50,000 50,000 255,300
Total Revenues $ 2,537,900 $ 2,055,000 $ 2,000,000 $ 2,000,000 $ 2,000,000 $ 10,592,900
- 200,000 200,000 200,000 200,000 800,000
140,000 55,000 - - - 195,000
150,000 - - - - 150,000
295,000 150,000 150,000 150,000 150,000 895,000
82,500 - - - - 82,500
1,000,000 1,000,000 1,000,000 1,000,000 1,000,000 5,000,000
770,100 500,000 500,000 500,000 500,000 2,770,100
55,300 50,000 50,000 50,000 50,000 255,300
- 100,000 100,000 100,000 100,000 400,000
Expenditures:
Desktop Replacement
Fleet Replacement - Fire
Assessment
Fleet Replacement - Fire
Inspectors
Fleet Replacement - General
Fleet Replacement - Parking
Fleet Replacement - Police
Fleet Replacement - Public
Utilities
Fleet Replacement - Sanitation
Police and Fire Laptops
Small Equipment - Fire
Inspectors 45,000 - - - - 45,000
Total Expenditures $ 2,537,900 $ 2,055,000 $ 2,000,000 $ 2,000,000 $ 2,000,000 $ 10,592,900
Fleet Replacement - Internal Services
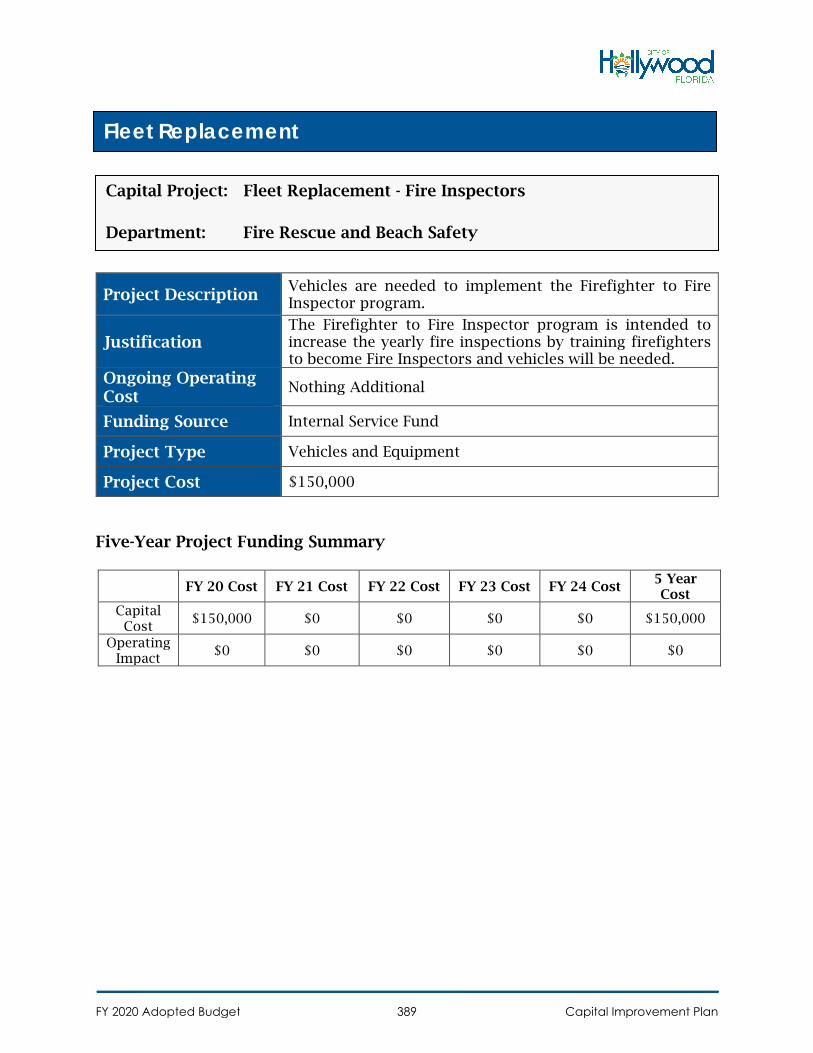
Project Description Vehicles are needed to implement the Firefighter to Fire Inspector program.
Justification The Firefighter to Fire Inspector program is intended to increase the yearly fire inspections by training firefighters to become Fire Inspectors and vehicles will be needed.
Ongoing Operating Cost
Nothing Additional
Funding Source Internal Service Fund
Project Type Vehicles and Equipment
Project Cost $150,000
Five-Year Project Funding Summary
FY 20 Cost FY 21 Cost FY 22 Cost FY 23 Cost FY 24 Cost 5 Year Cost
Capital Cost
$150,000 $0 $0 $0 $0 $150,000
Operating Impact
$0 $0 $0 $0 $0 $0
Fleet Replacement
Capital Project: Fleet Replacement - Fire Inspectors
Department: Fire Rescue and Beach Safety
FY 2020 Adopted Budget Capital Improvement Plan389
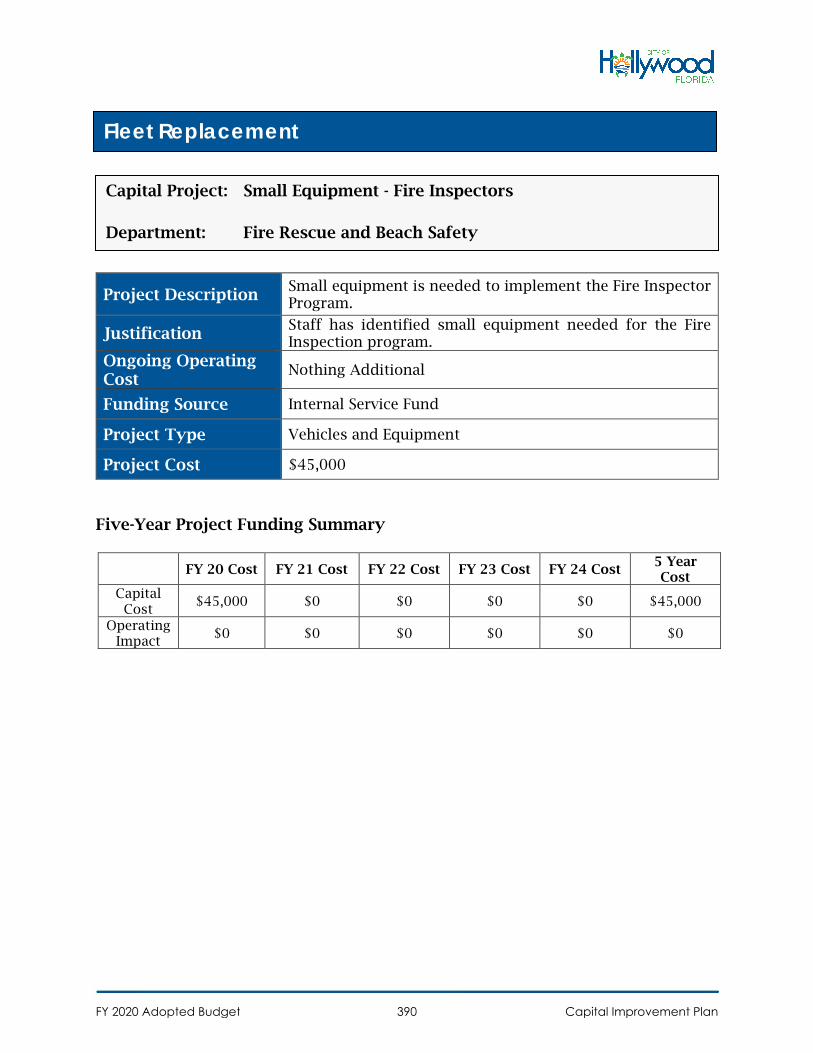
Project Description Small equipment is needed to implement the Fire Inspector Program.
Justification Staff has identified small equipment needed for the Fire Inspection program.
Ongoing Operating Cost
Nothing Additional
Funding Source Internal Service Fund
Project Type Vehicles and Equipment
Project Cost $45,000
Five-Year Project Funding Summary
FY 20 Cost FY 21 Cost FY 22 Cost FY 23 Cost FY 24 Cost 5 Year Cost
Capital Cost
$45,000 $0 $0 $0 $0 $45,000
Operating Impact
$0 $0 $0 $0 $0 $0
Fleet Replacement
Capital Project: Small Equipment - Fire Inspectors
Department: Fire Rescue and Beach Safety
FY 2020 Adopted Budget Capital Improvement Plan390
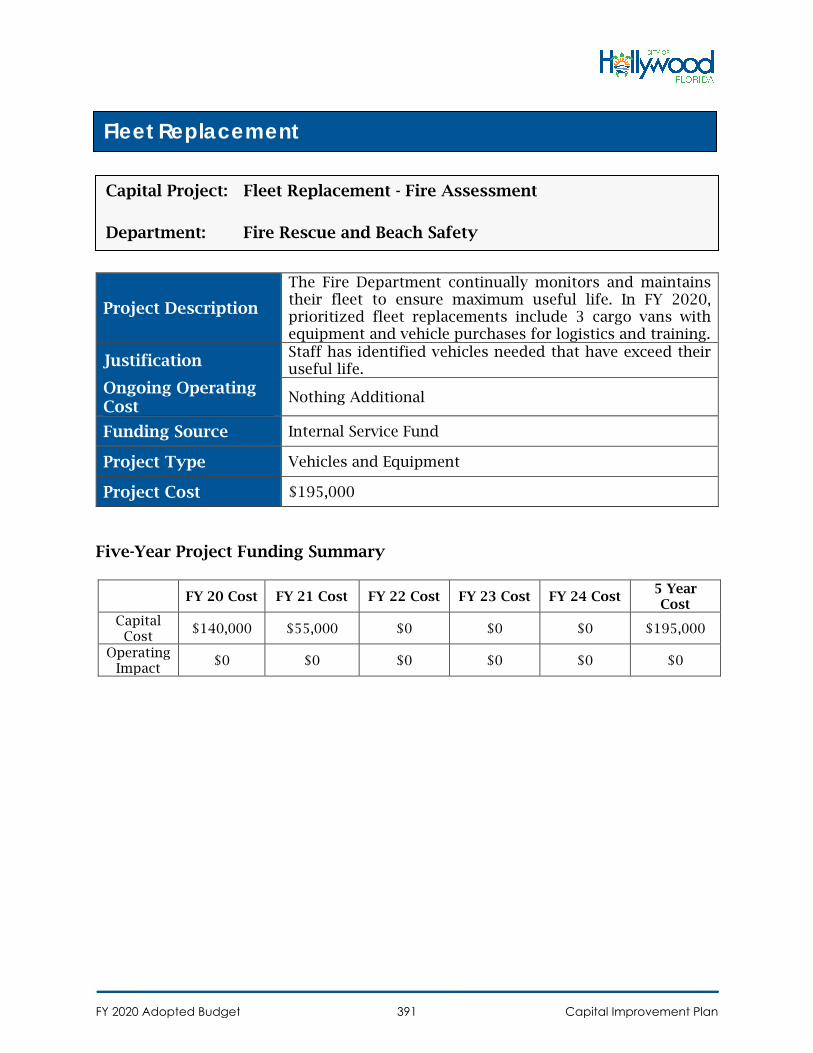
Project Description
The Fire Department continually monitors and maintains their fleet to ensure maximum useful life. In FY 2020, prioritized fleet replacements include 3 cargo vans with equipment and vehicle purchases for logistics and training.
Justification Staff has identified vehicles needed that have exceed their useful life.
Ongoing Operating Cost
Nothing Additional
Funding Source Internal Service Fund
Project Type Vehicles and Equipment
Project Cost $195,000
Five-Year Project Funding Summary
FY 20 Cost FY 21 Cost FY 22 Cost FY 23 Cost FY 24 Cost 5 Year Cost
Capital Cost
$140,000 $55,000 $0 $0 $0 $195,000
Operating Impact
$0 $0 $0 $0 $0 $0
Fleet Replacement
Capital Project: Fleet Replacement - Fire Assessment
Department: Fire Rescue and Beach Safety
FY 2020 Adopted Budget Capital Improvement Plan391
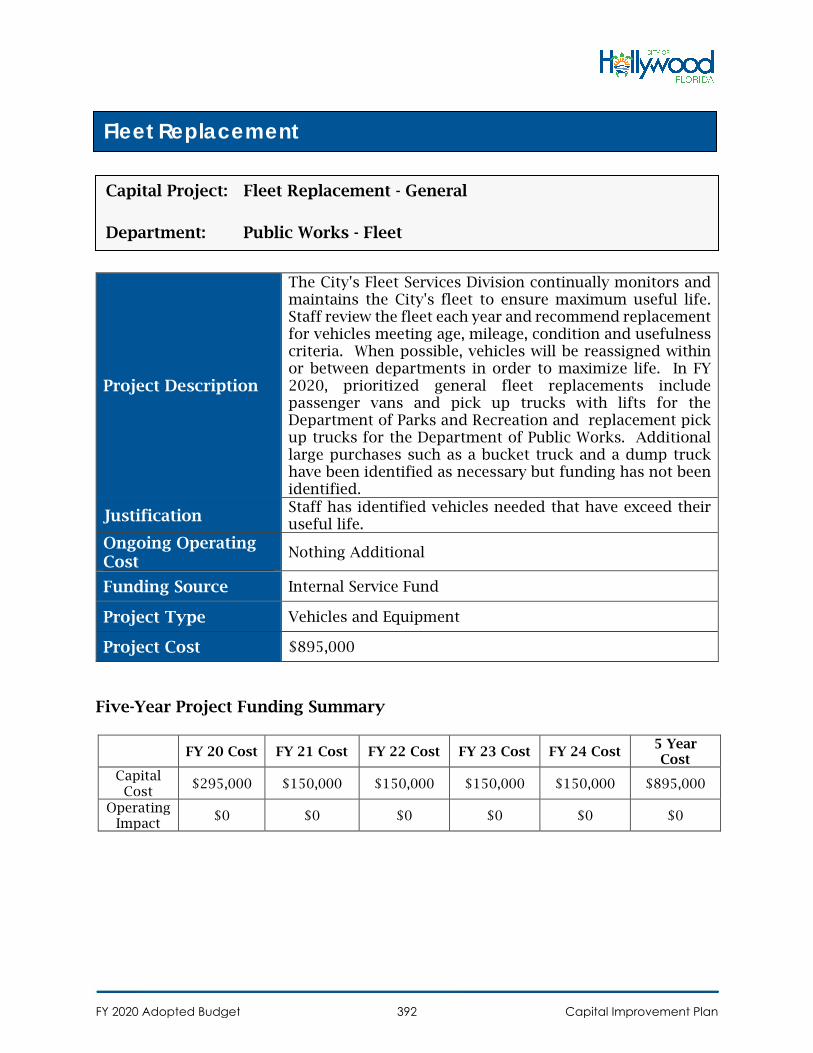
Project Description
The City's Fleet Services Division continually monitors and maintains the City's fleet to ensure maximum useful life. Staff review the fleet each year and recommend replacement for vehicles meeting age, mileage, condition and usefulness criteria. When possible, vehicles will be reassigned within or between departments in order to maximize life. In FY 2020, prioritized general fleet replacements include passenger vans and pick up trucks with lifts for the Department of Parks and Recreation and replacement pick up trucks for the Department of Public Works. Additional large purchases such as a bucket truck and a dump truck have been identified as necessary but funding has not been identified.
Justification Staff has identified vehicles needed that have exceed their useful life.
Ongoing Operating Cost
Nothing Additional
Funding Source Internal Service Fund
Project Type Vehicles and Equipment
Project Cost $895,000
Five-Year Project Funding Summary
FY 20 Cost FY 21 Cost FY 22 Cost FY 23 Cost FY 24 Cost 5 Year Cost
Capital Cost
$295,000 $150,000 $150,000 $150,000 $150,000 $895,000
Operating Impact
$0 $0 $0 $0 $0 $0
Fleet Replacement
Capital Project: Fleet Replacement - General
Department: Public Works - Fleet
FY 2020 Adopted Budget Capital Improvement Plan392

Project Description
The City's Fleet Services Division continually monitors and maintains the City's fleet to ensure maximum useful life and two pickup trucks have been identified for replacement in the Sanitation Fund. Staff review the fleet each year and recommend replacement for vehicles meeting age, mileage, condition and usefulness criteria. When possible, vehicles will be reassigned within or between departments in order to maximize life.
Justification Staff has identified vehicles needed that have exceed their useful life.
Ongoing Operating Cost
Nothing Additional
Funding Source Internal Service Fund
Project Type Vehicles and Equipment
Project Cost $255,300
Five-Year Project Funding Summary
FY 20 Cost FY 21 Cost FY 22 Cost FY 23 Cost FY 24 Cost 5 Year Cost
Capital Cost
$55,300 $50,000 $50,000 $50,000 $50,000 $255,300
Operating Impact
$0 $0 $0 $0 $0 $0
Fleet Replacement
Capital Project: Fleet Replacement - Sanitation
Department: Public Works - Fleet
FY 2020 Adopted Budget Capital Improvement Plan393
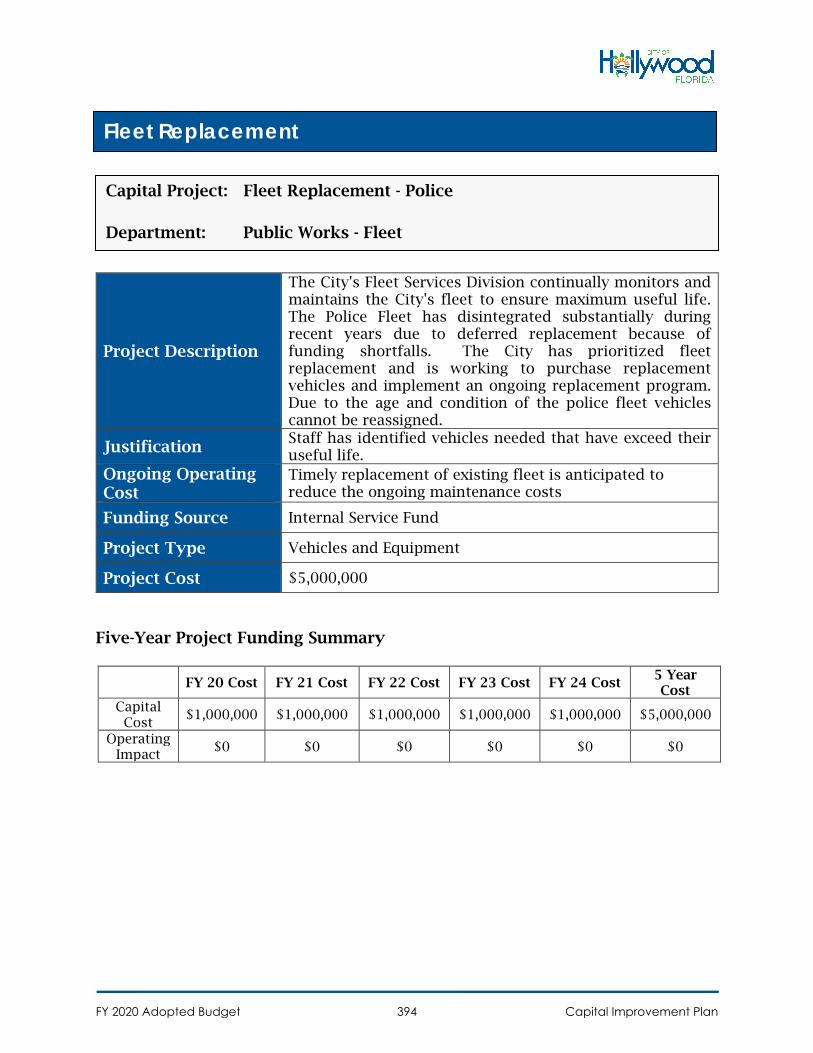
Project Description
The City's Fleet Services Division continually monitors and maintains the City's fleet to ensure maximum useful life. The Police Fleet has disintegrated substantially during recent years due to deferred replacement because of funding shortfalls. The City has prioritized fleet replacement and is working to purchase replacement vehicles and implement an ongoing replacement program. Due to the age and condition of the police fleet vehicles cannot be reassigned.
Justification Staff has identified vehicles needed that have exceed their useful life.
Ongoing Operating Cost
Timely replacement of existing fleet is anticipated to reduce the ongoing maintenance costs
Funding Source Internal Service Fund
Project Type Vehicles and Equipment
Project Cost $5,000,000
Five-Year Project Funding Summary
FY 20 Cost FY 21 Cost FY 22 Cost FY 23 Cost FY 24 Cost 5 Year Cost
Capital Cost
$1,000,000 $1,000,000 $1,000,000 $1,000,000 $1,000,000 $5,000,000
Operating Impact
$0 $0 $0 $0 $0 $0
Fleet Replacement
Capital Project: Fleet Replacement - Police
Department: Public Works - Fleet
FY 2020 Adopted Budget Capital Improvement Plan394
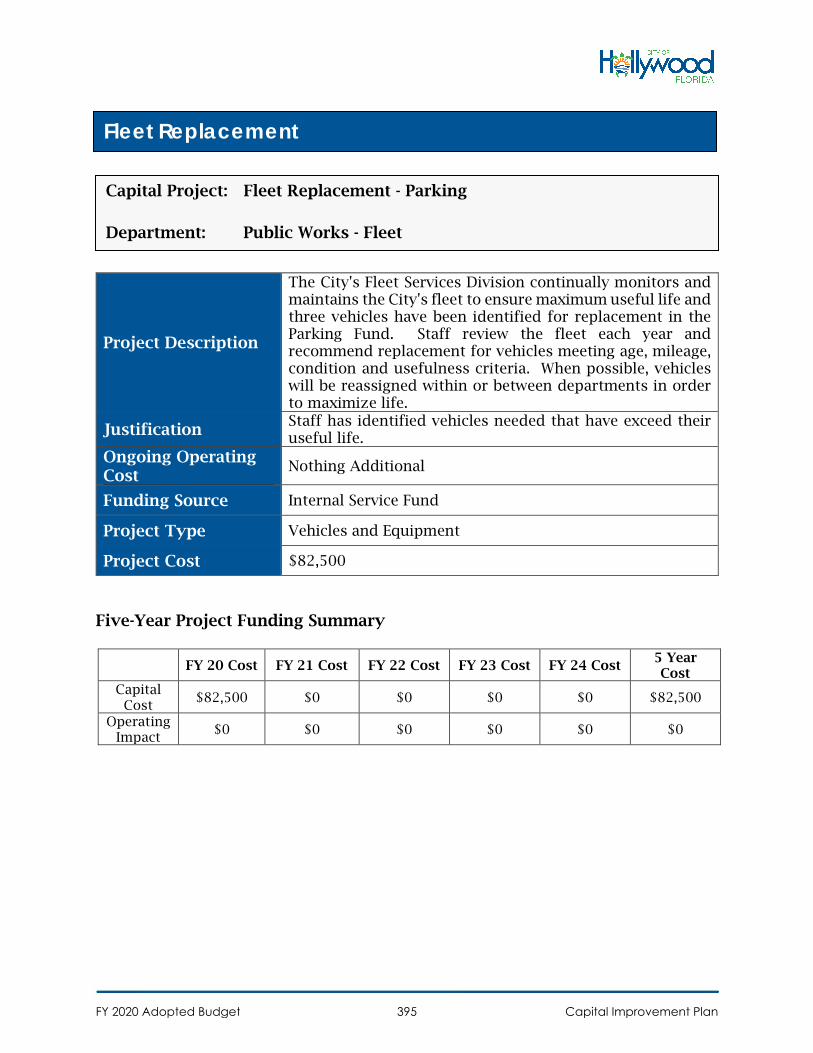
Project Description
The City's Fleet Services Division continually monitors and maintains the City's fleet to ensure maximum useful life and three vehicles have been identified for replacement in the Parking Fund. Staff review the fleet each year and recommend replacement for vehicles meeting age, mileage, condition and usefulness criteria. When possible, vehicles will be reassigned within or between departments in order to maximize life.
Justification Staff has identified vehicles needed that have exceed their useful life.
Ongoing Operating Cost
Nothing Additional
Funding Source Internal Service Fund
Project Type Vehicles and Equipment
Project Cost $82,500
Five-Year Project Funding Summary
FY 20 Cost FY 21 Cost FY 22 Cost FY 23 Cost FY 24 Cost 5 Year Cost
Capital Cost
$82,500 $0 $0 $0 $0 $82,500
Operating Impact
$0 $0 $0 $0 $0 $0
Fleet Replacement
Capital Project: Fleet Replacement - Parking
Department: Public Works - Fleet
FY 2020 Adopted Budget Capital Improvement Plan395
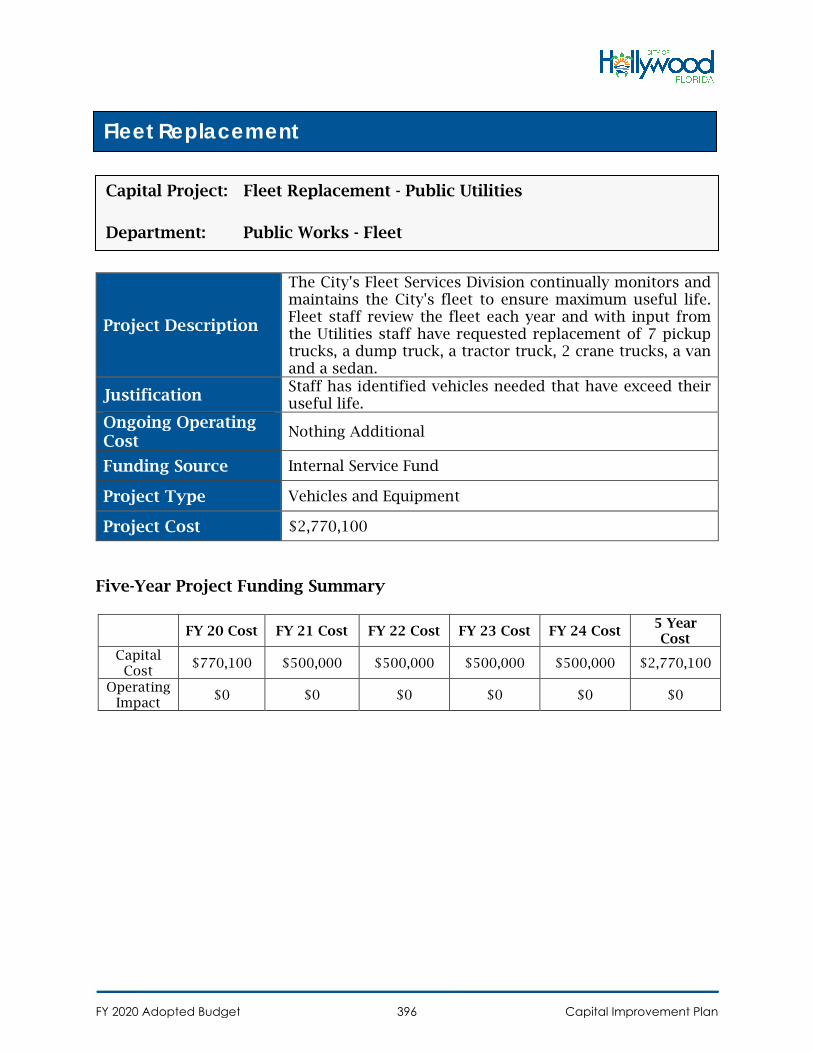
Project Description
The City's Fleet Services Division continually monitors and maintains the City's fleet to ensure maximum useful life. Fleet staff review the fleet each year and with input from the Utilities staff have requested replacement of 7 pickup trucks, a dump truck, a tractor truck, 2 crane trucks, a van and a sedan.
Justification Staff has identified vehicles needed that have exceed their useful life.
Ongoing Operating Cost
Nothing Additional
Funding Source Internal Service Fund
Project Type Vehicles and Equipment
Project Cost $2,770,100
Five-Year Project Funding Summary
FY 20 Cost FY 21 Cost FY 22 Cost FY 23 Cost FY 24 Cost 5 Year Cost
Capital Cost
$770,100 $500,000 $500,000 $500,000 $500,000 $2,770,100
Operating Impact
$0 $0 $0 $0 $0 $0
Fleet Replacement
Capital Project: Fleet Replacement - Public Utilities
Department: Public Works - Fleet
FY 2020 Adopted Budget Capital Improvement Plan396
Debt Service Funds
Debt Service Funds
Debt Service Funds are used to account for payments of principal and interest on
general obligation bonds, payments of principal and interest on special obligation
bonds, and accumulate resources to fund these debt service payments. The FY 2020
Adopted Budget for the Debt Service Funds is $13.2 million.
General Obligation Bonds
Payment of debt service on general obligation bonds is funded by a tax levy on
non-exempt property value. A millage rate is calculated and approved by the City
Commission based on the amount of general obligation debt outstanding at September
30, 2019. All general obligation bonds are voter-approved and used for specific projects
or purchases. The FY 2020 Adopted Budget for debt service on general obligation bonds
is approximately $7.56 million and includes the initial issuance of the 2019 GO Bonds.
The adopted millage rate for the existing 2005 Bonds is 0.2200 and adopted millage rate
for the 2019 GO bonds is 0.2361.
Special Obligation Bond Fund
Payment of debt service on the City’s various special obligation bonds are secured
by pledges of specific revenue sources in accordance with their bond indentures. The
City’s bond resolutions require that sufficient funds be available in reserve accounts to
meet the debt service requirement. The FY 2020 Adopted Budget for debt service on
special obligation bonds is $5.859 million, which is comprised of transfers in from the
General, Gas Tax, Golf and Central Services funds.
Additional Debt Service Payments
Within the City’s operating budget, $19.3 million in debt service payments are
made directly from the initiating fund and are not transferred to a Debt Service Fund.
These include Community Development Block Grant (Fund 111) $102,145, Parking
Enterprise Fund (446) $786,746, Water and Sewer Fund (442) $18 million, and the
Stormwater Fund (443) $108,592.
Additionally, for information purposes only, the schedule below contains both
the Downtown and Beach CRA’s tax incremental financing issuances. The Downtown’s
debt payment of $2.0 million and the Beach’s debt payment of $7.2 million are included
to provide a comprehensive overview of the Citywide Debt Payments although these are
not direct obligations of the City or part of the FY 2020 Adopted Budget.
FY 2020 Adopted Budget Debt Service Funds397
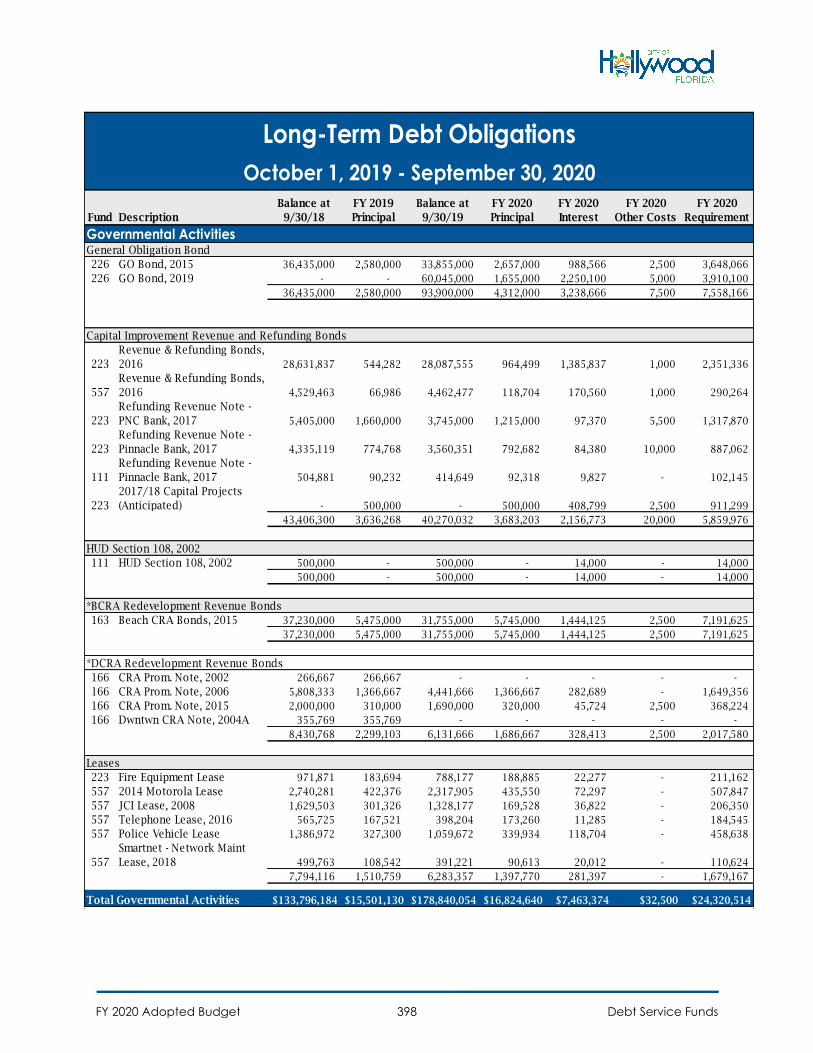
Fund Description
Balance at
9/30/18
FY 2019
Principal
Balance at
9/30/19
FY 2020
Principal
FY 2020
Interest
FY 2020
Other Costs
FY 2020
Requirement
Governmental Activities
226 GO Bond, 2015 36,435,000 2,580,000 33,855,000 2,657,000 988,566 2,500 3,648,066
226 GO Bond, 2019 - - 60,045,000 1,655,000 2,250,100 5,000 3,910,100
36,435,000 2,580,000 93,900,000 4,312,000 3,238,666 7,500 7,558,166
Capital Improvement Revenue and Refunding Bonds
223
Revenue & Refunding Bonds,
2016 28,631,837 544,282 28,087,555 964,499 1,385,837 1,000 2,351,336
557
Revenue & Refunding Bonds,
2016 4,529,463 66,986 4,462,477 118,704 170,560 1,000 290,264
223
Refunding Revenue Note -
PNC Bank, 2017 5,405,000 1,660,000 3,745,000 1,215,000 97,370 5,500 1,317,870
223
Refunding Revenue Note -
Pinnacle Bank, 2017 4,335,119 774,768 3,560,351 792,682 84,380 10,000 887,062
111
Refunding Revenue Note -
Pinnacle Bank, 2017 504,881 90,232 414,649 92,318 9,827 - 102,145
223
2017/18 Capital Projects
(Anticipated) - 500,000 - 500,000 408,799 2,500 911,299
43,406,300 3,636,268 40,270,032 3,683,203 2,156,773 20,000 5,859,976
HUD Section 108, 2002
111 HUD Section 108, 2002 500,000 - 500,000 14,000 14,000
500,000 - 500,000 - 14,000 - 14,000
*BCRA Redevelopment Revenue Bonds
163 Beach CRA Bonds, 2015 37,230,000 5,475,000 31,755,000 5,745,000 1,444,125 2,500 7,191,625
37,230,000 5,475,000 31,755,000 5,745,000 1,444,125 2,500 7,191,625
*DCRA Redevelopment Revenue Bonds
166 CRA Prom. Note, 2002 266,667 266,667 - - - - -
166 CRA Prom. Note, 2006 5,808,333 1,366,667 4,441,666 1,366,667 282,689 - 1,649,356
166 CRA Prom. Note, 2015 2,000,000 310,000 1,690,000 320,000 45,724 2,500 368,224
166 Dwntwn CRA Note, 2004A 355,769 355,769 - - - - -
8,430,768 2,299,103 6,131,666 1,686,667 328,413 2,500 2,017,580
Leases
223 Fire Equipment Lease 971,871 183,694 788,177 188,885 22,277 - 211,162
557 2014 Motorola Lease 2,740,281 422,376 2,317,905 435,550 72,297 - 507,847
557 JCI Lease, 2008 1,629,503 301,326 1,328,177 169,528 36,822 - 206,350
557 Telephone Lease, 2016 565,725 167,521 398,204 173,260 11,285 - 184,545
557 Police Vehicle Lease 1,386,972 327,300 1,059,672 339,934 118,704 - 458,638
557
Smartnet - Network Maint
Lease, 2018 499,763 108,542 391,221 90,613 20,012 - 110,624
7,794,116 1,510,759 6,283,357 1,397,770 281,397 - 1,679,167
Total Governmental Activities $133,796,184 $15,501,130 $178,840,054 $16,824,640 $7,463,374 $32,500 $24,320,514
General Obligation Bond
Long-Term Debt Obligations
October 1, 2019 - September 30, 2020
FY 2020 Adopted Budget Debt Service Funds398
- -
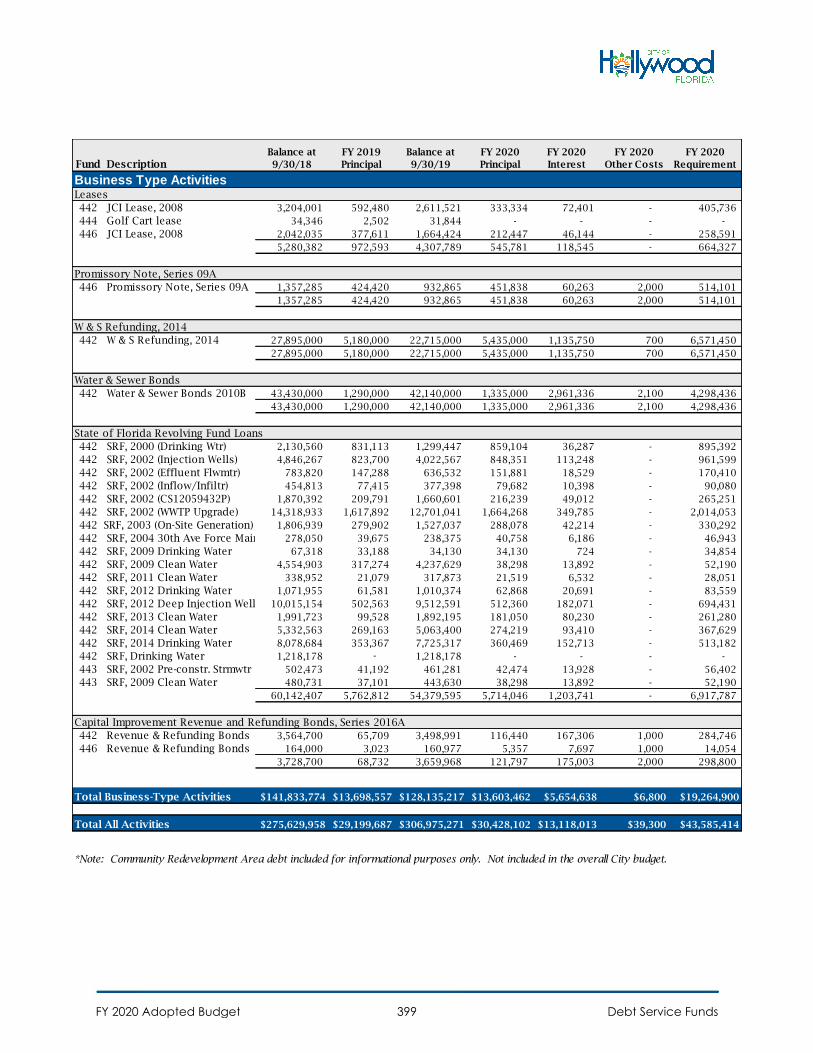
Fund DescriptionBalance at
9/30/18
FY 2019
Principal
Balance at
9/30/19
FY 2020
Principal
FY 2020
Interest
FY 2020
Other Costs
FY 2020
Requirement
Business Type ActivitiesLeases
442 JCI Lease, 2008 3,204,001 592,480 2,611,521 333,334 72,401 - 405,736
444 Golf Cart lease 34,346 2,502 31,844 - - - -
446 JCI Lease, 2008 2,042,035 377,611 1,664,424 212,447 46,144 - 258,591
5,280,382 972,593 4,307,789 545,781 118,545 - 664,327
Promissory Note, Series 09A
446 Promissory Note, Series 09A 1,357,285 424,420 932,865 451,838 60,263 2,000 514,101
1,357,285 424,420 932,865 451,838 60,263 2,000 514,101
W & S Refunding, 2014
442 W & S Refunding, 2014 27,895,000 5,180,000 22,715,000 5,435,000 1,135,750 700 6,571,450
27,895,000 5,180,000 22,715,000 5,435,000 1,135,750 700 6,571,450
Water & Sewer Bonds
442 Water & Sewer Bonds 2010B 43,430,000 1,290,000 42,140,000 1,335,000 2,961,336 2,100 4,298,436
43,430,000 1,290,000 42,140,000 1,335,000 2,961,336 2,100 4,298,436
State of Florida Revolving Fund Loans
442 SRF, 2000 (Drinking Wtr) 2,130,560 831,113 1,299,447 859,104 36,287 - 895,392
442 SRF, 2002 (Injection Wells) 4,846,267 823,700 4,022,567 848,351 113,248 - 961,599
442 SRF, 2002 (Effluent Flwmtr) 783,820 147,288 636,532 151,881 18,529 - 170,410
442 SRF, 2002 (Inflow/Infiltr) 454,813 77,415 377,398 79,682 10,398 - 90,080
442 SRF, 2002 (CS12059432P) 1,870,392 209,791 1,660,601 216,239 49,012 - 265,251
442 SRF, 2002 (WWTP Upgrade) 14,318,933 1,617,892 12,701,041 1,664,268 349,785 - 2,014,053
442 SRF, 2003 (On-Site Generation) 1,806,939 279,902 1,527,037 288,078 42,214 - 330,292
442 SRF, 2004 30th Ave Force Main 278,050 39,675 238,375 40,758 6,186 - 46,943
442 SRF, 2009 Drinking Water 67,318 33,188 34,130 34,130 724 - 34,854
442 SRF, 2009 Clean Water 4,554,903 317,274 4,237,629 38,298 13,892 - 52,190
442 SRF, 2011 Clean Water 338,952 21,079 317,873 21,519 6,532 - 28,051
442 SRF, 2012 Drinking Water 1,071,955 61,581 1,010,374 62,868 20,691 - 83,559
442 SRF, 2012 Deep Injection Wells 10,015,154 502,563 9,512,591 512,360 182,071 - 694,431
442 SRF, 2013 Clean Water 1,991,723 99,528 1,892,195 181,050 80,230 - 261,280
442 SRF, 2014 Clean Water 5,332,563 269,163 5,063,400 274,219 93,410 - 367,629
442 SRF, 2014 Drinking Water 8,078,684 353,367 7,725,317 360,469 152,713 - 513,182
442 SRF, Drinking Water 1,218,178 1,218,178 - - - -
443 SRF, 2002 Pre-constr. Strmwtr 502,473 41,192 461,281 42,474 13,928 - 56,402
443 SRF, 2009 Clean Water 480,731 37,101 443,630 38,298 13,892 - 52,190
60,142,407 5,762,812 54,379,595 5,714,046 1,203,741 - 6,917,787
Capital Improvement Revenue and Refunding Bonds, Series 2016A
442 Revenue & Refunding Bonds 3,564,700 65,709 3,498,991 116,440 167,306 1,000 284,746
446 Revenue & Refunding Bonds 164,000 3,023 160,977 5,357 7,697 1,000 14,054
3,728,700 68,732 3,659,968 121,797 175,003 2,000 298,800
Total Business-Type Activities $141,833,774 $13,698,557 $128,135,217 $13,603,462 $5,654,638 $6,800 $19,264,900
Total All Activities $275,629,958 $29,199,687 $306,975,271 $30,428,102 $13,118,013 $39,300 $43,585,414
*Note: Community Redevelopment Area debt included for informational purposes only. Not included in the overall City budget.
FY 2020 Adopted Budget Debt Service Funds399
-

Appendix
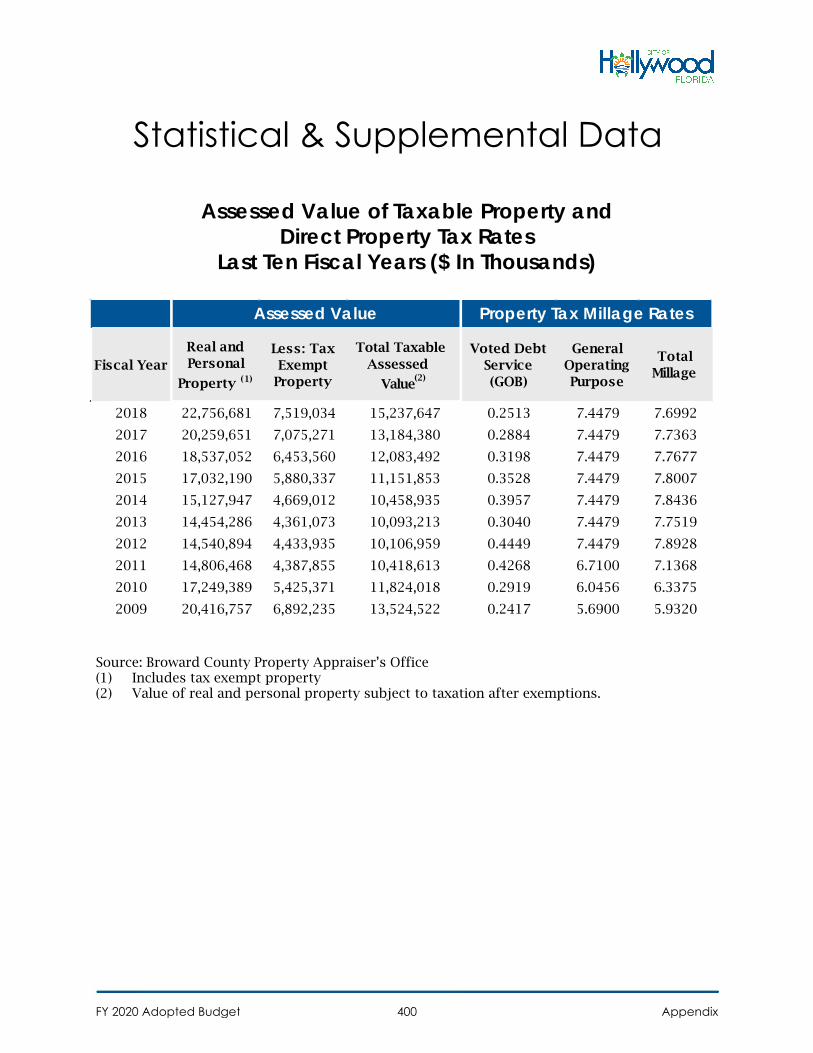
Statistical & Supplemental Data
Assessed Value of Taxable Property and Direct Property Tax Rates
Last Ten Fiscal Years ($ In Thousands)
Fiscal YearReal and Personal
Property (1)
Less: Tax Exempt
Property Value(2)
Voted Debt Service (GOB)
General Operating Purpose
Total Millage
2018 22,756,681 7,519,034 15,237,647 0.2513 7.4479 7.6992
2017 20,259,651 7,075,271 13,184,380 0.2884 7.4479 7.7363
2016 18,537,052 6,453,560 12,083,492 0.3198 7.4479 7.7677
2015 17,032,190 5,880,337 11,151,853 0.3528 7.4479 7.8007
2014 15,127,947 4,669,012 10,458,935 0.3957 7.4479 7.8436
2013 14,454,286 4,361,073 10,093,213 0.3040 7.4479 7.7519
2012 14,540,894 4,433,935 10,106,959 0.4449 7.4479 7.8928
2011 14,806,468 4,387,855 10,418,613 0.4268 6.7100 7.1368
2010 17,249,389 5,425,371 11,824,018 0.2919 6.0456 6.3375
2009 20,416,757 6,892,235 13,524,522 0.2417 5.6900 5.9320
Assessed Value Property Tax Millage Rates
Source: Broward County Property Appraiser’s Office (1) Includes tax exempt property (2) Value of real and personal property subject to taxation after exemptions.
Total TaxableAssessed
FY 2020 Adopted Budget 400 Appendix
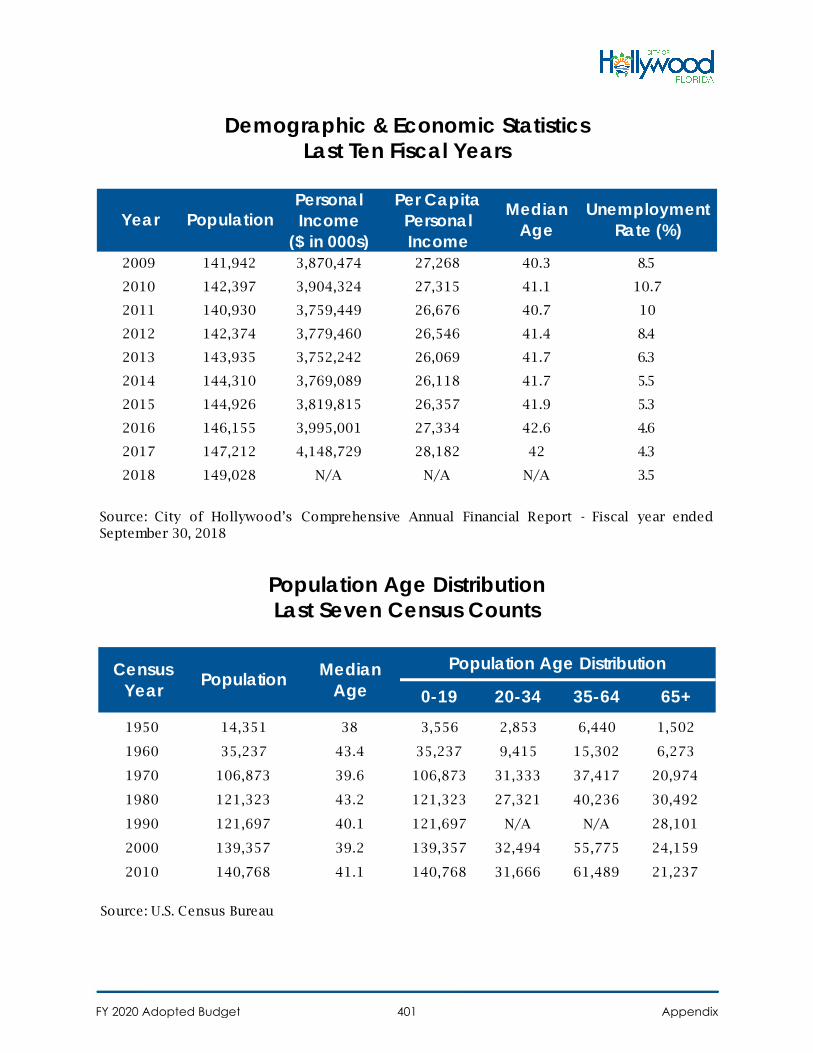
Demographic & Economic Statistics Last Ten Fiscal Years
Personal Income
($ in 000s)2009 141,942 3,870,474 27,268 40.3 8.5
2010 142,397 3,904,324 27,315 41.1 10.7
2011 140,930 3,759,449 26,676 40.7 10
2012 142,374 3,779,460 26,546 41.4 8.4
2013 143,935 3,752,242 26,069 41.7 6.3
2014 144,310 3,769,089 26,118 41.7 5.5
2015 144,926 3,819,815 26,357 41.9 5.3
2016 146,155 3,995,001 27,334 42.6 4.6
2017 147,212 4,148,729 28,182 42 4.3
2018 149,028 N/A N/A N/A 3.5
Year
Source: City of Hollywood’s Comprehensive Annual Financial Report - Fiscal year endedSeptember 30, 2018
Median Age
Unemployment Rate (%)Population
Per Capita Personal Income
Population Age Distribution Last Seven Census Counts
0-19 20-34 35-64 65+1950 14,351 38 3,556 2,853 6,440 1,502
1960 35,237 43.4 35,237 9,415 15,302 6,273
1970 106,873 39.6 106,873 31,333 37,417 20,974
1980 121,323 43.2 121,323 27,321 40,236 30,492
1990 121,697 40.1 121,697 N/A N/A 28,101
2000 139,357 39.2 139,357 32,494 55,775 24,159
2010 140,768 41.1 140,768 31,666 61,489 21,237
Population Age DistributionMedian AgePopulationCensus
Year
Source: U.S. Census Bureau
FY 2020 Adopted Budget 401 Appendix
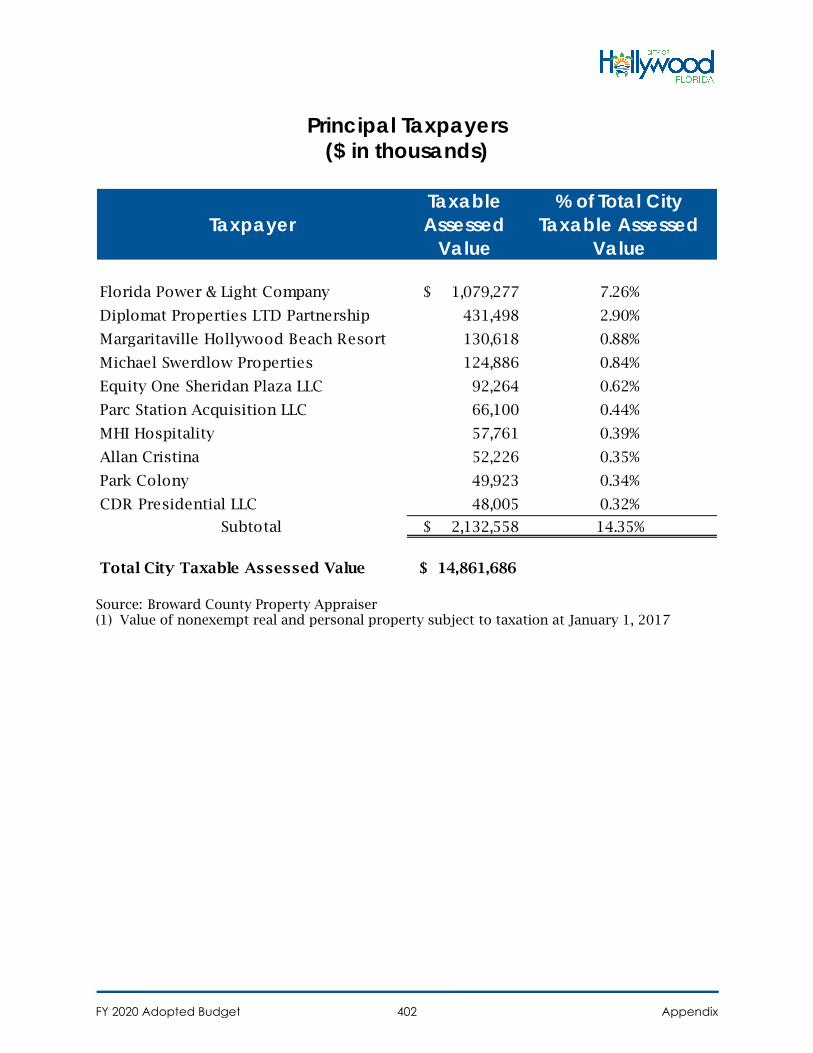
Principal Taxpayers ($ in thousands)
TaxpayerTaxable Assessed
Value
% of Total City Taxable Assessed
Value
Florida Power & Light Company $ 1,079,277 7.26%
Diplomat Properties LTD Partnership 431,498 2.90%
Margaritaville Hollywood Beach Resort 130,618 0.88%
Michael Swerdlow Properties 124,886 0.84%
Equity One Sheridan Plaza LLC 92,264 0.62%
Parc Station Acquisition LLC 66,100 0.44%
MHI Hospitality 57,761 0.39%
Allan Cristina 52,226 0.35%
Park Colony 49,923 0.34%
CDR Presidential LLC 48,005 0.32%
Subtotal $ 2,132,558 14.35%
Total City Taxable Assessed Value $ 14,861,686
Source: Broward County Property Appraiser (1) Value of nonexempt real and personal property subject to taxation at January 1, 2017
FY 2020 Adopted Budget 402 Appendix
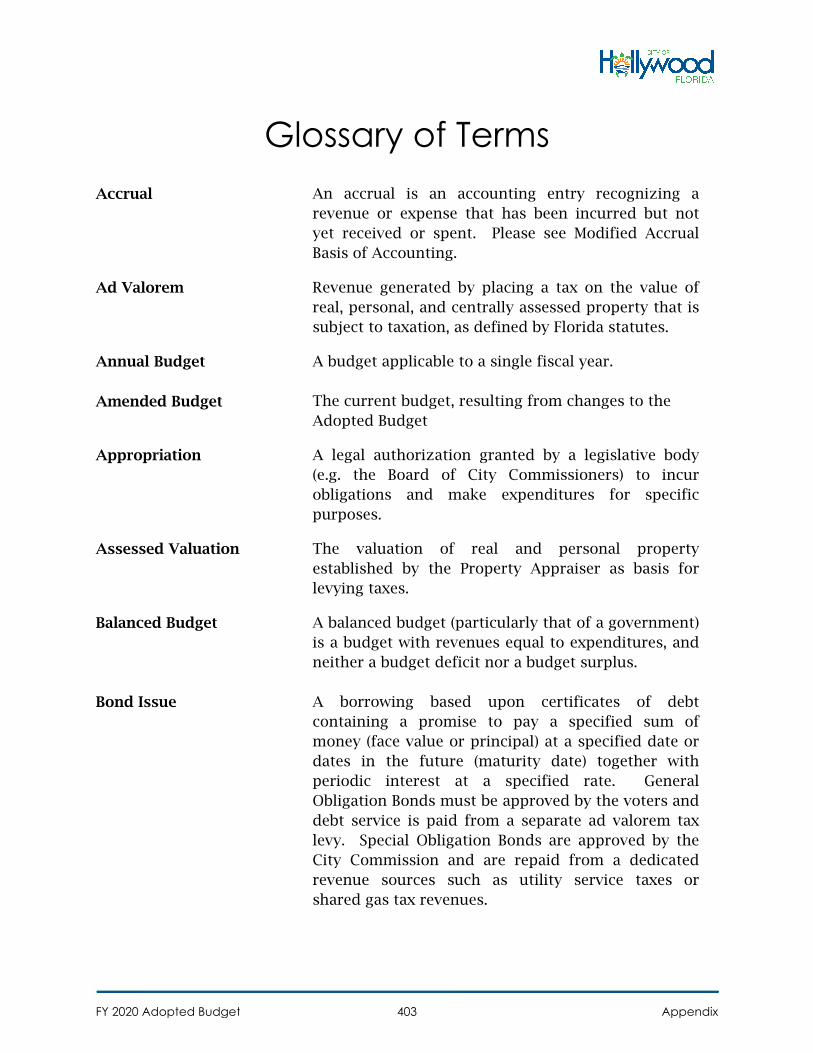
Glossary of Terms Accrual An accrual is an accounting entry recognizing a
revenue or expense that has been incurred but not yet received or spent. Please see Modified Accrual Basis of Accounting.
Ad Valorem Revenue generated by placing a tax on the value of real, personal, and centrally assessed property that is subject to taxation, as defined by Florida statutes.
Annual Budget
Amended Budget
A budget applicable to a single fiscal year.
The current budget, resulting from changes to the Adopted Budget
Appropriation A legal authorization granted by a legislative body (e.g. the Board of City Commissioners) to incur obligations and make expenditures for specific purposes.
Assessed Valuation The valuation of real and personal property established by the Property Appraiser as basis for levying taxes.
Balanced Budget A balanced budget (particularly that of a government) is a budget with revenues equal to expenditures, and neither a budget deficit nor a budget surplus.
Bond Issue A borrowing based upon certificates of debt containing a promise to pay a specified sum of money (face value or principal) at a specified date or dates in the future (maturity date) together with periodic interest at a specified rate. General Obligation Bonds must be approved by the voters and debt service is paid from a separate ad valorem tax levy. Special Obligation Bonds are approved by the City Commission and are repaid from a dedicated revenue sources such as utility service taxes or shared gas tax revenues.
FY 2020 Adopted Budget 403 Appendix
Budget A fiscal plan of operation. The budget is comprised of proposed expenditures and proposed revenues together with specific authorizations and restrictions as appropriate. It also includes the current and prior fiscal period history. The budget quantifies executive and legislative objectives and provides a means to measure performance. As a guide for operations, the budget changes over time in response to changes in conditions. The budget embodies public policy and provides insight into how that policy will be implemented.
Budget Calendar A schedule of key dates which the City follows in the preparation, adoption and administration of the budget
Budget Message An executive level overview of the proposed budget delivered by the City Manager to the Mayor and City Commissioners. It discusses the major City issues and the proposed means of dealing with them, highlights key experiences during the current fiscal year, and indicates how current and proposed budgetary plans will meet the City’s objectives. The budget message is normally the first comprehensive public statement of the City’s plans for the upcoming fiscal year.
Capital Budget The first year of the capital improvement plan which includes capital project appropriations and the revenues required to support the projects.
Capital Outlay Expenditures for capital items such as equipment, machinery, or vehicles greater than $1,000 from operating funds. These are appropriated in the programs within the City’s operating budget.
Capital Improvement Plan All capital expenditures planned for the next five years. The program specifies both proposed projects and the resources estimated to be available to fund projected expenditures.
FY 2020 Adopted Budget 404 Appendix
Central Services Fund This fund allocates the cost of providing certain centralized services (Information Technology, Public Affairs, Fleet Management, and Records and Archives Management) among user agencies, with the aim of full cost reimbursement for providing these services.
Charges for Services These refer to a revenue source for a program which is attributable to a particular service provided. An example would be revenue for the water and sewer fund based upon the usage of water by a customer.
Community Development Block Grant (CDBG)
A U.S. Department of Housing and Urban Development grant.
Contingency An appropriation of funds to cover unforeseen expenses that occur during the budget year.
COPS Grant A U.S. Department of Justice Community Oriented Policing Services grant. This grant provides enhancements to the current City-funded community oriented policing program.
Cost Allocation Method designed to recover indirect costs from activities for the administration of specific services provided to those activities.
CRA Community Redevelopment Agency – the Downtown CRA and the Beach CRA are districts of the Hollywood CRA, which is legally separate from the City and which was established in accordance with Florida statutes to finance and redevelop these two designated areas.
Debt An obligation resulting from the borrowing of money or from the purchase of goods and services. Debt instruments used by the City of Hollywood may include general obligation bonds (G.O.), special obligation bonds, bond anticipation notes, and tax anticipation notes. All debt instruments must be approved by the City Commission. All G. O. bonds must be approved by the voters.
FY 2020 Adopted Budget 405 Appendix
Debt Service Payment of principal and interest related to long-term borrowing.
Department An organizational unit responsible for carrying out a major governmental function, such as Police or Financial Services.
Division An organizational sub-unit of a department, with responsibility for carrying out a more specific function. An example would be the Streets & Highways Division or the Solid Waste Collection Division of the Public Works Department.
Depreciation A noncash expense that reduces the value of an asset
as a result of wear and tear, age, or obsolescence. EMS Emergency Medical Services Enterprise Fund A fund used to account for continuing operations
which provide services to the general public that are similar to private business enterprises in nature, and where the intent is that the costs recovered will primarily be used to account for activities where the periodic determination of revenues and expenses is appropriate for capital maintenance, management control, or other public policy.
Expenditures Please see Expense. Expense A decrease in net total assets. Expenses encompass
all costs associated with the delivery of goods and rendering of services, including costs related to borrowing, renting, leasing or purchasing assets (such as vehicles or machinery) and costs representing the use or time-related declining value (depreciation) of assets. Categories of expenses included in the operating budget are: personal services, operating expenditures, and capital outlay.
FY 2020 Adopted Budget 406 Appendix
Fiscal Year The annual period applicable to the annual operating budget. The City’s standard fiscal year runs from October 1 through September 30. Certain activities of the City, primarily state and federal grant programs which are separate from the annual budget, are required to be accounted for on different fiscal years.
Full-Time Equivalent (FTE)
The number of approved positions equated to a full-time basis (e.g., two half-time positions equal one full-time equivalent position).
Fund A fiscal and accounting entity which is comprised of
a self-balancing set of accounts which reflect all assets, liabilities, equity, revenue, and expenses necessary to disclose financial position and the results of operations. Generally, the number of individual funds should be kept at the lowest number which allows effective and efficient management, with activities which are similar in nature and purpose accounted for in the same fund.
Fund Balance The difference between assets and liabilities in a governmental fund
General Fund The fund used to account for both general government activities and those activities not required to be accounted for in another fund.
GIS Geographical Information System. GOB General Obligation Bond – A method of financing
used by municipalities for capital improvement projects that are specifically authorized and repaid using the City’s taxing power. See Bond Issue.
Governmental Funds Those individual funds through which most
governmental functions are typically financed. This category includes the General Fund, Special Revenue Funds, Capital Projects Funds, and Debt Service Funds.
FY 2020 Adopted Budget 407 Appendix
HCPAC Hollywood Cultural Performing Arts Center – The Hollywood Arts and Culture Center provides educational programming and performances at HCPAC and is partially sponsored by the City.
Homestead Exemption A state program which deducts $25,000 from the
gross value of the primary residential real estate property occupied by a Florida resident in order to determine the net taxable value. An additional $25,000 exemption is applied to taxable values between $50,000 and $75,000 to further reduce the net taxable value for homeowner occupants.
I.C.E. Instrumentation, Controls and Electrical Program –
this program can be found in both the Water Treatment and Wastewater Treatment Divisions of the Public Utilities Department.
Infrastructure The equipment, facilities, and other capital
improvements necessary to provide services. Intergovernmental Revenues
Revenues from other governments in the form of grants, entitlements, shared revenues, or payments in lieu of taxes.
Local MBE/SBE Program The mission of the City’s Local Minority Business Enterprise and Local Small Business Enterprise Program is to maximize City spending among qualified minority and local small business enterprises located within the corporate City limits.
Long-Term Debt Debt with a maturity more than one year after the date of issuance.
Millage Rate The ad valorem tax rate expressed in terms of the levy
per thousand dollars of taxable assessed value. Proprietary Fund A proprietary fund is a fund in which certain
transactions by the government and many nonprofit organizations are handled. These funds call for the services rendered under these accounts to be paid for by the patrons who use them.
FY 2020 Adopted Budget 408 Appendix
Modified Accrual Basis of Accounting
Revenues are recognized when they are both measurable and available. Revenues are considered measurable if the amount of the transaction can be reasonably determined. Expenditures are normally recognized when the related liability is incurred. All governmental funds and Expendable Trust Funds are accounted for using the modified accrual basis of accounting.
Non-Departmental Functions and accounts which are not directly related
to a department’s primary service activities, or which are separate from departmental operations for control purposes.
Non-Operating Expenses Expenses chargeable to a program which are not personnel costs or purchases of services, supplies or materials. One example would be debt service.
Objective A clear statement of what a program is intended to
achieve in the short-term, given set resources. Operating Expenses The costs of government services which are directly
attributable to a specific City program or operation. These represent non-personal services expenses such as cleaning, clothing allowance, training, transportation, printing, materials, supplies, etc.
Ordinance A law, statute or regulation enacted by City
government Other Revenues Includes miscellaneous revenue items and often
represents interest earnings on invested fund balances.
Payment in Lieu of Taxes (PILOT)
Payments made to compensate a local government for some or all of the tax revenue that it loses because of the nature of the ownership or use of a particular piece of real property
Performance Measures Specific quantitative and qualitative measures of work
performed.
FY 2020 Adopted Budget 409 Appendix
Personal Services Salaries, wages and benefits, such as overtime pay, pension plans, workers’ compensation, and insurance for employees.
Portability In the context of property taxes, portability refers to
the right to carry to a new homestead the savings accumulated from years of capped growth on a homeowner’s previous principal residence.
Principal In reference to repayment of debt obligations,
principal is the portion applied to the original debt. The remaining portion of the payment is applied to interest accrued on the outstanding debt and applicable services charges.
Program An organizational sub-unit of a Division, a program
consists of clearly defined resources applied towards achieving a specific public goal.
Retained Earnings An account which reflects accumulated net earnings
(or losses) of a proprietary or similar fund. As in the case of fund balance, retained earnings may include certain reservations of fund equity.
Revenue Funds that the government receives as income. It includes tax payments, service or user fees, receipts from other governments, fines, forfeitures, grants, shared revenues and interest income.
Right-of-Way (R.O.W.) Strip of land over which facilities such as highways,
railroads or power lines are built. Rolled Back Rate The millage rate which, exclusive of new construction,
will provide the same property (ad valorem) tax revenue for each taxing entity as was levied during the prior year. The rolled back rate controls for changes in the market value of property and represents “no tax increase”. The only source of additional tax revenue, if the rolled-back rate is levied, is the tax upon new construction.
FY 2020 Adopted Budget 410 Appendix
Special Revenue Fund A fund used to account for the proceeds of specific revenue sources (other than special assessments, expendable trusts, or for capital projects) which are legally restricted to expense for specified purposes.
Structurally Balanced Budget
A budget that not only achieves and maintains structural balance where recurring revenues are equal to recurring expenditures in the adopted budget but also supports financial stability for multiple years into the future.
Tax Abatement Program A program in which the City reduces the amount of tax (usually real estate tax) which a taxpayer must pay for a variety of reasons, including economic development or other.
Transfers Budget amounts transferred from one fund, one program, one unit, or one line item to another to assist in financing the service of the recipient fund, program, unit, or line item.
Trust Funds Funds used to account for assets, which are held by the City in a trustee capacity for individuals, private organizations, other governments, or other funds.
Truth in Millage Law (TRIM)
A 1980 Florida law which changed the budget process for local taxing governments. It was designed to keep the public informed about the taxing intentions of the various taxing authorities.
User Fee Fee charged for the use of certain municipal services.
FY 2020 Adopted Budget 411 Appendix
Mayor Josh Levy
Commissioner Caryl Shuham – District 1
Commissioner Peter Hernandez – District 2
Commissioner Traci Callari – District 3
Commissioner Richard Blattner – District 4
Commissioner Kevin Biederman – District 5
Commissioner Linda Sherwood – District 6
Dr. Wazir Ishmael, City Manager
Douglas R. Gonzales, City Attorney
Office of Budget and Performance Management
2600 Hollywood Boulevard
Hollywood, Florida 33020
(954) 921-3206
For more information, visit our website www.hollywoodfl.org
All information is true and accurate at the time of budget adoption
September 2019
FY 2020 Adopted Budget 412 Appendix
Related Documents