ARTICLE Admixture Mapping of White Cell Count: Genetic Locus Responsible for Lower White Blood Cell Count in the Health ABC and Jackson Heart Studies Michael A. Nalls, 1 James G. Wilson, 2 Nick J. Patterson, 3 Arti Tandon, 3 Joseph M. Zmuda, 4 Scott Huntsman, 5 Melissa Garcia, 1 Donglei Hu, 5 Rongling Li, 6 Brock A. Beamer, 7 Kushang V. Patel, 1 Ermeg L. Akylbekova, 8 Joe C. Files, 9 Cheryl L. Hardy, 9 Sarah G. Buxbaum, 8 Herman A. Taylor, 10 David Reich, 3,11 Tamara B. Harris, 1, * and Elad Ziv 5 White blood cell count (WBC) is an important clinical marker that varies among different ethnic groups. African Americans are known to have a lower WBC than European Americans. We surveyed the entire genome for loci underlying this difference in WBC by using admixture mapping. We analyzed data from African American participants in the Health, Aging, and Body Composition Study and the Jackson Heart Study. Participants of both studies were genotyped across R 1322 single nucleotide polymorphisms that were pre- selected to be informative for African versus European ancestry and span the entire genome. We used these markers to estimate genetic ancestry in each chromosomal region and then tested the association between WBC and genetic ancestry at each locus. We found a locus on chromosome 1q strongly associated with WBC (p < 10 12 ). The strongest association was with a marker known to affect the expres- sion of the Duffy blood group antigen. Participants who had both copies of the common West African allele had a mean WBC of 4.9 (SD 1.3); participants who had both common European alleles had a mean WBC of 7.1 (SD 1.3). This variant explained ~20% of population variation in WBC. We used admixture mapping, a novel method for conducting genetic-association studies, to find a region that was significantly associated with WBC on chromosome 1q. Additional studies are needed to determine the biological mechanism for this effect and its clinical implications. Introduction Peripheral white blood cell count (WBC) is a common clin- ical measurement, used to determine evidence of acute inflammation or infection. Peripheral WBC is the sum of several cell types including neutrophils and lymphocytes, which are the most common types of WBC, as well as less common cell types such as eosinophils, basophils, and monocytes. Elevated WBC has been associated with risk of coronary heart disease, 1 cancer, 2 and all-cause mor- tality. 3 White blood cell levels have widespread clinical applications including assessment of patients undergoing chemotherapy 4 and evaluation of infection. 5 Peripheral WBC is known to vary among different racial and ethnic groups. WBC is lower among African Ameri- cans when compared to European Americans 6,7 (NEUTRO- PENIA, CHRONIC FAMILIAL [MIM %162700]). Nonge- netic factors that influence WBC include smoking, socioeconomic status, systemic inflammatory diseases, and acute infection. 8,9 However, the difference in WBC be- tween racial and ethnic groups has not been explained by any of these factors. In addition, some studies have dem- onstrated a familial component to variation in WBC. 10 Admixture mapping is a technique for localizing genetic variants in recently mixed populations 11 in which linkage disequilibrium (LD) extends tens of megabases because the chromosomes have not had much time to break up by recombination. 12,13 The extended LD implies that in popu- lations like those of African Americans, whole genome asso- ciation studies are possible with 1,000–2,000 markers. 14,15 Admixture mapping in African Americans has already iden- tified putative loci affecting hypertension, prostate cancer, multiple sclerosis, and serum inflammatory markers. 16–21 We studied variation in WBC among participants in the Health, Aging, and Body Composition study (Health ABC). We first compared WBC among African Americans and European Americans in the study and thus confirmed a sig- nificant difference. We then used ancestry informative markers to estimate the individual ancestry of the African Americans in the study and demonstrated that there was a significant association of low WBC with a higher propor- tion of African ancestry. Finally, we utilized an admixture mapping approach to identify a novel locus that influences WBC levels, which we also independently identified in a separate admixture scan in the Jackson Heart Study (JHS). The peaks of association in both studies localize to 1 Laboratory of Epidemiology, Demography and Biometry, Intramural Research Program, National Institute on Aging, Bethesda, MD 20892, USA; 2 V.A. Med- ical Center and the University of Mississippi Medical Center, Jackson, MS 39216, USA; 3 Broad Institute of Harvard and MIT, Cambridge, MA 02142, USA; 4 Department of Epidemiology, Graduate School of Public Health, University of Pittsburgh, Pittsburgh, PA 15261, USA; 5 Institute for Human Genetics, Division of General Internal Medicine, Department of Medicine, University of California, San Francisco, San Francisco, CA 94143, USA; 6 Department of Preventive Medicine, Division of Biostatistics and Epidemiology, University of Tennessee, Memphis, Memphis, TN 38163, USA; 7 Division of Geriatric Medicine and Gerontology, Johns Hopkins University School of Medicine, Baltimore, MD 21287, USA; 8 Jackson Heart Study Coordinating Center, Jackson State University, Jackson, MS 39213, USA; 9 Department of Medicine, Division of Hematology, University of Mississippi Medical Center, Jackson, MS 39216, USA; 10 Jackson State University, Tougaloo College, and the University of Mississippi Medical Center, Jackson, MS 39216, USA; 11 Department of Genetics, Harvard Medical School, Boston, MA 02115, USA *Correspondence: [email protected] DOI 10.1016/j.ajhg.2007.09.003. ª2008 by The American Society of Human Genetics. All rights reserved. The American Journal of Human Genetics 82, 81–87, January 2008 81

Welcome message from author
This document is posted to help you gain knowledge. Please leave a comment to let me know what you think about it! Share it to your friends and learn new things together.
Transcript
ARTICLE
Admixture Mapping of White Cell Count:Genetic Locus Responsible for Lower White Blood CellCount in the Health ABC and Jackson Heart Studies
Michael A. Nalls,1 James G. Wilson,2 Nick J. Patterson,3 Arti Tandon,3 Joseph M. Zmuda,4
Scott Huntsman,5 Melissa Garcia,1 Donglei Hu,5 Rongling Li,6 Brock A. Beamer,7 Kushang V. Patel,1
Ermeg L. Akylbekova,8 Joe C. Files,9 Cheryl L. Hardy,9 Sarah G. Buxbaum,8 Herman A. Taylor,10
David Reich,3,11 Tamara B. Harris,1,* and Elad Ziv5
White blood cell count (WBC) is an important clinical marker that varies among different ethnic groups. African Americans are known
to have a lower WBC than European Americans. We surveyed the entire genome for loci underlying this difference in WBC by using
admixture mapping. We analyzed data from African American participants in the Health, Aging, and Body Composition Study and
the Jackson Heart Study. Participants of both studies were genotyped across R 1322 single nucleotide polymorphisms that were pre-
selected to be informative for African versus European ancestry and span the entire genome. We used these markers to estimate genetic
ancestry in each chromosomal region and then tested the association betweenWBC and genetic ancestry at each locus.We found a locus
on chromosome 1q strongly associated with WBC (p < 10!12). The strongest association was with a marker known to affect the expres-
sion of the Duffy blood group antigen. Participants who had both copies of the commonWest African allele had a meanWBC of 4.9 (SD
1.3); participants who had both common European alleles had a meanWBC of 7.1 (SD 1.3). This variant explained ~20% of population
variation in WBC. We used admixture mapping, a novel method for conducting genetic-association studies, to find a region that was
significantly associated with WBC on chromosome 1q. Additional studies are needed to determine the biological mechanism for this
effect and its clinical implications.
Introduction
Peripheral white blood cell count (WBC) is a common clin-ical measurement, used to determine evidence of acuteinflammation or infection. Peripheral WBC is the sum ofseveral cell types including neutrophils and lymphocytes,which are the most common types of WBC, as well asless common cell types such as eosinophils, basophils,and monocytes. Elevated WBC has been associated withrisk of coronary heart disease,1 cancer,2 and all-cause mor-tality.3 White blood cell levels have widespread clinicalapplications including assessment of patients undergoingchemotherapy4 and evaluation of infection.5
Peripheral WBC is known to vary among different racialand ethnic groups. WBC is lower among African Ameri-cans when compared to European Americans6,7 (NEUTRO-PENIA, CHRONIC FAMILIAL [MIM %162700]). Nonge-netic factors that influence WBC include smoking,socioeconomic status, systemic inflammatory diseases,and acute infection.8,9 However, the difference inWBC be-tween racial and ethnic groups has not been explained byany of these factors. In addition, some studies have dem-onstrated a familial component to variation in WBC.10
Admixture mapping is a technique for localizing geneticvariants in recently mixed populations11 in which linkagedisequilibrium (LD) extends tens of megabases becausethe chromosomes have not had much time to break up byrecombination.12,13 The extended LD implies that in popu-lations like those of AfricanAmericans,whole genomeasso-ciation studies are possible with 1,000–2,000 markers.14,15
Admixturemapping inAfricanAmericans has already iden-tified putative loci affecting hypertension, prostate cancer,multiple sclerosis, and serum inflammatory markers.16–21
We studied variation in WBC among participants in theHealth, Aging, and Body Composition study (Health ABC).We first compared WBC among African Americans andEuropean Americans in the study and thus confirmed a sig-nificant difference. We then used ancestry informativemarkers to estimate the individual ancestry of the AfricanAmericans in the study and demonstrated that there wasa significant association of lowWBC with a higher propor-tion of African ancestry. Finally, we utilized an admixturemapping approach to identify a novel locus that influencesWBC levels, which we also independently identified ina separate admixture scan in the Jackson Heart Study(JHS). The peaks of association in both studies localize to
1Laboratory of Epidemiology, Demography and Biometry, Intramural Research Program, National Institute on Aging, Bethesda, MD 20892, USA; 2V.A. Med-ical Center and the University of Mississippi Medical Center, Jackson, MS 39216, USA; 3Broad Institute of Harvard and MIT, Cambridge, MA 02142, USA;4Department of Epidemiology, Graduate School of Public Health, University of Pittsburgh, Pittsburgh, PA 15261, USA; 5Institute for Human Genetics,Division of General Internal Medicine, Department of Medicine, University of California, San Francisco, San Francisco, CA 94143, USA; 6Department ofPreventive Medicine, Division of Biostatistics and Epidemiology, University of Tennessee, Memphis, Memphis, TN 38163, USA; 7Division of GeriatricMedicine and Gerontology, Johns Hopkins University School of Medicine, Baltimore, MD 21287, USA; 8Jackson Heart Study Coordinating Center, JacksonState University, Jackson, MS 39213, USA; 9Department of Medicine, Division of Hematology, University of Mississippi Medical Center, Jackson, MS 39216,USA; 10Jackson State University, Tougaloo College, and the University of Mississippi Medical Center, Jackson, MS 39216, USA; 11Department of Genetics,Harvard Medical School, Boston, MA 02115, USA*Correspondence: [email protected] 10.1016/j.ajhg.2007.09.003. ª2008 by The American Society of Human Genetics. All rights reserved.
The American Journal of Human Genetics 82, 81–87, January 2008 81
a region ~0.9 Mb centered on the Duffy Antigen Receptorfor Chemokines gene (DARC [MIM 110700]).
Subjects and Methods
Description of the Health, Aging, and BodyComposition CohortHealth ABC is a cohort of 3075 community-dwelling men and
women between the ages of 70–79. The participants in the Health
ABC study were recruited from among Medicare beneficiaries re-
siding in the metropolitan areas of Pittsburgh, PA, and Memphis,
TN, and were selected to have high functional status at baseline.
This study focuses on the African American subset of Health
ABC. The clinical collection and genetic analysis for the Health
ABC study has been approved by the institutional review boards
of the University of Pittsburgh, the University of Tennessee, Mem-
phis, and the University of California, San Francisco.
GenotypingWithin the Health ABC population, 1281 participants identified
themselves as African American. From this subsample, 1184 par-
ticipants were genotyped at the Broad Institute at 1536 single
nucleotide polymorphisms (SNPs) with whole-genome amplified
DNA and an Illumina BeadLab platform.22 Details of the genotyp-
ing for this experiment are described by Reich et al.19 After quality
checks, including the requirement that at least 85% of SNPs were
successfully genotyped for each sample and that none of the SNPs
were in linkage disequilibrium in the ancestral populations, 201
SNPs were excluded. The physical genome positions used in this
study are based on build 35 of the public genome reference, and
the genetic positions are based on the Oxford high-resolution
map.23,24
Health ABC Samples Used in Admixture ScanningA total of 863 African Americans and 1339 European Americans
from Health ABC were used in the analysis. Included in the anal-
ysis were participants with WBC who were within two standard
deviations of the population mean and who also had information
on all relevant covariates. For ANCESTRYMAP analyses, we identi-
fied 216 cases in the highest quartile of WBC levels and 216 con-
trols in the lowest quartile of WBC levels. Related participants
were not included in the admixture scan.
Phenotypes Used in the AnalysisThe phenotype we studied is total white blood cell count (WBC)
measured on a Coulter counter and expressed in terms of thou-
sands of white blood cells per microliter. This measurement was
taken at the third year of the Health ABC clinic visit. No differen-
tial counts were available for Health ABC.
Covariates included gender, age at enrollment in Health ABC,
smoking status (from the year 3 exam), Health ABC study site
(Memphis or Pittsburgh), and percentage of European ancestry.
Gender, age, and smoking status (current or nonsmoker) were all
self-reported. The percentage of European ancestry was estimated
for each individual on the basis of the STRUCTURE software.25 A
larger set of covariates initially examined in analyses also included
body-mass index, socioeconomic status, self-reported comorbidity,
medications (for cancer, hypertension, hypercholesterolemia, and
diabetes), recent hospital stay, alcohol consumption, and physical-
activity levels; these factors were not significant in models that
included an association to our genomic region of interest, and so
in what follows, we do not report analyses including any of these
factors.
Admixture ScanWe used STRUCTURE, ADMIXMAP, and ANCESTRYMAP to per-
form admixture mapping analyses. We used STRUCTURE 2.125
to obtain locus-specific ancestry estimates, by using the ‘‘linkage’’
model within STRUCTURE to obtain multilocus estimates of
genetic ancestry in each region. This program utilizes an expecta-
tion maximization algorithm within a Bayesian Markov Chain
Monte Carlo (MCMC) to calculate probabilities that a particular
genotype or group of genotypes derive from a particular ancestral
population.26 Ancestry is output as a probability per locus as well
as an overall estimate for each individual. We calculated the per-
cent ancestry at each locus for each individual based on the prob-
ability of 0, 1, or 2 European chromosomes across 2500 iterations
of the MCMC, with a burn-in period of 500 iterations. We used
linear regression models to test for the association of the locus
specific ancestry from STRUCTURE and theWBC outcome, adjust-
ing the models on the basis of the covariates of genome-wide
ancestry estimate, study site, smoking status, gender, and age.
This analysis provided us with an output of T statistics and
p values.
We also used the program ADMIXMAP v.3.5.3.27 ADMIXMAP
uses a similarMCMC algorithm as STRUCTURE tomodel probabil-
ity distributions conditional on genotype, phenotypic values, and
a priori ancestral genotype frequencies.28 In our ADMIXMAP runs,
we adjusted for study site, individual ancestry, locus-specific
ancestry, smoking status, gender, and age over 2500 MCMC itera-
tions, with 500 burn-in iterations. The models from ADMIXMAP
calculate results in terms of standard normal Z statistics and
p values.
We finally used the ANCESTRYMAP software, which also uses
a MCMC-based methodology.12 ANCESTRYMAP is optimized for
dichotomous phenotypes, and so we did not perform a quantita-
tive trait analysis on all samples with this software. After remov-
ing individuals with WBC greater than two standard deviations
from the mean, we designated all individuals with WBC values
in the highest quartile to be cases, and all individuals with WBC
in the lowest quartile were assigned to be controls; this totaled
437 participants for analysis. We tested risk models of 1.1, 1.3,
1.5, 1.7, 1.8, 2.1, 2.4, 2.7, and 3.0 for cases, and 0.05, 0.1, 0.15,
0.2, 0.25, 0.3, 0.35, and 0.4 for controls. To accumulate evidence
of association in these models, we averaged the Bayes factors
emerging from each model at each point in the genome, taking
the log-base-10 of this number to produce a LOD score. As re-
ported in Reich and Patterson (2005), a LOD score for association
at a particular locus of >5 is approximately genome-wide
significant.29 To obtain a formal assessment of statistical signifi-
cance on a genome-wide level, we calculated an additional statis-
tic that averaged the risks specified in the models as genome-wide
Bayes factors and took the log-base-10; a value >2 indicates
statistically significant association to the phenotype (we report
a genome-wide Bayes factor of a LOD score of ~6.2).12,29 We ran
ANCESTRYMAP for a burn-in period of 100 iterations with 200
follow-on iterations, which yielded almost identical results to
runs with 200 iteration burn-in and 500 follow-on iterations. To
calculate the 99% confidence interval for the position of the dis-
ease locus once we found an association, we first summarized
the evidence for association by taking the sum of the likelihood
ratios across the entire locus. Then, starting at the peak of the
82 The American Journal of Human Genetics 82, 81–87, January 2008
locus, we moved in both directions until the region included 99%
of the value of the sum. This corresponds to a LOD score decrease
of 2.2.
Independent Detection of Admixture Associationin the Jackson Heart StudyWe independently carried out an admixture scan for variants af-
fecting WBC in African Americans from the Jackson Heart Study
(JHS),30 a community-based cohort of men and women ages 21–
84 from three counties surrounding Jackson, Mississippi. To carry
out a whole genome admixture scan on these samples, we used the
Illumina BeadLab technology22 and an updated version of the
panel of 1536 markers that had been studied in Health ABC. The
SNPs used in our final analyses included those that were typed
in both the Health ABC and JHS panels. These two SNP panels
are highly comparable because the updated JHS panel includes
all of the SNPs from the Health ABC panel that had passed neces-
sary quality-control measures in both studies. A complete list of
SNPs used is included in Table S1 available online. A total of
4581 individuals were successfully genotyped. We restricted the
present analysis to one randomly chosen individual from each
family in JHS to remove related individuals who could confound
analyses. We also excluded individuals with WBC greater than
two standard deviations from the mean (the same procedure
that was used to prepare the Health ABC data set). These exclu-
sions resulted in a final analysis population of 2846 participants
from the JHS cohort. For ANCESTRYMAP runs, we identified 775
cases in the top quartile ofWBC levels and 775 controls in the bot-
tom quartile of WBC levels. Replication of the STRUCTURE and
ADMIXMAP analyses from Health ABC were also later carried
out in the JHS cohort with the same covariates (see Table 2 for
a comparison of results).
Results
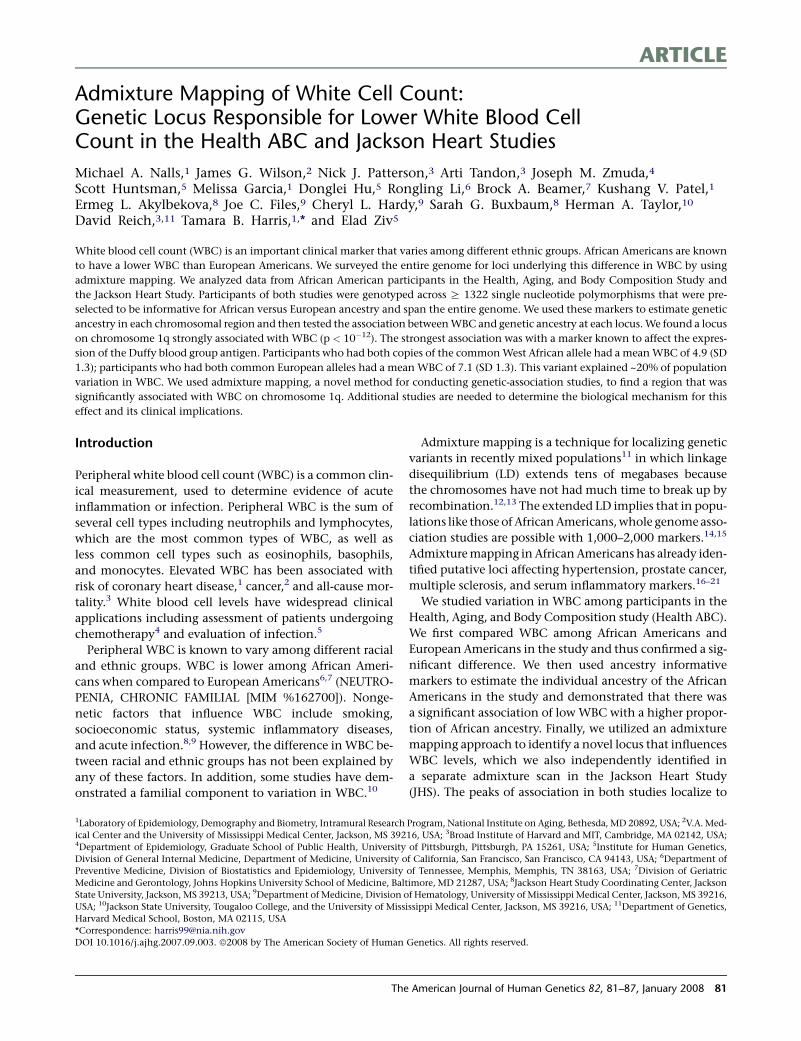
High WBC Levels Are Associatedwith European AncestryThere is a significant difference (p < 10!12) in mean WBCbetween African Americans and European Americans inthe Health ABC study (Table 1). Within African Americans,European ancestry estimates obtained by STRUCTUREanalysis vary from 0.1% to 71.1%. WBC increases signifi-
cantly with percent European ancestry (Figure 1) (p ¼3.33 10!9 from regression of residual), consistent with thedifference across ethnic groups shown in Table 1.
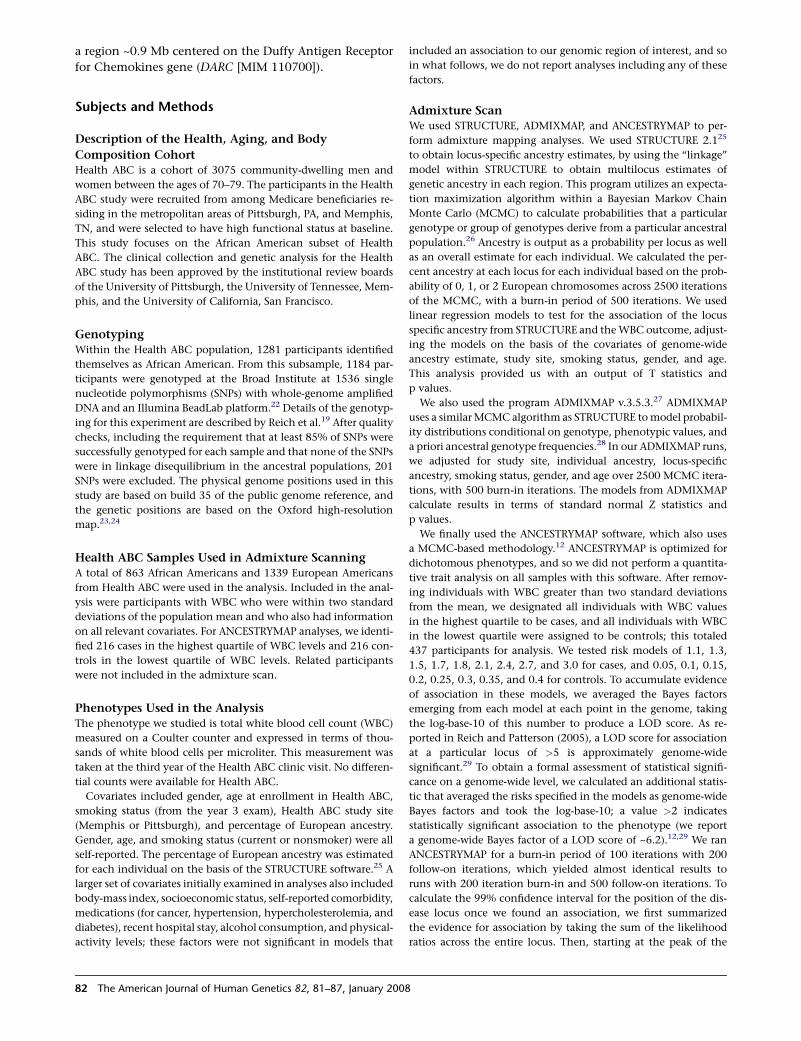
Admixture Mapping to Search for Loci AffectingWBC LevelsWe used three methods to screen for loci affecting WBClevels. By using the locus-specific ancestry estimates fromSTRUCTURE, we found a strong association between a lo-cus on chromosome 1 and WBC (Table 2). The strongestassociations were between 152.72 Mb and 158.68 Mbwith the strongest single association at rs2817784 at155.99Mb (p< 10!12). We found very similar results by us-ing the program ADMIXMAP (Table 2). These results fromSTRUCTURE and ADMIXMAP were similarly replicatedwithin the JHS cohort using identical analytic methods(Table 2).We also used the program ANCESTRYMAP to search for
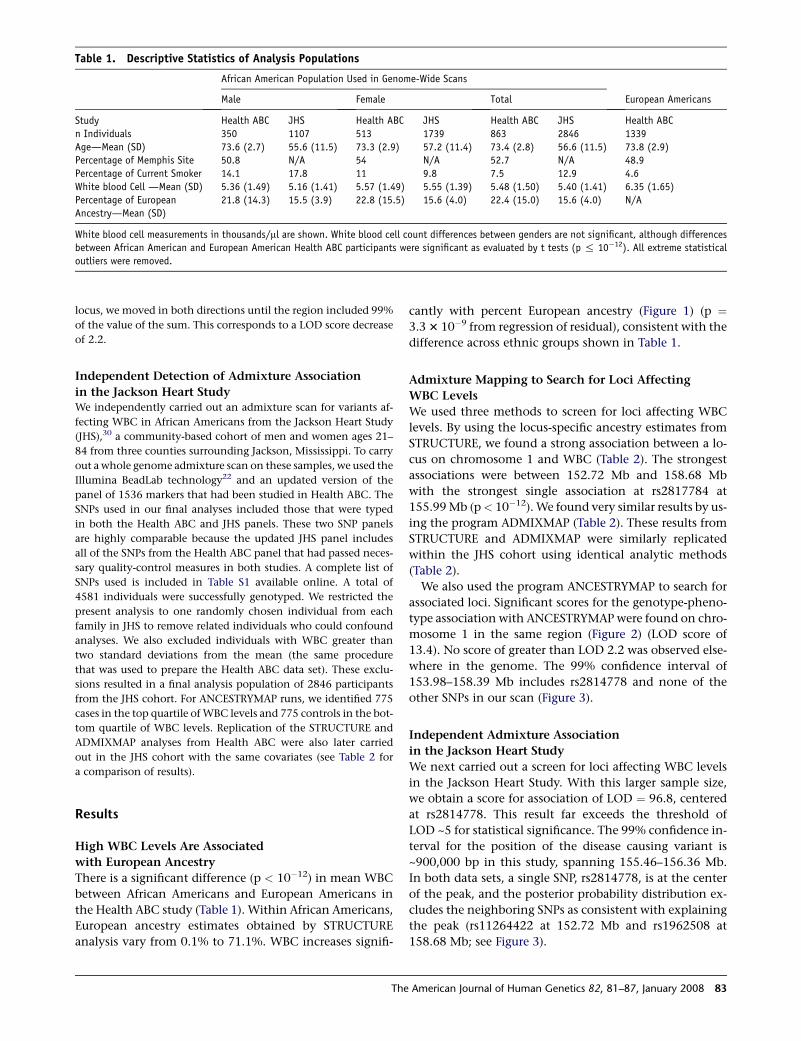
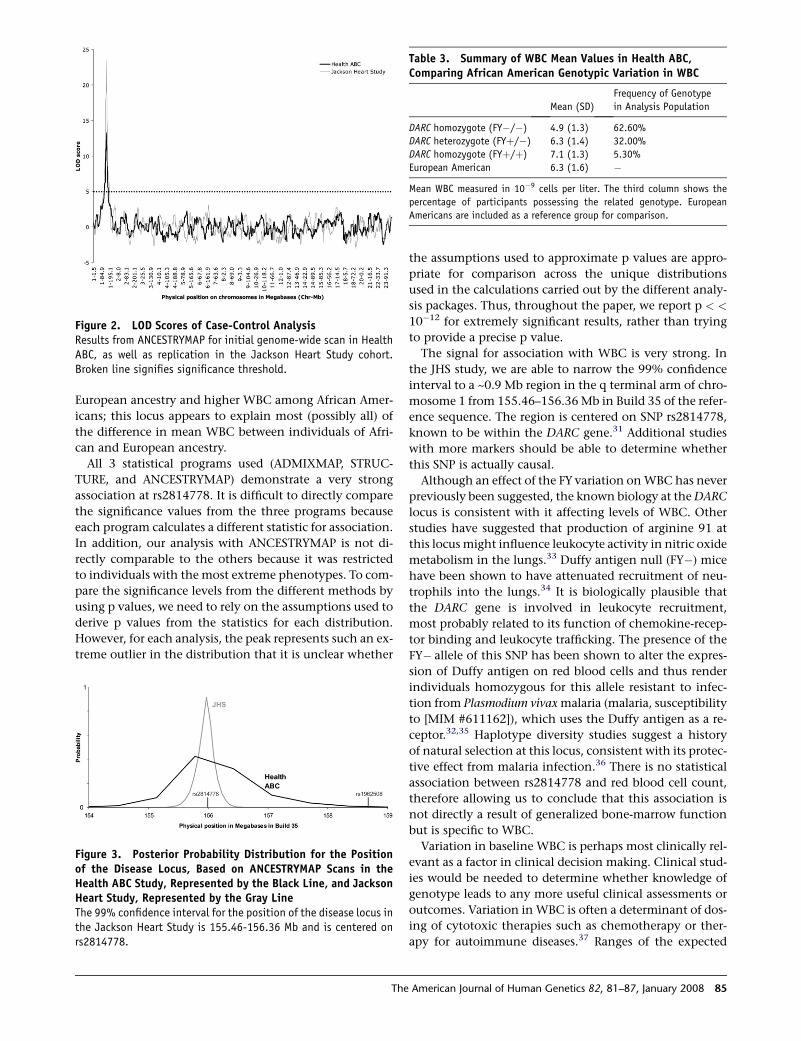
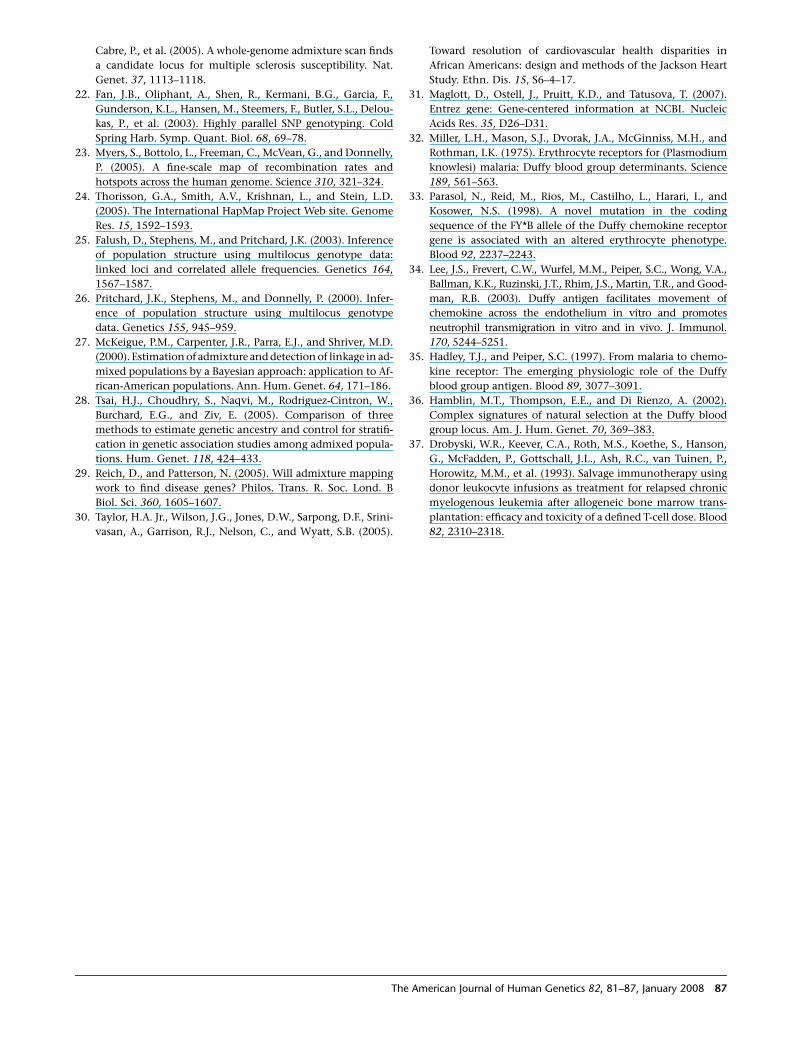
associated loci. Significant scores for the genotype-pheno-type association with ANCESTRYMAP were found on chro-mosome 1 in the same region (Figure 2) (LOD score of13.4). No score of greater than LOD 2.2 was observed else-where in the genome. The 99% confidence interval of153.98–158.39 Mb includes rs2814778 and none of theother SNPs in our scan (Figure 3).
Independent Admixture Associationin the Jackson Heart StudyWe next carried out a screen for loci affecting WBC levelsin the Jackson Heart Study. With this larger sample size,we obtain a score for association of LOD ¼ 96.8, centeredat rs2814778. This result far exceeds the threshold ofLOD ~5 for statistical significance. The 99% confidence in-terval for the position of the disease causing variant is~900,000 bp in this study, spanning 155.46–156.36 Mb.In both data sets, a single SNP, rs2814778, is at the centerof the peak, and the posterior probability distribution ex-cludes the neighboring SNPs as consistent with explainingthe peak (rs11264422 at 152.72 Mb and rs1962508 at158.68 Mb; see Figure 3).
Table 1. Descriptive Statistics of Analysis Populations
African American Population Used in Genome-Wide Scans
European AmericansMale Female Total
Study Health ABC JHS Health ABC JHS Health ABC JHS Health ABCn Individuals 350 1107 513 1739 863 2846 1339Age—Mean (SD) 73.6 (2.7) 55.6 (11.5) 73.3 (2.9) 57.2 (11.4) 73.4 (2.8) 56.6 (11.5) 73.8 (2.9)Percentage of Memphis Site 50.8 N/A 54 N/A 52.7 N/A 48.9Percentage of Current Smoker 14.1 17.8 11 9.8 7.5 12.9 4.6White blood Cell —Mean (SD) 5.36 (1.49) 5.16 (1.41) 5.57 (1.49) 5.55 (1.39) 5.48 (1.50) 5.40 (1.41) 6.35 (1.65)Percentage of EuropeanAncestry—Mean (SD)
21.8 (14.3) 15.5 (3.9) 22.8 (15.5) 15.6 (4.0) 22.4 (15.0) 15.6 (4.0) N/A
White blood cell measurements in thousands/ml are shown. White blood cell count differences between genders are not significant, although differencesbetween African American and European American Health ABC participants were significant as evaluated by t tests (p % 10!12). All extreme statisticaloutliers were removed.
The American Journal of Human Genetics 82, 81–87, January 2008 83
Effect at rs2814778, the DARC GeneThe SNP in our scan that gives the strongest association isrs2814778 at 155.99Mb on chromosome 1. This is a SNP inthe DARC gene that is known to eliminate expression ofthe Duffy blood group antigen (FYþ or FY!).31 This isone of the SNPs in the genome with the largest allele fre-quency difference between West Africans and EuropeanAmericans. It has been hypothesized that this is due tothe null allele conferring protection to malaria in WestAfricans.32 However, there has never been any suggestionthat it affects WBC levels as well.
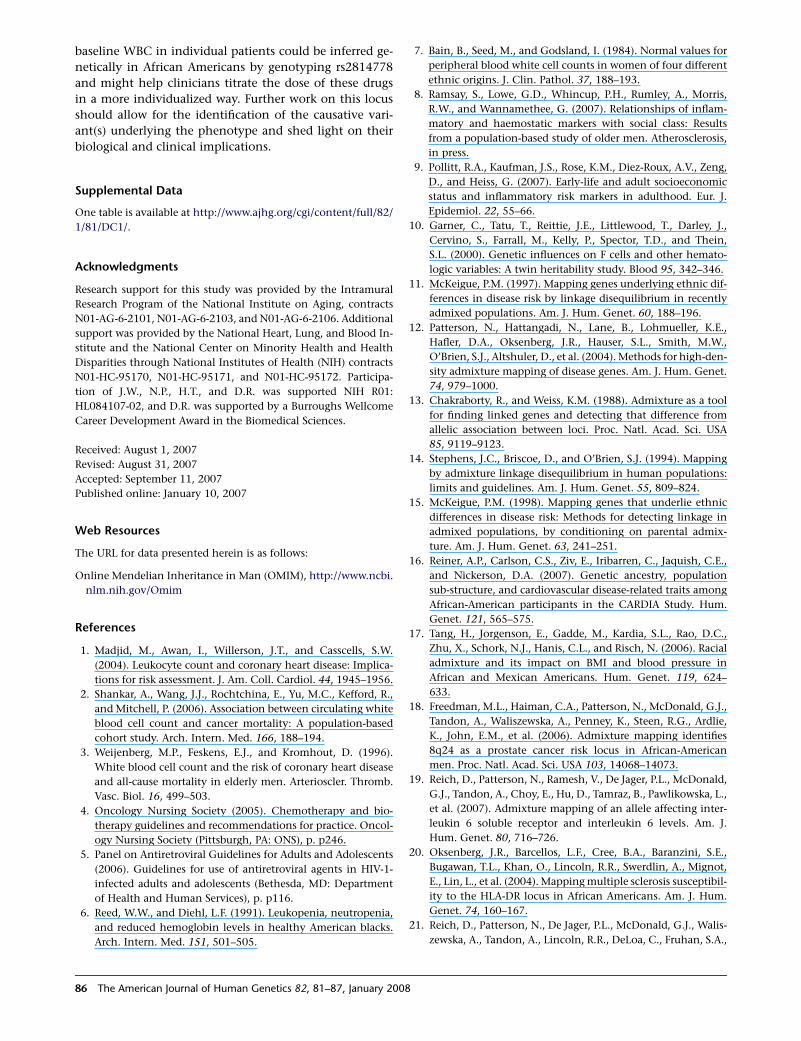
We next tested whether African Americans who arehomozygous for the functional allele at this SNP (the onemore common in Europeans) have a WBC level compara-ble to that in Europeans (see Table 3). African Americanswho are homozygous for the functional allele have meanWBC of 7.1 k/ml, significantly higher than in EuropeanAmericans (t test, p ¼ 0.009). Thus, this SNP is, by itself,sufficient to account for the difference in WBC levelsacross populations and explained 20.4% of the variancein WBC among African Americans.We finally sought to determinewhether there is evidence
of residual association with any other SNPs in the regionafter adjustment for the rs2814778 genotype. Regressionmodels adjusted for SNP rs2814778 indicate that the flank-ing SNPs showmarginal association with WBC at best (p ¼0.07). Further mapping is necessary to test whether theFY- variant itself is causative or whether other variants inthe ~0.9 Mb confidence interval might be responsible forsome or all of the effect.
Discussion
We utilized a genome-wide admixture scan to localize onchromosome 1 a region that affects baseline WBC amongAfrican Americans. We found a remarkably strong associa-tion between African ancestry at this region and lowerWBC. At least one genotype at this locus explains ~20%of the variance in baselineWBC among African Americans,indicating the presence of a genetic variant with a pro-found influence on WBC. After adjustment for ancestryat this locus, there is no association between overall
Table 2. Genome-Wide Admixture Scan Results
Location on Chromosome 1(Physical Position in Mb)
Locus-SpecificAncestry Association ZStatistic from ADMIXMAP
Locus-SpecificAncestry Association TStatistic from STRUCTURE
Locus-SpecificAncestry LOD Scoresfrom ANCESTRYMAP
Health ABC JHS Health ABC JHS Health ABC JHS
SNPrs6702883 104.96 5.1* 6.4** 4.1* 4.8* N.S N.Srs4311917 107.44 5.6* 6.5** 4.3* 4.5* N.S N.Srs345275 108.21 6.0* 7.1*** 4.3* 4.4* N.S N.Srs2365669 112.07 6.8** 9.1*** 5.2** 2.6 5.9 7.9rs7523839 115.89 6.7** 10.1*** 5.5** 0.12 6.9 13rs850610 116.66 6.7** 10.4*** 5.7** 0.7 7.2 14.3rs10923929 120.22 6.8** 12.3*** 6.1** 2.77 7.7 18.5rs11240089 144.29 7.7*** 15.0*** 6.3*** 6.1** 8.8 29.9rs12740969 151.3 12.8*** 22.4*** 10.3*** 12.9*** 20.6 61.7rs11264422 152.72 13.7*** 24.3*** 11.1*** 13.8*** 22.4 69.1rs2814778 155.99 17.3*** 31.7*** 13.9*** 16.0*** 30.1 96.8rs1962508 158.68 13.9*** 25.1*** 11.8*** 11.9*** 25.8 71.7rs2806424 159.42 13.2*** 23.5*** 11.4*** 11.0*** 24.5 65.5rs6426893 161.76 10.5*** 17.3*** 9.6*** 8.4*** 19.3 44.6rs919679 162.99 9.7*** 15.5*** 8.9*** 7.8*** 17.6 37.3
SNPs were tested so that association of loci with WBC in both studies could be evaluated. SNPs less significant than p < 1 3 10!5 or LOD < 5 have beenomitted; 95% CI for associations with WBC are in the shaded area. Significance levels indicated by *p < 10!5; **p < 10!9; and ***p < 10!12. Only SNPsused in both Health ABC and JHS were reported in the table; 95% CI for associations between SNPs and WBC is denoted by shaded area.
Figure 1. Association of White Blood Cell Count with Increas-ing Percent European Ancestry from STRUCTURE Estimates inthe Health ABC PopulationResults from nonparametric lowess smoothing analysis, trend sig-nificance p ¼ 3.3 3 10!9.
84 The American Journal of Human Genetics 82, 81–87, January 2008
European ancestry and higher WBC among African Amer-icans; this locus appears to explain most (possibly all) ofthe difference in mean WBC between individuals of Afri-can and European ancestry.All 3 statistical programs used (ADMIXMAP, STRUC-
TURE, and ANCESTRYMAP) demonstrate a very strongassociation at rs2814778. It is difficult to directly comparethe significance values from the three programs becauseeach program calculates a different statistic for association.In addition, our analysis with ANCESTRYMAP is not di-rectly comparable to the others because it was restrictedto individuals with the most extreme phenotypes. To com-pare the significance levels from the different methods byusing p values, we need to rely on the assumptions used toderive p values from the statistics for each distribution.However, for each analysis, the peak represents such an ex-treme outlier in the distribution that it is unclear whether
the assumptions used to approximate p values are appro-priate for comparison across the unique distributionsused in the calculations carried out by the different analy-sis packages. Thus, throughout the paper, we report p < <
10!12 for extremely significant results, rather than tryingto provide a precise p value.The signal for association with WBC is very strong. In
the JHS study, we are able to narrow the 99% confidenceinterval to a ~0.9 Mb region in the q terminal arm of chro-mosome 1 from 155.46–156.36 Mb in Build 35 of the refer-ence sequence. The region is centered on SNP rs2814778,known to be within the DARC gene.31 Additional studieswith more markers should be able to determine whetherthis SNP is actually causal.Although an effect of the FY variation onWBC has never
previously been suggested, the known biology at theDARClocus is consistent with it affecting levels of WBC. Otherstudies have suggested that production of arginine 91 atthis locus might influence leukocyte activity in nitric oxidemetabolism in the lungs.33 Duffy antigen null (FY!) micehave been shown to have attenuated recruitment of neu-trophils into the lungs.34 It is biologically plausible thatthe DARC gene is involved in leukocyte recruitment,most probably related to its function of chemokine-recep-tor binding and leukocyte trafficking. The presence of theFY! allele of this SNP has been shown to alter the expres-sion of Duffy antigen on red blood cells and thus renderindividuals homozygous for this allele resistant to infec-tion from Plasmodium vivaxmalaria (malaria, susceptibilityto [MIM #611162]), which uses the Duffy antigen as a re-ceptor.32,35 Haplotype diversity studies suggest a historyof natural selection at this locus, consistent with its protec-tive effect from malaria infection.36 There is no statisticalassociation between rs2814778 and red blood cell count,therefore allowing us to conclude that this association isnot directly a result of generalized bone-marrow functionbut is specific to WBC.Variation in baseline WBC is perhaps most clinically rel-
evant as a factor in clinical decision making. Clinical stud-ies would be needed to determine whether knowledge ofgenotype leads to any more useful clinical assessments oroutcomes. Variation inWBC is often a determinant of dos-ing of cytotoxic therapies such as chemotherapy or ther-apy for autoimmune diseases.37 Ranges of the expected
Figure 2. LOD Scores of Case-Control AnalysisResults from ANCESTRYMAP for initial genome-wide scan in HealthABC, as well as replication in the Jackson Heart Study cohort.Broken line signifies significance threshold.
Figure 3. Posterior Probability Distribution for the Positionof the Disease Locus, Based on ANCESTRYMAP Scans in theHealth ABC Study, Represented by the Black Line, and JacksonHeart Study, Represented by the Gray LineThe 99% confidence interval for the position of the disease locus inthe Jackson Heart Study is 155.46-156.36 Mb and is centered onrs2814778.
Table 3. Summary of WBC Mean Values in Health ABC,Comparing African American Genotypic Variation in WBC
Mean (SD)Frequency of Genotypein Analysis Population
DARC homozygote (FY!/!) 4.9 (1.3) 62.60%DARC heterozygote (FYþ/!) 6.3 (1.4) 32.00%DARC homozygote (FYþ/þ) 7.1 (1.3) 5.30%European American 6.3 (1.6) !
Mean WBC measured in 10!9 cells per liter. The third column shows thepercentage of participants possessing the related genotype. EuropeanAmericans are included as a reference group for comparison.
The American Journal of Human Genetics 82, 81–87, January 2008 85
baseline WBC in individual patients could be inferred ge-netically in African Americans by genotyping rs2814778and might help clinicians titrate the dose of these drugsin a more individualized way. Further work on this locusshould allow for the identification of the causative vari-ant(s) underlying the phenotype and shed light on theirbiological and clinical implications.
Supplemental Data
One table is available at http://www.ajhg.org/cgi/content/full/82/
1/81/DC1/.
Acknowledgments
Research support for this study was provided by the Intramural
Research Program of the National Institute on Aging, contracts
N01-AG-6-2101, N01-AG-6-2103, and N01-AG-6-2106. Additional
support was provided by the National Heart, Lung, and Blood In-
stitute and the National Center on Minority Health and Health
Disparities through National Institutes of Health (NIH) contracts
N01-HC-95170, N01-HC-95171, and N01-HC-95172. Participa-
tion of J.W., N.P., H.T., and D.R. was supported NIH R01:
HL084107-02, and D.R. was supported by a Burroughs Wellcome
Career Development Award in the Biomedical Sciences.
Received: August 1, 2007
Revised: August 31, 2007
Accepted: September 11, 2007
Published online: January 10, 2007
Web Resources
The URL for data presented herein is as follows:
Online Mendelian Inheritance in Man (OMIM), http://www.ncbi.
nlm.nih.gov/Omim
References
1. Madjid, M., Awan, I., Willerson, J.T., and Casscells, S.W.
(2004). Leukocyte count and coronary heart disease: Implica-
tions for risk assessment. J. Am. Coll. Cardiol. 44, 1945–1956.
2. Shankar, A., Wang, J.J., Rochtchina, E., Yu, M.C., Kefford, R.,
and Mitchell, P. (2006). Association between circulating white
blood cell count and cancer mortality: A population-based
cohort study. Arch. Intern. Med. 166, 188–194.
3. Weijenberg, M.P., Feskens, E.J., and Kromhout, D. (1996).
White blood cell count and the risk of coronary heart disease
and all-cause mortality in elderly men. Arterioscler. Thromb.
Vasc. Biol. 16, 499–503.
4. Oncology Nursing Society (2005). Chemotherapy and bio-
therapy guidelines and recommendations for practice. Oncol-
ogy Nursing Society (Pittsburgh, PA: ONS), p. p246.
5. Panel on Antiretroviral Guidelines for Adults and Adolescents
(2006). Guidelines for use of antiretroviral agents in HIV-1-
infected adults and adolescents (Bethesda, MD: Department
of Health and Human Services), p. p116.
6. Reed, W.W., and Diehl, L.F. (1991). Leukopenia, neutropenia,
and reduced hemoglobin levels in healthy American blacks.
Arch. Intern. Med. 151, 501–505.
7. Bain, B., Seed, M., and Godsland, I. (1984). Normal values for
peripheral blood white cell counts in women of four different
ethnic origins. J. Clin. Pathol. 37, 188–193.
8. Ramsay, S., Lowe, G.D., Whincup, P.H., Rumley, A., Morris,
R.W., and Wannamethee, G. (2007). Relationships of inflam-
matory and haemostatic markers with social class: Results
from a population-based study of older men. Atherosclerosis,
in press.
9. Pollitt, R.A., Kaufman, J.S., Rose, K.M., Diez-Roux, A.V., Zeng,
D., and Heiss, G. (2007). Early-life and adult socioeconomic
status and inflammatory risk markers in adulthood. Eur. J.
Epidemiol. 22, 55–66.
10. Garner, C., Tatu, T., Reittie, J.E., Littlewood, T., Darley, J.,
Cervino, S., Farrall, M., Kelly, P., Spector, T.D., and Thein,
S.L. (2000). Genetic influences on F cells and other hemato-
logic variables: A twin heritability study. Blood 95, 342–346.
11. McKeigue, P.M. (1997). Mapping genes underlying ethnic dif-
ferences in disease risk by linkage disequilibrium in recently
admixed populations. Am. J. Hum. Genet. 60, 188–196.
12. Patterson, N., Hattangadi, N., Lane, B., Lohmueller, K.E.,
Hafler, D.A., Oksenberg, J.R., Hauser, S.L., Smith, M.W.,
O’Brien, S.J., Altshuler, D., et al. (2004).Methods for high-den-
sity admixture mapping of disease genes. Am. J. Hum. Genet.
74, 979–1000.
13. Chakraborty, R., and Weiss, K.M. (1988). Admixture as a tool
for finding linked genes and detecting that difference from
allelic association between loci. Proc. Natl. Acad. Sci. USA
85, 9119–9123.
14. Stephens, J.C., Briscoe, D., and O’Brien, S.J. (1994). Mapping
by admixture linkage disequilibrium in human populations:
limits and guidelines. Am. J. Hum. Genet. 55, 809–824.
15. McKeigue, P.M. (1998). Mapping genes that underlie ethnic
differences in disease risk: Methods for detecting linkage in
admixed populations, by conditioning on parental admix-
ture. Am. J. Hum. Genet. 63, 241–251.
16. Reiner, A.P., Carlson, C.S., Ziv, E., Iribarren, C., Jaquish, C.E.,
and Nickerson, D.A. (2007). Genetic ancestry, population
sub-structure, and cardiovascular disease-related traits among
African-American participants in the CARDIA Study. Hum.
Genet. 121, 565–575.
17. Tang, H., Jorgenson, E., Gadde, M., Kardia, S.L., Rao, D.C.,
Zhu, X., Schork, N.J., Hanis, C.L., and Risch, N. (2006). Racial
admixture and its impact on BMI and blood pressure in
African and Mexican Americans. Hum. Genet. 119, 624–
633.
18. Freedman, M.L., Haiman, C.A., Patterson, N., McDonald, G.J.,
Tandon, A., Waliszewska, A., Penney, K., Steen, R.G., Ardlie,
K., John, E.M., et al. (2006). Admixture mapping identifies
8q24 as a prostate cancer risk locus in African-American
men. Proc. Natl. Acad. Sci. USA 103, 14068–14073.
19. Reich, D., Patterson, N., Ramesh, V., De Jager, P.L., McDonald,
G.J., Tandon, A., Choy, E., Hu, D., Tamraz, B., Pawlikowska, L.,
et al. (2007). Admixture mapping of an allele affecting inter-
leukin 6 soluble receptor and interleukin 6 levels. Am. J.
Hum. Genet. 80, 716–726.
20. Oksenberg, J.R., Barcellos, L.F., Cree, B.A., Baranzini, S.E.,
Bugawan, T.L., Khan, O., Lincoln, R.R., Swerdlin, A., Mignot,
E., Lin, L., et al. (2004). Mappingmultiple sclerosis susceptibil-
ity to the HLA-DR locus in African Americans. Am. J. Hum.
Genet. 74, 160–167.
21. Reich, D., Patterson, N., De Jager, P.L., McDonald, G.J., Walis-
zewska, A., Tandon, A., Lincoln, R.R., DeLoa, C., Fruhan, S.A.,
86 The American Journal of Human Genetics 82, 81–87, January 2008
Cabre, P., et al. (2005). A whole-genome admixture scan finds
a candidate locus for multiple sclerosis susceptibility. Nat.
Genet. 37, 1113–1118.
22. Fan, J.B., Oliphant, A., Shen, R., Kermani, B.G., Garcia, F.,
Gunderson, K.L., Hansen, M., Steemers, F., Butler, S.L., Delou-
kas, P., et al. (2003). Highly parallel SNP genotyping. Cold
Spring Harb. Symp. Quant. Biol. 68, 69–78.
23. Myers, S., Bottolo, L., Freeman, C., McVean, G., and Donnelly,
P. (2005). A fine-scale map of recombination rates and
hotspots across the human genome. Science 310, 321–324.
24. Thorisson, G.A., Smith, A.V., Krishnan, L., and Stein, L.D.
(2005). The International HapMap Project Web site. Genome
Res. 15, 1592–1593.
25. Falush, D., Stephens, M., and Pritchard, J.K. (2003). Inference
of population structure using multilocus genotype data:
linked loci and correlated allele frequencies. Genetics 164,
1567–1587.
26. Pritchard, J.K., Stephens, M., and Donnelly, P. (2000). Infer-
ence of population structure using multilocus genotype
data. Genetics 155, 945–959.
27. McKeigue, P.M., Carpenter, J.R., Parra, E.J., and Shriver, M.D.
(2000). Estimationof admixture anddetectionof linkage in ad-
mixed populations by a Bayesian approach: application to Af-
rican-American populations. Ann. Hum. Genet. 64, 171–186.
28. Tsai, H.J., Choudhry, S., Naqvi, M., Rodriguez-Cintron, W.,
Burchard, E.G., and Ziv, E. (2005). Comparison of three
methods to estimate genetic ancestry and control for stratifi-
cation in genetic association studies among admixed popula-
tions. Hum. Genet. 118, 424–433.
29. Reich, D., and Patterson, N. (2005). Will admixture mapping
work to find disease genes? Philos. Trans. R. Soc. Lond. B
Biol. Sci. 360, 1605–1607.
30. Taylor, H.A. Jr., Wilson, J.G., Jones, D.W., Sarpong, D.F., Srini-
vasan, A., Garrison, R.J., Nelson, C., and Wyatt, S.B. (2005).
Toward resolution of cardiovascular health disparities in
African Americans: design and methods of the Jackson Heart
Study. Ethn. Dis. 15, S6–4–17.
31. Maglott, D., Ostell, J., Pruitt, K.D., and Tatusova, T. (2007).
Entrez gene: Gene-centered information at NCBI. Nucleic
Acids Res. 35, D26–D31.
32. Miller, L.H., Mason, S.J., Dvorak, J.A., McGinniss, M.H., and
Rothman, I.K. (1975). Erythrocyte receptors for (Plasmodium
knowlesi) malaria: Duffy blood group determinants. Science
189, 561–563.
33. Parasol, N., Reid, M., Rios, M., Castilho, L., Harari, I., and
Kosower, N.S. (1998). A novel mutation in the coding
sequence of the FY*B allele of the Duffy chemokine receptor
gene is associated with an altered erythrocyte phenotype.
Blood 92, 2237–2243.
34. Lee, J.S., Frevert, C.W., Wurfel, M.M., Peiper, S.C., Wong, V.A.,
Ballman, K.K., Ruzinski, J.T., Rhim, J.S., Martin, T.R., and Good-
man, R.B. (2003). Duffy antigen facilitates movement of
chemokine across the endothelium in vitro and promotes
neutrophil transmigration in vitro and in vivo. J. Immunol.
170, 5244–5251.
35. Hadley, T.J., and Peiper, S.C. (1997). From malaria to chemo-
kine receptor: The emerging physiologic role of the Duffy
blood group antigen. Blood 89, 3077–3091.
36. Hamblin, M.T., Thompson, E.E., and Di Rienzo, A. (2002).
Complex signatures of natural selection at the Duffy blood
group locus. Am. J. Hum. Genet. 70, 369–383.
37. Drobyski, W.R., Keever, C.A., Roth, M.S., Koethe, S., Hanson,
G., McFadden, P., Gottschall, J.L., Ash, R.C., van Tuinen, P.,
Horowitz, M.M., et al. (1993). Salvage immunotherapy using
donor leukocyte infusions as treatment for relapsed chronic
myelogenous leukemia after allogeneic bone marrow trans-
plantation: efficacy and toxicity of a defined T-cell dose. Blood
82, 2310–2318.
The American Journal of Human Genetics 82, 81–87, January 2008 87
Related Documents