Admission to trading of the shares in Essity Aktiebolag (publ) on Nasdaq Stockholm

Welcome message from author
This document is posted to help you gain knowledge. Please leave a comment to let me know what you think about it! Share it to your friends and learn new things together.
Transcript
Admission to trading of the shares in Essity Aktiebolag (publ)
on Nasdaq Stockholm
Important information
For certain definitions used in this prospectus, see “Certain definitions” on the next page.This prospectus has been prepared following a resolution at the 2017 Annual General Meeting of Svenska Cellulosa Aktiebolaget
SCA (publ) (“SCA”) to distribute to SCA’s shareholders the shares in Essity Aktiebolag (publ) (“Essity” or the “Company”) and the Board of Directors of Essity’s application for listing of those shares on Nasdaq Stockholm.
A Swedish version of this prospectus has been approved and registered by the Swedish Financial Supervisory Authority (the “SFSA”) in accordance with Chapter 2, Sections 25 and 26 of the Swedish Financial Instruments Trading Act (lagen (1991:980) om handel med finansiella instrument). Approval and registration does not imply that the SFSA guarantees that the information in the prospectus is accurate or complete.
The prospectus is governed by Swedish law. Disputes arising in connection with this prospectus and related legal matters shall be settled exclusively by Swedish courts. The prospectus has been prepared in both Swedish and English language versions. The English version contains certain sections specifically directed to holders outside of Sweden, which are not included in the Swedish version. In the event of any conflict between the versions, the Swedish version shall prevail.
This prospectus has been prepared for the purpose of Essity’s application of admission to trading of the shares in Essity on Nasdaq Stockholm and does not contain any offer to subscribe for, or in any other way acquire shares or other financial instruments in the Company, neither in Sweden nor in any other jurisdiction. The prospectus and thereto related documents may not be distributed to or into the United States, Canada, Australia, Japan or any other jurisdiction where such distribution would require additional prospectuses, registration or measures besides those required by Swedish law or otherwise would be in conflict with applicable regulations in such countries or in such jurisdictions. Recipients of this prospectus are required to inform themselves about, and comply with, such restrictions. Any failure to comply with the restrictions described may result in a violation of applicable securities regulations.
Investing in shares is associated with risk (see “Risk factors”). When an investor makes an investment decision, he or she must rely on his or her own analysis of Essity, including applicable facts and risks. Investors may only rely on the information in this prospectus and any possible supplements to this prospectus. No person is authorized to provide any information or make any statements other than those made in this prospectus. Should such information or statement nevertheless be provided or be made it should not be considered to have been approved by Essity, and Essity is not responsible for such information or statements. Neither the publication of this prospectus nor any transaction made in respect of it shall be deemed to imply that the information in this prospectus is accurate or applicable at any time other than on the date of the publication of this prospectus or that there have been no changes in Essity’s business since this date. If significant changes relating to the information contained in this prospectus occur, such changes will be announced in accordance with the provisions on prospectus supplements under the Swedish Financial Instruments Trading Act.
Information to investors in the United States The distribution of Essity’s shares has not been and will not be registered under the United States Securities Act of 1933, as amended (the “Securities Act”). The Essity shares have not been approved or disapproved by the United States Securities and Exchange Commission (“SEC”), any state securities commission in the United States or any United States regulatory authority, nor have any of the foregoing authorities passed upon or endorsed the merits of the distribution of the Essity shares or the accuracy or adequacy of this document. Any representation to the contrary is a criminal offence in the United States.
Essity will be relying on an exemption provided by Rule 12g3-2(b) under the United States Securities Exchange Act of 1934, as amended, and therefore will not be required to register its shares with the SEC. In accordance with Rule 12g3-2(b), Essity will make available certain documents on its website. These documents will consist primarily of English-language versions of its annual reports, press releases and certain other information made public in Sweden. However, Essity will not be required to file with the SEC annual reports on Form 20-F or furnish reports on Form 6-K.
Essity will establish an American depositary receipt program (“ADR Program”) pursuant to a deposit agreement, setting out the terms of the program. For more information about Essity’s ADR Program and on the procedure pursuant to which holders of current SCA American depositary shares will receive Essity American depositary shares (“ADS”) representing the Essity shares deliverable to such holders, see “American depositary shares” in the section entitled “Information regarding the distribution of Essity” and “Depositary shares” in the section entitled “Share capital and ownership structure”.
Forward-looking statementsThe prospectus contains certain forward-looking information that reflects Essity’s present view of future events as well as financial and operational development. Words such as “intend”, “assess”, “expect”, “may”, “plan”, “believe”, “estimate” and other expressions entailing indications or predictions of future development or trends, not based on historical facts, constitute forward-looking information. Forward-looking information is inherently associated with both known and unknown risks and uncertainties as it depends on future events and circumstances. Forward-looking information is not a guarantee of future results or development and actual outcomes may differ materially from the statements set forth in the forward-looking information.
Factors that may cause Essity’s future results and development to differ from the forward-looking information include among other those described in “Risk factors”. The forward-looking information contained in this prospectus applies only as at the date of this prospectus. Essity does not undertake any obligation to publicly announce any update or change in the forward-looking information as a result of new information, future events or similar circumstances other than as required by applicable laws and regulations.
Presentation of financial informationCertain figures in this prospectus, including financial data, have been rounded. Accordingly, figures shown in totals in certain tables may not be an exact arithmetic aggregation of the figures which precede them.
Important dates
Last day of trading in SCA’s shares of Class A and Class B, respectively, with the right to the distribution of shares of Class A and Class B in Essity, respectively: ...................... June 9, 2017
SCA’s shares of Class A and Class B, respectively, are traded excluding the right to the distribution of shares of Class A and Class B in Essity, respectively: .................... June 12, 2017
Record date for receipt of shares in Essity and Essity ADSs: .................................................................................. June 13, 2017
Estimated first day of trading in Essity’s shares of Class A and Class B, respectively, on Nasdaq Stockholm: ............ June 15, 2017
Estimated date of delivery of Essity ADSs: .............................. June 15, 2017
Other information
Ticker symbol Class A share: ............................................................ ESSITY A
Ticker symbol Class B share: ............................................................ ESSITY B
ISIN code Class A share: ........................................................ SE0009922156
ISIN code Class B share: ........................................................ SE0009922164
Financial information
Interim report January–June 2017 ............................................ July 18, 2017
Interim report January–September 2017 ....................... October 26, 2017
Year-end report January–December 2017 ................... January 26, 2018
Table of contents
Summary ................................................................................................ 2
Risk factors ...........................................................................................10
Exchange rate information and regulation ................................. 18
Background and reasons ................................................................ 19
Information regarding the distribution of Essity .................. 20
Market and business description ................................................ 22
Selected historical financial information .................................... 40
Operational and financial review .................................................. 48
Capitalization and other financial information .......................... 62
Board of directors, executive management and auditor ..... 65
Corporate governance ..................................................................... 71
Share capital and ownership structure ....................................... 76
Articles of association ...................................................................... 79
Legal considerations and supplementary information .......... 81
Certain tax issues ............................................................................. 84
Historical financial information ..................................................... F-1
Addresses .......................................................................................... A-1
Certain definitions
In this prospectus, the following definitions are used:
“CNY” refers to Chinese Yuan Renminbi.
“EUR” refers to euro, “EURm” to millions of euros and “EURbn” to billions of euros.
“Euroclear Sweden” refers to Euroclear Sweden AB.
“GBP” refers to British Pound.
The “Group” refers to the group of which Essity Aktiebolag (publ) is the parent company.
“Handelsbanken” means, depending on the context, Svenska Handelsbanken AB (publ) (corp. reg. no. 502007-7862) or Handelsbanken Capital Markets (a part of Svenska Handelsbanken AB (publ)).
“HKD” refers to Hong Kong dollar, “HKDm” to millions of Hong Kong dollar and “HKDbn” to billions of Hong Kong dollar.
“Essity” or the “Company” refers to, depending on the context, Essity Aktiebolag (publ) (corp. reg. no. 556325-5511) or the group in which Essity Aktiebolag (publ) is the parent company.
“Nasdaq Stockholm” refers to, depending on the context, Nasdaq Stockholm AB’s principal market (the Stockholm Stock Exchange) or its operator Nasdaq Stockholm AB.
“SCA” refers to, depending on the context, Svenska Cellulosa Aktiebolaget SCA (publ) (corp. reg. no. 556012-6293) or the group in which Svenska Cellulosa Aktiebolaget SCA (publ) is the parent company.
The “SCA Group” refers to the group in which Svenska Cellulosa Aktiebolaget SCA (publ) is the parent company, which depending on the context or unless otherwise stated, does not include the Essity Group.
“SEK” refers to the Swedish krona, “SEKm” to millions of Swedish krona and “SEKbn” to billions of Swedish krona.
“USD” refers to United States dollar, “USDm” to millions of United States dollar.
1Admission to trading of the shares in Essity Aktiebolag (publ) on Nasdaq Stockholm
Summary
Prospectus summaries consist of information requirements presented in “items”. The items are numbered in sections A–E (A.1–E.7). The summary in this prospectus includes all of the items required in a summary for the relevant type of security and issuer. However, since certain items are not applicable to all types of prospectuses, there may be gaps in the numbering of the items. Even if an item is required to be included in the summary for the relevant type of security and issuer, it is possible that no relevant information can be provided regarding the item. In such case, the information is replaced by a brief description of the item together with the indication “not applicable”.
Section A – Introductions and warnings
A.1 Introduction and warnings
This summary should be read as an introduction to the prospectus. Any decision to invest in the securities should be based on consideration of the prospectus as a whole by the investor. Where a claim relating to the information in this prospectus is brought before a court, the plaintiff investor might,
under the national legislation of the Member States, have to bear the costs of translating the prospectus before the legal proceedings are initiated.
Civil liability may attach to those persons who produced the summary, including any translation thereof, only if the summary is misleading, inaccurate or inconsistent with other parts of the prospectus or if, together with other parts of the prospectus, it fails to provide key information to help investors when considering investing in such securities.
A.2 Consent to use the prospectus
Not applicable. Financial intermediaries are not entitled to use the prospectus for subsequent resale or final placement of securities.
Section B – Issuer
B.1 Legal and commercial name
The legal name of the Company (and its commercial name) is Essity Aktiebolag (publ), Swedish corporate ID No. 556325-5511.
B.2 Domicile and legal form The registered office of the Board of Directors is situated in Stockholm, Sweden. The Company is a Swedish public limited liability company (publikt aktiebolag) governed by the Swedish Companies Act (aktiebolagslagen (2005:551)).
B.3 Nature of operations and principal activities
Essity is a leading global hygiene and health company that operates on the global hygiene and health market, which amounted to approximately EUR 112bn in 2016. Europe is Essity’s largest market and the Company also holds strong positions in North America, Latin America and Asia. For 2016, the Company reported net sales of SEK 101bn and the number of employees as of December 31, 2016 amounted to 42,520.
The Company develops, produces and sells products and solutions within the Business Areas Personal Care, Consumer Tissue and Professional Hygiene. The Business Area Personal Care includes Incontinence Products, Baby Care, Feminine Care and Medical Solutions. Personal Care generated SEK 34bn in net sales in 2016, which accounted for 33% of Essity’s net sales in 2016.
The Consumer Tissue Business Area provides products including toilet paper, household towels, handkerchiefs, facial tissues, wet wipes and napkins. Consumer Tissue generated SEK 42bn in net sales in 2016, which accounted for 41% of Essity’s net sales in 2016.
The Professional Hygiene Business Area develops and sells complete hygiene solutions, including toilet paper, paper towels, napkins, hand soap, hand lotion, hand sanitizers, dispensers, cleaning and wiping products, sensor technology and service and maintenance to institutions and companies, amongst others. Professional Hygiene generated SEK 26bn in net sales in 2016, which accounted for 26% of Essity’s net sales in 2016.
Essity conducts sales of hygiene and health products in about 150 countries under many strong brands, including the leading global brands TENA and Tork, and other brands, such as Leukoplast, Libero, Libresse, Lotus, Nosotras, Saba, Tempo, Vinda and Zewa. BSN medical, which was acquired in 2017, develops, manufactures and sells products within wound care, compression therapy and orthopedics under well-known brands such as Leukoplast, Cutimed, JOBST, Delta and Actimove.
Admission to trading of the shares in Essity Aktiebolag (publ) on Nasdaq Stockholm2
Summary
B.4a Recent trends Shifts in global demographics such as population growth – primarily due to a lower infant mortality rate and increased longevity – and higher disposable income point to continued favorable growth for the personal care and tissue markets. The effect of higher disposable income is that more people prioritize hygiene and health when food and housing needs have been, or are in the process of being, satisfied. Consequently, demand for Essity’s products is rising in emerging markets. Growth is also occurring in mature markets owing to lifestyle changes and innovations that lead to increased use of hygiene and health products.
During the first quarter of 2017, the European and North American markets for incontinence products in the healthcare sector displayed higher demand, but with continued price pressure as a result of fierce competition. The European and North American retail markets for incontinence products showed high growth. Emerging markets noted higher demand for incontinence products. The global market for incontinence products was characterized by a continued high level of competition. In Europe, demand for baby care was stable, while a slight decline was reported for feminine care. In emerging markets, demand rose for baby care and feminine care. The global market for baby care and several markets for feminine care were characterized by increased competition and campaign activity. The European market for consumer tissue demonstrated low growth and increased competition. The Chinese consumer tissue market noted higher demand. The European and North American markets for professional hygiene displayed low growth.
B.5 Group Essity is the ultimate parent company of the Essity Group, which comprises approximately 300 legal entities in approximately 70 countries.
B.6 Major shareholders, etc. In Sweden, the lowest limit for disclosure of holdings (so-called flagging) is five percent of all shares or the voting rights of all shares.
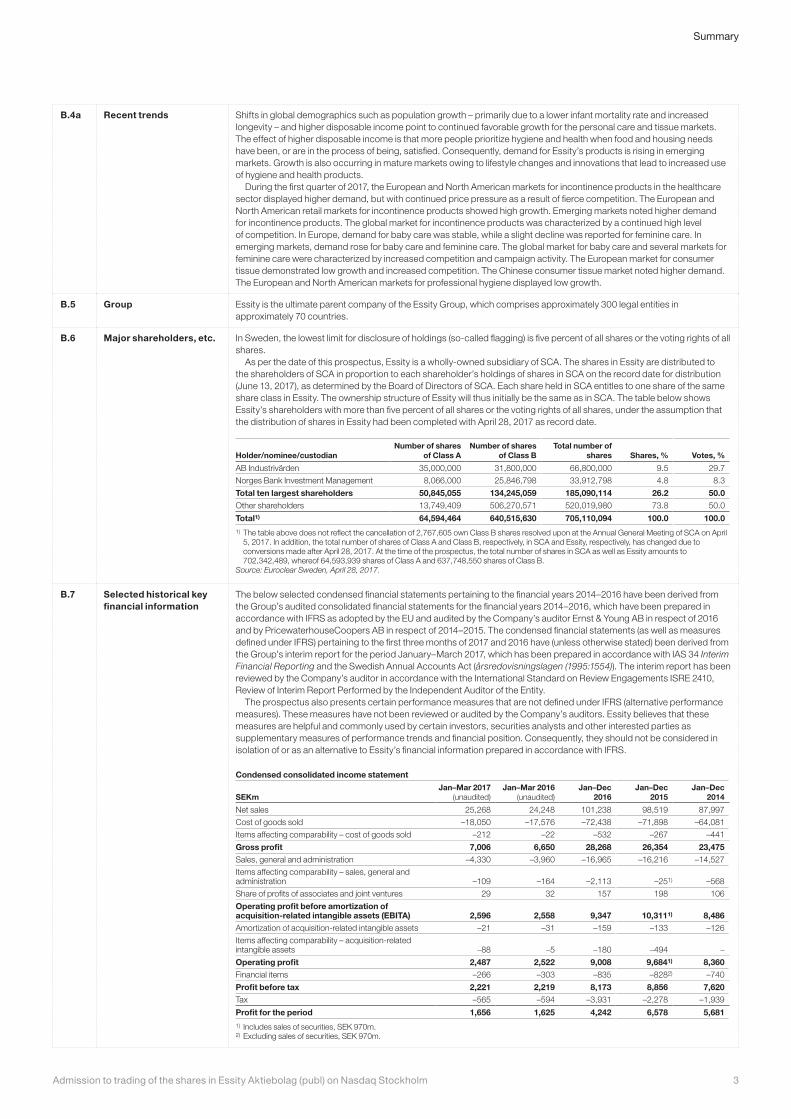
As per the date of this prospectus, Essity is a wholly-owned subsidiary of SCA. The shares in Essity are distributed to the shareholders of SCA in proportion to each shareholder’s holdings of shares in SCA on the record date for distribution (June 13, 2017), as determined by the Board of Directors of SCA. Each share held in SCA entitles to one share of the same share class in Essity. The ownership structure of Essity will thus initially be the same as in SCA. The table below shows Essity’s shareholders with more than five percent of all shares or the voting rights of all shares, under the assumption that the distribution of shares in Essity had been completed with April 28, 2017 as record date.
Holder/nominee/custodianNumber of shares
of Class ANumber of shares
of Class BTotal number of
shares Shares, % Votes, %
AB Industrivärden 35,000,000 31,800,000 66,800,000 9.5 29.7
Norges Bank Investment Management 8,066,000 25,846,798 33,912,798 4.8 8.3
Total ten largest shareholders 50,845,055 134,245,059 185,090,114 26.2 50.0Other shareholders 13,749,409 506,270,571 520,019,980 73.8 50.0
Total1) 64,594,464 640,515,630 705,110,094 100.0 100.01) The table above does not reflect the cancellation of 2,767,605 own Class B shares resolved upon at the Annual General Meeting of SCA on April
5, 2017. In addition, the total number of shares of Class A and Class B, respectively, in SCA and Essity, respectively, has changed due to conversions made after April 28, 2017. At the time of the prospectus, the total number of shares in SCA as well as Essity amounts to 702,342,489, whereof 64,593,939 shares of Class A and 637,748,550 shares of Class B.
Source: Euroclear Sweden, April 28, 2017.
B.7 Selected historical key financial information
The below selected condensed financial statements pertaining to the financial years 2014–2016 have been derived from the Group’s audited consolidated financial statements for the financial years 2014–2016, which have been prepared in accordance with IFRS as adopted by the EU and audited by the Company’s auditor Ernst & Young AB in respect of 2016 and by PricewaterhouseCoopers AB in respect of 2014–2015. The condensed financial statements (as well as measures defined under IFRS) pertaining to the first three months of 2017 and 2016 have (unless otherwise stated) been derived from the Group’s interim report for the period January–March 2017, which has been prepared in accordance with IAS 34 Interim Financial Reporting and the Swedish Annual Accounts Act (årsredovisningslagen (1995:1554)). The interim report has been reviewed by the Company’s auditor in accordance with the International Standard on Review Engagements ISRE 2410, Review of Interim Report Performed by the Independent Auditor of the Entity.
The prospectus also presents certain performance measures that are not defined under IFRS (alternative performance measures). These measures have not been reviewed or audited by the Company’s auditors. Essity believes that these measures are helpful and commonly used by certain investors, securities analysts and other interested parties as supplementary measures of performance trends and financial position. Consequently, they should not be considered in isolation of or as an alternative to Essity’s financial information prepared in accordance with IFRS.
Condensed consolidated income statement
SEKmJan–Mar 2017
(unaudited)Jan–Mar 2016
(unaudited)Jan–Dec
2016Jan–Dec
2015Jan–Dec
2014
Net sales 25,268 24,248 101,238 98,519 87,997
Cost of goods sold –18,050 –17,576 –72,438 –71,898 –64,081
Items affecting comparability – cost of goods sold –212 –22 –532 –267 –441
Gross profit 7,006 6,650 28,268 26,354 23,475Sales, general and administration –4,330 –3,960 –16,965 –16,216 –14,527
Items affecting comparability – sales, general and administration –109 –164 –2,113 –251) –568
Share of profits of associates and joint ventures 29 32 157 198 106
Operating profit before amortization of acquisition-related intangible assets (EBITA) 2,596 2,558 9,347 10,3111) 8,486Amortization of acquisition-related intangible assets –21 –31 –159 –133 –126
Items affecting comparability – acquisition-related intangible assets –88 –5 –180 –494 –
Operating profit 2,487 2,522 9,008 9,6841) 8,360Financial items –266 –303 –835 –8282) –740
Profit before tax 2,221 2,219 8,173 8,856 7,620Tax –565 –594 –3,931 –2,278 –1,939
Profit for the period 1,656 1,625 4,242 6,578 5,6811) Includes sales of securities, SEK 970m.2) Excluding sales of securities, SEK 970m.
3Admission to trading of the shares in Essity Aktiebolag (publ) on Nasdaq Stockholm
Summary
B.7 Selected historical key financial information, cont’d
Condensed consolidated balance sheet
SEKmMar 31, 2017
(unaudited)Mar 31, 2016
(unaudited)1)Dec 31,
2016Dec 31,
2015Dec 31,
2014
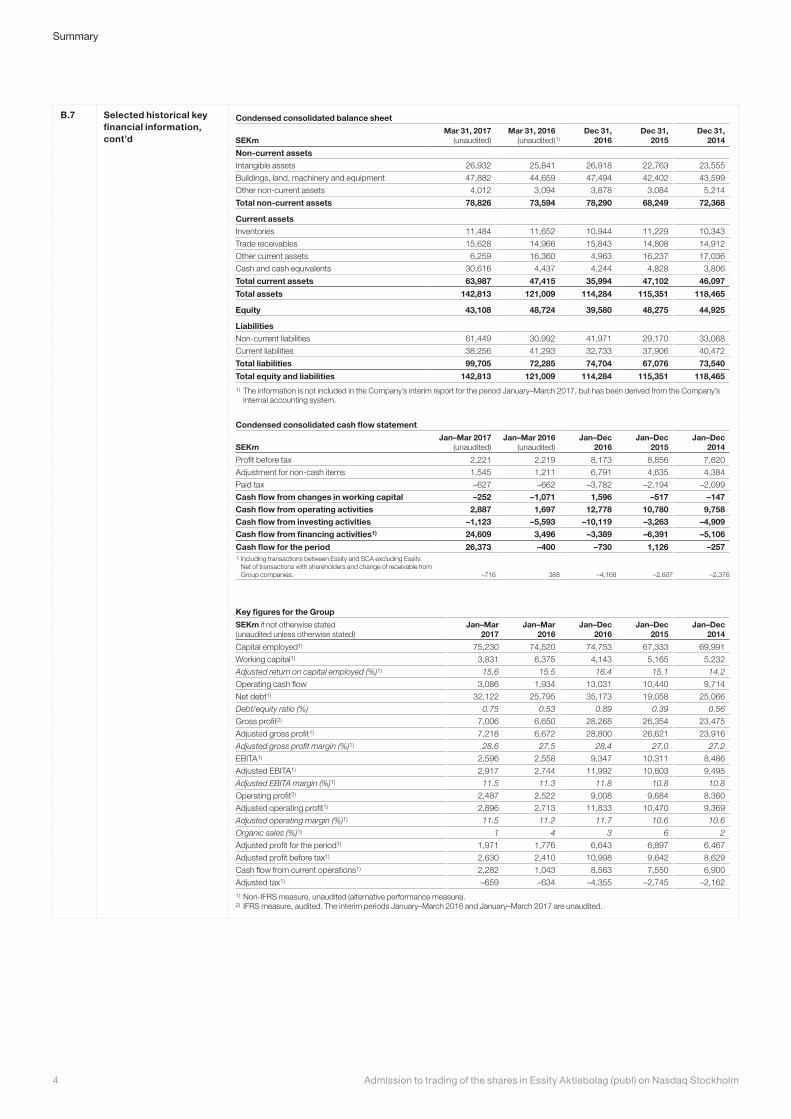
Non-current assetsIntangible assets 26,932 25,841 26,918 22,763 23,555
Buildings, land, machinery and equipment 47,882 44,659 47,494 42,402 43,599
Other non-current assets 4,012 3,094 3,878 3,084 5,214
Total non-current assets 78,826 73,594 78,290 68,249 72,368
Current assetsInventories 11,484 11,652 10,944 11,229 10,343
Trade receivables 15,628 14,966 15,843 14,808 14,912
Other current assets 6,259 16,360 4,963 16,237 17,036
Cash and cash equivalents 30,616 4,437 4,244 4,828 3,806
Total current assets 63,987 47,415 35,994 47,102 46,097
Total assets 142,813 121,009 114,284 115,351 118,465
Equity 43,108 48,724 39,580 48,275 44,925
LiabilitiesNon-current liabilities 61,449 30,992 41,971 29,170 33,068
Current liabilities 38,256 41,293 32,733 37,906 40,472
Total liabilities 99,705 72,285 74,704 67,076 73,540
Total equity and liabilities 142,813 121,009 114,284 115,351 118,4651) The information is not included in the Company’s interim report for the period January–March 2017, but has been derived from the Company’s
internal accounting system.
Condensed consolidated cash flow statement
SEKmJan–Mar 2017
(unaudited)Jan–Mar 2016
(unaudited)Jan–Dec
2016Jan–Dec
2015Jan–Dec
2014
Profit before tax 2,221 2,219 8,173 8,856 7,620
Adjustment for non-cash items 1,545 1,211 6,791 4,635 4,384
Paid tax –627 –662 –3,782 –2,194 –2,099
Cash flow from changes in working capital –252 –1,071 1,596 –517 –147Cash flow from operating activities 2,887 1,697 12,778 10,780 9,758Cash flow from investing activities –1,123 –5,593 –10,119 –3,263 –4,909Cash flow from financing activities1) 24,609 3,496 –3,389 –6,391 –5,106
Cash flow for the period 26,373 –400 –730 1,126 –2571) Including transactions between Essity and SCA excluding Essity.
Net of transactions with shareholders and change of receivable from Group companies. –716 368 –4,168 –2,607 –2,376
Key figures for the Group
SEKm if not otherwise stated(unaudited unless otherwise stated)
Jan–Mar 2017
Jan–Mar 2016
Jan–Dec 2016
Jan–Dec 2015
Jan–Dec 2014
Capital employed1) 75,230 74,520 74,753 67,333 69,991
Working capital1) 3,831 6,375 4,143 5,165 5,232
Adjusted return on capital employed (%)1) 15.6 15.5 16.4 15.1 14.2
Operating cash flow 3,086 1,934 13,031 10,440 9,714
Net debt1) 32,122 25,795 35,173 19,058 25,066
Debt/equity ratio (%) 0.75 0.53 0.89 0.39 0.56
Gross profit2) 7,006 6,650 28,268 26,354 23,475
Adjusted gross profit1) 7,218 6,672 28,800 26,621 23,916
Adjusted gross profit margin (%)1) 28.6 27.5 28.4 27.0 27.2
EBITA1) 2,596 2,558 9,347 10,311 8,486
Adjusted EBITA1) 2,917 2,744 11,992 10,603 9,495
Adjusted EBITA margin (%)1) 11.5 11.3 11.8 10.8 10.8
Operating profit2) 2,487 2,522 9,008 9,684 8,360
Adjusted operating profit1) 2,896 2,713 11,833 10,470 9,369
Adjusted operating margin (%)1) 11.5 11.2 11.7 10.6 10.6
Organic sales (%)1) 1 4 3 6 2
Adjusted profit for the period1) 1,971 1,776 6,643 6,897 6,467
Adjusted profit before tax1) 2,630 2,410 10,998 9,642 8,629
Cash flow from current operations1) 2,282 1,043 8,563 7,550 6,900
Adjusted tax1) –659 –634 –4,355 –2,745 –2,1621) Non-IFRS measure, unaudited (alternative performance measure). 2) IFRS measure, audited. The interim periods January–March 2016 and January–March 2017 are unaudited.
Admission to trading of the shares in Essity Aktiebolag (publ) on Nasdaq Stockholm4
Summary
B.7 Selected historical key financial information, cont’d
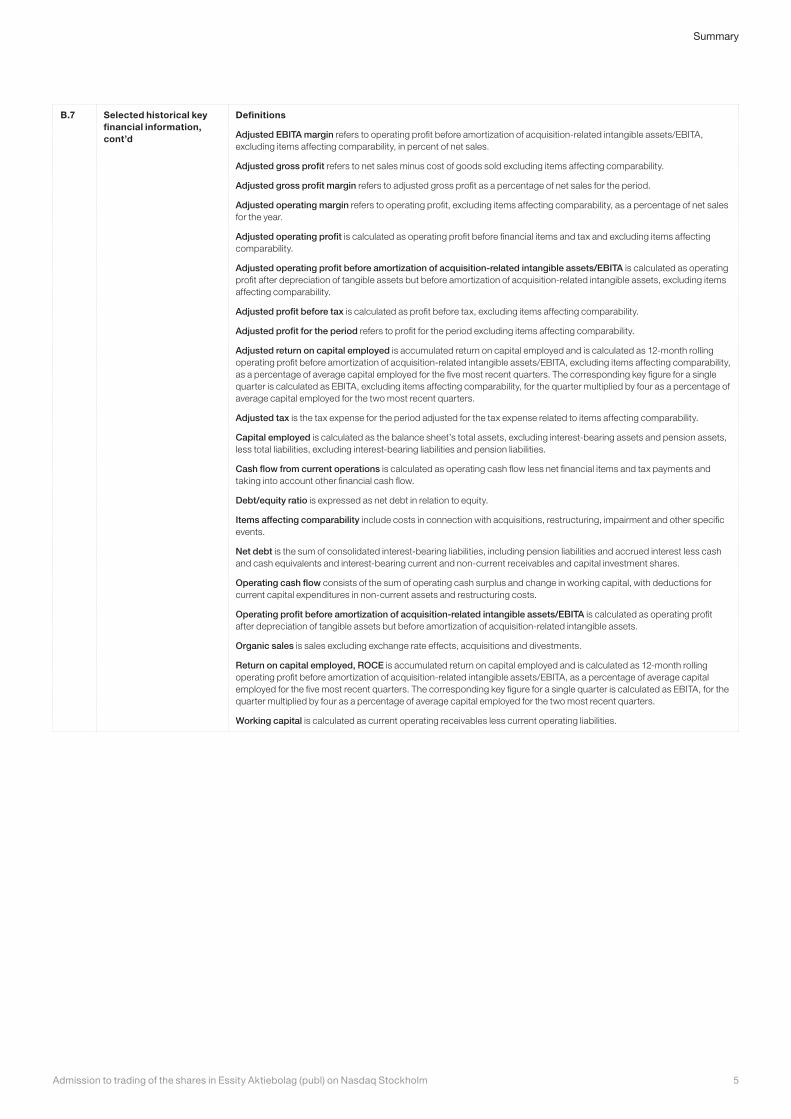
Definitions
Adjusted EBITA margin refers to operating profit before amortization of acquisition-related intangible assets/EBITA, excluding items affecting comparability, in percent of net sales.
Adjusted gross profit refers to net sales minus cost of goods sold excluding items affecting comparability.
Adjusted gross profit margin refers to adjusted gross profit as a percentage of net sales for the period.
Adjusted operating margin refers to operating profit, excluding items affecting comparability, as a percentage of net sales for the year.
Adjusted operating profit is calculated as operating profit before financial items and tax and excluding items affecting comparability.
Adjusted operating profit before amortization of acquisition-related intangible assets/EBITA is calculated as operating profit after depreciation of tangible assets but before amortization of acquisition-related intangible assets, excluding items affecting comparability.
Adjusted profit before tax is calculated as profit before tax, excluding items affecting comparability.
Adjusted profit for the period refers to profit for the period excluding items affecting comparability.
Adjusted return on capital employed is accumulated return on capital employed and is calculated as 12-month rolling operating profit before amortization of acquisition-related intangible assets/EBITA, excluding items affecting comparability, as a percentage of average capital employed for the five most recent quarters. The corresponding key figure for a single quarter is calculated as EBITA, excluding items affecting comparability, for the quarter multiplied by four as a percentage of average capital employed for the two most recent quarters.
Adjusted tax is the tax expense for the period adjusted for the tax expense related to items affecting comparability.
Capital employed is calculated as the balance sheet’s total assets, excluding interest-bearing assets and pension assets, less total liabilities, excluding interest-bearing liabilities and pension liabilities.
Cash flow from current operations is calculated as operating cash flow less net financial items and tax payments and taking into account other financial cash flow.
Debt/equity ratio is expressed as net debt in relation to equity.
Items affecting comparability include costs in connection with acquisitions, restructuring, impairment and other specific events.
Net debt is the sum of consolidated interest-bearing liabilities, including pension liabilities and accrued interest less cash and cash equivalents and interest-bearing current and non-current receivables and capital investment shares.
Operating cash flow consists of the sum of operating cash surplus and change in working capital, with deductions for current capital expenditures in non-current assets and restructuring costs.
Operating profit before amortization of acquisition-related intangible assets/EBITA is calculated as operating profit after depreciation of tangible assets but before amortization of acquisition-related intangible assets.
Organic sales is sales excluding exchange rate effects, acquisitions and divestments.
Return on capital employed, ROCE is accumulated return on capital employed and is calculated as 12-month rolling operating profit before amortization of acquisition-related intangible assets/EBITA, as a percentage of average capital employed for the five most recent quarters. The corresponding key figure for a single quarter is calculated as EBITA, for the quarter multiplied by four as a percentage of average capital employed for the two most recent quarters.
Working capital is calculated as current operating receivables less current operating liabilities.
5Admission to trading of the shares in Essity Aktiebolag (publ) on Nasdaq Stockholm
Summary
B.7 Selected historical key financial information, cont’d
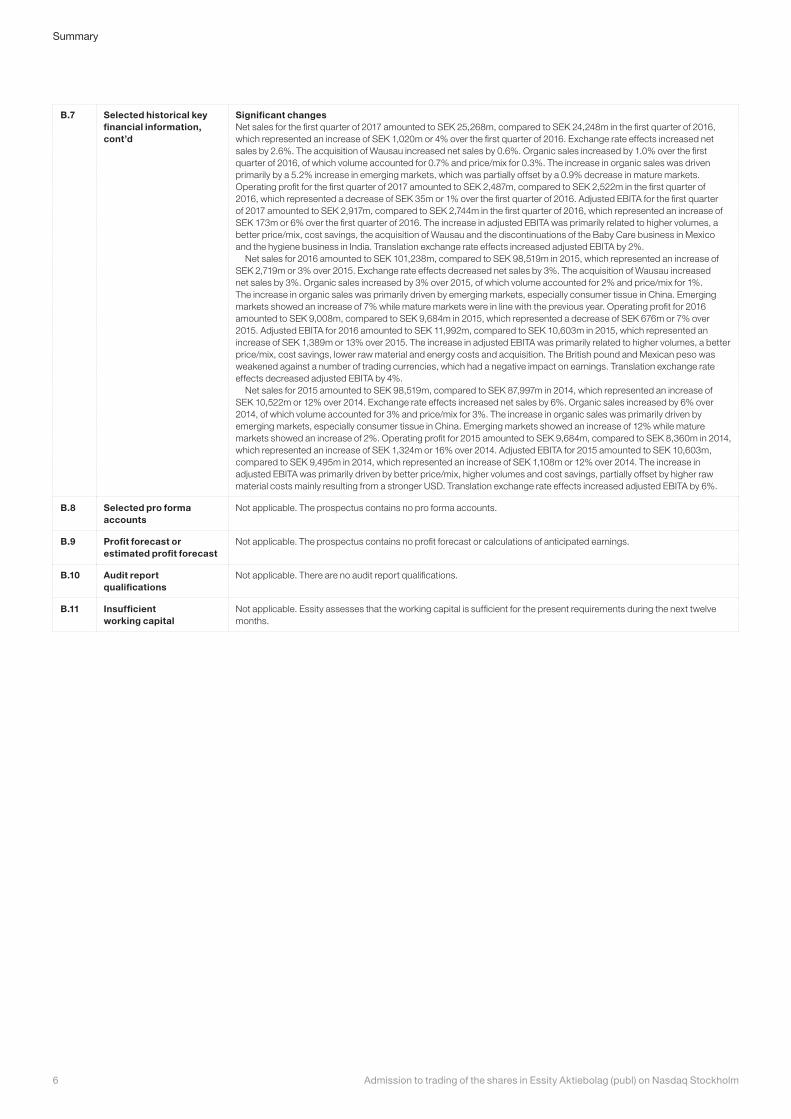
Significant changesNet sales for the first quarter of 2017 amounted to SEK 25,268m, compared to SEK 24,248m in the first quarter of 2016, which represented an increase of SEK 1,020m or 4% over the first quarter of 2016. Exchange rate effects increased net sales by 2.6%. The acquisition of Wausau increased net sales by 0.6%. Organic sales increased by 1.0% over the first quarter of 2016, of which volume accounted for 0.7% and price/mix for 0.3%. The increase in organic sales was driven primarily by a 5.2% increase in emerging markets, which was partially offset by a 0.9% decrease in mature markets. Operating profit for the first quarter of 2017 amounted to SEK 2,487m, compared to SEK 2,522m in the first quarter of 2016, which represented a decrease of SEK 35m or 1% over the first quarter of 2016. Adjusted EBITA for the first quarter of 2017 amounted to SEK 2,917m, compared to SEK 2,744m in the first quarter of 2016, which represented an increase of SEK 173m or 6% over the first quarter of 2016. The increase in adjusted EBITA was primarily related to higher volumes, a better price/mix, cost savings, the acquisition of Wausau and the discontinuations of the Baby Care business in Mexico and the hygiene business in India. Translation exchange rate effects increased adjusted EBITA by 2%.
Net sales for 2016 amounted to SEK 101,238m, compared to SEK 98,519m in 2015, which represented an increase of SEK 2,719m or 3% over 2015. Exchange rate effects decreased net sales by 3%. The acquisition of Wausau increased net sales by 3%. Organic sales increased by 3% over 2015, of which volume accounted for 2% and price/mix for 1%. The increase in organic sales was primarily driven by emerging markets, especially consumer tissue in China. Emerging markets showed an increase of 7% while mature markets were in line with the previous year. Operating profit for 2016 amounted to SEK 9,008m, compared to SEK 9,684m in 2015, which represented a decrease of SEK 676m or 7% over 2015. Adjusted EBITA for 2016 amounted to SEK 11,992m, compared to SEK 10,603m in 2015, which represented an increase of SEK 1,389m or 13% over 2015. The increase in adjusted EBITA was primarily related to higher volumes, a better price/mix, cost savings, lower raw material and energy costs and acquisition. The British pound and Mexican peso was weakened against a number of trading currencies, which had a negative impact on earnings. Translation exchange rate effects decreased adjusted EBITA by 4%.
Net sales for 2015 amounted to SEK 98,519m, compared to SEK 87,997m in 2014, which represented an increase of SEK 10,522m or 12% over 2014. Exchange rate effects increased net sales by 6%. Organic sales increased by 6% over 2014, of which volume accounted for 3% and price/mix for 3%. The increase in organic sales was primarily driven by emerging markets, especially consumer tissue in China. Emerging markets showed an increase of 12% while mature markets showed an increase of 2%. Operating profit for 2015 amounted to SEK 9,684m, compared to SEK 8,360m in 2014, which represented an increase of SEK 1,324m or 16% over 2014. Adjusted EBITA for 2015 amounted to SEK 10,603m, compared to SEK 9,495m in 2014, which represented an increase of SEK 1,108m or 12% over 2014. The increase in adjusted EBITA was primarily driven by better price/mix, higher volumes and cost savings, partially offset by higher raw material costs mainly resulting from a stronger USD. Translation exchange rate effects increased adjusted EBITA by 6%.
B.8 Selected pro forma accounts
Not applicable. The prospectus contains no pro forma accounts.
B.9 Profit forecast or estimated profit forecast
Not applicable. The prospectus contains no profit forecast or calculations of anticipated earnings.
B.10 Audit report qualifications
Not applicable. There are no audit report qualifications.
B.11 Insufficient working capital
Not applicable. Essity assesses that the working capital is sufficient for the present requirements during the next twelve months.
Admission to trading of the shares in Essity Aktiebolag (publ) on Nasdaq Stockholm6
Summary
Section C – Securities
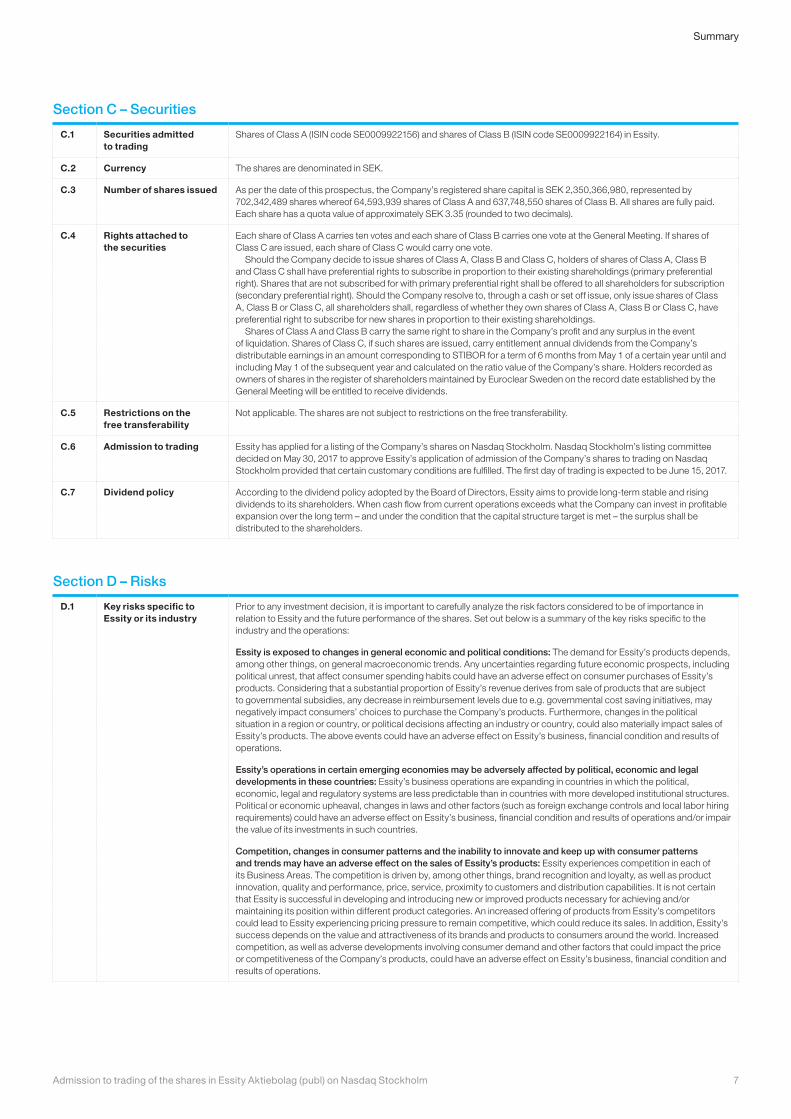
C.1 Securities admitted to trading
Shares of Class A (ISIN code SE0009922156) and shares of Class B (ISIN code SE0009922164) in Essity.
C.2 Currency The shares are denominated in SEK.
C.3 Number of shares issued As per the date of this prospectus, the Company’s registered share capital is SEK 2,350,366,980, represented by 702,342,489 shares whereof 64,593,939 shares of Class A and 637,748,550 shares of Class B. All shares are fully paid. Each share has a quota value of approximately SEK 3.35 (rounded to two decimals).
C.4 Rights attached to the securities
Each share of Class A carries ten votes and each share of Class B carries one vote at the General Meeting. If shares of Class C are issued, each share of Class C would carry one vote.
Should the Company decide to issue shares of Class A, Class B and Class C, holders of shares of Class A, Class B and Class C shall have preferential rights to subscribe in proportion to their existing shareholdings (primary preferential right). Shares that are not subscribed for with primary preferential right shall be offered to all shareholders for subscription (secondary preferential right). Should the Company resolve to, through a cash or set off issue, only issue shares of Class A, Class B or Class C, all shareholders shall, regardless of whether they own shares of Class A, Class B or Class C, have preferential right to subscribe for new shares in proportion to their existing shareholdings.
Shares of Class A and Class B carry the same right to share in the Company’s profit and any surplus in the event of liquidation. Shares of Class C, if such shares are issued, carry entitlement annual dividends from the Company’s distributable earnings in an amount corresponding to STIBOR for a term of 6 months from May 1 of a certain year until and including May 1 of the subsequent year and calculated on the ratio value of the Company’s share. Holders recorded as owners of shares in the register of shareholders maintained by Euroclear Sweden on the record date established by the General Meeting will be entitled to receive dividends.
C.5 Restrictions on the free transferability
Not applicable. The shares are not subject to restrictions on the free transferability.
C.6 Admission to trading Essity has applied for a listing of the Company’s shares on Nasdaq Stockholm. Nasdaq Stockholm’s listing committee decided on May 30, 2017 to approve Essity’s application of admission of the Company’s shares to trading on Nasdaq Stockholm provided that certain customary conditions are fulfilled. The first day of trading is expected to be June 15, 2017.
C.7 Dividend policy According to the dividend policy adopted by the Board of Directors, Essity aims to provide long-term stable and rising dividends to its shareholders. When cash flow from current operations exceeds what the Company can invest in profitable expansion over the long term – and under the condition that the capital structure target is met – the surplus shall be distributed to the shareholders.
Section D – Risks
D.1 Key risks specific to Essity or its industry
Prior to any investment decision, it is important to carefully analyze the risk factors considered to be of importance in relation to Essity and the future performance of the shares. Set out below is a summary of the key risks specific to the industry and the operations:
Essity is exposed to changes in general economic and political conditions: The demand for Essity’s products depends, among other things, on general macroeconomic trends. Any uncertainties regarding future economic prospects, including political unrest, that affect consumer spending habits could have an adverse effect on consumer purchases of Essity’s products. Considering that a substantial proportion of Essity’s revenue derives from sale of products that are subject to governmental subsidies, any decrease in reimbursement levels due to e.g. governmental cost saving initiatives, may negatively impact consumers’ choices to purchase the Company’s products. Furthermore, changes in the political situation in a region or country, or political decisions affecting an industry or country, could also materially impact sales of Essity’s products. The above events could have an adverse effect on Essity’s business, financial condition and results of operations.
Essity’s operations in certain emerging economies may be adversely affected by political, economic and legal developments in these countries: Essity’s business operations are expanding in countries in which the political, economic, legal and regulatory systems are less predictable than in countries with more developed institutional structures. Political or economic upheaval, changes in laws and other factors (such as foreign exchange controls and local labor hiring requirements) could have an adverse effect on Essity’s business, financial condition and results of operations and/or impair the value of its investments in such countries.
Competition, changes in consumer patterns and the inability to innovate and keep up with consumer patterns and trends may have an adverse effect on the sales of Essity’s products: Essity experiences competition in each of its Business Areas. The competition is driven by, among other things, brand recognition and loyalty, as well as product innovation, quality and performance, price, service, proximity to customers and distribution capabilities. It is not certain that Essity is successful in developing and introducing new or improved products necessary for achieving and/or maintaining its position within different product categories. An increased offering of products from Essity’s competitors could lead to Essity experiencing pricing pressure to remain competitive, which could reduce its sales. In addition, Essity’s success depends on the value and attractiveness of its brands and products to consumers around the world. Increased competition, as well as adverse developments involving consumer demand and other factors that could impact the price or competitiveness of the Company’s products, could have an adverse effect on Essity’s business, financial condition and results of operations.
7Admission to trading of the shares in Essity Aktiebolag (publ) on Nasdaq Stockholm
Summary
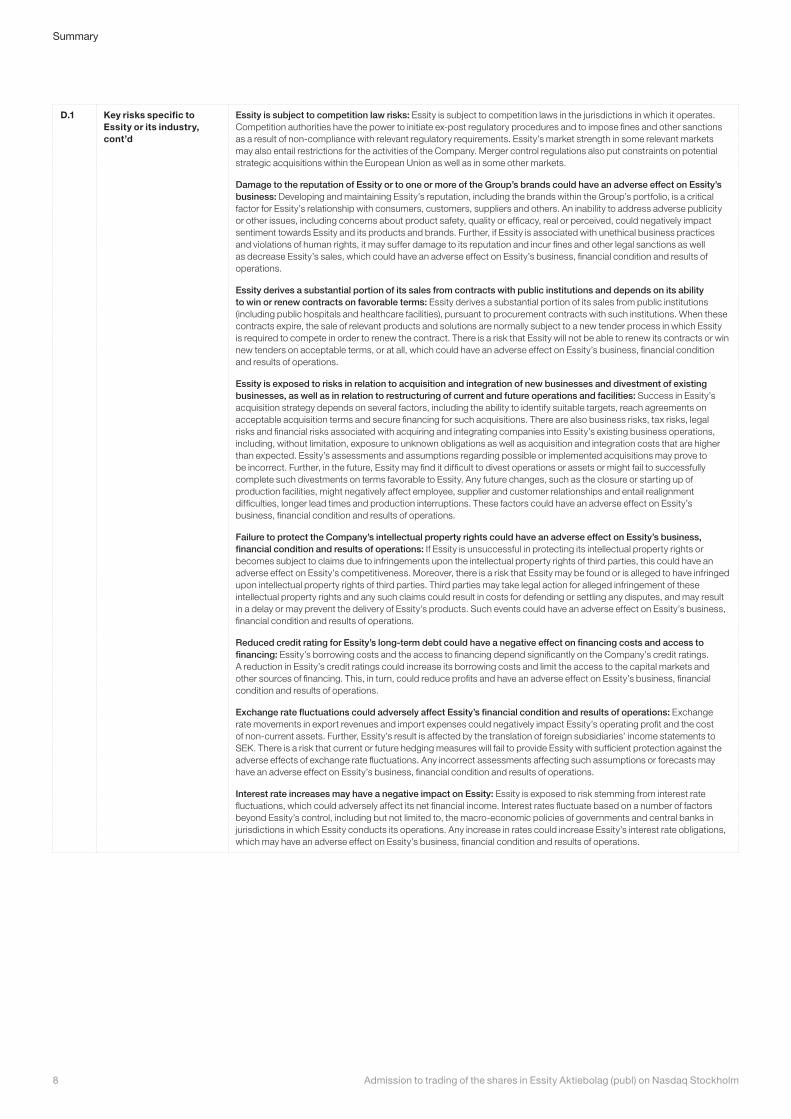
D.1 Key risks specific to Essity or its industry, cont’d
Essity is subject to competition law risks: Essity is subject to competition laws in the jurisdictions in which it operates. Competition authorities have the power to initiate ex-post regulatory procedures and to impose fines and other sanctions as a result of non-compliance with relevant regulatory requirements. Essity’s market strength in some relevant markets may also entail restrictions for the activities of the Company. Merger control regulations also put constraints on potential strategic acquisitions within the European Union as well as in some other markets.
Damage to the reputation of Essity or to one or more of the Group’s brands could have an adverse effect on Essity’s business: Developing and maintaining Essity’s reputation, including the brands within the Group’s portfolio, is a critical factor for Essity’s relationship with consumers, customers, suppliers and others. An inability to address adverse publicity or other issues, including concerns about product safety, quality or efficacy, real or perceived, could negatively impact sentiment towards Essity and its products and brands. Further, if Essity is associated with unethical business practices and violations of human rights, it may suffer damage to its reputation and incur fines and other legal sanctions as well as decrease Essity’s sales, which could have an adverse effect on Essity’s business, financial condition and results of operations.
Essity derives a substantial portion of its sales from contracts with public institutions and depends on its ability to win or renew contracts on favorable terms: Essity derives a substantial portion of its sales from public institutions (including public hospitals and healthcare facilities), pursuant to procurement contracts with such institutions. When these contracts expire, the sale of relevant products and solutions are normally subject to a new tender process in which Essity is required to compete in order to renew the contract. There is a risk that Essity will not be able to renew its contracts or win new tenders on acceptable terms, or at all, which could have an adverse effect on Essity’s business, financial condition and results of operations.
Essity is exposed to risks in relation to acquisition and integration of new businesses and divestment of existing businesses, as well as in relation to restructuring of current and future operations and facilities: Success in Essity’s acquisition strategy depends on several factors, including the ability to identify suitable targets, reach agreements on acceptable acquisition terms and secure financing for such acquisitions. There are also business risks, tax risks, legal risks and financial risks associated with acquiring and integrating companies into Essity’s existing business operations, including, without limitation, exposure to unknown obligations as well as acquisition and integration costs that are higher than expected. Essity’s assessments and assumptions regarding possible or implemented acquisitions may prove to be incorrect. Further, in the future, Essity may find it difficult to divest operations or assets or might fail to successfully complete such divestments on terms favorable to Essity. Any future changes, such as the closure or starting up of production facilities, might negatively affect employee, supplier and customer relationships and entail realignment difficulties, longer lead times and production interruptions. These factors could have an adverse effect on Essity’s business, financial condition and results of operations.
Failure to protect the Company’s intellectual property rights could have an adverse effect on Essity’s business, financial condition and results of operations: If Essity is unsuccessful in protecting its intellectual property rights or becomes subject to claims due to infringements upon the intellectual property rights of third parties, this could have an adverse effect on Essity’s competitiveness. Moreover, there is a risk that Essity may be found or is alleged to have infringed upon intellectual property rights of third parties. Third parties may take legal action for alleged infringement of these intellectual property rights and any such claims could result in costs for defending or settling any disputes, and may result in a delay or may prevent the delivery of Essity’s products. Such events could have an adverse effect on Essity’s business, financial condition and results of operations.
Reduced credit rating for Essity’s long-term debt could have a negative effect on financing costs and access to financing: Essity’s borrowing costs and the access to financing depend significantly on the Company’s credit ratings. A reduction in Essity’s credit ratings could increase its borrowing costs and limit the access to the capital markets and other sources of financing. This, in turn, could reduce profits and have an adverse effect on Essity’s business, financial condition and results of operations.
Exchange rate fluctuations could adversely affect Essity’s financial condition and results of operations: Exchange rate movements in export revenues and import expenses could negatively impact Essity’s operating profit and the cost of non-current assets. Further, Essity’s result is affected by the translation of foreign subsidiaries’ income statements to SEK. There is a risk that current or future hedging measures will fail to provide Essity with sufficient protection against the adverse effects of exchange rate fluctuations. Any incorrect assessments affecting such assumptions or forecasts may have an adverse effect on Essity’s business, financial condition and results of operations.
Interest rate increases may have a negative impact on Essity: Essity is exposed to risk stemming from interest rate fluctuations, which could adversely affect its net financial income. Interest rates fluctuate based on a number of factors beyond Essity’s control, including but not limited to, the macro-economic policies of governments and central banks in jurisdictions in which Essity conducts its operations. Any increase in rates could increase Essity’s interest rate obligations, which may have an adverse effect on Essity’s business, financial condition and results of operations.
Admission to trading of the shares in Essity Aktiebolag (publ) on Nasdaq Stockholm8
Summary
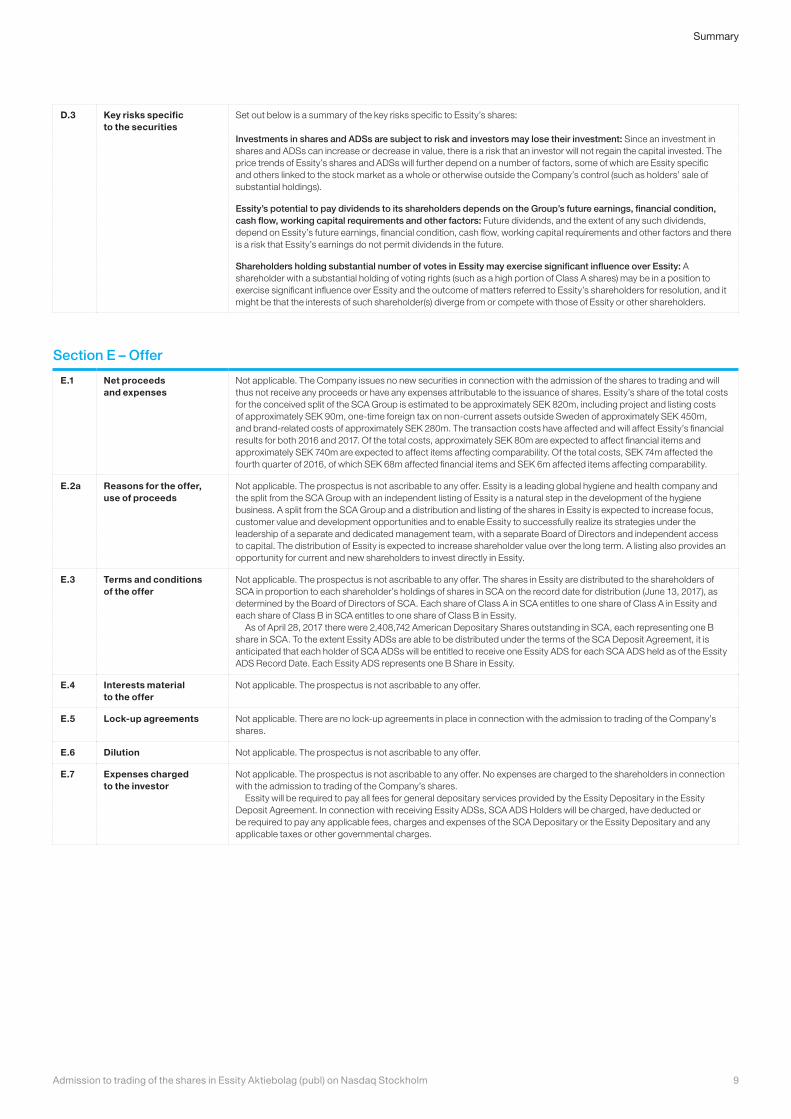
D.3 Key risks specific to the securities
Set out below is a summary of the key risks specific to Essity’s shares:
Investments in shares and ADSs are subject to risk and investors may lose their investment: Since an investment in shares and ADSs can increase or decrease in value, there is a risk that an investor will not regain the capital invested. The price trends of Essity’s shares and ADSs will further depend on a number of factors, some of which are Essity specific and others linked to the stock market as a whole or otherwise outside the Company’s control (such as holders’ sale of substantial holdings).
Essity’s potential to pay dividends to its shareholders depends on the Group’s future earnings, financial condition, cash flow, working capital requirements and other factors: Future dividends, and the extent of any such dividends, depend on Essity’s future earnings, financial condition, cash flow, working capital requirements and other factors and there is a risk that Essity’s earnings do not permit dividends in the future.
Shareholders holding substantial number of votes in Essity may exercise significant influence over Essity: A shareholder with a substantial holding of voting rights (such as a high portion of Class A shares) may be in a position to exercise significant influence over Essity and the outcome of matters referred to Essity’s shareholders for resolution, and it might be that the interests of such shareholder(s) diverge from or compete with those of Essity or other shareholders.
Section E – Offer
E.1 Net proceeds and expenses
Not applicable. The Company issues no new securities in connection with the admission of the shares to trading and will thus not receive any proceeds or have any expenses attributable to the issuance of shares. Essity’s share of the total costs for the conceived split of the SCA Group is estimated to be approximately SEK 820m, including project and listing costs of approximately SEK 90m, one-time foreign tax on non-current assets outside Sweden of approximately SEK 450m, and brand-related costs of approximately SEK 280m. The transaction costs have affected and will affect Essity’s financial results for both 2016 and 2017. Of the total costs, approximately SEK 80m are expected to affect financial items and approximately SEK 740m are expected to affect items affecting comparability. Of the total costs, SEK 74m affected the fourth quarter of 2016, of which SEK 68m affected financial items and SEK 6m affected items affecting comparability.
E.2a Reasons for the offer, use of proceeds
Not applicable. The prospectus is not ascribable to any offer. Essity is a leading global hygiene and health company and the split from the SCA Group with an independent listing of Essity is a natural step in the development of the hygiene business. A split from the SCA Group and a distribution and listing of the shares in Essity is expected to increase focus, customer value and development opportunities and to enable Essity to successfully realize its strategies under the leadership of a separate and dedicated management team, with a separate Board of Directors and independent access to capital. The distribution of Essity is expected to increase shareholder value over the long term. A listing also provides an opportunity for current and new shareholders to invest directly in Essity.
E.3 Terms and conditions of the offer
Not applicable. The prospectus is not ascribable to any offer. The shares in Essity are distributed to the shareholders of SCA in proportion to each shareholder’s holdings of shares in SCA on the record date for distribution (June 13, 2017), as determined by the Board of Directors of SCA. Each share of Class A in SCA entitles to one share of Class A in Essity and each share of Class B in SCA entitles to one share of Class B in Essity.
As of April 28, 2017 there were 2,408,742 American Depositary Shares outstanding in SCA, each representing one B share in SCA. To the extent Essity ADSs are able to be distributed under the terms of the SCA Deposit Agreement, it is anticipated that each holder of SCA ADSs will be entitled to receive one Essity ADS for each SCA ADS held as of the Essity ADS Record Date. Each Essity ADS represents one B Share in Essity.
E.4 Interests material to the offer
Not applicable. The prospectus is not ascribable to any offer.
E.5 Lock-up agreements Not applicable. There are no lock-up agreements in place in connection with the admission to trading of the Company’s shares.
E.6 Dilution Not applicable. The prospectus is not ascribable to any offer.
E.7 Expenses charged to the investor
Not applicable. The prospectus is not ascribable to any offer. No expenses are charged to the shareholders in connection with the admission to trading of the Company’s shares.
Essity will be required to pay all fees for general depositary services provided by the Essity Depositary in the Essity Deposit Agreement. In connection with receiving Essity ADSs, SCA ADS Holders will be charged, have deducted or be required to pay any applicable fees, charges and expenses of the SCA Depositary or the Essity Depositary and any applicable taxes or other governmental charges.
9Admission to trading of the shares in Essity Aktiebolag (publ) on Nasdaq Stockholm
Summary
Risk factors
Any investment decision is associated with risk. It is important to carefully analyze the risk factors considered to be of importance in relation to the Company and the future performance of its shares. The risks currently considered to be of importance to the Company are described below, without being ranked in any particular order of importance. There are risks both regarding circumstances linked to Essity and/or the industry in which it operates and those that are of a more general nature, as well as risks associated with the shares. Some risks are beyond Essity’s control. The description below does not purport to be complete and all risk factors cannot be predicted or described in detail. Therefore, an overall assessment must also include other information in the prospectus, as well as a general assessment of extraneous factors. The below risks and uncertainty factors may have an adverse effect on Essity’s business, financial condition and/or results of operations. They may also cause the shares in Essity to decrease in value, which may result in Essity’s shareholders losing all or part of their invested capital. Additional factors of which Essity is currently unaware, or which currently are not deemed to represent risks, may also have corresponding negative effects.
Risks related to Essity’s operations and its industry
Essity is exposed to changes in general economic and political conditions Essity conducts operations in several parts of the world and, similar to other companies, is affected by general global economic, financial and political circumstances. The demand for Essity’s products depends, among other things, on general macroeconomic trends, including recession, inflation, deflation, general weakness in retail markets and changes in consumer purchasing power. Any uncertainties regarding future economic prospects, including political unrest, that affect consumer spending habits could have an adverse effect on consumer purchases of Essity’s products and adversely affect Essity’s business, financial condition and results of operations.
Additionally, considering that a substantial proportion of Essity’s revenue derives from sale of products that are subject to governmental subsidies, any decrease in reimbursement levels due to e.g. governmental cost saving initiatives, may negatively impact consumers’ choices to purchase the Company’s products.
Furthermore, changes in the political situation in a region or country, or political decisions affecting an industry or country, could also materially impact sales of Essity’s products. These include recent political events, such as the United Kingdom’s vote to leave the European Union and the outcome of the United States presidential election, that have created uncertainty regarding for example future European Union and United States economic and trade policies.
Any adverse development involving global or regional factors of the type mentioned above could have an adverse effect on Essity’s business, financial condition and results of operations.
Essity’s operations in certain emerging economies may be adversely affected by political, economic and legal developments in these countriesEssity’s business operations are expanding in countries in which the political, economic, legal and regulatory systems are less predictable than in countries with more developed institutional structures. Political or economic upheaval, changes in laws and other factors (such as foreign exchange controls and local labor hiring requirements) could
have an adverse effect on Essity’s business, financial condition and results of operations and/or impair the value of its investments in such countries.
The establishment or enforcement of foreign exchange restrictions could prevent Essity from receiving profits from, or from selling, its investments in these countries. For example, China, where Essity through its ownership in Vinda International Holdings Ltd (“Vinda”) is one of the largest providers of hygiene products, imposes foreign exchange controls on foreign companies.
Competition, changes in consumer patterns and the inability to innovate and keep up with consumer patterns and trends may have an adverse effect on the sales of Essity’s productsEssity experiences competition in each of its Business Areas. There are several major competitors, of various number and size depending on the Business Area, some of which have larger production capacity than the Essity entity operating in that Business Area. Also, retailers’ and distributors’ marketing of own branded products (private label) result in competition with Essity branded products. The competition is driven by, among other things, brand recognition and loyalty, as well as product innovation, quality and performance, price, service, proximity to customers and distribution capabilities. It is not certain that Essity is successful in developing and introducing new or improved products as necessary for achieving and/or maintaining its position within different product categories. If Essity’s competitors were to increase their production capacity or marketing activities and/or sell substitute products (for example different products with a similar function as Essity’s products, such as cloth diapers, cloth rags for household or industrial cleaning, or completely different solutions to the needs of customers and consumers, such as electric hand dryers), the increased supply in the market may lead to Essity experiencing pricing pressure to remain competitive, which could reduce its sales. Inherent risks in Essity’s competitive strategy include uncertainties concerning trade and customer acceptance, the effects of consolidation of retailers and other customers and competitive reactions.
In addition, Essity’s success depends on the value and attractiveness of its brands and products to consumers around the world and on its ability to innovate and remain competitive. Consumer
Admission to trading of the shares in Essity Aktiebolag (publ) on Nasdaq Stockholm10
Risk factors
tastes, preferences and behaviors with regards to Essity’s products are constantly changing and the Company’s failure to anticipate, identify or react to these changes could result in a reduced demand for the Company’s products, which would adversely affect its operating results and profitability.
Competitive pressures, as well as adverse developments involving consumer demand and other factors that could impact the price or competitiveness of the Company’s products, could have an adverse effect on Essity’s business, financial condition and results of operations.
Essity is subject to competition law risksEssity is subject to competition laws in the jurisdictions in which it operates. Competition authorities have the power to initiate ex-post regulatory procedures and to require a party to cease applying contractual terms, prices and practices that are found to be anti-competitive. Competition authorities also have the power to impose fines and other sanctions as a result of non-compliance with relevant regulatory requirements. Essity is currently subject to investigations by competition authorities in certain countries. The outcomes of these investigations are uncertain. In addition, in 2016 competition authorities have imposed sanctions on Essity in Spain and Poland and on a joint venture in Colombia to which Essity is a party. The decisions have been appealed by Essity. Essity has made provisions in its financial statements of SEK 556m as of March 31, 2017 in order to cover litigation costs and potential sanctions related to these investigations and litigations. There is a risk that the measures taken by Essity, and that may be taken henceforth, to handle issues related to competition law have not prevented instances of non-compliance in the past or that no such non-compliance may occur in the future.
Essity’s market strength in some relevant markets may also entail an obligation to comply with the competition law rules prohibiting the abuse of a dominant position or otherwise restricting the activities of the Company. Merger control regulations also put constraints on potential strategic acquisitions within the European Union as well as in some other markets.
Essity is dependent on certain key customers and distributorsSuccessful customer relationships are vital to Essity’s business and continued growth. Maintaining strong relationships with its existing customers and building relationships with new customers are necessary to ensure that Essity’s brands are well presented to consumers and available for purchase at all times. The strength of Essity’s customer relationships also affects the ability to obtain competitive pricing and trade terms.
Retail customers represent Essity’s single largest customer group and thus the performance of this market has considerable impact on Essity’s overall performance. In 2016, approximately 63% of Essity’s sales were made to the retail trade, through both Essity’s brands and retailers’ brands. Essity also relies on other distributors or retailers to access certain markets. If such distributors or retailers are not successful in their sales of Essity’s products or if they fail to access these markets, this could consequently impact Essity’s overall performance and thereby also have an adverse effect on Essity’s business, financial condition and results of operations.
There is a general trend towards market consolidation taking place within several of Essity’s sales channels, which has resulted in an increased dependence on certain customers. For example, in the retail trade sector, this trend has resulted in fewer retail companies at a national and regional level. Essity also uses distributors, such as Bunzl, Sysco, Network and INPACS, mainly for the Professional Hygiene Business Area. In 2016, Essity’s ten largest customers accounted for 21% of Essity’s total net sales. The single largest customer accounted for 4% of the net sales. Most of these customers were retail companies. Within the B2B-business of the Professional Hygiene Business Area, there is also an important reliance on customers such
as large restaurant chains (for example Burger King and McDonalds). The ten largest customers also include some large distributors of the Professional Hygiene Business Area. The general market consolidation and increase in dependence could have an adverse effect on Essity’s business, financial condition and results of operations.
Essity is dependent on certain key suppliers and any disruptions in the supply as well as price adjustments could result in increased costs as well as adversely affect Essity’s ability to deliver orders to its customersEssity is dependent on certain suppliers for raw materials, key input goods (such as pulp, superabsorbent and non-woven materials), finished goods (such as wipes, wipers, soap, lotions and wound care products) as well as for its supply of energy (such as electricity, natural gas and to some extent petroleum-based fuels), and such raw materials and input goods account for a significant part of Essity’s total costs. Further, Essity’s supply chain network is exposed to potentially adverse events, such as physical disruptions, inefficient ordering and forecasting processes, environmental and industrial accidents or bankruptcy of key suppliers, which could impact Essity’s ability to deliver orders to its customers.
The loss of key suppliers or the inability of key suppliers to provide input goods could also result in costs for Essity or in problems in its manufacturing resulting in an inability for Essity to deliver products to its customers, which could have an adverse effect on Essity’s business, financial condition and results of operations.
Further, the market prices of many of the input goods and raw materials (including energy) used in the manufacturing of Essity’s products fluctuate over time due to, among other things, availability, supply and demand, energy costs, transportation costs, exchange rate fluctuations as well as local and national regulatory decisions. If Essity is not able to manage costs, the impact of price movements on input goods may adversely affect Essity’s business, financial condition and results of operations.
Damage to the reputation of Essity or to one or more of the Group’s brands could have an adverse effect on Essity’s businessDeveloping and maintaining Essity’s reputation, including the brands within the Group’s portfolio, is a critical factor for Essity’s relationship with consumers, customers, suppliers and others. An inability to address adverse publicity or other issues, including concerns about product safety, quality or efficacy, real or perceived, could negatively impact sentiment towards Essity and its products and brands, and Essity’s business, financial condition and results of operations could suffer. Consumers’ increasing reliance on social media for information could heighten the risk of adverse publicity, potentially with negative perception of Essity’s products or brands. Essity’s business, financial condition and results of operations could also be adversely affected by the effects of a significant product recall, product-related litigation, allegations of product tampering or contamination, the distribution and sale of counterfeit products or a failure or breach of Essity’s information technology systems.
Further, Essity is dependent on the marketing of its brands, products and solutions in order to promote its offering and to maintain and enhance the strength of the brands used within the Group. The Company’s marketing materials are often based on market data and other statistics obtained from external reliable sources, but compiled, analyzed and presented by the Company itself, such as statements on, among other things, Essity’s market position in various jurisdictions or product categories. There is a risk that conclusions made in such market material may be challenged by competitors and others, which could result in claims or negative publicity. Any such claims or negative publicity, irrespective of being accurate or not, could damage Essity’s reputation and have an adverse effect on the Company’s business.
11Admission to trading of the shares in Essity Aktiebolag (publ) on Nasdaq Stockholm
Risk factors
In addition, Essity conducts sales in about 150 countries through its subsidiaries and together with various business partners in markets and environments where unethical business practices and violations of human rights may occur. The working practices and cultures of such partners can increase the risk of being associated with such practices, if any. These risks may also be increased in connection with the Company’s acquisition of businesses that have operations in countries typically associated with unethical business practices and human rights violations. If Essity is associated with such practices, it may suffer damage to its reputation and incur fines and other legal sanctions as well as decrease Essity’s sales, which could have an adverse effect on Essity’s business, financial condition and results of operations.
Essity’s continued long-term success is dependent on its employees and managementEssity’s access to skilled and motivated employees and competent managers is essential to achieve established strategic and operational objectives. Essity is particularly dependent on its Executive Management team and on certain key employees. It is therefore important that Essity is successful in attracting and retaining employees with appropriate skills in the future. This may be especially challenging in Essity’s key emerging markets where there can be a high level of competition in a limited talent pool. The loss of management or other key personnel or the inability to identify, recruit and retain qualified personnel could make it difficult to manage Essity’s business and could adversely affect Essity’s financial condition and results of operations.
Unsuccessful product category expansion as well as unsuccessful expansion into new geographical markets may have an adverse effect on Essity’s business Essity’s business strategy includes expansion into new product categories as well as expansion of new types of products within existing product categories. For example, in April 2017, Essity completed the acquisition of BSN medical, a provider of medical solutions products, which is a new product market for Essity. Also, during 2016, Essity further developed its customer and consumer offering and launched 23 new innovations. There is a risk that Essity’s current or future expansion in these or other categories will not be successful. If Essity’s future product expansion is unsuccessful, this may have an adverse effect on Essity’s business, financial condition and results of operations.
The sales of Essity’s products in new geographical markets are managed by agents or by subsidiaries within the Group. Essity is also involved in manufacturing operations in certain foreign markets, through joint ventures in cooperation with other manufacturers or wholly-owned subsidiaries. The entering into new geographical markets entails risk related to, among other things, local legal requirements, business climate and common business practices and ethics. If the conditions in these jurisdictions change or differ from Essity’s expectations, an expansion could involve new and increased risks for Essity, and consequently have an adverse effect on Essity’s business, financial condition and results of operations.
Essity derives a substantial portion of its sales from contracts with public institutions and depends on its ability to win or renew contracts on favorable termsEssity derives a substantial portion of its sales from public institutions (including public hospitals and healthcare facilities), pursuant to procurement contracts with such institutions. When these contracts expire, the sale of relevant products and solutions are normally subject to a new tender process in which Essity is required to compete in order to renew the contract. There is a risk that Essity will not be able to renew its contracts or win new tenders on acceptable terms, or at all.
In tender processes, Essity must compete primarily on the basis of pricing, quality of products and environmental impact of solutions in order to win or renew contracts, but tender processes also focus on other considerations, such as market competition concerns, which may be partly or wholly outside the Company’s control. Essity’s failure to win or renew contracts on equally or more favorable terms, or at all, or to offset reduced prices through increased productivity could have an adverse effect on Essity’s business, financial condition and results of operations.
Essity is exposed to risks in relation to acquisition and integration of new businesses and divestment of existing businesses, as well as in relation to restructuring of current and future operations and facilities Success in Essity’s acquisition strategy depends on several factors, including the ability to identify suitable targets, reach agreements on acceptable acquisition terms and secure financing for such acquisitions. There is a risk that Essity will not be able to source a sufficient number of attractive targets available for acquisition, negotiate favorable terms for future acquisitions or secure the necessary financing. There are also business risks, tax risks, legal risks and financial risks associated with acquiring and integrating companies into Essity’s existing business operations, including, without limitation, exposure to unknown obligations as well as acquisition and integration costs that are higher than expected.
Essity’s assessments and assumptions regarding possible or implemented acquisitions (including assumptions regarding synergies) may prove to be incorrect or that obligations, contingent liabilities or other risks previously unknown to Essity might arise. Likewise, Essity’s assessments and assumptions concerning the return on investments or the possibilities and prospects for organic growth may prove to be incorrect.
Essity periodically divests operations that no longer fit Essity’s strategy. Several factors affect success in any divestment, including Essity’s ability to identify a buyer and negotiate acceptable terms. In addition, there is a risk that Essity might be required to provide certain warranties and undertakings in connection with such divestments. In the future, Essity may find it difficult to divest operations or assets or might fail to successfully complete such divestments on terms favorable to Essity.
Further, Essity has historically implemented a number of structural changes, such as moving or closing down production facilities and starting up new facilities, and has expanded geographically. Any future changes, such as the closure or starting up of production facilities, might negatively affect employee, supplier and customer relationships and entail realignment difficulties, longer lead times and production interruptions. These factors could have an adverse effect on Essity’s business, financial condition and results of operations.
Disruptions to operations could have an adverse effect on Essity’s operations and customer service levelsEssity’s manufacturing processes rely on a production chain that is dependent on the continuous operation of critical production equipment, including machinery, computer and electrical equipment as well as site infrastructure and supply of raw materials and energy. Therefore, production downtime may occur as a result of unanticipated technical failures or other events. Disruptions in any part of the production chain can rapidly have serious repercussions on the entire process, including the Company’s ability to distribute products to its customers. Essity has a number of production facilities across over 30 countries and many of these facilities carry out production on an ongoing basis. Given the nature of the Company’s business, production facilities, including warehouses, have experienced, and may in the future experience, plant shutdowns or periods of reduced production as a result of such equipment failures or accidents (such as fires experienced in the Group’s warehouses in Mannheim 2004 and in
Admission to trading of the shares in Essity Aktiebolag (publ) on Nasdaq Stockholm12
Risk factors
Mexico 2016). Operations (including production and distribution) may also be disrupted for a variety of other reasons including civil unrest or civil disobedience, natural disasters (for example, earthquakes, flood, snow, fires or other natural disasters or other force majeure events), cyber-attacks, terrorist attacks, flooding, release of substances harmful to the environment or health, strikes, transportation disruptions or other events occurring in the regions where it carries out its operations.
Furthermore, accidents may lead to production downtimes with respect to certain machinery or plants or even plant closures, including for the duration of any ongoing investigation, which could also impact the Company’s ability to distribute its products. To the extent disruptions cause a loss of production that are not covered by the Company’s insurance protection or that cannot be compensated for by increasing production in unaffected facilities, such disruptions could have an adverse effect on Essity’s business, financial condition and results of operations.
Essity is subject to stringent health and safety laws and regulations that may give rise to significant costs and liabilities Essity is subject to a broad range of health and safety laws and regulations in each of the jurisdictions in which it operates and these laws and regulations impose increasingly stringent health and safety protection standards. The costs of complying with, and the liabilities imposed pursuant to, health and safety laws and regulations could be significant, and failure to comply could result in the assessment of civil and criminal penalties, suspension of permits, temporary or permanent closure of production facilities or claims or lawsuits by third parties.
Given the nature of its operations, Essity is subject to the risk of industrial accidents that could lead to production stoppages, the loss of key assets and employees (and those of sub-contractors and suppliers) or injuries to persons living near the affected sites. The occurrence of any of these events could prevent or delay production, increase production costs and result in injury or death to employees, damage to property and liability for Essity, as well as substantially harm Essity’s reputation, which could have an adverse effect on Essity’s business, financial condition and results of operations.
Essity is exposed to environmental risks which may have an adverse effect on Essity’s business, financial condition and results of operationsEssity’s operations and the products used in the production processes have an impact on air, water, land and biological processes and Essity is subject to a wide variety of environmental regulations in multiple jurisdictions around the world. Compliance with these rules and regulations at the federal, state, provincial and local levels is important for Essity’s ability to continue its operations. As these environmental regulations are amended or as their application or enforcement is changed, significant costs in complying with new and more stringent regulations may be imposed on Essity. There is a risk that Essity will incur significant additional environmental costs and liabilities in the future (which may include paying for remediation of contaminations, for example if a certain production site is closed and the land will be used for other purposes). In addition, it is not certain that the businesses Essity has acquired, prior to the acquisition, always complied with all applicable environmental regulations.
Further, violations of applicable environmental laws and regulations could result in civil and criminal penalties, revocation of permits and licenses, the curtailment or cessation of operations, third-party claims or any combination thereof, any of which could have an adverse effect on Essity’s business, financial condition and results of operations.
Disruptions and faults in Essity’s IT systems as well as violations of data protection legislation may have an adverse effect on Essity’s business, financial condition and results of operationsEssity relies on IT systems (including its financial systems and logistics systems) for its day-to-day operations. Any disruptions or faults in these critical systems, including those caused by sabotage, computer viruses, operator errors, software errors or termination of IT agreements could impact Essity’s business and the reporting of its results, and consequently have an adverse effect on Essity’s business, financial condition and results of operations.
Disruption or faults in the IT systems may also impact Essity’s handling of personal data. Essity’s operations are subject to data protection legislation in various jurisdictions, for example in the European Union and in the United States. Relevant rules require, among other things, that requisite routines be in place for the processing, storage and deletion of personal data; that individuals be correctly informed regarding Essity’s processing of personal data; and that Essity has put in place the required procedures to comply with applicable rules. There is a risk that the measures taken by Essity in order to adjust and improve its processes and routines prove to be insufficient, and that unauthorized disclosure or incorrect processing of personal data occurs. This may give rise to adverse publicity and damage Essity’s reputation and lead to loss of customers and revenue. It may also result in fines, claims in damages from individuals and injunctions from supervisory authorities to effect rectification. Non-compliance with data protection legislation could thereby have an adverse effect on Essity’s business, financial condition and results of operations.
Essity employs a largely unionized labor force and Essity could be subject to organized labor actions, including work stoppages that could have an adverse effect on its businessUnion involvement varies among Essity’s countries of operation, but on average 58% of Essity’s employees are covered by collective agreements. There is a risk that Essity will not be able to maintain its stable relations with unions nor to negotiate salary agreements or labor conditions that meet the union demands. This could, in its turn, entail that Essity becomes subject to strikes and/or work stoppages before or during the negotiation process. Historically, the Group has experienced strikes and other incidents leading to work stoppages. For example, during first half of 2016 one of Essity’s joint ventures in Turkey experienced labor actions causing major disturbances to the production. Any such incidents could have an adverse effect on Essity’s business, financial condition and results of operations.
Certain operations carried out by Essity require permits, licenses, authorizations, approvals and notificationsFor certain parts of Essity’s operations and for the manufacturing, marketing and sale of certain products, Essity is required to obtain permits, licenses, authorizations and/or approvals from or to make notifications to various governmental authorities. For example, Essity is required to obtain permits under applicable environmental legislation for its operations related to paper manufacturing. Also, health care products from BSN medical are classified and CE marked under the European Union Medical Device Directive and respective national legislation, and similarly, in the United States, BSN medical’s products are regulated as medical devices under the jurisdiction of the United States Food and Drug Administration (FDA). In order for Essity to conduct its operations, the Company is dependent on being able to procure and maintain permits, licenses, authorizations and/or approvals or to duly notify the relevant authority. It is possible that permits, licenses, authorizations and/or approvals required for Essity in order to carry out its operations cannot be procured on reasonable terms or at all. It may also be uncertain whether Essity,
13Admission to trading of the shares in Essity Aktiebolag (publ) on Nasdaq Stockholm
Risk factors
following an application, will ultimately be granted such permit, license, authorization or approval.
In the event notifications or the granting or renewals of permits, licenses, authorizations and/or approvals necessary for the operations are delayed, if it is unsuccessful or if the conditions set forth in the permits, licenses, authorizations and/or approvals obtained by Essity cannot be fulfilled, or if Essity conducts operations without the necessary notifications, permits, licenses, authorizations and/or approvals, this may have an adverse effect on Essity’s business, financial condition and results of operations.
Essity is exposed to corporate governance and policy risksEssity faces the risk that its employees and Executive Management team make decisions that do not comply with Essity’s strategy, internal guidelines or policy documents. Further, employees and the Executive Management team of Essity may commit acts that are unethical, illegal or that otherwise conflict with applicable laws and regulations. If Essity’s internal controls and other compliance measures prove insufficient, Essity could suffer damage to its reputation, be subject to fines and regulatory penalties and suffer an adverse effect on its business, financial condition and results of operations.
Essity may be adversely affected by product liability claims against it, or other product-related claims or recallsGiven the nature of Essity’s operations, Essity has been, and may in the future become subject to product liability and other claims and recalls if the products it sources and produces are defective or are alleged to be defective or cause or are alleged to have caused personal injury or property damage. Damage to persons or property caused by a defective, wrongfully designed or wrongfully assembled product falling short of acceptable quality standards, may thus have a negative effect on Essity’s business, financial condition and results of operations. If Essity is made aware of a large-scale product defect, it may be required to recall all such affected products. Further, Essity may be unable to be fully indemnified for its losses arising from defects caused by its business partners, including its own suppliers. Moreover, there is a risk that product liability claims, other product-related claims or recalls cannot be fully covered by Essity’s insurance policies. Product liability claims, warranty claims and recalls could have an adverse effect on Essity’s business, financial conditions and results of operations.
Failure to protect intellectual property rights could have an adverse effect on Essity’s business, financial condition and results of operationsEssity considers its current and future intellectual property as important to its success and relies on a combination of patents, trademarks and contractual rights to protect its intellectual property rights. However, there is a risk that the measures Essity takes in order to keep its know-how confidential, to develop new products and technologies in reliance of non-disclosure agreements and certain other protective agreements, and overall to protect its intellectual properties, will not provide an effective protection for its intellectual properties. Competitors may misappropriate intellectual property owned by Essity, disputes as to the ownership rights of intellectual property may arise or intellectual property may otherwise become known or independently developed by competitors.
The laws of some foreign jurisdictions in which Essity operates do not protect intellectual property rights to the same extent as do the laws of Sweden, and therefore Essity’s means of protecting its proprietary rights abroad may not be adequate. Moreover, there is a risk that Essity may be found or is alleged to have infringed upon intellectual property rights of third parties. For example, certain technologies and processes licensed by Essity may be subject to the intellectual property rights of third parties. Third parties may take legal action for alleged infringement of these intellectual property rights
and any such claims could result in costs for defending or settling any disputes, and may result in a delay or may prevent the delivery of Essity’s products. Failure to protect Essity’s intellectual property or resulting claims of infringement on third-party intellectual property rights could have an adverse effect on Essity’s competitiveness and thus on its business, financial condition and results of operations.
Essity’s tax burden could increase due to changes in tax laws or regulations or their interpretation or applicationEssity’s tax burden could significantly increase due to changes in tax laws or regulations. Changes in the tax rules may adversely impact Essity both as one-time effects, such as revaluations of tax assets and liabilities, and on a recurring basis. There are also risks in the interpretation or application of tax rules that may result in an increased tax burden for Essity. Additional taxes (including, but not limited to, income taxes, withholding taxes, real estate taxes, capital taxes, stamp duties and value-added taxes) could be assessed against Essity and lead to an increase in Essity’s tax liabilities.
Due to the international nature of Essity’s business, Essity is subject to the various tax laws and regulations of several jurisdictions. Both the rules governing in which jurisdictions Essity is liable to tax and rules on how Essity’s tax burden shall be distributed between jurisdictions include interpretations that differ from time to time and from jurisdiction to jurisdiction. International transfer pricing guidelines require related enterprises in the Essity Group to conduct all inter-company transactions on an arm’s length basis but the guidelines will be subject to the interpretation by the individual jurisdictions. Tax authorities have historically, and may in the future challenge Essity’s compliance with applicable rules. This has in the past resulted, and may in the future result, in disputes or litigation, the outcome of which may adversely impact Essity’s tax position. Further, Essity has grown by means of a number of acquisitions. Acquisitions generally entail exposures of current and future tax positions relating to the targets of the acquisitions.
Any such additional tax exposure in relation to the above could have an adverse effect on Essity’s business, financial condition and results of operations.
Essity is, and may in the future become, involved in governmental, litigation and other similar proceedings that could adversely affect Essity’s business, financial condition and results of operationsEssity is, and may in the future become, involved in disputes related to the Company’s business activities and risks being the subject of civil claims and disputes concerning, among other things, agreements, product liability or defective supply of goods or services. In addition, the Group companies (including the companies’ officers, directors, employees or affiliates) may become subject to regulatory or criminal investigations and proceedings concerning, amongst other things, environmental, tax, competition or health and safety issues. Disputes or proceedings of this kind can be time consuming and protracted, disrupt normal operations, negatively affect customer relations and result in administrative and/or criminal sanctions and remedies as well as other considerable associated costs. Furthermore, should Essity be held liable pursuant to any such disputes or proceedings, there is a risk that any penalties assessed cannot be covered in full by Essity’s insurance policy. Future disputes, claims, investigation and proceedings may have an adverse effect on Essity’s business, financial condition and results of operations.
Essity’s insurance policies may provide limited coverage, potentially leaving it uninsured against certain risksThere is a risk that Essity’s insurance policies, in respect of inter alia property, equipment and business interruption as well as certain consequential losses, will not provide an adequate protection against all risks, and insurance against all types of risks may not be available.
Admission to trading of the shares in Essity Aktiebolag (publ) on Nasdaq Stockholm14
Risk factors
The occurrence of an accident or other incidents that causes losses in excess of limits specified under the relevant policy or losses arising from events not covered by insurance policies could have an adverse effect on Essity’s business, financial condition and results of operations.
Financial risksThe business of Essity may be adversely affected by liquidity and refinancing risk Essity’s ability to finance its on-going operations or refinance its outstanding debt depends on a number of factors, including the availability of cash flow from operations and access to additional sources of financing, and it is not certain that such funds will be available at commercially reasonable costs, if at all. Further, it is not certain that Essity will be able to incur additional debt and/or refinance its outstanding debt when it matures. Essity may face liquidity and refinancing risk in the event that it is unable to meet its payment obligations as a result of insufficient liquidity or difficulty in rolling over its debt.
If Essity is unable to secure sufficient financing on favorable terms, due to either market conditions generally or factors specific to its business, Essity may not have sufficient cash to implement its business strategy, fund acquisitions or meet ongoing financing needs, which in turn could have an adverse effect on Essity’s business, financial condition and results of operations.
Reduced credit rating for Essity’s long-term debt could have a negative effect on financing costs and access to financingEssity’s borrowing costs and the access to financing depend significantly on the Company’s credit ratings. These ratings are assigned by rating agencies, who may reduce or withdraw their ratings. A reduction in Essity’s credit ratings could increase its borrowing costs and limit the access to the capital markets and other sources of financing. This, in turn, could reduce profits and have an adverse effect on Essity’s business, financial condition and results of operations.
Exchange rate fluctuations could adversely affect Essity’s financial condition and results of operationsEssity is exposed to exchange rate risk in several ways. Exchange rate movements in export revenues and import expenses could negatively impact Essity’s operating profit and the cost of non-current assets. Further, Essity’s result is affected by the translation of foreign subsidiaries’ income statements to SEK. There is a risk that current or future hedging measures will fail to provide Essity with sufficient protection against the adverse effects of exchange rate fluctuations. In addition, the effectiveness of Essity’s hedging activities is largely dependent on the accuracy of its assumptions and forecasts. Any incorrect assessments affecting such assumptions or forecasts may have an adverse effect on Essity’s business, financial condition and results of operations.
Interest rate increases may have a negative impact on EssityEssity is exposed to risk stemming from interest rate fluctuations, which could adversely affect its net financial income. Interest rates fluctuate based on a number of factors beyond Essity’s control, including but not limited to, the macro-economic policies of governments and central banks in jurisdictions in which Essity conducts its operations. Any increase in rates could increase Essity’s interest rate obligations (for example in relation to the Group’s credit facilities and loans), which may have an adverse effect on Essity’s business, financial condition and results of operations.
There is a risk that current or future hedging measures will fail to provide Essity with sufficient protection against the immediate adverse effects of interest rate movements. In addition, the effectiveness of Essity’s hedging activities is largely dependent on the accuracy of
its assumptions and forecasts. Any incorrect assessments affecting such assumptions or forecasts may have an adverse effect on Essity’s business, financial condition and results of operations.
Essity is exposed to credit risksEssity is exposed to credit risk, including the risk of losses due to failure by Essity’s customers or counterparties in financial agreements to meet their payment obligations. There is a risk that Essity’s reviews of its customers’ payment capacity is proven to be insufficient or inaccurate. Credit risk exposure under Essity’s financial agreements includes exposure against counterparties in derivative instruments, leasing transactions and other financial investments and arrangements. The failure by customers and counterparties under financial agreements to fulfil payment obligations towards Essity may have an adverse effect on Essity’s business, financial condition and results of operations.
Essity may face impairment charges to the value of its goodwill and other intangible assetsGoodwill represents a significant part of Essity’s balance sheet. Essity does not amortize its goodwill, but rather tests it annually for any impairment and recognizes such impairments on its balance sheet as soon as there are any indications that the asset in question has diminished in value. Essity routinely monitors relevant circumstances affecting Essity’s operations and Essity’s general financial condition, as well as the possible impact such circumstances may have on the valuation of Essity’s goodwill and other intangible assets. It is possible that changes in such circumstances, or in any of the assumptions that Essity relies on in valuing its goodwill or other intangible assets, may require Essity to recognize impairment charges in the future. Goodwill impairment or amortization of other intangible assets and charges associated therewith, may have an adverse effect on Essity’s business, financial condition and results of operations.
Essity’s pension benefit obligations may exceed the reserve created for these obligationsWithin Essity there are defined benefit pension plans with unfunded exposures. The valuation of the defined benefit pension plans is dependent on market conditions, actuarial methods and the assumptions used as well as known pension obligations as of the valuation date. A decrease in the value of pension assets or different actuarial assumptions could lead to increased pension obligations. A decline in interest rates or the market value of the securities covered by the plan, a longer life expectancy for participants in the pension plan, a change in the discount rate, a change in the investment strategy used by the pension plan trustee or certain other changes may adversely affect the pension plan and affect the level and the timing of the necessary provisions and premium payments, and thereby increase Essity’s pension spending and reduce its profitability. Any shortfall in financing obligations for benefit pensions may exceed the reserve that have been created for these obligations and require additional funding.
Risks related to the distribution of Essity sharesThe distribution of Essity may fail to realize anticipated benefits The intended purpose of the distribution of Essity is to enhance the ability of each business to successfully implement its strategies and unlock value for the shareholders of Essity and SCA. However, there is a risk that the anticipated benefits of the distribution will not be achieved if the assumptions underlying the decision to carry out the distribution turn out to be incorrect. For example, Essity, as a standalone company, may not be able to procure external financing or other financial services on conditions as favorable as obtainable by the SCA Group, as constituted before the distribution. Moreover, to the extent that Essity as a standalone company incurs additional costs, achieves lower profits or has lower-than-expected cost savings, its business, financial condition and results of operations could be
15Admission to trading of the shares in Essity Aktiebolag (publ) on Nasdaq Stockholm
Risk factors
adversely affected and the anticipated benefits from the distribution could fail to be realized.
Indemnifications provided in connection with the split from the SCA Group may result in unforeseen costs for EssityUnder the asset transfer agreement entered into between Essity and SCA, Essity and SCA have agreed that SCA, as a main rule, will indemnify Essity for claims and obligations clearly attributable to SCA’s forest operations and, correspondingly, Essity will indemnify SCA for claims and obligations clearly attributable to Essity’s operations. Liabilities that cannot be allocated by applying the main rule, shall be allocated by applying the allocation principle, which entails that the liability shall be allocated by 85% to Essity and by 15% to SCA. The allocation principle is based on the SCA Group’s and the Essity Group’s respective representation of total net sales for the SCA Group as constituted before the distribution, at year end 2016. Should there occur unforeseen significant liabilities pertaining to the Essity business that would trigger Essity’s indemnification liability, this could lead to increased costs for the Company. Further, if Essity and SCA fail to agree on the application of the main rule or the allocation principle in any matter, the matter may finally need to be resolved in arbitration procedures, which may both be protracted and costly for Essity.
Following the distribution, Essity will be a more streamlined organization with a different asset pool, which may have an adverse effect on the Group’s ability to handle unforeseen costsThe asset pool of Essity as a standalone company will be smaller than the combined asset pool in the current SCA Group. Accordingly, every risk that currently exists in the SCA Group and that will continue to exist in Essity after the distribution may be of greater proportional significance to such business than for the SCA Group as constituted before the distribution. This may concern, for example, the capability to manage unforeseen claims and expenses of material significance. Any major unforeseen claims and costs could, therefore, have an adverse effect on Essity’s business, financial condition and results of operations.
Risks related to the shares
Investments in shares and ADSs are subject to risk and investors may lose their investmentRisk and risk-taking are unavoidable aspects of share ownership. Since an investment in shares and ADSs can increase or decrease in value, there is a risk that an investor will not regain the capital invested. There is a risk that the market will not react favorably to the distribution of the Essity shares, and investors may perceive the standalone companies less favorably than the SCA Group, as constituted before the distribution. The price trends of Essity’s shares and ADSs will further depend on a number of factors, some of which are Essity specific and others linked to the stock market as a whole or otherwise outside the Company’s control (such as holders’ sale of substantial holdings). These factors could also increase share price volatility. Consequently, every decision to invest in shares and ADSs should be preceded by a thorough analysis.
There is a risk that an active, liquid and functioning markets for trading in Essity’s shares or ADSs does not emergePrior to the listing on Nasdaq Stockholm, no public market exists for Essity’s shares and prior to Essity’s establishment of a “Level I” ADR Program, there was no market for its ADSs. Accordingly, there is a risk that an active market for trading in the shares or the ADSs will not develop following the listing of the shares on Nasdaq Stockholm and the creation of the ADR Program for Essity shares, respectively.
Furthermore, there is a risk that the liquidity of Essity’s shares of Class A will be more limited than the liquidity of Essity’s shares of Class B (among other things due to lower number of Class A shareholders
and Class A shares in issue). Low liquidity of Essity’s shares of Class A could entail difficulties in selling shares of Class A at a point in time that is considered desirable for the shareholder or at a price level that could be obtained if a favorable liquidity situation prevailed.
Under Essity’s ADR Program investors will trade ADSs in the United States in the over-the-counter (“OTC”) market. The OTC market is a significantly more limited and less regulated market than the national exchanges, and as a result, trading volume in the ADSs may be limited and investors may not have sufficient liquidity, which may make it more difficult for holders of the ADSs to sell their securities. It is not certain that the ADSs will continue to be traded on the OTC market or any other trading market.
Holders of shares or ADSs in the United States or other countries outside Sweden may not be able to participate in any potential future rights issuesIf Essity issues additional new shares with preferential rights for existing shareholders, shareholders in certain other countries may be subject to limitations that prevent them from participating in such rights offerings, or that otherwise makes participation difficult or limited. For example, shareholders and Essity ADS Holders (as defined below) in the United States may not be able to exercise any rights to subscribe for new shares unless a registration statement under the Securities Act is effective in respect to such shares or an exemption from the registration requirements under the Securities Act is available. Essity does not currently expect to prepare such a registration statement in the event it were to offer new shares. Other shareholders in jurisdictions outside Sweden may be similarly affected. Essity is under no obligation to file a registration statement under the Securities Act or to seek similar approvals or relevant exemptions under the laws of any other jurisdiction outside Sweden, and attempting to do so in the future may be impractical and costly. To the extent that Essity’s shareholders in jurisdictions outside Sweden are not able to subscribe for new shares in any future rights issues, their proportional interests in Essity will be reduced.
Essity’s potential to pay dividends to its shareholders depends on the Group’s future earnings, financial condition, cash flow, working capital requirements and other factorsShareholders of Essity are entitled to receive dividends (assuming dividends are resolved by the Annual General Meeting) as of the date on which the shareholders are included in the share register maintained by Euroclear Sweden. Future dividends, and the extent of any such dividends, depend on Essity’s future earnings, financial condition, cash flow, working capital requirements and other factors. There are also many risks that could adversely impact Essity’s operations (see above in this section), which could entail that Essity’s earnings do not permit dividends in the future.
Shareholders holding substantial number of votes in Essity may exercise significant influence over EssityA shareholder with a substantial holding of voting rights (such as a high portion of Class A shares) may be in a position to exercise significant influence over Essity and the outcome of matters referred to Essity’s shareholders for resolution, and it might be that the interests of such shareholder(s) diverge from or compete with those of Essity or other shareholders.
Any future capital increases by Essity could have a negative impact on the price of the shares and non-participation will result in a dilution of ownershipEssity may in the future increase its share capital in directed issues of instruments against cash or contributions in kind for various reasons, including to finance any future acquisition or other investment or to strengthen its balance sheet. Such share capital increases will result in a diluted ownership for shareholders who, for whatever reason are not
Admission to trading of the shares in Essity Aktiebolag (publ) on Nasdaq Stockholm16
Risk factors
invited or cannot participate in such an issue. A share capital increase without preferential rights for existing shareholders to participate may only be made in accordance with applicable Swedish law and good practices in the Swedish stock market, which among other things require objective and legitimate reasons for the deviation from the preferential rights. Such share capital increases dilute the stakes in Essity’s share capital held by existing shareholders at that time and could have an adverse effect on the share price, earnings per share and net asset value per share.
Differences in currency exchange rates may have an adverse effect on the value of ADSs or shareholdings or dividends The shares will be traded in SEK, and any dividends will be paid in SEK. As a result, shareholders outside Sweden or Essity ADS Holders may experience adverse effects on the value of their shareholding and their future dividends due to their exposure to SEK, if SEK depreciates against the relevant currency.
Holders of Essity ADSs may not be able to exercise voting rights as readily as an ordinary shareholder, or at allIn the past, the SCA Group has not offered the possibility for SCA ADS Holders to vote and has not instructed the depositary to distribute voting materials to the SCA ADS Holders, and Essity does not expect to enable voting by its own Essity ADS Holders in the future. While Essity ADS Holders may surrender those ADSs to the depositary and withdraw the underlying Essity shares, becoming direct shareholders of Essity, so long as they continue to hold those shares in ADS forms, their voting rights may be significantly limited.
The rights of Essity shareholders and holders of Essity ADSs may differ from the rights typically offered to shareholders of a United States corporationEssity is incorporated under Swedish law. The rights of holders of Essity shares are governed by Swedish law, including the provisions of the Swedish Companies Act (aktiebolagslagen (2005:551)) and by Essity’s Articles of Association. The rights of holders of Essity shares and ADSs may in certain respects differ from the rights of shareholders in United States corporations.
17Admission to trading of the shares in Essity Aktiebolag (publ) on Nasdaq Stockholm
Risk factors
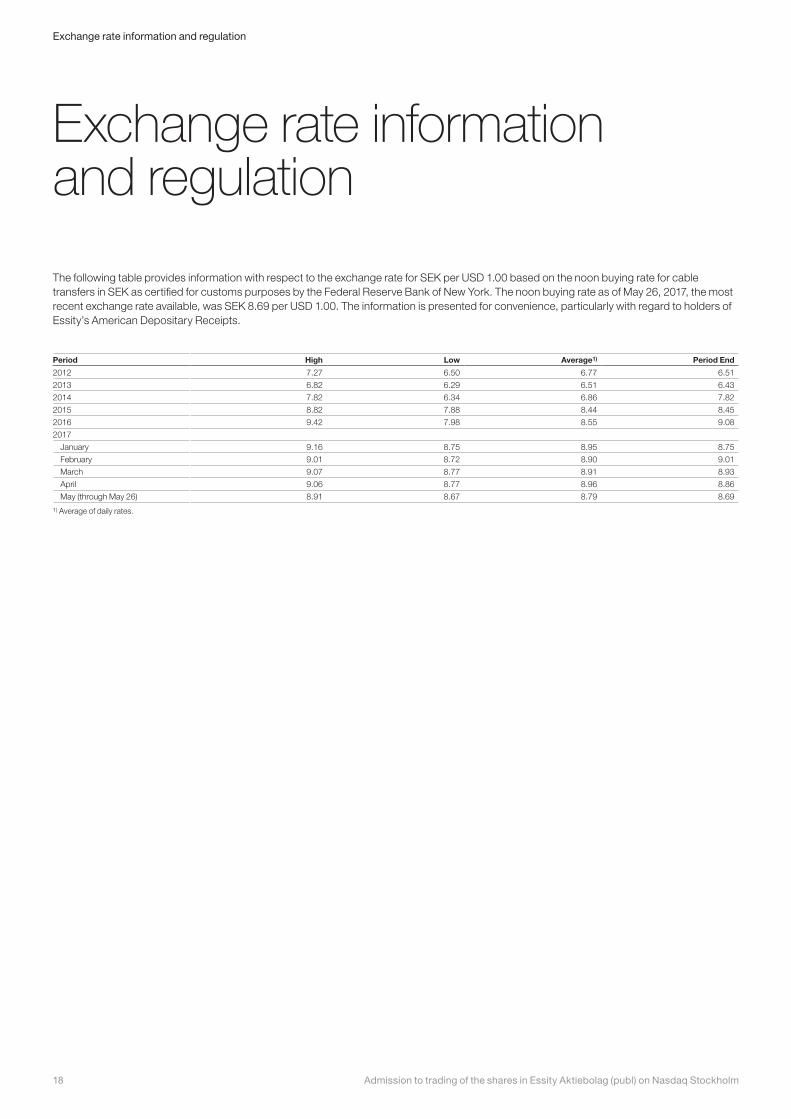
The following table provides information with respect to the exchange rate for SEK per USD 1.00 based on the noon buying rate for cable transfers in SEK as certified for customs purposes by the Federal Reserve Bank of New York. The noon buying rate as of May 26, 2017, the most recent exchange rate available, was SEK 8.69 per USD 1.00. The information is presented for convenience, particularly with regard to holders of Essity’s American Depositary Receipts.
Exchange rate information and regulation
Period High Low Average1) Period End
2012 7.27 6.50 6.77 6.51
2013 6.82 6.29 6.51 6.43
2014 7.82 6.34 6.86 7.82
2015 8.82 7.88 8.44 8.45
2016 9.42 7.98 8.55 9.08
2017
January 9.16 8.75 8.95 8.75
February 9.01 8.72 8.90 9.01
March 9.07 8.77 8.91 8.93
April 9.06 8.77 8.96 8.86
May (through May 26) 8.91 8.67 8.79 8.691) Average of daily rates.
Admission to trading of the shares in Essity Aktiebolag (publ) on Nasdaq Stockholm18
Exchange rate information and regulation
Background and reasons
SCA’s shareholders decided at the Annual General Meeting on April 5, 2017 in accordance with the proposal by the Board of Directors to distribute all shares in its wholly-owned subsidiary Essity to the shareholders of SCA. Essity intends to list its shares on Nasdaq Stockholm, with the first day of trading on June 15, 2017.
Essity’s heritage goes back to 1929 when the company SCA was founded in Sweden. Essity has over the years come to represent an increasing share of the SCA Group’s operations with Essity’s net sales representing approximately 86% of SCA Group’s total net sales in 2016. Essity has grown to encompass the Business Areas Personal Care, Consumer Tissue and Professional Hygiene. Essity is present in the attractive and growing hygiene and health market with strong global and regional brands, and has a strong presence in emerging markets. The Company has a track record of profitable growth and strong cash flow, driven by continuous work to grow profitable market positions, improve or exit underperforming positions as well as successful innovation programs and efficiency enhancements. In addition, the recent acquisition of BSN medical provides a new growth platform. BSN medical’s similarities with Essity’s incontinence business also provides opportunities for accelerated growth through cross-selling.
Essity is a leading global hygiene and health company and the split from the SCA Group with an independent listing of Essity is thus a natural step in the development of the hygiene business. A split from the SCA Group and a distribution and listing of the shares in Essity is expected to increase focus, customer value and development opportunities and to enable Essity to successfully realize its strategies under the leadership of a separate and dedicated management team, with a separate Board of Directors and independent access to capital.
The distribution of Essity is expected to increase shareholder value over the long term. A listing also provides an opportunity for current and new shareholders to invest directly in Essity.
The Board of Directors is responsible for the contents of this prospectus. The Board of Directors hereby declares that, having taken all reasonable care to ensure that such is the case, information in this prospectus is, to the best of the Board of Directors’ knowledge, in accordance
with the facts and contains no omissions likely to affect its import.
Stockholm on June 4, 2017
Essity Aktiebolag (publ)The Board of Directors
19Admission to trading of the shares in Essity Aktiebolag (publ) on Nasdaq Stockholm
Background and reasons
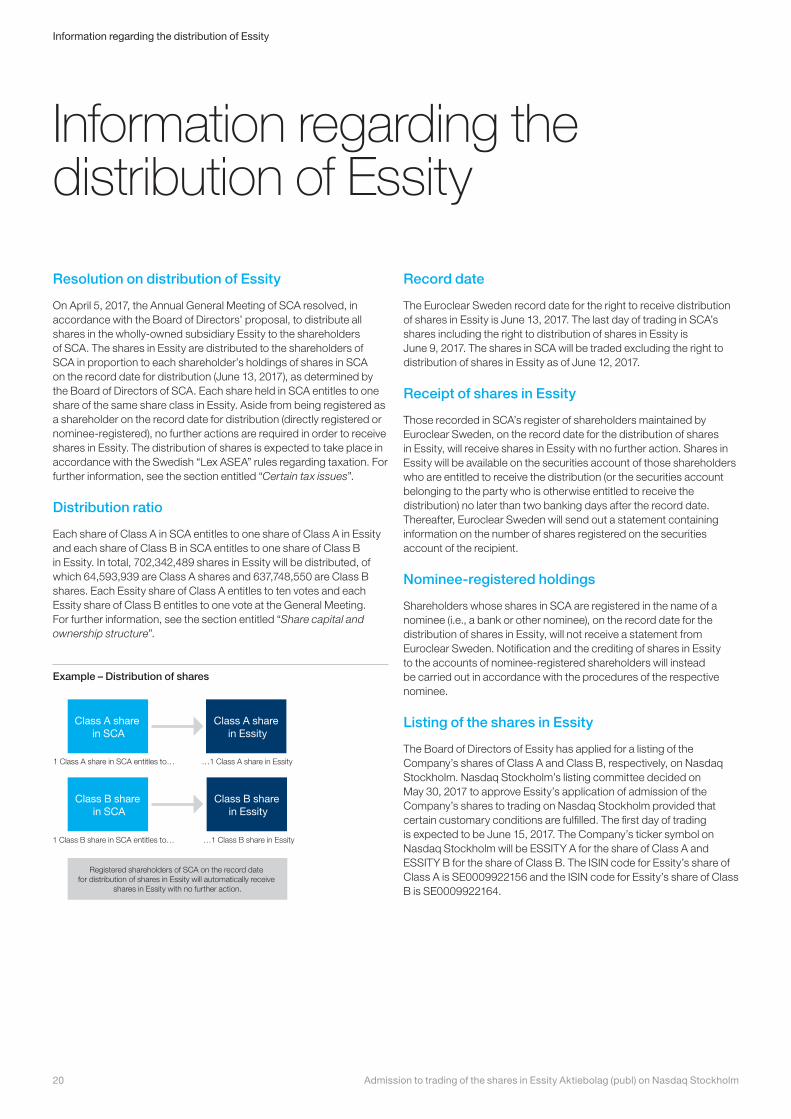
Information regarding the distribution of Essity
Resolution on distribution of Essity
On April 5, 2017, the Annual General Meeting of SCA resolved, in accordance with the Board of Directors’ proposal, to distribute all shares in the wholly-owned subsidiary Essity to the shareholders of SCA. The shares in Essity are distributed to the shareholders of SCA in proportion to each shareholder’s holdings of shares in SCA on the record date for distribution (June 13, 2017), as determined by the Board of Directors of SCA. Each share held in SCA entitles to one share of the same share class in Essity. Aside from being registered as a shareholder on the record date for distribution (directly registered or nominee-registered), no further actions are required in order to receive shares in Essity. The distribution of shares is expected to take place in accordance with the Swedish “Lex ASEA” rules regarding taxation. For further information, see the section entitled “Certain tax issues”.
Distribution ratio
Each share of Class A in SCA entitles to one share of Class A in Essity and each share of Class B in SCA entitles to one share of Class B in Essity. In total, 702,342,489 shares in Essity will be distributed, of which 64,593,939 are Class A shares and 637,748,550 are Class B shares. Each Essity share of Class A entitles to ten votes and each Essity share of Class B entitles to one vote at the General Meeting. For further information, see the section entitled “Share capital and ownership structure”.
Example – Distribution of shares
Class B share in SCA
Class A share in SCA
Class B share in Essity
Class A share in Essity
1 Class A share in SCA entitles to… …1 Class A share in Essity
…1 Class B share in Essity1 Class B share in SCA entitles to…
Registered shareholders of SCA on the record date for distribution of shares in Essity will automatically receive
shares in Essity with no further action.
Example – Distribution of shares
Record date
The Euroclear Sweden record date for the right to receive distribution of shares in Essity is June 13, 2017. The last day of trading in SCA’s shares including the right to distribution of shares in Essity is June 9, 2017. The shares in SCA will be traded excluding the right to distribution of shares in Essity as of June 12, 2017.
Receipt of shares in Essity
Those recorded in SCA’s register of shareholders maintained by Euroclear Sweden, on the record date for the distribution of shares in Essity, will receive shares in Essity with no further action. Shares in Essity will be available on the securities account of those shareholders who are entitled to receive the distribution (or the securities account belonging to the party who is otherwise entitled to receive the distribution) no later than two banking days after the record date. Thereafter, Euroclear Sweden will send out a statement containing information on the number of shares registered on the securities account of the recipient.
Nominee-registered holdings
Shareholders whose shares in SCA are registered in the name of a nominee (i.e., a bank or other nominee), on the record date for the distribution of shares in Essity, will not receive a statement from Euroclear Sweden. Notification and the crediting of shares in Essity to the accounts of nominee-registered shareholders will instead be carried out in accordance with the procedures of the respective nominee.
Listing of the shares in Essity
The Board of Directors of Essity has applied for a listing of the Company’s shares of Class A and Class B, respectively, on Nasdaq Stockholm. Nasdaq Stockholm’s listing committee decided on May 30, 2017 to approve Essity’s application of admission of the Company’s shares to trading on Nasdaq Stockholm provided that certain customary conditions are fulfilled. The first day of trading is expected to be June 15, 2017. The Company’s ticker symbol on Nasdaq Stockholm will be ESSITY A for the share of Class A and ESSITY B for the share of Class B. The ISIN code for Essity’s share of Class A is SE0009922156 and the ISIN code for Essity’s share of Class B is SE0009922164.
Admission to trading of the shares in Essity Aktiebolag (publ) on Nasdaq Stockholm20
Information regarding the distribution of Essity
American depositary shares
As of April 28, 2017 there were 2,408,742 American Depositary Shares (“SCA ADS”) outstanding. Each SCA ADS issued under the amended and restated deposit agreement (the “SCA Deposit Agreement”) dated as of April 29, 2010 among SCA, Deutsche Bank Trust Company Americas, as depositary (the “SCA Depositary”), and the registered holders of SCA ADSs (the “SCA ADS Holders”), represents one B share of SCA (each a “Deposited Share”).
Essity will establish an American Depositary Receipt (“Essity ADR”) program (the “ADR Program”) pursuant to a deposit agreement, which is to be entered into among Essity, Deutsche Bank Trust Company Americas, as depositary (the “Essity Depositary”), and the registered holders of Essity ADSs (the “Essity ADS Holders”), setting out the terms of the Essity ADR Program (the “Essity Deposit Agreement”). At the distribution of Essity, SCA will deliver through its custodian the B shares in Essity deliverable at the distribution of Essity with respect to the Deposited Shares held by the SCA Depositary’s custodian under the Essity Deposit Agreement and, subject to compliance with the provisions of the Essity Deposit Agreement and SCA Deposit Agreement, the Essity Depositary will issue Essity ADSs to the holders of SCA ADSs entitled thereto.
To the extent Essity ADSs are able to be distributed under the terms of the SCA Deposit Agreement, it is anticipated that each holder of SCA ADSs will be entitled to receive one Essity ADS for each SCA ADS held as of the record date established by the SCA Depositary for the distribution of Essity (the “Essity ADS Record Date”) with each Essity ADS representing one B Share of Essity.
The last day SCA ADSs will represent SCA’s shares including the right to the distribution of Essity ADSs is expected to be June 9, 2017. The first day SCA ADSs will represent SCA’s shares excluding the right to the distribution of Essity ADSs is expected to be June 12, 2017. The Essity ADS Record Date for the right to receive Essity ADSs is expected to be June 13, 2017. The date of delivery of Essity ADSs to SCA ADS Holders on the Essity ADS Record Date is expected to be June 15, 2017.
Persons holding SCA ADSs through a bank, broker or other nominee should contact such entity regarding the receipt of the Essity ADSs to which they may be entitled. Holders of SCA ADSs (other than the nominee of The Depository Trust Company) will receive the Essity ADSs in book-entry form and holding statements will be mailed to such holders as soon as practicable after the distribution of Essity.
Essity will be required to pay all fees for general depositary services provided by the Essity Depositary in the Essity Deposit Agreement. In
addition, in connection with receiving Essity ADSs, SCA ADS Holders will be charged, have deducted or be required to pay any applicable fees, charges and expenses of the SCA Depositary or the Essity Depositary and any applicable taxes or other governmental charges. The fees, charges and expenses applicable with respect to the Essity ADSs will be disclosed in the Essity Deposit Agreement. For additional information, see “American depositary shares” in the section entitled “Share capital and ownership structure”.
The Essity ADSs will not be listed on any United States securities exchange. It is anticipated, however, that such Essity ADSs will be eligible for trading on the United States OTC market.
Rights to dividends
The shares in Essity entitle to dividend for the first time on the record date for distribution of dividend which falls immediately after the distribution of shares in Essity has been executed. Any dividends will be paid following a resolution by a General Meeting. The payment of any dividends will be administered by Euroclear Sweden or, should the shares be nominee-registered, in accordance with the procedures of the respective nominee. Entitlement to receive such dividends is limited to shareholders registered in the share register maintained by Euroclear Sweden on the record date for distribution determined by the General Meeting. For further information, see “Financial targets and dividend policy” in the section entitled “Market and business description” and “Rights to dividends and surplus in the event of liquidation” in the section entitled “Share capital and ownership structure”. For information on tax on dividend, see the section entitled “Certain tax issues”.
Transaction costs
Essity’s share of the total costs for the conceived split of the SCA Group is estimated to be approximately SEK 820m, including project and listing costs of approximately SEK 90m, one-time foreign tax on non-current assets outside Sweden of approximately SEK 450m, and brand-related costs of approximately SEK 280m. The transaction costs have affected and will affect Essity’s financial results for both 2016 and 2017. Of the total costs, approximately SEK 80m are expected to affect financial items and approximately SEK 740m are expected to affect items affecting comparability. Of the total costs, SEK 74m affected the fourth quarter of 2016, of which SEK 68m affected financial items and SEK 6m affected items affecting comparability.
21Admission to trading of the shares in Essity Aktiebolag (publ) on Nasdaq Stockholm
Information regarding the distribution of Essity
Market and business description
This prospectus contains statistics, data and other information relating to markets, market sizes, market shares, market positions and other industry data pertaining to the Company’s business and markets. At certain points in this prospectus Essity’s market position is described. Unless otherwise indicated, such information is based on the Company’s analysis of information and market data from multiple external market sources1) and information otherwise obtained and has been compiled based on sales. Information derived from external sources has been accurately reproduced, and, as far as the Company is aware and able to ascertain from such information, no facts have been omitted which would render the information provided inaccurate or misleading.
Introduction
Essity is a leading global hygiene and health company that develops, produces and sells products and solutions within the Business Areas Personal Care, Consumer Tissue and Professional Hygiene. Sales are conducted in about 150 countries under many strong brands, including the leading global brands TENA and Tork, and other brands, such as Leukoplast, Libero, Libresse, Lotus, Nosotras, Saba, Tempo, Vinda and Zewa. For 2016 the Company reported net sales of SEK 101bn. Europe is Essity’s largest market and the Company also holds strong positions in North America, Latin America and Asia. Essity has its headquarters in Stockholm, Sweden and had 42,520 employees as of December 31, 2016.
Essity divides and reports its operations in three segments corresponding to the three Business Areas – Personal Care, Consumer Tissue and Professional Hygiene. The Business Area Personal Care includes Incontinence Products, Baby Care, Feminine Care and Medical Solutions. The Consumer Tissue Business Area provides products including toilet paper, household towels, handkerchiefs, facial tissues, wet wipes and napkins. The Professional Hygiene Business Area develops and sells complete hygiene solutions, including toilet paper, paper towels, napkins, hand soap, hand lotion, hand sanitizers, dispensers, cleaning and wiping products, sensor technology and service and maintenance to institutions and companies, amongst others. On April 3, 2017, Essity completed the acquisition of BSN medical, a leading global medical solutions company.2) BSN medical develops, manufactures and sells products within wound care, compression therapy and orthopedics. As of April 3, 2017, BSN medical will be included in the Business Area Personal Care and consolidated in the Group’s financial statements. BSN medical is consequently not included in the Company’s historical financial information presented in this prospectus. For further information regarding the Business Areas, see “Business Areas” below.
Market trends and drivers
The consumption of hygiene and health products and solutions is supported by favorable demographic trends. The Company believes the following factors to be the key market trends and drivers for the hygiene and health market’s development: • Population growth;• Aging population;• Increased urbanization;• Increased disposable income and higher standard of living;• Increased awareness about health and hygiene;• Increased prevalence of chronic conditions;• Access to healthcare; and• Changes in customer and consumer behavior.
Shifts in global demographics such as population growth – primarily due to a lower infant mortality rate and increased longevity – and higher disposable income point to continued favorable growth for the personal care and tissue markets. The effect of higher disposable income is that more people prioritize hygiene and health when food and housing needs have been, or are in the process of being, satisfied. Consequently, demand for Essity’s products is rising in emerging markets. Growth is also occurring in mature markets owing to lifestyle changes and innovations that lead to increased use of hygiene and health products.
Below is a short description of the above stated market factors that Essity believes have affected the Company’s business in the past, and are expected to continue to do so in the future.
1) Including IRI, Price Hanna Consultants, RISI, National Macro Economics, Nielsen, SmartTRAK, INSIGHT Health and others.2) The information has been compiled by Essity for presentation purposes based on statistics derived from external market sources including SmartTRAK and INSIGHT Health.
Admission to trading of the shares in Essity Aktiebolag (publ) on Nasdaq Stockholm22
Market and business description
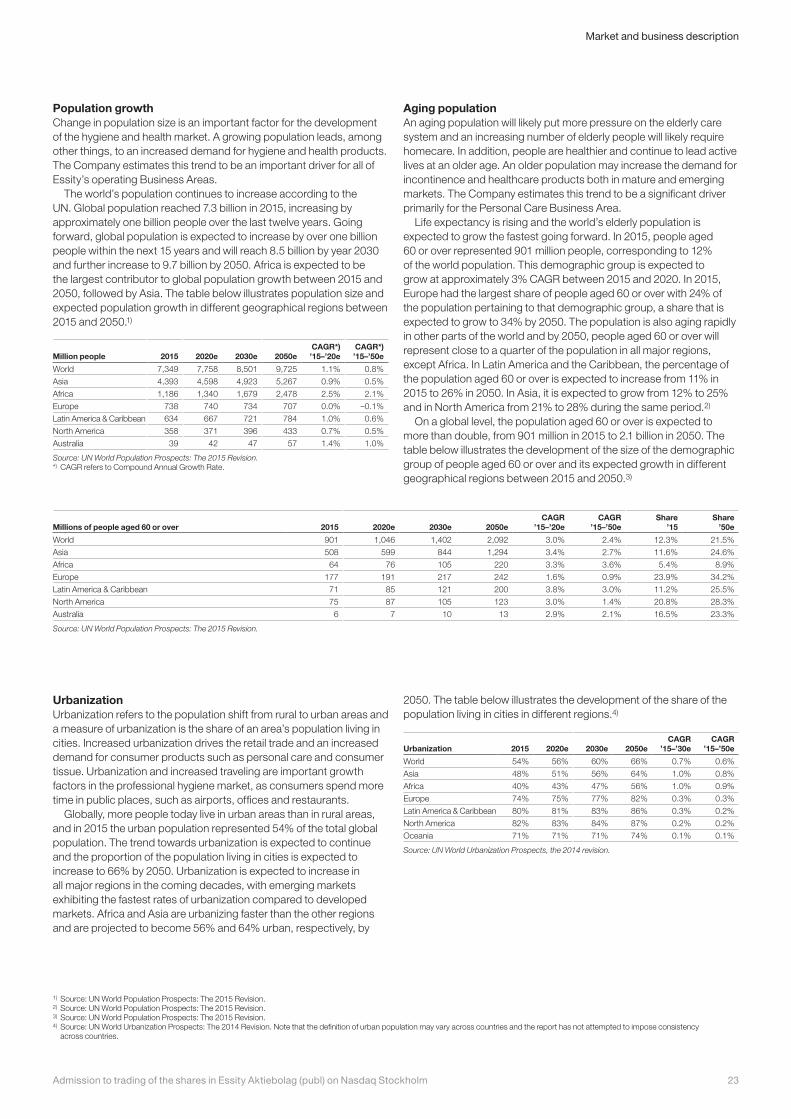
Population growthChange in population size is an important factor for the development of the hygiene and health market. A growing population leads, among other things, to an increased demand for hygiene and health products. The Company estimates this trend to be an important driver for all of Essity’s operating Business Areas.
The world’s population continues to increase according to the UN. Global population reached 7.3 billion in 2015, increasing by approximately one billion people over the last twelve years. Going forward, global population is expected to increase by over one billion people within the next 15 years and will reach 8.5 billion by year 2030 and further increase to 9.7 billion by 2050. Africa is expected to be the largest contributor to global population growth between 2015 and 2050, followed by Asia. The table below illustrates population size and expected population growth in different geographical regions between 2015 and 2050.1)
Million people 2015 2020e 2030e 2050eCAGR*) ’15–’20e
CAGR*) ’15–’50e
World 7,349 7,758 8,501 9,725 1.1% 0.8%
Asia 4,393 4,598 4,923 5,267 0.9% 0.5%
Africa 1,186 1,340 1,679 2,478 2.5% 2.1%
Europe 738 740 734 707 0.0% –0.1%
Latin America & Caribbean 634 667 721 784 1.0% 0.6%
North America 358 371 396 433 0.7% 0.5%
Australia 39 42 47 57 1.4% 1.0%
Source: UN World Population Prospects: The 2015 Revision.*) CAGR refers to Compound Annual Growth Rate.
Aging populationAn aging population will likely put more pressure on the elderly care system and an increasing number of elderly people will likely require homecare. In addition, people are healthier and continue to lead active lives at an older age. An older population may increase the demand for incontinence and healthcare products both in mature and emerging markets. The Company estimates this trend to be a significant driver primarily for the Personal Care Business Area.
Life expectancy is rising and the world’s elderly population is expected to grow the fastest going forward. In 2015, people aged 60 or over represented 901 million people, corresponding to 12% of the world population. This demographic group is expected to grow at approximately 3% CAGR between 2015 and 2020. In 2015, Europe had the largest share of people aged 60 or over with 24% of the population pertaining to that demographic group, a share that is expected to grow to 34% by 2050. The population is also aging rapidly in other parts of the world and by 2050, people aged 60 or over will represent close to a quarter of the population in all major regions, except Africa. In Latin America and the Caribbean, the percentage of the population aged 60 or over is expected to increase from 11% in 2015 to 26% in 2050. In Asia, it is expected to grow from 12% to 25% and in North America from 21% to 28% during the same period.2)
On a global level, the population aged 60 or over is expected to more than double, from 901 million in 2015 to 2.1 billion in 2050. The table below illustrates the development of the size of the demographic group of people aged 60 or over and its expected growth in different geographical regions between 2015 and 2050.3)
Millions of people aged 60 or over 2015 2020e 2030e 2050eCAGR
’15–’20eCAGR
’15–’50eShare
’15Share
’50e
World 901 1,046 1,402 2,092 3.0% 2.4% 12.3% 21.5%
Asia 508 599 844 1,294 3.4% 2.7% 11.6% 24.6%
Africa 64 76 105 220 3.3% 3.6% 5.4% 8.9%
Europe 177 191 217 242 1.6% 0.9% 23.9% 34.2%
Latin America & Caribbean 71 85 121 200 3.8% 3.0% 11.2% 25.5%
North America 75 87 105 123 3.0% 1.4% 20.8% 28.3%
Australia 6 7 10 13 2.9% 2.1% 16.5% 23.3%
Source: UN World Population Prospects: The 2015 Revision.
UrbanizationUrbanization refers to the population shift from rural to urban areas and a measure of urbanization is the share of an area’s population living in cities. Increased urbanization drives the retail trade and an increased demand for consumer products such as personal care and consumer tissue. Urbanization and increased traveling are important growth factors in the professional hygiene market, as consumers spend more time in public places, such as airports, offices and restaurants.
Globally, more people today live in urban areas than in rural areas, and in 2015 the urban population represented 54% of the total global population. The trend towards urbanization is expected to continue and the proportion of the population living in cities is expected to increase to 66% by 2050. Urbanization is expected to increase in all major regions in the coming decades, with emerging markets exhibiting the fastest rates of urbanization compared to developed markets. Africa and Asia are urbanizing faster than the other regions and are projected to become 56% and 64% urban, respectively, by
2050. The table below illustrates the development of the share of the population living in cities in different regions.4)
Urbanization 2015 2020e 2030e 2050eCAGR
’15–’30eCAGR
’15–’50e
World 54% 56% 60% 66% 0.7% 0.6%
Asia 48% 51% 56% 64% 1.0% 0.8%
Africa 40% 43% 47% 56% 1.0% 0.9%
Europe 74% 75% 77% 82% 0.3% 0.3%
Latin America & Caribbean 80% 81% 83% 86% 0.3% 0.2%
North America 82% 83% 84% 87% 0.2% 0.2%
Oceania 71% 71% 71% 74% 0.1% 0.1%
Source: UN World Urbanization Prospects, the 2014 revision.
1) Source: UN World Population Prospects: The 2015 Revision.2) Source: UN World Population Prospects: The 2015 Revision.3) Source: UN World Population Prospects: The 2015 Revision.4) Source: UN World Urbanization Prospects: The 2014 Revision. Note that the definition of urban population may vary across countries and the report has not attempted to impose consistency
across countries.
23Admission to trading of the shares in Essity Aktiebolag (publ) on Nasdaq Stockholm
Market and business description
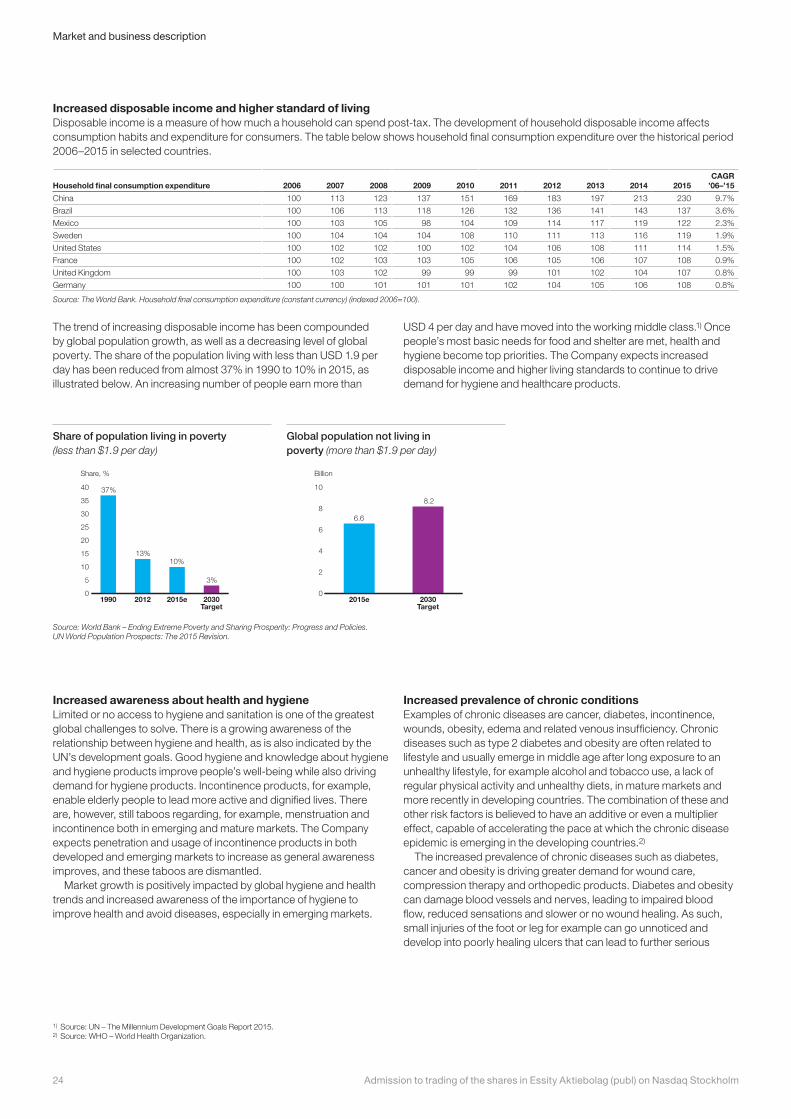
Increased disposable income and higher standard of livingDisposable income is a measure of how much a household can spend post-tax. The development of household disposable income affects consumption habits and expenditure for consumers. The table below shows household final consumption expenditure over the historical period 2006–2015 in selected countries.
Household final consumption expenditure 2006 2007 2008 2009 2010 2011 2012 2013 2014 2015CAGR
’06–’15
China 100 113 123 137 151 169 183 197 213 230 9.7%
Brazil 100 106 113 118 126 132 136 141 143 137 3.6%
Mexico 100 103 105 98 104 109 114 117 119 122 2.3%
Sweden 100 104 104 104 108 110 111 113 116 119 1.9%
United States 100 102 102 100 102 104 106 108 111 114 1.5%
France 100 102 103 103 105 106 105 106 107 108 0.9%
United Kingdom 100 103 102 99 99 99 101 102 104 107 0.8%
Germany 100 100 101 101 101 102 104 105 106 108 0.8%
Source: The World Bank. Household final consumption expenditure (constant currency) (indexed 2006=100).
The trend of increasing disposable income has been compounded by global population growth, as well as a decreasing level of global poverty. The share of the population living with less than USD 1.9 per day has been reduced from almost 37% in 1990 to 10% in 2015, as illustrated below. An increasing number of people earn more than
USD 4 per day and have moved into the working middle class.1) Once people’s most basic needs for food and shelter are met, health and hygiene become top priorities. The Company expects increased disposable income and higher living standards to continue to drive demand for hygiene and healthcare products.
1) Source: UN – The Millennium Development Goals Report 2015.2) Source: WHO – World Health Organization.
Source: World Bank – Ending Extreme Poverty and Sharing Prosperity: Progress and Policies. UN World Population Prospects: The 2015 Revision.
Increased awareness about health and hygiene Limited or no access to hygiene and sanitation is one of the greatest global challenges to solve. There is a growing awareness of the relationship between hygiene and health, as is also indicated by the UN’s development goals. Good hygiene and knowledge about hygiene and hygiene products improve people’s well-being while also driving demand for hygiene products. Incontinence products, for example, enable elderly people to lead more active and dignified lives. There are, however, still taboos regarding, for example, menstruation and incontinence both in emerging and mature markets. The Company expects penetration and usage of incontinence products in both developed and emerging markets to increase as general awareness improves, and these taboos are dismantled.
Market growth is positively impacted by global hygiene and health trends and increased awareness of the importance of hygiene to improve health and avoid diseases, especially in emerging markets.
Increased prevalence of chronic conditionsExamples of chronic diseases are cancer, diabetes, incontinence, wounds, obesity, edema and related venous insufficiency. Chronic diseases such as type 2 diabetes and obesity are often related to lifestyle and usually emerge in middle age after long exposure to an unhealthy lifestyle, for example alcohol and tobacco use, a lack of regular physical activity and unhealthy diets, in mature markets and more recently in developing countries. The combination of these and other risk factors is believed to have an additive or even a multiplier effect, capable of accelerating the pace at which the chronic disease epidemic is emerging in the developing countries.2)
The increased prevalence of chronic diseases such as diabetes, cancer and obesity is driving greater demand for wound care, compression therapy and orthopedic products. Diabetes and obesity can damage blood vessels and nerves, leading to impaired blood flow, reduced sensations and slower or no wound healing. As such, small injuries of the foot or leg for example can go unnoticed and develop into poorly healing ulcers that can lead to further serious
0
5
10
15
20
25
30
35
40
2030Target
2015e20121990
Share, %
Share of population in poverty
37%
13%10%
3%
0
2
4
6
8
10
2030Target
2015e
Billion
Share of population NOT in poverty
6.6
8.2
Share of population living in poverty (less than $1.9 per day)
Global population not living in poverty (more than $1.9 per day)
Admission to trading of the shares in Essity Aktiebolag (publ) on Nasdaq Stockholm24
Market and business description
medical complications. Globally there are around 50 million1) reported cases of patients suffering from difficult to heal wounds, including foot ulcers and venous leg ulcers, which affect over 600,000 people per annum2) in the United States alone. Lymphedema3) can be caused or exacerbated by cancer and cancer treatment, leading to swelling, discomfort and pain, as well as skin infections and wounds. Treatment options for patients suffering from lymphedema include compression therapy and vascular products. Bandages, wraps and pumps are used for decongestion, and then compression garments are used to prevent limb expansion. Obesity can also lead to joint injuries for patients. These injuries can be treated with orthopedic products which are used to support and stabilize joints, and allow for healing and prevention.
People are also living longer with chronic diseases due to their early detection and more effective treatment. For example, studies have shown that the life expectancy of people with type 1 diabetes has increased over the years.4) Life expectancy of people with type 1 diabetes has risen from 53 years for people born between 1950 and 1964 to 69 years for people born between 1965 and 1980.5) People with type 1 diabetes will also, in the majority of cases, develop diabetes at a younger age than those with type 2 diabetes, and therefore will usually spend a longer period of their life living with the condition. Increased prevalence and increased life expectancy of people with chronic conditions are expected to drive demand for healthcare products.
The burden of chronic diseases is rapidly increasing worldwide. Chronic diseases are estimated to account for approximately 70% of the total reported deaths in the world and deaths from chronic diseases are projected to increase from 38 million in 2012 to 52 million by 2030.6) Obesity and diabetes are also showing increased prevalence affecting a large proportion of the population and starting to appear earlier in life.
The chronic disease problem is not limited to the developed regions of the world. Developing countries are increasingly suffering from high levels of public health problems related to chronic diseases. Approximately 75% of all deaths worldwide that are attributable to chronic diseases are occurring in low- and middle-income countries.7) The prevalence of diabetes has also been steadily increasing for the past three decades and is growing most rapidly in low- and middle-income countries.8)
Incontinence, which is classified as a disease by the World Health Organization (WHO), affects 4–8% of the world’s population, corresponding to approximately 400 million people.9) The occurrence of incontinence among people over the age of 65 is expected to be
between 15 and 20%.10) Based on this, many indicators point to the proportion of people affected by incontinence to increase on a global scale, as a direct result of an aging population.
Access to healthcareHealthcare innovation and healthcare demand are rapidly increasing in emerging markets. Outside of the OECD area, health spending has increased rapidly in countries, such as China, as progress towards universal health coverage takes hold.11) Global healthcare spend is expected to increase from USD 1,024 per capita in 2015 to USD 1,178 per capita in 2020.12) Spending on healthcare in countries, such as China, is expected to continue to rise in line with their economic growth, and are predicted to become major markets for healthcare companies.13) A 2014 report by the World Economic Forum estimates that one third of all global health expenditure will occur in emerging economies by 2022.14) As an example of the increased access to healthcare in emerging markets, the number of physicians per 1,000 inhabitants in Latin America and the Caribbean increased by 61% between 1990 and 2011 compared to an increase of 22% worldwide.15) Increased access to healthcare in emerging markets drives demand for healthcare products.
Changes in customer and consumer behaviorTrends, technological developments and values cause customer and consumer behavior to change more rapidly. Accordingly, the ability to anticipate and exceed customer and consumer expectations is becoming increasingly important.• Increased awareness about health and hygiene.• Limited resources, political priorities and knowledgeable, conscious
customers and consumers are increasing the demand for sustainable products and services.
• Many purchases are now made online, which impacts product development, marketing and distribution strategies. Customers and consumers are increasingly demanding digital solutions.
• Highly innovative products, services and business models are required in order for companies to respond to these changing behaviors.
• Consumerization trend is transforming parts of the market. Customers role in decision making and sales points in the healthcare sector are moving closer to the end customer.
• Longer life expectancy combined with lifestyle choices and willingness to spend is driving demand for incontinence products and medical solutions in mature markets.
1) Source: Global Wound Care Market Outlook – Analysis of Wound Care Tecnologies, October 2014, Frost and Sullivan, Frost and Sullivan Inc.2) Source: The Global advanced wound care market to 2017, August 2012, Espicom Business Intelligence (BMI Research – Business Monitor International Ltd).3) Lymphedema involves blockage of the lymph vessels, with a resulting accumulation of lymphatic fluid in the interstitial tissues of the body.4) Source: Improvements in the Life Expectancy of Type 1 Diabetes. Rachel G. Miller, Aaron M. Secrest, Ravi K. Sharma, Thomas J. Songer, Trevor J. Orchard. Diabetes Nov 2012, 61 (11) 2987-2992;
DOI: 10.2337/db11-1625.5) Source: The Pittsburgh Epidemiology of Diabetes Complications Study Cohort (2012).6) Source: Noncommunicable diseases – Fact sheet, World Health Organization, updated April 2017, and Global Status report on noncommunicable diseases, 2014, World Health Organization.7) Source: Global status report on noncommunicable diseases, 2014, World Health Organization.8) Source: Global report on diabetes, World Health Organization, 2016.9) Source: Global Forum on Incontinence.10) Source: SCA Annual Report 2016 – Source: EPIC study.11) Source: FOCUS on Health Spending @ OECD Health Statistics 2015.12) Source: 2017 Business Monitor International Ltd.13) Source: Harvard Business Review (hbr.org), http://bit.ly/1vKUNdY.14) Source: World Economic Forum: Health Systems Leapfrogging in Emerging Economies – Project Paper, P. 5, http://bit.ly/1qMVwag.15) Source: World Health Organization’s Global Health Workforce Statistics, OECD, supplemented by country data.
25Admission to trading of the shares in Essity Aktiebolag (publ) on Nasdaq Stockholm
Market and business description
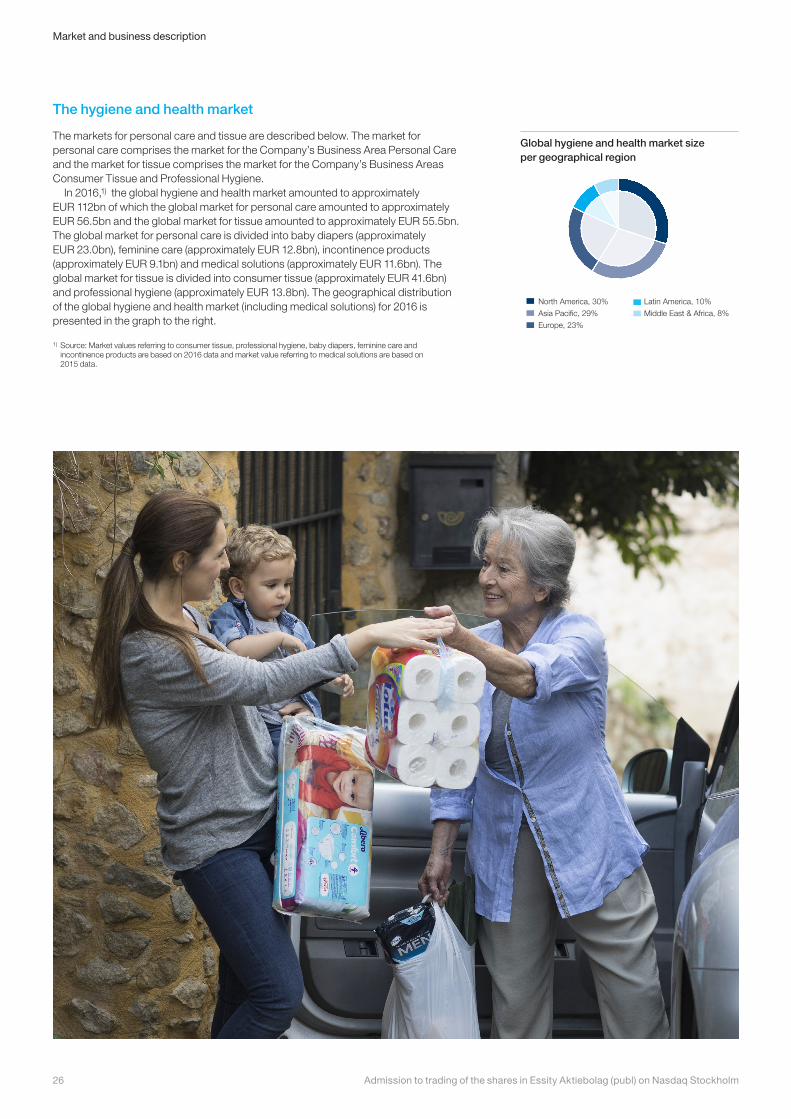
The hygiene and health market
The markets for personal care and tissue are described below. The market for personal care comprises the market for the Company’s Business Area Personal Care and the market for tissue comprises the market for the Company’s Business Areas Consumer Tissue and Professional Hygiene.
In 2016,1) the global hygiene and health market amounted to approximately EUR 112bn of which the global market for personal care amounted to approximately EUR 56.5bn and the global market for tissue amounted to approximately EUR 55.5bn. The global market for personal care is divided into baby diapers (approximately EUR 23.0bn), feminine care (approximately EUR 12.8bn), incontinence products (approximately EUR 9.1bn) and medical solutions (approximately EUR 11.6bn). The global market for tissue is divided into consumer tissue (approximately EUR 41.6bn) and professional hygiene (approximately EUR 13.8bn). The geographical distribution of the global hygiene and health market (including medical solutions) for 2016 is presented in the graph to the right.
1) Source: Market values referring to consumer tissue, professional hygiene, baby diapers, feminine care and incontinence products are based on 2016 data and market value referring to medical solutions are based on 2015 data.
Global hygiene and health market size per geographical region
North America, 30%
Asia Pacific, 29%
Europe, 23%
Latin America, 10%
Middle East & Africa, 8%
Global market
Admission to trading of the shares in Essity Aktiebolag (publ) on Nasdaq Stockholm26
Market and business description
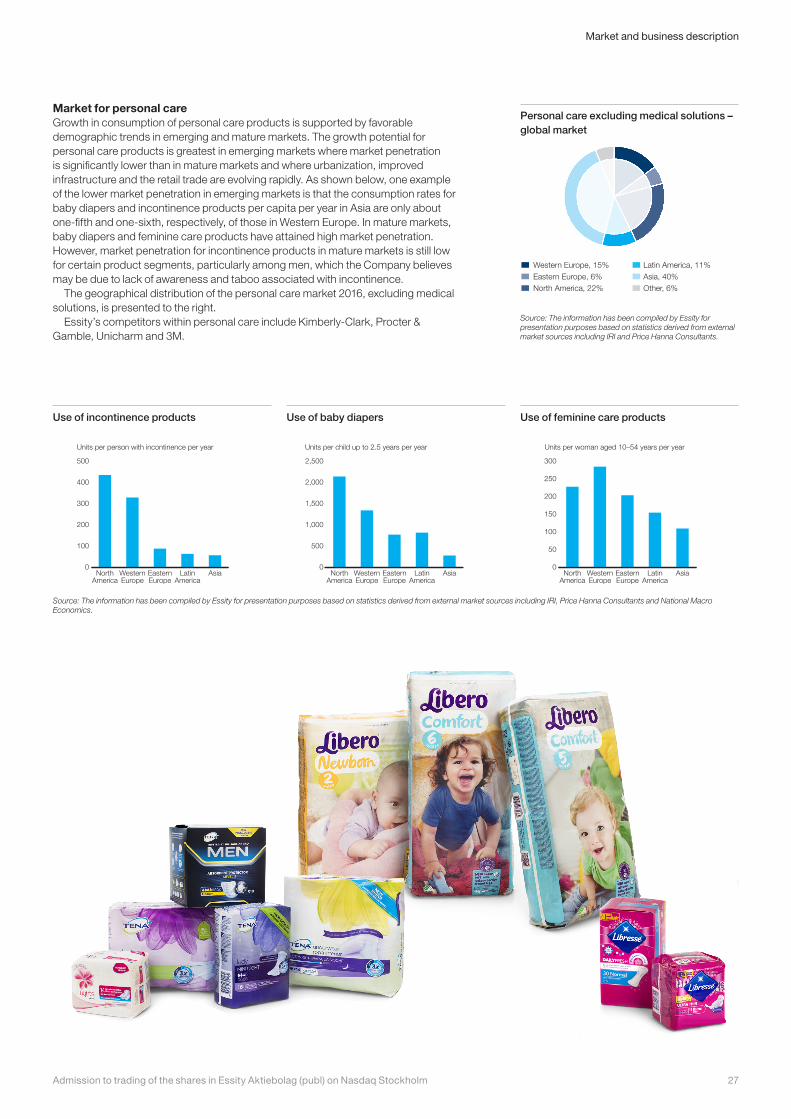
Use of incontinence products Use of baby diapers Use of feminine care products
0
100
200
300
400
500
AsiaLatinAmerica
EasternEurope
WesternEurope
NorthAmerica
Units per person with incontinence per year
0
500
1,000
1,500
2,000
2,500
AsiaLatinAmerica
EasternEurope
WesternEurope
NorthAmerica
Units per child up to 2.5 years per year
0
50
100
150
200
250
300
AsiaLatinAmerica
EasternEurope
WesternEurope
NorthAmerica
Units per woman aged 10–54 years per year
Personal care excluding medical solutions – global market
Western Europe, 15%Eastern Europe, 6%North America, 22%
Latin America, 11%Asia, 40%Other, 6%
Source: The information has been compiled by Essity for presentation purposes based on statistics derived from external market sources including IRI and Price Hanna Consultants.
Source: The information has been compiled by Essity for presentation purposes based on statistics derived from external market sources including IRI, Price Hanna Consultants and National Macro Economics.
Market for personal careGrowth in consumption of personal care products is supported by favorable demographic trends in emerging and mature markets. The growth potential for personal care products is greatest in emerging markets where market penetration is significantly lower than in mature markets and where urbanization, improved infrastructure and the retail trade are evolving rapidly. As shown below, one example of the lower market penetration in emerging markets is that the consumption rates for baby diapers and incontinence products per capita per year in Asia are only about one-fifth and one-sixth, respectively, of those in Western Europe. In mature markets, baby diapers and feminine care products have attained high market penetration. However, market penetration for incontinence products in mature markets is still low for certain product segments, particularly among men, which the Company believes may be due to lack of awareness and taboo associated with incontinence.
The geographical distribution of the personal care market 2016, excluding medical solutions, is presented to the right.
Essity’s competitors within personal care include Kimberly-Clark, Procter & Gamble, Unicharm and 3M.
27Admission to trading of the shares in Essity Aktiebolag (publ) on Nasdaq Stockholm
Market and business description
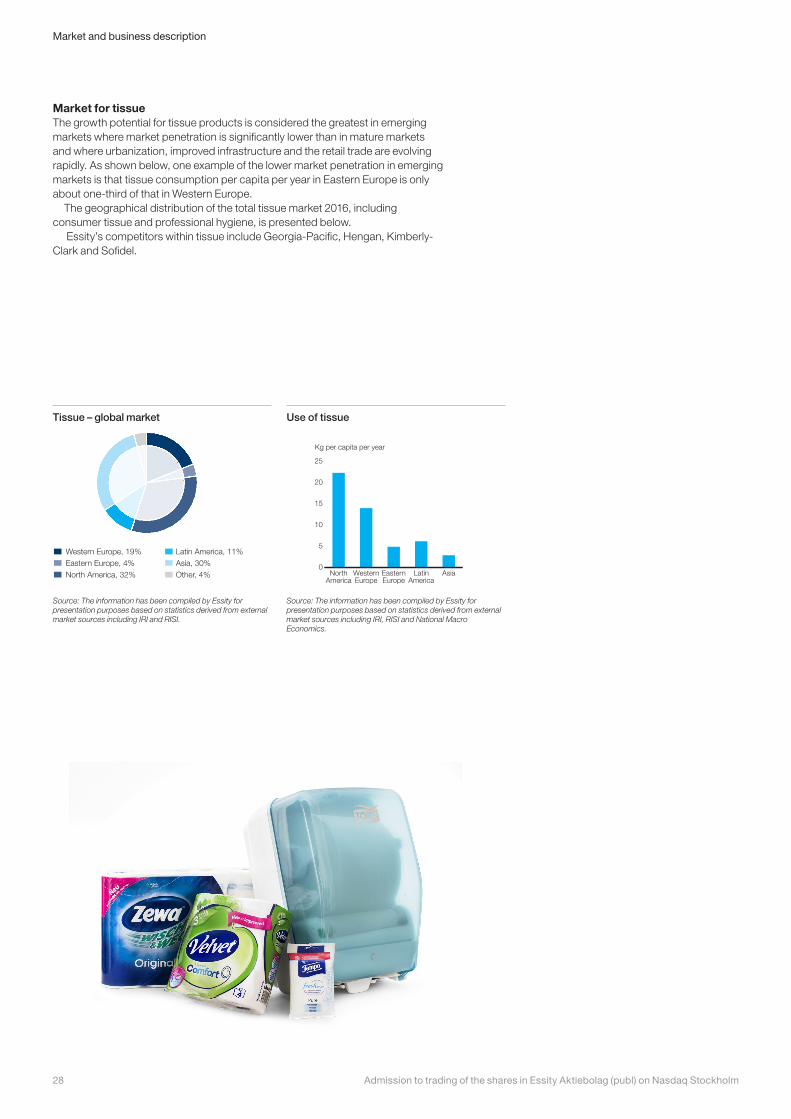
Market for tissueThe growth potential for tissue products is considered the greatest in emerging markets where market penetration is significantly lower than in mature markets and where urbanization, improved infrastructure and the retail trade are evolving rapidly. As shown below, one example of the lower market penetration in emerging markets is that tissue consumption per capita per year in Eastern Europe is only about one-third of that in Western Europe.
The geographical distribution of the total tissue market 2016, including consumer tissue and professional hygiene, is presented below.
Essity’s competitors within tissue include Georgia-Pacific, Hengan, Kimberly-Clark and Sofidel.
Tissue – global market
Western Europe, 19%Eastern Europe, 4%North America, 32%
Latin America, 11%Asia, 30%Other, 4%
Source: The information has been compiled by Essity for presentation purposes based on statistics derived from external market sources including IRI and RISI.
Use of tissue
0
5
10
15
20
25
AsiaLatinAmerica
EasternEurope
WesternEurope
NorthAmerica
Kg per capita per year
Source: The information has been compiled by Essity for presentation purposes based on statistics derived from external market sources including IRI, RISI and National Macro Economics.
Admission to trading of the shares in Essity Aktiebolag (publ) on Nasdaq Stockholm28
Market and business description
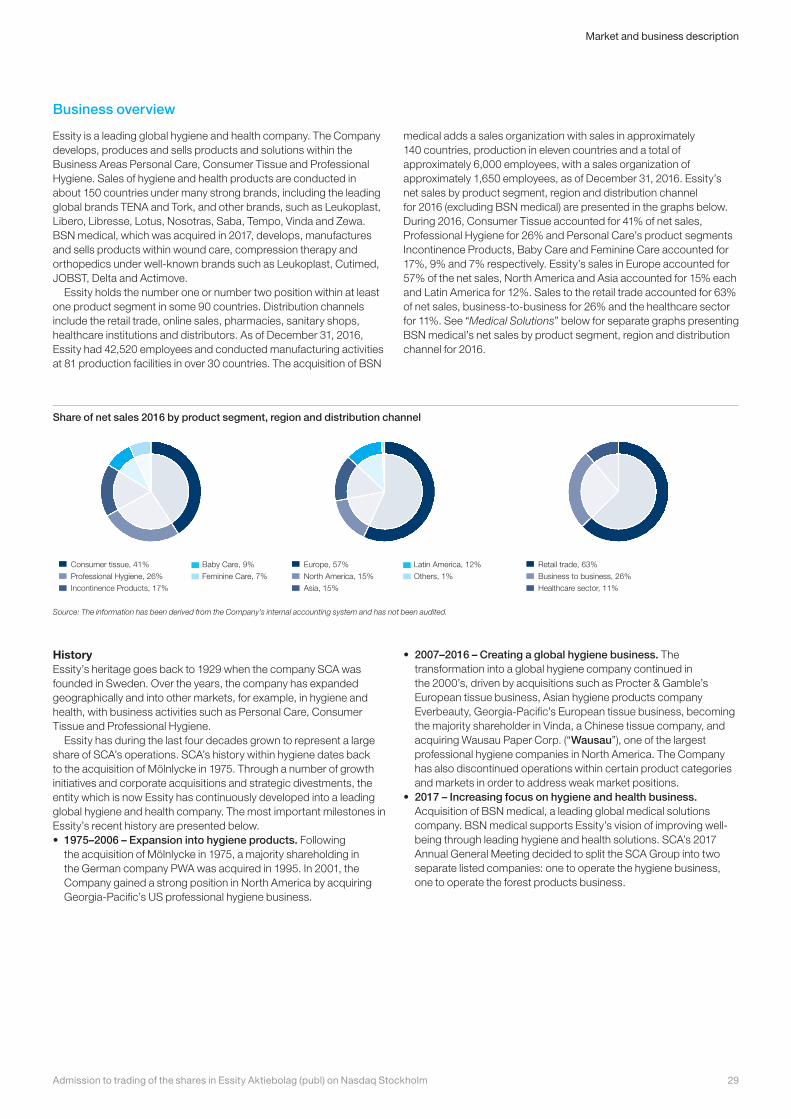
HistoryEssity’s heritage goes back to 1929 when the company SCA was founded in Sweden. Over the years, the company has expanded geographically and into other markets, for example, in hygiene and health, with business activities such as Personal Care, Consumer Tissue and Professional Hygiene.
Essity has during the last four decades grown to represent a large share of SCA’s operations. SCA’s history within hygiene dates back to the acquisition of Mölnlycke in 1975. Through a number of growth initiatives and corporate acquisitions and strategic divestments, the entity which is now Essity has continuously developed into a leading global hygiene and health company. The most important milestones in Essity’s recent history are presented below.• 1975–2006 – Expansion into hygiene products. Following
the acquisition of Mölnlycke in 1975, a majority shareholding in the German company PWA was acquired in 1995. In 2001, the Company gained a strong position in North America by acquiring Georgia-Pacific’s US professional hygiene business.
• 2007–2016 – Creating a global hygiene business. The transformation into a global hygiene company continued in the 2000’s, driven by acquisitions such as Procter & Gamble’s European tissue business, Asian hygiene products company Everbeauty, Georgia-Pacific’s European tissue business, becoming the majority shareholder in Vinda, a Chinese tissue company, and acquiring Wausau Paper Corp. (“Wausau”), one of the largest professional hygiene companies in North America. The Company has also discontinued operations within certain product categories and markets in order to address weak market positions.
• 2017 – Increasing focus on hygiene and health business. Acquisition of BSN medical, a leading global medical solutions company. BSN medical supports Essity’s vision of improving well-being through leading hygiene and health solutions. SCA’s 2017 Annual General Meeting decided to split the SCA Group into two separate listed companies: one to operate the hygiene business, one to operate the forest products business.
Share of net sales 2016 by product segment, region and distribution channel
Consumer tissue, 41%
Professional Hygiene, 26%
Incontinence Products, 17%
Baby Care, 9%
Feminine Care, 7%
Sales by product segment, 2016
Europe, 57%
North America, 15%
Asia, 15%
Latin America, 12%
Others, 1%
Sales per region, 2016
Retail trade, 63%
Business to business, 26%
Healthcare sector, 11%
Nettoförsäljning per distributionskanal
Business overview
Essity is a leading global hygiene and health company. The Company develops, produces and sells products and solutions within the Business Areas Personal Care, Consumer Tissue and Professional Hygiene. Sales of hygiene and health products are conducted in about 150 countries under many strong brands, including the leading global brands TENA and Tork, and other brands, such as Leukoplast, Libero, Libresse, Lotus, Nosotras, Saba, Tempo, Vinda and Zewa. BSN medical, which was acquired in 2017, develops, manufactures and sells products within wound care, compression therapy and orthopedics under well-known brands such as Leukoplast, Cutimed, JOBST, Delta and Actimove.
Essity holds the number one or number two position within at least one product segment in some 90 countries. Distribution channels include the retail trade, online sales, pharmacies, sanitary shops, healthcare institutions and distributors. As of December 31, 2016, Essity had 42,520 employees and conducted manufacturing activities at 81 production facilities in over 30 countries. The acquisition of BSN
medical adds a sales organization with sales in approximately 140 countries, production in eleven countries and a total of approximately 6,000 employees, with a sales organization of approximately 1,650 employees, as of December 31, 2016. Essity’s net sales by product segment, region and distribution channel for 2016 (excluding BSN medical) are presented in the graphs below. During 2016, Consumer Tissue accounted for 41% of net sales, Professional Hygiene for 26% and Personal Care’s product segments Incontinence Products, Baby Care and Feminine Care accounted for 17%, 9% and 7% respectively. Essity’s sales in Europe accounted for 57% of the net sales, North America and Asia accounted for 15% each and Latin America for 12%. Sales to the retail trade accounted for 63% of net sales, business-to-business for 26% and the healthcare sector for 11%. See “Medical Solutions” below for separate graphs presenting BSN medical’s net sales by product segment, region and distribution channel for 2016.
Source: The information has been derived from the Company’s internal accounting system and has not been audited.
29Admission to trading of the shares in Essity Aktiebolag (publ) on Nasdaq Stockholm
Market and business description
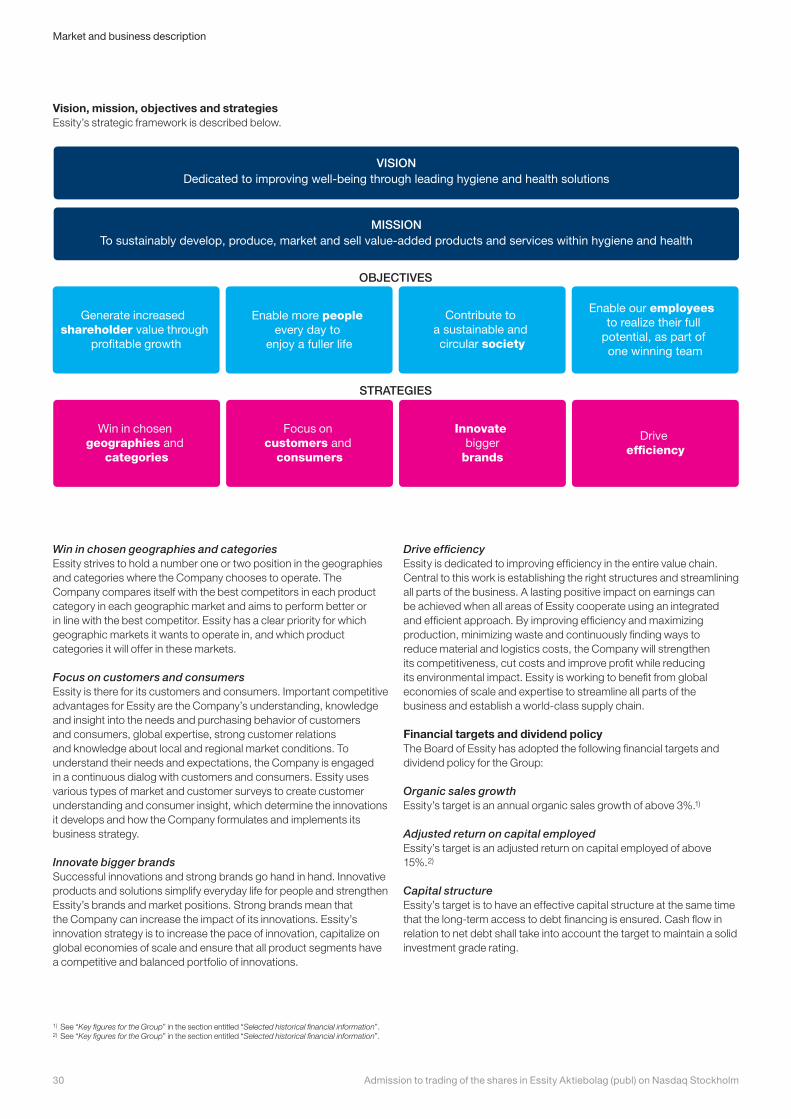
Win in chosen geographies and categoriesEssity strives to hold a number one or two position in the geographies and categories where the Company chooses to operate. The Company compares itself with the best competitors in each product category in each geographic market and aims to perform better or in line with the best competitor. Essity has a clear priority for which geographic markets it wants to operate in, and which product categories it will offer in these markets.
Focus on customers and consumersEssity is there for its customers and consumers. Important competitive advantages for Essity are the Company’s understanding, knowledge and insight into the needs and purchasing behavior of customers and consumers, global expertise, strong customer relations and knowledge about local and regional market conditions. To understand their needs and expectations, the Company is engaged in a continuous dialog with customers and consumers. Essity uses various types of market and customer surveys to create customer understanding and consumer insight, which determine the innovations it develops and how the Company formulates and implements its business strategy.
Innovate bigger brandsSuccessful innovations and strong brands go hand in hand. Innovative products and solutions simplify everyday life for people and strengthen Essity’s brands and market positions. Strong brands mean that the Company can increase the impact of its innovations. Essity’s innovation strategy is to increase the pace of innovation, capitalize on global economies of scale and ensure that all product segments have a competitive and balanced portfolio of innovations.
Drive efficiencyEssity is dedicated to improving efficiency in the entire value chain. Central to this work is establishing the right structures and streamlining all parts of the business. A lasting positive impact on earnings can be achieved when all areas of Essity cooperate using an integrated and efficient approach. By improving efficiency and maximizing production, minimizing waste and continuously finding ways to reduce material and logistics costs, the Company will strengthen its competitiveness, cut costs and improve profit while reducing its environmental impact. Essity is working to benefit from global economies of scale and expertise to streamline all parts of the business and establish a world-class supply chain.
Financial targets and dividend policyThe Board of Essity has adopted the following financial targets and dividend policy for the Group:
Organic sales growthEssity’s target is an annual organic sales growth of above 3%.1)
Adjusted return on capital employedEssity’s target is an adjusted return on capital employed of above 15%.2)
Capital structureEssity’s target is to have an effective capital structure at the same time that the long-term access to debt financing is ensured. Cash flow in relation to net debt shall take into account the target to maintain a solid investment grade rating.
Vision, mission, objectives and strategiesEssity’s strategic framework is described below.
STRATEGIES
OBJECTIVES
VISIONDedicated to improving well-being through leading hygiene and health solutions
MISSIONTo sustainably develop, produce, market and sell value-added products and services within hygiene and health
Generate increased shareholder value through
pro�table growth
Enable more people every day to
enjoy a fuller life
Contribute to a sustainable and circular society
Enable our employees to realize their full
potential, as part of one winning team
Win in chosen geographies and
categories
Focus on customers and
consumers
Innovate bigger
brands
Drive efficiency
1) See “Key figures for the Group” in the section entitled “Selected historical financial information”. 2) See “Key figures for the Group” in the section entitled “Selected historical financial information”.
Admission to trading of the shares in Essity Aktiebolag (publ) on Nasdaq Stockholm30
Market and business description
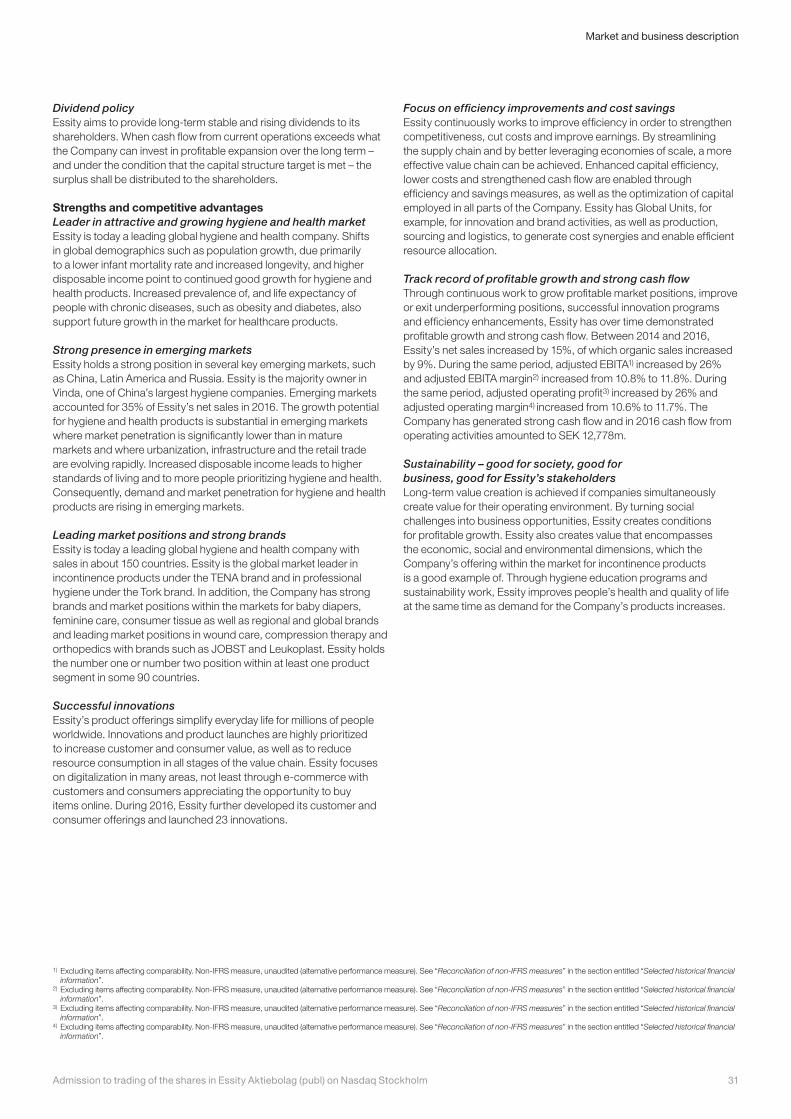
Dividend policyEssity aims to provide long-term stable and rising dividends to its shareholders. When cash flow from current operations exceeds what the Company can invest in profitable expansion over the long term – and under the condition that the capital structure target is met – the surplus shall be distributed to the shareholders.
Strengths and competitive advantagesLeader in attractive and growing hygiene and health marketEssity is today a leading global hygiene and health company. Shifts in global demographics such as population growth, due primarily to a lower infant mortality rate and increased longevity, and higher disposable income point to continued good growth for hygiene and health products. Increased prevalence of, and life expectancy of people with chronic diseases, such as obesity and diabetes, also support future growth in the market for healthcare products.
Strong presence in emerging marketsEssity holds a strong position in several key emerging markets, such as China, Latin America and Russia. Essity is the majority owner in Vinda, one of China’s largest hygiene companies. Emerging markets accounted for 35% of Essity’s net sales in 2016. The growth potential for hygiene and health products is substantial in emerging markets where market penetration is significantly lower than in mature markets and where urbanization, infrastructure and the retail trade are evolving rapidly. Increased disposable income leads to higher standards of living and to more people prioritizing hygiene and health. Consequently, demand and market penetration for hygiene and health products are rising in emerging markets.
Leading market positions and strong brandsEssity is today a leading global hygiene and health company with sales in about 150 countries. Essity is the global market leader in incontinence products under the TENA brand and in professional hygiene under the Tork brand. In addition, the Company has strong brands and market positions within the markets for baby diapers, feminine care, consumer tissue as well as regional and global brands and leading market positions in wound care, compression therapy and orthopedics with brands such as JOBST and Leukoplast. Essity holds the number one or number two position within at least one product segment in some 90 countries.
Successful innovationsEssity’s product offerings simplify everyday life for millions of people worldwide. Innovations and product launches are highly prioritized to increase customer and consumer value, as well as to reduce resource consumption in all stages of the value chain. Essity focuses on digitalization in many areas, not least through e-commerce with customers and consumers appreciating the opportunity to buy items online. During 2016, Essity further developed its customer and consumer offerings and launched 23 innovations.
Focus on efficiency improvements and cost savingsEssity continuously works to improve efficiency in order to strengthen competitiveness, cut costs and improve earnings. By streamlining the supply chain and by better leveraging economies of scale, a more effective value chain can be achieved. Enhanced capital efficiency, lower costs and strengthened cash flow are enabled through efficiency and savings measures, as well as the optimization of capital employed in all parts of the Company. Essity has Global Units, for example, for innovation and brand activities, as well as production, sourcing and logistics, to generate cost synergies and enable efficient resource allocation.
Track record of profitable growth and strong cash flowThrough continuous work to grow profitable market positions, improve or exit underperforming positions, successful innovation programs and efficiency enhancements, Essity has over time demonstrated profitable growth and strong cash flow. Between 2014 and 2016, Essity’s net sales increased by 15%, of which organic sales increased by 9%. During the same period, adjusted EBITA1) increased by 26% and adjusted EBITA margin2) increased from 10.8% to 11.8%. During the same period, adjusted operating profit3) increased by 26% and adjusted operating margin4) increased from 10.6% to 11.7%. The Company has generated strong cash flow and in 2016 cash flow from operating activities amounted to SEK 12,778m.
Sustainability – good for society, good for business, good for Essity’s stakeholdersLong-term value creation is achieved if companies simultaneously create value for their operating environment. By turning social challenges into business opportunities, Essity creates conditions for profitable growth. Essity also creates value that encompasses the economic, social and environmental dimensions, which the Company’s offering within the market for incontinence products is a good example of. Through hygiene education programs and sustainability work, Essity improves people’s health and quality of life at the same time as demand for the Company’s products increases.
1) Excluding items affecting comparability. Non-IFRS measure, unaudited (alternative performance measure). See “Reconciliation of non-IFRS measures” in the section entitled “Selected historical financial information”.
2) Excluding items affecting comparability. Non-IFRS measure, unaudited (alternative performance measure). See “Reconciliation of non-IFRS measures” in the section entitled “Selected historical financial information”.
3) Excluding items affecting comparability. Non-IFRS measure, unaudited (alternative performance measure). See “Reconciliation of non-IFRS measures” in the section entitled “Selected historical financial information”.
4) Excluding items affecting comparability. Non-IFRS measure, unaudited (alternative performance measure). See “Reconciliation of non-IFRS measures” in the section entitled “Selected historical financial information”.
31Admission to trading of the shares in Essity Aktiebolag (publ) on Nasdaq Stockholm
Market and business description
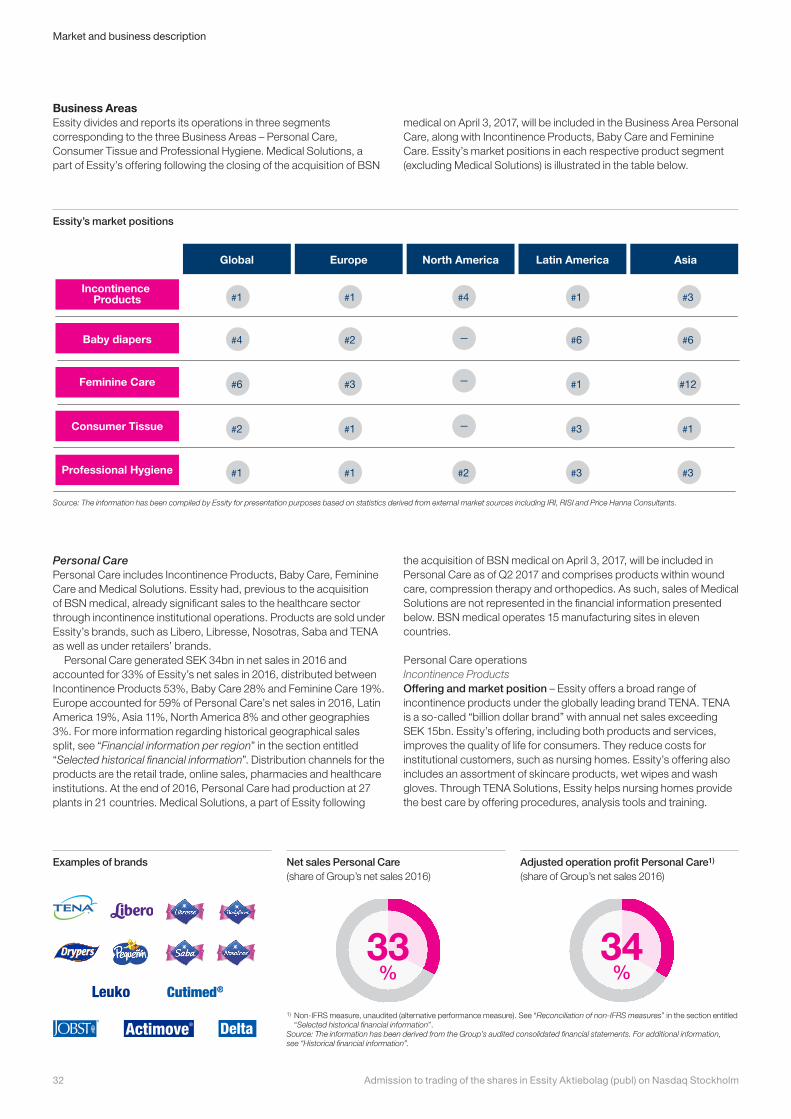
Business AreasEssity divides and reports its operations in three segments corresponding to the three Business Areas – Personal Care, Consumer Tissue and Professional Hygiene. Medical Solutions, a part of Essity’s offering following the closing of the acquisition of BSN
medical on April 3, 2017, will be included in the Business Area Personal Care, along with Incontinence Products, Baby Care and Feminine Care. Essity’s market positions in each respective product segment (excluding Medical Solutions) is illustrated in the table below.
Essity’s market positions
Global
#1
#4
#6
#1
#2
#1
#2
#3
#1
#1
#4
—
—
—
#2
#1
#6
#1
#3
#3
#3
#6
#12
#3
#1
Europe North America Latin America Asia
Incontinence Products
Baby diapers
Feminine Care
Professional Hygiene
Consumer Tissue
[Hygien]’s market position
Source: The information has been compiled by Essity for presentation purposes based on statistics derived from external market sources including IRI, RISI and Price Hanna Consultants.
Personal CarePersonal Care includes Incontinence Products, Baby Care, Feminine Care and Medical Solutions. Essity had, previous to the acquisition of BSN medical, already significant sales to the healthcare sector through incontinence institutional operations. Products are sold under Essity’s brands, such as Libero, Libresse, Nosotras, Saba and TENA as well as under retailers’ brands.
Personal Care generated SEK 34bn in net sales in 2016 and accounted for 33% of Essity’s net sales in 2016, distributed between Incontinence Products 53%, Baby Care 28% and Feminine Care 19%. Europe accounted for 59% of Personal Care’s net sales in 2016, Latin America 19%, Asia 11%, North America 8% and other geographies 3%. For more information regarding historical geographical sales split, see “Financial information per region” in the section entitled “Selected historical financial information”. Distribution channels for the products are the retail trade, online sales, pharmacies and healthcare institutions. At the end of 2016, Personal Care had production at 27 plants in 21 countries. Medical Solutions, a part of Essity following
the acquisition of BSN medical on April 3, 2017, will be included in Personal Care as of Q2 2017 and comprises products within wound care, compression therapy and orthopedics. As such, sales of Medical Solutions are not represented in the financial information presented below. BSN medical operates 15 manufacturing sites in eleven countries.
Personal Care operationsIncontinence ProductsOffering and market position – Essity offers a broad range of incontinence products under the globally leading brand TENA. TENA is a so-called “billion dollar brand” with annual net sales exceeding SEK 15bn. Essity’s offering, including both products and services, improves the quality of life for consumers. They reduce costs for institutional customers, such as nursing homes. Essity’s offering also includes an assortment of skincare products, wet wipes and wash gloves. Through TENA Solutions, Essity helps nursing homes provide the best care by offering procedures, analysis tools and training.
Examples of brands Net sales Personal Care (share of Group’s net sales 2016)
Adjusted operation profit Personal Care1) (share of Group’s net sales 2016)
33%
NETTOOMSÄTTNING
34%
JUSTERAT RÖRELSERESULTAT1)
1) Non-IFRS measure, unaudited (alternative performance measure). See “Reconciliation of non-IFRS measures” in the section entitled “Selected historical financial information”.
Source: The information has been derived from the Group’s audited consolidated financial statements. For additional information, see “Historical financial information”.
Admission to trading of the shares in Essity Aktiebolag (publ) on Nasdaq Stockholm32
Market and business description
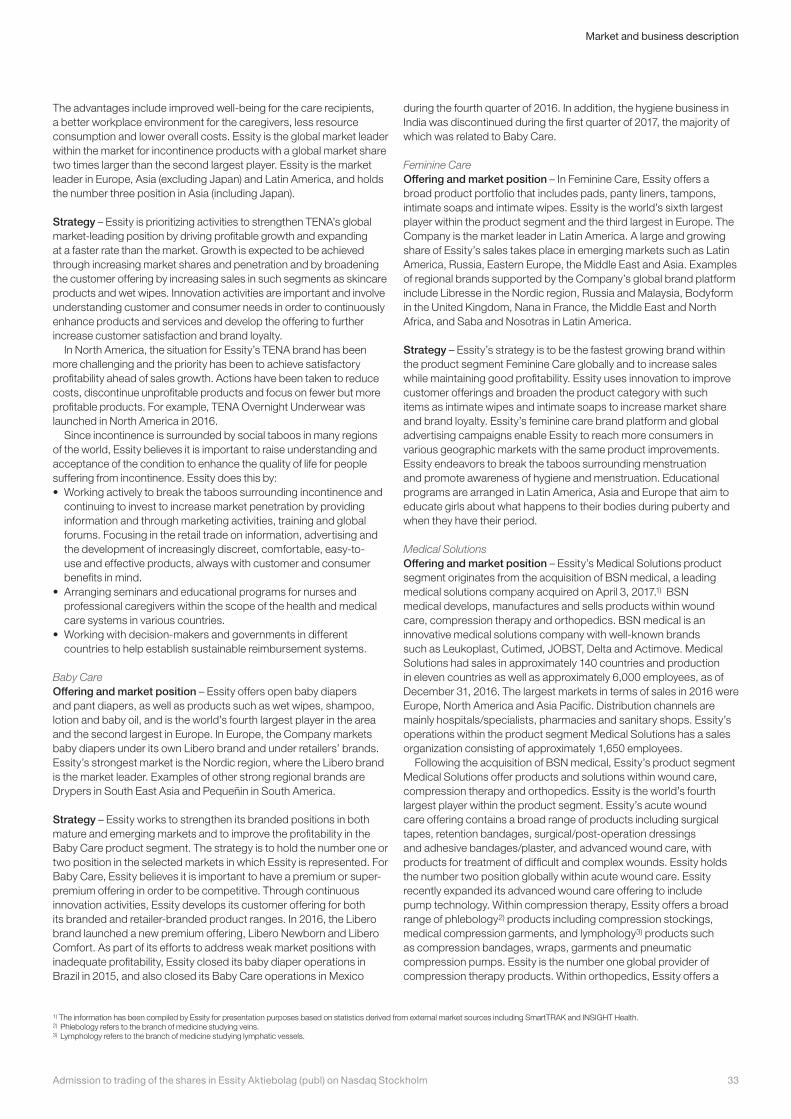
The advantages include improved well-being for the care recipients, a better workplace environment for the caregivers, less resource consumption and lower overall costs. Essity is the global market leader within the market for incontinence products with a global market share two times larger than the second largest player. Essity is the market leader in Europe, Asia (excluding Japan) and Latin America, and holds the number three position in Asia (including Japan).
Strategy – Essity is prioritizing activities to strengthen TENA’s global market-leading position by driving profitable growth and expanding at a faster rate than the market. Growth is expected to be achieved through increasing market shares and penetration and by broadening the customer offering by increasing sales in such segments as skincare products and wet wipes. Innovation activities are important and involve understanding customer and consumer needs in order to continuously enhance products and services and develop the offering to further increase customer satisfaction and brand loyalty.
In North America, the situation for Essity’s TENA brand has been more challenging and the priority has been to achieve satisfactory profitability ahead of sales growth. Actions have been taken to reduce costs, discontinue unprofitable products and focus on fewer but more profitable products. For example, TENA Overnight Underwear was launched in North America in 2016.
Since incontinence is surrounded by social taboos in many regions of the world, Essity believes it is important to raise understanding and acceptance of the condition to enhance the quality of life for people suffering from incontinence. Essity does this by:• Working actively to break the taboos surrounding incontinence and
continuing to invest to increase market penetration by providing information and through marketing activities, training and global forums. Focusing in the retail trade on information, advertising and the development of increasingly discreet, comfortable, easy-to-use and effective products, always with customer and consumer benefits in mind.
• Arranging seminars and educational programs for nurses and professional caregivers within the scope of the health and medical care systems in various countries.
• Working with decision-makers and governments in different countries to help establish sustainable reimbursement systems.
Baby CareOffering and market position – Essity offers open baby diapers and pant diapers, as well as products such as wet wipes, shampoo, lotion and baby oil, and is the world’s fourth largest player in the area and the second largest in Europe. In Europe, the Company markets baby diapers under its own Libero brand and under retailers’ brands. Essity’s strongest market is the Nordic region, where the Libero brand is the market leader. Examples of other strong regional brands are Drypers in South East Asia and Pequeñin in South America.
Strategy – Essity works to strengthen its branded positions in both mature and emerging markets and to improve the profitability in the Baby Care product segment. The strategy is to hold the number one or two position in the selected markets in which Essity is represented. For Baby Care, Essity believes it is important to have a premium or super-premium offering in order to be competitive. Through continuous innovation activities, Essity develops its customer offering for both its branded and retailer-branded product ranges. In 2016, the Libero brand launched a new premium offering, Libero Newborn and Libero Comfort. As part of its efforts to address weak market positions with inadequate profitability, Essity closed its baby diaper operations in Brazil in 2015, and also closed its Baby Care operations in Mexico
during the fourth quarter of 2016. In addition, the hygiene business in India was discontinued during the first quarter of 2017, the majority of which was related to Baby Care.
Feminine CareOffering and market position – In Feminine Care, Essity offers a broad product portfolio that includes pads, panty liners, tampons, intimate soaps and intimate wipes. Essity is the world’s sixth largest player within the product segment and the third largest in Europe. The Company is the market leader in Latin America. A large and growing share of Essity’s sales takes place in emerging markets such as Latin America, Russia, Eastern Europe, the Middle East and Asia. Examples of regional brands supported by the Company’s global brand platform include Libresse in the Nordic region, Russia and Malaysia, Bodyform in the United Kingdom, Nana in France, the Middle East and North Africa, and Saba and Nosotras in Latin America.
Strategy – Essity’s strategy is to be the fastest growing brand within the product segment Feminine Care globally and to increase sales while maintaining good profitability. Essity uses innovation to improve customer offerings and broaden the product category with such items as intimate wipes and intimate soaps to increase market share and brand loyalty. Essity’s feminine care brand platform and global advertising campaigns enable Essity to reach more consumers in various geographic markets with the same product improvements. Essity endeavors to break the taboos surrounding menstruation and promote awareness of hygiene and menstruation. Educational programs are arranged in Latin America, Asia and Europe that aim to educate girls about what happens to their bodies during puberty and when they have their period.
Medical SolutionsOffering and market position – Essity’s Medical Solutions product segment originates from the acquisition of BSN medical, a leading medical solutions company acquired on April 3, 2017.1) BSN medical develops, manufactures and sells products within wound care, compression therapy and orthopedics. BSN medical is an innovative medical solutions company with well-known brands such as Leukoplast, Cutimed, JOBST, Delta and Actimove. Medical Solutions had sales in approximately 140 countries and production in eleven countries as well as approximately 6,000 employees, as of December 31, 2016. The largest markets in terms of sales in 2016 were Europe, North America and Asia Pacific. Distribution channels are mainly hospitals/specialists, pharmacies and sanitary shops. Essity’s operations within the product segment Medical Solutions has a sales organization consisting of approximately 1,650 employees.
Following the acquisition of BSN medical, Essity’s product segment Medical Solutions offer products and solutions within wound care, compression therapy and orthopedics. Essity is the world’s fourth largest player within the product segment. Essity’s acute wound care offering contains a broad range of products including surgical tapes, retention bandages, surgical/post-operation dressings and adhesive bandages/plaster, and advanced wound care, with products for treatment of difficult and complex wounds. Essity holds the number two position globally within acute wound care. Essity recently expanded its advanced wound care offering to include pump technology. Within compression therapy, Essity offers a broad range of phlebology2) products including compression stockings, medical compression garments, and lymphology3) products such as compression bandages, wraps, garments and pneumatic compression pumps. Essity is the number one global provider of compression therapy products. Within orthopedics, Essity offers a
1) The information has been compiled by Essity for presentation purposes based on statistics derived from external market sources including SmartTRAK and INSIGHT Health.2) Phlebology refers to the branch of medicine studying veins.3) Lymphology refers to the branch of medicine studying lymphatic vessels.
33Admission to trading of the shares in Essity Aktiebolag (publ) on Nasdaq Stockholm
Market and business description
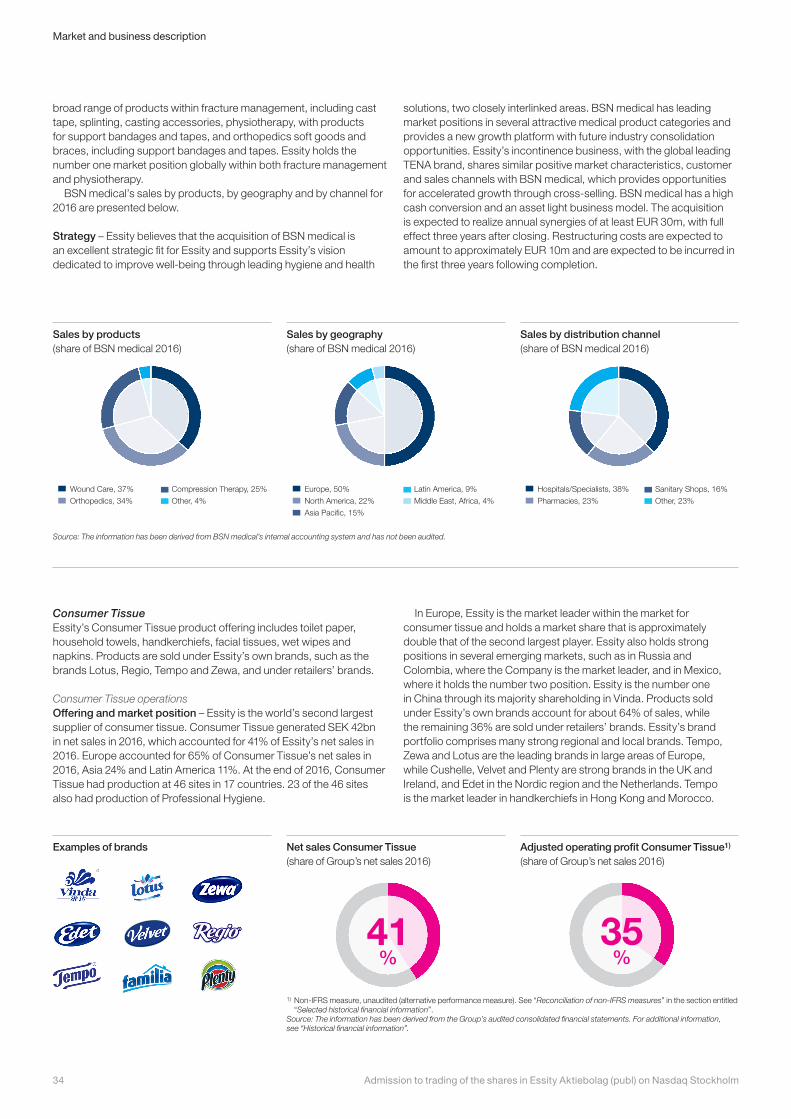
broad range of products within fracture management, including cast tape, splinting, casting accessories, physiotherapy, with products for support bandages and tapes, and orthopedics soft goods and braces, including support bandages and tapes. Essity holds the number one market position globally within both fracture management and physiotherapy.
BSN medical’s sales by products, by geography and by channel for 2016 are presented below.
Strategy – Essity believes that the acquisition of BSN medical is an excellent strategic fit for Essity and supports Essity’s vision dedicated to improve well-being through leading hygiene and health
solutions, two closely interlinked areas. BSN medical has leading market positions in several attractive medical product categories and provides a new growth platform with future industry consolidation opportunities. Essity’s incontinence business, with the global leading TENA brand, shares similar positive market characteristics, customer and sales channels with BSN medical, which provides opportunities for accelerated growth through cross-selling. BSN medical has a high cash conversion and an asset light business model. The acquisition is expected to realize annual synergies of at least EUR 30m, with full effect three years after closing. Restructuring costs are expected to amount to approximately EUR 10m and are expected to be incurred in the first three years following completion.
Source: The information has been derived from BSN medical’s internal accounting system and has not been audited.
Sales by geography (share of BSN medical 2016)
Sales by distribution channel (share of BSN medical 2016)
Sales by products (share of BSN medical 2016)
Wound Care, 37%
Orthopedics, 34%
Compression Therapy, 25%
Other, 4%
Sales by products
Europe, 50%
North America, 22%
Asia Pacific, 15%
Latin America, 9%
Middle East, Africa, 4%
Sales by geography
Hospitals/Specialists, 38%
Pharmacies, 23%
Sanitary Shops, 16%
Other, 23%
Sales by distrubution channel
Examples of brands Net sales Consumer Tissue (share of Group’s net sales 2016)
Adjusted operating profit Consumer Tissue1) (share of Group’s net sales 2016)
41%
NETTOOMSÄTTNING
35%
JUSTERAT RÖRELSERESULTAT1)
Consumer TissueEssity’s Consumer Tissue product offering includes toilet paper, household towels, handkerchiefs, facial tissues, wet wipes and napkins. Products are sold under Essity’s own brands, such as the brands Lotus, Regio, Tempo and Zewa, and under retailers’ brands.
Consumer Tissue operationsOffering and market position – Essity is the world’s second largest supplier of consumer tissue. Consumer Tissue generated SEK 42bn in net sales in 2016, which accounted for 41% of Essity’s net sales in 2016. Europe accounted for 65% of Consumer Tissue’s net sales in 2016, Asia 24% and Latin America 11%. At the end of 2016, Consumer Tissue had production at 46 sites in 17 countries. 23 of the 46 sites also had production of Professional Hygiene.
In Europe, Essity is the market leader within the market for consumer tissue and holds a market share that is approximately double that of the second largest player. Essity also holds strong positions in several emerging markets, such as in Russia and Colombia, where the Company is the market leader, and in Mexico, where it holds the number two position. Essity is the number one in China through its majority shareholding in Vinda. Products sold under Essity’s own brands account for about 64% of sales, while the remaining 36% are sold under retailers’ brands. Essity’s brand portfolio comprises many strong regional and local brands. Tempo, Zewa and Lotus are the leading brands in large areas of Europe, while Cushelle, Velvet and Plenty are strong brands in the UK and Ireland, and Edet in the Nordic region and the Netherlands. Tempo is the market leader in handkerchiefs in Hong Kong and Morocco.
1) Non-IFRS measure, unaudited (alternative performance measure). See “Reconciliation of non-IFRS measures” in the section entitled “Selected historical financial information”.
Source: The information has been derived from the Group’s audited consolidated financial statements. For additional information, see “Historical financial information”.
Admission to trading of the shares in Essity Aktiebolag (publ) on Nasdaq Stockholm34
Market and business description
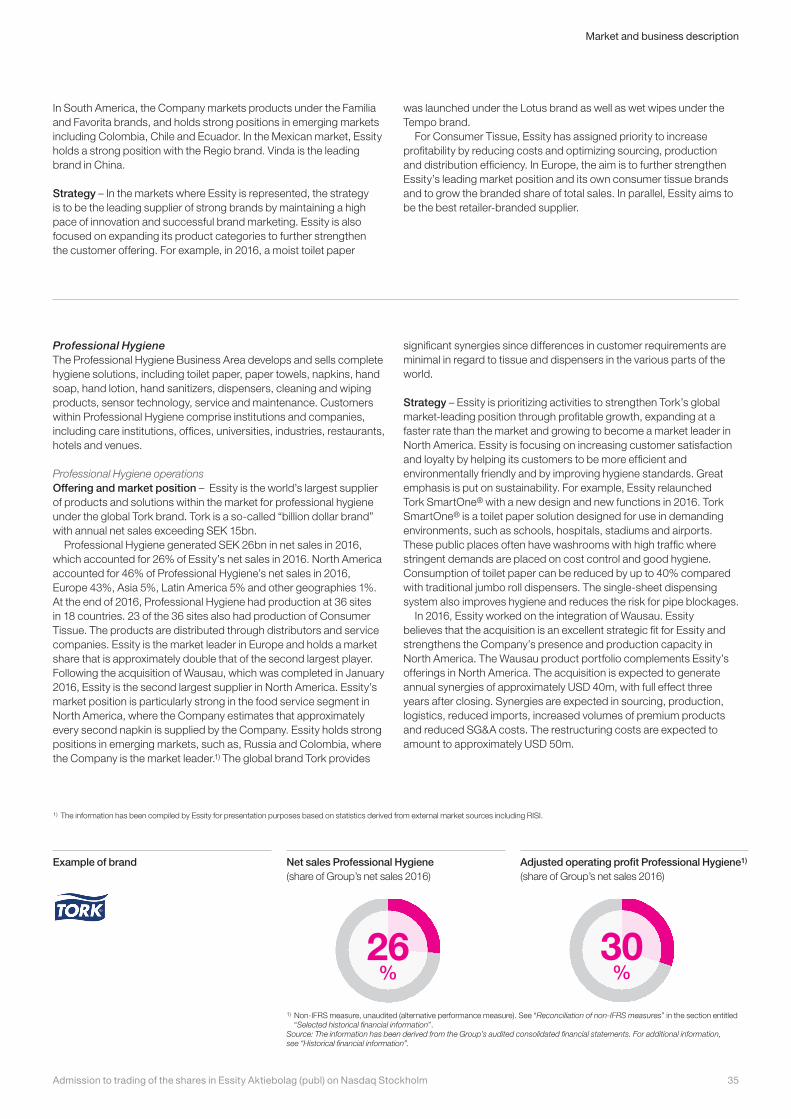
1) The information has been compiled by Essity for presentation purposes based on statistics derived from external market sources including RISI.
In South America, the Company markets products under the Familia and Favorita brands, and holds strong positions in emerging markets including Colombia, Chile and Ecuador. In the Mexican market, Essity holds a strong position with the Regio brand. Vinda is the leading brand in China.
Strategy – In the markets where Essity is represented, the strategy is to be the leading supplier of strong brands by maintaining a high pace of innovation and successful brand marketing. Essity is also focused on expanding its product categories to further strengthen the customer offering. For example, in 2016, a moist toilet paper
was launched under the Lotus brand as well as wet wipes under the Tempo brand.
For Consumer Tissue, Essity has assigned priority to increase profitability by reducing costs and optimizing sourcing, production and distribution efficiency. In Europe, the aim is to further strengthen Essity’s leading market position and its own consumer tissue brands and to grow the branded share of total sales. In parallel, Essity aims to be the best retailer-branded supplier.
Professional HygieneThe Professional Hygiene Business Area develops and sells complete hygiene solutions, including toilet paper, paper towels, napkins, hand soap, hand lotion, hand sanitizers, dispensers, cleaning and wiping products, sensor technology, service and maintenance. Customers within Professional Hygiene comprise institutions and companies, including care institutions, offices, universities, industries, restaurants, hotels and venues.
Professional Hygiene operationsOffering and market position – Essity is the world’s largest supplier of products and solutions within the market for professional hygiene under the global Tork brand. Tork is a so-called “billion dollar brand” with annual net sales exceeding SEK 15bn.
Professional Hygiene generated SEK 26bn in net sales in 2016, which accounted for 26% of Essity’s net sales in 2016. North America accounted for 46% of Professional Hygiene’s net sales in 2016, Europe 43%, Asia 5%, Latin America 5% and other geographies 1%. At the end of 2016, Professional Hygiene had production at 36 sites in 18 countries. 23 of the 36 sites also had production of Consumer Tissue. The products are distributed through distributors and service companies. Essity is the market leader in Europe and holds a market share that is approximately double that of the second largest player. Following the acquisition of Wausau, which was completed in January 2016, Essity is the second largest supplier in North America. Essity’s market position is particularly strong in the food service segment in North America, where the Company estimates that approximately every second napkin is supplied by the Company. Essity holds strong positions in emerging markets, such as, Russia and Colombia, where the Company is the market leader.1) The global brand Tork provides
significant synergies since differences in customer requirements are minimal in regard to tissue and dispensers in the various parts of the world.
Strategy – Essity is prioritizing activities to strengthen Tork’s global market-leading position through profitable growth, expanding at a faster rate than the market and growing to become a market leader in North America. Essity is focusing on increasing customer satisfaction and loyalty by helping its customers to be more efficient and environmentally friendly and by improving hygiene standards. Great emphasis is put on sustainability. For example, Essity relaunched Tork SmartOne® with a new design and new functions in 2016. Tork SmartOne® is a toilet paper solution designed for use in demanding environments, such as schools, hospitals, stadiums and airports. These public places often have washrooms with high traffic where stringent demands are placed on cost control and good hygiene. Consumption of toilet paper can be reduced by up to 40% compared with traditional jumbo roll dispensers. The single-sheet dispensing system also improves hygiene and reduces the risk for pipe blockages.
In 2016, Essity worked on the integration of Wausau. Essity believes that the acquisition is an excellent strategic fit for Essity and strengthens the Company’s presence and production capacity in North America. The Wausau product portfolio complements Essity’s offerings in North America. The acquisition is expected to generate annual synergies of approximately USD 40m, with full effect three years after closing. Synergies are expected in sourcing, production, logistics, reduced imports, increased volumes of premium products and reduced SG&A costs. The restructuring costs are expected to amount to approximately USD 50m.
Example of brand Net sales Professional Hygiene (share of Group’s net sales 2016)
Adjusted operating profit Professional Hygiene1) (share of Group’s net sales 2016)
26%
NETTOOMSÄTTNING
30%
JUSTERAT RÖRELSERESULTAT1)
1) Non-IFRS measure, unaudited (alternative performance measure). See “Reconciliation of non-IFRS measures” in the section entitled “Selected historical financial information”.
Source: The information has been derived from the Group’s audited consolidated financial statements. For additional information, see “Historical financial information”.
35Admission to trading of the shares in Essity Aktiebolag (publ) on Nasdaq Stockholm
Market and business description
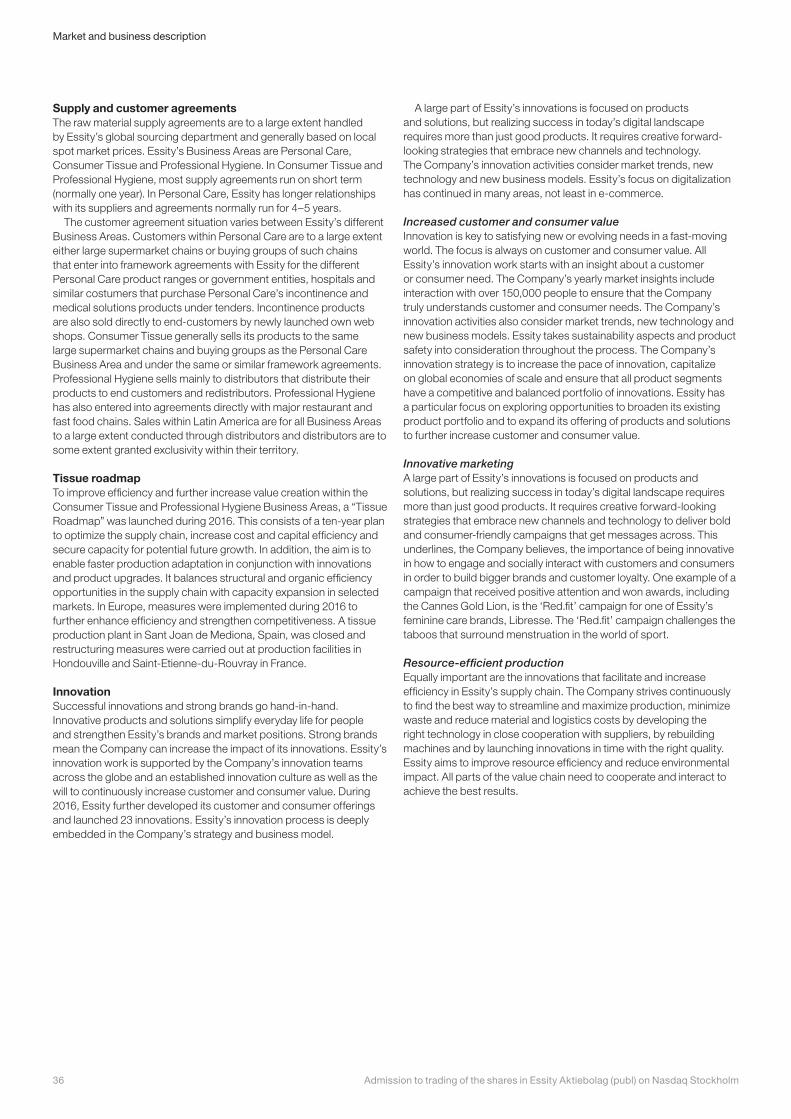
Supply and customer agreementsThe raw material supply agreements are to a large extent handled by Essity’s global sourcing department and generally based on local spot market prices. Essity’s Business Areas are Personal Care, Consumer Tissue and Professional Hygiene. In Consumer Tissue and Professional Hygiene, most supply agreements run on short term (normally one year). In Personal Care, Essity has longer relationships with its suppliers and agreements normally run for 4–5 years.
The customer agreement situation varies between Essity’s different Business Areas. Customers within Personal Care are to a large extent either large supermarket chains or buying groups of such chains that enter into framework agreements with Essity for the different Personal Care product ranges or government entities, hospitals and similar costumers that purchase Personal Care’s incontinence and medical solutions products under tenders. Incontinence products are also sold directly to end-customers by newly launched own web shops. Consumer Tissue generally sells its products to the same large supermarket chains and buying groups as the Personal Care Business Area and under the same or similar framework agreements. Professional Hygiene sells mainly to distributors that distribute their products to end customers and redistributors. Professional Hygiene has also entered into agreements directly with major restaurant and fast food chains. Sales within Latin America are for all Business Areas to a large extent conducted through distributors and distributors are to some extent granted exclusivity within their territory.
Tissue roadmapTo improve efficiency and further increase value creation within the Consumer Tissue and Professional Hygiene Business Areas, a “Tissue Roadmap” was launched during 2016. This consists of a ten-year plan to optimize the supply chain, increase cost and capital efficiency and secure capacity for potential future growth. In addition, the aim is to enable faster production adaptation in conjunction with innovations and product upgrades. It balances structural and organic efficiency opportunities in the supply chain with capacity expansion in selected markets. In Europe, measures were implemented during 2016 to further enhance efficiency and strengthen competitiveness. A tissue production plant in Sant Joan de Mediona, Spain, was closed and restructuring measures were carried out at production facilities in Hondouville and Saint-Etienne-du-Rouvray in France.
InnovationSuccessful innovations and strong brands go hand-in-hand. Innovative products and solutions simplify everyday life for people and strengthen Essity’s brands and market positions. Strong brands mean the Company can increase the impact of its innovations. Essity’s innovation work is supported by the Company’s innovation teams across the globe and an established innovation culture as well as the will to continuously increase customer and consumer value. During 2016, Essity further developed its customer and consumer offerings and launched 23 innovations. Essity’s innovation process is deeply embedded in the Company’s strategy and business model.
A large part of Essity’s innovations is focused on products and solutions, but realizing success in today’s digital landscape requires more than just good products. It requires creative forward-looking strategies that embrace new channels and technology. The Company’s innovation activities consider market trends, new technology and new business models. Essity’s focus on digitalization has continued in many areas, not least in e-commerce.
Increased customer and consumer valueInnovation is key to satisfying new or evolving needs in a fast-moving world. The focus is always on customer and consumer value. All Essity’s innovation work starts with an insight about a customer or consumer need. The Company’s yearly market insights include interaction with over 150,000 people to ensure that the Company truly understands customer and consumer needs. The Company’s innovation activities also consider market trends, new technology and new business models. Essity takes sustainability aspects and product safety into consideration throughout the process. The Company’s innovation strategy is to increase the pace of innovation, capitalize on global economies of scale and ensure that all product segments have a competitive and balanced portfolio of innovations. Essity has a particular focus on exploring opportunities to broaden its existing product portfolio and to expand its offering of products and solutions to further increase customer and consumer value.
Innovative marketingA large part of Essity’s innovations is focused on products and solutions, but realizing success in today’s digital landscape requires more than just good products. It requires creative forward-looking strategies that embrace new channels and technology to deliver bold and consumer-friendly campaigns that get messages across. This underlines, the Company believes, the importance of being innovative in how to engage and socially interact with customers and consumers in order to build bigger brands and customer loyalty. One example of a campaign that received positive attention and won awards, including the Cannes Gold Lion, is the ‘Red.fit’ campaign for one of Essity’s feminine care brands, Libresse. The ‘Red.fit’ campaign challenges the taboos that surround menstruation in the world of sport.
Resource-efficient productionEqually important are the innovations that facilitate and increase efficiency in Essity’s supply chain. The Company strives continuously to find the best way to streamline and maximize production, minimize waste and reduce material and logistics costs by developing the right technology in close cooperation with suppliers, by rebuilding machines and by launching innovations in time with the right quality. Essity aims to improve resource efficiency and reduce environmental impact. All parts of the value chain need to cooperate and interact to achieve the best results.
Admission to trading of the shares in Essity Aktiebolag (publ) on Nasdaq Stockholm36
Market and business description
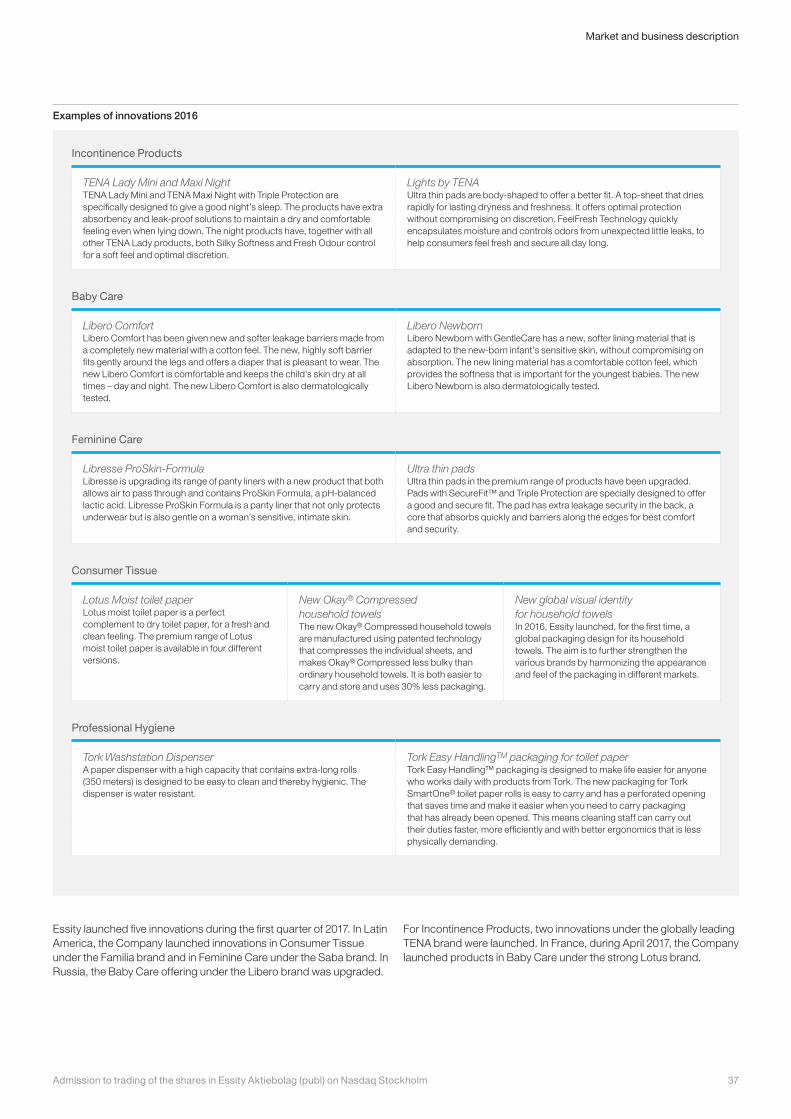
Incontinence Products
TENA Lady Mini and Maxi Night TENA Lady Mini and TENA Maxi Night with Triple Protection are specifically designed to give a good night’s sleep. The products have extra absorbency and leak-proof solutions to maintain a dry and comfortable feeling even when lying down. The night products have, together with all other TENA Lady products, both Silky Softness and Fresh Odour control for a soft feel and optimal discretion.
Lights by TENA Ultra thin pads are body-shaped to offer a better fit. A top-sheet that dries rapidly for lasting dryness and freshness. It offers optimal protection without compromising on discretion. FeelFresh Technology quickly encapsulates moisture and controls odors from unexpected little leaks, to help consumers feel fresh and secure all day long.
Baby Care
Libero Comfort Libero Comfort has been given new and softer leakage barriers made from a completely new material with a cotton feel. The new, highly soft barrier fits gently around the legs and offers a diaper that is pleasant to wear. The new Libero Comfort is comfortable and keeps the child’s skin dry at all times – day and night. The new Libero Comfort is also dermatologically tested.
Libero Newborn Libero Newborn with GentleCare has a new, softer lining material that is adapted to the new-born infant’s sensitive skin, without compromising on absorption. The new lining material has a comfortable cotton feel, which provides the softness that is important for the youngest babies. The new Libero Newborn is also dermatologically tested.
Feminine Care
Libresse ProSkin-Formula Libresse is upgrading its range of panty liners with a new product that both allows air to pass through and contains ProSkin Formula, a pH-balanced lactic acid. Libresse ProSkin Formula is a panty liner that not only protects underwear but is also gentle on a woman’s sensitive, intimate skin.
Ultra thin padsUltra thin pads in the premium range of products have been upgraded. Pads with SecureFit™ and Triple Protection are specially designed to offer a good and secure fit. The pad has extra leakage security in the back, a core that absorbs quickly and barriers along the edges for best comfort and security.
Consumer Tissue
Lotus Moist toilet paper Lotus moist toilet paper is a perfect complement to dry toilet paper, for a fresh and clean feeling. The premium range of Lotus moist toilet paper is available in four different versions.
New Okay® Compressed household towelsThe new Okay® Compressed household towels are manufactured using patented technology that compresses the individual sheets, and makes Okay® Compressed less bulky than ordinary household towels. It is both easier to carry and store and uses 30% less packaging.
New global visual identity for household towelsIn 2016, Essity launched, for the first time, a global packaging design for its household towels. The aim is to further strengthen the various brands by harmonizing the appearance and feel of the packaging in different markets.
Professional Hygiene
Tork Washstation DispenserA paper dispenser with a high capacity that contains extra-long rolls (350 meters) is designed to be easy to clean and thereby hygienic. The dispenser is water resistant.
Tork Easy HandlingTM packaging for toilet paperTork Easy Handling™ packaging is designed to make life easier for anyone who works daily with products from Tork. The new packaging for Tork SmartOne® toilet paper rolls is easy to carry and has a perforated opening that saves time and make it easier when you need to carry packaging that has already been opened. This means cleaning staff can carry out their duties faster, more efficiently and with better ergonomics that is less physically demanding.
Essity launched five innovations during the first quarter of 2017. In Latin America, the Company launched innovations in Consumer Tissue under the Familia brand and in Feminine Care under the Saba brand. In Russia, the Baby Care offering under the Libero brand was upgraded.
For Incontinence Products, two innovations under the globally leading TENA brand were launched. In France, during April 2017, the Company launched products in Baby Care under the strong Lotus brand.
Examples of innovations 2016
37Admission to trading of the shares in Essity Aktiebolag (publ) on Nasdaq Stockholm
Market and business description
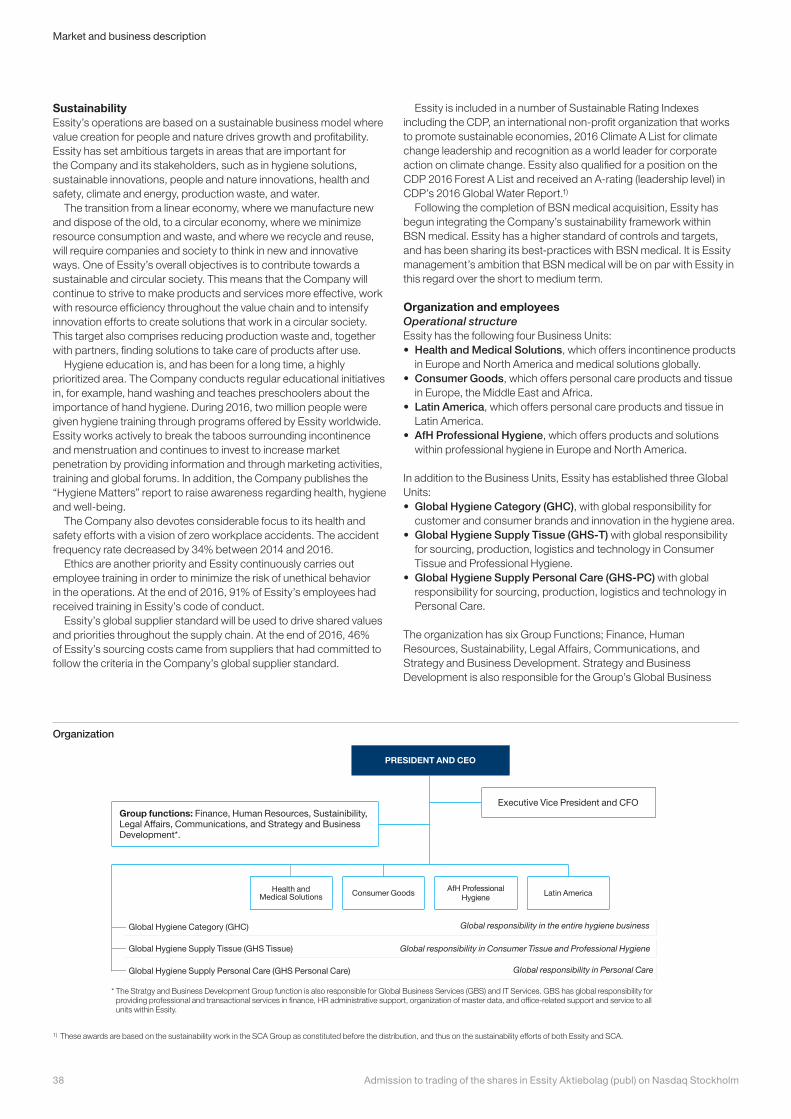
SustainabilityEssity’s operations are based on a sustainable business model where value creation for people and nature drives growth and profitability. Essity has set ambitious targets in areas that are important for the Company and its stakeholders, such as in hygiene solutions, sustainable innovations, people and nature innovations, health and safety, climate and energy, production waste, and water.
The transition from a linear economy, where we manufacture new and dispose of the old, to a circular economy, where we minimize resource consumption and waste, and where we recycle and reuse, will require companies and society to think in new and innovative ways. One of Essity’s overall objectives is to contribute towards a sustainable and circular society. This means that the Company will continue to strive to make products and services more effective, work with resource efficiency throughout the value chain and to intensify innovation efforts to create solutions that work in a circular society. This target also comprises reducing production waste and, together with partners, finding solutions to take care of products after use.
Hygiene education is, and has been for a long time, a highly prioritized area. The Company conducts regular educational initiatives in, for example, hand washing and teaches preschoolers about the importance of hand hygiene. During 2016, two million people were given hygiene training through programs offered by Essity worldwide. Essity works actively to break the taboos surrounding incontinence and menstruation and continues to invest to increase market penetration by providing information and through marketing activities, training and global forums. In addition, the Company publishes the “Hygiene Matters” report to raise awareness regarding health, hygiene and well-being.
The Company also devotes considerable focus to its health and safety efforts with a vision of zero workplace accidents. The accident frequency rate decreased by 34% between 2014 and 2016.
Ethics are another priority and Essity continuously carries out employee training in order to minimize the risk of unethical behavior in the operations. At the end of 2016, 91% of Essity’s employees had received training in Essity’s code of conduct.
Essity’s global supplier standard will be used to drive shared values and priorities throughout the supply chain. At the end of 2016, 46% of Essity’s sourcing costs came from suppliers that had committed to follow the criteria in the Company’s global supplier standard.
Essity is included in a number of Sustainable Rating Indexes including the CDP, an international non-profit organization that works to promote sustainable economies, 2016 Climate A List for climate change leadership and recognition as a world leader for corporate action on climate change. Essity also qualified for a position on the CDP 2016 Forest A List and received an A-rating (leadership level) in CDP’s 2016 Global Water Report.1)
Following the completion of BSN medical acquisition, Essity has begun integrating the Company’s sustainability framework within BSN medical. Essity has a higher standard of controls and targets, and has been sharing its best-practices with BSN medical. It is Essity management’s ambition that BSN medical will be on par with Essity in this regard over the short to medium term.
Organization and employeesOperational structureEssity has the following four Business Units:• Health and Medical Solutions, which offers incontinence products
in Europe and North America and medical solutions globally. • Consumer Goods, which offers personal care products and tissue
in Europe, the Middle East and Africa.• Latin America, which offers personal care products and tissue in
Latin America. • AfH Professional Hygiene, which offers products and solutions
within professional hygiene in Europe and North America.
In addition to the Business Units, Essity has established three Global Units:• Global Hygiene Category (GHC), with global responsibility for
customer and consumer brands and innovation in the hygiene area.• Global Hygiene Supply Tissue (GHS-T) with global responsibility
for sourcing, production, logistics and technology in Consumer Tissue and Professional Hygiene.
• Global Hygiene Supply Personal Care (GHS-PC) with global responsibility for sourcing, production, logistics and technology in Personal Care.
The organization has six Group Functions; Finance, Human Resources, Sustainability, Legal Affairs, Communications, and Strategy and Business Development. Strategy and Business Development is also responsible for the Group’s Global Business
1) These awards are based on the sustainability work in the SCA Group as constituted before the distribution, and thus on the sustainability efforts of both Essity and SCA.
PRESIDENT AND CEO
Group functions: Finance, Human Resources, Sustainibility, Legal Affairs, Communications, and Strategy and Business Development*.
Latin AmericaAfH Professional
HygieneConsumer GoodsHealth and
Medical Solutions
Global Hygiene Supply Tissue (GHS Tissue)
Global Hygiene Supply Personal Care (GHS Personal Care)
Global Hygiene Category (GHC) Global responsibility in the entire hygiene business
Global responsibility in Consumer Tissue and Professional Hygiene
Global responsibility in Personal Care
Executive Vice President and CFO
* The Stratgy and Business Development Group function is also responsible for Global Business Services (GBS) and IT Services. GBS has global responsibility for providing professional and transactional services in finance, HR administrative support, organization of master data, and office-related support and service to all units within Essity.
Organization
Admission to trading of the shares in Essity Aktiebolag (publ) on Nasdaq Stockholm38
Market and business description
Services (GBS) and IT Services. GBS has global responsibility for providing professional and transactional services in finance, HR administrative support, organization of master data, and office-related support and service to all units within Essity.
EmployeesAs of December 31, 2016, Essity had 42,520 employees. During 2016, the average number of employees outside Sweden represented 95.3% of the total average number of employees.
Number of employees 2016 2015 2014
At the end of the period 42,520 40,147 39,837
Average 42,149 39,951 40,165
Women, % 32 31 33
By Business Area
Personal Care 13,237 12,779 13,063
Consumer Tissue 20,880 20,021 20,518
Professional Hygiene 8,032 7,151 6,583
By region
Europe 17,577 17,468 17,614
Asia 11,117 10,162 10,272
Latin America 8,749 8,425 8,299
North America 3,659 2,778 2,799
Rest of the world 1,047 1,118 1,181
Research and developmentEssity has advanced product development processes within the core product categories in order to ensure that the products are safe, easy-to-use and of high quality. Essity’s focus on customer and consumer insight guides its innovation activities, ensuring that new products and services provide competitiveness and that the Company’s offering continuously evolves to meet customer and consumer needs. New technological solutions are developed through the Company’s own research and development activities and in cooperation with suppliers. Development work is thus often conducted in direct cooperation with customers and suppliers of material and machinery to provide a direct link to requirements and feedback from customers at the same time as more efficient processes and products are developed.
More than 500 employees within Essity are dedicated to research and development, divided into three different R&D departments supporting a broad product portfolio including more than 500 product categories.
See “Research and development expenses” in the section entitled “Operational and financial review” for a description of Essity’s expenses in relation to research and development.
Intellectual property rights, etc.Essity relies upon patents, proprietary expertise, continuing technological process innovations and other trade secrets to develop and maintain the Company’s competitive position. With the strong focus on its brands and product development leadership within the Group, the focus is naturally also very high on ensuring a strong intellectual property rights management across product categories and geographies.
Essity has established strategies for each product category that provide guidance on the prioritized areas for intellectual property activities e.g. for protection, enforcement, opposition of intellectual property rights. The centralized intellectual property department, consisting of more than 40 employees, has integrated patent and trademark attorney teams that mirror the categories for application of relevant IP protection.
Essity currently holds approximately 9,600 patent rights (pending and/or granted) worldwide and seeks to protect trade secrets by entering into confidentiality agreements with third-party developers. In addition, Essity seeks to ensure that information is exchanged only to the extent necessary in communications with customers and suppliers.
39Admission to trading of the shares in Essity Aktiebolag (publ) on Nasdaq Stockholm
Market and business description
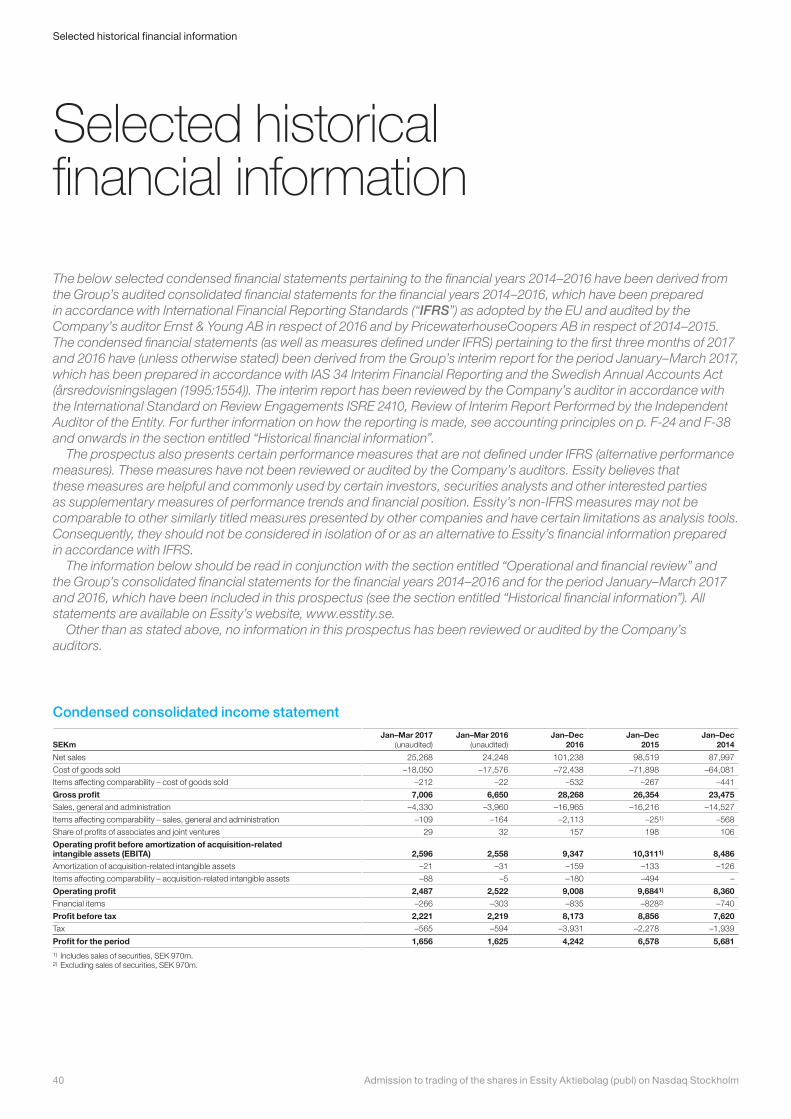
Selected historical financial information
Condensed consolidated income statement
SEKmJan–Mar 2017
(unaudited)Jan–Mar 2016
(unaudited)Jan–Dec
2016Jan–Dec
2015Jan–Dec
2014
Net sales 25,268 24,248 101,238 98,519 87,997
Cost of goods sold –18,050 –17,576 –72,438 –71,898 –64,081
Items affecting comparability – cost of goods sold –212 –22 –532 –267 –441
Gross profit 7,006 6,650 28,268 26,354 23,475Sales, general and administration –4,330 –3,960 –16,965 –16,216 –14,527
Items affecting comparability – sales, general and administration –109 –164 –2,113 –251) –568
Share of profits of associates and joint ventures 29 32 157 198 106
Operating profit before amortization of acquisition-related intangible assets (EBITA) 2,596 2,558 9,347 10,3111) 8,486Amortization of acquisition-related intangible assets –21 –31 –159 –133 –126
Items affecting comparability – acquisition-related intangible assets –88 –5 –180 –494 –
Operating profit 2,487 2,522 9,008 9,6841) 8,360Financial items –266 –303 –835 –8282) –740
Profit before tax 2,221 2,219 8,173 8,856 7,620Tax –565 –594 –3,931 –2,278 –1,939
Profit for the period 1,656 1,625 4,242 6,578 5,6811) Includes sales of securities, SEK 970m.2) Excluding sales of securities, SEK 970m.
The below selected condensed financial statements pertaining to the financial years 2014–2016 have been derived from the Group’s audited consolidated financial statements for the financial years 2014–2016, which have been prepared in accordance with International Financial Reporting Standards (“IFRS”) as adopted by the EU and audited by the Company’s auditor Ernst & Young AB in respect of 2016 and by PricewaterhouseCoopers AB in respect of 2014–2015. The condensed financial statements (as well as measures defined under IFRS) pertaining to the first three months of 2017 and 2016 have (unless otherwise stated) been derived from the Group’s interim report for the period January–March 2017, which has been prepared in accordance with IAS 34 Interim Financial Reporting and the Swedish Annual Accounts Act (årsredovisningslagen (1995:1554)). The interim report has been reviewed by the Company’s auditor in accordance with the International Standard on Review Engagements ISRE 2410, Review of Interim Report Performed by the Independent Auditor of the Entity. For further information on how the reporting is made, see accounting principles on p. F-24 and F-38 and onwards in the section entitled “Historical financial information”. The prospectus also presents certain performance measures that are not defined under IFRS (alternative performance measures). These measures have not been reviewed or audited by the Company’s auditors. Essity believes that these measures are helpful and commonly used by certain investors, securities analysts and other interested parties as supplementary measures of performance trends and financial position. Essity’s non-IFRS measures may not be comparable to other similarly titled measures presented by other companies and have certain limitations as analysis tools. Consequently, they should not be considered in isolation of or as an alternative to Essity’s financial information prepared in accordance with IFRS. The information below should be read in conjunction with the section entitled “Operational and financial review” and the Group’s consolidated financial statements for the financial years 2014–2016 and for the period January–March 2017 and 2016, which have been included in this prospectus (see the section entitled “Historical financial information”). All statements are available on Essity’s website, www.esstity. se. Other than as stated above, no information in this prospectus has been reviewed or audited by the Company’s auditors.
Admission to trading of the shares in Essity Aktiebolag (publ) on Nasdaq Stockholm40
Selected historical financial information
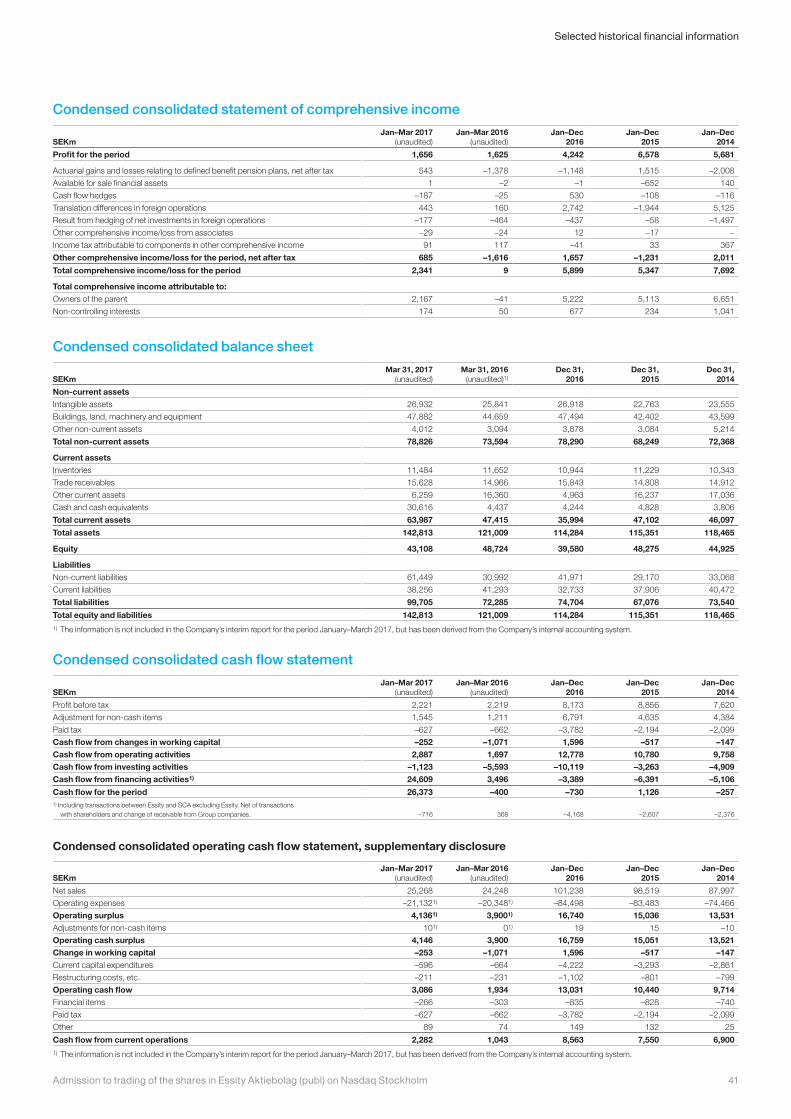
Condensed consolidated statement of comprehensive income
SEKmJan–Mar 2017
(unaudited)Jan–Mar 2016
(unaudited)Jan–Dec
2016Jan–Dec
2015Jan–Dec
2014
Profit for the period 1,656 1,625 4,242 6,578 5,681
Actuarial gains and losses relating to defined benefit pension plans, net after tax 543 –1,378 –1,148 1,515 –2,008
Available for sale financial assets 1 –2 –1 –652 140
Cash flow hedges –187 –25 530 –108 –116
Translation differences in foreign operations 443 160 2,742 –1,944 5,125
Result from hedging of net investments in foreign operations –177 –464 –437 –58 –1,497
Other comprehensive income/loss from associates –29 –24 12 –17 –
Income tax attributable to components in other comprehensive income 91 117 –41 33 367
Other comprehensive income/loss for the period, net after tax 685 –1,616 1,657 –1,231 2,011
Total comprehensive income/loss for the period 2,341 9 5,899 5,347 7,692
Total comprehensive income attributable to:Owners of the parent 2,167 –41 5,222 5,113 6,651
Non-controlling interests 174 50 677 234 1,041
Condensed consolidated balance sheet
SEKmMar 31, 2017
(unaudited)Mar 31, 2016
(unaudited)1)Dec 31,
2016Dec 31,
2015Dec 31,
2014
Non-current assetsIntangible assets 26,932 25,841 26,918 22,763 23,555
Buildings, land, machinery and equipment 47,882 44,659 47,494 42,402 43,599
Other non-current assets 4,012 3,094 3,878 3,084 5,214
Total non-current assets 78,826 73,594 78,290 68,249 72,368
Current assetsInventories 11,484 11,652 10,944 11,229 10,343
Trade receivables 15,628 14,966 15,843 14,808 14,912
Other current assets 6,259 16,360 4,963 16,237 17,036
Cash and cash equivalents 30,616 4,437 4,244 4,828 3,806
Total current assets 63,987 47,415 35,994 47,102 46,097
Total assets 142,813 121,009 114,284 115,351 118,465
Equity 43,108 48,724 39,580 48,275 44,925
LiabilitiesNon-current liabilities 61,449 30,992 41,971 29,170 33,068
Current liabilities 38,256 41,293 32,733 37,906 40,472
Total liabilities 99,705 72,285 74,704 67,076 73,540
Total equity and liabilities 142,813 121,009 114,284 115,351 118,4651) The information is not included in the Company’s interim report for the period January–March 2017, but has been derived from the Company’s internal accounting system.
Condensed consolidated cash flow statement
SEKmJan–Mar 2017
(unaudited)Jan–Mar 2016
(unaudited)Jan–Dec
2016Jan–Dec
2015Jan–Dec
2014
Profit before tax 2,221 2,219 8,173 8,856 7,620
Adjustment for non-cash items 1,545 1,211 6,791 4,635 4,384
Paid tax –627 –662 –3,782 –2,194 –2,099
Cash flow from changes in working capital –252 –1,071 1,596 –517 –147Cash flow from operating activities 2,887 1,697 12,778 10,780 9,758Cash flow from investing activities –1,123 –5,593 –10,119 –3,263 –4,909Cash flow from financing activities1) 24,609 3,496 –3,389 –6,391 –5,106
Cash flow for the period 26,373 –400 –730 1,126 –2571) Including transactions between Essity and SCA excluding Essity. Net of transactions
with shareholders and change of receivable from Group companies. –716 368 –4,168 –2,607 –2,376
Condensed consolidated operating cash flow statement, supplementary disclosure
SEKmJan–Mar 2017
(unaudited)Jan–Mar 2016
(unaudited)Jan–Dec
2016Jan–Dec
2015Jan–Dec
2014
Net sales 25,268 24,248 101,238 98,519 87,997
Operating expenses –21,1321) –20,3481) –84,498 –83,483 –74,466
Operating surplus 4,1361) 3,9001) 16,740 15,036 13,531Adjustments for non-cash items 101) 01) 19 15 –10
Operating cash surplus 4,146 3,900 16,759 15,051 13,521Change in working capital –253 –1,071 1,596 –517 –147Current capital expenditures –596 –664 –4,222 –3,293 –2,861
Restructuring costs, etc. –211 –231 –1,102 –801 –799
Operating cash flow 3,086 1,934 13,031 10,440 9,714Financial items –266 –303 –835 –828 –740
Paid tax –627 –662 –3,782 –2,194 –2,099
Other 89 74 149 132 25
Cash flow from current operations 2,282 1,043 8,563 7,550 6,9001) The information is not included in the Company’s interim report for the period January–March 2017, but has been derived from the Company’s internal accounting system.
41Admission to trading of the shares in Essity Aktiebolag (publ) on Nasdaq Stockholm
Selected historical financial information
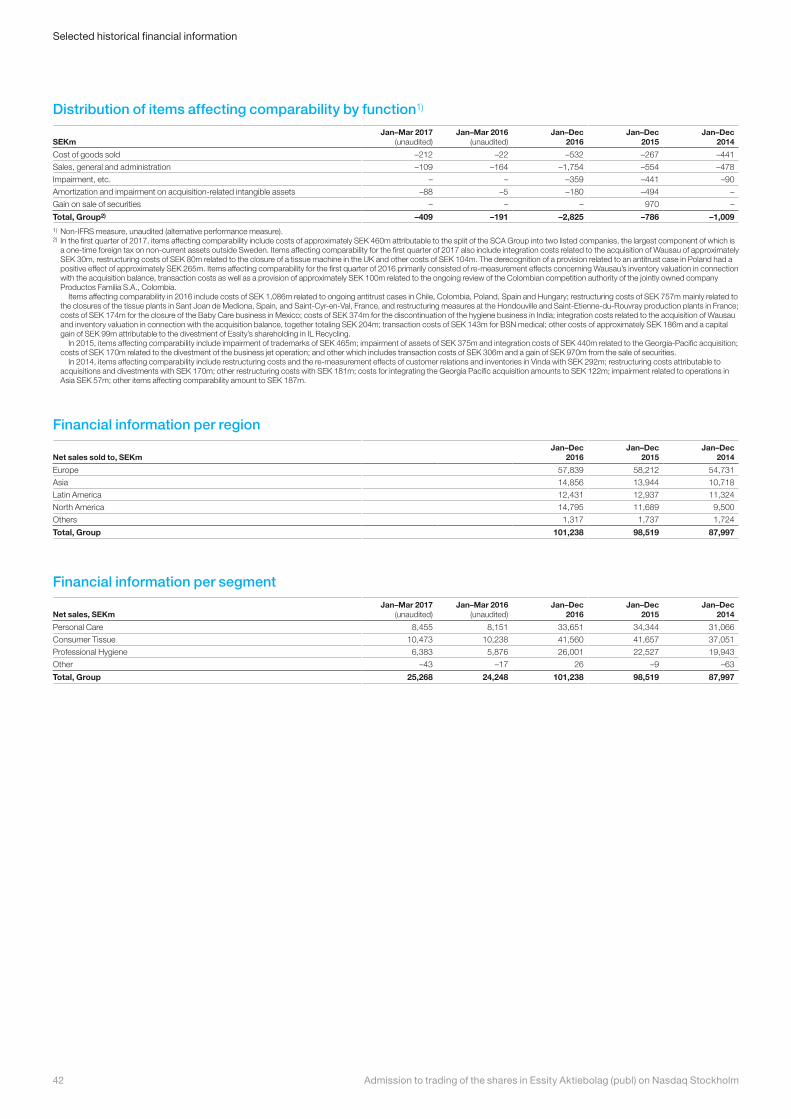
Distribution of items affecting comparability by function1)
SEKmJan–Mar 2017
(unaudited)Jan–Mar 2016
(unaudited)Jan–Dec
2016Jan–Dec
2015Jan–Dec
2014
Cost of goods sold –212 –22 –532 –267 –441
Sales, general and administration –109 –164 –1,754 –554 –478
Impairment, etc. – – –359 –441 –90
Amortization and impairment on acquisition-related intangible assets –88 –5 –180 –494 –
Gain on sale of securities – – – 970 –
Total, Group2) –409 –191 –2,825 –786 –1,0091) Non-IFRS measure, unaudited (alternative performance measure). 2) In the first quarter of 2017, items affecting comparability include costs of approximately SEK 460m attributable to the split of the SCA Group into two listed companies, the largest component of which is
a one-time foreign tax on non-current assets outside Sweden. Items affecting comparability for the first quarter of 2017 also include integration costs related to the acquisition of Wausau of approximately SEK 30m, restructuring costs of SEK 80m related to the closure of a tissue machine in the UK and other costs of SEK 104m. The derecognition of a provision related to an antitrust case in Poland had a positive effect of approximately SEK 265m. Items affecting comparability for the first quarter of 2016 primarily consisted of re-measurement effects concerning Wausau’s inventory valuation in connection with the acquisition balance, transaction costs as well as a provision of approximately SEK 100m related to the ongoing review of the Colombian competition authority of the jointly owned company Productos Familia S.A., Colombia. Items affecting comparability in 2016 include costs of SEK 1,086m related to ongoing antitrust cases in Chile, Colombia, Poland, Spain and Hungary; restructuring costs of SEK 757m mainly related to the closures of the tissue plants in Sant Joan de Mediona, Spain, and Saint-Cyr-en-Val, France, and restructuring measures at the Hondouville and Saint-Etienne-du-Rouvray production plants in France; costs of SEK 174m for the closure of the Baby Care business in Mexico; costs of SEK 374m for the discontinuation of the hygiene business in India; integration costs related to the acquisition of Wausau and inventory valuation in connection with the acquisition balance, together totaling SEK 204m; transaction costs of SEK 143m for BSN medical; other costs of approximately SEK 186m and a capital gain of SEK 99m attributable to the divestment of Essity’s shareholding in IL Recycling. In 2015, items affecting comparability include impairment of trademarks of SEK 465m; impairment of assets of SEK 375m and integration costs of SEK 440m related to the Georgia-Pacific acquisition; costs of SEK 170m related to the divestment of the business jet operation; and other which includes transaction costs of SEK 306m and a gain of SEK 970m from the sale of securities. In 2014, items affecting comparability include restructuring costs and the re-measurement effects of customer relations and inventories in Vinda with SEK 292m; restructuring costs attributable to acquisitions and divestments with SEK 170m; other restructuring costs with SEK 181m; costs for integrating the Georgia Pacific acquisition amounts to SEK 122m; impairment related to operations in Asia SEK 57m; other items affecting comparability amount to SEK 187m.
Financial information per region
Net sales sold to, SEKmJan–Dec
2016Jan–Dec
2015Jan–Dec
2014
Europe 57,839 58,212 54,731
Asia 14,856 13,944 10,718
Latin America 12,431 12,937 11,324
North America 14,795 11,689 9,500
Others 1,317 1,737 1,724
Total, Group 101,238 98,519 87,997
Financial information per segment
Net sales, SEKmJan–Mar 2017
(unaudited) Jan–Mar 2016
(unaudited) Jan–Dec
2016Jan–Dec
2015Jan–Dec
2014
Personal Care 8,455 8,151 33,651 34,344 31,066
Consumer Tissue 10,473 10,238 41,560 41,657 37,051
Professional Hygiene 6,383 5,876 26,001 22,527 19,943
Other –43 –17 26 –9 –63
Total, Group 25,268 24,248 101,238 98,519 87,997
Admission to trading of the shares in Essity Aktiebolag (publ) on Nasdaq Stockholm42
Selected historical financial information
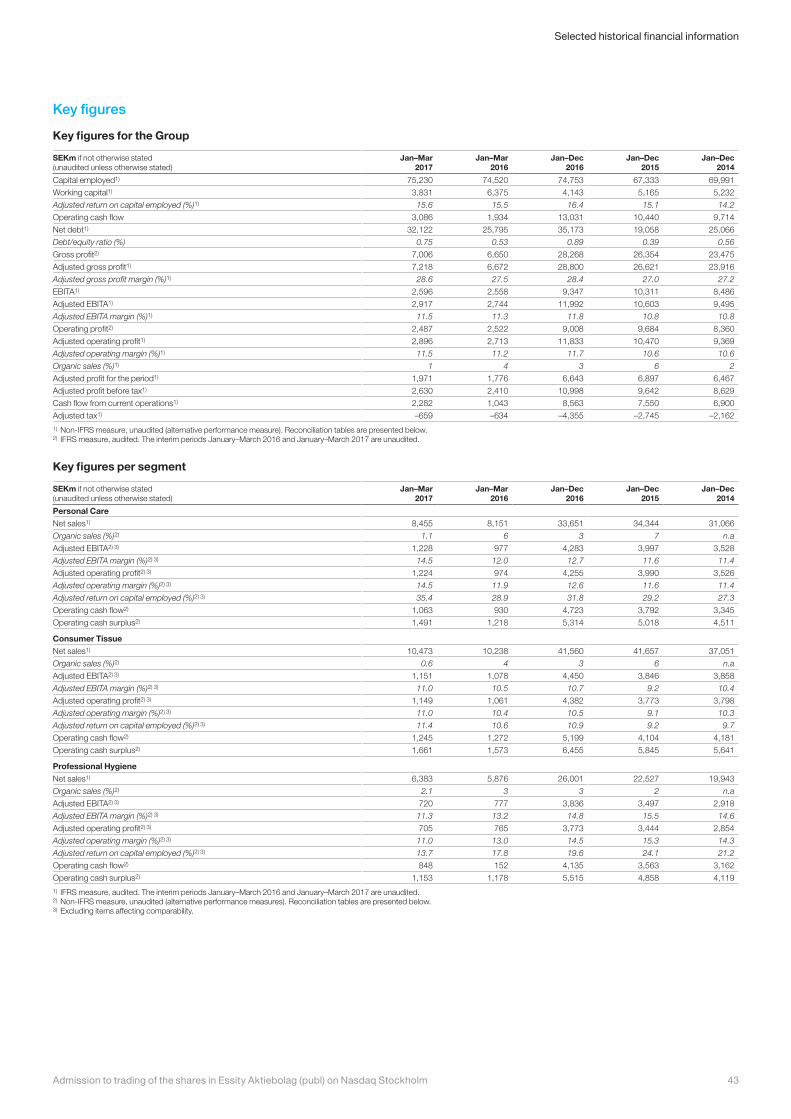
Key figures
Key figures for the Group
SEKm if not otherwise stated (unaudited unless otherwise stated)
Jan–Mar 2017
Jan–Mar 2016
Jan–Dec 2016
Jan–Dec 2015
Jan–Dec 2014
Capital employed1) 75,230 74,520 74,753 67,333 69,991
Working capital1) 3,831 6,375 4,143 5,165 5,232
Adjusted return on capital employed (%)1) 15.6 15.5 16.4 15.1 14.2
Operating cash flow 3,086 1,934 13,031 10,440 9,714
Net debt1) 32,122 25,795 35,173 19,058 25,066
Debt/equity ratio (%) 0.75 0.53 0.89 0.39 0.56
Gross profit2) 7,006 6,650 28,268 26,354 23,475
Adjusted gross profit1) 7,218 6,672 28,800 26,621 23,916
Adjusted gross profit margin (%)1) 28.6 27.5 28.4 27.0 27.2
EBITA1) 2,596 2,558 9,347 10,311 8,486
Adjusted EBITA1) 2,917 2,744 11,992 10,603 9,495
Adjusted EBITA margin (%)1) 11.5 11.3 11.8 10.8 10.8
Operating profit2) 2,487 2,522 9,008 9,684 8,360
Adjusted operating profit1) 2,896 2,713 11,833 10,470 9,369
Adjusted operating margin (%)1) 11.5 11.2 11.7 10.6 10.6
Organic sales (%)1) 1 4 3 6 2
Adjusted profit for the period1) 1,971 1,776 6,643 6,897 6,467
Adjusted profit before tax1) 2,630 2,410 10,998 9,642 8,629
Cash flow from current operations1) 2,282 1,043 8,563 7,550 6,900
Adjusted tax1) –659 –634 –4,355 –2,745 –2,1621) Non-IFRS measure, unaudited (alternative performance measure). Reconciliation tables are presented below. 2) IFRS measure, audited. The interim periods January–March 2016 and January–March 2017 are unaudited.
Key figures per segment
SEKm if not otherwise stated (unaudited unless otherwise stated)
Jan–Mar 2017
Jan–Mar 2016
Jan–Dec 2016
Jan–Dec 2015
Jan–Dec 2014
Personal CareNet sales1) 8,455 8,151 33,651 34,344 31,066
Organic sales (%)2) 1.1 6 3 7 n.a
Adjusted EBITA2) 3) 1,228 977 4,283 3,997 3,528
Adjusted EBITA margin (%)2) 3) 14.5 12.0 12.7 11.6 11.4
Adjusted operating profit2) 3) 1,224 974 4,255 3,990 3,526
Adjusted operating margin (%)2) 3) 14.5 11.9 12.6 11.6 11.4
Adjusted return on capital employed (%)2) 3) 35.4 28.9 31.8 29.2 27.3
Operating cash flow2) 1,063 930 4,723 3,792 3,345
Operating cash surplus2) 1,491 1,218 5,314 5,018 4,511
Consumer TissueNet sales1) 10,473 10,238 41,560 41,657 37,051
Organic sales (%)2) 0.6 4 3 6 n.a
Adjusted EBITA2) 3) 1,151 1,078 4,450 3,846 3,858
Adjusted EBITA margin (%)2) 3) 11.0 10.5 10.7 9.2 10.4
Adjusted operating profit2) 3) 1,149 1,061 4,382 3,773 3,798
Adjusted operating margin (%)2) 3) 11.0 10.4 10.5 9.1 10.3
Adjusted return on capital employed (%)2) 3) 11.4 10.6 10.9 9.2 9.7
Operating cash flow2) 1,245 1,272 5,199 4,104 4,181
Operating cash surplus2) 1,661 1,573 6,455 5,845 5,641
Professional HygieneNet sales1) 6,383 5,876 26,001 22,527 19,943
Organic sales (%)2) 2.1 3 3 2 n.a
Adjusted EBITA2) 3) 720 777 3,836 3,497 2,918
Adjusted EBITA margin (%)2) 3) 11.3 13.2 14.8 15.5 14.6
Adjusted operating profit2) 3) 705 765 3,773 3,444 2,854
Adjusted operating margin (%)2) 3) 11.0 13.0 14.5 15.3 14.3
Adjusted return on capital employed (%)2) 3) 13.7 17.8 19.6 24.1 21.2
Operating cash flow2) 848 152 4,135 3,563 3,162
Operating cash surplus2) 1,153 1,178 5,515 4,858 4,1191) IFRS measure, audited. The interim periods January–March 2016 and January–March 2017 are unaudited. 2) Non-IFRS measure, unaudited (alternative performance measures). Reconciliation tables are presented below. 3) Excluding items affecting comparability.
43Admission to trading of the shares in Essity Aktiebolag (publ) on Nasdaq Stockholm
Selected historical financial information
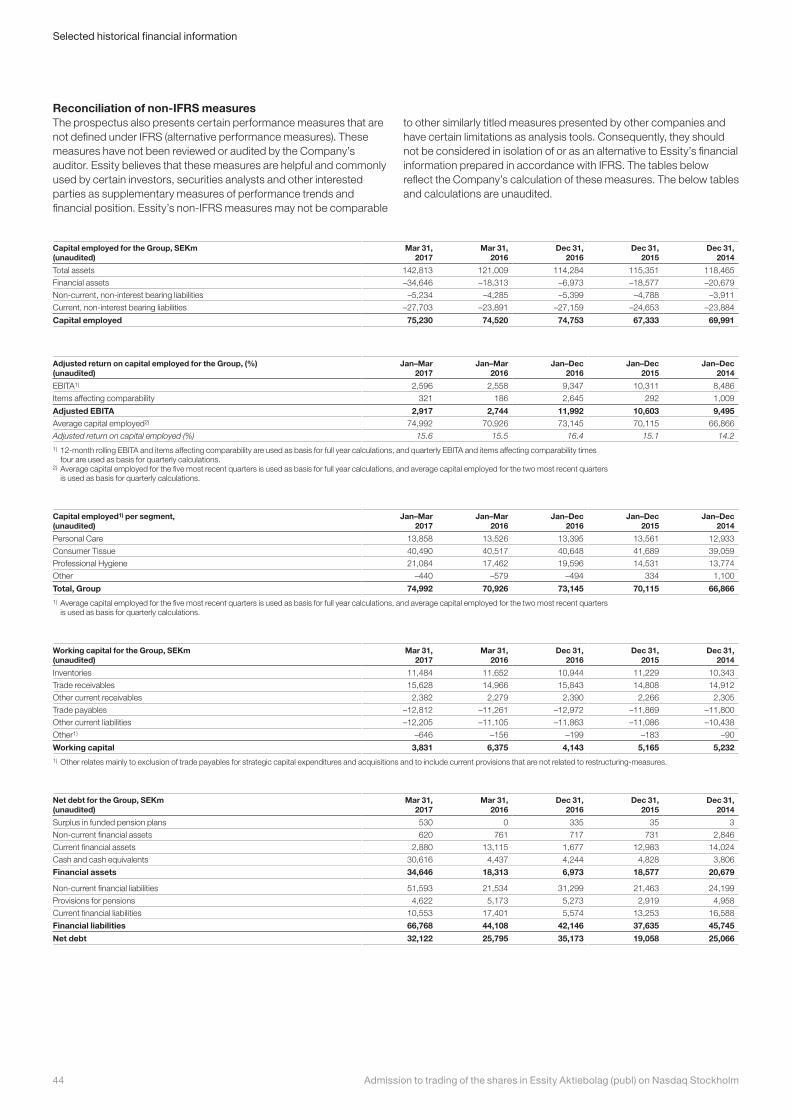
Reconciliation of non-IFRS measures The prospectus also presents certain performance measures that are not defined under IFRS (alternative performance measures). These measures have not been reviewed or audited by the Company’s auditor. Essity believes that these measures are helpful and commonly used by certain investors, securities analysts and other interested parties as supplementary measures of performance trends and financial position. Essity’s non-IFRS measures may not be comparable
to other similarly titled measures presented by other companies and have certain limitations as analysis tools. Consequently, they should not be considered in isolation of or as an alternative to Essity’s financial information prepared in accordance with IFRS. The tables below reflect the Company’s calculation of these measures. The below tables and calculations are unaudited.
Capital employed for the Group, SEKm (unaudited)
Mar 31, 2017
Mar 31, 2016
Dec 31, 2016
Dec 31, 2015
Dec 31, 2014
Total assets 142,813 121,009 114,284 115,351 118,465
Financial assets –34,646 –18,313 –6,973 –18,577 –20,679
Non-current, non-interest bearing liabilities –5,234 –4,285 –5,399 –4,788 –3,911
Current, non-interest bearing liabilities –27,703 –23,891 –27,159 –24,653 –23,884
Capital employed 75,230 74,520 74,753 67,333 69,991
Adjusted return on capital employed for the Group, (%) (unaudited)
Jan–Mar 2017
Jan–Mar 2016
Jan–Dec 2016
Jan–Dec 2015
Jan–Dec 2014
EBITA1) 2,596 2,558 9,347 10,311 8,486
Items affecting comparability 321 186 2,645 292 1,009
Adjusted EBITA 2,917 2,744 11,992 10,603 9,495Average capital employed2) 74,992 70,926 73,145 70,115 66,866
Adjusted return on capital employed (%) 15.6 15.5 16.4 15.1 14.2
1) 12-month rolling EBITA and items affecting comparability are used as basis for full year calculations, and quarterly EBITA and items affecting comparability times four are used as basis for quarterly calculations.
2) Average capital employed for the five most recent quarters is used as basis for full year calculations, and average capital employed for the two most recent quarters is used as basis for quarterly calculations.
Capital employed1) per segment, (unaudited)
Jan–Mar 2017
Jan–Mar 2016
Jan–Dec 2016
Jan–Dec 2015
Jan–Dec 2014
Personal Care 13,858 13,526 13,395 13,561 12,933
Consumer Tissue 40,490 40,517 40,648 41,689 39,059
Professional Hygiene 21,084 17,462 19,596 14,531 13,774
Other –440 –579 –494 334 1,100
Total, Group 74,992 70,926 73,145 70,115 66,8661) Average capital employed for the five most recent quarters is used as basis for full year calculations, and average capital employed for the two most recent quarters
is used as basis for quarterly calculations.
Working capital for the Group, SEKm (unaudited)
Mar 31, 2017
Mar 31, 2016
Dec 31, 2016
Dec 31, 2015
Dec 31, 2014
Inventories 11,484 11,652 10,944 11,229 10,343
Trade receivables 15,628 14,966 15,843 14,808 14,912
Other current receivables 2,382 2,279 2,390 2,266 2,305
Trade payables –12,812 –11,261 –12,972 –11,869 –11,800
Other current liabilities –12,205 –11,105 –11,863 –11,086 –10,438
Other1) –646 –156 –199 –183 –90
Working capital 3,831 6,375 4,143 5,165 5,2321) Other relates mainly to exclusion of trade payables for strategic capital expenditures and acquisitions and to include current provisions that are not related to restructuring-measures.
Net debt for the Group, SEKm(unaudited)
Mar 31, 2017
Mar 31, 2016
Dec 31, 2016
Dec 31, 2015
Dec 31, 2014
Surplus in funded pension plans 530 0 335 35 3
Non-current financial assets 620 761 717 731 2,846
Current financial assets 2,880 13,115 1,677 12,983 14,024
Cash and cash equivalents 30,616 4,437 4,244 4,828 3,806
Financial assets 34,646 18,313 6,973 18,577 20,679
Non-current financial liabilities 51,593 21,534 31,299 21,463 24,199
Provisions for pensions 4,622 5,173 5,273 2,919 4,958
Current financial liabilities 10,553 17,401 5,574 13,253 16,588
Financial liabilities 66,768 44,108 42,146 37,635 45,745
Net debt 32,122 25,795 35,173 19,058 25,066
Admission to trading of the shares in Essity Aktiebolag (publ) on Nasdaq Stockholm44
Selected historical financial information
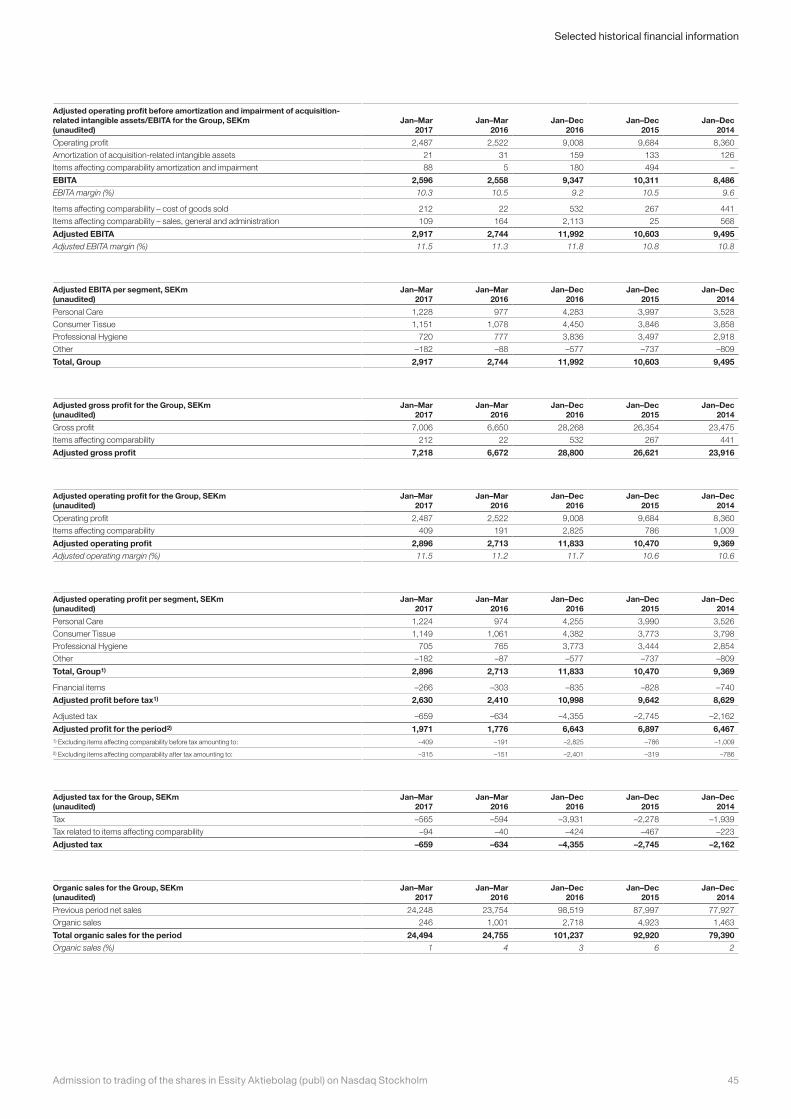
Adjusted operating profit before amortization and impairment of acquisition-related intangible assets/EBITA for the Group, SEKm(unaudited)
Jan–Mar 2017
Jan–Mar 2016
Jan–Dec 2016
Jan–Dec 2015
Jan–Dec 2014
Operating profit 2,487 2,522 9,008 9,684 8,360
Amortization of acquisition-related intangible assets 21 31 159 133 126
Items affecting comparability amortization and impairment 88 5 180 494 –
EBITA 2,596 2,558 9,347 10,311 8,486EBITA margin (%) 10.3 10.5 9.2 10.5 9.6
Items affecting comparability – cost of goods sold 212 22 532 267 441
Items affecting comparability – sales, general and administration 109 164 2,113 25 568
Adjusted EBITA 2,917 2,744 11,992 10,603 9,495Adjusted EBITA margin (%) 11.5 11.3 11.8 10.8 10.8
Adjusted EBITA per segment, SEKm(unaudited)
Jan–Mar 2017
Jan–Mar 2016
Jan–Dec 2016
Jan–Dec 2015
Jan–Dec 2014
Personal Care 1,228 977 4,283 3,997 3,528
Consumer Tissue 1,151 1,078 4,450 3,846 3,858
Professional Hygiene 720 777 3,836 3,497 2,918
Other –182 –88 –577 –737 –809
Total, Group 2,917 2,744 11,992 10,603 9,495
Adjusted gross profit for the Group, SEKm (unaudited)
Jan–Mar 2017
Jan–Mar 2016
Jan–Dec 2016
Jan–Dec 2015
Jan–Dec 2014
Gross profit 7,006 6,650 28,268 26,354 23,475
Items affecting comparability 212 22 532 267 441
Adjusted gross profit 7,218 6,672 28,800 26,621 23,916
Adjusted operating profit for the Group, SEKm (unaudited)
Jan–Mar 2017
Jan–Mar 2016
Jan–Dec 2016
Jan–Dec 2015
Jan–Dec 2014
Operating profit 2,487 2,522 9,008 9,684 8,360
Items affecting comparability 409 191 2,825 786 1,009
Adjusted operating profit 2,896 2,713 11,833 10,470 9,369Adjusted operating margin (%) 11.5 11.2 11.7 10.6 10.6
Adjusted operating profit per segment, SEKm (unaudited)
Jan–Mar 2017
Jan–Mar 2016
Jan–Dec 2016
Jan–Dec 2015
Jan–Dec 2014
Personal Care 1,224 974 4,255 3,990 3,526
Consumer Tissue 1,149 1,061 4,382 3,773 3,798
Professional Hygiene 705 765 3,773 3,444 2,854
Other –182 –87 –577 –737 –809
Total, Group1) 2,896 2,713 11,833 10,470 9,369
Financial items –266 –303 –835 –828 –740
Adjusted profit before tax1) 2,630 2,410 10,998 9,642 8,629
Adjusted tax –659 –634 –4,355 –2,745 –2,162
Adjusted profit for the period 2) 1,971 1,776 6,643 6,897 6,4671) Excluding items affecting comparability before tax amounting to: –409 –191 –2,825 –786 –1,009
2) Excluding items affecting comparability after tax amounting to: –315 –151 –2,401 –319 –786
Adjusted tax for the Group, SEKm (unaudited)
Jan–Mar 2017
Jan–Mar 2016
Jan–Dec 2016
Jan–Dec 2015
Jan–Dec 2014
Tax –565 –594 –3,931 –2,278 –1,939
Tax related to items affecting comparability –94 –40 –424 –467 –223
Adjusted tax –659 –634 –4,355 –2,745 –2,162
Organic sales for the Group, SEKm (unaudited)
Jan–Mar 2017
Jan–Mar 2016
Jan–Dec 2016
Jan–Dec 2015
Jan–Dec 2014
Previous period net sales 24,248 23,754 98,519 87,997 77,927
Organic sales 246 1,001 2,718 4,923 1,463
Total organic sales for the period 24,494 24,755 101,237 92,920 79,390Organic sales (%) 1 4 3 6 2
45Admission to trading of the shares in Essity Aktiebolag (publ) on Nasdaq Stockholm
Selected historical financial information
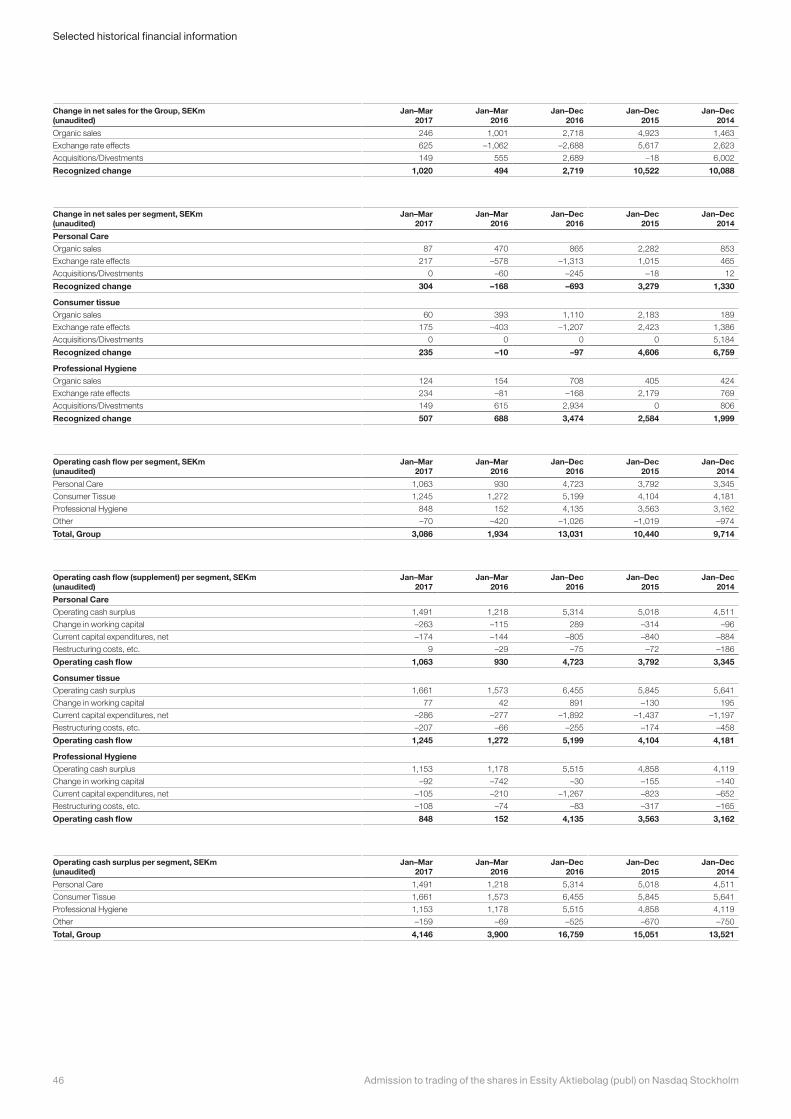
Change in net sales for the Group, SEKm (unaudited)
Jan–Mar 2017
Jan–Mar 2016
Jan–Dec 2016
Jan–Dec 2015
Jan–Dec 2014
Organic sales 246 1,001 2,718 4,923 1,463
Exchange rate effects 625 –1,062 –2,688 5,617 2,623
Acquisitions/Divestments 149 555 2,689 –18 6,002
Recognized change 1,020 494 2,719 10,522 10,088
Change in net sales per segment, SEKm (unaudited)
Jan–Mar 2017
Jan–Mar 2016
Jan–Dec 2016
Jan–Dec 2015
Jan–Dec 2014
Personal CareOrganic sales 87 470 865 2,282 853
Exchange rate effects 217 –578 –1,313 1,015 465
Acquisitions/Divestments 0 –60 –245 –18 12
Recognized change 304 –168 –693 3,279 1,330
Consumer tissueOrganic sales 60 393 1,110 2,183 189
Exchange rate effects 175 –403 –1,207 2,423 1,386
Acquisitions/Divestments 0 0 0 0 5,184
Recognized change 235 –10 –97 4,606 6,759
Professional HygieneOrganic sales 124 154 708 405 424
Exchange rate effects 234 –81 –168 2,179 769
Acquisitions/Divestments 149 615 2,934 0 806
Recognized change 507 688 3,474 2,584 1,999
Operating cash flow per segment, SEKm (unaudited)
Jan–Mar 2017
Jan–Mar 2016
Jan–Dec 2016
Jan–Dec 2015
Jan–Dec 2014
Personal Care 1,063 930 4,723 3,792 3,345
Consumer Tissue 1,245 1,272 5,199 4,104 4,181
Professional Hygiene 848 152 4,135 3,563 3,162
Other –70 –420 –1,026 –1,019 –974
Total, Group 3,086 1,934 13,031 10,440 9,714
Operating cash flow (supplement) per segment, SEKm (unaudited)
Jan–Mar 2017
Jan–Mar 2016
Jan–Dec 2016
Jan–Dec 2015
Jan–Dec 2014
Personal CareOperating cash surplus 1,491 1,218 5,314 5,018 4,511
Change in working capital –263 –115 289 –314 –96
Current capital expenditures, net –174 –144 –805 –840 –884
Restructuring costs, etc. 9 –29 –75 –72 –186
Operating cash flow 1,063 930 4,723 3,792 3,345
Consumer tissueOperating cash surplus 1,661 1,573 6,455 5,845 5,641
Change in working capital 77 42 891 –130 195
Current capital expenditures, net –286 –277 –1,892 –1,437 –1,197
Restructuring costs, etc. –207 –66 –255 –174 –458
Operating cash flow 1,245 1,272 5,199 4,104 4,181
Professional HygieneOperating cash surplus 1,153 1,178 5,515 4,858 4,119
Change in working capital –92 –742 –30 –155 –140
Current capital expenditures, net –105 –210 –1,267 –823 –652
Restructuring costs, etc. –108 –74 –83 –317 –165
Operating cash flow 848 152 4,135 3,563 3,162
Operating cash surplus per segment, SEKm (unaudited)
Jan–Mar 2017
Jan–Mar 2016
Jan–Dec 2016
Jan–Dec 2015
Jan–Dec 2014
Personal Care 1,491 1,218 5,314 5,018 4,511
Consumer Tissue 1,661 1,573 6,455 5,845 5,641
Professional Hygiene 1,153 1,178 5,515 4,858 4,119
Other –159 –69 –525 –670 –750
Total, Group 4,146 3,900 16,759 15,051 13,521
Admission to trading of the shares in Essity Aktiebolag (publ) on Nasdaq Stockholm46
Selected historical financial information
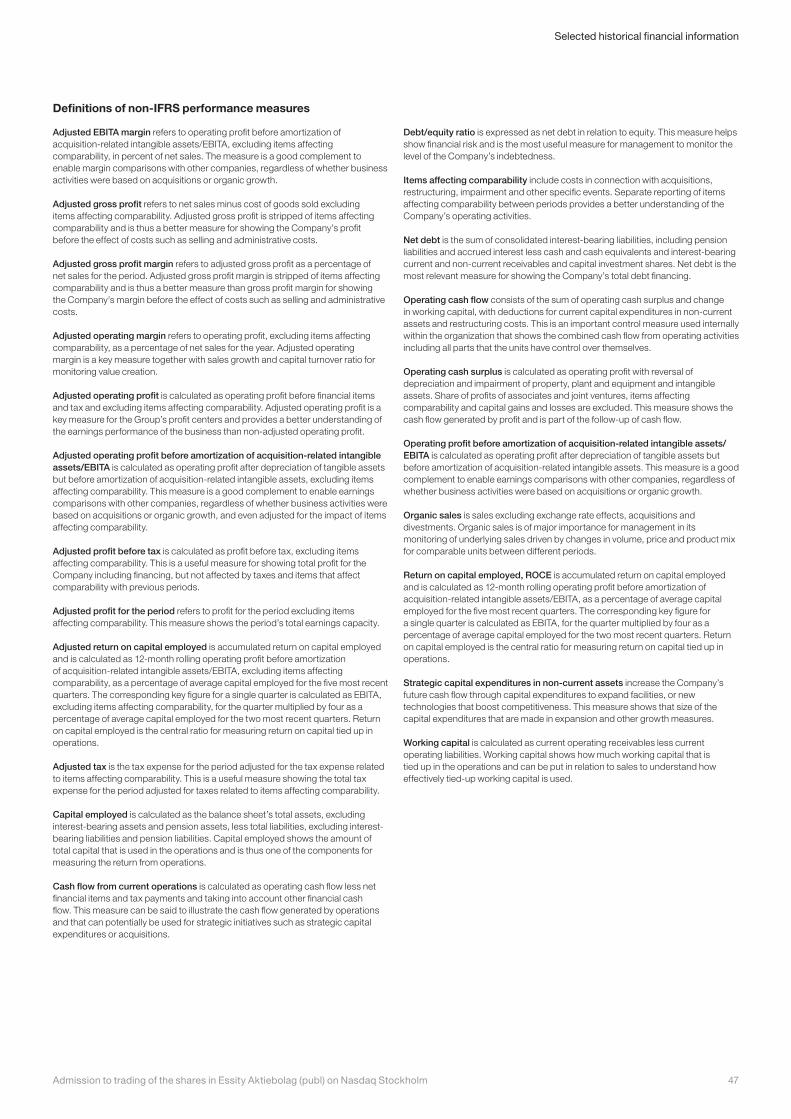
Definitions of non-IFRS performance measures
Adjusted EBITA margin refers to operating profit before amortization of acquisition-related intangible assets/EBITA, excluding items affecting comparability, in percent of net sales. The measure is a good complement to enable margin comparisons with other companies, regardless of whether business activities were based on acquisitions or organic growth.
Adjusted gross profit refers to net sales minus cost of goods sold excluding items affecting comparability. Adjusted gross profit is stripped of items affecting comparability and is thus a better measure for showing the Company’s profit before the effect of costs such as selling and administrative costs.
Adjusted gross profit margin refers to adjusted gross profit as a percentage of net sales for the period. Adjusted gross profit margin is stripped of items affecting comparability and is thus a better measure than gross profit margin for showing the Company’s margin before the effect of costs such as selling and administrative costs.
Adjusted operating margin refers to operating profit, excluding items affecting comparability, as a percentage of net sales for the year. Adjusted operating margin is a key measure together with sales growth and capital turnover ratio for monitoring value creation.
Adjusted operating profit is calculated as operating profit before financial items and tax and excluding items affecting comparability. Adjusted operating profit is a key measure for the Group’s profit centers and provides a better understanding of the earnings performance of the business than non-adjusted operating profit.
Adjusted operating profit before amortization of acquisition-related intangible assets/EBITA is calculated as operating profit after depreciation of tangible assets but before amortization of acquisition-related intangible assets, excluding items affecting comparability. This measure is a good complement to enable earnings comparisons with other companies, regardless of whether business activities were based on acquisitions or organic growth, and even adjusted for the impact of items affecting comparability.
Adjusted profit before tax is calculated as profit before tax, excluding items affecting comparability. This is a useful measure for showing total profit for the Company including financing, but not affected by taxes and items that affect comparability with previous periods.
Adjusted profit for the period refers to profit for the period excluding items affecting comparability. This measure shows the period’s total earnings capacity.
Adjusted return on capital employed is accumulated return on capital employed and is calculated as 12-month rolling operating profit before amortization of acquisition-related intangible assets/EBITA, excluding items affecting comparability, as a percentage of average capital employed for the five most recent quarters. The corresponding key figure for a single quarter is calculated as EBITA, excluding items affecting comparability, for the quarter multiplied by four as a percentage of average capital employed for the two most recent quarters. Return on capital employed is the central ratio for measuring return on capital tied up in operations.
Adjusted tax is the tax expense for the period adjusted for the tax expense related to items affecting comparability. This is a useful measure showing the total tax expense for the period adjusted for taxes related to items affecting comparability.
Capital employed is calculated as the balance sheet’s total assets, excluding interest-bearing assets and pension assets, less total liabilities, excluding interest-bearing liabilities and pension liabilities. Capital employed shows the amount of total capital that is used in the operations and is thus one of the components for measuring the return from operations.
Cash flow from current operations is calculated as operating cash flow less net financial items and tax payments and taking into account other financial cash flow. This measure can be said to illustrate the cash flow generated by operations and that can potentially be used for strategic initiatives such as strategic capital expenditures or acquisitions.
Debt/equity ratio is expressed as net debt in relation to equity. This measure helps show financial risk and is the most useful measure for management to monitor the level of the Company’s indebtedness.
Items affecting comparability include costs in connection with acquisitions, restructuring, impairment and other specific events. Separate reporting of items affecting comparability between periods provides a better understanding of the Company’s operating activities.
Net debt is the sum of consolidated interest-bearing liabilities, including pension liabilities and accrued interest less cash and cash equivalents and interest-bearing current and non-current receivables and capital investment shares. Net debt is the most relevant measure for showing the Company’s total debt financing.
Operating cash flow consists of the sum of operating cash surplus and change in working capital, with deductions for current capital expenditures in non-current assets and restructuring costs. This is an important control measure used internally within the organization that shows the combined cash flow from operating activities including all parts that the units have control over themselves.
Operating cash surplus is calculated as operating profit with reversal of depreciation and impairment of property, plant and equipment and intangible assets. Share of profits of associates and joint ventures, items affecting comparability and capital gains and losses are excluded. This measure shows the cash flow generated by profit and is part of the follow-up of cash flow.
Operating profit before amortization of acquisition-related intangible assets/EBITA is calculated as operating profit after depreciation of tangible assets but before amortization of acquisition-related intangible assets. This measure is a good complement to enable earnings comparisons with other companies, regardless of whether business activities were based on acquisitions or organic growth.
Organic sales is sales excluding exchange rate effects, acquisitions and divestments. Organic sales is of major importance for management in its monitoring of underlying sales driven by changes in volume, price and product mix for comparable units between different periods.
Return on capital employed, ROCE is accumulated return on capital employed and is calculated as 12-month rolling operating profit before amortization of acquisition-related intangible assets/EBITA, as a percentage of average capital employed for the five most recent quarters. The corresponding key figure for a single quarter is calculated as EBITA, for the quarter multiplied by four as a percentage of average capital employed for the two most recent quarters. Return on capital employed is the central ratio for measuring return on capital tied up in operations.
Strategic capital expenditures in non-current assets increase the Company’s future cash flow through capital expenditures to expand facilities, or new technologies that boost competitiveness. This measure shows that size of the capital expenditures that are made in expansion and other growth measures.
Working capital is calculated as current operating receivables less current operating liabilities. Working capital shows how much working capital that is tied up in the operations and can be put in relation to sales to understand how effectively tied-up working capital is used.
47Admission to trading of the shares in Essity Aktiebolag (publ) on Nasdaq Stockholm
Selected historical financial information
Operational and financial review
This operational and financial review is intended to facilitate the understanding and assessment of trends and changes in the Company’s earnings and financial position. The information below should be read together with the section entitled “Selected historical financial information” and the Financial Statements prepared in accordance with IFRS as adopted by the European Union and presented elsewhere in this prospectus. For information about the Company’s accounting principles, refer to the accounting principles on p. F-24 and F-38 and onwards in the section entitled “Historical financial information”. Historical earnings do not necessarily provide a correct indication of future earnings. This section contains forward-looking information. Such information is based on estimates and assumptions and is subject to risks, uncertainties and other factors, including, without limitation, those stated in the section entitled “Risk factors”. These factors could cause the Company’s future operating profit, financial position or cash flow to deviate significantly from the information stated or indicated in such forward-looking statements.
Factors affecting Essity’s results of operations
Essity’s results have been, and will likely continue to be, affected by a number of factors, some of which are beyond Essity’s control. Presented below is a description of the key factors that Essity considers to have affected the results of operations during the periods addressed in this section and which can be expected to continue to affect Essity’s results in the future:• Demand, market conditions and market penetration;• Market positions and brands;• Sales volume, price and mix;• Cost for raw materials;• Energy costs;• Efficiency and cost control;• Currency effects;• Financing costs;• Acquisitions;• Divestments; and• Essity as an independent company.
Demand, market conditions and market penetrationEssity’s earnings and cash flow depend on the demand for the Company’s products and services. Demand is driven by the development and penetration of the global hygiene and health markets, which are influenced by demographic trends, such as population growth, population aging, continued urbanization and increased prevalence of chronic medical conditions, as well as macroeconomic drivers such as increases in disposable income and standard of living. In addition, the development and penetration of global health and hygiene markets are affected by increased awareness of the importance of hygiene to improve health and prevent diseases, as well as global consumer preference trends in hygiene and health.
Certain underlying macroeconomic drivers, such as increases in disposable income have a larger impact on the demand for Essity’s products in emerging markets, compared to mature markets. Increases in disposable income allow people to satisfy their basic food and housing needs and lead to more people prioritizing hygiene and products of the type Essity offers. In mature markets, growth in demand for Essity’s products is driven by lifestyle changes and innovations that lead to increased use of hygiene and health products. For additional information on the effects of demographic trends on Essity’s business, macroeconomic drivers and consumer preference trends in health and hygiene, see “Market trends and drivers” in the section entitled “Market and business description”.
The Company conducts sales in about 150 countries and markets its products to different target groups. Essity is therefore not signi-ficantly dependent on any particular country, region or target group.
Market positions and brandsLeading market positions and strong brands are central to Essity’s sales and continued profitability. The Company aims to hold a number one or number two position in the markets and product categories in which it chooses to operate. As part of the Company’s strategy, Essity strives to grow profitable market positions, improve or exit under-performing positions and broaden its product offerings, including offering integrated solutions and services.
Sales volume, price and mixEssity’s net sales depend largely on sales volume, which is driven by market demand and Essity’s ability to offer competitive products. Fluctuations in the market prices of Essity’s products have a significant impact on the Company’s earnings and cash flow. Essity has developed a deep understanding of its customers’ needs and periodically monitors global trends in customer behavior in order to ensure that it develops products that meet customers’ expectations in terms of price and value. In addition, the Company employs an
Admission to trading of the shares in Essity Aktiebolag (publ) on Nasdaq Stockholm48
Operational and financial review
international sales force that continuously interacts with, and solicits feedback from, key stakeholders and customers.
To mitigate the possible impact of fluctuations in the market prices of its product, Essity aims to adapt its cost structure to lower market prices, for example, by seeking to renegotiate purchasing agreements, implementing personnel and capacity reductions and reviewing the Company’s business structure. In certain cases, Essity aims to adapt its product offerings by adjusting costs of production in order to reflect the market price of those products. In addition, changes to the mix of product offerings and geographical distribution also affect the Company’s earnings and cash flow.
Cost for raw materialsThe costs associated with the purchase of raw materials and consumable inputs used in Essity’s manufacturing process constitute the largest component of the Company’s production cost, amounting to 41% of total operating expenses for 2016. Of the raw materials and consumable inputs purchased by Essity, pulp is the most significant, along with recovered paper, super absorbents, non-woven, chemicals, plastics and packaging materials. The raw materials and consumable inputs are purchased from a large number of suppliers, and no single supplier represent a significant part of Essity’s costs.
Fluctuations in the market prices of these raw materials and inputs, including pulp and recovered paper, could have a major impact on the Company’s earnings and cash flow. Essity aims to mitigate the risks related to fluctuations in the costs of raw materials and inputs by making corresponding adjustments to its product prices, the content of its product offerings and streamlining the Company’s operations, whenever possible. Essity does not generally hedge its exposure to fluctuations in the prices of raw materials and inputs.
Energy costsEssity’s manufacturing process is energy-intensive. In 2016, the Company purchased approximately 5 TWh of electricity and approximately 8 TWh of natural gas, which amounted to approximately 5% of total operating expenses for 2016. Fluctuations in the prices of energy commodities such as electricity and natural gas could have a direct and indirect impact on the Company’s earnings and cash flow. Essity aims to mitigate the risks related to fluctuations in the prices of electricity and natural gas in unregulated markets by entering into hedging transactions for a period of up to 36 months. Energy price hedging is effected through derivative financial instruments and fixed pricing in existing supply agreements. The Company safeguards the supply of electricity and natural gas through centrally negotiated supply agreements.
Efficiency and cost controlsEssity’s ability to maintain operational efficiency and cost controls affects the Company’s earnings and cash flow. Essity’s operational efficiency is determined by its production processes, sourcing and logistics infrastructure, ability to generate cost synergies, efficient resource allocation as well as innovation and brand activities. Establishing the adequate structures to enhance operational efficiency along the entire value chain is a key part of Essity’s strategy. By implementing this strategy, the Company aims to improve its competitiveness, lower its costs and improve its earnings, while decreasing the environmental impact of its operations.
Essity has implemented several important initiatives to improve its operational efficiency. In 2016 Essity launched “Tissue Roadmap”, a ten-year plan to improve production efficiency in order to improve cost and capital efficiency and further increase the value-creation potential in the Company’s Business Areas Consumer Tissue and Professional
Hygiene. As part of the plan, Essity closed a production facility in Spain and implemented restructuring measures in France.
Cost of goods sold significantly impact Essity’s gross profit. Essity is implementing efficiency and cost saving initiatives in all stages of the value chain in an attempt to improve its gross margins (total sales revenue minus costs of goods sold, divided by total sales). The expenses associated with the purchase of raw materials and consumable inputs used in the manufacturing of Essity’s products constitute the largest part of cost of goods sold. Essity has been able to realize significant savings by increasing the efficiency with which it uses raw materials and inputs, reducing the waste generated during production and the substitution of new materials and inputs with lower costs.
Currency effectsCurrency exchange fluctuations may expose Essity to transaction risk and translation risk, which could potentially affect the Company’s financial statements. Transaction risk stems from export revenues and import expenses due to currency exchange fluctuations, which could negatively impact Essity’s operating profit and the cost of non-current assets. Translation risk stems from the possible negative impact of currency exchange fluctuations on the conversion of Essity subsidiaries’ foreign-currency denominated balance sheets and income statements to SEK. Essity’s global operations involve significant transactions in foreign currency. In 2016, 38% of net sales were generated in EUR, 17% in USD, 10% in CNY and 8% in GBP. For expenses, 39% were generated in EUR, 29% in USD, 6% in CNY and 4% in GBP. In 2016, the SEK was generally weaker against the Company’s main operating currencies compared to 2015.
Essity is able to hedge transaction risk resulting from exports and imports for a period of up to 18 months, while the Company is able to hedge transaction risk from future foreign-currency payments for non-current assets up to the full cost. Essity’s policy to mitigate translation risk related to foreign net assets is to hedge a sufficient proportion of such assets in relation to SEK to ensure that the Company’s debt/equity ratio is unaffected by currency exchange fluctuations. The Company enters into such translation risk hedges by financing a certain portion of capital employed in foreign currencies with loans and derivatives in corresponding currencies. The optimal degree of matching in connection with hedging depends on the current consolidated debt/equity ratio. Essity does not hedge translation risk in the income statements of foreign subsidiaries.
See “Financial exposure and risk management” and note E8 on p. F-69 in the section entitled “Historical financial information”, for a description of the Group’s exposure to and management of currency risks.
Throughout this document, “organic” figures refer to figures that exclude the effects of exchange rates, acquisitions and divestments, and “adjusted” figures refers to figures that exclude items affecting comparability, as described further below.
Financing costsEssity’s earnings and cash flow are affected by financing costs, especially interest expense. Interest expense is primarily affected by the amount of the Company’s interest-bearing liabilities, the general level of interest rates and foreign exchange fluctuations affecting the currency denominations of the Company’s liabilities. Essity seeks to diversify the maturity profile of its liabilities to avoid the need to refinance large amounts concurrently. Essity’s policy is to enter into floating-rate commercial financing agreements, since in the Company’s opinion, this leads to lower interest expense over time. The interest rate risk and interest term period are measured
49Admission to trading of the shares in Essity Aktiebolag (publ) on Nasdaq Stockholm
Operational and financial review
by currency and the average interest term shall be within the interval 3–36 months.1) When Essity was part of the SCA Group, SCA routinely entered into commercial financing agreements denominated in various currencies, and Essity expects to continue doing so as a standalone entity. As of December 31, 2016, Essity’s largest exposure was to SEK, USD and CNY denominated liabilities, which accounted for 45%, 16% and 14% of Essity’s outstanding liabilities, respectively. Further, Essity periodically enters into financial derivative agreements in order to achieve the desired interest term maturity profile and foreign currency liability exposure.
See “Financial exposure and risk management” and note E8 on p. F-69 in the section entitled “Historical financial information”, for a description of the Group’s exposure to and management of financing costs.
Acquisitions The Company continuously works to identify and evaluate new investment opportunities. Essity’s acquisition strategy aims to strengthen the Company’s market position and/or complement the Company’s portfolio of product offerings. Essity has previously executed a number of acquisitions of various targets ranging in size and has developed a structured process to identify desirable targets, conduct negotiations and integrate new assets into its business. See “Acquisitions and divestments” below for a description of certain acquisitions made by the Group.
DivestmentsEssity’s strategy is to secure a leading position in each of the markets and product categories where it operates. Essity is continually evaluating its holdings to identify under-performing businesses that may be subject for divestment. See “Acquisitions and divestments” below for a description of certain divestments made by the Group.
Essity as an independent companyEssity’s portion of the total costs for the conceived split of the SCA Group are estimated to be approximately SEK 820m, including project and listing costs of approximately SEK 90m, one-time foreign tax on non-current assets outside Sweden of approximately SEK 450m, and brand-related costs of approximately SEK 280m. The transaction costs have affected and will affect Essity’s financial results for both 2016 and 2017. Of the total costs, approximately SEK 80m are expected to affect financial items and approximately SEK 740m are expected to affect items affecting comparability. Of the total costs, SEK 74m affected the fourth quarter of 2016, of which SEK 68m affected financial items and SEK 6m affected items affecting comparability. Essity previously shared certain corporate functions with the SCA Group, which it will no longer share after the split. As a result, Essity is likely to incur increased administrative costs as compared to costs previously accounted for in the Group’s financial statements.
Business Areas
Essity divides and reports its results of operations according to three segments corresponding to the three Business Areas – Personal Care, Consumer Tissue and Professional Hygiene – each with a clear profit responsibility. On April 3, 2017 Essity closed the acquisition of BSN medical. BSN medical will be included in the Business Area Personal Care and consolidated in the Group’s financial statements starting on April 3, 2017 and onwards. For further information on Business Areas, see “Business Areas” in the section entitled “Market and business description”.
Key items in the income statement
Net salesNet sales refer to the consideration received or receivable for goods and services sold within Essity’s ordinary activities and primarily comprises sales of hygiene and health products. Sales are recognized at the time products are delivered to the customer according to the terms of the sale. Billed sales for products not yet delivered are recognized as deferred revenue.
Cost of goods soldCost of goods sold consist primarily of expenses related to raw materials and consumable inputs, energy, labor costs associated with production, depreciation of tangible assets, changes in inventory of finished products and products in progress and other operating expenses.
Selling, general and administration expensesSelling, general and administration expenses refer to expenses related to marketing and selling, as well as management compensation and central functions.
Share of profits of associates and joint ventures Essity’s share of profits from the Company’s associates and joint ventures consolidated according to the equity method are recognized as “Share of profits of associates and joint ventures” in the income statement.
Financial itemsFinancial items consist of financial income and financial expenses. Financial items includes results from shares and participations in other companies, interest income, interest expenses from borrowing and derivatives, unrealized fair value hedges and other financial expenses.
TaxesEssity’s tax expenses consist of current tax and deferred tax. Current tax is calculated on the taxable result for the period based on the tax rules prevailing in the jurisdictions where Essity operates. Current tax also includes adjustments relating to recognized current tax from prior periods. Deferred tax is calculated based on temporary differences between the carrying amounts and the taxable values of assets and liabilities and for tax loss carryforwards, insofar as it is probable that these can be utilized against future taxable profits.
Comparison between the period January–March 2017 and January–March 2016
Net salesNet sales for the first quarter of 2017 amounted to SEK 25,268m, compared to SEK 24,248m in the first quarter of 2016, which represented an increase of SEK 1,020m or 4% over the first quarter of 2016. Exchange rate effects increased net sales by 2.6%. The acquisition of Wausau increased net sales by 0.6%. Organic sales increased by 1.0% over the first quarter of 2016, of which volume accounted for 0.7% and price/mix for 0.3%. The increase in organic sales was driven primarily by a 5.2% increase in emerging markets, which was partially offset by a 0.9% decrease in mature markets.
Personal CareNet sales for Personal Care for the first quarter of 2017 amounted to SEK 8,455m, compared to SEK 8,151m in the first quarter of 2016, which represented an increase of SEK 304m or 4% over the first
1) As a result of the acquisition of BSN medical, which increased the Group’s indebtedness, Essity resolved in December 2016 to deviate from the Group’s financial policy with respect to interest term and currency, enabling the Company to issue EMTN bonds totalling EUR 2,000m in four tranches in the European bond market, with an average maturity of 6.3 years. The bonds were issued in March 2017, and were retained under this exception to fixed rate, as part of long-term financing of BSN medical.
Admission to trading of the shares in Essity Aktiebolag (publ) on Nasdaq Stockholm50
Operational and financial review
quarter of 2016. Exchange rate effects increased net sales by 2.7%. Organic sales increased by 1.1% over the first quarter of 2016, of which volume accounted for 0.4% and price/mix for 0.7%. This increase was driven primarily by emerging markets, which accounted for 42% of net sales, where organic sales increased by 3.1%. The increase was partially offset by a 0.3% decrease in organic sales in mature markets. The discontinuations of the Baby Care business in Mexico and the hygiene business in India together affected the organic sales negatively by approximately 1%.
Consumer TissueNet sales for Consumer Tissue for the first quarter of 2017 amounted to SEK 10,473m, compared to SEK 10,238m in the first quarter of 2016, which represented an increase of SEK 235m or 2% over the first quarter of 2016. Exchange rate effects increased net sales by 1.7%. Organic sales increased by 0.6% over the first quarter of 2016, of which volume accounted for 0.9% and price/mix for –0.3%. This increase was primarily driven by growth in emerging markets, which accounted for 44% of net sales, where organic sales increased by 5.2%, attributable to Asia, Latin America and Russia. The increase was partially offset by a 1.6% decrease in mature markets, primarily related to lower sales of products under retailers’ own brands and lower sales of mother reels.
Professional HygieneNet sales for Professional Hygiene for the first quarter of 2017 amounted to SEK 6,383m, compared to SEK 5,876m in the first quarter of 2016, which represented an increase of SEK 507m or 9% over the first quarter of 2016. The acquisition of Wausau increased net sales by 2.5% and exchange rate effects increased net sales by 4.0%. Organic sales increased by 2.1% over the first quarter of 2016, of which volume accounted for 1.2% and price/mix for 0.9%. Organic sales in mature markets were in line with the previous year, as increased sales in Western Europe compensated for lower sales in North America. In emerging markets, which accounted for 17% of the net sales, organic sales increased by 1.2%, primarily attributable to Asia and Latin America.
Cost of goods soldCost of goods sold for the first quarter of 2017 amounted to SEK 18,262m, compared to SEK 17,598m in the first quarter of 2016, which represented an increase of SEK 664m or 4% over the first quarter of 2016. In the first quarter of 2017, the Company recognized adjustments to items affecting comparability to cost of goods sold of SEK 212m, compared to SEK 22m in the first quarter of 2016, which represented an increase of SEK 190m or 864% over the first quarter of 2016. The increase in cost of goods sold was primarily driven by translation exchange rate effects, higher sales volumes, the acquisition of Wausau and higher costs of energy and raw material. The increased costs of raw material were primarily a result of higher recovered paper prices. Cost savings partially offset the increase in cost of goods sold.
Gross profitGross profit for the first quarter of 2017 amounted to SEK 7,006m, compared to SEK 6,650m in the first quarter of 2016, which represented an increase of SEK 356m or 5% over the first quarter of 2016. Adjusted gross profit for the first quarter of 2017 amounted to SEK 7,218m, compared to SEK 6,672m in the first quarter of 2016, which represented an increase of SEK 546m or 8% over the first quarter of 2016. The increase in adjusted gross profit was primarily driven by higher sales volume, better price/mix, the acquisition of Wausau, cost savings and translation exchange rate effects, which were partially offset by higher energy and raw material costs.
Sales, general and administration expensesSales, general and administration expenses for the first quarter of 2017 amounted to SEK 4,439m, compared to SEK 4,124m in the first quarter of 2016, which represented an increase of SEK 315m or 8% over the first quarter of 2016. In the first quarter of 2017, the Company recognized adjustments to items affecting comparability to sales, general and administration expenses of SEK 109m, compared to SEK 164m in the first quarter of 2016, which represented a decrease of SEK 55m or 34% over the first quarter of 2016. The increase in sales, general and administration expenses was primarily driven by translation exchange rate effects and increased investments in marketing activities, in particular within Personal Care.
Share of profits of associates and joint venturesShare of profits of associates and joint ventures for the first quarter of 2017 amounted to SEK 29m, compared to SEK 32m in the first quarter of 2016, which represented a decrease of SEK 3m or 9% over the first quarter of 2016. The decrease in share of profits of associates and joint ventures was primarily driven by a decrease in profits from Asaleo Care.
EBITA and Operating profitEBITA for the first quarter of 2017 amounted to SEK 2,596m, compared to SEK 2,558m for the first quarter of 2016, which represented an increase of SEK 38m or 1% over the first quarter of 2016. Adjusted EBITA for the first quarter of 2017 amounted to SEK 2,917m, compared to SEK 2,744m in the first quarter of 2016, which represented an increase of SEK 173m or 6% over the first quarter of 2016. Operating profit for the first quarter of 2017 amounted to SEK 2,487m, compared to SEK 2,522m in the first quarter of 2016, which represented a decrease of SEK 35m or 1% over the first quarter of 2016. Adjusted operating profit for the first quarter of 2017 amounted to SEK 2,896m, compared to SEK 2,713m in the first quarter of 2016, which represented an increase of SEK 183m or 7% over the first quarter of 2016. The increase in adjusted EBITA was primarily related to higher volumes, a better price/mix, cost savings, the acquisition of Wausau and the discontinuations of the Baby Care business in Mexico and the hygiene business in India. Translation exchange rate effects increased adjusted EBITA by 2%.
Personal CareAdjusted EBITA for the first quarter of 2017 amounted to SEK 1,228m, compared to SEK 977m in the first quarter of 2016, which represented an increase of SEK 251m or 26% over the first quarter of 2016. Adjusted operating profit for the first quarter of 2017 amounted to SEK 1,224m, compared to SEK 974m in the first quarter of 2016, which represented an increase of SEK 250m or 26% over the first quarter of 2016. The increase in adjusted EBITA was positively affected by a better price/mix, higher volumes, lower raw material costs, cost savings, higher profitability for Incontinence Products in North America and the discontinuations of the Baby Care business in Mexico and the hygiene business in India. Investments in increased marketing activities were conducted. Translation exchange rate effects increased adjusted EBITA by 2%.
Consumer TissueAdjusted EBITA for the first quarter of 2017 amounted to SEK 1,151m, compared to SEK 1,078m in the first quarter of 2016, which represented an increase of SEK 73m or 7% over the first quarter of 2016. Adjusted operating profit for the first quarter of 2017 amounted to SEK 1,149m, compared to SEK 1,061m in the first quarter of 2016, which represented an increase of SEK 88m or 8% over the first quarter of 2016. The increase in adjusted EBITA was primarily driven by higher volumes, cost savings and lower raw material costs. Lower prices and higher energy costs affected adjusted EBITA negatively. Translation exchange rate effects increased adjusted EBITA by 3%.
51Admission to trading of the shares in Essity Aktiebolag (publ) on Nasdaq Stockholm
Operational and financial review
Professional HygieneAdjusted EBITA for the first quarter of 2017 amounted to SEK 720m, compared to SEK 777m in the first quarter of 2016, which represented a decrease of SEK 57m or 7% over the first quarter of 2016. Adjusted operating profit for the first quarter of 2017 amounted to SEK 705m, compared to SEK 765m in the first quarter of 2016, which represented a decrease of SEK 60m or 8% over first quarter of 2016. The decrease in adjusted EBITA was primarily driven by higher raw material costs mainly resulting from significantly higher recovered paper prices. Higher selling costs had a negative earnings effect. A better price/mix, higher volumes, cost savings and the acquisition of Wausau increased adjusted EBITA. Translation exchange rate effects decreased adjusted EBITA by 7%.
Financial itemsFinancial income for the first quarter of 2017 amounted to SEK 48m, compared to SEK 17m in the first quarter of 2016, which represented an increase of SEK 31m or 182% over the first quarter of 2016. Financial expenses for the first quarter of 2017 amounted to SEK 314m, compared to SEK 320m in the first quarter of 2016, which represented a decrease of SEK 6m or 2% over the first quarter of 2016. Net financial expenses for the first quarter of 2017 amounted to SEK 266m, compared to SEK 303m in the first quarter of 2016, which represented a decrease of SEK 37m or 12% over the first quarter of 2016. The decrease in net financial expenses was primarily driven by a lower average net debt.
Profit before tax Profit before tax for the first quarter of 2017 amounted to SEK 2,221m, compared to SEK 2,219m in the first quarter of 2016, which represented an increase of SEK 2m or 0.1% over the first quarter of 2016. Adjusted profit before tax for the first quarter of 2017 amounted to SEK 2,630m, compared to SEK 2,410m in the first quarter of 2016, which represented an increase of SEK 220m or 9% over the first quarter of 2016. The increase in adjusted profit before tax was primarily driven by a higher adjusted EBITA and lower financial items.
TaxTax expense for the first quarter of 2017 amounted to SEK 565m, compared to SEK 594m in the first quarter of 2016, which represented a decrease of SEK 29m or 5% over the first quarter of 2016. The tax expense for the first quarter of 2017 corresponds to an effective tax rate of 25.4%, compared to 26.8% in the first quarter of 2016. Adjusted tax expense for the first quarter of 2017 amounted to SEK 659m, compared to SEK 634m in the first quarter of 2016, which represented an increase of SEK 25m or 4% over the first quarter of 2016.
Items Affecting ComparabilityThe costs attributable to items affecting comparability for the first quarter of 2017 amounted to SEK 409m, compared to SEK 191m in the first quarter of 2016, which represented an increase of SEK 218m or 114% over the first quarter of 2016. In the first quarter of 2017, items affecting comparability include costs of approximately SEK 460m attributable to the split of the SCA Group into two listed companies, the largest component of which is a one-time foreign tax on non-current assets outside Sweden. Items affecting comparability for the first quarter of 2017 also include integration costs related to the acquisition of Wausau of approximately SEK 30m, restructuring costs of SEK 80m related to the closure of a tissue machine in UK and other costs of SEK 104m. The derecognition of a provision related to an antitrust case in Poland had a positive effect of approximately SEK 265m.
Items affecting comparability for the first quarter of 2016 primarily consisted of re-measurement effects concerning Wausau’s inventory valuation in connection with the acquisition balance and transaction costs, as well as a provision of approximately SEK 100m related to the ongoing review of the Colombian competition authority of the jointly owned company Productos Familia S.A., Colombia.
Profit for the periodProfit for the first quarter of 2017 amounted to SEK 1,656m, compared to SEK 1,625m in the first quarter of 2016, which represented an increase of SEK 31m or 2% over the first quarter of 2016. Adjusted profit for the first quarter of 2017 amounted to SEK 1,971m, compared to SEK 1,776m in the first quarter of 2016, which represented an increase of SEK 195m or 11% over the first quarter of 2016. The increase in profit for the period was primarily driven by a higher gross profit, while sales, general and administration expenses had a negative impact on the profit for the period.
Comparison between the financial years 2016 and 2015
Net salesNet sales for 2016 amounted to SEK 101,238m, compared to SEK 98,519m in 2015, which represented an increase of SEK 2,719m or 3% over 2015. Exchange rate effects decreased net sales by 3%. The acquisition of Wausau increased net sales by 3%. Organic sales increased by 3% over 2015, of which volume accounted for 2% and price/mix for 1%. The increase in organic sales was primarily driven by emerging markets, especially consumer tissue in China. Emerging markets showed an increase of 7% while mature markets were in line with the previous year.
Personal CareNet sales for Personal Care for 2016 amounted to SEK 33,651m, compared to SEK 34,344m in 2015, which represented a decrease of SEK 693m or 2% over 2015. Exchange rate effects decreased net sales by 4%. The effects of the divestment of the baby diaper business in South Africa decreased net sales by 1%. Organic sales increased by 3% over 2015, of which volume accounted for 2% and price/mix for 1%. The increase in organic sales was primarily driven by higher sales of feminine care products especially in Latin America and Western Europe. Emerging markets and mature markets showed an increase in the organic sales of 3% and 2% respectively.
Consumer TissueNet sales for Consumer Tissue for 2016 amounted to SEK 41,560m, compared to SEK 41,657m in 2015, which represented a decrease of SEK 97m or less than 1% over 2015. Exchange rate effects decreased net sales by 3%. Organic sales increased by 3% over 2015, of which volume accounted for 1% and price/mix for 2%. The increase in organic sales was related to emerging markets, especially China. Emerging markets showed an increase of 9% while mature markets showed a decrease of 2% compared to the previous year.
Professional HygieneNet sales for Professional Hygiene for 2016 amounted to SEK 26,001m, compared to SEK 22,527m in 2015, which represented an increase of SEK 3,474m or 15% over 2015. Exchange rate effects decreased net sales by 1%. The effects of the acquisition of Wausau increased net sales by 13%. Organic sales increased by 3% over 2015, of which volume accounted for 3% while price/mix remained stable compared to the previous year. The increase in organic sales was primarily related to emerging markets, especially China, Latin America and Russia. Emerging markets showed an increase of 12%, mature markets showed an increase of 1% compared to the previous year.
Cost of goods soldCost of goods sold for 2016 amounted to SEK 72,970m, compared to SEK 72,165m in 2015, which represented an increase of SEK 805m or 1% over 2015. In 2016, the Company recognized adjustments for items affecting comparability to cost of goods sold of SEK 532m, compared to SEK 267m in 2015, which represented an increase of SEK 265m or 99% over 2015. The increase in costs of goods sold was primarily driven by higher sales volumes and the Wausau acquisition, which
Admission to trading of the shares in Essity Aktiebolag (publ) on Nasdaq Stockholm52
Operational and financial review
was partially offset by cost savings, lower energy costs and lower raw material costs primarily driven by lower pulp prices. Translation exchange rate effects had a positive impact on cost of goods sold.
Gross profitGross profit for 2016 amounted to SEK 28,268m, compared to SEK 26,354m in 2015, which represented an increase of SEK 1,914m or 7% over 2015. The adjusted gross profit for 2016 amounted to SEK 28,800m, compared to SEK 26,621m in 2015, which represented an increase of SEK 2,179m or 8% over 2015. The increase in adjusted gross profit was primarily driven by higher sales volumes, a better price/mix, acquisition of Wausau, cost savings, lower energy costs and lower raw material costs primarily driven by lower pulp prices. Translation exchange rate effects had a negative impact on gross profit.
Sales, general and administration expensesSales, general and administration expenses for 2016 amounted to SEK 19,078m, compared to SEK 16,241m in 2015, which represented an increase of SEK 2,837m or 17% over 2015. In 2016, the Company recognized adjustments to items affecting comparability to sales, general and administration expenses of SEK 2,113m, compared to SEK 995m in 2015, which represented an increase of SEK 1,118m or 112% over 2015. The increase in sales, general and administration expenses was primarily driven by increased investments in marketing activities, especially in Personal Care. Translation exchange rate effects had a positive effect on sales, general and administration expenses.
Share of profits of associates and joint venturesShare of profits of associates and joint ventures for 2016 amounted to SEK 157m, compared to SEK 198m in 2015, which represented a decrease of SEK 41m or 21% over 2015. The decrease was primarily related to lower profits from Asaleo Care.
EBITA and Operating profitEBITA for 2016 amounted to SEK 9,347m, compared to SEK 10,311m in 2015, which represented a decrease of SEK 964m or 9% over 2015. Adjusted EBITA for 2016 amounted to SEK 11,992m, compared to SEK 10,603m in 2015, which represented an increase of SEK 1,389m or 13% over 2015. Operating profit for 2016 amounted to SEK 9,008m, compared to SEK 9,684m in 2015, which represented a decrease of SEK 676m or 7% over 2015. Adjusted operating profit for 2016 amounted to SEK 11,833m, compared to SEK 10,470m in 2015, which represented an increase of SEK 1,363m or 13% over 2015. The increase in adjusted EBITA was primarily related to higher volumes, a better price/mix, cost savings, lower raw material and energy costs and acquisition. The British pound and Mexican peso was weakened against a number of trading currencies, which had a negative impact on earnings. Translation exchange rate effects decreased adjusted EBITA by 4%.
Personal CareAdjusted EBITA for 2016 amounted to SEK 4,283m, compared to SEK 3,997m in 2015, which represented an increase of SEK 286m or 7% over 2015. Adjusted operating profit for 2016 amounted to SEK 4,255m, compared to SEK 3,990m in 2015, which represented an increase of SEK 265m or 7% over 2015. The increase in adjusted EBITA was primarily driven by a better price/mix, higher volumes and cost savings, which were partially offset by higher costs for raw material, higher selling costs and increased investments in marketing activities. The British pound and Mexican peso weakened against a number of trading currencies, which had a negative earnings effect. Translation exchange rate effects decreased adjusted EBITA by 4%.
Consumer TissueAdjusted EBITA for 2016 amounted to SEK 4,450m, compared to SEK 3,846m in 2015, which represented an increase of SEK 604m or 16% over 2015. Adjusted operating profit for 2016 amounted to SEK 4,382m, compared to SEK 3,773m in 2015, which represented an increase of SEK 609m or 16% over 2015. The increase in adjusted EBITA was primarily driven by a better price/mix, higher volumes, cost savings, lower raw material and energy costs, which were partially offset by higher selling costs and investments in increased marketing activities. The British pound and Mexican peso weakened against several trading currencies, which had a negative earnings effect. Translation exchange rate effects decreased adjusted EBITA by 5%.
Professional HygieneAdjusted EBITA for 2016 amounted to SEK 3,836m, compared to SEK 3,497m in 2015, which represented an increase of SEK 339m or 10% over 2015. Adjusted operating profit for 2016 amounted to SEK 3,773m, compared to SEK 3,444m in 2015, which represented an increase of SEK 329m or 10% over 2015. The increase in adjusted EBITA was primarily driven by acquisitions, higher volumes, lower raw material and energy costs, which were partially offset by higher selling costs. The British pound and Mexican peso weakened against several trading currencies, which had a negative earnings effect. Translation exchange rate effects decreased adjusted EBITA by 1%.
Financial itemsFinancial income for 2016 amounted to SEK 202m, compared to SEK 312m in 2015, which represented a decrease of SEK 110m or 35% over 2015. Financial expenses for 2016 amounted to SEK 1,037m, compared to SEK 1,140m in 2015, which represented a decrease of SEK 103m or 9% over 2015. Net financial items for 2016 amounted to expenses of SEK 835m, compared to expenses of SEK 828m in 2015, which represented an increase of SEK 7m or 1% over 2015. The increase in net financial items was primarily driven by a higher average net debt, which was impacted by the Wausau acquisition.
Profit before tax Profit before tax for 2016 amounted to SEK 8,173m, compared to SEK 8,856m in 2015, which represented a decrease of SEK 683m or 8% over 2015. Adjusted profit before tax in 2016 amounted to SEK 10,998m, compared to SEK 9,642m in 2015, which represented an increase of SEK 1,356m or 14% over 2015. The increase in adjusted profit before tax was primarily driven by increased adjusted EBITA.
TaxTax expense for 2016 amounted to SEK 3,931m, compared to SEK 2,278m in 2015, which represented an increase of SEK 1,653m or 73% over 2015. The tax expense for 2016 corresponds to an effective tax rate of 48%, compared to 26% in 2015. Adjusted tax expense for 2016 amounted to SEK 4,355m, compared to SEK 2,745m for 2015, which represented an increase of SEK 1,610m or 59% over 2015. The tax expense for 2016 includes a provision of approximately SEK 1,300m among others related to ongoing tax cases in Sweden and Austria. The tax rate excluding items affecting comparability and excluding the tax provision of approximately SEK 1,300m amounted to 27%.
Items Affecting ComparabilityExpenses related to items affecting comparability for 2016 amounted to SEK 2,825m, compared to SEK 786m in 2015, which represented an increase of SEK 2,039m or 259% over 2015. In 2016, items affecting comparability include: costs of SEK 1,086m related to ongoing antitrust cases in Chile, Colombia, Poland, Spain and Hungary; restructuring costs of SEK 757m mainly related to the closures of the tissue plants in Sant Joan de Mediona, Spain, and Saint-Cyr-en-Val, France, and restructuring measures at the
53Admission to trading of the shares in Essity Aktiebolag (publ) on Nasdaq Stockholm
Operational and financial review
Hondouville and Saint-Etienne-du-Rouvray production plants in France; costs of SEK 174m for the closure of the Baby Care business in Mexico; costs of SEK 374m for the discontinuation of the hygiene business in India; integration costs related to the acquisition of Wausau and inventory valuation in connection with the acquisition balance, together totaling SEK 204m; transaction costs of SEK 143m for BSN medical; other costs of approximately SEK 186m and a capital gain of SEK 99m attributable to the divestment of Essity’s shareholding in IL Recycling.
Profit for the periodProfit for the period in 2016 amounted to SEK 4,242m, compared to SEK 6,578m in 2015, which represented a decrease of SEK 2,336m or 36% over 2015. Adjusted profit for the period in 2016 amounted to SEK 6,643m, compared to SEK 6,897m in 2015, which represented a decrease of SEK 254m or 4% over 2015. The decrease in profit for the period was primarily driven by higher tax expense and higher items affecting comparability.
Comparison between the financial years 2015 and 2014
Net salesNet sales for 2015 amounted to SEK 98,519m, compared to SEK 87,997m in 2014, which represented an increase of SEK 10,522m or 12% over 2014. Exchange rate effects increased net sales by 6%. Organic sales increased by 6% over 2014, of which volume accounted for 3% and price/mix for 3%. The increase in organic sales was primarily driven by emerging markets, especially consumer tissue in China. Emerging markets showed an increase of 12% while mature markets showed an increase of 2%.
Personal CareNet sales for Personal Care for 2015 amounted to SEK 34,344m, compared to SEK 31,066m in 2014, which represented an increase of SEK 3,278m or 11% over 2014. Exchange rate effects increased net sales by 4%. Organic sales increased by 7% over 2014, of which volume accounted for 4% and price/mix for 3%. The increase in organic sales was primarily driven by emerging markets, especially feminine care and incontinence products in Latin America and Russia. Emerging markets and mature markets showed an increase in the organic sales of 12% and 4% respectively.
Consumer TissueNet sales for Consumer Tissue for 2015 amounted to SEK 41,657m, compared to SEK 37,051m in 2014, which represented an increase of SEK 4,606m or 12% over 2014. Exchange rate effects increased net sales by 6%. Organic sales increased by 6% over 2014, of which volume accounted for 4% and price/mix for 2%. The increase in organic sales was primarily driven by emerging markets, especially China. Emerging markets and mature markets showed an increase in the organic sales of 14% and 1% respectively.
Professional HygieneNet sales for Professional Hygiene for 2015 amounted to SEK 22,527m, compared to SEK 19,943m in 2014, which represented an increase of SEK 2,584m or 13% over 2014. Exchange rate effects increased net sales by 11%. Organic sales increased by 2% over 2014, of which volume accounted for 1% and price/mix for 1%. The increase in organic sales was primarily driven by higher sales in emerging markets and North America. Emerging markets and mature markets showed an increase in the organic sales of 8% and 1% respectively.
Cost of goods soldCost of goods sold for 2015 amounted to SEK 72,165m, compared to SEK 64,522m in 2014, which represented an increase of SEK 7,643m
or 12% over 2014. In 2015, the Company recognized adjustments for items affecting comparability to cost of goods sold of SEK 267m, compared to SEK 441m in 2014, which represented a decrease of SEK 174m or 39% over 2014. The increase in costs of goods sold was primarily driven by higher volumes and higher raw material costs mainly owing to a stronger USD.
Gross profitGross profit for 2015 amounted to SEK 26,354m, compared to SEK 23,475m in 2014, which represented an increase of SEK 2,879m or 12% over 2014. The adjusted gross profit for 2015 amounted to SEK 26,621m, compared to SEK 23,916m in 2014, which represented an increase of SEK 2,705m or 11% over 2014. The increase in adjusted gross profit was primarily driven by better price/mix, higher volumes and cost savings. Higher raw material costs mainly resulting from a stronger USD had a negative impact on gross profit.
Sales, general and administration expensesSales, general and administration expenses for 2015 amounted to SEK 16,241m, compared to SEK 15,095m in 2014, which represented an increase of SEK 1,146m or 8% over 2014. In 2015, the Company recognized adjustments for items affecting comparability to sales, general and administration expense of SEK 995m, compared to SEK 568m in 2014, which represented an increase of SEK 427m or 75% over 2014. The increase in sales, general and administration expenses was primarily driven by increased investments in marketing activities for incontinence products.
Share of profits of associates and joint venturesShare of profits of associates and joint ventures for 2015 amounted to SEK 198m, compared to SEK 106m in 2014, which represented an increase of SEK 92m or 87% over 2014. The increase in profits of associates and joint ventures was primarily driven by a higher result of Asaleo Care.
EBITA and Operating profitEBITA for 2015 amounted to SEK 10,311m, compared to SEK 8,486m in 2014, which represented an increase of SEK 1,825m or 22% over 2014. Adjusted EBITA for 2015 amounted to SEK 10,603m, compared to SEK 9,495m in 2014, which represented an increase of SEK 1,108m or 12% over 2014. Operating profit for 2015 amounted to SEK 9,684m, compared to SEK 8,360m in 2014, which represented an increase of SEK 1,324m or 16% over 2014. Adjusted operating profit for 2015 amounted to SEK 10,470m, compared to SEK 9,369m in 2014, which represented an increase of SEK 1,101m or 12% over 2014. The increase in adjusted EBITA was primarily driven by better price/mix, higher volumes and cost savings, partially offset by higher raw material costs mainly resulting from a stronger USD. Translation exchange rate effects increased adjusted EBITA by 6%.
Personal CareAdjusted EBITA for 2015 amounted to SEK 3,997m, compared to SEK 3,528m in 2014, which represented an increase of SEK 469m or 13% over 2014. Adjusted Operating profit for 2015 amounted to SEK 3,990m, compared to SEK 3,526m in 2014, which represented an increase of SEK 464m or 13% over 2014. The increase in adjusted EBITA was primarily driven by a better price/mix, higher volumes and cost savings, partially offset by higher raw material costs mainly resulting from a stronger USD and increased marketing activities for incontinence products. Translation exchange rate effects increased adjusted EBITA by 1%.
Consumer TissueAdjusted EBITA for 2015 amounted to SEK 3,846m, compared to SEK 3,858m in 2014, which represented a decrease of SEK 12m or less than 1% over 2014. Adjusted Operating profit for 2015 amounted
Admission to trading of the shares in Essity Aktiebolag (publ) on Nasdaq Stockholm54
Operational and financial review
to SEK 3,773m, compared to SEK 3,798m in 2014, which represented a decrease of SEK 25m or less than 1% over 2014. The decrease in adjusted EBITA was primarily driven by higher raw material costs mainly resulting from a stronger USD. A better price/mix, higher volumes and cost savings had a positive earnings effect. Translation exchange rate effects increased adjusted EBITA by 7%.
Professional HygieneAdjusted EBITA for 2015 amounted to SEK 3,497m, compared to SEK 2,918m in 2014, which represented an increase of SEK 579m or 20% over 2014. Adjusted Operating profit for 2015 amounted to SEK 3,444m, compared to SEK 2,854m in 2014, which represented an increase of SEK 590m or 21% over 2014. The increase in adjusted EBITA was primarily driven by a better price/mix, higher volumes and cost savings, partially offset by higher raw material costs mainly resulting from a stronger USD. Translation exchange rate effects increased adjusted EBITA by 10%.
Financial itemsFinancial income for 2015 amounted to SEK 312m, compared to SEK 416m in 2014, which represented a decrease of SEK 104m or 25% over 2014. Financial expenses for 2015 amounted to SEK 1,140m, compared to SEK 1,156m in 2014, which represented a decrease of SEK 16m or 1% over 2014. Net financial items for 2015 amounted to expenses of SEK 828m, compared to expenses of SEK 740m in 2014, which represented an increase of SEK 88m or 12% over 2014. The increase in net financial items was primarily driven by somewhat higher average interest rates during the year.
Profit before tax Profit before tax for 2015 amounted to SEK 8,856m, compared to SEK 7,620m in 2014, which represented an increase of SEK 1,236m or 16% over 2014. Adjusted profit before tax for 2015 amounted to SEK 9,642m, compared to SEK 8,629m in 2014, which represented an increase of SEK 1,013m or 12% over 2014. The increase in adjusted profit before tax was primarily driven by a higher adjusted EBITA.
TaxTax expense for 2015 amounted to SEK 2,278m, compared to SEK 1,939m in 2014, which represented an increase of SEK 339m or 17% over 2014. The tax expense for 2015 corresponds to an effective tax rate of 26%, compared to 25% in 2014. Adjusted tax expense for 2015 amounted to SEK 2,745m, compared to SEK 2,162m for 2014, which represented an increase of SEK 583m or 27% over 2014. The increase in tax expense was primarily driven by higher profit before tax.
Items Affecting ComparabilityItems affecting comparability for 2015 amounted to SEK 786m, compared to SEK 1,009m in 2014, which represented a decrease of SEK 223m or 22% over 2014. In 2015, items affecting comparability related primarily to: impairment of trademarks of SEK 465m; impairment of assets of SEK 375m and integration costs of SEK 440m related to the Georgia-Pacific acquisition; costs of SEK 170m related to the divestment of the business jet operation; and other which includes transaction costs of SEK 306m and a gain of SEK 970m from the sale of securities.
Profit for the periodProfit for the period in 2015 amounted to SEK 6,578m, compared to SEK 5,681m in 2014, which represented an increase of SEK 897m or
16% over 2014. The adjusted profit for the period in 2015 amounted to SEK 6,897m, compared to SEK 6,467m in 2014, which represented an increase of SEK 430m or 7% over 2014. The increase in profit for the period was primarily driven by a higher EBITA.
Liquidity and capital resources
Working capital statementIt is Essity’s assessment that its working capital is sufficient for the present requirements during the next twelve months. In this context, working capital is the Company’s ability to access cash and other available liquid resources in order to meet its liabilities as they come due. As of March 31, 2017, Essity had SEK 30,616m in cash and cash equivalents.1)
Cash flowCash flow from operating activitiesCash flow from operating activities for the first quarter of 2017 amounted to SEK 2,887m, compared to SEK 1,697m in the first quarter of 2016, which represented an increase of SEK 1,190m or 70% over the first quarter of 2016. This increase in cash flow from operating activities was primarily driven by a decreased working capital, mainly due to changes in operating liabilities.
Cash flow from operating activities in 2016 amounted to SEK 12,778m, compared to SEK 10,780m in 2015, which represented an increase of SEK 1,998m or 19% over 2015. This increase was primarily attributable to changes in working capital, mainly due to a lower inventory. Increased tax paid had a negative impact on cash flow from operating activities.
Cash flow from operating activities in 2015 amounted to SEK 10,780m, compared to SEK 9,758m in 2014, which represented an increase of SEK 1,022m or 10% over 2014. This increase was primarily attributable to improved profit before tax.
Cash flow from investing activitiesCash flow from investing activities for the first quarter of 2017 amounted to an outflow of SEK 1,123m, compared to SEK 5,593m in the first quarter of 2016, which represented a decrease of SEK 4,470m or 80% over the first quarter of 2016. The decrease in cash flow from investing activities was primarily driven by the fact that the Company undertook no acquisitions during the first quarter of 2017, compared to the same period 2016 when it acquired Wausau.
Cash flow from investing activities in 2016 amounted to an outflow of SEK 10,119m, compared to SEK 3,263m in 2015, which represented an increase of SEK 6,856m or 210% over 2015. The increase was primarily attributable to acquisitions and increased investments in tangible and intangible assets. Effect on liquidity from the acquisition of Wausau amounted to SEK –4,387m.
Cash flow from investing activities in 2015 amounted to an outflow of SEK 3,263m, compared to SEK 4,909m in 2014, which represented a decrease of SEK 1,646m or 34% over 2014. Sale of securities impacted cash flow by SEK 2,046m in 2015.
Cash flow from financing activitiesCash flow from financing activities for the first quarter of 2017 amounted to an outflow of SEK 24,609m, compared to SEK 3,496m in the first quarter of 2016, which represented an increase of SEK 21,113m or 604% over the first quarter of 2016. The increase in cash flow from financing activities was primarily driven by new loans in connection with the financing of BSN medical.
1) The difference in liquid resources compared to December 31, 2016 is primarily related to that Essity raised new loans in connection with the financing of BSN medical. The acquisition of BSN medical was completed on April 3, 2017. See “Acquisition of BSN medical and presentation of certain financial information for BSN medical” in the section entitled ”Capitalization and other financial information”.
55Admission to trading of the shares in Essity Aktiebolag (publ) on Nasdaq Stockholm
Operational and financial review
Cash flow from financing activities in 2016 amounted to an outflow of SEK 3,389m, compared to SEK 6,391m in 2015, which represents a decrease of SEK 3,002m or 47% over 2015. The change was primarily attributable to an increase in loans raised during 2016.
Cash flow from financing activities in 2015 amounted to an outflow of SEK 6,391m, compared to SEK 5,106m in 2014, which represents an increase of SEK 1,285m or 25% over 2014. The change was primarily attributable to an increase of the amortization of the Company’s outstanding debt.
Capital expendituresStrategic and current capital expenditures Essity’s investments in intangible assets and property, plant and equipment during the financial years 2014–2016 and during the period January–March 2016 and 2017 consist mainly of:• Strategic capital expenditures in non-current assets, to increase
Essity’s future cash flow through capital expenditures to expand facilities, or new technologies that boost competitiveness; and
• Current capital expenditures consist of investments to maintain competitiveness such as maintenance, rationalization and replacement measures or investments of an environmental nature.
These investments are summarized in the table below.
Investments in intangible assets and property, plant and equipment
SEKmJan-Mar 2017
(unaudited)Jan-Mar 2016
(unaudited)Jan-Dec
2016Jan-Dec
2015Jan-Dec
2014
Measures to raise the capacity level of operations (Strategic capital expenditures) –256 –422 –2,033 –2,179 –1,632
Measures to uphold capacity level (Current capital expenditures) –627 –669 –4,306 –3,500 –2,964
Total –883 –1,091 –6,339 –5,679 –4,596
Strategic capital expenditures in non-current assets in the first quarter of 2017 amounted to SEK –256m, compared to SEK –422m in the first quarter of 2016, which represented a decrease of SEK 166m or 39% over the first quarter of 2016. The strategic capital expenditures in the first quarter of 2017 were related to several strategic investments to grow the business.
Strategic capital expenditures in non-current assets in 2016 amounted to SEK –2,033m, compared to SEK 2,179m in 2015, which represented a decrease of SEK 146m or 7% over 2015. The strategic capital expenditures in 2016 were related to several strategic investments, such as investments in a new product facility in Brazil.
Strategic capital expenditures in non-current assets in 2015 amounted to SEK –2,179m, compared to SEK 1,632m in 2014, which represented an increase of SEK 547m or 34% over 2014. The strategic capital expenditures in 2015 were related to several strategic investments, such as investments in a new product facility in Brazil.
Current capital expenditures in the first quarter of 2017 amounted to SEK –627m, compared to SEK –669m in the first quarter of 2016, which represented a decrease of SEK 42m or 6.3% over the first quarter of 2016. The investments consisted of current capital expenditures within all Business Areas.
Current capital expenditures in 2016 amounted to SEK –4,306m, compared to SEK –3,500m in 2015, which represented an increase of SEK 806m or 23% over 2015. The investments consisted of current capital expenditures within all Business Areas.
Current capital expenditures in 2015 amounted to SEK –3,500m, compared to SEK –2,964m in 2014, which represented an increase of SEK 536m or 18% over 2014. The investments consisted of current capital expenditures within all Business Areas.
The Group’s main capital expenditures in intangible assets and property, plant and equipment during the period from March 31, 2017 until the date of the prospectus, comprised of strategic and current capital expenditures customary to the Company. See also “Acquisitions and divestments” below for a description of the acquisitions and divestments made during the financial years 2014–2016 and during 2017 until the date of the prospectus.
On-going and future capital expendituresThe Group’s main on-going and future capital expenditures consist of the following: (i) current capital expenditures and (ii) strategic investments of approximately SEK 160m in a through-air drying (TAD) machine at Essity’s tissue plant in Skelmersdale, approximately SEK 950m in one of the Group’s facilities in Mexico and approximately SEK 380m in facilities in Europe to strengthen its baby diaper product offering.
The on-going and future capital expenditures are expected to be financed by cash flow generated from the Group’s operations.
Acquisitions and divestmentsThe following section contains a description of the main acquisitions and divestments pertaining to the hygiene business made by the SCA Group during the years 2014–2017 until the date of this prospectus.
In 2014, Essity made a number of minor acquisitions, which were jointly recognized in the acquisition balance sheet as of December 31, 2014, since no individual transaction was of a material nature. Acquisitions made during 2014 totaled SEK 508m, including assumed net debt. On August 1, 2014 Essity’s subsidiary Vinda acquired an additional 50% interest in its associated company Vinda Personal Care, for HKD 295m. Earlier holdings in Vinda Personal Care were restated in accordance with IFRS resulting in a positive re-measurement effect of SEK 33m. In June 2014, Essity acquired the remaining 50% of its joint venture Fine Sancella in Jordan from the Nuqul Group, for an aggregate consideration of SEK 171m. No divestments were made in 2014.
In July 2015, Essity and Nampak agreed to divest the baby diaper operations of the jointly-owned South African company Sancella S.A., through a sale to another South African company for an aggregate consideration of SEK 116m. Essity also signed an agreement to acquire the remaining 50% of Sancella S.A. from Nampak for an aggregate consideration of SEK 1. All of Essity’s acquisitions during 2015, which amounted to SEK 74m, were made in cash.
In June 2016, the SCA Group divested 33.3% of its holding in the recycling company IL Recycling, of which Essity owned 16.66%, of which Essity’s consideration amounted to SEK 120m. In November 2016, Essity divested its remaining non-current assets held in China (which were not included in the hygiene business transferred to Vinda in 2014), for an aggregate consideration of SEK 169m. In addition to these divestments, Essity received consideration for a number of minor divestments in China and Sweden, in a total amount of SEK 29m.
In 2016, Essity’s public bid for Wausau’s purchase was completed, for an aggregate consideration of USD 513m (SEK 4,401m) in cash.
In December 2016, Essity entered into an agreement to acquire BSN medical for a purchase price of EUR 1,400m for the shares and the takeover of net debt amounts to approximately EUR 1,340m1). On April 3, 2017, Essity completed the acquisition of BSN medical. The acquisition’s effect on the Company’s earnings, cash flow and financial position will be reflected in the Company’s future financial statements. See “Acquisition of BSN medical and presentation of certain financial information for BSN medical” in the section entitled “Capitalization and
1) Based on net debt as per December 31, 2016. Final takeover of net debt will be based on March 31, 2017.
Admission to trading of the shares in Essity Aktiebolag (publ) on Nasdaq Stockholm56
Operational and financial review
other financial information” for a description of BSN medical’s financial position.
See “Acquisitions and divestments” in the section entitled “Legal Considerations and supplementary information” for a description of material agreements related to the acquisitions and divestments of companies.
Credit facilities and loansThe tables below show Essity’s main credit facilities and loans as of March 31, 2017. See also the section entitled “Capitalization and other financial information” for a description of the Group’s capitalization and indebtedness as of March 31, 2017, and material changes thereafter.
Credit Facilities
Type (unaudited)Nominal amount
Utilized, Mar 31, 2017, SEKm
Unutilized, Mar 31, 2017, SEKm Maturity
Syndicated revolving credit facility1)
EUR 1,000m 0 9,542 2021
Syndicated revolving credit facility2)
EUR 1,000m 0 9,542 2019
Total 0 19,0841) The syndicate consists of ANZ Bank (Europe) Limited; BNP Paribas Fortis SA/NV, Bankfilial
Sverige; Citibank Europe plc; Commerzbank Aktiengesellschaft; Crédit Agricole Corporate and Investment Bank, France, Sweden branch; Danske Bank A/S, Danmark, Sverige Filial; Deutsche Bank Luxembourg S.A.; ING Belgium N.V./S.A.; J.P. Morgan Securities plc; Nordea Bank AB (publ); Skandinaviska Enskilda Banken AB (publ); Svenska Handelsbanken AB (publ); Swedbank AB (publ); The Royal Bank of Scotland plc and UniCredit Bank Austria AG.
2) The syndicate consists of Bank of America Merrill Lynch International Limited; BNP Paribas Fortis SA/NV, Bankfilial Sverige; Citibank Europe plc; Commerzbank Aktiengesellschaft; Crédit Agricole Corporate and Investment Bank, France, Sweden Branch; Danske Bank A/S, Danmark, Sverige Filial; Deutsche Bank Luxembourg S.A.; ING Belgium N.V./S.A.; Nordea Bank AB (publ); Skandinaviska Enskilda Banken AB (publ); Svenska Handelsbanken AB (publ); Standard Chartered Bank; Swedbank AB (publ); The Royal Bank of Scotland plc and UniCredit Bank Austria AG.
EMTN Program
Type (unaudited)Nominal amount Maturity
Carrying amount, Mar 31, 2017, SEKm
Fair value, Mar 31, 2017, SEKm Coupon
Notes EUR 300m EUR 300m 2018 2,857 2,860 0.000%
Notes SEK 600m SEK 600m 2019 603 606 3 month STIBOR plus 0.750%
Notes SEK 900m SEK 900m 2019 909 913 0.750%
Green bond SEK 1,000m SEK 1,000m 2019 999 1,002 3 month STIBOR plus 0.680%
Green bond SEK 500m SEK 500m 2019 500 525 2.500%
Notes EUR 300m EUR 300m 2020 2,847 2,840 0.500%
Notes EUR 500m EUR 500m 2021 4,712 4,721 0.500%
Notes EUR 600m EUR 600m 2022 5,689 5,674 0.625%
Notes EUR 500m EUR 500m 2023 5,165 5,179 2.500%
Notes EUR 600m EUR 600m 2024 5,701 5,685 1.125%
Notes EUR 300m EUR 300m 2025 2,867 2,792 1.125%
Notes EUR 500m EUR 500m 2027 4,733 5,071 1.625%
Total 37,582 37,868
Commercial Paper Programs
Type (unaudited)Amount issued,
Mar 31, 2017, SEKm
Swedish, SEK 15,000m 7,337
Belgian, EUR 800m -
Total 7,337
Other main loan facilities
Type (unaudited)Nominal amount
Amount, Mar 31, 2017, SEKm Maturity
European Investment Bank1) SEK 1,850m 1,850 2021
Nordic Investment Bank EUR 200m 1,908 2024
Swedish Export Credit Corporation SEK 2,900m 2,900 2018/20233)
Syndicated loans2) EUR 272.7m 1,342 2020/2022/2022
KFW Ipex-bank EUR 90m 859 2021
KFW Ipex-bank USD 124.3m 1,109 2021
Total 9,9681) AB SCA Finans is formally the borrower and Essity is the guarantor under the agreement.2) Consisting of three syndicated term loan facilities with various final repayment dates. The
syndicates consist of i) IKB Deutsche Industriebank AG, Nordea Bank AB (publ), Svenska Handelsbanken AB (publ), Deutsche Postbank AG and KFW Ipex-bank GmbH; ii) IKB Deutsche Industriebank AG, Nordea Bank AB (publ) and KFW Ipex-bank GmbH; and iii) IKB Deutsche Industriebank AG, BNP Paribas S.A. Niederlassung Frankfurt am Main, Crédit Agricole Corporate and Investment Bank Deutschland, Commerzbank Aktiengesellschaft, KFW Ipex-bank GmbH, SEB AG and Unicredit Bank Austria AG. IKB Deutsche Industribank AG acts as arranger and agent of the syndicated loans.
3) SEK 1,500m is due for final repayment 2018 and SEK 1,400m in 2023.
Description of certain main credit agreements and loansAs presented in the tables above, the Group’s financial arrangements are mainly comprised of (i) two EUR 1,000m committed multicurrency revolving credit facilities with a syndicate of banks due 2019 and 2021, (ii) a EUR 6,000m medium term note program under which the Company has issued EUR 3,600m and SEK 3,000m of nominal amount of notes as of March 31, 2017, (iii) a SEK 15,000m Swedish
commercial paper program and a EUR 800m Belgian commercial paper program under which the Company has issued SEK 7,337m of commercial paper under the Swedish program (as of the same date there were no amounts issued under the Belgian program), respectively, as of March 31, 2017, and (iv) bilateral loan facilities with the European Investment Bank, the Nordic Investment Bank, the Swedish Export Credit Corporation and KFW Ipex-bank and three syndicated loan facilities with IKB Deutsche Industribank AG as arranger and agent.
Most of the Group’s financing arrangements contain cross-default provisions that may accelerate the Company’s obligation to repay debts if certain events of default occur under the Company’s or its principal subsidiaries’ other financing arrangements. These cross-default provisions are subject to threshold amounts that must be exceeded for such cross-default provisions to be triggered.
The Group’s policy is to enter into financial arrangements that do not contain clauses that may entitle creditors to terminate or modify the material terms of the arrangements in the event that the Group’s financial key ratios or credit rating change.
As described below, SCA has provided guarantees as to the Group’s obligations under certain financing arrangements. Such guarantees will automatically be terminated upon the completion of the distribution of Essity on or around the first day of trading in the Essity shares on Nasdaq Stockholm, provided that (i) there are no outstanding claims towards SCA in relation to the guarantees, (ii) no events of default have occurred or are caused as a result of the release of SCA’s guarantees and (iii) the warranties provided in connection with the separation are correct. Essity expects that no additional costs will occur for Essity as a borrower as a result of the termination of the guarantees.
57Admission to trading of the shares in Essity Aktiebolag (publ) on Nasdaq Stockholm
Operational and financial review
Revolving Credit FacilitiesThe Group’s main credit facilities comprise (i) a EUR 1,000m committed multicurrency revolving credit facility due 2019 with a syndicate of banks, and (ii) a EUR 1,000m committed multicurrency revolving credit facility due 2021 with a syndicate of banks. The revolving credit facilities contain certain representation and warranties and covenants relating to, inter alia, financial reporting, negative pledges, restrictions on disposal of assets and restrictions regarding change of business. The revolving credit facilities also contain event of default provisions. All these provisions are in line with the Group’s finance policy. As of March 31, 2017, no amount had been drawn on the revolving credit facilities.
SCA guarantees the Group’s obligations under the revolving credit facilities. Upon the distribution of Essity being completed, the guarantees granted by SCA for the obligations of the Group will automatically be terminated and SCA will be released from all its obligations under such guarantees.
EMTN ProgramThe Group has a EUR 6,000m euro medium term note program. The EMTN program contains, inter alia, negative pledge and redemption covenants and event of default provisions, which are in line with the Group’s finance policy. As of March 31, 2017, the aggregated fair value of outstanding notes issued under the EMTN Program amounted to SEK 37,868m.
SCA guarantees the Group’s obligations under the notes issued under the EMTN program. Upon the distribution of Essity being completed, the guarantees granted by SCA for the obligations of the Group will automatically be terminated and SCA will be released from all its obligations under such guarantees.
Commercial Paper ProgramsThe Group has (i) a SEK 15,000m Swedish commercial paper program and (ii) a EUR 800m Belgian commercial paper program. The commercial paper programs contain, inter alia, negative pledge covenants and event of default provisions, which are in line with the Group’s finance policy. The Group’s short-term borrowing under these market programs has a refinancing risk which is partly secured through the unutilized committed bank credit facilities. As of March 31, 2017, commercial paper of an aggregate amount of SEK 7,337m was issued under the Swedish program. As of the same date, no commercial paper was issued under the Belgian program.
SCA guarantees the Group’s obligations pertaining to commercial paper issued under the Swedish commercial paper program. Upon the distribution of Essity being completed, the guarantees granted by SCA for the obligations of the Group will automatically be terminated and SCA will be released from all its obligations under such guarantees.
Certain other main loan facilitiesIn addition to the financial arrangements described above, the Group’s financial arrangements are mainly comprised of a number of term loan facilities with, among others, the European Investment Bank, the Nordic Investment Bank, the Swedish Export Credit Corporation and KFW Ipex-bank. In addition, the Group has entered into three syndicated loan facilities with IKB Deutsche Industribank AG as arranger and agent. The aggregate amount outstanding on these term loans was SEK 9,968m as of March 31, 2017. These agreements are subject to a range of representation and warranties and covenants
relating to, inter alia, financial reporting, negative pledges, restrictions on disposal of assets and restrictions regarding change of business, and also contain event of default provisions, which are in line with the Group’s finance policy.
Further, certain subsidiaries within the Group have entered into local credit facilities, mainly with local banks as lenders that are, in certain instances, guaranteed by the Company. The majority of such loan facilities are uncommitted and intended for subsidiaries’ working capital purposes.
Contractual obligationsThe following table summarizes the Group’s financial liabilities as of March 31, 2017.
SEKm (unaudited) March 31, 2017
Current financial liabilitiesAmortization within 1 year 283
Bond issues –
Derivatives 603
Loans with maturities of less than 1 year 9,078
Accrued financial expenses 105
Total1) 10,069
Non-current financial liabilitiesBond issues 37,582
Derivatives 37
Other long-term loans with maturities > 1 year < 5 years 9,808
Other long-term loans with maturities > 5 years 4,166
Total 51,593
Total financial liabilities 61,662Fair value of financial liabilities 61,7071) Fair value of short-term loans is estimated to be the same as the carrying amount.
In addition to the financial liabilities described above, the Group has a number of operating and financial leases, see note G2 on p. F-80 in the section entitled “Historical financial information”. The following tables summarize aggregated future minimum lease payments under the Group’s leasing agreements, as of December 31, 2016.
SEKm December 31, 2016
Operating leases, future minimum lease payments1)
Within 1 year 515
Between 1 year and 5 years 1,209
Later than 5 years 1,392
Total 3,1161) Operating lease objects comprise a large number of items, including warehouses, offices,
other buildings, machinery and equipment, IT equipment, office fixtures and various transport vehicles. The assessment for a number of the objects is that, in reality, it is possible to terminate contracts early.
SEKm December 31, 2016
Finance leases, future minimum lease paymentsWithin 1 year 1
Between 1 year and 5 years 1
Later than 5 years –
Total 2Of which, interest 0
Present value of future minimum lease payments 2
For a description of certain pension plans and obligations, see note C5 on p. F-56 in the section entitled “Historical financial information”.
See the section entitled “Legal considerations and supplementary information” for further information on the Group’s material agreements outside the ordinary course of business.
Admission to trading of the shares in Essity Aktiebolag (publ) on Nasdaq Stockholm58
Operational and financial review
Research and development expenses The table below shows Essity’s research and development expenses, including as a percentage of net sales, during the financial years 2014–2016 and the period January–March 2016 and 2017.
SEKmJan-Mar 2017
(unaudited)Jan-Mar 2016
(unaudited)Jan-Dec
2016Jan-Dec
2015Jan-Dec
2014
Research and development costs –289 –280 –1,211 –1,055 –1,017
Research and development costs, % of net sales 1.1% 1.2% 1.2% 1.1% 1.2%
See also “Research and development” in the section entitled “Market and business description” for a further description of the Group’s research and development processes. Also, see ”Acquisition of BSN medical and presentation of certain financial information for BSN medical” in the section entitled “Capitalization and other financial information” for a description of BSN medical’s research and development expenses.
Financial positionNet debt as of March 31, 2017, amounted to SEK 32,122m, compared to SEK 35,173m as of December 31, 2016, which represented a decrease of SEK 3,051m or 9%. The net cash flow decreased net debt by SEK 2,262m. Fair value measurement of pension assets and revision to the assumptions and assessments that influence the valuation of pension obligations decreased net debt by SEK 779m. Exchange rate movements decreased the net debt during the period by SEK 10m.
Equity as of March 31, 2017 amounted to SEK 43,108m, compared to SEK 39,580m as of December 31, 2016, which represented an increase of SEK 3,528m or 9%. Profit for the first quarter of 2017 increased equity by SEK 1,656m, while shareholder dividends to non-controlling interests reduced equity by SEK 16m. Equity was increased due to the fair value measurement of pension assets, and an update of the assumptions and assessments that influence the valuation of pension obligations, by SEK 543m after tax. The measurement of financial instruments at fair value decreased equity by SEK 186m. Exchange rate movements, including the effect of hedges of net foreign investments, increased equity by SEK 266m. Equity increased as a result of a private placement to non-controlling interests by SEK 960m. Other comprehensive income in associates decreased equity by SEK 29m, while transactions with shareholders increased equity by SEK 243m. Income tax attributable to components in other comprehensive income increased equity by SEK 91m.
Net debt as of December 31, 2016, amounted to SEK 35,173m, compared to SEK 19,058m as of December 31, 2015, which represented an increase of SEK 16,115m or 85%. The increase was primarily attributable to transactions with shareholders and the allocation of SCA Group’s net debt between SCA and Essity. Additionally, fair value measurement of pension assets and revision to the assumptions and assessments that influence the valuation of pension obligations, net increased net debt by SEK 1,570m. The increase in the net pension liability is largely attributable to assumptions of a lower discount rate that increases pension liabilities. Exchange rate movements increased net debt during the period by SEK 578m.
Equity as of December 31, 2016 amounted to SEK 39,580m, compared to SEK 48,275m as of December 31, 2015, which represented a decrease of SEK 8,695m or 18%. Profit for 2016 increased equity by SEK 4,242m, while shareholder dividends to non-controlling interests reduced equity by SEK 190m. Equity was reduced due to the fair value measurement of pension assets, and an update of the assumptions and assessments that influence the valuation of pension obligations, by SEK 1,149m after tax. The measurement of financial instruments at fair value increased equity by SEK 393m after tax. Exchange rate movements, including the effect of hedges of
net foreign investments, after tax, increased equity by SEK 2,401m. Equity increased as a result of a private placement to non-controlling interests by SEK 431m and decreased due to the acquisition of non-controlling interests by SEK 156m. Other comprehensive income in associates increased equity by SEK 11m after tax, while transactions with shareholders reduced equity by SEK 14,679m. Transactions with shareholders were mainly driven by the allocation of net debt between Essity and SCA, of SEK 11,912m.
Net debt as of December 31, 2015 decreased by SEK 6,008m to SEK 19,058m, compared with SEK 25,066m as of December 31, 2014. Higher net cash flow during 2015 decreased net debt by SEK 2,887m. Furthermore, net debt declined by SEK 1,281m as a result of fair value measurement of pension assets and re-measurement of pension obligations, together with fair valuation of financial instruments. Exchange rate movements decreased net debt by SEK 1,840m.
Equity as of December 31, 2015 increased by SEK 3,350m to SEK 48,275m, compared with SEK 44,925m as of December 31, 2014. Profit for 2015 increased equity by SEK 6,578m, while shareholder dividends to non-controlling interests reduced equity by SEK 216m. Equity was increased due to the fair value measurement of pension assets and re-measurement of pension obligations by SEK 1,515m after tax. The measurement of financial instruments to fair value decreased equity by SEK 741m after tax. Exchange rate movements, including the effect of hedges of net foreign investments, after tax, decreased equity by SEK 1,988m. Additionally, equity decreased due to the acquisition of non-controlling interests by SEK 19m. Other comprehensive income in associates decreased equity by SEK 17m after tax, while transactions with shareholders reduced equity by SEK 1,762m.
Property, plant and equipmentAs of March 31, 2017, Essity’s property, plant and equipment amounted to SEK 47,882m, mainly comprising of production facilities. Essity’s expense for operating leases on assets such as warehouses, offices, other buildings, machinery and equipment, IT equipment, office fixtures and various vehicles, totaled SEK 293m during the three-month period ended March 31, 2017. As of March 31, 2017, Essity owned and leased approximately 80 plants across over 30 countries.
For information on pledged assets, see note G3 on p. F-81 in the section entitled “Historical financial information”. See also “On-going and future capital expenditures” above for a description on certain significant future capital expenditures related to tangible fixed assets.
See ”Acquisition of BSN medical and presentation of certain financial information for BSN medical” in the section entitled “Capitalization and other financial information” for a description of certain material tangible assets in respect of BSN medical.
Sensitivity analysisThe Group has conducted sensitivity analyses in relation to its defined benefit pension obligations, its financial risk exposure and the financial income and expenses, as well as conducted impairment tests on goodwill. For further information, please see note C5, D1, E6 and E7 on p. F-56, 59, 66 and 68, in the section entitled “Historical financial information”.
Financial exposure and risk managementIn its operations, Essity is exposed to, among other things, currency risk, credit risk, liquidity and refinancing risk and interest rate risk. Essity has a centralized financial risk management policy and intra-Group cash-pooling arrangement to provide liquidity required for operations. The following section contains a brief description of the Group’s financial risk exposure and risk management policies. Please also see note E8 on p. F-69 in the section entitled “Historical financial information” for a further description.
59Admission to trading of the shares in Essity Aktiebolag (publ) on Nasdaq Stockholm
Operational and financial review
Currency riskThe Group’s currency risk stems from both transaction exposure and translation exposure.
Transaction exposureThe Group’s forecasted net flows of currency against SEK for 2017 amount to SEK –892m. As of December 31, 2016, a net flow against SEK corresponding to three months of the forecast flows for 2017, or SEK 233m, was hedged. The majority of these hedges matured during the first quarter of 2017. The Group’s forecast and hedges of net flows of currency against SEK for the full year 2017 are shown in the table below. For further information relating to hedging of transaction exposure, see note E6 on p. F-66 in the section entitled “Historical financial information”.
CurrencyNet flows,
SEKm
Currency inflows,
SEKm
Currency outflows,
SEKmHedged
inflows, %Hedged
outflows, %
CNY 3,697 3,697 0 0 0
GBP 3,210 3,688 –478 0 0
RUB 987 1,039 –52 0 0
PLN 975 2,154 –1,179 2 0
NOK 799 808 –9 0 0
CHF 761 818 –57 0 0
MXN 759 1,752 –993 1 0
DKK 595 644 –49 0 0
Other 2,529 4,365 –1,836 2 0
EUR –382 11,710 –12,092 2 0
SEK –892 5,839 –6,731 0 26
USD –13,038 3,171 –16,209 0 2
Translation exposureAs of December 31, 2016, the Group’s aggregate capital employed in foreign currency amounted to SEK 74,306m. The Group’s distribution of capital employed by currency at year-end 2016 is shown in the table below. As of December 31, 2016, capital employed of SEK 74,306m was financed in the amount of SEK 19,732m in foreign currency, which is equivalent to a total matching ratio of 27%. For further information relating to hedging of translation exposure, see note E6 on p. F-66 in the section entitled “Historical financial information”.
CurrencyCapital employed,
SEKmNet debt,
SEKmMatching
financing, %
EUR 25,016 4,658 19
USD 14,419 5,566 39
CNY 13,402 4,026 30
MXN 4,309 1,221 28
GBP 4,306 1,072 25
COP 2,599 462 18
RUB 2,209 515 23
Other 8,046 2,212 27
Total currencies 74,306 19,732 27SEK 447 15,441
Total 74,753 35,173
Long-term currency sensitivity The table below presents a breakdown of the Group’s net sales and operating expenses by currency, which provides an overview of the Group’s long-term currency sensitivity. The largest exposures are denominated in EUR, USD, CNY and GBP.
CurrencyNet sales
2016, %
Operating expenses
2016, %
Adjusted operating profit1)
2016, SEKmClosing rate Dec 31, 2016
Average rate 2016
EUR 38 39 3,854 9.5582 9.4560
USD 17 29 -8,679 9.0840 8.5435
CNY 10 6 4,930 1.3079 1.2866
GBP 8 4 4,939 11.1624 11.5778
MXN 4 3 1,516 0.4390 0.4585
COP 3 3 420 0.0030 0.0028
RUB 3 3 772 0.1492 0.1282
CAD 2 1 307 6.7339 6.4538
Other 15 12 3,774
Total 100 100 11,8331) Non-IFRS measure, unaudited (alternative performance measure). See “Reconciliation
of non-IFRS measures” in the section entitled “Selected historical financial information”.
Credit riskThe Group is exposed to credit risk stemming from the possible non-payment by the Group’s counterparties in financial agreements or by its customers.
Credit risk in financial agreements is managed by ensuring that counterparties have a minimum credit rating of A- (or its equivalent) from at least two of the following rating agencies: Moody’s, Fitch or Standard & Poor’s. The Group strives to enter into financial agreements that allow net calculation of receivables and liabilities. Credit exposure in derivative instruments is accounted for at fair value of the instrument. As of December 31, 2016, the Group’s total credit exposure was SEK 5,214m, which includes credit risk for financial investments in the amount of SEK 4,244m, credit exposure in derivative instruments in the amount of SEK 971m. There is also exposure to the SCA Group. For further information, please see note G4 on p. F-81 in the section entitled “Historical financial information”.
Credit risk in accounts receivable is managed through credit checks of customers using credit rating companies. The Group sets credit limits for its customers and regularly monitors them. Accounts receivable are recognized at the amount that is expected to be paid based on an individual assessment of each customer.
Liquidity and refinancing riskThe Group is exposed to liquidity and refinancing risk stemming from its possible inability to meet payment obligations as a result of insufficient liquidity or difficulty in rolling over old debt.
The Group strives to ensure continued access to financing on favorable terms, regardless of the economy, by maintaining a solid investment grade rating. The Group also maintains financial flexibility in the form of a liquidity reserve consisting of cash, cash equivalents and unutilized credit facilities totaling at least 10% of the Group’s forecasted annual sales. As of December 31, 2016, unutilized credit facilities amounted to SEK 19,164m and cash and cash equivalents amounted to SEK 4,244m. The Group limits its refinancing risk by ensuring that the maturity profile of its gross debt is diversified and has an average maturity in excess of three years, including unutilized credit facilities that are not considered liquidity reserves. As of December 31, 2016, the average maturity of gross debt was 4.0 years. Further, the Group’s policy is to not enter into financing arrangements that entitle the lender to withdraw loans or adjust interest rates as a direct consequence of movements in the Group’s financial key figures or credit rating. The Group primarily uses surplus liquidity to amortize external liabilities.
The Group’s financing is mainly comprised of the credit facilities, EMTN Program and commercial paper programs. The Group’s short-
Admission to trading of the shares in Essity Aktiebolag (publ) on Nasdaq Stockholm60
Operational and financial review
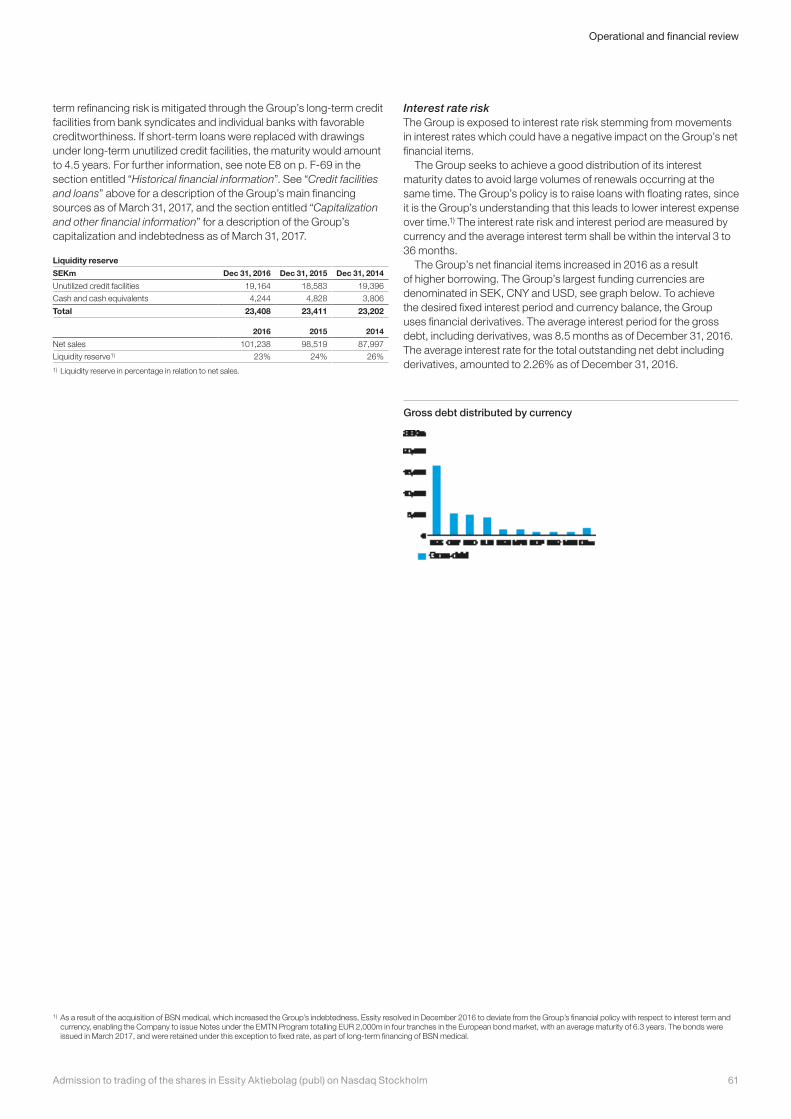
term refinancing risk is mitigated through the Group’s long-term credit facilities from bank syndicates and individual banks with favorable creditworthiness. If short-term loans were replaced with drawings under long-term unutilized credit facilities, the maturity would amount to 4.5 years. For further information, see note E8 on p. F-69 in the section entitled “Historical financial information”. See “Credit facilities and loans” above for a description of the Group’s main financing sources as of March 31, 2017, and the section entitled “Capitalization and other financial information” for a description of the Group’s capitalization and indebtedness as of March 31, 2017.
Liquidity reserve
SEKm Dec 31, 2016 Dec 31, 2015 Dec 31, 2014
Unutilized credit facilities 19,164 18,583 19,396
Cash and cash equivalents 4,244 4,828 3,806
Total 23,408 23,411 23,202
2016 2015 2014
Net sales 101,238 98,519 87,997
Liquidity reserve1) 23% 24% 26%1) Liquidity reserve in percentage in relation to net sales.
Interest rate riskThe Group is exposed to interest rate risk stemming from movements in interest rates which could have a negative impact on the Group’s net financial items.
The Group seeks to achieve a good distribution of its interest maturity dates to avoid large volumes of renewals occurring at the same time. The Group’s policy is to raise loans with floating rates, since it is the Group’s understanding that this leads to lower interest expense over time.1) The interest rate risk and interest period are measured by currency and the average interest term shall be within the interval 3 to 36 months.
The Group’s net financial items increased in 2016 as a result of higher borrowing. The Group’s largest funding currencies are denominated in SEK, CNY and USD, see graph below. To achieve the desired fixed interest period and currency balance, the Group uses financial derivatives. The average interest period for the gross debt, including derivatives, was 8.5 months as of December 31, 2016. The average interest rate for the total outstanding net debt including derivatives, amounted to 2.26% as of December 31, 2016.
Gross debt distributed by currency
1) As a result of the acquisition of BSN medical, which increased the Group’s indebtedness, Essity resolved in December 2016 to deviate from the Group’s financial policy with respect to interest term and currency, enabling the Company to issue Notes under the EMTN Program totalling EUR 2,000m in four tranches in the European bond market, with an average maturity of 6.3 years. The bonds were issued in March 2017, and were retained under this exception to fixed rate, as part of long-term financing of BSN medical.
61Admission to trading of the shares in Essity Aktiebolag (publ) on Nasdaq Stockholm
Operational and financial review
1) Based on net debt as of December 31, 2016. Final takeover of net debt will be based on net debt as of March 31, 2017.2) Calculated based on exchange rate EUR/SEK 9.456 as of December 31, 2016. 3) Excluding items affecting comparability.4) Calculated based on exchange rate EUR/SEK 9.456 as of December 31, 2016.5) Excluding items affecting comparability and including BSN medical’s purchase price allocation amortization.6) Calculated based on exchange rate EUR/SEK 9.456 as of December 31, 2016.7) Excluding items affecting comparability and including BSN medical’s purchase price allocation amortization.
Capitalization and other financial information
Equity and indebtedness
Equity and liabilitiesSet forth below is Essity’s capitalization as of March 31, 2017.
SEKm (unaudited) March 31, 2017
Total current debt 10,553Guaranteed*) 8,461
Secured –
Unguaranteed/unsecured 2,092
Total non-current debt 51,593Guaranteed*) 47,529
Secured –
Unguaranteed/unsecured 4,064
Shareholders’ equity 43,108Share capital 01)
Legal reserves –
Other reserves 43,108*) Primarily relates to guarantees provided by SCA for various loans raised by Essity. 1) The share capital amounted to SEK 500,000 as of March 31, 2017, but has been rounded in
the above table.
Net indebtednessSet forth below is Essity’s net indebtedness as of March 31, 2017.
SEKm (unaudited) March 31, 2017
(A) Cash 29,117
(B) Cash equivalents 1,499
(C) Trading securities –
(D) Liquidity (A)+(B)+(C) 30,616(E) Current financial receivables 2,880(F) Current bank debt 2,206
(G) Current portion of non-current debt 283
(H) Other current financial debt 8,064
(I) Current financial debt (F)+(G)+(H) 10,553(J) Net current financial indebtedness (I)-(E)-(D) –22,943(K) Non-current bank debt 7,254
(L) Bonds issued 37,582
(M) Other non-current loans 6,757
(N) Non-current financial indebtedness (K)+(L)+(M) 51,593(O) Net financial indebtedness (J)+(N) 28,650
Significant changes in Essity’s equity and net indebtedness since March 31, 2017See “Significant changes since March 31, 2017” below for a description of significant changes in Essity’s equity and net indebtedness since March 31, 2017 until the date of this prospectus.
Contingent liabilities/indirect indebtednessThe following table presents Essity’s contingent liabilities as of March 31, 2017.
SEKm (unaudited) March 31, 2017
Guarantees for
associates 6
customers and other 39
Other contingent liabilities1) 214
Total 2591) Other contingent liabilities above relates to recovery fees/taxes for packaging material in
France where the claim is subject to legal proceedings.
Significant changes since March 31, 2017
Acquisition of BSN medical and presentation of certain financial information for BSN medicalIn April 2017, Essity completed the acquisition of BSN medical for a purchase price of EUR 1,400m for the shares and the takeover of net debt amounting to approximately EUR 1,340m.1) The acquisition’s effect on the Company’s earnings, cash flow and financial position will be reflected in the Company’s future financial statements. BSN medical reported net sales for 2016 of EUR 850m (SEK 8,038m)2), adjusted EBITA3) of EUR 197m (SEK 1,863m)4), an adjusted operating profit5) of EUR 145m (SEK 1,371m)6), an adjusted operating margin7) of 17.1%. See “Acquisition of BSN medical” in the section entitled “Legal considerations and supplementary information” for a description of the agreement governing the acquisition of BSN medical and “Medical Solutions” in the section entitled “Market and business description” for a description of the operations of BSN medical.
The acquisition of BSN medical was mainly financed by the issuance of notes under the EMTN Program of EUR 2,000m and of the issuance of commercial papers under the Swedish Commercial Paper Program of SEK 7,337m in March 2017. The payment of the purchase price and the refinancing of overtaken net debt increased Essity’s net indebtedness with SEK 26,047m according to the preliminary purchase price allocation as of March 31, 2017.
The following section presents certain financial performance measures for BSN medical that are not defined under IFRS. These measures have not been reviewed or audited by the Company’s or BSN medical’s auditor. Essity believes that these measures are helpful and commonly used by certain investors, securities analysts and other interested parties as supplementary measures of performance trends and financial position. BSN medical’s non-IFRS measures differ from the non-IFRS measures used by Essity’s and may not be comparable to other similarly titled measures pre sented by other companies and therefore have certain limitations as analysis tools. Consequently, they should not be considered in isolation of or as an alternative to BSN
Admission to trading of the shares in Essity Aktiebolag (publ) on Nasdaq Stockholm62
Capitalization and other financial information
medical’s financial information prepared in accordance with IFRS. The information regarding BSN medical presented below is derived from BSN medical’s audited financial statements for the financial years 2015 and 2016 as well as BSN medical’s internal accounting for the financial years 2015 and 2016.
In the following, certain of the BSN medical performance measures that are deemed most essential by the Company are presented.
Adjusted sales
EURm (unaudited) 2016 2015
Sales 850 866
Phasing 0 –5
Adjusted sales1) 850 8611) Non-IFRS measure, unaudited (alternative performance measure).
Adjusted sales means sales adjusted due to Venezuela sales phasing, i.e., adjustment from 14 months sales to 12 months sales, but otherwise computed in accordance with IFRS. Adjusted sales is calculated in order to reflect the actual underlying result.
Organic sales
EURm (unaudited) 2016 2015
Adjusted sales 850 861
Exchange rate effects 15 –72
Acquisitions/Divestments –13 20
Organic sales1) 851 809Organic sales growth (%)1) 5.3 4.41) Non-IFRS measure, unaudited (alternative performance measure).
Organic sales are derived from adjusted sales but excluding exchange rate effects, acquisitions and divestments. It is essential for BSN medical to follow the organic growth separate from exchange rate, acquisitions and divestments. The effect from exchange rate 2015 is due to a material devaluation against the EUR of the currency in Venezuela and further adverse translation effects in the UK and South Africa.
Organic sales growth is sales growth excluding exchange rate effects, acquisitions and divestments. The organic growth rate 2016 was 5.3%.
EBITDA and adjusted EBITDA
EURm (unaudited) 2016 2015
Result from operating activities 75 76
Amortization and depreciation 61 57
Impairment 5 19
Restructuring expenses 23 27
EBITDA1) 164 181Items affecting comparability 462) 21
Adjusted EBITDA1) 210 201Adjusted EBITDA margin (%)1) 24.7 23.41) Non-IFRS measure, unaudited (alternative performance measure).2) Including EUR 24.4m related to sale of BSN medical.
EBITDA means income before income taxes and financial income (costs) plus depreciation and amortization, plus impairment of property, plant and equipment and intangible assets including goodwill. The measurement is a good complement to enable comparison as it shows the underlying cash surplus from operations.
Adjusted EBITDA is calculated as EBITDA adjusted for one-off costs such as costs related to the sale of the BSN medical, certain acquisition and integration projects, the one-off costs for a material
cost reduction program to fund growth investments and one-off costs for an ongoing change process (“Items affecting comparability”). The measurement is a good complement to enable comparison as it shows the underlying cash surplus from operations excluding Items affecting comparability.
Adjusted EBITDA margin refers to adjusted EBITDA in percent of adjusted sales.
Adjusted EBITA
EURm (unaudited) 2016 2015
Adjusted EBITDA1) 210 201
Depreciation –13 –13
Adjusted EBITA1) 197 189Adjusted EBITA margin (%)1) 23.2 21.91) Non-IFRS measure, unaudited (alternative performance measure).
Adjusted EBITA is derived from adjusted EBITDA and by subtracting the depreciation of tangible assets and other one-off depreciation, but excluding depreciation related to purchase price allocation. The measurement is a good complement to enable earnings comparison with other companies regardless of whether business activities were based on acquisitions or organic growth.
Adjusted EBITA margin refers to adjusted EBITA in percent of adjusted sales.
Adjusted operating profit
EURm (unaudited) 2016 2015
Adjusted EBITA1) 197 189
Amortization –11 –9
BSN medical’s purchase price allocation amortization –41 –442)
Adjusted operating profit1) 145 137Adjusted operating profit margin (%)1) 17.1 15.91) Non-IFRS measure, unaudited (alternative performance measure).2) Including EUR 8m related to impairment of intangibles and other purchase price allocation
adjustments.
Adjusted operating profit is derived from adjusted EBITA and by subtracting amortization and purchase price allocated amortization. The measurement is a key ratio for a better understanding of earnings performance of the operation including effects from cost in relation to acquisitions.
Adjusted operating profit margin refers to adjusted operating profit in percent of adjusted sales.
Certain other financial information in respect of BSN medicalResearch and development expensesThe table below shows BSN medical’s research and development expenses, including as a percentage of net sales, during the financial years 2015 and 2016.
EURm (unaudited) Jan–Dec 2016 Jan–Dec 2015
Research and development costs –16 –19
Research and development costs, % of net sales 1.9% 2.2%
Tangible assetsAs of March 31, 2017, BSN medical’s tangible assets amounted to EUR 147m (SEK 1,404m), mainly comprising of land, buildings and machines. As of March 31, 2017, BSN medical owned and leased approximately 15 facilities in 11 countries.
63Admission to trading of the shares in Essity Aktiebolag (publ) on Nasdaq Stockholm
Capitalization and other financial information
Other significant changesBonus issueOn April 5, 2017, the Annual General Meeting of Essity resolved on a bonus issue of SEK 2,350m (including the issuance of 64,589,523 Class A shares and 637,747,966 Class B shares). The bonus issue was registered with the Swedish Companies Registration Office on April 27, 2017, which resulted in an increase of the Company’s share capital by SEK 2,350m.
Allocation of net debt between Essity and SCAIn December 2016, Essity and SCA agreed on a reallocation of the SCA Group’s (including Essity) net debt as of December 31, 2016. Of the SCA Group’s total net debt of SEK 35,361m, it was agreed to allocate SEK 30,361m to Essity and SEK 5,000m to SCA as of December 31, 2016. In addition, it was agreed that SCA would settle the balance as of the date of the completion of the distribution of the Essity shares on or around the first day of trading in the Essity shares on Nasdaq Stockholm, as adjusted for the actual cash flow pertaining to SCA for the period from January 1, 2017 until the distribution of the Essity shares. The reallocation of SCA’s portion of the SCA Group’s net debt (i.e., SEK 5,000m, together with cash flow adjustments from January 1, 2017 until the distribution of the Essity shares on or around the first day of trading in the Essity shares) will be accomplished based on the following. • As of March 31, 2017, SCA’s internal net debt to Essity was
SEK 564m (including cash flow adjustments for the period from January 1, 2017 until and including March 31, 2017).1)
• On April 12, 2017, SCA paid SEK 4,214m in dividends to its shareholders pursuant to the resolution adopted at SCA’s Annual General Meeting. The dividend was financed with an internal loan from Essity to SCA in the amount of SEK 214m (through the cash-pooling arrangement that is legally incorporated within the Group)2) and by a loan from Svenska Handelsbanken of SEK 4,000m, which is guaranteed by Essity;
• On May 16, 2017, SCA made an unconditional shareholder contribution to Essity of SEK 598m, which was financed in full with an internal loan from Essity to SCA (through the cash-pooling arrangement);
• On or around the first day of trading in the Essity shares on Nasdaq Stockholm, SCA will repay the loan to Svenska Handelsbanken, amounting to SEK 4,000m. The guarantee provided by Essity under SCA’s loan from Svenska Handelsbanken, as well as SCA’s guarantees in favour of Essity’s financing agreements, will be automatically terminated (see “Description of certain main credit agreements and loans” in the section entitled “Operational and financial review”).
• SCA will also repay its then outstanding debt to Essity, which will result in an increase of Essity’s cash as well as in a decrease of its current financial receivables. Based on SCA’s net debt as of March 31, 2017 and the net debt reallocation agreement, but without taking into account the cash flow adjustment from April 1, 2017 until the first day of trading in the Essity shares, the amount to be paid by SCA to Essity amounts to SEK 1,376m.3)
Other than what has been stated above, no significant change in the financial or trading position of Essity has occurred since March 31, 2017.
See “Related-party transactions” in the section entitled “Legal considerations and supplementary information” for an additional description of related-party transactions between Essity and SCA.
Significant trends
Shifts in global demographics such as population growth – primarily due to a lower infant mortality rate and increased longevity – and higher disposable income point to continued favorable growth for the personal care and tissue markets. The effect of higher disposable income is that more people prioritize hygiene and health when food and housing needs have been, or are in the process of being, satisfied, which leads to an increased demand for Essity’s products in emerging markets. Growth is also occurring in mature markets owing to lifestyle changes and innovations that lead to increased use of hygiene and health products. See “Market trends and drivers” in the section entitled “Market and business description”.
During the first quarter of 2017, the European and North American markets for incontinence products in the healthcare sector displayed higher demand, but with continued price pressure as a result of fierce competition. The European and North American retail markets for incontinence products showed high growth. Emerging markets noted higher demand for incontinence products. The global market for incontinence products was characterized by a continued high level of competition. In Europe, demand for baby care was stable, while a slight decline was reported for feminine care. In emerging markets, demand rose for baby care and feminine care. The global market for baby care and several markets for feminine care were characterized by increased competition and campaign activity. The European market for consumer tissue demonstrated low growth and increased competition. The Chinese consumer tissue market noted higher demand. The European and North American markets for professional hygiene displayed low growth.
1) As of December 31, 2016, SCA’s internal net debt amounted to SEK 188m, which is to be deducted from the allocated net debt of SEK 5,000m.2) Essity, through its wholly-owned subsidiary AB SCA Finans, acts as internal bank between the Group and the SCA Group until the distribution of the Essity shares. Through this cash-pooling
arrangement, SCA is entitled to borrow funds from Essity, thereby increasing its internal net debt to Essity. The internal borrowing is recorded as current financial receivables for Essity.3) Consisting of the SCA’s net debt as of March 31, 2017, of SEK 564m, and the additional loans from Essity to SCA of SEK 214m and SEK 598m, respectively.
Admission to trading of the shares in Essity Aktiebolag (publ) on Nasdaq Stockholm64
Capitalization and other financial information
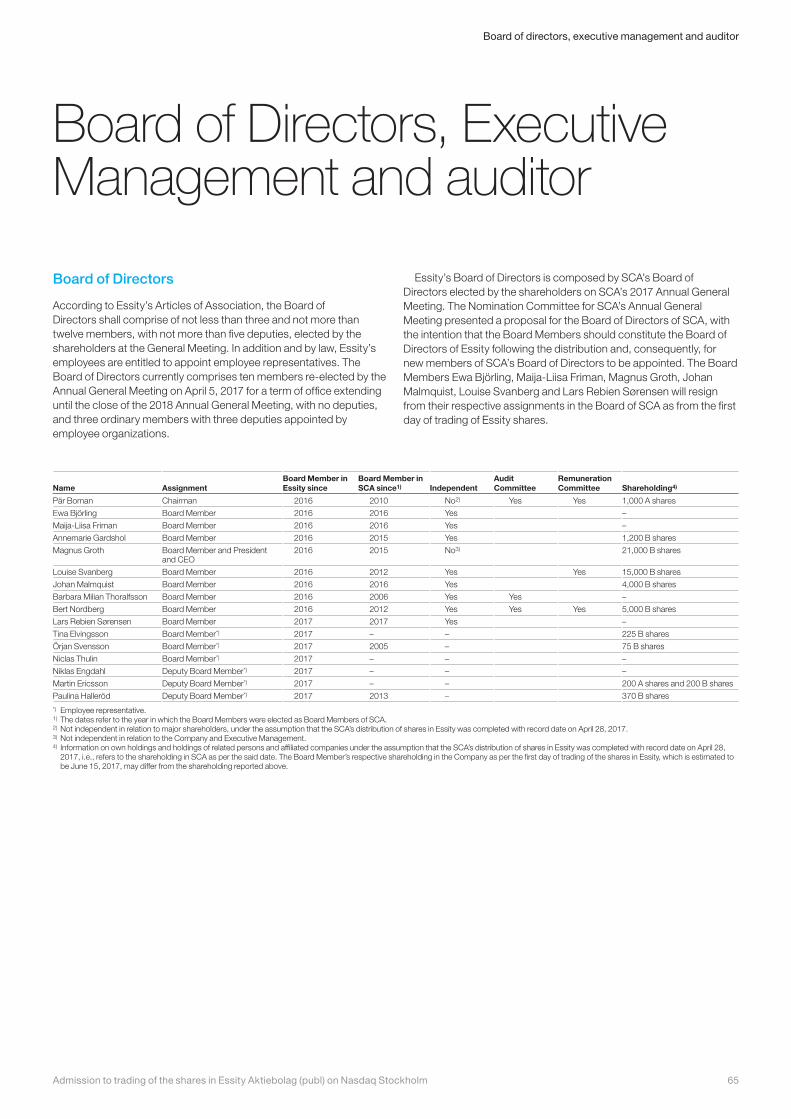
Board of Directors, Executive Management and auditor
Board of Directors
According to Essity’s Articles of Association, the Board of Directors shall comprise of not less than three and not more than twelve members, with not more than five deputies, elected by the shareholders at the General Meeting. In addition and by law, Essity’s employees are entitled to appoint employee representatives. The Board of Directors currently comprises ten members re-elected by the Annual General Meeting on April 5, 2017 for a term of office extending until the close of the 2018 Annual General Meeting, with no deputies, and three ordinary members with three deputies appointed by employee organizations.
Essity’s Board of Directors is composed by SCA’s Board of Directors elected by the shareholders on SCA’s 2017 Annual General Meeting. The Nomination Committee for SCA’s Annual General Meeting presented a proposal for the Board of Directors of SCA, with the intention that the Board Members should constitute the Board of Directors of Essity following the distribution and, consequently, for new members of SCA’s Board of Directors to be appointed. The Board Members Ewa Björling, Maija-Liisa Friman, Magnus Groth, Johan Malmquist, Louise Svanberg and Lars Rebien Sørensen will resign from their respective assignments in the Board of SCA as from the first day of trading of Essity shares.
Name AssignmentBoard Member in Essity since
Board Member in SCA since1) Independent
Audit Committee
Remuneration Committee Shareholding4)
Pär Boman Chairman 2016 2010 No2) Yes Yes 1,000 A shares
Ewa Björling Board Member 2016 2016 Yes –
Maija-Liisa Friman Board Member 2016 2016 Yes –
Annemarie Gardshol Board Member 2016 2015 Yes 1,200 B shares
Magnus Groth Board Member and President and CEO
2016 2015 No3) 21,000 B shares
Louise Svanberg Board Member 2016 2012 Yes Yes 15,000 B shares
Johan Malmquist Board Member 2016 2016 Yes 4,000 B shares
Barbara Milian Thoralfsson Board Member 2016 2006 Yes Yes –
Bert Nordberg Board Member 2016 2012 Yes Yes Yes 5,000 B shares
Lars Rebien Sørensen Board Member 2017 2017 Yes –
Tina Elvingsson Board Member*) 2017 – – 225 B shares
Örjan Svensson Board Member*) 2017 2005 – 75 B shares
Niclas Thulin Board Member*) 2017 – – –
Niklas Engdahl Deputy Board Member*) 2017 – – –
Martin Ericsson Deputy Board Member*) 2017 – – 200 A shares and 200 B shares
Paulina Halleröd Deputy Board Member*) 2017 2013 – 370 B shares*) Employee representative.1) The dates refer to the year in which the Board Members were elected as Board Members of SCA.2) Not independent in relation to major shareholders, under the assumption that the SCA’s distribution of shares in Essity was completed with record date on April 28, 2017.3) Not independent in relation to the Company and Executive Management. 4) Information on own holdings and holdings of related persons and affiliated companies under the assumption that the SCA’s distribution of shares in Essity was completed with record date on April 28,
2017, i.e., refers to the shareholding in SCA as per the said date. The Board Member’s respective shareholding in the Company as per the first day of trading of the shares in Essity, which is estimated to be June 15, 2017, may differ from the shareholding reported above.
65Admission to trading of the shares in Essity Aktiebolag (publ) on Nasdaq Stockholm
Board of directors, executive management and auditor
Pär Boman
Born 1961. Chairman and member of the Board since 2016 (Board Member in SCA since 2010). Chairman of the Remuneration Committee and member of the Audit Committee.
Principal education and professional experience: Engineer, Economist and Honorary Doctor of Economics. Former President and CEO of Svenska Handelsbanken AB. Previously also held other senior positions within Handelsbanken.
Other current assignments/positions: Chairman of the Board of Svenska Handelsbanken AB. Deputy Chariman of the Board of AB Industrivärden and Board Member of Hulabo AB, International Chamber of Commerce Sverige, Jan Wallanders och Tom Hedelius Stiftelse, Skanska AB and Tore Browaldhs Stiftelse.
Previous assignments/positions (past five years): Chairman of the Board of Anglo–Swedish Trade Service AB. Board Member of Affärsbankernas Serviceaktiebolag, Brittish-Swedish Chambers of Commerce and Svenska Bankföreningen, Näringsverksamhet. Member of the Advisory Board of Dutch Chamber of Commerce in Sweden. Member of the Council of Stockholm Chamber of Commerce and Finnish-Swedish Chamber of Commerce.
Holding: 1,000 shares of Class A.
Independent in relation to the Company and Executive Management, but not in relation to the Company’s major shareholders.
Ewa Björling
Born 1961. Board Member since 2016 (in SCA since 2016).
Principal education and professional experience: Dentistry, Doctor of Medical Science and Associate Professor, Karolinska Institutet, Sweden. Former member of the Swedish Parliament and the Boards of the Swedish National Insurance Office and the Swedish International Development Cooperation Agency (SIDA).
Other current assignments/positions: Board Member of Biogaia AB, Mobilaris AB and Ullr AB.
Previous assignments/positions (past five years): Swedish Minister for Trade and Minister for Nordic Cooperation.
Holding: –
Independent in relation to the Company and Executive Management as well as in relation to the Company’s major shareholders.
Maija-Liisa Friman
Born 1952. Board Member since 2016 (in SCA since 2016).
Principal education and professional experience: Master of Science in Engineering, Helsinki University of Technology, Finland. Previously CEO of Aspocomp Group Plc, President of Vattenfall Oy and Gyproc Oy.
Other current assignments/positions: Chairman of the Board of Helsinki Deaconess Institute. Board Member of Finnair Oyj and the Securities Market Association. Partner in Boardman Oy.
Previous assignments/positions (past five years): Chairman of the Board of Ekokem Oyj. Vice Chairman of the Board of Metso Oyj and of Neste Oyj. Board Member of LKAB, Rautaruukki, Talvivaara Mining Company Plc and TeliaSonera.
Holding: –
Independent in relation to the Company and Executive Management as well as in relation to the Company’s major shareholders.
Annemarie Gardshol
Born 1967. Board Member since 2016 (in SCA since 2015).
Principal education and professional experience: Master of Science in Engineering, Chalmers University of Technology, Sweden. Previously held various senior positions within Gambro AB, including Head of Research and Development and Global Marketing Director.
Other current assignments/positions: Board Member of Gardshol Consulting AB. Deputy Board Member of Gardshol Holding AB. CEO of PostNord Strålfors Group AB.
Previous assignments/positions (past five years): Board Member of Bygghemma Group Nordic AB, Etac AB and Ortivus AB.
Holding: 1,200 shares of Class B.
Independent in relation to the Company and Executive Management as well as the Company’s major shareholders.
Magnus Groth
Born 1963. Board Member and President and CEO since 2016 (in SCA since 2015).
See “Executive Management” below.
Independent in relation to the Company’s major shareholders, but not in relation to the Company and Executive Management.
Louise Svanberg
Born 1958. Board Member since 2016 (in SCA since 2012). Member of the Remuneration Committee.
Principal education and professional experience: Master of Science in Economics, Stockholm University, Sweden. Previously held various management positions within EF, including President and Chairman of the Board.
Other current assignments/positions: Board Member of Careers Australia Group. Member of Advisory Board for Cue Ball Capital, Boston, and Member of MPM Bio-tech, investment committee.
Previous assignments/positions (past five years): –
Holding: 15,000 shares of Class B.
Independent in relation to the Company and Executive Management as well as the Company’s major shareholders.
Johan Malmquist
Born 1961. Board Member since 2016 (in SCA since 2016).
Principal education and professional experience: Master of Science in Economics, Stockholm School of Economics, Sweden. Previously President of Getinge AB and Board Member of Capio AB.
Other current assignments/positions: Chairman of the Board of AB Tingstad Papper and Arjo AB. Board Member of the Chalmers University of Technology Foundation, Elekta AB, Getinge AB, Henry Dunkers Förvaltningsaktiebolag, Medvisor AB, Mölnlycke AB and Trelleborg AB.
Previous assignments/positions (past five years): –
Holding: 4,000 shares of Class B.
Independent in relation to the Company and Executive Management as well as the Company’s major shareholders.
Admission to trading of the shares in Essity Aktiebolag (publ) on Nasdaq Stockholm66
Board of directors, executive management and auditor
Barbara Milian Thoralfsson
Born 1959. Board Member since 2016 (in SCA since 2006). Chairman of the Audit Committee.
Principal education and professional experience: Master of Business Administration Marketing & Finance, Columbia University, US, and Bachelor of Arts in Psychology, Duke University, US. Previously President of Midelfart & Co AS and NetCom ASA. Currently Industry advisor to EQT.
Other current assignments/positions: Chairman of the Board of ColArt Holdings Ltd. Board Member of G4S Plc, Hilti AG and Norfolier GreenTec AS.
Previous assignments/positions (past five years): Board Member of AB Electrolux, Cable & Wireless Plc, Orkla ASA and Telenor ASA.
Holding: –
Independent in relation to the Company and Executive Management as well as the Company’s major shareholders.
Bert Nordberg
Born 1956. Board Member since 2016 (in SCA since 2012). Member of the Audit Committee and the Remuneration Committee.
Principal education and professional experience: Electrical Engineering, Malmö Tekniska Läroverk, Sweden, and Swedish Marines from Berga, Sweden, and International Management Marketing and Finance, INSEDA University, France.
Other current assignments/positions: Chairman of the Board of Innovativa Solutions Sweden AB, Sigma Connectivity AB and Vestas Wind Systems A/S. Board Member of AB Electrolux, Axis AB, Connectivity Spring AB, LU Holding AB, Rothschild Nordic AB, SAAB AB and Skistar AB.
Previous assignments/positions (past five years): Chairman of the Board of Ideonfonden AB and Sony Mobile Communications AB. Board Member of Abecede AB, BlackBerry Ltd, Materials Technology Economy Know-how Sweden AB, NOTE AB and United Influencers Media Group AB. President and CEO of Sony Ericsson.
Holding: 5,000 shares of Class B.
Independent in relation to the Company and Executive Management as well as the Company’s major shareholders.
Lars Rebien Sørensen
Born 1954. Board Member since 2017 (in SCA since 2017).
Principal education and professional experience: Master of Science in Forestry, Copenhagen University, Denmark, and Bachelor in International Economics, Copenhagen Business School, Denmark. Previously Board Member of Bertelsmann and SAS.
Other current assignments/positions: Vice Chairman of the Board of Carlsberg A/S. Board Member of Jungbunzlauer, the Novo Nordisk Foundation and Thermo Fisher Scientific Inc.
Previous assignments/positions (past five years): Board Member of Dong Energy. Member of the Board of Representatives of Danish National Bank. President and CEO of Novo Nordisk A/S.
Holding: –
Independent in relation to the Company and Executive Management as well as the Company’s major shareholders.
Tina Elvingsson
Born 1967. Board Member (employee representative) since 2017.
Principal education and professional experience: Quality Technician at SCA Hygiene Products AB.
Other current assignments/positions: –
Previous assignments/positions (past five years): –
Holding: 225 shares of Class B.
Örjan Svensson
Born 1963. Board Member (employee representative) since 2017.
Principal education and professional experience: Senior Industrial Safety Representative at SCA Hygiene Products AB.
Other current assignments/positions: –
Previous assignments/positions (past five years): –
Holding: 75 shares of Class B.
Niclas Thulin
Born 1976. Board Member (employee representative) since 2017.
Principal education and professional experience: Infrastructure Developer at SCA Hygiene Products AB.
Other current assignments/positions: Limited Partner in TH Tryck & Reklam Kommanditbolag.
Previous assignments/positions (past five years): Board Member of Nya Nyttokonst butik och galleri Uddevalla ekonomisk förening.
Holding: –
Niklas Engdahl
Born 1980. Deputy Board Member (employee representative) since 2017.
Principal education and professional experience: Bachelor of Science in Mechanical Engineering, University West, Sweden. RST Process Engineer at SCA Hygiene Products AB.
Other current assignments/positions: –
Previous assignments/positions (past five years): –
Holding: –
Martin Ericsson
Born 1968. Deputy Board Member (employee representative) since 2017.
Principal education and professional experience: Master of Science in Engineering, Chalmers University of Technology, Sweden. Project Engineer Electrical/Automation at SCA Hygiene Products AB.
Other current assignments/positions: –
Previous assignments/positions (past five years): –
Holding: 200 shares of Class A and 200 shares of Class B.
Paulina Halleröd
Born 1967. Deputy Board Member (employee representative) since 2017.
Principal education and professional experience: Master of Science in Engineering, Chalmers University of Technology, Sweden. Laboratory Manager Incontinence Care, SCA Hygiene Products AB.
Other current assignments/positions: –
Previous assignments/positions (past five years): –
Holding: 370 shares of Class B.
67Admission to trading of the shares in Essity Aktiebolag (publ) on Nasdaq Stockholm
Board of directors, executive management and auditor
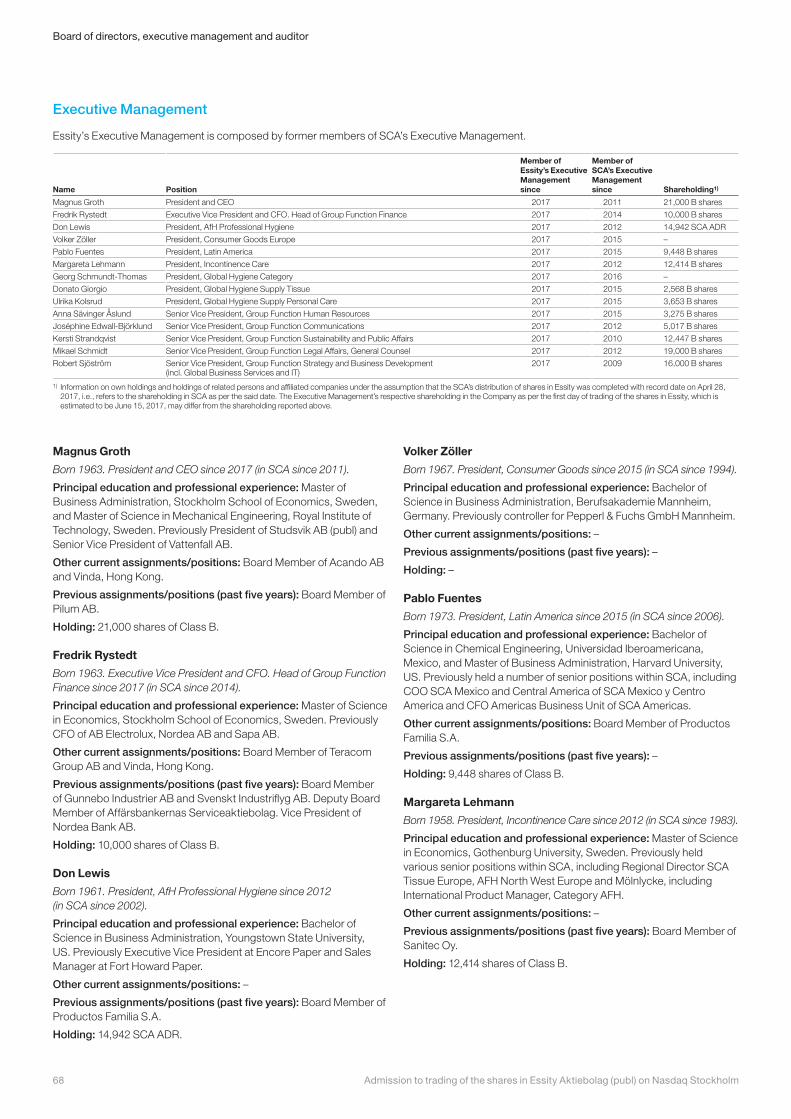
Executive Management
Essity’s Executive Management is composed by former members of SCA’s Executive Management.
Name Position
Member of Essity’s Executive Management since
Member of SCA’s Executive Management since Shareholding1)
Magnus Groth President and CEO 2017 2011 21,000 B shares
Fredrik Rystedt Executive Vice President and CFO. Head of Group Function Finance 2017 2014 10,000 B shares
Don Lewis President, AfH Professional Hygiene 2017 2012 14,942 SCA ADR
Volker Zöller President, Consumer Goods Europe 2017 2015 –
Pablo Fuentes President, Latin America 2017 2015 9,448 B shares
Margareta Lehmann President, Incontinence Care 2017 2012 12,414 B shares
Georg Schmundt-Thomas President, Global Hygiene Category 2017 2016 –
Donato Giorgio President, Global Hygiene Supply Tissue 2017 2015 2,568 B shares
Ulrika Kolsrud President, Global Hygiene Supply Personal Care 2017 2015 3,653 B shares
Anna Sävinger Åslund Senior Vice President, Group Function Human Resources 2017 2015 3,275 B shares
Joséphine Edwall-Björklund Senior Vice President, Group Function Communications 2017 2012 5,017 B shares
Kersti Strandqvist Senior Vice President, Group Function Sustainability and Public Affairs 2017 2010 12,447 B shares
Mikael Schmidt Senior Vice President, Group Function Legal Affairs, General Counsel 2017 2012 19,000 B shares
Robert Sjöström Senior Vice President, Group Function Strategy and Business Development (incl. Global Business Services and IT)
2017 2009 16,000 B shares
1) Information on own holdings and holdings of related persons and affiliated companies under the assumption that the SCA’s distribution of shares in Essity was completed with record date on April 28, 2017, i.e., refers to the shareholding in SCA as per the said date. The Executive Management’s respective shareholding in the Company as per the first day of trading of the shares in Essity, which is estimated to be June 15, 2017, may differ from the shareholding reported above.
Magnus Groth
Born 1963. President and CEO since 2017 (in SCA since 2011).
Principal education and professional experience: Master of Business Administration, Stockholm School of Economics, Sweden, and Master of Science in Mechanical Engineering, Royal Institute of Technology, Sweden. Previously President of Studsvik AB (publ) and Senior Vice President of Vattenfall AB.
Other current assignments/positions: Board Member of Acando AB and Vinda, Hong Kong.
Previous assignments/positions (past five years): Board Member of Pilum AB.
Holding: 21,000 shares of Class B.
Fredrik Rystedt
Born 1963. Executive Vice President and CFO. Head of Group Function Finance since 2017 (in SCA since 2014).
Principal education and professional experience: Master of Science in Economics, Stockholm School of Economics, Sweden. Previously CFO of AB Electrolux, Nordea AB and Sapa AB.
Other current assignments/positions: Board Member of Teracom Group AB and Vinda, Hong Kong.
Previous assignments/positions (past five years): Board Member of Gunnebo Industrier AB and Svenskt Industriflyg AB. Deputy Board Member of Affärsbankernas Serviceaktiebolag. Vice President of Nordea Bank AB.
Holding: 10,000 shares of Class B.
Don Lewis
Born 1961. President, AfH Professional Hygiene since 2012 (in SCA since 2002).
Principal education and professional experience: Bachelor of Science in Business Administration, Youngstown State University, US. Previously Executive Vice President at Encore Paper and Sales Manager at Fort Howard Paper.
Other current assignments/positions: –
Previous assignments/positions (past five years): Board Member of Productos Familia S.A.
Holding: 14,942 SCA ADR.
Volker Zöller
Born 1967. President, Consumer Goods since 2015 (in SCA since 1994).
Principal education and professional experience: Bachelor of Science in Business Administration, Berufsakademie Mannheim, Germany. Previously controller for Pepperl & Fuchs GmbH Mannheim.
Other current assignments/positions: –
Previous assignments/positions (past five years): –
Holding: –
Pablo Fuentes
Born 1973. President, Latin America since 2015 (in SCA since 2006).
Principal education and professional experience: Bachelor of Science in Chemical Engineering, Universidad Iberoamericana, Mexico, and Master of Business Administration, Harvard University, US. Previously held a number of senior positions within SCA, including COO SCA Mexico and Central America of SCA Mexico y Centro America and CFO Americas Business Unit of SCA Americas.
Other current assignments/positions: Board Member of Productos Familia S.A.
Previous assignments/positions (past five years): –
Holding: 9,448 shares of Class B.
Margareta Lehmann
Born 1958. President, Incontinence Care since 2012 (in SCA since 1983).
Principal education and professional experience: Master of Science in Economics, Gothenburg University, Sweden. Previously held various senior positions within SCA, including Regional Director SCA Tissue Europe, AFH North West Europe and Mölnlycke, including International Product Manager, Category AFH.
Other current assignments/positions: –
Previous assignments/positions (past five years): Board Member of Sanitec Oy.
Holding: 12,414 shares of Class B.
Admission to trading of the shares in Essity Aktiebolag (publ) on Nasdaq Stockholm68
Board of directors, executive management and auditor
Georg Schmundt-Thomas
Born 1962. President, Global Hygiene Category since 2016 (in SCA since 2016).
Principal education and professional experience: Doctor of Philosophy in English, Northwestern University, US. Previously held a number of senior positions within Procter & Gamble, including Vice President and Brand Franchise Leader Duracell and Vice President Special Assignment.
Other current assignments/positions: –
Previous assignments/positions (past five years): –
Holding: –
Donato Giorgio
Born 1974. President, Global Hygiene Supply Tissue since 2015 (in SCA since 2009).
Principal education and professional experience: Master of Science in Engineering, Politecnico di Bari, Italy. Previously held various senior positions within Procter & Gamble, including Operations Manager Beauty Care and Operations Manager Tissue.
Other current assignments/positions: –
Previous assignments/positions (past five years): –
Holding: 2,568 shares of Class B.
Ulrika Kolsrud
Born 1970. President, Global Hygiene Supply Personal Care since 2015 (in SCA since 1995).
Principal education and professional experience: Master of Science in Engineering, Chalmers University of Technology, Sweden. Previously held various senior positions within SCA, including Vice President R&D Personal Care and Global Product Director Baby.
Other current assignments/positions: Member of the Supervisory Board of UcM Joint Venture.
Previous assignments/positions (past five years): –
Holding: 3,653 shares of Class B.
Anna Sävinger Åslund
Born 1969. Senior Vice President, Group Function Human Resources since 2015 (in SCA since 2001).
Principal education and professional experience: Human Resource Management Degree, Linköping University. Previously Human Resource Manager at AstraZeneca.
Other current assignments/positions: –
Previous assignments/positions (past five years): –
Holding: 3,275 shares of Class B.
Joséphine Edwall-Björklund
Born 1964. Senior Vice President, Group Function Communications since 2012 (in SCA since 2012).
Principal education and professional experience: Bachelor of Science in Communications, Jönköping University, Sweden, and Advanced Management Program, Stockholm School of Economics, Sweden. Previously held various Communication positions within Ericsson.
Other current assignments/positions: –
Previous assignments/positions (past five years): –
Holding: 5,017 shares of Class B.
Kersti Strandqvist
Born 1963. Senior Vice President, Group Function Sustainability and Public Affairs since 2010 (in SCA since 1997).
Principal education and professional experience: Master of Science in Chemistry, Technology Licentiate, Chalmers University of Technology, Sweden. Previously served as Board Member of Swedish Match AB, and also held various senior positions within SCA, including Vice President Category Feminine Care and Category Director Baby Care.
Other current assignments/positions: Board Member of SJ AB.
Previous assignments/positions (past five years): Board Member of Telia Company AB.
Holding: 12,447 shares of Class B.
Mikael Schmidt
Born 1960. Senior Vice President, Group Function Legal Affairs, General Counsel since 2012 (in SCA since 1992).
Principal education and professional experience: Masters of Laws, Uppsala University, Sweden. Previously held various positions within the legal profession, including Associate Judge and Corporate Counsel.
Other current assignments/positions: Deputy Board Member of Vinda, Hong Kong.
Previous assignments/positions (past five years): Chairman of the Board of Svenskt Industriflyg AB.
Holding: 19,000 shares of Class B.
Robert Sjöström
Born 1964. Senior Vice President, Group Function Strategy and Business Development (incl. Global Business Services and IT) since 2009 (in SCA since 2009).
Principal education and professional experience: Master of Science in Economics, Uppsala University, Sweden, and Master of Business Administration, Stockholm School of Economics, Sweden. Previously President of Global Hygiene Category in SCA.
Other current assignments/positions: Board Member of Asaleo Care Ltd and Productos Familia S.A.
Previous assignments/positions (past five years): Board Member of Buildor AB and Ljung & Sjöberg AB.
Holding: 16,000 shares of Class B.
69Admission to trading of the shares in Essity Aktiebolag (publ) on Nasdaq Stockholm
Board of directors, executive management and auditor
Other information concerning the Board of Directors and Executive Management
All members of the Board of Directors and Executive Management can be reached through the Company’s address, P.O. Box 200, SE-101 23 Stockholm, Sweden.
There are no family ties between any of the members of the Board of Directors and/or Executive Management. No Board Member or senior executive has been convicted in any case involving fraudulence during the past five years. None of them have been involved in any bankruptcy, receiverships or liquidation during the past five years in the capacity of a member of administrative, management or supervisory bodies or a senior executive, save for Barbara Milian Thoralfsson who was Board Member and, together with closely related parties, owner of 85% of Longa Industrier AS which, as well as its subsidiary Norfolier, was placed into bankruptcy in 2012. The bankruptcy was concluded in 2014.
Except as described below, no incrimination and/or sanctions have been issued by statutory or regulatory authorities (including designated professional bodies) during the past five years against any of the members of the Board or Executive Management. Nor, during the past five years, has any member of the Board or Executive Management been disqualified by a court from acting as a member of the administrative, management or supervisory bodies of a company or from acting in the management or conduct of the affairs of any company.
Margareta Lehmann and Don Lewis respectively have been charged a fee by the Swedish Financial Supervisory Authority (Finansinspektionen) pursuant to the Act on Reporting Obligations for Certain Holdings of Financial Instruments (lagen (2000:1087) om anmälningsskyldighet för vissa innehav av finansiella instrument) with SEK 5,000 and SEK 20,000 respectively for failure to notify on changes in their holdings of shares and ADSs in SCA, within the prescribed period of time. The fees were attributable to changes in holdings in 2012. Bert Nordberg has been charged with a tax surcharge with SEK 4,000, regarding the assessment period of 2015. In April 2017, Pär Boman was notified of suspicion of receiving bribes related to hunting trips organized by Holmen AB which took place during his time as Group Chief Executive of Handelsbanken.
No member of the Board or Executive Management has any private interests which might conflict with their duties to Essity. However, as stated above, a number of the members of the Board and Executive Management will have a financial interest in Essity through shareholdings and holdings of ADSs in Essity.
Auditor
Ernst & Young AB (P.O. Box 7850, SE-103 99 Stockholm, Sweden) has been the Company’s auditor since the 2016 Annual General Meeting. The most recent auditor election was at the 2017 Annual General Meeting, when Ernst & Young was re-elected for the period until the end of the 2018 Annual General Meeting, with authorized public accountant Hamish Mabon as the main responsible auditor. Hamish Mabon is an authorized public accountant and member of FAR (professional institute for authorized public accountants in Sweden). Ernst & Young has audited the Group’s restated financial statement for the financial year 2016 on p. F-33 and onwards in the section entitled “Historical financial information” and has reviewed Essity’s interim report for the period January–March 2017 on p. F-4 and onwards in the section entitled “Historical financial information”.
PricewaterhouseCoopers AB with authorized public accountants Anna-Clara af Ekenstam and Mikael Eriksson as main responsible auditor in 2014 and 2015 respectively, has audited the SCA Group’s financial statements for the financial years 2014 and 2015, which included the hygiene business. Essity’s annual reports for the financial years 2014 and 2015 has been audited by authorized public accountant Michael Lindengren from PricewaterhouseCoopers AB. Anna-Clara af Ekenstam, Mikael Eriksson and Michael Lindengren are authorized accountants and members of FAR (professional institute for authorized public accountants in Sweden). PricewaterhouseCoopers AB, with Mikael Eriksson as auditor in charge, has audited the Group’s restated financial statements for the years 2014-2015 on p. F-33 and onwards in the section entitled “Historical financial information”.
Admission to trading of the shares in Essity Aktiebolag (publ) on Nasdaq Stockholm70
Board of directors, executive management and auditor
Corporate governance
Corporate governance within Essity
The governance of Essity is based on the Swedish Companies Act, Essity’s Articles of Association, the Swedish Corporate Governance Code (the “Code”) and Nasdaq Stockholm’s Rule Book for Issuers as well as other relevant laws and regulations. The Code is based on the “comply or explain” principle, meaning that companies are not obliged to at all times apply every rule in the Code, but are allowed the freedom to choose alternative solutions which they feel are better in their particular circumstances, provided they report every deviation, describe the alternative solution and explain the reasons for the deviation. Essity will apply the Code without any deviation as from the listing on Nasdaq Stockholm.
General Meeting
IntroductionPursuant to the Swedish Companies Act (aktiebolagslagen (2005:551)), the General Meeting is the supreme decision-making body in a Swedish limited liability company, and shareholders exercise their voting rights at such meetings. The Annual General Meetings of Essity are held annually before the end of June. In addition to the Annual General Meeting, Extraordinary General Meetings can be convened when required. The General Meetings of Essity are held either in the municipality of Stockholm, where the Company’s registered office is situated, or in the municipality of Gothenburg.
At the General Meeting, the shareholders of Essity resolve on several matters, including confirmation of income statements and balance sheets, the disposition of the Company’s profit or loss, discharge of liability for the members of the Board and the CEO, composition of the Nomination Committee, election of members of the Board (including the Chairman of the Board) and auditor, remuneration to the members of the Board and auditor, guidelines for remuneration to the CEO and other senior executives. The shareholders of Essity also resolve on other matters that are important to the Company, for example any changes of the Articles of Association, at the General Meeting.
Notice convening the General MeetingPursuant to Essity’s Articles of Association, notices convening General Meetings shall be issued through announcement in the Swedish National Gazette (Post- och Inrikes Tidningar), as well as on the Company’s website (www.essity. se). Announcement to the effect that a notice convening a General Meeting has been issued shall be made in the newspapers Dagens Nyheter and Svenska Dagbladet. Once Essity is listed, a press release in Swedish and English with the notice in its entirety will be issued ahead of each General Meeting.
Right to attend General MeetingsAll shareholders who are directly recorded in the Company’s share register maintained by Euroclear Sweden five weekdays (Saturdays included) prior to the General Meeting and who have notified the
Company of their intention to participate in the General Meeting not later than the date indicated in the notice of the General Meeting, are entitled to attend the General Meeting and vote for the number of shares they hold.
In addition to notifying the Company, shareholders whose shares are nominee registered through a bank or other nominee must request that their shares are temporarily registered in their own names in the register of shareholders maintained by Euroclear Sweden, in order to be entitled to participate in the General Meeting. Shareholders should inform their nominees well in advance of the record date.
Shareholders may attend Essity’s General Meetings in person or by proxy and may be accompanied by a maximum of two assistants. It will normally be possible for shareholders to register for the General Meeting in several different ways, as indicated in the notice of the meeting.
Shareholder initiativesAny shareholder of the Company who wishes to have a matter dealt with at an Annual General Meeting must submit a written request to the Board to that effect. The request must have been received by the Company not less than seven weeks prior to the Annual General Meeting, so that the matter may be included in the notice.
Nomination Committee
Under the Code, a company listed on Nasdaq Stockholm shall have a Nomination Committee, the purpose of which is to make proposals to the Annual General Meeting in respect of the Chairman at General Meetings, elections of Board of Directors, Chairman of the Board and auditor, remuneration of each Board Member (divided between the Chairman of the Board and other Board Members, and remuneration for committee work), remuneration to the auditor, and to the extent deemed necessary, proposals for amendments to the instruction for the Nomination Committee. At the Annual General Meeting held on April 5, 2017, the following instruction for the Nomination Committee was adopted to apply until further notice, provided that the Company is listed on Nasdaq Stockholm:
The Nomination Committee shall be composed of representatives of the four largest registered shareholders in terms of voting rights according to the shareholders’ register1) maintained by the Company as of the last banking day of August, and of the Chairman of the Board of Directors. The Chairman of the Board of Directors is to convene the first meeting of the Nomination Committee. The member representing the largest shareholder in terms of voting rights shall be appointed Chairman of the Nomination Committee. The Chairman of the Board shall not be Chairman of the Nomination Committee. If deemed important, due to later changes in the ownership structure, the Nomination Committee is authorized to appoint one or two additional members among the shareholders who in terms of voting rights are the shareholders next in turn. The total maximum number of members shall be seven. Should a member resign from the Nomination Committee before its work is completed and, if the Nomination
1) Euroclear Sweden is responsible for the Company’s share register.
71Admission to trading of the shares in Essity Aktiebolag (publ) on Nasdaq Stockholm
Corporate governance
Committee considers it desirable, a “substitute” member shall be appointed to represent the same shareholder or, if the shareholder is no longer one of the largest shareholders in terms of voting rights, the largest shareholder in terms of voting rights next in turn. Changes in the composition of the Nomination Committee shall be made public immediately.
The composition of the Nomination Committee is to be announced by Essity no later than by six months prior to the Annual General Meeting. Remuneration shall not to be paid to the members of the Nomination Committee. Any costs for the work of the Nomination Committee shall be borne by Essity. The term of office for the Nomination Committee ends when the composition of the following Nomination Committee has been announced. The Nomination Committee shall propose the following: the Chairman of the General Meeting, the Board of Directors, the Chairman of the Board of Directors, remuneration to the Board of Directors individually specified for the Chairman and each of the other directors including remuneration for committee work, auditor and remuneration to the auditor, and, to the extent deemed necessary, amendments to this instruction.
Board of Directors
Composition and independenceThe Board of Directors has overall responsibility for the Company’s organization and administration through regular monitoring of the business and by ensuring the appropriateness of the organization, management team, guidelines and internal control. The Board approves Essity’s strategies and targets, and decides on major investments, acquisitions and divestments of operations, among other matters. According to Essity’s Articles of Association, the Board of Directors shall comprise no less than three and no more than twelve members elected by the Annual General Meeting with no more than five deputies. In addition, the Board shall include three members and three deputies appointed by the employees. Essity’s Articles of Association contain no provisions regarding appointment or dismissal of Board Members or amendments to the Articles. The Board of Directors currently consist of ten Board Members, with no deputies, and three employee representatives with three deputies.
According to the Code, a majority of the Board Members appointed by the General Meeting must be independent in relation to the Company and its Executive Management. This does not apply for any employee representatives. To determine whether a member of the Board is independent, all circumstances should be considered that may put into question the independence of a member of the Board in relation to the Company or Executive Management, for instance if the Board Member was recently employed by the Company or an affiliated company. No more than one Board Member elected by the General Meeting may be a member of the Executive Management of the Company or a subsidiary. At least two of the Board Members that are independent in relation to the Company and the Executive Management must also be independent in relation to the major shareholders of the Company. To evaluate a Board Member’s independence, the extent of the Board Member’s direct or indirect relation to the larger shareholders should be taken into consideration. A major shareholder, according to the Code, is a shareholder that directly or indirectly controls 10% or more of the shares or votes in the Company.
The Board of Directors’ assessment of the independence of the Board Member in relation to the Company, its management and major shareholders are presented in “Board of Directors” in the section entitled “Board of Directors, Executive Management and auditor”. Besides Magnus Groth, who is the President and CEO of the Company, all Board Members are independent in relation to the Company and its management. Eight of these are also independent in relation to the major shareholders of the Company. The Company therefore complies with the requirements of independence in the Code.
The Board’s work and responsibilityThe duties of the Board of Directors are set forth in the Swedish Companies Act, the Company’s Articles of Association and the Code, the latter of which will be applicable for the Company as from the date of listing of the shares on Nasdaq Stockholm. In addition, the work of the Board of Directors is governed by instructions for the Board of Directors, adopted annually by the Board. The instructions for the Board of Directors govern, among other things, the division of work and responsibility between the Board of Directors, its Chairman and the CEO, and specify financial reporting procedures for the CEO. The Board of Directors also adopts instructions for the Board committees.
The Board of Directors’ tasks include adopting strategies, business plans, budgets, interim reports, year-end financial statements and policies. The Board of Directors is also required to follow the economic developments and ensure the quality of financial reporting and internal controls including compliance with laws and other rules as well as to evaluate operations on the basis of the objectives and policies set by the Board of Directors. The Board of Directors is also required to establish policies for the Company’s behaviour in society in order to ensure its long-term value-generating ability. In addition, the Board of Directors is responsible for regularly evaluating the work of the CEO. Furthermore, the Board of Directors decides on major investments and changes in the organization and operations of the Group. The Chairman of the Board of Directors leads and organizes the work of the Board, ensures that the Board fulfils its tasks and ensures that Board’s decisions are implemented. The Chairman of the Board of Directors shall, together with the CEO, monitor the Company’s performance and prepare and chair Board meetings. The Chairman is also responsible for ensuring that the Board Members evaluate their work each year and continuously receive the information necessary to effectively perform their tasks. The Chairman represents the Company in relation to its shareholders.
Board committeesAccording to the Companies Act and the Code, the Board of Directors shall institute an audit committee and a remuneration committee. The Company has established an audit committee and a remuneration committee.
Audit CommitteeThe tasks of the Company’s Audit Committee include monitoring financial reporting and the efficiency of the Company’s internal control, internal audit and risk management. The Committee keeps itself informed on the audit, reviews and monitors the impartiality and independence of the auditors. The Audit Committee continuously meets with the auditor to discuss the coordination of the internal control and the external audit. The Committee also assists the Nomination Committee with the preparation of its proposal to the Annual General Meeting regarding the appointment of auditor by, among other things, ensuring that the auditors term of office does not exceed what is allowed in accordance with applicable regulations, procuring an auditor (when applicable) and submitting a recommendation regarding the appointment of auditor to the Nomination Committee. In addition, the Committee submits information to the Board concerning the results of the audit, including how the audit contributed to the reliability of the Company’s financial reporting, and so forth in order to fulfill the requirements set out in the EU Audit Regulation and Directive. The Audit Committee sets guidelines for the procurement of services other than auditing services from the Company’s auditor and, when applicable, approve such services. Lastly, the Audit Committee evaluates the audit effort and informs the Nomination Committee of the results of the evaluation. The Audit Committee consists of Barbara Milian Thoralfsson (Chairman), Pär Boman and Bert Nordberg.
Admission to trading of the shares in Essity Aktiebolag (publ) on Nasdaq Stockholm72
Corporate governance
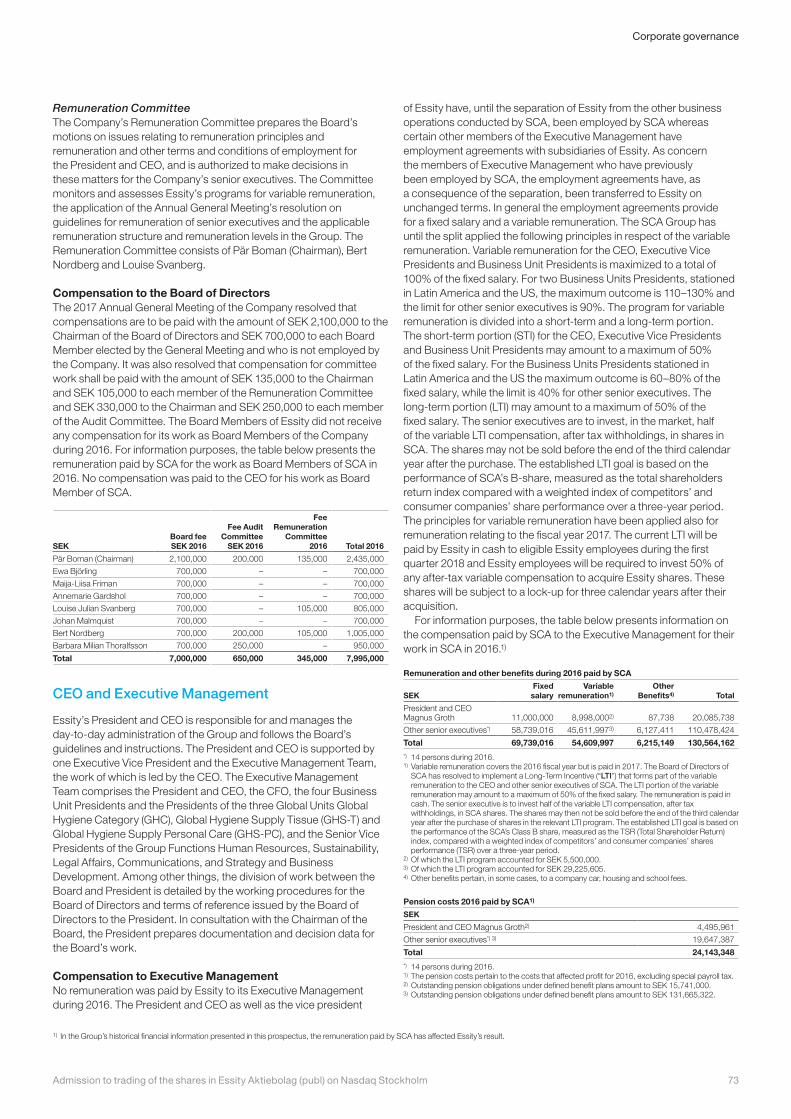
Remuneration CommitteeThe Company’s Remuneration Committee prepares the Board’s motions on issues relating to remuneration principles and remuneration and other terms and conditions of employment for the President and CEO, and is authorized to make decisions in these matters for the Company’s senior executives. The Committee monitors and assesses Essity’s programs for variable remuneration, the application of the Annual General Meeting’s resolution on guidelines for remuneration of senior executives and the applicable remuneration structure and remuneration levels in the Group. The Remuneration Committee consists of Pär Boman (Chairman), Bert Nordberg and Louise Svanberg.
Compensation to the Board of Directors The 2017 Annual General Meeting of the Company resolved that compensations are to be paid with the amount of SEK 2,100,000 to the Chairman of the Board of Directors and SEK 700,000 to each Board Member elected by the General Meeting and who is not employed by the Company. It was also resolved that compensation for committee work shall be paid with the amount of SEK 135,000 to the Chairman and SEK 105,000 to each member of the Remuneration Committee and SEK 330,000 to the Chairman and SEK 250,000 to each member of the Audit Committee. The Board Members of Essity did not receive any compensation for its work as Board Members of the Company during 2016. For information purposes, the table below presents the remuneration paid by SCA for the work as Board Members of SCA in 2016. No compensation was paid to the CEO for his work as Board Member of SCA.
SEKBoard fee SEK 2016
Fee Audit Committee
SEK 2016
Fee Remuneration
Committee 2016 Total 2016
Pär Boman (Chairman) 2,100,000 200,000 135,000 2,435,000
Ewa Björling 700,000 – – 700,000
Maija-Liisa Friman 700,000 – – 700,000
Annemarie Gardshol 700,000 – – 700,000
Louise Julian Svanberg 700,000 – 105,000 805,000
Johan Malmquist 700,000 – – 700,000
Bert Nordberg 700,000 200,000 105,000 1,005,000
Barbara Milian Thoralfsson 700,000 250,000 – 950,000
Total 7,000,000 650,000 345,000 7,995,000
CEO and Executive Management
Essity’s President and CEO is responsible for and manages the day-to-day administration of the Group and follows the Board’s guidelines and instructions. The President and CEO is supported by one Executive Vice President and the Executive Management Team, the work of which is led by the CEO. The Executive Management Team comprises the President and CEO, the CFO, the four Business Unit Presidents and the Presidents of the three Global Units Global Hygiene Category (GHC), Global Hygiene Supply Tissue (GHS-T) and Global Hygiene Supply Personal Care (GHS-PC), and the Senior Vice Presidents of the Group Functions Human Resources, Sustainability, Legal Affairs, Communications, and Strategy and Business Development. Among other things, the division of work between the Board and President is detailed by the working procedures for the Board of Directors and terms of reference issued by the Board of Directors to the President. In consultation with the Chairman of the Board, the President prepares documentation and decision data for the Board’s work.
Compensation to Executive ManagementNo remuneration was paid by Essity to its Executive Management during 2016. The President and CEO as well as the vice president
of Essity have, until the separation of Essity from the other business operations conducted by SCA, been employed by SCA whereas certain other members of the Executive Management have employment agreements with subsidiaries of Essity. As concern the members of Executive Management who have previously been employed by SCA, the employment agreements have, as a consequence of the separation, been transferred to Essity on unchanged terms. In general the employment agreements provide for a fixed salary and a variable remuneration. The SCA Group has until the split applied the following principles in respect of the variable remuneration. Variable remuneration for the CEO, Executive Vice Presidents and Business Unit Presidents is maximized to a total of 100% of the fixed salary. For two Business Units Presidents, stationed in Latin America and the US, the maximum outcome is 110–130% and the limit for other senior executives is 90%. The program for variable remuneration is divided into a short-term and a long-term portion. The short-term portion (STI) for the CEO, Executive Vice Presidents and Business Unit Presidents may amount to a maximum of 50% of the fixed salary. For the Business Units Presidents stationed in Latin America and the US the maximum outcome is 60–80% of the fixed salary, while the limit is 40% for other senior executives. The long-term portion (LTI) may amount to a maximum of 50% of the fixed salary. The senior executives are to invest, in the market, half of the variable LTI compensation, after tax withholdings, in shares in SCA. The shares may not be sold before the end of the third calendar year after the purchase. The established LTI goal is based on the performance of SCA’s B-share, measured as the total shareholders return index compared with a weighted index of competitors’ and consumer companies’ share performance over a three-year period. The principles for variable remuneration have been applied also for remuneration relating to the fiscal year 2017. The current LTI will be paid by Essity in cash to eligible Essity employees during the first quarter 2018 and Essity employees will be required to invest 50% of any after-tax variable compensation to acquire Essity shares. These shares will be subject to a lock-up for three calendar years after their acquisition.
For information purposes, the table below presents information on the compensation paid by SCA to the Executive Management for their work in SCA in 2016.1)
Remuneration and other benefits during 2016 paid by SCA
SEKFixed
salaryVariable
remuneration1)Other
Benefits4) Total
President and CEO Magnus Groth 11,000,000 8,998,0002) 87,738 20,085,738
Other senior executives*) 58,739,016 45,611,9973) 6,127,411 110,478,424
Total 69,739,016 54,609,997 6,215,149 130,564,162*) 14 persons during 2016.1) Variable remuneration covers the 2016 fiscal year but is paid in 2017. The Board of Directors of
SCA has resolved to implement a Long-Term Incentive (“LTI”) that forms part of the variable remuneration to the CEO and other senior executives of SCA. The LTI portion of the variable remuneration may amount to a maximum of 50% of the fixed salary. The remuneration is paid in cash. The senior executive is to invest half of the variable LTI compensation, after tax withholdings, in SCA shares. The shares may then not be sold before the end of the third calendar year after the purchase of shares in the relevant LTI program. The established LTI goal is based on the performance of the SCA’s Class B share, measured as the TSR (Total Shareholder Return) index, compared with a weighted index of competitors’ and consumer companies’ shares performance (TSR) over a three-year period.
2) Of which the LTI program accounted for SEK 5,500,000. 3) Of which the LTI program accounted for SEK 29,225,605. 4) Other benefits pertain, in some cases, to a company car, housing and school fees.
Pension costs 2016 paid by SCA1)
SEK
President and CEO Magnus Groth2) 4,495,961
Other senior executives*) 3) 19,647,387
Total 24,143,348*) 14 persons during 2016.1) The pension costs pertain to the costs that affected profit for 2016, excluding special payroll tax.2) Outstanding pension obligations under defined benefit plans amount to SEK 15,741,000.3) Outstanding pension obligations under defined benefit plans amount to SEK 131,665,322.
1) In the Group’s historical financial information presented in this prospectus, the remuneration paid by SCA has affected Essity’s result.
73Admission to trading of the shares in Essity Aktiebolag (publ) on Nasdaq Stockholm
Corporate governance
Notice period and severance payA notice of termination period of two years apply for the CEO if such notice is given by the Company. The CEO has a corresponding right with a notice period of one year. If notice is given by the Company, the CEO is not obligated to serve during the notice period. The agreement does not provide for any severance pay. Between the Company and other senior executives, a notice of termination period of seven to fifteen months normally applies, if such notice is given by the Company. The executive has a corresponding right with a notice of termination period of six to seven months. The executive is normally expected to be available to the Company during the notice period. No agreements provide for any severance pay, save for one executive who is entitled to a severance pay of twelve monthly salaries if notice of termination is given by the Company.
GuidelinesPursuant to the Swedish Companies Act, the General Meeting shall adopt guidelines for remuneration of the CEO and other senior executives. The following guidelines were adopted at the Annual General Meeting held on April 5, 2017 and apply up until the Annual General Meeting 2018.
Remuneration to senior managers1) will be a fixed amount, variable remuneration, additional benefits and pension. The total remuneration is to correspond to market practice and be competitive on the senior manager’s field of profession and is to be linked to the manager’s responsibility and authority. The variable remuneration is to be maximized and linked to the fixed remuneration based on performance results in relation to the annual and long-term goals respectively. In the event of termination of employment, the notice period should normally be not more than two years should the termination be initiated by the company, and not more than one year, when initiated by the senior manager. Severance pay shall not exist. Pension benefits shall, to the extent possible, solely contain pension benefits determined by charge and entitle the senior manager to pension from the age of 65. The pension is not to be based on variable remuneration. The board of directors shall be entitled to deviate from the adopted guidelines if, in an individual case, there are special reasons for doing so. The guidelines shall not prevail over mandatory conditions under labour law or collective agreements. Neither do they apply to existing agreements.
External audit
The Company’s auditor, elected at the Annual General Meeting, examines Essity’s six-month report, year end report, annual report and consolidated financial statements, the Board’s and President’s administration and the annual reports of subsidiaries, and submits an audit report. The audit is performed in accordance with the Swedish Companies Act, the EU Audit Regulation, International Standards on Auditing (ISA) and generally accepted auditing principles in Sweden.
Ernst & Young has been the Company’s auditor since the 2016 Annual General Meeting. For further information, see “Auditor” in the section entitled “Board of Directors, Executive Management and auditor”.
Internal control
IntroductionThe Board’s responsibility for internal governance and control is regulated in the Swedish Companies Act, the Swedish Annual Accounts Act and the Code. The Swedish Annual Accounts Act requires that the Company, each year, describe its system for internal control and risk management with respect to financial reporting. The Board bears the overall responsibility for financial reporting and its working procedures regulates the internal division of work between the Board and its committees.
The Audit Committee has the important task of preparing the Board’s work to assure the quality of financial reporting. This preparation work includes issues relating to internal control and regulation compliance, control of recognized values, estimations, assessments and other activities that may impact the quality of the financial statements. The Committee has charged the Company’s auditors with the task of specifically examining the degree of compliance in the Company with the rules for internal control, both general and detailed.
Financial reporting to the Board of DirectorsThe Board’s working procedures stipulates which reports and information of a financial nature shall be submitted to the Board at each scheduled meeting. The President and CEO ensures that the Board receives the reports required to enable the Board to continuously assess the Company’s and Group’s financial position. Detailed instructions specifically outline the types of reports that the Board is to receive at each meeting.
External financial reportingThe quality of Essity’s external financial reporting is guaranteed via a number of actions and procedures. The President and CEO is responsible for ensuring that all information issued, such as press releases with financial content, presentation material for meetings with the media, owners and financial institutions, is correct and of a high quality. For further information, see “External audit” above.
Risk managementThe Company conducts continuous risk assessment to identify and evaluate risks regarding the Company’s financial reporting. With regard to financial reporting, the risk that material errors may be made when reporting the Company’s financial position and results is considered to be the primary risk. To minimize this risk, control documents have been established pertaining to accounting, procedures for annual accounts and follow-up of reported annual accounts. There is also a joint system for reporting annual accounts. Essity’s Board of Directors and management assess the financial reporting from a risk perspective on an ongoing basis. To provide support for this assessment, the Company’s income statement and balance sheet items are compared with earlier reports, budgets and other planned figures. Control activities that are significant to financial reporting are carried out using the Company’s IT system.
1) Senior management include the President, Executive Vice President, Business Unit President and equivalent, and the like, as well as the Central Staff Managers.
Admission to trading of the shares in Essity Aktiebolag (publ) on Nasdaq Stockholm74
Corporate governance
Control activities and follow-upSignificant instructions and guidelines related to Essity’s financial reporting are prepared and updated regularly by the Group Function Finance and are easily accessible on the Group’s intranet. The Group Function Finance is responsible for ensuring compliance with instructions and guidelines. Process managers at various levels within Essity are responsible for carrying out the necessary control measures with respect to financial reporting. An important role is played by the Business Unit’s controller organizations, which are responsible for ensuring that financial reporting from each unit is correct, complete and delivered in a timely manner. In addition, each Business Unit has a Finance Manager with responsibility for the individual Business Unit’s financial statements. The Company’s control activities are supported by the budgets prepared by each Business Unit and updated during the year through continuous forecasts.
Essity has introduced a standardized system of control measures involving processes that are significant to the Company’s financial reporting. The controls are adapted to the operational process and system structure of each unit. Accordingly, each unit prepares a record of the actual controls to be carried out in the unit in question. The control of these processes is assessed through self-evaluation followed up by an internal audit. In some cases, Essity engaged external help to validate these control measures.
Financial results are reported and examined regularly within the management teams of the operating units and communicated to Essity’s management at monthly and quarterly meetings. Before reports are issued, results are analyzed to identify and eliminate any mistakes in the process until the yearend closing.
The Board follows up to ensure that the internal control and reporting to the Board functions through continuous reporting from the CEO and CFO and through reporting from the internal audit unit in the scope of the audit plan set annually. Internal audit also continuously reports its observations in this respect to the Audit Committee. Internal audit’s tasks include following up compliance with the Company’s policies, and the results of this follow-up are reported to the Board through the Audit Committee.
75Admission to trading of the shares in Essity Aktiebolag (publ) on Nasdaq Stockholm
Corporate governance
Share capital and ownership structure
Share information
According to Essity’s Articles of Association, the share capital shall be not less than SEK 1,700,000,000 and not more than SEK 6,800,000,000, divided into not less than 700,000,000 shares and not more than 2,800,000,000 shares. There are two classes of shares issued in the Company, shares of Class A and shares of Class B. According to Essity’s Articles of Association, the Company also has the option of issuing shares of Class C.1) No shares of Class C have been issued. As of the date of this prospectus, the Company’s registered share capital is SEK 2,350,366,980, represented by 702,342,489 shares whereof 64,593,939 shares of Class A and 637,748,550 shares of Class B, each with a quota value of approximately SEK 3.35 (rounded to two decimals).2) For information regarding changes in the Company’s share capital see “Share capital development” below.
The shares in Essity have been issued in accordance with Swedish law, are fully paid and denominated in SEK. The shares are not subject to any restrictions on transferability. The rights of the shareholders may only be changed pursuant to the procedures set out in the Swedish Companies Act.
Depositary Shares
American Depositary SharesDeutsche Bank Trust Company Americas serves as the depositary of the Essity ADSs (the “Depositary”). In its capacity as Depositary, Deutsche Bank Trust Company Americas will register and deliver the Essity ADSs, each of which represents (i) one Essity Class B share deposited with Handelsbanken, as custodian (including any successors thereto, the “Custodian”) for the Depositary and (ii) any other securities, cash or other property which may be held by the Depositary or the Custodian. The Depositary’s principal executive office at which the ADSs will be administered is located at 60 Wall Street, New York, NY 110005, USA.
Swedish law governs the rights of Essity’s shareholders. From the perspective of Swedish law, the Depositary, not the ADS holders, is the holder of all shares underlying the ADSs. Essity does not intend to treat ADS holders as Essity shareholders. Accordingly, ADS holders will not have shareholder rights but will instead have a more limited set of contractual rights in their capacity as ADS holders. A deposit agreement among Essity, the Depositary and the ADS holders sets out the rights of ADS holder and the rights and obligations of the Company and the Depositary. The laws of the State of New York govern the deposit agreement and the ADSs. For instructions on how to obtain copies of the deposit agreement and the form of American Depositary Receipt, see “Documents on display” in the section entitled “Legal Considerations and Supplementary Information”.
Fees and expensesPursuant to the Deposit Agreement, Essity ADS holders are required to pay the Depositary certain fees of up to USD 5.00 per 100 ADSs for each of the following services:(i) the issuance of ADSs and distributions in respect of ADSs
pursuant to stock dividends, stock splits or other distributions;(ii) the withdrawal of the shares underlying the ADSs or other
cancellation of ADSs; (iii) the distribution of cash dividends or any other distribution of cash
entitlements;(iv) the issuance of ADSs upon the exercise of rights; and(v) the annual administration, operation and maintenance of the
ADR Program.
In addition, ADS holders, beneficial owners, persons depositing shares for deposit, persons surrendering Essity ADSs for cancellation and persons withdrawing shares underlying the Essity ADSs will be required to pay the following charges:(i) taxes and other governmental charges;(ii) such registration fees as may from time to time be in effect for the
registration of shares with the foreign registrar;(iii) such cable, telex, facsimile and electronic transmission and
delivery expenses as are expressly provided in the Deposit Agreement;
(iv) expenses, fees and other charges incurred by the Depositary in the conversion of foreign currency;
(v) fees and expenses incurred by the Depositary in connection with compliance with exchange control regulations and other regulatory requirements applicable to the shares underlying the Essity ADSs, the Essity ADSs and the Essity ADRs;
(vi) fees and expenses incurred by the Depositary in connection with the delivery of shares underlying the Essity ADSs; and
(vii) any fees, charges, costs or expenses that may be incurred from time to time by the Depositary and/or any of the Depositary’s agents, including the Custodian, in connection with the servicing, sale or delivery of the shares underlying the Essity ADSs or the Essity ADSs, or otherwise in connection with the Depositary’s or its Custodian’s compliance with applicable laws, rules or regulations.
The fees owed to the Depositary for cash distributions are generally paid from deductions made by the Depositary from the cash being distributed. In the case of distributions other than cash, the Depositary charges the applicable fees concurrently with the distribution to the ADS holders as of the record date or from the sale by the Depositary of the distributable property.
1) The purpose of this provision is to enable the use of shares of Class C for delivery in certain incentive programs. No such incentive programs are currently offered by the Company.2) As of December 31, 2016, the Company’s registered share capital was SEK 500,000, represented by 5,000 shares, each with a quota value of SEK 100 per share.
Admission to trading of the shares in Essity Aktiebolag (publ) on Nasdaq Stockholm76
Share capital and ownership structure
Payment of TaxesADS holders will be responsible for any taxes or other governmental charges payable, or which become payable, on the ADRs, the ADSs or on the class B shares or other deposited securities represented by the ADSs. Until such taxes or other charges are paid by ADS holders, the Depositary may refuse the deposit of class B shares, and it may refuse to issue ADSs, to deliver ADRs, to register the transfer, split-up or combination of ADRs or to allow ADS holders to withdraw the deposited securities represented by the ADSs. The Depositary may withhold or deduct the amount of any outstanding taxes or charges from any distributions made in respect of deposited securities, or it may sell deposited securities represented by the ADSs to pay any such outstanding taxes or charges and ADS holders will remain liable for any deficiency. If the Depositary sells deposited securities, it will, if appropriate, reduce the number of ADSs to reflect the sale and pay to ADS holders any net proceeds, or send to ADS holders any property, remaining after it has paid the taxes or charges.
The obligations of ADS holders and beneficial owners regarding taxes survives any transfer of ADRs, any surrender of ADRs and withdrawal of underlying shares or the termination of the Deposit Agreement.
Requirements for Depositary ActionsBefore the Depositary will issue, deliver or register a transfer of an ADS, split-up, subdivide or combine ADSs, make a distribution on an ADS, or permit withdrawal of Essity shares, the Depositary will require the payment of the fees, charges and expenses provided for under the Deposit Agreement as well as the payment of stock transfer or other taxes or other governmental charges and transfer or registration fees charged by third parties for the transfer of any Class B shares or other deposited securities and payment of the applicable fees, expenses and charges of the Depositary.
Fees Payable by the Essity Depositary to Essity The Depositary may provide Essity with payments in consideration for its appointment as exclusive depositary for the ADS program.
Certain rights attached to the shares
Voting rights at the General MeetingEach share of Class A carries ten votes and each share of Class B carries one vote at the General Meeting. If shares of Class C are issued, each share of Class C would carry one vote. Each shareholder is entitled to vote for the total number of shares held without limitation of the voting powers. See “General Meeting” in the section entitled “Corporate governance” for further information about the General Meeting in Essity.
Preferential rights to new shares, etc.Should the Company decide on a cash or set off issue of shares of Class A, Class B and Class C, holders of shares of Class A, Class B and Class C shall have preferential rights to subscribe in proportion to their existing shareholdings (primary preferential right). Shares that are not subscribed for with primary preferential right shall be offered to all shareholders for subscription (secondary preferential right). Should the Company resolve to, through a cash or set off issue, only issue shares of Class A, Class B or Class C, all shareholders shall, regardless of whether they own shares of Class A, Class B or Class C, have preferential right to subscribe for new shares in proportion to their existing shareholdings. There are no provisions in the Company’s Articles of Association that limit the Company’s ability to decide to, in accordance with the rules set out in the Swedish Companies Act, issue new shares, warrants or convertibles with deviation from the shareholders’ preferential rights. See § 7 in the section entitled “Articles of Association”.
Rights to dividends and surplus in the event of liquidationShares of Class A and Class B carry the same right to share in the Company’s profit and any surplus in the event of liquidation. Shares of Class C, if such shares are issued, carry entitlement annual dividends from the Company’s distributable earnings in an amount corresponding to STIBOR for a term of 6 months from May 1 of a certain year until and including May 1 of the subsequent year and calculated on the ratio value of the Company’s share.
Dividends are resolved upon by the General Meeting and the payment is administered by Euroclear Sweden. Dividends may only be paid if the Company, after such dividends, still has full coverage of its restricted equity and further to the extent that such dividends are justified taking into consideration (i) the demands with respect to size of shareholders’ equity which are imposed by the nature, scope and risks associated with the operations, and (ii) the Company’s and the Group’s consolidation needs, liquidity and financial position in general (the so-called prudence rule). As a general rule, the shareholders may not decide upon larger dividends than those proposed or approved by the Board of Directors. Dividends are normally paid to shareholders in cash on a per share basis, but may also be paid in kind. See also “Dividend policy” below.
On the record date established by the General Meeting, holders recorded as owners of shares in the register of shareholders maintained by Euroclear Sweden will be entitled to receive dividends. If a shareholder cannot be paid through Euroclear Sweden, such shareholder still retains its claim to the dividend amount, and the claim remains against the Company subject to a statutory limitation of 10 years. Should the claim become barred by the statute of limitations, the dividend amount is forfeited to Essity. Neither the Swedish Companies Act nor Essity’s Articles of Association contain any restrictions regarding dividend rights of shareholders outside Sweden. Subject to any restrictions imposed by banks or clearing systems in the relevant jurisdiction, payments to such shareholders are made in the same manner as for shareholders resident in Sweden. However, shareholders with limited tax liability in Sweden are normally subject to Swedish withholding tax. See the section entitled “Certain tax issues” for additional information.
Conversion of shares of Class A to shares of Class BAccording to Essity’s Articles of Association, holders of shares of Class A are entitled to request that these be converted to shares of Class B. An application for conversion must be made in writing to the Company. The request shall state the number of shares that the holder wishes to convert and, if the conversion does not encompass the individual’s entire holding, which shares the individual wishes to convert. The Company’s Board of Directors should at its next scheduled meeting address issues relating to conversion of shares of Class A to shares of Class B, whose owners during the period prior to the meeting requested conversion. However, The Board of Directors has the right if there are reasonable grounds, to also address the issue of conversion at other times than those stated above. The conversion shall be reported for registration with the Swedish Companies Registration Office without delay.
RedemptionThe Board of Directors shall, during the period from July 1 up to and including July 31 of each year, be entitled to decide to reduce the share capital by redemption of all shares of Class C in issue. If a decision to redeem is made, holders of shares of Class C shall be obliged to accept redemption at a price equivalent to the quota value of the shares. The redemption price shall be paid as soon as possible. There are currently no issued shares of Class C.
77Admission to trading of the shares in Essity Aktiebolag (publ) on Nasdaq Stockholm
Share capital and ownership structure
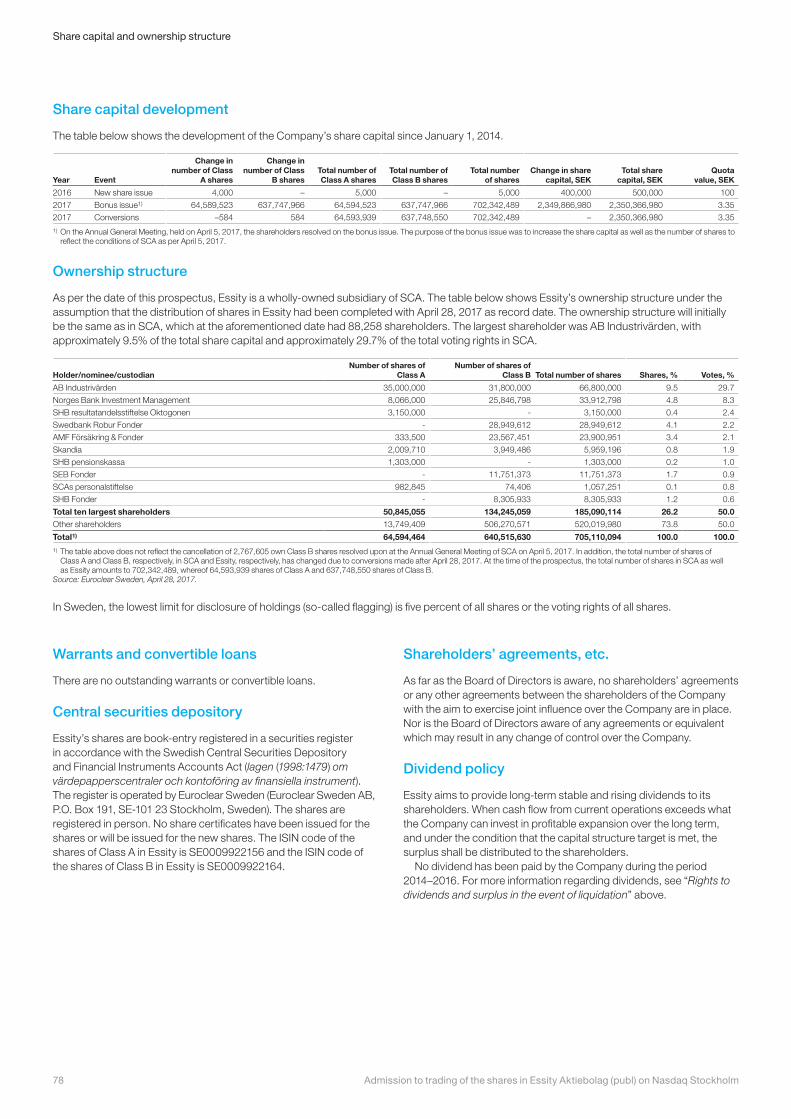
Share capital development
The table below shows the development of the Company’s share capital since January 1, 2014.
Year Event
Change in number of Class
A shares
Change in number of Class
B sharesTotal number of Class A shares
Total number of Class B shares
Total number of shares
Change in share capital, SEK
Total share capital, SEK
Quota value, SEK
2016 New share issue 4,000 – 5,000 – 5,000 400,000 500,000 100
2017 Bonus issue1) 64,589,523 637,747,966 64,594,523 637,747,966 702,342,489 2,349,866,980 2,350,366,980 3.35
2017 Conversions –584 584 64,593,939 637,748,550 702,342,489 – 2,350,366,980 3.351) On the Annual General Meeting, held on April 5, 2017, the shareholders resolved on the bonus issue. The purpose of the bonus issue was to increase the share capital as well as the number of shares to
reflect the conditions of SCA as per April 5, 2017.
Ownership structure
As per the date of this prospectus, Essity is a wholly-owned subsidiary of SCA. The table below shows Essity’s ownership structure under the assumption that the distribution of shares in Essity had been completed with April 28, 2017 as record date. The ownership structure will initially be the same as in SCA, which at the aforementioned date had 88,258 shareholders. The largest shareholder was AB Industrivärden, with approximately 9.5% of the total share capital and approximately 29.7% of the total voting rights in SCA.
Holder/nominee/custodianNumber of shares of
Class ANumber of shares of
Class B Total number of shares Shares, % Votes, %
AB Industrivärden 35,000,000 31,800,000 66,800,000 9.5 29.7
Norges Bank Investment Management 8,066,000 25,846,798 33,912,798 4.8 8.3
SHB resultatandelsstiftelse Oktogonen 3,150,000 - 3,150,000 0.4 2.4
Swedbank Robur Fonder - 28,949,612 28,949,612 4.1 2.2
AMF Försäkring & Fonder 333,500 23,567,451 23,900,951 3.4 2.1
Skandia 2,009,710 3,949,486 5,959,196 0.8 1.9
SHB pensionskassa 1,303,000 - 1,303,000 0.2 1.0
SEB Fonder - 11,751,373 11,751,373 1.7 0.9
SCAs personalstiftelse 982,845 74,406 1,057,251 0.1 0.8
SHB Fonder - 8,305,933 8,305,933 1.2 0.6
Total ten largest shareholders 50,845,055 134,245,059 185,090,114 26.2 50.0Other shareholders 13,749,409 506,270,571 520,019,980 73.8 50.0
Total1) 64,594,464 640,515,630 705,110,094 100.0 100.01) The table above does not reflect the cancellation of 2,767,605 own Class B shares resolved upon at the Annual General Meeting of SCA on April 5, 2017. In addition, the total number of shares of
Class A and Class B, respectively, in SCA and Essity, respectively, has changed due to conversions made after April 28, 2017. At the time of the prospectus, the total number of shares in SCA as well as Essity amounts to 702,342,489, whereof 64,593,939 shares of Class A and 637,748,550 shares of Class B.
Source: Euroclear Sweden, April 28, 2017.
In Sweden, the lowest limit for disclosure of holdings (so-called flagging) is five percent of all shares or the voting rights of all shares.
Warrants and convertible loans
There are no outstanding warrants or convertible loans.
Central securities depository
Essity’s shares are book-entry registered in a securities register in accordance with the Swedish Central Securities Depository and Financial Instruments Accounts Act (lagen (1998:1479) om värdepapperscentraler och kontoföring av finansiella instrument). The register is operated by Euroclear Sweden (Euroclear Sweden AB, P.O. Box 191, SE-101 23 Stockholm, Sweden). The shares are registered in person. No share certificates have been issued for the shares or will be issued for the new shares. The ISIN code of the shares of Class A in Essity is SE0009922156 and the ISIN code of the shares of Class B in Essity is SE0009922164.
Shareholders’ agreements, etc.
As far as the Board of Directors is aware, no shareholders’ agreements or any other agreements between the shareholders of the Company with the aim to exercise joint influence over the Company are in place. Nor is the Board of Directors aware of any agreements or equivalent which may result in any change of control over the Company.
Dividend policy
Essity aims to provide long-term stable and rising dividends to its shareholders. When cash flow from current operations exceeds what the Company can invest in profitable expansion over the long term, and under the condition that the capital structure target is met, the surplus shall be distributed to the shareholders.
No dividend has been paid by the Company during the period 2014–2016. For more information regarding dividends, see “Rights to dividends and surplus in the event of liquidation” above.
Admission to trading of the shares in Essity Aktiebolag (publ) on Nasdaq Stockholm78
Share capital and ownership structure
Articles of association
Adopted by the Annual General Meeting on April 5, 2017.
§1. NameThe name of the Company is Essity Aktiebolag (publ). The Company is a public company.
§2. Registered officeThe registered office of the Company is in Stockholm.
§3. Object of the Company’s businessThe object of the Company’s business is to own and manage shares and other certificates of participation in industrial undertakings, carry out industrial and commercial operations, principally business within the hygiene area, and engage in other similar activities, as well as activities consistent therewith.
§4. Share capitalThe share capital of the Company shall be not less than one billion seven hundred million (1,700,000,000) Swedish Kronor and not more than six billion eight hundred million (6,800,000,000) Swedish Kronor.
§5. Number of sharesThe number of shares shall not be less than 700,000,000 and shall not exceed 2,800,000,000.
§6. Share ClassesShares in the Company may be issued in three classes, Class A, Class B and Class C.
At General Meetings of the Shareholders, Class A shares carry ten votes, Class B and Class C shares one vote.
The entire share capital may be represented by Class A or Class B shares. The maximum number of Class C shares that may be issued is however 1,800,000.
Holders of Class A shares shall have the right, but not the obligation, to require that Class A shares are converted to Class B shares. Request for conversion shall be made in writing to the Board of Directors of the Company. The request shall state the number of shares to be converted and, if the request does not involve the entire holding, which of these are intended for conversion. The Board shall at its regular meetings consider issues regarding conversion to Class B shares of Class A shares whose owners have requested such conversion prior to the meeting. However, the Board has the right, if it deems advisable, to consider matters regarding conversion at other times than those stated above. The conversion shall be submitted for registration without delay.
Class C shares held by the Company itself shall at the request of the Board of Directors of the Company be convertible to Class B shares. The conversion shall be submitted for registration without delay and shall be effected when registration takes place.
§7. Preferential rightsIf the Company decides to issue new Class A, Class B and Class C shares through a cash issue or an issue against payment through set-off of claims, owners of Class A, Class B and Class C shares shall have preferential rights to subscribe for new shares of the same type in proportion to the number of shares already owned (primary preferential right). Shares not subscribed for on the basis of primary preferential rights shall be offered for subscription to all shareholders (subsidiary preferential right). If the number of shares offered in this manner is insufficient for subscription based on subsidiary rights, the shares shall be distributed in relation to the number of shares already held and, to the extent that this is not possible, by lot.
If the Company decides to issue new shares of only Class A or Class B or Class C through a cash issue or an issue against payment through set-off of claims, all shareholders, irrespective of whether they own Class A or Class B or Class C shares, shall have preferential rights to subscribe for new shares in proportion to the number of shares already held.
If the Company decides to issue warrants or convertibles through a cash issue or an issue against payment through set-off of claims, the shareholders have preferential rights to subscribe to warrants as if the issue were of the shares that may be subscribed to pursuant to the warrant and, respectively, preferential rights to subscribe to convertibles as if the issue were of the shares that the convertibles may be converted to.
The aforementioned stipulation shall not impose any restriction on the possibility to decide on a cash issue or an issue against payment through setoff of claims that deviates from shareholders’ preferential rights.
In the event of an increase in share capital through a bonus issue, new shares of each class shall be issued in proportion to the number of shares of the same class already issued. In such cases, shares of a specific class shall carry entitlement to new shares of the same class.
§8. CSD clauseThe Company’s shares shall be registered in a central securities depository register pursuant to the Financial Instruments Accounts Act (lagen (1998:1479) om värdepapperscentraler och kontoföring av finansiella instrument).
§9. Board of DirectorsThe Board of Directors of the Company shall consist of not less than three and not more than twelve members, with not more than five deputies.
§10. AuditorsThe General Meeting shall appoint at least one and not more than three auditors, with not more than three deputies.
79Admission to trading of the shares in Essity Aktiebolag (publ) on Nasdaq Stockholm
Articles of association
§11. NoticeNotice of General Meetings shall be made by advertisement in the Swedish Official Gazette (Post- och Inrikes Tidningar) and on the Company’s website. An announcement that this has been done shall be published in Dagens Nyheter and Svenska Dagbladet.
In order to be permitted to attend General Meetings, shareholders must, firstly, be registered in the transcript of the entire share ledger prevailing five weekdays prior to the general meeting and, secondly, notify the Company of its attendance no later than the day specified in the notice of the Meeting. This day must not be a Sunday, any other public holiday, Saturday, Midsummer Eve, Christmas Eve or New Year’s Eve, and must not fall earlier that the fifth weekday prior to the Meeting.
§12. The venue of General MeetingsGeneral Meetings shall be held in Stockholm or Gothenburg.
§13. Annual General MeetingThe following matters shall be dealt with at the Annual General Meeting:1. Election of Chairman of the Meeting2. Preparation and approval of the voting list3. Election of two persons to verify the minutes4. Determination of whether the Meeting has been duly convened5. Approval of the agenda6. Presentation of the annual report and the auditors’ report and
the consolidated financial statements and the auditors’ report in respect of the consolidated financial statements
7. Resolutions on: a. adoption of the income statement and balance sheet and the
consolidated income statement and the consolidated balance sheet
b. appropriations of the Company’s profit or loss as shown in the adopted balance sheet
c. discharge of the members of the Board of Directors and of the President from personal liability
8. Determination of the number of members and deputy members of the Board of Directors
9. Determination of the number of auditors and deputy auditors10. Determination of the fees to be paid to the Board of Directors and
the fees to be paid to the auditors11. Election of members and deputy members of the Board of
Directors12. Appointment of auditors and deputy auditors13. Any other matter to be considered at the Meeting under the
Swedish Companies Act (2005:551) or the Articles of Association
§14. Financial yearThe Company’s financial year shall be the calendar year.
§15. Redemption clause etc.Shares of Class C carry entitlement to annual dividends from the Company’s distributable earnings in an amount corresponding to STIBOR for a term of 6 months from 1 May of a certain year until and including 1 May of the subsequent year and calculated on the ratio value of the Company’s share.
The Board of Directors of the Company shall in the period from 1 July up to and including 31 July of each year be entitled to decide to reduce the share capital by redemption of all Class C shares.
If a decision to redeem is made, holders of Class C shares shall be obligated to accept redemption at a price equivalent to the ratio value of the shares. The redemption price shall be paid as soon as possible.
Admission to trading of the shares in Essity Aktiebolag (publ) on Nasdaq Stockholm80
Articles of association
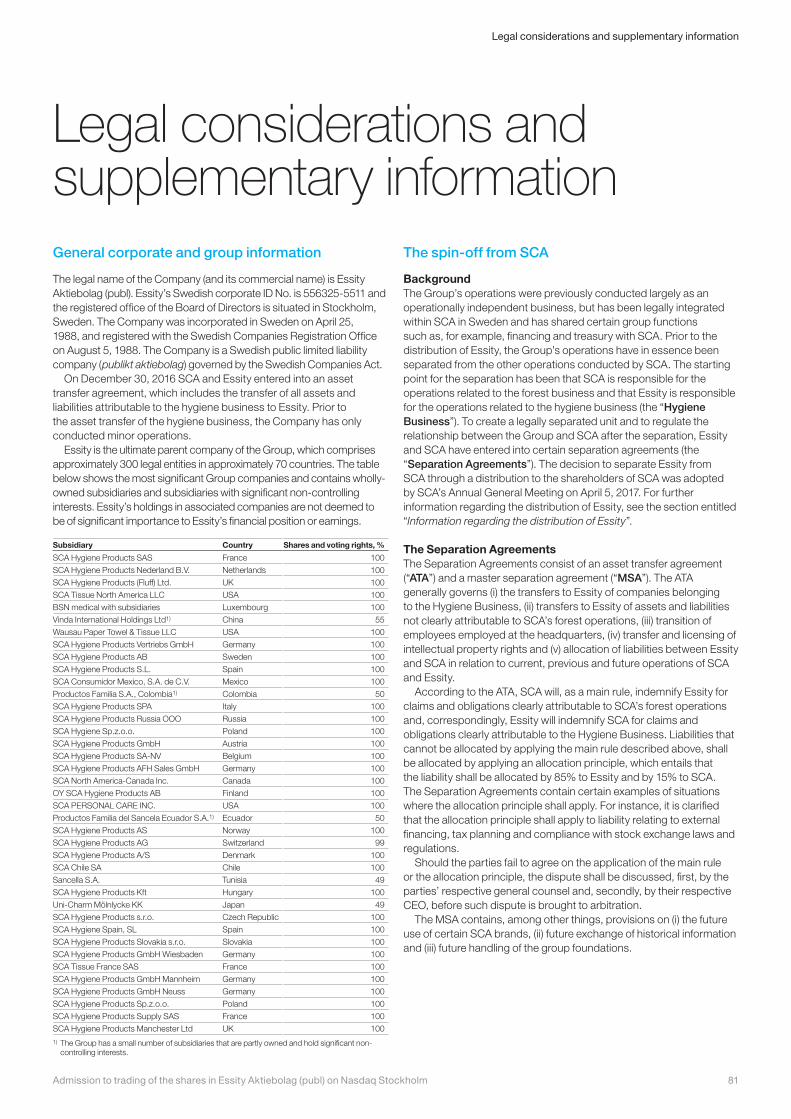
Legal considerations and supplementary informationGeneral corporate and group information
The legal name of the Company (and its commercial name) is Essity Aktiebolag (publ). Essity’s Swedish corporate ID No. is 556325-5511 and the registered office of the Board of Directors is situated in Stockholm, Sweden. The Company was incorporated in Sweden on April 25, 1988, and registered with the Swedish Companies Registration Office on August 5, 1988. The Company is a Swedish public limited liability company (publikt aktiebolag) governed by the Swedish Companies Act.
On December 30, 2016 SCA and Essity entered into an asset transfer agreement, which includes the transfer of all assets and liabilities attributable to the hygiene business to Essity. Prior to the asset transfer of the hygiene business, the Company has only conducted minor operations.
Essity is the ultimate parent company of the Group, which comprises approximately 300 legal entities in approximately 70 countries. The table below shows the most significant Group companies and contains wholly-owned subsidiaries and subsidiaries with significant non-controlling interests. Essity’s holdings in associated companies are not deemed to be of significant importance to Essity’s financial position or earnings.
Subsidiary Country Shares and voting rights, %
SCA Hygiene Products SAS France 100
SCA Hygiene Products Nederland B.V. Netherlands 100
SCA Hygiene Products (Fluff) Ltd. UK 100
SCA Tissue North America LLC USA 100
BSN medical with subsidiaries Luxembourg 100
Vinda International Holdings Ltd1) China 55
Wausau Paper Towel & Tissue LLC USA 100
SCA Hygiene Products Vertriebs GmbH Germany 100
SCA Hygiene Products AB Sweden 100
SCA Hygiene Products S.L. Spain 100
SCA Consumidor Mexico, S.A. de C.V. Mexico 100
Productos Familia S.A., Colombia1) Colombia 50
SCA Hygiene Products SPA Italy 100
SCA Hygiene Products Russia OOO Russia 100
SCA Hygiene Sp.z.o.o. Poland 100
SCA Hygiene Products GmbH Austria 100
SCA Hygiene Products SA-NV Belgium 100
SCA Hygiene Products AFH Sales GmbH Germany 100
SCA North America-Canada Inc. Canada 100
OY SCA Hygiene Products AB Finland 100
SCA PERSONAL CARE INC. USA 100
Productos Familia del Sancela Ecuador S.A.1) Ecuador 50
SCA Hygiene Products AS Norway 100
SCA Hygiene Products AG Switzerland 99
SCA Hygiene Products A/S Denmark 100
SCA Chile SA Chile 100
Sancella S.A. Tunisia 49
SCA Hygiene Products Kft Hungary 100
Uni-Charm Mölnlycke KK Japan 49
SCA Hygiene Products s.r.o. Czech Republic 100
SCA Hygiene Spain, SL Spain 100
SCA Hygiene Products Slovakia s.r.o. Slovakia 100
SCA Hygiene Products GmbH Wiesbaden Germany 100
SCA Tissue France SAS France 100
SCA Hygiene Products GmbH Mannheim Germany 100
SCA Hygiene Products GmbH Neuss Germany 100
SCA Hygiene Products Sp.z.o.o. Poland 100
SCA Hygiene Products Supply SAS France 100
SCA Hygiene Products Manchester Ltd UK 1001) The Group has a small number of subsidiaries that are partly owned and hold significant non-
controlling interests.
The spin-off from SCA
BackgroundThe Group’s operations were previously conducted largely as an operationally independent business, but has been legally integrated within SCA in Sweden and has shared certain group functions such as, for example, financing and treasury with SCA. Prior to the distribution of Essity, the Group’s operations have in essence been separated from the other operations conducted by SCA. The starting point for the separation has been that SCA is responsible for the operations related to the forest business and that Essity is responsible for the operations related to the hygiene business (the “Hygiene Business”). To create a legally separated unit and to regulate the relationship between the Group and SCA after the separation, Essity and SCA have entered into certain separation agreements (the “Separation Agreements”). The decision to separate Essity from SCA through a distribution to the shareholders of SCA was adopted by SCA’s Annual General Meeting on April 5, 2017. For further information regarding the distribution of Essity, see the section entitled “Information regarding the distribution of Essity”.
The Separation AgreementsThe Separation Agreements consist of an asset transfer agreement (“ATA”) and a master separation agreement (“MSA”). The ATA generally governs (i) the transfers to Essity of companies belonging to the Hygiene Business, (ii) transfers to Essity of assets and liabilities not clearly attributable to SCA’s forest operations, (iii) transition of employees employed at the headquarters, (iv) transfer and licensing of intellectual property rights and (v) allocation of liabilities between Essity and SCA in relation to current, previous and future operations of SCA and Essity.
According to the ATA, SCA will, as a main rule, indemnify Essity for claims and obligations clearly attributable to SCA’s forest operations and, correspondingly, Essity will indemnify SCA for claims and obligations clearly attributable to the Hygiene Business. Liabilities that cannot be allocated by applying the main rule described above, shall be allocated by applying an allocation principle, which entails that the liability shall be allocated by 85% to Essity and by 15% to SCA. The Separation Agreements contain certain examples of situations where the allocation principle shall apply. For instance, it is clarified that the allocation principle shall apply to liability relating to external financing, tax planning and compliance with stock exchange laws and regulations.
Should the parties fail to agree on the application of the main rule or the allocation principle, the dispute shall be discussed, first, by the parties’ respective general counsel and, secondly, by their respective CEO, before such dispute is brought to arbitration.
The MSA contains, among other things, provisions on (i) the future use of certain SCA brands, (ii) future exchange of historical information and (iii) future handling of the group foundations.
81Admission to trading of the shares in Essity Aktiebolag (publ) on Nasdaq Stockholm
Legal considerations and supplementary information
Service agreementsEssity and SCA have entered into a number of transitional services agreements, according to which Essity has agreed to provide certain services to SCA pending the establishment of SCA’s own independent capacity. Such service agreements mainly concern IT services (infrastructure) and HR. The service agreements generally have a term of 3–7 months, with the exception of a few services which have a longer duration (a maximum of 12 months from the separation).
Intellectual property rightsUnder the ATA, SCA has transferred intellectual property rights to certain SCA Group brands (i.e., the group logotype) to Essity, while the trademark “SCA” will remain under the ownership of SCA. The SCA corporate brands are widely used by both the forest and the Hygiene Business. In order to secure an orderly rebranding of the two businesses, the Separation Agreements contain certain provisions regarding the future use of these.
Transfer of pension liabilitiesEssity and SCA have between them agreed that all pension liabilities carried by SCA, as well as all pension assets constituting security for such liabilities (except the pension liabilities and pension assets connected to the employment of a few individuals including i.a. the deputy managing director Ulf Larsson), shall be transferred to Essity.
SCA Försäkringsaktiebolag (the Group’s insurance company)On December 31, 2016, Essity and SCA entered into an agreement regarding the transfer of SCA Försäkringsaktiebolag to Essity. Since SCA Försäkringsaktiebolag has an authorization to carry out insurance operations, the consent of the Swedish Financial Supervisory Authority is required for the transfer of the shares in the company, and the transfer of the company was consequently conditional upon such approval being obtained.1) The authority gave the consent on June 2, 2017.
Reallocation of net debt etc.See “Other significant changes” in the section entitled “Capitalization and other financial information” for a description of the reallocation of net debt and certain transactions that have been made between Essity and SCA and that will be made between the companies in connection with the completion of the distribution on or around the first day of trading in the Essity shares on Nasdaq Stockholm.
Material agreements
Presented below is a summary of material agreements entered into by Essity during the past two years as well as other agreements entered into by Essity which contains any right or obligation which is material to Essity (in both cases excluding agreements entered into in the ordinary course of business).
Acquisitions and divestmentsAcquisition of BSN medicalIn December 2016, Essity entered into an agreement to acquire BSN medical for a purchase price of EUR 1,400m for the shares and the takeover of net debt amounting to approximately EUR 1,340m2). On April 3, 2017, Essity closed the acquisition of BSN medical.
The share purchase agreement contains warranties from the seller regarding the corporate status of the selling company and its subsidiaries, including warranties regarding the ownership of the shares, on financial statements, intellectual property rights, conduct of business, permits, compliance, products, environment, tax and litigation, subject to customary limitations and exclusions including
a de minimis amount of EUR 1m and a non-tipping claims basket/deductible in the amount of EUR 15m. Essity has taken out warranty and indemnity insurance for warranty claims under share purchase agreement with an overall amount of coverage of EUR 440m; the warranty and indemnity insurance package is subject to customary limitations and exclusions.
Claims against the seller regarding the breach of a warranty (except for a warranty regarding corporate matters) will become time-barred thirteen months after the closing, claims regarding seller’s covenants become time-barred after four months after closing and all other claims at least three years after closing. Under the warranty and indemnity insurance package, the warranty periods have been extended to 24 months after closing for business warranties and 84 months for fundamental warranties.
Acquisition of Wausau Paper Corp.On January 21, 2016, Essity completed its acquisition of Wausau, a US-based company which manufactures and markets away-from-home towel and tissue products and soap and dispensing system products through its Artisa, DublNature, DublSoft and EcoSoft brands. The acquisition was governed by a merger agreement pursuant to which Salmon Acquisition, Inc., a wholly-owned subsidiary of SCA Americas Inc., was merged with Wausau, with the latter company continuing as the surviving company. Upon completion, each Wausau share (other than treasury shares or shares owned by SCA Americas Inc., or any direct or indirect wholly-owned subsidiary of SCA Americas or Wausau) was cancelled and automatically converted into the right to receive USD 10.25 in cash, and trading of Wausau shares on NYSE ceased. The total consideration paid for the acquisition was USD 513m in cash.
The merger was completed on the basis of representations and warranties given by Wausau to Essity in relation to the Wausau business; and Salmon Acquisition Inc’s obligations under the merger agreement were guaranteed by SCA.
Divestment of the hygiene business in Southeast Asia, Taiwan and South Korea for integration with VindaAs of the date of the prospectus Essity holds 54.6% of the shares in Vinda. Vinda markets and sells tissue and personal care products, principally in China, Hong Kong and Macau. Vinda is listed on the Hong Kong Stock Exchange.
On April 1, 2016, Essity completed the divestment to Vinda of its business in South East Asia, Taiwan and South Korea. The consideration amounted to HKD 2.8bn on a debt-free basis, made up of cash, consideration shares and convertible notes (which were converted to Vinda shares upon completion). Essity gave customary general, tax and environmental warranties under the share purchase agreement. Claims for tax warranties are time-barred 6 years after completion and, for all other warranties, 18 months after completion.
As part of the transaction, Essity and Vinda have signed an agree-ment pursuant to which Essity grants Vinda an exclusive license to market and sell the Essity brands TENA, Tork, Tempo, Libero and Libresse in South East Asia, Taiwan and South Korea. Pursuant to the acquisition agreement and a trademark assignment agreement, Vinda acquired the brands Drypers, Dr.P, Sealer, Prokids, EQ Dry and Control Plus in these same markets. Essity has also granted Vinda a licence to use patents and technology related to these acquired brands.
Essity and Vinda also cooperate by way of a services agreement, pursuant to which Essity and the divested business provide certain IT and accounting services to each other, and a procurement agreement, pursuant to which Essity and Vinda agree to sell certain personal care products and raw materials as required by their respective personal care businesses, for a period of three years from March 31, 2016.
1) SCA Försäkringsaktiebolag has been consolidated in Essity’s historical financial information presented in this prospectus. 2) Based on net debt as per December 31, 2016. Final takeover of net debt will be based on March 31, 2017.
Admission to trading of the shares in Essity Aktiebolag (publ) on Nasdaq Stockholm82
Legal considerations and supplementary information
Joint ventures and other joint operationsEssity carries out certain operations through cooperation with other business partners in joint ventures or other joint operations. Typically, the so-called joint ventures are construed so that Essity and its business partner through an agreement have shared control over the operations and are entitled to the net assets of their investment. In so-called joint operations, the respective party instead have the right to the assets and obligations for the liabilities associated with the investment which means that each party account for its share of the assets, liabilities, revenues and cost proportionally. Associates are companies in which the Group exercises a significant influence without the partly owned company being a subsidiary or a joint arrangement.
See note F2–F4 on p. F-75 and onwards in the section entitled “Historical financial information” for a further description of the Group’s jointly owned subsidiaries, joint ventures, joint operations and operations with associates.
Credit agreementsSee “Credit facilities and loans” in the section entitled “Operational and financial review” for a description of the material credit agreements within the Group.
Legal and arbitration proceedings
The Group has operations in several countries and from time to time the Group is subject to disputes, claims and administrative proceedings in the ordinary course of business. Other than as described below, during the past 12 months Essity has not been part to any governmental, legal or arbitration proceedings (including any such proceedings which are pending or threatened of which Essity is aware) which may have, or have had in the recent past, significant effects on Essity’s financial position or profitability. The Group makes provisions for the disputes that the Group is involved in accordance with applicable accounting regulations.
Some claims relating to the sale of the packaging business 2012 are ongoing of which the largest one relates to a tax dispute in Denmark. Essity has as of March 31, 2017 made provisions in its financial statements of SEK 558m for tax risks, the majority relating to provisions covering costs relating to an obligation to cover this tax dispute. Any costs that materialize for these claims will under the ATA be allocated between SCA and Essity based on the allocation principle.
In Sweden, the Swedish Tax Agency has decided on additional taxes and tax surcharges for the years 2008 to 2012 of approximately SEK 1,188m, including interest. The dispute pertains to interest expenses on loans in a Group company that arose in connection with the move of operations to Sweden in 2004. Essity has appealed the Administrative Court’s ruling to the Administrative Court of Appeal and has also, in 2016, paid the disputable amount and recognized this as an expense. Essity expects that the Administrative Court of Appeal will present its ruling no later than June 16, 2017.
Essity is currently subject to investigations by competition authorities in certain countries. The outcomes of these investigations are uncertain. In addition, in 2016 competition authorities have imposed sanctions on Essity in Spain and Poland and on a joint venture in Colombia to which Essity is a party. The decisions have been appealed by Essity. Essity has made provisions in its financial statements of SEK 556m as of March 31, 2017 in order to cover litigation costs and potential sanctions related to these investigations and litigations.
Related-party transactions
See note 3 on p. F-25 and note G4 on p. F-81 in the section entitled “Historical Financial Information” for a description of the Group’s transactions with related parties during the interim period January 1, 2017–March 31, 2017 and during the financial years 2014–2016, respectively.
In addition to the above and the related-party transactions with SCA as a result of the reallocation of net debt described in “Other significant changes” in the section entitled “Capitalization and other financial information”, the main related-party transactions between Essity and SCA during the period March 31, 2017, until the date of the prospectus primarily consist of lending from Essity to SCA under the cash-pooling arrangement and of purchase of pulp used in the Group’s manufacturing process.
Other than what has been described above, there have been no related-party transactions after March 31, 2017, which, as a single transaction or their entirety, are material to Essity.
For information on remuneration to the members of the Board of Directors and Executive Management, see the section entitled “Board of Directors, Executive Management and auditor”.
Advisors, etc.
Handelsbanken and Bank of America Merrill Lynch provide financial advice to Essity in conjunction with the distribution and the listing on Nasdaq Stockholm. From time to time, Handelsbanken (and its affiliates) have in the ordinary course of business provided, and may in the future provide, various banking, financial, investment, commercial and other services to Essity for which they have received, and may receive, compensation. Furthermore, Handelsbanken (and its affiliates) are lenders and/or brokers of loans granted to Essity.
Mannheimer Swartling Advokatbyrå and Cleary Gottlieb Steen & Hamilton LLP are Essity’s legal advisors in relation to the distribution and the listing on Nasdaq Stockholm.
Documents on display
The following documents (except for annual reports of subsidiaries and the deposit agreement and form of American Depositary Receipt) can be downloaded on Essity’s website, www.essity. se. Copies of all documents, including the prospectus, can also be obtained at the head office of Essity (Klarabergsviadukten 63, Stockholm, Sweden) during the validity of this prospectus (regular office hours on business days).• Essity’s Articles of Association.• Essity’s financial statements for the financial years 2014–2016
(also included in the section entitled “Historical financial information”) • Essity’s subsidiaries’ Annual Reports for the financial years
2015–2016 (including audit reports).• Essity’s interim report for the period January–March 2017.• Deposit agreement and form of American Depositary Receipt.
83Admission to trading of the shares in Essity Aktiebolag (publ) on Nasdaq Stockholm
Legal considerations and supplementary information
Certain tax issues
The following is a general description of certain tax considerations relating to the proposed distribution of shares in Essity to the shareholders of SCA. It does not purport to be a complete analysis of all tax considerations relating to the proposed distribution, neither in Sweden, the United States or elsewhere. The tax treatment of each individual shareholder depends on the shareholder’s particular circumstances and the tax laws in the country where the shareholder is resident. Each shareholder should therefore consult its own tax adviser with regard to the specific tax consequences that may arise in the individual case. This summary is based upon the laws as in effect on the date of this prospectus and is subject to any change in law that may take effect after such date.
Certain tax issues in Sweden
The following is a summary of certain Swedish tax consequences that may arise from the proposed distribution of shares in Essity to shareholders of SCA. The summary is based on current legislation, is intended to only provide general information and is only applicable to individuals and limited liability companies that are resident in Sweden for tax purposes, unless otherwise stated. The summary is not exhaustive and does not cover, for example, (i) shares held by partnerships or held as current assets in business operations, (ii) the specific rules on tax-exempt capital gains (including non-deductibility for capital losses) and dividends in the corporate sector, which may become applicable when shareholders hold shares that are considered to be held for business purposes (näringsbetingade andelar) or (iii) shares that are held in a so-called investment savings account (investeringssparkonto) and that are subject to special rules on notional taxation. Special tax rules also apply to certain categories of tax payers, such as investment companies and insurance companies. Accordingly, the tax treatment of each individual shareholder depends on the individual’s particular circumstances. Each shareholder should therefore consult a tax adviser with regard to the specific tax consequences that may arise in the individual case, including the applicability and effect of foreign rules and tax treaties.
IndividualsTaxation of the distribution of Essity sharesIt is expected that the distribution of the shares in Essity will be made in accordance with the “Lex ASEA” rules. This means that the distribution of Essity shares to SCA shareholders will not trigger any immediate taxation. The tax basis for shareholders holding SCA shares that give entitlement to participate in the distribution will, however, be allocated among these shares and the shares received in Essity. The allocation of the tax basis will be based on the change in value of the shares in SCA due to the distribution of the shares in Essity. SCA will request general guidelines from the Swedish Tax Agency concerning how this tax basis should be allocated. Information about the Tax Agency’s general guidelines will be provided as soon as possible on the websites of SCA, Essity and the Tax Agency.
Dividend taxationFor individuals, dividends on listed shares, which it is intended that the Essity shares will be, are taxed as income from capital at a rate of 30%. A preliminary tax of 30% is generally withheld on dividends to individuals tax resident in Sweden. The preliminary tax is withheld by Euroclear Sweden or, in respect of nominee registered shares, by the Swedish nominee.
Capital gains taxation upon disposal of Essity sharesWhen listed shares, which it is intended that the Essity shares will be, are sold or otherwise disposed of, a taxable capital gain or a deductible capital loss may arise. Capital gains are taxed as capital income at a rate of 30%. The capital gain or loss is normally calculated as the difference between the sales proceeds, after deducting sales costs, and the tax basis. The tax basis for all shares of the same class and type is calculated together in accordance with the “average cost method”. The acquisition cost, and thus the tax basis, for the shares received in Essity through the distribution from SCA is calculated based on the general guidelines received from the Swedish Tax Agency. Alternatively, upon the sale of listed shares, the tax basis may be determined as 20% of the sales proceeds, after deducting sales costs, under the “notional rule”.
Capital losses on listed shares are fully deductible against taxable capital gains on listed and non-listed shares and other listed equity-related securities with the exception of units in securities funds or special funds that consist solely of Swedish receivables (räntefonder). Capital losses that cannot be set off in this way can be deducted with up to 70% against other capital income. If there is a net loss in the capital income category, a tax reduction is allowed against municipal and national income tax, as well as against real estate tax and municipal real estate charges. A tax reduction is allowed with 30% on the portion of such net loss that does not exceed SEK 100,000 and with 21% on any remaining loss. Such net loss cannot be carried forward to future income years.
Admission to trading of the shares in Essity Aktiebolag (publ) on Nasdaq Stockholm84
Certain tax issues
Limited liability companiesTaxation of the distribution of Essity sharesAs noted above, it is expected that the distribution of the shares in Essity will be made in accordance with the “Lex ASEA” rules. This means that this distribution will not give rise to any immediate taxation. The tax basis for shareholders holding SCA shares that give entitlement to participate in the distribution will, however, be allocated among these shares and the shares received in Essity which will be made in accordance with the general guidelines from the Swedish Tax Agency that SCA will request, refer to the description above for individuals.
Taxation of dividends and capital gains with regard to Essity sharesFor Swedish limited liability companies (aktiebolag), all income, including taxable capital gains and dividends, is taxed as business income at a rate of 22%. Capital gains and capital losses are calculated in the same manner as described above for individuals. Deductible capital losses on shares or other equity-related securities may only be deducted against taxable capital gains on such securities. Under certain circumstances, such capital losses may also be deducted against capital gains in another company in the same group, provided that the requirements for exchanging group contributions (koncernbidragsrätt) between the companies are met. A capital loss that cannot be utilized during a given income year may be carried forward and be offset against taxable capital gains on shares and other equity-related securities during future income years, without limitation in time.
Specific tax considerations for shareholders who are not tax residents in SwedenWithholding tax on dividends The distribution of Essity shares to SCA shareholders is expected to be carried out in accordance with the “Lex ASEA” rules. This means that no Swedish withholding tax will be levied on the distribution.
However, dividends on the received Essity shares will normally be subject to Swedish withholding tax. The withholding tax rate is 30% but it is often reduced for shareholders who are tax resident in countries with which Sweden has entered into a tax treaty. In Sweden, Euroclear Sweden or, for nominee registered shares, the nominee normally carries out the withholding.
In the event that 30% withholding tax is deducted from a payment to a person entitled to be taxed at a lower rate, or if too much withholding tax has otherwise been withheld, a refund can be claimed from the Swedish Tax Agency prior to the expiry of the fifth calendar year following the dividend distribution.
Capital gains taxation upon disposal of Essity sharesShareholders with limited tax liability in Sweden and whose shareholding is not attributable to a permanent establishment in Sweden, are generally not subject to capital gains taxation in Sweden upon the disposal of shares. Shareholders may, however, be subject to taxation in their country of residence. Under a specific tax rule, individuals with limited tax liability in Sweden may, however, be subject to tax in Sweden on the sale of shares if they have been resident or lived permanently in Sweden at any time during the calendar year of such disposal or during any of the previous ten calendar years. The application of this rule may be limited by tax treaties between Sweden and other countries.
Certain United States federal income tax considerations
The following is a summary of certain U.S. federal income tax consequ ences that may arise for a U.S. Holder (as defined below) from the proposed distribution of Essity shares or Essity ADSs to holders of SCA shares or SCA ADSs (for the purpose of this summary, the “Distribution”) and of acquiring, owning and disposing of the Essity shares or ADSs received in the Distribution. This summary applies only to U.S. Holders that hold SCA shares or SCA ADSs, and will hold Essity shares or ADSs, as capital assets for U.S. federal income tax purposes and have as their functional currency the U.S. dollar, and does not address the tax treatment of U.S. Holders that are subject to special tax rules, such as banks, insurance companies, tax-exempt organizations, dealers in securities or currencies, traders in securities electing to mark-to-market, or persons that hedge their exposure in the SCA shares or Essity shares or ADSs or hold the SCA or Essity shares or ADSs as a position in a “straddle” for tax purposes or as part of a “synthetic security” or a “hedging” or “conversion” transaction or other integrated investment comprised of such SCA or Essity shares or ADSs and one or more other investments, holders that own or are treated as owning more than 10% of SCA’s or Essity’s shares or ADSs, nonresident aliens present in the United States for more than 182 days in a taxable year, U.S. expatriates, or entities taxed as partnerships or the partners therein. The discussion does not address the applicability and effect of the alternative minimum tax or the Medicare tax on net investment income to a U.S. Holder. U.S. Holders should consult their own tax advisers regarding the U.S. federal income tax consequences to them of receiving Essity shares or ADSs as a result of the Distribution.
For purposes of this summary, a “U.S. Holder” is a beneficial owner of SCA shares or ADSs, or of Essity shares or ADSs received in the Distribution, that is a citizen or resident of the United States or a U.S. domestic corporation or that otherwise is subject to U.S. federal income taxation on a net income basis in respect of the SCA or Essity shares or ADSs, as applicable.
Except as described below, a U.S. Holder of SCA ADSs or Essity ADSs will be treated for U.S. federal income tax purposes as the beneficial owner of the underlying SCA shares or Essity shares that are represented by those ADSs. Shares and ADSs on those shares are referred to below as “Shares”.
Distribution of Essity Shares The U.S. federal income tax consequences of the proposed Distribution of Essity Shares to a U.S. Holder will depend on whether the Distribution is treated as tax-free for U.S. federal income tax purposes.
SCA has obtained an opinion from its special U.S. tax counsel, Cleary Gottlieb Steen & Hamilton LLP (“Tax Counsel”), that on the basis of certain facts, representations, and assumptions on which Tax Counsel relied, the Distribution should be treated as a tax-free distribution to U.S. Holders pursuant to section 355 of the U.S. Internal Revenue Code. The opinion of Tax Counsel is not binding on the U.S. Internal Revenue Service (“IRS”), and the IRS or the courts may disagree with the opinion. Additionally, if any of the facts, representations or assumptions referred to above are inaccurate, incomplete or untrue in any material respect, the opinion may not correctly describe the U.S. federal income tax treatment of the Distribution. Moreover, future events that may or may not be within
85Admission to trading of the shares in Essity Aktiebolag (publ) on Nasdaq Stockholm
Certain tax issues
SCA’s or Essity’s control, such as the acquisition by one or more persons of significant interests in Essity from the Essity shareholders that received Essity shares in the Distribution, or of significant interests in SCA from SCA shareholders after the Distribution, could in some cases potentially cause the Distribution to not qualify for tax-free treatment to Essity’s U.S. Holders for U.S. federal income tax purposes. The absence of a significant time period prior to any such acquisition following the Distribution could increase the risk that the Distribution would not qualify for tax-free treatment.
The remainder of this summary assumes that the Distribution will be treated as tax-free for U.S. federal income tax purposes, except where otherwise stated.
Accordingly, U.S. Holders will not recognize any income, gain or loss for U.S. federal income tax purposes as a result of the Distribution.
A U.S. Holder’s basis in each SCA Share held prior to the Distribution should be allocated between that SCA Share and the Essity Share received in the Distribution with respect to that SCA Share in proportion to the fair market values of the Essity and SCA Shares. In addition, a U.S. Holder’s holding period in the Essity Shares will include its holding period in the SCA Shares with respect to which the Essity Shares were received.
U.S. Treasury regulations require certain U.S. Holders who are “significant distributees” with respect to the Distribution to attach to their U.S. federal income tax returns a statement setting forth information with respect to the Distribution. A U.S. Holder should consult its own tax advisor to determine whether it is a significant distributee required to provide the foregoing statement.
In the event that the Distribution does not qualify as a tax-free distribution for U.S. federal income tax purposes, U.S. Holders generally should expect to be treated as receiving ordinary dividend income as a result of the Distribution in an amount equal to the USD value of the Essity Shares they receive, and their tax basis in the Essity Shares would be equal to the value of those Shares on the date of the Distribution.
Distributions on Essity SharesSubject to the discussion under “Passive Foreign Investment Company Rules” below, the gross amount of any distributions made in respect of Essity Shares generally will be includible in a U.S. Holder’s taxable income as ordinary dividend income on the date the U.S. Holder receives the distribution (or on the date the depositary received the distribution, in the case of Essity ADSs), to the extent of Essity’s earnings and profits for U.S. federal income tax purposes and will not be eligible for the dividends-received deduction allowed to U.S. corporations. We do not expect Essity to maintain calculations of its earnings and profits in accordance with U.S. federal income tax principles. U.S. Holders therefore should expect that all distributions by Essity generally will be treated as dividends for U.S. federal income tax purposes.
Dividends paid in a currency other than U.S. dollars generally will be includible in a U.S. Holder’s income in a U.S. dollar amount calculated by reference to the exchange rate in effect on the date the U.S. Holder receives the dividends (or on the date the depositary received the dividend, in the case of Essity ADSs).
Subject to certain exceptions for short-term and hedged positions, the U.S. dollar amount of dividends received by an individual U.S. Holder with respect to the Essity Shares will be subject to taxation at
a preferential rate if the dividends are “qualified dividends”. Dividends paid on the Shares will be treated as qualified dividends if:• the Essity Shares are readily tradable on an established securities
market in the United States or Essity is eligible for the benefits of a comprehensive tax treaty with the United States that the U.S. Treasury determines is satisfactory for purposes of this provision and that includes an exchange of information program; and
• Essity was not, in the year prior to the year in which the dividend was paid, and is not, in the year in which the dividend is paid, a passive foreign investment company (a “PFIC”).
The U.S. Treasury has determined that the Convention between the Government of the United States of America and the Government of Sweden for the Avoidance of Double Taxation and the Prevention of Fiscal Evasion with respect to Taxes on Income dated 1 September 1996 (as amended by any subsequent protocols, including the protocol of September 2005) (the “Treaty”) meets the requirements for reduced rates of taxation, and it is expected that Essity will be eligible for the benefits of the Treaty. As further discussed below under “Passive Foreign Investment Company Rules” it is also expected that Essity will not be a PFIC for U.S. federal income tax purposes with respect to the 2017 taxable year. Accordingly, it is expected that dividends paid on the Shares will be treated as “qualified dividends”.
Subject to complex limitations and other rules, a U.S. Holder may be able to claim a foreign tax credit against its U.S. federal income tax liability for any Swedish taxes required to be withheld from a dividend paid in respect of Essity Shares. Alternatively, the U.S. Holder may deduct those Swedish taxes from its U.S. federal taxable income, provided that the U.S. Holder elects to deduct rather than credit all foreign income taxes for the relevant taxable year. The rules with respect to foreign tax credits are complex and involve the application of rules that depend on a U.S. Holder’s particular circumstances. Accordingly, U.S. Holders are urged to consult their tax advisors regarding the availability of the foreign tax credit under their particular circumstances.
Sale or Other Taxable Dispositions of Essity SharesSubject to the discussion under “Passive Foreign Investment Company Rules” below, gain or loss realized on the sale, exchange or other disposition of Essity Shares by a U.S. Holder will generally be capital gain or loss, and long-term capital gain or loss if the Essity Shares have been held (or treated as held, as discussed under “Distribution of Essity Shares”) for more than one year. Long-term capital gain realized by an individual U.S. Holder is subject to taxation at a preferential rate. The deductibility of capital losses is subject to limitations.
If a U.S. Holder sells or otherwise disposes of the Essity Shares (or the ADR depositary disposes of Essity ordinary shares) in exchange for currency other than U.S. dollars, any gain or loss that results from currency exchange fluctuations during the period from the date of the sale or other disposition until the date that the currency is converted into U.S. dollars will be treated as ordinary income or loss and will not be eligible for the reduced tax rate applicable to long-term capital gains. This gain or loss generally will be income or loss from sources within the United States for foreign tax credit limitation purposes. If the currency is converted into U.S. dollars on the date of receipt, a U.S. Holder generally would not be required to recognize foreign currency gain or loss in respect of the amount realized.
Admission to trading of the shares in Essity Aktiebolag (publ) on Nasdaq Stockholm86
Certain tax issues
Passive Foreign Investment Company RulesIf Essity were treated as a PFIC, U.S. Holders could be subject to an interest charge on dividend distributions, and would not be eligible for the preferential tax rate applicable to “qualified dividends.” Additionally, a U.S. Holder would generally be subject to an interest charge on any gain realized on a taxable disposition of Essity Shares, and any such gain would generally be treated as ordinary income.
Essity will be classified as a PFIC in a particular taxable year if either:• 75 percent or more of our gross income for the taxable year is
passive income; or• the average percentage of the value of our assets that produce or
are held for the production of passive income is at least 50 percent.
Essity is expected to derive sufficient active revenues and to hold sufficient active assets for U.S. federal income tax purposes so that Essity will not be treated as a PFIC for U.S. federal income tax purposes immediately following the Distribution or for the foreseeable future.
Information Reporting and Backup WithholdingDividends paid on, and proceeds from the sale or other disposition of Essity Shares by a U.S. Holder may be subject to U.S. information reporting requirements and may be subject to backup withholding unless the U.S. Holder provides an accurate taxpayer identification number and makes any other required certification or otherwise establishes an exemption. Backup withholding is not an additional tax. The amount of any backup withholding from a payment to a U.S. Holder will be allowed as a refund or credit against the U.S. Holder’s U.S. federal income tax liability, provided the required information is furnished to the IRS in a timely manner.
A holder that is a foreign corporation or a non-resident alien individual may be required to comply with certification and identification procedures in order to establish its exemption from information reporting and backup withholding.
Specified Foreign Financial AssetsCertain U.S. Holders that own “specified foreign financial assets” with an aggregate value in excess of USD 50,000 are generally required to file an information statement along with their tax returns, currently on Form 8938, with respect to such assets. “Specified foreign financial assets” include any financial accounts held at a non-U.S. financial institution, as well as securities issued by a non-U.S. issuer (which would include the Essity Shares) that are not held in accounts maintained by financial institutions. Higher reporting thresholds apply to certain individuals living abroad and to certain married individuals. Regulations extend this reporting requirement to certain entities that are treated as formed or availed of to hold direct or indirect interests in specified foreign financial assets based on certain objective criteria. U.S. Holders who fail to report the required information could be subject to substantial penalties. In addition, the statute of limitations for assessment of tax would be suspended, in whole or part. U.S. Holders should consult their own tax advisors concerning the application of these rules to their investment in the Essity Shares, including the application of the rules to their particular circumstances.
87Admission to trading of the shares in Essity Aktiebolag (publ) on Nasdaq Stockholm
Certain tax issues
Historical financial information
Admission to trading of the shares in Essity Aktiebolag (publ) on Nasdaq StockholmF-1
Historical financial information
F-2Admission to trading of the shares in Essity Aktiebolag (publ) on Nasdaq Stockholm
Historical financial information
Contents
Financial data for the period January–March 2017
Interim report January–March 2017 ��������������������������������������������������������������������������������������F-4
Financial data for the financial years 2014–2016
Contents �������������������������������������������������������������������������������������������������������������������������������������� F-31
Consolidated income statement ����������������������������������������������������������������������������������������� F-33
Consolidated statement of comprehensive income ����������������������������������������������������� F-33
Consolidated statement of change in equity ������������������������������������������������������������������� F-34
Consolidated operating cash flow statement, supplementary disclosure ����������������������������������������������������������������������������������������������������� F-34
Consolidated cash flow statement ������������������������������������������������������������������������������������� F-35
Correlation between consolidated cash flow statement and operating cash flow statement, supplementary disclosure ����������������������������������������������������������� F-36
Consolidated balance sheet ������������������������������������������������������������������������������������������������� F-37
Accounting principles of the Group and notes ��������������������������������������������������������������� F-38
Auditors’ reports ����������������������������������������������������������������������������������������������������������������������� F-84
Admission to trading of the shares in Essity Aktiebolag (publ) on Nasdaq StockholmF-3
Historical financial information
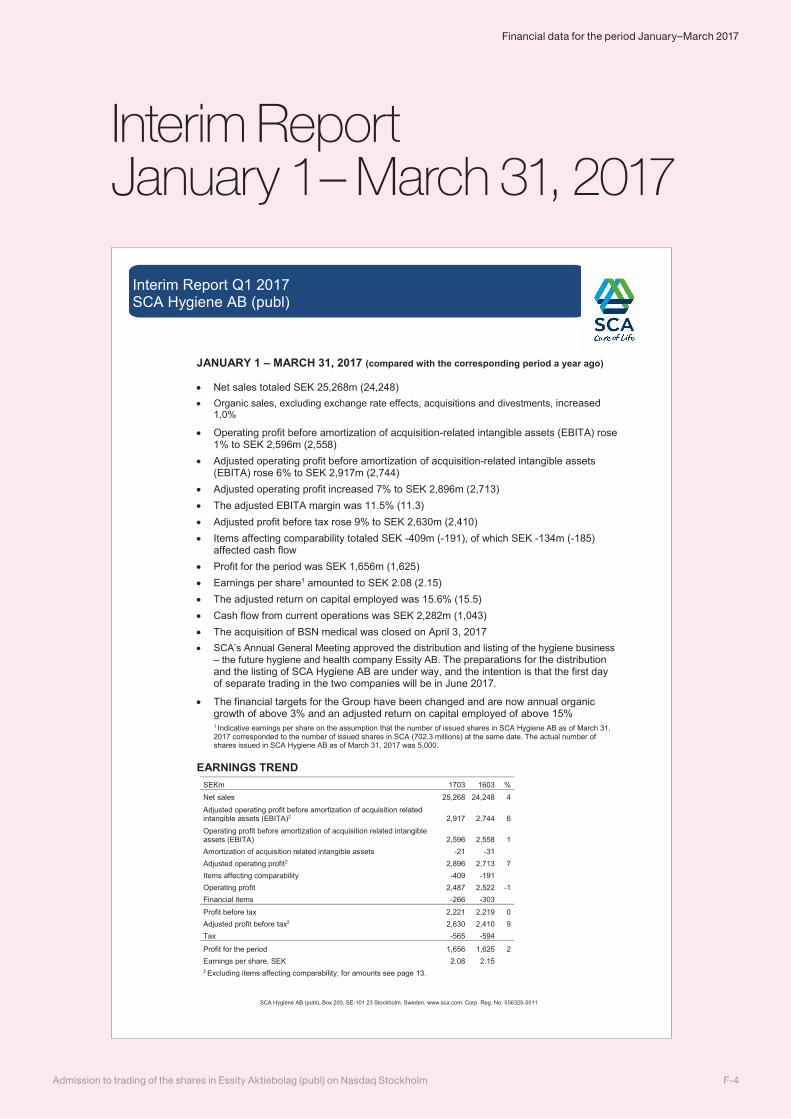
Interim Report January 1 – March 31, 2017
SCA Hygiene AB (publ), Box 200, SE-101 23 Stockholm, Sweden. www.sca.com. Corp. Reg. No. 556325-5511
Interim Report Q1 2017 SCA Hygiene AB (publ)
JANUARY 1 – MARCH 31, 2017 (compared with the corresponding period a year ago)
Net sales totaled SEK 25,268m (24,248) Organic sales, excluding exchange rate effects, acquisitions and divestments, increased
1,0%
Operating profit before amortization of acquisition-related intangible assets (EBITA) rose 1% to SEK 2,596m (2,558)
Adjusted operating profit before amortization of acquisition-related intangible assets (EBITA) rose 6% to SEK 2,917m (2,744)
Adjusted operating profit increased 7% to SEK 2,896m (2,713) The adjusted EBITA margin was 11.5% (11.3) Adjusted profit before tax rose 9% to SEK 2,630m (2,410) Items affecting comparability totaled SEK -409m (-191), of which SEK -134m (-185)
affected cash flow Profit for the period was SEK 1,656m (1,625) Earnings per share1 amounted to SEK 2.08 (2.15) The adjusted return on capital employed was 15.6% (15.5) Cash flow from current operations was SEK 2,282m (1,043) The acquisition of BSN medical was closed on April 3, 2017 SCA’s Annual General Meeting approved the distribution and listing of the hygiene business
– the future hygiene and health company Essity AB. The preparations for the distribution and the listing of SCA Hygiene AB are under way, and the intention is that the first day of separate trading in the two companies will be in June 2017.
The financial targets for the Group have been changed and are now annual organic growth of above 3% and an adjusted return on capital employed of above 15% 1 Indicative earnings per share on the assumption that the number of issued shares in SCA Hygiene AB as of March 31, 2017 corresponded to the number of issued shares in SCA (702.3 millions) at the same date. The actual number of shares issued in SCA Hygiene AB as of March 31, 2017 was 5,000.
EARNINGS TREND SEKm 1703 1603 % Net sales 25,268 24,248 4 Adjusted operating profit before amortization of acquisition related intangible assets (EBITA)2 2,917 2,744 6 Operating profit before amortization of acquisition related intangible assets (EBITA) 2,596 2,558 1 Amortization of acquisition related intangible assets -21 -31 Adjusted operating profit2 2,896 2,713 7 Items affecting comparability -409 -191 Operating profit 2,487 2,522 -1 Financial items -266 -303 Profit before tax 2,221 2,219 0 Adjusted profit before tax2 2,630 2,410 9 Tax -565 -594
Profit for the period 1,656 1,625 2 Earnings per share, SEK 2.08 2.15 2 Excluding items affecting comparability; for amounts see page 13.
F-4Admission to trading of the shares in Essity Aktiebolag (publ) on Nasdaq Stockholm
Financial data for the period January–March 2017
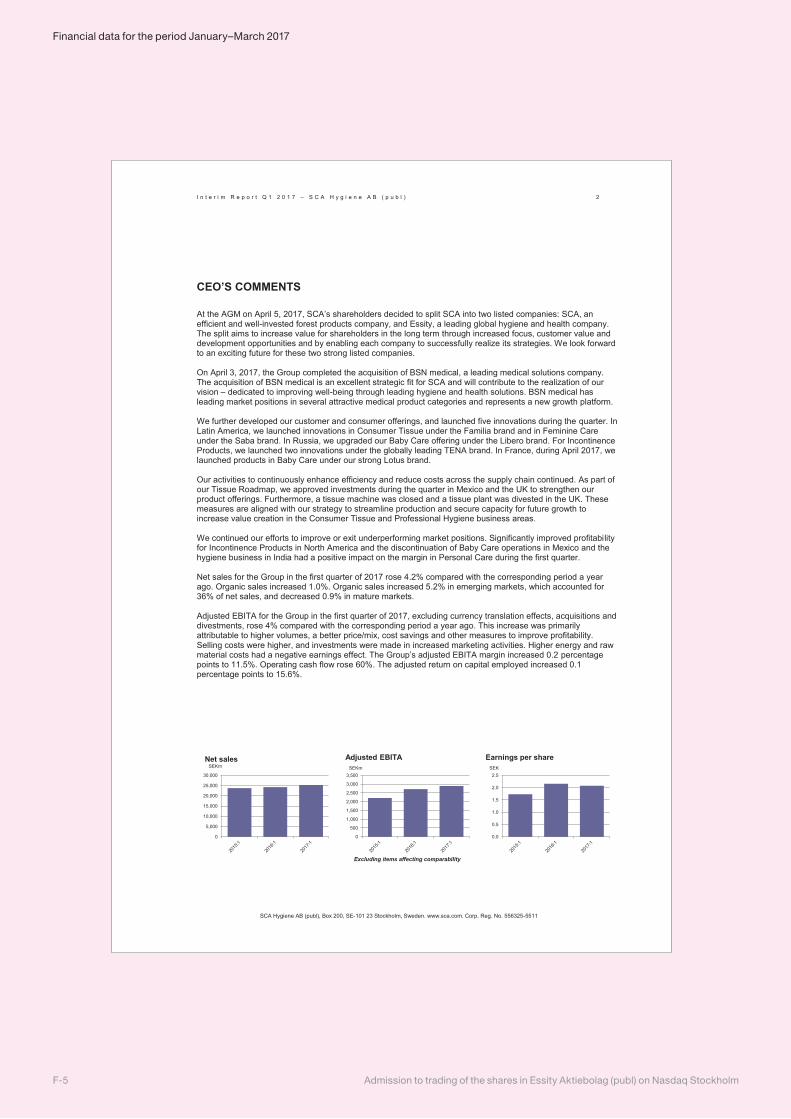
I n t e r i m R e p o r t Q 1 2 0 1 7 – S C A H y g i e n e A B ( p u b l ) 2
SCA Hygiene AB (publ), Box 200, SE-101 23 Stockholm, Sweden. www.sca.com. Corp. Reg. No. 556325-5511
CEO’S COMMENTS At the AGM on April 5, 2017, SCA’s shareholders decided to split SCA into two listed companies: SCA, an efficient and well-invested forest products company, and Essity, a leading global hygiene and health company. The split aims to increase value for shareholders in the long term through increased focus, customer value and development opportunities and by enabling each company to successfully realize its strategies. We look forward to an exciting future for these two strong listed companies. On April 3, 2017, the Group completed the acquisition of BSN medical, a leading medical solutions company. The acquisition of BSN medical is an excellent strategic fit for SCA and will contribute to the realization of our vision – dedicated to improving well-being through leading hygiene and health solutions. BSN medical has leading market positions in several attractive medical product categories and represents a new growth platform. We further developed our customer and consumer offerings, and launched five innovations during the quarter. In Latin America, we launched innovations in Consumer Tissue under the Familia brand and in Feminine Care under the Saba brand. In Russia, we upgraded our Baby Care offering under the Libero brand. For Incontinence Products, we launched two innovations under the globally leading TENA brand. In France, during April 2017, we launched products in Baby Care under our strong Lotus brand. Our activities to continuously enhance efficiency and reduce costs across the supply chain continued. As part of our Tissue Roadmap, we approved investments during the quarter in Mexico and the UK to strengthen our product offerings. Furthermore, a tissue machine was closed and a tissue plant was divested in the UK. These measures are aligned with our strategy to streamline production and secure capacity for future growth to increase value creation in the Consumer Tissue and Professional Hygiene business areas. We continued our efforts to improve or exit underperforming market positions. Significantly improved profitability for Incontinence Products in North America and the discontinuation of Baby Care operations in Mexico and the hygiene business in India had a positive impact on the margin in Personal Care during the first quarter. Net sales for the Group in the first quarter of 2017 rose 4.2% compared with the corresponding period a year ago. Organic sales increased 1.0%. Organic sales increased 5.2% in emerging markets, which accounted for 36% of net sales, and decreased 0.9% in mature markets. Adjusted EBITA for the Group in the first quarter of 2017, excluding currency translation effects, acquisitions and divestments, rose 4% compared with the corresponding period a year ago. This increase was primarily attributable to higher volumes, a better price/mix, cost savings and other measures to improve profitability. Selling costs were higher, and investments were made in increased marketing activities. Higher energy and raw material costs had a negative earnings effect. The Group’s adjusted EBITA margin increased 0.2 percentage points to 11.5%. Operating cash flow rose 60%. The adjusted return on capital employed increased 0.1 percentage points to 15.6%.
Excluding items affecting comparability
0
5,000
10,000
15,000
20,000
25,000
30,000
Net salesSEKm
0
500
1,000
1,500
2,000
2,500
3,000
3,500
Adjusted EBITASEKm
0.0
0.5
1.0
1.5
2.0
2.5
Earnings per shareSEK
Admission to trading of the shares in Essity Aktiebolag (publ) on Nasdaq StockholmF-5
Financial data for the period January–March 2017
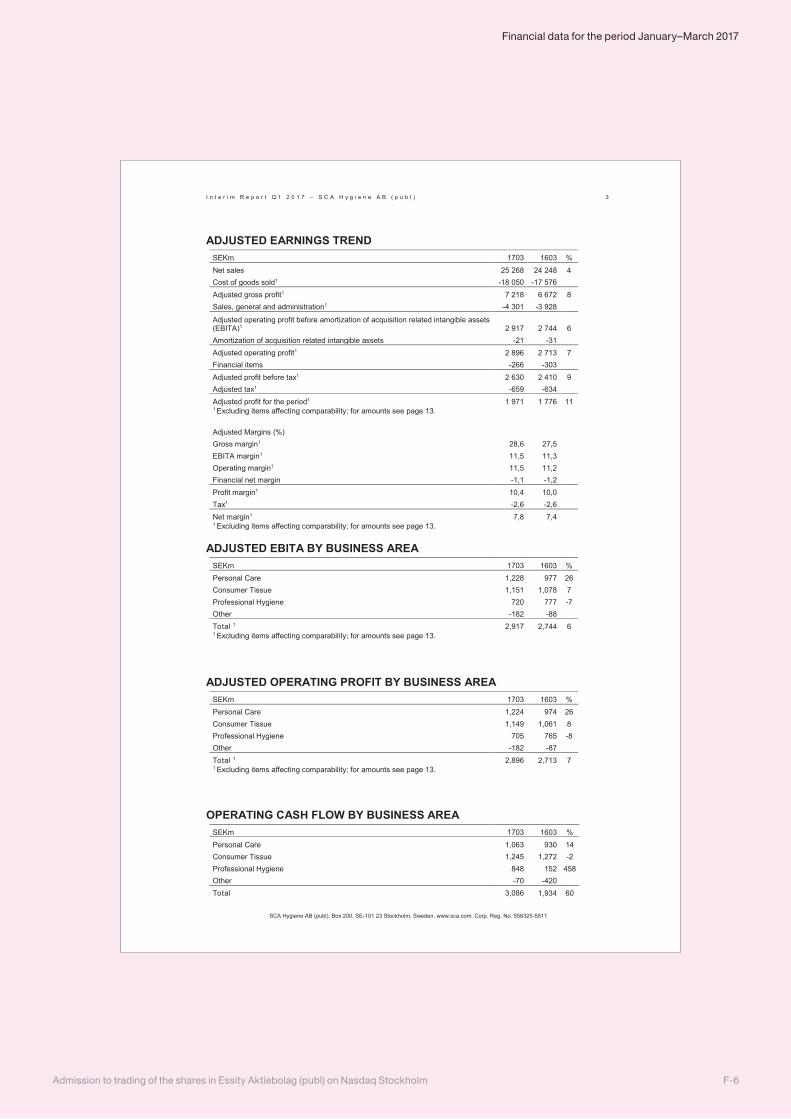
I n t e r i m R e p o r t Q 1 2 0 1 7 – S C A H y g i e n e A B ( p u b l ) 3
SCA Hygiene AB (publ), Box 200, SE-101 23 Stockholm, Sweden. www.sca.com. Corp. Reg. No. 556325-5511
ADJUSTED EARNINGS TREND SEKm 1703 1603 % Net sales 25 268 24 248 4 Cost of goods sold1 -18 050 -17 576 Adjusted gross profit1 7 218 6 672 8 Sales, general and administration1 -4 301 -3 928 Adjusted operating profit before amortization of acquisition related intangible assets (EBITA)1 2 917 2 744 6 Amortization of acquisition related intangible assets -21 -31 Adjusted operating profit1 2 896 2 713 7 Financial items -266 -303 Adjusted profit before tax1 2 630 2 410 9 Adjusted tax1 -659 -634 Adjusted profit for the period1 1 971 1 776 11 1 Excluding items affecting comparability; for amounts see page 13. Adjusted Margins (%) Gross margin1 28,6 27,5 EBITA margin1 11,5 11,3 Operating margin1 11,5 11,2 Financial net margin -1,1 -1,2 Profit margin1 10,4 10,0 Tax1 -2,6 -2,6 Net margin1 7,8 7,4 1 Excluding items affecting comparability; for amounts see page 13.
ADJUSTED EBITA BY BUSINESS AREA SEKm 1703 1603 % Personal Care 1,228 977 26 Consumer Tissue 1,151 1,078 7 Professional Hygiene 720 777 -7 Other -182 -88 Total 1 2,917 2,744 6 1 Excluding items affecting comparability; for amounts see page 13.
ADJUSTED OPERATING PROFIT BY BUSINESS AREA SEKm 1703 1603 % Personal Care 1,224 974 26 Consumer Tissue 1,149 1,061 8 Professional Hygiene 705 765 -8 Other -182 -87 Total 1 2,896 2,713 7 1 Excluding items affecting comparability; for amounts see page 13.
OPERATING CASH FLOW BY BUSINESS AREA SEKm 1703 1603 % Personal Care 1,063 930 14 Consumer Tissue 1,245 1,272 -2 Professional Hygiene 848 152 458 Other -70 -420 Total 3,086 1,934 60
F-6Admission to trading of the shares in Essity Aktiebolag (publ) on Nasdaq Stockholm
Financial data for the period January–March 2017
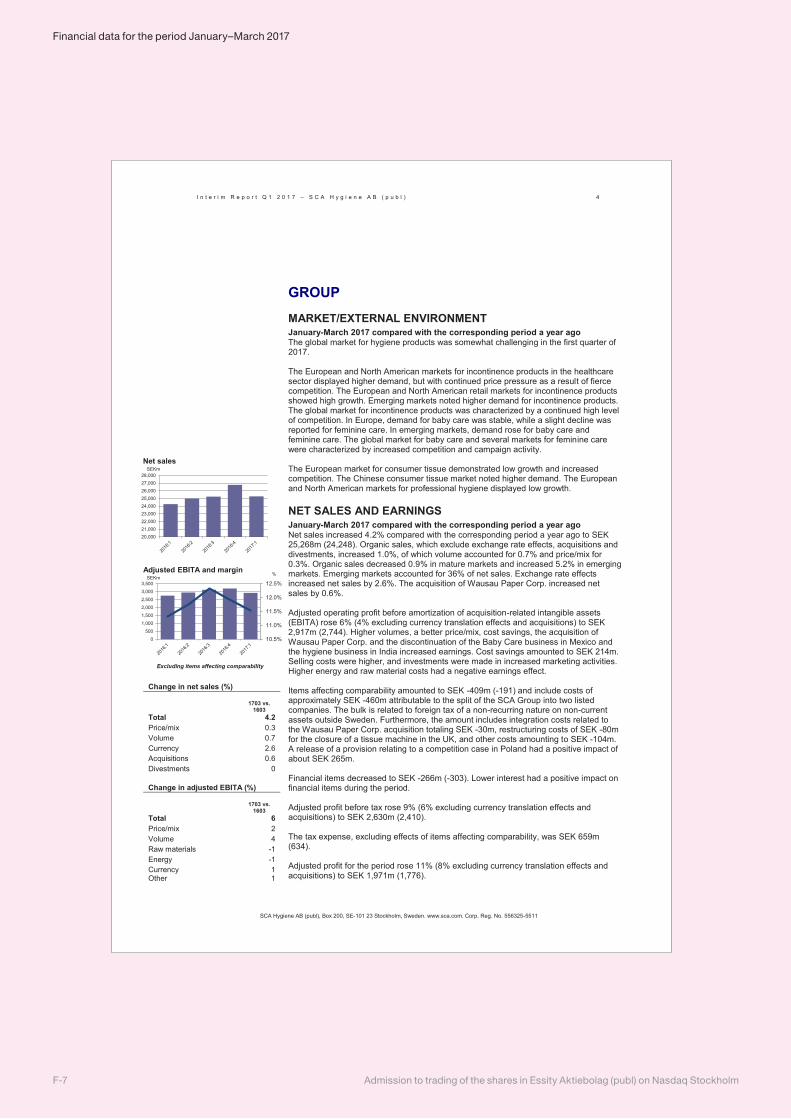
I n t e r i m R e p o r t Q 1 2 0 1 7 – S C A H y g i e n e A B ( p u b l ) 4
SCA Hygiene AB (publ), Box 200, SE-101 23 Stockholm, Sweden. www.sca.com. Corp. Reg. No. 556325-5511
Excluding items affecting comparability
Change in net sales (%) 1703 vs.
1603 Total 4.2 Price/mix 0.3 Volume 0.7 Currency 2.6 Acquisitions 0.6 Divestments 0 Change in adjusted EBITA (%) 1703 vs.
1603 Total 6 Price/mix 2 Volume 4 Raw materials -1 Energy -1 Currency Other
1 1
GROUP
MARKET/EXTERNAL ENVIRONMENT January-March 2017 compared with the corresponding period a year ago The global market for hygiene products was somewhat challenging in the first quarter of 2017. The European and North American markets for incontinence products in the healthcare sector displayed higher demand, but with continued price pressure as a result of fierce competition. The European and North American retail markets for incontinence products showed high growth. Emerging markets noted higher demand for incontinence products. The global market for incontinence products was characterized by a continued high level of competition. In Europe, demand for baby care was stable, while a slight decline was reported for feminine care. In emerging markets, demand rose for baby care and feminine care. The global market for baby care and several markets for feminine care were characterized by increased competition and campaign activity. The European market for consumer tissue demonstrated low growth and increased competition. The Chinese consumer tissue market noted higher demand. The European and North American markets for professional hygiene displayed low growth.
NET SALES AND EARNINGS January-March 2017 compared with the corresponding period a year ago Net sales increased 4.2% compared with the corresponding period a year ago to SEK 25,268m (24,248). Organic sales, which exclude exchange rate effects, acquisitions and divestments, increased 1.0%, of which volume accounted for 0.7% and price/mix for 0.3%. Organic sales decreased 0.9% in mature markets and increased 5.2% in emerging markets. Emerging markets accounted for 36% of net sales. Exchange rate effects increased net sales by 2.6%. The acquisition of Wausau Paper Corp. increased net sales by 0.6%. Adjusted operating profit before amortization of acquisition-related intangible assets (EBITA) rose 6% (4% excluding currency translation effects and acquisitions) to SEK 2,917m (2,744). Higher volumes, a better price/mix, cost savings, the acquisition of Wausau Paper Corp. and the discontinuation of the Baby Care business in Mexico and the hygiene business in India increased earnings. Cost savings amounted to SEK 214m. Selling costs were higher, and investments were made in increased marketing activities. Higher energy and raw material costs had a negative earnings effect. Items affecting comparability amounted to SEK -409m (-191) and include costs of approximately SEK -460m attributable to the split of the SCA Group into two listed companies. The bulk is related to foreign tax of a non-recurring nature on non-current assets outside Sweden. Furthermore, the amount includes integration costs related to the Wausau Paper Corp. acquisition totaling SEK -30m, restructuring costs of SEK -80m for the closure of a tissue machine in the UK, and other costs amounting to SEK -104m. A release of a provision relating to a competition case in Poland had a positive impact of about SEK 265m. Financial items decreased to SEK -266m (-303). Lower interest had a positive impact on financial items during the period. Adjusted profit before tax rose 9% (6% excluding currency translation effects and acquisitions) to SEK 2,630m (2,410). The tax expense, excluding effects of items affecting comparability, was SEK 659m (634). Adjusted profit for the period rose 11% (8% excluding currency translation effects and acquisitions) to SEK 1,971m (1,776).
20,00021,00022,00023,00024,00025,00026,00027,00028,000
Net salesSEKm
10.5%
11.0%
11.5%
12.0%
12.5%
0
500
1,000
1,500
2,000
2,500
3,000
3,500
Adjusted EBITA and marginSEKm
%
Admission to trading of the shares in Essity Aktiebolag (publ) on Nasdaq StockholmF-7
Financial data for the period January–March 2017
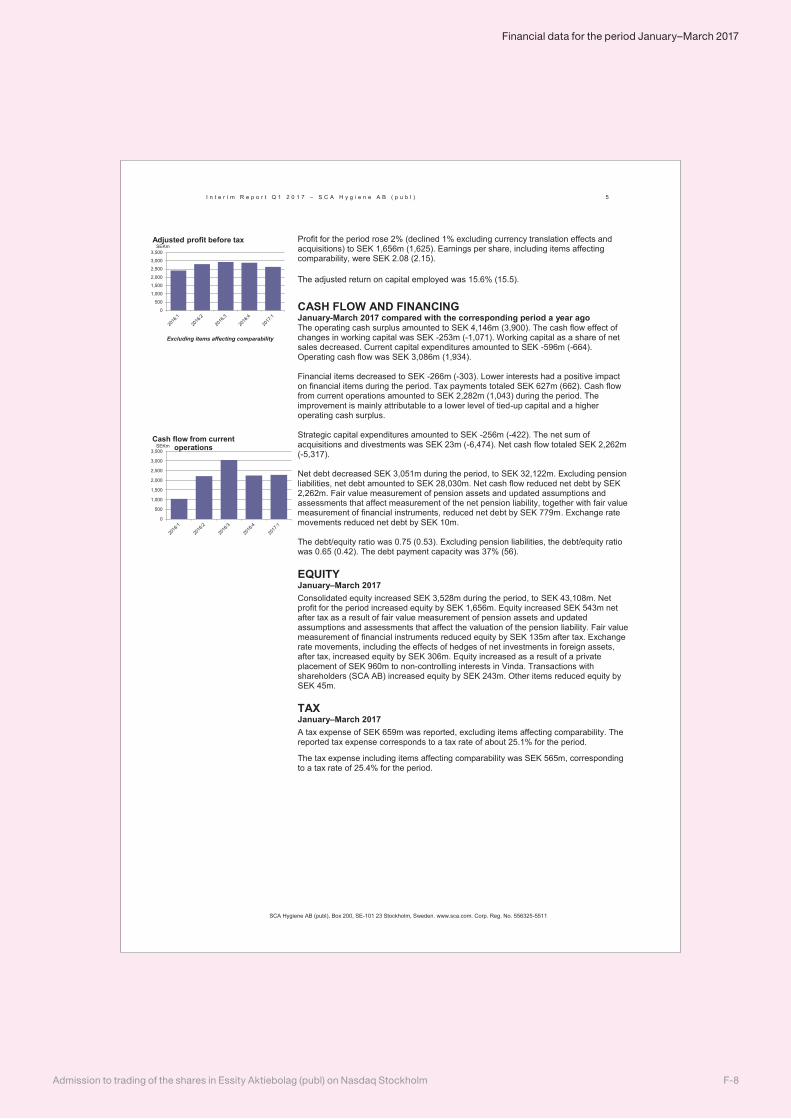
I n t e r i m R e p o r t Q 1 2 0 1 7 – S C A H y g i e n e A B ( p u b l ) 5
SCA Hygiene AB (publ), Box 200, SE-101 23 Stockholm, Sweden. www.sca.com. Corp. Reg. No. 556325-5511
Excluding items affecting comparability
Profit for the period rose 2% (declined 1% excluding currency translation effects and acquisitions) to SEK 1,656m (1,625). Earnings per share, including items affecting comparability, were SEK 2.08 (2.15).
The adjusted return on capital employed was 15.6% (15.5).
CASH FLOW AND FINANCING January-March 2017 compared with the corresponding period a year ago The operating cash surplus amounted to SEK 4,146m (3,900). The cash flow effect of changes in working capital was SEK -253m (-1,071). Working capital as a share of net sales decreased. Current capital expenditures amounted to SEK -596m (-664). Operating cash flow was SEK 3,086m (1,934). Financial items decreased to SEK -266m (-303). Lower interests had a positive impact on financial items during the period. Tax payments totaled SEK 627m (662). Cash flow from current operations amounted to SEK 2,282m (1,043) during the period. The improvement is mainly attributable to a lower level of tied-up capital and a higher operating cash surplus. Strategic capital expenditures amounted to SEK -256m (-422). The net sum of acquisitions and divestments was SEK 23m (-6,474). Net cash flow totaled SEK 2,262m (-5,317). Net debt decreased SEK 3,051m during the period, to SEK 32,122m. Excluding pension liabilities, net debt amounted to SEK 28,030m. Net cash flow reduced net debt by SEK 2,262m. Fair value measurement of pension assets and updated assumptions and assessments that affect measurement of the net pension liability, together with fair value measurement of financial instruments, reduced net debt by SEK 779m. Exchange rate movements reduced net debt by SEK 10m. The debt/equity ratio was 0.75 (0.53). Excluding pension liabilities, the debt/equity ratio was 0.65 (0.42). The debt payment capacity was 37% (56).
EQUITY January–March 2017 Consolidated equity increased SEK 3,528m during the period, to SEK 43,108m. Net profit for the period increased equity by SEK 1,656m. Equity increased SEK 543m net after tax as a result of fair value measurement of pension assets and updated assumptions and assessments that affect the valuation of the pension liability. Fair value measurement of financial instruments reduced equity by SEK 135m after tax. Exchange rate movements, including the effects of hedges of net investments in foreign assets, after tax, increased equity by SEK 306m. Equity increased as a result of a private placement of SEK 960m to non-controlling interests in Vinda. Transactions with shareholders (SCA AB) increased equity by SEK 243m. Other items reduced equity by SEK 45m.
TAX January–March 2017 A tax expense of SEK 659m was reported, excluding items affecting comparability. The reported tax expense corresponds to a tax rate of about 25.1% for the period. The tax expense including items affecting comparability was SEK 565m, corresponding to a tax rate of 25.4% for the period.
0
500
1,000
1,500
2,000
2,500
3,000
3,500
Adjusted profit before taxSEKm
0
500
1,000
1,500
2,000
2,500
3,000
3,500
Cash flow from current operationsSEKm
F-8Admission to trading of the shares in Essity Aktiebolag (publ) on Nasdaq Stockholm
Financial data for the period January–March 2017
I n t e r i m R e p o r t Q 1 2 0 1 7 – S C A H y g i e n e A B ( p u b l ) 6
SCA Hygiene AB (publ), Box 200, SE-101 23 Stockholm, Sweden. www.sca.com. Corp. Reg. No. 556325-5511
EVENTS DURING THE QUARTER SCA Hygiene AB strengthens tissue business in the UK On January 26, 2017, SCA announced that, to meet the growing demand for high-quality tissue and strengthen the product offering in the UK, SCA is investing in a through-air drying (TAD) machine at its tissue plant in Skelmersdale. SCA Hygiene AB has also decided to close an older tissue machine in Stubbins and signed an agreement to divest its tissue plant in Chesterfield to Sidcot Group Limited. These measures are part of SCA Hygiene AB’s Tissue Roadmap and are aligned with the company’s strategy to streamline production and secure capacity for future growth to increase value creation in the Consumer Tissue and Professional Hygiene business areas. Following the investment at the Skelmersdale tissue plant of approximately SEK 160m, the production capacity of high-quality TAD products will be 28,000 tons. The cost for closing the older tissue machine in Stubbins, with an annual production capacity of 20,000 tons, is expected to amount to approximately SEK 120m and will be recognized as an item affecting comparability, of which SEK 80m was recognized in the first quarter of 2017. Approximately SEK 70m of these costs are expected to impact cash flow. Sidcot Group Limited paid a consideration of approximately GBP 3m (approximately SEK 35m) for the production facility in Chesterfield. The facility produces mother reels but has no converting capacity. SCA Hygiene AB will have no internal need for the type of mother reels produced at the plant. The annual production capacity is 31,000 tons. An impairment loss of approximately SEK 10m was recognized as an item affecting comparability in the fourth quarter of 2016. The transaction was completed in the first quarter of 2017. SCA Hygiene AB invests to further strengthen tissue operations in Mexico and baby diaper operations in Europe On February 23, 2017, SCA announced that, to further strengthen competitiveness and enable future growth in the tissue operations in Mexico, the company has decided to invest about USD 105m (approximately SEK 950m) in one of the company’s facilities in the country. To strengthen its baby diaper product offering in Europe, SCA Hygiene AB has also decided to invest about EUR 40m (approximately SEK 380m) in facilities in Europe. The investment in Mexico will support SCA’s high-quality tissue offering under the Regio brand. SCA Hygiene AB raises EUR 2 billion in the bond market On March 15, 2017, SCA announced that SCA Hygiene AB, under its Euro Medium Term Note (EMTN) program, had raised EUR 2bn at an average interest rate of 0.98% and an average tenor of 6.35 years. The purpose of the transaction was to finance the acquisition of BSN medical.
EVENTS AFTER THE END OF THE QUARTER SCA Hygiene AB’s acquisition of BSN medical now closed On April 3, 2017, SCA announced that the company’s acquisition of BSN medical, a leading medical solutions company, had been closed. BSN medical develops, manufactures and sells products within wound care, compression therapy and orthopedics. The purchase price for the shares amounted to EUR 1,400m and takeover of net debt to approximately EUR 1,340m1). SCA Hygiene AB consolidates BSN medical as of April 3, 2017. BSN medical’s sales for 2016 amounted to EUR 850m (SEK 8,038m) and adjusted EBITDA2) for 2016 was EUR 210m (SEK 1,986m). Organic sales, which exclude exchange rate effects, acquisitions and divestments, increased 5.3%. BSN medical will be included in the Personal Care business area. Together with the business unit Incontinence Care, BSN medical will form the new business unit Health and Medical Solutions. This business unit is led by Margareta Lehmann, previously President of SCA Incontinence Care. The BSN medical acquisition is an excellent strategic fit for SCA Hygiene AB, supporting our vision, dedicated to improving well-being through leading hygiene and health solutions, two closely interlinked areas. SCA Hygiene AB’s Incontinence Products
Admission to trading of the shares in Essity Aktiebolag (publ) on Nasdaq StockholmF-9
Financial data for the period January–March 2017
I n t e r i m R e p o r t Q 1 2 0 1 7 – S C A H y g i e n e A B ( p u b l ) 7
SCA Hygiene AB (publ), Box 200, SE-101 23 Stockholm, Sweden. www.sca.com. Corp. Reg. No. 556325-5511
business, with the global leading TENA brand, shares similar positive market characteristics, customer base and sales channels with BSN medical, which provide opportunities for accelerated growth through cross-selling. BSN medical, with well-known brands such as Leukoplast, Cutimed, JOBST, Delta and Actimove, has leading market positions in several attractive medical product categories and provides a new growth platform with future industry consolidation opportunities. The acquisition is expected to realize annual synergies of at least EUR 30m with full effect three years after closing. Restructuring costs are expected to amount to a total of approximately EUR 10m to be incurred in the first three years following completion. The BSN medical acquisition is expected to be accretive to SCA Hygiene AB’s earnings per share from the first year. The company has high cash conversion and an asset-light business model. The acquisition is fully debt-funded. SCA Hygiene AB remains fully committed to retaining a solid investment grade rating. 1) Based on net debt as per December 31, 2016. Final takeover of net debt will be based on March 31, 2017. 2) Excluding items affecting comparability. SCA to become two listed companies: the forest products company SCA and the hygiene and health company Essity On April 5, 2017, the 2017 AGM of SCA decided that all shares in the wholly owned subsidiary SCA Hygiene AB (currently undergoing a change of name to Essity Aktiebolag), comprising the SCA Group’s hygiene business, will be distributed to the shareholders of SCA. The preparations for the distribution and the listing of SCA Hygiene AB are under way, and the intention is that the first day of separate trading in the two companies will be in June 2017. SCA has also convened an extraordinary general meeting at 12:00 CET on May 17, 2017 in Sundsvall to elect new members to the Board of SCA, who are expected to take up their new positions in conjunction with the first day of separate trading in the two companies. Changed financial targets On April 27, 2017, SCA announced that the financial targets for the hygiene business have been updated in conjunction with the split of the Group. The current targets for Personal Care and Tissue have been replaced with targets for the Group. The company will continue to apply targets for organic growth and adjusted return on capital employed (defined as adjusted operating profit before amortization of acquisition-related intangible assets (adjusted EBITA)/capital employed). The target levels have been determined on the basis of the weighted average of the previous targets, taking into account the assessed impact of the BSN medical acquisition. The new targets for the Group are now annual organic growth of above 3% and adjusted return on capital employed of above 15%.
F-10Admission to trading of the shares in Essity Aktiebolag (publ) on Nasdaq Stockholm
Financial data for the period January–March 2017
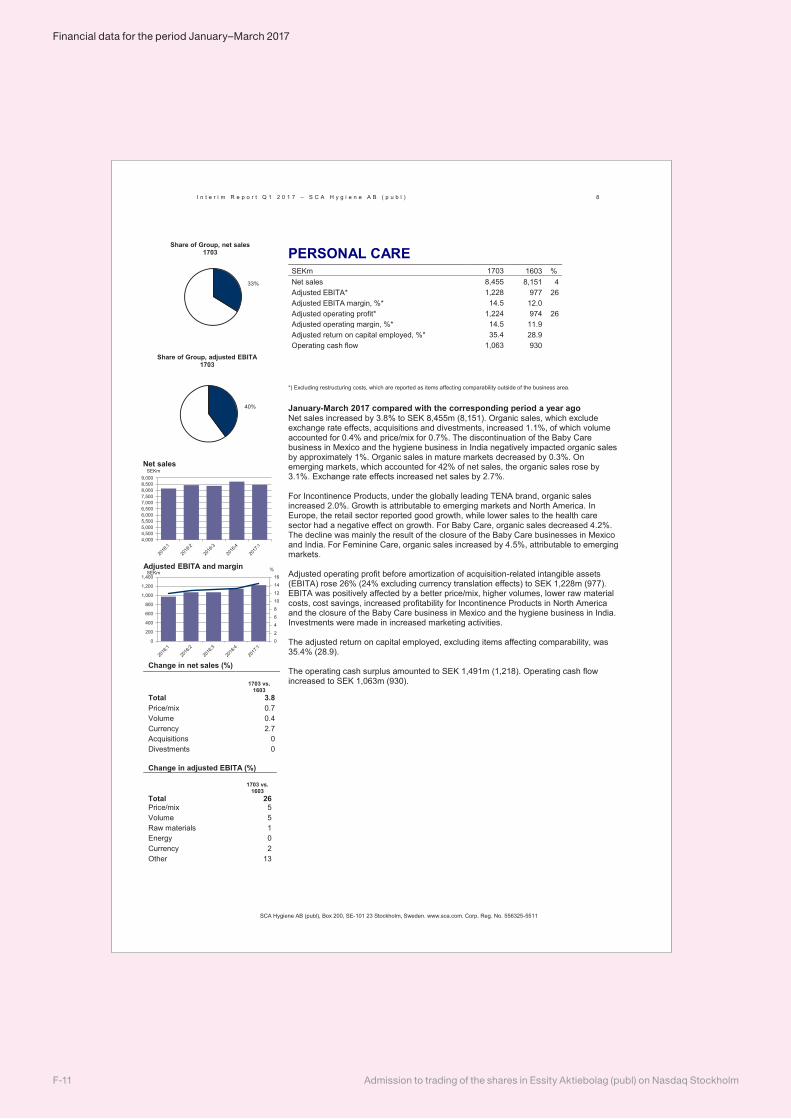
I n t e r i m R e p o r t Q 1 2 0 1 7 – S C A H y g i e n e A B ( p u b l ) 8
SCA Hygiene AB (publ), Box 200, SE-101 23 Stockholm, Sweden. www.sca.com. Corp. Reg. No. 556325-5511
Change in net sales (%) 1703 vs.
1603 Total 3.8 Price/mix 0.7 Volume 0.4 Currency 2.7 Acquisitions 0 Divestments 0 Change in adjusted EBITA (%)
-6
1703 vs. 1603
Total 26 Price/mix 5 Volume 5 Raw materials 1 Energy 0 Currency 2 Other 13
PERSONAL CARE SEKm 1703 1603 % Net sales 8,455 8,151 4 Adjusted EBITA* 1,228 977 26 Adjusted EBITA margin, %* 14.5 12.0 Adjusted operating profit* 1,224 974 26 Adjusted operating margin, %* 14.5 11.9 Adjusted return on capital employed, %* 35.4 28.9 Operating cash flow 1,063 930
*) Excluding restructuring costs, which are reported as items affecting comparability outside of the business area.
January-March 2017 compared with the corresponding period a year ago Net sales increased by 3.8% to SEK 8,455m (8,151). Organic sales, which exclude exchange rate effects, acquisitions and divestments, increased 1.1%, of which volume accounted for 0.4% and price/mix for 0.7%. The discontinuation of the Baby Care business in Mexico and the hygiene business in India negatively impacted organic sales by approximately 1%. Organic sales in mature markets decreased by 0.3%. On emerging markets, which accounted for 42% of net sales, the organic sales rose by 3.1%. Exchange rate effects increased net sales by 2.7%. For Incontinence Products, under the globally leading TENA brand, organic sales increased 2.0%. Growth is attributable to emerging markets and North America. In Europe, the retail sector reported good growth, while lower sales to the health care sector had a negative effect on growth. For Baby Care, organic sales decreased 4.2%. The decline was mainly the result of the closure of the Baby Care businesses in Mexico and India. For Feminine Care, organic sales increased by 4.5%, attributable to emerging markets. Adjusted operating profit before amortization of acquisition-related intangible assets (EBITA) rose 26% (24% excluding currency translation effects) to SEK 1,228m (977). EBITA was positively affected by a better price/mix, higher volumes, lower raw material costs, cost savings, increased profitability for Incontinence Products in North America and the closure of the Baby Care business in Mexico and the hygiene business in India. Investments were made in increased marketing activities. The adjusted return on capital employed, excluding items affecting comparability, was 35.4% (28.9). The operating cash surplus amounted to SEK 1,491m (1,218). Operating cash flow increased to SEK 1,063m (930).
33%
Share of Group, net sales1703
40%
Share of Group, adjusted EBITA1703
4,0004,5005,0005,5006,0006,5007,0007,5008,0008,5009,000
Net salesSEKm
0
2
4
6
8
10
12
14
16
0
200
400
600
800
1,000
1,200
1,400
Adjusted EBITA and marginSEKm
%
Admission to trading of the shares in Essity Aktiebolag (publ) on Nasdaq StockholmF-11
Financial data for the period January–March 2017
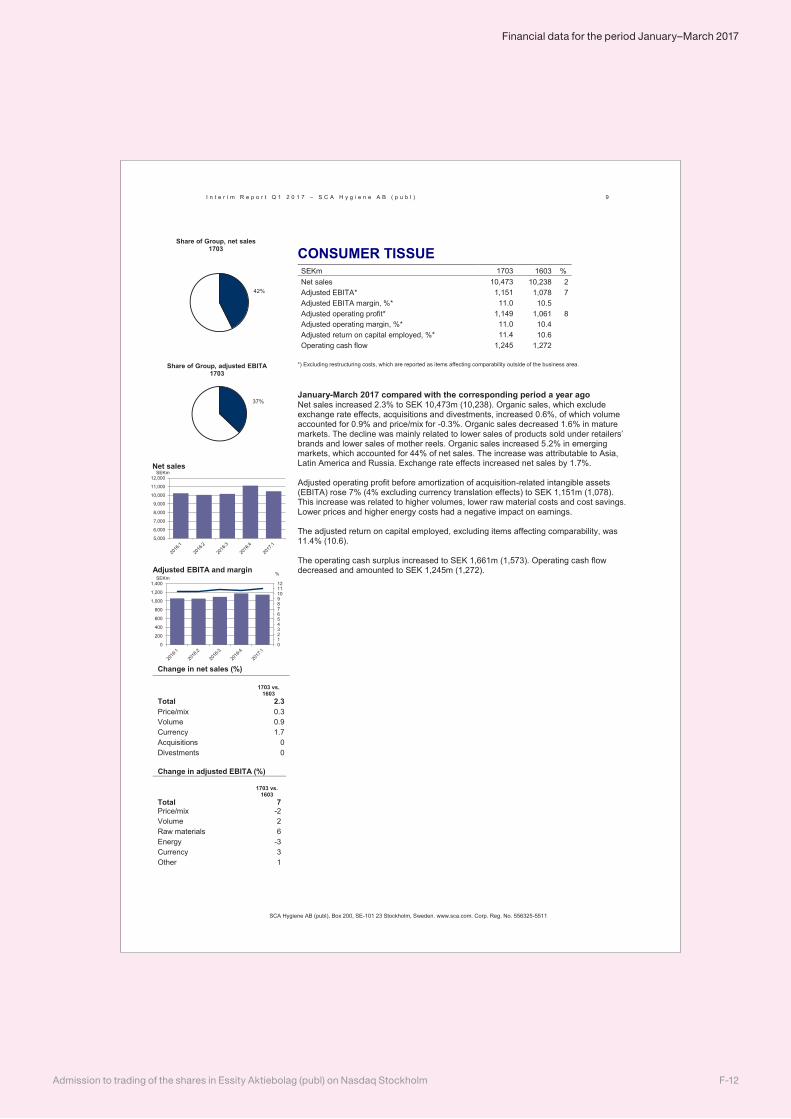
I n t e r i m R e p o r t Q 1 2 0 1 7 – S C A H y g i e n e A B ( p u b l ) 9
SCA Hygiene AB (publ), Box 200, SE-101 23 Stockholm, Sweden. www.sca.com. Corp. Reg. No. 556325-5511
Change in net sales (%) 1703 vs.
1603 Total 2.3 Price/mix 0.3 Volume 0.9 Currency 1.7 Acquisitions 0 Divestments 0 Change in adjusted EBITA (%)
-6
1703 vs. 1603
Total 7 Price/mix -2 Volume 2 Raw materials 6 Energy -3 Currency 3 Other 1
CONSUMER TISSUE SEKm 1703 1603 % Net sales 10,473 10,238 2 Adjusted EBITA* 1,151 1,078 7 Adjusted EBITA margin, %* 11.0 10.5 Adjusted operating profit* 1,149 1,061 8 Adjusted operating margin, %* 11.0 10.4 Adjusted return on capital employed, %* 11.4 10.6 Operating cash flow 1,245 1,272
*) Excluding restructuring costs, which are reported as items affecting comparability outside of the business area.
January-March 2017 compared with the corresponding period a year ago Net sales increased 2.3% to SEK 10,473m (10,238). Organic sales, which exclude exchange rate effects, acquisitions and divestments, increased 0.6%, of which volume accounted for 0.9% and price/mix for -0.3%. Organic sales decreased 1.6% in mature markets. The decline was mainly related to lower sales of products sold under retailers’ brands and lower sales of mother reels. Organic sales increased 5.2% in emerging markets, which accounted for 44% of net sales. The increase was attributable to Asia, Latin America and Russia. Exchange rate effects increased net sales by 1.7%. Adjusted operating profit before amortization of acquisition-related intangible assets (EBITA) rose 7% (4% excluding currency translation effects) to SEK 1,151m (1,078). This increase was related to higher volumes, lower raw material costs and cost savings. Lower prices and higher energy costs had a negative impact on earnings. The adjusted return on capital employed, excluding items affecting comparability, was 11.4% (10.6). The operating cash surplus increased to SEK 1,661m (1,573). Operating cash flow decreased and amounted to SEK 1,245m (1,272).
42%
Share of Group, net sales1703
37%
Share of Group, adjusted EBITA1703
5,000
6,000
7,000
8,000
9,000
10,000
11,000
12,000
Net salesSEKm
0123456789101112
0
200
400
600
800
1,000
1,200
1,400
Adjusted EBITA and marginSEKm
%
F-12Admission to trading of the shares in Essity Aktiebolag (publ) on Nasdaq Stockholm
Financial data for the period January–March 2017
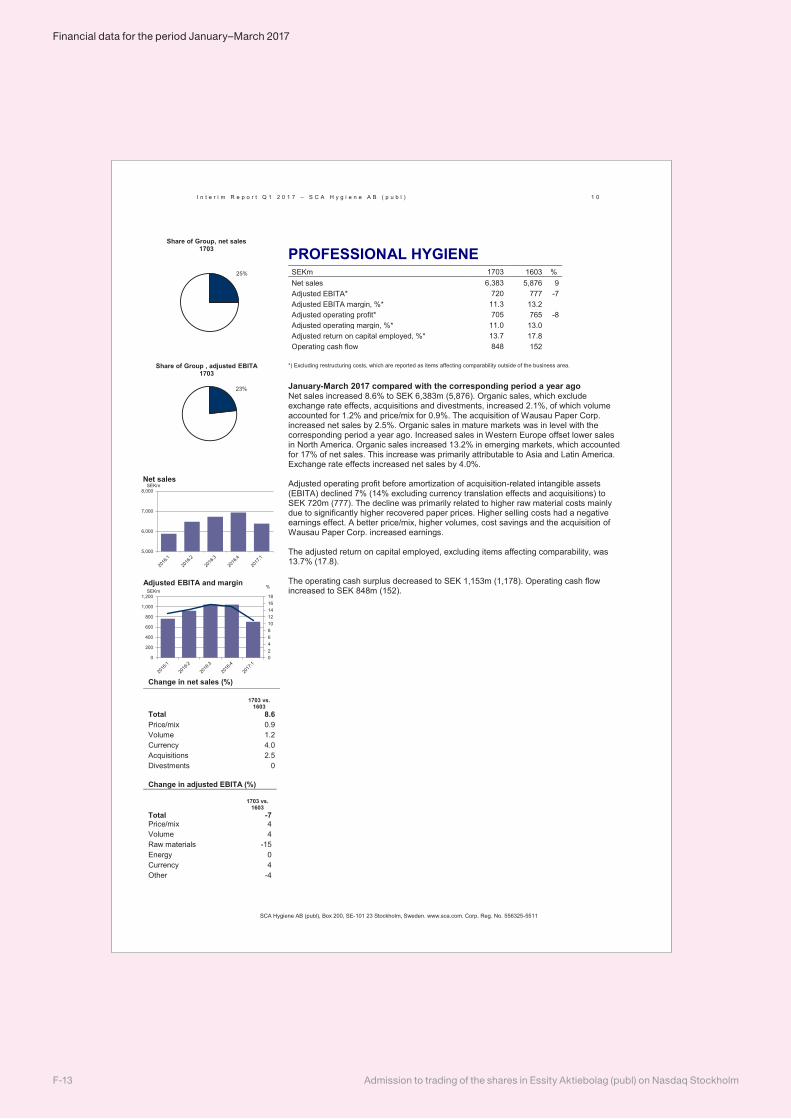
I n t e r i m R e p o r t Q 1 2 0 1 7 – S C A H y g i e n e A B ( p u b l ) 1 0
SCA Hygiene AB (publ), Box 200, SE-101 23 Stockholm, Sweden. www.sca.com. Corp. Reg. No. 556325-5511
Change in net sales (%) 1703 vs.
1603 Total 8.6 Price/mix 0.9 Volume 1.2 Currency 4.0 Acquisitions 2.5 Divestments 0 Change in adjusted EBITA (%)
-6
1703 vs. 1603
Total -7 Price/mix 4 Volume 4 Raw materials -15 Energy 0 Currency 4 Other -4
PROFESSIONAL HYGIENE SEKm 1703 1603 % Net sales 6,383 5,876 9 Adjusted EBITA* 720 777 -7 Adjusted EBITA margin, %* 11.3 13.2 Adjusted operating profit* 705 765 -8 Adjusted operating margin, %* 11.0 13.0 Adjusted return on capital employed, %* 13.7 17.8 Operating cash flow 848 152
*) Excluding restructuring costs, which are reported as items affecting comparability outside of the business area.
January-March 2017 compared with the corresponding period a year ago Net sales increased 8.6% to SEK 6,383m (5,876). Organic sales, which exclude exchange rate effects, acquisitions and divestments, increased 2.1%, of which volume accounted for 1.2% and price/mix for 0.9%. The acquisition of Wausau Paper Corp. increased net sales by 2.5%. Organic sales in mature markets was in level with the corresponding period a year ago. Increased sales in Western Europe offset lower sales in North America. Organic sales increased 13.2% in emerging markets, which accounted for 17% of net sales. This increase was primarily attributable to Asia and Latin America. Exchange rate effects increased net sales by 4.0%. Adjusted operating profit before amortization of acquisition-related intangible assets (EBITA) declined 7% (14% excluding currency translation effects and acquisitions) to SEK 720m (777). The decline was primarily related to higher raw material costs mainly due to significantly higher recovered paper prices. Higher selling costs had a negative earnings effect. A better price/mix, higher volumes, cost savings and the acquisition of Wausau Paper Corp. increased earnings. The adjusted return on capital employed, excluding items affecting comparability, was 13.7% (17.8). The operating cash surplus decreased to SEK 1,153m (1,178). Operating cash flow increased to SEK 848m (152).
25%
Share of Group, net sales1703
23%
Share of Group , adjusted EBITA1703
5,000
6,000
7,000
8,000
Net salesSEKm
024681012141618
0
200
400
600
800
1,000
1,200
Adjusted EBITA and marginSEKm
%
Admission to trading of the shares in Essity Aktiebolag (publ) on Nasdaq StockholmF-13
Financial data for the period January–March 2017
I n t e r i m R e p o r t Q 1 2 0 1 7 – S C A H y g i e n e A B ( p u b l ) 1 1
SCA Hygiene AB (publ), Box 200, SE-101 23 Stockholm, Sweden. www.sca.com. Corp. Reg. No. 556325-5511
The Board of Directors and President certify that the interim report gives a true and fair view of the Parent Company’s and Group’s operations, financial position and results of operations, and describes material risks and uncertainties facing the company and the companies included in the Group. Stockholm, April 27, 2017 SCA Hygiene AB (publ)
Pär Boman Chairman of the
Board
Ewa Björling Board member
Bert Nordberg Board member
Maija-Liisa Friman Board member
Louise Svanberg Board member
Annemarie Gardshol Board member
Lars Rebien Sörensen Board member
Johan Malmquist Board member
Barbara Milian Thoralfsson Board member
Magnus Groth Board member
President and CEO
Review report SCA Hygiene AB (publ), Corp. Reg. No. 556325-5511 Introduction We have reviewed this interim report for SCA Hygiene AB (publ.) as per March 31, 2017, and the three-month period then ended. The Board of Directors and the CEO are responsible for the preparation and presentation of this interim financial information in accordance with IAS 34 and the Swedish Annual Accounts Act. Our responsibility is to express a conclusion on this interim report based on our review. Approach and scope of the review We conducted our review in accordance with the International Standard on Review Engagements, ISRE 2410, Review of Interim Report Performed by the Independent Auditor of the Entity. A review consists of making inquiries, primarily of persons responsible for financial and accounting matters, and applying analytical and other review procedures. A review is substantially less in scope than an audit conducted in accordance with International Standards on Auditing (ISA) and other generally accepted auditing practices. The procedures performed in a review do not enable us to obtain a level of assurance that would make us aware of all significant matters that might be identified in an audit. Therefore, the conclusion based on a review does not give the same level of assurance as a conclusion based on an audit. Conclusion Based on our review, nothing has come to our attention that causes us to believe that the interim report is not prepared, in all material respects, in accordance with IAS 34 and the Annual Accounts Act for the Group, and in accordance with the Annual Accounts Act for the Parent Company. Stockholm, April 27, 2017 Ernst & Young AB Hamish Mabon Authorized Public Accountant
F-14Admission to trading of the shares in Essity Aktiebolag (publ) on Nasdaq Stockholm
Financial data for the period January–March 2017
I n t e r i m R e p o r t Q 1 2 0 1 7 – S C A H y g i e n e A B ( p u b l ) 1 2
SCA Hygiene AB (publ), Box 200, SE-101 23 Stockholm, Sweden. www.sca.com. Corp. Reg. No. 556325-5511
FUTURE REPORTS During 2017, quarterly reports will be published on July 18 and October 26. The year-end report for 2017 will be published on January 26, 2018.
INVITATION TO PRESS CONFERENCE ON INTERIM REPORT FOR THE FIRST QUARTER OF 2017 Media and analysts are invited to a press conference, where this interim report will be presented by Magnus Groth, President and CEO. Time: 10:00 CET, Thursday, April 27, 2017 Location: SCA’s headquarters, Waterfront Building, Klarabergsviadukten 63, Stockholm, Sweden The presentation will be webcast at www.sca.com. To participate, call: +44 (0)20 7162 0077, +1 646 851 2407 or +46 (0)8 505 201 10. Specify “SCA” or conference ID no. 961663. Stockholm, April 27, 2017 SCA Hygiene AB (publ)
Magnus Groth
President and CEO
For further information, please contact: Fredrik Rystedt, CFO and Executive Vice President, +46 8 788 51 31
Johan Karlsson, Vice President Investor Relations, Group Function Communications, +46 8 788 51 30
Linda Nyberg, Vice President Media and Online, Group Function Communications, +46 8 788 51 58
Joséphine Edwall-Björklund, Senior Vice President, Group Function Communications, +46 8 788 52 34 NB:
SCA discloses the information provided herein pursuant to the Securities Markets Act. This report has been prepared in both Swedish and English versions. In case of variations in the content between the two versions, the Swedish version shall govern. The information was submitted for publication, through the agency of the contact person set out below, at 8:00 CET on April 27, 2017. This interim report has been reviewed by the company's auditors.
Karl Stoltz, Media Relations Manager, +46 8 788 51 55
Admission to trading of the shares in Essity Aktiebolag (publ) on Nasdaq StockholmF-15
Financial data for the period January–March 2017
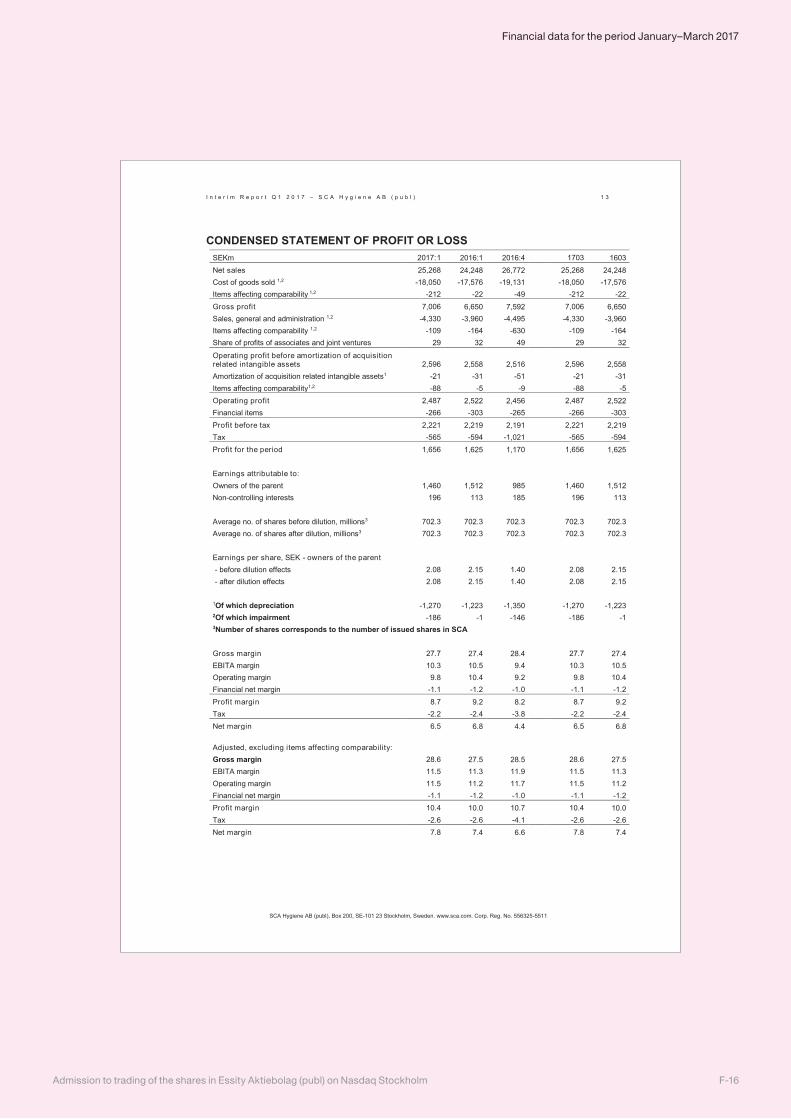
I n t e r i m R e p o r t Q 1 2 0 1 7 – S C A H y g i e n e A B ( p u b l ) 1 3
SCA Hygiene AB (publ), Box 200, SE-101 23 Stockholm, Sweden. www.sca.com. Corp. Reg. No. 556325-5511
CONDENSED STATEMENT OF PROFIT OR LOSS SEKm 2017:1 2016:1 2016:4 1703 1603 Net sales 25,268 24,248 26,772 25,268 24,248 Cost of goods sold 1,2 -18,050 -17,576 -19,131 -18,050 -17,576 Items affecting comparability 1,2 -212 -22 -49 -212 -22 Gross profit 7,006 6,650 7,592 7,006 6,650 Sales, general and administration 1,2 -4,330 -3,960 -4,495 -4,330 -3,960 Items affecting comparability 1,2 -109 -164 -630 -109 -164 Share of profits of associates and joint ventures 29 32 49 29 32
Operating profit before amortization of acquisition related intangible assets 2,596 2,558 2,516 2,596 2,558 Amortization of acquisition related intangible assets1 -21 -31 -51 -21 -31 Items affecting comparability1,2 -88 -5 -9 -88 -5 Operating profit 2,487 2,522 2,456 2,487 2,522 Financial items -266 -303 -265 -266 -303 Profit before tax 2,221 2,219 2,191 2,221 2,219 Tax -565 -594 -1,021 -565 -594 Profit for the period 1,656 1,625 1,170 1,656 1,625
Earnings attributable to: Owners of the parent 1,460 1,512 985 1,460 1,512 Non-controlling interests 196 113 185 196 113
Average no. of shares before dilution, millions3 702.3 702.3 702.3 702.3 702.3 Average no. of shares after dilution, millions3 702.3 702.3 702.3 702.3 702.3
Earnings per share, SEK - owners of the parent - before dilution effects 2.08 2.15 1.40 2.08 2.15 - after dilution effects 2.08 2.15 1.40 2.08 2.15
1Of which depreciation -1,270 -1,223 -1,350 -1,270 -1,223 2Of which impairment -186 -1 -146 -186 -1 3Number of shares corresponds to the number of issued shares in SCA Gross margin 27.7 27.4 28.4 27.7 27.4 EBITA margin 10.3 10.5 9.4 10.3 10.5 Operating margin 9.8 10.4 9.2 9.8 10.4 Financial net margin -1.1 -1.2 -1.0 -1.1 -1.2 Profit margin 8.7 9.2 8.2 8.7 9.2 Tax -2.2 -2.4 -3.8 -2.2 -2.4 Net margin 6.5 6.8 4.4 6.5 6.8 Adjusted, excluding items affecting comparability: Gross margin 28.6 27.5 28.5 28.6 27.5 EBITA margin 11.5 11.3 11.9 11.5 11.3 Operating margin 11.5 11.2 11.7 11.5 11.2 Financial net margin -1.1 -1.2 -1.0 -1.1 -1.2 Profit margin 10.4 10.0 10.7 10.4 10.0 Tax -2.6 -2.6 -4.1 -2.6 -2.6 Net margin 7.8 7.4 6.6 7.8 7.4
F-16Admission to trading of the shares in Essity Aktiebolag (publ) on Nasdaq Stockholm
Financial data for the period January–March 2017
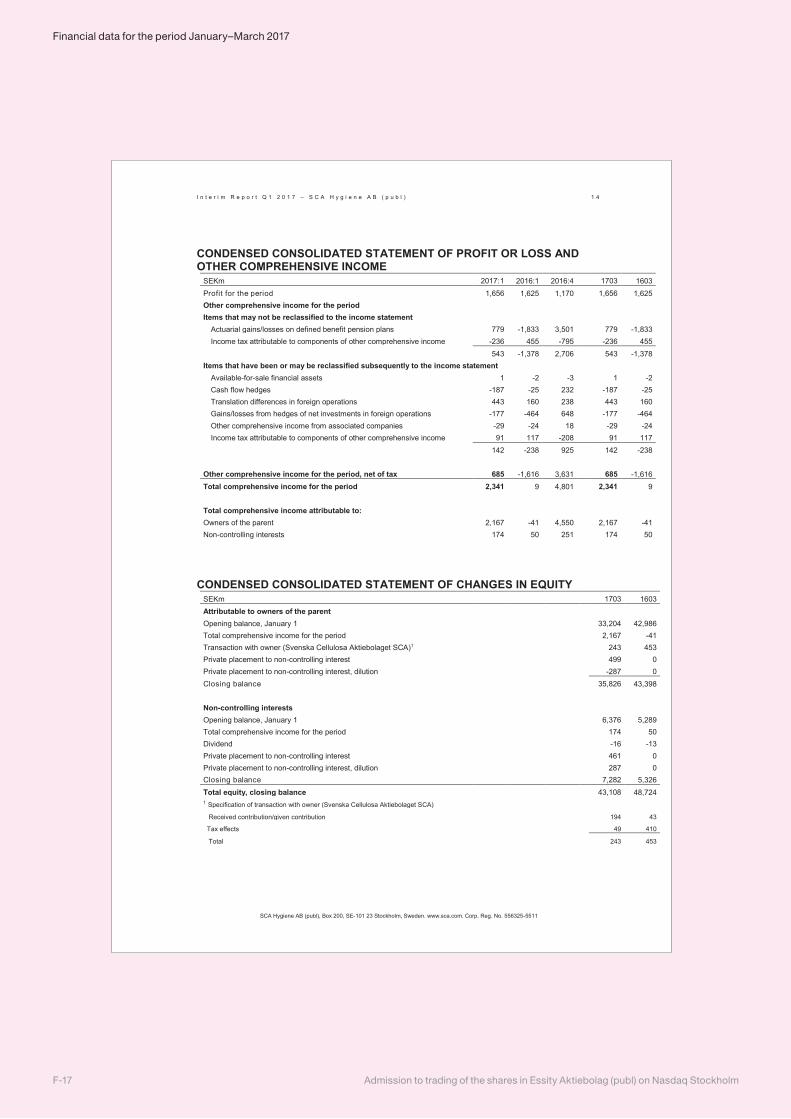
I n t e r i m R e p o r t Q 1 2 0 1 7 – S C A H y g i e n e A B ( p u b l ) 1 4
SCA Hygiene AB (publ), Box 200, SE-101 23 Stockholm, Sweden. www.sca.com. Corp. Reg. No. 556325-5511
CONDENSED CONSOLIDATED STATEMENT OF PROFIT OR LOSS AND OTHER COMPREHENSIVE INCOME
SEKm 2017:1 2016:1 2016:4 1703 1603 Profit for the period 1,656 1,625 1,170 1,656 1,625 Other comprehensive income for the period Items that may not be reclassified to the income statement
Actuarial gains/losses on defined benefit pension plans 779 -1,833 3,501 779 -1,833 Income tax attributable to components of other comprehensive income -236 455 -795 -236 455
543 -1,378 2,706 543 -1,378 Items that have been or may be reclassified subsequently to the income statement
Available-for-sale financial assets 1 -2 -3 1 -2 Cash flow hedges -187 -25 232 -187 -25 Translation differences in foreign operations 443 160 238 443 160 Gains/losses from hedges of net investments in foreign operations -177 -464 648 -177 -464 Other comprehensive income from associated companies -29 -24 18 -29 -24 Income tax attributable to components of other comprehensive income 91 117 -208 91 117
142 -238 925 142 -238
Other comprehensive income for the period, net of tax 685 -1,616 3,631 685 -1,616 Total comprehensive income for the period 2,341 9 4,801 2,341 9
Total comprehensive income attributable to: Owners of the parent 2,167 -41 4,550 2,167 -41 Non-controlling interests 174 50 251 174 50
CONDENSED CONSOLIDATED STATEMENT OF CHANGES IN EQUITY
SEKm 1703 1603 Attributable to owners of the parent Opening balance, January 1 33,204 42,986 Total comprehensive income for the period 2,167 -41 Transaction with owner (Svenska Cellulosa Aktiebolaget SCA)1 243 453 Private placement to non-controlling interest 499 0 Private placement to non-controlling interest, dilution -287 0 Closing balance 35,826 43,398
Non-controlling interests Opening balance, January 1 6,376 5,289 Total comprehensive income for the period 174 50 Dividend -16 -13 Private placement to non-controlling interest 461 0 Private placement to non-controlling interest, dilution 287 0 Closing balance 7,282 5,326 Total equity, closing balance 43,108 48,724 1 Specification of transaction with owner (Svenska Cellulosa Aktiebolaget SCA) Received contribution/given contribution 194 43
Tax effects 49 410
Total 243 453
Admission to trading of the shares in Essity Aktiebolag (publ) on Nasdaq StockholmF-17
Financial data for the period January–March 2017
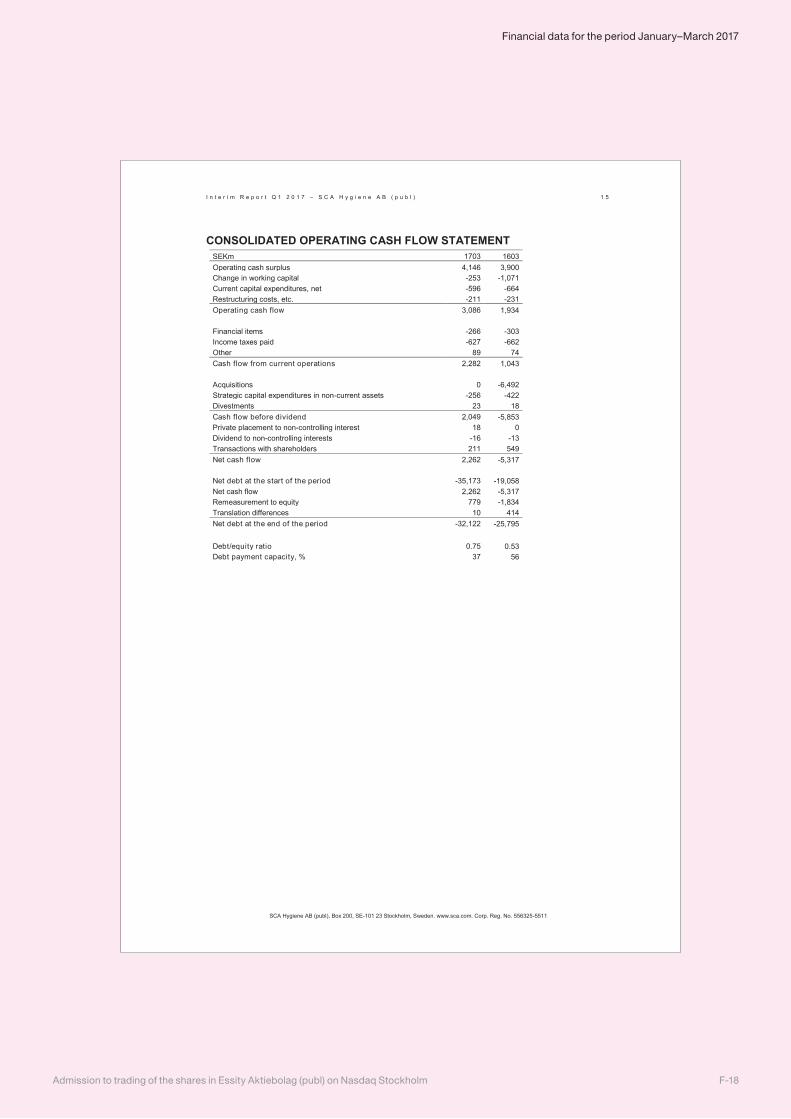
I n t e r i m R e p o r t Q 1 2 0 1 7 – S C A H y g i e n e A B ( p u b l ) 1 5
SCA Hygiene AB (publ), Box 200, SE-101 23 Stockholm, Sweden. www.sca.com. Corp. Reg. No. 556325-5511
CONSOLIDATED OPERATING CASH FLOW STATEMENT SEKm 1703 1603 Operating cash surplus 4,146 3,900 Change in working capital -253 -1,071 Current capital expenditures, net -596 -664 Restructuring costs, etc. -211 -231 Operating cash flow 3,086 1,934 Financial items -266 -303 Income taxes paid -627 -662 Other 89 74 Cash flow from current operations 2,282 1,043 Acquisitions 0 -6,492 Strategic capital expenditures in non-current assets -256 -422 Divestments 23 18 Cash flow before dividend 2,049 -5,853 Private placement to non-controlling interest 18 0 Dividend to non-controlling interests -16 -13 Transactions with shareholders 211 549 Net cash flow 2,262 -5,317 Net debt at the start of the period -35,173 -19,058 Net cash flow 2,262 -5,317 Remeasurement to equity 779 -1,834 Translation differences 10 414 Net debt at the end of the period -32,122 -25,795 Debt/equity ratio 0.75 0.53 Debt payment capacity, % 37 56
F-18Admission to trading of the shares in Essity Aktiebolag (publ) on Nasdaq Stockholm
Financial data for the period January–March 2017
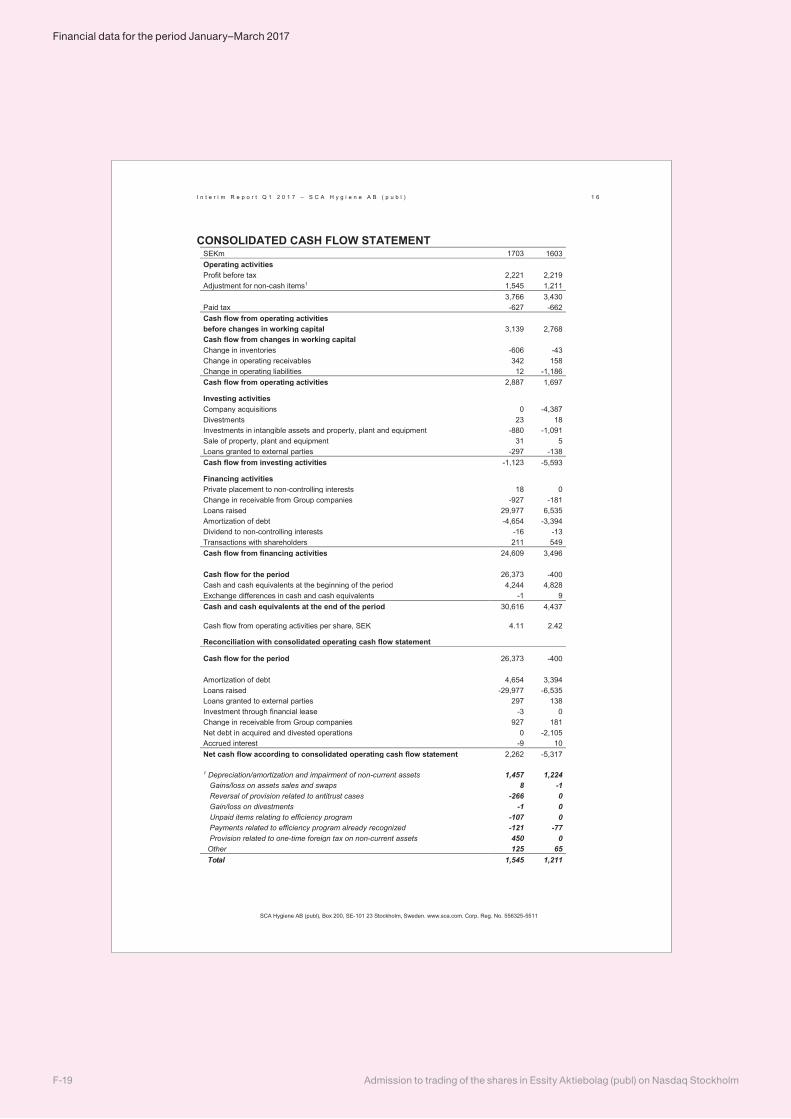
I n t e r i m R e p o r t Q 1 2 0 1 7 – S C A H y g i e n e A B ( p u b l ) 1 6
SCA Hygiene AB (publ), Box 200, SE-101 23 Stockholm, Sweden. www.sca.com. Corp. Reg. No. 556325-5511
CONSOLIDATED CASH FLOW STATEMENT SEKm 1703 1603 Operating activities Profit before tax 2,221 2,219 Adjustment for non-cash items1 1,545 1,211
3,766 3,430 Paid tax -627 -662 Cash flow from operating activities before changes in working capital 3,139 2,768 Cash flow from changes in working capital Change in inventories -606 -43 Change in operating receivables 342 158 Change in operating liabilities 12 -1,186 Cash flow from operating activities 2,887 1,697 Investing activities Company acquisitions 0 -4,387 Divestments 23 18 Investments in intangible assets and property, plant and equipment -880 -1,091 Sale of property, plant and equipment 31 5 Loans granted to external parties -297 -138 Cash flow from investing activities -1,123 -5,593 Financing activities Private placement to non-controlling interests 18 0 Change in receivable from Group companies -927 -181 Loans raised 29,977 6,535 Amortization of debt -4,654 -3,394 Dividend to non-controlling interests -16 -13 Transactions with shareholders 211 549 Cash flow from financing activities 24,609 3,496 Cash flow for the period 26,373 -400 Cash and cash equivalents at the beginning of the period 4,244 4,828 Exchange differences in cash and cash equivalents -1 9 Cash and cash equivalents at the end of the period 30,616 4,437 Cash flow from operating activities per share, SEK 4.11 2.42 Reconciliation with consolidated operating cash flow statement Cash flow for the period 26,373 -400 Amortization of debt 4,654 3,394 Loans raised -29,977 -6,535 Loans granted to external parties 297 138 Investment through financial lease -3 0 Change in receivable from Group companies 927 181 Net debt in acquired and divested operations 0 -2,105 Accrued interest -9 10 Net cash flow according to consolidated operating cash flow statement 2,262 -5,317 1 Depreciation/amortization and impairment of non-current assets 1,457 1,224 Gains/loss on assets sales and swaps 8 -1 Reversal of provision related to antitrust cases -266 0 Gain/loss on divestments -1 0 Unpaid items relating to efficiency program -107 0 Payments related to efficiency program already recognized -121 -77 Provision related to one-time foreign tax on non-current assets 450 0 Other 125 65 Total 1,545 1,211
Admission to trading of the shares in Essity Aktiebolag (publ) on Nasdaq StockholmF-19
Financial data for the period January–March 2017
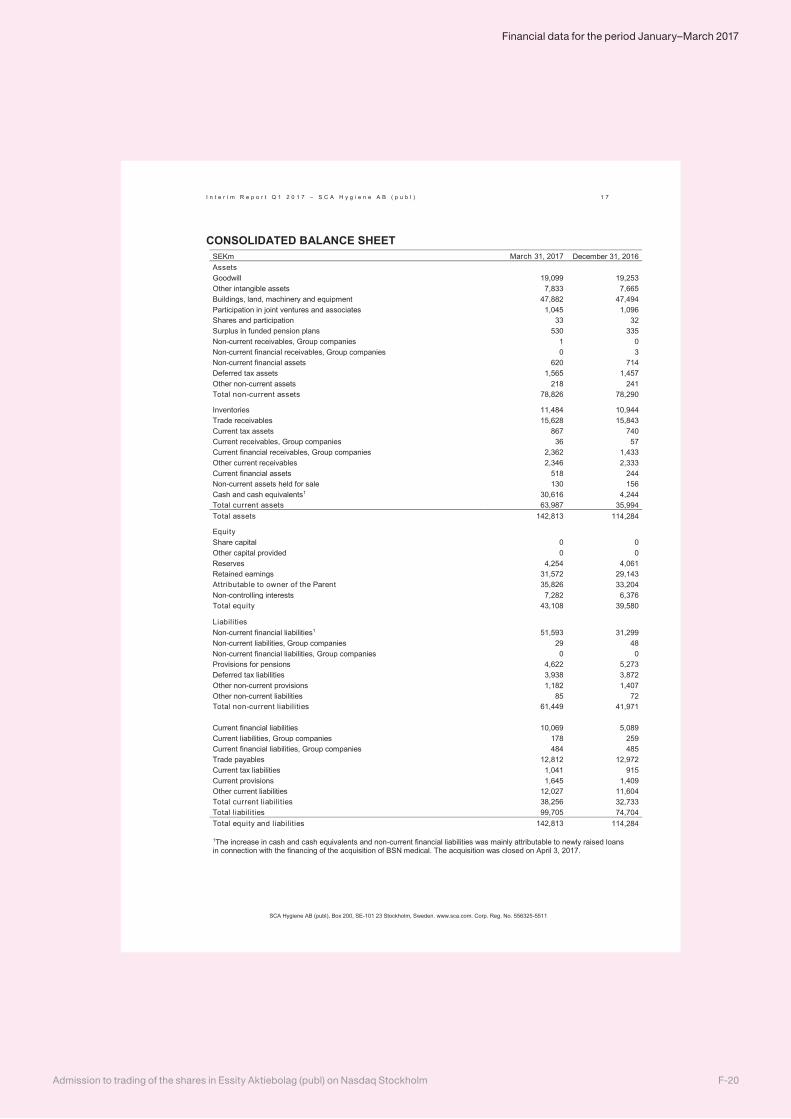
I n t e r i m R e p o r t Q 1 2 0 1 7 – S C A H y g i e n e A B ( p u b l ) 1 7
SCA Hygiene AB (publ), Box 200, SE-101 23 Stockholm, Sweden. www.sca.com. Corp. Reg. No. 556325-5511
CONSOLIDATED BALANCE SHEET SEKm March 31, 2017 December 31, 2016 Assets Goodwill 19,099 19,253 Other intangible assets 7,833 7,665 Buildings, land, machinery and equipment 47,882 47,494 Participation in joint ventures and associates 1,045 1,096 Shares and participation 33 32 Surplus in funded pension plans 530 335 Non-current receivables, Group companies 1 0 Non-current financial receivables, Group companies 0 3 Non-current financial assets 620 714 Deferred tax assets 1,565 1,457 Other non-current assets 218 241 Total non-current assets 78,826 78,290 Inventories 11,484 10,944 Trade receivables 15,628 15,843 Current tax assets 867 740 Current receivables, Group companies 36 57 Current financial receivables, Group companies 2,362 1,433 Other current receivables 2,346 2,333 Current financial assets 518 244 Non-current assets held for sale 130 156 Cash and cash equivalents1 30,616 4,244 Total current assets 63,987 35,994 Total assets 142,813 114,284 Equity Share capital 0 0 Other capital provided 0 0 Reserves 4,254 4,061 Retained earnings 31,572 29,143 Attributable to owner of the Parent 35,826 33,204 Non-controlling interests 7,282 6,376 Total equity 43,108 39,580 Liabilities Non-current financial liabilities1 51,593 31,299 Non-current liabilities, Group companies 29 48 Non-current financial liabilities, Group companies 0 0 Provisions for pensions 4,622 5,273 Deferred tax liabilities 3,938 3,872 Other non-current provisions 1,182 1,407 Other non-current liabilities 85 72 Total non-current liabilities 61,449 41,971 Current financial liabilities 10,069 5,089 Current liabilities, Group companies 178 259 Current financial liabilities, Group companies 484 485 Trade payables 12,812 12,972 Current tax liabilities 1,041 915 Current provisions 1,645 1,409 Other current liabilities 12,027 11,604 Total current liabilities 38,256 32,733 Total liabilities 99,705 74,704 Total equity and liabilities 142,813 114,284 1The increase in cash and cash equivalents and non-current financial liabilities was mainly attributable to newly raised loans in connection with the financing of the acquisition of BSN medical. The acquisition was closed on April 3, 2017.
F-20Admission to trading of the shares in Essity Aktiebolag (publ) on Nasdaq Stockholm
Financial data for the period January–March 2017
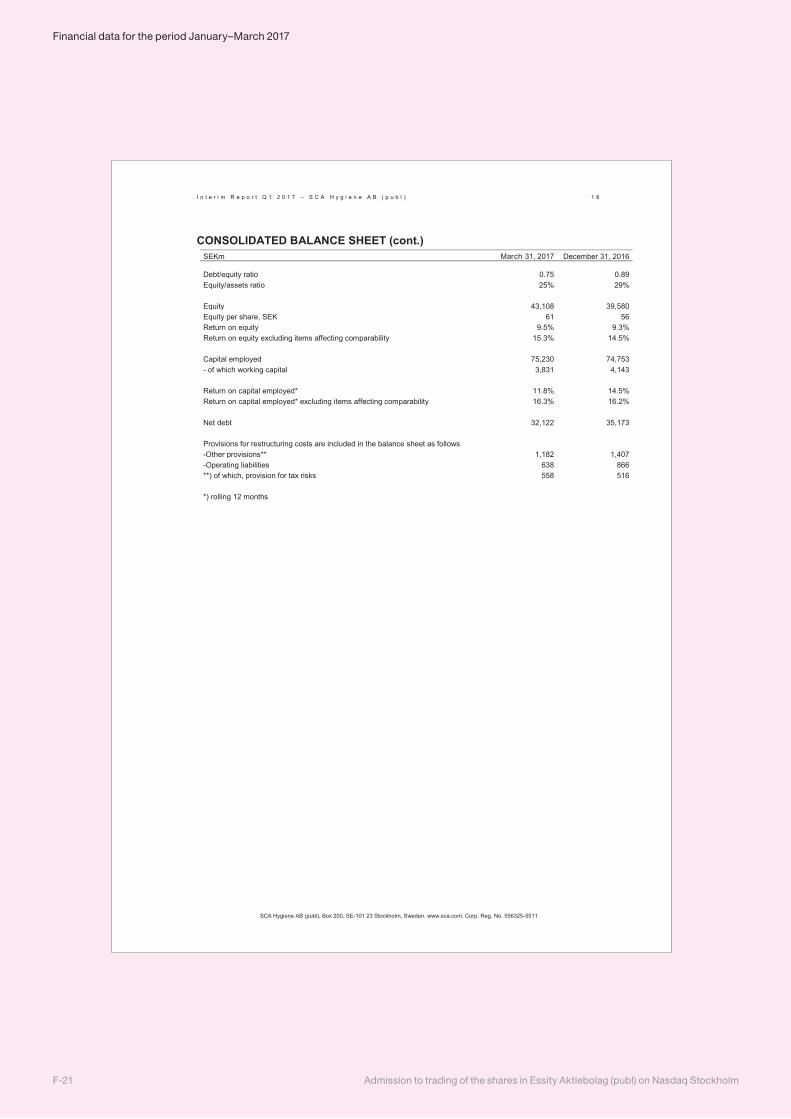
I n t e r i m R e p o r t Q 1 2 0 1 7 – S C A H y g i e n e A B ( p u b l ) 1 8
SCA Hygiene AB (publ), Box 200, SE-101 23 Stockholm, Sweden. www.sca.com. Corp. Reg. No. 556325-5511
CONSOLIDATED BALANCE SHEET (cont.) SEKm March 31, 2017 December 31, 2016 Debt/equity ratio 0.75 0.89 Equity/assets ratio 25% 29% Equity 43,108 39,580 Equity per share, SEK 61 56 Return on equity 9.5% 9.3% Return on equity excluding items affecting comparability 15.3% 14.5% Capital employed 75,230 74,753 - of which working capital 3,831 4,143 Return on capital employed* 11.8% 14.5% Return on capital employed* excluding items affecting comparability 16.3% 16.2% Net debt 32,122 35,173 Provisions for restructuring costs are included in the balance sheet as follows -Other provisions** 1,182 1,407 -Operating liabilities 638 866 **) of which, provision for tax risks 558 516 *) rolling 12 months
Admission to trading of the shares in Essity Aktiebolag (publ) on Nasdaq StockholmF-21
Financial data for the period January–March 2017
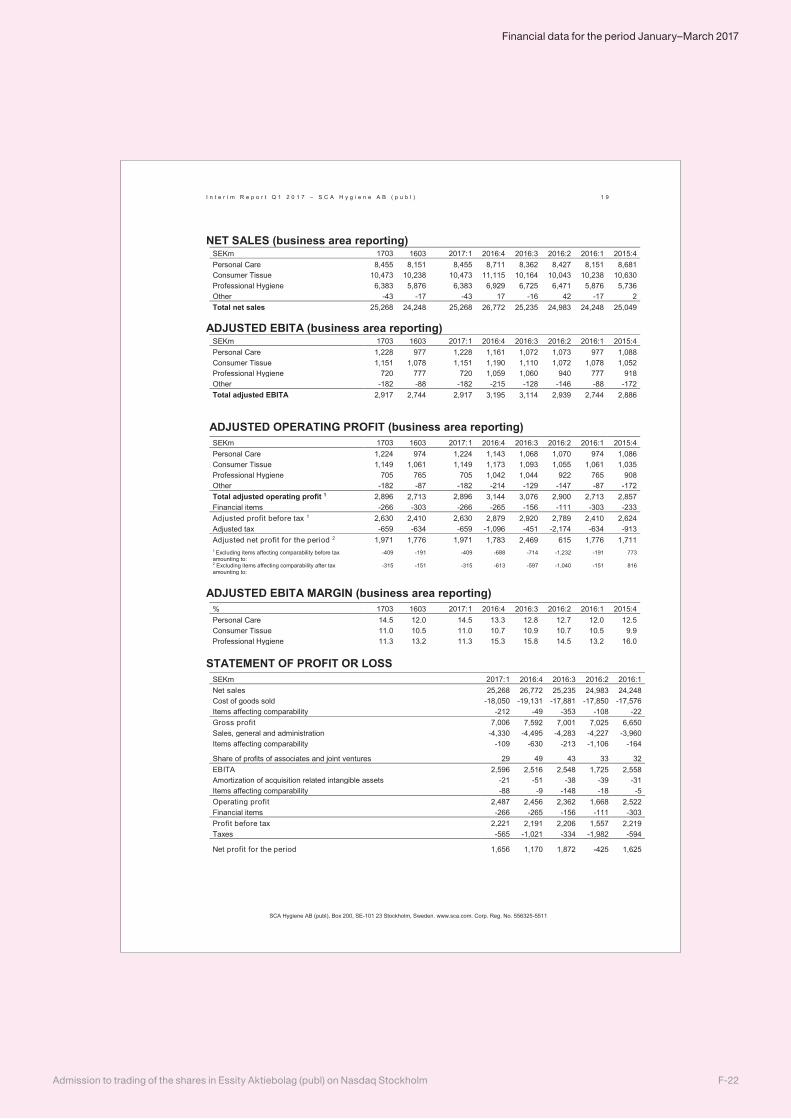
I n t e r i m R e p o r t Q 1 2 0 1 7 – S C A H y g i e n e A B ( p u b l ) 1 9
SCA Hygiene AB (publ), Box 200, SE-101 23 Stockholm, Sweden. www.sca.com. Corp. Reg. No. 556325-5511
NET SALES (business area reporting) SEKm 1703 1603 2017:1 2016:4 2016:3 2016:2 2016:1 2015:4 Personal Care 8,455 8,151 8,455 8,711 8,362 8,427 8,151 8,681 Consumer Tissue 10,473 10,238 10,473 11,115 10,164 10,043 10,238 10,630 Professional Hygiene 6,383 5,876 6,383 6,929 6,725 6,471 5,876 5,736 Other -43 -17 -43 17 -16 42 -17 2 Total net sales 25,268 24,248 25,268 26,772 25,235 24,983 24,248 25,049
ADJUSTED EBITA (business area reporting)
SEKm 1703 1603 2017:1 2016:4 2016:3 2016:2 2016:1 2015:4 Personal Care 1,228 977 1,228 1,161 1,072 1,073 977 1,088 Consumer Tissue 1,151 1,078 1,151 1,190 1,110 1,072 1,078 1,052 Professional Hygiene 720 777 720 1,059 1,060 940 777 918 Other -182 -88 -182 -215 -128 -146 -88 -172 Total adjusted EBITA 2,917 2,744 2,917 3,195 3,114 2,939 2,744 2,886
ADJUSTED OPERATING PROFIT (business area reporting) SEKm 1703 1603 2017:1 2016:4 2016:3 2016:2 2016:1 2015:4 Personal Care 1,224 974 1,224 1,143 1,068 1,070 974 1,086 Consumer Tissue 1,149 1,061 1,149 1,173 1,093 1,055 1,061 1,035 Professional Hygiene 705 765 705 1,042 1,044 922 765 908 Other -182 -87 -182 -214 -129 -147 -87 -172 Total adjusted operating profit 1 2,896 2,713 2,896 3,144 3,076 2,900 2,713 2,857 Financial items -266 -303 -266 -265 -156 -111 -303 -233 Adjusted profit before tax 1 2,630 2,410 2,630 2,879 2,920 2,789 2,410 2,624 Adjusted tax -659 -634 -659 -1,096 -451 -2,174 -634 -913 Adjusted net profit for the period 2 1,971 1,776 1,971 1,783 2,469 615 1,776 1,711 1 Excluding items affecting comparability before tax amounting to:
-409 -191
-409 -688 -714 -1,232 -191 773
2 Excluding items affecting comparability after tax amounting to:
-315 -151
-315 -613 -597 -1,040 -151 816
ADJUSTED EBITA MARGIN (business area reporting) % 1703 1603 2017:1 2016:4 2016:3 2016:2 2016:1 2015:4 Personal Care 14.5 12.0 14.5 13.3 12.8 12.7 12.0 12.5 Consumer Tissue 11.0 10.5 11.0 10.7 10.9 10.7 10.5 9.9 Professional Hygiene 11.3 13.2 11.3 15.3 15.8 14.5 13.2 16.0
STATEMENT OF PROFIT OR LOSS SEKm 2017:1 2016:4 2016:3 2016:2 2016:1 Net sales 25,268 26,772 25,235 24,983 24,248 Cost of goods sold -18,050 -19,131 -17,881 -17,850 -17,576 Items affecting comparability -212 -49 -353 -108 -22 Gross profit 7,006 7,592 7,001 7,025 6,650 Sales, general and administration -4,330 -4,495 -4,283 -4,227 -3,960 Items affecting comparability -109 -630 -213 -1,106 -164
Share of profits of associates and joint ventures 29 49 43 33 32 EBITA 2,596 2,516 2,548 1,725 2,558 Amortization of acquisition related intangible assets -21 -51 -38 -39 -31 Items affecting comparability -88 -9 -148 -18 -5 Operating profit 2,487 2,456 2,362 1,668 2,522 Financial items -266 -265 -156 -111 -303 Profit before tax 2,221 2,191 2,206 1,557 2,219 Taxes -565 -1,021 -334 -1,982 -594
Net profit for the period 1,656 1,170 1,872 -425 1,625
F-22Admission to trading of the shares in Essity Aktiebolag (publ) on Nasdaq Stockholm
Financial data for the period January–March 2017
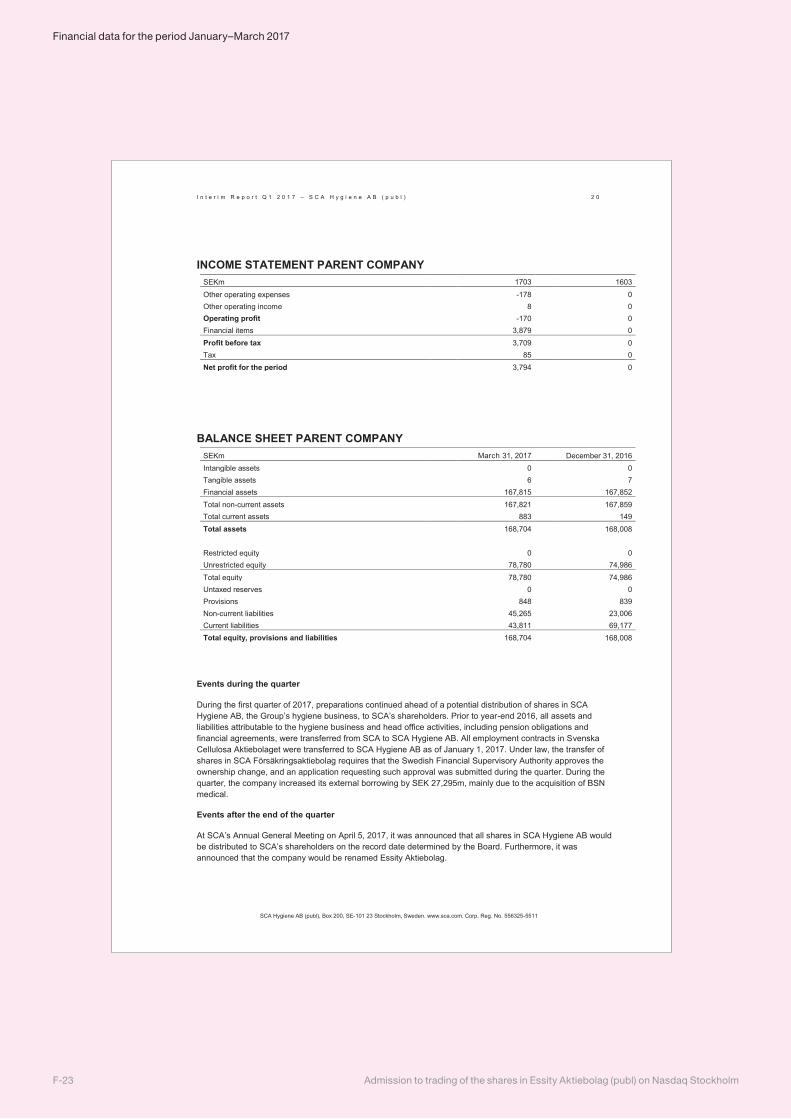
I n t e r i m R e p o r t Q 1 2 0 1 7 – S C A H y g i e n e A B ( p u b l ) 2 0
SCA Hygiene AB (publ), Box 200, SE-101 23 Stockholm, Sweden. www.sca.com. Corp. Reg. No. 556325-5511
INCOME STATEMENT PARENT COMPANY SEKm 1703 1603 Other operating expenses -178 0 Other operating income 8 0 Operating profit -170 0 Financial items 3,879 0 Profit before tax 3,709 0 Tax 85 0 Net profit for the period 3,794 0
BALANCE SHEET PARENT COMPANY SEKm March 31, 2017 December 31, 2016 Intangible assets 0 0 Tangible assets 6 7 Financial assets 167,815 167,852 Total non-current assets 167,821 167,859 Total current assets 883 149 Total assets 168,704 168,008
Restricted equity 0 0 Unrestricted equity 78,780 74,986 Total equity 78,780 74,986 Untaxed reserves 0 0 Provisions 848 839 Non-current liabilities 45,265 23,006 Current liabilities 43,811 69,177 Total equity, provisions and liabilities 168,704 168,008
Events during the quarter
During the first quarter of 2017, preparations continued ahead of a potential distribution of shares in SCA Hygiene AB, the Group’s hygiene business, to SCA’s shareholders. Prior to year-end 2016, all assets and liabilities attributable to the hygiene business and head office activities, including pension obligations and financial agreements, were transferred from SCA to SCA Hygiene AB. All employment contracts in Svenska Cellulosa Aktiebolaget were transferred to SCA Hygiene AB as of January 1, 2017. Under law, the transfer of shares in SCA Försäkringsaktiebolag requires that the Swedish Financial Supervisory Authority approves the ownership change, and an application requesting such approval was submitted during the quarter. During the quarter, the company increased its external borrowing by SEK 27,295m, mainly due to the acquisition of BSN medical.
Events after the end of the quarter
At SCA’s Annual General Meeting on April 5, 2017, it was announced that all shares in SCA Hygiene AB would be distributed to SCA’s shareholders on the record date determined by the Board. Furthermore, it was announced that the company would be renamed Essity Aktiebolag.
Admission to trading of the shares in Essity Aktiebolag (publ) on Nasdaq StockholmF-23
Financial data for the period January–March 2017
I n t e r i m R e p o r t Q 1 2 0 1 7 – S C A H y g i e n e A B ( p u b l ) 2 1
SCA Hygiene AB (publ), Box 200, SE-101 23 Stockholm, Sweden. www.sca.com. Corp. Reg. No. 556325-5511
NOTES
1 ACCOUNTING PRINCIPLES This interim report has been prepared in accordance with IAS 34 and recommendation RFR 1 of the Swedish Financial Reporting Board (RFR), and with regards to the Parent Company, RFR 2. Effective January 1, 2017, SCA applies the following new or amended International Financial Reporting Standards (IFRS):
Amendments to IAS 12: Recognition of Deferred Tax Assets for Unrealized Losses Amendments to IAS 7: Disclosure Initiative
These amendments are not judged to have any material impact on the Group’s or Parent Company’s result of operations or financial position. In other respects, the accounting principles applied correspond to those described in the 2016 Annual Report. At SCA’s Annual General Meeting on April 5, 2017, it was decided to distribute the hygiene business. Accordingly, a review has been conducted in accordance with IFRS 8 Operating Segments. SCA Hygiene AB decided to divide operations into three segments, with Tissue being split into Consumer Tissue and Professional Hygiene. In addition, Personal Care will continue to form a separate segment and will also include, as of the second quarter, the new acquisition BSN medical, Medical Solutions, which is in line with how the new organization will be developed and managed in the future. Comparative periods have been restated in the corresponding manner. SCA Hygiene AB has also decided to continue to present a function-based income statement, but increase the number of lines in the income statement by reporting amortization for acquisition-related intangible assets on a separate line, thereby making it easier to compare results with other companies irrespective of whether business activities are based on acquisitions or organic growth. In addition, the company has decided to introduce EBITA as a subtotal in the consolidated income statement, refer to Note 6 for further information.
2 RISKS AND UNCERTAINTIES SCA Hygiene AB’s risk exposure and risk management are described on pages 25-31 of the 2016 SCA Hygiene AB Annual Report. No significant changes have taken place that have affected the reported risks. Risks in conjunction with company acquisitions are analyzed in the due diligence processes that SCA carries out prior to all acquisitions. In cases where acquisitions have been carried out that may affect the assessment of SCA’s risk exposure, these are described under the heading “Other events” in the interim reports. Processes for risk management SCA’s Board determines the Group’s strategic direction based on recommendations from the Executive Management Team. Responsibility for the long-term, overall management of strategic risks corresponds to the company’s delegation structure, from the Board to the CEO and from the CEO to the business unit presidents. This means that most operational risks are managed by SCA’s business units at the local level, but that they are coordinated when considered necessary. The tools used in this coordination consist primarily of the business units’ regular reporting and the annual strategy process, where risks and risk management are a part of the process. SCA’s financial risk management is centralized, as is the Group’s internal bank for the Group companies’ financial transactions and management of the Group’s energy risks. Financial risks are managed in accordance with the Group’s finance policy, which is adopted by SCA’s Board and which – together with SCA’s energy risk policy – makes up a framework for risk management. Risks are aggregated and monitored on a regular basis to ensure compliance with these guidelines. SCA has also centralized other risk management. SCA has a staff function for internal audit, which monitors compliance in the organization with the Group’s policies.
F-24Admission to trading of the shares in Essity Aktiebolag (publ) on Nasdaq Stockholm
Financial data for the period January–March 2017
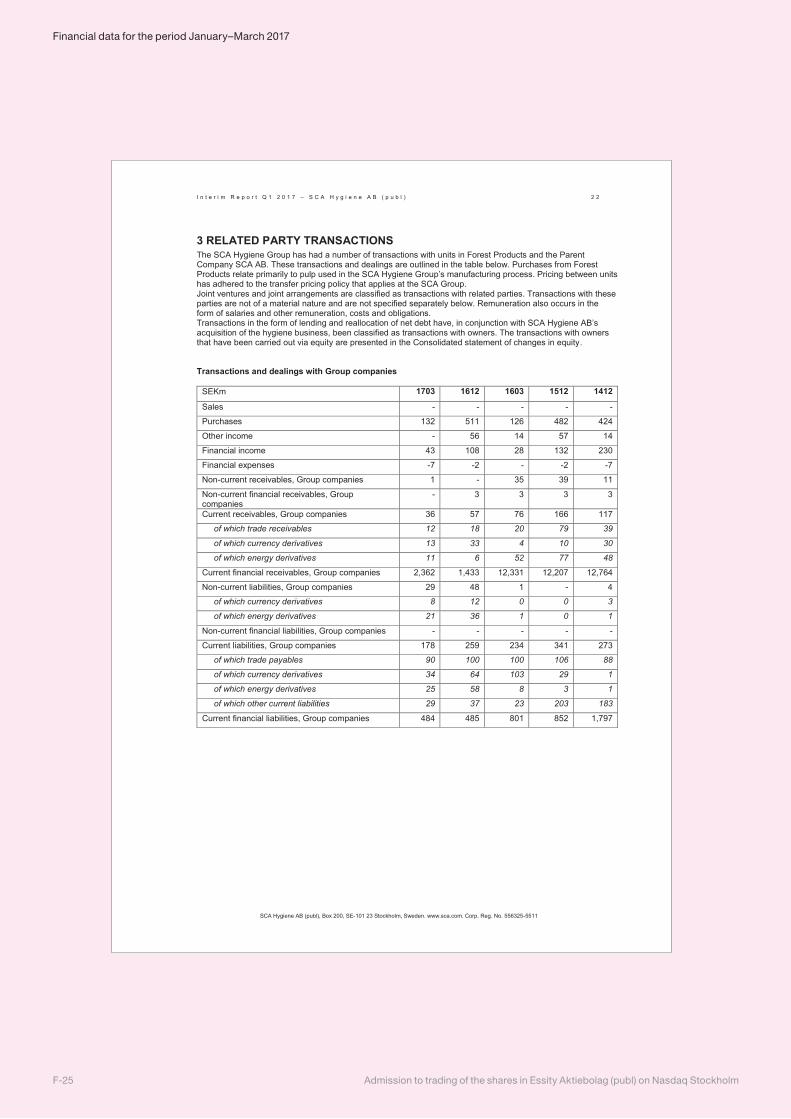
I n t e r i m R e p o r t Q 1 2 0 1 7 – S C A H y g i e n e A B ( p u b l ) 2 2
SCA Hygiene AB (publ), Box 200, SE-101 23 Stockholm, Sweden. www.sca.com. Corp. Reg. No. 556325-5511
3 RELATED PARTY TRANSACTIONS The SCA Hygiene Group has had a number of transactions with units in Forest Products and the Parent Company SCA AB. These transactions and dealings are outlined in the table below. Purchases from Forest Products relate primarily to pulp used in the SCA Hygiene Group’s manufacturing process. Pricing between units has adhered to the transfer pricing policy that applies at the SCA Group. Joint ventures and joint arrangements are classified as transactions with related parties. Transactions with these parties are not of a material nature and are not specified separately below. Remuneration also occurs in the form of salaries and other remuneration, costs and obligations. Transactions in the form of lending and reallocation of net debt have, in conjunction with SCA Hygiene AB’s acquisition of the hygiene business, been classified as transactions with owners. The transactions with owners that have been carried out via equity are presented in the Consolidated statement of changes in equity. Transactions and dealings with Group companies
SEKm 1703 1612 1603 1512 1412
Sales - - - - -
Purchases 132 511 126 482 424
Other income - 56 14 57 14
Financial income 43 108 28 132 230
Financial expenses -7 -2 - -2 -7
Non-current receivables, Group companies 1 - 35 39 11
Non-current financial receivables, Group companies
- 3 3 3 3
Current receivables, Group companies 36 57 76 166 117
of which trade receivables 12 18 20 79 39
of which currency derivatives 13 33 4 10 30
of which energy derivatives 11 6 52 77 48
Current financial receivables, Group companies 2,362 1,433 12,331 12,207 12,764
Non-current liabilities, Group companies 29 48 1 - 4
of which currency derivatives 8 12 0 0 3
of which energy derivatives 21 36 1 0 1
Non-current financial liabilities, Group companies - - - - -
Current liabilities, Group companies 178 259 234 341 273
of which trade payables 90 100 100 106 88
of which currency derivatives 34 64 103 29 1
of which energy derivatives 25 58 8 3 1
of which other current liabilities 29 37 23 203 183
Current financial liabilities, Group companies 484 485 801 852 1,797
Admission to trading of the shares in Essity Aktiebolag (publ) on Nasdaq StockholmF-25
Financial data for the period January–March 2017
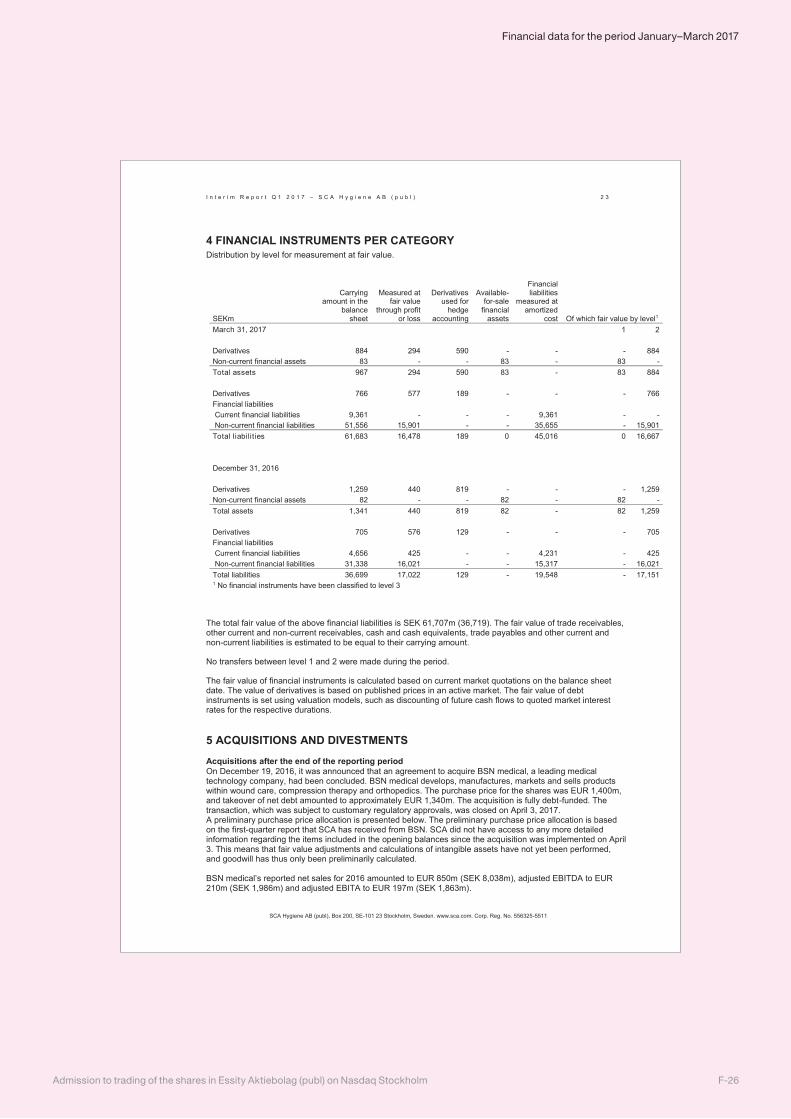
I n t e r i m R e p o r t Q 1 2 0 1 7 – S C A H y g i e n e A B ( p u b l ) 2 3
SCA Hygiene AB (publ), Box 200, SE-101 23 Stockholm, Sweden. www.sca.com. Corp. Reg. No. 556325-5511
4 FINANCIAL INSTRUMENTS PER CATEGORY Distribution by level for measurement at fair value.
SEKm
Carrying amount in the
balance sheet
Measured at fair value
through profit or loss
Derivatives used for
hedge accounting
Available-for-sale
financial assets
Financial liabilities
measured at amortized
cost Of which fair value by level1 March 31, 2017 1 2 Derivatives 884 294 590 - - - 884 Non-current financial assets 83 - - 83 - 83 - Total assets 967 294 590 83 - 83 884 Derivatives 766 577 189 - - - 766 Financial liabilities Current financial liabilities 9,361 - - - 9,361 - - Non-current financial liabilities 51,556 15,901 - - 35,655 - 15,901 Total liabilities 61,683 16,478 189 0 45,016 0 16,667 December 31, 2016 Derivatives 1,259 440 819 - - - 1,259 Non-current financial assets 82 - - 82 - 82 - Total assets 1,341 440 819 82 - 82 1,259 Derivatives 705 576 129 - - - 705 Financial liabilities Current financial liabilities 4,656 425 - - 4,231 - 425 Non-current financial liabilities 31,338 16,021 - - 15,317 - 16,021 Total liabilities 36,699 17,022 129 - 19,548 - 17,151 1 No financial instruments have been classified to level 3
The total fair value of the above financial liabilities is SEK 61,707m (36,719). The fair value of trade receivables, other current and non-current receivables, cash and cash equivalents, trade payables and other current and non-current liabilities is estimated to be equal to their carrying amount.
No transfers between level 1 and 2 were made during the period.
The fair value of financial instruments is calculated based on current market quotations on the balance sheet date. The value of derivatives is based on published prices in an active market. The fair value of debt instruments is set using valuation models, such as discounting of future cash flows to quoted market interest rates for the respective durations.
5 ACQUISITIONS AND DIVESTMENTS Acquisitions after the end of the reporting period On December 19, 2016, it was announced that an agreement to acquire BSN medical, a leading medical technology company, had been concluded. BSN medical develops, manufactures, markets and sells products within wound care, compression therapy and orthopedics. The purchase price for the shares was EUR 1,400m, and takeover of net debt amounted to approximately EUR 1,340m. The acquisition is fully debt-funded. The transaction, which was subject to customary regulatory approvals, was closed on April 3, 2017. A preliminary purchase price allocation is presented below. The preliminary purchase price allocation is based on the first-quarter report that SCA has received from BSN. SCA did not have access to any more detailed information regarding the items included in the opening balances since the acquisition was implemented on April 3. This means that fair value adjustments and calculations of intangible assets have not yet been performed, and goodwill has thus only been preliminarily calculated. BSN medical’s reported net sales for 2016 amounted to EUR 850m (SEK 8,038m), adjusted EBITDA to EUR 210m (SEK 1,986m) and adjusted EBITA to EUR 197m (SEK 1,863m).
F-26Admission to trading of the shares in Essity Aktiebolag (publ) on Nasdaq Stockholm
Financial data for the period January–March 2017
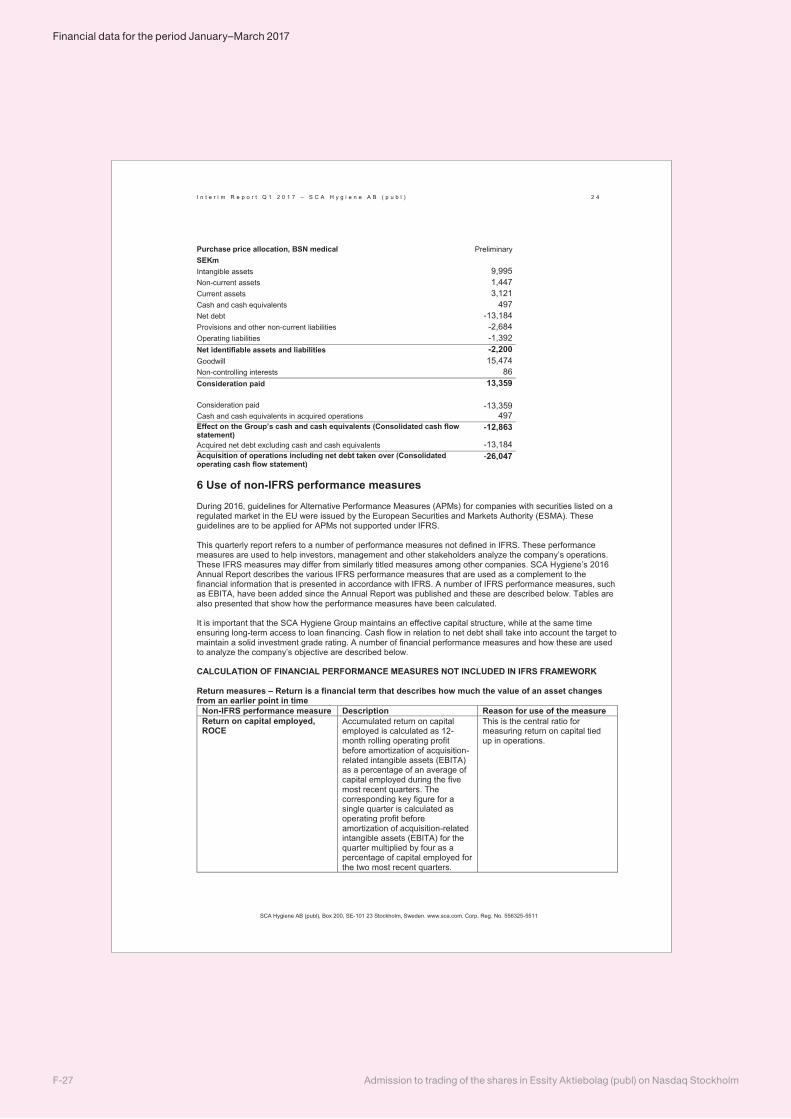
I n t e r i m R e p o r t Q 1 2 0 1 7 – S C A H y g i e n e A B ( p u b l ) 2 4
SCA Hygiene AB (publ), Box 200, SE-101 23 Stockholm, Sweden. www.sca.com. Corp. Reg. No. 556325-5511
Purchase price allocation, BSN medical Preliminary SEKm Intangible assets 9,995 Non-current assets 1,447 Current assets 3,121 Cash and cash equivalents 497 Net debt -13,184 Provisions and other non-current liabilities -2,684 Operating liabilities -1,392 Net identifiable assets and liabilities -2,200 Goodwill 15,474 Non-controlling interests 86 Consideration paid 13,359
Consideration paid -13,359 Cash and cash equivalents in acquired operations 497 Effect on the Group’s cash and cash equivalents (Consolidated cash flow statement)
-12,863
Acquired net debt excluding cash and cash equivalents -13,184 Acquisition of operations including net debt taken over (Consolidated operating cash flow statement)
-26,047
6 Use of non-IFRS performance measures During 2016, guidelines for Alternative Performance Measures (APMs) for companies with securities listed on a regulated market in the EU were issued by the European Securities and Markets Authority (ESMA). These guidelines are to be applied for APMs not supported under IFRS. This quarterly report refers to a number of performance measures not defined in IFRS. These performance measures are used to help investors, management and other stakeholders analyze the company’s operations. These IFRS measures may differ from similarly titled measures among other companies. SCA Hygiene’s 2016 Annual Report describes the various IFRS performance measures that are used as a complement to the financial information that is presented in accordance with IFRS. A number of IFRS performance measures, such as EBITA, have been added since the Annual Report was published and these are described below. Tables are also presented that show how the performance measures have been calculated. It is important that the SCA Hygiene Group maintains an effective capital structure, while at the same time ensuring long-term access to loan financing. Cash flow in relation to net debt shall take into account the target to maintain a solid investment grade rating. A number of financial performance measures and how these are used to analyze the company’s objective are described below. CALCULATION OF FINANCIAL PERFORMANCE MEASURES NOT INCLUDED IN IFRS FRAMEWORK Return measures – Return is a financial term that describes how much the value of an asset changes from an earlier point in time
Non-IFRS performance measure Description Reason for use of the measure Return on capital employed, ROCE
Accumulated return on capital employed is calculated as 12-month rolling operating profit before amortization of acquisition-related intangible assets (EBITA) as a percentage of an average of capital employed during the five most recent quarters. The corresponding key figure for a single quarter is calculated as operating profit before amortization of acquisition-related intangible assets (EBITA) for the quarter multiplied by four as a percentage of capital employed for the two most recent quarters.
This is the central ratio for measuring return on capital tied up in operations.
Admission to trading of the shares in Essity Aktiebolag (publ) on Nasdaq StockholmF-27
Financial data for the period January–March 2017
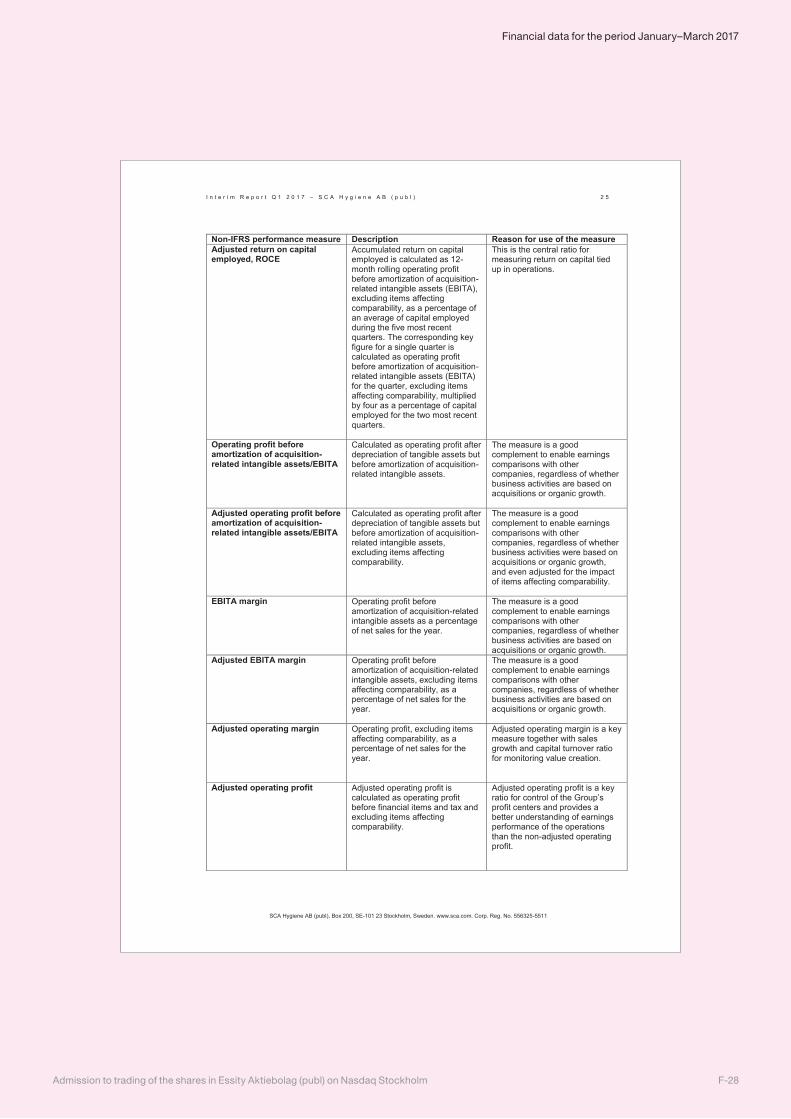
I n t e r i m R e p o r t Q 1 2 0 1 7 – S C A H y g i e n e A B ( p u b l ) 2 5
SCA Hygiene AB (publ), Box 200, SE-101 23 Stockholm, Sweden. www.sca.com. Corp. Reg. No. 556325-5511
Non-IFRS performance measure Description Reason for use of the measure Adjusted return on capital employed, ROCE
Accumulated return on capital employed is calculated as 12-month rolling operating profit before amortization of acquisition-related intangible assets (EBITA), excluding items affecting comparability, as a percentage of an average of capital employed during the five most recent quarters. The corresponding key figure for a single quarter is calculated as operating profit before amortization of acquisition-related intangible assets (EBITA) for the quarter, excluding items affecting comparability, multiplied by four as a percentage of capital employed for the two most recent quarters.
This is the central ratio for measuring return on capital tied up in operations.
Operating profit before amortization of acquisition-related intangible assets/EBITA
Calculated as operating profit after depreciation of tangible assets but before amortization of acquisition-related intangible assets.
The measure is a good complement to enable earnings comparisons with other companies, regardless of whether business activities are based on acquisitions or organic growth.
Adjusted operating profit before amortization of acquisition-related intangible assets/EBITA
Calculated as operating profit after depreciation of tangible assets but before amortization of acquisition-related intangible assets, excluding items affecting comparability.
The measure is a good complement to enable earnings comparisons with other companies, regardless of whether business activities were based on acquisitions or organic growth, and even adjusted for the impact of items affecting comparability.
EBITA margin Operating profit before amortization of acquisition-related intangible assets as a percentage of net sales for the year.
The measure is a good complement to enable earnings comparisons with other companies, regardless of whether business activities are based on acquisitions or organic growth.
Adjusted EBITA margin Operating profit before amortization of acquisition-related intangible assets, excluding items affecting comparability, as a percentage of net sales for the year.
The measure is a good complement to enable earnings comparisons with other companies, regardless of whether business activities are based on acquisitions or organic growth.
Adjusted operating margin Operating profit, excluding items affecting comparability, as a percentage of net sales for the year.
Adjusted operating margin is a key measure together with sales growth and capital turnover ratio for monitoring value creation.
Adjusted operating profit Adjusted operating profit is calculated as operating profit before financial items and tax and excluding items affecting comparability.
Adjusted operating profit is a key ratio for control of the Group’s profit centers and provides a better understanding of earnings performance of the operations than the non-adjusted operating profit.
F-28Admission to trading of the shares in Essity Aktiebolag (publ) on Nasdaq Stockholm
Financial data for the period January–March 2017
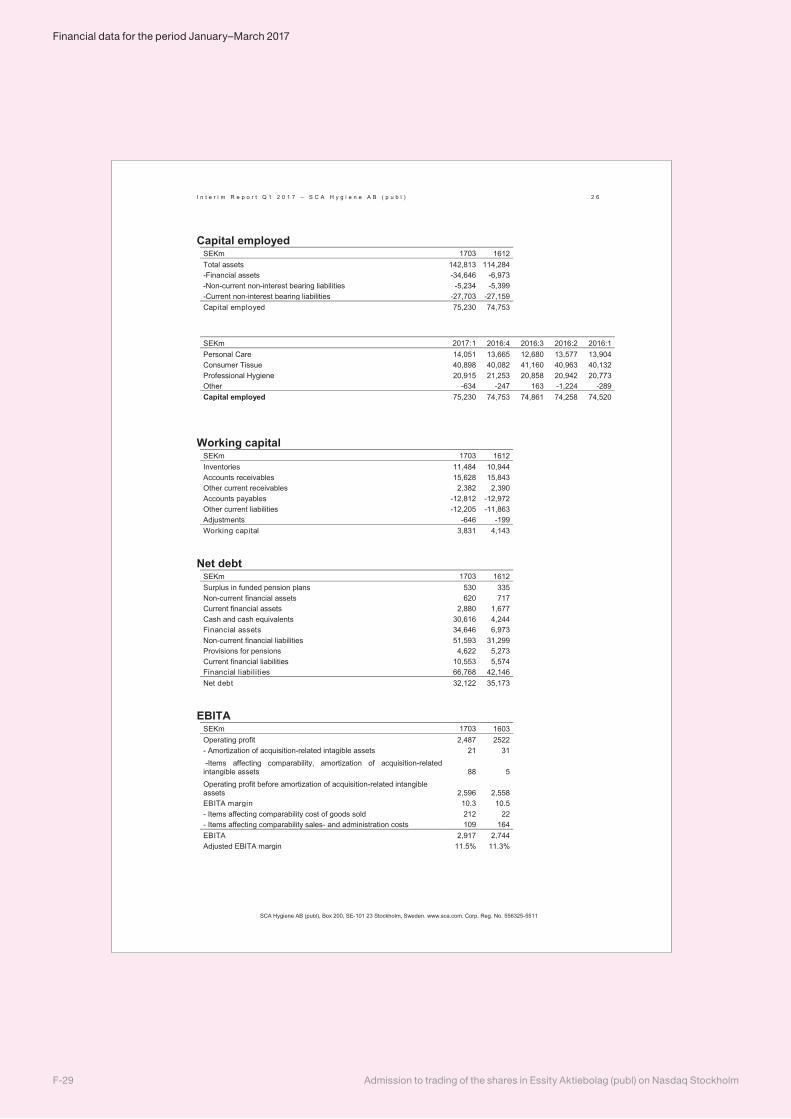
I n t e r i m R e p o r t Q 1 2 0 1 7 – S C A H y g i e n e A B ( p u b l ) 2 6
SCA Hygiene AB (publ), Box 200, SE-101 23 Stockholm, Sweden. www.sca.com. Corp. Reg. No. 556325-5511
Capital employed SEKm 1703 1612 Total assets 142,813 114,284 -Financial assets -34,646 -6,973 -Non-current non-interest bearing liabilities -5,234 -5,399 -Current non-interest bearing liabilities -27,703 -27,159 Capital employed 75,230 74,753
SEKm 2017:1 2016:4 2016:3 2016:2 2016:1 Personal Care 14,051 13,665 12,680 13,577 13,904 Consumer Tissue 40,898 40,082 41,160 40,963 40,132 Professional Hygiene 20,915 21,253 20,858 20,942 20,773 Other -634 -247 163 -1,224 -289 Capital employed 75,230 74,753 74,861 74,258 74,520
Working capital
SEKm 1703 1612 Inventories 11,484 10,944 Accounts receivables 15,628 15,843 Other current receivables 2,382 2,390 Accounts payables -12,812 -12,972 Other current liabilities -12,205 -11,863 Adjustments -646 -199 Working capital 3,831 4,143
Net debt
SEKm 1703 1612 Surplus in funded pension plans 530 335 Non-current financial assets 620 717 Current financial assets 2,880 1,677 Cash and cash equivalents 30,616 4,244 Financial assets 34,646 6,973 Non-current financial liabilities 51,593 31,299 Provisions for pensions 4,622 5,273 Current financial liabilities 10,553 5,574 Financial liabilities 66,768 42,146 Net debt 32,122 35,173
EBITA
SEKm 1703 1603 Operating profit 2,487 2522 - Amortization of acquisition-related intagible assets 21 31 -Items affecting comparability, amortization of acquisition-related intangible assets 88 5 Operating profit before amortization of acquisition-related intangible assets 2,596 2,558 EBITA margin 10.3 10.5 - Items affecting comparability cost of goods sold 212 22 - Items affecting comparability sales- and administration costs 109 164 EBITA 2,917 2,744 Adjusted EBITA margin 11.5% 11.3%
Admission to trading of the shares in Essity Aktiebolag (publ) on Nasdaq StockholmF-29
Financial data for the period January–March 2017
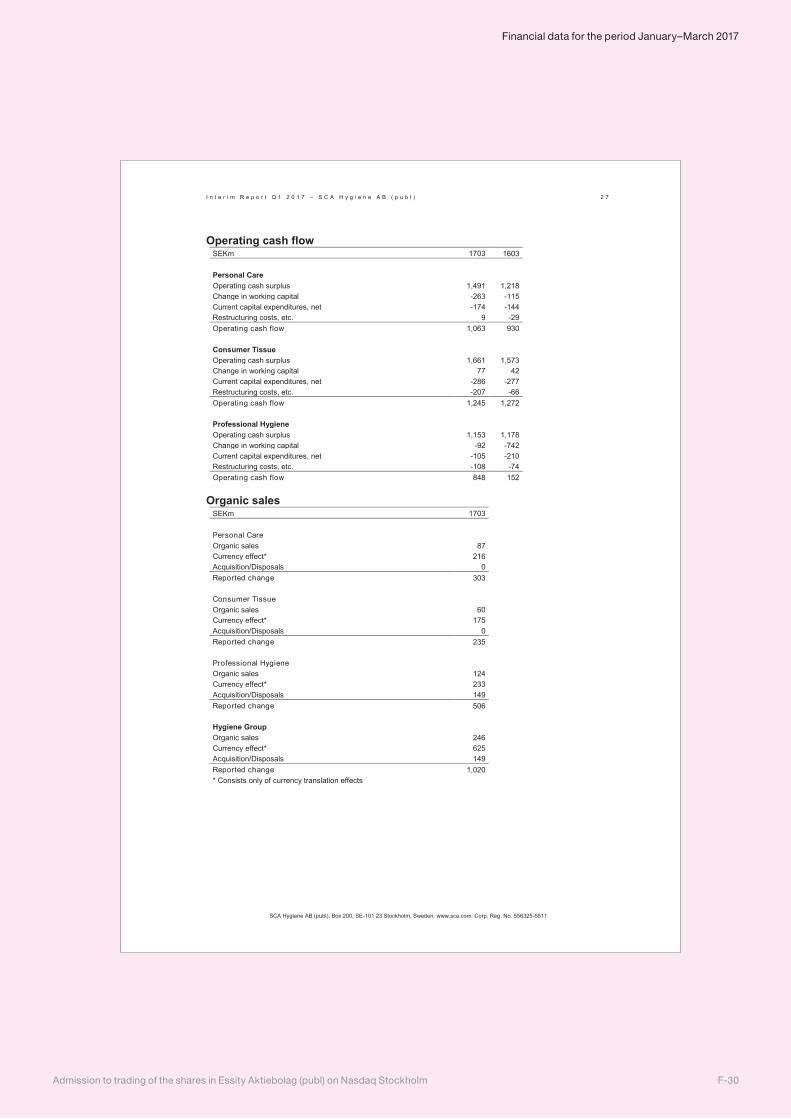
I n t e r i m R e p o r t Q 1 2 0 1 7 – S C A H y g i e n e A B ( p u b l ) 2 7
SCA Hygiene AB (publ), Box 200, SE-101 23 Stockholm, Sweden. www.sca.com. Corp. Reg. No. 556325-5511
Operating cash flow SEKm 1703 1603
Personal Care Operating cash surplus 1,491 1,218 Change in working capital -263 -115 Current capital expenditures, net -174 -144 Restructuring costs, etc. 9 -29 Operating cash flow 1,063 930 Consumer Tissue Operating cash surplus 1,661 1,573 Change in working capital 77 42 Current capital expenditures, net -286 -277 Restructuring costs, etc. -207 -66 Operating cash flow 1,245 1,272 Professional Hygiene Operating cash surplus 1,153 1,178 Change in working capital -92 -742 Current capital expenditures, net -105 -210 Restructuring costs, etc. -108 -74 Operating cash flow 848 152
Organic sales
SEKm 1703
Personal Care Organic sales 87 Currency effect* 216 Acquisition/Disposals 0 Reported change 303 Consumer Tissue Organic sales 60 Currency effect* 175 Acquisition/Disposals 0 Reported change 235 Professional Hygiene Organic sales 124 Currency effect* 233 Acquisition/Disposals 149 Reported change 506 Hygiene Group Organic sales 246 Currency effect* 625 Acquisition/Disposals 149 Reported change 1,020 * Consists only of currency translation effects
F-30Admission to trading of the shares in Essity Aktiebolag (publ) on Nasdaq Stockholm
Financial data for the period January–March 2017
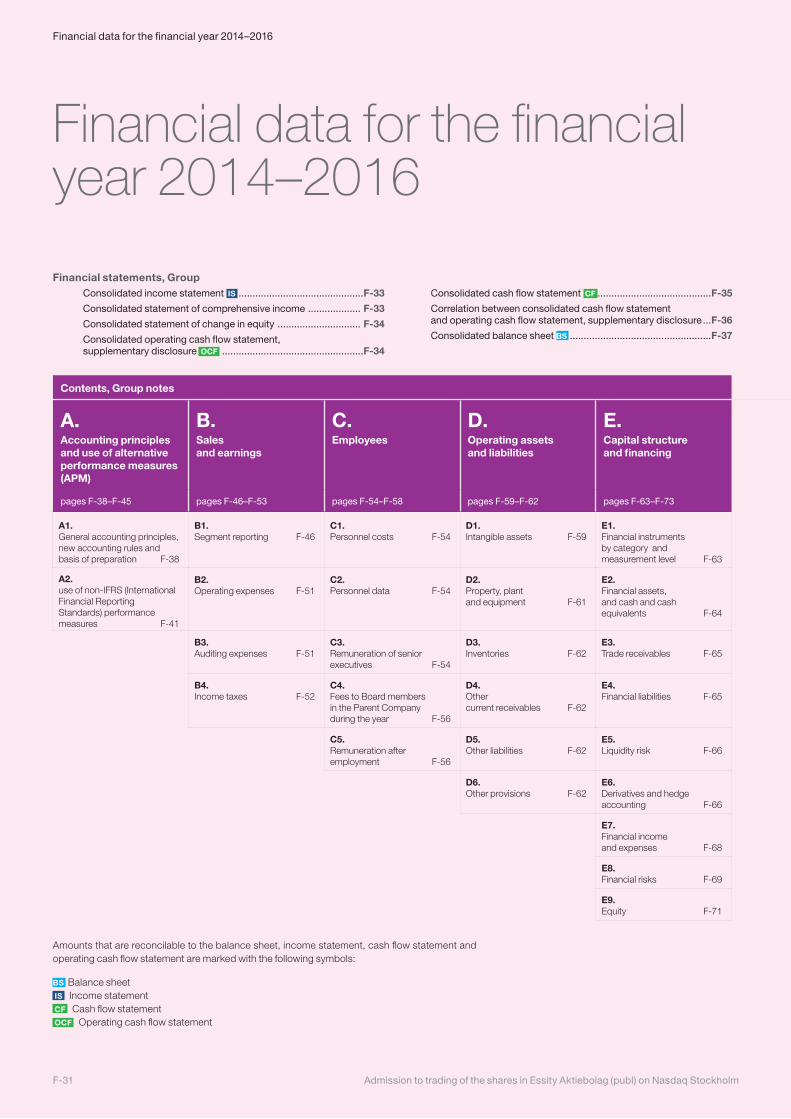
Financial statements, Group Consolidated income statement IS .............................................F-33
Consolidated statement of comprehensive income ................... F-33
Consolidated statement of change in equity .............................. F-34
Consolidated operating cash flow statement, supplementary disclosure OCF ...................................................F-34
Consolidated cash flow statement CF .........................................F-35
Correlation between consolidated cash flow statement and operating cash flow statement, supplementary disclosure ...F-36
Consolidated balance sheet BS ...................................................F-37
Financial data for the financial year 2014–2016
Contents, Group notes Group notes, cont.
A. Accounting principles and use of alternative performance measures (APM)
B. Sales and earnings
C. Employees
D.
Operating assets and liabilities
E. Capital structure and financing
F. Group structure
G. Other
pages F-38–F-45 pages F-46–F-53 pages F-54–F-58 pages F-59–F-62 pages F-63–F-73 pages F-74–F-79 pages F-80–F-85
A1.General accounting principles, new accounting rules and basis of preparation F-38
B1.Segment reporting F-46
C1. Personnel costs F-54
D1. Intangible assets F-59
E1. Financial instruments by category and measurement level F-63
F1. Subsidiaries F-74
G1. Non-current assets held for sale F-80
A2. use of non-IFRS (International Financial Reporting Standards) performance measures F-41
B2. Operating expenses F-51
C2.Personnel data F-54
D2. Property, plant and equipment F-61
E2. Financial assets, and cash and cash equivalents F-64
F2. Jointly owned subsidiaries with significant non- controlling interests F-75
G2. Leasing F-80
B3. Auditing expenses F-51
C3.Remuneration of senior executives F-54
D3. Inventories F-62
E3. Trade receivables F-65
F3. Joint ventures and associates F-75
G3. Contingent liabilities and pledged assets F-81
B4. Income taxes F-52
C4.Fees to Board members in the Parent Company during the year F-56
D4. Other current receivables F-62
E4. Financial liabilities F-65
F4. Joint operations F-77
G4. Transactions with related parties F-81
C5.Remuneration after employment F-56
D5. Other liabilities F-62
E5. Liquidity risk F-66
F5. Shares and participations F-77
G5. Description of costs F-82
D6. Other provisions F-62
E6. Derivatives and hedge accounting F-66
F6. Acquisitions and disposals F-78
G6. Events after the balance sheet F-83
E7. Financial income and expenses F-68
G7. Auditor’s reports F-84
E8. Financial risks F-69
E9. Equity F-71
Amounts that are reconcilable to the balance sheet, income statement, cash flow statement and operating cash flow statement are marked with the following symbols:
BS Balance sheet IS Income statement CF Cash flow statement OCF Operating cash flow statement
Admission to trading of the shares in Essity Aktiebolag (publ) on Nasdaq StockholmF-31
Financial data for the financial year 2014–2016
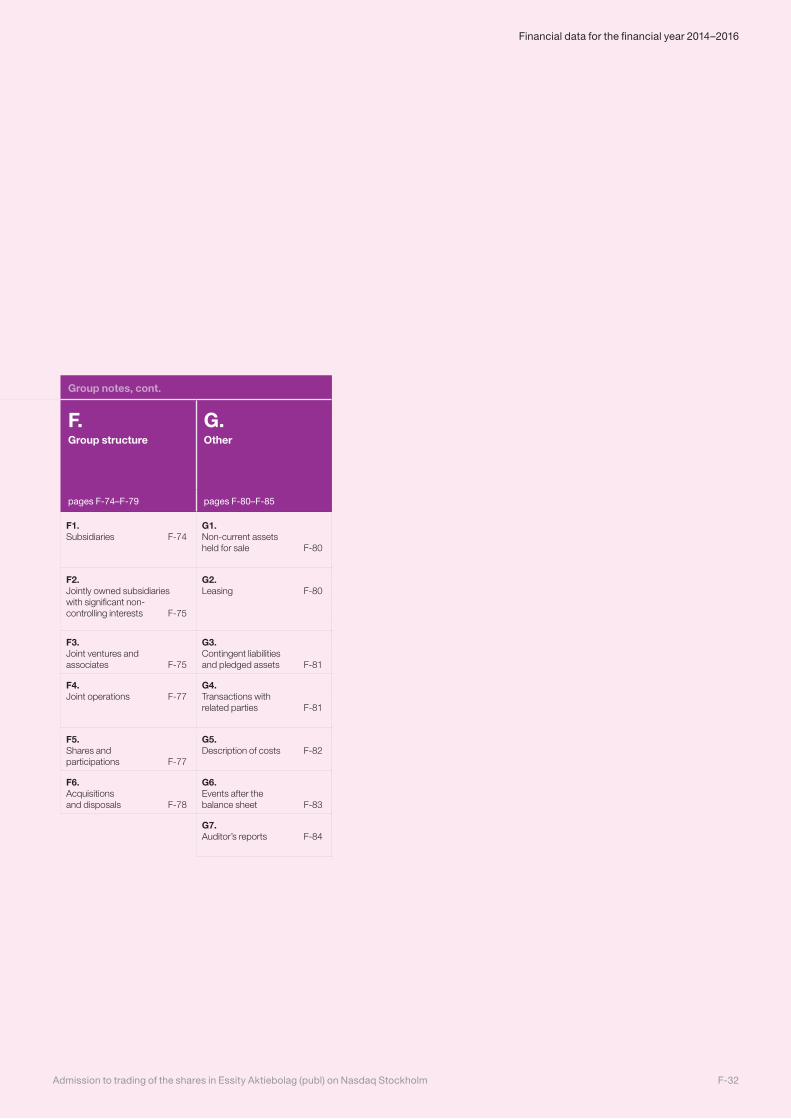
Contents, Group notes Group notes, cont.
A. Accounting principles and use of alternative performance measures (APM)
B. Sales and earnings
C. Employees
D.
Operating assets and liabilities
E. Capital structure and financing
F. Group structure
G. Other
pages F-38–F-45 pages F-46–F-53 pages F-54–F-58 pages F-59–F-62 pages F-63–F-73 pages F-74–F-79 pages F-80–F-85
A1.General accounting principles, new accounting rules and basis of preparation F-38
B1.Segment reporting F-46
C1. Personnel costs F-54
D1. Intangible assets F-59
E1. Financial instruments by category and measurement level F-63
F1. Subsidiaries F-74
G1. Non-current assets held for sale F-80
A2. use of non-IFRS (International Financial Reporting Standards) performance measures F-41
B2. Operating expenses F-51
C2.Personnel data F-54
D2. Property, plant and equipment F-61
E2. Financial assets, and cash and cash equivalents F-64
F2. Jointly owned subsidiaries with significant non- controlling interests F-75
G2. Leasing F-80
B3. Auditing expenses F-51
C3.Remuneration of senior executives F-54
D3. Inventories F-62
E3. Trade receivables F-65
F3. Joint ventures and associates F-75
G3. Contingent liabilities and pledged assets F-81
B4. Income taxes F-52
C4.Fees to Board members in the Parent Company during the year F-56
D4. Other current receivables F-62
E4. Financial liabilities F-65
F4. Joint operations F-77
G4. Transactions with related parties F-81
C5.Remuneration after employment F-56
D5. Other liabilities F-62
E5. Liquidity risk F-66
F5. Shares and participations F-77
G5. Description of costs F-82
D6. Other provisions F-62
E6. Derivatives and hedge accounting F-66
F6. Acquisitions and disposals F-78
G6. Events after the balance sheet F-83
E7. Financial income and expenses F-68
G7. Auditor’s reports F-84
E8. Financial risks F-69
E9. Equity F-71
F-32Admission to trading of the shares in Essity Aktiebolag (publ) on Nasdaq Stockholm
Financial data for the financial year 2014–2016
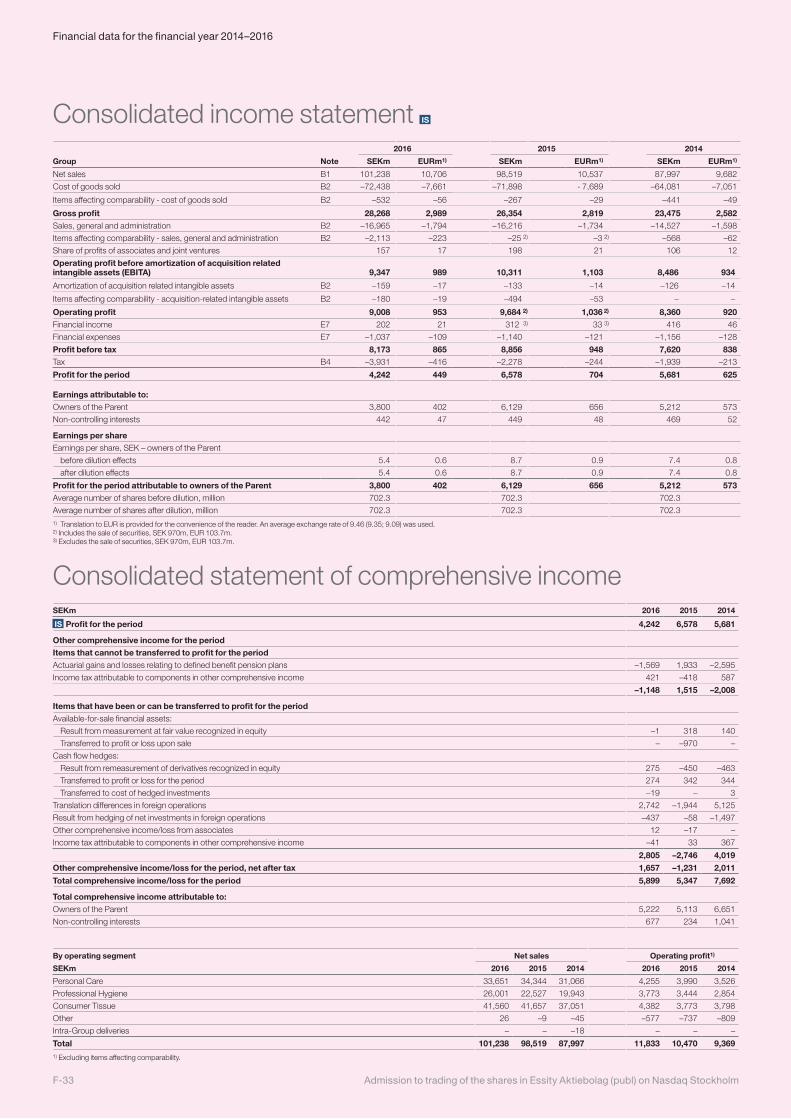
Consolidated income statement IS
2016 2015 2014
Group Note SEKm EURm1) SEKm EURm1) SEKm EURm1)
Net sales B1 101,238 10,706 98,519 10,537 87,997 9,682
Cost of goods sold B2 –72,438 –7,661 –71,898 - 7,689 –64,081 –7,051
Items affecting comparability - cost of goods sold B2 –532 –56 –267 –29 –441 –49
Gross profit 28,268 2,989 26,354 2,819 23,475 2,582Sales, general and administration B2 –16,965 –1,794 –16,216 –1,734 –14,527 –1,598
Items affecting comparability - sales, general and administration B2 –2,113 –223 –25 2) –3 2) –568 –62
Share of profits of associates and joint ventures 157 17 198 21 106 12
Operating profit before amortization of acquisition related intangible assets (EBITA) 9,347 989 10,311 1,103 8,486 934
Amortization of acquisition related intangible assets B2 –159 –17 –133 –14 –126 –14
Items affecting comparability - acquisition-related intangible assets B2 –180 –19 –494 –53 – –
Operating profit 9,008 953 9,684 2) 1,036 2) 8,360 920Financial income E7 202 21 312 3) 33 3) 416 46
Financial expenses E7 –1,037 –109 –1,140 –121 –1,156 –128
Profit before tax 8,173 865 8,856 948 7,620 838Tax B4 –3,931 –416 –2,278 –244 –1,939 –213
Profit for the period 4,242 449 6,578 704 5,681 625
Earnings attributable to:Owners of the Parent 3,800 402 6,129 656 5,212 573
Non-controlling interests 442 47 449 48 469 52
Earnings per shareEarnings per share, SEK – owners of the Parent
before dilution effects 5�4 0�6 8�7 0�9 7�4 0�8
after dilution effects 5�4 0�6 8�7 0�9 7�4 0�8
Profit for the period attributable to owners of the Parent 3,800 402 6,129 656 5,212 573Average number of shares before dilution, million 702�3 702�3 702�3
Average number of shares after dilution, million 702�3 702�3 702�31) Translation to EUR is provided for the convenience of the reader� An average exchange rate of 9�46 (9�35; 9�09) was used� 2) Includes the sale of securities, SEK 970m, EUR 103�7m� 3) Excludes the sale of securities, SEK 970m, EUR 103�7m�
Consolidated statement of comprehensive incomeSEKm 2016 2015 2014
IS Profit for the period 4,242 6,578 5,681
Other comprehensive income for the periodItems that cannot be transferred to profit for the periodActuarial gains and losses relating to defined benefit pension plans –1,569 1,933 –2,595
Income tax attributable to components in other comprehensive income 421 –418 587
–1,148 1,515 –2,008
Items that have been or can be transferred to profit for the periodAvailable-for-sale financial assets:
Result from measurement at fair value recognized in equity –1 318 140
Transferred to profit or loss upon sale – –970 –
Cash flow hedges:
Result from remeasurement of derivatives recognized in equity 275 –450 –463
Transferred to profit or loss for the period 274 342 344
Transferred to cost of hedged investments –19 – 3
Translation differences in foreign operations 2,742 –1,944 5,125
Result from hedging of net investments in foreign operations –437 –58 –1,497
Other comprehensive income/loss from associates 12 –17 –
Income tax attributable to components in other comprehensive income –41 33 367
2,805 –2,746 4,019
Other comprehensive income/loss for the period, net after tax 1,657 –1,231 2,011
Total comprehensive income/loss for the period 5,899 5,347 7,692
Total comprehensive income attributable to:Owners of the Parent 5,222 5,113 6,651
Non-controlling interests 677 234 1,041
By operating segment Net sales Operating profit1)
SEKm 2016 2015 2014 2016 2015 2014
Personal Care 33,651 34,344 31,066 4,255 3,990 3,526
Professional Hygiene 26,001 22,527 19,943 3,773 3,444 2,854
Consumer Tissue 41,560 41,657 37,051 4,382 3,773 3,798
Other 26 –9 –45 –577 –737 –809
Intra-Group deliveries – – –18 – – –
Total 101,238 98,519 87,997 11,833 10,470 9,3691) Excluding items affecting comparability�
Admission to trading of the shares in Essity Aktiebolag (publ) on Nasdaq StockholmF-33
Financial data for the financial year 2014–2016
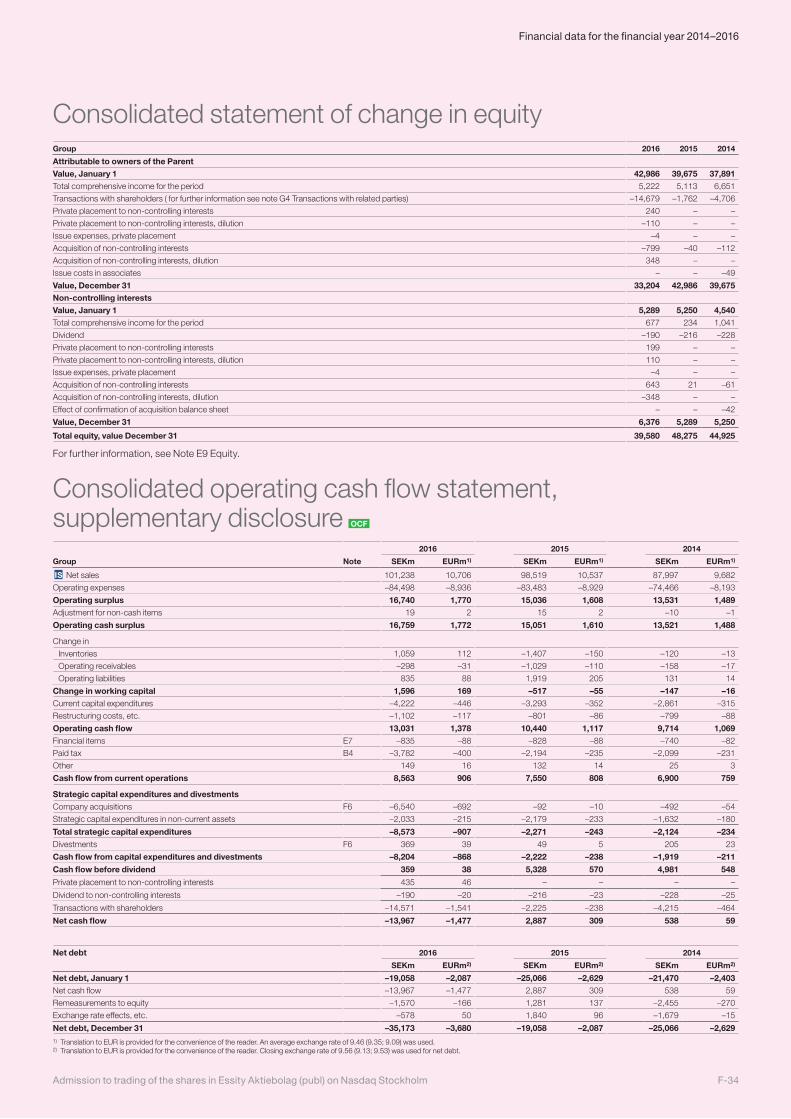
Consolidated statement of change in equityGroup 2016 2015 2014
Attributable to owners of the ParentValue, January 1 42,986 39,675 37,891Total comprehensive income for the period 5,222 5,113 6,651
Transactions with shareholders ( for further information see note G4 Transactions with related parties) –14,679 –1,762 –4,706
Private placement to non-controlling interests 240 – –
Private placement to non-controlling interests, dilution –110 – –
Issue expenses, private placement –4 – –
Acquisition of non-controlling interests –799 –40 –112
Acquisition of non-controlling interests, dilution 348 – –
Issue costs in associates – – –49
Value, December 31 33,204 42,986 39,675Non-controlling interestsValue, January 1 5,289 5,250 4,540Total comprehensive income for the period 677 234 1,041
Dividend –190 –216 –228
Private placement to non-controlling interests 199 – –
Private placement to non-controlling interests, dilution 110 – –
Issue expenses, private placement –4 – –
Acquisition of non-controlling interests 643 21 –61
Acquisition of non-controlling interests, dilution –348 – –
Effect of confirmation of acquisition balance sheet – – –42
Value, December 31 6,376 5,289 5,250
Total equity, value December 31 39,580 48,275 44,925
For further information, see Note E9 Equity�
Consolidated operating cash flow statement, supplementary disclosure OCF
2016 2015 2014
Group Note SEKm EURm1) SEKm EURm1) SEKm EURm1)
IS Net sales 101,238 10,706 98,519 10,537 87,997 9,682
Operating expenses –84,498 –8,936 –83,483 –8,929 –74,466 –8,193
Operating surplus 16,740 1,770 15,036 1,608 13,531 1,489Adjustment for non-cash items 19 2 15 2 –10 –1
Operating cash surplus 16,759 1,772 15,051 1,610 13,521 1,488
Change in
Inventories 1,059 112 –1,407 –150 –120 –13
Operating receivables –298 –31 –1,029 –110 –158 –17
Operating liabilities 835 88 1,919 205 131 14
Change in working capital 1,596 169 –517 –55 –147 –16Current capital expenditures –4,222 –446 –3,293 –352 –2,861 –315
Restructuring costs, etc� –1,102 –117 –801 –86 –799 –88
Operating cash flow 13,031 1,378 10,440 1,117 9,714 1,069Financial items E7 –835 –88 –828 –88 –740 –82
Paid tax B4 –3,782 –400 –2,194 –235 –2,099 –231
Other 149 16 132 14 25 3
Cash flow from current operations 8,563 906 7,550 808 6,900 759
Strategic capital expenditures and divestmentsCompany acquisitions F6 –6,540 –692 –92 –10 –492 –54
Strategic capital expenditures in non-current assets –2,033 –215 –2,179 –233 –1,632 –180
Total strategic capital expenditures –8,573 –907 –2,271 –243 –2,124 –234Divestments F6 369 39 49 5 205 23
Cash flow from capital expenditures and divestments –8,204 –868 –2,222 –238 –1,919 –211
Cash flow before dividend 359 38 5,328 570 4,981 548
Private placement to non-controlling interests 435 46 – – – –
Dividend to non-controlling interests –190 –20 –216 –23 –228 –25
Transactions with shareholders –14,571 –1,541 –2,225 –238 –4,215 –464
Net cash flow –13,967 –1,477 2,887 309 538 59
Net debt 2016 2015 2014
SEKm EURm2) SEKm EURm2) SEKm EURm2)
Net debt, January 1 –19,058 –2,087 –25,066 –2,629 –21,470 –2,403Net cash flow –13,967 –1,477 2,887 309 538 59
Remeasurements to equity –1,570 –166 1,281 137 –2,455 –270
Exchange rate effects, etc� –578 50 1,840 96 –1,679 –15
Net debt, December 31 –35,173 –3,680 –19,058 –2,087 –25,066 –2,6291) Translation to EUR is provided for the convenience of the reader� An average exchange rate of 9�46 (9�35; 9�09) was used�2) Translation to EUR is provided for the convenience of the reader� Closing exchange rate of 9�56 (9�13; 9�53) was used for net debt�
F-34Admission to trading of the shares in Essity Aktiebolag (publ) on Nasdaq Stockholm
Financial data for the financial year 2014–2016
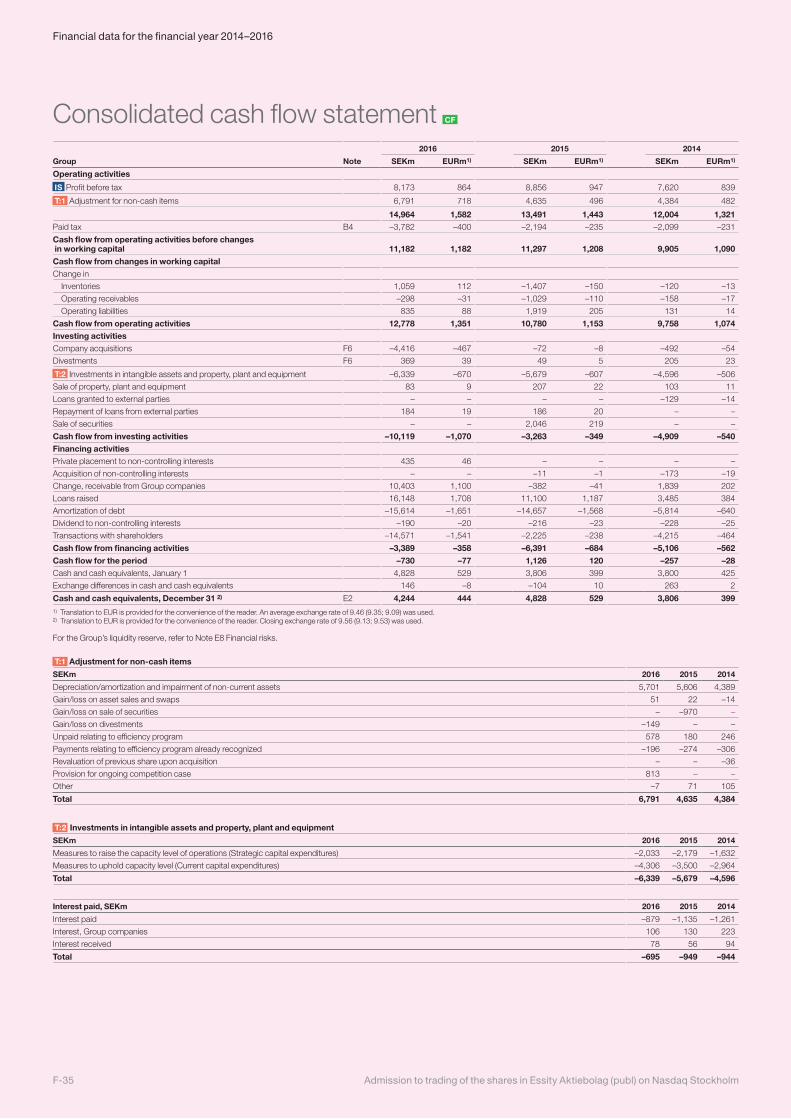
Consolidated cash flow statement CF
2016 2015 2014
Group Note SEKm EURm1) SEKm EURm1) SEKm EURm1)
Operating activities
IS Profit before tax 8,173 864 8,856 947 7,620 839
T:1 Adjustment for non-cash items 6,791 718 4,635 496 4,384 482
14,964 1,582 13,491 1,443 12,004 1,321Paid tax B4 –3,782 –400 –2,194 –235 –2,099 –231
Cash flow from operating activities before changes in working capital 11,182 1,182 11,297 1,208 9,905 1,090
Cash flow from changes in working capitalChange in
Inventories 1,059 112 –1,407 –150 –120 –13
Operating receivables –298 –31 –1,029 –110 –158 –17
Operating liabilities 835 88 1,919 205 131 14
Cash flow from operating activities 12,778 1,351 10,780 1,153 9,758 1,074Investing activitiesCompany acquisitions F6 –4,416 –467 –72 –8 –492 –54
Divestments F6 369 39 49 5 205 23
T:2 Investments in intangible assets and property, plant and equipment –6,339 –670 –5,679 –607 –4,596 –506
Sale of property, plant and equipment 83 9 207 22 103 11
Loans granted to external parties – – – – –129 –14
Repayment of loans from external parties 184 19 186 20 – –
Sale of securities – – 2,046 219 – –
Cash flow from investing activities –10,119 –1,070 –3,263 –349 –4,909 –540Financing activitiesPrivate placement to non-controlling interests 435 46 – – – –
Acquisition of non-controlling interests – – –11 –1 –173 –19
Change, receivable from Group companies 10,403 1,100 –382 –41 1,839 202
Loans raised 16,148 1,708 11,100 1,187 3,485 384
Amortization of debt –15,614 –1,651 –14,657 –1,568 –5,814 –640
Dividend to non-controlling interests –190 –20 –216 –23 –228 –25
Transactions with shareholders –14,571 –1,541 –2,225 –238 –4,215 –464
Cash flow from financing activities –3,389 –358 –6,391 –684 –5,106 –562
Cash flow for the period –730 –77 1,126 120 –257 –28Cash and cash equivalents, January 1 4,828 529 3,806 399 3,800 425
Exchange differences in cash and cash equivalents 146 –8 –104 10 263 2
Cash and cash equivalents, December 31 2) E2 4,244 444 4,828 529 3,806 3991) Translation to EUR is provided for the convenience of the reader� An average exchange rate of 9�46 (9�35; 9�09) was used�2) Translation to EUR is provided for the convenience of the reader� Closing exchange rate of 9�56 (9�13; 9�53) was used�
For the Group’s liquidity reserve, refer to Note E8 Financial risks�
T:1 Adjustment for non-cash items
SEKm 2016 2015 2014
Depreciation/amortization and impairment of non-current assets 5,701 5,606 4,389
Gain/loss on asset sales and swaps 51 22 –14
Gain/loss on sale of securities – –970 –
Gain/loss on divestments –149 – –
Unpaid relating to efficiency program 578 180 246
Payments relating to efficiency program already recognized –196 –274 –306
Revaluation of previous share upon acquisition – – –36
Provision for ongoing competition case 813 – –
Other –7 71 105
Total 6,791 4,635 4,384
T:2 Investments in intangible assets and property, plant and equipment
SEKm 2016 2015 2014
Measures to raise the capacity level of operations (Strategic capital expenditures) –2,033 –2,179 –1,632
Measures to uphold capacity level (Current capital expenditures) –4,306 –3,500 –2,964
Total –6,339 –5,679 –4,596
Interest paid, SEKm 2016 2015 2014
Interest paid –879 –1,135 –1,261
Interest, Group companies 106 130 223
Interest received 78 56 94
Total –695 –949 –944
Admission to trading of the shares in Essity Aktiebolag (publ) on Nasdaq StockholmF-35
Financial data for the financial year 2014–2016
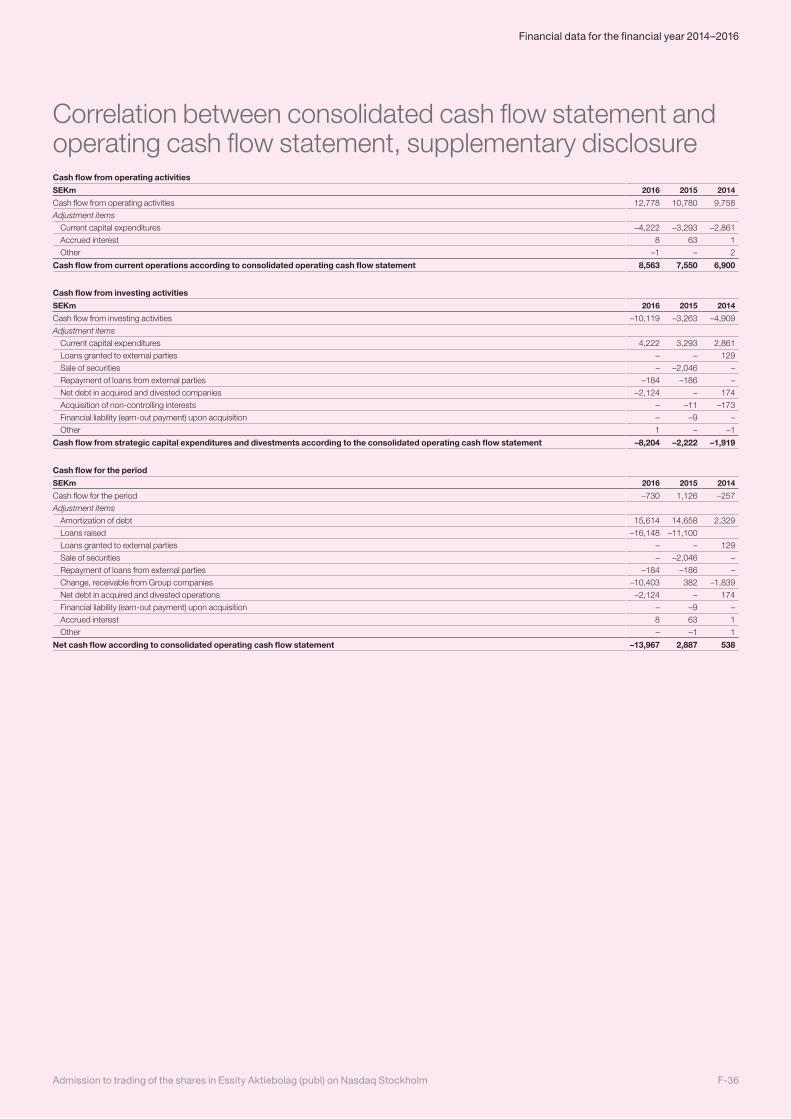
Correlation between consolidated cash flow statement and operating cash flow statement, supplementary disclosure Cash flow from operating activities
SEKm 2016 2015 2014
Cash flow from operating activities 12,778 10,780 9,758
Adjustment items
Current capital expenditures –4,222 –3,293 –2,861
Accrued interest 8 63 1
Other –1 – 2
Cash flow from current operations according to consolidated operating cash flow statement 8,563 7,550 6,900
Cash flow from investing activities
SEKm 2016 2015 2014
Cash flow from investing activities –10,119 –3,263 –4,909
Adjustment items
Current capital expenditures 4,222 3,293 2,861
Loans granted to external parties – – 129
Sale of securities – –2,046 –
Repayment of loans from external parties –184 –186 –
Net debt in acquired and divested companies –2,124 – 174
Acquisition of non-controlling interests – –11 –173
Financial liability (earn-out payment) upon acquisition – –9 –
Other 1 – –1
Cash flow from strategic capital expenditures and divestments according to the consolidated operating cash flow statement –8,204 –2,222 –1,919
Cash flow for the period
SEKm 2016 2015 2014
Cash flow for the period –730 1,126 –257
Adjustment items
Amortization of debt 15,614 14,658 2,329
Loans raised –16,148 –11,100
Loans granted to external parties – – 129
Sale of securities – –2,046 –
Repayment of loans from external parties –184 –186 –
Change, receivable from Group companies –10,403 382 –1,839
Net debt in acquired and divested operations –2,124 – 174
Financial liability (earn-out payment) upon acquisition – –9 –
Accrued interest 8 63 1
Other – –1 1
Net cash flow according to consolidated operating cash flow statement –13,967 2,887 538
F-36Admission to trading of the shares in Essity Aktiebolag (publ) on Nasdaq Stockholm
Financial data for the financial year 2014–2016
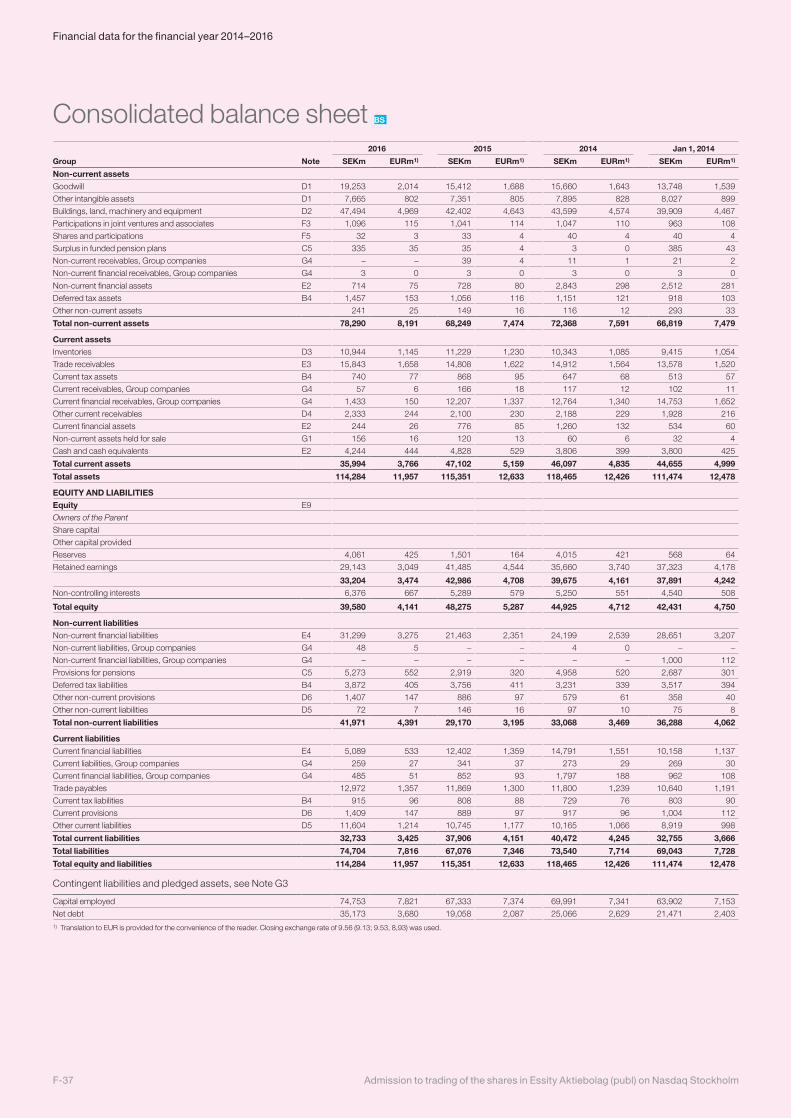
Consolidated balance sheet BS
2016 2015 2014 Jan 1, 2014
Group Note SEKm EURm1) SEKm EURm1) SEKm EURm1) SEKm EURm1)
Non-current assetsGoodwill D1 19,253 2,014 15,412 1,688 15,660 1,643 13,748 1,539
Other intangible assets D1 7,665 802 7,351 805 7,895 828 8,027 899
Buildings, land, machinery and equipment D2 47,494 4,969 42,402 4,643 43,599 4,574 39,909 4,467
Participations in joint ventures and associates F3 1,096 115 1,041 114 1,047 110 963 108
Shares and participations F5 32 3 33 4 40 4 40 4
Surplus in funded pension plans C5 335 35 35 4 3 0 385 43
Non-current receivables, Group companies G4 – – 39 4 11 1 21 2
Non-current financial receivables, Group companies G4 3 0 3 0 3 0 3 0
Non-current financial assets E2 714 75 728 80 2,843 298 2,512 281
Deferred tax assets B4 1,457 153 1,056 116 1,151 121 918 103
Other non-current assets 241 25 149 16 116 12 293 33
Total non-current assets 78,290 8,191 68,249 7,474 72,368 7,591 66,819 7,479
Current assetsInventories D3 10,944 1,145 11,229 1,230 10,343 1,085 9,415 1,054
Trade receivables E3 15,843 1,658 14,808 1,622 14,912 1,564 13,578 1,520
Current tax assets B4 740 77 868 95 647 68 513 57
Current receivables, Group companies G4 57 6 166 18 117 12 102 11
Current financial receivables, Group companies G4 1,433 150 12,207 1,337 12,764 1,340 14,753 1,652
Other current receivables D4 2,333 244 2,100 230 2,188 229 1,928 216
Current financial assets E2 244 26 776 85 1,260 132 534 60
Non-current assets held for sale G1 156 16 120 13 60 6 32 4
Cash and cash equivalents E2 4,244 444 4,828 529 3,806 399 3,800 425
Total current assets 35,994 3,766 47,102 5,159 46,097 4,835 44,655 4,999
Total assets 114,284 11,957 115,351 12,633 118,465 12,426 111,474 12,478
EQUITY AND LIABILITIESEquity E9
Owners of the Parent
Share capital
Other capital provided
Reserves 4,061 425 1,501 164 4,015 421 568 64
Retained earnings 29,143 3,049 41,485 4,544 35,660 3,740 37,323 4,178
33,204 3,474 42,986 4,708 39,675 4,161 37,891 4,242Non-controlling interests 6,376 667 5,289 579 5,250 551 4,540 508
Total equity 39,580 4,141 48,275 5,287 44,925 4,712 42,431 4,750
Non-current liabilitiesNon-current financial liabilities E4 31,299 3,275 21,463 2,351 24,199 2,539 28,651 3,207
Non-current liabilities, Group companies G4 48 5 – – 4 0 – –
Non-current financial liabilities, Group companies G4 – – – – – – 1,000 112
Provisions for pensions C5 5,273 552 2,919 320 4,958 520 2,687 301
Deferred tax liabilities B4 3,872 405 3,756 411 3,231 339 3,517 394
Other non-current provisions D6 1,407 147 886 97 579 61 358 40
Other non-current liabilities D5 72 7 146 16 97 10 75 8
Total non-current liabilities 41,971 4,391 29,170 3,195 33,068 3,469 36,288 4,062
Current liabilitiesCurrent financial liabilities E4 5,089 533 12,402 1,359 14,791 1,551 10,158 1,137
Current liabilities, Group companies G4 259 27 341 37 273 29 269 30
Current financial liabilities, Group companies G4 485 51 852 93 1,797 188 962 108
Trade payables 12,972 1,357 11,869 1,300 11,800 1,239 10,640 1,191
Current tax liabilities B4 915 96 808 88 729 76 803 90
Current provisions D6 1,409 147 889 97 917 96 1,004 112
Other current liabilities D5 11,604 1,214 10,745 1,177 10,165 1,066 8,919 998
Total current liabilities 32,733 3,425 37,906 4,151 40,472 4,245 32,755 3,666
Total liabilities 74,704 7,816 67,076 7,346 73,540 7,714 69,043 7,728
Total equity and liabilities 114,284 11,957 115,351 12,633 118,465 12,426 111,474 12,478
Contingent liabilities and pledged assets, see Note G3
Capital employed 74,753 7,821 67,333 7,374 69,991 7,341 63,902 7,153
Net debt 35,173 3,680 19,058 2,087 25,066 2,629 21,471 2,4031) Translation to EUR is provided for the convenience of the reader� Closing exchange rate of 9�56 (9�13; 9�53, 8,93) was used�
Admission to trading of the shares in Essity Aktiebolag (publ) on Nasdaq StockholmF-37
Financial data for the financial year 2014–2016
A. ACCOUNTING PRINCIPLES AND USE OF ALTERNATIVE PERFORMANCE MEASURES (APM)
A1. GENERAL ACCOUNTING PRINCIPLES, NEW ACCOUNTING RULES AND BASIS OF PREPARATION
READING INSTRUCTIONSGeneral accounting principles AP and new accounting rules are presented below. Other accounting principles considered material by the Essity Group are presented in conjunction with the respective notes. The same princi-ples are usually applied in both the Parent Company and the Group. In some cases, the Parent Company applies principles other than those used by the Group and, in such cases, these principles are specified under the respective note in the section about the Parent Company.
Key assessments and assumptions KAA are presented under the respec-tive notes; see application of assessments below.
Amounts that are reconcilable to the balance sheet, income statement, cash flow statement and the operating cash flow statement are marked with the following symbols:
BS Balance sheet IS Income statement CF Cash flow statement OCF Operating cash flow statement Tx:x Reference to table in note
GeneralThese combined financial statements (“financial statements”) are a part the annual accounts for the Group of Essity Aktiebolag. The material companies in the Essity Group are specified in Note F1. A complete list is kept by the Par-ent Company Essity Aktiebolag (publ).
BASIS OF PREPARATIONThese financial statements are prepared in accordance with International Financial Reporting Standards (IFRS)/International Accounting Standards (IAS), as adopted within the EU, and the Swedish Financial Reporting Board, Recommendation RFR 1 Supplementary Accounting Rules for Groups. The Parent Company’s annual accounts for the 2016 fiscal year are pre-pared in accordance with the Swedish Financial Reporting Board’s recom-mendation RFR 2, Reporting by Legal Entities, and the Annual Accounts Act. The material accounting principles for the Parent Company are presented in Notes PC1–PC15. During the fiscal year, Essity Aktiebolag transitioned from the Swedish Accounting Standards Board’s general guidelines 2012:1 Annual Accounts and Consolidated Financial Statements (K3), to application of RFR 2. The transition did not entail any changes that affect recognition and mea-surement, instead the changes relate solely to supplementary disclosures.
The financial statements relate to the fiscal year that ended on December 31, 2016. The Essity Group applies the historical cost method for measure-ment of assets and liabilities except for available-for-sale financial assets and financial assets and liabilities, including derivative instruments, measured at fair value through profit or loss, which are measured at fair value either in profit or loss or in other comprehensive income.
The formation of the Essity Group is a transaction under common control and is currently not covered by any IFRS standard, implying that a suitable accounting principle should be applied in accordance with IAS 8. A suitable and established method is to use previous carrying amounts (predecessor basis of accounting), which is the principle that the Essity Group has adopted to apply.
The financial statements have thus been prepared on the basis of the finan-cial information reported for the above units for the purposes of consoli-dated accounting in Svenska Cellulosa Aktiebolaget SCA, which is the Essity Group’s Parent Company. The financial statements are thus an aggregation of this financial information and are presented as though the units were a group as of the date they became part of the Svenska Cellulosa Aktiebolaget SCA Group. The accounting principles thus conform to the accounting principles presented in Svenska Cellulosa Aktiebolaget SCA’s financial statements for the 2016 fiscal year, which are outlined below, and mean that the units’ assets and liabilities are presented using the carrying amounts for the highest level
of common control (i.e. Svenska Cellulosa Aktiebolaget SCA) for the periods covered by this financial report.
This financial report is also the Essity Group’s first financial report to be prepared in accordance with IFRS. Considering the application of account-ing and presentation methods as stated above, IFRS 1 does not involve any impact on the measurement of assets and liabilities. However, the Essity Group has chosen, for the presentation of the financial statements, to apply the voluntary exception in IFRS 1 to reset translation differences to zero in the opening balance for 2014.
Due to the fact that it was not only separate legal entities that were trans-ferred in conjunction with the formation of the Essity Group, the following con-siderations were taken into account in conjunction with the preparation of the financial statements, together with the principles used to determine which assets, liabilities, revenues, costs and cash flows are to be included in the financial statements.
Allocation of income and expensesGiven that the majority of the current Svenska Cellulosa Aktiebolaget SCA´s central functions have been transferred to the Essity Group, these histori-cal income and expenses are, in all material respects, allocated to the Essity Group and are included in the financial statements.
Income statement Essity Aktiebolag has also decided to continue to report the income state-ment functional based, but increase the number of lines in the income state-ment by recognizing amortization of acquisition-related intangible assets on a separate line, which makes it easier to compare the results with other compa-nies regardless of whether the business is based on acquisitions or through organic growth. The company has also chosen to introduce EBITA as a sub-item in the consolidated income statement, see note A2 for further informa-tion.
Pension obligations The majority of the pension obligations and related plan assets have, for all periods, been reported by the respective legal entity in the Essity Group and have been calculated according to the principles presented below. The pen-sion obligations and fair value of the directly attributable plan assets for these obligations were recognized in the combined financial statements based on the calculated obligations in accordance with IAS 19 for the individuals and the individual pension obligations for former senior executives that were transferred to the Essity Group. The pension obligations and assets for which the approval of authorities is required for transfer were also included. The costs and remeasurement effects related to these obligations are reflected in the financial statements.
Derivatives and hedge accountingThe Essity Group includes the treasury function that was previously part of the Svenska Cellulosa Aktiebolaget SCA Group. This function has managed all of the Svenska Cellulosa Aktiebolaget SCA Group’s derivatives and hedg-ing relationships concerning the company’s commercial flows and net invest-ments. These financial statements only present the hedging reserve that is attributable to the Essity Group in relation to cash flow hedges and hedging of net investments. External derivative agreements that was entered into with regards to commercial flows and net investments in the Forest Products busi-ness are recognized at fair value in the balance sheet and any internal deriva-tives are also recognized as external positions from a Essity Group perspec-tive. The effects of the revaluation of external and internal positions for the Forest Products business were recognized net in comprehensive income.
Financial expenses and capital structure All financial expenses charged to the Essity Group were based on actual borrowings that the Essity Group and Svenska Cellulosa Aktiebolaget SCA had from external creditors. Furthermore, because the Treasury company was included in the Essity Group, the borrowing and lending and the inter-est income and expenses that the Treasury company had relating to the For-est Products business. The Essity Group’s historical capital structure have not been adjusted to reflect a potential capital structure for a separate entity.
F-38Admission to trading of the shares in Essity Aktiebolag (publ) on Nasdaq Stockholm
Financial data for the financial year 2014–2016
Transactions with shareholdersDividends that are financed through the corporate internal bank, group contributions and transactions between Forest Products business and the Essity Group which have been transferred without compensation have been accounted for as transactions with the shareholder. For further information see note E9 and G4
Income taxesBecause the Svenska Cellulosa Aktiebolaget SCA Group has been able to apply tax equalization between its entities, using for example Group contri-butions, the Swedish entities that make up the Essity Group historically has not been subject to tax in the same manner as if they were an independent Group. In the financial statements, tax has been recognized on the basis of the taxable earnings in the entities, and the opportunities that Group has had to apply tax equalization, for example, via Group contributions. In those cases were tax equalization have been applied between Swedish entities within the Essity Group and the Forest Products business these have been recognized as a transaction with the shareholder.
Earnings per shareIn these financial statements, the calculation of earnings per share has been based on the average number of shares outstanding in Svenska Cellulosa Aktiebolaget SCA, which is 702.3 million shares. This is considered more rele-vant given the intention to hereafter reflect the same share structure that exists in Svenska Cellulosa Aktiebolaget SCA in Essity Aktiebolag due to the pro-posed distribution of the Group.
Elimination of transactions in EssityReceivables, liabilities, revenue, costs and unrealized gains and losses that arise between entities in the Essity Group are eliminated in their entirety. Unre-alized losses are eliminated in the same manner as unrealized gains, but only to the extent there is no impairment requirement. The Essity Group had a number of transactions with SCA companies in Forest Products, and pric-ing follows the transfer pricing policy that applies for the Svenska Cellulosa Aktiebolaget SCA Group. In its balance sheet, the Essity Group has chosen to show these transactions on separate lines as current/non-current receiv-ables from/liabilities to Group companies. Further information on transactions between the Essity Group and the Forest Products business are described in Note G4 Transactions with related parties.
Segments At SCA’s Annual General Meeting on April 6, decisions were made to distrib-ute Hygiene operations to the shareholders. A review according to IFRS 8 Segments has therefore been implemented. Hygiene decided to divide the business into three segments, whereby Mjukpapper has been shared into Consumer Tissue and Professional Hygiene. In addition, Personal Care will continue to be a separate segment, which will also include the new acquisi-tion of BSN Medical, Medical Solutions, from Q2, which is in line with how the new organization will continue to be developed and managed. Comparative figures have been recalculated accordingly.
Significant events after the balance sheet dateWith regard to the potential impact of events after the balance sheet date in accordance with IAS 10, the principle has been chosen in the financial state-ments to only consider events in the most recent period presented, that is, the 2016 fiscal year. Accordingly, the 2015 and 2014 fiscal years are considered to be concluded.
New or amended accounting standards 2016No new standards or amendments to regulatory frameworks that had a mate-rial impact on the Essity Group’s earnings and financial position were imple-mented in 2016.• Amendments to IAS 1: Disclosure Initiative• Annual Improvements to IFRSs 2012-2014 Cycle• Amendments to IAS 27: Equity Method in Separate Financial Statements• Amendments to IAS 16 and IAS 38: Clarification of Acceptable Methods of• Depreciation and Amortization• Amendments to IFRS 11: Accounting for Acquisitions of Interests in Joint• OperationsThe amendments are not expected to have any material impact on the Group’s or parent company’s earnings or financial position.
New or amended accounting standards after 2016No new standards will be implemented 2017. However, a number of amend-ments of existing standards will be introduced. See below:• Amendments to IAS 12: Recognition of Deferred Tax Assets for Unrealized
losses• Annual Improvements to IAS7:Disclosure Initiative These amendments are not expected to have any material impact on the Group. The material new standards to be applied from their effective date are described below. No prospective application is planned.
IFRS 9 Financial instrumentsIFRS 9 Financial Instruments was issued in July 2014 and is a new standard that will replace IAS 39. The standard is divided into three areas: Classifica-tion and measurement of financial assets and liabilities, impairment and hedg-ing. The standard will become mandatory on January 1, 2018 with prospec-tive application permitted.
The company’s business model for managing the asset and the nature of the asset’s contractual cash flows comprise the basis for classification and measurement, in which the financial assets are classified in one of the follow-ing three categories: 1) financial assets measured at amortized cost 2) finan-cial assets measured at fair value through other comprehensive income and 3) financial assets measured at fair value through profit or loss. The new stan-dard entails essentially unchanged recognition of financial liabilities.
The standard introduces a new model for impairment of financial assets based on expected losses and not as previously under IAS 39 until the loss event has already occurred. Under the model, provisions are established for credit losses that may arise within the next 12 months for assets with low credit risk. In other cases where the credit risk has increased significantly since initial recognition and where the credit risk is not low, provisions are established for credit losses that are expected to occur during the full lifetime of the asset.
A simplified model has been developed for trade receivables and lease receivables, whereby anticipated losses are recognized over the estimated remaining term of the receivable.
The new standard focuses to a great extent on reflecting the company’s risk management strategies in hedge accounting and allowing more hedging strategies to qualify for hedge accounting.
The Essity Group has not fully evaluated the effects of IFRS 9 but expects the new rules for hedge accounting to increase the Essity Group’s possibili-ties for hedge accounting and facilitate the documentation of hedge account-ing. With respect to impairment, trade receivables are the main item affected for the Essity Group and the quantitative effects are deemed relatively small.
IFRS 15 Revenue from contracts with customersIFRS 15 Revenue from contracts with customers establishes a new regula-tory framework for the manner in which a company should recognize revenue. The new standard will replace IAS 11 Construction Contracts, IAS 18 Rev-enue, IFRIC (International Financial Reporting Interpretations Committee) 13 Customer Loyalty Programmes, IFRIC 15 Agreements for the Construction of Real Estate, IFRIC 18 Transfers of Assets from Customers and SIC (Standing Interpretation Committee of the IASC, predecessor to the IFRIC) 31 Revenue – Barter Transactions Involving Advertising Services. The date on which the standard will become effective has been postponed one year to January 1, 2018. During the year, IFRS 15 Clarification was issued, providing further guid-ance on when goods or services are to be recognized separately or jointly with other goods and services.The standard regulates commercial agreements (contracts) with custom-ers in which delivery of goods/services is divided into separately identifa-ble performance obligations that are recognized independently. In certain cases, the good/service can be integrated with other obligations in the con-tract, whereby a package of goods/services comprises a joint obligation. The standard establishes rules for calculating the transaction price for delivery of goods and services and the manner in which this can be allocated among the various performance obligations. Revenue is recognized when con-trol has passed to the customer by the customer being able to use or ben-efit from the good/service, at which point it is deemed to have been trans-ferred. Control may be passed at a given point in time, which is usually the case for sales. In other cases, a performance obligation may be satisfied over time, which is common for services. Three different criteria have been estab-
A. GENERAL ACCOUNTING PRINCIPLES AND NEW ACCOUNTING RULES AND BASIS OF PREPARATION, CONT.
Admission to trading of the shares in Essity Aktiebolag (publ) on Nasdaq StockholmF-39
Financial data for the financial year 2014–2016
lished for determining whether a performance obligation is satisfied over time. Either the customer receives and consumes all of the benefits as the obliga-tion is performed; the company’s performance enhances an asset that the customer controls; or the company’s performance does not create an asset with an alternative use to the company and the company has an enforceable right to payment for performance completed to date. IFRS 15 aims to create more comparable and transparent financial reporting, which will be achieved by separating customer contracts as specified above and by providing sig-nificantly expanded disclosures regarding how and when revenue is gener-ated. Disclosures encompass both quantitative and qualitative information to help the users of financial statements to understand the company’s business. Disclosures include information regarding contracts with customers, separa-tion of revenue into geographical regions, categories or similar with settlement against the recognized segment, information regarding balance sheet items and information concerning significant assessments.
In 2016, a project group at the Essity Group analyzed the implications of a switch of revenue standard in 2018. The group’s main task was to introduce and provide training to various parts of the Group in terms of what the stan-dard involves and the implications it will have for the Essity Group. In addi-tion, the Group has produced a questionnaire to determine the various types of contracts that exist in the Group. The questionnaire has been discussed at various levels with the company’s regions. Contact was made with the business development departments for various products, particularly within Incontinence Products and Professional Hygiene, to identify whether the Essity Group’s product offering encompasses services or whether the future development of new products will encompass services. Furthermore, infor-mation was compiled regarding how bonuses and discounts are handled in Essity’s contracts and reporting.
The conclusion can be drawn that Essity’s sales mainly comprise sales of products and, to a very limited extent, services, and thus the assessment has been made that no separate reporting of services is required. Developments in the area will continue to be monitored and in the event of a broadening of the service offering, separate reporting may be introduced.
The new reporting standard has transitioned from a risk and rewards con-cept to focusing more on when control has been transferred to the customer, which has given cargo clauses a more prominent role. As part of the proj-ect, it was found that for some of the shipments, the Essity Group booked the sales revenues before control had been transferred to the customer. How-ever, the extent was considered to be insignificant. Overall, this means that the new standard is not expected to have any significant impact on the Essity Group’s revenue recognition. During 2017, however, the Essity Group intends to ensure that the data is available for the expanded disclosure requirements in 2017.
IFRS 16 Leases In January 2016, the IASB published a new leases standard that will replace IAS 17 Leasing agreements and associated interpretations IFRIC 4, SIC-15 and SIC-27. The standard requires that all assets and liabilities attributable to all lease agreements, with a few exceptions, be recognized in the balance sheet. This type of recognition is based on the approach that the lessee is entitled to use an asset over a specific period and simultaneously has an obli-gation to pay for this entitlement. The only exceptions are agreements with a term of less than 12 months or assets with a low value, such as leasing con-tracts for computers and office furniture. Recognition for the lessor will remain essentially unchanged. The standard is applicable to fiscal years beginning on January 1, 2019 or later. Prospective application is permitted. The standard has not yet been adopted by the EU. The Essity Group will need to develop an overview of the lease agreements that exist in the Group to assess the mea-sures required and to adapt recognition to the new standard as well as the extent to which the Essity Group is to continue leasing equipment.
The cost of operational lease agreements for the 2016 fiscal year amounted to SEK 698m. As of December 31, 2016, the undiscounted amount relating to payment commitments for operational lease agreements totaled SEK 3,100m. However, the application of IFRS 16 would entail that a lower amount would be recognized as a liability and asset given that components of the lease agree-ments may refer to service and, moreover, the future payment commitments are also to be discounted. For more information about the company’s lease commitments, including the maturity structure, refer to G2.
USE OF ASSESSMENTSThe preparation of financial statements in conformity with IFRS and generally accepted Swedish accounting principles requires assessments and assump-tions to be made that affect recognized asset and liability items and income and expense items, respectively, as well as other information disclosed.
These assumptions and estimates are often based on historical experi-ence, but also on other factors, including expectations of future events. With other assumptions and estimates, the result may be different and the actual result will seldom fully concur with the estimated result.
In the opinion of the Essity Group, the areas that are impacted the most by assumptions and estimates are:Goodwill, D1Pensions, C5Taxes, B4Provisions, D6 The Essity Group’s assessments and assumptions are presented in the respective notes.
PRINCIPLES OF CONSOLIDATION Group companies are consolidated from the date the Group exercises control or influence over the company according to the definitions provided under the respective category of Group company below. Divested Group companies are included in the consolidated accounts until the date the Group ceases to control or exercise influence over the companies. Intra-Group transactions have been eliminated.
SubsidiariesAll companies included in the combined financial statements in which the Essity Group or Essity Aktiebolag has control are consolidated. The defini-tion of control is the ability to control the subsidiary, entitlement to a return and power to influence the activities that impact return. The consolidated financial statements are prepared based on transferred values from Svenska Cellulosa Aktiebolaget SCA.
Joint arrangementsThe Essity Group classifies its joint arrangements as joint ventures or joint operations. A joint venture entitles the joint owners to the net assets of the investment and is therefore recognized according to the equity method. In joint operations, parties to the agreement have rights to the assets and obliga-tions for the liabilities associated with the investment, meaning that the oper-ator must account for its share of the assets, liabilities, revenues and costs according to the proportional method.
AssociatesAssociates are companies in which the Group exercises a significant influ-ence without the partly owned company being a subsidiary or a joint arrange-ment. Normally, this means that the Group owns between 20% and 50% of the votes. Accounting for associates is carried out according to the equity method and they are initially measured at cost.
For further information, see Note F3.
TRANSLATION OF FOREIGN CURRENCYFunctional currency and translation of foreign Group companies to the presentation currencyThe Essity Group’s Parent Company has Swedish kronor (SEK) as its func-tional currency. The functional currency of Essity’s Group companies is deter-mined on the basis of the primary economic environment in which the respec-tive companies are active which, with a few exceptions, are the countries in which the individual companies operate. The financial statements of Group companies are translated to the Group’s presentation currency, which is SEK in the case of the Essity Group. Assets and liabilities are translated at the clos-ing rate, while income and expenses are translated at the average rate for the respective period. Translation differences on net assets are recognized as translation differences in other comprehensive income, which is a component of equity (translation reserve).
Exchange rate effects arising from financial instruments used to hedge for-eign subsidiaries’ net assets are recognized in the same manner in other com-prehensive income, which is a component of equity (translation reserve). On divestment, the translation difference on the foreign subsidiary and exchange
F-40Admission to trading of the shares in Essity Aktiebolag (publ) on Nasdaq Stockholm
Financial data for the financial year 2014–2016
A2. USE OF NON-IFRS (INTERNATIONAL FINANCIAL REPORTING STANDARDS) PERFORMANCE MEASURES
Guidelines concerning non-IFRS performance measures for companies with securities listed on a regulated market in the EU have been issued by the ESMA (The European Securities and Markets Authority). These guidelines are to be applied to alternative performance measures (APMs) applied as of July 3, 2016.
The Prospectus refers to a number of non-IFRS performance measures used to assist investors and company management to analyze the compa-ny’s operations. A description of the various non-IFRS performance measures
used as a complement to the financial information reported according to IFRS is presented below.
It is important that the Essity Group maintains an effective capital structure, while at the same time ensuring long-term access to loan financing. Cash flow in relation to net debt is to be taken into consideration in the target to maintain a solid investment grade rating.
A number of financial performance measures and how these are used to analyze the company’s objective are described below.
rate effects on the financial instrument used to currency hedge the net assets in the company are recognized as part of the gain or loss on disposal. Goodwill and surplus value adjustments arising in connection with the acqui-sition of a foreign subsidiary are to be translated, in a manner corresponding to the net assets in the company, from their functional currency to the presen-tation currency.
TRANSACTIONS AND BALANCE SHEET ITEMS IN FOREIGN CURRENCYTransactions in foreign currency are translated to a functional currency using the rate prevailing on the transaction date. At accounting year-end, monetary assets and liabilities are translated at the closing day rate and any exchange rate effects are recognized in profit or loss. In cases where the exchange rate effect is related to the operations, the effect is recognized net in operating profit. Exchange rate effects pertaining to borrowing and financial investments are recognized as other financial items. Non-monetary assets and liabilities recognized at historical cost are translated at the exchange rate prevailing on the transaction date.
If hedge accounting has been applied, for example, for cash flow hedges or hedging of net investments, the exchange rate effect is recognized in total equity under other comprehensive income.
If a financial instrument has been classified as available-for-sale financial assets, the portion of the value change pertaining to currency is recognized in profit or loss, while any other unrealized change is recognized in equity under other comprehensive income.
REVENUE RECOGNITIONSales revenue, synonymous with net sales, comprises the fair value of the consideration received or receivable for sold goods and services within the Essity Group’s ordinary activities. Revenue is recognized when delivery to the customer has taken place according to the terms of the sale. Other income includes compensation for sales that are not included in Essity’s ordi-nary activities and includes rental revenue, which is recognized in the period covered by the rental contract, royalties and similar items, which are recog-nized in accordance with the implied financial effect of the contract. Interest income is recognized in accordance with the effective interest method. Divi-dends received are recognized when the right to receive a dividend has been established.
GOVERNMENT GRANTSGovernment grants are measured at fair value when there is reasonable assur-ance the grants will be received and that Essity will comply with the conditions attached to them. Government grants related to acquisition of assets are rec-ognized in the balance sheet by the grant reducing the carrying amount of the asset. Government grants received as compensation for costs are accrued and recognized in profit or loss during the same period as the costs. If the gov-ernment grant or assistance is neither related to the acquisition of assets nor to compensation for costs, the grant is recognized as other income.
A. GENERAL ACCOUNTING PRINCIPLES AND NEW ACCOUNTING RULES AND BASIS OF PREPARATION, CONT.
CALCULATION OF PERFORMANCE MEASURES NOT INCLUDED IN IFRS FRAMEWORK
RETURN MEASURES Return is a financial term that describes how much the value of an asset changes from an earlier point in time
Non-IFRS measure Description Reason for use of the measure
Return on capital employed, ROCE
Accumulated return on capital employed is calculated as 12-month rolling operating profit before amortization of acquisition-related intangible assets/EBITA as a percentage of average capital employed for the five most recent quarters. The corresponding key figure for a single quarter is calculated as EBITA for the quarter multiplied by four as a percentage of average capital employed for the two most recent quarters.
This is the central ratio for measuring return on capital tied up in operations.
Adjusted return on capital employed, ROCE
Accumulated return on capital employed is calculated as 12-month rolling operating profit before amortization of acquisition-related intangible assets/EBITA, excluding items affecting comparability as a percentage of average capital employed for the five most recent quarters. The corresponding key figure for a single quarter is calculated as EBITA, excluding items affecting comparability, for the quarter multiplied by four as a percentage of average capital employed for the two most recent quarters.
Return on capital employed is the central ratio for measuring return on capital tied up in operations.
SEKm 2016 2015 2014
ADJUSTED RETURN ON CAPITAL EMPLOYED, ROCE
EBITA 9,347 10,311 8,486
Items affecting comparability 2,645 292 1,009
Adjusted EBITA 11,992 10,603 9,495
Average capital employed 73,145 70,115 66,866
Adjusted return on capital employed, ROCE 16.4% 15.1% 14.2%
Return on equity For the Group, return on equity is calculated as profit for the year as a percentage of average equity.
Shows, from a shareholder perspective, the return that is generated on the owners’ capital that is invested in the Company.
Admission to trading of the shares in Essity Aktiebolag (publ) on Nasdaq StockholmF-41
Financial data for the financial year 2014–2016
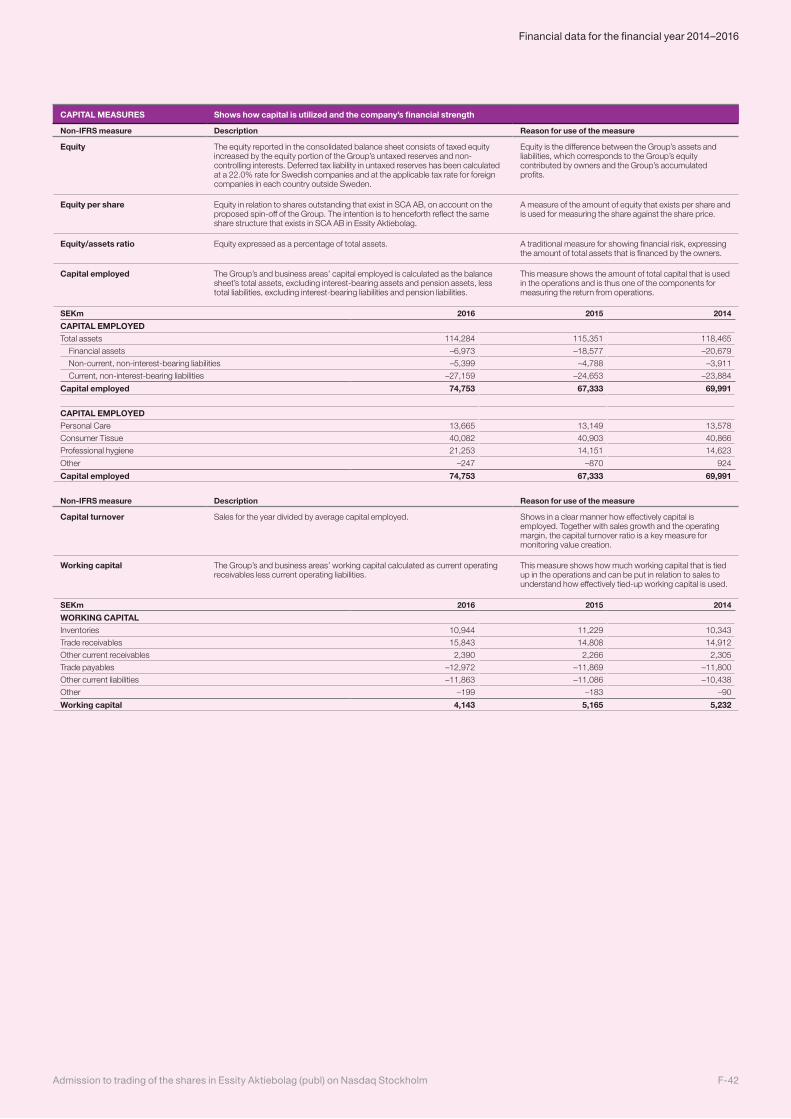
CAPITAL MEASURES Shows how capital is utilized and the company’s financial strength
Non-IFRS measure Description Reason for use of the measure
Equity The equity reported in the consolidated balance sheet consists of taxed equity increased by the equity portion of the Group’s untaxed reserves and non-controlling interests. Deferred tax liability in untaxed reserves has been calculated at a 22.0% rate for Swedish companies and at the applicable tax rate for foreign companies in each country outside Sweden.
Equity is the difference between the Group’s assets and liabilities, which corresponds to the Group’s equity contributed by owners and the Group’s accumulated profits.
Equity per share Equity in relation to shares outstanding that exist in SCA AB, on account on the proposed spin-off of the Group. The intention is to hence forth reflect the same share structure that exists in SCA AB in Essity Aktiebolag.
A measure of the amount of equity that exists per share and is used for measuring the share against the share price.
Equity/assets ratio Equity expressed as a percentage of total assets. A traditional measure for showing financial risk, expressing the amount of total assets that is financed by the owners.
Capital employed The Group’s and business areas’ capital employed is calculated as the balance sheet’s total assets, excluding interest-bearing assets and pension assets, less total liabilities, excluding interest-bearing liabilities and pension liabilities.
This measure shows the amount of total capital that is used in the operations and is thus one of the components for measuring the return from operations.
SEKm 2016 2015 2014
CAPITAL EMPLOYEDTotal assets 114,284 115,351 118,465
Financial assets –6,973 –18,577 –20,679
Non-current, non-interest-bearing liabilities –5,399 –4,788 –3,911
Current, non-interest-bearing liabilities –27,159 –24,653 –23,884
Capital employed 74,753 67,333 69,991
CAPITAL EMPLOYEDPersonal Care 13,665 13,149 13,578
Consumer Tissue 40,082 40,903 40,866
Professional hygiene 21,253 14,151 14,623
Other –247 –870 924
Capital employed 74,753 67,333 69,991
Non-IFRS measure Description Reason for use of the measure
Capital turnover Sales for the year divided by average capital employed. Shows in a clear manner how effectively capital is employed. Together with sales growth and the operating margin, the capital turnover ratio is a key measure for monitoring value creation.
Working capital The Group’s and business areas’ working capital calculated as current operating receivables less current operating liabilities.
This measure shows how much working capital that is tied up in the operations and can be put in relation to sales to understand how effectively tied-up working capital is used.
SEKm 2016 2015 2014
WORKING CAPITALInventories 10,944 11,229 10,343
Trade receivables 15,843 14,808 14,912
Other current receivables 2,390 2,266 2,305
Trade payables –12,972 –11,869 –11,800
Other current liabilities –11,863 –11,086 –10,438
Other –199 –183 –90
Working capital 4,143 5,165 5,232
F-42Admission to trading of the shares in Essity Aktiebolag (publ) on Nasdaq Stockholm
Financial data for the financial year 2014–2016
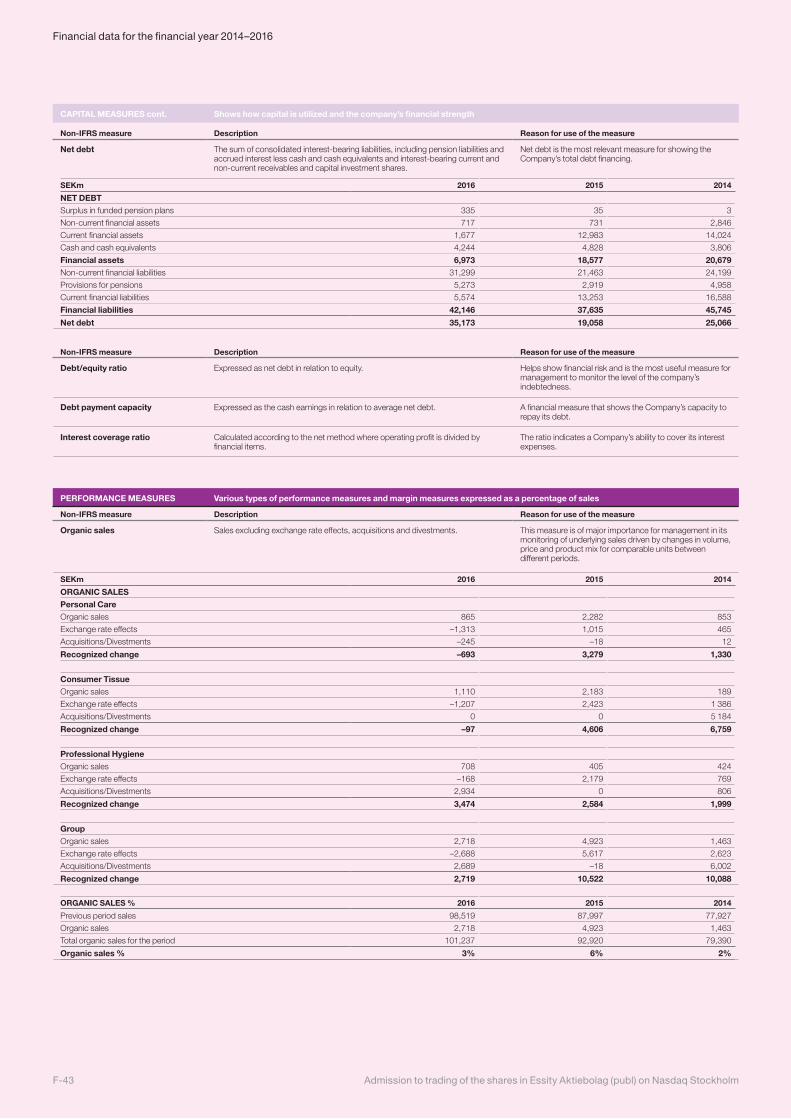
PERFORMANCE MEASURES Various types of performance measures and margin measures expressed as a percentage of sales
Non-IFRS measure Description Reason for use of the measure
Organic sales Sales excluding exchange rate effects, acquisitions and divestments. This measure is of major importance for management in its monitoring of underlying sales driven by changes in volume, price and product mix for comparable units between different periods.
SEKm 2016 2015 2014
ORGANIC SALESPersonal CareOrganic sales 865 2,282 853
Exchange rate effects –1,313 1,015 465
Acquisitions/Divestments –245 –18 12
Recognized change –693 3,279 1,330
Consumer TissueOrganic sales 1,110 2,183 189
Exchange rate effects –1,207 2,423 1 386
Acquisitions/Divestments 0 0 5 184
Recognized change –97 4,606 6,759
Professional HygieneOrganic sales 708 405 424
Exchange rate effects –168 2,179 769
Acquisitions/Divestments 2,934 0 806
Recognized change 3,474 2,584 1,999
GroupOrganic sales 2,718 4,923 1,463
Exchange rate effects –2,688 5,617 2,623
Acquisitions/Divestments 2,689 –18 6,002
Recognized change 2,719 10,522 10,088
ORGANIC SALES % 2016 2015 2014
Previous period sales 98,519 87,997 77,927
Organic sales 2,718 4,923 1,463
Total organic sales for the period 101,237 92,920 79,390
Organic sales % 3% 6% 2%
Non-IFRS measure Description Reason for use of the measure
Debt/equity ratio Expressed as net debt in relation to equity. Helps show financial risk and is the most useful measure for management to monitor the level of the company’s indebtedness.
Debt payment capacity Expressed as the cash earnings in relation to average net debt. A financial measure that shows the Company’s capacity to repay its debt.
Interest coverage ratio Calculated according to the net method where operating profit is divided by financial items.
The ratio indicates a Company’s ability to cover its interest expenses.
Non-IFRS measure Description Reason for use of the measure
Net debt The sum of consolidated interest-bearing liabilities, including pension liabilities and accrued interest less cash and cash equivalents and interest-bearing current and non-current receivables and capital investment shares.
Net debt is the most relevant measure for showing the Company’s total debt financing.
SEKm 2016 2015 2014
NET DEBTSurplus in funded pension plans 335 35 3
Non-current financial assets 717 731 2,846
Current financial assets 1,677 12,983 14,024
Cash and cash equivalents 4,244 4,828 3,806
Financial assets 6,973 18,577 20,679Non-current financial liabilities 31,299 21,463 24,199
Provisions for pensions 5,273 2,919 4,958
Current financial liabilities 5,574 13,253 16,588
Financial liabilities 42,146 37,635 45,745
Net debt 35,173 19,058 25,066
CAPITAL MEASURES cont. Shows how capital is utilized and the company’s financial strength
Admission to trading of the shares in Essity Aktiebolag (publ) on Nasdaq StockholmF-43
Financial data for the financial year 2014–2016
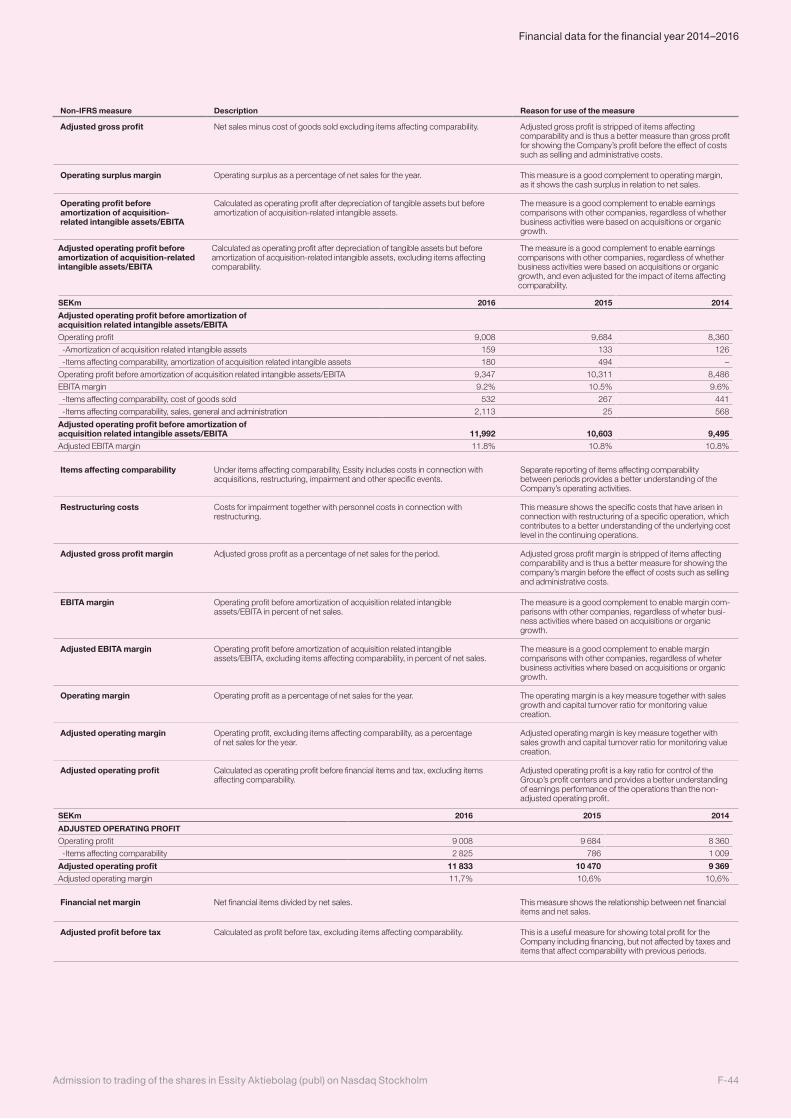
Non-IFRS measure Description Reason for use of the measure
Adjusted gross profit Net sales minus cost of goods sold excluding items affecting comparability. Adjusted gross profit is stripped of items affecting comparability and is thus a better measure than gross profit for showing the Company’s profit before the effect of costs such as selling and administrative costs.
Operating surplus margin Operating surplus as a percentage of net sales for the year. This measure is a good complement to operating margin, as it shows the cash surplus in relation to net sales.
Operating profit before amortization of acquisition-related intangible assets/EBITA
Calculated as operating profit after depreciation of tangible assets but before amortization of acquisition-related intangible assets.
The measure is a good complement to enable earnings comparisons with other companies, regardless of whether business activities were based on acquisitions or organic growth.
Adjusted operating profit before amortization of acquisition-related intangible assets/EBITA
Calculated as operating profit after depreciation of tangible assets but before amortization of acquisition-related intangible assets, excluding items affecting comparability.
The measure is a good complement to enable earnings comparisons with other companies, regardless of whether business activities were based on acquisitions or organic growth, and even adjusted for the impact of items affecting comparability.
SEKm 2016 2015 2014
Adjusted operating profit before amortization of acquisition related intangible assets/EBITAOperating profit 9,008 9,684 8,360
-Amortization of acquisition related intangible assets 159 133 126
-Items affecting comparability, amortization of acquisition related intangible assets 180 494 –
Operating profit before amortization of acquisition related intangible assets/EBITA 9,347 10,311 8,486
EBITA margin 9.2% 10.5% 9.6%
-Items affecting comparability, cost of goods sold 532 267 441
-Items affecting comparability, sales, general and administration 2,113 25 568
Adjusted operating profit before amortization of acquisition related intangible assets/EBITA 11,992 10,603 9,495Adjusted EBITA margin 11.8% 10.8% 10.8%
Items affecting comparability Under items affecting comparability, Essity includes costs in connection with acquisitions, restructuring, impairment and other specific events.
Separate reporting of items affecting comparability between periods provides a better understanding of the Company’s operating activities.
Restructuring costs Costs for impairment together with personnel costs in connection with restructuring.
This measure shows the specific costs that have arisen in connection with restructuring of a specific operation, which contributes to a better understanding of the underlying cost level in the continuing operations.
Adjusted gross profit margin Adjusted gross profit as a percentage of net sales for the period. Adjusted gross profit margin is stripped of items affecting comparability and is thus a better measure for showing the company’s margin before the effect of costs such as selling and administrative costs.
EBITA margin Operating profit before amortization of acquisition related intangible assets/EBITA in percent of net sales.
The measure is a good complement to enable margin com-parisons with other companies, regardless of wheter busi-ness activities where based on acquisitions or organic growth.
Adjusted EBITA margin Operating profit before amortization of acquisition related intangible assets/EBITA, excluding items affecting comparability, in percent of net sales.
The measure is a good complement to enable margin comparisons with other companies, regardless of wheter business activities where based on acquisitions or organic growth.
Operating margin Operating profit as a percentage of net sales for the year. The operating margin is a key measure together with sales growth and capital turnover ratio for monitoring value creation.
Adjusted operating margin Operating profit, excluding items affecting comparability, as a percentage of net sales for the year.
Adjusted operating margin is key measure together with sales growth and capital turnover ratio for monitoring value creation.
Adjusted operating profit Calculated as operating profit before financial items and tax, excluding items affecting comparability.
Adjusted operating profit is a key ratio for control of the Group’s profit centers and provides a better understanding of earnings performance of the operations than the non-adjusted operating profit.
SEKm 2016 2015 2014
ADJUSTED OPERATING PROFIT
Operating profit 9 008 9 684 8 360
-Items affecting comparability 2 825 786 1 009
Adjusted operating profit 11 833 10 470 9 369Adjusted operating margin 11,7% 10,6% 10,6%
Financial net margin Net financial items divided by net sales. This measure shows the relationship between net financial items and net sales.
Adjusted profit before tax Calculated as profit before tax, excluding items affecting comparability. This is a useful measure for showing total profit for the Company including financing, but not affected by taxes and items that affect comparability with previous periods.
F-44Admission to trading of the shares in Essity Aktiebolag (publ) on Nasdaq Stockholm
Financial data for the financial year 2014–2016
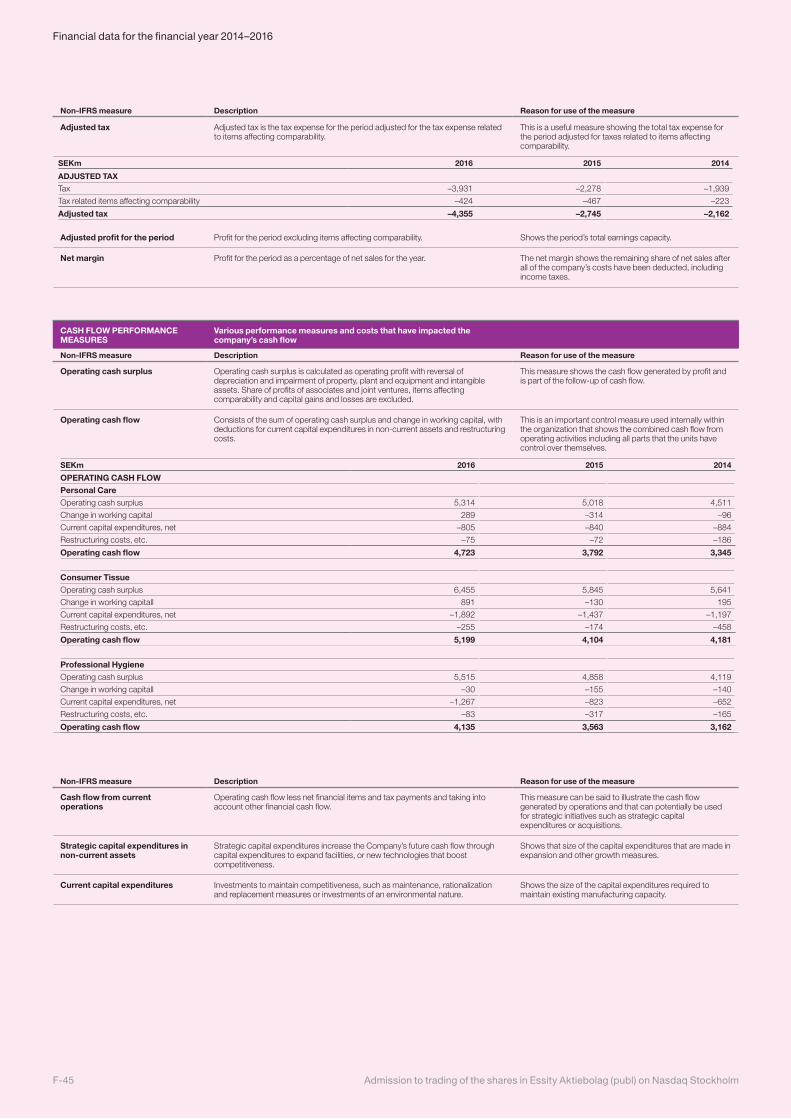
Non-IFRS measure Description Reason for use of the measure
Cash flow from current operations
Operating cash flow less net financial items and tax payments and taking into account other financial cash flow.
This measure can be said to illustrate the cash flow generated by operations and that can potentially be used for strategic initiatives such as strategic capital expenditures or acquisitions.
Strategic capital expenditures in non-current assets
Strategic capital expenditures increase the Company’s future cash flow through capital expenditures to expand facilities, or new technologies that boost competitiveness.
Shows that size of the capital expenditures that are made in expansion and other growth measures.
Current capital expenditures Investments to maintain competitiveness, such as maintenance, rationalization and replacement measures or investments of an environmental nature.
Shows the size of the capital expenditures required to maintain existing manufacturing capacity.
CASH FLOW PERFORMANCE MEASURES
Various performance measures and costs that have impacted the company’s cash flow
Non-IFRS measure Description Reason for use of the measure
Operating cash surplus Operating cash surplus is calculated as operating profit with reversal of depreciation and impairment of property, plant and equipment and intangible assets. Share of profits of associates and joint ventures, items affecting comparability and capital gains and losses are excluded.
This measure shows the cash flow generated by profit and is part of the follow-up of cash flow.
Operating cash flow Consists of the sum of operating cash surplus and change in working capital, with deductions for current capital expenditures in non-current assets and restructuring costs.
This is an important control measure used internally within the organization that shows the combined cash flow from operating activities including all parts that the units have control over themselves.
SEKm 2016 2015 2014
OPERATING CASH FLOWPersonal CareOperating cash surplus 5,314 5,018 4,511
Change in working capital 289 –314 –96
Current capital expenditures, net –805 –840 –884
Restructuring costs, etc. –75 –72 –186
Operating cash flow 4,723 3,792 3,345
Consumer TissueOperating cash surplus 6,455 5,845 5,641
Change in working capitall 891 –130 195
Current capital expenditures, net –1,892 –1,437 –1,197
Restructuring costs, etc. –255 –174 –458
Operating cash flow 5,199 4,104 4,181
Professional HygieneOperating cash surplus 5,515 4,858 4,119
Change in working capitall –30 –155 –140
Current capital expenditures, net –1,267 –823 –652
Restructuring costs, etc. –83 –317 –165
Operating cash flow 4,135 3,563 3,162
Non-IFRS measure Description Reason for use of the measure
Adjusted tax Adjusted tax is the tax expense for the period adjusted for the tax expense related to items affecting comparability.
This is a useful measure showing the total tax expense for the period adjusted for taxes related to items affecting comparability.
SEKm 2016 2015 2014
ADJUSTED TAX
Tax –3,931 –2,278 –1,939
Tax related items affecting comparability –424 –467 –223
Adjusted tax –4,355 –2,745 –2,162
Adjusted profit for the period Profit for the period excluding items affecting comparability. Shows the period’s total earnings capacity.
Net margin Profit for the period as a percentage of net sales for the year. The net margin shows the remaining share of net sales after all of the company’s costs have been deducted, including income taxes.
Admission to trading of the shares in Essity Aktiebolag (publ) on Nasdaq StockholmF-45
Financial data for the financial year 2014–2016
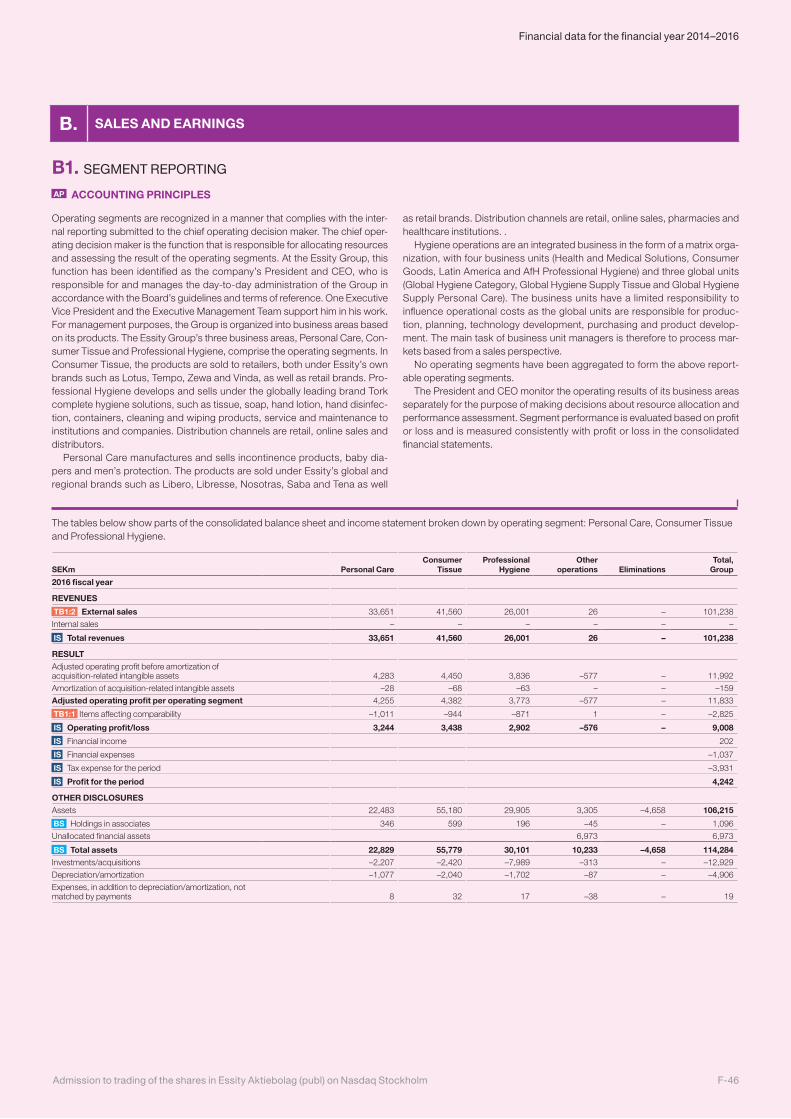
B1. SEGMENT REPORTING
AP ACCOUNTING PRINCIPLES
Operating segments are recognized in a manner that complies with the inter-nal reporting submitted to the chief operating decision maker. The chief oper-ating decision maker is the function that is responsible for allocating resources and assessing the result of the operating segments. At the Essity Group, this function has been identified as the company’s President and CEO, who is responsible for and manages the day-to-day administration of the Group in accordance with the Board’s guidelines and terms of reference. One Executive Vice President and the Executive Management Team support him in his work. For management purposes, the Group is organized into business areas based on its products. The Essity Group’s three business areas, Personal Care, Con-sumer Tissue and Professional Hygiene, comprise the operating segments. In Consumer Tissue, the products are sold to retailers, both under Essity’s own brands such as Lotus, Tempo, Zewa and Vinda, as well as retail brands. Pro-fessional Hygiene develops and sells under the globally leading brand Tork complete hygiene solutions, such as tissue, soap, hand lotion, hand disinfec-tion, containers, cleaning and wiping products, service and maintenance to institutions and companies. Distribution channels are retail, online sales and distributors.
Personal Care manufactures and sells incontinence products, baby dia-pers and men’s protection. The products are sold under Essity’s global and regional brands such as Libero, Libresse, Nosotras, Saba and Tena as well
as retail brands. Distribution channels are retail, online sales, pharmacies and healthcare institutions. .
Hygiene operations are an integrated business in the form of a matrix orga-nization, with four business units (Health and Medical Solutions, Consumer Goods, Latin America and AfH Professional Hygiene) and three global units (Global Hygiene Category, Global Hygiene Supply Tissue and Global Hygiene Supply Personal Care). The business units have a limited responsibility to influence operational costs as the global units are responsible for produc-tion, planning, technology development, purchasing and product develop-ment. The main task of business unit managers is therefore to process mar-kets based from a sales perspective.
No operating segments have been aggregated to form the above report-able operating segments.
The President and CEO monitor the operating results of its business areas separately for the purpose of making decisions about resource allocation and performance assessment. Segment performance is evaluated based on profit or loss and is measured consistently with profit or loss in the consolidated financial statements.
B. SALES AND EARNINGS
The tables below show parts of the consolidated balance sheet and income statement broken down by operating segment: Personal Care, Consumer Tissue and Professional Hygiene.
SEKm Personal CareConsumer
TissueProfessional
HygieneOther
operations EliminationsTotal,
Group
2016 fiscal year
REVENUES
TB1:2 External sales 33,651 41,560 26,001 26 – 101,238
Internal sales – – – – – –
IS Total revenues 33,651 41,560 26,001 26 – 101,238
RESULTAdjusted operating profit before amortization of acquisition-related intangible assets 4,283 4,450 3,836 –577 – 11,992
Amortization of acquisition-related intangible assets –28 –68 –63 – – –159
Adjusted operating profit per operating segment 4,255 4,382 3,773 –577 – 11,833
TB1:1 Items affecting comparability –1,011 –944 –871 1 – –2,825
IS Operating profit/loss 3,244 3,438 2,902 –576 – 9,008
IS Financial income 202
IS Financial expenses –1,037
IS Tax expense for the period –3,931
IS Profit for the period 4,242
OTHER DISCLOSURESAssets 22,483 55,180 29,905 3,305 –4,658 106,215
BS Holdings in associates 346 599 196 –45 – 1,096
Unallocated financial assets 6,973 6,973
BS Total assets 22,829 55,779 30,101 10,233 –4,658 114,284Investments/acquisitions –2,207 –2,420 –7,989 –313 – –12,929
Depreciation/amortization –1,077 –2,040 –1,702 –87 – –4,906
Expenses, in addition to depreciation/amortization, not matched by payments 8 32 17 –38 – 19
F-46Admission to trading of the shares in Essity Aktiebolag (publ) on Nasdaq Stockholm
Financial data for the financial year 2014–2016
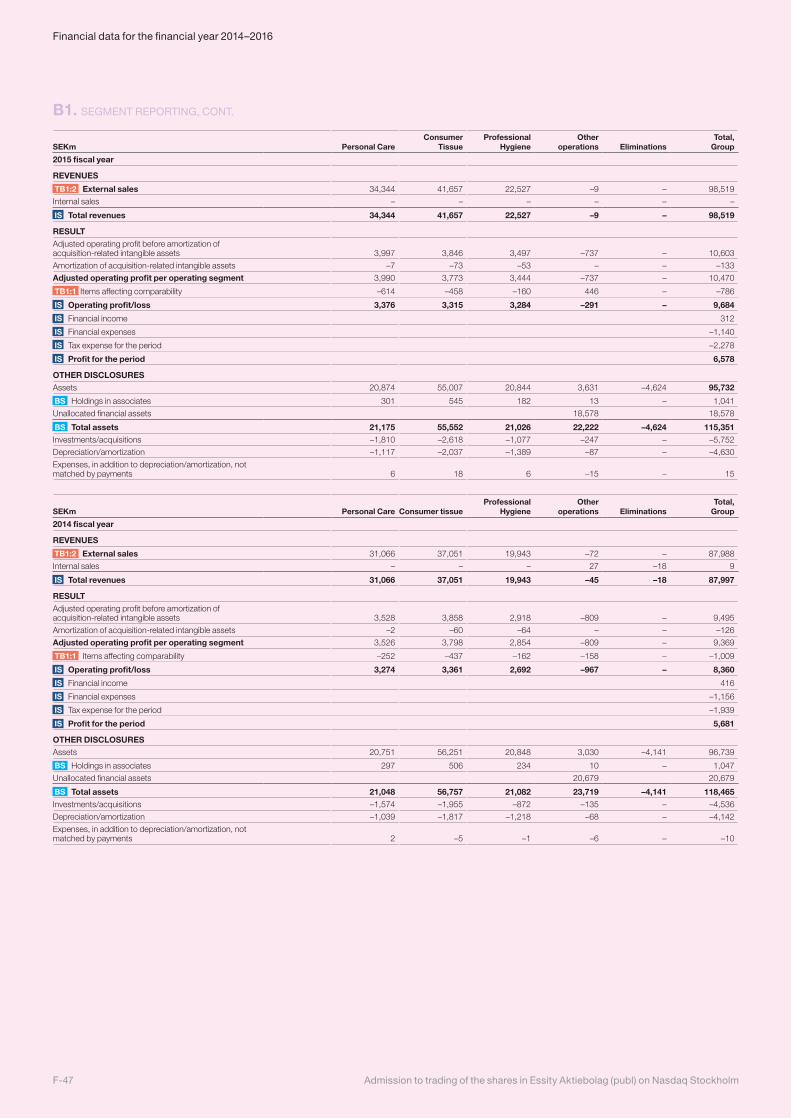
B1. SEGMENT REPORTING, CONT.
SEKm Personal CareConsumer
TissueProfessional
HygieneOther
operations EliminationsTotal,
Group
2015 fiscal year
REVENUES
TB1:2 External sales 34,344 41,657 22,527 –9 – 98,519
Internal sales – – – – – –
IS Total revenues 34,344 41,657 22,527 –9 – 98,519
RESULTAdjusted operating profit before amortization of acquisition-related intangible assets 3,997 3,846 3,497 –737 – 10,603
Amortization of acquisition-related intangible assets –7 –73 –53 – – –133
Adjusted operating profit per operating segment 3,990 3,773 3,444 –737 – 10,470
TB1:1 Items affecting comparability –614 –458 –160 446 – –786
IS Operating profit/loss 3,376 3,315 3,284 –291 – 9,684
IS Financial income 312
IS Financial expenses –1,140
IS Tax expense for the period –2,278
IS Profit for the period 6,578
OTHER DISCLOSURESAssets 20,874 55,007 20,844 3,631 –4,624 95,732
BS Holdings in associates 301 545 182 13 – 1,041
Unallocated financial assets 18,578 18,578
BS Total assets 21,175 55,552 21,026 22,222 –4,624 115,351Investments/acquisitions –1,810 –2,618 –1,077 –247 – –5,752
Depreciation/amortization –1,117 –2,037 –1,389 –87 – –4,630
Expenses, in addition to depreciation/amortization, not matched by payments 6 18 6 –15 – 15
SEKm Personal Care Consumer tissueProfessional
HygieneOther
operations EliminationsTotal,
Group
2014 fiscal year
REVENUES
TB1:2 External sales 31,066 37,051 19,943 –72 – 87,988
Internal sales – – – 27 –18 9
IS Total revenues 31,066 37,051 19,943 –45 –18 87,997
RESULTAdjusted operating profit before amortization of acquisition-related intangible assets 3,528 3,858 2,918 –809 – 9,495
Amortization of acquisition-related intangible assets –2 –60 –64 – – –126
Adjusted operating profit per operating segment 3,526 3,798 2,854 –809 – 9,369
TB1:1 Items affecting comparability –252 –437 –162 –158 – –1,009
IS Operating profit/loss 3,274 3,361 2,692 –967 – 8,360
IS Financial income 416
IS Financial expenses –1,156
IS Tax expense for the period –1,939
IS Profit for the period 5,681
OTHER DISCLOSURESAssets 20,751 56,251 20,848 3,030 –4,141 96,739
BS Holdings in associates 297 506 234 10 – 1,047
Unallocated financial assets 20,679 20,679
BS Total assets 21,048 56,757 21,082 23,719 –4,141 118,465Investments/acquisitions –1,574 –1,955 –872 –135 – –4,536
Depreciation/amortization –1,039 –1,817 –1,218 –68 – –4,142
Expenses, in addition to depreciation/amortization, not matched by payments 2 –5 –1 –6 – –10
Admission to trading of the shares in Essity Aktiebolag (publ) on Nasdaq StockholmF-47
Financial data for the financial year 2014–2016
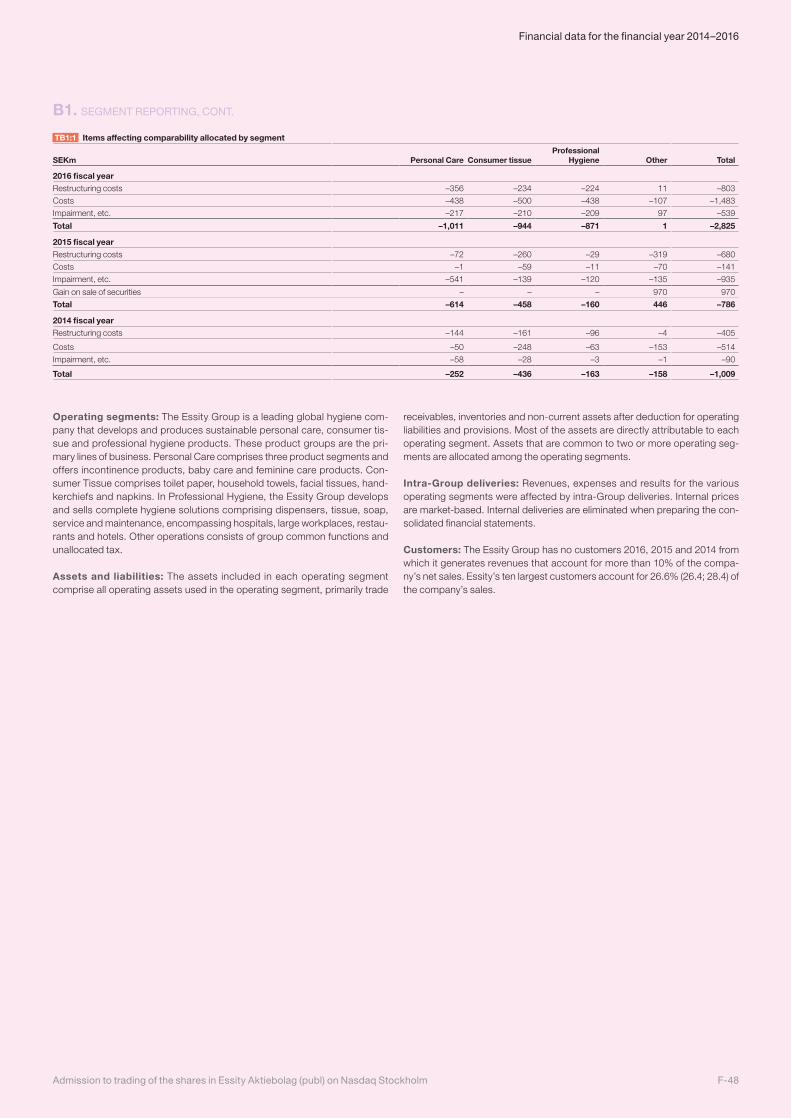
Operating segments: The Essity Group is a leading global hygiene com-pany that develops and produces sustainable personal care, consumer tis-sue and professional hygiene products. These product groups are the pri-mary lines of business. Personal Care comprises three product segments and offers incontinence products, baby care and feminine care products. Con-sumer Tissue comprises toilet paper, household towels, facial tissues, hand-kerchiefs and napkins. In Professional Hygiene, the Essity Group develops and sells complete hygiene solutions comprising dispensers, tissue, soap, service and maintenance, encompassing hospitals, large workplaces, restau-rants and hotels. Other operations consists of group common functions and unallocated tax.
Assets and liabilities: The assets included in each operating segment comprise all operating assets used in the operating segment, primarily trade
receivables, inventories and non-current assets after deduction for operating liabilities and provisions. Most of the assets are directly attributable to each operating segment. Assets that are common to two or more operating seg-ments are allocated among the operating segments.
Intra-Group deliveries: Revenues, expenses and results for the various operating segments were affected by intra-Group deliveries. Internal prices are market-based. Internal deliveries are eliminated when preparing the con-solidated financial statements.
Customers: The Essity Group has no customers 2016, 2015 and 2014 from which it generates revenues that account for more than 10% of the compa-ny’s net sales. Essity’s ten largest customers account for 26.6% (26.4; 28.4) of the company’s sales.
B1. SEGMENT REPORTING, CONT.
TB1:1 Items affecting comparability allocated by segment
SEKm Personal Care Consumer tissueProfessional
Hygiene Other Total
2016 fiscal yearRestructuring costs –356 –234 –224 11 –803
Costs –438 –500 –438 –107 –1,483
Impairment, etc. –217 –210 –209 97 –539
Total –1,011 –944 –871 1 –2,825
2015 fiscal yearRestructuring costs –72 –260 –29 –319 –680
Costs –1 –59 –11 –70 –141
Impairment, etc. –541 –139 –120 –135 –935
Gain on sale of securities – – – 970 970
Total –614 –458 –160 446 –786
2014 fiscal yearRestructuring costs –144 –161 –96 –4 –405
Costs –50 –248 –63 –153 –514
Impairment, etc. –58 –28 –3 –1 –90
Total –252 –436 –163 –158 –1,009
F-48Admission to trading of the shares in Essity Aktiebolag (publ) on Nasdaq Stockholm
Financial data for the financial year 2014–2016
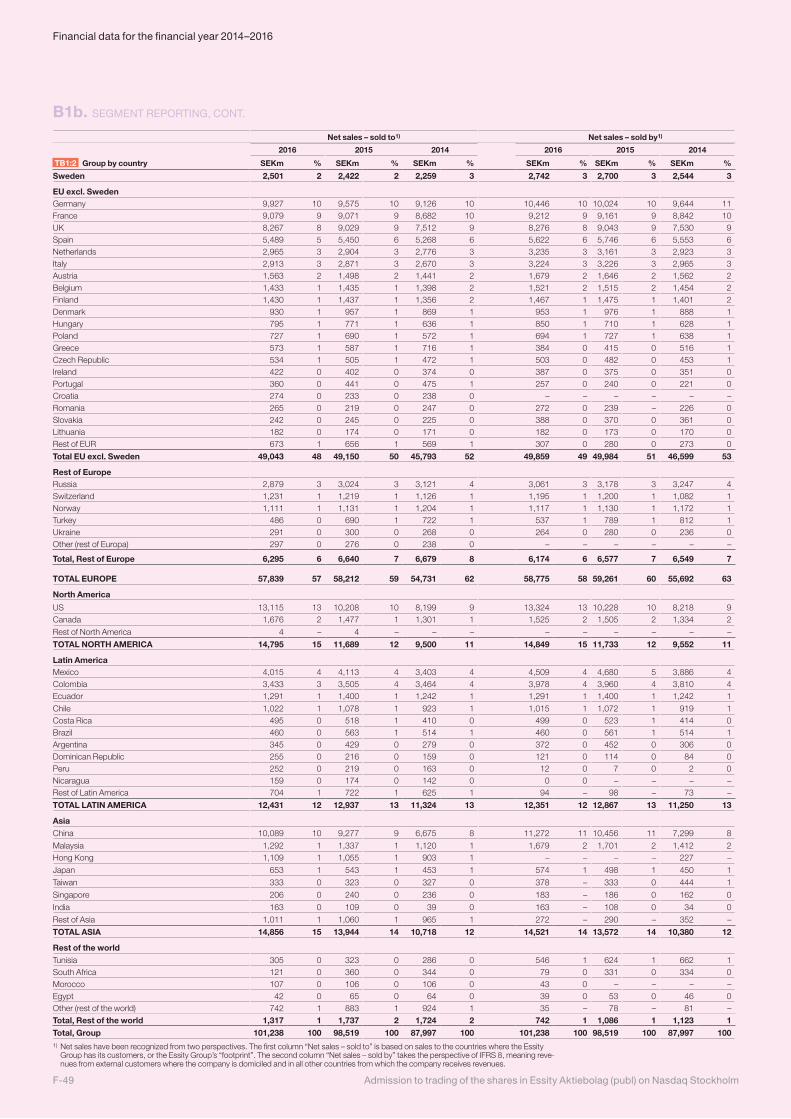
B1b. SEGMENT REPORTING, CONT.
Net sales – sold to1) Net sales – sold by1)
2016 2015 2014 2016 2015 2014
TB1:2 Group by country SEKm % SEKm % SEKm % SEKm % SEKm % SEKm %
Sweden 2,501 2 2,422 2 2,259 3 2,742 3 2,700 3 2,544 3
EU excl. SwedenGermany 9,927 10 9,575 10 9,126 10 10,446 10 10,024 10 9,644 11France 9,079 9 9,071 9 8,682 10 9,212 9 9,161 9 8,842 10UK 8,267 8 9,029 9 7,512 9 8,276 8 9,043 9 7,530 9Spain 5,489 5 5,450 6 5,268 6 5,622 6 5,746 6 5,553 6Netherlands 2,965 3 2,904 3 2,776 3 3,235 3 3,161 3 2,923 3Italy 2,913 3 2,871 3 2,670 3 3,224 3 3,226 3 2,965 3Austria 1,563 2 1,498 2 1,441 2 1,679 2 1,646 2 1,562 2Belgium 1,433 1 1,435 1 1,398 2 1,521 2 1,515 2 1,454 2Finland 1,430 1 1,437 1 1,356 2 1,467 1 1,475 1 1,401 2Denmark 930 1 957 1 869 1 953 1 976 1 888 1Hungary 795 1 771 1 636 1 850 1 710 1 628 1Poland 727 1 690 1 572 1 694 1 727 1 638 1Greece 573 1 587 1 716 1 384 0 415 0 516 1Czech Republic 534 1 505 1 472 1 503 0 482 0 453 1Ireland 422 0 402 0 374 0 387 0 375 0 351 0Portugal 360 0 441 0 475 1 257 0 240 0 221 0Croatia 274 0 233 0 238 0 – – – – – –Romania 265 0 219 0 247 0 272 0 239 – 226 0Slovakia 242 0 245 0 225 0 388 0 370 0 361 0Lithuania 182 0 174 0 171 0 182 0 173 0 170 0Rest of EUR 673 1 656 1 569 1 307 0 280 0 273 0
Total EU excl. Sweden 49,043 48 49,150 50 45,793 52 49,859 49 49,984 51 46,599 53
Rest of EuropeRussia 2,879 3 3,024 3 3,121 4 3,061 3 3,178 3 3,247 4Switzerland 1,231 1 1,219 1 1,126 1 1,195 1 1,200 1 1,082 1Norway 1,111 1 1,131 1 1,204 1 1,117 1 1,130 1 1,172 1Turkey 486 0 690 1 722 1 537 1 789 1 812 1Ukraine 291 0 300 0 268 0 264 0 280 0 236 0Other (rest of Europa) 297 0 276 0 238 0 – – – – – –
Total, Rest of Europe 6,295 6 6,640 7 6,679 8 6,174 6 6,577 7 6,549 7
TOTAL EUROPE 57,839 57 58,212 59 54,731 62 58,775 58 59,261 60 55,692 63
North America
US 13,115 13 10,208 10 8,199 9 13,324 13 10,228 10 8,218 9Canada 1,676 2 1,477 1 1,301 1 1,525 2 1,505 2 1,334 2
Rest of North America 4 – 4 – – – – – – – – –
TOTAL NORTH AMERICA 14,795 15 11,689 12 9,500 11 14,849 15 11,733 12 9,552 11
Latin AmericaMexico 4,015 4 4,113 4 3,403 4 4,509 4 4,680 5 3,886 4Colombia 3,433 3 3,505 4 3,464 4 3,978 4 3,960 4 3,810 4Ecuador 1,291 1 1,400 1 1,242 1 1,291 1 1,400 1 1,242 1
Chile 1,022 1 1,078 1 923 1 1,015 1 1,072 1 919 1Costa Rica 495 0 518 1 410 0 499 0 523 1 414 0Brazil 460 0 563 1 514 1 460 0 561 1 514 1Argentina 345 0 429 0 279 0 372 0 452 0 306 0Dominican Republic 255 0 216 0 159 0 121 0 114 0 84 0Peru 252 0 219 0 163 0 12 0 7 0 2 0Nicaragua 159 0 174 0 142 0 0 0 – – – –Rest of Latin America 704 1 722 1 625 1 94 – 98 – 73 –
TOTAL LATIN AMERICA 12,431 12 12,937 13 11,324 13 12,351 12 12,867 13 11,250 13
AsiaChina 10,089 10 9,277 9 6,675 8 11,272 11 10,456 11 7,299 8
Malaysia 1,292 1 1,337 1 1,120 1 1,679 2 1,701 2 1,412 2Hong Kong 1,109 1 1,055 1 903 1 – – – – 227 –
Japan 653 1 543 1 453 1 574 1 498 1 450 1
Taiwan 333 0 323 0 327 0 378 – 333 0 444 1
Singapore 206 0 240 0 236 0 183 – 186 0 162 0
India 163 0 109 0 39 0 163 – 108 0 34 0
Rest of Asia 1,011 1 1,060 1 965 1 272 – 290 – 352 –
TOTAL ASIA 14,856 15 13,944 14 10,718 12 14,521 14 13,572 14 10,380 12
Rest of the worldTunisia 305 0 323 0 286 0 546 1 624 1 662 1South Africa 121 0 360 0 344 0 79 0 331 0 334 0Morocco 107 0 106 0 106 0 43 0 – – – –Egypt 42 0 65 0 64 0 39 0 53 0 46 0Other (rest of the world) 742 1 883 1 924 1 35 – 78 – 81 –Total, Rest of the world 1,317 1 1,737 2 1,724 2 742 1 1,086 1 1,123 1Total, Group 101,238 100 98,519 100 87,997 100 101,238 100 98,519 100 87,997 1001) Net sales have been recognized from two perspectives. The first column “Net sales – sold to” is based on sales to the countries where the Essity
Group has its customers, or the Essity Group’s “footprint”. The second column “Net sales – sold by” takes the perspective of IFRS 8, meaning reve-nues from external customers where the company is domiciled and in all other countries from which the company receives revenues.
Admission to trading of the shares in Essity Aktiebolag (publ) on Nasdaq StockholmF-49
Financial data for the financial year 2014–2016
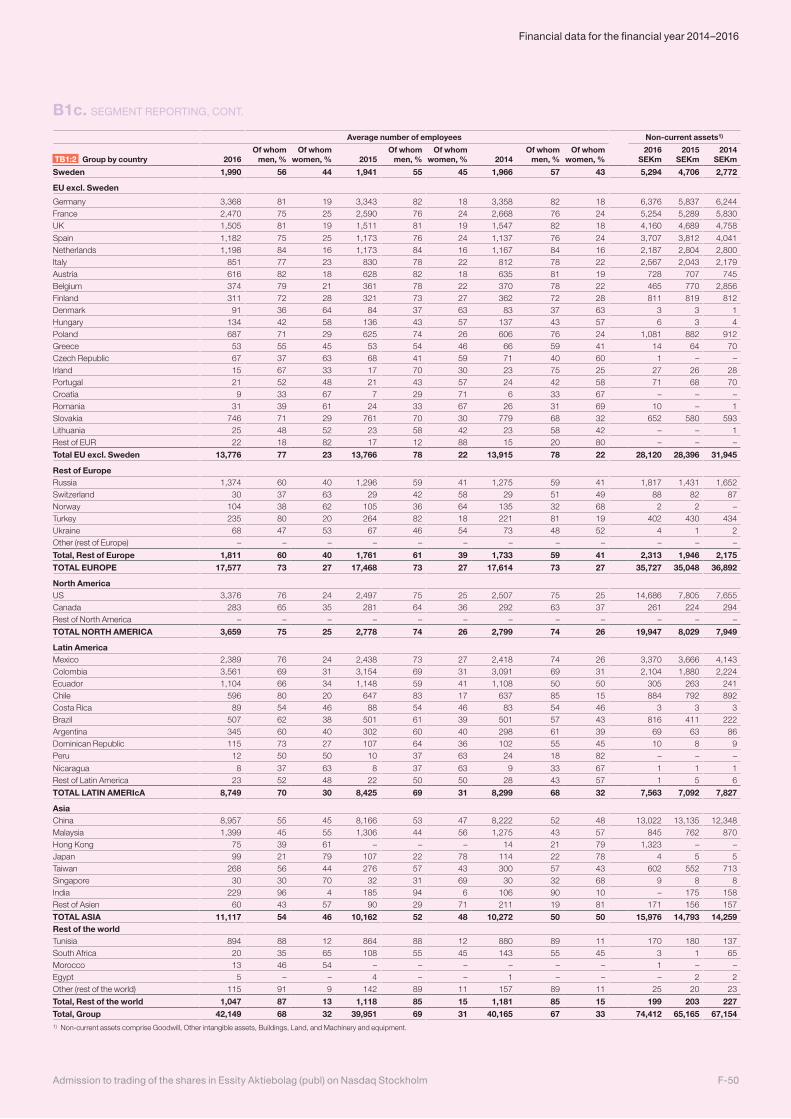
B1c. SEGMENT REPORTING, CONT.
Average number of employees Non-current assets1)
TB1:2 Group by country 2016Of whom
men, %Of whom
women, % 2015Of whom
men, %Of whom
women, % 2014Of whom
men, %Of whom
women, %2016
SEKm2015
SEKm2014
SEKm
Sweden 1,990 56 44 1,941 55 45 1,966 57 43 5,294 4,706 2,772
EU excl. Sweden
Germany 3,368 81 19 3,343 82 18 3,358 82 18 6,376 5,837 6,244France 2,470 75 25 2,590 76 24 2,668 76 24 5,254 5,289 5,830UK 1,505 81 19 1,511 81 19 1,547 82 18 4,160 4,689 4,758
Spain 1,182 75 25 1,173 76 24 1,137 76 24 3,707 3,812 4,041Netherlands 1,198 84 16 1,173 84 16 1,167 84 16 2,187 2,804 2,800Italy 851 77 23 830 78 22 812 78 22 2,567 2,043 2,179Austria 616 82 18 628 82 18 635 81 19 728 707 745Belgium 374 79 21 361 78 22 370 78 22 465 770 2,856Finland 311 72 28 321 73 27 362 72 28 811 819 812Denmark 91 36 64 84 37 63 83 37 63 3 3 1Hungary 134 42 58 136 43 57 137 43 57 6 3 4Poland 687 71 29 625 74 26 606 76 24 1,081 882 912Greece 53 55 45 53 54 46 66 59 41 14 64 70Czech Republic 67 37 63 68 41 59 71 40 60 1 – –Irland 15 67 33 17 70 30 23 75 25 27 26 28Portugal 21 52 48 21 43 57 24 42 58 71 68 70Croatia 9 33 67 7 29 71 6 33 67 – – –Romania 31 39 61 24 33 67 26 31 69 10 – 1Slovakia 746 71 29 761 70 30 779 68 32 652 580 593Lithuania 25 48 52 23 58 42 23 58 42 – – 1Rest of EUR 22 18 82 17 12 88 15 20 80 – – –
Total EU excl. Sweden 13,776 77 23 13,766 78 22 13,915 78 22 28,120 28,396 31,945
Rest of EuropeRussia 1,374 60 40 1,296 59 41 1,275 59 41 1,817 1,431 1,652Switzerland 30 37 63 29 42 58 29 51 49 88 82 87Norway 104 38 62 105 36 64 135 32 68 2 2 –Turkey 235 80 20 264 82 18 221 81 19 402 430 434Ukraine 68 47 53 67 46 54 73 48 52 4 1 2Other (rest of Europe) – – – – – – – – – – – –
Total, Rest of Europe 1,811 60 40 1,761 61 39 1,733 59 41 2,313 1,946 2,175TOTAL EUROPE 17,577 73 27 17,468 73 27 17,614 73 27 35,727 35,048 36,892
North AmericaUS 3,376 76 24 2,497 75 25 2,507 75 25 14,686 7,805 7,655Canada 283 65 35 281 64 36 292 63 37 261 224 294Rest of North America – – – – – – – – – – – –
TOTAL NORTH AMERICA 3,659 75 25 2,778 74 26 2,799 74 26 19,947 8,029 7,949
Latin AmericaMexico 2,389 76 24 2,438 73 27 2,418 74 26 3,370 3,666 4,143Colombia 3,561 69 31 3,154 69 31 3,091 69 31 2,104 1,880 2,224Ecuador 1,104 66 34 1,148 59 41 1,108 50 50 305 263 241Chile 596 80 20 647 83 17 637 85 15 884 792 892Costa Rica 89 54 46 88 54 46 83 54 46 3 3 3Brazil 507 62 38 501 61 39 501 57 43 816 411 222Argentina 345 60 40 302 60 40 298 61 39 69 63 86Dominican Republic 115 73 27 107 64 36 102 55 45 10 8 9Peru 12 50 50 10 37 63 24 18 82 – – –
Nicaragua 8 37 63 8 37 63 9 33 67 1 1 1Rest of Latin America 23 52 48 22 50 50 28 43 57 1 5 6
TOTAL LATIN AMERIcA 8,749 70 30 8,425 69 31 8,299 68 32 7,563 7,092 7,827
AsiaChina 8,957 55 45 8,166 53 47 8,222 52 48 13,022 13,135 12,348Malaysia 1,399 45 55 1,306 44 56 1,275 43 57 845 762 870Hong Kong 75 39 61 – – – 14 21 79 1,323 – –Japan 99 21 79 107 22 78 114 22 78 4 5 5Taiwan 268 56 44 276 57 43 300 57 43 602 552 713Singapore 30 30 70 32 31 69 30 32 68 9 8 8India 229 96 4 185 94 6 106 90 10 – 175 158Rest of Asien 60 43 57 90 29 71 211 19 81 171 156 157
TOTAL ASIA 11,117 54 46 10,162 52 48 10,272 50 50 15,976 14,793 14,259Rest of the worldTunisia 894 88 12 864 88 12 880 89 11 170 180 137South Africa 20 35 65 108 55 45 143 55 45 3 1 65Morocco 13 46 54 – – – – – – 1 – –Egypt 5 – – 4 – – 1 – – – 2 2Other (rest of the world) 115 91 9 142 89 11 157 89 11 25 20 23
Total, Rest of the world 1,047 87 13 1,118 85 15 1,181 85 15 199 203 227Total, Group 42,149 68 32 39,951 69 31 40,165 67 33 74,412 65,165 67,1541) Non-current assets comprise Goodwill, Other intangible assets, Buildings, Land, and Machinery and equipment.
F-50Admission to trading of the shares in Essity Aktiebolag (publ) on Nasdaq Stockholm
Financial data for the financial year 2014–2016
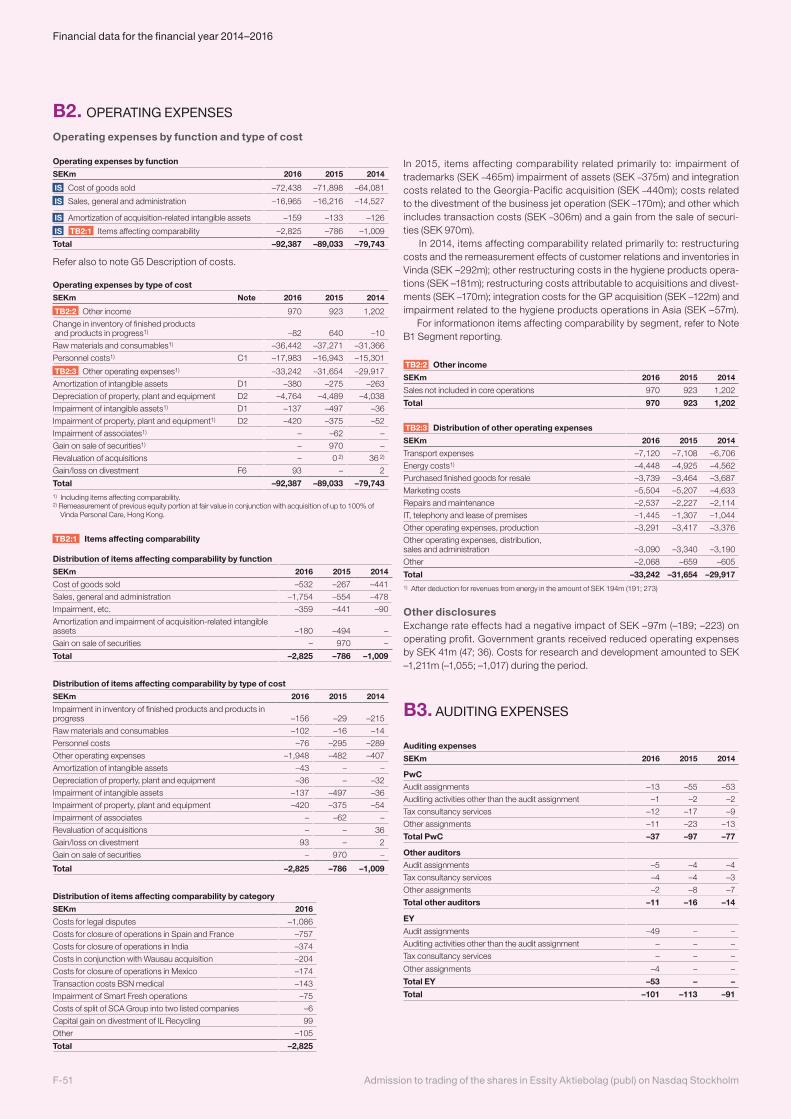
B2. OPERATING EXPENSES
Operating expenses by function and type of cost
Operating expenses by function
SEKm 2016 2015 2014
IS Cost of goods sold –72,438 –71,898 –64,081
IS Sales, general and administration –16,965 –16,216 –14,527
IS Amortization of acquisition-related intangible assets –159 –133 –126
IS TB2:1 Items affecting comparability –2,825 –786 –1,009
Total –92,387 –89,033 –79,743
Refer also to note G5 Description of costs.
Operating expenses by type of cost
SEKm Note 2016 2015 2014
TB2:2 Other income 970 923 1,202
Change in inventory of finished products and products in progress1) –82 640 –10
Raw materials and consumables1) –36,442 –37,271 –31,366
Personnel costs1) C1 –17,983 –16,943 –15,301
TB2:3 Other operating expenses1) –33,242 –31,654 –29,917
Amortization of intangible assets D1 –380 –275 –263
Depreciation of property, plant and equipment D2 –4,764 –4,489 –4,038
Impairment of intangible assets1) D1 –137 –497 –36
Impairment of property, plant and equipment1) D2 –420 –375 –52
Impairment of associates1) – –62 –
Gain on sale of securities1) – 970 –
Revaluation of acquisitions – 0 2) 36 2)
Gain/loss on divestment F6 93 – 2
Total –92,387 –89,033 –79,7431) Including items affecting comparability.2) Remeasurement of previous equity portion at fair value in conjunction with acquisition of up to 100% of
Vinda Personal Care, Hong Kong.
TB2:1 Items affecting comparability
Distribution of items affecting comparability by function
SEKm 2016 2015 2014
Cost of goods sold –532 –267 –441
Sales, general and administration –1,754 –554 –478
Impairment, etc. –359 –441 –90
Amortization and impairment of acquisition-related intangible assets –180 –494 –
Gain on sale of securities – 970 –
Total –2,825 –786 –1,009
Distribution of items affecting comparability by type of cost
SEKm 2016 2015 2014
Impairment in inventory of finished products and products in progress –156 –29 –215
Raw materials and consumables –102 –16 –14
Personnel costs –76 –295 –289
Other operating expenses –1,948 –482 –407
Amortization of intangible assets –43 – –
Depreciation of property, plant and equipment –36 – –32
Impairment of intangible assets –137 –497 –36
Impairment of property, plant and equipment –420 –375 –54
Impairment of associates – –62 –
Revaluation of acquisitions – – 36
Gain/loss on divestment 93 – 2
Gain on sale of securities – 970 –
Total –2,825 –786 –1,009
Distribution of items affecting comparability by category
SEKm 2016
Costs for legal disputes –1,086
Costs for closure of operations in Spain and France –757
Costs for closure of operations in India –374
Costs in conjunction with Wausau acquisition –204
Costs for closure of operations in Mexico –174
Transaction costs BSN medical –143
Impairment of Smart Fresh operations –75
Costs of split of SCA Group into two listed companies –6
Capital gain on divestment of IL Recycling 99
Other –105
Total –2,825
In 2015, items affecting comparability related primarily to: impairment of trademarks (SEK –465m) impairment of assets (SEK –375m) and integration costs related to the Georgia-Pacific acquisition (SEK –440m); costs related to the divestment of the business jet operation (SEK –170m); and other which includes transaction costs (SEK –306m) and a gain from the sale of securi-ties (SEK 970m). In 2014, items affecting comparability related primarily to: restructuring costs and the remeasurement effects of customer relations and inventories in Vinda (SEK –292m); other restructuring costs in the hygiene products opera-tions (SEK –181m); restructuring costs attributable to acquisitions and divest-ments (SEK –170m); integration costs for the GP acquisition (SEK –122m) and impairment related to the hygiene products operations in Asia (SEK –57m). For informationon items affecting comparability by segment, refer to Note B1 Segment reporting.
TB2:2 Other income
SEKm 2016 2015 2014
Sales not included in core operations 970 923 1,202
Total 970 923 1,202
TB2:3 Distribution of other operating expenses
SEKm 2016 2015 2014
Transport expenses –7,120 –7,108 –6,706
Energy costs1) –4,448 –4,925 –4,562
Purchased finished goods for resale –3,739 –3,464 –3,687
Marketing costs –5,504 –5,207 –4,633
Repairs and maintenance –2,537 –2,227 –2,114
IT, telephony and lease of premises –1,445 –1,307 –1,044
Other operating expenses, production –3,291 –3,417 –3,376
Other operating expenses, distribution, sales and administration –3,090 –3,340 –3,190
Other –2,068 –659 –605
Total –33,242 –31,654 –29,9171) After deduction for revenues from energy in the amount of SEK 194m (191; 273)
Other disclosures Exchange rate effects had a negative impact of SEK –97m (–189; –223) on operating profit. Government grants received reduced operating expenses by SEK 41m (47; 36). Costs for research and development amounted to SEK –1,211m (–1,055; –1,017) during the period.
B3. AUDITING EXPENSES
Auditing expenses
SEKm 2016 2015 2014
PwCAudit assignments –13 –55 –53
Auditing activities other than the audit assignment –1 –2 –2
Tax consultancy services –12 –17 –9
Other assignments –11 –23 –13
Total PwC –37 –97 –77
Other auditorsAudit assignments –5 –4 –4
Tax consultancy services –4 –4 –3
Other assignments –2 –8 –7
Total other auditors –11 –16 –14
EY
Audit assignments –49 – –
Auditing activities other than the audit assignment – – –
Tax consultancy services – – –
Other assignments –4 – –
Total EY –53 – –
Total –101 –113 –91
Admission to trading of the shares in Essity Aktiebolag (publ) on Nasdaq StockholmF-51
Financial data for the financial year 2014–2016
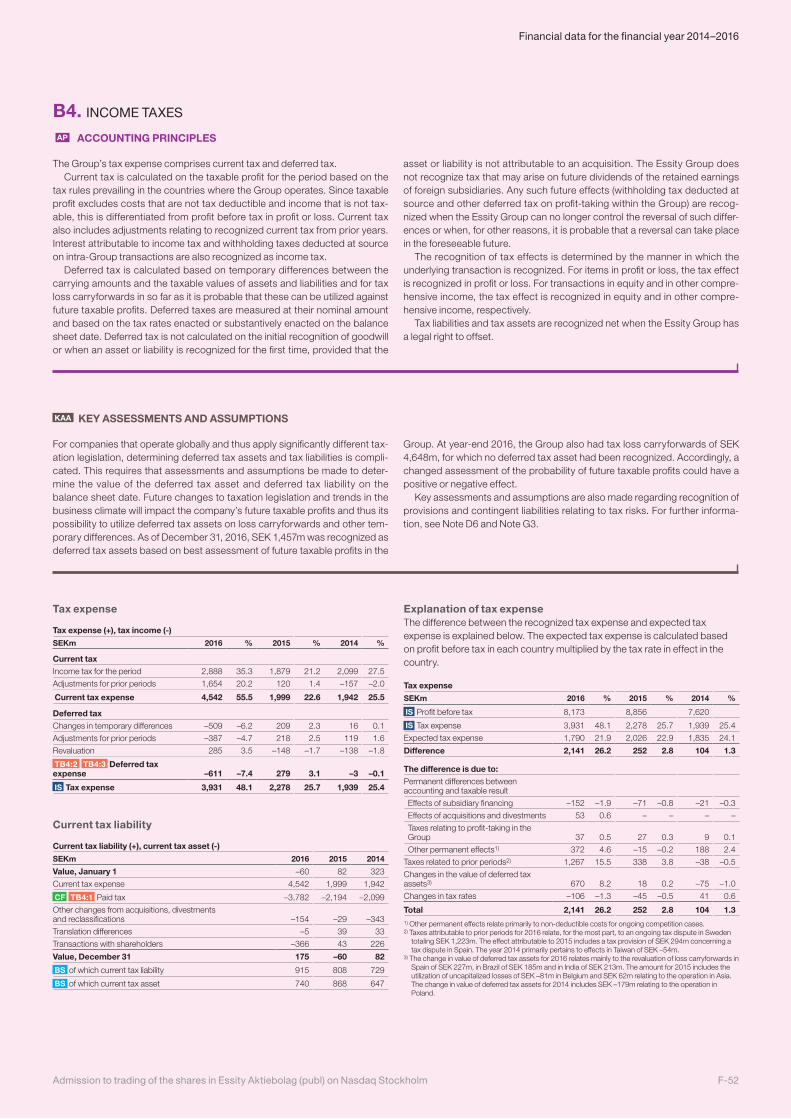
KAA KEY ASSESSMENTS AND ASSUMPTIONS
For companies that operate globally and thus apply significantly different tax-ation legislation, determining deferred tax assets and tax liabilities is compli-cated. This requires that assessments and assumptions be made to deter-mine the value of the deferred tax asset and deferred tax liability on the balance sheet date. Future changes to taxation legislation and trends in the business climate will impact the company’s future taxable profits and thus its possibility to utilize deferred tax assets on loss carryforwards and other tem-porary differences. As of December 31, 2016, SEK 1,457m was recognized as deferred tax assets based on best assessment of future taxable profits in the
Group. At year-end 2016, the Group also had tax loss carryforwards of SEK 4,648m, for which no deferred tax asset had been recognized. Accordingly, a changed assessment of the probability of future taxable profits could have a positive or negative effect.
Key assessments and assumptions are also made regarding recognition of provisions and contingent liabilities relating to tax risks. For further informa-tion, see Note D6 and Note G3.
Tax expense
Tax expense (+), tax income (-)
SEKm 2016 % 2015 % 2014 %
Current taxIncome tax for the period 2,888 35.3 1,879 21.2 2,099 27.5
Adjustments for prior periods 1,654 20.2 120 1.4 –157 –2.0
Current tax expense 4,542 55.5 1,999 22.6 1,942 25.5
Deferred taxChanges in temporary differences –509 –6.2 209 2.3 16 0.1
Adjustments for prior periods –387 –4.7 218 2.5 119 1.6
Revaluation 285 3.5 –148 –1.7 –138 –1.8
TB4:2 TB4:3 Deferred tax expense –611 –7.4 279 3.1 –3 –0.1
IS Tax expense 3,931 48.1 2,278 25.7 1,939 25.4
B4. INCOME TAXES
AP ACCOUNTING PRINCIPLES
The Group’s tax expense comprises current tax and deferred tax. Current tax is calculated on the taxable profit for the period based on the
tax rules prevailing in the countries where the Group operates. Since taxable profit excludes costs that are not tax deductible and income that is not tax-able, this is differentiated from profit before tax in profit or loss. Current tax also includes adjustments relating to recognized current tax from prior years. Interest attributable to income tax and withholding taxes deducted at source on intra-Group transactions are also recognized as income tax.
Deferred tax is calculated based on temporary differences between the carrying amounts and the taxable values of assets and liabilities and for tax loss carryforwards in so far as it is probable that these can be utilized against future taxable profits. Deferred taxes are measured at their nominal amount and based on the tax rates enacted or substantively enacted on the balance sheet date. Deferred tax is not calculated on the initial recognition of goodwill or when an asset or liability is recognized for the first time, provided that the
asset or liability is not attributable to an acquisition. The Essity Group does not recognize tax that may arise on future dividends of the retained earnings of foreign subsidiaries. Any such future effects (withholding tax deducted at source and other deferred tax on profit-taking within the Group) are recog-nized when the Essity Group can no longer control the reversal of such differ-ences or when, for other reasons, it is probable that a reversal can take place in the foreseeable future.
The recognition of tax effects is determined by the manner in which the underlying transaction is recognized. For items in profit or loss, the tax effect is recognized in profit or loss. For transactions in equity and in other compre-hensive income, the tax effect is recognized in equity and in other compre-hensive income, respectively.
Tax liabilities and tax assets are recognized net when the Essity Group has a legal right to offset.
Current tax liability
Current tax liability (+), current tax asset (-)
SEKm 2016 2015 2014
Value, January 1 –60 82 323
Current tax expense 4,542 1,999 1,942
CF TB4:1 Paid tax –3,782 –2,194 –2,099
Other changes from acquisitions, divestments and reclassifications –154 –29 –343
Translation differences –5 39 33
Transactions with shareholders –366 43 226
Value, December 31 175 –60 82
BS of which current tax liability 915 808 729
BS of which current tax asset 740 868 647
Explanation of tax expense The difference between the recognized tax expense and expected tax expense is explained below. The expected tax expense is calculated based on profit before tax in each country multiplied by the tax rate in effect in the country.
Tax expense
SEKm 2016 % 2015 % 2014 %
IS Profit before tax 8,173 8,856 7,620
IS Tax expense 3,931 48.1 2,278 25.7 1,939 25.4
Expected tax expense 1,790 21.9 2,026 22.9 1,835 24.1
Difference 2,141 26.2 252 2.8 104 1.3
The difference is due to:Permanent differences between accounting and taxable result
Effects of subsidiary financing –152 –1.9 –71 –0.8 –21 –0.3
Effects of acquisitions and divestments 53 0.6 – – – –
Taxes relating to profit-taking in the Group 37 0.5 27 0.3 9 0.1
Other permanent effects1) 372 4.6 –15 –0.2 188 2.4
Taxes related to prior periods2) 1,267 15.5 338 3.8 –38 –0.5
Changes in the value of deferred tax assets3) 670 8.2 18 0.2 –75 –1.0
Changes in tax rates –106 –1.3 –45 –0.5 41 0.6
Total 2,141 26.2 252 2.8 104 1.31) Other permanent effects relate primarily to non-deductible costs for ongoing competition cases.2) Taxes attributable to prior periods for 2016 relate, for the most part, to an ongoing tax dispute in Sweden
totaling SEK 1,223m. The effect attributable to 2015 includes a tax provision of SEK 294m concerning a tax dispute in Spain. The year 2014 primarily pertains to effects in Taiwan of SEK –54m.
3) The change in value of deferred tax assets for 2016 relates mainly to the revaluation of loss carryforwards in Spain of SEK 227m, in Brazil of SEK 185m and in India of SEK 213m. The amount for 2015 includes the utilization of uncapitalized losses of SEK –81m in Belgium and SEK 62m relating to the operation in Asia. The change in value of deferred tax assets for 2014 includes SEK –179m relating to the operation in Poland.
F-52Admission to trading of the shares in Essity Aktiebolag (publ) on Nasdaq Stockholm
Financial data for the financial year 2014–2016
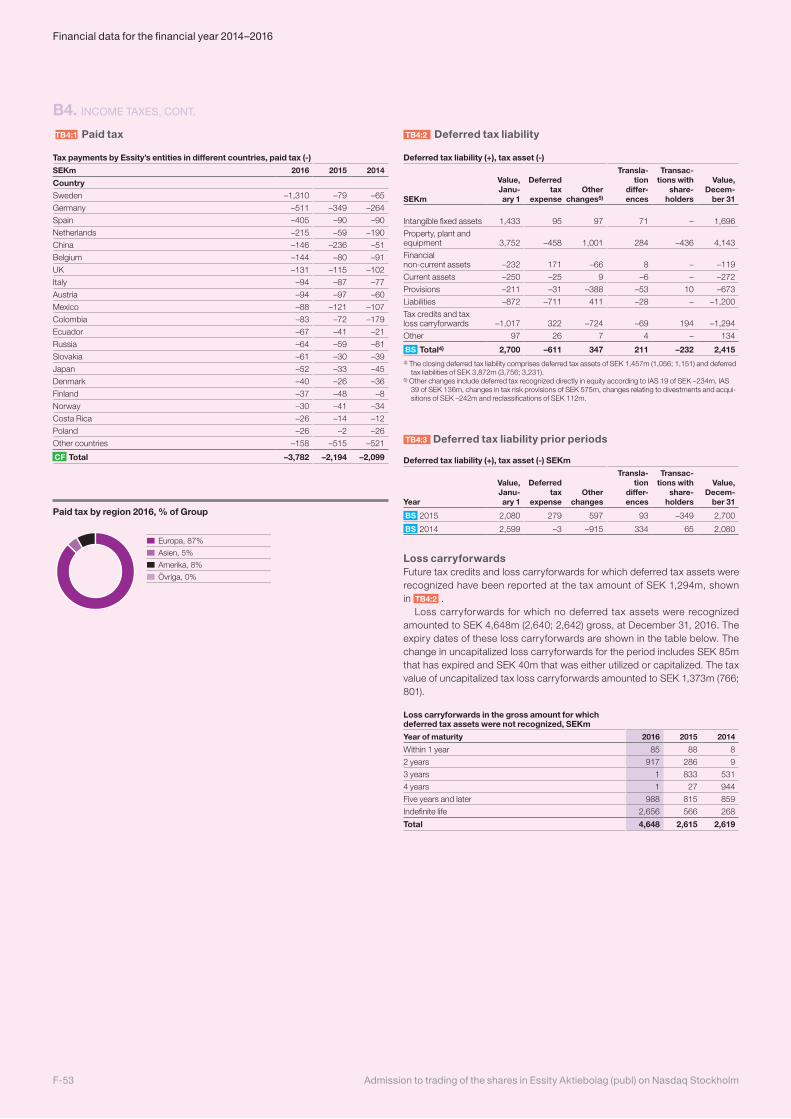
TB4:1 Paid tax
Tax payments by Essity’s entities in different countries, paid tax (-)
SEKm 2016 2015 2014
CountrySweden –1,310 –79 –65
Germany –511 –349 –264
Spain –405 –90 –90
Netherlands –215 –59 –190
China –146 –236 –51
Belgium –144 –80 –91
UK –131 –115 –102
Italy –94 –87 –77
Austria –94 –97 –60
Mexico –88 –121 –107
Colombia –83 –72 –179
Ecuador –67 –41 –21
Russia –64 –59 –81
Slovakia –61 –30 –39
Japan –52 –33 –45
Denmark –40 –26 –36
Finland –37 –48 –8
Norway –30 –41 –34
Costa Rica –26 –14 –12
Poland –26 –2 –26
Other countries –158 –515 –521
CF Total –3,782 –2,194 –2,099
Paid tax by region 2016, % of Group
Asien, 5%
Amerika, 8%
Övriga, 0%
Europa, 87%
TB4:2 Deferred tax liability
Deferred tax liability (+), tax asset (-)
SEKm
Value, Janu - ary 1
Deferred tax
expenseOther
changes5)
Transla-tion
differ-ences
Transac-tions with
share-holders
Value, Decem-
ber 31
Intangible fixed assets 1,433 95 97 71 – 1,696
Property, plant and equipment 3,752 –458 1,001 284 –436 4,143
Financial non-current assets –232 171 –66 8 – –119
Current assets –250 –25 9 –6 – –272
Provisions –211 –31 –388 –53 10 –673
Liabilities –872 –711 411 –28 – –1,200
Tax credits and tax loss carryforwards –1,017 322 –724 –69 194 –1,294
Other 97 26 7 4 – 134
BS Total4) 2,700 –611 347 211 –232 2,4154) The closing deferred tax liability comprises deferred tax assets of SEK 1,457m (1,056; 1,151) and deferred
tax liabilities of SEK 3,872m (3,756; 3,231).5) Other changes include deferred tax recognized directly in equity according to IAS 19 of SEK –234m, IAS
39 of SEK 136m, changes in tax risk provisions of SEK 575m, changes relating to divestments and acqui-sitions of SEK –242m and reclassifications of SEK 112m.
TB4:3 Deferred tax liability prior periods
Deferred tax liability (+), tax asset (-) SEKm
Year
Value, Janu- ary 1
Deferred tax
expenseOther
changes
Transla-tion
differ-ences
Transac-tions with
share-holders
Value, Decem-
ber 31
BS 2015 2,080 279 597 93 –349 2,700
BS 2014 2,599 –3 –915 334 65 2,080
Loss carryforwardsFuture tax credits and loss carryforwards for which deferred tax assets were recognized have been reported at the tax amount of SEK 1,294m, shown in TB4:2 .
Loss carryforwards for which no deferred tax assets were recognized amounted to SEK 4,648m (2,640; 2,642) gross, at December 31, 2016. The expiry dates of these loss carryforwards are shown in the table below. The change in uncapitalized loss carryforwards for the period includes SEK 85m that has expired and SEK 40m that was either utilized or capitalized. The tax value of uncapitalized tax loss carryforwards amounted to SEK 1,373m (766; 801).
Loss carryforwards in the gross amount for which deferred tax assets were not recognized, SEKm
Year of maturity 2016 2015 2014
Within 1 year 85 88 8
2 years 917 286 9
3 years 1 833 531
4 years 1 27 944
Five years and later 988 815 859
Indefinite life 2,656 566 268
Total 4,648 2,615 2,619
B4. INCOME TAXES, CONT.
Admission to trading of the shares in Essity Aktiebolag (publ) on Nasdaq StockholmF-53
Financial data for the financial year 2014–2016
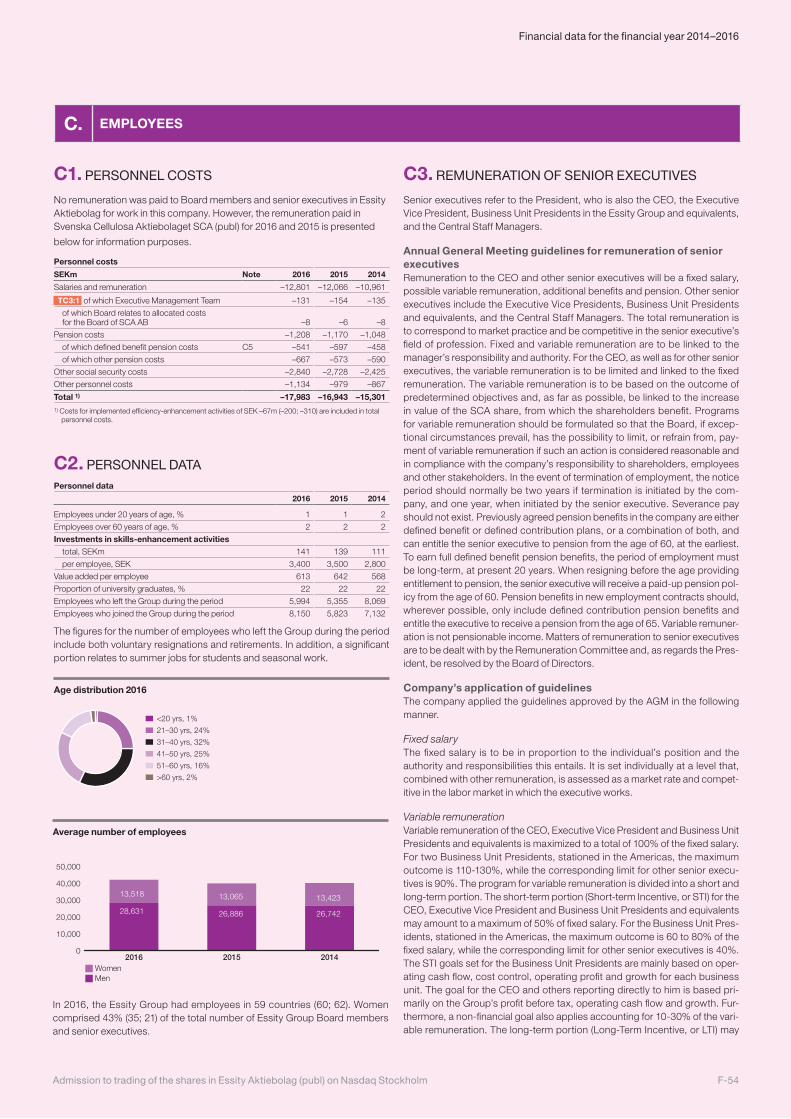
C. EMPLOYEES
C1. PERSONNEL COSTS
No remuneration was paid to Board members and senior executives in Essity Aktiebolag for work in this company. However, the remuneration paid in Svenska Cellulosa Aktiebolaget SCA (publ) for 2016 and 2015 is presented
below for information purposes.
Personnel costs
SEKm Note 2016 2015 2014
Salaries and remuneration –12,801 –12,066 –10,961
TC3:1 of which Executive Management Team –131 –154 –135
of which Board relates to allocated costs for the Board of SCA AB –8 –6 –8
Pension costs –1,208 –1,170 –1,048
of which defined benefit pension costs C5 –541 –597 –458
of which other pension costs –667 –573 –590
Other social security costs –2,840 –2,728 –2,425
Other personnel costs –1,134 –979 –867
Total 1) –17,983 –16,943 –15,3011) Costs for implemented efficiency-enhancement activities of SEK –67m (–200; –310) are included in total
personnel costs.
C2. PERSONNEL DATAPersonnel data
2016 2015 2014
Employees under 20 years of age, % 1 1 2
Employees over 60 years of age, % 2 2 2
Investments in skills-enhancement activities total, SEKm 141 139 111
per employee, SEK 3,400 3,500 2,800
Value added per employee 613 642 568
Proportion of university graduates, % 22 22 22
Employees who left the Group during the period 5,994 5,355 8,069
Employees who joined the Group during the period 8,150 5,823 7,132
The figures for the number of employees who left the Group during the period include both voluntary resignations and retirements. In addition, a significant portion relates to summer jobs for students and seasonal work.
C3. REMUNERATION OF SENIOR EXECUTIVES
Senior executives refer to the President, who is also the CEO, the Executive Vice President, Business Unit Presidents in the Essity Group and equivalents, and the Central Staff Managers.
Annual General Meeting guidelines for remuneration of senior executivesRemuneration to the CEO and other senior executives will be a fixed salary, possible variable remuneration, additional benefits and pension. Other senior executives include the Executive Vice Presidents, Business Unit Presidents and equivalents, and the Central Staff Managers. The total remuneration is to correspond to market practice and be competitive in the senior executive’s field of profession. Fixed and variable remuneration are to be linked to the manager’s responsibility and authority. For the CEO, as well as for other senior executives, the variable remuneration is to be limited and linked to the fixed remuneration. The variable remuneration is to be based on the outcome of predetermined objectives and, as far as possible, be linked to the increase in value of the SCA share, from which the shareholders benefit. Programs for variable remuneration should be formulated so that the Board, if excep-tional circumstances prevail, has the possibility to limit, or refrain from, pay-ment of variable remuneration if such an action is considered reasonable and in compliance with the company’s responsibility to shareholders, employees and other stakeholders. In the event of termination of employment, the notice period should normally be two years if termination is initiated by the com-pany, and one year, when initiated by the senior executive. Severance pay should not exist. Previously agreed pension benefits in the company are either defined benefit or defined contribution plans, or a combination of both, and can entitle the senior executive to pension from the age of 60, at the earliest. To earn full defined benefit pension benefits, the period of employment must be long-term, at present 20 years. When resigning before the age providing entitlement to pension, the senior executive will receive a paid-up pension pol-icy from the age of 60. Pension benefits in new employment contracts should, wherever possible, only include defined contribution pension benefits and entitle the executive to receive a pension from the age of 65. Variable remuner-ation is not pensionable income. Matters of remuneration to senior executives are to be dealt with by the Remuneration Committee and, as regards the Pres-ident, be resolved by the Board of Directors.
Company’s application of guidelinesThe company applied the guidelines approved by the AGM in the following manner.
Fixed salaryThe fixed salary is to be in proportion to the individual’s position and the authority and responsibilities this entails. It is set individually at a level that, combined with other remuneration, is assessed as a market rate and compet-itive in the labor market in which the executive works.
Variable remunerationVariable remuneration of the CEO, Executive Vice President and Business Unit Presidents and equivalents is maximized to a total of 100% of the fixed salary. For two Business Unit Presidents, stationed in the Americas, the maximum outcome is 110-130%, while the corresponding limit for other senior execu-tives is 90%. The program for variable remuneration is divided into a short and long-term portion. The short-term portion (Short-term Incentive, or STI) for the CEO, Executive Vice President and Business Unit Presidents and equivalents may amount to a maximum of 50% of fixed salary. For the Business Unit Pres-idents, stationed in the Americas, the maximum outcome is 60 to 80% of the fixed salary, while the corresponding limit for other senior executives is 40%. The STI goals set for the Business Unit Presidents are mainly based on oper-ating cash flow, cost control, operating profit and growth for each business unit. The goal for the CEO and others reporting directly to him is based pri-marily on the Group’s profit before tax, operating cash flow and growth. Fur-thermore, a non-financial goal also applies accounting for 10-30% of the vari-able remuneration. The long-term portion (Long-Term Incentive, or LTI) may
Age distribution 2016
31–40 yrs, 32%
41–50 yrs, 25%
51–60 yrs, 16%
>60 yrs, 2%
21–30 yrs, 24%
<20 yrs, 1%
Average number of employees
0
10,000
20,000
30,000
40,000
50,000
201420152016WomenMen
13,423
26,742
13,065
26,886
13,518
28,631
In 2016, the Essity Group had employees in 59 countries (60; 62). Women comprised 43% (35; 21) of the total number of Essity Group Board members and senior executives.
F-54Admission to trading of the shares in Essity Aktiebolag (publ) on Nasdaq Stockholm
Financial data for the financial year 2014–2016
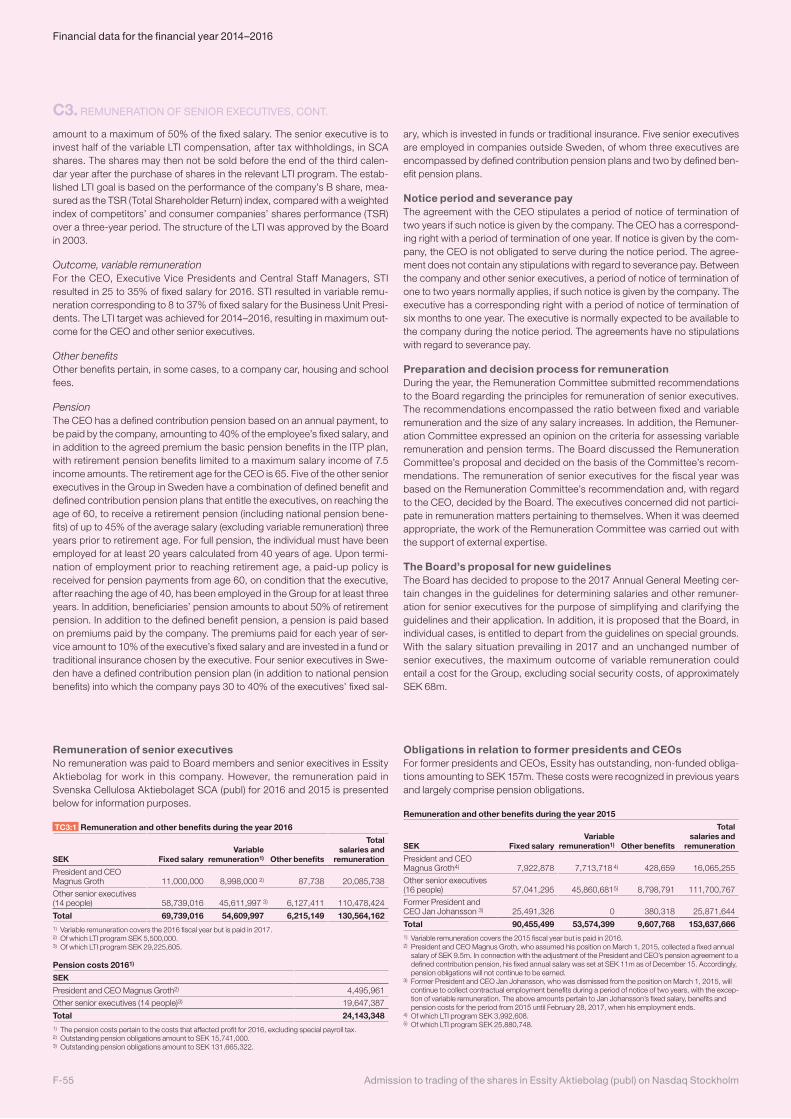
amount to a maximum of 50% of the fixed salary. The senior executive is to invest half of the variable LTI compensation, after tax withholdings, in SCA shares. The shares may then not be sold before the end of the third calen-dar year after the purchase of shares in the relevant LTI program. The estab-lished LTI goal is based on the performance of the company’s B share, mea-sured as the TSR (Total Shareholder Return) index, compared with a weighted index of competitors’ and consumer companies’ shares performance (TSR) over a three-year period. The structure of the LTI was approved by the Board in 2003.
Outcome, variable remunerationFor the CEO, Executive Vice Presidents and Central Staff Managers, STI resulted in 25 to 35% of fixed salary for 2016. STI resulted in variable remu-neration corresponding to 8 to 37% of fixed salary for the Business Unit Presi-dents. The LTI target was achieved for 2014–2016, resulting in maximum out-come for the CEO and other senior executives.
Other benefitsOther benefits pertain, in some cases, to a company car, housing and school fees.
PensionThe CEO has a defined contribution pension based on an annual payment, to be paid by the company, amounting to 40% of the employee’s fixed salary, and in addition to the agreed premium the basic pension benefits in the ITP plan, with retirement pension benefits limited to a maximum salary income of 7.5 income amounts. The retirement age for the CEO is 65. Five of the other senior executives in the Group in Sweden have a combination of defined benefit and defined contribution pension plans that entitle the executives, on reaching the age of 60, to receive a retirement pension (including national pension bene-fits) of up to 45% of the average salary (excluding variable remuneration) three years prior to retirement age. For full pension, the individual must have been employed for at least 20 years calculated from 40 years of age. Upon termi-nation of employment prior to reaching retirement age, a paid-up policy is received for pension payments from age 60, on condition that the executive, after reaching the age of 40, has been employed in the Group for at least three years. In addition, beneficiaries’ pension amounts to about 50% of retirement pension. In addition to the defined benefit pension, a pension is paid based on premiums paid by the company. The premiums paid for each year of ser-vice amount to 10% of the executive’s fixed salary and are invested in a fund or traditional insurance chosen by the executive. Four senior executives in Swe-den have a defined contribution pension plan (in addition to national pension benefits) into which the company pays 30 to 40% of the executives’ fixed sal-
ary, which is invested in funds or traditional insurance. Five senior executives are employed in companies outside Sweden, of whom three executives are encompassed by defined contribution pension plans and two by defined ben-efit pension plans.
Notice period and severance payThe agreement with the CEO stipulates a period of notice of termination of two years if such notice is given by the company. The CEO has a correspond-ing right with a period of termination of one year. If notice is given by the com-pany, the CEO is not obligated to serve during the notice period. The agree-ment does not contain any stipulations with regard to severance pay. Between the company and other senior executives, a period of notice of termination of one to two years normally applies, if such notice is given by the company. The executive has a corresponding right with a period of notice of termination of six months to one year. The executive is normally expected to be available to the company during the notice period. The agreements have no stipulations with regard to severance pay.
Preparation and decision process for remunerationDuring the year, the Remuneration Committee submitted recommendations to the Board regarding the principles for remuneration of senior executives. The recommendations encompassed the ratio between fixed and variable remuneration and the size of any salary increases. In addition, the Remuner-ation Committee expressed an opinion on the criteria for assessing variable remuneration and pension terms. The Board discussed the Remuneration Committee’s proposal and decided on the basis of the Committee’s recom-mendations. The remuneration of senior executives for the fiscal year was based on the Remuneration Committee’s recommendation and, with regard to the CEO, decided by the Board. The executives concerned did not partici-pate in remuneration matters pertaining to themselves. When it was deemed appropriate, the work of the Remuneration Committee was carried out with the support of external expertise.
The Board’s proposal for new guidelinesThe Board has decided to propose to the 2017 Annual General Meeting cer-tain changes in the guidelines for determining salaries and other remuner-ation for senior executives for the purpose of simplifying and clarifying the guidelines and their application. In addition, it is proposed that the Board, in individual cases, is entitled to depart from the guidelines on special grounds. With the salary situation prevailing in 2017 and an unchanged number of senior executives, the maximum outcome of variable remuneration could entail a cost for the Group, excluding social security costs, of approximately SEK 68m.
Remuneration of senior executivesNo remuneration was paid to Board members and senior execitives in Essity Aktiebolag for work in this company. However, the remuneration paid in Svenska Cellulosa Aktiebolaget SCA (publ) for 2016 and 2015 is presented below for information purposes.
TC3:1 Remuneration and other benefits during the year 2016
SEK Fixed salaryVariable
remuneration1) Other benefits
Total salaries and
remuneration
President and CEO Magnus Groth 11,000,000 8,998,000 2) 87,738 20,085,738
Other senior executives (14 people) 58,739,016 45,611,997 3) 6,127,411 110,478,424
Total 69,739,016 54,609,997 6,215,149 130,564,1621) Variable remuneration covers the 2016 fiscal year but is paid in 2017.2) Of which LTI program SEK 5,500,000.3) Of which LTI program SEK 29,225,605.
Pension costs 20161)
SEK
President and CEO Magnus Groth2) 4,495,961
Other senior executives (14 people)3) 19,647,387
Total 24,143,3481) The pension costs pertain to the costs that affected profit for 2016, excluding special payroll tax.2) Outstanding pension obligations amount to SEK 15,741,000.3) Outstanding pension obligations amount to SEK 131,665,322.
Obligations in relation to former presidents and CEOsFor former presidents and CEOs, Essity has outstanding, non-funded obliga-tions amounting to SEK 157m. These costs were recognized in previous years and largely comprise pension obligations.
Remuneration and other benefits during the year 2015
SEK Fixed salaryVariable
remuneration1) Other benefits
Total salaries and
remuneration
President and CEO Magnus Groth4) 7,922,878 7,713,718 4) 428,659 16,065,255
Other senior executives (16 people) 57,041,295 45,860,6815) 8,798,791 111,700,767
Former President and CEO Jan Johansson 3) 25,491,326 0 380,318 25,871,644
Total 90,455,499 53,574,399 9,607,768 153,637,6661) Variable remuneration covers the 2015 fiscal year but is paid in 2016.2) President and CEO Magnus Groth, who assumed his position on March 1, 2015, collected a fixed annual
salary of SEK 9.5m. In connection with the adjustment of the President and CEO’s pension agreement to a defined contribution pension, his fixed annual salary was set at SEK 11m as of December 15. Accordingly, pension obligations will not continue to be earned.
3) Former President and CEO Jan Johansson, who was dismissed from the position on March 1, 2015, will continue to collect contractual employment benefits during a period of notice of two years, with the excep-tion of variable remuneration. The above amounts pertain to Jan Johansson’s fixed salary, benefits and pension costs for the period from 2015 until February 28, 2017, when his employment ends.
4) Of which LTI program SEK 3,992,608.5) Of which LTI program SEK 25,880,748.
C3. REMUNERATION OF SENIOR EXECUTIVES, CONT.
Admission to trading of the shares in Essity Aktiebolag (publ) on Nasdaq StockholmF-55
Financial data for the financial year 2014–2016
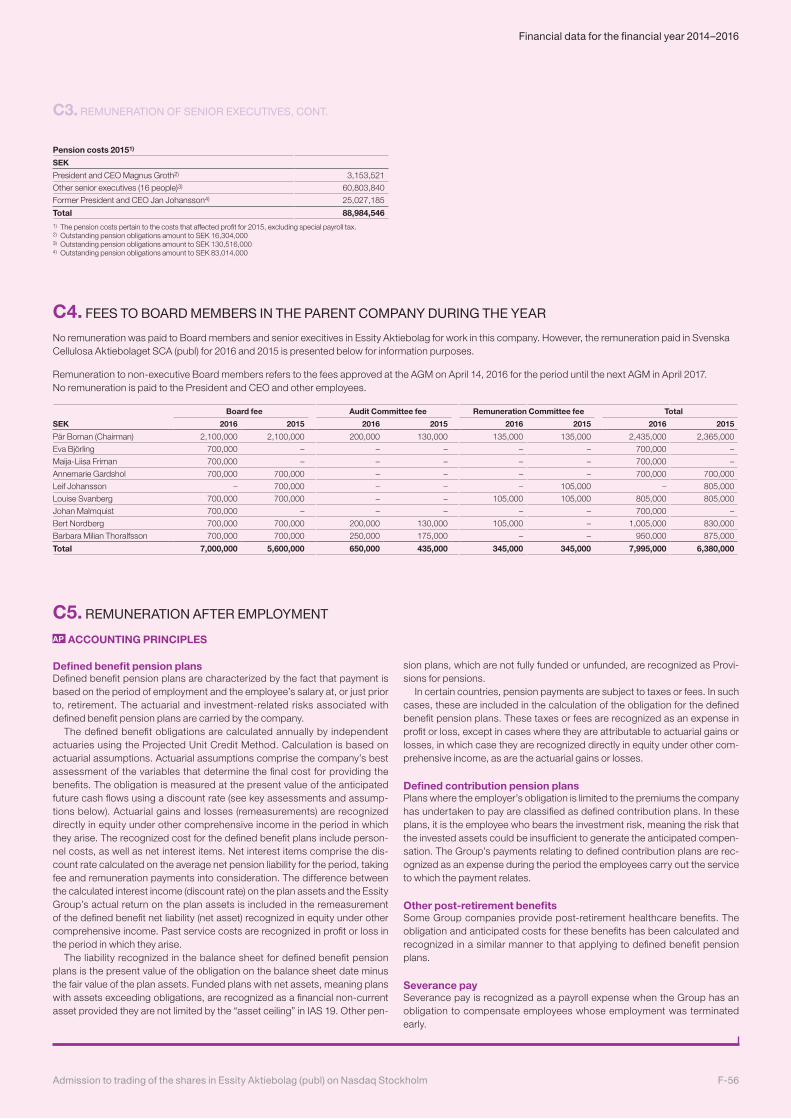
C3. REMUNERATION OF SENIOR EXECUTIVES, CONT.
C5. REMUNERATION AFTER EMPLOYMENT
AP ACCOUNTING PRINCIPLES
Defined benefit pension plansDefined benefit pension plans are characterized by the fact that payment is based on the period of employment and the employee’s salary at, or just prior to, retirement. The actuarial and investment-related risks associated with defined benefit pension plans are carried by the company.
The defined benefit obligations are calculated annually by independent actuaries using the Projected Unit Credit Method. Calculation is based on actuarial assumptions. Actuarial assumptions comprise the company’s best assessment of the variables that determine the final cost for providing the benefits. The obligation is measured at the present value of the anticipated future cash flows using a discount rate (see key assessments and assump-tions below). Actuarial gains and losses (remeasurements) are recognized directly in equity under other comprehensive income in the period in which they arise. The recognized cost for the defined benefit plans include person-nel costs, as well as net interest items. Net interest items comprise the dis-count rate calculated on the average net pension liability for the period, taking fee and remuneration payments into consideration. The difference between the calculated interest income (discount rate) on the plan assets and the Essity Group’s actual return on the plan assets is included in the remeasurement of the defined benefit net liability (net asset) recognized in equity under other comprehensive income. Past service costs are recognized in profit or loss in the period in which they arise.
The liability recognized in the balance sheet for defined benefit pension plans is the present value of the obligation on the balance sheet date minus the fair value of the plan assets. Funded plans with net assets, meaning plans with assets exceeding obligations, are recognized as a financial non-current asset provided they are not limited by the “asset ceiling” in IAS 19. Other pen-
sion plans, which are not fully funded or unfunded, are recognized as Provi-sions for pensions.
In certain countries, pension payments are subject to taxes or fees. In such cases, these are included in the calculation of the obligation for the defined benefit pension plans. These taxes or fees are recognized as an expense in profit or loss, except in cases where they are attributable to actuarial gains or losses, in which case they are recognized directly in equity under other com-prehensive income, as are the actuarial gains or losses.
Defined contribution pension plansPlans where the employer’s obligation is limited to the premiums the company has undertaken to pay are classified as defined contribution plans. In these plans, it is the employee who bears the investment risk, meaning the risk that the invested assets could be insufficient to generate the anticipated compen-sation. The Group’s payments relating to defined contribution plans are rec-ognized as an expense during the period the employees carry out the service to which the payment relates.
Other post-retirement benefitsSome Group companies provide post-retirement healthcare benefits. The obligation and anticipated costs for these benefits has been calculated and recognized in a similar manner to that applying to defined benefit pension plans.
Severance paySeverance pay is recognized as a payroll expense when the Group has an obligation to compensate employees whose employment was terminated early.
Pension costs 20151)
SEK
President and CEO Magnus Groth2) 3,153,521
Other senior executives (16 people)3) 60,803,840
Former President and CEO Jan Johansson4) 25,027,185
Total 88,984,5461) The pension costs pertain to the costs that affected profit for 2015, excluding special payroll tax.2) Outstanding pension obligations amount to SEK 16,304,0003) Outstanding pension obligations amount to SEK 130,516,000 4) Outstanding pension obligations amount to SEK 83,014,000
C4. FEES TO BOARD MEMBERS IN THE PARENT COMPANY DURING THE YEAR
No remuneration was paid to Board members and senior execitives in Essity Aktiebolag for work in this company. However, the remuneration paid in Svenska Cellulosa Aktiebolaget SCA (publ) for 2016 and 2015 is presented below for information purposes.
Remuneration to non-executive Board members refers to the fees approved at the AGM on April 14, 2016 for the period until the next AGM in April 2017. No remuneration is paid to the President and CEO and other employees.
Board fee Audit Committee fee Remuneration Committee fee Total
SEK 2016 2015 2016 2015 2016 2015 2016 2015
Pär Boman (Chairman) 2,100,000 2,100,000 200,000 130,000 135,000 135,000 2,435,000 2,365,000
Eva Björling 700,000 – – – – – 700,000 –
Maija-Liisa Friman 700,000 – – – – – 700,000 –
Annemarie Gardshol 700,000 700,000 – – – – 700,000 700,000
Leif Johansson – 700,000 – – – 105,000 – 805,000
Louise Svanberg 700,000 700,000 – – 105,000 105,000 805,000 805,000
Johan Malmquist 700,000 – – – – – 700,000 –
Bert Nordberg 700,000 700,000 200,000 130,000 105,000 – 1,005,000 830,000
Barbara Milian Thoralfsson 700,000 700,000 250,000 175,000 – – 950,000 875,000
Total 7,000,000 5,600,000 650,000 435,000 345,000 345,000 7,995,000 6,380,000
F-56Admission to trading of the shares in Essity Aktiebolag (publ) on Nasdaq Stockholm
Financial data for the financial year 2014–2016
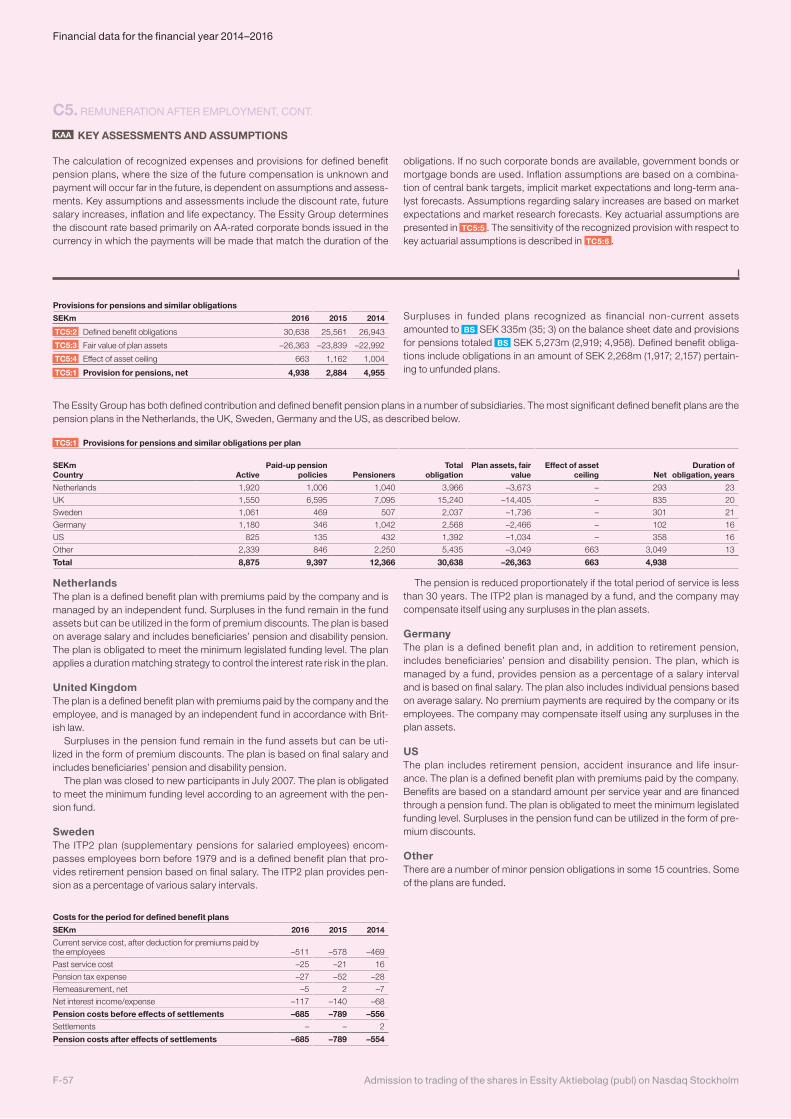
Provisions for pensions and similar obligations
SEKm 2016 2015 2014
TC5:2 Defined benefit obligations 30,638 25,561 26,943
TC5:3 Fair value of plan assets –26,363 –23,839 –22,992
TC5:4 Effect of asset ceiling 663 1,162 1,004
TC5:1 Provision for pensions, net 4,938 2,884 4,955
Surpluses in funded plans recognized as financial non-current assets amounted to BS SEK 335m (35; 3) on the balance sheet date and provisions for pensions totaled BS SEK 5,273m (2,919; 4,958). Defined benefit obliga-tions include obligations in an amount of SEK 2,268m (1,917; 2,157) pertain-ing to unfunded plans.
The Essity Group has both defined contribution and defined benefit pension plans in a number of subsidiaries. The most significant defined benefit plans are the pension plans in the Netherlands, the UK, Sweden, Germany and the US, as described below. TC5:1 TC5:1 Provisions for pensions and similar obligations per plan
SEKmCountry Active
Paid-up pension policies Pensioners
Total obligation
Plan assets, fair value
Effect of asset ceiling Net
Duration of obligation, years
Netherlands 1,920 1,006 1,040 3,966 –3,673 – 293 23
UK 1,550 6,595 7,095 15,240 –14,405 – 835 20
Sweden 1,061 469 507 2,037 –1,736 – 301 21
Germany 1,180 346 1,042 2,568 –2,466 – 102 16
US 825 135 432 1,392 –1,034 – 358 16
Other 2,339 846 2,250 5,435 –3,049 663 3,049 13
Total 8,875 9,397 12,366 30,638 –26,363 663 4,938
NetherlandsThe plan is a defined benefit plan with premiums paid by the company and is managed by an independent fund. Surpluses in the fund remain in the fund assets but can be utilized in the form of premium discounts. The plan is based on average salary and includes beneficiaries’ pension and disability pension. The plan is obligated to meet the minimum legislated funding level. The plan applies a duration matching strategy to control the interest rate risk in the plan.
United KingdomThe plan is a defined benefit plan with premiums paid by the company and the employee, and is managed by an independent fund in accordance with Brit-ish law.
Surpluses in the pension fund remain in the fund assets but can be uti-lized in the form of premium discounts. The plan is based on final salary and includes beneficiaries’ pension and disability pension.
The plan was closed to new participants in July 2007. The plan is obligated to meet the minimum funding level according to an agreement with the pen-sion fund.
SwedenThe ITP2 plan (supplementary pensions for salaried employees) encom-passes employees born before 1979 and is a defined benefit plan that pro-vides retirement pension based on final salary. The ITP2 plan provides pen-sion as a percentage of various salary intervals.
The pension is reduced proportionately if the total period of service is less than 30 years. The ITP2 plan is managed by a fund, and the company may compensate itself using any surpluses in the plan assets.
GermanyThe plan is a defined benefit plan and, in addition to retirement pension, includes beneficiaries’ pension and disability pension. The plan, which is managed by a fund, provides pension as a percentage of a salary interval and is based on final salary. The plan also includes individual pensions based on average salary. No premium payments are required by the company or its employees. The company may compensate itself using any surpluses in the plan assets.
USThe plan includes retirement pension, accident insurance and life insur-ance. The plan is a defined benefit plan with premiums paid by the company. Benefits are based on a standard amount per service year and are financed through a pension fund. The plan is obligated to meet the minimum legislated funding level. Surpluses in the pension fund can be utilized in the form of pre-mium discounts.
OtherThere are a number of minor pension obligations in some 15 countries. Some of the plans are funded.
C5. REMUNERATION AFTER EMPLOYMENT, CONT.
Costs for the period for defined benefit plans
SEKm 2016 2015 2014
Current service cost, after deduction for premiums paid by the employees –511 –578 –469
Past service cost –25 –21 16
Pension tax expense –27 –52 –28
Remeasurement, net –5 2 –7
Net interest income/expense –117 –140 –68
Pension costs before effects of settlements –685 –789 –556Settlements – – 2
Pension costs after effects of settlements –685 –789 –554
KAA KEY ASSESSMENTS AND ASSUMPTIONS
The calculation of recognized expenses and provisions for defined benefit pension plans, where the size of the future compensation is unknown and payment will occur far in the future, is dependent on assumptions and assess-ments. Key assumptions and assessments include the discount rate, future salary increases, inflation and life expectancy. The Essity Group determines the discount rate based primarily on AA-rated corporate bonds issued in the currency in which the payments will be made that match the duration of the
obligations. If no such corporate bonds are available, government bonds or mortgage bonds are used. Inflation assumptions are based on a combina-tion of central bank targets, implicit market expectations and long-term ana-lyst forecasts. Assumptions regarding salary increases are based on market expectations and market research forecasts. Key actuarial assumptions are presented in TC5:5 . The sensitivity of the recognized provision with respect to key actuarial assumptions is described in TC5:6 .
Admission to trading of the shares in Essity Aktiebolag (publ) on Nasdaq StockholmF-57
Financial data for the financial year 2014–2016
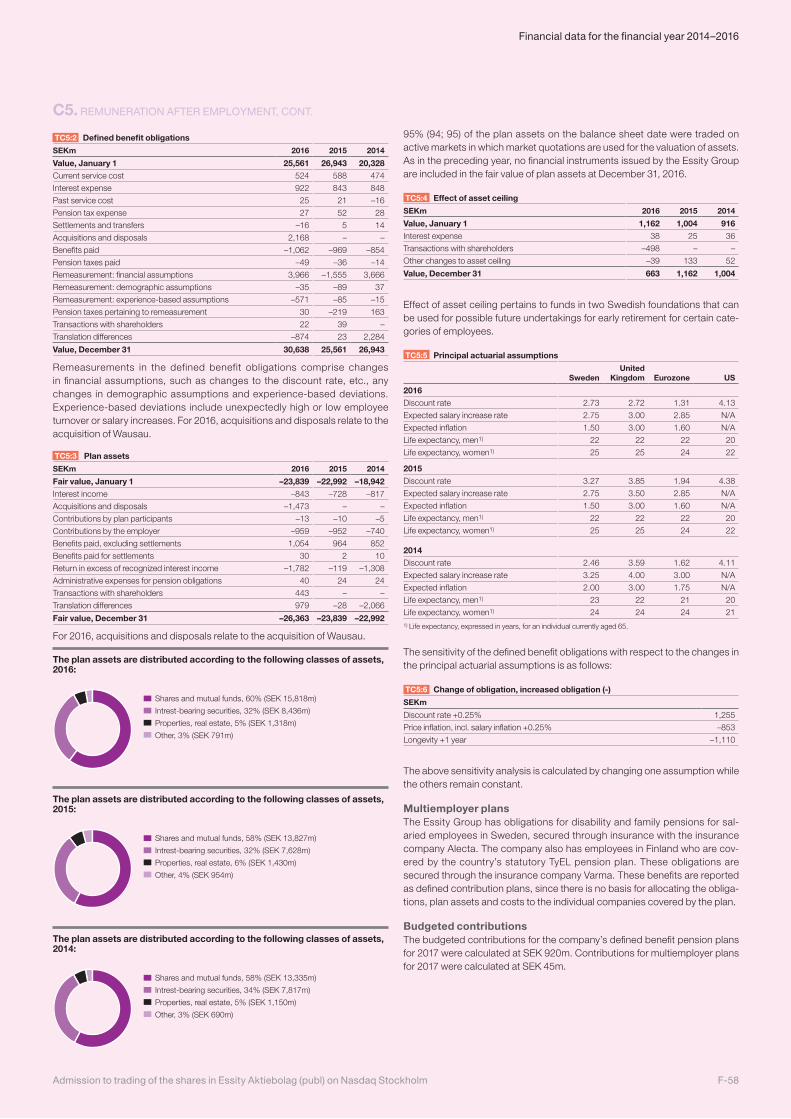
C5. REMUNERATION AFTER EMPLOYMENT, CONT.
TC5:2 Defined benefit obligations
SEKm 2016 2015 2014
Value, January 1 25,561 26,943 20,328Current service cost 524 588 474
Interest expense 922 843 848
Past service cost 25 21 –16
Pension tax expense 27 52 28
Settlements and transfers –16 5 14
Acquisitions and disposals 2,168 – –
Benefits paid –1,062 –969 –854
Pension taxes paid –49 –36 –14
Remeasurement: financial assumptions 3,966 –1,555 3,666
Remeasurement: demographic assumptions –35 –89 37
Remeasurement: experience-based assumptions –571 –85 –15
Pension taxes pertaining to remeasurement 30 –219 163
Transactions with shareholders 22 39 –
Translation differences –874 23 2,284
Value, December 31 30,638 25,561 26,943
Remeasurements in the defined benefit obligations comprise changes in financial assumptions, such as changes to the discount rate, etc., any changes in demographic assumptions and experience-based deviations. Experience-based deviations include unexpectedly high or low employee turnover or salary increases. For 2016, acquisitions and disposals relate to the acquisition of Wausau.
TC5:3 Plan assets
SEKm 2016 2015 2014
Fair value, January 1 –23,839 –22,992 –18,942Interest income –843 –728 –817
Acquisitions and disposals –1,473 – –
Contributions by plan participants –13 –10 –5
Contributions by the employer –959 –952 –740
Benefits paid, excluding settlements 1,054 964 852
Benefits paid for settlements 30 2 10
Return in excess of recognized interest income –1,782 –119 –1,308
Administrative expenses for pension obligations 40 24 24
Transactions with shareholders 443 – –
Translation differences 979 –28 –2,066
Fair value, December 31 –26,363 –23,839 –22,992
For 2016, acquisitions and disposals relate to the acquisition of Wausau.
The plan assets are distributed according to the following classes of assets, 2016:
Shares and mutual funds, 60% (SEK 15,818m)
Intrest-bearing securities, 32% (SEK 8,436m)
Properties, real estate, 5% (SEK 1,318m)
Other, 3% (SEK 791m)
The plan assets are distributed according to the following classes of assets, 2015:
Shares and mutual funds, 58% (SEK 13,827m)
Intrest-bearing securities, 32% (SEK 7,628m)
Properties, real estate, 6% (SEK 1,430m)
Other, 4% (SEK 954m)
The plan assets are distributed according to the following classes of assets, 2014:
Shares and mutual funds, 58% (SEK 13,335m)
Intrest-bearing securities, 34% (SEK 7,817m)
Properties, real estate, 5% (SEK 1,150m)
Other, 3% (SEK 690m)
95% (94; 95) of the plan assets on the balance sheet date were traded on active markets in which market quotations are used for the valuation of assets. As in the preceding year, no financial instruments issued by the Essity Group are included in the fair value of plan assets at December 31, 2016.
TC5:4 Effect of asset ceiling
SEKm 2016 2015 2014
Value, January 1 1,162 1,004 916Interest expense 38 25 36
Transactions with shareholders –498 – –
Other changes to asset ceiling –39 133 52
Value, December 31 663 1,162 1,004
Effect of asset ceiling pertains to funds in two Swedish foundations that can be used for possible future undertakings for early retirement for certain cate-gories of employees.
TC5:5 Principal actuarial assumptions
SwedenUnited
Kingdom Eurozone US
2016Discount rate 2.73 2.72 1.31 4.13
Expected salary increase rate 2.75 3.00 2.85 N/A
Expected inflation 1.50 3.00 1.60 N/A
Life expectancy, men1) 22 22 22 20
Life expectancy, women1) 25 25 24 22
2015Discount rate 3.27 3.85 1.94 4.38
Expected salary increase rate 2.75 3.50 2.85 N/A
Expected inflation 1.50 3.00 1.60 N/A
Life expectancy, men1) 22 22 22 20
Life expectancy, women1) 25 25 24 22
2014Discount rate 2.46 3.59 1.62 4.11
Expected salary increase rate 3.25 4.00 3.00 N/A
Expected inflation 2.00 3.00 1.75 N/A
Life expectancy, men1) 23 22 21 20
Life expectancy, women1) 24 24 24 211) Life expectancy, expressed in years, for an individual currently aged 65.
The sensitivity of the defined benefit obligations with respect to the changes in the principal actuarial assumptions is as follows:
TC5:6 Change of obligation, increased obligation (-)
SEKm
Discount rate +0.25% 1,255
Price inflation, incl. salary inflation +0.25% –853
Longevity +1 year –1,110
The above sensitivity analysis is calculated by changing one assumption while the others remain constant.
Multiemployer plans The Essity Group has obligations for disability and family pensions for sal-aried employees in Sweden, secured through insurance with the insurance company Alecta. The company also has employees in Finland who are cov-ered by the country’s statutory TyEL pension plan. These obligations are secured through the insurance company Varma. These benefits are reported as defined contribution plans, since there is no basis for allocating the obliga-tions, plan assets and costs to the individual companies covered by the plan.
Budgeted contributionsThe budgeted contributions for the company’s defined benefit pension plans for 2017 were calculated at SEK 920m. Contributions for multiemployer plans for 2017 were calculated at SEK 45m.
F-58Admission to trading of the shares in Essity Aktiebolag (publ) on Nasdaq Stockholm
Financial data for the financial year 2014–2016
D1. INTANGIBLE ASSETS
AP ACCOUNTING PRINCIPLES
GoodwillGoodwill arises in connection with business combinations where the consid-eration transferred exceeds the fair value of the acquired net assets. Good-will is recognized at cost less accumulated impairment and is an intangible asset with an indefinite useful life. This means that goodwill is not amortized, but rather is tested annually for impairment. All goodwill is allocated to the cash-generating units that are expected to benefit from the synergies from the business combination. In connection with the sale of Group companies, the remaining carrying amount of the goodwill attributable to the divested unit is included in the capital gain/loss. Goodwill that arises in acquisitions of asso-ciates or joint ventures is included in the carrying amount of the respective associate or joint venture.
TrademarksTrademarks arise either in connection with acquisitions or through agree-ments to purchase trademarks. Trademarks are recognized at cost after any accumulated amortization and accumulated impairment. Trademarks that have an indefinite useful life are not amortized, but rather are tested annually for impairment along with the impairment testing of goodwill. Trademarks with a limited useful life are amortized on a straight-line basis during their antici-pated useful life, which varies between three and ten years.
Licenses, patents and similar rightsIntangible assets also include patents, licenses and other similar rights. Acquired assets of this type are recognized at cost and are amortized on a straight-line basis during their anticipated useful life, which varies between three and 20 years.
Customer relationsCustomer relations are measured at fair value at the time of the acquisition. The value of these customer relations is amortized over their useful life, which is considered to be between three and 15 years.
Research and developmentResearch expenditure is recognized as an expense as incurred. Identifiable expenditure for development of new products and processes is capitalized to the extent it is expected to provide future economic benefits. In cases in which it is difficult to separate the research phase from the development phase in a project, the entire project is treated as research and expensed immediately. Capitalized expenditure is amortized on a straight-line basis from the date when the asset starts to be used during the estimated useful life of the asset. The amortization period is between five and ten years.
Impairment testing Goodwill is tested annually for possible impairment. When testing for impair-ment, the assets are grouped in cash-generating units. The Essity Group’s cash-generating units coincide with its defined operating segments. The test compares the carrying amounts of the cash-generating units with the recover-able amounts. The recoverable amount of each cash-generating unit is deter-mined by discounting future cash flows in order to determine their value in use. The calculation of future cash flows is based on the strategic plans adopted by the Executive Management Team for the next three years. The carrying amount for the cash-generating unit includes goodwill, trademarks with indef-inite useful lives and assets with definite useful lives, such as non-current assets, trademarks and working capital. Effects of expansion investments are excluded when calculating the value in use. The value of depreciated assets is tested for impairment whenever there are indications that the carrying amount might not be recoverable. In cases in which the carrying amount of an asset or cash-generating unit exceeds its estimated recoverable amount, an impair-ment loss is recognized on the asset down to the recoverable amount. An impairment loss recognized earlier is reversed, if the reasons for the impair-ment no longer exist. The carrying amount after the reversal is limited to what it would have been had no past impairment been recognized. Impairment losses on goodwill are never reversed.
Emission allowances and costs for carbon dioxide emissionsThe Essity Group participates in the European system for emission allow-ances.
When emission allowances relating to carbon dioxide emissions are received from an individual EU state, they are recognized as an intangible asset and as deferred income (liability). Allowances are received free of charge and measured and recognized at market value as of the date to which the allo-cation pertains. During the period, the initial liability for emission allowances received is dissolved over profit or loss as income in pace with carbon dioxide emissions made. If the emission allowances received do not cover emissions made, the Essity Group makes a provision for the deficit valued at the mar-ket value on the balance sheet date. Sales of surplus emission allowances are recognized as income on the delivery date.
If the market price of emission allowances on the balance sheet date is less than recognized cost, any surplus emission allowances that are not required to cover emissions made are impaired to the market price applying on the bal-ance sheet date. In conjunction with this, the remaining part of the deferred income is recognized as income by a corresponding amount and therefore no net effect occurs in profit or loss. The emission allowances are used as pay-ment in the settlement with the state regarding liabilities for emissions.
KAA KEY ASSESSMENTS AND ASSUMPTIONS
In connection with the annual impairment testing of goodwill, the recover-able amount is calculated. The recoverable amount for the cash-generat-ing units is determined by calculating value in use. Calculation of the value in use is based on the three-year strategy plans adopted by the Executive Man-agement Team, which in turn are based on assumptions and assessments. The most important assessments and assumptions pertain to forecasts for organic growth, the profit margin and the discount rate used. The discount rate used in the present value calculation of the anticipated future cash flows is the current weighted average cost of capital (WACC) established within the Group for the markets in which the cash-generating units conduct operations.
Profit margin assumptions are based on current market prices and costs with an addition for real price reductions and cost inflation as well as assumed productivity development. Growth assumption follow the Group’s target of an annual organic growth of above 3%. The growth assumptions are in line with historic outcome and expected global market growth.
The expected sustained future cash flow for periods that are beyond the planning horizon of the strategy plan are extrapolated for a ten-year period from the final year of the strategy plan using assumed sustained growth of 2% (2;2). The value of the cash flows for the period beyond ten years is calculated by applying an operating surplus multiple to estimated sustained cash flow.
D. OPERATING ASSETS AND LIABILITIES
Admission to trading of the shares in Essity Aktiebolag (publ) on Nasdaq StockholmF-59
Financial data for the financial year 2014–2016
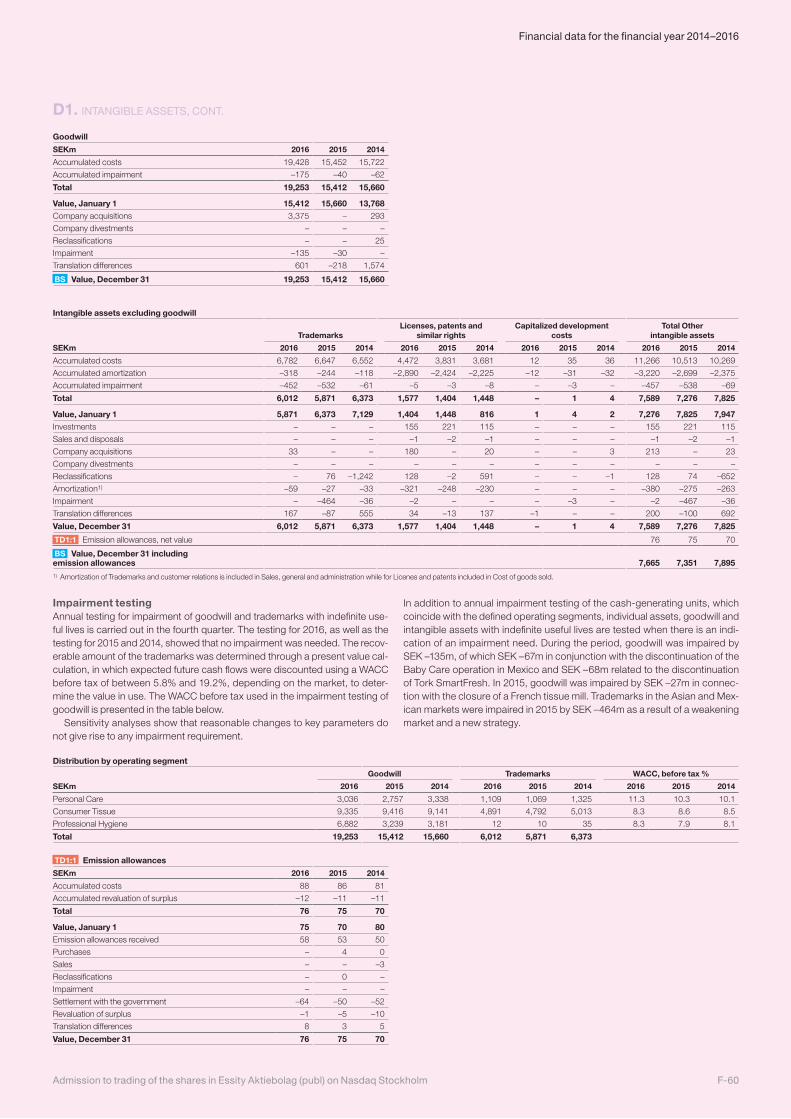
D1. INTANGIBLE ASSETS, CONT.
Goodwill
SEKm 2016 2015 2014
Accumulated costs 19,428 15,452 15,722
Accumulated impairment –175 –40 –62
Total 19,253 15,412 15,660
Value, January 1 15,412 15,660 13,768Company acquisitions 3,375 – 293
Company divestments – – –
Reclassifications – – 25
Impairment –135 –30 –
Translation differences 601 –218 1,574
BS Value, December 31 19,253 15,412 15,660
Intangible assets excluding goodwill
TrademarksLicenses, patents and
similar rightsCapitalized development
costsTotal Other
intangible assets
SEKm 2016 2015 2014 2016 2015 2014 2016 2015 2014 2016 2015 2014
Accumulated costs 6,782 6,647 6,552 4,472 3,831 3,681 12 35 36 11,266 10,513 10,269
Accumulated amortization –318 –244 –118 –2,890 –2,424 –2,225 –12 –31 –32 –3,220 –2,699 –2,375
Accumulated impairment –452 –532 –61 –5 –3 –8 – –3 – –457 –538 –69
Total 6,012 5,871 6,373 1,577 1,404 1,448 – 1 4 7,589 7,276 7,825
Value, January 1 5,871 6,373 7,129 1,404 1,448 816 1 4 2 7,276 7,825 7,947Investments – – – 155 221 115 – – – 155 221 115
Sales and disposals – – – –1 –2 –1 – – – –1 –2 –1
Company acquisitions 33 – – 180 – 20 – – 3 213 – 23
Company divestments – – – – – – – – – – – –
Reclassifications – 76 –1,242 128 –2 591 – – –1 128 74 –652
Amortization1) –59 –27 –33 –321 –248 –230 – – – –380 –275 –263
Impairment – –464 –36 –2 – – – –3 – –2 –467 –36
Translation differences 167 –87 555 34 –13 137 –1 – – 200 –100 692
Value, December 31 6,012 5,871 6,373 1,577 1,404 1,448 – 1 4 7,589 7,276 7,825
TD1:1 Emission allowances, net value 76 75 70
BS Value, December 31 including emission allowances 7,665 7,351 7,8951) Amortization of Trademarks and customer relations is included in Sales, general and administration while for Licenes and patents included in Cost of goods sold.
Impairment testing Annual testing for impairment of goodwill and trademarks with indefinite use-ful lives is carried out in the fourth quarter. The testing for 2016, as well as the testing for 2015 and 2014, showed that no impairment was needed. The recov-erable amount of the trademarks was determined through a present value cal-culation, in which expected future cash flows were discounted using a WACC before tax of between 5.8% and 19.2%, depending on the market, to deter-mine the value in use. The WACC before tax used in the impairment testing of goodwill is presented in the table below.
Sensitivity analyses show that reasonable changes to key parameters do not give rise to any impairment requirement.
In addition to annual impairment testing of the cash-generating units, which coincide with the defined operating segments, individual assets, goodwill and intangible assets with indefinite useful lives are tested when there is an indi-cation of an impairment need. During the period, goodwill was impaired by SEK –135m, of which SEK –67m in conjunction with the discontinuation of the Baby Care operation in Mexico and SEK –68m related to the discontinuation of Tork SmartFresh. In 2015, goodwill was impaired by SEK –27m in connec-tion with the closure of a French tissue mill. Trademarks in the Asian and Mex-ican markets were impaired in 2015 by SEK –464m as a result of a weakening market and a new strategy.
Distribution by operating segment
Goodwill Trademarks WACC, before tax %
SEKm 2016 2015 2014 2016 2015 2014 2016 2015 2014
Personal Care 3,036 2,757 3,338 1,109 1,069 1,325 11.3 10.3 10.1
Consumer Tissue 9,335 9,416 9,141 4,891 4,792 5,013 8.3 8.6 8.5
Professional Hygiene 6,882 3,239 3,181 12 10 35 8.3 7.9 8.1
Total 19,253 15,412 15,660 6,012 5,871 6,373
TD1:1 Emission allowances
SEKm 2016 2015 2014
Accumulated costs 88 86 81
Accumulated revaluation of surplus –12 –11 –11
Total 76 75 70
Value, January 1 75 70 80Emission allowances received 58 53 50
Purchases – 4 0
Sales – – –3
Reclassifications – 0 –
Impairment – – –
Settlement with the government –64 –50 –52
Revaluation of surplus –1 –5 –10
Translation differences 8 3 5
Value, December 31 76 75 70
F-60Admission to trading of the shares in Essity Aktiebolag (publ) on Nasdaq Stockholm
Financial data for the financial year 2014–2016
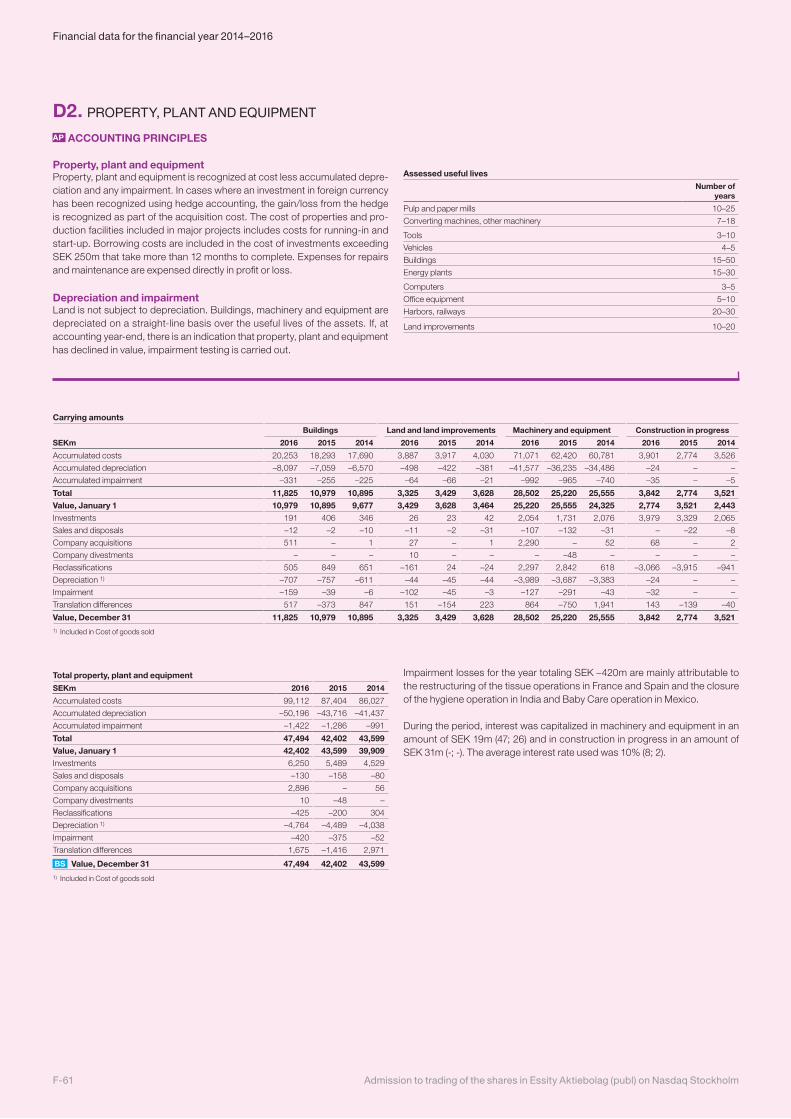
D2. PROPERTY, PLANT AND EQUIPMENT
AP ACCOUNTING PRINCIPLES
Property, plant and equipmentProperty, plant and equipment is recognized at cost less accumulated depre-ciation and any impairment. In cases where an investment in foreign currency has been recognized using hedge accounting, the gain/loss from the hedge is recognized as part of the acquisition cost. The cost of properties and pro-duction facilities included in major projects includes costs for running-in and start-up. Borrowing costs are included in the cost of investments exceeding SEK 250m that take more than 12 months to complete. Expenses for repairs and maintenance are expensed directly in profit or loss.
Depreciation and impairmentLand is not subject to depreciation. Buildings, machinery and equipment are depreciated on a straight-line basis over the useful lives of the assets. If, at accounting year-end, there is an indication that property, plant and equipment has declined in value, impairment testing is carried out.
Assessed useful lives
Number of years
Pulp and paper mills 10–25
Converting machines, other machinery 7–18
Tools 3–10
Vehicles 4–5
Buildings 15–50
Energy plants 15–30
Computers 3–5
Office equipment 5–10
Harbors, railways 20–30
Land improvements 10–20
Total property, plant and equipment
SEKm 2016 2015 2014
Accumulated costs 99,112 87,404 86,027
Accumulated depreciation –50,196 –43,716 –41,437
Accumulated impairment –1,422 –1,286 –991
Total 47,494 42,402 43,599Value, January 1 42,402 43,599 39,909Investments 6,250 5,489 4,529
Sales and disposals –130 –158 –80
Company acquisitions 2,896 – 56
Company divestments 10 –48 –
Reclassifications –425 –200 304
Depreciation 1) –4,764 –4,489 –4,038
Impairment –420 –375 –52
Translation differences 1,675 –1,416 2,971
BS Value, December 31 47,494 42,402 43,5991) Included in Cost of goods sold
Impairment losses for the year totaling SEK –420m are mainly attributable to the restructuring of the tissue operations in France and Spain and the closure of the hygiene operation in India and Baby Care operation in Mexico.
During the period, interest was capitalized in machinery and equipment in an amount of SEK 19m (47; 26) and in construction in progress in an amount of SEK 31m (-; -). The average interest rate used was 10% (8; 2).
Carrying amounts
Buildings Land and land improvements Machinery and equipment Construction in progress
SEKm 2016 2015 2014 2016 2015 2014 2016 2015 2014 2016 2015 2014
Accumulated costs 20,253 18,293 17,690 3,887 3,917 4,030 71,071 62,420 60,781 3,901 2,774 3,526
Accumulated depreciation –8,097 –7,059 –6,570 –498 –422 –381 –41,577 –36,235 –34,486 –24 – –
Accumulated impairment –331 –255 –225 –64 –66 –21 –992 –965 –740 –35 – –5
Total 11,825 10,979 10,895 3,325 3,429 3,628 28,502 25,220 25,555 3,842 2,774 3,521Value, January 1 10,979 10,895 9,677 3,429 3,628 3,464 25,220 25,555 24,325 2,774 3,521 2,443Investments 191 406 346 26 23 42 2,054 1,731 2,076 3,979 3,329 2,065
Sales and disposals –12 –2 –10 –11 –2 –31 –107 –132 –31 – –22 –8
Company acquisitions 511 – 1 27 – 1 2,290 – 52 68 – 2
Company divestments – – – 10 – – – –48 – – – –
Reclassifications 505 849 651 –161 24 –24 2,297 2,842 618 –3,066 –3,915 –941
Depreciation 1) –707 –757 –611 –44 –45 –44 –3,989 –3,687 –3,383 –24 – –
Impairment –159 –39 –6 –102 –45 –3 –127 –291 –43 –32 – –
Translation differences 517 –373 847 151 –154 223 864 –750 1,941 143 –139 –40
Value, December 31 11,825 10,979 10,895 3,325 3,429 3,628 28,502 25,220 25,555 3,842 2,774 3,5211) Included in Cost of goods sold
Admission to trading of the shares in Essity Aktiebolag (publ) on Nasdaq StockholmF-61
Financial data for the financial year 2014–2016
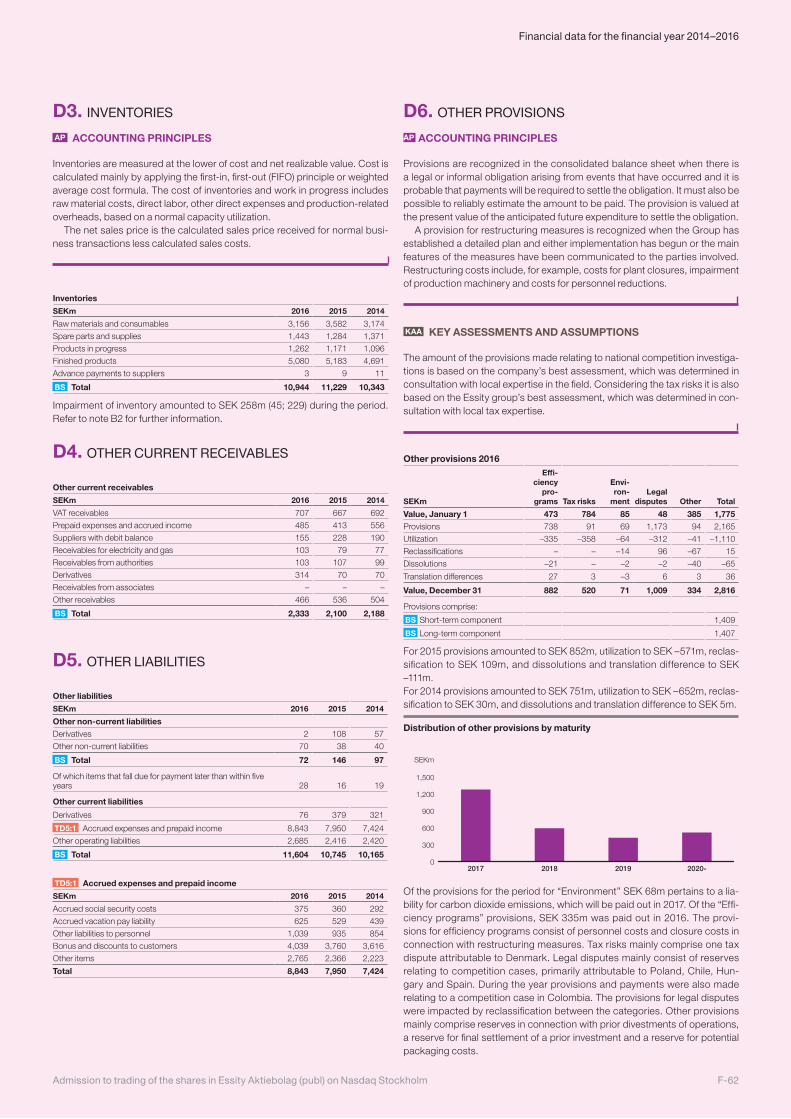
D3. INVENTORIES
AP ACCOUNTING PRINCIPLES
Inventories are measured at the lower of cost and net realizable value. Cost is calculated mainly by applying the first-in, first-out (FIFO) principle or weighted average cost formula. The cost of inventories and work in progress includes raw material costs, direct labor, other direct expenses and production-related overheads, based on a normal capacity utilization.
The net sales price is the calculated sales price received for normal busi-ness transactions less calculated sales costs.
Inventories
SEKm 2016 2015 2014
Raw materials and consumables 3,156 3,582 3,174
Spare parts and supplies 1,443 1,284 1,371
Products in progress 1,262 1,171 1,096
Finished products 5,080 5,183 4,691
Advance payments to suppliers 3 9 11
BS Total 10,944 11,229 10,343
D4. OTHER CURRENT RECEIVABLES
Other current receivables
SEKm 2016 2015 2014
VAT receivables 707 667 692
Prepaid expenses and accrued income 485 413 556
Suppliers with debit balance 155 228 190
Receivables for electricity and gas 103 79 77
Receivables from authorities 103 107 99
Derivatives 314 70 70
Receivables from associates – – –
Other receivables 466 536 504
BS Total 2,333 2,100 2,188
D6. OTHER PROVISIONS
AP ACCOUNTING PRINCIPLES
Provisions are recognized in the consolidated balance sheet when there is a legal or informal obligation arising from events that have occurred and it is probable that payments will be required to settle the obligation. It must also be possible to reliably estimate the amount to be paid. The provision is valued at the present value of the anticipated future expenditure to settle the obligation.
A provision for restructuring measures is recognized when the Group has established a detailed plan and either implementation has begun or the main features of the measures have been communicated to the parties involved. Restructuring costs include, for example, costs for plant closures, impairment of production machinery and costs for personnel reductions.
KAA KEY ASSESSMENTS AND ASSUMPTIONS
The amount of the provisions made relating to national competition investiga-tions is based on the company’s best assessment, which was determined in consultation with local expertise in the field. Considering the tax risks it is also based on the Essity group’s best assessment, which was determined in con-sultation with local tax expertise.
Other provisions 2016
SEKm
Effi-ciency
pro-grams Tax risks
Envi-ron-
mentLegal
disputes Other Total
Value, January 1 473 784 85 48 385 1,775Provisions 738 91 69 1,173 94 2,165
Utilization –335 –358 –64 –312 –41 –1,110
Reclassifications – – –14 96 –67 15
Dissolutions –21 – –2 –2 –40 –65
Translation differences 27 3 –3 6 3 36
Value, December 31 882 520 71 1,009 334 2,816
Provisions comprise:
BS Short-term component 1,409
BS Long-term component 1,407
For 2015 provisions amounted to SEK 852m, utilization to SEK –571m, reclas-sification to SEK 109m, and dissolutions and translation difference to SEK –111m.For 2014 provisions amounted to SEK 751m, utilization to SEK –652m, reclas-sification to SEK 30m, and dissolutions and translation difference to SEK 5m.
Distribution of other provisions by maturity
SEKm
0
300
600
900
1,200
1,500
2020-201920182017
Of the provisions for the period for “Environment” SEK 68m pertains to a lia-bility for carbon dioxide emissions, which will be paid out in 2017. Of the “Effi-ciency programs” provisions, SEK 335m was paid out in 2016. The provi-sions for efficiency programs consist of personnel costs and closure costs in connection with restructuring measures. Tax risks mainly comprise one tax dispute attributable to Denmark. Legal disputes mainly consist of reserves relating to competition cases, primarily attributable to Poland, Chile, Hun-gary and Spain. During the year provisions and payments were also made relating to a competition case in Colombia. The provisions for legal disputes were impacted by reclassification between the categories. Other provisions mainly comprise reserves in connection with prior divestments of operations, a reserve for final settlement of a prior investment and a reserve for potential packaging costs.
D5. OTHER LIABILITIES
Other liabilities
SEKm 2016 2015 2014
Other non-current liabilitiesDerivatives 2 108 57
Other non-current liabilities 70 38 40
BS Total 72 146 97
Of which items that fall due for payment later than within five years 28 16 19
Other current liabilities
Derivatives 76 379 321
TD5:1 Accrued expenses and prepaid income 8,843 7,950 7,424
Other operating liabilities 2,685 2,416 2,420
BS Total 11,604 10,745 10,165
TD5:1 Accrued expenses and prepaid income
SEKm 2016 2015 2014
Accrued social security costs 375 360 292
Accrued vacation pay liability 625 529 439
Other liabilities to personnel 1,039 935 854
Bonus and discounts to customers 4,039 3,760 3,616
Other items 2,765 2,366 2,223
Total 8,843 7,950 7,424
Impairment of inventory amounted to SEK 258m (45; 229) during the period. Refer to note B2 for further information.
F-62Admission to trading of the shares in Essity Aktiebolag (publ) on Nasdaq Stockholm
Financial data for the financial year 2014–2016
E. CAPITAL STRUCTURE AND FINANCING
E1. FINANCIAL INSTRUMENTS BY CATEGORY AND MEASUREMENT LEVEL
AP ACCOUNTING PRINCIPLES
Financial instruments recognized in the balance sheet include cash and cash equivalents, securities, other financial receivables, trade receivables, trade payables, loans and derivatives.
Current investments and derivatives are recognized on the trade date. Available-for-sale financial assets and loans are recognized on the settlement date. Trade receivables and trade payables are recognized in the balance sheet once the invoice has been sent or received, respectively.
Financial assets are initially recognized at cost, and transaction costs are included for certain instruments that are not measured at fair value. Finan-cial assets are recognized in the balance sheet until the rights in the agree-ment have been realized or the company no longer has the rights to the asset. Impairment of financial assets takes place when there is objective proof of impairment, such as cessation of an active market or where it is probable that the debtors cannot meet their commitments.
Financial liabilities are recognized at amortized cost, except in cases where they are recognized at fair value using hedge accounting. Financial liabilities are derecognized from the balance sheet when the Essity Group has met its commitments.
The Essity Group recognizes financial instruments with a remaining matu-rity of less than 12 months as current assets and liabilities, and those that exceed 12 months as non-current assets and liabilities.
Fair value measurementFor the financial instruments for which market quotations are available, actual prices are used for fair value measurement (Level 1). In the absence of market quotations for the instruments, the Essity Group determines fair va-lues with the aid of common valuation models, using quoted prices of similar assets or liabilities in active markets (Level 2).
For disclosures in a note relating to non-current loans, current market in- terest rates are taken into account in fair value calculations. The fair value of short-term loans and investments is considered to correspond to the carry-ing amount, since a change in market interest rates does not have a significant effect on market value.
Classification and subsequent recognitionOn the acquisition date, the Essity Group classifies financial instruments into the following categories.
Financial assets measured at fair value through profit or loss Assets are classified in this category when the intention is to sell in the short term and, if such is the case, they are recognized continuously at fair value through profit or loss.
This category also includes derivatives with positive market values not recog-nized using hedge accounting. Only financial derivatives were classified in this category during the year.
Held-to-maturity investments Held-to-maturity investments are defined as financial assets that have deter-minable payments and that the Essity Group intends to hold to maturity. Assets in this category are measured at amortized cost applying the effec-tive interest method, which means they are accrued so that a constant return is obtained.
Loan and trade receivables This category comprises loan receivables that have determinable payments and are not quoted in an active market, as well as trade receivables. Receiva- bles arise when the Essity Group provides money, goods or services directly to another party without any intention of conducting trading in the receivables. Assets in this category are measured at amortized cost less a potential provi-sion for impairment.
Available-for-sale financial assetsThis category includes assets that are available for sale or that have not been classified in any of the other categories. These assets are measured at fair value through other comprehensive income.
Financial liabilities measured at fair value through profit or loss This category includes derivatives with negative fair values that are not used for hedge accounting and financial liabilities held for trading. Liabilities in this category are continuously measured at fair value and changes in value are recognized in profit or loss. Only derivatives were classified in this category during the year.
Financial liabilities measured at amortized cost This category includes financial liabilities that are not held for trading. These are recognized initially at fair value, net after transaction costs, and subse-quently at amortized cost according to the effective interest method.
Accounting for derivatives used for hedging purposes All derivatives are initially and continuously recognized at fair value in the bala- nce sheet. Gains and losses on remeasurement of derivatives used for hedg-ing purposes are recognized in accordance with the accounting principles stated in Note E6 Derivatives and hedge accounting.
Admission to trading of the shares in Essity Aktiebolag (publ) on Nasdaq StockholmF-63
Financial data for the financial year 2014–2016
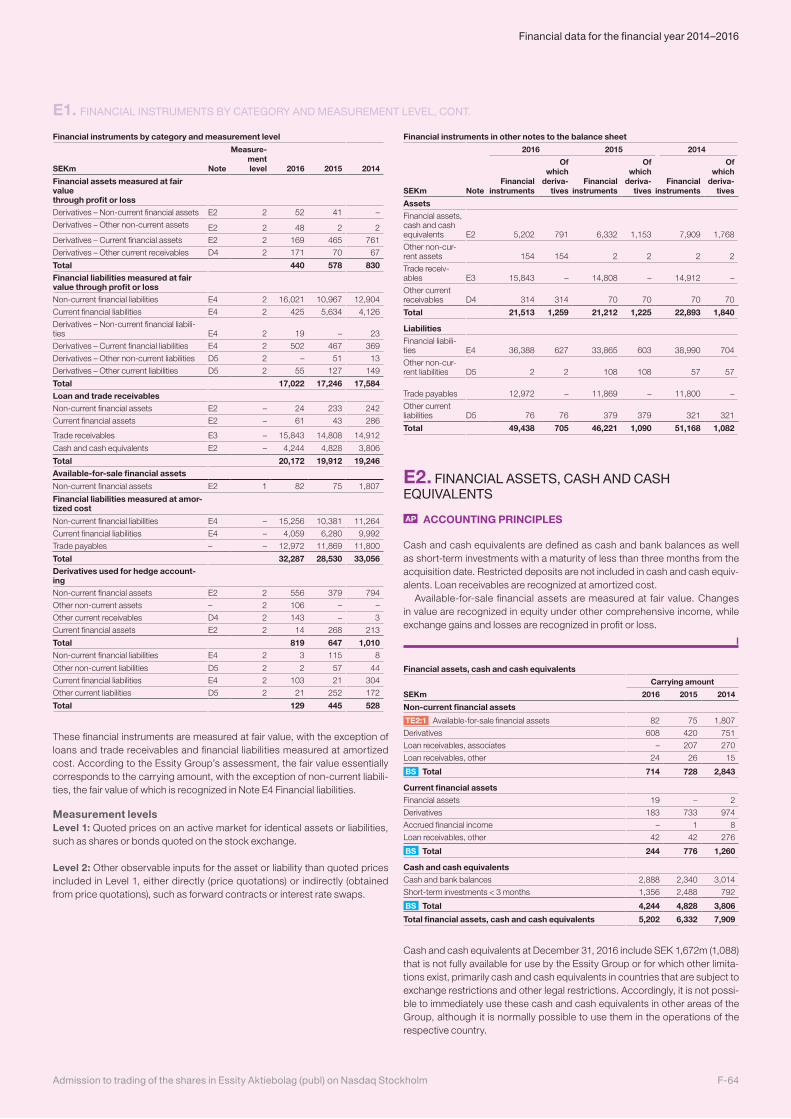
E1. FINANCIAL INSTRUMENTS BY CATEGORY AND MEASUREMENT LEVEL, CONT.
Financial instruments by category and measurement level
SEKm Note
Measure-ment level 2016 2015 2014
Financial assets measured at fair value through profit or lossDerivatives – Non-current financial assets E2 2 52 41 –
Derivatives – Other non-current assets E2 2 48 2 2
Derivatives – Current financial assets E2 2 169 465 761
Derivatives – Other current receivables D4 2 171 70 67
Total 440 578 830Financial liabilities measured at fair value through profit or lossNon-current financial liabilities E4 2 16,021 10,967 12,904
Current financial liabilities E4 2 425 5,634 4,126
Derivatives – Non-current financial liabili-ties E4 2 19 – 23
Derivatives – Current financial liabilities E4 2 502 467 369
Derivatives – Other non-current liabilities D5 2 – 51 13
Derivatives – Other current liabilities D5 2 55 127 149
Total 17,022 17,246 17,584Loan and trade receivablesNon-current financial assets E2 – 24 233 242
Current financial assets E2 – 61 43 286
Trade receivables E3 – 15,843 14,808 14,912
Cash and cash equivalents E2 – 4,244 4,828 3,806
Total 20,172 19,912 19,246Available-for-sale financial assets
Non-current financial assets E2 1 82 75 1,807
Financial liabilities measured at amor-tized cost
Non-current financial liabilities E4 – 15,256 10,381 11,264
Current financial liabilities E4 – 4,059 6,280 9,992
Trade payables – – 12,972 11,869 11,800
Total 32,287 28,530 33,056Derivatives used for hedge account-ingNon-current financial assets E2 2 556 379 794
Other non-current assets – 2 106 – –
Other current receivables D4 2 143 – 3
Current financial assets E2 2 14 268 213
Total 819 647 1,010Non-current financial liabilities E4 2 3 115 8
Other non-current liabilities D5 2 2 57 44
Current financial liabilities E4 2 103 21 304
Other current liabilities D5 2 21 252 172
Total 129 445 528
These financial instruments are measured at fair value, with the exception of loans and trade receivables and financial liabilities measured at amortized cost. According to the Essity Group’s assessment, the fair value essentially corresponds to the carrying amount, with the exception of non-current liabili-ties, the fair value of which is recognized in Note E4 Financial liabilities.
Measurement levelsLevel 1: Quoted prices on an active market for identical assets or liabilities, such as shares or bonds quoted on the stock exchange.
Level 2: Other observable inputs for the asset or liability than quoted prices included in Level 1, either directly (price quotations) or indirectly (obtained from price quotations), such as forward contracts or interest rate swaps.
Financial instruments in other notes to the balance sheet
2016 2015 2014
SEKm NoteFinancial
instruments
Of which
deriva-tives
Financial instruments
Of which
deriva-tives
Financial instruments
Of which
deriva-tives
AssetsFinancial assets, cash and cash equivalents E2 5,202 791 6,332 1,153 7,909 1,768
Other non-cur-rent assets 154 154 2 2 2 2
Trade receiv-ables E3 15,843 – 14,808 – 14,912 –
Other current receivables D4 314 314 70 70 70 70
Total 21,513 1,259 21,212 1,225 22,893 1,840
LiabilitiesFinancial liabili-ties E4 36,388 627 33,865 603 38,990 704
Other non-cur-rent liabilities D5 2 2 108 108 57 57
Trade payables 12,972 – 11,869 – 11,800 –
Other current liabilities D5 76 76 379 379 321 321
Total 49,438 705 46,221 1,090 51,168 1,082
E2. FINANCIAL ASSETS, CASH AND CASH EQUIVALENTS
AP ACCOUNTING PRINCIPLES
Cash and cash equivalents are defined as cash and bank balances as well as short-term investments with a maturity of less than three months from the acquisition date. Restricted deposits are not included in cash and cash equiv-alents. Loan receivables are recognized at amortized cost.
Available-for-sale financial assets are measured at fair value. Changes in value are recognized in equity under other comprehensive income, while exchange gains and losses are recognized in profit or loss.
Financial assets, cash and cash equivalents
Carrying amount
SEKm 2016 2015 2014
Non-current financial assets
TE2:1 Available-for-sale financial assets 82 75 1,807
Derivatives 608 420 751
Loan receivables, associates – 207 270
Loan receivables, other 24 26 15
BS Total 714 728 2,843
Current financial assetsFinancial assets 19 – 2
Derivatives 183 733 974
Accrued financial income – 1 8
Loan receivables, other 42 42 276
BS Total 244 776 1,260
Cash and cash equivalentsCash and bank balances 2,888 2,340 3,014
Short-term investments < 3 months 1,356 2,488 792
BS Total 4,244 4,828 3,806
Total financial assets, cash and cash equivalents 5,202 6,332 7,909
Cash and cash equivalents at December 31, 2016 include SEK 1,672m (1,088) that is not fully available for use by the Essity Group or for which other limita-tions exist, primarily cash and cash equivalents in countries that are subject to exchange restrictions and other legal restrictions. Accordingly, it is not possi-ble to immediately use these cash and cash equivalents in other areas of the Group, although it is normally possible to use them in the operations of the respective country.
F-64Admission to trading of the shares in Essity Aktiebolag (publ) on Nasdaq Stockholm
Financial data for the financial year 2014–2016
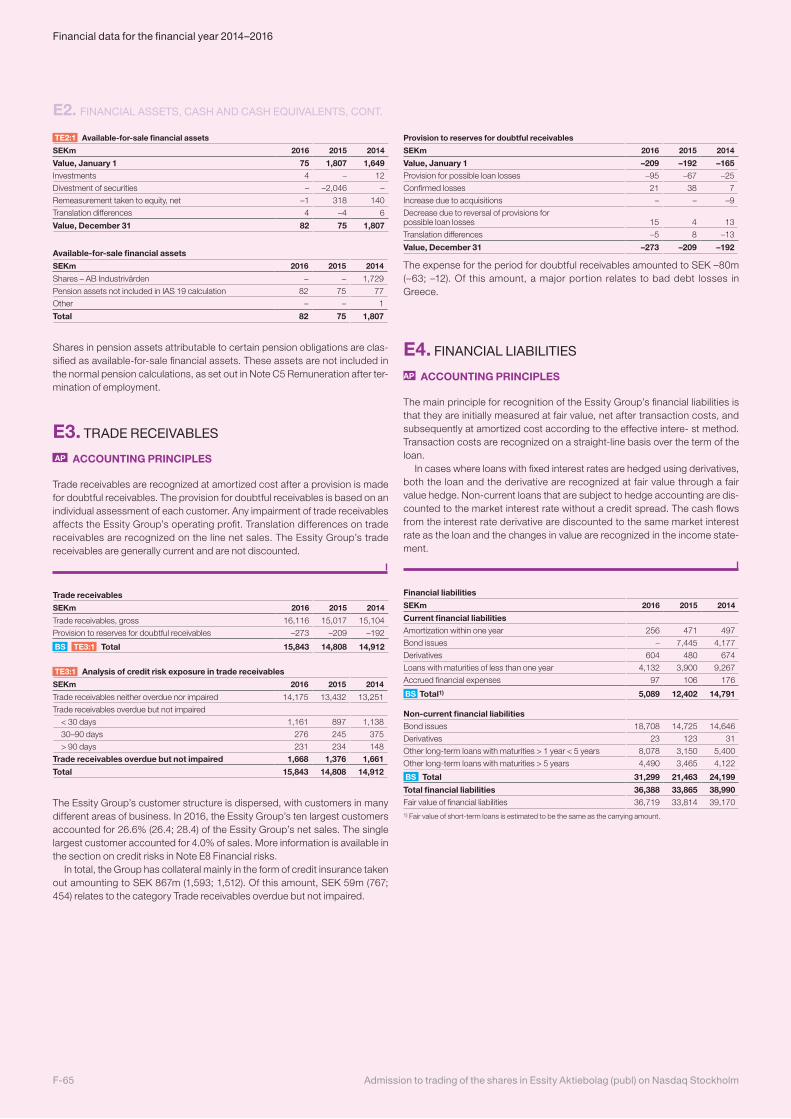
TE2:1 Available-for-sale financial assets
SEKm 2016 2015 2014
Value, January 1 75 1,807 1,649Investments 4 – 12
Divestment of securities – –2,046 –
Remeasurement taken to equity, net –1 318 140
Translation differences 4 –4 6
Value, December 31 82 75 1,807
Available-for-sale financial assets
SEKm 2016 2015 2014
Shares – AB Industrivärden – – 1,729
Pension assets not included in IAS 19 calculation 82 75 77
Other – – 1
Total 82 75 1,807
Shares in pension assets attributable to certain pension obligations are clas-sified as available-for-sale financial assets. These assets are not included in the normal pension calculations, as set out in Note C5 Remuneration after ter-mination of employment.
E3. TRADE RECEIVABLES
AP ACCOUNTING PRINCIPLES
Trade receivables are recognized at amortized cost after a provision is made for doubtful receivables. The provision for doubtful receivables is based on an individual assessment of each customer. Any impairment of trade receivables affects the Essity Group’s operating profit. Translation differences on trade receivables are recognized on the line net sales. The Essity Group’s trade receivables are generally current and are not discounted.
Trade receivables
SEKm 2016 2015 2014
Trade receivables, gross 16,116 15,017 15,104
Provision to reserves for doubtful receivables –273 –209 –192
BS TE3:1 Total 15,843 14,808 14,912
TE3:1 Analysis of credit risk exposure in trade receivables
SEKm 2016 2015 2014
Trade receivables neither overdue nor impaired 14,175 13,432 13,251
Trade receivables overdue but not impaired
< 30 days 1,161 897 1,138
30–90 days 276 245 375
> 90 days 231 234 148
Trade receivables overdue but not impaired 1,668 1,376 1,661
Total 15,843 14,808 14,912
The Essity Group’s customer structure is dispersed, with customers in many different areas of business. In 2016, the Essity Group’s ten largest customers accounted for 26.6% (26.4; 28.4) of the Essity Group’s net sales. The single largest customer accounted for 4.0% of sales. More information is available in the section on credit risks in Note E8 Financial risks.
In total, the Group has collateral mainly in the form of credit insurance taken out amounting to SEK 867m (1,593; 1,512). Of this amount, SEK 59m (767; 454) relates to the category Trade receivables overdue but not impaired.
Provision to reserves for doubtful receivables
SEKm 2016 2015 2014
Value, January 1 –209 –192 –165Provision for possible loan losses –95 –67 –25
Confirmed losses 21 38 7
Increase due to acquisitions – – –9
Decrease due to reversal of provisions for possible loan losses 15 4 13
Translation differences –5 8 –13
Value, December 31 –273 –209 –192
The expense for the period for doubtful receivables amounted to SEK –80m (–63; –12). Of this amount, a major portion relates to bad debt losses in Greece.
E4. FINANCIAL LIABILITIES
AP ACCOUNTING PRINCIPLES
The main principle for recognition of the Essity Group’s financial liabilities is that they are initially measured at fair value, net after transaction costs, and subsequently at amortized cost according to the effective intere- st method. Transaction costs are recognized on a straight-line basis over the term of the loan.
In cases where loans with fixed interest rates are hedged using derivatives, both the loan and the derivative are recognized at fair value through a fair value hedge. Non-current loans that are subject to hedge accounting are dis-counted to the market interest rate without a credit spread. The cash flows from the interest rate derivative are discounted to the same market interest rate as the loan and the changes in value are recognized in the income state-ment.
Financial liabilities
SEKm 2016 2015 2014
Current financial liabilitiesAmortization within one year 256 471 497
Bond issues – 7,445 4,177
Derivatives 604 480 674
Loans with maturities of less than one year 4,132 3,900 9,267
Accrued financial expenses 97 106 176
BS Total1) 5,089 12,402 14,791
Non-current financial liabilitiesBond issues 18,708 14,725 14,646
Derivatives 23 123 31
Other long-term loans with maturities > 1 year < 5 years 8,078 3,150 5,400
Other long-term loans with maturities > 5 years 4,490 3,465 4,122
BS Total 31,299 21,463 24,199
Total financial liabilities 36,388 33,865 38,990Fair value of financial liabilities 36,719 33,814 39,1701) Fair value of short-term loans is estimated to be the same as the carrying amount.
E2. FINANCIAL ASSETS, CASH AND CASH EQUIVALENTS, CONT.
Admission to trading of the shares in Essity Aktiebolag (publ) on Nasdaq StockholmF-65
Financial data for the financial year 2014–2016
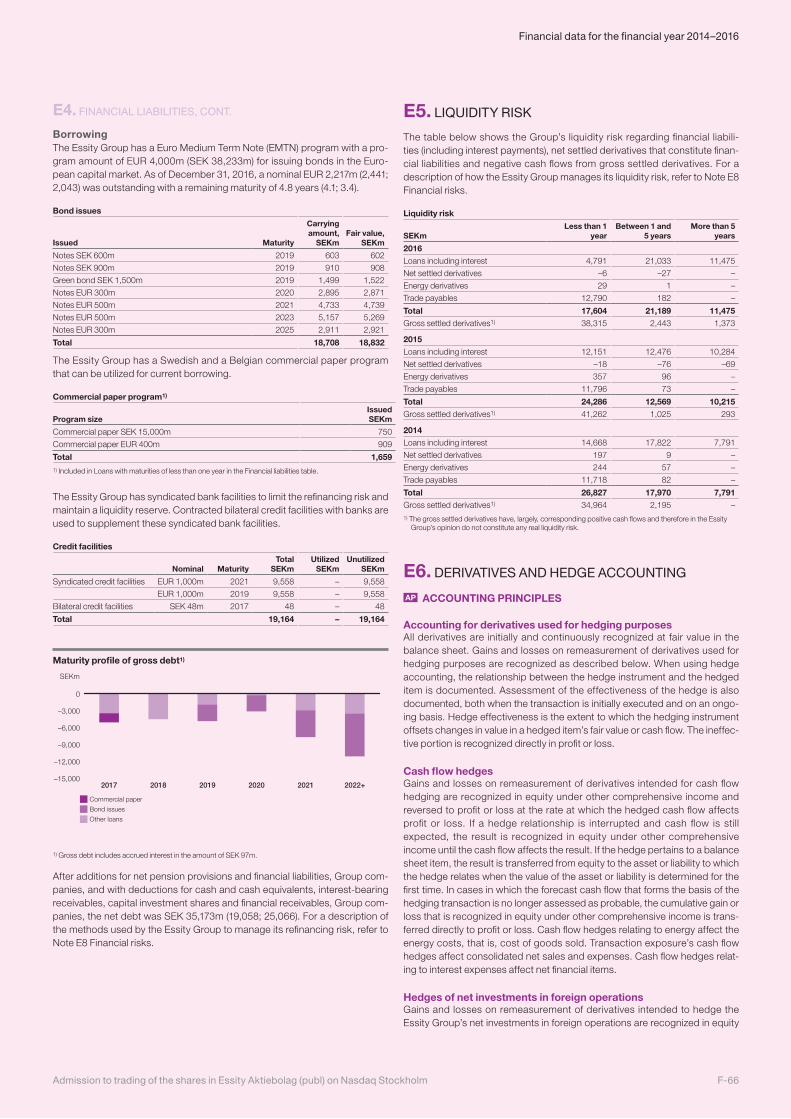
BorrowingThe Essity Group has a Euro Medium Term Note (EMTN) program with a pro-gram amount of EUR 4,000m (SEK 38,233m) for issuing bonds in the Euro-pean capital market. As of December 31, 2016, a nominal EUR 2,217m (2,441; 2,043) was outstanding with a remaining maturity of 4.8 years (4.1; 3.4).
Bond issues
Issued Maturity
Carrying amount,
SEKmFair value,
SEKm
Notes SEK 600m 2019 603 602
Notes SEK 900m 2019 910 908
Green bond SEK 1,500m 2019 1,499 1,522
Notes EUR 300m 2020 2,895 2,871
Notes EUR 500m 2021 4,733 4,739
Notes EUR 500m 2023 5,157 5,269
Notes EUR 300m 2025 2,911 2,921
Total 18,708 18,832
The Essity Group has a Swedish and a Belgian commercial paper program that can be utilized for current borrowing.
Commercial paper program1)
Program size Issued SEKm
Commercial paper SEK 15,000m 750
Commercial paper EUR 400m 909
Total 1,6591) Included in Loans with maturities of less than one year in the Financial liabilities table.
The Essity Group has syndicated bank facilities to limit the refinancing risk and maintain a liquidity reserve. Contracted bilateral credit facilities with banks are used to supplement these syndicated bank facilities.
Credit facilities
Nominal MaturityTotal
SEKmUtilized
SEKmUnutilized
SEKm
Syndicated credit facilities EUR 1,000m 2021 9,558 – 9,558
EUR 1,000m 2019 9,558 – 9,558
Bilateral credit facilities SEK 48m 2017 48 – 48
Total 19,164 – 19,164
Maturity profile of gross debt1)
SEKm
–15,000
–12,000
–9,000
–6,000
–3,000
0
2022+20212020201920182017
Commercial paper
Bond issues
Other loans
1) Gross debt includes accrued interest in the amount of SEK 97m.
After additions for net pension provisions and financial liabilities, Group com-panies, and with deductions for cash and cash equivalents, interest-bearing receivables, capital investment shares and financial receivables, Group com-panies, the net debt was SEK 35,173m (19,058; 25,066). For a description of the methods used by the Essity Group to manage its refinancing risk, refer to Note E8 Financial risks.
E4. FINANCIAL LIABILITIES, CONT. E5. LIQUIDITY RISK
The table below shows the Group’s liquidity risk regarding financial liabili-ties (including interest payments), net settled derivatives that constitute finan-cial liabilities and negative cash flows from gross settled derivatives. For a description of how the Essity Group manages its liquidity risk, refer to Note E8 Financial risks.
Liquidity risk
SEKmLess than 1
yearBetween 1 and
5 yearsMore than 5
years
2016Loans including interest 4,791 21,033 11,475
Net settled derivatives –6 –27 –
Energy derivatives 29 1 –
Trade payables 12,790 182 –
Total 17,604 21,189 11,475Gross settled derivatives1) 38,315 2,443 1,373
2015Loans including interest 12,151 12,476 10,284
Net settled derivatives –18 –76 –69
Energy derivatives 357 96 –
Trade payables 11,796 73 –
Total 24,286 12,569 10,215Gross settled derivatives1) 41,262 1,025 293
2014Loans including interest 14,668 17,822 7,791
Net settled derivatives 197 9 –
Energy derivatives 244 57 –
Trade payables 11,718 82 –
Total 26,827 17,970 7,791Gross settled derivatives1) 34,964 2,195 –1) The gross settled derivatives have, largely, corresponding positive cash flows and therefore in the Essity
Group’s opinion do not constitute any real liquidity risk.
E6. DERIVATIVES AND HEDGE ACCOUNTING
AP ACCOUNTING PRINCIPLES
Accounting for derivatives used for hedging purposes All derivatives are initially and continuously recognized at fair value in the balance sheet. Gains and losses on remeasurement of derivatives used for hedging purposes are recognized as described below. When using hedge accounting, the relationship between the hedge instrument and the hedged item is documented. Assessment of the effectiveness of the hedge is also documented, both when the transaction is initially executed and on an ongo-ing basis. Hedge effectiveness is the extent to which the hedging instrument offsets changes in value in a hedged item’s fair value or cash flow. The ineffec-tive portion is recognized directly in profit or loss.
Cash flow hedgesGains and losses on remeasurement of derivatives intended for cash flow hedging are recognized in equity under other comprehensive income and reversed to profit or loss at the rate at which the hedged cash flow affects profit or loss. If a hedge relationship is interrupted and cash flow is still expected, the result is recognized in equity under other comprehensive income until the cash flow affects the result. If the hedge pertains to a balance sheet item, the result is transferred from equity to the asset or liability to which the hedge relates when the value of the asset or liability is determined for the first time. In cases in which the forecast cash flow that forms the basis of the hedging transaction is no longer assessed as probable, the cumulative gain or loss that is recognized in equity under other comprehensive income is trans-ferred directly to profit or loss. Cash flow hedges relating to energy affect the energy costs, that is, cost of goods sold. Transaction exposure’s cash flow hedges affect consolidated net sales and expenses. Cash flow hedges relat-ing to interest expenses affect net financial items.
Hedges of net investments in foreign operationsGains and losses on remeasurement of derivatives intended to hedge the Essity Group’s net investments in foreign operations are recognized in equity
F-66Admission to trading of the shares in Essity Aktiebolag (publ) on Nasdaq Stockholm
Financial data for the financial year 2014–2016
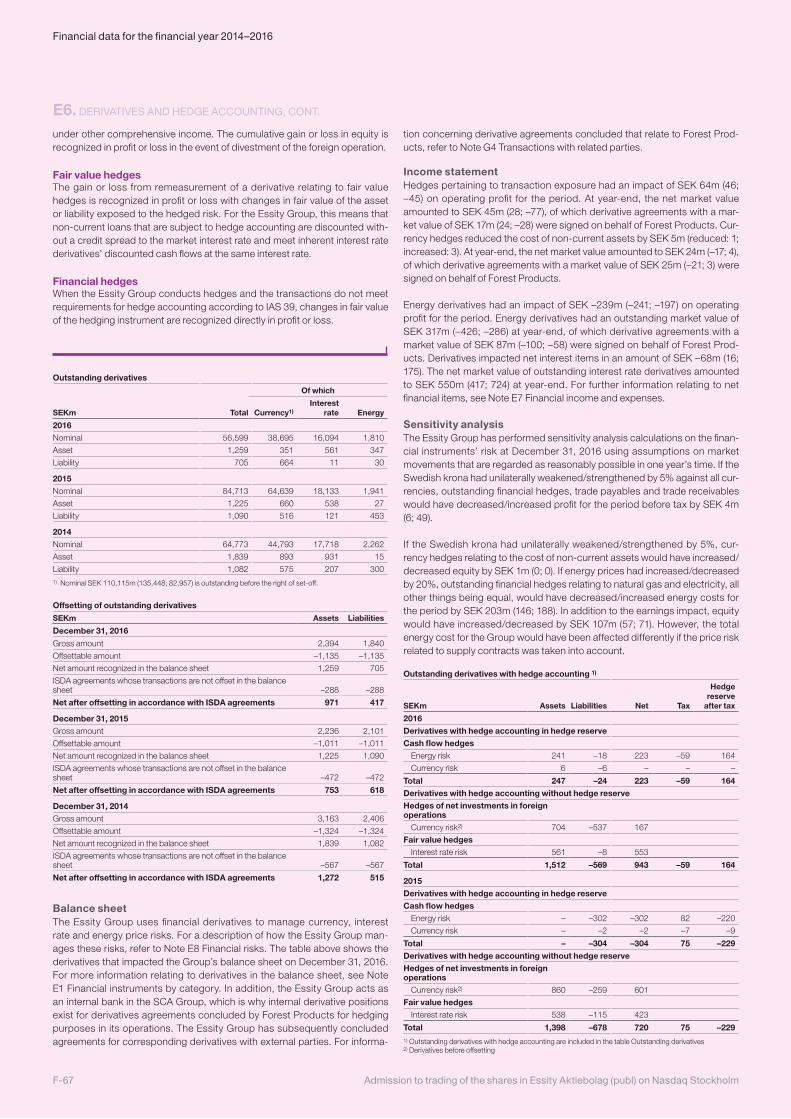
E6. DERIVATIVES AND HEDGE ACCOUNTING, CONT.
under other comprehensive income. The cumulative gain or loss in equity is recognized in profit or loss in the event of divestment of the foreign operation.
Fair value hedgesThe gain or loss from remeasurement of a derivative relating to fair value hedges is recognized in profit or loss with changes in fair value of the asset or liability exposed to the hedged risk. For the Essity Group, this means that non-current loans that are subject to hedge accounting are discounted with-out a credit spread to the market interest rate and meet inherent interest rate derivatives’ discounted cash flows at the same interest rate.
Financial hedgesWhen the Essity Group conducts hedges and the transactions do not meet requirements for hedge accounting according to IAS 39, changes in fair value of the hedging instrument are recognized directly in profit or loss.
Outstanding derivatives
Of which
SEKm Total Currency1)Interest
rate Energy
2016Nominal 56,599 38,695 16,094 1,810
Asset 1,259 351 561 347
Liability 705 664 11 30
2015Nominal 84,713 64,639 18,133 1,941
Asset 1,225 660 538 27
Liability 1,090 516 121 453
2014Nominal 64,773 44,793 17,718 2,262
Asset 1,839 893 931 15
Liability 1,082 575 207 3001) Nominal SEK 110,115m (135,448; 82,957) is outstanding before the right of set-off.
Offsetting of outstanding derivatives
SEKm Assets Liabilities
December 31, 2016
Gross amount 2,394 1,840
Offsettable amount –1,135 –1,135
Net amount recognized in the balance sheet 1,259 705
ISDA agreements whose transactions are not offset in the balance sheet –288 –288
Net after offsetting in accordance with ISDA agreements 971 417
December 31, 2015Gross amount 2,236 2,101
Offsettable amount –1,011 –1,011
Net amount recognized in the balance sheet 1,225 1,090
ISDA agreements whose transactions are not offset in the balance sheet –472 –472
Net after offsetting in accordance with ISDA agreements 753 618
December 31, 2014Gross amount 3,163 2,406
Offsettable amount –1,324 –1,324
Net amount recognized in the balance sheet 1,839 1,082
ISDA agreements whose transactions are not offset in the balance sheet –567 –567
Net after offsetting in accordance with ISDA agreements 1,272 515
Balance sheet The Essity Group uses financial derivatives to manage currency, interest rate and energy price risks. For a description of how the Essity Group man-ages these risks, refer to Note E8 Financial risks. The table above shows the derivatives that impacted the Group’s balance sheet on December 31, 2016. For more information relating to derivatives in the balance sheet, see Note E1 Financial instruments by category. In addition, the Essity Group acts as an internal bank in the SCA Group, which is why internal derivative positions exist for derivatives agreements concluded by Forest Products for hedging purposes in its operations. The Essity Group has subsequently concluded agreements for corresponding derivatives with external parties. For informa-
tion concerning derivative agreements concluded that relate to Forest Prod-ucts, refer to Note G4 Transactions with related parties.
Income statementHedges pertaining to transaction exposure had an impact of SEK 64m (46; –45) on operating profit for the period. At year-end, the net market value amounted to SEK 45m (28; –77), of which derivative agreements with a mar-ket value of SEK 17m (24; –28) were signed on behalf of Forest Products. Cur-rency hedges reduced the cost of non-current assets by SEK 5m (reduced: 1; increased: 3). At year-end, the net market value amounted to SEK 24m (–17; 4), of which derivative agreements with a market value of SEK 25m (–21; 3) were signed on behalf of Forest Products.
Energy derivatives had an impact of SEK –239m (–241; –197) on operating profit for the period. Energy derivatives had an outstanding market value of SEK 317m (–426; –286) at year-end, of which derivative agreements with a market value of SEK 87m (–100; –58) were signed on behalf of Forest Prod-ucts. Derivatives impacted net interest items in an amount of SEK –68m (16; 175). The net market value of outstanding interest rate derivatives amounted to SEK 550m (417; 724) at year-end. For further information relating to net financial items, see Note E7 Financial income and expenses.
Sensitivity analysisThe Essity Group has performed sensitivity analysis calculations on the finan-cial instruments’ risk at December 31, 2016 using assumptions on market movements that are regarded as reasonably possible in one year’s time. If the Swedish krona had unilaterally weakened/strengthened by 5% against all cur-rencies, outstanding financial hedges, trade payables and trade receivables would have decreased/increased profit for the period before tax by SEK 4m (6; 49).
If the Swedish krona had unilaterally weakened/strengthened by 5%, cur-rency hedges relating to the cost of non-current assets would have increased/decreased equity by SEK 1m (0; 0). If energy prices had increased/decreased by 20%, outstanding financial hedges relating to natural gas and electricity, all other things being equal, would have decreased/increased energy costs for the period by SEK 203m (146; 188). In addition to the earnings impact, equity would have increased/decreased by SEK 107m (57; 71). However, the total energy cost for the Group would have been affected differently if the price risk related to supply contracts was taken into account.
Outstanding derivatives with hedge accounting 1)
SEKm Assets Liabilities Net Tax
Hedge reserve
after tax
2016Derivatives with hedge accounting in hedge reserveCash flow hedges
Energy risk 241 –18 223 –59 164
Currency risk 6 –6 – – –
Total 247 –24 223 –59 164Derivatives with hedge accounting without hedge reserveHedges of net investments in foreign operations
Currency risk2) 704 –537 167
Fair value hedgesInterest rate risk 561 –8 553
Total 1,512 –569 943 –59 164
2015Derivatives with hedge accounting in hedge reserveCash flow hedges
Energy risk – –302 –302 82 –220
Currency risk – –2 –2 –7 –9
Total – –304 –304 75 –229Derivatives with hedge accounting without hedge reserveHedges of net investments in foreign operations
Currency risk2) 860 –259 601
Fair value hedgesInterest rate risk 538 –115 423
Total 1,398 –678 720 75 –2291) Outstanding derivatives with hedge accounting are included in the table Outstanding derivatives2) Derivatives before offsetting
Admission to trading of the shares in Essity Aktiebolag (publ) on Nasdaq StockholmF-67
Financial data for the financial year 2014–2016
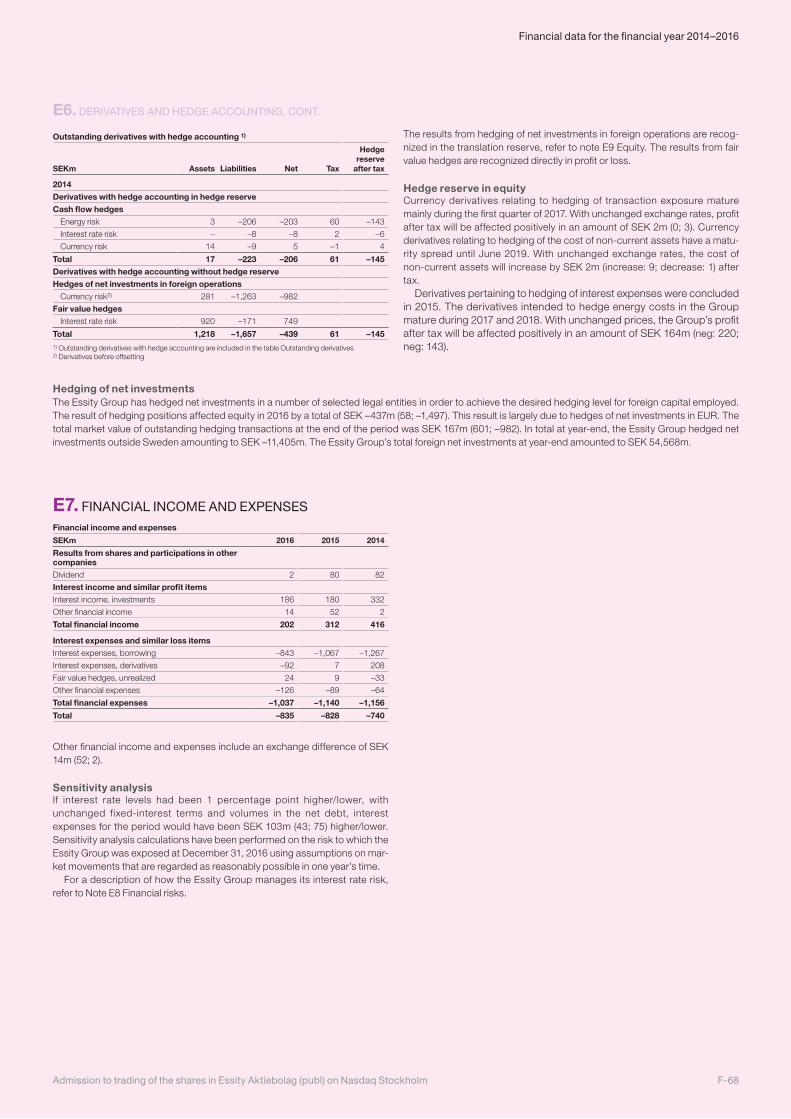
E6. DERIVATIVES AND HEDGE ACCOUNTING, CONT.
E7. FINANCIAL INCOME AND EXPENSES Financial income and expenses
SEKm 2016 2015 2014
Results from shares and participations in other companiesDividend 2 80 82
Interest income and similar profit itemsInterest income, investments 186 180 332
Other financial income 14 52 2
Total financial income 202 312 416
Interest expenses and similar loss itemsInterest expenses, borrowing –843 –1,067 –1,267
Interest expenses, derivatives –92 7 208
Fair value hedges, unrealized 24 9 –33
Other financial expenses –126 –89 –64
Total financial expenses –1,037 –1,140 –1,156
Total –835 –828 –740
Other financial income and expenses include an exchange difference of SEK 14m (52; 2).
Sensitivity analysisIf interest rate levels had been 1 percentage point higher/lower, with unchanged fixed-interest terms and volumes in the net debt, interest expenses for the period would have been SEK 103m (43; 75) higher/lower. Sensitivity analysis calculations have been performed on the risk to which the Essity Group was exposed at December 31, 2016 using assumptions on mar-ket movements that are regarded as reasonably possible in one year’s time.
For a description of how the Essity Group manages its interest rate risk, refer to Note E8 Financial risks.
Hedging of net investmentsThe Essity Group has hedged net investments in a number of selected legal entities in order to achieve the desired hedging level for foreign capital employed. The result of hedging positions affected equity in 2016 by a total of SEK –437m (58; –1,497). This result is largely due to hedges of net investments in EUR. The total market value of outstanding hedging transactions at the end of the period was SEK 167m (601; –982). In total at year-end, the Essity Group hedged net investments outside Sweden amounting to SEK –11,405m. The Essity Group’s total foreign net investments at year-end amounted to SEK 54,568m.
Outstanding derivatives with hedge accounting 1)
SEKm Assets Liabilities Net Tax
Hedge reserve
after tax
2014Derivatives with hedge accounting in hedge reserveCash flow hedges
Energy risk 3 –206 –203 60 –143
Interest rate risk – –8 –8 2 –6
Currency risk 14 –9 5 –1 4
Total 17 –223 –206 61 –145Derivatives with hedge accounting without hedge reserveHedges of net investments in foreign operations
Currency risk2) 281 –1,263 –982
Fair value hedgesInterest rate risk 920 –171 749
Total 1,218 –1,657 –439 61 –1451) Outstanding derivatives with hedge accounting are included in the table Outstanding derivatives2) Derivatives before offsetting
The results from hedging of net investments in foreign operations are recog-nized in the translation reserve, refer to note E9 Equity. The results from fair value hedges are recognized directly in profit or loss.
Hedge reserve in equityCurrency derivatives relating to hedging of transaction exposure mature mainly during the first quarter of 2017. With unchanged exchange rates, profit after tax will be affected positively in an amount of SEK 2m (0; 3). Currency derivatives relating to hedging of the cost of non-current assets have a matu-rity spread until June 2019. With unchanged exchange rates, the cost of non-current assets will increase by SEK 2m (increase: 9; decrease: 1) after tax.
Derivatives pertaining to hedging of interest expenses were concluded in 2015. The derivatives intended to hedge energy costs in the Group mature during 2017 and 2018. With unchanged prices, the Group’s profit after tax will be affected positively in an amount of SEK 164m (neg: 220; neg: 143).
F-68Admission to trading of the shares in Essity Aktiebolag (publ) on Nasdaq Stockholm
Financial data for the financial year 2014–2016
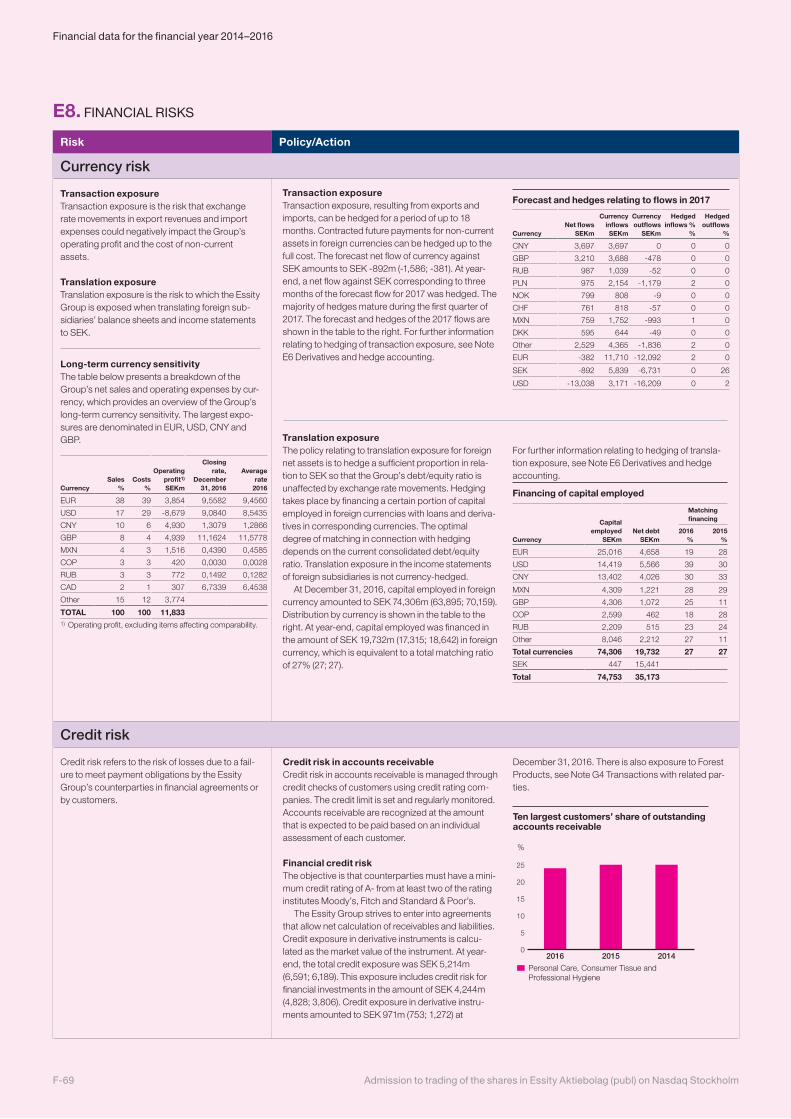
E8. FINANCIAL RISKS
Risk Policy/Action
Currency risk
Transaction exposureTransaction exposure is the risk that exchange rate movements in export revenues and import expenses could negatively impact the Group’s operating profit and the cost of non-current assets.
Translation exposureTranslation exposure is the risk to which the Essity Group is exposed when translating foreign sub-sidiaries’ balance sheets and income statements to SEK.
Long-term currency sensitivityThe table below presents a breakdown of the Group’s net sales and operating expenses by cur-rency, which provides an overview of the Group’s long-term currency sensitivity. The largest expo-sures are denominated in EUR, USD, CNY and GBP.
CurrencySales
%Costs
%
Operating profit1) SEKm
Closing rate,
December 31, 2016
Average rate
2016
EUR 38 39 3,854 9,5582 9,4560
USD 17 29 -8,679 9,0840 8,5435
CNY 10 6 4,930 1,3079 1,2866
GBP 8 4 4,939 11,1624 11,5778
MXN 4 3 1,516 0,4390 0,4585
COP 3 3 420 0,0030 0,0028
RUB 3 3 772 0,1492 0,1282
CAD 2 1 307 6,7339 6,4538
Other 15 12 3,774
TOTAL 100 100 11,8331) Operating profit, excluding items affecting comparability.
Credit risk
Credit risk refers to the risk of losses due to a fail-ure to meet payment obligations by the Essity Group’s counterparties in financial agreements or by customers.
Credit risk in accounts receivableCredit risk in accounts receivable is managed through credit checks of customers using credit rating com-panies. The credit limit is set and regularly monitored. Accounts receivable are recognized at the amount that is expected to be paid based on an individual assessment of each customer.
Financial credit riskThe objective is that counterparties must have a mini-mum credit rating of A- from at least two of the rating institutes Moody’s, Fitch and Standard & Poor’s.
The Essity Group strives to enter into agreements that allow net calculation of receivables and liabilities. Credit exposure in derivative instruments is calcu-lated as the market value of the instrument. At year-end, the total credit exposure was SEK 5,214m (6,591; 6,189). This exposure includes credit risk for financial investments in the amount of SEK 4,244m (4,828; 3,806). Credit exposure in derivative instru-ments amounted to SEK 971m (753; 1,272) at
December 31, 2016. There is also exposure to Forest Products, see Note G4 Transactions with related par-ties.
Ten largest customers’ share of outstanding accounts receivable
%
0
5
10
15
20
25
201420152016
Personal Care, Consumer Tissue and Professional Hygiene
Transaction exposureTransaction exposure, resulting from exports and imports, can be hedged for a period of up to 18 months. Contracted future payments for non-current assets in foreign currencies can be hedged up to the full cost. The forecast net flow of currency against SEK amounts to SEK -892m (-1,586; -381). At year-end, a net flow against SEK corresponding to three months of the forecast flow for 2017 was hedged. The majority of hedges mature during the first quarter of 2017. The forecast and hedges of the 2017 flows are shown in the table to the right. For further information relating to hedging of transaction exposure, see Note E6 Derivatives and hedge accounting.
Forecast and hedges relating to flows in 2017
CurrencyNet flows
SEKm
Currencyinflows SEKm
Currencyoutflows
SEKm
Hedged inflows %
%
Hedged outflows
%
CNY 3,697 3,697 0 0 0
GBP 3,210 3,688 -478 0 0
RUB 987 1,039 -52 0 0
PLN 975 2,154 -1,179 2 0
NOK 799 808 -9 0 0
CHF 761 818 -57 0 0
MXN 759 1,752 -993 1 0
DKK 595 644 -49 0 0
Other 2,529 4,365 -1,836 2 0
EUR -382 11,710 -12,092 2 0
SEK -892 5,839 -6,731 0 26
USD -13,038 3,171 -16,209 0 2
Translation exposureThe policy relating to translation exposure for foreign net assets is to hedge a sufficient proportion in rela-tion to SEK so that the Group’s debt/equity ratio is unaffected by exchange rate movements. Hedging takes place by financing a certain portion of capital employed in foreign currencies with loans and deriva-tives in corresponding currencies. The optimal degree of matching in connection with hedging depends on the current consolidated debt/equity ratio. Translation exposure in the income statements of foreign subsidiaries is not currency-hedged.
At December 31, 2016, capital employed in foreign currency amounted to SEK 74,306m (63,895; 70,159). Distribution by currency is shown in the table to the right. At year-end, capital employed was financed in the amount of SEK 19,732m (17,315; 18,642) in foreign currency, which is equivalent to a total matching ratio of 27% (27; 27).
For further information relating to hedging of transla-tion exposure, see Note E6 Derivatives and hedge accounting.
Financing of capital employed
Capital employed
SEKmNet debt
SEKm
Matching financing
Currency2016
%2015
%
EUR 25,016 4,658 19 28
USD 14,419 5,566 39 30
CNY 13,402 4,026 30 33
MXN 4,309 1,221 28 29
GBP 4,306 1,072 25 11
COP 2,599 462 18 28
RUB 2,209 515 23 24
Other 8,046 2,212 27 11
Total currencies 74,306 19,732 27 27
SEK 447 15,441
Total 74,753 35,173
Admission to trading of the shares in Essity Aktiebolag (publ) on Nasdaq StockholmF-69
Financial data for the financial year 2014–2016
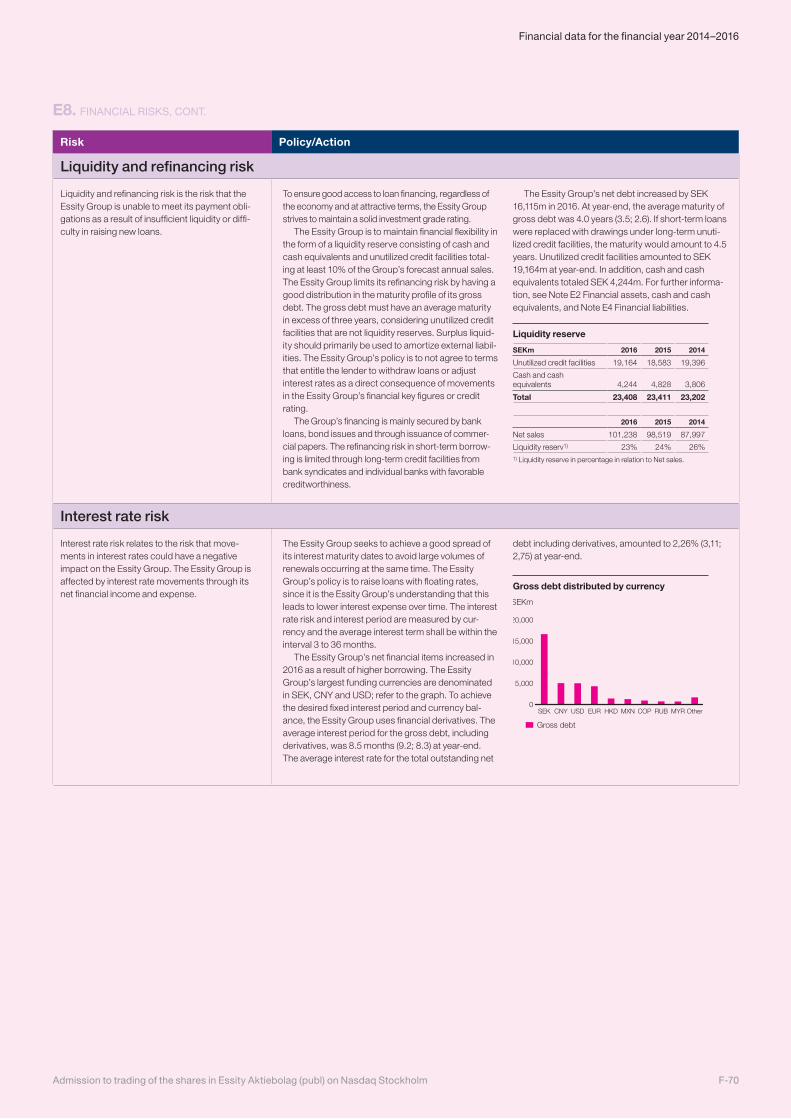
Risk Policy/Action
E8. FINANCIAL RISKS, CONT.
Liquidity and refinancing risk
Liquidity and refinancing risk is the risk that the Essity Group is unable to meet its payment obli-gations as a result of insufficient liquidity or diffi-culty in raising new loans.
To ensure good access to loan financing, regardless of the economy and at attractive terms, the Essity Group strives to maintain a solid investment grade rating.
The Essity Group is to maintain financial flexibility in the form of a liquidity reserve consisting of cash and cash equivalents and unutilized credit facilities total-ing at least 10% of the Group’s forecast annual sales. The Essity Group limits its refinancing risk by having a good distribution in the maturity profile of its gross debt. The gross debt must have an average maturity in excess of three years, considering unutilized credit facilities that are not liquidity reserves. Surplus liquid-ity should primarily be used to amortize external liabil-ities. The Essity Group’s policy is to not agree to terms that entitle the lender to withdraw loans or adjust interest rates as a direct consequence of movements in the Essity Group’s financial key figures or credit rating.
The Group’s financing is mainly secured by bank loans, bond issues and through issuance of commer-cial papers. The refinancing risk in short-term borrow-ing is limited through long-term credit facilities from bank syndicates and individual banks with favorable creditworthiness.
The Essity Group’s net debt increased by SEK 16,115m in 2016. At year-end, the average maturity of gross debt was 4.0 years (3.5; 2.6). If short-term loans were replaced with drawings under long-term unuti-lized credit facilities, the maturity would amount to 4.5 years. Unutilized credit facilities amounted to SEK 19,164m at year-end. In addition, cash and cash equivalents totaled SEK 4,244m. For further informa-tion, see Note E2 Financial assets, cash and cash equivalents, and Note E4 Financial liabilities.
Liquidity reserve
SEKm 2016 2015 2014
Unutilized credit facilities 19,164 18,583 19,396
Cash and cash equivalents 4,244 4,828 3,806
Total 23,408 23,411 23,202
2016 2015 2014
Net sales 101,238 98,519 87,997
Liquidity reserv1) 23% 24% 26%1) Liquidity reserve in percentage in relation to Net sales.
Interest rate risk
Interest rate risk relates to the risk that move-ments in interest rates could have a negative impact on the Essity Group. The Essity Group is affected by interest rate movements through its net financial income and expense.
The Essity Group seeks to achieve a good spread of its interest maturity dates to avoid large volumes of renewals occurring at the same time. The Essity Group’s policy is to raise loans with floating rates, since it is the Essity Group’s understanding that this leads to lower interest expense over time. The interest rate risk and interest period are measured by cur-rency and the average interest term shall be within the interval 3 to 36 months.
The Essity Group’s net financial items increased in 2016 as a result of higher borrowing. The Essity Group’s largest funding currencies are denominated in SEK, CNY and USD; refer to the graph. To achieve the desired fixed interest period and currency bal-ance, the Essity Group uses financial derivatives. The average interest period for the gross debt, including derivatives, was 8.5 months (9.2; 8.3) at year-end. The average interest rate for the total outstanding net
debt including derivatives, amounted to 2,26% (3,11; 2,75) at year-end.
Gross debt distributed by currency
Gross debt
SEKm
0
5,000
10,000
15,000
20,000
OtherMYRRUBCOPMXNHKDEURUSDCNYSEK
F-70Admission to trading of the shares in Essity Aktiebolag (publ) on Nasdaq Stockholm
Financial data for the financial year 2014–2016
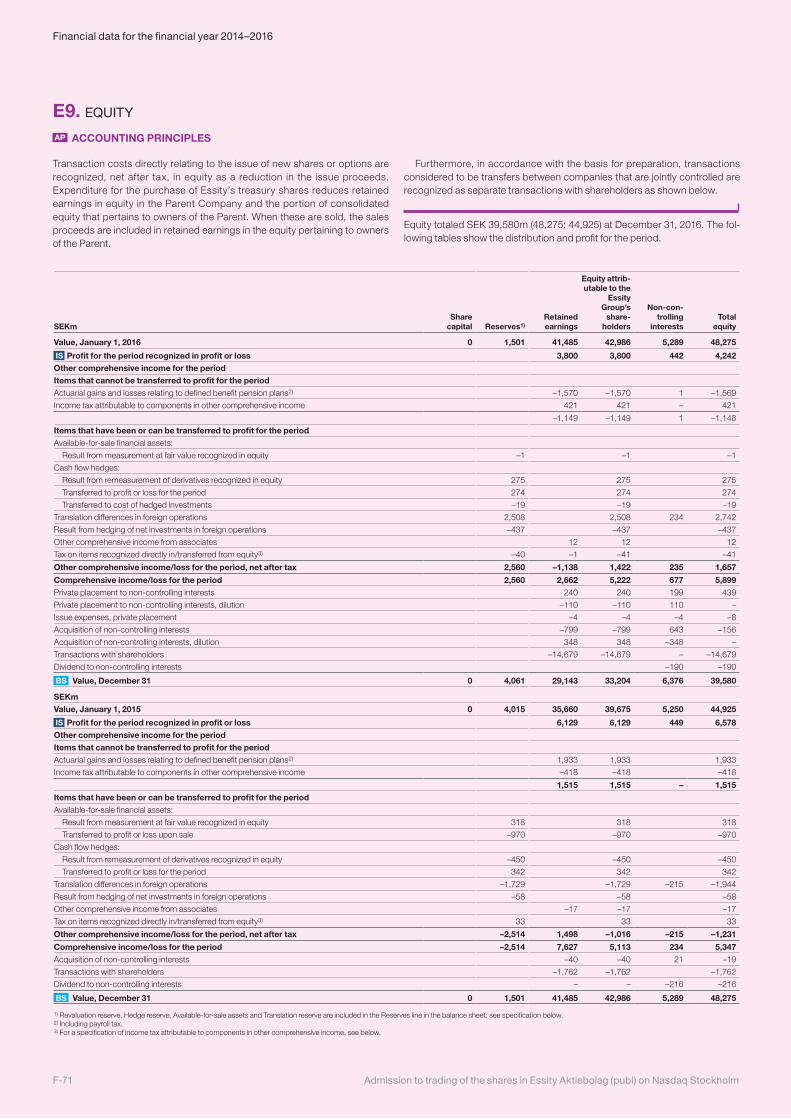
SEKmShare
capital Reserves1)Retained earnings
Equity attrib-utable to the
Essity Group’s
share- holders
Non-con-trolling
interests
Total
equity
Value, January 1, 2016 0 1,501 41,485 42,986 5,289 48,275
IS Profit for the period recognized in profit or loss 3,800 3,800 442 4,242Other comprehensive income for the periodItems that cannot be transferred to profit for the periodActuarial gains and losses relating to defined benefit pension plans2) –1,570 –1,570 1 –1,569
Income tax attributable to components in other comprehensive income 421 421 – 421
–1,149 –1,149 1 –1,148
Items that have been or can be transferred to profit for the periodAvailable-for-sale financial assets:
Result from measurement at fair value recognized in equity –1 –1 –1
Cash flow hedges:
Result from remeasurement of derivatives recognized in equity 275 275 275
Transferred to profit or loss for the period 274 274 274
Transferred to cost of hedged investments –19 –19 –19
Translation differences in foreign operations 2,508 2,508 234 2,742
Result from hedging of net investments in foreign operations –437 –437 –437
Other comprehensive income from associates 12 12 12
Tax on items recognized directly in/transferred from equity3) –40 –1 –41 –41
Other comprehensive income/loss for the period, net after tax 2,560 –1,138 1,422 235 1,657
Comprehensive income/loss for the period 2,560 2,662 5,222 677 5,899Private placement to non-controlling interests 240 240 199 439
Private placement to non-controlling interests, dilution –110 –110 110 –
Issue expenses, private placement –4 –4 –4 –8
Acquisition of non-controlling interests –799 –799 643 –156
Acquisition of non-controlling interests, dilution 348 348 –348 –
Transactions with shareholders –14,679 –14,679 – –14,679
Dividend to non-controlling interests –190 –190
BS Value, December 31 0 4,061 29,143 33,204 6,376 39,580
SEKmValue, January 1, 2015 0 4,015 35,660 39,675 5,250 44,925
IS Profit for the period recognized in profit or loss 6,129 6,129 449 6,578Other comprehensive income for the periodItems that cannot be transferred to profit for the periodActuarial gains and losses relating to defined benefit pension plans2) 1,933 1,933 1,933
Income tax attributable to components in other comprehensive income –418 –418 –418
1,515 1,515 – 1,515Items that have been or can be transferred to profit for the periodAvailable-for-sale financial assets:
Result from measurement at fair value recognized in equity 318 318 318
Transferred to profit or loss upon sale –970 –970 –970
Cash flow hedges:
Result from remeasurement of derivatives recognized in equity –450 –450 –450
Transferred to profit or loss for the period 342 342 342
Translation differences in foreign operations –1,729 –1,729 –215 –1,944
Result from hedging of net investments in foreign operations –58 –58 –58
Other comprehensive income from associates –17 –17 –17
Tax on items recognized directly in/transferred from equity3) 33 33 33
Other comprehensive income/loss for the period, net after tax –2,514 1,498 –1,016 –215 –1,231
Comprehensive income/loss for the period –2,514 7,627 5,113 234 5,347Acquisition of non-controlling interests –40 –40 21 –19
Transactions with shareholders –1,762 –1,762 –1,762
Dividend to non-controlling interests – – –216 –216
BS Value, December 31 0 1,501 41,485 42,986 5,289 48,275
1) Revaluation reserve, Hedge reserve, Available-for-sale assets and Translation reserve are included in the Reserves line in the balance sheet; see specification below.2) Including payroll tax.3) For a specification of income tax attributable to components in other comprehensive income, see below.
E9. EQUITY
AP ACCOUNTING PRINCIPLES
Transaction costs directly relating to the issue of new shares or options are recognized, net after tax, in equity as a reduction in the issue proceeds. Expenditure for the purchase of Essity’s treasury shares reduces retained earnings in equity in the Parent Company and the portion of consolidated equity that pertains to owners of the Parent. When these are sold, the sales proceeds are included in retained earnings in the equity pertaining to owners of the Parent.
Furthermore, in accordance with the basis for preparation, transactions considered to be transfers between companies that are jointly controlled are recognized as separate transactions with shareholders as shown below.
Equity totaled SEK 39,580m (48,275; 44,925) at December 31, 2016. The fol-lowing tables show the distribution and profit for the period.
Admission to trading of the shares in Essity Aktiebolag (publ) on Nasdaq StockholmF-71
Financial data for the financial year 2014–2016
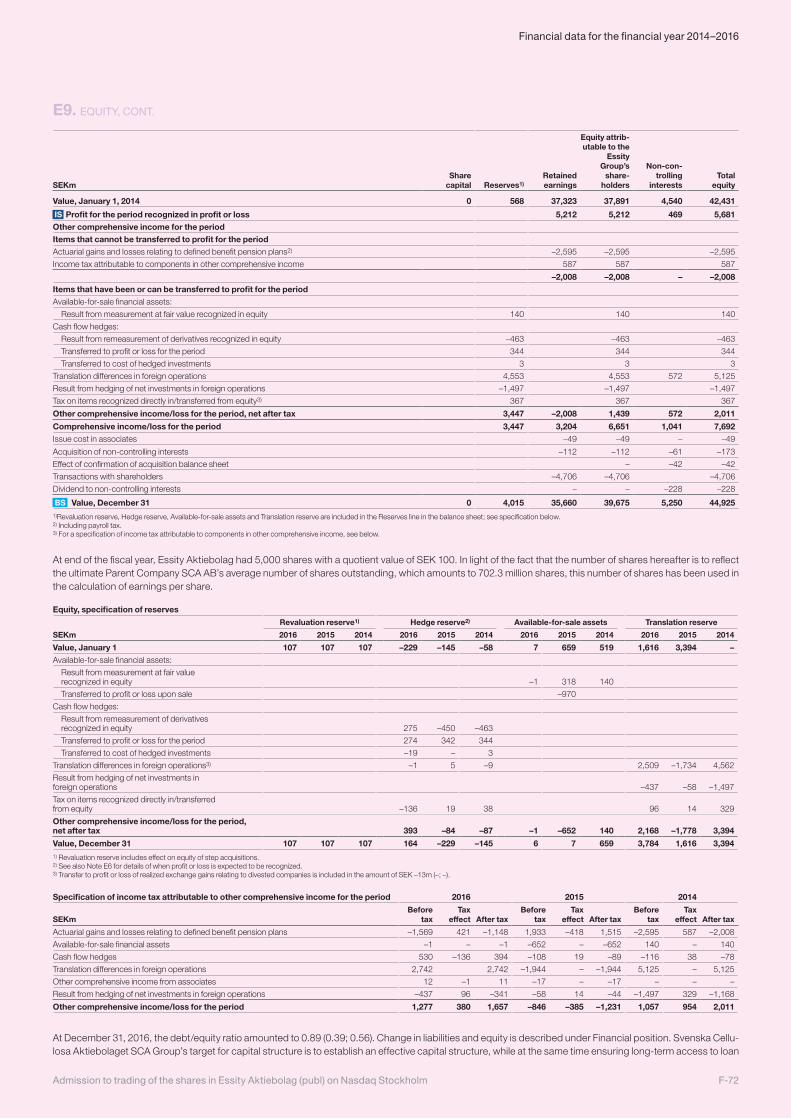
E9. EQUITY, CONT.
SEKmShare
capital Reserves1)Retained earnings
Equity attrib-utable to the
Essity Group’s
share- holders
Non-con-trolling
interests
Total
equity
Value, January 1, 2014 0 568 37,323 37,891 4,540 42,431
IS Profit for the period recognized in profit or loss 5,212 5,212 469 5,681Other comprehensive income for the periodItems that cannot be transferred to profit for the periodActuarial gains and losses relating to defined benefit pension plans2) –2,595 –2,595 –2,595
Income tax attributable to components in other comprehensive income 587 587 587
–2,008 –2,008 – –2,008Items that have been or can be transferred to profit for the periodAvailable-for-sale financial assets:
Result from measurement at fair value recognized in equity 140 140 140
Cash flow hedges:
Result from remeasurement of derivatives recognized in equity –463 –463 –463
Transferred to profit or loss for the period 344 344 344
Transferred to cost of hedged investments 3 3 3
Translation differences in foreign operations 4,553 4,553 572 5,125
Result from hedging of net investments in foreign operations –1,497 –1,497 –1,497
Tax on items recognized directly in/transferred from equity3) 367 367 367
Other comprehensive income/loss for the period, net after tax 3,447 –2,008 1,439 572 2,011
Comprehensive income/loss for the period 3,447 3,204 6,651 1,041 7,692Issue cost in associates –49 –49 – –49
Acquisition of non-controlling interests –112 –112 –61 –173
Effect of confirmation of acquisition balance sheet – –42 –42
Transactions with shareholders –4,706 –4,706 –4,706
Dividend to non-controlling interests – – –228 –228
BS Value, December 31 0 4,015 35,660 39,675 5,250 44,9251)Revaluation reserve, Hedge reserve, Available-for-sale assets and Translation reserve are included in the Reserves line in the balance sheet; see specification below.2) Including payroll tax.3) For a specification of income tax attributable to components in other comprehensive income, see below.
At end of the fiscal year, Essity Aktiebolag had 5,000 shares with a quotient value of SEK 100. In light of the fact that the number of shares hereafter is to reflect the ultimate Parent Company SCA AB’s average number of shares outstanding, which amounts to 702.3 million shares, this number of shares has been used in the calculation of earnings per share.
Equity, specification of reserves
Revaluation reserve1) Hedge reserve2) Available-for-sale assets Translation reserve
SEKm 2016 2015 2014 2016 2015 2014 2016 2015 2014 2016 2015 2014
Value, January 1 107 107 107 –229 –145 –58 7 659 519 1,616 3,394 –Available-for-sale financial assets:
Result from measurement at fair value recognized in equity –1 318 140
Transferred to profit or loss upon sale –970
Cash flow hedges:
Result from remeasurement of derivatives recognized in equity 275 –450 –463
Transferred to profit or loss for the period 274 342 344
Transferred to cost of hedged investments –19 – 3
Translation differences in foreign operations3) –1 5 –9 2,509 –1,734 4,562
Result from hedging of net investments in foreign operations –437 –58 –1,497
Tax on items recognized directly in/transferred from equity –136 19 38 96 14 329
Other comprehensive income/loss for the period, net after tax 393 –84 –87 –1 –652 140 2,168 –1,778 3,394
Value, December 31 107 107 107 164 –229 –145 6 7 659 3,784 1,616 3,3941) Revaluation reserve includes effect on equity of step acquisitions.2) See also Note E6 for details of when profit or loss is expected to be recognized.3) Transfer to profit or loss of realized exchange gains relating to divested companies is included in the amount of SEK –13m (–; –).
Specification of income tax attributable to other comprehensive income for the period 2016 2015 2014
SEKmBefore
taxTax
effect After taxBefore
taxTax
effect After taxBefore
taxTax
effect After tax
Actuarial gains and losses relating to defined benefit pension plans –1,569 421 –1,148 1,933 –418 1,515 –2,595 587 –2,008
Available-for-sale financial assets –1 – –1 –652 – –652 140 – 140
Cash flow hedges 530 –136 394 –108 19 –89 –116 38 –78
Translation differences in foreign operations 2,742 2,742 –1,944 – –1,944 5,125 – 5,125
Other comprehensive income from associates 12 –1 11 –17 – –17 – – –
Result from hedging of net investments in foreign operations –437 96 –341 –58 14 –44 –1,497 329 –1,168
Other comprehensive income/loss for the period 1,277 380 1,657 –846 –385 –1,231 1,057 954 2,011
At December 31, 2016, the debt/equity ratio amounted to 0.89 (0.39; 0.56). Change in liabilities and equity is described under Financial position. Svenska Cellu-losa Aktiebolaget SCA Group’s target for capital structure is to establish an effective capital structure, while at the same time ensuring long-term access to loan
F-72Admission to trading of the shares in Essity Aktiebolag (publ) on Nasdaq Stockholm
Financial data for the financial year 2014–2016
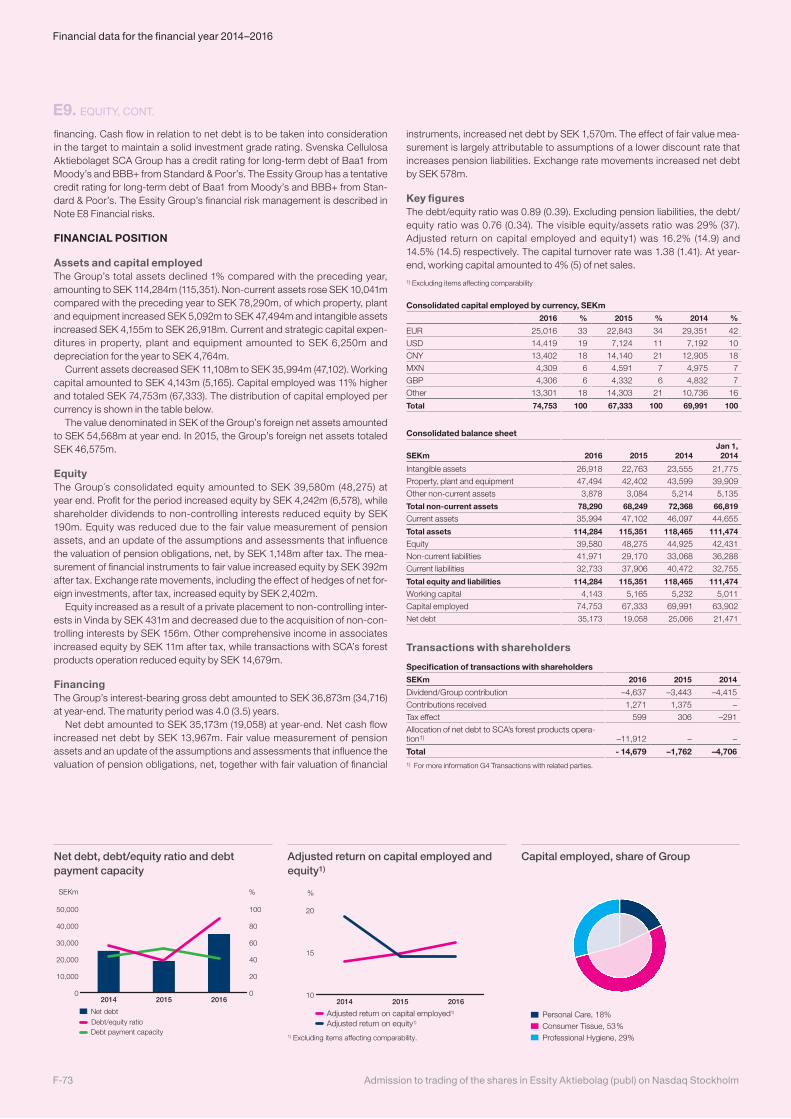
E9. EQUITY, CONT.
financing. Cash flow in relation to net debt is to be taken into consideration in the target to maintain a solid investment grade rating. Svenska Cellulosa Aktiebolaget SCA Group has a credit rating for long-term debt of Baa1 from Moody’s and BBB+ from Standard & Poor’s. The Essity Group has a tentative credit rating for long-term debt of Baa1 from Moody’s and BBB+ from Stan-dard & Poor’s. The Essity Group’s financial risk management is described in Note E8 Financial risks.
FINANCIAL POSITION
Assets and capital employedThe Group’s total assets declined 1% compared with the preceding year, amounting to SEK 114,284m (115,351). Non-current assets rose SEK 10,041m compared with the preceding year to SEK 78,290m, of which property, plant and equipment increased SEK 5,092m to SEK 47,494m and intangible assets increased SEK 4,155m to SEK 26,918m. Current and strategic capital expen-ditures in property, plant and equipment amounted to SEK 6,250m and depreciation for the year to SEK 4,764m.
Current assets decreased SEK 11,108m to SEK 35,994m (47,102). Working capital amounted to SEK 4,143m (5,165). Capital employed was 11% higher and totaled SEK 74,753m (67,333). The distribution of capital employed per currency is shown in the table below.
The value denominated in SEK of the Group’s foreign net assets amounted to SEK 54,568m at year end. In 2015, the Group’s foreign net assets totaled SEK 46,575m.
EquityThe Group´s consolidated equity amounted to SEK 39,580m (48,275) at year end. Profit for the period increased equity by SEK 4,242m (6,578), while shareholder dividends to non-controlling interests reduced equity by SEK 190m. Equity was reduced due to the fair value measurement of pension assets, and an update of the assumptions and assessments that influence the valuation of pension obligations, net, by SEK 1,148m after tax. The mea-surement of financial instruments to fair value increased equity by SEK 392m after tax. Exchange rate movements, including the effect of hedges of net for-eign investments, after tax, increased equity by SEK 2,402m.
Equity increased as a result of a private placement to non-controlling inter-ests in Vinda by SEK 431m and decreased due to the acquisition of non-con-trolling interests by SEK 156m. Other comprehensive income in associates increased equity by SEK 11m after tax, while transactions with SCA’s forest products operation reduced equity by SEK 14,679m.
FinancingThe Group’s interest-bearing gross debt amounted to SEK 36,873m (34,716) at year-end. The maturity period was 4.0 (3.5) years.
Net debt amounted to SEK 35,173m (19,058) at year-end. Net cash flow increased net debt by SEK 13,967m. Fair value measurement of pension assets and an update of the assumptions and assessments that influence the valuation of pension obligations, net, together with fair valuation of financial
instruments, increased net debt by SEK 1,570m. The effect of fair value mea-surement is largely attributable to assumptions of a lower discount rate that increases pension liabilities. Exchange rate movements increased net debt by SEK 578m.
Key figuresThe debt/equity ratio was 0.89 (0.39). Excluding pension liabilities, the debt/equity ratio was 0.76 (0.34). The visible equity/assets ratio was 29% (37). Adjusted return on capital employed and equity1) was 16.2% (14.9) and 14.5% (14.5) respectively. The capital turnover rate was 1.38 (1.41). At year-end, working capital amounted to 4% (5) of net sales.
1) Excluding items affecting comparability
Consolidated capital employed by currency, SEKm
2016 % 2015 % 2014 %
EUR 25,016 33 22,843 34 29,351 42
USD 14,419 19 7,124 11 7,192 10
CNY 13,402 18 14,140 21 12,905 18
MXN 4,309 6 4,591 7 4,975 7
GBP 4,306 6 4,332 6 4,832 7
Other 13,301 18 14,303 21 10,736 16
Total 74,753 100 67,333 100 69,991 100
Consolidated balance sheet
SEKm 2016 2015 2014Jan 1, 2014
Intangible assets 26,918 22,763 23,555 21,775
Property, plant and equipment 47,494 42,402 43,599 39,909
Other non-current assets 3,878 3,084 5,214 5,135
Total non-current assets 78,290 68,249 72,368 66,819
Current assets 35,994 47,102 46,097 44,655
Total assets 114,284 115,351 118,465 111,474
Equity 39,580 48,275 44,925 42,431
Non-current liabilities 41,971 29,170 33,068 36,288
Current liabilities 32,733 37,906 40,472 32,755
Total equity and liabilities 114,284 115,351 118,465 111,474
Working capital 4,143 5,165 5,232 5,011
Capital employed 74,753 67,333 69,991 63,902
Net debt 35,173 19,058 25,066 21,471
Transactions with shareholders
Specification of transactions with shareholders
SEKm 2016 2015 2014
Dividend/Group contribution –4,637 –3,443 –4,415
Contributions received 1,271 1,375 –
Tax effect 599 306 –291
Allocation of net debt to SCA’s forest products opera-tion1) –11,912 – –
Total - 14,679 –1,762 –4,7061) For more information G4 Transactions with related parties.
Capital employed, share of Group
Personal Care, 18%Consumer Tissue, 53 %Professional Hygiene, 29%
Adjusted return on capital employed and equity1)
%
10
15
20
201620152014
Adjusted return on capital employed1)
Adjusted return on equity1)
1) Excluding items affecting comparability.
Net debt, debt/equity ratio and debt payment capacity
Net debtDebt/equity ratio
SEKm %
0
10,000
20,000
30,000
40,000
50,000
201620152014
Debt payment capacity
0
20
40
60
80
100
Admission to trading of the shares in Essity Aktiebolag (publ) on Nasdaq StockholmF-73
Financial data for the financial year 2014–2016
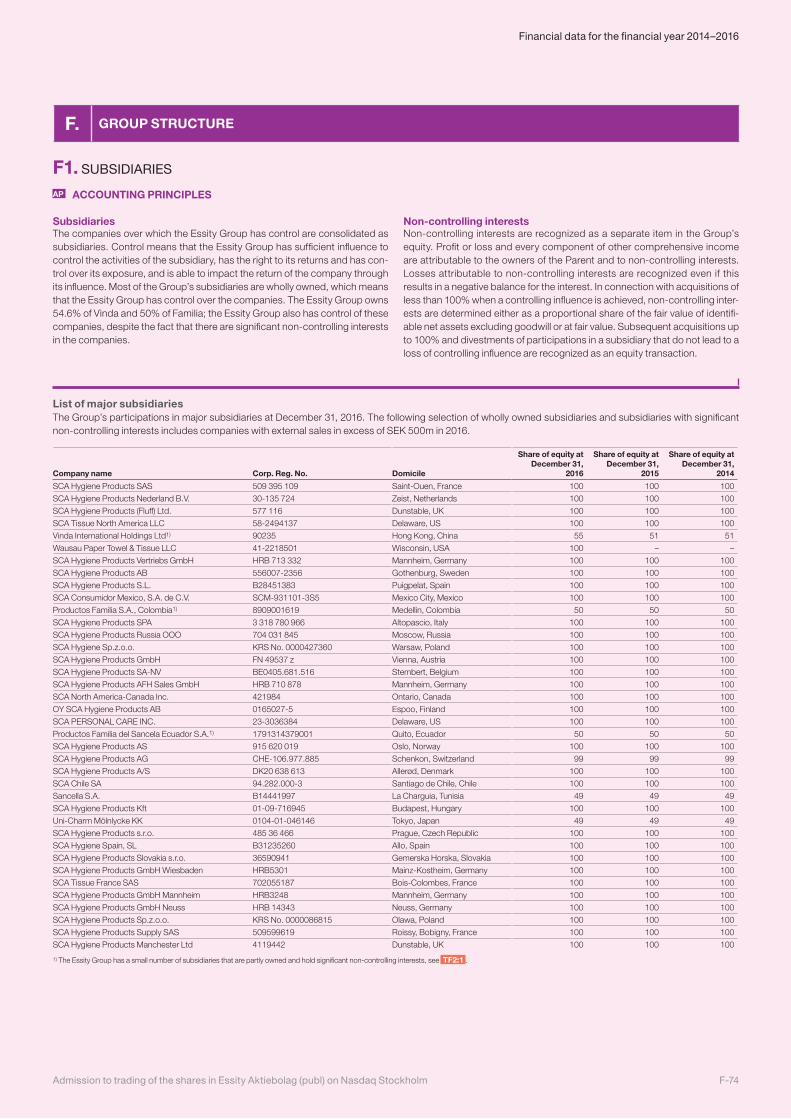
F1. SUBSIDIARIES
AP ACCOUNTING PRINCIPLES
SubsidiariesThe companies over which the Essity Group has control are consolidated as subsidiaries. Control means that the Essity Group has sufficient influence to control the activities of the subsidiary, has the right to its returns and has con-trol over its exposure, and is able to impact the return of the company through its influence. Most of the Group’s subsidiaries are wholly owned, which means that the Essity Group has control over the companies. The Essity Group owns 54.6% of Vinda and 50% of Familia; the Essity Group also has control of these companies, despite the fact that there are significant non-controlling interests in the companies.
Non-controlling interestsNon-controlling interests are recognized as a separate item in the Group’s equity. Profit or loss and every component of other comprehensive income are attributable to the owners of the Parent and to non-controlling interests. Losses attributable to non-controlling interests are recognized even if this results in a negative balance for the interest. In connection with acquisitions of less than 100% when a controlling influence is achieved, non-controlling inter-ests are determined either as a proportional share of the fair value of identifi-able net assets excluding goodwill or at fair value. Subsequent acquisitions up to 100% and divestments of participations in a subsidiary that do not lead to a loss of controlling influence are recognized as an equity transaction.
F. GROUP STRUCTURE
List of major subsidiariesThe Group’s participations in major subsidiaries at December 31, 2016. The following selection of wholly owned subsidiaries and subsidiaries with significant non-controlling interests includes companies with external sales in excess of SEK 500m in 2016.
Company name Corp. Reg. No. Domicile
Share of equity at December 31,
2016
Share of equity at December 31,
2015
Share of equity at December 31,
2014
SCA Hygiene Products SAS 509 395 109 Saint-Ouen, France 100 100 100
SCA Hygiene Products Nederland B.V. 30-135 724 Zeist, Netherlands 100 100 100
SCA Hygiene Products (Fluff) Ltd. 577 116 Dunstable, UK 100 100 100
SCA Tissue North America LLC 58-2494137 Delaware, US 100 100 100
Vinda International Holdings Ltd1) 90235 Hong Kong, China 55 51 51
Wausau Paper Towel & Tissue LLC 41-2218501 Wisconsin, USA 100 – –
SCA Hygiene Products Vertriebs GmbH HRB 713 332 Mannheim, Germany 100 100 100
SCA Hygiene Products AB 556007-2356 Gothenburg, Sweden 100 100 100
SCA Hygiene Products S.L. B28451383 Puigpelat, Spain 100 100 100
SCA Consumidor Mexico, S.A. de C.V. SCM-931101-3S5 Mexico City, Mexico 100 100 100
Productos Familia S.A., Colombia1) 8909001619 Medellin, Colombia 50 50 50
SCA Hygiene Products SPA 3 318 780 966 Altopascio, Italy 100 100 100
SCA Hygiene Products Russia OOO 704 031 845 Moscow, Russia 100 100 100
SCA Hygiene Sp.z.o.o. KRS No. 0000427360 Warsaw, Poland 100 100 100
SCA Hygiene Products GmbH FN 49537 z Vienna, Austria 100 100 100
SCA Hygiene Products SA-NV BE0405.681.516 Stembert, Belgium 100 100 100
SCA Hygiene Products AFH Sales GmbH HRB 710 878 Mannheim, Germany 100 100 100
SCA North America-Canada Inc. 421984 Ontario, Canada 100 100 100
OY SCA Hygiene Products AB 0165027-5 Espoo, Finland 100 100 100
SCA PERSONAL CARE INC. 23-3036384 Delaware, US 100 100 100
Productos Familia del Sancela Ecuador S.A.1) 1791314379001 Quito, Ecuador 50 50 50
SCA Hygiene Products AS 915 620 019 Oslo, Norway 100 100 100
SCA Hygiene Products AG CHE-106.977.885 Schenkon, Switzerland 99 99 99
SCA Hygiene Products A/S DK20 638 613 Allerød, Denmark 100 100 100
SCA Chile SA 94.282.000-3 Santiago de Chile, Chile 100 100 100
Sancella S.A. B14441997 La Charguia, Tunisia 49 49 49
SCA Hygiene Products Kft 01-09-716945 Budapest, Hungary 100 100 100
Uni-Charm Mölnlycke KK 0104-01-046146 Tokyo, Japan 49 49 49
SCA Hygiene Products s.r.o. 485 36 466 Prague, Czech Republic 100 100 100
SCA Hygiene Spain, SL B31235260 Allo, Spain 100 100 100
SCA Hygiene Products Slovakia s.r.o. 36590941 Gemerska Horska, Slovakia 100 100 100
SCA Hygiene Products GmbH Wiesbaden HRB5301 Mainz-Kostheim, Germany 100 100 100
SCA Tissue France SAS 702055187 Bois-Colombes, France 100 100 100
SCA Hygiene Products GmbH Mannheim HRB3248 Mannheim, Germany 100 100 100
SCA Hygiene Products GmbH Neuss HRB 14343 Neuss, Germany 100 100 100
SCA Hygiene Products Sp.z.o.o. KRS No. 0000086815 Olawa, Poland 100 100 100
SCA Hygiene Products Supply SAS 509599619 Roissy, Bobigny, France 100 100 100
SCA Hygiene Products Manchester Ltd 4119442 Dunstable, UK 100 100 100
1) The Essity Group has a small number of subsidiaries that are partly owned and hold significant non-controlling interests, see TF2:1 .
F-74Admission to trading of the shares in Essity Aktiebolag (publ) on Nasdaq Stockholm
Financial data for the financial year 2014–2016
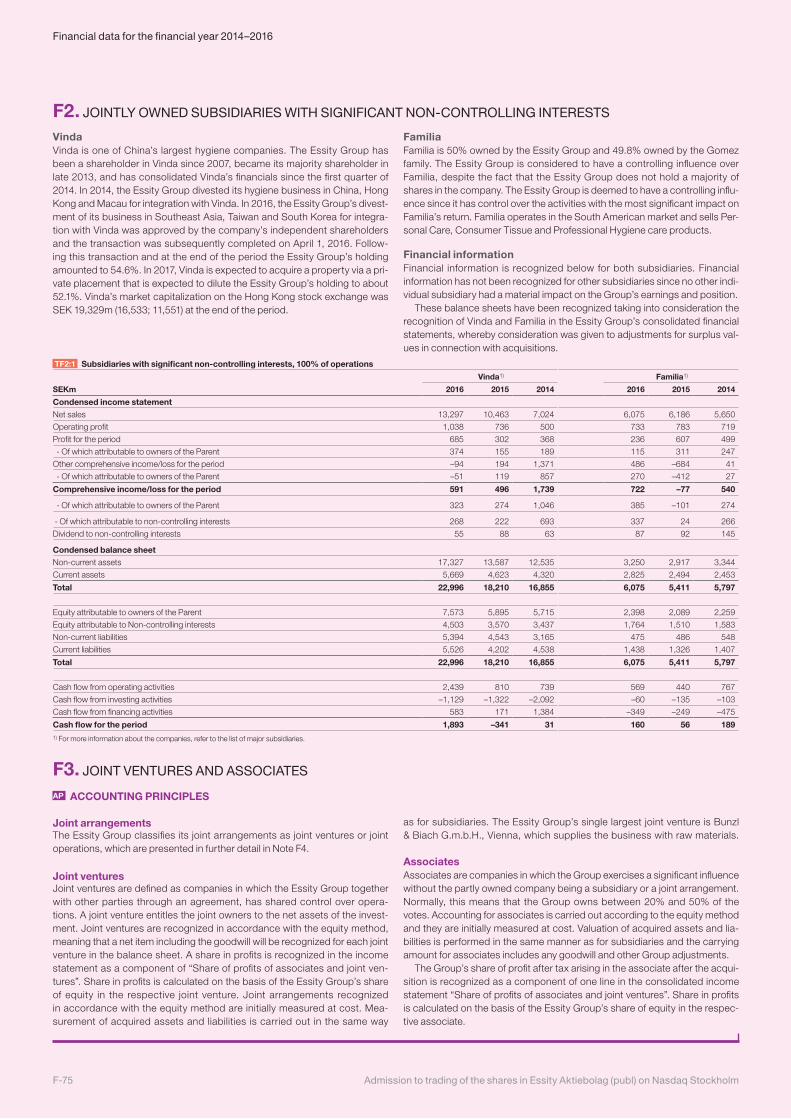
F2. JOINTLY OWNED SUBSIDIARIES WITH SIGNIFICANT NON-CONTROLLING INTERESTS
VindaVinda is one of China’s largest hygiene companies. The Essity Group has been a shareholder in Vinda since 2007, became its majority shareholder in late 2013, and has consolidated Vinda’s financials since the first quarter of 2014. In 2014, the Essity Group divested its hygiene business in China, Hong Kong and Macau for integration with Vinda. In 2016, the Essity Group’s divest-ment of its business in Southeast Asia, Taiwan and South Korea for integra-tion with Vinda was approved by the company’s independent shareholders and the transaction was subsequently completed on April 1, 2016. Follow-ing this transaction and at the end of the period the Essity Group’s holding amounted to 54.6%. In 2017, Vinda is expected to acquire a property via a pri-vate placement that is expected to dilute the Essity Group’s holding to about 52.1%. Vinda’s market capitalization on the Hong Kong stock exchange was SEK 19,329m (16,533; 11,551) at the end of the period.
FamiliaFamilia is 50% owned by the Essity Group and 49.8% owned by the Gomez family. The Essity Group is considered to have a controlling influence over Familia, despite the fact that the Essity Group does not hold a majority of shares in the company. The Essity Group is deemed to have a controlling influ-ence since it has control over the activities with the most significant impact on Familia’s return. Familia operates in the South American market and sells Per-sonal Care, Consumer Tissue and Professional Hygiene care products.
Financial informationFinancial information is recognized below for both subsidiaries. Financial information has not been recognized for other subsidiaries since no other indi-vidual subsidiary had a material impact on the Group’s earnings and position.
These balance sheets have been recognized taking into consideration the recognition of Vinda and Familia in the Essity Group’s consolidated financial statements, whereby consideration was given to adjustments for surplus val-ues in connection with acquisitions.
TF2:1 Subsidiaries with significant non-controlling interests, 100% of operations
Vinda1) Familia1)
SEKm 2016 2015 2014 2016 2015 2014
Condensed income statementNet sales 13,297 10,463 7,024 6,075 6,186 5,650
Operating profit 1,038 736 500 733 783 719
Profit for the period 685 302 368 236 607 499
- Of which attributable to owners of the Parent 374 155 189 115 311 247
Other comprehensive income/loss for the period –94 194 1,371 486 –684 41
- Of which attributable to owners of the Parent –51 119 857 270 –412 27
Comprehensive income/loss for the period 591 496 1,739 722 –77 540
- Of which attributable to owners of the Parent 323 274 1,046 385 –101 274
- Of which attributable to non-controlling interests 268 222 693 337 24 266
Dividend to non-controlling interests 55 88 63 87 92 145
Condensed balance sheetNon-current assets 17,327 13,587 12,535 3,250 2,917 3,344
Current assets 5,669 4,623 4,320 2,825 2,494 2,453
Total 22,996 18,210 16,855 6,075 5,411 5,797
Equity attributable to owners of the Parent 7,573 5,895 5,715 2,398 2,089 2,259
Equity attributable to Non-controlling interests 4,503 3,570 3,437 1,764 1,510 1,583
Non-current liabilities 5,394 4,543 3,165 475 486 548
Current liabilities 5,526 4,202 4,538 1,438 1,326 1,407
Total 22,996 18,210 16,855 6,075 5,411 5,797
Cash flow from operating activities 2,439 810 739 569 440 767
Cash flow from investing activities –1,129 –1,322 –2,092 –60 –135 –103
Cash flow from financing activities 583 171 1,384 –349 –249 –475
Cash flow for the period 1,893 –341 31 160 56 1891) For more information about the companies, refer to the list of major subsidiaries.
F3. JOINT VENTURES AND ASSOCIATES
AP ACCOUNTING PRINCIPLES
Joint arrangementsThe Essity Group classifies its joint arrangements as joint ventures or joint operations, which are presented in further detail in Note F4.
Joint venturesJoint ventures are defined as companies in which the Essity Group together with other parties through an agreement, has shared control over opera-tions. A joint venture entitles the joint owners to the net assets of the invest-ment. Joint ventures are recognized in accordance with the equity method, meaning that a net item including the goodwill will be recognized for each joint venture in the balance sheet. A share in profits is recognized in the income statement as a component of “Share of profits of associates and joint ven-tures”. Share in profits is calculated on the basis of the Essity Group’s share of equity in the respective joint venture. Joint arrangements recognized in accordance with the equity method are initially measured at cost. Mea-surement of acquired assets and liabilities is carried out in the same way
as for subsidiaries. The Essity Group’s single largest joint venture is Bunzl & Biach G.m.b.H., Vienna, which supplies the business with raw materials.
AssociatesAssociates are companies in which the Group exercises a significant influence without the partly owned company being a subsidiary or a joint arrangement. Normally, this means that the Group owns between 20% and 50% of the votes. Accounting for associates is carried out according to the equity method and they are initially measured at cost. Valuation of acquired assets and lia-bilities is performed in the same manner as for subsidiaries and the carrying amount for associates includes any goodwill and other Group adjustments.
The Group’s share of profit after tax arising in the associate after the acqui-sition is recognized as a component of one line in the consolidated income statement “Share of profits of associates and joint ventures”. Share in profits is calculated on the basis of the Essity Group’s share of equity in the respec-tive associate.
Admission to trading of the shares in Essity Aktiebolag (publ) on Nasdaq StockholmF-75
Financial data for the financial year 2014–2016
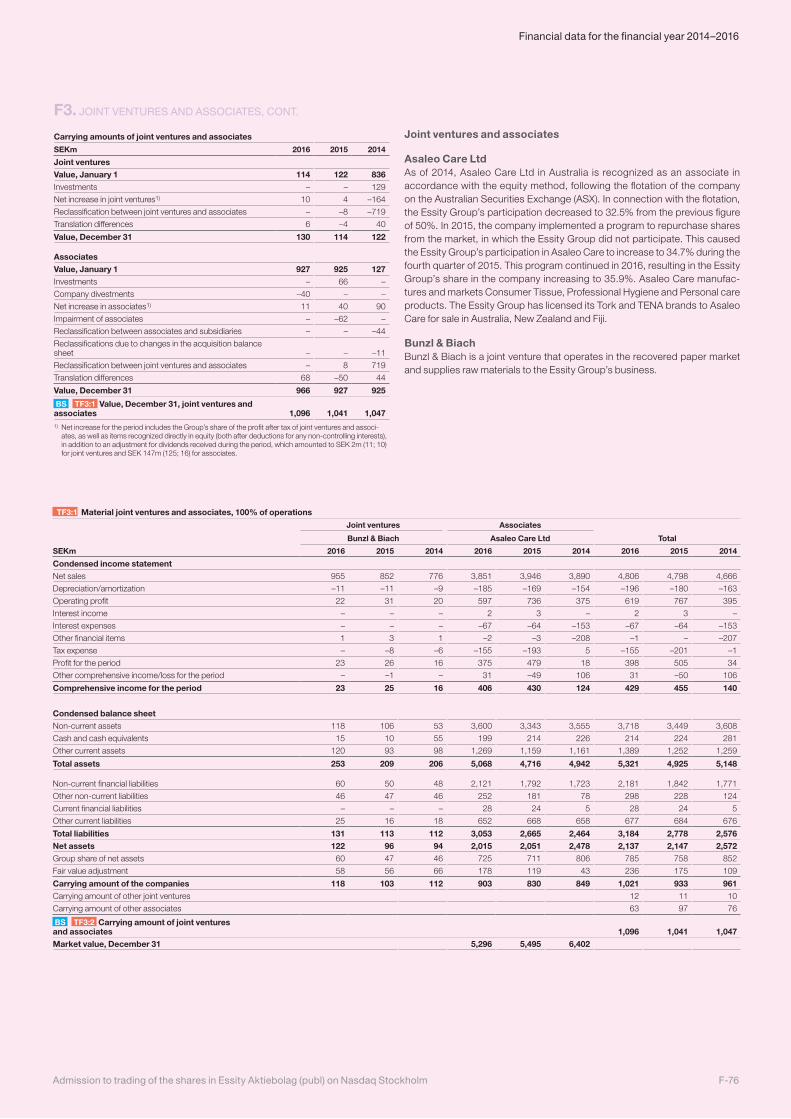
Carrying amounts of joint ventures and associates
SEKm 2016 2015 2014
Joint venturesValue, January 1 114 122 836Investments – – 129
Net increase in joint ventures1) 10 4 –164
Reclassification between joint ventures and associates – –8 –719
Translation differences 6 –4 40
Value, December 31 130 114 122
AssociatesValue, January 1 927 925 127Investments – 66 –
Company divestments –40 – –
Net increase in associates1) 11 40 90
Impairment of associates – –62 –
Reclassification between associates and subsidiaries – – –44
Reclassifications due to changes in the acquisition balance sheet – – –11
Reclassification between joint ventures and associates – 8 719
Translation differences 68 –50 44
Value, December 31 966 927 925
BS TF3:1 Value, December 31, joint ventures and associates 1,096 1,041 1,0471) Net increase for the period includes the Group’s share of the profit after tax of joint ventures and associ-
ates, as well as items recognized directly in equity (both after deductions for any non-controlling interests), in addition to an adjustment for dividends received during the period, which amounted to SEK 2m (11; 10) for joint ventures and SEK 147m (125; 16) for associates.
Joint ventures and associates
Asaleo Care LtdAs of 2014, Asaleo Care Ltd in Australia is recognized as an associate in accordance with the equity method, following the flotation of the company on the Australian Securities Exchange (ASX). In connection with the flotation, the Essity Group’s participation decreased to 32.5% from the previous figure of 50%. In 2015, the company implemented a program to repurchase shares from the market, in which the Essity Group did not participate. This caused the Essity Group’s participation in Asaleo Care to increase to 34.7% during the fourth quarter of 2015. This program continued in 2016, resulting in the Essity Group’s share in the company increasing to 35.9%. Asaleo Care manufac-tures and markets Consumer Tissue, Professional Hygiene and Personal care products. The Essity Group has licensed its Tork and TENA brands to Asaleo Care for sale in Australia, New Zealand and Fiji.
Bunzl & BiachBunzl & Biach is a joint venture that operates in the recovered paper market and supplies raw materials to the Essity Group’s business.
F3. JOINT VENTURES AND ASSOCIATES, CONT.
TF3:1 Material joint ventures and associates, 100% of operations
Joint ventures Associates
Bunzl & Biach Asaleo Care Ltd Total
SEKm 2016 2015 2014 2016 2015 2014 2016 2015 2014
Condensed income statementNet sales 955 852 776 3,851 3,946 3,890 4,806 4,798 4,666
Depreciation/amortization –11 –11 –9 –185 –169 –154 –196 –180 –163
Operating profit 22 31 20 597 736 375 619 767 395
Interest income – – – 2 3 – 2 3 –
Interest expenses – – – –67 –64 –153 –67 –64 –153
Other financial items 1 3 1 –2 –3 –208 –1 – –207
Tax expense – –8 –6 –155 –193 5 –155 –201 –1
Profit for the period 23 26 16 375 479 18 398 505 34
Other comprehensive income/loss for the period – –1 – 31 –49 106 31 –50 106
Comprehensive income for the period 23 25 16 406 430 124 429 455 140
Condensed balance sheetNon-current assets 118 106 53 3,600 3,343 3,555 3,718 3,449 3,608
Cash and cash equivalents 15 10 55 199 214 226 214 224 281
Other current assets 120 93 98 1,269 1,159 1,161 1,389 1,252 1,259
Total assets 253 209 206 5,068 4,716 4,942 5,321 4,925 5,148
Non-current financial liabilities 60 50 48 2,121 1,792 1,723 2,181 1,842 1,771
Other non-current liabilities 46 47 46 252 181 78 298 228 124
Current financial liabilities – – – 28 24 5 28 24 5
Other current liabilities 25 16 18 652 668 658 677 684 676
Total liabilities 131 113 112 3,053 2,665 2,464 3,184 2,778 2,576Net assets 122 96 94 2,015 2,051 2,478 2,137 2,147 2,572Group share of net assets 60 47 46 725 711 806 785 758 852
Fair value adjustment 58 56 66 178 119 43 236 175 109
Carrying amount of the companies 118 103 112 903 830 849 1,021 933 961Carrying amount of other joint ventures 12 11 10
Carrying amount of other associates 63 97 76
BS TF3:2 Carrying amount of joint ventures and associates 1,096 1,041 1,047Market value, December 31 5,296 5,495 6,402
F-76Admission to trading of the shares in Essity Aktiebolag (publ) on Nasdaq Stockholm
Financial data for the financial year 2014–2016
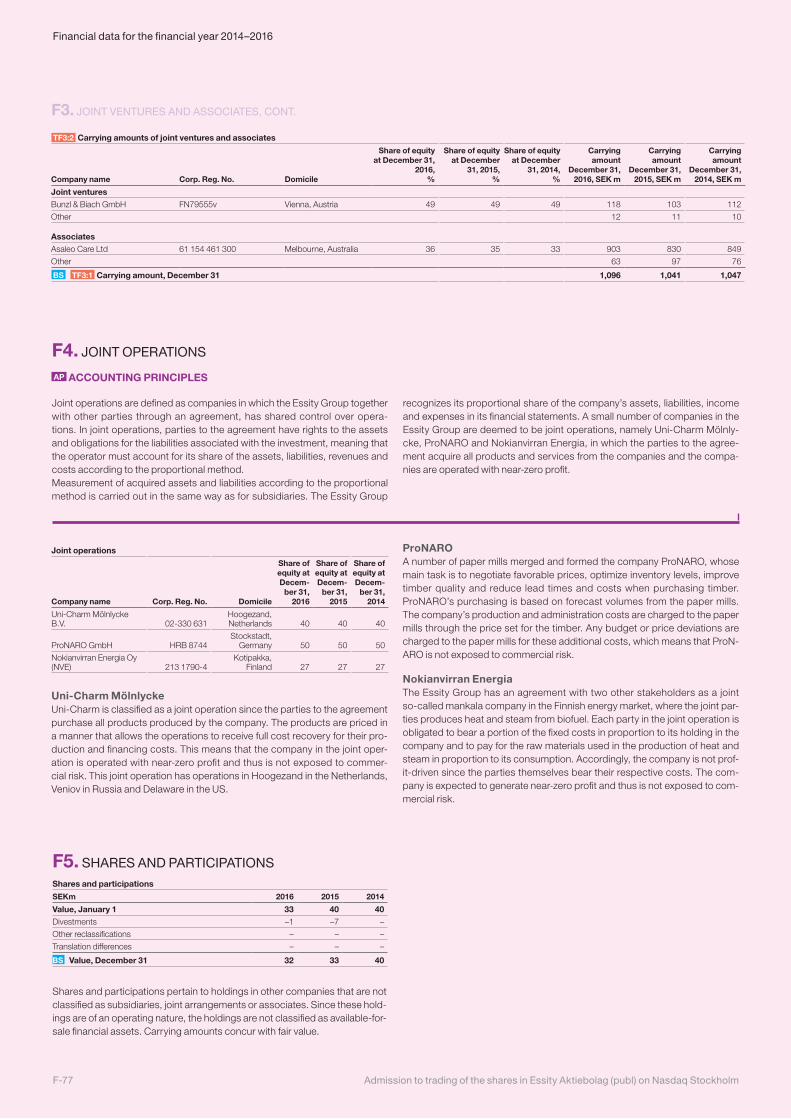
TF3:2 Carrying amounts of joint ventures and associates
Company name Corp. Reg. No. Domicile
Share of equity at December 31,
2016, %
Share of equity at December
31, 2015, %
Share of equity at December
31, 2014, %
Carrying amount
December 31, 2016, SEK m
Carrying amount
December 31, 2015, SEK m
Carrying amount
December 31, 2014, SEK m
Joint venturesBunzl & Biach GmbH FN79555v Vienna, Austria 49 49 49 118 103 112
Other 12 11 10
AssociatesAsaleo Care Ltd 61 154 461 300 Melbourne, Australia 36 35 33 903 830 849
Other 63 97 76
BS TF3:1 Carrying amount, December 31 1,096 1,041 1,047
F3. JOINT VENTURES AND ASSOCIATES, CONT.
F5. SHARES AND PARTICIPATIONS Shares and participations
SEKm 2016 2015 2014
Value, January 1 33 40 40Divestments –1 –7 –
Other reclassifications – – –
Translation differences – – –
BS Value, December 31 32 33 40
Shares and participations pertain to holdings in other companies that are not classified as subsidiaries, joint arrangements or associates. Since these hold-ings are of an operating nature, the holdings are not classified as available-for-sale financial assets. Carrying amounts concur with fair value.
Joint operations
Company name Corp. Reg. No. Domicile
Share of equity at Decem-
ber 31, 2016
Share of equity at Decem-
ber 31, 2015
Share of equity at Decem-
ber 31, 2014
Uni-Charm Mölnlycke B.V. 02-330 631
Hoogezand, Netherlands 40 40 40
ProNARO GmbH HRB 8744Stockstadt,
Germany 50 50 50
Nokianvirran Energia Oy (NVE) 213 1790-4
Kotipakka, Finland 27 27 27
Uni-Charm MölnlyckeUni-Charm is classified as a joint operation since the parties to the agreement purchase all products produced by the company. The products are priced in a manner that allows the operations to receive full cost recovery for their pro-duction and financing costs. This means that the company in the joint oper-ation is operated with near-zero profit and thus is not exposed to commer-cial risk. This joint operation has operations in Hoogezand in the Netherlands, Veniov in Russia and Delaware in the US.
ProNAROA number of paper mills merged and formed the company ProNARO, whose main task is to negotiate favorable prices, optimize inventory levels, improve timber quality and reduce lead times and costs when purchasing timber. ProNARO’s purchasing is based on forecast volumes from the paper mills. The company’s production and administration costs are charged to the paper mills through the price set for the timber. Any budget or price deviations are charged to the paper mills for these additional costs, which means that ProN-ARO is not exposed to commercial risk.
Nokianvirran EnergiaThe Essity Group has an agreement with two other stakeholders as a joint so-called mankala company in the Finnish energy market, where the joint par-ties produces heat and steam from biofuel. Each party in the joint operation is obligated to bear a portion of the fixed costs in proportion to its holding in the company and to pay for the raw materials used in the production of heat and steam in proportion to its consumption. Accordingly, the company is not prof-it-driven since the parties themselves bear their respective costs. The com-pany is expected to generate near-zero profit and thus is not exposed to com-mercial risk.
F4. JOINT OPERATIONS
AP ACCOUNTING PRINCIPLES
Joint operations are defined as companies in which the Essity Group together with other parties through an agreement, has shared control over opera-tions. In joint operations, parties to the agreement have rights to the assets and obligations for the liabilities associated with the investment, meaning that the operator must account for its share of the assets, liabilities, revenues and costs according to the proportional method.Measurement of acquired assets and liabilities according to the proportional method is carried out in the same way as for subsidiaries. The Essity Group
recognizes its proportional share of the company’s assets, liabilities, income and expenses in its financial statements. A small number of companies in the Essity Group are deemed to be joint operations, namely Uni-Charm Mölnly-cke, ProNARO and Nokianvirran Energia, in which the parties to the agree-ment acquire all products and services from the companies and the compa-nies are operated with near-zero profit.
Admission to trading of the shares in Essity Aktiebolag (publ) on Nasdaq StockholmF-77
Financial data for the financial year 2014–2016
Acquisitions in 2016On October 13, 2015, a public bid for Wausau Paper Corp., one of the larg-est Professional Hygiene companies in the North American market, was announced. The transaction was approved by US authorities on November 17, 2015, and Wausau Paper’s shareholders accepted the bid at the general meeting held on January 20, 2016. The transaction was completed on Janu-ary 21, 2016, with all shares in the company being acquired. Essity has con-solidated Wausau as of this date. The consideration transferred amounted to USD 513m (SEK 4,401m) in cash. Goodwill is motivated by synergies between Essity and Wausau Paper, including the capacity to offer customers a broad portfolio of products. The acquisition is expected to generate annual syn-ergies of approximately USD 40m, with full effect three years after closing. Synergies are expected in sourcing, production, logistics, reduced imports, increased volumes of premium products and reduced sales, general and administration costs. The restructuring costs are expected to amount to approximately USD 50m. The cost for the acquisition amounted to SEK 90m.
A minor acquisition of Sensassure in Canada was completed during the year. The consideration transferred amounted to SEK 47m, of which SEK 19m relates to an earn-out payment that is contingent upon certain performance measures being met.
Effect on sales and earnings of acquisitions for the period Since the acquisition date, the acquisition of Wausau has had an impact of SEK 2,996m on consolidated net sales, of SEK 272m on adjusted operating profit and of SEK 36m on profit for the period, including items affecting com-parability, before tax. If the acquisition had been consolidated from January 1, 2016, the expected net sales would have amounted to SEK 3,164m and profit before tax, including items affecting comparability, to SEK 48m. Sensassure is a development company and has initially only yielded costs of about SEK 2m.
Acquisitions in 2015With the exception of the acquisition of Nampak, which is described in more detail below, Essity Group made only minor supplementary investments in 2015 and made earn-out payments for previously acquired companies. In July, the Essity Group signed an agreement to acquire the remaining 50% of the jointly owned South African subsidiary Sancella S.A. Nampak. The pur-chase consideration amounted to SEK 1. The Essity Group had already rec-ognized Sancella S.A. as a subsidiary, which is why the acquisition will be rec-ognized as an equity transaction. The acquisitions conducted during the period, which amounted to SEK 74m, were paid in cash. The earn-out payment for FZCO Sancella amounted to SEK
19m, of which SEK 11m was paid in cash and the remaining SEK 8m was rec-ognized as a financial liability. Operating profit for the period includes acquisi-tion costs of approximately SEK 1.4m.
Effect on sales and earnings of acquisitions for the periodNo new acquisitions were carried out during the period.
Acquisitions in 2014In 2014, the Essity Group conducted a number of minor acquisitions, which were jointly recognized in the acquisition balance sheet for 2014, since no individual transaction was of a material nature. Acquisitions made during the year totaled SEK 508m, including assumed net debt.
On August 1, the Essity Group’s subsidiary Vinda acquired an additional 50% in the associate Vinda Personal Care for HKD 295m. Earlier holdings in Vinda Personal Care have been restated in accordance with IFRS and had a positive remeasurement effect of SEK 33m.
In June 2014, the Essity Group acquired the remaining 50% of the joint ven-ture Fine Sancella in Jordan from Nuqul Group. The consideration transferred amounted to SEK 171m. Following amendments to the IFRS governing con-solidated financial statements and joint arrangements (IFRS 10 and IFRS 11), Fine Sancella has been consolidated as a subsidiary since the Essity Group is deemed to have control. Accordingly, the acquisition has been recognized as an equity transaction, which means that no acquisition balance sheet has been prepared.
Of acquisitions for the year totaling SEK 508m, SEK 488m was paid in cash, including assumed cash and cash equivalents, and the remaining SEK 20m comprises assumed net debt. Acquisition costs of approximately SEK 25m relating to acquisitions during the year are included in operating profit.
Effect on sales and earnings of acquisitions for the periodSince the acquisition date, acquisitions have had an impact of SEK 210m on consolidated net sales and an impact of SEK 2m on profit after tax for the period. Had other acquisitions been consolidated as of January 1, 2014, the acquired net sales would have amounted to SEK 401m and profit after tax to SEK 7m.
Acquired operations The table below shows the fair value of acquired net assets recognized on the acquisition date, recognized goodwill and the effect on the Group’s cash flow statements.
F6. ACQUISITIONS AND DISPOSALS
AP ACCOUNTING PRINCIPLES
Acquisition of subsidiariesThe Essity Group applies IFRS 3 Business Combinations in connection with acquisitions. In business combinations, acquired assets and assumed liabil-ities are identified and classified at fair value on the date of acquisition (also known as an acquisition analysis). The acquisition analysis also includes an assessment of whether there are any assets that are intangible in nature, such as trademarks, patents, customer contracts or similar assets that were not recognized in the acquired unit. If the cost is higher than the net value of the acquired assets, assumed liabilities and identified intangible assets in the company, the difference is recognized as goodwill. Any surplus value on property, plant and equipment is depreciated over the estimated useful life of the asset. Goodwill and strong trademarks with indefinite useful lives are not amortized; instead, they are subjected to annual impairment testing. Some trademarks and customer contracts are amortized over their estimated use-ful lives.
If the transferred consideration is contingent on future events, it is mea-sured at fair value and any changes in value are recognized in profit for the period.
Transaction costs in conjunction with acquisitions are not included in cost, but rather expensed directly.
Companies acquired during the period are included in the consolidated financial statements as of the acquisition date. Divested companies are included in the consolidated financial statements until the divestment date.
Non-controlling interestsAcquisitions of non-controlling interests are measured on an acquisi-tion-by-acquisition basis, either as a proportional share of the fair value of identifiable net assets excluding goodwill (partial goodwill) or at fair value, which means that goodwill is also recognized on non-controlling interests (full goodwill).
In step acquisitions in which a controlling influence is achieved, any net assets acquired earlier in the acquired units are remeasured at fair value and the result of the remeasurement is recognized in profit or loss. If the controlling influence is lost upon the divestment of an operation, the result is recognized in profit or loss and the portion of the divested operation that remains in the Group is measured at fair value on the divestment date, with the remeasure-ment effect recognized in profit or loss.
Acquisitions in which a controlling influence is achieved that do not lead to loss of control are recognized as an equity transaction, meaning a transfer between equity attributable to owners of the Parent and non-controlling inter-ests. The same applies for divestments that take place without the loss of a controlling influence.
F-78Admission to trading of the shares in Essity Aktiebolag (publ) on Nasdaq Stockholm
Financial data for the financial year 2014–2016
F6. ACQUISITIONS AND DISPOSALS, CONT.
Acquisition balance sheetsSEKm 2016 2015 2014
Intangible assets 213 – 23Property, plant and equipment 2,896 – 56Other non-current assets – 66 166Operating assets 672 – 45Cash and cash equivalents 14 – 15Provisions and other non-current liabilities –71 – –5Net debt excl. cash and cash equivalents –2,124 – –20Operating liabilities –528 – –17
Fair value of net assets 1,072 66 263Goodwill 3,375 – 282Consolidated value of share in associates – – –72Revaluation of previously owned shares – – –35
Consideration transferred 4,447 66 438Consideration transferred –4,447 –66 –438Earn-out payment 19 – –Settled debt pertaining to acquisitions in earlier years –2 –6 –Cash and cash equivalents in acquired companies 14 – 15Adjustment of cash and cash equivalents in final acquisition analysis for Vinda – – –69
CF Effect on Group’s cash and cash equivalents, acquisition of operations –4,416 –72 –492Acquisition of non-controlling interests – –19 –173Acquired net debt excl. cash and cash equivalents –2,124 – –20Adjustment of net debt in final acquisition analysis for Vinda – – 193
OCF Acquisition of operations during the period, including net debt assumed –6,540 –91 –492
Specification of acquisition balance sheet 2016SEKm Wausau Other Total
Intangible assets 213 – 213Property, plant and equipment 2,896 – 2,896Other non-current assets – – 0Operating assets 672 – 672Cash and cash equivalents 14 – 14Provisions and other non-current liabilities –71 – –71Net debt excl. cash and cash equivalents –2,127 3 –2,124Operating liabilities –525 –3 –528
Fair value of net assets 1,072 0 1,072Goodwill 3,329 46 3,375
Consideration transferred 4,401 46 4,447Consideration transferred –4,401 –46 –4,447Earn-out payment – 19 19Settled debt pertaining to acquisitions in earlier years – –2 –2Cash and cash equivalents in acquired companies 14 – 14
CF Effect on Group’s cash and cash equivalents, acquisition of operations –4,387 –29 –4,416Acquired net debt excl. cash and cash equivalents –2,127 3 –2,124
OCF Acquisition of operations during the period, including net debt assumed –6,514 –26 –6,540
Adjustment of preliminary acquisition balance sheets for 2016 An acquisition analysis is considered preliminary until it is confirmed. A pre-liminary acquisition analysis is changed as soon as new information regarding assets/liabilities on the acquisition date is obtained, but not later than one year from the time of acquisition the acquisition balance sheet is confirmed. Adjust-ments to acquisition analyses result in changes to the income statement and balance sheet for the comparative period. The preliminary acquisition analy-sis for Wausau was adjusted compared with the first quarter as a result of fur-ther information being obtained regarding the market value and new calcula-tions were made relating to intangible assets. The other acquisition analyses prepared in the preceding year were confirmed in accordance with the prelim-inary acquisition analyses.
Acquisitions after the end of the reporting periodOn December 19, 2016, it was announced that an agreement to acquire BSN medical, a leading medical technology company, had been concluded. BSN medical develops, manufactures, markets and sells products within wound care, compression therapy and orthopedics. The purchase price for the shares was EUR 1,400m, and takeover of net debt amounted to approximately EUR 1,340m. The acquisition is fully debt-funded. The transaction, which was sub-ject to customary regulatory approvals, was closed on April 3, 2017.
A preliminary purchase price allocation is presented below. The preliminary purchase price allocation is based on the first-quarter report that Essity has received from BSN. Essity did not have access to any more detailed informa-tion regarding the items included in the opening balances since the acquisi-tion was implemented on April 3. This means that fair value adjustments and calculations of intangible assets have not yet been performed, and goodwill has thus only been preliminarily calculated.
BSN medical’s reported net sales for 2016 amounted to EUR 850m (SEK 8,038m), adjusted EBITDA to EUR 210m (SEK 1,986m) and adjusted EBITA to EUR 197m (SEK 1,863m).
Specification of acquisition balance sheet 2017SEKm BSN
Intangible assets 9,995Non-current assets 1,447Operating assets 3,121Cash and cash equivalents 497Provisions and other non-current liabilities –2,684Net debt excl. cash and cash equivalents –13,184Operating liabilities –1,392
Fair value of net assets –2,200Goodwill 15,474Non-controlling interests 86
Consideration transferred 13,359Consideration transferred –13,359Cash and cash equivalents in acquired companies 497
CF Effect on Group’s cash and cash equivalents, acquisition of operations –12,863Acquired net debt excl. cash and cash equivalents –13,184
OCF Acquisition of operations, including net debt assumed –26,047
Divestments In June, the 33.3% holding in the recycling company IL Recycling was divested, of which the Essity Group and SCA’s forest products operation each owned 16.65%. The purchase consideration in the Essity Group amounted to SEK 120m and the capital gain to SEK 99m. In November, the remaining non-cur-rent assets in China not included in the hygiene business transferred to Vinda in 2014 were divested. The purchase consideration amounted to SEK 169m and resulted in a capital gain of SEK 40m excluding divestment costs and the rever-sal of accumulated exchange rate differences in the divested operation previ-ously recognized in equity. Including divestment costs and the reversal of accu-mulated exchange rate differences, the outcome was SEK –26m. In addition to these divestments, payment was received for a number of minor divestments in China and Sweden, with the total purchase consideration for these amounting to SEK 29m and the capital gain to SEK 26m.
All capital gains were recognized in items affecting comparability in profit or loss. In addition, final settlement totaling SEK 59m was received relating to the earn-out payment for the Baby Care operation in South Africa, which was divested in 2015.
Assets and liabilities included in divestmentsSEKm 2016 2015 2014
Property, plant and equipment –10 48 –
Other non-current assets 43 – –
Operating assets 3 68 –Non-current assets held for sale 124 – –Cash and cash equivalents 8 – –Operating liabilities –15 – –Gain/loss on sale1) 165 – –
Compensation received 318 116 –Less:Unpaid purchase consideration – –67 –
Cash and cash equivalents in divested companies –8 – –Add:Payment of receivable for purchase consideration 59 – 205
CF Effect on Group’s cash and cash equivalents, divestments 369 49 205Less:Divested net debt excl. cash and cash equivalents – – –
OCF Divestment of operations during the period, including net debt transferred 369 49 2051) Excluding reversal of realized translation differences in divested companies to profit or loss. Gain/loss on
sale is included in items affecting comparability in profit or loss.
Admission to trading of the shares in Essity Aktiebolag (publ) on Nasdaq StockholmF-79
Financial data for the financial year 2014–2016
G. OTHER
G1. NON-CURRENT ASSETS HELD FOR SALE
AP ACCOUNTING PRINCIPLES
Non-current assets held for sale and discontinued operationsAssets are classified as held for sale if their value, within one year, will be recovered through a sale and not through continued use in the operations. On the reclassification date, the assets and liabilities are measured at the lower of fair value minus selling costs and the carrying amount. The assets are no lon-ger depreciated after reclassification. The gain is limited to the amount equiv-alent to previously made impairment charges. Gains and losses recognized on remeasurement and divestment are recognized in profit and loss for the period.
When an independent business segment or a significant operation within a geographic area is divested, it is classified as a discontinued operation. The divestment date, or the point in time when the operation fulfills the criteria for classification as held for sale, determines when the operation should be clas-sified as a discontinued operation.
Profit/loss after tax from discontinued operations is recognized on a sep-arate line in the income statement. The income statement is adjusted for the comparative period as though the discontinued operation had already been disposed of at the start of the comparative period.
Non-current assets held for sale and discontinued operations
SEKm 2016 2015 2014
Buildings 59 53 15
Land 31 67 43
Machinery and equipment 66 – 1
Construction in progress – – 1
BS Total 156 120 60
In 2016, non-current assets held for sale are attributable to the closure of a tis-sue production plant in Spain in the amount of SEK 59m and the discontinua-tion of the hygiene operation in India in the amount of SEK 97m.
G2. LEASING
AP ACCOUNTING PRINCIPLES
Lease agreements are classified and recognized as either operating or finance leases. In cases where a lease agreement essentially entails that the risks and rewards incidental to ownership have been transferred to the Essity Group, the lease agreement is classified as a finance lease. The leased asset is rec-ognized as a non-current asset with a corresponding interest-bearing liabil-ity. The initial value of both these items comprises the lower of the fair value of the assets or the present value of the minimum lease payments. Future lease fees are divided between amortization and interest, so that each reporting period is charged with an interest amount that corresponds to a fixed inter-est rate on the recognized liability for the respective period. The leased asset is depreciated according to the same principles that apply to other assets of the same nature. If it is uncertain whether the asset will be taken over at the end of the leasing period, the asset is depreciated over the lease term if this is shorter than the useful life that applies to other assets of the same nature. Lease agreements in which the risks and rewards incidental to ownership are essentially carried by the lessor are classified as operating leases, and the lease payments are expensed on a straight-line basis over the lease term.
Leasing expenses
SEKm 2016 2015 2014
Operating leases –696 –681 –655
Finance leases, depreciation/amortization –2 –5 –7
Finance leases, interest expense 0 –2 –2
Total –698 –688 –664
Operating leases, future minimum lease payments
SEKm 2016 2015 2014
Within 1 year 515 485 483
Between 1 and 5 years 1,209 933 975
Later than 5 years 1,392 545 631
Total 3,116 1,963 2,089
Operating lease objects comprise a large number of items, including ware-houses, offices, other buildings, machinery and equipment, IT equipment, office fixtures and various transport vehicles. The assessment for a number of the objects is that, in reality, it is possible to terminate contracts early.
Finance leases, future minimum lease payments
SEKm 2016 2015 2014
Within 1 year 1 6 39
Between 1 and 5 years 1 12 3
Later than 5 years – 35 –
Total 2 53 42Of which, interest 0 –18 –1
Present value of future minimum lease payments 2 35 41
Other disclosuresIn 2016, a rental contract for a distribution center was terminated. In conjunc-tion with this, the distribution center was acquired for SEK 29m. Total pay-ments for finance leases during the period amounted to SEK –31m (–9; –13), of which amortization of debt accounted for SEK –31m (–7; –11). The carry-ing amount of finance lease assets at year-end amounted to SEK 0m (29; 36) relating to buildings/land and SEK 5m (3; 5) relating to machinery.
F-80Admission to trading of the shares in Essity Aktiebolag (publ) on Nasdaq Stockholm
Financial data for the financial year 2014–2016
G3. CONTINGENT LIABILITIES AND PLEDGED ASSETS
AP ACCOUNTING PRINCIPLES
A contingent liability is recognized when there is a potential or actual obliga-tion arising from events that have occurred that is not recognized as a liability or provision, either because it is improbable that an outflow of resources will be required to settle the obligation or because the amount cannot be calcu-lated in a reliable manner.
Contingent liabilities
SEKm 2016 2015 2014
Guarantees for
associates 8 9 12
customers and others 39 38 35
Tax disputes – 1,302 1,554
Other contingent liabilities 214 243 248
Total 261 1,592 1,849
Other contingent liabilities above relates to recovery fees/taxes for pack-ing material in France where the requirement is subject to judicial review.
For the 2015 and 2014 periods, the following contingent liabilities were recognized Contingent liabilities for tax mainly relate to one tax dispute in Sweden where the Tax Agency has decided on additional taxes and tax surcharges for the years 2008 to 2012 of approximately SEK 1,188m, including interest. The dis-pute pertains to interest expenses on loans in a Group company that arose in connection with the move of operations to Sweden in 2004.
The Essity Group’s assessment is that the tax claim will not be upheld in court. Consequently, no provision has been made in the accounts for this claim.
The Essity Group is under examination by the competition autho- rities in certain countries. The Essity Group assesses that the ongoing inquiries will not have a material financial impact.
Pledged assets
Total
SEKm
Pledged assets related to financial
liabilities Other 2016 2015 2014
Real estate mortgages 7 – 7 7 6
Chattel mortgages 35 20 55 52 56
Other – 130 130 134 138
Total 42 150 192 193 200
Liabilities for which some of these assets were pledged as collateral amounted to SEK 0m (0; 0).
G4. TRANSACTIONS WITH RELATED PARTIES
The Essity Group has had a number of transactions with both units in Forest Products and the Parent Company SCA AB. These transactions and dealings are outlined in the table below for all fiscal years. Pricing between units has adhered to the transfer pricing policy that applies at the SCA Group. In rela-tion to renumeration of senior executives, refer to Note C3 and to disclosures regarding associates, joint ventures and joint operations in Notes F3 and F4.
Purchases from Forest Products during the fiscal years relate primarily to pulp used in the Essity Group’s manufacturing process. Other income relates to management fees that are invoiced to Forest Products for such items as management functions and which have been allocated to the Hygiene Group in connection with the preparation of the combined financial statements. The financial income is attribute to the internal bank’s lending to Forest Products.
The most significant dealing during the presented fiscal years relates to the lending that Essity has conducted via the internal bank to Forest products which is classified as current financial receivables, Group companies. In con-junction with Essity Aktiebolag’s acquisition of the hygiene products opera-tions in December 2016 and net debt is preliminary allocated between the lines of business, this receivable related to Forest Products is reduced. This is reflected as a transaction with owners that was recognized in equity in 2016, which explains the large change between the years. Other transactions with owners via equity that were carried out during the fiscal years are presented in Note E9. Other dealings primarily concern internal derivative positions and working capital items.
In conjunction with the transfer outlined above, Essity Aktiebolag is also assuming the majority of the external financing that exists in the SCA Group. In connection with this, a Parent Company guarantee is also issued from SCA AB for the benefit of Essity Aktiebolag as security for these debt instruments.
Transactions and dealings with Group companies
SEKm 2016 2015 2014
Sales – – –
Purchases 511 482 424
Other income 56 57 14
Financial income 108 132 230
Financial expenses –2 –2 –7
Non-current receivables, Group companies – 39 11
Non-current financial receivables, Group companies 3 3 3
Current receivables, Group companies 57 166 117
Of which, trade receivables 18 79 39
Of which, currency derivatives 33 10 30
Of which, energy derivatives 6 77 48
Current financial receivables, Group companies 1,433 12,207 12,764
Non-current liabilities, Group companies 48 – 4
Of which, currency derivatives 12 – 3
Of which, energy derivatives 36 – 1
Non-current financial liabilities, Group companies – – –
Current liabilities, Group companies 259 341 273
Of which, trade payables 100 106 88
Of which, currency derivatives 64 29 1
Of which, energy derivatives 58 3 1
Of which, other current liabilities 37 203 183
Current financial liabilities, Group companies 485 852 1,797
Admission to trading of the shares in Essity Aktiebolag (publ) on Nasdaq StockholmF-81
Financial data for the financial year 2014–2016
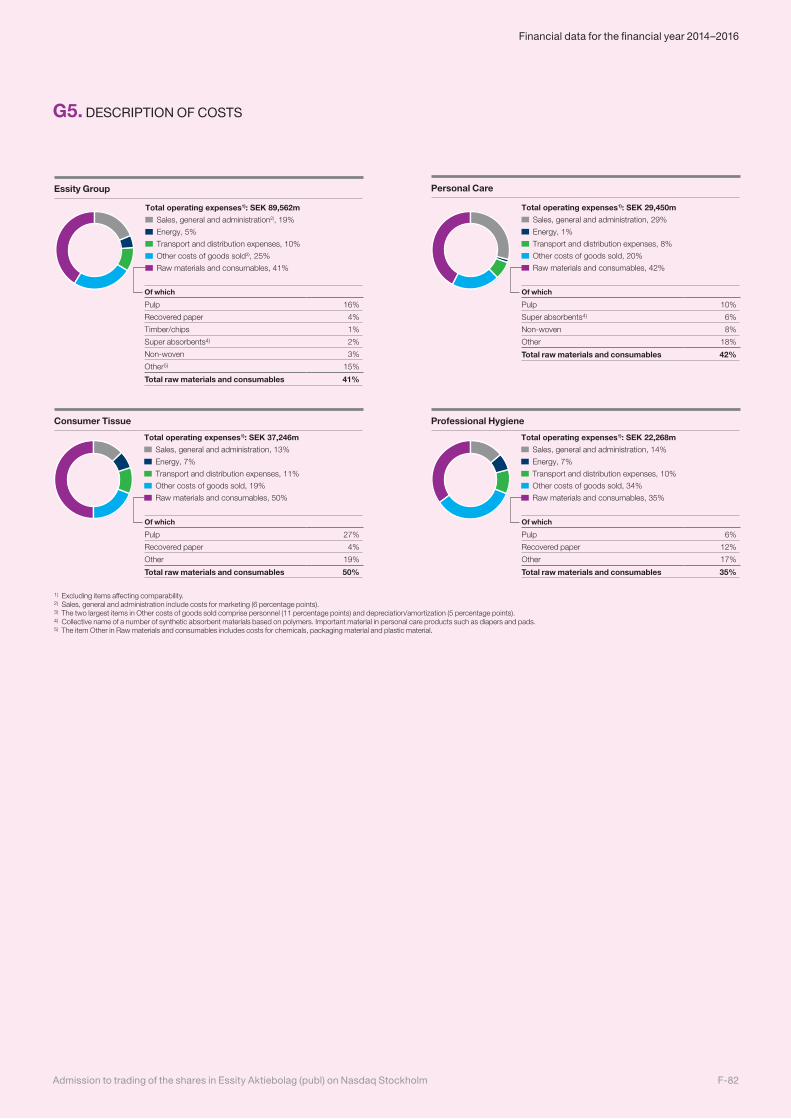
Essity Group Personal Care
Consumer Tissue Professional Hygiene
Energy, 5%
Transport and distribution expenses, 10%
Other costs of goods sold3), 25%
Raw materials and consumables, 41%
Total operating expenses1): SEK 89,562m
Sales, general and administration2), 19%
Energy, 1%
Transport and distribution expenses, 8%
Raw materials and consumables, 42%
Other costs of goods sold, 20%
Total operating expenses1): SEK 29,450m
Sales, general and administration, 29%
Energy, 7%
Transport and distribution expenses, 11%
Raw materials and consumables, 50%
Other costs of goods sold, 19%
Total operating expenses1): SEK 37,246m
Sales, general and administration, 13%
Energy, 7%
Transport and distribution expenses, 10%
Raw materials and consumables, 35%
Other costs of goods sold, 34%
Total operating expenses1): SEK 22,268m
Sales, general and administration, 14%
Of which
Pulp 16%
Recovered paper 4%
Timber/chips 1%
Super absorbents4) 2%
Non-woven 3%
Other5) 15%
Total raw materials and consumables 41%
Of which
Pulp 10%
Super absorbents4) 6%
Non-woven 8%
Other 18%
Total raw materials and consumables 42%
1) Excluding items affecting comparability.2) Sales, general and administration include costs for marketing (6 percentage points).3) The two largest items in Other costs of goods sold comprise personnel (11 percentage points) and depreciation/amortization (5 percentage points).4) Collective name of a number of synthetic absorbent materials based on polymers. Important material in personal care products such as diapers and pads.5) The item Other in Raw materials and consumables includes costs for chemicals, packaging material and plastic material.
Of which
Pulp 27%
Recovered paper 4%
Other 19%
Total raw materials and consumables 50%
Of which
Pulp 6%
Recovered paper 12%
Other 17%
Total raw materials and consumables 35%
G5. DESCRIPTION OF COSTS
F-82Admission to trading of the shares in Essity Aktiebolag (publ) on Nasdaq Stockholm
Financial data for the financial year 2014–2016
G6. EVENTS AFTER THE REPORTING PERIOD
On January 26, 2017, it was announced that the Essity Group is investing in a through-air drying (TAD) machine at its tissue plant in Skelmersdale in order to meet the growing demand for high-quality tissue and strengthen the prod-uct offering in the UK. It was also decided to close an older tissue machine in Stubbins and an agreement was signed to divest the tissue plant in Chester-field to Sidcot Group Limited. These measures are part of the Essity Group’s Tissue Roadmap and are aligned with the company’s strategy to streamline production and secure capacity for future growth in order to increase value creation in the Tissue business area. Both initiatives are subject to custom-ary consultation with employee representatives. Following the investment in the tissue plant in Skelmersdale of approximately SEK 160m, production capacity for TAD mother reels will amount to 28,000 tons. The cost for clos-ing the older tissue machine in Stubbins, with an annual production capacity of 20,000 tons, is expected to amount to approximately SEK 120m and will be recognized as an item affecting comparability, most of which in the first quar-ter of 2017. Of these costs, approximately SEK 70m is expected to affect cash flow. Sidcot Group Limited will pay a consideration of approximately GBP 3m (about SEK 35m) for the production facility in Chesterfield. The facility pro-duces mother reels but has no converting capacity. The Essity Group will have no internal need for the type of mother reels produced at the plant. The annual production capacity is 31,000 tons. An impairment loss of about SEK 10m is recognized as an item affecting comparability in the fourth quarter of 2016. Closing of the transaction is expected in the first quarter of 2017.
On March 15, 2017, SCA announced that Essity Aktiebolag (publ), under its Euro Medium Team Note (EMTN) program, had raised EUR 2bn at an average interest rate of 0,98% and an average tenor of 6,35 years. The purpose of the transaction was to finance the acquisition of BSN medical.
On April 3, 2017, SCA announced that the company’s acquisition of BSN medical, a leading medical solutions company, had been closed. BSN medi-cal develops, manufactures and sells products within wound care, compres-sion therapy and othopedics. The purchase price for the shares amounted to EUR 1,400m and takeover of net debt to approximately EUR 1,340m.
For more information se F6 Acquisitions and disposals.At the Annual General Meeting for SCA AB on April 5, 2017, it was decided
that all shares in the wholly owned subsidiary Essity Aktiebolag will be dis-tributed.
At the Annual General Meeting for Essity Aktiebolag on April 5, 2017, it was decided that the company will not pay any dividend.
Admission to trading of the shares in Essity Aktiebolag (publ) on Nasdaq StockholmF-83
Financial data for the financial year 2014–2016
G7. AUDITOR’S REPORTS
To the Board of Directors of Essity Aktiebolag (publ), reg.no 556325-5511
AUDITOR’S REPORT ON FINANCIAL STATEMENTS OF HISTORICAL FINANCIAL INFORMATIONWe have audited the financial statements for Essity Aktiebolag (publ) on pages F-31–F-83, which comprise the group balance sheet position as of December 31, 2016 and the statements of income, comprehensive income, cash flows and changes in equity for this year, and a summary of significant accounting policies and other explanatory notes.
The Board of Directors’ responsibility for the financial statementsThe Board of Directors and the CEO are responsible for the preparation and the fair presentation of the financial position, financial performance, statement of changes in equity and cash flows in accordance with International Financial Reporting Standards as adopted by the EU and additional applicable frame-work. This responsibility includes designing, implementing and maintaining internal control relevant to preparing and appropriately presenting financial statements that are free from material misstatement, whether due to fraud or error. The Board is also responsible for the preparation and fair presentation of the financial statements in accordance with the requirements in the Commis-sion Regulation (EC) No 809/2004.
The auditor’s responsibilityOur responsibility is to express an opinion on the financial statements based on our audit. We conducted our audit in accordance with FAR’s Recommen-dation RevR 5 Examination of Financial Information in Prospectuses. This rec-ommendation requires that we comply with ethical requirements and have planned and performed the audit to obtain reasonable assurance that the financial statements are free from material misstatements. The firm applies ISQC 1 (International Standard on Quality Control) and accordingly maintains a comprehensive system of quality control including documented policies and procedures regarding compliance with ethical requirements, professional standards and applicable legal and regulatory requirements.
We are independent in relationship to Essity Aktiebolag (publ) according to rules of professional ethics in Sweden and has otherwise fulfilled out ethical responsibilities under these requirements.
An audit in accordance with FAR’s Recommendation RevR 5 Examination of Financial Information in Prospectuses involves performing procedures to obtain audit evidence corroborating the amounts and disclosures in the finan-cial statements. The audit procedures selected are based on our assessment of the risks of material misstatements in the financial statements, whether due to fraud or error. In making those risk assessments, we consider the inter-nal control relevant to the company’s preparation and fair presentation of the financial statements as a basis for designing audit procedures that are appli-cable under those circumstances but not for the purpose of expressing an opinion on the effectiveness of the company’s internal control. An audit also involves evaluating the accounting policies applied and the reasonableness of the significant accounting estimates made by the Board of Directors and the Managing Director and evaluating the overall presentation of the finan-cial statements.
We believe that the audit evidence we have obtained is sufficient and appropriate to provide a basis for our opinion.
OpinionIn our opinion, the financial statements give a true and fair view in accor-dance with International Financial Reporting Standards as adopted by the EU and additional applicable framework, of the financial position of Essity Aktie-bolag (publ) as of December 31, 2016 and its financial performance, state-ment of changes in equity and cash flow for the year.
Stockholm, June 4, 2017
Ernst & Young AB
Hamish MabonAuthorized Public Accountant
Admission to trading of the shares in Essity Aktiebolag (publ) on Nasdaq Stockholm
Financial data for the financial year 2014–2016
F-84
To the Board of Directors of Essity Aktiebolag (publ) (556325-5511)
THE AUDITOR’S REPORT ON HISTORICAL FINANCIAL STATEMENTSWe have audited the financial statements for Essity Aktiebolag (publ) on pages F-31–F-83, which comprise the balance sheet as of 31 December 2015, 31 December 2014 and 1 January 2014 and the income statement, cash flow statement and statement of changes in equity for the years then ended, and a summary of significant accounting policies and other explanatory notes.
The Board of Directors’ and the Managing Director’s responsibil-ity for the financial statementsThe Board of Directors and the Managing Director are responsible for the preparation and the fair presentation of the financial statements in accordance with International Financial Reporting Standards as adopted by the EU and the Annual Accounts Act and additional applicable framework. This respon-sibility includes designing, implementing and maintaining internal control rel-evant to preparing and appropriately presenting financial statements that are free from material misstatement, whether due to fraud or error. The Board is also responsible for the preparation and fair presentation in accordance with the requirements in the Commission Regulation (EC) No 809/2004.
The auditor’s responsibilityOur responsibility is to express an opinion on these financial statements based on our audit. We conducted our audit in accordance with FAR’s Rec-ommendation RevR 5 Examination of Prospectuses. This recommendation requires that we comply with FAR’s ethical requirements and have planned and performed the audit to obtain reasonable assurance that the financial statements are free from material misstatements. The firm applies ISQC 1 (International Standard on Quality Control) and accordingly maintains a com-prehensive system of quality control including documented policies and pro-cedures regarding compliance with ethical requirements, professional stan-dards and applicable legal and regulatory requirements.
We are independent of the Essity Aktiebolag (publ) in accordance with pro-fessional ethics for accountants in Sweden and have otherwise fulfilled our ethical responsibilities in accordance with these requirements.
An audit in accordance with FAR’s Recommendation RevR 5 Examina-tion of Prospectuses involves performing procedures to obtain audit evidence corroborating the amounts and disclosures in the financial statements. The audit procedures selected depend on my (our) assessment of the risks of material misstatements in the financial statements, whether due to fraud or error. In making those risk assessments, we consider internal control rele-vant to the company’s preparation and fair presentation of the financial state-ments as a basis for designing audit procedures that are applicable under those circumstances but not for the purpose of expressing an opinion on the effectiveness of the company’s internal control. An audit also involves evalu-ating the accounting policies applied and the reasonableness of the signifi-cant accounting estimates made by the Board of Directors and the Manag-ing Director and evaluating the overall presentation of the financial statements.
We believe that the audit evidence we have obtained is sufficient and appropriate to provide a basis for our opinion.
OpinionIn our opinion the financial statements give a true and fair view in accordance with International Financial Reporting Standards as adopted by the EU/Annual Accounts Act and additional applicable framework of the financial position of Essity Aktiebolag (publ) as of 31 December 2015, 31 December 2014 and 1 January 2014 and its financial performance, statement of changes in equity and cash flows for these years.
Stockholm June 4, 2017
PricewaterhouseCoopers AB
Mikael ErikssonAuthorized Public Accountant
Admission to trading of the shares in Essity Aktiebolag (publ) on Nasdaq Stockholm
Financial data for the financial year 2014–2016
F-85
Addresses
Essity Aktiebolag (publ)
Head officeVisiting address
Klarabergsviadukten 63SE-111 64 Stockholm
Postal addressP.O. Box 200
SE-101 23 StockholmTelephone: +46 8 788 51 00
www.essity. se
Financial advisors
Handelsbanken Capital MarketsBlasieholmstorg 11-12SE-106 70 Stockholm
www.handelsbanken. se/capitalmarkets
Merrill Lynch International2 King Edward StreetEC1A 1HQ Londonwww.bofaml. com
Legal advisors
As to Swedish lawMannheimer Swartling Advokatbyrå
Norrlandsgatan 21P.O. Box 1711
SE-111 87 Stockholmwww.mannheimerswartling. se
As to US lawCleary Gottlieb Steen & Hamilton LLPCity Place House, 55 Basinghall Street
London EC2V 5EH, Englandwww.clearygottlieb. com
Auditor
Ernst & Young ABP.O. Box 7850
SE-103 99 Stockholmwww.ey. se
A-1Admission to trading of the shares in Essity Aktiebolag (publ) on Nasdaq Stockholm
Addresses

P.O. Box 200, SE-101 23 Stockholm, Swedenwww.essity. se
Related Documents