ADMINISTRATION OF DEVOLVED WATER SERVICES, TRANSFORMATIONAL LEADERSHIP, PLANNING AND WATER PROVISION IN ARID AND SEMI-ARID LANDS IN KENYA MOHAMUD MOHAMED GEDI A RESEARCH THESIS SUBMITTED TO THE SCHOOL OF MANAGEMENT AND LEADERSHIP IN PARTIAL FULFILLMENT OF THE REQUIREMENT FOR THE AWARD OF THE DEGREE OF DOCTOR OF PHILOSOPHY IN MANAGEMENT AND LEADERSHIP OF THE MANAGEMENT UNIVERSITY OF AFRICA NOVEMBER 2019

Welcome message from author
This document is posted to help you gain knowledge. Please leave a comment to let me know what you think about it! Share it to your friends and learn new things together.
Transcript

ADMINISTRATION OF DEVOLVED WATER SERVICES, TRANSFORMATIONAL
LEADERSHIP, PLANNING AND WATER PROVISION IN ARID AND SEMI-ARID LANDS IN
KENYA
MOHAMUD MOHAMED GEDI
A RESEARCH THESIS SUBMITTED TO THE SCHOOL OF MANAGEMENT AND
LEADERSHIP IN PARTIAL FULFILLMENT OF THE REQUIREMENT FOR THE AWARD
OF THE DEGREE OF DOCTOR OF PHILOSOPHY IN MANAGEMENT AND LEADERSHIP
OF THE MANAGEMENT UNIVERSITY OF AFRICA
NOVEMBER 2019

ii
DECLARATION
This research thesis is my original work and has not been presented for the award of a degree in any other
University.
Signature: ----------------------------------------- Date--------------------------------------------
Mohamud Mohamed Gedi
DML/3/00044/1/2016
Supervisors
This research thesis has been submitted for examination with our approval as the appointed University
Supervisors.
Signature: ----------------------------------------- Date: --------------------------------------------
Dr. Leonard Wambua (PhD)
School of Management and Leadership
Management University of Africa
Signature: ----------------------------------------- Date: --------------------------------------------
Dr. Michael O. Ngala (PhD)
School of Business and Economics
Co-operative University of Kenya

iii
DEDICATION
This research thesis is dedicated to my parents the late Mohamed Gedi and Zeinab Ibrahim Mohamed for
taking the decision to enroll me in school when my peers were herding camels and goats on the hills of
my village Takaba, Mandera West Kenya.

iv
ACKNOWLEDGEMENT
My sincere gratitude goes to my family and friends for the support accorded to me throughout the study. I
also express earnest appreciation to my supervisors Dr. Leonard Wambua and Dr Michael Ngala for
providing direction and guidance in the entire process of proposal development and thesis writing.
Special appreciation goes to my family Katra Abdullahi Dubow and Nasteha Mohamed Issack, my
daughter Rayan,sons Mahir and Ayad for their understanding and support during the entire academic
journey. I wish to acknowledge friends Faiz Awadh Abdalla, Dr. Gedi Abdi Mohamed and Abdihafidh
Abdullahi Yarrow for their encouragement and laughter that always helped ease tension that comes with
doing a PhD degree.I acknowledge support of my former Principal at Ngenia High School,Limuru the
late Mr.Joseph Mutharia who allowed me to continue with my Secondary Education despite my inability
to pay school fees due to humble background. Finally I thank the Management and Staffs of The
Management University of Africa for the support.
v
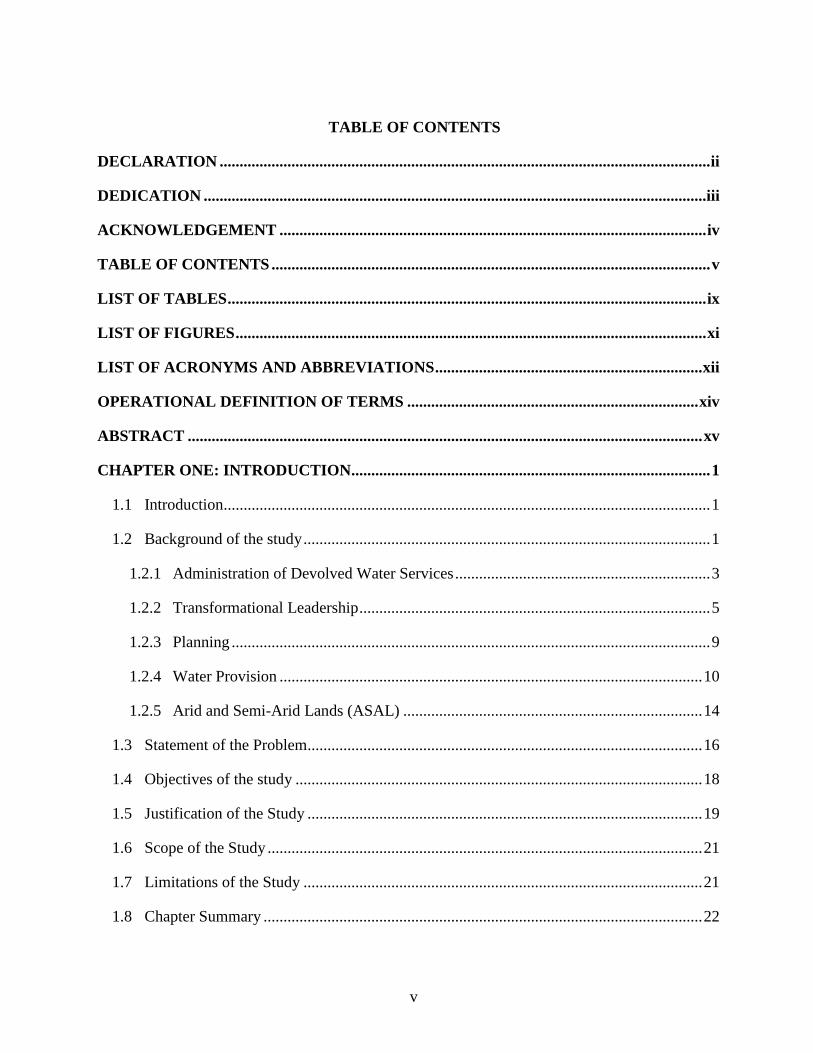
TABLE OF CONTENTS
DECLARATION ........................................................................................................................... ii
DEDICATION ..............................................................................................................................iii
ACKNOWLEDGEMENT ........................................................................................................... iv
TABLE OF CONTENTS .............................................................................................................. v
LIST OF TABLES ........................................................................................................................ ix
LIST OF FIGURES ...................................................................................................................... xi
LIST OF ACRONYMS AND ABBREVIATIONS ................................................................... xii
OPERATIONAL DEFINITION OF TERMS ......................................................................... xiv
ABSTRACT ................................................................................................................................. xv
CHAPTER ONE: INTRODUCTION .......................................................................................... 1
1.1 Introduction .......................................................................................................................... 1
1.2 Background of the study ...................................................................................................... 1
1.2.1 Administration of Devolved Water Services ................................................................ 3
1.2.2 Transformational Leadership ........................................................................................ 5
1.2.3 Planning ........................................................................................................................ 9
1.2.4 Water Provision .......................................................................................................... 10
1.2.5 Arid and Semi-Arid Lands (ASAL) ........................................................................... 14
1.3 Statement of the Problem ................................................................................................... 16
1.4 Objectives of the study ...................................................................................................... 18
1.5 Justification of the Study ................................................................................................... 19
1.6 Scope of the Study ............................................................................................................. 21
1.7 Limitations of the Study .................................................................................................... 21
1.8 Chapter Summary .............................................................................................................. 22

vi
CHAPTER TWO: LITERATURE REVIEW .......................................................................... 23
2.1 Introduction ........................................................................................................................ 23
2.2 Theoretical Literature Review ........................................................................................... 23
2.3 Empirical Literature Review .............................................................................................. 34
2.4 Summary of Research Gaps ............................................................................................... 58
2.5 Research Hypotheses ......................................................................................................... 66
2.6 Conceptual Framework ...................................................................................................... 67
CHAPTER THREE: RESEARCH METHODOLOGY .......................................................... 71
3.1 Introduction ........................................................................................................................ 71
3.2 Research Philosophy .......................................................................................................... 71
3.3 Research Design ................................................................................................................ 71
3.4 Population .......................................................................................................................... 72
3.5 Sample and Sampling Technique ...................................................................................... 72
3.6 Data Collection Instruments .............................................................................................. 75
3.7 Data Collection Procedure ................................................................................................. 76
3.8 Pilot Study ......................................................................................................................... 76
3.9 Data Analysis ..................................................................................................................... 78
3.10 Diagnostic Tests ................................................................................................................. 83
3.11 Ethical Considerations ....................................................................................................... 84
CHAPTER FOUR: DATA ANALYSIS AND RESEARCH RESULTS ................................ 86
4.1 Introduction ........................................................................................................................ 86
4.2 Response Rate .................................................................................................................... 86
4.3 Demographic Information ................................................................................................. 87
4.4 Administration of Devolved Water Services ..................................................................... 91

vii
4.5 Water Provision ................................................................................................................. 98
4.6 Effect of Administration of Devolved Water Services on Water Provision .................... 102
4.7 Administration of Devolved Water Services, Transformational Leadership and Water
Provision .......................................................................................................................... 115
4.8 Administration of Devolved Water Services, Planning and Water Provision ................. 122
4.9 Administration of Devolved Water Services, Transformational Leadership, Planning
and Water Provision ........................................................................................................ 129
CHAPTER FIVE: FINDINGS AND DISCUSSION .............................................................. 135
5.1 Introduction ...................................................................................................................... 135
5.2 Administration of devolved water services and Water Provision in ASAL .................... 135
5.3 Administration of Devolved Water Services, Transformational Leadership and Water
Provision .......................................................................................................................... 144
5.4 Administration of Devolved Water Services, Planning and Water Provision ................. 151
5.5 Administration of Devolved Water Services, Transformational Leadership, Planning
and Water Provision ........................................................................................................ 154
CHAPTER SIX: SUMMARY AND CONCLUSION ............................................................ 168
6.1 Introduction ...................................................................................................................... 168
6.2 Summary .......................................................................................................................... 169
6.3 Conclusion ....................................................................................................................... 173
CHAPTER SEVEN: RECOMMENDATIONS ...................................................................... 177
7.1 Introduction ...................................................................................................................... 177
7.2 Recommendations on Action and Managerial Practices ................................................. 177
7.3 Policy Contributions ........................................................................................................ 179
7.4 Study’s contribution to theory ......................................................................................... 182
7.5 Suggestions for Further Studies ....................................................................................... 182
REFERENCES .......................................................................................................................... 183

viii
APPENDICES ............................................................................................................................ 225
APPENDIX I: INTRODUCTION LETTER ........................................................................... 225
APPENDIX II: RESEARCH QUESTIONNAIRE .................................................................. 226
APPENDIX III: LIST OF DEVOLVED UNITS IN ASAL .................................................... 232
APPENDIX IV: RESEARCH AUTHORIZATION LETTER ................................................ 234
APPENDIX VI: TABLE OF THE STUDENT'S T-DISTRIBUTION .................................... 237
APPENDIX VII: F-DISTRIBUTION TABLE ........................................................................ 239
APPENDIX VIII: CERTIFICATE OF JOURNAL PUBLICATION ..................................... 240
APPENDIX IX: RAW DATA ................................................................................................. 242

ix
LIST OF TABLES
Table 3.1: Sample Size for the Arid Sub-Counties .................................................................... 73
Table 3.2: Sample Size for the Semi-Arid Sub-Counties ........................................................... 74
Table 3.3: Summary of Research Objectives, Hypotheses and Empirical Models .................... 81
Table 4.1: Response rate ............................................................................................................. 86
Table 4.2: Stakeholders’ Engagement as a Component of Administration of Devolved
Water Service .............................................................................................................................. 92
Table 4.3: Human Resource Development as a Component of Administration of Devolved
Water Service .............................................................................................................................. 94
Table 4.4: Application of Modern Technology as a Component of Administration of
Devolved Water Service .............................................................................................................. 96
Table 4.5: Descriptive Statistics on Water Provision ................................................................. 99
Table 4.6: One-Sample Kolmogorov-Smirnov Test ................................................................. 101
Table 4.7: Breusch - Pagan Test for Homoscedasticity ............................................................ 102
Table 4.8: Correlation Coefficient for the Administration of devolved water services and
Water Provision ......................................................................................................................... 103
Table 4.9: Model Summary for the Administration of Devolved Water Services and Water
Provision .................................................................................................................................... 103
Table 4.10: ANOVA for Administration of Devolved Water Services and Water Provision .. 104
Table 4.11: Regression Coefficients for Administration of Devolved Water Services and
Water Provision ......................................................................................................................... 104
Table 4.12: Correlation Coefficients for Components of Administration of Devolved Water
Services ...................................................................................................................................... 105
Table 4.13: Model Summary on Administration of Devolved Water Services and Water
Provision .................................................................................................................................... 106
Table 4.14: ANOVA for Components of Administration of Devolved Water Services .......... 106
Table 4.15: Regression Coefficients for Components of Administration of Devolved Water
Services ...................................................................................................................................... 107

x
Table 4.16: Descriptive Statistics Results on Administration of Devolved Water Services,
Transformational Leadership and Water Provision ................................................................... 115
Table 4.17: Regression Coefficients on Administration of Devolved Water Services,
Transformational Leadership and Water Provision ................................................................... 117
Table 4.18: ANOVA for Administration of Devolved Water Services, Transformational
Leadership and Water Provision ............................................................................................... 118
Table 4.19: R2 for Administration of Devolved Water Services, Transformational
Leadership and Water Provision ............................................................................................... 118
Table 4.20: Descriptive Statistics Results for Administration of Devolved Water Services,
Planning and Water Provision ................................................................................................... 122
Table 4.21: Regression Coefficients for Administration of Devolved Water Services,
Planning and Water Provision ................................................................................................... 124
Table 4.22: ANOVA for Administration of Devolved Water Services, Planning and Water
Provision .................................................................................................................................... 125
Table 4.23: R2 for Administration of Devolved Water Services, Planning and Water
Provision .................................................................................................................................... 125
Table 4.24: R2 for Administration of Devolved Water Services, Transformational
Leadership, Planning and Water Provision ............................................................................... 130
Table 4.25: ANOVA for Administration of Devolved Water Services, Transformational
Leadership, Planning and Water Provision ............................................................................... 130
Table 4.26: Regression Coefficients for Administration of Devolved Water Services,
Transformational Leadership, Planning and Water Provision .................................................. 131
Table 6.1: Summary of key findings ........................................................................................ 170

xi
LIST OF FIGURES
Figure 2.1: Conceptual model ......................................................................................................... 68
Figure 4.1: Economic activities in ASALs ...................................................................................... 87
Figure 4.2: Gender of the respondents ............................................................................................ 88
Figure 4.3: Respondents' Education Level ...................................................................................... 89
Figure 4.4: Profession of the Respondent ....................................................................................... 90
Figure 4.5: Respondents' First Year of Working in the County Leadership ................................... 91
Figure 4.6: Normal Q-Q Plot of Water Provision ......................................................................... 100
Figure 4.7: Bar Graph on Suggestions on Stakeholder’s Engagement in Water Provision .......... 109
Figure 4.8: World Cloud on Suggestions on Stakeholder’s Engagement in Water Provision ..... 110
Figure 4.9: Bar Graph Presenting Recommendations on Human Resource Development in Water
Provision ............................................................................................................................. 111
Figure 4.10: Word Cloud Presenting Recommendations on Human Resource Development in
Water Provision .................................................................................................................. 112
Figure 4.11: Bar Graph Presenting Recommendations on Application of Modern Technology in
Water Provision .................................................................................................................. 113
Figure 4.12: Word Cloud Presenting Recommendations on Application of Modern Technology in
Water Provision .................................................................................................................. 114
Figure 4.13: Bar Chart Presenting Improvements Needed on Transformative Leadership Qualities
in Water Provision .............................................................................................................. 120
Figure 4.14: Word Cloud Presenting Improvements Needed on Transformative Leadership
Qualities in Water Provision .............................................................................................. 121
Figure 4.15: Bar Chart Presenting Improvements Needed on Planning in Water Provision ........ 127
Figure 4.16: Word Cloud Presenting Improvements Needed on Planning in Water Provision .... 128
Figure 4.17: Bar Graph on Suggestions to Enhance Water Provision .......................................... 133
Figure 4.18: Bar Graph on Suggestions to Enhance Water Provision .......................................... 134
xii
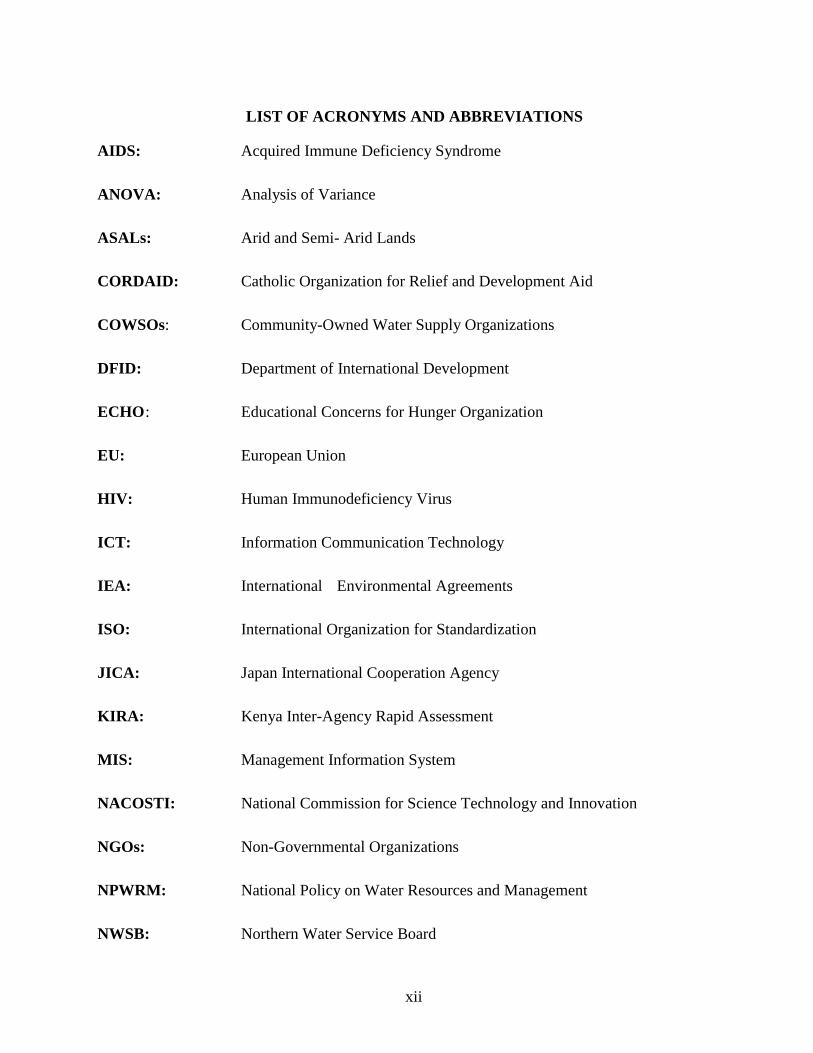
LIST OF ACRONYMS AND ABBREVIATIONS
AIDS: Acquired Immune Deficiency Syndrome
ANOVA: Analysis of Variance
ASALs: Arid and Semi- Arid Lands
CORDAID: Catholic Organization for Relief and Development Aid
COWSOs: Community-Owned Water Supply Organizations
DFID: Department of International Development
ECHO : Educational Concerns for Hunger Organization
EU: European Union
HIV: Human Immunodeficiency Virus
ICT: Information Communication Technology
IEA: International Environmental Agreements
ISO: International Organization for Standardization
JICA: Japan International Cooperation Agency
KIRA: Kenya Inter-Agency Rapid Assessment
MIS: Management Information System
NACOSTI: National Commission for Science Technology and Innovation
NGOs: Non-Governmental Organizations
NPWRM: National Policy on Water Resources and Management
NWSB: Northern Water Service Board

xiii
OECD : Organization for Economic Co-operation and Development
TLU: Tropical Livestock Unit
UNFPA: United Nations Population Fund
UNICEF: United Nations International Children’s Emergency Fund
VIF: Variance Inflation Factor
WHO: World Health Organization
WQI: Water Quality Index
WRI: World Resource Institute
WSP: Water Service Providers
WUCs: Water Use Committees
WWAP: World Water Assessment Programme

xiv
OPERATIONAL DEFINITION OF TERMS
Administration of Devolved Water Services: This entail the range of activities including
stakeholders’ engagement, human resource development, and application of
modern technology that are designed, put in place and implemented by County
leadership in Arid and Semi-Arid Lands in Kenya for service delivery.
Arid and Semi-Arid Lands: This consists of the level of aridity is the definitive feature of ASAL
where rainfall in every year ranges from 150mm to550mm (for arid) and from 550
to 850mm annually in the semi-arid areas. Evapo-transpiration and temperatures are
always very high for every season in a year. Therefore, for ASAL, the main
challenge in policy is ensuring food and nutritional security and sustainability (The
World Bank, 2012).
Planning: Planning entails a set goals and targets which include resource allocation, strategic
planning, as well as optimal and on-time deliverirs that aim to transform and
improve the image of the public service through quality delivery of services.
Planning when intensely applied in provision of services normally strengthen
administrative capacities for County Governments to perform their functions
effectively.
Transformational Leadership: this is a leadership style that emphasizes on the leader and
follower improving each other though inspirations and motivations, creativity and
innovations, rewards and recognition as well as intellectual stimulation.
Transformational leaders transmit to employees a strong vision of the growth
opportunities in their team, encourage them to think critically about change
initiatives, enhance their confidence in dealing with adaptation, and emphasize the
importance of performance while transcending self-interests for the team’s sake.
Water Provision: A source, means, or process of supplying water that is easily accessible,
affordable, quality, reliable and clear to Arid and Semi Arid Lands.
xv
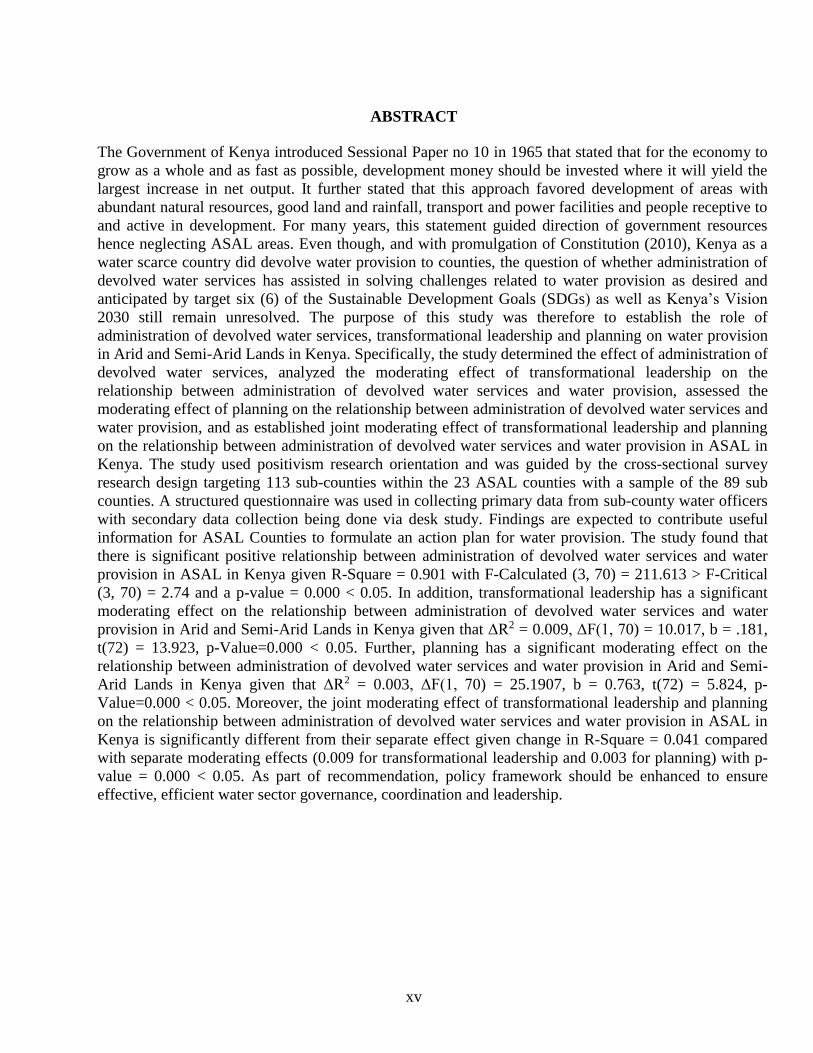
ABSTRACT
The Government of Kenya introduced Sessional Paper no 10 in 1965 that stated that for the economy to
grow as a whole and as fast as possible, development money should be invested where it will yield the
largest increase in net output. It further stated that this approach favored development of areas with
abundant natural resources, good land and rainfall, transport and power facilities and people receptive to
and active in development. For many years, this statement guided direction of government resources
hence neglecting ASAL areas. Even though, and with promulgation of Constitution (2010), Kenya as a
water scarce country did devolve water provision to counties, the question of whether administration of
devolved water services has assisted in solving challenges related to water provision as desired and
anticipated by target six (6) of the Sustainable Development Goals (SDGs) as well as Kenya’s Vision
2030 still remain unresolved. The purpose of this study was therefore to establish the role of
administration of devolved water services, transformational leadership and planning on water provision
in Arid and Semi-Arid Lands in Kenya. Specifically, the study determined the effect of administration of
devolved water services, analyzed the moderating effect of transformational leadership on the
relationship between administration of devolved water services and water provision, assessed the
moderating effect of planning on the relationship between administration of devolved water services and
water provision, and as established joint moderating effect of transformational leadership and planning
on the relationship between administration of devolved water services and water provision in ASAL in
Kenya. The study used positivism research orientation and was guided by the cross-sectional survey
research design targeting 113 sub-counties within the 23 ASAL counties with a sample of the 89 sub
counties. A structured questionnaire was used in collecting primary data from sub-county water officers
with secondary data collection being done via desk study. Findings are expected to contribute useful
information for ASAL Counties to formulate an action plan for water provision. The study found that
there is significant positive relationship between administration of devolved water services and water
provision in ASAL in Kenya given R-Square = 0.901 with F-Calculated (3, 70) = 211.613 > F-Critical
(3, 70) = 2.74 and a p-value = 0.000 < 0.05. In addition, transformational leadership has a significant
moderating effect on the relationship between administration of devolved water services and water
provision in Arid and Semi-Arid Lands in Kenya given that ΔR2 = 0.009, ΔF(1, 70) = 10.017, b = .181,
t(72) = 13.923, p-Value=0.000 < 0.05. Further, planning has a significant moderating effect on the
relationship between administration of devolved water services and water provision in Arid and Semi-
Arid Lands in Kenya given that ΔR2 = 0.003, ΔF(1, 70) = 25.1907, b = 0.763, t(72) = 5.824, p-
Value=0.000 < 0.05. Moreover, the joint moderating effect of transformational leadership and planning
on the relationship between administration of devolved water services and water provision in ASAL in
Kenya is significantly different from their separate effect given change in R-Square = 0.041 compared
with separate moderating effects (0.009 for transformational leadership and 0.003 for planning) with p-
value = 0.000 < 0.05. As part of recommendation, policy framework should be enhanced to ensure
effective, efficient water sector governance, coordination and leadership.

1
CHAPTER ONE
INTRODUCTION
1.1 Introduction
This chapter presents the background of this study by elaborating key concepts used in the study.
It also highlights the research problem, the study objectives, research hypotheses and study
justification. Moreover, the chapter describes the scope and delimitations of this research.
1.2 Background of the study
Water is the source of life, the most precious and important of all-natural resources, without
which the human species cannot survive (DSS, 2010). However, millions of people worldwide
are still victims of water scarcity given that the resource falls short of the desired physical
accessibility, affordability, quality, reliability, salinity, and clarity which in turn makes
consumers susceptible to a range of water-borne disease. The sustainability rate on water
projects in developing countries is alarmingly low due to a lack of resources, capabilities and
spare parts for service and maintenance (Hazelton, 2015).
Kiprono and Wanyoike (2016) affirm that development is related to the availability of water,
with this relationship being connected to the association between poverty and water availability,
which is common in rural regions. Water provision is a complex subject that entails using little
but achieving much. In this regard, the administration of devolved water services is expected to
enhance water provision and eventually improve the lives of the citizens in ASAL. This is
through minimizing resource wastage as well as reducing water pollution while using these
resources in producing goods and services. This should be at all levels in the value chain and in
provision of water (International Environmental Agreements, 2012). The Water Resource Group
(2009) warned that inefficient water usage will cause water demand to exceed its supply by forty
percent by 2030. The UNEP (2011) recommends that to address the shortage, it is critical to
invest in infrastructure, policies and modern technologies. However, this cannot just happen
since it will be subject to the effectiveness of the leadership styles and the planning exercised in

2
the counties. In this regard, this study explored the relationship amongst the transformational
leadership, planning and water provision in the Arid and Semi-Arid Lands, before and after
devolution.
However, in most Arid and Semi-Arid Lands of the developing world, safe drinking water from
an improved source remains unacceptably lacking (WHO-UNICEF 2014). Despite the
importance of these issues in the political agenda, water policies in many countries do not
promote the creation of appropriate institutions to manage water needs and enhance supply and
maintenance capabilities (Saleth & Dinar, 2013). This therefore calls for a more effective mode
of policies and that is closer to the community such as devolved governance.
Devolution entails the process of devolving administration, power, authority and responsibilities
to lower ranks, through legislative procedures. According to Robertson (2002), devolved
administration entails a complete shift in the coming up with the decisions, revenue generation,
responsibility and resources to the locally public unit which is under devolution. It has been
advocated as a political response to the ills plaguing fragile and plural societies, such as,
conflicts, inequalities, economic stagnation, corruption and inefficient use of public resources.
Besides, devolution is also implemented as a reaction to external pressure from organized groups
(or separatists). For devolution to be effective, however, the criteria of subsidiarity and
consensus must be observed (Dent, 2004; Kimenyi and Meagher, 2004). There are several ways
in which devolution impacts governance. First, by distributing authority over public goods and
revenues devolution makes it difficult for individuals or groups of official actors to collude and
engage in corrupt practices. Second, where devolution of authority takes place along territorial
and communal lines, it can foster effective cooperation within the devolved units. As a result,
local communities are able to mobilize social pressure against rent seeking and corruption.
Indeed, a growing number of countries have over the last three decades further decentralized
administrative, fiscal and political functions of central government to subnational governments.
Some of these countries include the United Kingdom, Italy and Spain. In many cases, devolution
has also been driven by the need to bring government closer to the people.

3
While devolution was intended to transfers some of these power, authority and responsibilities to
lower ranks this process is meant to yield a seamless relationship between the devolved units and
the central authority in a manner devoid of dissonance. The motivation of devolution in Kenya
was the perception that county governments were at a better administrative position to render
water provision as they are close to residents and thus can effectively identify challenges facing
their localities compared to the National Government Mukabi, Barasa and Viola (2015) pointed
out that needs vary from one region to another in Kenya.The Water Act 2002 established the
institutions that provide water services including Water Service Providers, Water Services
Regulatory Board and Water Services Boards (Owuor & Foeken, 2009). This study emphasized
on Arid and Semi-Arid Lands in Kenya.
1.2.1 Administration of Devolved Water Services
Worldwide, devolution continues to be perceived and implemented as a measure for enhancing
the provision of social services, through the allowance of a closer linkage of local area needs
with the public policy (World Bank, 2012). In Africa, devolution has grown significantly in the
last twenty years. Some African countries that have embraced this form of decentralization
include Uganda, South Africa, Ethiopia, Mali, Tanzania, Mozambique, Kenya, Nigeria and
Ghana (Riedl & Dickovick, 2010).
The water sector is especially vulnerable to poor governance as well as corruption. Procurement
processes involving large amounts of public money and investment decisions, characterized by
discretion and non-transparency, open the door for undue interference and capture. The
monopolistic nature of service delivery prevents competition and, when coupled with the failure
to recover costs and the need for subsidies, may lead to inefficient and clientelistic resource
allocation. Since water is a basic service, many consumers or water users can be easily coerced
into paying bribes for access. The asymmetry of information between consumers and water
institutions and the lack of public awareness about respective rights and responsibilities may
prevent citizens from obtaining services they are entitled to. Lines of accountability are often not
clear and informal service providers (ISPs) are frequently not subject to public regulation (World
Bank, 2012).

4
Administration of devolved water services is therefore a typical example that should result in
better services to the public. There have been attempts to decentralize powers in more than
seventy nations in the past decades. The ground basis of this change is the notion that the
closeness brings about more efficiency and the constituents’ needs are responded to promptly
and as a result, public service efficiency is guaranteed (Shen & Zou, 2015).
In Kenya, devolution was enacted with the promulgation of the new constitution in 2010. The
underlying principles of devolution are economic development, self-governance and the
equitable sharing of resources at the national and county levels (Holmquist, 2014). Following the
constitutional change, many functions that were devolved included administrative, political and
monetary commands within the countries 47 counties (Bagaka and Kobia, 2013). Through
devolution, devolved administrations in Arid and Semi-Arid Lands are able to deliver quality
services and in time (Wagana, Iravo & Nzulwa, 2015). The main ideologies for devolving
power as well as functions for the National Government and County Governments are spelt out
in chapter 11 of the Kenya constitution 2010 and were aimed at localizing administration of
services including in water provision for better results. Additionally, Article 189 of the Kenyan
constitution obliges both levels of the government to respect the functionality and institutional
integrity (Republic of Kenya, 2010).
Devolved water services and the resultant administrative roles allows for decentralized decision
making through engagement of stakeholders, local human resource development and application
of modern technology. Engaging stakeholders increases their participation in an affirmative way
in organizational activities (Greenwood, 2007). Devolving water services to counties was meant
to provide counties with an opportunity to provide clean, safe and reliable water for both its
residents and animals through effective administration. Additionally, administration of devolved
water services was meant to address the challenge of inadequate human capacity, lack of skills
and lack of a well-structured human resource system in water provision. This is attributed to
staff who may not have the necessary experience to perform their duties. It is also due to lack of
knowledge and a shared vision among the political leadership and staff on what good
governance entails and how to implement key governance issues. The County Government Act,
passed in 2012, provides the legislative framework for the functioning of county governments,

5
with some administrative guidance on the new roles and responsibilities of county governments,
including on the delivery of water and sanitation services. Devolution of these core services
became effective from July 1, 2013 under the guidance of the Transition Authority, a statutory
body with constitutional authority to facilitate the transition process.
This transfer of responsibilities to county governments, nonetheless, has wide-ranging
administrative implications for the water and sanitation sector. The creation of a two-tier system
of government, each with a legislature, together with the allocation of the functions of water and
sanitation services to county government, means that the policy role of national government with
respect to water and sanitation services requires a level of cooperative governance and
consultation with counties that was less evident in the previous system. Effective administration
of the devolved water services requires county governments to focus on key administrative
opportunities and challenges. In addition, counties will have to work with the National
Government to sustain existing services and to ensure a smooth transition as the legislative
framework for the sector is formalized, and new institutions settle in. Furthermore, county
governments also need to understand the specific legislation that applies to the delivery of water
and sanitation services – and be able to execute the mandate of delivering water and sanitation
services (World Bank Group, 2015).
1.2.2 Transformational Leadership
The concept of leadership has generated interesting debate with the evolving styles of the
Leadership. A review into the arguments advanced by scholars on the concept of leadership
indicates that there lacks a consensus regarding its expression. Some have contextualized it as
the induction of complaisance, a personality feature, a group practice, power relationship, goal-
achieving instrument, and the outcome of interactions, the instigation of a structure, some kind
of persuasion or influence (Bass, 2000). Recently, it has been perceived as entailing some kind
of responsibility geared towards the attainment of certain goals through the application of the
present material and manpower, ensuring that there is cohesiveness and coherence in the
organization (Ololube, 2013).
6
Leadership, being central to politics and government, is one of the important societal institutions
that have the potential to significantly impact the objectives and processes of governments
across all societies (Bolden, 2004). In a political context, leadership can be described as
individuals elected to positions of authority, influence and decision-making directed by a
constitutional mandate. From a sociological perspective, leadership can also be described as a
stimulus directed at individuals and/or organizations to act in a collective manner in achieving
identified goals (Northouse, 2013; Dubrin, 2013). According to Bhat, Rangnekar and Barua
(2013) the values of security and equality have drawn much attention to the essence and
responsibilities attached to political leadership. In modern day democratic states, it is informed
by the need for developmental changes not achieved due to economic instability, changes in
technology and urbanization. Furthermore, the values of democracy have placed the onus right
on those in governments and required the political leadership to be responsive, accountable and
visionary towards societies that have become extremely diverse, complicated and desperate for
meaning (Belias & Koustelios, 2014).
According to Puni, Ofei and Okoe (2014), there are different leadership styles including:
autocratic, democratic/participative, transformational, as well as laissez faire leadership styles.
Autocratic style entails telling others what to do without allowing them to give their inputs on
the decision, unlike democratic style which values involvement of all. Laissez faire style is
where the followers are free to make decisions without the leader’s interference (Iqbal, Anwar &
Haider, 2015). In this regard, it is evident that the ability of effective administration of devolved
water services to enhance water provision in the ASALs will be subject to the transformative
ability of leaders in the counties. Transformational leaders transmit to employees a strong vision
of the growth opportunities in their team, encourage them to think critically about change
initiatives, enhance their confidence in dealing with adaptation, and emphasize the importance of
performance while transcending self-interests for the team’s sake (Bass, 1999). Because of such
leadership influence, employees are more likely to react favorably to change both attitudinally
and behaviorally. For instance, Ololube (2013) reported positive relationships between
transformational leadership and employee change commitment. Similarly, Detert and Burris
(2007) provided evidence that change- oriented (i.e., transformational) leadership predicted job
performance at the unit level.

7
As managers strive to operationalize change through transformational leadership, employees
react to change in both intended and unintended ways. For example, managers might have
varying ideas on how to accomplish change that could be equally instrumental for invoking
supportive change reactions. If employees misinterpret managers’ ideas for implementing
change (Sonenshein, 2010), they might experience uncertainty about particular behaviors needed
to achieve desired change objectives. These experiences can emotionally charge change contexts
(Kouzes and Posner, 2002) and reduce employees’ confidence in effectively adjusting to change.
Such contexts, coupled with repeated adjustments in employees’ work routines, divert energy
from their daily performance. Tensions might mount in employees as they attempt to learn new
work routines while maintaining prior performance levels (Certo & Certo, 2006). Under these
conditions, transformational leaders cannot champion change personally, but must convince their
subordinates upon achieving the intended changes, that every stakeholder would only achieve
net benefits at both individual and corporate levels.
Leaders with transformational leadership qualities have over the years been held in very high
esteem. It is perceived as being superior to other types of leadership qualities capable of
transforming organizations. Kouzes and Posner (2002, P. 30) argue that when facing significant
change “ leadership is the art of mobilizing others to want to struggle for shared aspirations”
given that strategy implementation means effecting changes on how the organization runs in
terms of business focus, systems and processes, leaders must therefore be skilled managers, able
to create an enabling environment that motivate others to follow their aspirations and a shared
vision among organizational members (Van Knippenberg & Hogs 2003).
According to Broaweys and Price (2011) a transformational leader is far much preferred than a
transactional leader. The reason for this is based on what Broaweys and Price states that the
perception of leadership has changed over time in line with the current development ideas on
organizations and management. In organizations today, we are less likely to place our emphasis
on planning, allocating responsibilities and controlling functions of management rather we seek
to move towards emphasizing more on motivating and inspiring our employees, creating change
in organizations and empowering others in organizations. This new type of leadership creates,
communicates, and embodies a vision that seeks to influence changes in the employees’ attitudes

8
and basic assumptions of our subordinates and to continue building their commitment to the
company. In addition, a transformational leader inspires trust, confidence and loyalty which is
what is known as a transformational style of leadership. Simola, Barling and Turner (2010) state
that transformational leadership is a type of leadership in which interactions among interested
parties are organized “around a collective purpose” in a way that seeks to “transform, motivate,
and enhance the actions and ethical aspirations of followers” Furthermore, Geib and Swenson
(2013) define transformational leadership as a leadership style that seeks positive
transformations “in those who follow” and that achieves desired changes through the “strategy
and structure” of a company.
The resource-based theory argues that performance in an institution is a function of managers’
efficacy in building their institution around resources that are valuable, rare, inimitable, and lack
substitutes (Barney, 2001). A firm should care for and protect resources that possess these
characteristics, because doing so can improve organizational performance. Crook, Ketchen,
Combs and Todd (2008) indicated that human resource development as a resource that meet
these criteria, hence, it should be well managed. One dimension would be through
transformational leadership. Transformational leadership is a significant leadership style to
maximize efficiency and to achieve the objectives of the organization (Chaudhry & Javed,
2012)). According to Zhu, Chew and Spangler (2005), transformational leadership is one of the
fundamentals of a company performance, in which qualified managers make decision dealing
with the purpose and objectives of the company, compensation, interpersonal behavior, product,
target customers, delivery and others. At the organizational level, transformational leadership
establishes and transmits to all employees the overarching direction of the organization, as such,
developing a better understanding of effective leaders is important for future leader development
(Gupta, Solis, Calderon & 2005).
Transformational leaders therefore influence subordinates by motivating and inspiring them to
achieve organizational goals (Bass & Avolio, 1995). They also try to help subordinates imagine
appealing future outcomes related to the organization (Bass & Avolio). Research has shown that
transformational leaders affect organizational outcomes such as organizational citizenship
behavior, organizational commitment, job satisfaction, effort, and in-role performance (Nguni,

9
Sleegers, & Denessen, 2006). Therefore, transformational style emphasizes on the leader and
follower improving each other and it is therefore imperative to understand the moderating role
transformational leadership play in influencing the relationship between administration of
devolved water services and water provision in the context of ASAL.
1.2.3 Planning
Planning entails a set goals and targets that aim to transform and improve the image of the public
service through quality delivery of services. Planning when intensely applied in provision of
services normally strengthen administrative capacities for County Governments to perform their
functions effectively (Institutional Reform in the New Constitution of Kenya, 2013). Planning
entails a set goals and targets which include resource allocation, strategic planning, as well as
optimal and on-time deliveries that aim to transform and improve the image of the public service
through quality delivery of services, Therefore, the planning concept may be regarded to have a
major role in moderating the relationship between administration of water services and water
provision. At the same time, to achieve the goals of devolution, it is important for the county
administration to have a strategic plan that acts as a guide on planning objectives and how each
objective is to be achieved. Therefore, counties are guided by specific objectives to achieve its
planning goals. These objectives must be clear about what will be achieved, they must be
measurable to quantify results and measure when they have been achieved, they must be
achievable and realistic in order to be attained within project resources in a specified timescale.
Planning is aimed at providing the directions to the set plans in order to focus on the results
(Republic of Kenya, 2013).
As part of leaders’ capacity for planning, it is mandatory for successful leaders to have a
managerial and leadership trait. Management team is fully mandated to put into action the
formulated goals on the grounds of the already set organizational rules and procedures. Planning
involves overall competency and overall service quality given to the external and interior
shareholders (Sifuna, 2012). Hughes, Ginnett and Curphy (2012) argue that another main task of
the leadership in all organizations is to lay down the structure of the organization and the orders

10
to be followed. This implies that the planning is also vital in the provision of services in Arid
and Semi-Arid Lands.
Water management crisis response takes various facets especially in other countries globally. As
a result of inadequate public resources, public negligence and fraud, market mechanism such as
price and competition have been employed effectively to create water crisis (Golooba-Mutebi,
2012). Another fundamental concern that has been emphasized in water management involves
demand driven approach in water management involving the community. Therefore, the issues
affecting management of water continue to be highly native and contextual (Hirsch, 2006).
1.2.4 Water Provision
Water is the backbone for all known forms of life and therefore it is important to ensure adequate
supply in the right quantity and quality. According to UNESCO (2015), the available suitable
water resource for domestic use is only 2.7% of the available water on earth but only 1% of the
water (in lakes, rivers and groundwater) is accessible. Most of the available freshwater resources
are inaccessible because they are in the hidden part of the hydrologic cycles (deep aquifers) and
in glaciers (frozen in the polar ice), which means safe drinkable water on earth has very small
proportion (~3%) in the freshwater resources. In some countries, sufficient freshwater is not
available (physical scarcity). In some countries, abundant freshwater is available, but it is not
affordable to many (economic scarcity) but in arid and semi-arid lands, available water is not
only scarce but also has qualities below international standards (Samra & Fawzi, 2011).
Water provision is indicated by physio-economic accessibility such that the ease of physically
accessing the water facilities including the safety and adequacy of these resources constitute the
physical component of water provision. At the same time water is required to be within the
physical reach by every part of the population or at least within the visibility (Kaushik, 2011).
Jones, Parker and Reed (2002) insulated that, physical accessibility to water is indicated by the
households spending less time to identify the infrastructure and using the saved time on other
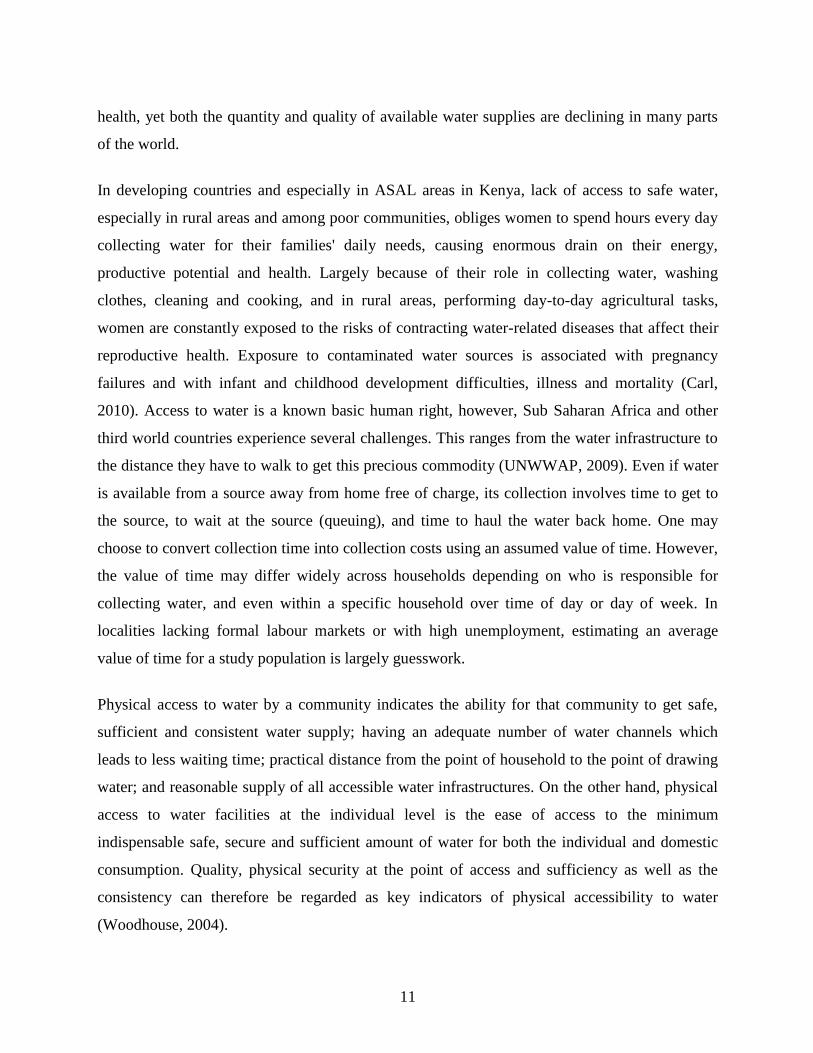
productive activities such as household chores. Water is an essential resource for sustaining
11
health, yet both the quantity and quality of available water supplies are declining in many parts
of the world.
In developing countries and especially in ASAL areas in Kenya, lack of access to safe water,
especially in rural areas and among poor communities, obliges women to spend hours every day
collecting water for their families' daily needs, causing enormous drain on their energy,
productive potential and health. Largely because of their role in collecting water, washing
clothes, cleaning and cooking, and in rural areas, performing day-to-day agricultural tasks,
women are constantly exposed to the risks of contracting water-related diseases that affect their
reproductive health. Exposure to contaminated water sources is associated with pregnancy
failures and with infant and childhood development difficulties, illness and mortality (Carl,
2010). Access to water is a known basic human right, however, Sub Saharan Africa and other
third world countries experience several challenges. This ranges from the water infrastructure to
the distance they have to walk to get this precious commodity (UNWWAP, 2009). Even if water
is available from a source away from home free of charge, its collection involves time to get to
the source, to wait at the source (queuing), and time to haul the water back home. One may
choose to convert collection time into collection costs using an assumed value of time. However,
the value of time may differ widely across households depending on who is responsible for
collecting water, and even within a specific household over time of day or day of week. In
localities lacking formal labour markets or with high unemployment, estimating an average
value of time for a study population is largely guesswork.
Physical access to water by a community indicates the ability for that community to get safe,
sufficient and consistent water supply; having an adequate number of water channels which
leads to less waiting time; practical distance from the point of household to the point of drawing
water; and reasonable supply of all accessible water infrastructures. On the other hand, physical
access to water facilities at the individual level is the ease of access to the minimum
indispensable safe, secure and sufficient amount of water for both the individual and domestic
consumption. Quality, physical security at the point of access and sufficiency as well as the
consistency can therefore be regarded as key indicators of physical accessibility to water
(Woodhouse, 2004).

12
Economic accessibility, on the other hand, is a component that is indicated by ease of
affordability of water facilities by every household regardless of their level of affluence (Frone
& Frone, 2013). This indicates that when the water levies are so unreasonable for household to
afford, there is an opportunity cost since they have to use their scarce resources for other basic
needs such as food, housing, education, health-care and clothing. Therefore, water as a resource
is said to be, economically speaking, accessible if household/family spends five percent or less
of its monthly disposable income on water (Allen, Dávila & Hofmann, 2006). Water
accessibility depends on its physical location and timely availability (Osei, 2004). Ariyabandu
(1999) express the fact that easy accessibility, reliability and timely availability of adequate safe
water to satisfy human needs ensures household water security for basic needs and economic
activities. Globally, the main sources of freshwater for socio-economic activities include rivers,
pipe water, protected and unprotected springs, open wells, protected wells, roof catchments,
dams, earth pans, boreholes, streams, lakes, reservoirs and underground aquifers resulting from a
complex hydrological cycle (UNEP, 1999).
The per capita domestic water consumption in the ASAL is estimated as 20 litres per day
(MoWRD, 2002). This includes water for cooking, bathing and washing. Nearly all the water
resources used by livestock are also used by humans, even when visibly turbid and polluted as in
rivers, dams and pans. Livestock water demand was estimated based on the drinking
requirements of one Tropical Livestock Unit (TLU). According to the Range Management
Handbook (Republic of Kenya, 2012), one TLU is equivalent to 250 kg live weight. Thus, an
average cow is about 0.9 to 1.0 TLU, while one cow is equivalent to 10 goats or sheep in terms
of water per day, because nearly all the animals are crossbreeds and have average body weight.
Human water requirement was calculated by multiplying the per capita requirement (60 litres)
with the total population, while livestock water demand was calculated using weighted values
derive livestock population in terms of TLU, and total TLU multiplied with daily water demand
(also 50 litres), (Wairua, 2011). Some water sources are meant only for human consumption;
hence they have zero water demand for livestock. Livestock water demand in Nyangores area is
affected by long distances to water sources, immigration of pastoralists in dry season, and
emigration in the wet season. In most cases, the demand does not match supply which is

13
variable. It has caused a lot of conflicts over water and other resources, especially during dry
season, when demand outstrips supply (Biamah, 2004). Apparently two – thirds of the water is
utilized for livestock drinking.
The Government of Kenya recognizes that for the country to meet its poverty-reduction
strategies and achieve the SDGs, water has to be made available, accessible and affordable,
especially to the poor. This is based on the fact that all the seventeen SDGs are directly or
indirectly related to access to water. The Kenyan water sector has for a long time been
characterized by inefficiencies, lack of investments, poor management and confusing array of
legal and institutional frameworks. This has resulted to inadequacies in water accessibility,
affordability, quality, reliability, and clarity as well as frequencies to which these water is
provided to Arid and Semi Arid Lands. In addition, the exponential growth of Kenya’s urban
centers has put increasing pressure on utilities to extend services to new areas.
To address these challenges and as part of a global trend, the Government of Kenya introduced
far reaching reforms in the water sector to restructure and improve sector performance (Owour
& Foeken, 2009). A major aspect of these reforms was ensuring financial viability of water
service providers (WSP). However, most WSPs are financially unsustainable. WSPs are faced
with weak management structures, processes and systems and poor systems of revenue
collection. Therefore, in order to ensure the sustainability of WSPs, it was vital to investigate the
interrelationship and importance of factors impacting corporate sustainability, paying greater
attention to financial viability of a WSP (GoK, 2015). The government further devolved water
provision in 2010 in attempt to address water provision challenges.
As a criterion, water provision needs to meet the suitability tests for adequacy, affordability,
quality and accessibility as well as reliability (Bos, Alves, Latorre, Macleod, Payen, Roaf &
Rouse, 2016). However, there is no universally acceptable standards for gauging the mentioned
parameters and various authors expressing different metrics. For instance, Bos et al. (2016)
underscores that distance covered by a household must be within 30-minutes’ walk or 0.2
kilometers for water resources to be termed as accessible. WHO/UNICEF (2013) also give
guidelines and principles that need to be followed for water to be considered fit for use by

14
stating that Chloride should not exceed 100 mg/L in domestic water to be palatable. At the same
time, Excessive Fluorine (F) (>2 mg/L) causes a dental disease known as fluorosis (mottling of
teeth) with F < 2 mg/L causes dental cavities in children.
To overcome the challenge of standardized measure in determining suitability of water
resources, the calculation of a general water quality index (WQI) is extremely important in order
to communicate the quality of water in a better and understandable ways. In the current study,
the researcher used an arithmetic Water Quality Index method proposed by Tiwari and Mishra
(1985). The overall WQI classes are expressed in percentages as follows: 76-100 (excellent,
grade A), 51–75 (good, grade B), 26–50 (poor, grade C), 0–25 (very poor, grade D), >100 (unfit
for domestic consumption, Grade E). The reverse of this scale is applicable for turbidity, color,
taste and odor. WQI was also adopted by Gupta, Purohit, & Jayita, (2001); Ramakrishnaiah,
Sadashivaiah & Ranganna (2009); Dinka (2010); Jagadeeswari & Ramesh (2012).
1.2.5 Arid and Semi-Arid Lands (ASAL)
ASALs occupy about 89 percent of Kenyan land mass and with around 36 percent of Kenyan
population, 70 percent of all the livestock and 90 percent of the wild game supporting tourism
sector in Kenya (Ministry of Planning & Devolution, 2016). In arid lands, water coverage is at
26 percent. Semi-arid lands, as well, have serious water scarcity with some regions like Kajiado
County having water coverage as low as 32% (Arid lands Resource Management Programme,
2006).
ASAL lands regularly experience recurrent water deficiency as a result of scarce rains received
over the years. Nonetheless, pastoralists are dominant in the area and they have to walk for a
very long distance in pursuit for water that they use domestically for human and livestock
consumption (Northern Water Service Board, 2011). With livestock being the main source of
livelihood for most of the communities living in Arid and Semi-Arid Lands, water is key to
survival. The region faces perennial drought which immensely affects the livestock and affecting
food security for humans. The insufficient food has resulted to increased deaths of children and
the elderly (ECHO/UNICEF, 2005). The girl child has been most affected by inadequacies in

15
water provision because they are forced to drop out of school to go and fetch water for their
families and livestock which in most cases are very far from their residences. This leads to
increased illiteracy levels among the girls.
Water provision in ASAL has been challenging over time as a result of persistent droughts and
land-use patterns. The climate scenarios show that rainfall variability and increased evaporation
due to higher temperatures will lead to further decreases in the available water (GoK, 2013).
Already there are dramatic reductions in the snow and glaciers of Mount Kenya, believed to be
associated with global warming. These glaciers could vanish in the next 15 years. The
disappearance of the glaciers will affect agricultural activities, the availability of water for both
rural and urban populations, hydroelectric production and tourist activities (Ministry of
Environment and Mineral Resources, 2009). Adaptation to water scarcity is one of the most
important issues facing Kenya today and rural Kenyans ‘livelihoods are already affected by a
changing climate, (Ritho, et al., 2012).
The economy in ASAL is largely built around pastoralism with some, the more wet lands,
having some mixed agro-pastoral economic activities that include among others crop farming
(through both irrigation and seasonal rain), tourism, agro-livestock businesses and bio-
businesses. Other activities include fisheries as well as hunting and gathering which are mostly
used for subsistence. The ecosystem in semi-arid lands permits escalated production beyond that
of arid. These lands, nonetheless, share the same experience of prolonged drought and food
insecurity with the further challenge of blotting population, uncertain climatic changes and
degraded ecosystems (UNICEF, 2013). The unit of analysis in this study entailed the sub-
counties in ASAL. According to the Ministry of Planning and Devolution Report (2016), there
are one hundred and thirteen (113) sub-counties demarcated as Arid and Semi-Arid Lands
(ASAL) and distributed within 23 counties in Kenya. The Ministry further categorises the 113
sub-counties into Arid (36 sub-counties in 8 counties) and Semi-Arid (77 sub-counties in 15
counties).
[
16
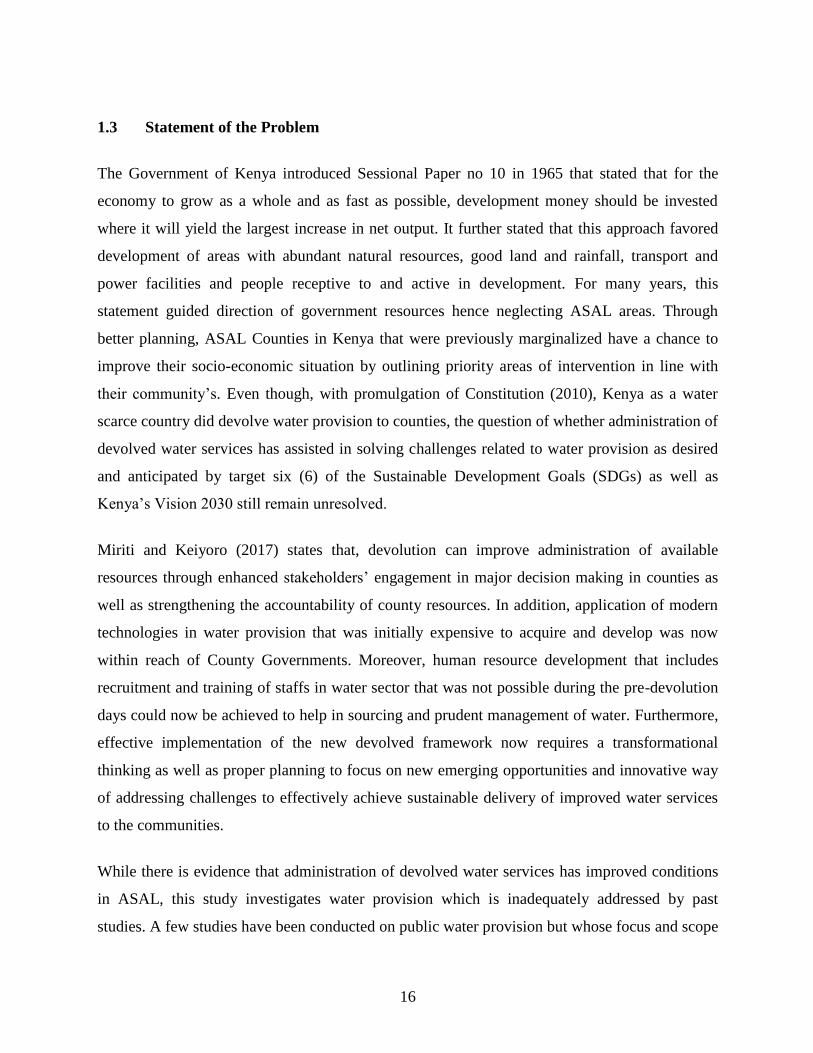
1.3 Statement of the Problem
The Government of Kenya introduced Sessional Paper no 10 in 1965 that stated that for the
economy to grow as a whole and as fast as possible, development money should be invested
where it will yield the largest increase in net output. It further stated that this approach favored
development of areas with abundant natural resources, good land and rainfall, transport and
power facilities and people receptive to and active in development. For many years, this
statement guided direction of government resources hence neglecting ASAL areas. Through
better planning, ASAL Counties in Kenya that were previously marginalized have a chance to
improve their socio-economic situation by outlining priority areas of intervention in line with
their community’s. Even though, with promulgation of Constitution (2010), Kenya as a water
scarce country did devolve water provision to counties, the question of whether administration of
devolved water services has assisted in solving challenges related to water provision as desired
and anticipated by target six (6) of the Sustainable Development Goals (SDGs) as well as
Kenya’s Vision 2030 still remain unresolved.
Miriti and Keiyoro (2017) states that, devolution can improve administration of available
resources through enhanced stakeholders’ engagement in major decision making in counties as
well as strengthening the accountability of county resources. In addition, application of modern
technologies in water provision that was initially expensive to acquire and develop was now
within reach of County Governments. Moreover, human resource development that includes
recruitment and training of staffs in water sector that was not possible during the pre-devolution
days could now be achieved to help in sourcing and prudent management of water. Furthermore,
effective implementation of the new devolved framework now requires a transformational
thinking as well as proper planning to focus on new emerging opportunities and innovative way
of addressing challenges to effectively achieve sustainable delivery of improved water services
to the communities.
While there is evidence that administration of devolved water services has improved conditions
in ASAL, this study investigates water provision which is inadequately addressed by past
studies. A few studies have been conducted on public water provision but whose focus and scope

17
make the suffer from either conceptual gap, contextual gap or methodological gap is either
jurisdictions outside Kenya or haven’t laid interest in ASAL. For instance, a study by Peprah,
Oduro-Ofori and Asante-Wusu (2015) in Ghana investigated provision of water in Awutu-Senya
East Municipality, Ghana. The study indicated that, individuals’ contribution on daily water
production amounted to 64.2% with public water provision effort constituting 35.8%. Close to
half of that water was salty with 28% being contaminated and impure. This study was inadequate
by failing to establish whether provision significantly relates to administration of devolved water
services, transformational leadership and planning which are examined in the current study. In
Kenya, Wagah, Onyango and Kibwage (2010) studied accessibility of water services in Kisumu
municipality and found that, although 77.1% of household could access piped water only 25%
accessed the minimum recommended amount. Further, low-income households were the most
affected by poor accessibility to water. This study was nonetheless carried out before
administration of devolved water services kicked off noting that the structure of municipality
could yield difference in management of water service from that of a devolved structure.
Additionally, Kisumu county is not demarcated as an ASAL thus making the study inadequate to
assess the actual effect of devolution on the marginalized communities.
Wachira (2014) carried out a study on challenges and prospects for effective water conservation
in Mwingi North District, Kitui County, Kenya. The study showed that there is stakeholders’
engagement in water conservation though it is not recognized by the local people. However, the
study by Wachira applied explanatory research design and did not consider the moderating effect
of planning on water provision. Other more relevant studies differ from the proposed study in
terms of study areas, scope, methodology or time. Mwendamseke (2016) investigated the
efficacy of the newly promoted strategy of Community – Owned Water Supply Organizations
(COWSOs) in seven ASAL districts of Dodoma region. The study found that the registration
process of COWSOs at the districts is undesirably low. Unfortunately, the study did not factor in
the aspects of planning in water provision and which from the background of this study has
turned out as an area that could have significant influence on the relationship between
administration of devolved water services and water provision. The study also seems to be
establishing strategies water management bodies, contrary to the current study which investigate

18
the outcome of devolution. It was also based in Dodoma and, therefore, cannot be generalized
into Kenyan context.
Cherunya, Janezic and Leuchner (2015) explored sustainability of supplying water that is safe
for drinking where it is underserved focusing on devolved solutions in Kenya. From the study,
majority of households often obtained water from different sources. Nonetheless, the contextual
focus for the study was not ASAL. This study also failed to interrogated the role of
transformational leadership motivated by (Serfonten, 2010) who established that, leaders ought
to have the appropriate skills and a wide spectrum of knowledge that would be applied in the
appropriate time to address various problems. Given that limited studies that have investigated
the issue of administration of devolved water services in ASAL, there is a need of insights to
understand the concerns put forward. To address this gap, this study explored the interplay
between administration of devolved water services, transformational leadership, planning and
water provision in ASAL in Kenyan.
1.4 Objectives of the study
The main objective of the study was to establish the role of administration of devolved water
services, transformational leadership and planning on water provision in Arid and Semi-Arid
Lands, Kenya.
The specific objectives are:
i. To determine the effect of administration of devolved water services on water provision
in ASAL in Kenya;
ii. To establish the moderating effect of transformational leadership on the relationship
between administration of devolved water services and water provision in ASAL in
Kenya;
iii. To establish the moderating effect of planning on the relationship between administration
of devolved water services and water provision in ASAL in Kenya;

19
iv. To establish if the joint moderating effect of transformational leadership and planning on
the relationship between administration of devolved water services and water provision
in ASAL in Kenya is significantly different from their separate effect.
1.5 Justification of the Study
The study will be beneficial to several stakeholders. The specific stakeholders include the
government of Kenya, County Governments, the society, scholars and researchers.
1.5.1 The Government of Kenya
The study will inform National Government policies to better align or revise the existing legal
framework, policies and the guidelines of devolution process. Further, the findings may
influence the National Government to develop appropriate policies to enhance devolution
processes so as to improve water provision to the public and thus propel the country towards
achieving Vision 2030. Furthermore, the National Government might use of the findings to
come up with strategic interventions to enhance devolution and water provision to its citizens.
The study also informs best strategies to employ in making turnaround in water provision both at
national and County Governments. This study finally came up with policy recommendations,
which can be used by National Government to improve management and leadership skills in
relation to water provision.
1.5.2 County Governments
The County Governments, which took effect with the new constitutional dispensation, may
benefit a lot from the study findings primarily because the study addresses gaps in water
provision with specific focus on ASAL counties in Kenya. The County Governments are
expected to play a critical role in improving water provision to the people. This study might
inform County Assemblies and County Executive on whether devolution of fiscal power,
political power and administrative power has improved water provision to the people as was

20
expected by the constitution. The members of County Assembly may use the finding of this
study to better align or revise the existing county legal framework to promote water provision in
the counties. This study finally came up with policy recommendations, which can be used by
County Assemblies and County Executives to improve on management and leadership skills so
as to increase water provision in County Governments.
1.5.3 The society
This study is of help to the entire society as it seeks to explain the relationship between
devolution, transformational leadership and water provision. By illustrating the effect of
governance decentralization on service delivery in County Governments in Kenya, the finding
may shape future devolution debate and water provision in the entire Kenya society. The
findings of this study may also benefit the entire Kenyan society including private practitioners
by providing them with in-depth understanding of the relationship between devolution and water
provision delivery. Similarly, the finding of this study will be of significance to other African
developing countries and especially the members of the East African community, that are
culturally, economically, and politically similar to Kenya.
1.5.4 Scholars and Researchers
To the scholars, the study is value-added to the existing body of knowledge as it developed
comprehensive model on devolution, transformational leadership, planning and water provision.
The study will thus benefit the scholars wishing to undertake further studies aimed at improving
devolved governance structures in local and global context. Academic researchers will be able to
refer to the data used in the study and benefit from the findings, cognizant of the fact that rich
literature is unavailable in Kenya relating to devolution, transformational leadership, planning
and water provision and service delivery. Moreover, the framework developed in the study may
be useful tool to academicians and other researchers wishing replicate this study in different
states, counties and countries. Nevertheless, this study serves as a stepping stone for newer
research on devolution, transformational leadership, planning and water provision.

21
1.6 Scope of the Study
This study was designed to be carried out in all sub-counties within ASAL Kenya. The study
generally examined the effect of administration of devolved water services on water provision.
How leadership and management moderate the interplay between administration of devolved
water services and water provision was also analyzed. The study covered 113 sub-counties
ASAL.
1.7 Limitations of the Study
The researcher encountered a number of challenges related to the research; but the limitations
did not have a significant interference with the outcome of the study. Although this study
covered all ASAL County Governments in Kenya, it only used a sample to draw conclusions and
inferences, which was as per the research design. Time factor was a limitation as the respondents
took longer time than expected. At times the researcher had to personally travel to some remote
local authorities where the research assistants failed to make headways. This escalated the costs
beyond the budget. The geographical spread of the 23 counties in Kenya made access difficult
In addition, some of the respondents found it difficult to fill the questionnaire because they felt
giving the information required might jeopardize their jobs; however, this was overcome by
assurance that the information will not be divulged and is for academic purpose. The study did
not obtain 100% response rate due to unwillingness and unavailability of some targeted
respondents given the nature of information to be collected. The other challenges faced was
resource limitations during the entire period of the research ranging from time, finances and
technical support during the data analysis and thesis development. The researcher overcame this
by selecting a sample from the entire population and thus making the available resources
adequate for the study.
Due to logistic challenges, the researcher was not in a position to acknowledge every element
within the population and instead only got a representation with the outcome being generalized

22
to the entire population. To mitigate any bias during the sampling, scientific and systematic
techniques were used to select the respondents. Respondents were required to give views that
have the potential of being subjective to their personal interpretation of the various research
questions which would have affected the accuracy and credibility of the outcome. To mitigate
this, the researcher undertook a pilot study where research instruments were subjected to
reliability and validity tests. The researcher encountered some security challenges especially in
Northern Counties bordering Somalia. The researcher mitigated this by getting security escort in
these areas.
Further, the study used ordinal scale among others to measure the variables. However, ordinal
scale does not give the investigator the level of precision required in a study, especially when
strong statistical procedures are to be applied (Saunders et al., (2007). The respondent was the
sole data source for both independent, moderating and dependent variables. Despite the
limitations experienced, the quality of the study was not compromised. The study was designed
in highly scientific manner following a thorough literature and theoretical review. Moreover, the
study was based on a single country using data from Kenya. There is an opportunity to conduct a
larger survey in other major cities and countries across the world. It may be interesting to
explore the relationship between administration of devolved water services, transformational
leadership, planning and water provision in arid and semi-arid lands countries that have similar
environments to Kenya. All in all, the study was rigorous in its approach analysis, interpretation
and reporting of the findings. The implications discussed did not therefore have any material
effect on the results and findings of the study
1.8 Chapter Summary
This chapter has presented a background of the study that in general describes the water situation
in Kenya, the water situation in ASAL and the interplay between administration of devolved
water services and water provision. The chapter also shows the research problem that the study
sought to address, highlighted study objectives, justification, scope and limitations of the study.

23
CHAPTER TWO
LITERATURE REVIEW
2.1 Introduction
In this chapter, theoretical and empirical literature in past works of different researchers, relevant
or related to the area of study is reviewed. In this regard, the review has been done about
administration of devolved water services and water provision, the relevant theory and the
researcher’s conceptualization of the research variables.
2.2 Theoretical Literature Review
This study is anchored on the theory of fiscal decentralization, Souffle theory, transformational
leadership theory, new public management theory, and the visionary leadership theory.
2.2.1 Theory of Fiscal Decentralization
This theory was intended to address administration of devolved water services as the
independent variable for this study. The theory particularly focused on the aspect of devolved
resources from national government to the county governments. Formulated by Oates (1972), the
theory of fiscal decentralization is based on a premise that the decentralization of funds from
National Governments to sub-National Governments meant for development would bring
services closer to local citizen levels (Oates, 1972). Oates (1972) noted that, fiscal
decentralization hinges heavily on the two concepts of efficient and effective distribution and
allocation of financial resources for enhanced service delivery in the public sector. In this vein,
Oates (2006) advances the arguments on the theory of fiscal decentralization which presupposes
that sub-National Governments are in a position to adapt outputs of public services to the
preferences and particular circumstances of their constituencies, as compared to a central
solution that presumes one size fits all.

24
The distribution function involves the role of government in changing the distribution of income,
wealth or other indicators of economic well-being to make them more equitable than would
otherwise be the case. The case for assigning this function to the National Government rests on
two assumptions: that the National Government’s broad taxing powers can more easily
redistribute income; and that the ability of taxpayers to move from one jurisdiction to another to
take advantage of more attractive spending and taxation policies weakens local government’s
ability to “soak the rich and redistribute to the poor.” The case for regional and local
redistributive policies rests on the fact that sub-national levels of government provide the
services most used by low-income families. However, most economists view the national role as
primary. The allocation function is government’s role in deciding the mix of public and private
goods that are provided by the economy or by government. Each level of government may be
more efficient in delivering certain governmental goods and services.
In adopting this theory therefore, this study contends that unlike the monopolistic environment
enjoyed by National Governments, devolved governments encounter stiff competition from their
peers. It is such competition that necessitates constraints in budgetary growth and contributes the
pressure for the efficient provision of services to the public for example through the
implementation of responsive health care projects (Oates, 2006; Tiebout, 1956). Through the
theory, this research also holds that fiscal decentralization can act as a critical vehicle to
achieving sustainable development in the health care sector especially the implementation of
projects if it is used to provide a logical framework for mobilizing local support and resources,
and promoting participation among beneficiaries of these public service development programs
(Porcelli, 2009). The superiority of the National Government in delivering national defines or
national health research is obvious as is the likelihood that certain services such as fire and
police protection are more suitable for local government.
Through the theory, the researcher also argues that fiscal decentralization should not be taken as
the panacea for the implementation of public services projects such as water provision. Its
existence may not even necessarily produce positive outcomes if there is no fair and clearly
defined mechanism for resource allocation and distribution. In fact, as it has been argued, fiscal
decentralization could lead to allocative inefficiencies, as well as poor accountability and

25
governance (Seabright, 1996). This has been found to limit innovations in the provision of public
sector services by devolved units of governance.
This theory was relevant to this study given that the theory hinges heavily on the two concepts of
efficient and effective distribution and allocation of financial resources for enhanced service
delivery in the public sector. This resonates with the object of devolving administration of water
services in Kenya in order to transfer finance resources from national government to self-
governing local agencies (counties). Additionally, the Theory of Fiscal Decentralization aligns
itself to Article 174 (g) of the Kenya Constitution on “Objectives of Devolution” to ensure
equitable sharing of national and local resources throughout Kenya.
2.2.2 The Souffle Theory
This theory was also intended to address administration of devolved water services but focusing
on the administrative aspect of the devolved resources. The Soufflé Theory was proposed by
(Parker, 1995) who postulates that there are three major elements of decentralization namely
administrative, fiscal, and political decentralization. Parker (1995) emphasized that
decentralization is a multi-dimensional process that proceeds with successes and setbacks. The
theory argues that like a Souffle that needs just the right combination of milk, eggs, and heat to
rise, a successful program of decentralization must include the right combination of political,
fiscal, and institutional elements to improve rural development outcomes (Farooq, Shamail, &
Awais, 2008; Laryea-Adjei, 2006). Decentralization initiatives will therefore be subject to a
continuous process of modification reflecting changes in social, political and economic
conditions (Laryea-Adjei, 2006). There is therefore the need to include all dimensions of
political, fiscal and administrative decentralization. Parker suggests a conceptual model, the
soufflé theory, which incorporates the essential elements of political, fiscal and administrative
decentralization as they combine to realize desired outcomes.
Godda (2014) cited (Hossain, 2000) and opined that administrative decentralization seeks to
redistribute authority, responsibility and financial resources for providing services among
different levels of government. The central government transfers some of its responsibilities for
planning, financing and management to the local level authorities. By doing so the central

26
government gives the local authorities administrative autonomy to respond effectively to the
local needs (World Bank, 2008). The local authorities can therefore make changes and enforce
regulatory decisions to govern various systems at local offices such as the procurement system
and human resources management-including recruitment and performance management (Godda,
2014). In addition, Ghazia (2009) contends that fiscal decentralization gives local government
authority and power to generate revenues and decide on expenditures. It also transfers some
funds from central government to local governments so that the local governments can deliver
decentralized function. Fiscal decentralization takes many forms like cost recovery through user
charges and expansion of local revenues through property or sales taxes, or indirect charges.
Nevertheless, there should be fiscal policies and procedures to govern the practices of local
officials; checks and balances must also be built into the system (Kerr, 1998 in Godda, 2014).
Political decentralization transfers policy and legislative powers from central government to
elected local authorities (Azfar, 1999). However, the allocation of the power of decision making
to local authorities is not enough to create successful decentralization if local officials are not
accountable to the local population (Elsageer & Mbwambo, 2004). Local accountability might
be promoted through various mechanisms such as third-party monitoring by media and NGOs,
extensive participation of citizens and central government oversight of local governments
(Godda, 2014).
Despite the propositions of the Soufflé theorist that are in favor of decentralization, governance
decentralization has been criticized due to several limitations. Saito (2001) posits that
decentralization may foster more local royalty to regional identities than the national identity,
and this may encourage more autonomy from the central government and even a territorial
secession in multi-ethnic and multi-religious societies, particularly in Africa. This puts the
national integrity itself at risk. Secondly, decentralization may increase corruption at local level
and thus this would not improve accountability. Lastly, the increased efficiency and
effectiveness of public resources may not be realized, since resources (capital, human and even
social) available at local level in low-income countries are very limited. These scarce resources
are more effectively utilized when they are concentrated at the national level.

27
Decentralization may also jeopardize equity among different localities. The Soufflé theory is at
the center of devolution. The theory is relevant to the current study as it provides insights on
various dimensions of decentralization adopted by County Governments in Kenya. Unlike other
countries where the devolution process of the three powers (political, administrative and
financial) has been sequentially attained, in Kenya the three types of decentralization were
achieved at once with the ratification of the constitution in 2010 (Kobia & Bagaka, 2014).
The Souffle Theory was applicable in this study since it provides in-depth understanding of
various decentralization constructs namely financial decentralization, political decentralization
and administrative decentralization aspects which affect the variables in this study. However, it
is the administrative component of decentralization that this this theory applied most given that,
the national government gives the county authorities administrative autonomy to respond
effectively to the local needs. This autonomy therefore makes administration of devolved water
services a variable since the county authorities can therefore make changes and enforce
regulatory decisions to govern various systems at local offices such as the procurement system
and human resources management-including recruitment and performance management.
Moreover, Article 174 (c) of the Kenyan Constitution further makes this theory adequately
relevant for the purpose of the study since devolution was meant to give powers of self-
governance to the people and enhance the participation of the people in the exercise of the
powers of the State and in making decisions affecting them.
2.2.3 Transformational Leadership Theory
This theory addressed transformational leadership as the first moderating variable for this study.
Transformational leadership theory, also known as relationship theory, was initiated by Burns
(1978) and Bass (1985), and has become quite popular in recent years. The theory focuses on the
connections formed between the leaders and followers. Burns (1978), in the book Leadership,
set the stage for the evolution of transformational leadership theory. The focus was on followers
and their sense of self-concept, encouraging followers to build self-concept based on the mission
and vision of the leader, by motivating followers to do their best and want to meet the
expectations of their leaders. In this process, followers can achieve self-esteem, be involved, and
28
be satisfied. In the 21st century, organizations are faced with new challenges, which in some
cases are different from face-to-face challenges and need quick and reliable intervention
strategies.
Burns (1978) posited that transformational leaders engage followers not only to get them to
achieve something of significance, as he described them as “visionary change agents,” but also
to “morally uplift” them to be leaders themselves hence, enriching the relationship by creating
followers’ interdependence (p. 20). Bass (1985) added that to be transformational, the leader has
to learn the needs, abilities and aspirations of the followers to develop them into leaders. The
outcome of implementing transformational leadership is a mutual relationship that converts
followers to leaders and leaders into moral agents to satisfy the needs of their followers (Gill,
2006). Groves and LaRocca (2011) stated in their analysis of the ethical emphasis of
transformational leaders that, “transformational leadership is predicated on deontological ethics
and a focus on the morality of the means rather than the ends … predicated on the norm of social
responsibility” (p. 513).
Leaders implementing transformational leadership can gain the trust, admiration, confidence,
and respect of other team members by personally demonstrating an extraordinary ability of one
kind or another. These leaders put the needs of their followers before their own and display high
standards of ethical and moral behavior that results in a high percentage of trust. Doing so will
result in increased motivation, intrinsic and extrinsic, in leaders and followers. Trust may be the
single most important factor in transformational leadership (Bass, 1999). Leaders implementing
transformational leadership will result in leaders becoming role models for their followers:
people identify with them and want to follow and emulate them. In general, organizations can
acquire the needed leadership either by recruiting new leaders or by building a leader from the
followers.
In essence, leadership is about the understanding of the behaviors and functions of individuals
and circumstances that are present in the workplace. The transformational style of leadership
(Dunford, 1992) builds on this concept to be the next step beyond the transactional leadership
paradigm, which is one of leader-follower relationship in the context of a formal exchange

29
seeking something more than just obedience and compliance from the followers (Lindgreen,
Palmer, Wetzels & Anticco, 2009). Individual job performance is reported by Walumbwa,
Avolio & Zhu (2008) and further supported by Tsai et al. (2009) to be related to the leader’s
transformational leadership input. Therefore, supporting identification of the leader/follower
relationship, and resulting in the improved work unit and individual performance of the follower.
Transformational leaders believe there is a need, as demonstrated in Tichy & Ulrich (1984)
whatever the situation, to change the followers’ beliefs, attitudes and values, for the good of the
organization and individual, and in doing so achieve a superior level of performance and
competitive advantage. According to Bass (1990) managers who behave like transformational
leaders are more likely to be seen by their colleagues and employees as satisfying and effective
leaders. In consideration, Robbins & Judge (2007, p. 437) explain transformational leadership as
“leaders who inspire followers to transcend their own self-interests and who are capable of
having a profound and extraordinary effect on followers”. In support are Castro, Perinan, Carlos
& Bueno (2008) who acknowledge that transformational leadership is positively related to
leadership effectiveness and has a significant influence on the attitudes and behaviors of
followers, and is a style that has a positive advantage for both the organization and the
individual.
From the arguments in this theory, it can be implied that exercising transformational leadership
in the devolved administrations can greatly improve service delivery to the residents in Arid and
Semi-Arid Lands given that the theory advocates for leaders to put the needs of their followers
before their own and display high standards of ethical and moral behavior that results in a high
percentage of trust. This would in turn result in increased motivation, intrinsic and extrinsic, in
leaders and followers meaning that there would be enhanced service delivery in the various
devolved functions. Thus, it is expected that water provision being a devolved function can be
improved by having Leaders in ASAL embrace transformational leadership. As such, this theory
helped examining the leadership styles adopted in ASAL in the light of what constitutes
transformation leadership. At the same time, it this theory helped to establish whether the
leadership has brought a valuable change in service delivery in ASAL as suggested in the theory,
especially pertaining to water provision.

30
2.2.4 New Public Management Theory
This theory was intended to address planning as the second moderating variable for this study.
The theory is also attentive on “water provision” which is the dependent variable for this theory.
The new public management theory emerged in the 1980s and 1990s. The theory was proposed
by Hood (1991) who argument was along the reconfiguration of the state along more cost
efficient (and effective) lines. The protagonist recommended that the public sector be opened up
to greater private sector influence. Mongkol (2011) citing (Balk, 1996; Hughes, 2003) avers that
new public management reforms were aimed at improving the quality of public services, saving
public expenditure, effective planning, increasing the efficiency of governmental operations and
making policy implementation more effective. The belief that large and monopolistic public
bureaucracies are inherently inefficient was a critical force driving the emergence of the new
public management (Andrews, 2012). The theory represents a set of ideas, values and practices
aimed at emulating private sector practices in the public sector (Bourgon, 2007). Recently,
Gumede & Dipholo (2014) citing Obsorne and Gaebler (1992) further opined that there was a
need to reinvent government and harness the entrepreneurial spirit to transform the public sector
and later “banish the bureaucracy”. Bourgon (2007) argued that the new public management
theory takes its intellectual foundations from public choice theory, which looks at government
from the standpoint of markets and productivity and from managerialism, which focuses on
management approaches to achieve productivity gains.
The three underlying issues which new public management theory attempts to resolve includes:
citizen-centered services; value for taxpayers’ money and a responsive public service workforce
(Bourgon, 2007). Notably, there are also studies that indicate that the new public management
reforms do not necessarily lead to improved service delivery. For example, Simonet (2008)
analyzed governments’ attempts at providing better health-care services for less in Germany, the
United Kingdom, Switzerland, France and Italy. The study concluded that new public
management led to greater inequity and more bureaucracy in some countries, but not all,
countries. Competition, a major characteristic of the theory, did not necessarily lead to better
health outcomes, and, unlike in other sectors, the application of new public management theory
in health care meant larger providers (insurers, hospitals) and regulations have remained strong.

31
The new public management is often mentioned together with governance (Tolofari, 2005).
Governance is about the overarching structure of government and the setting up of overall
strategy, while new public management is the operational aspect of the new type of public
administration. The theory has also been supported by (Zungura, 2014) who contends that the
dominant theme of new public management is the use of market techniques to improve the
performance of the public sector. The main features of new public management include
performance management, e-governance, contracting out and outsourcing, decentralization and
accountability among others (Zungura, 2014).
The new public management theory has also been criticized due to several short comings. First,
Mongkol (2011) citing (Kaboolian, 1998; Khademian, 1998) pointed out that the theory
introduces a paradox of centralization through decentralization. Giving public managers more
authority to manage programs may result in concentrating decisions making in them. Thus, new
public management may lead to centralized decision making by public managers, rather than
encouraging decentralization in public organizations as it claims. The second criticism concerns
applying private sector management techniques to the public sector. While new public
management has encouraged the use of private sector management techniques, there may be risk
associated with adopting some private sector practices Many academic commentators argued
that most areas of public service and administration have distinct political, ethical, constitutional
and social dimensions and these factors make the public sector different from the private sector
(Mongkol, 2011) citing (Armstrong, 1998; Flynn, 2002).
Lastly, the new public management theory is based on applying market principles into public
policy and management. However, Mongkol (2011) quoting (Hughes, 2003) argued that
developing country governments often have only little experience in the operation of markets.
Basic infrastructure of management in developing countries is also not developed enough to
support market-oriented reforms (Barker, 2006). Moreover, there are various factors which are
required before the market can be effective. Mongkol (2011) quoting Hughes (2003) pointed out
that markets are ineffective without the rule of law, for example, to ensure compliance with
contracts. The new public management theory is relevant to the current study as it informs
citizen’s participation, social accountability practices and service delivery variables. The theory

32
advocates for citizen’s participation in the process of evaluating public services since the new
public management principle of customer responsiveness requires that the degree of the user
satisfaction be measured (Pollitt, 1995).
This study drew from the theory of new public management in understanding the impact of
social accountability on service delivery. The broad idea of new public management theory, is
the use of market mechanisms in the public sector to make managers and providers more
responsive and accountable (Hughes, 2003; Mongkol, 2011). Given that the proponents of this
theory advocates for government to put in place social accountability mechanisms to increase
efficiency in service delivery, there is need for adequate and effective planning to achieve the
intended objectives. The theory is also important in understanding service delivery variable. The
rationale of establishing County Governments is to ensure efficient service delivery through
citizen-centered services; value for taxpayers’ money and a responsive public service workforce.
In this regard, County Governments are important tool for new public management reforms in
improving the quality public services and increasing the efficiency of governmental operations.
The new public management theory is, therefore, useful in analyzing the quality of services
delivered by the County Governments besides providing a foundation for predicting the link
between decentralization, e-government and service delivery variable with the moderating
variable being e-government.
2.2.5 Visionary Leadership Theory
This theory was intended to enhance both transformational leadership and planning as the
moderating variables for this study and therefore assist in addressing the fourth objective (joint
moderating effect of transformational leadership and planning on the relationship between
administration of devolved water services and water provision). Visionary theory concentrates
on both transactional (planning) and transformational leadership which were first articulated by
Burns (1978) and later developed further by Bass (1985, 1990). Transactional leadership style
emphasizes on contingency reward and management by exception. Contingency reward
emphasizes on the leader agreeing with followers on the goals, responsibilities, operating
structure and reward to be received upon achievement of set performance targets (Bass &

33
Avolio, 1994). On the other hand, planning through management by exception may be
categorized into two namely Management by Exception-Active (MBEA) and Management by
Exception-Passive (MBEP). MBEA arises in cases where the leader actively monitors progress
against planned benchmarks and initiates corrective action before things go wrong. In case of
MBEP, the leader waits passively and only acts when there are problems (Bass, 1985).
In transformational leadership, leaders motivate followers to achieve objectives by raising their
level of awareness, motivation as well as addressing and modifying their values and self–esteem.
According to Bass and Avolio (1994), transformation leadership involves four I’s namely
Idealized Influence (II), Inspirational Motivation (IM), Intellectual Stimulation (IS) and
Individualized Consideration (IC). Idealized influence refers to the ability of the leader to exert
influence by acting as a role model to the followers while IM refers to the ability of the leader to
develop and articulate a compelling future vision as well as creating an image of success. On the
other hand, IS arouses intelligence, rationality and focused problem solving by questioning
assumptions, seeking differing perspectives and encouraging innovation and creativity.
Individualized consideration emphasizes on the need for leaders to treat followers as individuals
and not as just as members of a group. As noted by Felfe, et al. (2004), transformational and
transactional leadership styles exist in a continuum and are not independent of each other since a
leader can combine certain aspects based on the circumstances. However, in most cases, one
may identify the dominant style for a given leader.
In the current study, this theory translates to the role of the devolved governments in Kenya
transformations and the planning within the devolved units to ensure sustainable water resource
provision to their communities by formulating and adopting appropriate policies and strategies
for the benefits of the wider communities. For the Arid and Semi-Arid Lands, the theory applies
by emphasizing on the change of approach from the pedagogical methods that were used by the
National Government to a more paid attention approach that clearly understands the dire need of
the communities in ASAL in terms of water and devising strategies to save the communities
from the perennial insufficient water. Therefore, developed authorities in Arid and Semi-Arid
Lands, through sound management of available resources, should ensure that within a given time
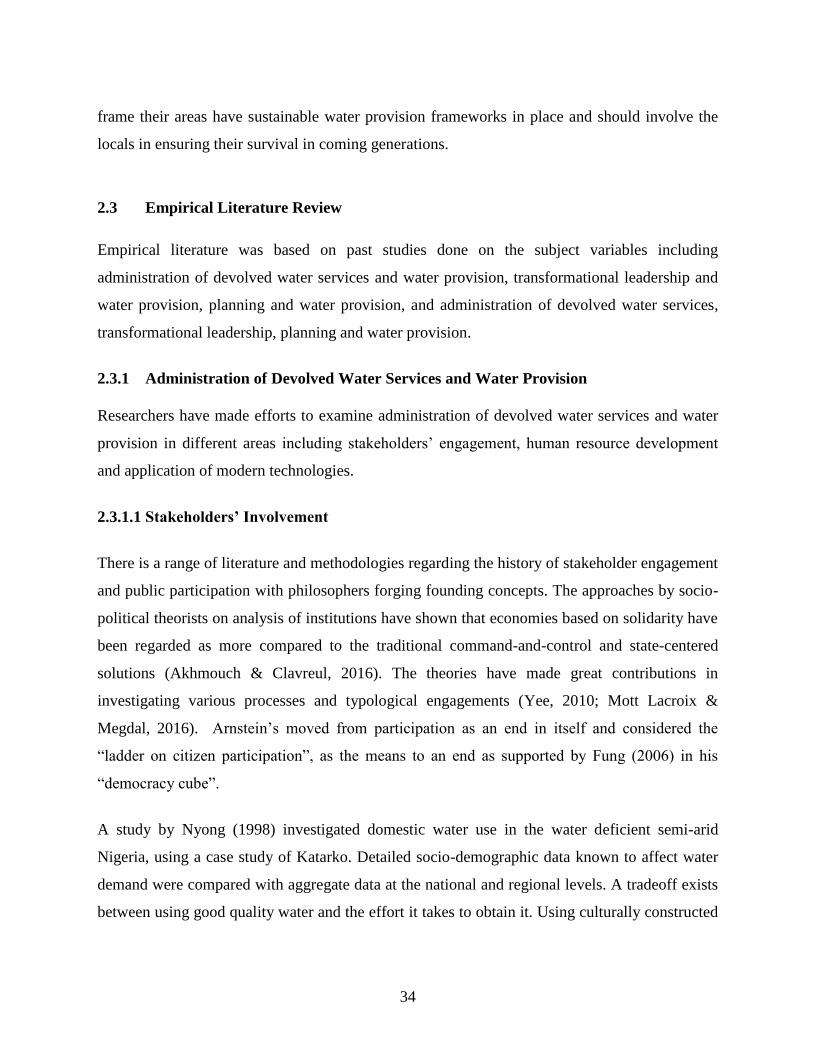
34
frame their areas have sustainable water provision frameworks in place and should involve the
locals in ensuring their survival in coming generations.
2.3 Empirical Literature Review
Empirical literature was based on past studies done on the subject variables including
administration of devolved water services and water provision, transformational leadership and
water provision, planning and water provision, and administration of devolved water services,
transformational leadership, planning and water provision.
2.3.1 Administration of Devolved Water Services and Water Provision
Researchers have made efforts to examine administration of devolved water services and water
provision in different areas including stakeholders’ engagement, human resource development
and application of modern technologies.
2.3.1.1 Stakeholders’ Involvement
There is a range of literature and methodologies regarding the history of stakeholder engagement
and public participation with philosophers forging founding concepts. The approaches by socio-
political theorists on analysis of institutions have shown that economies based on solidarity have
been regarded as more compared to the traditional command-and-control and state-centered
solutions (Akhmouch & Clavreul, 2016). The theories have made great contributions in
investigating various processes and typological engagements (Yee, 2010; Mott Lacroix &
Megdal, 2016). Arnstein’s moved from participation as an end in itself and considered the
“ladder on citizen participation”, as the means to an end as supported by Fung (2006) in his
“democracy cube”.
A study by Nyong (1998) investigated domestic water use in the water deficient semi-arid
Nigeria, using a case study of Katarko. Detailed socio-demographic data known to affect water
demand were compared with aggregate data at the national and regional levels. A tradeoff exists
between using good quality water and the effort it takes to obtain it. Using culturally constructed
35
measures of water qua1ity, the study found that the locals perceive the quality of water they use
as higher in the rainy, than in the dry season. Overall, the results show that although most of the
determinants of water demand in both seasons are subject to social-cultural interpretations, one
can approach the management of it with economic principles. The research recommended the
provision of a new set of optimal wells, in view of the offsetting benefits associated with them.
The results of the study contribute conceptually and factually to the understanding of domestic
water demand in rural areas of developing countries. This study, however, failed to consider
stakeholders engagement as a key administrative aspect in water provision. Similarly, key
indicators of water provision especially on quality and affordability of water were not
considered.
Wachira (2014) carried out a study on challenges and prospects for effective water conservation
in Mwingi North District, Kitui County, Kenya. The study adopted an explanatory research
design with the sample units being households and institutions. A total of 30 households were
sampled using simple random sampling method with medium and low income residential being
well represented. The study showed that there is stakeholders’ engagement in water conservation
though it is not recognized by the local people. A few of them were aware of some NGO’s that
were involved in community water projects but most of them did not know any of them by
name. The stakeholders’ engagement showed efforts to provide water projects and also offer
community awareness to the community. Even though this study was adequate in assessing some
challenges in water provision especially in creation of awareness to the community, a major
weakness on this study was identified in lack of inclusion of human resource development as
well as application of modern technology as important variables that compliments stakeholders’
engagement in implementation of water projects.
In a similar study, Cherunya et al., (2015) explored sustainability of supplying water that is safe
for drinking where it is underserved focusing on devolved solutions in Kenya. From the study,
majority of households often obtained water from different sources. Households largely
perceived the sources of water to be unsafe for drinking forcing them to chlorinate or boil the
drinking water. Nonetheless, it was found that majority of households in Kenya did not
consistently treat their drinking water. This study had the strength of addressing quality,

36
accessibility, salinity and reliability of water provided for human consumption. Nevertheless, the
study had the deficit of linking the administrative role in water provision with affordability by
residents of Arid and Semi-Arid Areas.
Korir (2013) did a study on challenges affecting devolution of public sector services in local
authorities in Kenya focusing on county government of Kericho. The population under this study
was constituted by the entire political, technical and civic leadership of Kericho County who are
residing within the bounds of the said county at the time the study is carried out. Stratified
random sampling was employed to select 84 respondents from the categories of sub-counties.
Primary data sources were used in this study. The research established that training of staff as
well as empowerments of the residents have not been effectively carried out. Resource
mobilization locally to generate resources is lacking despite the poor funding of devolution
services from the central government. This study recommended empowerment and mobilization
of resources in order for devolution to succeed. In addition, training should be encouraged by the
authorities. Systems should be established at local level to ensure the devolved services reaches
the ordinary citizens. Even though this study emphasized on the need of devolution as a solution
for local challenges, it failed to identify and examine the basic aspects of water provision as well
as show how local resource mobilization relate to reliability of water provision.
A study by Gambe (2013) on water provision in Harare, Zimbabwe indicated that residents were
yearning for involvement in the process of finding solutions to water problems bedeviling
Harare. They felt sidelined and this caused an unpleasant relationship between the residents and
the city fathers. Another study conducted by OECD (2015) on stakeholder engagement for
inclusive water governance in OECD development indicated that there has been some progress
to move towards more structural forms of stakeholder engagement in the water sector. The study
highlighted that new legislations, rules, procedures and values at different stages have yielded
more stakeholder engagement forms that are standardized and embedded in organizations’
overarching principles and policy to encourage greater information, co-operation, consultation or
awareness raising into their operational rules and procedures. This study, nonetheless, did not
consider the different indicators of water provision including physical accessibility, affordability,
quality, reliability, salinity, frequency as well as clarity of water used.

37
Shifting from an issue-based to a structural form of stakeholder engagement raises some
challenges for decision makers. The study (OECD, 2015) identified various barriers to
stakeholders’ engagement including “consultation fatigue”, often due to an insufficient clarity on
how to use stakeholder inputs in decision making and implementation; the absence of political
will and leadership; insufficient time, staff and funding; weak supportive legal frameworks;
consultation capture from over-represented categories; resistance to change and reluctance to
relinquish power; weak capacity; the insufficient public concern and awareness; information
asymmetry; fragmented institutional settings and complexity of the issues. Even though the
study thoroughly investigates the contribution of stakeholders’ involvement in water provision,
the study failed to bring alongside the contributions of human resource management and
application of modern technology, the variables that will be adequately be addressed in this
study.
2.3.1.2 Human Resource Development
Human resource development is simply a key aspect in the manoeuvres of the organization
(Armstrong, 2008). Human resource development Management can be viewed as the “paradigm
shift” from the ancient view to human resource management (Kearns, 2005). Kearns describes
human resource development management as the process of optimizing, obtaining and keeping
hold of those with the best talent by executing systems and processes that are in line with the
organizations’ core aims. According to Armstrong (2008), human resource development refers
to all human abilities either inherent or acquired features where its value can be enhanced by
suitable development investments. Leana and Pil (2009) viewed human resource development
as the individual’s skills, cumulative abilities and knowledge attained through expanded formal
and informal education and experience.
Leveraging an organization’s human resource development is a crucial source of efficiency and
effectiveness in performance (Hitt et al., 2001) and, thus; investments will directly vary with the
human resource development and may improve total employee output and service delivery. This
implies that if leaders in ASAL put in place good policies that improve the human resource
development, service delivery to the public in all spheres, including water services, which could

38
be improved. One of the key ways through which organizational leaders can influence
performance is through human resource development management. This is in line with Keith
(2009) who suggested that the customers are the most important and their needs ought to be fully
satisfied and this can be only achieved after addressing the needs of the employees (human
resource) in the organization.
A study by Zeraebruk, Mayabi, Gathenya and Tsige (2014) assessed the effects of water supply
services on operational performance. The study was based at Asmara Water Supply Department
(AWSD) and findings reveal that requirements of water provision are not only confined to new
structures and infrastructure but also employment of manpower as complementary investments.
This manpower entails investing in technical and administrative capabilities as well as capacity
building for the staff. Utility performance is largely indicated by manpower growth through the
rate of participation in employees’ training explaining the fraction of employees that have
participated in at least one training event (Zeraebruk, Mayabi, Gathenya & Tsige, 2014).
Improvement on quality and efficiency in water provision is achieved by service providers,
regulators and other decision makers to bring in relevant managerial tools to measure and
monitor performance of water utilities. Management of water resources, in addition, must be in
possession of knowledge on data collection, processing, verification and storage to analyze the
success of a water utility. The operators of private/public water utilities should, moreover, be in
knowhow of financial implications at the point of the task as well as well as the usefulness of the
data on management (Berg & Corton, 2007). This study failed to link human resource
development to accessibility and affordability of water in ASAL. The study also had a
methodological gap given the target respondents were limited only to a water supply department
as opposed to the current study that cut across different devolved administrations in ASAL.
An assessment of human resource development literature indicates that the existing literature is
too general and hence cannot be applied to the context of the Arid and Semi-Arid Lands. It
mainly describes the importance of proper human resource development management without
considering the devolved government structures, but rather an organization in general. As such,
its applicability in the specific context of Arid and Semi-Arid Lands government is limited. This

39
study therefore addressed this gap by examining the effect of human resource development in
ensuring efficient water provision in Arid and Semi-Arid Lands.
2.3.1.3 Application of Modern Technology
In spite of improved importance on societal and communal characteristics of water supply,
technology does still matter. Technological choices, which are easy to understand and are of low
cost, are likely to be more sustainable than those that require specialist skills or equipment.
Therefore, a range of options should be presented to potential users. Local innovation that brings
the technology closer to the people should also be encouraged in the interests of sustainability
(Wille, Williams & Pearce, 2016). Avila, Feigenblatt, & Heller (2010) suggest several water
sources and intake technologies that can be considered. These include: rainwater (roof rainwater
harvesting, catchment and storage dams); ground water (spring water collection, dug well,
drilled wells, subsurface harvesting systems); surface water (protected side intake, river-bottom
intake, sump intake).
The catchment of rainwater from using downpipes and gutters and directs it to storage
containers. Subsurface harvesting systems retain groundwater flows and facilitate their
abstraction (Pearce, Welle, & Dickinson, 2013). They are in two forms (Subsurface dams and
Raised-sand dams). The apex of the dam is about one meter beneath the ground surface, which
prevents the land becoming waterlogged. Subsurface dam is an impermeable dam built across a
surface aquifer, such as the bed of a seasonal sand-filled river, and based on top of an
impermeable layer. Each time the upstream part of the river fills with sand, the crest is raised a
little more to build up a groundwater reservoir. Raised-sand dam is an impermeable dam built
across the bed of a seasonal sand-filled river, with the crest reaching a few decimeters above the
upstream river bed (Bhatnagar, 2014)).
From the literature review, no past studies are known to exist that adequately address the effect
of application of modern technologies on in water provision. The existing literature is also too
general and hence cannot be generalized to the context of the Arid and Semi-Arid Lands. It
mainly describes the some of the technology in water provision without considering a particular

40
context. As such, its applicability in the specific context of Arid and Semi-Arid Lands
government is limited. This gap was addressed through having this study’s emphasis on
examination of the effect of applying modern technology in ensuring efficient water provision to
the people in Arid and Semi-Arid Lands.
2.3.2 Administration of Devolved Water Services, Transformational Leadership and
Water Provision
The concept of leadership has been perceived as a fundamental concern in organizational
behavior. Yukl (2013), defined leadership as the process of influencing others to understand
what needs to be done, and the process of facilitating individual and collective efforts to
accomplish those agreed-upon objectives. Whereas, Thill and Bovée, (2015) defined the leader
as a person who influences, helps, and guides followers to achieve their assigned duties and
effective goals in the organization, it is viewed as an interactive process through which
businesspeople develop an effective approach to collective goals by Hackman and Johnson
(2013). Leadership is by definition, a group process in which the team comes together to
improve their communities and commit to joint action and mutual accountability, a process
whereby an individual influence a group of individuals to achieve a common goal (DuBrin,
2013). “Leadership is the art of getting someone else to do something you want done because he
wants to do it.” - Eisenhower (as cited in Goodreads, Eisenhower, 2014, para 1).
Evidence is accumulating that servant transformational leadership is good for service delivery in
both public and private sectors. A study by Romig (2001) in Marietta in the United States with
thousands of employees demonstrated that when the practices of servant transformational
leadership are implemented through transformational leadership training in a business,
performance is improved by 15 - 20% and work group productivity by 20 –50%. This means an
increase in profitability. Another study by Hemlin (2006) among university and business
company researchers in Sweden analyzed how transformational leadership and organizational
support (LOS) influences creative knowledge environments for research groups in
biotechnology. The study asserted that transformational leadership, influence, and power are
inextricably linked. Douglas and Fredendall (2004) in their study among Hospitals in South
41
Carolina U.S.A found significant relationships between employee fulfillment and financial
performance and customer satisfaction. Another study by Douglas and Fredendall (2004) also
found a strong relationship between employee fulfillment and customer satisfaction.
Transformational leadership has also been linked to outcomes such as leadership effectiveness,
innovativeness, quality and improvement (Bass, 1985; Tsai et al. 2009). In the same studies,
transactional leadership was also positively correlated with these outcomes, but in general, the
relationships were considerably weaker than those found for transformational leadership.
Transformational leadership engages others through a social process of change and involving the
relationship of shared purpose between the leader and the followers to accomplish a shared goal
(Allix, 2000). Citing Burns (1978), Allix (2000) noted that “leadership over human beings is
exercised when persons with certain motives and purposes mobilize in competition or conflict
with others, institutional, political, psychological, and other resources so as to arouse, engage,
and satisfy the motives of followers” (p.9). According to Allix (2000), Burns sees leadership as
being indivisible from the needs and goals of followers; a transformational leader articulates and
motivates followers towards a common purpose and shared goals.
A number of studies have also suggested that transformational leadership, through its four
dimensions, has a profound positive influence on followers’ efforts and satisfaction (Bass &
Avolio, 1990b; Cacioppe, 1997; Coad & Berry, 2000; Cardona, 2000; Sarros & Santora, 2001;
Robbins et al. 2004; Robins & Judge, 2007; Tsai Chen, Cheng, 2009). The dimensions that make
up transformational leadership were described by Sarros and Santora (2001) and further
supported by Avolio, Waldman and Yammarino (1991) as individualized consideration,
inspirational motivation, intellectual stimulation and idealized influence. These categories
highlight the alignment to Bass’s (1985a) model, in that individualized consideration,
inspirational motivation, intellectual stimulation and idealized influence are integral within the
Bass’s (1985) model. It is important to understand the expanded descriptions of the four
dimensions of transformational leadership model are as follows:
Koech and Namusonge (2012) classify leadership styles into transformational, transactional and
laissez-faire leadership. Amongst the different approaches/styles of leadership for managing
42
organizations, transactional leadership and transformational leadership are common. According
to Saowalux and Peng (2007), the former is grounded on normal exchange interactions whereby
followers’ efforts, loyalty and productivity are rewarded. Conversely, the latter focuses on
raising the followers’ consciousness on significance of particular outcomes and how to achieve
them. It also inclines on motivating followers to go beyond self-interests for the sake of the
organizational mission and vision. This collective engagement triggers an above expectations
performance in the followers. Transformational approach entails the influence on main changes
in attitude across the organization for the achievement of the organizational objectives.
Transactional approach encompasses working on the organization’s culture, through the existent
rules/procedures. Conversely, transformational leadership modifies culture on the basis of a
newly formed vision and revising the shared norms, assumptions and values (Nongo, 2015). This
study however failed to link the relationship between the administration of devolved water
services and water provision as moderated by transformation leadership.
Datche (2015) carried out a study on influence of transformational leadership on organizational
performance of state corporations in Kenya. The study addressed this shortcoming by
establishing the influence of transformational leader behaviors on organizational performance
with an interest on the mediating effect of employee engagement between these relationships in
the state corporations in Kenya. A survey data from 90 sampled State Corporations in Kenya
was used to explore the existing relationships. Stratified random sampling technique was
employed to select the respondents for the study. Both primary and secondary data was used in
this study. Descriptive statistics such as means, standard deviations as well as inferential
statistics; correlations and regressions analyses were conducted to establish the relationships
between the study variables. A Sobel test was used to establish the mediating effect of employee
engagement between transformational leadership and organizational performance. The findings
indicate that both transformational leadership and employee engagement are significantly related
to organizational performance in State Corporations in Kenya. Three out of the four of
transformational leader dimensions in this study; inspirational motivation (though weak),
intellectual stimulation and individualized consideration were found to be significantly related to
both employee engagement and organizational performance. Idealized influence of leader was
however found to be negatively related to both. Employee engagement was found to partially
43
mediate the relationship between transformational leadership and organizational performance.
This study assessed the effect of transformational leadership on water provision on independent
versus dependent relationship model and thus did not factor in the effect of it as a moderator in
the study.
In their study, McIntosh and Taylor (2013) argue that strengthening the capacity of water
professionals to lead change in policy, planning, management and communities is an essential
component of the collective response to global water challenges. Kinicki and Kreitner (2008)
affirmed that transformational leaders are capable of developing valuable change in an
organization; instilling in followers, great intrinsic motivation and loyalty; newly establishing
the future image and stirring followers’ commitment to realize the image. The approach consists
of the following aspects: individualized attention, inspiring incentive, idealized influence
(behavior and attribute) and logical stimulation (Moss & Ritossa, 2007). This study failed to
examine the effect of administration of devolved services on water provision with
transformational leadership as the moderator.
Studies by Bass (2002), Avoilio, Jung and Berson (2003) portray transformational leadership as
having a direct relationship with organizational productivity. This was confirmed by Dumdum,
Lowe and Avolio (2002) for the case of private organizations. Likewise, analysis of empirical
studies by Judge and Piccolo (2004) indicated that subordinates’ productivity in formal tasks is
strongly associated with transformational leadership approach. According to Koene, Vogelaar
and Soeters (2002), the charismatic aspect of transformational leadership produces increased
employee performance and this were true in a study of 50 sampled supermarkets in the
Netherlands. Further, a study by Xenikou and Simosi (2006) in financial firms revealed that
when management practiced transformational leadership, the organizations performed well. It is
beyond doubt that most studies point to a positive relationship existing between transformational
leadership and the employee performance. It is apparent from the literature reviewed on
leadership that little has been done to investigate how leadership influences the relationship
between administration of devolved water services and water provision in Arid and Semi-Arid
Lands. The existing studies therefore have inadequate insights as far as the problem of water
provision as conceptualized in this study is concerned. This study however failed to link the

44
relationship between the administration of devolved water services and water provision as
moderated by transformation leadership
Kemboi and Tarus (2011) in their study in Kenya explored the existing links between
transformational leadership capabilities and business strategy implementation. These scholars
proposed that in enhancing transformational leadership capabilities, leveraging team based
transformational leadership through culture, shared vision, knowledge and transformational
leadership are important as ways of nurturing self-transformational leadership. They further
noted that at individual level, developing innovative behavior is considered a prerequisite to
enhancing transformational leadership capabilities. The study was not water provision.
A study of the relationship between Nigerian local government administrative leadership styles
and organizational outcomes (Adanri, 2016; Adanri & Thakkar, 2016) revealed that the Nigerian
public sector leadership styles play small role in the local government outcomes and the
perceived leadership effectiveness and employees’ satisfaction. The studies show that leadership
styles only account for a small variability in the local government outcomes and perceived
employees’ job satisfaction. Others have identified the high level of institutional corruption and
the structural ties of local governments to the state governments especially the political and
fiscal control of local governments by the state governments as impediments to effective local
government operations and outcomes in Nigeria. The context of this study was however not on
ASAL.
Lee (2012) examined the role of transformational leadership in the home healthcare industry by
finding a link between transformational leadership and workplace performance among home
health aides. The quantitative research study used secondary data from the 2007 National Home
Health Aides survey using binary analysis and multivariate regression analysis. Study findings
from the study revealed that there is a positive relationship between transformational leadership
and employee outcome. Employee outcome was measured by reduced injury, increasing career
satisfaction, and choosing the same career if they have to choose again. Lee (2012) showed that
transformational leadership play an important role in improving workplace performance and
financial implications because reduced absenteeism and injury could result in cost savings.

45
Irshad and Hashmi (2014) in their examination of the relationship between transformational
leadership, organizational citizenship behavior, and the mediating role of emotional intelligence
revealed that there is a relationship between transformational leadership and organizational
citizen behavior and that emotional intelligence plays a mediating role in the relationship. No
link of transformational leadership on the relationship between transformational leadership and
accessibility of water in ASAL.
Belias and Koustelios (2014) provided a critical review of the relationship between
transformational leadership and employee job satisfaction in the banking sector. They noted the
various leadership styles that have been examined in the literature and affirm that
transformational leadership is the most studied and widely accepted leadership style. The paper
identified various types of tools that have been developed to measure leadership effectiveness
and employee’s satisfaction. Transactional leadership is effective in some cases but
transformational leadership is most likely to be more effective in most situations because they
motivate others to go beyond what they had originally intended and empower others to achieve
individual and organizational goals, thereby creating more committed and loyal employees, a
better working environment and employees’ job satisfaction (Boga & Ensari, 2009; Bhat et al.,
2013). The study addressed employees job satisfaction and therefore failed to address any
indicators in water provision
2.3.3 Administration of Devolved Water Services, Planning and Water Provision
According to Munive-Hernandez, Dewhurst, Pritchard and Barber (2004), planning involves the
pattern or plan of action that integrates an organization’s major goals, policies and action
sequences into a cohesive whole. Aldehayyat and Khattab (2013) noted that planning techniques
enable managers to transform data into valuable decisions and suitable actions. According to
Daft and Marcic (2016) planning is effective to water provision in various aspects. The first one
involves its contribution to objectives. A plan must have the aspect of effectiveness. Every major
plan and its supporting plans should contribute to the accomplishment of the purpose and
objectives of the enterprise. Proper plans deliver the required output. According to Korir and
Moronge (2016) planning provides overall direction to the organization. Streiner (2003) states
46
that there is strategic consistency when the actions of an organization are consistent with the
expectations of its management. The exiting literature does not establish the moderating role
planning on the relationship between administration of devolved water services and water
provision.
Hansen and Villadsen (2010) noted that while there has been a significant amount of studies on
planning, there is only a few studies of planning in moderating the relationship between
administration of devolved water services and water provision. They compared public and
private managers’ leadership styles within the framework of their jobs. The study was based on a
survey of Danish public and private managers. It examined the impact of the sector within the
managerial job context on leadership behavior and suggested that the difference between public
and private leadership practices is due to the context of the jobs. The study shows that managers
in public and private sector use different leadership styles because they are bound by structural
settings of their jobs, role clarity, and perceived job autonomy. According to Hansen and
Villadsen (2010), public managers seek to achieve their task through a participative leadership
style while private managers use a more directive and task-oriented leadership style. No link of
transformational leadership on the relationship between planning and affordability of water in
ASAL.
Sorel and Pennequin (2008) advocate for planning to involve developing objectives or the
organizational strategic plans and looking for resources that would best be suited in achieving
the organizational goals as outlined in strategic plans. Each goal should have financial and
human resource projections associated with its completion so that it becomes successful. The
planning process also creates timelines for when the plans should be achieved. According to
Ballou (2007), planning also involves developing the tracking and assessment method that will
be used to monitor the project process.
Daft and Marcic (2016) emphasize the primacy of planning among the manager's tasks. Hence,
planning logically precedes the execution of all the other managerial functions. Awino et al.
(2012) argues that the more emphasis there is on planning, the greater the positive change in
firm’s performance. Planning is typically where the direction of the organization is established

47
through a variety of activities including the development of goals. As such, the planning
embodies various levels of decision making (Schraeder, et al. 2015).
Daft and Marcic (2016) also identified the third effect of planning on water provision as its
pervasiveness. All managers, from the first line supervisor to the Chief Executive Officer (CEO)
of a company, are to do planning. At lower levels, we may term it as operational planning and at
higher levels we may term it as planning. The amount of time spent in planning may vary with
the level type. CEOs may spend more time planning and organizing and departmental heads may
be there to take care of resource acquisition, directing people in their departments and
controlling the department performance. The efficiency of plans also contributes highly to water
provision.
According to Awino et al. (2012) positive change is caused by effective planning. The efficiency
of plans must be aligned to contribute to the objectives of the organization and to promote the
analyzing and improvement of strategies. Koontz and O'Donnell (2011) observed that the
efficiency aspect has to be applied not only in money terms to various resources used in
production and service activities but also to the individual and group satisfaction of human
resources.
Kibachia, Iravo and Luvanda (2014) have held the view that a common challenge faced by all
organizations, whether private or public, is how to successfully manage planning process for
attainment of organizational objectives. Planning which is carried out by top management
involves formulation of vision and mission statement, performance of situational analysis and
finally strategy implementation and choice. The process considers future implications of current
decisions, adjusts plans to the emerging business environment, manages the business analytically
and links, directs, and controls complex enterprises through a practical, working management
system. Robbins, DeCenzo and Coulter (2008) advanced that an effective planning system for
an organization links long-range strategic goals with both mid-range and operational plans.
Sosiawani, et al., (2015) state that each dimension of planning (formality, tools of planning,
employee participation, implementation of planning, time horizon and control of planning) all
contribute to water provision. Formality of planning has been proven to have a positive

48
relationship with the firms’ performance (Glaister, et al., 2008). Secondly, the tools of planning
are believed to be able to increase the efficiency and effectiveness of organization planning
(Kraus, Harms & Schwarz, 2006). These tools include the SWOT analysis, interrelationship
diagram and affinity diagrams. By employing tools of planning, it would be able to achieve
better performance as in the case of hotels in the Middle East (Aldehayyat & Khattab, 2013).
Thirdly, there is also positive relationship between employee participation and firms’
performance. It is believed that employees’ participation on planning contributed to the
effectiveness of the development of strategy and in return, leads to better effectiveness of
implementation.
Employees contribute in planning by giving their suggestion and test-driving the different
strategies so as to get the best fit in terms of strategies that an organization can adopt, resulting
in increased performance (Collier, Fishwick & Floyd, 2004). Whenever employees are involved
in the planning process of an organization, their motivation and attachment to the project is high
thus making them more effective while running the project. The implementation is likely to run
as smoothly as possible. The implementation of planning is also another dimension agreed upon
to be one of the most important parts in planning process. Successful planning can explain
whether the process addressed the corporate strategies and the objectives implemented properly.
Veettil (2008) proved that by implementing planning properly, it would be able to assist firms to
achieve better performance. Subsequently, creating assignments with timelines considering the
ability of individual employees in the completion of the task time horizon is also considered as
the key dimension of planning which is able to improve the performance of the organization.
Mitchelmore and Rowley (2013) through their study, recommend firms to lengthen their time
horizon of planning in order to gain better performance. Since enough allocated time will allow
employees to work efficiently without the pressure that time is running out on them, their
performance would greatly improve. There are various implementation strategies that
management in different organizations can adopt. The strategies may adopt a top-down approach
where the policies and plans are developed at the top and the information trickles down to the
bottom where the instructions are carried out. The implementation approach may also be bottom-
up or hybrid depending on the organization structure and their internal systems of handling
49
firm’s assignments (Veettil, 2008). Another dimension of planning is the control of planning
(Kraus, et al. 2006). Wijewardena, et al., (2004) suggested that by engaging control mechanism
like establishing the evaluation methods and identifying alternative courses of action through
implementation to the planning, firms are able to achieve better performance. This study,
nonetheless, did not assess the moderating role of planning on the relationship between
administration of devolved water services and water provision.
Wagaki (2013) describes planning as an ongoing, never-ending, integrated process requiring
continuous reassessment and reformation. Planning is, thus, a deliberate, emergent, dynamic and
interactive process. To establish your business within the industry to a performing level the
organization needs to strategize and use planning practices as key aspects towards establishing
and positioning themselves strategically in the market (Kathama, 2012). Aldehayyat and Twaissi
(2011) have proven that the relationship between planning and firms’ performance is positive
and significant in the Middle East context. Aldehayyat and Khattab (2013) also state that
employing tools of planning would be able to contribute to achieving better performance in
hotels in the Middle East.
According to O’Regan and Ghobadian (2002), the key components of planning include an
understanding of the firm's vision, mission, values and strategies. Strategy narrowly defines the
means by which it is seeking to get there. A strategic plan is the path chosen to follow towards
the end vision. The vision outlines what the organization wants to be, or how it wants the world
in which it operates to be in its long-term view and concentrates on the future (Kathama, 2012).
The mission defines the fundamental purpose of an organization or an enterprise, succinctly
describing why it exists and what it does to achieve its vision while the values are beliefs that are
shared among the stakeholders of an organization. Values drive an organization's culture and
priorities and provide a framework in which decisions are made. For an organization’s vision
and mission to be effective, they must become assimilated into the organization's culture
(Wijewardena, et al, 2004).
Planning forces an organization to look into the future and therefore provides an opportunity to
influence the future, or assume a proactive posture (Kathama, 2012). It provides better

50
awareness of needs and of the facilities related issues and environment, helps define the overall
mission of the organization and focuses on the objectives. Also, it provides a sense of direction,
continuity, and effective staffing and leadership and plugs everyone into the system as well as
providing standards of accountability for people, programs, and allocated resources. It is the key
to helping stake holders collectively and cooperatively gain control of the future and the destiny
of the organization (O’Regan & Ghobadian, 2002). Akinyele and Fasogbon (2010) suggest that
planning consists of a set of underlying processes that are intended to create or manipulate a
situation to create more favorable outcomes for a company. This is quite different from
traditional tactical planning that is more defensive based and depends on the move of
competition to drive the company's move. In business, planning provides overall direction for
specific units such as financial focuses, projects, human resources and marketing. Planning may
be conducive to productivity improvement when there is consensus about mission and when
most work procedures depend on technical or technological considerations.
Johnson and Christensen (2008) stated that the process of planning involved creating visions of
possible futures, making explicit the values underlying the preferences for those particular
futures, and establishing practical plans to achieve desired outcomes that are robust in the face of
uncertainty and changes in constraints. Chimbugia (2011) suggested that effective planning as a
practice is not as rational and analytical as it has been portrayed in the literature. He argues that
planning is both a generic activity whose success determinants are partially independent of the
area in which it is applied and an area where judgment, intuition and creativity are still
important. Therefore, planning should be creative intuitive meeting the demands of both the
organization and the employees. A good plan should be clearly understood to make it easy to be
implemented which will result in high performance on both the individual and organizational
level.
Khan and Khalique (2014) did their study in Pakistan and stated that in the world today, which is
very challenging and uncertain, the planning practice is the most reliable and effective way to
compete with these challenges for every kind of businesses. Koeneet al. (2002) on their study on
commercial banks in Kenya noted that the seven dimensions of planning were very crucial in
enhancing performance. Abdalkrim (2013) stated that planning involves having a vision,

51
mission, latent abilities of entrepreneurs, market orientation, competitors’ orientation and
customer relations. The study did not address the basic elements of water provision including the
reliability, accessibility, and affordability for residents in ASAL.
Planning provides the basic direction and rationale for determining the focus of an organization;
and also provides the specification against which any organization may best decide what to do
and how to do it. Simply put, it is a process for creating and describing a better future in
measurable terms and the selection of the best means to achieve the results desired. It is said that
failure to plan is akin to planning to fail. Thus, Abdalkrim (2013) summarized the importance of
planning as; increase in effectiveness, development of a sustainable competitive position,
developing a good fit between the external environment and the internal capabilities and helping
managers to consider the future implications of the current decisions. Having a good vision,
objective and strategy is no guarantee that the project performance will be good. Creative
planning by the management can help in improving performance outcome of the project. But on
the other side, without a vision, good plan or strategy, the performance of a project is sure to fail
or at best will be poor.
2.3.4 Administration of devolved water services, Transformational Leadership, Planning
and Water Provision
With the establishment of devolution, most of the poor regions were highly optimistic that they
would realize enhanced development (Holmquist, 2014). Among the areas where this
improvement was anticipated, therefore, is water provision since the water services were
devolved. To realize this however, it is apparent from the literature reviewed that the
transformational leadershipe and planning in the counties must be effective. Research linking
transformational leadership to outcomes has shown moderating effects for transformational
leadership and planning on performance of organizations (Schaubroeck, Lam, & Peng, 2011),
self-efficacy (James, McKechnie & Swanberg, 2011)), and intrinsic motivation (Zhu et al.,
2009). It appears that the link between transformational leadership and service delivery is
affected by many factors, suggesting that engagement will likely partially mediate this
relationship. Additionally, no studies have investigated this relationship at the task level; they
have instead focused on broader measures of overall job performance and job engagement. This

52
comes as a surprise given the foundational conceptualization that engagement is a fluid or
moment-to-moment state, varying within individuals based on contextual variables that are
related to a specific task (Kahn, 1990; Saks, 2006; Kelly, 2008). In understanding that
engagement can fluctuate based on task specific environmental influences, it is important to
study its antecedents and outcomes from the same perspective.
Existing literature does not address the joint moderating effect of transformational leadership
and planning on the administration of devolved water services and water provision. For instance,
Mwenda Mseke (2016) conducted a study in Dodoma region covering seven ASAL districts
which lack alternative sources of clean water from the surface. The aim of the study was to
assess rural water supply management system in Dodoma region. The main focus was to
measure the efficacy of the newly promoted strategy of Community – Owned Water Supply
Organizations (COWSOs). The study found that the registration process of COWSOs at the
districts is undesirably low. Many rural water projects were still under village water committees
at 56% and private operators (28%) while the COWSOs were managing only 15% of water
projects. Many districts highlighted that the major challenge was lack of funds to support the
program implementation. To improve the strategy’s performance, the study recommended that
the Government should intensify the investment by disbursing enough funds and resources for
the programme execution.
In their study, McIntosh and Taylor (2013) contend that there should be reinforcement of the
ability of water experts to enhance effective changes in planning, communities’ management as
well as revision of relevant policy. Kisiangani (2015) carried out a study establishing the
existing resource, ASAL use patterns and practices, the factors behind the current resource use,
patterns and practices as well as the implications on the socio-economic and environmental well-
being. The study was contextualized in Isiolo County, Central location aiming at analyzing the
land use potential with the aim of ensuring optimal utilization. It employed non-experimental
research methods which utilized both secondary and primary data. Secondary data was obtained
from books, journals, government publications among others. The study revealed that Isiolo
County is endowed with various resource potentials ranging from natural wealth and indigenous
knowledge among others. The main land use practices in the area are pastoralism and

53
subsistence crop farming. It was further established that the region has dispersed settlements
patterns which are lacking basic infrastructure services.
Omollo (2010) examines Kenya's experience with devolved system of government, the
challenges faced and prospects of devolution under a new Constitution. Her study notes that
Kenya attained independence under a Constitution that provided for regionalism but the system
was dismantled soon thereafter. During independence, municipal and county councils were
established with a significant measure of autonomy under the jurisdiction of the regional
assemblies. However, when the regional assemblies were dismantled, powers previously
exercised by the assemblies were transferred to the minister for local government leading to
dominance and control of local authorities by the central government. The study proposes a
well-designed devolution system to cure the weaknesses noted in the local authority system. One
essential of this design is the entrenchment of devolution in the Constitution so as to surmount
lack of political good will to implement it as happened at independence. The other essential is to
enshrine mechanisms for citizen participation in the Constitution. Devolution and public
participation are essential features of Kenya’s new Constitution. What remains to be ascertained
is how these novel provisions have been utilized specifically to empower Wananchi and bring
about development. However, this article was written before the first devolved government came
into office in 2013.
Nthenge (2016) assessed water access challenges and coping strategies in selected sites of
Makueni County, Kenya. The aim of this study was to establish water scarcity coping strategies
used by rural communities in Kilili sub-location in Makueni sub-county and Kyanguli sub-
location in Kibwezi East sub-county, all located Makueni County. The broad objective of the
study was to identify water sources, access challenges and coping mechanisms in selected sites
in Makueni County. The study also documented institutions promoting water resources and
coping mechanisms and hence water access in the selected sites of the County. The study
adopted cluster sampling and simple random approach to gather quantitative data using
household surveys. A total of 70 households in two selected sites were interviewed. The
collected data was coded and entered into the computer for analysis using the Statistical Package
for Social Sciences (SPSS) and presented using tables. Results obtained on water sources

54
revealed that rivers were the major sources of water (78%) across the study site followed by
shallow wells (31%) (SD=23.5). Most households (46%) in both sites could access water within
1-3km (SD=2.5). Five major water access problems were documented in the study sites and in
overall, scarcity of water was the most common problem in both study sites (77%) (SD=9.5).
On his part Juma (2015) observes what was practiced in Kenya after the collapse of regionalism
shortly after independence was delegation through the local authorities and de-concentration
through the provincial administration and field-based ministries. In his opinion, all attempts at
decentralization beginning with regionalism at independence, the Local Authorities and the
District Focus for Rural Development (herein after referred to as DFRD) failed because no
attention was paid to the normative value of these concepts and the ideology and political
philosophy that underlie them. He then discusses the perceived strengths of devolution, which
include prospects of democratic self-governance, public participation, nation and nationhood
building, equalization and efficient and effective delivery of services. He further looks at pitfalls
that could befall devolution if it is not well thought out and managed. Among other issues, he
argues that devolution can be captured and controlled by local elites to the exclusion of ordinary
citizens thereby rendering democratic governance and public participation elusive. He argues
that whether or not devolution of power will succeed will depend on the overall political and
Constitutional culture nurtured deliberately by the public alongside a committed leadership.
According to Barkan and Michael (1989) the District Focus Rural Development (DFRD) policy
of the early 80’s enhanced the potential for public input in development by establishing
subordinate development committees below the District Development Committee at the division,
location and sub-location levels. Their study however does not make any findings on whether
indeed it had improved governance. The evidence available, which we site with approval,
suggests that the policy was implemented in a manner that enhanced control of decision making
by local representatives of the central government hence undermining its very objective.
Wekesa (2012) examines the Constitution and the County Governments Act to establish their
potential to protect and promote the political and socio-economic rights of ethnic minorities in
counties. He concludes that both the Constitution and the County Governments Act are deficient

55
in protecting and promoting the ethnic minority's right to political participation in the sense that
the election to County assemblies is based on the first-past-the-post electoral system which
favors the ethnically dominant and therefore makes the chances of minorities being elected slim.
Given the important role of County Assemblies in debating and passing legislation necessary for
implementation of development as well as over sighting the Executive, and the identified
deficiency in the electoral system, it is opined there is need for deliberate mechanisms to
mainstream and safeguard the interests of ethnic, religious and other minorities within Counties.
This is necessary in ensuring an inclusive and equitable society.
Ochieng (2012) looks at the comparative Legal, Constitutional and Policy framework for public
participation in the devolved system of government among Kenya, South Africa, Uganda and
Tanzania and concludes that there are few formal and statutory spaces designed for public
engagement in the governance process in the Kenyan regime for County governance. He gives
an example of the fact that there are no inbuilt mechanisms within the system to ensure that
public input is taken into account in decision-making and implementation. This is a real danger
because there is possibility that wananchi can be consulted for the mere purpose of it without
necessary taking into consideration their views while designing and implementing programs and
projects.
Koech (2016) on his part carried out a study to analysis household water demand, distribution
and community management strategies in Nyangores Subcatchment, Bomet County, Kenya. The
objectives of this study were to determine the magnitude of household water demand, identify
key factors that influence the magnitude of water demand and distribution and to examine the
effectiveness of the current water use management strategies in Nyangores sub-catchment. The
study employed descriptive statistics based on survey responses from a total of 300 households
picked from Silibwet, Bomet and Sigor divisions. Household level data was supplemented with
key informant interviews of 20 professionals from the Ministry of Water and Irrigation, Water
Service Board and WRMA officials. The study also relied on secondary data from the National
Housing and Population Census report and the meter reading reports at the District offices. The
study found that the current mean water demand stands at 9,745 m3 per day, which is largely
met by unsafe water sources. Women and girls bear the greatest brunt of water related access

56
constraints because they spent a lot of time fetching water and this also exposes them to health
and safety risks. The expansion of piped water supply is slow with only 5.3% coverage since
2003. The community water use management strategies are below 30% and UfW is 53.77% up
from a benchmark of 25%. Non-payment of water bills is increasing at the rate of 4 % per
month. Management strategies currently employed include rationing, public education on
efficient water use while metering, pricing and enforcement of legislation on water governance
are employed on a limited extent.
A World Bank Report on Kenya’s economy indicated the strides Kenya had taken towards
achieving transformational leadership through County Governments. The report on this matter
lays down the impact devolution has had towards achievement of good governance in the
country especially with respect to public participation and notes that the County Governments,
with the support from the national authorities that have made considerable progress towards
implementing constitutional and legal provisions for transparency, accountability and
participation. In the early stages, they prioritized the setting up of structures and systems to
facilitate public participation. Counties have built communication frameworks, and established
participatory forums as per legislative requirements. Beyond meeting the legislative
Requirements Counties have adopted innovative initiatives to engage citizens (World Bank,
2015).
Wambua (2011) carried out a study on factors influencing household access to water supply in
Mutito Division, Kitui District Kenya. The objectives of the study were to identify main water
supply sources in Mutito Division, to analyze the factors influencing household accessibility to
potable water in the area, and to determine gender roles in water harvesting, transportation and
demand management. Both qualitative and quantitative techniques of data collection were used.
The questionnaire and a case study guide were the main instruments of data collection and this
was supported by secondary data from reviewed literature. Using survey data the study
formulated chi-square analysis to estimate relationships between the socio-economic and
physical factors that influence household water access in the study area. Pearson correlation
coefficient was used to determine the relationship between socio-economic factors and
household access to water. Further, the study conducted a T-test to compare actual amount of

57
water available for the household and the amount they would have spent if there was enough
water at their disposal. The study findings showed that female headed households were poorer
than their male counterparts and therefore, this impacted on their ability to invest in water
transporting implements reducing the amount of water transported home. The results of Chi-
Square test of significance (X2= 28.92; df = 2; p= 0.000) indicated that there was a significant
relationship between family size and access to water supply at probability of error = 0.05.
Pearson's correlation coefficient indicated that larger families were less likely to have access to
adequate water (r= -0.25, p=0.05, n=150).
A relatively more recent and related study to the current one was carried out by Maimuna and
Kidombo (2017) on Factors influencing performance of water projects in arid and semi-arid
areas with focus on Ewaso Ng’iro North borehole projects, Isiolo County, Kenya. The objectives
of the study were to determine how community participation, water infrastructure, project
management and maintenance funds affect performance of Ewaso Ng’iro North borehole
projects in Isiolo County. The study was grounded on the community participation theory,
institutional theory and resource-based view theory. The study adopted a descriptive research
design. The target population composed of employees in different management levels of the 12
development agencies including the NGOs, CBOs and RBOs and government officials from the
Ministry of Water and Irrigation. A sample population of 162 is arrived at by calculating the
target population of 281 with a 95% confidence level and an error of 0.05. Descriptive statistics
such as frequencies, percentages, mean score and standard deviation was estimated for all the
quantitative variables and information presented inform of tables. Inferential data analysis was
done using multiple regression analysis. Multiple regression analysis was used to establish the
relations between the independent and dependent variables. The study aimed at determining how
community participation affect performance of Ewaso Ng’iro North borehole projects in Isiolo
County and found that it greatly affects the performance of Ewaso Ng’iro North Borehole
Projects in Isiolo County. Further the study found that maintenance funds greatly influences
performance of Ewaso Ng’iro North borehole projects in Isiolo County.

58
2.4 Summary of Research Gaps
From a review of existing literature, the kind of leadership and management exercised in the
counties can influence the degree to which devolution of the water services enhance the water
provision in the Counties concerned. However, previous studies on devolved services have not
adequately addressed this relationship. Due to the inadequacies in existing studies, there is a
need of literature to provide an understanding of the interplay between administration of
devolved water services, transformational leadership, planning and water provision specifically
in ASAL.
Previous studies on devolved services and water provision have not adequately addressed this
relationship. For instance, Mwendamseke, (2016) carried out an assessment of COWSOs
Strategy for Sustainability of Rural Water Supply in Dodoma. The study did not consider the
effect of devolution of the water services. Wachira (2014) did a study on challenges and
prospects for effective water conservation in Mwingi North District, Kitui County. The study
also did not consider the moderating effect of planning on water provision. Kisiangani (2015)
carried out an analysis into land use potential in Arid and Semi-Arid Areas. The study gave a
general perspective of management of natural resources in arid and semi-arid areas and not on
water provision.
Due the inadequacies in existing studies, there is a dearth of literature to help understand the
effect of devolving water services on efficiency of water provision specifically in ASAL, in
consideration of the existing leadership. To address these gaps, this study seeks to explore
interplay between administration of devolved water services, transformational leadership,
planning on water provision in Kenya with specific concentration on ASAL as summarized in
Table 2.1.
Table 2.1: Research Gaps
Researcher Research
Topic
Methodology Findings Knowledge Gap Addressing the
Gap
Mwendam Assessment Population was Many rural Did not factor in This study

59
Researcher Research
Topic
Methodology Findings Knowledge Gap Addressing the
Gap
seke
(2016)
of
COWSOs
Strategy for
Sustainabili
ty of Rural
Water
Supply in
Dodoma
Region
covering
seven ASAL
districts
water projects were
still under village
water committees
by 56% and private
operators (28%)
while the COWSOs
were managing
only 15% of water
projects.
the aspects of
management in
water
management. It
was also based in
Dodoma and,
therefore, cannot
be generalized into
Kenyan context
explored the
interplay
between
planning as
moderating
variable and
water provision
in a Kenyan
context
Nyong
(1998)
Topographic
Survey of
Katarko
village. Sub-
Project
report
Multiple
regression
models
Although most of
the determinants
of water demand
in both seasons
are subject to
soçio-cultural
interpretations,
one can approach
the management
of it with
economic
principles.
Although the study
was conducted in
arid area, it was
based in Nigeria,
and not in Kenya.
The time it was
conducted is long
time ago to
address the current
water provision
challenges.
This study was
done in Kenya
and factored in
the effect of
administration
of devolved
water services,
considering the
moderating
effect of
transformational
leadership.
Wachira
(2014)
Challenges
and
prospects
for
effective
water
Explanatory
research
design with
the sample
units being
households
There is
stakeholders’
engagement in
water
conservation
though it is not
The study also did
not consider the
moderating effect
of management
styles on water
provision.
This study
considered the
moderating
effect of
planning on
water provision
in the light of
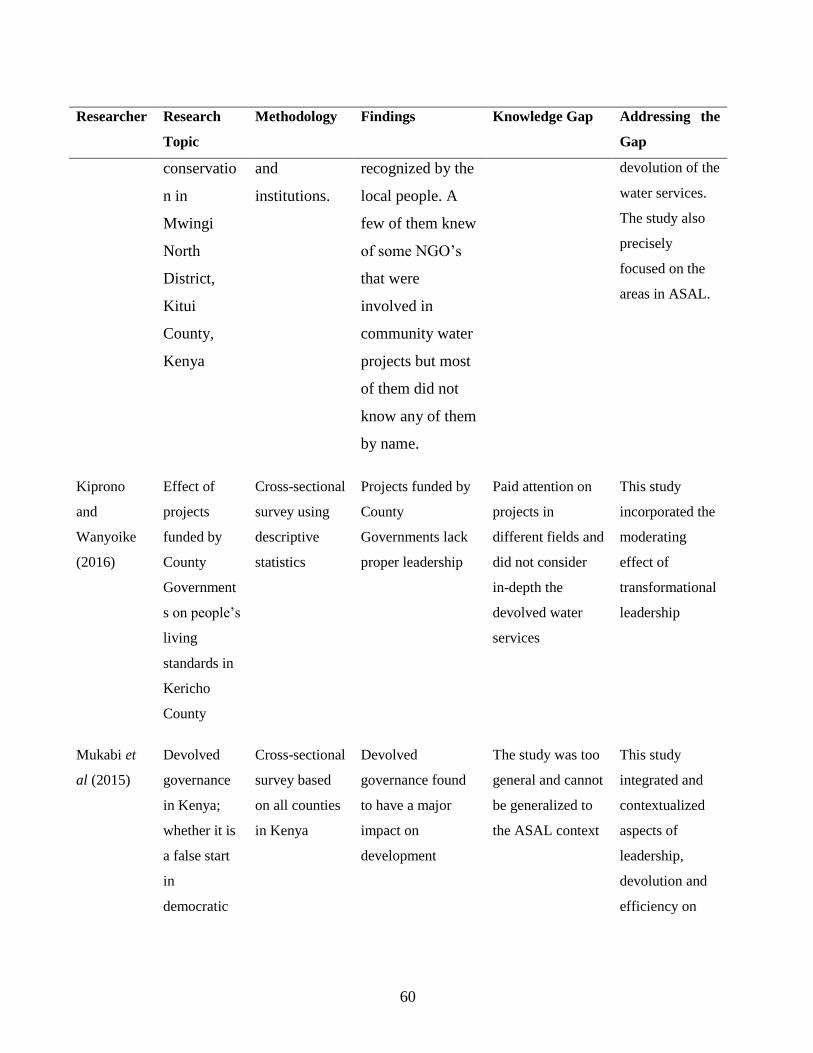
60
Researcher Research
Topic
Methodology Findings Knowledge Gap Addressing the
Gap
conservatio
n in
Mwingi
North
District,
Kitui
County,
Kenya
and
institutions.
recognized by the
local people. A
few of them knew
of some NGO’s
that were
involved in
community water
projects but most
of them did not
know any of them
by name.
devolution of the
water services.
The study also
precisely
focused on the
areas in ASAL.
Kiprono
and
Wanyoike
(2016)
Effect of
projects
funded by
County
Government
s on people’s
living
standards in
Kericho
County
Cross-sectional
survey using
descriptive
statistics
Projects funded by
County
Governments lack
proper leadership
Paid attention on
projects in
different fields and
did not consider
in-depth the
devolved water
services
This study
incorporated the
moderating
effect of
transformational
leadership
Mukabi et
al (2015)
Devolved
governance
in Kenya;
whether it is
a false start
in
democratic
Cross-sectional
survey based
on all counties
in Kenya
Devolved
governance found
to have a major
impact on
development
The study was too
general and cannot
be generalized to
the ASAL context
This study
integrated and
contextualized
aspects of
leadership,
devolution and
efficiency on

61
Researcher Research
Topic
Methodology Findings Knowledge Gap Addressing the
Gap
decentralizat
ion for
development
ASAL
Ngari
(2001)
The impact
of these
dams on the
recipient
communities
Cross-sectional
survey based in
ASALs in
Kenya
The study
confirmed that the
water from the
dams has been
beneficial to the
communities
where the water is
used for
irrigation, which
has created
employment by
people selling the
water, which is
also used for
irrigation.
The study also did
not consider the
moderating effect
of management
styles on water
provision.
This study
considered the
moderating
effect of
planning on the
water provision
in the light of
devolution of the
water services.
Kisiangani
(2015)
An Analysis
of Land Use
Potential in
Arid and
Semi-Arid
Areas
The study
was
contextualize
d in Isiolo,
Central
location. A
sample size
of 154 people
was used. It
Isiolo County is
endowed with
various resource
potential ranging
from natural
wealth and
indigenous
knowledge among
others. The main
The study gave a
general
perspective of
management of
natural resources
in arid and semi-
arid areas and not
on water provision
The current
study linked
administration
of devolved
water services
with water
provision in a
larger ASAL
area.
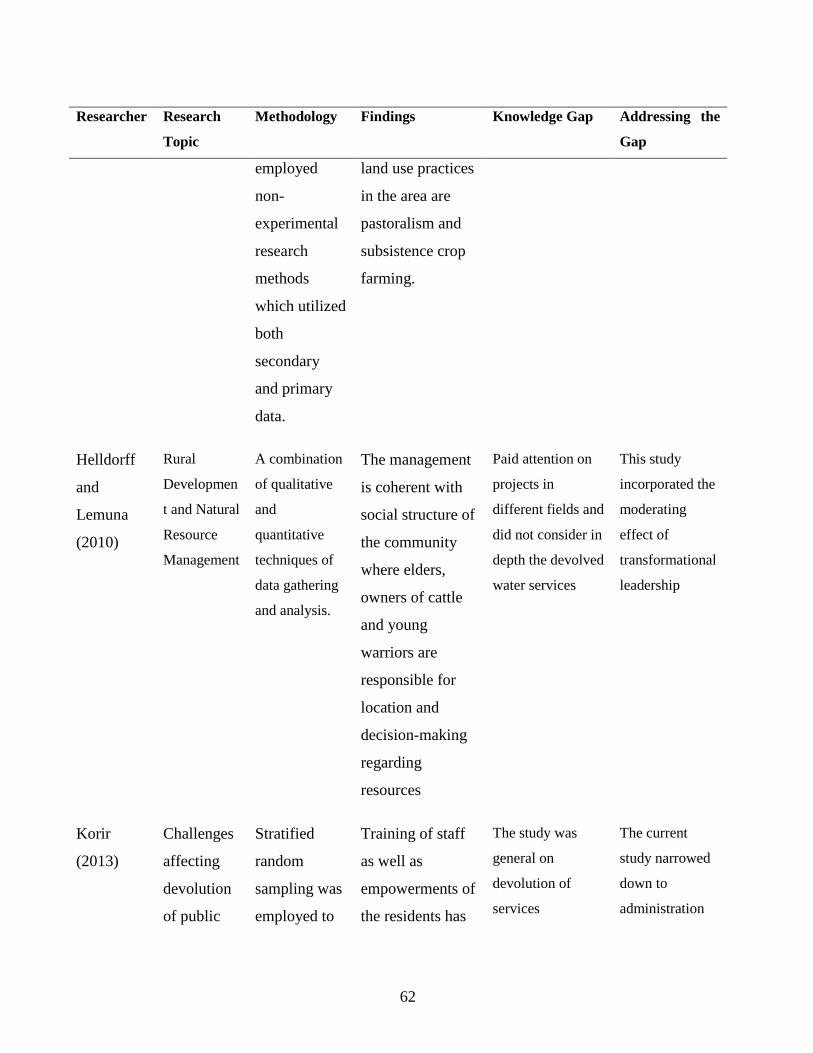
62
Researcher Research
Topic
Methodology Findings Knowledge Gap Addressing the
Gap
employed
non-
experimental
research
methods
which utilized
both
secondary
and primary
data.
land use practices
in the area are
pastoralism and
subsistence crop
farming.
Helldorff
and
Lemuna
(2010)
Rural
Developmen
t and Natural
Resource
Management
A combination
of qualitative
and
quantitative
techniques of
data gathering
and analysis.
The management
is coherent with
social structure of
the community
where elders,
owners of cattle
and young
warriors are
responsible for
location and
decision-making
regarding
resources
Paid attention on
projects in
different fields and
did not consider in
depth the devolved
water services
This study
incorporated the
moderating
effect of
transformational
leadership
Korir
(2013)
Challenges
affecting
devolution
of public
Stratified
random
sampling was
employed to
Training of staff
as well as
empowerments of
the residents has
The study was
general on
devolution of
services
The current
study narrowed
down to
administration

63
Researcher Research
Topic
Methodology Findings Knowledge Gap Addressing the
Gap
sector
services in
local
authorities
in Kenya:
Case of
county
government
of Kericho
select 84
respondents
from the
categories of
sub-counties
not been
effectively carried
out. Resource
mobilization
locally to
generate
resources is
lacking despite
the poor funding
of devolution
services from the
central
government
of devolved
water services.
The researcher
will also interact
relationship
between
administration
of devolved
water services
with moderating
effects of
transformational
leadership as
well as that of
planning
Datche
(2015)
Influence of
Transforma
tional
Leadership
on
Organizatio
nal
Performanc
e of State
Corporation
s in Kenya
Descriptive
statistics such
as means,
standard
deviations as
well as
inferential
statistics;
correlations
and
regressions
analyses
Three out of the
four of
transformational
leader dimensions
in this study;
inspirational
motivation
(though weak),
intellectual
stimulation and
individualized
consideration
were found to be
The study targeted
state corporation
and not counties.
In addition, the
study was not
based in Arid and
Semi-Arid Lands
This study will
focus on
counties in Arid
and Semi-Arid
Lands

64
Researcher Research
Topic
Methodology Findings Knowledge Gap Addressing the
Gap
significantly
related to both
employee
engagement and
organizational
performance.
Koech
(2016)
Analysis
household
water
demand,
distribution
and
community
managemen
t strategies
in
Nyangores
Subcatchm
ent, Bomet
County,
Kenya
Descriptive
statistics
based on
survey
responses
from a total
of 300
households
picked from
Silibwet,
Bomet and
Sigor
divisions.
Household
level data was
supplemented
with key
informant
interviews
Women and girls
bear the greatest
brunt of water
related access
constraints
because they
spent a lot of time
fetching water
and this also
exposes them to
health and safety
risks. The
expansion of
piped water
supply is slow
with only 5.3%
coverage since
2003
The study was
based only in one
county
This study was
be cross-section
based on all
counties in Arid
and Semi-Arid
Land
Nthenge
(2016)
Water
Access
The study
adopted
Rivers were the
major sources of
The study did not
incorporate any of
Considered
moderating

65
Researcher Research
Topic
Methodology Findings Knowledge Gap Addressing the
Gap
Challenges
and Coping
Strategies
in Selected
Sites of
Makueni
County,
Kenya
cluster
sampling and
simple
random
approach to
gather
quantitative
data using
household.
water (78%)
across the study
site followed by
shallow wells
(31%) (SD=23.5).
Most households
(46%) in both
sites could access
water within 1-
3km (SD=2.5).
the two
moderating
variables
(transformational
leadership and
planning
effect of both
transformational
leadership and
planning
The study also
interacted these
variables in a
step-wise
analysis
Wambua
(2011)
Factors
influencing
household
accessibilit
y to water
supply in a
semi-arid
area: a
study of
Mtito
Division,
Kitui
Ditrict
Kenya
Both
qualitative
and
quantitative
techniques of
data
collection
were used.
female headed
households were
poorer than their
male counterparts
and therefore, this
impacted on their
ability to invest in
water transporting
implements
reducing the
amount of water
transported home
The study brings
in the aspect of
gender in water
provision. The
study also puts a
lot of emphasis on
household factors
as the main driver
to water
accessibility as
opposed to
external factors
like administration
of devolved water
services
The current
study lay
emphasis on
devolution as the
main variable
that affects
water provision
in ASAL. The
study will also
consider all the
23 counties
categorized as
ASAL.
Maimuna
and
Kidombo
Factors
influencing
performanc
Descriptive
research
design. The
Community
participation
greatly affects the
The study was
limited to the
concept of
This study
covered a wide
scope of human

66
Researcher Research
Topic
Methodology Findings Knowledge Gap Addressing the
Gap
(2017) e of water
projects in
arid and
semi-arid
areas: Case
of Ewaso
Ng’iro
North
borehole
projects,
Isiolo
County,
Kenya
target
population
composed of
employees in
different
management
levels of the
12
development
agencies
including the
NGOs, CBOs
and RBOs
and
government
officials from
the Ministry
of Water and
Irrigation
performance of
Ewaso Ng’iro
North Borehole
Projects in Isiolo
County. Further
the study found
that maintenance
funds greatly
influences
performance of
Ewaso Ng’iro
North borehole
projects in Isiolo
County
community
participation
resource
development and
application of
modern
technology
beside
stakeholders’
engagement
(community
participation)
2.5 Research Hypotheses
The study sought to test the following research hypotheses:
H01= There is no significant effect of administration of devolved water services on water
provision in ASAL in Kenya;
H02 = There is no significant moderating effect of transformational leadership on the
relationship between administration of devolved water services and water provision in ASAL in
Kenya;

67
H03 = There is no significant moderating effect of planning on the relationship between
administration of devolved water services and water provision in ASAL in Kenya;
H04 = The joint moderating effect of transformational leadership and planning on the
relationship between administration of devolved water services and water provision in ASAL in
Kenya is not significantly different from their separate effects.
2.6 Conceptual Framework
Smyth (2004) defined the conceptual framework as a component of outline for the relationship
under scrutiny, test or review due to the assessment and indicates the probable link between
these aspects. In this study, water provision is the dependent variable which is deemed to be
affected by three major aspects in administration of devolved water services including
stakeholders’ engagement, human resource development and application of modern technology.
These three aspects, therefore, were considered as indicators under the independent variables.
The effect of the independent variable which is administration of devolved water services on
water provision is assumed to be influenced by transformational leadership and planning. As
such, transformational leadership and planning were considered as the moderating variables as
presented in Figure 2.1.

68
Figure 2.1: Conceptual model
Moderating Variable
Moderating
Variable
Independent
Variable
Dependent
Variable
H04
H03
H02
H01
Water Provision
Transformational
leadership
Planning
Administration of devolved
water services
• Stakeholders engagement
• Human Resource
Development
• Application of modern
technology

69
2.7 Measurement of Study Variables
Table 2.2: Operationalization of Variables
Variables Indicators Measure
Administration of
devolved water services
• Stakeholders’
engagement
• Human resource
development
• Application of
modern technology
• Holding stakeholders’ forum
• Communication
• Knowledge and skills
• Experience
• Transparency and
accountability
• Technology
• Support for technology by
residents
• Applicability of technology
5-point Likert Type Scale
1= Strongly Disagree
5= Strongly Agree
Transformational
leadership
• Inspiration and motivation
• Creativity/innovation
• Rewards and recognition
• Intellectual stimulation
5-point Likert Type Scale
1= Strongly Disagree
5= Strongly Agree
Planning • Resource allocation
• Strategic planning
• Optimal and on-time deliveries
5-point Likert Type Scale
1= Strongly Disagree
5= Strongly Agree

70
Variables Indicators Measure
Water provision • Efficiency in time and cost
• Accessibility and availability
of water
• Quality of water
• Adequacy/reliability of water
Percentage (%) change in level
of 2011 & 2012 vs 2015
&2016:
• Time taken to collect
water
• Cost of water
• Main barriers while
accessing water
• Salinity, alkalinity,
acidity and bacteria in
water
• Availability of water
• Reliability of water
Table 2.2 shows operationalization of variables against their indicators and units of measure.
The indicators of administration of devolved water services were the stakeholders’ engagement,
human resource development, and application of modern technology, while transformational
leadership was indicated by delegating of duties and innovation. Planning, on the other hand,
had budgeting, strategic planning and optimal and timely delivery of services as indicators with
water provision being indicated by efficiency in time and cost, accessibility and availability of
water, quality of water and adequacy/reliability of water.
71
CHAPTER THREE
RESEARCH METHODOLOGY
3.1 Introduction
This section explains the methodology to be applied in this research. The chapter presents the
design, target population, sampling technique and sample size, instruments for collecting data as
well as data collection procedure. The chapter further explains the data analysis and presentation
of the results.
3.2 Research Philosophy
This study used positivism research orientation. Positivism has been dominant in the social,
psychological and behavioural sciences as well as the management research (Ridenour &
Newman, 2008). It is aquantitative method entailing numerical data collection and analysis that
depends solely on numerical evidence to deduce inferences or test hypotheses. The philosphy is
chosen due to its ability to make it possible to measure the reactions of a large number of
subjects as representative of some wider population to a specificied string of questions that help
in the comparison and statistical aggregation of the data (Ridenour & Newman, 2008). This
study widely used these methods – questionnaire-based surveys, observation, and secondary
sources, which further makes the approach best suited for this study.
3.3 Research Design
The Research design is the plan for execution of the research method and subsequent analysis of
acquired data Kothari’s (2004). The research design helps the researcher to devise a plan to
tackle the various process and tasks required to conceptualize a plan of operation and tasks
required for the completion of the study being undertaken. This study applied a cross- sectional
survey research design because the variables under study were measured as naturally perceived

72
without manipulation or control. At the same time, The design allows for multiple variables at
the time of a data snapshot as well as creation of new theories/studies or in-depth research.
Cross-sectional studies concerned with finding out "what is" might be applied to investigate
research questions. The main goal of this type of research is to describe the data and
characteristics about what is being studied.
3.4 Population
A population is all of a particular type of entity either limited by geographical location or one or
more characteristics (Cramer &Howitt, 2004). The population for this study was 113 sub-
counties in Arid and Semi-Arid lands in Kenya. According to the Ministry of Planning and
Devolution Report (2016), there are one hundred and thirteen (113) sub-counties demarcated as
Arid and Semi-Arid Lands (ASAL) and distributed within 23 counties in Kenya.The Ministry
further categorises the 113 sub-counties into Arid (36 sub-counties in 8 counties) and Semi-Arid
(77 sub-counties in 15 counties).
3.5 Sample and Sampling Technique
A sample is a small proportion of targeted population selected. Sampling, hence, refers to the
selection of a number of participants in a resarch to represent the bigger population from which
they are selected (Saunders, Lewis & Thornhill, 2007). In cases where a census (a survey of the
entire population) is impossible, sampling procedures provide a justified option (Kothari, 2004).
In this regard, sampling of the ASAL Sub-Counties was done using the Slovin’s Formula (as
used by Ariola, 2006). The formula is expressed as n = N / (1 + Ne2)
Where: n is sample size; N is the population size and e is the tolerance error. The confidence
level gives the margin of error; in this formula, it ranges from 95% to 99% implying a tolerance
error of 0.05 and 0.01 respectively (Ariola, 2006). The current study used a 95% confidence
level implying a 0.05 tolerance error. Therefore, using Slovin's Formula, the sample size was
calculated as: n = 113 / (1 + 113(0.05)2) = 88.11 ≈ 89 sub-counties.

73
Proportionate sampling was then used to allocate the proportion of the sample size going to each
of the 23 counties. Kothari (2004) noted that proportionate sampling is used when a population
from which sample is to be drawn does not constitute a homogeneous group. Proportionate
sampling involves dividing the population into a series of relevant proportions which implies
that the sample is likely to be representative. Sub-counties which form our population are
characterized by heterogeneous groups, given that some fall in arid lands while others are in
semi-arid lands. Proportions for this study were effectively applied at county level where the
number of sub-counties in each county formed the proportion of sample size going to the county.
Random sampling was then applied to select sub-counties. The proportions used were computed
as Proportion (P) = Sample Size/Total population = 89/113 = 0.787611. The computation of
sample size for the sub-counties is presented in Tables 3.1 and 3.2:
Table 3.1: Sample Size for the Arid Sub-Counties
Arid Counties Arid Sub-county Proportion Sample Size (Rounded)
Garissa 6 0.787611 5
Isiolo 2 0.787611 2
Mandera 6 0.787611 5
Marsabit 4 0.787611 3
Samburu 3 0.787611 2
Tana River 3 0.787611 2
Turkana 6 0.787611 5
Wajir 6 0.787611 5
Sub-Total 36 29

74
Table 3.2: Sample Size for the Semi-Arid Sub-Counties
Semi-Arid Counties Semi-Arid Sub-county Proportion
Baringo 6 0.787611 5
Embu 4 0.787611 3
Kilifi 7 0.787611 5
Kwale 4 0.787611 3
Laikipia 3 0.787611 2
Lamu 2 0.787611 2
Makueni 6 0.787611 5
Meru 9 0.787611 7
Narok 6 0.787611 5
Nyeri 6 0.787611 5
Taita Taveta 4 0.787611 3
Tharaka Nithi 3 0.787611 2
Kitui 8 0.787611 6
Kajiado 5 0.787611 4
West Pokot 4 0.787611 3
Sub-Total 77 0.787611 60
TOTAL 113
89
Source: Researcher (2017)

75
3.5.1 Respondents
Study respondents were Sub-County Water Officers in ASAL counties. Each sub-county is
headed by a Sub-County Water Officer hence the number of sub-counties in ASAL equals the
number of Sub-County Water Officers. The total number of respondents was therefore eighty-
nine (89). This ensured a naturally heterogeneous but relatively homogeneous sample as
recommended by Saifuddin (2009).
3.6 Data Collection Instruments
According to (Kothari, 2004) data are facts presented to the researcher from the studying
environment. This study used questionnaire to collect primary data. Secondary data on the other
hand was collected through review of relevant publications and literature.
3.6.1 Questionnaire
In this study, questionnaires were self-administered and filled by Sub-county Water Officers.
This research instrument was organized into 5 sections as guided by research objectives. Section
A; sought the background information of the respondents to assess their suitability in addressing
the research objectives. Questions in Section A were in nominal form. Section B, Section C,
Section D and Section E sought information on administration of devolved water services,
transformational leadership, planning and water provision respectively. Questions in the four
sections were of 5-point Likert type scale.
3.6.2 Desk Study
Desk research refers to the collection and analysis of data already documented in print or availed
online (Business Dictionary, 2017). It entails collecting secondary data from secondary sources
like the internet, government agencies, published reports, libraries among others. In this study,
desk research was used to collect secondary data relating to water services from the Devolved

76
governments in ASAL records. Moreover, desk research was used to collect secondary data on
the subject concepts in the study objectives from published journals, books and articles that may
contain relevant information on the concepts investigated. These were sourced from the library
as well as online sources from the internet. Desk research survey was guided by objective with
the information sought relating to three different categories of literature including conceptual
literature (to be used in conceptualization of the main variables especially under background of
the study), theoretical literature (mainly in chapter two to identify relevant theories) and
empirical literature (presented in the statement of the problem and literature review to identify
the existing knowledge as well as the gap).
3.7 Data Collection Procedure
In this study, primary data was collected through and questionnaires. The researcher trained four
research assistants who were engaged in collecting primary data. The Secondary data was
collected by the researcher himself from records on water provision and related issues. This was
done by first seeking authority from the relevant county and sub-county authorities in ASALs.
For purposes of collecting data in this study, the questionnaires were administered to the relevant
respondents in the institutions.
The researcher got a permit and a letter of introduction from the Management University of
Africa, before embarking on the actual field activities. Permission was also obtained from the
National Commission for Science Technology and Innovation (NACOSTI) to engage the various
leaders in the study and obtain a permit.
3.8 Pilot Study
For this study, pretesting of the questionnaire was done through piloting to ensure its reliability
and consistency. The fundamental importance of piloting is to examine the viability of the
anticipated method to be used in the main research (Leon et al., 2011). In general, a 10% to 20%
of sample size for the main study is recommended for piloting (Osama & Issa, 2015). In this
regard, piloting was conducted on nine sub-counties within ASAL but who were not covered in

77
the final study. This constituted 10.11 percent (9/89) which was adequate for the purpose
piloting for this study.
In essence, the pre-test helped to provide real questionnaire tests as well as its mode of
administration. For that reason, it enabled the shortcomings of the instruments to be identified
and predict the extent of non-response likely to take place. The clarity of the instrument items to
the respondents was necessary so as to correct inconsistencies arising from the instruments,
which ensured that they measure what was intended. The pilot data was not included in the
actual study.
3.8.1 Validity
According to Griffee (2012) validity is defined as the guarantee that the items in the
questionnaire would be understood by respondents in a way similar to the way intended by the
questionnaire maker. There are three categories of validity: face, content and construct validity
(Cavana et al., 2001). Face validity was estimated by use of correlations between the objective
and subjective items utilized in the scales. Content validity was assessed through review and
verification of the extent literature for the items contained in the research instruments. Finally,
construct validity was assessed from the correlations of items (Kimberlin &Winterstein, 2008).
Both research instruments (a set of questionnaires were subjected to experts’ opinions and
recommendations and necessary adjustments were made. These experts included thesis
supervisors and independent research consultants who largely advised on how to make the
instruments more user-friendly as well as ensuring that all research objectives were adequately
covered. One major recommendation made, and which was implemented by the researcher, was
to treat transformational leadership considered in this study was treated as independent
moderator in this study.

78
3.8.2 Reliability
Reliability indicates the extent of consistency in results/data obtained after administering the
research instrument in subsequent trials (Kothari, 2004). In most cases, the preferred reliability
criterion in line with the literature is Cronbach Alpha (Bonett, 2002) and the Alpha takes values
in the range of 0 – 1 where 0 indicates no consistency while 1 indicates complete consistency.
Different thresholds have been suggested for accepting the alpha between 0.7 and 0.9 (DeVellis,
2003). This study therefore adopted Cronbach Alpha to determine reliability of research
instruments.
The alpha value can be as low as a result of less questions, low items interrelatedness or varied
constructs. Low correlation items are discarded. However, a very high alpha may be an indicator
of redundancy of some items that may be testing one question though in varied forms. The alpha
should take a maximum value of 0.95 (Streiner, 2003). Piloted instrument generated an overall
Cronbach Apha of 0.831 while that of final data collected was 0.902 indicating that the research
instruments were reliable for the purpose of this study.
3.9 Data Analysis
The Data collected was first sorted, cleaned and verified before actual analysis was conducted
using SPSS statistical software, version 24 and Microsoft excel. Filled data for respondents
whose level of response was found to be adequate were assigned numbers for coding into the
computer. Then the data collected was subjected to qualitative and quantitative analysis. With
respect to this, the quantitative data was categorized according to subject concept of the
objectives of this study. The organized data was then interpreted in the light of the research
problem to be addressed and used to enhance the quantitative findings. For qualitative data, data
was collected through open ended questions that sought respondents’ opinions on how various
components of administration of devolved water services can improve water provision in ASAL.
Analysis was done using R-based Qualitative Data Analysis (RQDA) software and results
presented in bar plots and word clouds using visual representation of text data in the form of

79
tags. For the case of word clouds, the frequency of occurrence of these tags indicated level of
prevalence as visualized by bar size, text size, text weight as well as the text color.
Quantitative analysis entailed computing descriptive statistics like the frequency and percentage
for the quantitative data. Measures of central tendency were also used in which case the mean,
median and mode were computed. At the same time, measures of dispersion were computed
particularly the standard deviation. Inferential statistics were all applied on the quantitative data
where correlation analysis, analysis of variance (ANOVA) and regression analyses were done.
Presentation of findings was done using tables, pie charts, bar graphs as well as histograms for
interpretation, summary and conclusions. In conducting the regression analysis, simple linear
regressions analysis and hierarchical multiple linear regressions analysis were done, in which
case, the regression was done at different levels. The models were expressed as follows:
i. Y = β0 + β1X + e; this analytical model tests the relationship between independent variable
(administration of devolved water services) and the dependent variable (water provision).
Where: Y is water provision
X is administration of devolved water services expressed as:
X = W1X1 + W2X2 + W3X3 where X1, X2, and X3 represents the three
components of administration of devolved water services considered in
this study (that is stakeholders’ engagement, human resource development
and application of modern technology). Similarly, W1, W2, and W3 are the
weighted parameter for their respective component.
e is the error term. Β0 is the constant and β1 is the model coefficient.
Therefore, the component model expressing the relationship between Y and X
can be summarized as follows:
Y = α + α 1X1 + α 2X2 + α 3X3 + e
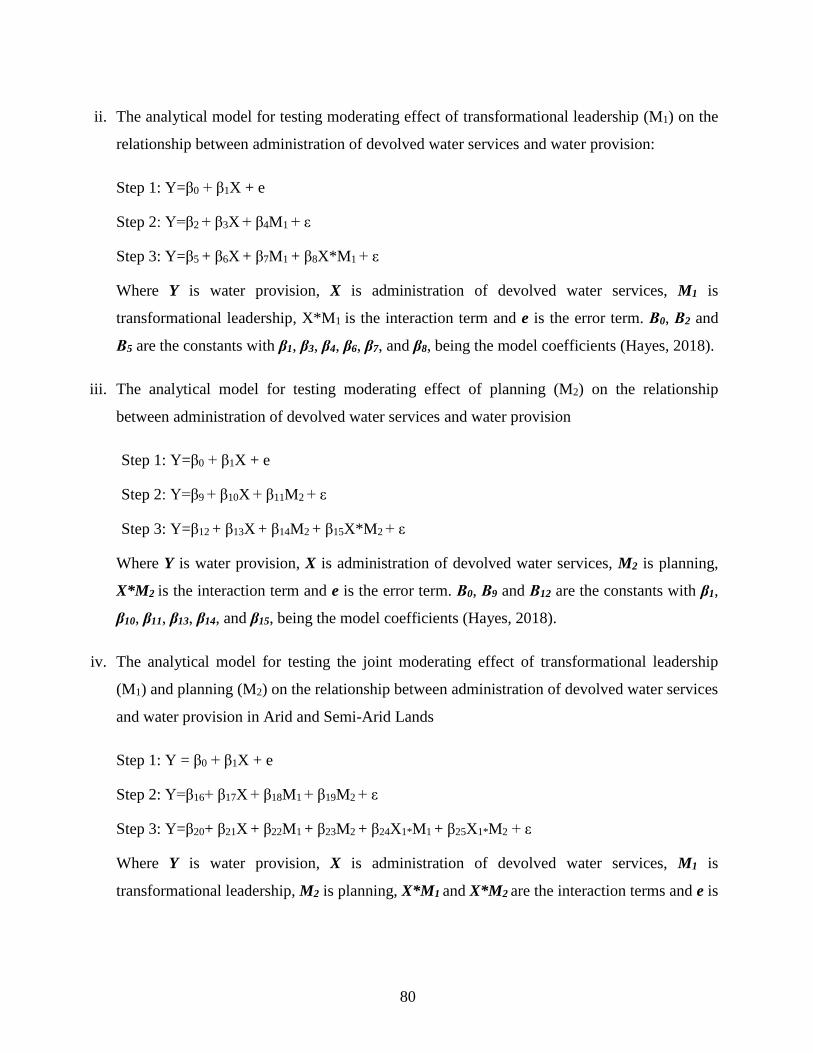
80
ii. The analytical model for testing moderating effect of transformational leadership (M1) on the
relationship between administration of devolved water services and water provision:
Step 1: Y=β0 + β1X + e
Step 2: Y=β2 + β3X + β4M1 + ε
Step 3: Y=β5 + β6X + β7M1 + β8X*M1 + ε
Where Y is water provision, X is administration of devolved water services, M1 is
transformational leadership, X*M1 is the interaction term and e is the error term. Β0, Β2 and
Β5 are the constants with β1, β3, β4, β6, β7, and β8, being the model coefficients (Hayes, 2018).
iii. The analytical model for testing moderating effect of planning (M2) on the relationship
between administration of devolved water services and water provision
Step 1: Y=β0 + β1X + e
Step 2: Y=β9 + β10X + β11M2 + ε
Step 3: Y=β12 + β13X + β14M2 + β15X*M2 + ε
Where Y is water provision, X is administration of devolved water services, M2 is planning,
X*M2 is the interaction term and e is the error term. Β0, Β9 and Β12 are the constants with β1,
β10, β11, β13, β14, and β15, being the model coefficients (Hayes, 2018).
iv. The analytical model for testing the joint moderating effect of transformational leadership
(M1) and planning (M2) on the relationship between administration of devolved water services
and water provision in Arid and Semi-Arid Lands
Step 1: Y = β0 + β1X + e
Step 2: Y=β16+ β17X + β18M1 + β19M2 + ε
Step 3: Y=β20+ β21X + β22M1 + β23M2 + β24X1*M1 + β25X1*M2 + ε
Where Y is water provision, X is administration of devolved water services, M1 is
transformational leadership, M2 is planning, X*M1 and X*M2 are the interaction terms and e is

81
the error term. Β0, Β16 and Β20 are the constants with β1, β17, β18, β19, β21, β22, β23, β24 and β25,
being the model coefficients (Hayes, 2018; Darlington & Hayes, 2017).
Table 3.3: Summary of Research Objectives, Hypotheses and Empirical Models
Objective Hypothesis Type of Analysis Interpretation of Results
Objective 1
To determine the
effect of
administration of
devolved water
services on water
provision in ASAL
in Kenya.
Hypothesis 1
Administration of
devolved water
services does not
significantly
influence water
provision in ASAL in
Kenya
Simple linear regression
analysis
Y = β0 + β1X + e
Coefficient of determination R2
=0.7 or more indicates perfect fit
of regression model.
ANOVA. F-Test, showing a
significant and valid model at
p<0.05
t-value > 1.962 shows statistical
significance
P-vale< 0.05 shows significant
correlation between variables
r=0.700 or more indicates a
strong positive relationship and
r=0.300 or less indicates a weak
relationship.
Objective 2
To establish the
moderating effect of
transformational
leaderships on the
relationship between
administration of
devolved water
services and water
provision in ASAL
in Kenya
Hypothesis 2
Transformative
leadership styles do
not have a significant
moderating effect on
the relationship
between
administration of
devolved water
services and water
provision in ASAL in
Kenya
Hierarchical Regression
Analysis
Step 1: Y=β0 + β1X + e
Step 2: Y=β2 + β3X + β4M1 + ε
Step 3: Y=β5 + β6X + β7M1 +
β8X*M1 + ε
[[
Coefficient of determination R2
=0.7 or more indicates perfect fit
of regression model.
ANOVA. F-Test, showing a
significant and valid model at
p<0.05
t-value > 1.962 shows statistical
significance
P-vale< 0.05 shows significant
correlation between variables

82
Objective Hypothesis Type of Analysis Interpretation of Results
r=0.700 or more indicates a
strong positive relationship and
r=0.300 or less indicates a weak
relationship.
Objective 3
To establish the
moderating effect of
planning on the
relationship between
administration of
devolved water
services and water
provision in ASAL
in Kenya
[Hypothesis 3
Planning do not have
a significant
moderating effect on
the relationship
between
administration of
devolved water
services and water
provision in ASAL in
Kenya
Hierarchic regression analysis
Step 1: Y=β0 + β1X + e
Step 2: Y=β9 + β10X + β11M2 + ε
Step 3: Y=β12 + β13X + β14M2 +
β15X*M2 + ε
Coefficient of determination R2
=0.7 or more indicates a
significant fit of regression
model.
ANOVA. F-Test, showing a
significant and valid model at
p<0.05
t-value > 1.962 shows statistical
significance
P-vale< 0.05 shows significant
correlation between variables
r=0.700 or more indicates a
strong positive relationship and
r=0.300 or less indicates a weak
relationship.
Objective 4
To establish if the
joint moderating
effect of
transformational
leadership and
planning on the
relationship between
administration of
devolved water
services and water
provision in ASAL
in Kenya is different
from their separate
effect.
Hypothesis 4
The joint moderating
effect of
transformational
leadership and
planning on the
relationship between
administration of
devolved water
services and water
provision in ASAL in
Kenya is not
significantly different
from their separate
effect.
Hierarchical multiple regression
analysis
Step 1: Y = β0 + β1X + e
Step 2: Y=β16+ β17X + β18M1 +
β19M2 + ε
Step 3: Y=β20+ β21X + β22M1 +
β23M2 + β24X1*M1 + β25X1*M2 +
ε
Squared multiple correlation
coefficient, R2 =0.7 or more
indicates significance of the
regression model.
ANOVA. F-Test, showing a
significant and valid model at
p<0.05
t-value > 1.962 shows statistical
significance
83
3.10 Diagnostic Tests
Diagnostic tests were based on tests for autocorrelation, multicollinearity, normality and
homoskedasticity.
3.10.1 Test for Autocorrelation
Ordinary Least Square (OLS) assumes that there is no serial or autocorrelation in the error terms
entering the regression functions. Autocorrelation, may be defined as correlation between
members of series of observations ordered in time (as in time series data) or space as in cross
section data. OLS estimates, in the presence of autocorrelation are still linear unbiased as well as
consistent and asymptotically normally distributed, but no longer efficient. They do not have
minimum variance among all linear unbiased estimators. In this study, autocorrelation was tested
using Durbin Watson Index
3.10.2 Test for Multicollinearity of Explanatory Variables
The term multicollinearity originally meant the existence of a perfect or exact, linear relationship
among some or all explanatory variables of a regression model. Multicollinearity is a problem
that occurs with regression analysis when there is a high correlation of at least one independent
variable with a combination of the other independent variables. The problem occurs when some
of the predictors are influenced by some variables within the model. This generates correlation
and impreciseness on regressed model because variables are not completely independent. This
study used Variable Inflation Factor (VIF) to measure the extent of multicollinearity, which
indicates that the extent of variance of a regression coefficient increases if the explanatory
variables are correlated, where the greater the VIF-Value, the more the extent of collinearity.
If there is perfect multicollinearity, the regression coefficients remain indeterminate and their
standard errors are infinite. On the other hand, if multicollinearity is imperfect but high,
Estimation of the regression coefficients may be possible (determinate) but could possess the
large standard errors (in relation to the coefficient themselves), which implies that the
coefficients cannot be estimated with great precision or accuracy. According to Gujarati (2003),
Multicollinearity becomes a serious problem if the pair wise or zero order correlation between

84
the two regressors is in excess of 0.8 that is, if the VIF is greater than 5, it indicates a high level
of collinearity with VIF of 10 or above presenting an extremely intolerable multicollinearity.
3.10.3 Normality Test for the Dependent Variable
Normality of the data collected on water provision was tested using Kolmoglov Smirnov test to
assess whether the sample was obtained from a normally distributed population. This assessment
was important since normal data is an underlying assumption in parametric testing. According to
Kolmoglov Smirnov test, if the p-value is greater than 0.05, the data are described as normally
distributed.
3.10.4 Test for Homoskedasticity and Heteroskedasticity
Another assumption of OLS is that the variance of each disturbance term conditional on the
chosen values of the explanatory variables is homoscedasticity i.e. they have the same or equal
variance. Violation of this assumption of homoscedasticity leads to estimates that are unbiased
and consistent but inefficient. They do not have a minimum variance as well. To test for
heteroskedasticity, the Breusch-Pagan/ Cook-Weisberg test was conducted and p-value used to
interpret the results. This test whether the error variances are equal or whether they are different
(or are heteroskedastic). Hypotheses was tested as follows:
Null Hypothesis (H0): The data (residuals) is homoscedastic
Alternative Hypothesis (H1): The data is heteroscedastic
3.11 Ethical Considerations
Research ethics aims at ensuring that the activities done in the research do not adversely affect or
harm any respondent or discredit sources of information (Kayunze, 2003). Before field exercises,
the researcher got authorization letter from the Management University of Africa and eventually
research permit from NACOSTI, Ministry of Interior and National Coordination in every County
in ASAL, as well as office of the County Secretary in the areas of this study.

85
The researcher made an assurance that the study findings as derived from the analyzed data
would ensure integrity with no manipulation whatsoever. At the same time, all the information
that would be obtained from the secondary sources and used in this study would be referenced
appropriately. Thus, the research instruments in this study were non-invasive. Moreover, data
collected was exclusively used for the academic purpose only. Before distributing the
instruments, permission was sought from the leaders and management of Devolved governments
in ASAL and other concerned institutions as well as the members of the communities involved
in the study.

86
CHAPTER FOUR
DATA ANALYSIS AND RESEARCH RESULTS
4.1 Introduction
In this chapter, data analysis is done and findings presented. The findings are also interpreted in
line with the study objectives. The chapter first presents a section on the bio data for the
respondents. The findings are then categorized into descriptive, inferential and qualitative
findings.
4.2 Response Rate
The researcher administered 89 questionnaires to the Sub-County water officers. Table 4.1
presents response rate for water officers.
Table 4.1: Response rate
Questionnaires Frequency Percent
Response 74 83.1%
No response 15 16.9%
Total 89 100%
A total of 89 questionnaires were administered to the water officers in the 89 Sub -Counties in
ASALs. While 74 of them completed and returned the questionnaires, 15 of them either failed to
complete the questionnaire or failed to return. This translates to a response rate of 83.1% as
illustrated in Table 4.1. Gall et al. (2007) asserts that, a response rate of over 60% of the target is
adequate for a study. Therefore, the response rate of 83.1% was considered adequate to
generalise findings of this study.

87
4.3 Demographic Information
The bio data that was collected includes data on economic activity in the areas studied; as well as
respondents’ gender, level of education, profession and the year they started working in the
county. The results are presented in Figure 4.1 to Figure 4.5.
Economic activities practiced by residents in arid and semi-arid lands are presented in Figure 4.1
Figure 4.1: Economic activities in ASALs
The main economic activities as presented in Figure 4.1 are Agriculture (54.1%) and Livestock
rearing (45.9%). However, some also practice Small Scale Business (29.7%) and Mixed farming
(18.9%). The least practiced economic activities are fishing (2.7%) and Poultry farming (1.4%).
This implies that most people in the ASALs are engaged in Agriculture and Livestock rearing
with very few being engaged in poultry farming and fishing.
These results portray ASAL inhabitants as having, over centuries, evolved a complex pattern of
survival in a region with extreme climatic conditions and erratic water supply. All their activities
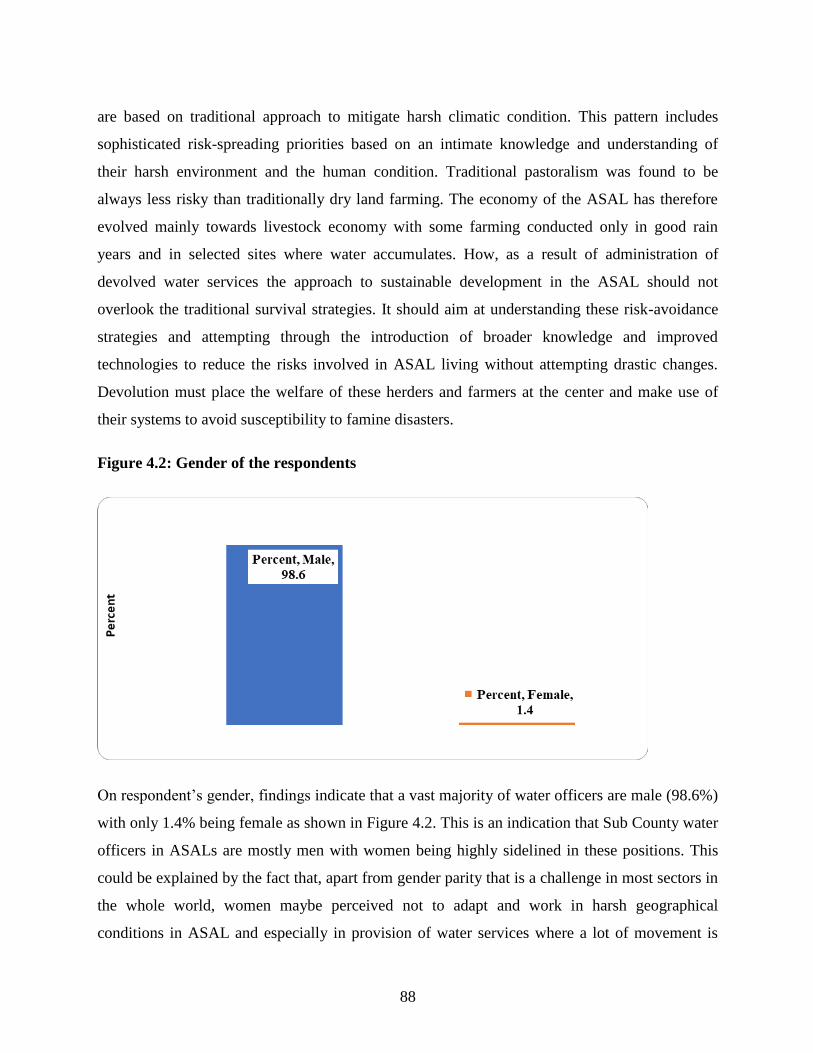
88
are based on traditional approach to mitigate harsh climatic condition. This pattern includes
sophisticated risk-spreading priorities based on an intimate knowledge and understanding of
their harsh environment and the human condition. Traditional pastoralism was found to be
always less risky than traditionally dry land farming. The economy of the ASAL has therefore
evolved mainly towards livestock economy with some farming conducted only in good rain
years and in selected sites where water accumulates. How, as a result of administration of
devolved water services the approach to sustainable development in the ASAL should not
overlook the traditional survival strategies. It should aim at understanding these risk-avoidance
strategies and attempting through the introduction of broader knowledge and improved
technologies to reduce the risks involved in ASAL living without attempting drastic changes.
Devolution must place the welfare of these herders and farmers at the center and make use of
their systems to avoid susceptibility to famine disasters.
Figure 4.2: Gender of the respondents
On respondent’s gender, findings indicate that a vast majority of water officers are male (98.6%)
with only 1.4% being female as shown in Figure 4.2. This is an indication that Sub County water
officers in ASALs are mostly men with women being highly sidelined in these positions. This
could be explained by the fact that, apart from gender parity that is a challenge in most sectors in
the whole world, women maybe perceived not to adapt and work in harsh geographical
conditions in ASAL and especially in provision of water services where a lot of movement is

89
required. The Counties also employ locals who have qualifications in Water Engineering and
this profession has attracted mostly men. However, ASAL Counties like Mandera are coming up
with deliberate affirmative action measures of training women in technical areas like
Engineering to bridge this gap.
Figure 4.3: Respondents' Education Level
Figure 4.3 presents the education level of the respondents where, 39.2% had a Bachelor degree
while 35.1% had a Diploma. A few had Post Graduate Diploma (8.1%), with 5.4% having
Masters Degrees. Others had Ordinary level (5.4%); A-Level (4.1%); PHD (1.4%). This
indicates that most of the water officers in the Sub Counties in ASALs have tertiary level of
education. These results are congruent with societal expectation that, a person employed at a
rank of Sob-County Water Officer must be a holder of an advanced academic certificate to
enable them articulate both theoretical and practical issues related to water provision. Further
analysis could indicate that, those with A-levels or O-Levels are the aged lot, who were
employed into water sector prior or just after introduction of the 8-4-4 system.

90
Figure 4.4: Profession of the Respondent
From figure 4.4, it is apparent that the profession background of an overwhelming majority of
the water officers in ASAL Sub Counties is water engineering (95.9%). Even so, there were few
in with a different profession background including accounting (1.4%), finance (1.4%) and water
technician (1.4%). The implication is that in the ASALs, majority of the Sub County water
officers have the right professional background. These findings are in line with expectations that
Sub-County Water Officers should be people in possession of great knowhow experience on
water provision matters

91
Figure 4.5: Respondents' First Year of Working in the County Leadership
As shown in Figure 4.5, most of the Sub County Water Officers started working in their
respective County Governments in 2013 (78.4%). However, there were some who started
working in 2014 (10.8%); 2015 (6.8%); 2016 (1.4%) and 2017 (2.7%) as presented in Figure
4.5. This indicates that most of the Sub County water officers had adequate experience to
respond to the queries regarding water provision in their respective counties. This further implies
that majority of the Water Officers were deployed in county leadership from the National
Government during transition from the old constitution to the new constitution.
4.4 Administration of Devolved Water Services
The first objective sought to determine the effect of administration of devolved water services on
water provision in ASAL in Kenya. This section presents both descriptive and inferential
statistics to establish the relationship between the independent variable (administration of
devolved water services) and the dependent variable (water provision).

92
Descriptive statistics on administration of devolved water services was presented on a 5-point
Likert-type scale data that was summarized using measure of distribution (percentages) measures
of central tendency (mean, mode, and median) as well as measure of dispersal (standard
deviation). Values of mean, mode and median that are relatively close to each other describe data
that is highly symmetric and normally distributed. At the same time mean, median and mode
were used in this study to rank prevalence of different factors grouped together with high mean
indicating high prevalence. On the other hand, larger standard deviation implies a greater spread
in the data. This section is organized in three sub-sections based on components of
administration of devolved water services including stakeholders’ engagement, human resource
development, and application of modern technology.
Table 4.2: Stakeholders’ Engagement as a Component of Administration of Devolved
Water Service
Not at
all
Low
extent
Moderate
extent
Great
Extent
Very
great
extent
SUMMARY
Mean Median Mode
Standard
Deviation
County Governments
engages local residents to
actively participate in
water provision decision
making processes
.0% 16.2% 23.0% 41.9% 18.9% 3.64 4.00 4.00 .97
County has increased the
number of water
management companies
31.1% 20.3% 29.7% 12.2% 6.8% 2.43 2.00 1.00 1.24
Administration of devolved
water services in the
county has enhanced the
rate at which County
Governments engages
members of county and
national assemblies to
actively participate in
4.1% 18.9% 27.0% 32.4% 17.6% 3.41 3.50 4.00 1.11

93
Not at
all
Low
extent
Moderate
extent
Great
Extent
Very
great
extent
SUMMARY
Mean Median Mode
Standard
Deviation
water provision decision
making processes
Administration of devolved
water services in the
county has enhanced the
rate at which County
Governments engages
professionals to give
valuable advice on
emerging efficient water
provision techniques and
mechanisms
6.8% 21.6% 37.8% 18.9% 14.9% 3.14 3.00 3.00 1.13
Administration of devolved
water services in the
county has enhanced
effectiveness with which
issues concerning water
provision are
communicated to all
stakeholders involved
.0% 18.9% 33.8% 32.4% 14.9% 3.43 3.00 3.00 .97
Administration of devolved
water services in the
county has led to the
development of supportive
legal frameworks under
active participation of all
stakeholders
10.8% 17.6% 45.9% 20.3% 5.4% 2.92 3.00 3.00 1.02
Table 4.2 indicates the descriptive statistics on stakeholders’ engagement. From the findings,
County Governments normally engage local residents to actively participate in water provision
decision making processes with mean of 3.64, median of 4.00, mode of 4.00 and standard
deviation of 0.97. Respondents, nonetheless distressed that administration of devolved water

94
services in the county has led to increase in the number of water management companies (mean
= 2.43, median = 2.00, mode = 1.00 and standard deviation = 1.24). Study findings also indicate
that the county leaderships have to a moderate extent been engaging members of their respective
county and national assemblies as well as professionals to actively participate in water provision
decision making processes including seeking valuable advice on emerging efficient water
provision techniques and mechanisms.
Table 4.3: Human Resource Development as a Component of Administration of Devolved
Water Service
Not at
all
Low
extent
Moderate
extent
Great
Extent
Very
great
extent
SUMMARY
Mean Median Mode
Standard
Deviation
There is recruitment of
adequate employees to
manage water services in
the County
17.6% 33.8% 27.0% 18.9% 2.7% 2.55 2.00 2.00 1.07
There is enhanced
principle of meritocracy
such that the staff
recruited possess the
requisite skills, knowledge
and experiences to
competently manage water
services in county
20.3% 27.0% 31.1% 18.9% 2.7% 2.57 3.00 3.00 1.10
There is enhanced level of
staff commitment in their
work related to water
services
9.5% 21.6% 41.9% 18.9% 8.1% 2.95 3.00 3.00 1.06

95
Not at
all
Low
extent
Moderate
extent
Great
Extent
Very
great
extent
SUMMARY
Mean Median Mode
Standard
Deviation
There is enhanced the
level of professionalism
among water service
personnel
10.8% 18.9% 33.8% 28.4% 8.1% 3.04 3.00 3.00 1.12
There is enhanced
transparency and
accountability in
procurement processes for
water service providers
10.8% 27.0% 32.4% 24.3% 5.4% 2.86 3.00 3.00 1.08
There is enhanced the
level of integrity and
prudence in management
of water service resources
among county and sub-
county administrators
5.4% 31.1% 33.8% 24.3% 5.4% 2.93 3.00 3.00 1.00
As shown in Table 4.3 regarding the extent to which human resource development as an
indicator of devolution has influenced water provision, respondents found that every aspect
assessed has enhanced water provision to a moderate extent. These aspects include recruitment
of adequate employees to manage water services in the County (mean = 2.55), meritocracy such
that the staff recruited possess the requisite skills, knowledge and experiences to competently
manage water services in county (mean = 2.57), level of staff commitment in their work related
to water services (mean = 2.95), and the level of professionalism among water service personnel
(mean = 3.04). Others include transparency and accountability in procurement processes for
water service providers (mean = 2.86) and level of integrity and prudence in management of
water service resources among county and sub-county administrators (mean = 2.93). Median and
mode for the same aspects were also averaging 3.0 with standard deviation of slightly over 1.0.
This implies that opinions on the extent to which different aspects of human resource

96
development influence water provision are highly distributed across the 5-point Likert scale with
little unanimity.
Table 4.4: Application of Modern Technology as a Component of Administration of
Devolved Water Service
Low
extent
Moderate
extent
Not
at all
Great
Extent
Very
great
extent
SUMMARY
Mean Median Mode
Standard
Deviation
There is enhancement of
technologies in facilities such
as water tanks, storage
dams/pans, drilled
wells/boreholes across the
county
10.8% 31.1% 8.1% 36.5% 13.5% 3.36 3.50 4.00 1.11
There are enhanced efforts
on adopting various water
technologies which are well
suited to the conditions on
water provision in the county
21.6% 31.1% 12.2% 31.1% 4.1% 2.93 3.00 3.00 1.09
The technologies applied by
county leadership in the
various areas of water service
have worked better with
devolved government as
opposed to earlier under the
National Government
20.3% 32.4% 20.3% 18.9% 8.1% 2.74 3.00 3.00 1.22

97
Low
extent
Moderate
extent
Not
at all
Great
Extent
Very
great
extent
SUMMARY
Mean Median Mode
Standard
Deviation
As a result of devolution,
water technologies applied
by county leadership have
been widely supported by
residents in county
24.3% 31.1% 10.8% 20.3% 13.5% 3.01 3.00 3.00 1.20
There is adoption of more
superior water technologies
in the county
18.9% 35.1% 21.6% 16.2% 8.1% 2.70 3.00 3.00 1.21
Administration of devolved
water services in the county
has led to the development of
modern technology adoption
framework under active
participation of all
stakeholders
29.7% 37.8% 10.8% 14.9% 6.8% 2.77 3.00 3.00 1.05
Based on results presented in Table 4.4, there is enhancement of technologies in facilities such
as water tanks, storage dams/pans, drilled wells/boreholes across the county (mean = 3.36).
however, only to a less extent has it enabled development of modern technology adoption
framework under active participation of all stakeholders (mean = 2.77) as well as enhancing
efforts on adopting various water technologies, which are well suited to the conditions on water
provision in counties (mean = 2.93).
At the same time administration of devolved water services is yet to fully enhance adoption of
more superior water technologies in counties (mean = 2.70) while the technologies applied by
county leadership in ASAL have not worked any better with devolved government as opposed to
earlier under the National Government (mean = 2.74) and as a result, water technologies applied

98
by county leadership have been moderately supported by residents in county (mean = 3.01). This
implies that, while devolution has consistently led to enhancement of technologies in facilities
such as water tanks, storage dams/pans, and drilled wells/boreholes across ASAL, there is
moderate support of these technologies by residents.
4.5 Water Provision
This section presents descriptive statistics (mean and mean difference) as well as tests for
normality on the various parameters used to measure water provision. Descriptive statistics are
expressed in terms of Water Quality Index (WQI) method proposed by Tiwari and Mishra
(1985). The overall WQI classes are expressed in percentages as follows: 76-100 (excellent,
grade A), 51–75 (good, grade B), 26–50 (poor, grade C), 0–25 (very poor, grade D), >100 (unfit
for domestic consumption, Grade E). The reverse of this scale is applicable for turbidity, color,
taste and odor.
4.5.1 Descriptive Statistics on Water Provision
Water provision was based on the average distance in Kilometers covered by a resident to access
the nearest water point, average cost in Kenya Shillings incurred by a resident to access a 20-liter
jerican of water, quality of water accessed by residents expressed as a percentage, reliability of
water access by residents expressed as a percentage and salinity of water accessible by the
residents expressed as a percentage. Other aspects considered included frequency in water
treatment expressed as a percentage as well as the clarity of water used by the residents
expressed as a percentage. Statistics on post-devolution are as shown in Table 4.5.

99
Table 4.5: Descriptive Statistics on Water Provision
Aspect Statistics of Water Provision
Physical Accessibility (%) 19.874
Affordability (%) 24.090
Quality (%) 58.3851
Reliability (%) 59.7972
Salinity (%) 32.5297
Frequency in Water Treatment (%) 51.3648
Clarity of Water Used (%) 66.5675
From the findings displayed in Table 4.5, the physical accessibility of water in ASAL
approximates 19.874 percent with affordability being at 24.090 percent. Majority (58.385%) of
respondents expressed their satisfaction with the quality of water with the remaining 41.615
percent articulating reservations on suitability of the available water resources in ASAL.
Likewise, majority (59.797%) stated that available water sources are reliable with salinity levels
estimated at 32.530% while frequency in water treatment being 51.365%. Respondents also
approximated the clarity of water used to 66.568%. Compared to the Water Quality Index
Method proposed by Tiwari and Mishra (1985), the findings imply that the quality of water
resources in ASAL is good as well as their reliability and clarity (51% - 75%). However, the
accessibility and affordability ranges between 0 – 25 percent.
4.5.2 Tests for Normality
Test for normality was done on the dependent variable (that is data on water provision) given
that, when the sample size or the number of cases analyzed are at least thirty (30), violation of
normality is not a problem for the predictors (Tabachinick and Fidell, 2007). Further,
distribution of (Y) depends on the predictors and therefore the assumptions for the model state
that the errors are normal since it (Y) is the only random variable in the model other than the
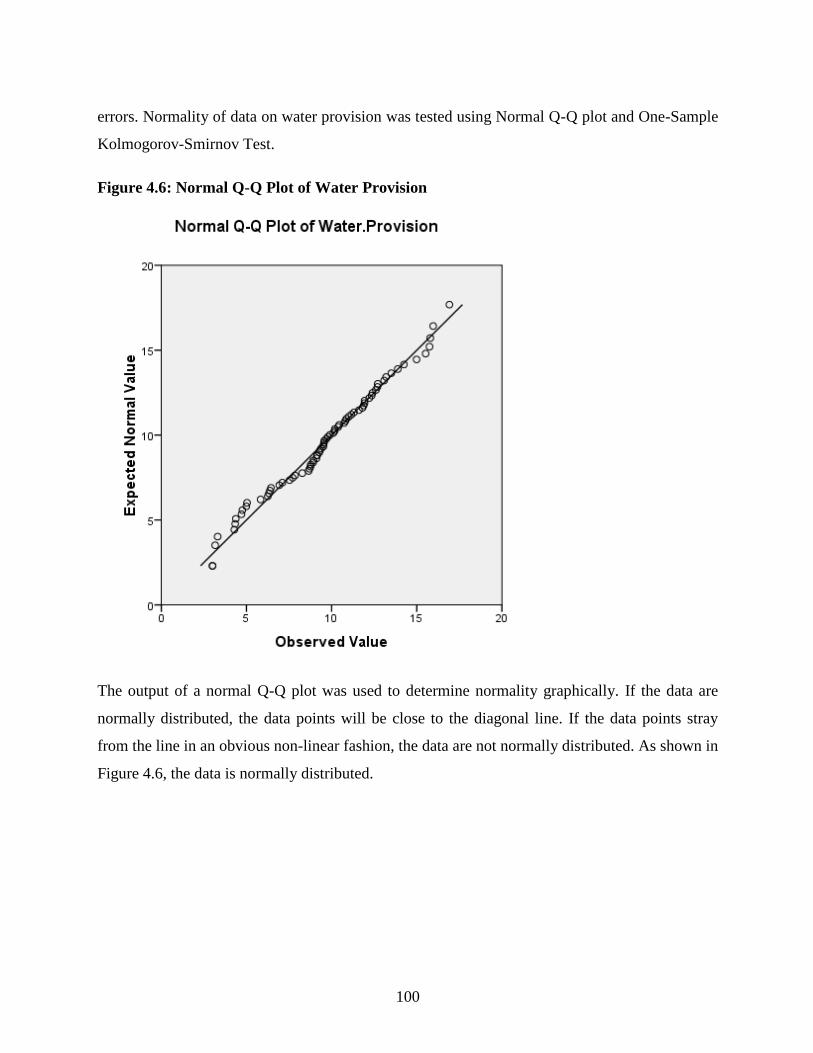
100
errors. Normality of data on water provision was tested using Normal Q-Q plot and One-Sample
Kolmogorov-Smirnov Test.
Figure 4.6: Normal Q-Q Plot of Water Provision
The output of a normal Q-Q plot was used to determine normality graphically. If the data are
normally distributed, the data points will be close to the diagonal line. If the data points stray
from the line in an obvious non-linear fashion, the data are not normally distributed. As shown in
Figure 4.6, the data is normally distributed.

101
Table 4.6: One-Sample Kolmogorov-Smirnov Test
N 74
Normal Parametersa Mean 9.6129
Std. Deviation 3.37640
Most Extreme Differences Absolute .090
Positive .061
Negative -.090
Kolmogorov-Smirnov Z .776
Asymp. Sig. (2-tailed) .584
The difference between the observed distribution and a perfectly normal one is checked based on
a p value. If the p-value is less than 0.05, the distribution is significantly different from a normal
distribution and might be cause for concern. If it is 0.05 or higher, there is no significant
difference from normality. As shown in Table 4.6, the data for administration of devolved water
services was normally distributed as p-value was greater than 0.05 for water provision with
overall p-value using Kolmogorov-Smirnova normality index being 0.776>0.05.
4.5.3 Test for Homoscedasticity
In statistics, a sequence (or a vector) of random variables is homoscedastic if all its random
variables have the same finite variance. This is also known as homogeneity of variance. The
complementary notion is called heteroscedasticity. The assumption of homoscedasticity
simplifies mathematical and computational treatment. Serious violations in homoscedasticity
(assuming a distribution of data is homoscedastic when in reality it is heteroscedastic may result
in overestimating the goodness of fit as measured by the Pearson coefficient. This study used
Breusch-Pagan test (named after Trevor Breusch and Adrian Pagan) as test for homoscedasticity.
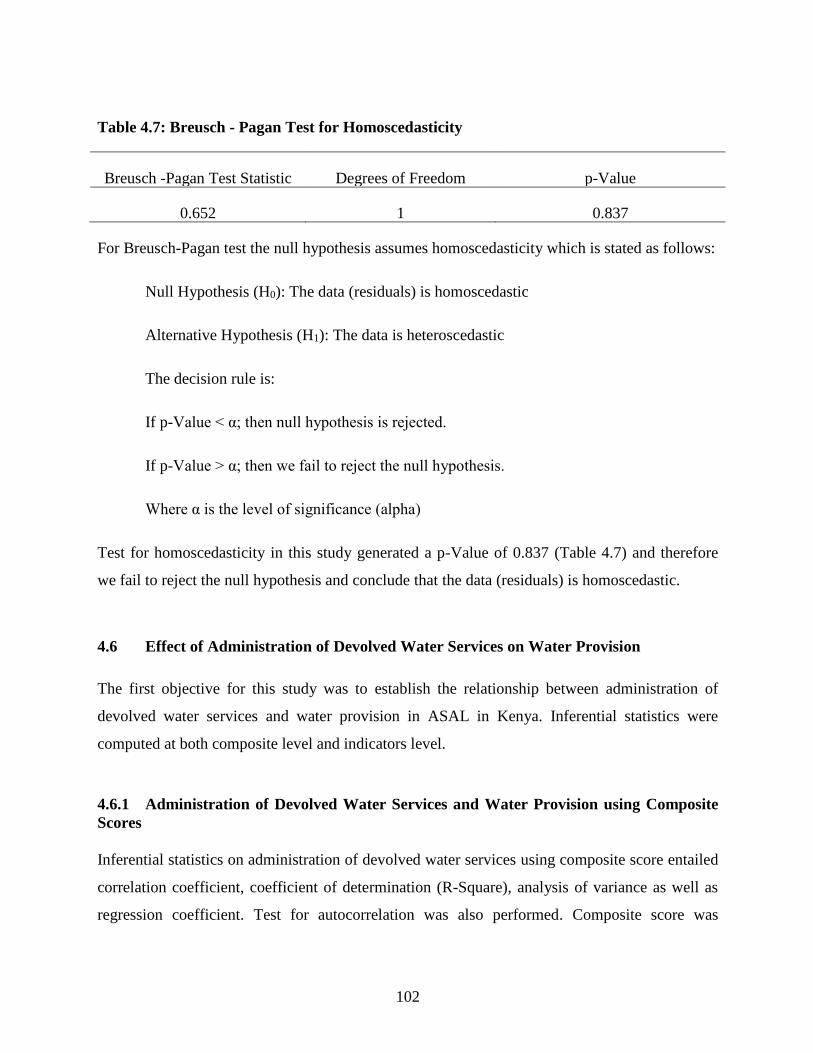
102
Table 4.7: Breusch - Pagan Test for Homoscedasticity
Breusch -Pagan Test Statistic Degrees of Freedom p-Value
0.652 1 0.837
For Breusch-Pagan test the null hypothesis assumes homoscedasticity which is stated as follows:
Null Hypothesis (H0): The data (residuals) is homoscedastic
Alternative Hypothesis (H1): The data is heteroscedastic
The decision rule is:
If p-Value < α; then null hypothesis is rejected.
If p-Value > α; then we fail to reject the null hypothesis.
Where α is the level of significance (alpha)
Test for homoscedasticity in this study generated a p-Value of 0.837 (Table 4.7) and therefore
we fail to reject the null hypothesis and conclude that the data (residuals) is homoscedastic.
4.6 Effect of Administration of Devolved Water Services on Water Provision
The first objective for this study was to establish the relationship between administration of
devolved water services and water provision in ASAL in Kenya. Inferential statistics were
computed at both composite level and indicators level.
4.6.1 Administration of Devolved Water Services and Water Provision using Composite
Scores
Inferential statistics on administration of devolved water services using composite score entailed
correlation coefficient, coefficient of determination (R-Square), analysis of variance as well as
regression coefficient. Test for autocorrelation was also performed. Composite score was

103
computed by treating the various key aspects of administration of devolved water service (that is
stakeholders’ engagement, human resource development, and application of modern technology)
as one cluster as opposed to regressing each component individually.
Table 4.8: Correlation Coefficient for the Administration of devolved water services and
Water Provision
Water Provision
Administration of devolved
water services
Water Provision Pearson Correlation 1.000 .943**
Sig. (2-tailed)
-
N 74 74
Administration of
devolved water
services
Pearson Correlation .943** 1.000
Sig. (2-tailed) -
N 74 74
**. Correlation is significant at the 0.01 level (2-tailed).
Table 4.8 indicates a Pearson Correlation coefficient between administration of devolved water
services and water provision of 0.943 at 2-tail test and 0.05 significant levels. This indicates that
administration of devolved water services and water provision positively influences each other
up to 0.943 showing a very strong relationship between the two variables.
Table 4.9: Model Summary for the Administration of Devolved Water Services and Water
Provision
R R Square Adjusted R Square
Std. Error of the
Estimate Durbin-Watson
.943a .890 .890 1.12727 2.077
Results in Table 4.9 show an R-Square of 0.89 with the standard error of estimate being 1.13.
This implies that using composite score, administration of devolved water services significantly
influences water provision. The researcher also tested for autocorrelation using Durbin Watson
statistic which is always between 0 and 4 where a value of 2 means that there is no presence of

104
autocorrelation in the residuals (prediction errors) from a regression analysis. The Hypotheses
for the Durbin Watson test are:
H0 = No first order autocorrelation
H1 = First order correlation exists.
(For a first order correlation, the lag is one-time unit).
A rule of thumb is that, test statistic values in the range of 1.5 to 2.5 are relatively normal.
Values outside of this range could be cause for concern. Field (2009) suggests that values under
1 or more than 3 are a definite cause for concern. For the current study, Durbin Watson statistic
was 2.077 which falls within the relatively-normal range and therefore there was no
autocorrelation in the residuals from regression analysis.
Table 4.10: ANOVA for Administration of Devolved Water Services and Water Provision
Sum of Squares Df Mean Square F Sig.
Regression 740.710 1 740.710 582.777 .000a
Residual 91.494 72 1.271
Total 832.204 73
As shown in Table 4.9, F-Calculated (1, 72) = 582.89 which is greater than F-Critical (1, 72) =
3.96 at 2-tail test and 95% confidence level (see Appendix IX). Results also show that p-value =
0.000 < 0.05. This further confirms that administration of devolved water services positively and
significantly influences water provision.
Table 4.11: Regression Coefficients for Administration of Devolved Water Services and
Water Provision
Unstandardized
Coefficients
Standardized
Coefficients
T Sig. B Std. Error Beta
(Constant) 1.993 .342 5.827 .000
Administration of devolved
water services .275 .011 .943 25.000 .000

105
Findings presented in Table 4.11 show that when administration of devolved water services is
held constant, water provision will remain at 1.993. At the same time, an increase in
administration of devolved water services by one unit leads to an increase in water provision by
0.275 units with a p-value of 0.000<0.05. This can be summarized by the following model:
In summary, given R-Square = 0.890 with F-Calculated (1, 72) = 582.777 which is greater than
F-Critical (1, 72) = 3.96 \t 2-tail test and 95% confidence level and p-value = 0.000 < 0.05 as
well as a positive elasticity (0.275) the researcher did not accept the null hypothesis (H01) and
therefore concludes that there is positive and significant effect of administration of devolved
water services on water provision in ASAL in Kenya.
4.6.2 Administration of Devolved Water Services and Water Provision using Component
Scores
Inferential statistics on components of administration of devolved water services (stakeholders’
engagement, human resource development, and application of Modern Technology) and water
provision entailed correlation coefficients, coefficient of determination, ANOVA, and regression
coefficient.
Table 4.12: Correlation Coefficients for Components of Administration of Devolved Water
Services
Water
provision
Stakeholders
engagement
Human resource
development
Application of
Modern Technology
Water
provision
Pearson Correlation 1.000 .771** .853** .886**
Sig. (2-tailed) .000 .000 .000
N 74 74 74 74
Stakeholders
engagement
Pearson Correlation .771** 1.000 .681** .659**
Sig. (2-tailed) .000 .000 .000
N 74 74 74 74
Human
resource
development
Pearson Correlation .853** .681** 1.000 .717**
Sig. (2-tailed) .000 .000 .000
N 74 74 74 74
Application of
Modern
Pearson Correlation .886** .659** .717** 1.000
Sig. (2-tailed) .000 .000 .000

106
Water
provision
Stakeholders
engagement
Human resource
development
Application of
Modern Technology
Technology N 74 74 74 74
**. Correlation is significant at the 0.01 level (2-tailed).
As indicated in Table 4.12, correlation between water provision and stakeholders’ engagement
was 0.771 with water provision correlating with human resource development correlating at
0.853 and 0.886 with application of modern technology. There was also a positive correlation
between application of modern technology and human resource development with a correlation
coefficient of 0.717. All relationships were found to be positive and significant with p-Value of
0.000 at 0.05 significant levels.
Table 4.13: Model Summary on Administration of Devolved Water Services and Water
Provision
R R Square Adjusted R Square
Std. Error of the
Estimate
.949a .901 .896 1.08660
Results in Table 4.13 show an R-Square of 0.901 with the standard error of estimate being 1.09.
This implies that administration of devolved water services through application of modern
technology, stakeholders’ engagement, and human resource development explains 90.1 percent
of any changes in water provision.
Table 4.14: ANOVA for Components of Administration of Devolved Water Services
Sum of Squares of Mean Square F Sig.
Regression 749.555 3 249.852 211.613 .000a
Residual 82.649 70 1.181
Total 832.204 73
ANOVA was used to test goodness of fit by applying F-tests on the ratio of variances. As shown
in Table 4.14, the P-value (p-Value=0.000<0.05) in the ANOVA table gives an overall

107
confidence that the fit for the regression model was good. Results further indicate that F-
Calculated (3, 70) = 211.613 which is greater than F-Critical (3, 70) = 2.74 at 2-tail test and 95%
confidence level with p-Value=0.000<0.05. This is an indication that administration of devolved
water services has a significant influence on water provision in ASAL.
Table 4.15: Regression Coefficients for Components of Administration of Devolved Water
Services
Unstandardized
Coefficients
Standardized
Coefficients
T Sig. Collinearity
Statistics
B Std. Error Beta Tolerance VIF
(Constant) 2.162 .336 6.435 .000 0.476 2.101
Stakeholders
engagement
.164 .045 .198 3.644 .001 0.409 2.445
Human resource
development
.287 .047 .364 6.106 .000 0.432 2.315
Application of
Modern Technology
.356 .041 .494 8.683 .000 0.476 2.101
Findings presented in Table 4.15 show that when administration of devolved water services
through stakeholders’ engagement, human resource development and application of modern
technology, is held constant, water provision will remain at 2.162. At the same time, an increase
in stakeholders’ engagement by one unit leads to an increase in water provision by 0.164 units
with a p-value of 0.001<0.05 while an increase in one unit of human resource development leads
to an increase in water provision by 0.287 with a p-value of 0.000<0.05. When application of
modern technology increases by one unit, water provision increases by 0.356 with a p-value of
0.000<0.05. This can be summarized by the following model:
where X1-1 is application of modern
technology, X1-2 human resource development and X1-3 stakeholders’ engagement.

108
Multicollinearity was assessed by examining tolerance and the Variance Inflation Factor (VIF).
Tolerance is a measure of collinearity reported by SPSS as 1-R2. A small tolerance value
indicates that the variable under consideration is almost a perfect linear combination of the
independent variables already in the equation and that it should not be added to the regression
equation. All variables involved in the linear relationship will have a small tolerance. If a low
tolerance value is accompanied by large standard errors and non-significance, multicollinearity
may be an issue.
The Variance Inflation Factor (VIF) is 1/Tolerance, it is always greater than or equal to 1. There
is no formal VIF value for determining presence of multicollinearity. Values of VIF that exceed
10 are often regarded as indicating multicollinearity and therefore a cause for concern. When
VIF values are high for any of the variables in the model, multicollinearity is probably an issue.
When VIF is high there is high multicollinearity and instability of the b and beta coefficients. It
is often difficult to sort this out. as indicated in Table 4.14 VIF was 2.445 (stakeholders’
engagement), 2.315 (human resource development) and 2.101(application of modern
technology) indicating little or no multicollinearity and thus indicators on administration of
devolved water services have stable beta and should be included in the regression equation
In summary, given R-Square = 0.901 with F-Calculated (3, 70) = 211.613 which is greater than
F-Critical (3, 70) = 2.74 at 2-tail test and 95% confidence level and a p-value = 0.000 < 0.05 it
can be confirmed that the researcher did not accept null hypothesis H01 and therefore conclude
that there is significant positive relationship between administration of devolved water services
and water provision in ASAL in Kenya.
4.6.3 Suggestions for Improvement of Water Provision through Administration of
Devolved Water Services
This section presents results of the qualitative (open-ended) questions that sought respondents’
opinions on how various components of administration of devolved water services can improve
water provision in ASAL. Analysis was done using R-based Qualitative Data Analysis (RQDA)
software and results presented in bar plots and word clouds using visual representation of text
data in the form of tags. For the case of word clouds, the frequency of occurrence of these tags
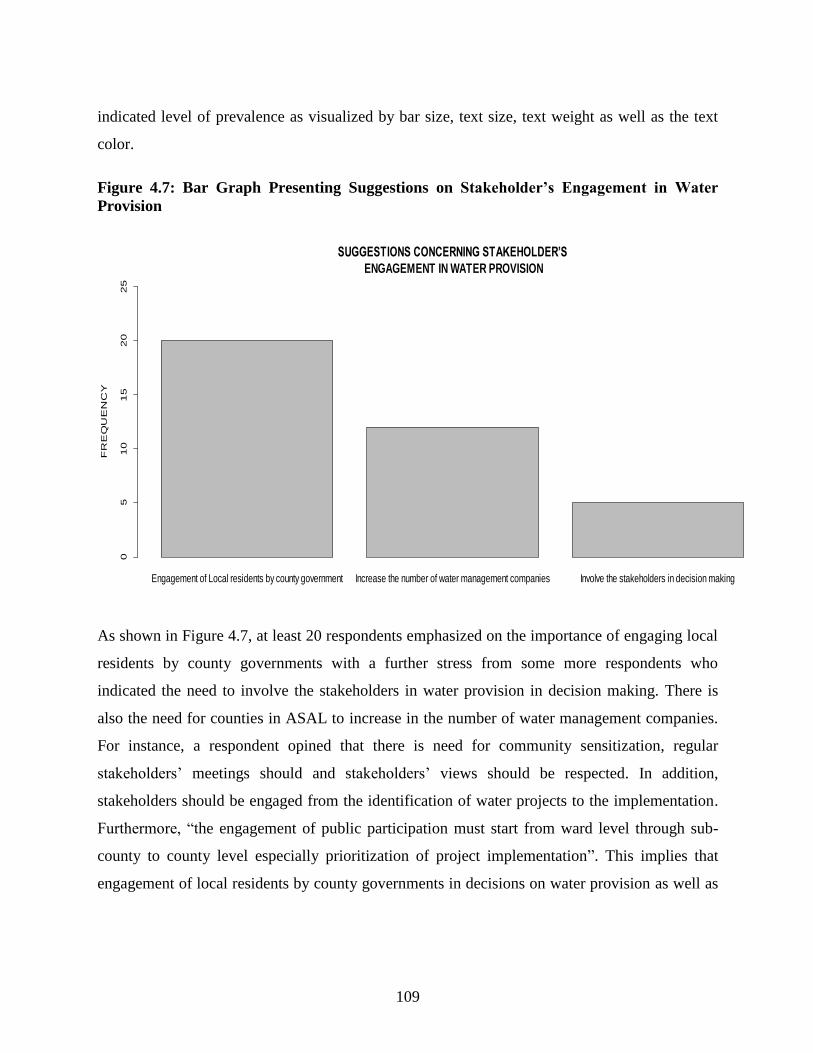
109
indicated level of prevalence as visualized by bar size, text size, text weight as well as the text
color.
Figure 4.7: Bar Graph Presenting Suggestions on Stakeholder’s Engagement in Water
Provision
Engagement of Local residents by county government Increase the number of water management companies Involve the stakeholders in decision making
SUGGESTIONS CONCERNING STAKEHOLDER’S
ENGAGEMENT IN WATER PROVISION
FR
EQ
UE
NC
Y
05
10
15
20
25
As shown in Figure 4.7, at least 20 respondents emphasized on the importance of engaging local
residents by county governments with a further stress from some more respondents who
indicated the need to involve the stakeholders in water provision in decision making. There is
also the need for counties in ASAL to increase in the number of water management companies.
For instance, a respondent opined that there is need for community sensitization, regular
stakeholders’ meetings should and stakeholders’ views should be respected. In addition,
stakeholders should be engaged from the identification of water projects to the implementation.
Furthermore, “the engagement of public participation must start from ward level through sub-
county to county level especially prioritization of project implementation”. This implies that
engagement of local residents by county governments in decisions on water provision as well as

110
increase in the number of companies managing water resources are some of the outstanding
suggestions made by the respondents in this study.
Figure 4.8: World Cloud Presenting Suggestions on Stakeholder’s Engagement in Water
Provision
waterstakeholders
county
stak
ehol
der
engagementen
gage
d
participation
pro
ject
sm
an
ag
em
en
t
pro
visi
on in
volv
emen
t
government
decision
sensitization
enhancedmust
proj
ect
service
implementation
invo
lved
hold
making
activities
avoi
d
duplication
com
mun
ity
need
regular
public
therefore
good
awareness
continuous
training
with
in
staff
developmentpartners
fully
start
put
also
established
mee
ting
policy
give
n
play
tech
nica
l
identif ication
prop
er
bottom
leve
l
services
w ill
together
w ork
greatly
made
info
rmat
ion
vital bette
r
completely
cons
erva
tion
placed
sustainablity
boar
ds
residents
high
lyim
port
ant
entr
y
grea
t
right
support
resources
communities
enhance
chart
mechanisms
undertaking
way
s
wor
ksho
ps
ensure
sustainability
com
mitt
ees
activ ely
participate
ev ery
process
offic
es
addi
tiona
l
prov iders
emph
asis
engegement
lot
joint
v entures
iii
meetings
respected
v iews
address
foru
m
issues
regulary
responsiblities
roles
advi
ce
knowledge
opposed
polit
ics
technicians
easy
save
time
harv esting
inv est
impo
rtan
ce
permanent
becomes
grou
nd
inclusiv eness
form
ulat
ion
directly
maj
or
end
chan
ced
best
consumers
inpu
t
wescoord
capacity delinkinginterf erence
political
lev e
sub
carr
ied
offic
er
point
low
offic
e
still
communicated
well
common
impact
sensitize
terms
choo
se
priorities
based
identif y
orga
niza
tion
viab
lle
progress
budg
et
extent
preparation
upheld
plans
share
coun
tys
intergrate
let
ef f ectiv e
precise
citizen
foru
ms
wat
ch
lev els
boreholes
ensuring
equiped
technology
ownership
prov isions
func
tiona
l
impo
rtan
tly
little
opinion
reso
urce
ful
f ormation
sublocation
enga
ge
f ull
purpose
aquitable
avai
labi
lity
dev olution
deliv ery
indev elopment
counties
currently
direction
ef f ort
muchpr
ogra
mm
es
som
ehow
towards
department
The most occurring words were “water”, “stakeholders”, “engaged”, “participation”,
“enhanced”, “county” and “management”. This indicated that there should be enhance
stakeholder participation through citizen forums and right watch groups in administration of
devolved water services in ASAL. Also, the stakeholders should be involved in all water
provision decision making so as to ensure ownership and sustainability of the projects since
“currently the county governments are doing their programmes without much involvement of the
communities. There is no deliberate effort being made towards their direction somehow in these
ASAL counties, the staff are not enough”. Respondents also intimated that stakeholders are
better placed in conservation and sustainability therefore should be engaged completely. A word
cloud on these findings is presented in Figure 4.8.

111
Figure 4.9: Bar Graph Presenting Recommendations on Human Resource Development in
Water Provision
RECOMMENDATIONS CONCERNING HUMAN CAPITAL DEVELOPMENT IN WATER PROVISION
Frequency
more specialist
more training
technical staff
water sector
motivation of staff
county staff
devolution of water services
devolution of water
experience in water technology
experience in water
courses among the staff
enhance training
right people
water services
skilled personnel
water technology
water resources
qualified personnel
capacity building
more staff
2.0 2.5 3.0 3.5 4.0 4.5 5.0
Figure 4.9 presents a bar graph on respondents’ recommendations concerning human resource
development in water provision. Respondents were insistent that, counties should employ more
staff and invest in capacity building because “most of the current staff have no basics in water
skills and counties need qualified personnel”. Importance of employing water technologies was
also put across by respondents elaborating that counties in ASAL should engage skilled and
competent staff in water technology to replace the existing and worn out water infrastructure due
to natural attrition.

112
Figure 4.10: Word Cloud Presenting Recommendations on Human Resource Development
in Water Provision
wa
ter
sta
ff
countystaffs
recruit
pe
rso
nn
el
right
training
capital
development
hu
ma
n
employ
skilled
leadership
level
recr
uite
dca
paci
ty
enhance
qualified
need
recruitment
manage
resourcesem
plo
yedcourses
experience
devolu
tion
services
build
ing
competentrelevant
improve
technical
service
issue
technology
skills
engage
within
trained
wellneeded
curr
ent
place
people
among
refr
esh
govern
ment
em
plo
yees
new
motivation
secto
r
department
professional
done
especially
employee
succession
required
specialist
education
upgraded
cla
nis
m
discouraged
em
bra
ce
nepotism
politicsprofessionalism
transparency
support
ive
will
existing
integrity
adequate
cadre
community
decentr
aliz
e decision
involve
low
makin
g
mid
dle
top
ensure
necessary
delivery
managem
ent
resource
qualif
ications
related
political
successful
chaninging
cope
regular
trainings
undergo
drilling
machin
e
purchase
tto
devolve
effecie
ncy
facilita
te
productivity
structure
various
boardaround
day
trend
w ard
relelvant
communities
giv
en
provision
majority
retir
ing
shortage
w orking
crises
depart
ments
placed
retired
there
fore
extr
a
proper
w orkers
group
train
palced
worr
k
suff icient
moderate
fair
vacuumempolyees
retain
appraisalassessment
carried
needs
also
impro
vin
g
makueniprojects
pro
vid
e
help
process
basics
professionals
council
defu
nct
excess
inherite
d
municipalnatio
nal
shedattrition
due
fill
natural
college
different
sendin
g
students
alw ays
effective
motivated
outp
ut
tools
work
boost
em
pow
erm
ent
consideredkew
i
others
refr
esher
utilised
utilized
direct
equally
seconded
treated
improvement
inte
rgra
tion
interms
require
enable
transfo
rm
inte
rvals
mostly
motivate
audit
dete
rmin
e
help
ed
hring
many
non
key
As shown in Figure 4.10, among the most words included water, staff, county, recruit, training,
personnel, leadership and skilled developments. Other largely conspicuous mentions were
nepotism, relevant, technical, competent and qualified. A few respondents suggested that
counties in ASAL should “shed off excess staff especially those inherited from the National
Government and from the defunct Municipal Council” with others underscoring the need to
ensure that all staff are well equipped with tools necessary for work and always motivated to
ensure effective output. Nonetheless, some respondents supposed that there is adequate human
resource development for effective administration of devolved water services in their respective
counties and what is only need is to motivate staff and train them on leadership resource
management and integrity. This implies that there is need to build sufficient competence around

113
the staff administering devolved water services. This will be achieved through capacity building,
trainings, more recruitments and matching employees to their relevant tasks based on skills.
Figure 4.11: Bar Graph Presenting Recommendations on Application of Modern
Technology in Water Provision
Figure 4.11 indicate displays a significant number of respondents (Over 25) suggesting new
technologies can highly aide in water provision in ASAL. There was also the mention of solar
power with roughly 6 respondents insisting that solar system should be used instead of diesel
engine “to reduce cost of services in water provision” explaining that solar power constitute
“simple technologies which communities can easily cope with in water harvesting technologies.
Those who mentioned new technologies intimated that, introduction of life cycle cost approach
system in the water system could enhance application of new and improved technology in the
water sector. Moreover, new technologies would help in water mapping, exploitation and
extraction such as solar and Geographical Information System (GIS).

114
Figure 4.12: Word Cloud Presenting Recommendations on Application of Modern
Technology in Water Provision
watertechnologies
new
tech
no
log
y solar
syste
mcounty
training
pow
er
improvement
go
ve
rnm
en
t
need
provisionenhance
used
staffadopted
improvecommunities
avail
modern
cost
use
equipments
applic
ation
available
metering
building
ca
pa
city
leve
l
na
tio
na
l
eq
uip
me
nt
increase
sta
ke
ho
lde
rs
required
service
supplies
decision
energydeliver
friendlygravity
install
pay
win
d
department
pro
fessio
nals
team
design
iii
survey
syste
ms
enhanced
services
personnel
w orkshopscourses
refresher
aw
are
ness
creation
involve
private
applie
d
ones
cope
delivery
diesel
instead
reduce
improving
keep
harvesting
approach
involvement
participation
example
simple
sustainability
especially
structures
makin
g
participate
public
green
intr
oductio
n
dynam
ic
embrace mapping
apply
f ir
grassroot
leaders
centre
resource
ground
like
osm
osis
purif y
rev erse
hea
din
g
order
will
auto
ca
d
hy drogeological
surv ey s
toke
n
typ
e
ict
v arious
employ
qualif ied
trainings
yo
un
grecruiting
communal
great
indiv idually
serv icedeliv ery deliv ery
achiev e
engage
institutions
serv icedeliv ery
mantaining
quality
co
nsid
era
tio
n
emerging
course
em
plo
ye
es
f resher
pumping
comes
f und
adv ance
late
st
operate
ca
n
rain
su
pp
ly
exposure
management
come
f easibility
proper
study
prov iders
equ
ipin
g allowed
civ ic
education
learn
ma
ku
en
i
residentse
mp
loyin
g
instance
long
sof tware
tra
in
citizens
tapp
ed
deep
lif e
sector
tech
nic
al
gen
era
ts
keeps
old
tech
no
log
ica
lly
thus
using
extraction
date
skill
s
aim
dev elop
actors
exce
rcis
e
kn
ow
ledg
e
tolerance
top
workers
benef iciaries
f ull
thoro
ug
h
appropriate
are
a
budgetsdone
ideas
intia
tive
s
sp
ecific
ally
perf ecting
gadgets
leakin
g
mn
imis
e
nrw
pap
erle
ss
pay ment
co
nstr
uctio
n
sources
Figure 4.12 presents a word cloud on recommendations for improving application of modern
technology in water provision. The most notable words are water, technologies, new, solar,
power, improvement, and enhance training. These findings do stress the need to employ new
technologies because of dynamics related to in water provision. For instance, a respondent stated
that:
“Technology is dynamic and keeps improving and thus I recommended the county to be
dynamic technologically instead of using the very old generators driven by diesel to
pump water”
This implies that application of modern technology is important in water provision and thus
administration of devolved water services ought to apply friendly technology such as solar

115
power, power gravity systems to deliver water, install system where you pay for consumed
water.
4.7 Administration of Devolved Water Services, Transformational Leadership and
Water Provision
The second objective for this study was to establish the moderating effect of transformational
leadership on the relationship between administration of devolved water services and water
provision in ASAL in Kenya. Moderating effect of transformational leadership was tested and
results used either to reject or not reject the null hypothesis.
4.7.1 Descriptive Statistics on Administration of Devolved Water Services,
Transformational Leadership and Water Provision
This section presents descriptive statistics on transformational leadership
Table 4.16: Descriptive Statistics Results on Administration of Devolved Water Services,
Transformational Leadership and Water Provision
Not at
all
Low
extent
Moderate
extent
Great
Extent
Very
great
extent
SUMMARY
Mean Median Mode
Standard
Deviation
County leaders always inspire
and motivate their staff in
order to optimize productivity
especially on Water services
24.3% 23.0% 31.1% 10.8% 10.8% 2.61 3.00 3.00 1.27
County Leaders always
challenge staffs to be creative
and generate lasting solutions
when faced with challenges
on water provisions
23.0% 17.6% 35.1% 18.9% 5.4% 2.66 3.00 3.00 1.19

116
Not at
all
Low
extent
Moderate
extent
Great
Extent
Very
great
extent
SUMMARY
Mean Median Mode
Standard
Deviation
County Leaders always
intellectually stimulate their
staff in order to optimize
productivity especially on
water provision
16.2% 29.7% 35.1% 12.2% 6.8% 2.64 3.00 3.00 1.11
County leaders always ensure
subordinates get recognition
and/or rewards when they
achieve difficult or complex
goals especially on water
provision.
24.3% 23.0% 31.1% 10.8% 10.8% 2.61 3.00 3.00 1.27
Findings presented in Table 4.16 indicates that, county leaders do inspire and motivate their staff
in order to optimize productivity especially on water services (mean = 2.61; standard deviation =
1.27), challenge their staffs to be creative to generate lasting solutions especially on water
provision (mean = 2.66; standard deviation = 1.19). Results also show that county leaders
intellectually stimulate their staffs to optimize productivity especially on water provision (mean
= 2.64; standard deviation = 1.11) and county leaders always endure subordinates get
recognition/reward when difficult tasks especially on water provision is achieved (mean = 2.61;
standard deviation = 1.27).
4.7.2 Inferential Statistics on the Administration of Devolved Water Services,
Transformational Leadership and Water Provision
The moderating effect of transformational leadership was assessed and results explained using
coefficient of determination (R-Square), Analysis of Variance (ANOVA) and the regression
coefficients. Hierarchical regression analysis was performed with an interaction term (a product
of transformational leadership and administration of devolved water services) introduced as an
additional predictor.

117
Table 4.17: Regression Coefficients on Administration of Devolved Water Services,
Transformational Leadership and Water Provision
Model
Unstandardized
Coefficients
Standardized
Coefficients t Sig.
B Std. Error Beta
1 (Constant) 1.993 .342
5.827 .000
Administration of devolved water
services 0.275 .011 0.943 25.000 .000
2 (Constant) 1.710 .316 5.411 .000
Administration of devolved water
services .252 .012 .864 21.000 .000
Transformational leadership .185 .045 .167 4.111 .000
3 (Constant) 1.764 .523
3.373 .001
Administration of devolved water
services .250 .018 0.858 13.889 .000
Transformational leadership .171 .016 0.154 10.688 .000
Devolution.Transformational .181 .013 0.017 13.923 .000
Table 4.17 presents regression coefficients and their significant values for model 1 (direct
effect), model 2 (controlling effect) and model 3 (moderating effect). From the unstandardized
coefficients, administration of devolved water services was making a unique significant and
positive contribution to water provision with transformational leadership for all the three models
(p-Value < 0.05). In model 3, this significance is particularly given by b=0.250, T-Calculated(73,
0.05)=13.889>T-Critical(0.05, 73)=1.658 and p-Value=0.000<0.05 for administration of devolved
water services; b=0.171, T-Calculated(73, 0.05)=10.688>T-Critical(0.05, 73)=1.658 and p-
Value=0.000<0.05 for transformational leadership; and b=0.181, T-Calculated(73, 0.05)=13.923>T-
Critical(0.05, 73)=1.658 and p-Value=0.000<0.05 for interaction term. The autonomous value is
1.764. The regression model can therefore be summarized as:

118
Where X*M1 represents interaction term given as a product of transformational leadership (M1)
is interacted with administration of devolved water services (X)
Table 4.18: ANOVA for Administration of Devolved Water Services, Transformational
Leadership and Water Provision
Model Sum of Squares df Mean Square F Sig.
1 Regression 740.710 1 740.710 582.777 .000a
Residual 91.494 72 1.271
Total 832.204 73
2 Regression 758.541 2 379.270 365.385 .000b
Residual 73.663 71 1.038
Total 832.204 73
3 Regression 758.559 3 252.853 240.355 .000c
Residual 73.645 70 1.052
Total 832.204 73
The ANOVA (Table 4.18) was intended to evaluate if models 1 is significant and if the amount
of variance accounted for in Model 3 (moderating effect) is significantly more than Model 2
(controlling effect). Findings indicate that the model 3 is significant given F(3, 70) = 240.355, p
= 0.000<.05.
Table 4.19: R2 for Administration of Devolved Water Services, Transformational
Leadership and Water Provision
Model R R2
Adjusted
R2
Std. Error
of the
Estimate
Change Statistics
R2-
Change
F-
Change df1 df2
Sig. F-
Change
1 .943a .890 .889 1.127 .890 582.777 1 72 .000
2 .955b .911 .909 1.01858 .021 17.186 1 71 .000
3 0.959 .920 .918 1.0057 .009 10.017 1 70 .037
119
Table 4.19 presents the percent of variability in the water provision (dependent variable) that can
be accounted for by administration of devolved water services and transformational leadership
(predictors). With introduction of interaction term (model 3), R2 changes (an increase) by 0.009
to 0.920 from 0.911 (model 2) with standard error of estimate also decreasing to 1.006 from
1.0185. This change was significant (p-Value=0.001<0.05) implying that transformational
leadership had a significant moderating effect on the relationship between administration of
devolved water services and water provision in ASAL in Kenya.
In summary and to test the hypothesis that transformational leadership does not significantly
moderate the relationship between administration of devolved water services and water provision
in Arid and Semi-Arid Lands in Kenya, a three-steps hierarchical multiple regression analysis
was conducted. In the first step, the independent variable was included: administration of
devolved water services and water provision. These variable accounted for a significant amount
of variance in water provision, R2 = 0.890, F(1, 72) = 582.777, p-Value 0.000 < 0.05. Next, the
controlling effect was determined which also accounted for a significant effect with R2 = 0.911,
F-Change (1, 71) = 17.186, p-Value 0.000 < 0.05. The third and last step entailed introduction of
interaction term to the regression model, which accounted for a significant proportion of the
variance in water provision, ΔR2 = 0.009, ΔF(1, 70) = 10.017, b = .181, t(72) = 13.923, p-
Value=0.000 < 0.05. Consequently, the researcher did not accept the null hypothesis (H02a) and
therefore concludes that transformational leadership has a significant moderating effect on the
relationship between administration of devolved water services and water provision in Arid
and Semi-Arid Lands in Kenya.
4.7.3 Improvements Needed Regarding Transformational Leadership Qualities in Water
Provision
This section presents results of the open-ended questions that sought respondents’ opinions on
how transformational leadership during administration of devolved water services can be
enhanced to achieve the desired levels of water provision in ASAL. Analysis was done using R-
based Qualitative Data Analysis (RQDA) software and results presented in bar plots and word
clouds using visual representation of text data in the form of tags. For the case of word clouds,

120
the frequency of occurrence of these tags indicated level of prevalence as visualized by bar size,
text size, text weight as well as the text color.
Figure 4.13: Bar Chart Presenting Improvements Needed on Transformative Leadership
Qualities in Water Provision
Involvement of all stakeholders Capacity Building Motivate Staff More facilitation
IMPROVEMENTS NEEDED REGARDING TRANSFORMATIVE LEADERSHIP
QUALITIES OF THE COUNTY EXECUTIVES
FR
EQ
UE
NC
Y
05
10
15
20
As shown in Figure 4.13, improvements needed regarding transformational leadership quality
include involvement of all stakeholders (20 respondents), capacity building (10), staff
motivation (8) and more facilitation (9). Respondents further explained that transformational
leadership is adequately achieved when there is participation of relevant stakeholders in every
decision-making process, project implementation, planning, staff motivation and keeping of
records for future references including more involvement in identification of priority created
projects for funding in respective areas. Additionally, respondents were of the view that in
administration of devolved water services, transformational leaders should be people with
knowledge and skills including adequate experience on water provision besides being people
who can exploit knowledge of their juniors and involve them in all water activities.

121
Figure 4.14: Word Cloud Presenting Improvements Needed on Transformative Leadership
Qualities in Water Provision
decisionwater
co
un
tysta
ffpro
cess
making
sub
executive
lea
de
rsh
ip
stakeholders
mo
tiva
tio
n
projects
involvement
invo
lve
people
sta
ffs
level
knowledge
leaders
facilitation
ordinate
motivated
provision
management
funds
political
planning
training
motivateneeded
empowerment
bottom
building
part
icip
atio
n
consultation
resourc
es
subord
inate
department
com
mitte
e
technical
decisions
employment
engage
skills
trainings
integrity
act
relevant
related
capacity
agreed
imple
menta
tion
record
s
support
regular
enough
exe
cu
tive
s
optimize
proper
offices
engineers
chief
officers
da
ily
need
technology
co
mm
un
ica
tio
n
giv
en
se
rvic
es
influence
low
made
mostly
de
ve
lop
me
nt
sector
focu
s
needy
region
areas
stakeholder
duties
policies
professionalism
field
lead
qu
alifie
d
flow
pri
ori
ty
s tructure
top
liste
n
departments
professionally
ne
ed
s
guide
must
full
activities
can
experience
exploit
jun
iors
especially
issues
reso
lutio
n
inspire
holders
meetings
sta
ke
wide
hcarge
are
a
bala
nce
one
politics
subordinates
dev olv e
empower
responsib
ilities
incharge
powers
supply
control
director
know
changes
date
gov ernance
improv ement
network
part
icip
ate
train
necessary
upw
ard
s
decsions
economical
gain
identif iedconsideration
equitable
iii
cate
gories
employ ee
em
plo
yees
required
kind
satisf action
conserv ativ e
existing
undertaking
background
engagem
ent
incentiv e
clear
distinction
gv ie
spelle
d
employ
firs
t
seminars
take
y ounger
bte
er
programs
main
tain
operations
introduce
policy
appro
aches
avoid
awarding
contract
polit
icin
g
order
activ ely
improv ed
involv
ed
advic
e
prioritization
accounting
prov isions
qualit
ies
regard
ing
buy ing
clo
sed
consider
f resh
particularly
confe
rences
created
fundin
g
respectiv e
equal
lev els
exam
ple
engaged
inspired
enhanced
dedic
ate
d
mandato
ry
Figure 4.14 is a word cloud presenting improvements needed regarding transformative
leadership qualities in water provision. Frequently mentioned words include decision, water,
process, staff, sub, county, stakeholders, involvement, facilitation and knowledge. Further
assertion from respondents called for regular meetings and wide consultation with all stake
holders. Besides the County Executive Committee member in charge should be a water engineer,
respondents cautioned that there should balance between politics and projects to reduce political
interference with little or no biasness in allocation of funds.” This implies that county leadership
in ASAL should engage sub-county leaders in decision making whilst subordinate leaders should
satisfactorily be motivated and inspired.
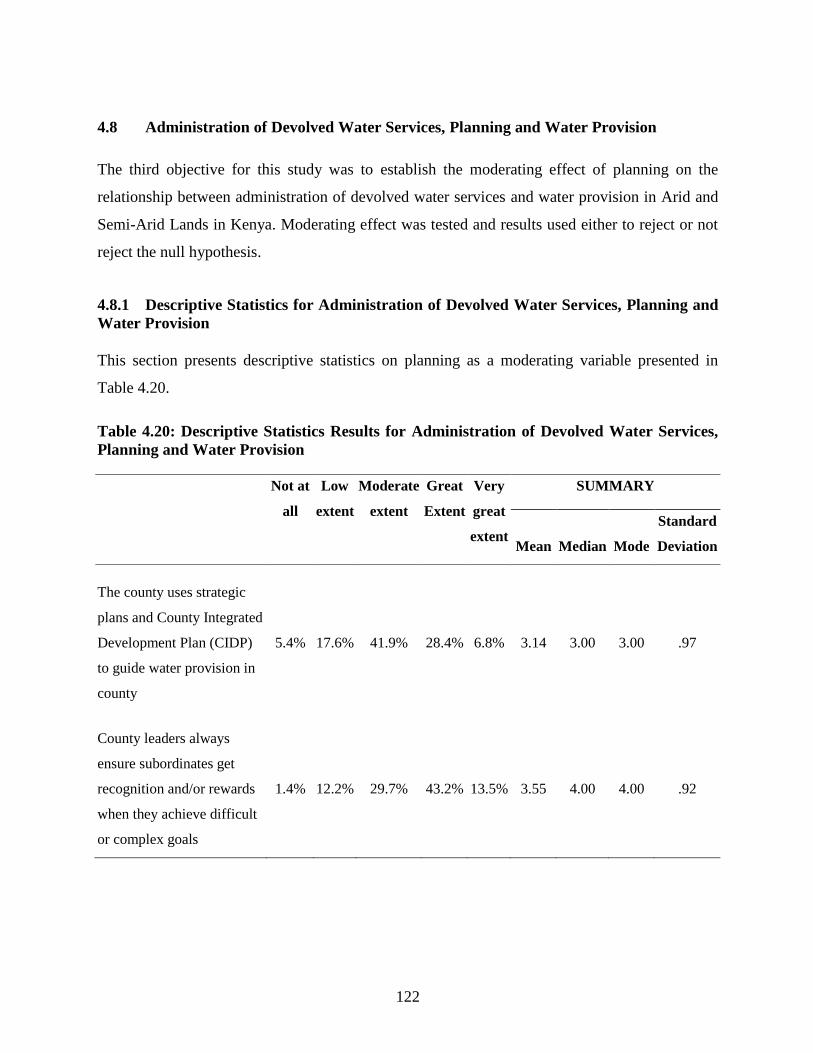
122
4.8 Administration of Devolved Water Services, Planning and Water Provision
The third objective for this study was to establish the moderating effect of planning on the
relationship between administration of devolved water services and water provision in Arid and
Semi-Arid Lands in Kenya. Moderating effect was tested and results used either to reject or not
reject the null hypothesis.
4.8.1 Descriptive Statistics for Administration of Devolved Water Services, Planning and
Water Provision
This section presents descriptive statistics on planning as a moderating variable presented in
Table 4.20.
Table 4.20: Descriptive Statistics Results for Administration of Devolved Water Services,
Planning and Water Provision
Not at
all
Low
extent
Moderate
extent
Great
Extent
Very
great
extent
SUMMARY
Mean Median Mode
Standard
Deviation
The county uses strategic
plans and County Integrated
Development Plan (CIDP)
to guide water provision in
county
5.4% 17.6% 41.9% 28.4% 6.8% 3.14 3.00 3.00 .97
County leaders always
ensure subordinates get
recognition and/or rewards
when they achieve difficult
or complex goals
1.4% 12.2% 29.7% 43.2% 13.5% 3.55 4.00 4.00 .92

123
Devolution has enhanced
appropriate allocation of
resources in county budget
towards water projects
13.5% 23.0% 43.2% 18.9% 1.4% 2.72 3.00 3.00 .97
Devolution has enabled
optimal and on-time
deliveries on water projects
5.4% 8.1% 21.6% 50.0% 14.9% 3.61 4.00 4.00 1.02
From the descriptive results illustrated in Table 4.20, respondents indicated that devolution has
enabled optimal and on-time deliveries on water projects to a great extent (mean 3.61 and
standard deviation of 1.02). Other moderately rated planning aspects included county leaders
ensuring subordinates get recognition and/or rewards when they achieve difficult or complex
goals (mean = 2.55 and standard deviation = 0.92), and the county using strategic plans and
County Integrated Development Plan (CIDP) to guide water provision in county (mean = 3.14;
standard deviation = 0.97).
4.8.2 Inferential Statistics for Administration of Devolved Water Services, Planning and
Water Provision
The moderating effect of planning was assessed and results explained using coefficient of
determination (R-Square), Analysis of Variance (ANOVA) and the regression coefficients.
Hierarchical regression analysis was performed with an interaction term (a product of planning
and administration of devolved water services) introduced as an additional predictor.

124
Table 4.21: Regression Coefficients for Administration of Devolved Water Services,
Planning and Water Provision
Model
Unstandardized
Coefficients
Standardized
Coefficients T Sig.
B Std. Error Beta
1 (Constant) 1.993 .342
5.827 .000
Administration of devolved water
services 0.275 .011 0.943 25.000 .000
2 (Constant) .474 .134 3.537 .000
Administration of devolved water
services .167 .006 .574 27.833 .000
Planning .160 .006 .485 25.003 .000
3 (Constant) 0.556 .085
6.541 .000
Administration of devolved water
services 0.164 .011 .563 14.909 .000
Planning 0.156 .011 .476 14.182 .000
AdmWater.Planning 0.763 .131 .020 5.824 .000
Table 4.21 presents regression coefficients and their significant values for model 1 (direct
effect), model 2 (controlling effect) and model 3 (moderating effect). From the unstandardized
coefficients, administration of devolved water services was making a unique significant and
positive contribution to water provision with planning for all the three models (p-Value < 0.05).
In model 3, this significance is particularly given by b=0.164, T-Calculated(73, 0.05)=14.909>T-
Critical(0.05, 73)=1.658 and p-Value=0.000<0.05 for administration of devolved water services;
b=0.156, T-Calculated(73, 0.05)=14.182>T-Critical(0.05, 73)=1.658 and p-Value=0.000<0.05 for
planning; and b=0.763, T-Calculated(73, 0.05)=5.824>T-Critical(0.05, 73)=1.658 and p-
Value=0.000<0.05 for interaction term. The autonomous value is 1.764. The regression model
can therefore be summarized as:

125
Where X*M2 represents interaction term given as a product of planning (M2) is interacted with
administration of devolved water services (X)
Table 4.22: ANOVA for Administration of Devolved Water Services, Planning and Water
Provision
Model Sum of Squares Df Mean Square F Sig.
1 Regression 740.710 1 740.710 582.777 .000a
Residual 91.494 72 1.271
Total 832.204 73
2 Regression 822.873 2 411.436 3,140.733 .000b
Residual 9.332 71 .131
Total 832.204 73
3 Regression 822.887 3 274.296 2,062.376 .000c
Residual 9.317 70 .133
Total 832.204 73
The ANOVA (Table 4.22) was intended to evaluate if models 1 is significant and if the amount
of variance accounted for in Model 3 (moderating effect) is significantly more than Model 2
(controlling effect). Findings indicate that the model 3 is significant given F(3, 70) = 2,062.376,
p = 0.000<.05.
Table 4.23: R2 for Administration of Devolved Water Services, Planning and Water
Provision
Model R R2
Adjusted
R2
Std. Error
of the
Estimate
Change Statistics
R2-
Change
F-
Change df1 df2
Sig. F-
Change
1 .943a .890 .889 1.127 .890 582.777 1 72 .000
2 .994 .989 .988 .36253 .099 625.140 1 71 .000
3 .996 .993 .990 .36484 .003 25.1907 1 70 .004

126
Table 4.23 presents the percent of variability in the water provision (dependent variable) that can
be accounted for by administration of devolved water services and planning (predictors). With
introduction of interaction term (model 3), R2 changes (an increase) by 0.003 to 0.993 from
0.989 (model 2) with standard error being 0.365. This change was significant (p-
Value=0.004<0.05) implying that planning had a significant moderating effect on the
relationship between administration of devolved water services and water provision in ASAL in
Kenya.
In summary and to test the hypothesis that planning does not significantly moderate the
relationship between administration of devolved water services and water provision in Arid and
Semi-Arid Lands in Kenya, a three-steps hierarchical multiple regression analysis was
conducted. In the first step, the independent variable was included: administration of devolved
water services and water provision. These variable accounted for a significant amount of
variance in water provision, R2 = 0.890, F(1, 72) = 582.777, p-Value 0.000 < 0.05. Next, the
controlling effect was determined which also accounted for a significant effect with R2 = 0.989,
F-Change (1, 71) = 625.140, p-Value 0.000 < 0.05. The third and last step entailed introduction
of interaction term to the regression model, which accounted for a significant proportion of the
variance in water provision, ΔR2 = 0.003, ΔF(1, 70) = 25.1907, b = 0.763, t(72) = 5.824, p-
Value=0.000 < 0.05. Consequently, the researcher did not accept the null hypothesis (H03) and
therefore concludes that planning has a significant moderating effect on the relationship
between administration of devolved water services and water provision in Arid and Semi-Arid
Lands in Kenya.
4.8.3 Responses for Improvements Needed Regarding Planning in Water Provision
This section presents results of the open-ended questions that sought respondents’ opinions on
how planning during administration of devolved water services should be enhanced to improve
water provision in ASAL. Analysis was done using R-based Qualitative Data Analysis (RQDA)
software and results presented in bar plots and word clouds using visual representation of text
data in the form of tags. For the case of word clouds, the frequency of occurrence of these tags
indicated level of prevalence as visualized by bar size, text size, text weight as well as the text
color.

127
Figure 4.15: Bar Chart Presenting Improvements Needed on Planning in Water Provision
Efficient and effective water services Optimal deliveries on water projects Timely decision making on water provision
IMPROVEMENTS
CONCERNING PLANNING IN THE COUNTY ESPECIALLY ON WATER PROVISION AFTER DEVOLUTION
FR
EQ
UE
NC
Y
05
10
15
20
25
30
Respondents mentioned that efficient and effective management of water services, optimal
deliveries on water projects, and timely decision making on water provision, more so in
administration of devolved water services, are the key elements of planning that would improve
water provision in ASAL as summarised in Figure 4.15. This can only be achieved if devolved
leadership ensure that skills of the staff are matched to their designated responsibilities in the
county and ensure appropriate structure are being created as well as enhancing appropriate
allocation of resources in county budget towards waste project. Moreover, respondents indicated
that county government should train the community on the management of water facilities to
improve their skills while Identification of water projects should be demand driven and not
political mileage. Over and above, more effort for improvement should be done especially in
water distribution systems besides increasing qualified staff in the water administrative field and
undertaking adequate induction and trainings.

128
Figure 4.16: Word Cloud Presenting Improvements Needed on Planning in Water
Provision
water
county
sta
ff
managementservice
resources providersfunds
provision
training
leve
l
projects
subensure
pro
per
professionals
allo
ca
tio
n
need
capacity
se
rvic
es
assigned
du
tie
s
per
skille
d
government
sta
ke
ho
lde
rs
facilities
qu
alifie
d
givenadoption
new
technologies
ease
devolutionqu
alifica
tio
n
s trengthening
pla
n
provide
iii
enhanced
project
skills
improvement
impro
ve
dem
and
dis
trib
utio
n
especia
lly
job
increase
properly
building
employ
manage
persons
authority
aw
ard
devolv
ing
minimise
ow nership
well
strategic
development
managed
since
sta
ffs
directo
rs
enough
exam
ple
leadership
number budget
responsibilities
structure
challenge
one
driven
identif ication
mile
age
political
effort
systms
increased train
ed
department
run
descriptio
n
existing
schemes
modern
accountable
corruptions
directed
listin
g
tender
corruption
com
muniti
es
of fer
effectiv
eness
resolution
can
citi
zen
deliv
eries
strength
w sps
cid
p
use
master
policy
done
planning
team
catc
hm
ent
com
mitte
es
resourc
e
trainings
rightf ul
specia
lization
allo
cate
chemicals
electricity
employ s
reduce
relev ant
subsidies
eff
ecie
ntly
matched
tio
towards
togeth
er aw
are
ness
communication
involv
em
ent
improv ements
suf f icient
community
train
f ield
least
motiv ated
y ears
consideration employ ing
y oung
utiliz
ation
fundin
g
atleast
engineers
registered
f orce
issues
organization
technician
em
plo
yed
pla
ced
prof essionally
assign
off
icer
tools
expenditure
giv
ern
incur
ov ersighted
committee
main
tenance
grassroot
lev els
wajwasco
taken
energy
solar
wind
eradicate
polit
ics
basis prioritize
prof essionaltenders
f ormation
ownedadditional
debt
know
ledge
conf erences
f ollow
issue
specially
council
gov ernors
resolv ed
function
implementation
guideminimal
mis
appro
priation
pla
ns a
rea
asal
constructed
surf ace
benef iciaries
Figure 4.16 displays key words on improvements needed regarding planning in water provision
as service management, provision, training and funds/resources. This implies that, for planning
to be effective in moderating the relationship between administration of devolved water services
and water provision, trainings and availability of resources need to be employed. Water
technician and professionals should be given chance to manage water provision facilities while
devolution should be extended to sub-county level. For policy making purpose, passing of Water
and Sanitation Bills should be fast tracked and passed to county assembly.

129
4.9 Administration of Devolved Water Services, Transformational Leadership,
Planning and Water Provision
The forth objective for this study sought to establish if the joint moderating effect of
transformational leadership and planning on the relationship between administration of devolved
water services and water provision in ASAL in Kenya is different from their separate effects.
4.9.1 Inferential Statistics for Administration of Devolved Water Services,
Transformational Leadership, Planning and Water Provision
Hierarchical multiple regression was used to assess the joint effects of the two moderating
variables particularly by looking at the interaction effect between administration of devolved
water services and transformational leadership (X*M1) as well as that for administration of
devolved water services and planning (X*M2) and whether or not such an effect is significant
different from their separate moderating effects in predicting water provision (Y). This was
achieved by interacting the variables in three blocks using multiple additive approach as
explained by Darlington and Hayes (2017) and Hayes (2018) to generate three models as
follows:
Block 1: Y as a function of X (to test the significance of the direct effect of administration of
devolved water services on water provision);
Block 2: Y as a function of X, M1, and M2 (to test the control effect of the three predictors, that
is administration of devolved water services, transformational leadership and planning, on water
provision;
Block 3: Y as a function of X, M1, M2, X*M1, and X*M1 (to test the joint moderating effect of
transformational leadership and planning on the relationship between administration of devolved
water services and water provision) as applied by Hayes (2018).
This was determined by coefficient of determination (R2), analysis of variance (ANOVA) as
well as regression model.

130
Table 4.24: R2 for Administration of Devolved Water Services, Transformational
Leadership, Planning and Water Provision
Model R
R
Square
Adjusted R
Square
Std. Error
of the
Estimate
Change Statistics
R Square
Change F Change df1 df2
Sig. F
Change
1 .943 .890 .890 1.12727 .890 582.777 1 72 .000
2 .973 .948 .940 .13490 .058 478.657 2 70 .000
3 .994 .989 .982 .13403 .041 111.459 2 68 .000
Table 4.24 shows model summary on water provision with R-square being 0.989 (p-value of
0.000) when both transformational leadership and planning are jointly moderating the
relationship with change in R-square being 0.041. This value when compared with separate
change in R-square (0.009 for transformational leadership and 0.003 for planning as shown in
Tables 4.19 and 4.23 respectively) shows that there exists a significant joint moderating effect of
transformational leadership and planning on the relationship between administration of devolved
water services and water provision in ASAL in Kenya.
Table 4.25: ANOVA for Administration of Devolved Water Services, Transformational
Leadership, Planning and Water Provision
Model Sum of Squares df Mean Square F Sig.
1 Regression 740.710 1 740.710 582.777 .000a
Residual 91.494 72 1.271
Total 832.204 73
2 Regression 830.930 3 276.977 15,387.611 .000b
Residual 1.274 70 .018
Total 832.204 73
3 Regression 830.983 5 166.197 9,233.167 .000c
Residual 1.222 68 .018
Total 832.204 73

131
Table 4.25 shows ANOVA on Water Provision. F-Calculated (5, 68) = 9,233.167> F-Critical (5,
68) = 2.346 when both transformational leadership and planning are jointly moderating the
relationship between administration of devolved water services and water provision. The
significance is further emphasized by comparison with model 1 (direct effect) and model 2
(controlling effect).
Table 4.26: Regression Coefficients for Administration of Devolved Water Services,
Transformational Leadership, Planning and Water Provision
Model
Unstandardized Coefficients
Standardized
Coefficients
T Sig. B Std. Error Beta
1 (Constant) 1.993 .342 5.827 .000
Administration of
devolved water services .275 .011 .943 25.000 .000
2 (Constant) .223 .050 4.460 .000
Administration of
Devolved Water Services .157 .002 .538 78.500 .000
Transformational
Leadership .126 .006 .113 21.000 .000
Planning .152 .002 .461 76.000 .000
3 (Constant) .712 .106 6.717 .000
Administration of
devolved water services .160 .004 .547 40.000 .000
Transformational
leadership .151 .020 .135 7.550 .000
Planning .151 .005 .461 30.200 .000
Administration of
devolved water services *
Transformational
leadership
.289 .054 .195 5.352 .000
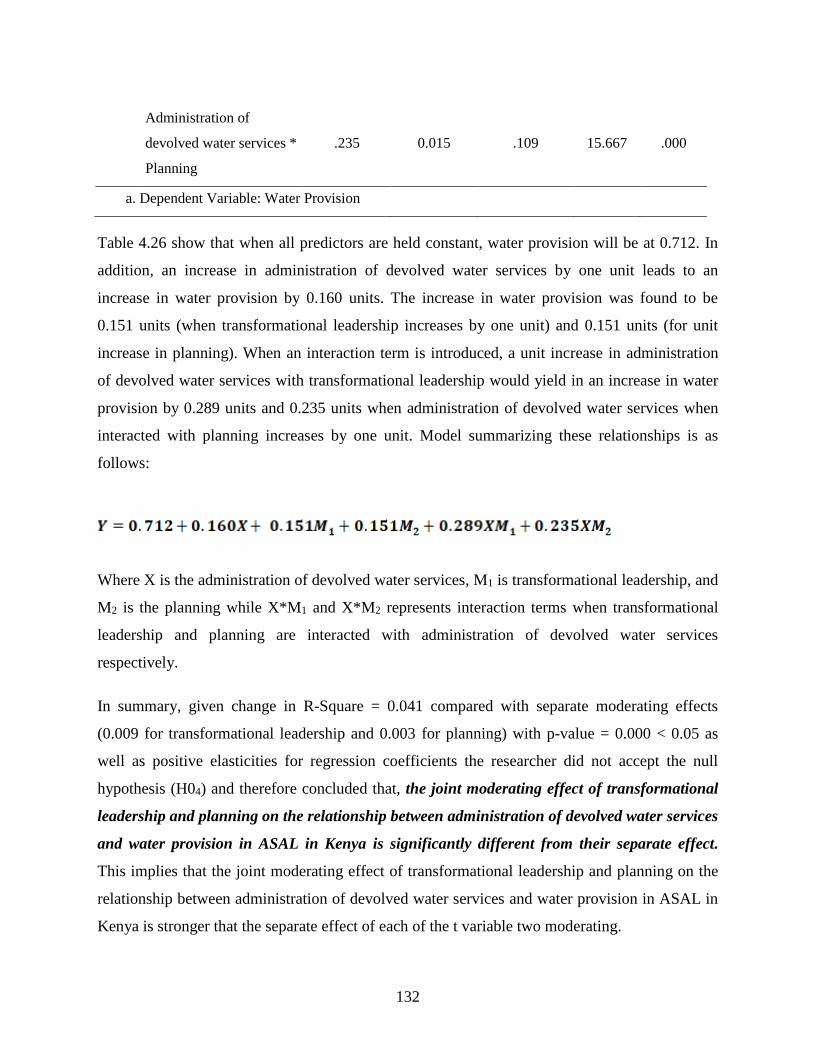
132
Administration of
devolved water services *
Planning
.235 0.015 .109 15.667 .000
a. Dependent Variable: Water Provision
Table 4.26 show that when all predictors are held constant, water provision will be at 0.712. In
addition, an increase in administration of devolved water services by one unit leads to an
increase in water provision by 0.160 units. The increase in water provision was found to be
0.151 units (when transformational leadership increases by one unit) and 0.151 units (for unit
increase in planning). When an interaction term is introduced, a unit increase in administration
of devolved water services with transformational leadership would yield in an increase in water
provision by 0.289 units and 0.235 units when administration of devolved water services when
interacted with planning increases by one unit. Model summarizing these relationships is as
follows:
Where X is the administration of devolved water services, M1 is transformational leadership, and
M2 is the planning while X*M1 and X*M2 represents interaction terms when transformational
leadership and planning are interacted with administration of devolved water services
respectively.
In summary, given change in R-Square = 0.041 compared with separate moderating effects
(0.009 for transformational leadership and 0.003 for planning) with p-value = 0.000 < 0.05 as
well as positive elasticities for regression coefficients the researcher did not accept the null
hypothesis (H04) and therefore concluded that, the joint moderating effect of transformational
leadership and planning on the relationship between administration of devolved water services
and water provision in ASAL in Kenya is significantly different from their separate effect.
This implies that the joint moderating effect of transformational leadership and planning on the
relationship between administration of devolved water services and water provision in ASAL in
Kenya is stronger that the separate effect of each of the t variable two moderating.

133
4.9.2 Responses for Enhancing Water Provision in ASAL
This section presents results of the open-ended questions that sought respondents’ opinions on
what can be done to enhance water provision in ASAL. Analysis was done using R-based
Qualitative Data Analysis (RQDA) software and results presented in bar plots and word clouds
using visual representation of text data in the form of tags. For the case of word clouds, the
frequency of occurrence of these tags indicated level of prevalence as visualized by bar size, text
size, text weight as well as the text color.
Figure 4.17: Bar Graph on Suggestions to Enhance Water Provision
Protection of Water catchment areas More boreholes More funds
SUGGESTIONS / RECOMMENDATIONS TO ENHANCE WATER PROVISION IN THE COUNTY
FR
EQ
UE
NC
Y
01
02
03
04
05
0
Figure 4.17 outlines protection of water catchment areas, more boreholes and more funding as
the key aspects that would enhance water provision in arid and semi-arid lands. This can be
achieved mainly through improvements in rain water harvesting through dams, pans and roof
catchment as well as drilling of boreholes. One of the respondents summarized the
recommendations by indicating that:
“… budget should adequately serve to build mega dams with provision of sola pumping,
treatment works and distribution network that should be able to last the whole year. ii)
Build mega dams with the capacity of above 10 million liters of water than have very

134
many boreholes which have saline water and do not address the issues of water
treatment and iii) there should also be constant checks on water quality…”
Figure 4.18: Bar Graph on Suggestions to Enhance Water Provision
water
da
ms
areasiiicounty
resourc
es
bore
hole
s
pro
tection
treatm
ent
improvecatc
hm
ent
harvesting
fundingincrease
mega
rain
existingquality
political
community
provision
use
service
technolo
gie
s
constr
uctio
n
project
stakeholders
pans
govern
ment
fundsmodern
sources
surface
doneespecially
constr
uct
drill
sector
fund
pow
er
sola
r
put
earth
high
train
managem
ent
department
imp
rove
me
nt
appropriate
parts
required
designednew
sy stem
need
supply
projects
tech
niq
ue
s
catchments
pro
vid
ers
point
budget
sa
line
human
control
co
ve
rag
e applicable
equip
harv est
skills
small
inv olv e
staf f
aw
ay
f ree
giv en
hand interf erence
drilling
inf rastructure
serv
e
allocation
proper
enh
an
ce
me
nt
are
a
demand
grounds
identif ied
implemented
pipe
enfo
rce
engage
increased
pumping
technology
additional
sustainable
ones
build
distribution
distance
place
imp
rovin
g
dev elopment
counties
exca
rate
y eilding
abstractions
av ailav oiding
better
cu
rre
ntly
prov ided
usa
ges
wastes
sta
ke
ho
lde
r
inv olv ement
store
rightimplement
efforts
observed
rendered
tap
period
systems
underserved
ground
inte
rgra
ted
recording
war
d
like
mag
adi
salty
avai
labi
lity
trainng
hold
er
nationa
participate
exploring
audi
ting
colle
ctio
n
passing
revenue
supe
rvis
ion
household
enhnace
enhance
dom
estic
exam
ple
livestock
order
baseline
issu
es
mill
ions
network
sola
year
aquivers
sub
bulk
exploit
optio
narid
give
reduce
aver
age de
salm
atio
n
fresh
standards
appl
y
poin
ts
desalinate
user
across
appr
oach
non
reso
urceadoption
geophysical
hydr
olog
ical
underground
matters
trai
ning
making
apparatus
completion
targ
eted
establish
inventory
policies
rainy
seasonswork
infr
astu
ctur
e
stra
tegi
c
delib
erat
e
enha
nced
prog
ram
me
streams
Word cloud on suggestions for enhanced water provision highlights dams, boreholes, harvesting,
resources, solar, stakeholders, technology, and management as some of the frequently mentioned
words on how water provision can be enhanced. Respondents were emphatic that suitable
leadership and management should as well be observed to drive administration of devolved
water services with further suggestions that there should be equitable distribution of resources
across the ASAL counties and leaders should play “non-political approach to water service
provision”. This implies that for sustainable water provision to be attained resources to use and
install the appropriate technologies should be availed in the devolved governments and
especially those ASAL. At the same time, more trainings are needed particularly on water
harvesting techniques to increase water availability.

135
CHAPTER FIVE
FINDINGS AND DISCUSSION
5.1 Introduction
This chapter explains the findings of the study and discusses the study results describing the
consistencies and contradictions of the findings with the findings of previous studies in regard to
the issues investigated.
5.2 Administration of devolved water services and Water Provision in ASAL
Study findings reveal that administration of devolved water services has had a positive and
significant relationship with water provision through the impact of stakeholders’ engagement,
human resource development and application of modern technology. Additionally, and in most
counties, the respondents indicated that there is adequate stakeholders’ engagement at all with
some respondents stating that the county governments is ensuring involvement of the
communities in decisions. Efforts have also been made towards their direction. However, a few
respondents were of the opinion that stakeholder engagement in water provision “is still very
low” with some more adding that “though they are engaged, little from their opinion is
importantly considered.” Generally, respondents were contented with the outcome of
administration of devolved water services especially in embraced stakeholders’ engagement in
delivery of water services.
From the findings it also emerged that County Governments in ASAL have made considerable
efforts to ensure stakeholders are involved in water provision services. One of the officers
described it as “good progress.” Another officer asserted that there is “good involvement of
residents and water boards in decision making.” Explaining the situation in one of Counties, a
respondent argued that “we have developed water management development committees and
they are functional.” These assertions point out that in some counties, the county leaders have
made some efforts by creating some platforms to engage the community in water provision. In
few cases, however, one of the respondents highlighted the sidelining of technical staff by
136
expressing that “public participation has been upheld in the county but involvement of technical
staff has some room for improvement.” In one of the counties that have made efforts to engage
the stakeholders, one of the officers asserted that “their engagement is very resourceful.” This
implies that where stakeholders’ engagement is done, it greatly enhances the effectiveness in
water provision.
The findings are consistent with the theory of fiscal decentralization where Oates (1972) noted
that, fiscal decentralization hinges heavily on the two concepts of efficient and effective
distribution and allocation of financial resources for enhanced service delivery in the public
sector. This also echoed the findings by Wachira (2014) which asserted that although there is
stakeholders’ engagement in the devolved water provision services; it is rarely recognized by the
local people. Administration of devolved water services has also moderately enhanced the level
of professionalism among water service personnel. Given that studies like Olufemi (2009) have
established a positive correlation between competent human resource development and
effectiveness in performance, it is unlikely that the current impact of devolution on human
resource development can enhance provision of water services in the counties. The
administration of devolved water services has further moderately enhanced technologies in
facilities such as water tanks, storage dams/pans, and drilled wells/boreholes across the county.
The findings affirm the assertions by Harvey and Reed (2004) that averted that technological
choice which are easy to understand and of low costs have the likelihood of higher sustainability
compared to those requiring some specialized knowledge, skills and equipment.
According to Greenwood (2007) the nexus between stakeholder engagement and responsibly
treating stakeholders is thus simplistic. Considerably, various scholars revealed contending
views on the suitable motivation, the mode and style of engaging the stakeholders that has ended
up in the materialization of better consciousness of the necessity to re-visualize the function of
the organization and the nature of its activities. Notably, the late development is put forward by
the scholars who have an interest in ethical strategist outlook. Their explanation gives a
theoretical ground for the inclusion of honesty, openness and a respectful engagement of
stakeholders as a crucial tool in the firm’s strategy (Phillips & Noland, 2010).

137
Respondents however highlighted the need to improve and enhance stakeholders’ engagement in
the County Governments with one of the respondents making an outright suggestion that “there
should be more engagement of stakeholders by the County Governments.” In the opinion of one
of the officers, “There must be thorough and proper engagement on how projects and other
water services are to be conducted.” According to one of the respondents, “Inclusiveness of all
stakeholders will make most water services decision at the ground level and it becomes a bottom
up approach.” This implies that most of the County Governments in ASALs need to take
measure that will enhance stakeholders’ engagement in their delivery of services to the
constituents.
Study findings also reveal that There is enhanced the level of integrity and prudence in
management of water service resources among County and Sub-county administrators. Staff
commitment in their work related to water services has also been enhanced as well as level of
professionalism among water service personnel. The findings imply that human resource
development in water services provision has been moderately influenced by devolution.
According to Armstrong (2008), human resource development is a key aspect in organizational
performance given that previous studies for instance Olufemi (2009) established a positive
correlation between human resource development and effectiveness in performance, it is likely
that the current impact of devolution on human resource development has enhanced provision of
water services in the counties.
Suggestions were also made on how the stakeholders’ engagement can be enhanced. One of the
officers suggested that, “Stakeholders should be engaged from the identification of water
projects to the implementation.” Another one suggested that it should be enhanced “through
citizen forums and right watch groups.” This was echoed by another officer who recommended
that “A water stakeholder forum should be established which should be meeting regularly to
address all water issues.” In his opinion, one of the Sub County Water Officer was categorical
that, “The engagement of public participation must start from ward level through sub-county to
county level especially prioritization of project identification and implementation.” Another one
added that the County Governments “…should put in place supportive legal frameworks for easy
participation of all stakeholders.” In his opinion, one of the water officers suggested that “The

138
water officer should be the entry point of all water activities to be carried out within the county.”
Another one opined that “The stakeholders to be meeting quarterly to share experience and
plans.”
It emerged that in several ASAL areas, there is sufficient matching of skills to tasks in the
recruitment and placement of employees. According to one of officers, “Most of the current staff
has adequate basics in water skills.” Another one emphasized that it was necessary to “continue
recruiting the right qualified personnel for productivity efficiency.” This was further reflected in
the strong assertions by majority of the respondents on the need to recruit competent staff in the
County Governments. One of the officers generalized that the County Governments should
“Recruit competent qualified staff relevant in the water sector.” Echoing the same, another
officer posited that they need to “Recruit qualified personnel with experience in water
technology.” One of the respondents boldly stated that the counties need “… to engage skilled
and competent staff in water technology to replace those existing.” In another perspective, one of
the chief officers expressed that: “There is need to shed off excess staff especially those inherited
from the National Government and from the defunct Municipal Council.” The findings indicate
that most of the staff placed in water provision services in most County Governments have
adequate requisite skills. However, continues training to impart new and emerging skills is
encouraged.
Findings further show that, through good policies that have been put in place by devolved
administration in ASAL, there has been improvement of the human resource development,
service delivery to the public in all sectors including water services. This is in line with Keith
(2009) who suggested that the customers are the most important and their needs ought to be fully
satisfied and this can only be achieved after addressing the needs of the employees (Human
Resource) in the organization. Improvement on quality and efficiency in water provision is
achieved by service providers, regulators and other decision makers to bring in relevant
managerial tools to measure and monitor performance of water utilities. In addition,
management of water resources must be in possession of knowledge on data collection,
processing, verification and storage to analyze the success of water utility. Moreover, the
operators of private and public water utilities should be in knowhow of financial implications at

139
the point of the task as well as well as the usefulness of the data on management (Berg &
Corton, 2007).
The case for regional and local redistributive policies rests on the fact that sub-national levels of
government provide the services most used by low-income families. However, most economists
view the national role as primary. The allocation function is government’s role in deciding the
mix of public and private goods that are provided by the economy or by government. Each level
of government may be more efficient in delivering certain governmental goods and services.
This opposes the Fiscal Decentralization theory which holds that fiscal decentralization can act
as a critical vehicle to achieving sustainable development in the health care sector especially the
implementation of projects if it is used to provide a logical framework for mobilizing local
support and resources, and promoting participation among beneficiaries of these public service
development programs (Porcelli, 2009).
The study findings further confirm Wachira (2014) study on challenges and prospects for
effective water conservation in Mwingi North District, Kitui County, Kenya. The study showed
that there is stakeholders’ engagement in water conservation though it is not recognized by the
local people. A few of them were aware of some NGO’s that were involved in community water
projects but most of them did not know any of them by name. The stakeholders’ engagement
showed efforts to provide water projects and also offer community awareness to the community.
In addition, Cherunya et al. (2015) explored sustainability of supplying water that is safe for
drinking where it is underserved focusing on devolved solutions in Kenya. From the study,
majority of households often obtained water from different sources. Households largely
perceived the sources of water to be unsafe for drinking forcing them to chlorinate or boil the
drinking water.
The respondents nonetheless highlighted several issues on human resource development training
of the current workforce. Inadequacy of the skilled human resource in water provision was
highlighted in several counties. One of the officers observed that “There is shortage of employee
and majority who are working are almost retiring”. This was affirmed by an overwhelming
majority of the respondents suggesting that the counties needed to employ more staff skilled in
water services management. One of the respondents generalized that the counties needed to

140
“Employ more staff.” Another officer was categorical that they should “Employ more
specialists.” One of the Sub County Water officer was more specific that they need to “Recruit
more water professionals.” This was seconded by another officer who recommended that the
counties ought to “Employ more skilled and knowledgeable staff on water sector.” The
indication is that though the Counties in ASAL have human resource development there is still
need to recruit more staffs for effective water provision in the counties in ASALs.
At the same time, the study indicated that the County Governments in the ASALs have not fully
attained the utmost requirement of stakeholder engagement. According to Greenwood (2007),
Stakeholder Engagement simply encompasses practices that an organization undertakes in the
interest of increasing the participation of the stakeholders in an affirmative way in organizational
activities. This is in line with the utmost purpose of administration of devolved water services
which according to Mukabi et al. (2015) was meant to ensure devolved decision making through
stakeholders’ engagement. Notably, the late development is put forward by the scholars who
have an interest in ethical strategist outlook. Their explanation gives a theoretical ground for the
inclusion of honesty, openness and a respectful engagement of stakeholders as a crucial tool in
the firm’s strategy (Phillips & Noland, 2010). Moreover, a study by Gambe (2013) on water
provision in Harare, Zimbabwe indicated that residents were yearning for involvement in the
process of finding solutions to water problems bedeviling Harare. They felt sidelined and this
caused a vinegary relationship between the residents and city fathers.
From the findings, counties are making efforts to use modern technologies in water provision.
The water technologies tools used fall into these main categories, data acquisition and
integration (sensor, networks, smart pipes, smart meters), modelling and analytics (radio
transmission and internet), data processing and storage (use of Cloud computing), management
and control as well as visualization and decision supporting (such as Web-based communication
tools). The real work on technology choice lies in approaching development as a dynamic and
hard-to-control process as opposed to a linear process, constrained to sequential phases, with
expected outcomes based on an approved strategy or business plan. Technology choice needs to
come to be understood as a complex interaction of technical and social processes, and policy on
implementation should reflect this at every stage. All the players in this process are important,
141
but the key decisions are often made by government officers/engineers, community leaders and
NGOs. These groups need information at the relevant time and in a format that they can
understand and use.
Several areas where improvement is evident in water provision as a result of application of
modern technologies were highlighted. It facilitates real-time monitoring. Technologies such as
smart metering, GIS, telecommunication sensors and decision support systems are effective tools
for the provision of real-time reliable data. This means that water utilities have the opportunity to
make improvements in demand response and in reducing water losses in the water distribution
system. There is also reduction in water consumption. ICTs provide the tools needed to create
advanced water use efficiency in all sectors. Incorporation of sensors in the water sectors ensures
that water is utilized when needed reducing large volumes of water normally lost due to over
use. It has also helped to reduce operation costs. Improvement in operational efficiencies means
that administrations cost can be reduced, creating an optimization of expenses. Technology was
also asserted to contribute in greater public involvement. One of the benefits of ICTs is the
improvement in communication between water management staff and the public which will lead
to an enhancement in public awareness with respect to consumption and water usage.
Therefore, there is enhancement of technologies in facilities such as water tanks, storage
dams/pans, drilled wells/boreholes across the ASAL counties. It has also enabled development
of modern technology adoption framework under active participation of all stakeholders as well
as enhancing efforts on adopting various water technologies which are well suited to the
conditions on water provision in counties. This is in line with findings from a study by Maimuna
and Kidombo (2017) which found that community participation had the greatest effect on the
performance of water projects in Ewaso Ng’iro north borehole projects, followed by project
management then water infrastructure while maintenance funds had the least effect to the
performance of water projects in Ewaso Ng’iro north borehole projects.
The study findings affirm the assertions by Harvey and Reed (2004) that technological choices
which are easy to understand and of low costs have the likelihood of higher sustainability
compared to those requiring some specialized knowledge, skills and equipment. Additionally,
they also affirm that locally innovated options that would bring the relevant technologies to the
142
residents in ASAL must also be advocated (Harvey & Reed, 2004). However, the findings
concur with Bhatnagar (2014) study that suggested that there ought to be diversification of water
sources and intake technologies that include rainwater (roof rainwater harvesting, catchment and
storage dams); ground water (spring water collection, dug well, drilled wells, subsurface
harvesting systems); surface water (protected side intake, river-bottom intake, sump intake).
It can also be said that, local innovation that brings the technology closer to the people should
also be encouraged. Bhatnagar (2014) suggest several water sources and intake technologies that
can be considered. These include: rainwater (roof rainwater harvesting, catchment and storage
dams); ground water (spring water collection, dug well, drilled wells, subsurface harvesting
systems); surface water (protected side intake, river-bottom intake, sump intake). Over and
above, Gleitsmann (2015) suggested that ownership of water supply project is dependent upon
the degree to which the technology corresponds to the needs of the users and the users’ ability
and willingness to maintain and protect it over time. According to Harvey and Reed (2013), low
sustainability rates are related to community issues such as limited demand, perceived lack of
ownership, limited community education, and limited sustainability of community management
structures, such as water use committees (WUCs). Harvey and Reed (2013) in addition described
forms of contribution such as the expression of demand for water, selection of the technology
and area, financial contributions, provision of labor and materials, and selection of management
systems.
Some challenges were also highlighted in application of modern technology in water provision.
One is lack of standardization. In spite of the efforts carried out by the County Governments in
this field, there still need for further standardization. Standardization maintains integrity, and
adherence ensures that there is compatibility, interoperability, and certain level of quality
therefore reduction of risks. Lack of awareness was also mentioned. Awareness, proper
education as well dissemination is essential for proper water resources management. Many
Counties are not conscious about the role technology can play in water management or its
usefulness, with little attention on how to use ICT as an enabler of sustainable water provision.
Proper ICTs governance is also a challenge. Lack of ICTs governance impacts investments as

143
well as prevents stable coordinated and comprehensive planning to address future requirements
and proper integration of water technologies.
A study by Nyong (1998) investigated domestic water use in the water deficient semi-arid
Nigeria, using a case study of Katarko. Detailed socio-demographic data known to affect water
demand were compared with aggregate data at the national and regional levels. A tradeoff exists
between using good quality water and the effort it takes to obtain it. Using culturally constructed
measures of water qua1ity, the study found that the locals perceive the quality of water they use
as higher in the rainy than in the dry season. Overall, the results revealed that although most of
the determinants of water demand in both seasons are subject to social-cultural interpretations,
one can approach the management with economic principles. The research recommended the
provision of a new set of optimal wells, in view of the offsetting benefits associated with them.
As can be drawn from these studies, direct management of water services by government
(whether at the national, regional or local levels) carries with it the risk that politicians become
too directly involved in the day-to-day management and operations of the utility, rather than
performing a supervisory role to provide strategic direction and hold the service provider
accountable for performance, including the direction of resources for investments to particular
political constituencies and involvement in recruitment. These interventions are often at the
expense of sound and rational allocation of resources and optimal recruitment practices, with
negative impacts on service improvements and on utility performance. The establishment of a
corporatized structure (with a Board of Directors, clear policies and procedures based on sound
government principles, and a clear mandate to management to operationalize the strategies
developed by the board) provides greater protection to management from interference, and
allows management to undertake their responsibilities professionally.
It was affirmed that the levels of community participation in the water sector in most County
Governments is still low due to the weaknesses and inadequacy of the community participation
platforms. The Constitution of Kenya 2010, and other statutes such as the County Governments
Act, 2012 and other laws make adequate provisions for citizen participation in the County
Governments affairs. In the water Act 2016, this is further reinforced by the provision of public
participation platforms such as Water Resources Users Associations (WRUAs) and Water Users

144
Associations (WUAs) where communities get effective representation in management of water
resources and services.
Findings of this study are therefore consistent with the underlying principles of devolution are
economic development, self-governance and the equitable sharing of resources at the national
and county levels (Holmquist, 2014). The main devolution ideologies, power as well as
functions for the National Government and County Governments are spelt out in chapter 11 of
the Kenya constitution 2010. The 47 counties were established to achieve these objectives. It is
the Kenyan constitution that brought about devolvement of many National Government
functions such county transport, health services and the disposal of solid waste to the counties.
Through devolution, Arid and Semi-Arid Lands governments are able to deliver quality services
and in time (Wagana et al., 2015). Additionally, article 189 of the Kenyan constitution obliges
both levels of the government to respect the functionality and institutional integrity (Republic of
Kenya, 2010).
5.3 Administration of Devolved Water Services, Transformational Leadership and
Water Provision
This study found a significant moderating role of transformational leadership on the relationship
between devolved water services and water provision. Adeyemi (2012) posited that
transformational leaders engage followers not only to get them to achieve something of
significance, as he described them as visionary change agents, but also to morally uplift them to
be leaders themselves hence, enriching the relationship by creating followers’ interdependence.
Bass (1985) added that to be transformational, the leader has to learn the needs, abilities and
aspirations of the followers to develop them into leaders. The outcome of implementing
transformational leadership is a mutual relationship that converts followers to leaders and leaders
into moral agents to satisfy the needs of their followers (Gill, 2006). Groves and LaRocca (2011)
stated in their analysis of the ethical emphasis of transformational leaders that, “transformational
leadership is predicated on deontological ethics and a focus on the morality of the means rather
than the ends … predicated on the norm of social responsibility” (p. 513).

145
The study findings indicate that County Governments in the ASALs use transformational
leadership in water provision. In particular, the study findings imply that County leaders
emphasize on incorporating subordinate advice when making final decisions. The study findings
concur with Iqbal, Anwar and Haider (2015) study that who highlighted that transformational
leadership is where the leader engages others in identifying the important goals and formulating
strategies to attain the goals. This style has been affirmed to enhance employees’ satisfaction,
collaboration and commitment as well as a great flexibility in decision making which results in
improved service delivery (Geib & Swenson, 2013). The study findings concur with Iqbal,
Anwar and Haider (2015) study that who highlighted that transformational leadership is where
the leader engages others in identifying the important goals and formulating strategies to attain
the goals. This style has been affirmed to enhance employees’ satisfaction, collaboration and
commitment as well as a great flexibility in decision making which results in improved service
delivery (Geib & Swenson, 2013).
Leaders implementing transformational leadership can gain the trust, admiration, confidence,
and respect of other team members by personally demonstrating an extraordinary ability of one
kind or another. These leaders put the needs of their followers before their own and display high
standards of ethical and moral behavior that results in a high percentage of trust. Doing so will
result in increased motivation, intrinsic and extrinsic, in leaders and followers. Trust may be the
single most important factor in transformational leadership (Bass, 1999). Leaders implementing
transformational leadership will result in leaders becoming role models for their followers:
people identify with them and want to follow and emulate them. In general, organizations can
acquire the needed leadership either by recruiting new leaders or by building a leader from the
followers.
In essence, leadership is about the understanding of the behaviors and functions of individuals
and circumstances that are present in the workplace. The transformational style of leadership
(Geib & Swenson, 2013) builds on this concept to be the next step beyond the transactional
leadership paradigm, which is one of leader-follower relationship in the context of a formal
exchange seeking something more than just obedience and compliance from the followers
(Lindgreen, Palmer, Wetzels & Anticco, 2009). Individual job performance is reported by

146
Walumbwa, Avolio & Zhu (2008) and further supported by Tsai et al. (2009) to be related to the
leader’s transformational leadership input. Therefore, supporting identification of the
leader/follower relationship, and resulting in the improved work unit and individual performance
of the follower.
Transformational leaders believe there is a need, as demonstrated in Hemsworth et al. (2013)
whatever the situation, to change the followers’ beliefs, attitudes and values, for the good of the
organization and individual, and in doing so achieve a superior level of performance and
competitive advantage. According to Bass (1990) managers who behave like transformational
leaders are more likely to be seen by their colleagues and employees as satisfying and effective
leaders. In consideration, Robbins & Judge (2007, p. 437) explain transformational leadership as
“leaders who inspire followers to transcend their own self-interests and who are capable of
having a profound and extraordinary effect on followers”. In support are Castro, Perinan, Carlos
& Bueno (2008) who acknowledge that transformational leadership is positively related to
leadership effectiveness and has a significant influence on the attitudes and behaviors of
followers, and is a style that has a positive advantage for both the organization and the
individual.
Respondents highly attested that County leaders inspire and motivate their staffs to optimize
productivity on water provision (mean = 2.61, standard deviation = 1.27). Ratings on other
aspects revealed that County leaders challenge their staffs to be creative to generate lasting
solutions (mean = 2.66, standard deviation = 1.19); County Leaders intellectually stimulate their
staffs to optimize productivity (mean = 2.64, standard deviation = 1.11); County leaders always
ensure subordinates get recognition/and or reward when they achieve difficult complex goals on
water provision (mean = 2.61, standard deviation = 1.27).
The findings imply that County Governments in the ASALs use transformational leadership in
delivery of water provision service. If Leaders in ASAL use transformational leadership, the
implication is that all the stakeholders in water provision are involved hence improving service
provision especially on water. This in turn will lead to more efficiency and effectiveness in
responding to the constituents’ needs. Transformational Leadership may cause positive effects
147
like innovation among subordinates leading to better ways of doing things especially in water
provision. However, one shortcoming identified to have transformational aspect in county
leadership was the lack of management capacity. Many counties have put in place the basic
management processes to operate efficiently and professionally, such as book keeping, record
keeping and payment collection systems. Their tariffs are based on real costs or on government
guidelines. Furthermore, in many cases, communication and accountability between the county
water officials and the community (its clients) is weak. Most of them do not hold regular open
meetings to report their plans and progress for the water system and to receive and discuss
complaints or other issues with customers. Citizens are rarely involved in the main decisions
related to the management of the system, including tariff setting. As a result, citizens have little
trust in the community group and are hardly willing to pay for water services.
It has been argued that when organizations find efficient methods to outdo others, the best choice
is to emphasize on the leadership effect (Mehra, Smith, Dixon & Robertson, 2006). Team
leaders are critical in determining collective norms, assisting groups to make it in their
situations, as well as co-ordination of organizational actions. According to Purcell et al. (2004),
intangible assets like styles of leadership, culture, competency, skills and motivation are
considered fundamental aspects in organizations capable of combining people, processes and
efficient service delivery.
Kinicki and Kreitner (2008) affirmed that transformative leaders are capable of developing
valuable change in an organization, instilling in follower’s great intrinsic motivation and loyalty,
newly establishing the future image and stirring followers’ commitment to realize the image.
The approach consists of the following aspects: individualized attention, inspiring incentive,
idealized influence (behavior and attribute) and logical stimulation (Moss & Ritossa, 2007). In
addition, a study by Bass, Avoilio, Jung and Berson (2003), portray transformative leadership as
one that has a direct relationship with organizational productivity. This was confirmed by
Dumdum, Lowe and Avolio (2002) for the case of private organizations.
The study findings also support Sarros & Santora (2001, 2002) and Alimo-Metcalfe & Alban-
Metcalfe (2000, 2001 & 2006) studies on transformational leadership construct as one that
provides an extensively well researched and supportive platform that endorses the facets and

148
virtues of the transformational leadership aspect of the visionary paradigm. In support of the
study findings, Avery (2004, p. 34) endorsed the transformational leadership as being within the
“ideal leadership paradigm, especially for transforming organizations”. A raft of authors that
have cross-supported the benefits of transformational leadership and publicly bestowed the
virtues, as a must have, for an organization to move forward, have contributed significantly to
reinforcing the base model (Bass, 1985a, 1985b; Cacioppe, 1997; Cardona, 2000; Sarros &
Santora, 2001, 2002; Alimo-Metcalfe & Alban-Metcalfe, 2001, 2006). The above authors have
provided the substance for the continual evolvement of the transformational leadership and have
continually cross-referenced each other, adding their particular thread of evolvement to the
transformational leadership construct, therefore, and increasing support.
Michel, Lyons and Cho (2011) as well as Babcock Roberson and Strickland (2010) confirm
findings of this study that, transformational leadership has a positive correlation with
subordinate outcome of intrinsic motivation, self-efficacy, creativity, justice perceptions, work
engagement, job performance, positive psychological capital, organizational performance,
organization citizenship, and leader effectiveness. Studies have also shown that organizations
with transformational leadership are perceived to be effective organizations (van Eeden, Colliers
& van Deventer, 2008).
Boga and Ensari (2009) examined transformational and transactional leadership styles and their
influence on workforce, and concluded that organizations managed by transformational leaders
are perceived as more successful under situations of high organizational change in comparison to
low organizational change. They suggested that an organization’s well-being depends on the
employees’ perceptions rather than financial data, citing examples of how corporations like
Enron misrepresented the financial well-being of the organization. Toor and Ofori (2009)
revealed that there is significant relationship between ethical leadership attributes and
transformational leadership attributes and effective leadership, employee commitment, and job
satisfaction.
The five factors of transformational leadership include idealized influence (attributed), idealized
influence (behavior), inspirational motivation, intellectual stimulation, and individualized
149
consideration. According to Babcock-Roberson and Strickland (2010), the idealized influence
(charisma) component of transformational leadership “consists of providing subordinates with a
role model of ethical conduct and clear sense of purpose that is energizing, and building
identification with the leader and his or her articulated vision” (p. 314). Idealized influence
occurs when a leader shows consistent ethical conduct and personal principles and values that
inspire subordinates; the leader builds respect, trust, and admiration of the followers to the point
that followers would want to emulate the leader. The leaders develop this relationship by putting
the interest of the followers above their own needs or interests (Bass, Avolio, Jung and Berson,
2003; Bhat et al., 2013).
Transformational leadership exercises influence rather than power or authority over followers
and motivates followers to achieve beyond what they could have done by themselves without the
influence and motivation of the leader (Bhat et al., 2013; Boga & Ensari, 2009). According to
Bhat et al. (2013), transformational leaders are those who motivate and inspire followers to both
achieve extraordinary outcomes and, in the process, develop their own leadership capacity.
Transformational leaders help followers grow and develop into leaders by responding to
individual followers’ needs by empowering them and by aligning the objectives and goals of the
individual followers, the leader, the group, and the larger organization. Transformational leaders
have the ability to influence the behavior of their subordinates and get them into foregoing self-
interest for the good of their group. Transformational leaders build trust and instill confidence in
their subordinates; they stimulate subordinates by questioning status quo, assumptions, and
traditions; they encourage organization learning and risk taking, and innovation (Boga & Ensari,
2009).
The effect of transformational leaders on service delivery in devolved governments can therefore be
seen in the output of employees in those governments. Transformational leaders help subordinates
discover who they are and what part they play in helping the organization achieve its mission. By
interacting with subordinates in this manner, transformational leaders help subordinates increase
their level of commitment to the organization (Tucker & Russell, 2004). Transformational leaders
also influence the organization’s culture through its impact on organizational productivity. When the
values and the culture of an organization are accentuated by transformational leaders, productivity

150
and innovation within the organization improves (Niehoff, Enz, & Grover, 1990). Moreover,
transformational leaders influence organizational culture by helping organizations see the world in
different ways (Mink, 1992). As the external environment of the organization changes,
transformational leaders influence organizational culture by helping organizations adapt to this new
environment (Smith, 1990).
This study has also affirmed that effective planning is a critical ingredient for sustainable
development especially in devolved units (Hope, 2012). Consequently, public sector reforms
remain necessary and on-going policy objectives for many countries. Many countries are taking
steps to streamline governments, strengthen institutions and modernize management (Obong’o,
2009). According to Wilkins (2014) there can be no meaningful public sector reforms without
public service renewal. The history of post – independent African states is that of monumental
democratic and developmental failures (Njiru, 2008). After almost five decades of independence,
most countries on the continent are characterized by underdevelopment and poverty among vast
majority of the citizens. These can be seen in Africa’s dominance in the primary sectors (not
manufacturing or industrial) such as agriculture, low domestic capital, heavy debt and high
unemployment rates.
It can thus be argued that, transformational leadership rests on the assertion that leader behavior
can arouse followers to a higher level of thinking (Bass, 1985; Burns, 1978). By appealing to
follower ideals and values, transformational leaders enhance subordinates’ commitment to a
well-articulated vision and inspire them to develop new ways of thinking and solutions to
problems. Indeed, the positive association between the transformational leader and follower is
well documented (Fuller, Patterson, Hester, & Stringe, 1996) and many studies too have begun
to examine the process by which those effects are ultimately being realized (Bono & Judge,
2003). It has been suggested that leadership is one of the most important factors that influence
work engagement (Schaufeli & Salanova, 2007). Miring’u and Muoria, 2011) found that
leadership can be used as an antecedent for institutional commitment. In particular Aditya (2009)
asserts that leadership style is crucial in encouraging employee engagement. Most studies also
indicate that leadership style has not only been recognized as a critical component in the
effective management of employees, but has also been suggested as one of the single biggest

151
elements contributing to employee perceptions in the workplace and workforce engagement
(Wang & Walumbwa, 2007; Macey & Schneider, 2008). Empirical data suggest that there are
many ways through which leaders for example focus on follower influence such as by forming
and communicating inspirational vision (Chung – Fang, & Yi Ying, 2012).
A central aspect of transformational leadership is the need for change for the benefit of residents
in the counties they lead. These leaders create an inspiring vision of their institutions, and
motivate their followers to work towards achieving institutional success (De Rue & Ashford,
2010). As promoters of change, the leader will influence their subordinates to follow in their
direction and act as a bridge between leadership behaviors and institutional performance. The
leaders elevate their followers’ interest, values and motivational levels (Bass, 1994) to perform
beyond expectation and achieve the institutions goals.
5.4 Administration of Devolved Water Services, Planning and Water Provision
This study found a significant moderating role of planning on the relationship between
administration of devolved water services and water provision in ASAL. The study findings
indicate that County Leaders use strategic plans; County Integrated Development Plans (CDIP).
The Counties in ASAL have also developed appropriate structures for water provision from the
County Headquarters to lower levels in Sub Counties as well as allocating resources to meet the
water demands by residents that has ensured timely delivery of services.
The study findings affirm the assertions by Sifuna (2012) that it is the management that puts into
action the formulated goals in the organization. They further echo Hughes et al. (2012) assertion
that it is the task of the management in all organizations is to lay down the structure of the
organization and the orders to be followed. These functions have been affirmed as necessary in
ensuring effectiveness and efficiency of the organization (Leung & Kleiner, 2004). However, in
Hirsch (2006) views, issues affecting management of water persist to be highly context-specific
hence the approaches used to manage the utilization of water sources may vary from one
manager to the other (Owuor & Foeken, 2009). However, water provision projects have been
strongly criticized for their planning approaches, which have focused excessively on physical
152
construction and increasing coverage targets, but largely ignored what happens at the water
sources after construction (Lockwood, 2014). For the last few decades, literature in the water
supply sector has shown that sustainability of rural water supply structures has become
positively associated with small-scale initiatives, which maintain public participation. Thus, the
key to sustainability is to meaningfully involve the users in the planning, implementation,
operation, protection and maintenance of water supply systems according to their needs and
potentials (Davis & Liyer, 2012). Findings also approves that, improved planning procedures
which fully consider the value and demand placed on different levels of service by the
community are a necessity for the ownership of rural water projects (Mbata, 2014). However, in
spite of the ever-increasing importance placed on the role of participation in development
efforts, there have been few quantitative studies to demonstrate the proposition that participation
measurably increases development outcomes (Prokopy, 2015).
Water management is particularly dependent on strong capacity, a solid knowledge base and
awareness at all levels, including those of the individual, the organization, the sector institutions
and the ‘enabling environment’. Yet getting all levels to operate in a coherent manner is
challenging, and requires vision and leadership. Leadership is needed to improve cooperation
and interaction between interdependent water uses such as food, energy, industry and the
environment in order to increase water security and promote sustainable development.
The respondents further reported that planning at the County is inclusive formal process and
stakeholder participation is an integral part of the water provision in ASAL. This has been
possible where the National Government, independent commissions, development partners,
general public, the representatives of the business community, employees, financial partners, and
the County executive participate in planning through public consultative meetings and forums
organized by the County’s planning. Findings in this study effectively advocates for improved
planning procedures which fully consider the value and demand placed on different levels of
service by the community are a necessity for the ownership of rural water projects (Mbata,
2014). However, in spite of the ever-increasing importance placed on the role of participation in
development efforts, there have been few quantitative studies to demonstrate the proposition that
participation measurably increases development outcomes (Prokopy, 2015).

153
As advocated by Sorel and Pennequin (2008), planning should involve developing objectives or
the organizational strategic plans and looking for resources that would best be suited in
achieving the organizational goals as outlined in strategic plans. Each goal should have financial
and human resource projections associated with its completion so that it becomes successful.
The planning process also creates timelines for when the plans should be achieved. According to
Ballou (2007), planning also involves developing the tracking and assessment method that will
be used to monitor the project process.
Daft and Marcic (2016) emphasize the primacy of planning among the manager's tasks. Hence,
planning logically precedes the execution of all the other managerial functions. Awino et al.
(2012) argues that the more emphasis there is on planning, the greater the positive change in
firm’s performance. Planning is typically where the direction of the organization is established
through a variety of activities including the development of goals. As such, the planning
embodies various levels of decision making (Schraeder, et al. 2015).
These findings therefore support the contention that planning provides the basic direction and
rationale for determining the focus of an organization; and also provides the specification against
which any organization may best decide what to do and how to do it. Planning is simply defined
as a process for creating and describing a better future in measurable terms and the selection of
the best means to achieve the results desired. It is said that failure to plan is akin to planning to
fail. Thus, Abdalkrim (2013) summarized the importance of planning as; the increase in
effectiveness, development of a sustainable competitive position, developing a good fit between
the external environment and the internal capabilities and helping managers to consider the
future implications of the current decisions. Having a good vision, objective and strategy is no
guarantee that the project performance will be good. Creative planning by the management can
help in improving performance outcome of the project. But on the other side, without a vision,
good plan or strategy, the performance of a project is sure to fail or at best will be poor.
154
5.5 Administration of Devolved Water Services, Transformational Leadership,
Planning and Water Provision
The researcher established that the joint moderating effect transformational leadership and
planning on the relationship between administration of devolved water services and water
provision in ASAL in Kenya is stronger than that of their separate effect. This is given by R-
square being 0.989 (p-value of 0.000) when both transformational leadership and planning are
jointly moderating the relationship with change in R-square being 0.041. This value when
compared with separate change in R-square (0.009 for transformational leadership and 0.003 for
planning. In addition, to access the nearest water point before devolution, 45.9% of the residents
covered an average distance of approximately 5km or less compared to 74.3% who cover the
same distance after devolution. This indicates a probability that after devolution, more water
points were established within a close proximity to the residents. Moreover, 8.1% of residents
covered the longest distance (over 20km) to access the nearest water point before devolution,
compared to 1.4% who covers the same distance after devolution. This further implies that
devolution has indeed helped to reduce the average distance that majority of the residents in
ASALs have to cover to access water.
This is a fulfillment of the aspect of physical accessibility requirement in water provision which
according to Kaushik (2011), entails the presence of water sources within a reasonable physical
reach by the population in terms of distance and time brought about by proper planning and
leadership. The findings further met the aspect that physical accessibility to water should be
characterized by spending of less time influenced by short distance to the water infrastructure,
thus saving time for other productive engagements (Jones et al., 2002). The study also
established that, before devolution came into place, 51.4% of the residents incurred an average
cost of Ksh.10 and above to access a 20-liter jerican of water compared to 64.9% who incur the
same cost after devolution. Similarly, the proportion that incurred an average cost of more than
Ksh.10 to Ksh.20 increased from 28.4% (before devolution) to 32.4% after devolution.
Moreover, the proportion of residents incurring the highest cost (of over Ksh.40) to access the
water reduced from 5.4% before devolution to 1.4% after devolution. The implication is that
devolution has helped to lower the cost of accessing water in ASALs. These positive changes
155
could be as a result of better administration of devolved water services. For instance,
engagement is viewed as a machinery of attaining certain objectives that include involvement
and accountability, cooperation, consent, control, and cooperation, as a way of boosting trust, or
an alternative for true trust, as a dissertation to improve fairness or as a device of corporate
governance (Greenwood, 2007).
This is also in line with the recommendations by Peprah et al. (2015) that it is critical to have a
mechanism that regulates water provision to ensure a reduced and reasonable price is charged on
water so as to avoid exploitation, and to protect the interest of citizens especially in the rural
areas. Moreover, the findings imply that devolution has helped to minimize the problem of water
companies taking advantage of the poor by establishing water kiosks selling water at high prices.
This according to Wagah et al. (2010) is due to a culture among these companies of perceiving
the poor as unattractive ‘investment’ who prefer to meet daily water costs as opposed to monthly
bills. More specifically, the development in the direction of a better spotlight on the shareholders
led to the development of a wide spectrum of engagement strategies that range from amplified
distribution of information in a specified report practice in the realization of better interactive
stakeholder relationships (Cook & Burchell, 2006). In respect of stakeholder engagement,
whereas, rigid classification of the precise persons who are eligible as shareholders could
eventually be dislodged, recognition of what adds up as a stakeholder claim is crucial. After the
identification, amplified emphasis follows on the stakeholders, concept communication and also
the dialogue in its many forms (Cook & Burchell, 2006). Regardless of institutional status
accorded to stakeholder engagement in water related procedures, what is more important is
accommodation of stakeholders in the management of water to achieve water governance
Access to water and management of water resources are among the main drivers of change in the
ASALs. Improving water access and resources management is said to open up new areas for dry
lands production and can also increase carrying capacity of the rangelands, only if strategically
placed and managed. Dry lands fodder and crop production is also promoted and is generally
seen as one, intervention, among others, that can contribute to resilience of people living in the
dry lands. Improved water access and more strategic management of water resources can be an
effective contribution to positive drivers of change with positive impact on poverty reduction

156
and increased productivity in dry lands production systems. Additionally, it promotes businesses
linked to ASAL production and water services for the ASAL populations. The dry lands
economic potentials can be unlocked with positive impact on green growth.
The engagement has a strong focus on reaching the poorest segment of society and of impacting
positively on domestic and productive needs of the ASAL communities. Water service needs are
relevant to all sections of society in the ASALs, including particularly the poorest of the poor.
WSTF and the counties target investments to the neediest areas and the actual investments will
be implemented following guidelines that seek to ensure benefits also to the poorest in the
respective investment areas. Community involvement will be in focus and capacity development
in water planning and implementation will be provided to counties and implementing agents.
Moreover, promoting indigenous knowledge through community participation will enhance
sustainability through ownership at grassroots level.
Results of this study also commensurate with argument by Veronica (2010) that, accessibility to
adequate supplies of water for domestic and industrial use has shaped the geographic distribution
of population, its quality of life and culture. In addition, adequate supply of quality water is
central to the integrity of the environment and the maintenance of the ecosystem (Govt. of
Australia, 2009). It enormously contributes to economic productivity and social wellbeing of the
human population (GWP, 2000). UNEP (2015) also emphasizes that estimated that in 2014, 40%
and 60% respectively of the world’ s population in ASAL do not access safe drinking water and
access to safe sanitation systems hence leading to serious water shortages and waterborne related
diseases. With the world’s population growing at the rate of 80 million people annually, there is
need to add about 64 billion m3 of water annually (GWP, 2000). Thus, although domestic water
consumption accounts for only 7% of the total water use in Africa (Hinrichsen et al., 1997), the
benefits related to an improved water supply, such as effects on health, time savings and high
productivity are quite immense.
Further, results are in tandem with World Bank (2015) findings that even though access to clean
drinking water has progressed enough to reach the MDG target, 780 million people remain
without access to clean drinking water. Only 61% of the population in Sub-Saharan Africa has
access to improved water supply sources. People lack proper services because systems fail, often

157
because not enough is invested to appropriately build and maintain them, and also because of the
stress that urbanization places on the existing infrastructure. In the past decade, Africa’s
population grew at an annual average of 2.5 percent, and the urban and slum population grew at
almost double that rate. In addition, water utilities in Africa differ greatly in terms of size,
organizational culture and operating environments. They share one major challenge of
expanding access to appropriate levels of services to their growing urban populations as can be
seen clearly in the context of the MDGs where Africa lags far behind other regions. It is now
widely acknowledged that the inefficiencies of African water utilities are a major cause of poor
access to water services.
As Demand theory dictates, as the price of good increases, the demand for those good decreases
(Froukh, 2001). Therefore, it is expected that price will negatively influence the quantity of
water use from purchased sources by residents in ASAL. When a price of water exists, then it is
quite easy to compute a per unit price for each household and each source. The price of non-
piped water has been considered exogenous in all studies except in David and Inocencio (1988).
These authors argue that the price of vended water is endogenous because price is determined by
demand and supply factors. Due to the fragmented nature of the water vending market especially
in ASAL, household decisions of water demand are likely to influence its price. Even if free of
charge, the collection of water from non- piped sources usually involves costs for hauling water
from distant sources.
Comparison of findings in this study in terms of affordability of water is nonetheless challenging
given that many analysts have not attempted to convert the time cost of water collection into a
pecuniary collection cost or other words, affordability. For example, Larson and others (2006)
consider round-trip walking time to water source and waiting time at the source. David and
Inocencio (1998), on a sample from Metro Manila in the Philippines, use distance from source in
metres as an explanatory variable in their demand model. Strand and Walker (2005) consider
hauling time per unit of water consumed. Whittington and others (1990b) are among the only
authors to provide some empirical evidence about the pecuniary cost of collecting water from
non-tap sources. Using data from Ukunda, a small market town in Kenya, they develop two
approaches, based on discrete choice theory, for estimating the value of time spent collecting

158
water. Their results indicate that the value of time for households relying on non-tap sources
(kiosks, vendors, or open wells in the village) was at least 50% of the market wage rate and
likely to approach the market wage rate for unskilled labour for some households.
Before devolution came into place, 36.5% of the residents accessed water whose quality was
greater than 40% to 60% compared to 31.1% who accessed this type of water after devolution.
Water with a quality of greater than 60% to 80% was accessed by 10.8% of the respondents
before devolution compared to 24.3% of them who accessed it after devolution. Similarly, the
highest water quality (over 80%) was accessed by 12.2% of the residents before devolution
compared to 17.6% after devolution. On the other hand, the least quality water (20% and below)
was accessed by 14.9% of the residents before devolution compared to 6.8% who accessed this
type of water. The findings imply that devolution has managed to enhance accessibility to high
quality water in the ASALs; this is by increasing the proportion of residents accessing the high-
quality water in these areas. Frone and Frone (2013) maintain that water accessible for
consumption should be of good quality that poses little or no threat to a person’s health.
Also confirming these findings is SCMP (2011) who reported that many communities living
ASAL experience water woes rooted in deteriorating access to quality water, unreliable
availability of water and the inefficiency of water providers (DFID, 2002). Residents in these dry
lands fear that the vital source of food, water and livelihoods is threatened. Women and young
girls bear the burden of water collection usually in unsafe environments, making them
vulnerable to sexual assault and accidents. The time and energy spent walking and hauling water
from distant sources and the resulting water borne diseases keeps them from school work and
care of their families (UN Water/ Africa, 2003). Water is central to the conservation of
ecosystems and also for the development of health, agriculture, power generation, livestock
production and other important economic activities (Winpenny, 1994). DFID (2002) village
report, affirms that there is hardly no enough water in ASAL to sustain any worthy investment as
the river water pollution increased to the highest limit in 2001 at which over 100 cases of
typhoid were reported.
Interviewees for this study also expressed that increasing competition for domestic water use
exacerbated by inconsistent water supply and the ever-mounting demands from other water

159
sectors has led compromised water quality due to abuse of the scarce water sources. For
example, people use the river water to drink and at the same time bathe and wash clothes.
Pollution from cattle dips along the river has greatly affected water quality of water sources.
These water challenges call for the need for new water demand management strategies and
expansion of water distribution networks (Conradie, 2002).
Therefore, inadequate access to quality water in the area is a priority problem in many counties
in arid lands. For semi-arid lands, inadequate knowledge in rain water harvesting techniques has
played an important role in contributing to water shortage and compromise in quality of water.
For example, Gichana (2014) found that water fetched using mainly donkeys, women and
children pose a great threat that has pushed many communities living in rural areas into abject
poverty (Molden, 2007). Efficient management of water resources to benefit rural and urban
communities requires a full understanding of existing patterns of water demand (Nyong, 1999).
The number of residents who reliably accessed water (reliability of over 80%) increased from
9.5% before devolution to 16.2% after devolution. Similarly, those whose access to water
were>60% to 80% reliable increased from 9.5% before devolution to 21.6% after devolution. In
contrast, the proportion of residents with unreliable water access (20% and below) reduced from
9.5% before devolution to 2.7% after devolution. This is a clear indication that devolution has
indeed improved the reliability of water access in ASALs, this is because more residents in these
areas having more reliable water access than before devolution came into place. Reliability of
water is a clear implication of the ease of access to water resource with water that does not
usually require to be treated for consumption, and whose water supply is rich enough to meet the
needs of the people in all seasons (Harvey & Reed, 2004).
To cope with unreliable water provision, respondents suggested that residents in ASAL should
adopt different water conservation methods either through conservation agriculture or
construction of rainwater control and management structures and rainwater storage in farm
ponds, water pans, sand/sub-surface dams, earth dams, tanks for supplemental irrigation are
gaining prominenc. Either through their own experiences or with technical assistance from
development agents especially local NGOs and development partners, rural communities are
adopting a variety of innovative technologies to cope with recurrent droughts (Mati, Mwepa, &

160
Temu, 2008 ). In the same area, Malesu, Odhiambo, Oduor, & Nyabenge (2006) found nine farm
ponds per km2 using satellite imagery, with most households possessing ponds. There has been
notable improvement in water security, crop production, diversification, and rural community
incomes.
The number of residents accessing less saline water (salinity of 20% and below) has slightly
reduced; from 43.2% before devolution to 41.9% after devolution. However, residents accessing
moderately saline water (salinity of >40% to 60%) increased from 17.6% before devolution to
21.6% after devolution. The findings indicate that though devolution good impact it needs to
improve its impact on the salinity of water accessed by residents in the ASALs. This is probably
because salinity of the water sources in these areas is more or less a natural aspect and the
County Governments have not implemented technologies to reduce the salinity of water
accessible to the residents. According to Peprah et al. (2015), salinity of water for consumption
provided to the citizenry should be low.
It was attested that after devolution, 29.7% of resident’s access water that is infrequently treated
(treatment frequency of 20% and below) compared to 32.4% of them before devolution. On the
other hand, residents accessing frequently treated water (treatment frequency of over 80%)
increased from 18.9% before devolution to 20.3% after devolution. Similarly, the number of
residents accessing water that is regularly treated (treatment frequency of >60% to 80%)
increased from 10.8% before devolution to 18.9% after devolution. The implication is that
although a simple majority of the residents in ASALs still access water that is infrequently
treated, devolution has made substantial efforts to increase the residents’ accessibility to treated
water in these areas. In line with Harvey and Reed (2004), the findings could mean that most of
the water sources are reliable since they do not need frequent treatment. However, they also
fulfill the recommendation by Wagah et al. (2010) that it is important to upgrade the water
treatment to enhance accessibility to safe water services.
After devolution, 28.4% of the residents used water whose was clarity over 80%. This was an
increase from 17.6% of residents who used such water before devolution. A similar trend was
affirmed for water whose clarity was >60% to 80% where the proportion of residents accessing
it increased from 27.0% before devolution to 29.7% after devolution. On the other hand, the

161
number of residents using unclear water (clarity of 20% and below) decreased from 8.1% before
devolution to 4.1% to after devolution. The findings imply that devolution has enhanced the
accessibility to clear water in the ASALs. This is line with Cherunya et al. (2015) description of
water accessibility that should also be reflected by ability to access clean water for consumption.
The findings on water provision indicate that devolution has largely enhanced the requirements
that define water accessibility: availability, quality and affordability of the water (Cherunya et
al., 2015). Physically accessibility is indicated by the ability for the community to get safe,
sufficient and consistent water supply; having an adequate number of water channels which
leads to less waiting time; practical distance from the point of household to the point of drawing
water; and reasonable supply of all accessible water infrastructures (Cherunya et al., 2015).
Economic accessibility is indicated by ease of affordability of water facilities by every
household regardless of their level of affluence (Frone & Frone, 2013).
Respondents were also categorical on the need to enhance water provision through improved
governance of the water sector. The County Governments should dedicate efforts to ensure
appropriate governance instruments are in place to support service delivery and sector
coordination. Some suggested that, the county water legislations should be enacted. This was
echoed through suggestions for development of water sector rules and regulations especially for
the coordination of operations of rural water supplies which are traditionally not included within
WASREB’s regulatory regime. At the same time, it was highlighted that water provision is not
being properly managed by the County leaders due to their lack of proper knowledge of where
the resource is, in what quantity and quality, and how variable it is likely to be in the foreseeable
future. In some counties, it was asserted that there is proper mechanism under which the County
Governments can access this information for planning, designing, operating and maintaining
multipurpose water provision leadership and service delivery systems.
Counties require a lot of information and data support in the management of the water facilities
at the communal level especially with respect to the number of water sources, status of systems
of management especially among water committee, facility ownership, capacity requirements
and operational reliability of water sources. However, in several counties, it was asserted that

162
currently there is no system in place to support knowledge management, monitoring and
evaluation resulting to erratic and unreliable decision making at the county level.
The way most County Governments run their water provision systems does not reflect their
understanding of the key areas of concern in their respective counties. According to one of the
officers, the communities rarely see the link between the county’s allegation of improved water
services and economic benefits of water services. There is hardly any appreciation of the value
of water services provision in advancing the productive economic activities of the community
such as farming. The main benefits perceived are associated with enhancing the social welfare of
members of the community. This partly explains the challenge that some counties face in
enforcing payment of tariffs for water use.
The lack of capacity, adequate processes and oversight can lead to mismanagement, where
committee members abuse their position for private gains. With no by-laws, constitutions or
codes of conduct in place, being in charge of operating the water system can be used as a means
of power, for example by cutting off some community members, serving others for free or
pocketing part of the money. Respondents mentioned some cases (especially in very arid areas)
where community groups conspire with informal vendors and systematically overcharge people
for water.
Respondents effectively brought around a significant and positive joint moderating effect of
transformational leadership and planning on the relationship between administration of water
services and water provision in ASAL is significantly different from their separate effect.
Majority of them highlighted the importance of transformational leadership that encourages
stakeholders’ engagement by the County Governments. According to one of the respondents,
“Stakeholders are better placed in conservation and sustainability and, therefore, should be
engaged completely.” One of the officers added that “They hold the best information as they are
the consumers and their input is important.” This was echoed by another officer who said that,
“They hold the vital information as they are the end users and need to be engaged.” On the same
note, another respondent pointed out that “They play a major role and decisions made directly
affects them and therefore they should be greatly involved.” Even so, one of the officers
critiqued that, “Technicians' advice should be given a priority since they have the technical

163
knowledge as opposed to local community leaders who play politics more.” A general statement
from one of the respondents was that “We need stakeholder engagement for precise and effective
decision making.” This implies a paradox that the importance of stakeholders’ engagement is
well recognized in the County Governments in ASAL. The findings are consistent with dictates
of The Souffle theory that successful program of decentralization must include the right
combination of political, fiscal, and institutional elements to improve rural development
outcomes (Farooq, Shamail, & Awais, 2008; Laryea-Adjei, 2006). There is therefore the need to
include all dimensions of political, fiscal and administrative decentralization. Parker suggests a
conceptual model, the soufflé theory, which incorporates the essential elements of political,
fiscal and administrative decentralization as they combine to realize desired outcomes.
McIntosh and Taylor research (2013) argue that strengthening planning and transformational
capacities among water professionals leads to change in policy, planning, management and
communities is an essential component of the collective response to global water challenges.
Cole and Phil (2011) asserted that managers ought to ensure there is a clear organizational vision
and challenging goals/targets. Achievement of organizational objectives can only be realized
through unified purpose and direction of employees. Employees at all levels are essential in any
firm and their total engagement allows their capabilities to be used for the company’s benefit.
Motivating and holding employees accountable as well as engaging them in decision making
instills innovation and creativity.
It was also apparent from the respondents that appropriate recruitment and placement of rightly
skilled personnel is needed. One of the respondents complained that “The issue of politics,
nepotism and clannism should be discouraged and embrace the issue of professionalism and
transparency in recruitment.” Another officer opined that “Right people should be placed in their
right place of work.” This was reverberated in a suggestion by one of the Sub County Officer
that “Right people with right qualifications and experience be employed.” Another opined that
there is need to “Employ well trained staff in the water docket.” The need for succession
planning was also highlighted by some respondents where one of them warned that “If County
Governments does not employ more technicians there will be a vacuum.” One of the officers
was also critical that “Retired officers are not being replaced therefore all departments are
164
having crisis.” This was resounded by another respondent expressing that the County
Governments ought to “Train and employ new staff to have a successful succession planning.”
Godda (2014) cited (Hossain, 2000) and opined that administrative decentralization seeks to
redistribute authority, responsibility and financial resources for providing services among
different levels of government. Saito (2001) posits that decentralization may foster more local
royalty to regional identities than the national identity, and this may encourage more autonomy
from the central government and even a territorial secession in multi-ethnic and multi-religious
societies, particularly in Africa. The distribution function involves the role of government in
changing the distribution of income, wealth or other indicators of economic well-being to make
them more equitable than would otherwise be the case.
Another notable issue was the need for capacity building especially through training. The
County Governments appreciate that they have a mix of public servants. The first category is the
public servants that they inherited from the National Government and, relatively, have some
good level of skills and understanding of government operations. The other is staff employed by
the County Governments upon inception in 2013. There was also concern that most of these
were largely employed based on county regional dynamics, clannism, nepotism and other non-
professional to reward political supporters. They, therefore, require greater training support.
However, they still need to be capacity-enhanced to adopt the best practices for County
Governments in water provision. Most significantly, the counties need to undertake demand-
driven training programs based on the mandate and core business of the County Governments
that is adequately informed by their respective areas of comparative advantage as opposed to
supply-driven ones based on personal staff desire.
Respondents largely affirmed that a lot of progress has been made in the water sector in the
counties since the inception of devolution. This includes: additional of water resources towards
enhancement of water service provision (drilling of boreholes and wells, connecting more people
to piped water); adoption of new technologies in hydrological/geophysical exploration of
underground water; construction of water treatment plant; and enforcement of water catchment
areas protection. As a result, increased water provision has been accorded to more people more
reliably.

165
Even so, several issues are still manifest regarding water provision in the counties. Some people
still have difficulty in accessing water partly as a result of increasing population in some areas.
In another concern, most residents in some counties access water from unhygienic sources such
as rivers and unprotected wells. It was also mentioned that despite residents’ reliance on multiple
water sources such as rivers, wells, and pipe borne water in the county, regular flow of water
from the available sources is also problematic. Water shortage was also mentioned to have
affected education in some regions where children miss crucial hours of school in search of
water. One of the main challenges was highlighted as the perception amongst citizens that water
should be a commodity and service provided by the County Governments for free. This was
alleged to have created the lack of willingness to pay for water in some of the counties.
To address water scarcity in ASAL, respondents gave suggestions that to expand access to safe
water services, there is need for upfront investment on rehabilitation and extension of existing
water network in addition to upgrading of treatment plant, thus reducing the cost of maintenance
and unaccounted for water and making better use of economies of scale. Others opined that
public investment in the water network could be the route to achieve reduction in unaccounted
for water and hence increasing accessibility to safe water services. Cost recovery with poor
infrastructure and small size of network seems a pipe dream. Among the world’s regions, Sub-
Saharan Africa (SSA) faces the greatest problem of water scarcity because the freshwater
resources are unevenly distributed over time and space. Africa uses only 4% of its water
resources (UNDP, 2007b) yet it faces the greatest problem of water shortage (Hopkins, 1998).
Despite the abundant fresh water resources in Africa’s lakes and rivers, still a great disparity in
water availability and use is experienced. Most freshwater in Africa comes from rain along the
equator, specifically around the Congo basin and Niger delta (UN-CSD, 1994).
In the period to 2025, it is expected that the world will need 17% more water to grow food for
the increasing population in developing countries, and that total water use will increase by some
40% (UNFPA, 2003). Both the shortage and the uncontrolled excess use of water can be life-
threatening, and the essential balance in-between must look to achieve appropriate priorities,
equity and economy in the dispensing of this most vital resource. It is with this understanding
that world leaders meeting at the Millennium Summit in 2000 set a target of halving by 2015 the
166
proportion of people without sustainable access to safe drinking water. According to the
Population Institute (2010), there has been a widespread failure to recognize that water provides
food, energy, sanitation, disaster relief, environmental sustainability and other benefits. This has
left hundreds of millions of people suffering from poverty and ill health and exposed to the risks
of water-related diseases. Given clean drinking water, fewer children will die from water-borne
diseases, more women will have time to engage in productive activities, reducing income
poverty and enlarging their social and economic opportunities (UNFPA, 2003). The most
immediate impact of measures to protect water sources and increase access to clean water will be
to reduce social and environmental vulnerability (UNWWAP, 2009). By so doing, reductions in
child and maternal mortality and improvements in child and maternal health are to be
anticipated, as well as reductions in the incidence of malaria and other water-borne diseases
(WHO, 2003). The availability of safe drinking water will also help in achieving the goal of
gender equality and empowerment of women, as time spent on water collection can be devoted
to more productive pursuits. In many localities, this task is undertaken by school-age girls, so
this measure should have a positive impact on girls’ education (Guisse, 2004).
Sub-County Water Officers in the ASALs stressed the need for enhanced follow-up, monitoring
and control activities in order to ensure efficient implementation and sustained infrastructure.
WSTF will, through County Resident Monitors (CRMs) and closer collaboration with the
counties improve follow up, monitoring and evaluation to ensure efficient implementation and
sustainability. WSTF has engaged County Resident Monitors with relevant skills who will
monitor the whole programme cycle. The CRMs will, within the framework of their
assignments, be able to address technical, social and financial issues related to all WSTF
Projects and will be based within each County where WSTF-funded projects are implemented.
They will work closely with WSTF’s implementing agents such as the Water Resources
Management Authority (WRMA), Water Resources Users Associations (WRUAs), Community
Based Organizations (CBOs) and Water Services Providers (WSPs). The CRMs will be the
liaison persons on the ground between the County, implementing agents, other stakeholders and
WSTF.

167
This harmonized monitoring of WSTF programmes at County level is intended to streamline
WSTF’s activities. Where Danida and EU programmes are implemented in the same County, the
Resident Monitors in that County will monitor both programmes. Projects in ASALs require
strong involvement of communities, as they are often the only option for outreach to many of the
underserved areas. Limited capacities for such specific project implementation are often found,
and continued capacity building to enhance proper governance, financial management and
projects implementation is needed. WSTF strategy is to include capacity building as part of
programme to ensure proper implementation, governance, management and sustainability of
projects. However, decentralization may also jeopardize equity among different localities. The
Soufflé theory is at the center of devolution. The theory is relevant to the current study as it
provides insights on various dimensions of decentralization adopted by County Governments in
Kenya.

168
CHAPTER SIX: SUMMARY AND CONCLUSION
6.1 Introduction
Even though, and with promulgation of Constitution (2010), Kenya as a water scarce country did
devolve water provision to counties, the question of whether administration of devolved water
services has assisted in solving challenges related to water provision as desired and anticipated
by target six (6) of the Sustainable Development Goals (SDGs) as well as Kenya’s Vision 2030
still remain unresolved.
The purpose of this study was therefore to establish the role of administration of devolved water
services, transformational leadership and planning on water provision in Arid and Semi-Arid
Lands in Kenya. Specifically, the study determined the effect of administration of devolved
water services, analyzed the moderating effect of transformational leadership on the relationship
between administration of devolved water services and water provision, assessed the moderating
effect of transformational leadership on the relationship between administration of devolved
water services and water provision, and as established if the joint moderating effect of
transformational leadership and planning on the relationship between administration of devolved
water services and water provision in ASAL in Kenya is different from their separate effects.
The study used positivism research orientation and was guided by the cross-sectional survey
research design targeting 113 sub-counties within the 23 ASAL counties with a sample of the 89
sub counties. A structured questionnaire was used in collecting primary data from sub-county
water officers with secondary data collection being done via desk study. The Data collected was
cleaned before analyzing using descriptive and inferential statistics (quantitative data) as well as
content analysis (qualitative data).
This chapter summarizes the study findings for each study objective and explains the research
conclusion for each objective. The conclusion indicates the inference made from the findings on
every objective. Thus, the conclusion explains whether every study objective was achieved or
not with reference to the study findings.

169
6.2 Summary
6.2.1 Administration of Devolved Water Service and Water Provision in ASAL
Administration of devolved water services was highly affirmed to have enhanced the rate at
which County Governments engages local residents to actively participate in water provision
decision making processes. However, it has not enhanced the effectiveness with which issues
concerning water provision are communicated to all stakeholders involved.
6.2.2 Administration of Devolved Water Services, Transformational Leadership and
Water Provision
The study findings indicate that the leadership in County Governments in the ASALs inspire and
motivate their teams to achieve reliable, accessible, quality water. In particular, the study
findings imply that County leaders emphasize on incorporating subordinate advice when making
final decisions. The findings imply that County Governments in the ASALs use transformational
leadership in delivery of water provision service. If Leaders in ASAL use transformational
leadership, the implication is that all the stakeholders in water provision are involved hence
improving service provision especially on water. This in turn will lead to more efficiency and
effectiveness in responding to the constituents’ needs. Transformational Leadership may cause
positive effects like innovation among subordinates leading to better ways of doing things
especially in water provision.
6.3.3 Administration of Devolved Water Services, Planning and Water Provision
Planning was found to have been at the center of success in water provision given the significant
change in water provision when planning is factored in. The study revealed that county leaders
clarify and gain consensus on the vision and mission in water provision and the need for
planning. Devolution was therefore affirmed to have enabled optimal and on-time deliveries on
water projects to a great extent.

170
6.2.4 Administration of Devolved Water Services, Transformational Leadership,
Planning and Water Provision
From the findings, all the parameters of water provision were found to have improved after
devolution as a result of both transformational leadership and planning which has significantly
affected administration of devolved water services. Nonetheless, reliability of water access by
residents was found to have been the most improved. Closely following was clarity of water
used by the residents expressed and quality of water accessed by residents expressed. On the
other hand, those services that were found to have least improved included average distance in
Kilometers covered by a resident to access the nearest water point and salinity of water
accessible by the residents expressed as a percentage. This implies that water provision has
significantly improved after devolution particularly in terms of distance covered, cost, quality,
reliability of water access, and frequency in water treatment as well as clarity of water used.
Table 6.1: Summary of key findings
Objective Hypothesis Findings Conclusion
To determine the effect of
administration of
devolved water services
on water provision in
ASAL in Kenya
H01= There is no
significant effect of
administration of
devolved water
services on water
provision in ASAL in
Kenya;
Administration of
devolved water
services explains
changes in water
provision up to 0.911
and p-value of 0.000
Given the p-value of
0.000 < than 0.05 the
researcher therefore fails
to accept null hypothesis
and conclude that,
administration of
devolved water services
positively and
significantly influences
water provision in
ASAL in Kenya
To establish the
moderating effect of
H02 = There is no
significant moderating
With the interaction
between
Given the p-value of
0.000 < than 0.05 the
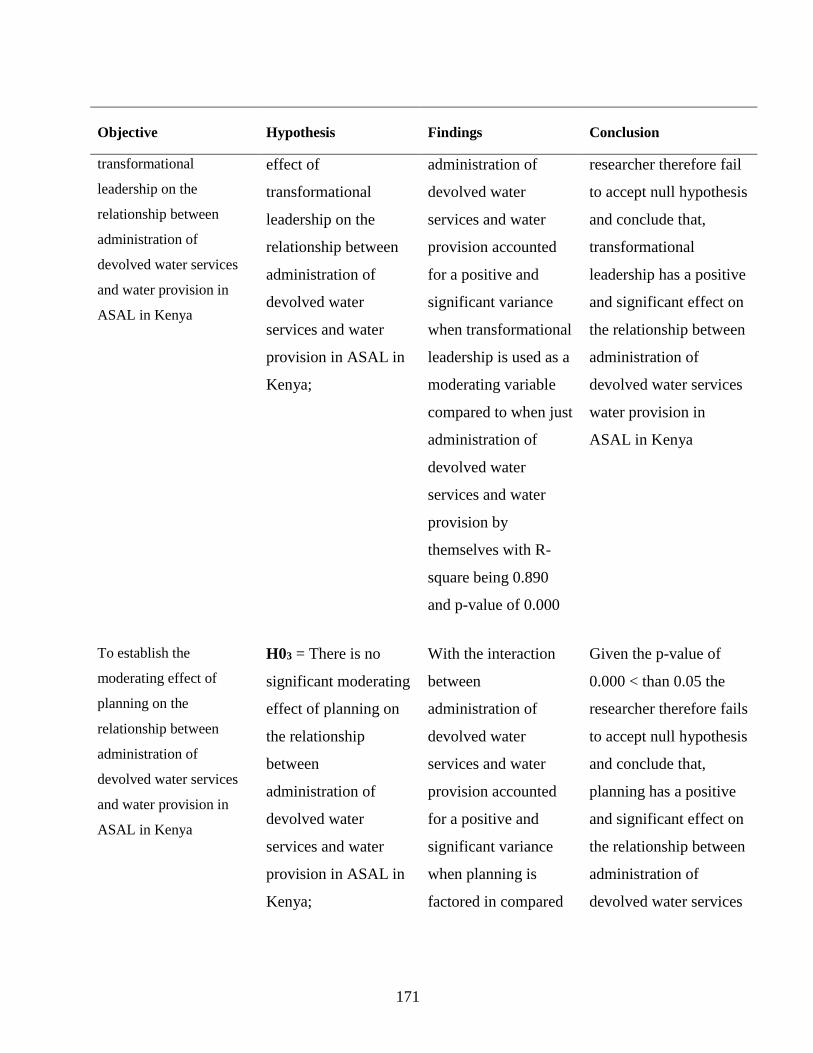
171
Objective Hypothesis Findings Conclusion
transformational
leadership on the
relationship between
administration of
devolved water services
and water provision in
ASAL in Kenya
effect of
transformational
leadership on the
relationship between
administration of
devolved water
services and water
provision in ASAL in
Kenya;
administration of
devolved water
services and water
provision accounted
for a positive and
significant variance
when transformational
leadership is used as a
moderating variable
compared to when just
administration of
devolved water
services and water
provision by
themselves with R-
square being 0.890
and p-value of 0.000
researcher therefore fail
to accept null hypothesis
and conclude that,
transformational
leadership has a positive
and significant effect on
the relationship between
administration of
devolved water services
water provision in
ASAL in Kenya
To establish the
moderating effect of
planning on the
relationship between
administration of
devolved water services
and water provision in
ASAL in Kenya
H03 = There is no
significant moderating
effect of planning on
the relationship
between
administration of
devolved water
services and water
provision in ASAL in
Kenya;
With the interaction
between
administration of
devolved water
services and water
provision accounted
for a positive and
significant variance
when planning is
factored in compared
Given the p-value of
0.000 < than 0.05 the
researcher therefore fails
to accept null hypothesis
and conclude that,
planning has a positive
and significant effect on
the relationship between
administration of
devolved water services

172
Objective Hypothesis Findings Conclusion
to when just
administration of
devolved water
services and water
provision by
themselves with R-
square being 0.98.9
and p-value of 0.000
water provision in
ASAL in Kenya
To establish if joint
moderating effect of
transformational
leadership and planning
on the relationship
between administration
of devolved water
services and water
provision in ASAL in
Kenya is different from
their separate effect.
H04 = The joint
moderating effect of
transformational
leadership and
planning on the
relationship between
administration of
devolved water
services and water
provision in ASAL in
Kenya is significant
from their separate
effects
The interaction
between
administration of
devolved water
services and water
provision accounted
for a significant
variance compared to
when just
administration of
devolved water
services and water
provision by
themselves, R2 = 99.9
and p-value of 0.000
Given the p-value of
0.000> than 0.05 the
researcher therefore fail
to accept null hypothesis
and conclude that, the
joint effect of
transformational leadership
and planning on the
relationship between
administration of
devolved water services
and water provision in
ASAL in Kenya is
significantly different
from their separate
effect

173
6.3 Conclusion
This section draws conclusion from findings from the study. The section is divided into sections
based on the research objectives in conclusion all the study objectives were achieved.
6.3.1 Administration of Devolved Water Services and Water Provision in ASAL
The first objective was to determine the effect of administration of devolved water services on
water provision in ASAL in Kenya. This objective was achieved and the study concludes that
administration of devolved water services has a positive and significant influence on water
provision in ASAL in Kenya. Engagement of different stakeholders’ management, adequate and
trained human resource development as well as information technology greatly contributed to
provision of water services in ASAL Counties.
Delivering better governance in water provision is therefore a matter of gradually changing the
values, perceptions and incentives of individual decision makers, managers and staff in this
sector. It will require a shift in the underlying power relationships and interests, and in the
formal and informal rules currently governing the sector. This leads to a more effective water
sector and also to more accountable practices at the sector and country levels in the long run.
This will pave the way to fulfilling the rights enshrined in the Constitution of Kenya as well as
the human right to safe drinking water and sanitation.
6.3.2 Administration of Devolved Water Services, Transformational Leadership and
Water Provision
The second objective was to establish the moderating effect of transformational leadership on the
relationship between administration of devolved water services and water provision in ASAL in
Kenya. The null hypothesis for this objective also not accepted and it was concluded that
transformational leadership has a positive and significant moderating effect on the relationship
between administration of devolved water services and water provision in ASAL in Kenya.
Transformational leadership has a positive influence on personal outcomes especially

174
stakeholders’ engagement, human resource development and application of modern
technologies. This comes as a result of empowerment, job satisfaction, commitment, trust, self-
efficacy beliefs, and motivation on the part of employees in the devolved units. Transformational
leadership is significantly correlated with personal outcomes. Thus, transformational leaders
apply their influence on followers for service delivery in counties. There is a clear need for
greater attention in this area to understand the mechanisms through which transformational
leadership influences personal attitudes and increase performance. Literature review
demonstrated that organizations can benefit greatly by providing transformational leadership
which would enhance positive personal outcomes among followers.
One might expect the greatest impact of transformational leadership on devolution is when those
seen as high on transformational leadership also engage in appropriate change-specific behaviors
in a transformative way and involving the stakeholders in major decisions, as followers feel
inspired by, and committed to, both the longer-term prospects for the work unit as well as the
change-specific vision communicated by the leader. Conversely, we would expect the lowest
levels of commitment to the change to be associated with leaders who are neither
transformational nor adept at managing the specific change. The enhanced positive personal
outcomes would then positively affect the overall productivity and organizational performance.
6.3.3 Administration of Devolved Water Services, Planning and Water Provision
The third objective was to establish the moderating effect of planning on the relationship
between administration of devolved water services and water provision in ASAL in Kenya. The
objective was achieved and the study concludes that planning has a positive and significant
moderating effect on the relationship between administration of devolved water services and
water provision in ASAL in Kenya. County leadership ought to ensure there is a clear
institutional vision and challenging goals/targets. Achievement of institutional objectives can
only be realized through unified purpose and direction of employees. Employees at all levels are
essential in any firm and their total engagement allows their capabilities to be used for the
company’s benefit.

175
Motivating and holding employees accountable as well as engaging them in decision making
instills innovation and creativity. Engagement of employees should include involving them in
simple information sharing on job related concerns, providing recommendations, goal setting,
business decision making and problem solving in cross-functional groups.
When County leaders use departmental strategic plans and County Integrated Development
Plans that was developed through a participatory process, allocation of adequate financial and
human resource as well as timely delivery of services especially water services, then efficiency
is achieved leading to better performance in water sector especially better water quality,
reliability of water, accessibility of water and cost of water by all residents among others. In this
study the ASAL counties achieved this by engaging stakeholders in coming up with strategic
plans, allocated resources towards achieving these results especially on water provision.
6.3.4 Administration of Devolved Water Services, Transformational Leadership,
Planning and Water Provision
The fourth and last objective was to establish if the joint effect of transformational leadership
and planning on the relationship between administration of devolved water services and Water
Provision in ASAL in Kenya is different from their separate effects. This was also achieved and
the study concludes that the joint effect of administration of devolved water services,
transformational leadership and planning on water provision in ASAL in Kenya is not
significantly different from their separate effect. County Governments are required by the
County Governments Act to ensure that devolved services are provided to citizens and National
Government to provide resources towards achieving it. A lot of progress has been made in the
water sector in Kenya over the last six years by applying principles of financial viability and
sustainability. As a result, increased services have been provided to more people more reliably.
There is evidence that customers can contribute to the full cost of providing services. This means
that a water service provider can deliver reliable services through proper maintenance and on-
going investment in the service without relying on external support. In rural areas the cost and
quality of water has greatly improved.
176
Administration of devolved water services through engagement of stakeholders, proper human
resource development and use of modern information technology has greatly contributed to
effective and efficient water provision in ASAL counties. Leaders in such Counties where proper
resource allocation is made to the water sector and who motivate employees have been found to
have greatly reduced cost of water to residents, water quality having improved as well as
reliability of water.

177
CHAPTER SEVEN
RECOMMENDATIONS
7.1 Introduction
Recommendations for this study were based on the study objectives, findings and conclusion of
the study findings. These recommendations are therefore drawn to address and contribute
towards theories, policy framework as well as future studies. The researcher based the
recommendations on action and managerial practices, policy contributions, contribution to
theory and suggestions for further studies.
7.2 Recommendations on Action and Managerial Practices
The first objective of the study was to find out the effect of administration of devolved water
services on water provision in ASAL. From the study findings, it was established that
administration of devolved water services has a significant and positive effect on water provision
in ASAL in Kenya. The study therefore recommends that administration of devolved water
services should be enhanced by ensuring there is frequent stakeholders’ engagement, enhanced
information technology as well as developed human resource. This can effectively be achieved
by carrying out regular stakeholders’ fora as well as real time communications on matters
pertaining to water provision. In addition, county governments should ensure employees of all
cadres in the water sector are taken through relevant and effective skills and knowledge
enhancement programs. These programs should be performed in tandem with employees’ level
of experience to enhance the levels of responsibilities, transparency and accountability. Given
the dynamic nature of water resources needed for human, animal and industrial consumptions,
the researcher recommends use of the most appropriate and adequately applicable technologies
in water provision in ASAL. This would ensure efficient and sustainable water provision
meeting the expected qualities. The county administrations should also ensure that, technologies
used are supported by residents through stakeholders’ engagement;

178
The second objective of the study was to find out the moderating effect of Transformational
Leadership on the relationship between administration of devolved water services and water
provision in ASAL in Kenya. Findings indicate that Transformational leadership was found to be
having a significant moderating effect on the relationship between the administration of
devolved water services and water provision. Given these findings, county administrations in
ASAL should adopt leadership that would nurture inspiration, motivation and
creativity/innovation among the staff. At the same time, the leadership should promote reward
and recognition system as well as build trust and be role models for desired service delivery in
water provision to be realized.
The third objective was to find out the moderating effect of planning on the relationship between
administration of devolved water services and water provision. Findings indicate that moderating
effect of planning has had a significant and positive effect on the relationship between
administration of devolved water services and water provision. The study therefore recommends
county leadership to delegate decision making on water provision to water officers at the sub-
county levels. This should be done in tandem with the budget appropriation which should
involve officers at the ground for efficient water provision. This can be accomplished by
incorporating in the county budget sub-county water provision fund that will be managed by
sub-county water officers. When this is done, there will be an effective and more participation of
residents in decision making on matters concerning water provision.
In addition, the study recommends that leaders in ASAL County Governments should formulate
comprehensive county water sector policies as well as strategic plans. The study further
recommends adoption, training and use of ICT as an enabler of sustainable water provision.
There is need for ASAL Counties to standardize water technologies since they have similar
conditions. Standardization achieves integrity and reduction of risks. Water projects in ASAL
areas should have a standardized way of doing them to reduce risks and wastage.
It is also necessary to ensure all water sector institutions develop and operationalize a services
charter. This can be adequately achieved if sub-county water officers are engaged in short term,
medium term and long-term decision making at both sub-county and county levels. Results
should be benchmarked with those of other counties that are either within or outside ASAL

179
delineation. Consumer satisfaction surveys should be conducted annually to establish the
citizen’s satisfaction with the water services and its management as well as the prevailing
leadership regarding water provision. Issues raised should be addressed accordingly. For
adequate planning and ensure effective water provision in counties, the study recommends the
need for county leadership to devolve further water provision to sub-counties. Moreover, the
study recommends an integrated approach by all stakeholders including National and County
Governments in ASAL, Non-State Actors and the Communities to address perennial water crisis.
There is also need for County Governments in ASAL to set up desalination plants to provide
safe and fresh water to its residents.
The forth objective for this study sought to establish if the joint moderating effect of
transformational leadership and planning on the relationship between administration of devolved
water services and water provision in ASAL in Kenya is different from their separate effects.
From the findings, it was established that the joint moderating effect of transformational
leadership and planning on the relationship between administration of devolved water services
and water provision in ASAL in Kenya is stronger than the separate effect. The study therefore
recommends that leaders should adopt transformational leadership traits like motivation,
inspiration, recognition and reward and blend with proper resource allocation and prudent
management of such funds to achieve accessible, quality and reliable water for its residents.
7.3 Policy Contributions
The first objective of the study was to find out the effect of administration of devolved water
services on water provision in ASAL. From the findings, it was established that administration
of devolved water services has a significant and positive effect on water provision in ASAL in
Kenya. This study therefore recommends policy documents to be developed and enhanced
including effective policies on stakeholder engagement, use of Information technology on water
as well as human resource development to achieve quality, reliable, accessible water for
residents in ASAL. For administration of devolved water services to be effective planning
should be done through proper resource allocation and strategic planning, as well as optimal and

180
on-time deliveries. This would lead to formulation of relevant and suitable policies on water
provision.
In addition, there is need to increase community awareness and participation in the decision
making. This should be a continuous process engaging all stakeholders and identify the issues of
concern among the public regarding water provision. Policy framework should ensure effective,
efficient and sustainable management of both urban and rural water services. The study
recommends building of the capacity of water management committees and strengthens the
operational capacity of water sector staff. This should entail skills development through training
of persons in the committees and the water officers from the senior positions to the lower
positions. Regulations should also be enacted on the minimum skills needed to serve in the
technical positions related to water provision management. This should be implemented by the
County Public Service Boards in collaboration with the office of the Governor. This should be
done regularly to ensure the members of staff are up to date with the current issues in the water
management concerns in their respective sub counties. Employees’ skills inventory should be
kept and updated after each training session. This should be used to continuously check on the
water management personnel continuously harnessing the skills.
For provision of water services to achieve social equity and affordability for residents in ASAL,
administration of devolved water services should apply effective tariff structure policy and social
income support policy. For tariff structure, water should be charged at a very low price for the
essential amount of water for drinking, domestic and sanitation purposes to enable residents in
the subject areas access the resources.
The second objective of the study was to find out the moderating effect of Transformational
Leadership on the relationship between administration of devolved water services and water
provision in ASAL in Kenya. Findings indicate that Transformational leadership was found to be
having a significant moderating effect on the relationship between the administration of
devolved water services and water provision. Given these findings, County Leadership should
promote culture of recognition and reward so that staffs can be motivated and achieve more.
This can be done at end year staff parties.
181
The third objective was to find out the moderating effect of planning on the relationship between
administration of devolved water services and water provision. Findings indicate that moderating
effect of planning has had a significant and positive effect on the relationship between
administration of devolved water services and water provision. The study recommends policies
developed to enhance this relationship. This policy include policies on funds devolved to sub
counties and managed by Sub County Water Officers, increased allocation to water sector in the
budget appropriation as well as ensure implementations of water projects as outlined in the
County Integrated Development Plan (CIDP) as well as strategic plans.
The County Assemblies in ASAL should come up with County Laws to ensure standardization
of water sector processes to achieve efficient and effective water service delivery. At the same
time, clear legislation and water policies enhanced at devolved levels. This would greatly
enhance the effectiveness of regulation in water sector. Without policy, it is not possible for
regulators to know what they need to regulate, and what the underlying premise for the delivery
of good services is. With a policy framework in place, it becomes more feasible for them to
manage the rules, for example to ensure that as many people as possible can afford water
services and that the quality of services is adequate. In addition, the type of regulation should be
considered. For example, economic regulation may be the mode for keeping tariffs in water
provision well related to reasonable costs, but there may be a need for additional measures to
enable regulators to uphold social objectives, such as incentivizing providers to extend services
to poor people who cannot afford to pay the full cost of service.
The forth objective for this study sought to establish if the joint moderating effect of
transformational leadership and planning on the relationship between administration of devolved
water services and water provision in ASAL in Kenya is different from their separate effects.
From the findings, it was established that the joint moderating effect of transformational
leadership and planning on the relationship between administration of devolved water services
and water provision in ASAL in Kenya is stronger than the separate effect. The study therefore
recommends that leaders should adopt transformational leadership traits like motivation,
inspiration, recognition and reward, blend with proper planning of resources and develop
policies to achieve results.

182
7.4 Study’s contribution to theory
This study has found that administration of devolved water services has significantly improved
water provision in Arid and Semi-Arid Lands. This was empirically ascertained through
hierarchical multiple regression analysis with transformational leadership as well as planning
separately and jointly influencing the relationship between administration of devolved water
services and water provision. This study was carried out in counties in Arid and Semi-Arid
Lands. These findings can therefore be adopted in the 47 counties in Kenya.
7.5 Suggestions for Further Studies
Given the limitations and the delimitations as well as findings of this study, the researcher
recommends a similar study to be carried out targeting residents in Arid and Semi-Arid Lands as
the respondents.
183
REFERENCES
Abdalkrim, G. M. (2013). The impact of strategic planning activities on private sector
organizations performance in Sudan: An empirical research. International Journal of
Business and Management, 8(10), 134.
Abdumlingo, H., and Mwirigi, M. F. (2014). Challenges of managing devolved funds in the
delivery of services: A case study of Mombasa county. International journal of research
in commerce & management, 5(5), 1-4.
Aboud, E. A. (2002). Effects of Land use type on the level of Microbial Contamination based on
total Caliform and Escherischia Coli count on the Mara River, EA.
Adanri, A. A. & Thakkar, B. (2016). Nigerian public administrator’s leadership practices and
their perceived effectiveness. International Journal of Academic Research in Business
and Social Sciences. 6(9) 1-16.
Adanri, A. A. (2016). The relationship between Nigerian local government administrative
leadership styles and organization outcomes (Order No. 10134346). Available from
Dissertations & Theses @ Walden University. (1803939357). Retrieved from
http://ezp.waldenulibrary.org/login?url=http://search.proquest.com/docview/1803939
357?accountid=14872
Adebisi, A. (2012). Local government and good governance in Nigeria’s emerging democracy,
1999-2011: An analysis of the constraining factors. Canada Social Science, 8(6), 114-
122.
Aderonmu, J. A. (2010). Local government and poverty eradication in rural Nigeria. Canadian
Social Science, 6(5), 200-208.
Adeyemi, O. O. (2012). Corruption and local government administration in Nigeria: A discourse
of core issues. European Journal of Sustainable Development, 1(2), 183-198. Allix, N.
M. (2000). Transformational Leadership Democratic or Despotic? Educational
Management & Administration, 28(1), 7-20.

184
Adeyemi, O. O., Akindele, S. T., Aluko, O. A., & Agesin, B. (2012). Institutionalizing the
culture of accountability in local government administration in Nigeria. African Journal
of Political Science and International Relations, 6(4), 81-91.
Aiken, L. S., & West, S. G. (1991). Multiple regression: Testing and interpreting
interactions. Newbury Park, London, Sage.
Ajzen, I., & Madden, T. J. (1986). Prediction of Goal-Directed Behavior: Attitudes and
Perceived Behavioral Control. Journal of Experimental Social Psychology, 22, 453- 474.
Akhmouch L. & Clavreul, K, (2016). Stakeholder engagement for inclusive water governance:
“Practicing what we preach” with the OECD water governance initiative. Water, 8(204),
1-17
Akinyele, S. T., & Fasogbon, O. I. (2010). Impact of strategic planning on organizational
performance and survival. Research Journal of Business Management, 4(1), 73-82.
Al Radif A. (1999). Integrated water resources management (IWRM): An approach to face the
challenges of the next century and avert future crises.
Aldehayyat, J. S. & Twaissi, N. (2011). Strategic planning and corporate performance
relationship in small business firms: Evidence from a Middle East country context.
International Journal of Business and Management, 6(8), 255-263.
doi:10.5539/ijbm.v6n8p255.
Aldehayyat, J. S., & Al Khattab, A. A. (2013). Strategic planning and organizational
effectiveness in Jordanian hotels. International Journal of Business and Management,
8(1), 11-25. doi:10.5539/ijbm.v8n1p11
Ali, B. J. & Abedalfattah, Z. A. (2012). The effect of quality management practices on
organizational performance in Jordan: An empirical study. International Journal of
Financial Research, 4(1), 37- 46
185
Alika, I. J., & Aibieyi, S. (2014). Human capitalHuman resource development: Definitions,
approaches and management dynamics. Journal of Business Administration and
Education, 5 (1), 55-68.
Alison M. J. (2004). No Water No Life, Watersheds of Africa and North America, IRC 501(c)
(3).
Allen, A., Dávila, J. D., & Hofmann, P. (2006). Governance of Water and Sanitation Services
for the Peri-urban Poor, A Framework for Understanding and Action in Metropolitan
Regions. London: The Development Planning Unit, University College.
Alvesson, M., & Willmott, H. (2012). Making sense of management: A critical introduction.
Sage.
America Water Works Association (1999). Water Statistics, Michigan.
American Water Works Association (2007). Water use efficiency and conservation management
strategies, Michigan. An Economic Analysis, Oxford Clarendon Press.
Andrews, R., Boyne, G. A., Law, J., & Walker, R. M. (2009). Centralization, organizational
strategy, and public service performance. Journal of Public Administration Research and
Theory, 19(1), 57-80.
Antonakis, J., Avolio, B. J., & Sivasubramaniam, N. (2003). Context and leadership: an
examination of the nine-factor full range leadership theory using the Multifactor
Leadership Questionnaire. The Leadership Quarterly, 14(3), 261-295.
Arbués, F., Garcı a-Valiñas, M. Á. & Martınez- Espiñeira, R. (2003). Estimation of residential
water demand: a state-of-the-art review. Journal of Socio-Economics, 32, pp. 81-102.
Ariola, M. (2006). Principles and methods of research. Slovin's Formula, 7, 140-141.
Ariyabandu R.De.S. (1999). Household water security using rainwater harvesting RWH,
Conference, New Delhi.
Armstrong, M. (2008). Strategic Human Resource Management: A Guide to Action. London.
Kogan Page.

186
Arouna, A; Dabbert, S. (2009). Determinants of domestic water use by rural households without
access to private improved water sources in Benin.
Asadi, S. S., Vappala, P., Reddy, A. M. (2007). Remotely sensing and GIS techniques for
evaluation of groundwater quality in municipal Corporation of Hydrabad (zone-V), India.
International Journal of Environmental Research and Public Health. 4(1):45-52
Atieno, Y. A. (2009). Corporate governance problems facing Kenyan parastatals: A case study
of the sugar industry. Unpublished Thesis, University of Nairobi, Kenya.
Avila, R., Feigenblatt, H., & Heller, N. (2010). Global Mapping of Technology for Transparency
and Accountability: New Technologies. London, UK: Transparency & Accountability
Initiative c/o Open Society Foundation.
Awino, Z. B., Muturia, J. M., & Oeba, L. K. (2012). Strategic planning, Planning outcomes and
organizational Performance.
Azfar, O. (1999). Decentralization, Governance and Public Services: The Impact of Institutional
Arrangements. Workimg Paper No.255, IRIS Center.
Babcock-Roberson, M. E., & Strickland, O. J. (2010). The relationship between charismatic
leadership, work engagement, and organizational citizenship behaviors. Journal of
Psychology, 144(3), 313-326.
Babel, M.S.; das Gupta, A.; Nayak, D.K. (2005). A Model for Optimal Allocation of Water to
Competing Demands. Water Resour. Manag. 19, 693–712.
Bagaka, O., & Kobia, M. (2013). Separation of Powers in Kenya’s Devolved Administrative
System: Opportunities and Challenges. Commonwealth Governance Handbook 2013/14
Bahri, A. (2012). Integrated Urban Water Management. Stockholm: Global Water Partnership.
Ballou, R. H. (2007). Business logistics/supply chain management: planning, organizing, and
controlling the supply chain. Pearson Education India.
187
Bancy, M. M. (2012). Annual Water Sector Conference Research and Resource Centre
(WARREC). Jomo Kenyatta University of Agriculture and Technology (JKUAT),
Nairobi.
Barney, J. B. (2001). Organizational culture: Can it be a source of sustained competitive
advantage? Academy of Management Review, 11: 656-665.
Bass, B. M. (1985). Leadership and Performance beyond Expectations. New York, NY: The
Free Press.
Bass, B. M. (2000). Transformative leadership: Industry, Military, and Educational Impact.
Mahwah, NJ: Lawrence Erlbaum Associates
Bass, B. M., Avoilio, B. J., Jung, D. I., & Berson, Y. (2003). Predicting unit performance by
assessing transformational and transactional leadership. Journal of Applied Psychology,
88(2), 207-218.
Bass, B. M., Avolio, B. J., Jung, D. I., & Berson, Y. (2003). Predicting unit performance by
assessing transformational and transactional leadership. Journal of Applied Psychology,
88(2), 207-218.
Belias, D. & Koustelios, A. (2014). Transformational leadership and job satisfaction in the
banking sector: A review. International Review of Management and Marketing, 4(3),
187-200.
Berg, S., & Corton, M. (2007). Water utility benchmarking for managerial and policy decisions:
lessons from developing countries. Paper Prepared for the International Water
Association Conference on Performance Assessment of Urban Infrastructure Services
(March 2008, Valencia, Spain). Available at:
http://bear.warrington.ufl.edu/centers/purc/docs/papers/0724_Berg_Water_Utility_Benc
hmarking.pdf
Bevan, D., Collier, P., & Gunning, J. W. (1989) .Village labour markets in Kenya and food
processing, grain, fetching wood and water and caring for children.

188
Bhat, A. B., Rangnekar, S., & Barua, M. (2013). Impact of transformational leadership on
organizational learning. Elite Research Journal of Education and Review, 1(4), 24-31.
Bhatnagar, S. (2014). Public service delivery: Role of information communication technology in
improving governance and development impact. Manila: Asian Development Bank.
Bhutta, M. N. & Van der Velde E. J. (1992). Equity of water distribution along secondary
canals, Punjab.
Biamah, E. K & Gichuki F. (2004). Land and Water Management for Poverty Alleviation:
Experiences from Iiuni Watershed, Machakos District, Kenya.
Bibhabasu M (2010). Water distribution system, Department of Civil Engineering.
Bloisi, W. (2007). An introduction to human resource management. McGraw-Hill.
Boga, I., & Ensari, N. (2009). The role of transformational leadership and organizational change
on perceived organizational success. Psychologist-Manager Journal, 12(4), 235-251.
Bolton, P., Brunnermeier, M. K., & Veldkamp, L. (2013). Leadership, coordination, and
corporate culture. The Review of Economic Studies, 80(2), 512-537.
Bomet County Development Plan (2010). Planning and natural development, vision 2030.
Bonett, D. G. (2002). Sample size requirements for testing and estimating coefficient alpha.
Journal of Educational and Behavioral Statistics, 27(4), 335-340.
Bontis, N., Crossan, M.M., & Hulland, J. (2002). Managing an organizational learning system
by aligning stocks and flows. Journal of Management Studies, 39 (4), 437-69.
Bos, R., Alves, D., Latorre, C., Macleod, N., Payen, G., Roaf, V., Rouse, M. (2016). Manual on
the Human Rights to Safe Drinking Water and Sanitation for Practitioners. London, UK:
IWA Publishing; 2016
Broaweys, M. J., & Price, R. (2011). Understanding cross-cultural management. Harlow:
Pearson Education Ltd.

189
Brown, L.R. (2001). How water scarcity will shape the new century, Water Science and
Technology, 43(4), pp. 17-22. Water Security for the 21st Century-Innovative
Approaches, the 10th Stockholm Water Symposium, August 14-17, 2000.
Bruns, B.R (2004). Pro-poor people lack water rights. Paper presented at the ADB water week,
Manila, 26th -30th August.
Burchi, S. & Andrea A. D. (2003). Preparing national regulations for water resources
management, Principles and practices, Rome.
Burns, J. M. (1978). Leadership, N.Y, Harper and Row
Business Dictionary (2017). Desk Research: Definition. WebFinance Inc. Retrieved from:
http://www.businessdictionary.com/definition/desk-research.html. Accessed on July 11,
2017.
Carl, B. (2010). Journal for contemporary water research and education vol.
Cavana, R., Delahaye, B., & Sekaran, U. (2001). Applied Business Research: Qualitative and
Quantitative Methods (3rd ed.). Sydney: John Wiley & Sons.
Cave, R. R. (2003). The Humber Catchment and Coastal Area, from U.K to European
perspectives, the science of the total environment, 314pp.31-52.
Certo, S. C. & Certo, S. T. (2006). Modern Management (10th ed.). New Delhi: Prentice Hall
Inc.
Chaudhry, A. Q. & Javed, H. (2012). Impact of transactional and laissez-faire transformational
leadership on motivation. International journal of business and social science, 3(7),
258-264
Cherunya, P. C., Janezic, C., & Leuchner, M. (2015). Sustainable supply of safe drinking water
for underserved households in Kenya: Investigating the viability of decentralized
solutions. Water 2015, 7(10), 5437-5457. doi:10.3390/w7105437
Chimbugia, P. (2011). Internal Communication for Developing Good Communication.

190
Chin D.A. (2000). Performance criteria for water use distribution, USA.
Choi, S. (2007). Democratic leadership: the lessons of exemplary models for democratic
governance. International Journal of Leadership Studies, 2(3), 243–262
Chowns, E. (2015). Is Community Management an Efficient and Effective Mc of Public Service
Delivery? Lessens from the Rural Water Supply Sector in Malawi. Public Administration
and Development, 35(4), 263-276. 10.1002/pad.1737
Chung – Fang, C. & Yi Ying, W. (2012). The effects of transactional and transformational
leadership on organizational commitment in Hotels: The mediating effect of trust.
Journal of hotel and business management , 1: 103.
CMWSP (Community Management of Water Supplies Project, 1997). Guidelines, Modalities
and Selection Criteria for Handing over Water Supply Schemes vol.II.
Cohn, J. B., Gillan, S. L., & Hartzell, J. C. (2016). On Enhancing Shareholder Control: A
(Dodd‐) Frank Assessment of Proxy Access. The Journal of Finance.
Cole, G. A. & Phil, K. (2011). Management: Theory and Practice (7th ed.). Hampshire, UK:
South-Western Cengage Learning
Collier, N., Fishwick, F., & Floyd, S. W. (2004). Managerial involvement and perceptions of
strategy process. Long Range Planning, 37(1), 67-83.
Conradie B. (2002). The value of water in the South African Economy: The opportunity for
efficient allocation through price, an extensive study on domestic water demand in low
income communities.
Cook, J., & Burchell, J. (2006). It's good to talk? Examining attitudes towards corporate social
responsibility dialogue and engagement processes. Business Ethics: A European Review,
15(2), 154-170.
Cooper, R.D., & Schindler, P.S. (2003). Business Research Methods. Tata-McGraw Hill.

191
CORDAID & Acacia Consultants (2004). Drought Cycle Management:A Toolkit for Dry lands
of the Greater Horn of Africa. Institute of Rural Reconstruction.
Costa, A. C., & Bijlsma-Frankema, K. (2007). Trust and control interrelations: New perspectives
on the trust-control nexus. Group & Organization Management, 32(4), 392-406.
Cramer, D., & Howitt, D. L. (2004). The SAGE Dictionary of Statistics: A Practical Resource
for Students in the Social Sciences. London: Sage Publications Ltd.
Crook, T. R., Ketchen, D. J., Jr., Combs, J. G., & Todd, S. Y. (2008). Strategic resources and
performance: A meta-analysis. Strategic Management Journal, 29, 1141–1154.
doi:10.1002/smj.703
DAAD – German Academic Exchange Programme (2008). Sub-catchment Management Plan –
Keuyaritha – Ngaciuma Watershed Kenya.
Daft, R. L., & Marcic, D. (2011). Understanding Management. Mason, OH: South-Western,
Cengage Learning.
Dale W. (1990). Calculating the value of time spent collecting water. Some Estimates for
Ukunda, Kenya, University of North Carolina, Washington DC.
Darlington, R. B., & Hayes, A. F. (2017). Regression Analysis and Linear Models. Concepts,
Applications, and Implementation. New York London: The Guilford Press.
Datche, E. A. (2015). Influence of Transformational Leadership on Organizational Performance
of State Corporations in Kenya
David S. (2006). Water we drink beyond 2006, Managing Uncertainty in the Provision of Safe
drinking water, Alberta Research Institute and the Ontario Centres.
David, C. C. & Inocencio A. B. (1998). Understanding Household Demand for Water: The
Metro Manila Case, Research Report, EEPSEA, Economy and Environment Program for
South East Asia, available at http://web.idrc.ca/en/ev-8441-201-1-
Davis, J. & Liyer, P. (2012). Taking Sustainable Rural Water Supply Services to Scale: A
Discussion Paper, Bank of Netherlands Water Partnership Energy and Water
Department, World Bank, Washington DC.

192
de Montalvo, U. W. & Alaerts, G. (2013). Leadership in knowledge and capacity development in
the water sector: A status review. Water Policy, 15 (2013) 1–14
De Rue, D. S. & Ashford, S. J. (2010). Who will lead and who will follow? A social process of
leadership identity construction in organizations. Academy of management review, 35
(4), 627-647.
Denhardt, R. B. & Denhardt, J. V. (2003). The new public service: An approach to reform.
International Review of Public Administration, 8(1), 3–10
Dent, Martin J. (2004). Identity Politics: Filling the gap between federalism and independence.
Hants: Ashgate Publishing Limited.
DePree, M. (2011). Leadership is an art. Crown Business.
Detert, J. R. & Burris, E. R. (2007). Leadership Behavior and Employee Voice: Is the Door
Really Open? Academy of Management Journal, Vol. 50, No. 4
DeVellis, R. (2003). Scale Development: Theory and Applications: Theory and Application.
Thousand Okas, CA: Sage Publications.
DFID (2002). Mara River Basin wide Water Allocation Plan, Nyangores sub-catchment Village
report.
Dinar A. (1990). Economics of Water Resources allocation mechanisms: The effects of pricing
policies on water conservation and drainage. American Journal of Agricultural
Economics, 55:77-82
Dinka, M. O. (2010). Analyzing the Extents of Basaka Lake Expansion and Soil and Water
Quality Status of Matahara Irrigation Scheme, Awash Basin (Ethiopia). [dissertation].
Vienna, Austria: University of Natural Resources and Applied Life Sciences
Dirks, K. T., & Ferrin, D. L. (2002). Trust in Leadership: Meta-analytic findings and
implications for research and practice. Journal of Applied Psychology, 87(4), 611-628.
193
Domnisoru, S., Gherghinescu, O., & Ogarca, R. (2010). Some issues concerning the elements of
control function of management. Annales Universitatis Apulensis: Series
Oeconomica, 12(1), 112.
Douglas, T.J. & Fredendall, L.D. (2004) Evaluating the Deming Management Model of Total
Quality in Services. Decision Science, 35, 393-423.
http://dx.doi.org/10.1111/j.0011-7315.2004.02569.x
DuBrin, A.J. (2013). Leadership Research: Findings, Practice and Skills (5th ed.). Boston, MA:
Houghton Mifflin Company.
Dumdum, U. R., Lowe, K. B., & Avolio, B. J. (2002). A Meta-Analysis of Transformational and
Transactional Leadership Correlates of Effectiveness and Satisfaction: An Update and
Extension. In B. Avolio & F. Yammarino (Eds.), Transformational and Charismatic
Leadership: The Road Ahead (pp. 35-66). New York: Elsevier Science.
Dunford, R. W. (1992) Organisational Behaviour: An Organisational Analysis Perspective
Sydney: Addison Wesle
ECHO/UNICEF (2005). Response to the Kenya Drought Emergency 2004–2005: End of Project
Report. Nairobi: ECHO/UNICEF.
Elsageer, A., & Mbwambo, J. (2004). Does Decentralization Have a Positive Impact on the Use
of Natural Resources? A Paper forInterdisciplinary Course, International Doctoral
Studies at University ofBonn.
Environmental and Resource Economics 21 (2), 161–187.
EPD (Environmental Development Plan). Guidance Document (2007). Methods for determining
future water demand, Georgia.
FAO (Food and Agriculture Organization, 2008). Coping with water scarcity, water Report 38.
Farooq, M. K., Shamail, S., & Awais, M. M. (2008). Devolution in a virtual enterprise. IFIP
International Federation for InformationProcessing, 283, 433–440.

194
Ferdous, J. (2016). Organization theories: From classical perspective. International Journal of
Business, Economics and Law, 9(2), 1-6
Fitzgerald, S., & Schutte, N. S. (2010). Increasing transformational leadership through
enhancing self-efficacy. Journal of Management Development, 29(5), 495-505.
Folkman, J. (2010). Top 9 Leadership Behaviors that drive employee commitment. Retrieved on
May, 1, 2012.
Frone, S., & Frone, D. F. (2013). Promoting access to water supply and sanitation: Issues and
challenges in Romania. Economic Engineering in Agriculture and Rural Development,
13(2), 1-6.
Froukh LM (2001). Decision-support system for domestic water demand forecasting and
management. Water Resource Management, 15(6):363-382
Fugate, M., Kinicki, A. J., & Prussia, G. P. (2008). Employee coping with organizational
change: An examination of alternative theoretical perspectives and models. Personnel
Psychology, 61: 1-36
Fuller, J.B., Patterson, C.E. P., Hester, K., & Stringer, D. Y. (1996). A quantitative research on
charismatic leadership. Psychological Reports 78, 271 – 287
Fung, A. (2006). Varieties of participation in complex governance. Public Adm. Rev., 66, 66–75.
Fürst, J; Herrnegger, M. & Olang, L O.(2014): MaMa-Hydro: Exploring Water Resources
Planning and Management of Options in Nyangores Headwater Catchment of the
Vulnerable Maasai Mara River Basin in Kenya. MID-TERM PROJECT REPORT KEF
Project p196.
Gakubia, M. (2009). .Impact: A performance report of Kenya’s water service sub-sector
(Issue2). Ministry of Water and Irrigation: Annual Water Sector Review, pp. 32 –34.
Galetic, L. (2008, June). Environmental performance as a function of strategic orientation and
organization design-case of Croatian firms. In An Enterprise Odyssey. International

195
Conference Proceedings (p. 1110). University of Zagreb, Faculty of Economics and
Business.
Gall, M. D., Gall, J. P., & Borg, W. R. (2007). Educational Research (8th Ed.). Boston: Pearson
Education, Inc.
Gambe, T. R. (2013). Stakeholders’ engagement in water provision: Lessons from Msasa park,
Harare, Zimbabwe. International Journal of Politics and Good Governance, 4(42), 1-21
Garcıa-Morales, V. J., Llorens-Montes, F. J. & VerduJover, A. J. (2008). The effects of
transformative leadership on organizational performance through knowledge and
innovation. British Journal of Management, 19(4), 299–319
Gazzinelli A, Souza MCC, Nascimento I et al (1998) Domestic water use in a rural village in
Minas Gerais, Brazil, with an emphasis on spatial patterns, sharing of water, and factors
in water use. Cad Sauda Publica 14:265-277.
Geib, P. & Swenson, J. (2013). China: ‘Transformational Leadership for Policy and Product
Innovation’. Advances in Management, 6(5), 3-10
George, J. M. & Jones, G. R. (2008). Organizational Behavior. New Delhi: Pearson Publication
Gică, O. A., & Negrusa, A. L. (2011). The Impact of Strategic Planning Activities on
Transylvanian SMEs-An Empirical Research. Procedia-Social and Behavioral Sciences,
24, 643-648.
Gichana Z. M., Njiru M., Raburu P.O., Masese F. O. (2014). Effects of Human Activities on
Microbial Water Quality in Nyangores stream Mara River Basin, Kenya.
Glaister, K. W., Dincer, O., Tatoglu, E., Demirbag, M., & Zaim, S. (2008). A causal analysis of
formal strategic planning and firm performance: Evidence from an emerging country.
Management Decision, 46(3), 365-391.
Gleick, P.H (1986). Methods of Evaluating the Regional Hydrological Impacts of Global
Climatic Changes, Journal of Hydrology, 8: 99-116.

196
Gleitsmann, B. (2015). The importance of community involvement in the planning and design
phases of rural water supply development projects in the Koro Region of Mali, West
Africa
Glenn, D. I (1992). Sampling the Evidence of extension program Impact. Programme Evaluation
and Organizational Development, IFAS, University of Florida.
Godda, H. G. (2014). Decentralization of secondary school management in Tanzania: Strengths
and prospects. Journal of Education and Practice,5(37), 116-124.
Goetsch, D. L. & Davis, S. B. (2013). Quality Management for Organizational Excellence:
Introduction to Total Quality (7th ed.). NJ: Pearson
Golooba-Mutebi, F. (2012). In search of the right formula: Public, private and community-driven
provision of safe water in Rwanda and Uganda. Public Administration and
Development, 32(4–5), 430–443.
Gopakumar, G. (2010). Transforming water supply regimes in India: Do public private
partnerships have a role to play? Water Alternatives, 3(3), 492–511.
Government of Kenya (2002). An Act of Parliament to provide for the Management,
Conservation, Use and Control of Water Resources and Acquisition.
Government of Western Australia (2009). Operational policy no.1.02 – Policy on water
Conservation /efficiency gains through water licensing, Department of Water, Perth.
Greenwood, M. (2007). Stakeholder engagement: Beyond the myth of corporate responsibility.
Journal of Business Ethics, 74, 315–327
Griffee, D. T. (2012). An Introduction to Second Language Research Methods: Design and Data
(1st ed.). CA: TESL-EJ Publications.
Groves, H. & LaRocca, L. (2011). An Empirical Study of Leader Ethical Values,
Transformational and Transactional Leadership, and Follower Attitudes Toward
Corporate Social Responsibility. The Journal of Business Ethics
197
Guisse, E. H (2004). Final report on human rights commission on the promotion and Protection
of human rights to water, South Africa.
Gujarati D. (2003). Basic Econometrics (4th edition). New York: McGraw Hill.
Gupta, D. M., Purohit, K. M., Jayita, D. (2001). Assessment of drinking water quality of river
Brahmani. Journal of Environmental and Pollution.8:285-291
Gupta, M. P., Solis, P.N. & Calderon, A. J. (2005). Medical ethnobotany of the tribes of Bocas
del Toro, Panama. Journal of Ethnopharmacology 96:389-401.
Gustainis, J. J. (2004). Autocratic Leadership. Encyclopedia of Leadership, 68–72.
GWP (2000). TAC background paper No 4. Integrated Water Resource Management, GWP,
Stockholm, Sweden.
Hackman, M. Z. & Johnson, C. E. (2013). Leadership and Communication. Faculty Publications
- School of Business. 54.
Hansen, J.R. & Villadsen, A. R. (2010). Comparing public and private managers' leadership
styles: Understanding the role of job context. International Public Management Journal,
13(3), 247-274, DOI: 10.1080/10967494.2010.503793
Harvey, P., & Reed, B. (2004). Rural Water Supply in Africa: Building Blocks for Handpump
Sustainability. Leicestershire, U.K.: Loughborough University, Water, Engineering and
Development Centre
Hayes, A. F. (2018). Introduction to Mediation, Moderation and Conditional Process Analysis.
A Regression-Based Approach (2nd Edition ed.). New York London: The Guilford Press.
Hazelton, D. (2015). The development of community water supply systems using deep and
shallow well hand pumps. WRC Report No, TT132/00, Water Research Centre, South
Africa.
Helldorff, H. & Lemuna, J. (2010). Rural Development and Natural Resource Management.
Swedish University of Agricultural Sciences Department of Urban and Rural
Development
198
Hemlin, S. (2006). Creative knowledge environments for research groups in biotechnology: The
influence of leadership and organizational support in universities and business
companies. Scientometrics, 67, 121–142
Hemsworth, D., Muterera, J., & Baregheh, A. (2013). Examining Bass’s transformational
leadership in public sector executives: A psychometric properties review. Journal of
Applied Business Research (JABR), 29(3), 853-862. Retrieved from
http://search.proquest.com/docview/1370363950?accountid=14872
Herold, D. M., Fedor, D. B., Caldwell, S., & Liu, Y. (2008). The effects of transformational and
change leadership on employees' commitment to a change: A multilevel study. Journal of
Applied Psychology, 93(2), 346-357.
Herrnegger, M. Senoner, (2014). Climate change scenarios for the assessment of future Drinking
water availability in the Alps, Australia.
Hinkin, T. R., & Schriesheim, C. A. (2008). A theoretical and empirical examination of the
transactional and non-leadership dimensions of the Multifactor Leadership
Questionnaire (MLQ). The Leadership Quarterly, 19(5), 501-513.
Hinkin, T. R., & Schriesheim, C. A. (2008). An examination of" no leadership": from laissez-
faire leadership to leader reward omission and punishment omission. Journal of Applied
Psychology, 93(6), 1234-1248. doi: 10.1037/a0012875
Hinrichsen D, Robey B, Upadhyay UD (1997). Solutions for a water-short world. Population
Reports 14. Johns Hopkins School of Public Health, Population Information Program,
Baltimore, Maryland.
Hirsch, P. (2006). Water governance reform and catchment management in the Mekong region.
The Journal of Environment & Development, 15(2), 184-201
Hitt, M.A., Bierman, L., Shimizu, K. & Kochhar, R. (2001). Direct and moderating effects of
human capitalhuman resource development on strategy and performance in professional
service firms: A resource-based perspective. Academy of Management Journal, 44(1),
13-28.

199
Hoffman, C. M. (2009). Geospatial mapping and analysis of water availability-demand-use
within the Mara River Basin. MSC. Thesis. Florida International University, Miami, FL,
USA. pp 114 - 2007.
Holmquist, F. (2014). Kenya: On Edge, Rights at Risk.Jadaliyya, 5 August 2014.
http://www.jadaliyya.com/pages/index/18734/kenya_on-edge-rights-at-risk
Hope Snr, R. K. (2012). Managing public sector in Kenya: Reform and transformation for
improved service performance. Journal of Public Administration and Governance. 2 (4),
128 – 143
Hopkins J. (1998) . Solutions for a Water- Short World. Population Informed Program,
Baltiware, Maryland, USA.
Howell, J. P. & Costley, D. L. (2006), Understanding Behaviors for Effective Leadership, 2nd
ed., Pearson Prentice Hall, Englewood Cliffs, NJ.
http://www.iboro.ac.uk/departments/cv/wedc/23 conts.htm.
Hughes, R. L., Ginnett, R. C., & Curphy, G. J. (2012). Leadership: Enhancing the Lessons of
Experience. New York, NY: McGraw-Hill Irwin.
Huselid, M. A., Jackson, S. E., & Schuler, R. S. (1997). Technical and strategic human resources
management effectiveness as determinants of firm performance. Academy of
Management journal, 40(1), 171-188.
Huttly, S., et al. (1990). The Imo State (Nigeria) drinking water supply and sanitation project, 2.
Impact on dracunculiasis, diarrhea, and nutritional status.” Transactions of the Royal
Society of Tropical Medicine and Hygiene 84, pp. 316- 321.
IEA (2012). World Energy Outlook: Executive Summary. Paris: IEA
Institutional Reform in the New Constitution of Kenya, 2013
International water management institute (IWMI), vii 20p, Research Report 39.
Iqbal, N., Anwar, S., & Haider, N. (2015). Effect of transformational leadership on employee
performance. Arabian Journal of Business and Management Review, 5(5), 1-6

200
Irefin, M. P., & Bwala, D. (2012). Organizational theories and analysis: A feminist perspective.
International Journal of Advancements in Research & Technology, 1(1), 71-97.
Irshad, R., & Hashmi, M. S. (2014). How transformational leadership is related to organizational
citizenship behavior? The mediating role of emotional intelligence. Pakistan Journal of
Commerce and Social Sciences, 8(2), 413-425.
Jack S. (2011). Water systems modeller, Stockholm Environmental Institute (Hydrologic
Engineering Centre).
Jagadeeswari, P., Ramesh, K. (2012). Water quality index for assessment of water quality in
South Chennai coastal aquifer, Tamil Nadu, India. International Journal of ChemTech
Research. 4(4):1582-1588
James, (2006). The ‘Q’ root ‘ n’ approach in determining household water demand.
James, J., McKechnie, S., & Swanberg, J. (2011). Predicting employee engagement in an
agediverse retail workforce. Journal of Organizational Behavior, 32, 173-196.
doi:10.1002/job.681
Jensen, M. C., & Meckling, W. H. (1976). Theory of the firm: Managerial behavior, agency
costs and ownership structure. Journal of financial economics, 3(4), 305-360.
Jerald L. (2008). Technologies for clean water: Living with changing water environment,
National Academy of Engineering, Annual Report vol. 38 No.3, Bangladesh.
Joanne M. P. & Robert L. W. (2012). Quantify household water demand: A review of Theory
and Practice in the U.K
Johnson, M. W., Christensen, C. M., & Kagermann, H. (2008). Reinventing your business
model. Harvard business review, 86(12), 57-68.
Jones, H., Parker, K. J., & Reed, R. (2002). Water Supply and Sanitation: Access and Use by
Physically Disabled People. Loughborough: WEDC Publications.
Judge, T. A., & Piccolo, R. F. (2004). Transformational and Transactional leadership: A meta-
analytic test of their relative validity. Journal of Applied Psychology, 89(5), 755-768.

201
Kahn, W. A. (1990). Psychological conditions of personal engagement and disengagement at
work. Academy of Management Journal, 33, 692-724. doi: 10.2307/256287
Kanten, P., Kanten, S., & Gurlek, M. (2015). The effects of organizational structures and
learning organization on job embeddedness and individual adaptive performance.
Procedia Economics and Finance, 23, 1358-1366.
Kaplan, R. S., & Norton, D. P. (2008). The execution premium: Linking strategy to operations
for competitive advantage. Harvard Business Press.
Karamat, A. U. (2013). Impact of leadership on organizational performance. Unpublished
doctoral dissertation, University of Applied Sciences, Finland.
Kathama, L. K. (2012). Strategic planning practices and performance of state corporations in
Kenya (Doctoral dissertation, University of Nairobi).
Kaushik, A. (2011). Literature Review on Right to Water for Basic Needs (Drinking and
Domestic Water, Sanitation): Forum for Policy Dialogue on Water Conflicts.
Maharashtra: Society for Promoting Participative Ecosystem Management
(SOPPECOM).
Kayunze, K. (2003), Social Science Research Methods – DS 300 Notes. Development Studies
Institute, Sokoine University of Agriculture, Morogoro.
Kearns, P. (2005). Human CapitalHuman resource development Management. Sutton, Surrey:
Reed Business Information.
Keith, K. M. (2009). Servant leaders. Leadership Excellence, 26(5), 18-27.
Keller A. & Seckler D. (2000). Water scarcity and the role of storage in development:
Keller, J., Keller, J. & Davis, G. (1998). River basin development phases and implementations of
closure, Journal of applied irrigation science, 33(2): 145-164.
Kelly, S. (2008). Leadership: A categorical mistake? Human Relations 61, 763–782. doi:
10.1177/0018726708092403

202
Kenny, D. (2005). Prior allocation of water right reform journal Vol. 1 US.
Kenya & UNICEF (1998). Access to improved water resources.
Keshavarzi AR, Sharifzadeh M, Haghighi AAK et al (2006) Rural domestic water consumption
behaviour: a case study in Ramjerd, Fars province, I.R. Iran. Water Res 40(6):1173-1178.
Khan, M. W. J., & Khalique, M. (2014). Strategic Planning and Reality of External Environment
of Organizations in Contemporary Business Environments. Business Management and
Strategy, 5(2).
Kibachia, K. Iravo, M. & Luvanda, A. (2014). A survey of risk factors in the strategic planning
process of parastatals in Kenya, European Journal of Business and Innovation Research
2(3): 51-67.
Kihanya, T. (2013), Challenges influencing the implementation of business strategies in public
sector firms in Kenya: A survey of parastatals in the Ministry of Agriculture,
International Journal of Social Sciences and Entrepreneurship. Vol.1, Issue 2, 2013, 1
(2), 635-649.
Kihara, J. C. (2013), Factors affecting the implementation of strategic performance measurement
system of parastatals in Kenya: A case study of the Kenya Rural Roads Authority,
International Journal of Social Sciences and Entrepreneurship. Vol.1, Issue 2, 2013, 1
(2), 621-634
Kim, W. G., & Brymer, R. A. (2011). The effects of ethical leadership on manager job
satisfaction, commitment, behavioral outcomes, and firm performance. International
Journal of Hospitality Management, 30(4), 1020-1026.
Kimberlin, C. L., & Winterstein, A. G. (2008). Research fundamentals: Validity and reliability
of measurement instruments used in research. Am. J. Health-Syst Pharm, 65(6), 2276 –
2284

203
Kimenyi, S. M. & Meaghar, P. (2004). General introduction. In: Kimenyi, S. Mwangi and
Meagher, P., ed. 2004. in Devolution and development: Governance prospects
decentralising states. Hants: Ashgate Publishing Ltd., Ch 1.
Kinicki, A., & Kreitner, R. (2008). Organizational Behavior: Key Concepts, Skills & Best
Practices (3rd ed.). New York, NY: McGraw-Hill/Irwin.
Kiprono, P., & Wanyoike, D. (2016). Influence of selected County Governments funded projects
on the living standards of the beneficiaries. A survey of Kericho County, Kenya.
International Journal of Economics, Commerce and Management, IV(5), 579-590
Kiragu, D. (2009). Daily sediment load in relation to flow level at Bomet Bridge on Nyangores
River, Kenya.
Kisiangani, R. N. (2015). An Analysis of Land Use Potential in Arid and Semi-Arid Areas:
Central Location, Isiolo County
Klettner, A., Clarke, T., & Boersma, M. (2014). The governance of corporate sustainability:
Empirical insights into the development, leadership and implementation of responsible
business strategy. Journal of Business Ethics, 122(1), 145-165.
KNBS (Kenya National Bureau of Statistics), Nekessa (2009). Population and Housing Census,
Vol.1c, Kenya.
Koech J. C. (2016). Analysis of Household Water Demand, Distribution and Community
Management Strategies in Nyangores Subcatchment, Bomet County, Kenya
Koech, P. M. M. & Namusonge, G. S. (2012). The effect of transformational leadership on
organizational performance at state corporations in Kenya. International Journal of
Business and Commerce, 2(1), 01-12.
Koene, B. A. S., Vogelaar, A. L. W., & Soeters, J. L. (2002). Leadership effects on
organizational climate and financial performance: Local leadership effect in chain
organizations. The Leadership Quarterly, 13(3), 193-215
204
Koontz, H., & O'donnell, C. (2011). Principles of Management; An Analysis of Managerial
Functions.
Korir, P. K. & Moronge, M. (2016) Drivers of implementation of corporate strategic plans in
government parastatals in Kenya: a case of Postal Corporation of Kenya, The Strategic
Journal of Business and Change Management, Vol. 3, Issue. 4 (67): 1275-1290.
Korir, V. C. (2013). Challenges affecting devolution of public sector services in local authorities
in Kenya: Case of county government of Kericho. Accessed from http://ir-
library.ku.ac.ke/handle/123456789/10158
Kothari, C. R. (2004). Research Methodology: Methods and Techniques (2nd Revised ed.).New
Delhi: New Age International (P).
Kouzes, J. M., & Posner, B. J. (2002). Leadership challenge (3rd ed.). San Francisco: Jossey-
Bass.
Kraus, S., Harms, R., & Schwarz, E. J. (2006). Strategic planning in smaller enterprises-new
empirical findings. Management Research News, 29(6), 334-344.
Larson E. A. (2006). Combating Water Scarcity in Southern Africa: A case study in Namibia;
Water use patterns.
Laryea-Adjei, G. Q. M. (2006). Central-Local Relations in the Provision ofBasic Services
Provision of Water and Sanitation Services in Ghana. A PhD Thesis, Erasmus
University: Rotterdam.
Latif, K. I., Baloch, Q. B., & Khan, M. N. (2012). Structure, Corporate strategy and the overall
effectiveness of the organisation. Abasyn Journal of Social Sciences, 5(2), 1-13.
Leana, C. R. & Pil, F. & (2009). Applying organizational research to public school reform: The
effects of teacher human and social capital on student performance. Academy of
Management Journal, 23(4), 145-158.

205
Lee, D. (2012). The Role of Transformational leadership in the Home Health Care Industry.
Home Health Care Management & Practice, 24(4), 169-174.
Lee, N., & Chuang, T (2009). The Impact of Transformational leadership on Job Stress and
Turnover Intention: Taiwan Insurance Industry as an Example. Available at:
Leon, A. C., Davis, L. L., & Kraemer, H. C. (2011). The role and interpretation of pilot studies
in clinical research. Journal of Psychiatric Research, 45(5), 626–629.
Leung, J., & Kleiner, B. H. (2004). Effective management in the food industry. Management
Research News, 27(4/5), 72-81
Lindgreen, A., Palmer, R., Wetzels, M. & Anticco, M. (2009). Do different marketing practices
require different leadership styles? An exploratory study‟, Journal of Business &
Industrial Marketing, vol. 24, no. 1, pp. 14-26.
Lockwood, H. (2014). Institutional Support Mechanisms for Community-Managed Rural Water
Supply and Sanitation Systems in Latin America, Prepared for the Bureau of Latin
American and the Caribbean USAID under EHP Project.
London School of Hygiene and Tropical Medicine; (2009). Indicators of Access to Household
Water Demand.
Mahmood, Z., Basharat, M., & Bashir, Z. (2012). Review of classical management theories.
International Journal of Social Sciences and Education, 2(1), 512-522.
Maidment, D.R., Miaou, S.P.,( 1986). Daily water use in nine cities. Water Resources Research
22 (6), 845–885.
Maimuna, M. & Kidombo, H. (2017). Factors influencing performance of water projects in arid
and semi-arid areas: A case of Ewaso Ng’iro North borehole projects, Isiolo County,
Kenya. International Academic Journal of Information Sciences and Project
Management, 2(1), 217-238
Maitlis, S. & Sonenshein, S. (2010). ‘Sense-making in crisis and change: inspiration and insights
from Weick (1988)’. Journal of Management Studies, 47, 551–80
206
Makule, D. E. (1997). “Water and sanitation—gender perspective.” Proceedings of the
Malesu, M. M, Sang, J. K, Odhiambo, J. O., Oduor, A. R. & Nyabenge, M. (2006) Rainwater
Harvesting Innovations in Response to Water Scarcity: The Lare Experience. Technical
Manual No.5. SearNet Secretariat, RELMA-in-ICRAF, World Agroforestry Centre,
Nairobi, Kenya.
Mart´ınez-Espiñeira, R. (2002). Residential water demand in the Northwest of Spain.
Marwa, S. M. (2014). Nurturing Corporate Excellence: Glimpses of Quality Challenges and
Management in Contemporary Corporate Africa.A Managerial Imperative. The Jomo
Kenyatta Foundation: Nairobi, Kenya.
Mati, B. M., Mutie, S. P. Home, F. M. & Gadain, H. (2005). Land use changes in the
Transboundary Mara Basin, 8th International River Symposium, Brisbane, Australia.
Mati, B. M., Mutie, S., Gadain, H., Home, P., and Mtalo, F. (2008). Impacts of land use / cover
changes on the hydrology of the transboundary Mara River, Kenya / Tanzania, Lake.
Reserv. Manage., 13: 169 – 177.
Mati, B. M., Mwepa, G. & Temu, R. (2008). Farmer Initiatives in Managing Water for
Agriculture in Eastern and South Africa. A Booklet of Farmer Innovations in AWM.
IMAWESA, SWMnet-ICRISAT, Nairobi.
Mati, B. M., Siame, D. & Mulinge, W. M. (2008). AWM on the Ground: Lessons from Projects
and Programs in Eastern and Southern Africa. IMAWESA, SWMnet ICRISAT, Nairobi.
Mbata, J. (2014). Estimating Household Willingness for Water Services in Rural economy: the
Case of Kanye in Southern Botswana. Development of Southern Africa, 23(1), 29-43.
McDonald, P. (2010). Teaching the concept of management: Perspectives from ‘six honest
serving men.’ Journal of Management and Organization, 16(5), 626-640.
McIntosh, B. & Taylor, A. (2013). Developing T-shaped water professionals: reflections on a
framework for building capacity for innovation through collaboration, learning and
leadership. Journal of Contemporary Water Research & Education, 150(1), 42–60.

207
MCKinney, D. C, Cai, X, Rosegrant M. W., & Ringler, C. (1999). Modelling water resources
management at the basin level, Colombo, Sri Lanka.
McShane, S. L. & Von Glinow, M. A. (2000). Organisational Behaviour. Burr Ridge,IL:
Irwin/McGraw-Hill.
Mehra, A., Smith, B., Dixon, A., & Robertson, B. (2006). Distributed leadership in teams: The
network of leadership perceptions and team performance. Leadership Quarterly, 17,
232-245.
Mehretu, A. & Mutambirwa, C. (1992) “Time and energy costs of distance in rural life space of
Zimbabwe: case study of the Chiduku Communal Area.” Social Science and Medicine
34(1), pp. 17-24.
Melesse, A., MMcClain, M. Abira, M. & Mutayoba, W. (2008). Hydrometerological Analysis of
the Mara River Basin, World Environmental Resources Congress.
Memon, M. A., Ahmad, M., & Chandan, L. (2009). Human Capital, Human resource
development a source of competitive advantage: Ideas for strategic leadership.
Australian journal of Basic and Applied Sciences, 3(4), 4182-4189.
Michel, J. W., Lyons, B. D., & Cho, J. (2011). Is the full-range model of leadership really a
fullrange model of effective leader behavior? Journal of Leadership & Organizational
Studies. 18(4), 493-507.
Minaya, V. (2010). land use influence on the benthic macro invertebrate communities of streams
in the Nyangores and Amala tributaries of Mara river, Kenya. UNESCO, Paris.
Ministry of Planning and Devolution (2016). National Policy for the Sustainable Development of
Northern Kenya and other Arid Lands: Unlocking Our Full Potential for Realization of
the Kenya Vision 2030. Government Press
Ministry of Water and Irrigation, (1998). Water Quality Improvement and Conservation Project,
Ruseifa Area, Water quality study training model, 1998.4.
208
Ministry of Water and Lands, (2006) Livestock Watering requirement requirements, quality and
quantity, British Columbia.
Mink, O. (1992). Creating new organizational paradigms for change. International Journal of
Quality & Reliability Management, 9, 21-23.
Miring’u, A. & Muoria, E. T. (2011). An analysis of the effect of corporate governance on the
performance of commercial state corporations in Kenya. International journal of
business and public management; 1 (1), 36-41.
Miriti, A. K. & Keiyoro, P. (2017). Influence of devolution of government service delivery on
provision of healthcare: A case of level five hospital in Meru County, Kenya.
International Academic Journal of Information Sciences and Project Management, 2(1),
300-315
Mitchelmore, S., & Rowley, J. (2013). Entrepreneurial competencies of women entrepreneurs
pursuing business growth. Journal of Small Business and Enterprise Development, 20(1),
125-142.
Molden E. A. (2010). Improving Agricultural Water productivity and Land management, p528-
535.
Molden, D., Sakthivadivel, R.& Keller J. (2007). Hydronomic Zones for developing basin water
conservation strategies. Research Report No.56. International Water Management
Institute, Colombo, SriLanka p30.
Moor J. W (1989). Balancing the need for water use. Springer-Verlag, New York.
Moss, S. A., & Ritossa, D. A. (2007). The impact of goal orientation on the association between
transformational leadership, planning and follower performance, creativity and work
attitudes. Leadership & Organization Development Journal, 3(4), 433-456.
Mott Lacroix, K. E., & Megdal, S. B. (2016). Explore, synthesize, and repeat: Unraveling
complex water management issues through the stakeholder engagement wheel. Water, 8,
13-19.

209
MOWRD (Ministry of Water Resource Management and Development, 2002).
Mugenda, O. M & Mugenda, A. G. (2003). Research methods: Quantitative and qualitative
approaches. Nairobi: ACTS Press.
Mukabi, F. K., Barasa, P. W. & Viola, C. (2015). Devolved governance in Kenya: Is it a false
start in democratic decentralization for development? International Journal of
Economics, Finance and Management, 4(1), 27-37
Mullins, L. J. (2008). Essentials of organisational behaviour. Pearson Education.
Munive-Hernandez, E. J., Dewhurst, F. W., Pritchard, M. C., & Barber, K. D. (2004). Modelling
the strategy management process: An initial BPM approach. Business Process
Management Journal, 10(6), 691-711.
Musangi, R.S. (2009). Water Resources Management Authority, Athi River, Kenya.
Mwendamseke, E. (2016). Assessment of Community-Owned Water Supply Organizations
(COWSOs) Strategy for Sustainability of Rural Water Supply in Dodoma Region
Nagendra, A., & Farooqui, S. (2016). Role of Transformational leadership on Organizational
Performance. International Journal of Research in Commerce & Management, 7(4).
Naidu, S. P. (1996). Public Administration: Concepts and Theories. Delhi: New Age
International Publishers.
Naiga, R., Penker, M., & Hogl, K. (2015). Challenging pathways to safe water access in rural
Uganda: From supply to demand-driven water governance. International Journal of the
Commons, 9(1), 237–260
Nalenga, D.W. (2010). Water allocation challenges in rural basins: report, South Africa.
National Housing and Population (1999). Kenya Population and Housing Census, Ministry of
Planning and National Development and Vision 2030.
National Water Policy (2006). Kenya National Water Development Report, 2nd UN World Water
Development Report Water: A shared Responsibility.

210
Newzealand (2004). Water allocation and use: Technical working paper, Ministry for
environment, Newzealand.
Ngari, S. (2001). The impact of these dams on the recipient communities. Analyzing the
government policies on water and Arid and Semi-Arid Lands (ASALs).
Ngigi, S. N, H. Savenije, H. G. & Gichuki, F. N. (2008) Hydrological Impacts of Flood Storage
and Management on Irrigation Water Abstraction in Upper Ewaso Ng’iro River Basin,
Kenya. Water Resources Management, 22: 1859-1879. http://www.springerlink.com
Ngodo, O. E. (2008). Procedural justice and trust: The link in the transformative leadership–
organizational outcomes relationship. International Journal of Leadership Studies, 4(1),
82-100.
Nguni, S., Sleegers, P. & Denessen, E. (2006). School Effectiveness and School Improvement,
Volume 17, Number 2, June 2006, pp. 145-177(33)
Nhema, A. G. (2015). Relevance of classical management theories to modern public
administration: A review. Journal of Public Administration and Governance, 5(3), 165-
179
Niehoff, B., Enz, C., & Grover, R. (1990). The impact of top-management actions on employee
attitudes and perceptions. Group & Organizational Studies, 15(3), 337-352
Nongo, S. (2015). Effects of transformational leadership on organizational performance in small
and medium scale enterprises (SMES) in Nigeria. International Journal of Research in
Management & Business Studies (IJRMBS), 2(2), 23-30
Northouse, P. G. (2013). Leadership: Theory and practice. Thousand Oaks, CA: SAGE
Publications.
Nthenge, A. K. (2016). Water Access Challenges and Coping Strategies in Selected Sites of
Makueni County, Kenya
NWSB (2011). Access to Water and Sanitation: Isiolo Town Water and Sanitation Project
Rehabilitation and Augmentation works
211
Nyong, A. (1998). Topographic Survey of Katarko village. Sub-Project report, JosMcMaster
Drought and Rural Water Use Research Project. University of JOS, Nigeria.
Nyong, A. O, Kinarogbu P. S, (1999). Domestic water demand in rural and semiarid North
eastern Nigeria: Identification of determinants and implementation for domestic water
demand.
Obongo, S. O. (2009). Implementation of performance contracting in Kenya. IPMR Journal.10
(2), 32 -38.
OECD (2015). OECD Studies on Water: Stakeholder Engagement for Inclusive Water
Governance. Paris: OECD Publishing. http://dx.doi.org/10.1787/9789264231122-en
Ogallo, L. A. (1996): Human induced climate changes: Myths or reality; Kenya National
Academy of Science (Ed.): Environment and Development in Kenya, pp.169-194,
Nairobi.
Ogendi, G. M. & Ong’oa, I. M. (2009) Water policy, accessibility and water ethics in Kenya.
Santa Clara Journal of International Law, 7(1), 177-196
Ojokuku, R. M., Odetayo, T. A., & Sajuyigbe, A. S. (2012). Impact of transformational
leadership on organizational performance: a case study of Nigerian banks. American
Journal of Business and Management, 1(4), 202-207.
Ololube, N. P. (2013). Educational Management, Planning and Supervision: Model for Effective
Implementation. Owerri: SpringField Publishers.
Olufemi, A. J. (2009). Human CapitalHuman resource development Development Practices and
Organizational Effectiveness: A focus on the contemporary Nigerian Banking Industry.
Pakistan Journal of Social Sciences, 6(3), 194-199.
O'Regan, N., & Ghobadian, A. (2002). Effective strategic planning in small and medium sized
firms. Management Decision, 40(7), 663-671.
Orie K.K. (1995): Legal regime of water allocation and the conservation of aquatic
environmental values in Kenya: Journal of Eastern African Research and Development
No. 25, pp 76-114.
212
Osama, A. H., & Issa, S. M. (2015). A pilot study: Vital methodological issue. Business: Theory
and Practice, 16(1), 53-62
Osei A.Y. (2004). Household water security and water demand in the Volta Basin, Ghana.
Oviasuyi, P. O., Idada, W., & Isiraojie, L. (2010). Constraints of local government
administration in Nigeria. Journal of Social Sciences, 24(2), 81-86. Rotberg, R. I. (2004).
Strengthening African leadership; Foreign Affairs, 83(4), 14-18. Retrieved from
http://search.proquest.com/docview/214292792?accountid=14872 Toor, S.R. & Ofori, G.
(2009). Ethical leadership: Examining the relationships with full range leadership model,
employee outcomes, and organizational culture. Journal of Business Ethics, 90(4), 533-
547.
Owuor, S. O., & Foeken, W. J. (2009). Water reforms and interventions in urban Kenya:
Institutional set-up, emerging impact and challenges. ASC Working Paper 83/2009:
Leiden: African Studies Centre.
Oyj, T. (2009). Examining Management Control Systems Packages and Organisational
Ambidexterity-Case.
Parker, A. N. (1995). Decentralization: The Way Forward for Rural Development. . Policy
Research Working Paper 1475. Washington, D.C:World Bank.
Pearce, J., Welle, K., & Dickinson, N. (2013). Information and Communication Technologies
(ICTs) for monitoring sustainable service delivery. Hague, The Netherlands: IRC.
Peprah, C., Oduro-Ofori, E., & Asante-Wusu, I. (2015). Analysis of accessibility to water supply
and sanitation services in the Awutu-Senya East Municipality, Ghana. Journal of
Sustainable Development, 8(8), 310-325
Perret, S. Farroli S. & Hassan R. (2009 ). Water Governance for sustainable Development Part
III Pg 169, London.
Peter, G. (2004). Poverty Reduction Strategy Paper, Bomet District Consultative Forum Report.

213
Phillips, R. & Noland, J. (2010). Stakeholder engagement, discourse ethics and strategic
management. International Journal of Management Reviews, 12(1), 33-45.
Pierce, J. L., &Newstorm, J. W. (2008). Leaders & the Leadership Process: Readings, Self-
Assessment & Applications (5th ed.). New York, NY: McGraw-Hill/Irwin.
Pieter Van der Zaag and D. Kammer (2003). Assessment of catchment water demand use
(DFID- Department for International Development) U.K.
Plunkett, W. R., Allen, G., & Attner, R. (2012). Management. Cengage Learning.
Population Institute (2010) population and water. New York
Prokopy, S. (2015). The Relationship between Participation and Project Outcomes Projects in
India: Evidence from Rural Water Supply, World Development,33(11), 1801– 1819.
Puni, A., Ofei, S. B., & Okoe, A. (2014). The effect of transformational leadership on firm
performance in Ghana. International Journal of Marketing Studies, 6(1), 177- 185
Purcell, J., Kinnie, N., Hutchinson, S., Rayton, B. & Swart, J. (2004). Understanding the People
& Performance Link: Unlocking the Black Box. Research Report Chartered Institute of
Personnel and Development.
Radhika de S., David S., and Upali A. (1998). Wold Water Supply and Demand, 1990 to 2025:
Scenario and Issues. Research Report 19, Colombo Sri Lanka: International Water
Management Institute.
Ramakrishnaiah, C. R., Sadashivaiah, C., & Ranganna, G. (2009). Assessment of water quality
index for the groundwater in Tumkur Taluk, Karnataka State, India. E-Journal of
Chemistry. 6(2):523-530
Rana, G., Garg, P., & Rastogi, R. (2011). Effect of Justice Perception on Managerial
Effectiveness. IUP Journal of Organizational Behavior, 10(2).
Renate, V. B. (2007). An analysis of current water distribution and rights system of an irrigation
system, Bolivia.
214
Republic of Kenya (1994). Range management Handbook of Kenya Volume 1. Introduction to
Rangeland Development in Kenya. Ministry of Agriculture, Livestock, Development and
Marketing, Nairobi.
Republic of Kenya (2013) Development Plan 2013/2017, Nairobi, Government Printer
Republic of Kenya, (1999). National Policy on Water Resources and Management. Sessional
Paper No. 1 of 1999. Nairobi: Government Printers
Republic of Kenya, (2010). Constitution of Kenya. Nairobi: The National Council for Law
Reporting
Ridenour, C. S., & Newman, I. (2008). Mixed Methods Research: Exploring the Interactive
Continuum. Carbondale, IL: Southern Illinois University Press.
Riedl, R. B. & Dickovick, T. J. (2010). Comparative Assessment Of Decentralization In Africa:
Final Report And Summary Of Findings. Washington, D.C.: United States Agency for
International Development.
Robbins, S. P., DeCenzo, D. A., & Coulter, M. K. (2008). Fundamentals of management:
essential concepts and applications. Upper Saddle River, NJ: Pearson Prentice Hall.
Robert, P. & Shirley C. (2007). Water demand module 4a, University of Alabama.
Robertson, W. (2002). Overview of decentralization worldwide: A stepping stone to improved
governance and human development. Proceedings of the 2nd International Conference
on Decentralization – Federalism: The Future of Decentralizing States. Manila,
Phillipines.
Romig, R. (2001). The Slums of Aspen: Immigrants vs. the Environment in America’s Eden
Rose, A. D. (2009). Domestic water supply an evaluation of the impacts challenges and prospect
on women in rural house hold, Uganda. LUMES, Lund University.
Rowe, W. G. (2001). Creating wealth in organisations: The role of strategic leadership. Academy
of Management Executive, 15, 81-94

215
Saifuddin, A. (2009). Methods in Sample Surveys: Cluster Sampling. John Hopkins Bloomberg
School of Public Health.
Saito, F. (2001). Decentralization Theories Revisited: Lessons from Uganda. Faculty of
Intercultural Communication, Ryukoku University, Japan.
Saks, A. M. (2006). Antecedents and consequences of employee engagement. Journal of
Managerial Psychology, 21, 600-619. doi: 10.1108/02683940610690169
Saleth, M. & Dinar. A. (2013). The Institutional Economics of Water: A Cross Country Analysis
of Institutions and Performance. Washington, DC, and Northampton, MA, USA: World
Bank and Edward Elgar
Samaitan, L. C. (2014). Transformational leadership and performance of commercial banks in
Kenya (Doctoral dissertation, University of Nairobi).
Samantha, M. (2011). The water crisis in Kenya: Causes, effects and solutions. Global Majority
E-Journal, 2(1), 31-45.
Samra, S. C. & Fawzi, S. C. (2011). The right to water in rural Punjab: Assessing equitable
access to water through the Punjab rural water supply and sanitation project. Health and
Human Rights. 2011;13(2):36-49
Sandiford, P, Gorter, A. C., Orozco, J. G., Pauw, J. P. (1990). Determinants of domestic water
use in rural Nicaragua. J Trop Med Hyg 93(6):383-389.
Saowalux, P. & Peng, C. (2007). Impact of Transformational leadership on Performance: A
Study of Six Sigma Professionals in Thailand. International DSI/Asia and Pacific DSI,
July, 2007.
Sapru, R. K. (2008). Administrative Theories and Management Practices. New Delhi: PHI
Learning Private Limited.
Sarker S. I., Rafiul, M. & Khan, A. (2013). Classical and neoclassical approaches of
management: An overview. IOSR Journal of Business and Management (IOSR-JBM),
14(6), 1-5.

216
Sarros, J. C. Santora & J. C. (2001). The transformational‐transactional leadership model in
practice, Leadership & Organization Development Journal, Vol. 22 Issue: 8, pp.383-394,
https://doi.org/10.1108/01437730110410107
Saunders, M., Lewis, P., & Thornhill, A. (2007). Research Methods for Business Students (4th
ed.). Harlow, England: Pearson Education Limited.
Schaubroeck, J., Lam, S. K., & Peng, A. (2011). Cognition-based and affect-based trust as
mediators of leader behavior influences on team performance. Journal of Applied
Psychology, 96, 863-871. doi: 10.1037/a0022625
Schaufeli, W. B., & Salanova, M. (2007). Work engagement: An emerging Psychological
concept and its implications for organizations in Gilliland, S. W. Steiner, D. D., &
Skarlicki, D. P. (Eds). Research in social issues management (pp. 1355 – 1377).
Information Age Publishers C.T.
Schraeder, M., Self, D. R., Jordan, M. H., & Portis, R. (2015). The Functions of Management as
Mechanisms for Fostering Interpersonal Trust. Advances in Business Research, 5(1), 50-
62.
SCMP (Sub-catchment management plan, 2011). Nyangores River basin sub-plan, Bomet.
Seckler, D., Amarasinghe, U., Molden, D., de Silva, R. & Barker, R. (1998). World water
demand and supply, 1990 to 2025: Scenarios and issues. Research Report 19. Colombo,
Sri Lanka: International Water Management Institute (IWMI).
Serfonten, J. (2010). The Impact of Strategic Leadership on Operational Strategy and
Performance of Business Organizations in South Africa. PHD thesis, University of
Stellenbosch, Stellenbosch, South Africa.
Shah, S., Ahmad, J., Devarajan, S., & Khemani, S. (2005). Decentralization and Service
Delivery. Policy Research Working Paper 3603. Washington, D.C.:The World Bank.
Sharma, N. P., Damhaug, T., Gilgan-Hunt, E. et al (1996) African water resources: challenges
and opportunity for sustainable development. World Bank Technical paper 331. The
World Bank, Washington, DC.

217
Sheehan, S. (2014). Is there no place on earth for me. Vintage.
Shen, C., & Zou, H.F. (2015). Fiscal decentralization and public services provision in China.
Annals of Economics and Finance, 16(1), 53-78.
Sieber, J, Yates, D., Huber- Lee, A, & Purkey, D. (2005). WEAP, A Demand Priority and
Preference Driven Water Planning Model Part 1, Model Characteristics, Water
International, 30 (4) pp 489-500.
Sifuna, D. N. (2012). Leadership in Kenyan public universities and the challenges of autonomy
and academic freedom: An overview of trends since independence. JHEA/RESA, 10(1),
121-137.
Simola, S. K., Barling, J., & Turner, N. (2010). Transformational leadership and leader moral
orientation: Contrasting an ethic of justice and an ethic of care. The Leadership
Quarterly, 21,179–188.
Slack, N., Chambers, S., & Johnston, R. (2010). Operations management. Pearson education.
Smith, A. (1990). Good leaders. Business & Economic Review, 37, 10-12.
Smyth, R. (2004). Exploring the usefulness of a conceptual framework as a research tool: A
researcher’s reflection. Issues in Education Research, 14(2), 167-180
Sofi, S. A. (2013). The changing concept of management. National Monthly Refereed Journal of
Research in Commerce & Management, 2(4), 157-164.
Sorel, O., & Pennequin, V. (2008). Aging of the planning process: The role of executive
functioning. Brain and cognition, 66(2), 196-201.
Sosiawani, I., Ramli, A. B., Mustafa, M. B., & Yusoff, R. Z. B. (2015). Strategic Planning and
Firm Performance: A Proposed Framework.
Sosik, J. J., Potosky, D., & Jung, D. I. (2002). Adaptive self-regulation: Meeting others'
expectations of leadership and performance. The Journal of Social Psychology, 142(2),
211-232.

218
Spendlove, M. (2007). Competences for effective leadership in higher education. International
Journal of Education Management, 21(5), 407-417
Stephenson, D. (1998). Theory of water demand management, water systems research Group,
University of Witwatersrand South Africa.
Strand & Walker, (2005). Estimation of Water Demand in Developing Countries:
Streiner, D. (2003). Starting at the beginning: An introduction to coefficient alpha and internal
consistency. Journal of Personality Assessment, 80(1), 99-103.
Sungai, L. (2005). Integrated River Basin Management Study, Final Report, Vol.3, Technical
Studies Part 1 of 4.
Swaminathan, M. S. (2001). Ecology and Equity: Key Determinants of Sustainable Water
Security, Water Science and Technology, 43 (4), pp. 35-44. Water Security for the 21st
Century-Innovative Approaches, the 10th Stockholm Water Symposium, August 14-17,
2000.
Tabachnick, B. G., & Fidell, L. S. (2007). Using Multivariate Statistics (5th ed.). New York:
Allyn and Bacon.
Tarricone, P., & Luca, J. (2002). Successful teamwork: A case study.
Taylor, F. W. (1911). The Principles of Scientific Management. New York: Harper & Brothers.
The Water Resource Group (2009). Arid and Semi-Arid Report
Thill, T. & Bovée, L. (2015). Business Communication Today. 11th Edition
Tiwari, T. N., & Mishra, M. A. (1985). Preliminary assignment of water quality index of major
Indian rivers. Indian Journal of Environmental Protection. 1985;5(4):276-279
Trivedi, G. (1963). Measurement and analysis of socio-economic status of rural families. New
Delhi.

219
Tsai, W. C., Chen, H. W., & Cheng, J. W. (2009), „Employee positive moods as a mediator
linking transformational leadership and employee work outcomes‟, The International
Journal of Human Resources Management, vol. 20, no. 1, pp. 206- 219.
Tucker, B. A., & Russell, R. F. (2004). The influence of the transformational leader. Journal of
Leadership &Organizational Studies, 10(4), 103-111.
Tue, K. N. (2004). Water Demand Management Report, Nigeria.
Tulvinschi, M. (2010). Relevant costs for decision in an effective controlling system. Theoretical
and Applied Economics, 5(5), 49.
UN-CSD, (United Nations Commission on Sustainable Development 1994). Human Settlements
and Freshwater Resources, Report of the Secretary General of the UN.
UNDP, (2007b). Effective Water governance, the key to sustainable water management and
poverty eradication, New York.
UNDP, (United Nations Development Program (2006). The human development report for 2006.
New York.
UNEP (2011). United Nations Permanent Forum on Indigenous Issues (UNPFII), United
Nations, New York
UNEP, (1999). Freshwater use by sector at the beginning of 2000, vital water graphics, Water
use and management.
UNEP, (2000). Executive Director Calls on Cities to Adopt Integrated Water Management
Strategy. Press Release UNEP/65. http://srch.1.un.org:80
UNEP, (2000). Global Environmental Outlook 2000, UNEP Earth Scan 1997, UK.
UN-ESCAP, (United Nations Economic and Social Commission for Asia and Pacific, 2000).
Principles and Practices of Water Allocation among water use sectors, Bangkok,
Thailand.
UNESCO (2010). Institute for water Education: Water footprint network.
UNFPA (2003). Global Population and Water- Access and Sustainability New York

220
UNFPA (2007). Measuring Water use in a Green Economy. International Resource Panel
working group on water efficiency.
United Nations Scientific and Cultural Organization (2015). Water for a Sustainable World. The
United Nations World Water Development Report. Paris, France
Unpublished records at the district water office, Isiolo.
UN-WATER, (2006). Water for wealth creation and health environment.
UN-WATER/ Africa (2003). Improving the Quantity, Quality and Use of Africa’s water.
UNWWAP (United Nations World Water Assessment Programme 2009). UN world water
development report: Water for life. UNESCO and Berghahn Books, Paris and New York.
USAID (2006). A Rapid Assessment of Kenya’s Water, Sanitation and Sewerage framework,
Nairobi.
USAID (2011). Land Use and Climate Change Impacts on the Hydrology of the Upper Mara
River basin, Nyangores sub-basin, Kenya. use in East Africa. Chicago: University of
Chicago Press.
van Eeden, R., Cilliers, F., & van Deventer, V. (2008). Leadership styles and associated
personality traits: Support for the conceptualisation of transactional and transformational
leadership. South African Journal of Psychology, 38(2), 253–267.
van Knippenberg, D., & Hogg, M. A. (2003). Leadership and power: Identity processes in
groups and organizations. London: Sage
Varma, S. & Charles C. (2010). Out of water: From abundance to scarcity and how to solve the
worlds water problems, USA.
Veettil, N. M. K. (2008). Strategy formulation and implementation in manufacturing
organisations: the impact on performance (Doctoral dissertation, Middlesex University).
Veronica G. Minaya M. (2010) . Land use influence on the benthic macro vertebrate
communities of streams in Nyangores and Amalo tributaries of Mara River, Kenya.

221
Wachira, N. S. (2014). Challenges and prospects for effective water conservation in Mwingi
North District, Kitui County, Kenya
Wagah, G. G., Onyango, G. M., & Kibwage, J. K. (2010). Accessibility of water services in
Kisumu municipality, Kenya. Journal of Geography and Regional Planning, 3(4), 114-
125
Wagaki, S. L. (2013). Strategic Management Practices and Challenges of Kenyan Projects
Assisted by Compassion International in Limuru Region.
Wagana, D. M., Iravo, M., & Nzulwa, J. D. (2015). Analysis of the relationship between
devolved governance, political decentralization, and service delivery: A critical review
of literature. European Scientific Journal, 11(31), 457-472
Wairua M. (2011). Water requirement for beef cattle reflects the amount needed for Growth,
(Extension Publication).
Walker I. (2005). Pricing Subsidies and the Poor: Demand for Improved Water Services.
Wallingford, H.R. (2003). Assessment of Catchment Water Demand and Use, DFID, U.K.
Walumbwa, F. O., Avolio, B. & Zhu, W. (2008). "How Transformational Leadership Weaves Its
Influence on Individual Job Performance: The Role of Identification and Efficacy
Beliefs". Management Department Faculty Publications. 6.
http://digitalcommons.unl.edu/managementfacpub/6
Wambua, K. J. (2011). Factors influencing household accessibility to water supply in a semi-arid
area: a study of Mtito Division, Kitui Ditrict Kenya. Accessed from http://ir-
library.ku.ac.ke/handle/123456789/1715
Wang, E.A (2007). Basin wide cooperative resources allocation, European journal of operation
research vol.2 (1).
Warren, V., Mark J. & Addison W. (1998). Trend in water withdrawals per water use category.
Warwick, J. J. (1997). Oriental model for efficient allocation in river basin Journal vol.2 issue
5, Australia.

222
Water Act (2002). Water Resources Management Authority (WRMA): Management,
Conservation, use and control of water resources, Kenya.
Water and River Commission (2000a). State wide policy no.3- Policy on water sharing, Perth.
Water Resources Group, (2009). Charting Our Water Future, Economic Frameworks to Inform
Decision-making: Executive Summary.
http://www.mckinsey.com/clientservice/water/charting_our_water_future.aspx
Weber, M. (1947). The Theory of Social and Economic Organisation. London: Oxford
University Press.
Website http://www/epnrm.sa.gov.au/water all. Plan saps.
Wesley, A. A. (2006). U.S. Patent No. 7,039,701. Washington, DC: U.S. Patent and Trademark
Office.
White, G.F., Bradley, D.J., and White, A.U. (1972) Drawers of water: domestic water
Whittington D. (2007). Estimation of water Demand in Developing Countries. USA.
WHO, (2008). Weekly Emergency Situation Update. Compendium 2008 Vol 1, No 1.
Brazzaville, Congo: WHO
WHO, (2009). The Resilience of Water Supply and Sanitation in the Face of Climate Change.
Summary and Policy Implications Vision 2030. Geneva: WHO: DFID
WHO, (Wold Health, Organization, (2004). The global burden of diseases, 2004 update.
WHO, (World Health Organization, (2003). The right to water. New York.
WHO, (World Health Organization, 2000). Global Water Supply and Assessment Report.
WHO/UNICEF (2013). Progress on Drinking Water and Sanitation: 2013 Update. New York:
Joint Monitoring Programme for Water Supply and Sanitation
WHO-UNICEF. (2014). Joint Monitoring Programme for Water and Sanitation.
http://www.wssinfo.org/en/238_wat_latino.html.

223
Wijewardena, H., De Zoysa, A., Fonseka, T., & Perera, B. (2004). The impact of planning and
control sophistication on performance of small and medium-sized enterprises: evidence
from Sri Lanka. Journal of Small Business Management, 42(2), 209.
Wille, K., Williams, J., & Pearce, J. (2016). ICTs Help Citizens Concerns over Water – Or Do
They? IDS Bulletin, 47(1), 41-50.
Winpenny, J.T. (1994). Managing Water as an economic resource, Routledge, London, UK.
Woodhouse, M. (2004). Realizing the right to water. Practical Action Publishing, 23(1), 22-23.
Workd Bank Group (2015). Water Services Devolution in Kenya: Briefing note to support
effective and sustainable devolution of water and sanitation services in Kenya. Water and
Sanitation Programme (P132025).
World Bank (2012). Devolution without Disruption – Pathways to a Successful New Kenya.
Nairobi: World Bank
World Bank, (2010). Kenya Briefing: IWRM & Transboundary Water Resources Management
in Kenya.
WRI (World Resource Institute, 2007). Department of Resource Survey and Remote Sensing,
Ministry of Environment and Natural Resources, Kenya.
WWAP, (World Water Assessment Programme, 2009) .World Water Development Report 3:
Water in changing world, Paris/ London, UNESCO/ Earth scan P.S.
Xenikou, A., & Simosi, M. (2006). Organizational culture and transformative leadership as
predictors of business unit performance. Journal of Managerial Psychology, 21(6), 566-
579.
Yang, C. X., Liu, H. M., & Wang, X. X. (2013). Organization theories: From classical to
modern. Journal of Applied Sciences, 13(21), 4470.
Yee, S. (2010). Stakeholder Engagement and Public Participation in Environmental Flows and
River Health Assessment. Project Code P0018. Australia-China Environment
Development Partnership. Available at:

224
http://watercentre.org/portfolio/rhef/attachments/technical-reports/stakeholder-
engagementand-public-participation-in-eflows-and-river-health-assessments
Yukl, G. (2013). Managerial Leadership a review theory and research‟, Journal of Management,
vol. 15, no. 2, pp. 251-289.
Zeraebruk, K. N., Mayabi, A. O., Gathenya, J. M., & Tsige, Z. (2014). Assessment of water
supply services and operational performance of Asmara Water Supply Department
(AWSD) for development of decision support tools. Environment and Natural
Resources Research, 4(4), 208- 222
Zhu, W., Chew, I., & Spangler, W. (2005). CEO transformative leadership and organizational
outcomes: The mediating role of human-capital-enhancing human resource
management. The Leadership Quarterly, 16(1), 39-52
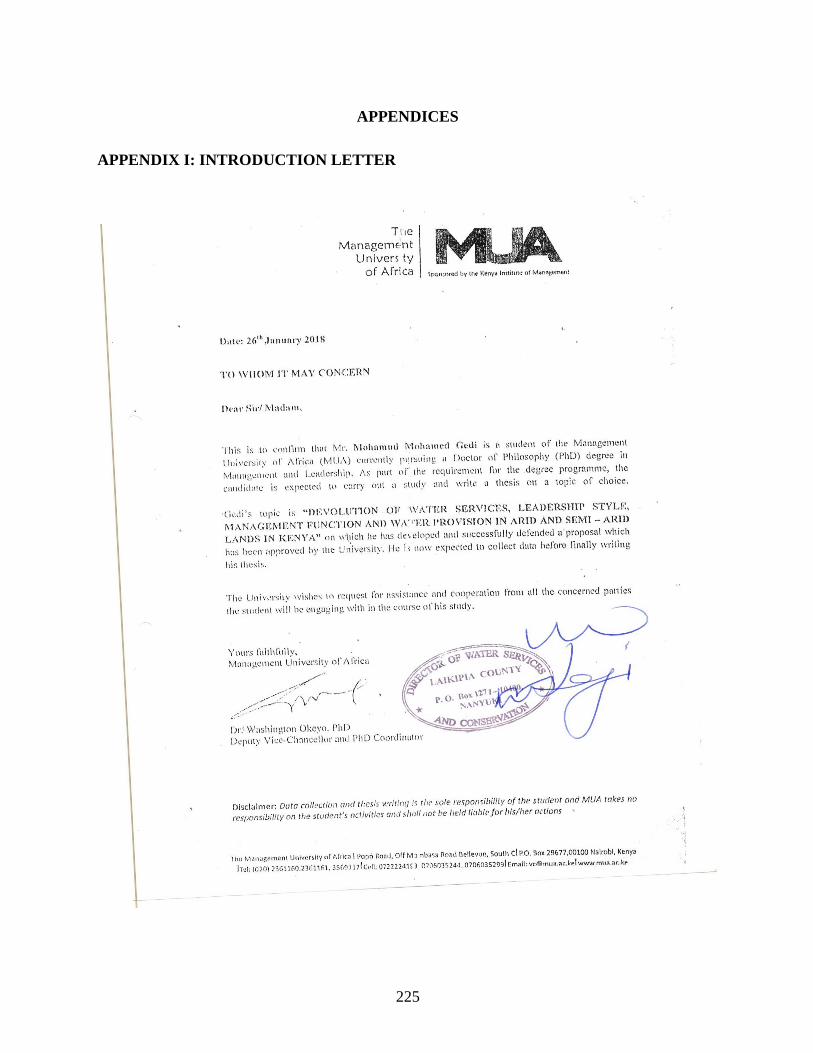
225
APPENDICES
APPENDIX I: INTRODUCTION LETTER

226
APPENDIX II: RESEARCH QUESTIONNAIRE
This questionnaire seeks to collect data to assist in conducting a study on ‘The Effect of
Administration of devolved water services on Water provision in ASAL.’ The data that you
provide herein will remain confidential and will be strictly for academic use. Please give honest
responses in every question.
Instructions
Do Not write your name anywhere on this questionnaire.
Where choices are given, kindly tick (√) inside the relevant box to indicate the correct answer.
Otherwise, write your answer in the spaces provided where there are no options given.
SUB-COUNTY BIO-DATA
i) Name of your County (Optional) ____________________
ii) Name of your Sub-County (Optional) ____________________
iii) How many wards are in this Sub-County? ______________________
iv)What is/are the main economic activity/activities in this Sub-County? (Tick all the applicable
options)
Crop Farming [ ] Zero grazing [ ]
Nomadic Pastoralism [ ] Fish Farming [ ] Any other (Specify)_________
SECTION A: BACKGROUND
1) Please indicate your gender by ticking the appropriate option
Male ( ) Female ( )
2) Kindly indicate your age bracket by ticking the appropriate option
25 years and below ( ) 26 to 35 years ( )
36 to 45 years ( ) 46 to 55 years ( ) Over 55 years ( )
3) What is your highest education level? (please tick the appropriate option)
University level ( ) College level ( ) A-Level ( )
Ordinary level ( ) Primary level ( ) Any other (Specify)…………….
4) When did you start working for the county leadership? (please tick the appropriate option)
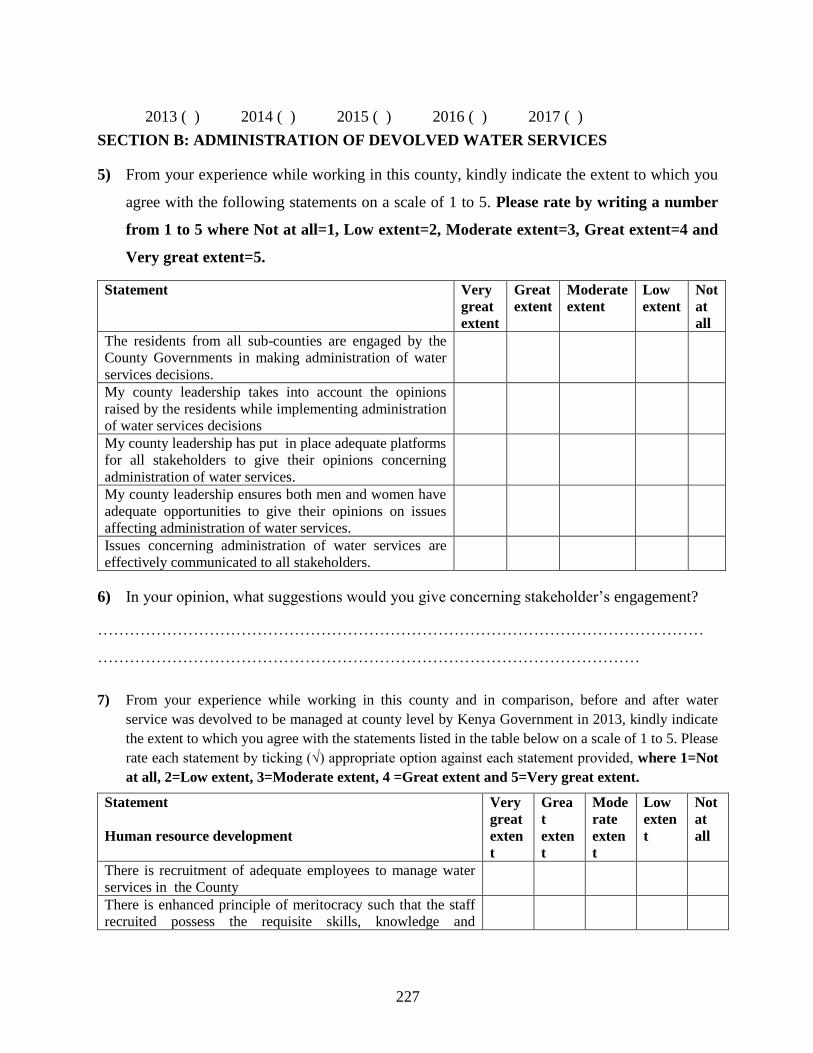
227
2013 ( ) 2014 ( ) 2015 ( ) 2016 ( ) 2017 ( )
SECTION B: ADMINISTRATION OF DEVOLVED WATER SERVICES
5) From your experience while working in this county, kindly indicate the extent to which you
agree with the following statements on a scale of 1 to 5. Please rate by writing a number
from 1 to 5 where Not at all=1, Low extent=2, Moderate extent=3, Great extent=4 and
Very great extent=5.
Statement Very
great
extent
Great
extent
Moderate
extent
Low
extent
Not
at
all
The residents from all sub-counties are engaged by the
County Governments in making administration of water
services decisions.
My county leadership takes into account the opinions
raised by the residents while implementing administration
of water services decisions
My county leadership has put in place adequate platforms
for all stakeholders to give their opinions concerning
administration of water services.
My county leadership ensures both men and women have
adequate opportunities to give their opinions on issues
affecting administration of water services.
Issues concerning administration of water services are
effectively communicated to all stakeholders.
6) In your opinion, what suggestions would you give concerning stakeholder’s engagement?
……………………………………………………………………………………………………
…………………………………………………………………………………………
7) From your experience while working in this county and in comparison, before and after water
service was devolved to be managed at county level by Kenya Government in 2013, kindly indicate
the extent to which you agree with the statements listed in the table below on a scale of 1 to 5. Please
rate each statement by ticking (√) appropriate option against each statement provided, where 1=Not
at all, 2=Low extent, 3=Moderate extent, 4 =Great extent and 5=Very great extent.
Statement
Human resource development
Very
great
exten
t
Grea
t
exten
t
Mode
rate
exten
t
Low
exten
t
Not
at
all
There is recruitment of adequate employees to manage water
services in the County
There is enhanced principle of meritocracy such that the staff
recruited possess the requisite skills, knowledge and

228
experiences to competently manage water services in county
There is enhanced level of staff commitment in their work
related to water services
There is enhanced the level of professionalism among water
service personnel
There is enhanced transparency and accountability in
procurement processes for water service providers
There is enhanced the level of integrity and prudence in
management of water service resources among county and
sub-county administrators
8) What recommendations would you give concerning human resource development in the county?
………………………………………………………………………………………………………………
………………………………………………………………………………………………………………
……………………
From your experience while working in this county and in comparison, before and after water service was
devolved to be managed at county level by Kenya Government in 2013, kindly indicate the extent to
which you agree with the statements listed in the table below on a scale of 1 to 5. Please rate each
statement by writing a number from 1 to 5 where 1=Not at all, 2=Low extent, 3=Moderate extent, 4
=Great extent and 5=Very great extent.
Statement
Application of Modern Technology
Very
great
extent
Great
extent
Moderate
extent
Low
extent
Not
at
all
There is enhancement of technologies in facilities such as
water tanks, storage dams/pans, drilled wells/boreholes
across the county
There is enhanced efforts on adopting various water
technologies which are well suited to the conditions of
administration of water services in the county
The technologies applied by county leadership in the various
areas of water service have worked better with devolved
government as opposed to earlier under the National
Government
As a result of devolution, water technologies applied by
county leadership have been widely supported by residents
in county
There is adoption of more superior water technologies in
the county
Administration of devolved water services in the county has
led to the development of modern technology adoption
framework under active participation of all stakeholders
9) In your opinion, what improvements are needed in application of modern technology on
administration of water services in the county?

229
………………………………………………………………………………………………………………
………………………………………………………………………………………………………………
……………………
SECTION C: TRANSFORMATIONAL LEADERSHIP
10) From your experience while working in this county and in comparison, before and after water
service was devolved to be managed at county level by Kenya Government in 2013, kindly indicate
the extent to which you agree with the statements listed in the table below on a scale of 1 to 5. Please
rate each statement by ticking (√) appropriate option against each statement provided, where 1=Not
at all, 2=Low extent, 3=Moderate extent, 4 =Great extent and 5=Very great extent.
Statement Very
great
extent
Great
extent
Mod
erate
exten
t
Low
extent
Not
at
all
a) County always leaders inspire and motivate their staff in
order to optimise productivity especially on Water
services
b) County leaders always challenge their staff to be creative
and generate lasting solutions when faced with
challenges on water provision
c) County leaders always intellectually stimulate their staff
in order to optimise productivity especially on Water
services
d) County leaders always ensure subordinates get
recognition and/or rewards when they achieve difficult or
complex goals
11) Suggest at least two improvements needed regarding transformative leadership qualities of the
County Executives especially on water provision?
………………………………………………………………………………………………………………
………………………………………………………………………………………………………………
……………………
SECTION D: PLANNING
12) From your experience while working in this county and in comparison, before and after water
service was devolved to be managed at county level by Kenya Government in 2013, kindly indicate
the extent to which you agree with the statements listed in the table below on a scale of 1 to 5. Please
rate each statement by ticking (√) appropriate option against each statement provided, where 1=Not
at all, 2=Low extent, 3=Moderate extent, 4 =Great extent and 5=Very great extent.

230
Statement Very
great
exten
t
Great
extent
Mode
rate
exten
t
Low
extent
Not
at
all
a) The county uses strategic plans and County Integrated
Development Plan (CIDP) to guide water provision in county
b) Devolution has led to appropriate structures being created to
efficiently and effectively offer water services
c) Devolution has enhanced appropriate allocation of resources in
the county budget towards water projects
d) Devolution has enabled optimal and on-time deliveries on water
projects
13) What improvements would you suggest concerning planning in the county especially on water
provision after devolution?
………………………………………………………………………………………………………………
………………………………………………………………………………………………………………
……
SECTION E: WATER PROVISION
14) Please indicate appropriate value against each aspect stated relating to water provision in the county
before and after devolution respectively.
Aspect Current Water Provision Statistics
Average distance in Kilometers covered
by a resident to access the nearest water
point
Average cost in Kenya Shillings incurred
by a resident to access a 20 litter jerican
of water
Quality of water accessed by residents
expressed as a percentage
Reliability of water access by residents
expressed as a percentage
231
Salinity of water accessible by the
residents expressed as a percentage
Frequency in water treatment expressed
as a percentage
Clarity of water used by the residents
expressed as a percentage
15) In your opinion, what suggestions/recommendations would you give to enhance water provision in
the County?
………………………………………………………………………………………………………………
………………………………………………………………………………………………………………
………………………………………………………………………………………………………………

232
APPENDIX III: LIST OF DEVOLVED UNITS IN ASAL
Arid Counties
Number of Arid
Sub-county Name of Arid Sub-County
Garissa 6
Dujis, Balambala, Lagdera, Dadaad, Fafi,
Ijara
Isiolo 2 Isiolo North, Isiolo South
Mandera 6
Mandera West, Banisa, Mandera North,
Mandera East, Mandera South, Lafey
Marsabit 4 Moyale, North Horr, Saku, Laisamis
Samburu 3
Samburu West, Samburu North, Samburu
East
Tana River 3 Bura, Galole, and Tana Delta
Turkana 6
Turkana North, Turkana West, Turkana
Central, Loima, Turkana South, Turkana East
Wajir 6
Wajir North, Wajir East, Tarbaj, Wajir West,
Eldas, Wajir Sout
SUB-TOTAL 36
Semi-Arid Counties
Number of Semi-
Arid Sub-county Name of Semi-Arid Sub-County
Baringo 6
Baringo East, Baringo West, Baringo Central,
Mochongoi, Mogotio, Eldama Ravine.
Embu 4 Manyatta, Runyejes, Gachoka, Siakago
Kilifi 7
Kilifi North, Kilifi South, Kaloleni, Rabai,
Ganze, Malindi, Magarini
Kwale 4 Msambweni, Lunga Lunga, Matuga, Kinango
Laikipia 3 Laikipia West, Laikipia East, Laikipia North
Lamu 2 Lamu East, Lamu West

233
Makueni 6
Mbooni, Kilome, Kaiti, Makueni, Kibwezi
West, Kibwezi East
Meru 9
Igembe South, Igembe Central, Igembe
North, Tigania West, Tigania East, North
Imenti, Mbuuri, Cenral Imenti, South Imenti
Narok 6
Kilgoris, Emurua Dikirr, Narok North,
Kajiado East, Kajiado West
Nyeri 6
Tetu, Kieni, Mathira, Othaya, Mukuwe-ini,
Nyeri Town
Taita Taveta 4 Taveta, Wundanyi, Mwatate, Voi
Tharaka Nithi 3 Nithi, Maara, Tharaka
Kitui 8
Mwingi North, Mwingi Central, Mwingi
South, Kitui West, Kitui Rural, Kitui Town,
Mutitu, Kitui South
Kajiado 5
Kajiado Central, Kajiado North, Kajiado
South
West Pokot 4 Kapenguri, Sigor, Kacheliba, Poko South
SUB-TOTAL 77
TOTAL
POPULATION 113

234
APPENDIX IV: RESEARCH AUTHORIZATION LETTER

235

236
APPENDIX V: RESEARCH AUTHORIZATION LETTER

237
APPENDIX VI: TABLE OF THE STUDENT'S T-DISTRIBUTION
The table gives the values of ;t where
Pr(T>t; ) = , with degrees of freedom
0.1 0.05 0.025 0.01 0.005 0.001 0.0005
1 3.078 6.314 12.076 31.821 63.657 318.310 636.620
2 1.886 2.920 4.303 6.965 9.925 22.326 31.598
3 1.638 2.353 3.182 4.541 5.841 10.213 12.924
4 1.533 2.132 2.776 3.747 4.604 7.173 8.610
5 1.476 2.015 2.571 3.365 4.032 5.893 6.869
6 1.440 1.943 2.447 3.143 3.707 5.208 5.959
7 1.415 1.895 2.365 2.998 3.499 4.785 5.408
8 1.397 1.860 2.306 2.896 3.355 4.501 5.041
9 1.383 1.833 2.262 2.821 3.250 4.297 4.781
10 1.372 1.812 2.228 2.764 3.169 4.144 4.587
11 1.363 1.796 2.201 2.718 3.106 4.025 4.437
12 1.356 1.782 2.179 2.681 3.055 3.930 4.318
13 1.350 1.771 2.160 2.650 3.012 3.852 4.221
14 1.345 1.761 2.145 2.624 2.977 3.787 4.140
15 1.341 1.753 2.131 2.602 2.947 3.733 4.073
16 1.337 1.746 2.120 2.583 2.921 3.686 4.015
17 1.333 1.740 2.110 2.567 2.898 3.646 3.965
18 1.330 1.734 2.101 2.552 2.878 3.610 3.922
19 1.328 1.729 2.093 2.539 2.861 3.579 3.883
20 1.325 1.725 2.086 2.528 2.845 3.552 3.850
;t

238
21 1.323 1.721 2.080 2.518 2.831 3.527 3.819
22 1.321 1.717 2.074 2.508 2.819 3.505 3.792
23 1.319 1.714 2.069 2.500 2.807 3.485 3.767
24 1.318 1.711 2.064 2.492 2.797 3.467 3.745
25 1.316 1.708 2.060 2.485 2.787 3.450 3.725
26 1.315 1.706 2.056 2.479 2.779 3.435 3.707
27 1.314 1.703 2.052 2.473 2.771 3.421 3.690
28 1.313 1.701 2.048 2.467 2.763 3.408 3.674
29 1.311 1.699 2.045 2.462 2.756 3.396 3.659
30 1.310 1.697 2.042 2.457 2.750 3.385 3.646
40 1.303 1.684 2.021 2.423 2.704 3.307 3.551
60 1.296 1.671 2.000 2.390 2.660 3.232 3.460
120 1.289 1.658 1.980 2.358 2.617 3.160 3.373
1.282 1.645 1.960 2.326 2.576 3.090 3.291

239
APPENDIX VII: F-DISTRIBUTION TABLE
df2\df1 1 2 3 4 5 6 7 8 10
1 161.448 199.500 215.707 224.583 230.162 233.986 236.768 238.883 241.882
2 18.513 19.000 19.164 19.247 19.296 19.330 19.353 19.371 19.396
3 10.128 9.552 9.277 9.117 9.013 8.941 8.887 8.845 8.786
4 7.709 6.944 6.591 6.388 6.256 6.163 6.094 6.041 5.964
5 6.608 5.786 5.409 5.192 5.050 4.950 4.876 4.818 4.735
6 5.987 5.143 4.757 4.534 4.387 4.284 4.207 4.147 4.060
7 5.591 4.737 4.347 4.120 3.972 3.866 3.787 3.726 3.637
8 5.318 4.459 4.066 3.838 3.687 3.581 3.500 3.438 3.347
9 5.117 4.256 3.863 3.633 3.482 3.374 3.293 3.230 3.137
10 4.965 4.103 3.708 3.478 3.326 3.217 3.135 3.072 2.978
11 4.844 3.982 3.587 3.357 3.204 3.095 3.012 2.948 2.854
12 4.747 3.885 3.490 3.259 3.106 2.996 2.913 2.849 2.753
13 4.667 3.806 3.411 3.179 3.025 2.915 2.832 2.767 2.671
14 4.600 3.739 3.344 3.112 2.958 2.848 2.764 2.699 2.602
15 4.543 3.682 3.287 3.056 2.901 2.790 2.707 2.641 2.544
16 4.494 3.634 3.239 3.007 2.852 2.741 2.657 2.591 2.494
17 4.451 3.592 3.197 2.965 2.810 2.699 2.614 2.548 2.450
18 4.414 3.555 3.160 2.928 2.773 2.661 2.577 2.510 2.412
19 4.381 3.522 3.127 2.895 2.740 2.628 2.544 2.477 2.378
20 4.351 3.493 3.098 2.866 2.711 2.599 2.514 2.447 2.348
21 4.325 3.467 3.072 2.840 2.685 2.573 2.488 2.420 2.321
22 4.301 3.443 3.049 2.817 2.661 2.549 2.464 2.397 2.297
23 4.279 3.422 3.028 2.796 2.640 2.528 2.442 2.375 2.275
24 4.260 3.403 3.009 2.776 2.621 2.508 2.423 2.355 2.255
25 4.242 3.385 2.991 2.759 2.603 2.490 2.405 2.337 2.236
26 4.225 3.369 2.975 2.743 2.587 2.474 2.388 2.321 2.220
27 4.210 3.354 2.960 2.728 2.572 2.459 2.373 2.305 2.204
28 4.196 3.340 2.947 2.714 2.558 2.445 2.359 2.291 2.190
29 4.183 3.328 2.934 2.701 2.545 2.432 2.346 2.278 2.177
30 4.171 3.316 2.922 2.690 2.534 2.421 2.334 2.266 2.165
35 4.121 3.267 2.874 2.641 2.485 2.372 2.285 2.217 2.114
40 4.085 3.232 2.839 2.606 2.449 2.336 2.249 2.180 2.077
45 4.057 3.204 2.812 2.579 2.422 2.308 2.221 2.152 2.049
50 4.034 3.183 2.790 2.557 2.400 2.286 2.199 2.130 2.026
55 4.016 3.165 2.773 2.540 2.383 2.269 2.181 2.112 2.008
60 4.001 3.150 2.758 2.525 2.368 2.254 2.167 2.097 1.993
70 3.978 3.128 2.736 2.503 2.346 2.231 2.143 2.074 1.969
80 3.960 3.111 2.719 2.486 2.329 2.214 2.126 2.056 1.951
90 3.947 3.098 2.706 2.473 2.316 2.201 2.113 2.043 1.938
100 3.936 3.087 2.696 2.463 2.305 2.191 2.103 2.032 1.927
110 3.927 3.079 2.687 2.454 2.297 2.182 2.094 2.024 1.918
120 3.920 3.072 2.680 2.447 2.290 2.175 2.087 2.016 1.910
130 3.914 3.066 2.674 2.441 2.284 2.169 2.081 2.010 1.904
140 3.909 3.061 2.669 2.436 2.279 2.164 2.076 2.005 1.899
150 3.904 3.056 2.665 2.432 2.274 2.160 2.071 2.001 1.894
160 3.900 3.053 2.661 2.428 2.271 2.156 2.067 1.997 1.890
180 3.894 3.046 2.655 2.422 2.264 2.149 2.061 1.990 1.884
200 3.888 3.041 2.650 2.417 2.259 2.144 2.056 1.985 1.878
220 3.884 3.037 2.646 2.413 2.255 2.140 2.051 1.981 1.874
240 3.880 3.033 2.642 2.409 2.252 2.136 2.048 1.977 1.870
260 3.877 3.031 2.639 2.406 2.249 2.134 2.045 1.974 1.867
280 3.875 3.028 2.637 2.404 2.246 2.131 2.042 1.972 1.865
300 3.873 3.026 2.635 2.402 2.244 2.129 2.040 1.969 1.862
400 3.865 3.018 2.627 2.394 2.237 2.121 2.032 1.962 1.854
500 3.860 3.014 2.623 2.390 2.232 2.117 2.028 1.957 1.850
600 3.857 3.011 2.620 2.387 2.229 2.114 2.025 1.954 1.846
700 3.855 3.009 2.618 2.385 2.227 2.112 2.023 1.952 1.844
800 3.853 3.007 2.616 2.383 2.225 2.110 2.021 1.950 1.843
900 3.852 3.006 2.615 2.382 2.224 2.109 2.020 1.949 1.841
1000 3.851 3.005 2.614 2.381 2.223 2.108 2.019 1.948 1.840
∞ 3.841 2.996 2.605 2.372 2.214 2.099 2.010 1.938 1.831
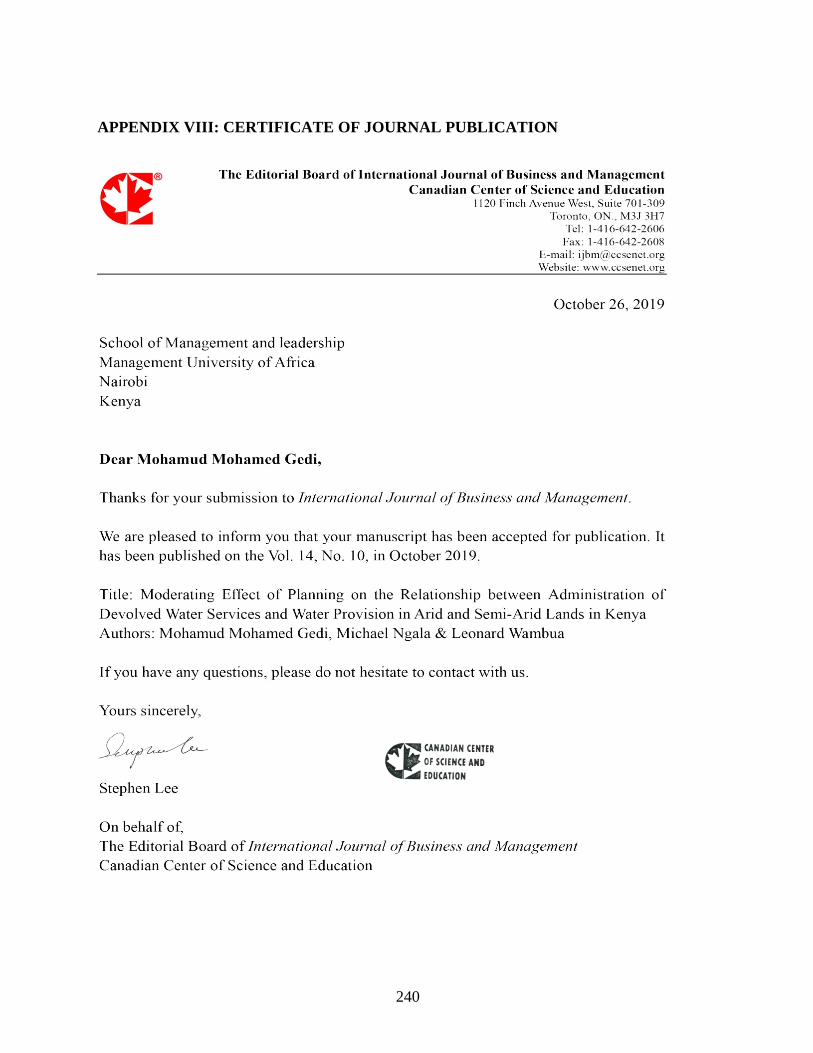
240
APPENDIX VIII: CERTIFICATE OF JOURNAL PUBLICATION

241
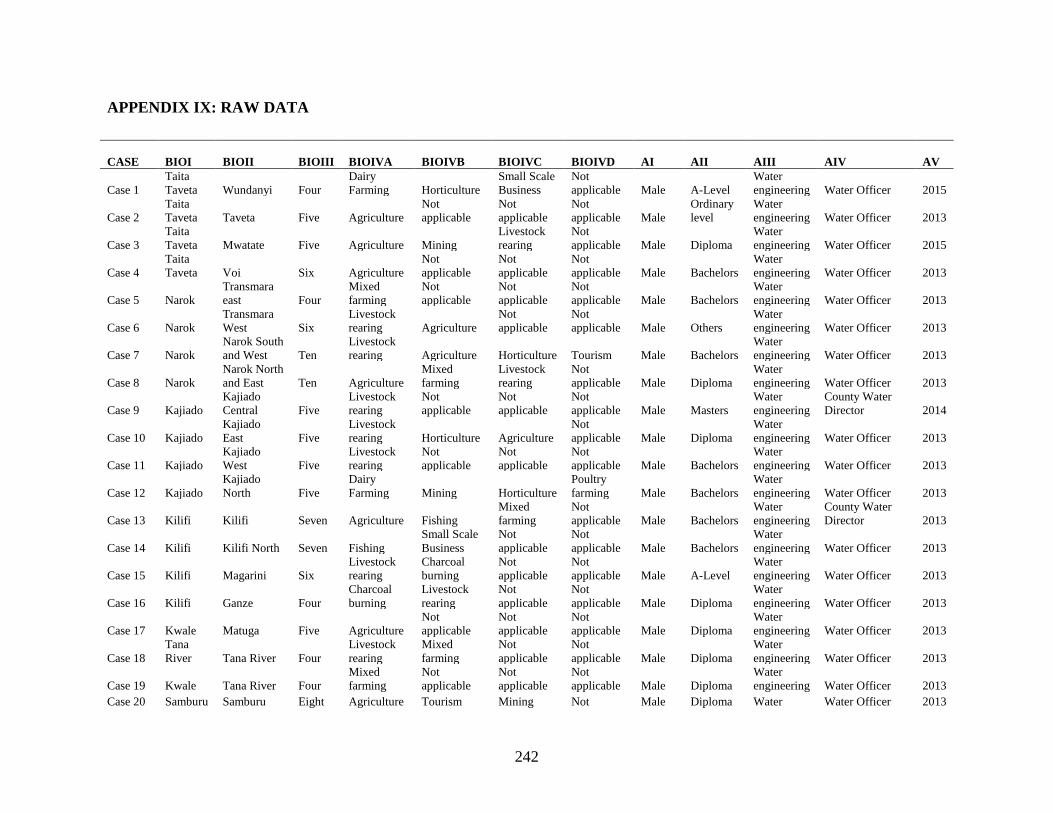
242
APPENDIX IX: RAW DATA
CASE BIOI BIOII BIOIII BIOIVA BIOIVB BIOIVC BIOIVD AI AII AIII AIV AV
Case 1
Taita
Taveta Wundanyi Four
Dairy
Farming Horticulture
Small Scale
Business
Not
applicable Male A-Level
Water
engineering Water Officer 2015
Case 2
Taita
Taveta Taveta Five Agriculture
Not
applicable
Not
applicable
Not
applicable Male
Ordinary
level
Water
engineering Water Officer 2013
Case 3
Taita
Taveta Mwatate Five Agriculture Mining
Livestock
rearing
Not
applicable Male Diploma
Water
engineering Water Officer 2015
Case 4
Taita
Taveta Voi Six Agriculture
Not
applicable
Not
applicable
Not
applicable Male Bachelors
Water
engineering Water Officer 2013
Case 5 Narok
Transmara
east Four
Mixed
farming
Not
applicable
Not
applicable
Not
applicable Male Bachelors
Water
engineering Water Officer 2013
Case 6 Narok
Transmara
West Six
Livestock
rearing Agriculture
Not
applicable
Not
applicable Male Others
Water
engineering Water Officer 2013
Case 7 Narok
Narok South
and West Ten
Livestock
rearing Agriculture Horticulture Tourism Male Bachelors
Water
engineering Water Officer 2013
Case 8 Narok
Narok North
and East Ten Agriculture
Mixed
farming
Livestock
rearing
Not
applicable Male Diploma
Water
engineering Water Officer 2013
Case 9 Kajiado
Kajiado
Central Five
Livestock
rearing
Not
applicable
Not
applicable
Not
applicable Male Masters
Water
engineering
County Water
Director 2014
Case 10 Kajiado
Kajiado
East Five
Livestock
rearing Horticulture Agriculture
Not
applicable Male Diploma
Water
engineering Water Officer 2013
Case 11 Kajiado
Kajiado
West Five
Livestock
rearing
Not
applicable
Not
applicable
Not
applicable Male Bachelors
Water
engineering Water Officer 2013
Case 12 Kajiado
Kajiado
North Five
Dairy
Farming Mining Horticulture
Poultry
farming Male Bachelors
Water
engineering Water Officer 2013
Case 13 Kilifi Kilifi Seven Agriculture Fishing
Mixed
farming
Not
applicable Male Bachelors
Water
engineering
County Water
Director 2013
Case 14 Kilifi Kilifi North Seven Fishing
Small Scale
Business
Not
applicable
Not
applicable Male Bachelors
Water
engineering Water Officer 2013
Case 15 Kilifi Magarini Six
Livestock
rearing
Charcoal
burning
Not
applicable
Not
applicable Male A-Level
Water
engineering Water Officer 2013
Case 16 Kilifi Ganze Four
Charcoal
burning
Livestock
rearing
Not
applicable
Not
applicable Male Diploma
Water
engineering Water Officer 2013
Case 17 Kwale Matuga Five Agriculture
Not
applicable
Not
applicable
Not
applicable Male Diploma
Water
engineering Water Officer 2013
Case 18
Tana
River Tana River Four
Livestock
rearing
Mixed
farming
Not
applicable
Not
applicable Male Diploma
Water
engineering Water Officer 2013
Case 19 Kwale Tana River Four
Mixed
farming
Not
applicable
Not
applicable
Not
applicable Male Diploma
Water
engineering Water Officer 2013
Case 20 Samburu Samburu Eight Agriculture Tourism Mining Not Male Diploma Water Water Officer 2013

243
CASE BIOI BIOII BIOIII BIOIVA BIOIVB BIOIVC BIOIVD AI AII AIII AIV AV
East applicable engineering
Case 21 Nyeri
Nyeri
Central Six Agriculture
Small Scale
Business
Not
applicable
Not
applicable Male Bachelors
Water
engineering Water Officer 2013
Case 22 Nyeri Tetu Three Agriculture
Not
applicable
Not
applicable
Not
applicable Male Bachelors
Water
engineering Water Officer 2013
Case 23 Nyeri Kieni Eight Agriculture
Not
applicable
Not
applicable
Not
applicable Male Bachelors
Water
engineering Water Officer 2013
Case 24 Nyeri Kieni Eight Agriculture
Small Scale
Business
Not
applicable
Not
applicable Male Masters
Water
engineering Water Officer 2017
Case 25 Samburu
Samburu
Central Six
Livestock
rearing Agriculture Tourism Mining Male Bachelors
Water
engineering Water Officer 2013
Case 26 Laikipia Nanyuki Three Agriculture
Not
applicable
Not
applicable
Not
applicable Male Bachelors
Water
engineering Water Officer 2013
Case 27 Laikipia Nyahururu Five Agriculture
Small Scale
Business
Not
applicable
Not
applicable Male Bachelors
Water
engineering Water Officer 2013
Case 28 Laikipia
Laikipia
East Five Agriculture
Not
applicable
Not
applicable
Not
applicable Male Bachelors
Water
engineering Water Officer 2013
Case 29 Nyeri Nyeri South Four Agriculture
Not
applicable
Not
applicable
Not
applicable Male Bachelors
Water
engineering Water Officer 2013
Case 30 Turkana Loima Four
Livestock
rearing
Small Scale
Business Agriculture
Not
applicable Male Diploma
Water
engineering Water Officer 2013
Case 31
West
Pokot Kapenguria Four
Mixed
farming
Not
applicable
Not
applicable
Not
applicable Male Bachelors
Water
engineering Water Officer 2013
Case 32 Turkana
Turkana
West Seven
Livestock
rearing
Small Scale
Business
Not
applicable
Not
applicable Male Bachelors
Water
engineering Water Officer 2013
Case 33
West
Pokot Pokot South Four
Dairy
Farming Agriculture
Not
applicable
Not
applicable Male Bachelors
Water
engineering Water Officer 2013
Case 34
West
Pokot West Pokot Six Agriculture
Dairy
Farming
Not
applicable
Not
applicable Male Diploma
Water
engineering Water Officer 2013
Case 35
West
Pokot
Pokot
Central Four Agriculture Mining
Not
applicable
Not
applicable Male
Odinary
level
Water
engineering Water Officer 2013
Case 36
West
Pokot North Pokot Six
Livestock
rearing
Not
applicable
Not
applicable
Not
applicable Male
Odinary
level
Water
engineering Water Officer 2013
Case 37 Kitui Kitui West Four Agriculture
Not
applicable
Not
applicable
Not
applicable Male Diploma
Water
engineering Water Officer 2014
Case 38 Baringo
Baringo
Central Five
Mixed
farming
Not
applicable
Not
applicable
Not
applicable Male
Post
Graduate
Diploma
Water
engineering Water Officer 2013
Case 39 Baringo
Baringo
North Five
Mixed
farming
Not
applicable
Not
applicable
Not
applicable Male Diploma
Water
engineering Water Officer 2013
Case 40 Makueni
Kibwezi
East Four
Mixed
farming
Small Scale
Business
Not
applicable
Not
applicable Male A-Level
Water
engineering Water Officer 2013
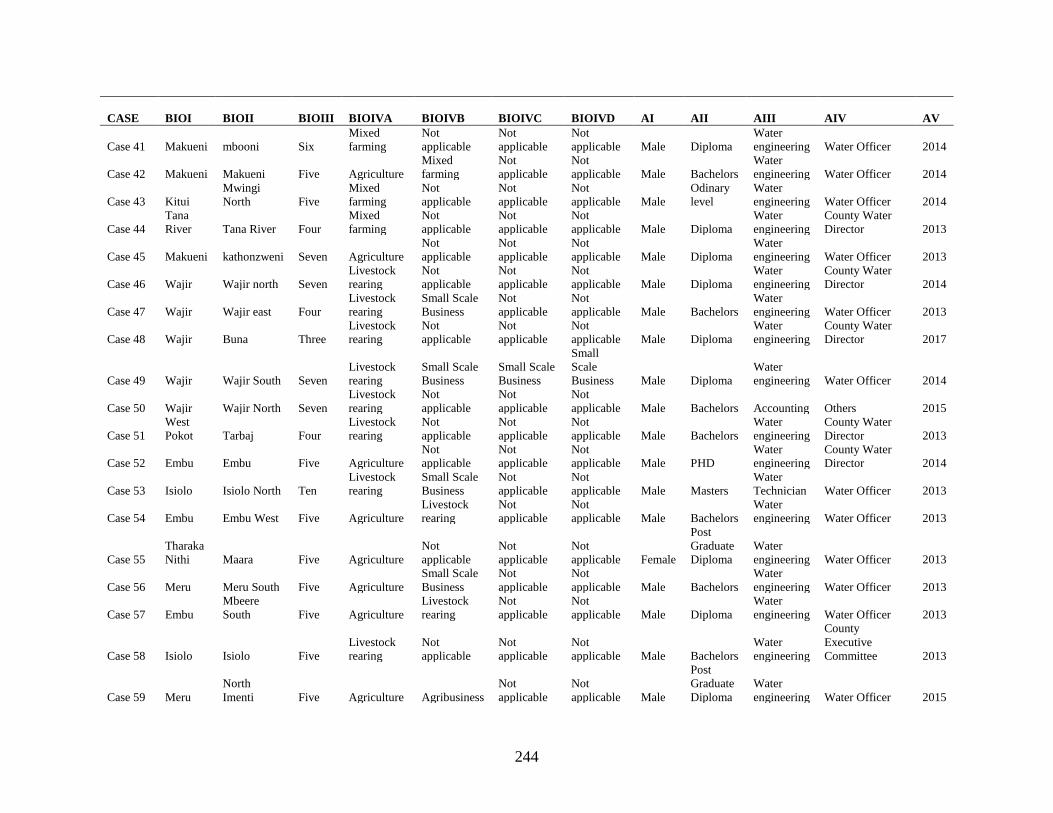
244
CASE BIOI BIOII BIOIII BIOIVA BIOIVB BIOIVC BIOIVD AI AII AIII AIV AV
Case 41 Makueni mbooni Six
Mixed
farming
Not
applicable
Not
applicable
Not
applicable Male Diploma
Water
engineering Water Officer 2014
Case 42 Makueni Makueni Five Agriculture
Mixed
farming
Not
applicable
Not
applicable Male Bachelors
Water
engineering Water Officer 2014
Case 43 Kitui
Mwingi
North Five
Mixed
farming
Not
applicable
Not
applicable
Not
applicable Male
Odinary
level
Water
engineering Water Officer 2014
Case 44
Tana
River Tana River Four
Mixed
farming
Not
applicable
Not
applicable
Not
applicable Male Diploma
Water
engineering
County Water
Director 2013
Case 45 Makueni kathonzweni Seven Agriculture
Not
applicable
Not
applicable
Not
applicable Male Diploma
Water
engineering Water Officer 2013
Case 46 Wajir Wajir north Seven
Livestock
rearing
Not
applicable
Not
applicable
Not
applicable Male Diploma
Water
engineering
County Water
Director 2014
Case 47 Wajir Wajir east Four
Livestock
rearing
Small Scale
Business
Not
applicable
Not
applicable Male Bachelors
Water
engineering Water Officer 2013
Case 48 Wajir Buna Three
Livestock
rearing
Not
applicable
Not
applicable
Not
applicable Male Diploma
Water
engineering
County Water
Director 2017
Case 49 Wajir Wajir South Seven
Livestock
rearing
Small Scale
Business
Small Scale
Business
Small
Scale
Business Male Diploma
Water
engineering Water Officer 2014
Case 50 Wajir Wajir North Seven
Livestock
rearing
Not
applicable
Not
applicable
Not
applicable Male Bachelors Accounting Others 2015
Case 51
West
Pokot Tarbaj Four
Livestock
rearing
Not
applicable
Not
applicable
Not
applicable Male Bachelors
Water
engineering
County Water
Director 2013
Case 52 Embu Embu Five Agriculture
Not
applicable
Not
applicable
Not
applicable Male PHD
Water
engineering
County Water
Director 2014
Case 53 Isiolo Isiolo North Ten
Livestock
rearing
Small Scale
Business
Not
applicable
Not
applicable Male Masters
Water
Technician Water Officer 2013
Case 54 Embu Embu West Five Agriculture
Livestock
rearing
Not
applicable
Not
applicable Male Bachelors
Water
engineering Water Officer 2013
Case 55
Tharaka
Nithi Maara Five Agriculture
Not
applicable
Not
applicable
Not
applicable Female
Post
Graduate
Diploma
Water
engineering Water Officer 2013
Case 56 Meru Meru South Five Agriculture
Small Scale
Business
Not
applicable
Not
applicable Male Bachelors
Water
engineering Water Officer 2013
Case 57 Embu
Mbeere
South Five Agriculture
Livestock
rearing
Not
applicable
Not
applicable Male Diploma
Water
engineering Water Officer 2013
Case 58 Isiolo Isiolo Five
Livestock
rearing
Not
applicable
Not
applicable
Not
applicable Male Bachelors
Water
engineering
County
Executive
Committee 2013
Case 59 Meru
North
Imenti Five Agriculture Agribusiness
Not
applicable
Not
applicable Male
Post
Graduate
Diploma
Water
engineering Water Officer 2015

245
CASE BIOI BIOII BIOIII BIOIVA BIOIVB BIOIVC BIOIVD AI AII AIII AIV AV
Case 60 Meru
Igembe
North Five Agriculture
Small Scale
Business
Livestock
rearing
Miraa
trade Male
Post
Graduate
Diploma
Water
engineering Water Officer 2013
Case 61 Meru Buuri Five Horticulture
Mixed
farming
Not
applicable
Not
applicable Male Bachelors
Water
engineering Water Officer 2015
Case 62 Meru
Igembe
South Five Miraa trade
Small Scale
Business
Livestock
rearing Agriculture Male
Post
Graduate
Diploma
Water
engineering Water Officer 2013
Case 63 Meru
Imenti
Central Four Agriculture
Small Scale
Business Mining
Livestock
rearing Male Bachelors
Water
engineering Water Officer 2013
Case 64 Meru Tigania East Five Agriculture
Small Scale
Business
Not
applicable
Not
applicable Male
Post
Graduate
Diploma
Water
engineering Water Officer 2013
Case 65 Meru Iment North Five Agriculture
Small Scale
Business
Not
applicable
Not
applicable Male Diploma
Water
engineering Water Officer 2013
Case 66 Wajir Wajir Five
Livestock
rearing
Small Scale
Business
Not
applicable
Not
applicable Male Masters Finance
County
Executive
Committee 2013
Case 67 Garisa Mbalambala Five
Livestock
rearing Pastrolism
Not
applicable
Not
applicable Male Bachelors
Water
engineering Others 2013
Case 68 Garisa Lagdera Five
Livestock
rearing Pastrolism
Not
applicable
Not
applicable Male Bachelors
Water
engineering Water Officer 2013
Case 69 Garisa Fafi Five
Livestock
rearing Pastrolism
Not
applicable
Not
applicable Male Diploma
Water
engineering Water Officer 2013
Case 70 Garisa Dadaab Six
Livestock
rearing Pastrolism
Not
applicable
Not
applicable Male Diploma
Water
engineering Water Officer 2016
Case 71 Garisa Township Six
Small Scale
Business Irrigation
Not
applicable
Not
applicable Male Diploma
Water
engineering Water Officer 2013
Case 72 Makueni
Kibwezi
West Five
Small Scale
Business Agriculture
Not
applicable
Not
applicable Male Diploma
Water
engineering Water Officer 2013
Case 73
Tana
River Tana Delta Six Agriculture
Livestock
rearing
Not
applicable
Not
applicable Male Diploma
Water
engineering Water Officer 2013
Case 74
Tana
River Tana North Five Mining Agriculture
Livestock
rearing
Charcoal
burning Male Diploma
Water
engineering Water Officer 2013

246
CASE B6I B6II B6III B6IV B6V B6VI
Stakeholders
engagement B8I B8II B8III
Case 1 Great Extent Low extent Great Extent Moderate extent Great Extent Moderate extent 10.12
Moderate
extent
Moderate
extent Great Extent
Case 2
Very great
extent Low extent
Very great
extent Low extent Low extent Moderate extent 9.44 Low extent
Moderate
extent Low extent
Case 3 Great Extent Not at all
Moderate
extent Not at all Great Extent Moderate extent 6.8 Great Extent Great Extent
Moderate
extent
Case 4 Great Extent Not at all Great Extent Great Extent
Very great
extent Moderate extent 11.04 Great Extent Great Extent
Very great
extent
Case 5
Moderate
extent
Moderate
extent
Moderate
extent Moderate extent
Moderate
extent Moderate extent 8.29 Low extent Low extent
Moderate
extent
Case 6
Moderate
extent
Moderate
extent
Moderate
extent Moderate extent Great Extent Low extent 8.26 Low extent Low extent Low extent
Case 7 Low extent Low extent Low extent Moderate extent Low extent Not at all 3.5 Low extent Not at all Not at all
Case 8 Low extent Low extent Low extent Moderate extent Low extent Not at all 3.5 Low extent Not at all Not at all
Case 9
Very great
extent
Very great
extent Great Extent Great Extent Great Extent Moderate extent 13.99
Moderate
extent
Moderate
extent
Moderate
extent
Case 10
Very great
extent Great Extent
Very great
extent Very great extent
Very great
extent
Very great
extent 17.82 Great Extent Great Extent Great Extent
Case 11 Great Extent Not at all Low extent Not at all Low extent Moderate extent 4.24 Not at all Not at all Not at all
Case 12 Great Extent Not at all
Very great
extent Moderate extent
Very great
extent Not at all 9.57 Not at all
Moderate
extent
Moderate
extent
Case 13 Great Extent
Moderate
extent Great Extent Moderate extent Great Extent Great Extent 11.74
Moderate
extent Great Extent Great Extent
Case 14 Great Extent
Moderate
extent Great Extent Moderate extent Great Extent Great Extent 11.74
Moderate
extent Great Extent Great Extent
Case 15
Moderate
extent
Moderate
extent
Moderate
extent Moderate extent
Moderate
extent Moderate extent 8.29 Low extent Low extent Low extent
Case 16
Moderate
extent
Moderate
extent
Moderate
extent Moderate extent
Moderate
extent Moderate extent 8.29 Low extent Low extent Low extent
Case 17 Great Extent Great Extent
Very great
extent Very great extent
Very great
extent Great Extent 15.85 Great Extent Great Extent
Very great
extent
Case 18 Great Extent Not at all Great Extent Very great extent
Very great
extent Great Extent 12.77
Very great
extent
Moderate
extent Low extent
Case 19 Great Extent Not at all Low extent Low extent
Moderate
extent Moderate extent 6.09 Low extent Not at all Not at all
Case 20
Very great
extent
Moderate
extent Great Extent Moderate extent
Moderate
extent Great Extent 11.94 Low extent
Moderate
extent Great Extent
Case 21 Great Extent
Moderate
extent
Very great
extent Moderate extent Great Extent Moderate extent 11.7 Low extent Low extent
Moderate
extent
Case 22 Moderate Not at all Great Extent Great Extent Moderate Moderate extent 8.39 Not at all Moderate Moderate

247
CASE B6I B6II B6III B6IV B6V B6VI
Stakeholders
engagement B8I B8II B8III
extent extent extent extent
Case 23
Very great
extent Not at all
Very great
extent Moderate extent Great Extent Moderate extent 11.32 Not at all Not at all
Moderate
extent
Case 24 Great Extent Low extent Great Extent Moderate extent Great Extent Great Extent 11.1
Moderate
extent Low extent
Moderate
extent
Case 25
Very great
extent
Very great
extent Great Extent Great Extent
Very great
extent Great Extent 15.92 Low extent
Moderate
extent
Very great
extent
Case 26 Great Extent Great Extent Great Extent Great Extent Great Extent Great Extent 13.22 Not at all Great Extent Great Extent
Case 27
Moderate
extent
Moderate
extent Great Extent Great Extent
Moderate
extent Moderate extent 9.82 Not at all Not at all
Moderate
extent
Case 28 Great Extent Great Extent Great Extent Moderate extent
Moderate
extent Moderate extent 10.62 Not at all Not at all
Moderate
extent
Case 29 Great Extent Not at all
Moderate
extent Great Extent Great Extent Great Extent 10.31
Moderate
extent
Moderate
extent Low extent
Case 30
Very great
extent Great Extent
Very great
extent Very great extent Great Extent Great Extent 15.96 Great Extent Great Extent
Very great
extent
Case 31 Great Extent
Moderate
extent Great Extent Great Extent Great Extent Great Extent 12.5
Moderate
extent Low extent
Moderate
extent
Case 32
Moderate
extent
Moderate
extent
Moderate
extent Moderate extent
Moderate
extent Moderate extent 8.29 Great Extent Low extent Low extent
Case 33
Moderate
extent Not at all Low extent Low extent
Moderate
extent Moderate extent 5.24 Great Extent Low extent
Moderate
extent
Case 34 Great Extent Not at all Low extent Low extent
Moderate
extent Moderate extent 6.09
Moderate
extent Low extent
Moderate
extent
Case 35 Great Extent
Moderate
extent Great Extent Very great extent
Very great
extent
Very great
extent 15.12 Great Extent Low extent Great Extent
Case 36
Moderate
extent Not at all Low extent Low extent
Moderate
extent Low extent 4.35 Great Extent Low extent
Moderate
extent
Case 37
Moderate
extent Great Extent Great Extent Low extent
Moderate
extent Low extent 8.02 Low extent
Moderate
extent Great Extent
Case 38
Very great
extent Great Extent
Very great
extent Very great extent
Very great
extent Moderate extent 15.93
Moderate
extent
Moderate
extent
Moderate
extent
Case 39
Moderate
extent Low extent
Moderate
extent Low extent
Moderate
extent Moderate extent 6.79 Low extent Low extent
Moderate
extent
Case 40
Very great
extent
Very great
extent
Very great
extent Very great extent
Very great
extent Not at all 14.98 Not at all Great Extent Great Extent
Case 41
Very great
extent Low extent
Very great
extent Moderate extent Great Extent Not at all 10.47 Not at all Not at all Great Extent
Case 42 Great Extent Not at all Great Extent Moderate extent Great Extent Moderate extent 9.33 Low extent
Moderate
extent
Moderate
extent
Case 43 Great Extent Not at all
Very great
extent Very great extent Great Extent
Very great
extent 13.67
Moderate
extent
Very great
extent
Very great
extent

248
CASE B6I B6II B6III B6IV B6V B6VI
Stakeholders
engagement B8I B8II B8III
Case 44 Low extent Not at all Not at all Low extent Low extent Low extent 1.65 Low extent
Moderate
extent Low extent
Case 45
Very great
extent
Very great
extent
Very great
extent Very great extent
Very great
extent
Very great
extent 18.52
Very great
extent
Moderate
extent Great Extent
Case 46 Low extent
Moderate
extent Low extent Not at all Low extent Not at all 2.38 Low extent Low extent Not at all
Case 47 Great Extent Not at all
Moderate
extent Moderate extent
Moderate
extent Low extent 6.82 Low extent Low extent
Moderate
extent
Case 48 Low extent Low extent Low extent Great Extent Great Extent Low extent 6.82 Great Extent Great Extent Great Extent
Case 49
Moderate
extent Low extent
Moderate
extent Low extent Great Extent Moderate extent 7.64
Moderate
extent Great Extent
Moderate
extent
Case 50 Great Extent
Moderate
extent
Moderate
extent Great Extent
Moderate
extent Moderate extent 9.9
Moderate
extent Great Extent Great Extent
Case 51
Moderate
extent Low extent Low extent Low extent Low extent Not at all 3.44 Low extent Low extent Low extent
Case 52
Moderate
extent Not at all
Moderate
extent Moderate extent
Moderate
extent Moderate extent 6.86 Low extent
Moderate
extent
Moderate
extent
Case 53 Great Extent Not at all
Moderate
extent Low extent
Moderate
extent Low extent 5.95 Not at all Not at all Low extent
Case 54 Low extent Not at all Not at all Low extent Low extent Low extent 1.65 Not at all Not at all Low extent
Case 55 Great Extent Low extent Great Extent Moderate extent Great Extent Low extent 9.23 Low extent
Moderate
extent
Moderate
extent
Case 56 Low extent Low extent Low extent Not at all Low extent Low extent 2.49 Low extent Not at all Not at all
Case 57 Low extent Not at all Not at all Low extent Low extent Low extent 1.65 Not at all Not at all Low extent
Case 58
Very great
extent Great Extent Great Extent Great Extent
Very great
extent Great Extent 15.23
Moderate
extent Great Extent Great Extent
Case 59 Great Extent Low extent
Moderate
extent Moderate extent
Moderate
extent Moderate extent 8.5 Great Extent
Moderate
extent
Moderate
extent
Case 60 Great Extent
Moderate
extent
Moderate
extent Moderate extent
Moderate
extent Moderate extent 9.14
Moderate
extent Great Extent
Moderate
extent
Case 61 Great Extent
Moderate
extent Great Extent Low extent Low extent Moderate extent 8.09
Moderate
extent
Moderate
extent Low extent
Case 62 Great Extent
Moderate
extent Great Extent Moderate extent
Moderate
extent Moderate extent 9.9
Moderate
extent
Moderate
extent Low extent
Case 63
Moderate
extent
Very great
extent
Moderate
extent Moderate extent
Moderate
extent Great Extent 10.68 Great Extent Low extent
Moderate
extent
Case 64 Great Extent
Moderate
extent
Moderate
extent Moderate extent Great Extent Moderate extent 10 Great Extent
Very great
extent
Very great
extent
Case 65 Low extent Low extent Low extent Not at all Low extent Low extent 2.49 Low extent Not at all Not at all
Case 66 Great Extent Great Extent
Moderate
extent Moderate extent Great Extent Moderate extent 10.71 Great Extent
Moderate
extent
Moderate
extent

249
CASE B6I B6II B6III B6IV B6V B6VI
Stakeholders
engagement B8I B8II B8III
Case 67
Moderate
extent
Moderate
extent Great Extent Great Extent Great Extent Great Extent 11.66
Moderate
extent Low extent
Moderate
extent
Case 68
Moderate
extent Low extent Low extent Moderate extent
Moderate
extent Moderate extent 6.89
Moderate
extent
Moderate
extent
Moderate
extent
Case 69 Low extent Not at all Low extent Low extent Low extent Moderate extent 3.48
Moderate
extent
Moderate
extent
Moderate
extent
Case 70 Great Extent Not at all
Moderate
extent Great Extent Great Extent Great Extent 10.31
Moderate
extent
Moderate
extent
Moderate
extent
Case 71 Low extent
Moderate
extent Great Extent Low extent Low extent Moderate extent 6.44 Low extent Not at all Low extent
Case 72
Very great
extent
Moderate
extent
Very great
extent Very great extent
Moderate
extent Low extent 12.52 Not at all Not at all Low extent
Case 73
Very great
extent
Moderate
extent
Moderate
extent Very great extent Great Extent Moderate extent 12.56 Low extent Low extent
Moderate
extent
Case 74 Low extent Not at all Great Extent Great Extent
Moderate
extent Not at all 5.94 Low extent Low extent
Moderate
extent
CASE B8IV B8V B8VI
Human
Capital B10I B10II B10III B10IV B10V B10VI
Application
of Modern
Technology
ADMINISTRATION
OF DEVOLVED
WATER SERVICES
Case 1
Moderate
extent
Moderate
extent
Great
Extent 12.03
Great
Extent
Moderate
extent
Moderate
extent
Moderate
extent
Moderate
extent
Moderate
extent 10.11 32.255
Case 2
Moderate
extent
Moderate
extent
Great
Extent 9.48
Very great
extent Low extent Not at all
Low
extent
Low
extent
Low
extent 6.61 25.536
Case 3 Low extent
Moderate
extent
Great
Extent 12.03
Moderate
extent
Moderate
extent
Moderate
extent
Great
Extent Not at all
Moderate
extent 8.49 27.321
Case 4
Great
Extent
Great
Extent
Very
great
extent 17.14
Very great
extent
Great
Extent
Great
Extent
Great
Extent
Great
Extent
Great
Extent 15.07 43.255
Case 5
Moderate
extent
Moderate
extent
Moderate
extent 8.77
Moderate
extent
Moderate
extent
Moderate
extent
Moderate
extent
Great
Extent
Great
Extent 10.84 27.909
Case 6 Low extent Not at all Not at all 3.42 Low extent Not at all Not at all Not at all Not at all Not at all 0.64 12.324
Case 7 Not at all
Low
extent
Low
extent 2.98 Not at all Low extent Not at all Not at all Not at all Not at all 0.81 7.289
Case 8 Not at all
Low
extent
Low
extent 2.98 Not at all Low extent Not at all Not at all Not at all Not at all 0.81 7.289
Case 9
Great
Extent
Moderate
extent
Great
Extent 12
Very great
extent
Very great
extent
Very
great
Very
great
Very
great
Very
great 19.37 45.355

250
CASE B8IV B8V B8VI
Human
Capital B10I B10II B10III B10IV B10V B10VI
Application
of Modern
Technology
ADMINISTRATION
OF DEVOLVED
WATER SERVICES
extent extent extent extent
Case 10
Very great
extent
Very
great
extent
Very
great
extent 18.3
Great
Extent
Very great
extent
Great
Extent
Moderate
extent
Moderate
extent
Moderate
extent 12.93 49.058
Case 11 Not at all Not at all Not at all 0 Not at all Low extent Not at all
Low
extent Not at all
Low
extent 2.63 6.87
Case 12 Low extent
Moderate
extent
Great
Extent 8.67
Great
Extent
Moderate
extent
Moderate
extent
Very
great
extent
Moderate
extent Not at all 9.74 27.976
Case 13
Great
Extent
Moderate
extent
Moderate
extent 12.87
Moderate
extent Low extent Not at all
Low
extent Not at all
Low
extent 3.97 28.582
Case 14
Great
Extent
Moderate
extent
Moderate
extent 12.87
Moderate
extent Low extent Not at all
Low
extent Not at all
Low
extent 3.97 28.582
Case 15 Low extent
Low
extent
Moderate
extent 6.35
Moderate
extent
Moderate
extent
Low
extent
Moderate
extent
Low
extent
Moderate
extent 7.85 22.487
Case 16 Low extent
Low
extent
Low
extent 5.45
Moderate
extent
Moderate
extent
Low
extent
Moderate
extent
Low
extent
Moderate
extent 7.85 21.594
Case 17
Great
Extent
Great
Extent
Great
Extent 16.14
Very great
extent
Great
Extent
Moderate
extent
Great
Extent
Great
Extent
Great
Extent 14.31 46.311
Case 18
Very great
extent
Great
Extent
Great
Extent 14.75
Very great
extent
Great
Extent
Great
Extent
Very
great
extent
Very
great
extent
Great
Extent 16.61 44.135
Case 19 Not at all Not at all
Low
extent 2.07
Moderate
extent
Moderate
extent
Low
extent
Moderate
extent
Low
extent
Low
extent 6.96 15.116
Case 20
Moderate
extent
Moderate
extent
Great
Extent 11.25
Moderate
extent
Moderate
extent
Moderate
extent
Great
Extent
Moderate
extent
Moderate
extent 9.93 33.119
Case 21
Great
Extent
Great
Extent
Low
extent 9.56
Great
Extent
Moderate
extent
Moderate
extent
Moderate
extent
Moderate
extent
Moderate
extent 10.11 31.359
Case 22
Moderate
extent
Moderate
extent
Moderate
extent 8.57
Moderate
extent
Great
Extent
Moderate
extent
Low
extent
Great
Extent
Moderate
extent 10.13 27.08
Case 23
Great
Extent
Very
great
extent
Low
extent 8.74
Great
Extent
Moderate
extent
Low
extent
Moderate
extent
Moderate
extent
Moderate
extent 9.42 29.485
Case 24
Moderate
extent
Great
Extent
Moderate
extent 10.39
Moderate
extent
Moderate
extent
Moderate
extent
Great
Extent
Moderate
extent
Moderate
extent 9.93 31.417
Case 25
Very great
extent
Very
great
extent
Very
great
extent 16.71
Very great
extent
Great
Extent
Very
great
extent
Very
great
extent
Great
Extent
Moderate
extent 15.83 48.46
Case 26
Very great
extent
Very
great
extent
Great
Extent 14.79
Great
Extent
Moderate
extent
Great
Extent
Great
Extent
Very
great
extent
Very
great
extent 14.7 42.703

251
CASE B8IV B8V B8VI
Human
Capital B10I B10II B10III B10IV B10V B10VI
Application
of Modern
Technology
ADMINISTRATION
OF DEVOLVED
WATER SERVICES
Case 27
Moderate
extent
Moderate
extent
Moderate
extent 6.96
Great
Extent
Moderate
extent
Moderate
extent
Great
Extent
Moderate
extent
Great
Extent 11.64 28.421
Case 28
Moderate
extent
Moderate
extent
Moderate
extent 6.96
Great
Extent
Moderate
extent
Moderate
extent
Moderate
extent
Moderate
extent
Moderate
extent 10.11 27.688
Case 29 Low extent
Moderate
extent
Low
extent 7.78
Moderate
extent Low extent Not at all
Low
extent
Low
extent
Low
extent 4.72 22.803
Case 30
Great
Extent
Moderate
extent
Moderate
extent 14.47
Great
Extent
Great
Extent
Great
Extent
Great
Extent
Great
Extent
Great
Extent 14.05 44.481
Case 31
Moderate
extent
Great
Extent
Moderate
extent 10.39
Great
Extent
Great
Extent
Great
Extent
Great
Extent
Moderate
extent
Moderate
extent 12.44 35.33
Case 32 Low extent
Low
extent
Low
extent 7.02
Great
Extent
Moderate
extent
Low
extent
Low
extent
Moderate
extent
Moderate
extent 8.67 23.976
Case 33
Great
Extent
Great
Extent
Low
extent 11.12
Great
Extent
Great
Extent
Great
Extent
Moderate
extent
Moderate
extent
Moderate
extent 11.74 28.103
Case 34
Great
Extent
Moderate
extent
Moderate
extent 10.4
Great
Extent
Great
Extent
Moderate
extent
Great
Extent
Moderate
extent
Moderate
extent 11.68 28.168
Case 35
Great
Extent
Great
Extent
Low
extent 12.01
Great
Extent
Great
Extent
Very
great
extent
Very
great
extent
Very
great
extent
Very
great
extent 17.16 44.28
Case 36
Great
Extent
Great
Extent
Low
extent 11.12
Very great
extent
Great
Extent
Moderate
extent
Low
extent
Low
extent
Low
extent 9.65 25.123
Case 37
Great
Extent
Low
extent
Moderate
extent 10.45
Moderate
extent
Great
Extent
Great
Extent
Moderate
extent
Great
Extent
Great
Extent 12.48 30.946
Case 38
Moderate
extent
Great
Extent
Very
great
extent 12.97
Moderate
extent
Great
Extent
Moderate
extent
Great
Extent
Moderate
extent
Moderate
extent 10.8 39.709
Case 39
Great
Extent
Low
extent
Great
Extent 9.67
Great
Extent
Moderate
extent
Moderate
extent
Great
Extent
Moderate
extent
Moderate
extent 10.81 27.263
Case 40
Great
Extent
Low
extent
Moderate
extent 10.34
Moderate
extent
Great
Extent
Great
Extent
Great
Extent
Great
Extent
Great
Extent 13.18 38.499
Case 41 Not at all
Moderate
extent
Moderate
extent 6.32
Great
Extent
Great
Extent
Low
extent
Moderate
extent
Moderate
extent
Moderate
extent 10.3 27.09
Case 42
Moderate
extent
Great
Extent
Great
Extent 11.2
Great
Extent
Great
Extent
Great
Extent
Great
Extent
Great
Extent
Great
Extent 14.05 34.58
Case 43
Very great
extent
Moderate
extent
Great
Extent 16.56
Very great
extent
Very great
extent
Very
great
extent
Very
great
extent
Moderate
extent
Very
great
extent 17.83 48.054
Case 44
Moderate
extent
Low
extent
Moderate
extent 7.84
Great
Extent
Moderate
extent
Great
Extent
Moderate
extent Not at all
Low
extent 8.53 18.019
Case 45
Great
Extent
Moderate
extent
Great
Extent 14.71
Very great
extent
Great
Extent
Very
great
Very
great
Very
great
Very
great 18.18 51.401
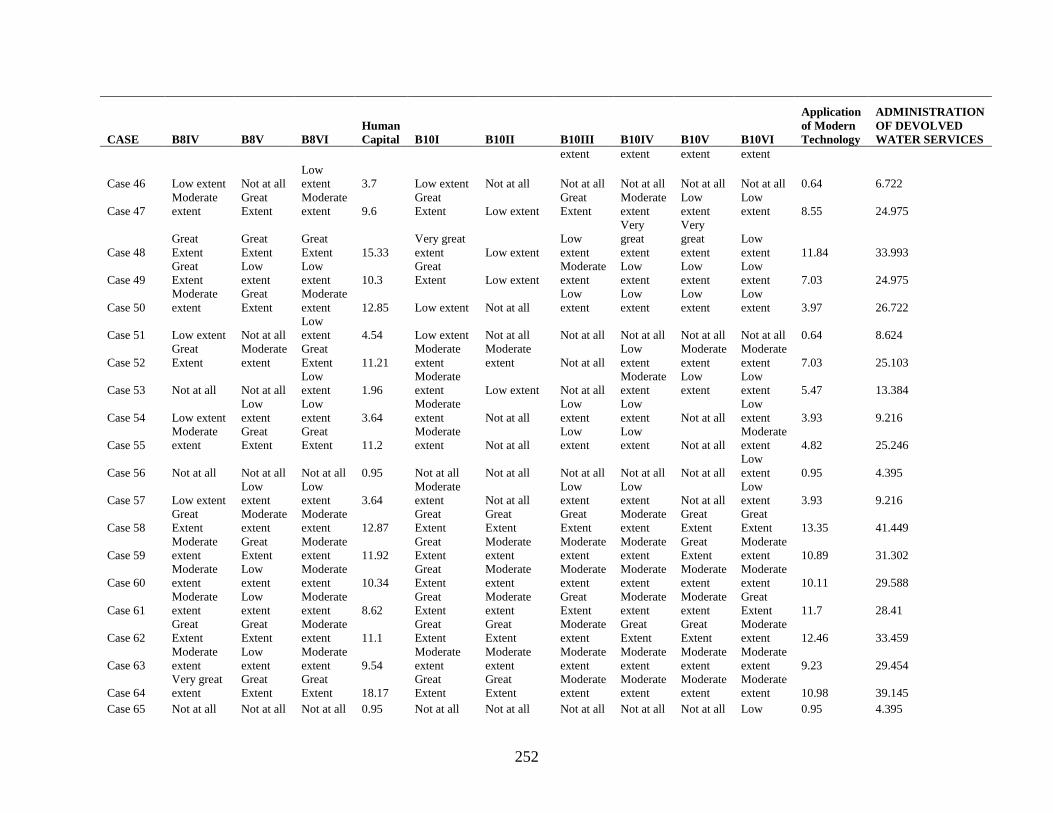
252
CASE B8IV B8V B8VI
Human
Capital B10I B10II B10III B10IV B10V B10VI
Application
of Modern
Technology
ADMINISTRATION
OF DEVOLVED
WATER SERVICES
extent extent extent extent
Case 46 Low extent Not at all
Low
extent 3.7 Low extent Not at all Not at all Not at all Not at all Not at all 0.64 6.722
Case 47
Moderate
extent
Great
Extent
Moderate
extent 9.6
Great
Extent Low extent
Great
Extent
Moderate
extent
Low
extent
Low
extent 8.55 24.975
Case 48
Great
Extent
Great
Extent
Great
Extent 15.33
Very great
extent Low extent
Low
extent
Very
great
extent
Very
great
extent
Low
extent 11.84 33.993
Case 49
Great
Extent
Low
extent
Low
extent 10.3
Great
Extent Low extent
Moderate
extent
Low
extent
Low
extent
Low
extent 7.03 24.975
Case 50
Moderate
extent
Great
Extent
Moderate
extent 12.85 Low extent Not at all
Low
extent
Low
extent
Low
extent
Low
extent 3.97 26.722
Case 51 Low extent Not at all
Low
extent 4.54 Low extent Not at all Not at all Not at all Not at all Not at all 0.64 8.624
Case 52
Great
Extent
Moderate
extent
Great
Extent 11.21
Moderate
extent
Moderate
extent Not at all
Low
extent
Moderate
extent
Moderate
extent 7.03 25.103
Case 53 Not at all Not at all
Low
extent 1.96
Moderate
extent Low extent Not at all
Moderate
extent
Low
extent
Low
extent 5.47 13.384
Case 54 Low extent
Low
extent
Low
extent 3.64
Moderate
extent Not at all
Low
extent
Low
extent Not at all
Low
extent 3.93 9.216
Case 55
Moderate
extent
Great
Extent
Great
Extent 11.2
Moderate
extent Not at all
Low
extent
Low
extent Not at all
Moderate
extent 4.82 25.246
Case 56 Not at all Not at all Not at all 0.95 Not at all Not at all Not at all Not at all Not at all
Low
extent 0.95 4.395
Case 57 Low extent
Low
extent
Low
extent 3.64
Moderate
extent Not at all
Low
extent
Low
extent Not at all
Low
extent 3.93 9.216
Case 58
Great
Extent
Moderate
extent
Moderate
extent 12.87
Great
Extent
Great
Extent
Great
Extent
Moderate
extent
Great
Extent
Great
Extent 13.35 41.449
Case 59
Moderate
extent
Great
Extent
Moderate
extent 11.92
Great
Extent
Moderate
extent
Moderate
extent
Moderate
extent
Great
Extent
Moderate
extent 10.89 31.302
Case 60
Moderate
extent
Low
extent
Moderate
extent 10.34
Great
Extent
Moderate
extent
Moderate
extent
Moderate
extent
Moderate
extent
Moderate
extent 10.11 29.588
Case 61
Moderate
extent
Low
extent
Moderate
extent 8.62
Great
Extent
Moderate
extent
Great
Extent
Moderate
extent
Moderate
extent
Great
Extent 11.7 28.41
Case 62
Great
Extent
Great
Extent
Moderate
extent 11.1
Great
Extent
Great
Extent
Moderate
extent
Great
Extent
Great
Extent
Moderate
extent 12.46 33.459
Case 63
Moderate
extent
Low
extent
Moderate
extent 9.54
Moderate
extent
Moderate
extent
Moderate
extent
Moderate
extent
Moderate
extent
Moderate
extent 9.23 29.454
Case 64
Very great
extent
Great
Extent
Great
Extent 18.17
Great
Extent
Great
Extent
Moderate
extent
Moderate
extent
Moderate
extent
Moderate
extent 10.98 39.145
Case 65 Not at all Not at all Not at all 0.95 Not at all Not at all Not at all Not at all Not at all Low 0.95 4.395

253
CASE B8IV B8V B8VI
Human
Capital B10I B10II B10III B10IV B10V B10VI
Application
of Modern
Technology
ADMINISTRATION
OF DEVOLVED
WATER SERVICES
extent
Case 66
Moderate
extent
Moderate
extent
Low
extent 10.19
Moderate
extent
Great
Extent
Moderate
extent
Low
extent
Moderate
extent
Low
extent 8.45 29.36
Case 67 Low extent
Moderate
extent
Great
Extent 9.66
Moderate
extent
Great
Extent
Moderate
extent
Moderate
extent
Moderate
extent
Moderate
extent 10.1 31.415
Case 68
Moderate
extent
Low
extent
Low
extent 8.61 Low extent Low extent
Moderate
extent
Moderate
extent
Low
extent
Low
extent 6.21 21.719
Case 69
Moderate
extent
Low
extent
Low
extent 8.61 Low extent Low extent
Low
extent
Low
extent
Low
extent
Low
extent 4.77 16.868
Case 70
Moderate
extent
Low
extent
Low
extent 8.61 Low extent Low extent
Low
extent
Low
extent
Moderate
extent
Low
extent 5.47 24.392
Case 71 Low extent
Low
extent
Low
extent 4.6 Not at all Low extent
Low
extent Not at all Not at all Not at all 1.57 12.602
Case 72 Low extent
Low
extent
Low
extent 3.64
Moderate
extent
Moderate
extent Not at all
Very
great
extent
Low
extent
Low
extent 7.67 23.834
Case 73
Moderate
extent
Moderate
extent
Moderate
extent 8.77 Low extent Low extent
Low
extent
Low
extent
Low
extent Not at all 3.82 25.16
Case 74
Moderate
extent
Moderate
extent
Moderate
extent 8.77
Great
Extent
Great
Extent
Very
great
extent
Very
great
extent
Moderate
extent
Moderate
extent 14.03 28.744
CASE C12I C12II C12III C12IV c12V C12VI C12VII C12VIII C12IX C12X
Case 1
Moderate
extent Great Extent
Moderate
extent Low extent Great Extent
Moderate
extent Low extent Great Extent
Moderate
extent Low extent
Case 2 Great Extent Not at all Not at all Not at all Not at all Not at all Not at all Not at all Not at all Not at all
Case 3 Low extent
Moderate
extent Not at all
Moderate
extent
Moderate
extent Not at all
Moderate
extent
Moderate
extent Not at all
Moderate
extent
Case 4
Moderate
extent Low extent Low extent
Moderate
extent Low extent Low extent
Moderate
extent Low extent Low extent
Moderate
extent
Case 5
Moderate
extent
Moderate
extent
Moderate
extent Low extent
Moderate
extent
Moderate
extent Low extent
Moderate
extent
Moderate
extent Low extent
Case 6 Not at all Not at all Low extent Not at all Not at all Low extent Not at all Not at all Low extent Not at all
Case 7 Low extent Low extent Low extent Not at all Low extent Low extent Not at all Low extent Low extent Not at all
Case 8 Low extent Low extent
Moderate
extent Low extent Low extent
Moderate
extent Low extent Low extent
Moderate
extent Low extent
Case 9 Great Extent Great Extent Great Extent Very great Great Extent Great Extent Very great Great Extent Great Extent Very great

254
CASE C12I C12II C12III C12IV c12V C12VI C12VII C12VIII C12IX C12X
extent extent extent
Case 10
Very great
extent Not at all Not at all Not at all Not at all Not at all Not at all Not at all Not at all Not at all
Case 11
Moderate
extent Great Extent Great Extent Not at all Great Extent Great Extent Not at all Great Extent Great Extent Not at all
Case 12
Very great
extent Not at all
Moderate
extent
Moderate
extent Not at all
Moderate
extent
Moderate
extent Not at all
Moderate
extent
Moderate
extent
Case 13 Not at all Not at all Not at all Not at all Not at all Not at all Not at all Not at all Not at all Not at all
Case 14 Not at all Not at all Not at all Not at all Not at all Not at all Not at all Not at all Not at all Not at all
Case 15
Moderate
extent
Moderate
extent Low extent
Moderate
extent
Moderate
extent Low extent
Moderate
extent
Moderate
extent Low extent
Moderate
extent
Case 16
Moderate
extent
Moderate
extent Low extent
Moderate
extent
Moderate
extent Low extent
Moderate
extent
Moderate
extent Low extent
Moderate
extent
Case 17
Moderate
extent Great Extent Low extent
Moderate
extent Great Extent Low extent
Moderate
extent Great Extent Low extent
Moderate
extent
Case 18
Moderate
extent
Moderate
extent Great Extent Low extent
Moderate
extent Great Extent Low extent
Moderate
extent Great Extent Low extent
Case 19 Great Extent Not at all
Moderate
extent Low extent Not at all
Moderate
extent Low extent Not at all
Moderate
extent Low extent
Case 20 Low extent Great Extent
Moderate
extent
Moderate
extent Great Extent
Moderate
extent
Moderate
extent Great Extent
Moderate
extent
Moderate
extent
Case 21 Great Extent Low extent
Moderate
extent Low extent Low extent
Moderate
extent Low extent Low extent
Moderate
extent Low extent
Case 22 Great Extent
Moderate
extent Great Extent
Moderate
extent
Moderate
extent Great Extent
Moderate
extent
Moderate
extent Great Extent
Moderate
extent
Case 23 Great Extent Low extent
Moderate
extent
Moderate
extent Low extent
Moderate
extent
Moderate
extent Low extent
Moderate
extent
Moderate
extent
Case 24
Moderate
extent
Moderate
extent Not at all Low extent
Moderate
extent Not at all Low extent
Moderate
extent Not at all Low extent
Case 25 Low extent Great Extent Great Extent Great Extent Great Extent Great Extent
Great
Extent Great Extent Great Extent Great Extent
Case 26 Not at all
Very great
extent Great Extent Great Extent
Very great
extent Great Extent
Great
Extent
Very great
extent Great Extent Great Extent
Case 27 Great Extent
Moderate
extent
Moderate
extent
Moderate
extent
Moderate
extent
Moderate
extent
Moderate
extent
Moderate
extent
Moderate
extent
Moderate
extent
Case 28 Great Extent
Moderate
extent
Moderate
extent Great Extent
Moderate
extent
Moderate
extent
Great
Extent
Moderate
extent
Moderate
extent Great Extent
Case 29 Low extent Not at all
Moderate
extent
Moderate
extent Not at all
Moderate
extent
Moderate
extent Not at all
Moderate
extent
Moderate
extent
Case 30 Low extent Great Extent Great Extent Great Extent Great Extent Great Extent
Great
Extent Great Extent Great Extent Great Extent
Case 31 Low extent Great Extent Very great Very great Great Extent Very great Very great Great Extent Very great Very great

255
CASE C12I C12II C12III C12IV c12V C12VI C12VII C12VIII C12IX C12X
extent extent extent extent extent extent
Case 32
Moderate
extent
Moderate
extent Not at all Low extent
Moderate
extent Not at all Low extent
Moderate
extent Not at all Low extent
Case 33 Great Extent
Moderate
extent
Moderate
extent Great Extent
Moderate
extent
Moderate
extent
Great
Extent
Moderate
extent
Moderate
extent Great Extent
Case 34 Great Extent
Moderate
extent
Moderate
extent
Moderate
extent
Moderate
extent
Moderate
extent
Moderate
extent
Moderate
extent
Moderate
extent
Moderate
extent
Case 35
Moderate
extent Low extent Low extent
Moderate
extent Low extent Low extent
Moderate
extent Low extent Low extent
Moderate
extent
Case 36
Moderate
extent Low extent Low extent
Moderate
extent Low extent Low extent
Moderate
extent Low extent Low extent
Moderate
extent
Case 37
Moderate
extent Great Extent
Very great
extent
Very great
extent Great Extent
Very great
extent
Very great
extent Great Extent
Very great
extent
Very great
extent
Case 38
Moderate
extent Great Extent Low extent
Very great
extent Great Extent Low extent
Very great
extent Great Extent Low extent
Very great
extent
Case 39 Low extent Great Extent Great Extent Low extent Great Extent Great Extent Low extent Great Extent Great Extent Low extent
Case 40
Moderate
extent
Moderate
extent
Moderate
extent Low extent
Moderate
extent
Moderate
extent Low extent
Moderate
extent
Moderate
extent Low extent
Case 41 Low extent Not at all
Moderate
extent Not at all Not at all
Moderate
extent Not at all Not at all
Moderate
extent Not at all
Case 42 Low extent
Moderate
extent Low extent
Moderate
extent
Moderate
extent Low extent
Moderate
extent
Moderate
extent Low extent
Moderate
extent
Case 43 Not at all
Very great
extent
Moderate
extent
Very great
extent
Very great
extent
Moderate
extent
Very great
extent
Very great
extent
Moderate
extent
Very great
extent
Case 44
Moderate
extent
Moderate
extent
Moderate
extent
Moderate
extent
Moderate
extent
Moderate
extent
Moderate
extent
Moderate
extent
Moderate
extent
Moderate
extent
Case 45
Very great
extent
Very great
extent
Very great
extent
Very great
extent
Very great
extent
Very great
extent
Very great
extent
Very great
extent
Very great
extent
Very great
extent
Case 46 Not at all Not at all Low extent Not at all Not at all Low extent Not at all Not at all Low extent Not at all
Case 47
Moderate
extent Low extent Low extent Not at all Low extent Low extent Not at all Low extent Low extent Not at all
Case 48 Low extent
Very great
extent Low extent
Very great
extent
Very great
extent Low extent
Very great
extent
Very great
extent Low extent
Very great
extent
Case 49
Moderate
extent
Moderate
extent Low extent Low extent
Moderate
extent Low extent Low extent
Moderate
extent Low extent Low extent
Case 50
Moderate
extent
Moderate
extent Low extent Low extent
Moderate
extent Low extent Low extent
Moderate
extent Low extent Low extent
Case 51 Not at all Not at all
Moderate
extent Low extent Not at all
Moderate
extent Low extent Not at all
Moderate
extent Low extent
Case 52 Great Extent Low extent Low extent
Moderate
extent Low extent Low extent
Moderate
extent Low extent Low extent
Moderate
extent
Case 53 Not at all Not at all Very great Low extent Not at all Very great Low extent Not at all Very great Low extent

256
CASE C12I C12II C12III C12IV c12V C12VI C12VII C12VIII C12IX C12X
extent extent extent
Case 54
Moderate
extent
Moderate
extent
Moderate
extent
Moderate
extent
Moderate
extent
Moderate
extent
Moderate
extent
Moderate
extent
Moderate
extent
Moderate
extent
Case 55
Moderate
extent
Moderate
extent
Moderate
extent Not at all
Moderate
extent
Moderate
extent Not at all
Moderate
extent
Moderate
extent Not at all
Case 56 Low extent Not at all Not at all Not at all Not at all Not at all Not at all Not at all Not at all Not at all
Case 57
Moderate
extent
Moderate
extent
Moderate
extent Not at all
Moderate
extent
Moderate
extent Not at all
Moderate
extent
Moderate
extent Not at all
Case 58 Not at all Not at all Low extent
Very great
extent Not at all Low extent
Very great
extent Not at all Low extent
Very great
extent
Case 59
Moderate
extent Great Extent
Moderate
extent Great Extent Great Extent
Moderate
extent
Great
Extent Great Extent
Moderate
extent Great Extent
Case 60
Moderate
extent
Moderate
extent Low extent Low extent
Moderate
extent Low extent Low extent
Moderate
extent Low extent Low extent
Case 61
Very great
extent Low extent Low extent Not at all Low extent Low extent Not at all Low extent Low extent Not at all
Case 62 Great Extent Great Extent
Moderate
extent
Moderate
extent Great Extent
Moderate
extent
Moderate
extent Great Extent
Moderate
extent
Moderate
extent
Case 63
Very great
extent
Moderate
extent Not at all Not at all
Moderate
extent Not at all Not at all
Moderate
extent Not at all Not at all
Case 64 Low extent Not at all Not at all Not at all Not at all Not at all Not at all Not at all Not at all Not at all
Case 65 Low extent Not at all Not at all Not at all Not at all Not at all Not at all Not at all Not at all Not at all
Case 66 Low extent
Moderate
extent
Moderate
extent
Moderate
extent
Moderate
extent
Moderate
extent
Moderate
extent
Moderate
extent
Moderate
extent
Moderate
extent
Case 67 Great Extent
Moderate
extent Great Extent
Moderate
extent
Moderate
extent Great Extent
Moderate
extent
Moderate
extent Great Extent
Moderate
extent
Case 68 Low extent Low extent Low extent Low extent Low extent Low extent Low extent Low extent Low extent Low extent
Case 69
Moderate
extent Low extent Low extent
Moderate
extent Low extent Low extent
Moderate
extent Low extent Low extent
Moderate
extent
Case 70
Moderate
extent
Moderate
extent
Moderate
extent Great Extent
Moderate
extent
Moderate
extent
Great
Extent
Moderate
extent
Moderate
extent Great Extent
Case 71
Moderate
extent
Moderate
extent
Moderate
extent Low extent
Moderate
extent
Moderate
extent Low extent
Moderate
extent
Moderate
extent Low extent
Case 72 Not at all Low extent Low extent
Moderate
extent Low extent Low extent
Moderate
extent Low extent Low extent
Moderate
extent
Case 73 Not at all Not at all Not at all Not at all Not at all Not at all Not at all Not at all Not at all Not at all
Case 74
Very great
extent Great Extent
Very great
extent Great Extent Great Extent
Very great
extent
Great
Extent Great Extent
Very great
extent Great Extent

257
CASE C12XI C12XII C12XIII C12XIV C12XV C12XVI
TRANSFORM
ATIONAL
LEADERSHIP D14I D14II D14III
Case 1
Moderate
extent
Moderate
extent Low extent Great Extent
Moderate
extent Low extent 5.593
Very great
extent Great Extent Great Extent
Case 2 Great Extent Great Extent Not at all Not at all Not at all Not at all 0 Great Extent Great Extent Great Extent
Case 3 Low extent Low extent
Moderate
extent
Moderate
extent Not at all Moderate extent 4.395 Moderate extent Great Extent
Moderate
extent
Case 4
Moderate
extent
Moderate
extent
Moderate
extent Low extent Low extent Moderate extent 4.62 Great Extent Great Extent Great Extent
Case 5
Moderate
extent
Moderate
extent Low extent
Moderate
extent
Moderate
extent Low extent 4.756 Moderate extent
Moderate
extent
Moderate
extent
Case 6 Not at all Not at all Not at all Not at all Low extent Not at all 0.904 Low extent Low extent Not at all
Case 7 Low extent Low extent Not at all Low extent Low extent Not at all 1.631 Moderate extent Low extent Low extent
Case 8 Low extent Low extent Low extent Low extent
Moderate
extent Low extent 4.077 Moderate extent Low extent Low extent
Case 9 Great Extent Great Extent
Very great
extent Great Extent Great Extent
Very great
extent 10.323
Very great
extent Not at all
Very great
extent
Case 10
Very great
extent
Very great
extent Not at all Not at all Not at all Not at all 0 Great Extent Great Extent Not at all
Case 11
Moderate
extent
Moderate
extent Not at all Great Extent Great Extent Not at all 4.775 Moderate extent
Moderate
extent Low extent
Case 12
Very great
extent
Very great
extent
Moderate
extent Not at all
Moderate
extent Moderate extent 4.732 Great Extent
Very great
extent
Moderate
extent
Case 13 Not at all Not at all Not at all Not at all Not at all Not at all 0 Low extent Great Extent Low extent
Case 14 Not at all Not at all Not at all Not at all Not at all Not at all 0 Low extent Great Extent Low extent
Case 15
Moderate
extent
Moderate
extent
Moderate
extent
Moderate
extent Low extent Moderate extent 5.299 Moderate extent
Moderate
extent
Moderate
extent
Case 16
Moderate
extent
Moderate
extent
Moderate
extent
Moderate
extent Low extent Moderate extent 5.299 Moderate extent
Moderate
extent
Moderate
extent
Case 17
Moderate
extent
Moderate
extent
Moderate
extent Great Extent Low extent Moderate extent 6.137 Moderate extent
Very great
extent Great Extent
Case 18
Moderate
extent
Moderate
extent Low extent
Moderate
extent Great Extent Low extent 5.544 Great Extent Great Extent
Moderate
extent
Case 19 Great Extent Great Extent Low extent Not at all
Moderate
extent Low extent 3.35 Moderate extent Great Extent Not at all
Case 20 Low extent Low extent
Moderate
extent Great Extent
Moderate
extent Moderate extent 6.976 Great Extent Great Extent Great Extent
Case 21 Great Extent Great Extent Low extent Low extent
Moderate
extent Low extent 4.077 Moderate extent
Moderate
extent
Moderate
extent
Case 22 Great Extent Great Extent
Moderate
extent
Moderate
extent Great Extent Moderate extent 6.927 Moderate extent
Moderate
extent
Moderate
extent
Case 23 Great Extent Great Extent Moderate Low extent Moderate Moderate extent 5.459 Moderate extent Moderate Moderate

258
CASE C12XI C12XII C12XIII C12XIV C12XV C12XVI
TRANSFORM
ATIONAL
LEADERSHIP D14I D14II D14III
extent extent extent extent
Case 24
Moderate
extent
Moderate
extent Low extent
Moderate
extent Not at all Low extent 3.013 Moderate extent Great Extent Great Extent
Case 25 Low extent Low extent Great Extent Great Extent Great Extent Great Extent 9.08 Great Extent Great Extent Great Extent
Case 26 Not at all Not at all Great Extent
Very great
extent Great Extent Great Extent 9.964 Great Extent
Moderate
extent Great Extent
Case 27 Great Extent Great Extent
Moderate
extent
Moderate
extent
Moderate
extent Moderate extent 6.138 Great Extent
Moderate
extent
Moderate
extent
Case 28 Great Extent Great Extent Great Extent
Moderate
extent
Moderate
extent Great Extent 7.454 Great Extent
Moderate
extent
Moderate
extent
Case 29 Low extent Low extent
Moderate
extent Not at all
Moderate
extent Moderate extent 4.732 Low extent
Moderate
extent
Moderate
extent
Case 30 Low extent Low extent Great Extent Great Extent Great Extent Great Extent 9.08
Very great
extent
Very great
extent
Moderate
extent
Case 31 Low extent Low extent
Very great
extent Great Extent
Very great
extent
Very great
extent 11.016 Great Extent
Very great
extent Low extent
Case 32
Moderate
extent
Moderate
extent Low extent
Moderate
extent Not at all Low extent 3.013 Moderate extent Great Extent Low extent
Case 33 Great Extent Great Extent Great Extent
Moderate
extent
Moderate
extent Great Extent 7.454 Low extent Low extent
Moderate
extent
Case 34 Great Extent Great Extent
Moderate
extent
Moderate
extent
Moderate
extent Moderate extent 6.138 Low extent Low extent
Moderate
extent
Case 35
Moderate
extent
Moderate
extent
Moderate
extent Low extent Low extent Moderate extent 4.62 Great Extent Great Extent
Moderate
extent
Case 36
Moderate
extent
Moderate
extent
Moderate
extent Low extent Low extent Moderate extent 4.62 Great Extent Great Extent
Moderate
extent
Case 37
Moderate
extent
Moderate
extent
Very great
extent Great Extent
Very great
extent
Very great
extent 11.016 Low extent
Moderate
extent
Moderate
extent
Case 38
Moderate
extent
Moderate
extent
Very great
extent Great Extent Low extent
Very great
extent 8.695 Moderate extent Great Extent Great Extent
Case 39 Low extent Low extent Low extent Great Extent Great Extent Low extent 6.382 Moderate extent Great Extent
Moderate
extent
Case 40
Moderate
extent
Moderate
extent Low extent
Moderate
extent
Moderate
extent Low extent 4.756 Moderate extent Great Extent Great Extent
Case 41 Low extent Low extent Not at all Not at all
Moderate
extent Not at all 1.743 Moderate extent Great Extent Not at all
Case 42 Low extent Low extent
Moderate
extent
Moderate
extent Low extent Moderate extent 5.299 Moderate extent Great Extent Great Extent
Case 43 Not at all Not at all
Very great
extent
Very great
extent
Moderate
extent
Very great
extent 10.418
Very great
extent
Very great
extent
Moderate
extent

259
CASE C12XI C12XII C12XIII C12XIV C12XV C12XVI
TRANSFORM
ATIONAL
LEADERSHIP D14I D14II D14III
Case 44
Moderate
extent
Moderate
extent
Moderate
extent
Moderate
extent
Moderate
extent Moderate extent 6.138 Moderate extent
Very great
extent
Moderate
extent
Case 45
Very great
extent
Very great
extent
Very great
extent
Very great
extent
Very great
extent
Very great
extent 11.901
Very great
extent
Very great
extent
Moderate
extent
Case 46 Not at all Not at all Not at all Not at all Low extent Not at all 0.904 Low extent
Moderate
extent Not at all
Case 47
Moderate
extent
Moderate
extent Not at all Low extent Low extent Not at all 1.631 Great Extent
Very great
extent
Moderate
extent
Case 48 Low extent Low extent
Very great
extent
Very great
extent Low extent
Very great
extent 9.579 Great Extent
Moderate
extent Great Extent
Case 49
Moderate
extent
Moderate
extent Low extent
Moderate
extent Low extent Low extent 3.917 Moderate extent
Moderate
extent Low extent
Case 50
Moderate
extent
Moderate
extent Low extent
Moderate
extent Low extent Low extent 3.917 Great Extent Great Extent Low extent
Case 51 Not at all Not at all Low extent Not at all
Moderate
extent Low extent 3.35 Moderate extent
Moderate
extent Not at all
Case 52 Great Extent Great Extent
Moderate
extent Low extent Low extent Moderate extent 4.62 Moderate extent
Moderate
extent
Moderate
extent
Case 53 Not at all Not at all Low extent Not at all
Very great
extent Low extent 4.833 Low extent
Very great
extent Low extent
Case 54
Moderate
extent
Moderate
extent
Moderate
extent
Moderate
extent
Moderate
extent Moderate extent 6.138 Not at all Great Extent Not at all
Case 55
Moderate
extent
Moderate
extent Not at all
Moderate
extent
Moderate
extent Not at all 3.149 Not at all Great Extent Not at all
Case 56 Low extent Low extent Not at all Not at all Not at all Not at all 0 Low extent
Moderate
extent
Moderate
extent
Case 57
Moderate
extent
Moderate
extent Not at all
Moderate
extent
Moderate
extent Not at all 3.149 Not at all Great Extent Not at all
Case 58 Not at all Not at all
Very great
extent Not at all Low extent
Very great
extent 6.452 Moderate extent Great Extent Great Extent
Case 59
Moderate
extent
Moderate
extent Great Extent Great Extent
Moderate
extent Great Extent 8.292 Great Extent
Moderate
extent
Moderate
extent
Case 60
Moderate
extent
Moderate
extent Low extent
Moderate
extent Low extent Low extent 3.917 Moderate extent Great Extent Low extent
Case 61
Very great
extent
Very great
extent Not at all Low extent Low extent Not at all 1.631 Moderate extent
Moderate
extent Low extent
Case 62 Great Extent Great Extent
Moderate
extent Great Extent
Moderate
extent Moderate extent 6.976 Great Extent Low extent Low extent
Case 63
Very great
extent
Very great
extent Not at all
Moderate
extent Not at all Not at all 1.406 Moderate extent Great Extent Low extent
Case 64 Low extent Low extent Not at all Not at all Not at all Not at all 0 Moderate extent Great Extent Great Extent
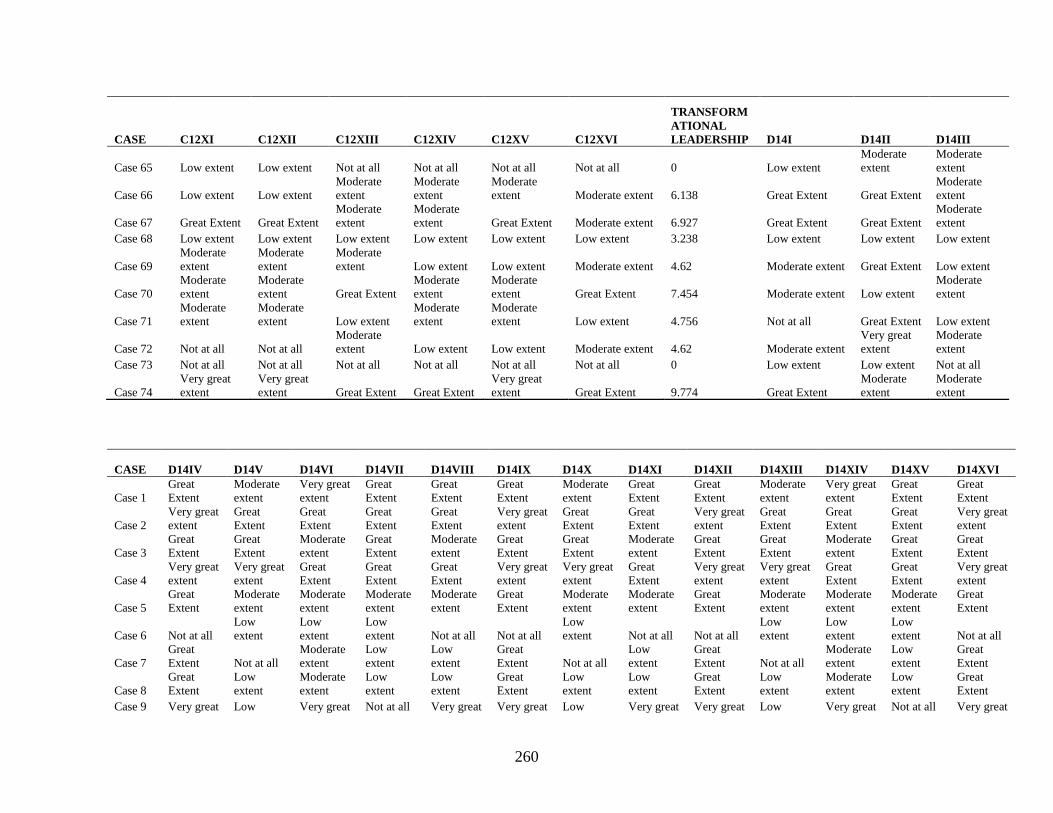
260
CASE C12XI C12XII C12XIII C12XIV C12XV C12XVI
TRANSFORM
ATIONAL
LEADERSHIP D14I D14II D14III
Case 65 Low extent Low extent Not at all Not at all Not at all Not at all 0 Low extent
Moderate
extent
Moderate
extent
Case 66 Low extent Low extent
Moderate
extent
Moderate
extent
Moderate
extent Moderate extent 6.138 Great Extent Great Extent
Moderate
extent
Case 67 Great Extent Great Extent
Moderate
extent
Moderate
extent Great Extent Moderate extent 6.927 Great Extent Great Extent
Moderate
extent
Case 68 Low extent Low extent Low extent Low extent Low extent Low extent 3.238 Low extent Low extent Low extent
Case 69
Moderate
extent
Moderate
extent
Moderate
extent Low extent Low extent Moderate extent 4.62 Moderate extent Great Extent Low extent
Case 70
Moderate
extent
Moderate
extent Great Extent
Moderate
extent
Moderate
extent Great Extent 7.454 Moderate extent Low extent
Moderate
extent
Case 71
Moderate
extent
Moderate
extent Low extent
Moderate
extent
Moderate
extent Low extent 4.756 Not at all Great Extent Low extent
Case 72 Not at all Not at all
Moderate
extent Low extent Low extent Moderate extent 4.62 Moderate extent
Very great
extent
Moderate
extent
Case 73 Not at all Not at all Not at all Not at all Not at all Not at all 0 Low extent Low extent Not at all
Case 74
Very great
extent
Very great
extent Great Extent Great Extent
Very great
extent Great Extent 9.774 Great Extent
Moderate
extent
Moderate
extent
CASE D14IV D14V D14VI D14VII D14VIII D14IX D14X D14XI D14XII D14XIII D14XIV D14XV D14XVI
Case 1
Great
Extent
Moderate
extent
Very great
extent
Great
Extent
Great
Extent
Great
Extent
Moderate
extent
Great
Extent
Great
Extent
Moderate
extent
Very great
extent
Great
Extent
Great
Extent
Case 2
Very great
extent
Great
Extent
Great
Extent
Great
Extent
Great
Extent
Very great
extent
Great
Extent
Great
Extent
Very great
extent
Great
Extent
Great
Extent
Great
Extent
Very great
extent
Case 3
Great
Extent
Great
Extent
Moderate
extent
Great
Extent
Moderate
extent
Great
Extent
Great
Extent
Moderate
extent
Great
Extent
Great
Extent
Moderate
extent
Great
Extent
Great
Extent
Case 4
Very great
extent
Very great
extent
Great
Extent
Great
Extent
Great
Extent
Very great
extent
Very great
extent
Great
Extent
Very great
extent
Very great
extent
Great
Extent
Great
Extent
Very great
extent
Case 5
Great
Extent
Moderate
extent
Moderate
extent
Moderate
extent
Moderate
extent
Great
Extent
Moderate
extent
Moderate
extent
Great
Extent
Moderate
extent
Moderate
extent
Moderate
extent
Great
Extent
Case 6 Not at all
Low
extent
Low
extent
Low
extent Not at all Not at all
Low
extent Not at all Not at all
Low
extent
Low
extent
Low
extent Not at all
Case 7
Great
Extent Not at all
Moderate
extent
Low
extent
Low
extent
Great
Extent Not at all
Low
extent
Great
Extent Not at all
Moderate
extent
Low
extent
Great
Extent
Case 8
Great
Extent
Low
extent
Moderate
extent
Low
extent
Low
extent
Great
Extent
Low
extent
Low
extent
Great
Extent
Low
extent
Moderate
extent
Low
extent
Great
Extent
Case 9 Very great Low Very great Not at all Very great Very great Low Very great Very great Low Very great Not at all Very great

261
CASE D14IV D14V D14VI D14VII D14VIII D14IX D14X D14XI D14XII D14XIII D14XIV D14XV D14XVI
extent extent extent extent extent extent extent extent extent extent extent
Case 10
Moderate
extent
Very great
extent
Great
Extent
Great
Extent Not at all
Moderate
extent
Very great
extent Not at all
Moderate
extent
Very great
extent
Great
Extent
Great
Extent
Moderate
extent
Case 11
Moderate
extent
Low
extent
Moderate
extent
Moderate
extent
Low
extent
Moderate
extent
Low
extent
Low
extent
Moderate
extent
Low
extent
Moderate
extent
Moderate
extent
Moderate
extent
Case 12
Moderate
extent
Low
extent
Great
Extent
Very great
extent
Moderate
extent
Moderate
extent
Low
extent
Moderate
extent
Moderate
extent
Low
extent
Great
Extent
Very great
extent
Moderate
extent
Case 13
Great
Extent
Great
Extent
Low
extent
Great
Extent
Low
extent
Great
Extent
Great
Extent
Low
extent
Great
Extent
Great
Extent
Low
extent
Great
Extent
Great
Extent
Case 14
Great
Extent
Great
Extent
Low
extent
Great
Extent
Low
extent
Great
Extent
Great
Extent
Low
extent
Great
Extent
Great
Extent
Low
extent
Great
Extent
Great
Extent
Case 15
Moderate
extent
Low
extent
Moderate
extent
Moderate
extent
Moderate
extent
Moderate
extent
Low
extent
Moderate
extent
Moderate
extent
Low
extent
Moderate
extent
Moderate
extent
Moderate
extent
Case 16
Moderate
extent
Low
extent
Moderate
extent
Moderate
extent
Moderate
extent
Moderate
extent
Low
extent
Moderate
extent
Moderate
extent
Low
extent
Moderate
extent
Moderate
extent
Moderate
extent
Case 17
Very great
extent
Very great
extent
Moderate
extent
Very great
extent
Great
Extent
Very great
extent
Very great
extent
Great
Extent
Very great
extent
Very great
extent
Moderate
extent
Very great
extent
Very great
extent
Case 18
Great
Extent
Great
Extent
Great
Extent
Great
Extent
Moderate
extent
Great
Extent
Great
Extent
Moderate
extent
Great
Extent
Great
Extent
Great
Extent
Great
Extent
Great
Extent
Case 19
Great
Extent
Low
extent
Moderate
extent
Great
Extent Not at all
Great
Extent
Low
extent Not at all
Great
Extent
Low
extent
Moderate
extent
Great
Extent
Great
Extent
Case 20
Great
Extent
Great
Extent
Great
Extent
Great
Extent
Great
Extent
Great
Extent
Great
Extent
Great
Extent
Great
Extent
Great
Extent
Great
Extent
Great
Extent
Great
Extent
Case 21
Great
Extent
Low
extent
Moderate
extent
Moderate
extent
Moderate
extent
Great
Extent
Low
extent
Moderate
extent
Great
Extent
Low
extent
Moderate
extent
Moderate
extent
Great
Extent
Case 22
Great
Extent
Moderate
extent
Moderate
extent
Moderate
extent
Moderate
extent
Great
Extent
Moderate
extent
Moderate
extent
Great
Extent
Moderate
extent
Moderate
extent
Moderate
extent
Great
Extent
Case 23
Great
Extent
Low
extent
Moderate
extent
Moderate
extent
Moderate
extent
Great
Extent
Low
extent
Moderate
extent
Great
Extent
Low
extent
Moderate
extent
Moderate
extent
Great
Extent
Case 24
Great
Extent
Moderate
extent
Moderate
extent
Great
Extent
Great
Extent
Great
Extent
Moderate
extent
Great
Extent
Great
Extent
Moderate
extent
Moderate
extent
Great
Extent
Great
Extent
Case 25
Very great
extent
Great
Extent
Great
Extent
Great
Extent
Great
Extent
Very great
extent
Great
Extent
Great
Extent
Very great
extent
Great
Extent
Great
Extent
Great
Extent
Very great
extent
Case 26
Great
Extent
Great
Extent
Great
Extent
Moderate
extent
Great
Extent
Great
Extent
Great
Extent
Great
Extent
Great
Extent
Great
Extent
Great
Extent
Moderate
extent
Great
Extent
Case 27
Great
Extent
Moderate
extent
Great
Extent
Moderate
extent
Moderate
extent
Great
Extent
Moderate
extent
Moderate
extent
Great
Extent
Moderate
extent
Great
Extent
Moderate
extent
Great
Extent
Case 28
Moderate
extent
Moderate
extent
Great
Extent
Moderate
extent
Moderate
extent
Moderate
extent
Moderate
extent
Moderate
extent
Moderate
extent
Moderate
extent
Great
Extent
Moderate
extent
Moderate
extent
Case 29
Great
Extent
Great
Extent
Low
extent
Moderate
extent
Moderate
extent
Great
Extent
Great
Extent
Moderate
extent
Great
Extent
Great
Extent
Low
extent
Moderate
extent
Great
Extent
Case 30 Very great Very great Very great Very great Moderate Very great Very great Moderate Very great Very great Very great Very great Very great

262
CASE D14IV D14V D14VI D14VII D14VIII D14IX D14X D14XI D14XII D14XIII D14XIV D14XV D14XVI
extent extent extent extent extent extent extent extent extent extent extent extent extent
Case 31
Great
Extent
Moderate
extent
Great
Extent
Very great
extent
Low
extent
Great
Extent
Moderate
extent
Low
extent
Great
Extent
Moderate
extent
Great
Extent
Very great
extent
Great
Extent
Case 32
Great
Extent
Low
extent
Moderate
extent
Great
Extent
Low
extent
Great
Extent
Low
extent
Low
extent
Great
Extent
Low
extent
Moderate
extent
Great
Extent
Great
Extent
Case 33
Great
Extent
Low
extent
Low
extent
Low
extent
Moderate
extent
Great
Extent
Low
extent
Moderate
extent
Great
Extent
Low
extent
Low
extent
Low
extent
Great
Extent
Case 34
Great
Extent
Moderate
extent
Low
extent
Low
extent
Moderate
extent
Great
Extent
Moderate
extent
Moderate
extent
Great
Extent
Moderate
extent
Low
extent
Low
extent
Great
Extent
Case 35
Great
Extent
Great
Extent
Great
Extent
Great
Extent
Moderate
extent
Great
Extent
Great
Extent
Moderate
extent
Great
Extent
Great
Extent
Great
Extent
Great
Extent
Great
Extent
Case 36
Very great
extent
Great
Extent
Great
Extent
Great
Extent
Moderate
extent
Very great
extent
Great
Extent
Moderate
extent
Very great
extent
Great
Extent
Great
Extent
Great
Extent
Very great
extent
Case 37
Moderate
extent
Low
extent
Low
extent
Moderate
extent
Moderate
extent
Moderate
extent
Low
extent
Moderate
extent
Moderate
extent
Low
extent
Low
extent
Moderate
extent
Moderate
extent
Case 38
Great
Extent
Moderate
extent
Moderate
extent
Great
Extent
Great
Extent
Great
Extent
Moderate
extent
Great
Extent
Great
Extent
Moderate
extent
Moderate
extent
Great
Extent
Great
Extent
Case 39
Great
Extent
Moderate
extent
Moderate
extent
Great
Extent
Moderate
extent
Great
Extent
Moderate
extent
Moderate
extent
Great
Extent
Moderate
extent
Moderate
extent
Great
Extent
Great
Extent
Case 40
Great
Extent
Very great
extent
Moderate
extent
Great
Extent
Great
Extent
Great
Extent
Very great
extent
Great
Extent
Great
Extent
Very great
extent
Moderate
extent
Great
Extent
Great
Extent
Case 41 Not at all Not at all
Moderate
extent
Great
Extent Not at all Not at all Not at all Not at all Not at all Not at all
Moderate
extent
Great
Extent Not at all
Case 42
Great
Extent
Moderate
extent
Moderate
extent
Great
Extent
Great
Extent
Great
Extent
Moderate
extent
Great
Extent
Great
Extent
Moderate
extent
Moderate
extent
Great
Extent
Great
Extent
Case 43
Great
Extent
Great
Extent
Very great
extent
Very great
extent
Moderate
extent
Great
Extent
Great
Extent
Moderate
extent
Great
Extent
Great
Extent
Very great
extent
Very great
extent
Great
Extent
Case 44
Moderate
extent
Moderate
extent
Moderate
extent
Very great
extent
Moderate
extent
Moderate
extent
Moderate
extent
Moderate
extent
Moderate
extent
Moderate
extent
Moderate
extent
Very great
extent
Moderate
extent
Case 45
Very great
extent
Great
Extent
Very great
extent
Very great
extent
Moderate
extent
Very great
extent
Great
Extent
Moderate
extent
Very great
extent
Great
Extent
Very great
extent
Very great
extent
Very great
extent
Case 46 Not at all
Moderate
extent
Low
extent
Moderate
extent Not at all Not at all
Moderate
extent Not at all Not at all
Moderate
extent
Low
extent
Moderate
extent Not at all
Case 47
Very great
extent
Moderate
extent
Great
Extent
Very great
extent
Moderate
extent
Very great
extent
Moderate
extent
Moderate
extent
Very great
extent
Moderate
extent
Great
Extent
Very great
extent
Very great
extent
Case 48
Low
extent
Great
Extent
Great
Extent
Moderate
extent
Great
Extent
Low
extent
Great
Extent
Great
Extent
Low
extent
Great
Extent
Great
Extent
Moderate
extent
Low
extent
Case 49
Great
Extent
Moderate
extent
Moderate
extent
Moderate
extent
Low
extent
Great
Extent
Moderate
extent
Low
extent
Great
Extent
Moderate
extent
Moderate
extent
Moderate
extent
Great
Extent
Case 50
Moderate
extent
Moderate
extent
Great
Extent
Great
Extent
Low
extent
Moderate
extent
Moderate
extent
Low
extent
Moderate
extent
Moderate
extent
Great
Extent
Great
Extent
Moderate
extent
Case 51 Not at all Moderate Moderate Moderate Not at all Not at all Moderate Not at all Not at all Moderate Moderate Moderate Not at all

263
CASE D14IV D14V D14VI D14VII D14VIII D14IX D14X D14XI D14XII D14XIII D14XIV D14XV D14XVI
extent extent extent extent extent extent extent
Case 52
Great
Extent
Moderate
extent
Moderate
extent
Moderate
extent
Moderate
extent
Great
Extent
Moderate
extent
Moderate
extent
Great
Extent
Moderate
extent
Moderate
extent
Moderate
extent
Great
Extent
Case 53
Moderate
extent Not at all
Low
extent
Very great
extent
Low
extent
Moderate
extent Not at all
Low
extent
Moderate
extent Not at all
Low
extent
Very great
extent
Moderate
extent
Case 54
Moderate
extent
Low
extent Not at all
Great
Extent Not at all
Moderate
extent
Low
extent Not at all
Moderate
extent
Low
extent Not at all
Great
Extent
Moderate
extent
Case 55
Moderate
extent
Low
extent Not at all
Great
Extent Not at all
Moderate
extent
Low
extent Not at all
Moderate
extent
Low
extent Not at all
Great
Extent
Moderate
extent
Case 56
Low
extent Not at all
Low
extent
Moderate
extent
Moderate
extent
Low
extent Not at all
Moderate
extent
Low
extent Not at all
Low
extent
Moderate
extent
Low
extent
Case 57
Moderate
extent
Low
extent Not at all
Great
Extent Not at all
Moderate
extent
Low
extent Not at all
Moderate
extent
Low
extent Not at all
Great
Extent
Moderate
extent
Case 58
Great
Extent
Great
Extent
Moderate
extent
Great
Extent
Great
Extent
Great
Extent
Great
Extent
Great
Extent
Great
Extent
Great
Extent
Moderate
extent
Great
Extent
Great
Extent
Case 59
Great
Extent
Very great
extent
Great
Extent
Moderate
extent
Moderate
extent
Great
Extent
Very great
extent
Moderate
extent
Great
Extent
Very great
extent
Great
Extent
Moderate
extent
Great
Extent
Case 60
Great
Extent
Moderate
extent
Moderate
extent
Great
Extent
Low
extent
Great
Extent
Moderate
extent
Low
extent
Great
Extent
Moderate
extent
Moderate
extent
Great
Extent
Great
Extent
Case 61
Moderate
extent
Low
extent
Moderate
extent
Moderate
extent
Low
extent
Moderate
extent
Low
extent
Low
extent
Moderate
extent
Low
extent
Moderate
extent
Moderate
extent
Moderate
extent
Case 62
Great
Extent
Moderate
extent
Great
Extent
Low
extent
Low
extent
Great
Extent
Moderate
extent
Low
extent
Great
Extent
Moderate
extent
Great
Extent
Low
extent
Great
Extent
Case 63
Moderate
extent
Moderate
extent
Moderate
extent
Great
Extent
Low
extent
Moderate
extent
Moderate
extent
Low
extent
Moderate
extent
Moderate
extent
Moderate
extent
Great
Extent
Moderate
extent
Case 64
Great
Extent
Moderate
extent
Moderate
extent
Great
Extent
Great
Extent
Great
Extent
Moderate
extent
Great
Extent
Great
Extent
Moderate
extent
Moderate
extent
Great
Extent
Great
Extent
Case 65
Low
extent Not at all
Low
extent
Moderate
extent
Moderate
extent
Low
extent Not at all
Moderate
extent
Low
extent Not at all
Low
extent
Moderate
extent
Low
extent
Case 66
Great
Extent
Moderate
extent
Great
Extent
Great
Extent
Moderate
extent
Great
Extent
Moderate
extent
Moderate
extent
Great
Extent
Moderate
extent
Great
Extent
Great
Extent
Great
Extent
Case 67
Great
Extent
Moderate
extent
Great
Extent
Great
Extent
Moderate
extent
Great
Extent
Moderate
extent
Moderate
extent
Great
Extent
Moderate
extent
Great
Extent
Great
Extent
Great
Extent
Case 68
Low
extent
Moderate
extent
Low
extent
Low
extent
Low
extent
Low
extent
Moderate
extent
Low
extent
Low
extent
Moderate
extent
Low
extent
Low
extent
Low
extent
Case 69
Low
extent
Moderate
extent
Moderate
extent
Great
Extent
Low
extent
Low
extent
Moderate
extent
Low
extent
Low
extent
Moderate
extent
Moderate
extent
Great
Extent
Low
extent
Case 70
Great
Extent
Moderate
extent
Moderate
extent
Low
extent
Moderate
extent
Great
Extent
Moderate
extent
Moderate
extent
Great
Extent
Moderate
extent
Moderate
extent
Low
extent
Great
Extent
Case 71
Low
extent
Low
extent Not at all
Great
Extent
Low
extent
Low
extent
Low
extent
Low
extent
Low
extent
Low
extent Not at all
Great
Extent
Low
extent
Case 72 Very great Moderate Moderate Very great Moderate Very great Moderate Moderate Very great Moderate Moderate Very great Very great

264
CASE D14IV D14V D14VI D14VII D14VIII D14IX D14X D14XI D14XII D14XIII D14XIV D14XV D14XVI
extent extent extent extent extent extent extent extent extent extent extent extent extent
Case 73
Moderate
extent
Moderate
extent
Low
extent
Low
extent Not at all
Moderate
extent
Moderate
extent Not at all
Moderate
extent
Moderate
extent
Low
extent
Low
extent
Moderate
extent
Case 74
Very great
extent
Great
Extent
Great
Extent
Moderate
extent
Moderate
extent
Very great
extent
Great
Extent
Moderate
extent
Very great
extent
Great
Extent
Great
Extent
Moderate
extent
Very great
extent
CASE PL
AN
NIN
G
NB: BD = BEFORE DEVOLUTION
AD = AFTER DEVOLUTION
Wa
ter
Pro
vis
ion
Ad
min
istr
ati
on
of
dev
olv
ed w
ate
r se
rvic
es
*tr
an
sfo
rma
tio
na
l
lea
der
ship
Ad
min
istr
ati
on
of
dev
olv
ed w
ate
r se
rvic
es
* P
lan
nin
g
E1
6IB
D
E1
6IA
D
E1
6II
BD
E1
6II
AD
E1
6II
IBD
E1
6II
IAD
E1
6IV
BD
E1
6IV
AD
E1
6V
BD
E1
6V
AD
E1
6V
IBD
E1
6V
IAD
E1
6V
IIB
D
E1
6V
IIA
D
Case 1 42.278 0.4 0.3 6 5 50 50 50 60 30 20 70 70 60 60 12.2 180.42 1363.67
Case 2 46.561 2 0.2 20 5 40 70 40 60 10 5 50 80 50 70 11.01 0 1188.96
Case 3 35.831 1 0.7 4 2.5 50 80 60 80 50 30 40 80 50 80 10.44 120.07 978.92
Case 4 49.151 1.2 1 10 5 95 97.5 82.5 85 30 30 82.5 90 90 90 14.99 199.83 2126.06
Case 5 30.379 2.5 1.5 6 5 30 40 40 45 30 50 10 15 25 30 9.55 132.73 847.85
Case 6 8.481 5 5 10 15 60 55 60 60 80 80 85 90 70 70 3.16 11.14 104.53
Case 7 19.589 5 4 17.5 17.5 10 15 40 30 30 30 100 100 45 45 4.29 11.89 142.78
Case 8 22.43 5 4 25 17.5 10 15 40 30 30 30 100 100 45 45 5.03 29.71 163.49
Case 9 39.479 6 5 2 2 80 80 35 40 80 80 10 10 90 90 14.25 468.18 1790.58
Case 10 32.398 5 2 10 20 1 3 50 70 80 80 0 0 80 80 12.6 0 1589.39
Case 11 21.237 3 2 20 15 25 25 30 40 20 15 30 30 15 15 4.71 32.8 145.89
Case 12 32.956 0.5 0.5 10 10 90 90 70 70 60 60 100 100 90 90 9.9 132.39 921.98
Case 13 30.437 5 4 5 5 90 90 55 55 50 50 100 100 100 100 9.14 0 869.95
Case 14 30.437 6 5 5 5 90 90 55 55 50 50 100 100 100 100 9.14 0 869.95
Case 15 23.874 10 5 10 5 75 75 50 50 40 40 70 70 85 90 7.71 119.16 536.86
Case 16 23.874 20 15 5 10 75 75 50 50 30 30 50 60 80 85 7.53 114.42 515.54
Case 17 49.605 10 5 10 5 20 30 25 35 20 15 35 40 20 30 15.52 284.19 2297.23
Case 18 38.715 10 5 10 10 50 55 40 50 30 25 60 60 30 40 13.5 244.7 1708.67
Case 19 25.449 7.5 5 7.5 2 50 50 50 60 10 10 60 60 70 80 6.44 50.64 384.68
Case 20 41.811 10 5 20 10 40 60 40 55 20 20 30 60 40 40 12.35 231.02 1384.72

265
CASE PL
AN
NIN
G
NB: BD = BEFORE DEVOLUTION
AD = AFTER DEVOLUTION
Wa
ter
Pro
vis
ion
Ad
min
istr
ati
on
of
dev
olv
ed w
ate
r se
rvic
es
*tr
an
sfo
rma
tio
na
l
lea
der
ship
Ad
min
istr
ati
on
of
dev
olv
ed w
ate
r se
rvic
es
* P
lan
nin
g
E1
6IB
D
E1
6IA
D
E1
6II
BD
E1
6II
AD
E1
6II
IBD
E1
6II
IAD
E1
6IV
BD
E1
6IV
AD
E1
6V
BD
E1
6V
AD
E1
6V
IBD
E1
6V
IAD
E1
6V
IIB
D
E1
6V
IIA
D
Case 21 27.685 0.5 0.2 15 10 90 90 80 90 5 4 98 98 80 80 9.51 127.84 868.2
Case 22 30.379 0.2 0.1 12.5 15 100 100 95 75 4 3 90 90 98 98 9.7 187.58 822.67
Case 23 27.685 3 2 25 15 90 70 4 60 5 5 60 65 40 60 9.38 160.96 816.32
Case 24 36.335 0.5 0.4 12.5 12.5 80 80 5 80 4 3 89 90 98 98 10.74 94.64 1141.53
Case 25 46.561 15 5 20 5 20 40 0.6 10 30 30 20 20 40 50 15.79 440.03 2256.3
Case 26 38.951 10 3 15 2 30 60 20 60 5 5 30 80 30 80 13.89 425.51 1663.3
Case 27 33.263 8 6 30 15 50 70 50 80 5 3 60 80 40 70 10.1 174.45 945.37
Case 28 29.452 8 7 30 20 50 70 50 80 0 0 60 80 60 80 9.57 206.39 815.48
Case 29 30.214 0.4 0.3 20 20 90 90 90 90 4 3 90 90 92 90 8.65 107.91 688.96
Case 30 52.451 15 5 5 5 20 35 50 70 60 55 70 60 90 90 15.96 403.9 2333.08
Case 31 36.823 7.5 4 40 20 40 30 50 30 20 20 30 50 40 60 12.4 389.21 1300.96
Case 32 27.908 20 15 5 5 40 45 45 55 25 30 15 15 15 15 8.28 72.23 669.13
Case 33 22.311 7 4 0 0 45 45 60 65 70 70 0 0 70 70 8.93 209.48 627
Case 34 25.004 4 2 15 15 30 35 50 50 20 20 10 15 65 65 9.11 172.9 704.33
Case 35 38.715 10 5 5 10 50 75 40 80 70 70 0 0 70 90 13.2 204.56 1714.29
Case 36 43.465 10 5 5 10 40 80 50 80 80 60 10 10 70 90 11.31 116.06 1091.96
Case 37 21.118 7 5 2 2 80 80 85 85 30 30 90 90 75 75 9.52 340.91 653.51
Case 38 36.335 15 9 3.5 2.5 40 60 35 52 20 30 30 40 25 55 12.71 345.27 1442.82
Case 39 33.239 10 5 5 5 98 98 50 60 50 50 98 98 95 98 10.18 173.99 906.18
Case 40 41.517 5 2 3 5 50 50 10 40 50 50 0 0 30 40 12.69 183.1 1598.39
Case 41 13.875 2 1.5 15 12 10 10 40 20 80 80 60 50 25 25 6.37 47.23 375.87
Case 42 36.335 17 7 25 5 3 30 50 80 70 50 30 50 40 70 11.61 183.24 1256.46
Case 43 45.111 12 6 30 10 48 52 42 58 50 50 50 50 40 60 15.75 500.63 2167.76
Case 44 32.765 6 1.5 20 10 50 55 50 60 30 30 90 90 20 50 8.76 110.6 590.39
Case 45 49.861 8 4 7 5 60 40 45 30 30 25 25 20 30 25 16.92 611.7 2562.91
Case 46 13.793 30 15 25 15 10 15 30 50 70 70 0 10 10 20 3.31 6.08 92.72
Case 47 44.21 30 15 5 2 20 40 40 60 100 100 9 18 45 60 10.87 40.73 1104.14
Case 48 32.671 15 15 10 20 50 100 40 60 20 80 10 90 30 50 11.81 325.62 1110.6
Case 49 27.741 35 17.5 13.5 15.2 30 50 60 60 10 20 40 30 50 45 8.7 97.82 692.85

266
CASE PL
AN
NIN
G
NB: BD = BEFORE DEVOLUTION
AD = AFTER DEVOLUTION
Wa
ter
Pro
vis
ion
Ad
min
istr
ati
on
of
dev
olv
ed w
ate
r se
rvic
es
*tr
an
sfo
rma
tio
na
l
lea
der
ship
Ad
min
istr
ati
on
of
dev
olv
ed w
ate
r se
rvic
es
* P
lan
nin
g
E1
6IB
D
E1
6IA
D
E1
6II
BD
E1
6II
AD
E1
6II
IBD
E1
6II
IAD
E1
6IV
BD
E1
6IV
AD
E1
6V
BD
E1
6V
AD
E1
6V
IBD
E1
6V
IAD
E1
6V
IIB
D
E1
6V
IIA
D
Case 50 29.674 65 17.5 60 20 30 50 30 50 50 50 10 10 50 50 9.31 104.66 792.96
Case 51 16.549 20 15 20 20 30 50 30 50 50 50 10 10 5 60 4.34 28.89 142.72
Case 52 30.379 5 3 30 10 60 75 60 75 10 8 75 80 80 85 9.28 115.97 762.61
Case 53 21.837 2 1 5 5 50 60 37 45 50 50 40 50 60 65 5.83 64.68 292.27
Case 54 16.318 10 5 15 10 80 50 30 50 70 40 80 80 70 80 4.76 56.57 150.38
Case 55 16.318 10 10 15 10 80 50 30 50 70 40 80 80 70 80 6.93 79.5 411.96
Case 56 15.809 0.1 0.1 5 5 30 30 85 85 0.1 0.1 10 10 90 90 3 0 69.49
Case 57 16.318 10 5 15 10 80 50 30 50 70 40 80 80 70 80 4.37 29.02 150.38
Case 58 38.927 2 1 5 5 50 60 37 45 50 50 40 50 60 65 13.08 267.41 1613.47
Case 59 38.445 2 1.5 10 5 60 90 65 85 0 0 25 40 40 65 11.88 259.55 1203.43
Case 60 30.601 4 2 50 20 40 65 20 30 40 20 20 25 50 50 9.78 115.89 905.43
Case 61 21.237 2 1.5 30 25 45 40 70 70 15 12 75 72 72 72 7.85 46.33 603.35
Case 62 28.007 5 2 50 20 50 70 20 40 0 0 20 30 50 60 10.38 233.4 937.1
Case 63 26.79 0.15 0.13 10 10 50 50 90 90 0 0 5 5 30 30 8.78 41.4 789.08
Case 64 36.335 3 1.5 10 5 50 75 45 60 50 50 50 50 50 50 11.93 0 1422.34
Case 65 15.809 0.1 0.1 5 5 30 30 85 85 0.1 0.1 10 10 90 90 3 0 69.49
Case 66 36.123 25 15 100 50 20 60 40 70 70 50 40 70 30 60 10.81 180.21 1060.58
Case 67 36.123 40 25 3 2 50 65 65 70 10 10 50 50 50 80 11.16 217.6 1134.79
Case 68 16.088 15 12.5 12.5 7.5 55 75 60 85 35 38 20 20 65 85 6.32 70.32 349.4
Case 69 24.322 12.5 7.5 7.5 2.5 50 85 65 85 20 20 20 20 75 90 7.11 77.93 410.26
Case 70 27.761 12.5 2.5 7.5 2.5 60 85 50 90 15 15 10 10 70 95 8.91 181.82 677.14
Case 71 16.309 12.5 7.5 7.5 2.5 50 85 65 85 20 38 20 20 65 85 4.99 59.93 205.52
Case 72 41.326 5 3 40 20 30 50 50 60 0 0 60 30 70 70 10.18 110.11 984.95
Case 73 16.097 4 4 20 20 30 40 30 35 10 10 50 55 50 60 6.25 0 405
Case 74 40.605 4 4 20 20 30 40 30 35 10 20 30 50 50 40 11.93 280.94 1167.12
Related Documents


![TRANSITION TO DEVOLVED GOVERNMENT ACTRev. 2014] Transition to Devolved Government No. 1 of 2012 3 NO. 1 OF 2012 TRANSITION TO DEVOLVED GOVERNMENT ACT ARRANGEMENT OF SECTIONS PART I](https://static.cupdf.com/doc/110x72/5aad27177f8b9aa06a8df495/transition-to-devolved-government-rev-2014-transition-to-devolved-government-no.jpg)