METHODOLOGY Open Access Adjusting microbiome profiles for differences in microbial load by spike-in bacteria Frank Stämmler 1,2* , Joachim Gläsner 2 , Andreas Hiergeist 2 , Ernst Holler 3 , Daniela Weber 3 , Peter J. Oefner 4 , André Gessner 2 and Rainer Spang 1 Abstract Background: Next-generation 16S ribosomal RNA gene sequencing is widely used to determine the relative composition of the mammalian gut microbiomes. However, in the absence of a reference, this does not reveal alterations in absolute abundance of specific operational taxonomic units if microbial loads vary across specimens. Results: Here we suggest the spiking of exogenous bacteria into crude specimens to quantify ratios of absolute bacterial abundances. We use the 16S rDNA read counts of the spike-in bacteria to adjust the read counts of endogenous bacteria for changes in total microbial loads. Using a series of dilutions of pooled faecal samples from mice containing defined amounts of the spike-in bacteria Salinibacter ruber, Rhizobium radiobacter and Alicyclobacillus acidiphilus, we demonstrate that spike-in-based calibration to microbial loads allows accurate estimation of ratios of absolute endogenous bacteria abundances. Applied to stool specimens of patients undergoing allogeneic stem cell transplantation, we were able to determine changes in both relative and absolute abundances of various phyla, especially the genus Enterococcus, in response to antibiotic treatment and radio-chemotherapeutic conditioning. Conclusion: Exogenous spike-in bacteria in gut microbiome studies enable estimation of ratios of absolute OTU abundances, providing novel insights into the structure and the dynamics of intestinal microbiomes. Keywords: Microbial load, Spike-in bacteria, 16S rRNA gene sequencing, Standardization, Microbiome profiling, Bacterial communities, Community analysis Background The human intestinal tract is populated by an ecological community of microorganisms, the gut microbiome. This complex community plays an important role in health and disease [1–7] and varies greatly among individuals. Next generation sequencing of the 16S rRNA gene allows profil- ing of the bacterial and archaeal components of the gut microbiome at unprecedented precision and depth [8–10]. Computational tools such as QIIME [11] and mothur [12] cluster reads into operational taxonomic units (OTUs) [13], which may then be jointed into taxonomic groups at the genus, family, order, class, and phylum level. Current studies focus on the relative abundance or pro- portions of OTUs [14, 15]. As an example, a specific OTU may contribute 5 % to microbiome A and 10 % to micro- biome B corresponding to a ratio of 1:2. If we further as- sume that the total number of bacteria or microbial load of in A is four times larger than in B, the 5 % in A account for twice as many bacteria as the 10 % in B, thus bringing the actual ratio to 2:1. Antibiotic treatment, diet, and/or disease affect both microbial loads and compositions. For example, Holler et al. [16] observed that the relative abundance of the genus Enterococcus in stool specimens collected from patients undergoing allogeneic stem cell transplantation (ASCT) can increase from undetectable levels prior to ASCT to up to 94 % after ASCT. More interestingly, this relative shift to Enterococcus was associated with an increased risk of acute gastrointestinal graft-versus-host * Correspondence: [email protected] 1 Chair of Statistical Bioinformatics, University of Regensburg, Am BioPark 9, 93053 Regensburg, Germany 2 Institute of Clinical Microbiology and Hygiene, University Medical Centre, Franz-Josef-Strauß-Allee 11, 93053 Regensburg, Germany Full list of author information is available at the end of the article © 2016 The Author(s). Open Access This article is distributed under the terms of the Creative Commons Attribution 4.0 International License (http://creativecommons.org/licenses/by/4.0/), which permits unrestricted use, distribution, and reproduction in any medium, provided you give appropriate credit to the original author(s) and the source, provide a link to the Creative Commons license, and indicate if changes were made. The Creative Commons Public Domain Dedication waiver (http://creativecommons.org/publicdomain/zero/1.0/) applies to the data made available in this article, unless otherwise stated. Stämmler et al. Microbiome (2016) 4:28 DOI 10.1186/s40168-016-0175-0

Welcome message from author
This document is posted to help you gain knowledge. Please leave a comment to let me know what you think about it! Share it to your friends and learn new things together.
Transcript
METHODOLOGY Open Access
Adjusting microbiome profiles fordifferences in microbial load by spike-inbacteriaFrank Stämmler1,2* , Joachim Gläsner2, Andreas Hiergeist2, Ernst Holler3, Daniela Weber3, Peter J. Oefner4,André Gessner2 and Rainer Spang1
Abstract
Background: Next-generation 16S ribosomal RNA gene sequencing is widely used to determine the relativecomposition of the mammalian gut microbiomes. However, in the absence of a reference, this does not revealalterations in absolute abundance of specific operational taxonomic units if microbial loads vary across specimens.
Results: Here we suggest the spiking of exogenous bacteria into crude specimens to quantify ratios of absolutebacterial abundances. We use the 16S rDNA read counts of the spike-in bacteria to adjust the read counts ofendogenous bacteria for changes in total microbial loads. Using a series of dilutions of pooled faecal samples frommice containing defined amounts of the spike-in bacteria Salinibacter ruber, Rhizobium radiobacter and Alicyclobacillusacidiphilus, we demonstrate that spike-in-based calibration to microbial loads allows accurate estimation of ratios ofabsolute endogenous bacteria abundances. Applied to stool specimens of patients undergoing allogeneic stem celltransplantation, we were able to determine changes in both relative and absolute abundances of various phyla,especially the genus Enterococcus, in response to antibiotic treatment and radio-chemotherapeutic conditioning.
Conclusion: Exogenous spike-in bacteria in gut microbiome studies enable estimation of ratios of absolute OTUabundances, providing novel insights into the structure and the dynamics of intestinal microbiomes.
Keywords: Microbial load, Spike-in bacteria, 16S rRNA gene sequencing, Standardization, Microbiome profiling,Bacterial communities, Community analysis
BackgroundThe human intestinal tract is populated by an ecologicalcommunity of microorganisms, the gut microbiome. Thiscomplex community plays an important role in health anddisease [1–7] and varies greatly among individuals. Nextgeneration sequencing of the 16S rRNA gene allows profil-ing of the bacterial and archaeal components of the gutmicrobiome at unprecedented precision and depth [8–10].Computational tools such as QIIME [11] and mothur [12]cluster reads into operational taxonomic units (OTUs)[13], which may then be jointed into taxonomic groups atthe genus, family, order, class, and phylum level.
Current studies focus on the relative abundance or pro-portions of OTUs [14, 15]. As an example, a specific OTUmay contribute 5 % to microbiome A and 10 % to micro-biome B corresponding to a ratio of 1:2. If we further as-sume that the total number of bacteria or microbial loadof in A is four times larger than in B, the 5 % in A accountfor twice as many bacteria as the 10 % in B, thus bringingthe actual ratio to 2:1.Antibiotic treatment, diet, and/or disease affect both
microbial loads and compositions. For example, Holleret al. [16] observed that the relative abundance of thegenus Enterococcus in stool specimens collected frompatients undergoing allogeneic stem cell transplantation(ASCT) can increase from undetectable levels prior toASCT to up to 94 % after ASCT. More interestingly, thisrelative shift to Enterococcus was associated with anincreased risk of acute gastrointestinal graft-versus-host
* Correspondence: [email protected] of Statistical Bioinformatics, University of Regensburg, Am BioPark 9,93053 Regensburg, Germany2Institute of Clinical Microbiology and Hygiene, University Medical Centre,Franz-Josef-Strauß-Allee 11, 93053 Regensburg, GermanyFull list of author information is available at the end of the article
© 2016 The Author(s). Open Access This article is distributed under the terms of the Creative Commons Attribution 4.0International License (http://creativecommons.org/licenses/by/4.0/), which permits unrestricted use, distribution, andreproduction in any medium, provided you give appropriate credit to the original author(s) and the source, provide a link tothe Creative Commons license, and indicate if changes were made. The Creative Commons Public Domain Dedication waiver(http://creativecommons.org/publicdomain/zero/1.0/) applies to the data made available in this article, unless otherwise stated.
Stämmler et al. Microbiome (2016) 4:28 DOI 10.1186/s40168-016-0175-0

disease (GI-GvHD). Without knowledge of total micro-bial load, however, it is impossible to infer whether thisshift was the result of either an absolute increase in thenumber of Enterococcus or a decrease in the number ofbacteria other than Enterococcus.Application of synthetic spike-in standards allows for
changing the profiles’ reference points. The referencepoint of relative abundances is a fixed aliquot of 16SrDNA. These profiles are insensitive to the microbialload of a stool specimen. Adding controlled amounts ofspike-in material allows for rescaling the profiles suchthat the measured concentrations of the standard areconstant across samples, making the spike-in standardthe new reference point of the profiles and the profilessensitive to microbial loads. Spike-in strategies featuringdifferent GC contents and covering a wide concentrationrange in combination with appropriate normalizationstrategies have already been proposed to correct for li-brary preparation and nuisance technical effects in theinference of gene expression levels from RNA-Seq exper-iments [17]. This approach, as well as similar schemesemployed in proteomics [18] and metabolomics, [19]adds the spike-in standards to transcriptomes, pro-teomes and metabolomes only after cell lysis and extrac-tion of mRNA, proteins and metabolites, respectively,and thus do not allow correction of variation originatingfrom these critical experimental steps. Recently Jones etal. [20] suggested using whole cell spike-in controls formonitoring this technical variability in the field ofmicrobiome research.Extending their results, we here suggest the addition of
exogenous viable spike-in bacteria to rescale the readcounts of endogenous bacteria. We call this protocol spike-in-based calibration to total microbial load (SCML), andtest it in a dilution experiment with defined absolute spike-in bacteria abundances against serially diluted backgroundmicrobiomes. Moreover, we reconsider the emergence ofEnterococcus as the predominant genus in ASCT usingSCML.
ResultsChoice of spike - in bacteriaWe used Salinibacter ruber (S. ruber, GenBank ID:CP000159), an extreme halophilic bacterium found inhypersaline environments [21], Rhizobium radiobacter(R. radiobacter, GenBank ID: ASXY01000000), a non-phytopathogenic member of the Biovar I group of Agro-bacterium found in the soil and the plant rhizosphere[22], as well as the thermo-acidophilic, endospore form-ing soil bacterium Alicyclobacillus acidiphilus (A. acidi-philus, GenBank ID: PRJDB697) [23]. These eubacteriabelong to different phyla typically found in mammalianfaecal microbiomes. They do not exist in the gut micro-biome under physiological conditions and are well
distinguishable from the bacteria in the gut using 16SrRNA gene sequencing. Whole bacteria are spiked-in atfixed amounts. 16S rRNA gene copy numbers per gen-ome vary between these species (1, 4 and 6 rRNA genecopies per genome for S. ruber, R. radiobacter and A.acidiphilus, respectively). We quantify spike-in concen-trations and measured concentrations relative to 16SrRNA gene copies. Hence, if we say that we spiked-inbacteria in the same amounts, this means that the num-ber of 16S rRNA copies, but not necessarily the numberof bacterial cells is identical.
Design of spike-in calibration experimentsExperiments were performed with spike-in bacteria whoseabsolute abundance was defined by design in increasinglydiluted gut microbiomes. The dilution simulates non-constant microbial loads.S. ruber, R. radiobacter and A. acidiphilus were spiked
into each of 36 aliquots of pooled murine stool samples.While A. acidiphilus and R. radiobacter were spiked intothese samples at variable amounts, that of S. ruber waskept constant. S. ruber was used to measure microbialloads, while A. acidiphilus and R. radiobacter were usedto validate the SCML approach. The precision of thespike-ins was independently validated using quantitativereal time PCR (qRT-PCR). Importantly, this analysis alsoverified that all three bacteria were in fact not present inthe pooled murine stool (Additional file 1: Table S1).Additional file 2: Table S2 summarizes the design of thevalidation experiment.To validate the spike-in assay we compare calibrated
ratios of observed reads with the expected ratios definedby the experimental design. The experimental designcontrols microbial loads at several levels:(i) For each sample, we have expected total microbial
loads defined by the stool dilution factor and the spike-inconcentrations. (ii) For each of the two spike-ins A. acidi-philus and R. radiobacter we have expected within-speciesratios of concentrations for every pair of samples (intra-OTU comparison). (iii) For every pair of samples we haveexpected inter-species ratios between the two spike-insboth within and across samples (inter-OTU comparison).(iv) For all taxonomic units of the background micro-biome we have expected abundance ratios defined by thedilution factor and the spike-in concentrations.
The three spike-in bacteria yield different read turnoutsbut correlate well with microbial loadsFigure 1a shows linear relationships between the spiked-in 16S rDNA copies (x-axis in log2 scale) of A. acidiphi-lus and R. radiobacter, respectively, and the resultinglog2 read counts. The total number of spike-in reads in-creases with dilution of the background microbiome.Simultaneously, as a constant amount of S. ruber was
Stämmler et al. Microbiome (2016) 4:28 Page 2 of 13

added to each sample, the portion of the spike-in bac-teria increases (Fig. 1b). As a result, the read countassigned to a spike-in OTU is expected to inversely cor-relate with the total microbial load.Figure 1b shows box plots of the log2 transformed read
counts of S. ruber, R. radiobacter and A. acidiphilus as afunction of microbial loads across all 36 samples. Thecounts were adjusted for their varying spike-in concen-trations by design. For example, if in an experiment theconcentration of the A. acidiphilus spike-in was only50 % of that of S. ruber, the A. acidiphilus counts weredoubled. After adjustment of A. acidiphilus and R. radio-bacter, we observe an inverse correlation of log2 spike-in
counts with the microbial load (reciprocal dilutionfactor) for all three spike-in bacteria (Fig. 1b). In detailthere is a correlation of r = -0.834 for S. ruber, r = -0.795for R. radiobacter (adjusted) and r = -0.725 for A. acidi-philus (adjusted). Additionally, we observe that the threebacteria have notably different read yields, with S. rubershowing the highest counts.
SCML yields almost unbiased estimates of ratios ofabsolute abundances within taxonomic unitsFor comparing SCML to standard relative abundanceanalysis, we generated two data sets by scaling the readcounts with respect to two different reference points:
a b
Fig. 1 Log2 transformed read counts of the three spike-in bacteria as a function of total microbial load. S. ruber was added at a constant numberof 16S rDNA copies, while A. acidiphilus and R. radiobacter were spiked in variably (cf. Additional file 2: Table S2). a Resulting read counts of A.acidiphilus and R. radiobacter versus spiked-in 16S rDNA copies at different background stool microbiota dilutions. Each dot represents a caecalspecimen, while the colour specifies its dilution. b Boxplots showing the read counts of all three spike-in bacteria as a function of total microbialload. The log2 read counts of S. ruber are coloured blue, while A. acidiphilus and R. radiobacter are coloured red and green, respectively. Readcounts of A. acidiphilus and R. radiobacter were adjusted by a factor corresponding to their difference of the predefined spike-in concentration toS. ruber. The x-axis is discrete and represents increasing stool dilution (bottom), as well as decreasing microbial load from left to right (grey arrowheadon the top)
Stämmler et al. Microbiome (2016) 4:28 Page 3 of 13

First, we scaled the observed read counts relative to thelibrary sizes. This gives us the standard relative abun-dances (standard data). In a second data set we scaledthe same counts relative to the spike-in reads of S. ruber(SCML data).We first compared the data for A. acidiphilus and R.
radiobacter separately. By design the expected ratio forA. acidiphilus and R. radiobacter between every pair ofsamples is known. Figure 2 shows the observed inter-sample ratios for both data sets as a function of expectedratios. Plot (a) was created using standard data, whileplot (b) was created using SCML data. We observe areduced systematic error in (b) when comparing the datatrend to the identity line (purple). The standard datashows systematically overestimated ratios in both direc-tions. SCML reduced this bias. Moreover, we observe ahigh variability of estimated ratios, which was almost cutin half by SCML (Fig. 2c).We next analysed the ratios for the background OTUs.
By design, experimentally controlled ratios can be calcu-lated from the dilution factor of the background micro-biome. In contrast to A. acidiphilus and R. radiobacter
the ratios derived from relative abundances (standarddata) of these OTUs is zero by experimental design.Figure 3 shows the distribution of observed backgroundratios as a function of corresponding expected ratios.Plot (a) was created using standard data, while plot (b)was created using SCML data. As expected, ratios ofrelative abundances cannot capture shifts in microbialloads that do not affect the composition (Fig. 3a). In linewith the previous observations, we observe a reductionof estimation variance when using SCML (Fig. 3c). Cor-relations between expected and observed log2 ratioswere 0.359 and 0.833 for the standard data and theSCML data, respectively.
SCML allows more accurate estimation of ratios thancalibrating for total 16S rRNA gene copies using qRT-PCRQuantification of the total number of 16S rRNA genecopies by qRT-PCR may be used to determine micro-bial loads. To compare the practicability of the latterwith SCML we used a SYBR Green-based qPCR assayto quantify 16S rDNA (Additional file 1: Table S1).Figure 4 shows observed and expected log2 ratios for
−10
−5
0
5
10
−10 −5 0 5 10expected log2 ratio
obse
rved
log 2
rat
io
a
−10
−5
0
5
10
−10 −5 0 5 10expected log2 ratio
obse
rved
log 2
rat
io
b
−10
−5
0
5
10
relative abundances
erro
r
expe
cted
vs
obse
rved
c
−10
−5
0
5
10
SC
MLer
ror
expe
cted
vs
obse
rved
A.acidiphilus R.radiobacter
Fig. 2 Comparison of log2 ratios derived from relative abundances and after applying SCML to A. acidiphilus and R. radiobacter. Observed log2ratios versus expected log2 ratios of the spike-ins A. acidiphilus and R. radiobacter as derived from (a) relative abundances and (b) SCML by S. ruberfor all pairwise sample comparisons. Both approaches were performed on the raw, not adjusted read counts of A. acidiphilus and R. radiobacter.The expected log2 ratios are calculated by the theoretical number of 16S rDNA copies predetermined in the design of the validation experiment(cf. Additional file 2: Table S2). The purple diagonal represents the identity, which represents the expected log2 ratios by design. The box plots in(c) show the error between the expected and observed log2 ratios for both approaches. The smaller this error, the better calibrated the ratios are
Stämmler et al. Microbiome (2016) 4:28 Page 4 of 13

background OTUs using either (a) SCML or (b) re-scaling to constant total 16S rRNA gene copies. It isapparent that observed ratios derived from SCMLshow higher concordance with the expected ratios re-garding estimation bias and variance. Correlations be-tween expected and observed log2 ratios were 0.717and 0.833 for the qPCR and the SCML approach, re-spectively. These findings are also supported by an
overall lower error between the observed and ex-pected log2 ratios when derived from SCML (Fig. 4c).However, it has to be acknowledged that the SYBRGreen-based quantification method of the bacterialload has not been explicitly compared to probe-basedformats, so any limitations/imprecisions possiblyresulting from the use of this universal detection for-mat were not taken into account.
−10
−5
0
5
10
obse
rved
log 2
rat
io
a
−10
−5
0
5
10
−5.0 −2.5 0.0 2.5 5.0expected log2 ratio
obse
rved
log 2
rat
io
b
10 20 30 40 50
percentage of valuesper exp. ratio
−10
−5
0
5
10
relative abundances
erro
r
expe
cted
vs
obse
rved
c
−10
−5
0
5
10
SC
MLer
ror
expe
cted
vs
obse
rved
cor = 0.833
cor = 0.359
Fig. 3 Comparison of log2 ratios derived from relative abundances and after applying SCML to all background OTUs. Observed log2 ratio versusexpected log2 ratio of all background OTUs for all pairwise comparisons as derived from (a) relative abundances and (b) SCML by S. ruber. Thedata is binned to hexagons because of the high number of data points. The colour of each hexagon represents the percentage of counts at thecorresponding level of expected log2 ratios contained in each bin. Bins that contributed to <0.05 % for each level of expected log2 ratio areomitted. The purple diagonal represents the identity, which represents the expected log2 ratios by design. The box-plots in (c) show the errorbetween the expected and observed log2 ratios for both approaches. The smaller this error, the better calibrated the ratios are
Stämmler et al. Microbiome (2016) 4:28 Page 5 of 13

Combining multiple spike-in bacteria reduces estimationerrorsFigure 1b shows that the adjusted counts of all threespike-in bacteria reciprocally correlated with microbialloads. We next investigated whether taking the sum ofall three spike-in read counts further improves the esti-mates. Since A. acidiphilus and R. radiobacter werespiked in variable amounts we had to adjust their countsprior to using them for calibration. For example, if in anexperiment the concentration of the A. acidiphilusspike-in was only 50 % of that of S. ruber, the A. acidi-philus counts were doubled. We then used the sum ofadjusted counts of all three spike-ins for calibration andrepeated the analysis of the previous section. Figure 4cshows box-plots of the error between expected and ob-served log2 ratios for background OTUs based on rela-tive abundances, read counts normalized by total 16SrDNA copies, as well as based on the SCML data with S.ruber only and the combined counts of all three spike-ins, respectively. The smaller this error, the better cali-brated are the ratios of absolute abundances. Variancesof these errors are 3.65, 2.01, 1.28 and 1.18, respectively.Thus, combined spike-ins yield a slightly increased pre-cision compared to single spike-in usage. Correlations
between expected and observed log2 ratios were 0.833and 0.845 for the SCML and the combined SCML ap-proach, respectively.
Calibration to microbial loads reveals absolute increase ofEnterococcus in the intestine during allogeneic stem celltransplantationFinally, we show that SCML expands our understandingof human microbiomes and their role in disease.Recently, a marked early loss of gastrointestinal micro-biome diversity and an increase in relative abundance ofmembers of the genus Enterococcus have been observedin the course of allogeneic stem cell transplantation(ASCT) and found to increase the risk of developingacute GI-GvHD [16, 24, 25]. Since the data had beengenerated without spike-in bacteria, it had not been pos-sible to conclude whether the observed increase in rela-tive abundance of Enterococcus was the result of anincrease in absolute abundance of Enterococcus or of adecrease in abundance of other bacterial species.Here we report on five patients, whose stool micro-
biomes were monitored prior to ASCT or on days 0(d0), 7 (d7), and 14 (d14) after ASCT, respectively, usingthe proposed spike-in approach. Figure 5a shows the
−10
−5
0
5
10
−5.0 −2.5 0.0 2.5 5.0expected log2 ratio
obse
rved
log 2
rat
io
a
−10
−5
0
5
10
−5.0 −2.5 0.0 2.5 5.0expected log2 ratio
obse
rved
log 2
rat
io
b
10 20 30 40 50
percentage of valuesper exp. ratio
cor = 0.833
cor = 0.717
−10
−5
0
5
10
relative abundances total 16S copies SCML(S. ruber)
SCML(combined)
erro
r
expe
cted
vs
obse
rved
c
Fig. 4 Comparison of SCML and normalization by qRT-PCR-derived total number of 16S rDNA copies to all background OTUs. Observed log2 ratioversus expected log2 ratio of all background bacteria OTUs for all pairwise sample comparisons after (a) SCML by S. ruber and (b) normalizationby qRT-PCR derived total 16S rDNA copy number. The data is binned to hexagons because of the high number of data points. The colour of eachhexagon represents the percentage of all counts at the corresponding level of expected log2 ratios contained in each bin. Bins that contributedto less than 0.05 percent for each level of expected log2 ratio are omitted. The purple diagonal represents the identity, which represents the expectedlog2 ratios by design. The box-plots in (c) summarize the error between the expected and observed log2 ratios for the four different approaches. Thesmaller this error, the better calibrated the ratios are. Variances of the log2 differences are 3.65, 2.01, 1.28 and 1.18 as derived from relative abundances,counts calibrated for differences in total number of 16S rRNA gene copies, SCML (by S. ruber) and combined SCML (by S. ruber, A. acidiphilus and R.radiobacter), respectively
Stämmler et al. Microbiome (2016) 4:28 Page 6 of 13

familiar diagram of relative microbiome compositionwithout taking the spike-in bacteria into consideration.Reads contributing to the genus of Enterococcus are re-ported at genus resolution, while all other bacteria areshown on phyla resolution. In line with Holler et al.[16], we observe dramatic relative increases in Entero-coccus abundance on days 7 and 14 after ASCT in threeof the five patients. By scaling read counts to an even
microbial load using the S. ruber counts, we observemarked changes in the microbial loads in the course ofthe treatment (Fig. 5b). Patient 5, for instance, shows analmost tenfold reduction of microbial load on day 14after ASCT (S. ruber reads 4721) compared to pre-ASCT (S. ruber reads 515). In our study, specimensdominated by Enterococcus generally have low microbialloads (Fig. 5b). We also observe an absolute increase in
Fig. 5 Bacterial abundances in stool specimens of ASCT patients. Specimens were collected prior to administration of prophylactic antibiotics andradio-chemotherapeutic conditioning (pre-ASCT) and on days 0, 7 and 14 after ASCT (d0, d7, d14). a Microbial composition given as in relativeabundances; (b) read counts scaled to a uniform count of the spike-in S. ruber and (c) log2 ratios of Enterococcus of the last time point to pre-ASCT ofpatients 2, 4 and 5 as derived from relative abundances (light grey) and SCML (dark grey). In (a) and (b) the reads of the three spike-in bacteria are omitted.Additionally, the reads that contributed to the genus of Enterococcus are excluded from the Firmicutes phylum and coloured separately (purple)
Stämmler et al. Microbiome (2016) 4:28 Page 7 of 13
abundance of the genus Enterococcus in these micro-biomes relative to the specimens collected before ASCT(Fig. 5c). Patients 2, 4 and 5 showed log2 ratios of En-terococcus between the last and first time point of 10.93,9.22 and 3.60, respectively, employing SCML, comparedto log2 ratios of 14.76, 11.46 and 8.69 based on standarddata. This suggests that Enterococcus dominance is infact associated with both a decrease in microbial loadand a rise in absolute abundance of Enterococcus.
DiscussionHere we suggest the use of spike-in bacteria to calibratemultiple intestinal microbiome profiles to microbialloads (SCML). We employed A. acidiphilus, R. radiobac-ter and S. ruber as spike-in bacteria and demonstratedtheir excellent suitability for a comprehensive and in-formative profiling of gut microbiomes. Usually, thesethree bacteria are absent in the intestinal microbiomes ofmammals, and their unique 16S rRNA gene sequencescannot be mistaken for those of bacteria found in thegastrointestinal tract. All three bacteria are valid reportersof the actual microbial load. Thus SCML adds a newperspective to gut microbiome profiling that expands thecommon relative microbiome composition analysis.Variability in microbial loads of intestines is a genuine
and potentially clinically relevant biological feature thatremains underutilised in standard protocols. On a moretechnical side, adding whole cells prior to lysis enablescontrol for DNA recovery and pyrosequencing errors asa side benefit. Following this, the addition of exogenousspike-ins could also enhance other studies like whole-genome sequencing, qPCR-based quantification of path-ogens as well as approaches using alternative markergenes [20, 26, 27].Bacterial species compete for nutrients and can mutu-
ally displace each other, while others can only live insymbiosis. These dynamics of the intestinal ecosystemshape the structure of microbiome profiles [28, 29]. Mu-tually displacing, e.g. concurrent or antagonistic, speciesdisplay anti-correlated profiles, while those of symbioticspecies are correlated [30]. This theoretical consider-ation holds true for absolute numbers of bacteria. Inter-preting the correlation structure on the basis of relativenumbers can be misleading. If one species grows in ab-solute number, this will lead (i) to an increase of its frac-tion within the microbiome and (ii) to a decrease of thefractions of all other species. Hence, every change of asingle species affects relative counts for all other speciesgenerating notorious anti-correlation between profiles ofdifferent species due to compositionality [31, 32]. Im-portantly, this effect is independent of ecological pro-cesses like displacement and symbiosis. Thus, profilescalibrated to ratios of total microbial loads provide a less
disturbed assessment of the dynamics of the intestinalecosystem.We observed different sequence read yields for the
three spike-in bacteria even upon addition of identicalnumbers of 16S rDNA gene copies to mouse faecessharing the same microbial load. Fortunately, this prob-lem should only arise with comparisons of different spe-cies. As demonstrated, it does not affect the estimationof intra-species ratios between samples, where species-specific yields cancel.There is a difference between absolute quantification
and calibration of ratios of absolute abundances. Theformer needs calibration to a defined unit such as bac-teria per volume. External spike-ins do not enable abso-lute quantification due to e.g. variable lysis efficiencyacross intestinal bacteria and variable 16S rDNA copynumbers. In ratios the unit cancels. Hence, if in a com-parison of the same OTU in two samples SCML cali-brated values show a ratio of 2, then the OTU is in factrepresented (almost) twice as often. With standard rela-tive data this is not the case, when microbial loads inthese samples differ. Importantly, ratios between differ-ent OTUs are not calibrated by SCML. We can thuscalibrate microbiome profiles to ratios of absolute abun-dance but not to absolute quantities of bacteriathemselves.A drawback of the spike-in approach is the propaga-
tion of PCR amplification errors from the spike-in bac-terium to all other taxonomic units. Indeed, the spike-incounts can be affected by PCR amplification or sequen-cing errors. The earlier these errors occur, the more theycould influence the final read tallies. By using thesereads to calibrate microbial ratios, this error-derivedvariance propagates to all other taxonomic units. Thecalibration reduces bias, but inflates variance. One mayattenuate this undesired effect by using multiple spike-inbacteria of fixed concentrations across samples and aver-aging or summing their counts as shown here.
ConclusionIn summary, we suggest that scaling of read counts tototal microbial load and thereby calibrating the ratios oftaxonomic units become standard routine in micro-biome analysis, complementing the classical analysis ofrelative microbiome composition. SCML allows for ac-curate inter-sample comparison of microbiome profileseven in the presence of variation in microbial loads. Fur-ther, compared to the measurement of total number 16SrDNA gene copies by qPCR, the spike-in bacteria areable to control additionally to DNA isolation and PCRamplification the sequencing process. Finally, ourmethod allows a more robust identification of differen-tially abundant OTUs by enabling more accurate estima-tions of OTU-specific ratios.
Stämmler et al. Microbiome (2016) 4:28 Page 8 of 13

MethodsSpike-in bacteriaIn this study we used Salinibacter ruber DSM 13855T, anextreme halophilic bacterium found in hypersaline envi-ronments [21], Rhizobium radiobacter DSM 30147T, anon-phytopathogenic member of the Biovar I group ofAgrobacterium found in soil and the plant rhizosphere[22], as well as the thermo-acidophilic, endospore formingsoil bacterium Alicyclobacillus acidiphilus DSM 14558T
[23]. All bacteria were purchased from the DSMZ(German Collection of Microorganisms and Cell CulturesGmbH, Braunschweig, Germany). These eubacteriabelong to different phyla typically found in mammalianfaecal microbiomes, contributing to Bacteroidetes/Chlor-obi group, Proteobacteria, and Firmicutes, respectively.They do not exist in the gut microbiome under physio-logical conditions and are well distinguishable from bac-teria commonly found in the gut using 16S rRNA genesequencing. S. ruber and R. radiobacter are gram-negativebacteria, whereas A. acidiphilus is a spore-forming gram-positive bacterium. The difference in the chemical consti-tution of the cell wall accounts for a specific susceptibilityto the cell lysis protocol used. Spike-in bacteria were har-vested in the late logarithmic/early stationary growthphase by centrifugation and subsequently resuspended in5 ml of sterile PBS buffer. Bacterial densities in suspen-sions were quantified by OD600 measurement using em-pirical conversion factors determined by directmicroscopic cell counting. Accordingly, 1 OD600 unit cor-responds to 4.6 x 10⁹ cells/ml for S. ruber, 1.4 x 10⁹ cells/ml for R. radiobacter, and 1.2 x 10⁹ cells/ml for A. acidi-philus, respectively. 16S rRNA gene copy numbers pergenome for the spike-in bacteria were obtained from therrnDB database [33]. Six pools of bacterial mock commu-nities containing S. ruber, R. radiobacter and A. acidiphi-lus were generated according to the scheme provided inAdditional file 3: Table S3.
Sample preparation and DNA extractionMouse specimensFor the validation experiment, cecum contents werecollected from three 12-week-old male C57BL/6J mice(200 mg wet weight each), immediately suspendedinto 1 ml of PBS, homogenized by means of the Tis-sueLyser II (QIAGEN, Hilden, Germany), pooled, ad-justed with PBS to a total volume of 4 ml, and splitinto seven aliquots of 550 μl each. Six of these ali-quots were diluted five times according to the schemeprovided in Additional file 2: Table S2. Aliquot 7 wasused as a non-spike control.Sixty microliters of the corresponding spike-bacteria
pool (whole cells) containing the desired number of 16SrDNA copies (see Additional file 3: Table S3) were addedto 250 μl of all prepared, unlysed stool dilutions (see
Fig. 6, step 1) according to the scheme provided inAdditional file 2: Table S2. Then, 180 μl of BacterialLysis Buffer (Roche, Mannheim, Germany) and 20 μlProteinase K (Fermentas GmbH, Sankt Leon-Rot,Germany) were added. Samples were incubated at 65 °Cfor 10 min followed by five cycles of freezing in liquidnitrogen (1 min) and boiling in hot water (95 °C, 1 min).Following the addition of 400 μl of Bacterial Lysis Bufferand a mixture of 0.1-mm and 2.5-mm beads, sampleswere treated for 2 min at 30 Hz in the TissueLyser II.Subsequently, samples were heated at 95 °C for 15 minand centrifuged at 4 °C to pellet stool particles andbeads (see Fig. 6, step 2). The final volume was adjustedto 1 ml and DNA was extracted (see Fig. 6, step 3) bymeans of the MagNA Pure 96 instrument employing theMagNA Pure 96 DNA and Viral NA Large Volume Kit(Roche). Nucleic acids were quantified using the Nano-Drop ND-1000 (Thermo Scientific, Wilmington, DE,USA).
Human ASCT specimensWith approval of the Ethics Committee of the UniversityMedical Centre of Regensburg and after receipt of signedinformed consent forms, stool specimens were collectedat four different time points: prior to administration ofprophylactic antibiotics and radio-chemotherapeutic con-ditioning, on days 0, 7, and 14, respectively, after ASCT.Stool specimens were stored at -80 °C until analysis. Fiftymg (wet weight) of each stool specimen were suspendedinto 250 μl PBS and subsequently subjected to DNA ex-traction as described above. Spiking of A. acidiphilus, S.ruber and R. radiobacter, and 454-pyrosequencing wereperformed according to the validation protocol describedabove. For these experiments, bacterial cells of S. ruber, R.radiobacter and A. acidiphilus equal to 3.0 x10⁸, 5.0x108,1.0x108 16S rDNA copies, respectively, were spiked intoeach crude sample.
Amplification of V3-V6 16S rDNA variable region and 454pyrosequencingSpike bacteria-specific qPCR was performed for all speci-mens (mice and human) to identify errors in DNA isola-tion before undergoing amplification and pyrosequencing(see Fig. 6).A total of 25 ng metagenomic DNA was used as a tem-
plate to amplify the V3-V6 variable regions of the 16SrRNA gene. PCR was performed using primer pair 341 F-1061R containing Lib-L adaptors and Roche standardmulitiplex identifiers (MIDs) in a final volume of 40 μlcontaining 0.088 μM of each primer, 2 mM MgCl2, and 1U Platinum Taq DNA Polymerase (Life Technologies).The PCR amplification (see Fig. 6, step 4) was carried outover 30 cycles (30s at 95 °C, 45 s at 64 °C, 45 s at 72 °C)with an initial 5-min hot start at 95 °C and a final
Stämmler et al. Microbiome (2016) 4:28 Page 9 of 13
extension step (7 min at 72 °C). The resulting 790-bpamplicons were analysed by standard agarose gel elec-trophoresis on a 1.5 % (w/v) gel. The amplicons wereextracted from agarose gels using the QIAquick GelExtraction Kit (Qiagen, Hilden, Germany) and purifiedwith Agencourt AMPure XP beads (Beckman Coulter,Krefeld, Germany). Copy numbers of amplicons con-taining LibL-adaptors were determined using theKAPA Library Quant 454 Titanium/Lib-L UniversalKit (KAPA Biosystems, Wilmington, DE, USA) andpooled to a normalized library with a concentrationof 1 x 10⁷ adaptor-labeled amplicon molecules/μl foreach sample. This library was subjected to sequencing(see Fig. 6, step 5) using the GS FLX+ system (454/Roche) and the GS FLX Titanium LV emPCR Kit(Lib-L) applying 0.4 copies per bead. Sequencing wasperformed on a full PTP according to manufacturer’sprotocol using the GS-FLX Titanium Sequencing KitXL+ and the acyclic flow pattern B. Sequencing rawdata was processed with gsRunProcessor v2.9 (Roche)using quality filtering as defined by the default Long-Amplicons 3 pipeline resulting in 895 Mb from
1,313,653 passed filter wells with a median readlength of 706 bases.
Quantification of 16S rRNA gene copy number by qRT-PCRPrimer design and validationPrimers and probes for quantification of eubacterial 16SrDNA copies (Additional file 4: Table S4) were designedand evaluated in silico based on the RefNR sequencecollection of the SILVA reference database release 119[34] containing 534,968 16S rRNA sequences. The over-all SILVA database coverage of universal 16S rDNAquantification primers 764 F and 907R allowing oneprimer mismatch was 86 %. Allowing no primermismatches, specificity of primers and probes targetingS. ruber, R. radiobacter and A. acidiphilus DNA exhib-ited specificities of 100 %. Specificity of primers andprobes were further evaluated in silico using the blastnalgorithm against the nucleotide collection (nt) database.Concentration of primers were optimized by titration inthe range of the kit manufacturer’s recommendationsafter PCR amplification of 16S rDNA targets from DNAextracts of human and murine faecal specimens.
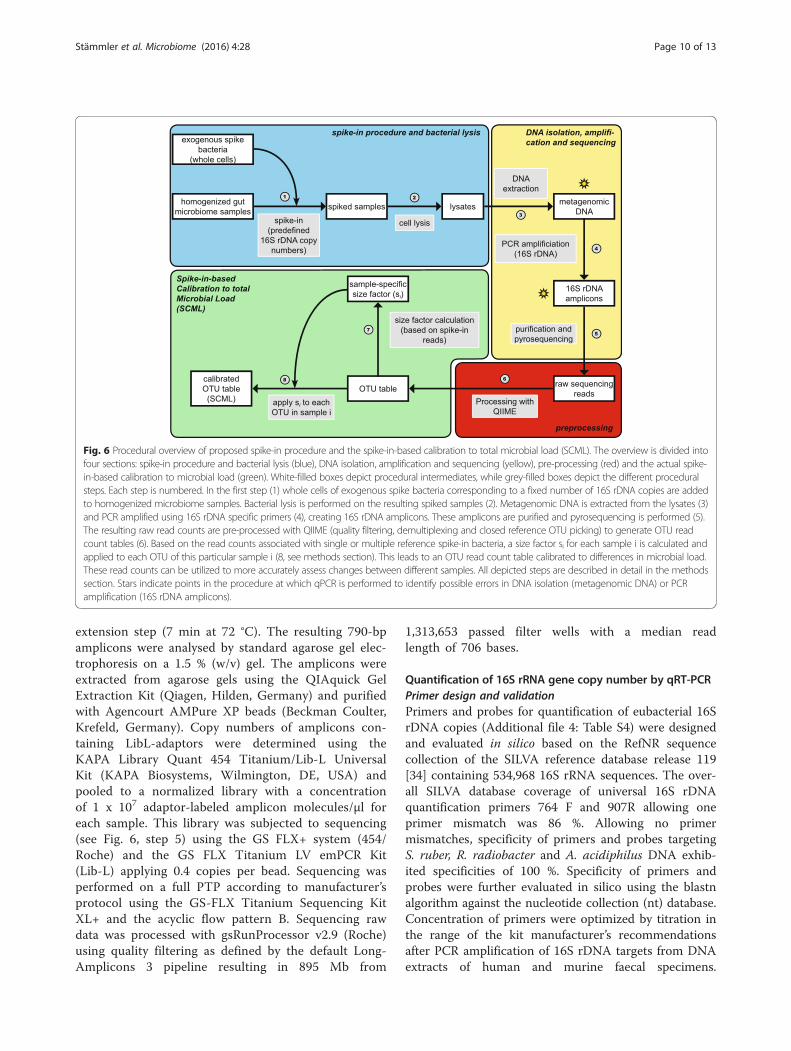
Fig. 6 Procedural overview of proposed spike-in procedure and the spike-in-based calibration to total microbial load (SCML). The overview is divided intofour sections: spike-in procedure and bacterial lysis (blue), DNA isolation, amplification and sequencing (yellow), pre-processing (red) and the actual spike-in-based calibration to microbial load (green). White-filled boxes depict procedural intermediates, while grey-filled boxes depict the different proceduralsteps. Each step is numbered. In the first step (1) whole cells of exogenous spike bacteria corresponding to a fixed number of 16S rDNA copies are addedto homogenized microbiome samples. Bacterial lysis is performed on the resulting spiked samples (2). Metagenomic DNA is extracted from the lysates (3)and PCR amplified using 16S rDNA specific primers (4), creating 16S rDNA amplicons. These amplicons are purified and pyrosequencing is performed (5).The resulting raw read counts are pre-processed with QIIME (quality filtering, demultiplexing and closed reference OTU picking) to generate OTU readcount tables (6). Based on the read counts associated with single or multiple reference spike-in bacteria, a size factor si for each sample i is calculated andapplied to each OTU of this particular sample i (8, see methods section). This leads to an OTU read count table calibrated to differences in microbial load.These read counts can be utilized to more accurately assess changes between different samples. All depicted steps are described in detail in the methodssection. Stars indicate points in the procedure at which qPCR is performed to identify possible errors in DNA isolation (metagenomic DNA) or PCRamplification (16S rDNA amplicons).
Stämmler et al. Microbiome (2016) 4:28 Page 10 of 13
Samples were spiked prior to DNA extraction with de-fined cell counts of S. ruber, R. radiobacter and A. acidi-philus, which were quantified microscopically using amodified Neubauer counting chamber. PCR productswere screened for nonspecific bands by agarose gel elec-trophoresis (probe based assays) or agarose gel and melt-ing curve analysis (SYBR Green I based assays).Specificity was further evaluated by quantitative real-time PCR amplification of total 16S rDNA and 16SrDNA of spike-in bacteria from ten non-spiked murineand human DNA extracts.
Quantification of total 16S rDNATo verify the experimental design, 16S rRNA gene cop-ies of total and spike-in bacteria were determined byqRT-PCR on a LightCycler 480 II Instrument (Roche).Primers and probes used are shown in Additional file 4:Table S4. PCR reactions included 1 μM each of eubac-terial 16S rRNA gene primers 764 F and 907R (quantifi-cation primers) and the LightCycler 480 SYBR Green IMaster Kit (Roche). Quantification standards were gen-erated by cloning complex PCR amplicon mixtures thatwere generated from a caecal microbiome DNA prepar-ation of wild type C57BL/6J mice (using primers 341 Fand 1061R) into the pGEM-T.Easy vector (Promega,Madison, WI, USA). Cloning of PCR amplicon mixtureswas carried out to mimic a complex murine microbiotawith respect to qPCR amplification efficiency in analyzedsamples as far as possible. Quantification PCR was con-ducted over 40 cycles (95 °C for 10s, 60 °C for 15 s and72 °C for 15 s) with an initial 10-min hot start at 95 °C.
Quantification of 16S rDNA of spike-in bacteria16S rRNA gene copy numbers of the spike-in bacteria S.ruber, R. radiobacter and A. acidiphilus were determinedwith 16S rDNA-targeted species-specific primers and hy-drolysis probes (see Additional file 4: Table S4). Quantifi-cation PCR was conducted using the LightCycler 480Probes Master kit (Roche) in a 20-μl reaction volume con-taining 4 mM MgCl2, 0.25 μM of each primer, and 0.1 μMprobes. Quantification standards were constructed bycloning full length 16S PCR amplicons of all spike-in bac-teria (amplified using 27 F and 1492R primers) intopGEM-T.Easy. Quantification PCR was conducted over40 cycles (95 °C for 30s, 60 °C for 30 s and 72 °C for 30s)with an initial 10-min hot start at 95 °C.
Computational analysisWe used a combination of QIIME [11] (v1.8.0) and Rversion 3.2.0 [35] with installed Bioconductor package[36] to process the read data. Reads were filtered forquality using QIIME’s split_libraries.py script (see Fig. 6,step 6) with default parameters except minimum andmaximum read length, which were set to 400 bp and
800 bp, respectively. This read length threshold covered99.99 % of all sequencing reads. The filtered reads weremapped to OTUs built on the SILVA [34] database (re-lease 111) using QIIME’s pick_closed_reference_otus.pyscript (see Fig. 6, step 6) with default parameters. Thereference database OTUs used here constituted compu-tationally built clusters of the SILVA SSU (small subunit)ribosomal RNA database. The clustering (see Fig. 6, step6) was achieved by UCLUST 1.2.20 [37] and provided bythe QIIME team (available at http://qiime.org/home_-static/dataFiles.html). Since reads from the three spike-in bacteria mapped to multiple OTUs, due to multiplereference OTUs encoding for the same spike-in genus,we deleted all but one OTU encoding for each spike-infrom the database before mapping, to accumulate allreads from the spike-in to just this one OTU. The usedreference sequences for these three OTUs are availablein Additional file 5. Raw sequencing data of the dilutionexperiment is deposited in the European NucleotideArchive (ENA) under the study accession numberPRJEB11953, at http://www.ebi.ac.uk/ena/data/view/PRJEB11953. Details of the sample design are shown inAdditional file 2: Table S2. Relative abundances were cal-culated by dividing each OTU read count by total readcount of the corresponding sample.Ratios of absolute abundances were calculated by
using the expectation that the counts of reference spike-ins are inversely correlated to total microbial load of thesamples under investigation. Let �s be the mean readcount of the reference spike-in S. ruber over all samples(see Fig. 6, step 7). The read count of every OTU in asamplei is rescaled by a factor si that is calibrated suchthat the spike-in count is equal to �s in every sample (seeFig. 6, step 8). SCML can be performed by the use of anindividual spike-in bacterium or the sum of all reads ob-tained for multiple spike-in bacteria. For further analysis,the counts are log2 transformed.To compare ratios derived from relative abundances
and those derived by SCML, we calculate log2 ratios be-tween every pair of samples for each method as a sym-metrical measure of difference. Ratios of relativeabundances are calculated by dividing the relative abun-dances of each OTU by its relative abundance in thecompared sample, whereas ratios for SCML are calcu-lated by means of the spike-in calibrated read counts(SCML data). If for example OTU A shows relativeabundances of 20 % and 40 % in samples 1 and 2,respectively, the corresponding ratio for this comparisonwould be 0.4/0.2 = 2, i.e. the abundance of OTU A insample 2 is two times higher than in sample 1. The cor-responding log2 ratio would be log2 (2) = 1. Both ratiosare calculated separately for each OTU.For the combination approach of SCML, the read
counts of A. acidiphilus and R. radiobacter were
Stämmler et al. Microbiome (2016) 4:28 Page 11 of 13

adjusted by their difference in the predefined spike-inconcentration (Additional file 2: Table S2) towards S.ruber. If for example A. acidiphilus was added by designin half the concentration compared to S. ruber, then allreads by A. acidiphilus were multiplied by two. The ad-justed read counts of A. acidiphilus, R. radiobacter andthe raw read counts of S. ruber were summed up to oneartificial entity. These summed reads were used in thesame fashion as the S. ruber read counts in the singlespike-in calculation. For the dilution experiment the ad-justment of A. acidiphilus and R. radiobacter readcounts was necessary, because both spike-ins were addedin varying amounts in this experiment. In an applicationof our spike-in procedure (e.g. ASCT specimens in thisstudy) all spike-in bacteria cells are added at fixedamounts. Therefore, an adjustment of the spike-in readcounts before the combination would be obsolete.
Additional files
Additional file 1: Table S1: Species-specific and total 16S rDNAquantitative realtime-PCR measurements. (XLSX 13 kb)
Additional file 2: Table S2: Design of dilution experiment. (XLSX 16 kb)
Additional file 3: Table S3: Pools of bacterial mock communitiescontaining S. ruber, A. acidiphilus and R. radiobacter. (XLSX 13 kb)
Additional file 4: Table S4: Primers and hydrolysis probes used in thisstudy. (XLSX 13 kb)
Additional file 5: 16S rDNA reference sequences of S. ruber, A.acidiphilus and R. radiobacter. (FASTA 4 kb)
Additional file 6: R-Script for reproduction of analysis and figures of thisstudy. (R 39 kb)
Additional file 7: Dilution experiment mapping file as used forreproduction. (TXT 3 kb)
Additional file 8: ASCT experiment mapping file as used forreproduction. (TXT 1 kb)
Additional file 9: Dilution experiment OTU table as used forreproduction. (TXT 460 kb)
Additional file 10: ASCT experiment OTU table as used forreproduction. (TXT 621 kb)
Additional file 11: Total 16S rDNA qRT-PCR measurements as used forreproduction. (CSV 1 kb)
Additional file 12: Spike-in concentrations by design as used forreproduction. (CSV 1 kb)
AbbreviationsA. acidiphilus, Alicyclobacillus acidiphilus; ASCT, allogeneic stem celltransplantation; GI-GvHD, gastrointestinal graft-versus-host disease; OTU,operational taxonomic unit; qRT-PCR, quantitative real-time polymerase chainreaction; R. radiobacter, Rhizobium radiobacter; S. ruber, Salinibacter ruber;SCML, spike-in-based calibration to microbial load
AcknowledgementsThe authors acknowledge the excellent assistance of Nadja Reul, ClaudiaDeinzer, Christine Irtenkauf and Holger Melzl with all experimental procedures.
FundingFS, RS, AG, JG and AH received core funding support by the DFG priorityprogram SPP 1656 from the German Research Foundation. EH and DWwere partially supported by the Regensburg Centre for InterventionalImmunology (RCI).
Availability of data and materialsQuantitative realtime-PCR measurements are shown in Additional file 1: TableS1. Additional file 2: Table S2 illustrates the design of the dilution experiment.A table with the six different spike-in pools is provided in Additional file 3:Table S3. Primers and hydrolysis probes used in this study, as well as theirreferences, are listed in Additional file 4: Table S4. Additional file 5 containsthe used 16S reference sequences of all three spike-in bacteria. A docu-mented R-script and the data needed to reproduce figures and analyses areprovided in Additional files 6, 7, 8, 9, 10, 11 and 12, respectively. Raw sequencingdata of both dilution experiment and human ASCT specimens is deposited in theEuropean Nucleotide Archive (ENA) under the study accession numberPRJEB11953, at http://www.ebi.ac.uk/ena/data/view/PRJEB11953.
Authors’ contributionsFS, RS, AG, AH and JG designed the validation experiment and thespike-in protocol. Acquisition and processing of the mice samples forthe validation experiment were performed by JG. AH performed qRT-PCRmeasurements and sequencing. EH and DW collected the human stoolspecimens and provided clinical information. FS performed the bioinformaticsanalysis and prepared the figures. FS, RS, PJO, JG and AH wrote the manuscript.All authors read and approved the final manuscript.
Competing interestsThe authors declare that they have no competing interests.
Consent for publicationAll patients consented in writing to the disclosure and publication of de-identified data.
Ethics approval and consent to participateMiceAll mice were maintained under specific pathogen–free conditions at thecentral animal laboratories of the University Medical Centre of Regensburg.Experiments were carried out according to the EU Directive 2010/63/EU onthe protection of animals used for scientific purposes as well as to theinstitutional guidelines for animal welfare.HumanSampling of human stool specimens, microbiome analysis and collection ofclinical data has been approved by the Local Ethical Committee of theUniversity Medical Centre of Regensburg (ethics application numbers: 02/220and 09/059). All patients gave written informed consent prior to admissionto ASCT.
Author details1Chair of Statistical Bioinformatics, University of Regensburg, Am BioPark 9,93053 Regensburg, Germany. 2Institute of Clinical Microbiology and Hygiene,University Medical Centre, Franz-Josef-Strauß-Allee 11, 93053 Regensburg,Germany. 3Department of Haematology and Oncology, Internal Medicine III,University Medical Centre, Franz-Josef-Strauß-Allee 11, 93053 Regensburg,Germany. 4Chair and Institute of Functional Genomics, University ofRegensburg, Am BioPark 9, 93053 Regensburg, Germany.
Received: 14 December 2015 Accepted: 2 June 2016
References1. Walker A, Pfitzner B, Neschen S, Kahle M, Harir M, Lucio M, et al. Distinct
signatures of host-microbial meta-metabolome and gut microbiome in twoC57BL/6 strains under high-fat diet. ISME J. 2014;8(12):2380–96. doi:10.1038/ismej.2014.79.
2. Buffie CG, Pamer EG. Microbiota-mediated colonization resistanceagainst intestinal pathogens. Nat Rev Immunol. 2013;13(11):790–801.doi:10.1038/nri3535.
3. Chung H, Pamp SJ, Hill JA, Surana NK, Edelman SM, Troy EB, et al. Gutimmune maturation depends on colonization with a host-specificmicrobiota. Cell. 2012;149(7):1578–93. doi:10.1016/j.cell.2012.04.037.
4. Haberman Y, Tickle TL, Dexheimer PJ, Kim MO, Tang D, Karns R, et al.Pediatric Crohn disease patients exhibit specific ileal transcriptomeand microbiome signature. J Clin Invest. 2014;124(8):3617–33.doi:10.1172/JCI75436.
Stämmler et al. Microbiome (2016) 4:28 Page 12 of 13

5. Kostic AD, Xavier RJ, Gevers D. The microbiome in inflammatory boweldisease: current status and the future ahead. Gastroenterology. 2014;146(6):1489–99. doi:10.1053/j.gastro.2014.02.009.
6. Iida N, Dzutsev A, Stewart CA, Smith L, Bouladoux N, Weingarten RA, et al.Commensal bacteria control cancer response to therapy by modulating thetumor microenvironment. Science. 2013;342(6161):967–70. doi:10.1126/science.1240527.
7. Klimesova K, Kverka M, Zakostelska Z, Hudcovic T, Hrncir T, Stepankova R, etal. Altered gut microbiota promotes colitis-associated cancer in IL-1receptor-associated kinase M-deficient mice. Inflamm Bowel Dis. 2013;19(6):1266–77. doi:10.1097/MIB.0b013e318281330a.
8. Huse SM, Dethlefsen L, Huber JA, Welch DM, Relman DA, Sogin ML.Exploring Microbial Diversity and Taxonomy Using SSU rRNAHypervariable Tag Sequencing. PLoS Genet. 2008;4(11):e1000255. doi:10.1371/journal.pgen.1000255.
9. Claesson MJ, Wang Q, O’Sullivan O, Greene-Diniz R, Cole JR, Ross RP, et al.Comparison of two next-generation sequencing technologies for resolvinghighly complex microbiota composition using tandem variable 16S rRNAgene regions. Nucleic Acids Res. 2010;38(22):e200. doi:10.1093/nar/gkq873.
10. Ong SH, Kukkillaya VU, Wilm A, Lay C, Ho EX, Low L, et al. Speciesidentification and profiling of complex microbial communities usingshotgun Illumina sequencing of 16S rRNA amplicon sequences. PLoS ONE.2013;8(4):e60811. doi:10.1371/journal.pone.0060811.
11. Caporaso JG, Kuczynski J, Stombaugh J, Bittinger K, Bushman FD, Costello EK,et al. QIIME allows analysis of high-throughput community sequencing data.Nat Methods. 2010;7(5):335–6. doi:10.1038/nmeth.f.303.
12. Schloss PD, Westcott SL, Ryabin T, Hall JR, Hartmann M, Hollister EB, et al.Introducing mothur: open-source, platform-independent, community-supported software for describing and comparing microbial communities.Appl Environ Microbiol. 2009;75(23):7537–41. doi:10.1128/AEM.01541-09.
13. Blaxter M, Mann J, Chapman T, Thomas F, Whitton C, Floyd R, et al. Definingoperational taxonomic units using DNA barcode data. Philos Trans R SocLond Ser B Biol Sci. 2005;360(1462):1935–43. doi:10.1098/rstb.2005.1725.
14. Turnbaugh PJ, Ridaura VK, Faith JJ, Rey FE, Knight R, Gordon JI. Theeffect of diet on the human gut microbiome: a metagenomic analysisin humanized gnotobiotic mice. Sci Transl Med. 2009;1(6):6ra14. doi:10.1126/scitranslmed.3000322.
15. Koren O, Knights D, Gonzalez A, Waldron L, Segata N, Knight R, et al. Aguide to enterotypes across the human body: meta-analysis of microbialcommunity structures in human microbiome datasets. PLoS Comput Biol.2013;9(1):e1002863. doi:10.1371/journal.pcbi.1002863.
16. Holler E, Butzhammer P, Schmid K, Hundsrucker C, Koestler J, Peter K, et al.Metagenomic analysis of the stool microbiome in patients receivingallogeneic stem cell transplantation: loss of diversity is associated with useof systemic antibiotics and more pronounced in gastrointestinal graft-versus-host disease. Biol Blood Marrow Transplant. 2014;20(5):640–5. doi:10.1016/j.bbmt.2014.01.030.
17. Risso D, Ngai J, Speed TP, Dudoit S. Normalization of RNA-seq data usingfactor analysis of control genes or samples. Nat Biotechnol. 2014;32(9):896–902. doi:10.1038/nbt.2931.
18. Geiger T, Wisniewski JR, Cox J, Zanivan S, Kruger M, Ishihama Y, et al.Use of stable isotope labeling by amino acids in cell culture as a spike-in standard in quantitative proteomics. Nat Protoc. 2011;6(2):147–57.doi:10.1038/nprot.2010.192.
19. Wu L, Mashego MR, van Dam JC, Proell AM, Vinke JL, Ras C, et al.Quantitative analysis of the microbial metabolome by isotope dilution massspectrometry using uniformly 13C-labeled cell extracts as internal standards.Anal Biochem. 2005;336(2):164–71. doi:10.1016/j.ab.2004.09.001.
20. Jones MB, Highlander SK, Anderson EL, Li W, Dayrit M, Klitgord N, et al.Library preparation methodology can influence genomic and functionalpredictions in human microbiome research. Proc Natl Acad Sci U S A. 2015;112(45):14024–9. doi:10.1073/pnas.1519288112.
21. Anton J, Oren A, Benlloch S, Rodriguez-Valera F, Amann R, Rossello-Mora R.Salinibacter ruber gen. nov., sp. nov., a novel, extremely halophilic memberof the Bacteria from saltern crystallizer ponds. Int J Syst Evol Microbiol. 2002;52(Pt 2):485–91. doi:10.1099/00207713-52-2-485.
22. Zhang L, Li X, Zhang F, Wang G. Genomic analysis of Agrobacteriumradiobacter DSM 30147(T) and emended description of A. radiobacter(Beijerinck and van Delden 1902) Conn 1942 (Approved Lists 1980)emend. Sawada et al. 1993. Stand Genomic Sci. 2014;9(3):574–84. doi:10.4056/sigs.4688352.
23. Matsubara H, Goto K, Matsumura T, Mochida K, Iwaki M, Niwa M, et al.Alicyclobacillus acidiphilus sp nov., a novel thermo-acidophilic, omega-alicyclic fatty acid-containing bacterium isolated from acidic beverages. Int JSyst Evol Microbiol. 2002;52(Pt 5):1681–5. doi:10.1099/ijs.0.02169-0.
24. Jenq RR, Ubeda C, Taur Y, Menezes CC, Khanin R, Dudakov JA, et al.Regulation of intestinal inflammation by microbiota following allogeneicbone marrow transplantation. J Exp Med. 2012;209(5):903–11. doi:10.1084/jem.20112408.
25. Weber D, Oefner PJ, Hiergeist A, Koestler J, Gessner A, Weber M, et al. Lowurinary indoxyl sulfate levels early after transplantation reflect a disruptedmicrobiome and are associated with poor outcome. Blood. 2015;126(14):1723–8. doi:10.1182/blood-2015-04-638858.
26. Brukner I, Longtin Y, Oughton M, Forgetta V, Dascal A. Assay for estimatingtotal bacterial load: relative qPCR normalisation of bacterial load withassociated clinical implications. Diagn Microbiol Infect Dis. 2015;83(1):1–6.doi:10.1016/j.diagmicrobio.2015.04.005.
27. Amend AS, Seifert KA, Bruns TD. Quantifying microbial communities with454 pyrosequencing: does read abundance count? Mol Ecol. 2010;19(24):5555–65. doi:10.1111/j.1365-294X.2010.04898.x.
28. Costello EK, Stagaman K, Dethlefsen L, Bohannan BJ, Relman DA. Theapplication of ecological theory toward an understanding of the humanmicrobiome. Science. 2012;336(6086):1255–62. doi:10.1126/science.1224203.
29. Cho I, Blaser MJ. The human microbiome: at the interface of health anddisease. Nat Rev Genet. 2012;13(4):260–70. doi:10.1038/nrg3182.
30. Walter J, Ley R. The human gut microbiome: ecology and recentevolutionary changes. Annu Rev Microbiol. 2011;65:411–29. doi:10.1146/annurev-micro-090110-102830.
31. Aitchison J. A New Approach to Null Correlations of Proportions. J Int AssMath Geol. 1981;13(2):175–89. doi:10.1007/Bf01031393.
32. Aitchison J. The Statistical-Analysis of Compositional Data. J Roy Stat Soc BMet. 1982;44(2):139–77.
33. Stoddard SF, Smith BJ, Hein R, Roller BR, Schmidt TM. rrnDB: improved toolsfor interpreting rRNA gene abundance in bacteria and archaea and a newfoundation for future development. Nucleic Acids Res. 2015;43(Databaseissue):D593–8. doi:10.1093/nar/gku1201.
34. Quast C, Pruesse E, Yilmaz P, Gerken J, Schweer T, Yarza P, et al. TheSILVA ribosomal RNA gene database project: improved data processingand web-based tools. Nucleic Acids Res. 2013;41(Database issue):D590–6. doi:10.1093/nar/gks1219.
35. RCoreTeam. R: A Language and Environment for Statistical Computing.Vienna: R Foundation for Statistical Computing; 2015. http://www.r-project.org. Accessed 10 Dec 2015.
36. Huber W, Carey VJ, Gentleman R, Anders S, Carlson M, Carvalho BS, et al.Orchestrating high-throughput genomic analysis with Bioconductor. NatMethods. 2015;12(2):115–21. doi:10.1038/nmeth.3252.
37. Edgar RC. Search and clustering orders of magnitude faster than BLAST.Bioinformatics. 2010;26(19):2460–1. doi:10.1093/bioinformatics/btq461.
• We accept pre-submission inquiries
• Our selector tool helps you to find the most relevant journal
• We provide round the clock customer support
• Convenient online submission
• Thorough peer review
• Inclusion in PubMed and all major indexing services
• Maximum visibility for your research
Submit your manuscript atwww.biomedcentral.com/submit
Submit your next manuscript to BioMed Central and we will help you at every step:
Stämmler et al. Microbiome (2016) 4:28 Page 13 of 13
Related Documents