16th IFIP TC.13 International Conference on Human-Computer Interaction September 25-29, 2017, Mumbai, India Anirudha Joshi, Devanuj K. Balkrishan, Adjunct Proceedings Indian Institute of Technology, Bombay Girish Dalvi & Marco Winckler (eds.) Industrial Design Centre

Welcome message from author
This document is posted to help you gain knowledge. Please leave a comment to let me know what you think about it! Share it to your friends and learn new things together.
Transcript
16th IFIP TC.13 International Conference on Human-Computer Interaction September 25-29, 2017, Mumbai, India
Anirudha Joshi, Devanuj K. Balkrishan,
Adjunct Proceedings
Indian Institute of Technology, Bombay
Girish Dalvi & Marco Winckler (eds.)
Industrial Design Centre
Anirudha Joshi, Devanuj K. Balkrishan, Girish Dalvi & Marco Winckler (eds).
Human-Computer Interaction—interact 2017
Adjunct ProceedingsINTERACT 2017 MUMBAI
16th IFIP TC.13 International Conference on Human Computer Interaction September 25–29, 2017, Mumbai, India
ISBN 978-81-931260-9-7
Published byIndustrial Design Centre Indian Institute of Technology Bombay INDIA
Volume Editors
Anirudha Joshi Indian Institute of Technology Bombay Mumbai, Maharashtra,India [email protected]
Devanuj K. Balkrishan Indian Institute of Technology Bombay Mumbai, Maharashtra, India [email protected]
Girish Dalvi Indian Institute of Technology Bombay Mumbai, Maharashtra, India [email protected]
Marco Winckler University Paul Sabatier, France [email protected]
Volume Co-Editors
Mrinal Biswas Indian Institute of Technology Bombay Mumbai, Maharashtra, India [email protected]
Shikha Verma Indian Institute of Technology Bombay Mumbai, Maharashtra, India [email protected]
Table of Content
Foreword (i)
IFIP-TC13 (v)
IFIP TC13 Members (ix)
Conference Organizing Committee (xiv)
Programme Committee (xvii)
Sponsors & Partners (xxii)
Student Research Consortium 1
Unifying E-Commerce and Markerless Mobile Augmented Reality
Using Real-time Face Tracking and Head Pose Estimation 2
Three Sixty Degree Vision Interfaces : Evaluation of Performance
and Eye Movements 6
Disambiguation Keyboard for Blind 11
Evaluation of Thumb-Movement Alternacy for Two-Thumb
Input in Marathi Soft Keyboard Layouts 16
Probabilistic Modeling of Swarachakra Keyboard for Improved
Touch Accuracy 22
How useful is 360-degree view for Cognitive Mapping? 29
Use of ICT for behavioral change in dietary habits 34
Student Design Consortium 40
Community Based System Designfor Indian Railways in the
Context of Senior Citizens 41
Seek: Art Teaching Aid 55
Service Design for Blood Bank System 66
TouchPIN: Numerical Passwords You Can Feel 76
SwitchTabs: More Efficient Natural Inte- raction with Browser
Tabs 85
Installations 90
Tick Tock: An Art Installation for Scientific Literacy 91
Who you are is what you get - A reflection on objectivity and bias
in information search 99
Insight-Out: Shaping Our World of Ideas 102
Snakes and Ladders: A Sonification 105
Data Jalebi Bot 108

Depth Data Visialization using Kinect and Processing 111
Voyages of Discovery: Conversations with Things, Places and
People 113
Air Draw 116
Workshops 118
Designing Gestures for Interactive Systems towards
Multicultural Perspectives 119
Prototypes for Exploring Gestural Interaction using
Smartphones 120
Technical Aspects of Gesture Recognition Devices 125
Distinct Techniques of Gesture Recognition 131
Beyond Computers Wearables, Humans, And Things -
WHAT! 138
From Painter to Interaction Designer: The Evolution of Visual
Art Things 139
WE-nner: Personalized, Multimodal and Dynamic Interaction
on a Wearable Sport Coach 150
Towards a Platform for Non-Visual Access of Web Pages on
Touch Screen Devices 160
Precious Things: Memories in Cultures – Memories in Space -
Memories in the Cloud 171
Architecture as Extension of Our Bodies 182
Designing Humor in Human-Computer Interaction 191
Humor in Human-Computer Interaction: A Short Survey 192
Detection of Humor Appreciation from Emotional and
paralinguistic Clues in Social Human-Robot Interaction 215
Humor Facilitation in Smart Workplaces 228
Context and Humor: Understanding Amul advertisements of
India 240
Making Humor Tick on Social Media 263
Human Work Interaction Design meets International
Development 272
Interaction Design of Emergency Medical Services Used in
Migrants Rescue Operations 273
Educational Games for Learning Sustainability Concepts 279

Collaborative Work without Large, Shared Displays: Looking for
“the Big Picture” on a Small Screen? 284
Socio-technical HCI for Ethical Value Exchange: A case of
Service Design and Innovation ‘at the Margins’ in Resource
Constrained Environments 290
Dealing with Conflicting User Interface Properties in
User-Centered Development Processes 299
Conflicting Requirements and Design Trade-Offs 301
Designing End-User Development systems: reflections on the
most valued system properties as perceived by end users 315
QBP Notation for Explicit Representation of Properties, their
Refinement and their Potential Conflicts: Application to
Interactive Systems 324
Similarity as a Design Driver for User Interfaces of Dependable
Critical Systems 341
Facilitating Evolutionary UI Prototyping through Declarative
Interaction 351
Whose Value Counts: Overcoming Stakeholder Value Conflicts in
Agile Software Development 359
The 16th iFiP TC13 International Conference on Human-Computer Interaction, interact 2017, was held from September 25 to 29, 2017 in Mumbai, India. This conference was housed in the beautiful campus of the Indian Institute of Technology, Bombay (iit Bombay) and the Industrial Design Centre (idc) was the principal host. The conference was co-sponsored by the hci Professionals Association of India and the Computer Society of India. It was in cooperation with acm and acm sigchi. The financial responsibility of interact 2017 was taken up by the hci Professionals Association of India.
The International Federation for Information Processing (IFIP) was created in 1960 under the auspices of unesco. The Technical Committee 13 (TC13) of the IFIP aims at developing the science and technology of human-computer interaction. TC13 has representatives from 36 countries, apart from 16 expert members and observers. TC13 started the series of interact conferences in 1984. These conferences have been an important showcase for researchers and practitioners in the field of hci. Situated under the open, inclusive umbrella of the IFIP, interact has been a truly international in its spirit and has attracted researchers from several countries and cultures. The venues of the interact conferences over the years bear a testimony to this inclusiveness.
In 2017, the venue was Mumbai. Located in western India, the city of Mumbai is the capital city of the state of Maharashtra. It is the financial, entertainment, and commercial capital of the country and is the most populous city in India. Mumbaikars might add that it is also the most hard working.
The theme of interact 2017 was “Global Thoughts, Local Designs”. The theme was designed to let hci researchers respond to challenges emerging in the new age of global connectivity where they often design products for users who are beyond their borders belonging to distinctly different cultures. As organizers of the conference,we focused our attention on four areas: India, developing countries, students and research.
Foreword
(i)
As the first interact in the sub-continent, the conference offered a distinctly Indian experience to its participants. The span of known history of India covers more than 5,000 years. Today, India is the world’s largest democracy and a land of diversity. Modern technology co-exists with ancient traditions within the same city, often within the same family. Indians speak 22 official languages and hundreds of dialects. India is also a hub of the information technology industry and a living lab of experiments with technology for developing countries.
interact 2017 made a conscious effort to lower barriers that prevent people from developing countries to participate in conferences. Thinkers and optimists believe that all regions of the world can achieve human development goals. Information and communication technologies (icts) can support this process and empower people to achieve their full potential. Today ict products have many new users and many new uses, but also present new challenges and provide new opportunities. It is no surprise that hci researchers are showing great interest in these emergent users. interact 2017 provided a platform to explore these challenges and opportunities but also made it easier for people from developing countries to participate. We also introduced a new track called field-trips which allowed participants to directly engage with stakeholders within the context of a developing country.
Students represent the future of our community. They bring in new energy, enthusiasm and fresh ideas. But it is often hard for students to participate in international conferences. interact 2017 made special efforts to bring students to the conference. The conference had low registration costs and several volunteering opportunities. Thanks to our sponsors, we could provide several travel grants. Most importantly, interact 2017 had special tracks such as Installations, Student Design Consortium, and Student Research Consortium that gave students the opportunity to showcase their work.
Finally, great research is the heart of a good conference. Like its predecessors, interact 2017 aimed to bring together high quality research. As a multidisciplinary field, hci requires interaction and discussion among diverse people with different interest and background. The beginners and the experienced, theoreticians and practitioners, and people from diverse disciplines and different countries gathered together in Mumbai to learn
from each other and to contribute to each other’s growth. We thank all the authors who chose interact 2017 as the venue to publish their research.
We received a total of 571 submissions distributed in 2 peer reviewed tracks, 5 curated tracks, and 7 juried tracks. Of these, the following contributions were accepted:
• 68 Full Papers (peer reviewed)
• 51 Short Papers (peer reviewed)
• 13 Case Studies (curated)
• 20 Industry Presentations (curated)
• 7 Courses (curated)
• 5 Demonstrations (curated)
• 3 Panels (curated)
• 9 Workshops (juried)
• 7 Field Trips (juried)
• 11 Interactive Posters (juried)
• 9 Installations (juried)
• 6 Doctoral Consortium (juried)
• 15 Student Research Consortium (juried)
• 6 Student Design Consortium (juried)
The acceptance rate for contributions received in the peer-reviewed tracks was of 30.7% for full papers and 29.1% for short papers. In addition to full papers and short papers, the present proceedings feature contributions accepted in the form of case studies, courses, demonstrations, interactive posters, field trips, and workshops.
The final decision on acceptance or rejection of full papers was taken in a Programme Committee meeting held in Paris, France in March 2017. The full papers chairs, the associate chairs and the TC13 members participated in this meeting. The meeting discussed a consistent set of criteria to deal
with inevitable differences among the large number of reviewers. The final decisions on other tracks were made by the corresponding track chairs and reviewers, often after electronic meetings and discussions.
interact 2017 was made possible by the persistent efforts across several months by 49 chairs, 39 associate chairs, 55 student volunteers and 499 reviewers. We thank them all. Finally, we wish to express a special thank you to the Proceedings Publication Co-chairs, Marco Winckler and Devanuj Balkrishan, who did extraordinary work to put together four volumes of the main proceedings and one volume of adjunct proceedings.
September 2017
Anirudha Joshi Girish Dalvi (INTERACT 2017 General Co-chairs)
Marco Winckler (INTERACT 2017 Technical Program Chair)
Established in 1989, the International Federation for Information Processing Technical Committee on Human–Computer Interaction (IFIP TC13) is an international committee of 37 member national societies and 10 Working Groups, representing specialists of the various disciplines contributing to the field of Human-Computer Interaction. This includes (among others) human factors, ergonomics, cognitive science, computer science and design. interact is its flagship conference of IFIP TC13, staged biennially in different countries in the world. The first interact conference was held in 1984 running triennially and became a biennial event in 1993.
IFIP TC13 aims to develop the science, technology and societal aspects of human–computer interaction (hci) by encouraging empirical research, promoting the use of knowledge and methods from the human sciences in design and evaluation of computer systems; promoting better understanding of the relation between formal design methods and system usability and acceptability; developing guidelines, models and methods by which designers may provide better human-oriented computer systems; and, cooperating with other groups, inside and outside IFIP, to promote user-orientation and humanization in system design. Thus, TC13 seeks to improve interactions between people and computers, to encourage the growth of HCI research and its practice in industry and to disseminate these benefits worldwide.
The main orientation is to place the users at the center of the development process. Areas of study include: the problems people face when interacting with computers; the impact of technology deployment on people in individual and organizational contexts; the determinants of utility, usability, acceptability and user experience; the appropriate allocation of tasks between computers and users especially in the case of automation; modeling the user, their tasks and the interactive system to aid better system design; and harmonizing the computer to user characteristics and needs.
While the scope is thus set wide, with a tendency toward general principles rather than particular systems, it is recognized that progress
IFIP TC13-http://ifip-tc13.org//
(v)
will only be achieved through both general studies to advance theoretical understanding and specific studies on practical issues (e.g., interface design standards, software system resilience, documentation, training material, appropriateness of alternative interaction technologies, guidelines, the problems of integrating multimedia systems to match system needs and organizational practices, etc.).
In 2015, TC13 has approved the creation of a steering committee for the interact conference. The Steering Committee (SC) is now in place, chaired by Jan Gulliksen and is responsible for:
• promoting and maintaining the interact conference as the premiere venue for researchers and practitioners interested in the topics of the conference (this requires a refinement of the topics above);
• ensuring the highest quality for the contents of the event;
• setting up the bidding process to handle the future interact conferences. Decision is made up at TC13 level;
• providing advice to the current and future chairs and organizers of the interact conference;
• providing data, tools and documents about previous conferences to the future conference organizers;
• selecting the reviewing system to be used throughout the conference (as this impacts the entire set of reviewers);
• resolving general issues involved with the interact conference;
• capitalizing history (good and bad practices).
In 1999, TC13 initiated a special IFIP Award, the Brian Shackel Award, for the most outstanding contribution in the form of a refereed paper submitted to and delivered at each interact. The award draws attention to the need for a comprehensive human-centered approach in the design and use of information technology in which the human and social implications have been taken into account. In 2007 IFIP TC13 also launched an Accessibility award to recognize an outstanding contribution in human-computer interaction with international impact dedicated to the field of accessibility for disabled users. In 2013 IFIP TC13 launched the Interaction
Design for International Development (idid) Award that recognizes the most outstanding contribution to the application of interactive systems for social and economic development of people in developing countries. Since the process to decide the award takes place after papers are sent to publisher for publication, the awards are not identified in the proceedings.
IFIP TC13 also recognizes pioneers in the area of Human-Computer Interaction. An IFIP TC13 Pioneer is one who, through active participation in IFIP Technical Committees or related IFIP groups, has made outstanding contributions to the educational, theoretical, technical, commercial or professional aspects of analysis, design, construction, evaluation and use of interactive systems. IFIP TC13 pioneers are appointed annually and awards are handed over at the interact conference.
IFIP TC13 stimulates working events and activities through its Working Groups (WGs). Working Groups consist of hci experts from many countries, who seek to expand knowledge and find solutions to hci issues and concerns within their domains. The list of Working Groups and their area of interest is given below.
WG13.1 (Education in hci and hci Curricula) aims to improve hci education at all levels of higher education, coordinate and unite efforts to develop hci curricula and promote hci teaching.
WG13.2 (Methodology for User-Centered System Design) aims to foster research, dissemination of information and good practice in the methodical application of hci to software engineering.
WG13.3 (hci and Disability) aims to make hci designers aware of the needs of people with disabilities and encourage development of information systems and tools permitting adaptation of interfaces to specific users.
WG13.4 (also WG2.7) (User Interface Engineering) investigates the nature, concepts and construction of user interfaces for software systems, using a framework for reasoning about interactive systems and an engineering model for developing user interfaces.
WG 13.5 (Resilience, Reliability, Safety and Human Error in System Development) seeks a frame- work for studying human factors relating to systems failure, develops leading edge techniques in hazard analysis and
safety engineering of computer-based systems, and guides international accreditation activities for safety-critical systems.
WG13.6 (Human-Work Interaction Design) aims at establishing relation- ships between extensive empirical work-domain studies and HCI design. It will promote the use of knowledge, concepts, methods and techniques that enable user studies to procure a better apprehension of the complex interplay between individual, social and organizational contexts and thereby a better understanding of how and why people work in the ways that they do.
WG13.7 (Human–Computer Interaction and Visualization) aims to establish a study and research program that will combine both scientific work and practical applications in the fields of Human–Computer Interaction and Visualization. It will integrate several additional aspects of further research areas, such as scientific visualization, data mining, information design, computer graphics, cognition sciences, perception theory, or psychology, into this approach.
WG13.8 (Interaction Design and International Development) are currently working to reformulate their aims and scope.
WG13.9 (Interaction Design and Children) aims to support practitioners, regulators and researchers to develop the study of interaction design and children across international contexts.
WG13.10 (Human-Centered Technology for Sustainability) aims to promote research, design, development, evaluation, and deployment of human-centered technology to encourage sustainable use of resources in various domains.
]New Working Groups are formed as areas of significance in HCI arise. Further information is available at the IFIP TC13 website: http://ifip-tc13.org/

Philippe Palanque, France
Jan Gulliksen, Sweden
Simone D. J. Barbosa, Brazil
Paula Kotze, South Africa
Virpi Roto, Finland
Marco Winckler, France
Helen Petrie, UK
Henry B.L. Duh Australian Computer Society
Geraldine Fitzpatrick Austrian Computer Society
Raquel Oliveira Prates Brazilian Computer Society(SBC)
Kamelia Stefanova Bulgarian Academy of Sciences
Lu Xiao Canadian Information Processing Society
Jaime Sánchez Chilean Society of Computer Science
Andrina Granic Croatian Information Technology Association (CITA)
(ix)

Panayiotis Zaphiris Cyprus Computer Society
Zdeněk Míkovec Czech Society for Cybernetics& Informatics
Torkil Clemmensen Danish Federation for Information Processing
Virpi Roto Finnish Information Processing Association
Philippe Palanque Société informatique de France (SIF)
Tom Gross Gesellschaft für Informatik e.V.
Cecilia Sik Lanyi John V. Neumann Computer So-ciety
Anirudha Joshi Computer Society of India (CSI)
Liam J. Bannon Irish Computer Society
Fabio Paternò ItalianComputerSociety
Yoshifumi Kitamura Information Processing Society of Japan
Gerry Kim KIISE
Vanessa Evers Nederlands Genootschap voor Informatica
Mark Apperley New Zealand Computer Society
Chris C. Nwannenna Nigeria Computer Society
Dag Svanes Norwegian Computer Society
Marcin Sikorski Poland Academy of Sciences

Pedro Campos Associacão Portuguesa para o Desenvolvimento da Sociedade da Informação (APDSI)
Shengdong Zhao Singapore Computer Society
Wanda Benešová The Slovak Society for Computer Science
Matjaž Debevc The Slovenian Computer Society INFORMATIKA
Janet L. Wesson The Computer Society of South Africa
JulioAbascal Asociación de Técnicos de In-formática (ATI)
Jan Gulliksen Swedish Interdisciplinary Society for Human-Computer Interaction Swedish Computer Society
Denis Lalanne Swiss Federation for Information Processing
Mona Laroussi Ecole Supérieure des Communica-tions De Tunis (SUP COM)
José Abdelnour Nocera British Computer Society (BCS)
Ghassan Al-Qaimari UAE Computer Society
Gerrit van der Veer Association for Computing Machi-nery (ACM)
Dan Orwa (Kenya) David Lamas (Estonia) Dorian Gorgan (Romenia) Eunice Sari (Australia / Indonesia) Fernando Loizides (UK / Cyprus) Frank Vetere (Australia) Ivan Burmistrov (Russia) Joaquim Jorge (Portugal)
Marta Kristin Larusdottir (Iceand) Nikolaos Avouris (Greece) Paula Kotze (South Africa) Peter Forbrig (Germany) Simone D. J. Barbosa (Brazil) Vu Nguyen (Vietnam) Zhengjie Liu (China)
Masaaki Kurosu (Japan)

)
Konrad Baumann, Austria
Marco Winckler, France
Helen Petrie, United Kingdom
José Creissac Campos, Portugal
Chris Johnson, UK
Pedro Campos, Portugal
)
Peter Dannenmann, Germany
José Adbelnour Nocera, United Kingdom
Janet Read, United Kingdom
Masood Masoodian, Finland
Anirudha Joshi, India Girish Dalvi, India
Marco Winckler, France
Regina Bernhaupt, France Jacki O’Neill, India
Peter Forbrig, Germany Sriganesh Madhvanath, USA
Ravi Poovaiah, India Elizabeth Churchill, USA
Gerrit van der Veer, Netherlands Dhaval Vyas, Australia
Takahiro Miura, Japan Shengdong Zhao, Singapore Manjiri Joshi, India
Paula Kotze, South Africa Pedro Campos, Portugal
Nimmi Rangaswamy, India José Abdelnour Nocera, UK Debjani Roy, India
Suresh Chande, Finland Fernando Loizides, UK
Ishneet Grover, India Jayesh Pillai, India Nagraj Emmadi, India
Philippe Palanque, France
Antonella De Angeli, Italy Rosa Arriaga, USA
Girish Prabhu, India Zhengjie Liu, China
Indrani Medhi Thies, India Naveen Bagalkot, India Janet Wesson, South Africa
Abhishek Shrivastava, India Prashant Sachan, India Arnab Chakravarty, India
Torkil Clemmensen, Denmark Venkatesh Rajamanickam, India
(xiv)

Prachi Sakhardande, India Sonali Joshi, India
Atish Patel, India Susmita Sharma, India
Rucha Tulaskar, India
Manjiri Joshi, India Nagraj Emmadi, India
Marco Winckler, France Devanuj K. Balkrishan, India
Atul Manohar, India
Rasagy Sharma, India Jayati Bandyopadhyay, India
Sugandh Malhotra, India
Naveed Ahmed, India
Simone Barbosa, Brazil Nicola Bidwell, Manibia Pernille Bjorn, Denmark Birgit Bomsdorf, Germany Torkil Clemmensen, Denmark José Creissac Campos, Portugal Peter Forbrig, Germany Tom Gross, Germany Jan Gulliksen, Sweden Nathalie Henry Riche, USA Abhijit Karnik, UK Dave Kirk, UK Denis Lalanne, Switzerland Airi Lampinen, Sweden Effie Law, UK Eric Lecolinet, France Zhengjie Liu, China Fernando Loizides, UK Célia Martinie, France Laurence Nigay, France
Monique Noirhomme, Belgium Philippe Palanque, France Fabio Paterno, Italy Helen Petrie, UK Antonio Piccinno, Italy Kari-Jouko Raiha, Finland Dave Randall, Germany Nimmi Rangaswamy, India John Rooksby, UK Virpi Roto, Finland Jan Stage, Denmark Frank Steinicke, Germany Simone Stumpf, UK Gerrit van der Veer, Netherlands Dhaval Vyas, India Gerhard Weber, Germany Janet Wesson, South Africa Marco Winckler, France Panayiotis Zaphiris, Cyprus
Julio Abascal, Spain José Abdelnour Nocera, UK Silvia Abrahão, Spain Abiodun Afolayan Ogunyemi,
Estonia Ana Paula Afonso, Portugal David Ahlström, Austria Muneeb Ahmad, Australia Deepak Akkil, Finland
Sarah Alaoui, France Komathi Ale, Singapore Jan Alexandersson, Germany Dzmitry Aliakseyeu, Netherlands Hend S. Al-Khalifa, Saudi Arabia Fereshteh Amini, Canada Junia Anacleto, Brazil Mads Schaarup Andersen,
Denmark
(xvi)

Leonardo Angelini, Switzerland Huckauf Anke, Germany Craig Anslow, New Zealand Nathalie Aquino, Paraguay Oscar Javier Ariza Núñez,
Germany Parvin Asadzadeh, UK Uday Athavankar, India David Auber, France Nikolaos Avouris, Greece Sohaib Ayub, Pakistan Chris Baber, UK Cedric Bach, France Naveen Bagalkot, India Jan Balata, Czech Republic Emilia Barakova, Netherlands Pippin Barr, Denmark Oswald Barral, Finland Barbara Rita Barricelli, Italy Michel Beaudouin-Lafon, France Astrid Beck, Germany Jordan Beck, USA Roman Bednarik, Finland Ben Bedwell, UK Marios Belk, Germany Yacine Bellik, France David Benyon, UK François Bérard, France Arne Berger, Germany Nigel Bevan, UK Anastasia Bezerianos, France Sudhir Bhatia, India Dorrit Billman, USA Pradipta Biswas, India Edwin Blake, South Africa Renaud Blanch, France Mads Bødker, Denmark Cristian Bogdan, Sweden Rodrigo Bonacin, Brazil
Claus Bossen, Denmark Paolo Bottoni, Italy Nadia Boukhelifa, France Nina Boulus-Rødje, Denmark Judy Bowen, New Zealand Margot Brereton, Australia Roberto Bresin, Sweden Barry Brown, Sweden Emeline Brulé, France Nick Bryan-Kinns, UK Sabin-Corneliu Buraga, Romania Ineke Buskens, South Africa Adrian Bussone, UK Maria Claudia Buzzi, Italy Marina Buzzi, Italy Federico Cabitza, Italy Diogo Cabral, Portugal Åsa Cajander, Sweden Eduardo Calvillo Gamez, Mexico Erik Cambria, Singapore Pedro Campos, Portugal Tara Capel, Australia Cinzia Cappiello, Italy Stefan Carmien, Spain Maria Beatriz Carmo, Portugal Luis Carriço, Portugal Stefano Carrino, Switzerland Géry Casiez, France Fabio Cassano, Italy Thais Castro, Brazil Vanessa Cesário, Portugal Arnab Chakravarty, India Matthew Chalmers, UK Teresa Chambel, Portugal Chunlei Chang, Australia Olivier Chapuis, France Weiqin Chen, Norway Mauro Cherubini, Switzerland Fanny Chevalier, France

Yoram Chisik, Portugal Eun Kyoung Choe, USA Mabrouka Chouchane, Tunisia Elizabeth Churchill, USA Gilbert Cockton, UK Ashley Colley, Finland Christopher Collins, Canada Tayana Conte, Brazil Nuno Correia, Portugal Joelle Coutaz, France Rui Couto, Portugal Céline Coutrix, France Nadine Couture, France Lynne Coventry, UK Benjamin Cowan, Ireland Paul Curzon, UK Edward Cutrell, India Florian Daiber, Germany Nick Dalton, UK Girish Dalvi, India Jose Danado, USA Chi Tai Dang, Germany Ticianne Darin, Brazil Jenny Darzentas, Greece Giorgio De Michelis, Italy Clarisse de Souza, Brazil Ralf de Wolf, Belgium Andy Dearden, UK Dmitry Dereshev, UK Giuseppe Desolda, Italy Heather Desurvire, USA Amira Dhouib, Tunisia Ines Di Loreto, Italy Paulo Dias, Portugal Shalaka Dighe, India Tawanna Dillahunt, USA Anke Dittmar, Germany Andre Doucette, Canada Pierre Dragicevic, France
Steven Drucker, USA Carlos Duarte, Portugal Julie Ducasse, France Andreas Duenser, Australia Bruno Dumas, Belgium Paul Dunphy, UK Sophie Dupuy-Chessa, France Sourav Dutta, India James Eagan, France Grace Eden, Switzerland Brian Ekdale, USA Linda Elliott, USA Chris Elsden, UK Morten Esbensen, Denmark Florian Evéquoz, Switzerland Shamal Faily, UK Carla Faria Leitao, Brazil Ava Fatah gen. Schieck, UK Camille Fayollas, France Tom Feltwell, UK Xavier Ferre, Spain Pedro Ferreira, Denmark Sebastian Feuerstack, Brazil Patrick Tobias Fischer, Germany Geraldine Fitzpatrick, Austria Rowanne Fleck, UK Daniela Fogli, Italy Asbjørn Følstad, Norway Manuel J. Fonseca, Portugal Renata Fortes, Brazil André Freire, UK Parseihian Gaëtan, France Radhika Gajalla, USA Teresa Galvão, Portugal Nestor Garay-Vitoria, Spain Roberto García, Spain Jose Luis Garrido, Spain Franca Garzotto, Italy Isabela Gasparini, Brazil

Cally Gatehouse, UK Sven Gehring, Germany Stuart Geiger, USA Helene Gelderblom, South Africa Cristina Gena, Ireland Cristina Gena, Italy Vivian Genaro Motti, USA Rosella Gennari, Italy Werner Geyer, USA Giuseppe Ghiani, Italy Anirban Ghosh, Canada Sanjay Ghosh, India Martin Gibbs, Australia Patrick Girard, France Victor Gonzalez, Mexico Rohini Gosain, Ireland Nicholas Graham, Canada Tiago Guerreiro, Portugal Yves Guiard, France Nuno Guimaraes, Portugal Tauseef Gulrez, Australia Thilina Halloluwa, Sri Lank Martin Halvey, UK Dave Harley, UK Richard Harper, UK Michael Harrison, UK Heidi Hartikainen, Finland Thomas Hartley, UK Mariam Hassib, Germany Ari Hautasaari, Japan Elaine Hayashi, Brazil Jonas Hedman, Denmark Ruediger Heimgaertner, Germany Tomi Heimonen, USA Mattias Heinrich, Germany Ingi Helgason, UK Wilko Heuten, Germany Uta Hinrichs, UK Daniel Holliday, UK
Jonathan Hook, UK Jettie Hoonhout, Netherlands Heiko Hornung, Brazil Axel Hösl, Germany Lara Houston, UK Roberto Hoyle, USA William Hudson, UK Stéphane Huot, France Christophe Hurter, France Husniza Husni, Malaysia Ebba Thora Hvannberg, Iceland Aulikki Hyrskykari, Finland Yavuz Inal, Turkey Petra Isenberg, France Poika Isokoski, Finland Minna Isomursu, Denmark Howell Istance, Finland Kai-Mikael Jää-Aro, Sweden Karim Jabbar, Denmark Isa Jahnke, USA Abhishek Jain, India Mlynar Jakub, Switzerland Yvonne Jansen, France Camille Jeunet, France Nan Jiang, UK Radu Jianu, UK Deepak John Mathew, India Matt Jones, UK Rui José, Portugal Anirudha Joshi, India Dhaval Joshi, China Manjiri Joshi, India Mike Just, UK Eija Kaasinen, Finland Hernisa Kacorri, USA Sanjay Kairam, USA Bridget Kane, Ireland Shaun K. Kane, USA Jari Kangas, Finland

Ann Marie Kanstrup, Denmark Evangelos Karapanos, Cyprus Turkka Keinonen, Finland Pramod Khambete, India Munwar Khan, India NamWook Kim, USA Yea-Seul Kim, USA Jennifer King, USA Reuben Kirkham, UK Kathi Kitner, South Africa Søren Knudsen, Denmark Janin Koch, Finland Lisa Koeman, Netherlands Uttam Kokil, USA Christophe Kolski, France Paula Kotze, South Africa Dennis Krupke, Germany Sari Kujala, Finland David Lamas, Estonia Eike Langbehn, Germany Rosa Lanzilotti, Italy Marta Larusdottir, Iceland Yann Laurillau, France Elise Lavoué, France Bongshin Lee, USA Matthew Lee, USA Barbara Leporini, Italy Agnes Lisowska Masson,
Switzerland Netta Livari, Finland Kiel Long, UK Víctor López-Jaquero, Spain Yichen Lu, Finland Stephanie Ludi, USA Bernd Ludwig, Germany Christopher Lueg, Australia Ewa Luger, UK Stephan Lukosch, Netherlands Jo Lumsden, UK
Christof Lutteroth, UK Kris Luyten, Belgium Miroslav Macik, Czech Republic Scott Mackenzie, Canada Allan MacLean, UK Christian Maertin, Germany Charlotte Magnusson, Sweden Jyotirmaya Mahapatra, India Ranjan Maity, India Päivi Majaranta, Finland Sylvain Malacria, France Marco Manca, Italy Kathia Marçal de Oliveira, France Panos Markopolous, Netherlands Paolo Masci, Portugal Dimitri Masson, France Stina Matthiesen, Denmark Claire McCallum, UK Roisin McNaney, UK Indrani Medhi-Thies, India Gerrit Meixner, Germany Johanna Meurer, Germany Luana Micallef, Finland Takahiro Miura, Japan Judith Molka-Danielsen, Norway Naja Holten Moller, Denmark Giulio Mori, Italy Alistair Morrison, UK Aske Mottelson, Denmark Omar Mubin, Australia Michael Muller, USA Lennart Nacke, Canada Amit Nanavati, India David Navarre, France Carla Nave, Portugal Luciana Nedel, Brazil Matti Nelimarkka, Finland Julien Nembrini, Switzerland David Nemer, USA

Vania Neris, Brazil Maish Nichani, Singapore James Nicholson, UK Diederick C. Niehorster, Sweden Shuo Niu, USA Manuel Noguera, Spain Nicole Novielli, Italy Diana Nowacka, UK Marcus Nyström, Sweden Marianna Obrist, UK Lars Oestreicher, Sweden Thomas Olsson, Finland Juliet Ongwae, UK Dympna O'Sullivan, UK Antti Oulasvirta, Finland Saila Ovaska, Finland Xinru Page, USA Ana Paiva, Portugal Sabrina Panëels, France Smitha Papolu, USA Hugo Paredes, Portugal Susan Park, Canada Oscar Pastor, Spain Jennifer Pearson, UK Simon Perrault, Singapore Mark Perry, UK Anicia Peters, Namibia Kevin Pfeil, USA Jayesh Pillai, India Marcelo Pimenta, Brazil Aparecido Fabiano Pinatti de
Carvalho, Germany Claudio Pinhanez, Brazil Stefania Pizza, Italy Bernd Ploderer, Australia Andreas Poller, Germany Ravi Poovaiah, India Christopher Power, UK Girish Prabhu, India
Denise Prescher, Germany Costin Pribeanu, Romania Helen Purchase, UK Xiangang Qin, Denmark Venkatesh Rajamanickam, India Dorina Rajanen, Finland Rani Gadhe Rani Gadhe, India Heli Rantavuo, Sweden Noopur Raval, USA Janet Read, UK Sreedhar Reddy, India Christian Remy, Switzerland Karen Renaud, UK António Nestor Ribeiro, Portugal Michael Rietzler, Germany Maurizio Rigamonti, Switzerland Kerem Rızvanoğlu, Turkey Teresa Romao, Portugal Maki Rooksby, UK Mark Rouncefield, UK Gustavo Rovelo, Belgium Debjani Roy, India Hamed R-Tavakolli, Finland Simon Ruffieux, Switzerland Angel Ruiz-Zafra, UK Katri Salminen, Finland Antti Salovaara, Finland Frode Eika Sandnes, Norway Supraja Sankaran, Belgium Vagner Santana, Brazil Carmen Santoro, Italy Vidya Sarangapani, UK Sayan Sarcar, Japan Somwrita Sarkar, Australia Christine Satchell, Australia Mithileysh Sathiyanarayanan, UK Anthony Savidis, Greece Susanne Schmidt, Germany Kevin Schneider, Canada

Dirk Schnelle-Walka, Germany Ronald Schroeter, Australia Vinícius Segura, Brazil Ajanta Sen, India Audrey Serna, France Marcos Serrano, France Leslie Setlock, USA Anshuman Sharma, India Patrick C. Shih, USA Shanu Shukla, India Gulati Siddharth, Estonia Bruno Silva, Brazil Carlos C. L. Silva, Portugal Milene Silveira, Brazil Adalberto Simeone, UK Jaana Simola, Finland Carla Simone, Finland Laurianne Sitbon, Australia Ashok Sivaji, Malasya Keyur Sorathia, India Alessandro Soro, Australia Oleg Spakov, Finland Lucio Davide Spano, Italy Susan Squires, USA Christian Stary, Austria Katarzyna Stawarz, UK Jürgen Steimle, Germany Revi Sterling, USA Agnis Stibe, USA Markus Stolze, Switzerland Selina Sutton, UK David Swallow, UK Aurélien Tabard, France Marcel Taeumel, Germany Chee-Wee Tan, Denmark Jennyfer Taylor, Australia Robyn Taylor, UK Robert Teather, Canada Luis Teixeira, Portugal
Paolo Tell, Denmark Jakob Tholander, Sweden Alice Thudt, Canada Subrata Tikadar, India Martin Tomitsch, Australia Ilaria Torre, Italy Noam Tractinsky, Jerusalem Hallvard Traetteberg, Norway Giovanni Troiano, USA Janice Tsai, USA Robert Tscharn, Germany Manfred Tscheligi, Austria Truna Turner, Australia Markku Turunen, Finland Pankaj Upadhyay, India Heli Väätäjä, Finland Pedro Valderas, Spain Stefano Valtolina, Italy Jan van den Bergh, Belgium Thea van der Geest, Netherlands Davy Vanacken, Belgium Jean Vanderdonckt, Belgium Christina Vasiliou, Cyprus Radu-Daniel Vatavu, Romania Shriram Venkatraman, India Nervo Xavier Verdezoto, UK Himanshu Verma, Switzerland Arnold P. O. S. Vermeeren,
Netherlands Jo Vermeulen, Belgium Chi Thanh Vi, UK Nadine Vigouroux, France Jean-Luc Vinot, France Dong Bach Vo, UK Lin Wan, Germany Xiying Wang, USA Yi Wang, USA Ingolf Waßmann, Germany Jenny Waycott, Australia

Gerald Weber, New Zealand Kurtis Weir, UK Benjamin Weyers, Germany Jerome White, USA Graham Wilson, UK Heike Winshiers-Theophilus,
Namibia Wolfgang Woerndl, Germany Katrin Wolf, Germany Andrea Wong, USA
Nelson Wong, Canada Gavin Wood, UK Adam Worrallo, UK Volker Wulf, Germany Naomi Yamashita, Japan Pradeep Yammiyavar, India Tariq Zaman, Malasya Massimo Zancanaro, Italy Juergen Ziegler, Germany Gottfried Zimmermann, Germany

Adobe Systems
Adobe SystemsDesign4India,
a NASSCOM InitiativeLead Partners: Facebook
ACM SIGCHI
a NASSCOM Initiative Lead Partners: Facebook
(xxiv)

Globant
Pitney Bowes
‘
Interaction Design Foundation (IDF)
Ruwido GmBH
Austria
Oxford University Press
Converge
CauseCode Technologies
Balsamiq Studios
Converge
CauseCode Technologies

International Federation for Information Processing
In-cooperation with ACM
Industrial Design
IIT Bombay
Computer Society of India
International Federation for Information Processing
cooperation with ACM
In-cooperation with SIGCHI
Industrial Design Centre, IIT Bombay
HCI Professionals' Association of
India
Computer Society of India
IIT Bombay
cooperation with SIGCHI
HCI Professionals' Association of

Student Research Consortium
People often do some of their best work as students. Current students are not only
future researchers and practitioners; they are also fresh thinkers and generators of
innovative ideas. Students often work on hard problems and pressing needs and
propose bold solutions. The Student Research Consortium (SRC) track celebrates the
best and bold research projects done by students at undergraduate or masters levels.
1

Unifying E-Commerce and Markerless MobileAugmented Reality Using Real-time Face
Tracking and Head Pose Estimation
Anuradha Welivita, Nanduni Nimalsiri, Ruchiranga Wickramasinghe, andUpekka Pathirana
Department of Computer Science and EngineeringUniversity of MoratuwaMoratuwa, Sri Lanka.
anuradha.12,nanduni.12,ruchiranga.12,[email protected]
Abstract. Augmented Reality has opened doors to numerous ways ofenhancing human computer interaction. It has brought up opportunitiesto seamlessly improve user experience in e-commerce applications. Inthis paper, we describe an approach of building a mobile augmentedreality application that enables the users to try out fashionable facialaccessories without physically visiting the outlets. The application usesface tracking and head pose estimation techniques in rendering virtualcontent realistically over human faces.
Keywords: Augmented Reality, E-Commerce, Face Detection, Face Track-ing, Head Pose Estimation
1 Introduction
Augmented Reality (AR) is a technology that superimposes computer generatedimages and graphics onto real world environments. This enhances the user's per-ception of reality by combining real and virtual elements. Increasingly, companiesare using AR technology to reach out to customers to market their products byallowing customers to virtually visualize product models of jewellery, eye-wearetc. on themselves.
The software behind AR applications need to have a method of getting thecorrect location and the correct orientation of the virtual models that need tobe rendered. In cases of augmenting the environment, this can be achieved withthe use of marker based approaches. But in scenarios that involve augmentingone's face, a markerless approach has to be used. For this, an efficient algorithmto robustly detect and track the human face and determine the head pose inreal-time is required.
As a lot of approaches exist in the literature to address the requirements offace detection, tracking and head pose estimation, finding an efficient approachthat combines the above three in estimating human head pose in real-time is
©Authors 2017, All Rights ReservedINTERACT 2017 Adjunct Proceedings
2

challenging. In this paper we intend to present a novel approach discovered afterconducting a comprehensive evaluation on a set of selected face detection andtracking algorithms. Using this novel approach, a mobile augmented reality basedreal-time virtual try-on solution was developed.
The paper first describes the related work in the field. Then it discussesthe research methodology and the architecture of the proposed application inbrief. Finally, an evaluation carried out on the final approach implemented inthe mobile platform is presented.
2 Related Work
The Viola-Jones algorithm [1], the neural network based approach proposed byH. Rowley [2] and the support vector machine (SVM) based approach proposedby E. Osuna et. al [3] are some approaches that serve the purpose of face de-tection. When considering face trackers, the KLT point tracker [4] is a popularfeature based tracker while the Active Appearance Model (AAM) [5] and theConstrained Local Model (CLM) are some model based face trackers.
When the positions of the facial landmark points are estimated by the tracker,a head pose estimation algorithm can be applied to derive the human head pose.The geometric head pose estimation approach introduced by A.H. Gee and R.Cipolla [7] and the POSIT (Pose from Orthography and Scaling with ITerations)algorithm introduced by Dementhon et al. [8] are two such approaches.
TryLive [9], Masquerade [10] and Snapchat [11] are three AR based appli-cations that make use of face detection, tracking and head pose estimation forpurposes of e-commerce, entertainment and social media respectively. The sig-nificance of the proposed mobile application being developed lies in the fact thatit primarily targets the e-commerce and retail industries.
3 Methodology
A comprehensive evaluation was conducted on the set of face detection, trackingand head pose estimation algorithms stated in section 2. It was carried out ona laptop PC platform having an Intel Core i5 1.80GHz CPU and 4GB memory,using several publicly available and our own data sets. According to the results,the Viola-Jones algorithm, the KLT algorithm and the geometric head pose es-timation technique were the most performant in terms of speed and accuracy.Hence, these three algorithms were used in developing the proposed AR appli-cation considering its requirements. Further in order to extract and get a properinitialization of the major facial feature points, the two eyes, the tip of the noseand the center of the mouth, a CLM was used.
The final application was developed using C#, Unity3D and OpenCV imageprocessing library. The system consists of three main components, the applica-tion controller, the camera handler and the object pose estimator. The applica-tion controller is responsible for coordinating the execution of the application.The camera handler component assists in reading image frames one at a time
3
Unifying E-Commerce and Markerless Mobile Augmented Reality 3
from the mobile device camera as a 640 x 480 image. The application controller would then feed the image frames into the object pose estimator component. The returned results from the object pose estimator are used in updating thepose of the 3D model used in terms of position, scale and rotation.
4 Evaluation and Results
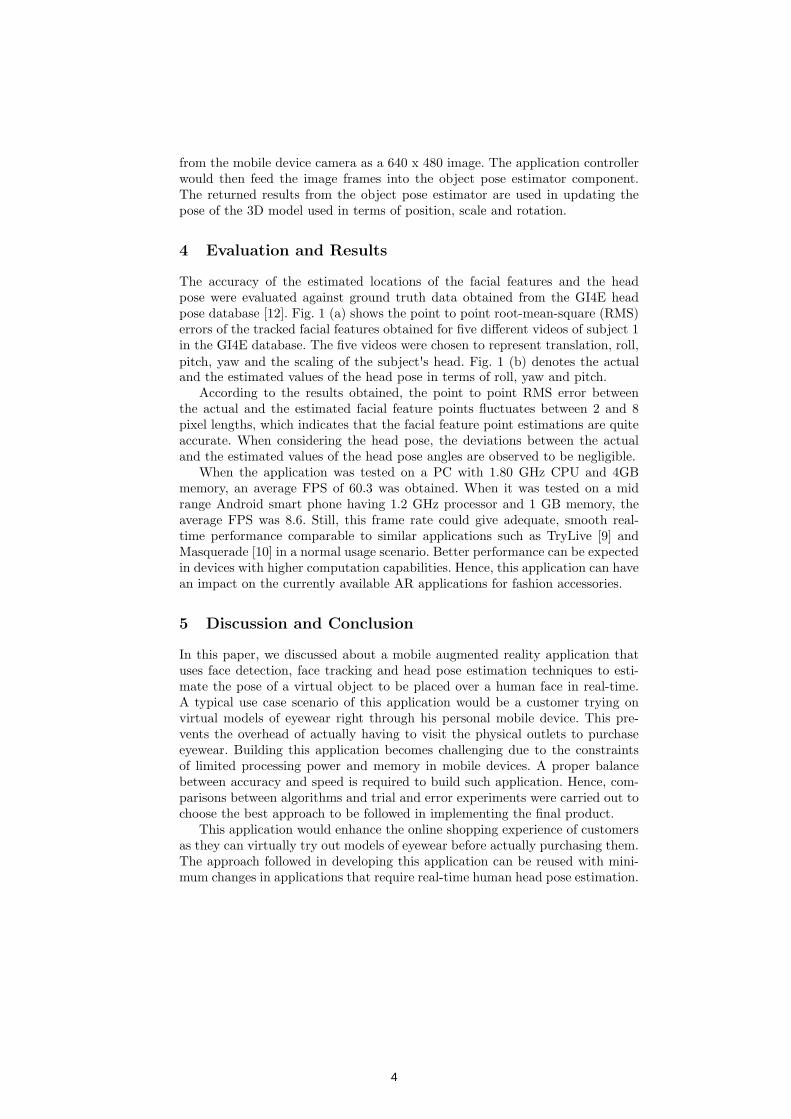
The accuracy of the estimated locations of the facial features and the head pose were evaluated against ground truth data obtained from the GI4E head pose database [12]. Fig. 1 (a) shows the point to point root-mean-square (RMS)errors of the tracked facial features obtained for five different videos of subject 1in the GI4E database. The five videos were chosen to represent translation, roll, pitch, yaw and the scaling of the subject's head. Fig. 1 (b) denotes the actual and the estimated values of the head pose in terms of roll, yaw and pitch.
According to the results obtained, the point to point RMS error between the actual and the estimated facial feature points fluctuates between 2 and 8 pixel lengths, which indicates that the facial feature point estimations are quite accurate. When considering the head pose, the deviations between the actual and the estimated values of the head pose angles are observed to be negligible.
When the application was tested on a PC with 1.80 GHz CPU and 4GB memory, an average FPS of 60.3 was obtained. When it was tested on a mid range Android smart phone having 1.2 GHz processor and 1 GB memory, the average FPS was 8.6. Still, this frame rate could give adequate, smooth real- time performance comparable to similar applications such as TryLive [9] and Masquerade [10] in a normal usage scenario. Better performance can be expected in devices with higher computation capabilities. Hence, this application can havean impact on the currently available AR applications for fashion accessories.
5 Discussion and Conclusion
In this paper, we discussed about a mobile augmented reality application that uses face detection, face tracking and head pose estimation techniques to esti- mate the pose of a virtual object to be placed over a human face in real-time. A typical use case scenario of this application would be a customer trying on virtual models of eyewear right through his personal mobile device. This pre- vents the overhead of actually having to visit the physical outlets to purchase eyewear. Building this application becomes challenging due to the constraints of limited processing power and memory in mobile devices. A proper balance between accuracy and speed is required to build such application. Hence, com- parisons between algorithms and trial and error experiments were carried out to choose the best approach to be followed in implementing the final product.
This application would enhance the online shopping experience of customers as they can virtually try out models of eyewear before actually purchasing them. The approach followed in developing this application can be reused with mini- mum changes in applications that require real-time human head pose estimation.
4
Fig. 1. (a) Point to point RMS errors between the ground truth and the estimatedfacial feature points. (b) Deviation of the roll, yaw and pitch angles.
6 Acknowledgement
We would like to acknowledge Dr. Chandana Gamage, senior lecturer at Univer-sity of Moratuwa for supervising this research project.
References
1. Viola, P., Jones, M.: Rapid object detection using a boosted cascade of simple fea-tures. IEEE Computer Society Conference on Computer Vision and Pattern Recog-nition. pp. 511 518. IEEE (2001).
2. Rowley, H., Baluja, S., Kanade, T.: Neural network-based face detection. In: IEEETransactions on pattern analysis and machine intelligence. pp. 23-38. IEEE (1998).
3. Osuna, E., Freund, R., Girosit, F.: Training support vector machines: an applicationto face detection. In: Proceedings of IEEE computer society conference, ComputerVision and Pattern Recognition. pp. 130136. IEEE (1997).
4. Tomasi, C., Kanade, T.: Detection and Tracking of Point Features. School of Com-puter Science, Carnegie Mellon University, Pittsburgh (1991).
5. Cootes, T., Edwards, G., Taylor, C.: Active appearance models. In: IEEE Transac-tions on pattern analysis and machine intelligence. pp. 681685. IEEE (2001).
6. Cristinacce, D., Cootes, T.: Automatic feature localisation with constrained localmodels. In: Pattern Recognition. pp. 30543067. IEEE (2008).
7. Gee, A., Cipolla, R.: Determining the gaze of faces in images. Image and VisionComputing. 12, 639-647 (1994).
8. DeMenthon, D., Davis, L. S.: Model-based object pose in 25 lines of code. In: Eu-ropean conference on computer vision, Springer Berlin Heidelberg. pp. 335-343.(1992).
9. TryLive http://www.trylive.com
10. Masquerade, http://msqrd.me11. Snapchat, https://www.snapchat.com12. Ariz, M., Bengoechea, J., Villanueva, A., Cabeza, R.: A novel 2D/3D database
with automatic face annotation for head tracking and pose estimation. ComputerVision and Image Understanding. 148, 201-210 (2016).
5
Three Sixty Degree Vision Interfaces : Evaluation ofPerformance and Eye Movements
Aniruddh Ravipati and Ambika Shahu
IIIT Hyderabad, Hyderabad Telangana 500032, India,[email protected], [email protected]
Abstract. The current study aims to evaluate the efficacy and efficiency of desktop 360o dis-play designs, specifically navigation and direction judgment in an unknown environment. Basedon previous studies, which showed an advantage of gaming experience on spatial abilities, wefurther tested the gaming experience and its relationship with the speed of understandingspace by varying the visibility of timer on screen. We conducted an eye-tracking experimentwith three factors: interface type, gaming and timer visibility as mixed-group design. Partici-pants were divided based on their gaming experience(gamers vs. non gamers) as well as timervisible condition(timer vs. no-timer). This resulted in four different groups of participants. Theresults show a significant effect of timer on the direction estimation across the three interfaces.Further, we found that gamers did outperformed non gamers in direction estimation and totaltime taken to complete the task. Eye tracker data with twelve selected participants showed,comparatively lesser ‘fixation counts’ in left AOIs across all 360o display designs indicating thepreferences in visual field. Further, the panoramic (360o x 1) interface showed reduced timeto first fixation indicating fewer saccades to scan the entire FOV as compared to the othertwo interfaces. The current results favor the 360o displays ’with visual boundaries’ comparedto the display ’without visual boundaries’ independent of the previous experience (gaming) orspeed of processing (timer visibility).
Keywords: Field of view, 360o vision, direction judgment
1 Introduction
Drones, both ground and airborne, are increasingly gaining widespread use in urban search and rescue(USAR) operations around the world. In a high stakes situation like these, maximum informationabout the environment in which the drone is operated is vital [1, 2]. We postulate that a 360o FOVis one of the features necessary for these situations. In tasks like USAR, covering 360o FOV becomesessential for acquiring spatial knowledge, more specifically navigation and direction judgment in agiven unknown environment [1–3]. Despite growing importance of 360o FOV, very few studies haveassessed the effect of 360o visual display on users’ remote spatial ability, specifically in the caseof ’2D 360o user interface (UI)’, which is the focus of the current study. We aim to evaluate theefficacy and efficiency of desktop 360o display designs on user’s egocentric spatial ability, specificallynavigation and direction judgment in an unfamiliar environment. A previous study Boonsuk et al.[4] showed an advantage of visual boundaries over seamless 360o UI design on direction judgment.However, it is still unknown whether the performance would remain the same when they wouldperform the task under time related stress condition, with an increased number of targets and withspatial cues like landmarks. In addition, would the sample from different population(i.e Asians,more specifically Indians) show the same variability? To address the aforementioned question, we
c© Authors 2017, All Rights ReservedINTERACT 2017 Adjunct Proceedings
6
replicated the Boonsuk et al. study [4] with a novel change of timer visibility to induce a time relatedstress while performing a given spatial task.
2 Approach And Method
The entire virtual simulation was developed in Unity 3D. The interfaces were rendered using Unity’sbuilt in camera objects. The experiment was divided into three phases: familiarization, main ex-periment followed by a satisfaction survey. We conducted two surveys to assess the each interfaceinteraction satisfaction and the overall interaction satisfaction. These phases were conducted in afixed order. In both the phases: familiarization and main experiment, participants were asked tonavigate and estimate the direction of a barrel, once detected, with respect to their position(i.e ego-centric). Familiarization task was conducted for 5 minutes to make them learn about the controlsrelated to navigation and direction estimation. Participants performed the direction estimation ona compass that appeared on the screen after registering the barrel detection. Their performancewas compared against the three interfaces by measuring direction estimation error with referenceto the actual barrel position and total time taken as behavioral measures; time to first fixation,fixation count and visit count as eye-tracking measure; and the self-report satisfaction survey asinterface interaction. The experiment consisted of three trials of three different interfaces presentedin a random fashion. Each interface consisted of 12 barrels presented randomly to reduce any spatiallearning. They were given total 12 minutes to complete the task. The entire experiment lasted forapproximately 50 minutes. The experiment was conducted with 40 participants (20 gamers). The20 gamers and 20 non gamers were randomly assigned to timer visible and no timer condition i.e 10participants per group.
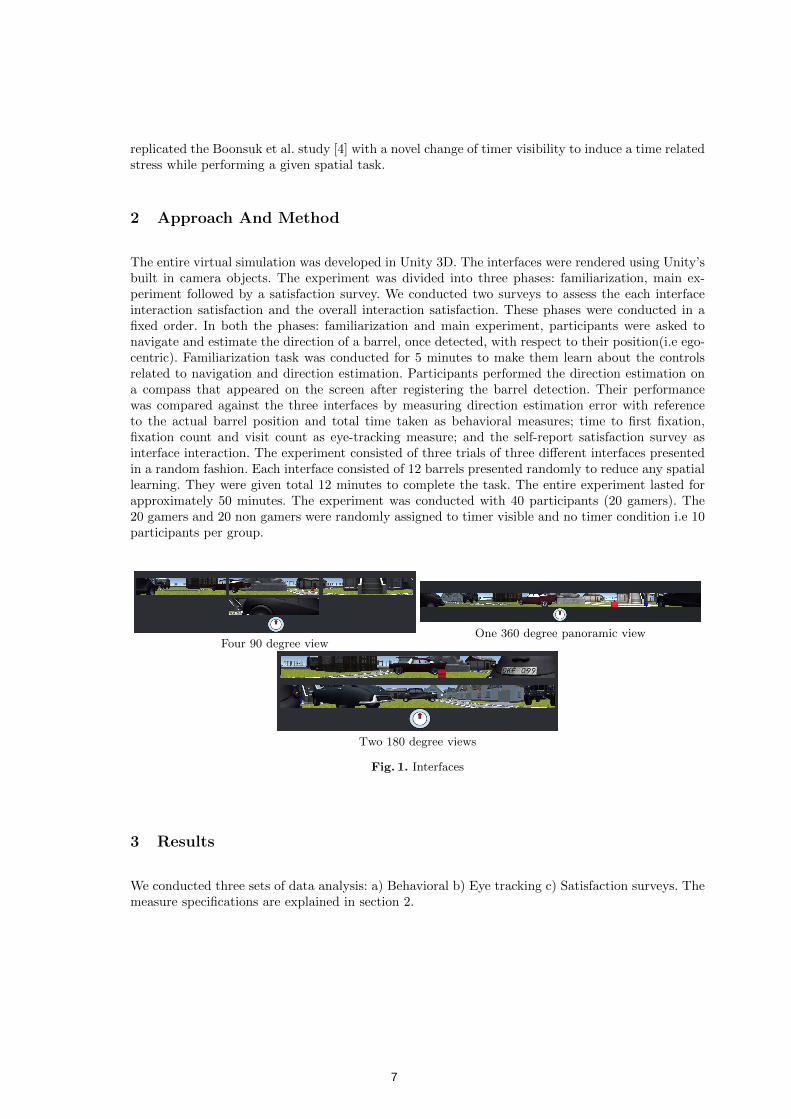
Four 90 degree viewOne 360 degree panoramic view
Two 180 degree views
Fig. 1. Interfaces
3 Results
We conducted three sets of data analysis: a) Behavioral b) Eye tracking c) Satisfaction surveys. Themeasure specifications are explained in section 2.
7
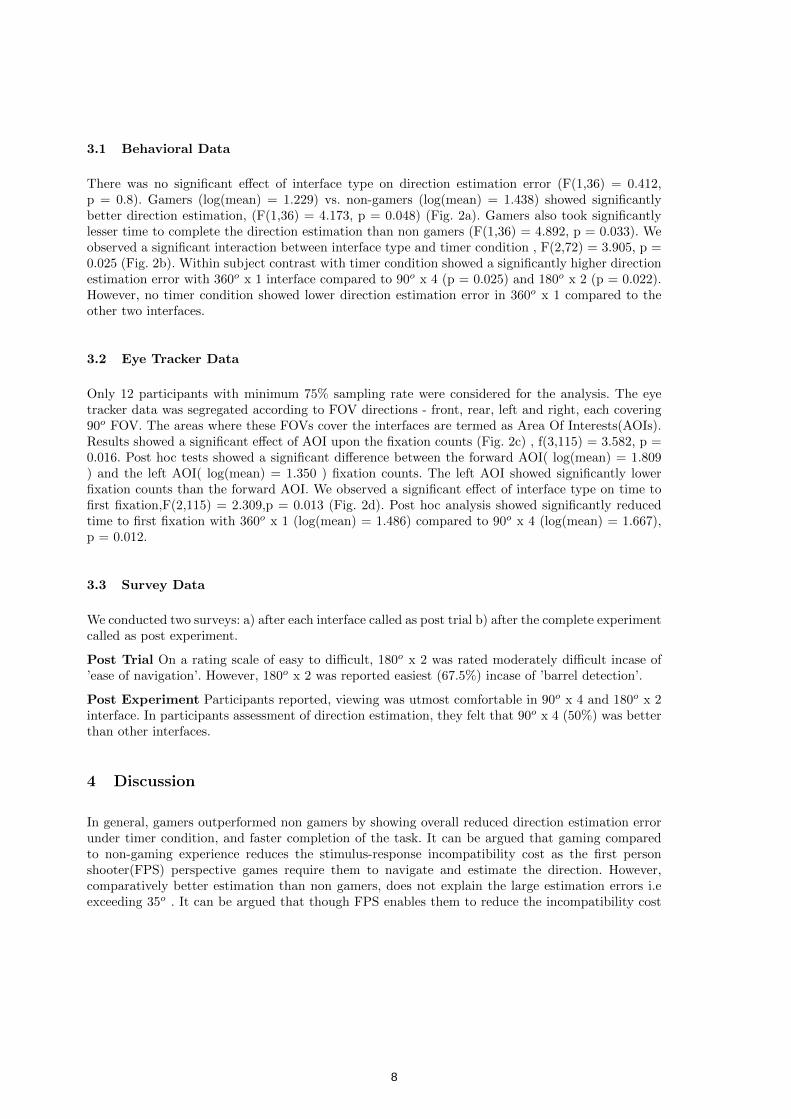
3.1 Behavioral Data
There was no significant effect of interface type on direction estimation error (F(1,36) = 0.412,p = 0.8). Gamers (log(mean) = 1.229) vs. non-gamers (log(mean) = 1.438) showed significantlybetter direction estimation, (F(1,36) = 4.173, p = 0.048) (Fig. 2a). Gamers also took significantlylesser time to complete the direction estimation than non gamers (F(1,36) = 4.892, p = 0.033). Weobserved a significant interaction between interface type and timer condition , F(2,72) = 3.905, p =0.025 (Fig. 2b). Within subject contrast with timer condition showed a significantly higher directionestimation error with 360o x 1 interface compared to 90o x 4 (p = 0.025) and 180o x 2 (p = 0.022).However, no timer condition showed lower direction estimation error in 360o x 1 compared to theother two interfaces.
3.2 Eye Tracker Data
Only 12 participants with minimum 75% sampling rate were considered for the analysis. The eyetracker data was segregated according to FOV directions - front, rear, left and right, each covering90o FOV. The areas where these FOVs cover the interfaces are termed as Area Of Interests(AOIs).Results showed a significant effect of AOI upon the fixation counts (Fig. 2c) , f(3,115) = 3.582, p =0.016. Post hoc tests showed a significant difference between the forward AOI( log(mean) = 1.809) and the left AOI( log(mean) = 1.350 ) fixation counts. The left AOI showed significantly lowerfixation counts than the forward AOI. We observed a significant effect of interface type on time tofirst fixation,F(2,115) = 2.309,p = 0.013 (Fig. 2d). Post hoc analysis showed significantly reducedtime to first fixation with 360o x 1 (log(mean) = 1.486) compared to 90o x 4 (log(mean) = 1.667),p = 0.012.
3.3 Survey Data
We conducted two surveys: a) after each interface called as post trial b) after the complete experimentcalled as post experiment.
Post Trial On a rating scale of easy to difficult, 180o x 2 was rated moderately difficult incase of’ease of navigation’. However, 180o x 2 was reported easiest (67.5%) incase of ’barrel detection’.
Post Experiment Participants reported, viewing was utmost comfortable in 90o x 4 and 180o x 2interface. In participants assessment of direction estimation, they felt that 90o x 4 (50%) was betterthan other interfaces.
4 Discussion
In general, gamers outperformed non gamers by showing overall reduced direction estimation errorunder timer condition, and faster completion of the task. It can be argued that gaming comparedto non-gaming experience reduces the stimulus-response incompatibility cost as the first personshooter(FPS) perspective games require them to navigate and estimate the direction. However,comparatively better estimation than non gamers, does not explain the large estimation errors i.eexceeding 35o . It can be argued that though FPS enables them to reduce the incompatibility cost
8
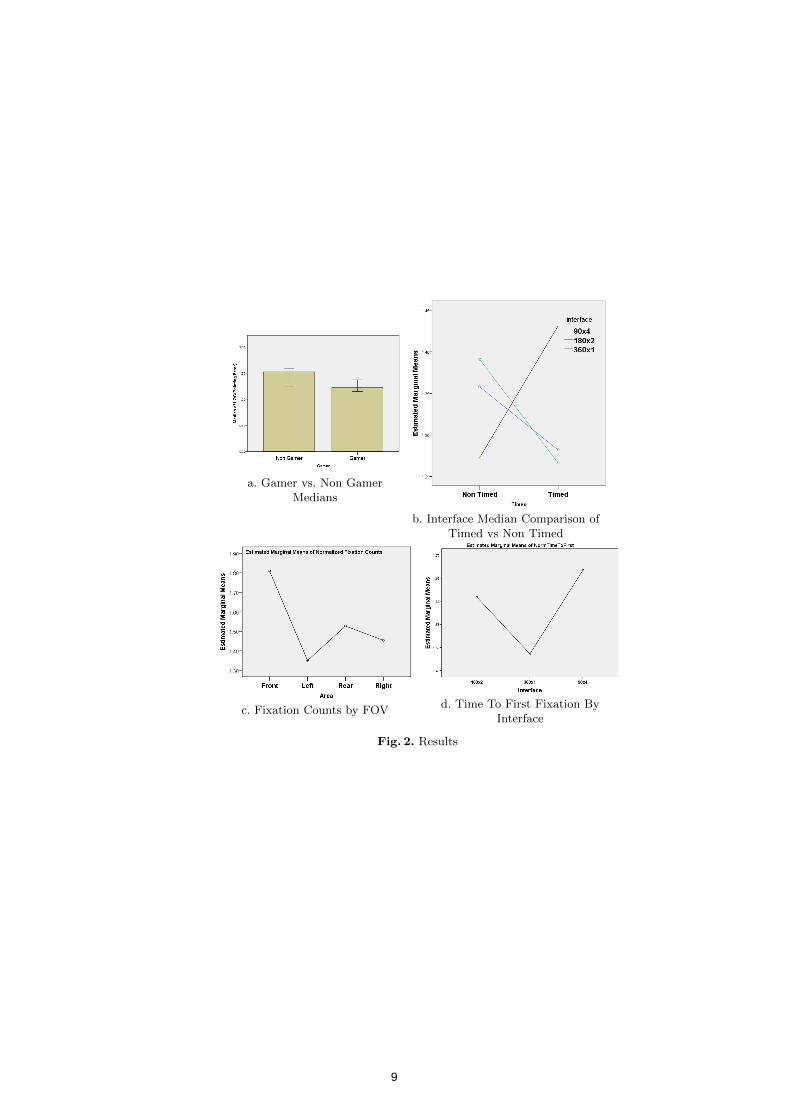
a. Gamer vs. Non GamerMedians
b. Interface Median Comparison ofTimed vs Non Timed
c. Fixation Counts by FOVd. Time To First Fixation By
Interface
Fig. 2. Results
9
because of the online corrections while playing, it does not ask them to estimate beyond 100o. As,the FPS game’s FOV varies from 60o to 100o, it still focuses on the front FOV. However, the 360o
desktop UI requires them to estimate the egocentric direction beyond 100o, which primarily forcesthem to mentally construct the 100+ FOV for the first time. Since the interface does not allowthe online correction, no learning is performed, which leads to the stimulus-response incompatibilitycost, even for the gamers as well [6, 7]. Further, the eye tracking data showed a significant higherfixation count with forward AOI compared to the left AOI. The performance cost with respect tothe left vs. right AOI is akin to the previous study[5]. In addition, we observed reduced time tothe first fixation in 360o x 1 vs. other interfaces. This might be due to the panoramic nature of theinterface, which requires fewer saccades to scan entirely, as compared to other two interfaces.
5 Conclusion
It can be concluded that gamers vs. non gamers do show a difference in spatial abilities becauseof their previous gaming experience. However, the influence is limited to front FOV only. The eyetracking data indicates the preference of scanning and fixation near heading direction ranging from−45o to +45o.
6 Acknowledgment
This work is supported by the Department of Science and Technology, India. Our sincere thanksgo to our advisor, Dr. Priyanka Srivastava and Amrendra Singh, a senior research fellow, for theirinvaluable guidance and support.
References
1. Scholtz, J., Young, J., Yanco, H.A., Drury, J.L.: Evaluation of Human-Robot Interaction Awareness inSearch and Rescue. (2006).
2. Steinfeld, A., Fong, T., Kaber, D., Lewis, M., Scholtz, J., Schultz, A., Goodrich, M.: Common metricsfor human-robot interaction. Proceeding of the 1st ACM SIGCHI/SIGART conference on Human-robotinteraction - HRI 06. (2006).
3. Tootell, R., Silverman, M., Switkes, E., Valois, R.D.: Deoxyglucose analysis of retinotopic organizationin primate striate cortex. Science. 218, 902–904 (1982)
4. Boonsuk, W., Gilbert, S., Kelly, J.: The impact of three interfaces for 360-degree video on spatial cognition.Proceedings of the 2012 ACM annual conference on Human Factors in Computing Systems - CHI 12.(2012).
5. Seya, Y., Nakayasu, H., Yagi, T.: Useful Field of View in Simulated Driving: Reaction Times and EyeMovements of Drivers. i-Perception. 4, 285–298 (2013).
6. Fitts, P.M., Seeger, C.M.: S-R compatibility: spatial characteristics of stimulus and response codes.PsycEXTRA Dataset (1953).
7. Rusconi, E., Kwan, B., Giordano, B., Umilta, C., Butterworth, B.: Spatial representation of pitch height:the SMARC effect. Cognition. 99, 113–129 (2006).
10
© Authors 2017, All Rights Reserved INTERACT 2017 Adjunct Proceedings
Disambiguation Keyboard for Blind
Neel Koradia1, Simran Pandey2
National Institute of Design1, IP College for Women, India2
[email protected], [email protected]
2
Abstract. Unavailability of easy and efficient text input system for
blind users has been a great barrier for their use of mobile phones in India. A partial disambiguation keyboard model for touch screen mobile phones which uses swipe gestures to predict the word for effective typing by the blinds in Indian languages is proposed. But, there is a cost of learnability and the cognitive toll that the user pays to decide if the particular word would be there in the suggestion list[1]. Often there is a conflict whether the prediction model would be useful every time or not. This paper shows that there is an optimum number of words that if included in the input corpus, would make the partial disambiguation model work in favor of the user.
Keywords: Accessibility, Disambiguation, Devanagari, Blind, Touch
keyboard, Corpus
1 Introduction
Absence of tactile feedback in touch phones, coupled with large number of keys having small sizes increases the difficulty level for the blinds to type us-ing a virtual keyboard. T9 keyboard implements a disambiguation model to predict words with English alphabets laid out across nine keys[3]. Building a similar keyboard model for Devanagari is a little more challenging. The speed of typing is significantly lower for Indian languages given the large number of characters, the complexity of the script, intricate rules, alphasyllabary script. Katre said that it took about 18-55 taps on a basic keypad phone to type a single word “महारा ” (Maharashtra), a word with only 10 Unicode characters[2]. The first section of the paper introduces the working of the proposed partial disambiguation model for Devanagari for predicting words. The second section
11
of the paper discusses about the optimum number of words that a corpus must have for the disambiguation model to work in the favor of the user.
2 Background and related work
The prediction-bar-based interfaces deployed on keyboards for Indian lan-guages seem to be counterproductive to speed in practice. There is a cost of learnability and cognitive toll that a user pays for decision making which makes the prediction models slow.[1] An accessible version of Swarachakra mobile input has been discussed trying to make it easier for a blind to use keyboard. It uses multitouch gestures to type a combination of consonant and vowel, and swipe gestures as a shorthand for this selection[4]
3 Research approach
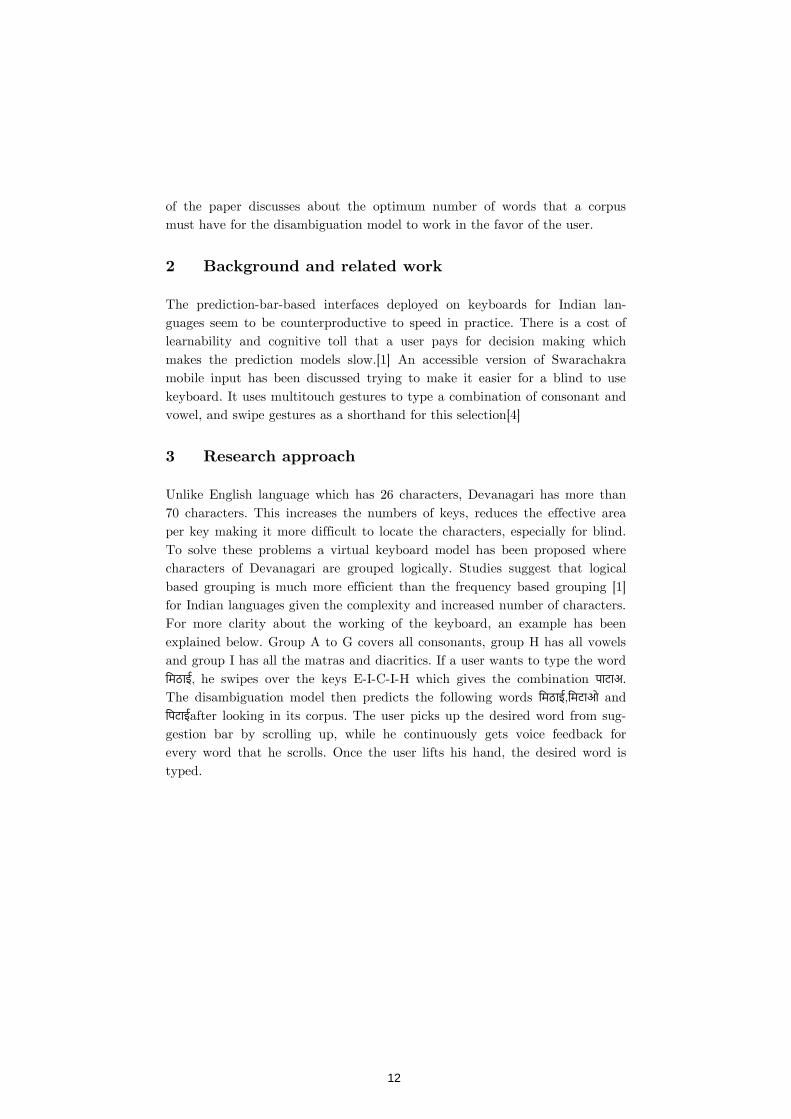
Unlike English language which has 26 characters, Devanagari has more than 70 characters. This increases the numbers of keys, reduces the effective area per key making it more difficult to locate the characters, especially for blind. To solve these problems a virtual keyboard model has been proposed where characters of Devanagari are grouped logically. Studies suggest that logical based grouping is much more efficient than the frequency based grouping [1] for Indian languages given the complexity and increased number of characters. For more clarity about the working of the keyboard, an example has been explained below. Group A to G covers all consonants, group H has all vowels and group I has all the matras and diacritics. If a user wants to type the word िमठाई, he swipes over the keys E-I-C-I-H which gives the combination पाटाअ. The disambiguation model then predicts the following words िमठाई,िमटाओ and िपटाईafter looking in its corpus. The user picks up the desired word from sug-gestion bar by scrolling up, while he continuously gets voice feedback for every word that he scrolls. Once the user lifts his hand, the desired word is typed.
12
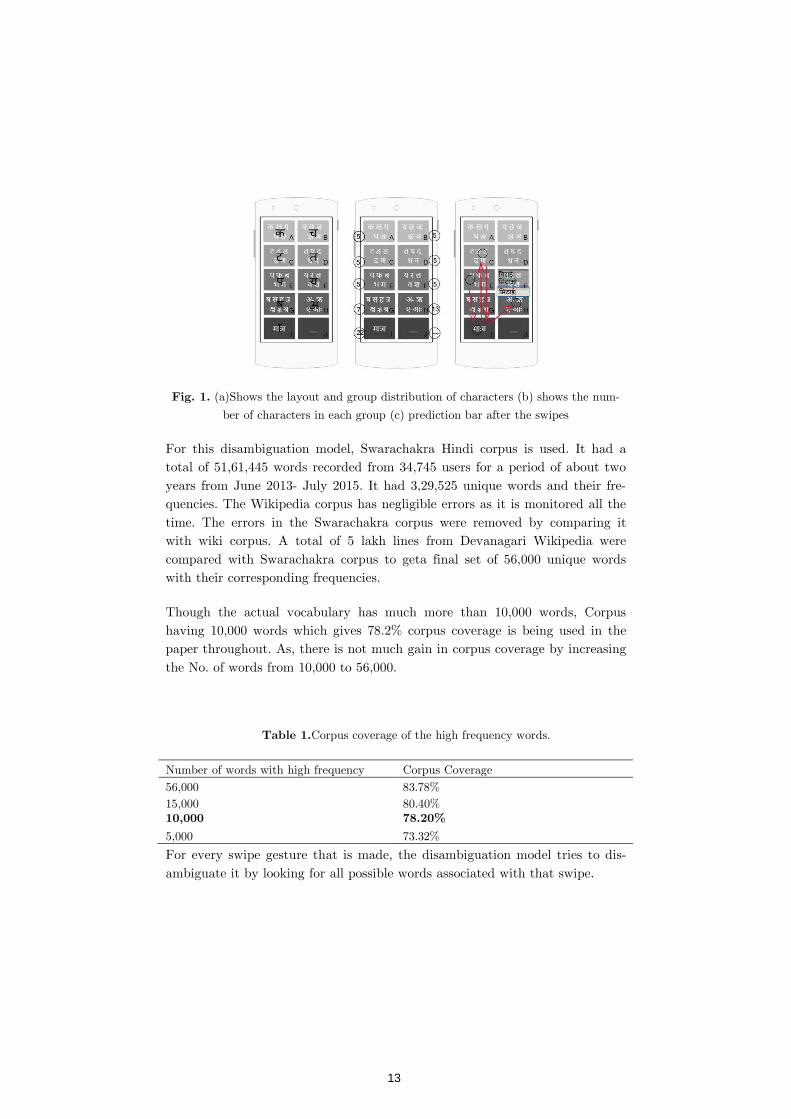
Fig. 1. (a)Shows the layout and group distribution of characters (b) shows the num-
ber of characters in each group (c) prediction bar after the swipes
For this disambiguation model, Swarachakra Hindi corpus is used. It had a total of 51,61,445 words recorded from 34,745 users for a period of about two years from June 2013- July 2015. It had 3,29,525 unique words and their fre-quencies. The Wikipedia corpus has negligible errors as it is monitored all the time. The errors in the Swarachakra corpus were removed by comparing it with wiki corpus. A total of 5 lakh lines from Devanagari Wikipedia were compared with Swarachakra corpus to geta final set of 56,000 unique words with their corresponding frequencies.
Though the actual vocabulary has much more than 10,000 words, Corpus having 10,000 words which gives 78.2% corpus coverage is being used in the paper throughout. As, there is not much gain in corpus coverage by increasing the No. of words from 10,000 to 56,000.
Table 1.Corpus coverage of the high frequency words.
Number of words with high frequency Corpus Coverage
56,000 83.78% 15,000 80.40% 10,000
5,000
78.20%
73.32%
For every swipe gesture that is made, the disambiguation model tries to dis-ambiguate it by looking for all possible words associated with that swipe.
13
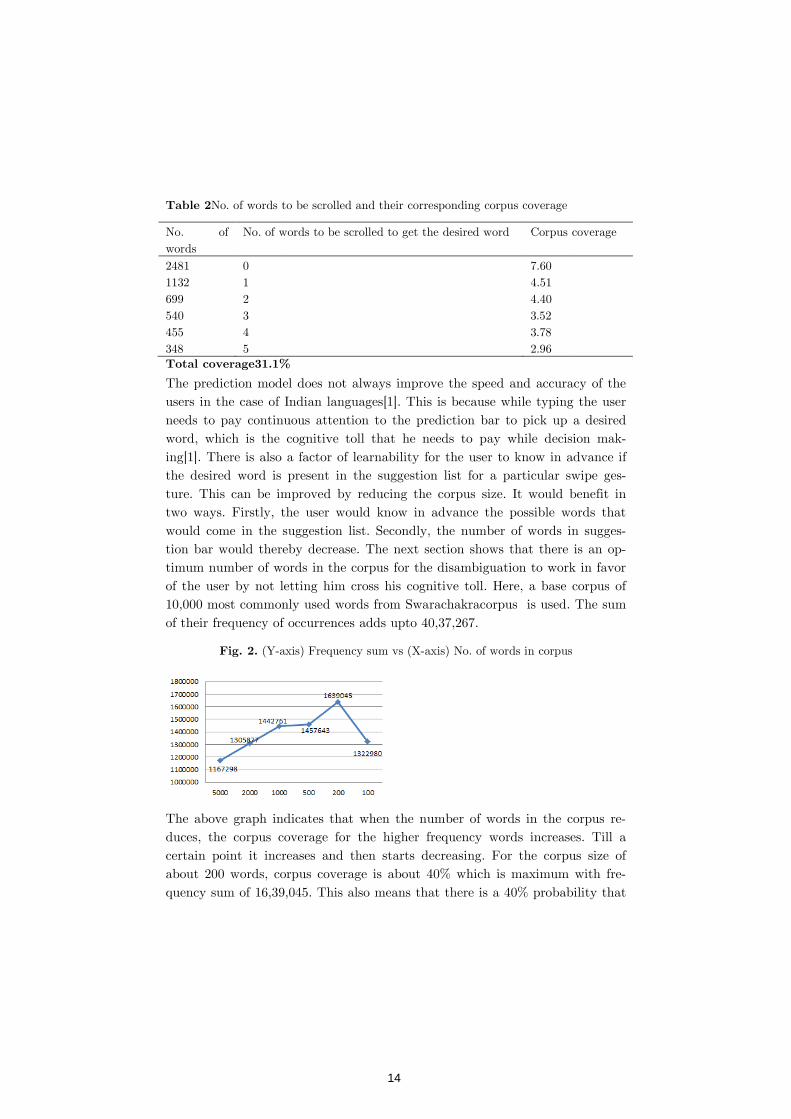
Table 2No. of words to be scrolled and
No. of words
No. of w
2481 1132 699 540 455 348
0 1 2 3 4 5
Total coverage31.1%
The prediction model does not always improve the speed and accuracy of the users in the case of Indian languages[1]. This is because while typing the user needs to pay continuous attention to the prediction bar to pick up a desired word, which is the cognitive toll that he needs to pay while decision maing[1]. There is also a factor of lthe desired word is present in the suggestture. This can be improved by reducing the corpus size. It would benefit in two ways. Firstly, the user would know in advance the powould come in the suggestion list. Secondly, the number of words in suggetion bar would thereby decrease. The next section shows that there is an otimum number of words in the corpus for the disambiguation to work in favor of the user by not letting him cross his cognitive toll. Here, 10,000 most commonof their frequency of occurrences adds upto 40,37,267.
Fig. 2. (Y-axis) Frequency sum vs (X
The above graph indicates that when the number of words in the corpus rduces, the corpus coverage for the higher frequency words increases. Till a certain point it increases and then starts about 200 words, corpus coverage is about 40% which is maximum with frquency sum of 16,39,045. This also means that there is a 40% probability that
No. of words to be scrolled and their corresponding corpus coverage
words to be scrolled to get the desired word Corpus coverage
7.60 4.51 4.40 3.52 3.78 2.96
Total coverage31.1%
The prediction model does not always improve the speed and accuracy of the the case of Indian languages[1]. This is because while typing the user
needs to pay continuous attention to the prediction bar to pick up a desired word, which is the cognitive toll that he needs to pay while decision maing[1]. There is also a factor of learnability for the user to know in advance if the desired word is present in the suggestion list for a particular swipe geture. This can be improved by reducing the corpus size. It would benefit in
the user would know in advance the possible words that would come in the suggestion list. Secondly, the number of words in suggetion bar would thereby decrease. The next section shows that there is an otimum number of words in the corpus for the disambiguation to work in favor
y not letting him cross his cognitive toll. Here, a base corpus of 10,000 most commonly used words from Swarachakracorpus is used. The sum of their frequency of occurrences adds upto 40,37,267.
axis) Frequency sum vs (X-axis) No. of words in corpus
The above graph indicates that when the number of words in the corpus rduces, the corpus coverage for the higher frequency words increases. Till a certain point it increases and then starts decreasing. For the corpus size of
corpus coverage is about 40% which is maximum with frof 16,39,045. This also means that there is a 40% probability that
Corpus coverage
The prediction model does not always improve the speed and accuracy of the the case of Indian languages[1]. This is because while typing the user
needs to pay continuous attention to the prediction bar to pick up a desired word, which is the cognitive toll that he needs to pay while decision mak-
earnability for the user to know in advance if list for a particular swipe ges-
ture. This can be improved by reducing the corpus size. It would benefit in ssible words that
would come in the suggestion list. Secondly, the number of words in sugges-tion bar would thereby decrease. The next section shows that there is an op-timum number of words in the corpus for the disambiguation to work in favor
base corpus of warachakracorpus is used. The sum
axis) No. of words in corpus
The above graph indicates that when the number of words in the corpus re-duces, the corpus coverage for the higher frequency words increases. Till a
decreasing. For the corpus size of corpus coverage is about 40% which is maximum with fre-
of 16,39,045. This also means that there is a 40% probability that
14
the top words shown in the prediction bar are the desired words even by keep-ing just 200 words in the entire corpus.
This paper differentiates its contribution in two ways from other similar pa-pers like Swarachakra. Firstly, it proposes a T9 inspired design of grouping the characters in a logical fashion leaving room for bigger sizes of keys. This gives a great advantage over previous Swarachakra keyboard which lays down all the characters on the screen making the location of the keys difficult. The Swarachakra evaluation paper discusses about the reasons of inefficiency of prediction model[1]. This paper takes it further to provide a discussion about the optimum corpus size that affects the learnability of the user.
4 Results
The paper proposes a novel design for word prediction based on partial dis-ambiguation for blinds. Results also state that there is an optimum number of words to be included in the corpus which would benefit the users by not in-creasing his cognitive toll. Empirically, we have found that for the Swaracha-kra Hindi corpus of 10,000 words, the prediction is best and most effective for the user when the corpus size consist of about 200 high frequency words. This also opens a room for further research where a general method could be im-plemented to find out the optimum size of corpus in any language model
5 References
1. Dalvi, G., Ahire, S., Emmadi, N., Joshi, M., Joshi, A., Ghosh, S., Ghone, P., Parmar, N.; Does prediction really help in Marathi text input?: empiri-cal analysis of a longitudinal study; Mobile HCI 2016
2. Dinesh S. Katre. 2006. Position Paper on “Crosscultural Usability Issues of Bilingual (Hindi & English) Mobile Phones”. In Indo-Danish HCI Research Symposium, 10-11
3. Silfverberg, M., MacKenzie, I. S., &Korhonen, P. (2000). Predicting text entry speed on mobile phones. Proceedings of the ACM Conference on
Human Factors in Computing Systems - CHI 2000, pp. 9-16. New York:
ACM. 4. Medha Srivastava and PabbaAnuBharath. 2016. Accessible Swarachakra: A
virtual Keyboard for Visually Impaired. In Proceedings of the 8th Indian Conference on Human Computer Interaction (IHCI '16). ACM, New York, NY, USA, 111-115
15
© Authors 2017, All Rights Reserved
INTERACT 2017 Adjunct Proceedings
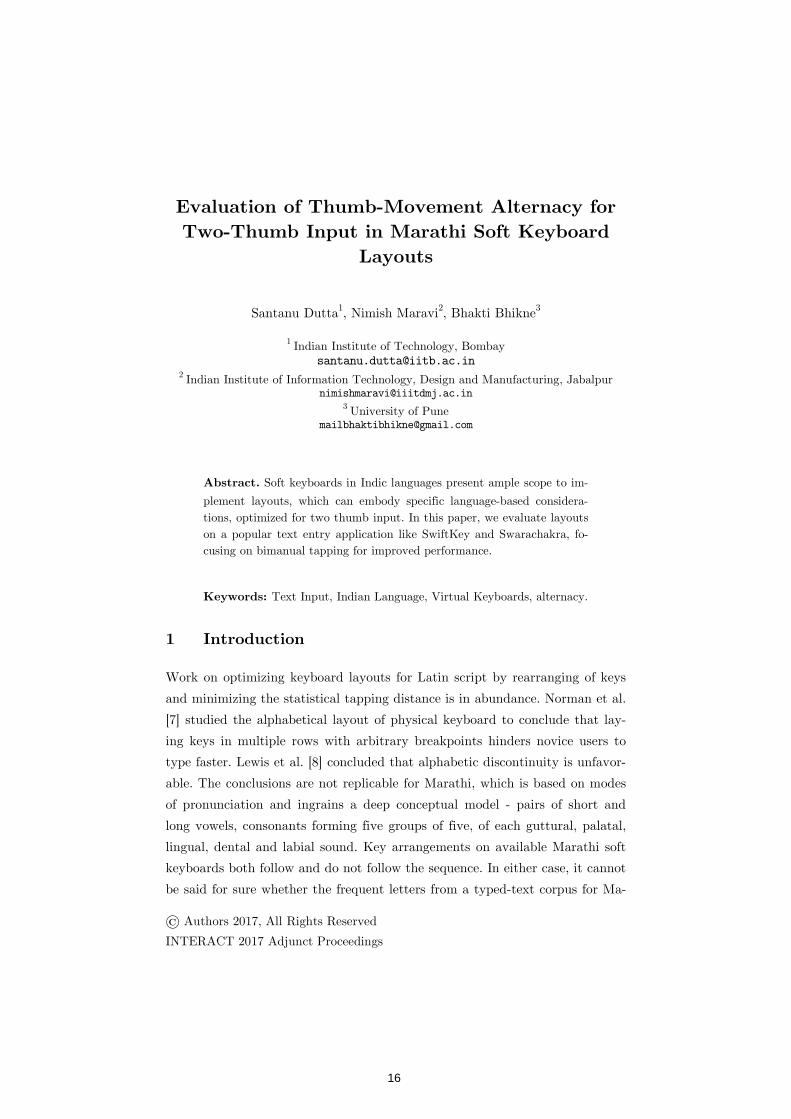
Evaluation of Thumb-Movement Alternacy for
Two-Thumb Input in Marathi Soft Keyboard
Layouts
Santanu Dutta1, Nimish Maravi2, Bhakti Bhikne3
1 Indian Institute of Technology, Bombay
[email protected] 2 Indian Institute of Information Technology, Design and Manufacturing, Jabalpur
[email protected] 3 University of Pune
Abstract. Soft keyboards in Indic languages present ample scope to im-
plement layouts, which can embody specific language-based considera-tions, optimized for two thumb input. In this paper, we evaluate layouts on a popular text entry application like SwiftKey and Swarachakra, fo-cusing on bimanual tapping for improved performance.
Keywords: Text Input, Indian Language, Virtual Keyboards, alternacy.
1 Introduction
Work on optimizing keyboard layouts for Latin script by rearranging of keys
and minimizing the statistical tapping distance is in abundance. Norman et al.
[7] studied the alphabetical layout of physical keyboard to conclude that lay-
ing keys in multiple rows with arbitrary breakpoints hinders novice users to
type faster. Lewis et al. [8] concluded that alphabetic discontinuity is unfavor-
able. The conclusions are not replicable for Marathi, which is based on modes
of pronunciation and ingrains a deep conceptual model - pairs of short and
long vowels, consonants forming five groups of five, of each guttural, palatal,
lingual, dental and labial sound. Key arrangements on available Marathi soft
keyboards both follow and do not follow the sequence. In either case, it cannot
be said for sure whether the frequent letters from a typed-text corpus for Ma-
16

rathi would augur well for two-thumb input. An optimized two-thumb input
method should maximize alternation for load-balancing between hands and
deliver ergonomically stable thumb behavior. We seek to evaluate the fre-
quency of alternating and repetitive key presses for consecutive keystrokes,
based on a standard Marathi corpus, evaluated on SwiftKey and Swarachakra.
2 Evaluation Approach
2.1 Evaluation Basis
Swarachakra [9], in the ‘Non-Staggered’ horizontal orientation, places two
consecutive chunks of five letters in a row, running left to right. The rows
arrange themselves one below the other in ‘Staggered’ version - the first four
on the left column and the next four in the right hand side. SwiftKey [2] fol-
lows InScript [10], a Government of India decreed standard keyboard layout
for Indian scripts. A letter can be typed by both SHIFT press (Shift+Tap
input), and by Tap+LongPress, the respective layouts are identified as ‘Shift’
and ‘LongPress’ hereafter (Refer Fig. 1). For our study, we have considered
both cases, which results in different number of keystrokes to type the same
letter. For both keyboards, for every letter being pressed, the next letter
pressed can either be sequential key presses on one side or alternating taps
between sides [4]. Possible combinations therefore can be: left hand-thumb key
press L followed by right hand-thumb R, an LR pattern, and similarly, LL,
RR and RL patterns. SPACE key can be pressed with both left and right
thumb. Also, a word might be within a sentence (SPACE before and after it)
or might be the first word (suffixed by SPACE). A possible combination can
be: SPACE pressed with left thumb, followed by word and then SPACE
pressed with left thumb, giving L-Word-L pattern. Similarly, R-Word-R,
Word-R, and Word-L patterns emerge.
17
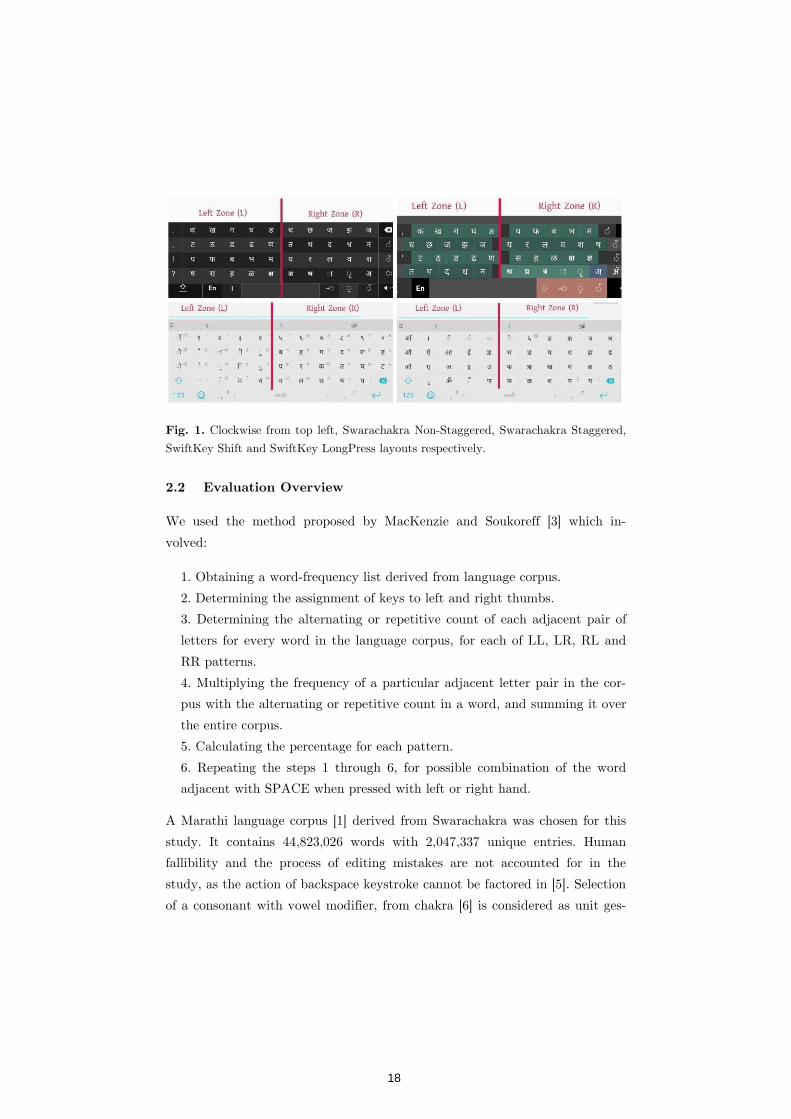
Fig. 1. Clockwise from top left, Swarachakra Non-Staggered, Swarachakra Staggered,
SwiftKey Shift and SwiftKey LongPress layouts respectively.
2.2 Evaluation Overview
We used the method proposed by MacKenzie and Soukoreff [3] which in-
volved:
1. Obtaining a word-frequency list derived from language corpus.
2. Determining the assignment of keys to left and right thumbs.
3. Determining the alternating or repetitive count of each adjacent pair of
letters for every word in the language corpus, for each of LL, LR, RL and
RR patterns.
4. Multiplying the frequency of a particular adjacent letter pair in the cor-
pus with the alternating or repetitive count in a word, and summing it over
the entire corpus.
5. Calculating the percentage for each pattern.
6. Repeating the steps 1 through 6, for possible combination of the word
adjacent with SPACE when pressed with left or right hand.
A Marathi language corpus [1] derived from Swarachakra was chosen for this
study. It contains 44,823,026 words with 2,047,337 unique entries. Human
fallibility and the process of editing mistakes are not accounted for in the
study, as the action of backspace keystroke cannot be factored in [5]. Selection
of a consonant with vowel modifier, from chakra [6] is considered as unit ges-
18
ture and not a fully-defined finger gesture for unique character key press. We
have considered separate vowel modifier key presses for SwiftKey and ignored
the same in case of Swarachakra.Both Swarachakra and SwiftKey allow cer-
tain frequent conjuncts to be typed directly in a single keystroke by assigning
them unique keys, for which each constituent consonants are considered as
unique key presses.
3 Results
As per our model, we developed a program which read the corpus and pre-
sented the output count of LL, LR, RL, and RR patterns. For each of the
layouts, we tabulated the pattern counts for corpus words under patterns:
Word-only, L-Word-L, R-Word-R, Word-R and Word-L. The cumulative
LL+RR count, a higher percentage of which indicates unfavorable alternacy,
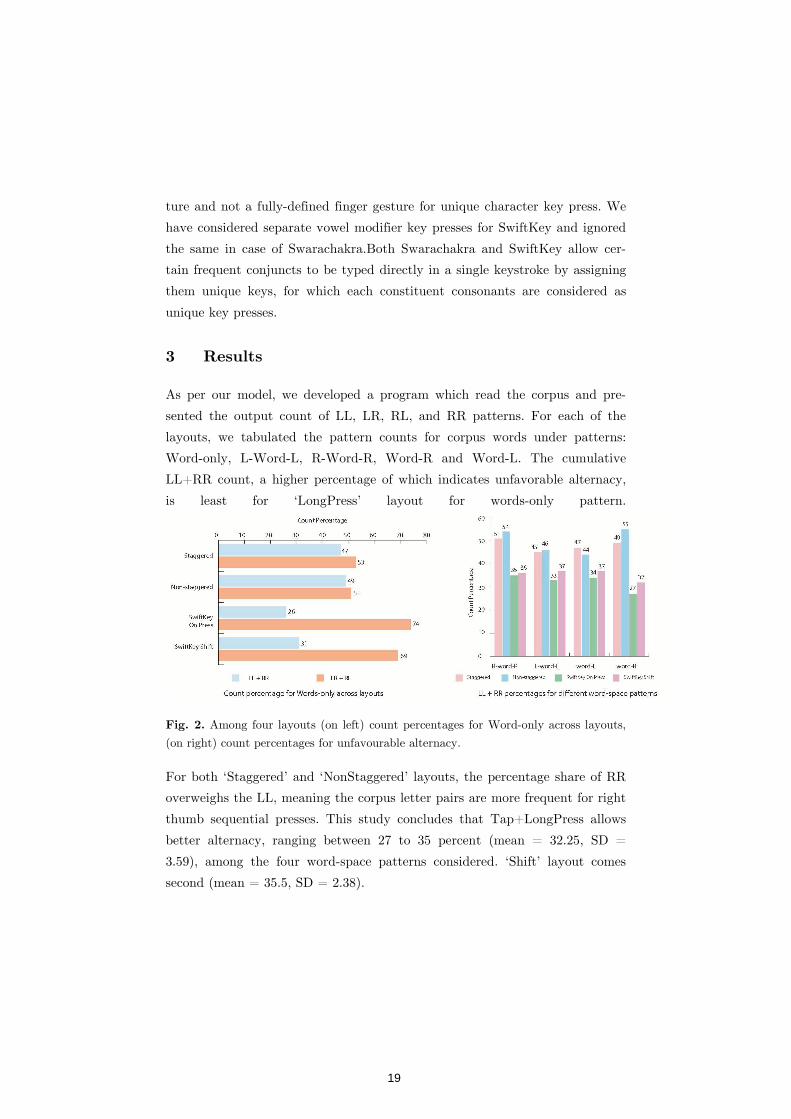
is least for ‘LongPress’ layout for words-only pattern.
Fig. 2. Among four layouts (on left) count percentages for Word-only across layouts,
(on right) count percentages for unfavourable alternacy.
For both ‘Staggered’ and ‘NonStaggered’ layouts, the percentage share of RR
overweighs the LL, meaning the corpus letter pairs are more frequent for right
thumb sequential presses. This study concludes that Tap+LongPress allows
better alternacy, ranging between 27 to 35 percent (mean = 32.25, SD =
3.59), among the four word-space patterns considered. ‘Shift’ layout comes
second (mean = 35.5, SD = 2.38).
19
4 Conclusion
Factoring alternacy would help develop a better arrangement of keys opti-
mized for two-thumb text entry. The input mode of SwiftKey, in both
layouts, fared better empirically. It corroborates load-balancing which InScript
layout inherently offers by placing the consonants on the right and vowel
modifiers on the left (a consonant + vowel modifier bigram being frequent in
Marathi). However, the cognitive benefit of a structured set of Swarachakra,
dedicatedly following the paradigm of Marathi and other Indic languages,
needs a separate and thorough evaluation.
5 References
1. Swarachakra Marathi Corpus, https://drive.google.com/drive/folders/0B8OvljyLzohRRDFsMW12UDBRSjQ
2. SwiftKey Keyboard,https://swiftkey.com/en/keyboard/android 3. MacKenzie, I. S.,Soukoreff, R. W.: A model of two-thumb text entry.
In:Proceedings of Graphics Interface 2002, pp.117–124. Canadian Informa-tion Processing Society, Toronto(2002).
4. Oulasvirta, A., Reichel, A., Li, W., Zhang, Y., Bachynskyi, M., Vertanen, K., Kristensson, P. O.: Improving Two-Thumb text entry on touchscreen devices. In: Proceedings of CHI 2013, pp. 2765-2774. ACM, New York (2013).
5. MacKenzie, I. S., Soukoreff, R. W.: Text entry for mobile computing: Models and Methods, Theory and Practice. Human-Computer Interaction. 17,pp. 147- 198. (2002).
6. Joshi, M., Joshi, A.,Emmadi, N., Malsettar, N.: Swarachakra Keyboard for Indic Scripts. In: MOBILESoft 2014 Proceedings of the 1st International Conference on Mobile Software Engineering and Systems, pp. 5-6. ACM, New York (2014).
7. Norman, D. A., Fisher, D.: Why alphabetic keyboards are not easy to use: Keyboard layout doesn't much matter. Human Factors, 24(5), pp. 509-519. Sage (1982)
8. Lewis, J. R., LaLomia, M. J., & Kennedy, P. J.: Evaluation of Typing Key Layouts for Stylus Input. In: Proceedings of the Human Factors and Ergonomics Society Annual Meeting, 43(5), pp. 420-424. Sage (1999).
20

9. Swarachakra Marathi Keyboard https://play.google.com/store/apps/details?id=iit.android.swarachakraMarathi
10. Keyboard Standards – Indian Language Technology Proliferation and Dep-loyment Centre. http://www.tdil-dc.in/index.php?option=com_vertical&parentid=12&lang=en.
21
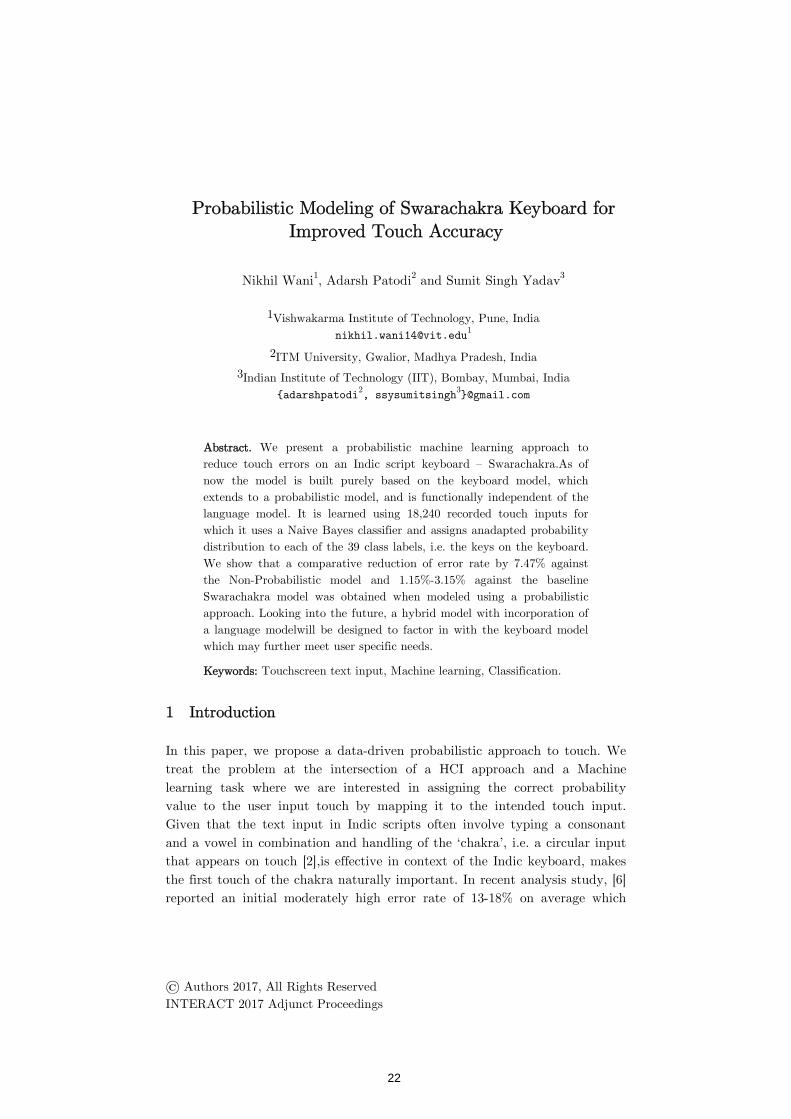
© Authors 2017, All Rights Reserved INTERACT 2017 Adjunct Proceedings
Probabilistic Modeling of Swarachakra Keyboard for Improved Touch Accuracy
Nikhil Wani1, Adarsh Patodi2 and Sumit Singh Yadav3
1Vishwakarma Institute of Technology, Pune, India
2ITM University, Gwalior, Madhya Pradesh, India 3Indian Institute of Technology (IIT), Bombay, Mumbai, India
adarshpatodi2, ssysumitsingh
Abstract. We present a probabilistic machine learning approach to reduce touch errors on an Indic script keyboard – Swarachakra.As of now the model is built purely based on the keyboard model, which extends to a probabilistic model, and is functionally independent of the language model. It is learned using 18,240 recorded touch inputs for which it uses a Naive Bayes classifier and assigns anadapted probability distribution to each of the 39 class labels, i.e. the keys on the keyboard. We show that a comparative reduction of error rate by 7.47% against the Non-Probabilistic model and 1.15%-3.15% against the baseline Swarachakra model was obtained when modeled using a probabilistic approach. Looking into the future, a hybrid model with incorporation of a language modelwill be designed to factor in with the keyboard model which may further meet user specific needs.
Keywords: Touchscreen text input, Machine learning, Classification.
1 Introduction
In this paper, we propose a data-driven probabilistic approach to touch. We treat the problem at the intersection of a HCI approach and a Machine learning task where we are interested in assigning the correct probability value to the user input touch by mapping it to the intended touch input. Given that the text input in Indic scripts often involve typing a consonant and a vowel in combination and handling of the ‘chakra’, i.e. a circular input that appears on touch [2],is effective in context of the Indic keyboard, makes the first touch of the chakra naturally important. In recent analysis study, [6] reported an initial moderately high error rate of 13-18% on average which
22
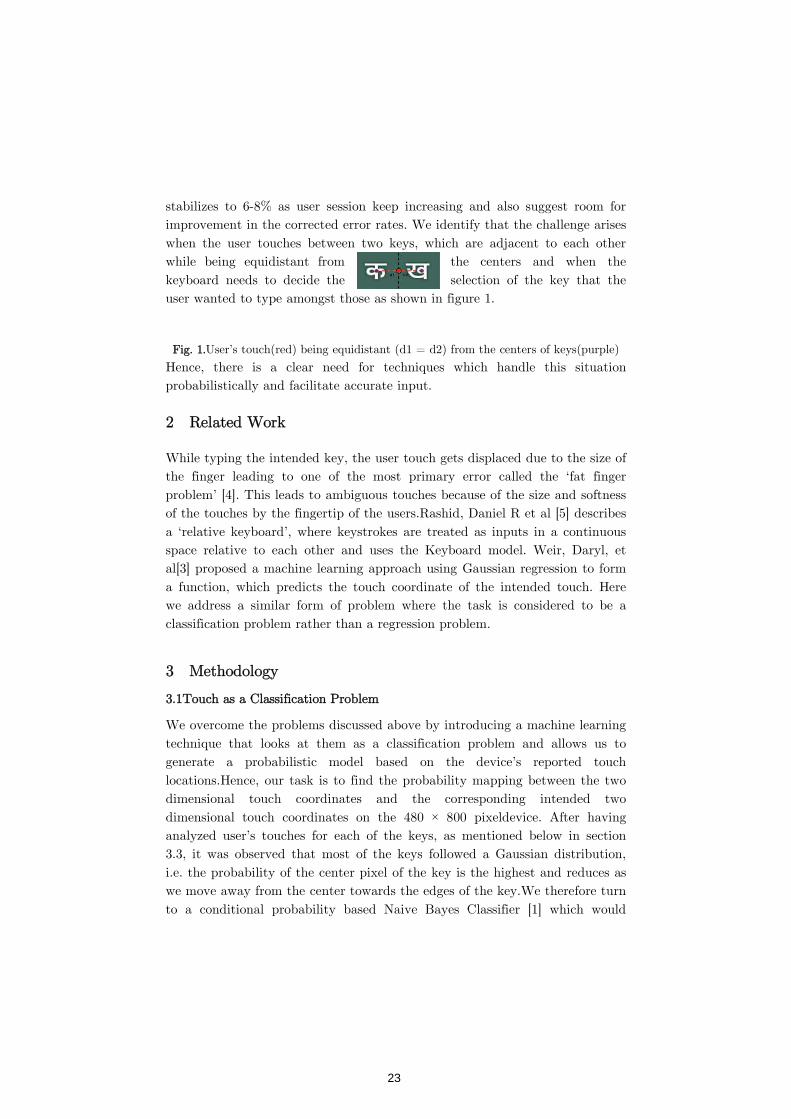
stabilizes to 6-8% as user session keep increasingimprovement in the corrected error rateswhen the user touches betwhile being equidistant from keyboard needs to decide the user wanted to type
Fig. 1.User’s touch(red)
Hence, there is a clear need for techniques which handle this situation probabilistically and facilitate accurate input.
2 Related Work
While typing the intended key, the user touch gets the finger leading to oproblem’ [4]. This leads to ambiguous touches because of the of the touches by the fingertip of the users.a ‘relative keyboard’, where keystrokes are treated as inputs in a continuous space relative to each otheral[3] proposed a machine learning approach using Gaussian regression to form a function, which predicts the touch coordinate of the intended touch. Here we address a similar form of problem where the task is considered to be a classification problem rather than a regression problem.
3 Methodology
3.1Touch as a Classification Problem
We overcome the problems discussed above by introducing a machine learning technique that looksgenerate a probabilistic model based on the device’s reported touch locations.Hence, our task is to find thdimensional touch coordinates and the corresponding intended dimensional touch coordinates analyzed user’s touches for each of the3.3, it was observed that most of the keys followed a Gaussian distribui.e. the probability of the cewe move away from the center towards the to a conditional probability based Naiv
8% as user session keep increasing and also suggest in the corrected error rates. We identify that the challenge arises
when the user touches between two keys, which are adjacent to each otherwhile being equidistant from the centers and when the keyboard needs to decide the selection of the key
amongst those as shown in figure 1.
(red) being equidistant (d1 = d2) from the centers of keys
Hence, there is a clear need for techniques which handle this situation and facilitate accurate input.
While typing the intended key, the user touch gets displaced due to the size of ger leading to one of the most primary error called the ‘fat finger
. This leads to ambiguous touches because of the size andof the touches by the fingertip of the users.Rashid, Daniel R et al [5] a ‘relative keyboard’, where keystrokes are treated as inputs in a continuous space relative to each other and uses the Keyboard model. Weir, Daryl, et al[3] proposed a machine learning approach using Gaussian regression to form
predicts the touch coordinate of the intended touch. Here we address a similar form of problem where the task is considered to be a classification problem rather than a regression problem.
Classification Problem
We overcome the problems discussed above by introducing a machine learning s at them as a classification problem and allows us to
a probabilistic model based on the device’s reported touch Hence, our task is to find the probability mapping between the
dimensional touch coordinates and the corresponding intended dimensional touch coordinates on the 480 × 800 pixeldevice. After having analyzed user’s touches for each of the keys, as mentioned below in section
it was observed that most of the keys followed a Gaussian distribui.e. the probability of the center pixel of the key is the highest and reducewe move away from the center towards the edges of the key.We therefore turn
probability based Naive Bayes Classifier [1] which would
room for challenge arises
each other and when the
that the
from the centers of keys(purple)
Hence, there is a clear need for techniques which handle this situation
displaced due to the size of error called the ‘fat finger
size and softness 5] describes
a ‘relative keyboard’, where keystrokes are treated as inputs in a continuous Weir, Daryl, et
al[3] proposed a machine learning approach using Gaussian regression to form predicts the touch coordinate of the intended touch. Here
we address a similar form of problem where the task is considered to be a
We overcome the problems discussed above by introducing a machine learning as a classification problem and allows us to
a probabilistic model based on the device’s reported touch e probability mapping between the two
dimensional touch coordinates and the corresponding intended two After having
keys, as mentioned below in section it was observed that most of the keys followed a Gaussian distribution,
and reduces as We therefore turn
which would
23
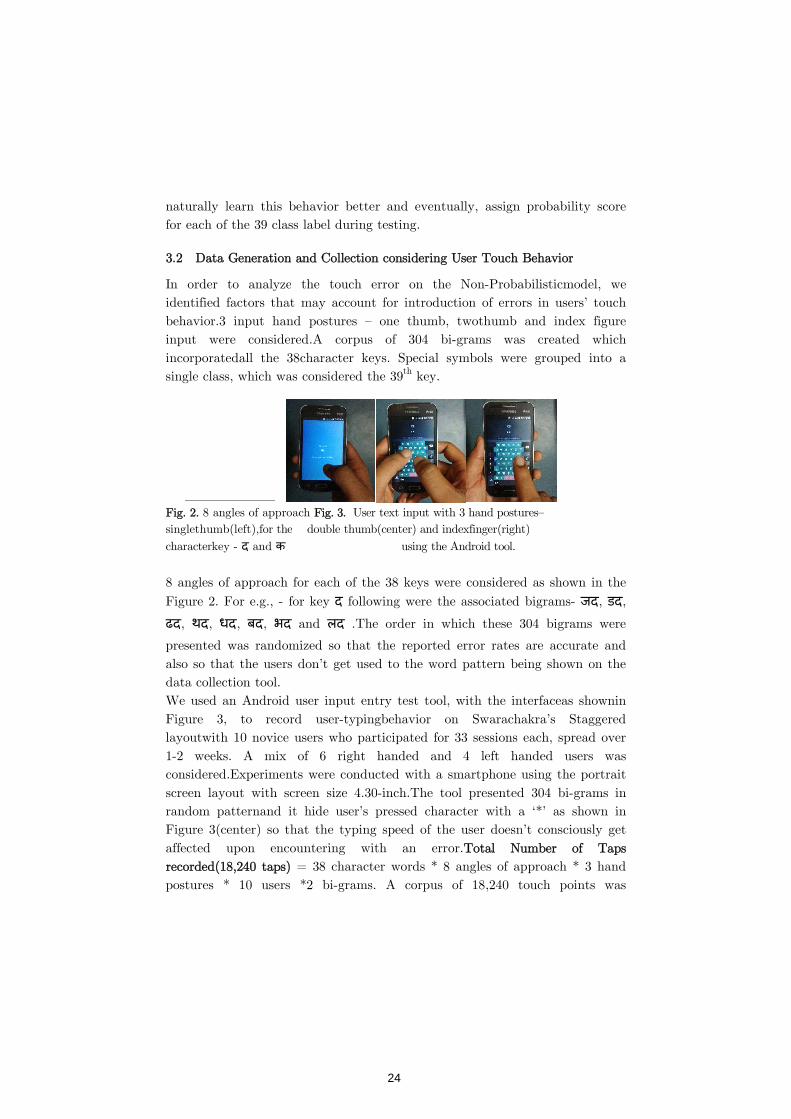
naturally learn this behavior better and eventually, assign probability score for each of the 39 class label during testing.
3.2 Data Generation
In order to analyzeidentified factors that may account forbehavior.3 input hand input were considered.incorporatedall the 38single class, which was considered the
Fig. 2. 8 angles of approach singlethumb(left),for the
characterkey - द and क
8 angles of approach for each of the 38 keys w
Figure 2. For e.g., -
ढद, थद, धद, बद, भद
presented was randomized so that the also so that the users don’t get used to tdata collection tool. We used an Android Figure 3, to record layoutwith 10 novice users who participated for 331-2 weeks. A mix of considered.Experiments were conducted with ascreen layout with screen size 4.30random patternand Figure 3(center) so that the typing speed of the user doesn’t consciously get affected upon encountering with an error.recorded(18,240 taps)postures * 10 users
naturally learn this behavior better and eventually, assign probability score for each of the 39 class label during testing.
Data Generation and Collection considering User Touch Behavior
analyze the touch error on the Non-Probabilisticmodelactors that may account for introduction of errors in user
hand postures – one thumb, twothumb and index figure considered.A corpus of 304 bi-grams was created
all the 38character keys. Special symbols were groupedwas considered the 39th key.
ngles of approach Fig. 3. User text input with 3 hand postures–
for the double thumb(center) and indexfinger(right)
using the Android tool.
8 angles of approach for each of the 38 keys were considered as shown in the
for key द following were the associated bigrams-
भद and लद .The order in which these 304 bigrams were
presented was randomized so that the reported error rates are accurate and users don’t get used to the word pattern being shown
Android user input entry test tool, with the interfaceas shown
record user-typingbehavior on Swarachakra’s Staggeredce users who participated for 33 sessions each, spread over
A mix of 6 right handed and 4 left handed users was Experiments were conducted with a smartphone using the portr
en layout with screen size 4.30-inch.The tool presented 304 bi- it hide user’s pressed character with a ‘*’ as shown in that the typing speed of the user doesn’t consciously get
affected upon encountering with an error.Total Number of 18,240 taps) = 38 character words * 8 angles of approach * 3 hand
users *2 bi-grams. A corpus of 18,240 touch points was
naturally learn this behavior better and eventually, assign probability score
considering User Touch Behavior
model, we introduction of errors in users’ touch
ndex figure grams was created which
ed into a
ere considered as shown in the
- जद, डद,
bigrams were
error rates are accurate and being shown on the
as shownin Staggered
sessions each, spread over users was
the portrait -grams in
as shown in that the typing speed of the user doesn’t consciously get
Total Number of Taps ngles of approach * 3 hand
A corpus of 18,240 touch points was
24
generated for modeling thA heat map of these user touchesis shown in
3.3Probabilistic Model
We first find the widtgenerate the center pixelhave equal probability of being pressed as shown in the training of the model has two phases, first phase deals with modelingour pixels in all of thethe probability of the cenFigure 4(right) and would reduce as we move the edges of the key
retrain the classifier by adding to the obtained distribution, which allows
Fig. 4.Prior probability (
probability, training phase 1
model to be influenced by the recorded 18,240 taps to reassign the distribution to meet and learn from the users’ touch.
(x - xc)2
In the equation above, (training phase 1, we decide the radius (r1, r2, r3probability value for the pixel which the classification model will first learnFor e.g., if r1 = 2, then p(
0.8, if r3 = 6 then p(
This would allow the classifier to learn the Gaussianwhich is the desired functionality that the keyboard would
generated for modeling the probabilistic model using theNaive Bayes A heat map of these user touchesis shown in Figure 5 (left).
Probabilistic Model
We first find the width and height of each key in the keyboard layout and generate the center pixel of each key. Initially, each pixel of the key would have equal probability of being pressed as shown in the Figure 4 (training of the model has two phases, first phase deals with modeling
in all of thekeys to followGaussian Distribution over the key, i.e. the probability of the center pixel of the key would be 1(highest) as shown in
and would reduce as we move away from the center towards key.Then we move towards the second phase where we
the classifier by adding to the obtained distribution, which allows
probability (left) and posteriorFig. 5.Left shows the plotted recorded
phase 1 (right)for key-क.points of the user taps. Right –shows
theboundaries of the probabilistic model.
model to be influenced by the recorded 18,240 taps to reassign the distribution to meet and learn from the users’ touch.
2 + (y - yc)2 < r2 Eq. 1
above, (xc, yc) represent the center point of the key. e decide the radius (r1, r2, r3, r4..rn) to assign the r
for the pixel which the classification model will first learnr e.g., if r1 = 2, then p(<x,y> | क) = 1, if r2 = 4, then, p(<x,y>
r3 = 6 then p(<x,y> | क) = 0.6 and if r4 = 8 then p(<x,y> | क
This would allow the classifier to learn the Gaussiandistribution for pixelsis the desired functionality that the keyboard would incorporate.
classifier.
layout and each pixel of the key would
(left).The training of the model has two phases, first phase deals with modeling each of
ver the key, i.e. as shown in er towards where we
the classifier by adding to the obtained distribution, which allows the
Left shows the plotted recorded
shows
boundaries of the probabilistic
model to be influenced by the recorded 18,240 taps to reassign the distribution
ent the center point of the key. For to assign the right
for the pixel which the classification model will first learn. > | क) =
क) = 0.4.
for pixels, incorporate.Any
25

pixel beyond the r4 and at the corners of the circle would have low probability (i.e. < 0.4) value of belonging to that key and become the prime candidates post-training for being assigned a changed probability value since we expect the trained model to decide these values which are also influenced by the change in post-training boundary shape of the key. Figure 4(right) shows the distribution using the shades of blue, darker shade at the center indicating
highest probability of a touch being Keyक.The retraining of current model, in
training phase 2, with the recorded user touchesintroduces a shift in the initial circle shape of the probability and resulted in thenon-circular boundaries shown below in Figure5(right).Hence, this results in reduced error rates and builds a novel approach for recognizing key presses.The retrained model was also experimented using 10 folds cross validation to achieve results which are described in the next section.
4 Results
As shown in Table 1, first an error rate with the Non-Probabilisticmodel was obtained by simply comparing the reported touch coordinates with the intended key’s boundary pixels, i.e. the area that defines the key and checks if they lie inside the boundary of the key. Thus, here for three posturesthe Error rate is calculated as follows -
Error rate (%) = Total number of wrong touches× 100 Eq.2 Total number of touches
Total Error rate is the combined error rate, i.e. when we combine the data from all the 3 postures – Double thumb, Single thumb, Index finger and then calculate the error rate using the equation 2. The baseline Swarachakra model [6] reported an initial 13-18% error and then 6-8% stable error rate as the number of typing sessions increased. Following table summarizes the empirical results that were observed. There was a slight increase in errors when the model was training used SVM classifier [7] and when we looked at the experiment as a multi class classification task.
Table 1.Comparative results of reduction in touch errors rate.
Model Type
Double Thumb(%)
Single Thumb(%)
Index Finger(%)
Total Error
Rate(%) Non-Probabilistic Model 15.26 11.24 10.5 12.32
SVM Classifier 17.69 14.71 13.47 15.29
Swarachakra Model(Baseline)
- - - 6–8
26
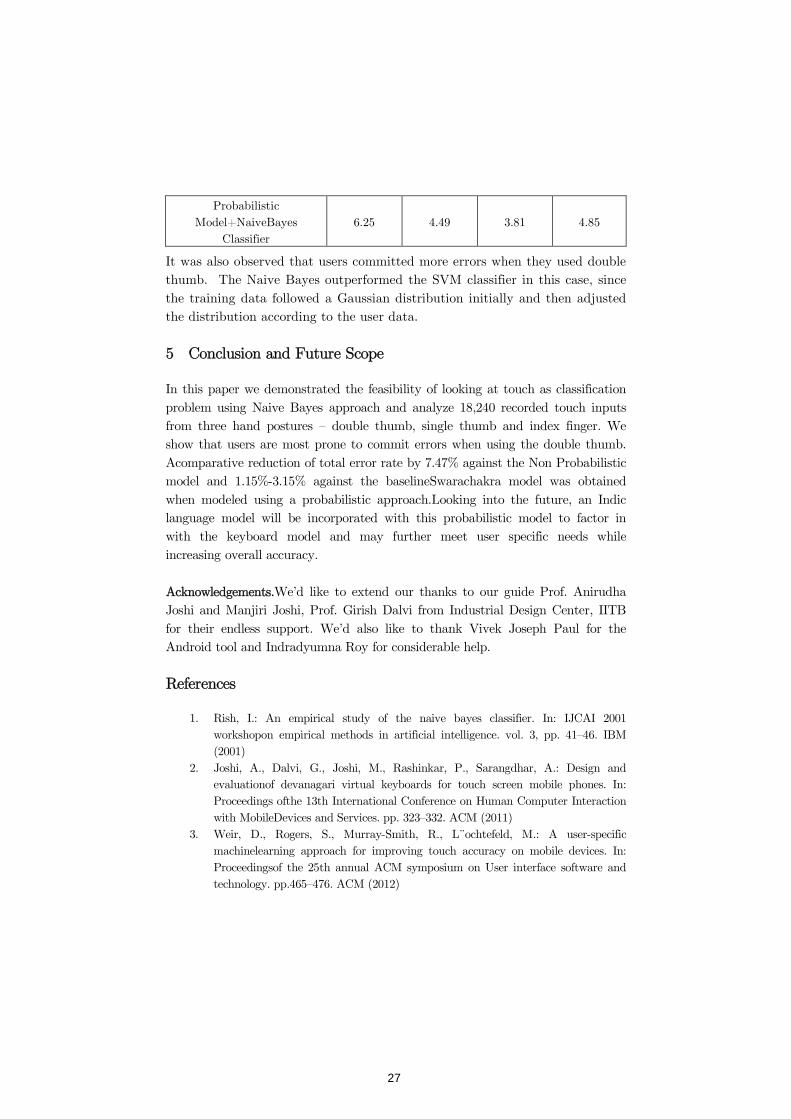
Probabilistic Model+NaiveBayes
Classifier
6.25
4.49
3.81
4.85
It was also observed that users committed more errors when they used double thumb. The Naive Bayes outperformed the SVM classifier in this case, since the training data followed a Gaussian distribution initially and then adjusted the distribution according to the user data.
5 Conclusion and Future Scope
In this paper we demonstrated the feasibility of looking at touch as classification problem using Naive Bayes approach and analyze 18,240 recorded touch inputs from three hand postures – double thumb, single thumb and index finger. We show that users are most prone to commit errors when using the double thumb. Acomparative reduction of total error rate by 7.47% against the Non Probabilistic model and 1.15%-3.15% against the baselineSwarachakra model was obtained when modeled using a probabilistic approach.Looking into the future, an Indic language model will be incorporated with this probabilistic model to factor in with the keyboard model and may further meet user specific needs while increasing overall accuracy. Acknowledgements.We’d like to extend our thanks to our guide Prof. Anirudha Joshi and Manjiri Joshi, Prof. Girish Dalvi from Industrial Design Center, IITB for their endless support. We’d also like to thank Vivek Joseph Paul for the Android tool and Indradyumna Roy for considerable help.
References
1. Rish, I.: An empirical study of the naive bayes classifier. In: IJCAI 2001 workshopon empirical methods in artificial intelligence. vol. 3, pp. 41–46. IBM (2001)
2. Joshi, A., Dalvi, G., Joshi, M., Rashinkar, P., Sarangdhar, A.: Design and evaluationof devanagari virtual keyboards for touch screen mobile phones. In: Proceedings ofthe 13th International Conference on Human Computer Interaction with MobileDevices and Services. pp. 323–332. ACM (2011)
3. Weir, D., Rogers, S., Murray-Smith, R., L¨ochtefeld, M.: A user-specific machinelearning approach for improving touch accuracy on mobile devices. In: Proceedingsof the 25th annual ACM symposium on User interface software and technology. pp.465–476. ACM (2012)
27

4. Baudisch, P., Chu, G.: Back-of-device interaction allows creating very small touchdevices. In: Proceedings of the SIGCHI Conference on Human Factors in ComputingSystems. pp. 1923–1932. ACM (2009)
5. Rashid, D.R., Smith, N.A.: Relative keyboard input system. In: Proceedings ofthe 13th international conference on Intelligent user interfaces. pp. 397–400. ACM(2008)
6. Dalvi, G., Ahire, S., Emmadi, N., Joshi, M., Joshi, A., Ghosh, S., Ghone, P., Parmar,N.: Does prediction really help in marathi text input?: empirical analysis of alongitudinal study. In: Proceedings of the 18th International Conference on HumanComputerInteraction with Mobile Devices and Services. pp. 35–46. ACM (2016)
7. Mayoraz, E., Alpaydin, E.: Support vector machines for multi-class classification.Engineering Applications of Bio-Inspired Artificial Neural Networks pp. 833–842 (1999)
28
How useful is 360-degree view for CognitiveMapping?
Ambika Shahu, Palash Vijay and Sasirekha Kambhampaty
International Institute of Information Technology, [email protected], [email protected],
Abstract.
We aim to evaluate the efficacy of 360-degree view compared to limited view,i.e. 90-degree front view only, on the development of cognitive map in anunknown environment. Participants were asked to explore the virtual envi-ronment (VE) and construct a map-sketch based on their exploration. Themap-sketch topographical relationship was evaluated to examine the cogni-tive map. Interfaces were compared based on map-sketch scoring. Resultsshow better cognitive mapping with 180x2 compared to other user-interface(UI) designs, indicating a better spatial compatibility with 180x2 UI design.Further, gamers scored better than non-gamers across the interfaces. The cur-rent pilot data suggest that the complete 360-degree view, specially 180x2UI design, supports constructing cognitive map. In addition, the data indi-cates that it's not only the UI designs, but the individual capabilities suchas gaming experience and gender also influence the given task performance.
Keywords: cognitive mapping, map-sketch, field of view
1 Introduction
360-degree field of view (FOV) is gaining widespread importance across varioustechnologies ranging from entertainment to security and surveillance. It is as-sumed that 360-degree view, especially desktop 360-degree view will enhance theremote operators' perception and decision making, by enabling them to accessboth central and peripheral view in a single glance [1,2,3]. However, presenting360-degree view on a single desktop screen leads to horizontal compression andspatial relationship distortion between objects in the camera's view. This putforth a challenge on 360-degree user interface(UI) designers to develop an intu-itive display design which would enable remote operators to develop a spatialknowledge or cognitive map as effectively as they would develop in real-timesettings. Cognitive map can be defined as a mental representation of the lay-out of one's environment[4]. Despite growing importance of 360-degree view,its impact on cognitive mapping is still unknown. [3], has shown a better ego-centric spatial perception (object-to-self spatial relationship) with non-seamlessdisplays compared to the seamless or panoramic display [see 3]. However, thenon-seamless display did not favour the cognitive mapping (object-to-object spa-tial relationship) when assessed through the spatial memory task [3], indicating
©Authors 2017, All Rights ReservedINTERACT 2017 Adjunct Proceedings
29
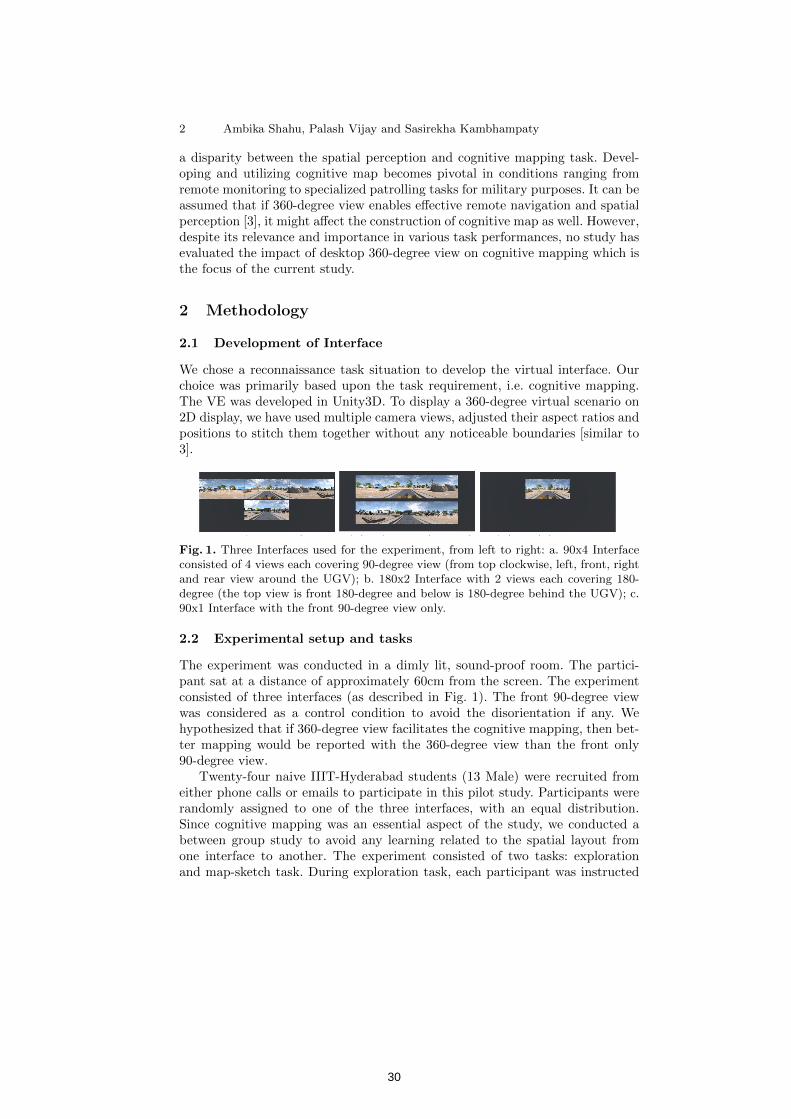
2 Ambika Shahu, Palash Vijay and Sasirekha Kambhampaty
a disparity between the spatial perception and cognitive mapping task. Devel-oping and utilizing cognitive map becomes pivotal in conditions ranging fromremote monitoring to specialized patrolling tasks for military purposes. It can beassumed that if 360-degree view enables effective remote navigation and spatialperception [3], it might affect the construction of cognitive map as well. However,despite its relevance and importance in various task performances, no study hasevaluated the impact of desktop 360-degree view on cognitive mapping which isthe focus of the current study.
2 Methodology
2.1 Development of Interface
We chose a reconnaissance task situation to develop the virtual interface. Ourchoice was primarily based upon the task requirement, i.e. cognitive mapping.The VE was developed in Unity3D. To display a 360-degree virtual scenario on2D display, we have used multiple camera views, adjusted their aspect ratios andpositions to stitch them together without any noticeable boundaries [similar to3].
Fig. 1. Three Interfaces used for the experiment, from left to right: a. 90x4 Interfaceconsisted of 4 views each covering 90-degree view (from top clockwise, left, front, rightand rear view around the UGV); b. 180x2 Interface with 2 views each covering 180-degree (the top view is front 180-degree and below is 180-degree behind the UGV); c.90x1 Interface with the front 90-degree view only.
2.2 Experimental setup and tasks
The experiment was conducted in a dimly lit, sound-proof room. The partici-pant sat at a distance of approximately 60cm from the screen. The experimentconsisted of three interfaces (as described in Fig. 1). The front 90-degree viewwas considered as a control condition to avoid the disorientation if any. Wehypothesized that if 360-degree view facilitates the cognitive mapping, then bet-ter mapping would be reported with the 360-degree view than the front only90-degree view.
Twenty-four naive IIIT-Hyderabad students (13 Male) were recruited fromeither phone calls or emails to participate in this pilot study. Participants wererandomly assigned to one of the three interfaces, with an equal distribution.Since cognitive mapping was an essential aspect of the study, we conducted abetween group study to avoid any learning related to the spatial layout fromone interface to another. The experiment consisted of two tasks: explorationand map-sketch task. During exploration task, each participant was instructed
30
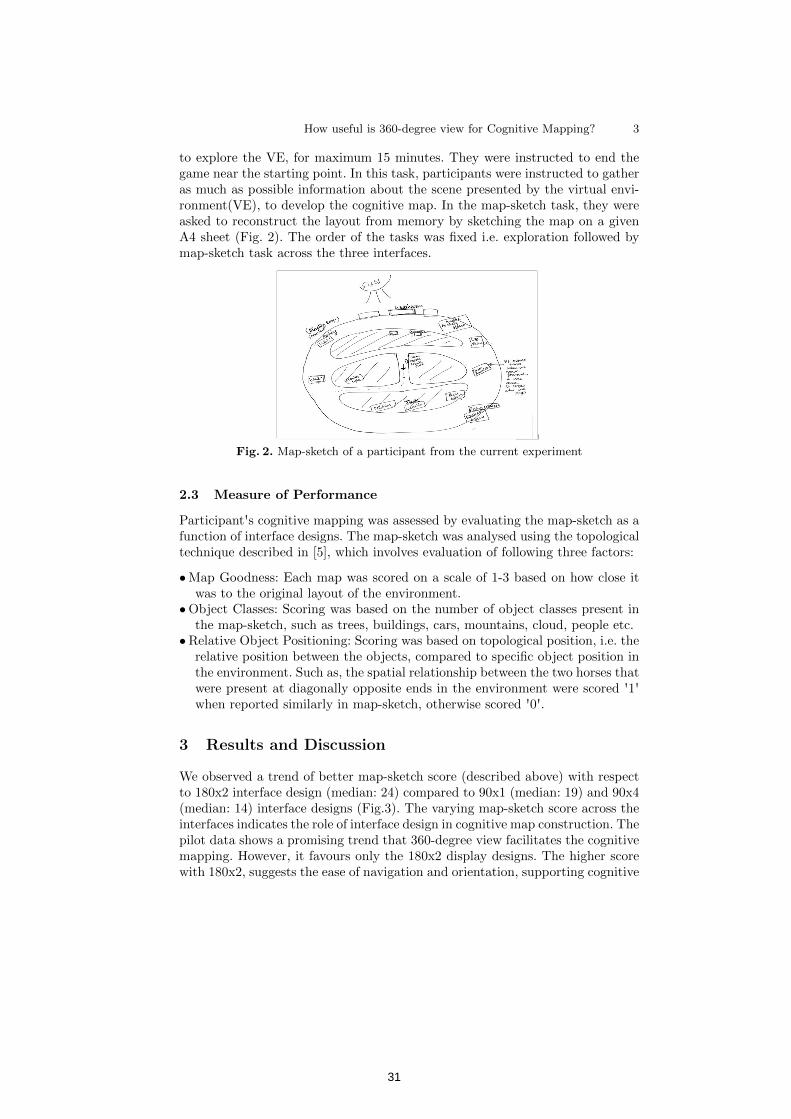
How useful is 360-degree view for Cognitive Mapping? 3
to explore the VE, for maximum 15 minutes. They were instructed to end thegame near the starting point. In this task, participants were instructed to gatheras much as possible information about the scene presented by the virtual envi-ronment(VE), to develop the cognitive map. In the map-sketch task, they wereasked to reconstruct the layout from memory by sketching the map on a givenA4 sheet (Fig. 2). The order of the tasks was fixed i.e. exploration followed bymap-sketch task across the three interfaces.
Fig. 2. Map-sketch of a participant from the current experiment
2.3 Measure of Performance
Participant's cognitive mapping was assessed by evaluating the map-sketch as afunction of interface designs. The map-sketch was analysed using the topologicaltechnique described in [5], which involves evaluation of following three factors:
• Map Goodness: Each map was scored on a scale of 1-3 based on how close itwas to the original layout of the environment.
• Object Classes: Scoring was based on the number of object classes present inthe map-sketch, such as trees, buildings, cars, mountains, cloud, people etc.
• Relative Object Positioning: Scoring was based on topological position, i.e. therelative position between the objects, compared to specific object position inthe environment. Such as, the spatial relationship between the two horses thatwere present at diagonally opposite ends in the environment were scored '1'when reported similarly in map-sketch, otherwise scored '0'.
3 Results and Discussion
We observed a trend of better map-sketch score (described above) with respectto 180x2 interface design (median: 24) compared to 90x1 (median: 19) and 90x4(median: 14) interface designs (Fig.3). The varying map-sketch score across theinterfaces indicates the role of interface design in cognitive map construction. Thepilot data shows a promising trend that 360-degree view facilitates the cognitivemapping. However, it favours only the 180x2 display designs. The higher scorewith 180x2, suggests the ease of navigation and orientation, supporting cognitive
31
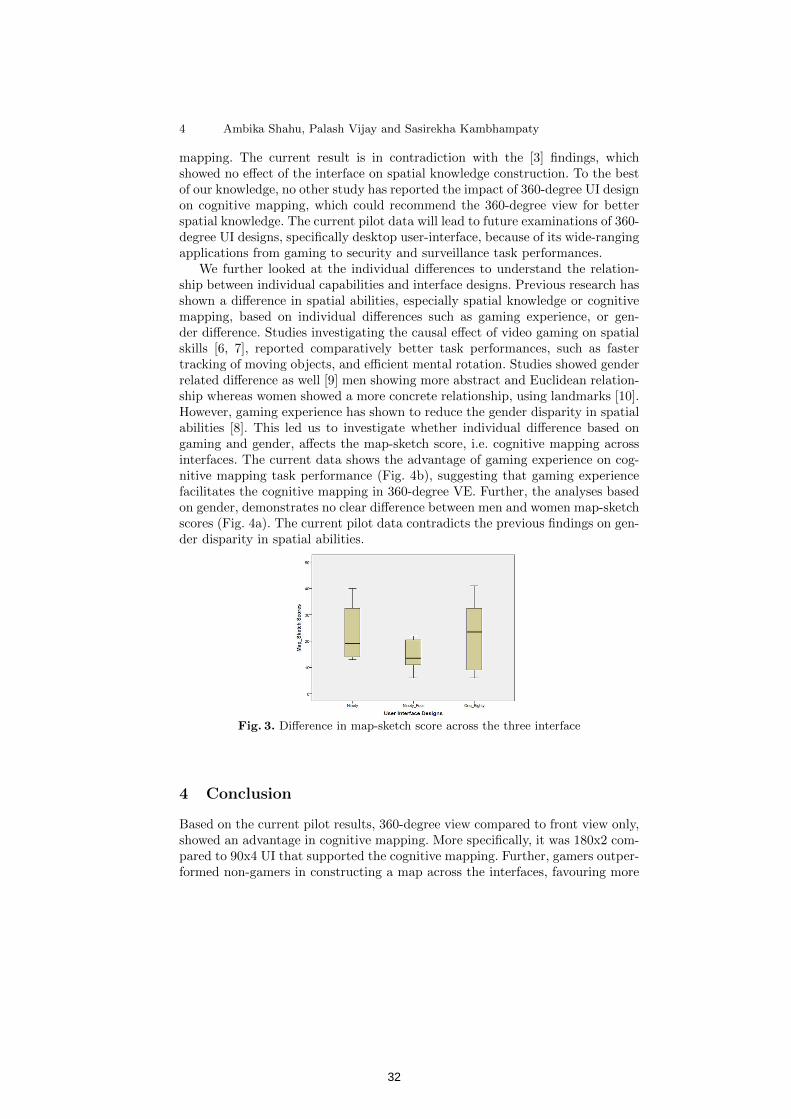
4 Ambika Shahu, Palash Vijay and Sasirekha Kambhampaty
mapping. The current result is in contradiction with the [3] findings, whichshowed no effect of the interface on spatial knowledge construction. To the bestof our knowledge, no other study has reported the impact of 360-degree UI designon cognitive mapping, which could recommend the 360-degree view for betterspatial knowledge. The current pilot data will lead to future examinations of 360-degree UI designs, specifically desktop user-interface, because of its wide-rangingapplications from gaming to security and surveillance task performances.
We further looked at the individual differences to understand the relation-ship between individual capabilities and interface designs. Previous research hasshown a difference in spatial abilities, especially spatial knowledge or cognitivemapping, based on individual differences such as gaming experience, or gen-der difference. Studies investigating the causal effect of video gaming on spatialskills [6, 7], reported comparatively better task performances, such as fastertracking of moving objects, and efficient mental rotation. Studies showed genderrelated difference as well [9] men showing more abstract and Euclidean relation-ship whereas women showed a more concrete relationship, using landmarks [10].However, gaming experience has shown to reduce the gender disparity in spatialabilities [8]. This led us to investigate whether individual difference based ongaming and gender, affects the map-sketch score, i.e. cognitive mapping acrossinterfaces. The current data shows the advantage of gaming experience on cog-nitive mapping task performance (Fig. 4b), suggesting that gaming experiencefacilitates the cognitive mapping in 360-degree VE. Further, the analyses basedon gender, demonstrates no clear difference between men and women map-sketchscores (Fig. 4a). The current pilot data contradicts the previous findings on gen-der disparity in spatial abilities.
Fig. 3. Difference in map-sketch score across the three interface
4 Conclusion
Based on the current pilot results, 360-degree view compared to front view only,showed an advantage in cognitive mapping. More specifically, it was 180x2 com-pared to 90x4 UI that supported the cognitive mapping. Further, gamers outper-formed non-gamers in constructing a map across the interfaces, favouring more
32
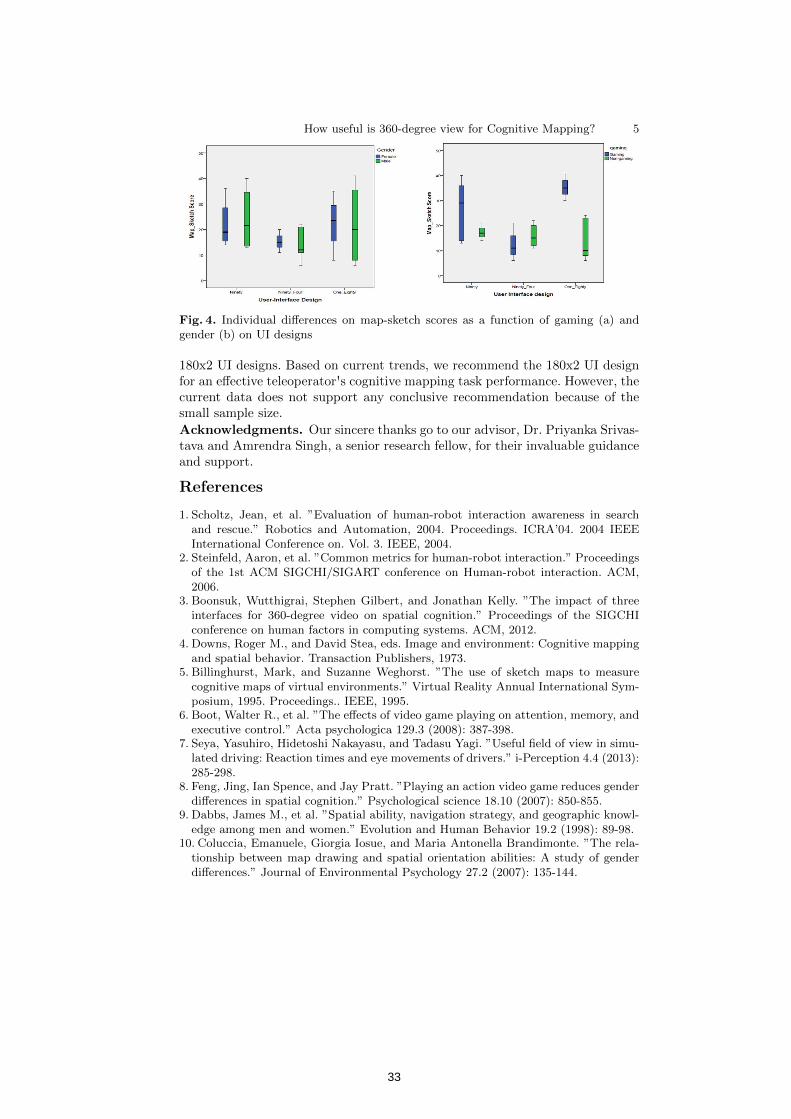
How useful is 360-degree view for Cognitive Mapping? 5
Fig. 4. Individual differences on map-sketch scores as a function of gaming (a) andgender (b) on UI designs
180x2 UI designs. Based on current trends, we recommend the 180x2 UI designfor an effective teleoperator's cognitive mapping task performance. However, thecurrent data does not support any conclusive recommendation because of thesmall sample size.
Acknowledgments. Our sincere thanks go to our advisor, Dr. Priyanka Srivas-tava and Amrendra Singh, a senior research fellow, for their invaluable guidanceand support.
References
1. Scholtz, Jean, et al. ”Evaluation of human-robot interaction awareness in searchand rescue.” Robotics and Automation, 2004. Proceedings. ICRA’04. 2004 IEEEInternational Conference on. Vol. 3. IEEE, 2004.
2. Steinfeld, Aaron, et al. ”Common metrics for human-robot interaction.” Proceedingsof the 1st ACM SIGCHI/SIGART conference on Human-robot interaction. ACM,2006.
3. Boonsuk, Wutthigrai, Stephen Gilbert, and Jonathan Kelly. ”The impact of threeinterfaces for 360-degree video on spatial cognition.” Proceedings of the SIGCHIconference on human factors in computing systems. ACM, 2012.
4. Downs, Roger M., and David Stea, eds. Image and environment: Cognitive mappingand spatial behavior. Transaction Publishers, 1973.
5. Billinghurst, Mark, and Suzanne Weghorst. ”The use of sketch maps to measurecognitive maps of virtual environments.” Virtual Reality Annual International Sym-posium, 1995. Proceedings.. IEEE, 1995.
6. Boot, Walter R., et al. ”The effects of video game playing on attention, memory, andexecutive control.” Acta psychologica 129.3 (2008): 387-398.
7. Seya, Yasuhiro, Hidetoshi Nakayasu, and Tadasu Yagi. ”Useful field of view in simu-lated driving: Reaction times and eye movements of drivers.” i-Perception 4.4 (2013):285-298.
8. Feng, Jing, Ian Spence, and Jay Pratt. ”Playing an action video game reduces genderdifferences in spatial cognition.” Psychological science 18.10 (2007): 850-855.
9. Dabbs, James M., et al. ”Spatial ability, navigation strategy, and geographic knowl-edge among men and women.” Evolution and Human Behavior 19.2 (1998): 89-98.
10. Coluccia, Emanuele, Giorgia Iosue, and Maria Antonella Brandimonte. ”The rela-tionship between map drawing and spatial orientation abilities: A study of genderdifferences.” Journal of Environmental Psychology 27.2 (2007): 135-144.
33
© Authors 2017, All Rights Reserved INTERACT 2017 Adjunct Proceedings
Use of ICT for behavioral change in dietary
habits
Ashish Jain1, Priyanka Arora1, and Umang Luhadia1
1IIIT-Bangalore, Bengaluru, India ashish.jain, priyanka.arora, [email protected]
Abstract. The research paper demonstrates the implementation of
“Theory of behavior change” for the design of an ICT intervention in the health domain. It highlights the use of this theory in design of an andro-id application that would facilitate the health workers to bring beha-vioral change in the dietary habits of the people of Channapatna, Kar-nataka, India. The paper highlights how the use of this theory in design would foster self-monitoring, goal-setting, enhanced knowledge and mo-tivation within the clients.
Keywords: ICT4H, behavior change, user-centric research, HCI4D, ICT
1 Introduction Following a proper, balanced diet is hard due to reasons like lack of aware-ness, lack of choice, and lack of agency. Changing a dietary practice involves behavior change both at an individual and household level. Our research done in Channapatna, a semi-urban area of Karnataka, presents one such case where the health navigators provide door-to-door preventive health care ser-vices. The research is based on the theory of behavior change and how this theory has been used to develop an ICT intervention to bring dietary changes in the lifestyles of people of Channapatna. It explains in depth how certain behavior change theories can be incorporated to design and develop a proof-of-concept of a software application for facilitating a health navigator and her clients to collaboratively plan and periodically track diet.
2 Related Work Recently various research literatures for use of ICT in preventive health care sector has caught mass attention [1]. Thomas [2] in her paper talks on how
34
introducing technology to the health intermediaries would lead to patient participation and wider knowledge base. In addition to this literature, Rama-chandran, et al. [3] talks about inclusion of mobile phones in the counseling activities and health behavior change activities conducted by the health work-ers. On the other hand there are literatures that talk about integrated theory of health behavior change that suggests, health behavior change can be im-proved by enriching the knowledge and beliefs, increasing self-regulation me-thods and abilities, and enhancing social facilitation [4]. In this paper we try to bring together the above two ideas of introducing an ICT intervention in form a mobile application, so as to bring about behavioral changes in the die-tary habits of the patients.
3 User Research
The project involved interactions with four HNs & MAYA representatives. The research was carried out using methods like shadowing, participant ob-servation and unstructured interviews. This allowed us to meticulously ob-serve HN’s activity around handling, behavior and comfort around the use of the tablets. These observations were recorded using a camera and a voice re-corder. The study was conducted over a period of four months i.e. August 2016 to November 2016. We followed a rapid iterative, but participatory me-thod to design the system.
4 Theoretical Framework
For our field research, there were four related illustrative theoretical frame-works out of 26 in Behavior Change Theories of Abraham & Michie [5].
• Prompt intention formation - Encouraging the person to set a
general goal. • Prompt specific goal setting - Control theory, Involves detailed
planning of what the person will do, including a definition of the be-havior specifying frequency, intensity, or duration.
• Prompt self-monitoring of behavior - The person is asked to
keep a record of specified behavior(s) (e.g., in a diary) • Agree on behavioral contract - Agreement of a contract specifying
behavior to be performed so that there is a written record of the per-son’s resolution witnessed by another.
35
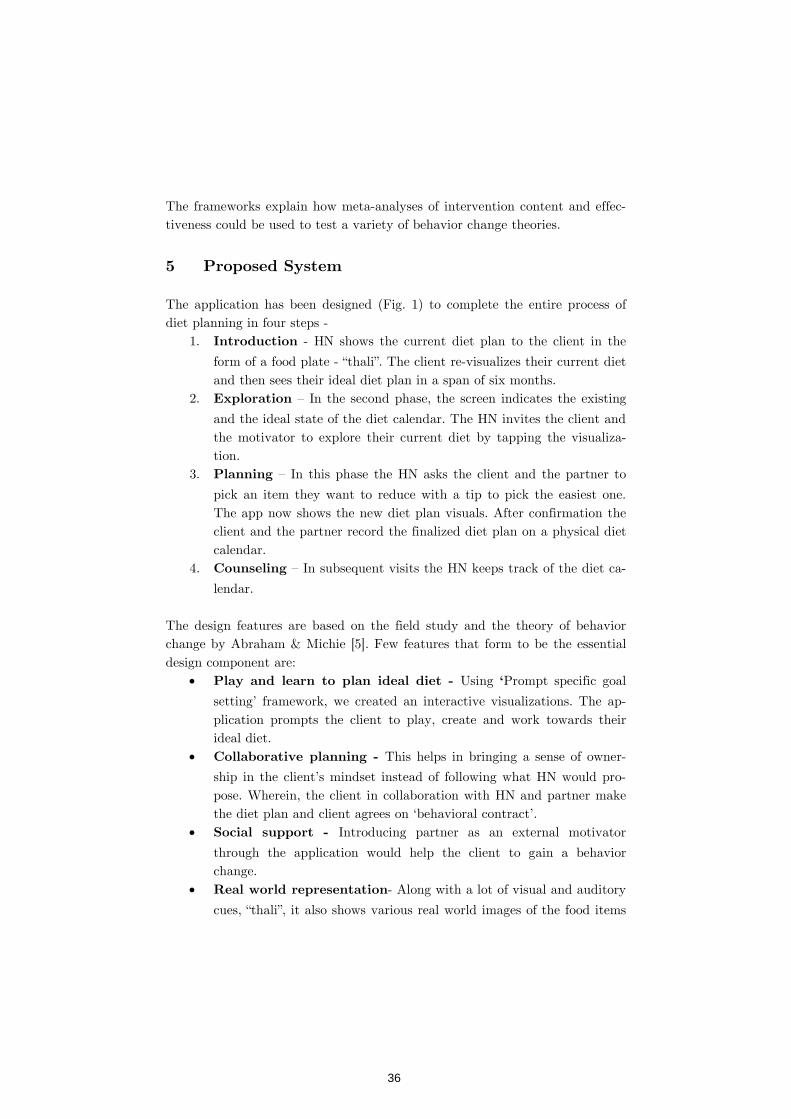
The frameworks explain how meta-analyses of intervention content and effec-tiveness could be used to test a variety of behavior change theories.
5 Proposed System The application has been designed (Fig. 1) to complete the entire process of diet planning in four steps -
1. Introduction - HN shows the current diet plan to the client in the
form of a food plate - “thali”. The client re-visualizes their current diet and then sees their ideal diet plan in a span of six months.
2. Exploration – In the second phase, the screen indicates the existing
and the ideal state of the diet calendar. The HN invites the client and the motivator to explore their current diet by tapping the visualiza-tion.
3. Planning – In this phase the HN asks the client and the partner to
pick an item they want to reduce with a tip to pick the easiest one. The app now shows the new diet plan visuals. After confirmation the client and the partner record the finalized diet plan on a physical diet calendar.
4. Counseling – In subsequent visits the HN keeps track of the diet ca-
lendar. The design features are based on the field study and the theory of behavior change by Abraham & Michie [5]. Few features that form to be the essential design component are:
• Play and learn to plan ideal diet - Using ‘Prompt specific goal
setting’ framework, we created an interactive visualizations. The ap-plication prompts the client to play, create and work towards their ideal diet.
• Collaborative planning - This helps in bringing a sense of owner-
ship in the client’s mindset instead of following what HN would pro-pose. Wherein, the client in collaboration with HN and partner make the diet plan and client agrees on ‘behavioral contract’.
• Social support - Introducing partner as an external motivator
through the application would help the client to gain a behavior change.
• Real world representation- Along with a lot of visual and auditory
cues, “thali”, it also shows various real world images of the food items
36
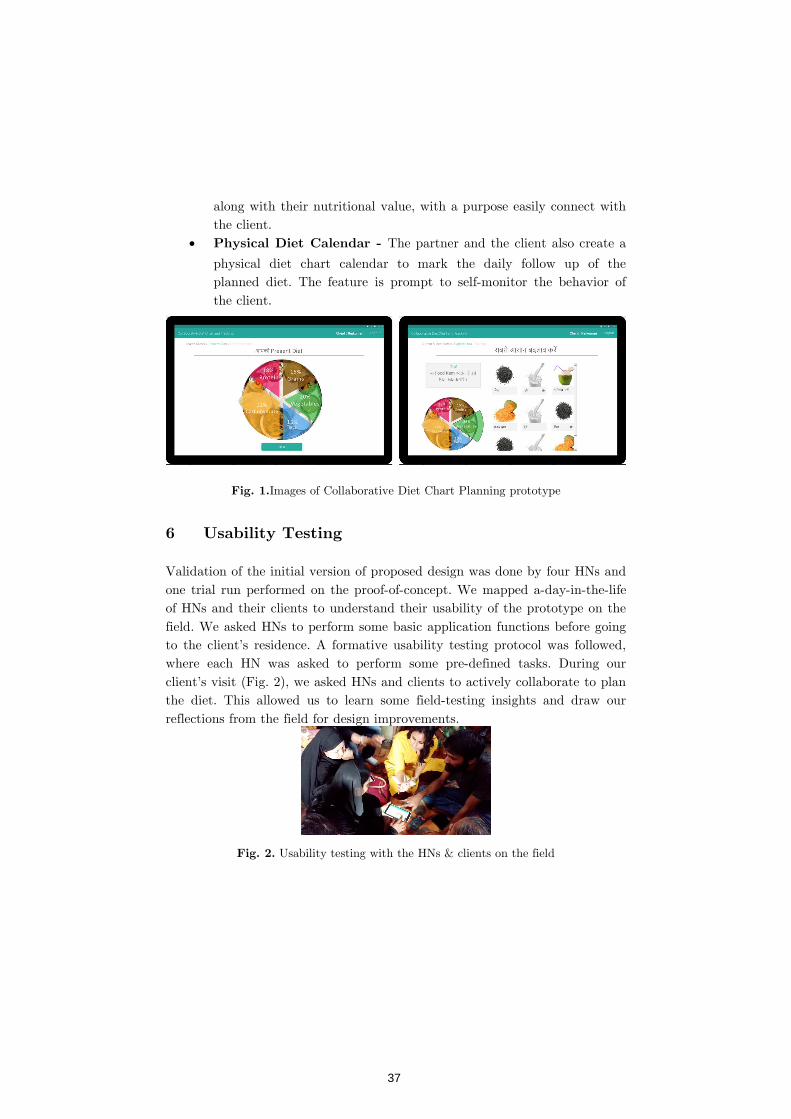
along with their nutritional value, with a purpose easily connect with the client.
• Physical Diet Calendar - The partner and the client also create a
physical diet chart calendar to mark the daily follow up of the planned diet. The feature is prompt to self-monitor the behavior of the client.
Fig. 1.Images of Collaborative Diet Chart Planning prototype
6 Usability Testing
Validation of the initial version of proposed design was done by four HNs and one trial run performed on the proof-of-concept. We mapped a-day-in-the-life of HNs and their clients to understand their usability of the prototype on the field. We asked HNs to perform some basic application functions before going to the client’s residence. A formative usability testing protocol was followed, where each HN was asked to perform some pre-defined tasks. During our client’s visit (Fig. 2), we asked HNs and clients to actively collaborate to plan the diet. This allowed us to learn some field-testing insights and draw our reflections from the field for design improvements.
Fig. 2. Usability testing with the HNs & clients on the field
37

7 Findings
We found that the HNs are really focused on spreading the right message to their clients in terms what they should eat, when and how. We also observed the reluctance of the HNs to share their tablets with the clients and to allow them to touch the tablets. These insights on the field gave us an idea on how the tablet should be made friendlier for the stakeholders. The tablet applica-tion acts as a facilitator for the HNs to do convey all the important informa-tion while creating the diet plan. Reflections from the field also lead to the introduction of the voiceover feature in the proof of concept at various stages of the application.
8 Conclusion
This paper describes the reflections of theories for health behavior change through an Android application that establishes collaboration between HNs and their clients for designing client’s diet plan. The approach took us through a revealing process on how the apps or the features of the tablet could become part of the real life situation. This design has a limitation to capture exact measures of food consumption by the client, since the consump-tion capacity and frequency maybe relative. This does not seem to be a major hindrance, since our main focus was to create awareness and behavior change with HN intervention through verbal counseling. The application brings forward a fresh perspective of participatory approach while diet planning. The idea can be used towards scaling this intervention across other geographies and domains. There are rich opportunities to broaden the scope of the Collaborative Diet Chart Planning application and the proof-of-concept as a whole.
Acknowledgement. We would like to express our gratitude to MAYA
Health, the health navigators and their clients for giving us access to their space. We would also like to thank Prof. Naveen Bagalkot and Prof. Amit Prakash for mentoring us and Prof. Janaki Srinivasan for her valuable inputs and suggestions in the paper.
References
38

1. Chib, A.: The Aceh Besar midwives with mobile phones project: Design and eval-uation perspectives using the ICTs for Healthcare development model. In: Journal of Computer-Mediated Communication, vol. 15, issue 3. (2010)
2. Thomas, S.: Affordable Mobile Technology towards Preventive Health Care: Rural India. In: Journal of Dental and Medical Sciences (JDMS),vol. 3, issue 3, pp. 32 – 36.(2012)
3. Ramachandran, D., Canny, J., Das, P.D.,Cutrell, E.: Mobile-izing health workers in rural India. In: Proceedings of the SIGCHI Conference on Human Factors in Computing Systems, pp. 1889-1898. ACM (2010)
4. Ryan: Integrated theory of health behavior change. vol. 23, number 3. Lippincott Williams & Wilkins (2009)
5. Abraham, C., Michie, S.:A Taxonomy of Behavior Change Techniques Used in In-terventions.pp. 379 – 387. American Psychological Association (2008)
39

Student Design Consortium
Student Design Consortium (SDC) entries address a range of design problems - from
organizing everyday mundane tasks to preparing an inventory for a much awaited
space journey. It provides platform to young and talented minds buzzing with ideas to
connect with an international community of design practitioners, academicians and
researchers. Through their submissions, students had an opportunity to talk about
their work, receive invaluable peer-reviewed feedback from experts, discover new fans
and showcase their work.
SDC submissions included thesis projects, classroom or personal projects and
collaborative work done by students as individuals or as teams. We had students from
various disciplines (HCI, Interaction Design, Communication Design, Industrial Design,
Architecture, Arts and Engineering etc.) making these submissions.
40
© Authors 2017, All Rights Reserved INTERACT 2017 Adjunct Proceedings
Community Based System Designfor Indian
Railways in the Context of Senior Citizens
Atul Kumar
National Institute of Design, R&D Campus, Bangalore, KA, India [email protected], [email protected]
Abstract.Carrying more than 8 billion passengers annually, Indian
Railways, the eighth biggest employer in the world, through its sheer
magnitude of scale, reach and components in both numbers and services,
is a system which is highly dynamic and versatile. Since this holistic sys-
tem is a sum of multiple constituent factors it is interesting to study it
with a purpose to empathize with the target user group and then accor-
dingly evaluate the existing system and suggest and/or enhance it
through design intervention. The chosen user group was senior citizens
and the rationale behind selecting this user group was the shifting de-
mographics as seen overall in the world as well as in India which sug-
gests increasing number of dependent senior citizens, thus arising the
need of their inclusion in every aspect of lives, which for the purpose of
the study was chosen as travelling with Indian Railways.
Keywords: Indian Railways · senior citizen · active aging · inclusion ·
empowerment · support · system design · design intervention · human
network · collaboration · government · integration · voluntary service ·
social change · harmony · assistance · social journey · travel buddy ·
Saarathi
1 Introduction
Indian Railways is the lifeline to a multitude of travelers across India. It is a
state-owned railway company operated by the Government of India through
the Ministry of Railways overseeing the fourth largest railway network in the
41
world, and carrying billions of passengers annually. Through the nature of its
scale and magnitude while catering to multiple services, it has become a living
system on account of its variety of components. This gives rise to an ever-
changing and sprawling, and yet cohesive and self-balancing system. In order
to focus on one of the parts of this system a target user group was selected to
understand their basic requirements expected out of the Indian Railways. For
this purpose, the user group selected was ‘senior citizens’, the parameter for
which is defined under Indian Railways as any female passenger who is above
58 years of age and any male passenger who is more than 60 years old. With
the changing demographics in the world through ageing population, we are
looking at a scenario which has never been witnessed before. It’s predicted
that more than two billion people of the world will be aged 60 or above by
2050 [4,5,6]. Developed nations aside, even developing countries, including
India, have seen a spike in the growth of senior citizens. India recently saw a
spike of 35% in the population of its senior citizens just in the last decade [3].
This change in demographics has already made concerned international groups
take up the matter seriously in order to provide better life-experiences to
those who fall in the category of dependents. John Beard, director of the
WHO Department of Ageing and Life Course, highlighted the point that “with
the rapid ageing of populations, finding the right model for long-term care
becomes more and more urgent.” The Madrid International Plan of Action on
Ageing (MIPAA) which is a resource for policy-makers, suggests ways for
governments, non-governmental organisations and other stakeholders to reori-
ent the ways in which their societies perceive, interact with and care for their
older citizens. Active Ageing is another concept which has the similar ideology
focusing on the process of optimising opportunities for health, participation
and security in order to enhance quality of life as people age. It applies to
both individuals and population groups. Active ageing allows people to realise
their potential for physical, social, and mental well-being throughout the life
course and to participate in society, while providing them with adequate pro-
tection, security and care when they need.The word “active” refers to continu-
ing participation in social, economic, cultural, spiritual and civic affairs, not
just the ability to be physically active or to participate in the labour force.
Older people who retire from work, ill or live with disabilities can remain ac-
42
tive contributors to their families, peers, communities and nations. While
most of these philosophies can be implemented early in few of the developed
nation, it is important for a country like India to understand its own capabili-
ties, short-comings and strengths and try and achieve similar goals with re-
spect to senior citizens. The same is inspected under the domain of Indian
Railways in this study.
2 Methodology
The existing system was scrutinized with respect to common traveler, who is a
senior citizen (or a dependent), and commuting through Indian Railways. For
the same, few personas were creating keeping in mind certain realities and
assumptions. The personas included senior citizens ranging from people who
were technically and physically sound and had a strong educational back-
ground, to those who were from a lower economic and academic stratum. Per-
sonal interviews were conducted as well to understand the user group for first-
hand research. For the purpose of this a set of 20 in-person interviews were
done which were open ended in nature and aimed towards understanding
problems and needs of senior citizens at Indian Railways. Since the Indian
Railways offers a variety of services, to draw a boundary for the system under
study, just the major component of the railways i.e. transportation was se-
lected as the main criteria. This also made sure that the user’s perspective
was understood as a traveler and hence the main thought process was around
the idea of commuting from point A to point B using Indian Railways. With
respect to the chosen user group the various aspects of commuting were dis-
cussed which roughly revolved around broader topics of navigation, locomo-
tion, luggage-carrying, health-monitoring, accessibility, technology-integration
and community-inclusion. While analyzing the system through the lens of
senior citizens it was also made sure to account for any other specific needs
and possibility of unforeseen or experimental interventions. Going forth, for
the sake of understandability, two systems were envisioned: the first one being
the “As-is” system which was the current state of the system under study and
the second one as the “To-be” system which was the desired system, an output
of design research and intervention. The As-is system is the snapshot the us-
er’s needs which were noted as per interviews and observations, and the ways
43
in which these are currently addressed, along with all the stakeholders. The
To-be system attempts to cater to these needs through different possible sug-
gestions, and highlight the desired state of the envisioned system.
2.1 As-is System
The existingAs-is system was mapped with the target user group of senior
citizens taking the centre stage in order to empathize and understand the user
better. The general behaviours of the user were mapped. It was noted that the
senior citizens, on account of their age, have certain generic behavioural char-
acteristics which include short attention span, delayed information processing,
emotionally attuned, weaker memory, and declined motor control. These were
the basis of finding out their common needs across various fragments of trav-
elling with the Indian Railways. These needs were seen as both empirical
needs (such as difficulties in carrying luggage, moving on platform, getting on
and off the train, navigating through the platform, accessibility of the berth,
and climbing foot-over-bridge, and accessibility to specific food, medicinal
supplies, hygienic spaces etc.) and psychological needs (such as sense of secu-
rity, ease of use, understand ability, social acceptance, friendly, inviting, &
non-daunting solutions, collaboration and contribution, totality of experience
etc.). Apart from this the major stakeholders who are directly or indirectly
involved with this system were charted out. The current situation with re-
spect to solutions already being provided by Indian Railways, irrespective of
the efficacy of implementation, was listed as well to understand the As-is sys-
tem in entirety. Please refer to Figure 1: As-is System on the next page.
2.1 To-be System
In order to map the To-be system it was necessary to not just provide arbi-
trary solution or suggestion at any few points within the As-is system itself,
but to come up with such design intervention which overhauls and impacts
the entire As-is system and in essence produces a new, unique and functioning
To-be system which allows for integration of fresh solutions into it.
The analysis of As-is system showed up certain drawbacks, few of which in-
cluded high dependability of senior citizens on someone from family for their
44

travel, lack of collaboration of the stakeholders to ensure better travel expe-
rience, negligible community inclusion, difficulty in navigating and moving
through the platform and the train itself, and feeling of insecurity and isola-
tion for the traveler.In order to understand whether these issues are addressed
in any form in other modes of transport such as air travel, an analogy was
drawn with respect to airports and airplanes for the air-travel system. It was
noted that the system of air-travel fairs well on various parameters such as
security,
45
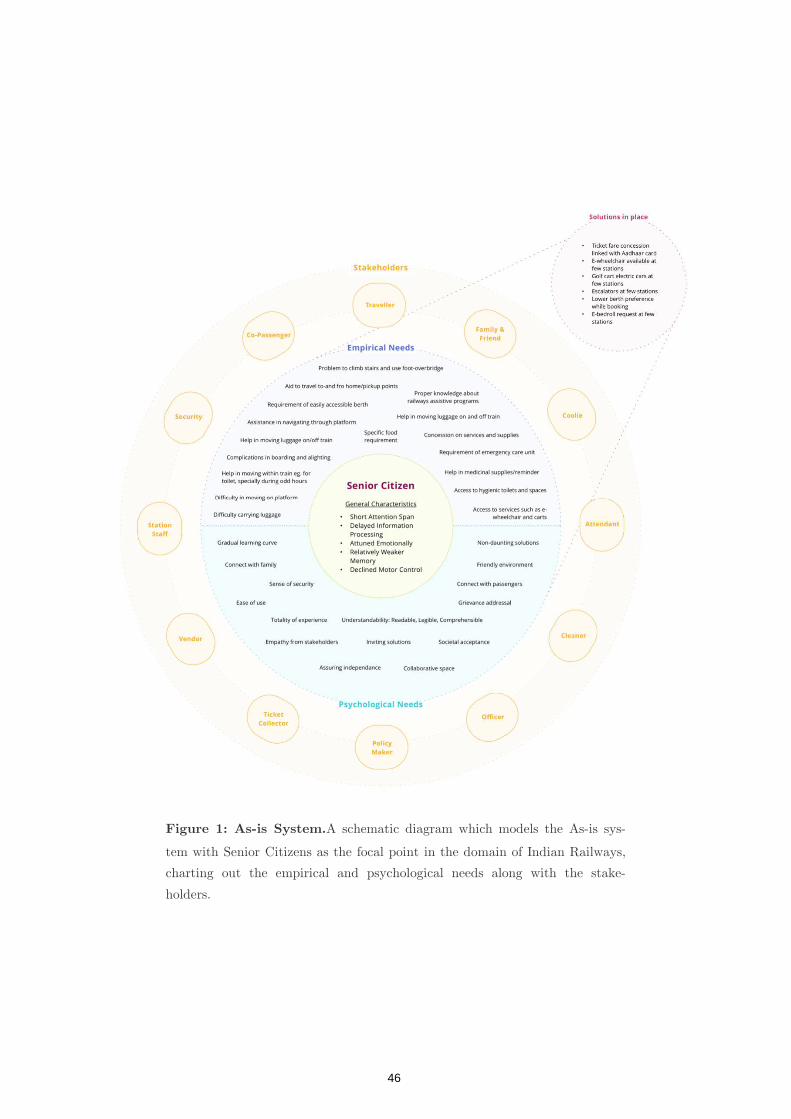
Figure 1: As-is System
tem with Senior Citizens as the focal point in the domain of
charting out the empirical and psychological needs along with the stak
holders.
is System.A schematic diagram which models the As
tem with Senior Citizens as the focal point in the domain of Indian Railways,
charting out the empirical and psychological needs along with the stak
A schematic diagram which models the As-is sys-
Indian Railways,
charting out the empirical and psychological needs along with the stake-
46
safety, cleanliness, on-demand-services, code-of-conduct of staff, emotional and
physical support, and crowd management. However, a direct comparison with
the Indian Railways is a bit too far-fetched given the cost and crowd consid-
erations in a vastly-diverse country like India. Yet there were few key takea-
ways in doing such an analysis. The Indian Railways can leverage similar
gains through the one thing which it has got a tremendous supply of, i.e. the
amount of available human resource. The To-be system envisions a human
network which strives to achieve unprecedented goals of bringing the target
user group, co-travelers, attendants, trained-staff, government officials, policy
makers and other stakeholders together to reap benefits and allow for safer,
secure and collaborative but independent travels. Please refer to Figure 2: To-
be System on the next page.
While there were other considerations as well during the assumptions of prob-
able To-be system such as usage of experimental infrastructure like ropeway
and lift systems, platforms with priority check-in and boarding, integration of
tools for locomotion aids like e-wheelchair, golf-cart-vehicles, escalators, spe-
cial equipment for boarding-alighting, and other preferential services such as
fare concession, berth allocation, attractive offers, on-demand-services, pick-up
& drop-off etc., it was noted that few of these suggestions were either already
in execution or implementation phase, or were too infrastructure or cost
heavy, and probably required revamping of the entire existing system.
Hence, the human network centered solution was considered as the way to go
forward for a better experience of travelling with Indian Railways for senior
47

citizens. The To-be system is envisaged with the human-service-network at
the core, which would provide support for senior citizens for their travel needs
and help in servicing the travelers better. Two solutions were examined, one
as a local support group, and other as the ad-hoc volunteering based help.
3 Local Support Group
The idea behind such initiative is a planned collaboration among people at
regional level to nurture people’s group under supervision which will actively
provide support for those who require and request for it, allowing possibility
of dedicated personnel for servicing concerned person across classes and
places. This would be possible only when such organization and values are
grown through local network, grass-root support, and community based solu-
tions. Such collaboration at spaces can be inculcated by getting those people
involved who are willing to come under one roof with the objective to provide
community support. Such a group can be created under the supervision of the
railway government at local levels, which are in turn supervised by retired
48

Figure 2: To-be System.
system with Senior Citizens as the main focal point in the domain of Indian
Railways, charting out the proposed human service network along with the
be System.A schematic diagram which models the To
system with Senior Citizens as the main focal point in the domain of Indian
, charting out the proposed human service network along with the
A schematic diagram which models the To-be
system with Senior Citizens as the main focal point in the domain of Indian
, charting out the proposed human service network along with the
49
stakeholders.
senior citizens and officers from that area. This will also help senior citizens to
get involved in community based planning as well as getting support when
required. Such association can provide help whenever someone requests for it.
A dedicated personnel would assist the concerned passenger in the travel and
thus remove the dependability of travel on anyone else. While this suggested
solution is built on the good-will of community support, a closer look reveals a
larger problem that is of bureaucratic overload and favouritism. Furthermore,
a nationwide setup will involve huge budget related repercussions and unfore-
seen cost and infrastructure related overhead.
4 Co-passenger Volunteering: Saarathi
While the Indian Railways keeps bustling with the myriads of travellers every
day, there is a huge amount of untapped potential lying with them. In an
attempt to find a solution that is non-taxing to already burdened railways
system, it was important to look for an answer that has the minimum cost
and infrastructure overhead. The envisioned idea is a medium which brings
together the co-passengers and encourages them to be empathetic and suppor-
tive towards concerned user group. It would formalize the idea of volunteering
and make people aware of the goals that can be achieved when we come to-
gether as people with common mind-set. The core objective is to bring people
together, encourage empathy among them and propagate the idea of mutual
help. This would promote collaboration among co-passengers in order to en-
able and inculcate the spirit of imparting voluntary service making sure that
the right set of people are connected, empowering those who need help and
building harmonious travel experience in the setting of train as a social jour-
ney.
50
The working example of this could be envisaged in situation where while
booking the travel ticket the passenger is prompted to participate in this ini-
tiative and register as volunteer or seeker and then the correct set of people
are connected together through the algorithm working in the background.
While such match happens, a notification will be sent to both the parties, and
they will get to know these details well in advance before the scheduled travel.
This will provide a formal channel for people to get to know each other. While
it gives opportunity for people to voluntary assist someone through the jour-
ney, it eliminates the anxiety of people who feel alienated during the travel.
The proposed system is imagined in a non-obtrusive and non-compulsive way.
It’s a system of give and take where anyone can impart their services volun-
tarily as per their capabilities. For instance, even an elder passenger can vol-
unteer for helping someone travelling with kids and they can socialise and
remove the monotony of travel.
The initiative is given the name Saarathi, a word originated in Sanskrit which
has a literal meaning of charioteer. Saarathi is also an epithet of Lord Krishna
in the Hindu epic Mahabharata which symbolises protection, guidance, assis-
tance, and friendship. Hence Saarathi proposes a solution of journeys in the
company of a Travel Buddy. The solution is conceptualised to be delivered via
both online and offline mediums. The Saarathi mobile/desktop based applica-
tion would allow the passengers to look for a Travel Buddy via PNR number
which will fetch all the travel details and profile type. The offline medium can
be just a simple request raised for a Travel Buddy at the ticket counter itself,
and the participants can be notified by SMS based service. The entire pro-
gram can be spread across India through national campaigns showcasing rail-
way journey as a social and harmonious event of coming together.Moreover,
the solution can cater to wider categories of dependent passengers other than
just senior citizens,like expecting mother, single parent, young students and
differently abled passengers.
51
This can be further promoted by providing a virtual ranking system and
technology integration which would recognize people who actively participate
in it via token of appreciation or virtual badges and traveller’s points. This
would foster the collaborative efforts to take place, strengthen the human
network, and bring about a behavioural change in the way people interact
with their co-passengers.
5 Conclusion
Saarathi as a solution can be a positive step towards building a travel experi-
ence which is collaborative and harmonious for travellers, specially for de-
pendents like senior citizens. It’s a democratic solution which just involves
people’s initiative. In order to maintain the efficacy of the solution it will be
required to appeal to people’s emotion towards comradery and empathy via
popular channels and influential figures. For the validity of the proposed
Travel Buddy solution as Saarathi, it will be good to note in future research
that how people will react to such initiative, and accordingly implement the
required changes. Also, the viewpoint of security must be addressed, and par-
ticipants must be made aware about this as per the Aadhar’s data (Unique
Identification Authority of India) linked with every ticket’s PNR number and
phone number of the participants, which can be useful in tracking details of
participants for security purposes. The possibilities of implementing Saarathi
are numerous. Saarathi can be a stand-alone application, or a simple integra-
tion with the IRCTC portal, or just an SMS request & notification based so-
lution. It can even be a solution with chat-bots incorporated in popular third
party mobile applications to provide a wider reach and connect to public.
Acknowledgements. Gratitude is expressed towards the faculty guidance at
National Institute of Design, R&D Campus Bangalore for valuable inputs and
assessment at different stages of research, documentation, output generation,
and evaluation. Also, students who helped in scrutinizing the system as well
as the solutions were of vital help.
52
A Appendix
Question Set
• How often do you travel with Indian Railways?
• Do you travel alone? If not, whom do you travel with?
• What is the reason behind not being able to travel alone?
• What are your major worries while travelling with the Indian Railways?
• What are the railways scheme and aids you know of provided by the gov-
ernment to senior citizens? Have you ever availed any of them?
• Which would you prefer for travelling alone - airplane or trains?
• What are the reasons you feel air-travel is more convenient than railways?
What about travelling via road?
• If money and time is not a factor, which one will you prefer – airplane or
train?
• How important is a co-passenger to you?
• What are the personal experiences of difficulties faced by you while train
travel?
References
1. RailElectrica, https://www.railelectrica.com/essential-amenities-for-
railway-passenger/climbing-the-stairs-nightmare-for-many/ (August 2014)
2. The Hindu Busi-
nessLine,http://www.thehindubusinessline.com/economy/logistics/reserva
tion-quota-for-senior-citizens-in-train-enhanced-by-50/article8390012.ece
(March 2016)
53
3. The Indian Express,http://indianexpress.com/article/india/india-news-
india/india-population-growth-people-over-sixty-senior-citizens-2764848/
(April 2016)
4. United Na-
tions,http://www.un.org/sustainabledevelopment/blog/2017/06/world-
population-projected-to-reach-9-8-billion-in-2050-and-11-2-billion-in-2100-
says-un/(June 2016)
5. United Nations,https://www.un.org/press/en/2007/pop952.doc.htm
(March 2017)
6. World Health Organiza-
tion,http://www.who.int/mediacentre/factsheets/fs404/en/ (September
2015)
7. Indian Railways Wikipe-
dia,https://en.wikipedia.org/wiki/Indian_Railways
8. Indian Railway News,
https://indianrlynews.wordpress.com/tag/passenger-services-in-indian-
railways/ (January 2015)
54
© Authors 2017, All Rights Reserved INTERACT 2017 Adjunct Proceedings
Seek: Art Teaching Aid
Abhijith KR
Industrial Design Centre, IIT Bombay, India ([email protected])
Abstract: Primary art education in India is troubled by lack of infra-
structure and insufficient teachers. The syllabus loses its effectiveness while being translated into classroom instruction. Children produce art-work that lacks character and is monotonous. This dearth of variety can be attributed to an absence of divergent thinking and ineffective systems supporting such thinking. We propose a design-led intervention in the form of a prompt generation tool as a step towards building better sup-port systems and effecting change in teacher outlook. The prompts present familiar objects in unfamiliar situations. These help children think beyond the obvious, trying to deal with the situations presented. Our focus was on achieving rich variety in art produced by children. The preliminary evaluation of our tool shows promise.
Keywords: Art Education, India, Technology in Education
1 Introduction
1.1 Background
Over 30 million children in India attend classes 7th and 8th, with 6.7 million teachers teaching in secondary (classes five to seven) schools.[1] Of these, art, craft, dance and theatre teachers are called specialist teachers. A number of Indian states have cut down on the number of specialist teachers appointed to fill the vacancies of retiring teachers, as well as fresh appointments. Many of these schools are resource constrained. As a result, primary art education in government schools in India suffers from inadequate infrastructure and insuffi-cient number of teachers. Children have limited access to technology-driven art learning tools. The schools are unable to allot enough class hours with art teachers. In most cases, the hours they get are not enough to complete exer-cises comfortably. There also exists a mismatch between the art education syllabus and how it is taught in classrooms.[2.3]
55
1.2 Motivation
Drawing as a tool to think has the potential for dealing with real-world prob-lems.[4] We wanted to find out how formal education equips a young genera-tion to think, by training them in art. We concentrated on the role of the instructor and how she brings in a mindset of creative, free thinking to the classroom. Previous encounters with art produced in classrooms had convinced us that for some reason, children were not being trained in this act of art as problem solving. Our interest was in finding what design can do to reinforce in children a spirit of using art as a thinking tool.
1.3 The Diversity Problem
We visited schools in Maharashtra and Kerala and spoke to art teachers dur-ing our earlier research. Apart from the infrastructure and administration related troubles, we observed that the artwork students produced lacked di-versity. For a given exercise, they resembled each other. Most artwork reflect-ed no local or cultural foundations and stuck to a generic version of objects and settings depicted devoid of contextual detail. Despite the rich variety in culture and environments, the lack of such diversity in the artwork was baf-fling. Therefore, addressing the need for systems to nurture rich variety in art and incorporating local context becomes an area ripe for design intervention.
In our opinion, the similarity in drawing output can be attributed to a lack of divergent thinking. Children are not encouraged to think differently enough to be able to produce work that reflects their individuality. They are condi-tioned to draw in certain specified ways to facilitate quick evaluation. There seemed to be three factors influencing the absence of variety. The first is the children’s lack of confidence in their own experiences. They were reluctant to draw from their immediate surroundings and everyday experiences. The second is a culture of following a prescribed norm which is put in place by teachers who use ‘observe and reproduce’ techniques to teach art. The norm defines classroom exercises—still-life arranged a certain way, certain specific topics copied from guidebooks, etc. Children are made to copy a drawing the teacher makes on the blackboard and are then assessed for their skills alone. The third factor is exam-centered education, where a standard, easy to eva-luate output at the end of each exercise is expected and encouraged. For teachers, such output is less time consuming to evaluate, as compared to con-ceptually and formally diverse artwork. These three factors work in tandem, often feeding off each other.
56
A recurring concern we encountered in texts we consulted [5,6,7,8,9] during research is the inefficiency of schools as places for exploratory learning, where there is no fear of failure. There is also an emphasis on need for experiential learning, where classroom activities are closely related to the students’ imme-diate environment and community. Our research shows that teachers ac-knowledge this disconnect, but are largely unable to counter it owing to re-source constraints—there are very few repositories critically discussing local artists and their work, and the ones available are not easily accessible.
We argue that diversity in artwork is linked to children’s ability to think on their own. While ‘observe and reproduce’ addresses mastery of skill and technique, continued emphasis on it diminishes children’s independent think-ing ability as they climb the education ladder. Our research and observations from the field point to the existing systems having failed the students. The students end up being unable to produce original, diverse artwork in response to a given problem. We further theorise that it is the instruction methodology and the teachers’ mindset that needs a change in direction to enable students to see every drawing as an opportunity to exercise their imagination. It is clear from teachers’ comments on the infrastructure and resource-related problems they face that such a change ought to exert very little strain on established ways of teaching and evaluation. A culture of ‘observe and repro-duce’ and a fear of straying far from expected norms have reduced variety in the artwork children produce in classrooms. This lack of variety is an indica-tor of a lack of divergent thinking. There is a need to help teachers make art exercises more enjoyable and help children think freely and in as many differ-ent directions as they are capable of, without fear of failure.[16] The evalua-tion criteria also needs to be rethought, based on the diversity goal. The dis-cussion brings us to the design brief, discussed next.
2 The Design Brief and Objectives
Our primary research in art classrooms and secondary research into prior ex-periments and existing interventions helped us formulate the objectives to include the following:
1. The solution must address the lack of diversity in students’ artwork such that it exerts very little strain on established practices, and
2. It must then positively affect the thinking process of the students and the teachers.
57
2.1 Areas of Intervention
An artwork can be looked at—and evaluated—from different perspectives. For instance we can look at the concepts it embodies and the skill with which it is produced. These are not exhaustive lists of ways of looking at art, but is a convenient subset to limit the scope of our discussion to. We acknowledge that judging art is subjective and don’t claim objectivity in the ways we use.
The question of whether it is appropriate to judge an artwork’s merits based on skills (as opposed to concepts) was raised during initial stages of the project. The consensus seems to be that “skills are essential to be taught to beginners, concepts are equally important.” The understanding that it is not an ‘either/or’ situation convinced us that within the scope of the project it was not possible to dwell on this choice of priorities. This led us to concen-trate on the issue of monotony we observed in the artwork children produce. We looked at the factors influencing this absence of original, diverse ap-proaches to see areas to focus on. The crippling workload on the teachers and the inescapable concern of economic viability were also taken into account before deciding a direction that made the least demands on them. Of the many ways to address the issue, we felt that an effective tool will have to operate in the classroom and offer the potential to expand to include existing communities.
2.2 Design Approaches
The research findings had suggested many avenues for design intervention, of which we first chose to concentrate on two project ideas. One was a forum for art teachers to form local, contextually relevant online communities. In these communities they can share their teaching techniques, their students’ artwork and their use of ingenious craft materials and processes. The second was a web-based generative tool that helps teachers with prompts related to topics to teach for specific children.
Acceptability of any such intervention would depend on respecting existing work-flows and known ways of conducting classes. We saw that children's enjoyment and extent of exploration of the boundaries depended the most on what they were asked to draw. The topics or the prompts that a teacher pre-sented in class decided how the class responded to an exercise. We decided that a prompt-level intervention, without judgments on syllabi, teaching me-thods and evaluation criteria was ideal. Approaching the problem via prompts is also validated by early studies on divergent thinking, creativity and experi-ments with sketching as a thinking tool. Such an intervention also comes with
58
its set of disadvantages. Beyond the ones generated by the tool, we expect the teachers to think for themselves and bring in local, cultural flavour. This teacher dependence is one of its weakest points. An excellent teacher can max-imise the variety of outcome of a prompt through effective classroom activi-ties, while another can limit explorations with prescriptions and references. We hope to overcome this when the teachers realise they can make their own schemes or modifying the existing ones. The web-tool nature puts it out of sight, unlike an application that is a visible presence on the mobile phone home-screens. Increasing the utility and variety of content within the tool is one way of addressing the problem. Absence of direct visual references is also likely to be a deviation from what is expected of a web-based tool. Image ref-erences tended to influence children's drawings and work against exploration. This observation informed our design decision to avoid such references. As we observed during our earlier research, textual prompts can, in contrast, help avoiding the ‘observe and reproduce’ trap easier. More than anything else, changing the prompts does not affect any other steps in the instruction process and does not upset the status quo of the classroom.
The prompt-generator, in contrast to the other approaches, used many be-haviour patterns gleaned from previous research findings, as well as docu-mented methods [10, 11] of generating unique ideas and themes to draw from. It also appeared to offer ample scope for approaching it as a lager system. Such a system could involve prompt generation, prompt evaluation, collection of feedback from the teachers to improve off kilter prompts and making of an accompanying evaluation rubric for classroom use. It even presented an op-portunity to build an archive of students’ work in response to the briefs. Such a gallery could serve as proof of the tool’s effectiveness and motivate more teachers to try unorthodox methods of instruction. We see the ‘solution as an ecosystem’ approach to be a worthy area for intervention.
3 The Tool
The approach was to prototype and test the prompt generation schemes and the tool in parallel. We followed an iterative design process. We looked at existing prompt collections for reference. [12, 13, 14, 15]The design began with a bare-bones prototype and moved on to higher fidelity ones incorporating feedback and insights from the evaluation.
59
3.1 Prompt Generation Schemes
The three schemes we reverse-engineered from successful prompts (used for initial research into effectiveness of our prompts over traditional prompts) are:
1. Random Word Combinations 2. Situations (What if?, How to?) 3. Lines from a Story
Random word combinations used as prompts seem to work better for younger children. The prompts are sets of objects and qualities, where the relationships are (almost always) non-obvious. For example, ‘unsuccessful bird’ is something that demands a fair amount of thinking up a back-story before one could get into drawing the characteristics that makes a bird (any bird) unsuccessful. Was it something to do with a competition, getting food in the morning, did the bird wake up too late to catch the worm, or did the bird simply fail to take off? How the bird and its lack of success is depicted then becomes the second layer using divergent thinking.
Of the situations-based prompts, the first of his prompt suggestions was “What would a kitchen on the moon look like?’’ The prompt presented a fa-miliar setup (kitchen) in an unfamiliar context, forcing children to rethink forms, properties and what it means to cook in zero gravity. Then we used the phrase ‘how to make the fruit bigger.’ Like the space-kitchen, this presented a familiar object in an unfamiliar situation. In getting it to work as a combina-tion exercise, we divided the prompt into question, object and situation. The combination is further abstracted into ‘How or Where to,’ ‘What’ and ‘Ob-ject.’ At times, this doesn’t work as a pure one-frame-drawing-only exercise, as description of such situations involve captions and diagrammatic represen-tation. We find those drawings with descriptions and captions to be more interesting than simple drawings, in that there is a deeper involvement with the subject as well as a more detailed thinking about the parts. In addition, the focus shifts from the objects themselves to ‘situating’ these objects. We see that children come up with unique and interesting drawings in response to situation based prompts.
60
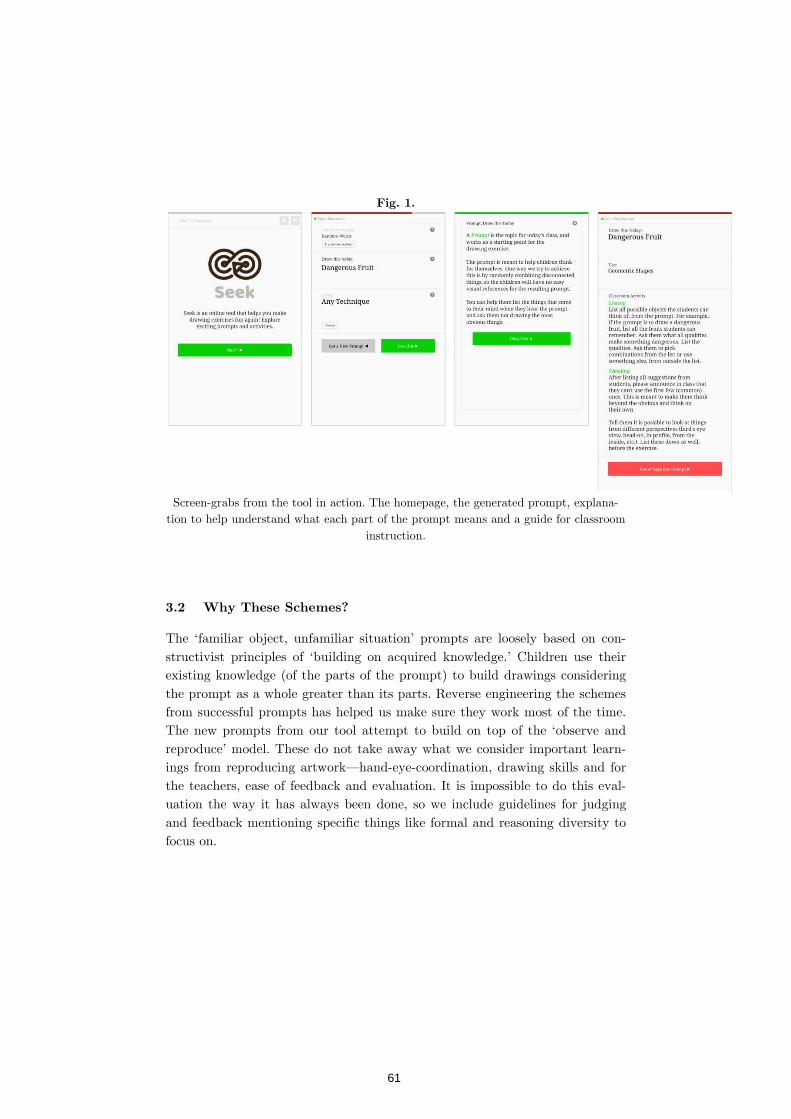
Fig. 1.
Screen-grabs from the tool in action. The homepage, the generated prompt, explana-tion to help understand what each part of the prompt means and a guide for classroom
instruction.
3.2 Why These Schemes?
The ‘familiar object, unfamiliar situation’ prompts are loosely based on con-structivist principles of ‘building on acquired knowledge.’ Children use their existing knowledge (of the parts of the prompt) to build drawings considering the prompt as a whole greater than its parts. Reverse engineering the schemes from successful prompts has helped us make sure they work most of the time. The new prompts from our tool attempt to build on top of the ‘observe and reproduce’ model. These do not take away what we consider important learn-ings from reproducing artwork—hand-eye-coordination, drawing skills and for the teachers, ease of feedback and evaluation. It is impossible to do this eval-uation the way it has always been done, so we include guidelines for judging and feedback mentioning specific things like formal and reasoning diversity to focus on.
61
4 Evaluation
We took the prompts generated by the first working prototype to schools and tested their appropriateness and efficacy. We discuss the results in brief be-low: Across the two schools in two locations, a total of twenty students made forty drawings. Apart from these, the initial prompts were tested with a diverse group of thirty first-year undergrad students and post-grad students. The tool is evaluated on these four aspects, each with multiple measures to triangulate from:
1. Difficulty of the prompt(s), 2. Diversity of resulting artwork, 3. Fun and engagement and 4. Teacher acceptance of the tool.
4.1 Inferences from Evaluation
After assigning student IDs to the artwork collected from exercises, we gave each artwork scores based on the diversity parameters discussed in detail in the previous section.
For scoring, we used the following scheme: Score 1: Unsatisfactory; all are typical objects and themes. Score 3: Okay, only perspective and details are different. Score 5: Only difference is the addition of some details. Score 7: Objects are similar, but context or combination, perspective and
details are different. Score 10: Very Good; each thing (perspective, context, details) is new, or
unique. We used the scoring system to assign each artwork points in all four as-
pects mentioned above. Then we calculated an average score that reflected the efficiency of each prompt against the base prompt. The results are inconclu-sive of the effectiveness of the tool. The average values from ranking diversity indicate that the ‘dream’ prompt works better than the ‘dangerous box’ prompt. It is also more engaging and fun.
From the limited set of results, we can claim the following:
62
1. The project is a step towards teachers embracing different ways of looking at a problem. And letting children explore those different ways. 2. The prompts manage to make the exercise fun, and are inclusive of the learning goals of ‘observe and reproduce.’ The skill and technique are still reflected in the drawing output.
5 Discussion
In our introduction, we described the effects of deficient infra-structure, insuf-ficient number of teachers and an exam-oriented instruction on primary school art education. We discussed how children put through such a system might end up incapable of thinking for themselves. Furthermore, we theorised that the monotony in artwork children produce is an indicator of their lack of di-vergent thinking. As an antidote, it was our suggestion that teachers approach art from a fresh perspective employing a problem solving attitude. We realise design for change in the way teachers—and their students—think has to con-sider the ground realities of economics and sheer numbers. There are toomany children in most classes for a teacher to be able to pay individual attention to them. Not all the children can afford expensive art material. Clearly, an ex-pensive solution—in terms of time and money—is not the answer.
As an instance of effective intervention, we designed and developed a tool embedded in the existing work-flow of classroom instruction. This integration is achieved by focusing on the prompt that sets children off making artwork. We argue that this focus on the prompt—an integral yet taken-for-granted part of a drawing exercise—adds limited burden to the teachers’ work-flow, while allowing them to help maximise the variety of their students’ output. The prompt generation schemes arebased on successful prompts we tested, where students were able to produce artwork with variety. The schemes equip children draw using the constructivist principle of building on existing know-ledge. We find that supplementing our prompts with in-class activities—listing ideas and weeding out bad ones—contribute to the diversity in subjects drawn. Our prompt testing benefited from this classroom activity with a marked increase in variety of themes and objects in classes. In the classroom, the teacher, with our help listed and weeded out obvious ideas at the begin-ning of the exercise. These activities were also seen to elicit a deliberate at-tempt from the students to understand each component of the problem. They would often question whether an approach is appropriate, and have discus-sions among friends. The more interesting and unusual the prompt, the dis-
63
cussions in class were richer with local context, the children's own experiences and unusual ideas.
We maintain that the tool is only one of the possible solutions addressing the diversity problem. In fact, it may be better to treat the project as a pre-cursor to a solution. For us, the tool is a medium; one that is meant to show simple changes such as the ones made to prompts can have a significant im-pact on the way students think. It is our belief that the teachers’ outlook to classroom instruction alone is powerful enough to incite young children to be brave, embracing their own experiences and drawing from them. The tool is positioned as a step towards transforming their—both teachers’ and stu-dents’—existing ways of looking at art education. After considering more tra-ditional interventions, we chose to present this provocative approach as to try and shake their perceptions of art exercises and explore the boundaries of ac-ceptance in the process. However, we have been cautious by presenting the tool in a non-threatening light, without explicitly stating our objectives. This surreptitious deployment is meant to let the people using it discover our in-tended goals on their own, in the hope of making it a richer, memorable and more rewarding experience for them.
Our hope is that this attempt serves as a springboard to projects exploring new avenues in art education.
References
1. Open Government Data (OGD) Platform India, Education Data, data.gov.in (ac-cessed December 2016)
2. Government of Kerala, Kalavidyabhyasam Sourcebook for UP Classes, SCERT (2016)
3. Government of Kerala, Kalavidyabhyasam Sourcebook for High-School Classes, SCERT (2016)
4. David W. Ecker, The Artistic Process as Qualitative Problem Solving,The Journal of Aesthetics and ArtCriticism, Vol. 21, No. 3 (Spring, 1963), pp. 283-290
5. Marjorie Sykes, The Story Of NaiTalim: Fifty Years Of Education At Sevagram India, NaiTalimSamiti(1937-1987)
6. J. Krishnamurthy, Education and the Significance of Life, Harper Collins (2008) 7. Ivan Illich, Deschooling Society, Harrow Books (1971) 8. Joyojeet Pal, Udai Singh Pawar, Eric A. Brewer, Kentaro Toyama, The Case for
Multi-User Design forComputer Aided Learning in Developing Regions, WWW 2006, Pages 781-789
64
9. AnandGiridharadas, Taking a Tire Iron to Techie Triumphalism, NYT Book Re-view, (2015)https://www.nytimes.com/2015/06/09/us/taking-a-tire-iron-to-techie-triumphalism.html (accessedAugust 2016)
10. Edward De Bono, Children Solve Problems, Pelican Books (1972) 11. Steven V Owen, Susan M Baum, The Validity of the Measurement of Originali-
ty,Educational and Scientific Measurement (Educational and Psychological Mea-surement Volume: 45 issue: 4, page(s): 939-944 1985)
12. The Art of Ed, 100 Sketchbook Prompts Your Students Will Love https://www.theartofed.com/2015/11/10/100-sketchbook-prompts-your-students-will-love/ (accessed 2016)
13. Susan Striker, Anti-Coloring Books (R), http://www.susanstriker.com/come_play.html(accessed December 2016)
14. Erik Van Blokland, Type Cooker, http://typecooker.com (accessed December 2016)
15. Creative Curriculum, WRITING: Drawing Prompts that also make great writing prompts!,https://scholtenart.wordpress.com/2015/09/25/writing-drawing-prompts-that-also-make-great-writingprompts/(accessed December 2016)
16. J P Guilford, Creativity: Yesterday, Today and Tomorrow, Wiley Online Library (1967)http://onlinelibrary.wiley.com/doi/10.1002/j.2162-6057.1967.tb00002.x/abstract
65

© Authors 2017, All Rights Reserved INTERACT 2017 Adjunct Proceedings
Service Design for Blood Bank System
Suchismita Naik
National Institute of Design, Bangalore, India [email protected]
Abstract. This paper presents a proposal of a collaborative service
model for a supply chain of a blood bank, which uses the concept of pre-diction tool to integrate the various stakeholders, which include donors, recipients, blood bank and hospitals. The paper reviews the aspects of the blood supply chain of a blood bank, understanding the supply and demand of blood in the country and then narrowing down to the city of Nashik. The paper includes the market analysis of the existing solutions and discusses the gaps and opportunity areas in the supply chain. The research analysis, findings and insights are captured in detail which then leads to the service design concepts. The last part includes a brief discus-sion on service models to make the chain more collaborative and efficient for all stakeholders.
Keywords: Blood bank system; predictive analysis; demand; supply;
healthcare; donors; recipients; inventory management system; issuing system; donation system; data visualization; blood donation camps; shortage; wastage
1 Introduction
Despite being a country with a population of 1.2 billion, India faces a blood shortage of 4.5 million units. According to World Health Organization report, only 5.5 million units are collected annually, while the need is for 10 million units. Reports also suggest that only one percent of eligible donors do so every day. The healthy donors are between the age of 18 to 65 years who should come out and donate blood more often but it doesn’t happen in India [1]. In a medical emergency, blood is usually a very critical component and a needy citizen should know where they can go to get the blood or how to get access to required quantity of blood quickly. This massive problem has existed in our society for a long time now and its impact on the people is immense.
66
Nashik is a bustling city of population around 14 lakhs whereas the number of blood banks in the city is thirteen [4]. So ideally, one blood bank should cater to approximately one lakh people but the blood banks are not equipped in terms of infrastructure or instruments to serve the purpose. There were some shocking findings that motivated to build an impactful solution. [2,3]
There was striking gap between the supply and demand of blood at national level as well as at Nashik district level. The main focus after this research was how might we optimize the supply of blood thereby meeting the demands of the recipients in least time and effort. The major stakeholders for whom we were solving this problem were recipients so that they receive blood in least time and effort, for blood banks so as to help them achieve efficiency in terms of time, effort and cost, and for donors by enhance their blood donation expe-rience.
The paper is structured as follows: the next section presents a brief descrip-tion of how the other existing solutions work; Section 2 discusses the research findings and the analysis which leads to interesting insights; in the sequel, Sec-tion 3 discusses the various service design concepts and how they work in the whole ecosystem of blood bank with a detailed explanation of one solution. Section 4 ends with a summary discussion and concluding remarks on the di-rection of on-going and future work in this project.
1.1 Background and Related Work
We tried to look at existing solutions in the market that addressed similar problems. Some of the competitors in the market are: Social Blood(solves through facebook includes recipients and donors) [5], Blood Hero (solves by geo-tracking donors with blood seekers bringing donors and recipients togeth-er) [6], Haemovigilance (covers the whole transfusion chain includes hospitals and recipients) [7], Iggbo (brings the phlebotomists to the patient’s doorsteps) [8], Bloodbuy (technology which connects the hospitals and blood bank) [9], Red cross blood (helps the donors in scheduling the donations) [10]. All these products and services covers any of the three stakeholders (i.e. blood bank, donors, recipients). There is a need of a service which can be an umbrella cov-ering all three of them.
To understand lives of recipients in hospitals, blood bank in-charges and donors, interviews and online surveys were conducted. The number of partici-pants was around 100 residents of Nashik. All the findings and insights were analyzed in the form of empathy mapping and affinity mapping. These exercis-
67
es helped us find out gaps and opportunities according to process, people,
technology, policy and communication.
2 Findings and Insights
The whole ecosystem mapping of the system was done which consisted of the Donation system, Inventory system and Issuing system. Research findings were found out from all three stakeholders point of view by literature review and by conducting field visits.
The data mapping of the blood bank data, like the supply and demand of blood for the year 2011 shows that the demand of blood has been significantly high in the months of June and October that was due to monsoons and rise of dengue (in the Fig1 below). Similarly, from this data, it is clear that the col-lection of blood from camps are more during the winter months of the year i.e. Jan and Dec which we assume is because of holiday season indicating lot of free time for the donors. On the other hand, the collection of blood from walk-in donations is always less throughout the year except for May when it exceeds the collection from camps. Problem identified from the blood bank side are: blood bank is unable to maintain a supply of blood at the time of seasonal high demand of blood i.e. during the dengue seasons, unable to reduce the wastage of blood especially during the oversupply season when there is more donation camps or walk-ins while comparatively less demand of blood, there is a constant fight amongst the blood banks to secure a good camp location so as to collect the blood bags according to their required quantity.
From the online surveys and questionnaires, it was found that around 67% of the Nashik residents believed that the number of donors in Nashik is high while in reality its less one percent. The problems identified from the donor point of view: there is general lack of knowledge about the process of donation and the demand of blood, no prior information on upcoming donation camps, fear of rejection at campsite due to some health issues, lack of motivation as the donors cannot see how the blood they donated is saving someone’s life hence they don’t see any need of donating, no transparency is maintained by the blood banks, perceived lack of time to go for donation, distance and time are the major issues.
From the recipient point of view, the process mapping of procurement of the blood starts when for the need of the blood, the friends or family approaches the government blood bank or private blood bank. The major problems faced by them are: lack of cheaper options for procurement of blood and rely solely
68
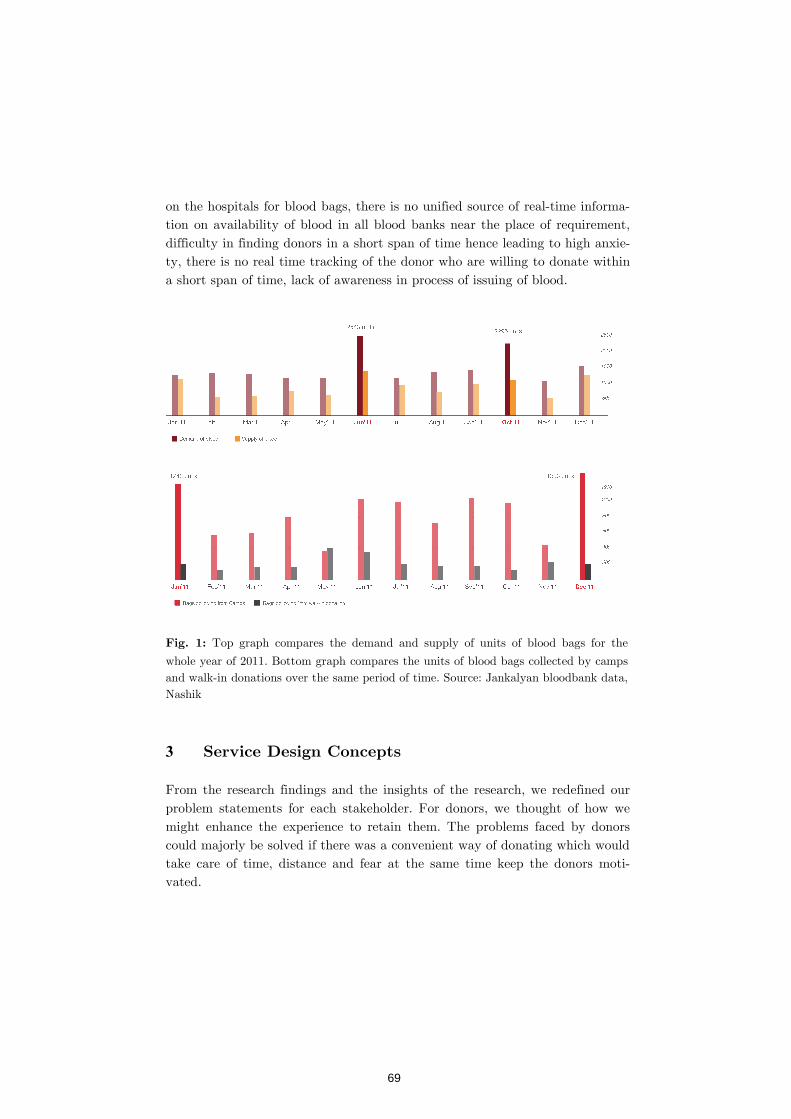
on the hospitals for blood bags, there is no unified source of realtion on availability of bldifficulty in finding donors in a short span of time hence leading to high anxity, there is no real time tracking of the donor who are willing to donate within a short span of time, lack of awareness i
Fig. 1: Top graph compares the demand and supply of units of blood bags
whole year of 2011. Bottom graph compares the units of blood bags collected by camps and walk-in donations over the same period of time. Nashik
3 Service Design
From the research findings aproblem statements for each stakeholder. For donors, we thought of how we might enhance the experience to retaincould majorly be solved if there was a convenient way of donating which would take care of time, distance and fearvated.
on the hospitals for blood bags, there is no unified source of real-time informtion on availability of blood in all blood banks near the place of requirement, difficulty in finding donors in a short span of time hence leading to high anxity, there is no real time tracking of the donor who are willing to donate within a short span of time, lack of awareness in process of issuing of blood.
Top graph compares the demand and supply of units of blood bags
whole year of 2011. Bottom graph compares the units of blood bags collected by camps in donations over the same period of time. Source: Jankalyan bloodbank data,
esign Concepts
findings and the insights of the research, we redefined our problem statements for each stakeholder. For donors, we thought of how we
the experience to retain them. The problems faced by donors could majorly be solved if there was a convenient way of donating which would take care of time, distance and fear at the same time keep the donors mot
time informa-ood in all blood banks near the place of requirement,
difficulty in finding donors in a short span of time hence leading to high anxie-ty, there is no real time tracking of the donor who are willing to donate within
Top graph compares the demand and supply of units of blood bags for the
whole year of 2011. Bottom graph compares the units of blood bags collected by camps bloodbank data,
nd the insights of the research, we redefined our problem statements for each stakeholder. For donors, we thought of how we
them. The problems faced by donors could majorly be solved if there was a convenient way of donating which would
at the same time keep the donors moti-
69
Similarly for blood banks, how we might achieve a balance between shortages and wastages of blood. The problems faced by blood banks could be solved if they can manage their inventory according to the time of the year. Retaining the existing donors for long term could solve shortages problem and better planning of camps could solve wastages. For maintaining an adequate invento-ry, standard required amount of blood units for each month could be fixed by predicting the future demand and supply.
For recipients, it was how we might ensure supply of blood at time of emer-gency in least time, effort and cost. Bringing the donors, hospital doctors and blood banks on a unified information platform would help in a collaborative attempt to save lives in least time. Owing to the highly sensitive situation, recipients or their family or friends won’t be directly involved in the system but would have all the assistance from the attending doctors/in-charges in the hospitals who would have access to the unified portal.
These were actually used to redesign the whole blood bank system of Nashik using a predictive model aided by data visualisation. This led to a holistic ser-vice solution that will connect all the three stakeholders. The proposed solu-tion is a system with three phase each targeting three different stakeholders but all systems operational from blood bank.
We conceptualized and designed all the three subsystems (as seen in Fig2 below). This product would be owned by blood bank that connects both reci-pients and donors.
70
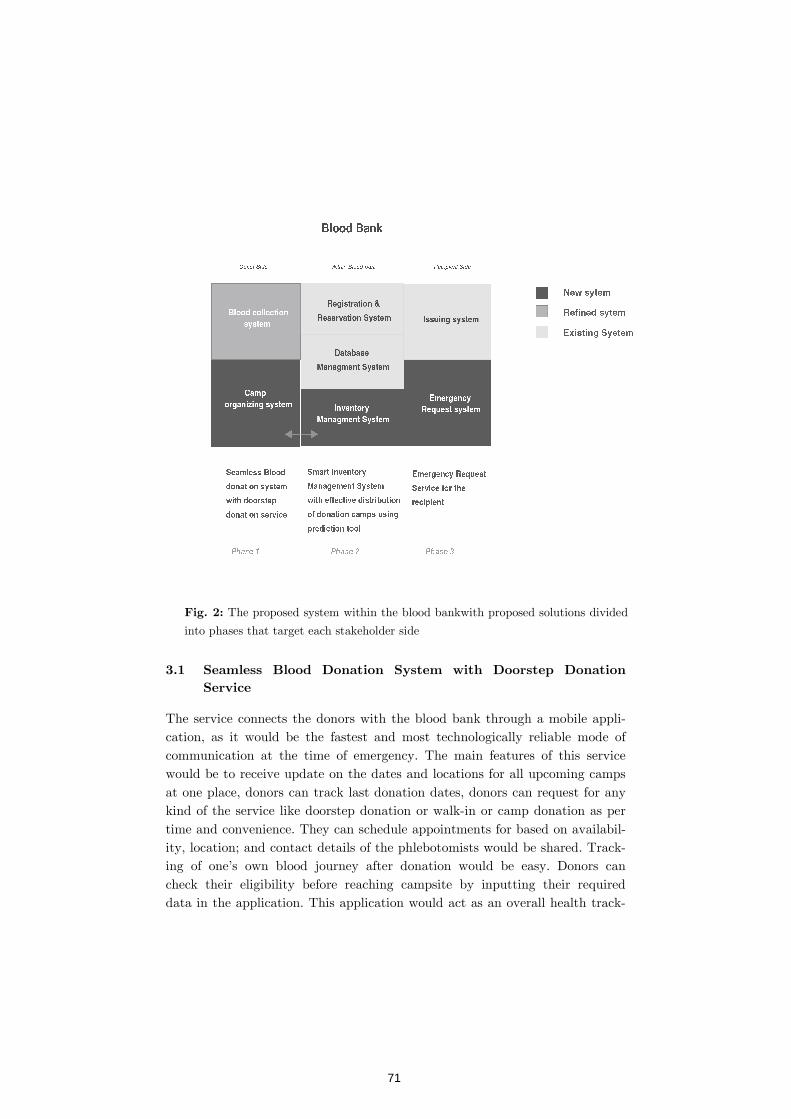
Fig. 2: The proposed
into phases that target
3.1 Seamless Blood
Service
The service connects the donors with the blood bancation, as it would be the fastest and most technologically reliable mode of communication at the time of emergency. would be to receive uat one place, donors can kind of the service like doorstep donation or walktime and convenience. They can ity, location; and contact details of the phlebotomiing of one’s own blood journey after donationcheck their eligibility before reaching campsite by inputting their required data in the application. This application would act as an overall health trac
oposed system within the blood bankwith proposed solutions
phases that target each stakeholder side
lood Donation System with Doorstep D
The service connects the donors with the blood bank through a mobile applcation, as it would be the fastest and most technologically reliable mode of communication at the time of emergency. The main features of this service
to receive update on the dates and locations for all upcoming camps donors can track last donation dates, donors can request for
like doorstep donation or walk-in or camp donation as per time and convenience. They can schedule appointments for based on availabi
and contact details of the phlebotomists would be sharedone’s own blood journey after donation would be easy. Donors
check their eligibility before reaching campsite by inputting their required data in the application. This application would act as an overall health trac
within the blood bankwith proposed solutions divided
Donation
k through a mobile appli-cation, as it would be the fastest and most technologically reliable mode of
The main features of this service pdate on the dates and locations for all upcoming camps
request for any in or camp donation as per
availabil-sts would be shared. Track-
easy. Donors can check their eligibility before reaching campsite by inputting their required data in the application. This application would act as an overall health track-
71
er or guide for the donor even after the donation by providing information or tips regarding their health and provide post-donation follow up checks.
The main motivation for donors in such an application is to track the num-ber of lives saved by the donor, the number of lives influenced by his/her do-nation and also generate a healthy competition viewing his/her friend’s track records. The reward system would also be in place for such application de-pending on the number of other donors he/she has influenced.
According to the feedback from the blood banks, this solution had a lot of infrastructural constraints like lack of phlebotomists in the area and also technological constraints. Because of these constraints, the solution was not taken forward to testing.
3.2 Smart Inventory Management System with Effective
Distribution of Donation Camps Using Prediction Tool
This is the service designed for within the blood bank through a multi-user web portal. This system would work based on this prediction tool which would have the input parameter like the historical supply and demand data, number of blood bags collected from a particular campsite in the past, blood group and location of registered donor in the city, historical data of units of blood group types collected at any time of the year. The solution would have feature like: Future demand patterns will be predicted, minimum stock requirement, alert message in case of shortage or wastage, camp date generation, visualising the donation patterns in the past, manage excess blood through communication channel with other hospitals or blood banks.
We collected feedbacks from the blood bank in-charges for this solution. This solution was the most feasible among the three as the data, technology and the infrastructure were readily available and were supporting our idea. This solu-tion went ahead for the growth phase and development and below is the story-boarding of the user scenario for the service (Fig.3). The usability test for this portal after the development is yet to be carried out.
72
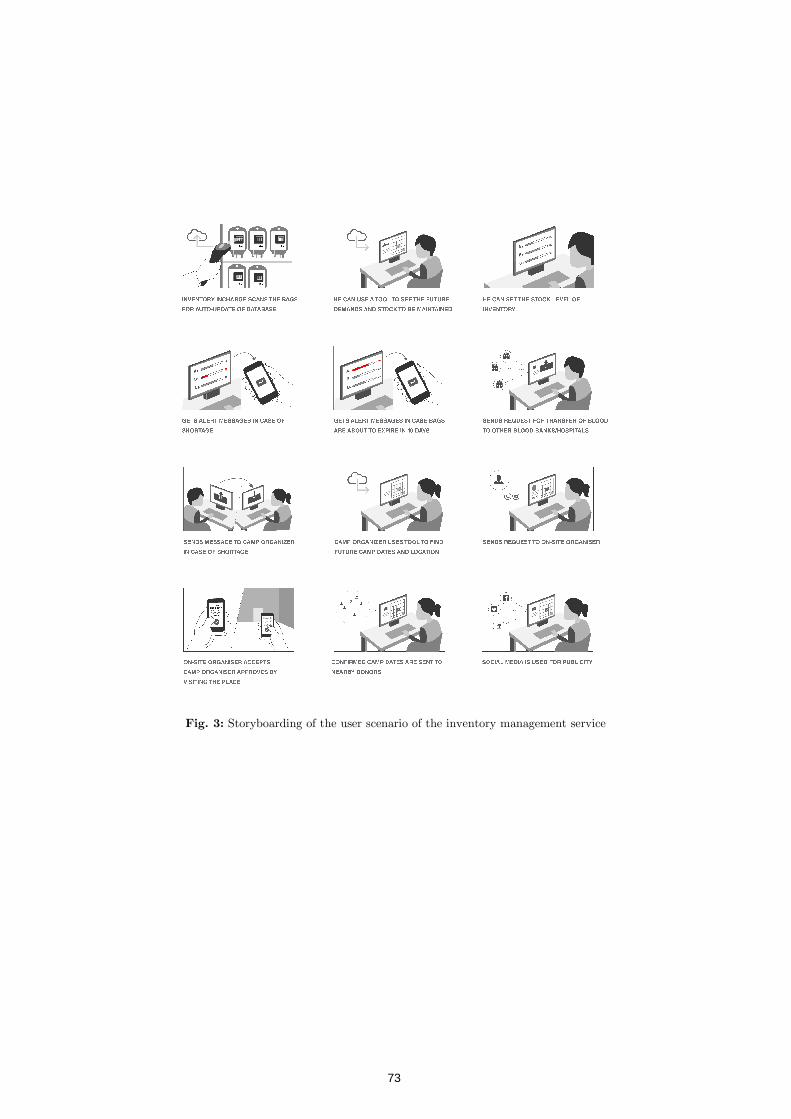
Fig. 3: Storyboarding of the user scenario of the ryboarding of the user scenario of the inventory management service
service
73

Fig. 4:Prediction tool for the future demands within three or six or twelve months. On
the right, camp date generator tool blood group types and pattern
3.3 Emergency request service for the recipients
This service is between the recipients and the blood bank via a portal that would be monitored by the doctor/ trauma inthe blood bank inventory inthis portal would be to reducrecipients and increase the access to the blood bag units.
The main features in this service would bethe hospital in-chargeaccording to the proximity to the hospital, delivery guys can carry the blood bags within the given time, online payment gateway for hospitals and blood banks, rating system for blood banks based on reliability, quickness, transprency to improvise their services.
This solution was a hypothetical one as the infrastructure support from blood bank side would have been difficult in terms of maintaining the realtime information and also it had few legal issues that were ignored while dsigning.
4 Conclusion
This solution if executed can impact in increasing the revenue of the blood bank, more number of lives would improve at the same time there would be a decrease in the price of
Prediction tool for the future demands within three or six or twelve months. On
amp date generator tool visualising the past donation pattern in the city and and pattern
Emergency request service for the recipients
This service is between the recipients and the blood bank via a portal that would be monitored by the doctor/ trauma in-charge on the hospital side and the blood bank inventory in-charge on the blood bank side. The main aim of this portal would be to reduce the anxiety among the family/friends of the recipients and increase the access to the blood bag units.
The main features in this service would be to place request easily either by charge, display the blood bags availability in each blood
according to the proximity to the hospital, delivery guys can carry the blood bags within the given time, online payment gateway for hospitals and blood banks, rating system for blood banks based on reliability, quickness, transp
heir services. This solution was a hypothetical one as the infrastructure support from
blood bank side would have been difficult in terms of maintaining the realtime information and also it had few legal issues that were ignored while d
on
This solution if executed can impact in increasing the revenue of the blood number of lives could be saved, inter blood bank relationship
would improve at the same time there would be a decrease in the price of
Prediction tool for the future demands within three or six or twelve months. On
visualising the past donation pattern in the city and
This service is between the recipients and the blood bank via a portal that charge on the hospital side and
charge on the blood bank side. The main aim of e the anxiety among the family/friends of the
request easily either by the blood bags availability in each blood bank
according to the proximity to the hospital, delivery guys can carry the blood bags within the given time, online payment gateway for hospitals and blood banks, rating system for blood banks based on reliability, quickness, transpa-
This solution was a hypothetical one as the infrastructure support from blood bank side would have been difficult in terms of maintaining the real-time information and also it had few legal issues that were ignored while de-
This solution if executed can impact in increasing the revenue of the blood , inter blood bank relationship
would improve at the same time there would be a decrease in the price of
74
blood bags making it standardised, replacement donation system would be removed and eventually reduce the anxiety level among the family/friends of the recipients. According to the feedback taken from the blood banks that were the major stakeholder here, it was only the second subsystem (within blood bank) that seemed to click with the stakeholders and showed promising results in terms of feasibility and impact it would create in business. Acknowledgement
I would like to thank all the faculties of Information design discipline of my college for their expert guidance and advice. I want to thank TCS Digital Impact Square, Nashik for providing a platform for carrying out such amazing project under Smart Nashik Initiative with required guidance and resources. I am also thankful to all my peers who helped me throughout the project.
References
1. India faces huge blood donation deficit. http://zeenews.india.com/exclusive/-india-faces-huge-blood-donation-deficit_5581.html
2. Accidental deaths and suicides, road accidents in Nashik. http://mahacid.com/14chapter_20.pdf
3. M.S. Vasaikar, S.N.Kanthikar, M.P.Tambse. Clinico-pathological co-relation of material death in rural areas of north Maharashtra. Int J Pharm Bio Sci 2014 Jan; 5(1): (B) 449 - 456 http://www.ijpbs.net/cms/php/upload/3105_pdf.pdf
4. Nashik District: Census 2011 data. http://www.census2011.co.in/census/district/354-nashik.html
5. Social blood. http://socialblood.org/ 6. Blood Hero. https://www.bloodhero.com/ 7. Haemovigilance network.
http://www.who.int/bloodsafety/haemovigilance/en/ 8. Iggbo now. http://www.iggbonow.com/ 9. Blood buy. https://www.bloodbuy.com/ 10. Red cross blood. http://www.redcrossblood.org/bloodapp
75

© Authors 2017, All Rights Reserved INTERACT 2017 Adjunct Proceedings
TouchPIN: Numerical Passwords You Can Feel
Gesu India
Indian Institute of Technology Patna, India [email protected]
Abstract. Password entry in public places poses threats of observation
attack, especially for visually impaired users. When headphones are not in use, entry of passwords using keyboards becomes completely inaccess-ible for visually impaired users. We describe a novel accessible password entry interface “Touch-PIN” designed for entering numerical passwords without the need of headphones. TouchPIN uses haptic cues and cue-counting for PIN input. We evaluated the interface for usability by vi-sually impaired users, and compared its performance with two other most commonly used input mechanisms (numeric keyboard with and without TalkBack). Users preferred TouchPIN as they found it easy to learn and easy to use. The study threw up several directions of future investigation.
Keywords: Visually impaired, Password entry, PIN, Observation at-
tacks, Shoulder surfing, Accessibility, Privacy.
1 Introduction
Accessible Technology has helped visually impaired users to do many tasks but one crucial task that is still difficult for them is to enter password [1]. There are two major problems associated with password entry on touch-screen phones by the visually impaired. First is the lack of audio feedback when headphones are not connected. When a visually impaired user types in a regu-lar text field, she slides her finger on the virtual keyboard in search of the desired character. The screen reader helps them by reading out the character under the finger. When the user finds a desired character, she types it using the “lift-to-type” interaction [2]. TalkBack reads out the character again (in a different pitch) for confirmation. This feedback is not available when typing in a password field. When user enters text in a password field, the screen reader either reads each character in the text field as “star” or just emits a beep. The
76
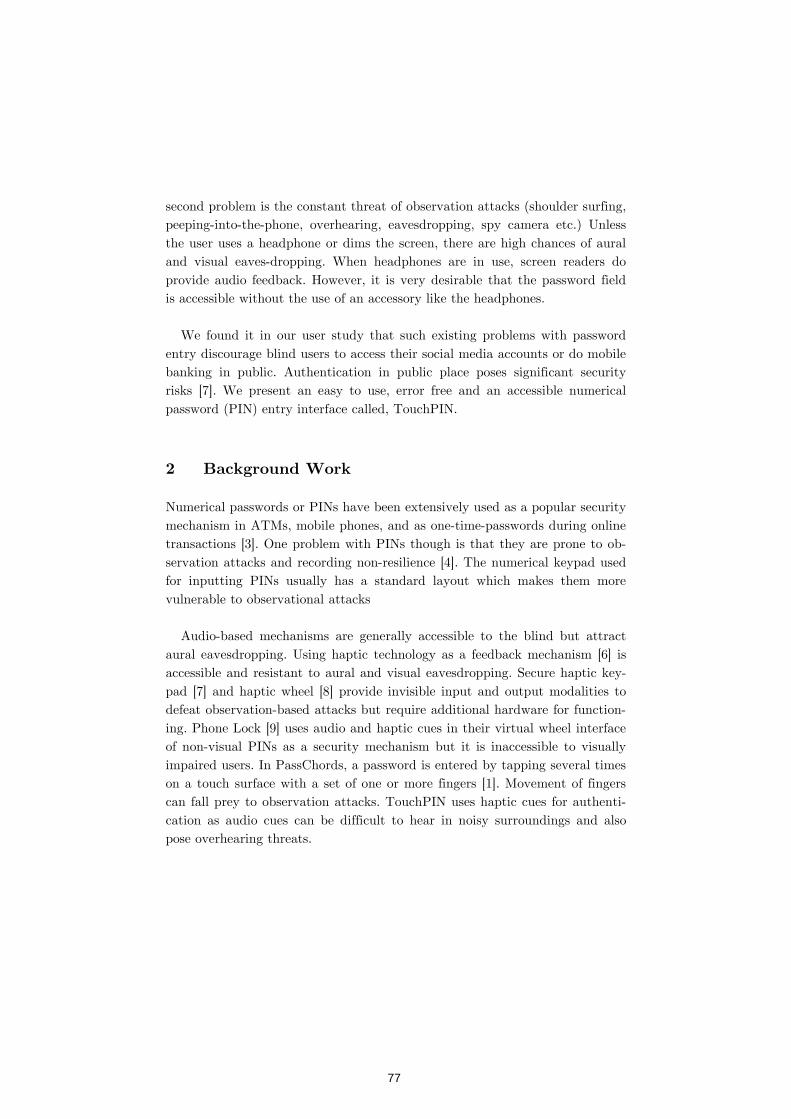
second problem is the constant threat of observation attacks (shoulder surfing, peeping-into-the-phone, overhearing, eavesdropping, spy camera etc.) Unless the user uses a headphone or dims the screen, there are high chances of aural and visual eaves-dropping. When headphones are in use, screen readers do provide audio feedback. However, it is very desirable that the password field is accessible without the use of an accessory like the headphones.
We found it in our user study that such existing problems with password
entry discourage blind users to access their social media accounts or do mobile banking in public. Authentication in public place poses significant security risks [7]. We present an easy to use, error free and an accessible numerical password (PIN) entry interface called, TouchPIN.
2 Background Work
Numerical passwords or PINs have been extensively used as a popular security mechanism in ATMs, mobile phones, and as one-time-passwords during online transactions [3]. One problem with PINs though is that they are prone to ob-servation attacks and recording non-resilience [4]. The numerical keypad used for inputting PINs usually has a standard layout which makes them more vulnerable to observational attacks
Audio-based mechanisms are generally accessible to the blind but attract
aural eavesdropping. Using haptic technology as a feedback mechanism [6] is accessible and resistant to aural and visual eavesdropping. Secure haptic key-pad [7] and haptic wheel [8] provide invisible input and output modalities to defeat observation-based attacks but require additional hardware for function-ing. Phone Lock [9] uses audio and haptic cues in their virtual wheel interface of non-visual PINs as a security mechanism but it is inaccessible to visually impaired users. In PassChords, a password is entered by tapping several times on a touch surface with a set of one or more fingers [1]. Movement of fingers can fall prey to observation attacks. TouchPIN uses haptic cues for authenti-cation as audio cues can be difficult to hear in noisy surroundings and also pose overhearing threats.
77
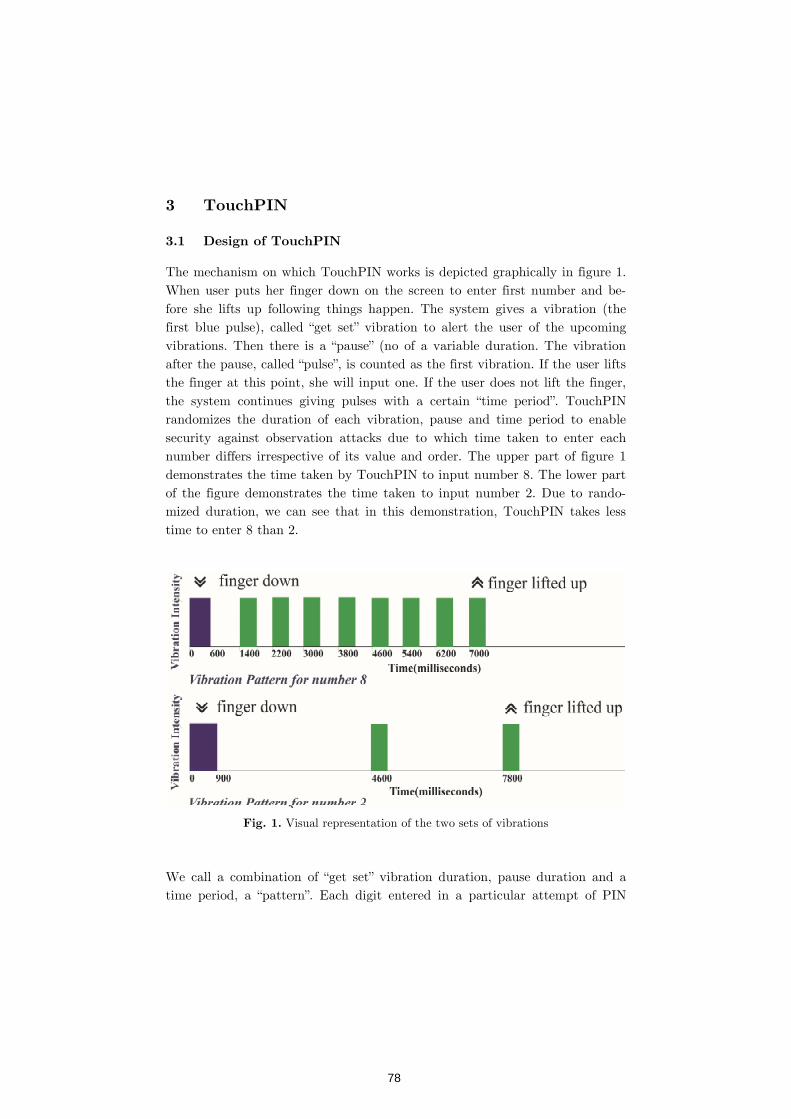
3 TouchPIN
3.1 Design of TouchPIN
The mechanism on which TouchPIN works is depicted graphically in figure 1. When user puts her finger down on the screen to enter first number and be-fore she lifts up following things happen. The system gives a vibration (the first blue pulse), called “get set” vibration to alert the user of the upcoming vibrations. Then there is a “pause” (no of a variable duration. The vibration after the pause, called “pulse”, is counted as the first vibration. If the user lifts the finger at this point, she will input one. If the user does not lift the finger, the system continues giving pulses with a certain “time period”. TouchPIN randomizes the duration of each vibration, pause and time period to enable security against observation attacks due to which time taken to enter each number differs irrespective of its value and order. The upper part of figure 1 demonstrates the time taken by TouchPIN to input number 8. The lower part of the figure demonstrates the time taken to input number 2. Due to rando-mized duration, we can see that in this demonstration, TouchPIN takes less time to enter 8 than 2.
Fig. 1. Visual representation of the two sets of vibrations
We call a combination of “get set” vibration duration, pause duration and a time period, a “pattern”. Each digit entered in a particular attempt of PIN
78
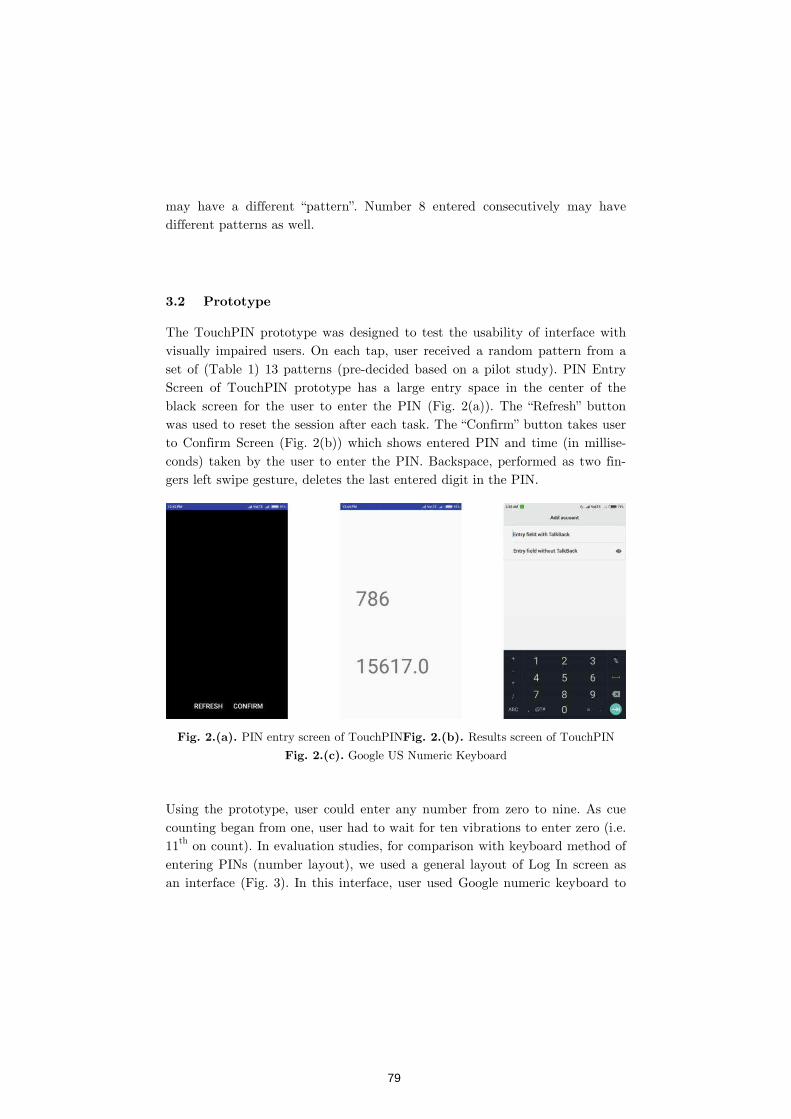
may have a different “pattern”. Number 8 entered consecutively may have different patterns as well.
3.2 Prototype
The TouchPIN prototype was designed to test the usability of interface with visually impaired users. On each tap, user received a random pattern from a set of (Table 1) 13 patterns (pre-decided based on a pilot study). PIN Entry Screen of TouchPIN prototype has a large entry space in the center of the black screen for the user to enter the PIN (Fig. 2(a)). The “Refresh” button was used to reset the session after each task. The “Confirm” button takes user to Confirm Screen (Fig. 2(b)) which shows entered PIN and time (in millise-conds) taken by the user to enter the PIN. Backspace, performed as two fin-gers left swipe gesture, deletes the last entered digit in the PIN.
Fig. 2.(a). PIN entry screen of TouchPINFig. 2.(b). Results screen of TouchPIN
Fig. 2.(c). Google US Numeric Keyboard
Using the prototype, user could enter any number from zero to nine. As cue counting began from one, user had to wait for ten vibrations to enter zero (i.e. 11th on count). In evaluation studies, for comparison with keyboard method of entering PINs (number layout), we used a general layout of Log In screen as an interface (Fig. 3). In this interface, user used Google numeric keyboard to
79
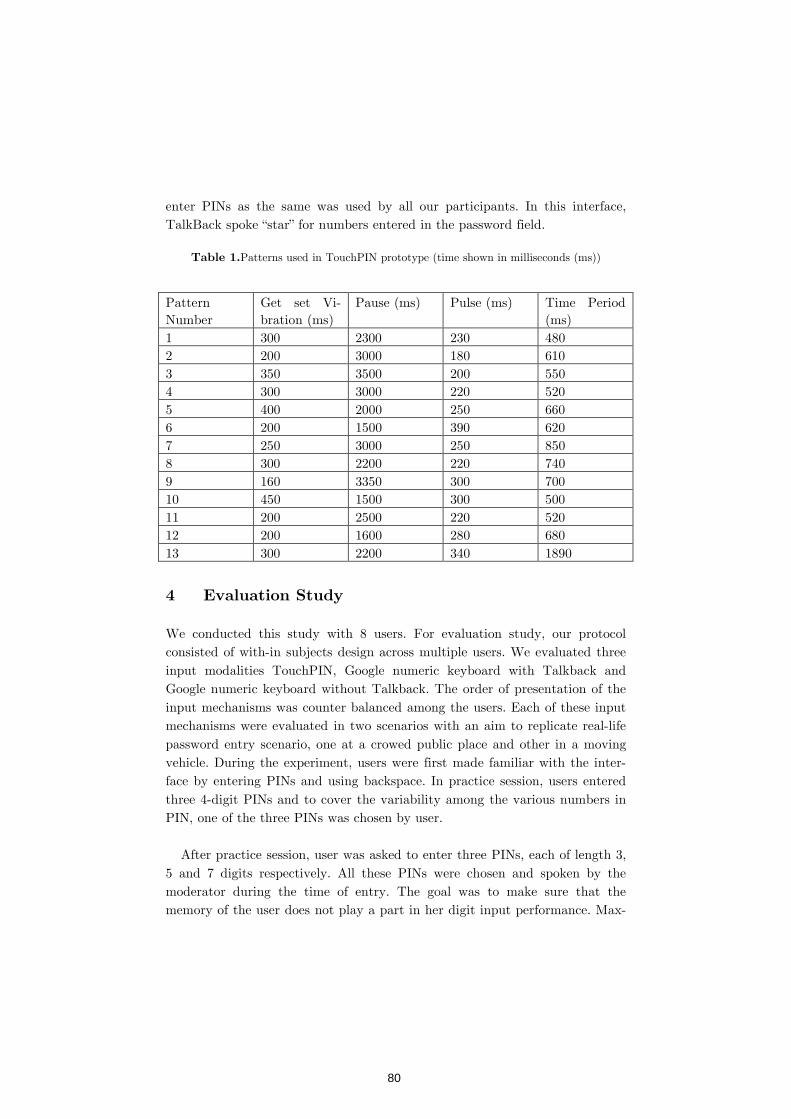
enter PINs as the same was used by all our participants. In this interface, TalkBack spoke “star” for numbers entered in the password field.
Table 1.Patterns used in TouchPIN prototype (time shown in milliseconds (ms))
Pattern Number
Get set Vi-bration (ms)
Pause (ms) Pulse (ms) Time Period (ms)
1 300 2300 230 480 2 200 3000 180 610 3 350 3500 200 550 4 300 3000 220 520 5 400 2000 250 660 6 200 1500 390 620 7 250 3000 250 850 8 300 2200 220 740 9 160 3350 300 700 10 450 1500 300 500 11 200 2500 220 520 12 200 1600 280 680 13 300 2200 340 1890
4 Evaluation Study
We conducted this study with 8 users. For evaluation study, our protocol consisted of with-in subjects design across multiple users. We evaluated three input modalities TouchPIN, Google numeric keyboard with Talkback and Google numeric keyboard without Talkback. The order of presentation of the input mechanisms was counter balanced among the users. Each of these input mechanisms were evaluated in two scenarios with an aim to replicate real-life password entry scenario, one at a crowed public place and other in a moving vehicle. During the experiment, users were first made familiar with the inter-face by entering PINs and using backspace. In practice session, users entered three 4-digit PINs and to cover the variability among the various numbers in PIN, one of the three PINs was chosen by user.
After practice session, user was asked to enter three PINs, each of length 3,
5 and 7 digits respectively. All these PINs were chosen and spoken by the moderator during the time of entry. The goal was to make sure that the memory of the user does not play a part in her digit input performance. Max-
80
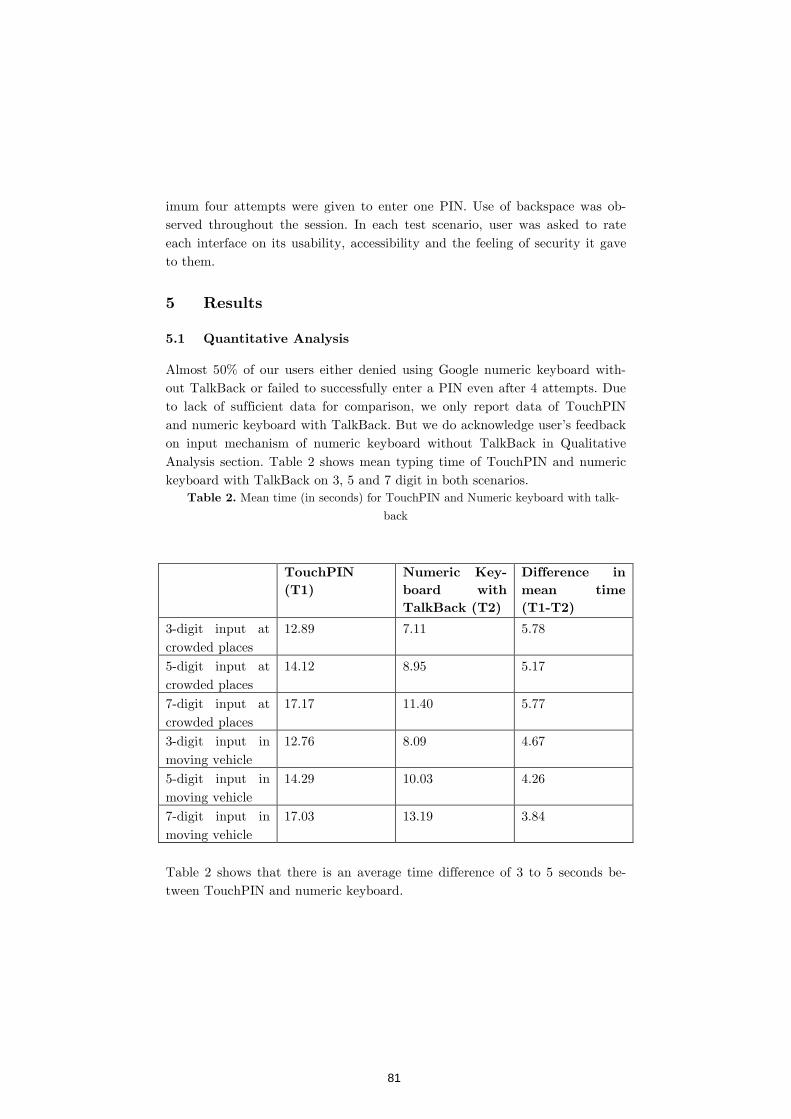
imum four attempts were given to enter one PIN. Use of backspace was ob-served throughout the session. In each test scenario, user was asked to rate each interface on its usability, accessibility and the feeling of security it gave to them.
5 Results
5.1 Quantitative Analysis
Almost 50% of our users either denied using Google numeric keyboard with-out TalkBack or failed to successfully enter a PIN even after 4 attempts. Due to lack of sufficient data for comparison, we only report data of TouchPIN and numeric keyboard with TalkBack. But we do acknowledge user’s feedback on input mechanism of numeric keyboard without TalkBack in Qualitative Analysis section. Table 2 shows mean typing time of TouchPIN and numeric keyboard with TalkBack on 3, 5 and 7 digit in both scenarios.
Table 2. Mean time (in seconds) for TouchPIN and Numeric keyboard with talk-
back
TouchPIN
(T1)
Numeric Key-
board with
TalkBack (T2)
Difference in
mean time
(T1-T2)
3-digit input at crowded places
12.89 7.11 5.78
5-digit input at crowded places
14.12 8.95 5.17
7-digit input at crowded places
17.17 11.40 5.77
3-digit input in moving vehicle
12.76 8.09 4.67
5-digit input in moving vehicle
14.29 10.03 4.26
7-digit input in moving vehicle
17.03 13.19 3.84
Table 2 shows that there is an average time difference of 3 to 5 seconds be-tween TouchPIN and numeric keyboard.
81

As the length of pattern generated on each tap decides the time taken by Touch-PIN, similar value of mean time could be observed in crowded place and in a moving vehicle for a given PIN. However, this is not a case in numer-ic keyboard where time taken by the user could increase based on multiple other factors, like unfamiliarity with the interface, performance of TalkBack and use of TalkBack in noisy places. Table 3 shows the percentage of correct attempts over total number of at-tempts in both the input mechanisms. Overall, 48 tasks were performed using TouchPIN out of which 38 tasks were completed in first attempt , 4 task were completed in second and third attempt and only 1 task was completed in last attempt. However, in the later mechanism out of 48 tasks, 47 tasks were per-formed successfully in first attempt and only one task was performed in second attempt.
Table 3. Percentage of correct attempts over total number of attempts for both
interfaces
Attempt 1 Attempt 2 Attempt 3 Attempt 4
TouchPIN 79.16% 8.33% 8.33% 2.08%
Numerical Keyboard with Talk-Back
97.01% 2.08% - -
A within-subject, repeated measures ANOVA is often used to compare the performance of the two keyboards. ANOVA of task-wise speed showed that the average digits per minute for 6 task (3 in moving and 3 in crowded places) 1-6 between the inputs TouchPIN and numeric keyboard were statistically
significant F(1, 14) = 25.449 p < 0.0005, partial η2 = 0.64. Our Users had
average minimum of six months experience with Google numeric keyboard. Our users never had any experience with a haptic cue interface which means TouchPIN was completely a new mechanism of password entry for them. This also justifies for the errors done and time taken more for TouchPIN than for numeric keyboards.
5.2 Qualitative Analysis
User’s preference was recorded on three criteria: accessibility, security and usability. Considering all these aspects, preferences are listed in Table 4.
82
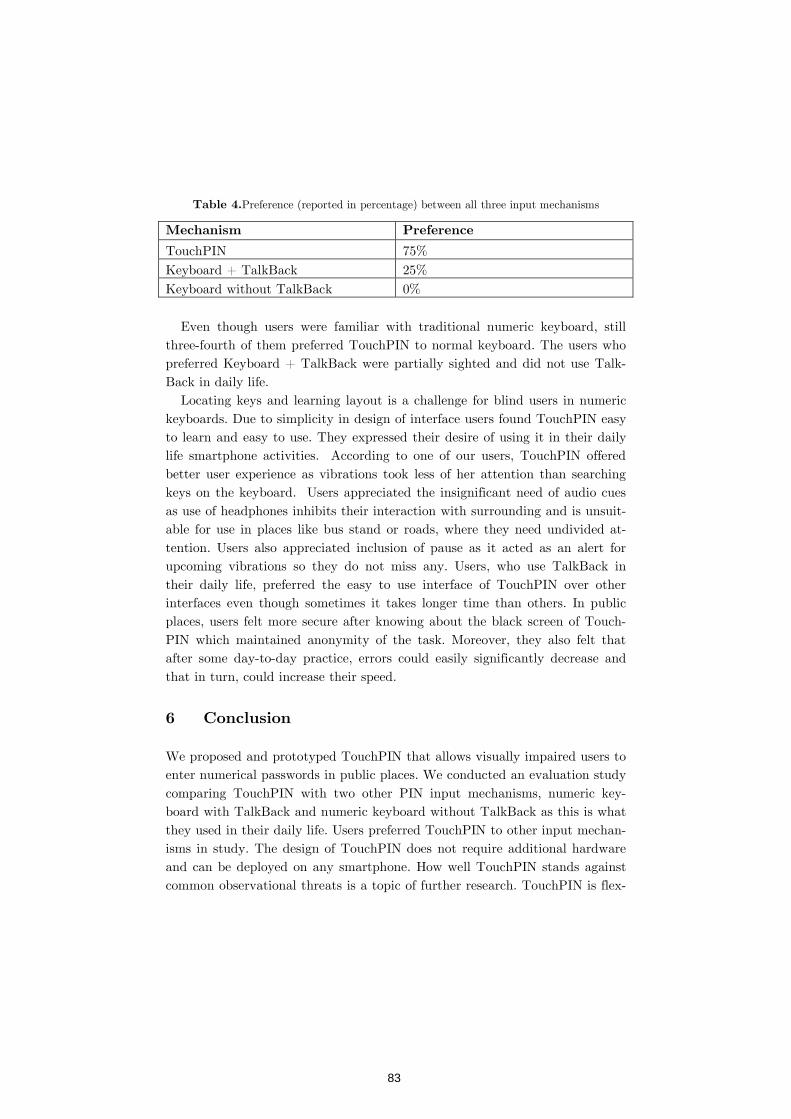
Table 4.Preference (reported in percentage) between all three input mechanisms
Mechanism Preference
TouchPIN 75%
Keyboard + TalkBack 25%
Keyboard without TalkBack 0%
Even though users were familiar with traditional numeric keyboard, still
three-fourth of them preferred TouchPIN to normal keyboard. The users who preferred Keyboard + TalkBack were partially sighted and did not use Talk-Back in daily life.
Locating keys and learning layout is a challenge for blind users in numeric keyboards. Due to simplicity in design of interface users found TouchPIN easy to learn and easy to use. They expressed their desire of using it in their daily life smartphone activities. According to one of our users, TouchPIN offered better user experience as vibrations took less of her attention than searching keys on the keyboard. Users appreciated the insignificant need of audio cues as use of headphones inhibits their interaction with surrounding and is unsuit-able for use in places like bus stand or roads, where they need undivided at-tention. Users also appreciated inclusion of pause as it acted as an alert for upcoming vibrations so they do not miss any. Users, who use TalkBack in their daily life, preferred the easy to use interface of TouchPIN over other interfaces even though sometimes it takes longer time than others. In public places, users felt more secure after knowing about the black screen of Touch-PIN which maintained anonymity of the task. Moreover, they also felt that after some day-to-day practice, errors could easily significantly decrease and that in turn, could increase their speed.
6 Conclusion
We proposed and prototyped TouchPIN that allows visually impaired users to enter numerical passwords in public places. We conducted an evaluation study comparing TouchPIN with two other PIN input mechanisms, numeric key-board with TalkBack and numeric keyboard without TalkBack as this is what they used in their daily life. Users preferred TouchPIN to other input mechan-isms in study. The design of TouchPIN does not require additional hardware and can be deployed on any smartphone. How well TouchPIN stands against common observational threats is a topic of further research. TouchPIN is flex-
83
ible enough to allow for alphanumeric input, usability of such mechanism also needs to be investigated in future.
Acknowledgment.I am grateful toAnirudha Joshi (IDC, IIT Bombay,
India) for his valuable guidance and support. I am also grateful for the im-mense help and support offered by CharudattaJadhav (Head Accessibility COE, Tata Consultancy Service, India). I am thankful to other team members - ShashankAhire (IDC, IIT Bombay, India), Manjiri Joshi (IDC, IIT Bombay, India), NagrajEmmadi (Tata Consultancy Service, India) and PabbaAnuBha-rath (IIITDM Jabalpur, India) for their valuable supervision and assistance.
References
1. Azenkot, S., Rector, K., E. Ladner, R., & O. Wobbrock, J.: PassChords: Secure Multi-Touch Authentication for Blind People. ASSETS '12 Proceedings of the 14th international ACM SIGACCESS conference on Computers and accessibility, pp. 159-166
2. Phillip Kissonergis: Smartphone Ownership, Usage and Penetration by Country; http://thehub.smsglobal.com/smartphone-ownership-usage-and-penetration (Oct 13, 2015)
3. ATM Card, https://en.wikipedia.org/wiki/ATM_card 4. Kwon, T., & Hong, J.: Analysis and Improvement of a PIN-Entry Method Resi-
lient to Shoulder-Surfing and Recording Attacks, In: IEEE Transactions on In-formation Forensicsand Security ( Volume: 10, Issue: 2, Feb. 2015), pp. 278 - 292
5. Sam Ryu, Y., HyongKoh, D., L. Aday, B., A. Gutierrez, X., D. Platt, J.: Usability Evalua-tion of Randomized Keypad, Published in Journal of Usability Studies arc-hive, vol. 5 Issue 2, February 2010, pp. 65-75
6. Haptic Technology, https://en.wikipedia.org/wiki/Haptic_technology 7. Bianchi, A., Oakley, I., & Kwon, D. S.: The secure haptic keypad: a tactile pass-
word sys-tem. In Proceedings of the SIGCHI Conference on Human Factors in Computing Systems pp. 1089-1092. ACM
8. Bianchi, A., Oakley, I., Lee, J. K., & Kwon, D. S.: The haptic wheel: design & evaluation of a tactile password system. In CHI'10 Extended Abstracts on Human Factors in Computing Systems, pp. 3625-3630. ACM. (2010)
9. Bianchi, A., Oakley, I., Kostakos, V., & Kwon, D. S.: The phone lock: audio and haptic shoulder-surfing resistant PIN entry methods for mobile devices. In Pro-ceedings of the fifth international conference on Tangible, embedded, and embo-died interaction, pp. 197-200. ACM. (2011)
84
© Authors 2017, All Rights Reserved INTERACT 2017 Adjunct Proceedings
SwitchTabs: More Efficient Natural Inte-
raction with Browser Tabs
ChinmayAnand, Kushagra Khandelwal and Sunny Kumar
Indian Institute of Technology Guwahati, Guwahati 78103 9, India [email protected]
Abstract. In the modern day browsing experience parallel browsing has
become an integral component with tasks such as comparing content, copy pasting, switching between multiple tabs. Conventional input de-vices such as keyboard and mouse pointers lack in natural interaction capabilities associated while browsing with multiple tabs. Lack of simp-ler execution techniques leads to decreased performance and broken user experience. In this paper, we present SwitchTabs a tangible device to easily manage tabs through a more organic interaction for completing common tasks such as navigation, frequent switching and copying past-ing of content between tabs. We’ve designed a bendable device with in-tuitive bend gestures for a faster way to accomplish these tasks. Initial user testing conducted found the device to be 32% faster in switching and copying pasting as compared to traditional keyboard and pointing devices. Further we discuss the scope for the concept to be explored as a tool that could be used for multiple scenarios while working with parallel active desktop environments.
Keywords: Parallel Web Browsing, Multiple Browser Tabs,
Tabs Switching, Bend Interactions.
1 Introduction
Browsing with multiple web pages is a common scenario in the modern-day internet world. Browsers provide the means to accomplish different parallel tasks such as comparing information, copying and pasting content across mul-tiple tabs. As per a study conducted, web users switch between browser tabs nearly 57.4% of the browsing time [1] which indicates the importance of tasks involving multiple tabs in the whole internet browser based working expe-rience. Ease and effectiveness in performing tasks such as continuous switch-ing and copy pasting content across tabs effect the overall work efficiency of
85
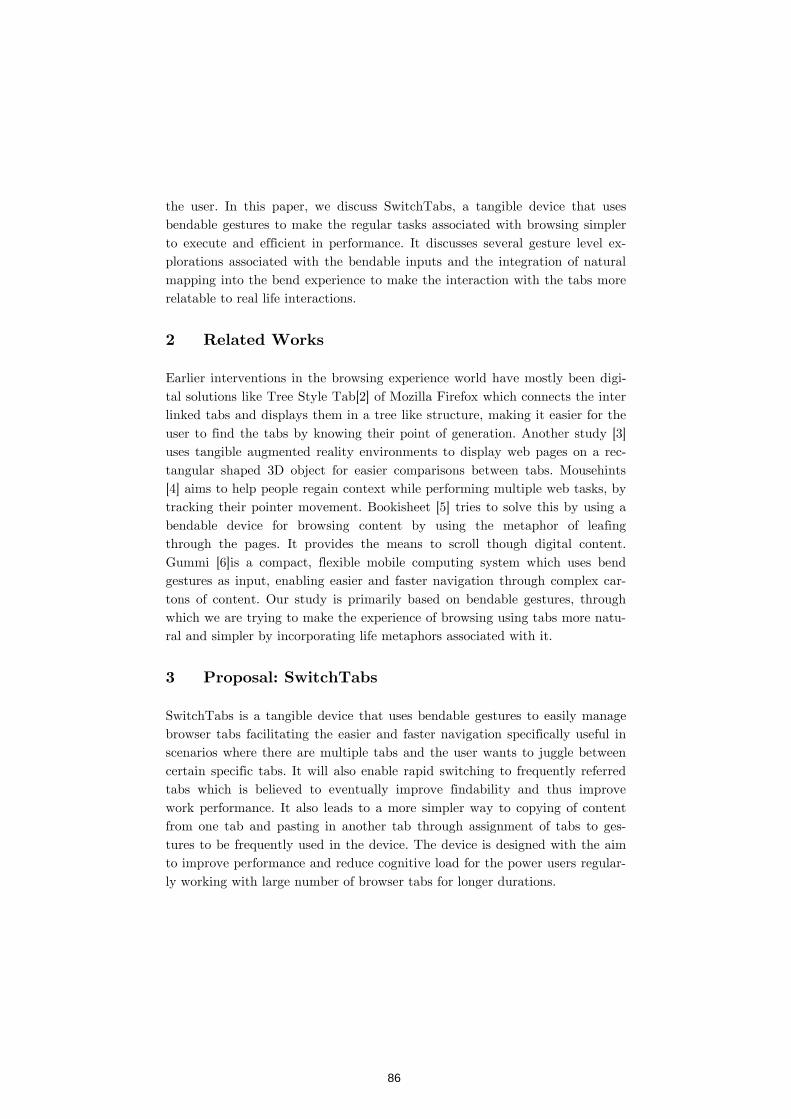
the user. In this paper, we discuss SwitchTabs, a tangible device that uses bendable gestures to make the regular tasks associated with browsing simpler to execute and efficient in performance. It discusses several gesture level ex-plorations associated with the bendable inputs and the integration of natural mapping into the bend experience to make the interaction with the tabs more relatable to real life interactions.
2 Related Works
Earlier interventions in the browsing experience world have mostly been digi-tal solutions like Tree Style Tab[2] of Mozilla Firefox which connects the inter linked tabs and displays them in a tree like structure, making it easier for the user to find the tabs by knowing their point of generation. Another study [3] uses tangible augmented reality environments to display web pages on a rec-tangular shaped 3D object for easier comparisons between tabs. Mousehints [4] aims to help people regain context while performing multiple web tasks, by tracking their pointer movement. Bookisheet [5] tries to solve this by using a bendable device for browsing content by using the metaphor of leafing through the pages. It provides the means to scroll though digital content. Gummi [6]is a compact, flexible mobile computing system which uses bend gestures as input, enabling easier and faster navigation through complex car-tons of content. Our study is primarily based on bendable gestures, through which we are trying to make the experience of browsing using tabs more natu-ral and simpler by incorporating life metaphors associated with it.
3 Proposal: SwitchTabs
SwitchTabs is a tangible device that uses bendable gestures to easily manage browser tabs facilitating the easier and faster navigation specifically useful in scenarios where there are multiple tabs and the user wants to juggle between certain specific tabs. It will also enable rapid switching to frequently referred tabs which is believed to eventually improve findability and thus improve work performance. It also leads to a more simpler way to copying of content from one tab and pasting in another tab through assignment of tabs to ges-tures to be frequently used in the device. The device is designed with the aim to improve performance and reduce cognitive load for the power users regular-ly working with large number of browser tabs for longer durations.
86
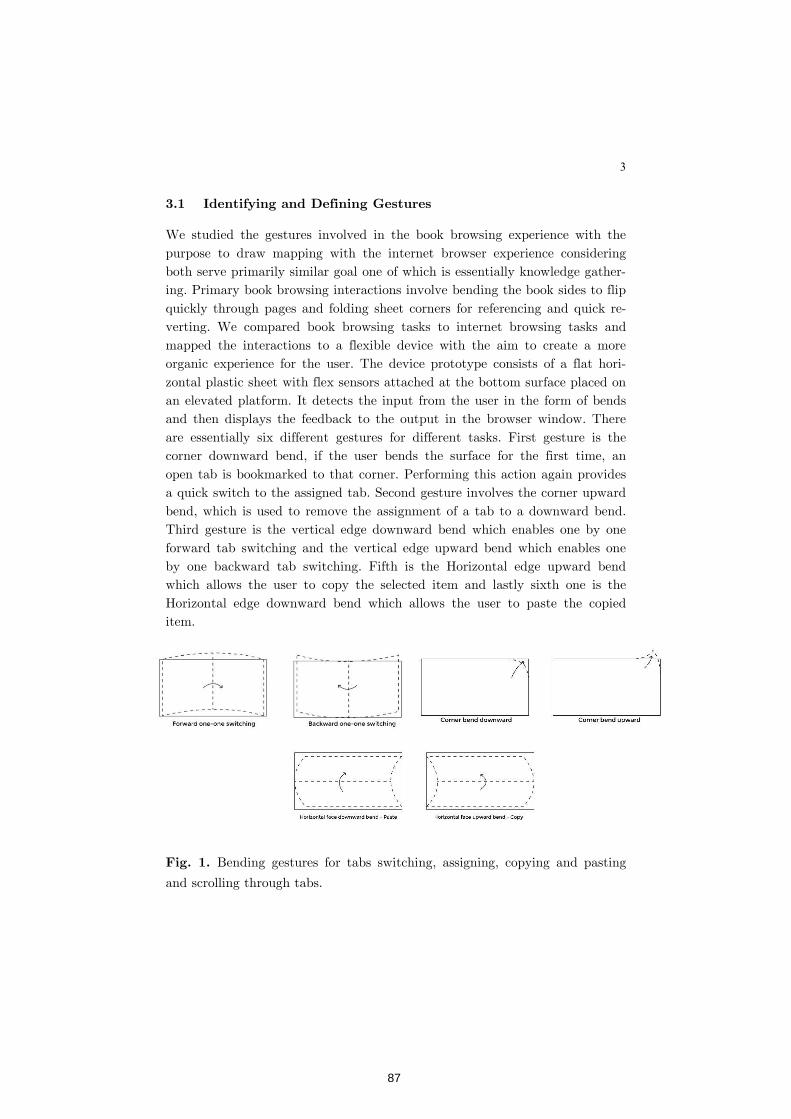
3
3.1 Identifying and Defining Gestures
We studied the gestures involved in the book browsing experience with the purpose to draw mapping with the internet browser experience considering both serve primarily similar goal one of which is essentially knowledge gather-ing. Primary book browsing interactions involve bending the book sides to flip quickly through pages and folding sheet corners for referencing and quick re-verting. We compared book browsing tasks to internet browsing tasks and mapped the interactions to a flexible device with the aim to create a more organic experience for the user. The device prototype consists of a flat hori-zontal plastic sheet with flex sensors attached at the bottom surface placed on an elevated platform. It detects the input from the user in the form of bends and then displays the feedback to the output in the browser window. There are essentially six different gestures for different tasks. First gesture is the corner downward bend, if the user bends the surface for the first time, an open tab is bookmarked to that corner. Performing this action again provides a quick switch to the assigned tab. Second gesture involves the corner upward bend, which is used to remove the assignment of a tab to a downward bend. Third gesture is the vertical edge downward bend which enables one by one forward tab switching and the vertical edge upward bend which enables one by one backward tab switching. Fifth is the Horizontal edge upward bend which allows the user to copy the selected item and lastly sixth one is the Horizontal edge downward bend which allows the user to paste the copied item.
Fig. 1. Bending gestures for tabs switching, assigning, copying and pasting
and scrolling through tabs.
87
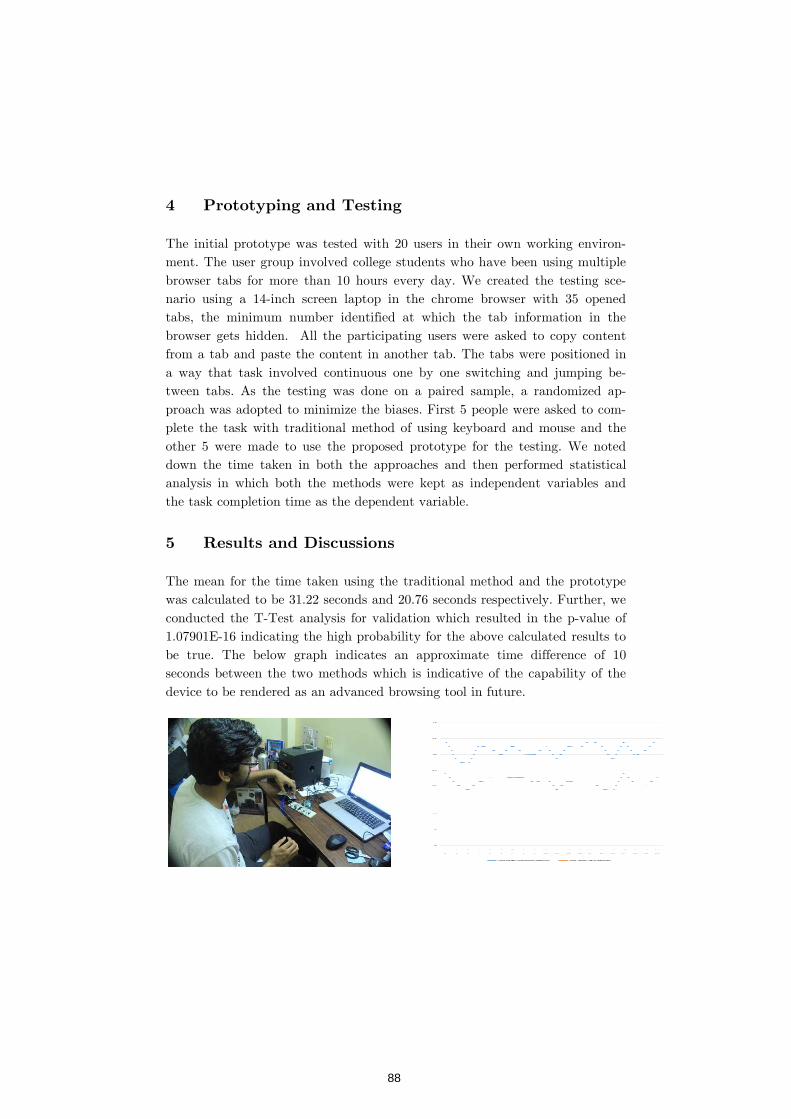
4 Prototyping and Testing
The initial prototype was tested with 20 ment. The user group browser tabs for more than 10 hours nario using a 14-inch screen laptoptabs, the minimum number identified browser gets hidden. from a tab and paste the content in another tab. The tabs were positioned in a way that task involved continuous tween tabs. As the testing was done on proach was adopted to minimize the biases. First 5 people were asked to coplete the task with traditional other 5 were made to use the proposed prototype for the testing. down the time taken ianalysis in which both the the task completion time
5 Results and Discussions
The mean for the time taken was calculated to be conducted the T-Test 1.07901E-16 indicating the highbe true. The below graph seconds between the two methodsdevice to be rendered as an advanced
Prototyping and Testing
prototype was tested with 20 users in their own working group involved college students who have been using
browser tabs for more than 10 hours every day. We created the testing scinch screen laptop in the chrome browser with 35 opened
the minimum number identified at which the tab information in the . All the participating users were asked to copy content
from a tab and paste the content in another tab. The tabs were positioned in a way that task involved continuous one by one switching and jumping btween tabs. As the testing was done on a paired sample, a randomized aproach was adopted to minimize the biases. First 5 people were asked to coplete the task with traditional method of using keyboard and mouse and the other 5 were made to use the proposed prototype for the testing. We noted down the time taken in both the approaches and then performed statistical
in which both the methods were kept as independent variabletime as the dependent variable.
Results and Discussions
he mean for the time taken using the traditional method and the prototype calculated to be 31.22 seconds and 20.76 seconds respectively. Further, w
Test analysis for validation which resulted in the pindicating the high probability for the above calculated results to
The below graph indicates an approximate time difference of 10seconds between the two methods which is indicative of the capability of the device to be rendered as an advanced browsing tool in future.
in their own working environ-have been using multiple
We created the testing sce-in the chrome browser with 35 opened
at which the tab information in the All the participating users were asked to copy content
from a tab and paste the content in another tab. The tabs were positioned in one by one switching and jumping be-
paired sample, a randomized ap-proach was adopted to minimize the biases. First 5 people were asked to com-
of using keyboard and mouse and the We noted statistical
independent variables and
the prototype Further, we
p-value of results to
difference of 10 tive of the capability of the
88
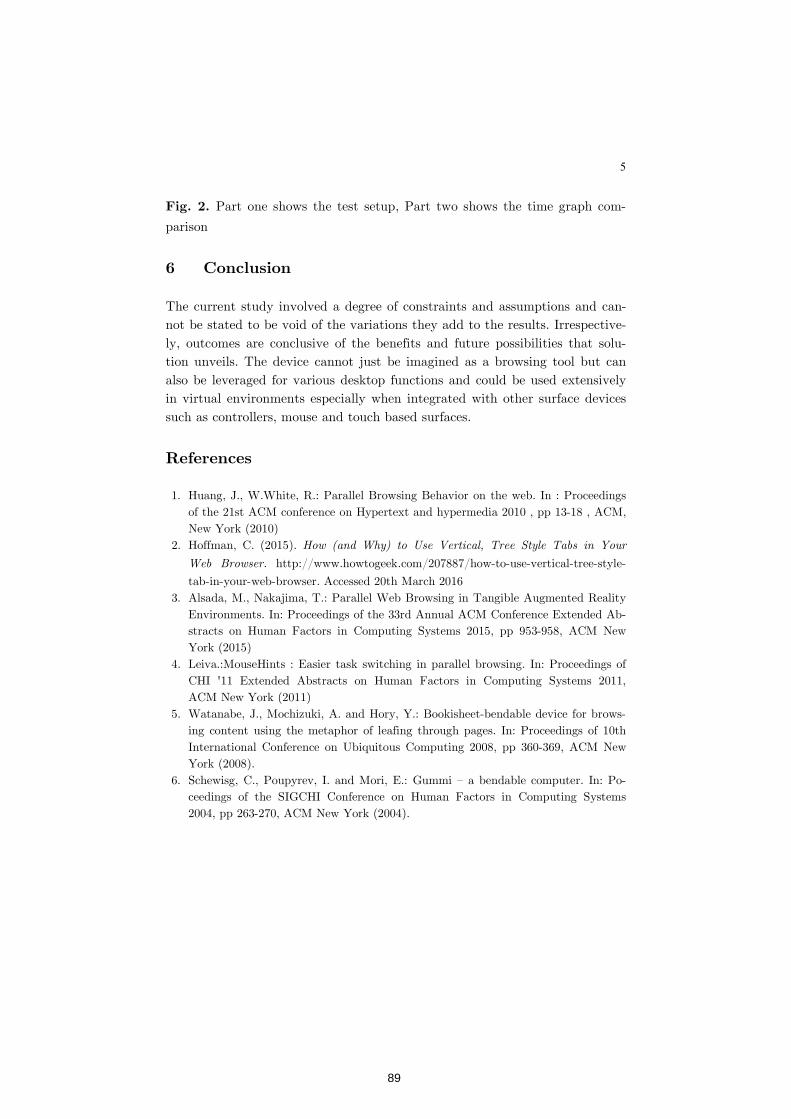
5
Fig. 2. Part one shows the test setup, Part two shows the time graph com-
parison
6 Conclusion
The current study involved a degree of constraints and assumptions and can-not be stated to be void of the variations they add to the results. Irrespective-ly, outcomes are conclusive of the benefits and future possibilities that solu-tion unveils. The device cannot just be imagined as a browsing tool but can also be leveraged for various desktop functions and could be used extensively in virtual environments especially when integrated with other surface devices such as controllers, mouse and touch based surfaces.
References
1. Huang, J., W.White, R.: Parallel Browsing Behavior on the web. In : Proceedings of the 21st ACM conference on Hypertext and hypermedia 2010 , pp 13-18 , ACM, New York (2010)
2. Hoffman, C. (2015). How (and Why) to Use Vertical, Tree Style Tabs in Your
Web Browser. http://www.howtogeek.com/207887/how-to-use-vertical-tree-style-
tab-in-your-web-browser. Accessed 20th March 2016 3. Alsada, M., Nakajima, T.: Parallel Web Browsing in Tangible Augmented Reality
Environments. In: Proceedings of the 33rd Annual ACM Conference Extended Ab-stracts on Human Factors in Computing Systems 2015, pp 953-958, ACM New York (2015)
4. Leiva.:MouseHints : Easier task switching in parallel browsing. In: Proceedings of CHI '11 Extended Abstracts on Human Factors in Computing Systems 2011, ACM New York (2011)
5. Watanabe, J., Mochizuki, A. and Hory, Y.: Bookisheet-bendable device for brows-ing content using the metaphor of leafing through pages. In: Proceedings of 10th International Conference on Ubiquitous Computing 2008, pp 360-369, ACM New York (2008).
6. Schewisg, C., Poupyrev, I. and Mori, E.: Gummi – a bendable computer. In: Po-ceedings of the SIGCHI Conference on Human Factors in Computing Systems 2004, pp 263-270, ACM New York (2004).
89
Installations
Installations are interesting interactive displays or setups showcased during the
conference. An installation may demonstrate function or act as an aesthetic piece of
art. An installation may directly relate to the theme, venue, conference-programme,
speakers or participants of the conference. It may use interactive technologies in an
interesting way or it may promote interaction amongst the participants. It may as well
inform the passersby near the convention venue about what is going on in the
conference.
90
© Authors 2017, All Rights Reserved INTERACT 2017 Adjunct Proceedings
Tick Tock: An Art Installation for Scientific
Literacy
Yash Chandak
Pearl Academy, New Delhi [email protected]
Abstract. Tick Tock is an interactive installation on the theory of
relativity. It presents the idea of 'time dilation' in an experiential manner while exploring the use of technology for scientific education, and of new media in public engagement with theories and ideas. It is also an experiment with artistic expression of unperceivable realities, and the role of gamified art in scientific understanding. The paper is a report on the journey of developing an interactive art project which communicates through Human Computer Interaction.
Keywords: Interactive, Installation, New Media, Space and Time, Face
Detection, Public Art
1 Introduction
As Digital interactions are coming deeply embedded in every area of our lives, it brings forth its own opportunities and challenges. Communication and media find an urgent need to evolve to keep up with technological developments. New media interactions exploit these technologies to show its impact, and justify the developments, while also shaping its future. Two worlds, one of engineers and technologists, the other of storytellers and artists, work coherently to mold the relationship between Humans and computers.
1.1 Background
Tick Tock was an outcome of research on human interaction with ‘Time’. Starting from the act of looking at the time, and its associations was the seed of the project. The cultural differences of time were also an interesting aspect
91

that showed how time has been quantified in different ways. The research was conducted from an interaction and communication point of view.
At the same time, the idea of being able to digitally manipulate the clock was explored. Since digital devices have become the indicators for time, its manipulation can have varied effects on perception of reality.
Temporal illusions and the psychological understanding of time were key areas to study. As time is perceived through a combination of all the senses, it can be tricked by manipulating light, sound, smell, touch and taste. The research question asked at the point was, can we play with the illusion of distorting time to get a better understanding of it. It also became a study of how our environment can affect our perception of time. The story of the installation was also being conceived at the same time. The aim was to bring the worlds of irrational narratives, and scientific studies together.
Research on scientific understanding of time, brought forth some of the most interesting thought experiments on time, which were the origins of modern understanding of time. Einstein's theory of relativity became the core of the project. An idea that was more than aa hundred years old, yet so hard to comprehend and perceive. It posed a communication challenge, as the concept is distant from common people yet is acknowledged as a world changing idea.
1.2 Theory
In the theory of relativity, time dilation is a difference of elapsed time between two events as measured by observers either moving relative to each other or differently situated from a gravitational mass or masses. This theory was tested through several experiments, the most prominent being the Hafele-Keating experiment of 1971. There is a point near the black hole below which time has practically stopped to an outside observer. This is what is known as the ‘event horizon’, a point beyond which not even light can escape. The theory was simplified to a setup that focused on communication and playful interaction.
92
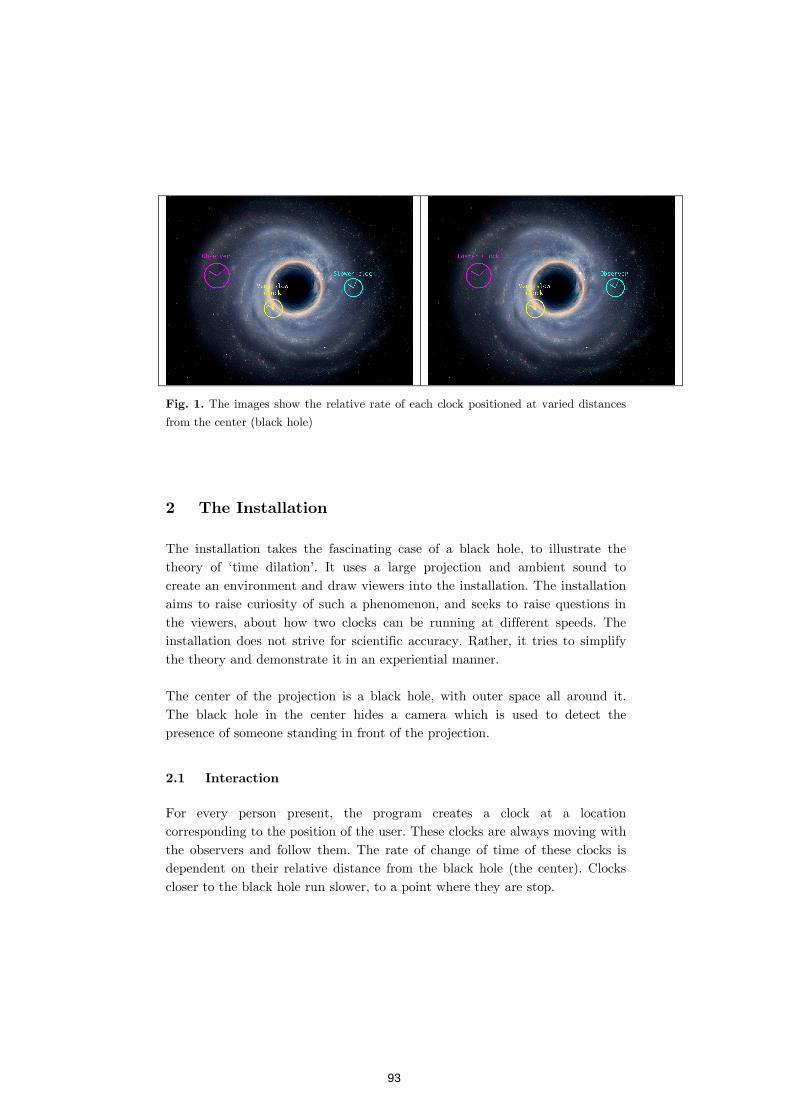
Fig. 1. The images show the relative rate of each clock positioned at varied distances
from the center (black hole)
2 The Installation
The installation takes the fascinating case of a black hole, to illustrate the theory of ‘time dilation’. It uses a large projection and ambient sound to create an environment and draw viewers into the installation. The installation aims to raise curiosity of such a phenomenon, and seeks to raise questions in the viewers, about how two clocks can be running at different speeds. The installation does not strive for scientific accuracy. Rather, it tries to simplify the theory and demonstrate it in an experiential manner. The center of the projection is a black hole, with outer space all around it. The black hole in the center hides a camera which is used to detect the presence of someone standing in front of the projection.
2.1 Interaction
For every person present, the program creates a clock at a location corresponding to the position of the user. These clocks are always moving with the observers and follow them. The rate of change of time of these clocks is dependent on their relative distance from the black hole (the center). Clocks closer to the black hole run slower, to a point where they are stop.
93
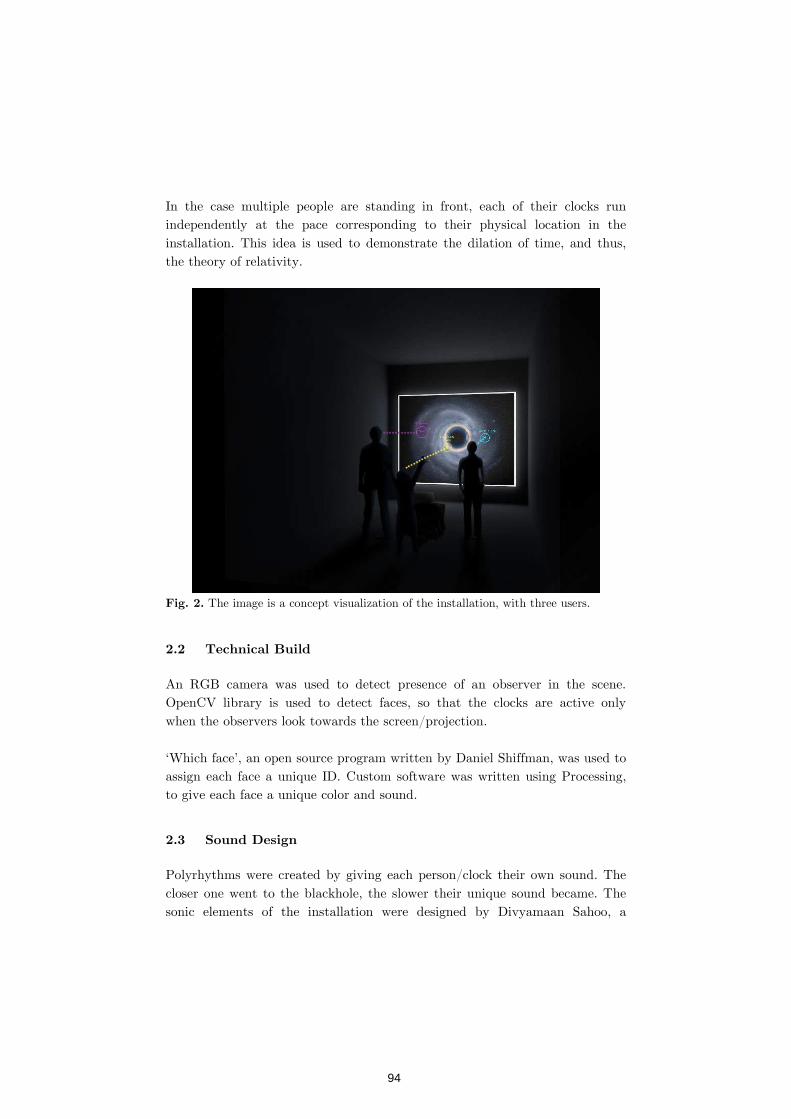
In the case multiple people are standing in front, each of their clocks run independently at the pace corresponding to their physical location in the installation. This idea is used to demonstrate the dilation of time, and thus, the theory of relativity.
Fig. 2. The image is a concept visualization of the installation, with three users.
2.2 Technical Build
An RGB camera was used to detect presence of an observer in the scene. OpenCV library is used to detect faces, so that the clocks are active only when the observers look towards the screen/projection. ‘Which face’, an open source program written by Daniel Shiffman, was used to assign each face a unique ID. Custom software was written using Processing, to give each face a unique color and sound.
2.3 Sound Design
Polyrhythms were created by giving each person/clock their own sound. The closer one went to the blackhole, the slower their unique sound became. The sonic elements of the installation were designed by Divyamaan Sahoo, a
94
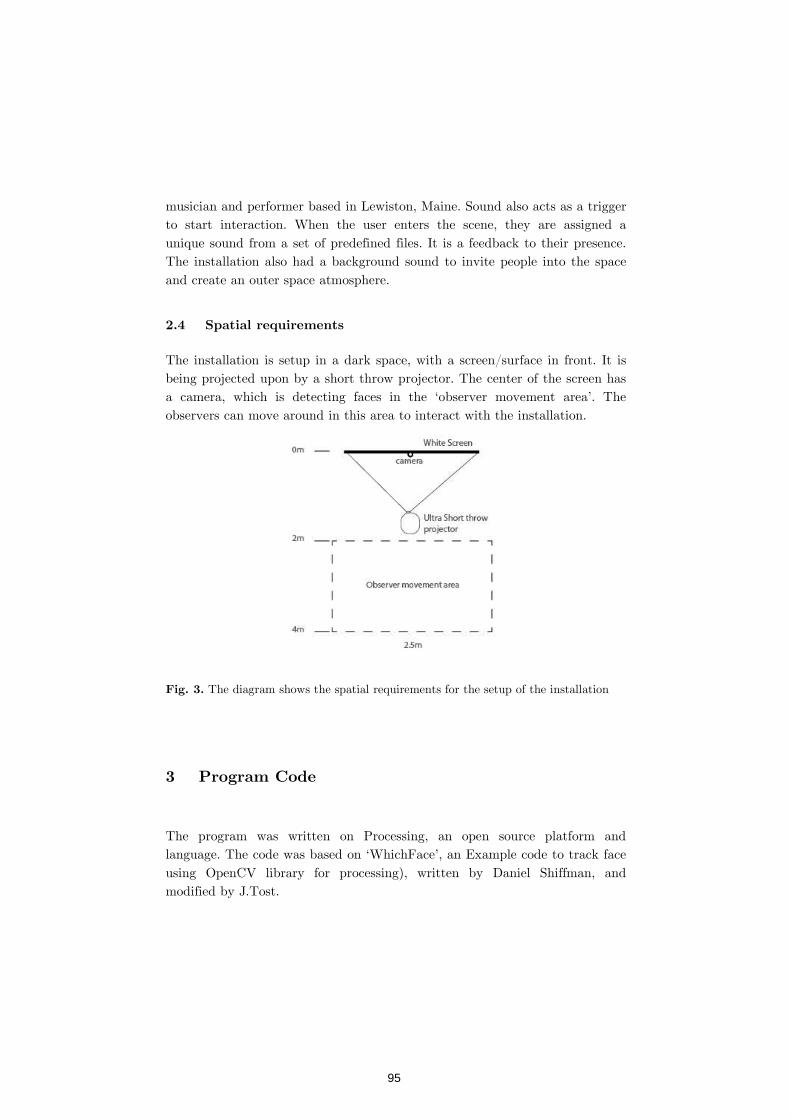
musician and performer based in Lewiston, Maine. Sound also acts as a trigger to start interaction. When the user enters the scene, they are assigned a unique sound from a set of predefined files. It is a feedback to their presence. The installation also had a background sound to invite people into the space and create an outer space atmosphere.
2.4 Spatial requirements
The installation is setup in a dark space, with a screen/surface in front. It is being projected upon by a short throw projector. The center of the screen has a camera, which is detecting faces in the ‘observer movement area’. The observers can move around in this area to interact with the installation.
Fig. 3. The diagram shows the spatial requirements for the setup of the installation
3 Program Code
The program was written on Processing, an open source platform and language. The code was based on ‘WhichFace’, an Example code to track face using OpenCV library for processing), written by Daniel Shiffman, and modified by J.Tost.
95

4 User Testing
User testing was conducted with students and faculty of Pearl Academy, New Delhi. Based on observations, the program was tweaked, for better usability, and intuitive reactions.
Fig. 4. The image shows one observer in front of the projection. The installation is
setup in a dark space, isolated from other sounds. The red clock on the screen moves with the user.
Fig. 5. In this image, four observers are standing in the installation. Each of them are
96
controlling a clock with the location of their face. The one close to the black hole, can see the clock getting distorted and the time is stopped. By viewing other clocks, each observer can notice that clocks are running at different speeds.
Users were able to observe that they had control over the clocks. However, it was not apparent for them that it was their face which did it. It was observed from the tests that some users waved their hands and tried to engage by waving or raising their hands. These interactions could be integrated to improve such an installation.
5 Suggestions and improvements
As the installation is prescribed for a dark environment, an infrared camera could a better fit to detect faces. Another test version was developed using Kinect’s infrared camera. Another alternate would be to use a depth camera, combined with skeletal tracking. This would give a more consistent tracking data. However, it would not be able to detect if the user was looking in some other direction. There could also be possible interactions between two or more users.
6 Acknowledgements
This project was built under the mentorship of Michael Dotolo. We would like to thank Prabhat Garg and Urvi Khanna, for their inputs and feedback, throughout the development. Special thanks to Milly Singh, for guiding the journey through design research. All of whom are professors at Pearl Academy, New Delhi. The author would like to thank Pranjal Kaila for collaboration on other research projects which influenced the shaped the development of this research. We thank all students and faculty of Pearl Academy who participated in the user testing throughout the development. We thank the Processing Foundation for their efforts towards promoting software literacy within visual arts.
97
References
Eagleman, D.M., Eagleman: Human time perception and its illusions. Current opinion in neurobiology (2008), 18(2), pp.131-136. Droit-Volet, S., Ramos, D., Bueno, J.L. and Bigand, E., Music, emotion, and time perception: the influence of subjective emotional valence and arousal? (2013) Joanne, K., How Gravity Changes Time: The Effect Known as Gravitational Time Dilation, The Science Explorer. (2015) Shiffman, D., Tost, J., WhichFace (Example code to track face using OpenCV library for processing) (2014), University of Applied Sciences Potsdam
98
Who you are is what you get - A reflection onobjectivity and bias in information search
Rohit Gupta
IDC School of Design , IIT Bombay, Mumbai, Maharashtra 40076 [email protected]
Abstract. Information seems to have affected the pace of human evolu-tion. Early humans could remember more information than the modernman. We today live in a world where information is ubiquitous and exter-nalized. With ambient connectivity, this seems to have lead to a reducedinformation storage in biological memory. Hence, information is ambient.The ease and implementation of search engines has affected the inherentconfirmation bias. This leads to a lack of objectivity in the informationpresented. Through the means of this installation, I intend to show thebiased nature of modern pursuit of information. The mirror reflects whata user is and not what maybe true.
Keywords: Installation, Interaction, Search, Metaphor, Mirror
1 Introduction
The externalization of information and its cognitive effects, discussed by Heersmink[1] brings forward arguments like people tend to remember where to retrieveinformation and not what the information is. It also mentions the change incognitive ecology with the current remediation of internet. This has inspired theuse of internet to get what we want by searching through an article rather thananalyzing it in totality.
Simpson [2] further argues that current move towards increased personaliza-tion in modern web systems reinforces bias and is detrimental to the objectivityof information. The search engine optimization strategies are often biased by ex-ternal factors like advertisements, public interest, geographic location, search his-tory and government interest which further impacts the objectivity. Heersmink[1] puts that this ’personalization’ may be convenient but contributes to confir-mation bias.
2 Setup
The installation consists of an old CRT monitor chassis(2) on which a mirror(1)is mounted instead of the screen. The vinyl cuts(3) representing a Google searchpage will be pasted on the mirror. This makes the background of the mirrorbe like the background of the web-page. The components are illustrated in thefigure 1.
99
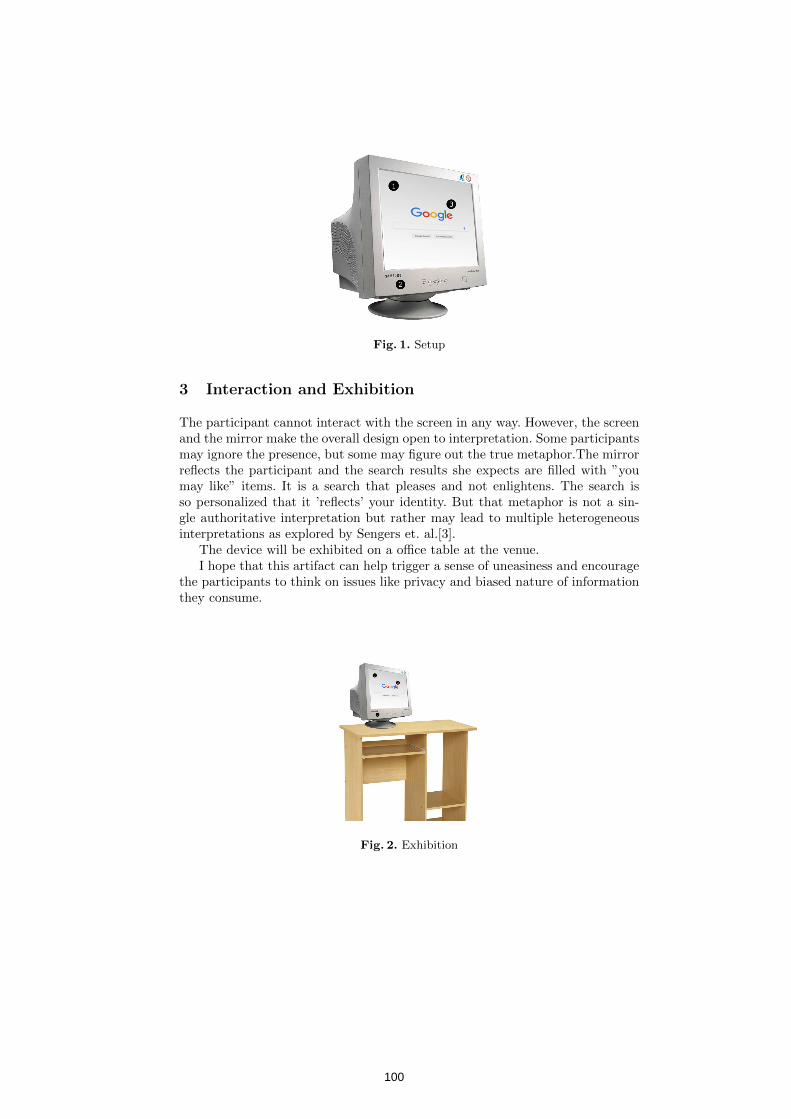
Fig. 1. Setup
3 Interaction and Exhibition
The participant cannot interact with the screen in any way. However, the screenand the mirror make the overall design open to interpretation. Some participantsmay ignore the presence, but some may figure out the true metaphor.The mirrorreflects the participant and the search results she expects are filled with ”youmay like” items. It is a search that pleases and not enlightens. The search isso personalized that it ’reflects’ your identity. But that metaphor is not a sin-gle authoritative interpretation but rather may lead to multiple heterogeneousinterpretations as explored by Sengers et. al.[3].
The device will be exhibited on a office table at the venue.I hope that this artifact can help trigger a sense of uneasiness and encourage
the participants to think on issues like privacy and biased nature of informationthey consume.
Fig. 2. Exhibition
100
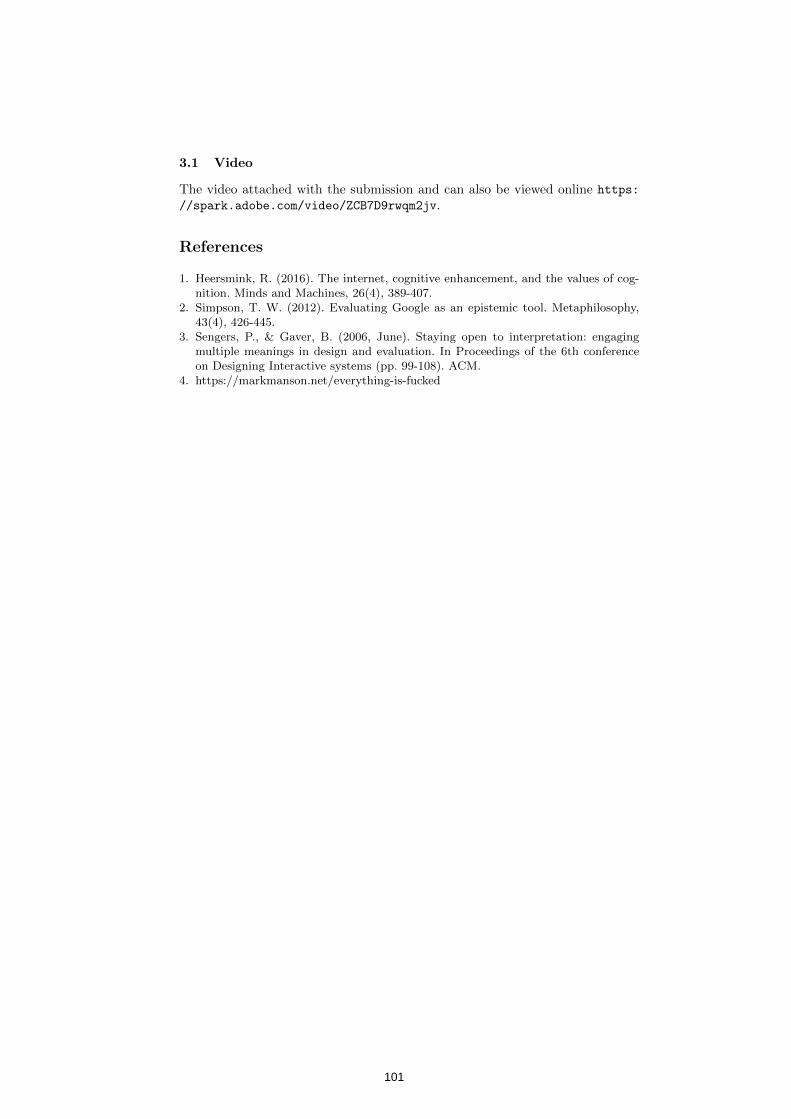
3.1 Video
The video attached with the submission and can also be viewed online https:
//spark.adobe.com/video/ZCB7D9rwqm2jv.
References
1. Heersmink, R. (2016). The internet, cognitive enhancement, and the values of cog-nition. Minds and Machines, 26(4), 389-407.
2. Simpson, T. W. (2012). Evaluating Google as an epistemic tool. Metaphilosophy,43(4), 426-445.
3. Sengers, P., & Gaver, B. (2006, June). Staying open to interpretation: engagingmultiple meanings in design and evaluation. In Proceedings of the 6th conferenceon Designing Interactive systems (pp. 99-108). ACM.
4. https://markmanson.net/everything-is-fucked
101

© Authors 2017, All Rights Reserved INTERACT 2017 Adjunct Proceedings
Insight-Out: Shaping Our World of Ideas
Chitra Chandrashekhar1, Lakshmi Deshpande2, Chinmayee Samant3, Himanshu Goyal4 Rohit Soni5
1 Creative Founder, Designer & Visual Storyteller, Mographies, 2 Visual Designer, 3 Illustrator & UI/ UX Designer, 4 Architect, Industrial & UI
Designer, 5 UX Designer
1 mographies,
2 lakshmi.deshpande,
3 cmsamant,
4 ar.himanshu1988,
Abstract. Conversations are the most basic way, in which, human
communication transpires. In a world where idea is currency and people are wealth, an idea germinated in one mind is nurtured to fruition when multiple people come together, interact and collaborate. But across the globe, every person, sees the world from their own unique perspective. And so, the same idea can have myriad interpretations and representa-tions. Technologies have evolved and continue to grow, enabling trans-mission of accurate and real time conversations, over long distances. But what about conversations that require presence? How have we been able to harvest ideas and thoughts, in events such as meetings and confe-rences where many minds meet? How could we tap into the diverse worlds of ideas that dwells within every participant of such an event? Can intent listening or viewing alone make for memorable, comprehen-sive experiences? Recording conversations for later recall becomes necessary in such cases. While storytelling/ stories ensure inter-linking of ideas and better me-morability, visuals aid this process further. Recording visuals for future use has been our primitive obsession as humans. Visualizations tran-scribe abstract words and thoughts into tangible comprehensive images and metaphors. From cave paintings to virtual images, we have always been largely dependent on visual memory. In spite of advancements in remote technology, social interactions and conversations are still, the most engaging and memorable through fun, play and live presence. In-
sight-Out aspires to create, such a platform, that not only captures di-
verse ideas but engages the conference participants with fun, live, tangi-ble and vivid visuals. It is also presented as a low cost, low tech public engagement solution that can be implemented globally.
102
Keywords: Visualization, Doodles, Graphics, Visual Communication,
Public Participation, Interaction, Engagement, Social Media, Video, Photography, Live Media, Tangible, Conversations, Low Cost, Global Application.
1 Insight-Out: A Live Social Intervention
1.1 Concept Note
The proposed installation is a live social intervention, that arises from
the need of facilitating conversations and visually evoking insights from
the world of ideas from the conference participants, in a casual and in-
formal manner. Insight-Out is participatory and focuses on encouraging
largely sedentary conference audience to stretch their muscles, move,
create, doodle, strike up conversations, opine and compare insights
through fun activities such as doodling and shape-making. It allows for
seamless sharing of concepts through facilitated live tangible and vivid
visuals, that are cohesively woven into a big picture, shared as co-
created visual testimony of the conference. It is a live visual experiment
that lets us observe diverse human responses and errors in understand-
ing each other’s mental imageries and points of view. It is also less re-
source intensive making it globally accessible solution for public par-
ticipation.
1.2 Components & Details of Intervention
Insight-Out is best located indoors in a lobby/ corridor space that al-
lows chance meetings and interactions. It’s live/ spontaneous nature is
conceptualised to be time bound over the duration of one day (28th Se-
petember, 2017). The intervention is most active during conference
break-times (Tea/ Lunch/ Pre-Dinner) when participants can be free
and casual. Although it will be open for anyone to engage with over the
entire day. The intervention is a linear arrangement of Foam board
panels of the dimension, 16 Ft. x 4Ft (4 4Ft. x 8 Ft. Foam board Pan-
els). It will have the following components as forms of conversations:
103
1) Introductions: Tangram-like colourful acrylic shapes are stuck on one
foamboard panel. They can be played with to create Figures/ Shapes in re-sponse to a warm up question of ‘Who Are You?’ This reveals images that
participants associates themselves with as a personal icon/ story. This will also be digitally recorded with hyperlapse video/ photographs as artefacts for live-casting on social media by Chitra. It will be facilitated by Lakshmi. 2) Expressions: Word cards containing concepts, emotions, actions can be
picked up by participants. These words will be doodled by Live-doodlers or eager & enthusiastic participants, filling up the canvas made up of 3 foam board panels. This will be facilitated by Rohit & Himanshu. 3) Opinions: Chinmayee will facilitate participants to paste stickers on
Visuals that seem to be most universally communicating the respective words. 4) Livecast: Participant interviews, hyper-lapse videos, photo-collages etc.
will be Livecast via social media capture glimpses of the proceedings and end of day visual summaries to garner added insights and live engagement, from remote audience through a virtual domain.
104
© Authors 2017, All Rights Reserved INTERACT 2017 Adjunct Proceedings
Snakes and Ladders: A Sonification
Hanif Baharin
Institute of Visual Informatics,UniversitiKebangsaan Malaysia, 43600Bangi, Malaysia [email protected]
Abstract. This soundscape installation is a sonification of Snakes and
Ladders, a board game originated in ancient India. The idea to create this work was inspired by INTERACT 2017 theme, Mumbai as a place forthe conference, and ancient Indian philosophies behind Snakes and Ladders. The work is a representation of Snakes and Ladders being played perpetually by two players, denoted by the sounds of guitar and beats. It aims to create a variety of soundscape experience for each indi-vidual listener, and invites reflections onthe ideas from the peak of In-dian civilisation that contribute to the modern world.
Keywords: Soundscape installation, sonification, gamification.
1 Concept and Inspiration
A sentence from INTERACT 2017 website sparked my imagination to create this work - “Many regions that are considered least developed or developing
today, have witnessed the peak of their civilization in the past.”[1]This, along with the theme of ‘Global Thoughts, Local Designs’ and Mumbai as the confe-rence venue, have rekindled my fascination with an ancient game originated in India, but is still played in many places in the world today – the board game of Snakes and Ladders.
Gamification is the use of game elements in non-game context[2]. Based on this definition, perhaps, Snakes and Laddersis one of the oldest and surviving examples of gamification, since itwas played in ancient India to teach children the principle of causality in the philosophies of Karma, where good and bad effects in life are caused by good and bad deeds, respectively[3]. The simplicity of the game allows it to be played by the youngest of children, if they knew how to count. Perhaps, the universality of the need to teach young children, through play, to differentiate between good and bad actions, combined with
105
the simplicity of the game made it a popular game. Instead of Hindu cultural and religious iconography to link the cause and effect for each snake and lad-der, the game was first published in England in 1892 with Christian virtues and morals used on the board[3]. Here, for me, lies the beauty of the game which allows it to cater to Global Thoughts through Local Design.
2 Sonification of Snakes and Ladders
One of the aims of this work is to highlight Snakes and Ladders as a gamifica-tionof philosophical ideas, rather than just a simple children’s game, by re-placing the visual aspects of the game with sounds. Sonification is the use of sounds to represent non-auditory information[4]. This work is a sonification of two players playing a perpetual game of Snakes and Ladders. The first player is represented by the sound of a guitar. Each digit, from zero to nine, of the box number is denoted by a note of the guitar, playing an Indian musical scale inspired by Raga. The second player is represented by beats, each unique beat marks the digit of each box the player is in. When a player reaches a box that contains a snake or a ladder, the notes or beats will be played faster, descending or ascending respectively. When a player reaches the hundredth box, the player will return to box one and repeats the game. The roll of the dice is determined by generating of a random number from one to 12. The result is a unique soundscape that sits somewhere between noise and music. It is a nonsensical music of random, rule-following patterns.
This work is programmed using Processing programming language. A five-port multi headphone splitter adapter is used with four headphones to allow four listeners to experience this work at the same time. The program will be running continuously throughout the exhibition.
3 Conclusion
This artwork invites the audience to reflect on ancient Indian civilisation contributions to the modern world, suitable with the conference theme of ‘Global Thoughts, Local Design.’ The sounds produced by this works follows the rule of the game, but since it is a game of pure chance, the listening ex-perience may be different from one listener to another and from one moment to another.
106
Acknowledgements.89 Friends Pty Ltd sponsors the headphones for this
artwork.
References
1. About INTERACT - INTERACT 2017, https://www.interact2017.org/about.
2. Deterding, S., Dixon, D., Khaled, R., Nacke, L.: From game design elements to gamefulness: Defining gamification. Proc. 15th Int. Acad. MindTrek Conf. Envisioning Futur. Media Environ. - MindTrek ’11. 9–11 (2011).
3. The Museum of Gaming Newsletter Issue Number 2, http://www.museumofgaming.org.uk/documents/Newsletter2.pdf, (2015).
4. Hermann, T.: Taxonomy and Definitions for Sonification and Auditory Display. In: Proceedings of the 14th International Conference on Auditory Display (ICAD 2008) (2008).
107
© Authors 2017, All Rights Reserved INTERACT 2017 Adjunct Proceedings
Karan Dudeja1, Gaurav Patekar2, Himanshu Bablani3 and Debanshu Bhaumik4
1 Globant India Pvt Ltd, User Experience Studio, Bangalore, India
2 Pramati Technologies, Interaction Design, Hyderabad, India
3 Ardubotics, Design and Development, New Delhi, India
4 National Institute of Design, Ahmedabad, India
Data Jalebi Bot is an exploration into data visualization us-
ing edible materials. The data provided by an individual through a cus-tom interface provides an overview of their professional profile. Using this data, the software generates a visualization that is printed as a popular Indian sweet - the Jalebi.
Data Visualization · Food Printing · Interactive Installation
We are producing large amounts of data every day, which is consumed pri-marily through visual and auditory interfaces. This project explores alterna-tive ways of data visualization and consumption.
Research and brainstorming on the culture of India led us to food, specifically sweets, as the exchange of confectionaries on important occasions is a phe-nomena prevalent worldwide, especially in India. On exploring further, Jalebi was chosen for its similarity to 3D printing process and scope of data visuali-zation. Data Jalebi Bot is an interactive installation that converts data col-lected from the individuals at an HCI conference, into a Jalebi. Participants can experience their personal data in a tangible and edible format. The data is submitted by the participant through a form, in digital format. The form cap-
108

tures the 'professional profile' of the participants. This data is converted into a unique 2D pattern parametrically, which is sent to the Jalebi printer. The printed data sculpture is served along with a small souvenir card to help the viewer 'read' the pattern.
The shape generation algorithm receives the following data points from the form:
Professional Titles (Maker, Designer, Entrepreneur, Student, Re-searcher, Academician, Researcher, and Developer)
Experience (Beginner, Intermediate, Advanced, Expert and Veteran) Purpose (Delegate, Presenter, Organizer and Volunteer) Interests (The interests could be in many of the subfields of HCI)
The visual aesthetic of the patterns are inspired from Mehendi, Rangoli and Mandala patterns, which are an integral part of Indian culture and are two dimensional in nature. Fig. 1 depicts how the variables are mapped to a pat-tern; their superimposition leading to the data sculpture.
. Pattern mapping to data points
109
The generated shape is converted into SVG format and then to a G-Code file sent to the printer. The printer is based on CoreXY Plotting Mechanism. The Jalebi is made by dropping the batter in a pan containing heated oil. The batter's flow is controlled by a custom pneumatic mechanism.
Data Jalebi Bot is an exploration in alternative modes of data consumption. It encourages dialogues about the future and implications of new technologies such as Automation, Digital Fabrication, Food Printing and Quantification of Self.
110
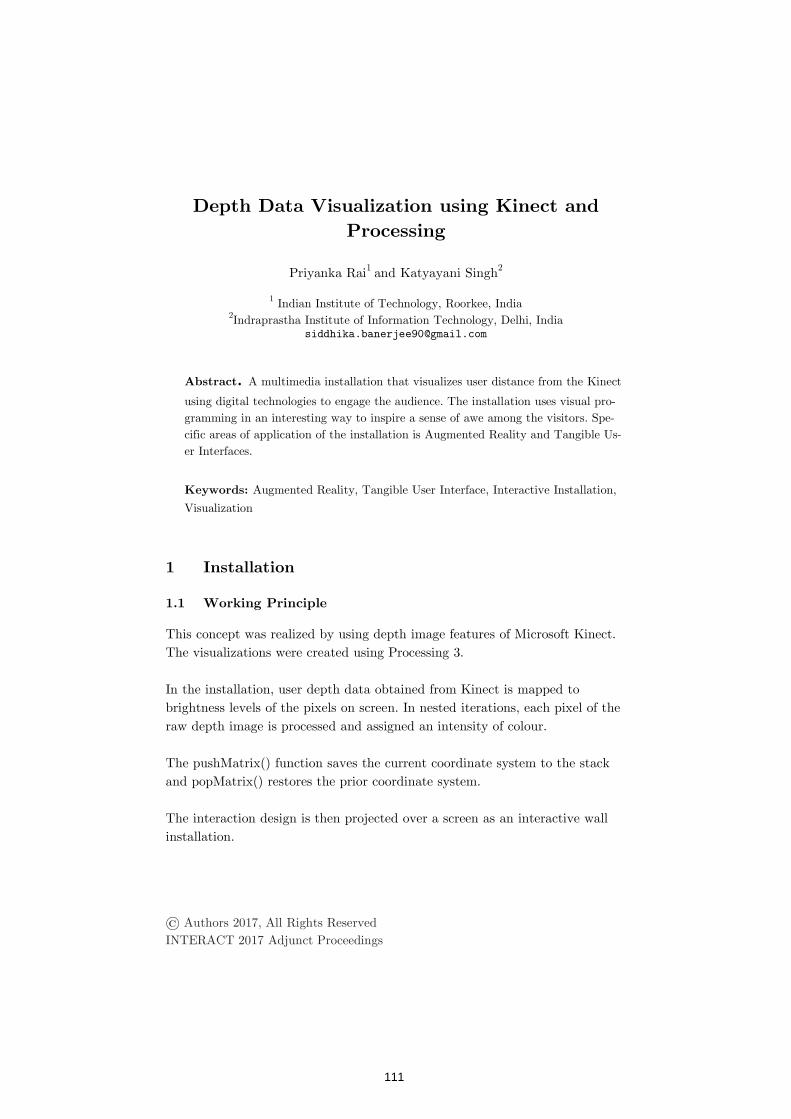
© Authors 2017, All Rights Reserved INTERACT 2017 Adjunct Proceedings
Priyanka Rai1 and Katyayani Singh2
1 Indian Institute of Technology, Roorkee, India 2Indraprastha Institute of Information Technology, Delhi, India
A multimedia installation that visualizes user distance from the Kinect
using digital technologies to engage the audience. The installation uses visual pro-gramming in an interesting way to inspire a sense of awe among the visitors. Spe-cific areas of application of the installation is Augmented Reality and Tangible Us-er Interfaces.
Augmented Reality, Tangible User Interface, Interactive Installation,
Visualization
This concept was realized by using depth image features of Microsoft Kinect. The visualizations were created using Processing 3. In the installation, user depth data obtained from Kinect is mapped to brightness levels of the pixels on screen. In nested iterations, each pixel of the raw depth image is processed and assigned an intensity of colour. The pushMatrix() function saves the current coordinate system to the stack and popMatrix() restores the prior coordinate system. The interaction design is then projected over a screen as an interactive wall installation.
111
2
Purpose of the installation is to keep viewerperformance. Its application could be in the ing arts, live concerts, discotheques. This could also help create live data visalization of audiences
Processing 3 Projector Screen/Wall
We thank UE – HCI Lab, IIT Guwahati for allowing us to access their infrstructure and equipments
1. Daniel Shiffman (https://www.youtube.com/watch?v=FBmxc4EyVjs&t=759s2. Library for Kinect v2 in Processing 3:
(https://github.com/ThomasLengeling/KinectPV2/tree/master/KinectPV2
Purpose of the installation is to keep viewers enthralled throughout a live performance. Its application could be in the entertainment industry, perforing arts, live concerts, discotheques. This could also help create live data vis
of audiences.
Kinect V2
Processing 3 Projector Screen/Wall
HCI Lab, IIT Guwahati for allowing us to access their infrd equipments.
https://www.youtube.com/watch?v=FBmxc4EyVjs&t=759sLibrary for Kinect v2 in Processing 3: https://github.com/ThomasLengeling/KinectPV2/tree/master/KinectPV2
thralled throughout a live entertainment industry, perform-
ing arts, live concerts, discotheques. This could also help create live data visu-
Kinect V2
HCI Lab, IIT Guwahati for allowing us to access their infra-
https://www.youtube.com/watch?v=FBmxc4EyVjs&t=759s)
https://github.com/ThomasLengeling/KinectPV2/tree/master/KinectPV2)
112
1
© Authors 2017, All Rights Reserved INTERACT 2017 Adjunct Proceedings
Voyages of Discovery: Conversations with
Things, Places and People
Reeta Mehrishi, Anindita Saha, Astha Johri, Mayur Shankar Jadhav
Tata Consultancy Service [email protected]
Abstract. This installation aims to provoke new, paradigm shifting
ideas for the Internet of Things, and other emerging technologies. This is achieved through a combination of ideation and insight generation.
Keywords: Participatory Installations, Interactive Installations, Parti-
cipatory Design, Design Research, Lateral Thinking, Insight, Insight Ga-thering, Ideation Tools, Ideation Methods, Idea Generation, Problem Identification, Design for IoT, Design for Emerging Technologies
1 Introduction
This installation aims to provoke new, paradigm-shifting ideas for emerging technologies that have the potential to significantly improve our lives and our future.
The installation ‘grows’ from a digital to a physical form. To begin with, it is purely digital, with an application running on a giant touch screen. Gradu-ally, the physical component begins to build around it – in the form of an ‘idea wall’ that grows over time.
2 Methodology
The installation begins with a giant touchscreen. Data types are
represented by colour-coded Post-its, grouped into families based on data sources.
When no one is around, the Post-its fly around the screen, periodically forming themselves into random groupings.
113
These associations trigger lateral thinking (as do ideation methods like ran-dom word association) – challenging participants to find a use-case for these groupings.
Visitors to the installation can also play with the Post-its, moving them around to create new groupings and then define use-cases for these.
When a visitor is done creating a use-case, she/he can send it for display on a giant carousel.
Visitors can also print a visual of the use-case they created, and stick it on to the lattice mapped around the touchscreen. They can embellish the visual, sketching in any extra details they might like to add. It is assumed that since this audience is largely comprised of design practitioners/students/researchers, they are likely to appropriately utilize the opportunity to build on an idea.
3 Outcome
As more and more ideas and insights emerge, a “wall” or “curtain” of ideas starts to grow around the touchscreen.
Gradually, the wall itself starts to become a source of inspiration – sparking fresh ideas and triggering conversations on problems and possibilities.
Thus, the installation grows into a pop-up studio/gallery – where people ideate, create, discuss, display, critique and get inspired.
Each use-case is tagged with the creator’s country, which corresponds to its position on the wall – thus providing insight into local patterns across the globe.
4 Caveats
Certain factors may impact the quality of the results:
4.1 Calibration
The touchscreen needs to be carefully calibrated, as inaccuracies have been observed to lead to frustration among participants
4.2 Sturdiness
The physical structure carrying the map needs to be designed such that it can withstand the increasing load, as more and more ideas are added to the
114

map, and the handling, as an increasing number to people come to view those ideas.
4.3 Facilitation
Also the installation is self-explanatory, human facilitation is seen to great-ly enhance the ideas it generates – qualitatively as well as quantatively
115
© Authors 2017, All Rights Reserved
INTERACT 2017 Adjunct Proceedings
Air Draw
Prabhat Mahapatra, Nikhil Tailang
Adobe Design Lab, India [email protected], [email protected]
Abstract. Air Draw explores the use of mobile devices for co-creation in
social spaces. It is an interactive installation that allows multiple people to create interesting works of art, together, using motion captured by their phones.
Keywords: social, art, motion, phones
1 Introduction
At large social gatherings, like a conference, it is not uncommon for
people to ignore the real people around and be immersed in their
phone screens “talking” to a virtual crowd. This led us to think of ways
to bring people together around an act of co-creation and enable them
to converse with each other. Utilizing an object available on everyone
these days – the smartphone – and making use of the motion sensors in
it, we built an installation that allows people to use their phones like a
brush, in the air. This allows multiple people to connect their phones
to this installation and sketch together, hence starting conversations,
first on the shared canvas, and then in person.
2 Installation Details
The installation consists of a large projected canvas with a QR code.
Visitors use their phones to scan this code and get connected to the
116
application. Once connected, they simply need to wave their phones in
air to create beautiful strokes and patterns on the projected canvas.
Multiple people can similarly scan the code and join the canvas at the
same time. Each person gets a different brush or a pattern to paint
with. These brushes and patterns have been created such that they go
well together to create interesting abstract artworks.
These artworks are captured by the system at regular intervals and
can be made available to the visitors to share to their social networks
or even printed at high resolution. This is possible since the artwork is
vector in its format. The application can also add the conference
branding directly onto the artwork before sharing it on the social net-
works. This adds to the marketing possibilities for a conference. This is
Air Draw.
The installation requires the application running on a Macintosh sys-
tem, a projector with a display wall or a screen, and a strong Wi-Fi
network for a lag-free drawing experience. And yes, visitors to try it
out and create together. The Adobe Design Lab team is also working
towards extending this experience to smart watches like the Apple
Watch in addition to smart phones.
117
Workshops
The accepted workshops at INTERACT2017 reflect and develop on the spirit and
theme of the conference. The INTERACT2017 theme was GLOBAL THOUGHTS,
LOCAL DESIGNS. In this new age of global connectivity, designers are often required
to design products for users who are beyond their borders and belonging to distinctly
different cultures. The process of designing products is becoming more multi-
disciplinary by the day. Solutions are now designed with a global perspective in mind,
however local the solution might be. For those in the field of human-computer
interaction, the phenomenon of global thoughts, local designs would have a direct
impact. It encompasses the areas of HCI in the industry of emerging economies, HCI
contributions in socio-economic development, HCI for products and services in
emerging markets, including mobile systems, HCI and designs for low-literacy users,
HCI and designs for bottom of the pyramid users, and HCI for remote contexts,
including issues related to international outsourcing / global software development.
An INTERACT Workshop provides a one-day or two-day forum for participants to
compare their experiences and explore research issues or topics of special interest to
the HCI community. Workshop proposals with specific objectives and address
stimulating topics were selected. One new idea at INTERACT2017 was that workshop
organisers got an opportunity to present a summary of outcomes in a session during
the conference.
Workshop proposals were: a) Traditional workshops with paper presentations, followed
by forum discussions and a shared poster for presentation during the conference, b)
Interactive events, where participants work together on experimenting with or
evaluating an artefact, and make a 360 degree video of the design or evaluation work
highlights for presentation during the conference, c) Design workshops with focus on
artefacts, with a gallery / showroom exhibition during the conference, and d) Other,
innovative formats of the workshop were invited.
118
Workshop 4
This workshop addresses the problem of designing gestures in interactive systems. Current multi-touch and motion sensing technologies allow for capturing a large scope of gestures and movements that can be used to interact expressively with different media. Yet, the common use of gestures remains limited to few well-known strokes such as wipes and pinches. The use of hand or body movements is even rarer, with the exception in some video-game systems using the Wii or the Kinect.
Several issues can be invoked to explain the difficulties to include rich gestural input in interactive systems. First, the choice of possible gestures is generally imposed by manufacturers that focus on easiness of use (and even patent them). Only few systems let users to propose their own vocabularies with rich expressive content. Second, we argue that shared methodologies for and gestures are generally lacking in the
engineering fields.
The aim of the workshop is precisely to explore the question of in a participatory workshop. In
particular, it focuses the discussion on possible differences in cultures and contexts, and how this might affect both positively or adversely the appropriation of shared gestural interaction paradigms.
119
Frédéric Bevilacqua, Joseph Larralde, Benjamin Matuszewski
ST MS Lab IRCAM-CNRS-UPMC, Paris, France
We present here the concept and the implementation of
CoMo, a set of collaborative web apps that make use of gesture recognition with smartphones. A gesture vocabulary can be easily recorded and associated to soundfiles. This set of tools, which allows for rapid and iterative experimentation with various movements and gestures, can be a useful resource for gesture design in interactive systems.
Gesture, Design, Multi-Modal Interfaces, Interactive
Machine Learning, Human-Computer Interaction, Sound, Mobiles
In the context of the workshop “Designing Gestures for Interactive Systems”, we propose a series of web applications called CoMo for recording and using movement recognition using smartphones. The implemented architecture allows for easily sharing movement units among users and thus, for the collective creation of various interaction scenarios. More generally, these web apps can be used to assess and evaluate different gestures and body movements as input in interactive applications. Currently, the CoMo web apps are designed to trigger or modulate sound feedbacks. We believe that these web apps can be useful for a series of workshops directed towards “gesture design”.
Our goal is to provide simple tools for collectively design and assess movement input and gesture-sound mapping in interactive systems. Ideally, the system should implement different gesture following and recognition algorithms that could be easily trained based on a limited number of gesture
120
recordings [Bevilacqua et al 2011]. More precisely, the training should be performed by designers or users, which allows for rapid cycles of tests and user adaptation. Such approaches, i.e. allowing users to choose the gesture vocabulary and customize themselves the recognition procedures, are generally called Interactive Machine Learning [Fiebrink et Caramiaux 2016] (or Human Centered Machine Learning1). We have previously proposed several methods and algorithms [Bevilacqua et al 2011, Françoise et at al 2014]. In particular, in the context of the Rapid-Mix project2, an interactive machine learning API has been released as a concerted effort among several European partners3. This API enables the use of different algorithms with a unified API for developers.
In this framework, we have implemented a version that can be used with smartphones, taking advantage of the embedded motion sensors. Moreover, as explained in more detail in the next section, our implementation is aimed towards collective use, where users can share and test various gesture units recorded by the mobile phones.
The prototype, named CoMo (for collective movements), implements a Client-Server architecture with the training algorithm running on the server side and a simple recognition process on the client side (i.e. web pages). Therefore, CoMo can be seen as a set of web services and applications dedicated to Interactive Machine Learning, where users can record, share and test collections of gesture models through specific web pages. Furthermore, the users can experiment with different algorithms and compare their behaviours and results, as described in Figure 1.
The server-side software is composed of 3 main components: a classical HTTP server with WebSocket communication a host able to launch child processes for machine learning of various
types a database to store models and collections of each user
121
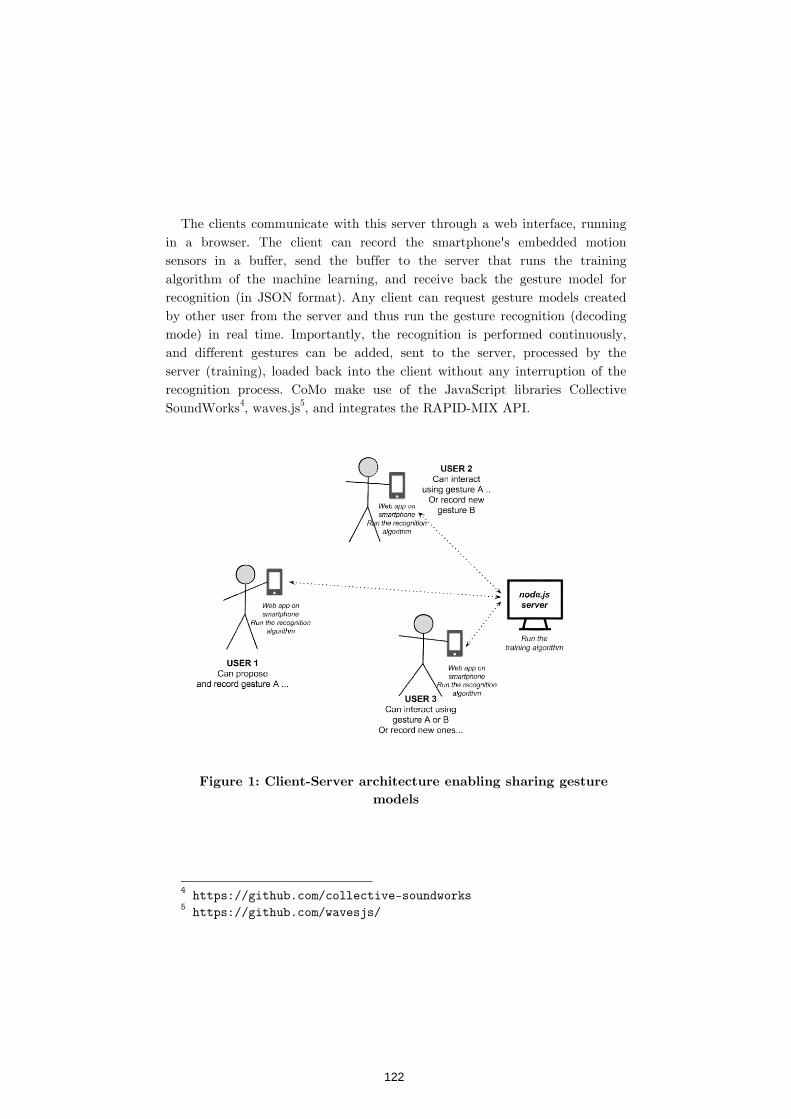
The clients communicate with this server through a web interface, running
in a browser. The client can record the smartphone's embedded motion sensors in a buffer, send the buffer to the server that runs thalgorithm of the machine learning, and receive back the gesture model for recognition (in JSON format). Any client can request gesture models created by other user from the server and thus run the gesture recognition (decoding mode) in real time. Importantly, the recognition is performed continuously, and different gestures can be added, sent to the server, processed by the server (training), loaded back into the client without any interruption of the recognition process. CoMo make use of the SoundWorks4, waves.js
The clients communicate with this server through a web interface, running in a browser. The client can record the smartphone's embedded motion sensors in a buffer, send the buffer to the server that runs the training algorithm of the machine learning, and receive back the gesture model for recognition (in JSON format). Any client can request gesture models created by other user from the server and thus run the gesture recognition (decoding
. Importantly, the recognition is performed continuously, and different gestures can be added, sent to the server, processed by the server (training), loaded back into the client without any interruption of the recognition process. CoMo make use of the JavaScript libraries Collective
, waves.js5, and integrates the RAPID-MIX API.
The clients communicate with this server through a web interface, running in a browser. The client can record the smartphone's embedded motion
e training algorithm of the machine learning, and receive back the gesture model for recognition (in JSON format). Any client can request gesture models created by other user from the server and thus run the gesture recognition (decoding
. Importantly, the recognition is performed continuously, and different gestures can be added, sent to the server, processed by the server (training), loaded back into the client without any interruption of the
Collective
122
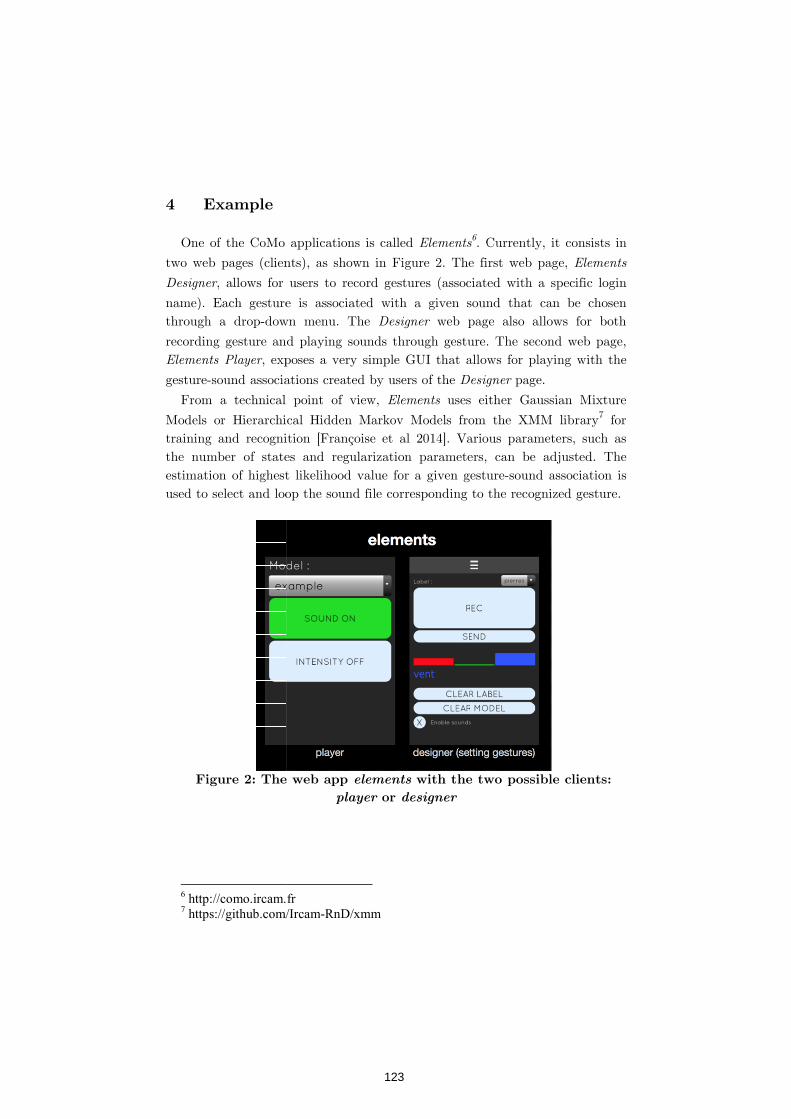
One of the CoMo applications is called
two web pages (clients), as shown in Figure 2. The first web page,
, allows for users to record gestures (associated with a specific login
name). Each gesture is associated with a given sound that can be chosen through a drop-down menu. The
recording gesture and playing sounds through gesture. The second web page, , exposes a very simple GUI that allows for playing with the
gesture-sound associations created by users of the
From a technical point of view,
Models or Hierarchical Hidden Markov Models from the XMM librarytraining and recognition [Françoise et al 2014]. Various parameters, such athe number of states and regularization paraestimation of highestused to select and loop the sound file corresponding to the recognized gesture.
6 http://como.ircam.fr7 https://github.com/Ircam
One of the CoMo applications is called . Currently, it consists in
pages (clients), as shown in Figure 2. The first web page,
, allows for users to record gestures (associated with a specific login
name). Each gesture is associated with a given sound that can be chosen down menu. The web page also allows for both
recording gesture and playing sounds through gesture. The second web page, , exposes a very simple GUI that allows for playing with the
sound associations created by users of the page.
a technical point of view, uses either Gaussian Mixture
Models or Hierarchical Hidden Markov Models from the XMM librarytraining and recognition [Françoise et al 2014]. Various parameters, such athe number of states and regularization parameters, can be adjusted. The
of highest likelihood value for a given gesture-sound association is used to select and loop the sound file corresponding to the recognized gesture.
http://como.ircam.fr https://github.com/Ircam-RnD/xmm
. Currently, it consists in
pages (clients), as shown in Figure 2. The first web page,
, allows for users to record gestures (associated with a specific login
name). Each gesture is associated with a given sound that can be chosen web page also allows for both
recording gesture and playing sounds through gesture. The second web page, , exposes a very simple GUI that allows for playing with the
uses either Gaussian Mixture
Models or Hierarchical Hidden Markov Models from the XMM library7 for training and recognition [Françoise et al 2014]. Various parameters, such as
meters, can be adjusted. The sound association is
used to select and loop the sound file corresponding to the recognized gesture.
123
We proposed a set of tools for collective gesture recognition using smartphones. In particular, as several scenarios can be elaborated without additional programming, the CoMo web applications can prove to be a valuable tool in workshop settings where various participants can record and play sound with gesture. We believe that this framework could foster the exploration of gesture design.
We acknowledge from the Rapid-Mix project (H2020-ICT-2014-1 Project ID 644862). We thank Norbert Schnell for his important contribution to the libraries used in the project (waves.js, Collective SoundWorks), and Jules Françoise for the XMM library used for gesture recognition.
1. Bevilacqua, F., Schnell, N., Rasamimanana, N., Zamborlin, B., and
Guédy, F. (2011). Online Gesture Analysis and Control of Audio Processing. In Musical Robots and Interactive Multimodal Systems, pages 127–142. Springer.
2. Françoise, J., Schnell, N., Borghesi, R., and Bevilacqua, F. (2014). Probabilistic Models for Designing Motion and Sound Relationships. In Proceedings of the International Conference on New Interfaces for Musical Expression (NIME’14), London, UK.
3. Fiebrink, R. and Caramiaux, B. (2016). The machine learning algorithm as creative musical tool. arXiv preprint arXiv:1611.00379.
124
Amanpreet Kaur1*, Bhanu Sharma2, Amit Pandey3, Archana Mantri4**
1,2,3 Research Scholar, 4 Professor Department of Electronics and Communication Engineering, Chitkara University Institute of Engineering & Technology.
Chitkara University, Chandigarh, Punjab.
The field of human– computer interaction has been
advanced with many technologies in recent years. Gesture based human-computer interactions hold promise for more so-called “naturalness" in the interactions. Many of the gesture input devices such as Wii Mote Controller, Kinect and Leap Motion Controller (LMC) allows for using more complex gestures than the basic input devices such as keyboard and mouse. With the advancement in the gesture technologies, human beings are able to operate the devices and machines even without having any physical contact with them. These devices might escalate the life standards of common man by providing them with enchanting new facilities in the field of entertainment, education, automobiles, health etc. The next phase of emotion detection is also under process by combining the facial expressions and gestures of the human body that can bring wonders to the life of the common man. The operating principles and the technical aspects of the different gesture input devices have been explored in the following paper. A comparison table has been also drawn between the two most widespread gesture acquisition devices that are Kinect and Leap Motion Controller.
: Gesture Recognition, Leap Motion, Kinnect, Wii Mote
Contoller, Technical Aspects.
Since the introduction of computers to our world, we have been continuously encountering the intriguing inventions in the field of human-computer interactions. For providing input from the user to the machine, the
125
keyboard and the mouse have for a long time been the only devices commonly available. Now with the increase in the research, techniques and technologies, a large set of new input devices have been introduced [1]. The new human-interaction techniques are facilitating the natural way of interaction between the humans and the machines. The interactive multimodalities are also playing a great role new emerging techniques that are enhancing the realism in the human and computer interaction. Gesture recognition can be defined as the computational interpretation of the motions of the human body. Gestures are generally related to the hand or face motions. Interaction with the devices and machines can be possible with the help of simple gestures without physically touching any device or machine. Gesture based user interfaces in collaboration with the latest techniques are producing the new era of input devices in a way to inculcate the sense of realism in the various fields of health, entertainment, learning, engineering, automobiles etc.[3]. Gesture acquisition can be done in two ways either by holding the device in the hand or by hands free methods.
The operating principle of optical 3D sensors is divided into following 3 categories:
The 3D information is
computed from the deformation of a light pattern projected onto a scene [4].The Microsoft Kinect 360 (Kinect 1) makes use of such a technology.
The distance to an object is measured by
determining the time that is required by reflected light to travel back to the sensor, using an emitting pulsed laser beams [5]. Alternatively, it can be obtained, in the case of modulated infrared light, by determining the phase shift between the emitted and the reflected light. The Microsoft Kinect One 2.0 (Kinect) makes use of such a technology.
It consists of 2 optical 2D cameras, and the depth
is determined by searching the corresponding points in the 2D images [6].
126

The revolutionary and most widespread gesture acquisition devices that brought a major leap in input technology are explained below:
: It is one of the very first commercially
available, inexpensive and accurate 3 D gesture acquisition devices that have been released in 2006. It consists of a multimodal device with haptics feedback and motion sensing, that allow for capturing full 3D gestures. It is bundled with the Wii console [7]. One of the most attracting features of Wii Mote Controller is its motion sensing capability [7].Wii Mote Controller is a spatial convenient device. One of the most attracting features of Wii Mote Controller is its motion sensing capability. Wii Mote provides the 3 axes of acceleration through the use of an accelerometer and an optical sensing technology. Wiimote’s spatial data doesn’t directly map to a real-world position [7]. Wii Mote controller allows the user to interact with the manipulated items on screen via recognizing the gestures. Wii Mote has several buttons in its gamepad. Wii Mote also consists of speaker and rumble device in order to offer the multimodal feedback.
Another milestone for gesture recognition has been
introduced by Microsoft in 2010 and named as Kinect sensor. The Kinect sensor has been developed for the gesture recognition of hand or arm or full-body. It is an add-on for Xbox 360 console. It consists of auditory inputs, visual inputs as well as depth-sensing camera. It is capable of acquiring and recognizing the full body gestures of multiple users at a single point of time in a combination with software development kits [8].The range of sensor is typically from approximately 1 to 4 meters and it has been noticed by the authors in [10] that the accuracy of in the depth measurement decreases on increasing the distance from the sensor. The data has also been influenced by the latency of the device, spatial jitter and low resolution of depth measurements. The accuracy in the precise hand gestures such as movement of fingers and hand writing cannot be obtained by the device [8].
Another breakthrough has been introduced by
Leap Motion, United States in year 2013 and named as Leap Motion Controller. Leap Motion Controller (LMC) can be considered as a groundbreaking device in the field of hand gesture controlled human-computer interface. The controller is approximately of the size of matchbox. It is capable of precisely and accurate tracking the fingers, small objects and multiple hands in free space [9]. The Leap Motion is capable of sensing the
127
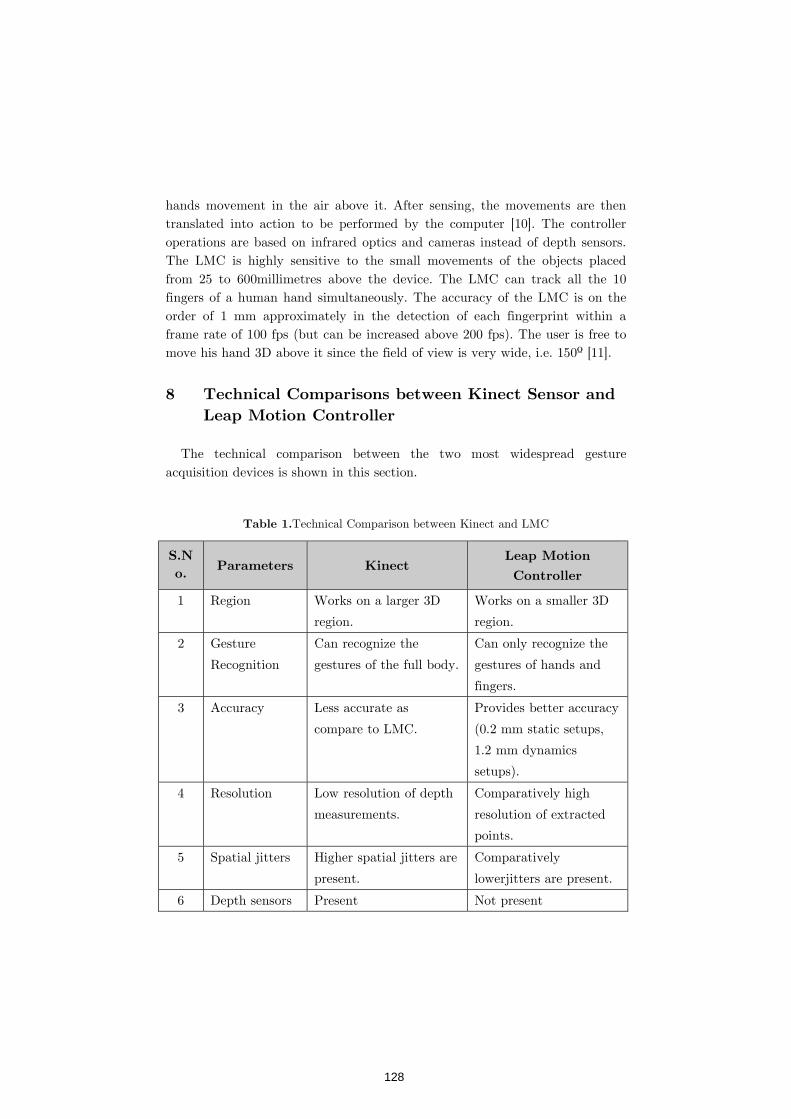
hands movement in the air above it. After sensing, the movements are then translated into action to be performed by the computer [10]. The controller operations are based on infrared optics and cameras instead of depth sensors. The LMC is highly sensitive to the small movements of the objects placed from 25 to 600millimetres above the device. The LMC can track all the 10 fingers of a human hand simultaneously. The accuracy of the LMC is on the order of 1 mm approximately in the detection of each fingerprint within a frame rate of 100 fps (but can be increased above 200 fps). The user is free to move his hand 3D above it since the field of view is very wide, i.e. 150º [11].
The technical comparison between the two most widespread gesture acquisition devices is shown in this section.
Technical Comparison between Kinect and LMC
1 Region Works on a larger 3D
region.
Works on a smaller 3D
region.
2 Gesture
Recognition
Can recognize the
gestures of the full body.
Can only recognize the
gestures of hands and
fingers.
3 Accuracy Less accurate as
compare to LMC.
Provides better accuracy
(0.2 mm static setups,
1.2 mm dynamics
setups).
4 Resolution Low resolution of depth
measurements.
Comparatively high
resolution of extracted
points.
5 Spatial jitters Higher spatial jitters are
present.
Comparatively
lowerjitters are present.
6 Depth sensors Present Not present
128
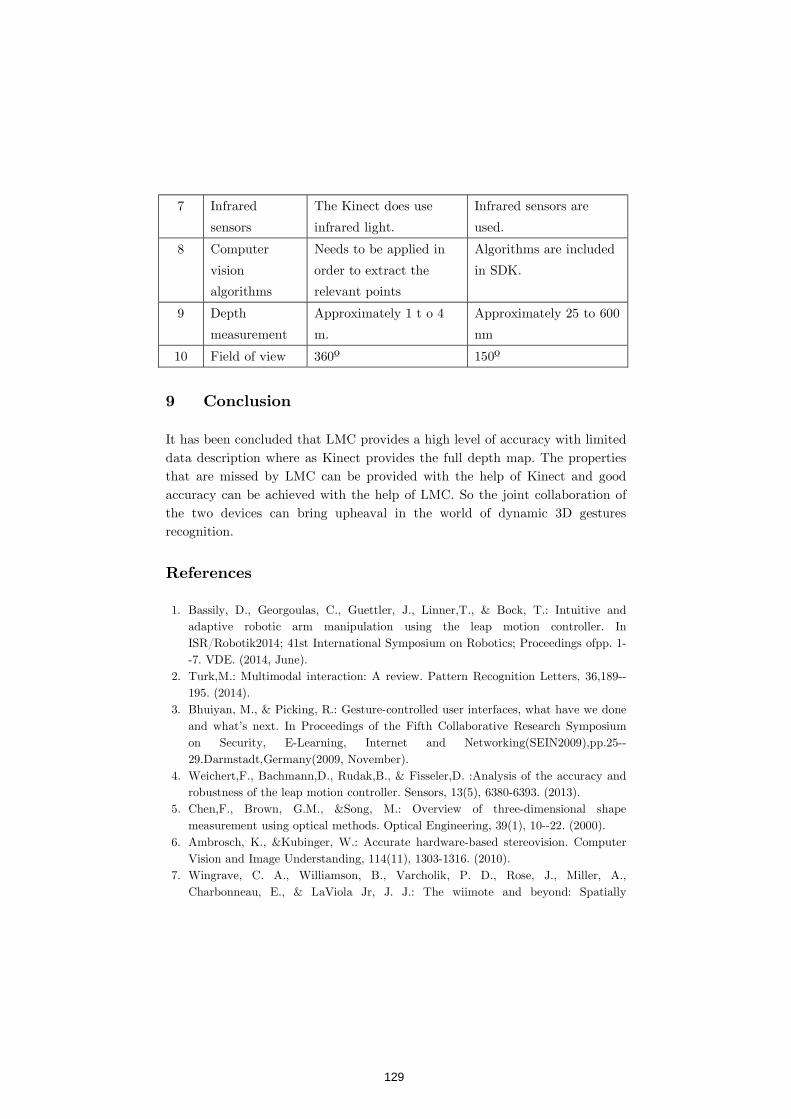
7 Infrared
sensors
The Kinect does use
infrared light.
Infrared sensors are
used.
8 Computer
vision
algorithms
Needs to be applied in
order to extract the
relevant points
Algorithms are included
in SDK.
9 Depth
measurement
Approximately 1 t o 4
m.
Approximately 25 to 600
nm
10 Field of view 360º 150º
It has been concluded that LMC provides a high level of accuracy with limited data description where as Kinect provides the full depth map. The properties that are missed by LMC can be provided with the help of Kinect and good accuracy can be achieved with the help of LMC. So the joint collaboration of the two devices can bring upheaval in the world of dynamic 3D gestures recognition.
1. Bassily, D., Georgoulas, C., Guettler, J., Linner,T., & Bock, T.: Intuitive and adaptive robotic arm manipulation using the leap motion controller. In ISR/Robotik2014; 41st International Symposium on Robotics; Proceedings ofpp. 1--7. VDE. (2014, June).
2. Turk,M.: Multimodal interaction: A review. Pattern Recognition Letters, 36,189--195. (2014).
3. Bhuiyan, M., & Picking, R.: Gesture-controlled user interfaces, what have we done and what’s next. In Proceedings of the Fifth Collaborative Research Symposium on Security, E-Learning, Internet and Networking(SEIN2009),pp.25--29.Darmstadt,Germany(2009, November).
4. Weichert,F., Bachmann,D., Rudak,B., & Fisseler,D. :Analysis of the accuracy and robustness of the leap motion controller. Sensors, 13(5), 6380-6393. (2013).
5. Chen,F., Brown, G.M., &Song, M.: Overview of three-dimensional shape measurement using optical methods. Optical Engineering, 39(1), 10--22. (2000).
6. Ambrosch, K., &Kubinger, W.: Accurate hardware-based stereovision. Computer Vision and Image Understanding, 114(11), 1303-1316. (2010).
7. Wingrave, C. A., Williamson, B., Varcholik, P. D., Rose, J., Miller, A., Charbonneau, E., & LaViola Jr, J. J.: The wiimote and beyond: Spatially
129
convenient devices for 3d user interfaces. IEEE Computer Graphics and Applications, 30(2), 71--85. (2010).
8. Zhang, Z. (2012). : Microsoft kinect sensor and its effect. IEEE multimedia, 19(2), 4-10.
9. Potter,L.E., Araullo,J., & Carter,L. : The leap motion controller: a view on sign language. In Proceedings of the 25th Australian computer-human interaction conference: augmentation, application, innovation, collaboration ,pp.175--178.ACM.(2013, November).
10. Guna,J., Jakus,G., Pogačnik,M., Tomažič,S., & Sodnik,J. : Ananalysis of the precision and reliability of the leap motion sensor and its suitability for static and dynamic tracking. Sensors, 14(2), 3702-3720. (2014).
11. Bassily, D.,Georgoulas, C., Guettler,J., Linner,T., & Bock,T.: Intuitive and adaptive robotic arm manipulation using the leap motion controller. In ISR/Robotik 2014;41st International Symposium on Robotics; Proceedings of VDE, pp. 1—7 (2014, June).
130
1Bhanu Sharma*,2Amanpreet Kaur,3Amit Kumar,4Archana Mantri**
1,2,3ResearchScholar,4Professor
Department of Electronics and Communication Engineering, Chitkara University Institute of Engineering & Technology.
Chitkara University, Chandigarh, Punjab.
Gesture Recognition uses computer-based techniques to
recognize meaningful information of human movement and expressions. Gestures involve meaningful motions involving different parts of human body such as hands, fingers, head, arms and even facial expressions. Gesture recognition techniques can be useful in human – computer interaction, for interpreting movements and synchronizing them with computer processes. Gesture recognition applications have been widely used in various communication situations in almost every field including the research areas. In this paper, we discuss the various aspects of gesture recognition, their types and the tools developed to carry out different communicative requirements. Most of these applications are found useful in virtual reality.
Leap motion, Kinect, pen and data glove, gesture
recognition.
The role of Information and Communication Technologies (ICTs) has been world-wide recognized as highly influential in educational and social systems. It is clear thatno one in human society can live isolated: every human being need to interact with others as well as with one’s environment. Carrying out various societal functions entails every human being to interact with the surroundings that includes communication situations as well as tools. Computers, smart phones, etc. are some of the technological tools being utilized to perform different interactive tasks. Considering the ever-growing need for complex communication tasks, tradition ways and tools for interacting might become inefficient and outdated.So there is a need of using
131

emerging technology to facilitate challenging communication situations, such as virtual reality interactions. Nevertheless, traditional devices like keyboard, touch screen, joy stick and mouse supportive GUI are generally not suitable in virtual environments. As the main goal is to maintain powerful, natural, flexible and efficient interaction [1], specific systems should be used to sense body position, gaze direction, sound and speech, orientation, facial expression, other body movements and states and ultimately pave the path between human and virtual interaction [2].
A gesture can be seen as a compressed information that is transmitted through the environment in the form of a coded message, which is received and decoded by the recipient, follow the given set of instructions or training. Gesture recognition can be used to control virtual environments. It has number of applications like enabling young children to work together with computers, lie detection, video conferencing, learning through distance, navigation and manipulation in virtual environment, tele-teaching assistance, drowsiness level, automobiles monitoring, forensic identification, monitoring of stress and emotional levels of patients and sign language recognition, etc. [3].Gestures can be dynamic and static, and sometimesspecific of culture and language. Gestures types are arm and hand based, body gesture and hand and face (shaking of head, eye gaze direction, looks of fear, surprise, anger, and sadness). With the help of it (gesture recognition) the user communicates with the system [4]. Image processing and computer vision are techniques for achieving gesture recognition.
132

Users communicate with virtual environment in different ways. This task includes some specific parameters. These are controlling virtual entities, specific commands for particular task, navigation in space, varying the object values and manipulation of entities in the environment. Basically gestures depend on their environment, the path followed by them, the sign representing the coded message and conveyed emotions.
Gesture recognition is widely used in multidisciplinary research where the virtual environment like smart rooms [5], performance spaces [6] and virtual work [7] is controlled by gesture recognition tools. Table 1 shows the static and dynamic gesture recognition tools.
Table 1 Gesture Recognition Tools
(i)
We can recognize gestures by using mouse and pen, which are 2-D input devices. In 60’s light pen were used in sketchpad system for gesture input [8].This system was used for commercial purpose in the 70’s. Examples of pen based gesture recognition are for editing document [9][10], for controlling air traffic [11] and for editing splines. The OGI Quickset system [12] proposed multimodal gesture/voice input, using both pen-based gesture recognition
133

system and speech recognition. Gesture recognition interfaces werealso developed by Zeleznick[13 and Landay and Myers [14] using pen sketching.
(ii) Communication with virtual
environment can be achieved tracking devices. Sensor based devices are used for input to recognition for gestures. These devises are:
Hands are natural way of communication and manipulation. Hands are really demonstrative and effort less way of communication. Exoframe devices and instrumented gloves are mounted on fingers for gesture recognition. These devices are low in cost, makes direct measurement of joint angles, perform wrist rotation and translate data within range. Nevertheless, these devices have some disadvantages: they are difficult to calibrate, prone to noise and relatively in accurate in poor quality systems.
Complex identities, gestures and activities are achieved by placing dots on body. Tracking is facilitated by small dots or balls placed on user’s clothes. It is often used with Data Gloves. Instrumented Jacket for analyzing physiological conditions of user was developed by Picard and Marrin [15] to study the relation between musical expression and gestures. Eventually these body suits are expected to be replaced by sensor-based technologies, like embedded sensors in eyeglasses, shoes, shirts and pants.
Leap motion Controller is used for hand gesture interface. Posture and position of hands in 3D space in real world are manipulated by leap motion invirtual world. It is based on optical tracking system which works on stereo vision principle. It senses the hand movements in a limited range with the two IR cameras and three infra-red emitters [16]. It acquires data approximately at frequency range of 115 Hz within 24 cm2 surface area.
The Leap motion controller senses the gestures in limited range. The Kinect provides a wider range of possible gestures, since it can image the whole body.. Kinect uses 20 body joints coordinated to construct 3D skeletons with SDK (software development kit). The sampling rate is 30 frames per second. Kinect has various advantages as compare to leap motion. Both the Kinect and the Leap motion are versatile, cost-effective and have ability to be used continuously. Multiple source lighting and shadows effect is reduced by Kinect that affects the scenes captured by cameras. Depth sensors are present in Kinect.
134
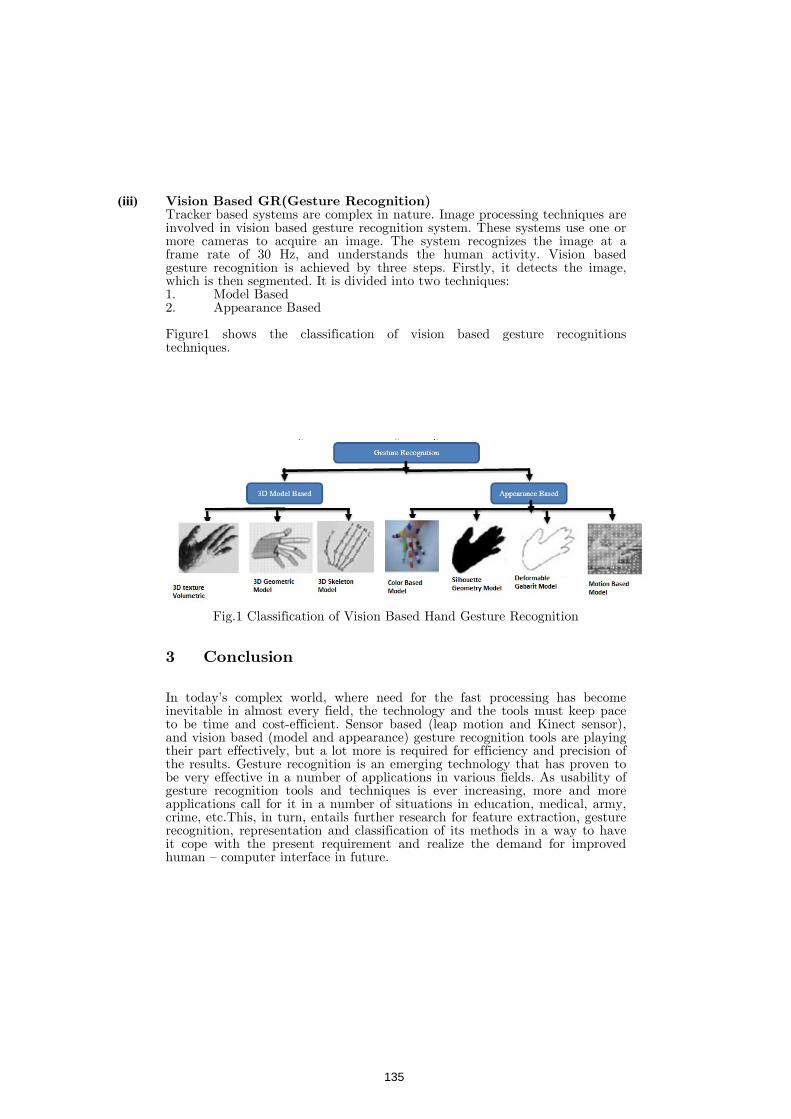
(iii) Tracker based systems are complex in nature. Image processing techniques are involved in vision based gesture recognition system. These systems use one or more cameras to acquire an image. The system recognizes the image at a frame rate of 30 Hz, and understands the human activity. Vision based gesture recognition is achieved by three steps. Firstly, it detects the image, which is then segmented. It is divided into two techniques: 1. Model Based 2. Appearance Based
Figure1 shows the classification of vision based gesture recognitions techniques.
Fig.1 Classification of Vision Based Hand Gesture Recognition
In today’s complex world, where need for the fast processing has become inevitable in almost every field, the technology and the tools must keep pace to be time and cost-efficient. Sensor based (leap motion and Kinect sensor), and vision based (model and appearance) gesture recognition tools are playing their part effectively, but a lot more is required for efficiency and precision of the results. Gesture recognition is an emerging technology that has proven to be very effective in a number of applications in various fields. As usability of gesture recognition tools and techniques is ever increasing, more and more applications call for it in a number of situations in education, medical, army, crime, etc.This, in turn, entails further research for feature extraction, gesture recognition, representation and classification of its methods in a way to have it cope with the present requirement and realize the demand for improved human – computer interface in future.
135

1 Turk, M. (2014). Gesture recognition. Computer Vision: A Reference Guide, 346-349.
2 Billinghurst, M. and Savage, J. (1996). Adding Intelligence to the Interface. In Proceedings of the IEEE 1996 Virtual Reality Annual International Symposium (pp. 168-176). Piscataway, NJ: IEEE Press.
3 Mitra, S., & Acharya, T. (2007). Gesture recognition: A survey. IEEE Transactions on Systems, Man, and Cybernetics, Part C (Applications and Reviews), 37(3), 311-324.
4 G. Baratoff and D. Searles, “Gesture Recognition,” http://www.hitl.washington.edu/scivw/EVE/I.D.2.b.GestureRecognition.html.
5 S. Shafer, J.Krumm, B. Brumitt, B.Meyers, M. Czerwinski, and D.Robbins”The New Easy Living Project at Microsoft research,” Proc. Joint DARPA/NIST smart Spaces Workshop, Gaithersburg, Maryland ,July 30-31,1998
6 Fels, S., Nishimoto, K., and Mase, K., MusiKalscope: A Graphical Musical Instrument, IEEE Multimedia Magazine, Vol.5, No.3, Jul/Sep, pp. 26-35,1998
7 W. Kruger, C.A. Bohn, B. Frohlich, H. Schuth, W. Strauss, and G. Wesche, “The responsive workbench: A virtual work environment,” IEEE Computer, 28(7), 1995.
8 Johnson, T.” Sketchpad III: Three Dimensional Graphical Communication with a Digital Computer,” in AFIPS Spring Joint Computer Conference.1963.23.pp.347-353.
9 G. Kurtenbach, and W. Buxton,(1991).GEdit: a testbed for editing by contiguous gesture. SIGCHI Bulletin 23(2), 22-26.
10 D. Rubine, (1991) The Automatic Recognition of Gestures .Ph.D. Dissertation, Carnegie-Mellon University.
11 C.P. Mertz and P. Lecoanet, “GRIGRI: gesture recognition on interactive graphical radar image,” in P. Harling and A. Edwards (eds.), Progress in Gesture Interaction: Proceedings of Gesture Workshop 96, Springer- Verlag, 1997.
12 Cohen, P.R. , Johnson, M., McGee. D., Oviatt, S., Pittman, J., Smith, I., Chen, L., and Clow, J.(1997). Quickset : Multimodal interaction for distributed applications, Proceedings of the Fifth Annual International Multimodal Conference(Multimedia’97), (Seattle,WA,Nov1997), ACM Press ,pp. 31-40
13 Zeleznik, R.C., Herndon, K.P., and Hughes J.F. Sketch: An Interface for
136

sketching 3D scenes. Computer Graphics(Proceedings of SIGGRAPH’96) 14 J.A. Landay and B.A. Myers. Interactive sketching for the early stages of user
interface design. Proceedings of CHI’95, Pages 43-50, 1995. 15 T. Marrin and R. Picard. “The Conductor’s Jacket: a Testbed for Research on
Gestural and Affective Expression.” Presented at the XII Colloquium for Musical Informatics, in Gorizia. Italy, September 1998.
16 Weichert, F., Bachmann, D., Rudak, B., Fisseler, D., Analysis of the accuracy and robustness of the leap motion controller, sensors,13(5) (2013) 6380-6393
137
Workshop 6
Considerable attention has been paid for years to the relationships between humans and computers. But, over the years, the computer chip migrated from the computer internal organs to many other devices - to things, wearables, and even onto the skin (skinnables) and into the human body (implantables). This workshop will focus on how this revolution may affect the way we look at the relationships between humans and among humans, human elements and computing devices and what should be done to improve these interactions and “entanglements” and to understand them better.
This workshop, provides a platform for discussions about the relationships among humans, technology embedded in the environment (networked or not), and humans whose physical, physiological or/and mental capabilities are extended and/or modified by technology. Given these extended realities, the interface, as it has been known, and even the practical meaning of the word “interaction” have changed. This workshop is intended to provide a platform for scholars, practitioners, and students to think together about how to frame the new interaction, engagement, and relationship between technology, humans, “modified” humans and the new reality.
138
!
Danzhu Li1 and Gerrit C. van der Veer2
1 University Twente, Enschede, the Netherlands 2 LuXun Academy of Fine Arts, Liaoning, 69121 China
This paper focuses on the application of interactive
technology in contemporary visual art, showing that current development has traces in history. We sketch an evolution, from the creation of primitive visual art to interaction design and wearable art. We will discuss how the artist communicates through his creation with the intended audience, and how new technology enables the art work to interact autonomously.
Interaction Design, Wearables, Stakeholders, Visual Art,
Co-creation of Artistic Experiences.
Goal of our research is to attract attention from different stakeholders in visual arts, so that they discover their changing roles and appreciate the potential for unknown mutual collaboration and cooperation. In this way, we may achieve an ecological art environment that supports survival, co-creation, and development. The current paper focuses on the application of interactive technology in contemporary visual art, showing that current development has traces in history. We sketch an evolution, from the creation of primitive visual art to interaction design and wearable art. In section 2, we will show how visual art has always resulted in an artifact (a “thing”) to communicate and to trigger understanding, experiences and behavior in an audience. In section 3, we will discover how in the new world this “thing” can be created to interact: Visual art is getting a true life of its own.
139
!
Inter Interactive technology is developing rapidly. The Internet of things promotes interaction design for diverse audiences and many platforms, more practical, more interesting and more approachable than ever before. As Weiser points: “
” [1].
Early visual art works were intended to present images (drawings, sculptures) of important entities: gods, people, hunting. Such is prehistoric art: It is a mixed state of aesthetic and non-aesthetic factors;it does not only serve practical purposes but also shows aesthetic consciousness. Prehistoric art with its simple form and immature techniques attracts modern audiences and artists, partly because the content does not show too many ideas and values, which is also the goal of some streams in modern art [2].
Prehistoric cave- or rock paintings represent the earliest forms of painting that survived, traced back to 40 thousand years ago. We experience a hint of the spiritual life of our ancestors, and we may imagine the intended audience (members of the same tribe, gods), who were supposed to (actively) interpret and understand the message as depicted. Figure 1 shows how the artist triggers his audience to see a depicted hand, where “she” (According to archaeologists, these are feminine handprints.) in fact, paints the space around the (invisible) hand – the audience will “fill in” the invisible. The dear in Figure 2 may well represent something related to hunt, and tribal relatives of the artist will have known much more about the values, activities, and emotions related to the scene than modern viewers will ever be able to understand.
140
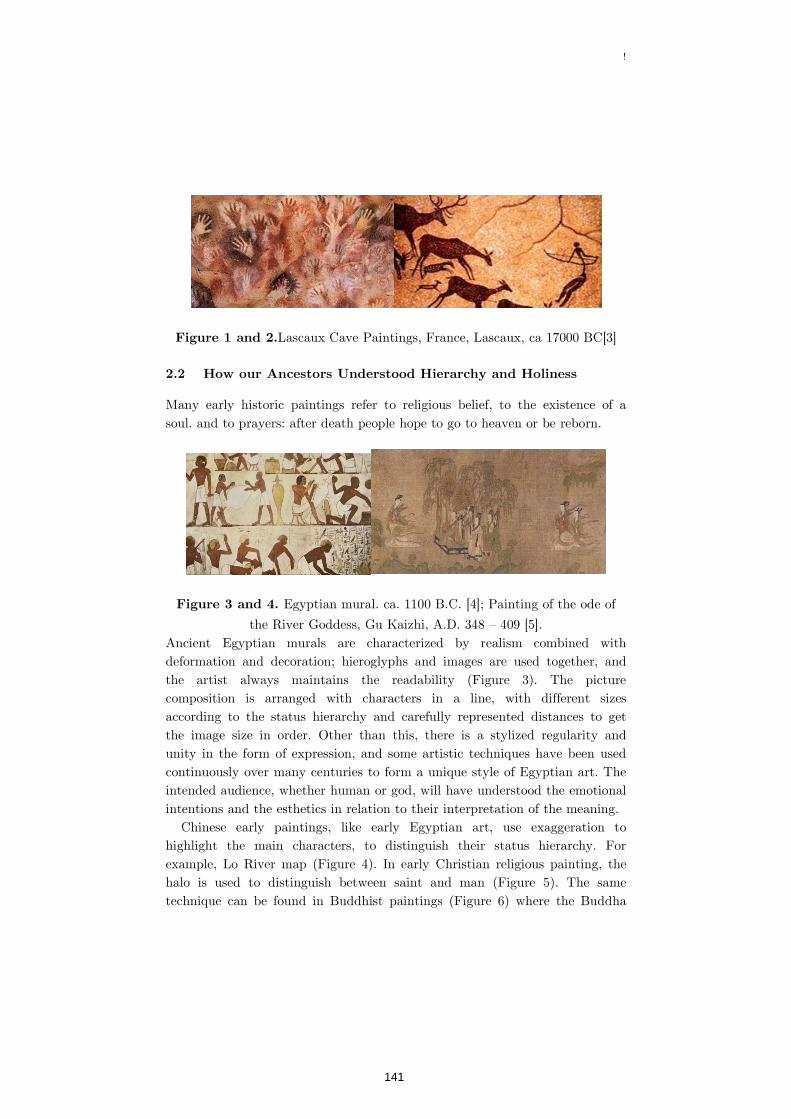
!
Lascaux Cave Paintings, France, Lascaux, ca 17000 BC[3]
Many early historic paintings refer to religious belief, to the existence of a soul. and to prayers: after death people hope to go to heaven or be reborn.
Egyptian mural. ca. 1100 B.C. [4]; Painting of the ode of
the River Goddess, Gu Kaizhi, A.D. 348 – 409 [5]. Ancient Egyptian murals are characterized by realism combined with deformation and decoration; hieroglyphs and images are used together, and the artist always maintains the readability (Figure 3). The picture composition is arranged with characters in a line, with different sizes according to the status hierarchy and carefully represented distances to get the image size in order. Other than this, there is a stylized regularity and unity in the form of expression, and some artistic techniques have been used continuously over many centuries to form a unique style of Egyptian art. The intended audience, whether human or god, will have understood the emotional intentions and the esthetics in relation to their interpretation of the meaning.
Chinese early paintings, like early Egyptian art, use exaggeration to highlight the main characters, to distinguish their status hierarchy. For example, Lo River map (Figure 4). In early Christian religious painting, the halo is used to distinguish between saint and man (Figure 5). The same technique can be found in Buddhist paintings (Figure 6) where the Buddha
141

!
has a head halo and a back halo, which represents the highest level of this god. Some gods only feature a head light, indicating the difference in rank. This style shows many expressive techniques in painting and sculpture, representing the meaning as well as the specific style and workmanship, which is related to a specific period. These characteristics often are used as the basis for dating.
Halos ofChristion gods (Giotto di Bondone: Ognissanti
Madonna. Italy. c. 1310) and Buddhist gods (Dunhuang Mural. China. ca. 538 AD). [6][7]
In a next stage of civilizations, series of images were used to represent spoken language, where the individual imagines were supposed to be named and the string of names was supposed to (actively) be interpreted by the audience as a spoken sentence. E.g., Mayan texts (Figure 7), Egyptian hieroglyphics (see right bottom corner of Figure 3), and Sumerian cuneiform script. In each case, this type of script was used extensively for several centuries.
Mayan text, Around the Christian era. [8] and Examples of
transformation of Chinese characters “Horse” over time [9] However, in due time, the images lost pictorial details and developed into new type of “abstract” art styles, like Chinese calligraphy. Chinese characters are the only words in the oldest text that are still in use today. Figure 8 provides an impression of the development over time. Chinese calligraphy has independent aesthetic value, so it can be appreciated as a visual art. It is a technique which people learn by copying and creating their own style. The
142
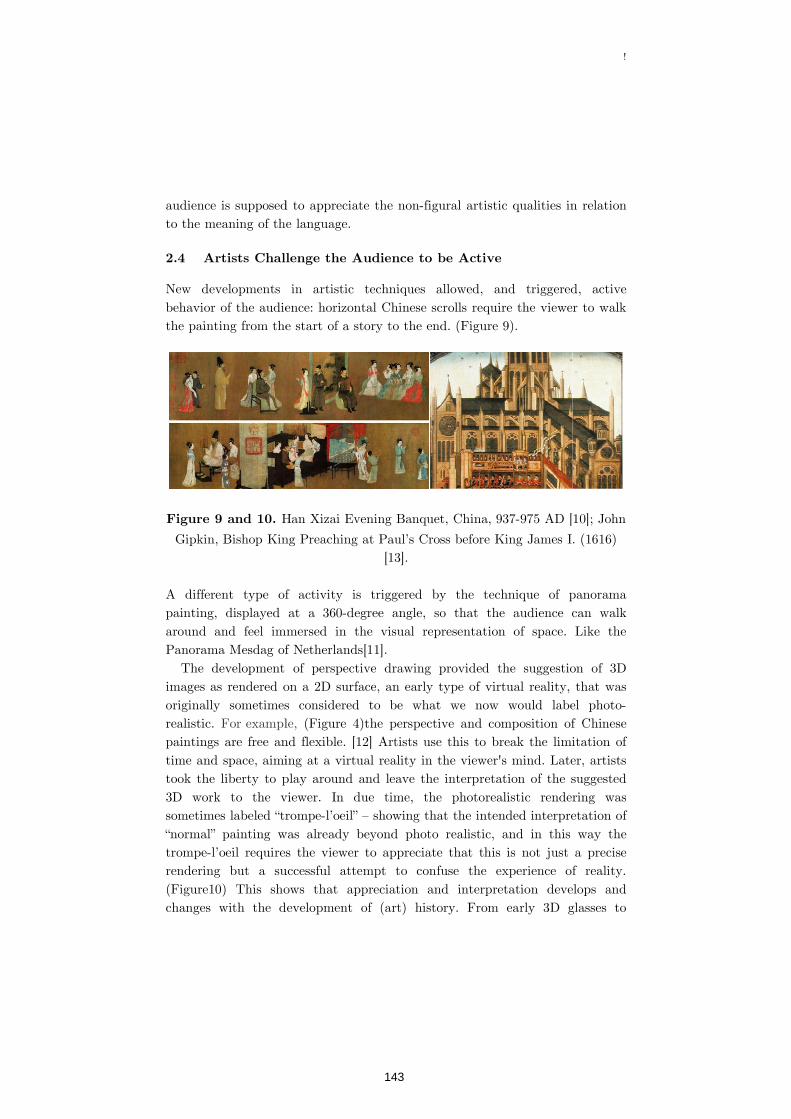
audience is supposed to appreciate the nonto the meaning of the langu
New developments in artistic techniques allowed, and triggered, active behavior of the audience: horizontal Chinese scrolls require the viewer to walk the painting from the start of a story to the end. (Fi
Han Xizai Evening Banquet
Gipkin, Bishop King Preaching at Paul’s Cross before King James I. (1616)
A different type of activity is triggered by the technique of panorama painting, displayed at a 360around and feel immersed in the visual representation of space. Like the Panorama Mesdag of Netherlands
The development of perspective drawing provided the suggestion of 3D images as rendered onoriginally sometimes considered to be what we now would label photorealistic. For example,paintings are free and flexible. [12] Artists use thitime and space, aiming at a virtual reality in the viewer's mind. Later, artists took the liberty to play around and leave the interpretation of the suggested 3D work to the viewer. In due time, the photorealistic rendering wassometimes labeled “trompe“normal” painting wtrompe-l’oeil requires the viewer to appreciate that this is not just a precise rendering but a succe(Figure10) This shows that appreciation and interpretation develops and changes with the development of (art) history. From early 3D glasses to
audience is supposed to appreciate the non-figural artistic qualities in relation to the meaning of the language.
New developments in artistic techniques allowed, and triggered, active behavior of the audience: horizontal Chinese scrolls require the viewer to walk the painting from the start of a story to the end. (Figure 9).
Han Xizai Evening Banquet, China, 937-975 AD [10];
Gipkin, Bishop King Preaching at Paul’s Cross before King James I. (1616) [13].
A different type of activity is triggered by the technique of panorama yed at a 360-degree angle, so that the audience can walk
around and feel immersed in the visual representation of space. Like the Panorama Mesdag of Netherlands[11].
The development of perspective drawing provided the suggestion of 3D images as rendered on a 2D surface, an early type of virtual reality, that was originally sometimes considered to be what we now would label photo
example, (Figure 4)the perspective and composition of Chinese paintings are free and flexible. [12] Artists use this to break the limitation of time and space, aiming at a virtual reality in the viewer's mind. Later, artists took the liberty to play around and leave the interpretation of the suggested 3D work to the viewer. In due time, the photorealistic rendering wassometimes labeled “trompe-l’oeil” – showing that the intended interpretation of “normal” painting was already beyond photo realistic, and in this way the
l’oeil requires the viewer to appreciate that this is not just a precise rendering but a successful attempt to confuse the experience of reality. (Figure10) This shows that appreciation and interpretation develops and changes with the development of (art) history. From early 3D glasses to
!
figural artistic qualities in relation
New developments in artistic techniques allowed, and triggered, active behavior of the audience: horizontal Chinese scrolls require the viewer to walk
975 AD [10]; John
Gipkin, Bishop King Preaching at Paul’s Cross before King James I. (1616)
A different type of activity is triggered by the technique of panorama degree angle, so that the audience can walk
around and feel immersed in the visual representation of space. Like the
The development of perspective drawing provided the suggestion of 3D a 2D surface, an early type of virtual reality, that was
originally sometimes considered to be what we now would label photo-(Figure 4)the perspective and composition of Chinese
s to break the limitation of time and space, aiming at a virtual reality in the viewer's mind. Later, artists took the liberty to play around and leave the interpretation of the suggested 3D work to the viewer. In due time, the photorealistic rendering was
showing that the intended interpretation of tic, and in this way the
l’oeil requires the viewer to appreciate that this is not just a precise ssful attempt to confuse the experience of reality.
(Figure10) This shows that appreciation and interpretation develops and changes with the development of (art) history. From early 3D glasses to
143

!
virtual reality, augmented reality, and so on, the audience of visual art changes in understanding, experience, and active participation.
In addition to the evolution of painting style and techniques, there is the development of color, material and composition. Developments are the result of artists applying new techniques, and of artists triggering their audience to give meaning and be active viewers to appreciate new types of experiences.
Today, people can interact, talk, and touch art works in real space or by wearing equipment. Information and communication technology allows visual artists to develop active pieces of art. The art work can, in principle, be provided with sensors to be aware of the presence, the movements, the facial emotion features, and even the identity of individuals or groups of spectators. The art work could be programmed to react to spectator behavior or to trigger spectator behavior.
From our analysis of museums,
galleries, and international conferences we detect an amazing jump in the impact of technology on art. We will discuss some examples from the art exhibition at CHI 2016, San Jose: 'Breaking Andy Wall' (Figure11) is an interactive installation. When participants smash the canvas with the hammer, they can gradually break down the art piece. Through the playful destruction and reconfiguration of iconic art pieces, this installation reconfigures relations between art objects and their audiences [14].
. Breaking Andy Wall, Interactive Art, Leo Kang
144
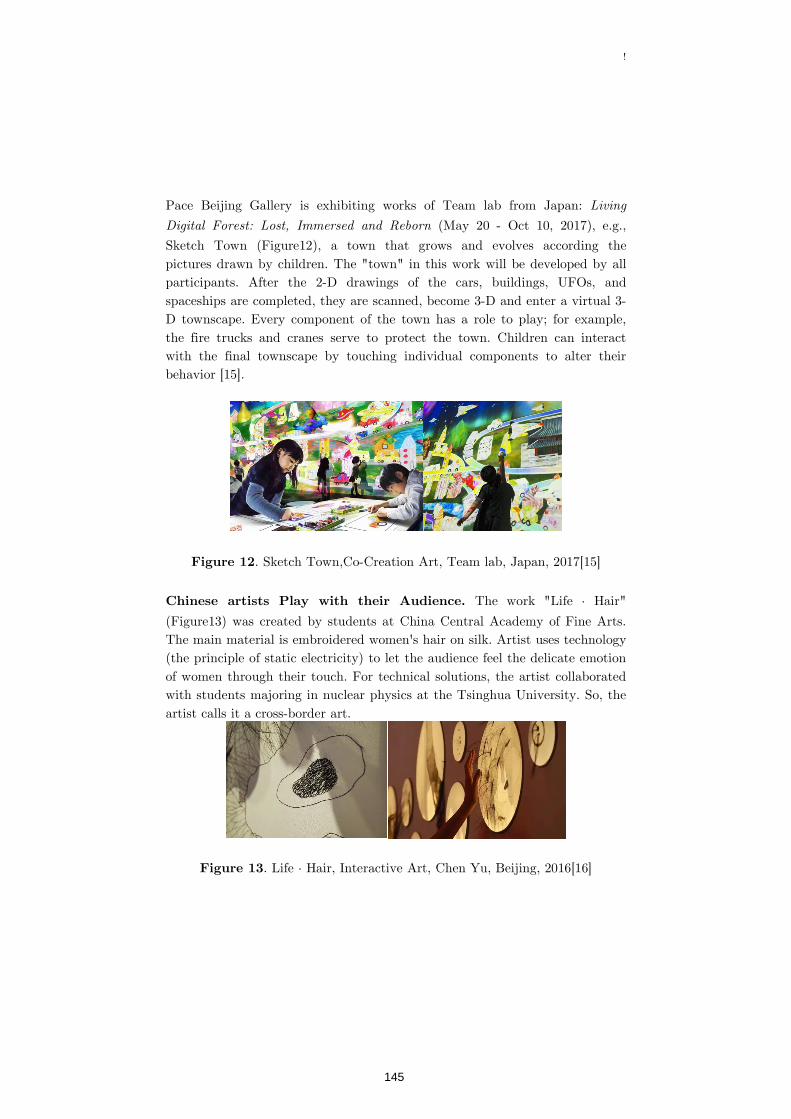
!
Pace Beijing Gallery is exhibiting works of Team lab from Japan:
(May 20 - Oct 10, 2017), e.g.,
Sketch Town (Figure12), a town that grows and evolves according the pictures drawn by children. The "town" in this work will be developed by all participants. After the 2-D drawings of the cars, buildings, UFOs, and spaceships are completed, they are scanned, become 3-D and enter a virtual 3-D townscape. Every component of the town has a role to play; for example, the fire trucks and cranes serve to protect the town. Children can interact with the final townscape by touching individual components to alter their behavior [15].
. Sketch Town,Co-Creation Art, Team lab, Japan, 2017[15]
The work "Life · Hair"
(Figure13) was created by students at China Central Academy of Fine Arts. The main material is embroidered women's hair on silk. Artist uses technology (the principle of static electricity) to let the audience feel the delicate emotion of women through their touch. For technical solutions, the artist collaborated with students majoring in nuclear physics at the Tsinghua University. So, the artist calls it a cross-border art.
. Life · Hair, Interactive Art, Chen Yu, Beijing, 2016[16]
145
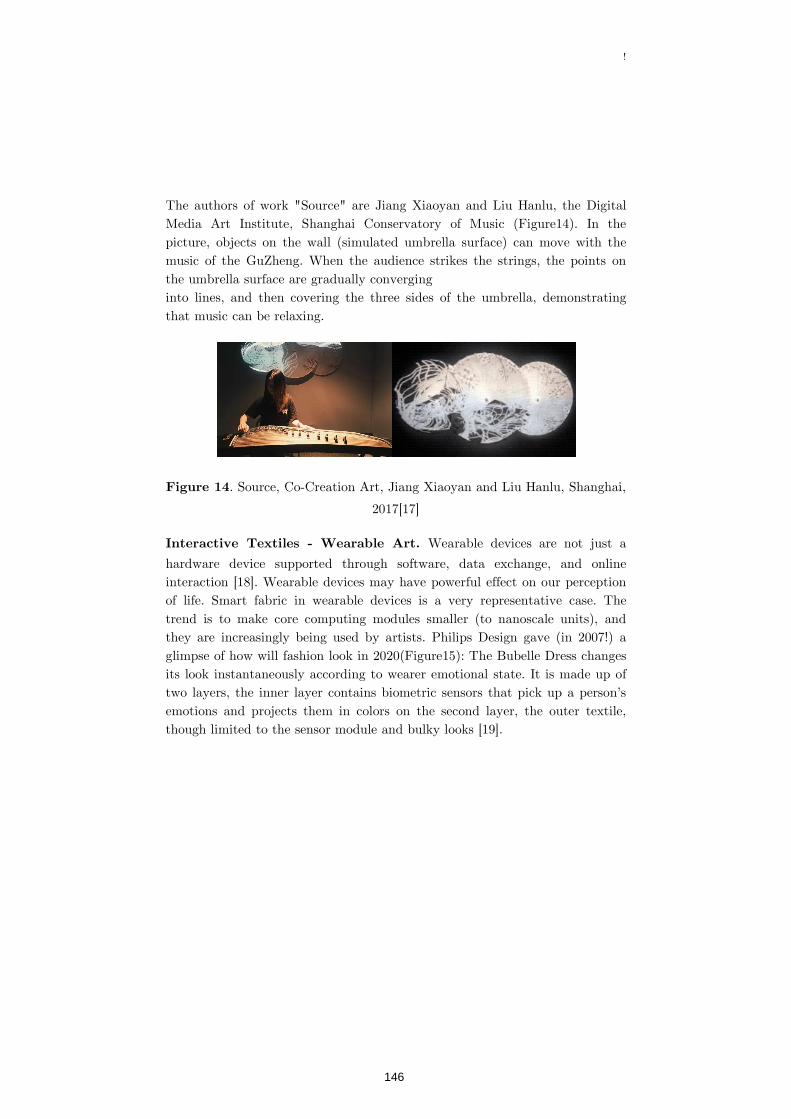
!
The authors of work "Source" are Jiang Xiaoyan and Liu Hanlu, the Digital Media Art Institute, Shanghai Conservatory of Music (Figure14). In the picture, objects on the wall (simulated umbrella surface) can move with the music of the GuZheng. When the audience strikes the strings, the points on the umbrella surface are gradually converging into lines, and then covering the three sides of the umbrella, demonstrating that music can be relaxing.
. Source, Co-Creation Art, Jiang Xiaoyan and Liu Hanlu, Shanghai,
2017[17]
Wearable devices are not just a
hardware device supported through software, data exchange, and online interaction [18]. Wearable devices may have powerful effect on our perception of life. Smart fabric in wearable devices is a very representative case. The trend is to make core computing modules smaller (to nanoscale units), and they are increasingly being used by artists. Philips Design gave (in 2007!) a glimpse of how will fashion look in 2020(Figure15): The Bubelle Dress changes its look instantaneously according to wearer emotional state. It is made up of two layers, the inner layer contains biometric sensors that pick up a person’s emotions and projects them in colors on the second layer, the outer textile, though limited to the sensor module and bulky looks [19].
146

!
. Bubelle Emotion Sensing Dress. Design group at Royal
Philips Electronics. Netherlands. 2007 [19]; Fabric Strain Sensor, AdvanPro. Hong Kong [20]
In fact, both artists and scientists are aiming at a substance between visible and invisible. Sensors are become smaller, and smart fabric applications become more flexible and comfortable. The SOFTCEPTOR technology of fabric sensors is currently the world's softest smart sensor being developed by the Hong Kong Polytech University team. It’s a piece of washable fabric as well as a strain gauge (Figure16) [20]. In contact with human skin it senses physiological information and activity signals. Artists can develop more creative channels allowing the audience and different stakeholders to work together to co-creative [21].
We followed examples of historical steps in visual art to interaction design. From ancient times to the present, technology and science have played a fundamental role, and people's understanding and application has been closely followed.
Artists and their works will be more diverse and the number of participants will increase. Stakeholders of current and future visual art should understand their new roles. Technology is still an alien domain for most artists. They should develop insight and learning ability for new techniques and paradigms, and consider blended creative patterns. It also requires stakeholders to study and develop components that are smaller, flexible and easy to use, so that more people will accept them. Universities should understand the importance of interdisciplinary collaboration. Galleries should be tolerant and encourage
147
!
artists to innovate and experiment. Audiences should improve their understanding of contemporary art and become happy to co-create.
We thank Ernest Edmonds for his presentation on CHI 2017 that gave us inspiration to study the relation between art and technology, and we thank Elly Lammers who gave us advice and support.
1. Simon Carlile: Ubiquitous Computing a.k.a. "The Internet of Things” (2016) http://www.starkey.com/blog/2016/01/Ubiquitous-Computing
2. 2. Jean Clottes: What Is Paleolithic Art? University of Chicago Press. Chicago (2016)
3. Lascaux Cave Paintings. France. http://art.china.com/news/yjjj/11159337/20160418/22457325_all.html
4. Egyptian mural. ca. 1100 B.C. http://tupian.baike.com/14315/11.html?prd=zutu_next
5. Gu Kaizhi: Painting of the ode of the River Goddess. A.D. 348 – 409 http://blog.sina.com.cn/s/blog_6b1108160102y3xy.html
6. Giotto di Bondone: Ognissanti Madonna. Italy. c. 1310. http://www.youhuaaa.com/page/painting/show.php?id=46909
7. Dunhuang Mural. China. ca. 538 AD. http://baike.sogou.com/h192919.htm?sp=Snext&sp=l53037306
8. Mayan text, Around the Christian era. http://www.360doc.com/content/15/0413/07/21704376_462795051.shtml
9. Examples of transformation of Chinese characters “Horse” over time http://www.ahshuhua.net/wenhuachuanbo/2014shang/whcb20140131madeyingbian.html
10. Han Xizai Evening Banquet, China, 937-975 AD.https://fejune.tuchong.com/albums/0/19280734
11. Panorama Mesdag. http://www.panorama-mesdag.nl/bezoek/ 12. ChenYudong: Art of Chinese painting. Shanxi Education Press. Shanghai
(2009) 13. John Gipkin: Bishop King Preaching at Paul’s Cross before King James I.
1616. journalofdigitalhumanities.org/3-1/transforming-the-object-of-our-study-by- john-n-wall/
148
!
14. Leo Kang Transgressive and Playful Exploration on the Dynamic Role of
Users in Art and Design (2015) http://www.laewoo.com/breaking_andywall/index.html
15. Team lab: Sketch Town.Pace Beijing (2017)http://art.team-lab.cn/w/sketchtown/
16. Chen Yu:Life · Hair. Beijing (2016) http://wx.paigu.com/a/774622/50374629.html
17. Jiang Xiaoyan, Liu Hanlu. Source, Shanghai (2017)http://www.sohu.com/a/152503391_309195
18. Ramyah Gowrishankar, Katharina Bredies and Salu Ylirisku: A Strategy for Material-Specific e-Textile Interaction Design. In Smart Textiles. Springer, HCIS. pp. 233-257 (2017)
19. John Weir: Bubelle Emotion Sensing Dress (2007) http://crunchwear.com/bubelle-emotion-sensing-dress/comment-page-1/
20. AdvanPro: Fabric Strain Sensor, Hong Kong. http://advanpro.hk/?p=25&tab=0
21. Linda Candy, Ernest Edmonds: Explorations in art and technology. Springer, London (2002)
149
!
Jean-Claude MARTIN, Virginie DEMULIER, Tong XUE
LIMSI-CNRS, Université Paris-Sud, Orsay, France
A growing body of evidence from Psychology and Sport
Sciences shows that physical activity can be a cost-effective and safe intervention for the prevention and treatment of a wide range of mental and physical health problems. Research in domains such as the Internet of Things (IoT), wearables and persuasive technologies suggest that a coach intended to promote physical activities needs to provide personalized interaction. In this paper we introduce the WE-nner (pronounce “winner”) framework for designing an automated coach promoting physical activity which supports interactions between the user and a smart wearable that are: 1) personalized to the user, 2) dynamic (e.g. occurring during a physical activity), and 3) multimodal (e.g. combine graphics, text, audio and touch). We explain how we implemented this framework on a commercial smartwatch and provide illustrative examples on how it provides dynamic personalized and multimodal interactions considering features from user’s profile. Future directions are discussed in terms of how this framework can be used and adapted to consider theories and models from Psychology and Sport Sciences.
Wearables, Embedded Computing, Physical Activity,
Personalization, Multimodal Interaction, Sport Coach.
Researchers are designing for health [6, 7] and
sport experts or beginners [10]. A growing body of evidence from Psychology and Sport Sciences shows that physical activity can be a cost-effective and safe intervention for the prevention and treatment of a wide range of mental
150
!
and physical health problems [1]. Yet, the design of virtual health agents faces multiple challenges such as [9]: (1) interpreting the situation and people’s intentions, (2) intervention reasoning, (3) generating informative, educative, persuasive computer behavior, and (4) engineering generic solutions. Research in domains such as the Internet of Things (IoT), wearables and persuasive technologies [2] does suggest that a coach intended to promote physical activities needs to provide [8, 17],
and bring into play persuasive strategies that depend on gender and personality [3], and stage of behavior change [4]. The use of persuasive technologies and virtual coaches for promoting physical activity might help stress management [5], but adhesion might also depend on aspects of the self [15, 16].
Although lots of people still use a phone for collecting data during a physical activity, display several advantages over mobile phones:
they are closer to the body, safer to use than the mobile phone when moving, and they are designed to have a longer battery life. Using smartwatches to support affective interaction nevertheless rises challenges in terms of human-computer interaction. Multiple commercial wearables for sport activities are available. We claim that in order to become smart, an automated coach requires to provide via a smartwatch: 1) interactions that are personalized to the user, 2) dynamic support occurring not only before and after a physical activity but also during a physical activity, and 3) multimodal interactions (including subtle and complementary use of embedded graphics, audio and touch).
In this paper, we introduce WE-nner, a framework for the design of a coach supporting personalized interaction for physical activities. We illustrate how we implemented this coach using a commercial platform for embedded programming. We discuss how this framework impacts the relation between users and computing devices (smartwatch, mobile phone, web site) and may improve the relationships between users and computing devices.
Brinkman [9] proposes a research framework for behavior change support systems that brings into play situation interpretation, intervention reasoning (using personal and population data ; possibly calling for remote assistance from human health professionals), and the generation of informative, educative and persuasive behaviors. In our framework we focus on this last
151
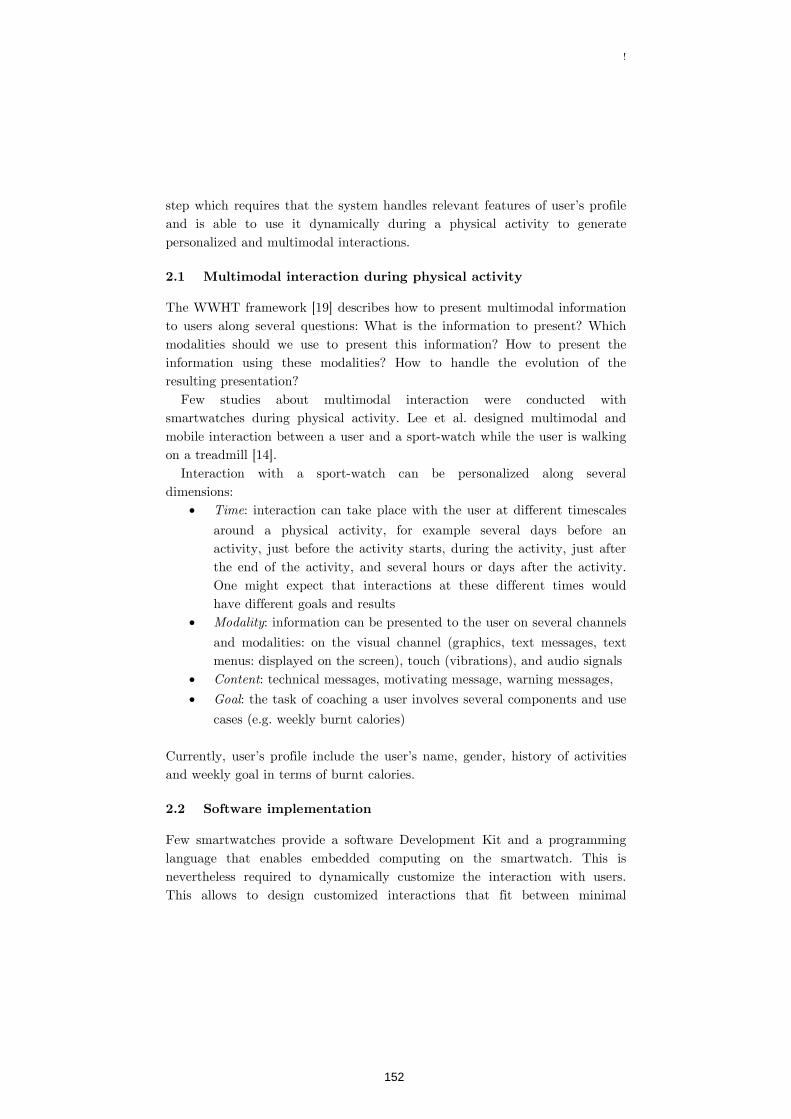
!
step which requires that the system handles relevant features of user’s profile and is able to use it dynamically during a physical activity to generate personalized and multimodal interactions.
The WWHT framework [19] describes how to present multimodal information to users along several questions: What is the information to present? Which modalities should we use to present this information? How to present the information using these modalities? How to handle the evolution of the resulting presentation?
Few studies about multimodal interaction were conducted with smartwatches during physical activity. Lee et al. designed multimodal and mobile interaction between a user and a sport-watch while the user is walking on a treadmill [14].
Interaction with a sport-watch can be personalized along several dimensions:
: interaction can take place with the user at different timescales
around a physical activity, for example several days before an activity, just before the activity starts, during the activity, just after the end of the activity, and several hours or days after the activity. One might expect that interactions at these different times would have different goals and results
: information can be presented to the user on several channels
and modalities: on the visual channel (graphics, text messages, text menus: displayed on the screen), touch (vibrations), and audio signals
: technical messages, motivating message, warning messages,
: the task of coaching a user involves several components and use
cases (e.g. weekly burnt calories) Currently, user’s profile include the user’s name, gender, history of activities and weekly goal in terms of burnt calories.
Few smartwatches provide a software Development Kit and a programming language that enables embedded computing on the smartwatch. This is nevertheless required to dynamically customize the interaction with users. This allows to design customized interactions that fit between minimal
152

!
interactions available on other commercial wearables and full symbiosis that are investigated in research.
We implemented the WE-nner framework using the GARMIN Connect IQ environment and its MonkeyC object oriented programming language. GARMIN is one of the few smartwatch manufacturer that provides a Software Development Kit that enables to develop a program on a PC and to upload and embed the software on the watch itself. GARMIN offers a dedicated programming environment called Connect IQ8 which enables to program and upload several kinds of applications on a smartwatch (face, widget, data field and apps). Different types of applications have different degrees of access to the sensors and actuators of the watch and allow for different types of interactive capabilities. GARMIN wearables support four types of interactions components:
provide personalized “passive” displays of the main
screen. Users are able to choose and download the watch face they prefer and add any information they like.
provide at-a-glance information to the user that meets the
individual customization. They are usually small practical tools like a compass or a weather report and are limited in terms of interaction capabilities.
are fields displaying data which is computed or
available at runtime (e.g. speed, time). The expert user can select the fields that she wants to be displayed and their order of presentation. DataFiels do not support any interaction.
are the most interactive components that can be uploaded on
the watch. They can contain menus, data, textual and graphical messages that can be selected and combined at runtime. An app is explicitly started from the main menu of the watch.
Interaction with a GARMIN watch can be quite tricky for the ordinary
user. Furthermore, even apps available on the GARMIN store do not provide flexible and personalized multimodal interactions.
We implemented our WE-nner framework as a Connect IQ App in order to benefit from the maximum access to sensors and actuators. Fig. 1 illustrates how the WE-nner software uploaded on the GARMIN Fenix 5 smartwatch provides interaction that is personalized at runtime before an activity starts. The smartwatch collects information from an .xml file detailing user’s profile
153
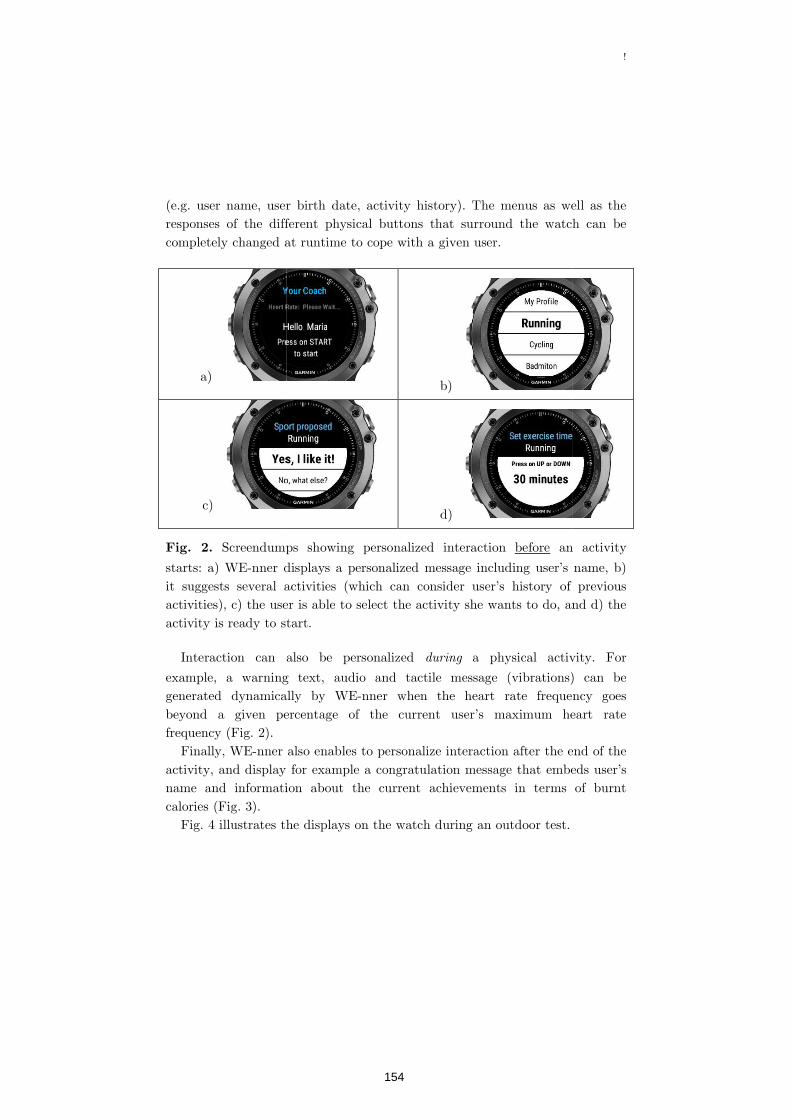
(e.g. user name, user birth date, activity history). The menus as well as the responses of the different physical buttons that surround the watch can be completely changed at runtime to cope with a given user.
a)
c)
Screendumps showing personalized interaction
starts: a) WE-nner displays a personalized message including user’s name, b) it suggests several activities (which can consider user’s history of previouactivities), c) the user is able to select the activity she wants to do, and d) the activity is ready to start.
Interaction can also be personalized
example, a warning text, audio and tactile message (vibrations) can be generated dynamically by WEbeyond a given percentage of the current user’s maximum heart rate frequency (Fig. 2).
Finally, WE-nner also enables to personalize interaction after the end of the activity, and display foname and information about the current achievements in terms of burnt calories (Fig. 3).
Fig. 4 illustrates the displays on the watch during an outdoor test.
(e.g. user name, user birth date, activity history). The menus as well as the responses of the different physical buttons that surround the watch can be completely changed at runtime to cope with a given user.
b)
d)
Screendumps showing personalized interaction before an activity
nner displays a personalized message including user’s name, b) it suggests several activities (which can consider user’s history of previouactivities), c) the user is able to select the activity she wants to do, and d) the activity is ready to start.
Interaction can also be personalized a physical activity. For
example, a warning text, audio and tactile message (vibrations) can be nerated dynamically by WE-nner when the heart rate frequency goes
beyond a given percentage of the current user’s maximum heart rate
nner also enables to personalize interaction after the end of the activity, and display for example a congratulation message that embeds user’s name and information about the current achievements in terms of burnt
Fig. 4 illustrates the displays on the watch during an outdoor test.
!
(e.g. user name, user birth date, activity history). The menus as well as the responses of the different physical buttons that surround the watch can be
an activity
nner displays a personalized message including user’s name, b) it suggests several activities (which can consider user’s history of previous activities), c) the user is able to select the activity she wants to do, and d) the
a physical activity. For
example, a warning text, audio and tactile message (vibrations) can be nner when the heart rate frequency goes
beyond a given percentage of the current user’s maximum heart rate
nner also enables to personalize interaction after the end of the r example a congratulation message that embeds user’s
name and information about the current achievements in terms of burnt
Fig. 4 illustrates the displays on the watch during an outdoor test.
154
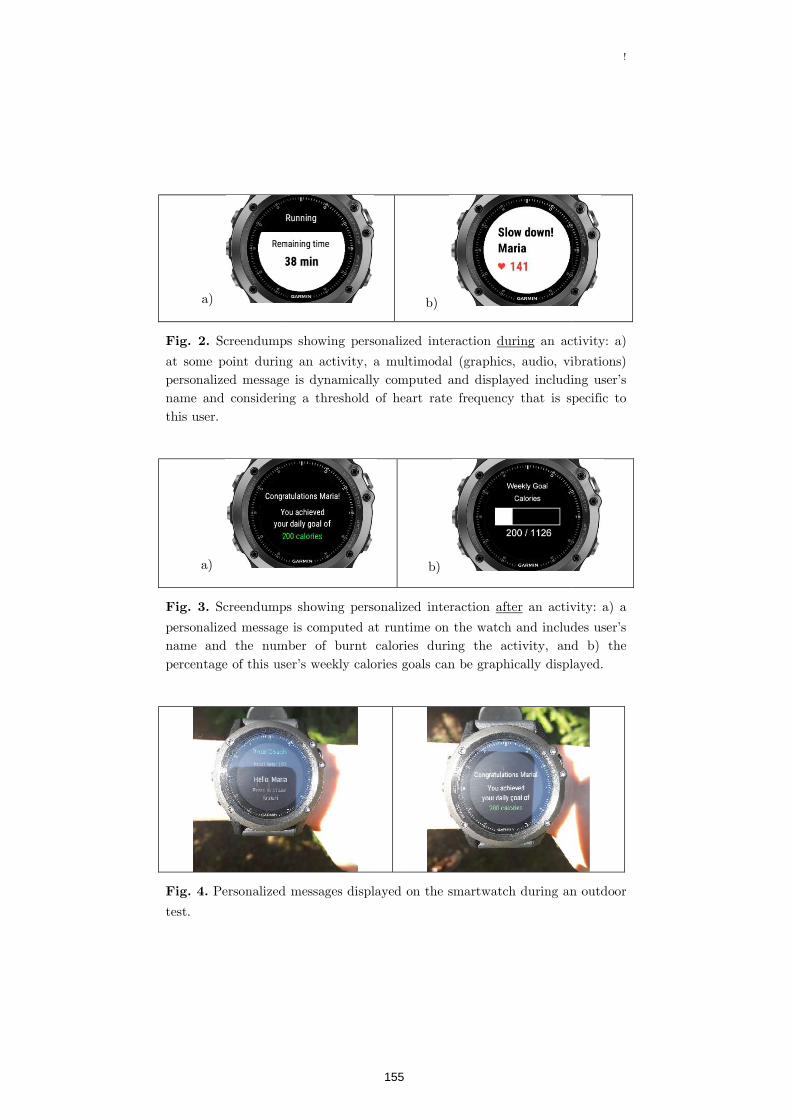
a)
Screendumps showing persona
at some point during an activity, a multimodal (graphics, audio, vibrations) personalized message is dynamically computed and displayed including user’s name and considering a threshold of heart rate frequency that this user.
a)
Screendumps showing personalized interaction
personalized message is computed at runtime on the watch and includes user’s name and the number of burnt calories during the activity, and b) thepercentage of this user’s weekly calories goals can be graphically displayed.
Personalized messages displayed on the smartwatch during an outdoor
test.
b)
Screendumps showing personalized interaction during an activity: a)
at some point during an activity, a multimodal (graphics, audio, vibrations) personalized message is dynamically computed and displayed including user’s name and considering a threshold of heart rate frequency that is specific to
b)
Screendumps showing personalized interaction after an activity: a) a
personalized message is computed at runtime on the watch and includes user’s name and the number of burnt calories during the activity, and b) thepercentage of this user’s weekly calories goals can be graphically displayed.
Personalized messages displayed on the smartwatch during an outdoor
!
an activity: a)
at some point during an activity, a multimodal (graphics, audio, vibrations) personalized message is dynamically computed and displayed including user’s
is specific to
an activity: a) a
personalized message is computed at runtime on the watch and includes user’s name and the number of burnt calories during the activity, and b) the percentage of this user’s weekly calories goals can be graphically displayed.
Personalized messages displayed on the smartwatch during an outdoor
155
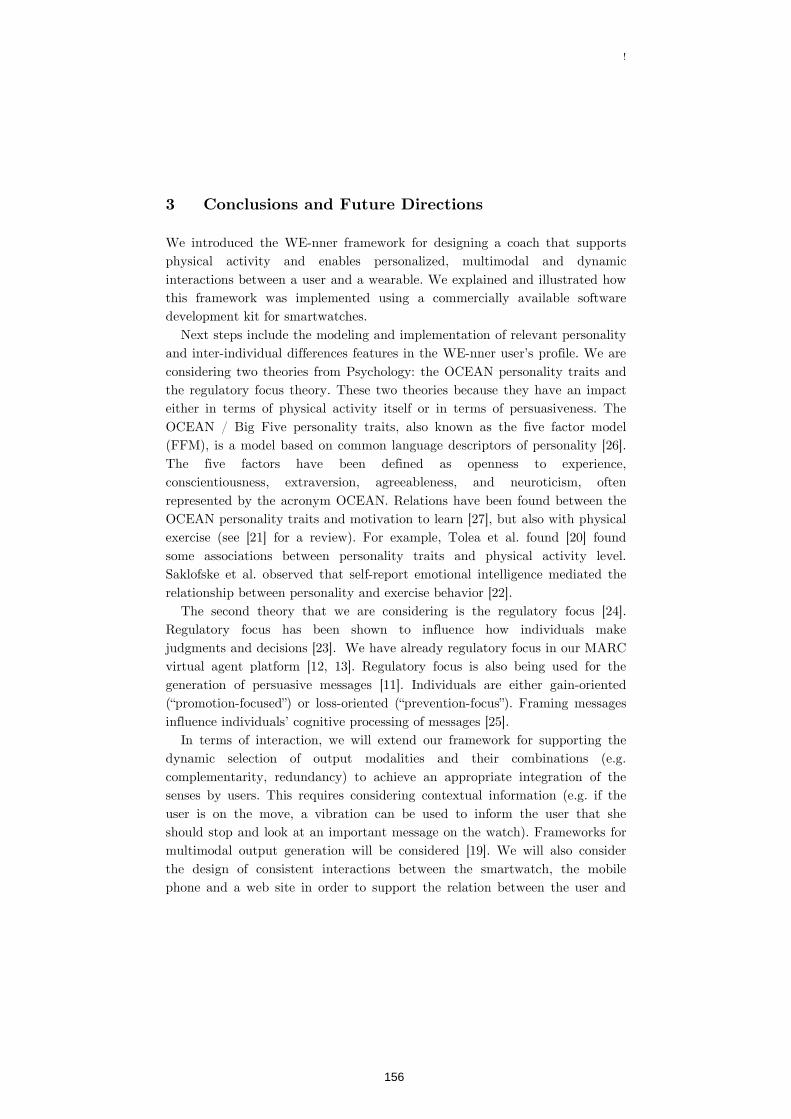
!
We introduced the WE-nner framework for designing a coach that supports physical activity and enables personalized, multimodal and dynamic interactions between a user and a wearable. We explained and illustrated how this framework was implemented using a commercially available software development kit for smartwatches.
Next steps include the modeling and implementation of relevant personality and inter-individual differences features in the WE-nner user’s profile. We are considering two theories from Psychology: the OCEAN personality traits and the regulatory focus theory. These two theories because they have an impact either in terms of physical activity itself or in terms of persuasiveness. The OCEAN / Big Five personality traits, also known as the five factor model (FFM), is a model based on common language descriptors of personality [26]. The five factors have been defined as openness to experience, conscientiousness, extraversion, agreeableness, and neuroticism, often represented by the acronym OCEAN. Relations have been found between the OCEAN personality traits and motivation to learn [27], but also with physical exercise (see [21] for a review). For example, Tolea et al. found [20] found some associations between personality traits and physical activity level. Saklofske et al. observed that self-report emotional intelligence mediated the relationship between personality and exercise behavior [22].
The second theory that we are considering is the regulatory focus [24]. Regulatory focus has been shown to influence how individuals make judgments and decisions [23]. We have already regulatory focus in our MARC virtual agent platform [12, 13]. Regulatory focus is also being used for the generation of persuasive messages [11]. Individuals are either gain-oriented (“promotion-focused”) or loss-oriented (“prevention-focus”). Framing messages influence individuals’ cognitive processing of messages [25].
In terms of interaction, we will extend our framework for supporting the dynamic selection of output modalities and their combinations (e.g. complementarity, redundancy) to achieve an appropriate integration of the senses by users. This requires considering contextual information (e.g. if the user is on the move, a vibration can be used to inform the user that she should stop and look at an important message on the watch). Frameworks for multimodal output generation will be considered [19]. We will also consider the design of consistent interactions between the smartwatch, the mobile phone and a web site in order to support the relation between the user and
156

!
her personalized coach which is in fact dispatched over several devices (possibly including other sensors and wearables).
We are also considering on how an animated and expressive agent displayed on the smartphone (and simple representations of it on the watch) can motivate the user based on affective reasoning and data [18].
Long term user studies need to be conducted to test if this wearable and its personalized and multimodal interactions do induce engagement and behavior change, and to assess how much they are impacted by aspect of the self [15, 16].
12. Ekkekakis, P.: Routeledge Handbook of Physical Activity and Mental Health. Routeledge Handbooks, New York (2013).
13. De Vries, P.W.: Persuasive Technology: Development and implementation of personalized technologies to change attitudes and behaviors. Adjunct Proceedings of the 12th International Conference, PERSUASIVE 2017, Amsterdam, The Netherlands, April 4-6, 2017.
14. de Vries, R. A. J., Truong, K.P., Zaga, C., Li, J., Evers, V.: A Word of Advice: How to Tailor Motivational Text Messages Based on Behavior Change Theory to Personality and Gender. Personal and Ubiquitous Computing. pp 1–13 (2017).
15. de Vries, R. A. J., Truong, K.P., Kwint, S., Drossaert, C., Evers, V.: Crowd-Designed Motivation: Motivational Messages for Exercise Adherence Based on Behavior Change Theory. In: Proceedings of the 2016 CHI Conference (2016)
16. Sano, A., P. Johns, M. Czerwinski, HealthAware: An Advice System for Stress, Sleep, Diet and Exercise. In: Proceedings of the International Conference on Affective Computing and Intelligent Interaction (ACII), Xi'an, China (2015)
17. Bickmore, T.: Context Awareness in a Handheld Exercise Agent. Pervasive and Mobile Computing special issue on Pervasive Health and Wellness, Vol 5, 226-235 (2009).
18. Bickmore, T. W., Silliman, R. A., Nelson, K., Cheng, D. M., Winter, M., Henault, L., Paasche-Orlow, M.K.: A Randomized Controlled Trial of an Automated Exercise Coach for Older Adults. J. Am. Geriatr Soc., 61(10):1676-83 (2013)
19. Bjarne, M., Christian, R., Gutvik, C., Lavie, J., Nauman, J., Wisløff, U.: Personalized Activity Intelligence (PAI) for Prevention of Cardiovascular
157
!
Disease and Promotion of Physical Activity. The American Journal of Medicine (2016).
20. Brinkman, P.: Virtual Health Agents for Behavior Change: Research Perspectives and Directions. In: Proceedings of the Workshop on Graphical and Robotic Embodied Agents for Therapeutic Systems (GREATS16) held during the International Conference on Intelligent Virtual Agents (IVA16), (2016)
21. Chen, J. J., Chung, Y.-F., Chang, C.-P., King, C. T., Hsu, C.-H.: A Wearable Virtual Coach for Marathon Beginners. In: Proceedings of the 20th IEEE International Conference on Parallel and Distributed Systems (ICPADS) (2014).
22. Corrégé, J.-B., Clavel, C., Sabouret, N., Hadoux, E., Hunter, A., Ammi, M.: Persuasive Dialogue System for Energy Conservation. In: Adjunct Proceedings of the 12th International Conference Persuasive Technology: Development and Implementation of Personalized Technologies to Change Attitudes and Behaviours (PERSUASIVE 2017), Amsterdam, The Netherlands, Peter W. de Vries, Thomas Van Rompay (Eds.), April 4-6, pp. 24-25 (2017)
23. Faur, C., Caillou, P., Martin, J-C., Clavel, C.: A Socio-cognitive Approach to Personality: Machine-learned Game Strategies as Cues of Regulatory Focus. In: Proceedings of the 6th International Conference on Affective Computing and Intelligent Interaction (ACII 2015), Xi'an, China, pp. 581-587 (2015)
24. Faur, C., Martin, J.-C., Clavel, C. : Measuring Chronic Regulatory Focus with Proverbs: the Developmental and Psychometric Properties of a French Scale. Journal of Personality and Individual Differences. Vol. 107, pp. 137–145 (2017)
25. Lee, J., Lee, C., Jounghyun, G.K.: Vouch: Multimodal Touch-and-Voice Input for Smart Watches under Difficult Operating Conditions. Journal on Multimodal User Interfaces. Springer (2017).
26. Strachan, S. M., Whaley, D. E.: Identities, Schemas and Definitions: How Aspects of the Self Influence Exercise Behavior. In: Ekkekakis, P. (Ed.) Routeledge Handbook of Physical Activity and Mental Health. Routeledge Handbooks, New York, pp. 212-223 (2013).
27. McAuley, E., Mailey, E. L. Szabo, A. N., Gother, N.: Physical Activity and Personal Agency: Self-Efficacy as a Determinant, Consequence and Mediator. In: Ekkekakis, P. (Ed.) Routeledge Handbook of Physical Activity and Mental Health. Routeledge Handbooks, New York, pp. 224-235 (2013).
158
!
28. Noar, S. M., Benac, C. N., Harris, M. S.: Does Tailoring Matter? Meta-analytic Review of Tailored Print Health Behavior Change Interventions. Psychological Bulletin, 133(4), pp. 673-693 (2007)
29. Callejas, Z., Griol, D., McTear, M., Lopez-Cozar, R.: A Virtual Coach for Active Ageing Based on Sentient Computing and m-health. In: Proceedings of IWAAL, LNCS 8868, pp. 59-66 (2014)
30. Rousseau, C., Bellik, Y., Vernier, F., Bazalgette, D.: A Framework for the Intelligent Multimodal Presentation of Information. Signal Processing, Elsevier Publ., European Association for Signal Processing (EURASIP), ISSN: 0165-1684, Vol. 86, Issue 12, (2006)
31. Tolea, M.I., Terracciano, A., Simonsick, E.M., Metter E.J., Costa, Jr. P.T. and Ferruccic, L. Associations between personality traits, physical activity level, and muscle strength. J Res Pers. 2012 Jun; 46(3): 264–270.
32. Rhodes, R.E., Smith, N.E. Personality correlates of physical activity: a review and meta-analysis. Br J Sports Med. 2006 Dec;40(12):958-65.
33. Saklofske, D.H., Austin, E.J., Rohr, B.A., Andrews, J.J. Personality, emotional intelligence and exercise. J Health Psychol. 2007 Nov;12(6):937-48.
34. Cesario, J. et al.: Regulatory Fit and Persuasion: Basic Principles and Remaining Questions. Soc. Personal. Psychol. Compass. 2, 1, 444–463 (2008).
35. Higgins, E.T.: Beyond pleasure and pain. Am. Psychol. 52, 12, 1280 (1997).
36. Lee, A.Y., Aaker, J.L.: Bringing the Frame Into Focus: The Influence of Regulatory Fit on Processing Fluency and Persuasion. J. Pers. Soc. Psychol. 86, 2, 205–218 (2004).
37. McCrae, R.R., John, O.P. An introduction to the five-factor model and its applications. Journal of Personality. 60 (2): 175–215. 1992.
38. De Feyter, T., Caers, R., Vigna, C., Berings, D. Unraveling the impact of the Big Five personality traits on academic performance: The moderating and mediating effects of self-efficacy and academic motivation. Learning and Individual Differences. 22: 439–448. 2012.
159

!
Waseem Safi, Fabrice Maurel, Jean-Marc Routoure, Pierre Beust, Michèle Molina, Coralie Sann
University of Caen Normandy – UNICAEN - 14032 Caen- France
In this paper, we present results of an empirical study for
examining the performance of sighted and blind individuals in discriminating ranges of frequencies. The suggested tactile vision substitution system is based on a vibro-tactile solution, portable, cheap and efficient in noisy and public environments. The system converts semi-automatically the visual structures of web pages into vibrating rectangular shapes presented on touch-screen mobile devices.
Visually impaired people; vibro-tactile feedback; low-
frequencies tactical vibrations.
An important accessibility drawback of current screen readers is the failure of individuals who are blind or visually-impaired to quickly get an overall sense of a web page in terms of overall semantics, main message, structure, and interaction affordances [1]. Interpreting the layout of a document is often indispensable to understand its contents [10] [11] [12]. Sighted persons navigate the web pages first by scanning it quickly to get a global overview of the content structure (this process is called skimming) [13]. After that, they read the contents by following various reading paths [12] [13]. Our work focuses on developing and evaluating a sensory substitution system based on a vibro-tactile solution, cheap and efficient in noisy and public environments.
Many authors have proposed the attachment of vibro-tactile actuators on users’ body for working as mnemonic information [2]. Opticon is one of oldest systems that proposed a vibro-tactile feedback [3]. Opticon translates the
160
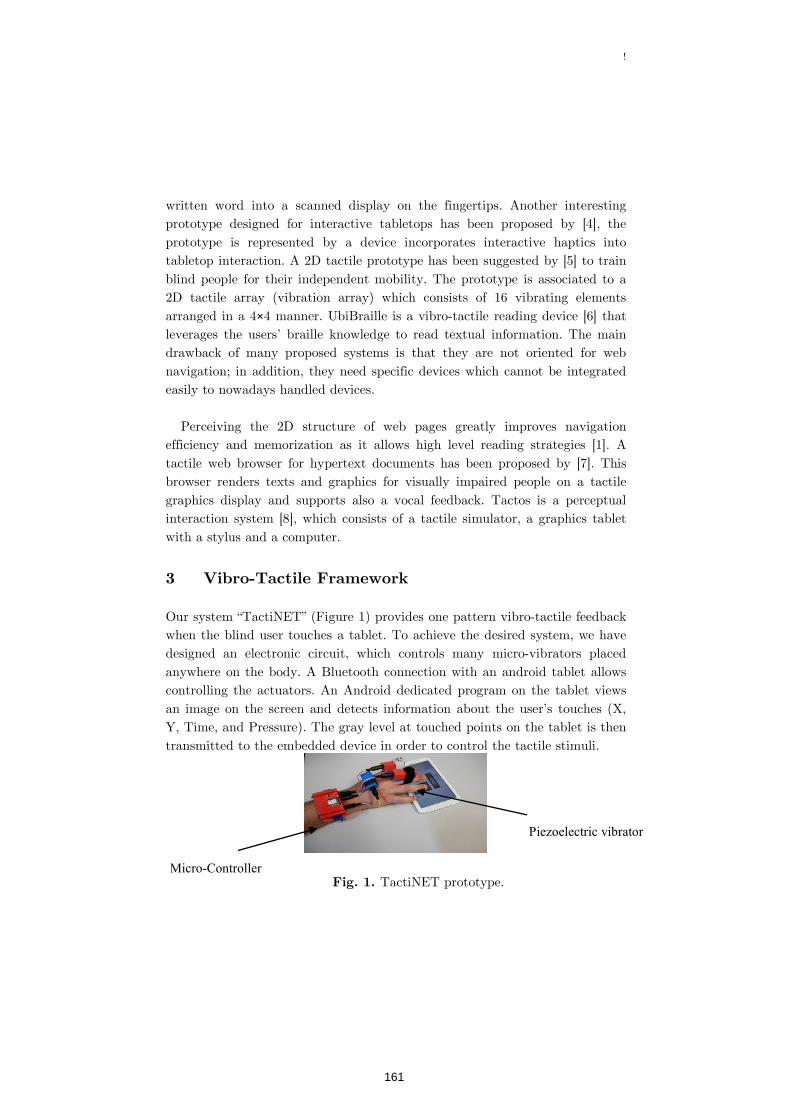
!
written word into a scanned display on the fingertips. Another interesting prototype designed for interactive tabletops has been proposed by [4], the prototype is represented by a device incorporates interactive haptics into tabletop interaction. A 2D tactile prototype has been suggested by [5] to train blind people for their independent mobility. The prototype is associated to a 2D tactile array (vibration array) which consists of 16 vibrating elements arranged in a 4×4 manner. UbiBraille is a vibro-tactile reading device [6] that leverages the users’ braille knowledge to read textual information. The main drawback of many proposed systems is that they are not oriented for web navigation; in addition, they need specific devices which cannot be integrated easily to nowadays handled devices.
Perceiving the 2D structure of web pages greatly improves navigation
efficiency and memorization as it allows high level reading strategies [1]. A tactile web browser for hypertext documents has been proposed by [7]. This browser renders texts and graphics for visually impaired people on a tactile graphics display and supports also a vocal feedback. Tactos is a perceptual interaction system [8], which consists of a tactile simulator, a graphics tablet with a stylus and a computer.
Our system “TactiNET” (Figure 1) provides one pattern vibro-tactile feedback when the blind user touches a tablet. To achieve the desired system, we have designed an electronic circuit, which controls many micro-vibrators placed anywhere on the body. A Bluetooth connection with an android tablet allows controlling the actuators. An Android dedicated program on the tablet views an image on the screen and detects information about the user’s touches (X, Y, Time, and Pressure). The gray level at touched points on the tablet is then transmitted to the embedded device in order to control the tactile stimuli.
TactiNET prototype.
Piezoelectric vibrator
Micro-Controller
161
!
A series of experiments validated our prototype and concepts of vibro-tactile access to visual structures of web pages [9]. First pre-tests validated our hypothesis: visually impaired people can explore and redraw simple grayscale shapes by using vibration motors [9]. The series of experiments described in this paper aims to select a range of frequencies most perceptible by sighted and visually impaired persons. These ranges of frequencies will be used in generating vibro-tactile feedbacks that represent contrasts of visual elements in web pages.
38 sighted children (average 8.26 years) and 25 adults participated in the study. The 25 adult participants were composed of 20 sighted persons (average 29.8 years) and of 5 blind persons (average 57 years). Each participant had to navigate on the touch-screen, split in two equal-sized parts. They were asked whether the vibration feedbacks generated when touching the first part of the screen were identical to the vibration feedbacks generated when touching the second part of the screen. To run the experiments, two tablets of type Samsung GALAXY Tab 2 (10.1 inch) have been used. The first tablet, connected with the prototype device of TactiNET, is dedicated to the haptic exploration of the participant. The second tablet is dedicated to the experimenter to generate the various pattern of vibration sent to the first tablet. The two tablets are connected by a Bluetooth connection.
Participants navigate on the tablet by using the index of their preferred hand (left or right). The actuator to perceive the vibrations are placed on the non-preferred hand. The experimenter asked them a single question: « are the vibration feedbacks generated when navigating the left part equal to that generated when navigating the right part?"
Five frequencies have been chosen to be evaluated as reference frequencies:
101.5625Hz; 203.125Hz; 304.6875Hz; 406.25Hz; and 500Hz. Each value of these five reference frequencies have been evaluated with two conditions of amplitude variability V0 and V5. Variability V0 means that the amplitude value is always 255 for all the vibration feedbacks generated when the participant navigates any part of the tablet screen. Variability V5 means that the amplitude value is between 255 and 250 (255-5). When the variability V5 is activated, a random integer value between 0 and 5 will be generated for each touch on any part of the tablet screen. This random integer value will be
162
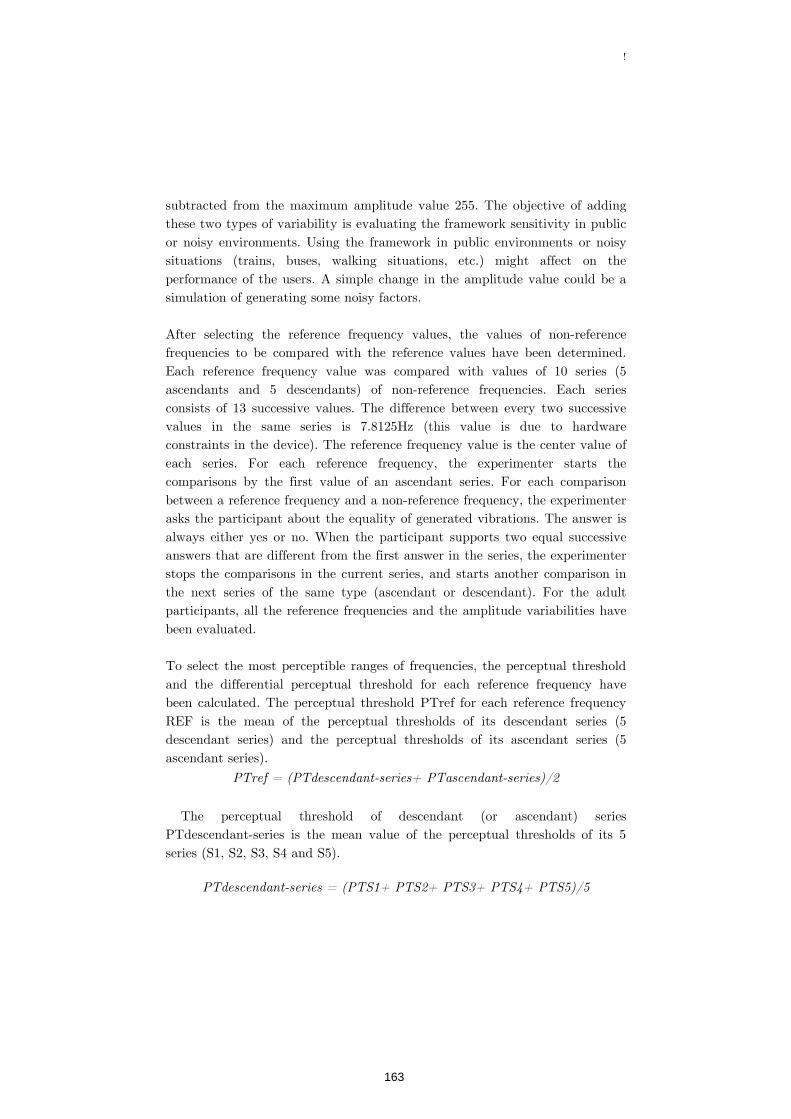
!
subtracted from the maximum amplitude value 255. The objective of adding these two types of variability is evaluating the framework sensitivity in public or noisy environments. Using the framework in public environments or noisy situations (trains, buses, walking situations, etc.) might affect on the performance of the users. A simple change in the amplitude value could be a simulation of generating some noisy factors.
After selecting the reference frequency values, the values of non-reference frequencies to be compared with the reference values have been determined. Each reference frequency value was compared with values of 10 series (5 ascendants and 5 descendants) of non-reference frequencies. Each series consists of 13 successive values. The difference between every two successive values in the same series is 7.8125Hz (this value is due to hardware constraints in the device). The reference frequency value is the center value of each series. For each reference frequency, the experimenter starts the comparisons by the first value of an ascendant series. For each comparison between a reference frequency and a non-reference frequency, the experimenter asks the participant about the equality of generated vibrations. The answer is always either yes or no. When the participant supports two equal successive answers that are different from the first answer in the series, the experimenter stops the comparisons in the current series, and starts another comparison in the next series of the same type (ascendant or descendant). For the adult participants, all the reference frequencies and the amplitude variabilities have been evaluated. To select the most perceptible ranges of frequencies, the perceptual threshold and the differential perceptual threshold for each reference frequency have been calculated. The perceptual threshold PTref for each reference frequency REF is the mean of the perceptual thresholds of its descendant series (5 descendant series) and the perceptual thresholds of its ascendant series (5 ascendant series).
The perceptual threshold of descendant (or ascendant) series
PTdescendant-series is the mean value of the perceptual thresholds of its 5 series (S1, S2, S3, S4 and S5).
163

!
The perceptual threshold of a series is the mean value of its successive values that have been compared with the reference frequency.
After measuring the perceptual threshold for each reference frequency for
each participant. The perceptual threshold for each reference frequency for each group is calculated. The perceptual threshold for certain reference frequency (REF) for a group (G) is the average of perceptual thresholds of that reference frequency for all the group members (N members).
The differential perceptual threshold DT for each reference frequency REF is calculated by subtracting the perceptual threshold value from the value of the reference frequency:
The result is represented as an absolute value. For example, for the reference frequency 101.5625Hz, if the perceptual threshold is 99.01Hz, the differential perceptual threshold will be |101.5625 - 99.01|=2.5525Hz. The differential perceptual threshold indicates how the perceptual threshold is far or close of the reference frequency value.
The differential perceptual thresholds for each reference frequency have been calculated under two conditions: variability V0, and variability V5. The reference frequency 304.6875Hz has the smallest differential perceptual thresholds either with the variability V0 or with the variability V5. Figure 2 presents the mean and standard deviation values of differential perceptual thresholds for blind and sighted participants with two conditions of variability V0 and V5. It is noticeable that the reference frequency 304.6875Hz has the smallest differential perceptual thresholds either with the variability V0 or with the variability V5.
164
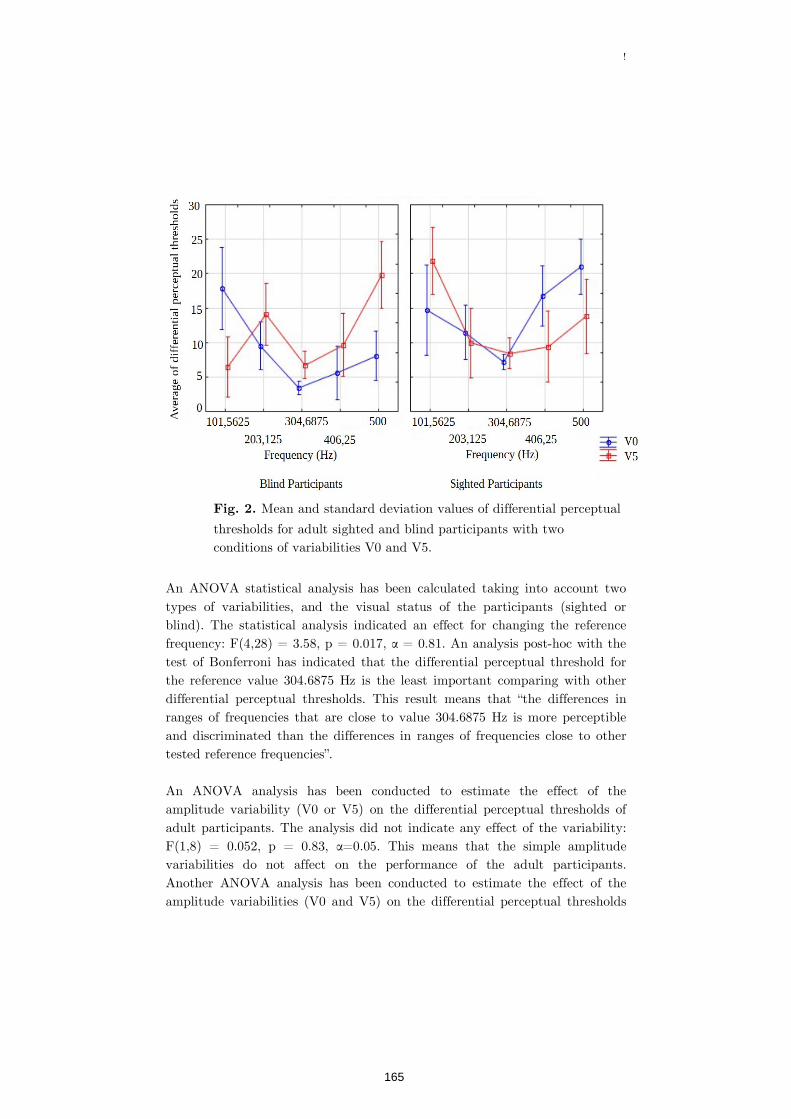
!
Mean and standard deviation values of differential perceptual
thresholds for adult sighted and blind participants with two conditions of variabilities V0 and V5.
An ANOVA statistical analysis has been calculated taking into account two types of variabilities, and the visual status of the participants (sighted or blind). The statistical analysis indicated an effect for changing the reference frequency: F(4,28) = 3.58, p = 0.017, α = 0.81. An analysis post-hoc with the test of Bonferroni has indicated that the differential perceptual threshold for the reference value 304.6875 Hz is the least important comparing with other differential perceptual thresholds. This result means that “the differences in ranges of frequencies that are close to value 304.6875 Hz is more perceptible and discriminated than the differences in ranges of frequencies close to other tested reference frequencies”. An ANOVA analysis has been conducted to estimate the effect of the amplitude variability (V0 or V5) on the differential perceptual thresholds of adult participants. The analysis did not indicate any effect of the variability: F(1,8) = 0.052, p = 0.83, α=0.05. This means that the simple amplitude variabilities do not affect on the performance of the adult participants. Another ANOVA analysis has been conducted to estimate the effect of the amplitude variabilities (V0 and V5) on the differential perceptual thresholds
165
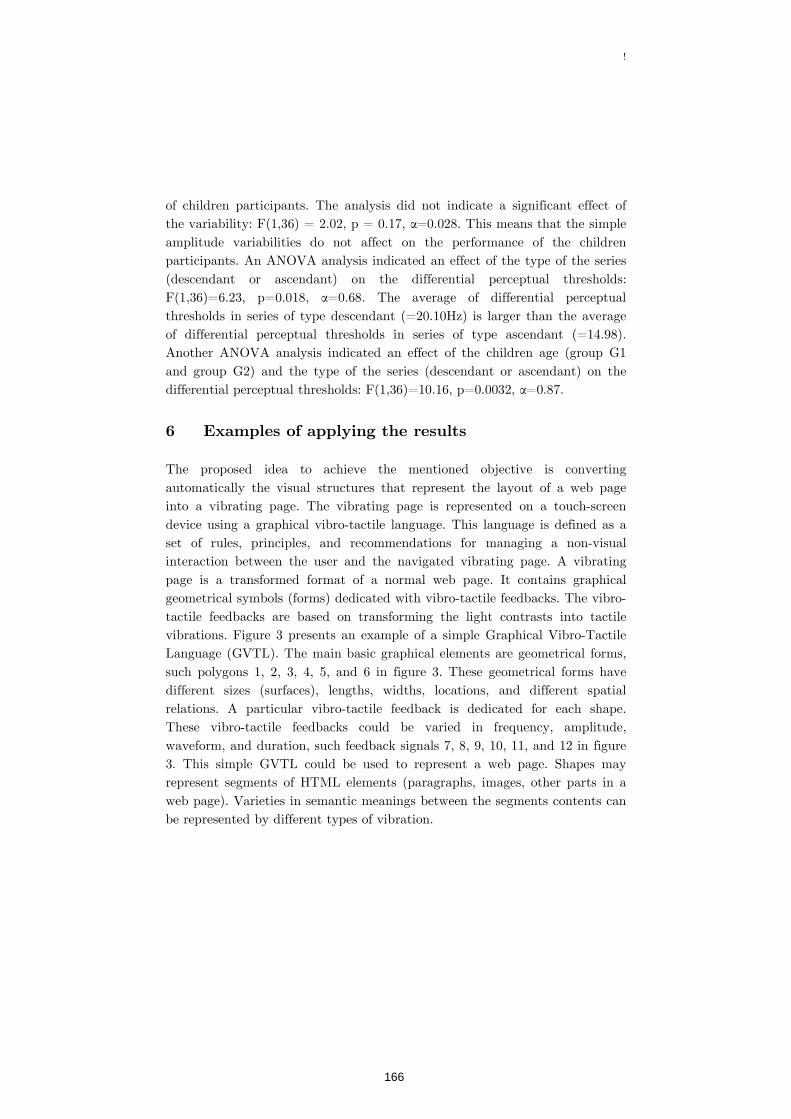
!
of children participants. The analysis did not indicate a significant effect of the variability: F(1,36) = 2.02, p = 0.17, α=0.028. This means that the simple amplitude variabilities do not affect on the performance of the children participants. An ANOVA analysis indicated an effect of the type of the series (descendant or ascendant) on the differential perceptual thresholds: F(1,36)=6.23, p=0.018, α=0.68. The average of differential perceptual thresholds in series of type descendant (=20.10Hz) is larger than the average of differential perceptual thresholds in series of type ascendant (=14.98). Another ANOVA analysis indicated an effect of the children age (group G1 and group G2) and the type of the series (descendant or ascendant) on the differential perceptual thresholds: F(1,36)=10.16, p=0.0032, α=0.87.
The proposed idea to achieve the mentioned objective is converting automatically the visual structures that represent the layout of a web page into a vibrating page. The vibrating page is represented on a touch-screen device using a graphical vibro-tactile language. This language is defined as a set of rules, principles, and recommendations for managing a non-visual interaction between the user and the navigated vibrating page. A vibrating page is a transformed format of a normal web page. It contains graphical geometrical symbols (forms) dedicated with vibro-tactile feedbacks. The vibro-tactile feedbacks are based on transforming the light contrasts into tactile vibrations. Figure 3 presents an example of a simple Graphical Vibro-Tactile Language (GVTL). The main basic graphical elements are geometrical forms, such polygons 1, 2, 3, 4, 5, and 6 in figure 3. These geometrical forms have different sizes (surfaces), lengths, widths, locations, and different spatial relations. A particular vibro-tactile feedback is dedicated for each shape. These vibro-tactile feedbacks could be varied in frequency, amplitude, waveform, and duration, such feedback signals 7, 8, 9, 10, 11, and 12 in figure 3. This simple GVTL could be used to represent a web page. Shapes may represent segments of HTML elements (paragraphs, images, other parts in a web page). Varieties in semantic meanings between the segments contents can be represented by different types of vibration.
166
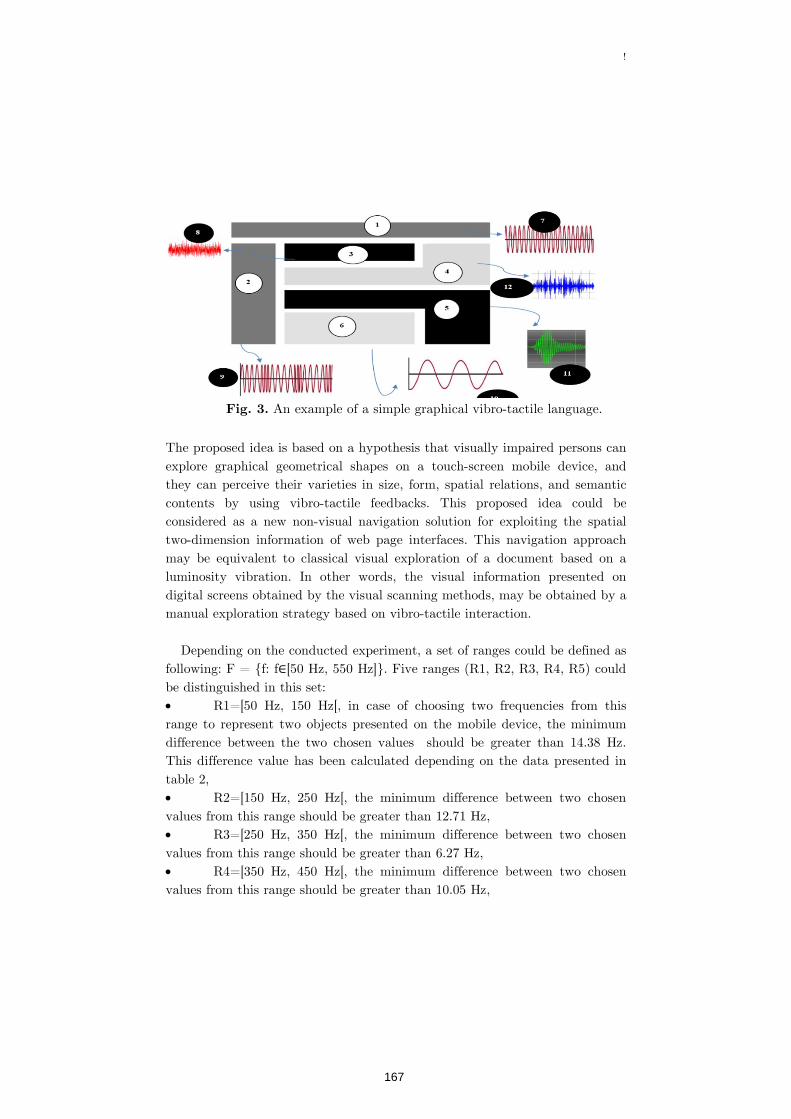
!
An example of a simple graphical vibro-tactile language.
The proposed idea is based on a hypothesis that visually impaired persons can explore graphical geometrical shapes on a touch-screen mobile device, and they can perceive their varieties in size, form, spatial relations, and semantic contents by using vibro-tactile feedbacks. This proposed idea could be considered as a new non-visual navigation solution for exploiting the spatial two-dimension information of web page interfaces. This navigation approach may be equivalent to classical visual exploration of a document based on a luminosity vibration. In other words, the visual information presented on digital screens obtained by the visual scanning methods, may be obtained by a manual exploration strategy based on vibro-tactile interaction.
Depending on the conducted experiment, a set of ranges could be defined as
following: F = f: f∈[50 Hz, 550 Hz]. Five ranges (R1, R2, R3, R4, R5) could be distinguished in this set: R1=[50 Hz, 150 Hz[, in case of choosing two frequencies from this range to represent two objects presented on the mobile device, the minimum difference between the two chosen values should be greater than 14.38 Hz. This difference value has been calculated depending on the data presented in table 2, R2=[150 Hz, 250 Hz[, the minimum difference between two chosen values from this range should be greater than 12.71 Hz, R3=[250 Hz, 350 Hz[, the minimum difference between two chosen values from this range should be greater than 6.27 Hz, R4=[350 Hz, 450 Hz[, the minimum difference between two chosen values from this range should be greater than 10.05 Hz,
167
!
R5=[450 Hz, 550 Hz[, the minimum difference between two chosen values from this range should be greater than 15.07 Hz.
This experiment aimed to select the most perceptible ranges of reference frequencies with two types of amplitude variabilities. The results indicated that it is possible for participants to detect a very simple difference between frequencies close to the frequency 304.6875 Hz. This ability of discrimination is not identical for differences close to other frequencies such as 500 Hz. The results indicated that there is not a significant difference between the sighted and blind participants in perceiving the evaluated referential frequencies. Many enhancements to be achieved such as increasing the number and quality of micro-vibrators, and applying the obtained results on the designed framework.
1. Maurel, F., Dias, G., Routoure, J-M., Vautier, M., Beust, P., Molina, M., Sann, C. 2012. "Haptic Perception of Document Structure for Visually Impaired People on Handled Devices", Procedia Computer Science, Volume 14, Pages 319-329, 2012.
2. Kammoun, S., Jouffrais, C., Guerreiro, T., Nicolau, H., Jorge, J.,
"Guiding Blind People with Haptic Feedback". In Pervasive Workshop on Frontiers in Accessibility for Pervasive Computing, New Castle, UK, 2012.
3. Bliss, J., Katcher M., Rogers C., Shepard R., "Optical-to-Tactile Image
Conversion for the Blind", Published in: Man-Machine Systems, IEEE Transactions, Volume:11, Issue:1, March; pages: 58 – 65, 1970.
4. Marquardt, N., Nacenta, M., Young, J., Carpendale, S., Greenberg, S.,
Sharlin, E., "The Haptic Tabletop Puck: tactile feedback for interactive tabletops." Proceedings of the ACM International Conference on Interactive Tabletops and Surfaces. ACM, Pages 85-92, 2009.
168
!
5. Dakopoulos, D., Bourbakis, N., "Towards a 2D tactile vocabulary for navigation of blind and visually impaired.", In proceedings of the 2009 IEEE international conference on Systems, Man and Cybernetics, Pages: 45-51, ISSN: , 1062-922X, 2009.
6. Nicolau, H., Guerreiro, J., Guerreiro, T., Carriço, L., "UbiBraille:
Designing and Evaluating a Vibrotactile Braille-Reading Device", Proceedings of the 15th International ACM SIGACCESS Conference on Computers and Accessibility, Article No. 23. ACM New York, USA 2013.
7. Rotard, M., Knödler, S., Ertl, T., "A Tactile Web Browser for the
Visually Disabled". In Proceedings of the sixteenth ACM Conference on Hypertext and Hypermedia. ACM, New York, NY, USA, pages 15-22, 2005.
8. Tixier, M., Lenay, C., Le-Bihan, G., Gapenne, O., Aubert, D.,
"Designing Interactive Content with Blind Users for a Perceptual Supplementation System", TEI 2013, 2013, in Proceedings of the 7th International Conference on Tangible, Embedded and Embodied Interaction, Pages 229-236, Barcelona, Spain, 2013.
9. Safi, W, Maurel, F., Routoure, J-M, Beust, P, Dias, G., 2015. "An Empirical Study for Examining the Performance of Visually Impaired People in Recognizing Shapes through a Vibro-tactile Feedback", ASSETS'15, October 26-28, 2015, Lisbon, Portugal.
10. Hornof, A., 2001. "Visual search and mouse-pointing in labeled versus
unlabeled two-dimensional visual hierarchies", ACM Transactions on Computer-Human Interaction, Vol. 8, No. 3, September 2001, Pages:171–197, DOI:http://dx.doi.org/10.1145/502907.502908
11. Yesilada, Y., Stevens, R., Goble, C., Hussein, S. 2004. "Rendering tables
in audio: the interaction of structure and reading styles". Proceeding of the 6th international ACM SIGACCESS Conference on Computers and Accessibility, USA, October 18-20, 2004, Pages: 16-23, ISBN:1-58113-911-X, DOI: http://dx.doi.org/10.1145/1028630.1028635
12. Francisco-Revilla, L., Crow, J., 2009. "Interpreting the Layout of Web
Pages", Proceeding of 20th ACM Conference on Hypertext and
169

!
Hypermedia (HT’09), Torino, Italy, June 29-July 1, 2009, ACM, New York, USA, Pages: 157-166, ISBN: 978-1-60558-486-7, DOI: http://dx.doi.org/10.1145/1557914.1557943
13. Ahmed, F., Borodin, Y., Puzis, Y., Ramakrishnan, I.V., 2012. "Why
Read if You Can Skim: Towards Enabling Faster Screen Reading". In Proceeding of W4A'12 the International Cross-Disciplinary Conference on Web Accessibility, Article No. 39, ISBN: 978-1-4503-1019-2, DOI: 10.1145/2207016.2207052.
170
!
Teresa Consiglio1 and Gerrit C. van der Veer2
1 Dutch Open University, Heerlen, the Netherlands 2 LuXun Academy of Fine Arts, Liaoning, 69121 China
This contribution shows how we discovered, by teaching and
design, the need for ICT support in the domain of cultural heritage collections. We show examples of current situations with, both, workable solutions and logistic problems regarding the maintenance, documentation, and availability of precious artifacts to keep cultures alive. We point to currently available techniques to incorporate cultural heritage artifacts in a cloud based structure for knowledge and communication that might enable the continuation of cultures in an easy and safe way.
Internet of Things, Wearable Devices, Cultural heritage.
We have been developing and teaching university level courses on Design for Cultural Heritage in different countries and in different academic cultures [1]: In Alghero (Italy) in a faculty or Architecture and Design; In Amsterdam (the Netherlands) in a consulting company to experts in designing for cultural institutes; In Dalian and in Liaoning (China) to students of Usability Engineering and students of Multimedia and Animation; in San Sebastian (Spain) to students in Human-Computer Interaction and to curators of museum collections in various domains of Cultural Heritage.
We have been designing ICT support for collections of cultural heritage and developed an ontology for systematic support of scholars in domains of living cultures [2].
We collaborated with curators of a variety of cultural heritage domains: Folk costumes and the history of local dress habits [2]; Folk music, including a
171
!
collection of instruments, the history, maintenance, documentation, historic recordings, and teaching [3]; A museum institute on the conservation and history of 35 mm celluloid movies [4,5]; A collection of 17th – 19th century European Art Music Instruments [6].
We visited some large cultural heritage collections where we analyzed documentation and retrieval problems: e.g., a Dutch museum of Natural History that keeps 17th – 19th century specimen of plants collected mainly in (former) Dutch territory and colonies [7]; a Spanish museum of Folk Musical Instruments around the world [8].
Based on these experiences we developed an understanding of the opportunities that state of the art ICT can contribute to the preservation of cultures and the maintenance, documentation, and accessibility of cultural heritage.
1.2
”.
This definition from Merriam-Webster indicates that cultures are patterns of knowledge and behavior shared by a community that transfers the knowledge and behavior to new generations. People involved in such a culture we label in relation their role:
Scholars: members of the community who are accepted to “know”, and who may, consequently, act as teacher, researcher, restorer, copyist, historian, documenter. Examples in the domain of music: composer, performer, maker or maintainer of instruments, recorder of performances;
Amateur: member of the community who participates in a meaning full way based on enough knowledge to experience the activities and to share the beliefs, and who aims at continuing to participate. Examples from the domain of music: people who choose the type of performance, the type of music played, the performers, they want to go to, who may keep souvenirs of events in the culture they want to remember.
In many cases these roles may be exchanged: a flute maker, may be happy to travel as an amateur to a performance where the artifact will be used by a performer.
172
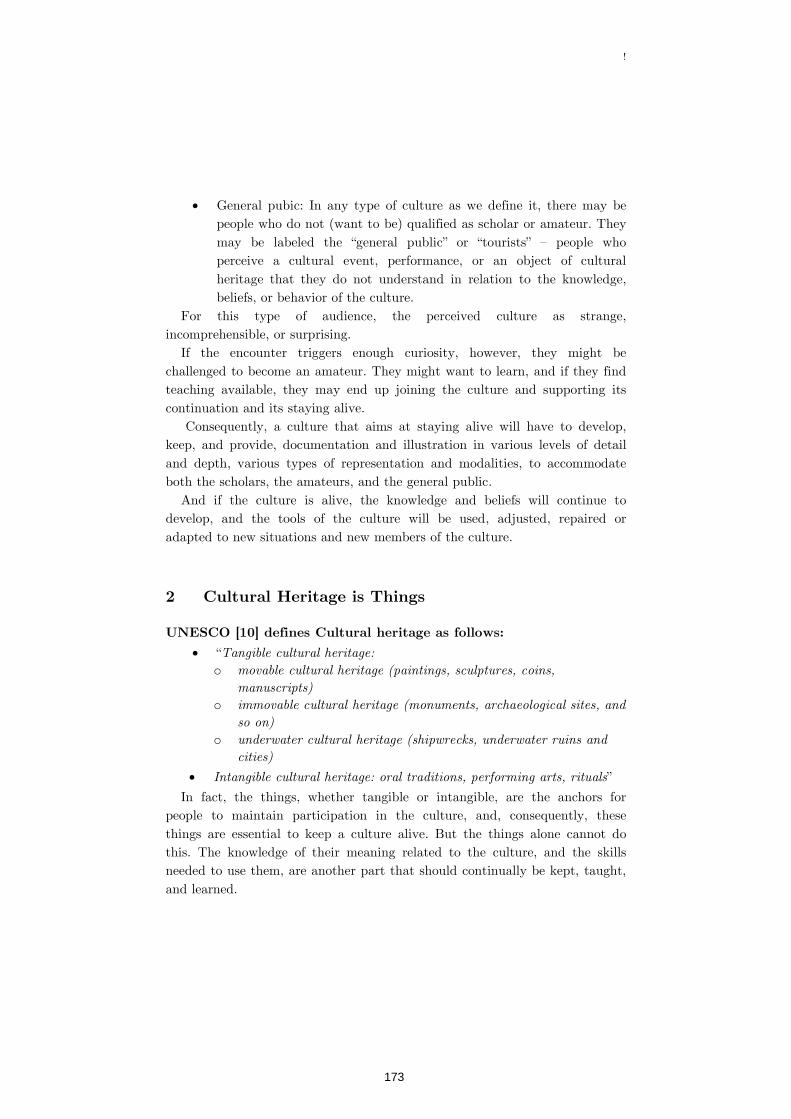
!
General pubic: In any type of culture as we define it, there may be people who do not (want to be) qualified as scholar or amateur. They may be labeled the “general public” or “tourists” – people who perceive a cultural event, performance, or an object of cultural heritage that they do not understand in relation to the knowledge, beliefs, or behavior of the culture.
For this type of audience, the perceived culture as strange, incomprehensible, or surprising.
If the encounter triggers enough curiosity, however, they might be challenged to become an amateur. They might want to learn, and if they find teaching available, they may end up joining the culture and supporting its continuation and its staying alive.
Consequently, a culture that aims at staying alive will have to develop, keep, and provide, documentation and illustration in various levels of detail and depth, various types of representation and modalities, to accommodate both the scholars, the amateurs, and the general public.
And if the culture is alive, the knowledge and beliefs will continue to develop, and the tools of the culture will be used, adjusted, repaired or adapted to new situations and new members of the culture.
“o
o
o
”
In fact, the things, whether tangible or intangible, are the anchors for people to maintain participation in the culture, and, consequently, these things are essential to keep a culture alive. But the things alone cannot do this. The knowledge of their meaning related to the culture, and the skills needed to use them, are another part that should continually be kept, taught, and learned.
173

!
Things, in any culture, are from different types: tangible objects need to be maintained (and during the life of the culture often copied) by using (tangible) tools and (often intangible) prescriptions and standards. The actual use of the tangible objects will follow rules and customs (choreographies, scores, scripts, storylines) that are often itself intangible but may be recorded for memory, for teaching and learning in tangible ways (drawings, sketches, literature).
2.1
In the different types of cultural heritage collections that we analyzed during our teaching, we mostly found some type of ontology being used to be able to retrieve the objects and refer to them in documentation, in reaching, and in learning. Sometimes, a single cultural collection needs in fact several ontologies, depending on the viewpoint needed for retrieval. In the website of [3] we find what seem to be separate collections for:
Music instruments (over 1400 artifacts, of which 400 are on display and visible at the virtual museum in the website), where the collection is structured along the standard description ontologies by Hornbostel and Sachs, as published in [11] and along categories of Basque traditional ensembles;
Library (over 5800 documents); Sound library (over 4800 recordings) structures along locations
(countries and regions in the Spanish and France bask area) and period of recording;
Photographs, video, and films (hundreds); where all these objects are described in documents in a single content management system, where single or multiple elements can be searched through the search page illustrated in Figure 1. The result of a single search may be a single or a series of records, where each record is a description that may well refer to various objects, like a video recording, a sound recording, the instrument being played, a restoration report for the instrument, and a picture of the artist; all to be found in the museum premises, though stored on servers (for the digital recordings) or in different rooms and on different shelves related to the physical type of the artifact.
In [7] the ontology is still a challenge, since the 1000s of collected specimen have originally (often several centuries ago) been categorized according to different ontologies and taxonomies that have been overthrown, developed, or the category or species names translated. In addition, apart from the
174
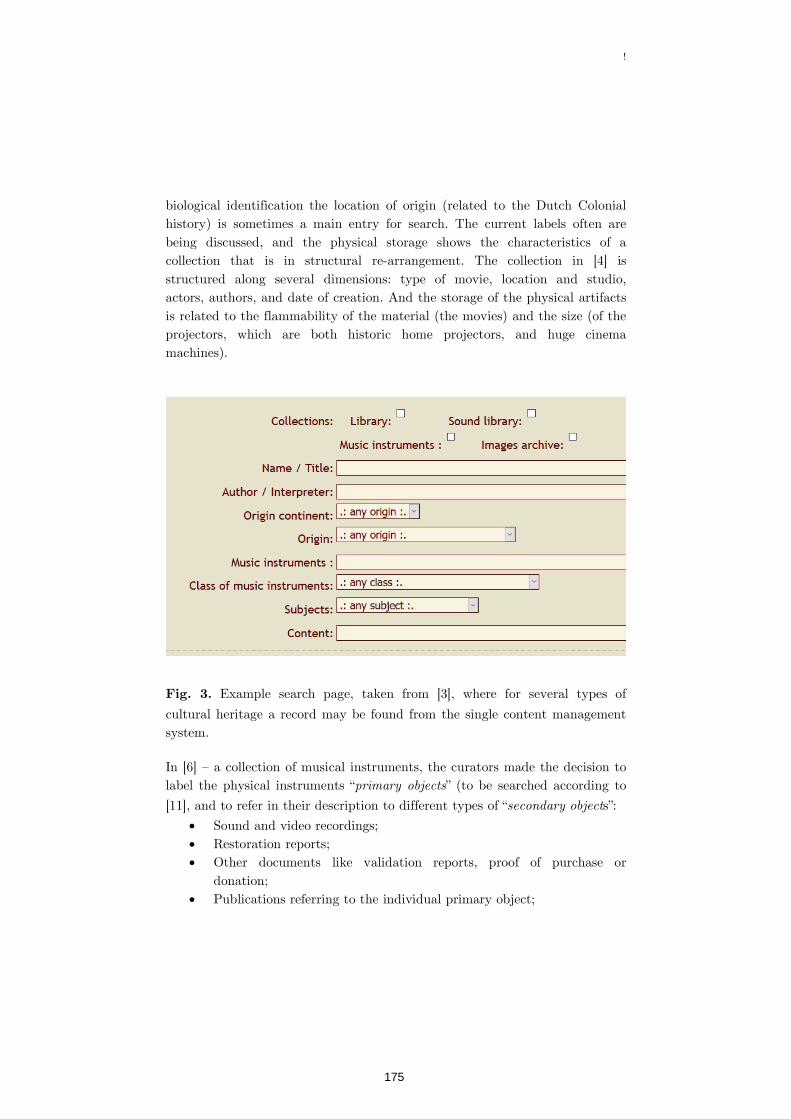
!
biological identification the location of origin (related to the Dutch Colonial history) is sometimes a main entry for search. The current labels often are being discussed, and the physical storage shows the characteristics of a collection that is in structural re-arrangement. The collection in [4] is structured along several dimensions: type of movie, location and studio, actors, authors, and date of creation. And the storage of the physical artifacts is related to the flammability of the material (the movies) and the size (of the projectors, which are both historic home projectors, and huge cinema machines).
Example search page, taken from [3], where for several types of
cultural heritage a record may be found from the single content management system.
In [6] – a collection of musical instruments, the curators made the decision to label the physical instruments “ ” (to be searched according to
[11], and to refer in their description to different types of “ s”:
Sound and video recordings; Restoration reports; Other documents like validation reports, proof of purchase or
donation; Publications referring to the individual primary object;
175
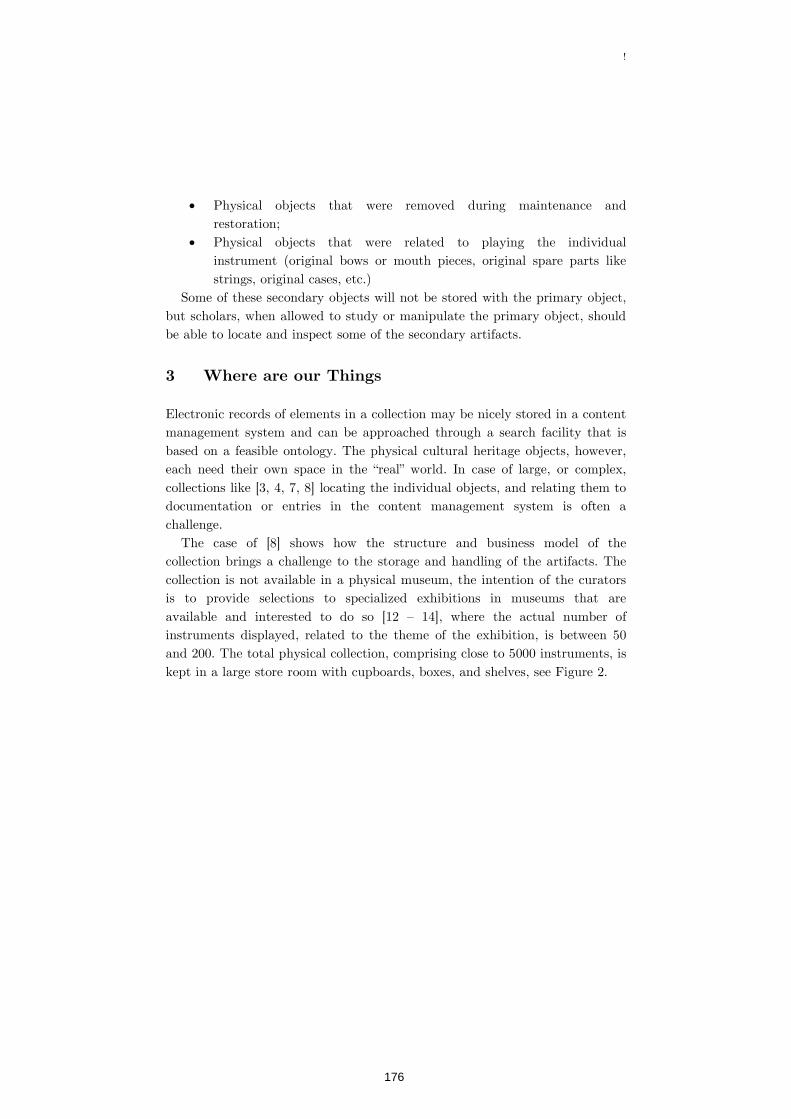
!
Physical objects that were removed during maintenance and restoration;
Physical objects that were related to playing the individual instrument (original bows or mouth pieces, original spare parts like strings, original cases, etc.)
Some of these secondary objects will not be stored with the primary object, but scholars, when allowed to study or manipulate the primary object, should be able to locate and inspect some of the secondary artifacts.
Electronic records of elements in a collection may be nicely stored in a content management system and can be approached through a search facility that is based on a feasible ontology. The physical cultural heritage objects, however, each need their own space in the “real” world. In case of large, or complex, collections like [3, 4, 7, 8] locating the individual objects, and relating them to documentation or entries in the content management system is often a challenge.
The case of [8] shows how the structure and business model of the collection brings a challenge to the storage and handling of the artifacts. The collection is not available in a physical museum, the intention of the curators is to provide selections to specialized exhibitions in museums that are available and interested to do so [12 – 14], where the actual number of instruments displayed, related to the theme of the exhibition, is between 50 and 200. The total physical collection, comprising close to 5000 instruments, is kept in a large store room with cupboards, boxes, and shelves, see Figure 2.
176
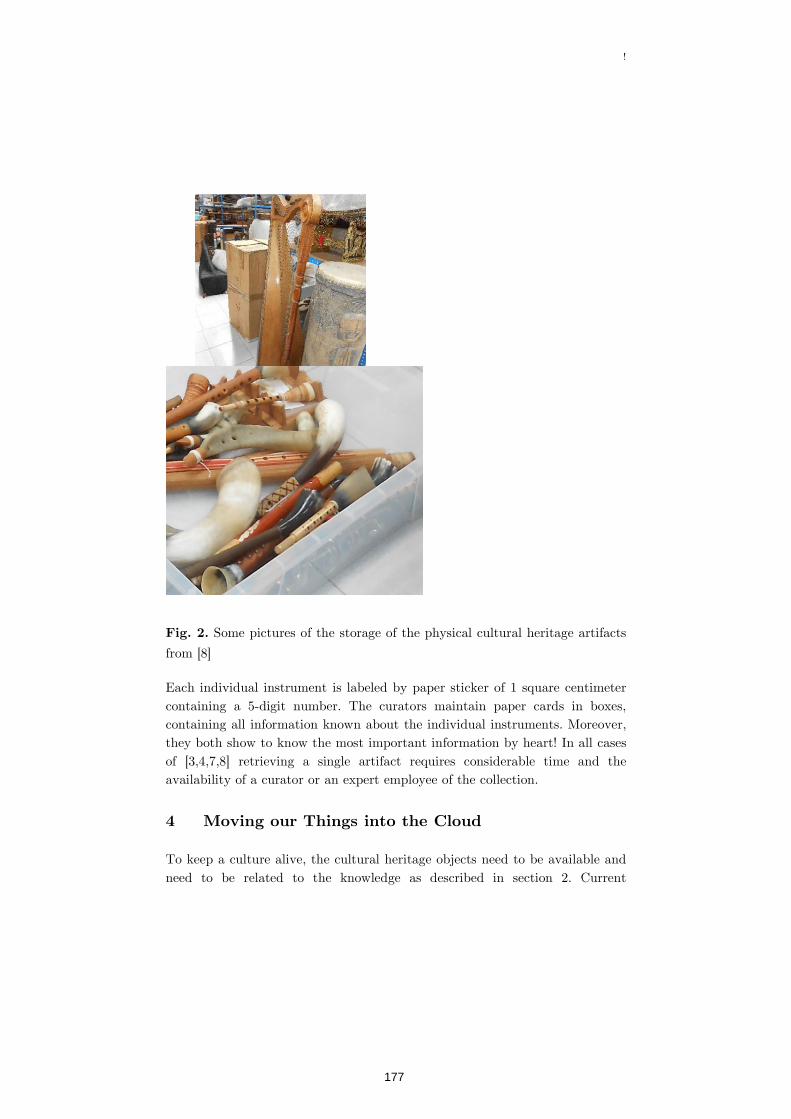
!
Some pictures of the storage of the physical cultural heritage artifacts
from [8]
Each individual instrument is labeled by paper sticker of 1 square centimeter containing a 5-digit number. The curators maintain paper cards in boxes, containing all information known about the individual instruments. Moreover, they both show to know the most important information by heart! In all cases of [3,4,7,8] retrieving a single artifact requires considerable time and the availability of a curator or an expert employee of the collection.
To keep a culture alive, the cultural heritage objects need to be available and need to be related to the knowledge as described in section 2. Current
177
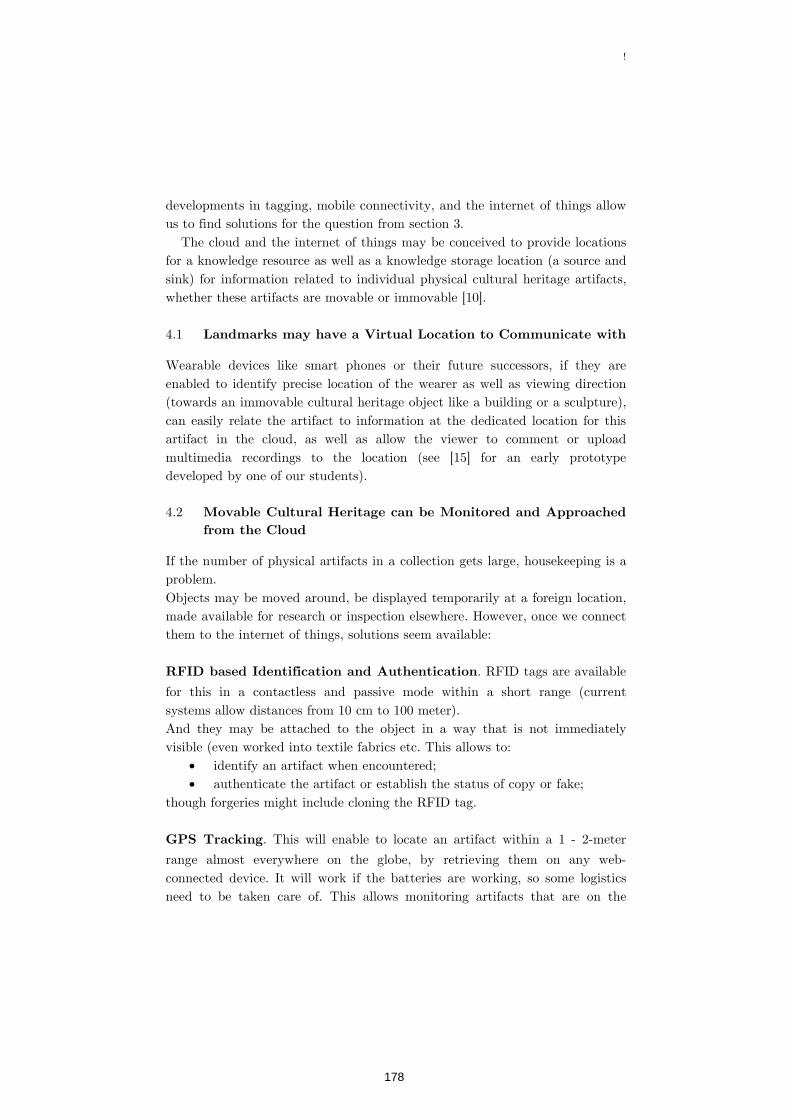
!
developments in tagging, mobile connectivity, and the internet of things allow us to find solutions for the question from section 3.
The cloud and the internet of things may be conceived to provide locations for a knowledge resource as well as a knowledge storage location (a source and sink) for information related to individual physical cultural heritage artifacts, whether these artifacts are movable or immovable [10].
4.1
Wearable devices like smart phones or their future successors, if they are enabled to identify precise location of the wearer as well as viewing direction (towards an immovable cultural heritage object like a building or a sculpture), can easily relate the artifact to information at the dedicated location for this artifact in the cloud, as well as allow the viewer to comment or upload multimedia recordings to the location (see [15] for an early prototype developed by one of our students).
4.2
If the number of physical artifacts in a collection gets large, housekeeping is a problem. Objects may be moved around, be displayed temporarily at a foreign location, made available for research or inspection elsewhere. However, once we connect them to the internet of things, solutions seem available:
. RFID tags are available
for this in a contactless and passive mode within a short range (current systems allow distances from 10 cm to 100 meter). And they may be attached to the object in a way that is not immediately visible (even worked into textile fabrics etc. This allows to:
identify an artifact when encountered; authenticate the artifact or establish the status of copy or fake;
though forgeries might include cloning the RFID tag.
. This will enable to locate an artifact within a 1 - 2-meter
range almost everywhere on the globe, by retrieving them on any web-connected device. It will work if the batteries are working, so some logistics need to be taken care of. This allows monitoring artifacts that are on the
178
!
move, and retrieving lost or stolen artifacts. The latter functionality, obviously, will only work if the thief is not aware of the GOS tracker, or fails in removing it.
. QR codes can now be captured by wearable
devices, and allow direct connection to web locations that provide access to multimedia information that is relevant and related to the artifact. In the same way, the code can provide access to comment on the artifact and to upload multimedia data that could be used to involve the audience in cultural events or allow them to enrich the connotations of the object.
5
The techniques discussed in section 4 each provide part of the functionality, and currently the size of the tags and tracker is shrinking to a level where unobtrusive application seems feasible. Still, in case of criminal intend locating a missing artifact, and in case of potential forgery fake authentication is still a problem. There are current attempts to, in some cases, overcome these dangers [16].
However, in case of the current large collections of tangible artifacts that are only loosely connected to the intangible knowledge and the relation structure of a living culture, current technical facilities promise a considerable improvement in supporting a living culture. On the other hand, it requires a change in the logistics of many current collections that seem based on traditional paper index cards and backroom storage. We will need to educate the scholars in our cultures as well as to provide IT solutions that are understandable and usable for them.
We thank our students and the scholars and amateurs in the cultural domains who allowed us access to their precious cultural heritage and to their struggles in keeping their cultures alive.
179
!
1. Teresa Consiglio, Selene Uras, Gerrit van der Veer (2015) Teaching Design for Living Memory. HCITOCH 2015, Human-Computer Interaction, Tourism and Cultural Heritage.
2. Selene Uras, Teresa Consiglio, Gerrit van der Veer (2015) Keeping Cultural Heritage Alive – Opportunities with ICT. HCITOCH 2015, Human-Computer Interaction, Tourism and Cultural Heritage
3. Soinuenea (2017) retrieved June 10, 2017, from
http://www.soinuenea.eus/museoa/index.php?id=en
4. Geoffrey Donaldson Institute (2017) downloaded June 10, 2017, from donaldsoninstituut.nl/en/homepage
5. Van den Tempel M. (2017) Een tweede leven voor celluloid. In: Holland Film Nieuws 28 Februari 2017, p. 24-25
6. Living heritage (2017) gerritvanderveer.eu retrieved June 10, 2017 7. Universiteitsmuseum Utrecht (2017)
http://www.universiteitsmuseum.nl/english/exhibitions/the-oude-hortus downloaded June 10, 2017, from
8. Música Para Ver (2017) downloaded June 10, 2017, from www.musicaparaver.org/index.asp?atal=1&hizk=3
9. Definition of culture from Merriam-Webster (2017) https://www.merriam-webster.com/dictionary/culture June 10, 2017
10. UNESCO (2017) http://www.unesco.org/new/en/culture/themes/illicit-trafficking-of-cultural-property/unesco-database-of-national-cultural-heritage-laws/frequently-asked-questions/definition-of-the-cultural-heritage/ June 10 2017
11. Erich M. von Hornbostel and Curt Sachs (1914) Systematik der Musikinstrumente: Ein Versuch. Translated as "Classification of Musical Instruments," by Anthony Baines and Klaus Wachsmann, Galpin Society Journal (1961), 14: 3-29.
12. Loidi J.L. & Yarza L. (1999) Música Para Ver – Instrumentos del Mundo. Diputación Foral de Gipuzkoa
13. Loidi J.L. & Yarza L. (2002) Otras Culturas – Otros Instrumentos. Quincena musical
14. López-Diéguez R. (2007) Música Paraver – Instrumentos Africanus Subsaharianos. Fundación Alberto Jiménez-Arllano Alonso
15. Yamane L. & Lores J. (2004) Els Vilars: A Cultural Heritage Augmented Reality Device. In Lorez J. & Navarro R., ed. Interacción 2004, V
180

!
Congreso Interacción Persona-Ordenador. Lleida: Universität de Lleida, p. 62-69
16. Meng-Day Yu and Srinivas Devadas (2017) Pervasive, Dynamic Authentication of Physical Items. Communications of the ACM 60 (4) p. 32-39
181
!
Himanshu Verma, Hamed S. Alavi, and Denis Lalanne
Human-IST Research Center University of Fribourg
Boulevard de Pérolles 90, 1700 Fribourg, Switzerland
The architectural built environments, which so ubiquitously,
act as shelters and shape our daily personal and social experiences, can soon be envisioned as being interacted with and mediated through
. This conjecture is becoming salient with the increased
interactivity (via retrofitted technology) of our built environments, and a sustained drive to render them energy efficient. This entails for the
re-design, appropriation, and assessment of functions that are
typically ascribed to wearable technologies, as well as the grounding of users’ socio-technical interactions and experiences within the built environments. In this position paper, we discuss this inevitable shift in the role of wearables and the expansion of its functional spectrum to include the built environments and the constituent social constructs, thus facilitating a comprehensive experience of inhabitants’ well-being.
well-being, built environments, sustainable HCI
Le Corbusier, in his 1923 book , has referred to a
building as a machine to inhabit. This perspective is growing ever more relevant with the continued accelerated measures to increase the efficiency of built environments in terms of energy consumption and performance. Consequently, existing built environments are increasingly retrofitted with interactive elements (for example, NEST thermostat9) to optimize energy usage by automating specific functions, providing awareness about (the
consequences of) inhabitants’ actions, and providing a platform (in a long
9 https://nest.com/thermostat/meet-nest-thermostat/
182
!
term) to change one’s behavior towards energy-efficient living. Additionally, in newly constructed buildings, more specifically the one certified by low-energy-consumption standards (for example, Minergie in Switzerland), automated heating and ventilation systems have mandated the removal of operational windows. While these developments have been reported to be advantageous in conserving energy, the lack of control over the environment (as a consequence of automation) has raised concerns about the inhabitants’ perceived comfort [1], [2]. Furthermore, the furnishing of varied interactive and awareness devices calls for the design, appropriation, and assessment of new interaction paradigms and socio-technical practices. These evolving concerns and opportunities entail the monitoring of environmental parameters, knowledge about existing social constructs, and acute context awareness followed by recommendations for contextualized actions on the part of both the built environment and the inhabitants.
The functions of continued observance, diagnosis, and awareness of individuals’ physical or physiological state are already ascribed to numerous wearable devices (for example fitness and activity trackers, medical implants, etc.). We believe that with the evolution of our built environments, these aforementioned functions are being expanded to include, beyond just the physiological state, the (spatio-temporal) knowledge about our physical environment and social contexts. Consequently, we can envision supplementing the role of wearables as a facilitator for our (two-way) interactions with the built environments and other inhabitants, in a way that our living/working experiences are grounded within an ecosystem of socio-technical systems comprising of sensors, actuators, ambient information, and data analyses. Furthermore, a (multi-modal) data-centric approach may manifest in the “quantified home (or office)” as an extension of the lifelogging movement.
In the following sections, we will illustrate this notion with the (developing) perspective of Human-Building Interaction (HBI) [3] [4], as well as our own participatory experiences within an interdisciplinary living lab project comprising of architects, building performance researchers, designers, and us (HCI researchers).
Human-Building Interaction (HBI) is an emerging notion at the intersection of architecture, interaction design, and UbiComp that aims “
183
!
” [3]. Interaction design and
UbiComp have on numerous occasions drawn inspirations from the domains of architecture and urban design. However, the concrete possibilities for these domains to closely work together have been rare in the past [4]. HBI is (consequently) an attempt to bring together researchers from these contributing domains to share knowledge and work in close cooperation, in order to design for the sustainable living experiences while addressing the evolving living and working styles and habits of inhabitants. Smart Living Lab, as discussed in the next section, is a unique project which is the manifestation of principles at the core of HBI.
Smart Living Lab10 is an inter-disciplinary lab engaged in the envisioning of the built environments of the future by examining the research questions that concern sustainable living and working experiences, which are grounded in the evolving socio-cultural practices. A prototype building was constructed to study these aspects in central Switzerland, in the bilingual city of Fribourg. This building currently serves as a workspace for around 100 researchers from three academic institutions - Swiss Federal Institute of Technology (EPFL), University of Fribourg, and School of Engineering and Architecture in Fribourg (HEIA). The researchers come from different domains of Architecture, Building Physics and Performance, Design, Law, and HCI. Amongst multiple projects that are currently being pursued, inhabitants’ well-being and the perception of comfort within the changing landscape of modern architecture, as well as the role of human factors in building design are the research topics which we are currently investigating.
Our contributions within the Smart Living Lab, so far have focused on the ecologically valid and multivariate building-data visualization, exploration and analysis, which may reveal varied aspects of occupants’ behavior in different scenarios. This data-centered approach has implications for the comprehension of occupants’ well-being, and simultaneously augment it through well-grounded socio-technical interactions and experiences. Here, we believe that the wearable technologies have a crucial part to play.
10 https://smartlivinglab.ch
184
!
The potential expansion of wearables’ functional spectrum to include our built environment may augment our self-awareness about our well-being by including aspects of comfort and its perception, as well as the contextualized negotiation of environmental state (temperature, air quality, etc.) with fellow inhabitants while maintaining a sustainable living practice. This entails design, appropriation, and evaluation of new interaction mechanisms with the built environment, either directly or indirectly through wearables by examining the dynamic socio-cultural practices through an amalgamation of ethnography, interaction design, and (sensor-) data analytics. In this section, we illustrate the varied dimensions and scenarios that may constitute this shift in our fine-grained awareness beyond ourselves to our environment. These dimensions correspond to the multiple sources of available physical and physiological data from sensors, which can facilitate the acquisition of knowledge about the context (number of inhabitants, ongoing activity, physiological history, etc.), and offer a quantitative platform to negotiate environmental state between a human and a building (for example POEM [1]), or amongst inhabitants themselves. In the following sections, we will especially focus on dimensions pertaining to the quality of indoor environment and mobility of its individuals, as these are the dimensions which can afford an extension to the conventional wearables.
Environmental characteristics concerning well-being can be grouped into four categories of thermal, respiratory, visual, and acoustic well-being [5], [6]. While significant amount of research has been conducted in different domains on the thermal and respiratory aspects, relatively less work accounts for the visual and acoustic aspects. This can be attributed to the immediately perceived effects of thermal environment (temperature, humidity, and air-flow) [7], and the adverse effects of inferior respiratory environment owing to the increased concentration of gases such as Carbon Dioxide, pollutants and particulate matter [8], [9]. The relevance of the respiratory environment is further heightened due to the adverse effects of poor air quality on human health, the lack of awareness about the air quality within buildings [10], [11], and especially crucial in metropolitan cities which experience increased levels of pollution.
185
!
Sensors recording different attributes of these dimensions can be distributed within the built environment, which in tandem with ambient and distributed awareness tools may prove to be informative to the inhabitants. Subsequently, these awareness (and visualization) tools can offer informed recommendations to the inhabitants about the set of possible actions (for example opening windows to allow for cross-ventilation). In addition, they can also provide an interactive platform for inhabitants to negotiate their comfort parameters (for example, in case of conflicts resulting from varying thermal perceptions). ComfortBox by Alavi et al. [12] is an example of such a tool that affords for awareness about these four dimensions, a possibility to inform the building (through interactions) about levels of acceptable comfort, and communicate one’s perceived comfort to other inhabitants.
The perceived loss of control over different architectural elements such as windows and shades, with the increased automation of buildings and its environment, has also been observed by Brambilla et al. [2] to negatively influence the perceived well-being of inhabitants. This further exacerbates the need for tools and mechanisms that can mitigate this negative perception by providing awareness, empowering inhabitants to express their opinions about their well-being, and eventually enabling them to negotiate the desired environment. Furthermore, we envision that the living experience can be enriched by combining physiological information from conventional wearables (for example, body temperature, skin conductance), as it can facilitate the acquisition of precise knowledge about an inhabitant's health status, and enable the development of personalized and contextualized well-being models.
Presence (or absence) of inhabitants within home, office, or a specific room, or proximity to certain artifacts and architectural elements within the building are vital resources to establish a precise context awareness for the built environment. Smart home technologies (for example, NEST thermostat, smart lighting) leverage this information to regulate the environmental state by controlling the HVAC (Heating, Ventilation, and Air Conditioning), or lighting systems, and consequently optimize the energy consumption. These systems often use the geo-location information of an inhabitant’s smart phone to accomplish their goals.
Furthermore, at a finer level of granularity, the presence information can be used to precisely model the context such as the number of inhabitants and thus the likely activity the inhabitants are engaged in, or in specific cases to
186
!
detect unexpected behavior for security reasons. Indoor localization techniques can be used to access this information. Besides allowing for finer control over the environmental attributes, the presence information can also be used to assess various building functions in the post-occupancy phase of a building. The study conducted by Verma et al. [13] employed presence information (specifically indoor mobility) to assess if the rooms within an office building were used to their full capacity, and how inhabitants with different professional profiles contributed to the utilization of office space. Such studies, in the short term, allow for the sustainable use of buildings and provide implications for design and appropriation. In the medium term, they can act as valuable knowledge resources for the next phase of building life-cycle, and in the long term they contribute to the repertoire of knowledge about human factors in built environment. Therefore, the presence and proximity information can be leveraged with the wearables to attain a comprehensive understanding of inhabitants’ behavior, and this can be utilized extensively to expand wearables’ functionality beyond health monitoring to design contextualized interactive services and tools.
Environmental attributes and inhabitants’ localized information can be easily accessed through a combination of distributed sensors, and can be simultaneously leveraged to interact with our built environments. In addition, social cues and signals (such as speech times, turn-taking, proximity to other inhabitants, etc.) which constitute an integral aspect of human communication, can further enrich the contextualized knowledge of the built environment. These social aspects which are investigated and designed for by researchers in the CSCW (Computer Supported Collaborative Work) community can be utilized, either directly or indirectly, by wearables to enable occupants to exercise fine control over buildings. Furthermore, the abundant knowledge within the CSCW community, which was acquired through the analysis of social interactions (verbal and non-verbal) may foster the design of collective awareness tools (about environmental factors – both indoor and outdoor). Such tools, in the short term may allow the occupants to negotiate their comfort levels, and in the long term can motivate occupants to regulate their behavior for a sustainable living experience.
187
!
In this position paper, we have argued that with the increased interactivity of our built environments and an enhanced need for sustainable living, the well-being (or comfort) of inhabitants is being rendered crucial. Here, we believe, that the wearable technologies can play a vital role in diluting the boundaries of to (also) include our built environments. This extension in the
functional spectrum of wearables is happening with the increased diffusion of different sensors (recording the thermal, respiratory, acoustic, and visual aspects of built environments), and the increasing interactivity of our living and working spaces. Furthermore, the physiological data that is being collected and analyzed by wearable devices can be combined and communicated with our built environments to maintain a precise awareness
of the context (inhabitants’ health status and the ongoing activity),
increase the inhabitants’ awareness about the environmental factors and their influence on health, enable a fine grained control over our built
environments while optimizing the energy consumption, provide
inhabitants with a platform to negotiate their comfort with others, and thus foster an enhanced living and working experience.
This extensive goal provides fertile grounds for inter-disciplinary collaborations between researchers from architecture, building physics, machine learning, interaction design, UbiComp, and so on. Workshops (such as this one) and symposiums can supply an opportune platform to discuss and refine the many research questions, define the future research agenda, and most importantly offer possibilities to initiate collaborative efforts at the intersection of sustainability, health, and HCI.
1 M. Milenkovic, U. Hanebutte, Y. Huang, D. Prendergast and H. Pham, "Improving User Comfort and Office Energy Efficiency with POEM (Personal Office Energy Monitor)," in
, Paris, France,
2013.
2 A. Brambilla, H. Alavi, H. Verma, D. Lalanne, T. Jusselme and M. Andersen, ""Our inherent desire for control": A case study of
188
!
automation's impact on the perception of comfort," in
, Lausanne, Switzerland, 2017.
3 H. S. Alavi, D. Lalanne, J. Nembrini, E. Churchill, D. Kirk and W. Moncur, "Future of human-building interaction," in
, San Jose, 2016.
4 H. S. Alavi, E. Churchill, D. Kirk, J. Nembrini and D. Lalanne, "Deconstructing human-building interaction," vol. 23,
no. 6, pp. 60-62, 2016.
5 P. M. Bluyssen, M. Aries and P. van Dommelen, "Comfort of workers in office buildings: The European HOPE project,"
vol. 46, no. 1, pp. 280-288, 2011.
6 D. Hawkes, The environmental imagination: technics and poetics of the architectural environment, Taylor & Francis, 2008.
7 P. O. Fanger, Thermal comfort. Analysis and applications in environmental engineering., Copenhagen: Copenhagen: Danish Technical Press., 1970.
8 C.-G. Bornehag, J. Sundell, C. J. Weschler, T. Sigsgaard, B. Lundgren, M. Hasselgren and L. Hägerged-Engman, "The association between asthma and allergic symptoms in children and phthalates in house dust: a nested case--control study,"
vol. 112, no. 14, p. 1393, 2004.
9 W. J. Fisk, Q. Lei-Gomez and M. J. Mendell, "Meta-analyses of the associations of respiratory health effects with dampness and mold in homes," vol. 17, no. 4, pp. 248-296, 2007.
10 S. Kim and E. Paulos, "inAir: measuring and visualizing indoor air quality," in
, Orlando, Florida, 2009.
11 M. Frešer, A. Gradišek, B. Cvetković and M. Luštrek, "An intelligent system to improve THC parameters at the workplace," in
, Heidelberg, Germany.
12 H. S. Alavi, H. Verma, M. Papinutto and D. Lalanne, ""Comfort": A coordinate of User Experience in Interactive Built Environments," in
189

!
, Mumbai, India, 2017.
13 H. Verma, H. S. Alavi and D. Lalanne, "Studying Space Use: Bringing HCI Tools to Architectural Projects," in
, Denver,
Colorado, USA, 2017.
190
Workshop 9
Humour is pervasive in human social relationships and one of the most common ways to produce positive affect in others. Research studies have shown that innocent humour increases likability, boosts friendship, alleviates stress, encourages creativity and improves teamwork. Humour embraces various types of expression - both verbal and non-verbal - and can be used to enhance the interaction outcome while being socially and culturally appropriate.
While humour is a well-established branch in artificial intelligence and natural language processing communities, in the human-computer interaction field humour is regarded as a rather marginal research topic, despite its positive effects scientifically proven by decades of research.
Therefore, this workshop aims to explore challenges in designing and evaluating humorous interactions, as well as benefits and downsides of using humour in interactive tasks with artificial entities.
191
Anton Nijholt, Andreea I. Niculescu, Alessandro Valitutti, Rafael E. Banchs
University of Twente, Institute for Infocomm Research (I2R),Universita di Bari
This paper is a short survey on humor in human-
computer interaction. It describes how humor is designed and interacted with in social media, virtual agents, social robots and smart environments. Benefits and future use of humor in interactions with artificial entities are discussed based on literature reviews.
Humor · Social Media . Embodied Agents . Smart
Environments
Humor is a complex cognitive process that frequently, but not necessarily, leads to laughter [53]. The Oxford English dictionary defines humor as “the faculty of observing what is ludicrous or amusing or of expressing it” [62]. The fact that even a simple joke uses simultaneously language skills, theory-of-mind, symbolism, abstract thinking, and social perception, makes humor arguably the most complex cognitive attribute humankind may have [34].
Humor is consistently found in all cultures around the world [69]: people of all ages and backgrounds seem to have an instinctive ability to perceive humor attempts, a fact suggesting humor has an evolutionary basis. Researchers found close ties between humor and playfulness: humor appears to be the very complex ability of the mind to be playful with thoughts [34]. Further, researchers also found that mock aggression usually exhibited in playful behavior was a way to resolve social conflict, relieve tension [34] and facilitate cooperation by transferring information on sympathy levels through recipients laughter [26].
192
Along the history, humor has played an important role in our cultural and social life as it manifested in literature, poetry, arts, and theater. Taking various ways of expression and functionalities, humor appears in the performances of native North American tribal clowns [53], Arabic storyteller tradition [20], Indonesian Wayankulit puppet shows [59], Polynesian clowning wedding traditions [24], modern television comedies or more classic stand-up comedy in cafes around the world [15]. Although the use of humor is universal, what is held to be funny is relative and may vary from culture to culture: for example, jokes that provoke laughter in Indian popular theaters would hardly draw a smile from a Dutch observer [15]; Americans seem to prefer aggressive humor more than Belgians, Hong-Kongese [12], Senegalese or Japanese [60] do while native Hungarians show more appreciation for jokes featuring ethnic stereotypes as compared to their bilingual English-Hungarians counterparts [19] [33]. Such differences explain why many jokes or ironic remarks often go unremarked, misunderstood or perceived as offensive [56]. As such, creating humor seems to be a very challenging task: one needs to be aware of social norms and culture-specific conventions, share a common background with the audience, master language subtleties and sense the appropriate context for spinning a good story [56].
Humor is also found to be an attractive characteristic in people increasing the interpersonal attraction [9], strengthen friendship and boosting trust among peers [21] and business partners [30]. Also, in learning environments humor proved to be an excellent tool for promoting content retention and student motivation [72]. In this paper, we explore the benefits humor can bring in human-computer interaction (HCI). More specific, we look at how humorous interaction can be created in social media, virtual agents, social robots and smart environments with the goal of ultimately achieving a better user experience (UX). It is a fact that humor continues to evolve in our modern times through memes, YouTube clips, funny tweets and other playful interactions.
Since humor has always shown positive influences in our lives, we can expect similar beneficial consequences in interaction with technology. However, the HCI field holds rather an undecided view on humor in task-oriented interactions: on one side, the traditional view considers humor to increase overall competition time by distracting users and causing them to take the task less seriously; on the other side, research studies have found task competition time and amount of effort to be mainly unaffected by incorporating humor in interaction [38].
193
Concerning non task-oriented interactions, HCI has a rather neutral view: neither are humor interactions recommended nor discouraged. As technology started moving from our work environment to our home and less goal-directed interactions are starting to become predominant [48], we believe humor can positively affect the interaction.
This paper has four sections each one corresponding to a technology under review, namely social media, virtual agents and social robots and smart environments - smart environments is given special consideration in our paper due to the relative importance it has in nowadays context. The survey ends with conclusions and a future work outline.
Since humor is a social phenomenon, it is not surprising to find plenty of humorous events occurring in mobile and web-based dialogue. For example, it a is a common experience to type unintentionally funny texts by using the auto correction feature of instant messaging systems. This situation happens so often that there are websites where users share the humorous messages they consider mostly hilarious11. One of the strategies employed in computational humor consists of identifying these sources of unintentional humor and recreating them intentionally. In the case of the above example, previous attempts have been performed to model short texts containing humorous mistakes, using forms of lexical similarity to produce funny puns [66][64].
During the last decade, social media enabled people to produce and share a vast amount of multimodal material, including humorous texts, images, and videos. For instance, YouTube hosts a large number of videos showing pranks or funny mistakes. Humorous comments are commonly posted on Facebook as well as Twitter and YouTube. Internet memes, generally consisting of a picture and a short message, are one of the most common types of potentially viral content. Despite their simple structure, internet memes are enough complex to combine linguistic and visual creativity and thus achieve forms of multimodal humor that have been modeled computationally[31][49].
Social media not only give the opportunity to share content between members of an online community but also allow them to provide feedback, rate what is posted and select the posts they like most. The feedback can be explicit, such as Facebook likes or Reddit upvotes or downvotes, or implicit, as in the case of Twitter’s retweet or Facebook's share features (where
11www.damnyouautocorrect.com
194
reposting some content may be used as an indirect indicator of humor appreciation). Web sites such as Sickipedia12 collects jokes posted by the users and rank them according to the users’ feedback (as either up-votes or down-votes). It may happen that some users provide a new version, possibly more successful, of an already posted joke. In this way, a form of evolutionary selection promotes the creation and transformation of jokes. This process achieves, at a higher speed, the same type of collective creativity underlying the creation of jokes communicated in oral, face-to-face, channels. In the case of media environments where comments can be nested (e.g., comments on comments, etc.), such as Reddit [14], the repartee generated by this feature produces original and funny conversational traces.
A particularly interesting research line is about computational analysis and generation of verbal irony in tweets. Irony and sarcasm typically have a double audience. They are used both “laugh at someone” and “laugh with someone” [61]. Sarcastic tweets, in particular, express a negative opinion about some target (e.g. a politician) and, at the same time, are meant to amuse the readers and to make them willing to retweet them. This explains the explosion of interest in automated sarcasm detection, on which recent advancements has been performed using various machine-learning techniques [22][57][5][51]. Moreover, there have been first attempts to generate irony automatically and provide Twitter bots with ironic capabilities [67].
One of the main advantages in the study of humor in social media is the possibility to analyze the ongoing collective response of users to humorous messages. For instance, an empirical study shows that practical jokes, performed by brands as a way to attract the attention of consumers, are not particularly useful as a marketing strategy [27]. Pranks are a kind of disparagement humor, relying on the induction of negative emotions such as fear or other negative stimuli such as derision or aggression. According to this study, people often tend to empathize with the victim of the prank and thus associate negative sentiments to the brand.
In summary, we envision two stages in the computational treatment of humor in social media. The first phase would consist of the development of computational resources for modeling humor expressed by events, social behaviors, shared knowledge and its rating by online communities. In a second stage, computational humor researchers will hopefully be able to build systems proactively able to create humorous events and adapt their humorous behavior according to the individual and collective responses.
12www.sickipedia.ne
195

Humor underlies a highly complex cognitive process that clearly distinguishes humans from other species in the animal kingdom: it is a sign of intelligence, an ice-breaker in social gathering, a way to relieve stress and to induce good mood. And yet until recently from the HCI point of view, humor has received little attention.
However, why virtual agents and machines should use humor? Through their visual appearance, speech and gesture, virtual agents and social robots try to mimic the style of human interaction. On one side, this human-likeliness brings familiarity; on the other side, it could lead to unfulfilled expectations and feelings of uncanniness [37]. A way of dealing with such shortcomings could be to lower the user expectations, decrease the degree of striking human resemblance and improve the user experience by making the interaction less tensioned. Perhaps, humor could induce a key change of perspective, making users laugh at a yet imperfect technology and, thus, accept it.
This hypothesis seems to be confirmed by early studies on humor in HCI re-port on similar beneficial effects as encountered in human-human interaction. For example, Morkes and colleagues [38] studied the effects of humor in task-oriented interactions and found that users rated significantly better the system that gave humorous comments. He found no evidence of users wasting task completion time as previously thought in the HCI community but rather an overall improved perception of systems qualities. Similarly, the study by Huan and Szafir [25] found positive effects of humor in education: students interacting with a humorous teacher - robot or human - gave more positive comments about the instructor than otherwise. Also, a later study by Niculescu and colleagues [42] demonstrated that humor increases the likeliness of a social robot’s speaking style and personality, as well as it contributes towards increasing the overall task enjoyment.
Expressing humor gives the machine the ultimate human touch: the study by Dybala et al. [17] showed that users evaluated a humorous agent as more human-like and consequently rated it as more likable and funny. Babu and colleagues [4] also found that social conversations increased up to 50% when a virtual receptionist used jokes in interaction with human users.
Humor in non-verbal form of expression (e.g. gestures, facial expressions, whole body movements) was studied by Wend and Berg [68] in interaction with a service robot. Their study showed that non-verbal humor has
196
significant positive effects on the way different robot characteristics were perceived, as well as on the entire interaction quality evaluation.
Another study by Katevas and colleagues [28] investigates social dynamics between a robot performing stand-up comedy and a human audience. Results showed that people respond more positively when the robot looks at them while performing. Also, robot’s gestures seemed to contribute to different patterns in the audience response. The study provides good insights on how humor and stand-up comedy should be designed in a multimodal interaction context.
Further, the study by Niculescu and Banchs [41] shows how humor can be used to help chatbots recovering from errors: in situations of failures, i.e. when the system is unable to retrieve the correct answer, it may use humorous responses to prompt the user to reformulate the query and consequently recover from failure.
Humor also seems to be a successful tool to persuade people to change bad habits. Started as an initiative of the Volkswagen Group Sweden, the so-called ‘fun theory’ explores how fun, playfulness and humor can change user behavior for the better. Within a competition organized for the best fun idea, several interactive ‘ideas’ were developed - such as an interactive piano staircase, an noise making garbage bin, a playful recycling automaton, rewarding speed camera etc. These devices were used to persuade people to do more sport, throw garbage in the bins, recycle more and reduce speed while driving. Empirical results confirmed that more people tended to change their behavior as a result of experiencing fun in interaction [1].
Implementing humor however, given its subtleties and nuanced facets is one of the major challenges in computer science. There are three important steps for a successful deployment of humor in autonomous systems: firstly, humor needs to be detected and semantically understood. Secondly, it needs to be generated. Thirdly, humor needs to be delivered at the right moment and appropriate situation; the last one is perhaps, the most challenging task, as background knowledge, emotional intelligence, context and culture awareness are needed. While notable advancements in the area of detection [50][13] [45] [23], understanding [55], generation [65], appropriate delivery [16] [3] were made, the development of fully automatic humorous machines capable of recognizing, generating and using humor appropriately is still in its infancy.
Recognizing the value of humor in interaction, big corporations such as Apple, Microsoft and Amazon started investing in creating virtual agents having gender, level of education, personality, political opinions and of course their very own style of humor. Siri, Cortana and Alexa are already famous for
197
their funny responses. Interestingly, here is that behind the answers stand not carefully designed algorithms but rather teams of novelists hired by the corporations to give the audience the best possible responses [18].
In the future, we expect humor to be used on a large scale in interaction with virtual agents and social robots for an increased number of purposes. This could be learning tasks, i.e. to help retain content more easily, motivate people pursuing a specific goal, change people’s behavior and improve system usability in case of errors. At the moment, artificial devices still struggle with understanding natural language semantics and as such, mastering humor will be - with no doubt - a huge technological step forward to be probably accomplished not in a few years’ time.
Sensor technology is about devices that obtain information from pressure (touch: screen, button, mat), movement (camera), identification (intelligent vision), gesture (intelligent vision), temperature (thermometer, infrared camera), tags (RFID scanners), sound and speech, (neuro-) physical sensors, and even implants that provide information about brain activity. Actuators are computer controlled devices that make physical changes to the environment (movements, replacements, appearances, volumes, sound, temperature, pressure, light, humidity, smell, taste, ...). In smart environments these actuators, fed by computing devices (embedded micro-processors) that assess sensor information, take care of communication, control of heating, lighting, humidity, safety, and other issues that deal with efficiency and sustainability. Sensors and actuators are in our wearables: smart phones, smart watches, smart textile. Smart materials [36] act as sensors and actuators at the same time.
Thanks to sensor technology our environments become smart. We are used to doors that open when we approach or escalators that start moving when we get close. Air conditioning or heating devices in our rooms know about the temperature and know about our preferences. Sprinkler installations can detect smoke and actuate sprinkling. Home security systems guard our houses. Our activities are monitored. Audio-visual and haptic information can be sensed, manipulated, and distributed, and can become input to actuators that can make changes to the environment. Our smartphones sense and are sensed, they are context-aware and allow implicit interactions with the environment. In our homes we can talk with domestic digital assistants that control devices in our house.
198
Embedded smartness in our environments, our wearables and bodies will penetrate all our activities, including our home, recreational, travel and office activities. Will it also penetrate our ways of generating and appreciating humor in verbal and non-verbal contexts? In this section we are interested in generating and experiencing humor that involves digital technology in real world environments. Hence, digitally enhanced real world environments, in which we live (smart domestic environments), work (smart workplaces), travel (smart public transport, smart cars) or do shopping and recreate (smart public spaces).
How can the design of humorous and playful events make use of digital technology? Can we have spontaneous use of digital technology, by on the fly changing and reconfiguring sensors and actuators, to create a humorous situation? Can smart technology and Artificial Intelligence autonomously decide what to do in order to create a humorous situation? And, finally, does the presence of smart technology increase the chance of unintentional humor?
Humor research is usually focused on the use of humor in texts and in verbal interaction. Theories of verbal humor, for example the so-called “General Theory of Verbal Humor” developed by Victor Raskin and Salvatore Attardo [2], provide an analysis of jokes, where jokes are represented as conflicting scripts. That is, when someone is telling a joke usually, at first, a stereotypical situation is introduced. But, this set-up allows ambiguity that we become aware of when there is an unexpected change in the story (in a joke, the punch line). The change makes us clear that we gave a wrong interpretation to the set-up, and we are surprised and confused, especially when the new situation is opposing the original one. But our confusion is changed to understanding once we have resolved the incongruity we were experiencing.
Although not all jokes follow this pattern, we can certainly learn from this incongruity view on humor when investigating non-language humor, including nonverbal aspects of interaction, cartoons, comedies, sitcoms, stand-up comedy, movies, video games, and the real, physical world. We can use this view when investigating the creation and experiencing of humor in our daily activities, when we intentionally or unintentionally take part in humorous events or witness events that make us laugh. Again, incongruities, unexpected but forced deviations from stereotypical interpretations of how things should appear or be done are the key elements of humor in real-life situations. But we need to add two other viewpoints.
199
The first one is that when we abandon the language domain, incongruities can become cross-modal incongruities. There can be incongruity between appearance and behavior, between language use and behavior, or more detailed, between gestures and eye gaze behavior, et cetera. When sufficiently conflicting, these cross-modal incongruities can help to let a humorous situation appear.
The second viewpoint we need to mention is that speech, conversations, and text present humor in a sequential way. There is the explicit possibility to mislead a reader or listener by presenting story elements in a particular order. This can also happen in a real-life situation, we see events happening sequentially, we change our physical viewpoint, we understand what’s going on after seeing the reaction of bystanders. But it can also be the case that two conflicting interpretations are presented at the same time. For example, in a cartoon, where the visual information conflicts with the text balloon or the caption, or when in “The Goldrush” Charlie Chaplin is eating his shoelaces pretending they are spaghetti strings (a literal and metaphorical interpretation appearing at the same time). We have two concurrent, but opposing meanings. At a more global level, behavior that is expected in one social context can become inappropriate and potentially humorous in another. In real life we can observe pets and children acting in ways that are non-stereotypical from the point of view of grown-ups. Hence we can observe incongruities and humor that follows from them.
There is an enormous amount of humor research in psychology. There is research on the appreciation of humor, the various types of humor, functions of humor or the cultural aspects of humor. There is research on humor in sitcoms, movies, and video games. There are numerous books on comedy writing. In applications such as advertising, healthcare and education the persuasive role of humor is investigated. Collections of chapters on fundamental and applied studies of humor can be found for example, in [35] and [54].
We are interested in how humor can be created, rather than in its functioning, its various roles and possible ways of appreciation. Moreover, we are interested in humor as it appears in the physical world, rather than in language. And, because of the digital enhancement of our physical world, we are interested what role digital technology can play in creating non-language humor. Since our aim is to study opportunities for humor to appear in
200

digitally enhanced real-life environments it is useful to see what has been said - before the advent of digital technology about generating humorous events in real-life environments.
Unfortunately, although there are typologies of humor and descriptions of basic techniques, the viewpoint that is usually taken is the characterization or the analysis of humor. Nevertheless, knowing about characterizations of humorous events should help us to design humorous events in smart environments or to design conditions that can help in creating humorous events, whether de-signed in advance, or created spontaneously, on the spur of the moment when an opportunity arises and humor seems to be appropriate.
There is another shortcoming of these typologies, they hardly address humorous situations in real life. In the tradition of Bergson [7] who was very much influenced by French theater play in his and previous centuries, more recent re-searchers usually make references to events that occur in movies, rather than in the real world. Noël Carroll [10] investigated ‘sight gags’ in movies from an incongruity point of view. Most examples are taken from silent movies. In Morreall [40] categories of humor are introduced as it can appear in objects, persons, or situations. These categories are: ‘Deficiency in an object or person’, ‘One thing/situation seeming to be another’, ‘Coincidence in things/situations’, ‘Incongruous juxtaposition’, and ‘Presence of things in inappropriate situations’. We notice that in all these categories incongruity plays an important role. In Berger [6] forty-five basic techniques of humor are distinguished. The techniques were obtained by studying jokes and humorous texts (jokes, comedies, short stories). Hence we can find many linguistic, logic and style related techniques. They have been used in comedy writing and the analysis of jokes. But, interestingly, the techniques have also been used in the analysis of TV commercials [8]. In jokes, humorous texts, in comedy and in TV commercials the humor is designed.
Situations differ from what we experience in real life, human behavior is more exaggerated and events are not always plausible or even possible. Nevertheless, the characterizations of incongruities that are made available by the various categories are useful for thinking about the creation of humor in the physical world.
Physical objects can be found in domestic and public environments. Research on humorous products usually addresses products that are used in our homes, such as furniture, door mats, vases, mugs, writing material, kitchen and bath products, et cetera. Products have texture, appearance weight, volume. Sometimes a product can emit, absorb or reflect sound, light or heat. It means, as discussed in [32], that there are many possibilities to
201
introduce cross-modal in-congruities in the design of humorous products. Rather than having cross-modal or cross-sensorial incongruities based on appearance and product properties (for example, a visual-auditory incongruity is present in a rubber duck that roars like a lion when it is squeezed).
It is also possible to have product incongruities with characteristics similar to those we can recognize in the categories of Morreall [40]. For example, in [70] representational aspects, operational aspects and aspects of context of use incongruities are introduced. An example of a representational (shape) incongruity is a floor lamp with the form of a match stick. There is a clear relation between a floor lamp and a match stick (they both give light), but they are certainly opposed in size. An example of an operational incongruity is a balloon that is used as a business card of a chest physician. When the balloon is inflated the address of the physician becomes visible. Again, there is a clear relation between the balloon and the profession of the business card holder, but of course it is an unexpected use of a balloon. The results of their research have been used in the design of interactive humorous (indoor) water fountains [71]. Categories of techniques for humorous product design are also introduced in [58] and [29]. There is overlap between the categories, expected versus unexpected is of course a common viewpoint, but this viewpoint can be approached from different directions and in different detail, such as function, representation, and context, or product properties, or more concrete suggestions concerning the use of irony, parody, visual puns, anthropomorphization and zoomorphization.
Our observations in this subsection help to make clear what conditions play a role in order to perceive behavior, an event or a product as humorous. A further systematic differentiation between incongruities in order to obtain more comprehensive design guidelines for introducing incongruities in the physical, non-language world seems to be useful. The typologies that have been introduced are about observing humorous events, they donot mention how to introduce humorous events or how to invite humorous interactions. Moreover, what is missing in these typologies is a possible role of digital technology to introduce humorous products in a smart home or public space environment or to introduce or what role digital technology can play in making environments not only smart, but also playful and humorous. Can we use smart technology to design environments that have a sense of humor?
202
Humans are able to create humor. That is, a remark, a joke or text, a gesture, a behavior, an object, or an event that provides us with the emotion of comic amusement [11]. Traditional humor research is about analyzing humor, rather than on creating humor. Humor can be created, that is, intentionally. Humor can also appear unintentionally.
If we would have necessary and sufficient conditions for humor to be created or to appear, we would understand humor. That is not yet the case. But, we can at least try to find necessary conditions for humor to appear. Conditions include the introduction of incongruities that surprise us, maybe confuse and challenge us, but are not threatening. A humorous event can also be suggested. Someone can comment on a particular situation, drawing our attention to a particular viewpoint that makes it humorous. Hence, complementing the event with the necessary conditions that are missing.
For humor as it appears in the real world or in the digitally enhanced real world we need to distinguish the various roles that human actors play. Let us first look at how we have a role in joke telling.
In the case of a joke we have a speaker (the joker) and one or more listeners (the audience). The joker plays with the audience, he or she is misleading the audience with the set-up of the joke and then introduces an incongruity for the audience to resolve. A joke is usually about a human activity and involves human actors. For them there is no incongruity in their behavior or the situation. The incongruity is in the different viewpoints that are introduced by the joker and have to be understood by the audience in order to get the joke. We can laugh about the way we have been fooled and misunderstood the event that is described in the joke. However, often a joke involves a human actor who is doing stupid things, who is fooled or is made ridiculous. And we laugh about the misfortune of this person.
What about the roles of human actors in the real world? We smile a lot, particularly while face-to-face interacting with other people, but not necessarily because there is humor involved. But, more importantly for this section, we also often smile about events that happen in our environment and that we experience as humorous. Laughing aloud happens when we see an event is seriously humorous or changes from mildly humorous to seriously humorous. We smile or laugh when someone is fooled, when someone acts stupidly or completely misunderstands a particular situation. A person can act in a way that is inappropriate in a social setting. When confronted with an unknown situation or with unfamiliar technology, someone can fall back on
203

previous experiences, but they may not be valid anymore. Similarly, we can laugh about the behavior of pets and children that are confused by changes in their environment.
Taking these observations into account, in real life humorous situations we can distinguish various roles for the human `participants. We can have observers of humorous situations (the audience). We can have creators of humorous situations. Here we need to make a distinction between intentional and unintentional humor creation. In intentional humor creation we have a creator. The creator has planned the humor in advance. An artist can make a humorous interactive installation. An interactive fountain can be designed in such a way that it makes a difference between an adult and a child when squirting water upon them. An urban game designer can introduce different roles for the players of the game.
Hence, we can have persons that introduce, knowingly or unknowingly, humorous events or add to events in order to make them humorous. We can be observers of such humorous events. We can be actors that are involved in humorous events. In the latter case we can help, knowingly or unknowingly, to make the event possible, or we can be the target and the ‘victim’ of the humor. We have humorous event creators, we have observers (the audience) and we have actors that are part of the humorous event, including ‘actors’ that are the butt of joke making.
The typologies and incongruity distinctions we mentioned earlier do not take into account digital technology. They were mainly composed before the advent of personal computers, the Internet and the World Wide Web. Apart from observations on humorous product design, examples that illustrate these categories are usually taken from ‘artificial’ worlds, that is, stage plays and movies. There are exceptions, but usually we find these exceptions also artificial (how often see you someone slipping over a banana peel?) or childish (playing keek-a-boo). Obviously, whether it is about comedy or movies, humorous events in real life, or real or imagined events in children’s play, in many such situations we have events that are blown out of all proportion if we compare it with the mild humor that we experience in our daily routines and activities. We nevertheless think we can learn how to introduce humorous events in the digitally enhanced real world by looking at the principles of the techniques that are used to generate humorous products or at humor as it appears in theater play, sitcoms or movies in more extreme forms.
204

We provide two views on creating humor in smart environments. The first one is a traditional one. Civic authorities can ask artists or media studios to de-sign humorous and playful interactive installations in public spaces. This is not necessarily different from designing objects using digital technology in amusement parks. In public spaces these installations are meant to be available for an audience during a particular period of time, an exhibition, a celebration or some other kind of festivity. In certain locations, for example an amusement park, they can be available for a longer time. But an interesting difference can be that in public spaces use is made of objects that are natural (rather than artificial objects in an amusement park) in the public space. Such objects can include lamp posts, buildings, statues, street signs, traffic lights, metro entrances, billboards, et cetera. Many examples where sensors and actuators make use of such city objects in order to create smart humor exist [44][43]. In these projects sensors and actuators are added to existing street furniture in order to create playful and humorous situations. Incongruities are introduced because it turns out that we can interact with lampposts and mailboxes (anthropomorphization) in a conversational (chatbot) way or because when we pass a lamppost equipped with an infrared camera and projector we see not only our own shadow on the street, but also see shadows that have been recorded from previous passers-by. Although at first this leads to confusion, we can also see that people become amused and start playing with their own and projected shadows [47].
Unfortunately, despite the availability of playful and humorous installations, in public spaces, museums, and workplaces, such projects are not really integrated into a local community, let alone that a local community can decide to use available IoT technology to introduce playful technology in its environment. The latter has been done and can expected to be done when more people involved in the Do-It-Yourselves (DIY) and makers communities start using their and civic hackers knowledge to ‘attack’ existing smart street furniture or to add community sensor technology to already existing Internet of Things (IoT) technology. In the ‘shadowing’ project mentioned above we have a top-down approach, future and potential users have not been involved in the design and implementation of the project.
Our second viewpoint is a more visionary one. When smart digital technology is available we have the possibility to make the real world more look like the worlds we know from movies, stage plays, TV serials, video games, and virtual reality. Making use of (IoT) technology there is the possibility to make changes to physical environment, the appearance of an environment can change, objects can occupy different positions, light and
205

other environmental conditions can change, sensors and actuators can be given different functions or different access can be allowed. New sensors and actuators can be introduced and configured to serve particular purposes. Humans participating in these IoT networks are becoming nodes in the IoT. They are both sensors and actuators because of their possibility to interact in traditional ways (speech, facial expression, eye gaze, body language) with the IoT, but also because their sensorial and intellectual capabilities will be amplified with smart technology, such as smart wearables (smart phones, glasses, watches, neuro-physiological sensors, electronic tattoos, implants, brain stimulation). Moreover, their taste, touch and smell senses can be amplified. Artificial Intelligence can be used to make us smarter and to make the environment smarter. Augmented reality should be mentioned as a technology that allows us to integrate the physical with any digital world. Hence, in this second viewpoint humans become smarter and have digitally enhanced sensorial capabilities, and their environments become smarter. It is unclear yet what consequences this has for new kinds of humor. Evgeny Morozov [39] suggests that those who control the IoT will control humor.
As mentioned in section 2, in humor research we usually distinguish three viewpoints, the superiority, the relief, and the incongruity (resolution) viewpoint. The first two viewpoints are about the functional and the emotional aspects of humor. The incongruity viewpoint is about the cognitive aspects of humor and how we can give different interpretations to a particular situation, how we can make a shift from one interpretation to another and how we can integrate different interpretations into one. Smart technology makes it possible to change an environment and to manipulate the perception of an environment. For that reason we are interested in the incongruity viewpoint. How can smart technology introduce incongruities that can become humor, that is, that become the object of comic amusement?
We introduce four categories of intentional humor creation in smart environments. There can be other, unintentional ways that humor appears in a smart environment. There can be bugs in the technology and it may also be the case that humor appears because of not being able to handle the technology, making errors, and clumsy behavior. In [47][46][63] more can be found about this kind of humor in smart environments.
The objects of humor are generated autonomously by the smart
technology. This requires that the smart technology has a sense of humor and uses it, whenever it is appropriate, to generate an event that will be considered humorous by someone present in the
206
environment. There can be unwanted ‘participation’ of an actor that is the ‘butt’ of the humor. Other participants can have a passive role (audience) or be involved in the use of smart technology to see this event happen.
Smart technology allows us to perceive different views on a particular situation. We can be persuaded to perceive these views at the same time (con-currently) or sequentially. This can be done using audio-visual media, augmented reality, or virtual reality technology. An incongruity can be there when we have a metaphorical versus a literal interpretation of a particular scene in our real world. Augmented reality provides us with different views on the same event. Rather than having the environment decide about the creation of humor, we can leave it to the human participant to use this in-formation to create a humorous event, making use of sensors and actuators available in the environment.
We can have autonomous generation of humor by a smart environment, we can have smart technology that suggest how to use this technology in or-der to create such events. There are other possibilities to use the smart technology to introduce humor. One of them is auto completion or, rather, prediction. Machine learning methods will make it possible to complete certain activities in a humorous way, suggesting, persuading, or forcing the user to complete his or her activities in a way that leads to a humorous situation. The environment becomes a digital humor adviser. The adviser can become embodied (a virtual agent or a social robot) to make it more convincing.
Rather than having agents that help in creating humorous situations we can also think of agents that give humorous comments on events that are happening in a smart environment. The events are not necessarily humorous. A humorous comment can be constructed by providing an alternative and op-posing view on a particular event. In this case there is no need to implement such a humorous view using available technology. Such an agent role can be compared with the Agneta and Frida personas introduced in [52] who have ironic comments on the websites a user is visiting.
207
In this paper we have presented a short survey on the specific role and use of humor in human-computer interaction. Although humor has received increasing attention in computer science areas such as natural language processing and artificial intelligence, it appears to be a neglected research topic in the field of human-computer interaction. Given the significantly important role humor has played in human social behavior and relations since the origins of society, we assert that the proper understanding and study of humor in human-computer interaction should be consider strategically important to research and practice in this field. This paper is an attempt to draw special attention towards the importance of studying humor in human-computer interaction, with special attention to humor creation, rather to humor interpretation, as well as to the programmatic use of humor to support and improve the user experience.
With the advent of new technologies, human social and cultural activities have expanded from interpersonal interactions within the natural and urban environments to new environments: the cyberspace and the augmented and smart physical spaces. Regardless of the virtual or physical world settings, the use of humor in artificial agents (either virtual agents in the cyberspace or robots in the physical world) is of fundamental importance to make human-computer interaction more natural and inviting in terms of similarity to human-human interaction. The current trend of human-computer interaction is on “humanization”, although it is still debated in the research community. However, we rather emphasize the focus on “humorization” of human-computer interaction, since we believe it could improve the user experience in terms of acceptance, engagement and collaboration.
The future work in this area should focus on strategies and mechanisms to generate humor in different human-computer interaction settings (social networks, virtual agents, robots and smart physical spaces) with the objective of improving the overall user experience. Some of the interesting research questions to be addressed in future agenda on humor in HCI must include, but should not be restricted to, at least the following:
What are the most effective mechanisms for humor generation in the different human-computer interaction settings?
What are the social and cultural contexts in which different types of humor are proper and acceptable?
208
How to use humor with the objective of minimizing system failure effects and/or augment user tolerance to failure?
How to use humor in human-computer interaction to increase acceptability and reduce/mediate social friction and social divide?
What are the most effective ways of using humor for maximizing the use and utility of public spaces?
What is the impact of using humor in human-computer interaction towards the treatment or prevention of mental health diseases?
How to use humor in human-computer interaction to improve on-line education and self-paced learning?
Human-computer interaction is becoming pervasive and ubiquitous in the physical world and the cyberspace. It is progressively and dangerously replacing most of our traditional human-human interactions. Humor is a paramount indicator of socially desirable and positive interrelationships. The increasing use of human-computer interfaces seems to projecting us into a dark era of human isolation. Providing them with humor, instead, they will likely enhance our humanity.
39. The fun theory, http://www.thefuntheory.com/ 40. Attardo, S., Raskin, V.: Script theory revis(it)ed: joke similarity and joke
representation model. Humour 4(3), 293-347 (1991) 41. Augello, A., Saccone, G., Gaglio, S., Pilato, G.: Humorist bot: Bringing
computational humour in a chat-bot system. In: Complex, Intelligent and Software Intensive Systems, 2008. CISIS 2008. International Conference on. pp. 703-708. IEEE (2008)
42. Babu, S., Schmugge, S., Barnes, T., Hodges, L.: “What would you like to talk about?” an evaluation of social conversations with a virtual receptionist. In: Intelligent virtual agents. pp. 169-180. Springer (2006)
43. Barbieri, F., Saggion, H.: Modelling irony in twitter, features analysis and evaluation. In: Proceedings of the Language Resources and Evaluation conference (LREC 2014). Reykjavik, Iceland (2014)
44. Berger, A.: An Anatomy of Humor. Transaction Publishers, New Brunswick, NJ (1993)
45. Bergson, H.: Laughter. An essay on the meaning of the comic. Translated from Le Rire. Essai sur la signification du comique (1900). Gutenberg Project (2003)
46. Buijzen, M., Valkenburg, P.: Developing a typology of humor in audiovisual media. Media Psychology 6(2), 147-167 (2004)
47. Cann, A., Calhoun, L.G., Banks, J.S.: On the role of humour appreciation in interpersonal attraction: It’s no joking matter. International Journal of Humour Research 10(1), 77-90 (1997)
209

48. Carroll, N.: Theorizing the Moving Image. Cambridge University Press, Cambridge, UK (1996)
49. Carroll, N.: Humour. A Very Short Introduction. Oxford University Press, Oxford, UK (2014)
50. Castell, P.J., Goldstein, J.H.: Social occasions for joking: a cross-cultural study. In: It’s a funny thing, humour: International conference on humour and laughter. pp. 193-197 (1977)
51. Chandrasekaran, A., Vijayakumar, A.K., Antol, S., Bansal, M., Batra, D., Lawrence Zitnick, C., Parikh, D.: We are humor beings: Understanding and predicting visual humor. In: Proceedings of the IEEE Conference on Computer Vision and Pattern Recognition. pp. 4603-4612 (2016)
52. Choi, D., Han, J., Chung, T., Ahn, Y.Y., Chun, B.G., Kwon, T.T.: Characterizing conversation patterns in reddit: From the perspectives of content properties and user participation behaviors. In: ACM Conference on Online Social Networks (COSN 2015). Stanford, CA, USA (November 2015)
53. Driessen, H.: Anthropology of humor. In: International Encyclopaedia of the Social & Behavioural Sciences - Second Edition, pp. 416-419 (2015)
54. Dybala, P.: Humor to facilitate HCI: Implementing a Japanese pun generator into a non-task oriented conversational system. Ph.D. thesis, (2010)
55. Dybala, P., Ptaszynski, M., Rzepka, R., Araki, K.: Humoroids: conversational agents that induce positive emotions with humor. In: Proceedings of The 8th International Conference on Autonomous Agents and Multiagent Systems-Volume 2. pp. 1171-1172. International Foundation for Autonomous Agents and Multiagent Systems (2009)
56. Elgan, M.: Virtual assistants: They’re made out of people!, http://www.computerworld.com/article/3028003/personal-technology/ virtual-assistants-theyre-made-out-of-people.html
57. Erdodi, L., Lajiness-O’Neill, R.: Humor perception in bilinguals: Is language more than a code? Journal of Cross-Cultural Psychology (2012)
58. Gingrich, A., Al-Dubai, Z., Kamal, N.: Smiles and smallness : Jokes in Yemen and Palestine. In: Hannerz, U., Gingrich, A. (eds.) Small Countries: Structures and Sensibilities. University of Pennsylvania Press, Philadelphia (2017)
59. Hampes, W.P.: The relationship between humour and trust. International Journal of Humour Research 12(3), 253-260 (1999)
60. Hao, Y., Veale, T.: An ironic fist in a velvet glove: Creative mis-representation in the construction of ironic similes. Minds and Machines 20(4), 635-650 (2010)
61. Hempelmann, C.F., Petrenko, M.: An AI for humorously reframing interaction narratives with human users. In: International Conference on Distributed, Ambient, and Pervasive Interactions. pp. 651-658. Springer (2015)
62. Hereniko, V.: Clowning as political commentary: Polynesia, then and now. The Contemporary Pacific pp. 1-28 (1994)
63. Huan, C., Szafir, D.: No joke: examining the use of humor in computer-mediated learning (2001)
210
64. Jung, W.E.: The inner eye theory of laughter: Mindreader signals cooperator value. Evolutionary Psychology 1(1), 214-253 (2003)
65. Karpinska-Krakowiak, M., Modlinski, A.: The effects of pranks in social media on brands. Journal of Computer Information Systems (October 2016)
66. Katevas, K., Healey, P.G., Harris, M.T.: Robot comedy lab: experimenting with the social dynamics of live performance. Frontiers in psychology 6 (2015)
67. Klein, S.: Humor and contemporary product design: international perspectives. In: Chiaro, D., Baccolini, R. (eds.) Gender and Humor: Interdisciplinary and International Perspectives, Routledge Research in Cultural and Media Studies, vol. 64, chap. 12, pp. 201-211. Routledge (Taylor & Francis Group), New York, London (2014)
68. Kurtzberg, T.R., Naquin, C.E., Belkin, L.Y.: Humor as a relationship-building tool in online negotiations. International Journal of Conflict Management 20(4), 377-397 (2009)
69. Lin, C.C., Huang, Y.C., Jen Hsu, J.Y.: Crowdsourced explanations for humorous internet memes based on linguistic theories. In: Proceedings of the Second AAAI Conference on Human Computation and Crowdsourcing (HCOMP-2014). Pitts-burgh, Pennsylvania, USA (November 2014)
70. Ludden, G., Kudrowitz, B., Schifferstein, H., Hekkert, P.: Surprise and humor in product design: Designing sensory metaphors in multiple modalities. Humor 25(3), 285-309 (2012)
71. Martin, G.N., Sullivan, E.: Sense of humour across cultures: A comparison of British, Australian and American respondents. North American Journal of Psychology 15(2), 375 (2013)
72. McDonald, P.: The philosophy of humour. Humanities-Ebooks (2013) 73. McGhee, P., Goldstein, J.: Handbook of Humor Research: Volume I: Basic Issues,
Volume II: Applied Studies. Springer, New York, NY (1983) 74. Minuto, A., Nijholt, A.: Smart material interfaces as a methodology for
interaction. a survey of smis’ state of the art and development. In: Proceedings of the 2nd Workshop on Smart Material Interfaces (SMI 2013). Workshop in conjunction with 15th ACM International Conference on Multimodal Interaction (ICMI’13). pp. 1-6. ACM, New York, NY, Sidney, NSW, Australia (2013)
75. Mori, M., MacDorman (Translator), K.F., Minato (Translator), T.: The uncanny valley. Energy 7(4), 33-35 (2005)
76. Morkes, J., Kernal, H.K., Nass, C.: Effects of humour in task-oriented human-computer interaction and computer-mediated communication: A direct test of srct theory. Human-Computer Interaction 14(4), 395-435 (1999)
77. Morozov, E.: Dafür sollte uns der humor zu schade sein (2014), http: //www.faz.net/\protect\discretionary\char\hyphenchar\fonthbj\protect\discretionary\char\hyphenchar\font7tf7i
78. Morreall, J.: Taking Laughter Seriously. State University of New York Press, New York, NY (1983)
211
79. Niculescu, A.I., Banchs, R.E.: Strategies to cope with errors in human-machine spoken interactions: using chatbots as back-off mechanism for task-oriented dialogues. ERRARE 2015 - Errors by Humans and Machines in multimedia, multimodal and multilingual data processing (Mathematics, Physics, Technical Sciences) (2015)
80. Niculescu, A.I., van Dijk, B., Nijholt, A., Li, H., See, S.L.: Making social robots more attractive: the effects of voice pitch, humor and empathy. International journal of social robotics 5(2), 171-191 (2013)
81. Nijholt, A.: Cites intelligentes ... et joueuses! SciencesPsy (11), ISSN 2417-5412. To appear (September 2017)
82. Nijholt, A.: How To Make Cities More Fun. The Wall Street Journal. Online May 30th (2017), https://www.wsj.com/articles/ how-to-make-cities-more-fun-1496163790
83. Nijholt, A.: Humor engineering in smart environments. In: Emotional Engineering Volume 4, pp. 3757. Springer (2016)
84. Nijholt, A.: Humor engineering in smart environments. In: Fukuda, S. (ed.) Emotional Engineering, vol. 4, chap. 3, pp. 37-57. Springer, Cham, Switzerland (2016)
85. Nijholt, A.: Mischief humor in smart and playable cities. In: Nijholt, A. (ed.) Playable Cities: The City as a Digital Playground, chap. 11, pp. 235-253. Springer, Singapore (2016)
86. Nijholt, A., Stock, O., Dix, A., Morkes, J.: Humour modeling in the interface. In: CHI’03 Extended Abstracts on Human Factors in Computing Systems. pp. 1050-1051. ACM (2003)
87. Oliveira, H.G., Costa, D., Pinto, A.M.: One does not simply produce funny memes! - Explorations on the automatic generation of internet humor. In: Proceedings of the Seventh International Conference on Computational Creativity (ICCC 2016). Paris, France (2016)
88. de Oliveira, L., Rodrigo, A.L.: Humor detection in yelp reviews. 89. Ozdemir, C., Bergler, S.: CLaC-SentiPipe: SemEval2015 Subtasks 10 B, E, and
Task 11. In: Proceedings of the 9th International Workshop on Semantic Evaluation (SemEval 2015). pp. 479-485. Denver, Colorado (June 4-5 2015)
90. Persson, P., Höök, K., Sjölinder, M.: Agneta & Frida: Merging web and narrative? In: Mateas, M., Sengers, P. (eds.) Narrative Intelligence, chap. 15, pp. 245-258. John Benjamins, Amsterdam, The Netherlands (2003)
91. Polimeni, J., Reiss, J.P.: The first joke: Exploring the evolutionary origins of humor. Evolutionary Psychology 1, 347-366 (2006)
92. Raskin, V. (ed.): The Primer of Humor Research. Mouton de Gruyter, Berlin (2008)
93. Rayz, J.T.: In pursuit of human-friendly interaction with a computational system: Computational humor. In: Applied Machine Intelligence and Informatics (SAMI), 2017 IEEE 15th International Symposium on. pp. 000015-000020. IEEE (2017)
212
94. Reimann, A.: Intercultural communication and the essence of humour. Journal of the Faculty of International Studies 29(1), 23-34 (2010)
95. Reyes, A., Rosso, P., Buscaldi, D.: From humor recognition to irony detection: The figurative language of social media. Data & Knowledge Engineering 74, 1-12 (2012)
96. Roukes, N.: Humor in art. Davis Press, Worcester, MA (1997) 97. Sedana, I.N.: Kawi dalang: creativity in wayang theatre. Ph.D. thesis, Fuga (2002) 98. Silverman, J.G.A., Anderson, P.: A cross-cultural investigation of humour:
Appreciation of jokes varying in familiarity and hostility. In: Proc. of the 21st meeting of the International Congress of Psychology. Paris (1976)
99. Sperber, D.: Verbal irony: pretense or echoic mention? Journal of Experimental Psychology: General 113(1), 13-136 (1984)
100. Trumble, W.R., Brown, L., Stevenson, A. (eds.): Shorter Oxford English Dictionary 5th Edition. Oxford University Press (2004)
101. Valitutti, A.: Making fun of failures computationally. In: Markopoulos, N.S.P. (ed.) Proceedings of the International Conference on Distributed, Ambient, and Pervasive Interactions (DAPI 2017), held as part of HCI International 2017. Lecture Notes in Computer Science, vol. 10291, pp. 684-695. Springer, Vancouver, BC, Canada (July 9-14 2017)
102. Valitutti, A., Doucet, A., Toivanen, J.M., Toivonen, H.: Computational generation and dissection of lexical replacement humor. Natural Language Engineering pp. 1-23 (April 2015)
103. Valitutti, A., Toivonen, H., Doucet, A., Toivanen, J.M.: “Let everything turn well in your wife”: Generation of adult humor using lexical constraints. In: ACL (2). pp. 243-248 (2013)
104. Valitutti, A., Toivonen, H., Gross, O., Toivanen, J.M.: Decomposition and distribution of humorous effect in interactive systems. In: Artificial Intelligence of Humor, AAAI Fall Symposium Series. pp. 96-100. Arlington, Virginia, USA (November 2012)
105. Valitutti, A., Veale, T.: Inducing an ironic effect in automated tweets. In: Proceedings of the 6th International Conference on Affective Computing and Intelligent Interaction (ACII2015). pp. 153-159. Xi'an, China (September 21-24 2015)
106. Wendt, C.S., Berg, G.: Nonverbal humor as a new dimension of HRI. In: Robot and Human Interactive Communication, 2009. RO-MAN 2009. The 18th IEEE International Symposium on. pp. 183-188. IEEE (2009)
107. Wikipedia: Humour, https://en.wikipedia.org/wiki/Humour 108. Yu, Y., Nam, T.J.: Let’s giggle!: Design principles for humorous products. In:
Proceedings of DIS 2014. pp. 275-284. ACM, New York, NY, Vancouver, BC, Canada (2014)
109. Yu, Y., Nam, T.Y.: Products with a sense of humor: Case study of humorous products with giggle popper. International Journal of Design 11(1), 79-92 (2017)
213

110. Ziv, A.: Personality and sense of humour. Springer Pub Co, Berlin (1984)Bergson, H.: Laughter. An essay on the meaning of the comic. Translated from Le Rire. Essai sur la signification du comique (1900). Gutenberg project (2003)
214
Detection of Humor Appreciation from Emotional and Paralinguistic Clues in Social
Human-Robot Interaction
Lucile Bechade and Laurence Devillers
LIMSI, CNRS, Université Paris-Saclay, F-91405 Orsay Sorbonne Universités, Université Paris-Sorbonne, 75006 Paris
bechade,[email protected]
Abstract. This study is carried out in the framework of the European Chist-Era Joker project, which aims to design a generic user interface that provides a multimodal dialog system to enrich human-robot social dialog with humor mechanisms. This paper addresses the issue of auto-matically interpreting the participant reactions to the robot’s humorous utterances. Through the examination of a corpus, using emotional and paralinguistic clues, (e.g. duration and type of basic emotions, duration of speech and reaction time) we have explored participant’s reactions to a joking robot. We assume that the participant emotional and paralin-guistic behavior can be classified to extract automatically rules defining appreciation or not. This study relies on 45 human-robot interactions and 246 human humor reactions to the joking robot. The human humor reactions, elicited through puns, riddles and canned jokes, were annotat-ed. A Learning Classifier System (LCS) system is used to extract the most accurate behaviors from data. A new experiment has been made to test the results from the LCS classifier.
Keywords. Humor, human-robot interaction, automatic classification, genetic algorithm, annotation, emotion recognition
1 Introduction
Since humorous utterances can provide benefits and support the dialog, human-robot interaction can take advantage of the sociability role of humor in interaction. In order to generate an appropriate humorous dialog, that is con-sidered to be funny and to make participants laugh (Nijholt, 2007), the robot must interpret the participant reactions to humor. This work is a result from the Joker project which aims at building a generic user interface that provides
215
a multimodal dialog system to enrich human-robot social dialog with humor mechanisms. In human interaction, nonverbal elements such as gesture, facial expressions and paralinguistic cues are considered to be valuable cues to un-derstand the communicated message. This paper aims at inferring automati-cally participants' humor reactions from emotional and paralinguistic cues in participants’ speech through the examination of a social human-robot corpus, in face-to-face interaction. We assume that the participant emotional and paralinguistic behavior can be classified to extract automatically rules defining appreciation or not. An expert annotator annotated the human reactions to the humorous robot, elicited through food-related puns, teasing and end rhymes. Emotional and behavioral cues are extracted from annotations (246 annotated humor reactions and 483 emotional and paralinguistic associated cues). Section 3 presents the corpus collection, scenario and data. Section 4 is dedicated to the corpus annotation process and analysis. In section 5 a Learn-ing Classifier System (LCS) is used to extract the most accurate behaviors from data. Classifier systems with genetic algorithms have been fruitfully em-ployed to develop autonomous agents (Dorigo & Colombetti, 1994). Based on the 483 rules, a classification with the LCS return a set of 5 rules for the au-tomatic recognition of participant's humor appreciation and 2 rules for the non-appreciation. A new experimentation has been carried out to test rules and results from the LCS. Section 6 concludes this paper and presents per-spectives.
2 Related Works
Humans communicate a wide range of affective and cognitive mental states, which enrich the interaction. If they are not to leave out important communi-cative information, robots must be equipped with the ability to infer mental states of their human interlocutor. Interest in detecting emotion in conversa-tional speech has emerged only in the past few years as a response to the needs of real-world systems.
While affect recognition systems have mainly focus on the detection of ex-pressions of the six basic emotions from Eckman (Eckman, 1972), some works have undertaken the detection of specific mental states. Mainly based on visu-al cues, facial expression recognition methods have been used to detect com-plex mental states such as agreeing, disagreeing, interested or thinking from a video stream of facial expressions and head gestures (El Kaliouby, 2005). Af-fect expression recognition in audio has mainly focused on emotion (see, e.g., (Devillers, Vidrascu, & Lamel, 2005)). Nevertheless some works have been made on specific application-dependent affective states such as, e.g., frustra-
216
tion and annoyance (Ang, 2002) or certainness in spoken tutorial dialogs based on acoustic-paralinguistic features (Liscombe, 2005).
The reaction to humor, or humor support, is important to show the under-standing and appreciation of a joke. Hay (Hay, 2001) and Bell (Bell, 2009) pointed out that there are many different humor support strategies such as smiles and laughter but also linguistic evaluation of a joke or metalinguistic comments about the joke or the joke teller. The humor support is a way of showing involvement in a discussion and how much the interlocutor enjoys the interaction (Nijholt, 2007). Few works focused on humor support in human-robot interaction, as the study (Bechade, 2016) based on linguistic contribu-tion of the participant and (Knight, S., Satkin, & Ramakrishna, 2011) based on audio-visual tracking for a robot in front of an audience. In (Knight, S., Satkin, & Ramakrishna, 2011) the system tracks the audience appreciation based on laughter, applause or chatter. The aim of our study is to infer the participant appreciation in a face-to-face interaction with the robot.
3 Data Description
3.1 Experimental Process
The corpus used in this study consists of two experiments following the same scenario and the same protocol (a more detailed description is given in (Devillers, et al., 2015) and (Bechade, 2016)). The first experimentation took place in the cafeteria of the LIMSI-CNRS laboratory with 37 French-speaking participants (62\% male and 38\% female). Participants are volunteers work-ing in the laboratory and ages range from 21 to 62 years old (mean age : 35). The second experimentation took place at the Parisian Broca Hospital with 8 French-speaking participants (35\% male and 65\% female). Participants ages range from 64 to 86 (mean age : 74). The two experiments allowed us to have a large variety of ages. In both experiments, participants were seated facing the NAO robot at around one meter from it. Audio and video data have been recorded with a total duration of 3h 57min of data.
3.2 System Description
Data were collected using a Wizard of Oz and an autonomous system. First, the autonomous system was used. The system features an emotion detection module based on audio (Delaborde, 2015). The audio signal is cut into seg-ments, which contain or not an emotion detected. The robot takes into ac-count the majority emotion during a speech turn. The emotion recognized Ekman's six basic emotions (Eckman, 1972). The emotion recognition module
217

works with a linear Support Vector Machines (SVM) with data normalization and acoustic descriptors such as acoustic parameters (e.g. fundamental fre-quency F0, energy, rhythm and spectral envelope or energy per spectral bands).
Second, the Wizard of Oz dedicated to social dialog through the NAO robot (Devillers, et al., 2015) implemented in French language was used for a second interaction with each participant. The system is configured by a predefined dialog tree that specifies the text utterances, gestures and laughter that can be executed by the NAO robot. At each node, the operator chooses the next node of dialog to visit according to the participant’s emotion.
3.3 Scenario
The scenario implements a system-directed social interaction dialog that adapts the telling of riddles and other humorous contributions to some aspect of the user model. During the experiment the robot adapts its humor to the automatically detected users emotions. The behavior of the system depends on the receptiveness of the human to the humorous contributions of the robot. Positive reactions (e.g. laughter, positive comments or positive emotions) lead to more humorous contributions, whereas repeated negative reactions (e.g. sarcastic laughter, negative comments and negative emotions) drive the dialog to the end. If there is no reaction, the robot tries to change its kind of humor so as to make the user react. The emotion detection is made by the paralin-guistic system in the first interaction and by the experimenter in the second interaction. In this scenario, the system displays various humor capabilities of the hackneyed variety (puns, riddles, childish rhymes and word-play) as for instance:
• Riddle: What is a cow making while closing its eyes? / Concentrated milk! • Pun: Anyway, don’t worry, I have a small head too ! • Word-play: Really, it’s a piece of cake !
4 Annotation and Extraction of Emotional Cues
4.1 Humor Reaction Annotation
An expert annotator performed the multimodal annotation of data. All par-ticipants speaking turns containing human speech in our corpus (6778 in to-tal) were labeled for humor response. Humor labels (or HumorAct) describe the contextual human response to a humorous intervention from the robot viewed as the second part of an adjacency pair of humorous act and humor
218
response. These labels are derived from observation made in (Bechade, 2016) on the verbal responses to a humorous robot. The labels are:
• Humor (the participant reacts with a humorous comment) • Like (participant shows appreciation towards the robot or the humorous act
made by the robot) • Dislike • Sarcasm (the participant responds by laughing at the robot or at the joke).
In addition to the humor response annotation, the corpus is also labeled with an emotional annotation scheme indicating the emotional effect of the humor response. In order to describe the complexity of humor positive or neg-ative appreciation, we used a detailed annotation scheme. This annotation scheme allowed us to observe and compare the way participant reacted emo-tionally to a humorous linguistic contribution of the robot. The following di-mensions have been annotated:
• Affective state labels (or FeelingAct) describe each emotional segment (the emotion can be express verbally or by the paralinguistic channel): Surprise, Sadness, Joy, Doubt, Angry, Contempt, Pride, Disappointment, Awareness
• Valence labels (or FeelingAct) are used for non decidable affective states express by the human participant: positive, negative
• Activation labels (or EmotionAct): active, passive • Laugh labels (or LaughAct) describe laughter and the intention disseminat-
ed by the participant laugh: Embarrassment, Amused, Sarcastic, Politeness, Relief, Non-Understanding.
4.2 Emotional and Paralinguistic Cues Extraction
This annotated corpus has been exploited by deriving cues of positive and negative reactions for each participant. As described in figure 1, positive ap-preciation cues are defined from all other annotated labels occurring in the same time as Humor and Like labels. Negative appreciation cues are derived from all other annotated labels occurring in the same time as Sarcasm and Dislike labels. The paralinguistic cues include type and duration as the speech duration and the speech reaction time. The speech reaction time is defined as the duration between the end of the speech produced by the robot and the start of the first speech segment of the human following the robot contribu-tion).
219
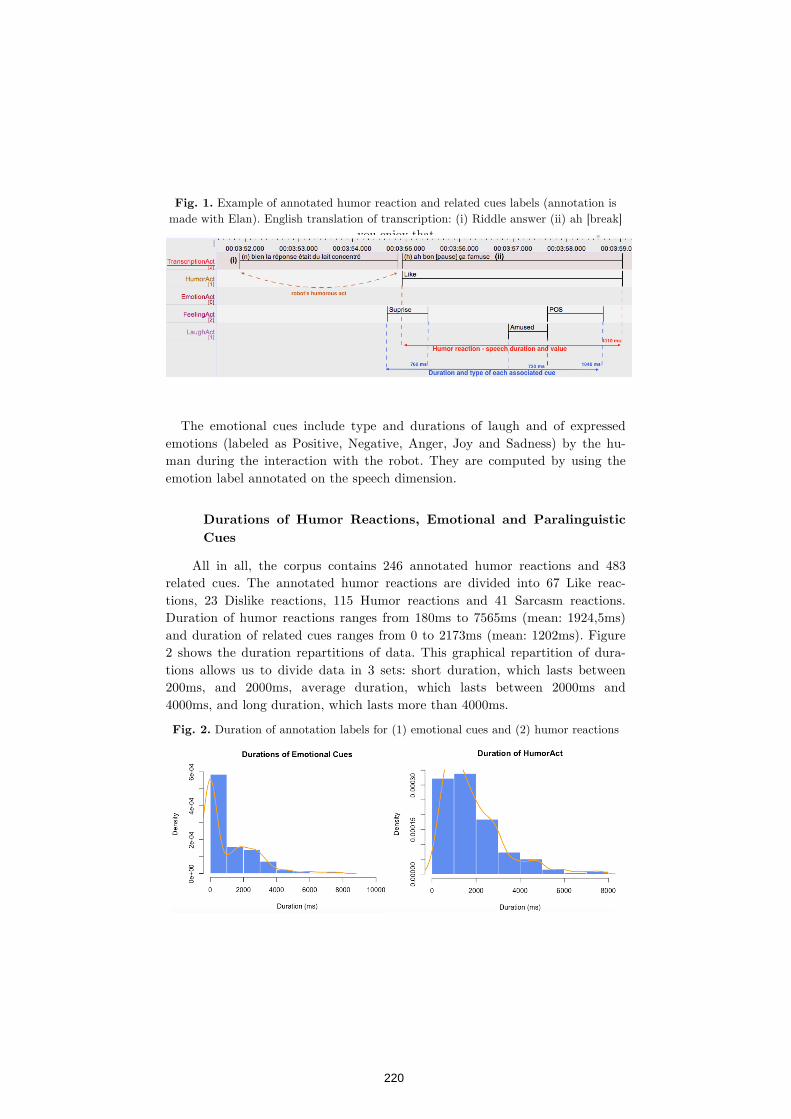
Fig. 1. Example of annotated humor reaction and related cues labels (annotation is made with Elan). English translation of transcription: (i) Riddle answer (ii) ah [break]
you enjoy that
The emotional cues include type and durations of laugh and of expressed
emotions (labeled as Positive, Negative, Anger, Joy and Sadness) by the hu-man during the interaction with the robot. They are computed by using the emotion label annotated on the speech dimension.
4.3 Durations of Humor Reactions, Emotional and Paralinguistic Cues
All in all, the corpus contains 246 annotated humor reactions and 483 related cues. The annotated humor reactions are divided into 67 Like reac-tions, 23 Dislike reactions, 115 Humor reactions and 41 Sarcasm reactions. Duration of humor reactions ranges from 180ms to 7565ms (mean: 1924,5ms) and duration of related cues ranges from 0 to 2173ms (mean: 1202ms). Figure 2 shows the duration repartitions of data. This graphical repartition of dura-tions allows us to divide data in 3 sets: short duration, which lasts between 200ms, and 2000ms, average duration, which lasts between 2000ms and 4000ms, and long duration, which lasts more than 4000ms.
Fig. 2. Duration of annotation labels for (1) emotional cues and (2) humor reactions
220
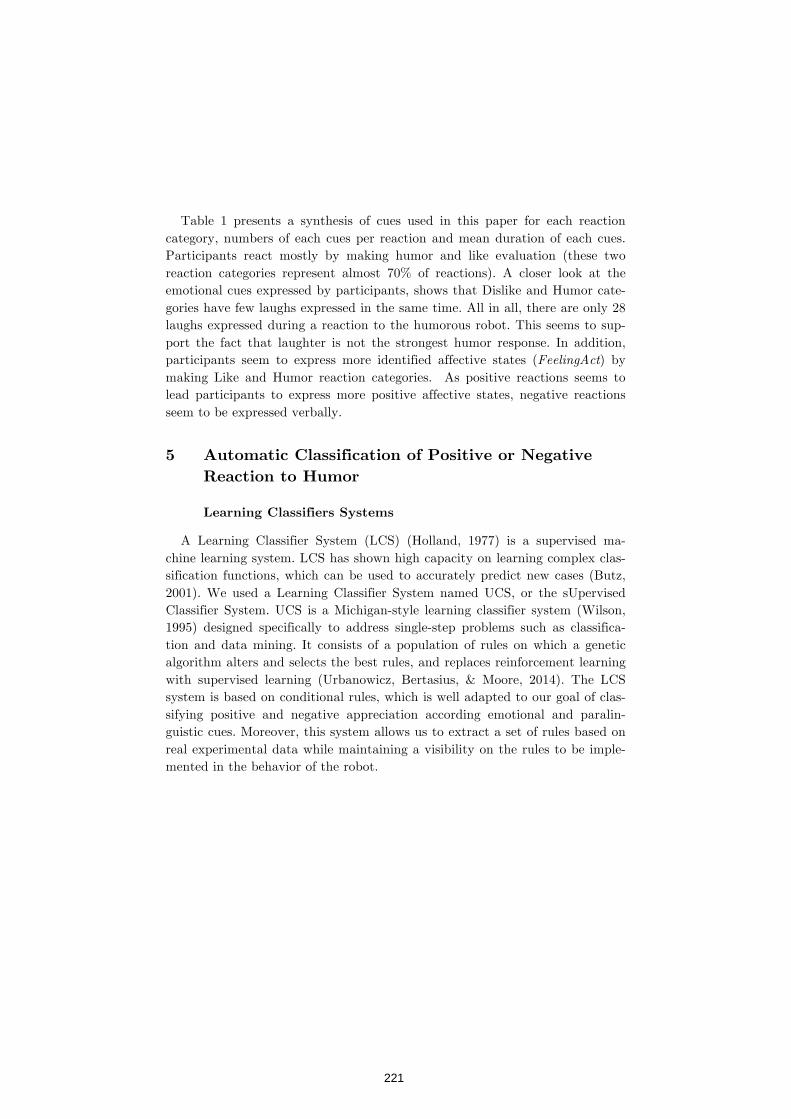
Table 1 presents a synthesis of cues used in this paper for each reaction
category, numbers of each cues per reaction and mean duration of each cues. Participants react mostly by making humor and like evaluation (these two reaction categories represent almost 70% of reactions). A closer look at the emotional cues expressed by participants, shows that Dislike and Humor cate-gories have few laughs expressed in the same time. All in all, there are only 28 laughs expressed during a reaction to the humorous robot. This seems to sup-port the fact that laughter is not the strongest humor response. In addition, participants seem to express more identified affective states (FeelingAct) by making Like and Humor reaction categories. As positive reactions seems to lead participants to express more positive affective states, negative reactions seem to be expressed verbally.
5 Automatic Classification of Positive or Negative Reaction to Humor
5.1 Learning Classifiers Systems
A Learning Classifier System (LCS) (Holland, 1977) is a supervised ma-chine learning system. LCS has shown high capacity on learning complex clas-sification functions, which can be used to accurately predict new cases (Butz, 2001). We used a Learning Classifier System named UCS, or the sUpervised Classifier System. UCS is a Michigan-style learning classifier system (Wilson, 1995) designed specifically to address single-step problems such as classifica-tion and data mining. It consists of a population of rules on which a genetic algorithm alters and selects the best rules, and replaces reinforcement learning with supervised learning (Urbanowicz, Bertasius, & Moore, 2014). The LCS system is based on conditional rules, which is well adapted to our goal of clas-sifying positive and negative appreciation according emotional and paralin-guistic cues. Moreover, this system allows us to extract a set of rules based on real experimental data while maintaining a visibility on the rules to be imple-mented in the behavior of the robot.
221
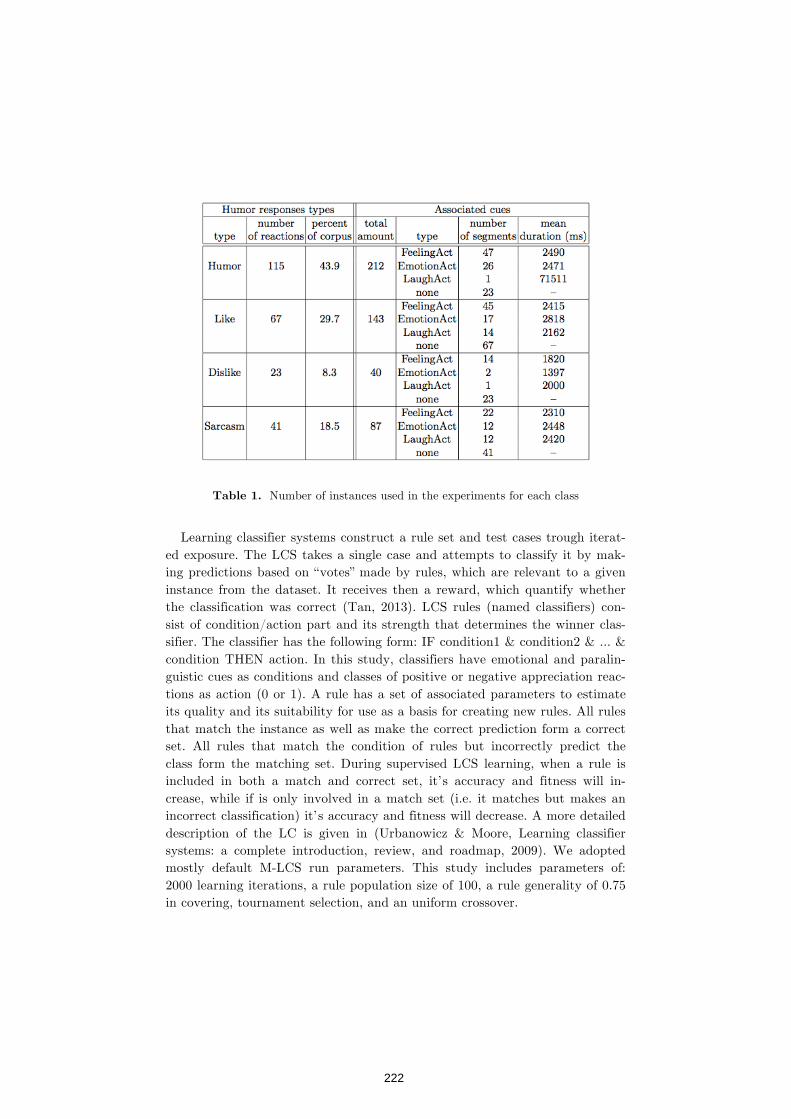
Table 1. Number of instances used in the experiments for each class
Learning classifier systems construct a rule set and test cases trough iterat-
ed exposure. The LCS takes a single case and attempts to classify it by mak-ing predictions based on “votes” made by rules, which are relevant to a given instance from the dataset. It receives then a reward, which quantify whether the classification was correct (Tan, 2013). LCS rules (named classifiers) con-sist of condition/action part and its strength that determines the winner clas-sifier. The classifier has the following form: IF condition1 & condition2 & ... & condition THEN action. In this study, classifiers have emotional and paralin-guistic cues as conditions and classes of positive or negative appreciation reac-tions as action (0 or 1). A rule has a set of associated parameters to estimate its quality and its suitability for use as a basis for creating new rules. All rules that match the instance as well as make the correct prediction form a correct set. All rules that match the condition of rules but incorrectly predict the class form the matching set. During supervised LCS learning, when a rule is included in both a match and correct set, it’s accuracy and fitness will in-crease, while if is only involved in a match set (i.e. it matches but makes an incorrect classification) it’s accuracy and fitness will decrease. A more detailed description of the LC is given in (Urbanowicz & Moore, Learning classifier systems: a complete introduction, review, and roadmap, 2009). We adopted mostly default M-LCS run parameters. This study includes parameters of: 2000 learning iterations, a rule population size of 100, a rule generality of 0.75 in covering, tournament selection, and an uniform crossover.
222
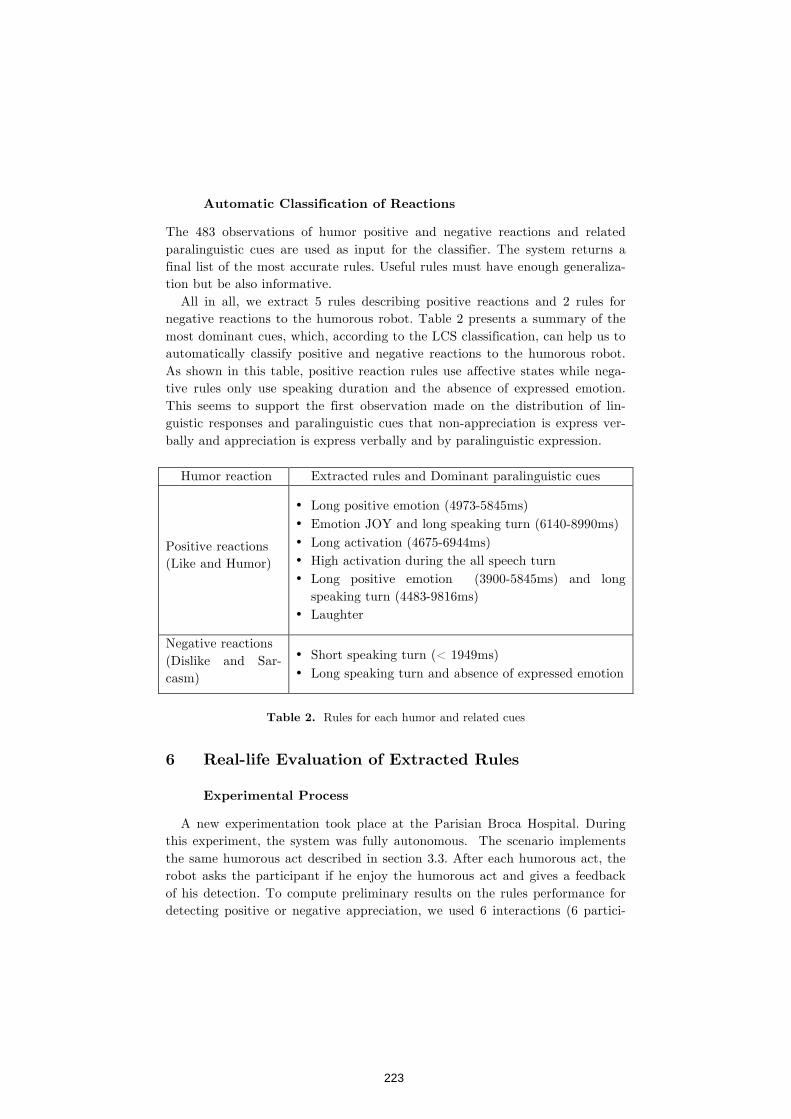
5.2 Automatic Classification of Reactions
The 483 observations of humor positive and negative reactions and related paralinguistic cues are used as input for the classifier. The system returns a final list of the most accurate rules. Useful rules must have enough generaliza-tion but be also informative.
All in all, we extract 5 rules describing positive reactions and 2 rules for negative reactions to the humorous robot. Table 2 presents a summary of the most dominant cues, which, according to the LCS classification, can help us to automatically classify positive and negative reactions to the humorous robot. As shown in this table, positive reaction rules use affective states while nega-tive rules only use speaking duration and the absence of expressed emotion. This seems to support the first observation made on the distribution of lin-guistic responses and paralinguistic cues that non-appreciation is express ver-bally and appreciation is express verbally and by paralinguistic expression.
Humor reaction Extracted rules and Dominant paralinguistic cues
Positive reactions (Like and Humor)
• Long positive emotion (4973-5845ms) • Emotion JOY and long speaking turn (6140-8990ms) • Long activation (4675-6944ms) • High activation during the all speech turn • Long positive emotion (3900-5845ms) and long
speaking turn (4483-9816ms) • Laughter
Negative reactions (Dislike and Sar-casm)
• Short speaking turn (< 1949ms) • Long speaking turn and absence of expressed emotion
Table 2. Rules for each humor and related cues
6 Real-life Evaluation of Extracted Rules
6.1 Experimental Process
A new experimentation took place at the Parisian Broca Hospital. During this experiment, the system was fully autonomous. The scenario implements the same humorous act described in section 3.3. After each humorous act, the robot asks the participant if he enjoy the humorous act and gives a feedback of his detection. To compute preliminary results on the rules performance for detecting positive or negative appreciation, we used 6 interactions (6 partici-
223
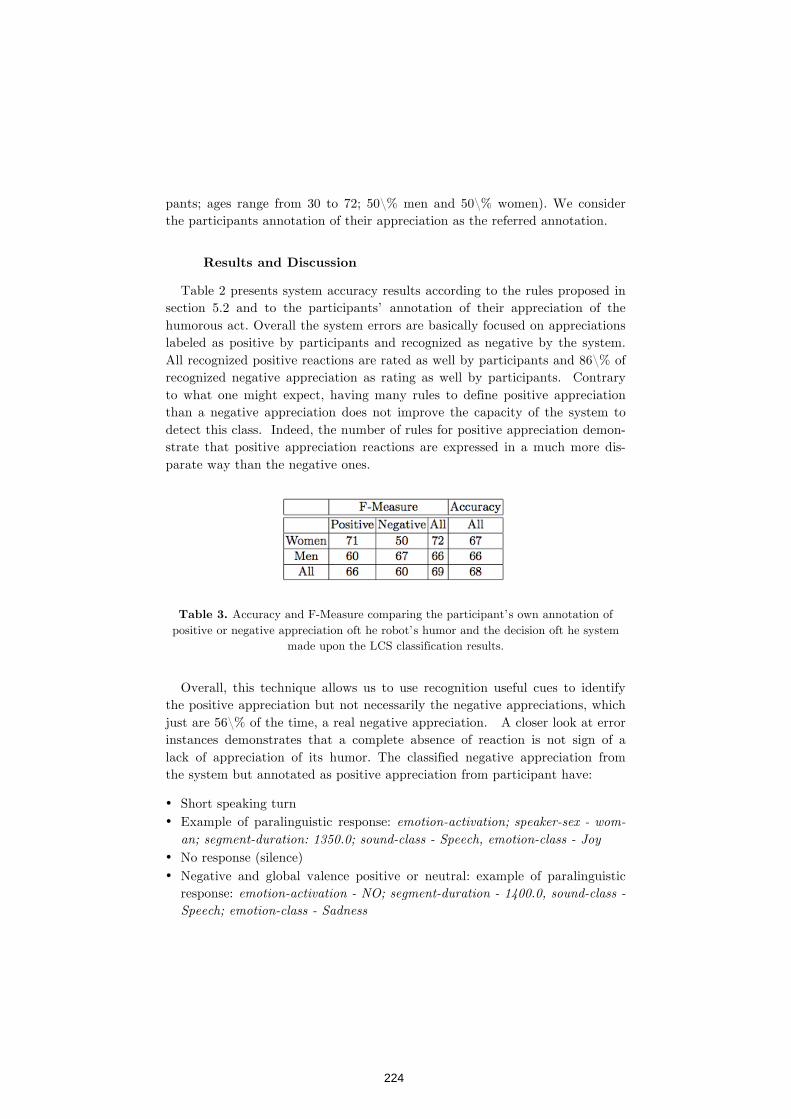
pants; ages range from 30 to 72; 50\% men and 50\% women). We consider the participants annotation of their appreciation as the referred annotation.
6.2 Results and Discussion
Table 2 presents system accuracy results according to the rules proposed in section 5.2 and to the participants’ annotation of their appreciation of the humorous act. Overall the system errors are basically focused on appreciations labeled as positive by participants and recognized as negative by the system. All recognized positive reactions are rated as well by participants and 86\% of recognized negative appreciation as rating as well by participants. Contrary to what one might expect, having many rules to define positive appreciation than a negative appreciation does not improve the capacity of the system to detect this class. Indeed, the number of rules for positive appreciation demon-strate that positive appreciation reactions are expressed in a much more dis-parate way than the negative ones.
Table 3. Accuracy and F-Measure comparing the participant’s own annotation of positive or negative appreciation oft he robot’s humor and the decision oft he system
made upon the LCS classification results.
Overall, this technique allows us to use recognition useful cues to identify
the positive appreciation but not necessarily the negative appreciations, which just are 56\% of the time, a real negative appreciation. A closer look at error instances demonstrates that a complete absence of reaction is not sign of a lack of appreciation of its humor. The classified negative appreciation from the system but annotated as positive appreciation from participant have:
• Short speaking turn • Example of paralinguistic response: emotion-activation; speaker-sex - wom-
an; segment-duration: 1350.0; sound-class - Speech, emotion-class - Joy • No response (silence) • Negative and global valence positive or neutral: example of paralinguistic
response: emotion-activation - NO; segment-duration - 1400.0, sound-class - Speech; emotion-class - Sadness
224
These instances are most often due to the participants' lack of response (lack of linguistic contribution or laughter), a short contribution, or recogni-tion of a negative emotion in the speech. These errors may be due to the module of emotion recognition, as well as to a lack of responsiveness of the participant. The only instance where the system recognized a positive appreci-ation while the participant said he did not appreciate the humorous contribu-tion of the robot is due to a laugh of the participant (the paralinguistic con-tribution consists in: segment-duration": 1310.0; sound-class – Laughter). In deed, researches have demonstrate that laughter in human-robot interaction in frame of a game can be positive or negative and express amused as well as embarrassment for example (Soury, 2014). Finally, this test have been running with only elderly people while most of the training corpus has been collected with a younger population.
7 Conclusion
This paper has explored ideas related to emotional and a paralinguistic ap-preciation response of participants to humorous acts made by the robot in a social dialog. The aim of this paper was to infer automatically participants humor positive and negative appreciation reactions from emotional and para-linguistic cues in participant’s speech through the examination of a social hu-man-robot interaction corpus.
The human reactions to the humorous robot, elicited through food-related puns, teasing and end rhymes were annotated an expert annotator. Emotional and behavioral cues are extracted from annotations. All in all, the corpus con-tains 246 annotated humor reactions and 483 associated cues. In order to ex-tract the most accurate positive and negative behaviors from data, a Learning Classifier System (LCS) system is used. The LCS system is based on condi-tional rules, which is well fitting to our goal of classifying positive and nega-tive appreciation according to emotional and paralinguistic cues. Moreover, this system allows us to extract a set of rules based on real experimental data while maintaining a visibility on the rules to be implemented in the behavior of the robot. Results demonstrate that negative cues are well suited to detect negative appreciation whereas positive appreciation is more difficult to detect.
225
Bibliography
Urbanowicz, R. a. (2014). An extended Michigan-style learning classifier system for flexible supervised learning, classification, and data mining . Lecture Notes in Computer Science, in press.
Urbanowicz, R. a. (2009). Learning classifier systems: a complete introduction, review, and roadmap. Journal of Artificial Evolution and Applications , 1.
Zeng, Z. a. (2009). A survey of affect recognition methods: Audio, visual, and spontaneous expressions. Pattern Analysis and Machine Intelligence, IEEE Transactions , 31, 39-58.
Wilson, S. S. (1995). Classifier fitness based on accuracy. Evolutionary Computation , 159-175.
Ang, J. a. (2002). Prosody-Based Automatic Detection of Annoyance and Frustration in Human-Computer Dialog. Proceedings Prceedings of ICSLP, Denver, Colorad, USA, (pp. 2037-2039).
Butz, M. a. (2001). An Algorithmic Description of XCS. IWLCS '00 - Third International Workshop on Advances in Learning Classifier Systems, (pp. 253--272). London, UK, UK.
Bechade, L. a.-D. (2016). Empirical Study of Humor Support in Social Human-Robot Interaction. Streitz N., Markopoulos P. (eds) Distributed, Ambient and Pervasive Interactions. DAPI 2016.
Bell, N. D. (2009). Responses to failed humor. Journal of Pragmatics , 41, 1825-1836.
Eckman, P. (1972). Universal and cultural differences in facial expression of emotion. Nebraska symposium on motivation , 207-284.
El Kaliouby, R. a. (2005). Real-time inference of complex mental states from facial expressions and head gestures. In Real-time vision for human-computer interaction (pp. 181-200). Springer.
Devillers, L. a. (2005). Challenges in real-life emotion annotation and machine learning based detection . Neural Networks , 18, 407-422.
Devillers, L. a. (2015). Multimodal Data Collection of Human-Robot Humorous Interactions in the JOKER Project . Affective Computing and Intelligent Interaction (ACII).
Delaborde, L. D. (2015). Inference of human beings' emotional states from speech in human-robot interactions. International Journal of Social Robotics , 1-13.
Dorigo, M. a., Dorigo, M., & Colombetti, M. (1994). Robot shaping: developing autonomous agents through learning. Artificial Intelligence , 71 (2), pp. 321-370.
226
Fuchs, I. V. (2012). Humor support in synchronous computer-mediated classrooms discussions. Humor - International Journal of Humor Research , 4, 437-458 .
Fuchs, I. V. (2012). Humor support in synchronous computer-mediated classrooms discussions. Humor - International Journal of Humor Research , 24, 437-458.
Gardner, R. (2001). When Listeners Talk: Response Tokens and Listener Stance. Amsterdam: J.Benjamins Publishing.
Hay, J. (2001). The pragmatics of humor support . Humor -- International Journal of Humor Research , 14, 55-82.
Holland, ,. J. (1977). Cognitive systems based on adaptive algorithms . ACM SIGART Bulletin.
Kahn Jr., P. H. (2014). No Joking Aside -- Using Humor to Establish Sociality in HRI. ACM/IEEE International Conference on Human-Robot Interaction .
Knight, H. a. (2011). A Savy Robot Standup Comic: Oline Learning Through Audience Tracking. TEI '11: Proceedings of the Fifth International Conference on Tangible, Embedded, and Embodied Interaction. ACM.
Knight, H. (2011). Eight Lessons learned about Non verbal Interactions through Robot Theater. Third International Conference ICSR 2011 , 42-51.
Liscombe, J. a. (2005). Detecting certainness in spoken tutorial dialogues. SIGDIAL '09 Proceedings of the SIGDIAL 2009 Conference: The 10th Annual Meeting of the Special Interest Group on Discourse and Dialogue (pp. 286-289 ). ACM.
Nijholt, A. (2007). Conversational Agents and the Construction of Humorous Acts. In T. Nishida (Ed.), Wiley Series in Agent Technology (pp. 19--47). John Wiley \& Sons, Ltd.
Soury, M. a. (2014). Smile and Laughter in Human-Machine Interaction: a study of engagement. LREC 2014: proceedings. ACM.
Reeves, B. a. (1996). The Media Equation: How People Treat Computers, Television, and New Media Like Real People and Places. . Cambridge University Press.
Rich, C. a. (2010). Collaborative Discourse, Engagement and Always-On Relational Agents. AAAI Fall Symposium: Dialog with Robots .
Tan, J. a. (2013). Rapid Rule Compaction Strategies for Global Knowledge Discovery in a Supervised Learning Classifier System . (pp. 110--117 ). MIT Press.
7.1
227
Anton Nijholt
University of Twente, the Netherlands Imagineering Institute, Malaysia
We become nodes in the Internet of Things (IoT),
not only because we are monitored and our actions can be predicted and understood, but also because sensors and actuators attached to our body or in our body make us a ‘living’ sensor and actuator, and an active node in the IoT. Also, digital technology amplifies our intelligence and our sensorial capabilities. With this background (smart environments, the IoT, and our amplified intelligence and senses), in this paper we explore humor as it can appear in digitally enhanced physical worlds, with a focus on humor in smart workplaces.
Humor · Workplace · Incongruity humor · Functional
humor · Subversive humor · Digital technology · Smart environments · Internet of Things · Trolling · Hacking · Virtual agents · Social robots
Humor is the ‘object’ of an emotion that has been called ‘comic amusement’ [3]. How does that object occur or how can it be created? We make a distinction between accidental humor, spontaneous humor and designed humor. Accidental humor does not necessarily require human decision-making. Spontaneous humor, despite its name, is made on purpose, and there usually is some reflection on whether it is appropriate to construct and use this humor, for example in a conversation. Designed humor requires planning in advance. In Figure 1 we display this humor continuum from accidental to designed humor.
228
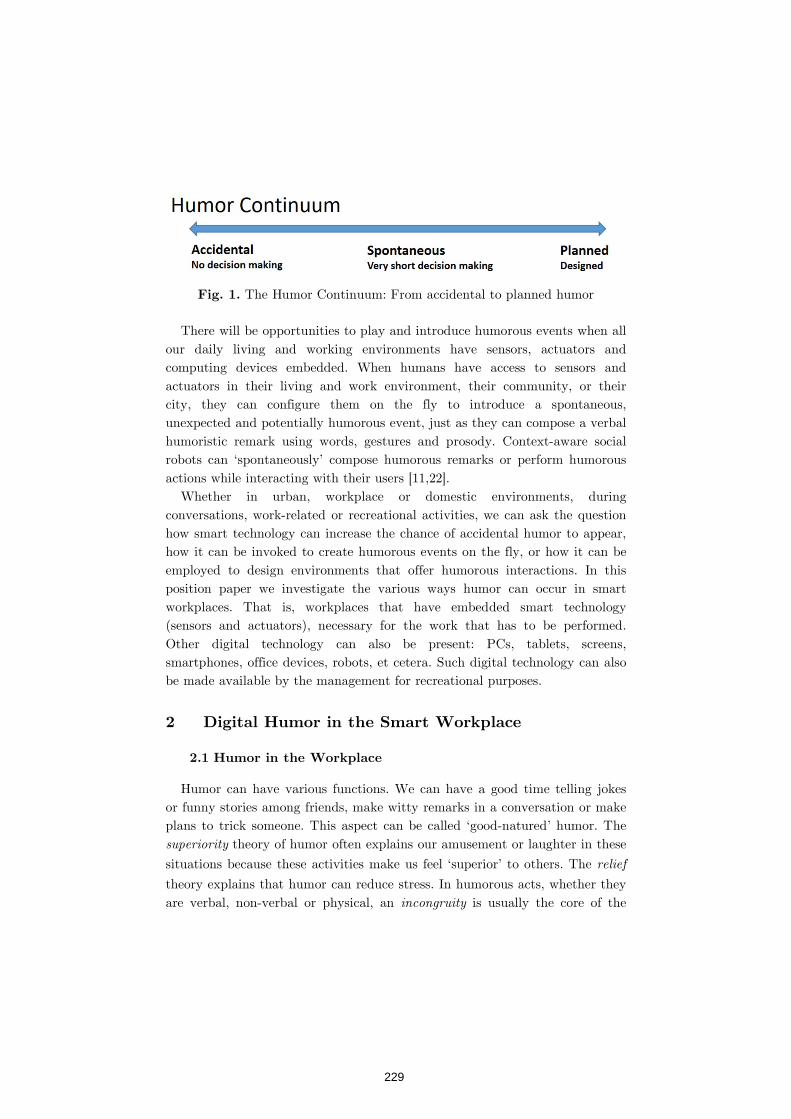
The Humor Continuum: From accidental to planned humor
There will be opportunities to play and introduce humorous events when all our daily living and working environments have sensors, actuators and computing devices embedded. When humans have access to sensors and actuators in their living and work environment, their community, or their city, they can configure them on the fly to introduce a spontaneous, unexpected and potentially humorous event, just as they can compose a verbal humoristic remark using words, gestures and prosody. Context-aware social robots can ‘spontaneously’ compose humorous remarks or perform humorous actions while interacting with their users [11,22].
Whether in urban, workplace or domestic environments, during conversations, work-related or recreational activities, we can ask the question how smart technology can increase the chance of accidental humor to appear, how it can be invoked to create humorous events on the fly, or how it can be employed to design environments that offer humorous interactions. In this position paper we investigate the various ways humor can occur in smart workplaces. That is, workplaces that have embedded smart technology (sensors and actuators), necessary for the work that has to be performed. Other digital technology can also be present: PCs, tablets, screens, smartphones, office devices, robots, et cetera. Such digital technology can also be made available by the management for recreational purposes.
Humor can have various functions. We can have a good time telling jokes or funny stories among friends, make witty remarks in a conversation or make plans to trick someone. This aspect can be called ‘good-natured’ humor. The
theory of humor often explains our amusement or laughter in these
situations because these activities make us feel ‘superior’ to others. The
theory explains that humor can reduce stress. In humorous acts, whether they are verbal, non-verbal or physical, an is usually the core of the
229
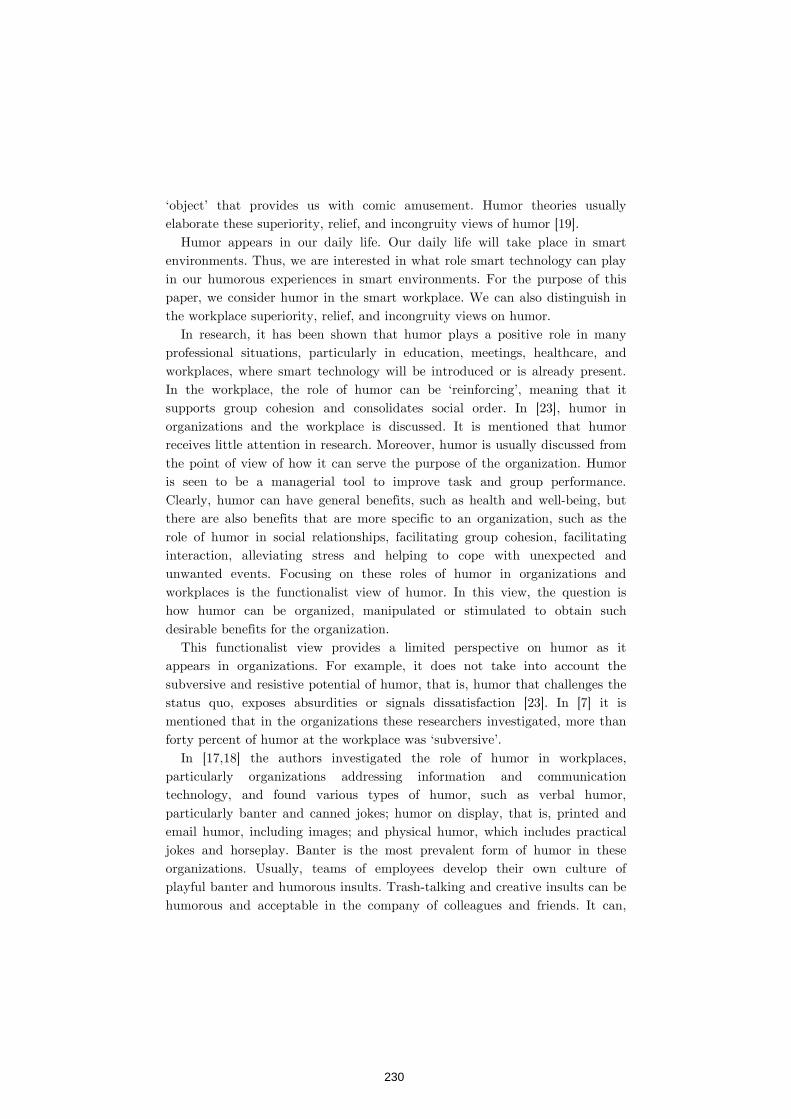
‘object’ that provides us with comic amusement. Humor theories usually elaborate these superiority, relief, and incongruity views of humor [19].
Humor appears in our daily life. Our daily life will take place in smart environments. Thus, we are interested in what role smart technology can play in our humorous experiences in smart environments. For the purpose of this paper, we consider humor in the smart workplace. We can also distinguish in the workplace superiority, relief, and incongruity views on humor.
In research, it has been shown that humor plays a positive role in many professional situations, particularly in education, meetings, healthcare, and workplaces, where smart technology will be introduced or is already present. In the workplace, the role of humor can be ‘reinforcing’, meaning that it supports group cohesion and consolidates social order. In [23], humor in organizations and the workplace is discussed. It is mentioned that humor receives little attention in research. Moreover, humor is usually discussed from the point of view of how it can serve the purpose of the organization. Humor is seen to be a managerial tool to improve task and group performance. Clearly, humor can have general benefits, such as health and well-being, but there are also benefits that are more specific to an organization, such as the role of humor in social relationships, facilitating group cohesion, facilitating interaction, alleviating stress and helping to cope with unexpected and unwanted events. Focusing on these roles of humor in organizations and workplaces is the functionalist view of humor. In this view, the question is how humor can be organized, manipulated or stimulated to obtain such desirable benefits for the organization.
This functionalist view provides a limited perspective on humor as it appears in organizations. For example, it does not take into account the subversive and resistive potential of humor, that is, humor that challenges the status quo, exposes absurdities or signals dissatisfaction [23]. In [7] it is mentioned that in the organizations these researchers investigated, more than forty percent of humor at the workplace was ‘subversive’.
In [17,18] the authors investigated the role of humor in workplaces, particularly organizations addressing information and communication technology, and found various types of humor, such as verbal humor, particularly banter and canned jokes; humor on display, that is, printed and email humor, including images; and physical humor, which includes practical jokes and horseplay. Banter is the most prevalent form of humor in these organizations. Usually, teams of employees develop their own culture of playful banter and humorous insults. Trash-talking and creative insults can be humorous and acceptable in the company of colleagues and friends. It can,
230
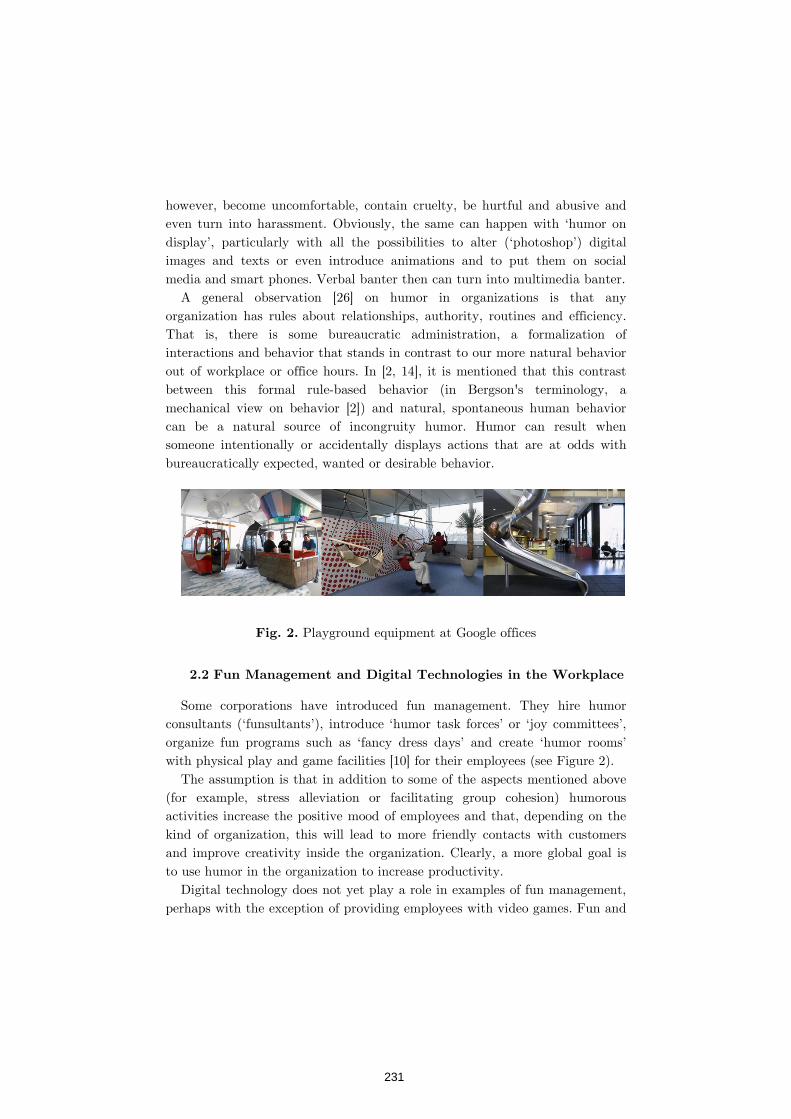
however, become uncomfortable, contain cruelty, be hurtful and abusive and even turn into harassment. Obviously, the same can happen with ‘humor on display’, particularly with all the possibilities to alter (‘photoshop’) digital images and texts or even introduce animations and to put them on social media and smart phones. Verbal banter then can turn into multimedia banter.
A general observation [26] on humor in organizations is that any organization has rules about relationships, authority, routines and efficiency. That is, there is some bureaucratic administration, a formalization of interactions and behavior that stands in contrast to our more natural behavior out of workplace or office hours. In [2, 14], it is mentioned that this contrast between this formal rule-based behavior (in Bergson's terminology, a mechanical view on behavior [2]) and natural, spontaneous human behavior can be a natural source of incongruity humor. Humor can result when someone intentionally or accidentally displays actions that are at odds with bureaucratically expected, wanted or desirable behavior.
Playground equipment at Google offices
Some corporations have introduced fun management. They hire humor consultants (‘funsultants’), introduce ‘humor task forces’ or ‘joy committees’, organize fun programs such as ‘fancy dress days’ and create ‘humor rooms’ with physical play and game facilities [10] for their employees (see Figure 2).
The assumption is that in addition to some of the aspects mentioned above (for example, stress alleviation or facilitating group cohesion) humorous activities increase the positive mood of employees and that, depending on the kind of organization, this will lead to more friendly contacts with customers and improve creativity inside the organization. Clearly, a more global goal is to use humor in the organization to increase productivity.
Digital technology does not yet play a role in examples of fun management, perhaps with the exception of providing employees with video games. Fun and
231
humor are to be consumed in a prescribed way, and there is no encouragement for a more pro-active attitude of employees to be playful or generate humor in the workplace. A nice example of prescribed humor that was not appreciated by employees can be found in [21]. A set of funny looking human-sized ‘Russian dolls’ was introduced in the reception area of a company. The employees, not happy with the company’s policies, did not appreciate the fun that had been envisaged by the management. Instead, they started ‘playing’ with the dolls in a way they enjoyed, such as putting them in the ladies’ toilet, in the elevator, or punching them in the face (leaving an indented fist mark). The management installed CCTV cameras to prevent such playful behavior (or rather, resistive humor) by its employees. In this case, the digital technology (CCTV cameras) was meant to prevent unmanaged fun.
In the common view of pervasive computing and Internet of Things technology, we have sensors and actuators everywhere in our daily life environments, including our home, office and workplace environments. This pervasiveness means that future organizational and workplace humor needs to be investigated from the viewpoint of available sensor and actuator technology and its accessibility. What role can be played by digital technology in the functionalist point of view or in subversive and resistive humor? The organization can make decisions about the introduction of digital technology that is meant to support the functionalist view of humor. This technology is then added to the already existing range of sensors and actuators that are embedded in the workplace, namely, in PCs, laptops, tablets and wearables (such as smart phones, smart watches, smart textile) or that are embedded in equipment and machinery already present in the office or production environment.
Various examples of humorous digital technologies that can be included in a workplace are mentioned in [1]. They range from joke-telling robots, humorous office messages and memes, to playful devices as illustrated in Figure 2. In this paper the three humor viewpoints (incongruity, superiority and relief) are used to make some observations on issues that need to be taken into consideration when an organization decides to introduce humorous and playful elements in a workplace. Hence, is there a specific reason for why a particular kind of humor at a particular time and in a certain period is introduced? What will be the effect of introducing incongruities in the workplace to visitors or customers? And will the humor that is introduced be probably ‘misused’ and become part of unwanted subversive humor? Concerning the latter, introducing humor to let off steam by frustrated or dissatisfied workers fits within a functionalist view on the use of humor,
232
especially when it contains some kind of self-deprecation toward the organization. This functionalist viewpoint does not take into account spontaneous humor made possible by digital technology or accidental humor caused by digital technology. Rather, the viewpoints introduced in [1] assume that humor helps increase engagement and happiness and, therefore, indirectly, productivity.
In addition to the designed playfulness and humor that has been introduced by the organization, there is the possibility that employees with access to sensors and actuators or using their own digital devices may design alternative playfulness and humor or use the available technology to introduce humorous events during their work activities. There can be designed and spontaneously created incongruities. A digitally enhanced physical environment can be explored in search for incongruities. Memes [9] are among the easiest ways to create humor. Company-related memes can be distributed using social media as well as specific ways of distributing company information. Employees can horse around with their creativity and their happiness or vent their frustrations by creating memes to share with their colleagues. These memes can contain critical comments on what is happening inside a company and a company’s policies and can take the form of subversive humor. Rather than having memes that combine pictures with text - the usual form of memes - we can ask whether it will be possible to have digital memes whereby, instead of having a multimedia display (text, image, sound), there is a display that involves changes in a physical environment. As mentioned by Daniel Dennett [4], going back to the original definition of memes by Richard Dawkins [5], “Memes are ways, ways of doing something, or making something, …”. In a workplace configurations or manipulation of objects and handling of devices can display particular messages, for example making someone or a workplace policy ridiculous and then become part of a workplace culture. This can also happen when workers know how to manipulate (or find ways to cheat) sensors and actuators in their environment and have it spread and replicated in a humorous way in their organization.
Incongruities can also emerge because of the behavior of workers who are not yet familiar with the technology and are not fully aware of the consequences of their behavior in smart environments. More experienced workers can exploit this lack of knowledge to introduce humorous situations. Disruptive humor can also make use of available digital technology, for example, the creative re-use or misuse of bugs. In that way the technology is explored in ways that had never been intended by the designers.
233
In [15], we discussed ‘mischief humor’, whereby the assumption was that this kind of humor that is present in video games and social media will also appear in smart physical environments. Mischief humor is humor that follows from looking for and exploiting bugs, behaving in unexpected and maybe inappropriate ways, thwarting, harassing, upsetting and provoking others, disrupting activities, cheating, and posting inflammatory comments. Clearly, such humor can also appear in smart workplaces. Trolling (for example, using someone’s identity), griefing (for example, continuously disrupting someone’s digital activity) or hacking (for example, acting as someone else) can occur in smart workplaces. They can give rise to humorous situations where, of course, there can be disagreement between the hacker and the owner of the identity and his or her information about what is humorous. Mischief humor certainly does not fit in the functionalist view. It can challenge the status quo, for example, when the digital technology is used to display weaknesses, absurdities or inconsistencies in the organization. Hence, it can be subversive and we can investigate how digital technology can facilitate subversive humor. However, mischief humor is usually directed toward a particular person or group and not toward the organization.
Controlling sensors and actuators helps to create digital pranks, usually planned and therefore designed humor, although there may be situations where it can be done spontaneously. Digital pranks have been around since the introduction of workstations and the PC. Some pranks that can be played when one has access to someone else's computing device are discussed in [16]. Internet-connected PCs, workstations or ‘things’ allow remote access and the playing of digital pranks. Hence, ‘our’ workplace is accessible to others, others may have the same rights to use it [20] as we have, and our workplace may not be at one particular physical location anymore. This scenario increases the possibility of facing unexpected situations or introducing unexpected situations for co-workers. Clearly, hoaxes can also be introduced but these are more serious deceptions, rather than humor.
Computing devices, sensors, and actuators can be the cause of humor, can be used to create humor, or can make decisions about humor themselves. But we still need to introduce another viewpoint on having humor in smart environments, including workplaces. In our smart environments, we can have virtual agents or avatars appear on displays to assist workers with their
234
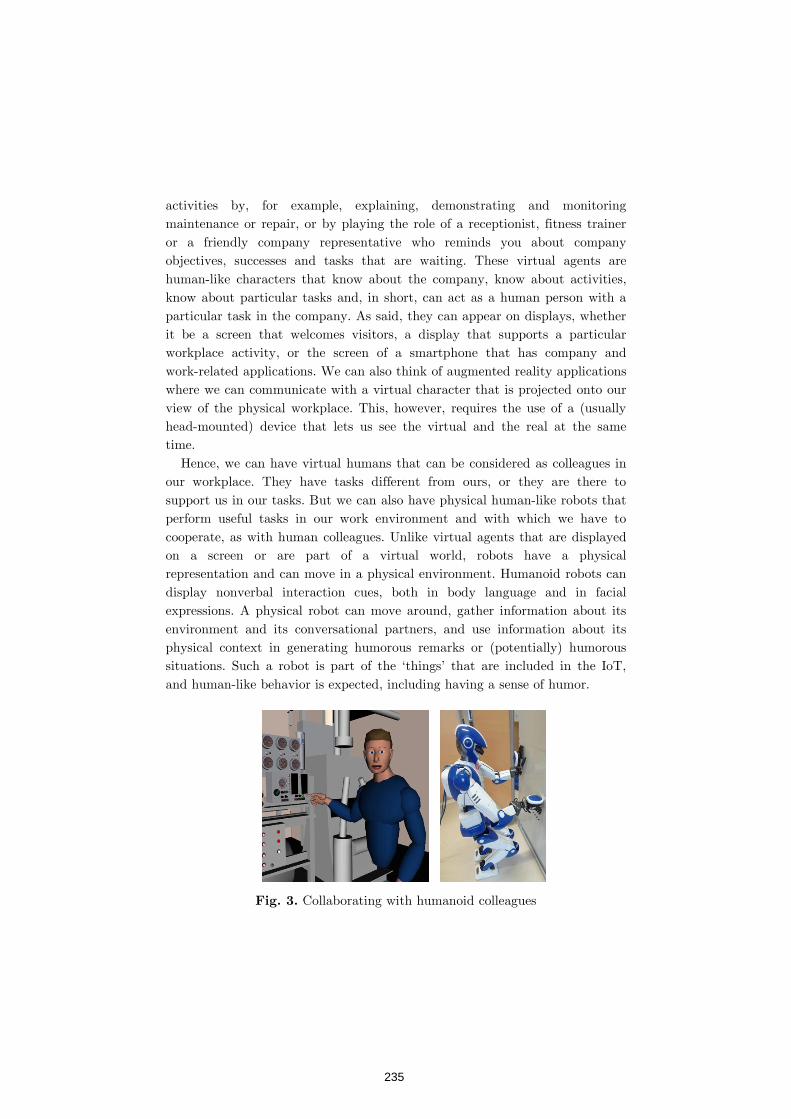
activities by, for example, explaining, demonstrating and monitoring maintenance or repair, or by playing the role of a receptionist, fitness trainer or a friendly company representative who reminds you about company objectives, successes and tasks that are waiting. These virtual agents are human-like characters that know about the company, know about activities, know about particular tasks and, in short, can act as a human person with a particular task in the company. As said, they can appear on displays, whether it be a screen that welcomes visitors, a display that supports a particular workplace activity, or the screen of a smartphone that has company and work-related applications. We can also think of augmented reality applications where we can communicate with a virtual character that is projected onto our view of the physical workplace. This, however, requires the use of a (usually head-mounted) device that lets us see the virtual and the real at the same time.
Hence, we can have virtual humans that can be considered as colleagues in our workplace. They have tasks different from ours, or they are there to support us in our tasks. But we can also have physical human-like robots that perform useful tasks in our work environment and with which we have to cooperate, as with human colleagues. Unlike virtual agents that are displayed on a screen or are part of a virtual world, robots have a physical representation and can move in a physical environment. Humanoid robots can display nonverbal interaction cues, both in body language and in facial expressions. A physical robot can move around, gather information about its environment and its conversational partners, and use information about its physical context in generating humorous remarks or (potentially) humorous situations. Such a robot is part of the ‘things’ that are included in the IoT, and human-like behavior is expected, including having a sense of humor.
Collaborating with humanoid colleagues
235
We need to ask how virtual agents and human-like robots can actively take part in creating humor, initiate the creation of humor, become the butt of jokes, or be hacked or otherwise misused to create humor. These are areas of research that have hardly been investigated. Developing virtual agents is usually about conversational agents that have knowledge about human-human interaction, and research aims at designing models of face-to-face human-human interaction (conversational interaction, management of dialogue, natural language processing) and then using these models to have a virtual agent display natural, human-like behavior. We can have these virtual agents as conversational partners [13], but it is also possible that they can move around in virtual or augmented reality environments. An example of this is Steve [8], a virtual agent that is meant to train Navy personnel to operate engines aboard their ships (Figure 3, left). Examples of collaboration with human-like robots can be found in [25], where a robot acts as a camera man recording a bicycle repair session, or the humanoid robots (Figure 3, right) that are developed in a joint French-Japanese research project and that will be deployed with human colleagues in airplane assembly lines. Presently, in some Chinese restaurants, there are waiter robots serving food. The Henn-na Hotel in Nagasaki, Japan, aims at having 90% of the staff being robotic. Such robots can take care of check-in and bring your luggage to your room. Not everyone is enthusiastic about the service that is provided.
The use of humor by virtual agents and robots while interacting with their human partners has been investigated. Usually, this research is about joke telling during conversational human-agent or conversational human-robot interaction. Either the agent or robot tells a joke and the accompanying non-verbal behavior (non-verbal speech, gestures, facial expressions) is modeled, or the nonverbal behavior of a listener is modeled in a virtual agent or robot, including smiling and laughing. Laugh-aware virtual agents are discussed in [12] and laughing agents in [6]. Robots that use humor are discussed in [11,12,23,25].
As mentioned earlier, humor and laughter are usually considered in social and conversational settings only. But, of course, social and conversational settings also appear in workplaces. In addition, we can have employees make jokes about clumsy and non-intelligent behavior of agents and robots or make them part of their subversive humor, similar to what happened with the earlier-mentioned Russian dolls.
236
In this paper, we surveyed how humor can appear in smart environments, particularly in smart workplaces, and how such appearances can be stimulated and facilitated by available smart technology. Humor can appear accidentally, spontaneously, or be planned. As discussed, humor has different functions. When planned humor or playfulness is introduced by the management it is usually hoped that it helps to increase motivation, creativity and productivity. This functionalist way may also include the support of group cohesion, establish connections and facilitate good working relations among employees. Workers can also use smart technology in their digitally enhanced workplaces to introduce incongruent and surprising situations with the aim to create humor, whether it is done spontaneously or planned. This aim can be achieved if they have access to sensors and actuators and we can configure them in such a way that surprising and humorous situations appear. Rather than humorous situations, we can also mention the creation of humorous
situations that can be made humorous by human intervention or that can be made humorous by the comments of a human observer or participant. Social media can also be used for workplace humor. Virtual agents or humanoid robots that perform particular tasks in the organization can become colleagues, but their limited intelligence and their far-from-perfect simulation of human behavior can make them the butt of jokes and the object of subversive humor. Humor research has not yet given us models of humor. For that reason, we cannot expect that the ‘smartness’ in smart environments can be employed to automatically generate humorous situations. A sense for introducing surprise rather than having a sense of humor seems to be possible for smart environments, virtual agents and humanoid robots. Taking advantage of surprising situations in order to introduce humor requires some cooperation between humans and digital technology.
1 Andujar, M., Nijholt, A., Gilbert, J.E.: Designing a Humorous Workplace:
Improving and Retaining Employee’s Happiness. In: Chung, W., Shin, C.S. (eds.) Advances in Affective and Pleasurable Design. Vol. 483, Orlando, Florida, USA, pp. 683-694. Springer, Cham, Switzerland (2016)
2 Bergson, H.: Laughter. An essay on the meaning of the comic. Translated from Le Rire. Essai sur la signification du comique (1900). Gutenberg project (2003)
237
3 Carroll, N.: Humour. A Very Short Introduction. Oxford University Press, UK (2014)
4 Dawkins, R.: The Selfish Gene. Oxford University Press, UK (1976) 5 Dennett, D.: Memes Saved from Extinction. Talk at Santa Fe Institute
May 11, 2017. https://youtu.be/04CHFLP2hMc?list=PL_WseQlK4ozKtCUPi2tf-SxbAWyUElHBu
6 Duijn, J. van: Real-time Laughter on Virtual Characters. Master Thesis Game & Media Technology, Utrecht University (2014)
7 Holmes, J., Marra, M.: Over the edge? Subversive humour between colleagues and friends. Humor 15(1), 65–87 (2002)
8 Johnson, W.L., Rickel, J.W., Lester, J.C.: Animated Pedagogical Agents: Face-to-Face Interaction in Interactive Learning Environments. International Journal of Artificial Intelligence in Education 11, 47-78 (2000)
9 Magel, I.: Stereotypes in Internet Memes. A Linguistic Analysis. Munich: GRIN Verlag. Retrieved from http://www.grin.com/en/e-book/354386/stereotypes-in-internet-memes-a-linguistic-analysis (2016)
10 Morreall, J.: Humor Works. HRD Press, Inc., Amherst, MA, USA (1997) 11 Niculescu, A., van Dijk, B., Nijholt, A.: Making social robots more
attractive: the effects of voice pitch, humor and empathy. Int. Journal of Social Robotics 5(2), 171-191 (2013)
12 Niewiadomski, R., Hofmann, J., Urbain, J., Platt, T., Wagner, J., Piot, B.: Laugh-aware virtual agent and its impact on user amusement. In: 12th International Conference on Autonomous Agents and Multiagent Systems, Saint Paul, MN, USA, pp. 619-626. ACM, New York, NY, USA (2013)
13 Nijholt, A.: Conversational Agents and the Construction of Humorous Acts. Chapter 2 in Nishida, T. (ed.), Conversational Informatics: An Engineering Approach, pp. 21-47. John Wiley & Sons, Chicester, England (2007)
14 Nijholt, A.: Incongruity Humor in Language and Beyond: From Bergson to Digitally Enhanced Worlds. In: 14th International Symposium on Comunicación Social: retos y perspectivas, Volumen II, pp. 594-599, Ediciones CLA, Santiago de Cuba, Cuba (2015)
15 Nijholt, A.: Mischief Humor in Smart and Playable Cities. Chapter 11 in A. Nijholt (Ed.) Playable Cities: The City as a Digital Playground (pp. 235-253), Series: Gaming Media and Social Effects. Springer, Singapore (2016b)
238
16 PC Plus: 22 PC pranks to make the office less boring. Retrieved from http://www.techradar.com/news/computing/pc/22-pc-pranks-to-make-the-office-less-boring-611029 (2009)
17 Plester, B., Sayers, J.: “Taking the piss”: Functions of banter in the IT industry. Humor 20(2), 157-187 (2007)
18 Plester, B.: The Complexity of Workplace Humour. Laughter, Jokers and the dark Side of Humour. Springer, Heidelberg, Germany (2016)
19 Raskin, V. (ed.): The Primer of Humor Research. Mouton de Gruyter, Berlin (2008)
20 Tay, B.T.C., Low, S.L., Ko, K.H., Park, T.: Types of humor that robots can play. Comput. Hum. Behav. 60, C, 19-28 (2016) doi 10.1016/j.chb.2016.01.042
21 Wakefield, J.: Why the future office will be as much about fun as work. Retrieved from http://www.bbc.com/news/business-36342595 (2016)
22 Warren, S., Fineman, S.: “Don’t get me wrong, it’s fun here but...”: Ambivalence and paradox in a “fun” work environment. In: Westwood, R., Rhodes, C. (eds.). Humour, work and organization, pp. 92-112, Routledge, Abingdon, Oxford, UK (2007)
23 Wendt, C.S., Berg, G.: Nonverbal humor as a new dimension of HRI. Proceedings 18th IEEE International Symposium on Robot and Human Interactive Communication, Toyama, Japan, pp. 183-188. IEEE, New York, NY, USA (2009)
24 Westwood, R.I., Johnston, A.: Humor In organization: From function to resistance. Humor 26(2), 219-247 (2013) doi 10.1515/humor-2013-0024
25 Xu, Y., Hiramatsu, T., Tarasenko, K., et al.: A two-layered approach to communicative artifacts. AI & Society 22, 185-196 (2007) doi 10.1007/s00146-007-0131-4
26 Yarwood, D.L.: Humor and administration: A serious inquiry into unofficial organizational communication. Public Administration Review 55(i), 81-90 (1995)
239
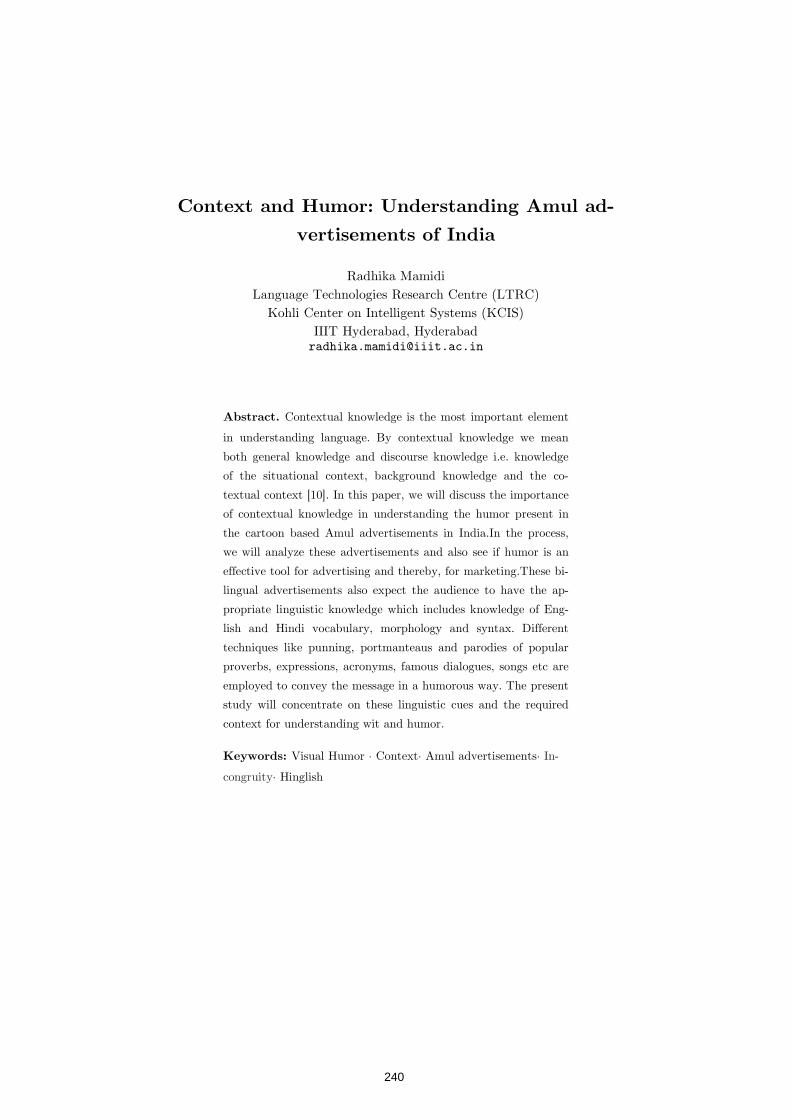
Context and Humor: Understanding Amul ad-
vertisements of India
Radhika Mamidi
Language Technologies Research Centre (LTRC)
Kohli Center on Intelligent Systems (KCIS)
IIIT Hyderabad, Hyderabad [email protected]
Abstract. Contextual knowledge is the most important element
in understanding language. By contextual knowledge we mean
both general knowledge and discourse knowledge i.e. knowledge
of the situational context, background knowledge and the co-
textual context [10]. In this paper, we will discuss the importance
of contextual knowledge in understanding the humor present in
the cartoon based Amul advertisements in India.In the process,
we will analyze these advertisements and also see if humor is an
effective tool for advertising and thereby, for marketing.These bi-
lingual advertisements also expect the audience to have the ap-
propriate linguistic knowledge which includes knowledge of Eng-
lish and Hindi vocabulary, morphology and syntax. Different
techniques like punning, portmanteaus and parodies of popular
proverbs, expressions, acronyms, famous dialogues, songs etc are
employed to convey the message in a humorous way. The present
study will concentrate on these linguistic cues and the required
context for understanding wit and humor.
Keywords: Visual Humor · Context· Amul advertisements· In-
congruity· Hinglish
240
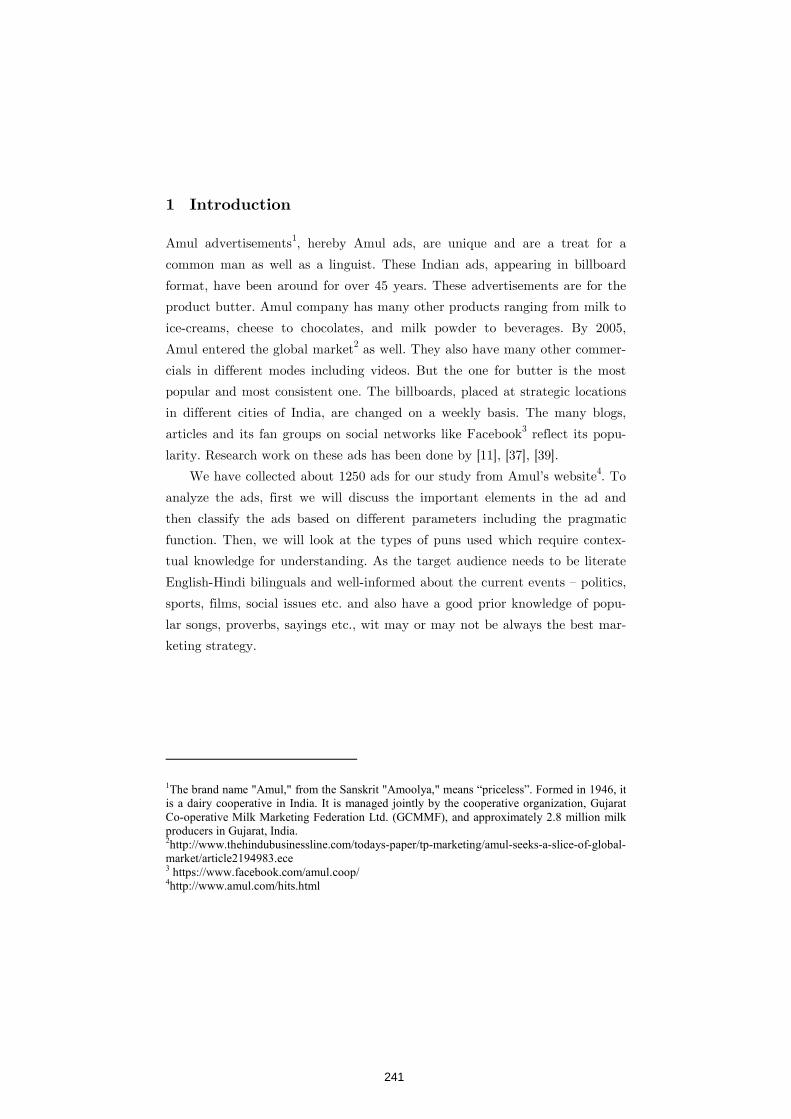
1 Introduction
Amul advertisements1, hereby Amul ads, are unique and are a treat for a
common man as well as a linguist. These Indian ads, appearing in billboard
format, have been around for over 45 years. These advertisements are for the
product butter. Amul company has many other products ranging from milk to
ice-creams, cheese to chocolates, and milk powder to beverages. By 2005,
Amul entered the global market2 as well. They also have many other commer-
cials in different modes including videos. But the one for butter is the most
popular and most consistent one. The billboards, placed at strategic locations
in different cities of India, are changed on a weekly basis. The many blogs,
articles and its fan groups on social networks like Facebook3 reflect its popu-
larity. Research work on these ads has been done by [11], [37], [39].
We have collected about 1250 ads for our study from Amul’s website4. To
analyze the ads, first we will discuss the important elements in the ad and
then classify the ads based on different parameters including the pragmatic
function. Then, we will look at the types of puns used which require contex-
tual knowledge for understanding. As the target audience needs to be literate
English-Hindi bilinguals and well-informed about the current events – politics,
sports, films, social issues etc. and also have a good prior knowledge of popu-
lar songs, proverbs, sayings etc., wit may or may not be always the best mar-
keting strategy.
1The brand name "Amul," from the Sanskrit "Amoolya," means “priceless”. Formed in 1946, it is a dairy cooperative in India. It is managed jointly by the cooperative organization, Gujarat Co-operative Milk Marketing Federation Ltd. (GCMMF), and approximately 2.8 million milk producers in Gujarat, India. 2http://www.thehindubusinessline.com/todays-paper/tp-marketing/amul-seeks-a-slice-of-global-market/article2194983.ece 3 https://www.facebook.com/amul.coop/ 4http://www.amul.com/hits.html
241
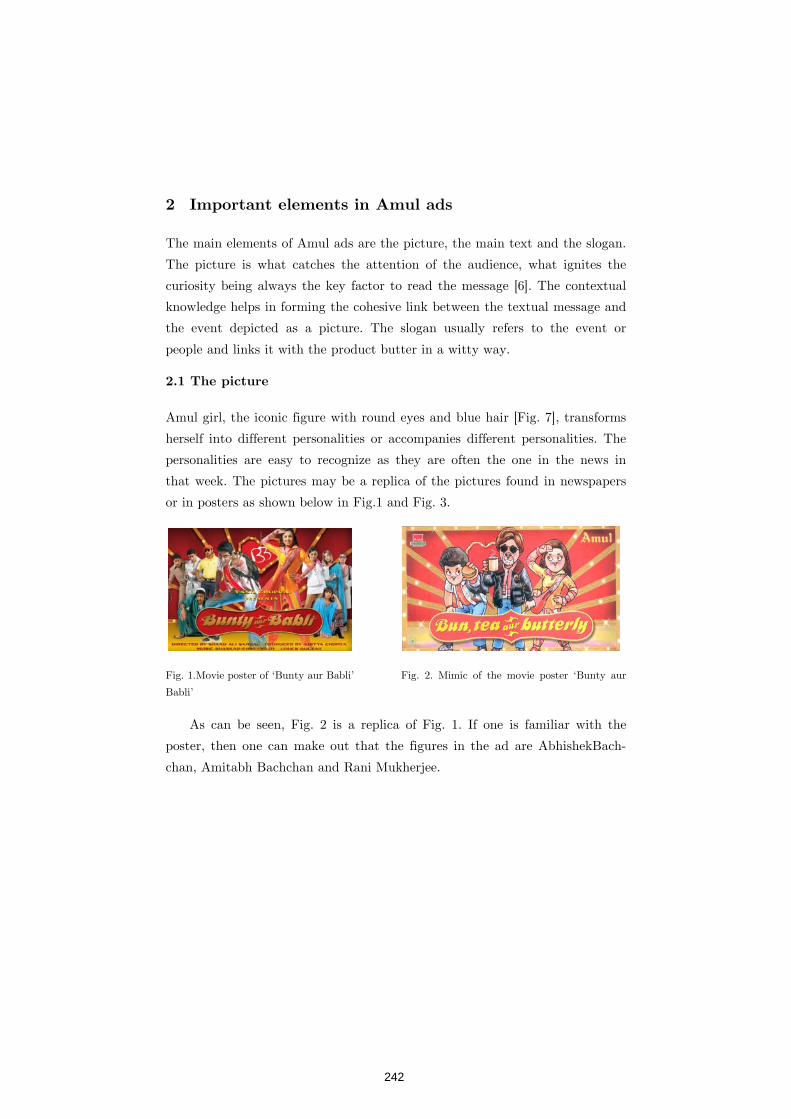
2 Important elements in Amul ads
The main elements of Amul ads are the picture, the main text and the slogan.
The picture is what catches the attention of the audience, what ignites the
curiosity being always the key factor to read the message [6]. The contextual
knowledge helps in forming the cohesive link between the textual message and
the event depicted as a picture. The slogan usually refers to the event or
people and links it with the product butter in a witty way.
2.1 The picture
Amul girl, the iconic figure with round eyes and blue hair [Fig. 7], transforms
herself into different personalities or accompanies different personalities. The
personalities are easy to recognize as they are often the one in the news in
that week. The pictures may be a replica of the pictures found in newspapers
or in posters as shown below in Fig.1 and Fig. 3.
Fig. 1.Movie poster of ‘Bunty aur Babli’ Fig. 2. Mimic of the movie poster ‘Bunty aur
Babli’
As can be seen, Fig. 2 is a replica of Fig. 1. If one is familiar with the
poster, then one can make out that the figures in the ad are AbhishekBach-
chan, Amitabh Bachchan and Rani Mukherjee.
242
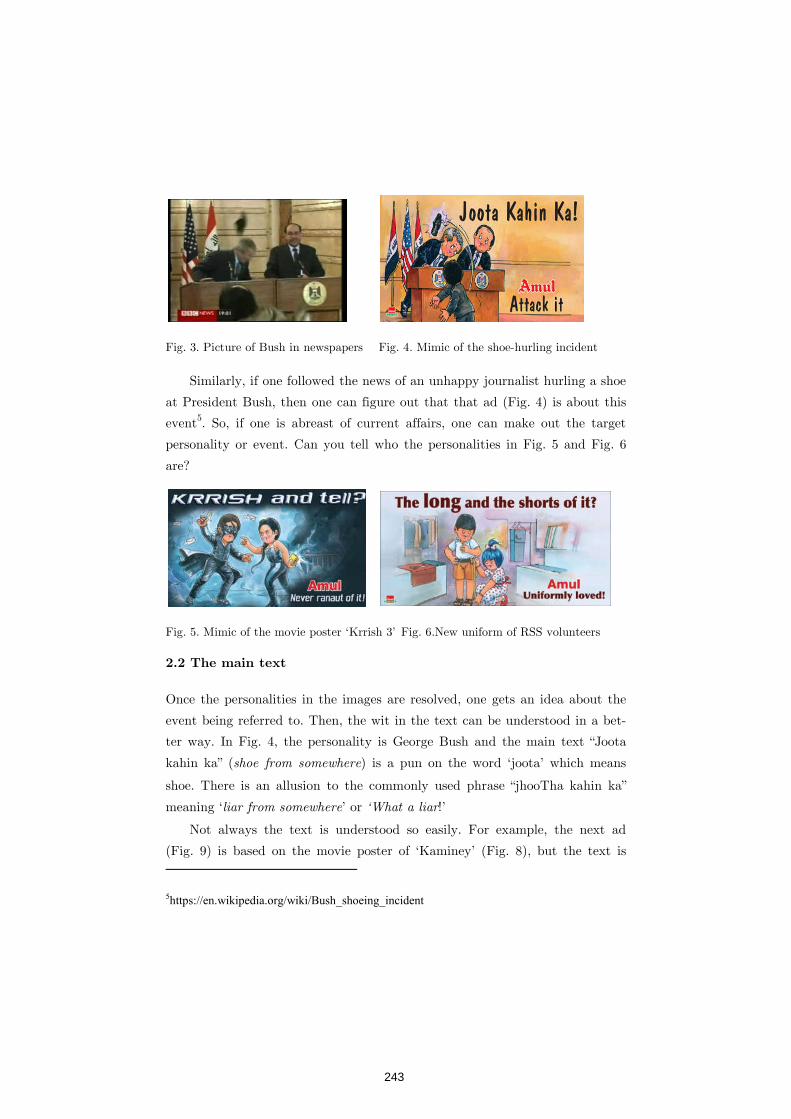
Fig. 3. Picture of Bush in newspapers Fig. 4. Mimic of the shoe-hurling incident
Similarly, if one followed the news of an unhappy journalist hurling a shoe
at President Bush, then one can figure out that that ad (Fig. 4) is about this
event5. So, if one is abreast of current affairs, one can make out the target
personality or event. Can you tell who the personalities in Fig. 5 and Fig. 6
are?
Fig. 5. Mimic of the movie poster ‘Krrish 3’ Fig. 6.New uniform of RSS volunteers
2.2 The main text
Once the personalities in the images are resolved, one gets an idea about the
event being referred to. Then, the wit in the text can be understood in a bet-
ter way. In Fig. 4, the personality is George Bush and the main text “Joota
kahin ka” (shoe from somewhere) is a pun on the word ‘joota’ which means
shoe. There is an allusion to the commonly used phrase “jhooTha kahin ka”
meaning ‘liar from somewhere’ or ‘What a liar!’
Not always the text is understood so easily. For example, the next ad
(Fig. 9) is based on the movie poster of ‘Kaminey’ (Fig. 8), but the text is
5https://en.wikipedia.org/wiki/Bush_shoeing_incident
243
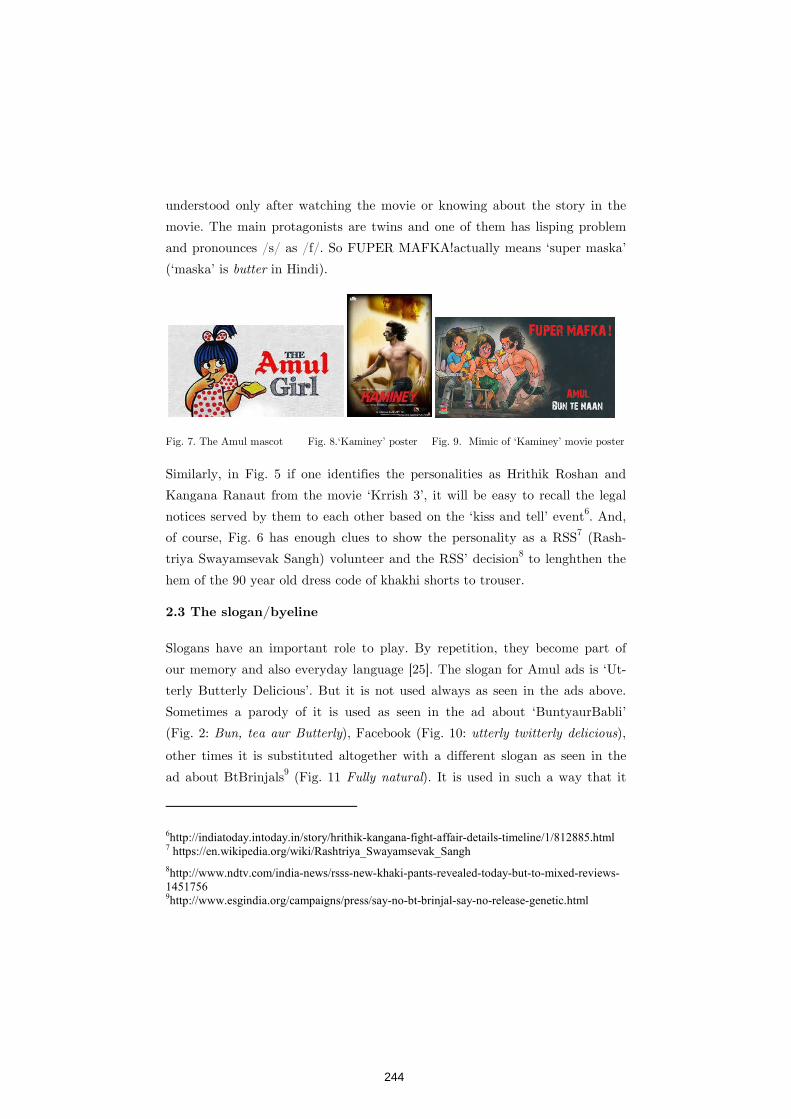
understood only after watching the movie or knowing about the story in the
movie. The main protagonists are twins and one of them has lisping problem
and pronounces /s/ as /f/. So FUPER MAFKA!actually means ‘super maska’
(‘maska’ is butter in Hindi).
Fig. 7. The Amul mascot Fig. 8.‘Kaminey’ poster Fig. 9. Mimic of ‘Kaminey’ movie poster
Similarly, in Fig. 5 if one identifies the personalities as Hrithik Roshan and
Kangana Ranaut from the movie ‘Krrish 3’, it will be easy to recall the legal
notices served by them to each other based on the ‘kiss and tell’ event6. And,
of course, Fig. 6 has enough clues to show the personality as a RSS7 (Rash-
triya Swayamsevak Sangh) volunteer and the RSS’ decision8 to lenghthen the
hem of the 90 year old dress code of khakhi shorts to trouser.
2.3 The slogan/byeline
Slogans have an important role to play. By repetition, they become part of
our memory and also everyday language [25]. The slogan for Amul ads is ‘Ut-
terly Butterly Delicious’. But it is not used always as seen in the ads above.
Sometimes a parody of it is used as seen in the ad about ‘BuntyaurBabli’
(Fig. 2: Bun, tea aur Butterly), Facebook (Fig. 10: utterly twitterly delicious),
other times it is substituted altogether with a different slogan as seen in the
ad about BtBrinjals9 (Fig. 11 Fully natural). It is used in such a way that it
6http://indiatoday.intoday.in/story/hrithik-kangana-fight-affair-details-timeline/1/812885.html 7 https://en.wikipedia.org/wiki/Rashtriya_Swayamsevak_Sangh
8http://www.ndtv.com/india-news/rsss-new-khaki-pants-revealed-today-but-to-mixed-reviews-1451756 9http://www.esgindia.org/campaigns/press/say-no-bt-brinjal-say-no-release-genetic.html
244
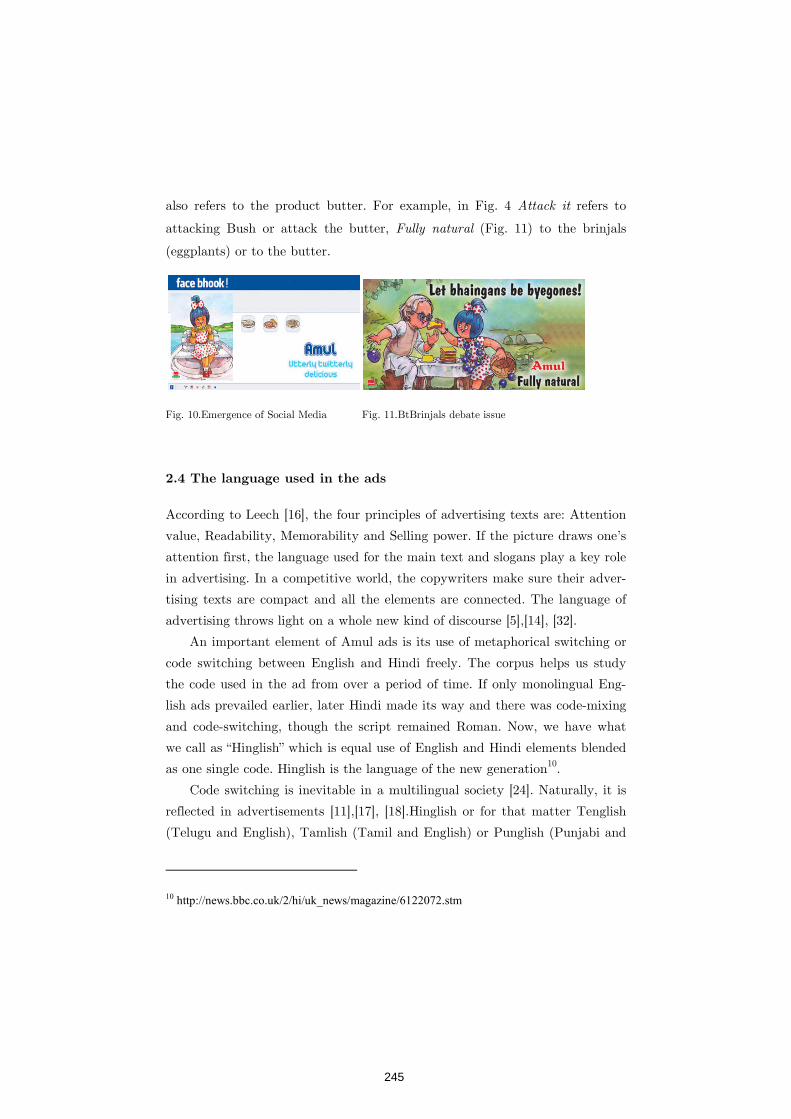
also refers to the product butter. For example, in Fig. 4 Attack it refers to
attacking Bush or attack the butter, Fully natural (Fig. 11) to the brinjals
(eggplants) or to the butter.
Fig. 10.Emergence of Social Media Fig. 11.BtBrinjals debate issue
2.4 The language used in the ads
According to Leech [16], the four principles of advertising texts are: Attention
value, Readability, Memorability and Selling power. If the picture draws one’s
attention first, the language used for the main text and slogans play a key role
in advertising. In a competitive world, the copywriters make sure their adver-
tising texts are compact and all the elements are connected. The language of
advertising throws light on a whole new kind of discourse [5],[14], [32].
An important element of Amul ads is its use of metaphorical switching or
code switching between English and Hindi freely. The corpus helps us study
the code used in the ad from over a period of time. If only monolingual Eng-
lish ads prevailed earlier, later Hindi made its way and there was code-mixing
and code-switching, though the script remained Roman. Now, we have what
we call as “Hinglish” which is equal use of English and Hindi elements blended
as one single code. Hinglish is the language of the new generation10
.
Code switching is inevitable in a multilingual society [24]. Naturally, it is
reflected in advertisements [11],[17], [18].Hinglish or for that matter Tenglish
(Telugu and English), Tamlish (Tamil and English) or Punglish (Punjabi and
10 http://news.bbc.co.uk/2/hi/uk_news/magazine/6122072.stm
245
English) are English language blended with a regional language. The function
of this code may be stated to be for proficiency in communication. This code
is here to stay. The new generation wants to mark it as theirown language;
they want to decolonize English and give it an Indian flavour. Most of the
international brands make use of Hinglish to relate closely with the Indian.
We see that it is not just the words that are borrowed, but also the syntactic
structures of Indian English. For example, the slogans for Coke “Life ho to
aisi” (Life should be like this), Pepsi “Yeh dil maange more” (The heart wants
more), McDonald’s “What your bahana is?” (What’s your excuse?) and Domi-
no’s Pizza “Hungry, kya?” (Are you hungry?). Also, most of the times, the
variety of English used is Indian English which has its own quirks and specific
phrases. In Amul ads, which reflect the current events, this change in code has
been adopted by its copywriters as mentioned earlier. For example, the con-
junction in Bun, tea aur Butterly (Fig. 2), in a compound formation face
bhook (Fig. 10) where bhook means ‘hunger’ or a parody of the phrase Let
byegones be byegones (Fig.11) in which the word ‘byegone’ is replaced by
bhaingans meaning ‘brinjals/eggplants’. [37] present a detailed study of the
literary devices used in these codemixed ads emphasizing that “the use of Hin-
glish to juxtapose is to juxtapose twodifferent cultures – the local and
global, the traditional and modern, the indigenous andforeign.”
3 Is context based humor effective?
As seen from the previous sections, the popular Indian billboard adver-
tisements which are topical in nature require the audience to be well-informed
about the current events to identify the personality the moppet, known as
the Amul girl/baby11
, is depicting or accompanying the personalities who have
been targeted for that week.
In a competitive world, there is a pressure on copywriters to bring out ads
that stand out from the rest. We come across many ads that are done so crea-
tively that it leaves a good feeling in us. This positive feeling is what makes us
11https://en.wikipedia.org/wiki/Amul_girl
246
receptive to the indirect persuasive function and makes us buy the product [3],
[12]. The relevance-theoretic framework [28, 29] extended to study wittiness in
advertising by [6] throws light on the aspect of the process of interpretation of
witty advertising messages to be rewarding. The ads that are creative and
innovative are remembered for a long time. If the message in the ad requires
additional cognitive processing on the audience’s part, it will increase its me-
morability [6], [21]. If the message in the ad is indirect and is intellectually
satisfying and if the audience solve it, they feel happy for getting the witty
message. This positive state of mind in return increases a positive attitude
towards the product endorsed [7].
Studies have shown that the more attractive an advertisement is, the
longer attention span it can command and lingers longer in one’s memory [4].
The popularity of the witty Amul ads support the findings of the above stu-
dies. However, it contradicts with Dynel’s[7] view that a witty advertisement
hinders the interpreter’s evaluation of the product as Amul butter is the most
popular product in India mainly because its quality is maintained over the
years since 194612
. It has withstood competition from international as well as
indigenous brands like Nestle, Britannia and Mother Diary. It has also entered
the world market and has established itself as a high quality product13
,14
.It
would be apt to reproduce the ad that came out when the gates were opened
to the international market in early 1990s. Amul proudly proclaimed itself to
be truly Indian [Fig. 12]. The message ‘Be Indian. Bye Indian’ makes an allu-
sion to ‘Be Indian, Buy Indian’ slogan under colonial rule before India became
independent in1947 revolting against foreign (British) goods made from Indian
raw materials. The pun is on the word ‘buy’ making one rethink if globaliza-
tion is good for the Indian economy. Amul ads try to sensitize us by using
humor which makes us like it. In the next ad [Fig. 13], Amul makes us think
if we are going forward or backward by banning Pakistani artists to work in
Indian film industry. Here the pun is on the actor Fawad’s name – Fa-
wad/forward.
12http://www.india-reports.com/reports/Cheese3.aspx 13http://www.amuldairy.com/index.php/cd-programmes/quality-movement 14 http://www.marketing91.com/swot-analysis-amul/
247
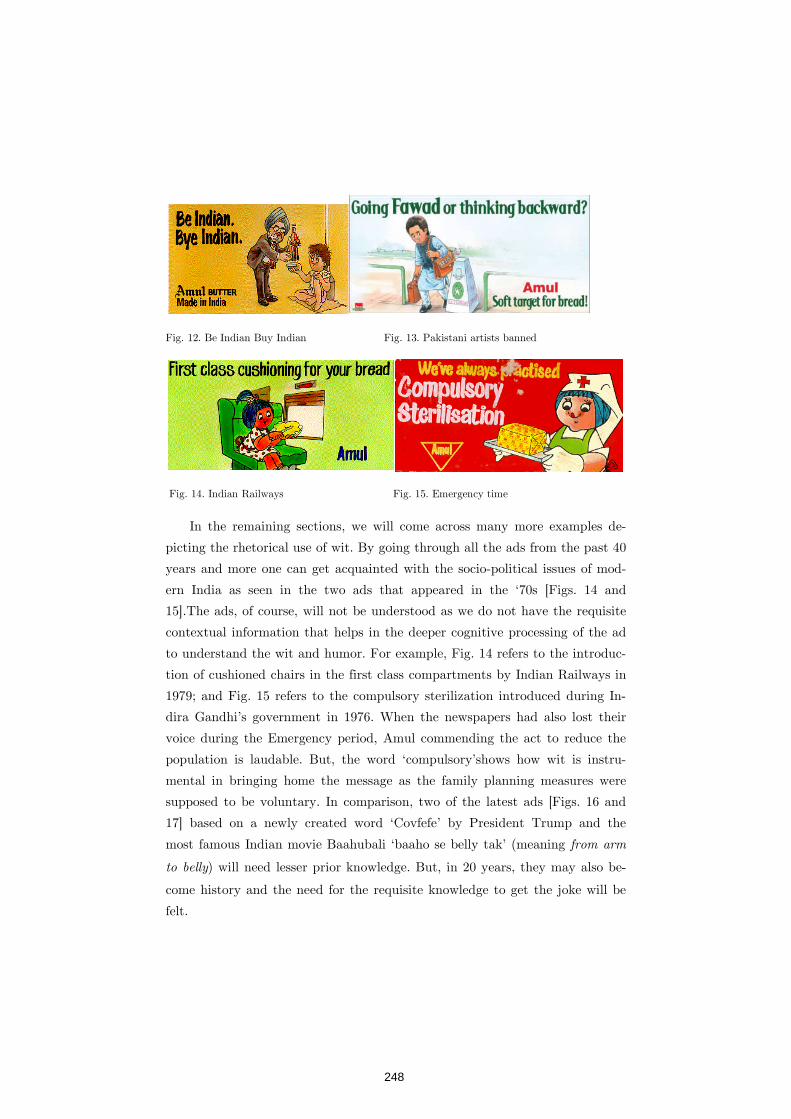
Fig. 12. Be Indian Buy Indian Fig. 13. Pakistani artists banned
Fig. 14. Indian Railways Fig. 15. Emergency time
In the remaining sections, we will come across many more examples de-
picting the rhetorical use of wit. By going through all the ads from the past 40
years and more one can get acquainted with the socio-political issues of mod-
ern India as seen in the two ads that appeared in the ‘70s [Figs. 14 and
15].The ads, of course, will not be understood as we do not have the requisite
contextual information that helps in the deeper cognitive processing of the ad
to understand the wit and humor. For example, Fig. 14 refers to the introduc-
tion of cushioned chairs in the first class compartments by Indian Railways in
1979; and Fig. 15 refers to the compulsory sterilization introduced during In-
dira Gandhi’s government in 1976. When the newspapers had also lost their
voice during the Emergency period, Amul commending the act to reduce the
population is laudable. But, the word ‘compulsory’shows how wit is instru-
mental in bringing home the message as the family planning measures were
supposed to be voluntary. In comparison, two of the latest ads [Figs. 16 and
17] based on a newly created word ‘Covfefe’ by President Trump and the
most famous Indian movie Baahubali ‘baaho se belly tak’ (meaning from arm
to belly) will need lesser prior knowledge. But, in 20 years, they may also be-
come history and the need for the requisite knowledge to get the joke will be
felt.
248

4 Wit and Marketing
Humor in advertising has mixed statistics15
. On one hand, it is shown that
creativity and wit helps in the retention power of the product [34], [36], and
on the other hand psychologists feel it colors the proper evaluation of the
product, and the distraction may not help remember the product [35]. But,
creativity in advertising was always appreciated. Some marketing analysts
have given the credit for the popularity of Amul brand to the creativity factor
found in the billboards. These billboards along with the brand itself have loyal
customers from 2-3 generations. The company itself employs different strate-
gies to promote all its products16
. So given its strong position in the market,
the copywriters have a field day playing with words as they don’t have to
worry about the persuasive function all the time as seen in the ads paying
tribute [Figs. 18, 19] or condolence [Figs. 20,21] which may not carry a witty
remark or any reference to the product, but it definitely is remembered for the
message. As the ads are topical in nature, one may study the changes in times
with respect to technology, socio-economic reforms, political winds etc. by
doing a diachronic study of these ads.
Over the years, the size of the word ‘Amul’ in the ads has also reduced.
As the billboards occupy the same place, one knows that the ad is by Amul.
The respect for a brand grows when it indulges in social message without
15http://www.armi-marketing.com/library/LRE090121.pdf 16http://www.docstoc.com/docs/6464627/International-Marketing--Amul/
Fig. 16. President Trump’s vocabulary Fig. 17. Mimic of Baahubali 2 movie poster
249
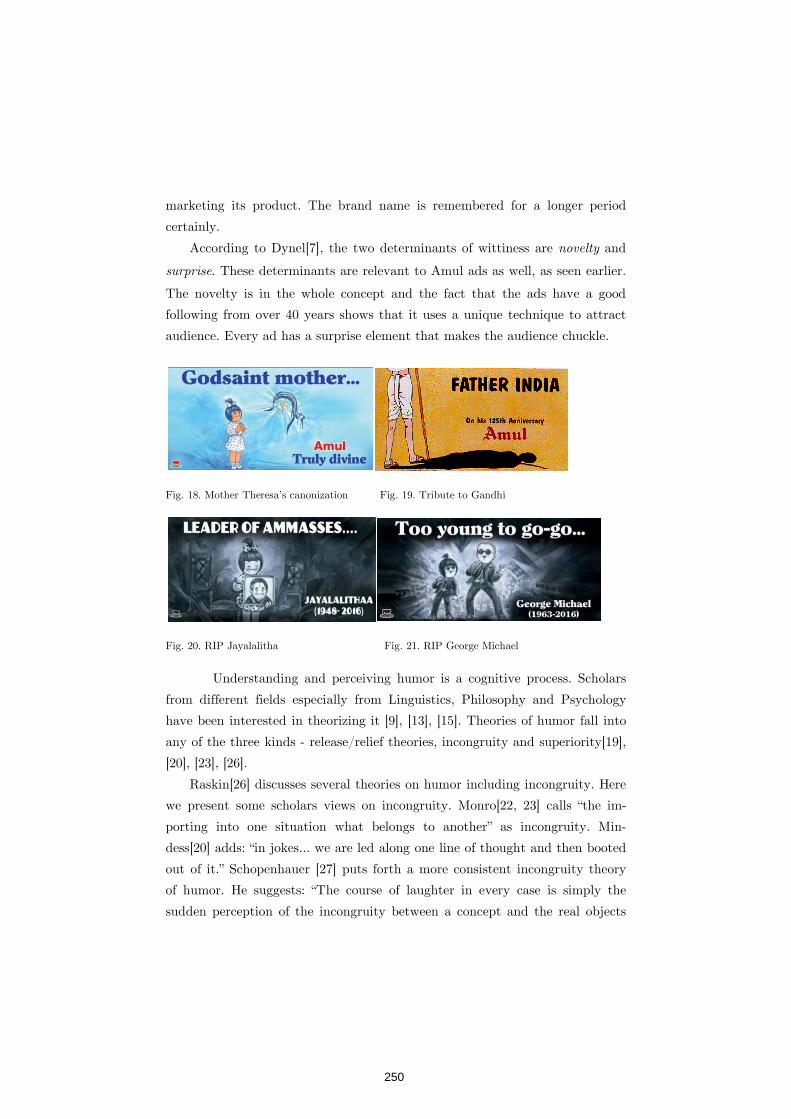
marketing its product. The brand name is remembered for a longer period
certainly.
According to Dynel[7], the two determinants of wittiness are novelty and
surprise. These determinants are relevant to Amul ads as well, as seen earlier.
The novelty is in the whole concept and the fact that the ads have a good
following from over 40 years shows that it uses a unique technique to attract
audience. Every ad has a surprise element that makes the audience chuckle.
Fig. 18. Mother Theresa’s canonization Fig. 19. Tribute to Gandhi
Fig. 20. RIP Jayalalitha Fig. 21. RIP George Michael
Understanding and perceiving humor is a cognitive process. Scholars
from different fields especially from Linguistics, Philosophy and Psychology
have been interested in theorizing it [9], [13], [15]. Theories of humor fall into
any of the three kinds - release/relief theories, incongruity and superiority[19],
[20], [23], [26].
Raskin[26] discusses several theories on humor including incongruity. Here
we present some scholars views on incongruity. Monro[22, 23] calls “the im-
porting into one situation what belongs to another” as incongruity. Min-
dess[20] adds: “in jokes… we are led along one line of thought and then booted
out of it.” Schopenhauer [27] puts forth a more consistent incongruity theory
of humor. He suggests: “The course of laughter in every case is simply the
sudden perception of the incongruity between a concept and the real objects
250
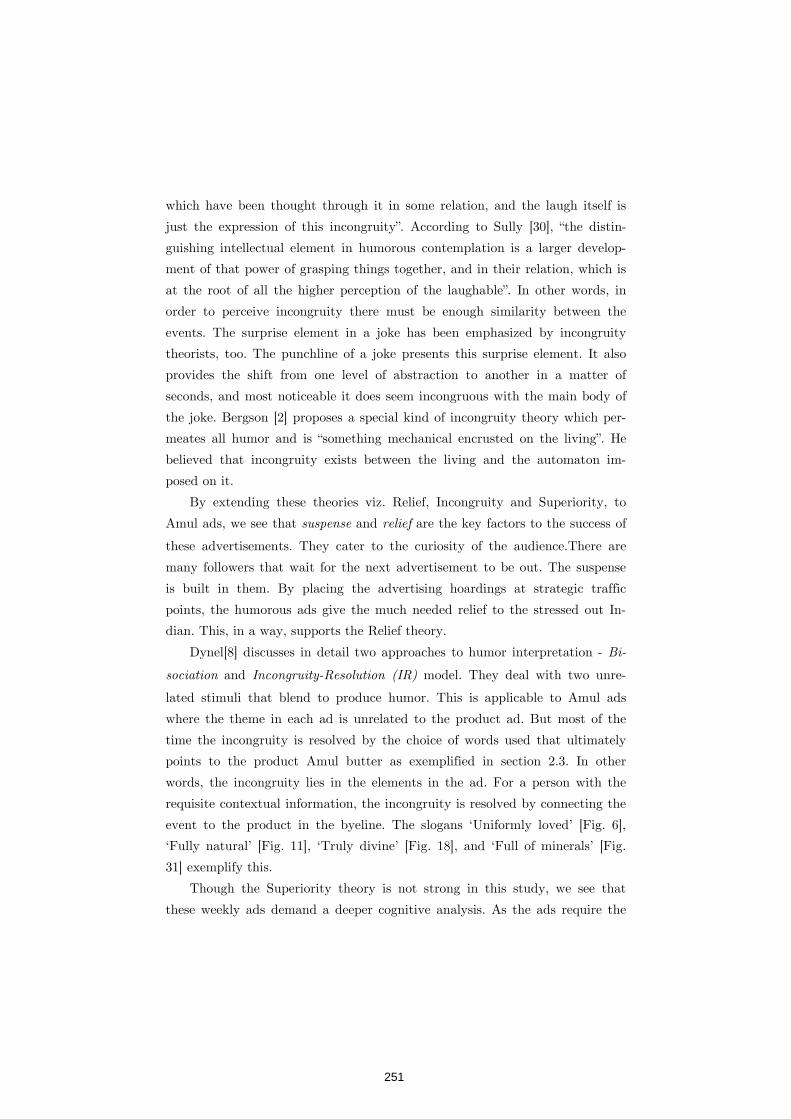
which have been thought through it in some relation, and the laugh itself is
just the expression of this incongruity”. According to Sully [30], “the distin-
guishing intellectual element in humorous contemplation is a larger develop-
ment of that power of grasping things together, and in their relation, which is
at the root of all the higher perception of the laughable”. In other words, in
order to perceive incongruity there must be enough similarity between the
events. The surprise element in a joke has been emphasized by incongruity
theorists, too. The punchline of a joke presents this surprise element. It also
provides the shift from one level of abstraction to another in a matter of
seconds, and most noticeable it does seem incongruous with the main body of
the joke. Bergson [2] proposes a special kind of incongruity theory which per-
meates all humor and is “something mechanical encrusted on the living”. He
believed that incongruity exists between the living and the automaton im-
posed on it.
By extending these theories viz. Relief, Incongruity and Superiority, to
Amul ads, we see that suspense and relief are the key factors to the success of
these advertisements. They cater to the curiosity of the audience.There are
many followers that wait for the next advertisement to be out. The suspense
is built in them. By placing the advertising hoardings at strategic traffic
points, the humorous ads give the much needed relief to the stressed out In-
dian. This, in a way, supports the Relief theory.
Dynel[8] discusses in detail two approaches to humor interpretation - Bi-
sociation and Incongruity-Resolution (IR) model. They deal with two unre-
lated stimuli that blend to produce humor. This is applicable to Amul ads
where the theme in each ad is unrelated to the product ad. But most of the
time the incongruity is resolved by the choice of words used that ultimately
points to the product Amul butter as exemplified in section 2.3. In other
words, the incongruity lies in the elements in the ad. For a person with the
requisite contextual information, the incongruity is resolved by connecting the
event to the product in the byeline. The slogans ‘Uniformly loved’ [Fig. 6],
‘Fully natural’ [Fig. 11], ‘Truly divine’ [Fig. 18], and ‘Full of minerals’ [Fig.
31] exemplify this.
Though the Superiority theory is not strong in this study, we see that
these weekly ads demand a deeper cognitive analysis. As the ads require the
251
target audience to be well informed about current events including national
and international politics, sports, cinema, social issues etc, the author wonders
if Amul ads is aimed at only a smaller target audience who are literate and
follow news everyday either on television or newspapers. Given the language
used is bilingual – Hindi and English, the audience number is further reduced
in the multilingual country, India. They need to do a deeper cognitive
processing to get the intended humor. This long process of cognitive
processing also enhances the retention value. One of the reasons for the grow-
ing popularity of the ads in spite of such deeper cognitive processing is the
smaller target audience (which given the population of India is not so small
after all) that feel special. This feeling of ‘being special’, we feel, is no less
than being Superior compared to those who do not get the joke.
5 Classifying Amul ads
Amul ads may be classified according to their themes or the pragmatic func-
tion or illocutionary force or the language used. Another way of classifying the
ads is on the basis of the punning techniques employed in the main text. If we
look at the themes, the ads can be classified as follows:
a. Sports: Cricket; Tennis; Badminton; Olympics
b. Politics: Regional; National; International
c. Films: Hollywood and Bollywood
d. Current events/social issues: Swine flu; Btbrinjal; Narmada dam;
scams and scandals
Based on their illocutionary force they may be classified as follows:
a. Condemning: racial attacks; separation of states; wrong-doers; ter-
rorist attacks
b. Complimenting: Sportspersons;world leaders; city’s spirit; new poli-
cies; festivals
c. Creating Awareness campaign: to vote; to support a cause
d. Mimicking/Acknowledging other contemporary products: Vodafone;
Facebook; Ipod; Films
e. Mourning: Death of celebrities – actors, singers, leaders
252

If we look at the code used in the ads, they may be classified as monolingual
(only English) or bilingual (English and Hindi). The ads may be classified in a
different way based on the punning element as will be seen in the sample ana-
lyses. Though we will focus on punning which is the trigger for generating
humor, we tried to be representative of the different themes and pragmatic
functions in the selection of our ads in this paper. It will be apt to mention a
recent study on Amul ads [38] which classified the ads based on the three
dominant colors used. They found that 1970s ads were very vibrant and color-
ful and the late 1990s had more of yellowish shades compared to the ads of
2000s.
6 Sample analysis
In this section, we will focus on the punning techniques employed in the
ads. Punning is the most frequently employed technique in generating hu-
mor[1], [7], [31]. Puns are an important rhetorical device in advertisements
[33]. To understand the humor generated using pun, a deeper cognitive
processing is needed linking all the elements in our selected ads. An important
external element is the contextual information which includes the general
knowledge and linguistic knowledge as discussed earlier. The ads needs one to
be up-to-date with the popular phrases, proverbs, movie dialogues etc. and a
good knowledge of what is happening around. By studying the data we have,
we see that there is a recurrent technique employed to generate humor.
We classified the ads based on puns into four types after studying our da-
ta consisting of 1250 (and more ads). We classified them based on sound/form
(homophones and homographs), portmanteau or blending of two words, poly-
semous words and parody (of sayings, idioms, common phrases, acronyms,
movie titles and songs etc). A sample analysis of these types is given below.
We see that there is an overlapping of the classes. For example, the punning
at sound level may also be using a portmanteau. In the Fig. 22, the ad is con-
gratulating Pat Cash for a win over Ivan Lendl, who never won at Wimble-
don. The pun is on the words Cash (polysemous – Cash and cash) and Czech
(sounds as check). The byeline has a blended word Lendlicious (Lendl + Deli-
cious) linking the event to the product. Similarly, the word Devilopmentin
253
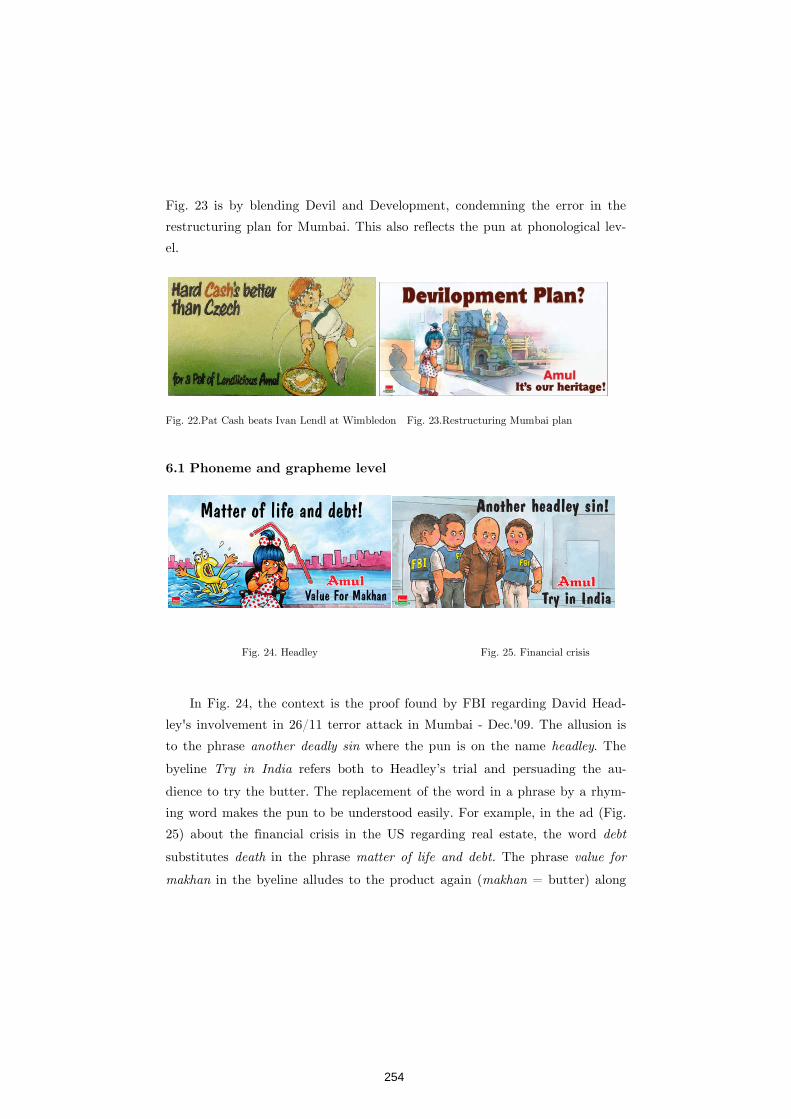
Fig. 23 is by blending Devil and Development, condemning the error in the
restructuring plan for Mumbai. This also reflects the pun at phonological lev-
el.
Fig. 22.Pat Cash beats Ivan Lendl at Wimbledon Fig. 23.Restructuring Mumbai plan
6.1 Phoneme and grapheme level
In Fig. 24, the context is the proof found by FBI regarding David Head-
ley's involvement in 26/11 terror attack in Mumbai - Dec.'09. The allusion is
to the phrase another deadly sin where the pun is on the name headley. The
byeline Try in India refers both to Headley’s trial and persuading the au-
dience to try the butter. The replacement of the word in a phrase by a rhym-
ing word makes the pun to be understood easily. For example, in the ad (Fig.
25) about the financial crisis in the US regarding real estate, the word debt
substitutes death in the phrase matter of life and debt. The phrase value for
makhan in the byeline alludes to the product again (makhan = butter) along
Fig. 24. Headley Fig. 25. Financial crisis
254
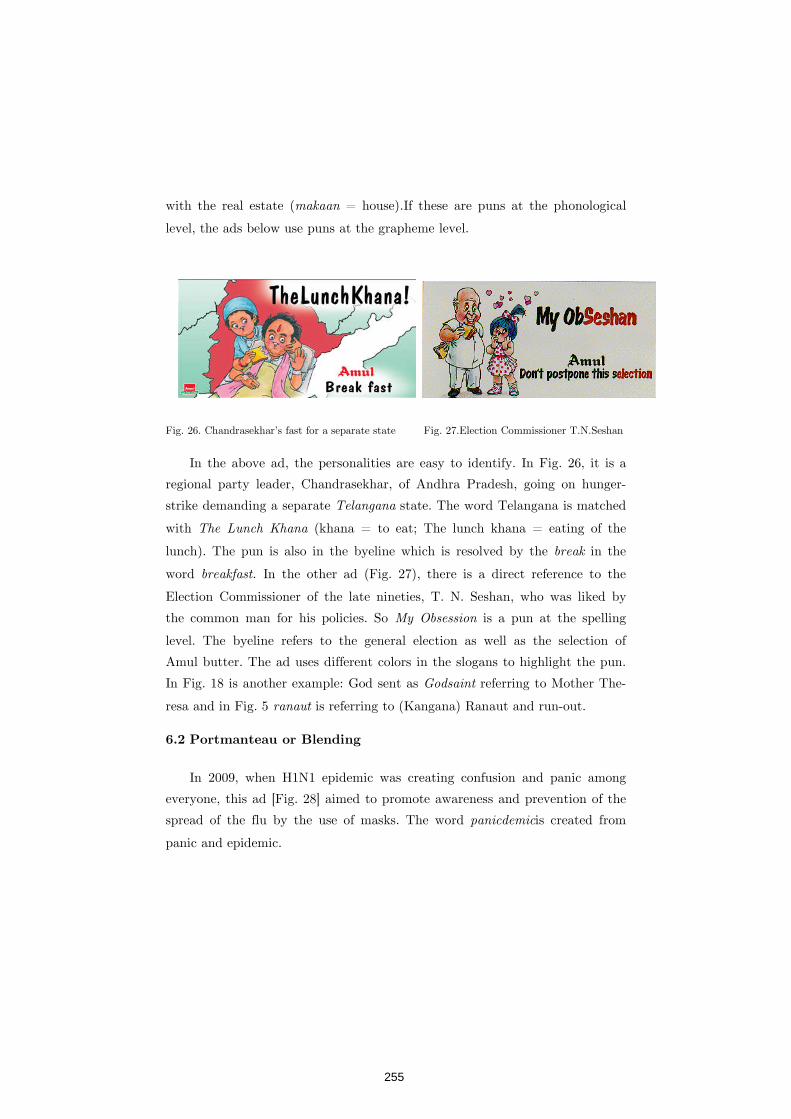
with the real estate (makaan = house).If these are puns at the phonological
level, the ads below use puns at the grapheme level.
Fig. 26. Chandrasekhar’s fast for a separate state Fig. 27.Election Commissioner T.N.Seshan
In the above ad, the personalities are easy to identify. In Fig. 26, it is a
regional party leader, Chandrasekhar, of Andhra Pradesh, going on hunger-
strike demanding a separate Telangana state. The word Telangana is matched
with The Lunch Khana (khana = to eat; The lunch khana = eating of the
lunch). The pun is also in the byeline which is resolved by the break in the
word breakfast. In the other ad (Fig. 27), there is a direct reference to the
Election Commissioner of the late nineties, T. N. Seshan, who was liked by
the common man for his policies. So My Obsession is a pun at the spelling
level. The byeline refers to the general election as well as the selection of
Amul butter. The ad uses different colors in the slogans to highlight the pun.
In Fig. 18 is another example: God sent as Godsaint referring to Mother The-
resa and in Fig. 5 ranaut is referring to (Kangana) Ranaut and run-out.
6.2 Portmanteau or Blending
In 2009, when H1N1 epidemic was creating confusion and panic among
everyone, this ad [Fig. 28] aimed to promote awareness and prevention of the
spread of the flu by the use of masks. The word panicdemicis created from
panic and epidemic.
255
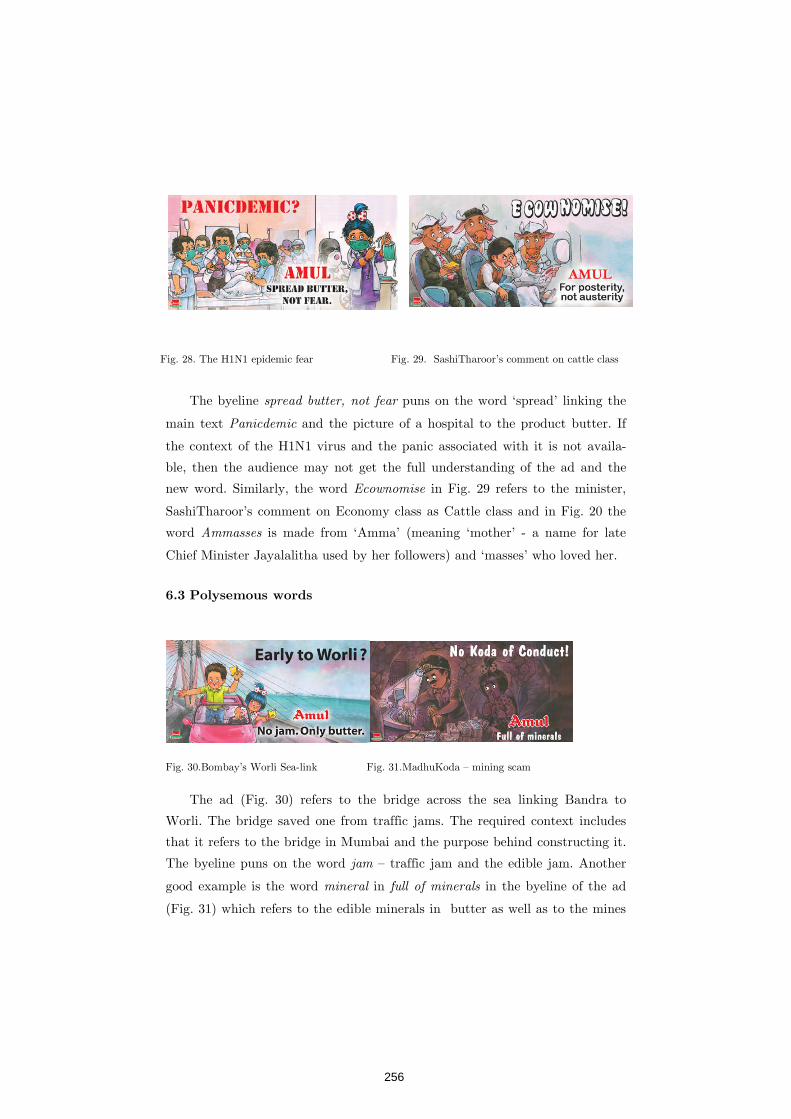
The byeline spread butter, not fear puns on the word ‘spread’ linking the
main text Panicdemic and the picture of a hospital to the product butter. If
the context of the H1N1 virus and the panic associated with it is not availa-
ble, then the audience may not get the full understanding of the ad and the
new word. Similarly, the word Ecownomise in Fig. 29 refers to the minister,
SashiTharoor’s comment on Economy class as Cattle class and in Fig. 20 the
word Ammasses is made from ‘Amma’ (meaning ‘mother’ - a name for late
Chief Minister Jayalalitha used by her followers) and ‘masses’ who loved her.
6.3 Polysemous words
Fig. 30.Bombay’s Worli Sea-link Fig. 31.MadhuKoda – mining scam
The ad (Fig. 30) refers to the bridge across the sea linking Bandra to
Worli. The bridge saved one from traffic jams. The required context includes
that it refers to the bridge in Mumbai and the purpose behind constructing it.
The byeline puns on the word jam – traffic jam and the edible jam. Another
good example is the word mineral in full of minerals in the byeline of the ad
(Fig. 31) which refers to the edible minerals in butter as well as to the mines
Fig. 28. The H1N1 epidemic fear Fig. 29. SashiTharoor’s comment on cattle class
256
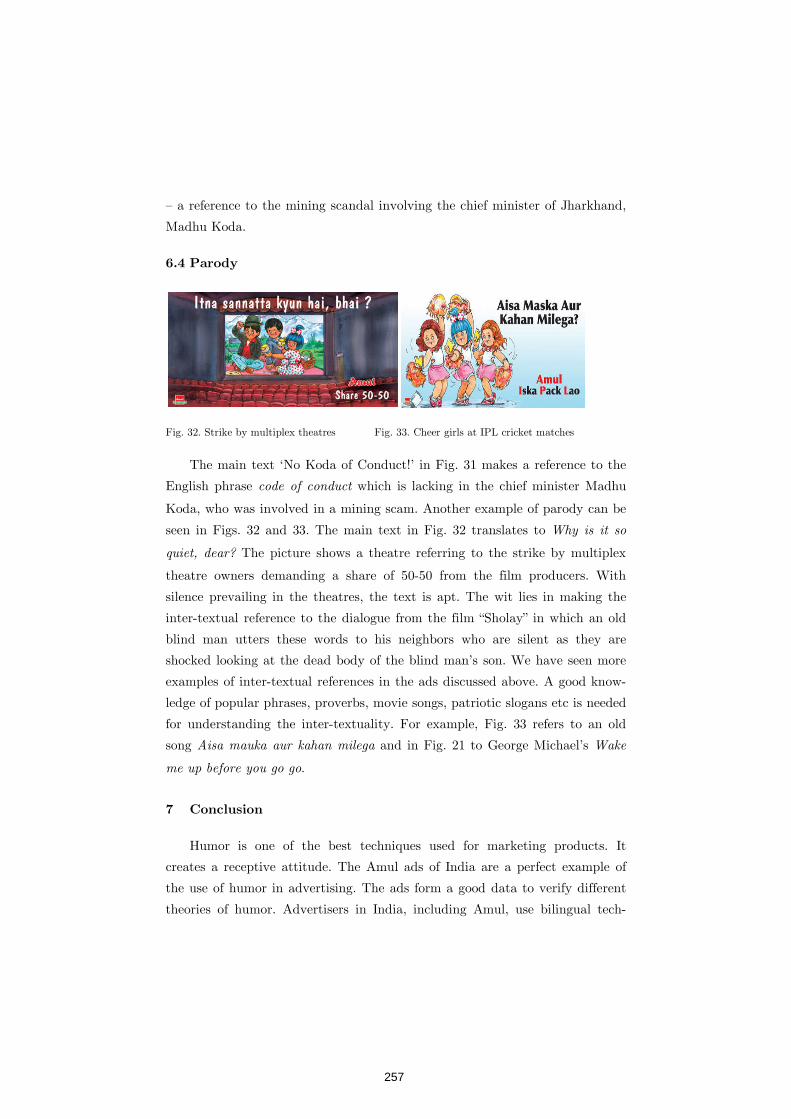
– a reference to the mining scandal involving the chief minister of Jharkhand,
Madhu Koda.
6.4 Parody
Fig. 32. Strike by multiplex theatres Fig. 33. Cheer girls at IPL cricket matches
The main text ‘No Koda of Conduct!’ in Fig. 31 makes a reference to the
English phrase code of conduct which is lacking in the chief minister Madhu
Koda, who was involved in a mining scam. Another example of parody can be
seen in Figs. 32 and 33. The main text in Fig. 32 translates to Why is it so
quiet, dear? The picture shows a theatre referring to the strike by multiplex
theatre owners demanding a share of 50-50 from the film producers. With
silence prevailing in the theatres, the text is apt. The wit lies in making the
inter-textual reference to the dialogue from the film “Sholay” in which an old
blind man utters these words to his neighbors who are silent as they are
shocked looking at the dead body of the blind man’s son. We have seen more
examples of inter-textual references in the ads discussed above. A good know-
ledge of popular phrases, proverbs, movie songs, patriotic slogans etc is needed
for understanding the inter-textuality. For example, Fig. 33 refers to an old
song Aisa mauka aur kahan milega and in Fig. 21 to George Michael’s Wake
me up before you go go.
7 Conclusion
Humor is one of the best techniques used for marketing products. It
creates a receptive attitude. The Amul ads of India are a perfect example of
the use of humor in advertising. The ads form a good data to verify different
theories of humor. Advertisers in India, including Amul, use bilingual tech-
257
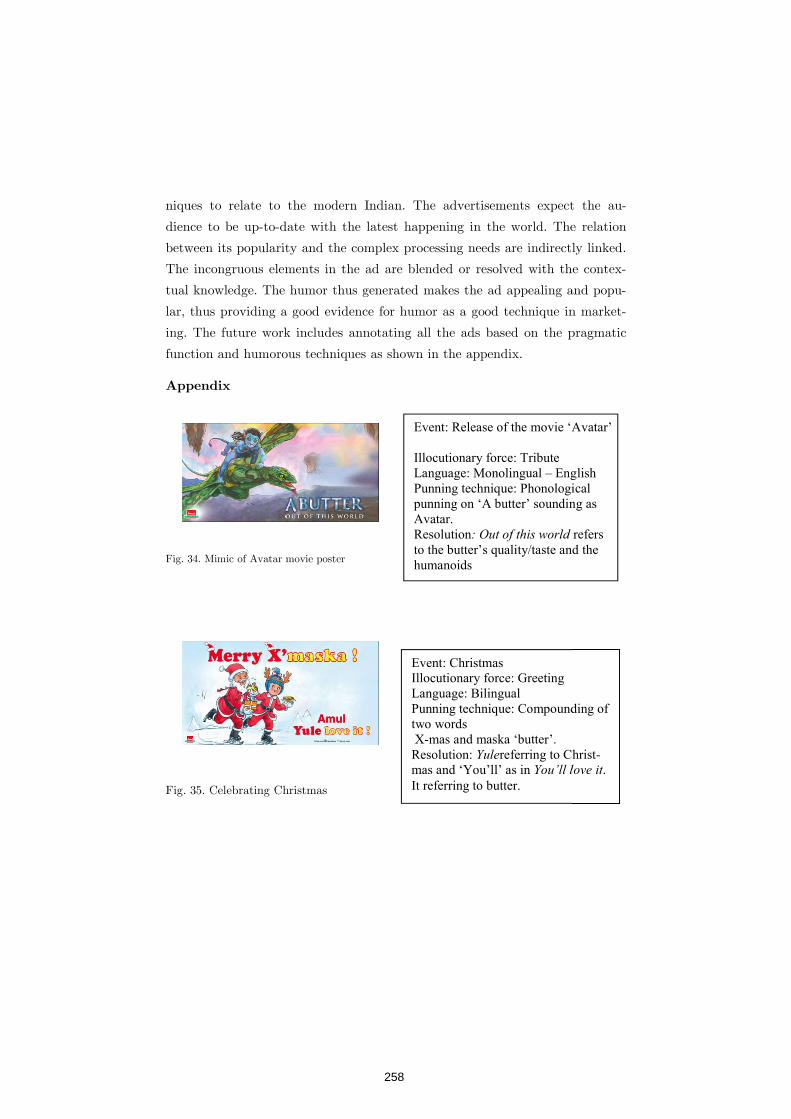
niques to relate to the modern Indian. The advertisements expect
dience to be up-to-date with the latest happen
between its popularity and the complex processing needs are indirectly
The incongruous elements in the ad are blended or resolved with the conte
tual knowledge. The
lar, thus providing a good evidence for
ing. The future work includ
function and humorous techniques
Appendix
Fig. 34. Mimic of Avatar movie poster
Fig. 35. Celebrating Christmas
niques to relate to the modern Indian. The advertisements expect
date with the latest happening in the world. The relation
between its popularity and the complex processing needs are indirectly
The incongruous elements in the ad are blended or resolved with the conte
tual knowledge. The humor thus generated makes the ad appealing and pop
lar, thus providing a good evidence for humor as a good technique in marke
The future work includes annotating all the ads based on the pragmatic
function and humorous techniques as shown in the appendix.
Mimic of Avatar movie poster
hristmas
Event: Christmas Illocutionary force: Greeting Language: Bilingual Punning technique: Compoundingtwo words X-mas and maska ‘butter’. Resolution: Yulereferring to Chrismas and ‘You’ll’ as in You’ll love itIt referring to butter.
niques to relate to the modern Indian. The advertisements expect the au-
The relation
between its popularity and the complex processing needs are indirectly linked.
The incongruous elements in the ad are blended or resolved with the contex-
thus generated makes the ad appealing and popu-
as a good technique in market-
es annotating all the ads based on the pragmatic
Event: Release of the movie ‘Avatar’
Illocutionary force: Tribute Language: Monolingual – English Punning technique: Phonological punning on ‘A butter’ sounding as Avatar.Resolution: Out of this world refers to the butter’s quality/taste and the humanoids
Punning technique: Compounding of
referring to Christ-You’ll love it.
258
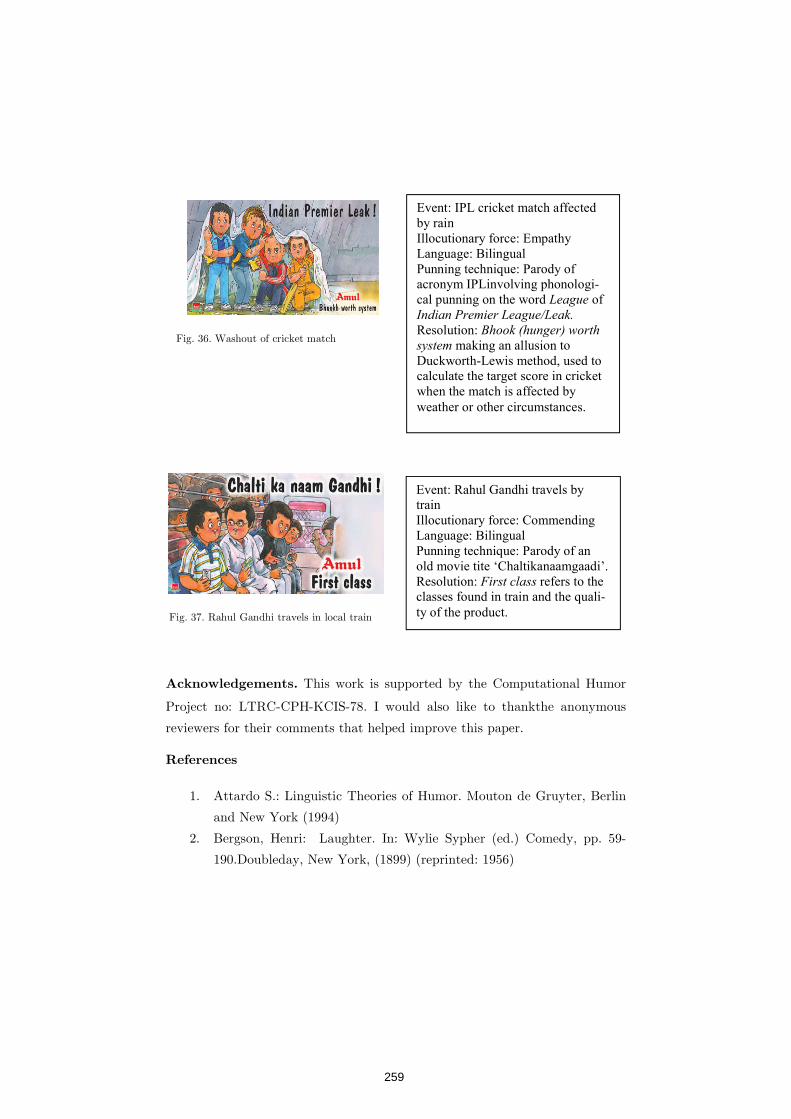
Fig. 37. Rahul Gandhi travels in local train
Acknowledgements. This work is supported by the Computational Humor
Project no: LTRC-CPH-KCIS-78. I would also like to thankthe anonymous
reviewers for their comments that helped improve this paper.
References
1. Attardo S.: Linguistic Theories of Humor. Mouton de Gruyter, Berlin
and New York (1994)
2. Bergson, Henri: Laughter. In: Wylie Sypher (ed.) Comedy, pp. 59-
190.Doubleday, New York, (1899) (reprinted: 1956)
Event: IPL cricket match affected by rain Illocutionary force: Empathy Language: Bilingual Punning technique: Parody of acronym IPLinvolving phonologi-cal punning on the word League of Indian Premier League/Leak. Resolution: Bhook (hunger) worth system making an allusion to Duckworth-Lewis method, used to calculate the target score in cricket when the match is affected by weather or other circumstances.
Event: Rahul Gandhi travels by train Illocutionary force: Commending Language: Bilingual Punning technique: Parody of an old movie tite ‘Chaltikanaamgaadi’. Resolution: First class refers to the classes found in train and the quali-ty of the product.
Fig. 36. Washout of cricket match
259

3. Biel, Alexander and Carole Bridgwater: Attributes of likable televi-
sion commercials. In: Journal of Advertising Research, 30, 38-44
(1990)
4. Duncan, Calvin P. and James E. Nelson: Effects of Humor in a Radio
Advertising Experiment.In: Journal of Advertising, 14(2), 33-40
(1985)
5. DwiNugroho, Aylanda: The Generic Structure of Print Advertisement
of Elizabeth Arden’s INTERVENE: A Multimodal Discourse Analysis.
In: K@ta journal,11, 1, 70-84 (2009)
6. Dynel, M.: Wittiness in the visual rhetoric of advertising.
In:EwaWałaszewska, Marta Kisielewska-Krysiuk, AnielaKorzeniows-
ka, MalgorzataGrzegorzewska (eds.) Relevant Worlds: Current Pers-
pectives on Language, Translation and Relevance Theory, pp. 48-66.
Cambridge Scholars Publishing, Newcastle, (2008)
7. Dynel, M.: Add humor to your ad: Humor in advertising slogans. In:
Marta Dynel (ed.) Advances in Discourse Approaches, pp. 201-225.
Cambridge Scholars Publishing, Newcastle (2009)
8. Dynel, M.: Blending the incongruity-resolution model and the concep-
tual integration theory: The case of blends in pictorial advertising. In:
International Review of Pragmatics, 3, 59-83 (2011)
9. Freud, Sigmund: Wit and its relation to the unconscious. In: A. A.
Brill (tr. and ed.) The Basic Writings of Sigmund Freud. Modern Li-
brary, New York, (1905) (reprinted:1938)
10. Cutting, Joan: Pragmatics and Discourse – A resource book for stu-
dents. Routledge, London and New York (2002)
11. Gupta, Renu: Bilingual advertising in a multilingual country. In:
Language in India, vol.7,pp. 8-9 (2007)
12. Haley, Russell and Allan Baldinger: The ARF copy research project.
In: Journal of Advertising, 31, 1-32 (1991)
13. Koestler, A.:Humor and Wit. In: Encyclopedia Brittanica:Macropedia,
vol. 9, pp. 5-11 (1973)
14. Lapsanská, Jana: The language of advertising with the concentration
on the linguistic means and the analysis of advertising slogans. Dip-
260
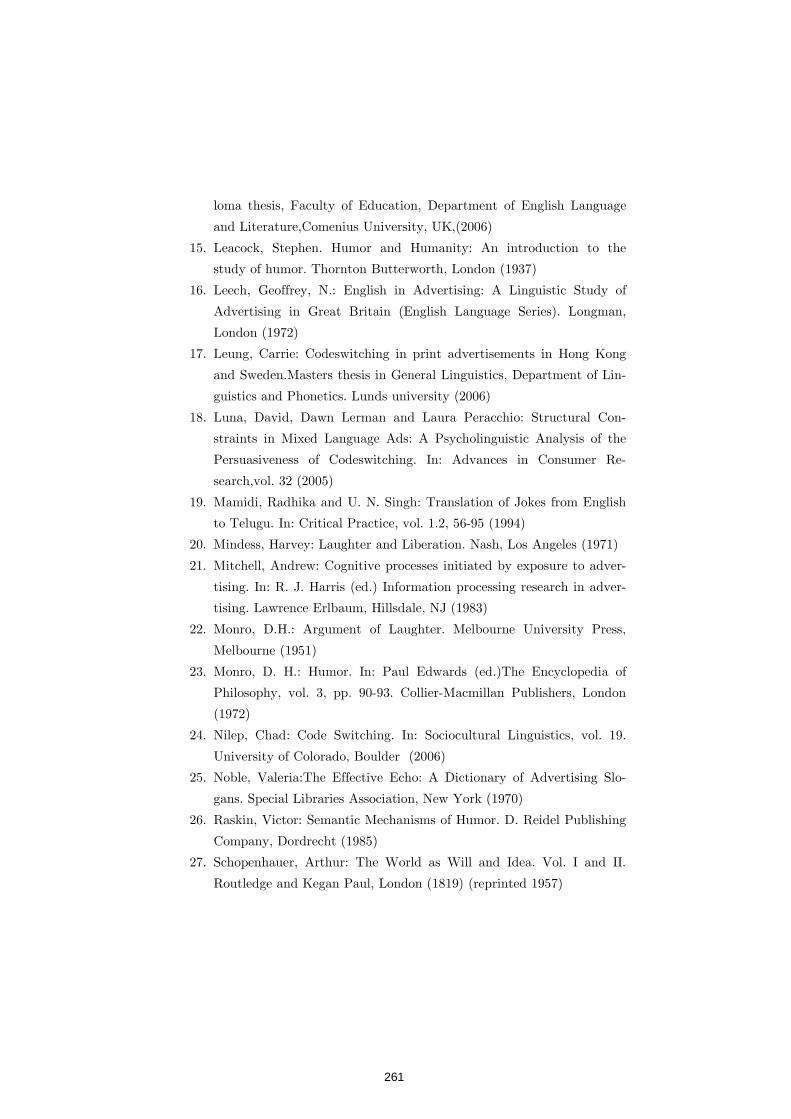
loma thesis, Faculty of Education, Department of English Language
and Literature,Comenius University, UK,(2006)
15. Leacock, Stephen. Humor and Humanity: An introduction to the
study of humor. Thornton Butterworth, London (1937)
16. Leech, Geoffrey, N.: English in Advertising: A Linguistic Study of
Advertising in Great Britain (English Language Series). Longman,
London (1972)
17. Leung, Carrie: Codeswitching in print advertisements in Hong Kong
and Sweden.Masters thesis in General Linguistics, Department of Lin-
guistics and Phonetics. Lunds university (2006)
18. Luna, David, Dawn Lerman and Laura Peracchio: Structural Con-
straints in Mixed Language Ads: A Psycholinguistic Analysis of the
Persuasiveness of Codeswitching. In: Advances in Consumer Re-
search,vol. 32 (2005)
19. Mamidi, Radhika and U. N. Singh: Translation of Jokes from English
to Telugu. In: Critical Practice, vol. 1.2, 56-95 (1994)
20. Mindess, Harvey: Laughter and Liberation. Nash, Los Angeles (1971)
21. Mitchell, Andrew: Cognitive processes initiated by exposure to adver-
tising. In: R. J. Harris (ed.) Information processing research in adver-
tising. Lawrence Erlbaum, Hillsdale, NJ (1983)
22. Monro, D.H.: Argument of Laughter. Melbourne University Press,
Melbourne (1951)
23. Monro, D. H.: Humor. In: Paul Edwards (ed.)The Encyclopedia of
Philosophy, vol. 3, pp. 90-93. Collier-Macmillan Publishers, London
(1972)
24. Nilep, Chad: Code Switching. In: Sociocultural Linguistics, vol. 19.
University of Colorado, Boulder (2006)
25. Noble, Valeria:The Effective Echo: A Dictionary of Advertising Slo-
gans. Special Libraries Association, New York (1970)
26. Raskin, Victor: Semantic Mechanisms of Humor. D. Reidel Publishing
Company, Dordrecht (1985)
27. Schopenhauer, Arthur: The World as Will and Idea. Vol. I and II.
Routledge and Kegan Paul, London (1819) (reprinted 1957)
261

28. Sperber, D. and Wilson, D.: Relevance: Communication and Cogni-
tion. Basil Blackwell Ltd., Oxford (1998)
29. Sperber, Dan, and Deirdre Wilson:Relevance Theory. In: L. Horn, and
G. Ward (ed.) The Handbook of Pragmatics. Blackwell, Oxford
(2004)
30. Sully, J.: Essay on Laughter. Longmans, New York(1902)
31. Tanaka, Keiko: The pun in advertising: A pragmatic approach. In:
Lingua,87, 91-102 (1992)
32. Tanaka, Keiko: Advertising Language. Routledge, London (1994)
33. Van Mulken, Margot, Renske van Enschot-van Dijk, and Hans Hoe-
ken: Puns, relevance and appreciation in advertisements. In: Journal
of Pragmatics. 37, 707-721 (2005)
34. Chang, Wan Yu and I Ying Chang: The Influences of Humorous Ad-
vertising on Brand Popularity and Advertising Effects in the Tourism
Industry. In: Sustainability, 6, 9205-9217; doi:10.3390/su6129205
(2014)
35. Strick M, Holland RW, van Baaren RB, and van Knippenberg A:
Those who laugh are defenseless: How humor breaks resistance to in-
fluence.In: Journal of Experimental Psychology. Applied, 18 (2), 213-
23 PMID:22564085(2012)
36. Karpinska-Krakowiak, Małgorzata: and ArturModlinskiPrankvertising
– Pranska as a new form of brand advertising online. In: MMR, vol.
XIX, 21 (3/2014), pp. 31-44 (2014)
37. Kathpalia, Sujata S and Kenneth Keng Wee Ong: The use of code-
mixing in Indian billboard advertising. In World Englishes 34(4), 557-
575 (2015)
38. Graemener Blog, https://gramener.com/playground/amul/
39. Mamidi, Radhika: Context and humor - Understanding Amul adver-
tisements. Presentation at LAFAL Linguistic Approaches to Funni-
ness, Amusement and Laughter, 1st International Symposium. Lodz,
Poland (2010)
262
Making Humor Tick on Social Media
Ankit Bansal1, Anmol Varma1, and Bimlesh Wadhwa2
1 Samsung Research Institute Bangalore,[email protected],
[email protected] National University of Singapore
Abstract. With social media becoming one of the most important meansof delivering any kind of content in today's world, user-communities aresubject to information overload. This makes it difficult for brands andtheir advertisements to stand out from the competition and attract con-sumers. One tool that brands choose to employ is humor, which can leadto the ad campaign going viral, and hence generating brand awareness.This paper attempts to analyze cases and isolate the factors which areessential for a humorous interaction/advertisement to go well with thesocial media user communities. In addition, we also explore what aspectsneed to be taken care of while attempting such interactions, by going overa few negative cases.
Keywords: Humor, Human-Computer Interaction, Social Media, UserInteraction, Advertising
1 Introduction
Humor is a social phenomenon. It is increasingly flourishing on social net-work sites through various media and technologies e.g. Stickers, Tweets, Memes,Videos etc. Its increasing pervasiveness has to do with the positive characteris-tics that humor is believed to have. It can deliver a very serious message withan ease which enhances user experience and make humans laugh a naturallyloved state. Humor in online communities passes along from one user to another,and can go viral in no time. Virality, though, depends on the comic potential,tone, voice, timing and connection with the intended audience. This paper isprimarily addressing the question of perception and role of user communities inhumor virality. Having analyzed a sample of 6 virals from popular channels, weisolate and report humor characteristics that are essential for user communitiesto like it. Brand Awareness, Customer Engagement and Relationship Market-ing all impact the market share and profitability of a company[1]. Consideringsocial media advertisements as a way of interaction between brands and theirprospective customers, we have tried to explore what factors are important tomake such humorous interactions leave a lasting impact on customers, and inturn, on the brand.
263
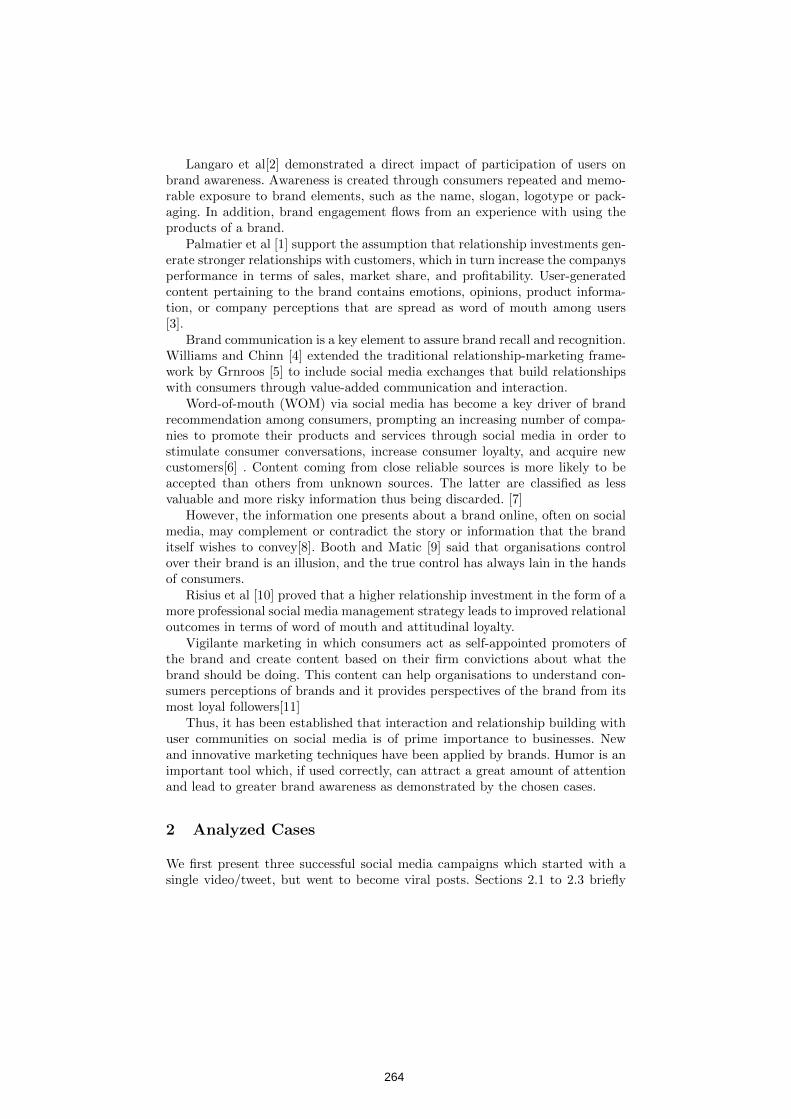
Langaro et al[2] demonstrated a direct impact of participation of users onbrand awareness. Awareness is created through consumers repeated and memo-rable exposure to brand elements, such as the name, slogan, logotype or pack-aging. In addition, brand engagement flows from an experience with using theproducts of a brand.
Palmatier et al [1] support the assumption that relationship investments gen-erate stronger relationships with customers, which in turn increase the companysperformance in terms of sales, market share, and profitability. User-generatedcontent pertaining to the brand contains emotions, opinions, product informa-tion, or company perceptions that are spread as word of mouth among users[3].
Brand communication is a key element to assure brand recall and recognition.Williams and Chinn [4] extended the traditional relationship-marketing frame-work by Grnroos [5] to include social media exchanges that build relationshipswith consumers through value-added communication and interaction.
Word-of-mouth (WOM) via social media has become a key driver of brandrecommendation among consumers, prompting an increasing number of compa-nies to promote their products and services through social media in order tostimulate consumer conversations, increase consumer loyalty, and acquire newcustomers[6] . Content coming from close reliable sources is more likely to beaccepted than others from unknown sources. The latter are classified as lessvaluable and more risky information thus being discarded. [7]
However, the information one presents about a brand online, often on socialmedia, may complement or contradict the story or information that the branditself wishes to convey[8]. Booth and Matic [9] said that organisations controlover their brand is an illusion, and the true control has always lain in the handsof consumers.
Risius et al [10] proved that a higher relationship investment in the form of amore professional social media management strategy leads to improved relationaloutcomes in terms of word of mouth and attitudinal loyalty.
Vigilante marketing in which consumers act as self-appointed promoters ofthe brand and create content based on their firm convictions about what thebrand should be doing. This content can help organisations to understand con-sumers perceptions of brands and it provides perspectives of the brand from itsmost loyal followers[11]
Thus, it has been established that interaction and relationship building withuser communities on social media is of prime importance to businesses. Newand innovative marketing techniques have been applied by brands. Humor is animportant tool which, if used correctly, can attract a great amount of attentionand lead to greater brand awareness as demonstrated by the chosen cases.
2 Analyzed Cases
We first present three successful social media campaigns which started with asingle video/tweet, but went to become viral posts. Sections 2.1 to 2.3 briefly
264
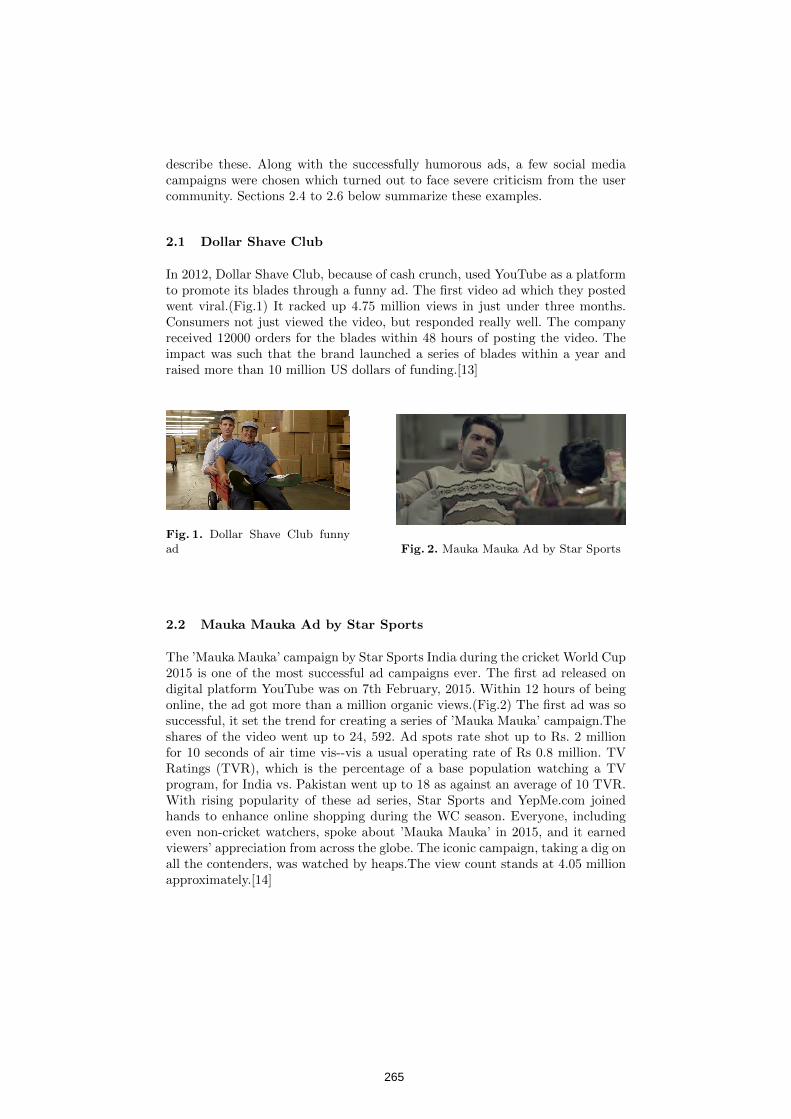
describe these. Along with the successfully humorous ads, a few social mediacampaigns were chosen which turned out to face severe criticism from the usercommunity. Sections 2.4 to 2.6 below summarize these examples.
2.1 Dollar Shave Club
In 2012, Dollar Shave Club, because of cash crunch, used YouTube as a platformto promote its blades through a funny ad. The first video ad which they postedwent viral.(Fig.1) It racked up 4.75 million views in just under three months.Consumers not just viewed the video, but responded really well. The companyreceived 12000 orders for the blades within 48 hours of posting the video. Theimpact was such that the brand launched a series of blades within a year andraised more than 10 million US dollars of funding.[13]
Fig. 1. Dollar Shave Club funnyad Fig. 2. Mauka Mauka Ad by Star Sports
2.2 Mauka Mauka Ad by Star Sports
The ’Mauka Mauka’ campaign by Star Sports India during the cricket World Cup2015 is one of the most successful ad campaigns ever. The first ad released ondigital platform YouTube was on 7th February, 2015. Within 12 hours of beingonline, the ad got more than a million organic views.(Fig.2) The first ad was sosuccessful, it set the trend for creating a series of ’Mauka Mauka’ campaign.Theshares of the video went up to 24, 592. Ad spots rate shot up to Rs. 2 millionfor 10 seconds of air time vis--vis a usual operating rate of Rs 0.8 million. TVRatings (TVR), which is the percentage of a base population watching a TVprogram, for India vs. Pakistan went up to 18 as against an average of 10 TVR.With rising popularity of these ad series, Star Sports and YepMe.com joinedhands to enhance online shopping during the WC season. Everyone, includingeven non-cricket watchers, spoke about ’Mauka Mauka’ in 2015, and it earnedviewers’ appreciation from across the globe. The iconic campaign, taking a dig onall the contenders, was watched by heaps.The view count stands at 4.05 millionapproximately.[14]
265
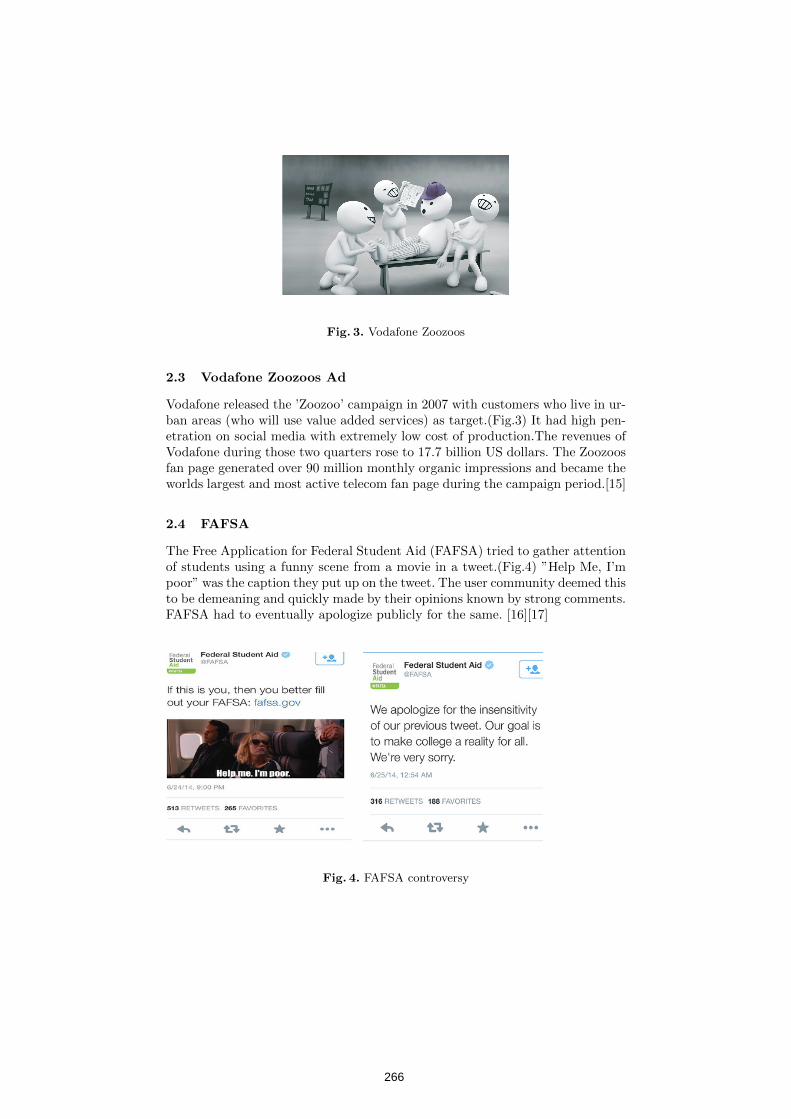
Fig. 3. Vodafone Zoozoos
2.3 Vodafone Zoozoos Ad
Vodafone released the ’Zoozoo’ campaign in 2007 with customers who live in ur-ban areas (who will use value added services) as target.(Fig.3) It had high pen-etration on social media with extremely low cost of production.The revenues ofVodafone during those two quarters rose to 17.7 billion US dollars. The Zoozoosfan page generated over 90 million monthly organic impressions and became theworlds largest and most active telecom fan page during the campaign period.[15]
2.4 FAFSA
The Free Application for Federal Student Aid (FAFSA) tried to gather attentionof students using a funny scene from a movie in a tweet.(Fig.4) ”Help Me, I’mpoor” was the caption they put up on the tweet. The user community deemed thisto be demeaning and quickly made by their opinions known by strong comments.FAFSA had to eventually apologize publicly for the same. [16][17]
Fig. 4. FAFSA controversy
266
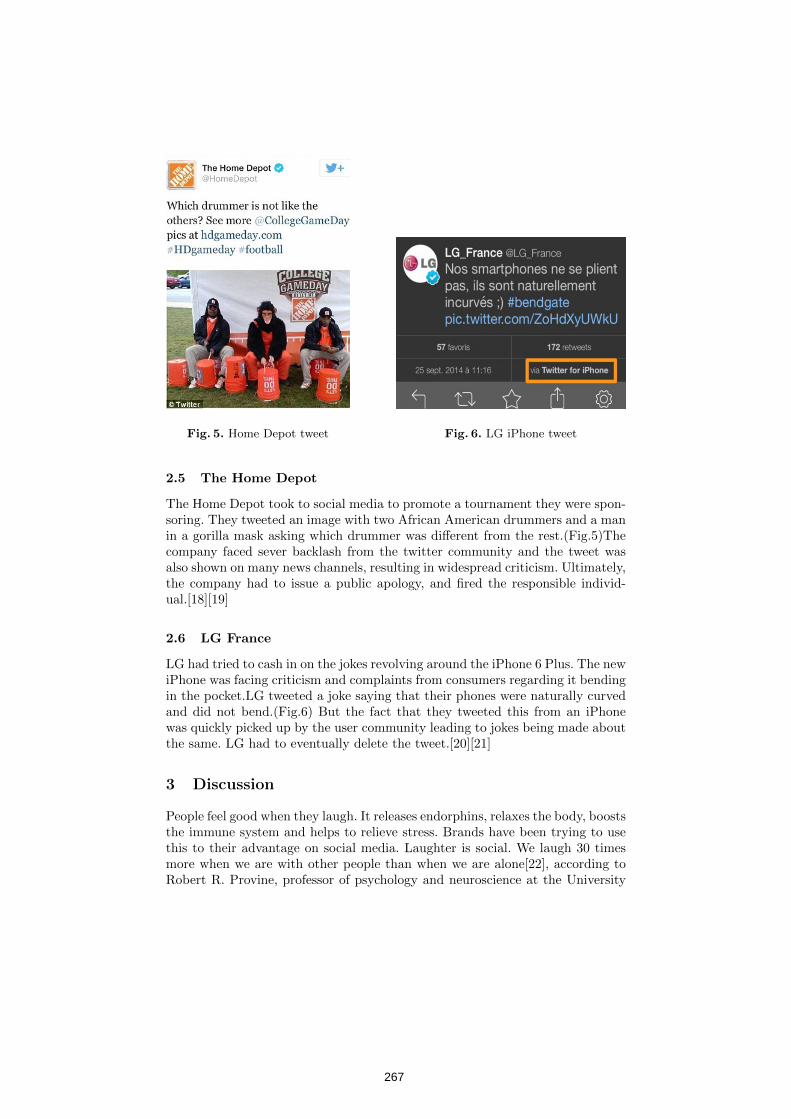
Fig. 5. Home Depot tweet Fig. 6. LG iPhone tweet
2.5 The Home Depot
The Home Depot took to social media to promote a tournament they were spon-soring. They tweeted an image with two African American drummers and a manin a gorilla mask asking which drummer was different from the rest.(Fig.5)Thecompany faced sever backlash from the twitter community and the tweet wasalso shown on many news channels, resulting in widespread criticism. Ultimately,the company had to issue a public apology, and fired the responsible individ-ual.[18][19]
2.6 LG France
LG had tried to cash in on the jokes revolving around the iPhone 6 Plus. The newiPhone was facing criticism and complaints from consumers regarding it bendingin the pocket.LG tweeted a joke saying that their phones were naturally curvedand did not bend.(Fig.6) But the fact that they tweeted this from an iPhonewas quickly picked up by the user community leading to jokes being made aboutthe same. LG had to eventually delete the tweet.[20][21]
3 Discussion
People feel good when they laugh. It releases endorphins, relaxes the body, booststhe immune system and helps to relieve stress. Brands have been trying to usethis to their advantage on social media. Laughter is social. We laugh 30 timesmore when we are with other people than when we are alone[22], according toRobert R. Provine, professor of psychology and neuroscience at the University
267
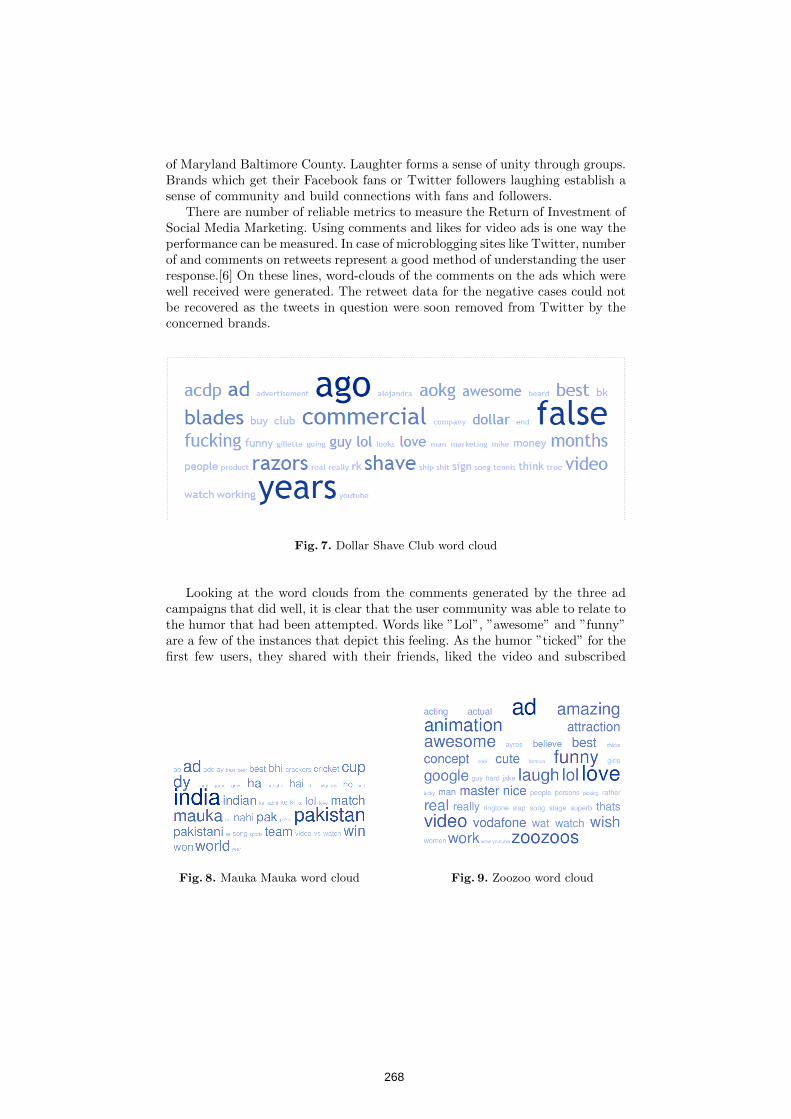
of Maryland Baltimore County. Laughter forms a sense of unity through groups.Brands which get their Facebook fans or Twitter followers laughing establish asense of community and build connections with fans and followers.
There are number of reliable metrics to measure the Return of Investment ofSocial Media Marketing. Using comments and likes for video ads is one way theperformance can be measured. In case of microblogging sites like Twitter, numberof and comments on retweets represent a good method of understanding the userresponse.[6] On these lines, word-clouds of the comments on the ads which werewell received were generated. The retweet data for the negative cases could notbe recovered as the tweets in question were soon removed from Twitter by theconcerned brands.
Fig. 7. Dollar Shave Club word cloud
Looking at the word clouds from the comments generated by the three adcampaigns that did well, it is clear that the user community was able to relate tothe humor that had been attempted. Words like ”Lol”, ”awesome” and ”funny”are a few of the instances that depict this feeling. As the humor ”ticked” for thefirst few users, they shared with their friends, liked the video and subscribed
Fig. 8. Mauka Mauka word cloud Fig. 9. Zoozoo word cloud
268
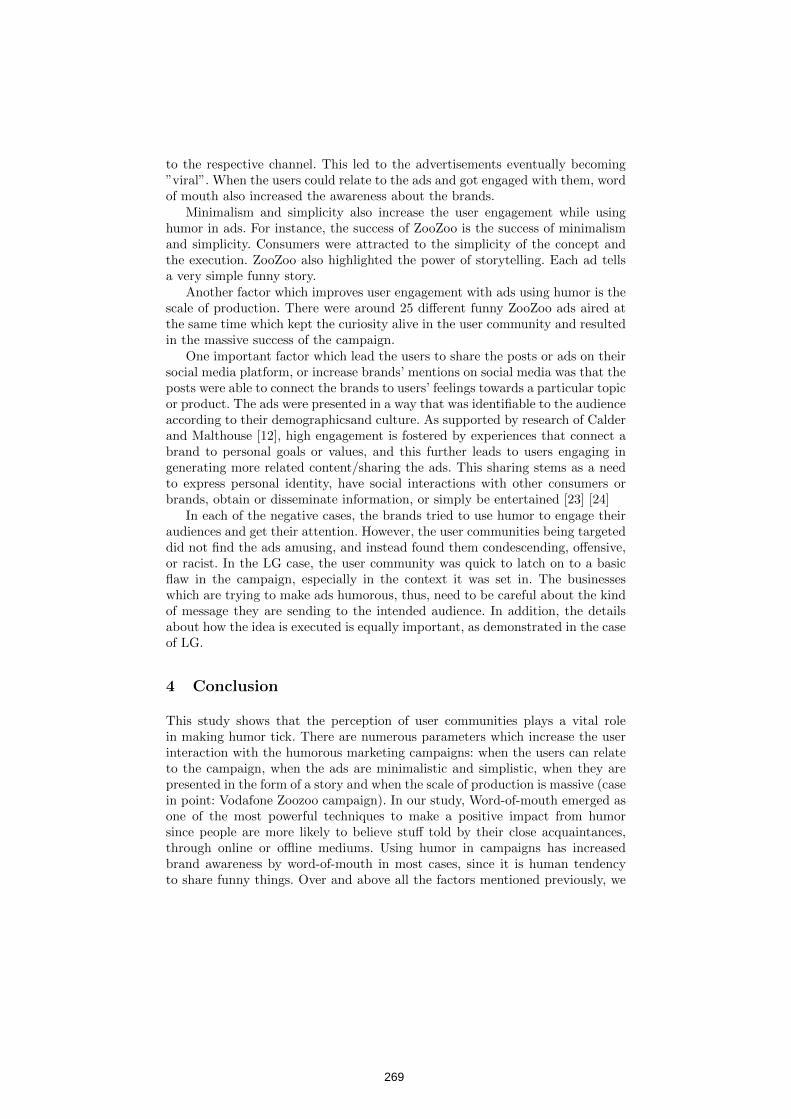
to the respective channel. This led to the advertisements eventually becoming”viral”. When the users could relate to the ads and got engaged with them, wordof mouth also increased the awareness about the brands.
Minimalism and simplicity also increase the user engagement while usinghumor in ads. For instance, the success of ZooZoo is the success of minimalismand simplicity. Consumers were attracted to the simplicity of the concept andthe execution. ZooZoo also highlighted the power of storytelling. Each ad tellsa very simple funny story.
Another factor which improves user engagement with ads using humor is thescale of production. There were around 25 different funny ZooZoo ads aired atthe same time which kept the curiosity alive in the user community and resultedin the massive success of the campaign.
One important factor which lead the users to share the posts or ads on theirsocial media platform, or increase brands’ mentions on social media was that theposts were able to connect the brands to users’ feelings towards a particular topicor product. The ads were presented in a way that was identifiable to the audienceaccording to their demographicsand culture. As supported by research of Calderand Malthouse [12], high engagement is fostered by experiences that connect abrand to personal goals or values, and this further leads to users engaging ingenerating more related content/sharing the ads. This sharing stems as a needto express personal identity, have social interactions with other consumers orbrands, obtain or disseminate information, or simply be entertained [23] [24]
In each of the negative cases, the brands tried to use humor to engage theiraudiences and get their attention. However, the user communities being targeteddid not find the ads amusing, and instead found them condescending, offensive,or racist. In the LG case, the user community was quick to latch on to a basicflaw in the campaign, especially in the context it was set in. The businesseswhich are trying to make ads humorous, thus, need to be careful about the kindof message they are sending to the intended audience. In addition, the detailsabout how the idea is executed is equally important, as demonstrated in the caseof LG.
4 Conclusion
This study shows that the perception of user communities plays a vital rolein making humor tick. There are numerous parameters which increase the userinteraction with the humorous marketing campaigns: when the users can relateto the campaign, when the ads are minimalistic and simplistic, when they arepresented in the form of a story and when the scale of production is massive (casein point: Vodafone Zoozoo campaign). In our study, Word-of-mouth emerged asone of the most powerful techniques to make a positive impact from humorsince people are more likely to believe stuff told by their close acquaintances,through online or offline mediums. Using humor in campaigns has increasedbrand awareness by word-of-mouth in most cases, since it is human tendencyto share funny things. Over and above all the factors mentioned previously, we
269
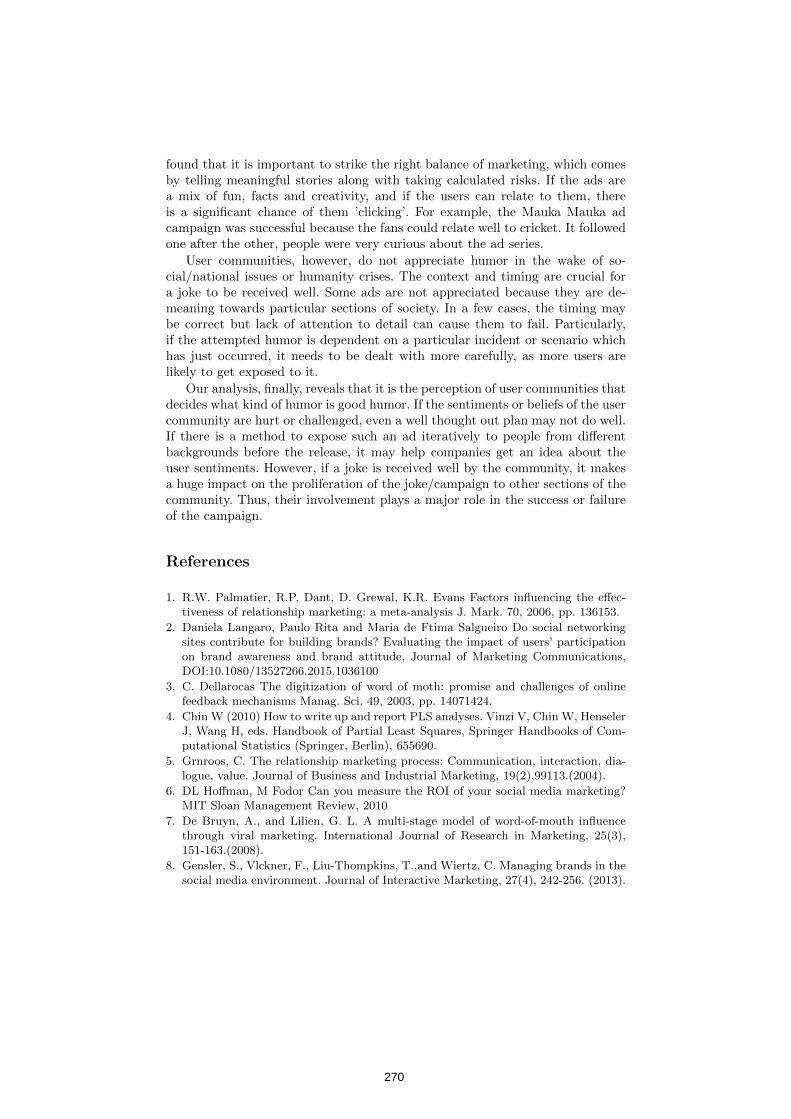
found that it is important to strike the right balance of marketing, which comesby telling meaningful stories along with taking calculated risks. If the ads area mix of fun, facts and creativity, and if the users can relate to them, thereis a significant chance of them ’clicking’. For example, the Mauka Mauka adcampaign was successful because the fans could relate well to cricket. It followedone after the other, people were very curious about the ad series.
User communities, however, do not appreciate humor in the wake of so-cial/national issues or humanity crises. The context and timing are crucial fora joke to be received well. Some ads are not appreciated because they are de-meaning towards particular sections of society. In a few cases, the timing maybe correct but lack of attention to detail can cause them to fail. Particularly,if the attempted humor is dependent on a particular incident or scenario whichhas just occurred, it needs to be dealt with more carefully, as more users arelikely to get exposed to it.
Our analysis, finally, reveals that it is the perception of user communities thatdecides what kind of humor is good humor. If the sentiments or beliefs of the usercommunity are hurt or challenged, even a well thought out plan may not do well.If there is a method to expose such an ad iteratively to people from differentbackgrounds before the release, it may help companies get an idea about theuser sentiments. However, if a joke is received well by the community, it makesa huge impact on the proliferation of the joke/campaign to other sections of thecommunity. Thus, their involvement plays a major role in the success or failureof the campaign.
References
1. R.W. Palmatier, R.P. Dant, D. Grewal, K.R. Evans Factors influencing the effec-tiveness of relationship marketing: a meta-analysis J. Mark. 70, 2006, pp. 136153.
2. Daniela Langaro, Paulo Rita and Maria de Ftima Salgueiro Do social networkingsites contribute for building brands? Evaluating the impact of users’ participationon brand awareness and brand attitude, Journal of Marketing Communications,DOI:10.1080/13527266.2015.1036100
3. C. Dellarocas The digitization of word of moth: promise and challenges of onlinefeedback mechanisms Manag. Sci. 49, 2003, pp. 14071424.
4. Chin W (2010) How to write up and report PLS analyses. Vinzi V, Chin W, HenselerJ, Wang H, eds. Handbook of Partial Least Squares, Springer Handbooks of Com-putational Statistics (Springer, Berlin), 655690.
5. Grnroos, C. The relationship marketing process: Communication, interaction, dia-logue, value. Journal of Business and Industrial Marketing, 19(2),99113.(2004).
6. DL Hoffman, M Fodor Can you measure the ROI of your social media marketing?MIT Sloan Management Review, 2010
7. De Bruyn, A., and Lilien, G. L. A multi-stage model of word-of-mouth influencethrough viral marketing. International Journal of Research in Marketing, 25(3),151-163.(2008).
8. Gensler, S., Vlckner, F., Liu-Thompkins, T.,and Wiertz, C. Managing brands in thesocial media environment. Journal of Interactive Marketing, 27(4), 242-256. (2013).
270

9. Norman Booth, Julie Ann Matic Mapping and leveraging influencers in social mediato shape corporate brand perceptions Corporate Communications: An InternationalJournal, Vol. 16 Issue: 3, pp.184-191, doi: 10.1108/13563281111156853 . (2011).
10. Marten Risius, Roman Beck Effectiveness of corporate social media activities inincreasing relational outcomes Journal of Information and Management 52(2015)824-839
11. Muiz Jr., A.M., Schau, H.J. Vigilante marketing and consumer-created communi-cations Journal of Advertising Volume 36, Issue 3, September 2007, Pages 35-50
12. Edward C. Malthouse, Bobby J. Calder, Su Jung Kim and Mark Vanden-bosch (2016) Evidence that user-generated content that produces engagement in-creases purchase behaviours Journal of Marketing Management, 32:5-6, 427-444,DOI:10.1080/0267257X.2016.1148066
13. Darren Dahl Dollar Shave Club, From Viral Video to Real BusinessNytimes.com,http://www.nytimes.com/2013/04/11/business/smallbusiness/dollar-shave-club-from-viral-video-to-real-business.html?pagewanted=all (2013)
14. Avinash Ramkumar Case Study On Star Sports Mauka Mauka Campaign On So-cial Media Channels Digital Vidya, http://www.digitalvidya.com/blog/case-study-on-star-sports-mauka-mauka-campaign-on-social-media-channels/ (2016)
15. Vodafone Social Engagement Case Study — OgilvyOneOgilvyone.com,https://www.ogilvyone.com/our-work/case-studies/vodafone(2015)
16. FAFSA Student Loan Agency Apologizes For Insensitive Tweet DiversityInc,http://www.diversityinc.com/news/student-loan-agency-apologizes-insensitive-tweet/ (2014)
17. FAFSA ’I’m Poor’ Tweet Sparks Online Backlash NBC News,http://www.nbcnews.com/better/money/fafsa-i-m-poor-tweet-sparks-online-backlash-n140356 (2014)
18. Home Depot Dedicates Twitter Feed To Apologies And Terminates Social MediaAgency After Racist Tweet Business Insider, http://www.businessinsider.in/Home-Depot-Dedicates-Twitter-Feed-To-Apologies-And-Terminates-Social-Media-Agency-After-Racist-Tweet/articleshow/25459685.cms (2013)
19. Home Depots Accidental Tweet Causes Controversy Ohio University StrategicSocial Media,http://oustrategicsocialmedia.com/2015/02/16/home-depots-racist-social-fail/ (2015)
20. LG mocks Apple’s bent iPhone (but uses an iPhone to send its tweet) CNET,https://www.cnet.com/news/lg-mocks-apples-bent-iphone-but-uses-an-iphone-to-send-its-tweet/ (2014)
21. LG tweets Bendgate joke... using an iPhone Tech Times,http://www.techtimes.com/articles/16564/20140928/lg-tweets-bendgate-joke-using-an-iphone.htm (2014)
22. Provine, Robert R. Laughing, Tickling, and the Evolution of Speech and Self Cur-rent Directions in Psychological Science (Vol. 13, No. 6, pages 215-218):
23. Daugherty, T., Eastin, M., and Bright, L. Exploring consumer motivations forcreating user-generated content. Journal of Interactive Advertising, 8(2), 1625.doi:10.1080/15252019.2008.10722139. (2008).
24. Muntinga, D. G., Moorman, M., and Smit, E. G. Introducting COBRAs: Exploringmotivations for brand-related social media use. International Journal of Advertising,30(1), 1346. doi:10.2501/IJA-30-1-013-046 . (2011).
271
Workshop 11
Today, it is a true challenge to design applications that support users of technology in complex and emergent organizational and work contexts. Today’s technologies change the way we work with pervasive interfaces and smart places, often shifting our physical boundaries and our operational modes. This is even more challenging when one is away from the mainstream industrial sites of the global north.
To meet these challenges, the Working Group 13.6 (WG13.6) on (HWID) was established
with objective of providing the analysis of this complexity and establishing its relationships with extensive empirical work domains studies and HCI designs.
In line with recent suggestions that HCI should “turn to practice” and do practice based research, the utility and merit of defining a field from its published works stems from providing a conceptual frame to organize a variety of issues emerging in recent HCI research.
This workshop adopts a practice oriented, bottom up approach. In this manner, it provides a unique opportunity to observe technology-mediated innovative work practices in informal settings, in a social development context. While doing so, it aims to follow along the existing series of HWID discussions, focusing on identifying HCI patterns and its relations to the HWID field and related fields.
272

Stefano Valtolina1, Barbara Rita Barricelli1, Alessandro Rizzi1, Sabrina Menghini2, Ascanio Ciriaci2
1 Dept. of Computer Science, Università degli Studi di Milano, Italy
2 INMM s.r.l., Italy
This position paper illustrates the research and
development work done in the last years for understanding how to support domain experts in the rescue operations of migrants who attempt to reach Italian coasts via sea journeys on Mediterranean routes. The context, characterized by humanitarian, social, and organizational issues, presents complex challenges that can only be tackled with a multidisciplinary, participatory, and internationalized approach.
Participatory design, Human Work Interaction
Design, international development, domain experts, migration, emergency medical services.
In recent years, Italy is handling the difficult situation of migratory flows ending with landing on the southern coast of the Country. According to UNHCR (United Nations High Commissioner for Refugees) report [1], since the beginning of 2017, 50,275 immigrants have entered Italy from the Mediterranean. In [2] World Health Organization defines a mass casualty incident as “an event which generates more patients at one time than locally available resources can manage using routine procedures. It requires exceptional emergency arrangements and additional or extraordinary assistance”. This definition is well suited to describe what happens during the rescue operations for managing immigrants ‘landing when it is necessary to
273
offer medical assistance to a number of people who often exceed what the relief structures can accommodate. These conditions make it essential to study and implement specific strategies and work plans observed by all actors involved. Assistance operations are carried out by staff specialized in various disciplines such as doctors, nurses, and paramedics. Experts from different domains are called upon to perform their profession in a complex environment and with very challenging timing and intervention modes. This means having to perform sensitive tasks in a short time, though maintaining a high level of security, efficiency, and reliability of performance. This leads to the need of designing and developing IT applications to support the whole rescue operations. In particular, our research and development work is framed into studying how to design the interaction of IT-solutions for enabling Emergency Medical Services (EMS). EMS are defined in [3] as “[…] the ambulance services component that responds to the scene of a medical or surgical emergency, stabilizes the victim of a sudden illness or injury by providing emergency medical treatment at the scene and transports the patient to a medical facility for definitive treatment”. However, the issues in this context do not relate only with medical assistance: operation workflows have to be put in place and leadership and organizational aspects have to be faced. To manage rescue operation in an efficient way it means to nominate one or more managers who can successfully lead and coordinate all team members. One of the most critical actions to be taken in rescue operations, is the triage, i.e. efficiently determining severities of injuries and prioritizing treatments; this action constitutes one of the most important task for basic life support. Furthermore, there are other crucial activities, like organizing and running specifics areas of operation for triage, treatment, and transportation. Therefore, it is mandatory to take care of specific flow of information between the operation managers and the team members. Such a research context can be clearly seen as framed into Human Work Interaction Design (HWID) [4, 5, 6, 7], a lightweight version of Cognitive Work Analysis, addressing the concept of Work in Human-Computer Interaction. The background and experience we bring in the field is twofold. On one hand, INMM – In Manibus Meis - is a registered supplier to NATO and is responsible for providing medical information support systems for first responders and military rescuers, medical control systems for first aid rescue teams, supporting systematic collaborative to emergencies management. On the other hand, the members of MIPS (Multimedia Interaction Perception Society) Laboratory of Università degli Studi di Milano bring into play their experience in interaction design for domain experts in several application domains [8, 9, 10, 11, 12].
274
In designing and developing IT solutions to be used in such a critical context, we identified six main challenges:
1. the applications need to support the
rescuers in gathering medical data and in managing the operation as a whole as quickly as possible but keeping a high-level quality of the actions.
electronic guides are provided to avoid
incomplete and incorrect medical data collection in stressful situation, which could impair the final outcome exposing patients to possibility of mistakes along the rescue chain.
3. : the entire workflow needs to be addressed
efficiently and in reasonable time but always paying attention to not overcome human rights and dignity in the process. Specifically, discriminations on any ground have to be avoided.
4. : medical data have to be managed in compliance
with law requirements. This means to collect, store, protect and use all gathered data in conformance with the requirements of legislation and regulations, both on a National and EU level [13].
5. : there are two different aspects of the context that
require an internationalized approach. Firstly, the migratory wave is characterized by a multiplicity of different nationalities. To enable the collection of medical data and informed consent, and to efficiently and effectively deploy medical care, any IT application has to be designed and developed in more than one language. Secondly, it is desirable to trigger an information exchange process in order to facilitate the transmission and analysis of the data between European countries.
6. : information security controls had to be implemented to protect
databases against compromises of their confidentiality, integrity and availability.
INMM in collaboration with researchers of Università degli Studi di Milano has designed and developed ITHEALTH (International Traveller Health Surveillance System) a digital tool that through a Tablet device, provides rescuers with a set of functionalities for gathering ipatients’ medical data and
275
for managing and coordinating rescue operations. ITHEALTH allows rescuers to assign a TAG to the patient including a unique alphanumeric code (manually, by reading an NFC chip or scanning a QR Code), and then, Screening is assisted by the System in use at entry points (seaports and on board of ships) and along with transfer and relocation of migrants and refuges. Each care giver authorised is assigned a portable device (tablet or smartphone); each migrant is assigned a medical TAG. All personal data are securely encrypted in it, the medical TAG is worn by the migrant as his/her right to access to health care. The resulting electronic health records (EHRs) are automatically and securely stored locally both in the ITHEALTH storage system and on the medical TAG. Only authorised personnel who have access credentials to the system can see the data, thus physically the data is sent and visible only on authorized devices: laptop or Pc. When any connection is available data can be transferred to a server , installed on a laptop computer, normally placed at an Advanced Doctor's Place and/or at an operating centre, and/or at the Hospital. Additional feature include: in case of arrival from an epidemiological ‘area of risk’ system updated with previous preloaded information, matches data and instruct care givers to deepen screening while alerting of a possible threat. In case disease is confirmed, the care giver is assisted to command the prompt EVAC, hospitalisation ad or isolation of the case, sending an alarm to the Main Institution that there may be the risk of a public health threat to monitor. The workflow implemented in ITHEALTH follows official protocols and standard procedures, so that screening is guided through unified protocols, throughout the whole chain of care. The digitalization of such protocols allows to face the first two challenges mentioned in the previous Section – i.e. time and resource management and clinical risk reduction. The quality of the workflow is guaranteed by the implementation of standard protocols, whereas the digital processes enable a quick data collection, management, and delivery. When a rescuer collects data, an informed consent is shown to the migrant to be signed. This page is translated in a set of languages and offers information about the reasons behind the data acquisition process. When an intervention is completed, the resulting electronic health records (EHRs) are automatically and securely stored locally both in the ITHEALTH storage system and on the medical TAG. When communications are available,
276
the rescuer can send the EHRs and the additional information through any communication channel available (recently radio communications have been exploited too) . The server keeps a database that securely stores all that has been done during the operations, enabling the creation of reporting to use for coordinating different rescues and for enabling the cooperation between various intervention agencies. About Human rights and privacy presentation, we remark as EHR systems need to manage new and additional safeguards to address the fundamental conflicts and dangers of exchanging information in an electronic environment [13]. As said in the previous Section, any IT application has to be designed and developed in more than one language. This because misunderstandings between the rescuer and the immigrant about data processing and collection purposes could block or slow down the information transmission process. To face off this possible communication gaps ITHEALTH tries to report medial information by using appropriate images and very simple interfaces that can be understood even if the migrant does not speak one of the languages known by the rescuers. Finally, to deal with the second aspect concerning international issues we designed an information exchange protocol among the Parties in order to: (i) set forth the Information to be exchanged, the operational procedures to be followed, and the security mechanisms and other safeguards to be maintained; (ii) and set out the ways that such exchange of the particular Information would be consistent with the purposes To this aim, ITHEALTH provides modules that allow coordinators
of the involved teams to follow remote rescue operations, giving orders, guiding the actions of the individual rescuer, recording data about injured, and setting up coordination tasks. In order to evaluated ITHEALTH we carried out several tests in different scenarios for testing how the tool can support rescuers during their actions and other rescue operations in order to decrease their workload while accomplishing several unusual tasks in parallel and under time pressure.
1 The Mediterranean Refugees/Migrants Data Portal UNHCR. https://data2.unhcr.org/en/situations/mediterranean. Accessed 24 May 2017.
2 WHO (2007). Mass casualty management systems strategies and guidelines for building health sector capacity. http://www.who.int/hac/techguidance/MCM_guidelines_inside_final.pdf Accessed 24 May 2017
277
3 World Health Organization (2008). Emergency medical services systems in the European Union. http://www.euro.who.int/__data/assets/pdf_file/0003/114564/E92039.pdf Accessed 24 May 2017
4 Clemmensen, T., Campos, P., Ørngreen, R., Pejtersen, A.M., Wong W. (Eds.): Human Work Interaction Design: Designing for Human Work. Springer US (2006).
5 Katre, D., Ørngreen, R., Yammiyavar, P., Clemmensen, T. (Eds.): Human Work Interaction Design: Usability in Social, Cultural and Organizational Contexts. Springer-Verlag Berlin Heidelberg (2010).
6 Campos, P., Clemmensen, T., Abdelnour Nocera, J., Katre, D., Lopes, A., Ørngreen, R. (Eds.): Human Work Interaction Design. Work Analysis and HCI. Springer-Verlag Berlin Heidelberg (2013).
7 Abdelnour Nocera, J., Barricelli, B.R., Lopes, A., Campos, P., Clemmensen T. (Eds.): Human Work Interaction Design. Work Analysis and Interaction Design Methods for Pervasive and Smart Workplaces. Springer International Publishing (2015).
8 Barricelli, B.R., Fischer, G., Mørch, A., Piccinno, A., Valtolina, S. Cultures of participation in the digital age: Coping with information, participation, and collaboration overload (2015) LNCS 9083, pp. 271-275. DOI: 10.1007/978-3-319-18425-8_28
9 Barricelli, B.R., Gheitasy, A., Mørch, A., Piccinno, A., Valtolina, S. Culture of participation in the digital age: Social computing for learning, working, and living (2014) Proc. AVI, pp. 387-390. DOI: 10.1145/2598153.2602223
10 Barricelli, B.R., Devis, Y., Abdelnour-Nocera, J., Wilson, J., Moore, J. MANTRA: Mobile anticoagulant therapy management (2013) Proc. PervasiveHealth 2013, pp. 278-281. DOI: 10.4108/icst.pervasivehealth.2013.252096
11 Zhu, L., Vaghi, I., Barricelli, B.R. A meta-reflective wiki for collaborative design (2011) Proc. WikiSym 2011, pp. 53-62. DOI: 10.1145/2038558.2038569
12 Gianni, G.B., Marzullo, M., Valtolina, S., Barricelli, B.R., Bortolotto, S., Favino, P., Garzulino, A., Simonelli, R. An ecosystem of tools and methods for archeological research (2012) Proc. VSMM 2012, pp. 133-140. DOI: 10.1109/VSMM.2012.6365917
13 Article 29 Data Protection Working Party (2016), supra note 130, at 11-12. http://ec.europa.eu/newsroom/just/item-detail.cfm?item_id=50083 Accessed 24 May 2017
278
Anant Bhaskar Garg1, Manisha Agarwal2
HaritaDhara Research Development and Education Foundation
Games have been traditionally associated with
entertainment. Different games offer players a high level of engagement, decision making, learning, and team management. On the other hand, games enable individuals to know about curriculum subjects, sports, grasp management skills, and they are now increasingly becoming a source of learning and development among various age groups. Thus, games are emerging as educational and entertainment tools for preparing 21st century citizens. This paper, discuss game based learning of sustainability concepts by underserved community youth.
Educational Games, Learning, Human Work
Interaction Design,Sustainability
Games offer experience of adventure challenge and hold the attention of
players for hours. People acquire new knowledge and complex skills from game play preparing them for 21st century Skills. Games are unique with their rules, choices, consequences, constraints, and good educational games force players to form theories and develop computational thinking. This paper discusses use of games in an after school pro-gram for underprivileged students and youth in different settings as informal education for building sustainability concepts.
279
Games enable players to face competitive environment virtually, as
important mechanisms for learning 21st century skills because they can accommodate a wide variety of learning styles within a complex decision-making context. The skills and context of many games take advantage of technology that is familiar to students and use relevant situations. Games foster collaboration, problem-solving, behavior change, and computational thinking. Multi-player role playing games can also support problem-based learning; allowing players to see the results of their actions play out much faster than they could in real time and allowing them to experience situations rather than simply reading descriptions. Games require players to think systemically and consider relationships instead of isolated events or facts for sustainability and sustainable development [1].
This paper focus on two questions with respect to learners; how can games introduce various topics (learning experience), and improvement in learning.
Playing games, provided entertainment and many advantages for learner, as it makes the player a decision maker, facts investigator, evaluating his strategy, prioritizing their actions and abilities like spatial and coordination cognition [2]. Best game environments enable players to construct understanding actively, and at individual paces at different rates in response to each player’s interests and abilities, while also fostering cooperation, collaboration and just-in-time learning. Besides this, games build 21st century skills to collaborate, innovate, problem-solve and communicate effectively in a global society. Educational games are one of the most growing fields of gaming development. They cater to primary schools, colleges, management professionals, defense personnel, pilots, and scientists. Games meet learning needs of students when new concepts are introduced as the sequence in different levels. Hence, educational games are open, independent learning platform for students, to learn-by-fun, take risks, do mistakes, take a lesson from them, succeed in the game. Learner can play the game any number of
280
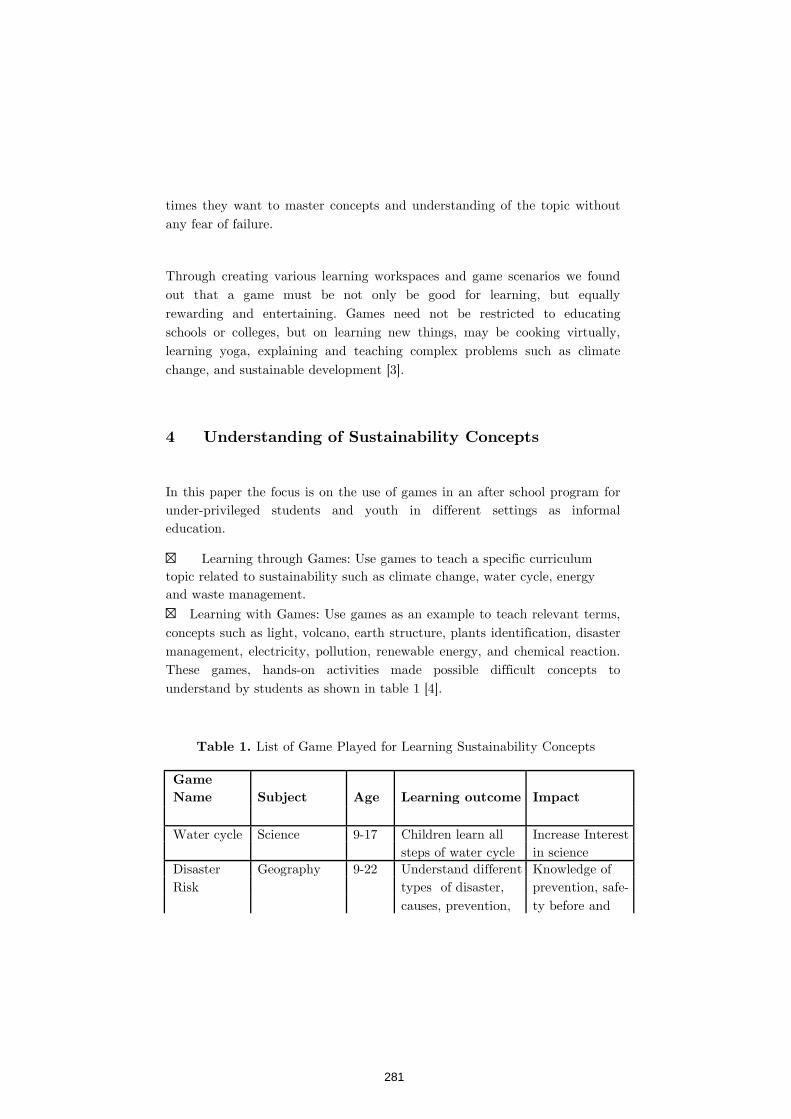
times they want to master concepts and understanding of the topic without any fear of failure.
Through creating various learning workspaces and game scenarios we found out that a game must be not only be good for learning, but equally rewarding and entertaining. Games need not be restricted to educating schools or colleges, but on learning new things, may be cooking virtually, learning yoga, explaining and teaching complex problems such as climate change, and sustainable development [3].
In this paper the focus is on the use of games in an after school program for under-privileged students and youth in different settings as informal education. Learning through Games: Use games to teach a specific curriculum topic related to sustainability such as climate change, water cycle, energy and waste management. Learning with Games: Use games as an example to teach relevant terms, concepts such as light, volcano, earth structure, plants identification, disaster management, electricity, pollution, renewable energy, and chemical reaction. These games, hands-on activities made possible difficult concepts to understand by students as shown in table 1 [4].
List of Game Played for Learning Sustainability Concepts
Water cycle Science 9-17 Children learn all Increase Interest
in sciencesteps of water cycleDisaster Geography 9-22 Understand different Knowledge of
prevention, safe-types of disaster,Risk ty before andcauses, prevention,
281
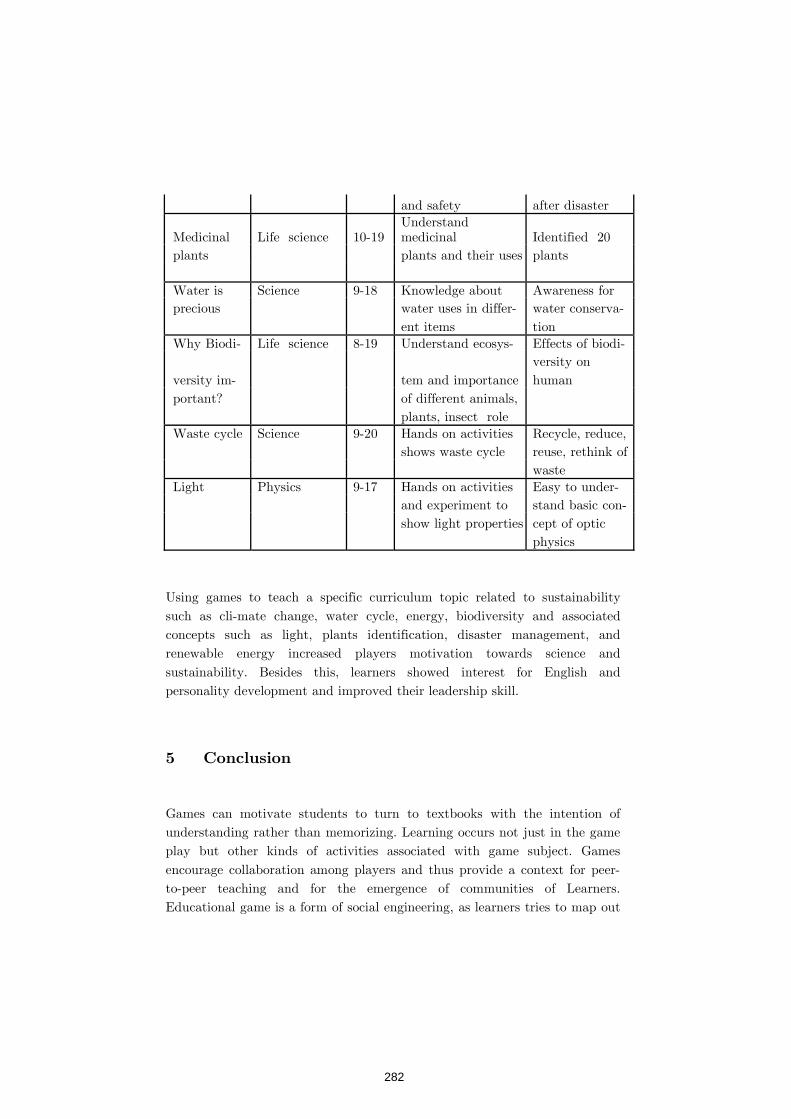
after disasterand safety
Medicinal Life science 10-19 Understand medicinal Identified 20 plants and their usesplants plants
Water is Science 9-18 Knowledge about Awareness for
water uses in differ-precious water conserva- tionent items
Why Biodi- Life science 8-19 Understand ecosys- Effects of biodi-
tem and importanceversity im- versity on human
of different animals,portant? plants, insect role Waste cycle Science 9-20 Hands on activities Recycle, reduce,
reuse, rethink ofshows waste cycle waste Light Physics 9-17 Hands on activities Easy to under-
stand basic con-and experiment to show light properties cept of optic physics
Using games to teach a specific curriculum topic related to sustainability such as cli-mate change, water cycle, energy, biodiversity and associated concepts such as light, plants identification, disaster management, and renewable energy increased players motivation towards science and sustainability. Besides this, learners showed interest for English and personality development and improved their leadership skill.
Games can motivate students to turn to textbooks with the intention of understanding rather than memorizing. Learning occurs not just in the game play but other kinds of activities associated with game subject. Games encourage collaboration among players and thus provide a context for peer-to-peer teaching and for the emergence of communities of Learners. Educational game is a form of social engineering, as learners tries to map out
282
situations that will encourage solving compelling problems. For example, to learn about climate change and sustainability problems, learners team-up for gathering and discussing information in a project way. Such games foster effective learning habits to change our lifestyle for sustainable living. Further, we need to address how games can be applied in formal education, why are games important for educational institutions to incorporate into their curriculums? How has games been incorporated into already existing subjects / courses?
1. Stommen, S.M.& Farley, K. (2016). Games for Grownups: The Role of Gamification in Climate Change and Sustainability, Indicia Consulting LLC 2. Green, CS, & Bavelier, D (2006). Effect of action video games on the spatial distribution of visuospatial attention. Journal of Experimental Psychology: Human Perception and Per-formance, 32, 1465–1478. 3. Katsaliaki, K. & Mustafee, N. (2012). A survey of serious games on sustainable develop-ment, Proceedings of IEEE Winter Simulation Conference C. Laroque, J. Himmelspach, R.Pasupathy, O.Rose, and A.M.Uhrmacher, eds 4. Garg, A. B. & Agarwal, M. (2015). "ALANKRIT" Model for Environmental Education and Planning in World Engineers Summit: Sustainable Urban Development for Global Climate Resilience, Singapore
283
136
Morten Hertzum
University of Copenhagen, Denmark
. Large, shared displays – such as electronic whiteboards –
have proven successful in supporting actors in forming and maintaining an overview of tightly coupled collaborative activities. However, in many developing countries the technology of choice is mobile phones, which have neither a large nor a shared screen. It therefore appears relevant to ask: How may mobile devices with small screens support, or fail to support, actors in forming and maintaining an overview of their collaborative activities?
: overview, awareness, collaborative work, small-screen
devices
In tightly coupled collaboration, the actors coordinate their activities by monitoring what the others are doing and by displaying their own activities for others to monitor [1]. The ways in which this monitoring and displaying is accomplished vary across contexts, as evidenced by the considerable research on awareness [e.g., 2] and overview [e.g., 3]. Unless the actors are permanently co-located, awareness and overview must be mediated by technology. These technologies include large, shared displays, which are becoming increasingly common in settings where the actors are locally mobile but co-located part of the time. Hospitals are a prominent example of such work settings. In European and North American hospitals wall-mounted electronic whiteboards are replacing dry-erase whiteboards [4], and the clinicians who use these large, shared electronic displays experience an improved overview of their work [5]. In contrast, the technology of choice in many developing countries is mobile phones with comparatively small screens [6, 7]. Thus, in systems that target
284
137
developing countries the need for supporting actors in maintaining an overview of their collaborative work will often have to be accomplished on a small screen.
Before proceeding it should be noted that it obviously is a simplification to associate display size with country. The argument is neither that large, shared displays such as electronic whiteboards are non-existent in developing countries, nor that small interfaces are rare in developed countries. Rather, the argument is that the ways in which large, shared displays support actors in maintaining an overview are irrelevant in settings characterized by small interfaces. To develop for these settings we need to understand how small interfaces may support, or fail to support, actors in maintaining an overview of their collaborative work. Clearly, this need is accentuated if the application of large, shared displays is not feasible, economically or otherwise.
Hertzum and Simonsen [8] find that in a collaborative setting with an electronic whiteboard the users adopted a strategy that could be described as: visual overview, oral detail. That is, they glanced at the whiteboard to get “the big picture” and augmented this visually acquired overview with asking their colleagues for clarification and detail. This finding can be seen as a collaborative-work extension of Shneiderman’s [9] visual information seeking mantra (overview first, zoom and filter, then details-on-demand). Specifically, the focus on (collaborative) work emphasizes that an overview is the user’s awareness and understanding of the information relevant in the situation; it is not merely a property or component of a user interface [10]. The overview is a collaborative accomplishment in that the individual actors consult each other for information that elaborates and supplements the information they glean from the whiteboard. Apart from the obvious difference in screen real estate between a 52-inch whiteboard and a 4-inch smartphone the large, shared displays have at least three strengths that appear to be absent on small screens: . The whiteboard may hold different pieces of
information that are relevant to different groups of users, and it may also interrelate these pieces of information, thereby facilitating the coordination among user groups [11]. The interrelating of the pieces of information is accomplished through their simultaneous presence on the display.
285
138
. Because the whiteboard is shared it makes the same
information visible to all actors. The actors are, however, not simply made aware of information they are also held accountable: As an actor I know that everybody knows what information I can read on the whiteboard [12]. Thus, actors can rely on each other regularly glancing at the whiteboard and reacting on its content.
. The whiteboard is not simply an information
display, it also creates a physical place where actors meet [13]. They may visit the area around the whiteboard to interact with the whiteboard or to consult a colleague, who is there to interact with the whiteboard, consult a colleague or make herself available for consultation [14].
While the three strengths are described on the basis of studies of whiteboards, it appears likely that the same strengths exist for wall-size displays, tabletop interfaces, and other large, shared displays. The situation is different for small, mobile devices.
On a mobile device the functionality of the applications is narrowly focused to fit the small screen. This narrow focus reduces the possibilities for artefactual multiplicity. In addition, the personal nature of the device reduces social translucence because it is less apparent to others what information I have available and when I have the opportunity to access it. Finally, the mobility of the device prevents it from functioning as a physical location for actors to meet. While it is tempting to presume that actors who collaborate using small, mobile devices need other means of achieving these three ends, it is also possible that they transmute artefactual multiplicity, social translucence, and information hotspots into alternative ways of gaining and maintaining an overview. Either way, it is important to human work interaction design to understand how the actors gain and maintain the overview they need to conduct their activities collaboratively and competently. Studies of the use of mobile phones in developing countries are beginning to address these issues, but tend to investigate loosely coupled activities. The studied activities include societal as well as local collaborations that exploit the wide adoption of mobile phones: Nearly everybody has a mobile phone, thus making it possible to reach
most people with information and include many people in collaborative activities. For example, multiple African initiatives use mobile phones as
286
139
tools to disseminate and collect health information via text messages, to improve the transparency and accountability of elections by sending local observations about polls to central monitoring groups, and to promote reforestation by transferring payments to rural farmers for planting trees [7].
The actors carry their mobile phones everywhere, attend to them repeatedly, and may, thereby, interact with each other when needed rather than when they happen to be in the same place at the same time. For example, geographically distributed herders of livestock in rural Kenyan communities use mobile phones to share information about the changing location of water resources for the livestock and of rangers likely to disrupt herding practices [15].
Mobile phones can broadcast information about the whereabouts and activities of actors, thereby providing information for others to monitor. However, this possibility may primarily have been exploited in developed countries. For example, studies of collaborative web search have found that such activity information supports remotely located actors in aligning their search activities and progressing on a shared task [16].
The ways in which mobile devices may support actors in forming and maintaining an overview of their collaborative activities appear an important research area. Similarly, it is important to research the ways in which collaborative work arrangements may transmute what overview is about or what role technology plays in supporting it. This research should, in particular, attend to the conditions in developing countries, in which mobile phones are widespread whereas large-display technologies are not.
1. Schmidt, K.: The problem with 'awareness'. Computer Supported Cooperative Work 11(3&4), 285-298 (2002).
2. Gross, T.: Supporting effortless coordination: 25 years of awareness research. Computer Supported Cooperative Work 22(4), 425-474 (2013).
3. Bossen, C., Jensen, L.G.: How physicians 'achieve overview': A case-based study in a hospital ward. In: Proceedings of the CSCW2014 Conference on Computer Supported Cooperative Work & Social Computing, pp. 257-268. ACM Press, New York (2014).
4. Rasmussen, R.: Electronic whiteboards in emergency medicine: A systematic review. In: Luo, G., Liu, J., Yang, C.C. (eds.) Proceedings of
287
140
the IHI2012 International Health Informatics Symposium, pp. 483-492. ACM Press, New York (2012).
5. Hertzum, M.: Electronic emergency-department whiteboards: A study of clinicians' expectations and experiences. International Journal of Medical Informatics 80(9), 618-630 (2011).
6. Nottebohm, O., Manyika, J., Bughin, J., Chui, M., Syed, A.-R.: Online and upcoming: The internet's impact on aspiring countries. McKinsey & Company (2012).
7. Etzo, S., Collender, G.: The mobile phone 'revolution' in Africa: Rhetoric or reality? African Affairs 109(437), 659-668 (2010).
8. Hertzum, M., Simonsen, J.: Visual overview, oral detail: The use of an emergency-department whiteboard. International Journal of Human-Computer Studies 82, 21-30 (2015).
9. Shneiderman, B.: The eyes have it: A task by data type taxonomy for information visualizations. In: Proceedings of the 1996 IEEE Conference on Visual Languages, pp. 336-343. IEEE Press, Los Alamitos, CA (1996).
10. Hornbæk, K., Hertzum, M.: The notion of overview in information visualization. International Journal of Human-Computer Studies 69(7&8), 509-525 (2011).
11. Bjørn, P., Hertzum, M.: Artefactual multiplicity: A study of emergency-department whiteboards. Computer Supported Cooperative Work 20(1&2), 93-121 (2011).
12. Erickson, T., Kellogg, W.A.: Social translucence: An approach to designing systems that support social processes. ACM Transactions on Computer-Human Interaction 7(1), 59-83 (2000).
13. Scupelli, P., Xiao, Y., Fussell, S.R., Kiesler, S., Gross, M.D.: Supporting coordination in surgical suites: Physical aspects of common information spaces. In: Proceedings of the CHI 2010 Conference on Human Factors in Computing Systems, pp. 1777-1786. ACM Press, New York (2010).
14. Hertzum, M., Reddy, M.: Procedures and collaborative information seeking: A study of emergency departments. In: Hansen, P., Shah, C., Klas, C.-P. (eds.) Collaborative Information Seeking: Best Practices, New Domains and New Thoughts, pp. 55-71. Springer, Berlin (2015).
15. Butt, B.: Herding by mobile phone: Technology, social networks and the "transformation" of pastoral herding in East Africa. Human Ecology 43(1), 1-14 (2015).
16. Morris, M.R., Horvitz, E.: SearchTogether: An interface for collaborative web search. In: Proceedings of the UIST2007 Symposium on User
288

141
Interface Software and Technology, pp. 3-12. ACM Press, New York (2007).
289
142
José Abdelnour-Nocera1, Lene Nielsen, Lars Rune Christensen
2,
Torkil Clemmensen 3
1 University of West London and Madeira Interactive Technologies Institute
2 IT University of Copenhagen
3 Copenhagen Business School
Ensuring ethical value exchange is moving to the forefront of
the global challenges that HCI will have to address in the coming years. In this position paper, we argue that applying a context-sensitive, sociotechnical approach to HCI can help meet the challenge. The background is that the life of marginalized people in contemporary society is challenging and uncertain. The marginalized can face health and cognitive issues as well as a lack of stability of social structures such as family, work and social inclusion. Three questions are of concern when innovating together with people ‘at the margins’: how can we describe users without attempting to stereotype badly, what sociotechnical HCI methods fit the local societal context, and how to make the design sustainable in face of current planetary challenges (e.g., climate change)? We adapt the sociotechnical HCI approach called human work interaction design (HWID) to meet the challenges of designing for ethical value exchange. We present three cases of service design, and suggest how to add a fourth similar case using the HWID approach during the INTERACT ‘field trip plus workshop’. We conclude that applying a context sensitive sociotechnical HCI framework implies that both the backend and frontend of service design and product innovations should be executed and valorized from with the local context.
290

143
Ethical value exchange is moving to the foreground of HCI in these years, adding a new dimension to the current user experience and web 2.0 platform designs [1]. For example, emerging product and service innovations in resource constrained environments network explores new design methods, experiences and knowledge of doing innovation with people ‘at the margins’, for example in South Africa, India, Brazil, Denmark and UK[2]. In these projects looking at Global South Service Innovation there is a lot of focus on a fronstage mindset (touchpoint, user friendliness, UI, etc.), but the methods, tools and infrastructure used to analyse and/or do ‘work’ in the backstage are envisioned and driven to a large extent by Global North assumptions (analytical styles, etc.). We argue that through a socio-technical HCI design approach, exemplified with the HWID model [3], researchers and designers can visualise and do something about these critical gaps, and more generally, contribute to an ‘HCI of ethical value exchange’.
The life of marginalized people in contemporary society is challenging and uncertain. The marginalized face a lack of stability of social structures such as family, work and social inclusion. People are typically said to be marginalized due to unequal social structures and a lack of education, proper housing, it-services and healthcare. Marginalized people in Denmark and UK share some of these traits, but in what we might call a first-world guise. Meaning that for example the elderly, refugees, and the disabled in UK or Denmark compared to Brazil or South Africa have more economic resources. However, relative to the rest of the British and Danes they are marginalized and suffer the ill effects associated with that position such as estrangement and a lack of participation in innovation. The elderly may for example be marginalized due to cognitive and physical decline associated with the aging process. In South Africa black students are presented with equal opportunities to attend university, but its very different socio-economic and cultural background make it challenging for them to remain in higher education leading towards high drop-out rates for this sector of society. Approaching marginalized people is challenging – their exclusion from society and societal resources has created estrangement. Moreover, a lack of resources may make it hard to take part in the dominant patterns of innovation and consumption. In addition, a significant problem is that stereotypes of these marginalized people fail to understand their experiences and life perspectives.
There is therefore a need to revisit socio-technical HCI analysis and design methods with the aim to co-create alternative patterns of innovation that
291
144
include the marginalized. Furthermore, in the emerging transformation economy, the focus on ethical value exchange with trust and collaboration in the foreground requires empathic, in-context experimentation and data collection through living labs [1], which requires a socio-technical, context-sensitive approach such as HWID [3].
The larger questions that we want to discuss by discussing cases of innovating together with people ‘at the margins’ are: how can we describe users without attempting to stereotype badly, what sociotechnical HCI methods fit the local societal context, and how to make the design sustainable in face of current planetary challenges (e.g., climate change)? We suggest the IFIP WG 13.6 Human Work Interaction Design HWID framework as an example of a sociotechnical HCI approach to frame service design cases and assess the extent to which HWID is suitable and how it should be modified to support open, bottom-up innovation in the global south.
The service design field emanates from the appearance of information technology and an increased design focus within management and organizational studies. The field is relatively new, but stems partly from interaction design and participatory design (PD), [4,5,6]. PD frames how service design is understood and with what service design contributes [5]. Thus, what is transferred to service design is a basic structure consisting of involvement techniques, collaborative approaches, and liberating objectives.
As Fig. 1points out there are 3 instances in service design users, touch-points, and service journey. Contrary to many design methods service design tries to capture what is outside the IT system and has a focus also on the surroundings and contexts of use as well as the different sequences of interactions. Similar to PD techniques such as future workshop, service design looks at both the front end and the backend users of the IT system [7]. Service design focuses on the contexts around the solutions and as such has a holistic approach to problem solving.
292
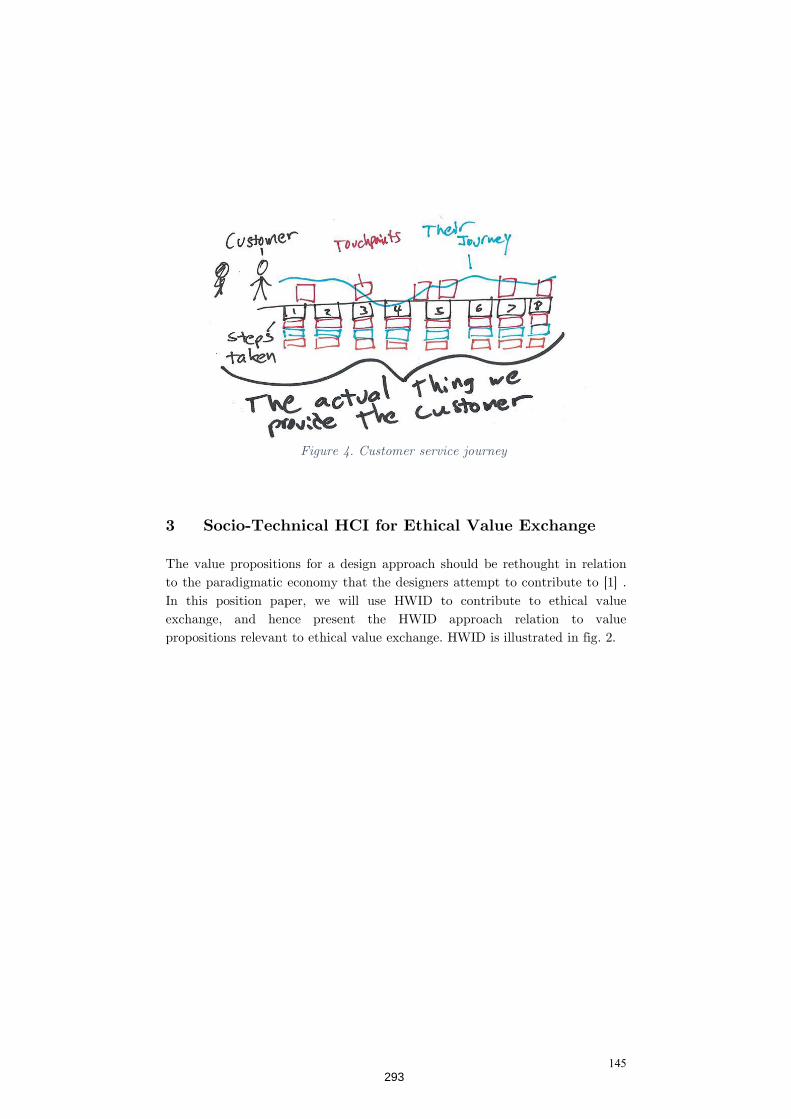
The value propositions for a design approach should be rethought in relation to the paradigmatic economy that the designers attempt to contribute to In this position paper, we will use HWID to contribute to ethical value exchange, and hence present the HWID approach relation to value propositions relevant to ethical value exchange. HWID is illustrated in fig. 2.
The value propositions for a design approach should be rethought in relation to the paradigmatic economy that the designers attempt to contribute to In this position paper, we will use HWID to contribute to ethical value exchange, and hence present the HWID approach relation to value propositions relevant to ethical value exchange. HWID is illustrated in fig. 2.
145
The value propositions for a design approach should be rethought in relation to the paradigmatic economy that the designers attempt to contribute to [1] . In this position paper, we will use HWID to contribute to ethical value exchange, and hence present the HWID approach relation to value propositions relevant to ethical value exchange. HWID is illustrated in fig. 2.
293
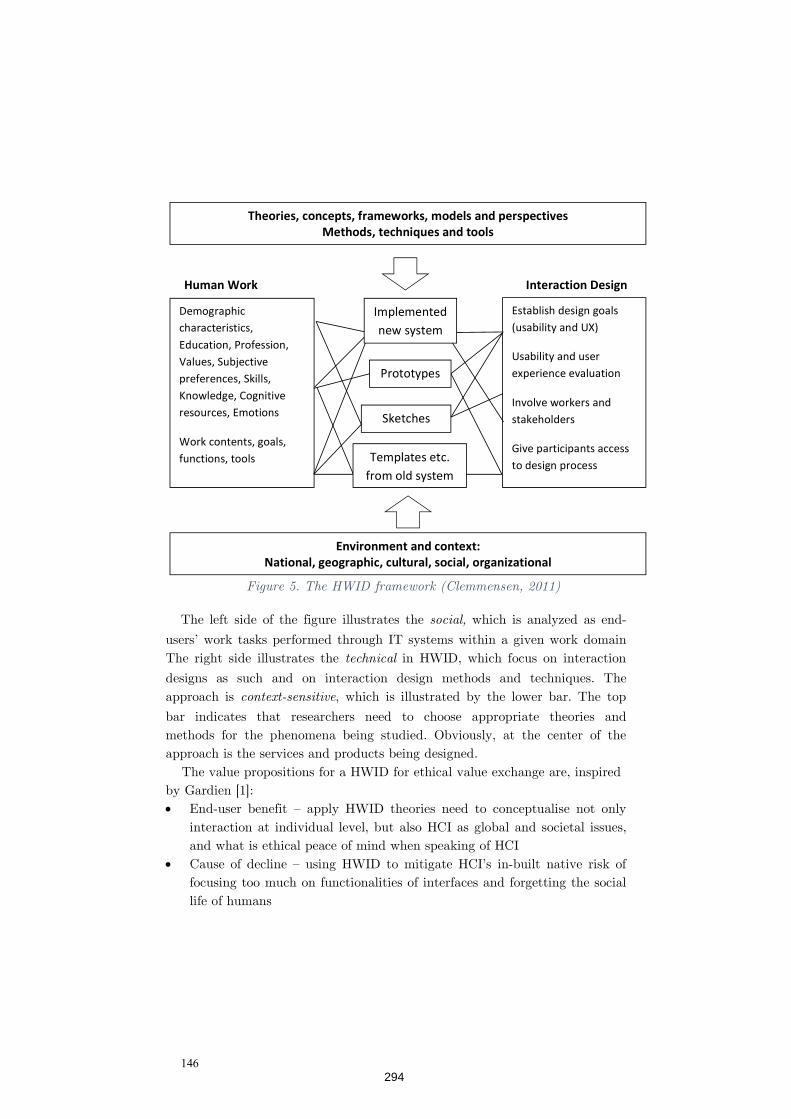
146
The left side of the figure illustrates the which is analyzed as end-
users’ work tasks performed through IT systems within a given work domain The right side illustrates the in HWID, which focus on interaction
designs as such and on interaction design methods and techniques. The approach is , which is illustrated by the lower bar. The top
bar indicates that researchers need to choose appropriate theories and methods for the phenomena being studied. Obviously, at the center of the approach is the services and products being designed.
The value propositions for a HWID for ethical value exchange are, inspired by Gardien [1]: End-user benefit – apply HWID theories need to conceptualise not only
interaction at individual level, but also HCI as global and societal issues, and what is ethical peace of mind when speaking of HCI
Cause of decline – using HWID to mitigate HCI’s in-built native risk of focusing too much on functionalities of interfaces and forgetting the social life of humans
Theories, concepts, frameworks, models and perspectives Methods, techniques and tools
Human Work Interaction Design
Demographic characteristics, Education, Profession, Values, Subjective preferences, Skills, Knowledge, Cognitive resources, Emotions
Work contents, goals, functions, tools
Establish design goals (usability and UX)
Usability and user experience evaluation
Involve workers and stakeholders
Give participants access to design process
Environment and context: National, geographic, cultural, social, organizational
Prototypes
Sketches
Implemented new system
Templates etc. from old system
294

147
People research objective – the aim with using HWID should include not stereotyping users (badly), execute sociotechnical HCI methods from within the local societal context, and design for planetary sustainability (e.g., climate change)
People research method – HWID analysis and design should be in-context of everyday life
Aesthetics – HWID as a design approach should be thought of as a parametric platform that can be valorized for a given local context
Innovative integration – cradle to cradle sustainability achieved by the continuous, never ending analysis-design relations in HWID
Brand – transparent and easy to understand what HWID analysis and design activities have been done so far, and thus instantiating trust
Each of the projects described below shares a common interest in answering the questions presented above within a service design framework.
The first project is concerned with socio-cultural and human interaction approaches in the design of interventions to support students at risk in South African Universities. In South Africa (SA) 25% of schools are functional, the rest are dysfunctional in terms of accountability, teachers’ knowledge of content, absenteeism, coverage of curriculum; high dropout and poor performance on national assessments’ [8]. Many dysfunctional schools are in townships and rural areas - in black communities. Consequently, many black students are underprepared to enter university and successfully complete their studies within the set time. There is a 50% higher completion rate for white students compared to black students [9]. Dropout rate at university is a serious concern that results in wastage and perpetuates the vicious poverty cycle. Research on designing information systems as intervention for students at the risk of dropping out or failing to complete their studies in the minimum set time is critical in SA.
SA universities attract students from diverse races, religions and cultures. Sometimes students at risk are identified late and the tendency is often to offer more readings and remedial classes thus adding an information burden to them. Given the situation, through an existing Newton Mobility Grant between the University of West London (UWL), University of Cape Town (UCT) and Cape Town University of Technology (CPUT) we are exploring how service design approaches can be used to design intervention information system for students at risk in SA universities.
295
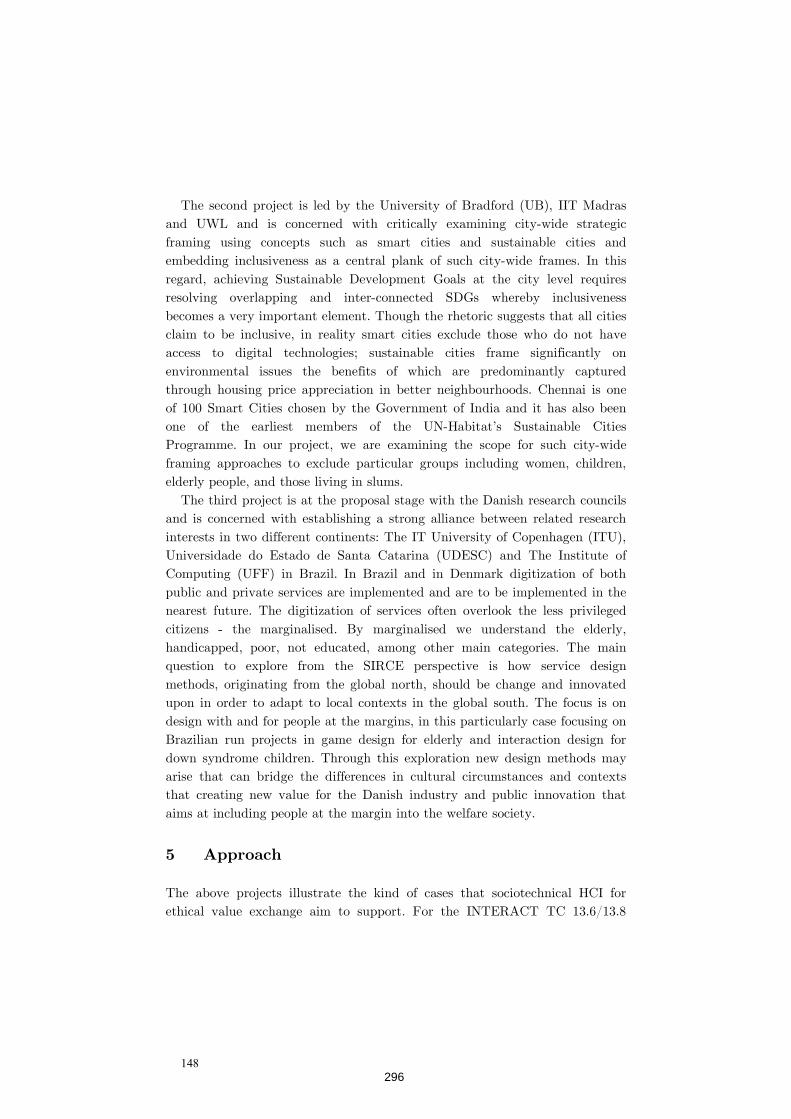
148
The second project is led by the University of Bradford (UB), IIT Madras and UWL and is concerned with critically examining city-wide strategic framing using concepts such as smart cities and sustainable cities and embedding inclusiveness as a central plank of such city-wide frames. In this regard, achieving Sustainable Development Goals at the city level requires resolving overlapping and inter-connected SDGs whereby inclusiveness becomes a very important element. Though the rhetoric suggests that all cities claim to be inclusive, in reality smart cities exclude those who do not have access to digital technologies; sustainable cities frame significantly on environmental issues the benefits of which are predominantly captured through housing price appreciation in better neighbourhoods. Chennai is one of 100 Smart Cities chosen by the Government of India and it has also been one of the earliest members of the UN-Habitat’s Sustainable Cities Programme. In our project, we are examining the scope for such city-wide framing approaches to exclude particular groups including women, children, elderly people, and those living in slums.
The third project is at the proposal stage with the Danish research councils and is concerned with establishing a strong alliance between related research interests in two different continents: The IT University of Copenhagen (ITU), Universidade do Estado de Santa Catarina (UDESC) and The Institute of Computing (UFF) in Brazil. In Brazil and in Denmark digitization of both public and private services are implemented and are to be implemented in the nearest future. The digitization of services often overlook the less privileged citizens - the marginalised. By marginalised we understand the elderly, handicapped, poor, not educated, among other main categories. The main question to explore from the SIRCE perspective is how service design methods, originating from the global north, should be change and innovated upon in order to adapt to local contexts in the global south. The focus is on design with and for people at the margins, in this particularly case focusing on Brazilian run projects in game design for elderly and interaction design for down syndrome children. Through this exploration new design methods may arise that can bridge the differences in cultural circumstances and contexts that creating new value for the Danish industry and public innovation that aims at including people at the margin into the welfare society.
The above projects illustrate the kind of cases that sociotechnical HCI for ethical value exchange aim to support. For the INTERACT TC 13.6/13.8
296
149
workshop WS11: Human Work Interaction Design meets International Development, the approach will be similar. Since the workshop takes place at the INTERACT 2017 Conference in Mumbai, there is a unique opportunity to observe technology-mediated innovative work practices in informal settings. In this context, away from the mainstream industrial sites of the global north, this workshop proposes to use the HWID approach to analyze findings related to opportunities for design research in this type of work domains. On day one, we will do a field trip visit a fishery in a small village that has been implemented with the support of the India-based company TATA, ICT business solutions. On day 2, we will gather at the workshop and reflect critically over the ethical value exchange aspects of the ICT solutions, and propose possible add-ons or new designs. If possible, the workshop participants will attend a follow up meeting with the TATA representative to share interpretations of field trip and workshop HWID activities for ethical value exchange.
We will provide the workshop participants with an observation script based on the above presented HWID model and research objective and method to support their engagement with the field trip. The data gathered by participants will then be presented and co-analysed in day 2.
In summary, the overall objective of this position paper is to hint at a possible sociotechnical HCI framework, customize value propositions, and present cases, to enable discussion of:
- how can we describe users without attempting to stereotype badly, - what sociotechnical HCI methods fit the local societal context, - how to make the design sustainable in face of current planetary
challenges (e.g., climate change)? One of the answers that the cases may support is to see service design’s
backend issues as the side of HWID, and frontend issues as the
side of HWID. The Indian fisheries case study will surely provide
another case study to the SIRCE network where we can explore how service design could be adapted, through the socio-technical lens of HWID, to articulate ethical issues of value exchange. Given the of the
framework, both sides and their interrelations should thus be considered as a design platform that is executed and valorized from within the local context. This is what we hope to illustrate at the INTERACT workshop.
297
150
1. Gardien, P, Djajadiningrat, T, Hummels, C, Brombacher, A: Changing your hammer: The implications of paradigmatic innovation for design practice. International Journal of Design. 8(2).
2. Abdelnour-Nocera, J., Nielsen, L., Anand, P., Gasparini, I., Bitso, C., Trevisan, D., Christensen, L., Hounsell, M., Money, A.: Service Design and Innovation ‘at the Margins’ in Resource Constrained Environments. In: EDTPD’17 Workshop., Troyes, France (2017).
3. Clemmensen, T.: A Human Work Interaction Design (HWID) Case Study in E-Government and Public Information Systems. International Journal of Public Information Systems. 2011, 105–113 (2011).
4. Johan Blomkvist and Stefan Holmlid. 2011. Existing Prototyping Perspectives: Considerations for Service Design. In Proceedings of the Nordes’ 11: The 4th Nordic Design Research Conference, Making Design Matter, 29-31 May Helsinki, Finland.
5. Stefan Holmlid. 2009. Interaction Design And Service Design: Expanding A Comparison Of Design Disciplines. Nordes, 2.
6. Elizabeth B-N Sanders and Pieter Jan Stappers. 2008. Co-creation and the new landscapes of design. Co-design 4, 1: 5–18
7. Finn Kensing, Jesper Simonsen, K Bødker, and N Ueno. 2004. Participatory IT Design–an exemplary case. Journal of the Center for Information Studies 5, 3.
8. Brenda Leibowitz and Vivienne Bozalek. 2014. Access to higher education in South Africa. Widening Participation and Lifelong Learning 16, 1: 91–109. https://doi.org/doi:10.5456/WPLL.16.1.91
9. Mike Murray. 2014. Factors affecting graduation and student dropout rates at the University of KwaZulu-Natal. South African Journal of Science 110, 11–12: 1–6.
298
Workshop 14
Whilst usability, accessibility and, more recently, user experience have been prominent in the HCI research, other properties such as privacy, trust, security, and reliability (among others) might also affect the development process of interactive systems. In some cases, a property might complement or enlarge the scope of another. For example, whilst accessibility addresses the needs of impaired users to accomplish their tasks with the system, UX goes beyond the pragmatic aspect of usability by taking into account dimensions such as emotion, aesthetics or visual appearance, identification, stimulation, meaning/value or even fun, enjoyment, pleasure or flow state experience. In some situations, a property might be tributary to another one such is the case of reliability and usability when non reliability of interactive software can jeopardize usability evaluation by showing unexpected or undesired behaviors. Moreover, there are some evidence that properties can trade off against each other as it is the case of usability and security. For example, requiring users to change their passwords periodically may improve security but reduce usability as it represents a burden for users to frequently create and remember passwords. As a consequence, users might be keen to workarounds, such as when users take hard notes of hard-to-remember passwords.
299
Conflicting user interface properties often appear in recommendations for user interface design. The resolution of conflicts between user interface properties is a daunting and demanding task that might require taking into account the trade-offs associated with alternative design choices. It is interesting to notice that when the conflict between properties is understood, the effects of conflicts can be mitigated/reduced by appropriate design.
This workshop aims to cover a large set of user interface properties and try to reveal their inner dependencies. It also aims to develop an understanding of how different stakeholders value user interface properties. In a long run, it aims at helping the development of theories, methods, tools and approaches for dealing with multiple properties that should be taken into account when developing interactive system.
300
Alistair Sutcliffe
Manchester Business School, University of Manchester, Booth Street West, Manchester M15 6PB, UK
The conflict between goals, needs and requirements from different stakeholders has received considerable attention in the Requirements Engineering (RE) community, where the conventional response has been to negotiate the conflicts to arrive at a common viewpoint (Sommerville & Kotonya, 1998; Robertson & Robertson, 1999). Goal modelling (Mylopoulos et al., 1999; van Lamsweerede, 2009) can make conflicts explicit, thereby supporting the negotiation process; however, resolution of conflicting requirements inevitably leads to compromises by some users. User interface (UI) properties, usually referred to as non-functional requirements in RE are a sub-set of the more general problem; for instance, the clash between usability, privacy and security in passwords is a well known design dilemma (Braz et al., 2007).
In HCI the requirements conflict-resolution process is an essential
component of user-centred design (UCD) (Sutcliffe, 2002). However, different user needs might be accommodated by different versions of the user interface, via a process of configuration or personalisation. While surface personalisation of UI features such as menu toolbars, display colours and layouts, and message terseness/verbosity, are standard components of all major operating systems, resolution of deeper functional differences between users is more problematic. Offering users choice of UI/application versions by configuration facilities imposes a cost on users when operating the configuration user interface, and most users accept the default version. The design dilemma is how to fit the requirements of diverse user groups while minimising the configuration cost and maximising the functional fit of the application to users’ needs.
301
This paper reports experiences in resolving requirements conflicts in user interfaces, approached through examining users’ needs at a more fundamental level in the form of their values. Values have been explored in value-sensitive design (Friedman, 2008) and the related concept of worth can help to frame users’ viewpoints as worth maps (Cockton et al., 2009). In Value-Based Requirements Engineering VBRE (Thew & Sutcliffe, 2017), users’ values are made explicit by analysis with a reference taxonomy of values, motivations and potential emotional reactions. Making users’ values explicit provides a richer context for negotiation and resolution of conflicts. The VBRE method has been applied to two case studies in health informatics. This paper describes the ADVISES the SAMS projects; experience and lessons learned from these projects is synthesised in a discussion about different approaches and implications for conflicting requirements.
ADVISES is a decision-support system for academic researchers and National Health Service public health analysts who investigate epidemiology problems (Sutcliffe et al., 2011). The two distinct stakeholder communities had different goals. For academic researchers, understanding the generic causes of childhood obesity by statistical analysis of health records was a high-level goal. In contrast, the goal of public health analysts was local health management; for example, identifying where best to target interventions, such as promotion of healthy eating campaigns. Two academic research epidemiologists (both male, age 31, 52) and seven public health analysts (four male, three female, age range 27-41) were interviewed and participated in requirements workshops. VBRE augmented UCD techniques to investigate the users’ workflows to explore how new decision-support tools might be used by academic epidemiologists as well as by public health professionals.
The key issues identified were the apparent contradiction between expected
and actual collaboration among the stakeholders, which suggested requirements for better collaborative tools with trust-building measures, e.g. visualisation of workflows and research activities. Security and privacy of data emerged as an important value, in particular the addition of security features to customise data access to particular stakeholder roles. Collaboration, security and trust were shared values, but differences between the stakeholder emerged during design exploration of prototypes, concerning customisation,
302
adaptability and security. These were addressed by adding requirements for data security on servers, configurable workflows to match systematic or more opportunistic processes, while creative values were supported by interactive visualisation for data analysis. Collaboration and trust were fostered by an iterative user-centred RE process to build up trust, and by implementing the system as a collaborative application.
The workflows for each stakeholder group were quite different; see Figure 1.
The major functional requirements (goals) of the systems were for research and analysis support, namely database searches ranging from simple queries to complex associations between variables, leading to display of a detailed epidemiological data set in a context with map and graph overviews and functions to compare trends over time and different areas on maps. The researchers had a more sophisticated query investigation cycle and used more complicated statistical tests. In contrast, the public health analysts asked simpler questions directly related to spatial locations and used simpler statistical tests. Sociability, altruism and achievement motivations informed decomposition of stakeholder goals. For example achievement, altruism and systematic values led to a sub-goal to record analytic procedures, enabling academic researchers to track their own work, while also supporting public health analysts in sharing analysis techniques and results with colleagues. Another value clash between the stakeholders was the desire by the researchers to increase the statistical rigour of the the analysts’ investigation. Not surprisingly the analysts saw this as an imposition into their area of competence.
303

Figure 1. Workflows for the research and
Figure 1. Workflows for the research and public health analyst user
stakeholders
public health analyst user
304
The system was implemented in C# using MS Silverlight for graphics and animating map displays for trend questions, so that successive displays gradually morphed into each other to enable users to see change over time within different map areas. A distributed architecture (Figure 2) was adopted and developed as a set of web services, with major class packages in the following functional areas:
Dataset access: loads datasets from remote servers. Map display: displays maps using MS Charting libraries. Map displays
can be overlaid with point data (e.g. location of health clinics, sports facilities).
Charts and statistics display: runs basic statistical analysis scripts (R script calls) then displays range split histograms, box-and-whisker plots, etc., using MS Charting.
Dialogue management: handles the query interface, interactive query-by-pointing and sliders.
Expert advisors: classes that implement the statistics and visualisation experts, with data set monitors to trigger advice.
305
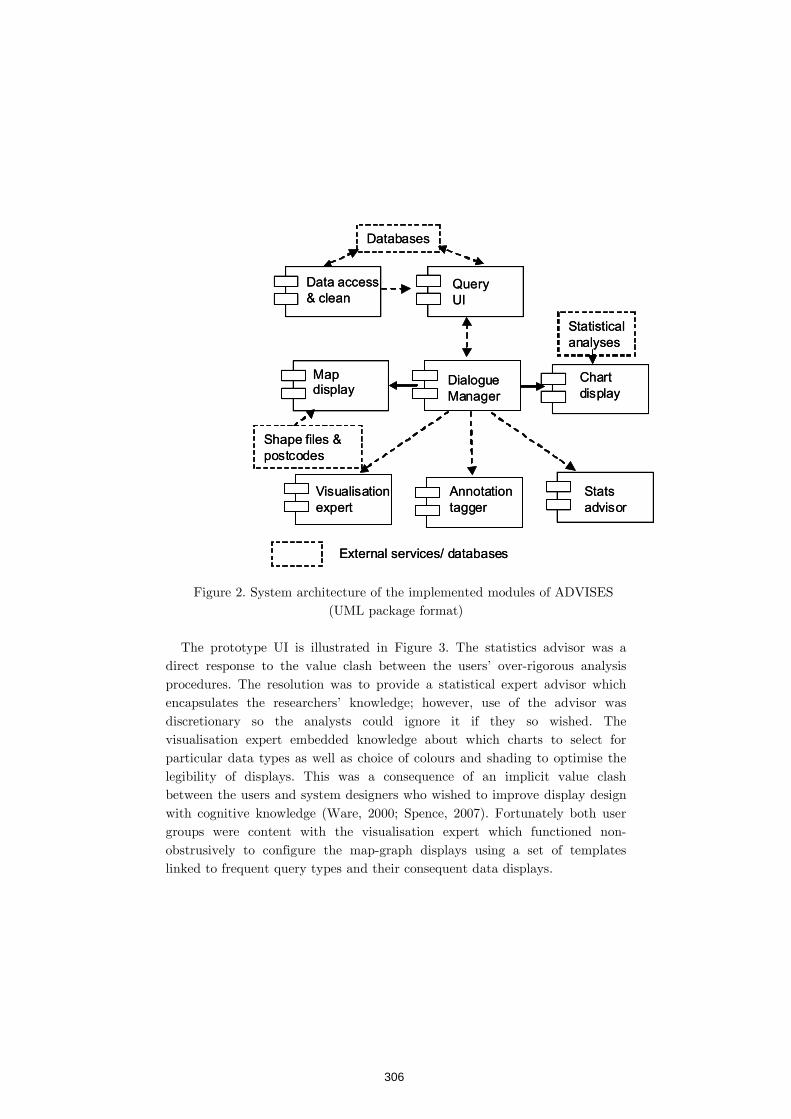
Figure 2. System architecture of the implemented modules of ADVISES
(UML package format) The prototype UI is illustrated in Figure 3. The statistics advisor was a
direct response to the value clash between the users’ over-rigorous analysis procedures. The resolution was to provide a statistical expert advisor which encapsulates the researchers’ knowledge; however, use of the advisor was discretionary so the analysts could ignore it if they so wished. The visualisation expert embedded knowledge about which charts to select for particular data types as well as choice of colours and shading to optimise the legibility of displays. This was a consequence of an implicit value clash between the users and system designers who wished to improve display design with cognitive knowledge (Ware, 2000; Spence, 2007). Fortunately both user groups were content with the visualisation expert which functioned non-obstrusively to configure the map-graph displays using a set of templates linked to frequent query types and their consequent data displays.
Data access& clean
Mapdisplay
Chart display
DialogueManager
Statsadvisor
Visualisationexpert
Annotationtagger
Query UI
Databases
Shape files &postcodes
Statisticalanalyses
External services/ databases
Data access& clean
Mapdisplay
Chart display
DialogueManager
Statsadvisor
Visualisationexpert
Annotationtagger
Query UI
Databases
Shape files &postcodes
Statisticalanalyses
External services/ databases
306
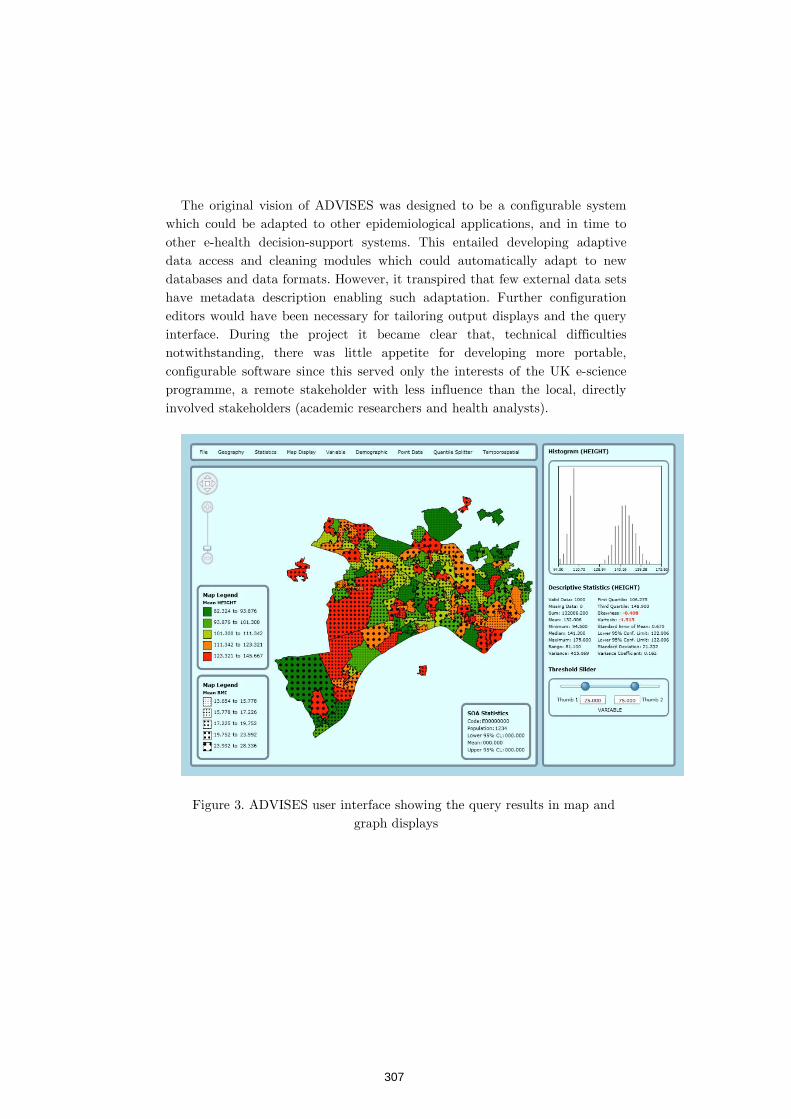
The original vision of ADVISES was designed to be a configurable system which could be adapted to other epidemiological applications, and in time to other e-health decisiodata access and cleaning modules which could automatically adapt to new databases and data formats. However, it transpired that few external data sets have metadata description enabling such adaptation. editors would have been necessary for tailoring output displays and the query interface. During the project it became clear that, technical difficulties notwithstanding, there was little appetite for developing more portable, configurable software since this served only the interests of the UK eprogramme, a remote stakeholder with less influence than the local, directly involved stakeholders (academic researchers and health analysts).
Figure 3. ADVISES user interface showi
The original vision of ADVISES was designed to be a configurable system which could be adapted to other epidemiological applications, and in time to
health decision-support systems. This entailed developing adaptive data access and cleaning modules which could automatically adapt to new databases and data formats. However, it transpired that few external data sets have metadata description enabling such adaptation. Further configuration editors would have been necessary for tailoring output displays and the query interface. During the project it became clear that, technical difficulties notwithstanding, there was little appetite for developing more portable,
able software since this served only the interests of the UK eprogramme, a remote stakeholder with less influence than the local, directly involved stakeholders (academic researchers and health analysts).
Figure 3. ADVISES user interface showing the query results in map and graph displays
The original vision of ADVISES was designed to be a configurable system which could be adapted to other epidemiological applications, and in time to
support systems. This entailed developing adaptive data access and cleaning modules which could automatically adapt to new databases and data formats. However, it transpired that few external data sets
Further configuration editors would have been necessary for tailoring output displays and the query interface. During the project it became clear that, technical difficulties notwithstanding, there was little appetite for developing more portable,
able software since this served only the interests of the UK e-science programme, a remote stakeholder with less influence than the local, directly
ng the query results in map and
307

The SAMS (Software Architecture for Mental health Self management) project’s main aim was to increase the proportion of dementia sufferers receiving an early diagnosis by detecting changes in their pattern of computer use (Stringer et al., 2015). At its core was a set of passive monitors that collect data as the user interacts routinely with the computer. This data is analysed to infer the stakeholders’ cognitive health against a set of clinical indicators representing memory, motor control, use of language, etc. If the system detected potential problems, an alert message was sent to the user urging them to self-refer themselves to their GP for a check-up. There was a potential conflict between the clinical motivation to ensure that users responded to warning alert messages and users’ need for privacy and self control.
The VBRE method was applied during interviews, scenario-storyboard
requirements exploration sessions, and requirements analysis workshops. Requirements analysis was initiated with five workshops, conducted with a total of 24 participants (14 male, 10 female, age range 60-75). In the first session, the system aims, major components and operation were explained by presentation of PowerPoint storyboards illustrating design options (see Figure 4), for the alert-feedback user interface, such as choice of media (video, text, computer avatars), content (level of detail, social network) and monitoring (periodic feedback, alert-only, explicit tests). Discussion focused on privacy issues in monitoring computer use, data sharing and security, ethical considerations, emotional impact of alert messages, stakeholders’ motivations and their likelihood of taking follow-up tests. Requirements issues raised in the workshops were explored further in 13 interviews presenting scenarios to illustrate similar design options with discussion on privacy, security and ethical issues. The scenarios used in both sessions were designed to test different design approaches that tacitly explored values, such as human-like presence in exploration, social networks (trust, sociability values) and explicitly probing issues of security and privacy.
308
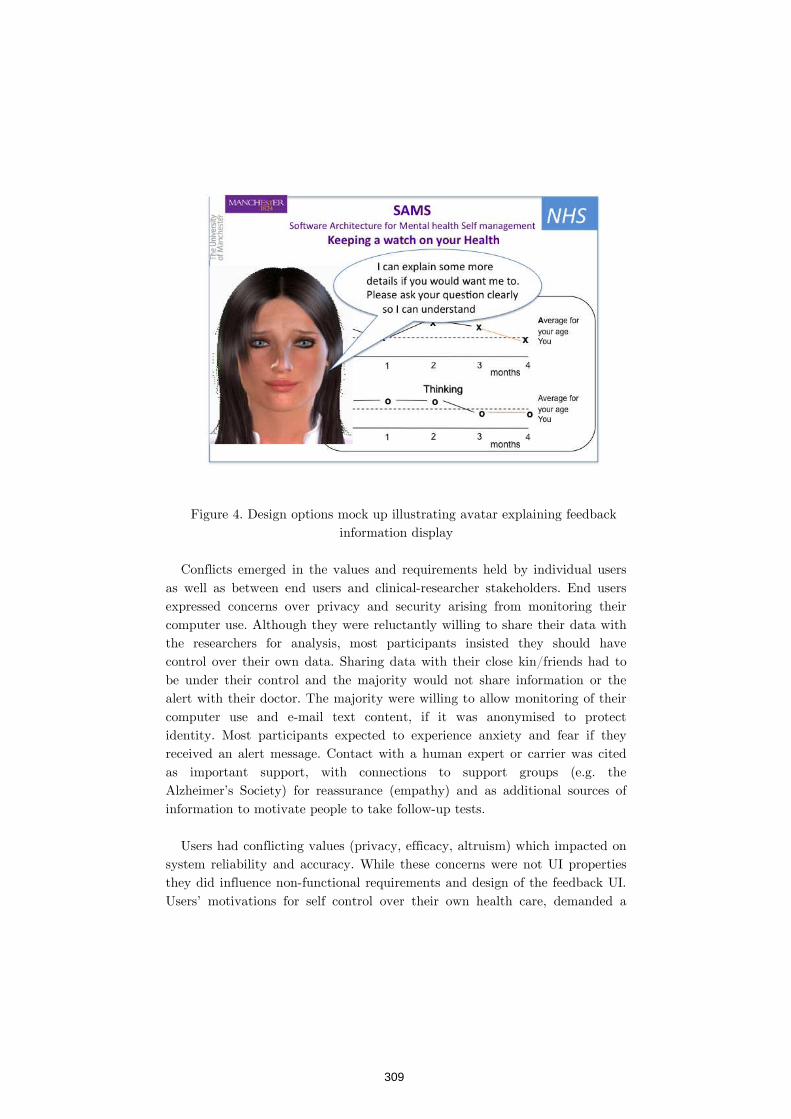
Figure 4. Design options mock up illustrating avatar explaining feedb
Conflicts emerged in the values and requirements held by individual users
as well as between end users and clinicalexpressed concerns over privacy and security arising from monitoring their computer use. Although they were reluctantly willing to share their data with the researchers for analysis, most participants insisted they should have control over their own data. Sharing data with their close kin/friends had to be under their control and the alert with their doctor. The majority were willing to allow monitoring of their computer use and eidentity. Most participants expected to experience anxiety andreceived an alert message. Contact with a human expert or carrier was cited as important support, with connections to support groups (e.g. the Alzheimer’s Society) for reassurance (empathy) and as additional sources of information to motivate
Users had conflicting values (privacy, efficacy, altruism) which impacted on
system reliability and accuracy. While these concerns were not UI properties they did influence nonUsers’ motivations for self control over their own health care, demanded a
Figure 4. Design options mock up illustrating avatar explaining feedbinformation display
Conflicts emerged in the values and requirements held by individual users as well as between end users and clinical-researcher stakeholders. End users expressed concerns over privacy and security arising from monitoring their
ter use. Although they were reluctantly willing to share their data with the researchers for analysis, most participants insisted they should have control over their own data. Sharing data with their close kin/friends had to be under their control and the majority would not share information or the alert with their doctor. The majority were willing to allow monitoring of their computer use and e-mail text content, if it was anonymised to protect identity. Most participants expected to experience anxiety and fear if they received an alert message. Contact with a human expert or carrier was cited as important support, with connections to support groups (e.g. the Alzheimer’s Society) for reassurance (empathy) and as additional sources of information to motivate people to take follow-up tests.
Users had conflicting values (privacy, efficacy, altruism) which impacted on system reliability and accuracy. While these concerns were not UI properties they did influence non-functional requirements and design of the feedback UI. Users’ motivations for self control over their own health care, demanded a
Figure 4. Design options mock up illustrating avatar explaining feedback
Conflicts emerged in the values and requirements held by individual users researcher stakeholders. End users
expressed concerns over privacy and security arising from monitoring their ter use. Although they were reluctantly willing to share their data with
the researchers for analysis, most participants insisted they should have control over their own data. Sharing data with their close kin/friends had to
majority would not share information or the alert with their doctor. The majority were willing to allow monitoring of their
mail text content, if it was anonymised to protect fear if they
received an alert message. Contact with a human expert or carrier was cited as important support, with connections to support groups (e.g. the Alzheimer’s Society) for reassurance (empathy) and as additional sources of
Users had conflicting values (privacy, efficacy, altruism) which impacted on system reliability and accuracy. While these concerns were not UI properties
edback UI. Users’ motivations for self control over their own health care, demanded a
309

reliable and accurate system which detected early signs of dementia. Signs of change and usual behaviour patterns in the recorded data might indicate dementia, but they could have many other causes, such as mental health problems, e.g. depression, and not pathological causes such as mood changes. Teasing apart the signal of potential pathology from the noise of normal variation was part of the research problem. The user implications were to avoid false positive alarms. Furthermore, even true positive indications were unlikely to be 100% accurate, so potentially disturbing messages had to be delivered sensitively. This posed a further requirements dilemma. On one hand, the feedback messages needed to urge users to self refer themselves to their doctors for a check-up, but on the other, messages should not alarm people unnecessarily. The ‘fear of diagnosis’ problem implies complex persuasive UI design which is part of our continuing research.
Privacy and security were the most common values, with implications for
controls over any data sharing, encryption, secure transmission and depersonalised data for research. These values clashed with users’ motivations for monitoring so they could manage their own health (efficacy, empowerment), the desire for self control, and altruism by participating in the research which might help research on dementia. Self control was prioritised by implementing a user control to ‘stop recording’, and information visualisation so users could view summaries of their own activity.
Trust in the SAMS system was closely related to security, but it also
involved accuracy of system information and diagnosis as well as organisational trust in the healthcare professionals. Trust-building was helped by a co-design consultation processes that involved users in the research and its results. The value clash between the need for privacy and continuous recording of users’ activity resulted from the need to record as much data as possible to improve the fidelity of the analysis. This improved the effectiveness of SAMS as a research tool, and its subsequent version as a healthcare self-management system, aligned with users’ self-efficacy and altruism (help research) values. The privacy goal also clashed with the researchers’ motivation to record as much data as possible for research purposes. Data security was a shared concern for all stakeholders.
310
To resolve the privacy clash, a UI function was provided so users could turn off data recording at their discretion. The system then prompted users to turn the recording back on after set time intervals of 5 and 10 minutes. If users did not comply after three reminders this was visible to the researchers from recording log files. They had the choice to phone the user to ask them to re set the recording. Data security was ensured by encryption of the recorded data and secure transmission to the university’s server. Data depersonalisation also protected user privacy.
Preferences between users for different styles of feedback UI was addressed
by providing a limited number of options which users could select when the system was set up, e.g. verbosity and tone of messages (empathetic/terse); delivery modality (text only, speech, speech plus avatar) and information provision (on/off). The latter choice allowed users access to visualisations and graphs of their recorded data on demand, with a limited set of display options of the quantity of data and summarisation. Choices were limited by the cost of configuration and developing different UI displays. To date only a limited implementation of the feedback UI has been attempted, backed up by human intervention when the system detects potential problems. The persuasive UI design with its inherent conflict between the designer’s goal of persuading people to take a course of action and possibly infringing personal freedom is still to be resolved.
Conflicting UI properties and, more generally, conflicting user requirements, are inherent in many systems. This paper has reported some experiences in trying to make these conflicts explicit so they can be resolved by negotiation or design. Conflicts may appear as explicit differences in stated requirements; however, frequently different viewpoints between users are tacit and need to be analysed in terms of values and motivations. Methods such as VBRE (Thew and Sutcliffe 2017) and Value Sensitive Design (Friedman, 2008) help in this endeavour.
If negotiation fails to resolve requirements conflicts, then a design response
is necessary. Configuration at design time or adaptation at runtime are the
311
usual choices. Configuration has the advantage of user participation, so they are aware of their choice and can pick design options that match their needs (Sutcliffe et al., 2006). However, configuration involves user effort and most users do not use customisation features provided by operating systems, and resent having to spend time choosing configuration options. Adaptation via an intelligent monitoring and automated change saves the user effort, but the changes are chosen by the designer and the change may produce inconsistency in the UI and induce usability problems (Fischer, 2001). Apart from specialised areas such as recommender systems (Bonhard et al., 2006), manual adaptation or configuration has been preferred.
However, configuration imposes learning and operational costs on users.
Furthermore, the configuration options are provided by designers, and this may limit the fit between the users’ needs and the design options offered. In the ADVISES system we did not implement most configuration facilities because of constraints on developer resources. This decision was a trade-off between the perceived user demand for configuration, which was estimated to be low, and the considerable software development effect necessary. ADVISES implemented a resolution of clashes between user groups by giving users control over which facilities they chose to use, in particular the statistics advisor. This choice was a compromise since it failed to satisfy the researchers’ wish to enforce statistical rigour in the public health analysts’ work, although it did preserve the freedom of the analysts to control their own workflow.
In SAMS the value clashes between users’ desire for privacy and their self-
efficacy/empowerment motivation for healthcare self-management was partially resolved by provision of a UI control to temporarily halt data recording. The potential clash between the outcome of the monitoring where emotive messages had to be conveyed has not been resolved. This is an ongoing research issue concerning persuasive technology (Fogg, 2009) where the designer or system owner’s goal, i.e. to persuade the use to take a particular course of action, conflicts with ethical concerns that technology should not control people’s behaviour by explicit or covert means.
Conflicts in the user interface may be overt in the form of different tasks,
workflows or functional requirements owned by different user groups, as was the case with the researchers and public health analysts in ADVISES. In this case provision of tools to fulfil both sets of tasks is the answer. Harder to resolve are conflicts involving clashes between user values or non-functional
312
requirements. These have to be refined into design choices which may partially satisfy one or more stakeholder groups; but as our experience has demonstrated, conflicts can often pose deep-seated irreconcilable dilemmas.
1 Bonhard, P., Harries, C., McCarthy, J. & Sasse, M.A. (2006). Accounting for taste: using profile similarity to improve recommender systems. In
, 1057-1066. C
2 Braz, C., Seffah, A., & M’Raihi, D. (2007). Designing a trade-off between usability and security: a metrics based-model.
, 114-126.
3 Cockton, G., Kirk, D., Sellen, A. & Banks, R. (2009) Evolving and augmenting worth mapping for family archives. In:
. London: British Computer Society.
4 Fischer, G. (2001). User modeling in human-computer interaction. .
11(1-2), 65-86. 5 Fogg, B. J. (2009). The behavior grid: 35 ways behavior can change. In
Proceedings of the 4th international Conference on Persuasive Technology (p. 42). ACM.
6 Friedman, B. (2008). Value sensitive design. In: Schular, D. (ed.). .
Cambridge: MIT Press. 7 Lamsweerde, A. van. (2009).
. Chichester: Wiley.
8 Mylopoulos, J., Chung, L. && Yu, E.S.K. (1999). From object-oriented to goal-oriented requirements analysis. , 42(1),
31-37. 9 Robertson, S. & Robertson, J. (1999).
. Harlow: Addison Wesley.
10 Sommerville, I. & Kotonya, G. (1998).
. Chichester: Wiley.
11 Spence, R. (2007). (2nd ed.). Harlow: Pearson
Education.
313
12 Stringer, G., Sawyer, P., Sutcliffe, A.G. & Leroi, I. (2015). From click to cognition: detecting cognitive decline through daily computer use. In: D. Bruno (ed.),
(pp. 93-103). Hove: Psychology Press.
13 Sutcliffe, A.G., Fickas, S. & Sohlberg, M.M. (2006). PC-RE: a method for personal and contextual requirements engineering with some experience.
, 11, 157-163.
14 Sutcliffe, A.G., Thew, S. & Jarvis, P. (2011). Experience with user-centred requirements engineering. , 16(4), 267-280.
15 Sutcliffe, A.G. (2002). . London:
Springer. 16 Thew, S. & Sutcliffe, A.G. (2017). Value Based Requirements
Engineering: method and experience. , .
17 Ware, C. (2000). . San
Francisco, CA: Morgan Kaufmann.
314

Carmelo Ardito1, Maria Francesca Costabile1, Giuseppe Desolda1, Rosa Lanzilotti1, Maristella Matera2
1Dipartimento di Informatica, Università degli Studi di Bari Aldo Moro Via Orabona, 4 – 70125 – Bari, Italy
2Dipartimento di Elettronica, Informazione e Bioingegneria, Politecnico di Milano Piazza Leonardo da Vinci, 32 – 20134 – Milano, Italy
Over the years, interaction design has become increasingly
complex due to the evolution of end users of interactive systems. Approaches such as user-centered design (UCD), which proved effective in the creation of usable interactive systems, have to deal with this evolution. As HCI researchers working at the design of interactive systems in several and various application domains, we are experiencing the effects of this evolution, in particular when we have to weigh up every usability aspect depending on the specific context or the target end users. In this position paper, we report our experience from the perspective of designing End-User Development (EUD) systems, i.e., software artifacts that can be modified, extended, or even created by non-professional software developers.
Exponential technological advances push end users to evolve from having traditional roles as passive information consumers to more active ones. Users are increasingly willing to shape the systems they use to adapt them to their needs, tasks and habits, by manipulating and tailoring software artifacts and create new configurations or new designs. Accordingly, the goal of human–computer interaction (HCI) has been evolving from just making systems
(even though that goal has not yet been completely achieved) to
building frameworks that can lead to systems . This challenge is
315
addressed by the End-User Development (EUD), an emerging paradigm that aims to empower end users to let them develop and adapt systems by themselves. A widely accepted definition of EUD is provided by Lieberman et al.:
[1].
Enabling EUD entails providing end users, who in most cases are not technologically skilled, with appropriate environments and tools that allow them to contribute to the design, development and evolution overtime of software artifacts. Tasks that are traditionally performed by professional software developers are thus transferred to end users, who become co-designers of the tools and products they will use. This does not imply transferring the responsibility of good system design to them. It actually makes the work of professional developers even more difficult, since end users have to be supported in their new roles as designers and developers.
Building systems that permit EUD activities requires a shift in the design paradigm, which must move from user-centered and participatory design to meta-design, characterized by two main phases [2, 3]. The first phase consists of creating the design environments that allow system stakeholders to participate in the design (meta-design phase). The second phase consists of the design of the final applications, carried out by the joint work of the various stakeholders, who collaborate through their design environments (design phase).
According to the meta-design paradigm, all system stakeholders, including end users, are active members of the design team. The professional developers involved in the traditional design are the team of meta-designers, who create software environments through which the other stakeholders, acting as designers, can be creative and can adapt the software to fit their specific needs. They can create and modify elements (objects, functions, user interface widgets, etc.) of the system of interest, and exchange the results of their activities to converge to a common design.
Since 2004, the researchers at the Interaction, Visualization, Usability and UX (IVU) Lab13 have worked on theories, methodologies, models and tools to foster the adoption of EUD systems by non-technical end users in real and various contexts such as e-health, e-commerce, serious games, and cultural heritage (see [4] for a short description of these tools). Later, starting 2012, they have been collaborating on these topics with researchers of the
13http://ivu.di.uniba.it/
316
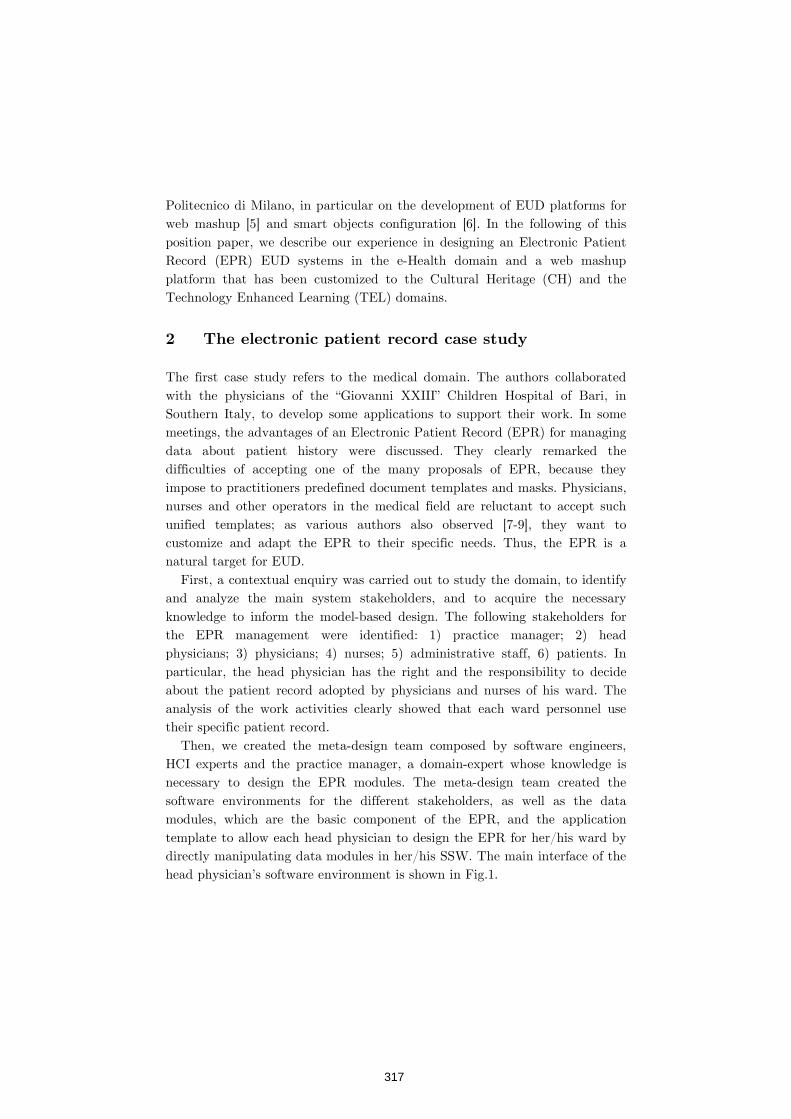
Politecnico di Milano, in particular on the development of EUD platforms for web mashup [5] and smart objects configuration [6]. In the following of this position paper, we describe our experience in designing an Electronic Patient Record (EPR) EUD systems in the e-Health domain and a web mashup platform that has been customized to the Cultural Heritage (CH) and the Technology Enhanced Learning (TEL) domains.
The first case study refers to the medical domain. The authors collaborated with the physicians of the “Giovanni XXIII” Children Hospital of Bari, in Southern Italy, to develop some applications to support their work. In some meetings, the advantages of an Electronic Patient Record (EPR) for managing data about patient history were discussed. They clearly remarked the difficulties of accepting one of the many proposals of EPR, because they impose to practitioners predefined document templates and masks. Physicians, nurses and other operators in the medical field are reluctant to accept such unified templates; as various authors also observed [7-9], they want to customize and adapt the EPR to their specific needs. Thus, the EPR is a natural target for EUD.
First, a contextual enquiry was carried out to study the domain, to identify and analyze the main system stakeholders, and to acquire the necessary knowledge to inform the model-based design. The following stakeholders for the EPR management were identified: 1) practice manager; 2) head physicians; 3) physicians; 4) nurses; 5) administrative staff, 6) patients. In particular, the head physician has the right and the responsibility to decide about the patient record adopted by physicians and nurses of his ward. The analysis of the work activities clearly showed that each ward personnel use their specific patient record.
Then, we created the meta-design team composed by software engineers, HCI experts and the practice manager, a domain-expert whose knowledge is necessary to design the EPR modules. The meta-design team created the software environments for the different stakeholders, as well as the data modules, which are the basic component of the EPR, and the application template to allow each head physician to design the EPR for her/his ward by directly manipulating data modules in her/his SSW. The main interface of the head physician’s software environment is shown in Fig.1.
317
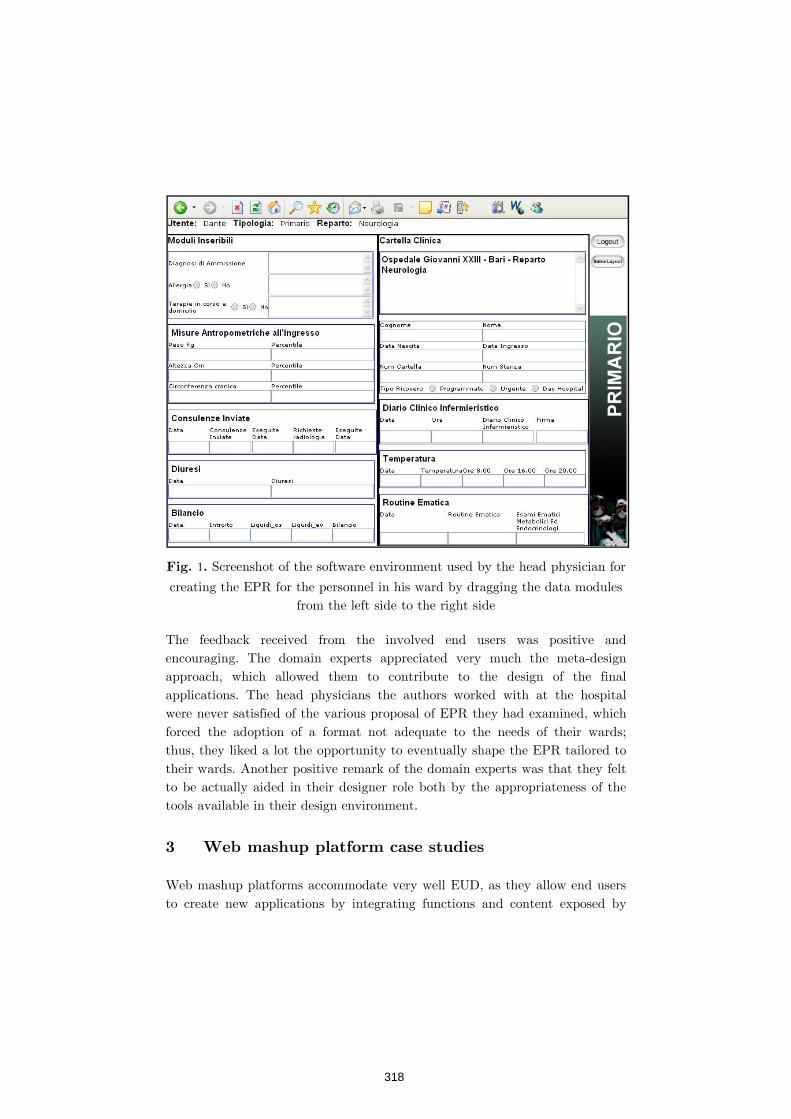
1 Screenshot of the software environment used by the head physician for
creating the EPR for the personnel in his ward by dragging the data modules from the left side to the right side
The feedback received from the involved end users was positive and encouraging. The domain experts appreciated very much the meta-design approach, which allowed them to contribute to the design of the final applications. The head physicians the authors worked with at the hospital were never satisfied of the various proposal of EPR they had examined, which forced the adoption of a format not adequate to the needs of their wards; thus, they liked a lot the opportunity to eventually shape the EPR tailored to their wards. Another positive remark of the domain experts was that they felt to be actually aided in their designer role both by the appropriateness of the tools available in their design environment.
Web mashup platforms accommodate very well EUD, as they allow end users to create new applications by integrating functions and content exposed by
318
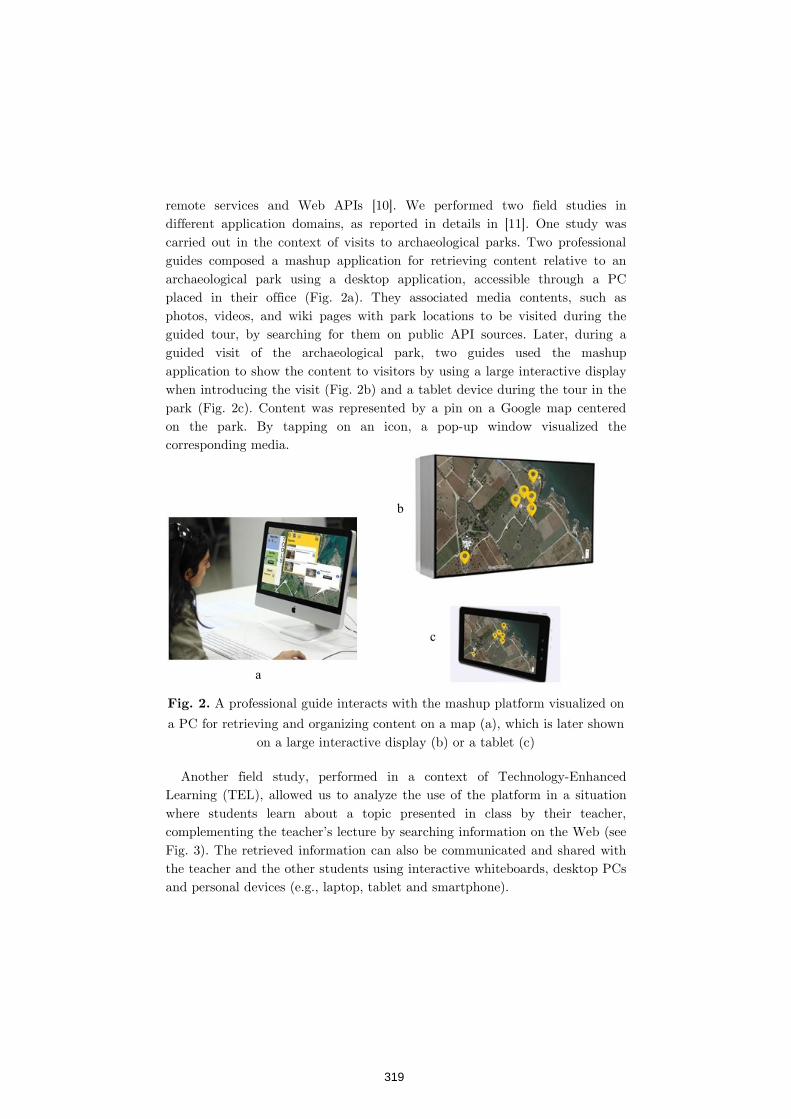
remote services and Web APIs [10]. We performed two field studies in different application domains, as reported in details in [11]. One study was carried out in the context of visits to archaeological parks. Two professional guides composed a mashup application for retrieving content relative to an archaeological park using a desktop application, accessible through a PC placed in their office (Fig. 2a). They associated media contents, such as photos, videos, and wiki pages with park locations to be visited during the guided tour, by searching for them on public API sources. Later, during a guided visit of the archaeological park, two guides used the mashup application to show the content to visitors by using a large interactive display when introducing the visit (Fig. 2b) and a tablet device during the tour in the park (Fig. 2c). Content was represented by a pin on a Google map centered on the park. By tapping on an icon, a pop-up window visualized the corresponding media.
A professional guide interacts with the mashup platform visualized on
a PC for retrieving and organizing content on a map (a), which is later shown on a large interactive display (b) or a tablet (c)
Another field study, performed in a context of Technology-Enhanced Learning (TEL), allowed us to analyze the use of the platform in a situation where students learn about a topic presented in class by their teacher, complementing the teacher’s lecture by searching information on the Web (see Fig. 3). The retrieved information can also be communicated and shared with the teacher and the other students using interactive whiteboards, desktop PCs and personal devices (e.g., laptop, tablet and smartphone).
a
c
b
319
A workspace on , organized as a mind map,
created by the teacher using a desktop PC and later integrated by the students with further content as part of their homework.
Both the studies demonstrated that the platform is sufficiently easy to use and users felt quite supported in accomplishing their tasks. Most participants appreciated the value of the platform in enabling easy and effective integration of content retrieved on the fly from online APIs. Low response time of the platform was indicated as a negative aspect, but this was due to the very poor technology infrastructure available both at the archaeological park and at the school lab.
Participants highlighted the lack of collaboration tools, such as chats or forums. Other remarks also concerned distributed collaborative creation of components and functions to annotate services, widgets, and information items.
The studies also revealed new requirements that mashup platforms should feature to foster their adoption in real contexts. The users expressed the need to “manipulate” data extracted from services. They highlighted that through the platform they could not perform much more than visualizing data, modifying visualizations, and inspecting data details. They would instead appreciate functions to make the displayed information , i.e.,
suitable for being manipulated according to their task goals [12]. For example, in the content retrieval task, beyond composing services and choosing how to visualize retrieved content, participants also wanted to perform ordering, filtering, or selecting a specific part of a content item, possibly annotating the selected parts with comments. Another important requirement that emerged is
320
related to the information retrieval power of the mashup platforms: users reported that, in order to satisfy complex information needs, data should be gathered from the entire Web - not only from web service APIs.
EUD has started the trend toward a more active involvement of end users in the overall software design, development, and evolution processes, to allow them becoming co-designers of the tools and products they will use. The studies showed that the users of EUD tools are focused on aspects related to the effectiveness in supporting the tasks they are performing and the customizability of the system in respect to the their tasks. Therefore, other system properties come into play. One is the system flexibility, an ingredient that can be favored by the identification of elementary components that can then be assembled together to give life to brand new interactive systems. In this case, the focus on usability is more related to the composition paradigm offered to the end users than to the final interactive applications the end users build by themselves. In the specific context of the mashup platform, in which the overarching goal was information retrieval, end users also considered important other factors such as quality, completeness and trust of the retrieved data [13], as well as peer communication, sharing and annotating features. Nobody considered other attributes related to aesthetic, graphic aspect, security, privacy. The results of previous evaluations of EUD tools applied in different application domains and based on various technologies (e.g., electronic patient records, e-commerce websites, cultural heritage authoring tools) also confirm that end users consider important the capability of their own tools to support them in hitting their goal.
This analysis suggests that in this new process, the responsibility of good system design cannot be transferred to end users, who have to be assisted by other ICT professional stakeholders in this new role of designers and developers. This actually makes the work of professional developers even more difficult, since: a) it is still their responsibility to ensure the quality of the software artifacts created by end users [14], and b) they have to create proper tools that support end users in these new roles of designers and developers.
In order to address these issues, our methodology for designing EUD systems is based on a meta-design model. Meta-design means “design for designers”. It consists of two types of activities that might also alternate: meta-design activities are performed by professional developers, who create
321
the design environments that allow the diverse stakeholders to participate in the creation of the final applications; design activities consist of designing the final applications and are performed also by end users, and possibly other stakeholders, by using the design environments devoted to them. Differently than in traditional design, professional developers do not directly create a final application, but they build software environments thorough which non-technical end users, acting as co-designers, are enabled to shape up the application they are going to use.
Another issue, which emerged in the field studies that we have conducted to validate our tools, is that some problems occur when the proposed EUD systems are too “general”, claiming that one single design might satisfy the requirements of many domains. We therefore proposed domain customization as a solution to make meta-design still more effective in creating platforms that really fit the end-user needs. For example, in the case of the mashup platform experiences, customization occurs by selecting and registering into the platform services and data sources (public or private) that, for any different domain, can provide content able to fulfill specific users’ information needs. Service registration is kept as simple as possible, so that even non-technical users can possibly add new services if needed.
1. Lieberman, H., Paternò, F., Klann, M., Wulf, V.: End-User Development: An Emerging Paradigm. In: Lieberman, H., Paternò, F., Wulf, V. (eds.), End User Development, pp. 1-8. Springer Netherlands, Dordrecht (2006)
2. Costabile, M.F., Fogli, D., Mussio, P., Piccinno, A.: Visual Interactive Systems for End-User Development: A Model-Based Design Methodology. IEEE Transactions on Systems, Man, and Cybernetics - Part A: Systems and Humans 37(6), pp. 1029-1046 (2007)
3. Fischer, G., Giaccardi, E., Ye, Y., Sutcliffe, A., Mehandjiev, N.: Meta-design: a manifesto for end-user development. Communications of the ACM 47(9), pp. 33-37 (2004)
4. Ardito, C., Buono, P., Costabile, M.F., Lanzilotti, R., Piccinno, A.: End users as co-designers of their own tools and products. Journal of Visual Languages & Computing 23(2), pp. 78-90 (2012)
5. Ardito, C., Costabile, M.F., Desolda, G., Lanzilotti, R., Matera, M., Piccinno, A., Picozzi, M.: User-driven visual composition of service-based interactive spaces. Journal of Visual Languages & Computing 25(4), pp. 278-296 (2014)
322
6. Ardito, C., Costabile, M.F., De Angeli, A., Lanzilotti, R.: Enriching exploration of archaeological parks with mobile technology. ACM Trans. Comput.-Hum. Interact. 19(4), Article 29, pp. 1-30 (2012)
7. Morrison, C., Blackwell, A.: Observing End-User Customisation of Electronic Patient Records. In: Pipek, V., Rosson, M.B., de Ruyter, B., Wulf, V. (eds.), End-User Development. Vol. 5435, pp. 275-284. Springer, Berlin / Heidelberg (2009)
8. Cabitza, F., Simone, C.: WOAD: A Framework to Enable the End-User Development of Coordination-Oriented Functionalities. Journal of Organizational and End User Computing, pp. 1-20 (2010)
9. Cabitza, F., Gesso, I., Corna, S.: Tailorable flexibility: Making end-users autonomous in the design of active interfaces. In: IADIS Multi Conference on Computer Science and Information Systems (Tailorable flexibility: Making end-users autonomous in the design of active interfaces), Rome, Italy. pp. 53-60 (2011)
10. Daniel, F., Matera, M.: Mashups - Concepts, Models and Architectures. Springer (2014)
11. Ardito, C., Bottoni, P., Costabile, M.F., Desolda, G., Matera, M., Picozzi, M.: Creation and Use of Service-based Distributed Interactive Workspaces. Journal of Visual Languages & Computing 25(6), pp. 717-726 (2014)
12. Ardito, C., Costabile, M.F., Desolda, G., Latzina, M., Matera, M.: Making mashups actionable through elastic design principles. In: Díaz, P., Pipek, V., Ardito, C., Jensen, C., Aedo, I., Boden, A. (eds.), End-User Development - IS-EUD 2015. Vol. LNCS 9083, pp. 236–241. Springer, Berlin Heidelberg (2015)
13. Cappiello, C., Daniel, F., Matera, M., Pautasso, C.: Information Quality in Mashups. IEEE Internet Computing 14(4), pp. 14-22 (2010)
14. Ko, A.J., Abraham, R., Beckwith, L., Blackwell, A., Burnett, M., Erwig, M., Scaffidi, C., Lawrance, J., Lieberman, H., Myers, B., Rosson, M.B., Rothermel, G., Shaw, M., Wiedenbeck, S.: The state of the art in end-user software engineering. ACM Comput. Surv. 43(3), pp. 1-44 (2011)
323
Camille Fayollas, Célia Martinie, Philippe Palanque1, Yamine Ait-Ameur3, FORMEDICIS2
1 ICS-IRIT, Université Toulouse III, France 2 Collective name
3 ACADIE-IRIT, ENSEEIHT, France
This paper presents a notation called QBP (Question,
Behavior, Property) to represent software and system properties and their relationship. The properties are structured in a tree-shape format from very abstract and generic ones (such as safety or security) to more concrete (leave of the tree). This tree-shape representation is used in the paper to represent properties classification in several areas such as Dependable and Secure computing and Human-Computer Interaction. The notation makes it possible to connect the properties among each other and to connect them to concrete properties expressed in temporal logic. Those concrete properties are, in turn, connected to behavioral descriptions of interactive systems satisfying (or not) the properties. An example is given on a set of different traffic lights from different countries.
Properties, interactive systems, safety, security, usability,
user experience.
With the early work on understanding interactive systems [1] came the identification of properties that “good” interactive systems should exhibit (e.g. honesty) and “bad” properties that they should avoid (e.g. deadlocks). Later, guidelines for the design of interactive systems [22] were provided, identifying in a similar way “good” properties (e.g. guidance), in order to favor usability of these systems. In the area of software engineering, early work [7] identified two main good properties of computing systems namely safety (i.e. nothing
324
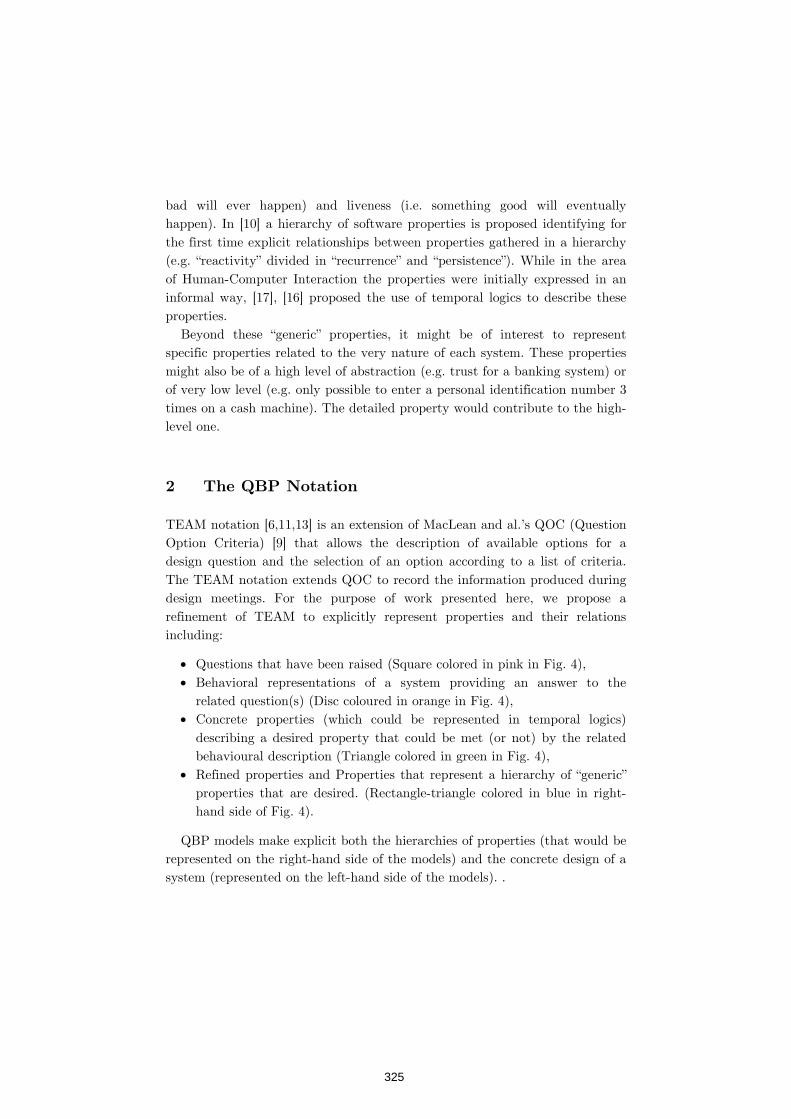
bad will ever happen) and liveness (i.e. something good will eventually happen). In [10] a hierarchy of software properties is proposed identifying for the first time explicit relationships between properties gathered in a hierarchy (e.g. “reactivity” divided in “recurrence” and “persistence”). While in the area of Human-Computer Interaction the properties were initially expressed in an informal way, [17], [16] proposed the use of temporal logics to describe these properties.
Beyond these “generic” properties, it might be of interest to represent specific properties related to the very nature of each system. These properties might also be of a high level of abstraction (e.g. trust for a banking system) or of very low level (e.g. only possible to enter a personal identification number 3 times on a cash machine). The detailed property would contribute to the high-level one.
TEAM notation [6,11,13] is an extension of MacLean and al.’s QOC (Question Option Criteria) [9] that allows the description of available options for a design question and the selection of an option according to a list of criteria. The TEAM notation extends QOC to record the information produced during design meetings. For the purpose of work presented here, we propose a refinement of TEAM to explicitly represent properties and their relations including:
Questions that have been raised (Square colored in pink in Fig. 4), Behavioral representations of a system providing an answer to the
related question(s) (Disc coloured in orange in Fig. 4), Concrete properties (which could be represented in temporal logics)
describing a desired property that could be met (or not) by the related behavioural description (Triangle colored in green in Fig. 4),
Refined properties and Properties that represent a hierarchy of “generic” properties that are desired. (Rectangle-triangle colored in blue in right-hand side of Fig. 4).
QBP models make explicit both the hierarchies of properties (that would be represented on the right-hand side of the models) and the concrete design of a system (represented on the left-hand side of the models). .
325
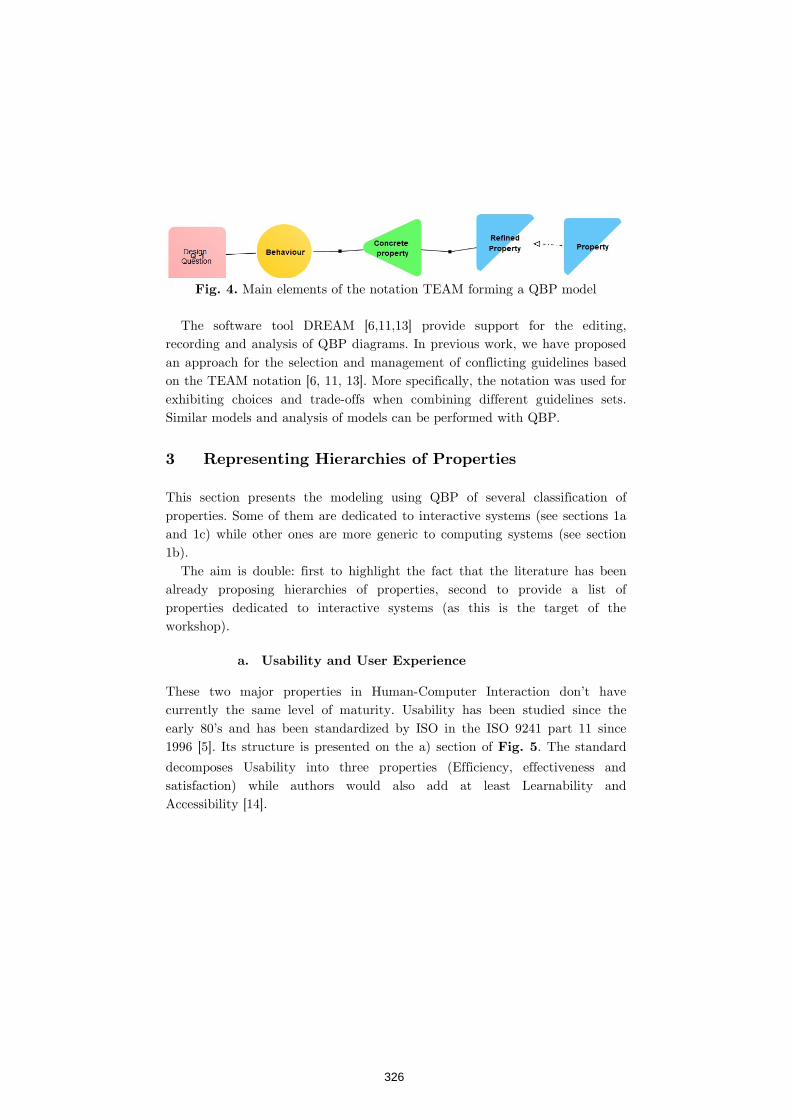
Main elements of the notation TEAM forming a QBP model
The software tool DREAM [6,11,13] provide support for the editing, recording and analysis of QBP diagrams. In previous work, we have proposed an approach for the selection and management of conflicting guidelines based on the TEAM notation [6, 11, 13]. More specifically, the notation was used for exhibiting choices and trade-offs when combining different guidelines sets. Similar models and analysis of models can be performed with QBP.
This section presents the modeling using QBP of several classification of properties. Some of them are dedicated to interactive systems (see sections 1a and 1c) while other ones are more generic to computing systems (see section 1b).
The aim is double: first to highlight the fact that the literature has been already proposing hierarchies of properties, second to provide a list of properties dedicated to interactive systems (as this is the target of the workshop).
These two major properties in Human-Computer Interaction don’t have currently the same level of maturity. Usability has been studied since the early 80’s and has been standardized by ISO in the ISO 9241 part 11 since 1996 [5]. Its structure is presented on the a) section of . The standard
decomposes Usability into three properties (Efficiency, effectiveness and satisfaction) while authors would also add at least Learnability and Accessibility [14].
326
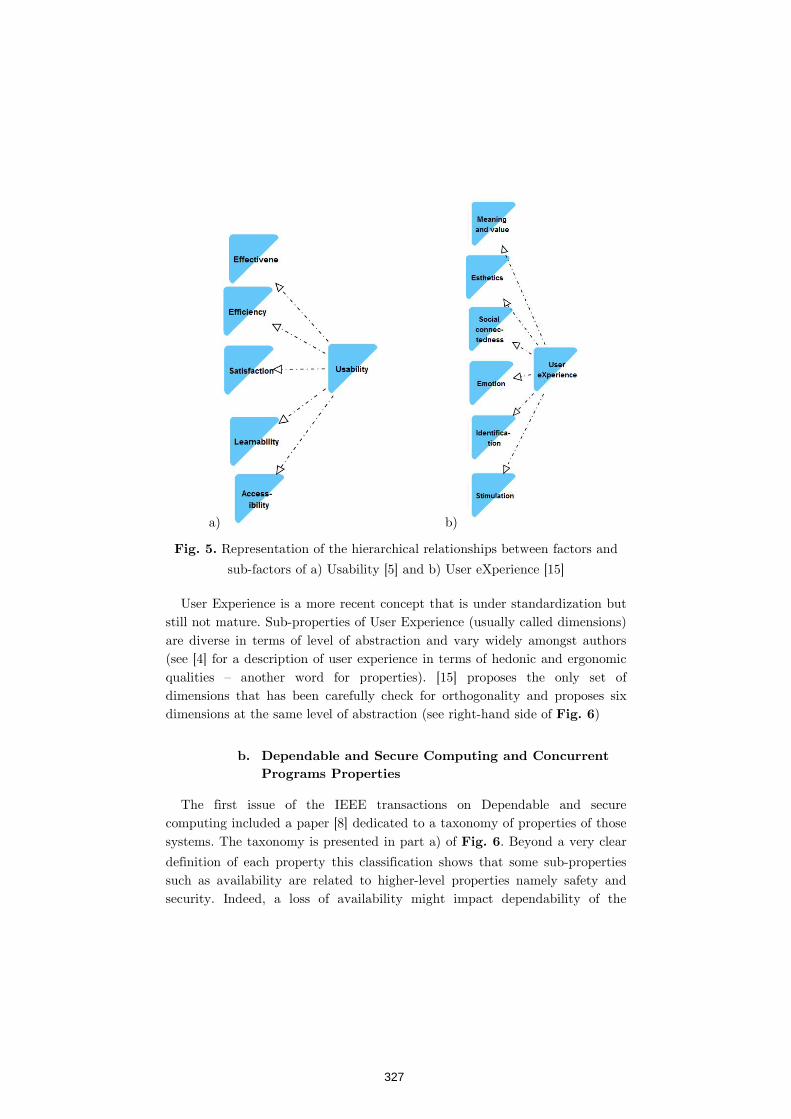
a)
Representation of the hierarchical relati
sub-factors of a) Usability [
User Experience is a more recent concept that is under standardization but still not mature. Subare diverse in terms of level of abstraction and vary widely amongst authors (see [4] for a description of user experience in terms ofqualities – another word for properties). [dimensions that has been carefully check for orthogonality and proposes six dimensions at the same level of abstract
The first issue of the IEEE transactions on Dependable and secure computing included a paper [systems. The taxonomy is presented in part a) of
definition of each property this classification shows thsuch as availability are related to highersecurity. Indeed, a loss of availability might impact dependability of the
b)
Representation of the hierarchical relationships between factors and
factors of a) Usability [5] and b) User eXperience [15]
User Experience is a more recent concept that is under standardization but ll not mature. Sub-properties of User Experience (usually called dimensions)
are diverse in terms of level of abstraction and vary widely amongst authors ] for a description of user experience in terms of hedonic and ergonomic
another word for properties). [15] proposes the only set of dimensions that has been carefully check for orthogonality and proposes six dimensions at the same level of abstraction (see right-hand side of
The first issue of the IEEE transactions on Dependable and secure computing included a paper [8] dedicated to a taxonomy of properties of those systems. The taxonomy is presented in part a) of . Beyond a very clear
definition of each property this classification shows that some sub-properties such as availability are related to higher-level properties namely safety and security. Indeed, a loss of availability might impact dependability of the
onships between factors and
User Experience is a more recent concept that is under standardization but properties of User Experience (usually called dimensions)
are diverse in terms of level of abstraction and vary widely amongst authors hedonic and ergonomic
] proposes the only set of dimensions that has been carefully check for orthogonality and proposes six
)
The first issue of the IEEE transactions on Dependable and secure ] dedicated to a taxonomy of properties of those
. Beyond a very clear
properties level properties namely safety and
security. Indeed, a loss of availability might impact dependability of the
327
systems (if the service not available is requested) while security attacks mighttarget at a reduction of availability of service (as in the classical DDoS Distributed Denial of Service).
The right-hand side of
decomposition of properties of concurrhave been introduced in the introduction. Beyond this separation, Sistla proposed in [20] a refinement of these properties in more precise ones contributing to the presence
a)
Representation of hierarchical relationships between factors and sub
factors of Security and Dependability [
In his seminal work in the domain of formal [1], Dix proposed a detailed classification of properties in two main groups: external and internal properties. This refers to the fact that part of the interactive is perceivablemight be of “good” quality (presence of the external properties detailed in
). The internal properties (see
interactive system focusing on its internal behavior. These properties are thus closer to the ones presented above in the area of computing systems.
systems (if the service not available is requested) while security attacks mighttarget at a reduction of availability of service (as in the classical DDoS Distributed Denial of Service).
hand side of presents a very old and classical
decomposition of properties of concurrent systems: safety and liveness that have been introduced in the introduction. Beyond this separation, Sistla
] a refinement of these properties in more precise ones contributing to the presence or the absence of the more high-level ones.
b)
Representation of hierarchical relationships between factors and sub
factors of Security and Dependability [8] (a) as well as of concurrent programs [16, 17]
In his seminal work in the domain of formal methods for interactive systems ], Dix proposed a detailed classification of properties in two main groups:
external and internal properties. This refers to the fact that part of the interactive is perceivable by the user and that what is presented to the user might be of “good” quality (presence of the external properties detailed in
). The internal properties (see ) refer to the quality of the
interactive system focusing on its internal behavior. These properties are thus closer to the ones presented above in the area of computing systems.
systems (if the service not available is requested) while security attacks might target at a reduction of availability of service (as in the classical DDoS –
presents a very old and classical
ent systems: safety and liveness that have been introduced in the introduction. Beyond this separation, Sistla
] a refinement of these properties in more precise ones level ones.
Representation of hierarchical relationships between factors and sub-
] (a) as well as of concurrent programs
methods for interactive systems ], Dix proposed a detailed classification of properties in two main groups:
external and internal properties. This refers to the fact that part of the by the user and that what is presented to the user
might be of “good” quality (presence of the external properties detailed in ) refer to the quality of the
interactive system focusing on its internal behavior. These properties are thus
328
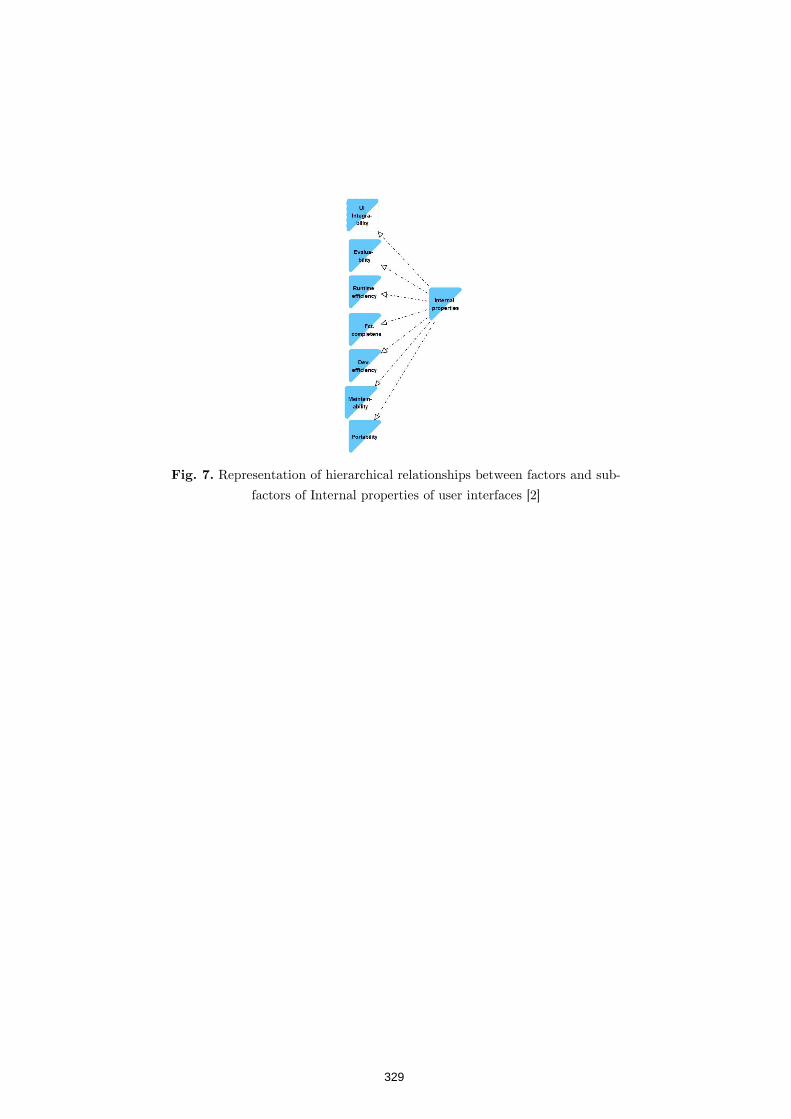
Representation of hierarchica
factors of Internal properties of user interfaces [
Representation of hierarchical relationships between factors and sub
factors of Internal properties of user interfaces [2]
l relationships between factors and sub-
329
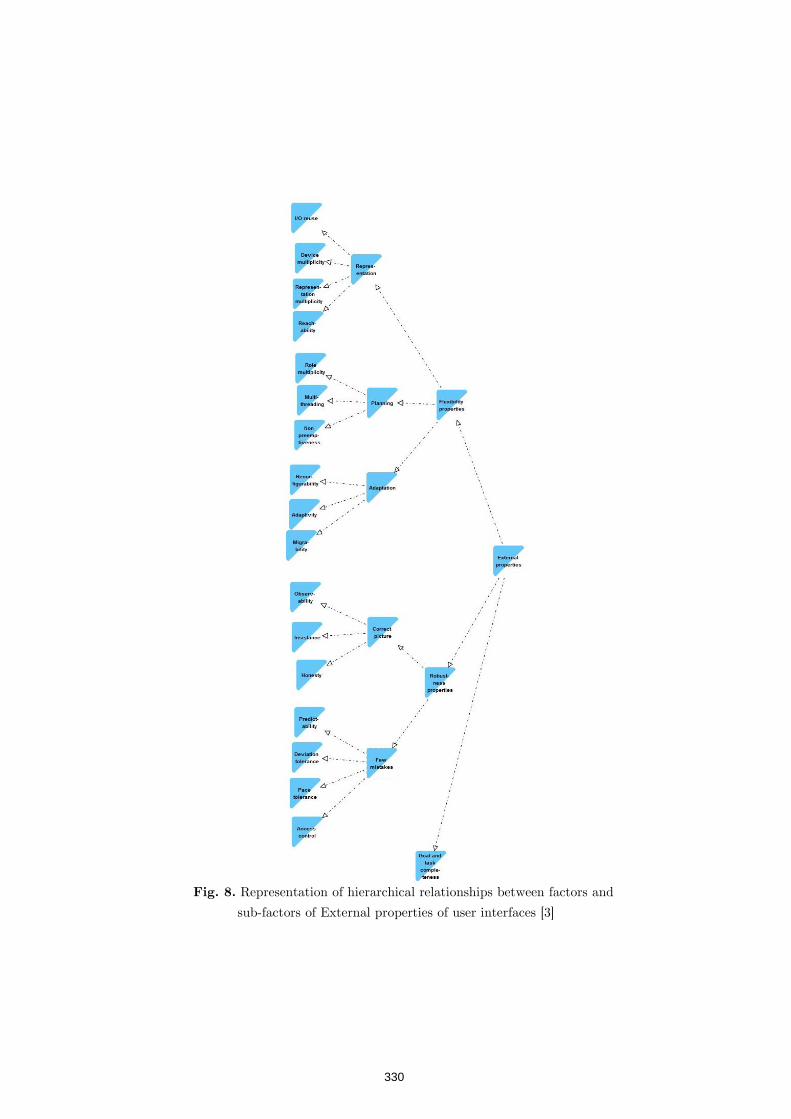
Representation of hierarchical relationships between factors and
sub-factors of External properties of user interfaces [3]
330
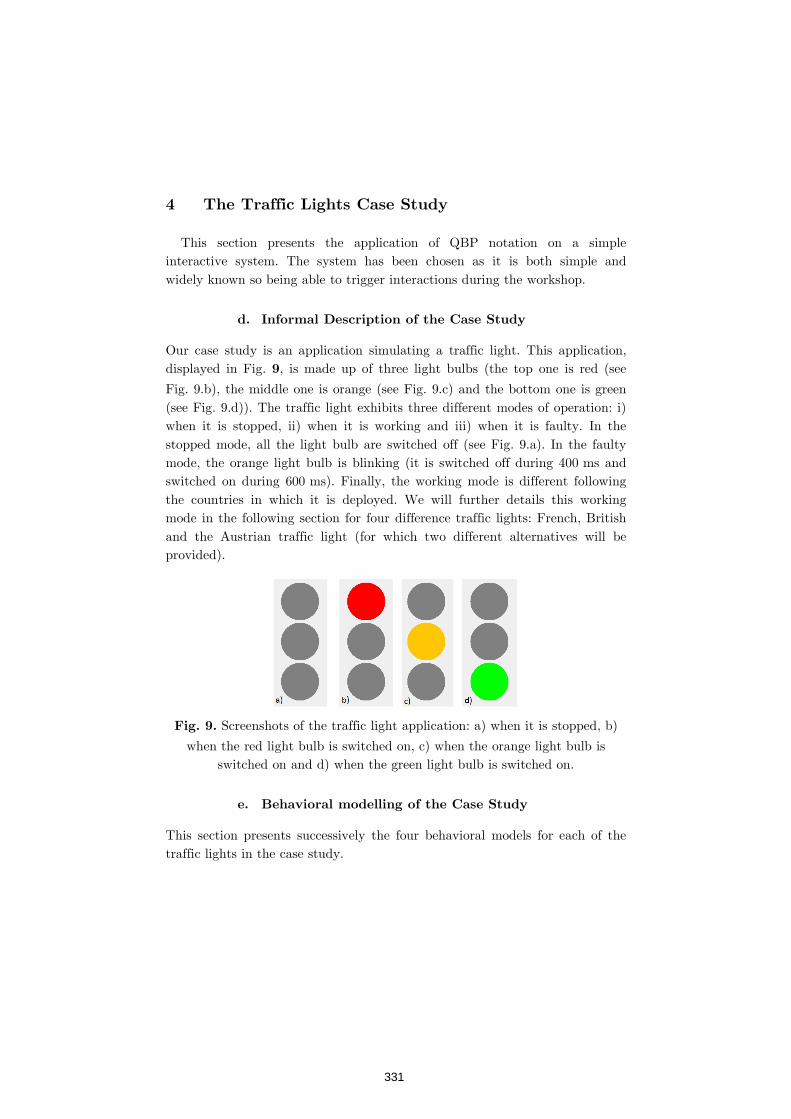
This section presents the application of QBP notation on a simple interactive system. The system has been chosen as it is both simple and widely known so being able to trigger interactions during the workshop.
Our case study is an application simulating a traffic light. This application, displayed in Fig. , is made up of three light bulbs (the top one is red (see
Fig. 9.b), the middle one is orange (see Fig. 9.c) and the bottom one is green (see Fig. 9.d)). The traffic light exhibits three different modes of operation: i) when it is stopped, ii) when it is working and iii) when it is faulty. In the stopped mode, all the light bulb are switched off (see Fig. 9.a). In the faulty mode, the orange light bulb is blinking (it is switched off during 400 ms and switched on during 600 ms). Finally, the working mode is different following the countries in which it is deployed. We will further details this working mode in the following section for four difference traffic lights: French, British and the Austrian traffic light (for which two different alternatives will be provided).
Screenshots of the traffic light application: a) when it is stopped, b)
when the red light bulb is switched on, c) when the orange light bulb is switched on and d) when the green light bulb is switched on.
This section presents successively the four behavioral models for each of the traffic lights in the case study.
331
i. French Traffic light.
The French traffic light is the simpler one and the other ones are more complex and precise behavior of the French one. When entering the working mode, the traffic light starts with only the red light on, after 1000 ms the red lightbulb is switched off and the green lightbulb is switched on. This bulb remains on for 2000ms before being switched off while the orange light is switched on for 500ms. When this delay is elapsed, the traffic light comes back to the initial state with only the red light on.
At any time, a fault event may occur that will set the traffic light to the faulty mode. When entering this mode whatever light which is on is switched off and the organe light is switched on for 600 ms (as explained in the informal presentation of the case study above). At any time, a recover event may be triggered setting the traffic light to the initial state of the working mode (i.e. only the red light switched on). A fail event may also occur. When this occurs, whatever state the traffic light is in, it is set to the Fail mode (represented by the state A in ).
represents with an Augmented Transition Network [24] the
behavior described informally above. In the initial state, the traffic light is in the Fail mode (state A in the diagram). When an event Start is received, the traffic light changes state to the R state in the diagram. During this state change, the red lightbulb is switched on (“r” action on the arc label from state “A” to state “R”). From that initial state of the working mode, the timer “tR” will be switched on starting the autonomous behavior of the traffic light in this mode, alternating from Red to Green, from Green to Orange and then back to Red.
332
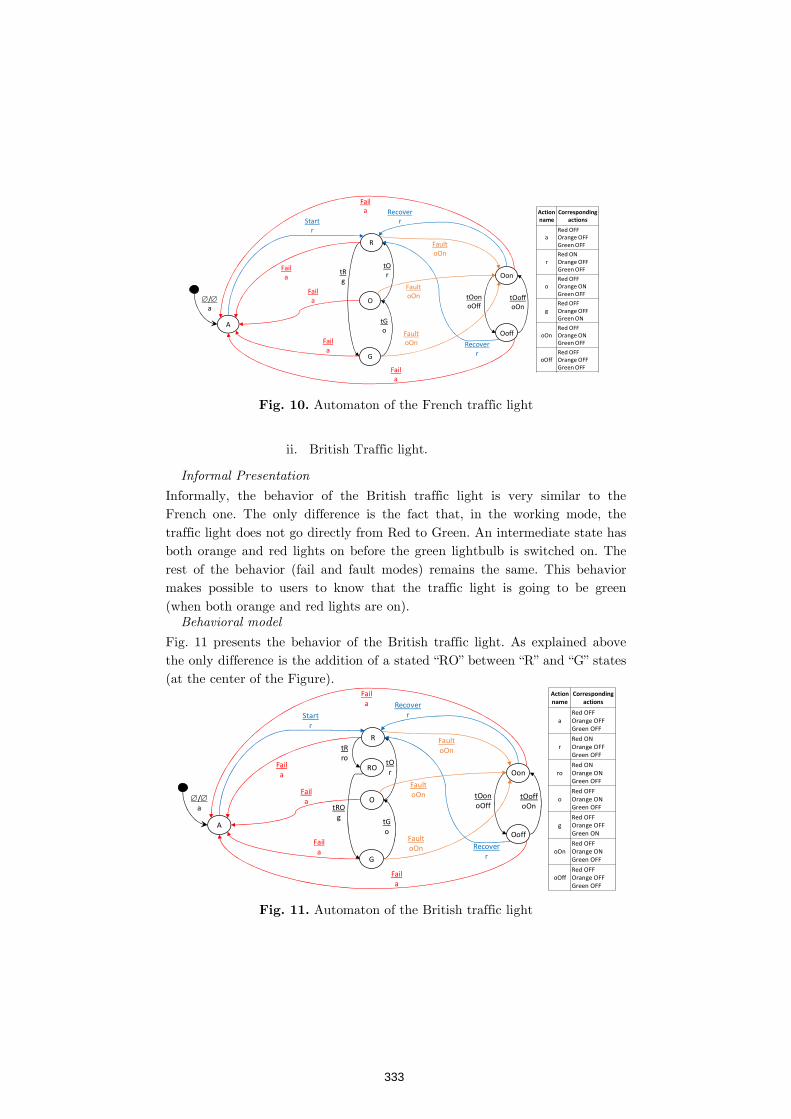
A
G
O
R
Ooff
OontRg
tOr
tGo
tOonoOff
FaultoOn
/a
Faila Recover
rStartr
tOoffoOn
FaultoOn
FaultoOn Recover
r
Faila
Faila
Faila
Faila
Actionname
Correspondingactions
aRed OFFOrange OFFGreen OFF
rRed ONOrange OFFGreen OFF
oRed OFF Orange ONGreen OFF
gRed OFFOrange OFFGreen ON
oOnRed OFFOrange ONGreen OFF
oOffRed OFFOrange OFFGreen OFF
Automaton of the French traffic light
ii. British Traffic light.
Informally, the behavior of the British traffic light is very similar to the French one. The only difference is the fact that, in the working mode, the traffic light does not go directly from Red to Green. An intermediate state has both orange and red lights on before the green lightbulb is switched on. The rest of the behavior (fail and fault modes) remains the same. This behavior makes possible to users to know that the traffic light is going to be green (when both orange and red lights are on).
Fig. 11 presents the behavior of the British traffic light. As explained above the only difference is the addition of a stated “RO” between “R” and “G” states (at the center of the Figure).
A
G
O
R
Ooff
Oon
tROg
tOr
tGo
tOonoOff
FaultoOn
/a
Faila Recover
rStartr
tOoffoOn
FaultoOn
FaultoOn Recover
r
Faila
Faila
Faila
Faila
Actionname
Correspondingactions
aRed OFFOrange OFFGreen OFF
rRed ONOrange OFFGreen OFF
roRed ONOrange ONGreen OFF
oRed OFF Orange ONGreen OFF
gRed OFFOrange OFFGreen ON
oOnRed OFFOrange ONGreen OFF
oOffRed OFFOrange OFFGreen OFF
RO
tRro
Automaton of the British traffic light
333

iii. Austrian Traffic light.
A
G
O
R
Ooff
Oon
tROg, n=0
tOr, n=0
tGoff/n<=4o, n=0
tOonoOff, n=0
/a, n=0
Startr, n=0
tOoffoOn, n=0
FaultoOn, n=0
Recoverr, n=0
Faila, n=0
Actionname
Correspondingactions
aRed OFFOrange OFFGreen OFF
rRed ONOrange OFFGreen OFF
roRed ONOrange ONGreen OFF
oRed OFF Orange ONGreen OFF
gRed OFFOrange OFFGreen ON
gOffRed OFFOrange OFFGreen OFF
gOnRed OFFOrange OFFGreen ON
oOnRed OFFOrange ONGreen OFF
oOffRed OFFOrange OFFGreen OFF
RO
tRro, n=0
tGgOff, n=0
tGongOff, n=n
Gon
GofftGoff/n>4gOn, n++
FaultoOn, n=0
FaultoOn, n=0
FaultoOn, n=0
FaultoOn, n=0
Recoverr, n=0
Faila, n=0
Faila, n=0
Faila, n=0
Faila, n=0
Faila, n=0
Faila, n=0
Automaton of the Austrian traffic light
Informally, the Austrian traffic is an extension of the British traffic light. The only difference is when the green light is on. In that state, the Austrian traffic light will present a blinking green status. The green light will blink 4 times before the green light goes definitively off and the orange light is switched on. This allows users to know that the green light will finish soon and that it is thus better to start to break (or to accelerate in order to avoid being stuck at the red light).
The model in presents one possible description of the behavior
presented above. The “G” state in previous models is now a set of three states, the original “G” state plus a set of two states “Goff” and “Gon” modelling the blinking in green light. A timer will alternatively set the automata from state “Goff” to “Gon” until this has been performed the adequate number of time. The number of blinking is stored in the variable (called register in ATNs) n that increases each time the green light is switched on (label n++). When this has been performed 4 times (precondition n>=4 on the label from state “Goff” to “O”, the orange light is switched on and the traffic light goes to the state “O”.
334
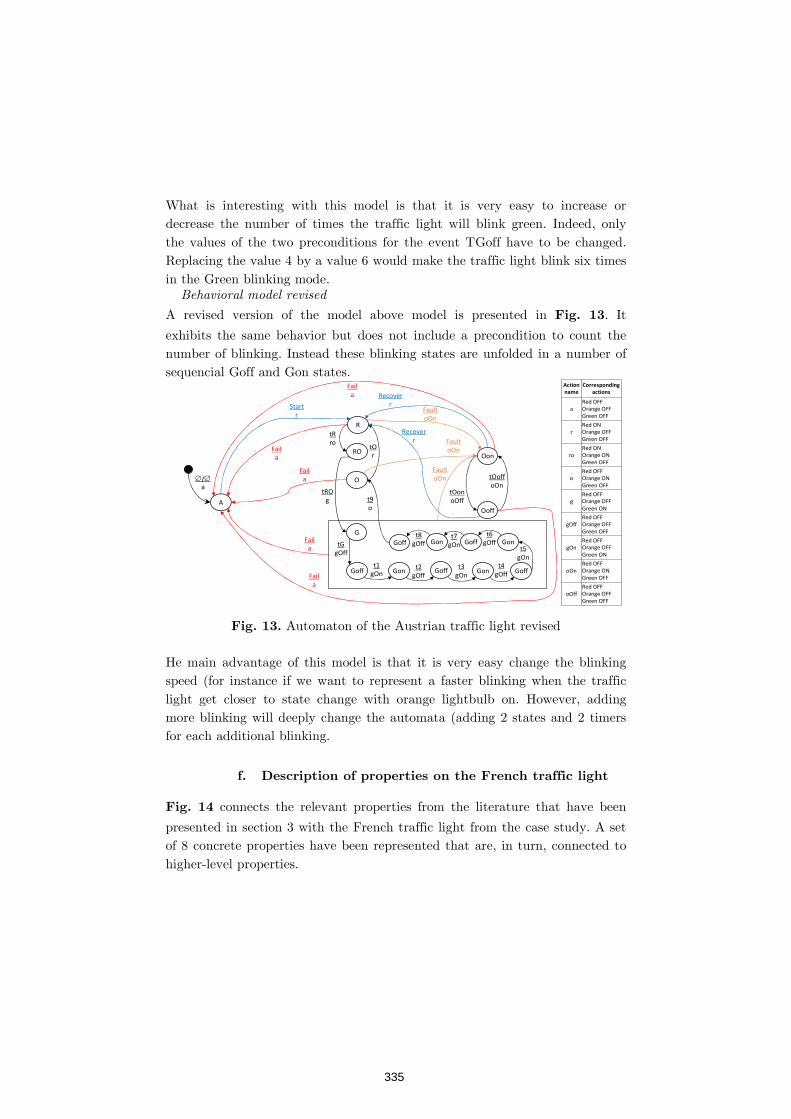
What is interesting with this model is that it is very easy to increase or decrease the number of times the traffic light will blink green. Indeed, only the values of the two preconditions for the event TGoff have to be changed. Replacing the value 4 by a value 6 would make the traffic light blink six times in the Green blinking mode.
A revised version of the model above model is presented in . It
exhibits the same behavior but does not include a precondition to count the number of blinking. Instead these blinking states are unfolded in a number of sequencial Goff and Gon states.
A
G
O
R
Ooff
Oon
tROg
tOr
t9o
tOonoOff
FaultoOn
/a
Faila Recover
rStartr
tOoffoOn
FaultoOn
FaultoOn
Recoverr
Faila
Faila
Faila
Faila
Actionname
Correspondingactions
aRed OFFOrange OFFGreen OFF
rRed ONOrange OFFGreen OFF
roRed ONOrange ONGreen OFF
oRed OFF Orange ONGreen OFF
gRed OFFOrange OFFGreen ON
gOffRed OFFOrange OFFGreen OFF
gOnRed OFFOrange OFFGreen ON
oOnRed OFFOrange ONGreen OFF
oOffRed OFFOrange OFFGreen OFF
RO
tRro
GonGofftGgOff
Goff
t7gOn
GonGoffGonGoff
Gon Gofft8
gOfft5
gOnt3
gOnt1
gOnt2
gOff
t6gOff
t4gOff
Automaton of the Austrian traffic light revised
He main advantage of this model is that it is very easy change the blinking speed (for instance if we want to represent a faster blinking when the traffic light get closer to state change with orange lightbulb on. However, adding more blinking will deeply change the automata (adding 2 states and 2 timers for each additional blinking.
connects the relevant properties from the literature that have been
presented in section 3 with the French traffic light from the case study. A set of 8 concrete properties have been represented that are, in turn, connected to higher-level properties.
335
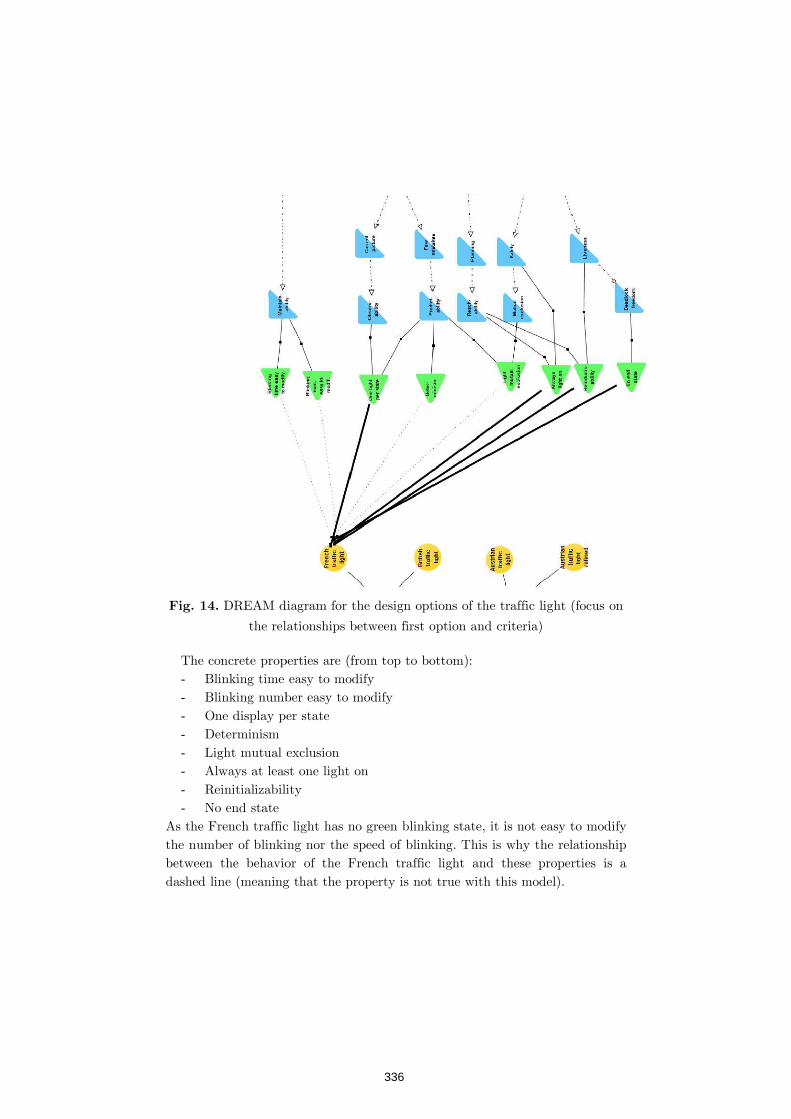
DREAM diagram for the design options of the traffic light (focus on
the relationships between first option and criteria)
The concrete propertie- Blinking time easy to modify - Blinking number easy to modify - One display per state - Determinism - Light mutual exclusion - Always at least one light on - Reinitializability - No end state
As the French traffic light has no green bthe number of blinking nor the speed of blinking. This is why the relationship between the behavior of the French traffic light and these properties is a dashed line (meaning that the property is not true with this m
DREAM diagram for the design options of the traffic light (focus on
the relationships between first option and criteria)
The concrete properties are (from top to bottom): Blinking time easy to modify Blinking number easy to modify One display per state
Light mutual exclusion Always at least one light on Reinitializability
As the French traffic light has no green blinking state, it is not easy to modify the number of blinking nor the speed of blinking. This is why the relationship between the behavior of the French traffic light and these properties is a dashed line (meaning that the property is not true with this model).
DREAM diagram for the design options of the traffic light (focus on
linking state, it is not easy to modify the number of blinking nor the speed of blinking. This is why the relationship between the behavior of the French traffic light and these properties is a
336
The property “One display per state” is true (bold line) as or each state in the model, there is either a switching light on or a switching light off when entering the state.
presents a summary of the properties that true or false for the four
behavioral model of traffic light presented above. It is interesting to note that the Austrian traffic light hold more properties than the other ones. This is because these traffic light have more states with different lights on and off than the other ones and to the fact that the first two properties are meaningful for them.
This position paper has presented a notation of the structuring of properties for computing systems in general but also adapted for interactive systems. This notation has been used for representing sets of properties from the literature in these domains.
We have used a set of behavioral models from a simple case study to connect an application to this hierarchy of properties. The notation can thus be used for comparing design alternatives as this has been demonstrated on the alternative traffic lights that are.deployed in real life
337

DREAM diagram for the design options of the traffic light
1 Alan J. Dix: Abstract, Generic Models of Interactive Systems. BCS HCI 1988, 63-77 (1988).
2 Gram, C. and Cockton, G. (eds): Internal Properties: The Software Developer’s Perspecpp. 53-89, Springer US (1996).
3 Gram, C. and Cockton, G. (eds.): External Properties: the User’s Perspective. In Design Principles for Interactive Software, pp. 25Springer US (1996).
DREAM diagram for the design options of the traffic light
Alan J. Dix: Abstract, Generic Models of Interactive Systems. BCS HCI 77 (1988).
Gram, C. and Cockton, G. (eds): Internal Properties: The Software Developer’s Perspective. In Design Principles for Interactive Software,
89, Springer US (1996). Gram, C. and Cockton, G. (eds.): External Properties: the User’s Perspective. In Design Principles for Interactive Software, pp. 25Springer US (1996).
DREAM diagram for the design options of the traffic light
Alan J. Dix: Abstract, Generic Models of Interactive Systems. BCS HCI
Gram, C. and Cockton, G. (eds): Internal Properties: The Software tive. In Design Principles for Interactive Software,
Gram, C. and Cockton, G. (eds.): External Properties: the User’s Perspective. In Design Principles for Interactive Software, pp. 25-51,
338
4 Hassenzahl M., Platz A., Burmester M., Lehner K. Hedonic and ergonomic quality aspects determine a software's appeal. CHI 2000: 201-208
5 International Standard Organization: “ISO 9241-11.” Ergonomic requirements for office work with visual display terminals (VDT) – Part 11 Guidance on Usability (1996).
6 Lacaze X., Palanque P., Barboni E., Bastide R., Navarre D.: From DREAM to Realitiy: Specificities of Interactive Systems Development with respect to Rationale Management. In: Rationale Management in Software Engineering. Allen H. Dutoit, Raymond McCall, Ivan Mistrik, Barbara Paech (Eds.), Springer Verlag, Springer-Verlag/Computer Science Editorial, p. 155-172 (2006)
7 Lamport, L.: Proving the correctness of multiprocess programs. IEEE transactions on software engineering (2), 125-143 (1977).
8 Laprie, J. and Randell, B. 2004. Basic Concepts and Taxonomy of Dependable and Secure Computing. IEEE Trans. Dependable Secur. Comput. 1, 1 (Jan. 2004), 11-33
9 MacLean, A., Young, R. M., Bellotti, V. M. E. and Moran, T. P.: Questions, Options, and Criteria: Elements of Design Space Analysis. Lawrence Erlbaum Associates, 6, pp. 201-250 (1991).
10 Manna, Z., Pnueli, A.: A Hierarchy of Temporal Properties. ACM Symposium on Principles of Distributed Computing1990: 377-410 (1990).
11 Martinie, C., Palanque, P., Winckler, M., Conversy, S. DREAMER: a Design Rationale Environment for Argumentation, Modeling and Engineering Requirements. In proceedings of the 28th ACM International Conference on Design of Communication (SIGDOC'2010), September 26-29, 2010, São Carlos, Brazil. ACM Press. pp. 73-80.
12 Masip, L., Martinie, C., Winckler, M., Palanque, P., Granollers, T. and Oliva, M.: A design process for exhibiting design choices and trade-offs in (potentially) conflicting user interface guidelines. In: Proc. of the 4th international conference on Human-Centered Software Engineering (HCSE'12). Springer-Verlag, Berlin, Heidelberg, 53-71 (2012).
13 Palanque P. & Lacaze X. DREAM-TEAM: A Tool and a Notation Supporting Exploration of Options and Traceability of Choices for Safety Critical Interactive Systems. In Proceedings of INTERACT 2007, Lecture Notes in Computer Science 4662, p. 234-250 Springer Verlag.
14 Petrie H. and Kheir O.: The relationship between accessibility and usability of websites. In: Proceedings of the SIGCHI Conference on
339

Human Factors in Computing Systems (CHI '07). ACM, New York, NY, USA, 397-406 (2007).
15 Pirker, M. and Bernhaupt, R.: Measuring user experience in the living room: results from an ethnographically oriented field study indicating major evaluation factors. EuroITV 2011, 79-82 (2011).
16 Pnueli A.: Applications of Temporal Logic to the Specification and Verification of Reactive Systems: A Survey of Current Trends. LNCS n° 224 p.510-584. Springer Verlag (1986).
17 Pnueli, A.: The Temporal Logic of Programs. 18th IEEE symposium on the Foundations of Computer Science, 46-57 (1977)
18 Sasse M. A., Karat C.-M., and Maxion R.: Designing and evaluating usable security and privacy technology. In: Proceedings of the 5th Symposium on Usable Privacy and Security (SOUPS '09). ACM, New York, NY, USA, Article 16, 1 page (2009).
19 Section 508: The Road to Accessibility. Available at: http://www.section508.gov/
20 Sistla, A. P.: On characterization of safety and liveness properties in temporal logic. In: Proceedings of the fourth annual ACM symposium on Principles of distributed computing, pp. 39-48, ACM (1985).
21 Toulmin, S.E. (1958) The Uses of Argument. Cambridge: Cambridge University Press.
22 Vanderdonckt, J.: Development milestones towards a tool for working with guidelines. Interacting with Computers 12(2), 81-118 (1999).
23 Whitacre JM, Bender A.: Degeneracy: a design principle for achieving robustness and evolvability. Journal of Theoretical Biology 263(1), 143-153 (2010).
24 Wood W.A. Transition network grammars for natural language analysis. Communications of the ACM 13, 10 (October 1970), 591-606
25 Yan J. and El Ahmad A. S.: Usability of CAPTCHAs or usability issues in CAPTCHA design. In Proceedings of the 4th symposium on Usable privacy and security (SOUPS '08). ACM, New York, NY, USA, 44-52 (2008).
340
David Navarre & Philippe Palanque
ICS-IRIT, Université Toulouse III, France
Assuring that operators will be able to perform their
activities even though the interactive system exhibits failures is one of the main issues to address when designing and implementing interactive systems in safety critical contexts. The zero-defect approaches (usually based on formal methods) aim at guaranteeing that the interactive system will be defect free. While this has been proven a good mean for detecting and removing faults and bugs at development time, natural faults (such as bit-flips due to radiations) are beyond their reach. One of the way to tackle this kind of issue is to propose redundant user interfaces offering multiple ways for the user to perform operations. When one of the interaction mean is failing, the operator can select another functional one. However, to avoid errors and increase learnability, it is important to ensure that the various user interfaces are “similar” at presentation and interaction levels. This position paper investigates this relation between dependability and similarity for fault-tolerant interactive systems.
UI properties, similarity, dependability, usability,
learnability.
Usability [5] and user experience [4] properties have received (and are still receiving) a lot of attention in the area of Human-Computer Interaction to the extent that they are perceived as the main properties to study and consider while designing interactive systems or while performing research activities in HCI.
Beyond this main stream of research and design, other more marginal approaches have tried to investigate the relationship between these properties
341
and other ones such as security [15], accessibility [16, 14], dependability [2] or privacy [5] (among many others).
Each of these specific domains bring specific issues in order to ensure that the associated properties have been taken into account. Taking into account these properties usually requires identifying and managing trade-off i.e. favoring one property above the other. For instance, adding an undo function to an interactive system will improve usability by make it more efficient for users to recover from errors. However, adding undo functionality to a system increases significantly the number of line of code and thus the likelihood of bugs. This position paper focuses on dependability related issues and how dealing with them might bring additional concerns for the design of user interfaces and their associated interaction techniques. However, despite this specific focus on one property, similar constraints would apply to other conflicting properties.
Assuring that operators will be able to perform their activities even though the interactive system exhibits failures is one of the main issues to address when designing and implementing interactive systems in safety critical contexts. Exploiting methods, techniques and tools from the dependable computing field [8] can ensure this even though they have not been designed and developed to meet the challenges of interactive systems [3]. Such approaches can be dived into two main categories:
- (usually based on formal methods [18])
that aim at guaranteeing that the interactive system will be defect free. While this has been proven a good mean for detecting and removing faults and bugs at development time, natural faults (such as bit-flips due to radiations) are beyond their reach.
- that promote the use of
(multiple versions of the system), (the various versions are
developed using different means, technologies and providers) and
(the various versions are integrated in the operational environment by independent means e.g. executed on different computers, using different communication means, …). Segregation ensures that a fault in one of the versions will not induce a fault in another version – usually called common point of failure.
One of the way to apply dependability principles to the user interface of the interactive system is to propose redundant user interfaces offering multiple ways for the user to perform operations. This can be displaying the same information on different screens or offering multiple input devices for triggering the same action. This can also be performed at the interaction
342
technique level as presented in [12] where mouse failures were mitigated by the use of “similar” configurations based on use of multiples keys on the keyboard. However, to avoid user errors (such as capture errors [14]) and increase , it is important to ensure that the various user
interfaces are “similar” at presentation and interaction levels. This concept of has already been used in the field of web engineering [7] but only
with a focus of designing new web systems being consistent with legacy non-web systems.
This position paper refines the concept of similarity and shows how this concept is relevant at different levels of the architecture of interactive systems. The paper then presents a set of examples from the avionics domain where dependability is a major concern and where development of fault-tolerant mechanisms is a requirement from standardization authorities such as DO 178C standard [1]. These examples present how similarity has been driving the design of multiple user interfaces even though they are as different as hardware only (interaction taking place through knobs and dials) and software mainly using WIMP interaction techniques. Conclusions and discussions for the workshop are presented in the last section.
In order to increase resilience to failures, fault-tolerance (i.e. guaranteeing the continuity of service), requires for the command
and control of a single system. This ends up with
serving the same purpose. If those interfaces are built using the
same processes and offer the same interaction techniques, it is possible that a single fault could trigger failures in both user interfaces. This could be the case for instance when using the idea of cloning the UI as proposed by [17]. In order to avoid such common points of failure the redundant user interfaces must ensure . Diversity can be guaranteed if the user interfaces have
been developed using diverse means such as different programming languages, different notations for describing their specification, executed on top of different operating systems, exploiting different output and input devices, … Such diversity is only efficient if the command and control system offers
343
confinement mechanisms avoiding cascading faults i.e. the failure of one user interface triggering a failure in the duplicated one.
Such fault tolerant basic principles raise design issues when
applied to user interfaces. Indeed, diversity requires the user interfaces to be very different in terms of structure, content and in terms of interaction techniques they offer, even though they must guarantee that they support the same tasks and the same goals of the operators [4]. Another aspect is that they must be located in different places in the system i.e. distributed as this is one of the most efficient way of ensuring confinement of faults.
In that context, distribution of user interface does not concern the presentation of complementary information in different contexts (as presented in [10]) but the presentation of redundant information in those contexts.
In terms of design, it is important to be able to assess that the various user interfaces make it possible for the operators to reach their goals (this would be called similarity in terms of ). Beyond that, it is also important
to be able to assess the relative complexity and diversity of these interfaces in order to be sure that operations will not be drastically degraded when a redundant user interface has to be used after a failure has occutred on another one. Studying the effective (in terms of ) at the level of
input and output is thus required even though different type of displays and different types of input devices have to be used. This goes beyond the study of similarity at effectiveness level, but both contribute to the usability of the systems.
The case study presents (in the area of aircraft cockpits) examples of redundant user interfaces. More precisely, we present in the context of the cockpit of the A380 (see Figure ) aircraft. In this new generation of large civil aircrafts, the cockpit presents display units (that can be considered here as computers screens) of which some of them are offering interaction via a mouse and a keyboard by means of an integrated input device called KCCU (Keyboard Cursor Control Unit). Applications are allocated to the various display unit (DU).
344

In the A380, two redundant ways of using the autopilot are offered to the pilot in order to change the heading of the aircraft. One is performed using the electronic user interface of the Flight Control Unit (FCU on top of Figure )while the other one exploits the graphical user interface of the Flight Control Unit Backup interface and the KCCU (bottom of Figure ).
Figure 2. Heading selection.
Figure 1. Two possible means to control flight heading within the A380 interactive cockpit,
one using the FCU and the other using the FCU Software application and the KCCU
345
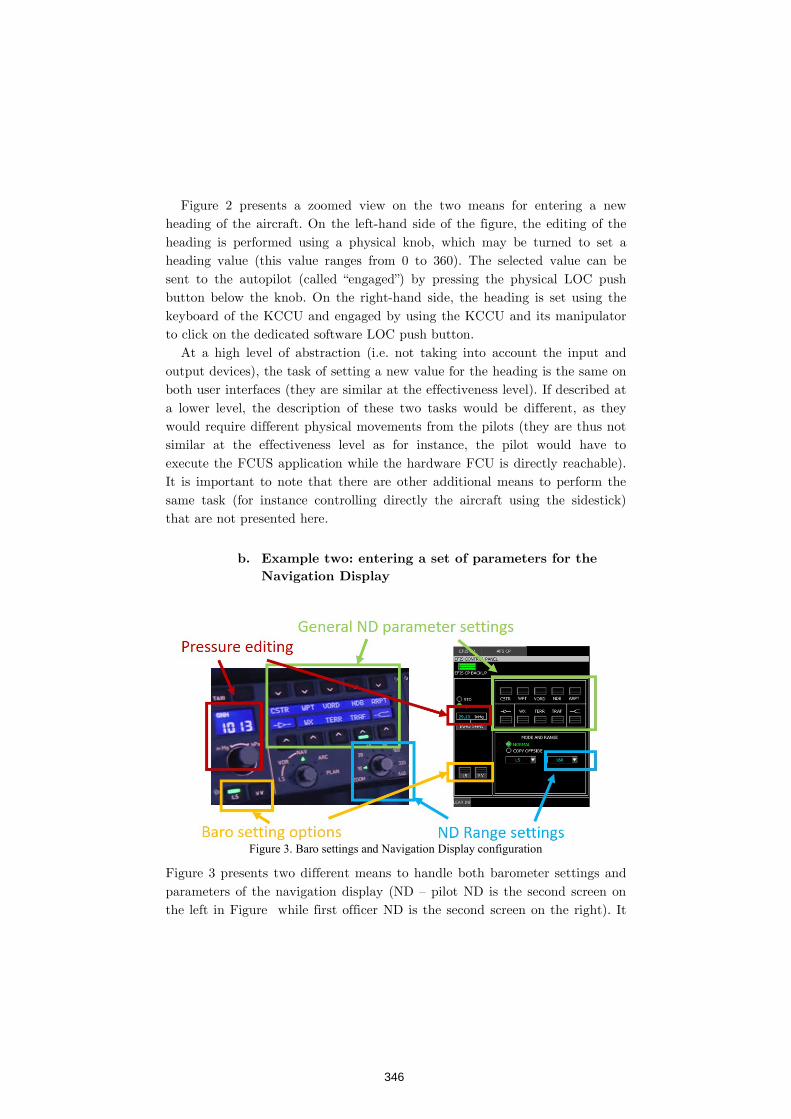
Figure 2 presents a zoomed view on the two means for entering a new heading of the aircraft. On the left-hand side of the figure, the editing of the heading is performed using a physical knob, which may be turned to set a heading value (this value ranges from 0 to 360). The selected value can be sent to the autopilot (called “engaged”) by pressing the physical LOC push button below the knob. On the right-hand side, the heading is set using the keyboard of the KCCU and engaged by using the KCCU and its manipulator to click on the dedicated software LOC push button.
At a high level of abstraction (i.e. not taking into account the input and output devices), the task of setting a new value for the heading is the same on both user interfaces (they are similar at the effectiveness level). If described at a lower level, the description of these two tasks would be different, as they would require different physical movements from the pilots (they are thus not similar at the effectiveness level as for instance, the pilot would have to execute the FCUS application while the hardware FCU is directly reachable). It is important to note that there are other additional means to perform the same task (for instance controlling directly the aircraft using the sidestick) that are not presented here.
Figure 3 presents two different means to handle both barometer settings and parameters of the navigation display (ND – pilot ND is the second screen on the left in Figure while first officer ND is the second screen on the right). It
Figure 3. Baro settings and Navigation Display configuration
346
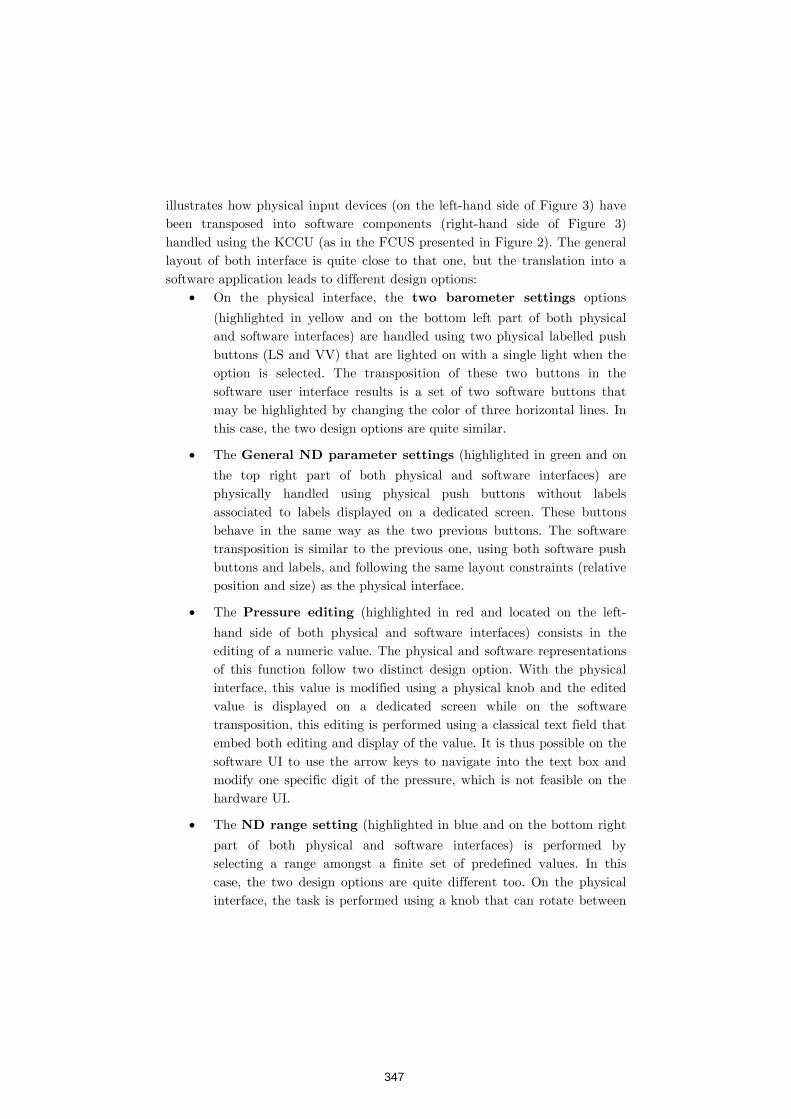
illustrates how physical input devices (on the left-hand side of Figure 3) have been transposed into software components (right-hand side of Figure 3) handled using the KCCU (as in the FCUS presented in Figure 2). The general layout of both interface is quite close to that one, but the translation into a software application leads to different design options:
On the physical interface, the options
(highlighted in yellow and on the bottom left part of both physical and software interfaces) are handled using two physical labelled push buttons (LS and VV) that are lighted on with a single light when the option is selected. The transposition of these two buttons in the software user interface results is a set of two software buttons that may be highlighted by changing the color of three horizontal lines. In this case, the two design options are quite similar.
The (highlighted in green and on
the top right part of both physical and software interfaces) are physically handled using physical push buttons without labels associated to labels displayed on a dedicated screen. These buttons behave in the same way as the two previous buttons. The software transposition is similar to the previous one, using both software push buttons and labels, and following the same layout constraints (relative position and size) as the physical interface.
The (highlighted in red and located on the left-
hand side of both physical and software interfaces) consists in the editing of a numeric value. The physical and software representations of this function follow two distinct design option. With the physical interface, this value is modified using a physical knob and the edited value is displayed on a dedicated screen while on the software transposition, this editing is performed using a classical text field that embed both editing and display of the value. It is thus possible on the software UI to use the arrow keys to navigate into the text box and modify one specific digit of the pressure, which is not feasible on the hardware UI.
The (highlighted in blue and on the bottom right
part of both physical and software interfaces) is performed by selecting a range amongst a finite set of predefined values. In this case, the two design options are quite different too. On the physical interface, the task is performed using a knob that can rotate between
347
the set of values, these values being physically written around the knob (making it visible at any time). The software translation of this interface is made up using a drop down combo box that embed both the display and selection of the value. In this case, the selectable values are only displayed while using the software component.
Figure 4 presents two different design of the gyroscope instrument that aims at providing the pilot with information about the position of the aircraft relatively to the horizon (both pitch and roll). At the bottom right-hand side of Figure 4 the cockpit presents the physical analog display of these values. This device is also called the artificial horizon as the information it displays is similar to the view the pilots have when they look outside through the windshield. The software transposition of this instrument (on the left-hand side of Figure 4 – called Primary Flight Display) embeds several other functions such as an altimeter or a speed controller. The graphical layout of the software UI is clearly inspired by the physical one which was, in the early days of aviation only a physical ball emerged in a container filled with liquid.
Figure 4. Physical and software representation of the aircraft gyroscope.
This position paper has presented the similarity property for interactive systems offering redundant ways for the users to enter and perceive information. In order to ensure diversity and segregation (that are required for building dependable interactive systems) the similarity property may be violated. We have shown on the first example that the hardware and the software user interface are similar at the effectiveness level but distinct at interaction level. The following examples have shown bigger gaps in terms of similarity as the use of computing systems and graphical interfaces provides designers and developers with more advanced communication and interaction
348
means. Digital devices are thus more informative and more efficient than the hardware ones. However, they are also less reliable than hardware systems and must not be used if failures are detected [2]. This means that the design and the evaluation of the training program is a complex and expensive activity requiring tools and technique to assess (and explain to trainees) gaps in similarity.
1 DO-178C / ED-12C, Software Considerations in Airborne Systems and Equipment Certification, published by RTCA and EUROCAE, 2012.
2 Fayollas C., Martinie C., Palanque P., Deleris Y., Fabre J-C., Navarre D. An Approach for Assessing the Impact of Dependability on Usability: Application to Interactive Cockpits. Tenth European Dependable Computing Conference (EDCC 2014), IEEE Computer Society: 198-209
3 Fayollas C., Fabre J-C., Palanque P., Cronel M., Navarre D., Deleris Y.A Software-Implemented Fault-Tolerance Approach for Control and Display Systems in Avionics. 20th IEEE Pacific Rim International Symposium on Dependable Computing, PRDC 2014, 2014. IEEE Computer Society 2014: 21-30
4 Fayollas C., Martinie C., Navarre D., Palanque P., and Fahssi R. Fault-Tolerant User Interfaces for Critical Systems: Duplication, Redundancy and Diversity as New Dimensions of Distributed User Interfaces.
(DUI '14),
ACM DL, 27-30. 5 Gerber P., Volkamer M., and Renaud K. 2015. Usability versus privacy instead of usable privacy: Google's balancing act between usability and privacy. 45, 1 (February 2015), 16-21.
6 Hassenzahl M., Platz A., Burmester M., Lehner K. Hedonic and ergonomic quality aspects determine a software's appeal. CHI 2000: 201-208
7 Heil S., Bakaev M., Gaedke M.Measuring and Ensuring Similarity of User Interfaces: The Impact of Web Layout.Web Information Systems Engineering - WISE 2016 - 17th International Conference, Shanghai, China, LNCS 10041, 2016: 252-260
8 International Standard Organization: “ISO 9241-11.” Ergonomic requirements for office work with visual display terminals (VDT) – Part 11 Guidance on Usability (1996).
349
9 Laprie, J. and Randell, B. 2004. Basic Concepts and Taxonomy of Dependable and Secure Computing. IEEE Trans. Dependable Secur. Comput. 1, 1 (Jan. 2004), 11-33
10 Martinie C., Navarre D., Palanque P. A multi-formalism approach for model-based dynamic distribution of user interfaces of critical interactive systems. Int. J. Hum.-Comput. Stud. 72(1): 77-99 (2014).
11 Martinie C., Palanque P., Navarre D., Winckler M., Poupart E.Model-based training: an approach supporting operability of critical interactive systems. EICS 2011, ACM DL, 53-62
12 Navarre D., Palanque P., Basnyat S. A Formal Approach for User Interaction Reconfiguration of Safety Critical Interactive Systems. SAFECOMP 2008: 373-386
13 Petrie H. and Kheir O.: The relationship between accessibility and usability of websites. SIGCHI Conference on Human Factors in Computing Systems (CHI '07). ACM, 397-406 (2007).
14 Reason J., “Human Error”, 1990, Cambridge University Press. 15 Sasse M. A., Karat C.-M., and Maxion R.: Designing and evaluating usable security and privacy technology. 5th Symposium on Usable Privacy and Security (SOUPS '09). ACM, (2009).
16 Section 508: The Road to Accessibility. Available at: http://www.section508.gov/
17 Villanueva,P. G., Tesoriero, R., Gallud, J. A. 2013. Distributing web components in a display ecosystem using Proxywork. 27th BCS HCI Conference (BCS-HCI '13), 2013, British Computer Society.
18 Weyers B., Bowen J., Dix A., Palanque P. The Handbook of Formal Methods in Human-Computer Interaction. Springer International Publishing 2017, ISBN 978-3-319-51837-4
350
Cristian Bogdan
School of Computer Science and Communication (CSC), KTH Royal Institute of Technology (KTH), 10044 Stockholm, Sweden
I examine the potential of describing interactive systems in a
declarative manner and with concepts familiar to developers and designers. Declarative interaction descriptions often enable evolutionary prototyping processes. I reflect upon a case of such declarative interaction, detail on the new design and development processes that can emerge, and their benefits for human-centred system design. I also raise a few challenges for future research in this area.
prototyping, declarative, user interface, evolutionary,
conflict
Attempts were made to describe interactive systems declaratively for several decades, for example Model-Based UI Development (MBUID, e.g. [16]). Once a declarative description of an interactive system is available, there are several advantages: the system can be in regard to its usability or safety, or
human error (e.g. [7]), and it can be , which includes the
generation of code towards the running interactive product. These advantages stem from declarative models being relatively easy to process by computing systems, unlike procedural code.
MBUID approaches are often highly theoretical, aiming to drive the description of the interactive system from a very abstract model (e.g. the Tasks and Concepts level [5]), which is hard to understand by designers, users or even developers. Furthermore, MBUID has very little support for user interface [1,15]. When a user interface is generated, it is hard for
users and designers to adjust it and iterate with it for improvement according to their needs.
351
In this paper I aim to address the issue of finding
, so that they are understandable for developers and end-users.
Another objective is to , where developers,
users, or customers are free to iterate with the interactive prototype. This work is inspired from a large, long-term case [2,3] whereby users, designers and voluntary developers were able to develop, maintain and extend predominantly declarative interactive systems for long periods of time.
If we take a [14] approach to conceptualizing an
interactive system, important parts of the are declarative in current
practice, at least in regard to describing how the data is structured, and what methods are available to process it. While the methods are most frequently implemented as procedural code, the declarative part of the model is often enough for describing the user interface in the other conceptual modules (
and ). Similarly, templates are often described in a declarative
manner, in languages such as HTML or XML. In the quest to find fully or predominantly declarative representations of interactive systems, it is therefore the where the procedural code still dominates. Since
Controllers describe the “feel” of the user interface, the interaction itself, I use to refer this quest as “ ”.
Furthermore, it is important to note that once a declarative controller exists, a fully testable system can be obtained from the declarative interactive system. That is, if an online (running) prototype has been made in a declarative manner, with an approach that allows a powerful declarative description of interaction, that prototype can be iterated into the running product. Therefore, declarative interaction will often lead to
[1]
The top of Figure 1 illustrates the traditional process of designing and developing interactive systems (often in a user centered manner). A few (cheap) paper prototypes are produced, and based on designer judgment and user feedback, a few ideas continue to the online prototyping phase. After a number of formative iterations, one of the online prototypes is delivered (“Online Delivered” in the figure) for the developers to implement. As already introduced, the Model-View-Controller [14] approach is often used, whereby the non-interactive Model (backend, business rules) is manipulated via a user interface programmed in the target technology. The interactive behavior,
352
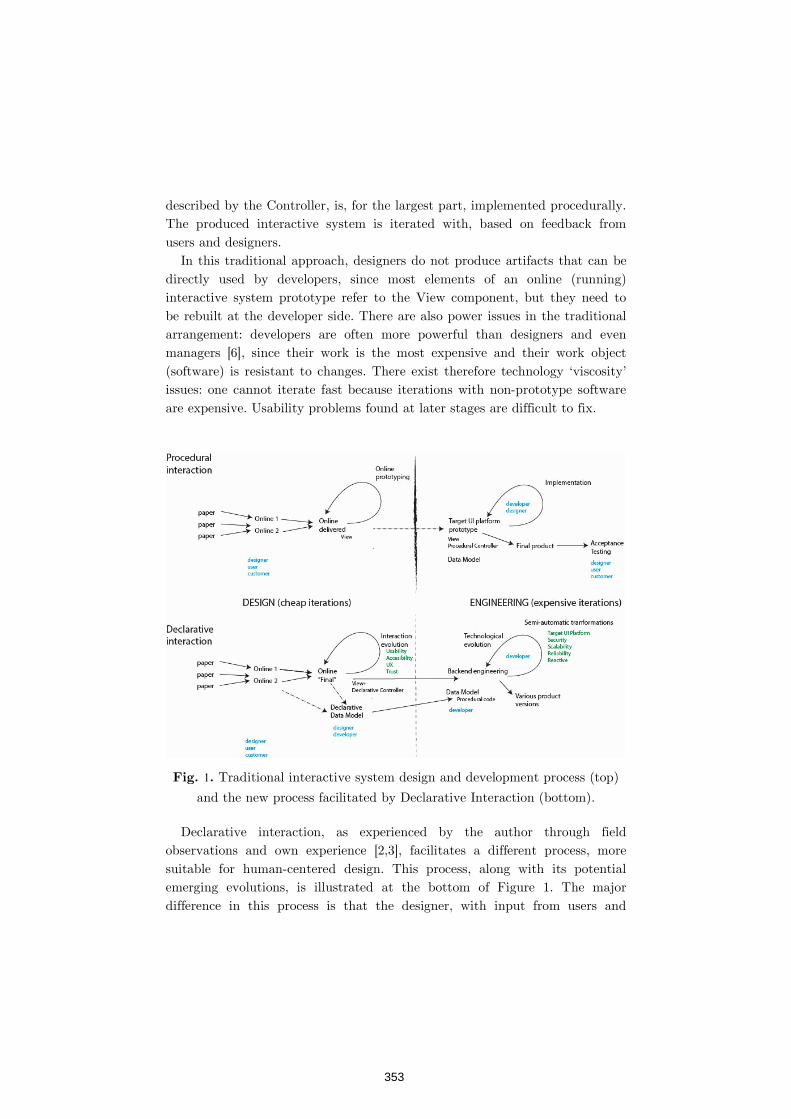
described by the Controller, is, for the largest part, implemented procedurally. The produced interactive system is iterated with, based on feedback from users and designers.
In this traditional approach, designers do not produce artifacts that can be directly used by developers, since most elements of an online (running) interactive system prototype refer to the View component, but they need to be rebuilt at the developer side. There are also power issues in the traditional arrangement: developers are often more powerful than designers and even managers [6], since their work is the most expensive and their work object (software) is resistant to changes. There exist therefore technology ‘viscosity’ issues: one cannot iterate fast because iterations with non-prototype software are expensive. Usability problems found at later stages are difficult to fix.
1 Traditional interactive system design and development process (top)
and the new process facilitated by Declarative Interaction (bottom).
Declarative interaction, as experienced by the author through field observations and own experience [2,3], facilitates a different process, more suitable for human-centered design. This process, along with its potential emerging evolutions, is illustrated at the bottom of Figure 1. The major difference in this process is that the designer, with input from users and
353

customers, can work not just on the View, but also on the declarative controller, and on the declarative parts of the model. The developer has a role in this process, by helping in structuring a convenient data Model, and possibly also to help express more complex interaction. However, the designer drives the iterations, changing the UI look and feel (View and Controller) while the developer only helps when relevant aspects of the data Model need to be adjusted. Early on, or in more advanced phases, online prototypes can be directly made using the target UI technology.
Once a final UI is decided upon, engineers can take over the prototype and optimize it for Computer Science concerns (Security, Reliability, Scalability) using semi-automatic tools. Automatic processing (similar to model transformation) and analysis are possible thanks to the declarative nature of the interactive system representation. Most of the design side uses declarative representations, while in the engineering side, procedural code can be added. It is interesting to note that in this case developers work mostly on the system backend, which is why their work is termed “backend engineering”. We have demonstrated an early version of this development cycle [3] and refined it in [9,11,12,13]. We have also shown a combination with MBUID approaches in [10].
Design is a balancing act, a suite of tradeoffs that are made along the way between the needs and desires of various users and the institutions they may represent. Therefore conflicting UI design concerns are bound to occur. One way to address such conflicting concerns is the Participatory Design approach [8] of keeping the users involved at all stages of design, therefor ensuring that various conflicting qualities that users, designers and developers require are balanced in an acceptable way.
Declarative Interaction supports the resolution of UI requirement conflicts by supporting Participatory Design through (1) facilitating equal-footing communication between users, designers and developers and (2) encouraging iterations until the late stages of the product design and implementation, thanks to its Evolutionary Prototyping nature.
Even in situations where Participatory Design is not suitable, the balanced power relation facilitated by Declarative Interaction between designers and developers is likely to achieve, through iteration, a good balance between the
354
interactive system properties championed by designers and those guarded by developers. Especially the Interaction Evolution (Figure 1 left) iterations are also accessible to managers, letting them bring their own concerns. Therefore,
and the are the general process qualities that allow
Declarative Interaction to support the resolution of conflicting UI design concerns.
A European Non-Governmental Organization (NGO) with almost 100 locations developed their own systems for over 20 years: member database, document archives, summer course participant selection and management, virtual job fair, etc. All systems are tailor-made for the NGO rules and needs, ensuring greater user understanding and usability compared to general-purpose systems, if such systems are available at all. Users of such systems are 1000s of members and students of participant universities, creating 10000s of new data objects per year.
A major role in this success is played by the Makumba framework [2,3]. It was designed with learning in mind, so that members have to learn two small declarative programming languages (a SQL variant for data retrieval, and HTML for data formatting). More advanced members can continue their learning path and “career” within the NGO by using Java for more complex application logic. Furthermore, a few production Makumba systems exist that use declarative SQL code for most of their application logic, including authentication and authorization, leaving just a few functions to be implemented in procedural Java code.
Reflecting on this long process, I believe that much of the success of Makumba in NGOs is due to the declarative nature of its languages. Declarative code is often small: if a declarative language suitable for a specific programming problem exists, the code will typically be more compact than the procedural correspondent. For an NGO this means less code to track and maintain. Declarative code is often intuitive to read, reducing the initial threshold that junior NGO volunteers have to face before they can contribute with code of their own. Once one makes the code work during development, declarative code is reliable to run, reducing the NGO maintenance costs. Because declarative code can be analyzed and transformed into other representations or technologies, it reduces technology lock-in for the NGO.
Another Makumba success factor stems from its facilitation of evolutionary prototyping, being therefore an early incarnation of Declarative Interaction.
355
Systems are typically prototyped in HTML or directly in Makumba first, and are iteratively refined to become the production system. Systems are often prototyped starting from the user interface (and much of the system code is the user interface), which is intuitive and motivating for the developers, as they can work directly with the artifact that their fellow NGO members will use.
The first generation of Makumba technologies, based on Java Server Pages (JSP) and pre-Web 2.0 user interaction, is by now outdated. Kis [11,12,13] has explored the possibilities of combining data from a multitude of APIs into one interactive application, rather than data from a single relational database, thus using data as a “prototyping material”. This has resulted in Endev [12], a Javascript framework that is, however, not production-ready. One major reason is that, unlike Makumba, Endev does not optimize the number of queries sent to its data sources (a very complex problem when there are multiple data sources).
The current approach in modernizing Makumba recognizes that most organizations have one single main data source, and that the Makumba approach of binding data to elements of a HTML user interface has been taken by many other technologies such as AngularJS14. However, Angular still requires a lot of procedural Javascript code to be written, which breaks the principle of declarative development. Therefore, the current approach is to develop ‘plugins’ for Angular and other suitable technologies to replace the current Makumba JSP layer, while keeping the declarative engines of Makumba: optimal SQL query combination, SQL query inlining for code re-use, authentication and authorization, etc. This approach is well under way and since Angular does much of the data binding that Makumba-JSP did, the resulting Angular ‘plugin’ is quite small and easy to maintain.
While the problem of Declarative Interaction has not yet been fully explored with Makumba, a number of experimental prototypes exist that allow fully declarative description of complex interaction such as Drag and drop, or simpler interaction such as form fill-in with UI update as the user types. One of the next steps considered is to describe declaratively various UI design pattern libraries (e.g. [4]) or other exemplary systems. But before this exploration ends, a few potential implications of Declarative Interaction can be discussed.
14 https://angularjs.org
356
There are many ways to achieve declarative interaction, the Makumba approach (using declarative queries to connect the UI to the data model) is just one. is thus one
important future challenge. Is any user interaction possible to describe declaratively based on simple
abstractions, familiar to designers and users?
is probably the biggest challenge faces by
researchers in the field. While the impact on the human centered software engineering processes has
already been considered, is another
important challenge. This includes
but also to
1 Beaudouin-Lafon, M. and Mackay, W., 2002. Prototyping Tools and Techniques. The Human Computer Interaction Handbook. J.A. Jacko and A. Sears, eds., p. 1006–1031.
2 Bogdan, C., 2003. IT Design for Amateur Communities. PhD dissertation. KTH Royal Institute of Technology
3 Bogdan, C. and Mayer, R., 2009. Makumba: the Role of Technology or the Sustainability of Amateur Programming Practice and Community. Proceedings of the 4th international conference on Communities and technologies (C&T). New York, New York, USA: ACM Press, p. 205–214.
Boxes and Arrows, Implementing a Pattern Library in the Real World: A Yahoo! Case Study, http://boxesandarrows.com/implementing-a-pattern-library-in-the-real-world-a-yahoo-case-study, accessed August 2017
5 Calvary, G., Coutaz, J., Thevenin, D., Limbourg, Q., Bouillon, L., and Vanderdonckt, J., 2003. A Unifying Reference Framework for multi-target user interfaces. Interacting with Computers, Vol. 15, No. 3, p. 289–308
6 Cooper, A. 1999. The inmates are running the asylum, Sams Publishing 7 Fahssi, R., Célia Martinie, Philippe A. Palanque, 2015. Enhanced Task
Modelling for Systematic Identification and Explicit Representation of Human Errors. INTERACT 2015 192-212
357
8 Greenbaum, J. & Kyng, M. (Eds.) Design at Work, pp. 169 – 196. Hillsdale, New Jersey: Laurence Erlbaum Associates.
9 Kis, F. and Bogdan, C., 2013. Lightweight Low-Level Query-Centric User Interface Modeling. 2013 46th Hawaii International Conference on System Sciences (HICSS). Washington, DC, USA: IEEE, p. 440–449.
10 Kis, F., Bogdan, C., Kaindl, H., and Falb, J., 2014. Towards Fully Declarative High-Level Interaction Models: An Approach Facilitating Automated GUI Generation. 2014 47th Hawaii International Conference on System Sciences (HICSS). Washington, DC, USA: IEEE, p. 412–421.
11 Kis, F. and Bogdan, C., 2015. Generating Interactive Prototypes from Query Annotated Discourse Models. I-Com. Journal of Interactive Media, Vol. 14, No. 3, p. 205–219.
12 Kis, F. and Bogdan, C., 2016. Declarative Setup-free Web Application Prototyping Combining Local and Cloud Datastores. 2016 IEEE Symposium on Visual Languages and Human-Centric Computing (VL/HCC). IEEE Computer Society.
13 Kis, F. 2016. Prototyping with data. Opportunistic Development of Data-Driven Interactive Applications. PhD thesis. KTH Royal Institute of Technology 2016
14 Krasner, G.E. and Pope, S.T., 1988. A description of the model-view-controller user interface paradigm in the smalltalk-80 system. Journal of object oriented programming, Vol. 1, No. 3, p. 26–49.
15 Lim, Y.-K., Stolterman, E., and Tenenberg, J., 2008. The anatomy of prototypes. ACM Transactions on Computer-Human Interaction, Vol. 15, No. 2, p. 1–27.
16 Patternó, F., 2000. Model-based design and evaluation of interactive applications, Springer-Verlag
358
Kati Kuusinen
University of Southern Denmark,
Campusvej 55, 5230 Odense M, Denmark
Agile software development aims at early and
continuous value delivery. Yet the concept of value in agile development is underdefined and the meaning can be different for different stakeholders. Successful value delivery requires continuous collaboration with relevant stakeholders which is a main challenge in agile development. In fact, most software project failures are caused by poor communication and misunderstandings between stakeholders. This position paper discusses the meaning of value for business owners, customers, users, software developers, and user experience specialists and works towards an understanding on how to align and articulate value in a software project.
Software design tradeoffs, Agile software
development, Collaboration in software development, Value creation, Requirements engineering
Value creation is a continuous process throughout the development life cycle in agile software development and it can be described as follows. User or stakeholder needs are frequently written in the user story format: “
” which captures both the
requirement and its value. To create user stories the development team needs first to identify the relevant stakeholder roles, dig out what those roles value and what kind of value proposition would then help the team in trying to make the role happier or solve their problem. Then the team needs to chunk
359
down those values and needs to the size and format of a user story. Finally, as the last step before implementation, the created stories are to be ordered based on their business value which might or might not be in line with the original stakeholder value. After this the team implements the user story into working software and gets feedback from the stakeholders for improvement. The development team then grooms and reorders the stories after each implementation increment when they have learned more about the stakeholders and their needs. The process is repeated until the customer is satisfied or the project otherwise comes to an end.
The described process is not straightforward and there are no established guidelines or tools to support stakeholder value identification and prioritization. In fact, it often remains unspoken in teams what value means in the project context [3]. Business value frequently represents only the most important customers’ point of view and it can differ from the user value [19]. In addition to business value, the required developer effort (cost of implementation) has an impact on the order of the user stories. Thus, from the beginning of the project, there are at least four competing forces – the voice of the business owner, customer, user and developer - which might all base on conflicting values.
There are no established means to balance between these values although several approaches have been presented. Decisions are habitually made based on the business owners’, product owners’ or customers’ gut feeling. On the other hand, as the process is iterative and incremental, decisions can and should be made as late as possible with the then understanding throughout the software lifecycle and improved later when further information is available. Nevertheless, the concept of value remains often vague as the project proceeds and a shared idea of value between different stakeholders is rarely formed [3].
Thus, in a software project, several people can work together towards undefined value goal which each of them might understand in their own way from their own perspective. The big picture of the project then becomes blurred from the beginning and does not improve towards the end either [22]. Moreover, working with different stakeholders means working with people from various disciplines and backgrounds, which inherently makes communication more difficult as the used concepts and foci are different.
This position paper discusses the values and needs of different stakeholder roles and the assumptions these roles habitually have on other roles. Furthermore, it discusses how to overcome value conflicts to develop highly valuable software. Section 2 discusses the concept of value in software
360
engineering. Section 3 presents the five focal roles (business owner, customer, developer user, and UX specialist) and their needs and values. Finally, section 4 presents conclusions over this emerging work.
This section discusses the concept of value in agile software engineering literature.
Graeber [6] defines value from three perspectives; in
and sense as the conception of what is ,
as a for certain product or service benefits
and as a . The three perspectives are relevant to software
development as well. Software engineering aims at enabling the creation of complex computer-based systems which will meet the needs of users in a timely manner with quality [24]. Thus, a software system is both “
” created during the development and “
” [24]. In
general, software developers traditionally have their focus on the programs, documents and data whereas user experience specialists focus on ensuring that the resultant information will make the user’s world better. Thus, user experience specialists’ task is to understand the sociological side of value whereas the business owner brings in the economic perspective. As the software project proceeds, each software increment should bring in a meaningful difference (growth) in value.
The approach where distinct business and user experience specialists bring social and economic value to the project works in traditional development where developers implement predefined requirements. However, developers are in a central role in agile and the development team should be able to make decisions that foster business, customer and user value as well as technical quality and rapid development. Multidisciplinarity and cross-functional teams help in rapid decision-making on issues related to different value types [14]. The developer must learn from other disciplines to think about economic and societal value and the other internal roles should understand something about the technical side to make the work effortless and improve the communication [13, 14]. Also, it is beneficial for the customer to understand about the economic, technical and user side of the software project to be able to make informed decisions about the scope of the project, where to have users involved and so forth [19].
361
In software engineering, value is frequently understood as usefulness, utility, and importance or as the relative worth or monetary worth of something [3]. These types of value often necessitate that external stakeholders outside the development team (customer, user etc.) assign the value. Thus, the team must learn what the external stakeholders such as customers and users value during a development project. However, estimating, calculating, and measuring business value of software delivery is abstruse [25]. Software is ubiquitous and increasing in size and complexity. For these reasons, software development decisions have a crucial impact on the value delivery and better ways to address the value proposition are needed.
This section presents value from different stakeholder perspectives. The views mostly reflect on our own previous research but are also built on other literature. The roles are according to business to business development where a company orders software from another company typically for its own internal users who will use the software in their work.
is the person in the company developing the
software whose main role is to ensure the economic revenue for the developing company but also to guarantee the customer satisfaction. Business or product owner’s view is on the business and monetary value of the project for the developing company; how to maximize the return on investment for the shareholders. The secondary goal is to keep the customer happy and to build the relationship with the customer. Thus, the product owner might, for example, drive the development of features that they know are not useful for the user but which the customer wants for some reason [17, 19]. Sure, some business owners might want to explain why such a feature would be a bad idea and suggest a more feasible solution for example, to improve the long-term customer relationship and trust between the partners. For business owner, it is good to keep in mind that customer and user values are distinct. Customer does not necessarily know what the user values although they might say so [16, 17, 19]. Moreover, assessing the impact of a business decision on user experience can be beneficial in cases where user value differs from customer value [17].
is a person from the purchasing company who often manages
the requirements engineering and scoping of the project. Thus, a business customer values a solution for their problem. Typically, it includes a more
362
efficient, robust, safer, faster, automated or cheaper approach compared to the current one. It can also be a novel approach or field for the customer. Software projects are typically mainly negotiated between the customer and the business or product owner roles. Customer usually selects the way of working in the project on a high level. They decide whether users are involved, whether the project is agile and so forth. It is crucial that the person who represents the customer has the required power of decision to enable fast and agile decision-making throughout the project. It is also critical that the customer understands the importance of user involvement and does not think they can decide for the user only because they understand the business process behind the software being purchased [19].
designs and implements the software. They value the
work itself [2, 4]. Their goal typically is to build working, technically sophisticated software. Many developers are motivated by the thought that someone will use the software and that they are helping other people whereas others are mainly driven by being able to solve challenging technical problems [21]. Feeling good about the work, being in control of the development tasks, sense of competence, and being able to work with the development environment without effort are associated with developers’ motivation and good developer experience [15, 18]. A pitfall for a developer is to love too much the technical side of the software and forget about the user or vice versa [17].
is the person who interacts with the system [11]. Hassenzahl [8] sees
user as a person with multiple hierarchical goals they are to achieve by interacting with a system. Users have instrumental goals, so called “ ”,
such as making a phone call. These instrumental goals can be satisfied with traditional usability properties such as ease of use, efficiency and usefulness. Hedonic goals or “ ” on the other hand are supported by systems
hedonic quality, the perceived ability to self-expression, competency, autonomy, stimulation, relatedness and popularity. In professional life, the system’s ability to motivate and create sense of professionalism are indicators of hedonic quality [20].
is responsible for the social value of the
software under development. Their main goal is to satisfy users’ needs and design for good user experience. UX specialist is typically the one who ensures that users’ voice is heard from the beginning and throughout the project. UX specialist diffuses the user value from what the user is saying or showing. UX specialist is especially responsible of the hedonic quality of the software since
363
the users cannot express that by themselves. Moreover, understanding and designing for the hedonic value is difficult without deep understanding of UX [20]. Thus, the other stakeholder roles are usually not able to do it although they can successfully learn many other UX tasks [13, 14, 20].
This section discusses practices found in literature that can help the agile team to identify and create value in a software project.
Business value is characteristically ambiguous and it is difficult to define it accurately in an agile software project [25]. Supporting social interactions between stakeholders [1] and having value workshops [23] can make it easier to identify value and form a mutual understanding of it. Even a short workshop between the business owner and users before writing user stories can help to clarify the project focus and lead to better economic and user value [16]. Also, different stakeholder roles can be identified and participated into thinking of what value means for that role. These role-biased values are then discussed together for example in a value workshop to create a mutual understanding of the overall business value before starting the actual development. The mutual understanding can then be groomed later as required.
A software value map [12] can broaden the thinking of value. It presents various value perspectives such as those of customer, financial, internal business learning and innovation. Customer value consists of perceived value including usability, reliability, delivery time and cost and lifetime value including customer revenue and different sources of cost.
Value points [9] or benefit points [7] can be used to concretize and order identified sources of value. They are used similarly to agile story points. Whereas story points measure the required implementation effort of a user story, value points or benefit points measure its value. For example, numbers 1, 2, 4, 8, 16 or Fibonacci series can be used to evaluate the value. The scale and scoring is arbitrary and subjective and the idea is not to create absolute value scores but to enable comparing between the importance of different sources of business value.
As value is not independent from cost, Gillain et al. [5] suggest that value should be assessed together with cost-estimates. The customer can consider one feature more valuable than another per se, but if there is a substantial difference in cost, they might change their opinion. One practical tool for
364
assessing both value and cost is a scale that takes both value and cost points into account. This encourages to select between features instead of giving high value points to all of them.
Agile embraces change. The overall value can be unknown when the project starts and it can be challenging to conceptualize it. Therefore, revisiting and reordering the sources of value in increment reviews can be beneficial. Also, assessing the ability of the implemented software to generate expected value can make it easier to focus the project and in making estimations of the anticipated business value of the future increments. Continuous customer and user involvement helps in reassessing value as most of the business value ought to be assigned by external stakeholders [3].
This position paper presented views on value identification and creation in agile business to business software development. Early and continuous value delivery is a core function of agile software development. However, the value itself often remains undefined in agile projects and each stakeholder role might take it as given from their own perspective. That can lead to misunderstandings and make the project goals unclear. It can also lead to arbitrary decisions on product scope which may endanger the delivery of good user experience. This paper presented common pitfalls and thinking biases different stakeholder roles might fall into if they are not aware of those. Furthermore, this paper presented practices that can help in the identification and prioritization of value in agile software projects. Future work includes observing the value creation process in organizations to generate a sounder understanding of value sources and conflicts between them.
The research behind this paper has been conducted
while I was working at Tampere University of Technology, Finland and for the Agile Research Network (ARN http://agileresearchnetwork.org) which is a collaboration between researchers at the Open University and the University of Central Lancashire, UK.
365

1. Alahyari, H., Svensson, R. B., & Gorschek, T. (2017). A study of value in agile software development organizations. ,
125, 271-288. 2. Beecham, S., Baddoo, N., Hall, T., Robinson, H., and Sharp, H. (2008).
Motivation in software engineering: A systematic literature review. , 50, 860–878.
3. Dingsøyr, T., & Lassenius, C. (2016). Emerging themes in agile software development: Introduction to the special section on continuous value delivery. , 77, 56-60.
4. Franca, A. C. C., Gouveia, T. B., Santos, P. C. F., Santana, C. A., and da Silva, F. Q. B. (2011). Motivation in software engineering: A systematic review update. Proc.
, pages 154–163
5. Gillain, J., Jureta, I., & Faulkner, S. (2016, September). Planning Optimal Agile Releases via Requirements Optimization. In
(REW), IEEE International (pp. 10-
16). IEEE. 6. Graeber, D. (2001). Toward an anthropological theory of value: The false
coin of our own dreams. Springer. 7. Hannay, J. E., Benestad, H. C., & Strand, K. (2017). Benefit Points: The
Best Part of the Story. , 34(3), 73-85.
8. Hassenzahl, M., Schöbel, M., & Trautmann, T. (2008). How motivational orientation influences the evaluation and choice of hedonic and pragmatic interactive products: The role of regulatory focus.
, 20(4-5), 473-479.
9. Highsmith, J. (2009). Agile project management: creating innovative products. Pearson Education
10. Hoda, R., Noble, J., & Marshall, S. (2011). The impact of inadequate customer collaboration on self-organizing Agile teams.
, 53(5), 521-534.
11. ISO 9241-210:2010. (2010). Ergonomics of human-system interaction. Part 210: Human-centered design for interactive systems
12. Khurum, M., Gorschek, T., & Wilson, M. (2013). The software value map—an exhaustive collection of value aspects for the development of
366
software intensive products. ,
25(7), 711-741. 13. Kuusinen, K. (2015, September). Task allocation between UX
specialists and developers in agile software development projects. In (pp. 27-44). Springer, Cham.
14. Kuusinen, K. (2016). BoB: A Framework for Organizing Within-Iteration UX Work in Agile Development. In
(pp. 205-224). Springer International
Publishing. 15. Kuusinen, K. (2016, August). Are Software Developers Just Users of
Development Tools? Assessing Developer Experience of a Graphical User Interface Designer. In
(pp. 215-233). Springer International Publishing.
16. Kuusinen, K., & Mikkonen, T. (2013, December). Designing user experience for mobile apps: Long-term product owner perspective. In
, 2013 20th Asia-Pacific (Vol. 1,
pp. 535-540). IEEE. 17. Kuusinen, K., Mikkonen, T., & Pakarinen, S. (2012). Agile user
experience development in a large software organization: good expertise but limited impact. , 94-111.
18. Kuusinen, K., Petrie, H., Fagerholm, F., & Mikkonen, T. (2016, May). Flow, intrinsic motivation, and developer experience in software engineering. In
(pp. 104-117). Springer International Publishing. 19. Kuusinen, K., & Väänänen-Vainio-Mattila, K. (2012, October). How
to make agile UX work more efficient: management and sales perspectives. In Proceedings of the 7th
(pp. 139-148). ACM.
20. Kuusinen, K., Väätäjä, H., Mikkonen, T., & Väänänen, K. (2016). Towards understanding how agile teams predict user experience. In Integrating User-Centred Design in Agile Development (pp. 163-189).
.
21. Lakhani, K. R., & Wolf, R. G. (2003). Why hackers do what they do: Understanding motivation and effort in free/open source software projects.
No. 4425-03
22. Lárusdóttir, M., Cajander, Å., & Gulliksen, J. (2012, October). The Big Picture of UX is Missing in Scrum Projects. In (pp. 42-48).
367

23. Paasivaara, M., Väättänen, O., Hallikainen, M., & Lassenius, C. (2014, May). Supporting a large-scale lean and agile transformation by defining common values. In
(pp. 73-82). Springer International Publishing.
24. Pressman, R. (2010) Software engineering - A practitioner's approach, 7th ed., McGraw-Hill
25. Racheva, Z., Daneva, M., Sikkel, K., & Buglione, L. (2010, June). Business value is not only dollars–results from case study research on agile software projects. In
(pp. 131-145). Springer Berlin Heidelberg.
368

Related Documents