This is an Accepted Article that has been peer-reviewed and approved for publication in the The Journal of Physiology, but has yet to undergo copy-editing and proof correction. Please cite this article as an 'Accepted Article'; doi: 10.1113/jphysiol.2014.284109. This article is protected by copyright. All rights reserved. 1 Title: Adiponectin Fine-Tuning of Liver Regeneration Dynamics Revealed Through Cellular Network Modeling Running Title: Adiponectin Fine-Tuning of Liver Regeneration Authors: Jason M. Correnti 1,#,% , Daniel Cook 2,3,# , Edita Aksamitiene 1, ¥ , Aditi Swarup 1 , Babatunde Ogunnaike 3 , Rajanikanth Vadigepalli 1,2,3,* , Jan B. Hoek 1,2,* Affiliations: 1. MitoCare Center for Mitochondrial Research, Department of Pathology, Anatomy and Cell Biology, Thomas Jefferson University, Philadelphia, PA 19107, United States 2. Daniel Baugh Institute for Functional Genomics and Computational Biology, Department of Pathology, Anatomy and Cell Biology, Thomas Jefferson University, Philadelphia, PA 19107, United States 3. Department of Chemical and Biomolecular Engineering, University of Delaware, Newark, DE 19716, United States Author Notes: # Co-first authors *Co-corresponding authors: Rajanikanth Vadigepalli, [email protected] Jan B. Hoek, [email protected] % Current affiliation: Division of Gastroenterology, University of Pennsylvania, Philadelphia, PA 19107, United States ¥ Current affiliation: Department of Otolaryngology – Head & Neck Surgery, Thomas Jefferson University, Philadelphia, PA 19107, United States

Welcome message from author
This document is posted to help you gain knowledge. Please leave a comment to let me know what you think about it! Share it to your friends and learn new things together.
Transcript
This is an Accepted Article that has been peer-reviewed and approved for publication in the The Journal of
Physiology, but has yet to undergo copy-editing and proof correction. Please cite this article as an 'Accepted
Article'; doi: 10.1113/jphysiol.2014.284109.
This article is protected by copyright. All rights reserved. 1
Title:
Adiponectin Fine-Tuning of Liver Regeneration Dynamics Revealed Through Cellular
Network Modeling
Running Title:
Adiponectin Fine-Tuning of Liver Regeneration
Authors:
Jason M. Correnti1,#,%, Daniel Cook2,3,#, Edita Aksamitiene1, ¥, Aditi Swarup1, Babatunde
Ogunnaike3, Rajanikanth Vadigepalli1,2,3,*, Jan B. Hoek1,2,*
Affiliations:
1. MitoCare Center for Mitochondrial Research, Department of Pathology, Anatomy and
Cell Biology, Thomas Jefferson University, Philadelphia, PA 19107, United States
2. Daniel Baugh Institute for Functional Genomics and Computational Biology,
Department of Pathology, Anatomy and Cell Biology, Thomas Jefferson University,
Philadelphia, PA 19107, United States
3. Department of Chemical and Biomolecular Engineering, University of Delaware,
Newark, DE 19716, United States
Author Notes:
#Co-first authors
*Co-corresponding authors:
Rajanikanth Vadigepalli, [email protected] Jan B. Hoek, [email protected]
%Current affiliation: Division of Gastroenterology, University of Pennsylvania, Philadelphia, PA 19107, United States
¥Current affiliation: Department of Otolaryngology – Head & Neck Surgery, Thomas Jefferson University, Philadelphia, PA 19107, United States
This article is protected by copyright. All rights reserved. 2
Key Points:
Loss of adiponectin delays the initiation of liver regeneration after partial
hepatectomy, but later accelerates regeneration.
Loss of adiponectin modulates these regeneration kinetics through decreased
hepatocyte response to inflammation and increased growth factor bioavailability.
Increased adiponectin suppresses liver regeneration through decreased growth
factor bioavailability.
Our predictive computational model was able to connect these molecular regulatory
events to tissue physiology.
Abstract
Following partial hepatectomy, the liver initiates a regenerative program involving hepatocyte
priming and replication driven by coordinated cytokine and growth factor actions. We
investigated the mechanisms underlying Adiponectin’s (Adn) regulation of liver regeneration
through modulation of these mediators. Adn-/- mice showed delayed onset of hepatocyte
replication, but accelerated cell cycle progression relative to wild-type mice, suggesting Adn
has multiple effects fine-tuning the kinetics of liver regeneration. We developed a
computational model describing the molecular and physiological kinetics of liver regeneration
in Adn-/- mice. We employed this computational model to evaluate the underlying regulatory
mechanisms. Our analysis predicted that Adn is required for an efficient early cytokine
response to partial hepatectomy, but is inhibitory to later growth factor actions. Consistent
with this prediction, Adn knockout reduced hepatocyte responses to IL-6 during the priming
phase, but enhanced growth factor levels through peak hepatocyte replication. By contrast,
supraphysiological concentrations of Adn resulting from rosiglitazone treatment suppressed
regeneration by reducing growth factor levels during S phase, consistent with computational
predictions. Together, these results revealed that Adn fine-tunes the progression of liver
regeneration through dynamically modulating molecular mediator networks and cellular
interactions within the liver.
This article is protected by copyright. All rights reserved. 3
Abbreviations: Adn, Adiponectin; Adn-/-, Adiponectin knockout; Ang-1, Angiogenin-1; CCl4,
Carbon tetrachloride; DLS, Dynamic local sensitivity; ECM, Extracellular matrix; FGF-2 or
bFGF, Fibroblast growth factor 2; GF, Growth factor; HGF, Hepatocyte growth factor; IE,
Immediate early; IL-6, Interleukin 6; JAK, Janus kinase; kiSOCS3, SOCS3 inhibition parameter
of STAT3 production; kMXX, Michaelis-Menten constant; kprol, Replication rate; kP, P to R rate
parameter; kQ, Q to P rate parameter; kR, R to Q rate parameter; kup, GF uptake rate by
ECM; kXX, XX production rate; k1 – k7, Steady-state molecular production rates; M, Metabolic
demand; M/N, Metabolic load; N, Number of hepatocytes; PBS, Phase-based sensitivity; PS,
Pulsatile sensitivity; PSA, Pulsatile sensitivity analysis; pSTAT3, Phosphorylated STAT3;
proSTAT3, monomeric STAT3; P, Primed; Q, Quiescent; R, Replicating; SHP-1, Src
homology region 2 domain-containing phosphatase-1; SOCS-3, Suppressor of cytokine
signaling 3; STAT3, Signal transducer and activator of transcription 3; TNFα, Tumor necrosis
factor alpha; VEGF, Vascular endothelial growth factor; VXX, Michaelis-Menten maximum
reaction rate; WT, Wild-type; PHx, Partial hepatectomy; β, Response parameter; κXX, XX
degradation rate; θ, Threshold parameter
Introduction
Liver regeneration is a unique repair mechanism that allows a damaged liver to
recover following traumatic or toxic injury or hepatic surgical procedures. This process is
clinically important in liver mass recovery in both donor and recipient following live donor
liver transplantation. After partial hepatectomy (PHx) normally quiescent hepatocytes are
activated to reenter the cell cycle through a highly synchronized pro-proliferative response,
which requires precise timing of cytokine and growth factor (GF) signals. This response is
orchestrated through a dynamic pattern of activation and inhibition of a wide range of
signaling processes coordinated across multiple cell types in the liver, including hepatocytes,
Kupffer cells and hepatic stellate cells (Taub, 2004). Kupffer cells are primary coordinators of
the dynamic cytokine microenvironment following tissue damage. Hepatic stellate cells
produce growth factors critical to induce hepatocyte replication. Once lost tissue mass is
recovered, hepatic stellate cells also produce factors terminating regeneration (Taub, 2004).
In addition, signals from extra-hepatic tissues, including adipokines, play a role in modulating
this coordinated cellular response. Because adipokines originate from outside the liver,
treatment of hepatic surgery patients with adipokines is an attractive option to modulate liver
regenerative ability following surgical intervention without the complications involved in
modifying liver function directly.
One of the factors implicated in modulating both liver cytokine microenvironment and
growth factor bioavailability is the serum adipokine adiponectin (Adn) (Yamauchi &
Kadowaki, 2013). Adn is a 30 kD protein produced primarily by adipose tissue that circulates
as low molecular weight (trimeric), middle molecular weight (hexameric), and high molecular
weight oligomers (Turer & Scherer, 2012). Adn directly sensitizes the body to insulin, and
This article is protected by copyright. All rights reserved. 4
Adn levels are low in patients with Type II diabetes (Kadowaki et al, 2006). It is thought to
act in large part through two identified adiponectin cell surface receptors, adiponectin
receptor (AdipoR) 1 and AdipoR2. Additionally, Adn has been shown to increase acute
inflammation (Awazawa et al, 2011;Park et al, 2007) and is known to modulate balances of
cytokines and growth factors critical to liver regeneration and repair. There is evidence that
Adn also can act through direct binding and inhibition of growth factors. Taken together,
these findings suggest Adn may have both pro- and anti-proliferative effects during liver
regeneration (Kajimura et al, 2013;Landskroner-Eiger et al, 2009). Consistent with this
hypothesis, previous studies suggested both reduced and increased Adn levels can impair
regeneration. Adn -/- mice were reported to exhibit a delayed liver regeneration phenotype
(Ezaki et al, 2009;Shu et al, 2009), whereas treatment with the antidiabetic drug
rosiglitazone, which is thought to act at least in part by elevating serum Adn (Nawrocki et al,
2006;Yamauchi & Kadowaki, 2013), inhibits liver mass recovery (Turmelle et al, 2006). By
contrast, rats with induced diabetes show a delayed initiation of hepatocyte replication after
PHx, which is corrected by an increased replication from 36-72 hours post-surgery (Barra &
Hall, 1977). We hypothesize that low Adn levels may have contributed to the regeneration
dynamics observed in these diabetic animals.
The apparently conflicting actions through which Adn impacts liver regeneration
points to nonlinear effects that are difficult to parse out with typical over/under-expression
experimental analyses. In this study, we aim to develop a deeper understanding of the
multifaceted impact of Adn on liver regeneration using an integrated computational modeling
and experimental approach to characterize the molecular mechanisms underlying the Adn-
mediated fine-tuning of liver regeneration dynamics.
Molecular mechanisms underlying liver regeneration are both redundant and
complex, making prediction of effects of molecular or cellular manipulations difficult. For
example, in studies using CI2MDP-liposomes to eliminate Kupffer cells from the liver, IL-6,
TNFα, and HGF were all significantly decreased; however, mass recovery appeared to be
only delayed but not blunted (Meijer et al, 2000). Similarly, mice harboring a hepatocyte-
specific deletion of c-Met were expected to show little or no regeneration following CCl4
injection. These mice, however, showed similar kinetics and magnitude of proliferation
following a single CCl4 injection, indicating multiple compensatory mechanisms (Huh et al,
2004). After more extensive injury, the c-Met deficient mice did show lower recovery, but this
was likely due to decreased cell motility rather than decreased proliferation.
Our computational modeling approach was designed to account for the net effect of
such molecular redundancies and complex cellular interactions governing liver regeneration.
Through model simulations and sensitivity analysis, we investigated how changes to relative
balances and timing of multiple regulatory mechanisms contribute to shaping the liver
This article is protected by copyright. All rights reserved. 5
regeneration dynamics. We started with a computational model of liver regeneration,
recently developed by Furchtgott et al. (Furchtgott et al, 2009). This model considers
hepatocytes as being distributed across multiple cellular states: quiescent, primed, or
replicating. The dynamic shift between these states is mediated by factors produced by non-
parenchymal cells. Cytokines, such as TNFα and IL-6, produced primarily by Kupffer cells,
initiate the JAK-STAT signaling cascade resulting in activation of the expression of
immediate early (IE) genes, which shifts hepatocytes from the quiescent to the primed state.
GF produced by hepatic stellate cells stimulate replication of primed hepatocytes.
Termination of replication requires renormalization of cytokine and growth factor levels, and
buildup of extracellular matrix (ECM). Using this cellular interaction framework, the model
acts as a bridge connecting the kinetics of molecular regulation to the regeneration
dynamics.
We used Adn -/- and rosiglitazone-treated mice to examine the kinetics of liver
regeneration response after PHx through the priming and replicative phase and applied
these experimental data to the computational model. We utilized the recently developed
Pulsatile Sensitivity Analysis (PSA) to investigate which regulatory balances are critical for
the effect of Adn on liver regeneration, and in what temporal intervals the specific changes to
regulatory balances have the greatest impact on regeneration.
The experimental data indicate that absence of Adn caused lower STAT3 tyrosine
phosphorylation during the first 6 hours post-PHx, likely associated with decreased
hepatocyte priming and causing a 6-hour delay in the onset of hepatocyte replication. Lack
of Adn, however, also increased GF levels following PHx, accelerating cell cycle
progression. When circulating Adn was raised to super-physiological levels by treatment of
wild-type (WT) mice with the anti-diabetic drug rosiglitazone, GF levels were decreased
during peak hepatocyte replication and regeneration was suppressed. Our model suggests
that Adn modulates hepatocyte priming and GF bioavailability during time-windows when
regeneration is most sensitive to alterations in these factors.
This article is protected by copyright. All rights reserved. 6
Materials and Methods
Animals
All animal studies were approved by the Institutional Animal Care and Use Committee
(IACUC) at Thomas Jefferson University. Jefferson’s IACUC is accredited by the
Association for Assessment and Accreditation of Laboratory Animal Care and experiments
were designed using the Guide for the Care and Use of Laboratory Animals.
10-12 week old male Adn-/- mice (B6.129-Adipoqtm1Chan), bred from mice kindly donated
by Dr. Lawrence Chan, or C57BL/6J mice (Jackson Laboratories, Bar Harbor, Me)
underwent partial hepatectomy based on surgical methods outlined by Mitchell and
Willenbring (Mitchell & Willenbring, 2008). Briefly, animals were anesthetized by inhalation of
5% isoflurane in an induction chamber and anesthetic plane was confirmed by toe pinch.
Anesthesia was maintained during surgery by continual inhalation of 2% isoflurane
administered by nose cone. A midline incision was made followed by the sequential ligation
and excision of the left-lateral and medial lobes of the liver. The abdominal cavity was rinsed
with warm lactated Ringer’s solution, the abdominal muscle layer was sutured and the skin
was closed with wound clips. Following surgery, animals were given subcutaneous lactated
Ringer’s solution (1 mL/animal) and placed in a fresh cage under a heat lamp with ad libitum
access to hydrogel (Contact ClearH20, Portland, Me) and food. At specified times after PHx,
animals were anesthetized with isoflurane as described for partial hepatectomy (induction
and maintenance). While anesthetized, animals were weighed and sacrificed. The livers
were either immediately (within 10 sec) freeze clamped using liquid nitrogen-cooled
aluminum clamps as previously described (Crumm et al, 2008), preventing rapid post-
mortem changes in cytokine or growth factor levels and protein phosphorylation, or the livers
were fixed in 10 percent neutral buffered formalin (NBF) for assessment of BrdU labeling.
For determination of liver to body weight ratios, the liver was dissected out and weighed prior
to freeze clamping.
Blood was collected from the tail vein of live animals and from the vena cava under
anesthesia at sacrifice. Collected blood was incubated at room temperature for 30 min, then
centrifuged at 1500 rpm for 5 minutes. Serum was isolated and flash frozen for further
analysis. In some cases, animals were given intraperitoneal injections of Bromodeoxyuridine
(BrdU) solution (Sigma, St. Louis, Mo) (150 mg/kg) in sterile 0.9 percent saline two hours
prior to sacrifice. For rosiglitazone treatment, animals were administered rosiglitazone (10
mg/kg, Cayman Chemical, Ann Arbor, MI) or vehicle (1:1 mixture of 1x phosphate buffered
This article is protected by copyright. All rights reserved. 7
saline and polyethylene glycol, Sigma) by gavage twice daily beginning 2 days before
surgery.
Histological analysis
Samples fixed in 10% NBF were paraffin-embedded, sectioned, and stained for
hematoxylin and eosin by the Kimmel Cancer Center pathology core facility (Thomas
Jefferson University) for analysis of hepatosteatosis. BrdU staining was performed using
Impact DAB staining (Vector Laboratories, Burlingame, CA) according to manufacturer’s
instructions. For BrdU quantitation, five 20x fields were scored per animal.
Biochemical analysis
For Western blotting, tissue lysates were generated by homogenizing frozen tissue in
RIPA buffer (Sigma) supplemented with phosphatase and protease inhibitor cocktails
(Sigma). Protein was normalized using BCA Protein Assay Reagent (Pierce Biotechnology,
Rockford, IL). 20 µg of protein was loaded onto an SDS-PAGE gel and Western blotting for
cell cycle markers and pSTAT3/STAT3 was performed as previously described (Crumm et
al, 2008). Alternatively, for comparison of growth factor expression time-course, 50 µg of
protein was resolved by LDS-PAGE, transferred onto nitrocellulose membrane using Multi-
Strip Western blotting approach as described previously (Aksamitiene et al, 2007) and
probed with mouse monoclonal antibodies against HGF (SBF5) (Thermo Fisher Scientific,
Rockford, IL), FGF-2 (6) (sc-136255, Santa Cruz Biotechnology, Dallas, TX), ANG I (C-1)
(sc-74528, Santa Cruz Biot.), GAPDH (6C5) (EMD Millipore, Billerica, MA) or rabbit
polyclonal antibodies against β-Actin (D6A8) (Cell Signaling, Danvers, MA). ELISA kits were
used for measurement of adiponectin (B-Bridge International) and TNFα (eBioscience, San
Diego, CA) according to manufacturer’s instructions. Transcription factor binding activity
was assessed from nuclear extracts prepared from frozen tissue using a nuclear extraction
kit (Origene, Rockville, MD). NF-κB DNA binding activity in 100 µg of nuclear extract was
measured using the NF-κB transcription factor assay kit (Cayman Chemical) according to
manufacturer’s instructions. Some samples were sent to Raybiotech for analysis of cytokine
and chemokine levels using Quantibody® Multiplex ELISA Array (Raybiotech, Norcross,
GA).
For RT-PCR analysis, RNA was extracted from frozen tissue using the RNeasy RNA
extraction kit (Qiagen, Valencia, CA, USA). 2 µg of RNA was reverse transcribed with
EasyScript Plus Reverse Transcriptase (Applied Biological Materials Inc.). cDNA was
preamplified with TaqMan PreAmp Master Mix (Applied Biosystems, Foster City, CA, USA)
and PCR reactions were performed using BioMark™ Dynamic Arrays (Fluidigm, South San
Francisco, CA, USA). Primer sequences are shown in Table 1. CT values were calculated
This article is protected by copyright. All rights reserved. 8
using Real-Time PCR Analysis software (Fluidigm) and normalized to the expression of
housekeeping genes TBP and β2-microglobulin using the established -ΔΔCT method (Livak
& Schmittgen, 2001).
Data were compared using Student’s t-test on raw data (BrdU incorporation and liver-
to-body weight ratios) or log-transformed data (molecular measurements). Paired statistics
were used when appropriate. Data are presented as mean +/- standard error of the mean
(SEM).
Computational modeling of liver regeneration
Molecular regulation was connected to regeneration phenotype using a previously
published model of liver regeneration (Furchtgott et al, 2009). The computational model
simulates liver regeneration as a series of regulatory events initiated in non-parenchymal
cells and influencing hepatocyte quiescence, priming and replication (shown schematically in
Fig. 2A). The initiation of regeneration is governed by a mismatch between “metabolic
demand” (M) of the organism and the total number of hepatocytes (N) available to meet this
demand. In this scheme, the “metabolic load” per hepatocyte (M/N) increases proportional to
the mass of the liver removed, initiating non-parenchymal cell activation following PHx. Once
activated, non-parenchymal cells respond to liver damage by early induction of IL-6
(representative of the inflammatory milieu observable post-PHx and its effect on
hepatocytes), later production of GF (representative of the growth factor environment and
effect post-PHx), and ECM remodeling. These molecular signals induce hepatocytes to
proceed from quiescence (Q) to a primed state (P), from the primed state to a replicating
state (R) to recover lost liver tissue, and finally from primed and replicating states back to
quiescence. This computational model uses representative molecular components to
describe archetypical classes of signaling during liver regeneration. Such an empirical and
approximate model allows for investigation into how changes to the magnitude and timing of
signaling activation may affect regeneration dynamics. While the metabolic load parameter
has no direct molecular correlate, it likely captures the effects of the molecular drivers of liver
metabolism and mitochondrial activity such as AMPK activation or ATP levels or ATP/ADP
ratio. Modulation of metabolic load by perturbing this metabolic demand parameter may
therefore be considered to reflect a general metabolic challenge.
This model includes the JAK-STAT signaling pathway induced by IL-6 and GF
produced by non-parenchymal cells as drivers of regeneration and includes ECM as a
negative regulator of regeneration. Shifts between hepatocytes states (Q, P, or R) are
governed by the following equations:
([ ] [ ]) [ ] (1)
This article is protected by copyright. All rights reserved. 9
([ ] [ ]) ([ ] [ ]) (2)
([ ] [ ]) [ ] (3)
Where IE gene expression catalyzes a shift in hepatocytes from the Quiescent state to
the Primed state with a rate parameter of kQ. GF produced in response to metabolic load
catalyze a shift in hepatocytes from the Primed state to the Replicating state with a rate
parameter of kP. Upon entering the Replicating state, hepatocytes begin to replicate at a rate
kprol. However, hepatocytes also return to the Quiescent state due to natural requiescence
and ECM buildup (with rate parameters of kreq and kR, respectively).
The parameters σap and σreq in the above equations govern the amount of hepatocytes
undergoing apoptosis (or removal by other means from the pool of hepatocytes entering the
cell cycle) and requiescence, respectively. They are calculated as sigmoidal functions to
account for a switch-like behavior, equations 4 and 5.
( ((
⁄ )
)) (4)
( (( [ ])
)) (5)
Where θ is the threshold parameter governing at what level a response occurs and β is
the response parameter governing how much of a response occurs.
For hepatectomies up to 75-80% σap remains small, but for partial hepatectomies greater
than 80% σap becomes large enough to prevent regeneration and induce liver. Similarly, σreq
is low when GF levels are high but increases when GF levels return to baseline, capturing
the phenomenon that GFs are needed for cells to progress through the cell cycle.
IL-6 produced in response to metabolic load induces IE gene expression through the
JAK-STAT signaling cascade, which also includes negative feedback from SOCS-3. IL-6
levels, the JAK-STAT signaling cascade, and IE gene levels are calculated using a
combination of linear and Michaelis-Menton kinetics, Equations 6-12. GF is modeled as
being produced in response to metabolic load and sequestered by ECM, Equation 11. ECM
is modeled as constitutively produced (k6) but degraded both consitutively (κECM) and
dynamically in response to IL-6 induced MMPs (κdeg), Equation 12. This simulates a
continuous steady-state turnover of ECM which is dynamically regulated during periods of
tissue remodeling. All molecules are modeled as being degraded at a rate proportional to the
amount present in the liver.
[ ]
[ ]
[ ] [ ] (6)
[ ]
[ ]
[ ] [ ] (7)
[ ]
[ ][ ]
[ ] ( [ ]
⁄ )
This article is protected by copyright. All rights reserved. 10
[ ]
[ ]
[ ]
[ ] [ ] (8)
[ ]
[ ]
[ ] [ ] (9)
[ ]
[ ]
[ ] [ ]
(10)
[ ]
[ ][ ] [ ]
(11)
[ ] ( [ ])[ ]
(12)
Parameters for each molecule (XX) include production rate (kxx), degradation rate (κXX), and
Michaelis-Menten parameters (VXX and kMXX). Further model parameters include
concentration of monomeric STAT3 ([proSTAT3]), rate of GF uptake by ECM (kup), and the
parameter governing inhibition of STAT3 phosphorylation by SOCS3 (kISOCS3). The
parameters k1 – k7 represent steady-state production or degradation of the molecule which
each equation describes.
Model differential equations were solved simultaneously using ode15s in MATLAB®
(Mathworks, Inc.).
Sensitivity analyses for identifying key factors controlling regeneration phenotype
Parametric sensitivities were estimated based on a dynamic local sensitivity analysis
(Zak et al, 2005), phase-based sensitivity (Gunawan & Doyle, 2007), and pulsatile sensitivity
methodologies (Perumal & Gunawan, 2011). To calculate the dynamic local sensitivities
(DLS), parameters were changed by +/- 10% and sensitivity was calculated as the change in
overall liver recovery normalized to the number of cells at each time in the nominal
regeneration profile divided by the percentage change in the parameter (20%), according to
Equation 13.
( ) ( ) ( )
(13)
where N(t) is the nominal fraction of hepatocytes at any given time, and ΔN(t) is the
deviation from nominal caused by the parameter change.
Phase-based sensitivities (PBS) were calculated following the formulations of
(Gunawan & Doyle, 2007; Perumal & Gunawan, 2011). Simulations were run with the value
of a single parameter increased by 10% of its nominal value within one of the three phases
This article is protected by copyright. All rights reserved. 11
of regeneration: the priming phase (0-6 hours post-PHx), the regeneration phase (12-100
hours post-PHx), and the termination phase (100-200 hours post-PHx). The simulations
were then run again with the same parameter decreased by 10% within the same phase.
These two simulations were repeated for every parameter. Sensitivities were estimated as
the change in overall liver faction recovered at 300 hours post-PHx normalized to the
nominal regeneration profile divided by the percentage change in parameter value for the
phase when the change occurs (20%), as shown in Equation 14.
( ) ( )
(14)
Pulsatile sensitivities (PS) were calculated using an approach modified from
(Perumal & Gunawan, 2011). In this modified approach, we altered each model parameter
by + or – 10% of the corresponding nominal value at each hour following PHx for one hour,
where represents the beginning of the time step where the parameter was changed. We
estimated the pulsatile sensitivity at each time point after the pulsatile parametric change (at
time ) according to Equation 15.
( ) ( ) ( )
(15)
While this equation appears similar to that used to calculate DLS, the pulsatile sensitivity
values (PSi) take on nonzero values only after the time of the pulse change in the
corresponding parameter value.
Parameter estimation to match Adn-/- regeneration phenotype
To estimate parameters characterizing the Adn-/- mice, Sobol sampling was used to
search the parameter space of sensitive model parameters (Bratley & Fox, 1988). Each
parameter was allowed to vary from its nominal value over approximately one order of
magnitude (10x). Simulations were then run with each of ten thousand parameter sets, and
the resulting regeneration profiles were compared to the experimental Adn-/- mouse
regeneration profile generated in this study. Parameter sets generating similar regeneration
profiles were then analyzed for common molecular regulation governing tissue behavior. The
search of the parameter space resulted in multiple parameter sets that could simulate
regeneration profiles similar to that seen experimentally, but these multiple parameter sets
contained similar parameters and caused similar molecular regulation. Therefore, parameter
sets generating regeneration profiles similar to that observed in the experiments were further
explored using a combination of manual manipulation and local optimization (fminsearch in
This article is protected by copyright. All rights reserved. 12
Matlab). The parameter set resulting in the lowest mean squared error between simulation
and experimental observations of liver regeneration in Adn-/- mice was reported as the
parameter set for Adn-/- mice.
Results
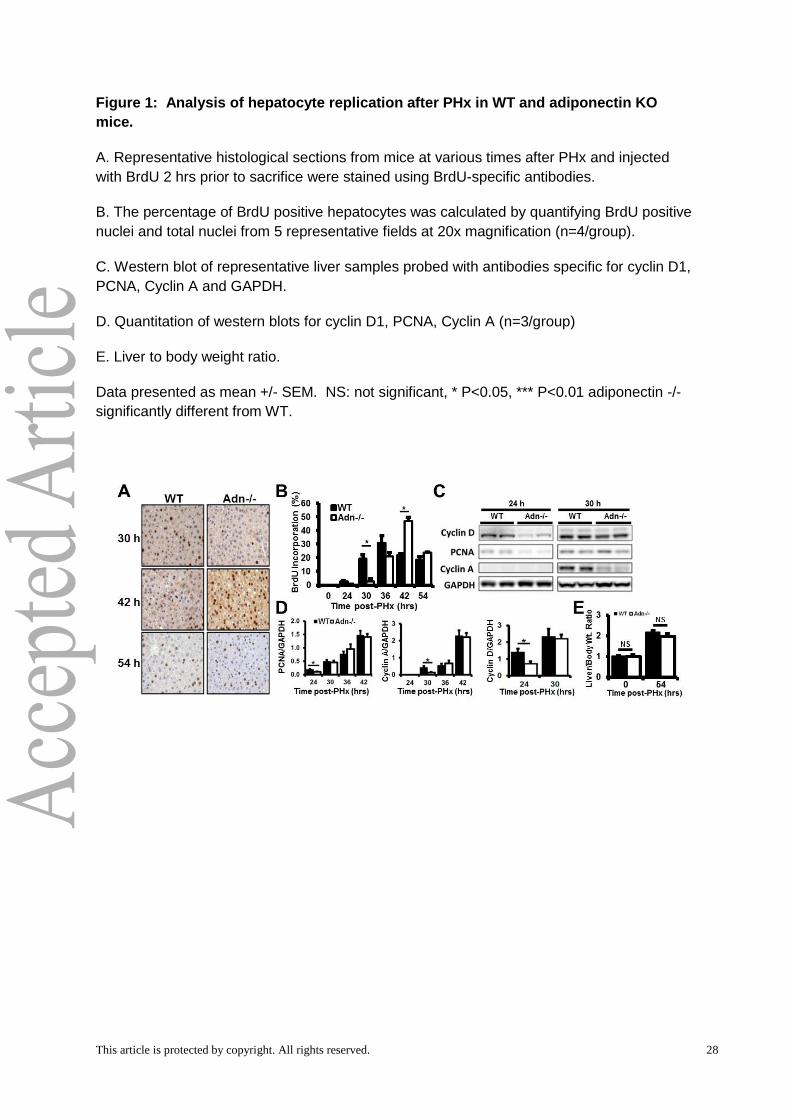
Hepatocyte proliferation is delayed after PHx in Adn -/- mice
The dynamics of liver regeneration in Adn-/- and WT mice after PHx were assessed
by BrdU pulse labeling and expression of cell cycle marker proteins between 24-54 hours
post-PHx. BrdU incorporation increased in WT mice at 30 hours post-PHx relative to
baseline levels. However, Adn-/- mice showed no increase at 30 hours (Fig. 1A,B). WT and
Adn-/- mice showed similar levels of BrdU incorporation 36 hours post-PHx (Fig. 1A,B). Adn-
/- mice incorporated significantly more BrdU at 42 hours post-PHx (Fig. 1A,B). By 54 hours
post-PHx, WT and Adn-/- mice again showed no difference in BrdU incorporation. When
compared to WT mice, Adn-/- mice also expressed significantly lower levels of G1-phase cell
cycle markers proliferating cell nuclear antigen (PCNA) and cyclin D1 at 24 hours post-PHx
(Fig. 1C,D). Both PCNA and cyclin D1 levels were renormalized by 30 hours post-PHx and
PCNA levels remained similar at all subsequent times (Fig. 1C,D). Similarly, Adn-/- mice
expressed cyclin A, an important S phase cyclin, at lower levels than WT mice at 30 hours
post-PHx; cyclin A levels were renormalized by 36 hours post-PHx and remained similar at
42 hours (Fig. 1C,D). Liver to body weight ratio was assessed as a measure of liver mass
recovery. By 54 hours post PHx, both WT and Adn-/- mouse livers had approximately
doubled in mass (Fig. 1E). No significant difference was detected between WT and Adn-/-
liver mass recovery at this time.
Taken together, these results suggest that the onset of hepatocyte proliferation after
PHx is delayed in Adn-/- relative to WT mice but that the cell cycle may be accelerated in
Adn-/- mice to renormalize regeneration after a delayed cell-cycle onset. However, the
dynamic changes to molecular balances underlying Adn fine-tuning control of liver
regeneration remain unclear.
This article is protected by copyright. All rights reserved. 13
Pulsatile Sensitivity Analysis reveals critical time-windows of molecular effects on
liver regeneration
We pursued a computational modeling approach to investigate which molecular
balances are critical to alter regeneration dynamics and the time-windows over which
regenerating hepatocytes are responsive to these signals. We initially employed local
parametric sensitivity analysis to analyze a recently developed computational model of liver
regeneration, shown schematically in Fig. 2A, in order to identify the regulatory balances that
control the dynamics of regeneration (Furchtgott et al, 2009). This dynamic sensitivity metric
considers how the time profile of liver regeneration responds to changes in the network
parameters. We defined liver regeneration profile as “highly sensitive” to a given parameter if
the maximum value of the corresponding normalized sensitivity coefficient had a magnitude
greater than 0.15 at any time point. Our analysis identified 12 out of 32 parameters as
significantly controlling the dynamics of liver regeneration. These included both molecular
parameters -- metabolic load (M), IL-6 production rate (kIL6), concentration of monomeric
STAT3 ([proSTAT3]), ECM degradation rate by MMPs (κdeg), ECM constitutive degradation
rate (κECM), GF production rate (kGF), and GF degradation rate (κGF) -- and physiological
parameters governing hepatocyte phenotypic state and apoptosis -- kP, kR, kprol, θap, and βap -
- (Table 2).
One consideration in the above sensitivity analysis is that the network parameters
are altered as a step change throughout the regenerative response time. While the effect on
the regeneration is dynamic, it is not possible to deconvolute the changes leading to
instantaneous effects vs those altering response at later times. To address this issue, we
employed a recently developed Impulse Sensitivity Analysis and modified the scheme to
consider finite pulses of parameter changes in defined temporal intervals (Perumal &
Gunawan, 2011). The pulsatile sensitivity analysis revealed that magnitude and timing of
changes to parameters were both key controlling factors in fine-tuning the regeneration
profile. Among the parameters evaluated for their pulsatile sensitivity, the metabolic demand
parameter showed a unique sensitivity profile. Changing metabolic demand using a short
pulse or longer step increase caused a decreased early regenerative response post-PHx,
but led to an enhanced regeneration response at later times (Fig. 2B). Such a time interval-
dependent effect occurred through multiple processes affected by metabolic demand
changes. Within the 0-50 hours post-hepatectomy period, additional increases in the
metabolic demand led to a transient increase in hepatocyte apoptosis and delayed
regeneration, but a renormalization (or moderately enhanced regeneration) caused by
increased IL-6 signaling and hepatocyte priming. Additional increase of metabolic demand at
later time intervals between 75-150 hours post-PHx caused increased GF signaling leading
to enhanced liver regeneration. In contrast, a 50% impulse decrease in IL-6 production rate
This article is protected by copyright. All rights reserved. 14
caused a transient decrease in IL-6 levels that was quickly renormalized (Fig. 2C).
Downstream STAT3 phosphorylation, however, showed a much larger magnitude decrease
that persisted for several hours before renormalization. The time-window during which these
changes consistently resulted in observable changes to regeneration profile were limited to
the first 50 hours of regeneration (Fig. 2C). In contrast, a 50% impulse increase in GF
production rate caused a sustained increase in hepatocyte number when GF production was
increased between 0-50 hours or at certain time points between 50-127 hours post-PHx.
These results suggest that fine-tuning signaling dynamics by modulating the timing and
temporal balances of non-parenchymal cell activation can have significant functional
consequences, with persistent impact on regeneration dynamics and tissue mass recovery.
While all of the molecular parameters apart from metabolic load showed similar
pulsatile sensitivity profiles, the key subset identified as significant controlling factors by the
parametric sensitivity analysis displayed a phase-dependent sensitivity (Fig. 2D). For
example, a transient increase in IL-6 production rate during the priming phase (0-6 hours)
caused an early increase in IL-6 levels followed by a persistent decrease below nominal
levels(Fig. 3A,B). This persistent decrease in IL-6 levels caused a persistently decreasing
rate of hepatocyte replication and a blunted overall tissue recovery (Fig. 3C). In contrast,
transiently increasing IL-6 production rate during the replication phase (12-100 hours)
caused IL-6 levels to remain elevated above nominal levels (Fig. 3A,B). This persistent
elevation caused a persistently increasing rate of hepatocyte replication and enhanced
overall tissue recovery (Fig. 3C). This phase-dependent effect predicts that mistiming of
enhanced factor production influences pro- or anti-regenerative effects. Therefore, our
computational modeling and sensitivity analysis revealed the dynamic balances of initiation-
related and replication-related factors that must be closely regulated to ensure the dynamics
and magnitude of the normal liver regeneration profile.
Computational modeling of the altered regenerative response in the Adn -/- mice
reveals the key controlling molecular regulatory balances
We predicted the factors governing molecular control of the Adn-/- regeneration
phenotype by considering simultaneous alterations to multiple molecular parameters
including those identified as sensitive in the above analyses (M, kIL6, κIL6, kGF, κGF, κdeg, κECM,
kup). Our Monte Carlo approach ensured efficient sampling coverage of the physiologically
reasonable parameter space by using a Sobol sampling strategy to modify sensitive
parameter values simultaneously (Bratley & Fox, 1988). We analyzed the simulation results
for similar model parameter values that led to the Adn-/- regeneration phenotype. Our results
revealed that the magnitude and timing of IL-6 signaling controlled the priming response of
hepatocytes and therefore fine-tuned the timing of initiation of regeneration. Timing and
This article is protected by copyright. All rights reserved. 15
magnitude of the GF peak controlled the hepatocyte entry into the replicating phase and
therefore fine-tuned the overall tissue regeneration rate and magnitude.
However, modulating these molecular parameters did not adequately account for the
observed regeneration profile of Adn-/- mice. In all of the simulated scenarios, the
hepatocytes entered the cell cycle either too early, renormalized too late, or showed a large
increase in cell death in the early phase post-PHx coupled with a large overshoot in
recovery. These regeneration profiles were inconsistent with the experimental observations
in the Adn-/- mice. Because the length of the cell cycle was modeled as lasting
approximately 30 hours, any molecular changes that allow renormalization of regeneration
by 54 hours cause regeneration to increase earlier than was seen experimentally in the Adn-
/- mice. To account for this difference, we increased the replication rate of hepatocytes in the
Adn-/- condition. By increasing hepatocyte replication rate by 15%, the model captured the
experimentally observed regenerative profile, including a delay in initiation of regeneration,
similar replication by 36 hours post-PHx, and renormalization by 54 hours post-PHx (Fig.
4A). Table 3 contains the key parameters and their modified values for which the model
simulations exhibit an Adn-/- regeneration phenotype that is consistent with the experimental
observations.
Simulations with these parameters predicted that one of the key features driving the
Adn-/- regeneration phenotype was a slightly decreased IL-6 level, detectable by 3 hours
after PHx (Fig. 4B). This moderate decrease (~2% decrease in peak levels) led to a
simultaneous decrease in tyrosine phosphorylation of STAT3 by 3 hours post-PHx (Fig. 4B).
Despite this decrease, the levels of phosphorylated STAT3 (pSTAT3) remained at sufficient
levels to induce production of Suppressor Of Cytokine Signaling-3 (SOCS-3) at levels nearly
identical to that in the wild-type mice (Fig. 4B). The combination of lower IL-6 and normal
SOCS-3 synergistically inhibited STAT3 phosphorylation (~25% decrease in peak levels)
and thus its activity, leading to the impaired priming response in simulated Adn-/- mice
underlying the delayed regeneration. It should be emphasized that the IL-6 levels in the
model are representative of the production of multiple inflammatory molecules, release,
diffusion, receptor binding, and cellular response. Hence, the effects of changing the
cytokine milieu post-PHx may be seen as relatively small changes in many inflammatory
signaling levels instead of an isolated change in the IL-6 protein levels.
Our simulations pointed to an increase in the GF levels, detectable by 12 hours post-
PHx and peaking at approximately 24 hours post-PHx as another key feature driving the
Adn-/- regeneration profile (Fig. 4B). This increased GF bioavailability stimulated the
hepatocytes in the primed state to begin replication. Our analysis predicted that an increased
number of replicating hepatocytes in Adn-/- mice, coupled with an increase in proliferation
rate, can compensate for the initial delay in regeneration. Similar to the modeled changes in
This article is protected by copyright. All rights reserved. 16
the IL-6 levels, increased GF levels in the simulated scenarios do not necessarily represent
a single growth factor but rather reflect a strengthening of the growth factor milieu and their
effects on hepatocyte replication. Based on the model predictions, we postulate that an
increased bioavailability of growth factors associated with cell-cycle progression may also
contribute to the enhanced cell-cycle rate seen in Adn-/- mice.
Biochemical analysis revealed an altered balance of cytokine and growth factor
profiles in Adn-/- mice, consistent with computational model predictions
We next analyzed biological correlates of the predicted control factors from the
computational analysis. We focused on cytokine production and response during priming (0-
6 hours post-PHx) and growth factor levels leading up to and during peak hepatocyte
replication (6-42 hours post-PHx). We evaluated the changes in the inflammatory cytokines
TNFα and IL-6 as well as several growth factors implicated in liver repair: hepatocyte growth
factor (HGF), Angiogenin-1 (Ang-1), and fibroblast growth factor 2 (FGF-2 or bFGF). TNFα
and IL-6 are the main inflammatory-type molecules identified as priming hepatocytes to enter
the cell cycle. HGF is a potent mitogen and strongly contributes to hepatocyte entry into the
cell cycle (Michalopoulos, 2007;Taub, 2004). Ang-1 contributes to regulation of angiogenesis
in a variety of pathological conditions and has been shown to be involved in several
processes involved in liver recovery from hepatectomy, including wound healing and
negative regulation of inflammation (Lee et al, 2014;Pan et al, 2012). In contrast to these two
growth factors, FGF2 is not typically associated with liver repair, and genetic deletion does
not impair regeneration post-PHx (Sturm et al, 2004). When FGF2 is deleted, however,
VEGF increases post-PHx above that in WT mice, indicating that FGF2 may act
synergistically with VEGF to maintain liver architecture, activate non-parenchymal cells, and
induce hepatocyte replication.
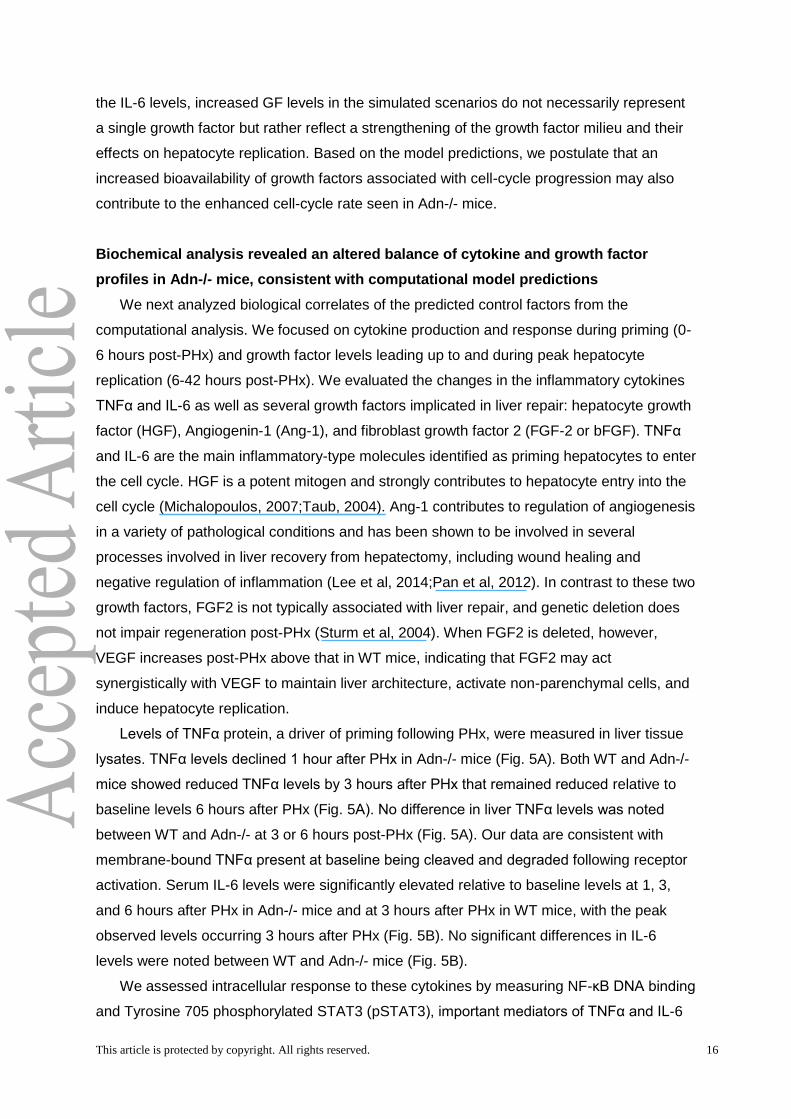
Levels of TNFα protein, a driver of priming following PHx, were measured in liver tissue
lysates. TNFα levels declined 1 hour after PHx in Adn-/- mice (Fig. 5A). Both WT and Adn-/-
mice showed reduced TNFα levels by 3 hours after PHx that remained reduced relative to
baseline levels 6 hours after PHx (Fig. 5A). No difference in liver TNFα levels was noted
between WT and Adn-/- at 3 or 6 hours post-PHx (Fig. 5A). Our data are consistent with
membrane-bound TNFα present at baseline being cleaved and degraded following receptor
activation. Serum IL-6 levels were significantly elevated relative to baseline levels at 1, 3,
and 6 hours after PHx in Adn-/- mice and at 3 hours after PHx in WT mice, with the peak
observed levels occurring 3 hours after PHx (Fig. 5B). No significant differences in IL-6
levels were noted between WT and Adn-/- mice (Fig. 5B).
We assessed intracellular response to these cytokines by measuring NF-κB DNA binding
and Tyrosine 705 phosphorylated STAT3 (pSTAT3), important mediators of TNFα and IL-6
This article is protected by copyright. All rights reserved. 17
action, respectively (Fausto et al, 2006). A significant increase in NF-κB DNA binding activity
was observed 1 hour after PHx in Adn-/- mice (Fig. 5C), simultaneous with the observed
reduction in tissue levels of TNFα protein (Fig. 5A). NF-κB activity remained elevated at 3
and 6 hours after PHx in Adn-/- mice. Although NF-κB was significantly elevated only at 3
hours after PHx in WT mice, no significant differences in NF-κB DNA binding activity
detected between WT and Adn-/- mice (Fig. 5C). Although pSTAT3 levels at baseline were
low in both genotypes, Adn-/- mice had significantly lower baseline pSTAT3 level than WT
mice (Fig. 5D,E). pSTAT3 levels increased relative to baseline levels in Adn-/- but not WT
mice 1 hour after PHx (Fig. 5D,E). Liver pSTAT3 was significantly elevated in WT mice
relative to baseline at 3 and 6 hours after PHx (Fig. 5D,E), coinciding with elevated serum IL-
6 levels (Fig. 5B). Despite similar IL-6 levels in WT and Adn-/- mice at 3 and 6 hours after
PHx (Fig. 5B), pSTAT3 was significantly lower in Adn-/- mice than WT mice at 3 hours after
PHx (Fig. 5D,E), possibly leading to reduced hepatocyte priming.
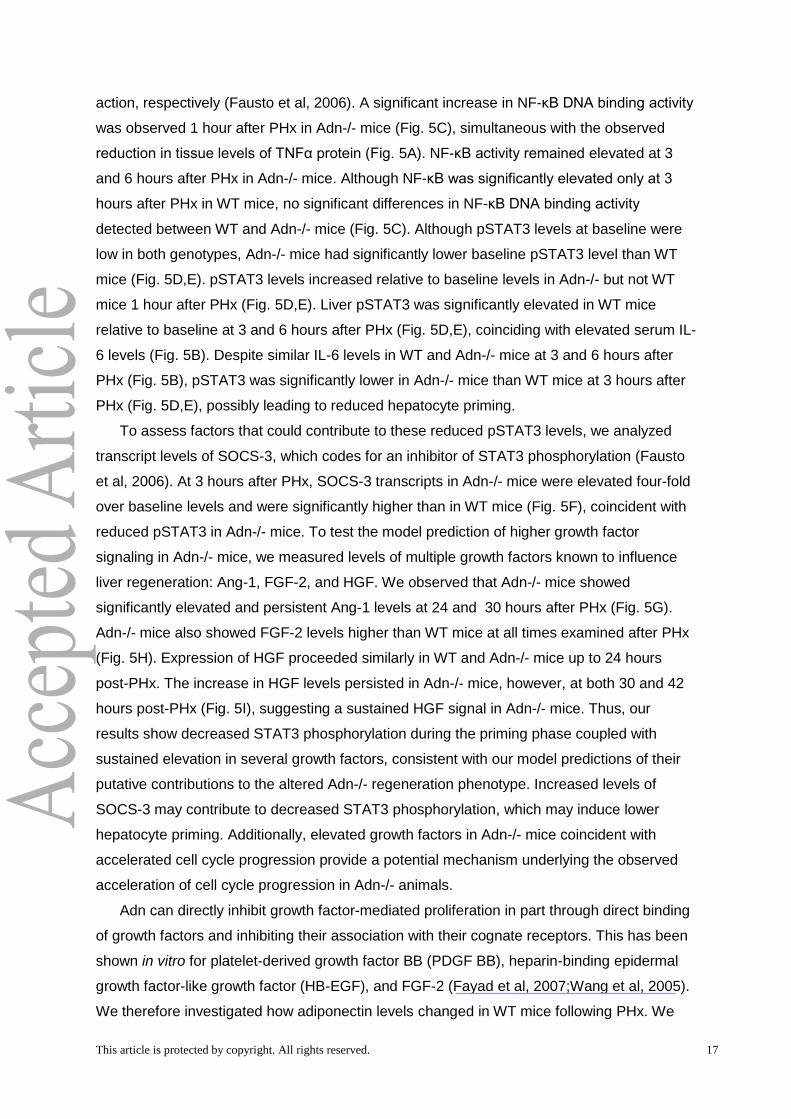
To assess factors that could contribute to these reduced pSTAT3 levels, we analyzed
transcript levels of SOCS-3, which codes for an inhibitor of STAT3 phosphorylation (Fausto
et al, 2006). At 3 hours after PHx, SOCS-3 transcripts in Adn-/- mice were elevated four-fold
over baseline levels and were significantly higher than in WT mice (Fig. 5F), coincident with
reduced pSTAT3 in Adn-/- mice. To test the model prediction of higher growth factor
signaling in Adn-/- mice, we measured levels of multiple growth factors known to influence
liver regeneration: Ang-1, FGF-2, and HGF. We observed that Adn-/- mice showed
significantly elevated and persistent Ang-1 levels at 24 and 30 hours after PHx (Fig. 5G).
Adn-/- mice also showed FGF-2 levels higher than WT mice at all times examined after PHx
(Fig. 5H). Expression of HGF proceeded similarly in WT and Adn-/- mice up to 24 hours
post-PHx. The increase in HGF levels persisted in Adn-/- mice, however, at both 30 and 42
hours post-PHx (Fig. 5I), suggesting a sustained HGF signal in Adn-/- mice. Thus, our
results show decreased STAT3 phosphorylation during the priming phase coupled with
sustained elevation in several growth factors, consistent with our model predictions of their
putative contributions to the altered Adn-/- regeneration phenotype. Increased levels of
SOCS-3 may contribute to decreased STAT3 phosphorylation, which may induce lower
hepatocyte priming. Additionally, elevated growth factors in Adn-/- mice coincident with
accelerated cell cycle progression provide a potential mechanism underlying the observed
acceleration of cell cycle progression in Adn-/- animals.
Adn can directly inhibit growth factor-mediated proliferation in part through direct binding
of growth factors and inhibiting their association with their cognate receptors. This has been
shown in vitro for platelet-derived growth factor BB (PDGF BB), heparin-binding epidermal
growth factor-like growth factor (HB-EGF), and FGF-2 (Fayad et al, 2007;Wang et al, 2005).
We therefore investigated how adiponectin levels changed in WT mice following PHx. We
This article is protected by copyright. All rights reserved. 18
found that serum Adn decreased significantly during the onset of S phase in WT mice, 30h
post-PHx, and remained low through 48 hours post-PHx (Fig. 6).
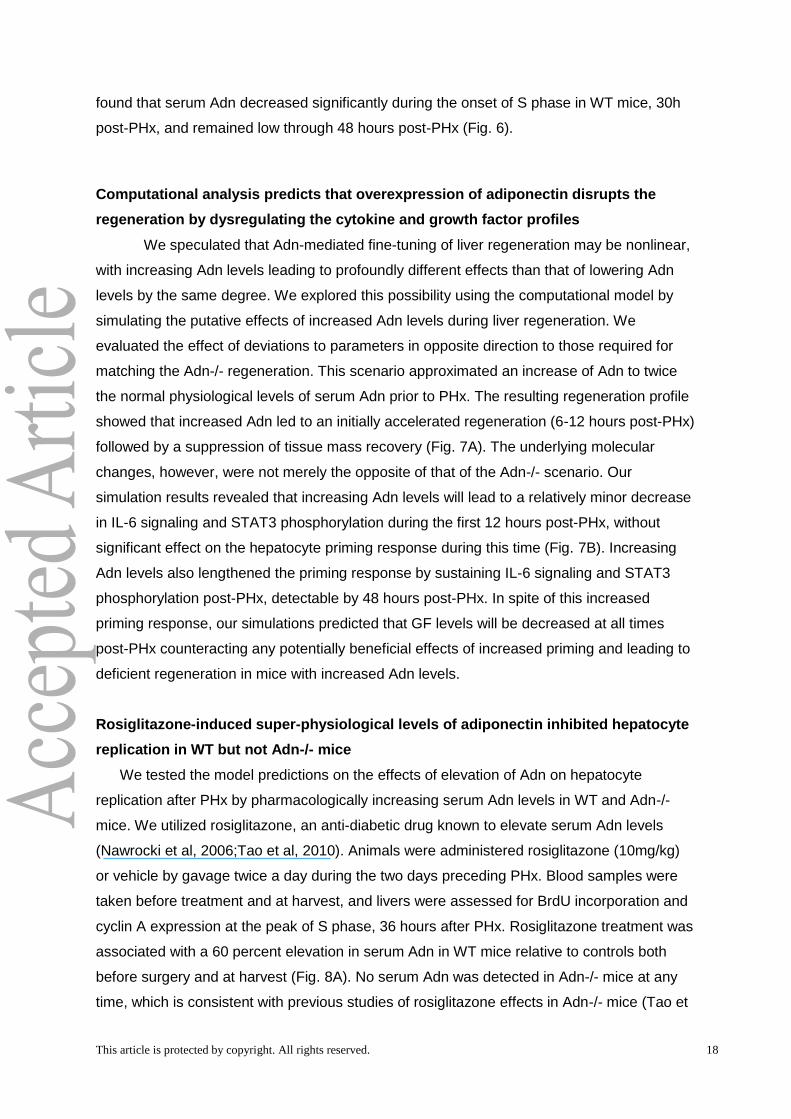
Computational analysis predicts that overexpression of adiponectin disrupts the
regeneration by dysregulating the cytokine and growth factor profiles
We speculated that Adn-mediated fine-tuning of liver regeneration may be nonlinear,
with increasing Adn levels leading to profoundly different effects than that of lowering Adn
levels by the same degree. We explored this possibility using the computational model by
simulating the putative effects of increased Adn levels during liver regeneration. We
evaluated the effect of deviations to parameters in opposite direction to those required for
matching the Adn-/- regeneration. This scenario approximated an increase of Adn to twice
the normal physiological levels of serum Adn prior to PHx. The resulting regeneration profile
showed that increased Adn led to an initially accelerated regeneration (6-12 hours post-PHx)
followed by a suppression of tissue mass recovery (Fig. 7A). The underlying molecular
changes, however, were not merely the opposite of that of the Adn-/- scenario. Our
simulation results revealed that increasing Adn levels will lead to a relatively minor decrease
in IL-6 signaling and STAT3 phosphorylation during the first 12 hours post-PHx, without
significant effect on the hepatocyte priming response during this time (Fig. 7B). Increasing
Adn levels also lengthened the priming response by sustaining IL-6 signaling and STAT3
phosphorylation post-PHx, detectable by 48 hours post-PHx. In spite of this increased
priming response, our simulations predicted that GF levels will be decreased at all times
post-PHx counteracting any potentially beneficial effects of increased priming and leading to
deficient regeneration in mice with increased Adn levels.
Rosiglitazone-induced super-physiological levels of adiponectin inhibited hepatocyte
replication in WT but not Adn-/- mice
We tested the model predictions on the effects of elevation of Adn on hepatocyte
replication after PHx by pharmacologically increasing serum Adn levels in WT and Adn-/-
mice. We utilized rosiglitazone, an anti-diabetic drug known to elevate serum Adn levels
(Nawrocki et al, 2006;Tao et al, 2010). Animals were administered rosiglitazone (10mg/kg)
or vehicle by gavage twice a day during the two days preceding PHx. Blood samples were
taken before treatment and at harvest, and livers were assessed for BrdU incorporation and
cyclin A expression at the peak of S phase, 36 hours after PHx. Rosiglitazone treatment was
associated with a 60 percent elevation in serum Adn in WT mice relative to controls both
before surgery and at harvest (Fig. 8A). No serum Adn was detected in Adn-/- mice at any
time, which is consistent with previous studies of rosiglitazone effects in Adn-/- mice (Tao et
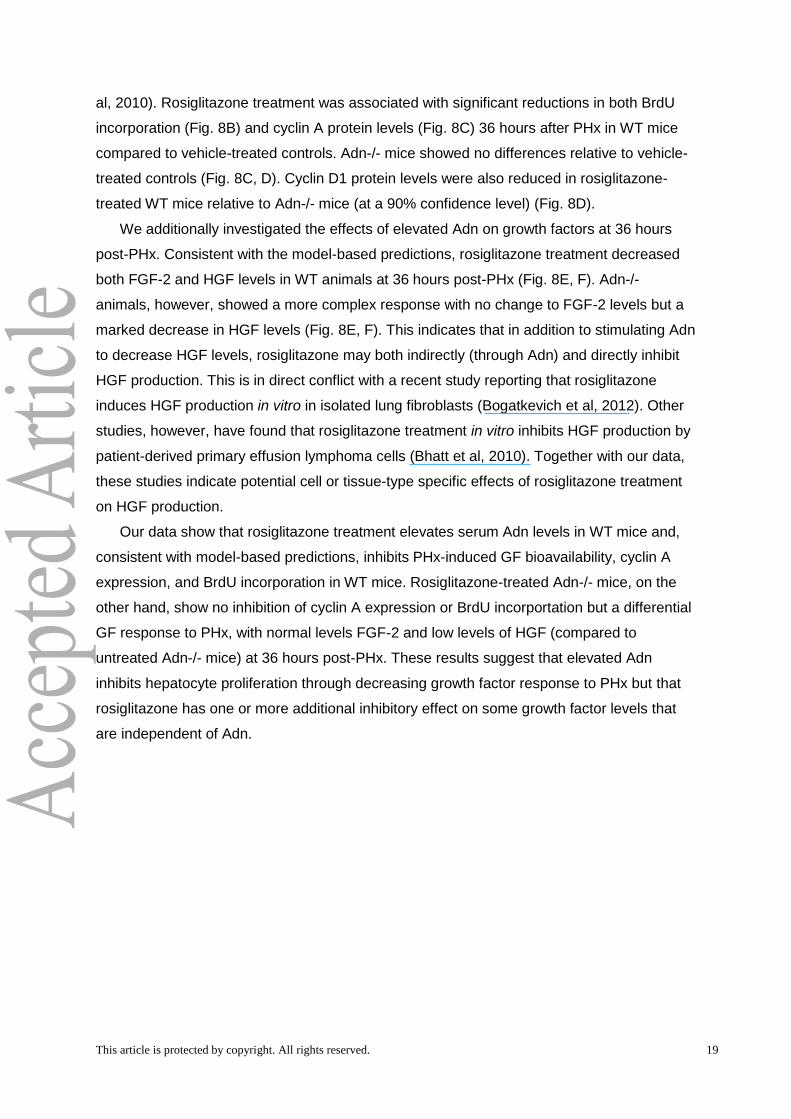
This article is protected by copyright. All rights reserved. 19
al, 2010). Rosiglitazone treatment was associated with significant reductions in both BrdU
incorporation (Fig. 8B) and cyclin A protein levels (Fig. 8C) 36 hours after PHx in WT mice
compared to vehicle-treated controls. Adn-/- mice showed no differences relative to vehicle-
treated controls (Fig. 8C, D). Cyclin D1 protein levels were also reduced in rosiglitazone-
treated WT mice relative to Adn-/- mice (at a 90% confidence level) (Fig. 8D).
We additionally investigated the effects of elevated Adn on growth factors at 36 hours
post-PHx. Consistent with the model-based predictions, rosiglitazone treatment decreased
both FGF-2 and HGF levels in WT animals at 36 hours post-PHx (Fig. 8E, F). Adn-/-
animals, however, showed a more complex response with no change to FGF-2 levels but a
marked decrease in HGF levels (Fig. 8E, F). This indicates that in addition to stimulating Adn
to decrease HGF levels, rosiglitazone may both indirectly (through Adn) and directly inhibit
HGF production. This is in direct conflict with a recent study reporting that rosiglitazone
induces HGF production in vitro in isolated lung fibroblasts (Bogatkevich et al, 2012). Other
studies, however, have found that rosiglitazone treatment in vitro inhibits HGF production by
patient-derived primary effusion lymphoma cells (Bhatt et al, 2010). Together with our data,
these studies indicate potential cell or tissue-type specific effects of rosiglitazone treatment
on HGF production.
Our data show that rosiglitazone treatment elevates serum Adn levels in WT mice and,
consistent with model-based predictions, inhibits PHx-induced GF bioavailability, cyclin A
expression, and BrdU incorporation in WT mice. Rosiglitazone-treated Adn-/- mice, on the
other hand, show no inhibition of cyclin A expression or BrdU incorportation but a differential
GF response to PHx, with normal levels FGF-2 and low levels of HGF (compared to
untreated Adn-/- mice) at 36 hours post-PHx. These results suggest that elevated Adn
inhibits hepatocyte proliferation through decreasing growth factor response to PHx but that
rosiglitazone has one or more additional inhibitory effect on some growth factor levels that
are independent of Adn.
This article is protected by copyright. All rights reserved. 20
Discussion
The partial hepatectomy studies reported here demonstrate that Adn-/- mice have a
delayed onset of hepatocyte proliferation compared to WT mice after PHx but show no
difference in BrdU incorporation or liver mass recovery 54 hours after PHx. This suggests
that the loss of Adn suppresses the processes associated with priming of the liver, at least in
part through a deregulation of STAT3 signaling. Cell-cycle kinetics, however, eventually
accelerate to normalize the regenerative response. Our model analysis suggests that this
acceleration is likely due to sustained increases in critical pro-proliferative growth factors.
During hepatocyte priming, Adn-/- mice have similar serum IL-6 levels to WT mice;
however they have reduced pSTAT3, coupled with increased expression of the STAT3
inhibitor SOCS3. The computational model suggests that small deficiencies in IL-6 signaling
transduction during the priming phase (modeled as ~2% decrease in IL-6 levels) in Adn-/-
mice may be responsible for larger decreases in downstream STAT3 phosphorylation (up to
~25% decrease, based on the model). Two clear implications arise from these results. The
first implication is that subtle, unobservable changes in upstream signaling may cause large,
significant changes downstream. Therefore, it is important to consider systems-level
interactions when unraveling complex disease phenotypes. The second implication is that
interventions with relatively small effect on targeted upstream regulators may be effective at
renormalizing the altered regeneration phenotypes.
Our data showing delayed onset of hepatocyte proliferation after PHx is consistent
with previous reports involving Adn-/- mice (Ezaki et al, 2009;Shu et al, 2009). In addition,
Shu et al. also observed reduced STAT3 activation coordinate with SOCS3 upregulation at
24 and 48 hours after PHx in Adn-/- mice relative to WT. However, STAT3 phosphorylation
at these times is much lower than STAT3 phosphorylation at 3 and 6 hours after PHx
(Aoyama et al, 2009), and the functional importance of the later phosphorylation remains
unclear.
Additionally, other signaling processes may contribute to the observed profile. Adn may
also regulate changes in liver ceramide levels after hepatectomy (Correnti et al, 2014). TNFα
is a potent activator of sphingomyelinase which hydrolyzes sphingomyelin to ceramide.
Therefore, inflammatory signals early after PHx likely promote increases in cellular
ceramide, which have been observed after PHx (Alessenko et al, 1999). We expect this
effect to be enhanced in Adn-/- mice because of the absence of Adn receptor-dependent
ceramidase activity (Holland et al, 2011). Increased ceramide levels have also recently been
linked to elevated levels of the tyrosine phosphatase SHP-1 (Gopalan et al, 2013). Increased
SHP-1, which can dephosphorylate STAT3, provides an additional potential mechanism for
the abrogated STAT3 signaling observed in Adn-/- mice.
This article is protected by copyright. All rights reserved. 21
While hepatocytes are in the replicating stage of regeneration, Adn-/- mice have
sustained higher levels of growth factors that are known drivers of regeneration as well as
growth factors not typically associated with regeneration. HGF is one of only a few potent
mitogens which can induce hepatocyte proliferation without the benefit of cofactors (Court et
al, 2002). It is produced predominantly in hepatic stellate cells, can be bound to the ECM,
and is released from ECM matrix metalloproteases produced by non-parenchymal cells.
HGF signals through the c-Met receptor in hepatoctyes to stimulate regeneration
(Michalopoulos, 2007;Taub, 2004). The sustained increase in HGF suggests hepatocytes
from Adn-/- mice receive a more sustained growth signal, which may both promote cell cycle
entry and contribute to the accelerated cell cycle progression in Adn-/- mice. Ang-1 is one of
the highest expressed genes in activated hepatic stellate cells in vitro and contributes to
vascularization in tissues (Jiang et al, 2006;Pan et al, 2012). Higher Ang-1 levels likely
correspond to increased tissue remodeling in Adn-/- mice to maintain liver architecture
during later periods of enhanced regeneration. In contrast to these two growth factors, FGF2
has been shown to have little effect during liver regeneration in wild-type animals. It is
therefore not surprising that FGF2 levels were not altered after PHx in WT mice. In contrast,
Adn-/- mice expressed elevated FGF2 following PHx, suggesting that Adn negatively
regulates the FGF2 response. Also, an earlier report of an increase in VEGF after PHx in
mice carrying a genetic deletion of FGF2 suggests that FGF2 can act similarly to VEGF to
regulate liver structure and non-parenchymal cell activity. By measuring these three growth
factors, we were able to characterize classical growth factor signaling to hepatocytes,
remodeling growth factor signaling influencing non-parenchymal cell activity, and
compensatory or additional growth factor signaling (Sturm et al, 2004). The sustained
bioavailability of these growth factors in Adn-/- mice suggests that cells producing these
growth factors (predominantly hepatic stellate cells) may be constitutively activated or
activated to an alternate phenotype following PHx in the absence of Adn (Friedman,
2008;Jiang et al, 2006).
A recent study suggests that Adn may inhibit hepatic stellate cell activation and induce
apoptosis by binding to AdipoR1 and AdipoR2, inducing activation of PPAR-α (Ding et al,
2005). It is possible that the absence of Adn removes this inhibition on stellate cell activation
thus enabling stellate cell-produced factors to persist longer in the liver, including the growth
factors FGF-2, Ang-1, and HGF. The altered dynamics of growth factor signaling during the
first 20 hours post-PHx, however, indicates that the modulatory effect of Adn on stellate cells
is more complex than a simple activation/deactivation relationship.
Adn has also been shown to directly inhibit growth factor-mediated proliferation in
part through direct binding of growth factors and inhibiting their association with their
cognate receptors (Fayad et al, 2007;Wang et al, 2005). We observed significant decreases
This article is protected by copyright. All rights reserved. 22
in serum Adn during the onset of S phase in WT mice, 30h post-PHx. While these decreases
were modest, because serum Adn levels are tightly regulated, small decreases in Adn may
have larger effects on sequestering GFs (Nawrocki et al, 2006). Although GFs were higher in
Adn-/- mice, we noted no differences in cyclin D1 expression between genotypes at this
time, suggesting the effect of elevated Adn is to block hepatocyte cell cycle after G1,
potentially at the G1/S transition. We have investigated intracellular pathways classically
activated by growth factors (ERK, JNK, Akt) but have found no differential regulation
between WT and Adn-/- mice.
Rosiglitazone also modulates liver regeneration, likely in part through raising serum
adiponectin. Rosiglitazone-treated mice show higher levels of serum adiponectin and
opposite changes in the progression of regeneration to that observed in Adn-/- mice.
Rosiglitazone-treated mice have lower growth factor levels and lower regeneration markers
than WT mice. Our data show that deficient regeneration is associated with a significant
elevation of serum adiponectin in WT mice and is abrogated in the Adn-/- mice, suggesting
that adiponectin is required for this effect. This is also consistent with a growing body of
literature demonstrating that adiponectin is required for the full beneficial effects of
rosiglitazone treatment in diabetic patients (Combs et al, 2002;Hoo et al, 2007;Nawrocki et
al, 2006;Tao et al, 2010). Rosiglitazone, however, may have an additional inhibitory effect on
HGF production that is independent of Adn.
These results have further implications the systemic effects of rosiglitazone (and
possibly other drugs of the glitazone class that act through increasing Adn levels).
Rosiglitazone, which likely has tissue-specific effects, does not specifically target the liver.
Previous studies have shown that rosiglitazone treatment increases risk of myocardial
infarction and subsequent death from cardiovascular causes in humans (Nissen & Wolski,
2007), decreases the extent of lung injury in animals (Honiden & Gong, 2009), and may be
protective in cancer (Monami et al, 2008), in addition to blunting liver repair as we have
shown in the present study and has been shown previously (Turmelle et al, 2006).
Additionally, our study suggests that Adn is required for the suppressive effect of
rosiglitazone on liver regeneration. It is possible that the sustained inflammatory response to
injury and reduced GF response that we observed may parallel the effect of rosiglitazone on
other tissues as well, which may also be mediated by Adn.
Our integrated experimental and computational modeling demonstrates that Adn
regulates liver regeneration through modulating multiple opposing hepatocyte signaling
inputs from non-parenchymal cells governing the rate of progression through the cell cycle,
cytokine signaling, and growth factor bioavailability. Adn likely fine-tunes the dynamics of
regeneration by enhancing onset of hepatocyte proliferation during the priming phase by
This article is protected by copyright. All rights reserved. 23
increasing STAT3 phosphorylation but suppressing overall liver regeneration through
sequestration of GFs and decreasing GF persistence in the liver.
References
Aksamitiene E, Hoek JB, Kholodenko B, Kiyatkin A. (2007) Multistrip Western blotting to increase quantitative data output. Electrophoresis 28 (18):3163-3173
Alessenko AV, Platonova LV, Sakevarashvili GR, Khrenov AV, Shingarova LN, Shono NI, Galperin EI (1999) Role of endogenous TNF-alpha and sphingosine in induced DNA synthesis in regenerating rat liver after partial hepatectomy. Biochemistry (Mosc) 64:890-895
Aoyama T, Ikejima K, Kon K, Okumura K, Arai K, Watanabe S (2009) Pioglitazone promotes survival and prevents hepatic regeneration failure after partial hepatectomy in obese and diabetic KK-A(y) mice. Hepatology 49:1636-1644. doi: 10.1002/hep.22828; 10.1002/hep.22828
Arita Y, Kihara S, Ouchi N, Maeda K, Kuriyama H, Okamoto Y, Kumada M, Hotta K, Nishida M, Takahashi M, Nakamura T, Shimomura I, Muraguchi M, Ohmoto Y, Funahashi T, Matsuzawa Y (2002) Adipocyte-derived plasma protein adiponectin acts as a platelet-derived growth factor-BB-binding protein and regulates growth factor-induced common postreceptor signal in vascular smooth muscle cell. Circulation 105:2893-2898
Awazawa M, Ueki K, Inabe K, Yamauchi T, Kubota N, Kaneko K, Kobayashi M, Iwane A, Sasako T, Okazaki Y, Ohsugi M, Takamoto I, Yamashita S, Asahara H, Akira S, Kasuga M, Kadowaki T (2011) Adiponectin enhances insulin sensitivity by increasing hepatic IRS-2 expression via a macrophage-derived IL-6-dependent pathway. Cell Metab 13:401-412. doi: 10.1016/j.cmet.2011.02.010; 10.1016/j.cmet.2011.02.010
Barra R, Hall JC (1977) Liver regeneration in normal and alloxan-induced diabetic rats. J Exp Zool 201:93-99. doi: 10.1002/jez.1402010111 [doi]
Bhatt AP, Bhende PM, Sin SH, Roy D, Dittmer DP, Damania B (2010) Dual inhibition of PI3K and mTOR inhibits autocrine and paracrine proliferative loops in PI3K/Akt/mTOR-addicted lymphomas. Blood 115:4455-4463. doi: 10.1182/blood-2009-10-251082 [doi]
Bogatkevich GS, Highland KB, Akter T, Silver RM (2012) The PPARgamma Agonist Rosiglitazone Is Antifibrotic for Scleroderma Lung Fibroblasts: Mechanisms of Action and Differential Racial Effects. Pulm Med 2012:545172. doi: 10.1155/2012/545172 [doi]
Bratley P, Fox B (1988) Algorithm 659 Implementing Sobol's Quasirandom Sequence Generator. ACM Transactions on Mathematical Software 14:88-100
Combs TP, Wagner JA, Berger J, Doebber T, Wang WJ, Zhang BB, Tanen M, Berg AH, O'Rahilly S, Savage DB, Chatterjee K, Weiss S, Larson PJ, Gottesdiener KM, Gertz BJ, Charron MJ, Scherer PE, Moller DE (2002) Induction of adipocyte complement-related protein of 30 kilodaltons by PPARgamma agonists: a potential mechanism of insulin sensitization. Endocrinology 143:998-1007
This article is protected by copyright. All rights reserved. 24
Correnti JM, Juskeviciute E, Swarup A, Hoek JB (2014) Pharmacological ceramide reduction alleviates alcohol-induced steatosis and hepatomegaly in adiponectin knockout mice. Am J Physiol Gastrointest Liver Physiol 306:G959-73. doi: 10.1152/ajpgi.00395.2013 [doi]
Court FG, Wemyss-Holden SA, Dennison AR, Maddern GJ (2002) The mystery of liver regeneration. Br J Surg 89:1089-1095. doi: 2166 [pii]
Crumm S, Cofan M, Juskeviciute E, Hoek JB (2008) Adenine nucleotide changes in the remnant liver: An early signal for regeneration after partial hepatectomy. Hepatology 48:898-908. doi: 10.1002/hep.22421; 10.1002/hep.22421
Ding X, Saxena NK, Lin S, Xu A, Srinivasan S, Anania FA (2005) The roles of leptin and adiponectin: a novel paradigm in adipocytokine regulation of liver fibrosis and stellate cell biology. Am J Pathol 166:1655-1669. doi: S0002-9440(10)62476-5 [pii]
Ezaki H, Yoshida Y, Saji Y, Takemura T, Fukushima J, Matsumoto H, Kamada Y, Wada A, Igura T, Kihara S, Funahashi T, Shimomura I, Tamura S, Kiso S, Hayashi N (2009) Delayed liver regeneration after partial hepatectomy in adiponectin knockout mice. Biochem Biophys Res Commun 378:68-72. doi: 10.1016/j.bbrc.2008.10.176; 10.1016/j.bbrc.2008.10.176
Fausto N, Campbell JS, Riehle KJ (2006) Liver regeneration. Hepatology 43:S45-53. doi: 10.1002/hep.20969
Fayad R, Pini M, Sennello JA, Cabay RJ, Chan L, Xu A, Fantuzzi G (2007) Adiponectin deficiency protects mice from chemically induced colonic inflammation. Gastroenterology 132:601-614. doi: 10.1053/j.gastro.2006.11.026
Friedman SL (2008) Hepatic stellate cells: protean, multifunctional, and enigmatic cells of the liver. Physiol Rev 88:125-172. doi: 10.1152/physrev.00013.2007 [doi]
Furchtgott LA, Chow CC, Periwal V (2009) A model of liver regeneration. Biophys J 96:3926-3935. doi: 10.1016/j.bpj.2009.01.061; 10.1016/j.bpj.2009.01.061
Gopalan A, Yu W, Sanders BG, Kline K (2013) Eliminating drug resistant breast cancer stem-like cells with combination of simvastatin and gamma-tocotrienol. Cancer Lett 328:285-296. doi: 10.1016/j.canlet.2012.10.003; 10.1016/j.canlet.2012.10.003
Gunawan R, Doyle FJ,3rd (2007) Phase sensitivity analysis of circadian rhythm entrainment. J Biol Rhythms 22:180-194. doi: 22/2/180 [pii]
Holland WL, Miller RA, Wang ZV, Sun K, Barth BM, Bui HH, Davis KE, Bikman BT, Halberg N, Rutkowski JM, Wade MR, Tenorio VM, Kuo MS, Brozinick JT, Zhang BB, Birnbaum MJ, Summers SA, Scherer PE (2011) Receptor-mediated activation of ceramidase activity initiates the pleiotropic actions of adiponectin. Nat Med 17:55-63. doi: 10.1038/nm.2277; 10.1038/nm.2277
Honiden S, Gong MN (2009) Diabetes, insulin, and development of acute lung injury. Crit Care Med 37:2455-2464. doi: 10.1097/CCM.0b013e3181a0fea5 [doi]
Hoo RL, Chow WS, Yau MH, Xu A, Tso AW, Tse HF, Fong CH, Tam S, Chan L, Lam KS (2007) Adiponectin mediates the suppressive effect of rosiglitazone on plasminogen activator inhibitor-1 production. Arterioscler Thromb Vasc Biol 27:2777-2782. doi: 10.1161/ATVBAHA.107.152462
This article is protected by copyright. All rights reserved. 25
Huh CG, Factor VM, Sanchez A, Uchida K, Conner EA, Thorgeirsson SS (2004) Hepatocyte growth factor/c-met signaling pathway is required for efficient liver regeneration and repair. Proc Natl Acad Sci U S A 101:4477-4482. doi: 10.1073/pnas.0306068101
Jiang F, Parsons CJ, Stefanovic B (2006) Gene expression profile of quiescent and activated rat hepatic stellate cells implicates Wnt signaling pathway in activation. J Hepatol 45:401-409. doi: S0168-8278(06)00226-1 [pii]
Kadowaki T, Yamauchi T, Kubota N, Hara K, Ueki K, Tobe K (2006) Adiponectin and adiponectin receptors in insulin resistance, diabetes, and the metabolic syndrome. J Clin Invest 116:1784-1792. doi: 10.1172/JCI29126 [doi]
Kajimura D, Lee HW, Riley KJ, Arteaga-Solis E, Ferron M, Zhou B, Clarke CJ, Hannun YA, Depinho RA, Guo EX, Mann JJ, Karsenty G (2013) Adiponectin Regulates Bone Mass via Opposite Central and Peripheral Mechanisms through FoxO1. Cell Metab . doi: 10.1016/j.cmet.2013.04.009; 10.1016/j.cmet.2013.04.009
Landskroner-Eiger S, Qian B, Muise ES, Nawrocki AR, Berger JP, Fine EJ, Koba W, Deng Y, Pollard JW, Scherer PE (2009) Proangiogenic contribution of adiponectin toward mammary tumor growth in vivo. Clin Cancer Res 15:3265-3276. doi: 10.1158/1078-0432.CCR-08-2649; 10.1158/1078-0432.CCR-08-2649
Lee SH, Kim KW, Min KM, Kim KW, Chang SI, Kim JC (2014) Angiogenin reduces immune inflammation via inhibition of TANK-binding kinase 1 expression in human corneal fibroblast cells. Mediators Inflamm 2014:861435. doi: 10.1155/2014/861435 [doi]
Livak KJ, Schmittgen TD (2001) Analysis of relative gene expression data using real-time quantitative PCR and the 2(-Delta Delta C(T)) Method. Methods 25:402-408. doi: 10.1006/meth.2001.1262
Meijer C, Wiezer MJ, Diehl AM, Schouten HJ, Schouten HJ, Meijer S, van Rooijen N, van Lambalgen AA, Dijkstra CD, van Leeuwen PA (2000) Kupffer cell depletion by CI2MDP-liposomes alters hepatic cytokine expression and delays liver regeneration after partial hepatectomy. Liver 20:66-77
Michalopoulos GK (2007) Liver regeneration. J Cell Physiol 213:286-300. doi: 10.1002/jcp.21172
Mitchell C, Willenbring H (2008) A reproducible and well-tolerated method for 2/3 partial hepatectomy in mice. Nat Protoc 3:1167-1170. doi: 10.1038/nprot.2008.80; 10.1038/nprot.2008.80
Monami M, Lamanna C, Marchionni N, Mannucci E (2008) Rosiglitazone and risk of cancer: a meta-analysis of randomized clinical trials. Diabetes Care 31:1455-1460. doi: 10.2337/dc07-2308 [doi]
Nawrocki AR, Rajala MW, Tomas E, Pajvani UB, Saha AK, Trumbauer ME, Pang Z, Chen AS, Ruderman NB, Chen H, Rossetti L, Scherer PE (2006) Mice lacking adiponectin show decreased hepatic insulin sensitivity and reduced responsiveness to peroxisome proliferator-activated receptor gamma agonists. J Biol Chem 281:2654-2660. doi: 10.1074/jbc.M505311200
This article is protected by copyright. All rights reserved. 26
Nissen SE, Wolski K (2007) Effect of rosiglitazone on the risk of myocardial infarction and death from cardiovascular causes. N Engl J Med 356:2457-2471. doi: 10.1056/NEJMoa072761
Pan SC, Wu LW, Chen CL, Shieh SJ, Chiu HY (2012) Angiogenin expression in burn blister fluid: implications for its role in burn wound neovascularization. Wound Repair Regen 20:731-739. doi: 10.1111/j.1524-475X.2012.00819.x [doi]
Park PH, McMullen MR, Huang H, Thakur V, Nagy LE (2007) Short-term treatment of RAW264.7 macrophages with adiponectin increases tumor necrosis factor-alpha (TNF-alpha) expression via ERK1/2 activation and Egr-1 expression: role of TNF-alpha in adiponectin-stimulated interleukin-10 production. J Biol Chem 282:21695-21703. doi: 10.1074/jbc.M701419200
Perumal TM, Gunawan R (2011) Impulse Parametric Sensitivity Analysis. Proceedings of the 18th IFAC World Congress 18:9686-9690
Shu RZ, Zhang F, Wang F, Feng DC, Li XH, Ren WH, Wu XL, Yang X, Liao XD, Huang L, Wang ZG (2009) Adiponectin deficiency impairs liver regeneration through attenuating STAT3 phosphorylation in mice. Lab Invest 89:1043-1052. doi: 10.1038/labinvest.2009.63; 10.1038/labinvest.2009.63
Sturm J, Keese M, Zhang H, Bonninghoff R, Magdeburg R, Vajkoczy P, Dono R, Zeller R, Gretz N (2004) Liver regeneration in FGF-2-deficient mice: VEGF acts as potential functional substitute for FGF-2. Liver Int 24:161-168. doi: 10.1111/j.1478-3231.2004.0896.x [doi]
Tao L, Wang Y, Gao E, Zhang H, Yuan Y, Lau WB, Chan L, Koch WJ, Ma XL (2010) Adiponectin: an indispensable molecule in rosiglitazone cardioprotection following myocardial infarction. Circ Res 106:409-417. doi: 10.1161/CIRCRESAHA.109.211797; 10.1161/CIRCRESAHA.109.211797
Taub R (2004) Liver regeneration: from myth to mechanism. Nat Rev Mol Cell Biol 5:836-847. doi: 10.1038/nrm1489
Turer AT, Scherer PE (2012) Adiponectin: mechanistic insights and clinical implications. Diabetologia 55:2319-2326. doi: 10.1007/s00125-012-2598-x; 10.1007/s00125-012-2598-x
Turmelle YP, Shikapwashya O, Tu S, Hruz PW, Yan Q, Rudnick DA (2006) Rosiglitazone inhibits mouse liver regeneration. FASEB J 20:2609-2611. doi: 10.1096/fj.06-6511fje
Wang Y, Lam KS, Xu JY, Lu G, Xu LY, Cooper GJ, Xu A (2005) Adiponectin inhibits cell proliferation by interacting with several growth factors in an oligomerization-dependent manner. J Biol Chem 280:18341-18347. doi: 10.1074/jbc.M501149200
Yamauchi T, Kadowaki T (2013) Adiponectin receptor as a key player in healthy longevity and obesity-related diseases. Cell Metab 17:185-196. doi: 10.1016/j.cmet.2013.01.001; 10.1016/j.cmet.2013.01.001
Zak DE, Stellingb J, Doyle III FJ (2005) Sensitivity analysis of oscillatory (bio)chemical systems. Computers & Chemical Engineering 29:663-673
This article is protected by copyright. All rights reserved. 27
Competing Interests
The authors declare that no conflicts of interest exist.
Author Contributions
RV and JH conceived and designed the research. JC, JH, DC and RV designed the
experimental procedures. JC, EA, AS, and DC performed the experiments. RV, BO, and DC
designed the computational analysis. DC performed the computational analysis. DC, JC,
BO, JH, and RV contributed to writing the paper.
Funding
Funding for this work was provided by R01 AA018873, R21 AA022417, and T32 AA007463.
Acknowledgements
We thank Dr. Lawrence Chan for kindly donating the Adn-/- mice used in this study
and Dr. Periwal for providing his Matlab code.
This article is protected by copyright. All rights reserved. 28
Figure 1: Analysis of hepatocyte replication after PHx in WT and adiponectin KO
mice.
A. Representative histological sections from mice at various times after PHx and injected
with BrdU 2 hrs prior to sacrifice were stained using BrdU-specific antibodies.
B. The percentage of BrdU positive hepatocytes was calculated by quantifying BrdU positive
nuclei and total nuclei from 5 representative fields at 20x magnification (n=4/group).
C. Western blot of representative liver samples probed with antibodies specific for cyclin D1,
PCNA, Cyclin A and GAPDH.
D. Quantitation of western blots for cyclin D1, PCNA, Cyclin A (n=3/group)
E. Liver to body weight ratio.
Data presented as mean +/- SEM. NS: not significant, * P<0.05, *** P<0.01 adiponectin -/-
significantly different from WT.
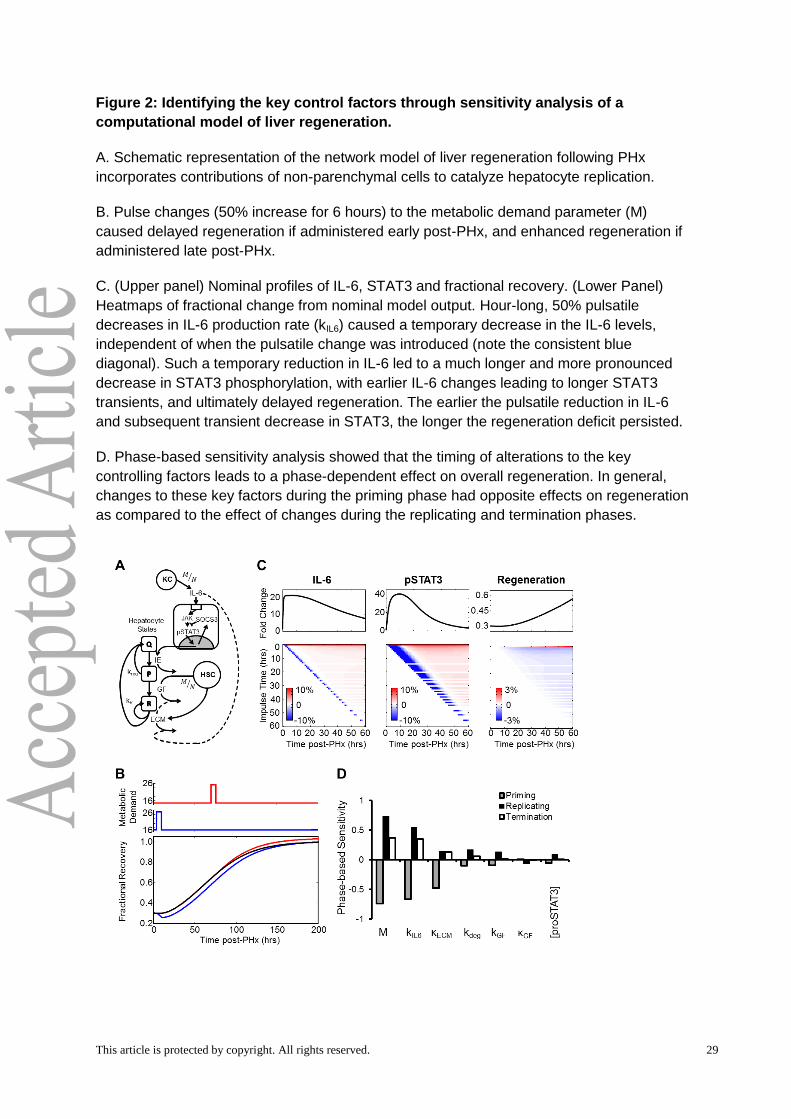
This article is protected by copyright. All rights reserved. 29
Figure 2: Identifying the key control factors through sensitivity analysis of a
computational model of liver regeneration.
A. Schematic representation of the network model of liver regeneration following PHx
incorporates contributions of non-parenchymal cells to catalyze hepatocyte replication.
B. Pulse changes (50% increase for 6 hours) to the metabolic demand parameter (M)
caused delayed regeneration if administered early post-PHx, and enhanced regeneration if
administered late post-PHx.
C. (Upper panel) Nominal profiles of IL-6, STAT3 and fractional recovery. (Lower Panel)
Heatmaps of fractional change from nominal model output. Hour-long, 50% pulsatile
decreases in IL-6 production rate (kIL6) caused a temporary decrease in the IL-6 levels,
independent of when the pulsatile change was introduced (note the consistent blue
diagonal). Such a temporary reduction in IL-6 led to a much longer and more pronounced
decrease in STAT3 phosphorylation, with earlier IL-6 changes leading to longer STAT3
transients, and ultimately delayed regeneration. The earlier the pulsatile reduction in IL-6
and subsequent transient decrease in STAT3, the longer the regeneration deficit persisted.
D. Phase-based sensitivity analysis showed that the timing of alterations to the key
controlling factors leads to a phase-dependent effect on overall regeneration. In general,
changes to these key factors during the priming phase had opposite effects on regeneration
as compared to the effect of changes during the replicating and termination phases.
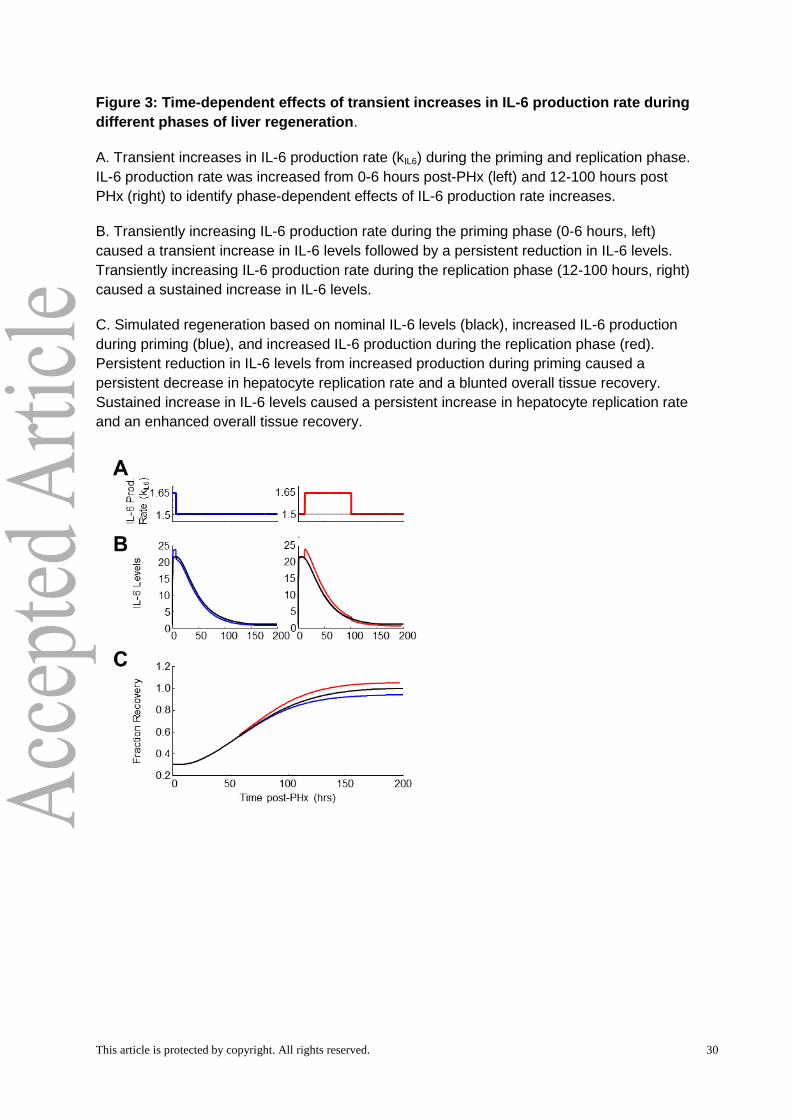
This article is protected by copyright. All rights reserved. 30
Figure 3: Time-dependent effects of transient increases in IL-6 production rate during
different phases of liver regeneration.
A. Transient increases in IL-6 production rate (kIL6) during the priming and replication phase.
IL-6 production rate was increased from 0-6 hours post-PHx (left) and 12-100 hours post
PHx (right) to identify phase-dependent effects of IL-6 production rate increases.
B. Transiently increasing IL-6 production rate during the priming phase (0-6 hours, left)
caused a transient increase in IL-6 levels followed by a persistent reduction in IL-6 levels.
Transiently increasing IL-6 production rate during the replication phase (12-100 hours, right)
caused a sustained increase in IL-6 levels.
C. Simulated regeneration based on nominal IL-6 levels (black), increased IL-6 production
during priming (blue), and increased IL-6 production during the replication phase (red).
Persistent reduction in IL-6 levels from increased production during priming caused a
persistent decrease in hepatocyte replication rate and a blunted overall tissue recovery.
Sustained increase in IL-6 levels caused a persistent increase in hepatocyte replication rate
and an enhanced overall tissue recovery.
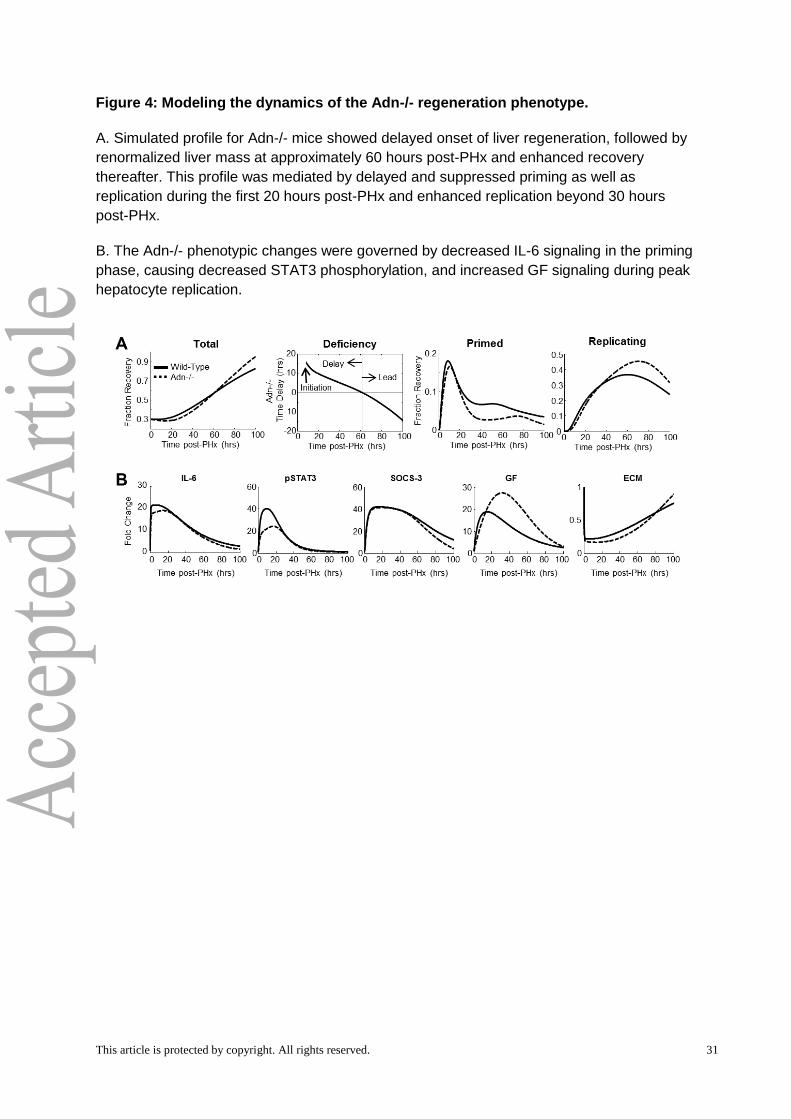
This article is protected by copyright. All rights reserved. 31
Figure 4: Modeling the dynamics of the Adn-/- regeneration phenotype.
A. Simulated profile for Adn-/- mice showed delayed onset of liver regeneration, followed by
renormalized liver mass at approximately 60 hours post-PHx and enhanced recovery
thereafter. This profile was mediated by delayed and suppressed priming as well as
replication during the first 20 hours post-PHx and enhanced replication beyond 30 hours
post-PHx.
B. The Adn-/- phenotypic changes were governed by decreased IL-6 signaling in the priming
phase, causing decreased STAT3 phosphorylation, and increased GF signaling during peak
hepatocyte replication.
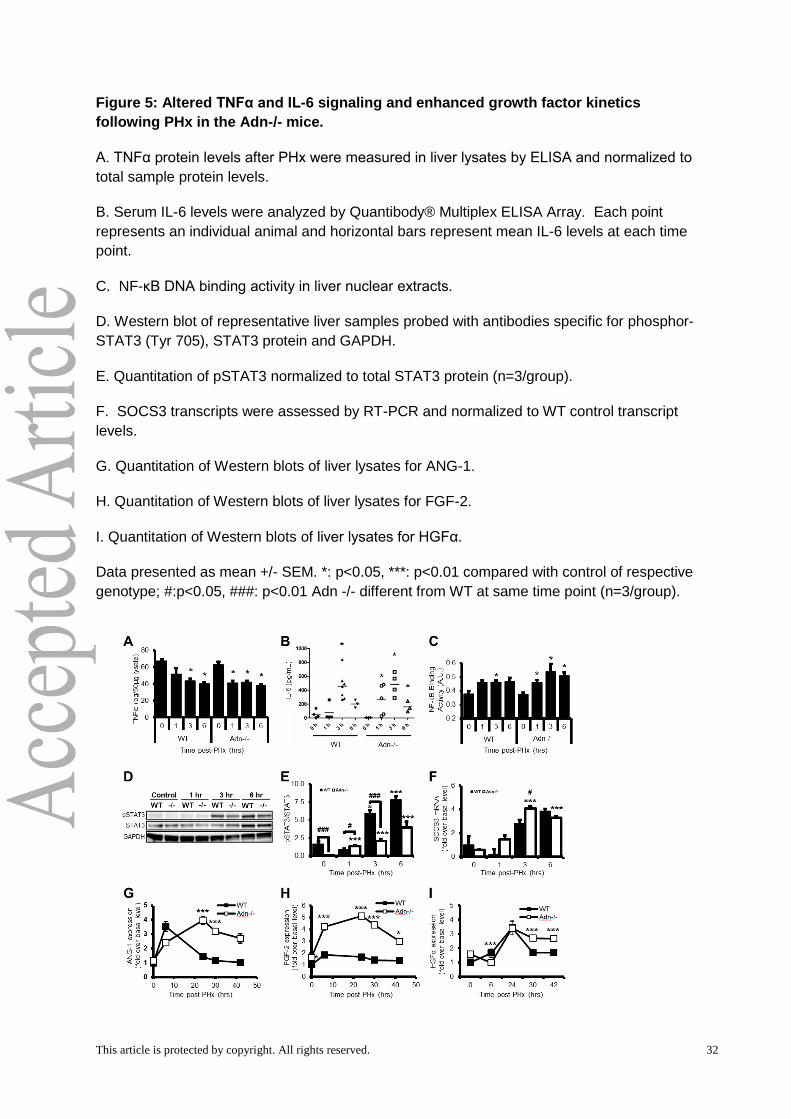
This article is protected by copyright. All rights reserved. 32
Figure 5: Altered TNFα and IL-6 signaling and enhanced growth factor kinetics
following PHx in the Adn-/- mice.
A. TNFα protein levels after PHx were measured in liver lysates by ELISA and normalized to
total sample protein levels.
B. Serum IL-6 levels were analyzed by Quantibody® Multiplex ELISA Array. Each point
represents an individual animal and horizontal bars represent mean IL-6 levels at each time
point.
C. NF-κB DNA binding activity in liver nuclear extracts.
D. Western blot of representative liver samples probed with antibodies specific for phosphor-
STAT3 (Tyr 705), STAT3 protein and GAPDH.
E. Quantitation of pSTAT3 normalized to total STAT3 protein (n=3/group).
F. SOCS3 transcripts were assessed by RT-PCR and normalized to WT control transcript
levels.
G. Quantitation of Western blots of liver lysates for ANG-1.
H. Quantitation of Western blots of liver lysates for FGF-2.
I. Quantitation of Western blots of liver lysates for HGFα.
Data presented as mean +/- SEM. *: p<0.05, ***: p<0.01 compared with control of respective
genotype; #:p<0.05, ###: p<0.01 Adn -/- different from WT at same time point (n=3/group).
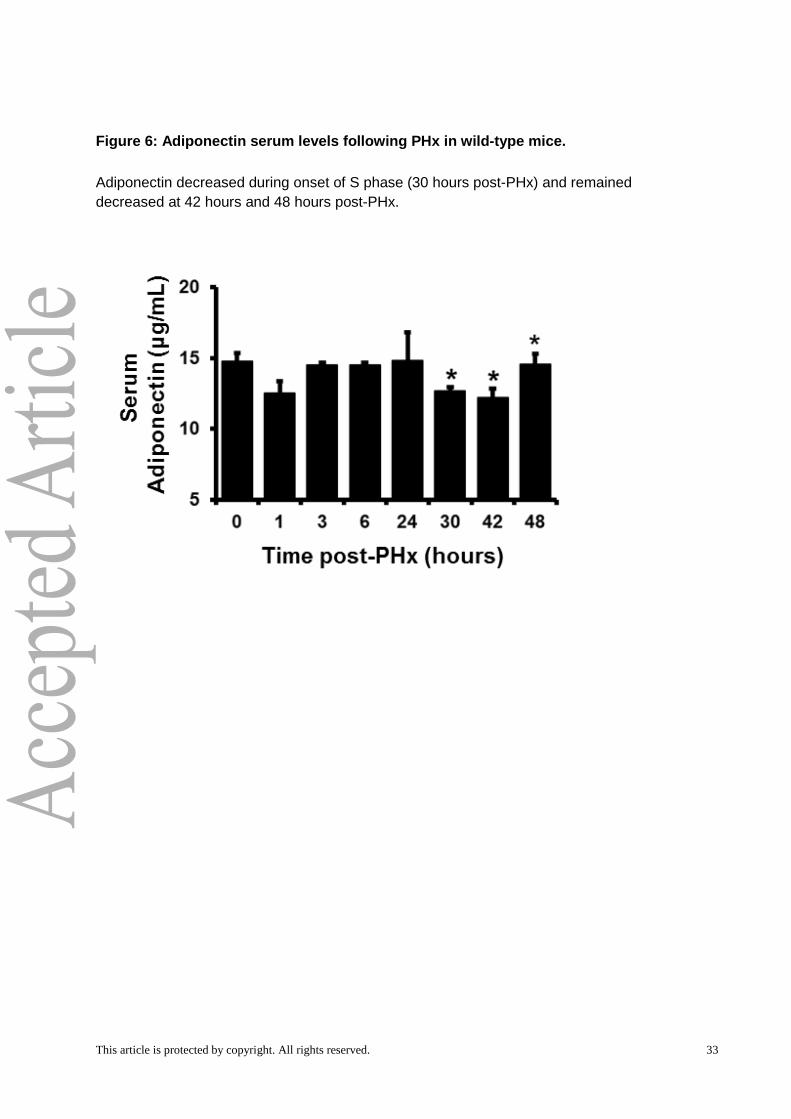
This article is protected by copyright. All rights reserved. 33
Figure 6: Adiponectin serum levels following PHx in wild-type mice.
Adiponectin decreased during onset of S phase (30 hours post-PHx) and remained
decreased at 42 hours and 48 hours post-PHx.
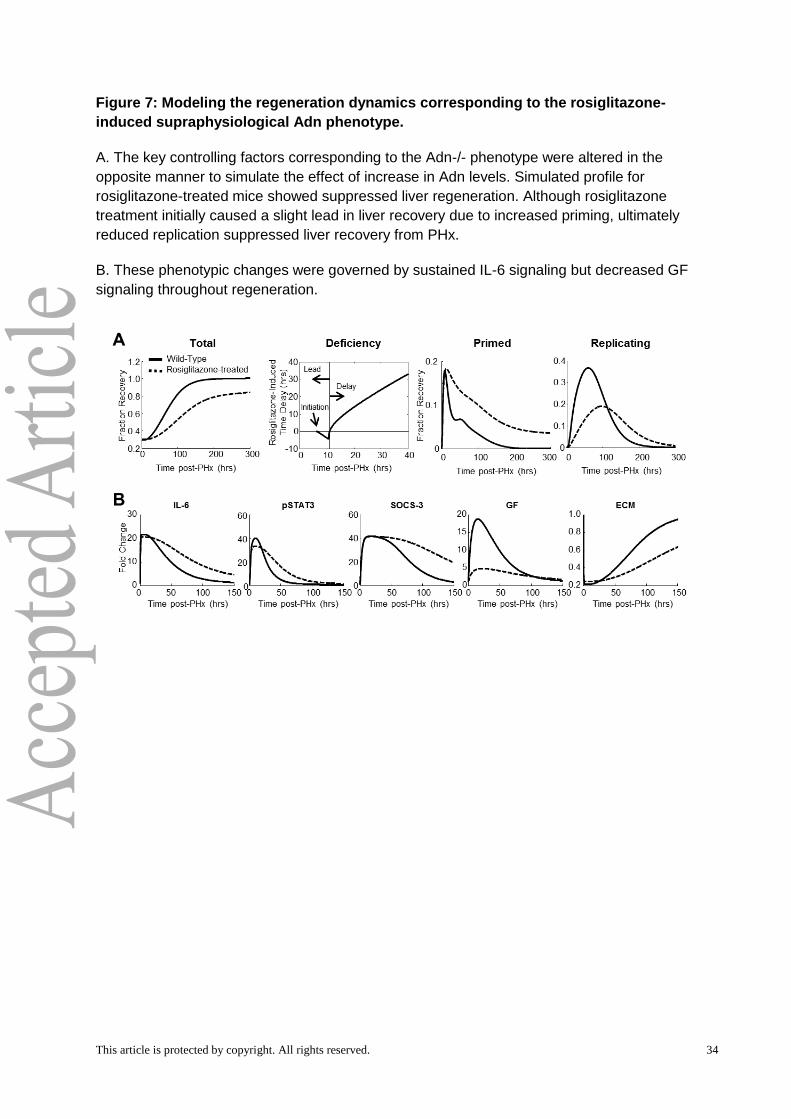
This article is protected by copyright. All rights reserved. 34
Figure 7: Modeling the regeneration dynamics corresponding to the rosiglitazone-
induced supraphysiological Adn phenotype.
A. The key controlling factors corresponding to the Adn-/- phenotype were altered in the
opposite manner to simulate the effect of increase in Adn levels. Simulated profile for
rosiglitazone-treated mice showed suppressed liver regeneration. Although rosiglitazone
treatment initially caused a slight lead in liver recovery due to increased priming, ultimately
reduced replication suppressed liver recovery from PHx.
B. These phenotypic changes were governed by sustained IL-6 signaling but decreased GF
signaling throughout regeneration.
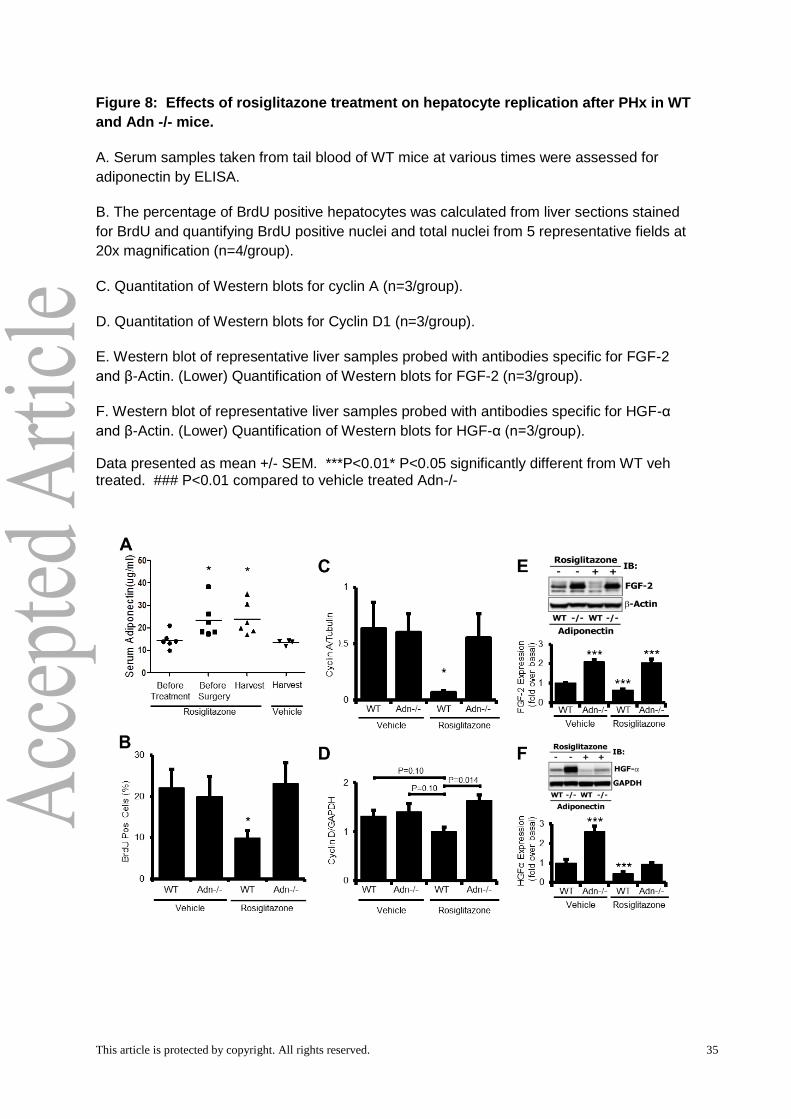
This article is protected by copyright. All rights reserved. 35
Figure 8: Effects of rosiglitazone treatment on hepatocyte replication after PHx in WT
and Adn -/- mice.
A. Serum samples taken from tail blood of WT mice at various times were assessed for
adiponectin by ELISA.
B. The percentage of BrdU positive hepatocytes was calculated from liver sections stained
for BrdU and quantifying BrdU positive nuclei and total nuclei from 5 representative fields at
20x magnification (n=4/group).
C. Quantitation of Western blots for cyclin A (n=3/group).
D. Quantitation of Western blots for Cyclin D1 (n=3/group).
E. Western blot of representative liver samples probed with antibodies specific for FGF-2
and β-Actin. (Lower) Quantification of Western blots for FGF-2 (n=3/group).
F. Western blot of representative liver samples probed with antibodies specific for HGF-α
and β-Actin. (Lower) Quantification of Western blots for HGF-α (n=3/group).
Data presented as mean +/- SEM. ***P<0.01* P<0.05 significantly different from WT veh treated. ### P<0.01 compared to vehicle treated Adn-/-
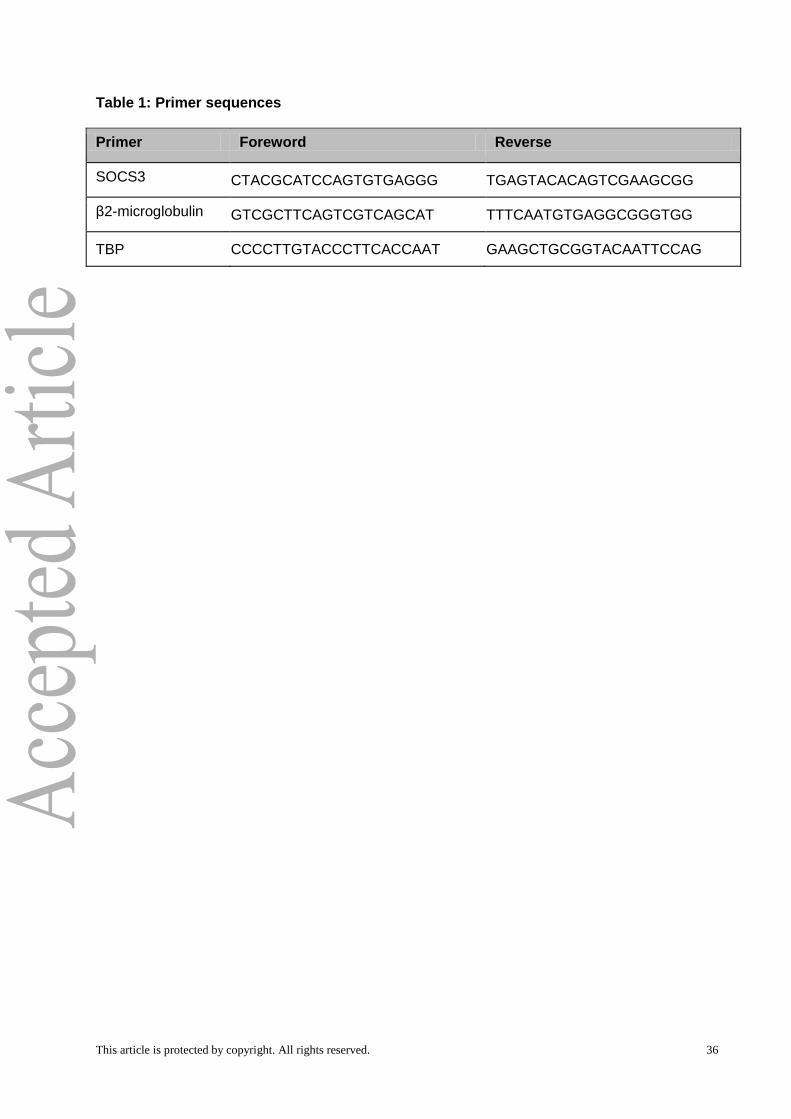
This article is protected by copyright. All rights reserved. 36
Table 1: Primer sequences
Primer Foreword Reverse
SOCS3 CTACGCATCCAGTGTGAGGG TGAGTACACAGTCGAAGCGG β2-microglobulin GTCGCTTCAGTCGTCAGCAT TTTCAATGTGAGGCGGGTGG
TBP CCCCTTGTACCCTTCACCAAT GAAGCTGCGGTACAATTCCAG
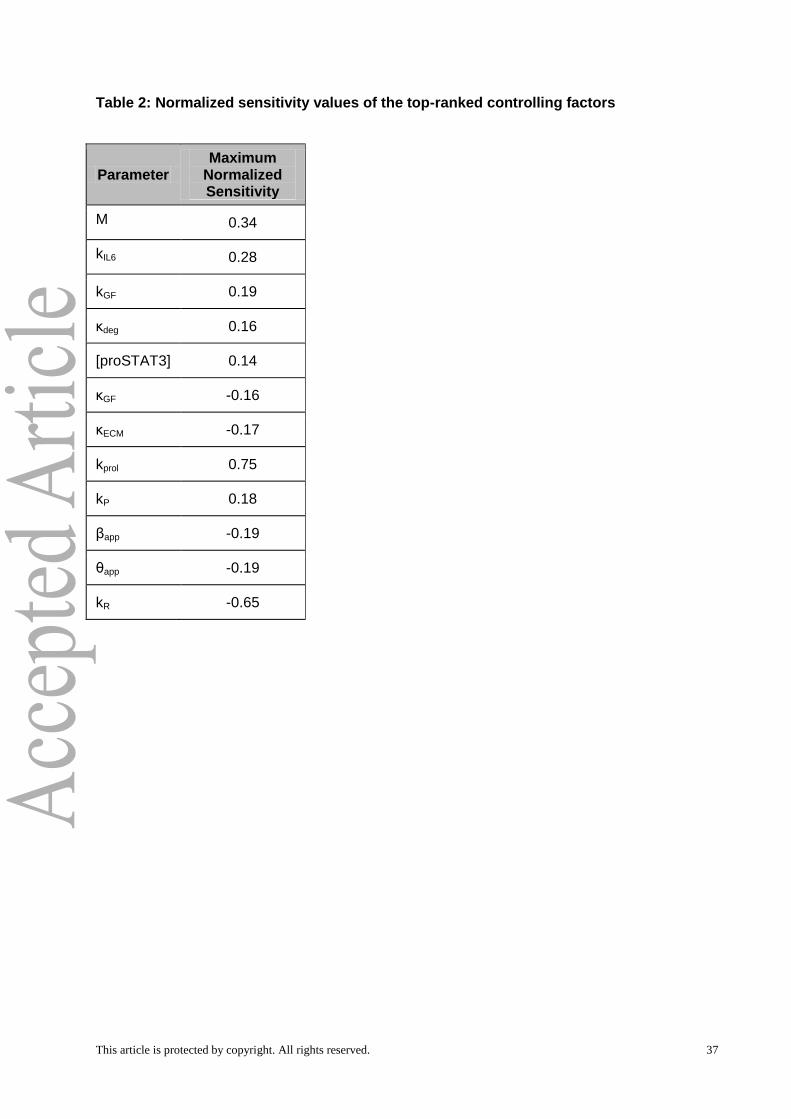
This article is protected by copyright. All rights reserved. 37
Table 2: Normalized sensitivity values of the top-ranked controlling factors
Parameter Maximum
Normalized Sensitivity
M 0.34
kIL6 0.28
kGF 0.19
κdeg 0.16
[proSTAT3] 0.14
κGF -0.16
κECM -0.17
kprol 0.75
kP 0.18
βapp -0.19
θapp -0.19
kR -0.65
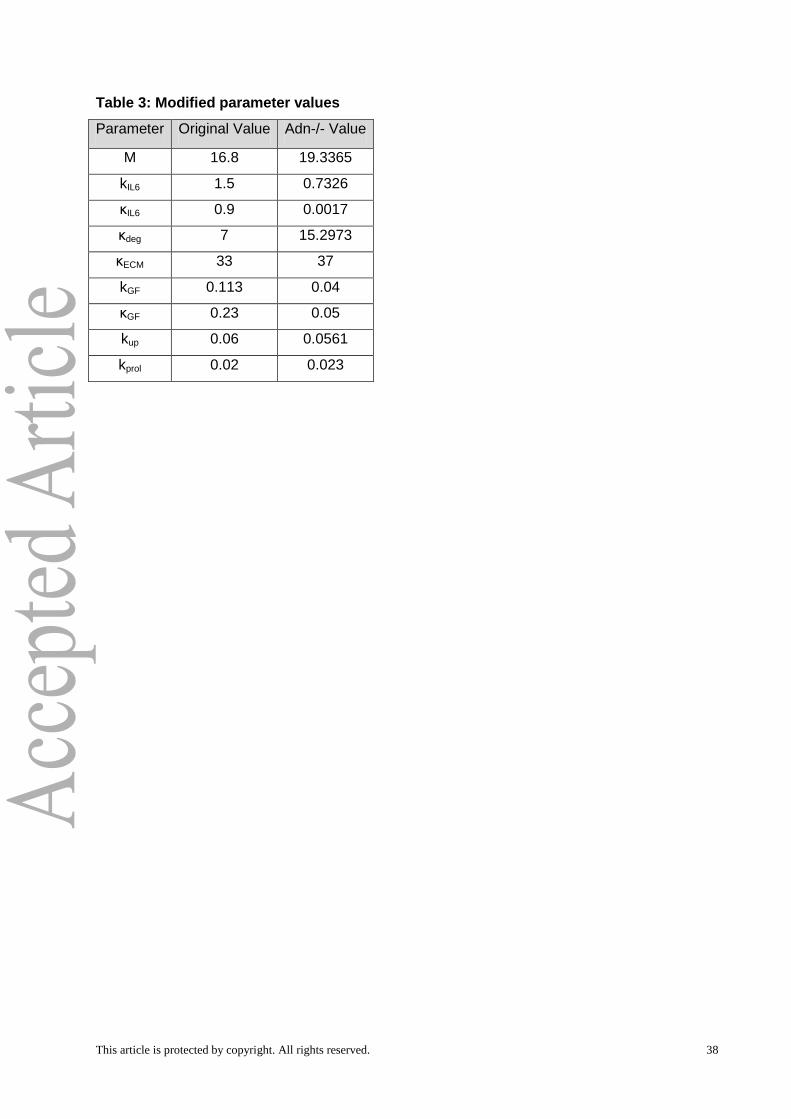
This article is protected by copyright. All rights reserved. 38
Table 3: Modified parameter values
Parameter Original Value Adn-/- Value
M 16.8 19.3365
kIL6 1.5 0.7326
κIL6 0.9 0.0017
κdeg 7 15.2973
κECM 33 37
kGF 0.113 0.04
κGF 0.23 0.05
kup 0.06 0.0561
kprol 0.02 0.023
Related Documents


![ITRUMP [inner Thekwini Regeneration and Urban … · Management Programme] AREA BASED CONTRIBUTION ... [inner Thekwini Regeneration and Urban Management Programme] ... revealed this](https://static.cupdf.com/doc/110x72/5b66f4d17f8b9a87148db7c9/itrump-inner-thekwini-regeneration-and-urban-management-programme-area-based.jpg)