Marquette University e-Publications@Marquette Education Faculty Research and Publications Education, College of 4-1-2003 Addressing Health Disparities in Middle School Students’ Nutrition and Exercise Marilyn Frenn Marquette University, [email protected] Shelly Malin Marquette University Naveen Bansal Marquette University, [email protected] Mary Delgado Milwaukee Public Schools Yvonne Greer Milwaukee Health Department See next page for additional authors Originally published in Journal of Community Health Nursing, Volume 20, No. 1 (Spring 2003), online here.

Welcome message from author
This document is posted to help you gain knowledge. Please leave a comment to let me know what you think about it! Share it to your friends and learn new things together.
Transcript
Marquette Universitye-Publications@Marquette
Education Faculty Research and Publications Education, College of
4-1-2003
Addressing Health Disparities in Middle SchoolStudents’ Nutrition and ExerciseMarilyn FrennMarquette University, [email protected]
Shelly MalinMarquette University
Naveen BansalMarquette University, [email protected]
Mary DelgadoMilwaukee Public Schools
Yvonne GreerMilwaukee Health Department
See next page for additional authors
Originally published in Journal of Community Health Nursing, Volume 20, No. 1 (Spring 2003),online here.

AuthorsMarilyn Frenn, Shelly Malin, Naveen Bansal, Mary Delgado, Yvonne Greer, Michael Havice, Mary Ho, andHeidi Schweizer
This article is available at e-Publications@Marquette: http://epublications.marquette.edu/edu_fac/35
Frenn, Malin, Bansal, Delgado, Greer, Havice, Ho, Schweizer 1
Addressing Health Disparities in Middle School Stud ents’ Nutrition
and Exercise
By Marilyn Frenn, Shelly Malin, Naveen Bansal, Mary Delgado, Yvonne Greer,
Michael Havice, Mary Ho, and Heidi Schweizer
Those with low income, especially women of African American and Hispanic heritage
have the greatest risk of inactivity and obesity. A 4-session (Internet and video) intervention with
healthy snack and gym labs was tested in 2 (gym lab in 1) urban low–middle-income middle
schools to improve low fat diet and moderate and vigorous physical activity.1 The gym lab was
particularly beneficial (p = .002). Fat in diet decreased with each Internet session in which
students participated. Percentage of fat in food was reduced significantly p = .018 for Black,
White, and Black/Native American girls in the intervention group. Interventions delivered through
Internet and video may enable reduction of health disparities in students by encouraging those
most at risk to consume 30% or less calories from fat and to engage in moderate and vigorous
physical activity.
One in five adolescents (21%) in the United States is overweight (National Center for
Health Statistics, 1999). Patterns established during middle school years are important in the
development of adult health-related habits (Leger & Nutbeam, 2000). Given that poor diet,
obesity, and inactivity result in more than 300,000 preventable deaths per year and that chronic
disease accounts for 60% of medical care expenditures in the United States (National Center for
Disease Prevention & Health Promotion, 2001a), high priority must be given to developing
effective interventions. Nearly half of American youths aged 12 to 21 years, lack vigorous activity
on a regular basis. Inactivity is more common among women (14%) than men (7%) and among
Black women (21%) than White women (12%). Participation in all types of physical activity
declines strikingly as age or grade in school increases (National Center for Chronic Disease
Prevention & Health Promotion, 2001b). Extensive reviews (Contento et al., 1995; Kennedy,
1998; Meininger, 1997) of research on the effectiveness of nutrition education revealed many
studies in which nutrition knowledge and attitudes of children were improved. School-based
interventions were more effective than interventions conducted outside the school setting
(Contento et al., 1995).
Harrell, McMurray, Gansky, Bandiwala, and Bradley (1999) demonstrated
population-based approaches in schools are more effective than intervening with those at most
Frenn, Malin, Bansal, Delgado, Greer, Havice, Ho, Schweizer 2
risk for cardiovascular disease. Dietz and Gortmaker (2001) identified the great impact of
school-based approaches, but noted that study findings often are not implemented.
Conceptual Framework for the Intervention
The intervention in this study incorporated concepts from the Transtheoretical (TM;
Prochaska et al., 1994) and Health Promotion (HP; Pender, 1996) models, and was tailored to
participants’ stage of change. Conceptual development and prior work with these models have
been described (Bowen, Meischke, & Tomoyasu, 1994; Brug, Hospers, & Kok, 1997; Cardinal,
1997; Cardinal, Engels, & Zhu, 1997; Frenn & Malin, 1998, in press; Frenn, Malin, & Bansal, in
press; Frenn & Porter, 1999; Garcia et al., 1995; Greene et al., 1999; Lamb & Joshi, 1996;
Marcus, Eaton, Rossi, & Harlow, 1994; Marcus & Simkin, 1994; Nigg & Courneya, 1998; Rossi,
Greene, et al., 1994; Potvin, Gauvin, & Nyuyen, 1997; Robbins et al., 2001; Steptoe, Wijetunge,
Doherty, & Wardle, 1996). Briefly, stages of change in the TM (Prochaska et al., 1994) include
the following: Precontemplation(PC)—people may “wish” to change, but have no plans to do so
in the next six months; Contemplation (C)—people seriously considering change within six
months, but have no specific plans; Preparation (P)—people who state the intention to change
within one month and/or have a prior unsuccessful attempt within last year; Action (A)—people
actively engaging in the new behavior, experiences, or environment for one day to six months;
Maintenance (M)—people sustaining the change six months or more.
Internet and video sessions for students in PC and C stages of change focused on raising
awareness of current eating and exercise, identifying pros(or benefits) of both low fat diet and
exercise, and overcoming cons (or barriers) to consuming low fat diets and participating in
exercise. Those in P, A, and M stages of change were prepared as “peer models” and led the
healthy snack and exercise labs with the assistance of senior nursing students and faculty.
Online feedback was given to all students in the intervention for each Internet session.
This Study
A four-session (Internet and video) intervention with healthy snack and gym labs (gym lab
in one school only) was tested in two urban low–middle income middle schools during the
2000–2001 academic year. The purpose was to examine improvement related to Healthy People
2010 Objectives (U.S. Department of Health & Human Services, 2000) for low fat diet, moderate
and vigorous physical activity. The research questions examined in this study were:
1. Immediately after the intervention, when compared with students in the usual school
curriculum, will students who receive the intervention have (a) a significantly greater
Frenn, Malin, Bansal, Delgado, Greer, Havice, Ho, Schweizer 3
decrease in dietary fat intake (within a range of 20%–30% of total calories); and (b)
greater duration of weekly moderate and vigorous physical activity (PA)?
2. Were there differences in response to the intervention for race, sex, income level, or
school attended?
3. Did response to the intervention differ based on number of sessions or use of gym lab?
Method
Design
A quasi-experimental design was used with assignment to group by classroom. The intervention
also took place in the classroom computer lab.
Sample
Following review and approval by the University’s Institutional Review Board, the study sample
was recruited from two urban schools in the Midwest. Entire classrooms of students were
recruited to intervention or control groups based on classroom assignment to prevent diffusion of
the intervention to the control group. The sample included 341 students. Because students had
missing data for some instruments, listwise deletion to include all variables in analyses resulted
in a sample of 67 for the intervention group and 63 for the control. Those included in all analyses
were 58 African American, 47 White, 4 Hispanic, 9 Asian, and 4 Native American. Participants
ranged in age from 12 to15, 90 in seventh grade, 33 in eighth grade, 56 were boys, 68 girls.
Forty-one were eligible for free lunch, 15 reduced fee, and 68 had no reduction in fee.
Measures
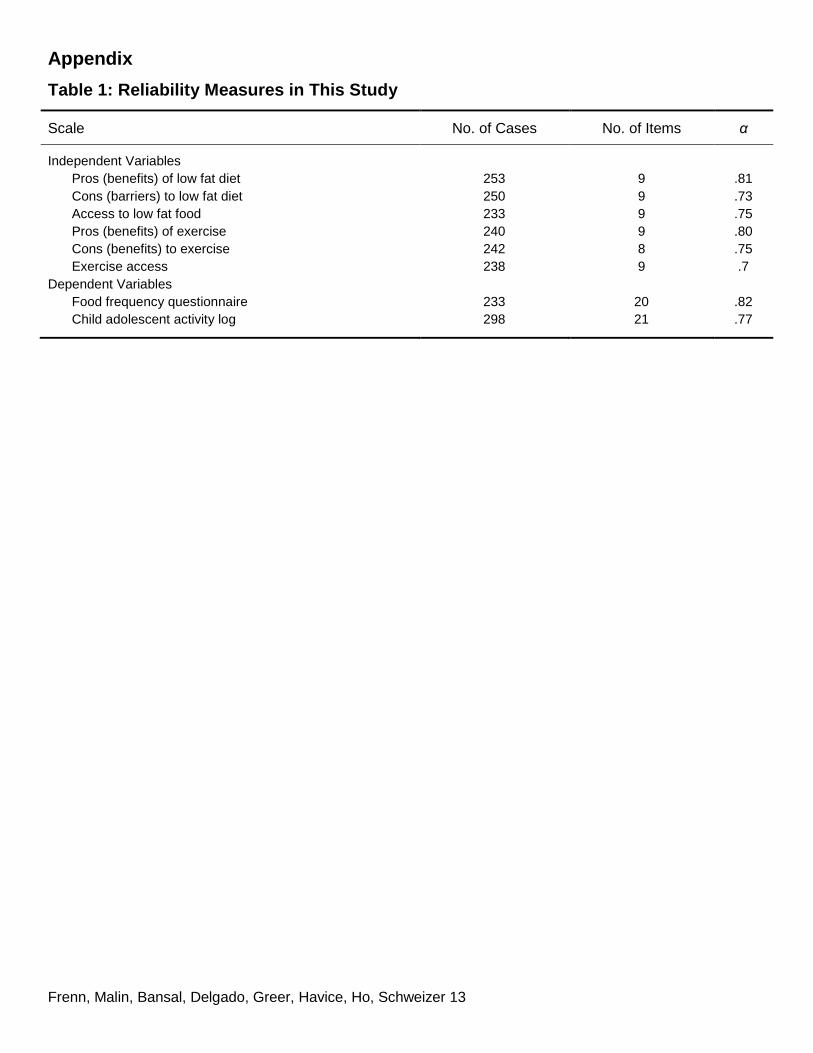
The measures used, number of items, and Chronbach’s alpha in this study sample are
shown in Table 1. Independent variables for both low fat and physical activity included: stage of
change, decisional balance, and access. Dependent variables included: the Food Habits
Questionnaire and the Child and Adolescent Activity Log (CAAL).
Independent variables. Staging questions used by Prochaska’s team (Greene et al.,
1999) were used with the addition of anchors, such as “at the beginning of the school year,” to
helpstudentsthinkabouthowmuchfattheywereeatingandhowmuchphysical activity they were
engaging in six months ago. Participants describing themselves in the action or maintenance
stages of change were restaged to precontemplation if their fat intake exceeded 30% according
to the algorithm used by Rossi, Rossi, et al. (1994) or if their physical activity was less than 90
minutes for three days. In this study stages for low fat were coded: Precontemplation = 1;
Frenn, Malin, Bansal, Delgado, Greer, Havice, Ho, Schweizer 4
Contemplation = 2; Preparation = 3; Action = 4; Maintenance = 5; such that a higher score
indicated improvement in willingness to change to a diet composed of 30% or less calories from
fat. Stages for exercise were the opposite, such that a lower score indicated maintenance of
physical activity for more than six months.
Decisional balance is conceptualized in the TM (Prochaska et al., 1994) as the relative
importance of pros and cons for making a behavior change (this relationship is conceptualized as
benefits–barriers ratio in the HP model). Pros and cons are reported separately, higher scores
indicate higher pros or higher cons. The problems in using test–retest with psychological
measures in that participants’ responses may change have long been acknowledged (Burns &
Grove, 1987). However, two week test–retest reliability was previously examined with 34 low
income, culturally diverse middle school students: pros low fat R = 0.575, p = .003; cons low fat R
= 0.615, p = .000; pros exercise R = 0.318, p = .113; and cons exercise R = 0.423, p = .025.
Access to low-fat foods is a HP model construct examining availability of low-fat foods
such as skim or 1% milk, fruits and vegetables, foods that are baked or broiled rather than fried
(Frenn & Malin, in press). Access to exercise programs and facilities is a HP Model construct
examining availability of such things as parks, playgrounds, recreational programs, and health
clubs, such as the Boys and Girls club and YMCA (Frenn & Malin, in press; Garcia et al., 1995).
A higher score on each instrument indicated greater access. Test–retest in a previous sample
with 34 culturally diverse middle school students was: access to low fat foods R =.555, p = .000;
access to exercise facilities and programs R = .407, p =.002. In order not to ask more than one
class period of participants for administration of instruments, the access instruments were only
included on post-test because less time was required to complete the other instruments the
second time and these surveys could be included.
Dependent variables. The Food Habits Questionnaire was used as discussed by
Greene et al. (1999). This instrument includes a 21-item series of questions about consumption
of high and low fat foods with a five-option response format. Low fat items were reverse scored
and an algorithm used to calculate percentage off at, such that the resulting total score indicated
percentage of fat in diet during the last month. This instrument was found to have the same
distributions of stage of change to low fat diet when tested with Block’s Food Frequency
Questionnaire modified to increase sensitivity to high fat foods (Greene et al., 1999).
The CAAL was used to collect the physical activity data. Participants were asked to check
activities they had done the previous day for each of 7 days and circle the amount of time spent
on each. The CAAL contains 21 activities commonly engaged in by middle school age youth and
previously was found to correlate highly with exercise as measured by Caltrac accelerometers
Frenn, Malin, Bansal, Delgado, Greer, Havice, Ho, Schweizer 5
and with fitness as measured by a step test (Garcia et al., 1995). Similar to Garcia et al. (1995),
participants who had completed 3 days of log data were included in the analysis. Because
Healthy People 2010 objectives focus on increasing moderate and vigorous activity among youth,
only moderate and vigorous activity were included in the analyses (U.S. Department of Health &
Human Services, 2000).
Measure of participation in the intervention. We did not wish to make a type III error in
which the study outcomes are evaluated based on the number of interventions delivered, rather
than the number in which participants actually participated (Resnicow et al., 1998). For that
reason participants were asked to respond to questions in each module by recording their
answers in notebooks provided and online. Participant responses were tallied on completion of
the study to determine their level of participation.
Procedures
An interviewer read the survey aloud while students marked their responses from their
own copy. An additional interviewer circulated around the room to answer questions, check for
missing data, and check for pattern response completion without attention to the items (these
surveys were not included in the analyses). Pre-and post-test data collection each lasted
approximately 45 min. The CAAL logs were completed for three school days requiring
approximately 5 min each day. Participants received a fruit snack at pre-and post-test and those
completing both received a two dollar coupon for use in the school bookstore.
The intervention was conducted in four Internet sessions plus a healthy snack session
and a gym class (one school only) of approximately 50 min (six total sessions). Interventions
were delivered in the classroom computer lab. Content for each session and video is shown in
Table 2.
Data Analyses
Descriptive statistics were used to examine percentage fat in diet and duration of
moderate and vigorous activity. CAAL activities include those of mild, moderate, and vigorous
intensity activities. Moderate and vigorous activity were included in analyses because these
reflect Healthy People 2010 goals for adolescents. Total activity was also analyzed, because this
has value for improving health (Twisk, Kemper, & van Mechelen, 2000). Statistical Package for
the Social Sciences (SPSS) General Linear Model (GLM; SPSS, Inc., 1999) was used with age
as a covariate to compare participants on variables by sex, race, eligibility for free or reduced fee
lunch (proxy for family income), and school, as well as interactions among these demographic
Frenn, Malin, Bansal, Delgado, Greer, Havice, Ho, Schweizer 6
characteristics with response to the intervention. Pre-test data on each measure were subtracted
from post-test data to create a difference score for analysis. The number of sessions with
answers recorded in notebooks and online were summed.
Results
Findings of the study are described for each research question (RQ). Figures include
those most at risk for obesity later in life: African American and Hispanic girls and those with low
income.
RQ1: Immediately after the intervention, when compared with students in the usual school
curriculum, will students who receive the intervention have a significantly greater
decrease in dietary fat intake (within a range of 20%–30% of total calories); and (b)
greater duration of weekly moderate and vigorous PA?
The difference in percentage fat between the intervention and control groups as a whole
was not significant. Mean percentage fat was 31% for the intervention group and 32% for the
control on both pre- and post-test.
Both control and intervention groups decreased their amount of moderate and vigorous
activity, but the level of decrease in moderate and vigorous activity was less among the
intervention group (–8.58 min) as compared to the control (–37.61 min; p = .024).
RQ2: Were there differences in response to the intervention for race, sex, income level, or
school attended?
There were significant interactions for the mean differences between demographic
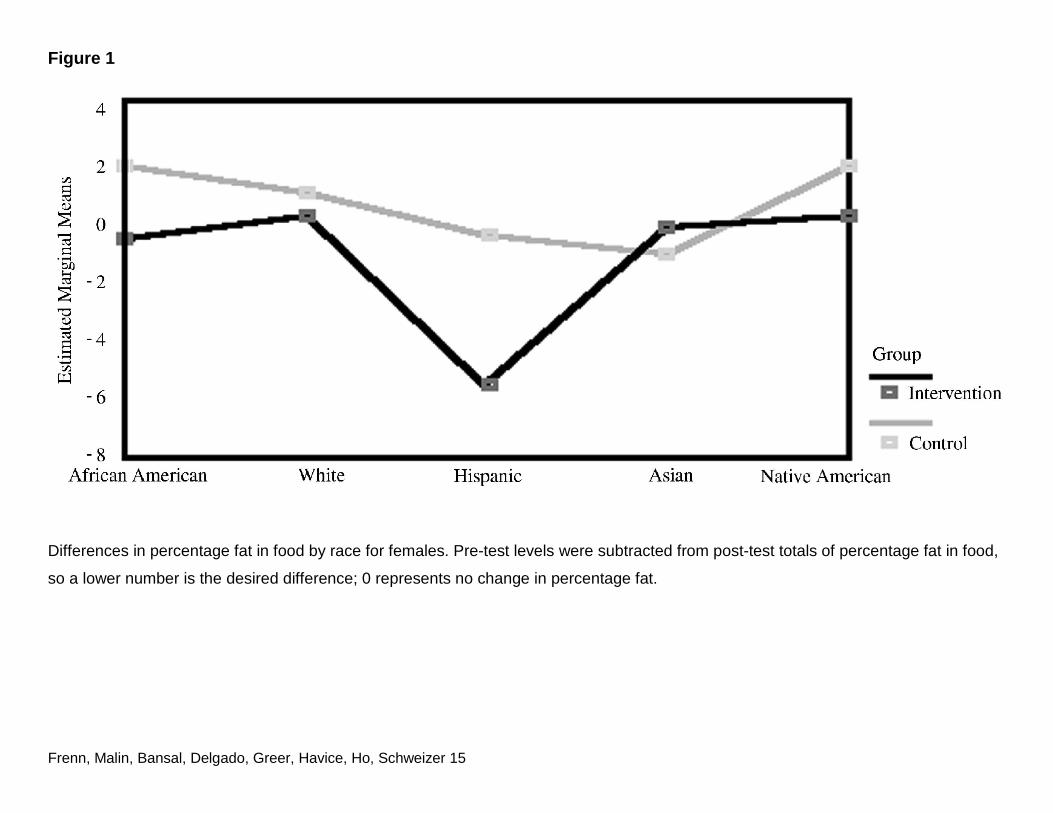
variables and the intervention and control groups. As shown in Figure 1, girls in the intervention
group decreased their dietary fat in comparison to the control group (p = .018) for African
Americans, White, Hispanics, and Native Americans. There was also an interaction effect for
access to low fat foods among race, sex, and group (p = .036). White, Hispanic, and Asian girls
in the intervention group had greater access to low fat foods.
Boys in the control group decreased their fat more in each racial group. This may be
explained by the fact that boys (except Blacks) in the intervention group reported less access to
low fat foods than boys in the control group.
The response to the intervention differed in percentage fat in diet from pre-to post-test (p
= .002) between sexes at each school. No other variables differed significantly in this interaction.
Frenn, Malin, Bansal, Delgado, Greer, Havice, Ho, Schweizer 7
When a comparison of demographic variables and differences in stage, pros, cons, and fat in
diet was conducted, there were significant differences in free lunch status (p = .000) and age (p
= .000) between the schools (only seventh grade students were included in the first school that
also had more students with low income, whereas seventh and eighth grade students were
included in the second school).
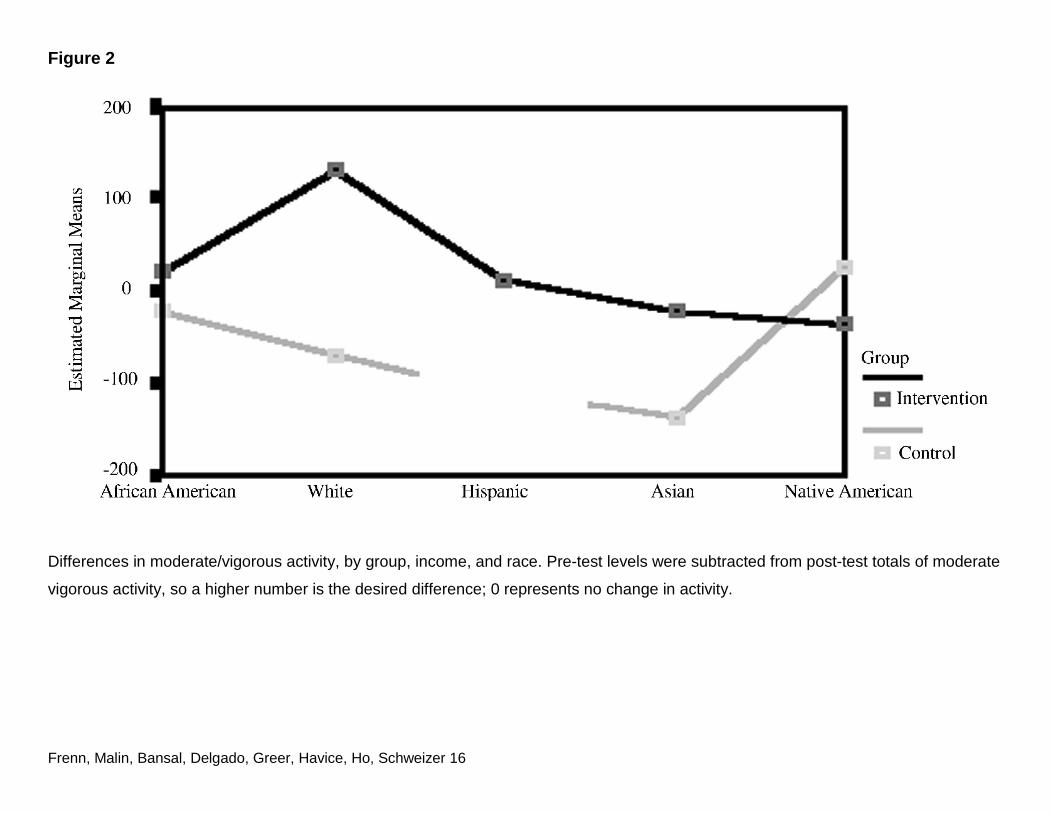
There was also a significant (p = .04) interaction among race, income, and group as
shown in Figure 2, with the intervention group increasing physical activity among those with the
lowest income for all races except Native Americans, whereas the opposite was true for the
control group. Response to the intervention did not differ significantly by sex for physical activity.
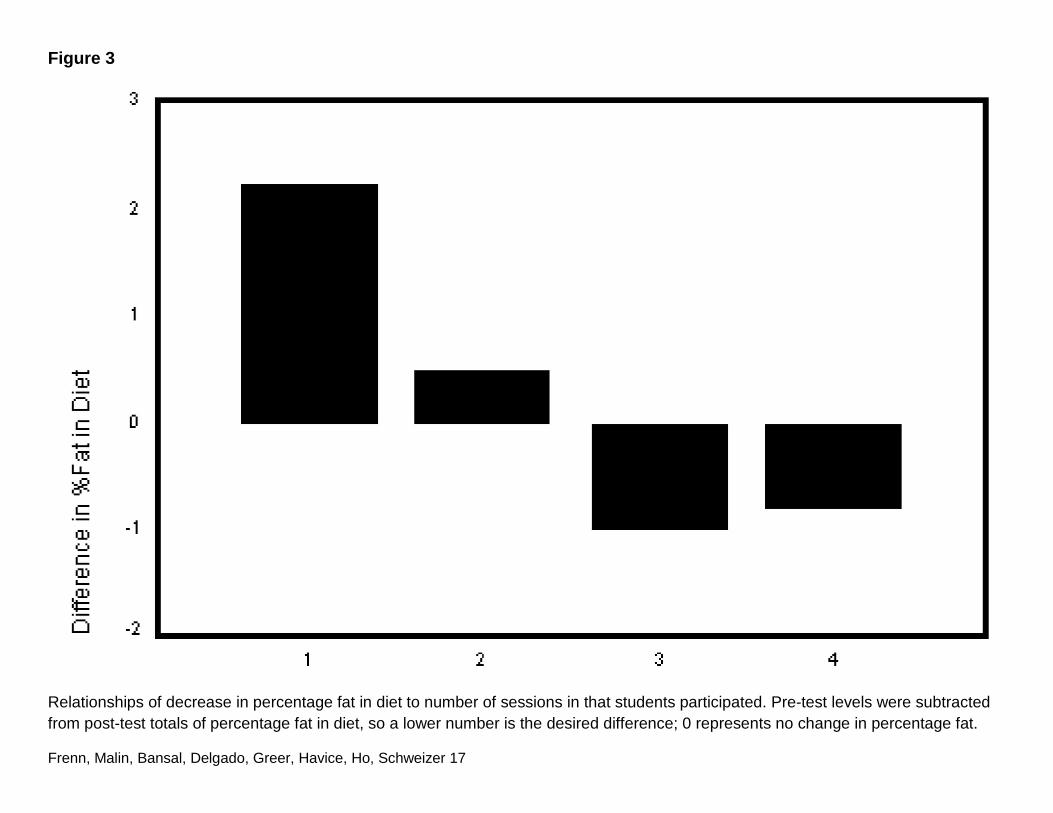
RQ3: Did response to the intervention differ based on number of sessions or use of gym lab?
Individual school analyses demonstrated that the number of sessions students
responded to the Internet program online and/or in their notebook were associated with a
decrease in their percentage fat in diet as shown in Figure 3.
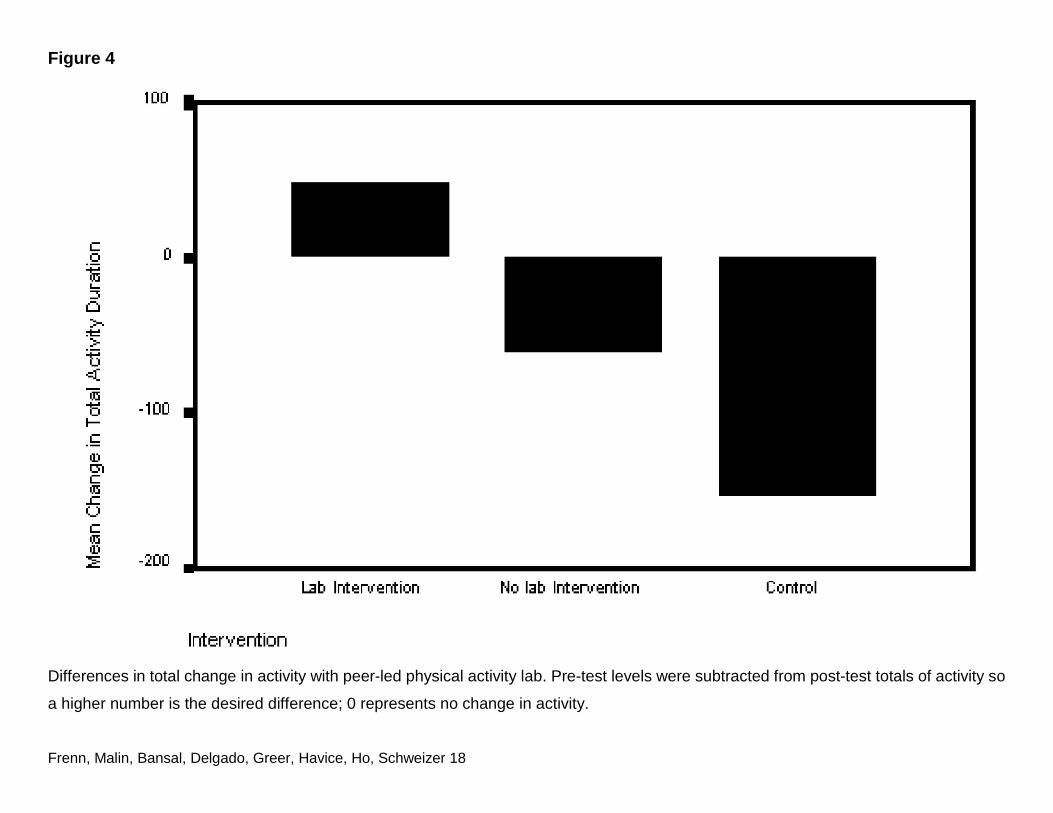
The gym lab was only conducted in the first school. When demographic variables, as well
as difference in exercise stage, pros, and cons, were regressed on differences in total activity,
the only significant variable was whether or not a physical activity lab was used (p = .002) with an
adjusted R2 = 0.24; F(9, 28) = 2.325; p = .042. Those with the peer-led gym lab increased their
total physical activity, whereas those with only the Internet and video intervention decreased
their total physical activity, but not as much as those in the control group as shown in Figure 4.
Discussion
The statistical analyses with significant interactions demonstrate that the effect of
intervention varies from race to race and from boys to girls. Both the low fat diet and physical
activity aspects of the intervention resulted in significantly better outcomes for all but one racial
subgroup in girls, who have the greatest risk of obesity later in life.
The effectiveness of the intervention in reducing fat in diet increased with each additional
session that students responded to online and/or in the notebook provided. Because the Healthy
People 2010 target of 30% or less calories from fat (U.S. Department of Health & Human
Services 2000) was not reached with the four Internet sessions and videos tested, additional
sessions should be added. Gortmaker et al.’s (1999) middle school diet and exercise intervention
included 16 sessions, so more than the four examined in this study likely will be needed for
maximal effectiveness using Internet and video delivery as well. Kumianyka et al.’s (2000)
Frenn, Malin, Bansal, Delgado, Greer, Havice, Ho, Schweizer 8
comprehensive review of dietary fat reduction intervention studies also noted greater effect with
a greater number of intervention contacts.
This study adds to knowledge in that it is a short, conceptually-based intervention that is
an improvement over traditional education in reducing dietary fat and maintaining increased
frequency of moderate and vigorous physical activity for those most at risk for obesity later in life.
Dale and Corbin (2000) similarly found that the conceptual approach with ninth grade students
resulted in less sedentary behavior among girls.
The study results depict the complexity of intervention research. Even a standardized
intervention (with the same Internet and video content) interacts differently with sex, age, income,
and race. To the degree schools differ on these demographic variables, there will also be
different responses by school. Gordon-Larsen, McMurray, and Popkin (2000) identified the
importance of such demographic factors in middle and high school students engaging in
moderate and vigorous activity. An intervention that works with those at highest risk is important,
given the lower amounts of moderate and vigorous exercise of Black and Hispanic adolescents.
There were no significant differences in intervention effectiveness whether or not the
peer-led food lab was included. Because this is time, personnel, and resource intensive by
comparison to the Internet sessions and videos, the latter type of sessions should be developed
and tested in subsequent research.
The sample size in the first school was sufficient to examine physical activity variables
with and without the peer lead gym lab. The lab was very effective, especially for girls and those
with low income, both subgroups who are at greatest risk for lower activity and for obesity as they
grow older. This aspect of the intervention was not re-examined in the second school, because
there was not a way to access gym space during times for the computer classes wherein the
intervention took place. Because nursing students assisted with the peer-led gym class, the
personnel costs of this aspect of the intervention may require that such resources be allocated to
schools with the lowest income students for the addition of a peer-led gym class, especially for
girls.
Limitations and Needs for Further Research
This study was limited by the number of participants who completed all instruments with
less than 20% missing data. Listwise deletion is used for multivariate analysis and the amount of
missing data in instruments greatly reduced the number of students whose data could be used
for analysis. The resulting sample did not permit analyses of both diet and exercise variables in
the same equation. A larger study is warranted once additional sessions have been added to
Frenn, Malin, Bansal, Delgado, Greer, Havice, Ho, Schweizer 9
attain the 30% of fat in diet target in Healthy People 2010.
The low test–retest correlations for instruments, is a further study limitation. Burns and
Grove (1987) questioned the use of such estimates of stability in paper and pencil tests
measuring attitudes, because it is assumed the attitudes may change.
The sex differences in access that resulted in different responses to this intervention by
boys compared with girls requires further examination. Especially in groups with low income and
middle school aged children, who do not independently have access to foods and opportunities
or equipment for exercise, the effectiveness of any intervention may be compromised if
participants do not have access to necessary requisites for the behavior.
Conclusion
The exercise session with peer-led, physical activity lab was effective in increasing
moderate and vigorous activity. The Internet content alone prevented decrease in exercise to the
degree it occurred in the control group. Adding an additional Internet session focused on
exercise may be helpful, because Internet sessions can be administered across many schools
with less personnel and without access to a gym. Most important, the intervention examined in
this study significantly reduced percentage of dietary fat among girls, who are at greatest risk of
obesity in later life.
Notes
1. Funded in part by the Milwaukee Area Health Education Center and the State of
Wisconsin. Requests for reprints should be sent to Marilyn Frenn, Marquette University, P.O.
Box 1881, Milwaukee, WI 53201-1881. Email: [email protected]
References
Baranowski, T., Cullen, K. W., & Baranowski, J. (1999). Psychosocial correlates of dietary intake:
Advancing dietary intervention. Annual Review of Nutrition, 19, 17–40.
Bowen, D.J., Meischke, H.,& Tomoyasu, N.(1994).Preliminary evaluation of the processes of
changing to a low-fat diet. Health Education Research, 9(1), 85–94.
Brug, J., Hospers, H. J., & Kok, G. (1997). Differences in psychosocial factors and fat
consumption between stages of change for fat reduction. Psychology & Health, 12,
719–727.
Burns, N., &Grove, S. K. (1987). The practice of nursing research: Conduct, critique and
utilization. Philadelphia: W. B. Saunders.
Frenn, Malin, Bansal, Delgado, Greer, Havice, Ho, Schweizer 10
Cardinal, B.(1997).Construct validity of stages of change for exercise behavior. American
Journal of Health Promotion, 12(1), 68–74.
Cardinal, B., Engels, H. J., & Zhu, W. (1997). Application of the transtheoretical model of
behavior change to preadolescents’ physical activity and exercise behavior. Pediatric
Exercise Science, 10(1), 69–80.
Contento,I.,Balch,G.,Bronner,Y.,Lytle,L.,Maloney,S.,Olson,C.,etal.(1995).Theeffectivenessof
nutrition education and implications for nutrition education policy: A review of research.
Journal of Nutritional Education, 27(4), 191–199.
Dale, D., & Corbin, C. B.(2000).Physical activity participation of high school graduates following
exposure to conceptual or traditional physical education. Research Quarterly in Exercise
& Sports, 71, 61–68.
Dietz, W. H., & Gortmaker, S. L. (2001). Preventing obesity in children and adolescents. Annual
Review of Public Health, 22, 337–353.
Frenn, M., & Malin, S. (in press). Diet and exercise in low income, culturally diverse middle
school students. Public Health Nursing.
Frenn, M., & Malin, S.(1998).Health promotion: Theoretical perspectives and clinical applications.
Holistic Nursing Practice, 12, 1–8.
Frenn, M., Malin, S., & Bansal, N. K. (in press). Stage based interventions for low fat diet with
middle school students. Journal of Pediatric Nursing.
Frenn, M., Porter, C. P. (1999). Exercise and nutrition: What do adolescents think is important?
Applied Nursing Research, 12(4), 179–184.
Garcia, A., Broda, M. A., Frenn, M., Coviak, C., Pender, N. J., & Ronis, D. L. (1995). Gender and
developmental differences in exercise beliefs among youth and prediction of their
exercise behavior. Journal of School Health, 65(6), 213–219.
Gordon-Larsen, P., McMurray, R. G., & Popkin, B. M. (2000). Determinants of adolescent
physical activity and inactivity patterns. Pediatrics, 105(6). Retreived August 1, 2000 from
http://www.pediatrics.org/cgi/content/full/106/6/e83.
Gortmaker,S.L.,Peterson,K.,Wiecha,J.,Sobol,A.M.,Dixit,S.,Fox,M.K.,etal.(1999).Reducing
obesity via a school-based interdisciplinary intervention among youth. Archives of
Pediatric and Adolescent Medicine, 153, 975–983.
Greene, G. W., Rossi, S. R., Rossi, J. S., Velicer, W. F., Fava, J. L., & Prochaska, J. O. (1999).
Dietary applications of the stages of change model. Journal of the American Dietetic
Association, 99, 673–678.
Harrell, J. S., McMurray, R. G., Gansky. S, A., Bangdiwala, S.I., Bradley, C.B. (1999).A public
Frenn, Malin, Bansal, Delgado, Greer, Havice, Ho, Schweizer 11
health vs. a risk-based intervention to improve cardiovascular health in elementary school
children: The Cardiovascular Health in Children study. American Journal of Public Health,
89, 1529–1535.
Kennedy, C. M. (1998). Childhood nutrition. In J. J. Fitzpatrick (Ed.), Annual review of nursing
research (Vol 16, pp. 3–38). New York: Springer.
Kumianyka, S. K., Bowen, D., Rolls, B. J., Van Horn, L., Perri, M. G., Czajikowski, S. M., et al.
(2000). Maintenance of dietary behavior change. Health Psychology, 19, 42–56.
Lamb, R., & Joshi, M. S. (1996). The stage model and processes of change in dietary fat
reduction. Journal of Human Nutrition & Dietetics, 9, 43–53.
Leger, L., & Nutbeam, D. (2000). A model for mapping linkages between health and education
agencies to improve school health. Journal of School Health, 70, 45–50.
Leiberman, D.A. (1997).Interactive video games for health promotion: Effects on knowledge,
self-efficacy, social support, and health. In R. L. Street, W. R. Gold, & T. Manning (Eds.),
Health promotion and interactive technology: Theoretical applications and future
directions (pp. 103–120). Mahwah, NJ: Lawrence Erlbaum Associates, Inc.
Maibach, E., & Parrott, R. L. (Eds.). (1995). Designing health messages: Approaches from
communication theory and public health practice. Thousand Oaks, CA: Sage.
Marcus, B. H., Eaton, C. A., Rossi, J. S., & Harlow, L. I. (1994). Self-efficacy, decision-making,
and stages of change: An integrative model of physical exercise. Journal of Applied
Social Psychology, 24, 489–508.
Marcus, B. H., & Simkin, L.R. (1994).The transtheoretical model: Applications to exercise
behavior. Medicine & Science Sports & Exercise, 26, 1400–1404.
Meininger, J. C. (1997). Primary prevention of cardiovascular disease risk factors: Review and
implications for population-based practice. Advance Practice Nurse Quarterly, 3, 70–79.
National Center for Disease Prevention and Health Promotion. (2001a). Physical Activity and
good nutrition: Essential elements to prevent chronic diseases and obesity. Retreived
October 25, 2001 from http://www.cdc.gov/nccdphp/dnpa/dnpaaag.htm
National Center for Chronic Disease Prevention & Health Promotion. (2001b). Physical activity
and health: Adolescents and young adults. Retrieved October 25, 2001
http://www.cdc.gov/nccdphp/sgr/adoles.htm
National Center for Health Statistics. (1999). Healthy People 2000 Review, 1998–99. Hyattsville,
MD: Public Health Service.
Nigg, C. R., & Courneya, K. S. (1998). Transtheoretical model: Examining adolescent exercise
behavior. Journal of Adolescent Health, 22, 214–224.
Frenn, Malin, Bansal, Delgado, Greer, Havice, Ho, Schweizer 12
Pender, N. J. (1996). Health promotion in nursing practice (3rd ed). Stamford, CT: Appleton &
Lange.
Potvin, L., Gauvin, L., & Nyuyen, N.M. (1997).Prevalence of stages of change for physical
activity in rural, suburban and inner-city communities. Journal of Community Health, 22,
1–12.
Prochaska, J. O., Velicer, W. F., Rossi, J. S., Goldstein, M. G., Marcus, B. H., Rakowski, W., et al.
(1994). Stages of change and decisional balance for 12 problem behaviors. Health
Psychology, 13, 39–46.
Resnicow,K.,Davis,M.,Smith,M.,Lazarus-Yaroch,A.,Baranowski,T.,Baranowski, J., et
al.(1998).How best to measure implementation of school health curricula: A comparison
of three measures. Health Education Research, 13, 239–250.
Robbins, L. B., Pender, N. J., Conn, V. S., Frenn, M. D., Neuberger, G. B., Nies, M. A., et al.
(2001). Physical activity research in nursing. Image Journal of Nursing Scholars, 33,
315–321.
Rossi, S. R., Greene, G. W., Reed, G. R., Rossi, J. S., Prochaska, J. O., & Velicer, W. F. (1994).
Cross validation of a decisional balance measure for dietary fat reduction (abstract).
Annals of Behavioral Medicine, 16 (suppl), 167.
Rossi, S. R., Rossi, J.R., Rossi-Delprete, L.M., Prochaska, J.O., Bonspach, S.W.,& Carleton,
R.A. (1994). A process of change model for weight control for participants in
community-based weight loss program. International Journal of Addictions, 29, 162–177.
Sallis, J .F. (1993). Promoting healthful diet and physical activity. In S. G. Millstein, A. C.
Petersen, & E. O. Nightingale (Eds). Promoting adolescent health: Rationale, goals, and
objectives (pp. 209–241). Washington, DC: The Carnegie Corporation.
SPSS, Inc. (1999). Statistical Program for the Social Sciences. Version 9.0. Chicago: Author.
Steptoe, A., Wijetunge, S., Doherty, S., & Wardle, J. (1996). Stages of change for dietary fat
reduction: Associations with food intake, decisional balance and motives for food choice.
Health Education Journal, 55, 108–122.
Twisk, J. W .R., Kemper, H. C. G., & van Mechelen, W. (2000). Tracking of activity and fitness
and the relationship with cardiovascular disease risk factors. Medicine & Science in
Sports & Exercise, 32, 1455–1461.
U.S. Department of Health and Human Services, Office of Public Health and Science.(2000).
Healthy People 2010. Washington, DC: US Government Printing Office.
Frenn, Malin, Bansal, Delgado, Greer, Havice, Ho, Schweizer 13
Appendix
Table 1: Reliability Measures in This Study
Scale No. of Cases No. of Items α
Independent Variables Pros (benefits) of low fat diet 253 9 .81 Cons (barriers) to low fat diet 250 9 .73 Access to low fat food 233 9 .75 Pros (benefits) of exercise 240 9 .80 Cons (benefits) to exercise 242 8 .75 Exercise access 238 9 .7
Dependent Variables Food frequency questionnaire 233 20 .82 Child adolescent activity log 298 21 .77
Frenn, Malin, Bansal, Delgado, Greer, Havice, Ho, Schweizer 14
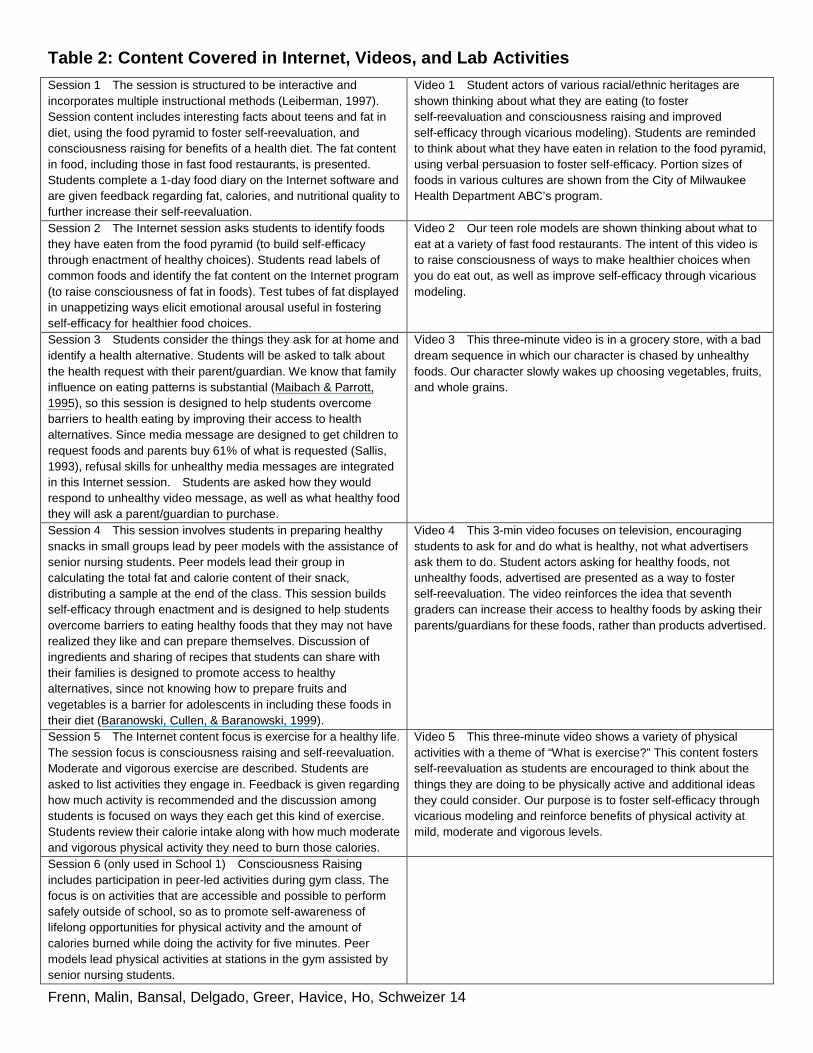
Table 2: Content Covered in Internet, Videos, and L ab Activities Session 1 The session is structured to be interactive and incorporates multiple instructional methods (Leiberman, 1997). Session content includes interesting facts about teens and fat in diet, using the food pyramid to foster self-reevaluation, and consciousness raising for benefits of a health diet. The fat content in food, including those in fast food restaurants, is presented. Students complete a 1-day food diary on the Internet software and are given feedback regarding fat, calories, and nutritional quality to further increase their self-reevaluation.
Video 1 Student actors of various racial/ethnic heritages are shown thinking about what they are eating (to foster self-reevaluation and consciousness raising and improved self-efficacy through vicarious modeling). Students are reminded to think about what they have eaten in relation to the food pyramid, using verbal persuasion to foster self-efficacy. Portion sizes of foods in various cultures are shown from the City of Milwaukee Health Department ABC’s program.
Session 2 The Internet session asks students to identify foods they have eaten from the food pyramid (to build self-efficacy through enactment of healthy choices). Students read labels of common foods and identify the fat content on the Internet program (to raise consciousness of fat in foods). Test tubes of fat displayed in unappetizing ways elicit emotional arousal useful in fostering self-efficacy for healthier food choices.
Video 2 Our teen role models are shown thinking about what to eat at a variety of fast food restaurants. The intent of this video is to raise consciousness of ways to make healthier choices when you do eat out, as well as improve self-efficacy through vicarious modeling.
Session 3 Students consider the things they ask for at home and identify a health alternative. Students will be asked to talk about the health request with their parent/guardian. We know that family influence on eating patterns is substantial (Maibach & Parrott, 1995), so this session is designed to help students overcome barriers to health eating by improving their access to health alternatives. Since media message are designed to get children to request foods and parents buy 61% of what is requested (Sallis, 1993), refusal skills for unhealthy media messages are integrated in this Internet session. Students are asked how they would respond to unhealthy video message, as well as what healthy food they will ask a parent/guardian to purchase.
Video 3 This three-minute video is in a grocery store, with a bad dream sequence in which our character is chased by unhealthy foods. Our character slowly wakes up choosing vegetables, fruits, and whole grains.
Session 4 This session involves students in preparing healthy snacks in small groups lead by peer models with the assistance of senior nursing students. Peer models lead their group in calculating the total fat and calorie content of their snack, distributing a sample at the end of the class. This session builds self-efficacy through enactment and is designed to help students overcome barriers to eating healthy foods that they may not have realized they like and can prepare themselves. Discussion of ingredients and sharing of recipes that students can share with their families is designed to promote access to healthy alternatives, since not knowing how to prepare fruits and vegetables is a barrier for adolescents in including these foods in their diet (Baranowski, Cullen, & Baranowski, 1999).
Video 4 This 3-min video focuses on television, encouraging students to ask for and do what is healthy, not what advertisers ask them to do. Student actors asking for healthy foods, not unhealthy foods, advertised are presented as a way to foster self-reevaluation. The video reinforces the idea that seventh graders can increase their access to healthy foods by asking their parents/guardians for these foods, rather than products advertised.
Session 5 The Internet content focus is exercise for a healthy life. The session focus is consciousness raising and self-reevaluation. Moderate and vigorous exercise are described. Students are asked to list activities they engage in. Feedback is given regarding how much activity is recommended and the discussion among students is focused on ways they each get this kind of exercise. Students review their calorie intake along with how much moderate and vigorous physical activity they need to burn those calories.
Video 5 This three-minute video shows a variety of physical activities with a theme of “What is exercise?” This content fosters self-reevaluation as students are encouraged to think about the things they are doing to be physically active and additional ideas they could consider. Our purpose is to foster self-efficacy through vicarious modeling and reinforce benefits of physical activity at mild, moderate and vigorous levels.
Session 6 (only used in School 1) Consciousness Raising includes participation in peer-led activities during gym class. The focus is on activities that are accessible and possible to perform safely outside of school, so as to promote self-awareness of lifelong opportunities for physical activity and the amount of calories burned while doing the activity for five minutes. Peer models lead physical activities at stations in the gym assisted by senior nursing students.
Frenn, Malin, Bansal, Delgado, Greer, Havice, Ho, Schweizer 15
Figure 1
Differences in percentage fat in food by race for females. Pre-test levels were subtracted from post-test totals of percentage fat in food,
so a lower number is the desired difference; 0 represents no change in percentage fat.
Frenn, Malin, Bansal, Delgado, Greer, Havice, Ho, Schweizer 16
Figure 2
Differences in moderate/vigorous activity, by group, income, and race. Pre-test levels were subtracted from post-test totals of moderate
vigorous activity, so a higher number is the desired difference; 0 represents no change in activity.
Frenn, Malin, Bansal, Delgado, Greer, Havice, Ho, Schweizer 17
Figure 3
Relationships of decrease in percentage fat in diet to number of sessions in that students participated. Pre-test levels were subtracted from post-test totals of percentage fat in diet, so a lower number is the desired difference; 0 represents no change in percentage fat.
Frenn, Malin, Bansal, Delgado, Greer, Havice, Ho, Schweizer 18
Figure 4
Differences in total change in activity with peer-led physical activity lab. Pre-test levels were subtracted from post-test totals of activity so
a higher number is the desired difference; 0 represents no change in activity.
Related Documents