Additive Manufacturing of Free Standing Structure from Thermally Cured Resins Shervin Foroughi A Thesis in The Department of Mechanical and Industrial Engineering Presented in Partial Fulfillment of the Requirements for the Degree of Masters of Applied Science (Mechanical Engineering) at Concordia University Montreal, Quebec, Canada July 2018

Welcome message from author
This document is posted to help you gain knowledge. Please leave a comment to let me know what you think about it! Share it to your friends and learn new things together.
Transcript

Additive Manufacturing of Free Standing Structure from Thermally Cured Resins
Shervin Foroughi
A Thesis in
The Department of
Mechanical and Industrial Engineering
Presented in Partial Fulfillment of the Requirements
for the Degree of Masters of Applied Science (Mechanical Engineering) at
Concordia University
Montreal, Quebec, Canada
July 2018

ii
CONCORDIA UNIVERSITY
School of graduate Studies
This is to certify that thesis prepared, By: SHERVIN FOROUGHI
Entitled: Additive Manufacturing of Free Standing Structure from Thermally Cured Resins
and submitted in the partial fulfilment of the requirements for the degree of
Master of Applied Science (Mechanical and Industrial Engineering)
Compiles with the regulation of the university and meets the accepted standards with respect to originality and quality.
Signed by final examining committee:
Dr. Subhash Rakheja Chair Dr. Rama Bhat Examiner Dr. Wei-Ping Zhu External to the department Co-supervisor Dr. Muthukumaran Packirisamy Co- supervisor
Approved by
Graduate Program Director
Dean of Faculty
Date
iii
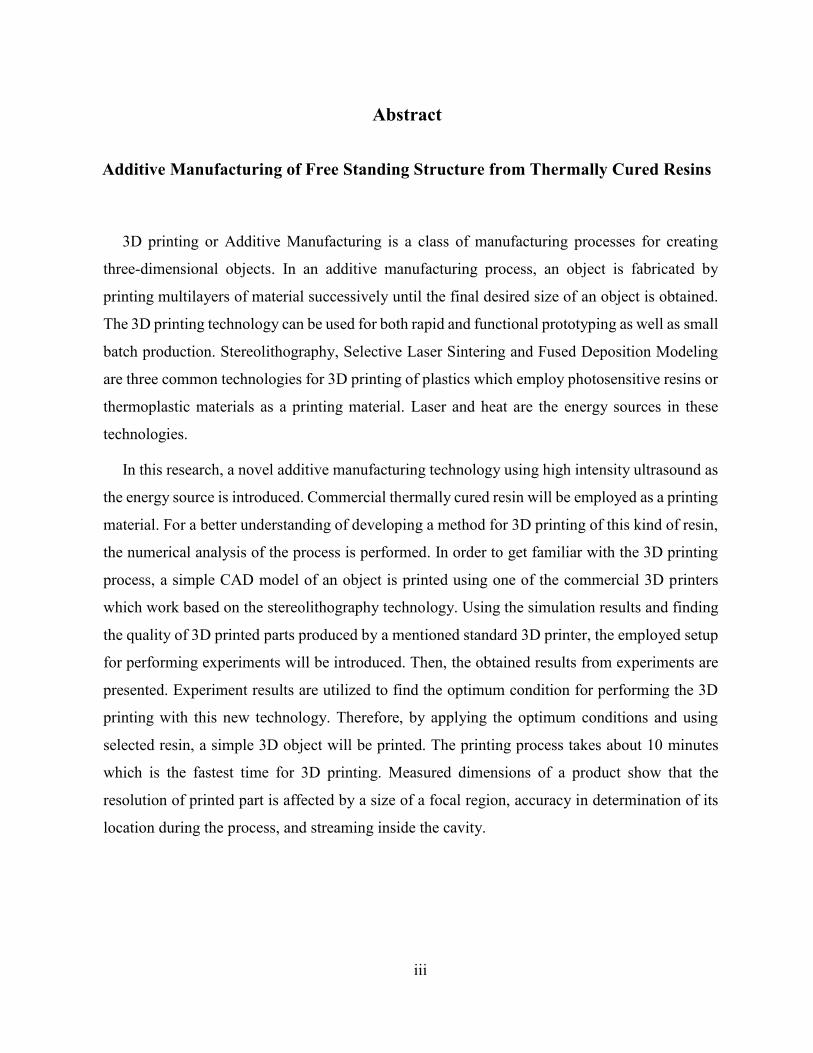
Abstract
Additive Manufacturing of Free Standing Structure from Thermally Cured Resins
3D printing or Additive Manufacturing is a class of manufacturing processes for creating
three-dimensional objects. In an additive manufacturing process, an object is fabricated by
printing multilayers of material successively until the final desired size of an object is obtained.
The 3D printing technology can be used for both rapid and functional prototyping as well as small
batch production. Stereolithography, Selective Laser Sintering and Fused Deposition Modeling
are three common technologies for 3D printing of plastics which employ photosensitive resins or
thermoplastic materials as a printing material. Laser and heat are the energy sources in these
technologies.
In this research, a novel additive manufacturing technology using high intensity ultrasound as
the energy source is introduced. Commercial thermally cured resin will be employed as a printing
material. For a better understanding of developing a method for 3D printing of this kind of resin,
the numerical analysis of the process is performed. In order to get familiar with the 3D printing
process, a simple CAD model of an object is printed using one of the commercial 3D printers
which work based on the stereolithography technology. Using the simulation results and finding
the quality of 3D printed parts produced by a mentioned standard 3D printer, the employed setup
for performing experiments will be introduced. Then, the obtained results from experiments are
presented. Experiment results are utilized to find the optimum condition for performing the 3D
printing with this new technology. Therefore, by applying the optimum conditions and using
selected resin, a simple 3D object will be printed. The printing process takes about 10 minutes
which is the fastest time for 3D printing. Measured dimensions of a product show that the
resolution of printed part is affected by a size of a focal region, accuracy in determination of its
location during the process, and streaming inside the cavity.

iv
To my beloved wife Nastaran
v
Acknowledgment
I would like to express my gratitude, first and foremost, to my advisor Professor
Muthukumaran Packirisamy for letting me to be a part of his Optical-Bio Microsystems group. I
am honored working under his supervision as a member of the 3D printing team, which has been
working on a novel and cutting-edge technology. Dr. Packirisamy has mentored and directed me
throughout the obscure and foggy path of the research. His positive attitude towards the burden
of the scientific problem solving has inspired me to be creative and accomplish meaningful
research.
Another person to whom I am immensely debtor is Dr. Mohsen Habibi, the research associate
in the Optical-Bio Microsystems Lab, who has been involved completely in project and never
hesitated to help me for accomplishing the project. I must also express my appreciation for
assistance of my colleagues in this project including Vahid Karamzadeh and Mahdi Derayatifar.
At the end, I would like to thank my wife and kids for their unconditional supports and patience
throughout my graduate study.

vi
CONTENTS List of Figures ix
List of Tables xiii
Nomenclature xiv
CHAPTER 1 INTRODUCTION AND LITERATURE REVIEW ..................................... 1
1.1. Emergence and evolution of 3D printing .................................................................. 1
1.2. Additive manufacturing processes ............................................................................ 2
1.3. 3D Microfabrication.................................................................................................. 3
1.4. Advantages and disadvantages of different AM technologies .................................. 4
1.5. 3D printing materials ................................................................................................ 5
1.6. Energy sources in 3D printing processes .................................................................. 6
1.7. High intensity focused ultrasound ............................................................................ 6
1.8. Objective of research ................................................................................................ 7
1.9. Contributions............................................................................................................. 8
CHAPTER 2 EXISTING ADDITIVE MANUFACTURING TECHNOLOGIES ........... 10
2.1. Direct Metal Deposition .......................................................................................... 11
2.2. Selective Laser Sintering ........................................................................................ 12
2.3. Selective Laser Melting ......................................................................................... 13
2.4. 3D Printing .............................................................................................................. 13
2.5. Laminated Object Manufacturing ........................................................................... 14
2.6. Stereolithography ................................................................................................... 15
2.7. Fused Deposition Modelling .................................................................................. 16
2.8. Dispensing 3D printing ........................................................................................... 16
2.9. Conclusions ............................................................................................................. 17

vii
CHAPTER 3 HIFU NUMERICAL ANALYSIS, THEORY AND SIMULATION ........ 18
3.1. Acoustics ................................................................................................................. 18
3.2. Governing equations ............................................................................................... 21
3.3. Numerical analysis .................................................................................................. 23
3.4. Results ..................................................................................................................... 27
3.5. Conclusions ............................................................................................................. 39
CHAPTER 4 COMMERCIAL 3D PRINTERS ................................................................ 40
4.1. 3D printers working with plastics as printing materials ......................................... 40
4.2. 3D printing of a free standing structure and setup .................................................. 42
4.3. Results ..................................................................................................................... 45
4.4. Conclusions ............................................................................................................. 49
CHAPTER 5 DESIGN AND INSTALLATION OF HIFU 3D MANUFACTURING .... 50
5.1. HIFU transducer and pulse generator ..................................................................... 51
5.2. CNC machine .......................................................................................................... 51
5.3. Temperature measurement system .......................................................................... 52
5.4. Resins ...................................................................................................................... 54
5.5. Tank and liquid cavity ............................................................................................ 58
CHAPTER 6 EXPERIMENTAL RESULTS AND DISCUSSION .................................. 59
6.1. Experimental conditions ......................................................................................... 59
6.2. Determination of focal region’s location and size .................................................. 59
6.3. Temperature measurement inside water ................................................................. 65
6.4. Curing of PDMS inside liquid cavity...................................................................... 67
6.5. Temperature measurement at focal region inside PDMS ....................................... 68
6.6. Final printed product ............................................................................................... 70

viii
6.7. Elastic behavior of 3D printed cantilever beam ...................................................... 72
6.8. Conclusions ............................................................................................................. 79
CHAPTER 7 CONCLUSIONS AND FUTURE WORKS ............................................... 81
REFERENCES …………………………………………………………………………......83

ix
List of Figures
Figure 1-1 Configuration of HIFU transducer
Figure 2-1 Additive Manufacturing Processes Categories
Figure 2-2 Schematic of Direct Metal Deposition Process
Figure 2-3 Schematic of SLS process
Figure 2-4 Schematic of Selective Laser Melting Process
Figure 2-5 Schematic of 3D printing process for metals
Figure 2-6 Schematic of LOM process
Figure 2-7 Schematic of Stereolithography (SLA) Process
Figure 2-8 Schematic of FDM process
Figure 2-9 Schematic of dispensing 3D printing process
Figure 3-1 Wave incident at two liquid interface and generated reflected and transmitted waves
Figure 3-2 2D Axisymmetric Model Implemented in Simulation
Figure 3-3 Generated acoustic pressure fields by applying different input powers at frequency
of 2.15 MHz
Figure 3-4 Change in Maximum Pressure Wave at Focal Point with respect to Input Power
Figure 3-5 Generated acoustic intensity fields by applying different input powers at frequency
of 2.15 MHz
Figure 3-6 Acoustic intensity profile along the symmetrical line for different input powers
Figure 3-7 Acoustic pressure amplitude profiles for different input powers along the
symmetrical line at frequency of 2.15 MHz
Figure 3-8 Acoustic pressure amplitude profiles for multiple input powers along the radial line
which passes through the focal point at frequency of 2.15 MHz
Figure 3-9 The temperature distributions at time equal to 1(s) inside the water for different
input powers and with insonation at frequency of 2.15 MHz

x
Figure 3-10 The heat transfer over a period of 10 seconds inside the water
Figure 3-11 Pressure field in the water at frequency of 2.15 MHz and input power of 218 W
Figure 3-12 Intensity field in the water at frequency of 2.15 MHz and Input power of 218 W
Figure 3-13 Heat transfer in a period of 10 seconds inside the water in presence of 2 different
dividers at frequency of 2.15 MHz and input power 218 W
Figure 3-14 Pressure field in the liquid cavity at frequency of 2.15 MHz and input power of
218 W in presence of Polystyrene divider
Figure 3-15 Intensity field in the liquid cavity at frequency of 2.15 MHz and input power of
218 W in presence of Polystyrene divider
Figure 3-16 Temperature field in the liquid cavity at frequency of 2.15 MHz and input power
of 218 W in presence of polystyrene divider
Figure 4-1 “LulzBot TAZ” FDM 3D printer and a “Flange” prototype printed with this
machine
Figure 4-2 “ProX SLS 6100” SLS 3D printer and a “Engine Body” printed with this
technology
Figure 4-3 “Form 2” SLA 3D printer and three different small prototypes of “Gears” built by
this printer
Figure 4-4 CAD models of designed cantilevers (all dimensions are in mm)
Figure 4-5 Postcured parts – Printed in different directions with respect to the platform
Figure 4-6 The direction of roughness measurement, and measured roughness over the length
of printed cantilevers
Figure 4-7 Schematic for layer-by-layer printing of a 3D object
Figure 5-1 Schematic of experimental setup
Figure 5-2 CNC machine used in this research and its axes of movements
Figure 5-3 Viscosity vs Time for a thermoset resin material

xi
Figure 6-1 Schematic of the setup used for determination of focal location and effect of power
on its size
Figure 6-2 Rising up the surface of the water while running the transducer with
Figure 6-3 Change in the size of the spindle’s girth due to decreasing the applied input power
Figure 6-4 Schematic of setup for using thermochromic sheet
Figure 6-5 Focal region appearance on the thermochromic sheet that has been positioned along
the vertical symmetrical plane of transducer
Figure 6-6 Schematic of setup (Top View) in presence of Acrylic sheet in order to define the
focal region’s size
Figure 6-7 Focal region sections appeared by burning the acrylic sheet
Figure 6-8 Setup for positioning the thermocouple inside water tank
Figure 6-9 Temperature profile at focal point inside water for 1 (s) sonication with input power
of 218 W
Figure 6-10 Schematic configuration of setup for printing the PDMS
Figure 6-11 Sequence of building the layers
Figure 6-12 Embedded thermocouple inside PDMS cavity to measure the temperature during
sonication
Figure 6-13 The heat transfer over a period of 10 seconds inside the PDMS resulted from
experiment
Figure 6-14 Directly 3D printed cantilever beams
Figure 6-15 Selected cantilever with its average dimensions
Figure 6-16 Preparation of box for fabrication of PDMS mold
Figure 6-17 Fabricated PDMS mold
Figure 6-18 Two side views of fabricated PDMS cantilever with an appendage to help for
pulling out the part from the mold
Figure 6-19 Schematic of employed balance method to obtain the stiffness of cantilevers

xii
Figure 6-20 Balance method setup for measuring the force on the tip of the cantilevers
Figure 6-21 Force-Deflection graph for directly 3D printed cantilever and indirectly molded
PDMS cantilever
Figure 6-22 Linear graphs of force-deflection for 3D printed cantilever and PDMS cantilever

xiii
List of Tables
Table 1-1 Advantages and disadvantages of different AM technologies
Table 3-1 Characteristics of HIFU transducer
Table 3-2 Material Properties of Dividers
Table 3-3 Liquid’s Properties
Table 3-4 Length of focal region through different frequencies
Table 4-1 Characteristics of “Form 2” Flexible Resin
Table 4-2 Dimensional comparison between the designed and printed samples
Table 5-1 HIFU transducer’s characteristics
Table 5-2 Characteristics of the CNC machine
Table 5-3 Specification of DAQ NI 9212
Table 5-4 Thermocouples’ specification
Table 5-5 Liquid Crystal Specification
Table 5-6 Selected resins’ characteristics
Table 5-7 Resin accelerator component
Table 5-8 Sylgard resin component
Table 5-9 Curing agent component
Table 6-1 Material Properties of Acrylic Plastic
Table 6-2 Optimized operation conditions of the printing
Table 6-3 Dimensions of cantilevers (CAD designed and 3D printed)

xiv
Nomenclature
AM Additive Manufacturing
ABS Acrylonitrile Butadiene Styrene
ASTM American Society of Testing and Materials
CNC Computer Numerical Control
DAQ Data Acquisition System
EBDM Electron Beam Direct Manufacturing
EFAB Electrochemical Fabrication
FDM Fused Deposition Modelling
FIB Focused Ion Beam
HIFU High Intensity Focused Ultrasound
LCVD Laser Chemical Vapor Deposition
LIFT Laser Induced Forward Transfer
LOM laminated object manufacturing
MLS Microlaser Sintering
MSL Micro Stereolithography
PDMS Polydimethylsiloxane
PML Perfectly Matched Layer
PZT Lead Zirconate Titanate
SDM Shape Deposition Modeling
SLA Stereolithography
SLM Selective Laser Melting
SLS Selective Laser Sintering
STL Stereolithography
1
CHAPTER 1
INTRODUCTION AND LITERATURE REVIEW
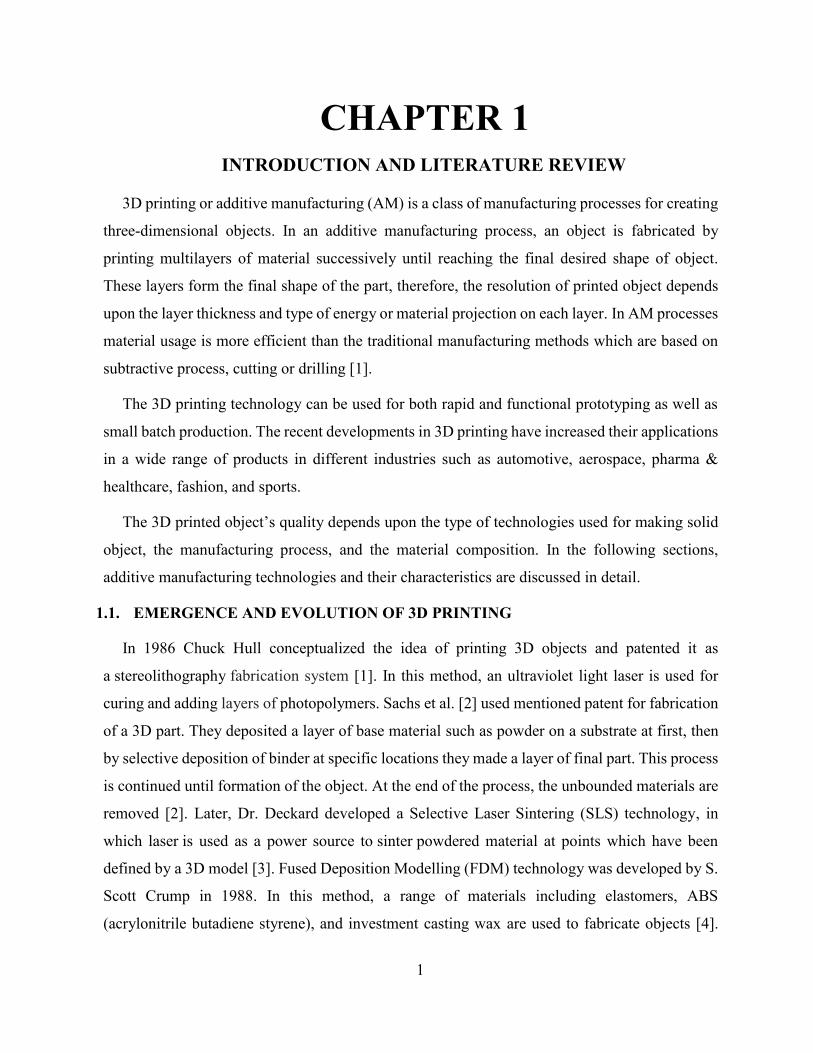
3D printing or additive manufacturing (AM) is a class of manufacturing processes for creating
three-dimensional objects. In an additive manufacturing process, an object is fabricated by
printing multilayers of material successively until reaching the final desired shape of object.
These layers form the final shape of the part, therefore, the resolution of printed object depends
upon the layer thickness and type of energy or material projection on each layer. In AM processes
material usage is more efficient than the traditional manufacturing methods which are based on
subtractive process, cutting or drilling [1].
The 3D printing technology can be used for both rapid and functional prototyping as well as
small batch production. The recent developments in 3D printing have increased their applications
in a wide range of products in different industries such as automotive, aerospace, pharma &
healthcare, fashion, and sports.
The 3D printed object’s quality depends upon the type of technologies used for making solid
object, the manufacturing process, and the material composition. In the following sections,
additive manufacturing technologies and their characteristics are discussed in detail.
1.1. EMERGENCE AND EVOLUTION OF 3D PRINTING
In 1986 Chuck Hull conceptualized the idea of printing 3D objects and patented it as
a stereolithography fabrication system [1]. In this method, an ultraviolet light laser is used for
curing and adding layers of photopolymers. Sachs et al. [2] used mentioned patent for fabrication
of a 3D part. They deposited a layer of base material such as powder on a substrate at first, then
by selective deposition of binder at specific locations they made a layer of final part. This process
is continued until formation of the object. At the end of the process, the unbounded materials are
removed [2]. Later, Dr. Deckard developed a Selective Laser Sintering (SLS) technology, in
which laser is used as a power source to sinter powdered material at points which have been
defined by a 3D model [3]. Fused Deposition Modelling (FDM) technology was developed by S.
Scott Crump in 1988. In this method, a range of materials including elastomers, ABS
(acrylonitrile butadiene styrene), and investment casting wax are used to fabricate objects [4].

2
Seven years later, in 1995, Fraunhofer Institute developed another additive manufacturing
process which is called Selective Laser Melting (SLM). In this process, like as SLS, thermal
energy is provided by a laser or an electron beam which fuses selective regions of a powder bed
according to the designed 3D model [5].
1.2. ADDITIVE MANUFACTURING PROCESSES
Considering the mentioned technologies, American Society for Testing and Materials (ASTM)
has categorized the additive manufacturing technologies based on 7 processes that are mentioned
in the following [6]:
1- Material Jetting
2- Powder Bed Fusion
3- Binder Jetting
4- Direct Energy Deposition
5- Material Extrusion
6- Sheet Lamination
7- Vat Photopolymerization
Polyjet Process, SLS, Powder 3D Printing, Electron Beam Direct Manufacturing (EBDM),
FDM, Laminated Object Manufacturing, and SLA are some examples of technologies based on
mentioned processes respectively.
As a matter of fact, in all additive manufacturing technologies, the final part can be fabricated
directly within a process or indirectly in combination with other traditional manufacturing
techniques [1]. Selection of methods is performed upon the characteristics of parts.
In a direct process, the final part is produced directly with additive manufacturing machine. In
this method, post processing will be applied in order to improve the surface finish of the
component.
In some processes after fabrication of middle staged product which is called green part, further
processes should be applied on it, then the final part will be produced. Sintering is an example of
this kind of complementary processes. These processes are addressed as a Multi-stage process.

3
Indirect processes are the method in which additive manufacturing is combined with
traditional manufacturing. For instance, the mold can be fabricated by using 3d printing
technology which can be used for the casting process to produce the final part.
1.3. 3D MICROFABRICATION
So far, the types of additive manufacturing technologies that have been widely utilized to
produce complicated macro 3D components in the past decade were introduced. By applying
some essential modifications and improvements proper to microfabrication characteristics to
these technologies, fabrication of 3D microparts is also possible. There are 3 groups of additive
manufacturing technologies that can be employed for fabrication of 3D micro-components [7].
The first group is scalable additive manufacturing that includes: micro stereolithography
(MSL), microlaser sintering (MLS), inkjet printing processes, fused deposition modeling (FDM),
and laminated object manufacturing (LOM). Since these technologies have been developed for
fabrication of normal sized components, there are still some limitations on adaption of this
category for micromanufacturing. But despite that, MSL can be identified as a promising
approach for true 3D micromanufacturing in comparison with others.
The second group is 3D direct writing technologies. Although this category of technologies
has been developed for 2D fabrication, some of them can be utilized for high resolution 3D
microcomponents such as laser chemical vapor deposition (LCVD), focused ion beam (FIB),
laser induced forward transfer (LIFT), and nozzle dispensing processes which includes a pump
and syringe-based deposition. LCVD and FIB are more efficient technologies in order to be
employed for 3D fabrication. Generally, bio 3D printers function based on a basic syringe/pump
extrusion.
The third category of 3D micromanufacturing technology is the hybrid process. The shape
deposition modeling (SDM) and electrochemical fabrication (EFAB) are additive manufacturing
technologies that belong to this group. Additive and subtractive processes are used in SDM to
produce microparts. EFAB employs electrochemical deposition and subtractive planarization to
fabricate 3D microcomponent. EFAB is based on layer-by-layer process. This process is more
applicable for 3D micromanufacturing among the third category.
4
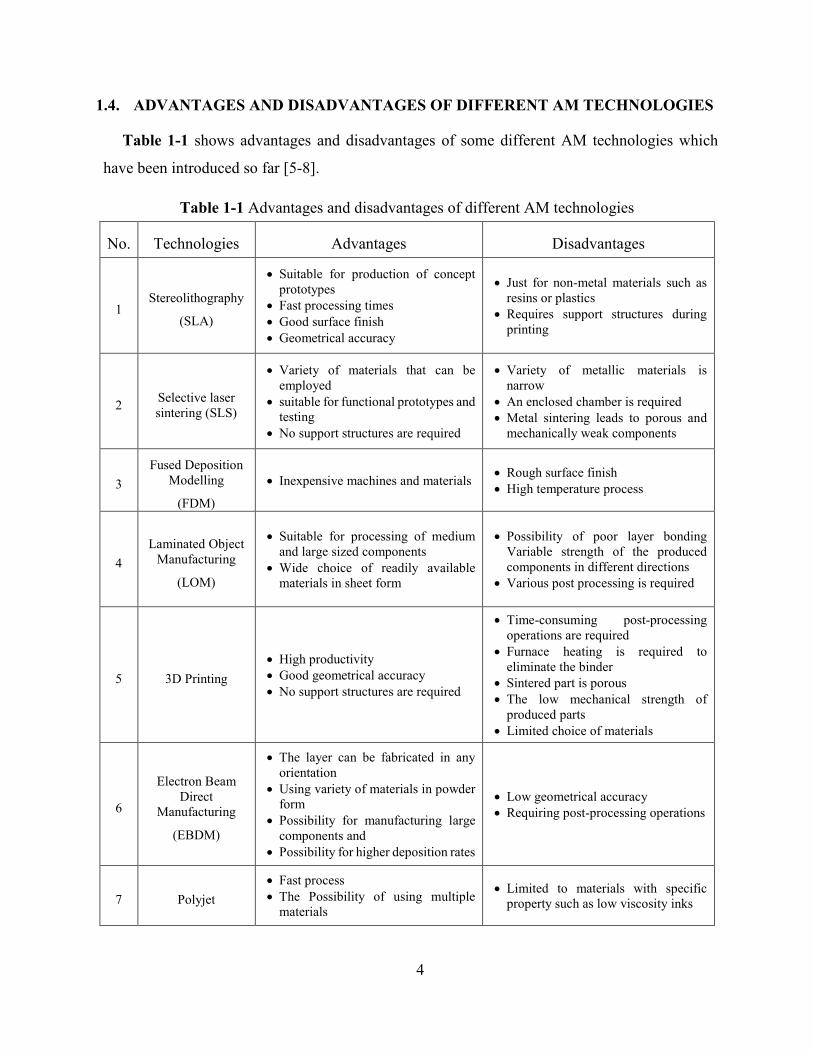
1.4. ADVANTAGES AND DISADVANTAGES OF DIFFERENT AM TECHNOLOGIES
Table 1-1 shows advantages and disadvantages of some different AM technologies which
have been introduced so far [5-8].
Table 1-1 Advantages and disadvantages of different AM technologies
No. Technologies Advantages Disadvantages
1 Stereolithography
(SLA)
Suitable for production of concept prototypes
Fast processing times Good surface finish Geometrical accuracy
Just for non-metal materials such as resins or plastics
Requires support structures during printing
2 Selective laser sintering (SLS)
Variety of materials that can be employed
suitable for functional prototypes and testing
No support structures are required
Variety of metallic materials is narrow
An enclosed chamber is required Metal sintering leads to porous and
mechanically weak components
3 Fused Deposition
Modelling
(FDM)
Inexpensive machines and materials Rough surface finish High temperature process
4 Laminated Object
Manufacturing
(LOM)
Suitable for processing of medium and large sized components
Wide choice of readily available materials in sheet form
Possibility of poor layer bonding Variable strength of the produced components in different directions
Various post processing is required
5 3D Printing High productivity Good geometrical accuracy No support structures are required
Time-consuming post-processing operations are required
Furnace heating is required to eliminate the binder
Sintered part is porous The low mechanical strength of
produced parts Limited choice of materials
6
Electron Beam Direct
Manufacturing
(EBDM)
The layer can be fabricated in any orientation
Using variety of materials in powder form
Possibility for manufacturing large components and
Possibility for higher deposition rates
Low geometrical accuracy Requiring post-processing operations
7 Polyjet Fast process The Possibility of using multiple
materials
Limited to materials with specific property such as low viscosity inks

5
1.5. 3D PRINTING MATERIALS
Final mechanical properties of 3D printed parts, flexibility in design and fabrication are
defined by properties of raw material [9]. Powder, filament, pellets, granules, resin etc., are
different material types or states that are used in 3D printing. In addition, specific material types
and material properties have been developed more precisely to suit the application. In following
some of the popular types of AM materials are introduced.
Metals
Metals are used in the form of powder. The most common types of metals are titanium,
aluminum and cobalt derivatives. Stainless steel powder is one of the strongest metals for 3D
printing.
Plastics
In Fusion Deposition Modeling (FDM) process or sintering process nylon is used as a strong,
flexible and durable plastic material. It can be in a filament or powder form. Nylon is naturally
white but the color can be added to it also. It can be used as a bonding powder combined with
aluminum powder to form Alumide which is used in SLS 3D printing.
ABS is another strong plastic which is available in filament form. Polylactic acid (PLA) is a
biodegradable plastic material in forms of resin and filament that is employed in
stereolithography and FDM processes respectively. Same as nylon it can be prepared in a variety
of colors but it is not as flexible as ABS.
Ceramics
The new group of material is ceramics. They can be used in stereolithography combined with
the photosensitive liquid resin. The produced green part is needed to undergo sintering post-
processing in order to obtain a final object.
Bio Compatible Materials
A huge amount of researches are conducted in order to find and develop bio compatible
materials for 3D printing of the parts. Even living tissue can be addressed as one of the 3D printing
productions. Compositions of collagen, chitosan, hyaluronic acid, and alginate are widely being
used in bio 3D printing [10]. Polydimethylsiloxane (PDMS) is another bio compatible material

6
that has been extensively used in medical applications such as tissue/organ on-a-chip devices and
two-dimensional (2D) or three-dimensional (3D) cell culture. PDMS naturally is liquid resin and
by adding a curing agent and exposing to heat becomes cured. It is transparent, gas permeable,
and economical. PDMS is mostly used in dispensing 3D printing [11]. In this method, pure PDMS
is not used individually, but its composition should be modified in order to utilize as 3D printing
material [11].
1.6. ENERGY SOURCES IN 3D PRINTING PROCESSES
3D printing process defines the type of material which can be used in AM technology and
source of energy in each process could be different. Generally, in 3D printing processes light,
laser or external heat are used to transform a raw material to the final part. The UV-light is used
to activate a chemical reaction of photosensitive liquid material and starting the curing process.
High energy laser, electron beam, or simple external heat source are employed to melt powder
materials or plastic filaments.
Also in novel innovation which have been patented by Habibi and Packirisamy, high intensity
focused ultrasound (HIFU) energy has been employed to polymerize the thermoset resins inside
the chamber selectively. Polymerization of resin happens when the focused field interacts with
liquid and causes to produce heat due to absorption of wave by material. The fabricated final part
in this process has a layerless structure in contrast of 3D printed parts manufactured by so far
mentioned conventional layer-by-layer processes. In addition, fast processing time is one of the
main competitive factors of this technology. In this technology, focused ultrasound is produced
by HIFU transducer. This is the first time that ultrasound energy is utilized in additive
manufacturing. In following the HIFU and its common usages will be explained more.
1.7. HIGH INTENSITY FOCUSED ULTRASOUND
High intensity ultrasound energy has been frequently employed as an operating energy in
various devices for different applications. This energy can be used for plastic welding in
automotive, electronic appliance, and medical equipment industries [12]. It also is being utilized
in acoustic compressors, refrigerators, and other industrial processes [13].
In therapeutic methods for non-invasive ablation of tumors, high intensity focused ultrasound
(HIFU) is used [14]. The possibility of performing treatment operation from outside of body on

7
a tissue is the main advantages of this method over other thermal ablation techniques [15]. Since
ultrasound wave transfers through the materials such as liquids, targeting a specific point inside
the medium by using HIFU is completely possible.
HIFU transducers are often formed as spherical or parabolic surfaces with a geometric focal
point at a center of curvature. Figure 1-1 illustrates the configuration of this kind of transducer.
Figure 1-1 Configuration of HIFU transducer
Mostly, transducers are made from PZT (Lead Zirconate Titanate) which is a
piezoelectric ceramic material. The advantages of using a ceramic compared to other materials
include ceramic’s ability to be manufactured in different shapes and sizes and its capability of
operating efficiently at low voltage. Piezoelectric transducers convert the electrical charges
produced by their structural materials into energy. A piezoelectric ultrasonic transducer produces
sound waves above the frequencies that can be heard by the human ear. It functions by rapidly
expanding and contracting when appropriate electrical frequency and voltage is applied.
1.8. OBJECTIVE OF RESEARCH
The current research introduces an additive manufacturing technology using high intensity
focused ultrasound as the energy source. As a result of investigations a thermally cured resin has
been selected and printed directly without any additives. In fact, using pure thermally cured resin
as a printing material can pave the way for new inventions in additive manufacturing using high
intensity ultrasound.
In this work, after presenting more details about existing additive manufacturing technologies
in Chapter 2, numerical analysis of HIFU wave propagation inside two Newtonian liquids water,
HIF
U
Tran
sduc
er
Focal Region

8
and a type of thermally cured resin, in presence of changes in physical properties of them as well
as ultrasound source power will be performed in Chapter 3. It is believed that this physic brings
a better understanding of developing a method for 3D printing of thermoset resins.
The applied acoustic pressure is generated by a HIFU transducer. This aperture concentrates
pressure wave at a focal point and the following studies are performed in this region. As a matter
of fact, analysis is done by implementation of basic governing equations for sound propagation
and heat transfer. The result of acoustic study is heat energy due to absorbance of acoustic by the
bulk of liquid during transmission of ultrasound. Therefore, heat transfer study can be performed
in the time domain in presence of the computed heat source. Next, investigation of results is
proceeded by implementing characteristics of multiple liquids in the simulation and altering
acoustic source input parameters.
In Chapter 4, one of the standard 3D printers which has been fabricated based on
Stereolithography technology will be introduced. Then, a simple designed sample will be printed
by using this device. Dimensional precision and finishing quality are investigated after all.
By using the simulation results and finding the quality of 3D printed parts produced by one of
the existing standard 3D printers, the employed setup for performing experiments in this work
will be introduced in Chapter 5.
In Chapter 6, the obtained results from experiments will be presented. Discussion on
experiment and simulation results will be done as well. By understanding the optimum condition
for performing the 3D printing, a simple object will be printed by using selected resin. Finally, in
order to find out the quality of the printing process, dimensional and finishing check will be
performed.
The last chapter of this thesis is dedicated to concluding the findings and suggestions for future
works.
1.9. CONTRIBUTIONS
1. Sh.Foroughi, V.Karamzadeh, M.Packirisamy, “Design and Analysis of an Electro
Thermally Symmetrical Actuated Microgripper”, ICME 2018:20th International
Conference on Mechanical Engineering, Montreal, Canada, May 2018.

9
2. Sh.Foroughi, V.Karamzadeh, M.Habibi, M.Packirisamy, “Numerical Analysis of Acoustic
Propagation inside Multiple Liquids”, 5th International Conference of Fluid Flow, Heat and
Mass Transfer, Toronto, Canada, May 2018.
3. V.Karamzadeh, Sh.Foroughi, A.Sohrabi, M.Packirisamy, “Characterization of a 3D Printed
Mold for a Cell Culturing Microfluidic Device”, 5th International Conference of Fluid Flow,
Heat and Mass Transfer, Toronto, Canada, May 2018.
4. Sh.Foroughi, V.Karamzadeh, M.Habibi, M.Packirisamy, “Study the effect of lamilar
orientation in layer-by-layer 3D printing for fabrication of free standing structure”, (Journal
paper to be submitted).
5. V.Karamzadeh, Sh.Foroughi, and M.Packirisamy, “Characterization of a 3D Printed Mold
for a Droplet Generation Microfluidic Device”, (Journal paper to be submitted).

10
CHAPTER 2
EXISTING ADDITIVE MANUFACTURING TECHNOLOGIES
In the previous chapter, a brief discussion on AM technology has been performed. In following
detail characteristics of each technology will be introduced.
Additive Manufacturing (AM) is one of the best solutions for the fabrication of an object
layer-by-layer. As it was mentioned due to the simplicity of working with plastic AM started with
producing plastic parts in order to make a simple prototype. Today most of the materials are
included in AM processes for instance even ceramic powders are utilized in SLA by Formlabs
Company. In fact, based on material which is used in 3D printing operation the Additive
Manufacturing processes can be divided into metal and non-metal categories. These categories
are shown in Figure 2-1.
Figure 2-1 Additive Manufacturing Processes Categories [16]
Additive Manufacturing
Metal
Components
Melting System
Direct Metal Deposition
Selective Laser Melting
Non-Melting System
Selective Laser Sintering
3D Printing
Laminated Object Manufacturing
Non-Metal Components
Stereolithography
3D Printing
Selective Laser Sintering
Fused Deposition Modeling
Dispensing 3D Printing

11
All AM techniques are based on the layer-by-layer fabrication approach. The first step in this
fabrication includes the preparation of CAD model of the desired object. The CAD design is then
transformed into a file format which is acceptable by the 3D printer. Normally files are generated
in Stereolithography (STL) format. In this file format, the surfaces of a solid body are tessellated
into triangles and geometrical properties of triangle nodes are kept in a database. Next, this
database is mathematically cross-sectioned into small layers including a contour and a raster
surface. Layer slicing separation depends on the characteristics of a specified 3D printing process.
Finally, the 3D object will be printed layer by layer [17]. By considering mentioned steps to reach
the final part, in following each 3D printing technologies is introduced in detail.
2.1. DIRECT METAL DEPOSITION
This technology is based on direct energy deposition process [18]. The basic working principle
of Direct Metal Deposition is displayed in Figure 2-2. A high power laser beam is traveled over
the metal substrate. In this process laser beam generates a small melt pool over the base then the
powder is injected through a nozzle to a melting point which will be fused to the melt pool and
be bonded with the last melted part. By continuing the process, a deposited layer over the
substrate will be formed. The process is performed according to the pre-defined pattern which
has been loaded to CNC system or robotic arm by using the proper software program. In this
technology, the overlapping of melting tracks is used to create a layer and by stacking layers the
three-dimensional shape will be formed [8].
Figure 2-2 Schematic of Direct Metal Deposition Process [19]
12
This process is also called as Laser Powder Fusion or Laser Direct Casting. In this technology
fabrication of large components are possible but geometrical accuracy is low.
2.2. SELECTIVE LASER SINTERING
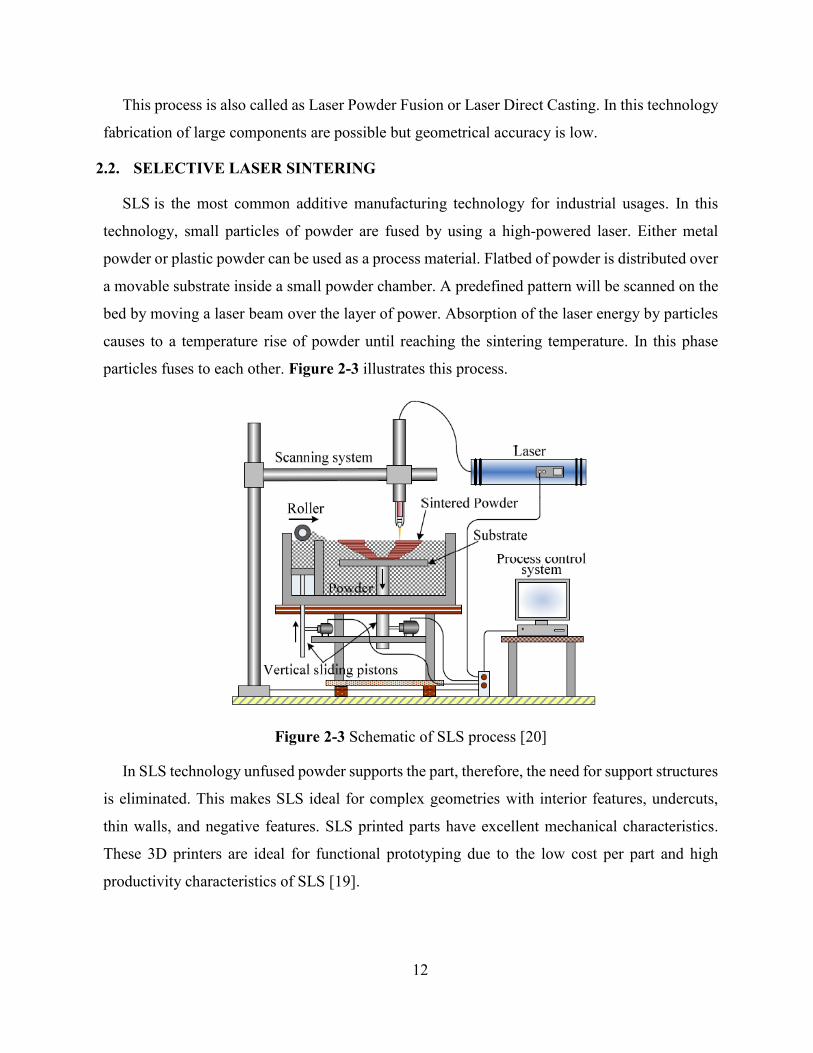
SLS is the most common additive manufacturing technology for industrial usages. In this
technology, small particles of powder are fused by using a high-powered laser. Either metal
powder or plastic powder can be used as a process material. Flatbed of powder is distributed over
a movable substrate inside a small powder chamber. A predefined pattern will be scanned on the
bed by moving a laser beam over the layer of power. Absorption of the laser energy by particles
causes to a temperature rise of powder until reaching the sintering temperature. In this phase
particles fuses to each other. Figure 2-3 illustrates this process.
Figure 2-3 Schematic of SLS process [20]
In SLS technology unfused powder supports the part, therefore, the need for support structures
is eliminated. This makes SLS ideal for complex geometries with interior features, undercuts,
thin walls, and negative features. SLS printed parts have excellent mechanical characteristics.
These 3D printers are ideal for functional prototyping due to the low cost per part and high
productivity characteristics of SLS [19].

13
2.3. SELECTIVE LASER MELTING (SLM)
This process is similar to SLS. The same as SLS, a laser beam scans over a bed of powder
material which is mounted on a piston. After forming each layer, the piston is moved down equal
to the desired thickness of the layer and a wiper tool deposits a new layer of powder material.
This process is continued until forming the final part. Figure 2-4 shows a schematic of this
process.
Figure 2-4 Schematic of Selective Laser Melting Process [21]
2.4. 3D PRINTING
Figure 2-5 presents the schematic of 3D printing process for metals. In this process after
dispensing the powder by a roller over a movable platform, an inkjet printing head will print a
binder over the powder bed based on the predefined pattern in order to build a layer. The same as
previous processes the platform is moved down equal to the desired thickness of the layer. This
process is continued until forming the final shape. In order to sinter the bounded metal particles
and removing the binder, the produced part is put in a furnace. As a final post-process, the sintered
part is infiltrated in a furnace using with a low-viscosity and low melting point material, such as
copper [8].

14
Figure 2-5 Schematic of 3D printing process for metals [22]
2.5. LAMINATED OBJECT MANUFACTURING
The Laminated Object Manufacturing (LOM) process is based on stacking thin sheets of
material in a suitable binding method. Each sheet is cut with a laser or cutter according to the
predefined layer raster pattern. Paper, metals, plastics, fabrics, synthetic materials, and
composites all are kind of materials that can be used in this process [23]. After cutting, all sheet
layers are bonded together to form a three dimensional object. In fact, any material in sheet form
can be utilized in this process but as it has been mentioned the suitable binding method should be
considered. Making a 3D model by using paper layers and glue is the simplest example of this
process [24]. Figure 2-6 shows schematic of LOM.

15
Figure 2-6 Schematic of LOM process [24]
2.6. STEREOLITHOGRAPHY (SLA)
Stereolithography (SLA) is the first invented AM technology. In this process, a movable
platform is submerged in tank which is filled with photo-curing resin. The height of resin over
the surface of platform determines the layers’ thickness. A layer will be built when the laser beam
scans over the resin based on the CAD model STL file. The Laser beam is guided by galvo
scanning mirrors. After finishing the curing of the layer, platform is lowered deep into the resin
tank equal to the predefined height of each layer and the process is repeated and continues layer
by layer until achieving the final shape of desired object. Figure 2-7 shows the schematic of this
process.
Figure 2-7 Schematic of Stereolithography (SLA) Process [19]

16
Multiple laser cure resins have been manufactured for SLA 3D printers which have developed
the application of SLA into different fields such as medicine. These materials cover a wide range
of optical, mechanical, and thermal properties and are competitive with the standard and
industrial thermoplastics.
2.7. FUSED DEPOSITION MODELLING (FDM)
Fused Deposition Modeling is the common form of 3D printing for rapid prototyping. In FDM
3D printers, printing starts by melting and extruding the thermoplastic filament. Then melted
plastic is deposited layer by layer over the printing platform until building the part.
ABS and PLA are the common thermoplastics that are generally used in FDM printers. This
technique is well-suited for printing a basic model as well as low-cost simple parts. Figure 2-8
illustrates this process.
Figure 2-8 Schematic of FDM process [25]
2.8. DISPENSING 3D PRINTING
Dispensing 3D printing originated from FDM technology and is classified under the category
of extrusion process. This technology has been used in various fields but the main application of
this technology is in biotechnology and organ-printing technology [26]. Unlike the SLA
technology in dispensing additive manufacturing, the 3D part is fabricated directly with extruded
material which dispenses from the nozzle.

17
This technology is based on layer-by-layer process. The 3D object is designed in a CAD
software and is subdivided to 2D patterns with a specific thickness which is identified based on
the specification of 3D printer machine. After loading the material into a syringe or dispensing
equipment, plane patterns are stacked up in a layer-by-layer process, to build a final 3D object.
The dispensing system includes a heater and/or cooler parts as well as dispenser which control
the flow rate of material by applying the pressure. Although the application of this method is
limited to the viscosity of the printing material, simplicity in use, the absence of post-processing
and simple drive-mechanism parts are advantages of this technology in comparison with others
[26]. Figure 2-9 displays the schematic of this process.
Figure 2-9 Schematic of dispensing 3D printing process [27]
2.9. CONCLUSIONS
In this chapter existing additive manufacturing methods have been introduced. As it has been
mentioned, powders made of either plastic or metal, plastic fibers, and photosensitive resins are
the most common materials that are used in these technologies. They work based on layer-by-
layer process and either high energy laser, simple external heat source or UV-light is employed
to perform the process of fabrication. In this research the photosensitive resin and mentioned
energy sources will be substituted by thermally cured resins and HIFU energy respectively.
Therefore, in order to get familiar with the process of this new method numerical analysis of the
problem will be performed in next chapter.
Printed Layer
Dispensing Part
Nozzle
Manipulator
Pressure Generator

18
CHAPTER 3 HIFU NUMERICAL ANALYSIS, THEORY AND SIMULATION
In order to achieve the inclusive overview of the expected experimental results, numerical
simulation of the problem, at first step, is a promising method to validate the accuracy of
approaches. Therefore, in this research before carrying out the experiments on sound propagation
inside the liquid media, numerical simulation and analysis of the problem will be performed in
advance. In the following context, after introducing the acoustics and its characteristics, the
governing equations will be explained. Next, the methodology of numerical analysis for
problem’s simulation will be described. Finally, investigation of results will be proceeded by
implementing characteristics of multiple materials in the simulation.
3.1. ACOUSTICS
The sound is generated by oscillation of an object as a source inside the physical medium.
Sound waves are either longitudinal or transverse. Longitudinal acoustic waves are waves which
are produced by changing the pressure from equilibrium state. In other definition, when the wave
motion is in direction or opposite direction of energy moving, the wave is called longitudinal
while transverse waves are generated due to altering the sheer stress perpendicular to the wave
transmission direction. Inside fluids and solids, sound propagates as a longitudinal or
compression wave. Also, the transverse or shear waves transmit in solids. For instance, in the air
sound is a longitudinal wave where the wave motion is in direction of the movement of energy.
When the air is influenced by an oscillating object, speaker as an example, starts to follow the
motion behavior of the speaker’s cone. As the cone moves forward, the air is compressed that
causes increasing the air pressure. In reverse, when the cone moves back and passes its static
position the air pressure will reduce. In fact, along with the harmonic sinusoidal shape of the
longitudinal acoustic wave, crests and troughs represent the maximum and minimum pressure
respectively. In a solid medium, sound propagation happens by a small-amplitude elastic
vibration of solid’s shape [28, 29].

19
3.1.1. ACOUSTIC WAVE CHARACTERISTICS
Acoustic waves are often characterized by the following properties:
1. Frequency and Period
2. Wavelength and Amplitude
3. Speed of sound
4. Intensity
These parameters are the fundamentals that distinguish waves from each other. One of the
forms of the sound is Ultrasound. Ultrasound is no different from the normal sound in physical
properties except its frequency is higher than the audible limit of human hearing and is
approximately 20 kilohertz (KHz).
As a matter of fact, the acoustic wave transports its energy during traveling through the
medium. The energy of a sound wave per unit volume is called the energy density. The energy
flow due to sound wave movement is characterized by the sound intensity and also called energy
flux density [29]. Sound intensity describes the rate of energy flow through a unit area.
Acoustic waves can pass through one or multiple mediums. Different physical properties of
mediums cause to alter the speed and intensity characteristics. For instance, during traveling the
sound wave between two different liquids, reflection, and refraction of pressure waves at the
interface will happen. In this process, the amplitudes of the transmitted and reflected waves are
only the function of Acoustic Impedance. The meaning of the term impedance is resistance.
Acoustic impedance is defined as a ratio of a sound pressure (in complex form) to an oscillation
velocity which almost is used to describe the acoustic wave propagation. In the propagation of a
plane harmonic wave in liquids, acoustic impedance is calculated by the following formula:
𝑧 =𝑝
𝑉= 𝜌𝑐 (3-1)
where 𝑧 is acoustic impedance, 𝑝 complex form of sound pressure, 𝑉 is the vibration velocity, 𝜌
is the density of the liquid medium and 𝑐 is the velocity of sound in liquid. Acoustic impedance
characterizes a medium of wave propagation [30].

20
When an acoustic wave strikes an interface between two liquid media part of the wave will
transmit and refract through the second media and the rest will reflect. Figure 3-1 shows the
geometry of the process.
Figure 3-1 Wave incident at two liquid interface and generated reflected and transmitted waves
𝛽𝑖, 𝛽𝑟 and 𝛽𝑡 are the angle of incident, reflection and transmission, respectively. In this figure, 𝜌
is the density of the liquid medium and 𝑐 is the velocity of sound in liquid. The magnitude of the
transmitted wave angle with the normal vector of interface plane is dependent on the wave speeds
in each media and the angle of incident [31]:
sin 𝛽𝑖
𝑐1=
sin 𝛽𝑡
𝑐2 (3-2)
Equation “3-2” is called Snell’s Law for acoustic waves.
In reality, acoustic wave’s energy is dissipated during propagating through the medium. This
process is defined as attenuation [30]. Generally, the source of attenuation in materials are:
Attenuation due to grain scattering
Attenuation due to absorption
Energy loss due to grain scattering comes from the scattering of incident wave in different
directions that results in increasing the net loss of amplitude with distance in propagation’s
direction. In contrast, the absorption attenuation is the energy loss due to the conversion of wave
energy to heat during wave movement in medium. This type of material’s attenuation typically

21
varies with the frequency of the wave passing through the material. For example, in water at
room temperature the attenuation can be determined by the following relation [31]:
𝛼𝑤(𝑓) = 25.3 × 10⁻¹⁵𝑓2 (𝑁𝑝
𝑚) (3-3)
where 𝑓 is the frequency in 𝐻𝑧 and the unit of 𝛼𝑤 is Nepers (Np) per meter.
As it has been mentioned in Chapter 1, in HIFU transducers the intensity of ultrasound wave
is focused at a certain location which is called focal point. Focal region is one of the
characteristics that determines the application of transducer. Normally the size of focal region is
altered by changing the magnitude of wave’s frequency and can be calculated by using the
following equation [32]:
𝐹𝑟 =8 × 𝐹𝑙
2 × 𝑐
𝐷𝑡2 × 𝑓 + 2𝐹𝑙 × 𝑐
(𝑚) (3-4)
where 𝐹𝑟 is the focal region size, 𝐹𝑙 is focal length of transducer in (m), 𝐷𝑡 is the transducer’s
diameter in (m), 𝑐 is velocity of the sound in medium in (𝑚
𝑠) and 𝑓 is the frequency of the acoustic
wave generated by transducer in (𝐻𝑧).
3.2. GOVERNING EQUATIONS
3.2.1. ACOUSTICS EQUATION
In an ideal fluid, the equation of wave can be obtained by using conservation of mass equation,
Euler’s equation and the adiabatic equation of state. By retaining the only first-order terms in
these equations the linear wave equation is achieved [33]:
𝛻2𝒑 −1
𝑐2
𝜕2𝒑
𝜕𝑡2= 0 (3-5)
where 𝒑 is the pressure and 𝑐 is the sound speed. This equation is represented in time domain
since by using frequency–time Fourier transform the equation in the frequency domain will be
obtained [28,33]:
1
𝜌𝜔2[∇2 + (
𝜔
𝑐)
2
] 𝐩(𝑟, 𝑧) = 0 (3-6)

22
which is presented in the cylindrical coordinate. In this relation 𝜔 is angular velocity, 𝐩 is an
acoustic pressure and 𝜌 is the fluid’s density. Equation “3-6” represents homogeneous form of
linear Helmholtz equation. In axisymmetric cylindrical coordinate ∇2 is defined as:
∇2=1
𝑟
𝜕
𝜕𝑟𝑟
𝜕
𝜕𝑟+
𝜕2
𝜕𝑧2 (3-7)
As it has been mentioned so far, the major effect of acoustic propagation inside liquid is the
thermal energy produced due to absorption of ultrasound wave by liquid that yields to rising
medium temperature. The temperature distribution depends on a convection and conduction
properties of the liquid. The amount of generated ultrasound power per unit volume 𝑸𝐴 is
obtained by applying the following expression [34]:
𝑸𝐴 = 2𝛼𝐴𝑏𝐼 (3-8)
where, 𝛼𝐴𝑏 is the local absorption coefficient or attenuation of the liquid, 𝐼 is the local acoustic
intensity.
Considering having a time-harmonic wave the 𝐼 can be given by:
𝐼 =1
𝜔2𝜌𝑐⟨(
𝜕P1
𝜕𝑡)
2
⟩ (3-9)
where 𝜔 is angular velocity, P1 is the first-order approximation of acoustic pressure, 𝜌 is the
fluid’s density, 𝑐 is the sound speed, and the brackets defines a time average over one acoustic
cycle.
3.2.2. HEAT TRANSFER EQUATION
In Section 3.1.1 it was indicated that the absorption attenuation of a fluid causes the energy
loss due to the conversion of wave energy to heat during wave movement in medium. Therefore,
to investigate the effect of generated heat energy in an incompressible liquid media of wave
propagation without considering the effect of viscosity, the following equation is used to model
the heat transfer [35]:
𝜌𝐶𝑝
𝐷𝑻
𝐷𝑡= −(∇. 𝑞) + 𝑸𝐴 (3-10)

23
where 𝜌 is the density of liquid, 𝐶𝑝 is the specific heat capacity at constant pressure, 𝑻 is the
absolute temperature, 𝑞 is the heat flux from conduction, and 𝑸𝐴 is an additional heat source due
to acoustic pressure. The term (∇. 𝑞) governs the thermal diffusion through the fluid and can be
expanded as k∇2𝑻. In which k is the thermal conductivity of the fluid.
Therefore, the final form of Equation “3-10” for incompressible fluid will be:
𝜌𝐶𝑝
𝐷𝑻
𝐷𝑡= −𝑘∇2𝑻 + 𝑸𝐴 (3-11)
By solving this equation temperature distribution through the liquid media can be determined.
3.3. NUMERICAL ANALYSIS
So far governing equations of acoustic wave propagation inside a liquid media have been
introduced. Therefore, to solve the equations and for determination of the acoustic effects,
pressure and temperature distributions as well as intensity, in liquid media, a finite difference
analysis will be performed by using COMSOL Multiphysics 5.2 in a two-step process:
1. Solving acoustic Equation “3-6” in frequency domain in absence of nonlinear acoustic wave
propagation effects to find acoustic pressure distribution as well as heat energy due to
absorption of sound wave by liquid.
2. Obtaining temperature distribution by solving heat transfer Equation “3-11” incorporated
with computed heat source from acoustic stage, in time domain. This heat energy will apply
during 1 second in simulation. Multiple time steps are considered in order to assure the
accuracy of computation. The final results are presented for 0.1 second time step in total
process duration of 10 seconds to illustrate the temperature propagation inside the liquids.
In COMSOL, pressure acoustics physics in a frequency domain study, as well as Heat Transfer
physics in a time domain study, will be used to perform the simulation.
3.3.1. MODEL
The model includes two parts: Acoustic apparatus and Fluid container. In this study, as it has
been indicated so far, a high intensity focused ultrasound (HIFU) transducer has been selected as
a sound source. The fluid container is divided into two compartments, one is liquid cavity which
contains the liquid of experiment that the focal point will be placed at there and another part is

24
filled by pure water which provides medium for operation of transducer. In experiments, liquid
cavity will be a closed plastic container which is filled by the liquid of experiment. Since, only
the front face of this container has an interaction with the transmitted acoustic waves and acts as
a barrier, from now on this face will be called a divider.
It is assumed that the geometry of model elements is symmetrical and water medium has
uniform acoustic properties. Therefore, 2D axisymmetric assumption for acoustic field model
will be an acceptable approximation that leads to reduce computation time. The COMSOL model
of a system under investigation and its components are shown in Figure 3-2. The 5mm perfectly
matched layers (PML) region are considered in model to absorb the outgoing acoustic waves.
Figure 3-2 2D Axisymmetric Model Implemented in Simulation

25
In this figure, the liquid cavity and divider sheet has a rectangle shape in a size of 42mm x
35mm (width x height) and 42mm x 1.1mm (width x height) respectively. Forty-one-millimeter
height rectangle in a width of 42 mm has been considered as a space between sound source and
divider sheet. This part and the rest of the remained spaces will be filled by the pure water.
The sound source specification has been displayed in Table 3-1. This device is a spherically
focused piezoceramic transducer and the focal region has an oval shape. This type of HIFU
transducer is used in biomedical applications and need to be immersed in water during operation
for transmitting the wave to the target medium. This transducer has a hole at the center.
Table 3-1 Characteristics of HIFU transducer
Frequency
(MHz)
Focal Length
(mm)
Aperture
Diameter
(mm)
Hole
Diameter
(mm)
Input Powers
(Watts)
Power
Efficiency
(%)
2.15 63.2 64 22.6 218, 131, 67 85
The simulation of pressure acoustics is implemented in all domains. But because of the small
size of the focal region compare to the size of the liquid cavity the heat transfer simulation is
performed only in the liquid cavity domain.
3.3.2. MESH CONFIGURATION
To obtain accurate results from numerical analysis of acoustics pressure, the fine triangular
meshes with size 𝜆/6 (𝜆 is the wavelength of the acoustic wave) and coarser triangular meshes
with size 𝜆/4 are chosen for the focal region and the rest of domain respectively [28]. For heat
transfer simulation, the entire liquid cavity is meshed with the triangular elements with a size of
𝜆/8 .
3.3.3. CALCULATIONS AND CASE STUDIES
Acoustics pressure and heat transfer studies of the model is performed by using COMSOL
Multiphysics 5.2. Three case studies have been considered to investigate the effect of altering
input parameters such as power and material properties on wave pressure and temperature. Each
case is described as follow:

26
Case Study No.1:
In this case study, the size of focal region will be calculated. Then, in the absence of a divider,
multiple powers are applied in the simulation. Therefore, the effect of altering power on pressure
wave and temperature field will be reported.
Case Study No.2:
Case study no.2 includes applying multiple dividers’ material in the simulation. As a result,
the effect of changing material property on pressure wave and temperature field will be illustrated
in figures.
Case Study No.3:
In this case, multiple liquids in presence of divider will be implemented in simulation.
Therefore, the effect of altering liquid’s property on pressure wave and temperature field will be
reported.
3.3.4. INPUT DATA
In addition to the transducer’s characteristics, material properties of dividers and liquids
should be gathered for accomplishment of input data. In this work, PDMS (Polydimethylsiloxane)
resin as well as water have been selected as a liquid of experiments by which the liquid cavity
will be filled. The reason for selection of PDMS will be discussed in detail in section 5.4.
Divider’s material is chosen as either Polystyrene or ABS. In Table 3-2 and Table 3-3 material
properties of dividers and liquids have been identified respectively.
Table 3-2 Material Properties of Dividers [36]
Material Density (kg/m3)
Sound Speed (m/s)
Acoustic Impedance (kg/m2.s)
Attenuation (Np/m)
@ 2.15 (MHz)
Thickness (mm)
ABS, grey 1070 2170 2.32 × 10⁶ 24.060 1.1
Polystyrene, GP 1050 2400 2.52 × 10⁶ 3.991 1.1
27
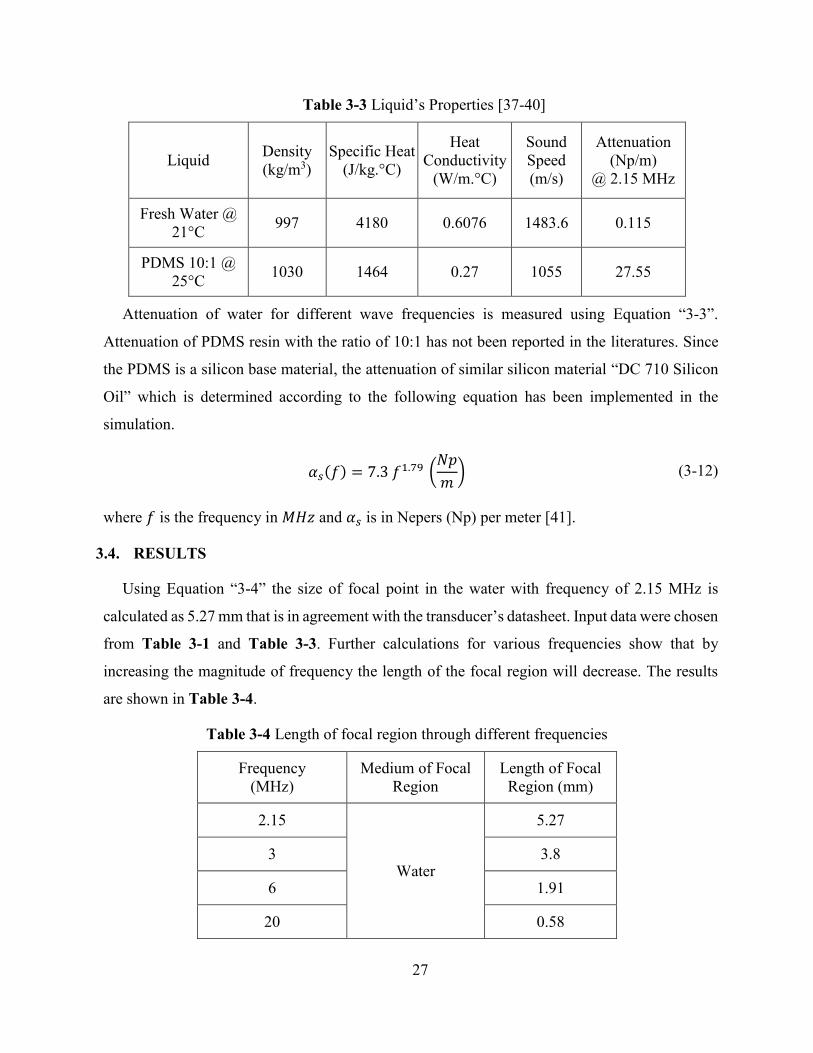
Table 3-3 Liquid’s Properties [37-40]
Liquid Density (kg/m3)
Specific Heat (J/kg.°C)
Heat Conductivity
(W/m.°C)
Sound Speed (m/s)
Attenuation (Np/m)
@ 2.15 MHz
Fresh Water @ 21°C 997 4180 0.6076 1483.6 0.115
PDMS 10:1 @ 25°C 1030 1464 0.27 1055 27.55
Attenuation of water for different wave frequencies is measured using Equation “3-3”.
Attenuation of PDMS resin with the ratio of 10:1 has not been reported in the literatures. Since
the PDMS is a silicon base material, the attenuation of similar silicon material “DC 710 Silicon
Oil” which is determined according to the following equation has been implemented in the
simulation.
𝛼𝑠(𝑓) = 7.3 𝑓1.79 (𝑁𝑝
𝑚) (3-12)
where 𝑓 is the frequency in 𝑀𝐻𝑧 and 𝛼𝑠 is in Nepers (Np) per meter [41].
3.4. RESULTS
Using Equation “3-4” the size of focal point in the water with frequency of 2.15 MHz is
calculated as 5.27 mm that is in agreement with the transducer’s datasheet. Input data were chosen
from Table 3-1 and Table 3-3. Further calculations for various frequencies show that by
increasing the magnitude of frequency the length of the focal region will decrease. The results
are shown in Table 3-4.
Table 3-4 Length of focal region through different frequencies
Frequency (MHz)
Medium of Focal Region
Length of Focal Region (mm)
2.15
Water
5.27
3 3.8
6 1.91
20 0.58
28
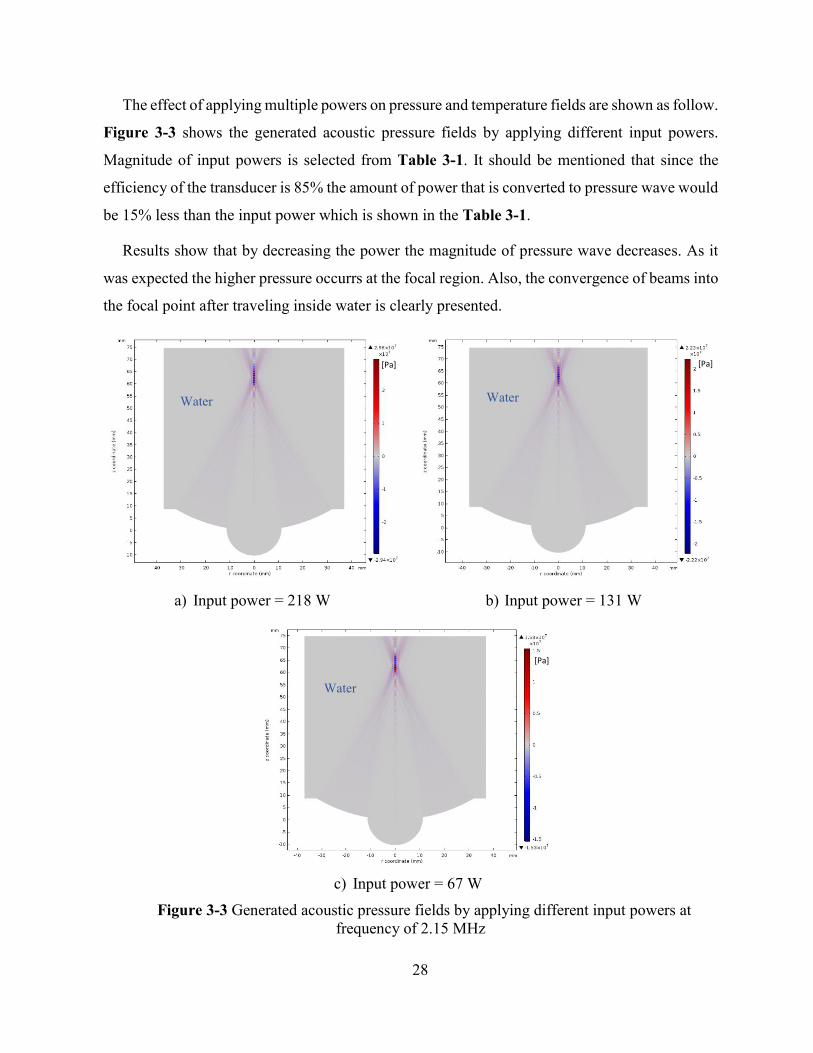
The effect of applying multiple powers on pressure and temperature fields are shown as follow.
Figure 3-3 shows the generated acoustic pressure fields by applying different input powers.
Magnitude of input powers is selected from Table 3-1. It should be mentioned that since the
efficiency of the transducer is 85% the amount of power that is converted to pressure wave would
be 15% less than the input power which is shown in the Table 3-1.
Results show that by decreasing the power the magnitude of pressure wave decreases. As it
was expected the higher pressure occurrs at the focal region. Also, the convergence of beams into
the focal point after traveling inside water is clearly presented.
a) Input power = 218 W b) Input power = 131 W
c) Input power = 67 W
Figure 3-3 Generated acoustic pressure fields by applying different input powers at frequency of 2.15 MHz
Water
Water Water
[Pa] [Pa]
[Pa]

29
Using achieved data from Figure 3-3, the rate of change in maximum pressure wave at the
focal point with respect to input power can be found. These results are shown in Figure 3-4. The
graph shows by applying 10 watts deduction in input power the pressure wave will decrease 3%
approximately.
Figure 3-4 Change in Maximum Pressure Wave at Focal Point with respect to Input Power
The intensity fields of different input powers are presented in Figure 3-5. Results clearly show
the distribution of acoustic energy inside the fluid. It can be seen that the most of the acoustic
energy is focused at the focal region with the oval shape. Focal region’s length is determined
about 5.21 mm which agrees with the calculated data in Table 3-4 for frequency 2.15 MHz.
a) Input power = 218 W b) Input power = 131 W
15
17
19
21
23
25
27
29
31
60 70 80 90 100
110
120
130
140
150
160
170
180
190
200
210
220
Mag
nitu
de o
f Max
imum
Pre
ssur
e W
ave
[MPa
]
Input Power (Watt)
Water Water
[W/m2] [W/m2]

30
c) Input power = 67 W
Figure 3-5 Generated acoustic intensity fields by applying different input powers at frequency of 2.15 MHz
The acoustic intensity profile along the symmetrical axis of the model is represented in
Figure 3-6. The highest magnitude of intensity occurs at the focal point. As it has been mentioned
so far, the diversity in intensities’ amplitudes is due to different input powers. Peak points on
graphs happened at focal point and they reveal its location. The location of focal is about 63 mm
far from the center point of the transducer which agrees with the presented focal length in
Table 3-1.
Figure 3-6 Acoustic intensity profile along the symmetrical line for different input powers
0
50
100
150
200
250
300
0 10 20 30 40 50 60 70 80
Input Power = 218 wattsInput Power = 131 wattsInput Power = 67 watts
z-coordinate (mm)
Aco
ustic
Inte
nsity
(MW
/m2 )
Water
[W/m2]

31
The acoustic pressure amplitude profiles for multiple input powers along the symmetrical line
and the radial line which passes through the focal point are presented in Figure 3-7 and
Figure 3-8 respectively. The existence of higher and lower magnitude of pressure field around
the focal region are illustrated in these figures.
a) Input power = 218 W b) Input power = 131 W
c) Input power = 67 W
Figure 3-7 Acoustic pressure amplitude profiles for different input powers along the symmetrical line at frequency of 2.15 MHz

32
a) Input power = 218 W
b) Input power = 131 W
c) Input power = 67 W
Figure 3-8 Acoustic pressure amplitude profiles for multiple input powers along the radial line which passes through the focal point at frequency of 2.15 MHz
The profiles in Figure 3-8 show that by going a bit far (about 1.5 mm) from the focal point
that locates at r=0 the acoustic pressure drastically reduces which is completely in agreement with
the definition of compressed waves inside liquids. The narrow band around the focal point in
these graphs is in agreement with the oval geometry of the focal region.

33
As it has been mentioned, the heat source energy is determined from acoustics study.
Therefore, for different input power different heat energies have been calculated and employed
in heat transfer simulation. These energies have been implemented for 1 second. In other word,
the temperature distribution has been determined for 1 second insonation. The temperature
distributions inside the water at t=1s are illustrated in Figure 3-9. It is clearly illustrated that the
most of the heat energy is concentrated at the focal region.
a) Input power =218 W b) Input power =131 W
c) Input power =67 W
Figure 3-9 The temperature distributions at time equal to 1(s) inside the water for different input powers and with insonation at frequency of 2.15 MHz
Figure 3-10 displays the heating up and heat dissipation process at focal region for a period
of 10 seconds for different pressure wave generated from applying different input powers. In this
situation when the liquid is insonated for a second it heats up and after that it starts to cool down
Water Water
Water
[ºK] [ºK]
[ºK]

34
because of the natural conduction. By increasing the duration of insonation higher temperature
rise will be obtained.
Figure 3-10 The heat transfer over a period of 10 seconds inside the water
In another study, sensitivity of results with respect to time steps and mesh size at focal region
have been investigated. It was found, by decreasing the time step, changes occurred in
temperature at focal point were less than 2.9%. By modifying the focal region mesh size to 𝜆/8
and 𝜆/10 the changes in pressure and temperature at this region happened less than 3.6% and
3.8% respectively. As a result, this configuration of meshes has been maintained for continuing
studies.
So far, results showed by applying the 218 W input power, maximum pressure, temperature,
and intensity achieved. Therefore, the following studies are performed for this input power at
frequency of 2.15 MHz.
Generally, transmission of acoustic wave through two adjacent different liquid media
associates with diffraction and reflection at the interface of two liquids. The diffraction angle can
be determined by Snell’s Law which was introduced by Equation “3-2”. To study this
phenomenon, different materials with different properties have been placed in front of transducer
21
22
23
24
25
26
27
0 1 2 3 4 5 6 7 8 9 10
Tem
pera
ture
diff
eren
ce (º
K)
Time (s)
Input Power = 218 watts
Input Power = 131 watts
Input Power = 67 watts
Transducer is off

35
at distance 50 mm. Properties of chosen materials were introduced in Table 3-2. Transducer has
been operated in 1 second at frequency of 2.15 MHz for the input power of 218 W.
As a matter of fact, a part of acoustic energy during passing through the divider is absorbed
by the material. The other part of the wave beam reflects into the water behind the divider and
changes the pressure and intensity in this region. Integration of these events causes to deduction
of intensity at focal. In Figure 3-11 the pressure fields in presence of 2 different materials have
been presented. Figure 3-12 illustrates the effect of using multiple dividers on intensity field as
well as movement of focal point with respect to the case without inserting the divider, presented
in Figure 3-5, which is in agreement with the Snell’s Law. In fact, Figure 3-12 indicates by using
a divider with lower sound speed, the focal is getting away from the surface of the transducer. In
addition, these figures present, by placing the divider in the system the intensity and pressure at
focal will decrease. Also, the reflected beams at the interface of divider and water are
recognizable in both figures.
a) Polystyrene as a divider b) ABS as a divider
Figure 3-11 Pressure field in the water at frequency of 2.15 MHz and input power of 218 W
in presence of 2 different dividers
Water
Water
Divider ABS
Water
Water
Divider Polystyrene
[Pa] [Pa]

36
a) Polystyrene Divider
focal point movement with respect to
case without existing divider = 1.55 mm
b) ABS Divider
focal point movement with respect to
case without existing divider = 0. 98 mm
Figure 3-12 Intensity field in the water at frequency of 2.15 MHz and Input power of 218 W
in presence of 2 different dividers
Because of the lower acoustic impedance of ABS the more wave energy can pass through this
material, therefore, the pressure and intensity at the focal in presence of ABS will be greater than
the case with Polystyrene as a divider.
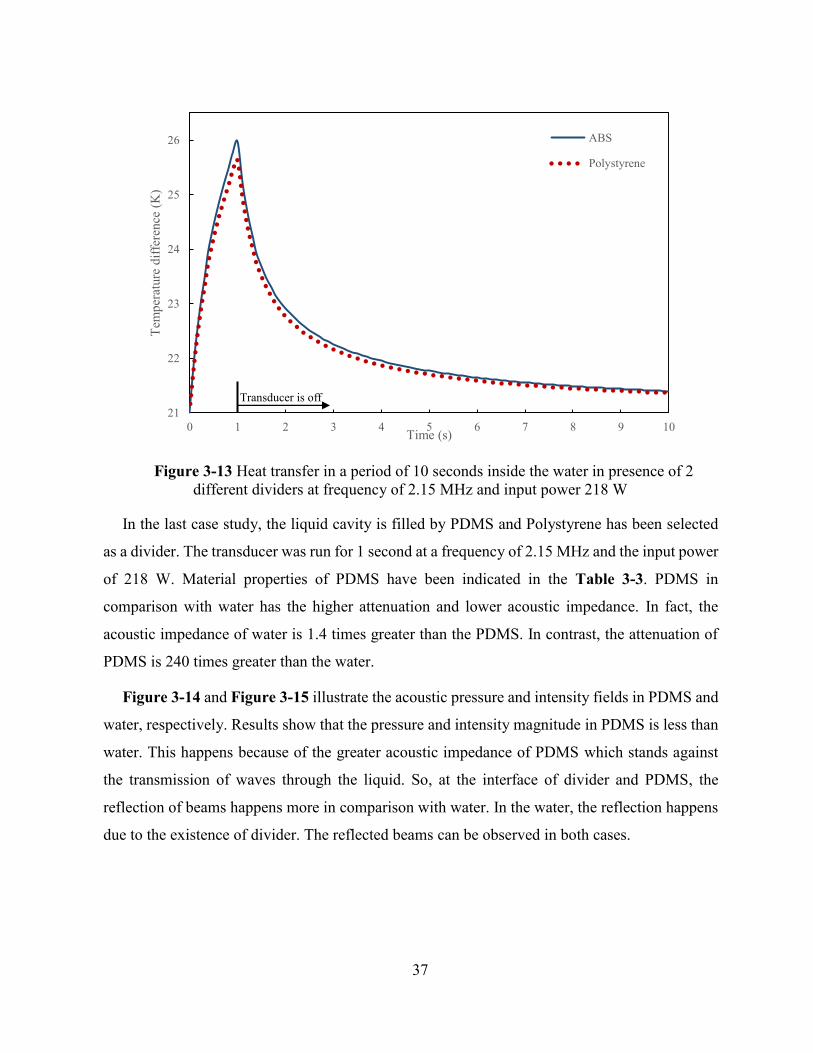
Figure 3-13 shows the heating up and heat dissipation at focal region due to 1 (s) insonation
over a period of 10 seconds in presence of different dividers at the frequency of 2.15 MHz and
input power of 218 W. As it has been expected the temperature rise in a model with divider is
less than the previous case study. On the other hand, because of the less transmission of acoustic
through Polystyrene the temperature rise at the other side will be less than the case with ABS.
Water
Water
Divider Polystyrene
Water
Water
Divider ABS
[W/m2] [W/m2]
37
Figure 3-13 Heat transfer in a period of 10 seconds inside the water in presence of 2 different dividers at frequency of 2.15 MHz and input power 218 W
In the last case study, the liquid cavity is filled by PDMS and Polystyrene has been selected
as a divider. The transducer was run for 1 second at a frequency of 2.15 MHz and the input power
of 218 W. Material properties of PDMS have been indicated in the Table 3-3. PDMS in
comparison with water has the higher attenuation and lower acoustic impedance. In fact, the
acoustic impedance of water is 1.4 times greater than the PDMS. In contrast, the attenuation of
PDMS is 240 times greater than the water.
Figure 3-14 and Figure 3-15 illustrate the acoustic pressure and intensity fields in PDMS and
water, respectively. Results show that the pressure and intensity magnitude in PDMS is less than
water. This happens because of the greater acoustic impedance of PDMS which stands against
the transmission of waves through the liquid. So, at the interface of divider and PDMS, the
reflection of beams happens more in comparison with water. In the water, the reflection happens
due to the existence of divider. The reflected beams can be observed in both cases.
21
22
23
24
25
26
0 1 2 3 4 5 6 7 8 9 10
Tem
pera
ture
diff
eren
ce (K
)
Time (s)
ABS
Polystyrene
Transducer is off

38
a) Liquid Cavity filled by PDMS b) Liquid Cavity filled by Water
Figure 3-14 Pressure field in the liquid cavity at frequency of 2.15 MHz and input power of 218 W in presence of Polystyrene divider
a) Liquid Cavity filled by PDMS b) Liquid Cavity filled by Water
Figure 3-15 Intensity field in the liquid cavity at frequency of 2.15 MHz and input power of 218 W in presence of Polystyrene divider
In final study, the heat transfers inside water and PDMS was investigated. Results showed the
temperature rise at the focal region in PDMS is much more than the water. This happens because
of the higher attenuation and lower heat conductivity of PDMS compare to the water. The
temperature distributions inside the PDMS and water at t=1s are illustrated in Figure 3-16. The
high magnitude of the temperature inside PDMS is noticeable. In addition, movement of focal
point due to different acoustic impedance of water and PDMS is recognizable.
PDMS
Water
Divider Polystyrene
Water
Water
Divider Polystyrene
Water
Water
Divider Polystyrene
PDMS
Water
Divider Polystyrene
[Pa] [Pa]
[W/m2] [W/m2]
1.1

39
a) Liquid Cavity filled by PDMS
focal point at z = 67.5 mm
b) Liquid Cavity filled by Water
focal point at z = 62.3 mm
Figure 3-16 Temperature field in the liquid cavity at frequency of 2.15 MHz and input power of 218 W in presence of polystyrene divider
3.5. CONCLUSIONS
In this chapter numerical simulation of high intensity focused ultrasound (HIFU) wave
propagation in multiple materials has been performed. Acoustic waves were generated by HIFU
transducer. In order to investigate the effect of altering input parameters such as power and
material properties on wave pressure and temperature different case studies were investigated. In
addition, to cut down the computation time and computer expenses, 2D axisymmetric simulation
has been performed. Results showed wave frequency and fluid properties have the major
influence on acoustic and thermal effects in a liquid medium. The present research illustrated the
acoustic wave pressure field varied by liquid’s acoustic impedance. On the other hand, during
traveling acoustic wave among different materials the wave power was changing as a result of
acoustic impedance alteration. Furthermore, the magnitude of temperature rise in liquid, directly
depends on the absorption coefficient of fluid. So, a small variation in attenuation causes the high
order change in heat energy. It should be mentioned the accuracy of computed results depended
on alteration of fluids characterization during the process, simulation’s time step and model’s
mesh size. In this study, it was considered that the properties of liquids during the process
remained constant.
Water Water
[ºK] [ºK]
Divider Divider

40
CHAPTER 4
COMMERCIAL 3D PRINTERS
In order to get familiar with the process of additive manufacturing in standard 3D printers as
well as exploring the abilities and precision of the theses printing machines, an investigation on
3D printed part fabricated by a commercial 3D printer will be performed in following.
A suitable 3D printer will be selected based on availability, precision in printing, and proper
surface finish of the final product. After choosing a machine, a simple free standing structure
such as cantilever will be built by 3D printer. The Cantilever is a simple structure which can be
used in the study of mechanical properties of materials, structural dynamics simulation, or to
make sensors in a microscale. Next, the dimensional resolution of the product in comparison with
the designed model and surface properties of fabricated part will be investigated.
4.1. 3D PRINTERS WORKING WITH PLASTICS AS PRINTING MATERIALS
As it has been mentioned so far, using 3D printing technology leads to reducing the cost, time
saving and resolving the limits of fabrication processes for product development. This technology
offers various solutions for different requirements such as concept models, functional prototypes
or even final parts to use in industry. Over the past years, 3D printers have become reliable and
more accurate [42].
Among the technologies which have been used for 3D printers’ development, fused deposition
modeling (FDM), selective laser sintering (SLS), and stereolithography (SLA) are three most
developed technologies for plastic 3D printing [6].
Final product fabricated by FDM has a rough surface, the process is fast but it happens in high
temperature [5]. The machine is not expensive in comparison with other 3D printers. ABS and
PLA are the common thermoplastics that are generally used in FDM printers. The products made
by these materials are solid. Figure 4-1 shows a picture of a 3D printer which works based on
this technology made by About Aleph Objects, Inc. as well as a 3D printed object that has been
printed with this machine.

41
Figure 4-1 “LulzBot TAZ” FDM 3D printer and a “Flange” prototype printed with this machine
3D printed products with SLS technology have the best mechanical properties, are less
anisotropic, and the same as FDM, have a rough surface. In this process, unsintered powders
cannot be used for new operation [5]. Nylon is the most common thermoplastic material for SLS
which is strong and flexible. Although SLS 3D printers are ideal for functional prototyping, the
machine is more expensive [8]. Figure 4-2 displays a picture of a SLS 3D printer fabricated by
3D Systems company. A part that has been printed by this technology is presented as well.
Figure 4-2 “ProX SLS 6100” SLS 3D printer and a “Engine Body” printed with this technology

42
Among the other type of 3D printing technologies, SLA provides a highest resolution,
smoothest surface finish and more accurate final dimensions of the parts. The parts have excellent
surface quality and precision but the mechanical property is poor [5]. Most of the parts need to
be post processed. Multiple laser cure resins have been produced for SLA 3D printers. Actually,
each 3D printer has its own specific resin. SLA 3D printers are reasonable in price by considering
the quality of their final products. They also can be used to fabricate the micro-objects. Figure 4-3
displays a picture of “Form 2”, 3D printer and printed parts built by this machine.
Figure 4-3 “Form 2” SLA 3D printer and three different small prototypes of “Gears” built by this printer
4.2. 3D PRINTING OF A FREE STANDING STRUCTURE AND SETUP
In this section, 3D printing process of fabricating a simple free standing structure such as
cantilever will be explained. Since bending ability of cantilever structures is the main reason for
their usage in experiments, using a flexible material to build a component will improve the
performance of this structure. The resolution of printing is another main parameter for selection
of the 3D printer. Therefore, due to the versatility of material types as well as achieving the high
resolution and smooth surfaces in SLA technology “Form 2” SLA printer, was chosen and used
to build a flexible cantilever. This 3D printer is manufactured by Formlabs Company.
There are multiple types of resins that are presented by Formlabs Company. One of these
resins is a flexible resin, which is ideal for functional prototyping and adds enough flexibility to
bending structures. Table 4-1 shows the characteristics of this resin.
10 mm

43
Table 4-1 Characteristics of “Form 2” Flexible Resin
Green part Postcured part
Mechanical Properties
Ultimate Tensile Strength 3.3 – 3.4 (MPa) 7.7 – 8.5 MPa
Elongation at Failure 60% 75 – 85%
Compression Set 0.40% 0.40%
Tear Strength 9.5 – 9.6 kN/m 13.3 – 14.1 kN/m
Thermal Properties
Vicat Softening Point 231 °C 230 °C
All data have been extracted from flexible resin’s datasheet provided by Formlabs Company.
According to Form 2 datasheet, the laser spot size is 140 microns and the highest resolution of
device in the XY plane is 150 μm and 25 μm in the Z axis.
In order to verify the effect of printing directions on quality of the final part, 2 identical models
of cantilever were fabricated by this printer. A CAD model of cantilever was designed in Autocad
(Autodesk). Models were oriented in different directions with respect to the 3D printer’s building
platform. In fact, one of the model’s CAD design the long edge of cantilever was oriented parallel
to the platform and for another one, it was perpendicular to the platform. Next, all models were
exported to the printer as STL file. Figure 4-4 shows the CAD model of designed cantilevers and
orientation of them on printing platform as well as the direction which the part was printed in a
layer-by-layer process.

44
a) Horizontally oriented cantilever b) Vertically oriented cantilever
Figure 4-4 CAD models of designed cantilevers (all dimensions are in mm)
After finishing the printing, green parts were washed with isopropanol for removing the
uncured resins. As it has been mentioned so far considering the supports for stabilizing the parts
during the 3D printing is part of this process therefore in the next step printed supports were
detached from the objects. Supports of these parts are illustrated in Figure 4-5 (a) and (c). Then,
printed parts were exposed to UV light in a Stratalinker® UV Crosslinker 2400 for 3 minutes.
Finally, dimensions and line roughness of the printed cantilevers were measured by using a
Confocal Laser Scanning Microscope (Olympus Inc.).

45
4.3. RESULTS
Samples’ green parts and Postcured parts are illustrated in Figure 4-5. As it was expected, by
the visual test, samples have the smooth surfaces. Printing of each the samples took about 4 hours.
a) Green part on a printing platform – Horizontal Orientation b) Postcured sample – Printed Horizontally
c) Green part on a printing platform – Vertical Orientation d) Postcured sample – Printed Vertically
Figure 4-5 Postcured parts – Printed in different directions with respect to the platform
Samples’ dimensions have been measured by using Confocal microscope. Making a
comparison between the designed and measured sizes shows a small difference. As a matter of
fact, in a standard printing condition, when the printer is fully aligned and the proper resin is
Z
X Y Printing Platform
Supports
Printing Platform
Supports Z
X Y
10 mm
10 mm

46
being used, the dimensional resolution of printing part is affected by the radial beam scattering
[43]. Table 4-2 illustrates the quantities.
Table 4-2 Dimensional comparison between the designed and printed samples
Base sizes (mm) Cantilever sizes (mm)
Length (along X)
Width (along Z)
Height (along Y)
Length (along X)
Width (along Z)
Height (along Y)
Parts
(a) a
nd (b
)
Designed Sizes 13 13 3 8 4 10
Measured 13.04 13.02 3.01 8.07 4.03 10.03
Difference (mm) 0.04 0.02 0.01 0.07 0.03 0.03
Parts
(c) a
nd (d
)
Designed Sizes 13 3 13 8 10 4
Measured 13.03 3.02 13.02 8.04 10.02 4.02
Difference (mm) 0.03 0.02 0.02 0.04 0.02 0.02
Deviations identify the resolution of the printing process in different directions. Therefore, before
starting the process of printing considering the proper orientation of the model in order to obtain a
desired dimensional accuracy is the key parameter.
As it has been mentioned so far, in SLA technology, 3D part is completed layer-by-layer which
the thickness of each layer determines the roughness along the normal axis of the layer. So, Line
roughness was measured by a 10x lens of the Confocal Microscope and the cutoff value was set
to 2.5 mm. The average roughness over the length of the object (Ra) for horizontally and vertically
printed cantilevers was determined 0.692 μm and 3.383 μm respectively. In Figure 4-6 the edge
of cantilevers along which the roughness was measured is identified. Also, this figure presents
the measured roughness results.

47
(a) The direction of roughness measurement
(b) Measured roughness of vertically oriented cantilever
(c) Measured roughness of horizontally oriented cantilever
Figure 4-6 The direction of roughness measurement, and measured roughness over the length of printed cantilevers
L (μm)
L (μm)
Rou
ghne
ss
(μm
) R
ough
ness
(μ
m)

48
Results show that the higher value of average roughness was measured in vertically oriented
cantilever, Figure 4-5 (d). As a matter of fact, in the layer-by-layer process the horizontal layers
are bonded in vertical direction altogether. Therefore, depends on a thickness of each layer as
well as its edge sharpness, the roughness of the part’s edge could be changed. Figure 4-7
illustrates this explanation.
Figure 4-7 Schematic for layer-by-layer printing of a 3D object
Therefore as it has been illustrated in Figure 4-6, the average line roughness of vertically
printed cantilever along its length is more than the horizontally printed one. In fact, achieving the
desired roughness for a specific surface will be attained by changing the angle of the surface with
respect to the printing direction. This action can be performed in a CAD software just by adjusting
the orientation of a surface with respect to the horizontal plane with a proper angle.
By the way, the line roughness is not a significant characteristic for a cantilever object,
although this parameter can define the microscopic resolution of SLA 3D printer.
Edges are more rough
Horizontal layers are bonded together along
the direction of printing
Planes perpendicular to the direction of printing have a
smooth surface

49
4.4. CONCLUSIONS
In this chapter three different types of 3D printers that works with plastics as printing materials
were introduced and “Form 2” 3D printer was selected to fabricate a simple 3D object for study
the characteristics of printing process and a printer. By investigation of results, it can be verified
that the 3D printer is more accurate in XY plane compared to the Z direction. Also, acquiring the
highest resolution associates with increasing of printing time. As a matter of fact, before starting
the process of printing considering the proper orientation of the model in order to obtain a desired
dimensional accuracy is the key parameter. Although the flexible resin adds a proper flexibility
to the printed cantilever, this material is not biocompatible and cannot be used in bio-experiments.
By getting familiar with the SLA process performed by one of the commercial 3D printers,
in next two chapters the experimental setup and results extracted from HIFU additive
manufacturing method’s experiments, as a main objective of this research, will be presented.

50
CHAPTER 5 DESIGN AND INSTALLATION OF HIFU 3D MANUFACTURING
Before starting to explain the experiments and obtained results, devices that will be used in
the experimental setup will be introduced in this chapter. Schematic of this setup is presented in
Figure 5-1.
Figure 5-1 Schematic of experimental setup
As it is shown experimental set-up includes the following components:
1. High Intensity Focused Ultrasound (HIFU) Transducer and pulse generator
2. CNC machine
3. Temperature Measurement System
Data Acquisition System
Thermocouples
Liquid Crystal Sheets
4. Resins
5. Water Tank and Liquid Cavity
In following each device will be introduced in detail.

51
5.1. HIFU TRANSDUCER AND PULSE GENERATOR
HIFU transducer was selected as a sound source. This device is fabricated from a piezoceramic
material. It is a spherically focused transducer which focuses the generated ultrasound waves at
a focal point. This transducer has a hole at the center which can be used as a place for mounting
the hydrophone. The focal region is in an oval shape. The transducer characteristics are
represented in Table 5-1.
Table 5-1 HIFU transducer’s characteristics
Frequency (MHz)
Focal Length (mm)
Focal Region Size (mm) Aperture
Diameter (mm)
Hole Diameter
(mm)
Maximum Intensity at
Focal Region
(Watts/cm2)
Maximum Pressure at Focal Region (MPa)
Maximum Input Power (Watts)
Power Efficiency
(%) Length Girth
2.15 63.2 5.33 0.7 64 22.6 54695.36 40.24 218 85
This kind of transducers is used in the biomedical applicant and needs to be immersed in water
for performing an operation.
Furthermore, in order to supply an input power of the transducer a pulse generator was
purchased. Device could provide maximum power 218 (w) for the range of frequencies between
2 to 2.49 (MHz) with the 0.1 (ms) steps as an interval. Also by adjusting the time, the duration of
supplying power could be controlled.
5.2. CNC MACHINE
In order to move the transducer precisely, it is mounted on a Computer Numerical Control
(CNC) machine. Figure 5-2 shows the picture of the CNC which is used in this research.
Transducer is mounted on a holder. This system has three stepper motors that provide movement
in 3 directions in Cartesian coordinate system (X, Y, Z).

52
Figure 5-2 CNC machine used in this research and its axes of movements
The desired movement of a system, which is determined by required speed, location of the
focal point, and geometry of the object to be printed, is imported to the interface software by
using the G-Code program.
After installation of transducer, according to axes definition shown in Figure 5-2, it is
expected that by applying movement along the X and Z direction the plane geometry of the final
part can be printed, and with moving along Y, the height of 3D part will be adjusted. The
characteristics of the CNC machine are illustrated in Table 5-2.
Table 5-2 Characteristics of the CNC machine
Working Space (X,Y,Z) (mm)
Repeatability (mm)
Maximum Speed
(mm/sec)
Input AC Voltage
(V)
Programmable Resolution
(mm)
Interface Software
300 x 420 x 140 0.04 50 100 - 240 0.005 UCCNC
5.3. TEMPERATURE MEASUREMENT SYSTEM
Temperature is one of the most common types of physical measurements. For measuring the
temperature depending on the desired accuracy and range, several sensor options can be used. In
the following, 3 devices which have been utilized to define the temperature magnitude at the focal
region are introduced.
Holder
Moving Arms
Working Space
Y
Z
X

53
Data Acquisition System
National Instruments offers a wide variety of devices to make temperature measurements.
Compact Data Acquisition System (DAQ) is a portable, rugged DAQ platform that integrates
connectivity and signal conditioning into modular I/O for directly interfacing to any sensor or
signal. In this work “NI 9212” has been purchased as a data acquisition system. By using this
system combined with the LabVIEW software the needs for measuring the temperature field
inside a liquid cavity was reachable. Table 5-3 presents some information from the specification
of this device.
Table 5-3 Specification of DAQ NI 9212
Voltage Measurement Range
(mV)
Conversion Time at High-Speed Mode
(ms)
Sample Rate at High-Speed Mode
(Samples/s)
Temperature Measurement sensitivity
for T-type thermocouples (ºC)
±78.125 10.5 95 0.01
Thermocouples
Thermocouples are the most popular temperature measurement transducers available. Because
of their low cost and wide temperature acceptance range, they can be used for a wide variety of
applications in all industries. In this research two types of “T-type” thermocouples, with the
measuring junction at the tip, have been purchased from National Instruments Company and
OMEGA Engineering. Specification of the thermocouples is illustrated in Table 5-4.
Table 5-4 Thermocouples’ specification
Supplier Wire
Diameter (mm)
Material Maximum
Permitted Error* (ºC)
National Instrument Company 1.7 Copper- Constantan 0.5
OMEGA Engineering 0.125
* Maximum permitted error complies with IEC 60 584-2 (1995)

54
Liquid Crystal Sheets
Generally, liquid crystal sheets are used for a thermal mapping. As a result of low accuracy in
determination of temperature as well as limited operation temperature, this type of sensors is not
comparable with other instruments, in this work they were used just for identification of focal
point’s location as well as the approximate size of the focal region. Table 5-5 shows the
specification of this item.
Table 5-5 Liquid Crystal Specification
Supplier Operating
Temperature (°C)
Thickness (in)
Output Wavelength (nm)
Edmund Optics 40 - 45 0.007 0 - 650
5.4. RESINS
In this project, a 3D printing process is introduced as a method to create 3D object by curing
a thermoset resin and converting it to the thermoset solid. The process of curing or cross-linking
is the main distinguishing element of a thermosetting material. The word “thermo” indicates that
the cross-linking happens by adding a heat energy, although, much cross-linking occurs at room
temperature or even below it [44]. Lately, some researchers have described the thermoset, which
cures at or below the room temperature, as “chemoset” although this term has not been universally
accepted [44]. The second term “setting” implies that the process of cross-linking is an
irreversible reaction.
The cross-linking process can be tracked by observing the change of viscosity within a time
at a certain temperature. While all commercial thermosetting reactions are exothermic [44], the
viscosity of the mixture at the beginning of the process will be decreased due to generated heat
from the reaction. Since during the process the molecular weight of the mixture will increase by
cross-linking of the molecules, the resultant viscosity of the mixture will increase and quickly
overcomes any happened reduction in viscosity by heat. The molecular growth will continue over
a time until reaching the gel-like state. The time of sensing this state is called gel time. After
passing this point the viscosity goes to infinity. Figure 5-3 shows the described process and
indicates the gel time.
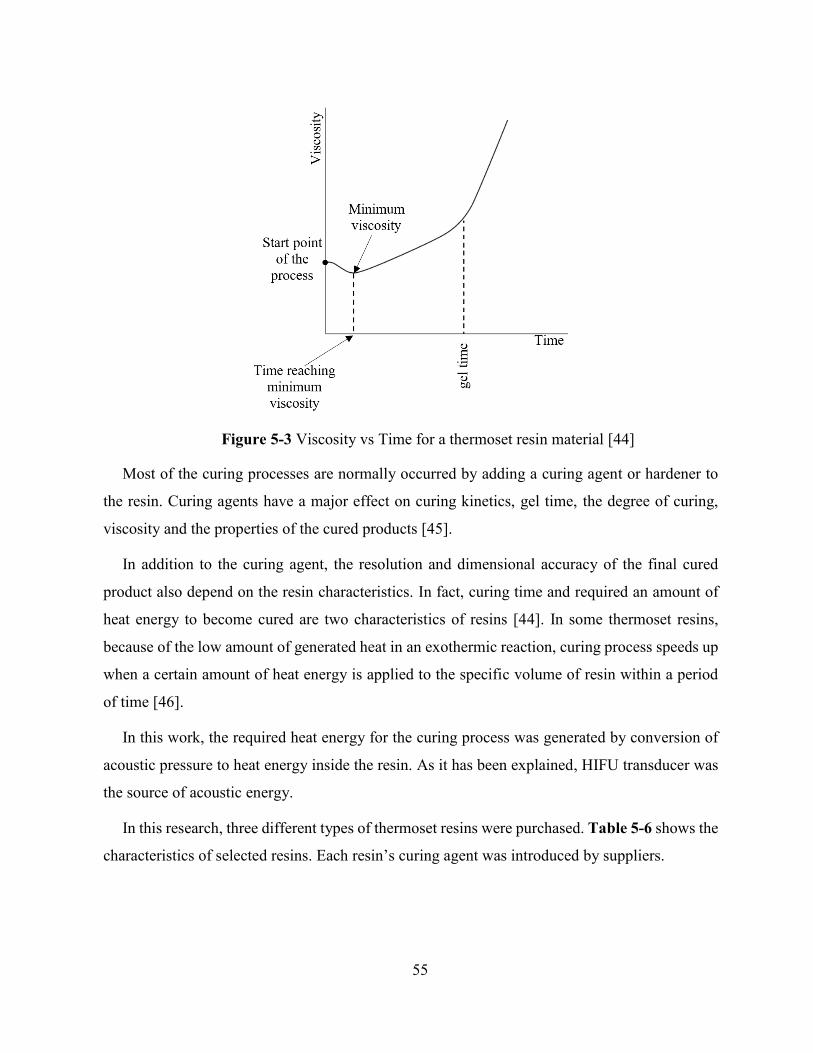
55
Figure 5-3 Viscosity vs Time for a thermoset resin material [44]
Most of the curing processes are normally occurred by adding a curing agent or hardener to
the resin. Curing agents have a major effect on curing kinetics, gel time, the degree of curing,
viscosity and the properties of the cured products [45].
In addition to the curing agent, the resolution and dimensional accuracy of the final cured
product also depend on the resin characteristics. In fact, curing time and required an amount of
heat energy to become cured are two characteristics of resins [44]. In some thermoset resins,
because of the low amount of generated heat in an exothermic reaction, curing process speeds up
when a certain amount of heat energy is applied to the specific volume of resin within a period
of time [46].
In this work, the required heat energy for the curing process was generated by conversion of
acoustic pressure to heat energy inside the resin. As it has been explained, HIFU transducer was
the source of acoustic energy.
In this research, three different types of thermoset resins were purchased. Table 5-6 shows the
characteristics of selected resins. Each resin’s curing agent was introduced by suppliers.

56
Table 5-6 Selected resins’ characteristics
Resin Curing Agent Mixing Ratio
Viscosity (CP)
Density (Kg/m3)
EPON™ 828 EPIKURE™ 3270 6:4 110-150 @ 25 °C 1160 @ 25 °C
EPON™ 8021 EPIKURE™ 3271 6:4 85-115 @ 25 °C 120 @ 25 °C
Sylgard 184 (PDMS) Catalyst 87- RC 10:1 3500 @ 25 °C 1030 @ 25 °C
Before starting to use the thermoset resins, a small volume of each resin was mixed with the
curing agent to understand their curing process in a normal condition. For epoxy resins with the
mixing ratio of 6:4, it was seen that the curing reaction started during mixing. Then, after passing
a short time, less than six minutes, epoxies became fully cured. As it has been mentioned so far,
due to the exothermic reaction of this curing process, significant amount of heat was generated
during the process which decreased the duration of curing process. Actually, generated heat
deformed the plastic container of the resin. In contrast, curing process of Sylgard 184 with mixing
ratio of 10:1 produces negligible heat energy. In fact, for preparation of fully cured Sylgard in
one hour, it should be baked at 80ºC. As a matter of fact, longer duration of Sylgard curing process
provided proper time to perform the printing. Therefore, this resin was selected as a printing
liquid.
Sylgard 184 is a two-part, liquid silicone-based polymer: base resin and resin accelerator [47].
The composition of the resin accelerator, Syligard resin, and the curing agent are presented in
Table 5-7, Table 5-8 and Table 5-9.
Table 5-7 Resin accelerator component [47]
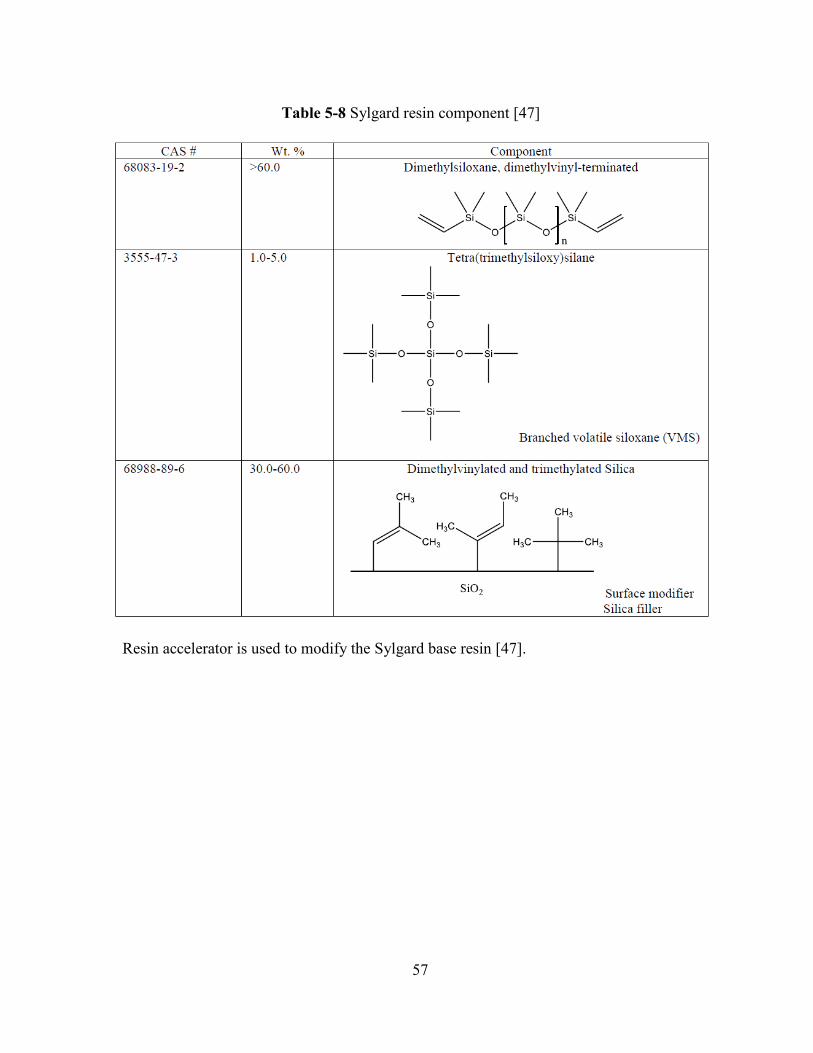
57
Table 5-8 Sylgard resin component [47]
Resin accelerator is used to modify the Sylgard base resin [47].

58
Table 5-9 Curing agent component [47]
5.5. TANK AND LIQUID CAVITY
The tank was employed as a water container for operation of transducer. It was fabricated from
Acrylic plastic sheet with an internal size 46.5 x 27.5 x 14.5 (cm). In addition, polystyrene petri
dish was used as a PDMS cavity. Uniform thickness of plastic was 1.1 mm. The petri-dish’s cap
is considered as a divider which has been introduced in simulation of problem in Chapter 3.
Specification of polystyrene has been shown in Table 3-2.
By considering the introduced experimental setup’s equipment, the performed experiments
based on HIFU additive manufacturing method will be presented in next chapter.

59
CHAPTER 6
EXPERIMENTAL RESULTS AND DISCUSSION
In order to reach the acceptable 3D printed objects, different experiments have been designed
and executed to be ensured about the integrity of the setup devices to achieve the precise results
as well as fabrication of a 3D printed object as a final product.
It was expected, manipulation of significant parameters such as input power of transducer,
transducer’s frequency as well as material property were playing the major role in achieving the
desired results. As it was explained so far since the working frequency of transducer was 2.15
MHz, this frequency has been considered as a constant parameter in all experiments.
By the way, temperature variation at the specified points in the cavity has been measured by
employing thermocouple probe as well as data acquisition system DAQ NI 9212 during a certain
period of time. Both devices have been introduced in the previous chapter.
By considering the introduced experimental setup in Chapter 5, in following sections designed
experiments and their corresponding results are explained.
6.1. EXPERIMENTAL CONDITIONS
All experiments have been performed at room temperature (21°C). The water tank was filled
by degassed Distilled Water. The water temperature during the experiments was also at 21°C.
6.2. DETERMINATION OF FOCAL REGION’S LOCATION AND SIZE
Three different experiments were performed to find the location of the focal region inside
water. In addition to location and size of focal, the focal region’s size change in response of
altering the input power was investigated. In this section, each experiment will be explained in
detail.
6.2.1. FINDING THE LOCATION AND SIZE OF FOCAL FROM CHANGING THE LEVEL OF WATER’S FREE SURFACE
Firs, the central axis of the transducer was aligned with the static water’s free surface which
was at the level 12 (mm). Then device was run with input power 218 W and frequency 2.15 MHz.
Figure 6-1 shows the schematic of this setup.

60
Figure 6-1 Schematic of the setup used for determination of focal location and effect of power on its size
By performing the experiment, it was observed that at the distance 62 (mm) ahead of
transducer’s face the water surface raised up to 12.3 (mm) and became in a form of a spindle. The
level change of free surface was identified by using the ruler which was put inside the water tank.
Figure 6-2 displays this result. Although part of the transducer was placed out of the water, this
location was a good approximation for specifying the location of the focal region.
Figure 6-2 Rising up the surface of the water while running the transducer with
input power 218 W
Top Level =12.3 mm
Z
Y

61
Changing the form of water’s free surface is due to the applied acoustic pressure at that
location. Formation of spindle shape at the surface of water showed that the generated streams
inside the water were following the oval shape of the focal region.
By decreasing the magnitude of input power from 218 W to 131 W and 67 W it was observed
that the girth of the spindle was getting flatten simultaneously and the level of rising water
decreased. These results are illustrated in Figure 6-3. This shows the direct relation between the
magnitude of the acoustic pressure wave and input power of transducer and is completely in
agreement with the results shown in Figure 3-7 and Figure 3-8.
a) Input power equal to 131 W b) Input power equal to 67 W
Figure 6-3 Change in the size of the spindle’s girth due to decreasing the applied input power
6.2.2. USING THERMOCHROMIC SHEET FOR FINDING THE LOCATION AND SIZE OF FOCAL
In addition to finding the position of focal point with previous experiment, by using the
thermochromic sheet, recognition of focal region’s shape as well as its location will be possible.
By placing the thermochromic sheet along the symmetrical plane of the transducer inside water
and running the acoustic source, image of the focal region appeared on the surface of the sheet.
Figure 6-4 represents the schematic of the setup.
Top Level = 12.2 mm
Z
Y
Top Level = 12.1 mm
Z
Y

62
a) Side view of setup b) Top view of setup
Figure 6-4 Schematic of setup for using thermochromic sheet
In this experiment transducer’s frequency and input powers were 2.15MHz and 218 and 131
watts respectively. Obtained results are illustrated in Figure 6-5.
a) Input power = 218 W b) Input power = 131 W
Figure 6-5 Focal region appearance on the thermochromic sheet that has been positioned along the vertical symmetrical plane of transducer
Focal Region
Thermochromic Sheet
Focal Region
Thermochromic Sheet
5.3 mm
Z
Y
Z
Y
5.3 mm

63
By looking at the images it can be realized that the focal region does not have a regular shape
which is completely in agreement with the transducer’s datasheet but its shape is close to the oval.
Furthermore, by altering the magnitude of input power, the length of focal region remained
constant but the shape of heat region was changed. According to thermochromic sheet’s
specification, in Table 5-5, the developed color spectrum on a surface of plate represents
temperature gradient inside the focal region. However, due to low precision of thermochromic
sheet in showing temperature magnitude, the exact determination of temperature variation inside
the region is not possible. But this setup is reliable for finding the location of focal region.
6.2.3. USING ACRYLIC PLASTIC SHEET FOR DETERMINATION OF FOCAL SIZE
As it has been discussed so far, absorption of acoustic wave in solids and liquids generates a
heat inside the media and the amount of generated heat depends on the attenuation of material.
Applying the heat to solids makes the different effects such as rising temperature, deformation,
size change, etc. The temperature rise in plastics mostly associates with the shape deformation.
By using this effect, identification of focal region size along different sections of its shape will
be possible.
Therefore, a thin plastic plate made of acrylic was placed inside the water medium in front of
the transducer but far from the focal region. The focal region’s primary location could be obtained
by using each of two previous methods. Figure 6-6 and Table 6-1 display schematic of setup and
the material property of acrylic sheet respectively.
Figure 6-6 Schematic of setup (Top View) in presence of Acrylic sheet in order to define the focal region’s size

64
Table 6-1 Material Properties of Acrylic Plastic [36]
Material Density (kg/m3)
Sound Speed (m/s)
Acoustic Impedance (kg/m2.s)
Attenuation (Np/m)
@ 2.15 (MHz)
Thickness (mm)
Acrylic, Clear 1190 2750 3.272 × 10⁶ 13.63 2.5
By moving the transducer towards the acrylic sheet along Y direction, focal point became
close to the surface of the plate. Once the tip of the focal region touched the sheet, the sign of
burning with a circle section appeared on the surface. By continuing the forward movement, in
Y direction, and placing the transducer at certain distances from plastic sheet, different burned
signs appeared at plate. In this experiment, transducer was run for 1 second at each station. Due
to the semi oval shape of the focal region which was observed in the last experiment it was
expected by approaching the transducer towards the sheet, the size of sections kept growing up
until reaching the maximum size at girth then by continuing the motion the sizes started to reduce
while reaching the tail of oval. Figure 6-7 illustrates size of sections with respect to distance of
transducer with the acrylic sheet. The experiment has been done at frequency 2.15 MHz and input
power 218 W and the total movement of transducer along Y axis was 6.5 mm.
Figure 6-7 Focal region sections appeared by burning the acrylic sheet
Z
X
Acrylic Sheet
Decreasing the distance between
transducer and Acrylic Sheet
Tip
of F
ocal
Reg
ion
Tale
of F
ocal
Reg
ion
Girth of focal region
6 mm

65
6.3. TEMPERATURE MEASUREMENT INSIDE WATER
To measure the temperature inside the focal region a T-type thermocouple, which was
introduced in section 5.3, has been used. The schematic of the setup is illustrated in Figure 6-8
(a). The probe was located horizontally inside the water tank that has been illustrated in
Figure 6-8 (b). The syringe shown in this figure was used to hold the thermocouple in a straight
line.
a) Schematic of setup for positioning the thermocouple inside the tank
b) Close view of thermocouple setup
Figure 6-8 Setup for positioning the thermocouple inside water tank
Thermocouple Tip
Z
Y

66
Next, by knowing the location of the focal point from previous experiments, the transducer
was moved toward the probe’s tip in order to place the focal point on it. Then, by running the
transducer for 1 second in a frequency 2.15 MHZ with input power 218 W, the temperature profile
was obtained. This profile illustrates the heating up and cooling down process in the centre of
focal region inside water for a period of 3.5 seconds. Figure 6-9 displays these results.
Figure 6-9 Temperature profile at focal point inside water for 1 (s) sonication with input power of 218 W
This graph shows that the water was heated up gradually during the sonication and slightly
after finishing it. Then, the water started to cool down sharply. In contrast, simulation’s results
illustrated in Figure 3-10, showed the peak at time 1 (s) in which water was heated up sharply
and cool down process started quickly after finishing the sonication, then water gradually went
back to its initial temperature within 9 seconds. This difference between simulation and
experiment results could happen due to applied linear acoustic equation as well as the assumption
regard to ignoring the variation in material properties of water during the sonication in simulation.
Another effect is well known as “Thermocouple Artifact” which is caused by increasing the
21.5
22.5
23.5
24.5
25.5
26.5
27.5
28.5
29.5
30.5
31.5
32.5
33.5
0 0.2 0.4 0.6 0.8 1 1.2 1.4 1.6 1.8 2 2.2 2.4 2.6 2.8 3 3.2 3.4
Tem
pera
ture
(◦C
)
Time (s)
Transducer is off

67
temperature of the thin layer of water around the thermocouple due to heating up the probe in
acoustic field [34].
6.4. CURING OF PDMS INSIDE LIQUID CAVITY
According to information explained in section 5.4, PDMS was selected as a printing liquid.
Therefore, discussion about PDMS 3D printing as well as parameters that influence the process
are performed in this chapter.
A polystyrene petri dish was selected as a cavity for PDMS. This container had the unified
wall thickness equal to 1.1 mm in all sides. Petri dish was fixed inside the water tank and parallel
to the transducer’s surface. As it has been mentioned so far the cap of petri-dish has been
considered as a divider. Figure 6-10 shows the schematic configuration of setup.
Figure 6-10 Schematic configuration of setup for printing the PDMS
As it has been explained in Section 3.1.1 by passing the acoustic wave through the petri dish’s
cap and entering into the PDMS medium, the angle of transmission would change due to different
sound speed property of each medium. Therefore, for determination of focal region’s location
inside the cavity, a calculation based on a Snell’s law was performed. The Result showed by 0.5
mm movement of the transducer toward or away from the petri dish front wall, the location of
focal point inside PDMS cavity will change equal to 0.75 mm. In the printing process, this
quantity has been used to adjust the location of a new layer with respect to the last printed one.

68
After calculating the approximate location of the focal point, the printing process started by
focusing the focal point on a spot in PDMS adjacent to the backing wall of petri dish. Therefore,
the PDMS at this spot became cured and adhered to the surface. Therefore, by maintaining this
process the first layer of the desired 3D object was printed. By repeating the process other layers
were printed over the previous ones. Figure 6-11 illustrates this explanation. Finally, after
finishing this operation full shape of the desired object were printed completely.
Figure 6-11 Sequence of building the layers
6.5. TEMPERATURE MEASUREMENT AT FOCAL REGION INSIDE PDMS
In order to understand the temperature change at a focal region inside the PDMS cavity during
sonication, a thermocouple probe was embedded inside petri dish. The probe was aligned along
the symmetrical line of transducer and its tip was located close to the backing plate of the cavity.
Next, the location of transducer with respect to petri dish was set so that the focal region placed
at the tip of the embedded thermocouple. Figure 6-12 shows the schematic configuration of the
setup.

69
Figure 6-12 Embedded thermocouple inside PDMS cavity to measure the temperature during sonication
Next, the transducer was run for a period of 15 seconds with input power 218 W at frequency
2.15 MHz. To investigate the heating up and cooling down processes at focal, temperature data
were acquired for 30 seconds.
Results showed that the temperature rise continued for a second after finishing the sonication
due to exothermic curing process and after that the temperature declines because of the natural
conduction. The maximum recorded temperature was 40.858 (ºC) which happened at t = 16.2 (s).
Figure 6-13 illustrates the experiment result.
Figure 6-13 The heat transfer over a period of 10 seconds inside the PDMS resulted from experiment
23
25
27
29
31
33
35
37
39
41
0 2 4 6 8 10 12 14 16 18 20 22 24 26 28 30
Tem
pera
ture
(ºC
)
Time (s)
Transducer is off

70
It should be mentioned, the maximum temperature rise recorded in this experiment is much
less than the temperature rise resulted from the simulation. This result happened because of
streaming occurrence inside the cavity which helps in heat dissipation. The streaming
phenomenon was not considered in simulation and it is beyond the scope of this research. In fact,
in presence of streaming accurate measurement of temperature is not possible, although the
generated heat at the focal is enough for curing the PDMS at this region though.
6.6. FINAL PRINTED PRODUCT
After examining the effect of parameters such as applying different input powers, changing
CNC’s feed rate and movement along Y as well as altering the PDMS ratio, the proper results
were achieved with employing optimized operating conditions that are shown in Table 6-2.
Therefore, in this section by applying these optimized parameters, 2 copies of a cantilever beam
have been printed in one PDMS cavity. The geometry of cantilever was the same as a model
presented in Figure 4-4. Purposes of this experiment were to determine the operability of setup
for printing a simple 3D objects as well as repeatability of the printing process.
Table 6-2 Optimized operation conditions of the printing
Input Power
(W)
Frequency (MHz)
PDMS Ratio
CNC Feed Rate along
Z and X axes (mm/min)
CNC total movement along Y axis (mm)
Step Movement
Total movement
218 2.15 10:1 300 0.5 9
The generated G-code of samples’ CAD model was imported to CNC. Then printing was
started. This process took about 10 minutes for printing each of cantilevers. Actually, the printing
time was drastically less than the “Form 2” printing operation that was introduced in Section 4.3.
Printed samples are presented in Figure 6-14.

71
Figure 6-14 Directly 3D printed cantilever beams
Table 6-3 presents the dimension of CAD designed cantilever and average measured
dimensions of two directly 3D printed samples.
Table 6-3 Dimensions of cantilevers (CAD designed and 3D printed)
Dimensions (mm)
Length (L) Width (W) Thickness (th)
CAD Designed Cantilever 10 8 4
Directly 3D Printed Sample 1 9.8 8.8 4.5
Directly 3D Printed Sample 2 10.2 8.4 4.3
Illustrated information in Table 6-3 identifies the resolution of printing setup which is
influenced by the size of the focal region, accuracy in determination of its location during the
process, and controlling streaming inside the cavity.
Furthermore, Figure 6-14 illustrates the existence of bulgy appendages on samples which
deformed the expected shape of the sample. This happened because after finishing the printing
operation, the curing process was being continued until fully dissipation of heat inside the liquid
and decreasing the magnitude of temperature below the PDMS gel temperature. This unfinished
process caused to steak an unexpected cured PDMS to printed sample after finishing the
Sample 1
Sample 2
Sample 1
Sample 2
10 mm 10 mm
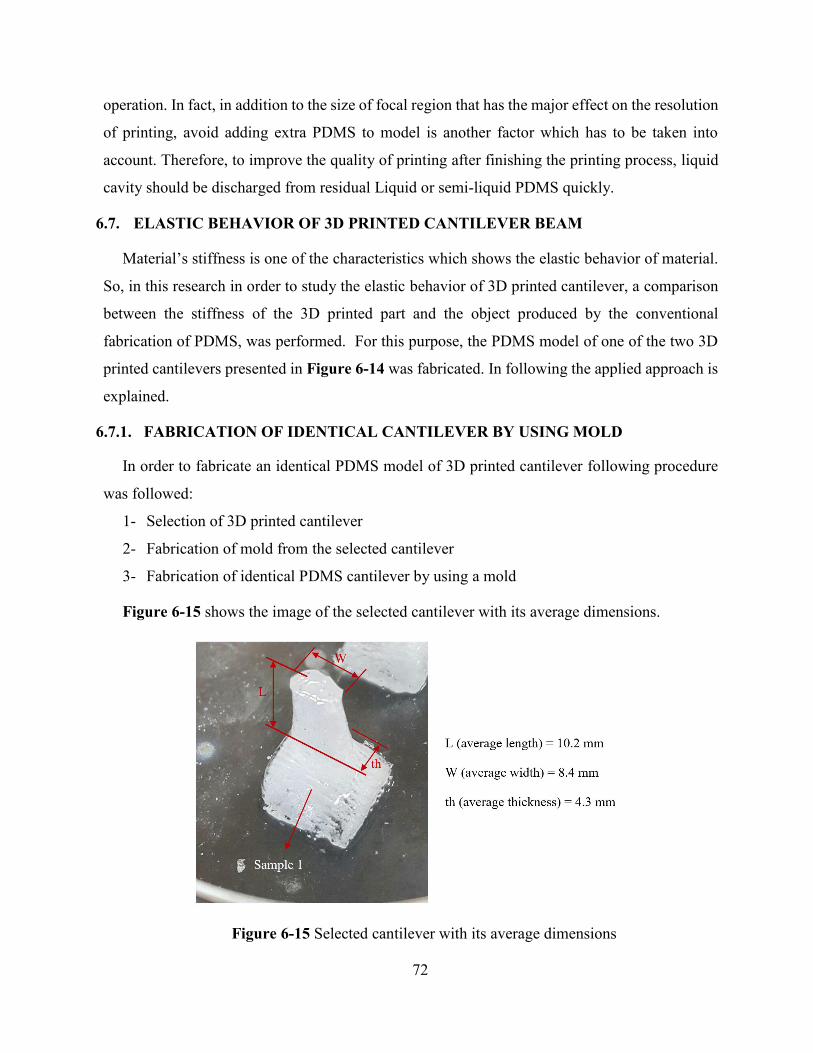
72
operation. In fact, in addition to the size of focal region that has the major effect on the resolution
of printing, avoid adding extra PDMS to model is another factor which has to be taken into
account. Therefore, to improve the quality of printing after finishing the printing process, liquid
cavity should be discharged from residual Liquid or semi-liquid PDMS quickly.
6.7. ELASTIC BEHAVIOR OF 3D PRINTED CANTILEVER BEAM
Material’s stiffness is one of the characteristics which shows the elastic behavior of material.
So, in this research in order to study the elastic behavior of 3D printed cantilever, a comparison
between the stiffness of the 3D printed part and the object produced by the conventional
fabrication of PDMS, was performed. For this purpose, the PDMS model of one of the two 3D
printed cantilevers presented in Figure 6-14 was fabricated. In following the applied approach is
explained.
6.7.1. FABRICATION OF IDENTICAL CANTILEVER BY USING MOLD
In order to fabricate an identical PDMS model of 3D printed cantilever following procedure
was followed:
1- Selection of 3D printed cantilever
2- Fabrication of mold from the selected cantilever
3- Fabrication of identical PDMS cantilever by using a mold
Figure 6-15 shows the image of the selected cantilever with its average dimensions.
Figure 6-15 Selected cantilever with its average dimensions

73
To fabricate a mold, the selected cantilever was washed with isopropanol for 2 minutes, and
it was dried by using nitrogen gas. In order to decrease the adherence between the cantilever with
new PDMS mold, the cantilever was coated with fluorinated silane (Trichlorosilane, Sigma-
Aldrich, Inc.) for 4 hours at 65 °C. As a result, the cured PDMS mold and cantilever could be
separated easily after curing the mold. Next, a small box was made from thin aluminum sheet for
making a mold then the coated cantilever was put inside a box. Figure 6-16 shows this setup.
Figure 6-16 Preparation of box for fabrication of PDMS mold
Syligard 184 (PDMS resin) was prepared by mixing 30 ml base resin and 3 ml curing agent (in a
ratio of 10:1) and then degassing the mixture by using vacuum until complete removal of the trapped
bubble inside mixture. Then the mixture was poured into a prepared box shown in Figure 6-16.
Then, the setup was put inside the oven and baked for 90 minutes at 70ºC. After curing process,
cured PDMS was removed from the aluminum box and then the 3D printed cantilever was pulled
out of the cured part. Figure 6-17 shows the fabricated PDMS mold.
Selected cantilever
Box made from thin aluminum sheet

74
Figure 6-17 Fabricated PDMS mold
For the fabrication of PDMS cantilever, in next step, the previous approach was repeated
again. PDMS mold was coated with fluorinated silane for 4 hours at 65 °C. Then, 10 ml PDMS
with the mixture of base resin and curing agent in a ratio of 10:1 was prepared. Next, the
fabricated mold was filled by PDMS and resin was baked for 90 minutes at 70ºC. After finishing
the process, the new PDMS cantilever was removed from the mold. Figure 6-18 shows a
fabricated part.
Figure 6-18 Two side views of fabricated PDMS cantilever with an appendage to help for pulling out the part from the mold
The dimension of the fabricated PDMS cantilever was measured and the results were the same
as the dimensions of printed cantilever that has been shown in Figure 6-15.
Void space after pulling out the 3D printed part
10 mm 10 mm

75
6.7.2. STIFFNESS DETERMINATION OF CANTILEVERS
A precision balance method was employed to measure the force on the tip of the cantilevers
and hence the stiffness of them. Figure 6-19 shows the schematic of this experimental setup.
Figure 6-19 Schematic of employed balance method to obtain the stiffness of cantilevers
Each of cantilevers was bonded on a small 3 mm thick rectangular plexiglass sheet. After
sticking the part, the contact surface of cantilever with plastic sheet became fully solid and hence
there was no relative movement between the cantilever and the sheet. After that, the new
component was mounted on a positioner. On the other hand, a type of solid attachment was made
and bonded to the surface of the balance (Ohaus Scout Pro Portable Electronic Balance, 200g
Capacity, 0.01g accuracy) to serve a rigid body and in order to transfer the applied load from
cantilever to the balance. For aligning the setups, positioner was moved toward the balance and
bolted to the table in a manner that the tip of attachment placed at 1 mm behind the tip of the
mounted cantilever which considered as the location of applying force to the cantilever.
Figure 6-20 shows all the experimental setups.

76
a) Location of positioner with respect to the balance
b) Cantilever bonded on a small plexiglass sheets
c) Attachment for transferring the load from cantilever to the balance, bonded to the
surface of the balance
Figure 6-20 Balance method setup for measuring the force on the tip of the cantilevers
10 mm Attachment setup
1mm distance between the tip of cantilever and connection
point of attachment’s tip
Tip of Attachment
Positioner bolted to the
table
Positioner
Cantilever mounted on a positioner
Balance
Z
Y

77
6.7.3. MEASURING THE STIFFNESS
At first, the 3D printed cantilever was mounted on a positioner. When the setup was completed
and positioned at the certain location that was explained in the previous section, the positioner
was gradually moved down until touching the tip of the attachment without exerting a force. This
location was considered as a start point of measurement. Then by continuing movement of the
cantilever, the variation of force (F) against deflection (d) was obtained based on the displacement
of positioner (d) and the force that was recorded from the balance. In order to investigate the
effect of out of centre error in this method, a sample mass was positioned on the centre and out
of centre on the tip of attachment [48]. The measured deviation due to the out of centre was 0 g,
which could be happened due to the sensitivity of balance, therefore the out of centre error for
this system was neglected. In continuation of process, the force (F) was measured for the
deflections (d) of {1.0, 1.25, 1.5, 1.75, 2.0, 2.25 and 2.5} mm. This procedure was also repeated
for the PDMS cantilever. Figure 6-21 shows the recorded data. The slight non-linearity in results
was due to the large deflections compare to the size of the cantilevers. Also, these data were
extracted from repeating the experiments 3 times.
a) Directly 3D printed cantilever
100120140160180200220240260280300320340360380400420440460
0.75 1 1.25 1.5 1.75 2 2.25 2.5 2.75
Forc
e (F
)(N
)
Deflection (d) (mm)
Y = 213.11 X
Experimental Data
Linear Regression
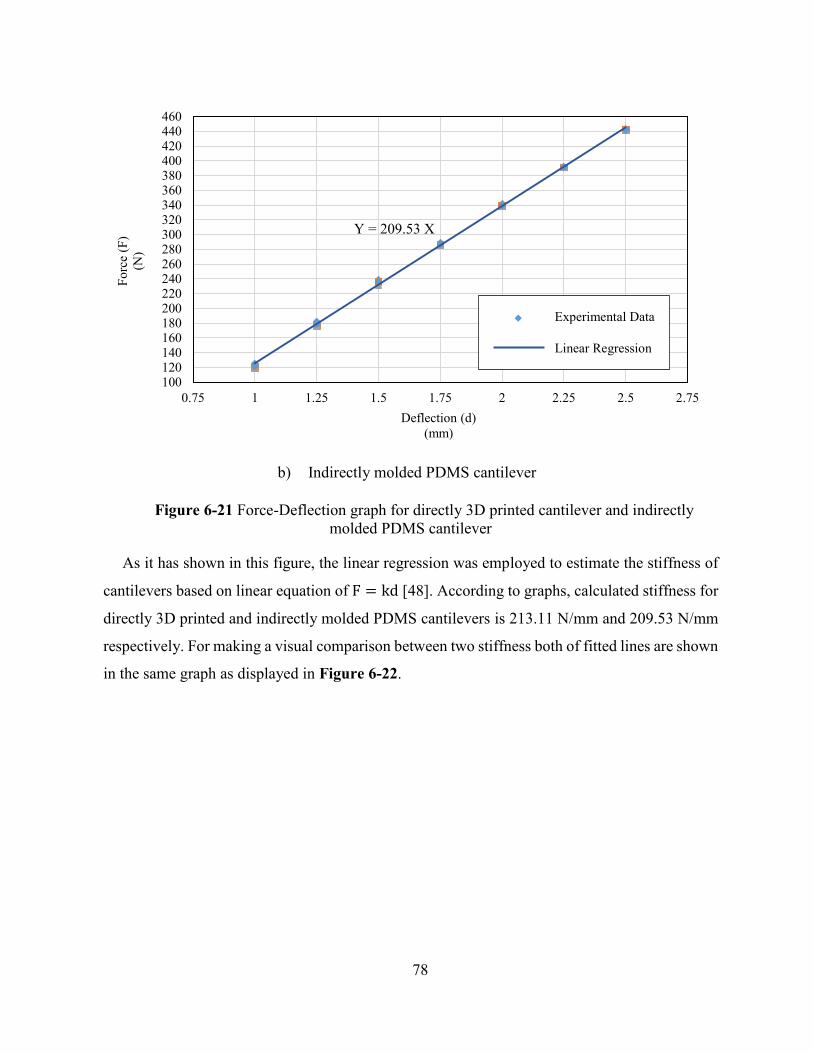
78
b) Indirectly molded PDMS cantilever
Figure 6-21 Force-Deflection graph for directly 3D printed cantilever and indirectly molded PDMS cantilever
As it has shown in this figure, the linear regression was employed to estimate the stiffness of
cantilevers based on linear equation of F = kd [48]. According to graphs, calculated stiffness for
directly 3D printed and indirectly molded PDMS cantilevers is 213.11 N/mm and 209.53 N/mm
respectively. For making a visual comparison between two stiffness both of fitted lines are shown
in the same graph as displayed in Figure 6-22.
100120140160180200220240260280300320340360380400420440460
0.75 1 1.25 1.5 1.75 2 2.25 2.5 2.75
Forc
e (F
)(N
)
Deflection (d) (mm)
Y = 209.53 X
Experimental Data
Linear Regression

79
Figure 6-22 Linear graphs of force-deflection for 3D printed cantilever and PDMS cantilever
As it has been mentioned the graph shows that both of cantilevers have almost the same
stiffness. Having close look at the graph, linear elastic behavior of 3D printed cantilever can be
distinguished.
6.8. CONCLUSIONS
In this chapter different experiments have been performed in order to examine the ability of
HIFU additive manufacturing method and integrity of the setup devices for fabrication of a 3D
printed object as a final product as well as achieving the precise results. The PDMS was selected
as a printing resin. Results showed accuracy and resolution of final object depends on the size of
the focal region, accuracy in determination of its location during the process, and controlling
streaming inside the cavity. In continue, two identical cantilevers were printed as a final directly
3D printed objects. Printing process took about 10 minutes for printing of each samples. By
measuring the dimensions, the existence of 2 to 12.5% dimensional deviation between the CAD
designed model and printed objects was investigated. In addition, in order to study the elastic
100120140160180200220240260280300320340360380400420440460
0.75 1 1.25 1.5 1.75 2 2.25 2.5 2.75
Forc
e (F
)(N
)
Deflection (d) (mm)
Linear Regression (Y = 209.53 X) (Indirectly molded PDMS Cantilever) Linear Regression (Y = 213.11 X) (Directly 3D printed Cantilever)
Y = 213.11 X
Y = 209.53 X

80
behavior of the 3D printed object, another cantilever by using the molding method was fabricated.
Then, by employing a balance method comparison between the stiffness of two built objects was
performed. Results showed the directly 3D printed object has almost the same stiffness as the
indirectly molded PDMS cantilever. Also, linear elastic behavior of 3D printed cantilever was
confirmed.

81
CHAPTER 7
CONCLUSIONS AND FUTURE WORKS
A novel additive manufacturing technology using high intensity ultrasound as the energy
source was introduced in this work. In order to achieve the inclusive overview of the expected
experimental results, numerical simulation of the problem was performed in order to validate the
accuracy of approaches. Simulation results showed input power and fluid properties have the
major influence on acoustic and thermal effects in a liquid medium. It was shown that the acoustic
wave pressure field varied by liquid’s acoustic impedance. Also, during traveling acoustic wave
among different materials the wave power decreased as a result of acoustic impedance alteration.
In addition, the magnitude of temperature rise in liquid directly depends on the absorption
coefficient of fluid so that a small variation in attenuation causes the high order change in heat
energy.
Next, in order to get familiar with the process of additive manufacturing in standard 3D
printers as well as exploring the abilities and precision of theses printing machines further
investigation on 3D printed cantilever, fabricated by a Form 2 SLA 3D printer, was performed.
Results showed that the dimensional resolution of 3D printed part is more accurate in horizontal,
XY, plane in comparison with the vertical, Z, direction. In fact, increasing the resolution of
printing will associate with increasing the printing time. While Form 2 printer operates based on
layer-by-layer process, the surface finish of the printed objects strongly depends on the direction
of printing.
Finally, in order to examine the integrity of the setup devices in achieving the precise results
for fabrication of a 3D printed object as a final product, different experiments were designed and
executed. Results showed that the magnitude of input power for transducer and properties of the
fluid medium in which acoustic wave propagates, had a major effect on intensity and generated
acoustic field pressure. This result was completely in agreement with the simulation results. In
contrast, the size of the focal region was independent of input power and medium properties.
Investigation of heat transfer inside the water showed the difference between the simulation
and experiment results. This could happen due to the applied linear acoustic equation and the
assumption of ignoring the variation in material properties of water during the sonication in the

82
simulation. Another effect that influenced the results was the “Thermocouple Artifact” which
happened because of increasing the temperature of the thin layer of water around the
thermocouple due to heating up the probe in the acoustic field.
In the next step, the temperature rise during the curing of the PDMS was measured. The
maximum temperature recorded at this experiment was much less than the temperature rise
resulted from the simulation. This result happened because of streaming inside the cavity which
helped in heat dissipation.
After examining the effect of parameters such as applying different input powers, changing
CNC’s feed rate and movement along Y as well as altering the PDMS ratio, the optimized
operation conditions for performing the 3D printing of an object were achieved. Based on these
parameters 3D printing process was performed in order to fabricate a simple cantilever beam.
Printing operation took about 10 minutes that was drastically less than the normal printing time
with “Form 2”. By measuring the dimensions of 3D printed cantilever, 2 to 12.5% difference with
the dimensions of design model was found.
The linear elastic behavior of 3D printed cantilever was confirmed by obtaining the relation
between force and deflection. Furthermore, results showed the 3D printed object had almost the
same stiffness as the PDMS cantilever that was fabricated by employing the conventional
molding method.
As a future work, by employing the nonlinearity of acoustic phenomenon in simulation the
accuracy of results can be improved. Furthermore, in this work the streaming phenomenon was
not considered in simulation and was beyond the scope of this research but the implementation
of the streaming in simulation would help obtaining more accurate results from the numerical
analysis.
As it has been mentioned, the resolution of printing setup is influenced by the size of the focal
region, accuracy in determination of its location during the process, and streaming inside the
cavity. Therefore, by employing a HIFU transducer with the smaller focal region and controlling
the streaming inside cavity more accurate results will be obtained.
By improving the dimensional resolution of printing, accurate determination of other
characteristics of printed object such as moment of inertia and elastic modulus is possible.

83
REFERENCES
[1] A. Pandian, and C. Belavek. “A review of recent trends and challenges in 3D printing.”
Proceedings of the ASEE North Central Section Conference, 2016.
[2] E.M. Sachs, J.S. Haggerty, M.J. Cima, and P.A. Williams. “Three-dimensional printing
techniques.” US patent 5,204,055, 1989.
[3] D.A. Roberson, D. Espalin, and R.B. Wicker. “3D printer selection: A decision-making
evaluation and ranking model”, Virtual and Physical Prototyping, 2013, vol. 8(3), pp.
201-212.
[4] P. F. D. M. Dudek. “FDM 3D printing technology in manufacturing composite
elements.” Archives of Metallurgy and Materials, 2013, vol. 58(4), pp. 1415-1418.
[5] S.C. Ligon, R. Liska, J. Stampfl, M. Gurr, and R. ���aupt. “Polymers for 3D printing
and customized additive manufacturing.” Chemical reviews, 2017, vol. 117(15), pp.
10212-10290.
[6] “Additive manufacturing - General principles – Terminology”, ISO/ASTM 52900, 2015,
Retrieved 2017-06-15.
[7] M. Vaezi, S. Hermann, and Y. Shoufeng. “A review on 3D micro-additive manufacturing
technologies.” The International Journal of Advanced Manufacturing Technology, 2013,
vol. 67.5(8), pp. 1721-1754.
[8] S. Kumar, A. K. S. Choudhary, A. K. Singh, A. K. Gupta. “A Comparison of Additive
Manufacturing Technologies.” IJIRST-International Journal for Innovative Research in
Science & Technology, 2016, vol. 3(01), p. 06.
[9] D. Bourell, J.P. Kruth, M. Leu, G. Levy, D. Rosen, A. M. Beese, and A. Clare. “Materials
for additive manufacturing.” CIRP Annals, 2017, vol. 66(2), pp. 659-681.
[10] A.V. Wijk, and I.V. Wijk. 3D Printing with Biomaterials: Towards a Sustainable and
Circular Economy. Amsterdam, The Netherlands: IOS Press, 2015, pp. 10-15.
[11] V. Ozbolat, D. Madhuri, A. Bugra, P. Adomas, C.D. Melik, and I.T. Ozbolat. “3D
printing of PDMS improves its mechanical and cell adhesion properties.” ACS
Biomaterials Science & Engineering, 2018, vol. 4(2), pp. 682-693.
[12] H. Nguye, H. Nguyen, J. Uan and D. Wang. “A nonrational B-spline profiled horn with
high displacement amplification for ultrasonic welding.” Journal of Ultrasonics, 2014,
vol. 54(8), pp. 2063-2071.

84
[13] W. Han, J. Liu, D. Chong and J. Yan. “Analysis of Temperature Field in a High-Intensity
Ultrasonic Chamber.” Journal of Thermophysics and Heat Transfer, 2015, vol. 30(4), pp.
745-753.
[14] M. Solovchuk, T.W.H. Sheu, and M. Thiriet. “Simulation of nonlinear Westervelt
equation for the investigation of acoustic streaming and nonlinear propagation effects.”
Acoustical Society of America, 2013, vol. 134(5), pp. 3931-3942.
[15] G.T. Haar, and C. Coussios. “High intensity focused ultrasound: physical principles and
devices,” International Journal of Hyperthermia, 2007, vol. 23(2), pp. 89-104.
[16] G.N. Levy, R. Schindel, and J.P. Kruth, “Rapid manufacturing and rapid tooling with
layer manufacturing (LM), state of the art and future perspectives.” CIRP Annals -
Manufacturing Technology, 2003, vol. 52(2), pp. 589-609.
[17] J. Bakkelund, R. Karlsen, and Ø. Bjørke. “Fabricating metal objects using laser
manufacturing technologies and powder metallurgy science.” Annals of CIRP, 1997, vol.
46(1), pp. 135-138.
[18] T. Duda, and L.V. Raghavan. “3D metal printing technology.” IFAC-Papers On Line,
2016, vol. 49(29), pp. 103-110.
[19] H. Tan, W. Shang, F. Zhang, A.T. Clare, X. Lin, J. Chen, and W. Huang. “Process
mechanisms based on powder flow spatial distribution in direct metal
deposition.” Journal of Materials Processing Technology, 2018, vol. 254, pp. 361-372.
[20] D. King, and T. Tansey. “Rapid tooling: selective laser sintering injection tooling.”
Journal of Materials Processing Technology, 2003. Vol. 132(1-3), pp. 42-48.
[21] A.T. Sidambe. “Biocompatibility of advanced manufactured titanium implants-A
review.” Materials, 2014, vol. 7(12), pp. 8168-8188.
[22] W.J. Sames, F.A. List, S. Pannala, R.R. Dehoff, and S.S. Babu, “The metallurgy and
processing science of metal additive manufacturing.” International Materials Reviews,
2016, vol. 61(5), pp. 315-360.
[23] P. Parandoush, and L. Dong. “A review on additive manufacturing of polymer-fiber
composites.” Composite Structures, 2017, vol. 182, pp. 36-53.
[24] C.K. Chua, K.F. Leong, and C.S. Lim. Rapid prototyping: principles and applications.
2nd ed. Singapore: World Scientific Publishing Co., 2003.

85
[25] S. Telfer, J. Pallari, J. Munguia, K. Dalgarno, M. McGeough, and J. Woodburn.
“Embracing additive manufacture: implications for foot and ankle orthosis
design.” BMC musculoskeletal disorders, 2012, vol. 13(1), p. 84.
[26] D.W. Cho, J.S. Lee, J. Jang, J.W. Jung, J.H. Park, and F. Pati. “Organ Printing”, Morgan
& Claypool Publishers, Chapter 4, 2015, pp.4-1-4-4.
[27] H. Ahasan, V. Sathish, S. Mallik, and B. Khoda. “3D printability of alginate-
carboxymethyl cellulose hydrogel.” Materials, 2018, vol. 11(3), p. 454.
[28] COMSOL Multiphysics 5.2a, application ID: 12659, Focused Ultrasound Induced
Heating in Tissue Phantom, [Online]. Available:
https://www.comsol.com/model/focused-ultrasound-induced-heating-in-tissue-
phantom-12659.
[29] H. Kuttruff, Acoustics: an introduction. NewYork: CRC Press, 2006.
[30] N. Zinoviy, V. Skalskyi, and O. Serhiyenko. “Propagation of elastic waves in solids.”
Springer, Cham, 2017, Chapter 2: In Acoustic Emission, pp. 29-73.
[31] L.W. Schmerr. Fundamentals of Ultrasonic Nondestructive Evaluation-A Modeling
Approach, Springer Series in Measurement Science and Technology, 1998, 2nd ed.
[32] Panametrics-NDT, Ultrasonic Transducers Technical Notes, OLYMPUS, 2006.
[33] F.B. Jensen, W.A. Kuperman, M.B. Porter, and H. Schmidt. Computational Ocean
Acoustics. Series: Modern Acoustics and Signal Processing, 2nd ed., New York: Springer,
2011, Chapter 2, pp. 65-71.
[34] J. Huang, R.G. Holt, R.O. Cleveland, and R.A. Roy. “Experimental validation of a
tractable numerical model for focused ultrasound heating in flow-through tissue
phantoms,” The Journal of the Acoustical Society of America, 2004, vol.116(4),
pp.2451-2458.
[35] R.B. Bird, W.E. Stewart, and E.N. Lightfoot, Transport Phenomena, 2nd ed., New York:
John Wiley & Sons, 2007, pp. 333-361.
[36] A.R. Selfridge. “Approximate Material Properties in Isotropic Materials.” IEEE
Transactions on Sonics and Ultrasonics, 1985, vol. su-32(3), pp. 381-394.
[37] 26th ITTC Specialist Committee on Uncertainty Analysis, ITTC recommended
procedures, “Fresh Water and Seawater Procedure,” International Towing Tank
Conference, Rev. 02, 2011, vol. 7.5(02), pp. 01-03.
86
[38] J.J. Markham, R.T. Beyer, and R.B. Lindsay, “Absorption of Sounds in Fluids,” Reviews
of Modern Physics, 1951, vol. 23(4).
[39] J.P. Abulencia, and L. Theodore, “Fluid Flow for the Practicing Chemical Engineer,”
New York: John Wiley & Sons Inc., 2009, pp. 555-556.
[40] J.M.M. Pinkerton, “A pulse method for the Measurement of Ultrasonic Absorption in
Liquids-Results for Water”, Nature Publishing Group, 1947, vol. 160(4056), pp. 128-
129.
[41] B. Zeqiri. “Reference liquid for ultrasonic attenuation.” Ultrasonics, 1989, vol. 27(5), pp.
314-315.
[42] C.K. Chua, M.V. Matham, and Y.J. Kim. “Lasers in 3D printing and manufacturing.”
World Scientific, 2017, pp. 1-13.
[43] B. C. Gross, J. L. Erkal, S. Y. Lockwood, C. Chen, and D. M. Spence, “Evaluation of 3D
printing and its potential impact on biotechnology and the chemical sciences,” Anal.
Chem., 2014, vol. 86(7), pp. 3240-3253.
[44] H. Dodiuk, and S.H. Goodman. “Handbook of Thermoset Plastics.” 3rd ed., Springer,
2014, pp. 1-12.
[45] N. Karak. Vegetable oil-based polymers: properties, processing and applications.
Elsevier, 2012.
[46] D. Ratna. Handbook of thermoset resins. Shawbury: UK, ISmithers, 2009, pp. 1-53.
[47] D. Ortiz-Acosta, and C. Densmore. “Sylgard® Cure Inhibition Characterization-
Report.” Los Alamos National Laboratory, Chemical Diagnostics and Engineering
Group, 2012.
[48] A.S. Nezhad, M. Ghanbari, C.G. Agudelo, M. Packirisamy, R. Bhat, and A. Geitmann.
“PDMS microcantilever-based flow sensor integration for lab-on-a-chip.” IEEE Sensors
journal, 2013, vol.13(2), pp. 601-609.
Related Documents