0 | Page Addis Ababa University, College of Health Sciences, School of Public Health Ethiopia Field Epidemiology Training Program (EFETP) Compiled Body of Works in Field Epidemiology By Markos Gurmamo Kalore [BSc (HO)] Submitted to the Graduate Studies of Addis Ababa University in partial fulfillment for the degree of Master of Public Health in Field Epidemiology June, 2017 Addis Ababa

Welcome message from author
This document is posted to help you gain knowledge. Please leave a comment to let me know what you think about it! Share it to your friends and learn new things together.
Transcript
0 | P a g e
Addis Ababa University, College of Health Sciences, School of Public Health
Ethiopia Field Epidemiology Training
Program (EFETP)
Compiled Body of Works in Field Epidemiology
By
Markos Gurmamo Kalore [BSc (HO)]
Submitted to the Graduate Studies of Addis Ababa University in partial fulfillment for the degree of Master of Public Health in Field Epidemiology
June, 2017
Addis Ababa
1 | P a g e
Addis Ababa University College of Health Sciences
School of Public Health
Ethiopian Field Epidemiology Training Program (EFETP)
Compiled Body of Works in Field Epidemiology
By Markos Gurmamo Kalore [BSc (HO)]
Submitted to the Graduate Studies of Addis Ababa University in partial fulfillment for the degree of Master of Public Health in Field Epidemiology
Advisors (1st) Dr. Adamu Addissie Nuramo (MD, MPH, MA, PhD) (2nd) Mr. Muluken Gizaw (BSC, MPH, Candidate PhD.)
June, 2014
Addis Ababa
B | P a g e
ADDIS ABABA UNIVERSITY College of Health Sciences School of Public Health
Ethiopian Field Epidemiology Training Program (EFETP)
Compiled Body of Works in Field Epidemiology
By Markos Gurmamo Kalore [BSc.(HO)]
Ethiopia Field Epidemiology Training Program (EFETP) School of Public Health, College of Health Sciences
Addis Ababa University
Approval by Examining Board _________________________ ___________________ Chairman, School Graduate Committee _________________________ ___________________ Advisor _________________________ ___________________ Examiner _________________________ ___________________ Examiner
i | P a g e
Acknowledgments
I would like to thank my advisers Dr.Adamu Addissie who acts for me as (my 1st Mentor) and
(academic coordinator) and Mr. Muluken Gizaw (my 2nd Mentor )for spending their time
correcting the individual drafts of this Body of Work and constructive comments for each output
in this document.
I would like to acknowledge Addis Ababa University, School of public health, Ethiopia Field
Epidemiology Program coordinators, resident advisors (Dr Adamu Addissie, Prof Mohamed Ali,
Dr Alemayehu Desassa, Dr. Zegeye Hilemariam and Dr. Lucy Boulanger & Mr. Abdulnasir
Abagaro) in Residency one and two outputs contribution and class sessions respectively. I also
say thank you all individuals, organizations and the community who provided me their support
during all field investigation and program evaluation activities. I also I acknowledge Dr. Tatek
Bogale Ethiopian MoH representative for EFETP Coordinator and Financial support linking with
EPHA in my field work time.
At the last but not the list I acknowledge Mr. Endashew Shibru my supervisor in Residency time
and all SNNPR PHEM staffs those who supported me friendly in the duration of the field
attachment in the regional health bureau.
Table of Contents
Table of Contents Table of Contents ..................................................................................................................................... i
List of Tables ......................................................................................................................................... iii
List of Figures ......................................................................................................................................... v
List of Annexes ..................................................................................................................................... vii
Abbreviation and Acronyms ................................................................................................................... ix
Executive Summary .............................................................................................................................. xii
CHAPTER – I Malaria Outbreak Investigation ...................................................................................... 1
1.1. Malaria Outbreak Investigation in Le-Zembara, Tembaro Woreda, Kembata Tembaro Zone, SNNPR, Ethiopia, 2016 ....................................................................................................................... 1
1.2. Scabies Outbreak Investigation, Kacha Birra District, Kembata Tembaro Zone, SNNP region, Ethiopia, November 11-20, 2016 ....................................................................................................... 16
ii | P a g e
CHAPTER –II Surveillance Data Analysis .......................................................................................... 32
2.1. Surveillance Data Analysis of Severe Acute Malnutrition, Kembata Tembaro Zone, SNNP Region, Ethiopia, 2004-2008 E.C.................................................................................................................... 32
CHAPTER –III- Disease Surveillance System Evaluation ...................................................................... 48
3.1. Disease Surveillance System Evaluation, Damboya Woreda Kembata Tembaro Zone, SNNPR, 20 Jan 2016 – 11 Feb /2017 .................................................................................................................... 48
Chapter IV –Health Profile Description ....................................................................................................................... 74
4.1. Health Profile Description of Tembaro District, Kembata Tembaro Zone, SNNPR, 2016 ............ 74
Chapter –V- Scientific Manuscript for Peer Reviewed Journals.............................................................. 87
5.1. Malaria Outbreak investigation, in Le-Zembara Kebele, Tembaro District, Kembata Tembaro Zone, SNNPR, Ethiopia, January 2016 GC ........................................................................................ 87
CHAPTER VI: - Abstracts For Scientific Presentation. .......................................................................... 96
6.1. Malaria Outbreak investigation, in Le-Zembara Kebele, Tembaro District, Kembata Tembaro Zone, SNNPR, Ethiopia, January 2016 GC ........................................................................................ 96
6.2. Surveillance Data Analysis of Severe Acute Malnutrition, Kembata Tembaro Zone, SNNP Region, Ethiopia, 2004-2008 E.C.................................................................................................................... 97
CHAPTER VII:- Belg assessment Narrative Summary Report ............................................................. 100
7.1. Belg assessment Narrative Summary Report on in South Omo and Segen Area people’s Zone, SNNPR, Ethiopia, 2016 ................................................................................................................... 100
CHAPTER – VIII- FLOOD DISASTER SITUATION VISITED ........................................................ 132
8.1. Narrative Report of Flood Disaster Situation Visited on Halaba special ..................................... 132
Woreda, SNNPR, May 2016. ........................................................................................................... 132
Other Public Health Risks.................................................................................................................... 140
CHAPTER –IX - Project Proposal ....................................................................................................... 148
9.1. Project Proposal on prevalence and factors associated with hypertension among adults in Halaba Kulito Town Administration, Halaba Special Woreda, Southern Ethiopia, 2016. .............................. 148
CHAPTER- X- Additional Output on Conflict Disaster Situation Need Assessment Done ................... 162
9.1 Conflict Disaster Situation Need Assessment on Geode Zone, SNNPR, Ethiopia, Oct, 2016 ....... 162
Chapter –x- ANNEXES ....................................................................................................................... 168
iii | P a g e
10-1. Trainings Provided On Residency times in SNNPR, 2016-2017 .............................................. 168
10-2 . Photos Pictures Taken at field sites in differen occassions 2016-2017 ................................... 173
10-3. Various Outbreak Investigation & Project Proposal Questionnaires ......................................... 183
10- 4. PHEM WEEKLY BULLETIN (Week 47) , 2016 ................................................................... 201
List of Tables TABLE 0-1 . 1.1.1 MALARIA CASE TREND OF LE-ZEMBARA KEBELE OF FIVE YEARS, TEMBARO
DISTRICT, KT ZONE, SNNPR, DEC-MARCH, 2016. ................................................................8 TABLE 0-2TABLE 1.1.2. CONFIRMED MALARIA CASES WITHIN TWO MONTHS OF THE SAME PERIOD,
IN LE- ZEMBARA KEBELE, KT ZONE, SNNPR, 2011-2016. ....................................................9 TABLE 0-3 , 1.1.3 MALARIA ATTACK RATE PER 100 AND CASE FATALITY RATIO BY AGE AND SEX,
WITHIN TWO MONTHS OF THE SAME PERIOD, IN LE-ZEMBARA KEBELE, TEMBARO DISTRICT, KEMBATA TEMBARO ZONE, SNNPR, ETHIOPIA, 2011-2016 ..................................................9
TABLE 0-4 : 1.1.4 DEMOGRAPHIC; PERSONAL AND ENVIRONMENTAL PROTECTION FACTORS
AMONG MALARIA CASES AND UNMATCHED CONTROLS; LE-ZEMBARA KEBELE, TEMBARO
DISTRICT, KEMBATA TEMBARO ZONE, SSNPR, ETHIOPIA, 2016. ..........................................11 TABLE 0-5TABLE 1.2.1: SCABIES ATTACK RATE BY AGE-GROUP OF AFFECTED KEBELES, KACHA
BIRRA DISTRICT, KEMBATA TEMBARO ZONE, SNNP REGION, ETHIOPIA, NOVEMBER 11-20, 2016 ...................................................................................................................................24
TABLE 0-6TABLE 1.2.2 SOCIO- DEMOGRAPHIC CHARACTERISTICS OF THE CASES AND CONTROLS, KACHA BIRA DISTRICT, KEMBATA TEMBARO ZONE, SNNP REGION, ETHIOPIA, NOVEMBER
11-20, 2016 ........................................................................................................................26 TABLE 0-7TABLE 1.2.3: BI-VARIETY ANALYSIS OF SCABIES OUTBREAK, KACHA BIRA DISTRICT,
KEMBATA TEMBARO ZONE, SNNP REGION, ETHIOPIA, NOVEMBER 11-20, 2016 ...................27 TABLE 0-8TABLE 1.2.4 : BIVARIATE VERSES MULTIVARIATE ANALYSIS OF RISK FACTORS
ASSOCIATED WITH SCABIES OUTBREAK, KACHA BIRA DISTRICT, KEMBATA TEMBARO ZONE, SNNP REGION, ETHIOPIA, NOVEMBER 11-20, 2016..............................................................28
TABLE 0-1TABLE 2.1.1. HOTSPOT CLASSIFICATION OF THE WOREDAS OF KEMBATA TEMBARO ZONE, SNNPR, IN
2016. ..................................................................................................................................34 TABLE 0-1TABLE 3.1.1 DISEASES UNDER SURVEILLANCE BASED ON THE 2009 PHEM STRUCTURE
..........................................................................................................................................50 TABLE 0-2TABLE 3.1.2 COMPLETENESS OF REPORTS IN THE HEALTH POST IN DAMBOYA WOREDA
KEMBATA TEMBARO ZONE, SNNPR, 2016 ..........................................................................64 TABLE 0-1TABLE 4.1.1. TOTAL POPULATION AND POPULATION STRUCTURE OF THE TEMBARO
DISTRICT, KEMBATA TEMBARO ZONE, SNNPR, 2015. .........................................................78
iv | P a g e
TABLE 0-2TABLE 4.1.2. MANPOWER TO POPULATION RATIO, BY PROFESSION IN TEMBARO
DISTRICT, KEMBATA TEMBARO ZONE, SNNPR, ETHIOPIA, 2015 ..........................................81 TABLE 0-3TABLE 4.1.3. LEADING CASE LOAD IN THE DISTRICT TEMBARO DISTRICT DURING THE
YEAR 2015 ..........................................................................................................................81 0-1TABLE 1.5.1 MALARIA ATTACK RATE PER 100 AND CASE FATALITY RATIO BY AGE AND SEX,
WITHIN TWO MONTHS OF THE SAME PERIOD, IN LE-ZEMBARA KEBELE, TEMBARO DISTRICT, KEMBATA TEMBARO ZONE, SNNPR, ETHIOPIA, 2011-2016 ................................................90
0-2 1.5.2: DEMOGRAPHIC; PERSONAL AND ENVIRONMENTAL PROTECTION FACTORS AMONG
MALARIA CASES AND UNMATCHED CONTROLS; LE-ZEMBARA KEBELE, TEMBARO DISTRICT, KEMBATA TEMBARO ZONE, SSNPR, ETHIOPIA, 2016. .........................................................91
TABLE (0-1) 1.7.1 FACILITIES WITH SAM MANAGEMENT IN MA’LE WOREDA, SOUTH OMO, 2016 ........................................................................................................................................ 107
TABLE(0-2). 1.7.2 ADMISSION AND PERFORMANCE OF THERAPEUTIC FEEDING PROGRAM, MA’LE
WOREDA, SOUTH OMO, 2016 ............................................................................................. 108 TABLE (0-3 TAB. 1.7.3 FACILITIES WITH SAM MANAGEMENT IN DASENECH WOREDA, SOUTH OMO,
2016 ................................................................................................................................. 114 TABLE (0-4). TAB. 1.7.4 ADMISSION AND PERFORMANCE OF THERAPEUTIC FEEDING PROGRAM FOR
SAM MANAGEMENT DASENECH WOREDA, ......................................................................... 115 TABLE (0-5) TAB. 1.7.5. .FACILITIES WITH SAM MANAGEMENT IN SOUTH OMO ZONE, 2016 ...... 118 0-6 ).TAB. 1.7.6. STATUS OF WATER SUPPLY SCHEMES IN DROUGHT AFFECTED WOREDAS OF SEGEN
AREA PEOPLE’S ZONE, SNNPR .......................................................................................... 126 TABLE (0-1) TAB 1.8.1. TABLE DEPICTING THE TOTAL FLOOD AFFECTED KEBELES IN HALABA
SPECIAL WOREDA AND THE NUMBER OF AFFECTED POPULATION. ........................................ 134 TABLE (0-2 ) TABLE1.8.1. SUMMARY OF RISK OF COMMUNICABLE DISEASES IN FLOOD-AFFECTED
POPULATION, HALABA SPECIAL WOREDA, MAY 2016 ......................................................... 140 TABLE (0-3) TABLE 1.8.2.INTENSIFIED PLAN OF ACTION FOR FLOOD RESPONSE BY KEY THEMATIC
AREAS OF INTERVENTION, HALABA SPECIAL WOREDA, SNNPR PHEM, MAY 2016 ............. 143 TABLE (0-1) TABLE 1.9.1 WORK PLAN FOR THE ASSESSMENT OF PREVALENCE AND RISK FACTORS
ASSOCIATED WITH HYPERTENSION AMONG ADULTS IN HALABA KULITO TOWN, HALABA
SPECIAL WOREDA , SOUTHERN ETHIOPIA, FROM NOVEMBER MARCH , 2016-2017. ............ 158 TABLE (0-2) TABLE 1.9.2 BUDGET COST BREAKDOWN FOR THE ASSESSMENT OF PREVALENCE AND
RISK FACTORS ASSOCIATED WITH HYPERTENSION AMONG ADULTS IN HALABA KULITO TOWN, HALABA SPECIAL WOREDA, SOUTHERN ETHIOPIA, 2016 .................................................... 159
TABLE (0-1)TABLE 1.10.1. IDPS AND DISPLACED (AFFECTED WOREDAS) DUE TO CONFLICT IN
GEDEO ZONE, OCT, 2016 ................................................................................................. 163 TABLE (0-2) TAB 1.10.2. SHOWS INJURED PATIENTS TREATED IN DILLA HOSPITAL BY THEIR AGE
CATEGORY ........................................................................................................................ 165 TABLE (0-3) TAB. 1.10.3. SHOWS TOTAL INJURED PATIENTS IN GEDEO ZONE BY THEIR WOREDAS
........................................................................................................................................ 165 TABLE (0-4)TAB. 1.10.4 BUDGET SUMMARY FOR EMERGENCY RESPONSE IN IDPS IN GEDEO ZONE
AFFECTED DISTRICTS, SNNPR, SEPT 2016 ........................................................................ 166
v | P a g e
List of Figures FIGURE 1 MAP OF LE-ZEMBARA KEBELE, TEMBARO WOREDA AND KEMBATA TEMBARO ZONE,
SNNPR, ETHIOPIA, 2016. .....................................................................................................3 FIGURE 2 . EPI CURVE OF MALARIA OUTBREAK INVESTIGATION, IN LE-ZEMBARA KEBELE,
TEMBARO DISTRICT, KEMBATA TEMBARO ZONE, SNNPR, ETHIOPIA, 2011-2016. ...............10 FIGURE 3FIGURE. 1.2.1 MAP OF THE KACHA BIRA WOREDA, IN THE KT ZONE SNNPR, ETHIOPIA,
NOVEMBER, 2016. ..............................................................................................................20 FIGURE 4FIGURE 1. 2.2: THE PROPORTIONS OF SCABIES CASES BY SEX, KACHA BIRA DISTRICT,
KEMBATA ZONE, SNNP REGION, ETHIOPIA, NOVEMBER 11-20, 2016 ...................................23 FIGURE 5 FIGURE. 1.2.3. PHOTOS OF SCABIES CASES, TAKEN AT FIELD VISIT ................................24 FIGURE 6FIGURE 1.2.4: EPIDEMIC CURVE OF SCABIES OUTBREAK BY DATE OF ONSET, KACHA BIRA
DISTRICT, KEMBATA TEMBARO ZONE, SNNP REGION, ETHIOPIA, NOVEMBER 11-20, 2016. ..25 FIGURE 7FIGURE2.1.1: TOTAL NEW ADMISSIONS OF SAM AT OTP AND SC PROGRAMS IN KEMBATA TEMBARO,
SNNPR, 2004-2008 E.C. .......................................................................................................37 FIGURE 8FIG 2.1.2. TREND OF TOTAL SAM ADMISSIONS BY YEARS IN KEMBATA TEMBARO ZONE,
SNNPR, FROM2004 -2008 EC.............................................................................................38 FIGURE 9FIG. 2.1.3 THE SAM ADMISSION TREND OF DIFFERENT YEARS IN KEMBATA TEMBARO
ZONE, FROM 2004-2008 EC. ...............................................................................................39 FIGURE 10FIG.2.1.4.THE OTP AND SC ADMISSIONS IN FIVE YEARS (2004-2005 EC) COMPARED IN
ITS OWN YEAR, IN KEMBATA TEMBARO ZONE, SNNPR. .......................................................40 FIGURE 11 FIG. 2.1.5 TOTAL OTP NEW ADMISSIONS OF SEVERE ACUTE MALNUTRITION, KEMBATA
TEMBARO, SNNPR, 2004 - 2008 E.C ..................................................................................41 FIGURE 12FIG.2.1.6. TOTAL SC NEW ADMISSIONS IN KEMBATA TEMBARO ZONE, SNNPR, FROM
2004 E.C TO 2008 EC. ........................................................................................................42 FIGURE 13FIG.2.1.7.THE TREND OF TOTAL SAM ADMISSION BY MONTHS OF THE YEARS, IN
KEMBATA TEMBARO ZONE, SNNPR, FROM 2004 E.C TO 2008 E.C. .....................................42 FIGURE 14FIG.2.1.8.THE SAM ADMISSIONS WITH MUAC AND EDEMA COMPARED WITH ITS OWN
YEAR ADMISSIONS, IN KEMBATA TEMBARO ZONE, 2004 - 2008 E.C. ....................................43 FIGURE 15FIG 2.1.9 THE NUMBER OF OTP AND SC SITES FROM YEAR 2004 -2008 EC IN KT ZONE,
SSNPR. ..............................................................................................................................44 FIGURE 16FIG.2.1.10 TOTAL SC ADMISSION CASES AND DEATHS FROM YEAR 2004 EC TO 2008 EC,
IN KT ZONE, SNNPR ..........................................................................................................45 FIGURE 17FIGURE 3.1.1 DATA AND INFORMATION FLOW IN PUBLIC HEALTH SURVEILLANCE
INDICATING VARYING CYCLES AT VARIOUS LEVELS ..............................................................51 FIGURE 18FIGURE 3.1.1 MAP OF SELECTED WOREDAS FOR SURVEILLANCE SYSTEM EVALUATION,
DAMBOYA , KEMBATA-TEMBARO ZONE, SNNPR, 2017. ......................................................56 FIGURE 19FIG. 3.1.2 MALARIA TREND IN DAMBOYA WOREDA, KEMBATA TEMBARO ZONE, SNNP
REGION BY WHO EPIDEMIOLOGICAL WEEK OF 2016. .........................................................61
vi | P a g e
FIGURE 20FIG.3.1.2 MALARIA CASES TREND IN DAMBOYA WOREDA, KEMBATA TEMBARO ZONE, SNNP REGION BY WHO EPIDEMIOLOGICAL WEEK OF 2016 .................................................61
FIGURE 21FIG.3.1.3. MALARIA MONITORING CHART BY EPI WEEK OF DAMBOYA WOREDA, KT
ZONE, SNNPR, 2016. ..........................................................................................................62 FIGURE 22FIG.3.1.4 MALARIA PREVALENCE IN 20115/2016 BY MONTHS IN DAMBOYA WOREDA,
KEMBATA-TEMBARO ZONE, SNNPR, 2016 ..........................................................................62 FIGURE 23FIG. 3.1.5 COMPLETENESS OF REPORT IN SELECTED HEALTH POSTS IN DAMBOYA
WOREDA, KEMBATA TEMBARO ZONE, FEB 2016 ..................................................................65 FIGURE 24FIG. 4.1.1MAP OF TEMBARO DISTRICT, KT ZONE, SNNPR, ETHIOPIA ........................76 FIGURE 25FIG 4.1.2 ORGANIZATIONAL STRUCTURE OF TEMBARO DISTRICT HEALTH OFFICE
SYSTEM, KEMBATA TEMBARO ZONE, SNNPR, 2015 ............................................................80 FIGURE 26FIG4.1. 3. THE THREE YEARS (2013-2015) MALARIA CASES OF TEMBARO DISTRICT,
KEMBATA TEMBARO ZONE, SNNPR, ETHIOPIA, 2016 .........................................................82 FIGURE 27FIG 4.1.4. MALARIA CASES AND ITS THRESHOLD IN TEMBARO DISTRICT, KEMBATA
TEMBARO ZONE, SNNPR, ETHIOPIA, 2015 ..........................................................................83 FIGURE 28 FIG 4.1.5 THE TREND OF SEVERE ACUTE MALNUTRITION CASES, IN TEMBARO
DISTRICT, KEMBATA TEMBARO ZONE, SNNPR, 2012-2015 .................................................85 FIGURE 29FIG. 1.5.1 EPI CURVE OF MALARIA OUTBREAK INVESTIGATION, IN LE-ZEMBARA KEBELE,
TEMBARO DISTRICT, KEMBATA TEMBARO ZONE, SNNPR, ETHIOPIA, 2011-2016 ................92 FIGURE 30FIG. 1.7.1 MAP OF SOUTH OMO WOREDAS VISITED IN CASES OF BELG ASSESSMENT BY
THE REGIONAL AND FEDERAL COMPOSED TEAM MEMBERS INCLUDING RESIDENTS, OCT, 2016. ........................................................................................................................................ 103
FIGURE 31. 1.7.2. MAP OF SEGEN AREA PEOPLE’S ZONE WOREDAS VISITED IN CASES OF BELG
ASSESSMENT BY THE REGIONAL AND FEDERAL COMPOSED TEAM MEMBERS INCLUDING
RESIDENTS, OCT, 2016. ..................................................................................................... 104 FIGURE 32 FIG. 1.7.3 COMPARISON OF SAM CASES IN 2015 AND 2016, MA’LE WOREDA, SOUTH
OMO, 2016 ....................................................................................................................... 109 FIGURE 33. FIG 1.7.4 SCREENING PERFORMANCE OF CHILDREN MA’LE WOREDA, SOUTH OMO, 2016
........................................................................................................................................ 110 FIGURE 34. FIG 1.7.5 SCREENING PERFORMANCE FOR PREGNANT AND LACTATING ..................... 110 FIGURE 35. FIG 1.7.6 TRENDS OF SAM CASES IN BENATSEMAY WOREDA, SOUTH OMO, 2016 .... 111 FIGURE 36. FIG 1.7.7 SCREENING PERFORMANCE FOR CHILDREN IN BENATSEMAY WOREDA, SOUTH
OMO, 2016 ....................................................................................................................... 112 FIGURE 37. FIG 1.7.8 SCREENING PERFORMANCE FOR PREGNANT AND LACTATING WOMEN IN
BENATSEMAY WOREDA, SOUTH OMO, 2016 ....................................................................... 113 FIGURE 38. FIG. 1.7.9 TRENDS OF MALARIA CASES IN DASENECH WOREDA 2007 AND 2008 E.C,
SOUTH OMO, 2016 ............................................................................................................ 116 FIGURE 39. FIG. 1.7.10. SCREENING PERFORMANCE FOR CHILDREN IN DASENECH WOREDA, SOUTH
OMO, 2016 ....................................................................................................................... 117 FIGURE 40.FIG 1.7.11. SCREENING PERFORMANCE OF PREGNANT AND LACTATING WOMEN IN
DASENECH WOREDA, SOUTH OMO, 2016 ........................................................................... 117
vii | P a g e
FIGURE 41. FIG. 1.7.12. TRENDS OF SAM CASES IN SOUTH OMO ZONE, SNNPR, 2016 ............... 119 FIGURE 42. FIG. 1.7.13. SCREENING PERFORMANCE OF CHILDREN IN SOUTH OMO, SNNPR, 2016
........................................................................................................................................ 119 FIGURE 43. FIG 1.7.14. SCREENING PERFORMANCE FOR PREGNANT AND LACTATING WOMEN IN
SOUTH OMO, SNNPR, 2016 .............................................................................................. 120 FIGURE 44.FIG 1.7.15. TREND OF SAM CASES IN ALLE WOREDA, SEGEN, 2016. ....................... 121 FIGURE 45.FIG.1.7.16. SCREENING PERFORMANCE FOR CHILDREN FOR MALNUTRITION IN ALLE
WOREDA, SEGEN, 2016 ...................................................................................................... 121 FIGURE 46.FIG 1.7.18. SCREENING PERFORMANCE FOR CHILDREN IN DERASHE WOREDA, SEGEN,
2016 ................................................................................................................................. 122 FIGURE 47.FIG 1.7.19. SCREENING PERFORMANCE FOR PREGNANT AND LACTATING WOMEN IN
DERASHE WOREDA, SEGEN ZONE, SNNPR, 2016. .............................................................. 122 FIGURE 48. FIG. 1.7.20 TRENDAS OF SAM CASES IN SEGEN ZONE, 2016 .................................... 123 FIGURE 49.FIG 1.7.21. SCREENING PERFORMANCE FOR CHILDREN FOR MALNUTRITION IN SEGEN,
2016 ................................................................................................................................. 123 FIGURE 50. FIG. 1.7.22 SCREENING PERFORMANCE FOR PREGNANT AND LACTATING WOMEN IN
SEGEN, 2016 ..................................................................................................................... 124 FIGURE 51FIGURE 52. FIG 1.8.1. MAP OF SEVERELY FLOOD AFFECTED KEBELES IN HALABA
SPECIAL WOREDA , SNNPR, ETHIOPIA , MAY/ 2016 ....................................................... 136 FIGURE 52FIGURE 1.8.2.(A &B). PHOTO OF FLOOD AFFECTED HALABA KULITO TOWON WHICH
DISPLACED 509 HOUSEHOLD MAY/2/2008E.C ................................................................... 137 FIGURE 53 FIG.1.8.3. HALABA SPECIAL WOREDA KULITO TAOWN FLOOD TAKEN HALABA
DISTRICT HOSPITAL COLD CHAIN EQUIPMENT TO ROAD SIDES DISTANT FROM HOSPITAL AND B)
UDANA MINO KEBELE PICTURE AFTER FLOOD, WITH HIGHEST DISPLACED POPULATION
AMONG THE HALABA SPECIAL WOREDA KEBELE, MAY, 2008 EC ....................................... 137 FIGURE 54 CONCEPTUAL FRAME WORK OF HYPERTENSION DISEASE RISK FACTORS. .................. 152
List of Annexes ANNEXES 1 . THE PHOTO A,TAKEN WHEN ORIENTATION GIVEN FOR SHELE MELA CTC
DISINFECTING TEAM MEMBERS, GUARDS AND CLEANERS NEARBY CTC AND IN THE
COMMUNITY HOUSE FROM WHERE AWD CASE APPEARED AND PHOTO B PHOTO TAKEN IN
SHELEMELA CTC, ARBAMICH ZURIA WOREDA, VISUALIZING ITS INSIDE VIEW. ................... 173 ANNEXES 2 PICTURE. 11.2 THE GEDIO ZONE CONFLICT DISASTER SITUATION VISITED, PICTURE OF
THE VEHECLES BURNT IN THE DILLA TOWN. ....................................................................... 174 ANNEXES 3FIG 11.3 PHOTO TAKEN DURING RAPID NEED ASSESSMENT AT DILLA HOSPITAL,
INJURED PEOPLE ON TREATMENT, OCTOBER 2016. ............................................................. 175 ANNEXES 4TABLE 1.11.1 FIGARATIVE DIPCTION OF NUMBER OF INJURIES AND CASE FATALITY,
SHOWS INJURED PATIENTS TREATED IN DILLA HOSPITAL BY THEIR AGE CATEGORY ........... 175 ANNEXES 5 PHOTO 11.4. PICTURE TAKEN DURING MALARIA OUTBREAK INVESTIGATION FIELD
WORK IN TEMBARO DISTRICT, IN KEBELE OF LEMEJA,2016. ............................................... 176
viii | P a g e
ANNEXES 6 PHOTOS OF STAGNANT WATER BODIES ON OBSERVATION OF LARVAE OF MOSQUITO, RDT OF MALARIA TESTING IN THE KEBELE HEALTH POST HEALTH EXTENSION WORKERS, OF
THE KEBELE BEING DRAINED BENEATH THE DUM OF ROAD NEWLY UNDER CONSTRUCTION
ROAD, PHOTOS TAKEN IN FIELD VISIT IF MALARIA OUT BREAK INVESTIGATION, TEMBARO
DISTRICT IN KEMBATA TEMBARO ZONE SNNPR, FEB,2016 ............................................... 177 ANNEXES 7PHOTO TAKEN IN HALABA & LANFURO WOREDA FLOOD EMERGENCY WHEN THE TEAM
MEMBERS CROSSING THE LOCAL RIVER AFTER SUDDEN RAINING WHEN THE TEAM IS AT FIELD, ON MAY, 2016. ................................................................................................................. 178
ANNEXES 8PHOTO A & B DEICTING THE HALABA KULITO TOWN FLOOD DISASTER AND THE
RURAL KEBELE CROPS EROSION BY THE FLOOD, SNNPR, MAY 2016. ................................ 179 ANNEXES 9PHOTO A & B DEPICTING THE HALABA SPECIAL WOREDA DISPLACED PEOPLE DUE TO
FLOOD ESTABLISHED TEMPORARY CLINIC IN TEMPORARY SETTLEMENT SITES AND PEOPLE
DISCUSSING FOR EMERGENCY BASIC NEEDS. ....................................................................... 180 ANNEXES 10PHOTO TAKEN THE HIGHER OFFICIALS VISITED THE FLOOD DISASTER OCCURRENCE
AREA, HALABA SPECIAL WOREDA AND LANFARO WOREDA, SNNPR, 2016. (SNNP REGIONAL
STATE HEAD ADMINISTRATOR AND OTHER HIGHER OFFICIALS ON SITE VISIT OF VICTIM
WOREDAS, SNNPR, MAY 2016 ........................................................................................ 181 ANNEXES 11PHOTO TAKEN AT SNNPR HEALTH BUREAU PHEM CORE PROCESS ANNUAL
REVIEW MEETING AND WE RESIDENTS PRESENTING THE OUTBREAK INVESTIGATIONS
FINDINGS FOR THE MEETING PARTICIPANTS , MARKOS GURMAMO (MALARIA OBI), DISCUSSION AFTER PRESENTATION (HAWASSA), 17 AUGUST,2016. ..................................... 182
ANNEXES 12A QUESTIONNAIRES OF MALARIA OUTBREAK INVESTIGATION QUESTIONNAIRE, TEMBARO DISTRICT KEMBATA TEMBARO ZONE, SNNPR ETHIOPIA, 2016......................... 183
ANNEXES 13 A CONSENT FORMS AND A QUESTIONNAIRE PREPARED TO ASSESS PREVALENCE AND
ASSOCIATED FACTORS OF HYPERTENSION AMONG ADULTS IN HALABA KULITO TOWN, HALABA
SPECIAL WOREDA, AND SOUTHERN ETHIOPIA. ................................................................... 190 ANNEXES 14A QUESTIONNAIRE FOR SCABIES OUTBREAK INVESTIGATION IN KACHA BIRA
WOREDA, KEMBATA TEMBARO ZONE, SNNPR, ETHIOPIA, 2016 ........................................ 197 ANNEXES 15 ANNEX 15. PHEM WEEKLY BULLETIN SNNPR BULLETIN PREPARED BY RESIDENT
(MARKOS GURMAMO) IN 47TH WEEK OF 2016 ................................................................... 201 ANNEXES 16 DECLARATION STATEMENT ................................................................................. 206
ix | P a g e
Abbreviation and Acronyms AAU-SPH Addis Ababa University School of public health
AIDS Acquired Immune-Deficiency Syndrome
ANC Antenatal care
AR attack Rate
ART Anti-retroviral treatment
AWD Acute watery diarrhea
BMI Body Mass Index
BP Blood Pressure
BSC Bachelor of Science
CDC Communicable Disease Control
CI Confidence Interval
CTC Cholera treatment centre
DBP Diastolic Blood Pressure
EFETP Ethiopian Field Epidemiology Training Program
EPHA Ethiopian Public Health Association
EPI Extended program on immunization
ETB Ethiopian Birr
FDRE Federal Democratic Republic of Ethiopia
FMOH Federal Ministry of Health
H.C Health Center
H.F Health Facilities
HH house Hold
H.P Health Post
HAD Health Development Army
HDA Health Development Army
H Health extension worker
HEWs Health extension workers
x | P a g e
HIV Human Immune-Deficiency Virus
HMI Health Management Information System
IDSR Integrated Disease Surveillance and Response
ITN Insecticide treated net
ITNs Insecticide treated nets
KG kilogram
MDG Millennium Development Goal
MDSR Maternal Death Surveillance Report
MmHG millimeter of mercury
MPH Masters of Public Health
NCD Non Communicable Disease
NGO Nongovernmental Organization
ODF Open-field Defecation Free
OPD Outpatient department
OPD Outpatient department
OPV Oral polio vaccine
OR Odds Ratio
PF Plasmodium Falciparum
PF Plasmodium Falciparum
PH Public Health Emergency Management
PI Principal Investigator
PICT provided initiated counseling and testing
PMTCT Prevention mother to child transmission
PNC postnatal care
PTB Pulmonary tuberculosis
RDT Rapid diagnostic test
RHB Regional Health Bureau
RRT Rapid Response Team
xi | P a g e
Rx Treatment
RVI Retro-Viral Infection
SBP Systolic Blood Pressure
SNNPR Southern Nations Nationalities and Peoples Region
Sr. no Serial number
TB Tuberculosis
TT Tetanus toxoid
USA United States of American
USD United States Dollar
VCT Voluntary counseling and test
WhO World Health Organization
ZHD Zonal Health Department
xii | P a g e
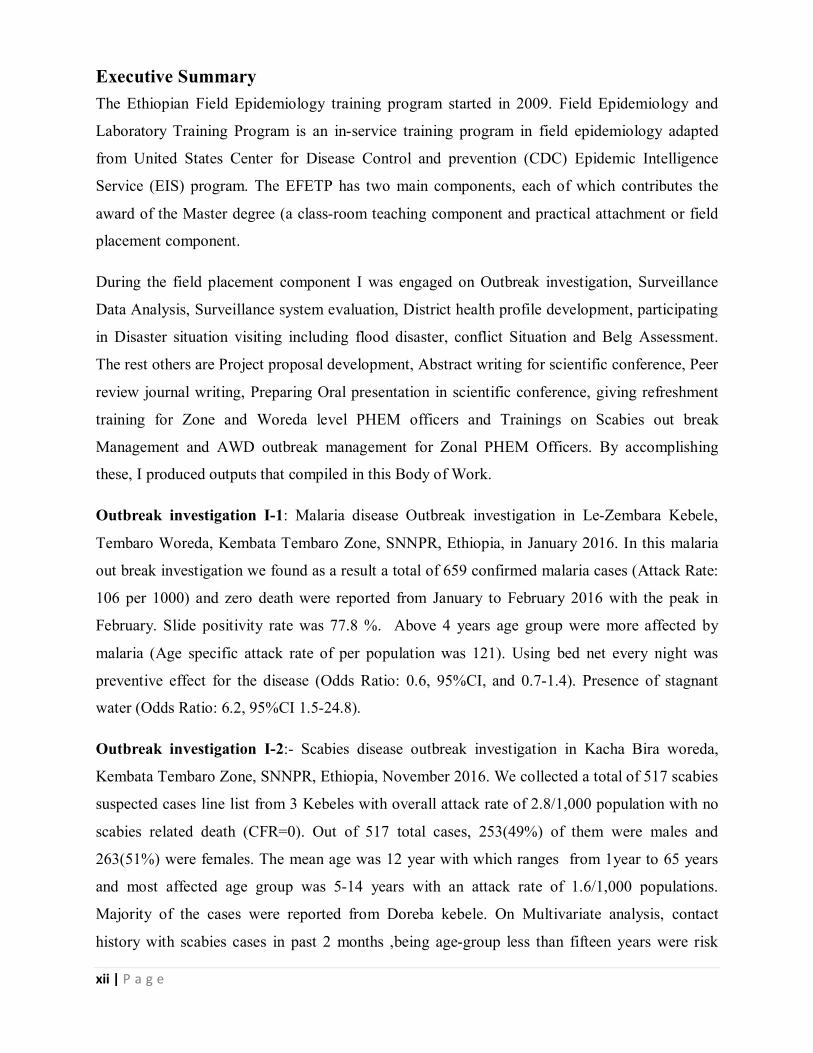
Executive Summary The Ethiopian Field Epidemiology training program started in 2009. Field Epidemiology and
Laboratory Training Program is an in-service training program in field epidemiology adapted
from United States Center for Disease Control and prevention (CDC) Epidemic Intelligence
Service (EIS) program. The EFETP has two main components, each of which contributes the
award of the Master degree (a class-room teaching component and practical attachment or field
placement component.
During the field placement component I was engaged on Outbreak investigation, Surveillance
Data Analysis, Surveillance system evaluation, District health profile development, participating
in Disaster situation visiting including flood disaster, conflict Situation and Belg Assessment.
The rest others are Project proposal development, Abstract writing for scientific conference, Peer
review journal writing, Preparing Oral presentation in scientific conference, giving refreshment
training for Zone and Woreda level PHEM officers and Trainings on Scabies out break
Management and AWD outbreak management for Zonal PHEM Officers. By accomplishing
these, I produced outputs that compiled in this Body of Work.
Outbreak investigation I-1: Malaria disease Outbreak investigation in Le-Zembara Kebele,
Tembaro Woreda, Kembata Tembaro Zone, SNNPR, Ethiopia, in January 2016. In this malaria
out break investigation we found as a result a total of 659 confirmed malaria cases (Attack Rate:
106 per 1000) and zero death were reported from January to February 2016 with the peak in
February. Slide positivity rate was 77.8 %. Above 4 years age group were more affected by
malaria (Age specific attack rate of per population was 121). Using bed net every night was
preventive effect for the disease (Odds Ratio: 0.6, 95%CI, and 0.7-1.4). Presence of stagnant
water (Odds Ratio: 6.2, 95%CI 1.5-24.8).
Outbreak investigation I-2:- Scabies disease outbreak investigation in Kacha Bira woreda,
Kembata Tembaro Zone, SNNPR, Ethiopia, November 2016. We collected a total of 517 scabies
suspected cases line list from 3 Kebeles with overall attack rate of 2.8/1,000 population with no
scabies related death (CFR=0). Out of 517 total cases, 253(49%) of them were males and
263(51%) were females. The mean age was 12 year with which ranges from 1year to 65 years
and most affected age group was 5-14 years with an attack rate of 1.6/1,000 populations.
Majority of the cases were reported from Doreba kebele. On Multivariate analysis, contact
history with scabies cases in past 2 months ,being age-group less than fifteen years were risk
xiii | P a g e
factor for developing the scabies infestation and statistically significant with an AOR of 146
[95%CI=54.3-396.6 P= < 0.0001] and 2.355 [95%CI=1.36-4.03, P<0.0001] respectively.
Surveillance Data Analysis Report II: Five years (2004-2008) Zonal data of Severe Acute
Malnutrition in Kembata Tembaro Zone data was analyzed. In the zone a total of 18, 175 total
admissions of Severe Acute Malnutrition (SAM) cases were reported at Outpatient Therapeutic Program
(OTP) and Stabilization Center (SC) in the last analyzed consecutive five years (2004 - 2008 E.C).
Children 6-59 months of age constituted almost all % of new admissions. Admissions from severe acute
malnutrition were decreased from 2004 to 2008 E.C, but for the last consecutive 4 years it was increasing.
The total highest is in 2004 EC but constantly increasing from 2005-2008 EC. From the past consecutive
five-year's report of SAM in the Zone 32 deaths with a fatality rate of 0.18 to 0.42% were reported.
Evaluation of surveillance system III: The completeness of the selected Health posts was
86%, health centers were 95.6% and selected woredas and Zone had 100% in 2016. The
timeliness was difficult to know at health facility level due to absence of time of report. 5(28%)
HEW in the health post did not get any training. 28 (100%) of respondents were accepted the
surveillance system and its data was helpful to detect cases early. Written epidemic preparedness
and response plan was only at two woreda offices and at zonal level. The case definition was not
available in some health post visited; this may lead to low detection of malaria, measles and
AWD from the community. During the analyzed period, there was no outbreak of malaria,
AWD, and measles in the evaluated kebeles and woreda.
Scientific manuscript journal IV: Scientific journals prepared to communicate findings or
present new ideas that help improve the health, safety and well being of the population. As a
result a peer review journal was prepared on a disease entitled “Malaria disease Outbreak
investigation in Le-Zembara Kebele, Tembaro Woreda, Kembata Tembaro Zone, SNNPR,
Ethiopia, in January 2016".
Abstracts for scientific Presentation V: Three abstracts were prepared. The three abstracts are
" Scabies disease outbreak investigation in Kacha Bira woreda, Kembata Tembaro Zone,
SNNPR, Ethiopia, November 2016", “Malaria disease Outbreak investigation in Le-Zembara
Kebele, Tembaro Woreda, Kembata Tembaro Zone, SNNPR, Ethiopia, in January 2016” and
“Surveillance Data analysis of five years (2004 -2008 EC) on Severe Acute Malnutrition
(SAM) in zone of KT, SNNPR, Ethiopia.
xiv | P a g e
Disaster situation visited VI: I was participated in Belg Assessment in June 2016 at South Omo
Zone and Segen area People’s Zone and 7 selected Woredas of the above Mentioned zones the
assessment conducted mainly on health and nutrition disaster assessment and response. On the
Belg Assessment some emergency decisions discussed with the regional concerned bureaus after
field feedback and remedial actions taken based on it. And I also participated in Flood disaster
situation need assessment and emergency response team member on in Halaba Special Woreda
on May 2016. Because of flood disaster from Halaba special woreda of 36 flood affected
kebeles, 13 deaths, 13,318 populations displaced from 2,673 Households. Based on the field
disaster visited on site communications to the region, actions taken like emergency food supply,
shelter management on refuges, road re-designing during flood time, evacuating the people from
flooded sites to normal sites, temporary clinics for refuges arranged, potential health risks
identified and planned for action. Besides to this I participated in Conflict Situation need
assessment and management in Gedeo Zone, on October 2016. During this conflict disaster time
from the Gedio Zone, 23 people died, 180 people injured, 14,787 people displaced from 3,241
Households. Temporary clinics at different prison sites and refuge sites established, prison
hygiene and class adequacy for prisoners commented and corrected, re-putting on of the health
system functionality supported by our team members.
Proposal development for research VII: Double burden of communicable and non
communicable chronic disease like hypertension are undergoing epidemiological transition
worldwide. The problem is of special concern in sub Saharan Africa due to this double burden of
disease and transition to a more Western lifestyle. Ethiopia is one of the Sub-Saharan Africa
which shares the problem that needs intervention. The aim of this study is to assess prevalence
and factors associated with hypertension among adults, Halaba Kulito Town residents, Southern
Ethiopia, 2016. A community based cross sectional study will be conducted. The study will
include 422 adults (age >30) residing in mentioned area. Data on risk factors will be collected by
interview method using Questionnaire adapted from WHO STEP wise approach to Surveillance
on non communicable disease. In-addition measurements on Blood pressure, height and weight
will be taken by using standard mercury sphygmomanometer, tape meter and digital balance
respectively. The data will be entered into SPSS or EPI-Info 7.1 & analyzed.
Other additional outputs VIII: In the residency time additional outputs done were Conflict
situation need assessment in Gedeo Zone on October 2016. It is mentioned above but counted as
xv | P a g e
other outputs in this document. Besides to this we provided refresher training for Zonal and
Woreda level PHERM officers on EPRP, AWD outbreak management in CTC sites and Scabies
outbreak management in community level. Besides to these, I gave the training on Severe Acute
Malnutrition Management in stabilization (SC) sites and OTP sites which is modular training for
Zonal and Woreda and Health facility Health Workers in year 2016 and 2017.
1 | P a g e ( B O W , M a r k o s G u r m a m o K a l o r e ) J u n e , 2 0 1 7 .
CHAPTER – I Malaria Outbreak Investigation
1.1. Malaria Outbreak Investigation in Le-Zembara, Tembaro Woreda, Kembata Tembaro Zone, SNNPR, Ethiopia, 2016 Back Ground: Malaria is Mosquito vector borne blood parasitic Disease and One of the major
Health problems of humankind. Even though intensive control measure like vector control,
environmental management through community participation, malaria disease remained public
Health concern of our country. Unusual Malaria cases increment was reported from Le-Zembara
kebele, Tembaro district, Kembata Tembaro Zone, SNNPR, Ethiopia, in January 2016. We
investigated the outbreak to describe the Magnitude of the disease and identify the risk factors
associated with the outbreak.
Method: Microscopic and RDT laboratory investigation conducted to confirm the disease.
Person, place and time describe the disease magnitude. The threshold of the malaria disease in
this kebele is compared by using the previous same season case data. We conducted the case
control study with randomly selected 44 cases and 88 unmatched community controls. Epi Info
7.1.4 and Microsoft Excel were used to perform data entry and analysis. We also assessed
environmental risk factors for the outbreak.
Previous years’ malaria data was received to establish threshold level and understand trends of
the disease. We conducted case control study randomly selected 44 cases unmatched 88
community controls from the community.
Result: - A total of 659 confirmed malaria cases (Attack Rate: 106 per 1000) and zero death
were reported from January to February 2016 with the peak in February. Slide positivity rate was
77.8 %. Above 4 years age group were more affected by malaria (Age specific attack rate of per
population was 121). Using bed net every night was preventive effect for the disease (Odds
Ratio: 0.6, 95%CI, and 0.7-1.4). Presence of stagnant water (Odds Ratio: 6.2, 95%CI 1.5-24.8),
presence of intermittent rivers in the area is (Odds of 1.6, 95%, 0.7-3.3 were associated with the
disease occurrence.
Conclusion and Recommendation:- Presence of stagnant water bodies near living area ,
Low utilization of Insecticide treated bed nets in the households and staying more time outside
during night time are most associated factors for this malaria disease outbreak .Kebele was not
2 | P a g e ( B O W , M a r k o s G u r m a m o K a l o r e ) J u n e , 2 0 1 7 .
sprayed with IRS (Propecxure chemical) since 12 months. We recommend the draining of
stagnant water bodies, Proper Utilization of ITNs, and spray of IRS FOR households.
Key Words: Malaria, Outbreak, Case-Control, Le-Zembara, Ethiopia.
3 | P a g e ( B O W , M a r k o s G u r m a m o K a l o r e ) J u n e , 2 0 1 7 .
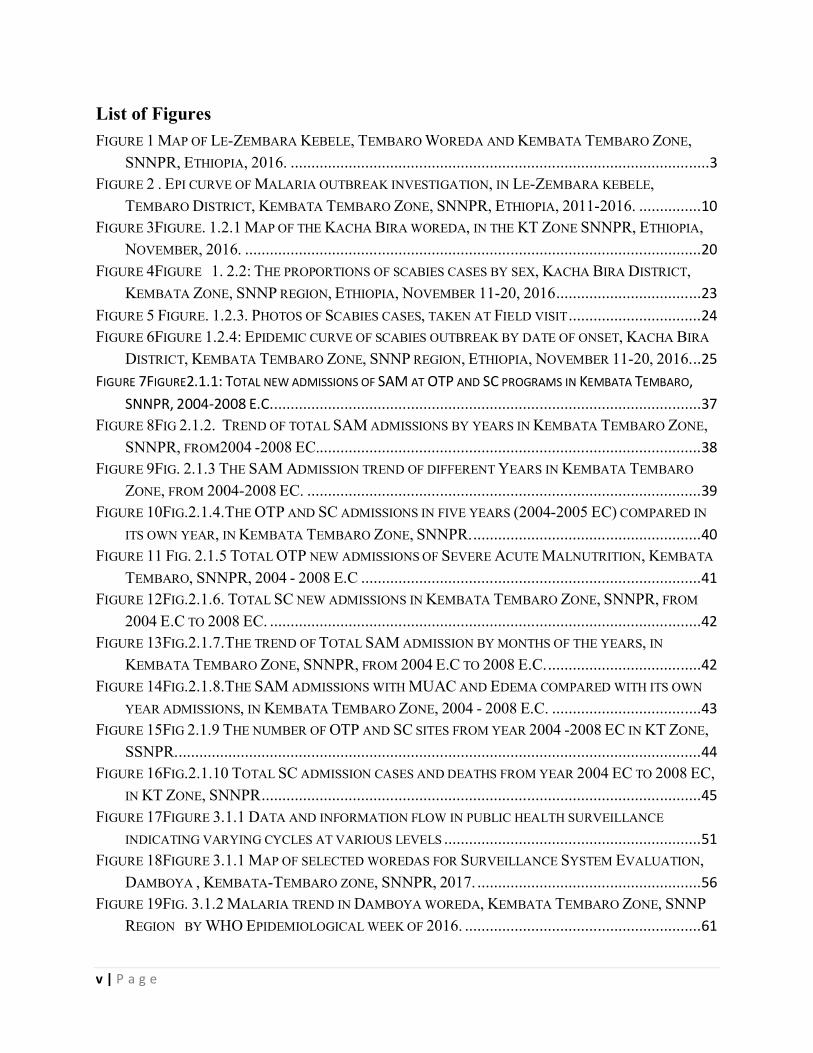
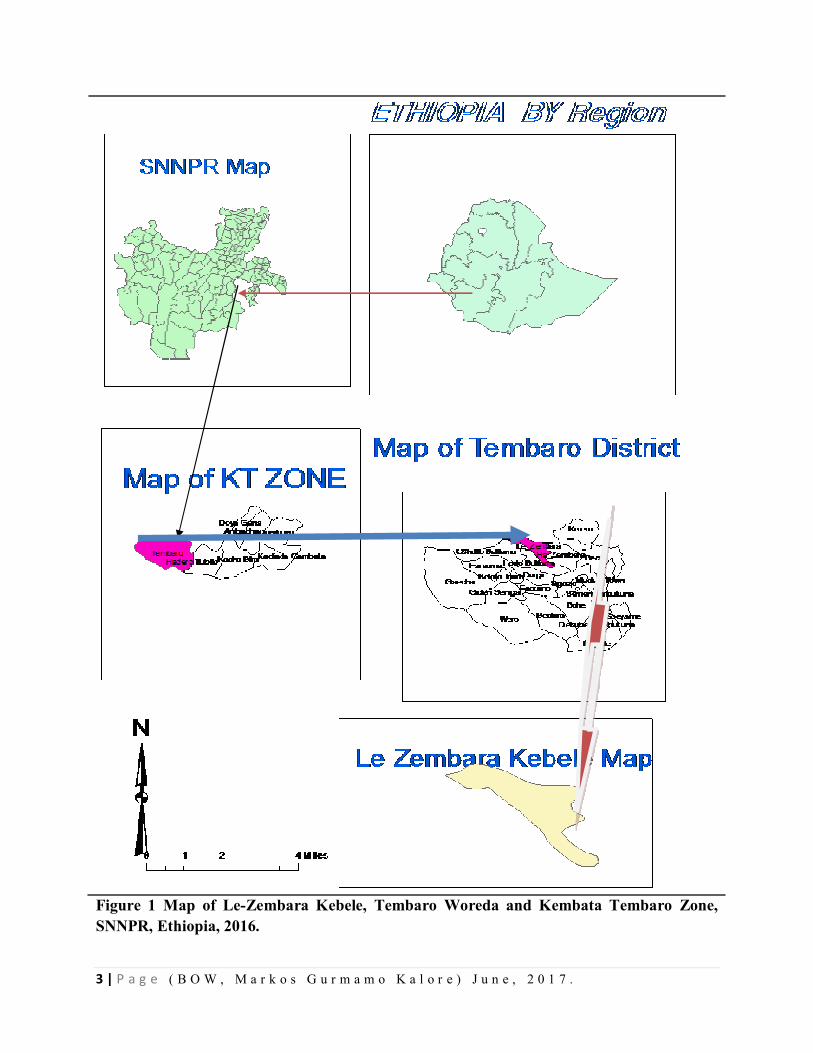
Figure 1 Map of Le-Zembara Kebele, Tembaro Woreda and Kembata Tembaro Zone, SNNPR, Ethiopia, 2016.
4 | P a g e ( B O W , M a r k o s G u r m a m o K a l o r e ) J u n e , 2 0 1 7 .
Introduction
Malaria is mosquito-borne parasitic disease and one of the most major public health problems of
human beings. It makes occur 300 to 500 million episodes of acute illness and 1.2 million deaths
per year worldwide. Malaria is affecting more than 100 countries of tropical and subtropical
regions of the world. It is one of the leading causes of death in children under 5 years in Sub-
Saharan African countries and accounts nearly 25% of all deaths.
Ethiopia is among the few countries with unstable malaria transmission. Consequently, malaria
epidemics are serious public health emergencies. In most situations, malaria epidemics develop
over several weeks, allowing some lead-time to act proactively to avoid larger numbers of
illnesses and to prevent transmission. Approximately 52 million people (68%) live malaria-
endemic areas in Ethiopia, chiefly at altitudes below 2,000 meters. Malaria is mainly seasonal in
the highland fringe areas and of relatively longer transmission duration in lowland areas, river
basins and valleys. Although historically there have been an estimated 10 million clinical malaria
cases annually, cases have reduced since 2006 (National Malaria Guideline of Ethiopia, 3rd
Edition, 2012).
Due to Ethiopian’s complex topography and seasonal rainfall supports largely seasonal short
term transmission, malaria is generally unstable that put population non immuned[Epidemiology
and Ecology of disease and Health in Ethiopia, 3rd Edition Edited by Yemane Berhane; Damene
Haile Mariam; Helmut kloos, Ethiopia 2011]. Unlike other Sub Saharan countries asymptomatic
paracitimia is not a common phenomenon in Ethiopia. Recurrent outbreaks and epidemics are
associated with cyclical climatic variations that lead to increased vector survival in the country.
Generally malaria cases are peaked after two rainy seasons (March to May and July to
September). The country has entertained the worst malaria Epidemic in 1958 with million cases
and 150,000 mortality [Draft guideline for malaria control in Ethiopia; Malaria and other vector
borne diseases prevention and control Department; Federal ministry of health; Addis Ababa
Ethiopia, January 2002]
In years 200 1to 2005 Ethiopia with an average of 5 million cases per year and on average 9.5
million cases per year and accounts for 17% of outpatient visits to health institutions and also
accounts 15 % of total admissions and 29% of inpatient deaths even though on those years the
facility number is not like today to get patients to access health services in facilities to get full
5 | P a g e ( B O W , M a r k o s G u r m a m o K a l o r e ) J u n e , 2 0 1 7 .
data of inpatient and facility deaths will be not full among morbid population[, Malaria in
Ethiopia , Aynalem Adugna ,Lesson 14]
Since 2005, Ethiopia has scaled up malaria control programs using key malaria interventions
such as effective case management and vector control options (indoor residual spray and long
lasting insecticidal nets) in Malaria endemic areas[ Prevalence and risk factors for malaria in
Ethiopia, Dawit G Ayele,Ethiopia; 2012]
SNNPR is one of the regions of Ethiopia which consists of prone to malaria epidemic in the
country. SNNPR consists of 76 districts and many districts of the region identified to be hot spot
areas for malaria disease. Among these districts Tembaro district is one of the hot spot districts
among SNNPR Regional districts. The districts found in Kembata Tembaro Zone and the zone
consists of 7 rural districts and 1 town administration. And the zone consists of 128 kebeles,
Tembaro districts consists of 23 kebeles. Among 23 kebeles 17 kebeles are fully malaria risk
kebeles. Le-Zembara Kebele is one of the malaria risks Kebeles with total population of 6208 by
being the whole population is malaria risk population in the Kebele.
Usually the malaria case increment occurs in the Le-Zembara kebele in normal trends of other
areas. The kebele has one health post and one Health center in nearby the kebele. The increased
number of cases reported from Le-Zembara kebele at Epi -week3 of 2016.
After having this information we deployed to the Le-Zembara kebele and investigated the
outbreak.
1.1.2. Objectives 1.1.2.1. General objectives
To investigate the malaria outbreak in Le-Zembara Kebele.
1.1.2.2. Specific objectives
To verify the existence of malaria outbreak in Le-Zembara Kebele
To summarize the magnitude of the disease by person, place and time.
To identify factors associated with contracting malaria during the
outbreak.
6 | P a g e ( B O W , M a r k o s G u r m a m o K a l o r e ) J u n e , 2 0 1 7 .
1.1.3. Methods and Materials
1.1.3.1Study Area
The study was conducted in Le-Zembara kebele, Tembaro District, Kembata Tembaro
Zone, SNNPR January to February 2016.
1.1. 3.2. Case Definition
1.1.3.2.1. Community Case definition
Any person with fever OR fever with headache, back pain, chills, rigor, sweats, muscle pain,
Nausea and vomiting OR suspected case confirmed by RDT.
1.1.3.2.2. Standard case Definition
Suspected Case: Any person with fever or fever with headache, back pain, chills, rigor, sweating, muscle pain, nausea and vomiting diagnosed clinically as malaria.
1.1.3.3. Study Design
1.1.3.3.1. Descriptive Epidemiology
Malaria was defined and identified as acute febrile illness with blood smear positive for
malaria in Le-Zembara kebele in this outbreak. We reviewed the previous five years data
of malaria from Le-Zembara kebele Health post and Hodo Health center level. According
to five years data similar week’s malaria case data for threshold comparing purpose. The
cases number crossed the threshold by vast variation. During this outbreak investigation,
number of malaria cases and deaths were collected from Health post and Health center in
daily and weekly basis. The magnitude of this outbreak was described by age, sex, gott,
week and months of the year. Besides to these the slide and RDT positivity rate was
calculated as those positive for malaria among total examined.
1.1.3.3.2. Analytic Epidemiology
Unmatched case –control study was conducted to identify risk factors associated with
disease from January 30 to February 8/2016. Community controls were selected from
recently (within two weeks of interview) confirmed Malaria case patient’s 1:2 ratio basis.
Selected cases were those confirmed cases at Health posts, by outreach site in community
by RDT and Health center and those controls were selected from the community of the
7 | P a g e ( B O W , M a r k o s G u r m a m o K a l o r e ) J u n e , 2 0 1 7 .
case residing kebele which is Le- Zembara residents. Controls were defined as having no
malaria. During this investigation standard check list was used to assess risk factors
including staying area during night, use of ITNS, spray of IRS, and presence of stagnant
water near by the residing home. Selected case patients and controls were interviewed
about the presence of mosquito breeding sites in their compound and nearby to home
within 200 meters or less than it. Those sites include unprotected and uncovered surface
water, open deep well and also the availability of uncovered plastic water container, old
tires and broken glass bottles in the home area also were critically assessed.
Epi Info 7.1.4 and Microsoft Excel were used to describe and analyze associated risk
factors. The significance of the risk factors for the Outbreak was determined through
bivariate analysis by calculating Odds Ratio and 95% Confidence interval.
1.1.3.3.3 Laboratory Method
The blood film of thin and thick smears with a 100x oil emersion microscopy was done
by laboratory technicians and RDT were conducted in Health post level and at outreach
level for the community in this malaria outbreak period to reach the part of the
community with suspected sign and symptom of malaria in outbreak investigation.
1.1.3.3.4. Environmental Assessment
The collection of data was done for the presence of mosquito breeding sites from the
district health office and health facilities. Since the outbreak is in a kebele, we made the
observation of the presence of potential mosquito breeding sites and presence of
anopheles larvae in stagnant water was done.
1.1.4. Result
1.1.4.1. Laboratory result
From January to March 2016, a total of 847 blood smear tests were done by microscopy
and RDT for suspected malaria cases at all sites of the Le-Zembara kebele including the
Health post, Health center , and the community outreach sites in the Kebele and 659
(77.8%)were positive. From the positive cases, 406(61.6%) were p.falciparum,
76(11.5%) were p.vivax and 177(26.8%) were mixed malaria cases.
8 | P a g e ( B O W , M a r k o s G u r m a m o K a l o r e ) J u n e , 2 0 1 7 .
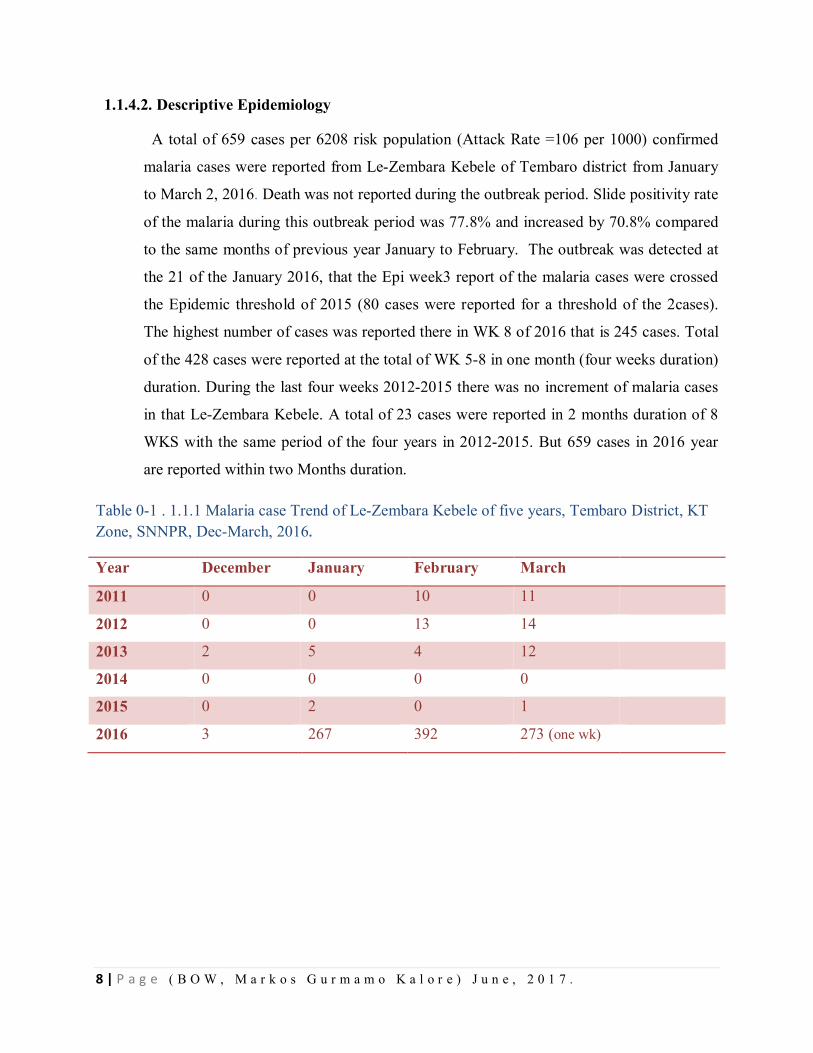
1.1.4.2. Descriptive Epidemiology
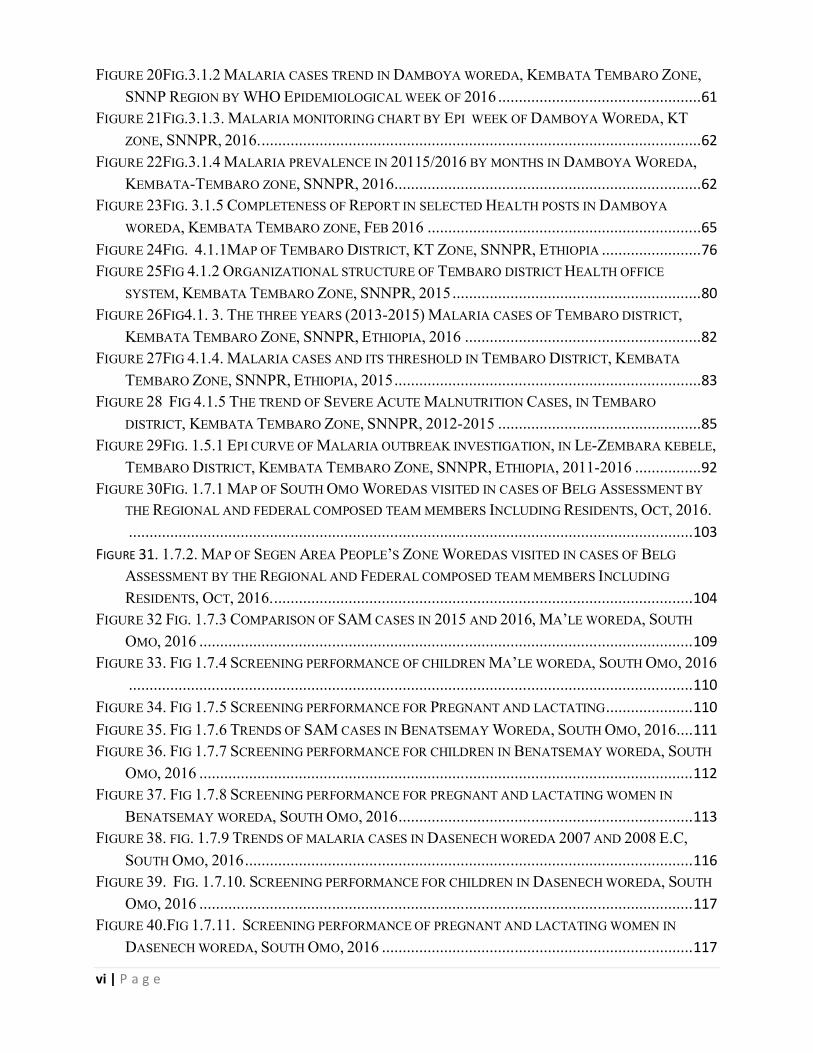
A total of 659 cases per 6208 risk population (Attack Rate =106 per 1000) confirmed
malaria cases were reported from Le-Zembara Kebele of Tembaro district from January
to March 2, 2016. Death was not reported during the outbreak period. Slide positivity rate
of the malaria during this outbreak period was 77.8% and increased by 70.8% compared
to the same months of previous year January to February. The outbreak was detected at
the 21 of the January 2016, that the Epi week3 report of the malaria cases were crossed
the Epidemic threshold of 2015 (80 cases were reported for a threshold of the 2cases).
The highest number of cases was reported there in WK 8 of 2016 that is 245 cases. Total
of the 428 cases were reported at the total of WK 5-8 in one month (four weeks duration)
duration. During the last four weeks 2012-2015 there was no increment of malaria cases
in that Le-Zembara Kebele. A total of 23 cases were reported in 2 months duration of 8
WKS with the same period of the four years in 2012-2015. But 659 cases in 2016 year
are reported within two Months duration.
Table 0-1 . 1.1.1 Malaria case Trend of Le-Zembara Kebele of five years, Tembaro District, KT Zone, SNNPR, Dec-March, 2016.
Year December January February March
2011 0 0 10 11
2012 0 0 13 14
2013 2 5 4 12
2014 0 0 0 0
2015 0 2 0 1
2016 3 267 392 273 (one wk)
9 | P a g e ( B O W , M a r k o s G u r m a m o K a l o r e ) J u n e , 2 0 1 7 .
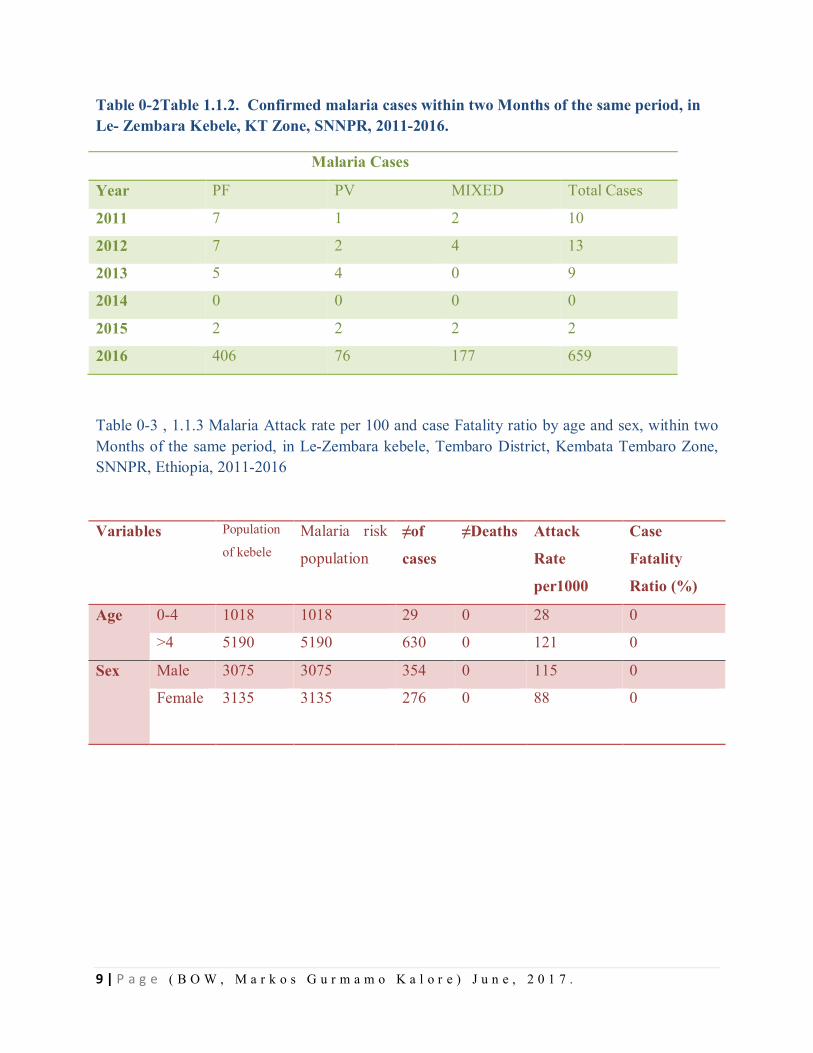
Table 0-2Table 1.1.2. Confirmed malaria cases within two Months of the same period, in Le- Zembara Kebele, KT Zone, SNNPR, 2011-2016.
Malaria Cases
Year PF PV MIXED Total Cases
2011 7 1 2 10
2012 7 2 4 13
2013 5 4 0 9
2014 0 0 0 0
2015 2 2 2 2
2016 406 76 177 659
Table 0-3 , 1.1.3 Malaria Attack rate per 100 and case Fatality ratio by age and sex, within two Months of the same period, in Le-Zembara kebele, Tembaro District, Kembata Tembaro Zone, SNNPR, Ethiopia, 2011-2016
Variables Population
of kebele Malaria risk
population
≠of
cases
≠Deaths Attack
Rate
per1000
Case
Fatality
Ratio (%)
Age 0-4 1018 1018 29 0 28 0
>4 5190 5190 630 0 121 0
Sex Male 3075 3075 354 0 115 0
Female 3135 3135 276 0 88
0
10 | P a g e ( B O W , M a r k o s G u r m a m o K a l o r e ) J u n e , 2 0 1 7 .
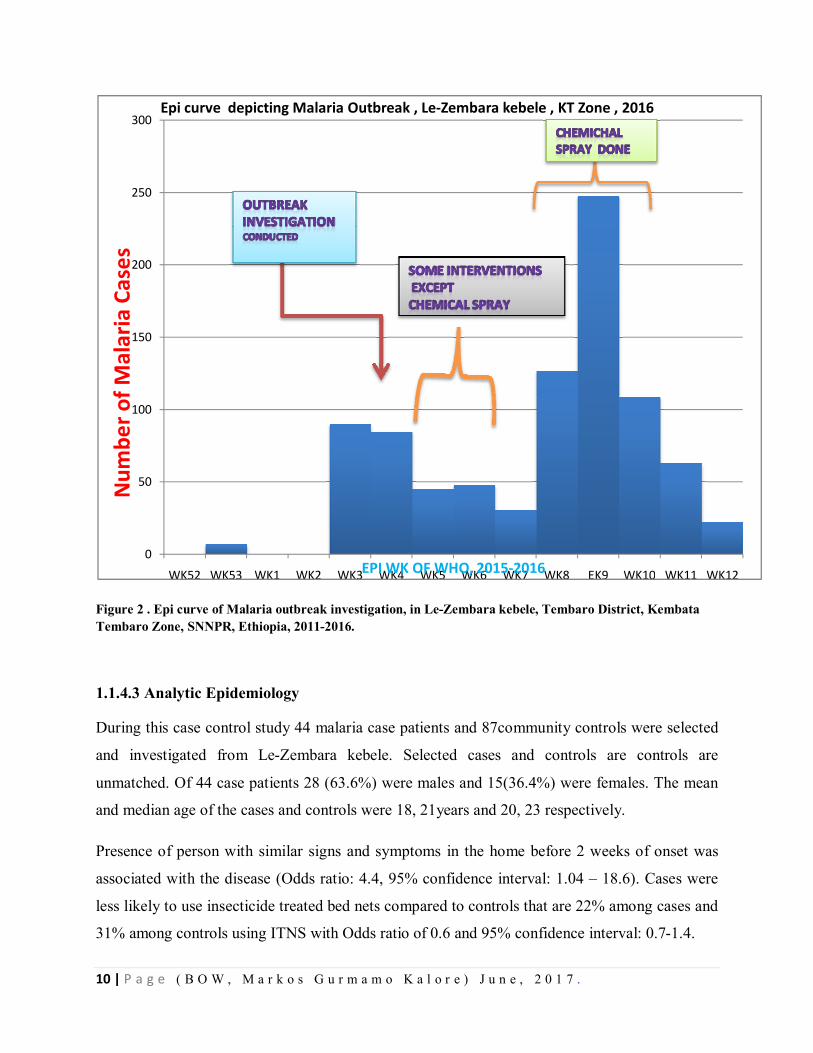
Figure 2 . Epi curve of Malaria outbreak investigation, in Le-Zembara kebele, Tembaro District, Kembata Tembaro Zone, SNNPR, Ethiopia, 2011-2016.
1.1.4.3 Analytic Epidemiology
During this case control study 44 malaria case patients and 87community controls were selected
and investigated from Le-Zembara kebele. Selected cases and controls are controls are
unmatched. Of 44 case patients 28 (63.6%) were males and 15(36.4%) were females. The mean
and median age of the cases and controls were 18, 21years and 20, 23 respectively.
Presence of person with similar signs and symptoms in the home before 2 weeks of onset was
associated with the disease (Odds ratio: 4.4, 95% confidence interval: 1.04 – 18.6). Cases were
less likely to use insecticide treated bed nets compared to controls that are 22% among cases and
31% among controls using ITNS with Odds ratio of 0.6 and 95% confidence interval: 0.7-1.4.
0
50
100
150
200
250
300
WK52 WK53 WK1 WK2 WK3 WK4 WK5 WK6 WK7 WK8 EK9 WK10 WK11 WK12
Num
ber o
f Mal
aria
Cas
es
EPI WK OF WHO, 2015-2016
Epi curve depicting Malaria Outbreak , Le-Zembara kebele , KT Zone , 2016
11 | P a g e ( B O W , M a r k o s G u r m a m o K a l o r e ) J u n e , 2 0 1 7 .
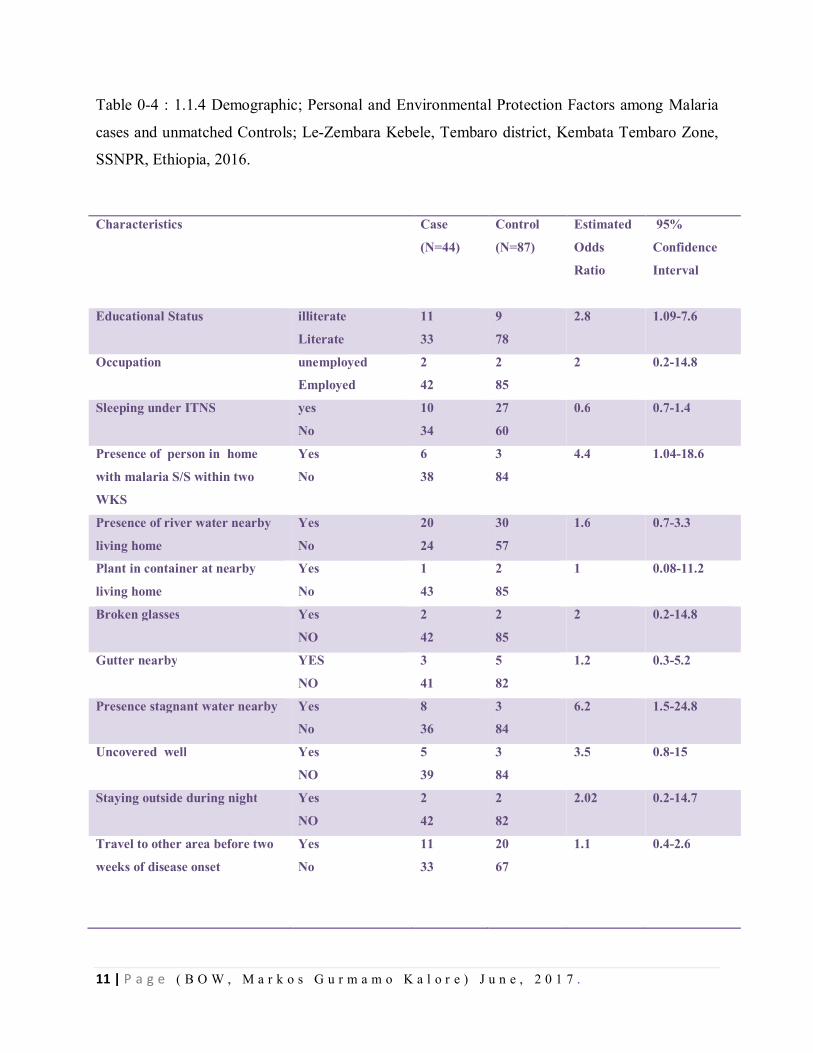
Table 0-4 : 1.1.4 Demographic; Personal and Environmental Protection Factors among Malaria
cases and unmatched Controls; Le-Zembara Kebele, Tembaro district, Kembata Tembaro Zone,
SSNPR, Ethiopia, 2016.
Characteristics
Case
(N=44)
Control
(N=87)
Estimated
Odds
Ratio
95%
Confidence
Interval
Educational Status illiterate
Literate
11
33
9
78
2.8 1.09-7.6
Occupation unemployed
Employed
2
42
2
85
2 0.2-14.8
Sleeping under ITNS yes
No
10
34
27
60
0.6 0.7-1.4
Presence of person in home
with malaria S/S within two
WKS
Yes
No
6
38
3
84
4.4 1.04-18.6
Presence of river water nearby
living home
Yes
No
20
24
30
57
1.6 0.7-3.3
Plant in container at nearby
living home
Yes
No
1
43
2
85
1 0.08-11.2
Broken glasses Yes
NO
2
42
2
85
2 0.2-14.8
Gutter nearby YES
NO
3
41
5
82
1.2 0.3-5.2
Presence stagnant water nearby Yes
No
8
36
3
84
6.2 1.5-24.8
Uncovered well Yes
NO
5
39
3
84
3.5 0.8-15
Staying outside during night Yes
NO
2
42
2
82
2.02 0.2-14.7
Travel to other area before two
weeks of disease onset
Yes
No
11
33
20
67
1.1 0.4-2.6
12 | P a g e ( B O W , M a r k o s G u r m a m o K a l o r e ) J u n e , 2 0 1 7 .
Presence of stagnant water nearby living area for mosquito breeding was associated with malaria
outbreak (Odds ratio: 6.2, 95% confidence interval: 1.5 - 24.8). Staying outside during night time
is associated with malaria case (Odds ratio: 2.02, 95% confidence interval: 0.2-14.7). Illiteracy is
found to be associated with the cases with odds ratio of 2.8, 95% confidence interval is 1.09-7.6.
Presence uncovered well is found to be associated with the cases with (Odds ratio: 3.5, 95%
confidence interval: 0.8-15). Also the presence of broken glasses home area is associated with
the disease (Odds ratio: 2, 95% confidence interval: 0.2-14.8).
Neither Use of protective closes nor repellents is common; neither in cases nor in controls is being used. Indoor residual spray was not done in the Kebele last year that it is sprayed before 12 month in the Kebele, so that it is not statistically significant conducted for both cases and controls.
1.1.4.4. Environmental Assessment
By observing in the field sites in the kebele, the uncovered stagnant water bodies are observed.
Observation was conducted for availability of stagnant water, uncovered plastic water containers,
broken glass bottles and other potential mosquito breeding sites. In different sites of the kebele,
larvae of mosquitoes were identified in observed stagnant water bodies by naked eyes.
1.1.5. Discussion
Many factors may have contributed to the occurrence of this outbreak in Le-Zembara Kebele.
Multiple risk factors were assessed during the investigation besides intervention activities.
Usually poor individual practice towards Malaria prevention, Temperature, rain fall, population
movement is contributors for malaria the existence of malaria outbreak. This outbreak was
detected after the middle of January 2016. The small amount of rain fall in kebele made stagnant
water in this kebele of seasonal rain and some local river water bodies became stagnant due to
road construction bridges and unwashed away of small stagnant waters increased malaria
incidence in the kebele. Besides to these the high temperature and the low altitudes (some areas
registered 1490 m by GPS measurement) are also contributed the breeding of mosquito on the
site. There were no death recorded in the kebele, the possible reason could be strong case
detection and management at time of outbreak management including at the period of outbreak.
13 | P a g e ( B O W , M a r k o s G u r m a m o K a l o r e ) J u n e , 2 0 1 7 .
The Study done at India on risk factors of malaria outbreak indicates the lower risk of malaria
attack people sleep under ITNs, and it almost concedes with this study. Also the case control
study which was conducted assessing risk factor for malaria outbreak by Gemechu Shume in
Oromia Region, Ethiopia ; has almost the similar findings with this study on stagnant water is the
risk factor for malaria outbreak.
The presence of stagnant water nearby living environment is found to be the major cause for this
out break since it is the good media for mosquito larvae breeding and observed by naked eye.
The Villages closer to those water bodies are more affected than others. Research conducted in
Gurau Region of Peru also showed the availability of water bodies has higher association with
malaria attack rate and transmission possibility in human population. Besides to these the last
year the kebele spray was skipped due to shortage of chemical for Indoor Residual Spray and this
probably gave weakling gate for mosquito availability and resting in households.
When we compare sex, male sexes are more affected than females; this could be the activity
done outdoors by males is higher than females at night times. Among this study respondents are
also higher number of males stay outside during night times and that could be the reason to be
bitten by mosquito at night time and contracting the malaria disease.
1.1.7. Conclusion
There was malaria Outbreak in Le-zembara Kebele, Tembarodistirict, Kembata Tembaro Zone,
and SNNPR. The age group of above four years is more affected in the outbreak of malaria
disease. The villages called Lemeja and 3rd Zembara is more affected by malaria outbreak. The
presence of stagnant water, staying outside the home during night time, some uncovered wells
for mosquito breeding plus the presence of person with malaria sign and symptoms are
associated factors for having or contracting the malaria disease in this Le- Zembara kebele. Even
though the outbreak was notified timely, the combating strategies like Indoor residual for focal
spray was late due to shortage of the chemical. The already available old ITNs was not being
monitored for proper utilization in the HHs, and the Abate chemical for spraying on water bodies
for larvaecidale purpose was bit expired and the kebele is still utilizing it. Due to shortage of
Propecxure chemical for the kebele at previous year time, it was not totally sprayed in the kebele
at expected time period of spray in 2015.
14 | P a g e ( B O W , M a r k o s G u r m a m o K a l o r e ) J u n e , 2 0 1 7 .
Observed gaps administratively which we obtained from the health system
Indoor residual spray (IRS) was not sprayed In the Kebele Since 12 months. The ITNS
Replacement was not done within two years , that is 40% when assessed 2 years data of ITNs.
ITNS unloaded from the region to the woreda was retuned back to other woredas by refusal of
the woreda health head who were working formerly. The new tar road was being constructed
which is crossing the kebele long distance. Stagnant water bodies beneath the bridges & other
areas due to small amount of rain fall was not drained at the before the outbreak time.
1.1.8 Public Interventions
A total of 1,300 pieces of new ITNS (Insecticide Treated bed nets) distributed for the kebele during the outbreak. The environmental management like draining of the stagnant water due to newly being constructed road is bridges is also made drain during the intervention time. Community was mobilized and the proper utilization of ITNs in the HH is enhanced. The case detection and case management at each level like outreach community, Health posts and Health centers level was well done during the outbreak management period. Additional IRS was done 100% at the kebele by spray chemicals those are , Ethio-Propecxure and Bendiocarb chemicals.
The chemical spray was delayed due to loading and unloading dalliance to regional from Adama Tulu chemical industry. After spray of the chemical the outbreak of malaria is stopped. Additional drug and RDT for diagnosis is supplied to the zone and woreda to combat the Malaria outbreak.
1.1.9. Recommendations
Regular indoor residual spray per required standard should be kept in place and sprayed with
in standard.
Identifying and draining potential mosquito breeding site has to be done.
Since the kebele is malarious, the ITNs should be distributed as standard for the kebele
households and the proper utilization of the ITNs should be monitored and maximized.
At weekly basis trend of malaria cases should be monitored and reported for the next level.
Community ownership strengthening has to be done in 1to5 level and at health Development
army level to manage the environment at abate chemical spray community participation.
15 | P a g e ( B O W , M a r k o s G u r m a m o K a l o r e ) J u n e , 2 0 1 7 .
Besides to this multi-sect oral collaboration and woreda administration has to play great role
on facilitating the outbreak control managing activities.
Weekly and monthly morbidity data has to be kept and documented.
ITNs coverage has to be done at yearly basis in district and kebele levels.
1.1.10. References
1. Guideline for Malaria epidemic prevention and control in Ethiopia ; Federal ministry of Health ;2nd
Edition ; Addis Ababa Ethiopia;2014
2. Malaria risk factors in Butajira area, south central Ethiopia: a multilevel Analysis: Adugna Woyessa;
Wakgari Deressa; Ahmed Ali and BerntLindtjorn; Ethiopia; 2013.
3. Ethiopian Roll back Malaria consultative mission; Essential Actions to Support the Attainment of
Abuja Targets; Kasssahun Negash; Ethiopia RBM country consultative Mission Final Report ;2004
4. Epidemiology and Ecology of disease and Health in Ethiopia, 3rd Edition Edited by Yemane Berhane;
Damene Hailemariam; Helmut kloos, Ethiopia 2011
5. Malaria in Ethiopia, Aynalem Adugna, Lesson 14
6. Prevalence and risk factors for malaria in Ethiopia, Dawit G Ayele, Ethiopia; 2012
7. Community Participation in Malaria Epidemic control in High land areas of southern Oromia; Wakgari
Deressa; Dereje Olana; Sheleme chibsa; Ethiopia; 2005.
8.A Malaria outbreak in Naxalbari; Darjeeling District; West Bangal , India; weakness in disease control,
important risk factors ; Puran K Sharma ; Ramakrishnan Ramanandran ; Yvan J Hutin ;Raju Sharma ;
Mohan D Gupte; India; 2005
9. Malaria Risk Factors in Butajira Area, South central Ethiopia; a multilevel analysis; Adugna Woyessa;
Wakigari Deressa; Ahmed Ali, and Bernt Lindtjørn; Ethiopia; 20
16 | P a g e ( B O W , M a r k o s G u r m a m o K a l o r e ) J u n e , 2 0 1 7 .
1.2. Scabies Outbreak Investigation, Kacha Birra District, Kembata Tembaro Zone, SNNP region, Ethiopia, November 11-20, 2016 Abstract
Introduction: Scabies is one of the common but neglected parasitic diseases and major public
health problem globally and resource limited country particularly. It affects about 300 million
people worldwide each year with incidences increase during natural and manmade disasters, and
can affect all age group, both sexes, all races, and at all social class. It usually spread by direct,
prolonged, skin-to-skin contact with a person who has scabies infestation.
Objective: It was to investigate the Scabies suspected outbreak and its risk factors in Kacha Bira
district of Kembata Tembaro zone, Southern Nations Nationalities & peoples Region, Ethiopia.
Methods: We conducted community based unmatched case-control (1:3) study design. Data
were collected Using face to face interview administered structured questionnaire. Data were
analyzed using Epi info and MS Excel is also used.
Result: we collected a total of 517 scabies suspected cases line list from 3 Kebeles with overall
attack rate of 2.8/1,000 population with no scabies related death (CFR=0). Out of 517 total cases,
253(49%) of them were males and 263(51%) were females. The mean age was 12 year with
ranges from 1year to 65 year and most affected age group was 5-14 years with an attack rate of
1.6/1,000 populations. Majority of the cases were reported from Doreba kebele. On Multivariate
analysis, contact history with scabies cases in past 2 months and being age-group less than
fifteen years were risk factor for developing the scabies infestation and found statistically
significant with an AOR:146 [95% CI=54.3-396.6 P= < 0.0001] and 2.355 [95%CI=1.36-4.03,
P<0.0001] respectively. Active case search, health education & drug treatment conducted during
investigation.
Conclusion and recommendations: we confirmed scabies outbreak was occurred in Kacha
Birra District of Kembata Tembaro Zone, SNNP region. Contact history, presence of person
infested with scabies in the family and age less than 15 years were risk factors for transmission
of scabies. We recommend continuous active case search at all kebele levels, Prevention
methods, controls especially at community level including schools and mass treatment.
Keywords: Scabies outbreak, risk factors, Kaca Birra District.
17 | P a g e ( B O W , M a r k o s G u r m a m o K a l o r e ) J u n e , 2 0 1 7 .
Introduction
Scabies is one of the common but neglected parasitic diseases and major public health problem
globally and resource-limited countries particularly. It affects about 300 million people
worldwide each year. Its incidences can increase during natural and man-made disasters (1).
Scabies occurs at all age group, sexes, all races and at all social classes. It is caused by the mite
Sarcoptes scabies variety hominis, an arthropod of the order Acarina (2).
The scabies mite usually spread by direct, prolonged, skin-to-skin contact with a person who has
scabies. It can also spread easily to sexual partners and household members. Scabies sometimes
can spread indirectly by sharing articles such as clothing, towels, or bedding used by an infected
individuals. A tiny scabies mite burrows into the epidermis of the skin where it lives and lays its
eggs. The most common symptoms of scabies are severe itching especially at night and papular
skin rash that may affect much of the body or be limited to common sites like inter digital space,
flexor of the wrist, elbow, armpit, penis, nipple and buttocks. Sign and symptoms usually begin
3-6 weeks after primary infestation (3).
Untreated and delayed diagnosis of scabies can contribute to prolonged outbreaks and is linked
with secondary bacterial infection which may lead to cellulitis, folliculitis, boils, impetigo, or
lymphangitis and may also exacerbate other pre-existing dermatosis such as eczema and
psoriasis (4).
Many secondary bacterial infections were caused by group A streptococci and Staphylococcus
aureus, which leads to nephritis, rheumatic fever, glomerulonephritis, chronic renal diseases,
rheumatic heart diseases and sepsis especially in developing countries(5).
The highest attack rates in developing countries are among preschool children to adolescents and
rates significantly decreased in mid-adulthood, and increase in the older age. Overcrowded living
conditions, sleeping together, sharing of clothes, sharing of towels, poor hygiene practices,
malnutrition and travel to affected areas are common risk factors for scabies (6).
In Ethiopia, as somewhere else, scabies is common where there is poverty, drought, poor water
supply, poor sanitation and overcrowding (7).
18 | P a g e ( B O W , M a r k o s G u r m a m o K a l o r e ) J u n e , 2 0 1 7 .
Next to the 2015 and 2016 El-Nino event which affected many countries worldwide including
Ethiopia, drought, severe water shortage, malnutrition, flooding, landslide and many disease
outbreaks were occurred in many regional states of Ethiopia such as Amhara, Tigray, Afar,
Oromia and Southern Nation Nationality People’s Region. This compromises the hygiene and
sanitation practice of the rural community and gives favorable environment for water-washed
communicable diseases like scabies and others. Example, as of December 25, 2015, a total of 77
districts [22, 47 & 8 from Tigray, Amhara and Oromia respectively] were affected by scabies (8).
Hence, the aim of this study was to investigate the scabies suspected outbreak and its risk factors
among Kacha Bira district residents, in Kembata Tembaro Zone of Southern nation nationality
people’s Region, Ethiopia.
2.1.1Objective
2.1.2. General objective
To investigate the Scabies suspected outbreak and Risk factors in Kacha Bira district of Kembata
Tembaro Zone, SNNP Region, November, 2016.
2.1.2.1. Specific objectives
To verify the existence of the outbreak.
To describe the outbreak in terms of person place and time.
To identify the risk factors of the outbreak
To take possible intervention measures based on finding.
Methods and materials
Study area and population
The study was conducted in, Kacha Bira district which is one of the 7 districts and 3 Town
Administrations in Kembata Tembaro Zone of Southern Nations Nationalities People’s Regional
State. Administratively, the district has 23 kebeles of which 3 and 20 of them are urban and rural
respectively.
As of 2007 GC population and housing census projection, the 2009 EFY population of the
district is estimated to be 133,475 of which, 65,420 and 68,072 of them are males and females
respectively and 27,239 households with the average household size of 4.9 persons.
19 | P a g e ( B O W , M a r k o s G u r m a m o K a l o r e ) J u n e , 2 0 1 7 .
Shinshicho Town is the district capital, is found at 17 km from Durame, the capital city of
Kembata Tembaro zone and 134 km from Hawassa city, the capital of the South Nation
Nationality and People region in the southwest and 365 km from Addis Ababa.
The majority of the population (80.6%) resides in the rural and the remaining 19.4% of them
were urban dwellers.
Currently, the Woreda has 1 district hospital, 6 health centers, and 23 health posts with 100 %
potential health service coverage. The overall water supply coverage of the district was 47 %.
20 | P a g e ( B O W , M a r k o s G u r m a m o K a l o r e ) J u n e , 2 0 1 7 .
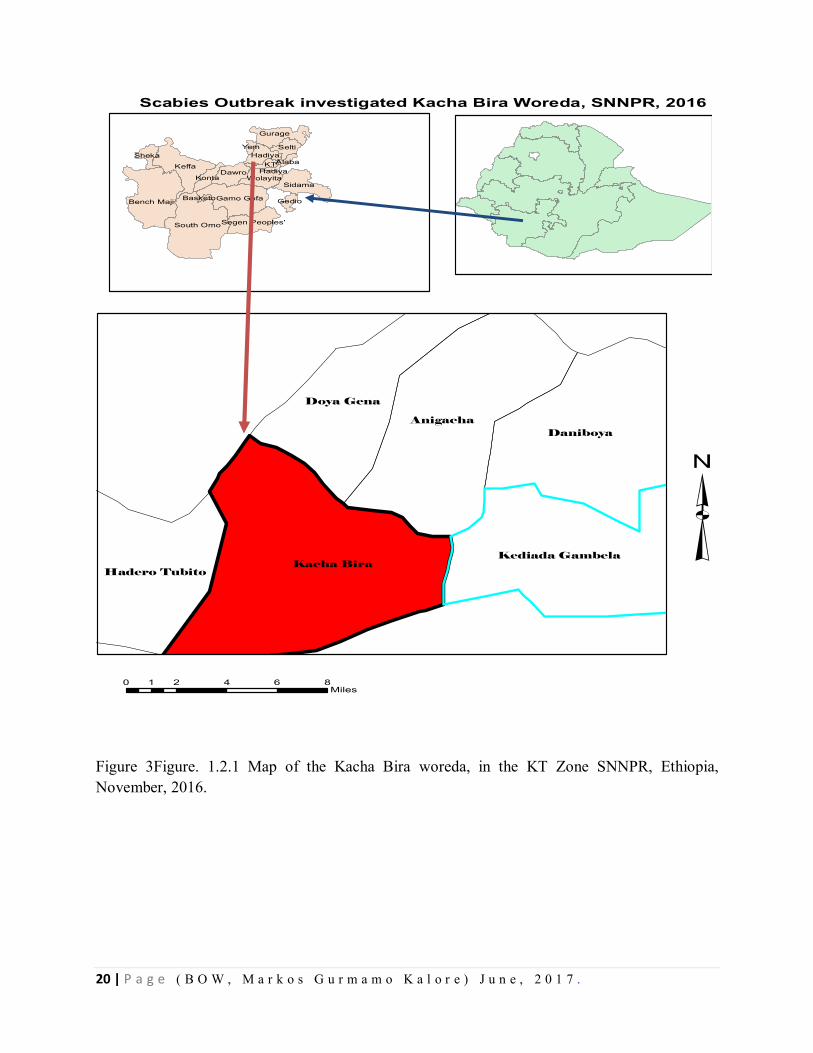
Figure 3Figure. 1.2.1 Map of the Kacha Bira woreda, in the KT Zone SNNPR, Ethiopia, November, 2016.
Scabies Outbreak investigated Kacha Bira Woreda, SNNPR, 2016
³0 2 4 6 81
Miles
Kacha Bira
AnigachaDaniboya
Doya Gena
Kediada Gambela
Hadero Tubito
South Omo
Keffa
Bench Maji Gamo Gofa
Gurage
Dawro
Sidama
Selti
Wolayita
KTHadiya
Segen Peoples'
Konta
Sheka
Gedio
Yem
AlabaHadiya
Basketo
21 | P a g e ( B O W , M a r k o s G u r m a m o K a l o r e ) J u n e , 2 0 1 7 .
Study design and period We conducted community based unmatched case-control (1 to 3 ratio) study design and from
December 1- 10/2016 to identify potential risk factors and ways of transmission. Line listing data
analysis was performed.
Data collection methods and tool
We used a structured questionnaire, which is adapted from different literatures, to collect
information including socio-economic, demography characteristics, and knowledge of
respondents about the scabies, clinical features & management of the cases and the possible risk
factors and prevention measures. The data were collected through face-to-face interview with
individual respondents. Two unmatched controls were selected per each case. Line list of cases
were collected for further analysis.
Inclusion and exclusion criteria
Inclusion criteria
Cases: Any residents of kebeles selected for investigation, Kacha Bira district, with sign and
symptoms (itching, rash...) of scabies and agreed to participate in the study at data collection
period.
Controls: Any residents of kebeles selected for investigation, Kacha Bira district, without any signs
and symptom of scabies but neighbors to selected cases during the investigation period and agreed to
participate in the study.
Exclusion criteria Cases: Those who refused to participate, or none-residents of the selected kebeles excluded.
Controls: Those who refused to participate as well as family members from the same household
excluded.
Data analysis procedures and quality control
The data were entered, cleaned and analyzed using EPI Info version 7.1.4 and Microsoft Office
Excel 2007. Arc map was also used for administrative area of the study. Results were presented
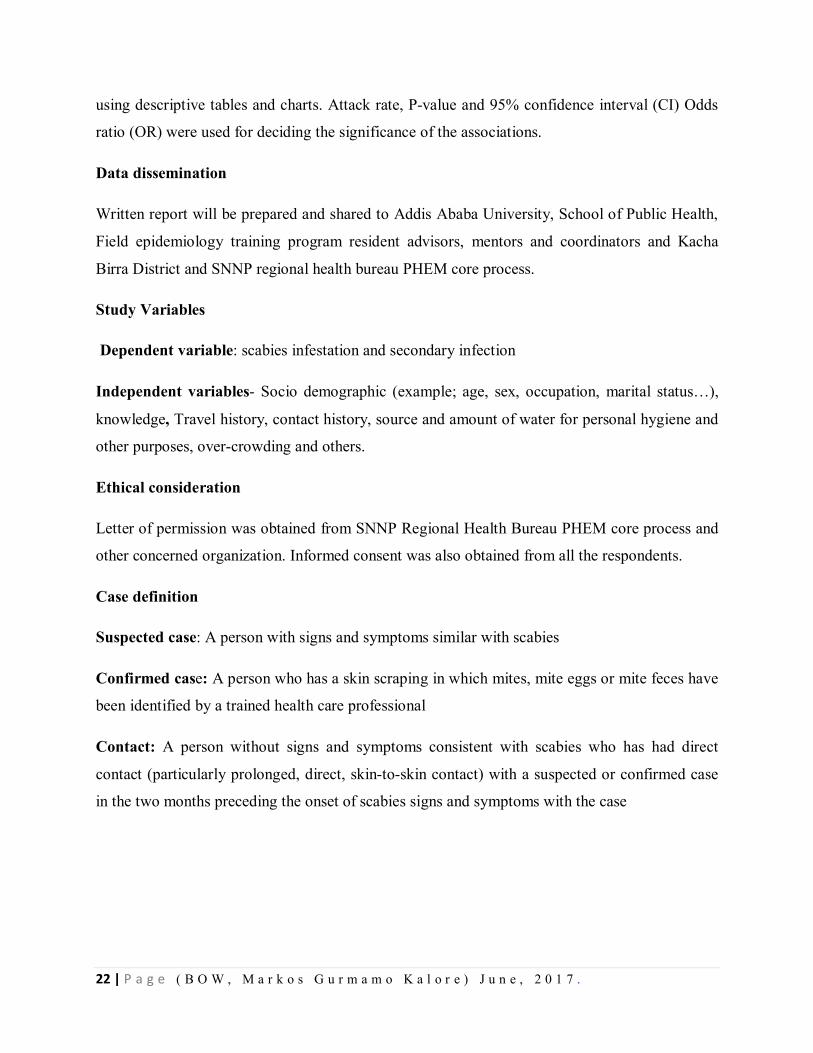
22 | P a g e ( B O W , M a r k o s G u r m a m o K a l o r e ) J u n e , 2 0 1 7 .
using descriptive tables and charts. Attack rate, P-value and 95% confidence interval (CI) Odds
ratio (OR) were used for deciding the significance of the associations.
Data dissemination
Written report will be prepared and shared to Addis Ababa University, School of Public Health,
Field epidemiology training program resident advisors, mentors and coordinators and Kacha
Birra District and SNNP regional health bureau PHEM core process.
Study Variables
Dependent variable: scabies infestation and secondary infection
Independent variables- Socio demographic (example; age, sex, occupation, marital status…),
knowledge, Travel history, contact history, source and amount of water for personal hygiene and
other purposes, over-crowding and others.
Ethical consideration
Letter of permission was obtained from SNNP Regional Health Bureau PHEM core process and
other concerned organization. Informed consent was also obtained from all the respondents.
Case definition
Suspected case: A person with signs and symptoms similar with scabies
Confirmed case: A person who has a skin scraping in which mites, mite eggs or mite feces have
been identified by a trained health care professional
Contact: A person without signs and symptoms consistent with scabies who has had direct
contact (particularly prolonged, direct, skin-to-skin contact) with a suspected or confirmed case
in the two months preceding the onset of scabies signs and symptoms with the case
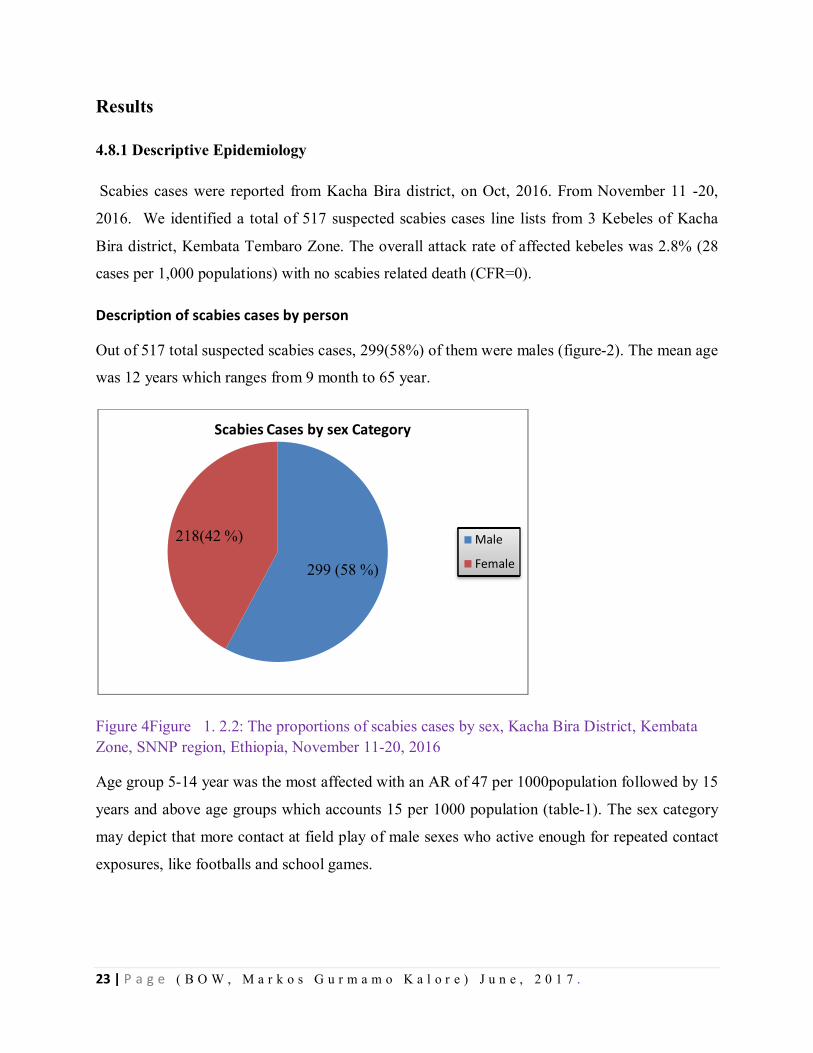
23 | P a g e ( B O W , M a r k o s G u r m a m o K a l o r e ) J u n e , 2 0 1 7 .
Results
4.8.1 Descriptive Epidemiology
Scabies cases were reported from Kacha Bira district, on Oct, 2016. From November 11 -20,
2016. We identified a total of 517 suspected scabies cases line lists from 3 Kebeles of Kacha
Bira district, Kembata Tembaro Zone. The overall attack rate of affected kebeles was 2.8% (28
cases per 1,000 populations) with no scabies related death (CFR=0).
Description of scabies cases by person
Out of 517 total suspected scabies cases, 299(58%) of them were males (figure-2). The mean age
was 12 years which ranges from 9 month to 65 year.
Figure 4Figure 1. 2.2: The proportions of scabies cases by sex, Kacha Bira District, Kembata Zone, SNNP region, Ethiopia, November 11-20, 2016
Age group 5-14 year was the most affected with an AR of 47 per 1000population followed by 15
years and above age groups which accounts 15 per 1000 population (table-1). The sex category
may depict that more contact at field play of male sexes who active enough for repeated contact
exposures, like footballs and school games.
299 (58 %)
218(42 %)
Scabies Cases by sex Category
Male
Female
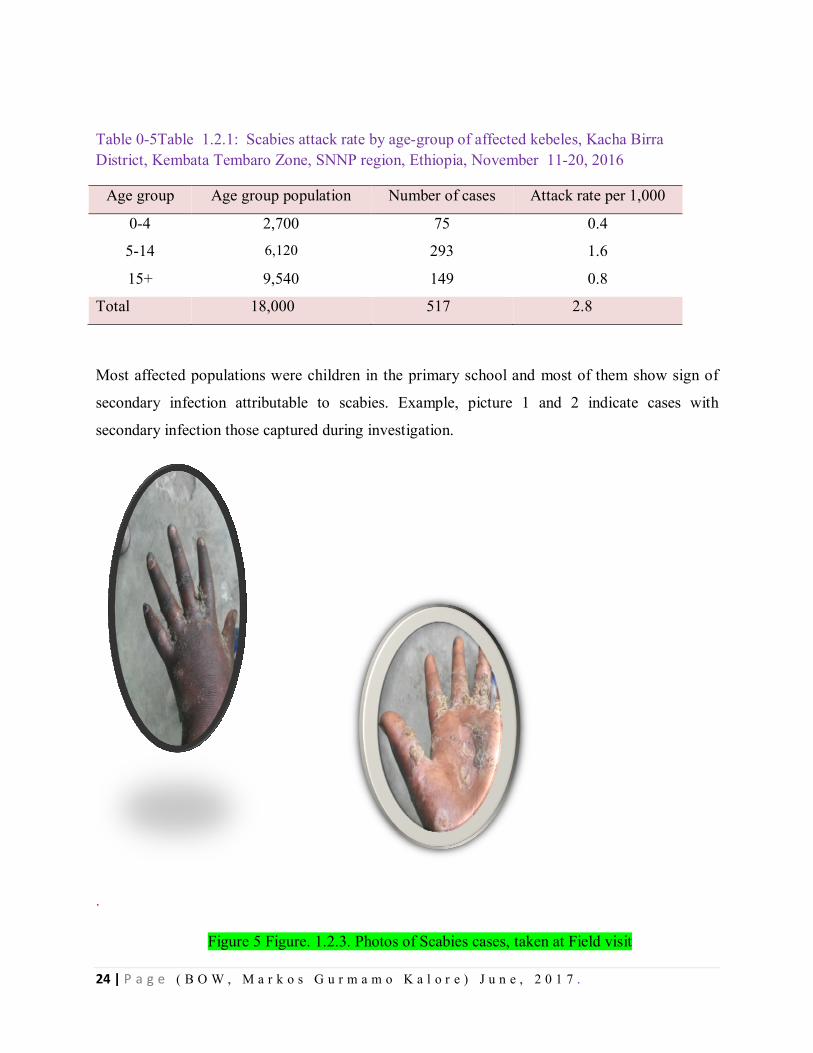
24 | P a g e ( B O W , M a r k o s G u r m a m o K a l o r e ) J u n e , 2 0 1 7 .
Table 0-5Table 1.2.1: Scabies attack rate by age-group of affected kebeles, Kacha Birra District, Kembata Tembaro Zone, SNNP region, Ethiopia, November 11-20, 2016
Age group Age group population Number of cases Attack rate per 1,000
0-4 2,700 75 0.4
5-14 6,120 293 1.6
15+ 9,540 149 0.8
Total 18,000 517 2.8
Most affected populations were children in the primary school and most of them show sign of
secondary infection attributable to scabies. Example, picture 1 and 2 indicate cases with
secondary infection those captured during investigation.
.
Figure 5 Figure. 1.2.3. Photos of Scabies cases, taken at Field visit
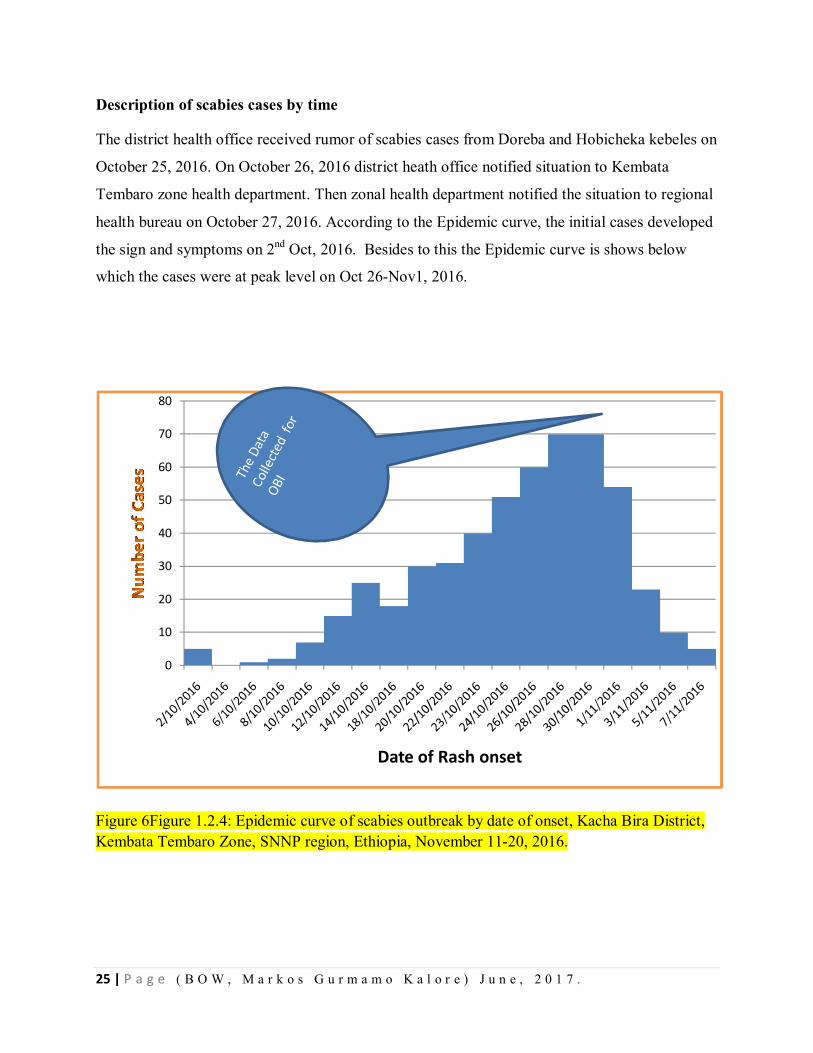
25 | P a g e ( B O W , M a r k o s G u r m a m o K a l o r e ) J u n e , 2 0 1 7 .
Description of scabies cases by time
The district health office received rumor of scabies cases from Doreba and Hobicheka kebeles on
October 25, 2016. On October 26, 2016 district heath office notified situation to Kembata
Tembaro zone health department. Then zonal health department notified the situation to regional
health bureau on October 27, 2016. According to the Epidemic curve, the initial cases developed
the sign and symptoms on 2nd Oct, 2016. Besides to this the Epidemic curve is shows below
which the cases were at peak level on Oct 26-Nov1, 2016.
Figure 6Figure 1.2.4: Epidemic curve of scabies outbreak by date of onset, Kacha Bira District, Kembata Tembaro Zone, SNNP region, Ethiopia, November 11-20, 2016.
0
10
20
30
40
50
60
70
80
Date of Rash onset
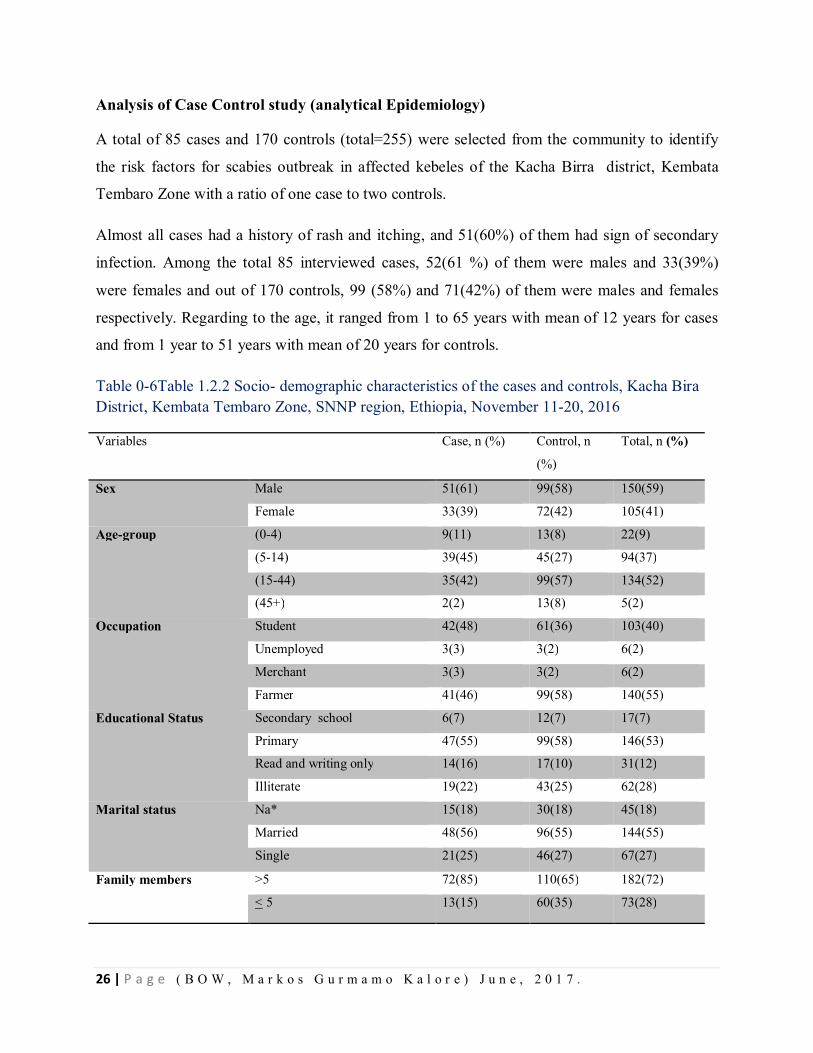
26 | P a g e ( B O W , M a r k o s G u r m a m o K a l o r e ) J u n e , 2 0 1 7 .
Analysis of Case Control study (analytical Epidemiology)
A total of 85 cases and 170 controls (total=255) were selected from the community to identify
the risk factors for scabies outbreak in affected kebeles of the Kacha Birra district, Kembata
Tembaro Zone with a ratio of one case to two controls.
Almost all cases had a history of rash and itching, and 51(60%) of them had sign of secondary
infection. Among the total 85 interviewed cases, 52(61 %) of them were males and 33(39%)
were females and out of 170 controls, 99 (58%) and 71(42%) of them were males and females
respectively. Regarding to the age, it ranged from 1 to 65 years with mean of 12 years for cases
and from 1 year to 51 years with mean of 20 years for controls.
Table 0-6Table 1.2.2 Socio- demographic characteristics of the cases and controls, Kacha Bira District, Kembata Tembaro Zone, SNNP region, Ethiopia, November 11-20, 2016
Variables Case, n (%) Control, n
(%)
Total, n (%)
Sex Male 51(61) 99(58) 150(59)
Female 33(39) 72(42) 105(41)
Age-group (0-4) 9(11) 13(8) 22(9)
(5-14) 39(45) 45(27) 94(37)
(15-44) 35(42) 99(57) 134(52)
(45+) 2(2) 13(8) 5(2)
Occupation Student 42(48) 61(36) 103(40)
Unemployed 3(3) 3(2) 6(2)
Merchant 3(3) 3(2) 6(2)
Farmer 41(46) 99(58) 140(55)
Educational Status Secondary school 6(7) 12(7) 17(7)
Primary 47(55) 99(58) 146(53)
Read and writing only 14(16) 17(10) 31(12)
Illiterate 19(22) 43(25) 62(28)
Marital status Na* 15(18) 30(18) 45(18)
Married 48(56) 96(55) 144(55)
Single 21(25) 46(27) 67(27)
Family members >5 72(85) 110(65) 182(72)
< 5 13(15) 60(35) 73(28)
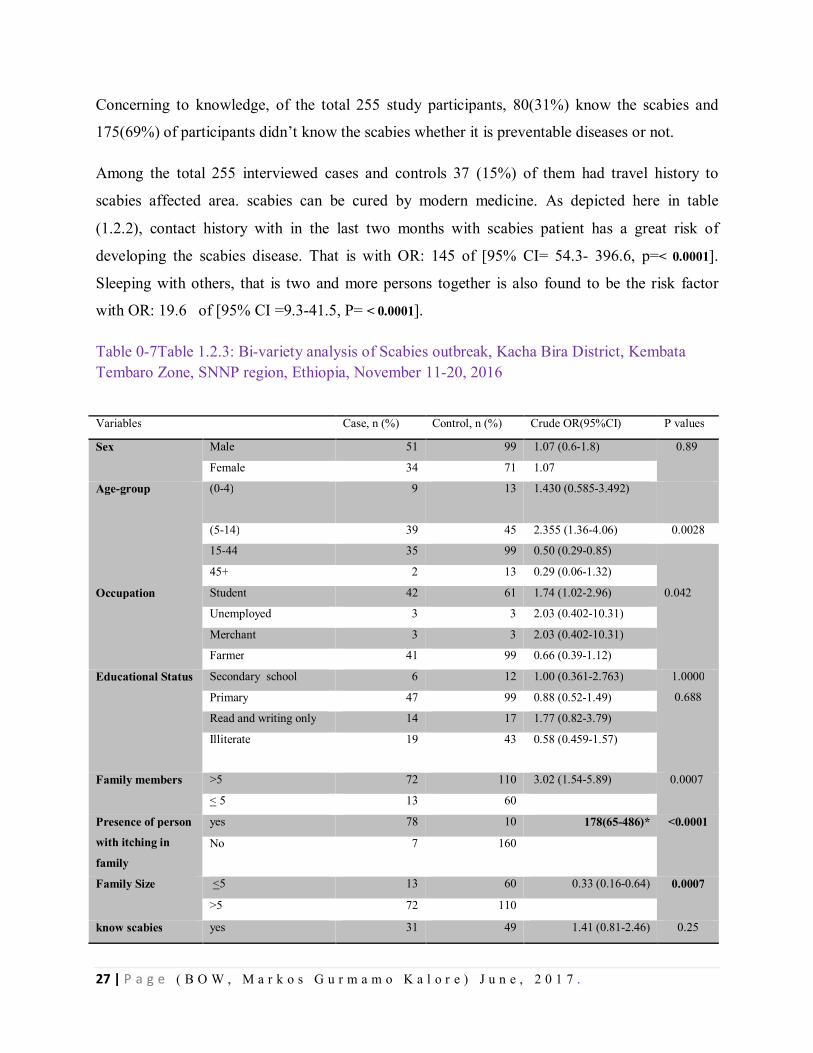
27 | P a g e ( B O W , M a r k o s G u r m a m o K a l o r e ) J u n e , 2 0 1 7 .
Concerning to knowledge, of the total 255 study participants, 80(31%) know the scabies and
175(69%) of participants didn’t know the scabies whether it is preventable diseases or not.
Among the total 255 interviewed cases and controls 37 (15%) of them had travel history to
scabies affected area. scabies can be cured by modern medicine. As depicted here in table
(1.2.2), contact history with in the last two months with scabies patient has a great risk of
developing the scabies disease. That is with OR: 145 of [95% CI= 54.3- 396.6, p=< 0.0001].
Sleeping with others, that is two and more persons together is also found to be the risk factor
with OR: 19.6 of [95% CI =9.3-41.5, P= < 0.0001].
Table 0-7Table 1.2.3: Bi-variety analysis of Scabies outbreak, Kacha Bira District, Kembata Tembaro Zone, SNNP region, Ethiopia, November 11-20, 2016
Variables Case, n (%) Control, n (%) Crude OR(95%CI) P values
Sex Male 51 99 1.07 (0.6-1.8) 0.89
Female 34 71 1.07
Age-group (0-4) 9 13 1.430 (0.585-3.492)
(5-14) 39 45 2.355 (1.36-4.06) 0.0028
15-44 35 99 0.50 (0.29-0.85)
45+ 2 13 0.29 (0.06-1.32)
Occupation Student 42 61 1.74 (1.02-2.96) 0.042
Unemployed 3 3 2.03 (0.402-10.31)
Merchant 3 3 2.03 (0.402-10.31)
Farmer 41 99 0.66 (0.39-1.12)
Educational Status Secondary school 6 12 1.00 (0.361-2.763) 1.0000
0.688
Primary 47 99 0.88 (0.52-1.49)
Read and writing only 14 17 1.77 (0.82-3.79)
Illiterate 19 43 0.58 (0.459-1.57)
Family members >5 72 110 3.02 (1.54-5.89) 0.0007
< 5 13 60
Presence of person
with itching in
family
yes 78 10 178(65-486)* <0.0001
No 7 160
Family Size <5 13 60 0.33 (0.16-0.64) 0.0007
>5 72 110
know scabies yes 31 49 1.41 (0.81-2.46) 0.25
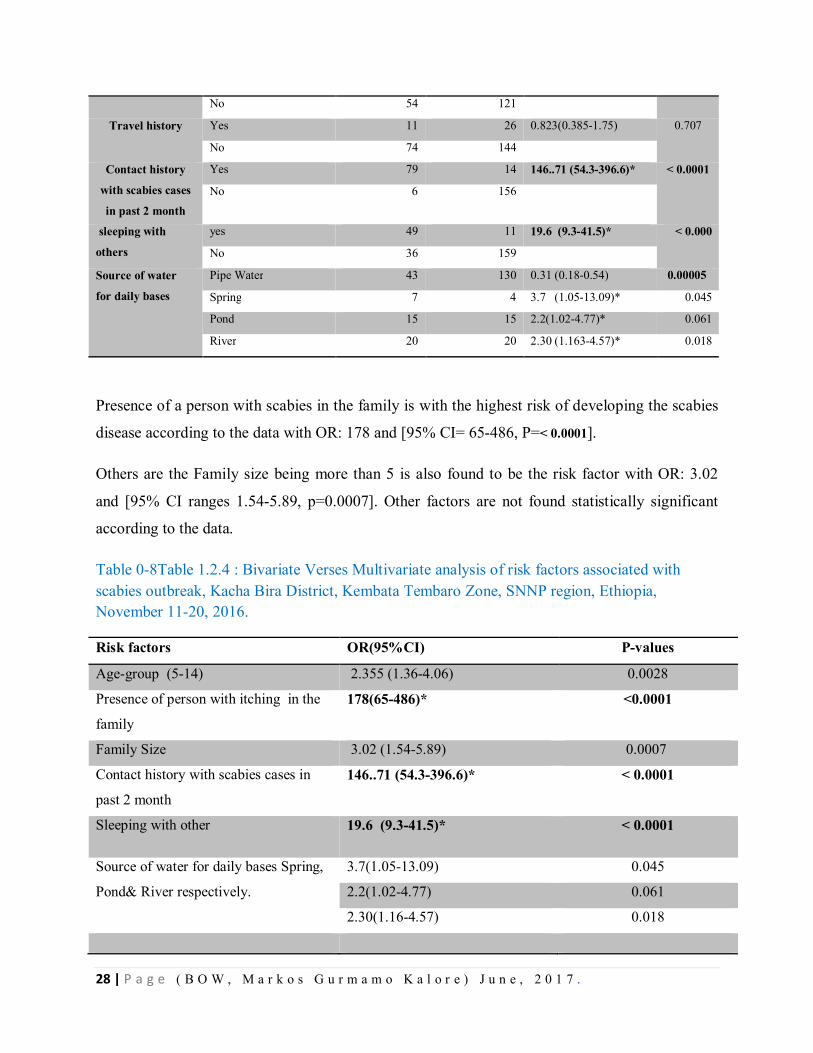
28 | P a g e ( B O W , M a r k o s G u r m a m o K a l o r e ) J u n e , 2 0 1 7 .
Presence of a person with scabies in the family is with the highest risk of developing the scabies
disease according to the data with OR: 178 and [95% CI= 65-486, P=< 0.0001].
Others are the Family size being more than 5 is also found to be the risk factor with OR: 3.02
and [95% CI ranges 1.54-5.89, p=0.0007]. Other factors are not found statistically significant
according to the data.
Table 0-8Table 1.2.4 : Bivariate Verses Multivariate analysis of risk factors associated with scabies outbreak, Kacha Bira District, Kembata Tembaro Zone, SNNP region, Ethiopia, November 11-20, 2016.
Risk factors OR(95%CI) P-values
Age-group (5-14) 2.355 (1.36-4.06) 0.0028
Presence of person with itching in the
family
178(65-486)* <0.0001
Family Size 3.02 (1.54-5.89) 0.0007
Contact history with scabies cases in
past 2 month
146..71 (54.3-396.6)* < 0.0001
Sleeping with other 19.6 (9.3-41.5)* < 0.0001
Source of water for daily bases Spring,
Pond& River respectively.
3.7(1.05-13.09) 0.045
2.2(1.02-4.77) 0.061
2.30(1.16-4.57) 0.018
No 54 121
Travel history Yes 11 26 0.823(0.385-1.75) 0.707
No 74 144
Contact history
with scabies cases
in past 2 month
Yes 79 14 146..71 (54.3-396.6)* < 0.0001
No 6 156
sleeping with
others
yes 49 11 19.6 (9.3-41.5)* < 0.000
No 36 159
Source of water
for daily bases
Pipe Water 43 130 0.31 (0.18-0.54) 0.00005
Spring 7 4 3.7 (1.05-13.09)* 0.045
Pond 15 15 2.2(1.02-4.77)* 0.061
River 20 20 2.30 (1.163-4.57)* 0.018
29 | P a g e ( B O W , M a r k o s G u r m a m o K a l o r e ) J u n e , 2 0 1 7 .
Interventions done
Mass Drug administration of the permethrine treatment conducted for all scabies cases and contacts.
Active cases search was done and mobilized for treatment. Cases with secondary infections treated with
antibiotics accordingly. Scabies management technical guideline in both hard and soft copies was
distributed to the Zonal health department and the woreda health office as well as the PHEM focal
persons. The zonal and the woreda health professionals were trained on the National Guideline of scabies.
The kebele members were given Health Education on scabies prevention and control.
Discussion
We investigated that scabies outbreak was occurred in Kacha Birra district of Kembata Zone,
Southern nation nationality and people Regional State, Ethiopia. We identified a total of 517
suspected scabies cases line lists from 3 kebeles during investigation period. The overall
prevalence was 2.8 % in studied area and zero case fatality rate. More than half of the cases
(58%) were males. This result was in agreement with the results (male=52.8%) of population-
based study conducted in Taiwan countries (9).
Children in the primary school were most affected populations and most of them show sign of
secondary infection attributable to scabies. This may due to the school environments increase the
vulnerability of cross-infection.
Concerning the sites of rash, inter digital spaces (71 %), flexor wrists (64 %) and buttocks (75
%) were the main sites. This is nearly similar with study conducted at boarding schools in
Cameroon with 61 % on the inter digital spaces and 54 % on the flexor wrists (10).
Regarding to risk factors, having contact in past 2 month with a person infested with scabies,
being age less than 15 years, having a family history of itchy skin, family size >5, and sleeping
with others were significantly associated with scabies infestation in bi-variate analysis.
Different studies conducted on risk factors for scabies also showed that prevalence of the itching
within a family is an important factor in scabies infestation (1, 11-12).
Physical contact with infested individuals and sleeping with infested persons were risk factors
for the spread of scabies(6). Our study in line with this finding, which we found, having skin
30 | P a g e ( B O W , M a r k o s G u r m a m o K a l o r e ) J u n e , 2 0 1 7 .
contact in past 2 month with a person infested with scabies and sleeping with others were risk
factors for scabies. Being younger than 15 years old was also a risk factor for scabies in our
study. This is also true in the study conducted at boarding schools in Cameroon with crude OR of
1.90 (10).
Conclusion and recommendations
Scabies outbreak occurred in Kacha Bira District of Kembata Tembaro Zone, Southern nation nationality
peoples. Presence of contact History with in past 2 month with a person infested with scabies, being age
younger than 15 years, having a family history of itchy skin and sleeping with others were the
independent significant risk factors for scabies outbreak in Kacha Bira districts of Kembata Tembaro
zone in studied kebeles particularly.
Recommendations
Strong and continuous active case search should be strengthened at all levels.
Providing risk factors relate health education on prevention and controls especially at
community level and schools.
Scabies mass drug treatment should be initiated as soon as possible in Kebeles with
prevalence > 15%.
Regional Health Bureau should avail all the needed drugs like permethrine; antibiotics
launder soap and other supplies.
District and Regional Water, mineral and energy Offices should maintain water points,
construct new water point if need, water tracking and water storage at critical service points.
Maintaining mobilization at health facilities, schools and market places and at any public
gathering areas to alleviate the spread of scabies
Advocate decision makers like different level cabinets, kebele administrators and sector
offices about scabies outbreak control and management.
31 | P a g e ( B O W , M a r k o s G u r m a m o K a l o r e ) J u n e , 2 0 1 7 .
References
1. N. Raza1, S.N.R. Qadir 2 and H.Agha3 Risk factors for scabies among male soldiers in Pakistan:
case–control study. Eastern Mediterranean Health Journal. 2009;15(5).
2. Chosidow O. Clinical practices. Scabies. N Engl J Med. 2006;354(16):1718–1727.
3. CDC guide line: scabies. 2010.
4. Scabies Infestations/Outbreaks and Management A Guide for General Practitioners. 2015.
5. Engelman1 D, Kiang1 K, Chosidow2 O, McCarthy3 J, Fuller4 C, Lammie5 P, et al. Toward the
Global Control of Human Scabies: Introducing the International Alliance for the Control of Scabies.
PLOS Neglected Tropical Diseases 2013; 7(8).
6. Hayl1 RJ, Steer2 AC, Engelman2 D, Walton3 S. Scabies in the developing world—its prevalence,
complications, and management. Clin Microbiol Infect. 2012;8.
7. http://www.open.edu/openlearnworks/mod/oucontent/view.php?id=125§ion=1.4.2
8. FDRE, MOH. Scabies Outbreak Preparedness and Response Plan. Dec. 2015.
9. Liu J-M, Wang H-W, Chang F-W, Liu Y-P, Chiu F-H, Lin Y-C, et al. The effects of climate
factors on scabies. A 14-year population-based study in Taiwan. Parasite. 2016;23(54).
10. Emmanuel Armand Kouotou1, 3 , Jobert Richie N. Nansseu2, Kouawa2 MK, Bissek2 A-CZ-K.
Prevalence and drivers of human scabies among children and adolescents living and studying in
Cameroonian boarding schools. Parasites & Vectors 2016.
11. Hegab1 DS, Kato1 AM, Kabbash2 IA, Dabish3 GM. Scabies among primary schoolchildren in
Egypt: sociomedical environmental study in Kafr El-Sheikh administrative area. Dovepress:
Clinical,Cosmetic and Investigational Dermatology. 2015.
12. Arlian LG, Estes SA, Vvszenski-Moher DL. Prevalence of Sarcoptes scabiei in homes and
nursing homes of scabietic patients. Journal of the American Academy of Dermatology,1988,19(5 Pt
1):806–11.
32 | P a g e ( B O W , M a r k o s G u r m a m o K a l o r e ) J u n e , 2 0 1 7 .
CHAPTER –II Surveillance Data Analysis
2.1. Surveillance Data Analysis of Severe Acute Malnutrition, Kembata Tembaro Zone, SNNP Region, Ethiopia, 2004-2008 E.C Abstract Background: Malnutrition is one of the leading causes of child death in developing countries
including Ethiopia. Kembata Tembaro Zone, Southern Region is prone to severe acute
malnutrition since the past decades. This study is intended to analyze severe acute malnutrition
(SAM) reports of this zone to understand its trends and propose recommendation.
Methods: Cross-sectional descriptive study was conducted during collection of SAM data. Five
years (2004 - 2008 E.C) report of SAM from the Zone and Regional database were reviewed.
Different variables such as, SAM admissions, deaths, cures, total discharges in different age
category with respect to time and place were included in the analysis of SAM report.
Results: In Kembata Tembaro zone 18, 175 total admissions of SAM were reported at both
Outpatient Therapeutic Program (OTP) and Stabilization Center (SC) in the last consecutive five
years (2004 - 2008 E.C). Children 6-59 months of age constituted almost all % of new
admissions. Admissions from severe acute malnutrition were decreased from 2004 to 2008 E.C,
but for the last consecutive 4 years it was increasing. The total highest is in 2004 EC but
constantly increasing from 2005-2008 EC. From the past consecutive five-year's report of SAM
in the Zone 32 deaths with a fatality rate of 0.18 to 0.42% were reported.
Conclusion and Recommendation:, Therapeutic Feeding Program (TFP) admissions Sites were
increased from 2004 to 2008 E.C including SC Sites. Deaths number high in 2008 EC. This may
be due to admission of severe cases due to the year’s Eli Niño effect in 2008 EC. The existing
reporting format also needs to be revised to include sex category, pregnant, and lactating
mothers.
Keywords: Severe Acute Malnutrition, Surveillance Data Analysis, Kembata Tembaro Zone,
Ethiopia.
33 | P a g e ( B O W , M a r k o s G u r m a m o K a l o r e ) J u n e , 2 0 1 7 .
3.1.1. Introduction
Malnutrition is a pathological state resulting from a relative or absolute deficiency or excess of
one or more essential nutrients. This state clinically manifests or detected only by biochemical,
anthropometric or physiological tests. There are four forms of malnutrition: namely; under
nutrition, specific deficiency, and imbalance and over nutrition. The number of possible
underlying causes of malnutrition are seems endless and their interrelationships are complex.
However, one way of identifying these causes is to identify the three positive conditions
necessary for adequate nutrition or, more precisely, necessary for adequate dietary intake and
absence of disease. These are: - adequate access to food (household food security); adequate care
of children and women: adequate access to health services & a healthy environment. In many
Countries, nutrition policy and intervention is aimed at young child, pregnant and lactating
women (2). Reducing malnutrition among children under the age of five remains a huge
challenge in developing countries. An estimated 230 million under-five children are believed to
be chronically malnourished in developing countries (Van de Poel et. al., 2008). Malnutrition
contributes to over 50% of all child deaths worldwide each year (3). In Sub-Saharan Africa, 41%
of under-five children are malnourished and deaths from malnutrition are increasing on daily
basis in the region (FAO, 2008).
In Ethiopia, severe acute malnutrition is among one of 20 notifiable and weekly reportable
diseases in the Public Health Emergency Management system. Ethiopian government has
adopted a crosscutting approach to nutrition over the last decade (2). The problem of
malnutrition in Ethiopia is relatively well documented currently. Nationally, 44 percent of
children under age five years are stunted, and 21 percent of children are severely stunted (DHS,
2011). Regional variation in the prevalence of stunting in children is substantial. Stunting levels
are somewhat above the national average in the Amhara (52 percent), Tigray (51 percent), Afar
(50 percent), and Benshangui-Gumuz (49 percent) regions and are lowest in Addis Ababa and
the Gambela region (22 and 27 percent ), respectively (DHS, 2011).
In Kembata Tembaro Zone, malnutrition has been a priority health issue like other health cases.
Even though it varies from year to year, Nutritional assessment which was carried out in this
zone in 2006 EFY, identified 2 woredas hotspot Priority 1 and 2 woredas hotspot priority 2
which means more than 50% woredas of the zone. Among 7 rural woredas of the zone, 4 are in
34 | P a g e ( B O W , M a r k o s G u r m a m o K a l o r e ) J u n e , 2 0 1 7 .
hotspot 1 and 2 categories. There were a total of 169 OTP Sites and 13 SC sites in the Zone
Functioning since 2008 EC.
Table 0-1Table 2.1.1. Hotspot Classification of the Woredas of Kembata Tembaro Zone, SNNPR, in 2016.
S.no Name of Woreda Category of Priority
Priority 1 Priority 2 Neither 1 Nor 2
1 Angacha √
2 Danboya √
3 Doyogena Woreda √
4 Kedida Gamella √
5 Kacha Bira √
6 Hadero Tunto Zuria √
7 Tembaro woreda √
3.1.2. Study Rationale
Routinely analysis of surveillance data is a key function for detecting/identifying outbreaks,
monitoring disease trends, and evaluating the effectiveness of disease control programs and
policies. Results from data analysis can alert public health action when incidence of diseases
increases.
3.1.3. Objectives
3.1.3.1. General Objective
To analyze five years (2004-2008 EFY) data of severe acute malnutrition (SAM) and
describe trends of morbidity and mortality of a disease, Kembata Tembaro Zone, SNNPR,
Ethiopia
3.1.3.2. Specific Objectives
To understand prevalence of a disease in districts of the zone
To identify morbidity and mortality of disease by person, time and place over the last
consecutive four years
35 | P a g e ( B O W , M a r k o s G u r m a m o K a l o r e ) J u n e , 2 0 1 7 .
To propose recommendation based on the findings
3.1.4. Methods and Materials
3.1.4.1. Case Definitions
3.1.4.1.1. Suspected
Children age from 6 months to 5 years with MUAC less than 11cm and/or children with bilateral
edema regardless of their MUAC.
3.1.4.1.2. Confirmed
Children with MUAC less than 11cm and/or children with bilateral edema regardless of their
MUAC
3.1.4.2. Study Area
Kembata Tembaro Zone of SNNP Regional State studied as area for Severe Acute Malnutrition
surveillance data analysis.
3.1.4.3. Study Period
Secondary data of Malnutrition for the past three years (2004-200 8E.C) collected analyzed and
interpreted.
3.1.4.4. Study Design
Descriptive cross-sectional study conducted during collection of severe acute malnutrition data
pertaining person, time, and place.
3.1.4.5. Study Population
All population of Kembata Tembaro Zone, which is estimated to be 865,945 according to 2008
EFY projection, was included in the study.
3.1.4.6. Data Collection Procedure
36 | P a g e ( B O W , M a r k o s G u r m a m o K a l o r e ) J u n e , 2 0 1 7 .
Secondary data of malnutrition for the last consecutive four years from Zonal PHEM and Family
Health departments, Regional MCH database reviewed and collected by using structured
checklist. In addition, hard copy of SAM reports at Zonal health departments also reviewed.
3.1.4.7. Data Analysis Procedure
The collected data was analyzed by using Microsoft Excel in respect to important variables.
3.1.4.8. Data Variables
During data collection and analysis variables such as age category, admission type, therapeutic
feeding sites with respect to time and place considered accordingly.
3.1.4.9. Data Dissemination
The study finding is prepared to share with AAU/School of public health/Department of EFETP
Coordinators and mentors, SNNP RHB and Kembata Tembaro Zonal Health Department in both
hard copy and electronic soft copy.
3.1.5. Results
During the last Four years (2004-2008 E.C18,175 total admissions of severe acute malnutrition
were identified at OTP and SC programs in Kembata Tembaro zone, SNNP region. Among
these admissions, almost all are new admissions. Among total new admissions, 79.2% of them
were screened with MUAC measurement and 20.8% were Edema and Others. SAM cases are
high from Feb to Jun in 2004 EC, Feb to may in 2005 EC, constant in 2006 EC, March to Jun in
2007 EC and high the whole year of 2008 EC except months November December and January.
The prevalence of SAM in under five children was 6.4 in 2004 EC., 2.4 in 2005 EC, 2.7 in 2005
and 2006 EC and 3.0 in 2008 EC. The SC admission sites were increased from 6 to 13 sites and
OTP admission sites were increased from 142 to169 from 2004 EC to 2008 EC in the Zone.
37 | P a g e ( B O W , M a r k o s G u r m a m o K a l o r e ) J u n e , 2 0 1 7 .
Figure 7Figure2.1.1: Total new admissions of SAM at OTP and SC programs in Kembata Tembaro, SNNPR, 2004-2008 E.C.
15,818
2,357
Total SC & OTP 2004-2008 CE
OTP SC
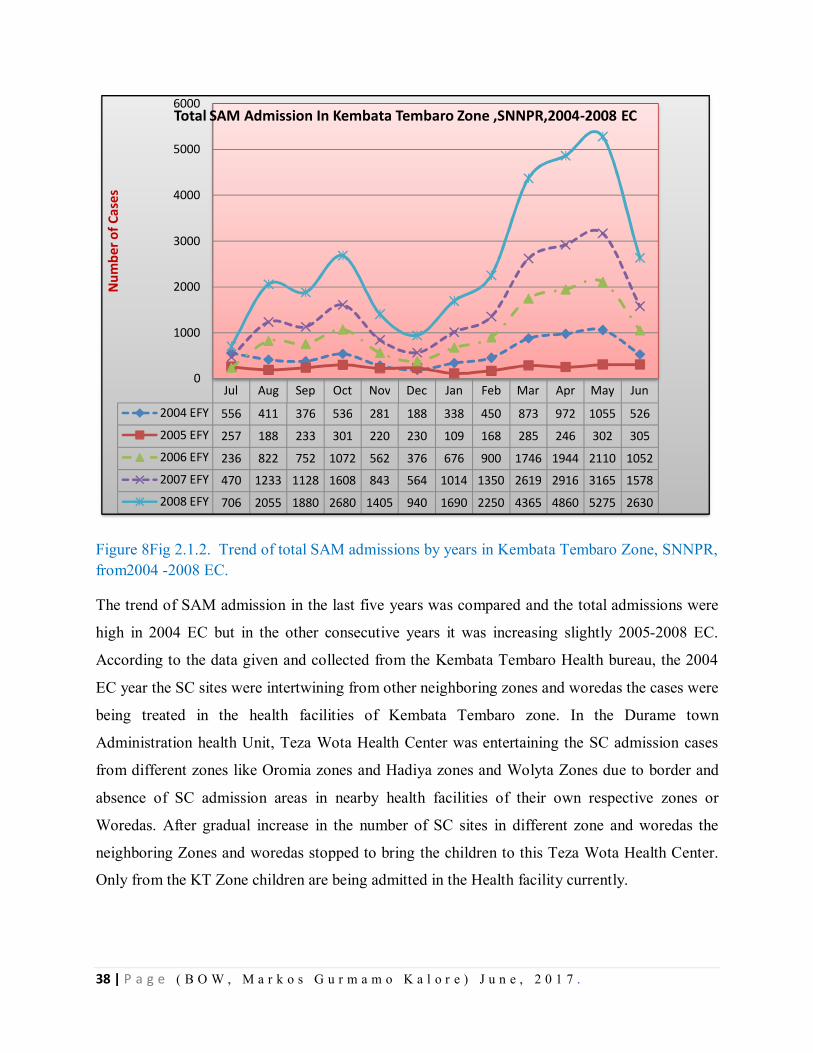
38 | P a g e ( B O W , M a r k o s G u r m a m o K a l o r e ) J u n e , 2 0 1 7 .
Figure 8Fig 2.1.2. Trend of total SAM admissions by years in Kembata Tembaro Zone, SNNPR, from2004 -2008 EC.
The trend of SAM admission in the last five years was compared and the total admissions were
high in 2004 EC but in the other consecutive years it was increasing slightly 2005-2008 EC.
According to the data given and collected from the Kembata Tembaro Health bureau, the 2004
EC year the SC sites were intertwining from other neighboring zones and woredas the cases were
being treated in the health facilities of Kembata Tembaro zone. In the Durame town
Administration health Unit, Teza Wota Health Center was entertaining the SC admission cases
from different zones like Oromia zones and Hadiya zones and Wolyta Zones due to border and
absence of SC admission areas in nearby health facilities of their own respective zones or
Woredas. After gradual increase in the number of SC sites in different zone and woredas the
neighboring Zones and woredas stopped to bring the children to this Teza Wota Health Center.
Only from the KT Zone children are being admitted in the Health facility currently.
Jul Aug Sep Oct Nov Dec Jan Feb Mar Apr May Jun
2004 EFY 556 411 376 536 281 188 338 450 873 972 1055 526
2005 EFY 257 188 233 301 220 230 109 168 285 246 302 3052006 EFY 236 822 752 1072 562 376 676 900 1746 1944 2110 10522007 EFY 470 1233 1128 1608 843 564 1014 1350 2619 2916 3165 15782008 EFY 706 2055 1880 2680 1405 940 1690 2250 4365 4860 5275 2630
0
1000
2000
3000
4000
5000
6000N
umbe
r of C
ases
Total SAM Admission In Kembata Tembaro Zone ,SNNPR,2004-2008 EC
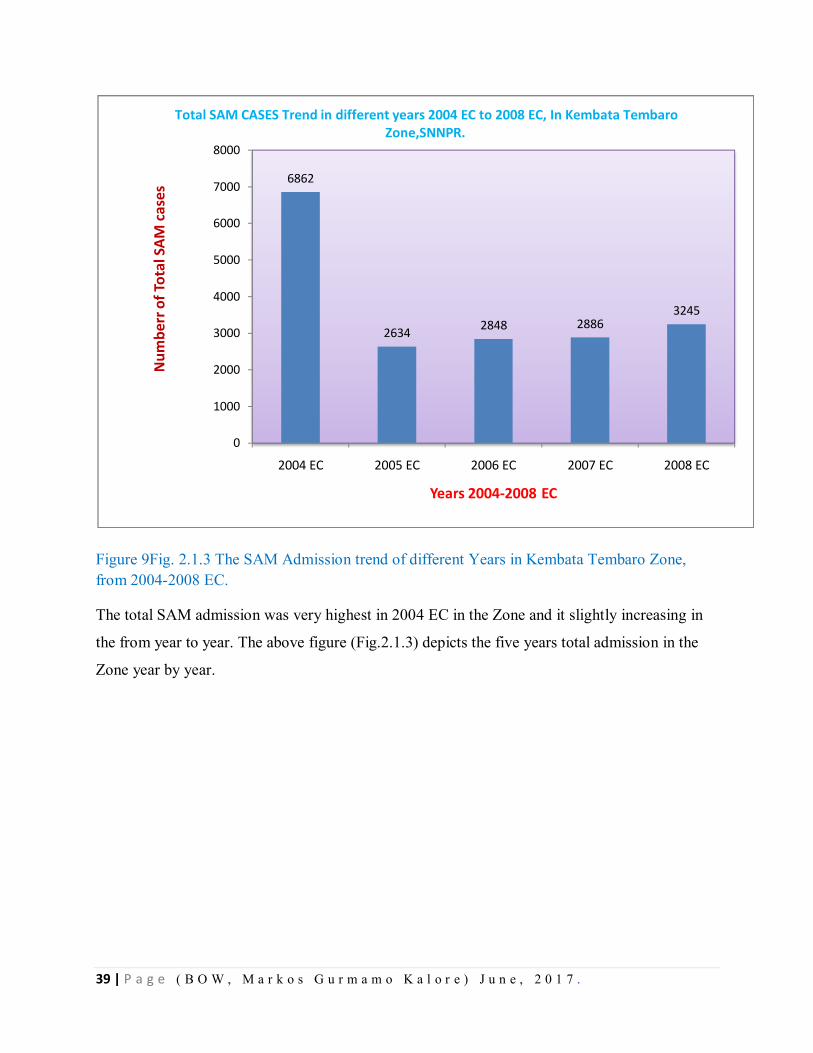
39 | P a g e ( B O W , M a r k o s G u r m a m o K a l o r e ) J u n e , 2 0 1 7 .
Figure 9Fig. 2.1.3 The SAM Admission trend of different Years in Kembata Tembaro Zone, from 2004-2008 EC.
The total SAM admission was very highest in 2004 EC in the Zone and it slightly increasing in
the from year to year. The above figure (Fig.2.1.3) depicts the five years total admission in the
Zone year by year.
6862
2634 2848 28863245
0
1000
2000
3000
4000
5000
6000
7000
8000
2004 EC 2005 EC 2006 EC 2007 EC 2008 EC
Num
berr
of T
otal
SAM
cas
es
Years 2004-2008 EC
Total SAM CASES Trend in different years 2004 EC to 2008 EC, In Kembata Tembaro Zone,SNNPR.
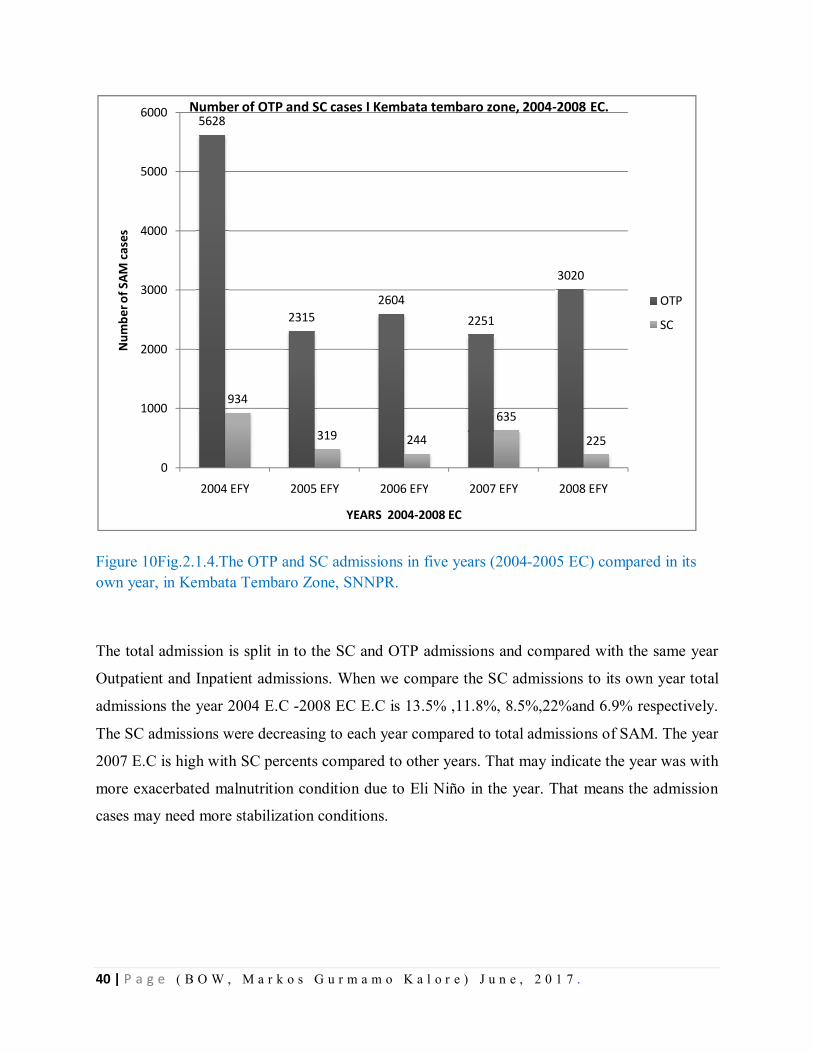
40 | P a g e ( B O W , M a r k o s G u r m a m o K a l o r e ) J u n e , 2 0 1 7 .
Figure 10Fig.2.1.4.The OTP and SC admissions in five years (2004-2005 EC) compared in its own year, in Kembata Tembaro Zone, SNNPR.
The total admission is split in to the SC and OTP admissions and compared with the same year
Outpatient and Inpatient admissions. When we compare the SC admissions to its own year total
admissions the year 2004 E.C -2008 EC E.C is 13.5% ,11.8%, 8.5%,22%and 6.9% respectively.
The SC admissions were decreasing to each year compared to total admissions of SAM. The year
2007 E.C is high with SC percents compared to other years. That may indicate the year was with
more exacerbated malnutrition condition due to Eli Niño in the year. That means the admission
cases may need more stabilization conditions.
5628
23152604
2251
3020
934
319 244
635
225
0
1000
2000
3000
4000
5000
6000
2004 EFY 2005 EFY 2006 EFY 2007 EFY 2008 EFY
Num
ber o
f SAM
cas
es
YEARS 2004-2008 EC
Number of OTP and SC cases I Kembata tembaro zone, 2004-2008 EC.
OTP
SC
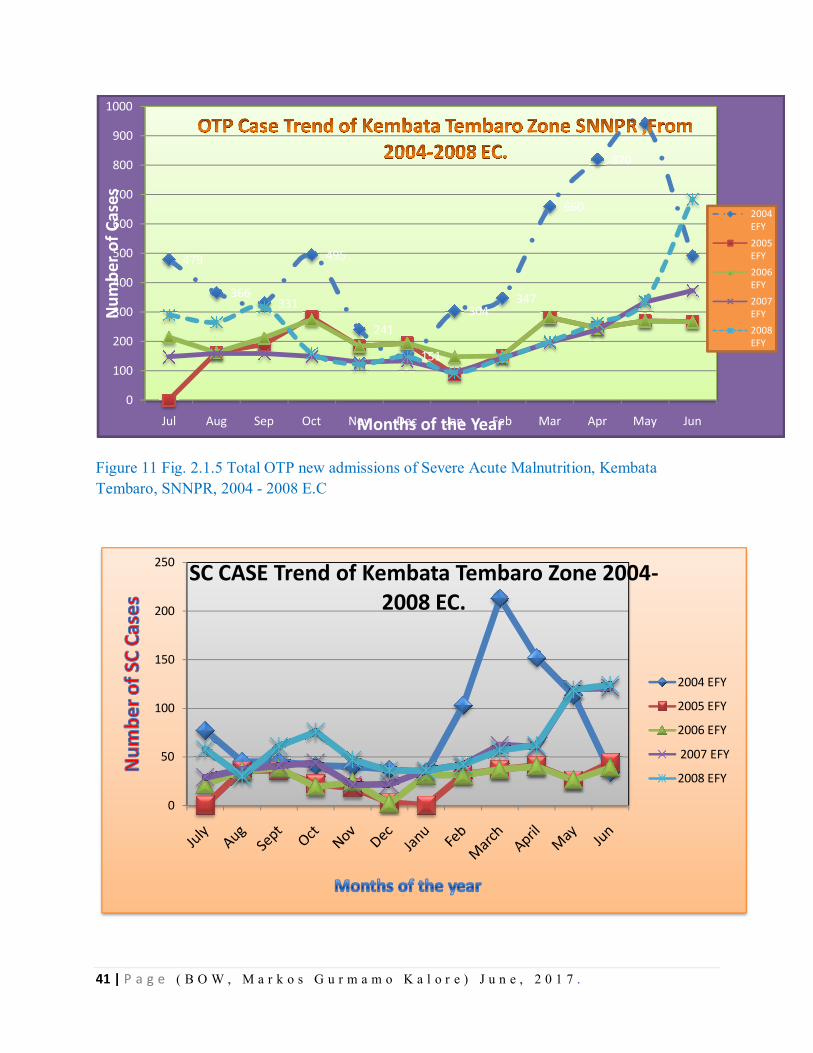
41 | P a g e ( B O W , M a r k o s G u r m a m o K a l o r e ) J u n e , 2 0 1 7 .
Figure 11 Fig. 2.1.5 Total OTP new admissions of Severe Acute Malnutrition, Kembata Tembaro, SNNPR, 2004 - 2008 E.C
479
366331
495
241
151
304347
660
820
942
492
0
100
200
300
400
500
600
700
800
900
1000
Jul Aug Sep Oct Nov Dec Jan Feb Mar Apr May Jun
Num
ber o
f Cas
es
Months of the Year
2004 EFY2005 EFY2006 EFY2007 EFY2008 EFY
0
50
100
150
200
250 SC CASE Trend of Kembata Tembaro Zone 2004-2008 EC.
2004 EFY
2005 EFY
2006 EFY
2007 EFY
2008 EFY
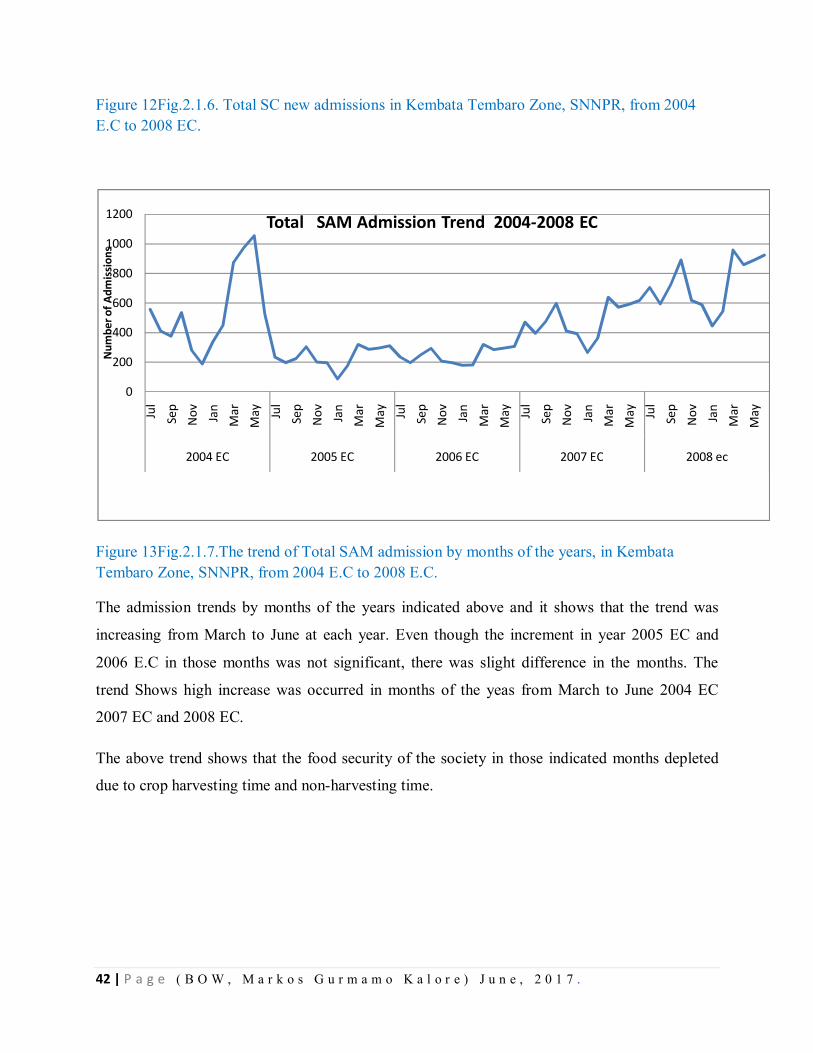
42 | P a g e ( B O W , M a r k o s G u r m a m o K a l o r e ) J u n e , 2 0 1 7 .
Figure 12Fig.2.1.6. Total SC new admissions in Kembata Tembaro Zone, SNNPR, from 2004 E.C to 2008 EC.
Figure 13Fig.2.1.7.The trend of Total SAM admission by months of the years, in Kembata Tembaro Zone, SNNPR, from 2004 E.C to 2008 E.C.
The admission trends by months of the years indicated above and it shows that the trend was
increasing from March to June at each year. Even though the increment in year 2005 EC and
2006 E.C in those months was not significant, there was slight difference in the months. The
trend Shows high increase was occurred in months of the yeas from March to June 2004 EC
2007 EC and 2008 EC.
The above trend shows that the food security of the society in those indicated months depleted
due to crop harvesting time and non-harvesting time.
0
200
400
600
800
1000
1200
Jul
Sep
Nov Jan
Mar
May Ju
lSe
pN
ov Jan
Mar
May Ju
lSe
pN
ov Jan
Mar
May Ju
lSe
pN
ov Jan
Mar
May Ju
lSe
pN
ov Jan
Mar
May
2004 EC 2005 EC 2006 EC 2007 EC 2008 ec
Num
ber o
f Adm
issi
ons
Total SAM Admission Trend 2004-2008 EC
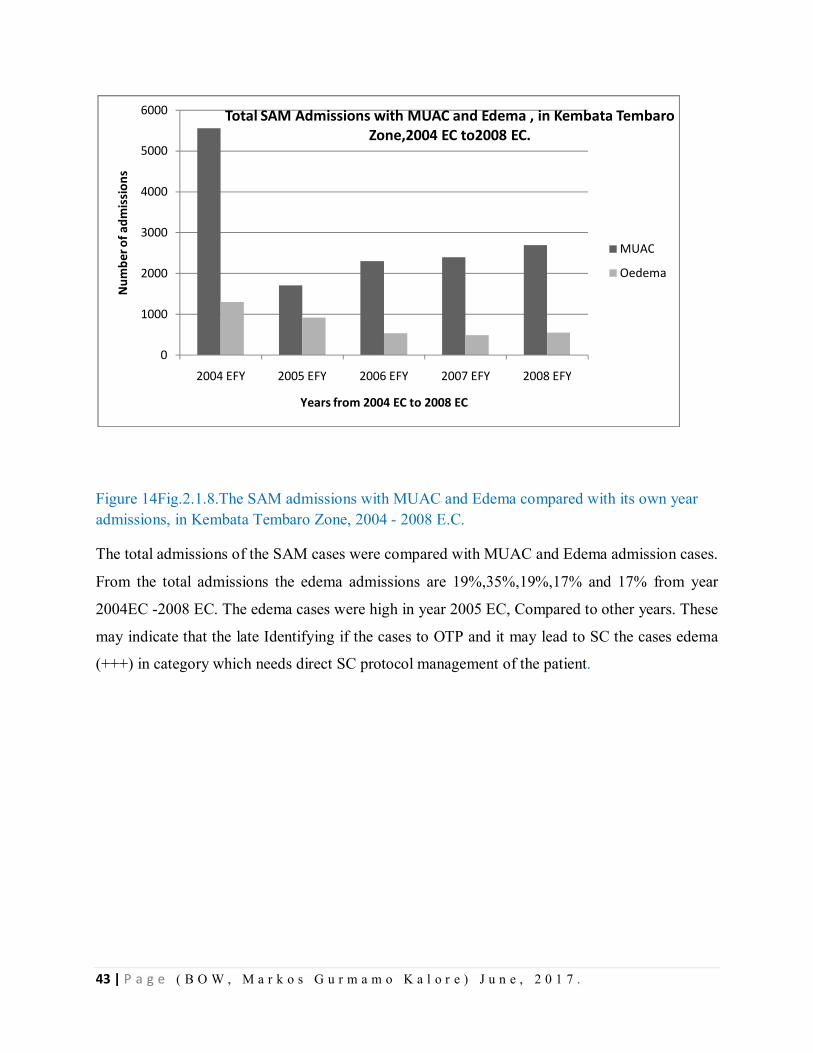
43 | P a g e ( B O W , M a r k o s G u r m a m o K a l o r e ) J u n e , 2 0 1 7 .
Figure 14Fig.2.1.8.The SAM admissions with MUAC and Edema compared with its own year admissions, in Kembata Tembaro Zone, 2004 - 2008 E.C. The total admissions of the SAM cases were compared with MUAC and Edema admission cases.
From the total admissions the edema admissions are 19%,35%,19%,17% and 17% from year
2004EC -2008 EC. The edema cases were high in year 2005 EC, Compared to other years. These
may indicate that the late Identifying if the cases to OTP and it may lead to SC the cases edema
(+++) in category which needs direct SC protocol management of the patient.
0
1000
2000
3000
4000
5000
6000
2004 EFY 2005 EFY 2006 EFY 2007 EFY 2008 EFY
Num
ber o
f adm
issi
ons
Years from 2004 EC to 2008 EC
Total SAM Admissions with MUAC and Edema , in Kembata Tembaro Zone,2004 EC to2008 EC.
MUAC
Oedema
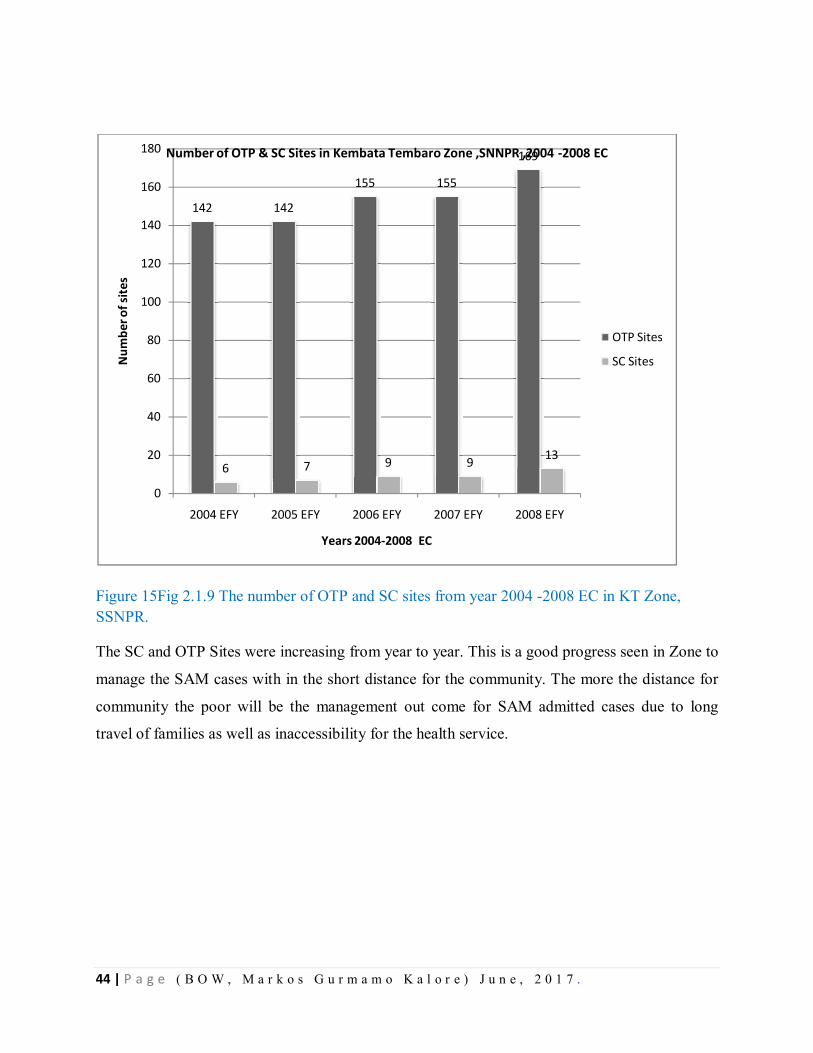
44 | P a g e ( B O W , M a r k o s G u r m a m o K a l o r e ) J u n e , 2 0 1 7 .
Figure 15Fig 2.1.9 The number of OTP and SC sites from year 2004 -2008 EC in KT Zone, SSNPR.
The SC and OTP Sites were increasing from year to year. This is a good progress seen in Zone to
manage the SAM cases with in the short distance for the community. The more the distance for
community the poor will be the management out come for SAM admitted cases due to long
travel of families as well as inaccessibility for the health service.
142 142
155 155
169
6 7 9 9 13
0
20
40
60
80
100
120
140
160
180
2004 EFY 2005 EFY 2006 EFY 2007 EFY 2008 EFY
Num
ber o
f site
s
Years 2004-2008 EC
Number of OTP & SC Sites in Kembata Tembaro Zone ,SNNPR ,2004 -2008 EC
OTP Sites
SC Sites
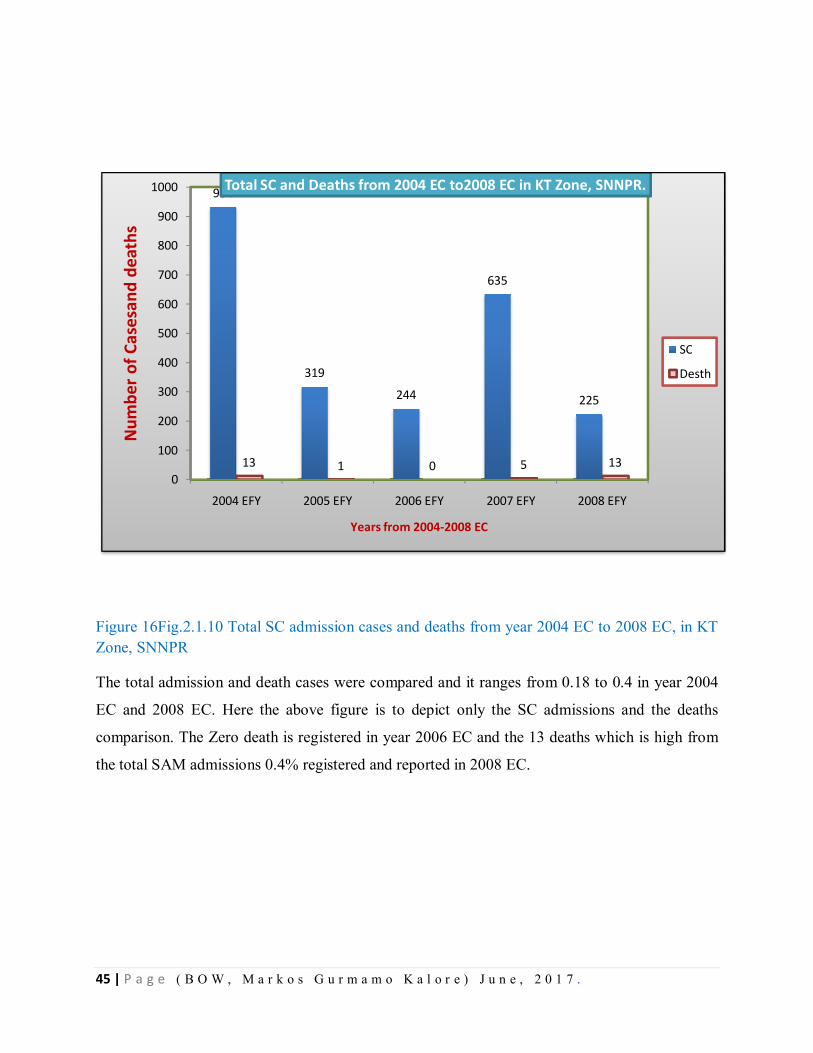
45 | P a g e ( B O W , M a r k o s G u r m a m o K a l o r e ) J u n e , 2 0 1 7 .
Figure 16Fig.2.1.10 Total SC admission cases and deaths from year 2004 EC to 2008 EC, in KT Zone, SNNPR
The total admission and death cases were compared and it ranges from 0.18 to 0.4 in year 2004
EC and 2008 EC. Here the above figure is to depict only the SC admissions and the deaths
comparison. The Zero death is registered in year 2006 EC and the 13 deaths which is high from
the total SAM admissions 0.4% registered and reported in 2008 EC.
934
319
244
635
225
13 1 0 5 130
100
200
300
400
500
600
700
800
900
1000
2004 EFY 2005 EFY 2006 EFY 2007 EFY 2008 EFY
Num
ber o
f Cas
esan
d de
aths
Years from 2004-2008 EC
Total SC and Deaths from 2004 EC to2008 EC in KT Zone, SNNPR.
SC
Desth
46 | P a g e ( B O W , M a r k o s G u r m a m o K a l o r e ) J u n e , 2 0 1 7 .
3.1.6. Discussion
The proportion of malnutrition is highest in the age group of 24-35 months (34%) and lowest
among those under six months (10%) children (EDHS, 2011). This may be explained by the fact
that foods for weaning are typically introduced to children in the older age group, thus increasing
their exposure to infections and susceptibility to illness (DHS, 2011). From this surveillance data
analysis of SAM, it is possible to understand that almost all children analyzed with SAM are 6-
59 months old.
Increasing admissions of SAM may be associated with the deterioration of food security in the
Belg season and intensive screening conducted at community level at different times. In the
studied zone, number of deaths is less than 0.5% from admissions. This may be due to
intervention programs were well conducted in previous successive years. For example in 2004
E.C,) 100 % children screened those age of 6-59 months. Children with age of 2-5 years almost
100% were supplied Vit A and were de-wormed. In addition, expansions of OTP and SC sites
occurred at the same time as decreasing of severity and deaths from SAM in the zone. From
previous consecutive five years data, it is understood that, cases of malnutrition is high between
March and August months of the year. This is may be due to shortage of yields become scarce
during these periods of months due to un-harvesting of the crops and depletion of food items
from households.
3.1.7. Conclusion
Malnutrition is one of major public problems of the country and highest in2004 EC and slightly
increasing over the last five years in Kembata Tembaro Zone. Cases were almost all are 6-59
months age of children. Of the hotspot priority 1 woredas of the zone, the prevalence rate was
highest in Tembaro Woreda. The existing reporting format is lacked important variables such as
sex category of SAM case patients.
3.8. Limitations/Gaps
The existing report format of a region did not include sex category variable.
It was unable to get enough recent literatures to discuss more about the burden and
prevalence of severe acute malnutrition in Ethiopia.
47 | P a g e ( B O W , M a r k o s G u r m a m o K a l o r e ) J u n e , 2 0 1 7 .
3.1.9. Recommendation
Reports should be compiled and analyzed weekly, monthly, annually at all level to
understand disease trends and take action
The intervention strategies of malnutrition mainly focus on children, pregnant and
lactating women.
SAM reporting format should include sex category because EDHS of 2011 reported that
male children are more likely to be malnourished than females.
Communities should be aware of maintaining food security at all season and different
partners those who are working on Nutrition Program should be mobilized to supply
feeding nutrients with logistics.
OTP and SC sites should be expanded mainly in highly affected woredas.
The weekly or monthly SAM report should be communicated with higher officials timely
for decision-making purposes.
References
1 Central Statistical Agency, Ethiopia Demographic and Health Survey 2011, Addis Ababa,
Ethiopia,
2 2. Girma, Genebo, Determinants of Nutritional Status of Women and Children in Ethiopia,
Ethiopia Health and Nutrition Research Institute, Addis Ababa, Ethiopia, 2002
3 3. Eticha, Prevalence and Determinants of Child Malnutrition in Gimbi district, Oromia
Region, Ethiopia, Addis Ababa, Ethiopia, 2007.
4 Child Malnutrition in Ethiopia, Africa Region Working Paper Series No. 22, October 2001
5 SNNPR, Health bureau MCH and Nutrition core process, administrative Reports, 2012-
2016.
6 Ethiopian Health and Nutrition Research Institute, Public Health Emergency Management
Centre, PHEM Guideline for Ethiopia, Ethiopia, Addis Ababa, February 2012
7 SNNP Regional Health Bureau, PHEM Department, Meher Assessment Report, Hawassa,
Ethiopia, 2015
8 Training course on Management of Severe Acute Malnutrition, Ethiopian FMoH, Addis
Ababa Ethiopia, Second Edition, 2013
48 | P a g e ( B O W , M a r k o s G u r m a m o K a l o r e ) J u n e , 2 0 1 7 .
CHAPTER –III- Disease Surveillance System Evaluation
3.1. Disease Surveillance System Evaluation, Damboya Woreda Kembata Tembaro Zone, SNNPR, 20 Jan 2016 – 11 Feb /2017
Executive Summary
Public health surveillance is an ongoing systematic collection, analysis, interpretation and
dissemination of data regarding a health related events for use in public health action to reduce
morbidity and mortality and to improve health. Still people in some woredas of Kembata
Tembaro Zone have experiencing epidemic of malaria and Acute Watery Diarrhea, therefore the
aim of this study is to assess the performance of core activities and attributes of surveillance
system in selected Woredas (Damboya) of Kembata Tembaro zone, Feb 2017.
Methods: - A cross-sectional descriptive study was conducted from 20 Jan 2016 – 11 Feb /2017 in
Kembata Tembaro zone, Southern Nation and Nationality People Regional State. Purposive
sampling techniques were utilized. Questionnaire was administered to focal persons; documents
and reports were observed; and data was analyzing using MS-Excel. A total of 12 study sites
were included in the study, (Zonal Health Department, 1 District Health Offices, 2 Health
Centers and 8 Health Posts). Three priority diseases (Malaria, Measles and Acute Watery
Diarrhea) were used as a proxy for the evaluation of the surveillance system.
Result: - The completeness of the selected Health posts was 89%, health centers were 95.6% and
selected woredas and Zone had 100% in 2016. It was difficult to know the timeliness at health
facility level due to absence of time of report. Four sites of Health posts (50%) HEW in the
health post did not get recent refresher training. Twelve (100%) of respondents were accepted
the surveillance system and its data was helpful to detect cases early. Written epidemic
preparedness and response plan was only at woreda offices and at zonal level. The case
definition was not available in some health post visited; this may lead to low detection of
malaria, measles and AWD from the community.
Conclusion: - The overall structure of the surveillance data flow from lower to higher was well
organized. However, Coordination and supervision of the surveillance activities were not
frequent. From those supervised health facilities, most of them are not received feedbacks.
49 | P a g e ( B O W , M a r k o s G u r m a m o K a l o r e ) J u n e , 2 0 1 7 .
Private health facilities (7) were not included in surveillance report. Absence of timely analysis
and utilization of data made the existing surveillance system weak at health centers and health
posts level. Therefore, it is necessary to strengthen the surveillance system by capacitating health
workers at all levels to analyze and utilize available data. Besides to this the private Health
Facilities should have to report the cases to the concerning levels.
4.1 Introduction
Public health surveillance is the ongoing, systematic collection, analysis, interpretation, and
dissemination of data regarding a health-related events for use in public health action to reduce
morbidity and mortality and to improve health(1). This will be effective through meticulous
monitoring of trends of disease burdens and guiding immediate action to be taken; the health
policy, planning, evaluation of health programs, formulating research hypotheses and so on (2)
Disease surveillance is essential for early detection of outbreaks, epidemics and pandemics in
order to initiate timely response and it is essential to evaluate or monitor progress of ongoing
interventions targeted for disease reduction. A well functioning disease surveillance system is
critical to measure the burden of diseases (health-related event), identification of populations at
high risk and new or emerging health concerns to the health system, in providing evidence-based
information for planning. In addition, for implementation, monitoring trends of a disease and
evaluation of public health intervention programs to prevent and control disease, injury, or
adverse exposure. Moreover, to evaluate program performance, prioritize the allocation of health
resources, describe the clinical course of disease; and stimulate for epidemiologic research (2).
An effective communicable disease surveillance system is one of the basic strategies of the
national disease prevention and control and evidence-based decision-making practices. In most
developing countries, surveillance systems are often weak even though the burden of
communicable disease remains major public health concern. Surveillance system evaluation
answers questions like what are the successes and deficiencies of the surveillance system, Is the
surveillance system meeting its public health objective?, How does surveillance both support and
benefit stakeholders and what measures could improve performance and productivity of the
surveillance system and the program that it supports?(3).
The public health system is challenged by recurrent and unexpected disease outbreaks and is
facing the challenge of managing health consequences of natural and man-made disasters,
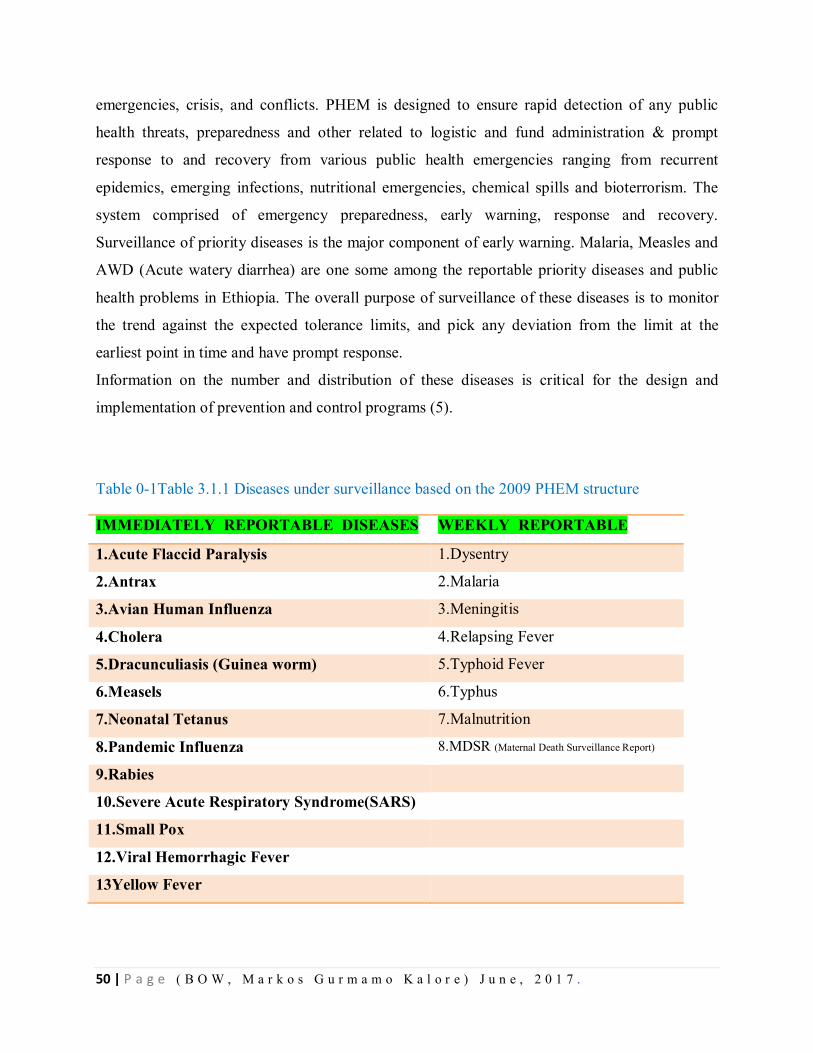
50 | P a g e ( B O W , M a r k o s G u r m a m o K a l o r e ) J u n e , 2 0 1 7 .
emergencies, crisis, and conflicts. PHEM is designed to ensure rapid detection of any public
health threats, preparedness and other related to logistic and fund administration & prompt
response to and recovery from various public health emergencies ranging from recurrent
epidemics, emerging infections, nutritional emergencies, chemical spills and bioterrorism. The
system comprised of emergency preparedness, early warning, response and recovery.
Surveillance of priority diseases is the major component of early warning. Malaria, Measles and
AWD (Acute watery diarrhea) are one some among the reportable priority diseases and public
health problems in Ethiopia. The overall purpose of surveillance of these diseases is to monitor
the trend against the expected tolerance limits, and pick any deviation from the limit at the
earliest point in time and have prompt response.
Information on the number and distribution of these diseases is critical for the design and
implementation of prevention and control programs (5).
Table 0-1Table 3.1.1 Diseases under surveillance based on the 2009 PHEM structure
IMMEDIATELY REPORTABLE DISEASES WEEKLY REPORTABLE
1.Acute Flaccid Paralysis 1.Dysentry
2.Antrax 2.Malaria
3.Avian Human Influenza 3.Meningitis
4.Cholera 4.Relapsing Fever
5.Dracunculiasis (Guinea worm) 5.Typhoid Fever
6.Measels 6.Typhus
7.Neonatal Tetanus 7.Malnutrition
8.Pandemic Influenza 8.MDSR (Maternal Death Surveillance Report)
9.Rabies
10.Severe Acute Respiratory Syndrome(SARS)
11.Small Pox
12.Viral Hemorrhagic Fever
13Yellow Fever
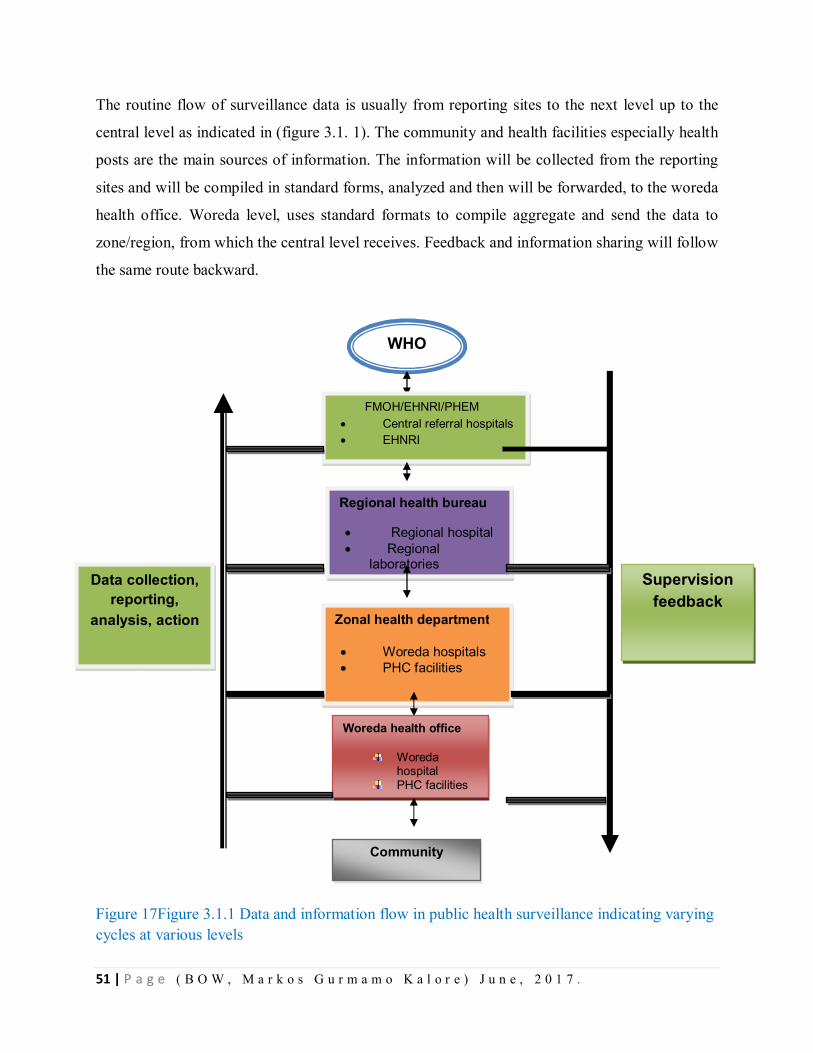
51 | P a g e ( B O W , M a r k o s G u r m a m o K a l o r e ) J u n e , 2 0 1 7 .
The routine flow of surveillance data is usually from reporting sites to the next level up to the
central level as indicated in (figure 3.1. 1). The community and health facilities especially health
posts are the main sources of information. The information will be collected from the reporting
sites and will be compiled in standard forms, analyzed and then will be forwarded, to the woreda
health office. Woreda level, uses standard formats to compile aggregate and send the data to
zone/region, from which the central level receives. Feedback and information sharing will follow
the same route backward.
Figure 17Figure 3.1.1 Data and information flow in public health surveillance indicating varying cycles at various levels
WHO
FMOH/EHNRI/PHEM Central referral hospitals EHNRI
Regional health bureau
Regional hospital Regional
laboratories Supervision
feedback
Data collection, reporting,
analysis, action Zonal health department
Woreda hospitals PHC facilities
Woreda health office
Woreda hospital
PHC facilities heath posts
Community
52 | P a g e ( B O W , M a r k o s G u r m a m o K a l o r e ) J u n e , 2 0 1 7 .
Malaria is one of the most severe public health problems worldwide. It is a leading cause of
morbidity and mortality in many developing countries, where young children and pregnant
women are the groups most affected. People 3.4 billion (half the world’s population) live in areas
at risk of malaria transmission in 106 countries and territories (6). Malaria kills a child
somewhere in the world every minute. It infects approximately 219 million people each year (a
range of 154 – 289 million), with an estimated 66,000 deaths, mostly children in Africa. The
90% of malaria deaths occur in Africa where malaria accounts for about one in six of all
childhood deaths. The disease also contributes greatly to anemia among children — a major
cause of poor growth and development.
Malaria is ranked as the leading communicable disease in Ethiopia, accounting for about 30% of
the overall Disability Adjusted Life Years lost (10). Malaria transmission in Ethiopia is unstable.
Around 52 million people (68%) live in malaria endemic area, mostly an altitude of below 2000
meters (8). Enhanced surveillance for malaria cases and deaths aids’ ministry of health to
determine which areas and/or population groups are most affected and enables countries to
monitor changing disease patterns. Strong malaria surveillance systems also help countries
design effective health interventions and evaluate the impact of their malaria control programs.
Malaria surveillance is currently weakest in countries with the highest malaria burden,
interpreting it difficult to accurately assess disease trends and plan interventions. At present, only
one tenth of the 219 million cases that are estimated to occur each year are detected and reported
through national malaria surveillance systems. (WHO’s uncertainty range for malaria cases is
154 million to 289 million.) Only 58 of the 99 countries with ongoing malaria transmission
produce sufficiently complete and consistent data on malaria that allow a reliable assessment of
malaria trends over time (8).
In Ethiopia outbreaks of measles reported every year. There were 16,028 suspected measles
cases in 2014 and 14,100 confirmed measles cases in the same year. This represents a steep
increase on the data for 2013, when there were 6,137 confirmed measles cases in Ethiopia.
Ethiopia has reported 6,137 and 14,100 totally confirmed measles cases with their respective
incidence rates of 6.52 and 14.61 in 2013 and 2014 respectively. (9)
53 | P a g e ( B O W , M a r k o s G u r m a m o K a l o r e ) J u n e , 2 0 1 7 .
Cholera is on the rise with an estimated 1.4 billion people at risk in endemic countries and an
estimated 3 million to 5 million cases and 100,000-120,000 deaths per year worldwide (10). The
disease is now considered to be endemic in many countries and the pathogen causing cholera
cannot currently be eliminated from the environment. Regions of the world where Cholera is
currently prevalent are Africa, Asia and parts of the Middle East. Sub-Saharan Africa is broadly
affected by many cholera epidemics. Africa reported 211,748 cases in 1998, the highest number
of cases ever reported and accounted for 72% of the global total. (10, 11, 12)
Risk for AWD spread exist in Ethiopia, which include: overcrowding in Refugee camps,
increased population movements across borders, inadequate access to safe water, low personal
and environmental hygiene and sanitation practices, inadequate food safety, low latrine coverage
and utilization, unexpected flooding, low health seeking behavior, low community awareness on
AWD prevention and limited capacity of health system in some regions. The effect of the El-
Nino also contributes to increased risks for spread of communicable diseases and disease
outbreaks. (13)
Literature Review
Reporting from facilities to districts and from districts to the ministry of health varies by its
Completeness and timeliness from country to country and often does not include
nongovernment facilities. Thus, routine reports of the number of malaria cases and deaths
have limited value for comparisons of the malaria burden between countries. Demographic
and health surveys (DHS) and other sources (9) indicate that less than 40% of malaria
morbidity and mortality is seen in formal health facilities – a small fraction of the total
burden. However, routinely collected data are often the only information available over a
prolonged period and over a wide geographical area. While these data are of use for local
programmed planning, major investment in improving both the quality of health information
systems and access to health services would be required before their utility for monitoring
changes in malaria disease trends could be assessed. The burden of malaria in Africa
(https://www.againstmalaria.com/downloads/RBMBurdenMalariaAfrica.pdf)
54 | P a g e ( B O W , M a r k o s G u r m a m o K a l o r e ) J u n e , 2 0 1 7 .
Rational of the study
Damboya woreda is one of the high risks in woredas for various public health emergencies
including malnutrition, malaria and others. Public health surveillance systems should be
evaluated periodically to assess the quality, efficiency, efficacy, usefulness and gap of the
existing system accordingly to improve the surveillance system.
Public health system of the South Nations, Nationalities, and people’s region is challenged by
different recurrent and unforeseen disease outbreaks and facing the challenges of managing
health consequences in different parts of the region. Kembata Tembaro zone is one of the 15
zones and 4 special woreda in the region and Damboya woreda is one of the rural woreda in
Kembata Tembaro Zone. Still Malaria, Measles and others are the public health problems among
priority diseases in the Woreda. The woreda is also in priority II among the zonal woredas in
risk categorization. Therefore, Public health surveillance system of the woreda should be
evaluated periodically.
Objectives
General:
To evaluate the performance of the existing surveillance system of malaria,
measles and Acute watery diarrhea of Damboya woreda, in Kembata Tembaro
zone, SNNPR, 20 Jan 2016 – 11 Feb /2017.
Specific
To Describe the implementation of core surveillance activities notifiable diseases
reporting system in respect to case detection, registration, confirmation, reporting,
epidemic preparedness and response.
To assess supportive activities of surveillance system such as supervision, staff
training, information feedback, equipment and financial support.
To assess the status of surveillance system attributes like sensitivity, simplicity,
positive predictive value, flexibility, completeness, timeliness, acceptability,
representativeness and specificity
To identify gaps in the malaria, measles and AWD surveillance system and
forward recommendations for improvement
55 | P a g e ( B O W , M a r k o s G u r m a m o K a l o r e ) J u n e , 2 0 1 7 .
Methods
Study area The study was conducted in Damboya woreda of Kembata Tembaro zone. It is one of the 7 rural
Woredas and 3 town administrations and 145 kms far from the regional town, Hawassa, and 360
km from the central town of the country. Out of these, Damboya woreda is known malaria
endemic and 2nd hot spot woreda in the region as well as in the country. In 2016 the total
population of the woreda was 105,842. The woreda has 2 urban and 19 rural kebeles. From these,
49% of kebeles are malarious (9/49). Regarding to health facility distribution in the woreda,
there are 4 health centers and 19- health posts. Woreda health office, health centers, and health
posts were taken as the study units of the surveillance system evaluation
56 | P a g e ( B O W , M a r k o s G u r m a m o K a l o r e ) J u n e , 2 0 1 7 .
Figure 18Figure 3.1.1 Map of selected woredas for Surveillance System Evaluation, Damboya , Kembata-Tembaro zone, SNNPR, 2017.
Surveillance System Evaluation, D amboya woreda, SN NP R,2016
S out h O mo
Keffa
B ench M aji G am o Go fa
Sida ma
G urag e
Dawro
S elti
Wo layita
Ha diya
KT
Se gen Pe op les'
Ko nta
S he ka
G edio
Yem
A la baHad iya
Ba sketo
0 2.5 5 7.5 101.25M iles
Le gendE th_ W ore d a_20 13 se lect ion se lect ion
< all ot he r value s>
WORE DANAMEAn iga cha
D an iboy a
D oya Ge na
H ad ero Tu bito
Ka cha Bira
Ke dia da Gam b ela
Te mb aro
²
Danib oya
Kacha B ira
Anigac ha
Ke diad a G am bela
Doya G ena
H ad ero Tub ito
57 | P a g e ( B O W , M a r k o s G u r m a m o K a l o r e ) J u n e , 2 0 1 7 .
Study design.
We used a cross-sectional descriptive study design using the CDC "updated guideline for
evaluating public health surveillance system" published in 2001 as a frame work for
evaluation(5).
Study period: We conducted the surveillance system evaluation from 20 Jan 2016 – 11 Feb
2017 in Damboya woreda of Kembata-Tembaro zone, SNNPR.
Sample size determination and Sampling technique
Woreda health office and 10 health facilities these are 2 health centers and 8-health posts were
randomly selected using lottery method for the evaluation.
Data collection
We obtained data through observation, review of document, quantitative interviews of the PHEM
officers, disease prevention and health promotion, and IDSR focal persons in health centers and
health posts.
Data analysis and presentation: We used Micro-soft Excel 2007 to calculate frequency, ratio,
rate, and proportion. We also used Microsoft excel to construct tables and figures.
Ethical issue: Official permission was obtained from RHB, ZHD, WhO and then from the
respective selected institutions for evaluation.
Standard Cases definition
Malaria
Suspected
Any person with fever or fever with headache, rigor, back pain, chills, sweats, myalgia, nausea,
and vomiting diagnosed clinically as malaria.
Confirmed
A suspected case confirmed by microscopy or RDT for plasmodium parasites.
58 | P a g e ( B O W , M a r k o s G u r m a m o K a l o r e ) J u n e , 2 0 1 7 .
Measles
Suspected
Any person with fever and maculopapular (nonvascular) generalized rash and cough, coryza or
conjunctivitis (red eyes) OR any person in whom a clinician suspects measles.
Confirmed
A suspected case with laboratory confirmation (positive IgM antibody) or epidemiological link
to confirmed cases in an epidemic.
Suspected case (AWD)
– in an area where the disease is not known to be present, a patient aged 5 years or more
develops severe dehydration or dies from acute watery diarrhea;
– in an area where there is a cholera epidemic, a patient aged 5 years or more develops acute
watery diarrhea, with or without vomiting.
Confirmed case: A suspected case in which Vibrio cholera O1 or O139 has been isolated from
their stool.
Operational case definitions
Terms used in the evaluation were operationally mentioned as follows:-
Case detection: is the process of identifying cases and outbreaks.
Case registration: is the process of recording the identified cases
Case/outbreak Confirmation: refers to the epidemiological and laboratory
capacity for confirmation.
Reporting: Refers to the process by which surveillance data moves through the
surveillance system from the point of generation.
Epidemic preparedness: Refers to the existing level of preparedness for
potential epidemics
Stakeholders: The organizations or individuals that generate or use surveillance
data for promotion of health, prevention and control of diseases
Acceptability: Acceptability is the willingness of persons, institutions or
organizations to participate in the surveillance system
59 | P a g e ( B O W , M a r k o s G u r m a m o K a l o r e ) J u n e , 2 0 1 7 .
Usefulness: Usefulness of the surveillance system is reflected by documented
changes in policies and procedures as a result of information generated by the
system.
Simplicity: Simplicity denotes the structure and ease of operation of the
surveillance system.
Flexibility: Flexibility of a surveillance system is its capacity to adapt to
changing information needs or operating systems within minimal additional time,
personnel and funding.
Quality: The quality of data reflects the completeness and validity of the data
recorded in the Health Department, WhO and Facility levels.
Sensitivity: Sensitivity refers to the ability of the system to detect cases or
outbreaks through trends in the surveillance data.
Positive predictive value: Positive predictive value refers to cases that actually
have the health condition in question.
Representativeness: Representativeness refers to the extent to which the
surveillance system accurately describes the occurrence of medical condition
over time and their distribution in the population by place and person.
Stability: Stability was assessed by questioning the surveillance officers on the
consistency of the system.
Results Sites visited
Prior to the evaluation of the surveillance system started, discussing with Zonal Public Health
Emergency Core Process and the Damboya woreda office Public Health Emergency Core
Process coordinator ensure that the evaluation of a public health surveillance system addresses
appropriate questions and assesses pertinent attributes and findings to be interpreted.
The purpose of the document review was to understand and assess the data reporting process and
to compare data across different sources to identify any problems with data quality, consistency,
completeness, and compilation. In2016 Damboya woreda received a surveillance report from a
60 | P a g e ( B O W , M a r k o s G u r m a m o K a l o r e ) J u n e , 2 0 1 7 .
total of 24 reporting units (20-health posts, 4-governmental health centers, no private health
facilities were included in the reporting units).
The population resided in Damboya woreda was the population under surveillance for malaria,
Measles and AWD disease.
The visited sites include woreda health office, 2 health centers and 9 health posts accordingly. In
the surveillance systems assessment checklist, three epidemic-prone diseases were included. A
total of 11 sites were visited, of which 1 Woreda, 2() health centers, 7() health posts, and woreda
PHEM was our study subject. The Health Centers incorporated were Funto and Danboya Health
center and four Health posts and three health Posts from each health centers respectively.
Core Functions of Surveillance System
Case detection
Case detection is the process of identifying cases and outbreaks. For malaria case detection, the
WHO malaria standard case definitions was available in 9(81.8%) evaluated reporting units. 3
(100%) suspected Measles cases were detected in the woreda. 8(77%) of sites were using
standard case definition of measles.
Malaria Damboya woreda 1,186 of malaria cases were reported to the Zone. Of total malaria
confirmed cases 735 (62%) were P.falciparum and 430 (36.3%) were P.vivax. Among the cases
21 (1.7%) cases were treated clinically. Total cases were managed out-patient department and no
deaths were reported from malaria.
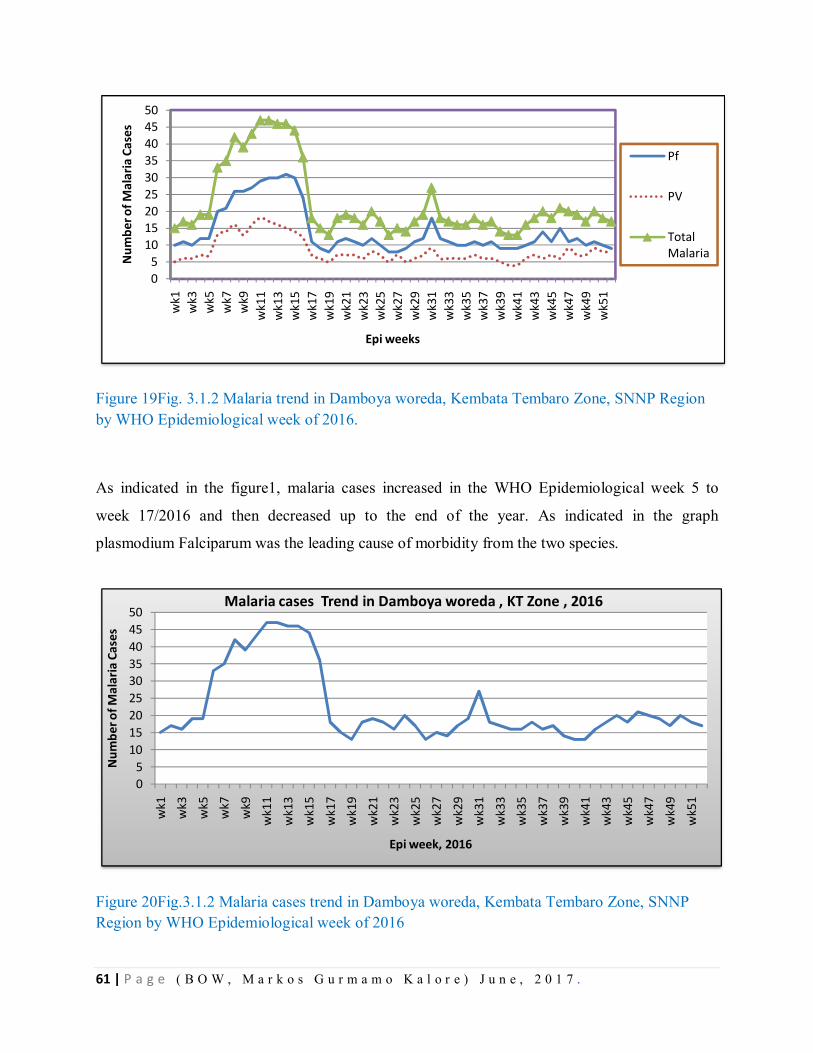
61 | P a g e ( B O W , M a r k o s G u r m a m o K a l o r e ) J u n e , 2 0 1 7 .
Figure 19Fig. 3.1.2 Malaria trend in Damboya woreda, Kembata Tembaro Zone, SNNP Region by WHO Epidemiological week of 2016.
As indicated in the figure1, malaria cases increased in the WHO Epidemiological week 5 to
week 17/2016 and then decreased up to the end of the year. As indicated in the graph
plasmodium Falciparum was the leading cause of morbidity from the two species.
Figure 20Fig.3.1.2 Malaria cases trend in Damboya woreda, Kembata Tembaro Zone, SNNP Region by WHO Epidemiological week of 2016
05
101520253035404550
wk1
wk3
wk5
wk7
wk9
wk1
1w
k13
wk1
5w
k17
wk1
9w
k21
wk2
3w
k25
wk2
7w
k29
wk3
1w
k33
wk3
5w
k37
wk3
9w
k41
wk4
3w
k45
wk4
7w
k49
wk5
1
Num
ber o
f Mal
aria
Cas
es
Epi weeks
Pf
PV
Total Malaria
05
101520253035404550
wk1
wk3
wk5
wk7
wk9
wk1
1
wk1
3w
k15
wk1
7w
k19
wk2
1w
k23
wk2
5w
k27
wk2
9w
k31
wk3
3w
k35
wk3
7w
k39
wk4
1w
k43
wk4
5w
k47
wk4
9
wk5
1
Num
ber o
f Mal
aria
Cas
es
Epi week, 2016
Malaria cases Trend in Damboya woreda , KT Zone , 2016
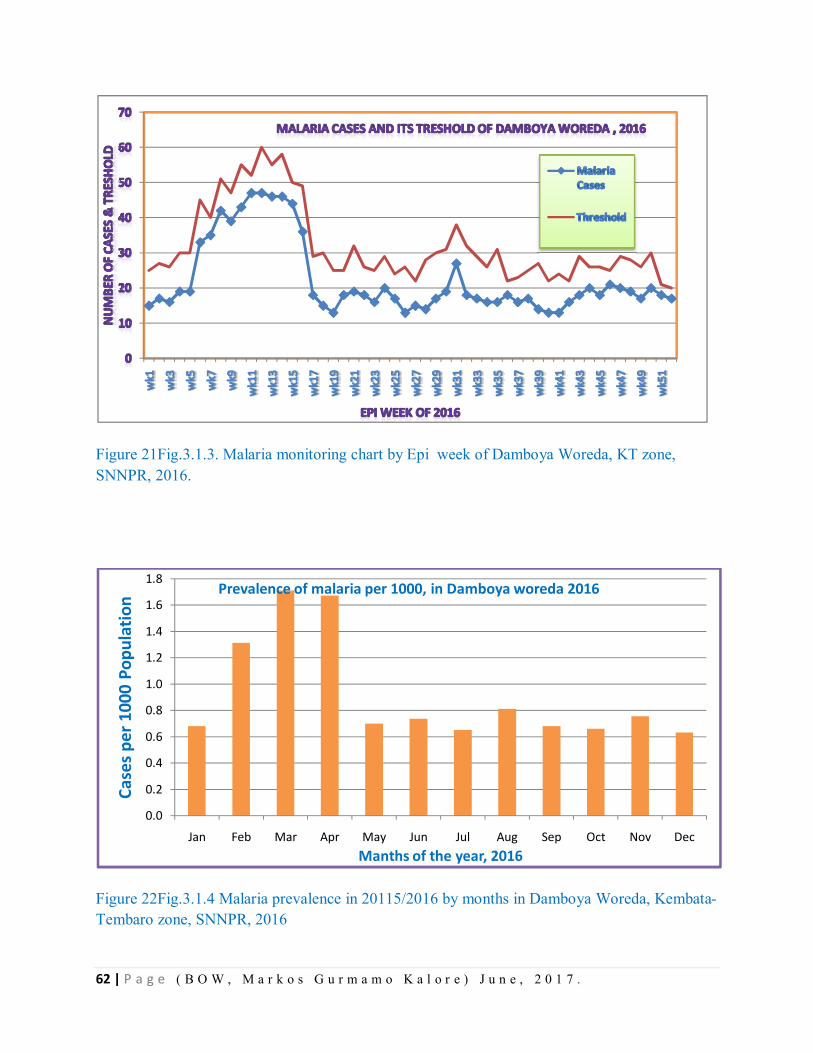
62 | P a g e ( B O W , M a r k o s G u r m a m o K a l o r e ) J u n e , 2 0 1 7 .
Figure 21Fig.3.1.3. Malaria monitoring chart by Epi week of Damboya Woreda, KT zone, SNNPR, 2016.
Figure 22Fig.3.1.4 Malaria prevalence in 20115/2016 by months in Damboya Woreda, Kembata-Tembaro zone, SNNPR, 2016
0.0
0.2
0.4
0.6
0.8
1.0
1.2
1.4
1.6
1.8
Jan Feb Mar Apr May Jun Jul Aug Sep Oct Nov Dec
Case
s per
100
0 Po
pula
tion
Manths of the year, 2016
Prevalence of malaria per 1000, in Damboya woreda 2016
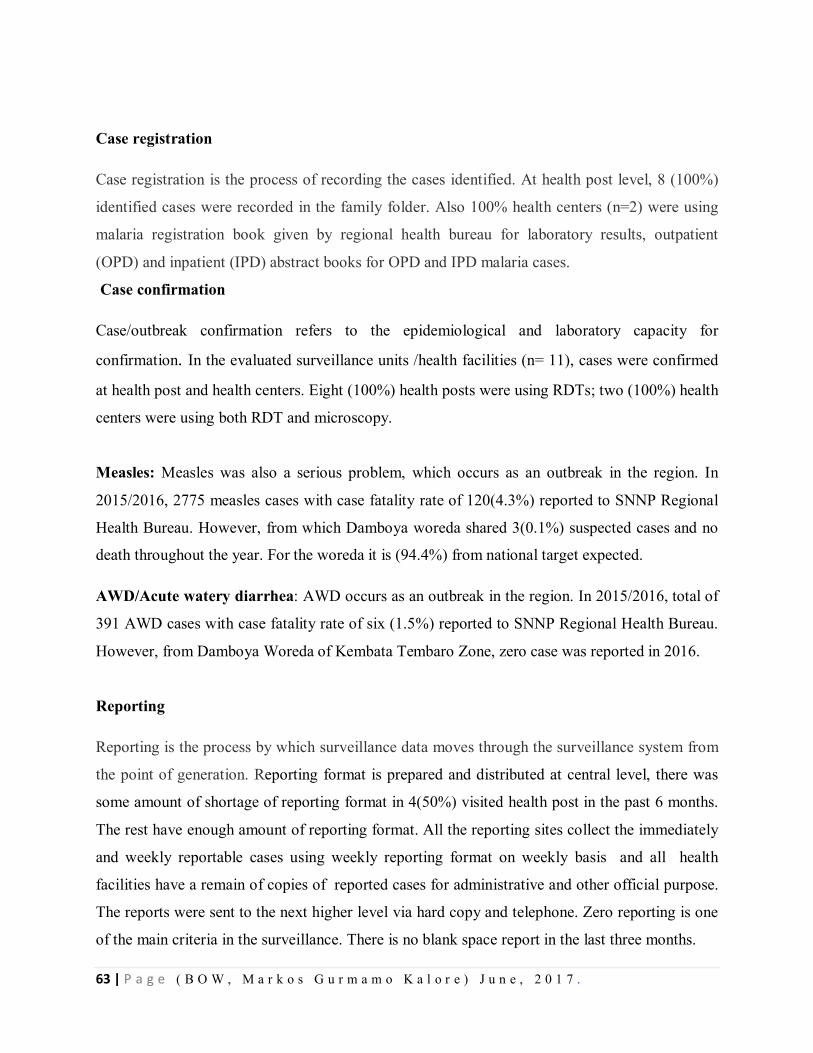
63 | P a g e ( B O W , M a r k o s G u r m a m o K a l o r e ) J u n e , 2 0 1 7 .
Case registration
Case registration is the process of recording the cases identified. At health post level, 8 (100%)
identified cases were recorded in the family folder. Also 100% health centers (n=2) were using
malaria registration book given by regional health bureau for laboratory results, outpatient
(OPD) and inpatient (IPD) abstract books for OPD and IPD malaria cases.
Case confirmation
Case/outbreak confirmation refers to the epidemiological and laboratory capacity for
confirmation. In the evaluated surveillance units /health facilities (n= 11), cases were confirmed
at health post and health centers. Eight (100%) health posts were using RDTs; two (100%) health
centers were using both RDT and microscopy.
Measles: Measles was also a serious problem, which occurs as an outbreak in the region. In
2015/2016, 2775 measles cases with case fatality rate of 120(4.3%) reported to SNNP Regional
Health Bureau. However, from which Damboya woreda shared 3(0.1%) suspected cases and no
death throughout the year. For the woreda it is (94.4%) from national target expected.
AWD/Acute watery diarrhea: AWD occurs as an outbreak in the region. In 2015/2016, total of
391 AWD cases with case fatality rate of six (1.5%) reported to SNNP Regional Health Bureau.
However, from Damboya Woreda of Kembata Tembaro Zone, zero case was reported in 2016.
Reporting
Reporting is the process by which surveillance data moves through the surveillance system from
the point of generation. Reporting format is prepared and distributed at central level, there was
some amount of shortage of reporting format in 4(50%) visited health post in the past 6 months.
The rest have enough amount of reporting format. All the reporting sites collect the immediately
and weekly reportable cases using weekly reporting format on weekly basis and all health
facilities have a remain of copies of reported cases for administrative and other official purpose.
The reports were sent to the next higher level via hard copy and telephone. Zero reporting is one
of the main criteria in the surveillance. There is no blank space report in the last three months.
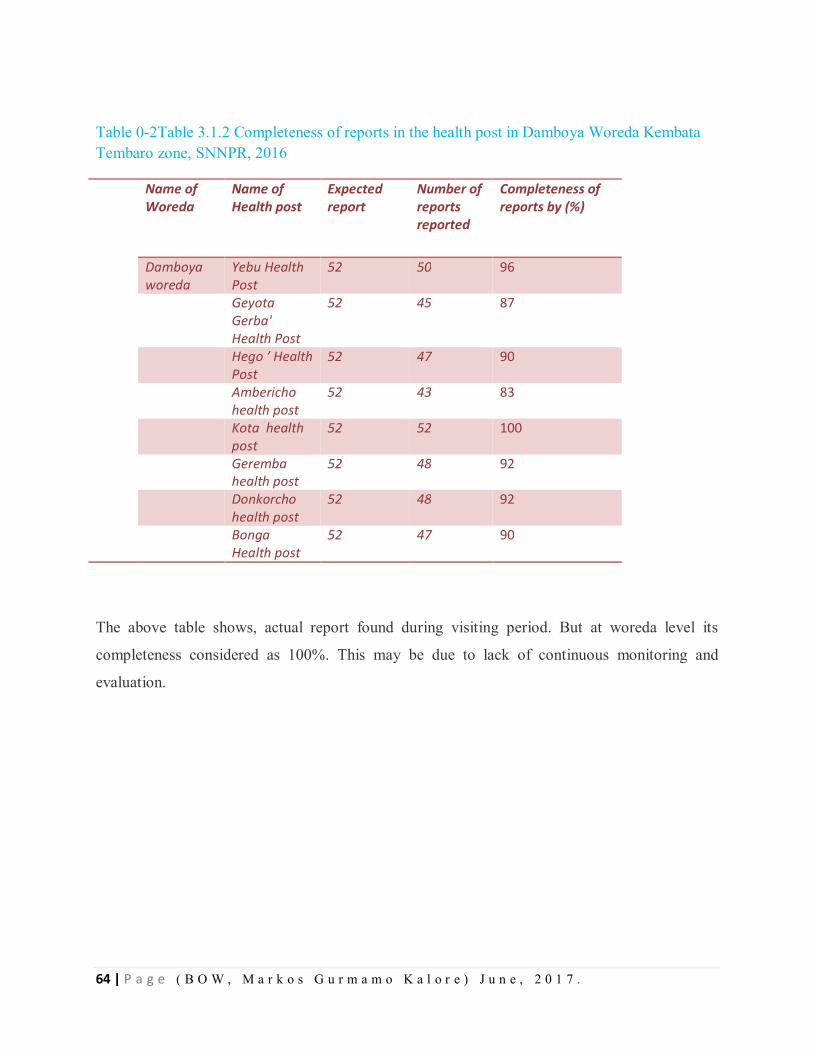
64 | P a g e ( B O W , M a r k o s G u r m a m o K a l o r e ) J u n e , 2 0 1 7 .
Table 0-2Table 3.1.2 Completeness of reports in the health post in Damboya Woreda Kembata Tembaro zone, SNNPR, 2016
Name of Woreda
Name of Health post
Expected report
Number of reports reported
Completeness of reports by (%)
Damboya woreda
Yebu Health Post
52 50 96
Geyota Gerba' Health Post
52 45 87
Hego ’ Health Post
52 47 90
Ambericho health post
52 43 83
Kota health post
52 52 100
Geremba health post
52 48 92
Donkorcho health post
52 48 92
Bonga Health post
52 47 90
The above table shows, actual report found during visiting period. But at woreda level its
completeness considered as 100%. This may be due to lack of continuous monitoring and
evaluation.
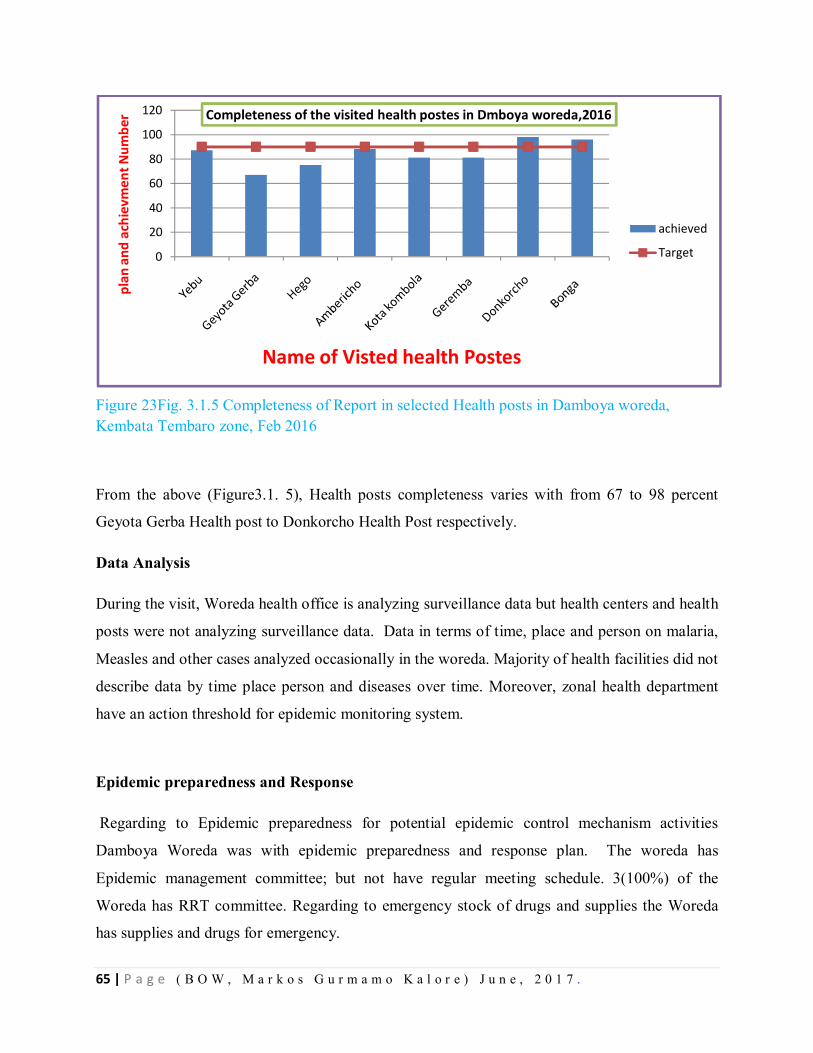
65 | P a g e ( B O W , M a r k o s G u r m a m o K a l o r e ) J u n e , 2 0 1 7 .
Figure 23Fig. 3.1.5 Completeness of Report in selected Health posts in Damboya woreda, Kembata Tembaro zone, Feb 2016
From the above (Figure3.1. 5), Health posts completeness varies with from 67 to 98 percent
Geyota Gerba Health post to Donkorcho Health Post respectively.
Data Analysis
During the visit, Woreda health office is analyzing surveillance data but health centers and health
posts were not analyzing surveillance data. Data in terms of time, place and person on malaria,
Measles and other cases analyzed occasionally in the woreda. Majority of health facilities did not
describe data by time place person and diseases over time. Moreover, zonal health department
have an action threshold for epidemic monitoring system.
Epidemic preparedness and Response
Regarding to Epidemic preparedness for potential epidemic control mechanism activities
Damboya Woreda was with epidemic preparedness and response plan. The woreda has
Epidemic management committee; but not have regular meeting schedule. 3(100%) of the
Woreda has RRT committee. Regarding to emergency stock of drugs and supplies the Woreda
has supplies and drugs for emergency.
0
20
40
60
80
100
120pl
an a
nd a
chie
vmen
t Num
ber
Name of Visted health Postes
Completeness of the visited health postes in Dmboya woreda,2016
achieved
Target
66 | P a g e ( B O W , M a r k o s G u r m a m o K a l o r e ) J u n e , 2 0 1 7 .
Supervision
Supportive supervision helps to strengthen the capacity of staff and ensure that the right skills
transfer, check necessary logistics are in place and so on. But those planned activities are not
implemented according to schedule. From 11 health institution observed 9(81.8%) supervised by
higher level. From these supervised health facilities, most of them not received feedbacks.
Communication facilities
In order to support the function of reporting, appropriate and effective medium for
communication at each level is advantageous for early detection of outbreak of diseases. Health
development army (HDA) was providing the routine report from their Village by means of hard
copy and oral report. Health posts were providing the routine report by two means.
Communication is by using hard copy and their mobile phones. The reporting day for health
posts is Monday morning up to mid-day. All health posts 8(100%) were using mobile phone
access.
Resource
Surveillance and response activities performed, if the required and appropriate financial, human
and logistic resources are in place. Resources for data management, communication, and other
logistics were comparatively available at the Zonal level. However, they all became limited
down in the hierarchy. Two (67%) of the Woreda have only a single computer for overall office
activities in the health office. In addition to this, 2(67%) of the woreda public health, emergency
management focal person has their own computer for data management and analysis. All health
facilities in the respective woreda have complained the logistic and budget constraints.
Monitoring
In 2016, all level (health posts, health centers, and woreda) the health workers were assigned to
monitor all planned activities. Even if they assigned at every level of the system, their support is
irregular. Malaria monitoring/ norm chart was not used at (all health posts) evaluated
surveillance units.
67 | P a g e ( B O W , M a r k o s G u r m a m o K a l o r e ) J u n e , 2 0 1 7 .
Co-ordination
The coordination between implementers and stakeholders is important for effective and efficient
implementation of surveillance and response systems. Woreda health office and zonal health
department were working along with rural development, education office, water office, NGOs
like world vision and WHO etc. The mentioned stakeholders did not evaluate the performances
and not had regular meeting schedule.
Training
Conduct training on disease surveillance, outbreak investigation, Surveillance data analysis and
response is the backbone for early detection and confirmation of the cases, consequently
1(100%) of health personnel in zone get training on public health surveillance system. Woreda
and health center was already get training on surveillance system respectively. While the HEWs
4(50%) in the health post did not get refresher training regarding to some of the components of
surveillance.
Description of Quality and attributes of surveillance system
Surveillance quality
Completeness of reporting sites/surveillance forms
Completeness of reporting of visited sites is the proportion of reporting sites that submitted the
surveillance report irrespective of the time when the report was submitted.
Health posts were reported an average of 86% completeness of reporting site ranging from 42%
to 98%. The average completeness of the health center was 95.6%. The percentage completeness
of reporting sites of woreda health office and zonal health department was 100%.
Timeliness of reporting
It is the single most important measure of timeliness whether data are submitted in time to begin
investigations and implement control measures. The timeliness was difficult to know at health
facility level due to absence of time of report.
68 | P a g e ( B O W , M a r k o s G u r m a m o K a l o r e ) J u n e , 2 0 1 7 .
Usefulness of surveillance system and surveillance data
The 12 (100%) of respondents were accepted as the surveillance system and its data was helpful
to detect cases early, to estimate the magnitude of morbidity and mortality, permit assessment of
the effect of prevention and control program and estimate research intended to lead to prevention
and control.
Simplicity
Simplicity is the structure of the system and the ease of implementation. At all evaluated
surveillance units, the cases definition was easy for case detection, the surveillance formats
allowed all professionals to fill data, was easy to record and report data on time, allowed
updating data on the formats, the time to fill the format was 5-15 minutes.
Flexibility
The format can accommodate enough types of disease and still possible to add new disease in it
as well to discard and to report other new cases and also possible for modification of the
reporting frequency, requirement needed, etc all can be occurred without difficulty in visited
health unit in the woreda.
Positive predictive value
We divided the positivity rate of total examined by RDT and microscope for malaria. PVP for
malaria = Total confirmed cases by laboratory / Total suspected cases diagnosed in laboratory for
confirmation
= 10766/50612= 21.3%
Sensitivity in surveillance case definition
Sensitivity of a surveillance system based on the level of case detection and the ability of the
system to detect outbreaks, including the ability to monitor changes in the number of cases over
time mentioned as follows:
In the detection of cases
Health facilities use loose case definition to detect malaria, measles and AWD cases for example
those with acute febrile illness send to laboratory for confirmation.
69 | P a g e ( B O W , M a r k o s G u r m a m o K a l o r e ) J u n e , 2 0 1 7 .
In detection of outbreaks
Outbreak detection depends on regular data analysis, health-seeking behavior of the society,
availability of reagents and definition of thresholds, timeliness and completeness of reporting,
population under surveillance. Timeliness and completeness of the report is in the acceptable
range indicates good sensitivity of the system to detect the outbreak.
Acceptability
Acceptability of a system is a reflection of the willingness of the surveillance staff to implement
the system, and of the end users to accept and use the data generated through the system. At all
evaluated reporting sites all reporting agents accepted and well engaged. Health posts, health
centers, woreda health offices, and zonal health department were using the surveillance data for
prevention and control. Health professionals were using the standard case definition to identify
cases. All reporting units were using the given surveillance reporting formats.
Data quality
Seven (87.5%) health posts reported complete surveillance report. All 7 (100%) of them
reported clear records to read and understand. Both (100%) of health centers sent complete and
clearly recorded report for woreda health office. The woreda health office sent complete and
clear data report to zonal health office.
Representativeness
Representativeness refers to the degree to which the reported cases reflect the occurrence and
distribution of all the cases in the population under surveillance. Geographical representativeness
and health service physical accessibility in the zone is particularly greater important in an early
warning system to ensure detection of outbreaks nationally notifiable diseases. At health post
level the surveillance report incorporated the population under surveillance. Non-governmental
health facilities were also included in all surveillance reports. However, 7 private health facilities
found at kebeles and woreda level were not included in surveillance report. Still people were
using private health facilities for malaria and other diseases treatment. So that, the surveillance
system in the woreda was not representative.
70 | P a g e ( B O W , M a r k o s G u r m a m o K a l o r e ) J u n e , 2 0 1 7 .
Stability
Still the system was not interrupted by different reasons. In the absence of budget from donor,
the government was running all activities along with other integrated services.
Discussion
Public health surveillance is the ongoing, systematic collection, analysis, interpretation, and
dissemination of data regarding a health-related event for use in public health action to reduce
morbidity and mortality and to improve health. The standard and community cases definition
were supposed to be available and posted at all health facilities and health offices for detection of
suspected cases using the case definition, the case definition was not available in some health
post visited this may lead to low detection of malaria, measles and AWD from the community.
The data of reportable diseases were collected, but not analyzed and reported on time.
From those supervised health facilities, most of them are not received feedbacks. Such weak
performance could be due to poor monitoring, supportive supervision and feedback system at
lower level in the surveillance activities. This may undermine the attention given to surveillance
and response of epidemic prone diseases- like malaria, measles and Acute Watery Diarrhea.
Malaria cases were confirmed at all nearest health facility level. Not need to refer malaria case
for confirmation to distant health facilities. By using the malaria monitoring chart (figure6),
malaria outbreak was seen in Tembaro district between week5 to week17, 2016.
At least one case of suspected measles sample per 100,000 populations is expected from each
woreda. According to national target, 80% and above woredas should report at least one case of
measles with a blood specimen per year (13). According to the assessment results, target set, at
least one measles suspected cases per 100,000 populations in the previous two years. Moreover,
the recent performance of the woreda was more than the national target.
At health centers, surveillance data was not entered in to the computer and analyzed by person,
place, and time. No surveillance data was interpreted and used for public health action. Epidemic
management and rapid response team were established in almost all reporting units. From the
visited health centers, none of them was used epidemic preparedness plan. No rapid response
team was conducted scheduled regular meeting. Communication facilities only (mobile and hard
copy) were accessible at all level. Human, logistic resources (computer technologies), and
71 | P a g e ( B O W , M a r k o s G u r m a m o K a l o r e ) J u n e , 2 0 1 7 .
financial resources were available at woreda, health centers and health posts except computers in
Health posts.
Timeliness was not measured at surveillance reporting units. The respondents accepted as the
surveillance system and data was useful to detect cases early to permit accurate diagnosis, to
estimate the magnitude of morbidity and mortality and so on. Case definition was understood at
all levels except some health posts. Standardized tools were in place (formats, line lists).
Reporting formats were easy to fill. Communication channels between all levels were well
established. The surveillance system staff was well engaged in surveillance data reporting.
Stakeholders were using data for public health action.
The system was easy for modification of frequency of reporting and can be operated with other
system. The formats were possible to incorporate new variables. Malaria surveillance case
definition was sensitive and detected cases in different geographic areas. Still incomplete data
was reported from health posts. But at higher level the report completeness above the standard.
Data from private health facilities were not included in the surveillance reporting (17).
Limitation
Due to shortage of time and transport, the study was conducted on accessible health facilities
which might be limited its representativeness. Date of receipt and reported is not registered in
reporting format because of this we did not calculate timeliness of the report. Important data was
difficult to get and to calculate the disease trend. We could not calculate sensitivity and
specificity in terms of case detection. Because we could not get variables required to calculate
sensitivity and specificity.
Conclusion
According to the finding of this assessment, in order to strengthen malaria, measles and Acute
Watery Diarrhea surveillance and response in the woreda, surveillance core activities-case
detection, analysis and reporting of surveillance data for action is very crucial. The standard case
definition was not available and used consistently at some health facilities. Even there were
functioning computers, skilled personnel in different surveillance units, but the surveillance
system was not using the current technologies to store, analyze and interpret data for public
health action. Epidemic preparedness plan was not prepared in most surveillance units. Epidemic
and rapid response team was not conducting scheduled regular meeting. Specific surveillance
72 | P a g e ( B O W , M a r k o s G u r m a m o K a l o r e ) J u n e , 2 0 1 7 .
system evaluation and feedback is not practiced at regular basis. Most of the surveillance units
were not used malaria monitoring/norm chart. It is difficult to calculate timeliness from the
current documentation system. As a result, timely action will not be undertaken. Therefore,
strengthening data processing capacity at all levels by providing necessary computing facilities
where needed; strengthening feedback system at lower levels; strengthening documentation and
document retrieval system at all levels. The surveillance system in Damboya woreda is useful,
complete, easy to implement, acceptable, flexible, stable, but poor quality data, not timely, not
representative.
Recommendation
Zonal health department and woreda health offices should put in place written feedback
and supervision specifically to surveillance system at least quarterly.
Training on data analysis should be given to the surveillance focal persons and reserve
health professionals, including onsite training
To capacitate the new surveillance staff, and to refresh/update the existing one training
should be facilitated by woreda and zonal health department with the computer
technologies
Epidemic preparedness plan should be prepared and used by health centers, and woredas
to response emergency condition
Malaria monitoring tool should be prepared and posted on the wall at all surveillance
units for easy track of malaria changes.
To measure timeliness indicators should be prepared by all surveillance units
All private health facilities should be incorporated in to surveillance reporting unit
73 | P a g e ( B O W , M a r k o s G u r m a m o K a l o r e ) J u n e , 2 0 1 7 .
References
1. Centers for Disease Control and Prevention (CDC). Updated Guidelines for Evaluating
Public Health Surveillance Systems. Recommendations from the Guidelines Working
Group. MMWR, July 27, 2001; 50 ( RR-13 )
2. Ministry of Health, Federal Democratic Republic of Ethiopia, National Technical Integrated
Disease Surveillance and Response Guideline, Version 1.1.September 2002
3. Centre for Surveillance Coordination Population & Public Health Branch. Framework and
Tools for Evaluating Health Surveillance Systems. Health Surveillance Coordinating
Committee (HSCC)Population and Public Health Branch, March 2004
4. CDC, Updated guidelines for evaluating public health surveillance systems July 27, 2001. p.
(1-35).
5. Public health emergency management guidelines for Ethiopia, 2012.
6. Ethiopia Malaria Operational Plan, 2014
7. Malaria Guideline in Ethiopia, 2012; 3rd edition.
8. http//www.who.int/malaria/areas/surveillance/overview/en/
9. Public Health Emergency Management, Southern region Emergency Report, 2014.
10. Elizabeth .L and Jesee . K OXFAM, Cholera outbreak guidelines preparedness, prevention
and control, June 2012
11. http://www.who.int/emc WHO Report on Global Surveillance of Epidemic-prone Infectious
Diseases
12. UNICEF Cholera Toolkit http://www.unicef.org/cholera/ (Accessed Feb 1, 2017.)
13. http://www.who 2016 Prevention and control of cholera outbreaks: WHO policy and
recommendations (on 19/2/2017)
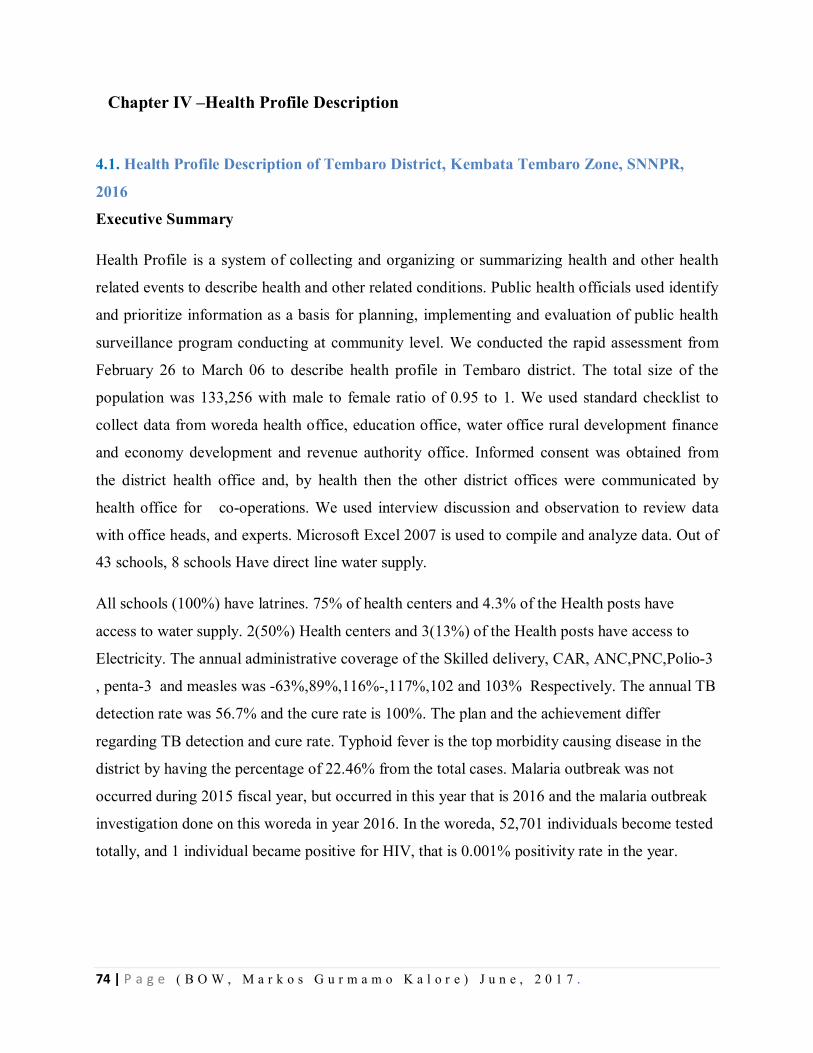
74 | P a g e ( B O W , M a r k o s G u r m a m o K a l o r e ) J u n e , 2 0 1 7 .
Chapter IV –Health Profile Description
4.1. Health Profile Description of Tembaro District, Kembata Tembaro Zone, SNNPR,
2016
Executive Summary
Health Profile is a system of collecting and organizing or summarizing health and other health
related events to describe health and other related conditions. Public health officials used identify
and prioritize information as a basis for planning, implementing and evaluation of public health
surveillance program conducting at community level. We conducted the rapid assessment from
February 26 to March 06 to describe health profile in Tembaro district. The total size of the
population was 133,256 with male to female ratio of 0.95 to 1. We used standard checklist to
collect data from woreda health office, education office, water office rural development finance
and economy development and revenue authority office. Informed consent was obtained from
the district health office and, by health then the other district offices were communicated by
health office for co-operations. We used interview discussion and observation to review data
with office heads, and experts. Microsoft Excel 2007 is used to compile and analyze data. Out of
43 schools, 8 schools Have direct line water supply.
All schools (100%) have latrines. 75% of health centers and 4.3% of the Health posts have
access to water supply. 2(50%) Health centers and 3(13%) of the Health posts have access to
Electricity. The annual administrative coverage of the Skilled delivery, CAR, ANC,PNC,Polio-3
, penta-3 and measles was -63%,89%,116%-,117%,102 and 103% Respectively. The annual TB
detection rate was 56.7% and the cure rate is 100%. The plan and the achievement differ
regarding TB detection and cure rate. Typhoid fever is the top morbidity causing disease in the
district by having the percentage of 22.46% from the total cases. Malaria outbreak was not
occurred during 2015 fiscal year, but occurred in this year that is 2016 and the malaria outbreak
investigation done on this woreda in year 2016. In the woreda, 52,701 individuals become tested
totally, and 1 individual became positive for HIV, that is 0.001% positivity rate in the year.
75 | P a g e ( B O W , M a r k o s G u r m a m o K a l o r e ) J u n e , 2 0 1 7 .
Introduction
Kembata -Tembaro Zone is one 15 Zones and 4- Special woredas in SNNPR. Tembaro district is one of
the seven districts found in Kembata Tembaro zone. The district is found 60kms away from the Zonal
town Durame. Administratively the Tembaro woreda consists of 23 kebeles. Health profile description is
the collection, organizing and summarizing of health and health related data to assess effectiveness of a
policy, programs or project in terms of its potential effects on the health of population and the distribution
of those effects within the population. In epidemiologic point of view, it is crucial to prioritize health and
other health related conditions prevailing in the community. Knowing the health profile of a specific area
helps a public health officials to prioritize resource allocation and take appropriate Public Health actions
effectively and efficiently.
Purpose፡ Health profile description helps to determine the effectiveness of policies, programs
and projects to improve the health and social services of a given population by assessing the
existing health service coverage, the developmental activities, social services major health
problems, risk factors and it indicates area that needs attention or focuses to improve the health
status of the specifically identified community or population. In addition to these the health
profile of the district has not yet been done in the area. So this rapid assessment was designed to
describe the health profile of Tembaro district.
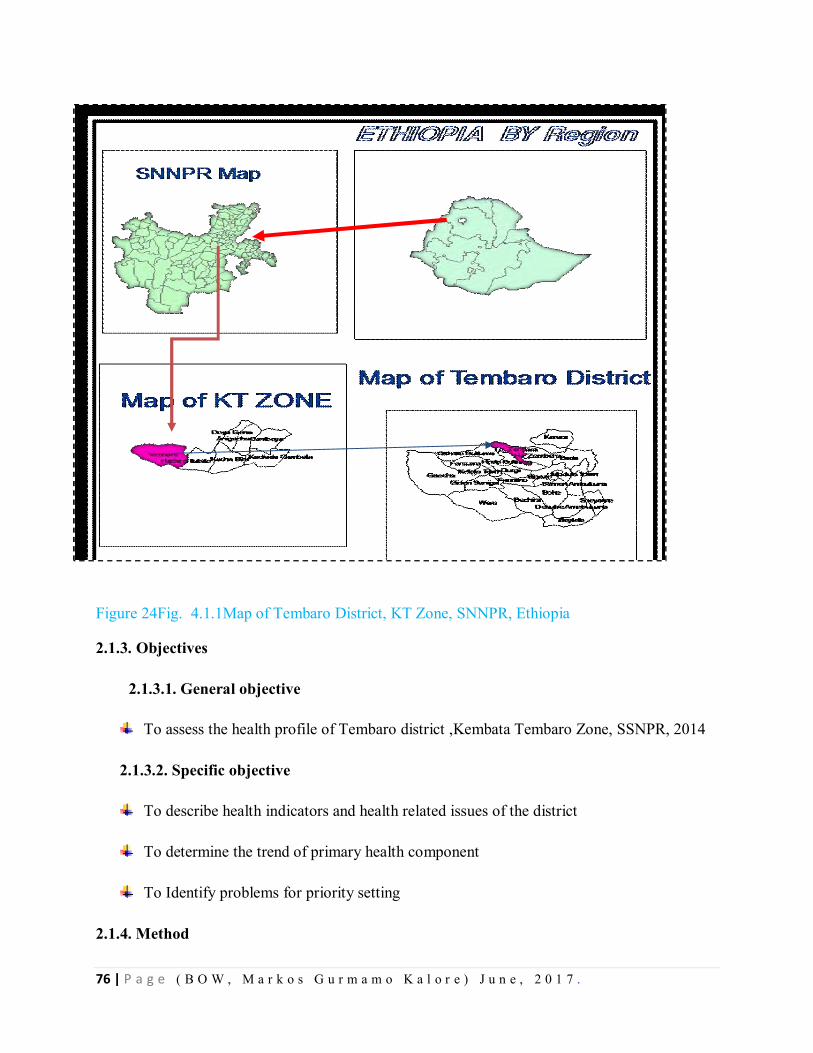
76 | P a g e ( B O W , M a r k o s G u r m a m o K a l o r e ) J u n e , 2 0 1 7 .
Figure 24Fig. 4.1.1Map of Tembaro District, KT Zone, SNNPR, Ethiopia 2.1.3. Objectives
2.1.3.1. General objective
To assess the health profile of Tembaro district ,Kembata Tembaro Zone, SSNPR, 2014
2.1.3.2. Specific objective
To describe health indicators and health related issues of the district
To determine the trend of primary health component
To Identify problems for priority setting
2.1.4. Method
77 | P a g e ( B O W , M a r k o s G u r m a m o K a l o r e ) J u n e , 2 0 1 7 .
Study setting: We conducted a rapid assessment in Tembaro district. The total population of the
district was 133,526.
2.1.4.1 Study Period
We conducted the rapid assessment in Tembaro district from February 26- March-6/2016,
Kembata Tembaro Zone, SNNPR.
2.1.4.2. Sample size determination
We used the Only Tembaro district. In the district for data collection we included the sectors of
Woreda Health Office, Woreda educational office, woreda water office, woreda rural
development office, finance and economic development office and woreda revenue authority.
4.1.4.3. Sampling Technique
Due to the district is hot spot for different health events, this woreda is selected.
4.1.4.4. Data collection
We used standard check list to collect secondary data from different offices. Data available in
Woreda Health Office, Woreda educational office, woreda water office, woreda rural
development office, finance and economic development office and woreda revenue authority
branch were collected using a standard check list by reviewing secondary data, observation and
interview of key informants in the relevant sectors of the district with office heads and experts.
4.1.4.5. Data analysis and presentation
We used Microsoft excel to compile the data, to calculate frequency, ratio, proportion and rate.
We also used the excel office to construct figures and tables.
4.1.5 Ethical Issues
Official permission letter was obtained from the regional Health bureau Public Health
Emergency core process to Kembata Tembaro Zone. Cooperation letter was written to Tembaro
Woreda Health office and the woreda health office phoned to concerned woreda sectoral offices
for cooperation also.
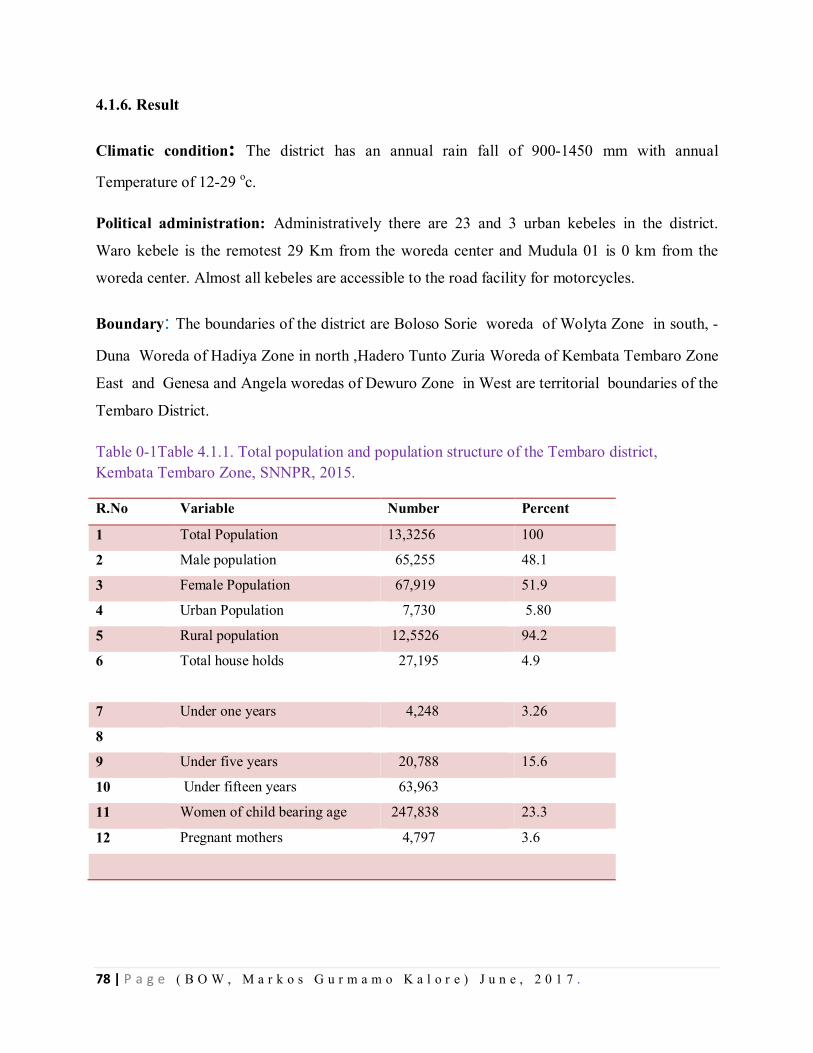
78 | P a g e ( B O W , M a r k o s G u r m a m o K a l o r e ) J u n e , 2 0 1 7 .
4.1.6. Result
Climatic condition: The district has an annual rain fall of 900-1450 mm with annual
Temperature of 12-29 oc.
Political administration: Administratively there are 23 and 3 urban kebeles in the district.
Waro kebele is the remotest 29 Km from the woreda center and Mudula 01 is 0 km from the
woreda center. Almost all kebeles are accessible to the road facility for motorcycles.
Boundary: The boundaries of the district are Boloso Sorie woreda of Wolyta Zone in south, -
Duna Woreda of Hadiya Zone in north ,Hadero Tunto Zuria Woreda of Kembata Tembaro Zone
East and Genesa and Angela woredas of Dewuro Zone in West are territorial boundaries of the
Tembaro District.
Table 0-1Table 4.1.1. Total population and population structure of the Tembaro district, Kembata Tembaro Zone, SNNPR, 2015.
R.No Variable Number Percent
1 Total Population 13,3256 100
2 Male population 65,255 48.1
3 Female Population 67,919 51.9
4 Urban Population 7,730 5.80
5 Rural population 12,5526 94.2
6 Total house holds
27,195 4.9
7 Under one years 4,248 3.26
8
9 Under five years 20,788 15.6
10 Under fifteen years 63,963
11 Women of child bearing age 247,838 23.3
12 Pregnant mothers 4,797 3.6
79 | P a g e ( B O W , M a r k o s G u r m a m o K a l o r e ) J u n e , 2 0 1 7 .
Ethnicity and Religion፡-The ethnic groups in the district were Tembaro, Kembata, Hadiya and
Wolyta by being the most dominant ethnic group is Tembaro in number. The office language of
the district is Amharic. The religious groups are Protestant, orthodox, Muslim catholic and others
by being the protestant religion is dominant in number.
Economy፡ The source of income in the district was agriculture, and trade. Agriculture was the
major source of income.
Budget ፡The district allocated the operational and workers salary budget. The increment of the
budget was seen 10% from the previous years. The budget for indoor residual spray 60,000 Birr
was allocated by the woreda administration.
Education: There were total of 43 governmental and non-governmental schools in the district.
In year 2015/2016 and a total number of 33,752 students were enrolled in education program.
Among the total students 17,680 (52.38) were males and 16,072 (47.62%) were females. Total
of 29,873 (88.50%) were enrolled in the primary (1-8) school and 3087(9.14%) were enrolled in
secondary (9-10) school and 358(1.06%) were enrolled in preparatory (11-12) level. The teacher
to student ratio of the woreda in (1-4) primary, (5-8), Secondary (9-10) preparatory (11-12) is
1:84, 1:35, 1:31 and 1:88 respectively. When we see the total schools to the kebele ratio nearly 2
schools to one kebele ratio available.
The DOR (Dropout rate) of the students are by total is 666(1.97%) and among these students
296(0.87%) are Female students and from the total of female students 296(1.86%) are female
DOR and among male students 370 (2.09%) are male DOR from their own category.
From the total of the 43 schools 8(18%) have access to water supply and total of 43 schools have
latrine for use.
Anti- HIV AIDS club, environmental health club, eye health are clubs being functioning in the
schools by being eye care club is the main functioning club in all schools by the district during
the study time.
All most all kebeles have access to the mobile telecommunication in the district.
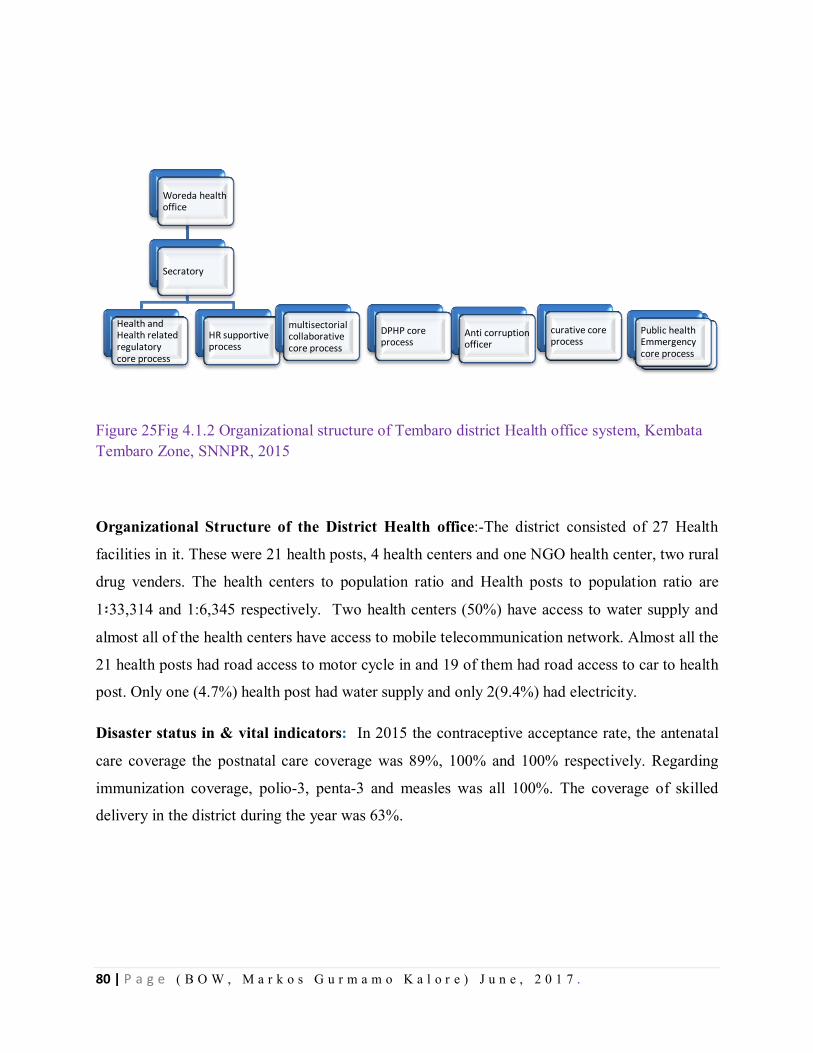
80 | P a g e ( B O W , M a r k o s G u r m a m o K a l o r e ) J u n e , 2 0 1 7 .
Figure 25Fig 4.1.2 Organizational structure of Tembaro district Health office system, Kembata Tembaro Zone, SNNPR, 2015
Organizational Structure of the District Health office:-The district consisted of 27 Health
facilities in it. These were 21 health posts, 4 health centers and one NGO health center, two rural
drug venders. The health centers to population ratio and Health posts to population ratio are
1፡33,314 and 1:6,345 respectively. Two health centers (50%) have access to water supply and
almost all of the health centers have access to mobile telecommunication network. Almost all the
21 health posts had road access to motor cycle in and 19 of them had road access to car to health
post. Only one (4.7%) health post had water supply and only 2(9.4%) had electricity.
Disaster status in & vital indicators: In 2015 the contraceptive acceptance rate, the antenatal
care coverage the postnatal care coverage was 89%, 100% and 100% respectively. Regarding
immunization coverage, polio-3, penta-3 and measles was all 100%. The coverage of skilled
delivery in the district during the year was 63%.
Woreda health office
Secratory
Health and Health related regulatory core process
HR supportive process
multisectorial collaborative core process
DPHP core process
Mothers and children core process
Anti corruption officer
Public health Emmergency core process
curative core process
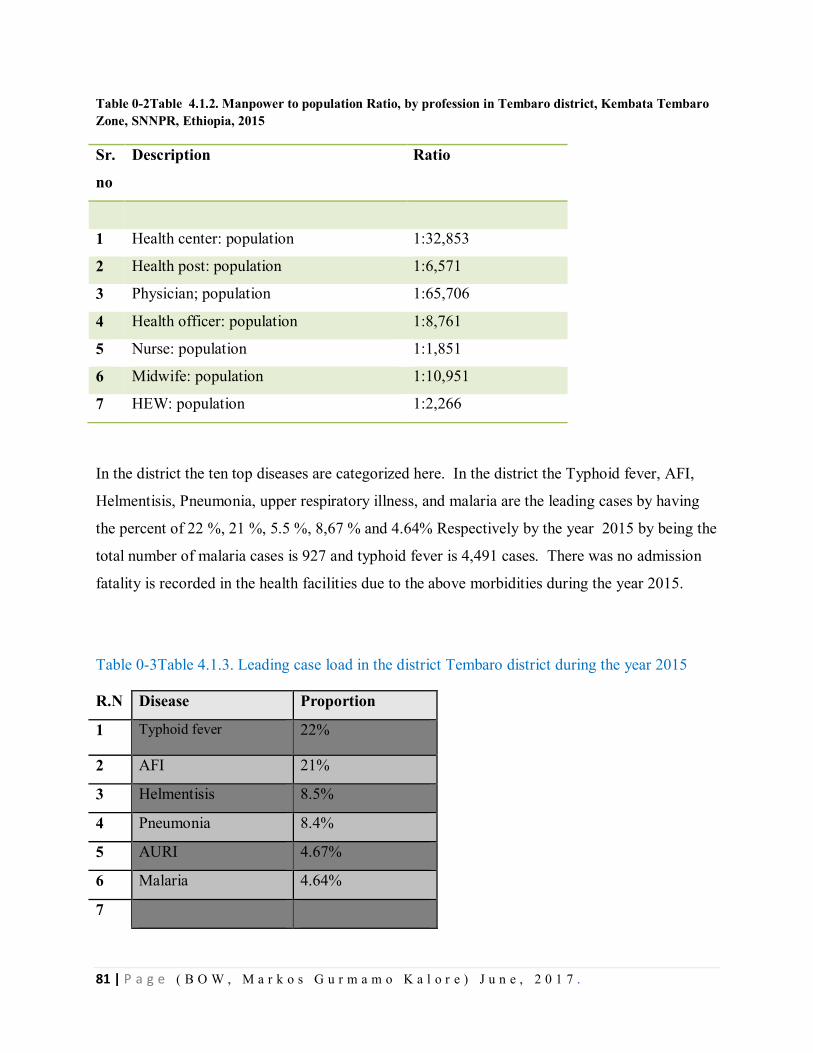
81 | P a g e ( B O W , M a r k o s G u r m a m o K a l o r e ) J u n e , 2 0 1 7 .
Table 0-2Table 4.1.2. Manpower to population Ratio, by profession in Tembaro district, Kembata Tembaro Zone, SNNPR, Ethiopia, 2015
Sr.
no
Description Ratio
1 Health center: population 1:32,853
2 Health post: population 1:6,571
3 Physician; population 1:65,706
4 Health officer: population 1:8,761
5 Nurse: population 1:1,851
6 Midwife: population 1:10,951
7 HEW: population 1:2,266
In the district the ten top diseases are categorized here. In the district the Typhoid fever, AFI,
Helmentisis, Pneumonia, upper respiratory illness, and malaria are the leading cases by having
the percent of 22 %, 21 %, 5.5 %, 8,67 % and 4.64% Respectively by the year 2015 by being the
total number of malaria cases is 927 and typhoid fever is 4,491 cases. There was no admission
fatality is recorded in the health facilities due to the above morbidities during the year 2015.
Table 0-3Table 4.1.3. Leading case load in the district Tembaro district during the year 2015
R.N Disease Proportion
1 Typhoid fever 22%
2 AFI 21%
3 Helmentisis 8.5%
4 Pneumonia 8.4%
5 AURI 4.67%
6 Malaria 4.64%
7
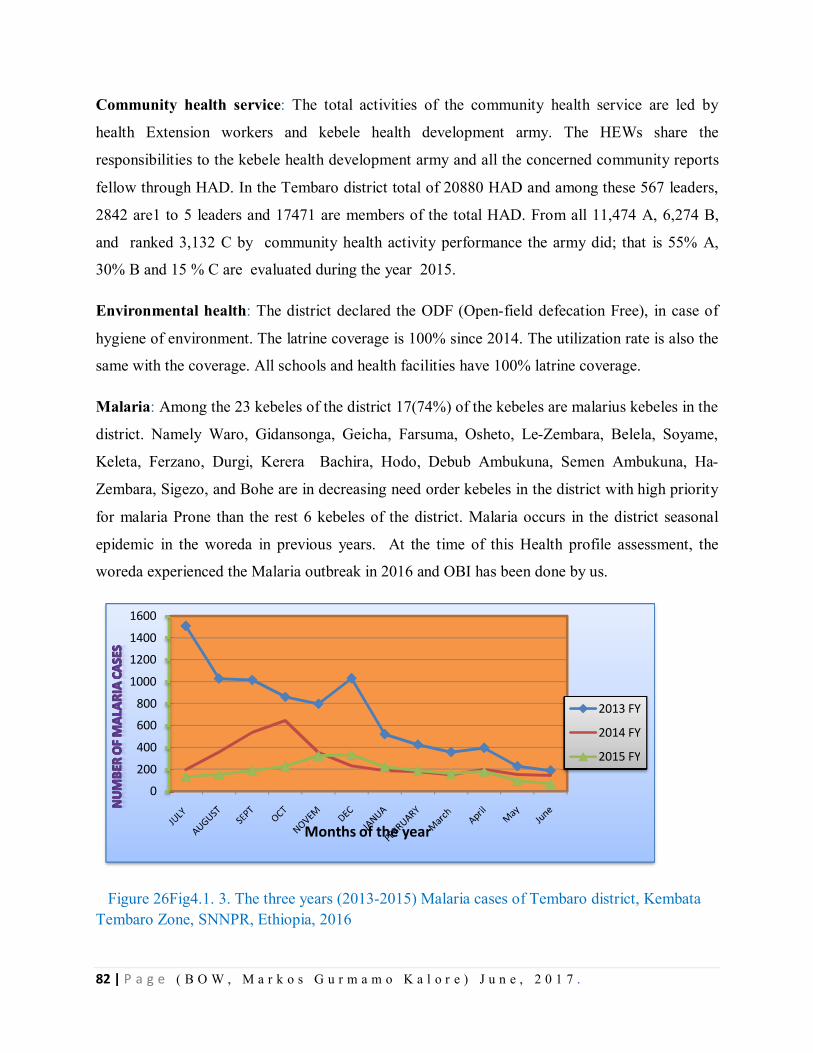
82 | P a g e ( B O W , M a r k o s G u r m a m o K a l o r e ) J u n e , 2 0 1 7 .
Community health service: The total activities of the community health service are led by
health Extension workers and kebele health development army. The HEWs share the
responsibilities to the kebele health development army and all the concerned community reports
fellow through HAD. In the Tembaro district total of 20880 HAD and among these 567 leaders,
2842 are1 to 5 leaders and 17471 are members of the total HAD. From all 11,474 A, 6,274 B,
and ranked 3,132 C by community health activity performance the army did; that is 55% A,
30% B and 15 % C are evaluated during the year 2015.
Environmental health: The district declared the ODF (Open-field defecation Free), in case of
hygiene of environment. The latrine coverage is 100% since 2014. The utilization rate is also the
same with the coverage. All schools and health facilities have 100% latrine coverage.
Malaria: Among the 23 kebeles of the district 17(74%) of the kebeles are malarius kebeles in the
district. Namely Waro, Gidansonga, Geicha, Farsuma, Osheto, Le-Zembara, Belela, Soyame,
Keleta, Ferzano, Durgi, Kerera Bachira, Hodo, Debub Ambukuna, Semen Ambukuna, Ha-
Zembara, Sigezo, and Bohe are in decreasing need order kebeles in the district with high priority
for malaria Prone than the rest 6 kebeles of the district. Malaria occurs in the district seasonal
epidemic in the woreda in previous years. At the time of this Health profile assessment, the
woreda experienced the Malaria outbreak in 2016 and OBI has been done by us.
Figure 26Fig4.1. 3. The three years (2013-2015) Malaria cases of Tembaro district, Kembata Tembaro Zone, SNNPR, Ethiopia, 2016
0
200
400
600
800
1000
1200
1400
1600
Months of the year
2013 FY
2014 FY
2015 FY
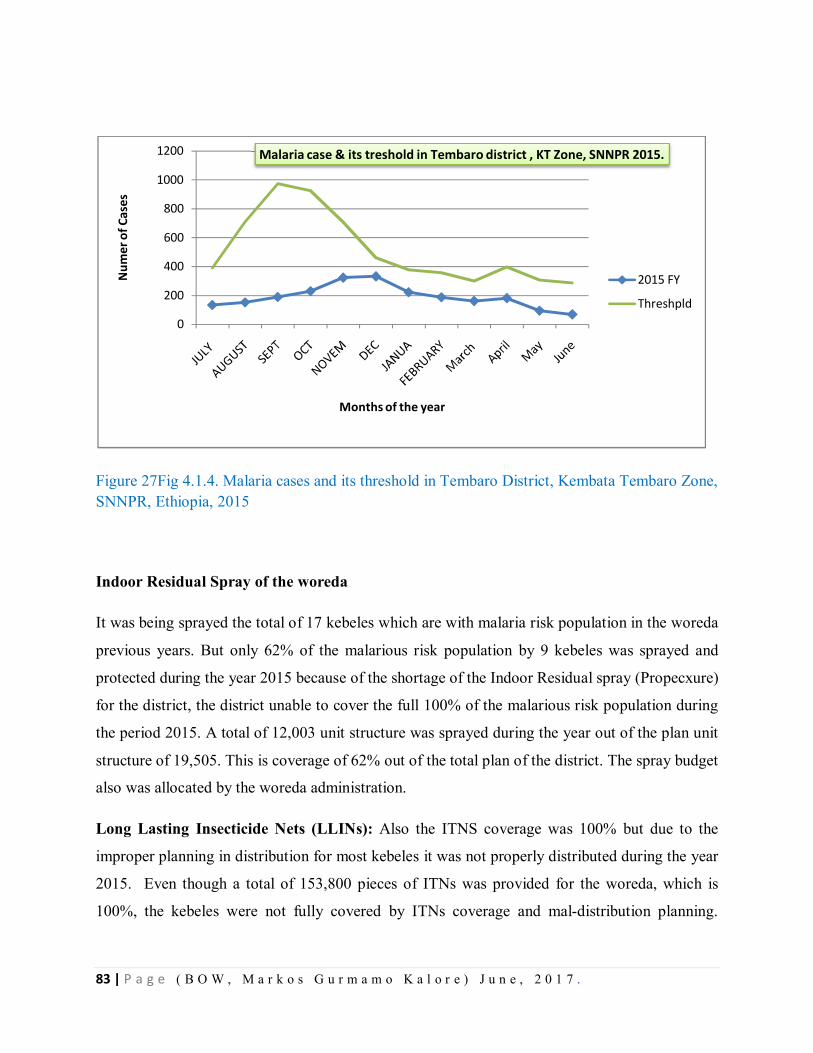
83 | P a g e ( B O W , M a r k o s G u r m a m o K a l o r e ) J u n e , 2 0 1 7 .
Figure 27Fig 4.1.4. Malaria cases and its threshold in Tembaro District, Kembata Tembaro Zone, SNNPR, Ethiopia, 2015
Indoor Residual Spray of the woreda
It was being sprayed the total of 17 kebeles which are with malaria risk population in the woreda
previous years. But only 62% of the malarious risk population by 9 kebeles was sprayed and
protected during the year 2015 because of the shortage of the Indoor Residual spray (Propecxure)
for the district, the district unable to cover the full 100% of the malarious risk population during
the period 2015. A total of 12,003 unit structure was sprayed during the year out of the plan unit
structure of 19,505. This is coverage of 62% out of the total plan of the district. The spray budget
also was allocated by the woreda administration.
Long Lasting Insecticide Nets (LLINs): Also the ITNS coverage was 100% but due to the
improper planning in distribution for most kebeles it was not properly distributed during the year
2015. Even though a total of 153,800 pieces of ITNs was provided for the woreda, which is
100%, the kebeles were not fully covered by ITNs coverage and mal-distribution planning.
0
200
400
600
800
1000
1200
Num
er o
f Cas
es
Months of the year
Malaria case & its treshold in Tembaro district , KT Zone, SNNPR 2015.
2015 FY
Threshpld
84 | P a g e ( B O W , M a r k o s G u r m a m o K a l o r e ) J u n e , 2 0 1 7 .
Abate chemical and other community mobilization activities was done in the district to prevent
malaria disease infection.
HIV/AIDS: A total of 52,701 cases were tested for HIV/AIDS during the year and only one
female individual was reactive for RVI and linked to the ART clinic for treatment. Out of the
total HIV screened individuals 23,312 were males and 29,389 were female individuals. On
voluntary counseling and Testing (VCT) a total of 24,147 people were tested and among these
10691 were males and 13,456 were female which is more number of tested females were
registered in it. By provider Initiated counseling and testing a total of 24,082 people were tested
and 12,621 and 11,461 were males and females respectively. On PMTCT a total of 4,472
females were tested. According to the district report indicats during the 2015 year finding a total
people on ART are 70 since 2015 by being 23 females and 37 Males in the District.
TB and Leprosy: There were a total of 178 TB case in the district during the year 2015. Out of
these 127(71.34%) were pulmonary positive, 18(10.11%) were pulmonary Negative and
33(18.53) were Extra pulmonary cases. During the year TB detection Rate was 56.7 % and TB
treatment completion was 100%. All the TB cases those 178 were screened for HIV/AIDS
during the year in the District. Even though all screened fortunately no one was reactive for HIV
among the TB cases. There was no any Leprosy case recorded in the year 2015 in the district.
Malnutrition: The district was being faced the problem of Malnutrition since long years. Severe
acute malnutrition was one problem of the District. Even though there were the slight decrement
among new admissions of the woreda malnourished cases 2012-2015, on 2015 the months like
May and June were with High cases. The malnutrition cases in the district per 1000 population
were, 8, 4.3, 3.7, 4 from 2012 to 2015 respectively in years recently order.
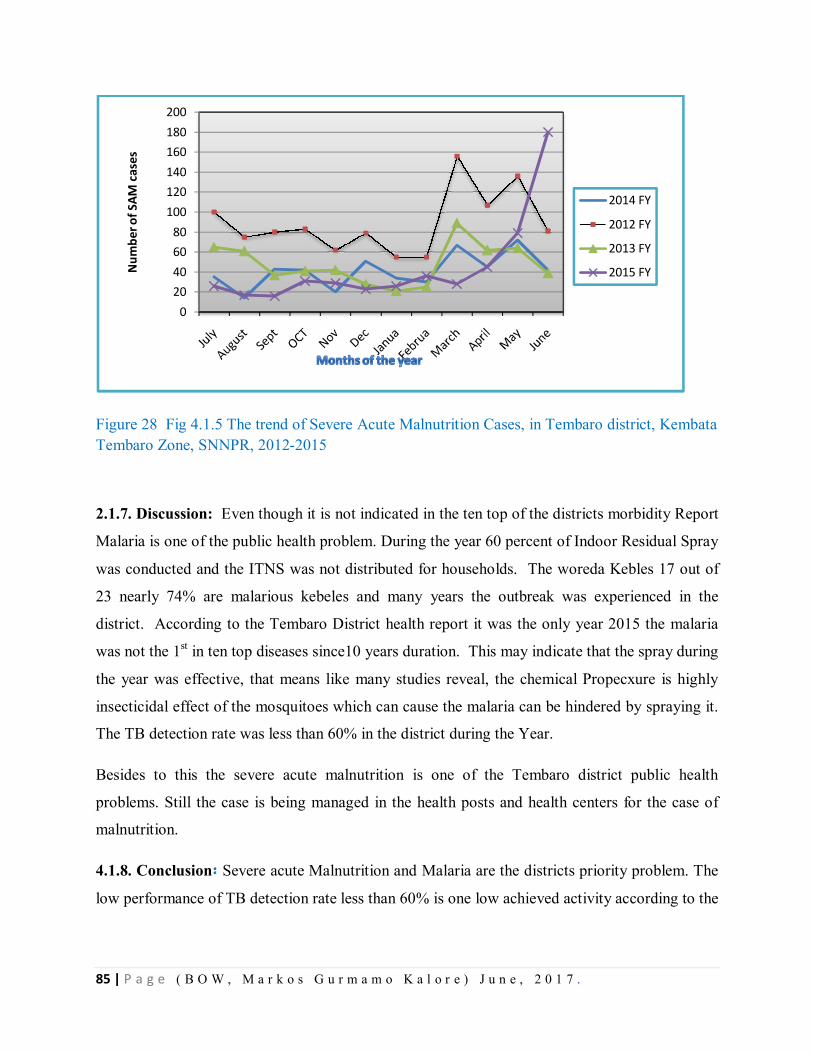
85 | P a g e ( B O W , M a r k o s G u r m a m o K a l o r e ) J u n e , 2 0 1 7 .
Figure 28 Fig 4.1.5 The trend of Severe Acute Malnutrition Cases, in Tembaro district, Kembata Tembaro Zone, SNNPR, 2012-2015
2.1.7. Discussion: Even though it is not indicated in the ten top of the districts morbidity Report
Malaria is one of the public health problem. During the year 60 percent of Indoor Residual Spray
was conducted and the ITNS was not distributed for households. The woreda Kebles 17 out of
23 nearly 74% are malarious kebeles and many years the outbreak was experienced in the
district. According to the Tembaro District health report it was the only year 2015 the malaria
was not the 1st in ten top diseases since10 years duration. This may indicate that the spray during
the year was effective, that means like many studies reveal, the chemical Propecxure is highly
insecticidal effect of the mosquitoes which can cause the malaria can be hindered by spraying it.
The TB detection rate was less than 60% in the district during the Year.
Besides to this the severe acute malnutrition is one of the Tembaro district public health
problems. Still the case is being managed in the health posts and health centers for the case of
malnutrition.
4.1.8. Conclusion፡ Severe acute Malnutrition and Malaria are the districts priority problem. The
low performance of TB detection rate less than 60% is one low achieved activity according to the
020406080
100120140160180200
Num
ber o
f SAM
cas
es
2014 FY
2012 FY
2013 FY
2015 FY
86 | P a g e ( B O W , M a r k o s G u r m a m o K a l o r e ) J u n e , 2 0 1 7 .
plan of the district Tembaro. Malaria was problem of the woreda before years even though
currently there is no malaria case increment. In year 2015 there was no outbreak of malaria.
4.1.9. Recommendation:
Malnutrition management of the patients should be enhanced for admitted cases and
malt sectoral approach for prevent malnutrition has to be done
Early community based nutrition for less than 2 years children have to be enhanced
The malaria prevention and control activities like Indoor Residual Spray and others has
to be given priority because 73 % of the woreda kebeles are known to be malarious
TB Detection has to be done for all clients with cough of two weeks and more
2.1.11. References
1. Tembaro woreda health office Annual report 2015
2. Million T, Adamu description of Sidama Zone 2012A, Luc R. Health Profile 2012
3. Tembaro Woreda Educational Office Annual report of 2015
4. Tembaro woreda finance and economic development Report of201
87 | P a g e ( B O W , M a r k o s G u r m a m o K a l o r e ) J u n e , 2 0 1 7 .
Chapter –V- Scientific Manuscript for Peer Reviewed Journals Title
5.1. Malaria Outbreak investigation, in Le-Zembara Kebele, Tembaro District, Kembata Tembaro Zone, SNNPR, Ethiopia, January 2016 GC Markos Gurmamo1, A. Adamu2, G. Muluken2, S. Endashew3
1. Ethiopian FETP- Cohort VII-Resident 2. Addis Ababa University College of Health Science School of Public
Health 3. SNNPR Regional Health Bureau PHEM Core Process
Name of FETP: Ethiopia FETP
FETP Entry/Graguation: 2015/16
[email protected] (+251) 912134585
Abstract
Back Ground: In January 2016, increment of malaria cases was reported from Le-Zembara
kebele, Tembaro district, Kembata Tembaro Zone, SNNPR, Ethiopia. We conducted outbreak
investigation, described its magnitude, identified risk factors and control measures implemented.
Method: We defined cases and controls. Laboratory smear or Rapid Diagnostic Test (RDT)
positive within that two weeks being the cases and persons who are not cases plus without
malaria symptoms within that two weeks among kebele residents. We conducted the case control
study with randomly selected 44 cases and 88 unmatched community controls. It’s magnitude
described by person, place and time. It’s threshold compared by using the previous same season
case data. Epi Info7.1.4 and Microsoft Excel were used for data entry and analysis. We also
assessed environmental risk factors for the outbreak.
Result: A total of 659 confirmed malaria cases (Attack Rate: 106 per 1000) and zero death were
reported from Jan to Feb 2016. Positivity rate was 77.8 % among with sign symptoms tested.
Presence of stagnant water and intermittent rivers found (OR: 6.2, 95% CI 1.5-24.8) and (OR of
1.6, 95%, 0.7-3.3) respectively. Using bed net was preventive effect (OR: 0.6, 95% CI, and 0.7-
1.4).
Conclusion and Recommendation:-Presence of stagnant water bodies nearby living area and
low use of bed nets are most associated factors for this outbreak. Stagnant water bodies drained,
additional bed nets distributed and indoor residual chemical sprayed for households.
Key Words: Malaria, Outbreak, Case-Control, Le-Zembara, Ethiopia
88 | P a g e ( B O W , M a r k o s G u r m a m o K a l o r e ) J u n e , 2 0 1 7 .
Introduction
Malaria is mosquito-borne parasitic disease and one of the most major public health problems of
human beings. It makes occur 300 to 500 million episodes of acute illness and 1.2 million deaths
per year worldwide. Malaria is affecting more than 100 countries of tropical and subtropical
regions of the world. It is one of the leading causes of death in children under 5 years in Sub-
Saharan African countries and accounts nearly 25% of all deaths.
Ethiopia is among the few countries with unstable malaria transmission. Consequently, malaria
epidemics are serious public health emergencies. In most situations, malaria epidemics develop
over several weeks, allowing some lead-time to act proactively to avoid larger numbers of
illnesses and to prevent transmission. Although historically there have been an estimated 10
million clinical malaria cases annually, cases have reduced since 2006(National Malaria
Guideline of Ethiopia, 3rd Edition, 2012).
Due to Ethiopian’s complex topography and seasonal rainfall supports largely seasonal short
term transmission, malaria is generally unstable that put population non immuned[Epidemiology
and Ecology of disease and Health in Ethiopia, 3rd Edition Edited by Yemane Berhane; Damene
Haile Mariam; Helmut kloos, Ethiopia 2011]. Unlike other Sub Saharan countries asymptomatic
paracitimia is not a common phenomenon in Ethiopia. Recurrent outbreaks and epidemics are
associated with cyclical climatic variations that lead to increased vector survival in the country.
Generally malaria cases are peaked after two rainy seasons (March to May and July to
September). The country has entertained the worst malaria Epidemic in 1958 with million cases
and 150,000 mortality [Draft guideline for malaria control in Ethiopia; Malaria and other vector
borne diseases prevention and control Department; Federal ministry of health; Addis Ababa
Ethiopia, January 2002]
Methods and Materials
Method - Study Design
Descriptive Epidemiology & Analytic Epidemiology was conducted to investigate the outbreak.
89 | P a g e ( B O W , M a r k o s G u r m a m o K a l o r e ) J u n e , 2 0 1 7 .
Method -Data Collection
Unmatched case –control study was conducted to identify risk factors associated with disease
from January 30 to February 8/2016. Community controls were selected from recently (within
two weeks of interview) confirmed Malaria case patient’s 1:2 ratio
Method
Method Data Analysis: – The data analyzed with Epi Info and Microsoft Excel.
Method Definition
Community Case definition
Any person with fever OR fever with headache, Back pain, chills, rigor, sweating, muscle pain,
Nausea and vomiting OR suspected case confirmed by RDT.
Standard case Definition
Suspected Case: Any person with fever or fever with headache, back pain, chills, rigor, sweating,
muscle pain, nausea and vomiting diagnosed clinically as malaria
Result
Laboratory result
From January to March 2016, a total of 847 blood smear tests were done by microscopy and
RDT for suspected malaria cases at all sites of the Le-Zembara kebele including the Health post,
the Health center , and the community outreach in site in the Kebele and 659 (77.8%)were
positive . From the positive cases, 406(61.6%) were p. falciparum, 76(11.5%) were p.vivax and
177(26.8%) were mixed malaria cases.
Descriptive Epidemiology
A total of 659 cases per 6208 risk population (Attack Rate =106 per 1000) confirmed malaria
cases were reported from Le-Zembara Kebele of Tembaro district from January to March 2,
2016( Table1). Death was not reported during the outbreak period. Slide positivity rate of the
malaria during this outbreak period was 77.8% and increased by 70.8% compared to the same
months of previous year January to February. The outbreak was detected at the 21 of the January
2016, that the Epi week3 report of the malaria cases were crossed the Epidemic threshold of
2015 (80 cases were reported for a threshold of the 2cases). The highest number of cases was
reported there in WK 8 of 2016 that is 245 cases. Total of the 428 cases were reported at the total
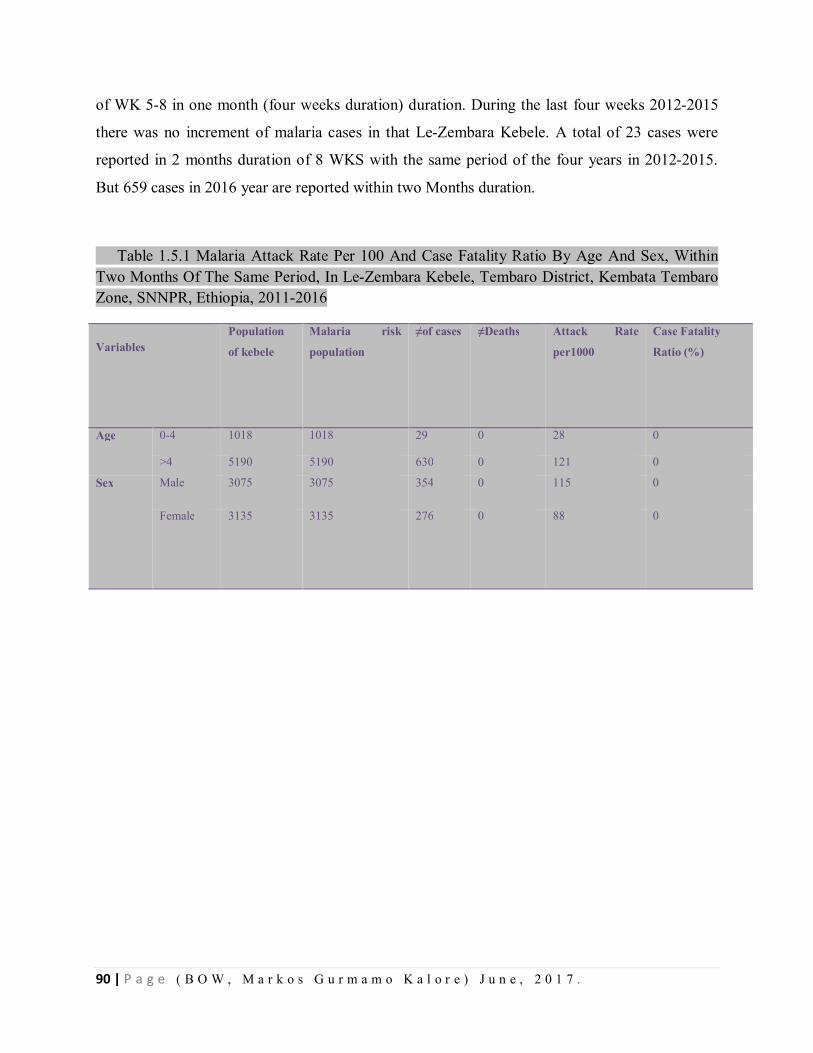
90 | P a g e ( B O W , M a r k o s G u r m a m o K a l o r e ) J u n e , 2 0 1 7 .
of WK 5-8 in one month (four weeks duration) duration. During the last four weeks 2012-2015
there was no increment of malaria cases in that Le-Zembara Kebele. A total of 23 cases were
reported in 2 months duration of 8 WKS with the same period of the four years in 2012-2015.
But 659 cases in 2016 year are reported within two Months duration.
0-1Table 1.5.1 Malaria Attack Rate Per 100 And Case Fatality Ratio By Age And Sex, Within Two Months Of The Same Period, In Le-Zembara Kebele, Tembaro District, Kembata Tembaro Zone, SNNPR, Ethiopia, 2011-2016
Variables Population
of kebele
Malaria risk
population
≠of cases ≠Deaths Attack Rate
per1000
Case Fatality
Ratio (%)
Age 0-4 1018 1018 29 0 28 0
>4 5190 5190 630 0 121 0
Sex Male 3075 3075 354 0 115 0
Female 3135 3135 276 0 88
0
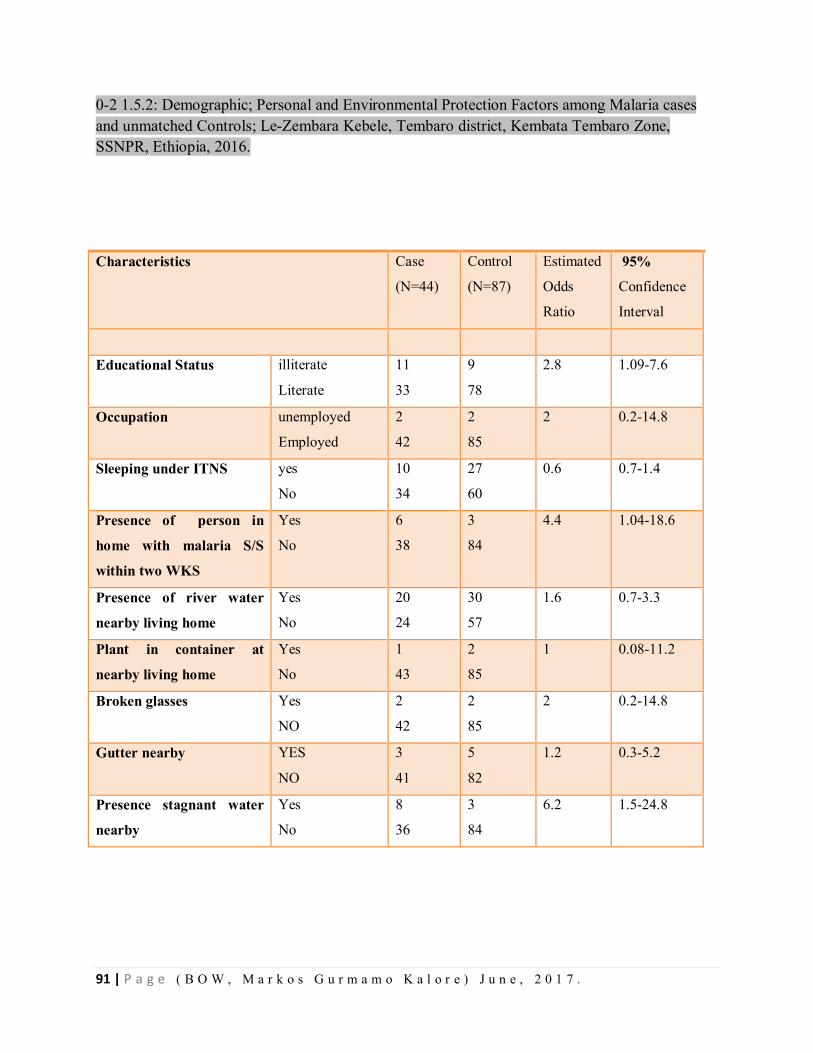
91 | P a g e ( B O W , M a r k o s G u r m a m o K a l o r e ) J u n e , 2 0 1 7 .
0-2 1.5.2: Demographic; Personal and Environmental Protection Factors among Malaria cases and unmatched Controls; Le-Zembara Kebele, Tembaro district, Kembata Tembaro Zone, SSNPR, Ethiopia, 2016.
Characteristics
Case
(N=44)
Control
(N=87)
Estimated
Odds
Ratio
95%
Confidence
Interval
Educational Status illiterate
Literate
11
33
9
78
2.8 1.09-7.6
Occupation unemployed
Employed
2
42
2
85
2 0.2-14.8
Sleeping under ITNS yes
No
10
34
27
60
0.6 0.7-1.4
Presence of person in
home with malaria S/S
within two WKS
Yes
No
6
38
3
84
4.4 1.04-18.6
Presence of river water
nearby living home
Yes
No
20
24
30
57
1.6 0.7-3.3
Plant in container at
nearby living home
Yes
No
1
43
2
85
1 0.08-11.2
Broken glasses Yes
NO
2
42
2
85
2 0.2-14.8
Gutter nearby YES
NO
3
41
5
82
1.2 0.3-5.2
Presence stagnant water
nearby
Yes
No
8
36
3
84
6.2 1.5-24.8
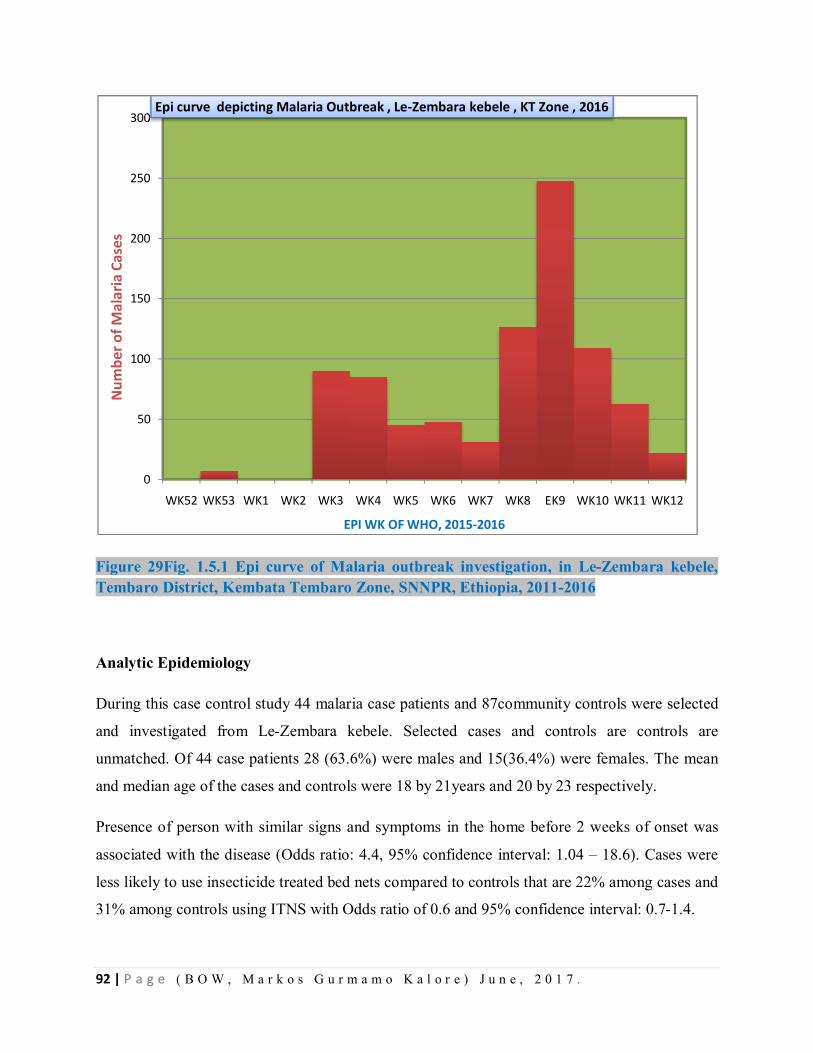
92 | P a g e ( B O W , M a r k o s G u r m a m o K a l o r e ) J u n e , 2 0 1 7 .
Figure 29Fig. 1.5.1 Epi curve of Malaria outbreak investigation, in Le-Zembara kebele, Tembaro District, Kembata Tembaro Zone, SNNPR, Ethiopia, 2011-2016
Analytic Epidemiology
During this case control study 44 malaria case patients and 87community controls were selected
and investigated from Le-Zembara kebele. Selected cases and controls are controls are
unmatched. Of 44 case patients 28 (63.6%) were males and 15(36.4%) were females. The mean
and median age of the cases and controls were 18 by 21years and 20 by 23 respectively.
Presence of person with similar signs and symptoms in the home before 2 weeks of onset was
associated with the disease (Odds ratio: 4.4, 95% confidence interval: 1.04 – 18.6). Cases were
less likely to use insecticide treated bed nets compared to controls that are 22% among cases and
31% among controls using ITNS with Odds ratio of 0.6 and 95% confidence interval: 0.7-1.4.
0
50
100
150
200
250
300
WK52 WK53 WK1 WK2 WK3 WK4 WK5 WK6 WK7 WK8 EK9 WK10 WK11 WK12
Num
ber o
f Mal
aria
Cas
es
EPI WK OF WHO, 2015-2016
Epi curve depicting Malaria Outbreak , Le-Zembara kebele , KT Zone , 2016
93 | P a g e ( B O W , M a r k o s G u r m a m o K a l o r e ) J u n e , 2 0 1 7 .
Discussion
Many factors may have contributed to the occurrence of this outbreak in Le-Zembara Kebele.
Multiple risk factors were assessed during the investigation besides intervention activities.
Usually poor individual practice of towards Malaria prevention, Temperature, rain fall,
population movement is contributors for malaria the existence of malaria outbreak. This outbreak
was detected after the middle of January 2016. The small amount of rain fall in kebele made
stagnant water in this kebele of seasonal rain and some local river water bodies became stagnant
due to road construction bridges and unwashed away of small stagnant waters increased malaria
incidence in the kebele. Besides to these the high temperature and the low altitudes (some areas
registered 1490 m by GPS measurement) are also contributed the breeding of mosquito on the
site. There were no death recorded in the kebele, the possible reason could be strong case
detection and management at time of outbreak management including at the period of outbreak.
The Study done at India on risk factors of malaria outbreak indicates the lower risk of malaria
attack people sleep under ITNs, and it almost concedes with this study. Also the case control
study which was conducted assessing risk factor for malaria outbreak by Gemechu Shume in
Oromia Region, Ethiopia ; has almost the similar findings with this study on stagnant water is the
risk factor for malaria outbreak.
The presence of stagnant water nearby living environment is found to be the major cause for this
out break since it is the good media for mosquito larvae breeding and observed by naked eye.
The Villages closer to those water bodies are more affected than others. Research conducted in
Gurau Region of Peru also showed the availability of water bodies has higher association with
malaria attack rate and transmission possibility in human population. Besides to these the last
year the kebele spray was skipped due to shortage of chemical for Indoor Residual Spray and this
probably gave weakling gate for mosquito availability and resting in households.
Conclusion:- There was malaria Outbreak in Le-zembara Kebele, Tembaro district, Kembata
Tembaro Zone, SNNPR. The age group of above four years is more affected in the outbreak of
malaria disease. The villages called Lemeja and 3rd Zembara is more affected by malaria
outbreak. The presence of stagnant water, staying outside the home during night time, some
uncovered wells for mosquito breeding plus the presence of person with malaria sign and
94 | P a g e ( B O W , M a r k o s G u r m a m o K a l o r e ) J u n e , 2 0 1 7 .
symptoms are associated factors for having or contracting the malaria disease in this Le-
Zembara kebele. Even though the outbreak was notified timely, the combating strategies like
Indoor residual for focal spray was late due to shortage of the chemical. The already available
old ITNs is was not being monitored for proper utilization in the HHs, and the Abate chemical
for spraying on water bodies for larvaecidale purpose was bit expired and the kebele is still
utilizing it. Due to shortage of Propecxure chemical for the kebele at previous year time, it was
not totally sprayed in the kebele at expected time period of spray in 2015.
Public Intervention
A total of 1,300 pieces of new ITNS (Insecticide Treated bed nets) distributed for the kebele
during the outbreak. The environmental management like draining of the stagnant water due to
newly being constructed road is bridges is also made drain during the intervention time.
Community was mobilized and the proper utilization of ITNs in the HH is enhanced. The case
detection and case management at each level like outreach community, Health posts and Health
centers level was well done during the outbreak management period.
Recommendation
Identifying and draining potential mosquito breeding site has to be done.
Since the kebele is malarious, the ITNs should be distributed as standard for the kebele
households and the proper utilization of the ITNs should be monitored and maximized.
Regular indoor residual spray per required standard should be kept in place and sprayed with
in standard.
At weekly basis trend of malaria cases should be monitored and reported for the next level.
Community ownership strengthening has to be done in 1to5 level and at health Development
army level to manage the environment at abate chemical spray community participation.
Besides to this multi-sectoral collaboration and woreda administration has to play great role
on facilitating the outbreak control managing activities.
Weekly and monthly morbidity data has to be kept and documented.
ITNs coverage analysis has to be done at yearly basis in district and kebele levels.
95 | P a g e ( B O W , M a r k o s G u r m a m o K a l o r e ) J u n e , 2 0 1 7 .
References
1. Guideline for Malaria epidemic prevention and control in Ethiopia ; Federal ministry of Health
;2nd Edition ; Addis Ababa Ethiopia;2014
2. Malaria risk factors in Butajira area, south central Ethiopia: a multilevel Analysis: Adugna
Woyessa; Wakgari Deressa; Ahmed Ali and Bernt Lindtjorn; Ethiopia; 2013.
3. Ethiopian Roll back Malaria consultative mission; Essential Actions to Support the Attainment
of Abuja Targets; Kasssahun Negash; Ethiopia RBM country consultative Mission Final Report
;2004
4. Epidemiology and Ecology of disease and Health in Ethiopia, 3rd Edition Edited by Yemane
Berhane; Damene Hailemariam; Helmut kloos, Ethiopia 2011
5. Malaria in Ethiopia, Aynalem Adugna, Lesson 14
6. Prevalence and risk factors for malaria in Ethiopia, Dawit G Ayele, Ethiopia; 2012
7. Community Participation in Malaria Epidemic control in High land areas of southern Oromia;
Wakgari Deressa; Dereje Olana; Sheleme chibsa; Ethiopia; 2005.
8.A Malaria outbreak in Naxalbari; Darjeeling District; West Bangal , India; weakness in disease
control, important risk factors ; Puran K Sharma ; Ramakrishnan Ramanandran ; Yvan J Hutin
;Raju Sharma ; Mohan D Gupte; India; 2005
9. Malaria Risk Factors in Butajira Area, South central Ethiopia; a multilevel analysis; Adugna
Woyessa; Wakigari Deressa; Ahmed Ali, and BerntLindtjørn; Ethiopia; 2013
96 | P a g e ( B O W , M a r k o s G u r m a m o K a l o r e ) J u n e , 2 0 1 7 .
CHAPTER VI: - Abstracts For Scientific Presentation. Title
6.1. Malaria Outbreak investigation, in Le-Zembara Kebele, Tembaro District, Kembata Tembaro Zone, SNNPR, Ethiopia, January 2016 GC Markos Gurmamo1, A. Adamu2, G. Muluken2, S. Endashew3
1. Ethiopian FETP- Cohort VII-Resident 2. Addis Ababa University, College of Health Science, School
of Public Health 3. SNNPR Regional Health Bureau PHEM Core Process
Name of FETP: Ethiopia FETP
FETP Entry/Graduation: 2015/16
[email protected] (+251) 912134585)
Abstract
Back Ground: In January 2016, increment of malaria cases was reported from Le-Zembara kebele, Tembaro district, Kembata Tembaro Zone, SNNPR, Ethiopia. We conducted outbreak investigation, described its magnitude, identified risk factors with this outbreak and control measures implemented.
Method: We defined cases and controls. Laboratory smear or Rapid Diagnostic Test (RDT) positive within that two weeks being the cases and persons who are not cases plus without malaria symptoms within that two weeks among kebele residents. We conducted the case control study with randomly selected 44 cases and 88 unmatched community controls. It’s magnitude described by person, place and time. It’s threshold compared by using the previous same season case data. Epi Info7.1.4 and Microsoft Excel were used for data entry and analysis. We also assessed environmental risk factors for the outbreak.
Result:- A total of 659 confirmed malaria cases (Attack Rate: 106 per 1000) and zero death were reported from Jan to Feb 2016. Positivity rate was 77.8 % with sign symptoms tested. Presence of stagnant water and intermittent rivers found (OR: 6.2, 95% CI 1.5-24.8) and (OR of 1.6, 95%, 0.7-3.3) respectively. Using bed net was preventive effect (OR: 0.6, 95%CI, and 0.7-1.4).
Conclusion and Recommendation:-Presence of stagnant water bodies nearby living area and low use of bed nets are most associated factors for this outbreak. Stagnant water bodies drained, additional bed nets distributed and indoor residual chemical sprayed for households.
Key Words:- Malaria, Outbreak, Case-Control, Le-Zembara, Ethiopia.
97 | P a g e ( B O W , M a r k o s G u r m a m o K a l o r e ) J u n e , 2 0 1 7 .
Title
6.2. Surveillance Data Analysis of Severe Acute Malnutrition, Kembata Tembaro Zone, SNNP Region, Ethiopia, 2004-2008 E.C Markos Gurmamo1, A. Adamu2, G. Muluken2, S. Endashew3
1. Ethiopian FETP- Cohort VII-Resident 2. Addis Ababa University, College of Health Science,
School of Public Health 3. SNNPR Regional Health Bureau PHEM Core Process
Name of FETP: Ethiopia FETP
FETP Entry/Graduation: 2015/16
[email protected] (+251) 912134585)
Abstract
Background: Malnutrition causes child death in developing countries including Ethiopia.
Kembata Tembaro Zone is on among prone zone in SNNPR for severe acute malnutrition
currently. This study is intended to analyze severe acute malnutrition (SAM) reports of this zone
to understand its trends and propose recommendation.
Methods: Cross-sectional descriptive study was conducted during collection of SAM data. Five
years (2004 - 2008 E.C) report of SAM from the Zone and Regional database were reviewed.
Different variables such as, SAM admissions, deaths, cures, total discharges in different age
category with respect to time and place were included in the analysis of SAM report.
Results: In the zone total of 18, 175 SAM cases admitted during consecutive five years (2004 -
2008 E.C). Children 6-59 months of age constituted almost all % of new admissions. Admissions
decreased from 2004 to 2008 E.C, but for recent 4 years it was increasing. In five-year's report
32 deaths with a fatality rate of 0.18 to 0.42% reported.
Conclusion and Recommendation: Therapeutic Feeding Program admissions Sites increased
from 2004 to 2008 E.C. Deaths number was high in 2008 EC. This may be due to admission of
severe cases due to the year’s Eli Niño effect in 2008 EC. The existing reporting format needs to
be revised to include sex, pregnancy, and lactation status category.
Keywords: Severe Acute Malnutrition, Surveillance Data Analysis, Kembata Tembaro Zone,
Ethiopia
98 | P a g e ( B O W , M a r k o s G u r m a m o K a l o r e ) J u n e , 2 0 1 7 .
Title
6.3. Scabies Outbreak Investigation, Kacha Birra District, Kembata Tembaro Zone, SNNP
region, Ethiopia, November 11-20, 2016
Markos Gurmamo1, A. Adamu2, G. Muluken2, S. Endashew3
1. Ethiopian FETP- Cohort VII-Resident 2. Addis Ababa University, College of Health Science,
School of Public Health 3. SNNPR Regional Health Bureau PHEM Core Process
Name of FETP: Ethiopia FETP
FETP Entry/Graduation: 2015/16
[email protected] (+251) 912134585)
Abstract
Introduction: Scabies is one of the common but neglected parasitic diseases and major public
health problem globally and resource limited country in particularly. It affects about 300 million
people worldwide yearly with increased incidences during natural and manmade disasters. It
affects all age group, sexes, races and social class. It spreads by direct, prolonged, skin-to-skin
contact with a person who has scabies infestation.
Objective: To investigate the Scabies suspected outbreak and its risk factors in Kacha Birra
district of Kembata Tembaro Zone, Southern nation nationality people Region, Ethiopia.
Methods: We conducted community based unmatched case-control (1:3) study design. Data
were collected Using face to face interview administered structured questionnaire. Data were
coded entered, cleaned and then analyzed using Epi info and MS Excel is also Used.
Result: we collected a total of 517 scabies suspected cases line list from 3 Kebeles with overall
attack rate of 2.8/1,000 population with no scabies related death (CFR=0). The mean age was 12
year with ranges from 1year to 65 year and most affected age group was 5-14 years with an
attack rate of 1.6/1,000 populations. On Multivariate analysis, contact history with scabies cases
in past 2 month ,being age-group less than fifteen years were risk factor for developing the
scabies infestation and statistically significant with an AOR of 146 [95%CI=54.3-396.6 P= <
0.0001] and 2.355 [95%CI=1.36-4.03, P<0.0001] respectively. Active case search, health
education & drug treatment conducted during investigation.
99 | P a g e ( B O W , M a r k o s G u r m a m o K a l o r e ) J u n e , 2 0 1 7 .
Conclusion and recommendations: we confirmed scabies outbreak was occurred in Kacha
Birra District of Kembata Tembaro Zone, SNNP region. Contact history, presence of person
infested with scabies in the family and age less than 15 years were risk factors for transmission
of scabies. We recommend continuous active case search at all kebele levels, Prevention
methods, controls especially at community level including schools and mass treatment.
Keywords: Scabies outbreak, risk factors, Kaca Birra District.
100 | P a g e ( B O W , M a r k o s G u r m a m o K a l o r e ) J u n e , 2 0 1 7 .
CHAPTER VII:- Belg assessment Narrative Summary Report
7.1. Belg assessment Narrative Summary Report on in South Omo and Segen Area people’s Zone, SNNPR, Ethiopia, 2016 Executive Summary
Total of 06 teams established SNNPR regional level for Belg Assessment, one of the six was
assigned at South Omo and Segen area people’s zones in selected five woredas of both zones.
Both zones are located at Southern West of the SNNPR Region. This assessment is intended to
investigate the extent, types, magnitude, severity and likelihood of different risks in most
vulnerable woredas and develop the response plan based on the findings.
The visited districts were selected by discussing with Zonal Epidemic Preparedness Task force
and taking in to consideration those selected by the Regional Task forces. The same procedures
were done at district level to select visited Kebeles, Health Facilities and Villages. By following
these procedures, from South Omo Zone three woredas namely; (Malle, Benatsemay and
Dasench) and from Segen Area People’s Zone the two woredas namely; (Gedole and Alle) were
assessed from June 7 to 15, 2016. At each level interviews and discussions were conducted with
concerned bodies including community members by using prepared checklist. Additionally,
review of document at zonal and woreda level was conducted.
Despite of the fact that both Zones did not conduct the regular meeting, the multi-sectoral
coordination forum was being conducted in both zones at zonal level. In South Omo Zone there
was yellow Fever with total case of 22 and with Mortality of 5 cases and also salmonella
outbreak with total 772 cases and no death, contained two weeks prior to the assessment and in
Segen Area people’s zone there was outbreak of AWD with 9 cases no death at total from
March to June 2016. There were no other severe outbreaks in both zones in assessed time period.
There was shortage of emergency drug supplies in both visited zones. The water coverage of
both visited zones was blow 50% and schools Health Facilities and community level potable
water points and coverage was low and most of the health facilities and schools are without
water points. Anticipated outbreaks in both zones are AWD, Malaria, Meningitis and Measles in
addition to this Yellow fever is anticipated for outbreak in South Omo Zone.
101 | P a g e ( B O W , M a r k o s G u r m a m o K a l o r e ) J u n e , 2 0 1 7 .
Emergency Preparedness plan Task Force meeting has to be conducted regularly in both visited
zones and also the multi-sectoral coordination should be strengthened in both Zones and the
woredas level too.
Back ground
South Omo and Segen zones are two of neighboring zones in the Southern part of the region.
South Omo has 8 woredas whereas Segen has 5 woredas. The total population of South Omo and
Segen zones is 714, 588 and 718,886 respectively. South Omo is one of the malaria endemic
zones of the region. In Addition yellow fever, meningitis, measles are some of the diseases that
could cause outbreak in this zone (South Omo). The majority of the populations in South Omo
are pastoralists or semi pastoralists. South Omo is one of the tourist destinations and investment
corridors of the country.
Introduction
Access to food and the maintenance of adequate nutritional status are critical determinants of
people’s survival in a disaster. Malnutrition can be the most serious public health problem and
may be a leading cause of death, whether directly or indirectly. The resilience of livelihoods and
people’s subsequent food security determine their health and nutrition in the short term and their
future survival and well-being. Food aid can be important in protecting and providing for food
security and nutrition, as part of a combination of measures.
Malnutrition in one or more of its various forms frequently characterizes emergency situations,
both natural and man-made. Access to food and maintenance of adequate nutritional status is a
critical determinant of people’s survival in the initial stages of an emergency. Ensuring that the
food and nutritional needs of disaster-stricken populations, refugees or internally displaced
people are adequately met is often the principal component of the humanitarian, logistic,
management and financial response to an emergency. When the nutritional needs of a population
or population subgroup – are not adequately met, some form of malnutrition soon emerges,
usually among the most vulnerable individuals. Malnutrition can be the most serious public
health problem and may be a leading cause of death, whether directly or indirectly.
Health and nutrition are indeed closely linked: disease contributes to malnutrition and
malnutrition makes an individual more susceptible to disease and consequently more likely to
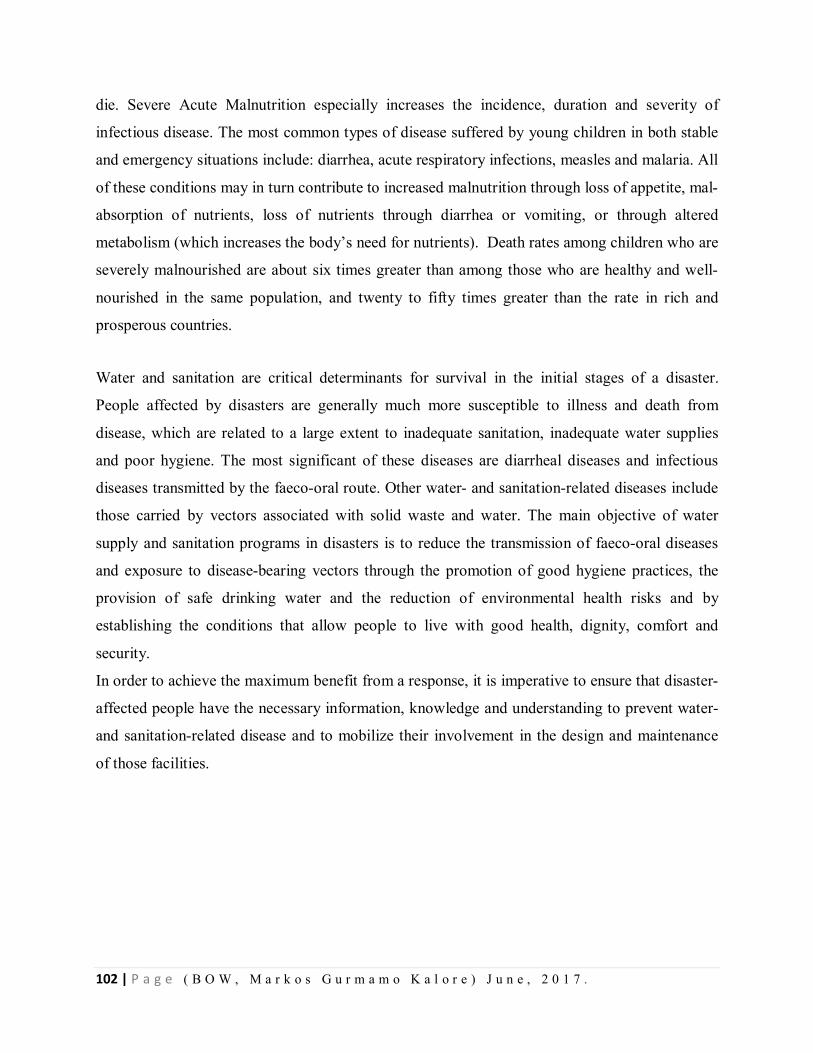
102 | P a g e ( B O W , M a r k o s G u r m a m o K a l o r e ) J u n e , 2 0 1 7 .
die. Severe Acute Malnutrition especially increases the incidence, duration and severity of
infectious disease. The most common types of disease suffered by young children in both stable
and emergency situations include: diarrhea, acute respiratory infections, measles and malaria. All
of these conditions may in turn contribute to increased malnutrition through loss of appetite, mal-
absorption of nutrients, loss of nutrients through diarrhea or vomiting, or through altered
metabolism (which increases the body’s need for nutrients). Death rates among children who are
severely malnourished are about six times greater than among those who are healthy and well-
nourished in the same population, and twenty to fifty times greater than the rate in rich and
prosperous countries.
Water and sanitation are critical determinants for survival in the initial stages of a disaster.
People affected by disasters are generally much more susceptible to illness and death from
disease, which are related to a large extent to inadequate sanitation, inadequate water supplies
and poor hygiene. The most significant of these diseases are diarrheal diseases and infectious
diseases transmitted by the faeco-oral route. Other water- and sanitation-related diseases include
those carried by vectors associated with solid waste and water. The main objective of water
supply and sanitation programs in disasters is to reduce the transmission of faeco-oral diseases
and exposure to disease-bearing vectors through the promotion of good hygiene practices, the
provision of safe drinking water and the reduction of environmental health risks and by
establishing the conditions that allow people to live with good health, dignity, comfort and
security.
In order to achieve the maximum benefit from a response, it is imperative to ensure that disaster-
affected people have the necessary information, knowledge and understanding to prevent water-
and sanitation-related disease and to mobilize their involvement in the design and maintenance
of those facilities.
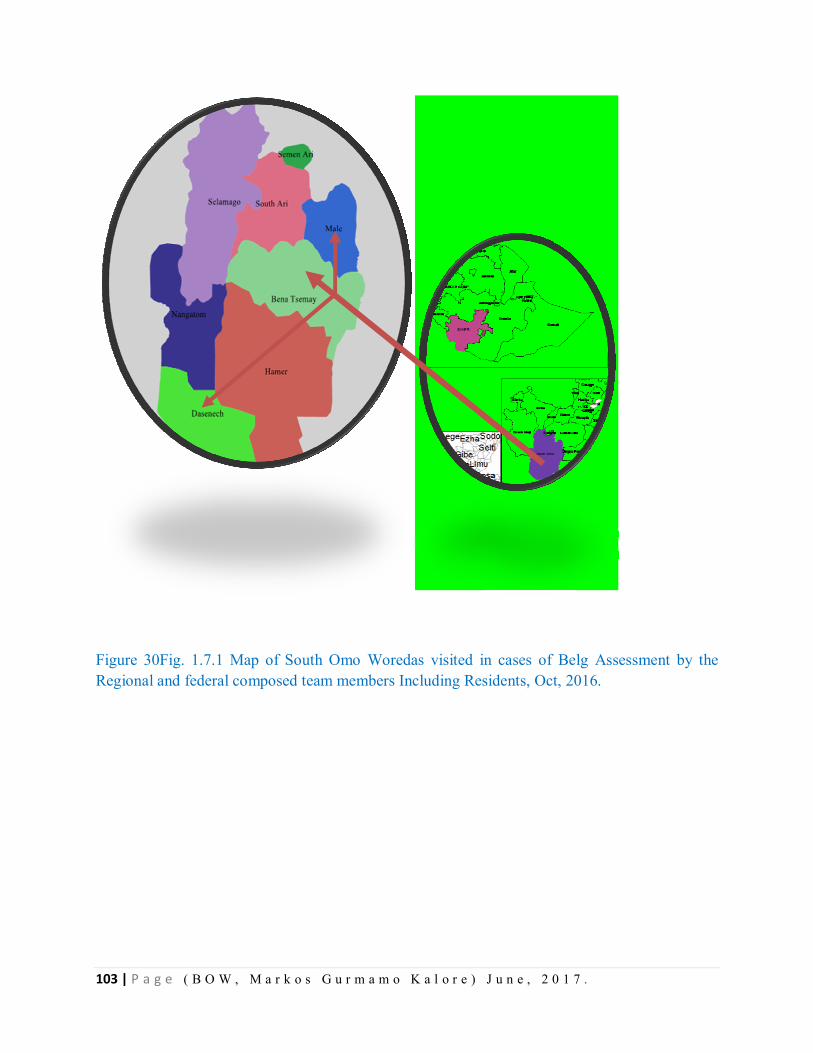
103 | P a g e ( B O W , M a r k o s G u r m a m o K a l o r e ) J u n e , 2 0 1 7 .
Figure 30Fig. 1.7.1 Map of South Omo Woredas visited in cases of Belg Assessment by the Regional and federal composed team members Including Residents, Oct, 2016.
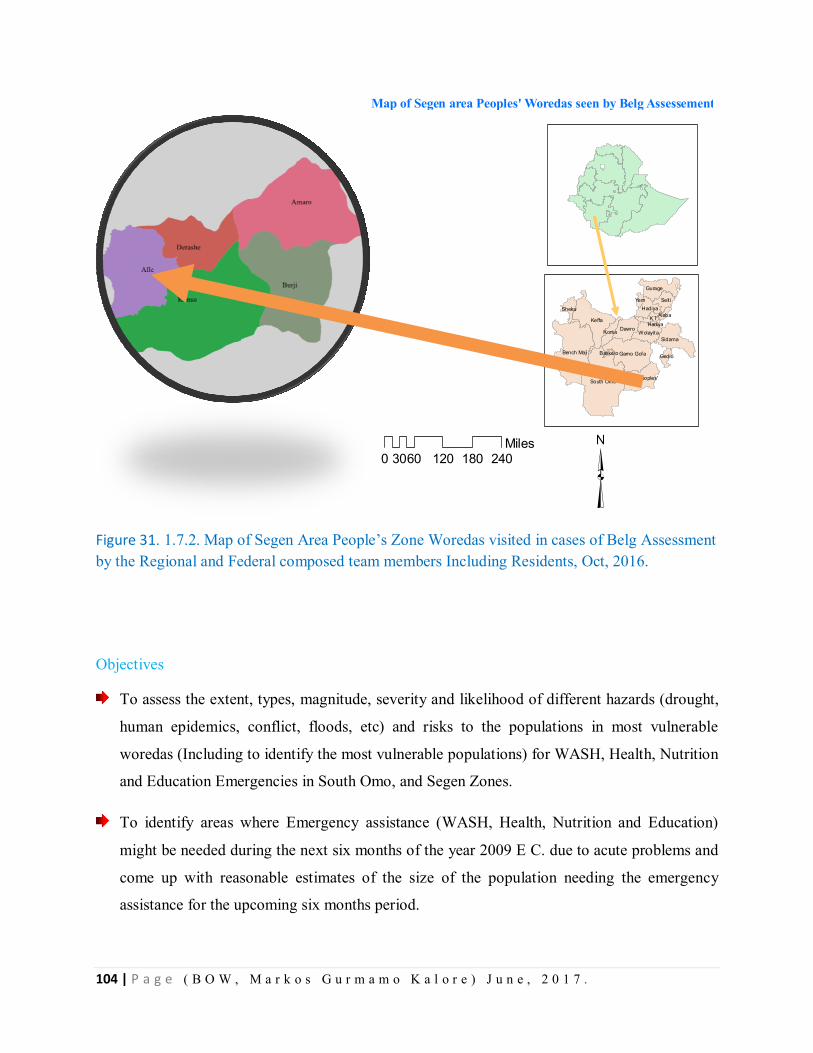
104 | P a g e ( B O W , M a r k o s G u r m a m o K a l o r e ) J u n e , 2 0 1 7 .
Figure 31. 1.7.2. Map of Segen Area People’s Zone Woredas visited in cases of Belg Assessment by the Regional and Federal composed team members Including Residents, Oct, 2016.
Objectives
To assess the extent, types, magnitude, severity and likelihood of different hazards (drought,
human epidemics, conflict, floods, etc) and risks to the populations in most vulnerable
woredas (Including to identify the most vulnerable populations) for WASH, Health, Nutrition
and Education Emergencies in South Omo, and Segen Zones.
To identify areas where Emergency assistance (WASH, Health, Nutrition and Education)
might be needed during the next six months of the year 2009 E C. due to acute problems and
come up with reasonable estimates of the size of the population needing the emergency
assistance for the upcoming six months period.
0 60 120 180 24030Miles
³
Map of Segen area Peoples' Woredas seen by Belg Assessement
South Omo
Keffa
Bench Maji Gamo Gofa
Sidama
Gurage
Dawro
Selt i
Wolayita
Hadiya
KT
Segen Peoples'
Konta
Sheka
Gedio
Yem
Alaba
Hadiya
Basketo
105 | P a g e ( B O W , M a r k o s G u r m a m o K a l o r e ) J u n e , 2 0 1 7 .
Based on the findings of the assessment the need to address potential emergencies to
develop; necessary plans and complete preparedness actions early in WASH, Health,
Nutrition and Education sectors for adequately addressing the potential Emergency
Methodology and Procedures
The assessment was conducted from June 7 to 16, 2016 in South Omo and Segen Zones, which
has a total population of 714,588 and 718,886 respectively. Three woredas from South Omo
(Benatsemay, Dasenech and Malle) and two woredas from Segen zone (Alle and Derashe) were
included in the assessment. The team submitted the permission letter to the zone administration
and the administration arranged a multi-sectoral meeting including (Early warning, education
office, Water mineral and energy office, Health department, Women and youth office) for
briefing.
The contents of the briefing are: weather condition; crop and livestock situation; Health and
nutrition; Water hygiene and Sanitation education and prospect of the Belg harvest. Based on
these each sector presented their plan and achievements for the year 2016. The team asked
different questions to have a depth understanding of the current status of respective zones.
Finally the team and the zone administration reached in a common consensus on which woredas
to be included in the assessment. Subsequently the team travelled to selected woredas and did
similar briefing to the woreda administration and sector office representatives. The team
captured important data using a structured questionnaire prepared by National Disaster Risk
Management Commission, visit to the affected kebeles, key informant interview and document
review. Before departing each visited zone and woreda the team gave debriefing to the respective
administrations about the preliminary findings of the assessment.
Results of Belg Assessment in South Omo Zone
Coordination
In all woredas the coordination of the multi- sectoral body is there but the gap is the members
are not having a meeting regularly. The NGOs and other related bodies are being assembled
when the need rises only like when the emergency phenomenon occurs.
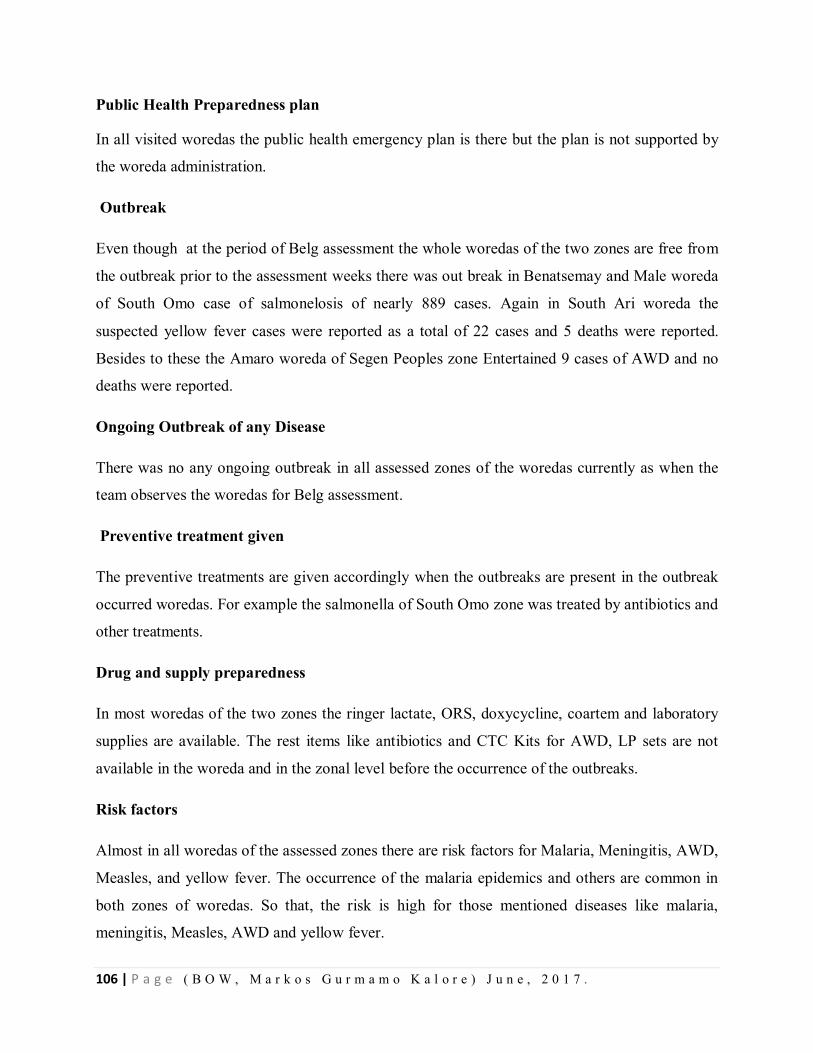
106 | P a g e ( B O W , M a r k o s G u r m a m o K a l o r e ) J u n e , 2 0 1 7 .
Public Health Preparedness plan
In all visited woredas the public health emergency plan is there but the plan is not supported by
the woreda administration.
Outbreak
Even though at the period of Belg assessment the whole woredas of the two zones are free from
the outbreak prior to the assessment weeks there was out break in Benatsemay and Male woreda
of South Omo case of salmonelosis of nearly 889 cases. Again in South Ari woreda the
suspected yellow fever cases were reported as a total of 22 cases and 5 deaths were reported.
Besides to these the Amaro woreda of Segen Peoples zone Entertained 9 cases of AWD and no
deaths were reported.
Ongoing Outbreak of any Disease
There was no any ongoing outbreak in all assessed zones of the woredas currently as when the
team observes the woredas for Belg assessment.
Preventive treatment given
The preventive treatments are given accordingly when the outbreaks are present in the outbreak
occurred woredas. For example the salmonella of South Omo zone was treated by antibiotics and
other treatments.
Drug and supply preparedness
In most woredas of the two zones the ringer lactate, ORS, doxycycline, coartem and laboratory
supplies are available. The rest items like antibiotics and CTC Kits for AWD, LP sets are not
available in the woreda and in the zonal level before the occurrence of the outbreaks.
Risk factors
Almost in all woredas of the assessed zones there are risk factors for Malaria, Meningitis, AWD,
Measles, and yellow fever. The occurrence of the malaria epidemics and others are common in
both zones of woredas. So that, the risk is high for those mentioned diseases like malaria,
meningitis, Measles, AWD and yellow fever.
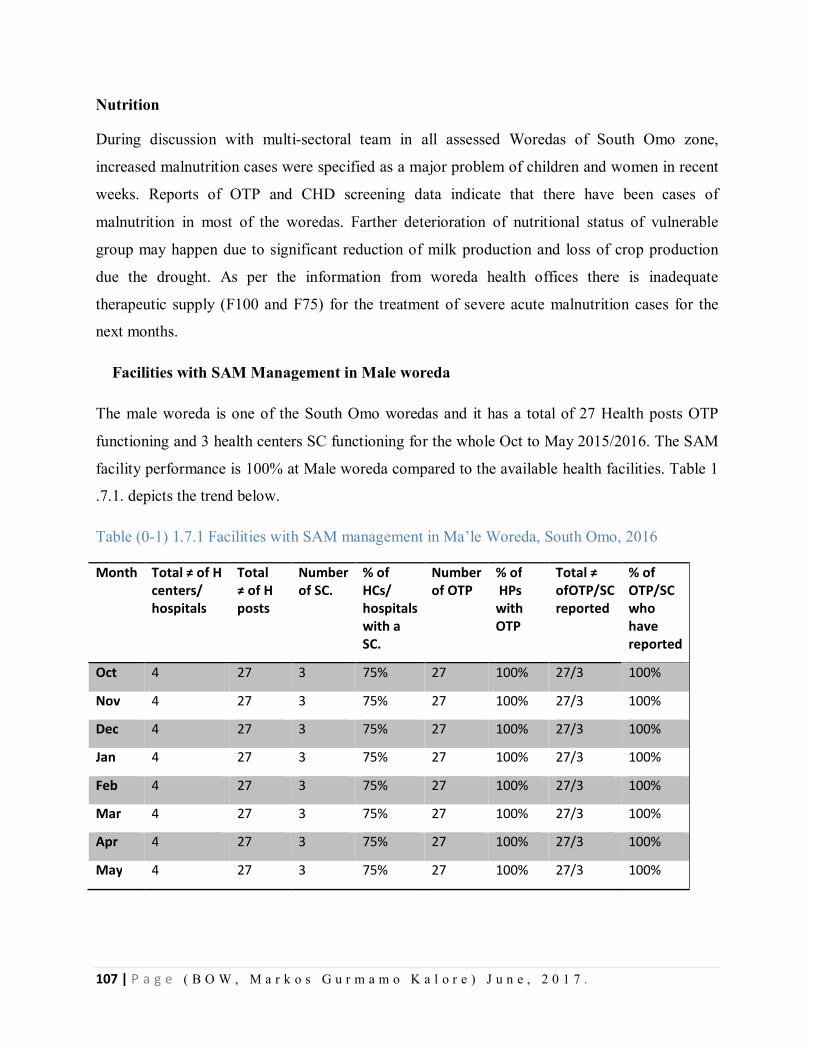
107 | P a g e ( B O W , M a r k o s G u r m a m o K a l o r e ) J u n e , 2 0 1 7 .
Nutrition
During discussion with multi-sectoral team in all assessed Woredas of South Omo zone,
increased malnutrition cases were specified as a major problem of children and women in recent
weeks. Reports of OTP and CHD screening data indicate that there have been cases of
malnutrition in most of the woredas. Farther deterioration of nutritional status of vulnerable
group may happen due to significant reduction of milk production and loss of crop production
due the drought. As per the information from woreda health offices there is inadequate
therapeutic supply (F100 and F75) for the treatment of severe acute malnutrition cases for the
next months.
Facilities with SAM Management in Male woreda
The male woreda is one of the South Omo woredas and it has a total of 27 Health posts OTP
functioning and 3 health centers SC functioning for the whole Oct to May 2015/2016. The SAM
facility performance is 100% at Male woreda compared to the available health facilities. Table 1
.7.1. depicts the trend below.
Table (0-1) 1.7.1 Facilities with SAM management in Ma’le Woreda, South Omo, 2016
Month Total ≠ of H centers/ hospitals
Total ≠ of H posts
Number of SC.
% of HCs/ hospitals with a SC.
Number of OTP
% of HPs with OTP
Total ≠ ofOTP/SC reported
% of OTP/SC who have reported
Oct 4 27 3 75% 27 100% 27/3 100%
Nov 4 27 3 75% 27 100% 27/3 100%
Dec 4 27 3 75% 27 100% 27/3 100%
Jan 4 27 3 75% 27 100% 27/3 100%
Feb 4 27 3 75% 27 100% 27/3 100%
Mar 4 27 3 75% 27 100% 27/3 100%
Apr 4 27 3 75% 27 100% 27/3 100%
May 4 27 3 75% 27 100% 27/3 100%
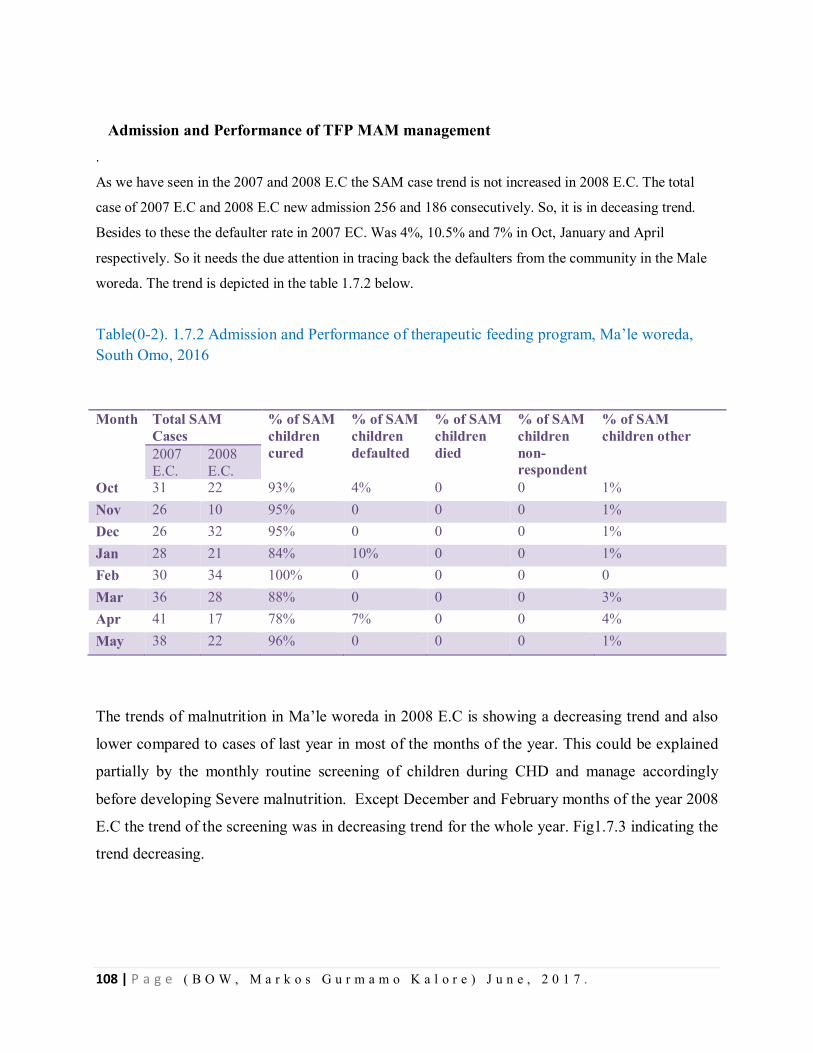
108 | P a g e ( B O W , M a r k o s G u r m a m o K a l o r e ) J u n e , 2 0 1 7 .
Admission and Performance of TFP MAM management .
As we have seen in the 2007 and 2008 E.C the SAM case trend is not increased in 2008 E.C. The total
case of 2007 E.C and 2008 E.C new admission 256 and 186 consecutively. So, it is in deceasing trend.
Besides to these the defaulter rate in 2007 EC. Was 4%, 10.5% and 7% in Oct, January and April
respectively. So it needs the due attention in tracing back the defaulters from the community in the Male
woreda. The trend is depicted in the table 1.7.2 below.
Table(0-2). 1.7.2 Admission and Performance of therapeutic feeding program, Ma’le woreda, South Omo, 2016
The trends of malnutrition in Ma’le woreda in 2008 E.C is showing a decreasing trend and also
lower compared to cases of last year in most of the months of the year. This could be explained
partially by the monthly routine screening of children during CHD and manage accordingly
before developing Severe malnutrition. Except December and February months of the year 2008
E.C the trend of the screening was in decreasing trend for the whole year. Fig1.7.3 indicating the
trend decreasing.
Month Total SAM Cases
% of SAM children cured
% of SAM children defaulted
% of SAM children died
% of SAM children non-respondent
% of SAM children other
2007 E.C.
2008 E.C.
Oct 31 22 93% 4% 0 0 1% Nov 26 10 95% 0 0 0 1% Dec 26 32 95% 0 0 0 1% Jan 28 21 84% 10% 0 0 1% Feb 30 34 100% 0 0 0 0 Mar 36 28 88% 0 0 0 3% Apr 41 17 78% 7% 0 0 4% May 38 22 96% 0 0 0 1%
109 | P a g e ( B O W , M a r k o s G u r m a m o K a l o r e ) J u n e , 2 0 1 7 .
Figure 32 Fig. 1.7.3 Comparison of SAM cases in 2015 and 2016, Ma’le woreda, South Omo, 2016
Availability of Therapeutic supplies
In all the assessed woredas the supplies for OTP and SC are available and some shortage in
Dasenech Woreda of the F100 and F75 are assessed. I n all the rest assessed woredas the supply
of plump nut, F100 and F75 are available.
The screening performance of the Male Woreda
The screening coverage in Male wore compared for the 8 months of the year and the
performance coverage ranges from minimum 55% to muximum 92 % at January and May
2015/2016 from the targat under five children. The SAM percentage of the children screened
was 0.1% and 0.2% in minimum and Maximum months respectively. Besides to this the GAM
percentage of the screening is 0.4% and 1.5% in minimum and in maximum respectively. As a
total the SAM cases in Male woreda were in decreasing trend when we compare the 8 months
trend.
0
5
10
15
20
25
30
35
40
45
Oct Nov Dec Jan Feb Mar Apr May
Num
ber o
f cas
es
Month
2007 E.C.
2008 E.C.
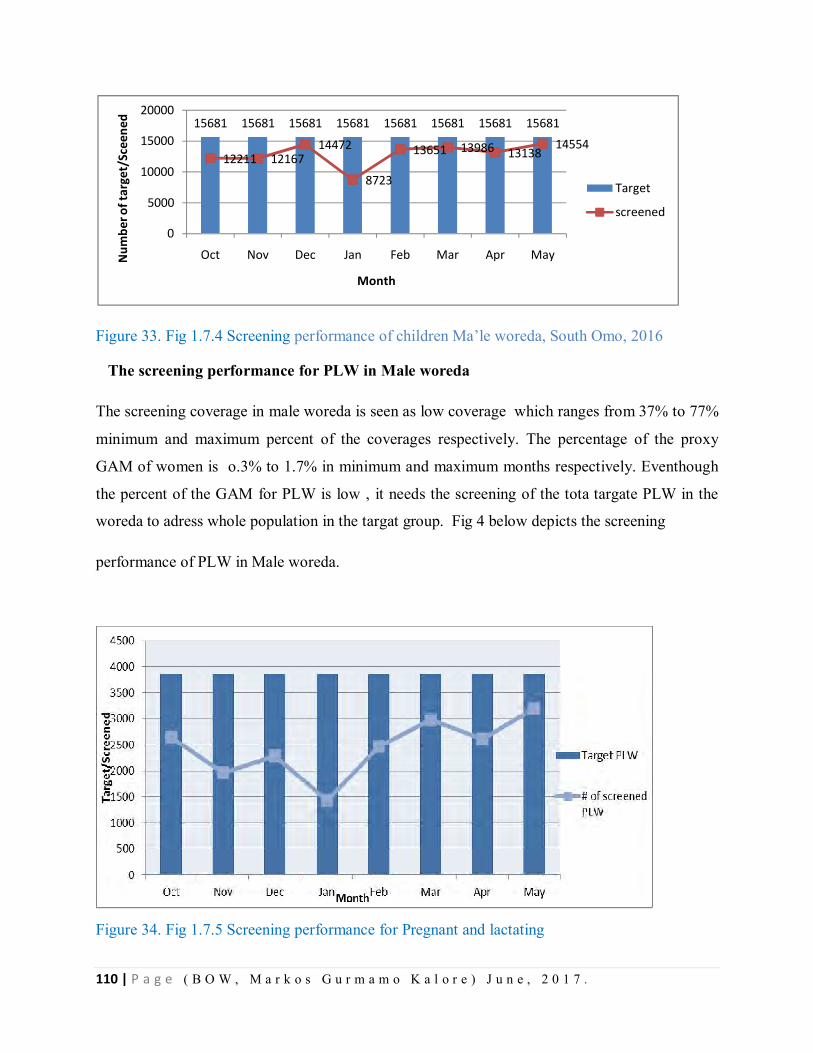
110 | P a g e ( B O W , M a r k o s G u r m a m o K a l o r e ) J u n e , 2 0 1 7 .
Figure 33. Fig 1.7.4 Screening performance of children Ma’le woreda, South Omo, 2016
The screening performance for PLW in Male woreda
The screening coverage in male woreda is seen as low coverage which ranges from 37% to 77%
minimum and maximum percent of the coverages respectively. The percentage of the proxy
GAM of women is o.3% to 1.7% in minimum and maximum months respectively. Eventhough
the percent of the GAM for PLW is low , it needs the screening of the tota targate PLW in the
woreda to adress whole population in the targat group. Fig 4 below depicts the screening
performance of PLW in Male woreda.
Figure 34. Fig 1.7.5 Screening performance for Pregnant and lactating
15681 15681 15681 15681 15681 15681 15681 15681
12211 1216714472
8723
13651 13986 1313814554
0
5000
10000
15000
20000
Oct Nov Dec Jan Feb Mar Apr MayNum
ber o
f tar
get/
Scee
ned
Month
Target
screened
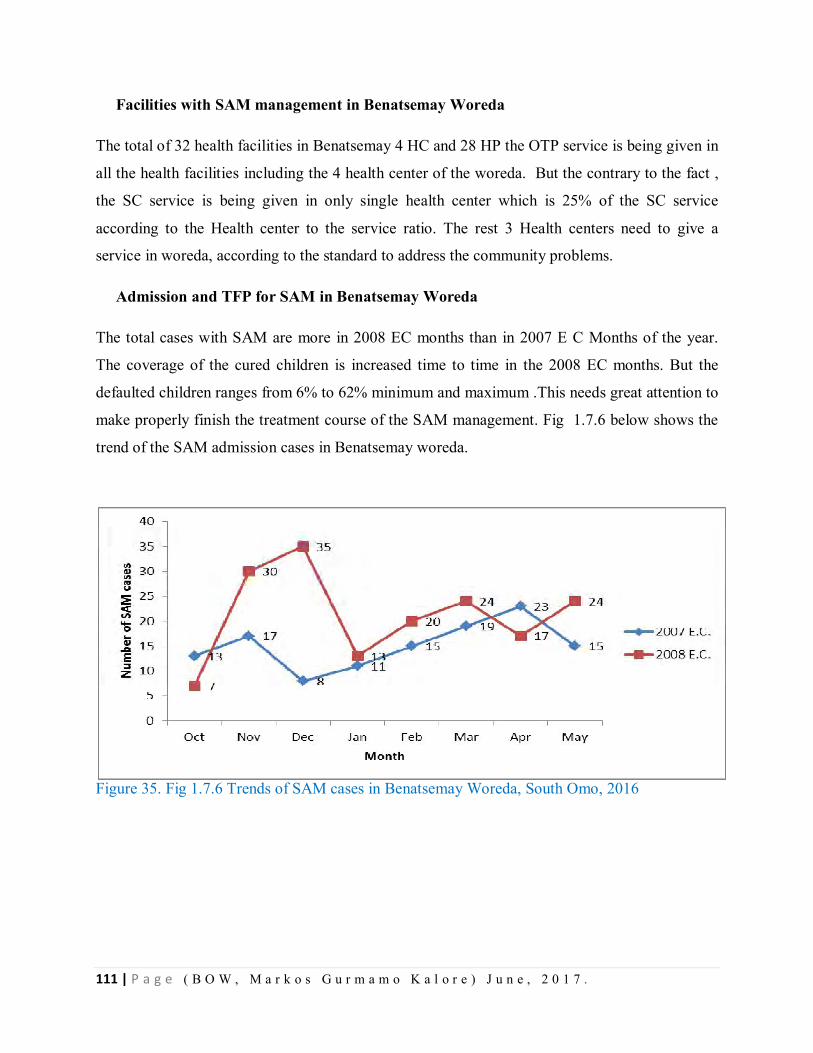
111 | P a g e ( B O W , M a r k o s G u r m a m o K a l o r e ) J u n e , 2 0 1 7 .
Facilities with SAM management in Benatsemay Woreda
The total of 32 health facilities in Benatsemay 4 HC and 28 HP the OTP service is being given in
all the health facilities including the 4 health center of the woreda. But the contrary to the fact ,
the SC service is being given in only single health center which is 25% of the SC service
according to the Health center to the service ratio. The rest 3 Health centers need to give a
service in woreda, according to the standard to address the community problems.
Admission and TFP for SAM in Benatsemay Woreda
The total cases with SAM are more in 2008 EC months than in 2007 E C Months of the year.
The coverage of the cured children is increased time to time in the 2008 EC months. But the
defaulted children ranges from 6% to 62% minimum and maximum .This needs great attention to
make properly finish the treatment course of the SAM management. Fig 1.7.6 below shows the
trend of the SAM admission cases in Benatsemay woreda.
Figure 35. Fig 1.7.6 Trends of SAM cases in Benatsemay Woreda, South Omo, 2016
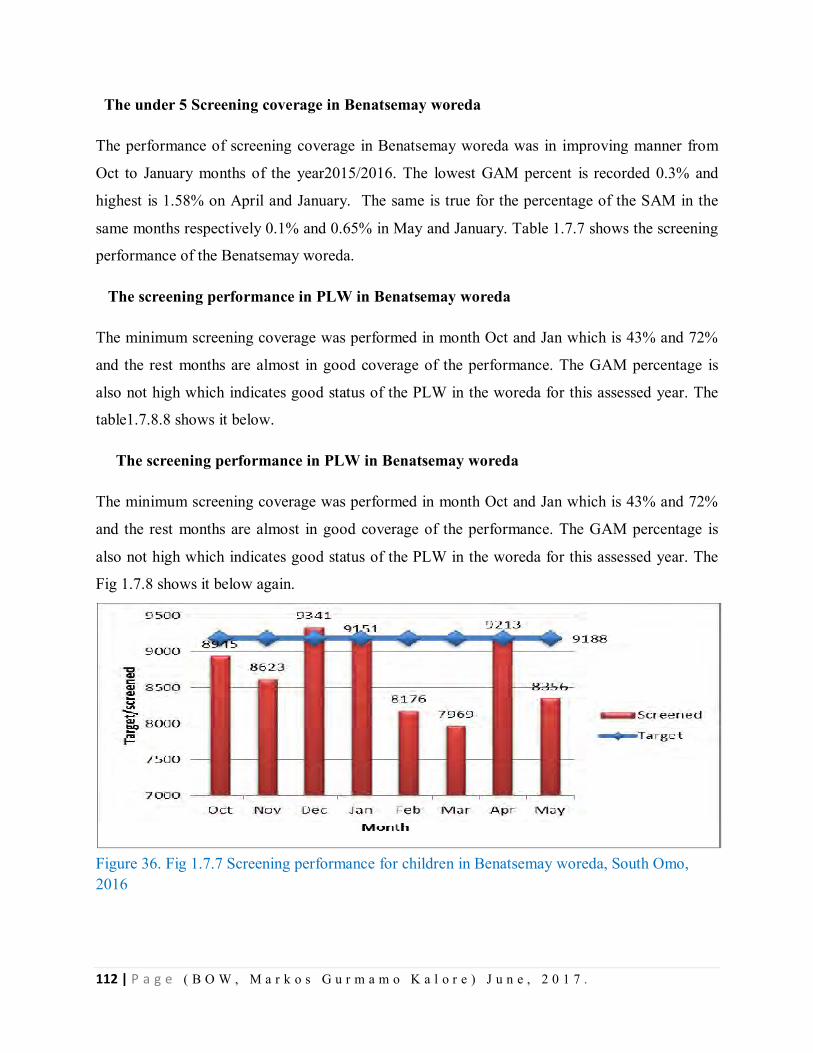
112 | P a g e ( B O W , M a r k o s G u r m a m o K a l o r e ) J u n e , 2 0 1 7 .
The under 5 Screening coverage in Benatsemay woreda
The performance of screening coverage in Benatsemay woreda was in improving manner from
Oct to January months of the year2015/2016. The lowest GAM percent is recorded 0.3% and
highest is 1.58% on April and January. The same is true for the percentage of the SAM in the
same months respectively 0.1% and 0.65% in May and January. Table 1.7.7 shows the screening
performance of the Benatsemay woreda.
The screening performance in PLW in Benatsemay woreda
The minimum screening coverage was performed in month Oct and Jan which is 43% and 72%
and the rest months are almost in good coverage of the performance. The GAM percentage is
also not high which indicates good status of the PLW in the woreda for this assessed year. The
table1.7.8.8 shows it below.
The screening performance in PLW in Benatsemay woreda
The minimum screening coverage was performed in month Oct and Jan which is 43% and 72%
and the rest months are almost in good coverage of the performance. The GAM percentage is
also not high which indicates good status of the PLW in the woreda for this assessed year. The
Fig 1.7.8 shows it below again.
Figure 36. Fig 1.7.7 Screening performance for children in Benatsemay woreda, South Omo, 2016
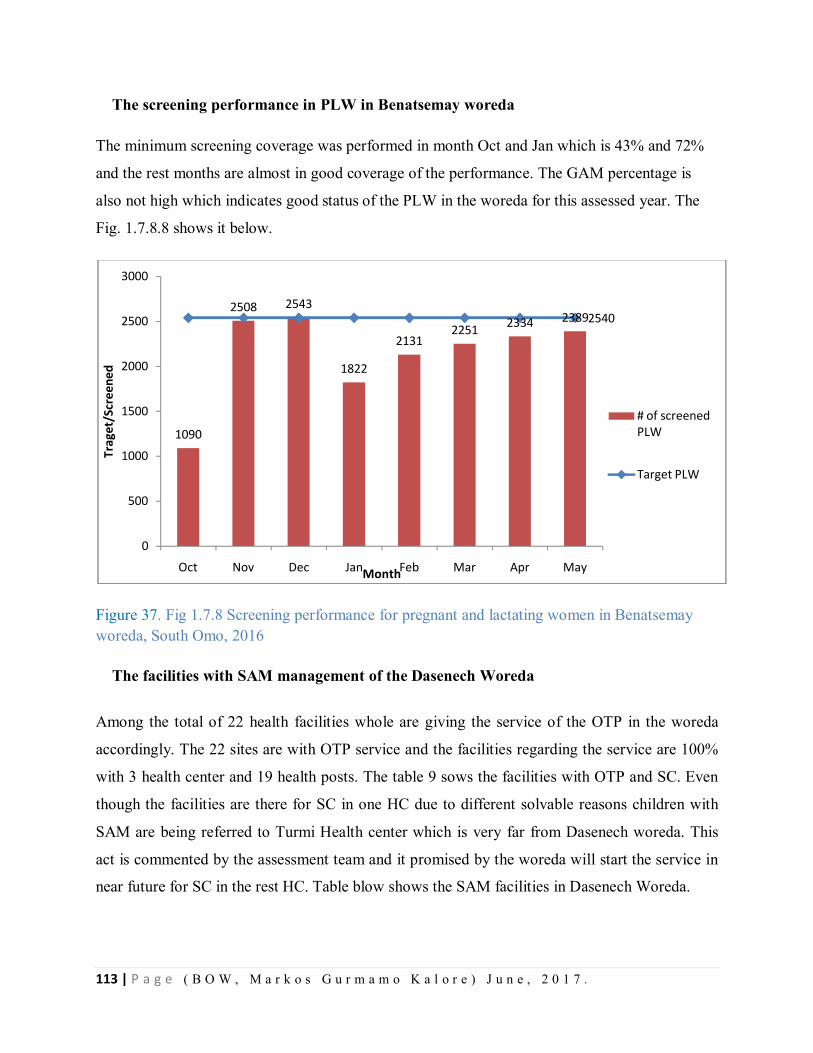
113 | P a g e ( B O W , M a r k o s G u r m a m o K a l o r e ) J u n e , 2 0 1 7 .
The screening performance in PLW in Benatsemay woreda
The minimum screening coverage was performed in month Oct and Jan which is 43% and 72%
and the rest months are almost in good coverage of the performance. The GAM percentage is
also not high which indicates good status of the PLW in the woreda for this assessed year. The
Fig. 1.7.8.8 shows it below.
Figure 37. Fig 1.7.8 Screening performance for pregnant and lactating women in Benatsemay woreda, South Omo, 2016
The facilities with SAM management of the Dasenech Woreda
Among the total of 22 health facilities whole are giving the service of the OTP in the woreda
accordingly. The 22 sites are with OTP service and the facilities regarding the service are 100%
with 3 health center and 19 health posts. The table 9 sows the facilities with OTP and SC. Even
though the facilities are there for SC in one HC due to different solvable reasons children with
SAM are being referred to Turmi Health center which is very far from Dasenech woreda. This
act is commented by the assessment team and it promised by the woreda will start the service in
near future for SC in the rest HC. Table blow shows the SAM facilities in Dasenech Woreda.
1090
2508 2543
1822
21312251 2334 23892540
0
500
1000
1500
2000
2500
3000
Oct Nov Dec Jan Feb Mar Apr May
Trag
et/S
cree
ned
Month
# of screened PLW
Target PLW
114 | P a g e ( B O W , M a r k o s G u r m a m o K a l o r e ) J u n e , 2 0 1 7 .
Table (0-3 Tab. 1.7.3 Facilities with SAM management in Dasenech woreda, South Omo, 2016
Mont
h
Total
Number of
Health
centers/
hospitals
Total
Number
of Health
posts
Numb
er of
SC.
% of health
centers/
hospitals
with a SC.
Numbe
r of
OTP
% of
health
posts with
an OTP
Total
Number of
OTP/SC
reported
% of
OTP/SC
who have
reported
Oct 3 19 3 100% 22 100% 19/3 100%
Nov 3 19 3 100% 22 100% 19/3 100%
Dec 3 19 3 100% 22 100% 19/3 100%
Jan 3 19 3 100% 22 100% 19/3 100%
Feb 3 20 3 100% 23 100% 20/3 100%
Mar 3 21 3 100% 24 100% 21/3 100%
Apr 3 21 3 100% 24 100% 21/3 100%
May 3 21 3 100% 24 100% 21/3 100%
The admission performance of SAM cases in Dasenech Woreda
The admission performance was being done in all months of the year in the woreda, which is
with the good cure rates in all months observed except the month of the December which is with
defaulter rate of the 1.6%. The total cases admitted with SAM cases are increased in year 2008
EC than in 2007 EC which is 361 and 291 respectively. Table 1.7.4 shows the admission of SAM
cases in Dasench woreda.
115 | P a g e ( B O W , M a r k o s G u r m a m o K a l o r e ) J u n e , 2 0 1 7 .
Table (0-4). Tab. 1.7.4 Admission and Performance of therapeutic feeding program for SAM management Dasenech woreda,
Trend of Malaria cases in Dasenech Woreda
The malaria cases in Dasenech woreda are shown in figure that shows the cases in 2008 EC were
high in number than in 2007 EC except the month October. The rest months are registered with
case number of increasing trend and still in this assessed month the case number is increasing
sharply to when compared to the last year one. Different preventive mechanisms like IRS, ITNS
and others are needed to combat the situation. The ITNs coverage was not 100% and the woreda
was complaining about its shortage for the team. Also the woreda forwarded the challenge about
the IRS in pastoralist community its feasibility. Anti Malaria drugs were there to treat the cases
when the need arises.
Month Total SAM Cases % of SAM
children
cured
% of SAM
children
defaulted
% of SAM
children died
% of SAM
children non-
respondent
% of SAM
children
other 2007
E.C.
2008
E.C.
Oct 90 49 100% 0 0 0 0
Nov 62 65 100% 0 0 0 0
Dec 36 36 98% 1.6% 0 0 0
Jan 20 44 100% 0 0 0 0
Feb 22 26 97.6% 0 0 0 2.4%
Mar 19 59 100% 0 0 0 0
Apr 28 33 100% 0 0 0 0
May 14 49 97.9% 0 2.1% 0 0
116 | P a g e ( B O W , M a r k o s G u r m a m o K a l o r e ) J u n e , 2 0 1 7 .
Figure 38. fig. 1.7.9 Trends of malaria cases in Dasenech woreda 2007 and 2008 E.C, South Omo, 2016
Screening performance in Dasenech Woreda
The screening performance in Dasenech Woreda was assessed as with some omissions in some
months like February 2008 EC and by rest months screenings were performed. All the rest
months were with the coverage above 70% except in months April and May which is 28% and
64% respectively. This low screening coverage has to be improved for the rest months of the
year and the recommendation was given by the assessment team. Also the screening coverage of
the PLW is low in the woreda with minimum overages 23%, 41% and 57% April Jan and Dec
respectively. The average 8 months screening coverage is 61% for PLW in Dasenech woreda
which is very low coverage. Tables below shows that the screening in children and in PLWs.
0102030405060708090
100
Oct Nov Dec Jan Feb Mar Apr May
Nun
umbe
r of c
ases
month
2007 E.C.
2008 E.C.
117 | P a g e ( B O W , M a r k o s G u r m a m o K a l o r e ) J u n e , 2 0 1 7 .
Figure 39. Fig. 1.7.10. Screening performance for children in Dasenech woreda, South Omo, 2016
Figure 40.Fig 1.7.11. Screening performance of pregnant and lactating women in Dasenech woreda, South Omo, 2016
0 2000 4000 6000 8000 10000
Oct
Nov
Dec
Jan
Feb
Mar
Apr
May
Target/Screened
Mon
th
Screened
Target
2176 20951900 1866
0
2263
780
1391
3353
0
500
1000
1500
2000
2500
3000
3500
4000
Oct Nov Dec Jan Feb Mar Apr May
Targ
et/s
cree
ned
Month
# of screened PLW
Target PLW
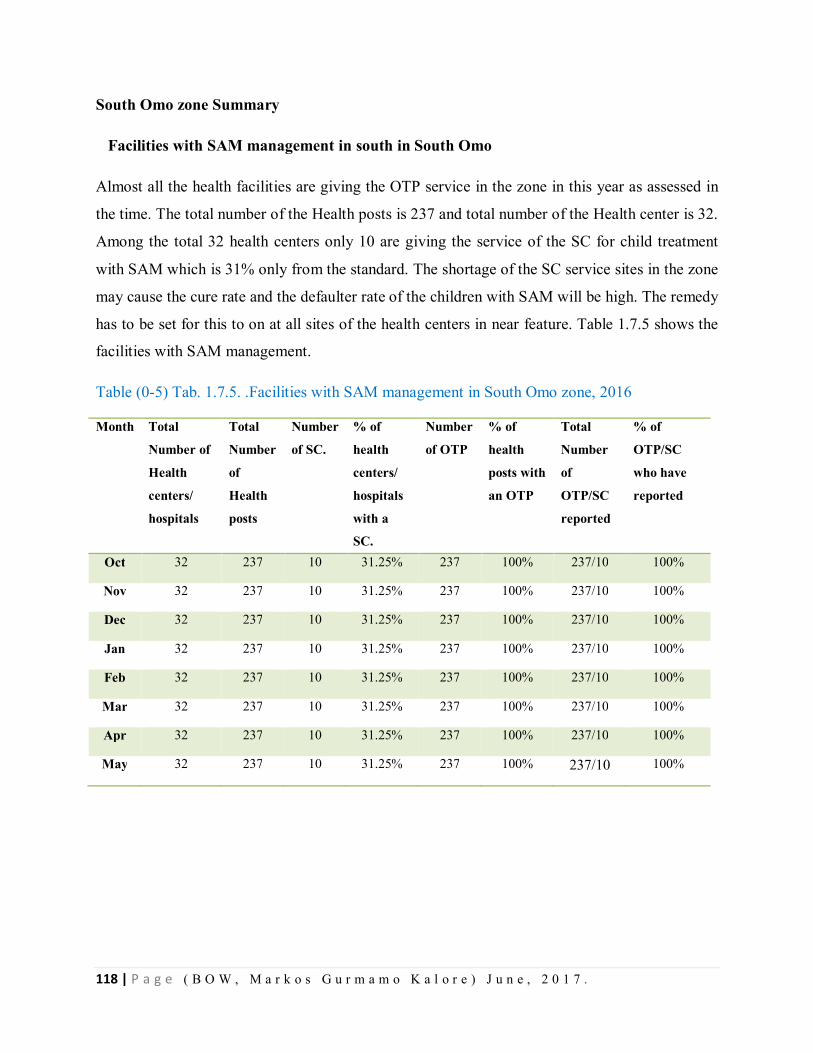
118 | P a g e ( B O W , M a r k o s G u r m a m o K a l o r e ) J u n e , 2 0 1 7 .
South Omo zone Summary
Facilities with SAM management in south in South Omo
Almost all the health facilities are giving the OTP service in the zone in this year as assessed in
the time. The total number of the Health posts is 237 and total number of the Health center is 32.
Among the total 32 health centers only 10 are giving the service of the SC for child treatment
with SAM which is 31% only from the standard. The shortage of the SC service sites in the zone
may cause the cure rate and the defaulter rate of the children with SAM will be high. The remedy
has to be set for this to on at all sites of the health centers in near feature. Table 1.7.5 shows the
facilities with SAM management.
Table (0-5) Tab. 1.7.5. .Facilities with SAM management in South Omo zone, 2016
Month Total
Number of
Health
centers/
hospitals
Total
Number
of
Health
posts
Number
of SC.
% of
health
centers/
hospitals
with a
SC.
Number
of OTP
% of
health
posts with
an OTP
Total
Number
of
OTP/SC
reported
% of
OTP/SC
who have
reported
Oct 32 237 10 31.25% 237 100% 237/10 100%
Nov 32 237 10 31.25% 237 100% 237/10 100%
Dec 32 237 10 31.25% 237 100% 237/10 100%
Jan 32 237 10 31.25% 237 100% 237/10 100%
Feb 32 237 10 31.25% 237 100% 237/10 100%
Mar 32 237 10 31.25% 237 100% 237/10 100%
Apr 32 237 10 31.25% 237 100% 237/10 100%
May 32 237 10 31.25% 237 100% 237/10 100%
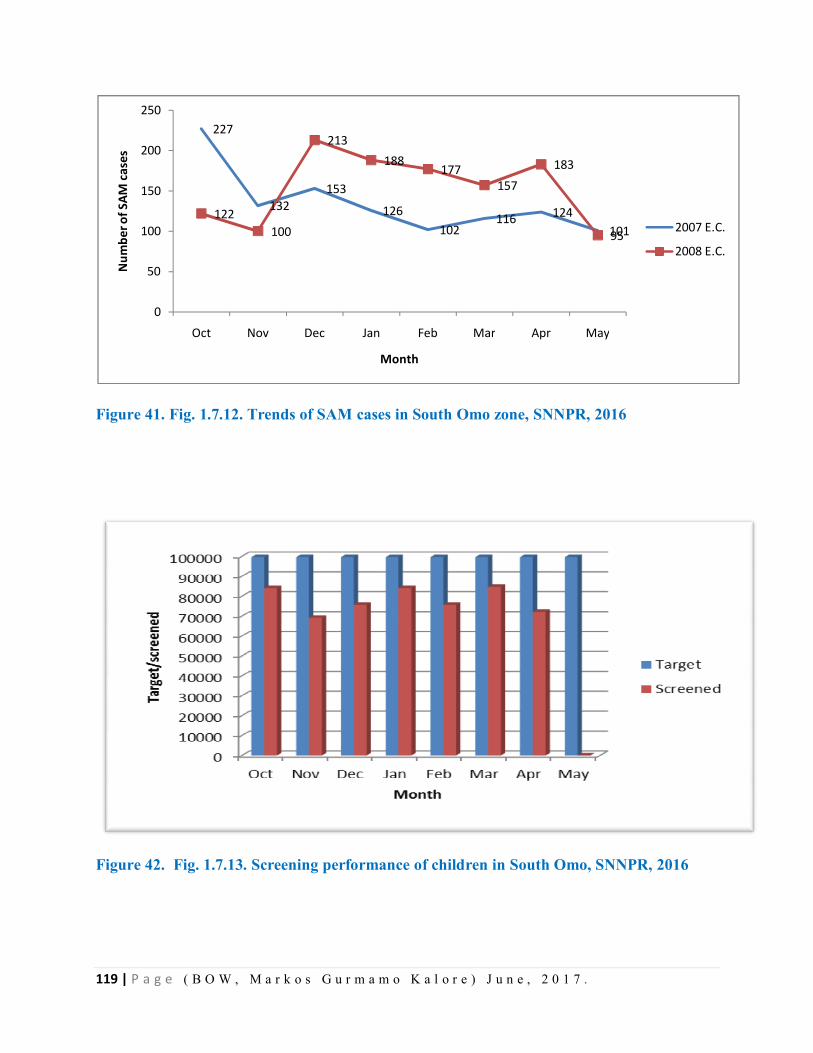
119 | P a g e ( B O W , M a r k o s G u r m a m o K a l o r e ) J u n e , 2 0 1 7 .
Figure 41. Fig. 1.7.12. Trends of SAM cases in South Omo zone, SNNPR, 2016
Figure 42. Fig. 1.7.13. Screening performance of children in South Omo, SNNPR, 2016
227
132153
126102
116 124101
122100
213188
177157
183
95
0
50
100
150
200
250
Oct Nov Dec Jan Feb Mar Apr May
Num
ber o
f SAM
cas
es
Month
2007 E.C.
2008 E.C.
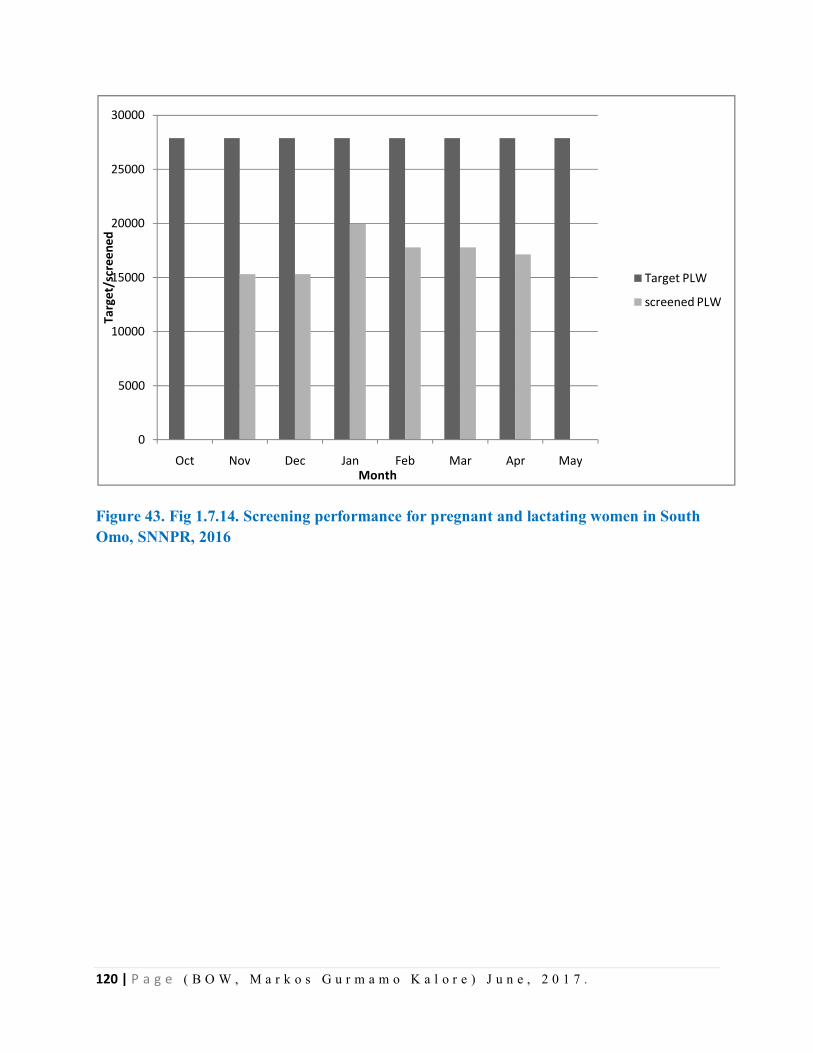
120 | P a g e ( B O W , M a r k o s G u r m a m o K a l o r e ) J u n e , 2 0 1 7 .
Figure 43. Fig 1.7.14. Screening performance for pregnant and lactating women in South Omo, SNNPR, 2016
0
5000
10000
15000
20000
25000
30000
Oct Nov Dec Jan Feb Mar Apr May
Targ
et/s
cree
ned
Month
Target PLW
screened PLW
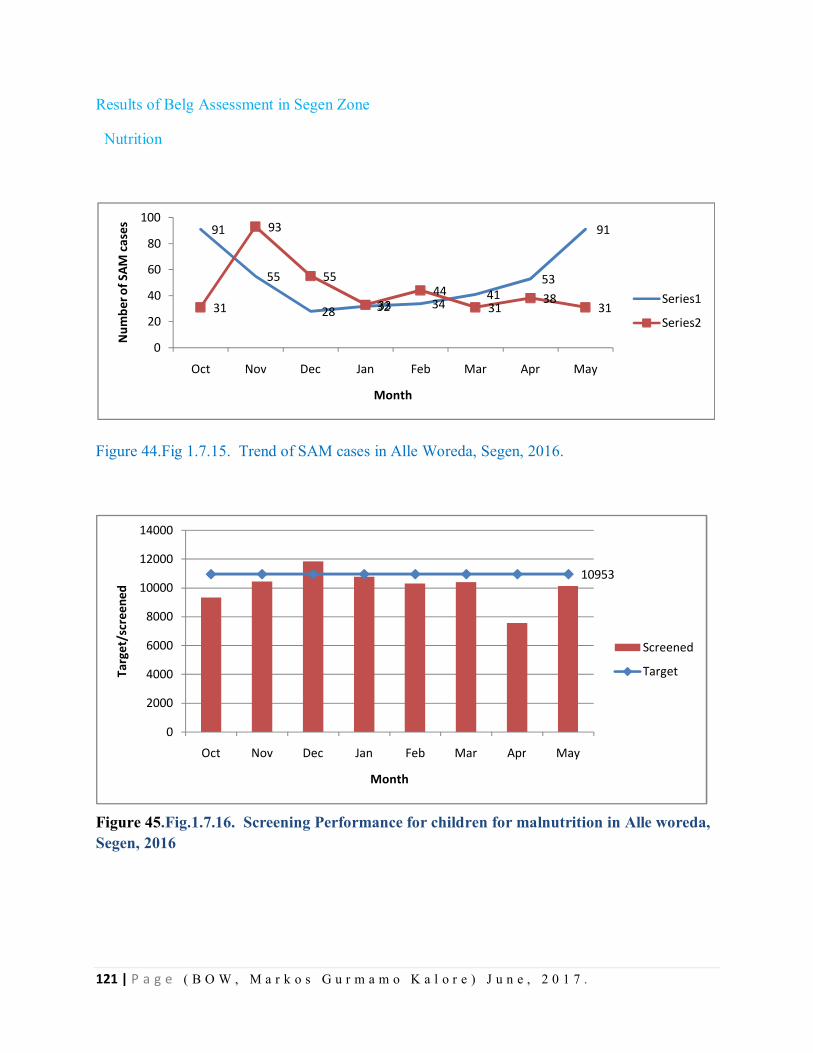
121 | P a g e ( B O W , M a r k o s G u r m a m o K a l o r e ) J u n e , 2 0 1 7 .
Results of Belg Assessment in Segen Zone
Nutrition
Figure 44.Fig 1.7.15. Trend of SAM cases in Alle Woreda, Segen, 2016.
Figure 45.Fig.1.7.16. Screening Performance for children for malnutrition in Alle woreda, Segen, 2016
91
55
28 32 3441
53
91
31
93
55
3344
3138
31
0
20
40
60
80
100
Oct Nov Dec Jan Feb Mar Apr May
Num
ber o
f SAM
cas
es
Month
Series1
Series2
10953
0
2000
4000
6000
8000
10000
12000
14000
Oct Nov Dec Jan Feb Mar Apr May
Targ
et/s
cree
ned
Month
Screened
Target
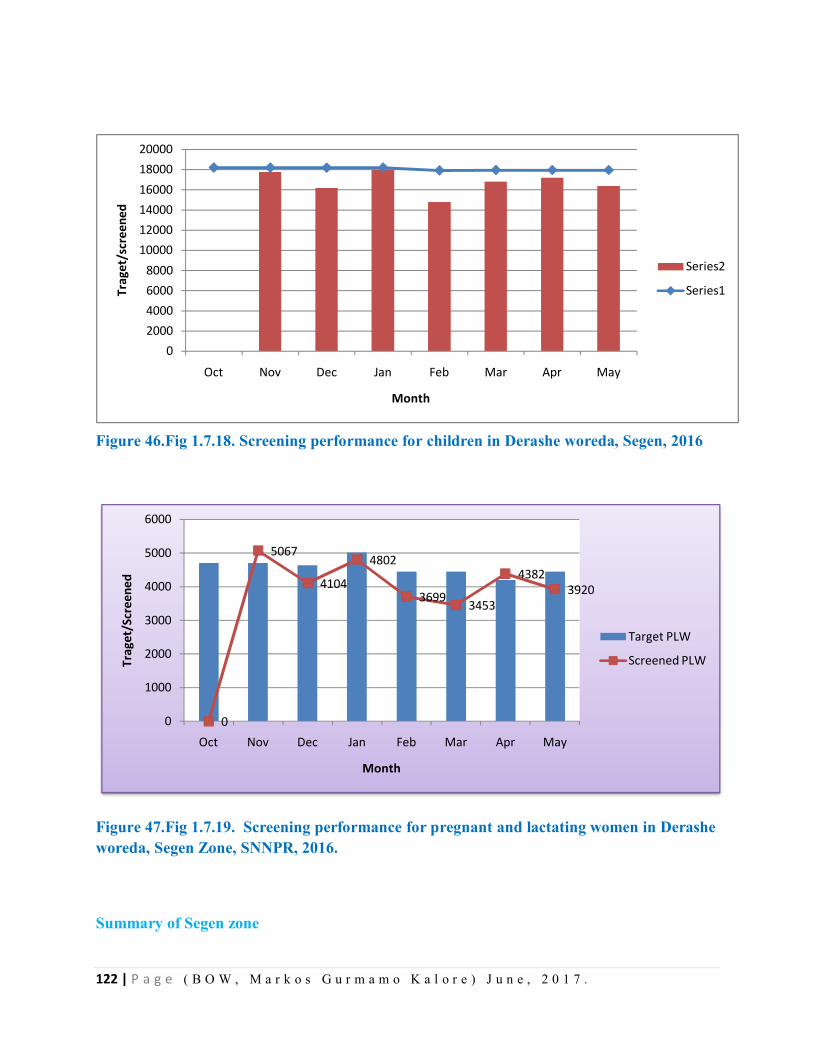
122 | P a g e ( B O W , M a r k o s G u r m a m o K a l o r e ) J u n e , 2 0 1 7 .
Figure 46.Fig 1.7.18. Screening performance for children in Derashe woreda, Segen, 2016
Figure 47.Fig 1.7.19. Screening performance for pregnant and lactating women in Derashe woreda, Segen Zone, SNNPR, 2016.
Summary of Segen zone
02000400060008000
100001200014000160001800020000
Oct Nov Dec Jan Feb Mar Apr May
Trag
et/s
cree
ned
Month
Series2
Series1
0
5067
4104
4802
3699 3453
43823920
0
1000
2000
3000
4000
5000
6000
Oct Nov Dec Jan Feb Mar Apr May
Trag
et/S
cree
ned
Month
Target PLW
Screened PLW
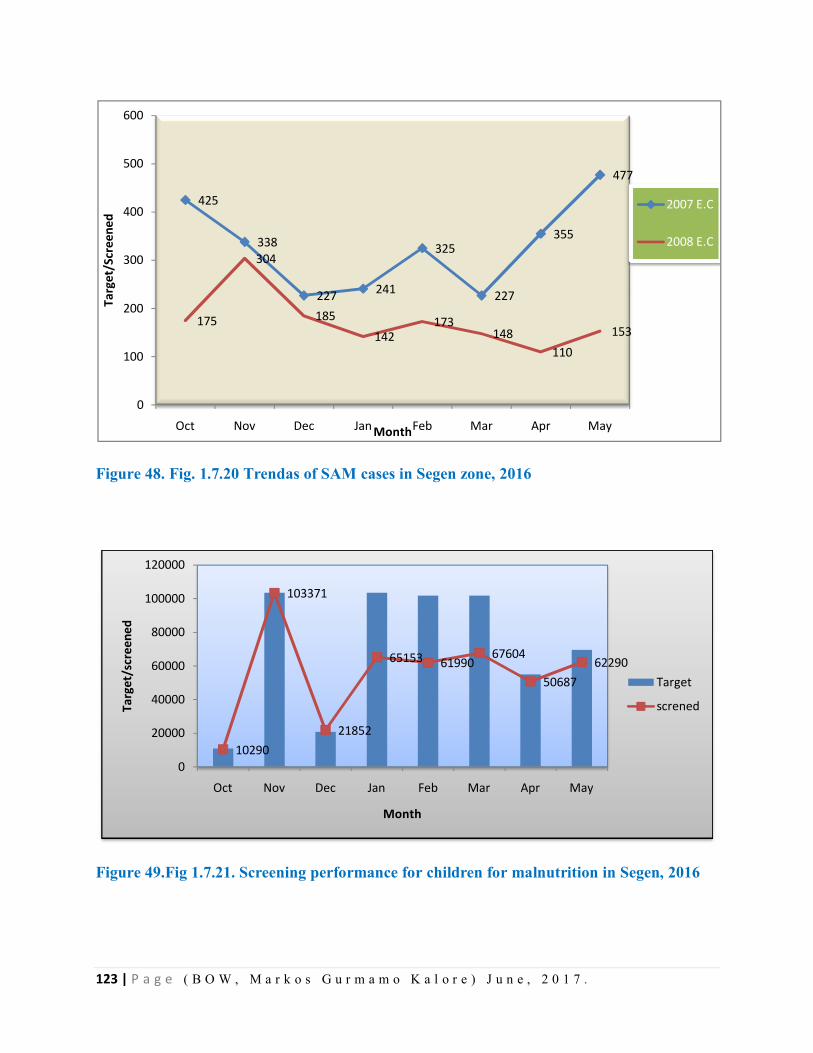
123 | P a g e ( B O W , M a r k o s G u r m a m o K a l o r e ) J u n e , 2 0 1 7 .
Figure 48. Fig. 1.7.20 Trendas of SAM cases in Segen zone, 2016
Figure 49.Fig 1.7.21. Screening performance for children for malnutrition in Segen, 2016
425
338
227 241
325
227
355
477
175
304
185142
173148
110153
0
100
200
300
400
500
600
Oct Nov Dec Jan Feb Mar Apr May
Targ
et/S
cree
ned
Month
2007 E.C
2008 E.C
10290
103371
21852
65153 6199067604
5068762290
0
20000
40000
60000
80000
100000
120000
Oct Nov Dec Jan Feb Mar Apr May
Targ
et/s
cree
ned
Month
Target
screned
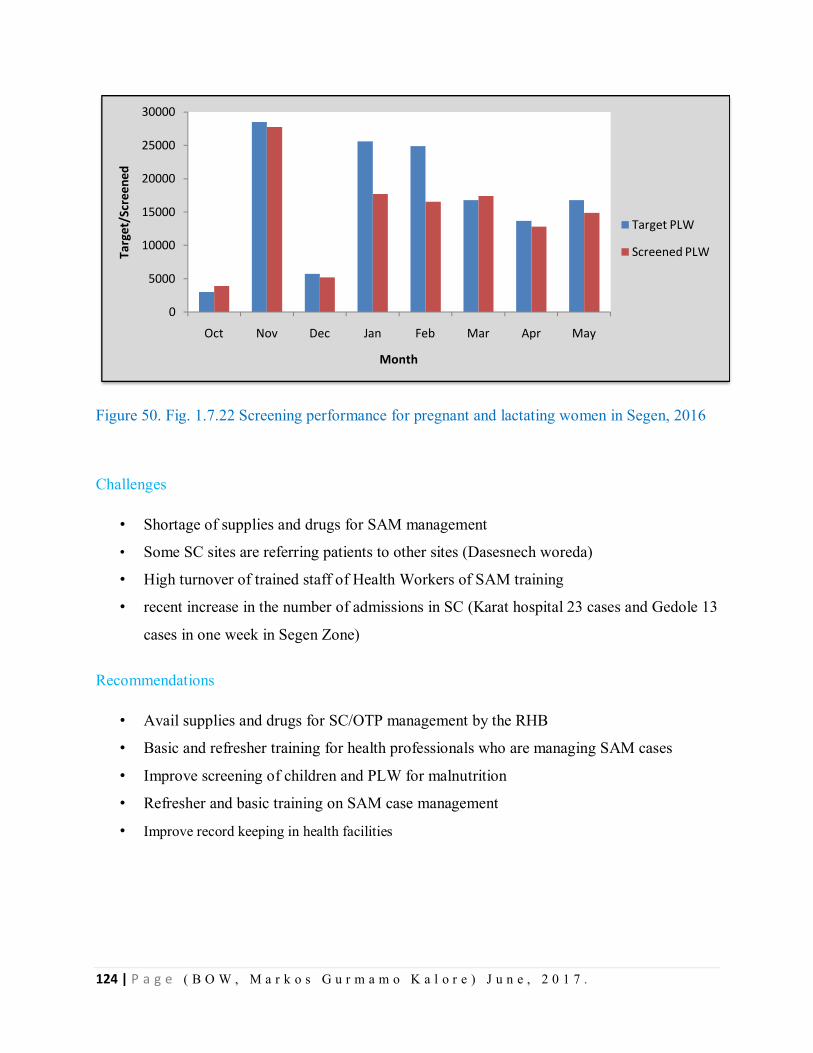
124 | P a g e ( B O W , M a r k o s G u r m a m o K a l o r e ) J u n e , 2 0 1 7 .
Figure 50. Fig. 1.7.22 Screening performance for pregnant and lactating women in Segen, 2016
Challenges
• Shortage of supplies and drugs for SAM management
• Some SC sites are referring patients to other sites (Dasesnech woreda)
• High turnover of trained staff of Health Workers of SAM training
• recent increase in the number of admissions in SC (Karat hospital 23 cases and Gedole 13
cases in one week in Segen Zone)
Recommendations
• Avail supplies and drugs for SC/OTP management by the RHB
• Basic and refresher training for health professionals who are managing SAM cases
• Improve screening of children and PLW for malnutrition
• Refresher and basic training on SAM case management
• Improve record keeping in health facilities
0
5000
10000
15000
20000
25000
30000
Oct Nov Dec Jan Feb Mar Apr May
Targ
et/S
cree
ned
Month
Target PLW
Screened PLW
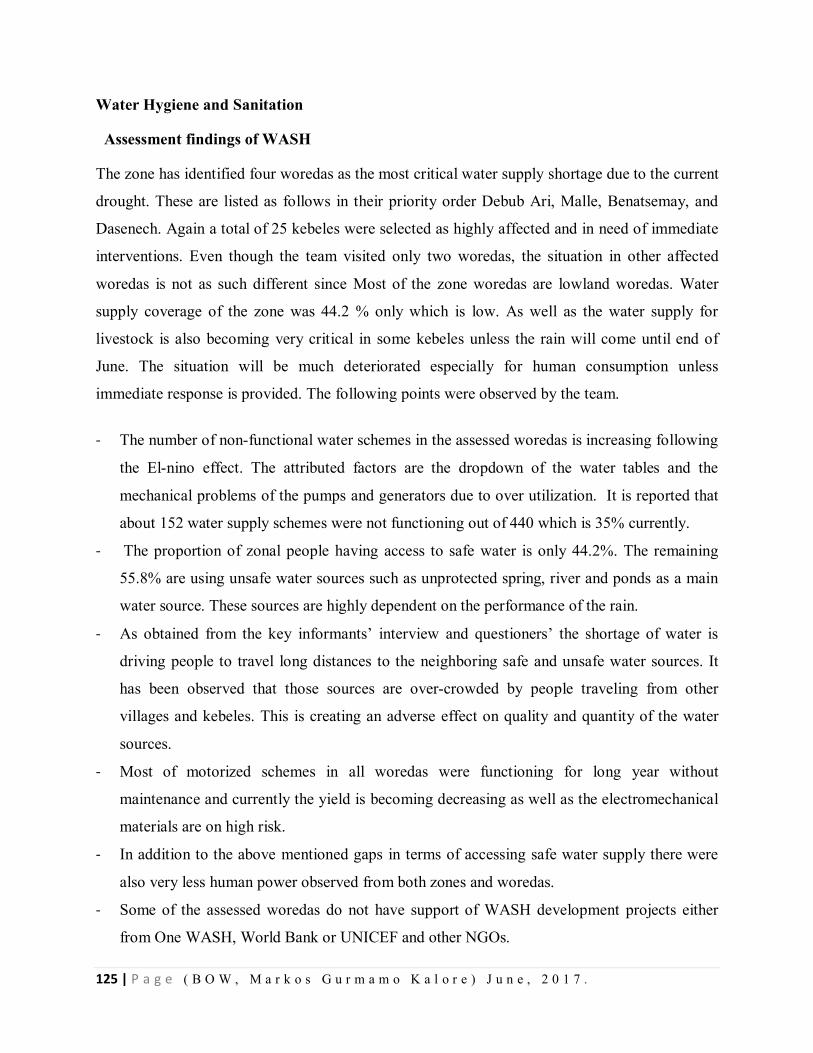
125 | P a g e ( B O W , M a r k o s G u r m a m o K a l o r e ) J u n e , 2 0 1 7 .
Water Hygiene and Sanitation
Assessment findings of WASH
The zone has identified four woredas as the most critical water supply shortage due to the current
drought. These are listed as follows in their priority order Debub Ari, Malle, Benatsemay, and
Dasenech. Again a total of 25 kebeles were selected as highly affected and in need of immediate
interventions. Even though the team visited only two woredas, the situation in other affected
woredas is not as such different since Most of the zone woredas are lowland woredas. Water
supply coverage of the zone was 44.2 % only which is low. As well as the water supply for
livestock is also becoming very critical in some kebeles unless the rain will come until end of
June. The situation will be much deteriorated especially for human consumption unless
immediate response is provided. The following points were observed by the team.
- The number of non-functional water schemes in the assessed woredas is increasing following
the El-nino effect. The attributed factors are the dropdown of the water tables and the
mechanical problems of the pumps and generators due to over utilization. It is reported that
about 152 water supply schemes were not functioning out of 440 which is 35% currently.
- The proportion of zonal people having access to safe water is only 44.2%. The remaining
55.8% are using unsafe water sources such as unprotected spring, river and ponds as a main
water source. These sources are highly dependent on the performance of the rain.
- As obtained from the key informants’ interview and questioners’ the shortage of water is
driving people to travel long distances to the neighboring safe and unsafe water sources. It
has been observed that those sources are over-crowded by people traveling from other
villages and kebeles. This is creating an adverse effect on quality and quantity of the water
sources.
- Most of motorized schemes in all woredas were functioning for long year without
maintenance and currently the yield is becoming decreasing as well as the electromechanical
materials are on high risk.
- In addition to the above mentioned gaps in terms of accessing safe water supply there were
also very less human power observed from both zones and woredas.
- Some of the assessed woredas do not have support of WASH development projects either
from One WASH, World Bank or UNICEF and other NGOs.
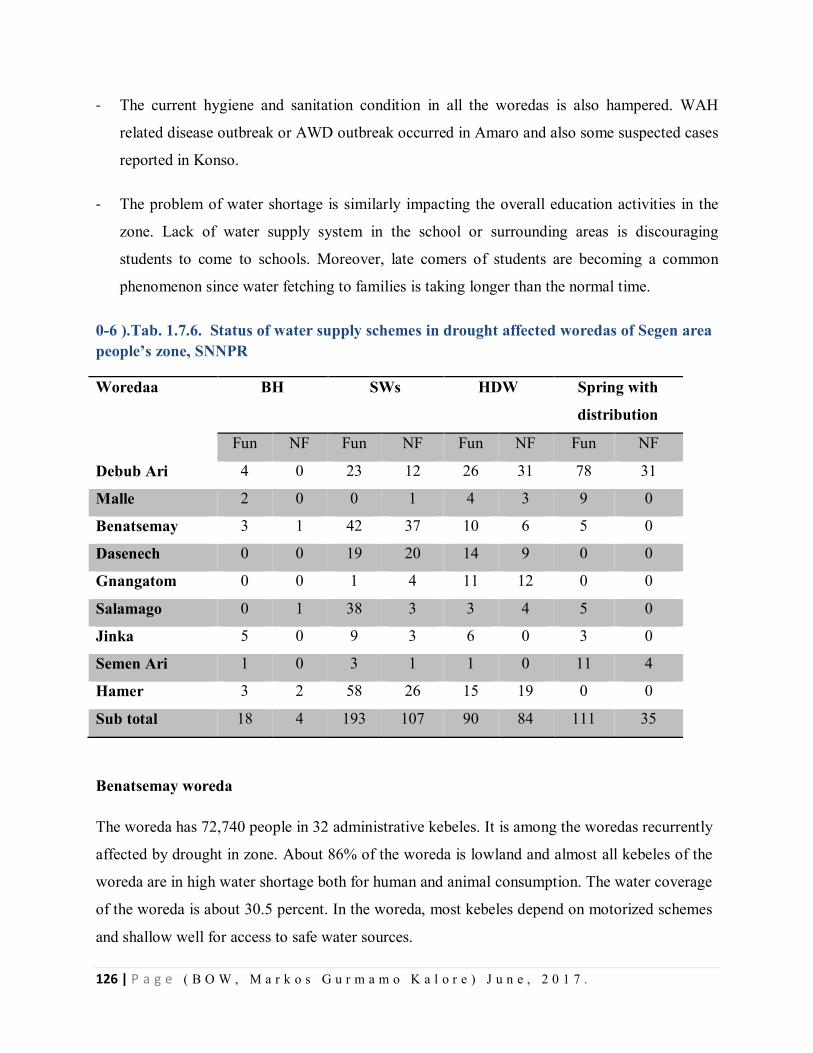
126 | P a g e ( B O W , M a r k o s G u r m a m o K a l o r e ) J u n e , 2 0 1 7 .
- The current hygiene and sanitation condition in all the woredas is also hampered. WAH
related disease outbreak or AWD outbreak occurred in Amaro and also some suspected cases
reported in Konso.
- The problem of water shortage is similarly impacting the overall education activities in the
zone. Lack of water supply system in the school or surrounding areas is discouraging
students to come to schools. Moreover, late comers of students are becoming a common
phenomenon since water fetching to families is taking longer than the normal time.
0-6 ).Tab. 1.7.6. Status of water supply schemes in drought affected woredas of Segen area people’s zone, SNNPR
Woredaa BH SWs HDW Spring with
distribution
Fun NF Fun NF Fun NF Fun NF
Debub Ari 4 0 23 12 26 31 78 31
Malle 2 0 0 1 4 3 9 0
Benatsemay 3 1 42 37 10 6 5 0
Dasenech 0 0 19 20 14 9 0 0
Gnangatom 0 0 1 4 11 12 0 0
Salamago 0 1 38 3 3 4 5 0
Jinka 5 0 9 3 6 0 3 0
Semen Ari 1 0 3 1 1 0 11 4
Hamer 3 2 58 26 15 19 0 0
Sub total 18 4 193 107 90 84 111 35
Benatsemay woreda
The woreda has 72,740 people in 32 administrative kebeles. It is among the woredas recurrently
affected by drought in zone. About 86% of the woreda is lowland and almost all kebeles of the
woreda are in high water shortage both for human and animal consumption. The water coverage
of the woreda is about 30.5 percent. In the woreda, most kebeles depend on motorized schemes
and shallow well for access to safe water sources.
127 | P a g e ( B O W , M a r k o s G u r m a m o K a l o r e ) J u n e , 2 0 1 7 .
Dasenech woreda
The woreda is affected by recurrent droughts and Omo river flash /flood. The water supply
coverage in the woreda is 19 percent only. Out of the total 62 existing water supply schemes in
the woreda 29 are non-functional. There are no other water supply sources rather than shallow
wells and hand dug wells in the woreda.
Challenges
o The number of non-functional water supply schemes is increasing due to over utilization and
drop down of water table.
o Women and children travel long distance in search of water.
o Most of health facilities have no water access despite implementation of nutrition programs.
o Many health facilities are forced to buy unsafe water either from river or pond.
o Poor hygiene practice and sanitation situation.
o Less skilled human power in the woreda
Recommendations
o Maintaining the functionality of the existed water supply schemes should be the priority
activity in responding to water shortage of the affected woredas.
o The urgency of averting the current emergency should be well recognized by the zonal and
woreda administration. Therefore the zone and woredas should allocate their internal budget
for response activities.
o Since the zone is adjacent to Oromiya region where currently AWD outbreak occurred, water
treatment chemical distribution, and hygiene promotion activities will be strongly
recommended to continued.
o Zone and woreda water office should have to fill gaps related to human power and provide
competency strengthening capacity building training for water technicians.
128 | P a g e ( B O W , M a r k o s G u r m a m o K a l o r e ) J u n e , 2 0 1 7 .
o In Dasench Woreda most of SWs are not serving due to high salinity content, therefore,
before drilling SW and HDW in this are the woreda must conduct geophysics assessment.
Education
The team assessed 2 zones and 5 woredas and the education sector situation analysis and needs
assessment are based on secondary data from desk review and checklist collected from the
selected zones and woredas of the region. These include number of schools currently closed as a
result of emergency, number of schools currently damaged as result of emergency/partially
functioning, and number of schools functional but overcrowded as a result of emergency.
According to the assessment finding there is no any major manmade or Natural factors causing
disruption of school systems in the visited Woredas.
According to the assessment findings from the visited zones and woredas the current enrollment
of students when compared with previous year south Omo zone showed progressive increment
by 21,481 i.e. from 179,102 in 2007 E.C to 200,583 in 2008 E.C. Segen people zone showed
decrement by 7,352 i.e. from 182,258 in 2007 E.C to 174,906 in 2008 E.C
From the assessed Woredas the students drop out compared with the last year as shown in the
above table, the assessment finding indicates Benatsemay Woreda was increased dropout rate
from 1.43 % in 2007 to 4.8% in the year 2008.The other woredas except Malie are decreasing the
dropouts significantly from the year 2007 to 2008E.C. We could not get Malie woreda dropout
rates of the year 2007 due to regional grade 8 examination, the office was closed. Derashe
Woreda greatly reduces the dropout rate from 9.87% to 6.49% in 2007to 2008 respectively. A lot
to be done specially in Segen zone in Konso woreda to know the teaching and learning
process .The woreda has no chain with the zone, no proper government structure in that Woreda.
The dropout number of Konso woreda is not included due to conflict in structure with Segen
people’s Zone.
According to the table above, comparing zone to zone the highest drop-out rate is registered in
Seen people’s Zone increasing from 2.0% to3.30% by 1.3% from the last year. The Segen Zone
needs a great effort to reduce dropout rate in the coming school year.
129 | P a g e ( B O W , M a r k o s G u r m a m o K a l o r e ) J u n e , 2 0 1 7 .
Possible reasons for drop out
To find daily labor to satisfy their temporary needs
Low awareness of Parents about benefits of education
Families do not send more than one child to school for exploiting children labor
Early Marriage starting at grade 5 level students(14 years age)
Movement from place to place in pastoral areas
Social problem and conflict between ethnic groups
Shortage of water and latrine in the schools
Shortage of food in pastoralist areas
School feeding problem
Flooding problem
Lack of daily follow up school leaders and coordinators
Based on the assessment finding, in the visited woreda Malie two schools of 9 section
classrooms and 3 blocks latrine were damaged more than average by high winds and the schools
were closed for two weeks until it repaired by woreda and the community. We do not get the
number of enrolled students after the maintenance of the schools.
In Dasenech Woreda due to flood:
Three (3) formal schools and seven (7) ABE schools were surrounded by flood and one
school damaged
327male and 244 female total of 571 students were displaced from these schools
257male and 225 female total 482 students were distributed to five other schools and two
tents
Out of 571 displaced students from formal school 28male and 8 female students, finally
from ABE 42 male and 11 female totals of 89 students did not return to school after
flood.
Based on the assessment schools in the woredas two woredas Benatsemay and Alle do not
affected by any of emergency and the teaching and learning process were going smoothly except
in the above mentioned woredas.
130 | P a g e ( B O W , M a r k o s G u r m a m o K a l o r e ) J u n e , 2 0 1 7 .
Extent of damaged schools
o Benatsemay woreda 1 school damaged
o Derashe 2 blocks of building and 8 classrooms seriously damaged
o Malie woreda 2 schools of nine rooms and three latrine blocks seriously damaged
Emergency responses from Agencies
The Regional education office sends to Dasenech woreda 402 Quintal foods on May 26/2008 E.C and
distributed to 26 flooded and non-flooded schools. By the feeding program 653male and 478 female students
was beneficiary.
One tent for one ABE were donated by UNICEF after flooding
UNICEF support money to Alie woreda to purchase reference books of six cluster center schools. The
reference books are beneficiary for 3301male and 2331female students
WFP supports school feeding till now in Alie woreda because of this 5 schools of 1217male and 944 are
beneficiaries in addition to this WFP purchases shoos, exercise book, pen and pencil for all the five school
students in Alie Woreda.
In all the rest assessed woredas WFP were supporting till the end of January 2008E.C, unfortunately the
feeding program stopped in February fist.
Save the children built 10 roof catchment water and four standard latrines for boys and girls in
Benatsemay woreda
Conclusions Executive
Diseases like Malaria, yellow fever, measles and AWD were identified risks for Epidemic prone
areas in woredas visited.
Many woredas among the visited Zones have low Malnutrition screening Coverage
Under five children SC sites were in few health centers, some Health centers are not treating
inpatient malnutrition Cases and referring to long sites for SC.
Some woredas were with shortage of SC treatment logistics
131 | P a g e ( B O W , M a r k o s G u r m a m o K a l o r e ) J u n e , 2 0 1 7 .
Some drop out of school students was observed due to shortage of food in schools feeding areas.
Some schools constructions taken away by flood in Dasenech wareda of South omo Zone .
The EPRP Plan was there in visited Woredas but budget was not supported by government
Except for Malaria Spray budget
There was no regular meeting of EPRP Committee in woredas except the Zonal levels.
Some drought affected areas in South Omo shifted their cattle to Omo river lines.
Recommendations
The plan for epidemic prone disease like malaria, measles, yellow fever and AWD should
be budgeted by Woreda
The malnutrition screening has to be enhanced to 100% for children.
All health center has to give treatment for SC treatment
School feeding has to be continued to decrease school dropout
The food items for human and cattle have to be provided by the government and different
stake holders.
The woredas has to allocate the budget for emergency preparedness.
132 | P a g e ( B O W , M a r k o s G u r m a m o K a l o r e ) J u n e , 2 0 1 7 .
CHAPTER – VIII- FLOOD DISASTER SITUATION VISITED
8.1. Narrative Report of Flood Disaster Situation Visited on Halaba special
Woreda, SNNPR, May 2016.
Background
Halaba special Woreda is found in Southern Nations, Nationalities and Peoples Regional State
(SNNPRS). The Woreda’s Capital town is Halaba Kulito, which is located at a distance of 315
kilometers south west of Addis Ababa, through Addis Ababa – Arbaminch highway road and 90
kilometers far from the regional city, Hawassa.
Halaba Special Woreda is situated in the east African rift valley at a cross connection point of
070’ 05’N and 380’ 35’E Latitude and longitude respectively. The Woreda is bounded by Silti
zone of SNNPR in the north, Kembata Tembaro zone of SNNPR in the South West, Hadiya zone
of SNNPR in the North West and South West, and Oromiya Region in the East.
The total area of the Woreda is about 973.7 Sq. Km and has a topographic feature that ranges
from 1554-2149 meters above sea level. The climate is characterized as temperate or locally
called “woina-dega”, mean annual temperature is about 17.6 _ 22.5 OC and the mean annual
rainfall reaches 857-1200mm.
It is divided in to 2 urban sub- cities with a total of 5 urban Kebeles and with 79 rural Kebeles.
Based on figures from the Central Statistical Agency of Ethiopia (CSA, 2013), the Woreda has
an estimated projected total population of 310,690 in 2016 GC. An estimated 12.4 % (38,525)
urban and 87.6 % (272,164) rural population lives in it. From the total population less than one
year children 9,911, < 5 years 48,508 and pregnant women 10,750.
Introduction
Floods is a natural catastrophe that can be caused by many different events, including
overflowing of natural or manmade bodies of water, surface water, tidal water, rainwater runoff,
rising ground water, sewer back-up, or from blocked yard and roof drainage systems. Flooding
133 | P a g e ( B O W , M a r k o s G u r m a m o K a l o r e ) J u n e , 2 0 1 7 .
poses a greater threat in low-lying areas, near a body of water, or downstream from dams, but
even the smallest streams, creek beds, ditches, culverts, or drains can overflow and create
flooding. Some floods develop slowly over a period of days, but flash floods can develop within
a few minutes to a few hours and possibly without any visible signs of rain.
In Ethiopia, floods are the second natural disaster next to drought. It has been occurring more
frequently and affecting the country almost every year between 1993 and 2013. Based on limited
available data, between 1980 and 2010 an estimated 45 flooding events had happened in
different parts of the country. The main types of floods in Ethiopia are flash and river-ine
(overflow of rivers and inundating the nearby regions). The most catastrophic floods documented
have been in 2006, which affected many regions of Ethiopia and an estimate of over 600 people
were killed and more than 500,000 people affected. Limited studies have been carried out on how
flood events affect human health in the country.
Halaba special woreda flood disaster effect
Halaba Special woreda has 79 rural and 5 urban kebeles 84 as total and it lie in SNNPR. The
woreda population mainly produces different cereals like maize, teff, beans and others for food.
Besides to these the people of the woreda also used cattle as cash production and food production
like the sheep, goat, ox, cow, hen, horse, donkey and others for different activities.
On Halaba special woreda the flood occurred due to heavy rain since 28/8/2008 EC. The flood
caused very devastating loss of property and live loss on different kebeles of the Special woreda.
The heavy rain occurred on almost all kebeles of the woreda but the severely affected kebeles of
the woredas are nearly 34 out of 79 kebeles. Which is 43 % of the total kebeles of the total
population of the 2,235 population are displaced people and 13,318 populations are affected due
to the flood effect on the people’s house and farm circumscribed by the flood. Due to the disaster
nearly 14 persons are died at incident of the flood from the rural kebeles and no death was
occurred at urban kebeles except displacement and severe loss of property from Halaba District
Hospital and individuals households.
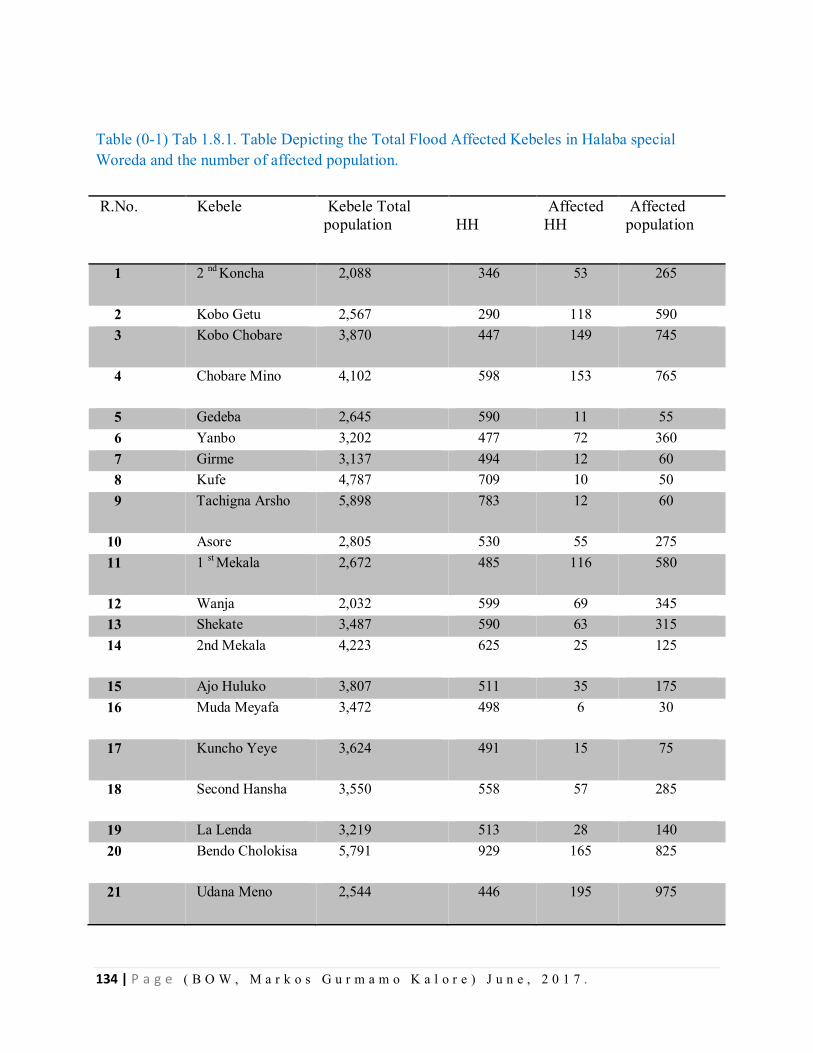
134 | P a g e ( B O W , M a r k o s G u r m a m o K a l o r e ) J u n e , 2 0 1 7 .
Table (0-1) Tab 1.8.1. Table Depicting the Total Flood Affected Kebeles in Halaba special Woreda and the number of affected population.
R.No. Kebele Kebele Total population
HH
Affected HH
Affected population
1 2 nd Koncha 2,088 346 53 265
2 Kobo Getu 2,567 290 118 590 3 Kobo Chobare 3,870 447 149 745
4 Chobare Mino 4,102 598 153 765
5 Gedeba 2,645 590 11 55 6 Yanbo 3,202 477 72 360 7 Girme 3,137 494 12 60 8 Kufe 4,787 709 10 50 9 Tachigna Arsho 5,898 783 12 60
10 Asore 2,805 530 55 275 11 1 st Mekala 2,672 485 116 580
12 Wanja 2,032 599 69 345 13 Shekate 3,487 590 63 315 14 2nd Mekala 4,223 625 25 125
15 Ajo Huluko 3,807 511 35 175 16 Muda Meyafa 3,472 498 6 30
17 Kuncho Yeye 3,624 491 15 75
18 Second Hansha 3,550 558 57 285
19 La Lenda 3,219 513 28 140 20 Bendo Cholokisa 5,791 929 165 825
21 Udana Meno 2,544 446 195 975
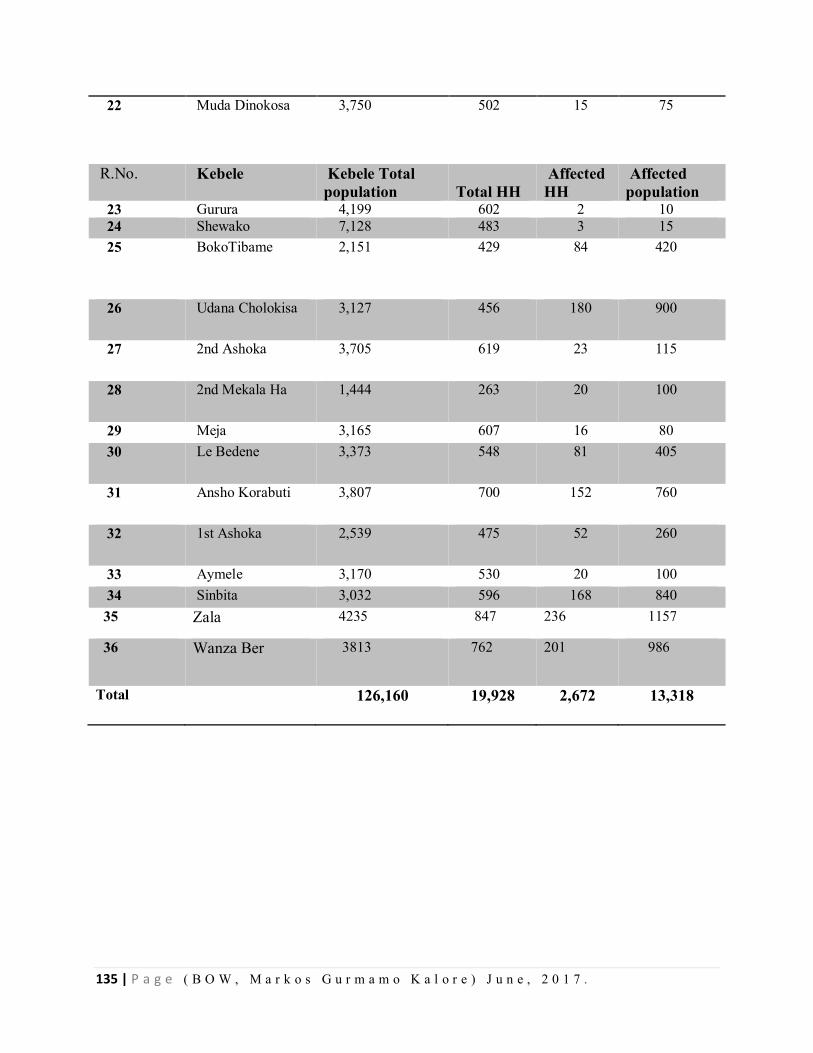
135 | P a g e ( B O W , M a r k o s G u r m a m o K a l o r e ) J u n e , 2 0 1 7 .
22 Muda Dinokosa 3,750 502 15 75
R.No. Kebele Kebele Total population
Total HH
Affected HH
Affected population
23 Gurura 4,199 602 2 10 24 Shewako 7,128 483 3 15 25 BokoTibame 2,151 429 84 420
26 Udana Cholokisa 3,127 456 180 900
27 2nd Ashoka 3,705 619 23 115
28 2nd Mekala Ha 1,444 263 20 100
29 Meja 3,165 607 16 80 30 Le Bedene 3,373 548 81 405
31 Ansho Korabuti 3,807 700 152 760
32 1st Ashoka 2,539 475 52 260
33 Aymele 3,170 530 20 100 34 Sinbita 3,032 596 168 840 35 Zala 4235 847 236 1157
36 Wanza Ber 3813 762 201 986
Total 126,160 19,928 2,672 13,318
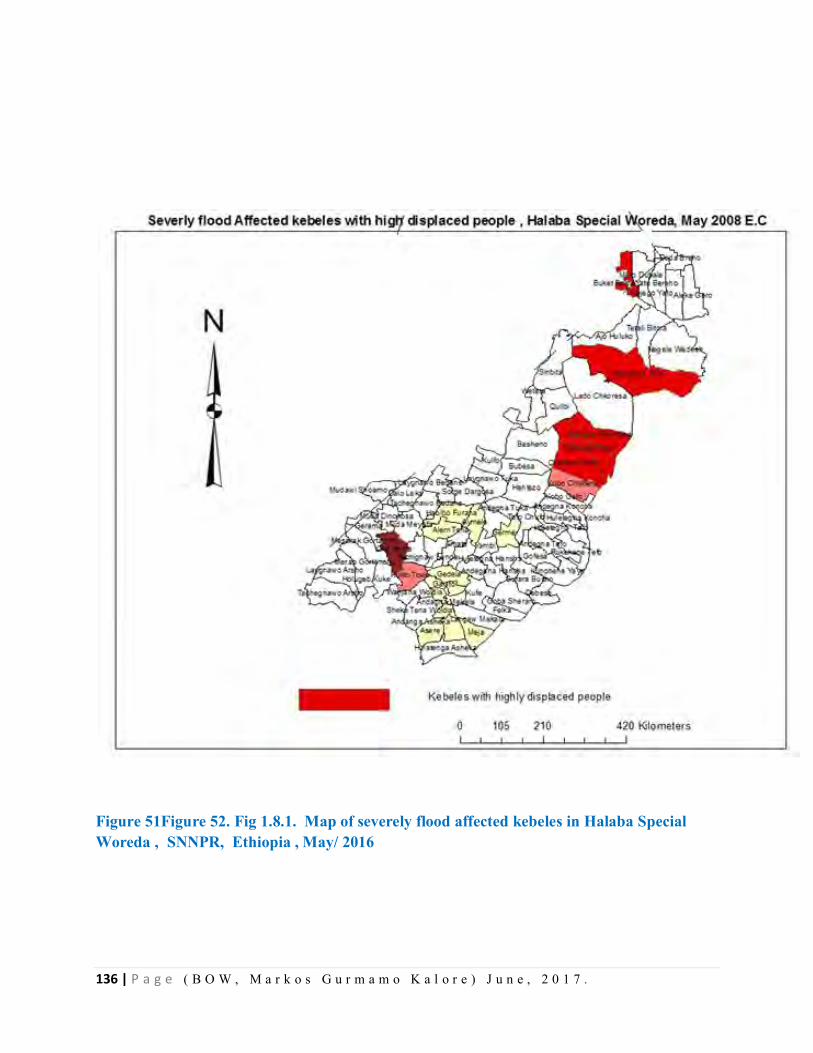
136 | P a g e ( B O W , M a r k o s G u r m a m o K a l o r e ) J u n e , 2 0 1 7 .
Figure 51Figure 52. Fig 1.8.1. Map of severely flood affected kebeles in Halaba Special Woreda , SNNPR, Ethiopia , May/ 2016
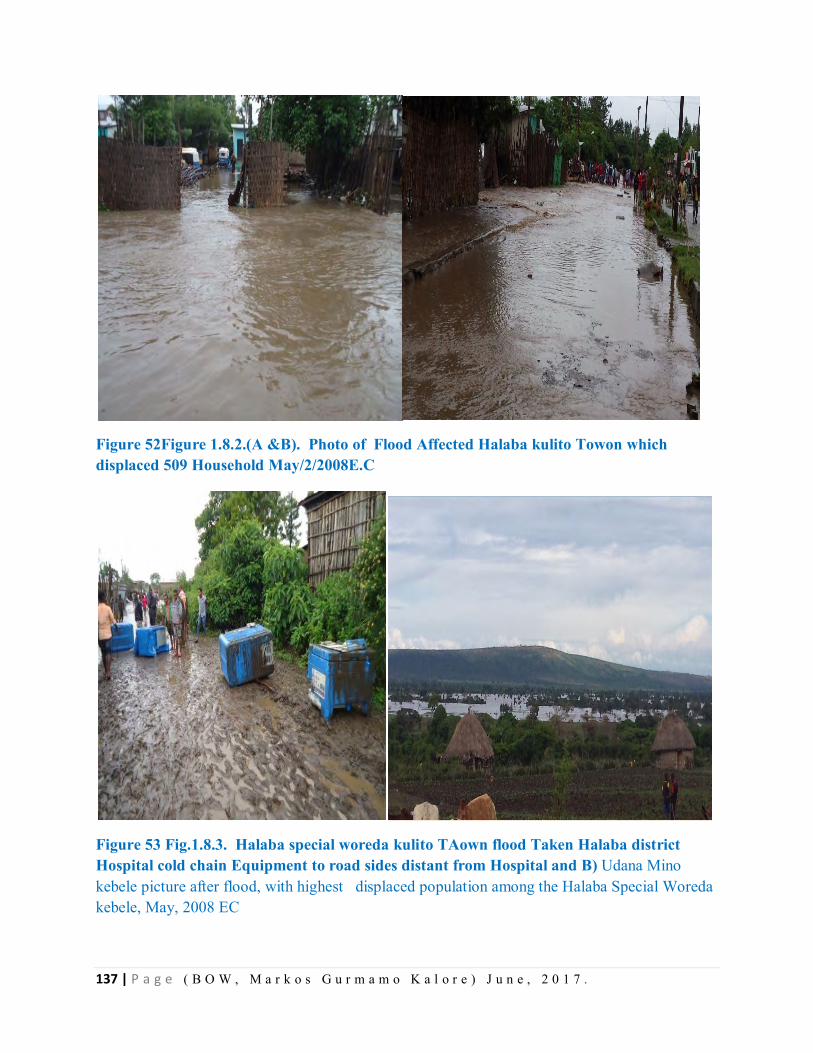
137 | P a g e ( B O W , M a r k o s G u r m a m o K a l o r e ) J u n e , 2 0 1 7 .
Figure 52Figure 1.8.2.(A &B). Photo of Flood Affected Halaba kulito Towon which displaced 509 Household May/2/2008E.C
Figure 53 Fig.1.8.3. Halaba special woreda kulito TAown flood Taken Halaba district Hospital cold chain Equipment to road sides distant from Hospital and B) Udana Mino kebele picture after flood, with highest displaced population among the Halaba Special Woreda kebele, May, 2008 EC
138 | P a g e ( B O W , M a r k o s G u r m a m o K a l o r e ) J u n e , 2 0 1 7 .
By being in a field of Disaster visit to Halaba Special Woreda we identified certain need assessments and health risks to the population immediately and long run.
Immediate Public Health Risks
The main public health threats of this flooding are related to communicable diseases, related to
the risk factors listed below.
Interruption of safe water and sanitation supplies
The populations displaced by flooding are at immediate and high risk of outbreaks of waterborne
and food borne diseases, such as AWD.
Population displacement with overcrowding
Populations in the affected areas have been displaced into schools, temporary shelters/camps or
with host families, and are at immediate and high risk for transmission of measles and meningitis
and increased incidence of acute respiratory infections (ARI), especially pneumonia in children
under 5 years.
Vector breeding
Flooding can result in the proliferation of vector breeding sites, increasing the medium-term
(weeks to months) risk of malaria.
Poor access to quality health services
Is of immediate concern, as the health infrastructure could have been overwhelmed
Malnutrition and transmission of communicable diseases
Malnutrition compromises natural immunity, leading to more frequent, severe and prolonged
episodes of infections.
Waterborne and food borne diseases
The populations affected by the flooding are at immediate risk from outbreaks of waterborne and
food borne diseases, particularly AWD, typhoid, Shigellosis, hepatitis A and E.
Population displacement, crowding, poor access to safe water, inadequate hygiene and toilet
facilities, and unsafe food preparation and handling practices are associated with transmission.
Usual water sources can become unsafe for drinking for several reasons: the incursion of flood
waters; faecal contamination caused by overflow of latrines and inadequate sanitation;
139 | P a g e ( B O W , M a r k o s G u r m a m o K a l o r e ) J u n e , 2 0 1 7 .
contamination by dead animals; and upstream contamination if water sources are interconnected.
Since AWD transmission was documented before the current flooding in the neighboring Shala
district of the Oromiya region and there are routinely reported cases of diarrhea and dysentery,
the immediate risk of further cases will remain extremely high.
Vector-borne diseases
Malaria is endemic in all flood-affected Kebeles of the district. Even though now a day the
burden of malaria in the district is low, in previous years the Woreda had experience or history of
seasonal epidemics and populations will be at increased risk due to the proliferation of vector
breeding sites secondary to flooding. Water supply and storage of safe water practices should
also be put in place to prevent vector breeding in water storage containers. Discarded tires and
other water holding containers could further facilitate vector breeding.
Diseases associated with crowding
Population displacement caused by flooding can result in crowding in resettlement areas, raising
the risk of transmission of certain communicable diseases. Measles, ARI and meningococcal
disease are transmitted from person to person, and risk is increased in situations of forced
relocation to shared areas of high ground, often with inadequate shelter. Crowding can also
increase the likelihood of transmission of waterborne and vector-borne diseases.
Other communicable diseases
When an emergency develops, people may be subjected to situations that substantially increase
their risk of contracting: Sexually transmitted infection, including HIV and Transmission of
tuberculosis (TB) may also increase.
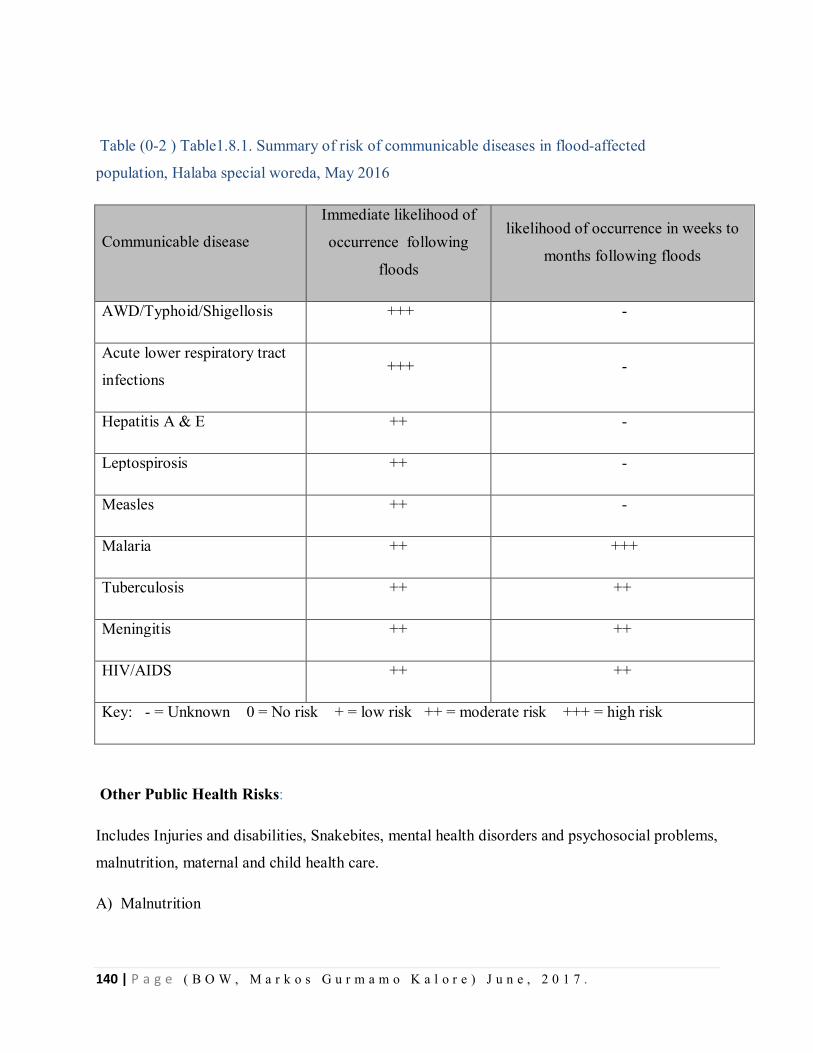
140 | P a g e ( B O W , M a r k o s G u r m a m o K a l o r e ) J u n e , 2 0 1 7 .
Table (0-2 ) Table1.8.1. Summary of risk of communicable diseases in flood-affected
population, Halaba special woreda, May 2016
Communicable disease
Immediate likelihood of
occurrence following
floods
likelihood of occurrence in weeks to
months following floods
AWD/Typhoid/Shigellosis +++ -
Acute lower respiratory tract
infections +++ -
Hepatitis A & E ++ -
Leptospirosis ++ -
Measles ++ -
Malaria ++ +++
Tuberculosis ++ ++
Meningitis ++ ++
HIV/AIDS ++ ++
Key: - = Unknown 0 = No risk + = low risk ++ = moderate risk +++ = high risk
Other Public Health Risks:
Includes Injuries and disabilities, Snakebites, mental health disorders and psychosocial problems,
malnutrition, maternal and child health care.
A) Malnutrition
141 | P a g e ( B O W , M a r k o s G u r m a m o K a l o r e ) J u n e , 2 0 1 7 .
If the crisis is prolonged and there is a lack of access to appropriate and adequate food, including
complementary foods, risk of malnutrition could increase for vulnerable groups such as young
children, pregnant and lactating women and older persons. The risk is also likely to increase if
there is a lack of or inadequate support for, mothers or caretakers to exclusively breastfeed for
six months and to continue breastfeeding up to two years, with appropriate and safe
complementary feeding.
PRIORITY INTERVENTIONS
Health sector priorities
• Multi- Sectoral assessments to identify needs, gaps and priorities
• Restore access to basic and secondary health care services including provision of
temporary mobile health services with relevant medicines and supplies to increase access
to care.
• Ensure appropriate triage and referral systems for emergency medical, surgical and
obstetric care.
• Resume vaccination services as soon as possible and consider mass measles vaccination
in crowded settings/camps.
• Prevent disease outbreaks and ensure capacity for early detection and rapid response to
public health emergencies by strengthening EWARN and ensuring outbreak preparedness
and prepositioning.
• Support adequate maternal and newborn health services, ensuring privacy and cultural
sensitivity, with registration in camps, early detection of and referral for complications of
pregnancy and childbirth, safe delivery, and provision of relevant commodities.
• Support appropriate infant and young child feeding, supplementation for pregnant and
lactating mothers, and management of malnutrition, including building health worker
capacity and supporting referral and hospital care for management of severe malnutrition.
• Intensify community social mobilization including health risk communication to promote
safe water, sanitation and hygiene practices.
• Assess the early recovery needs of the affected population and prioritize recovery
interventions.
142 | P a g e ( B O W , M a r k o s G u r m a m o K a l o r e ) J u n e , 2 0 1 7 .
Non-health sector priorities impacting health
• Ensure adequately sized and ventilated shelter.
• Provide sufficient and safe water.
• Provide adequate sanitation and hygiene facilities.
• Provide blankets and non-food items in camps
Provide safe food, including complementary food for children less than two years of age.
The Woreda is one of the prone areas for natural disasters of flood usually lead to lose of life and
properties, and also to sickness and population displacement
Situation of the current flood event
The rainy and dry season of Halaba Special Woreda is from April to September and October to
March respectively. On 27/08/2008 E.C there was a torrential rain fall through the night which
caused flash floods in many areas of the lowland Kebeles in the Woreda. This could be the worst
flooding in many years. It has left 13 people dead and many displaced. Since then a total of 36
Kebeles are severely and 17 moderately affected. The hardest hit Kebeles by the flood are Udana
Meno, Chobare Meno, Bendo Choloksa, Sinbita, Hanshekora Buti, Ajo Huluko, Buko Tibame,
Yato Bereho among the rural and Lendaber and Mehal Arada from Halaba town Administration.
An estimated 35,708 (33,876 from rural and 1832 urban) population have been affected with this
flood. The total number of households displaced from these 53 Kebeles are3721 (3212 rural and
509 urban) with a population of 18,203.
Many houses and 4 health posts submerged in the flood. In addition parts of Kulito Primary
Hospital, particularly stabilization center (Sc); medical supplies store, Laundry room and staff
dormitory with their medical and non medical supplies was damaged by flood.
Condition of Mobile Clinics in temporary shelter areas for displaced people.
Many mobile clinics formed with temporary shelters arranged places. The mobile clinics are
functioning for acute cases treatment and the other cases are being treated with health centers
and others like delivery services are being taken to Health centers by Ambulance service. Every
item of the logistics and medical equipment are being availed in the nearby temporary clinics.
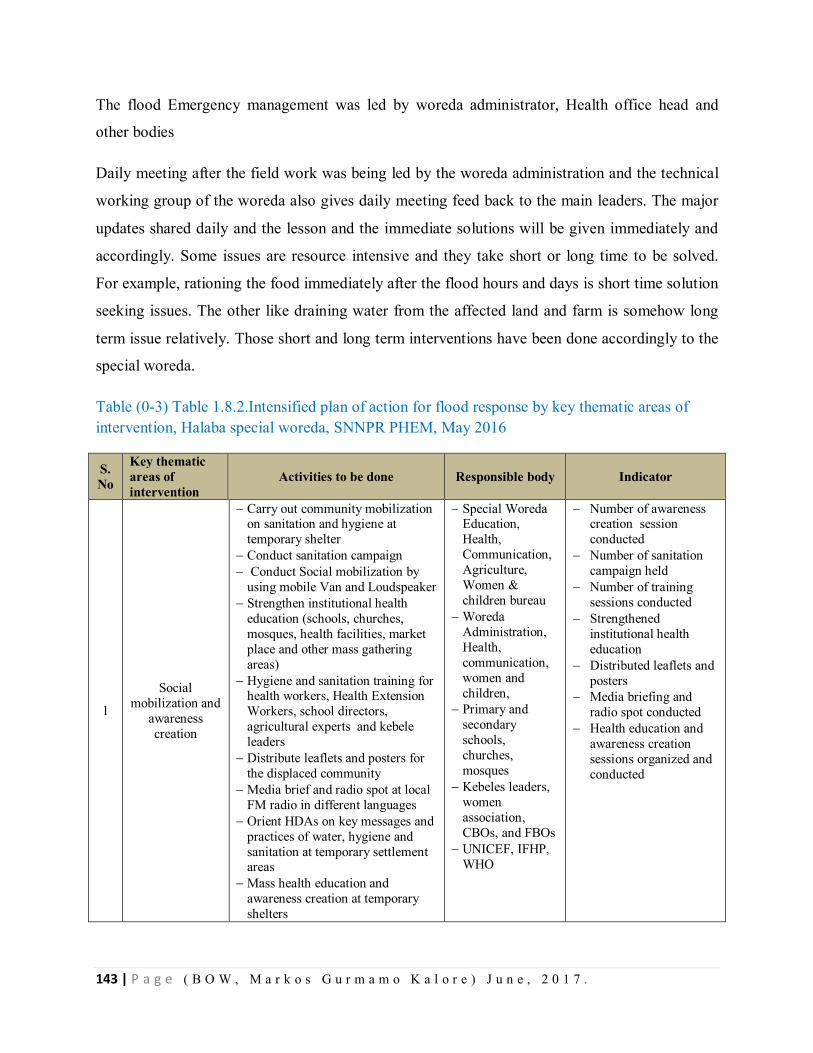
143 | P a g e ( B O W , M a r k o s G u r m a m o K a l o r e ) J u n e , 2 0 1 7 .
The flood Emergency management was led by woreda administrator, Health office head and
other bodies
Daily meeting after the field work was being led by the woreda administration and the technical
working group of the woreda also gives daily meeting feed back to the main leaders. The major
updates shared daily and the lesson and the immediate solutions will be given immediately and
accordingly. Some issues are resource intensive and they take short or long time to be solved.
For example, rationing the food immediately after the flood hours and days is short time solution
seeking issues. The other like draining water from the affected land and farm is somehow long
term issue relatively. Those short and long term interventions have been done accordingly to the
special woreda.
Table (0-3) Table 1.8.2.Intensified plan of action for flood response by key thematic areas of intervention, Halaba special woreda, SNNPR PHEM, May 2016
S. No
Key thematic areas of intervention
Activities to be done Responsible body Indicator
1
Social mobilization and
awareness creation
Carry out community mobilization on sanitation and hygiene at temporary shelter
Conduct sanitation campaign Conduct Social mobilization by
using mobile Van and Loudspeaker Strengthen institutional health
education (schools, churches, mosques, health facilities, market place and other mass gathering areas)
Hygiene and sanitation training for health workers, Health Extension Workers, school directors, agricultural experts and kebele leaders
Distribute leaflets and posters for the displaced community
Media brief and radio spot at local FM radio in different languages
Orient HDAs on key messages and practices of water, hygiene and sanitation at temporary settlement areas
Mass health education and awareness creation at temporary shelters
Special Woreda Education, Health, Communication, Agriculture, Women & children bureau
Woreda Administration, Health, communication, women and children,
Primary and secondary schools, churches, mosques
Kebeles leaders, women association, CBOs, and FBOs
UNICEF, IFHP, WHO
Number of awareness creation session conducted
Number of sanitation campaign held
Number of training sessions conducted
Strengthened institutional health education
Distributed leaflets and posters
Media briefing and radio spot conducted
Health education and awareness creation sessions organized and conducted
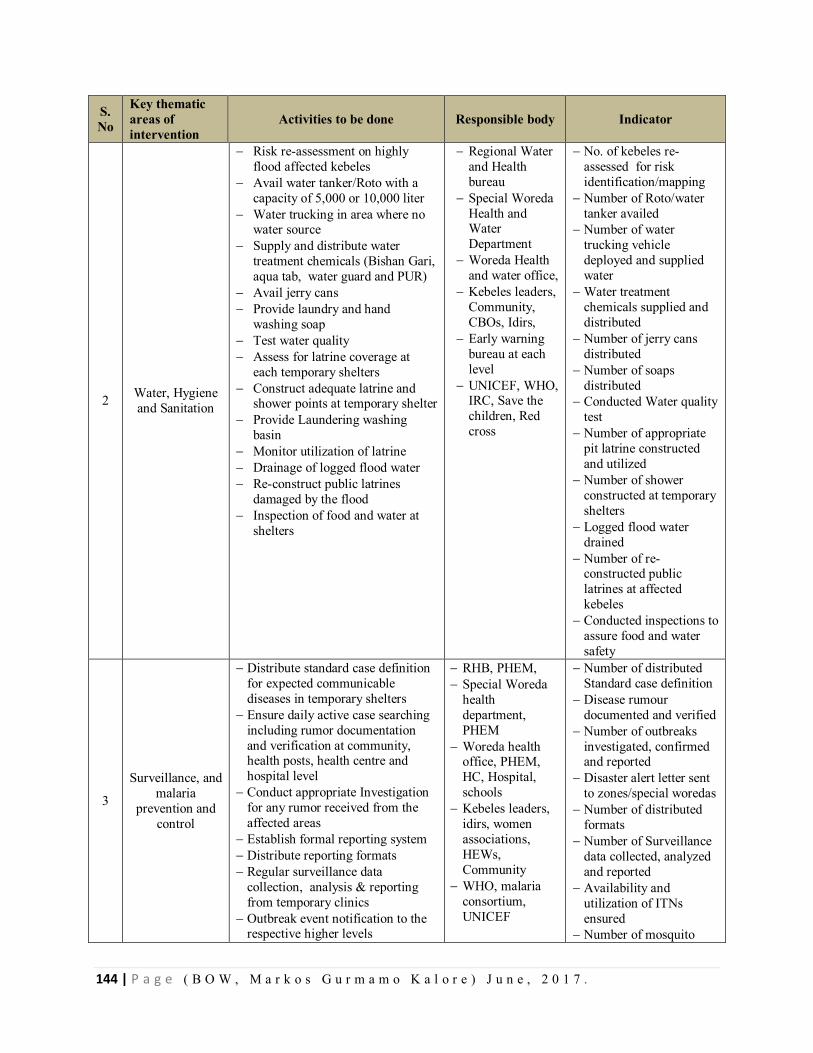
144 | P a g e ( B O W , M a r k o s G u r m a m o K a l o r e ) J u n e , 2 0 1 7 .
S. No
Key thematic areas of intervention
Activities to be done Responsible body Indicator
2 Water, Hygiene and Sanitation
Risk re-assessment on highly flood affected kebeles
Avail water tanker/Roto with a capacity of 5,000 or 10,000 liter
Water trucking in area where no water source
Supply and distribute water treatment chemicals (Bishan Gari, aqua tab, water guard and PUR)
Avail jerry cans Provide laundry and hand
washing soap Test water quality Assess for latrine coverage at
each temporary shelters Construct adequate latrine and
shower points at temporary shelter Provide Laundering washing
basin Monitor utilization of latrine Drainage of logged flood water Re-construct public latrines
damaged by the flood Inspection of food and water at
shelters
Regional Water and Health bureau
Special Woreda Health and Water Department
Woreda Health and water office,
Kebeles leaders, Community, CBOs, Idirs,
Early warning bureau at each level
UNICEF, WHO, IRC, Save the children, Red cross
No. of kebeles re- assessed for risk identification/mapping
Number of Roto/water tanker availed
Number of water trucking vehicle deployed and supplied water
Water treatment chemicals supplied and distributed
Number of jerry cans distributed
Number of soaps distributed
Conducted Water quality test
Number of appropriate pit latrine constructed and utilized
Number of shower constructed at temporary shelters
Logged flood water drained
Number of re- constructed public latrines at affected kebeles
Conducted inspections to assure food and water safety
3
Surveillance, and malaria
prevention and control
Distribute standard case definition for expected communicable diseases in temporary shelters
Ensure daily active case searching including rumor documentation and verification at community, health posts, health centre and hospital level
Conduct appropriate Investigation for any rumor received from the affected areas
Establish formal reporting system Distribute reporting formats Regular surveillance data
collection, analysis & reporting from temporary clinics
Outbreak event notification to the respective higher levels
RHB, PHEM, Special Woreda
health department, PHEM
Woreda health office, PHEM, HC, Hospital, schools
Kebeles leaders, idirs, women associations, HEWs, Community
WHO, malaria consortium, UNICEF
Number of distributed Standard case definition
Disease rumour documented and verified
Number of outbreaks investigated, confirmed and reported
Disaster alert letter sent to zones/special woredas
Number of distributed formats
Number of Surveillance data collected, analyzed and reported
Availability and utilization of ITNs ensured
Number of mosquito
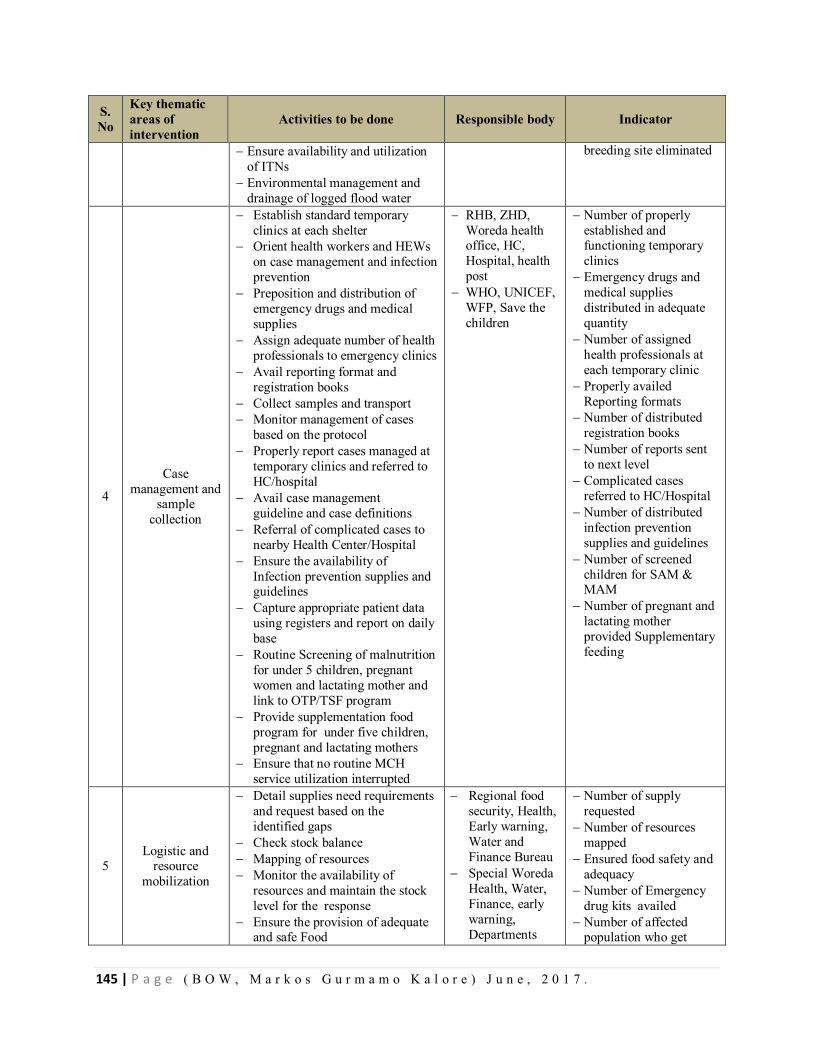
145 | P a g e ( B O W , M a r k o s G u r m a m o K a l o r e ) J u n e , 2 0 1 7 .
S. No
Key thematic areas of intervention
Activities to be done Responsible body Indicator
Ensure availability and utilization of ITNs
Environmental management and drainage of logged flood water
breeding site eliminated
4
Case management and
sample collection
Establish standard temporary clinics at each shelter
Orient health workers and HEWs on case management and infection prevention
Preposition and distribution of emergency drugs and medical supplies
Assign adequate number of health professionals to emergency clinics
Avail reporting format and registration books
Collect samples and transport Monitor management of cases
based on the protocol Properly report cases managed at
temporary clinics and referred to HC/hospital
Avail case management guideline and case definitions
Referral of complicated cases to nearby Health Center/Hospital
Ensure the availability of Infection prevention supplies and guidelines
Capture appropriate patient data using registers and report on daily base
Routine Screening of malnutrition for under 5 children, pregnant women and lactating mother and link to OTP/TSF program
Provide supplementation food program for under five children, pregnant and lactating mothers
Ensure that no routine MCH service utilization interrupted
RHB, ZHD, Woreda health office, HC, Hospital, health post
WHO, UNICEF, WFP, Save the children
Number of properly established and functioning temporary clinics
Emergency drugs and medical supplies distributed in adequate quantity
Number of assigned health professionals at each temporary clinic
Properly availed Reporting formats
Number of distributed registration books
Number of reports sent to next level
Complicated cases referred to HC/Hospital
Number of distributed infection prevention supplies and guidelines
Number of screened children for SAM & MAM
Number of pregnant and lactating mother provided Supplementary feeding
5 Logistic and
resource mobilization
Detail supplies need requirements and request based on the identified gaps
Check stock balance Mapping of resources Monitor the availability of
resources and maintain the stock level for the response
Ensure the provision of adequate and safe Food
Regional food security, Health, Early warning, Water and Finance Bureau
Special Woreda Health, Water, Finance, early warning, Departments
Number of supply requested
Number of resources mapped
Ensured food safety and adequacy
Number of Emergency drug kits availed
Number of affected population who get
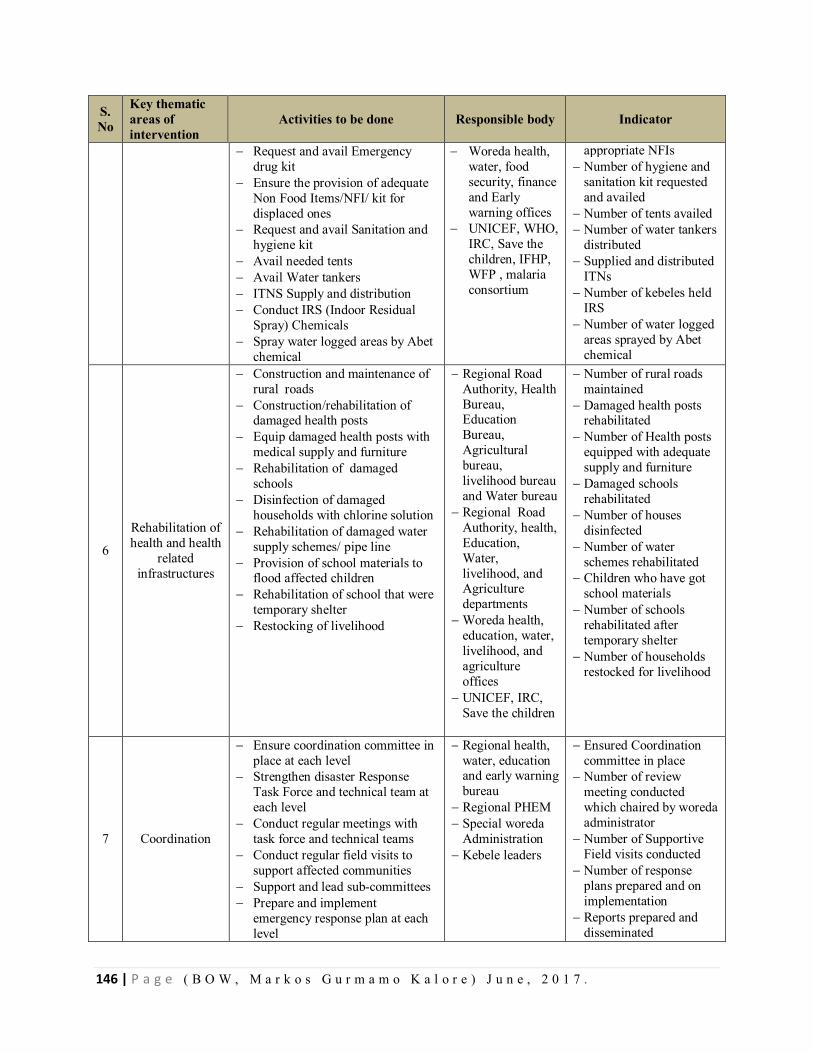
146 | P a g e ( B O W , M a r k o s G u r m a m o K a l o r e ) J u n e , 2 0 1 7 .
S. No
Key thematic areas of intervention
Activities to be done Responsible body Indicator
Request and avail Emergency drug kit
Ensure the provision of adequate Non Food Items/NFI/ kit for displaced ones
Request and avail Sanitation and hygiene kit
Avail needed tents Avail Water tankers ITNS Supply and distribution Conduct IRS (Indoor Residual
Spray) Chemicals Spray water logged areas by Abet
chemical
Woreda health, water, food security, finance and Early warning offices
UNICEF, WHO, IRC, Save the children, IFHP, WFP , malaria consortium
appropriate NFIs Number of hygiene and
sanitation kit requested and availed
Number of tents availed Number of water tankers
distributed Supplied and distributed
ITNs Number of kebeles held
IRS Number of water logged
areas sprayed by Abet chemical
6
Rehabilitation of health and health
related infrastructures
Construction and maintenance of rural roads
Construction/rehabilitation of damaged health posts
Equip damaged health posts with medical supply and furniture
Rehabilitation of damaged schools
Disinfection of damaged households with chlorine solution
Rehabilitation of damaged water supply schemes/ pipe line
Provision of school materials to flood affected children
Rehabilitation of school that were temporary shelter
Restocking of livelihood
Regional Road Authority, Health Bureau, Education Bureau, Agricultural bureau, livelihood bureau and Water bureau
Regional Road Authority, health, Education, Water, livelihood, and Agriculture departments
Woreda health, education, water, livelihood, and agriculture offices
UNICEF, IRC, Save the children
Number of rural roads maintained
Damaged health posts rehabilitated
Number of Health posts equipped with adequate supply and furniture
Damaged schools rehabilitated
Number of houses disinfected
Number of water schemes rehabilitated
Children who have got school materials
Number of schools rehabilitated after temporary shelter
Number of households restocked for livelihood
7 Coordination
Ensure coordination committee in place at each level
Strengthen disaster Response Task Force and technical team at each level
Conduct regular meetings with task force and technical teams
Conduct regular field visits to support affected communities
Support and lead sub-committees Prepare and implement
emergency response plan at each level
Regional health, water, education and early warning bureau
Regional PHEM Special woreda
Administration Kebele leaders
Ensured Coordination committee in place
Number of review meeting conducted which chaired by woreda administrator
Number of Supportive Field visits conducted
Number of response plans prepared and on implementation
Reports prepared and disseminated
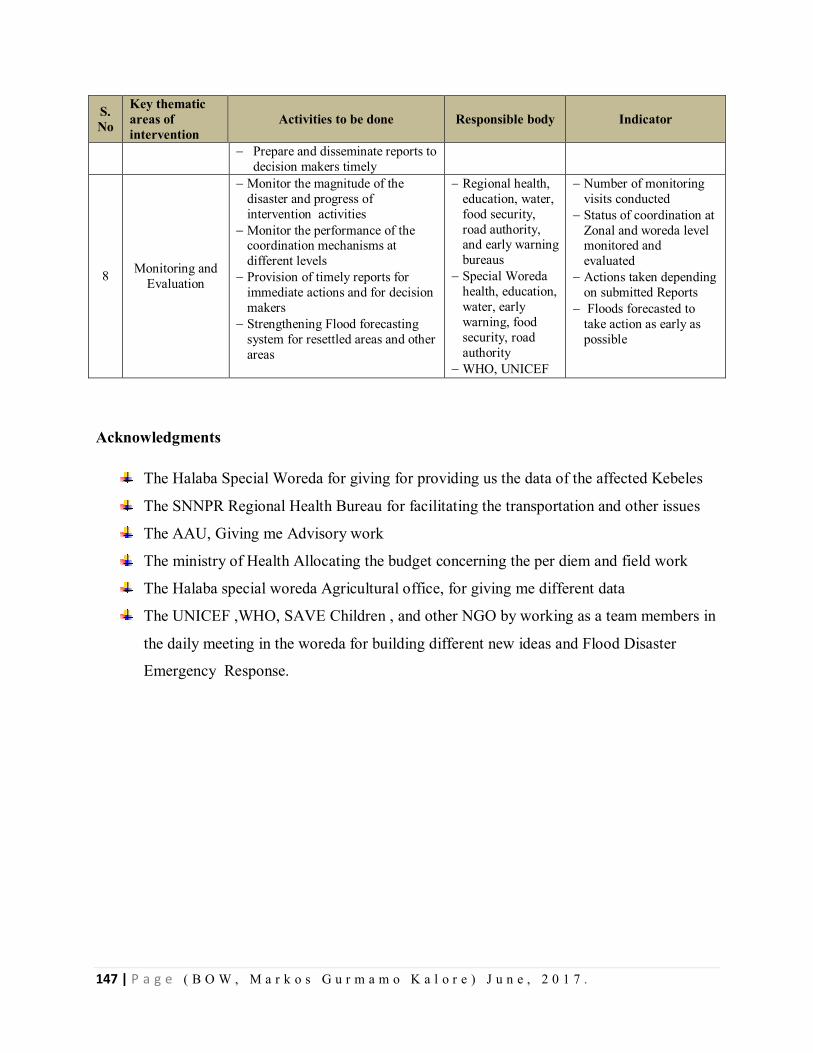
147 | P a g e ( B O W , M a r k o s G u r m a m o K a l o r e ) J u n e , 2 0 1 7 .
S. No
Key thematic areas of intervention
Activities to be done Responsible body Indicator
Prepare and disseminate reports to decision makers timely
8 Monitoring and Evaluation
Monitor the magnitude of the disaster and progress of intervention activities
Monitor the performance of the coordination mechanisms at different levels
Provision of timely reports for immediate actions and for decision makers
Strengthening Flood forecasting system for resettled areas and other areas
Regional health, education, water, food security, road authority, and early warning bureaus
Special Woreda health, education, water, early warning, food security, road authority
WHO, UNICEF
Number of monitoring visits conducted
Status of coordination at Zonal and woreda level monitored and evaluated
Actions taken depending on submitted Reports
Floods forecasted to take action as early as possible
Acknowledgments
The Halaba Special Woreda for giving for providing us the data of the affected Kebeles
The SNNPR Regional Health Bureau for facilitating the transportation and other issues
The AAU, Giving me Advisory work
The ministry of Health Allocating the budget concerning the per diem and field work
The Halaba special woreda Agricultural office, for giving me different data
The UNICEF ,WHO, SAVE Children , and other NGO by working as a team members in
the daily meeting in the woreda for building different new ideas and Flood Disaster
Emergency Response.
148 | P a g e ( B O W , M a r k o s G u r m a m o K a l o r e ) J u n e , 2 0 1 7 .
CHAPTER –IX - Project Proposal
9.1. Project Proposal on prevalence and factors associated with hypertension among adults
in Halaba Kulito Town Administration, Halaba Special Woreda, Southern Ethiopia, 2016.
Abstract
Introduction: Double burden of communicable and non communicable chronic disease like
hypertension are undergoing epidemiological transition worldwide. The problem is of special
concern in sub Saharan Africa due to this double burden of disease and transition to a more
Western lifestyle. Ethiopia being one of the Sub-Saharan Africa may share this problem that
needs intervention.
Objectives: The aim of this study is to assess prevalence and factors associated with
hypertension among adults, Halaba Kulito Town residents, Southern Ethiopia, 2016.
Methods: A community based cross sectional study will be conducted from November 15 to
December14, 2016 among adults of Halaba Kulito Town residents. The study will include 422
adults (age >30) residing in Halaba Kulito Town who will be selected from the study population
using systematic random sampling technique. Data on risk factors will be collected by interview
method using Questionnaire adapted from WHO STEP wise approach to Surveillance on non
communicable disease. In-addition measurements on Blood pressure, height and weight will be
taken by using standard mercury sphygmomanometer, tape meter and digital balance
respectively. The data will be entered into EPI-Info 7.1 & analyzed.
Frequency tables, graphs, percentages, means and standard deviations will be used to describe
the study population in relation to relevant variables. Bivariate and multivariate analysis to see
the effect of independent on dependent variable will be done.
Work plan and Budget: the study will be conducted from November 15 to March 25, 2016
/2017 and budget required for this project is 5,000 USD.
149 | P a g e ( B O W , M a r k o s G u r m a m o K a l o r e ) J u n e , 2 0 1 7 .
1.0 Introduction
1.1. Statement of the problem
Double burden of communicable and non communicable disease are undergoing epidemiological
transition worldwide. According to report from WHO chronic non communicable disease are
among the major causes of mortality and morbidity contributing for more than half of all death
all over the world, Of all the non-communicable chronic disease hypertension is one of the most
important causes of mortality and morbidity(1, 2).
Hypertension is the force of blood against the wall of arteries which increase the chance of heart
diseases it is also called silent killer. Hypertension augments the risk of cardiovascular diseases,
including coronary heart disease, congestive heart failure, ischemic and hemorrhagic stroke,
renal failure, and peripheral arterial disease. Hypertension is an independent predisposing factor
for heart failure, coronary artery disease, stroke, renal disease, and peripheral arterial disease. It
is often linked with additional cardiovascular disease risk factors and the risk of cardiovascular
disease increases with the total burden of risk factors(3).
In some developed countries like U.S.A 81.9% adults with hypertension were aware of their
blood pressure status and 76.4% were currently taking medication to lower their blood pressure.
There have been significant boost in hypertension control over time among persons with
hypertension, from 48.4% in 2007–2008 to 53.3% in 2009–2010. Unlike U.S.A, although
antihypertensive therapy clearly reduces the risks of hypertension, large segments of the
hypertensive population are either untreated or inadequately treated largely in the world(3, 4,).
The rising burden of chronic illness such as hypertension what have been historically considered
Western disease also threatened millions in Africa particularly the sub-Saharan Africa due to
transition to a more Western lifestyle(Developed Countries’ life Style) especially in urban areas
of the region (5).
According to the latest WHO data published in April 2011 hypertension Deaths in Ethiopia
reached 9,743 or 1.19% of total deaths which rank 12 from the top 20 cause of death in the
country. The age adjusted Death Rate is 29.89 per 100,000 of population ranks Ethiopia number
72 in the world. for 3,709 adults in Addis Ababa on whom verbal autopsies were completed
150 | P a g e ( B O W , M a r k o s G u r m a m o K a l o r e ) J u n e , 2 0 1 7 .
Overall,51% of deaths were attributed to non communicable diseases Of this the leading cause of
death was cardiovascular disease (24%) hypertension taking the greatest proportions for all
(12%) (6, 7)
1.2. Literature Review
Analysis of worldwide data reported prevalence of hypertension around the world varies from
3.4% to 72.5%, the lowest prevalence being in rural India men and the highest prevalence in
Poland in women. The same review has summarized the global prevalence of hypertension was
estimated 26% of the adult population in the year 2000(8).
Population-based studies done in Some developed countries like in France showed the Prevalence of
hypertension to be 37.7% in males and 22.2% in females and the prevalent cardiovascular risk factor was
shown to increase with the severity of hypertension except smoking, in Brazilian capital the overall
prevalence was 36.4% for the male (41.8%) and females (31.8%) association between Hypertension with
Body Mass Index and age was strong. The female gender and higher income were protective factors
against high blood pressure and there was no correlation with education(9, 10). This studies shows
higher prevalence of hypertension unlike the lower prevalence found in Population-based cross-sectional
surveys done among Canadian adults to be 16% of men and 13% of women in this study Hypertensive
subjects showed a higher prevalence of elevated total cholesterol, high body mass index, diabetes and
sedentary lifestyle than normotensive subjects (11).
In the study of high blood pressure among Canadian adults the prevalence of hypertension sharply
increased in men (40%) and women (49%) 65 to 74 years old and similar study in Portugal showed the
age-specific prevalence of hypertension in three age groups studied--younger than 35 years, 35-64 years
and older than 64 years--was 26.2, 54.7 and 79% in men and 12.4, 41.1 and 78.7% in women,
respectively (11, 12).
Some African countries like in Cameroon Community-based multicentre Cross-sectional study in major
cities showed the overall prevalence of hypertension was 47.5% which shows a higher prevalence like
similar study in Tunisia adolescents has showed a high prevalence of hypertension to be 35.1% [32.9-
37.4] through a national cross-sectional study(13, 14).
Two linked cross-sectional population-based surveys in urban and rural area of Tanzania showed
Hypertension prevalence was 30% ( 25.1-34.9%) in men and 28.6% (24.3-32.9%) in women in Ilala, and
32.2% (27.7-36.7%) in men and 31.5% (27.8-35.2%) in women in Shari the study showed Old age,
151 | P a g e ( B O W , M a r k o s G u r m a m o K a l o r e ) J u n e , 2 0 1 7 .
smoking, heavy alcohol consumption, physical inactivity, diabetes and greater body mass indices had
more risk factors for hypertension and its complications than non-hypertensive’s(15).
A cross-sectional survey conducted in Kinshasa showed the prevalence of hypertension was 21.3%.
Hypertension was associated with aging and alcohol intake .similar study done on a random sample
drawn from a population register study in Ghana showed prevalence of hypertension was 19.3% where
BP was significantly associated with age, BMI(16, 17).
In studies conducted in Nigeria and Eritrea prevalence of hypertension was, 10.3% (CI, 8.4%, 12.2%)
and 16 % in the general population by cross sectional study among all the ethnic groups respectively. Of
this studies the study in Eritrea showed the highest levels of hypertension in unemployed people and local
merchants the prevalence of hypertension steadily increased with age in both sexes and BMI was
positively correlated with BP (18, 19).
Cross-sectional study employed among adults in Addis Ababa City, Ethiopia, showed the age-adjusted
prevalence of high blood pressure or reported use of anti-hypertensive medication to be 31.5% (29.0,
33.9) among males and 28.9% (26.8, 30.9) among females. In this study age and BMI were significantly
associated (P < 0.001) with mean SBP and DBP in males and females sex, while educational level was
inversely associated with both blood pressure in males. Current daily smoking was associated with BP,
while level of total physical activity was inversely association with SBP in males (20).
A community based cross sectional study conducted among adults in Gondar city, Northern Ethiopia,
revealed that the overall prevalence of hypertension was 28.3% (95%CI: 24.9-31.7) The study showed
that among subjects aged 55 years and above the AOR of hypertension was 3.33 [95%CI: 1.88-5.90] as
compared to those 35–44 years old. Participants with family history of hypertension were three times
more at risk of hypertension compared to thus from normotensive family. Participants how had self-
reported diabetes were about four times more likely to be hypertensive. Thus who did not walk at least
for 10 minutes continuously on daily basis were about three times highly likely to be hypertensive.
compared to having normal BMI obesity was significantly associated with hypertension(21).
A cross-sectional comparative study conducted in Southern Ethiopia at Sidama Zone in the same region
with this study area found a prevalence of hypertension to 18.8%(22).
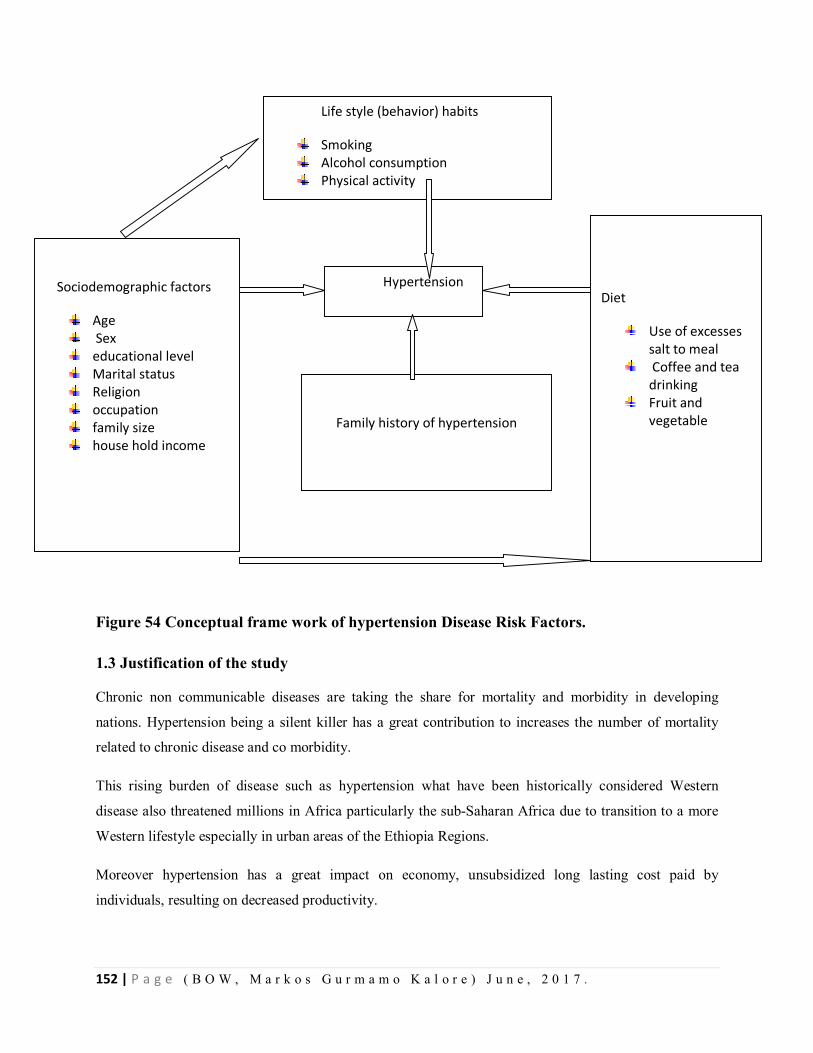
152 | P a g e ( B O W , M a r k o s G u r m a m o K a l o r e ) J u n e , 2 0 1 7 .
Figure 54 Conceptual frame work of hypertension Disease Risk Factors.
1.3 Justification of the study
Chronic non communicable diseases are taking the share for mortality and morbidity in developing
nations. Hypertension being a silent killer has a great contribution to increases the number of mortality
related to chronic disease and co morbidity.
This rising burden of disease such as hypertension what have been historically considered Western
disease also threatened millions in Africa particularly the sub-Saharan Africa due to transition to a more
Western lifestyle especially in urban areas of the Ethiopia Regions.
Moreover hypertension has a great impact on economy, unsubsidized long lasting cost paid by
individuals, resulting on decreased productivity.
Life style (behavior) habits
Smoking Alcohol consumption Physical activity
Diet
Use of excesses salt to meal
Coffee and tea drinking
Fruit and vegetable
Hypertension
Sociodemographic factors
Age Sex educational level Marital status Religion occupation family size house hold income
Family history of hypertension
153 | P a g e ( B O W , M a r k o s G u r m a m o K a l o r e ) J u n e , 2 0 1 7 .
Reliable information about the prevalence and risk factors of hypertension is essential for assigning
sufficient priority and resources to prevention and control of this condition
To the best of my knowledge no study is done in the area this study is intended to be conducted therefore
this study will be the first study and will be base line for further studies in the study area
2. Objective
2.1. General objective
To assess prevalence and factors associated with hypertension among adults in Halaba Kulito Town
Administration, Halaba Special Woreda, Southern Ethiopia, 2016.
2.2. Specific objectives
To determine the prevalence of hypertension among adults in Halaba Kulito Town Administration,
Halaba Special Woreda, Southern Ethiopia 2016
To identify factors associated with hypertension among adults in Halaba Kulito Town Administration,
Halaba Special Woreda, and Southern Ethiopia 2016.
3. Methods
3.1. Study Design
A community based cross sectional quantitative study design will be employed.
3.2. Study Period
The study will be conducted from November 15 to December 14, 2016
3.3 Study Area
The study will be carried out in Halaba Kulito Town Administration, Halaba Special Woreda, SNNPR,
which is located 315 Km far from Addis Ababa in the southern part of the country. Halaba Kulito Town
Administration is the only Town Administration of Halaba Special Woreda, bounded by Halaba Special
Woreda in all the four directions. The Town Administration has a total of 7,872 households. Total
population size of the Town Administration is 38,577 of which 18,903 are males and 19,674 females.(23)
In the Town Administration there is one district hospital, 3 primary level private clinics, 1 health center
and 05 drug stores .
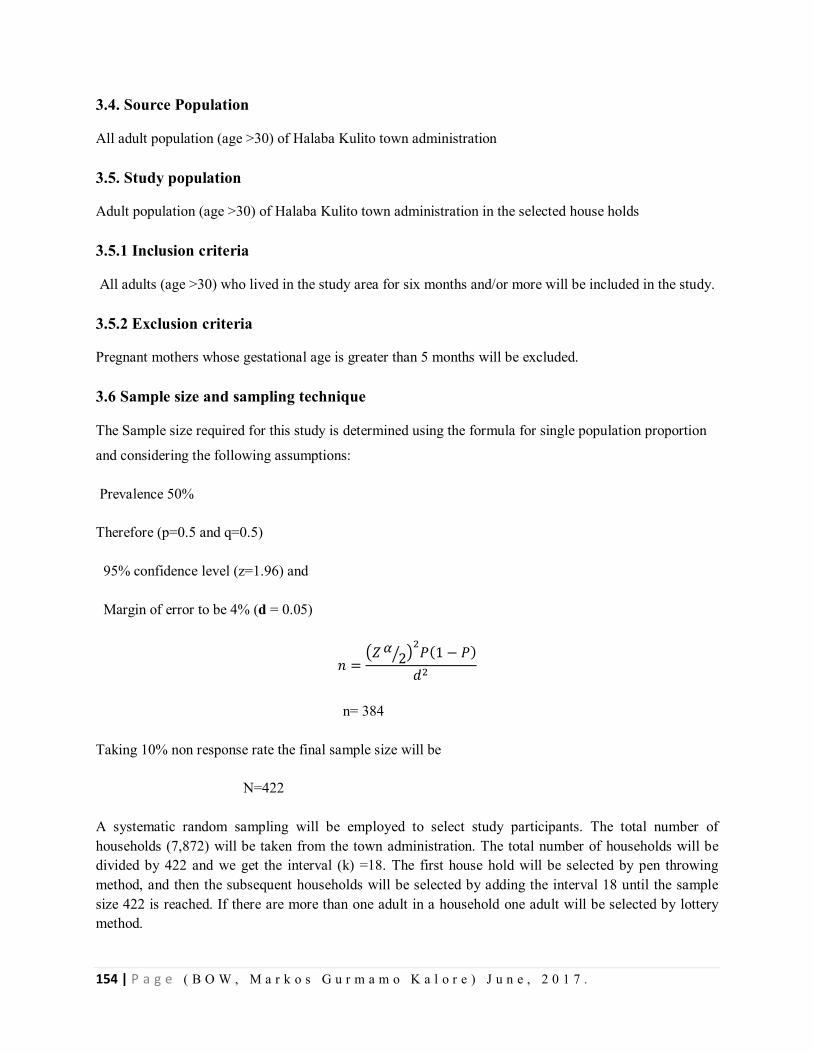
154 | P a g e ( B O W , M a r k o s G u r m a m o K a l o r e ) J u n e , 2 0 1 7 .
3.4. Source Population
All adult population (age >30) of Halaba Kulito town administration
3.5. Study population
Adult population (age >30) of Halaba Kulito town administration in the selected house holds
3.5.1 Inclusion criteria
All adults (age >30) who lived in the study area for six months and/or more will be included in the study.
3.5.2 Exclusion criteria
Pregnant mothers whose gestational age is greater than 5 months will be excluded.
3.6 Sample size and sampling technique
The Sample size required for this study is determined using the formula for single population proportion
and considering the following assumptions:
Prevalence 50%
Therefore (p=0.5 and q=0.5)
95% confidence level (z=1.96) and
Margin of error to be 4% (d = 0.05)
= 2 (1 − )
n= 384
Taking 10% non response rate the final sample size will be
N=422
A systematic random sampling will be employed to select study participants. The total number of households (7,872) will be taken from the town administration. The total number of households will be divided by 422 and we get the interval (k) =18. The first house hold will be selected by pen throwing method, and then the subsequent households will be selected by adding the interval 18 until the sample size 422 is reached. If there are more than one adult in a household one adult will be selected by lottery method.
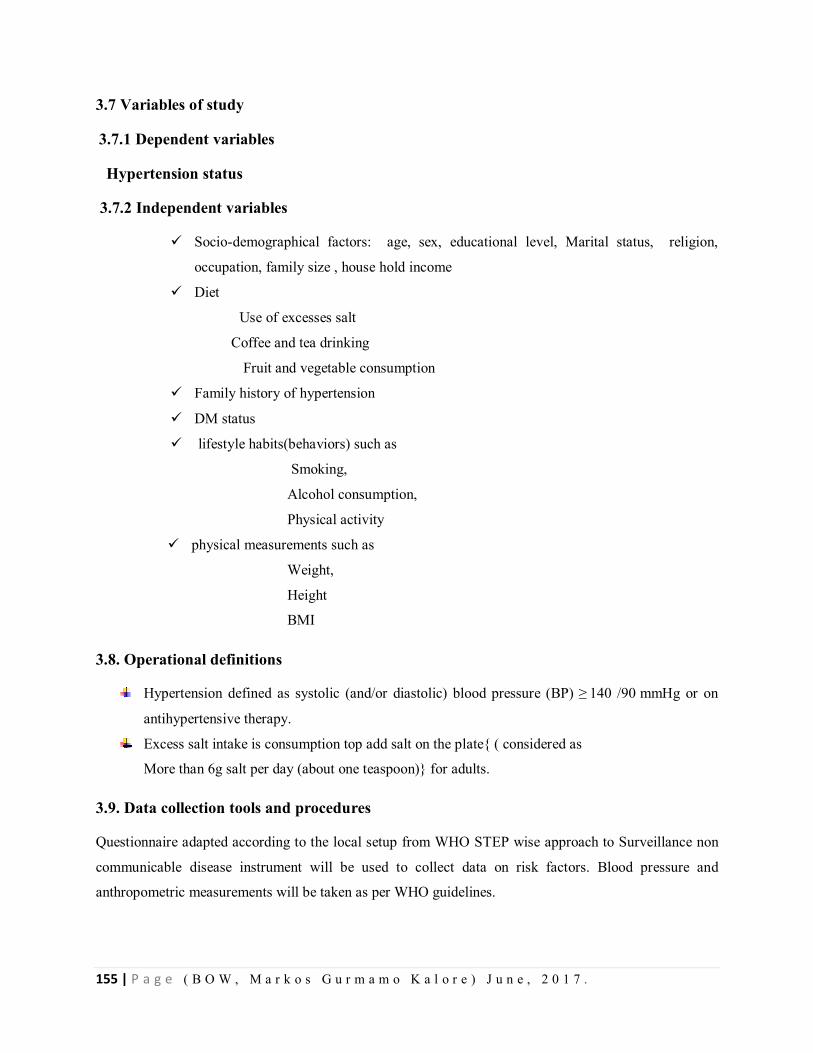
155 | P a g e ( B O W , M a r k o s G u r m a m o K a l o r e ) J u n e , 2 0 1 7 .
3.7 Variables of study
3.7.1 Dependent variables
Hypertension status
3.7.2 Independent variables
Socio-demographical factors: age, sex, educational level, Marital status, religion,
occupation, family size , house hold income
Diet
Use of excesses salt
Coffee and tea drinking
Fruit and vegetable consumption
Family history of hypertension
DM status
lifestyle habits(behaviors) such as
Smoking,
Alcohol consumption,
Physical activity
physical measurements such as
Weight,
Height
BMI
3.8. Operational definitions
Hypertension defined as systolic (and/or diastolic) blood pressure (BP) ≥ 140 /90 mmHg or on
antihypertensive therapy.
Excess salt intake is consumption top add salt on the plate{ ( considered as
More than 6g salt per day (about one teaspoon)} for adults.
3.9. Data collection tools and procedures
Questionnaire adapted according to the local setup from WHO STEP wise approach to Surveillance non
communicable disease instrument will be used to collect data on risk factors. Blood pressure and
anthropometric measurements will be taken as per WHO guidelines.
156 | P a g e ( B O W , M a r k o s G u r m a m o K a l o r e ) J u n e , 2 0 1 7 .
Data will be collected by trained nurses and the training will be given for two days by
supervisors and principal investigator.
Three separate measurements will be obtained on the left arm of the seated subject using a cuff
of an appropriate size and BP reading will be recorded. The average of the readings will be taken
as the BP of the participant. The blood pressure measurements will be obtained after the subject
has rest for at least five minutes in a seated position. It will be made sure that the subjects have
not consumed any hot beverages, such as tea or coffee, smoked cigarette or undertaken vigorous
physical activity within the last 30 minutes preceding the interview if so the measurement will be
postponed for 30 minutes. Height of the participant will be measured at standing upright position
on bare footed and weight of participant wearing light cloth.
3.10. Data processing and analysis
The data will be entered, cleaned and edited by EPI-Info 7 and statistical further analysis will be done.
Data cleaning will be performed to check for accuracy, consistencies and missed values and variables.
Descriptive statistics of the collected data will be done for variables in the study using statistical
measurements. Frequency tables, graphs, percentages, means and standard deviations will be used.
Bivariate analysis will be conducted primarily to check which variables have association with the
dependent variable individually. Variables found to have association with the dependent variables at 0.2
P-value will be entered in to multivariate logistic regression for controlling the possible effect of
confounders and finally the variables which have significant association will be identified on the basis of
Odds Ratio OR, with 95%CI and 0.05 p-values to fit into the final regression model.
3.11 Data Quality Assurance
To assure data quality questionnaire will be prepared in English and translated into Amharic and back to
English, data collectors will be trained on the data collection techniques and measurements. The data
collection tools will be pre-tested on non-selected study participants; to check for ambiguity and
sequencing of questions, prior to the actual data collection time in other place than Halaba Kulito Town.
In addition, the completeness, accuracy and consistency of the collected data will be checked on daily
basis during the data collection time, by the principal investigator and supervisor.
4. Ethical considerations
The study will be carried out after getting approval from the Institutional Review Board of Institute of
public health, university of Addis Ababa, Ethiopia. A letter of support which indicates the objective of the
157 | P a g e ( B O W , M a r k o s G u r m a m o K a l o r e ) J u n e , 2 0 1 7 .
study will be written to SNNPR, health bureau, from University of Addis Ababa. Permission letter will be
obtained from the regional health bureau (RHB), Halaba Special Woreda health office and Halaba Kulito
Town Administration health office. The Addis Ababa University IRB committee will conduct the ethical
clearance approval.
The purpose and importance of the study will be explained to the participants. Data will be collected after
full informed written consent obtained and confidentiality of the information will also be maintained by
omitting their names and personal identification or privacy.
For all participant information on their blood pressure status will be given. If participants is found to be
hypertensive information will be given how to control or prevent and referral to health facility if in
hypertension crisis.
5. Dissemination of Results
The final report will be presented for Halaba Kulito Town Administration and for district level leaders,
Regional level Leaders and Ministry of Health of Ethiopia as needed and for the university of Addis
Ababa, College of Health Science for Scientific community in TEPHINET. Also the document will be
written in body of work for degree of Master in public health to, Addis Ababa University. Findings of the
study will be submitted to University of Addis Ababa, school of Public Health and College of Health
science, also the results will be disseminated by making different types of Governmental meetings and
seminars in the study are level, and other seminars and Annual Regional Health Meetings by gating
permission first from the government. Besides to this the finding will be presented for Addis Ababa
university, Ethiopia, where I am taking the study of Musters in Field Epidemiology currently so that, the
findings will be presented in invited scientific communities level and will address many readers through
the level of Publication in international scientific journals through correct procedures.
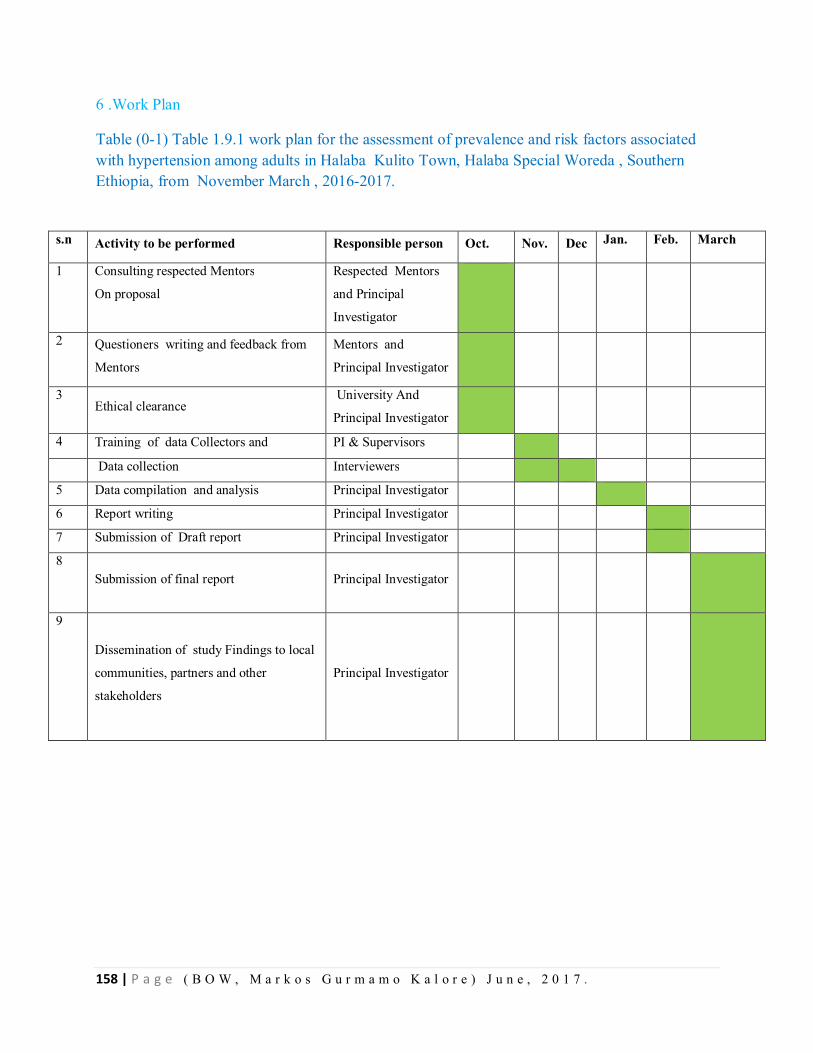
158 | P a g e ( B O W , M a r k o s G u r m a m o K a l o r e ) J u n e , 2 0 1 7 .
6 .Work Plan
Table (0-1) Table 1.9.1 work plan for the assessment of prevalence and risk factors associated with hypertension among adults in Halaba Kulito Town, Halaba Special Woreda , Southern Ethiopia, from November March , 2016-2017.
s.n Activity to be performed Responsible person Oct. Nov. Dec Jan. Feb. March
1 Consulting respected Mentors
On proposal
Respected Mentors
and Principal
Investigator
2 Questioners writing and feedback from
Mentors
Mentors and
Principal Investigator
3 Ethical clearance
University And
Principal Investigator
4 Training of data Collectors and PI & Supervisors
Data collection Interviewers
5 Data compilation and analysis Principal Investigator
6 Report writing Principal Investigator
7 Submission of Draft report Principal Investigator
8 Submission of final report Principal Investigator
9
Dissemination of study Findings to local
communities, partners and other
stakeholders
Principal Investigator
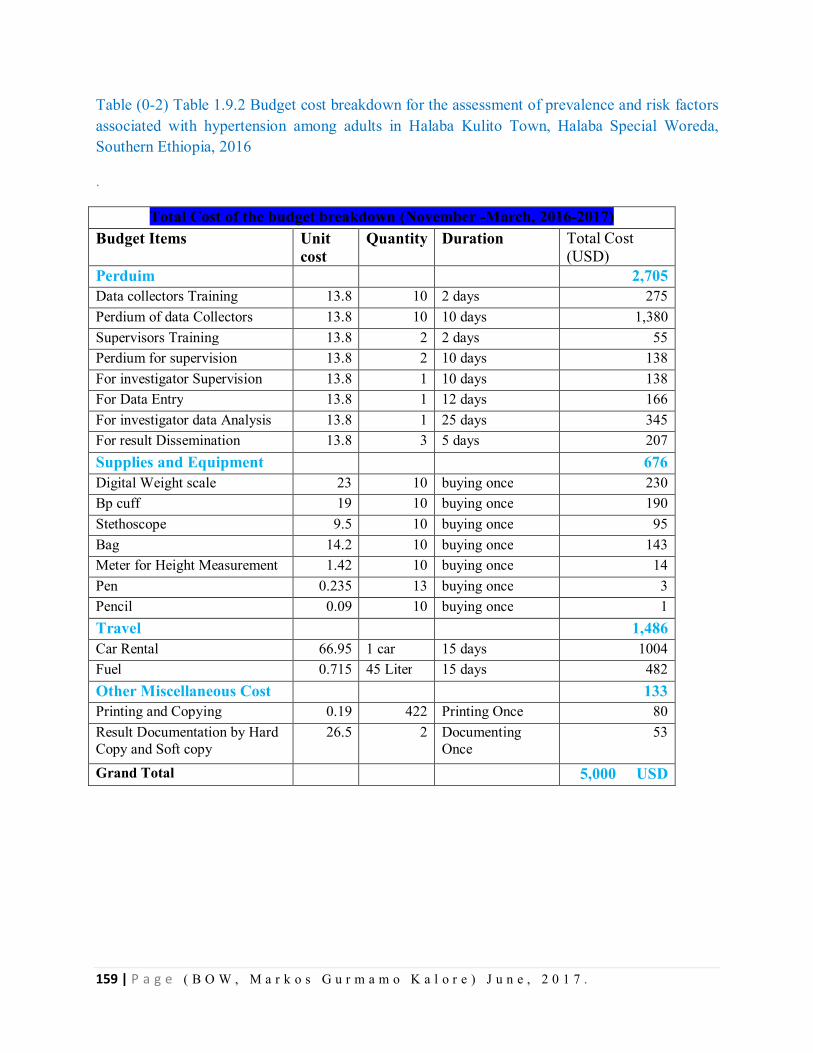
159 | P a g e ( B O W , M a r k o s G u r m a m o K a l o r e ) J u n e , 2 0 1 7 .
Table (0-2) Table 1.9.2 Budget cost breakdown for the assessment of prevalence and risk factors associated with hypertension among adults in Halaba Kulito Town, Halaba Special Woreda, Southern Ethiopia, 2016
.
Total Cost of the budget breakdown (November -March, 2016-2017) Budget Items Unit
cost Quantity Duration Total Cost
(USD) Perduim 2,705 Data collectors Training 13.8 10 2 days 275 Perdium of data Collectors 13.8 10 10 days 1,380 Supervisors Training 13.8 2 2 days 55 Perdium for supervision 13.8 2 10 days 138 For investigator Supervision 13.8 1 10 days 138 For Data Entry 13.8 1 12 days 166 For investigator data Analysis 13.8 1 25 days 345 For result Dissemination 13.8 3 5 days 207 Supplies and Equipment 676 Digital Weight scale 23 10 buying once 230 Bp cuff 19 10 buying once 190 Stethoscope 9.5 10 buying once 95 Bag 14.2 10 buying once 143 Meter for Height Measurement 1.42 10 buying once 14 Pen 0.235 13 buying once 3 Pencil 0.09 10 buying once 1 Travel 1,486 Car Rental 66.95 1 car 15 days 1004 Fuel 0.715 45 Liter 15 days 482 Other Miscellaneous Cost 133 Printing and Copying 0.19 422 Printing Once 80 Result Documentation by Hard Copy and Soft copy
26.5 2 Documenting Once
53
Grand Total 5,000 USD
160 | P a g e ( B O W , M a r k o s G u r m a m o K a l o r e ) J u n e , 2 0 1 7 .
7. References
1. Addo J, Smeeth L, Leon DA. Hypertension in sub-saharan Africa: a systematic review. Hypertension. 2007 Dec;50(6):1012-8. PubMed PMID: 17954720. Epub 2007/10/24. eng.
2. who. preventing chronic disease a vital investiment WHO global report. 2005.
3. Harrison. Harrison's principle of internal medicine the McGraw-Hill Compaines2008.
4. Yoon SS BV, Louis T, Carroll MD. Hypertension among adults in the United States, 2009–2010. National Center for Health Statistics 2012;107.
5. KAMINER B LWP. Blood Pressure in Bushmen of the Kalahari Desert [cited 2013 feb 23]. Available from: http://circ.ahajournals.org/content/22/2/289.short.
6. WHO. World health rankings. 2011 [cited 2013 feb 13]. Available from: http://www.worldlifeexpectancy.com/ethiopia-hypertension.
7. Misganaw A MD, Araya T. The double mortality burden among adults in Addis Ababa, Ethiopia, 2006-2009. CDC. 2012;9.
8. Patricia M Kearney MW, Kristi Reynolds, Paul Muntner, Paul K Whelton, Jiang He. Global burden of hypertension: analysis of worldwide data. The Lancet. 15 January 2005;365( 9455):217-23.
9. Asmar R VS, Pannier B, Brisac AM, Tichet J, El Hasnaoui A. High blood pressure and associated cardiovascular risk factors in France. J Hypertens. 2001 Oct;10(19):1727-32.
10. Jardim PC GMR, Monego ET, Moreira HG, Vitorino PV, Souza WK, Scala LC. High blood pressure and some risk factors in a Brazilian capital. Arq Bras Cardiol. 2007 Apr;4(88):452-7.
11. Joffres MR HP, Rabkin SW, Gelskey D, Hogan K, Fodor G. Prevalence, control and awareness of high blood pressure among Canadian adults. . CMAJ. 1992 Jun;11(146).
12. Macedo ME LM, Silva AO, Alcantara P, Ramalhinho V, Carmona J. Prevalence, awareness, treatment and control of hypertension in Portugal: the PAP study. J Hypertens. 2005 Sep;9(23):1661-6.
13. Hajer Aounallah-Skhiri JEA, Pierre Traissac,Habiba Ben Romdhane, Sabrina Eymard-Duvernay, Francis Delpeuch,Noureddine Achour, Bernard Maire. Blood pressure and associated factors in a North African adolescent population. a national cross-sectional study in Tunisia. BMC Public Health. 2012;12(98).
14. Anastase Dzudie ea. Prevalence, awareness, treatment and control of hypertension in a self-selected sub-Saharan African urban population: a cross-sectional study. BMJ. 2012;2(4).
15. Edwards R UN, Mugusi F, Whiting D, Rashid S, Kissima J, Aspray TJ, Alberti KG. Hypertension prevalence and care in an urban and rural area of Tanzania. J Hypertens. 2000 Feb;2(18):145-52.
161 | P a g e ( B O W , M a r k o s G u r m a m o K a l o r e ) J u n e , 2 0 1 7 .
16. Longo-Mbenza B NBJ, Vangu Ngoma D, Mbungu S. Prevalence and risk factors of arterial hypertension among urban Africans in workplace: the obsolete role of body mass index. Niger J Med. 2007 Jan-Mar;1(16):42-9.
17. Kunutsor S PJ. Descriptive epidemiology of blood pressure in a rural adult population in Northern Ghana. Rural Remote Health. 2009 Apr-Jun;9(2):1095.
18. J Mufunda1 GM, A Usman3, P Nyarango1, A Kosia3, Y Ghebrat3, A Ogbamariam4,, Gebremichael1 MMaA. The prevalence of hypertension and its relationship with obesity: results from a national blood pressure survey in Eritrea. Journal of Human Hypertension 2006;20:59-65.
19. Olatunbosun ST KJ, Cooper RS, Bella AF. Hypertension in a black population: prevalence and biosocial determinants of high blood pressure in a group of urban Nigerians. J Hum Hypertens. 2000 Apr;14(4):249-57.
20. Tesfaye F. BP, Wall S. Population based prevalence of high blood pressure among adults in Addis Ababa: uncovering a silent epidemic. BMCCardiovascular Disorders. 2009;39(9).
21. Awoke A. A, Alemu S.,Megabiaw B. . Prevalence and associated factors of hypertension among adults in Gondar, Northwest Ethiopia: a community based cross-sectional study. BMCCardiovascular Disorders. 2012;12(113).
22. Giday A., Wolde M., Yihdego D. . Hypertension, obesity and central obesity in diabetics and non diabetics in Southern Ethiopia. . Ethiop J Health Dev 2010;2(24).
23. commission FDRoEpc. summary and statistical report of the 2016 population.
162 | P a g e ( B O W , M a r k o s G u r m a m o K a l o r e ) J u n e , 2 0 1 7 .
CHAPTER- X- Additional Output on Conflict Disaster Situation Need Assessment Done
9.1 Conflict Disaster Situation Need Assessment on Geode Zone, SNNPR, Ethiopia, Oct, 2016 INTRODUCTION
The global number of people internally displaced by violence; armed conflict; natural disaster;
inter alia; stood at 26.4 million, a number that surpasses global estimates of refugees. This
number is approximately 6 million larger than the figure at the fall of 1999. I internally displaced
people are people or groups of people who have been forced or obliged to flee or to leave their
homes or places of habitual residence, in particular as a result of or in order to avoid the effects
of armed conflict, situations of generalized violence, violations of human rights or natural or
human-made disasters, and who have not crossed an internationally recognized State border.
Ethiopia has been affected by natural (drought, disease outbreaks, flooding) and manmade
disasters (internal and external conflicts). Such conditions are known to increase and aggravate
the incidence of diseases and effect of health threats including the spread of communicable
diseases, diseases outbreaks, and malnutrition in a given population. Children and mothers are
the most at risk for increased morbidity and mortality from these diseases. In Ethiopia,
emergencies of natural and manmade cause are very common, among which the major ones are
disease outbreaks, IDPs and severe acute malnutrition due to recurrent droughts.
Gedeo Zone is densely populated zone in the region. It has a population of 1,112,951 .The zone
administered with 6 districts and two town administrations. There are 3 Hospitals, 39 health
centers and144 Health posts in the zone. Majority of the zone is boarded with Oromiya region.
On Sept 27/2008 EC, there was a conflict between Gedeo Zone people themselves at Dilla
Town, Yirgachafe town, Dilla zuria, Wonago, Kochre and Gedeb Woredas within the same
week near to all woredas. As some people explained, the conflict was between community
members who support the Yirga chafe Union and those who support the Dilla town merchants.
During at this conflict time a number of house completely burned and a significant number of
people displaced from their Residences.
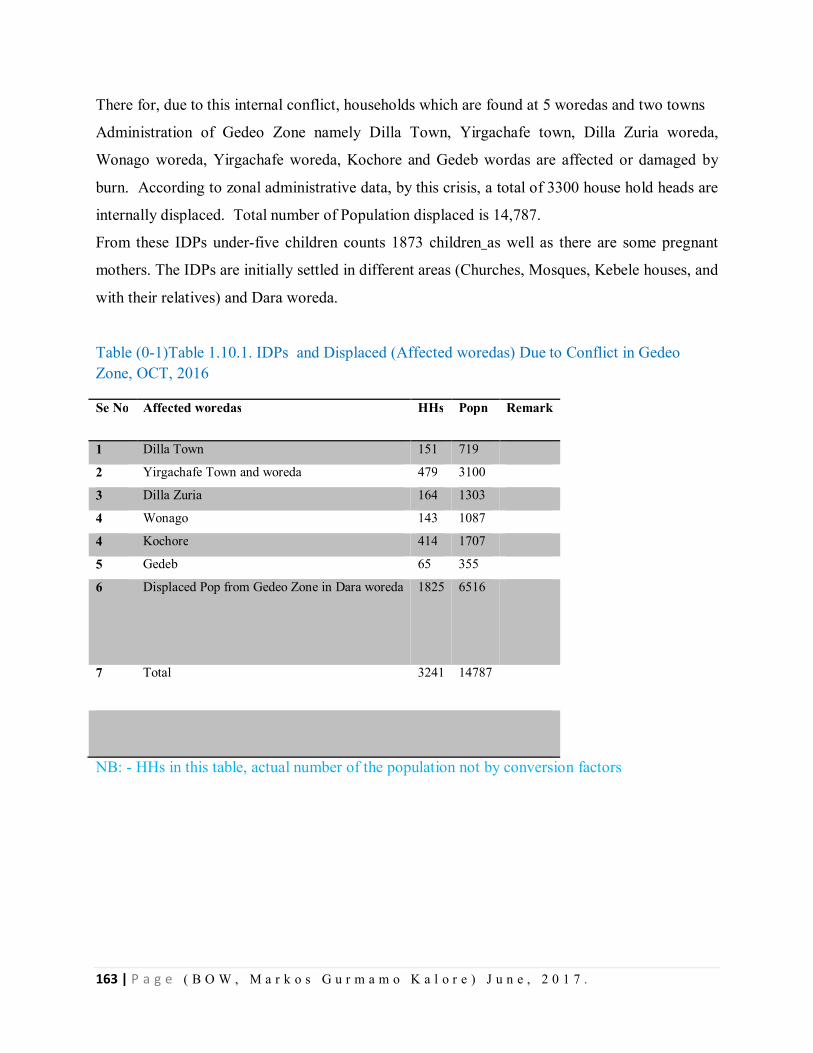
163 | P a g e ( B O W , M a r k o s G u r m a m o K a l o r e ) J u n e , 2 0 1 7 .
There for, due to this internal conflict, households which are found at 5 woredas and two towns
Administration of Gedeo Zone namely Dilla Town, Yirgachafe town, Dilla Zuria woreda,
Wonago woreda, Yirgachafe woreda, Kochore and Gedeb wordas are affected or damaged by
burn. According to zonal administrative data, by this crisis, a total of 3300 house hold heads are
internally displaced. Total number of Population displaced is 14,787.
From these IDPs under-five children counts 1873 children as well as there are some pregnant
mothers. The IDPs are initially settled in different areas (Churches, Mosques, Kebele houses, and
with their relatives) and Dara woreda.
Table (0-1)Table 1.10.1. IDPs and Displaced (Affected woredas) Due to Conflict in Gedeo Zone, OCT, 2016
Se No Affected woredas HHs Popn Remark
1 Dilla Town 151 719
2 Yirgachafe Town and woreda 479 3100
3 Dilla Zuria 164 1303
4 Wonago 143 1087
4 Kochore 414 1707
5 Gedeb 65 355
6 Displaced Pop from Gedeo Zone in Dara woreda 1825 6516
7 Total 3241
14787
NB: - HHs in this table, actual number of the population not by conversion factors
164 | P a g e ( B O W , M a r k o s G u r m a m o K a l o r e ) J u n e , 2 0 1 7 .
Objectives
General Objective
To reduce mortality, morbidity, health impacts of conflicts and rehabilitate the displaced
community in Gedeo Zone, September, 2016
Specific Objectives
To provide emergency medical services in all displaced community
To provide health promotion and psycho-Social support for the affected population
To improve access to latrine, shower and hand washing facilities
To improve the quality of shelter for displaced community as per the standard
To secure food and non food items for displaced community
Current Emergency response Coordination
To address the basic need of IDPs, we are implementing every activity in a coordinated
manner. Functional coordination committees established by dividing it in to main & Sub-
technical committees
Coordination meeting established which is leading by Zonal Adminstrator and it is
conducting every day. Members of this multiagency meeting are Health office, water
office, early warning, Security/protection office, Agriculture, Education, women and
young children.
Further, all sectors established the coordination committees per thematic areas. besides,
they are evaluating their daily performance with their immediate coordinators
The emergency response plan prepared at zonal level and is on track for utilization
Emergency Health service
In Gedeo Zone, Initially, Regional health bureau representatives, and zonal health
department representatives are coordinating the overall health activities
The health team established functional health coordination committee into three basic
thematic areas (Team 1- Case management, surveillance and logistics, Team 2- Social
mobilization and psychosocial support team and Team 3- Hygiene and sanitation team);
the sub-committee is evaluating its daily activities in a regular bases.
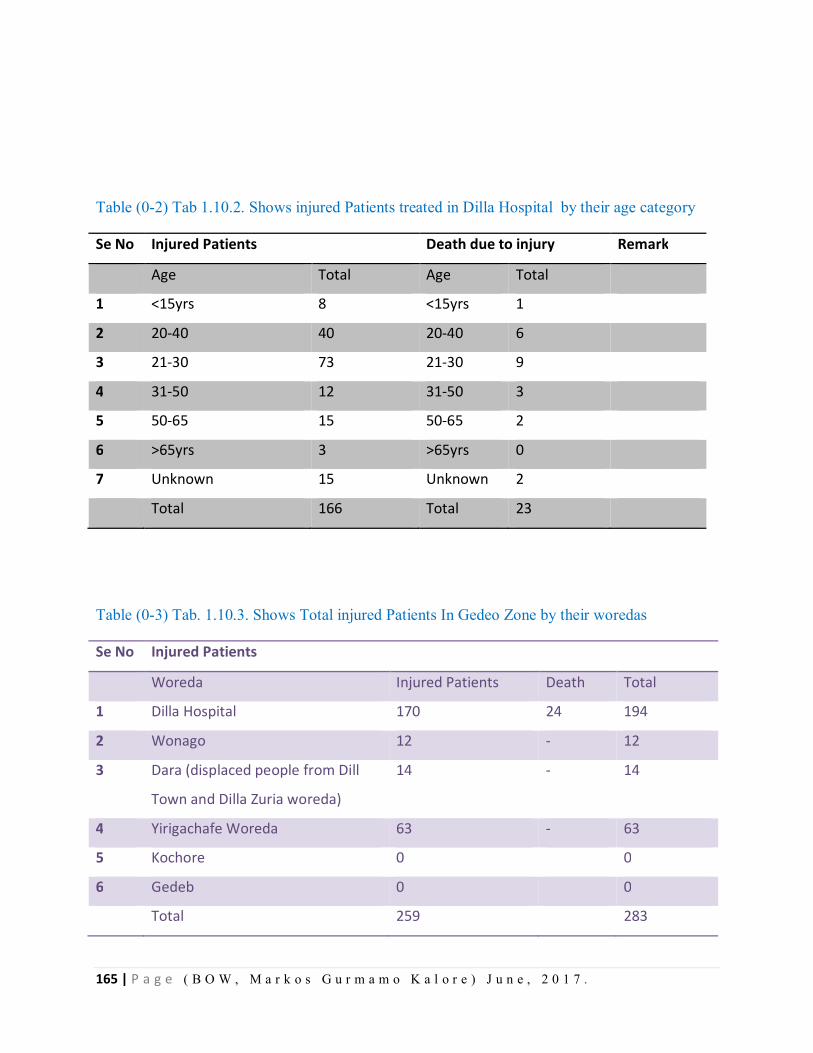
165 | P a g e ( B O W , M a r k o s G u r m a m o K a l o r e ) J u n e , 2 0 1 7 .
Table (0-2) Tab 1.10.2. Shows injured Patients treated in Dilla Hospital by their age category
Se No Injured Patients Death due to injury Remark
Age Total Age Total
1 <15yrs 8 <15yrs 1
2 20-40 40 20-40 6
3 21-30 73 21-30 9
4 31-50 12 31-50 3
5 50-65 15 50-65 2
6 >65yrs 3 >65yrs 0
7 Unknown 15 Unknown 2
Total 166 Total 23
Table (0-3) Tab. 1.10.3. Shows Total injured Patients In Gedeo Zone by their woredas
Se No Injured Patients
Woreda Injured Patients Death Total
1 Dilla Hospital 170 24 194
2 Wonago 12 - 12
3 Dara (displaced people from Dill
Town and Dilla Zuria woreda)
14 - 14
4 Yirigachafe Woreda 63 - 63
5 Kochore 0 0
6 Gedeb 0 0
Total 259 283
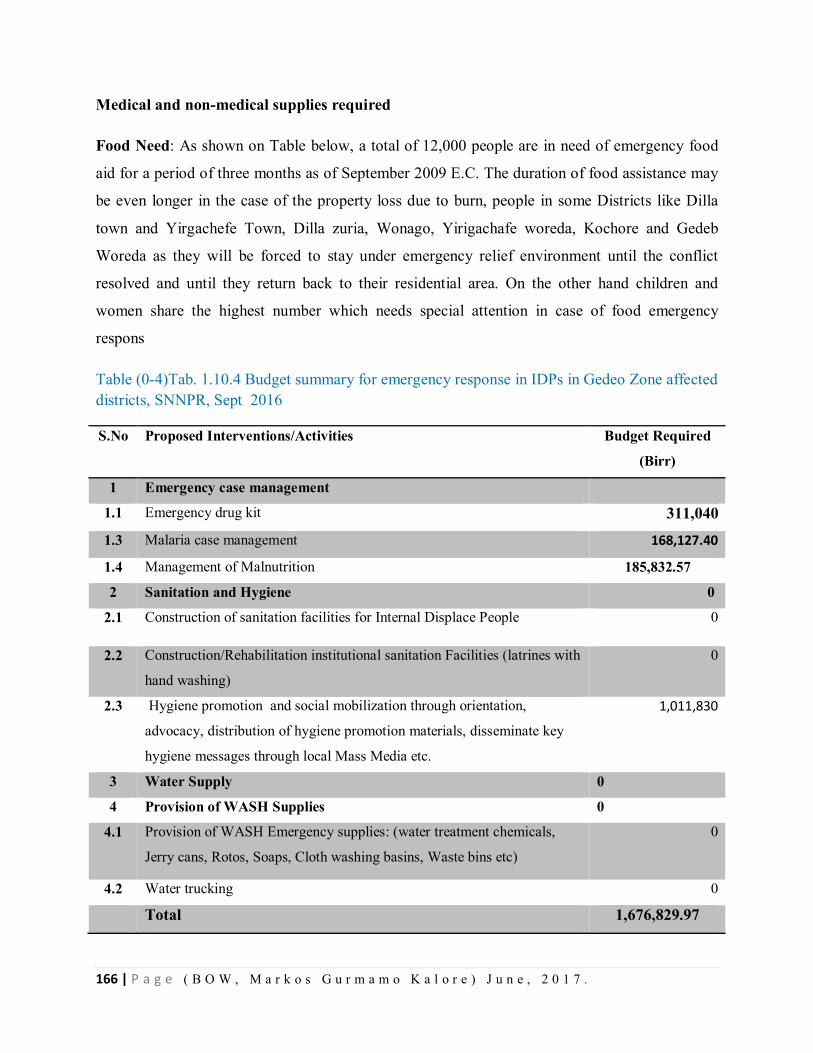
166 | P a g e ( B O W , M a r k o s G u r m a m o K a l o r e ) J u n e , 2 0 1 7 .
Medical and non-medical supplies required
Food Need: As shown on Table below, a total of 12,000 people are in need of emergency food
aid for a period of three months as of September 2009 E.C. The duration of food assistance may
be even longer in the case of the property loss due to burn, people in some Districts like Dilla
town and Yirgachefe Town, Dilla zuria, Wonago, Yirigachafe woreda, Kochore and Gedeb
Woreda as they will be forced to stay under emergency relief environment until the conflict
resolved and until they return back to their residential area. On the other hand children and
women share the highest number which needs special attention in case of food emergency
respons
Table (0-4)Tab. 1.10.4 Budget summary for emergency response in IDPs in Gedeo Zone affected districts, SNNPR, Sept 2016
S.No Proposed Interventions/Activities Budget Required
(Birr)
1 Emergency case management
1.1 Emergency drug kit 311,040
1.3 Malaria case management 168,127.40
1.4 Management of Malnutrition 185,832.57
2 Sanitation and Hygiene 0
2.1 Construction of sanitation facilities for Internal Displace People 0
2.2 Construction/Rehabilitation institutional sanitation Facilities (latrines with
hand washing)
0
2.3 Hygiene promotion and social mobilization through orientation,
advocacy, distribution of hygiene promotion materials, disseminate key
hygiene messages through local Mass Media etc.
1,011,830
3 Water Supply 0
4 Provision of WASH Supplies 0
4.1 Provision of WASH Emergency supplies: (water treatment chemicals,
Jerry cans, Rotos, Soaps, Cloth washing basins, Waste bins etc)
0
4.2 Water trucking 0
Total 1,676,829.97
167 | P a g e ( B O W , M a r k o s G u r m a m o K a l o r e ) J u n e , 2 0 1 7 .
Observed Gaps or Identified Gaps during assessment
1. Poor data handing practice in order to know the exact number of program beneficiaries
2. Shortage of Man power(Health professionals)due to fear of coflict
3. Inadequate data about displaced population
4. Shortage of Anti malaria drugs
Recommendations
Strengthen data management and sharing system at all level
Resource mapping, mobilizing, distribution and proper utilization
Priority interventions to pregnant, lactating mothers and under five children from the District
health office, RHB and other stakeholders
Re-establish damaged HHs
Strengthening active surveillance in all affected Gotts
Further risk mapping and vulnerability assessment for better risk mitigation and early
warning
M&E for further emergency response activities
168 | P a g e ( B O W , M a r k o s G u r m a m o K a l o r e ) J u n e , 2 0 1 7 .
Chapter –x- ANNEXES
10-1. Trainings Provided On Residency times in SNNPR, 2016-2017 A. Program Specific Trainings
Introduction
Early warning is the process with set of defined activities that help to provide, anticipated health
hazard or health threats, information in order to minimize its potential impact or prevent disaster.
The purpose of early warning is to enable the provision of timely and effective information to the
public and to responders through identified institutions that allow preparing effective response to
reduce the risk.
Surveillance is systematic ongoing collecting, organized, analyzing, and dissemination of health
data (information) that used for planning, implementation, and evaluation of health service or
intervention. It is also defined as information for action. A functional disease surveillance system
is essential for understanding problems and taking action. Understanding about public health
surveillance system helps health workers that work in the surveillance system for priority setting,
initiate prompt response to epidemics and improve the quality of the surveillance system
functions.
.
Preparedness is defined as the range of "deliberate, critical tasks and activities necessary to build,
sustain, and improve the operational capability to prevent, protect against, respond to, and
recover from incidents".
The public health emergency preparedness capabilities includes
Putting in place the necessary logistic and funding
Building the essential systems specific to protection, prevention and response
Equipping public health personnel and respondents with the necessary knowledge and
tools, and
Educating the public on related measures to be taken to prevent and control the event.
Outbreak investigation is a set of procedures used to identify public health threat.
The purpose of outbreak investigation is;-
Stop the outbreak
169 | P a g e ( B O W , M a r k o s G u r m a m o K a l o r e ) J u n e , 2 0 1 7 .
o Ensure public’s health / Prevent spread of disease
o Usually requires:
o Identifying the agent, reservoir, source, and/or mode of transmission
o Determining who is at risk for disease, place, time
o Identifying the exposures or risk factors that increase risk of disease
Prevent future outbreaks
Improve surveillance and outbreak detection
Rational of the training
In the case of 2016 and 2017, the SNNP region entertained different outbreaks and disasters.
Namely; the outbreaks are AWD, Scabies, Measles, Malaria and others. The training of
Capacity on different types of diseases is very mandatory investigate and control the diseases in
the community.
For support of regional health workers who are working in different Zones and Woredas, we
gave trainings on some crucial topics bases on the need of the SNNP Regional Health Bureau.
According to the need, we deployed to different zones and Woredas of the region besides to the
Outbreak investigations, we gave trainings on various topics.
1. Training Given on AWD cases management its Outbreak control strategies.
Topics covered 1.Epidemiology of AWD
2. AWD Case Managemene
3. Organizing CTC on Outbreak control
4. Disinfecting the case Households and corpse
Training period =June 20-21 for 02 Days
Participants: - Woreda and Health Center staffs
-Arbaminch Zuria Woreda staffs
- Arbaminch Zuria Woreda Different Health center staffs
- Infection Prevention staffs on CTC of the site
Number of Participants
Planned -Health Workers; 15 Health Workers
170 | P a g e ( B O W , M a r k o s G u r m a m o K a l o r e ) J u n e , 2 0 1 7 .
-Supportive staffs ; 10
Total Planned= 25
Attended= 25
Achievement 100%
Training Venue: Shelemela Health Center Hall, Shelemela
2. Training Given on AWD and Scabies outbreak Control and Case management
Topics Covered
On Scabies
o Epidemiology of scabies and life cycle
o Case Management and Mass drug Treatment
o Public health response
o Coordination
o Ongoing Responses
o Challenges
o Develop Action Plan For Scabies outbreak control
On AWD
o .Epidemiology of AWD
o AWD Case Managemene
o Organizing CTC on Outbreak control
o Disinfecting the case Households and corpse
Training on Public Health Surveillance
o Definition of Surveillance
o Types of Surveillance
o Purpose of Surveillance
o Diseases Under Surveillance
o Case Definition
o Reporting channels
Training period =January 10-14 for 05 Days
Participants: - Zonal, Woreda and Health Center staffs
171 | P a g e ( B O W , M a r k o s G u r m a m o K a l o r e ) J u n e , 2 0 1 7 .
o Hawassa Town Health Departement & its
Structure health workers
o Hawassa Zuria Woreda Staff and its structure
Health Workers
o Halaba Special Woreda Health Office and its
Structure health workers
Number of Participants
Planned -Health Workers; 32
Attended= 32
Achievement 100%
Training Venue: Hawassa Millineum Health Center Hall, Hawassa
3. Training Given Scabies outbreak Control and Case management
Topics Covered
o Epidemiology of scabies and life cycle
o Case Management and Mass drug Treatment
o Public health response
o Coordination
o Ongoing Responses
o Challenges
o Develop Action Plan For Scabies outbreak control
Training period =November 21-22 for 02 Days
Participants: - Zonal and Woreda Health staffs
o Kembata Tembaro Zone and its Woredas Office
o Gurage Zone and its Woreda Health Office
o Hadiya Zone and Its Health Office
Number of Participants
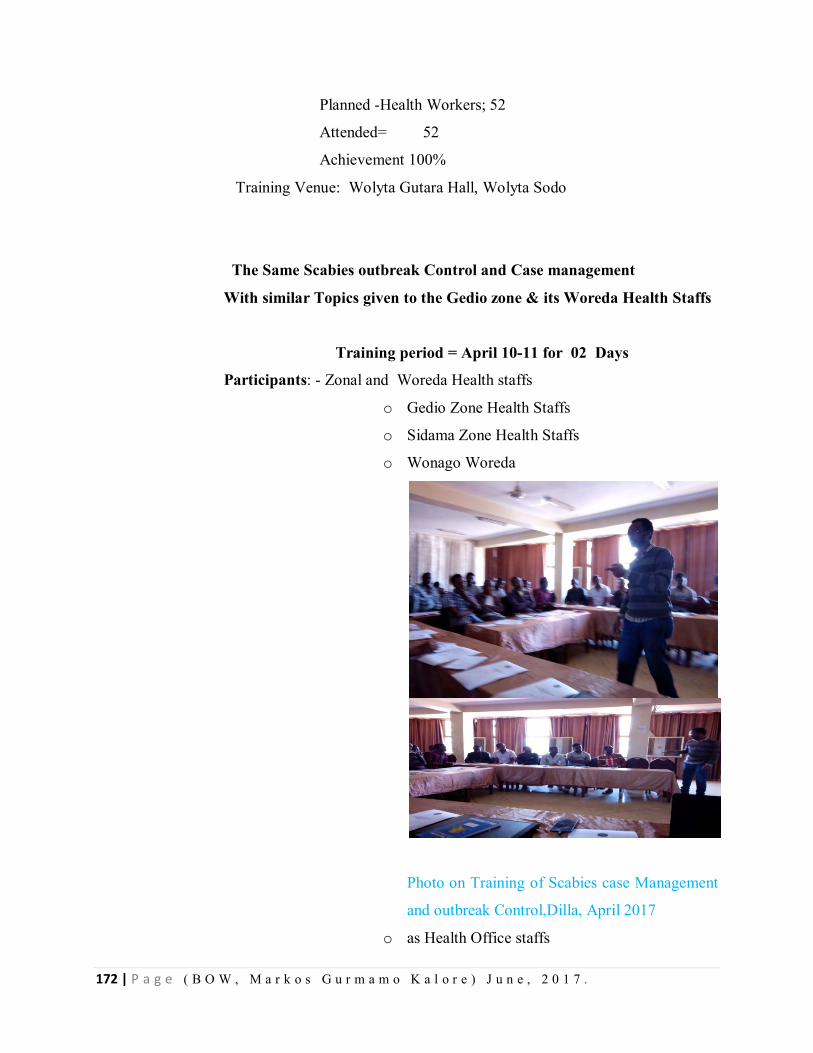
172 | P a g e ( B O W , M a r k o s G u r m a m o K a l o r e ) J u n e , 2 0 1 7 .
Planned -Health Workers; 52
Attended= 52
Achievement 100%
Training Venue: Wolyta Gutara Hall, Wolyta Sodo
The Same Scabies outbreak Control and Case management
With similar Topics given to the Gedio zone & its Woreda Health Staffs
Training period = April 10-11 for 02 Days
Participants: - Zonal and Woreda Health staffs
o Gedio Zone Health Staffs
o Sidama Zone Health Staffs
o Wonago Woreda
Photo on Training of Scabies case Management
and outbreak Control,Dilla, April 2017
o as Health Office staffs
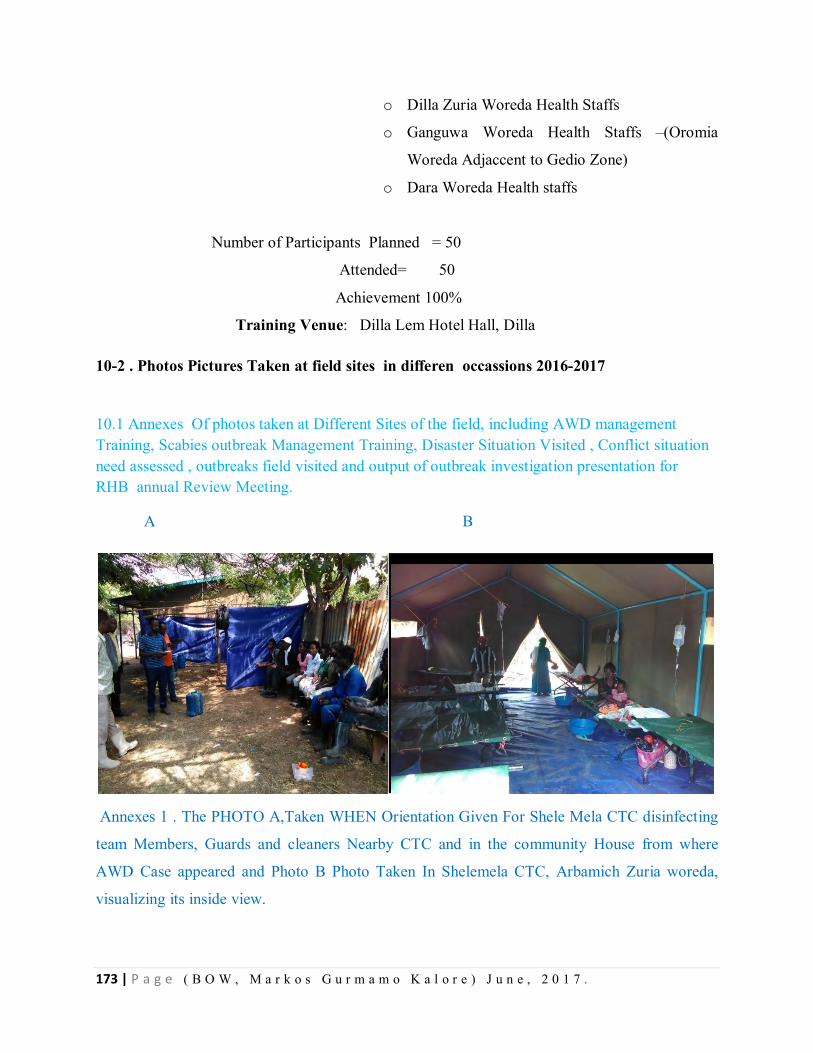
173 | P a g e ( B O W , M a r k o s G u r m a m o K a l o r e ) J u n e , 2 0 1 7 .
o Dilla Zuria Woreda Health Staffs
o Ganguwa Woreda Health Staffs –(Oromia
Woreda Adjaccent to Gedio Zone)
o Dara Woreda Health staffs
Number of Participants Planned = 50
Attended= 50
Achievement 100%
Training Venue: Dilla Lem Hotel Hall, Dilla
10-2 . Photos Pictures Taken at field sites in differen occassions 2016-2017
10.1 Annexes Of photos taken at Different Sites of the field, including AWD management Training, Scabies outbreak Management Training, Disaster Situation Visited , Conflict situation need assessed , outbreaks field visited and output of outbreak investigation presentation for RHB annual Review Meeting.
A B
Annexes 1 . The PHOTO A,Taken WHEN Orientation Given For Shele Mela CTC disinfecting
team Members, Guards and cleaners Nearby CTC and in the community House from where
AWD Case appeared and Photo B Photo Taken In Shelemela CTC, Arbamich Zuria woreda,
visualizing its inside view.
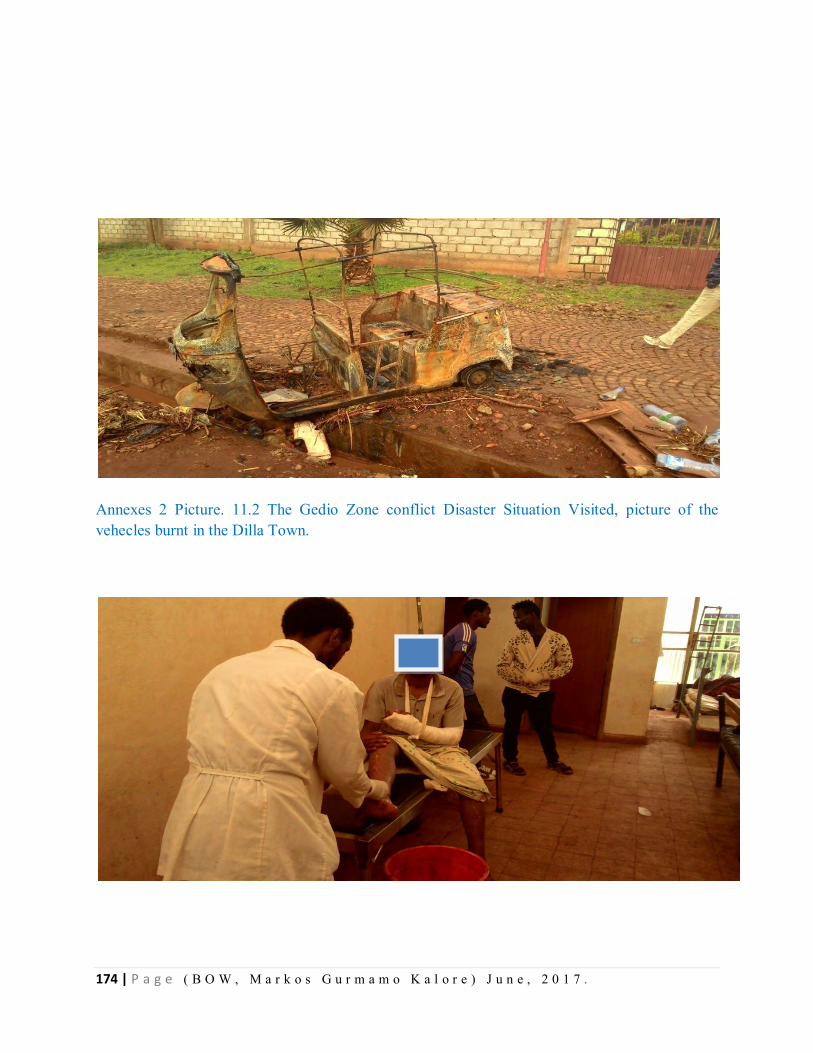
174 | P a g e ( B O W , M a r k o s G u r m a m o K a l o r e ) J u n e , 2 0 1 7 .
Annexes 2 Picture. 11.2 The Gedio Zone conflict Disaster Situation Visited, picture of the vehecles burnt in the Dilla Town.
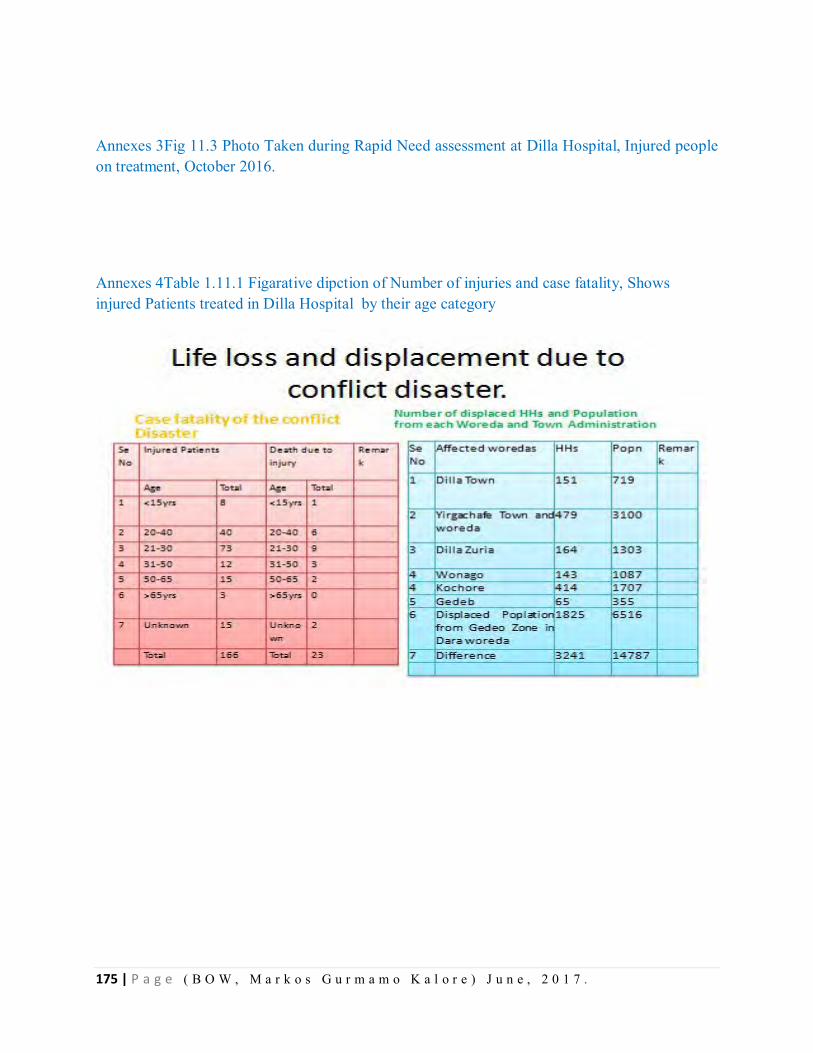
175 | P a g e ( B O W , M a r k o s G u r m a m o K a l o r e ) J u n e , 2 0 1 7 .
Annexes 3Fig 11.3 Photo Taken during Rapid Need assessment at Dilla Hospital, Injured people on treatment, October 2016.
Annexes 4Table 1.11.1 Figarative dipction of Number of injuries and case fatality, Shows injured Patients treated in Dilla Hospital by their age category
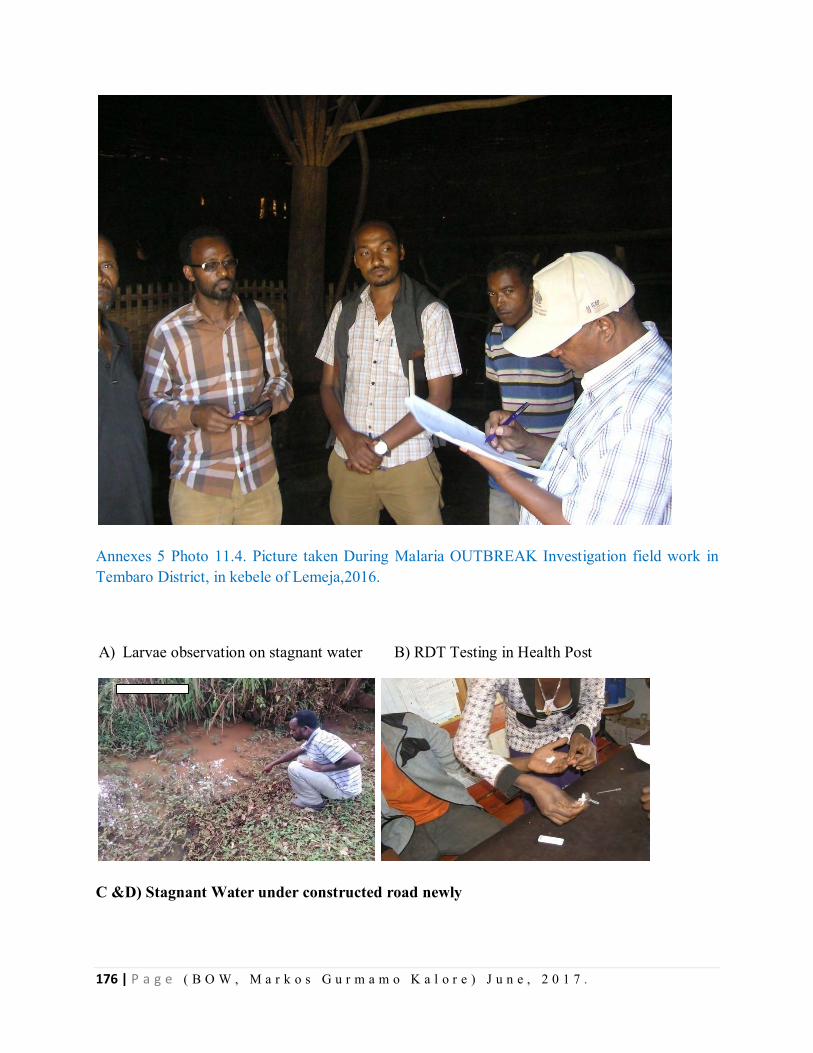
176 | P a g e ( B O W , M a r k o s G u r m a m o K a l o r e ) J u n e , 2 0 1 7 .
Annexes 5 Photo 11.4. Picture taken During Malaria OUTBREAK Investigation field work in Tembaro District, in kebele of Lemeja,2016.
A) Larvae observation on stagnant water B) RDT Testing in Health Post
C &D) Stagnant Water under constructed road newly
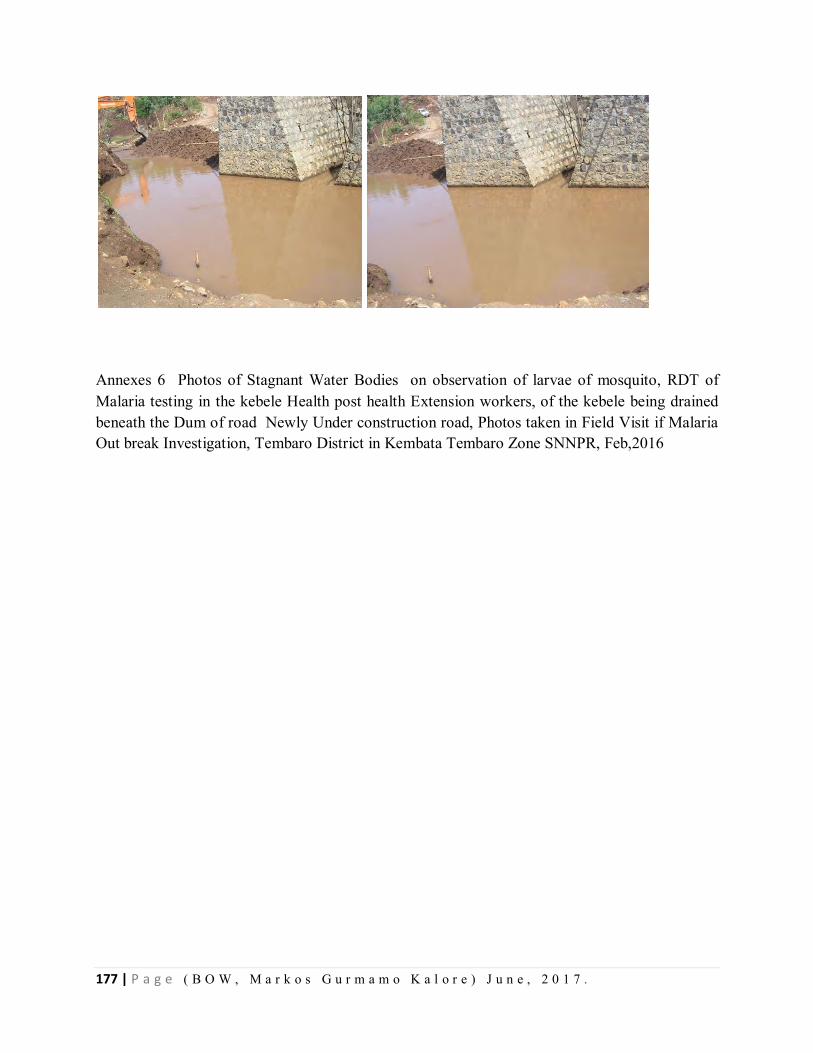
177 | P a g e ( B O W , M a r k o s G u r m a m o K a l o r e ) J u n e , 2 0 1 7 .
Annexes 6 Photos of Stagnant Water Bodies on observation of larvae of mosquito, RDT of Malaria testing in the kebele Health post health Extension workers, of the kebele being drained beneath the Dum of road Newly Under construction road, Photos taken in Field Visit if Malaria Out break Investigation, Tembaro District in Kembata Tembaro Zone SNNPR, Feb,2016
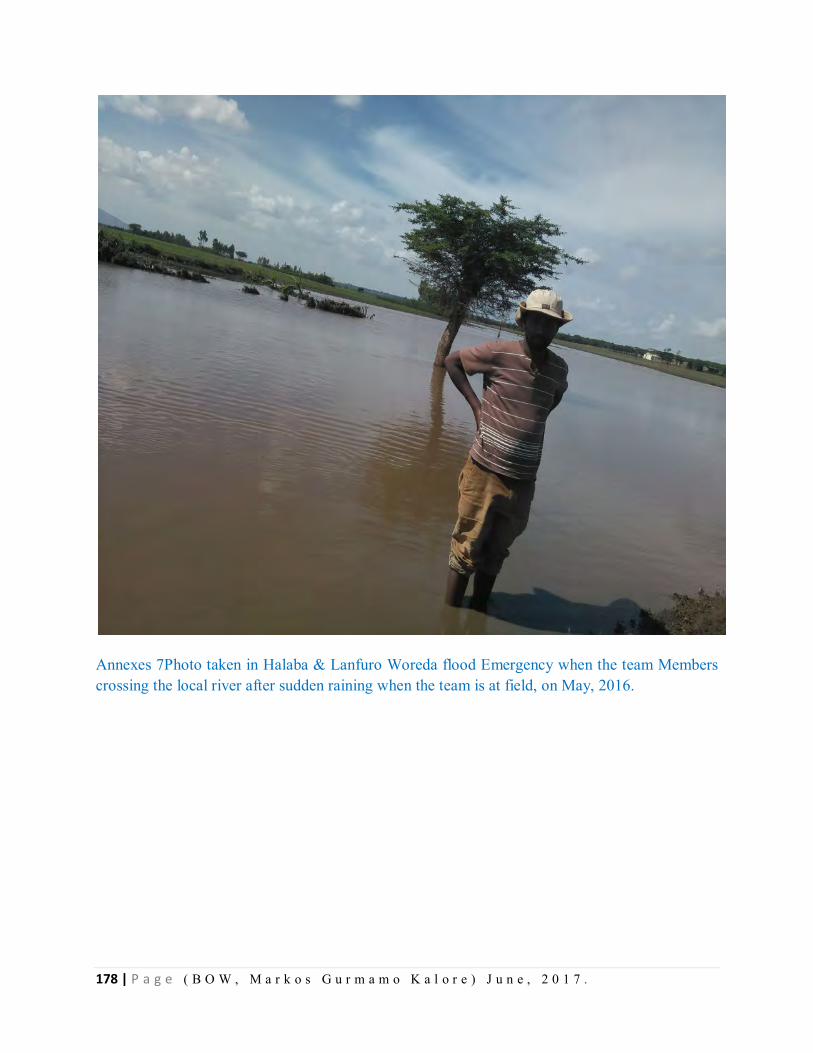
178 | P a g e ( B O W , M a r k o s G u r m a m o K a l o r e ) J u n e , 2 0 1 7 .
Annexes 7Photo taken in Halaba & Lanfuro Woreda flood Emergency when the team Members crossing the local river after sudden raining when the team is at field, on May, 2016.
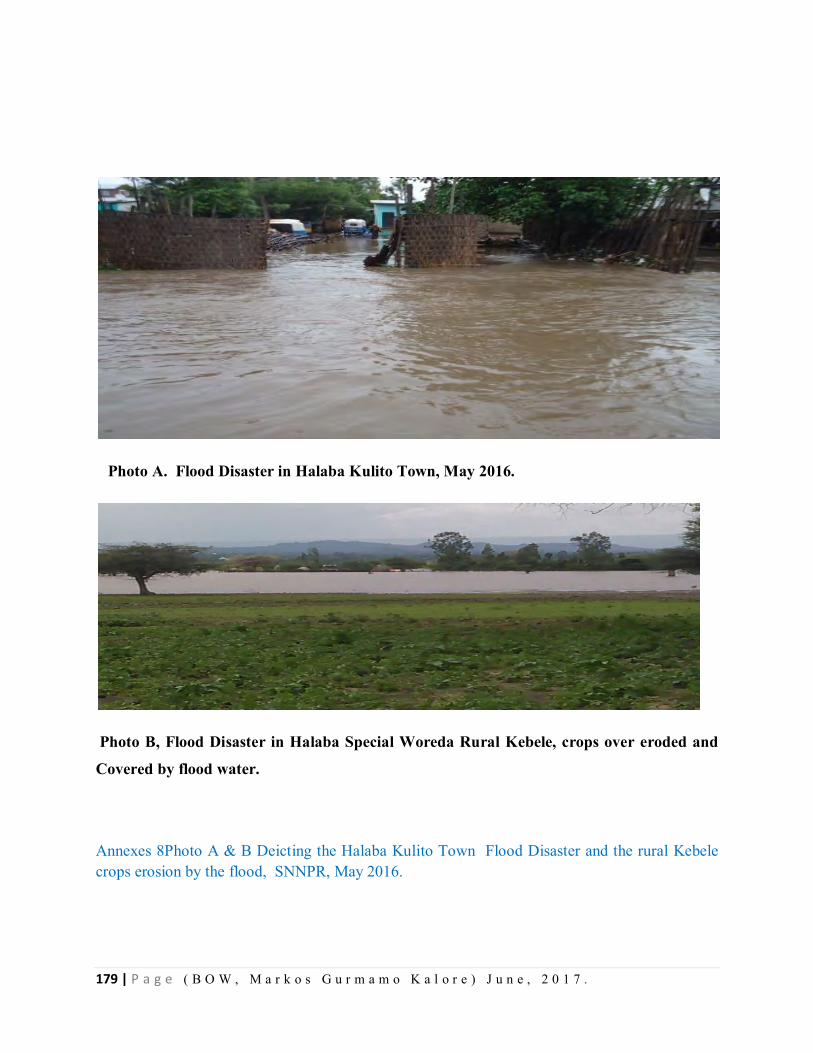
179 | P a g e ( B O W , M a r k o s G u r m a m o K a l o r e ) J u n e , 2 0 1 7 .
Photo A. Flood Disaster in Halaba Kulito Town, May 2016.
Photo B, Flood Disaster in Halaba Special Woreda Rural Kebele, crops over eroded and
Covered by flood water.
Annexes 8Photo A & B Deicting the Halaba Kulito Town Flood Disaster and the rural Kebele crops erosion by the flood, SNNPR, May 2016.
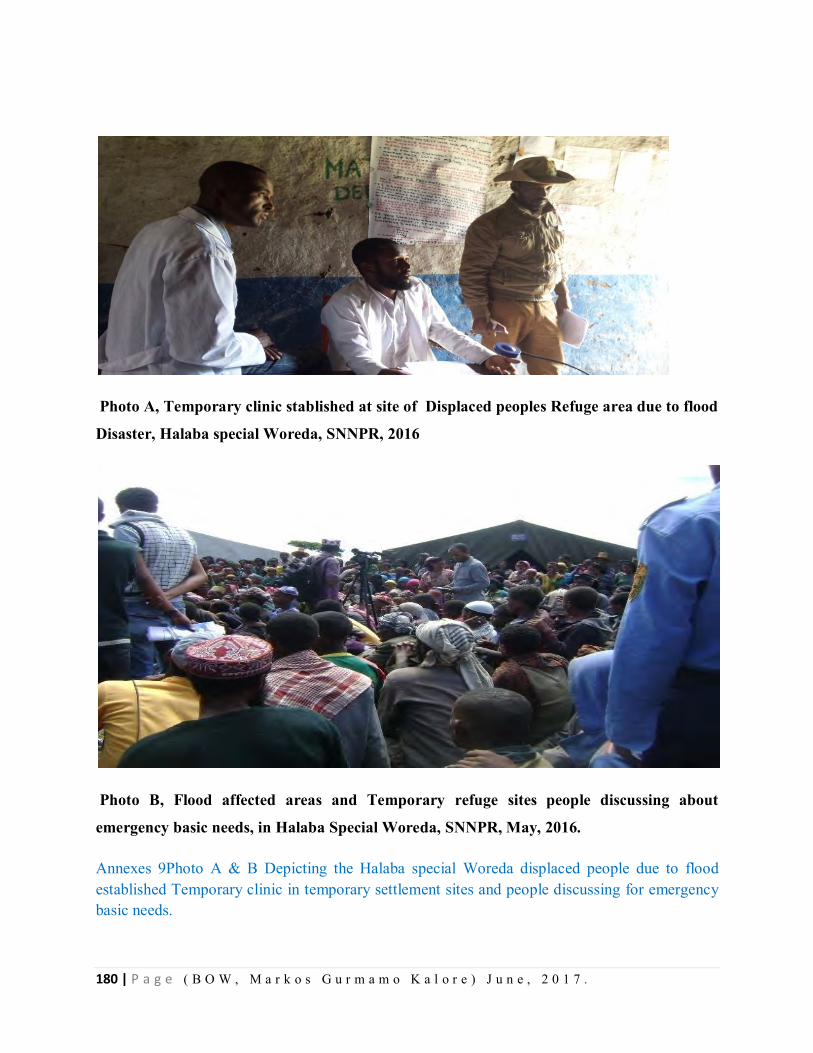
180 | P a g e ( B O W , M a r k o s G u r m a m o K a l o r e ) J u n e , 2 0 1 7 .
Photo A, Temporary clinic stablished at site of Displaced peoples Refuge area due to flood
Disaster, Halaba special Woreda, SNNPR, 2016
Photo B, Flood affected areas and Temporary refuge sites people discussing about
emergency basic needs, in Halaba Special Woreda, SNNPR, May, 2016.
Annexes 9Photo A & B Depicting the Halaba special Woreda displaced people due to flood established Temporary clinic in temporary settlement sites and people discussing for emergency basic needs.
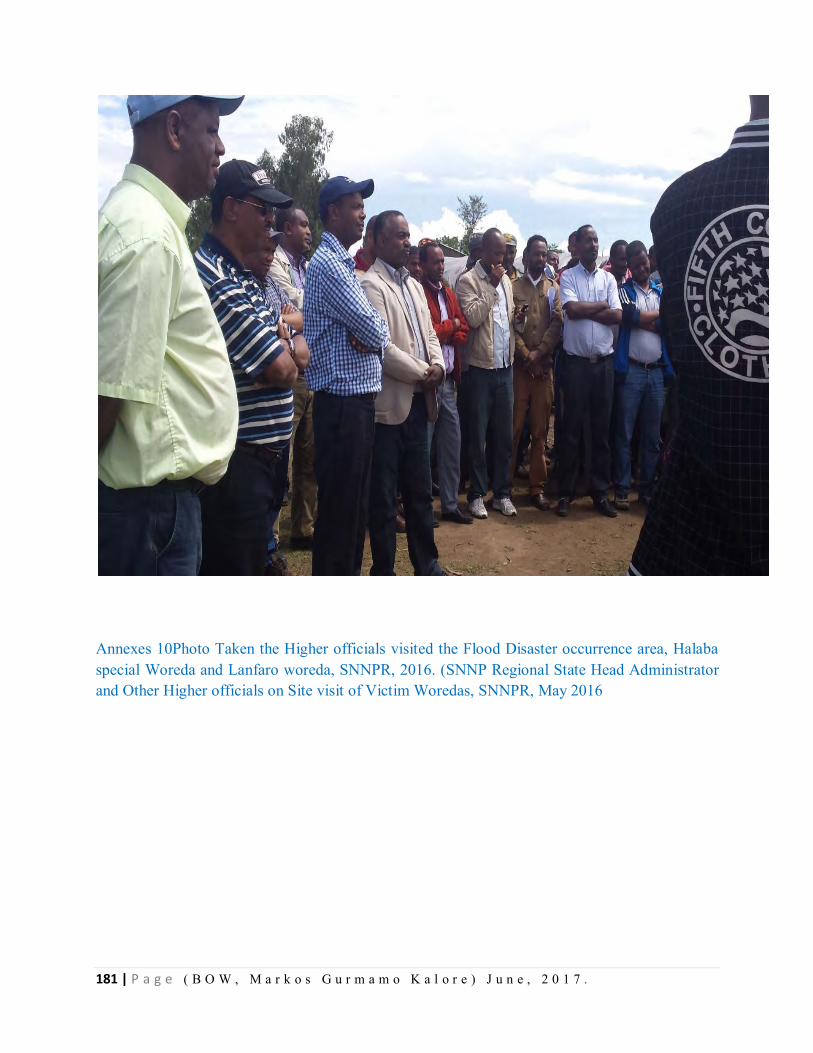
181 | P a g e ( B O W , M a r k o s G u r m a m o K a l o r e ) J u n e , 2 0 1 7 .
Annexes 10Photo Taken the Higher officials visited the Flood Disaster occurrence area, Halaba special Woreda and Lanfaro woreda, SNNPR, 2016. (SNNP Regional State Head Administrator and Other Higher officials on Site visit of Victim Woredas, SNNPR, May 2016
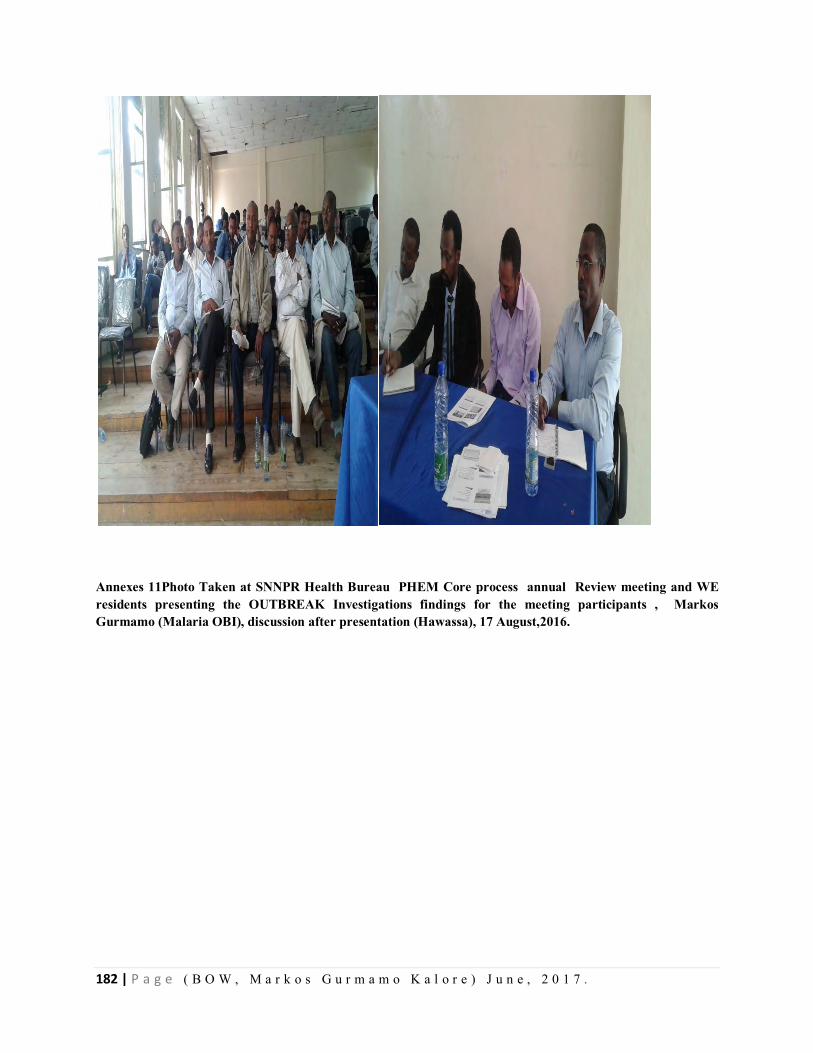
182 | P a g e ( B O W , M a r k o s G u r m a m o K a l o r e ) J u n e , 2 0 1 7 .
Annexes 11Photo Taken at SNNPR Health Bureau PHEM Core process annual Review meeting and WE residents presenting the OUTBREAK Investigations findings for the meeting participants , Markos Gurmamo (Malaria OBI), discussion after presentation (Hawassa), 17 August,2016.
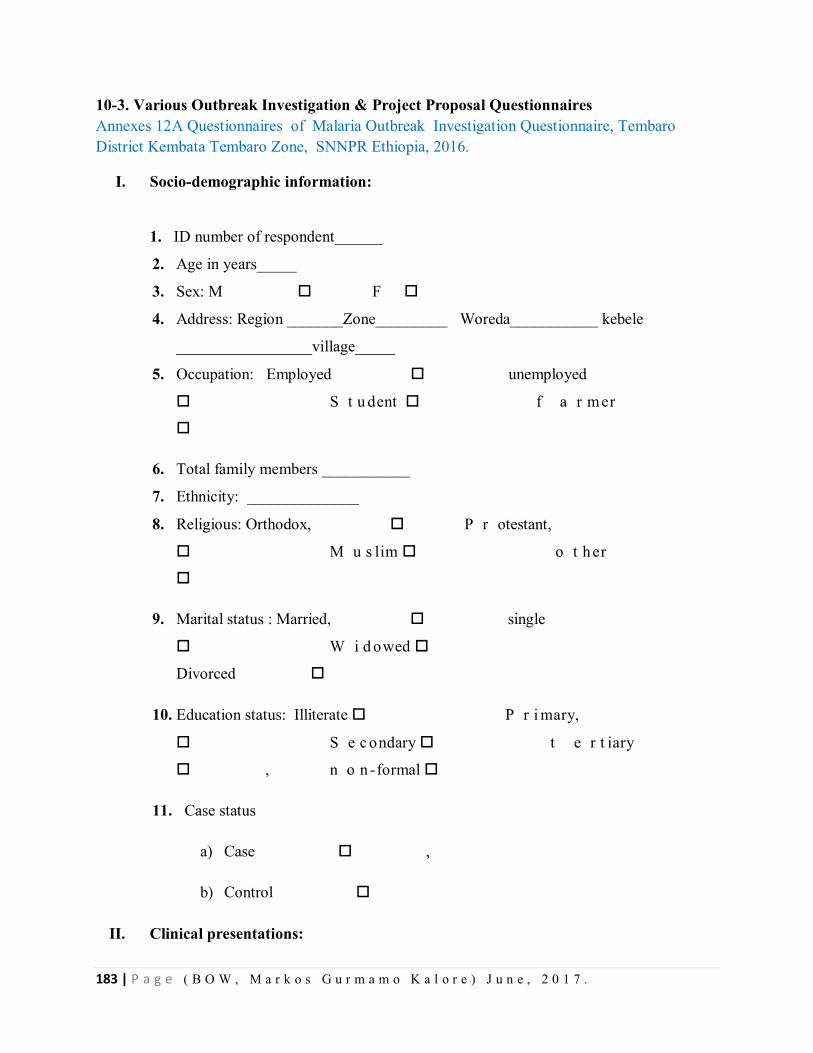
183 | P a g e ( B O W , M a r k o s G u r m a m o K a l o r e ) J u n e , 2 0 1 7 .
10-3. Various Outbreak Investigation & Project Proposal Questionnaires Annexes 12A Questionnaires of Malaria Outbreak Investigation Questionnaire, Tembaro District Kembata Tembaro Zone, SNNPR Ethiopia, 2016.
I. Socio-demographic information:
1. ID number of respondent______
2. Age in years_____
3. Sex: M F
4. Address: Region _______Zone_________ Woreda___________ kebele
_________________village_____
5. Occupation: Employed unemployed
S t u dent f a r mer
6. Total family members ___________
7. Ethnicity: ______________
8. Religious: Orthodox, P r otestant,
M u s lim o t her
9. Marital status : Married, single
W i d owed
Divorced
10. Education status: Illiterate P r i mary,
S e c ondary t e r t iary
, n o n -formal
11. Case status
a) Case ,
b) Control
II. Clinical presentations:
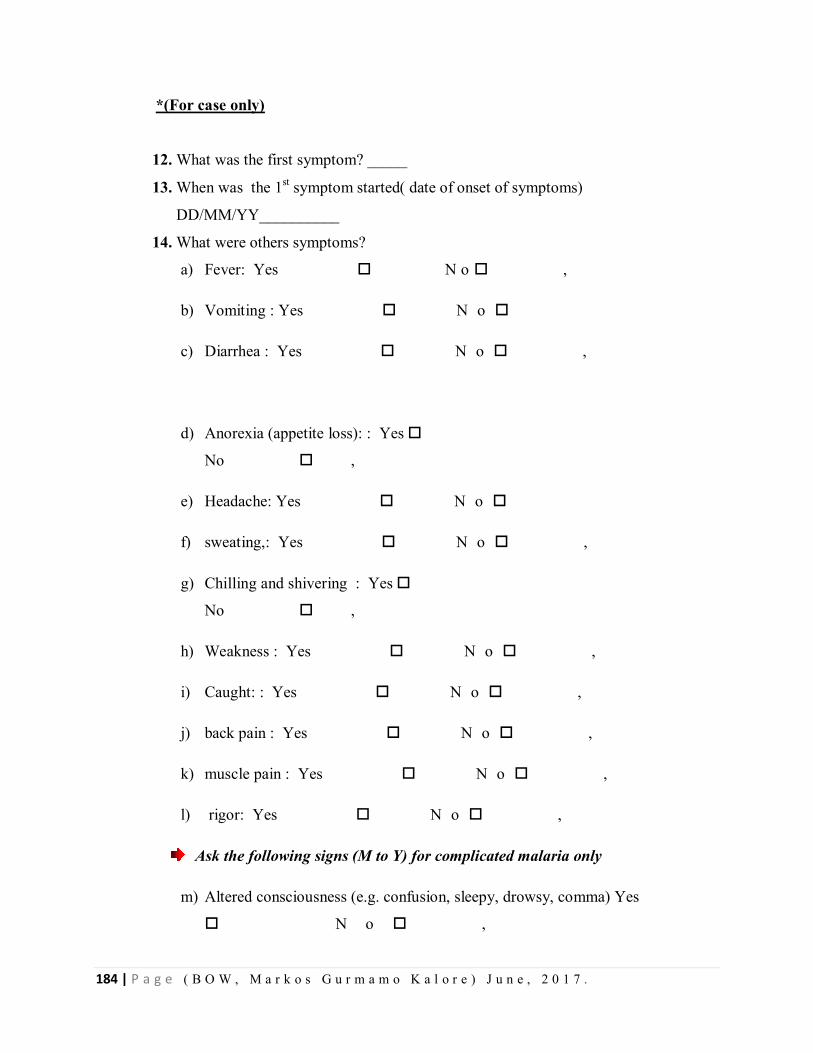
184 | P a g e ( B O W , M a r k o s G u r m a m o K a l o r e ) J u n e , 2 0 1 7 .
*(For case only)
12. What was the first symptom? _____
13. When was the 1st symptom started( date of onset of symptoms)
DD/MM/YY__________
14. What were others symptoms?
a) Fever: Yes N o ,
b) Vomiting : Yes N o
c) Diarrhea : Yes N o ,
d) Anorexia (appetite loss): : Yes
No ,
e) Headache: Yes N o
f) sweating,: Yes N o ,
g) Chilling and shivering : Yes
No ,
h) Weakness : Yes N o ,
i) Caught: : Yes N o ,
j) back pain : Yes N o ,
k) muscle pain : Yes N o ,
l) rigor: Yes N o ,
Ask the following signs (M to Y) for complicated malaria only
m) Altered consciousness (e.g. confusion, sleepy, drowsy, comma) Yes
N o ,
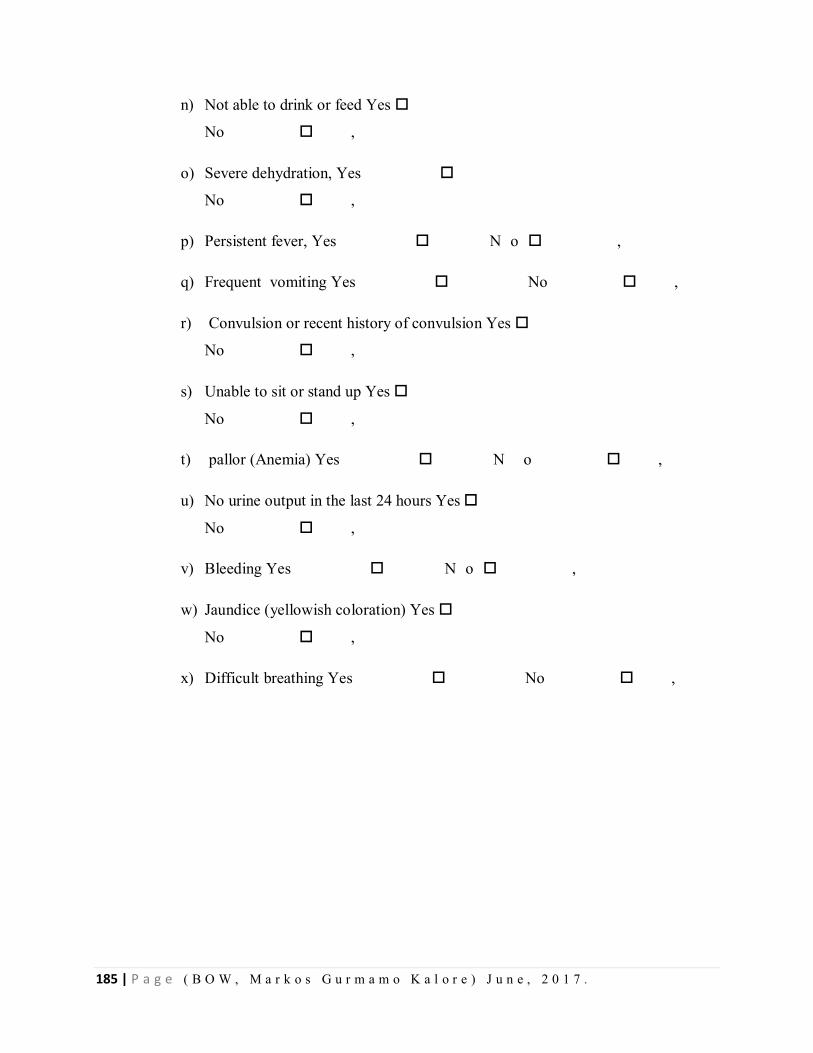
185 | P a g e ( B O W , M a r k o s G u r m a m o K a l o r e ) J u n e , 2 0 1 7 .
n) Not able to drink or feed Yes
No ,
o) Severe dehydration, Yes
No ,
p) Persistent fever, Yes N o ,
q) Frequent vomiting Yes No ,
r) Convulsion or recent history of convulsion Yes
No ,
s) Unable to sit or stand up Yes
No ,
t) pallor (Anemia) Yes N o ,
u) No urine output in the last 24 hours Yes
No ,
v) Bleeding Yes N o ,
w) Jaundice (yellowish coloration) Yes
No ,
x) Difficult breathing Yes No ,
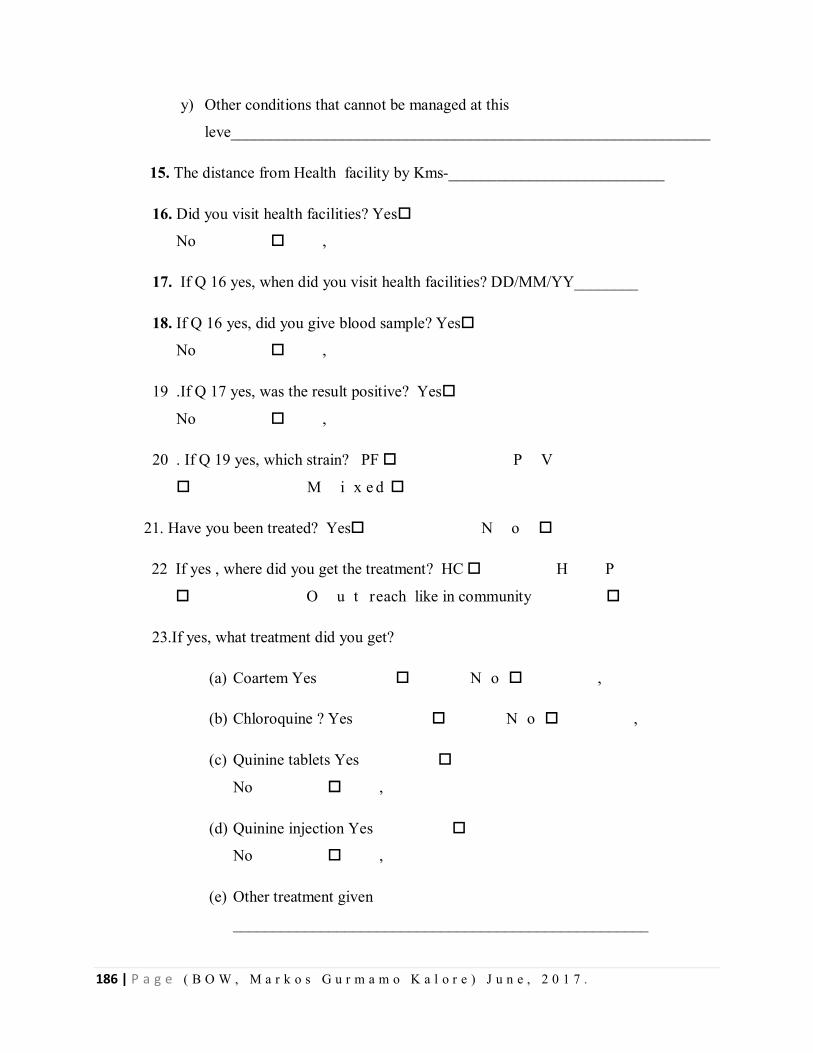
186 | P a g e ( B O W , M a r k o s G u r m a m o K a l o r e ) J u n e , 2 0 1 7 .
y) Other conditions that cannot be managed at this
leve____________________________________________________________
15. The distance from Health facility by Kms-___________________________
16. Did you visit health facilities? Yes
No ,
17. If Q 16 yes, when did you visit health facilities? DD/MM/YY________
18. If Q 16 yes, did you give blood sample? Yes
No ,
19 .If Q 17 yes, was the result positive? Yes
No ,
20 . If Q 19 yes, which strain? PF P V
M i x e d
21. Have you been treated? Yes N o
22 If yes , where did you get the treatment? HC H P
O u t reach like in community
23.If yes, what treatment did you get?
(a) Coartem Yes N o ,
(b) Chloroquine ? Yes N o ,
(c) Quinine tablets Yes
No ,
(d) Quinine injection Yes
No ,
(e) Other treatment given
____________________________________________________
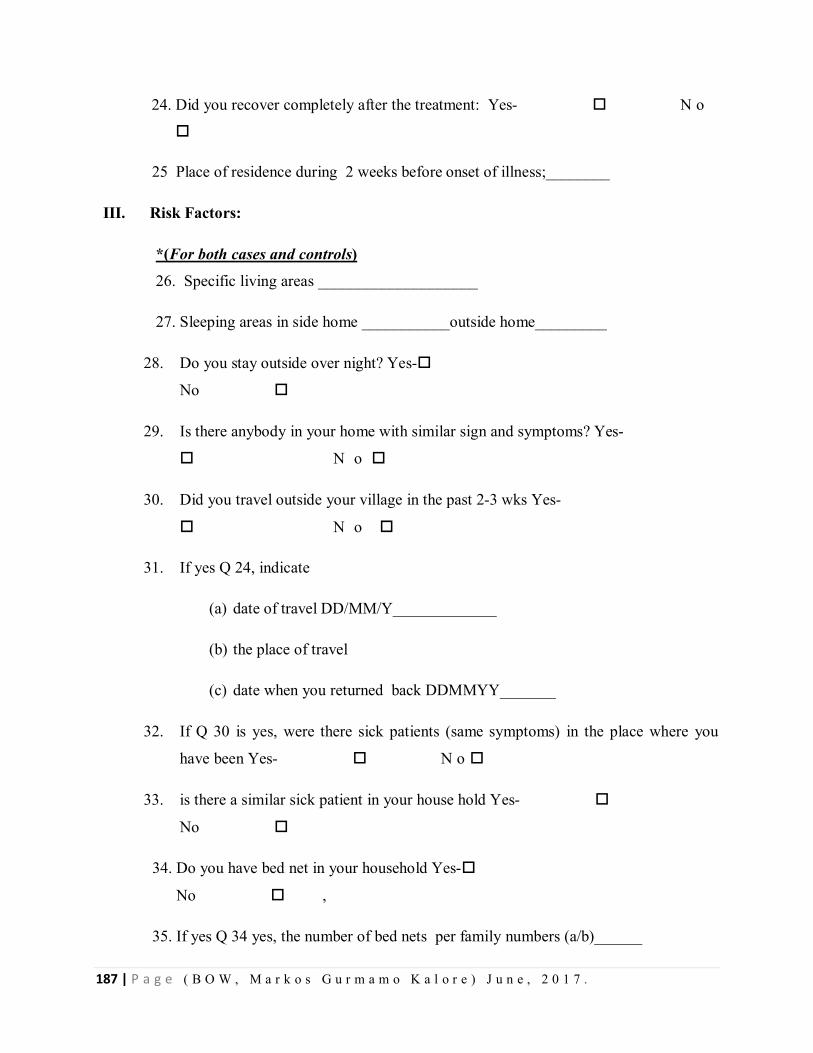
187 | P a g e ( B O W , M a r k o s G u r m a m o K a l o r e ) J u n e , 2 0 1 7 .
24. Did you recover completely after the treatment: Yes- N o
25 Place of residence during 2 weeks before onset of illness;________
III. Risk Factors:
*(For both cases and controls)
26. Specific living areas ____________________
27. Sleeping areas in side home ___________outside home_________
28. Do you stay outside over night? Yes-
No
29. Is there anybody in your home with similar sign and symptoms? Yes-
N o
30. Did you travel outside your village in the past 2-3 wks Yes-
N o
31. If yes Q 24, indicate
(a) date of travel DD/MM/Y_____________
(b) the place of travel
(c) date when you returned back DDMMYY_______
32. If Q 30 is yes, were there sick patients (same symptoms) in the place where you
have been Yes- N o
33. is there a similar sick patient in your house hold Yes-
No
34. Do you have bed net in your household Yes-
No ,
35. If yes Q 34 yes, the number of bed nets per family numbers (a/b)______
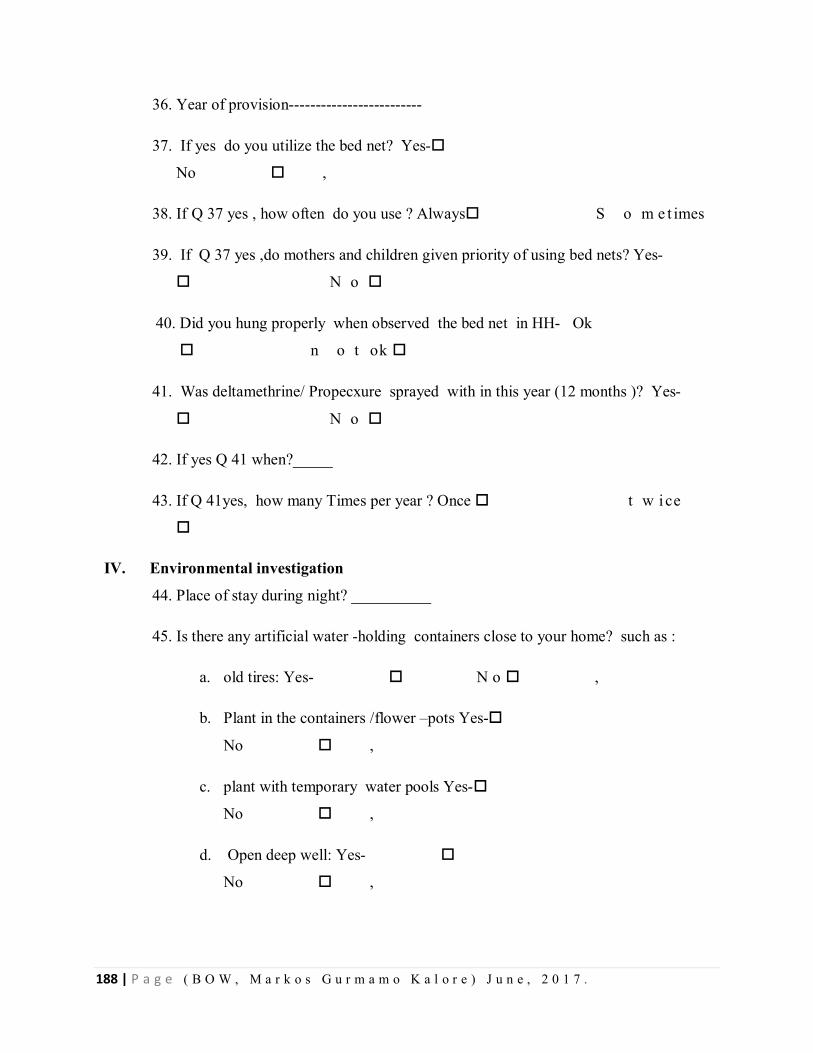
188 | P a g e ( B O W , M a r k o s G u r m a m o K a l o r e ) J u n e , 2 0 1 7 .
36. Year of provision-------------------------
37. If yes do you utilize the bed net? Yes-
No ,
38. If Q 37 yes , how often do you use ? Always S o m e t imes
39. If Q 37 yes ,do mothers and children given priority of using bed nets? Yes-
N o
40. Did you hung properly when observed the bed net in HH- Ok
n o t ok
41. Was deltamethrine/ Propecxure sprayed with in this year (12 months )? Yes-
N o
42. If yes Q 41 when?_____
43. If Q 41yes, how many Times per year ? Once t w ice
IV. Environmental investigation
44. Place of stay during night? __________
45. Is there any artificial water -holding containers close to your home? such as :
a. old tires: Yes- N o ,
b. Plant in the containers /flower –pots Yes-
No ,
c. plant with temporary water pools Yes-
No ,
d. Open deep well: Yes-
No ,
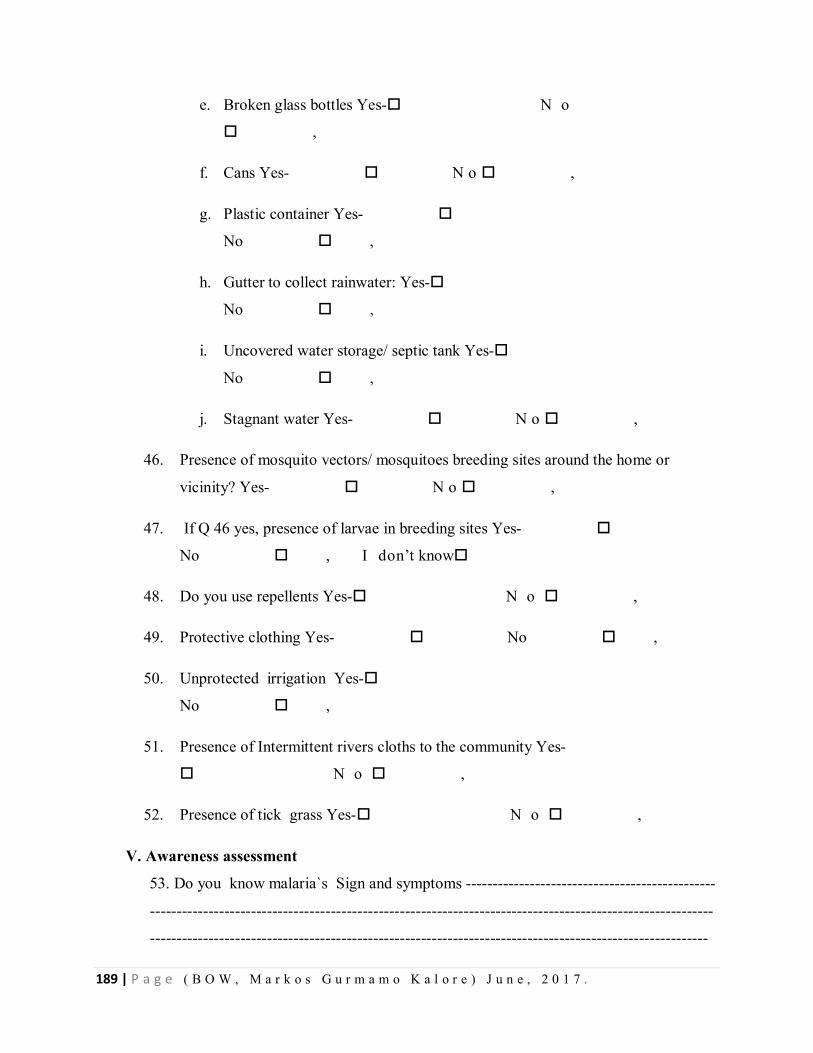
189 | P a g e ( B O W , M a r k o s G u r m a m o K a l o r e ) J u n e , 2 0 1 7 .
e. Broken glass bottles Yes- N o
,
f. Cans Yes- N o ,
g. Plastic container Yes-
No ,
h. Gutter to collect rainwater: Yes-
No ,
i. Uncovered water storage/ septic tank Yes-
No ,
j. Stagnant water Yes- N o ,
46. Presence of mosquito vectors/ mosquitoes breeding sites around the home or
vicinity? Yes- N o ,
47. If Q 46 yes, presence of larvae in breeding sites Yes-
No , I don’t know
48. Do you use repellents Yes- N o ,
49. Protective clothing Yes- No ,
50. Unprotected irrigation Yes-
No ,
51. Presence of Intermittent rivers cloths to the community Yes-
N o ,
52. Presence of tick grass Yes- N o ,
V. Awareness assessment
53. Do you know malaria`s Sign and symptoms -----------------------------------------------
----------------------------------------------------------------------------------------------------------
---------------------------------------------------------------------------------------------------------
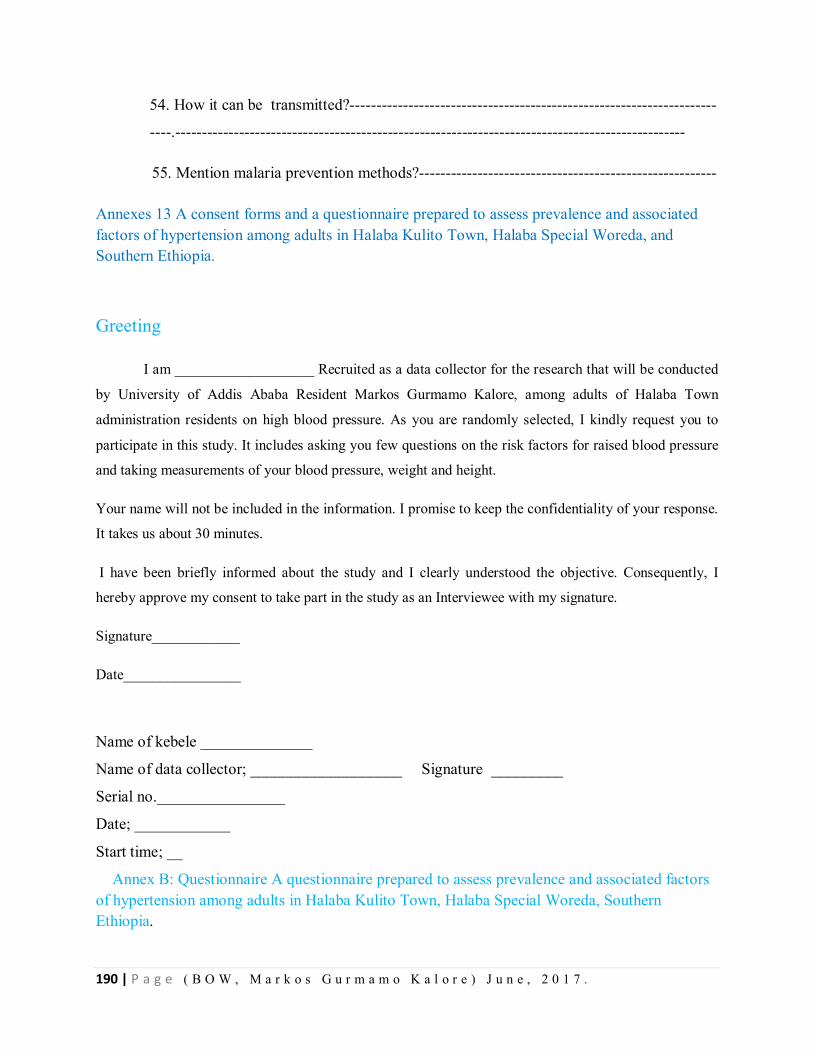
190 | P a g e ( B O W , M a r k o s G u r m a m o K a l o r e ) J u n e , 2 0 1 7 .
54. How it can be transmitted?---------------------------------------------------------------------
----.------------------------------------------------------------------------------------------------
55. Mention malaria prevention methods?--------------------------------------------------------
Annexes 13 A consent forms and a questionnaire prepared to assess prevalence and associated factors of hypertension among adults in Halaba Kulito Town, Halaba Special Woreda, and Southern Ethiopia.
Greeting
I am ___________________ Recruited as a data collector for the research that will be conducted
by University of Addis Ababa Resident Markos Gurmamo Kalore, among adults of Halaba Town
administration residents on high blood pressure. As you are randomly selected, I kindly request you to
participate in this study. It includes asking you few questions on the risk factors for raised blood pressure
and taking measurements of your blood pressure, weight and height.
Your name will not be included in the information. I promise to keep the confidentiality of your response.
It takes us about 30 minutes.
I have been briefly informed about the study and I clearly understood the objective. Consequently, I
hereby approve my consent to take part in the study as an Interviewee with my signature.
Signature____________
Date________________
Name of kebele ______________
Name of data collector; ___________________ Signature _________
Serial no.________________
Date; ____________
Start time; __
Annex B: Questionnaire A questionnaire prepared to assess prevalence and associated factors of hypertension among adults in Halaba Kulito Town, Halaba Special Woreda, Southern Ethiopia.
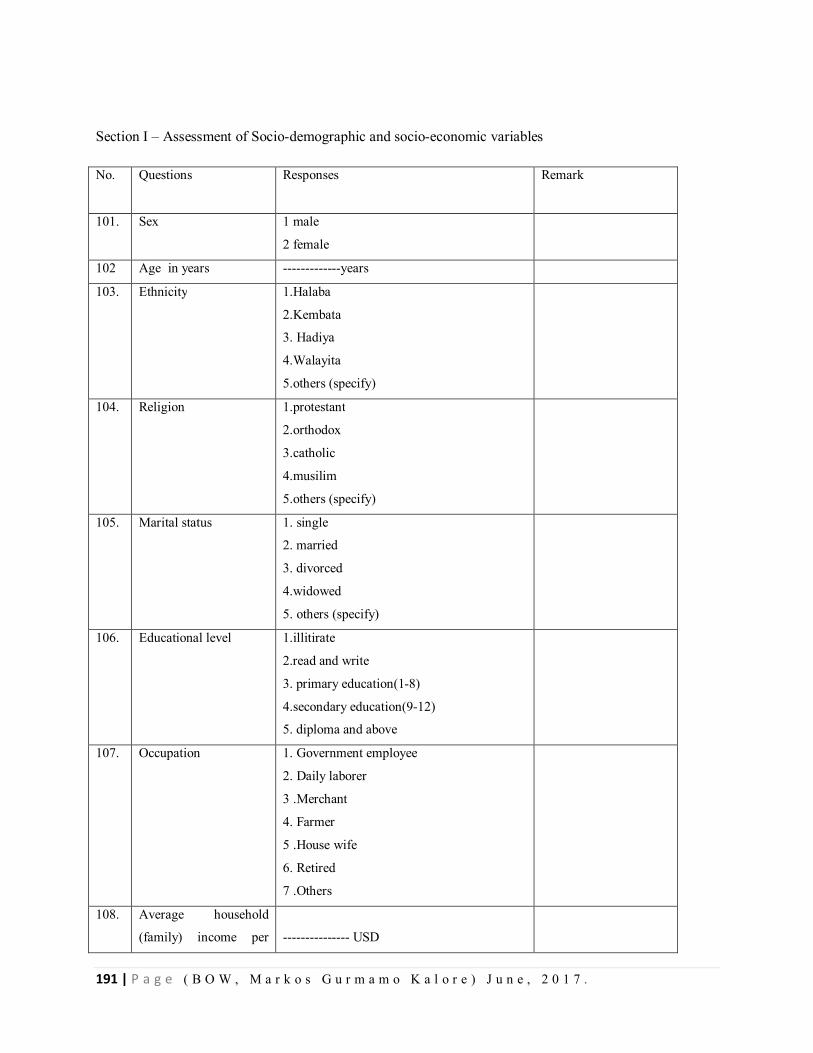
191 | P a g e ( B O W , M a r k o s G u r m a m o K a l o r e ) J u n e , 2 0 1 7 .
Section I – Assessment of Socio-demographic and socio-economic variables
No. Questions
Responses
Remark
101. Sex 1 male
2 female
102 Age in years -------------years
103. Ethnicity 1.Halaba
2.Kembata
3. Hadiya
4.Walayita
5.others (specify)
104. Religion 1.protestant
2.orthodox
3.catholic
4.musilim
5.others (specify)
105. Marital status 1. single
2. married
3. divorced
4.widowed
5. others (specify)
106. Educational level 1.illitirate
2.read and write
3. primary education(1-8)
4.secondary education(9-12)
5. diploma and above
107. Occupation 1. Government employee
2. Daily laborer
3 .Merchant
4. Farmer
5 .House wife
6. Retired
7 .Others
108. Average household
(family) income per
--------------- USD
192 | P a g e ( B O W , M a r k o s G u r m a m o K a l o r e ) J u n e , 2 0 1 7 .
month
109 Family size in number
with in a house hold
--------
Section II Behavioral Measurements
Tobacco Use
No. Question Response Remark
201 Do you currently smoke tobacco
products daily?
1.Yes
2 .No
202 On average, how much tobacco
products do you smoke each day
203 If no. for Q201 did you use to smoke
previously
1 .Yes
2 .No
Alcohol Consumption
204 Have you ever consumed an
alcoholic drink
1.Yes
2 No
205 How frequently have you had at least
one bottle alcoholic drink?
1. Daily
2. 5-6 days per week
3 .1-4 days per week
4 .1-3 days per week
Caffeine Consumption
206 Coffee 1. One cup a day
2 .Two cups a day
3 .Three and more
cups a day
207 Tea 1. one cup a day
2 .two cups a day
193 | P a g e ( B O W , M a r k o s G u r m a m o K a l o r e ) J u n e , 2 0 1 7 .
3 .three and more
cups a day
Diet
208 how many days do you eat fruit in a
week in number
-------------
209 How many servings of fruit do you
eat in these days
--------------
210 how many days do you eat
vegetables in a week in number
--------------
211 How many servings of vegetables do
you eat in these days
--------------
Salt Consumption
212 Do you use excessive salt? 1 .Yes
2. No
Physical Activity
213 Does your work involve vigorous-
intensity activity that causes large
increases in breathing or heart rate
like (carrying or lifting heavy loads,
digging or construction work) for at
least 10 minutes continuously?
1. Yes
2 .No
Travel to and from places
214 Do you walk or use vehicle for at
least 10 minutes continuously to get
to and from places?
1. Use vehicle
2 .Walk on foot
History of Raised Blood Pressure
215 Have you ever had your blood
pressure measured by a doctor or
other health worker?
1. Yes
2. No
216 Have you ever been told by a doctor 1. Yes
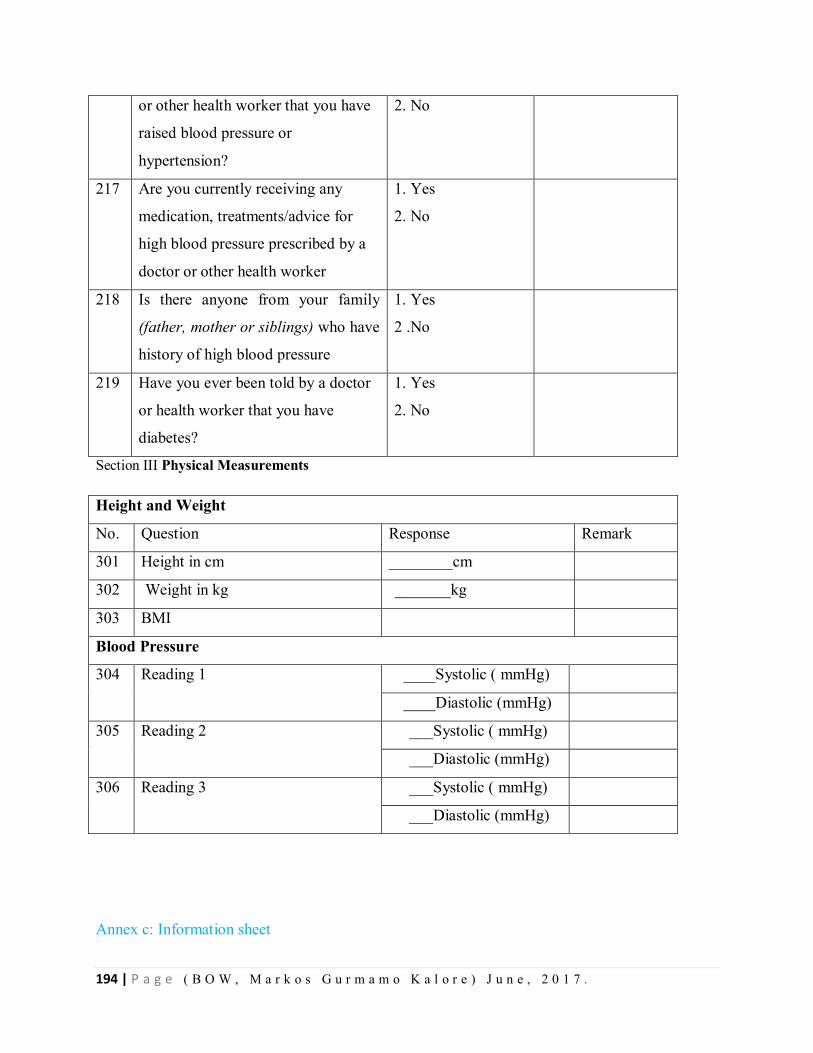
194 | P a g e ( B O W , M a r k o s G u r m a m o K a l o r e ) J u n e , 2 0 1 7 .
or other health worker that you have
raised blood pressure or
hypertension?
2. No
217 Are you currently receiving any
medication, treatments/advice for
high blood pressure prescribed by a
doctor or other health worker
1. Yes
2. No
218 Is there anyone from your family
(father, mother or siblings) who have
history of high blood pressure
1. Yes
2 .No
219 Have you ever been told by a doctor
or health worker that you have
diabetes?
1. Yes
2. No
Section III Physical Measurements
Height and Weight
No. Question Response Remark
301 Height in cm ________cm
302 Weight in kg _______kg
303 BMI
Blood Pressure
304 Reading 1 ____Systolic ( mmHg)
____Diastolic (mmHg)
305 Reading 2 ___Systolic ( mmHg)
___Diastolic (mmHg)
306 Reading 3 ___Systolic ( mmHg)
___Diastolic (mmHg)
Annex c: Information sheet
195 | P a g e ( B O W , M a r k o s G u r m a m o K a l o r e ) J u n e , 2 0 1 7 .
Title of the Research Project
Assessment of prevalence and factors associated with hypertension among adults in Halaba KulitoTown
Administration, Halaba Special Woreda, Southern Ethiopia, 2016
Name of Principal Investigator: Markos Gurmamo Kalore
Name of Advisors: 1. Dr. Adamu Addissie (MD, MA, MPH, PhD) – 1st Mentor
2. Mr.Muluken Gizaw (BSC, MPH, Candidate PhD)-2nd Mentor
Name of the Organization: Addis Ababa University, College of Health Science, School of Public Health.
Name of the Sponsor: TEPHINET (Training Programs in Epidemiology and Public Health Interventions
Network)
Introduction
This information sheet is prepared with the aim of explaining about the research project that you are
asked to join by the group of research investigators. The research group includes one main principal
investigator, 10 trained data collectors, two Supervisors and two Mentors from University of Addis
Ababa, Ethiopia.
Purpose of the research project.
The purpose of this project is to assess prevalence and factors associated with hypertension among adults
in Halaba Kulito Town Administration, Halaba Special Woreda, Southern Ethiopia.
Procedure
The study mainly uses data obtained through study subjects interview and physical measurement.
Permission will be obtained from University of Addis Ababa, SNNP regional health bureau, Halaba
Special Woreda, Halaba Kulito Town Administration health office and the selected study subjects.
Risk and/or Discomfort
By participating in this research project you will not feel any discomfort except wasting some time
(around 30 minutes). Every piece of information will be kept confidentially. There is no risk in
participating in this research.
196 | P a g e ( B O W , M a r k o s G u r m a m o K a l o r e ) J u n e , 2 0 1 7 .
Benefits
There will not be monetary benefits or any provided incentives to you for participating in this research
project but you will be told about your blood pressure status, how to prevent and control blood pressure
and the results of the study are very important in improving program on chronic non communicable
disease.
Confidentiality
The information collected for this research project will be kept confidential and information will be stored
in a file and kept without your name, but a code number assigned to it. And it will not be accessed by
anyone except the principal investigator.
Right to Refusal or Withdraw
Your participation in this research study is voluntary. You may choose not to participate and you may
withdraw your consent to participate at any time without losing any of your right.
Person to contact
This research project was reviewed and approved by the Ethical clearance Committee of University of
Addis Ababa. If you want to know more information you can contact the committee through the address
below. If you have any questions or concerns about this study please contact the following individuals:
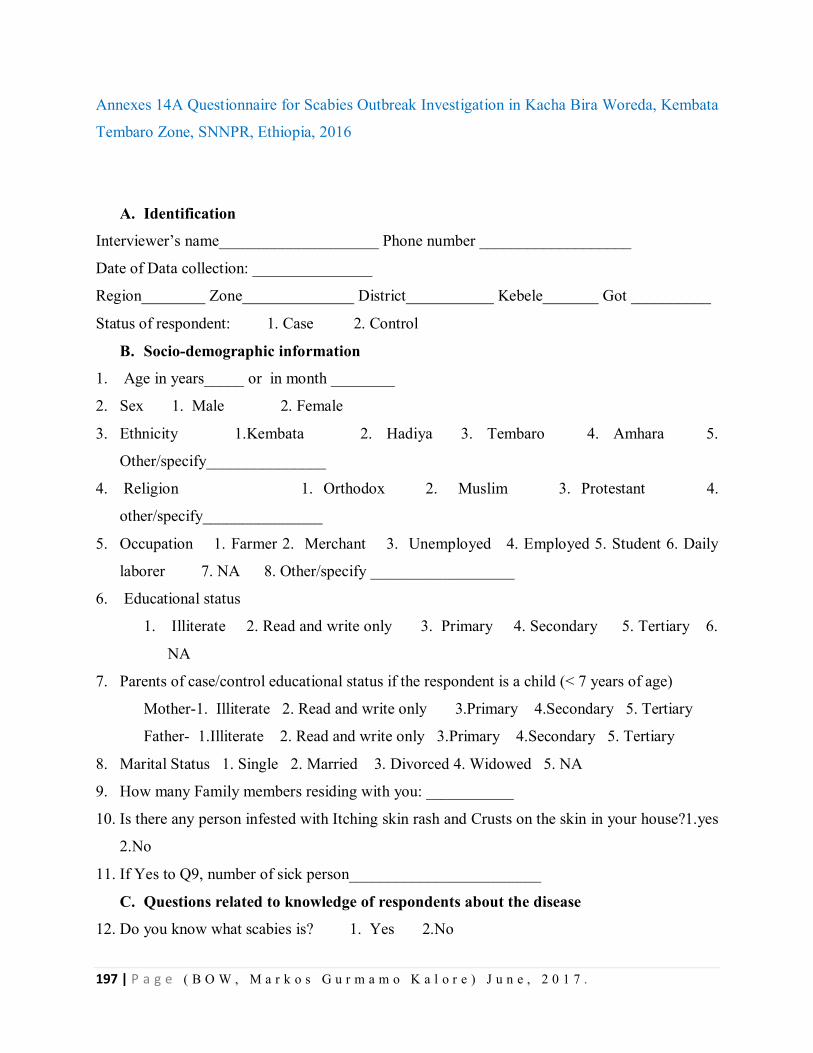
197 | P a g e ( B O W , M a r k o s G u r m a m o K a l o r e ) J u n e , 2 0 1 7 .
Annexes 14A Questionnaire for Scabies Outbreak Investigation in Kacha Bira Woreda, Kembata
Tembaro Zone, SNNPR, Ethiopia, 2016
A. Identification
Interviewer’s name____________________ Phone number ___________________
Date of Data collection: _______________
Region________ Zone______________ District___________ Kebele_______ Got __________
Status of respondent: 1. Case 2. Control
B. Socio-demographic information
1. Age in years_____ or in month ________
2. Sex 1. Male 2. Female
3. Ethnicity 1.Kembata 2. Hadiya 3. Tembaro 4. Amhara 5.
Other/specify_______________
4. Religion 1. Orthodox 2. Muslim 3. Protestant 4.
other/specify_______________
5. Occupation 1. Farmer 2. Merchant 3. Unemployed 4. Employed 5. Student 6. Daily
laborer 7. NA 8. Other/specify __________________
6. Educational status
1. Illiterate 2. Read and write only 3. Primary 4. Secondary 5. Tertiary 6.
NA
7. Parents of case/control educational status if the respondent is a child (< 7 years of age)
Mother-1. Illiterate 2. Read and write only 3.Primary 4.Secondary 5. Tertiary
Father- 1.Illiterate 2. Read and write only 3.Primary 4.Secondary 5. Tertiary
8. Marital Status 1. Single 2. Married 3. Divorced 4. Widowed 5. NA
9. How many Family members residing with you: ___________
10. Is there any person infested with Itching skin rash and Crusts on the skin in your house?1.yes
2.No
11. If Yes to Q9, number of sick person________________________
C. Questions related to knowledge of respondents about the disease
12. Do you know what scabies is? 1. Yes 2.No

198 | P a g e ( B O W , M a r k o s G u r m a m o K a l o r e ) J u n e , 2 0 1 7 .
13. What do you think the cause of scabies? 1. Parasites 2. Consequence of curse 3.
Witchcraft
4. other/specify___________________
14. How do you think scabies is transmitted? (You can pick more than one response). 1. By
direct skin to skin contact with ill person 2. By sharing clothes of ill person 3. Hugging (hold
in your arms) 4. Other/specify ______________________
15. Do you think scabies preventable diseases? 1. Yes 2. No 3. Don’t know
16. If yes for Q12, How it can be prevented?
1. Personal hygiene& sanitation 2. Avoid contact with Scabies patient(s) 3. Don’t know
4. Other/specify ______________________
17. Who do you think can be affected more by Scabies?
1. Children less than 5 years old 2. Children between 5-18 years 3. People over 18
years old 4.People of any age group 5. don’t know
18. Where did you go first when you get Scabies?
1. Health Facility 2. Traditional Healers 3. Holy Water 4. Stayed at home
5.other/Specify_______________________________________
19. How do you think Scabies can be cured?
1. Using modern medicine 2. Using traditional Medicine 3. Holly water 4. by feeding
nutritious foods 5. Keeping the sick person in door 6. Other (Specify) _______
D. Clinical features & management of the disease(for cases ONLY)
20. What are the signs &symptoms of the disease?
A. skin rash: 1. Yes 2. No D. relentless itching: 1. Yes 2. No
B. red bumps and blisters: 1. Yes 2. No E. Crusts on the skin 1. Yes 2. No
C. tiny red burrows: 1. Yes 2. No F. Sign of secondary infection (observe) 1. Yes 2. No
21. Site of rash on the body (you can select as more responses as possible)
1. Flexor wrist surface 2.inter digital spaces 3. Abdomen 4. Inter gluteal cleft
5.Buttocks 6.Highs 7. Elbow 8.Feet 9.Ankles 10. Anterior axillary (under
arm folds).
11. Other/specify_________________________
22. Date of rash onset ____/_____/_________(dd.mm. yy)
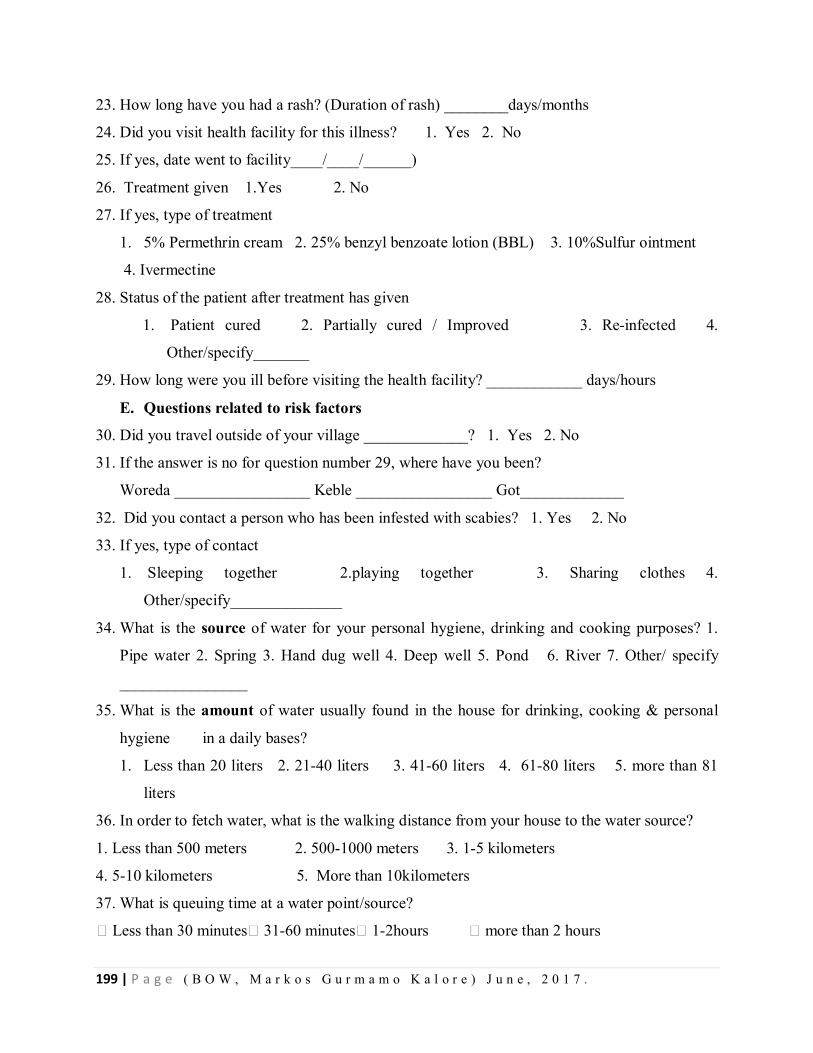
199 | P a g e ( B O W , M a r k o s G u r m a m o K a l o r e ) J u n e , 2 0 1 7 .
23. How long have you had a rash? (Duration of rash) ________days/months
24. Did you visit health facility for this illness? 1. Yes 2. No
25. If yes, date went to facility____/____/______)
26. Treatment given 1.Yes 2. No
27. If yes, type of treatment
1. 5% Permethrin cream 2. 25% benzyl benzoate lotion (BBL) 3. 10%Sulfur ointment
4. Ivermectine
28. Status of the patient after treatment has given
1. Patient cured 2. Partially cured / Improved 3. Re-infected 4.
Other/specify_______
29. How long were you ill before visiting the health facility? ____________ days/hours
E. Questions related to risk factors
30. Did you travel outside of your village _____________? 1. Yes 2. No
31. If the answer is no for question number 29, where have you been?
Woreda _________________ Keble _________________ Got_____________
32. Did you contact a person who has been infested with scabies? 1. Yes 2. No
33. If yes, type of contact
1. Sleeping together 2.playing together 3. Sharing clothes 4.
Other/specify______________
34. What is the source of water for your personal hygiene, drinking and cooking purposes? 1.
Pipe water 2. Spring 3. Hand dug well 4. Deep well 5. Pond 6. River 7. Other/ specify
________________
35. What is the amount of water usually found in the house for drinking, cooking & personal
hygiene in a daily bases?
1. Less than 20 liters 2. 21-40 liters 3. 41-60 liters 4. 61-80 liters 5. more than 81
liters
36. In order to fetch water, what is the walking distance from your house to the water source?
1. Less than 500 meters 2. 500-1000 meters 3. 1-5 kilometers
4. 5-10 kilometers 5. More than 10kilometers
37. What is queuing time at a water point/source?
Less than 30 minutes 31-60 minutes 1-2hours more than 2 hours
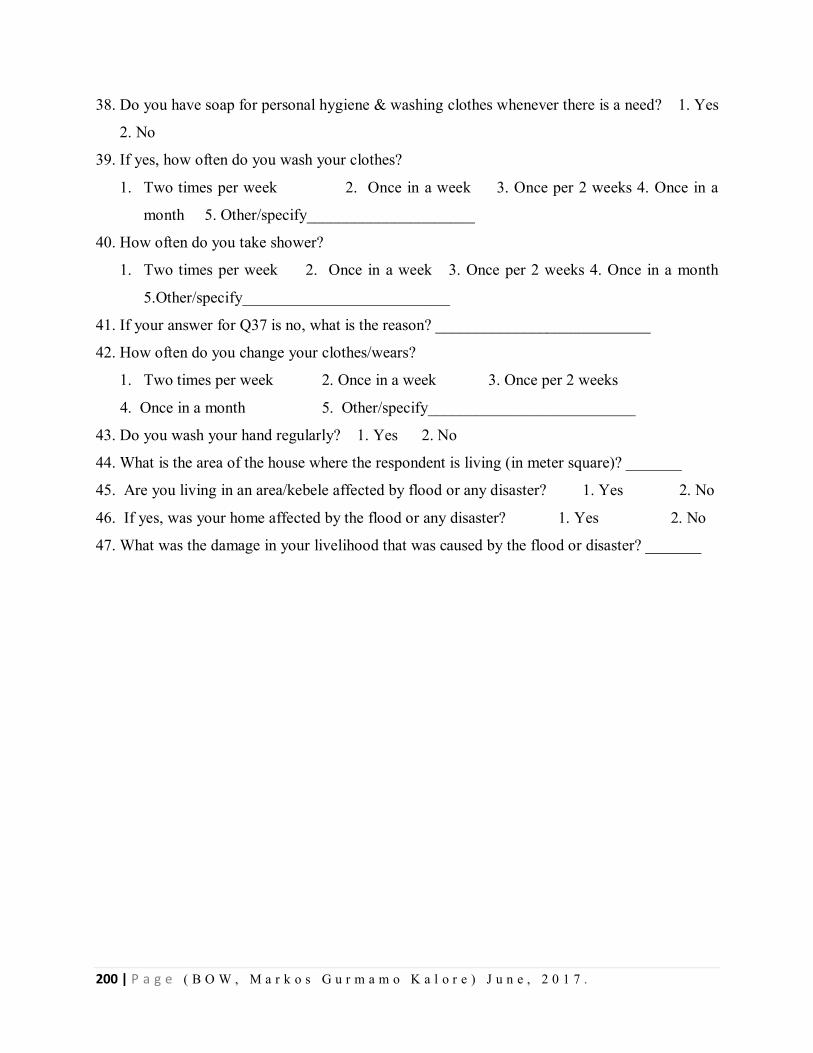
200 | P a g e ( B O W , M a r k o s G u r m a m o K a l o r e ) J u n e , 2 0 1 7 .
38. Do you have soap for personal hygiene & washing clothes whenever there is a need? 1. Yes
2. No
39. If yes, how often do you wash your clothes?
1. Two times per week 2. Once in a week 3. Once per 2 weeks 4. Once in a
month 5. Other/specify_____________________
40. How often do you take shower?
1. Two times per week 2. Once in a week 3. Once per 2 weeks 4. Once in a month
5.Other/specify__________________________
41. If your answer for Q37 is no, what is the reason? ___________________________
42. How often do you change your clothes/wears?
1. Two times per week 2. Once in a week 3. Once per 2 weeks
4. Once in a month 5. Other/specify__________________________
43. Do you wash your hand regularly? 1. Yes 2. No
44. What is the area of the house where the respondent is living (in meter square)? _______
45. Are you living in an area/kebele affected by flood or any disaster? 1. Yes 2. No
46. If yes, was your home affected by the flood or any disaster? 1. Yes 2. No
47. What was the damage in your livelihood that was caused by the flood or disaster? _______
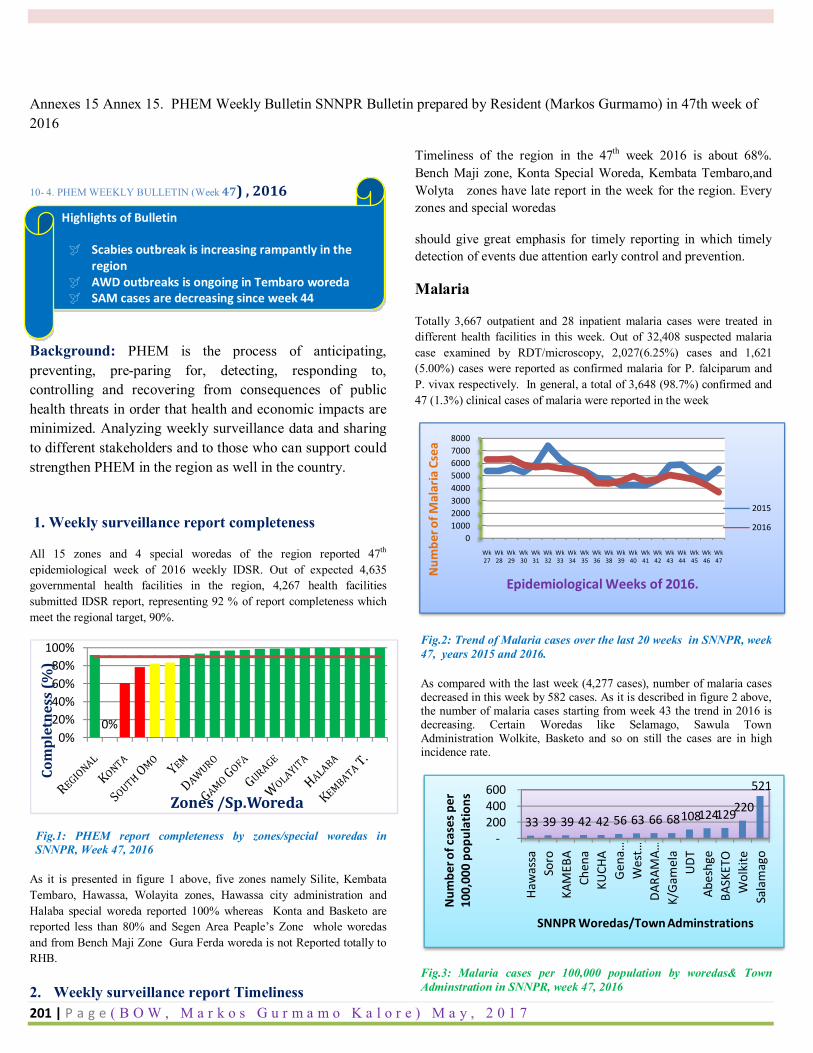
201 | P a g e ( B O W , M a r k o s G u r m a m o K a l o r e ) M a y , 2 0 1 7
Annexes 15 Annex 15. PHEM Weekly Bulletin SNNPR Bulletin prepared by Resident (Markos Gurmamo) in 47th week of 2016
10- 4. PHEM WEEKLY BULLETIN (Week 47) , 2016
Background: PHEM is the process of anticipating, preventing, pre-paring for, detecting, responding to, controlling and recovering from consequences of public health threats in order that health and economic impacts are minimized. Analyzing weekly surveillance data and sharing to different stakeholders and to those who can support could strengthen PHEM in the region as well in the country.
1. Weekly surveillance report completeness
All 15 zones and 4 special woredas of the region reported 47th epidemiological week of 2016 weekly IDSR. Out of expected 4,635 governmental health facilities in the region, 4,267 health facilities submitted IDSR report, representing 92 % of report completeness which meet the regional target, 90%.
Fig.1: PHEM report completeness by zones/special woredas in SNNPR, Week 47, 2016
As it is presented in figure 1 above, five zones namely Silite, Kembata Tembaro, Hawassa, Wolayita zones, Hawassa city administration and Halaba special woreda reported 100% whereas Konta and Basketo are reported less than 80% and Segen Area Peaple’s Zone whole woredas and from Bench Maji Zone Gura Ferda woreda is not Reported totally to RHB.
2. Weekly surveillance report Timeliness
Timeliness of the region in the 47th week 2016 is about 68%. Bench Maji zone, Konta Special Woreda, Kembata Tembaro,and Wolyta zones have late report in the week for the region. Every zones and special woredas
should give great emphasis for timely reporting in which timely detection of events due attention early control and prevention.
Malaria
Totally 3,667 outpatient and 28 inpatient malaria cases were treated in different health facilities in this week. Out of 32,408 suspected malaria case examined by RDT/microscopy, 2,027(6.25%) cases and 1,621 (5.00%) cases were reported as confirmed malaria for P. falciparum and P. vivax respectively. In general, a total of 3,648 (98.7%) confirmed and 47 (1.3%) clinical cases of malaria were reported in the week
Fig.2: Trend of Malaria cases over the last 20 weeks in SNNPR, week 47, years 2015 and 2016.
As compared with the last week (4,277 cases), number of malaria cases decreased in this week by 582 cases. As it is described in figure 2 above, the number of malaria cases starting from week 43 the trend in 2016 is decreasing. Certain Woredas like Selamago, Sawula Town Administration Wolkite, Basketo and so on still the cases are in high incidence rate.
Fig.3: Malaria cases per 100,000 population by woredas& Town Adminstration in SNNPR, week 47, 2016
0%0%
20%40%60%80%
100%
Com
plet
ness
(%)
Zones /Sp.Woreda
010002000300040005000600070008000
Wk 27
Wk 28
Wk 29
Wk 30
Wk 31
Wk 32
Wk 33
Wk 34
Wk 35
Wk 36
Wk 38
Wk 39
Wk 40
Wk 41
Wk 42
Wk 43
Wk 44
Wk 45
Wk 46
Wk 47
Num
ber o
f Mal
aria
Cse
a
Epidemiological Weeks of 2016.
2015
2016
33 39 39 42 42 56 63 66 68 108 124 129 220
521
-200 400 600
Haw
assa
Soro
KAM
EBA
Chen
aKU
CHA
Gen
a …W
est …
DARA
MA…
K/G
amel
aU
DTAb
eshg
eBA
SKET
OW
olki
teSa
lam
ago
Num
ber o
f cas
es p
er
100,
000
popu
latio
ns
SNNPR Woredas/Town Adminstrations
Highlights of Bulletin
Scabies outbreak is increasing rampantly in the region
AWD outbreaks is ongoing in Tembaro woreda SAM cases are decreasing since week 44
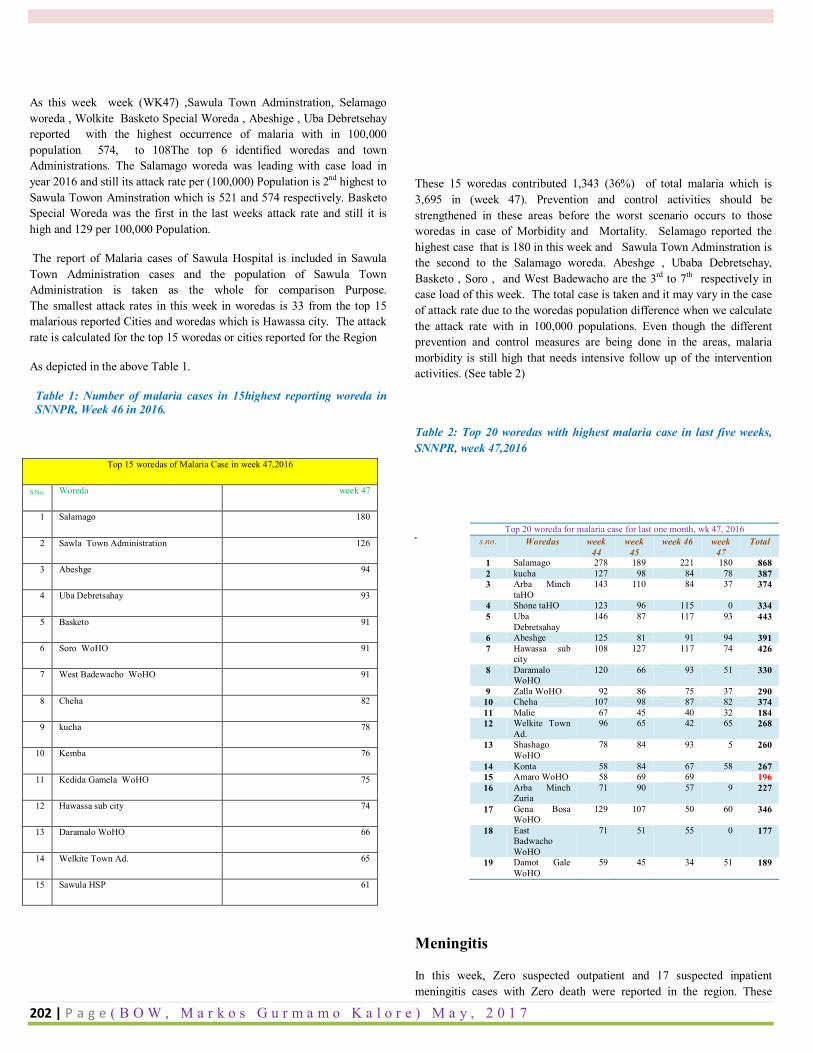
202 | P a g e ( B O W , M a r k o s G u r m a m o K a l o r e ) M a y , 2 0 1 7
As this week week (WK47) ,Sawula Town Adminstration, Selamago woreda , Wolkite Basketo Special Woreda , Abeshige , Uba Debretsehay reported with the highest occurrence of malaria with in 100,000 population 574, to 108The top 6 identified woredas and town Administrations. The Salamago woreda was leading with case load in year 2016 and still its attack rate per (100,000) Population is 2nd highest to Sawula Towon Aminstration which is 521 and 574 respectively. Basketo Special Woreda was the first in the last weeks attack rate and still it is high and 129 per 100,000 Population.
The report of Malaria cases of Sawula Hospital is included in Sawula Town Administration cases and the population of Sawula Town Administration is taken as the whole for comparison Purpose. The smallest attack rates in this week in woredas is 33 from the top 15 malarious reported Cities and woredas which is Hawassa city. The attack rate is calculated for the top 15 woredas or cities reported for the Region
As depicted in the above Table 1.
Table 1: Number of malaria cases in 15highest reporting woreda in SNNPR, Week 46 in 2016.
These 15 woredas contributed 1,343 (36%) of total malaria which is 3,695 in (week 47). Prevention and control activities should be strengthened in these areas before the worst scenario occurs to those woredas in case of Morbidity and Mortality. Selamago reported the highest case that is 180 in this week and Sawula Town Adminstration is the second to the Salamago woreda. Abeshge , Ubaba Debretsehay, Basketo , Soro , and West Badewacho are the 3rd to 7th respectively in case load of this week. The total case is taken and it may vary in the case of attack rate due to the woredas population difference when we calculate the attack rate with in 100,000 populations. Even though the different prevention and control measures are being done in the areas, malaria morbidity is still high that needs intensive follow up of the intervention activities. (See table 2)
Table 2: Top 20 woredas with highest malaria case in last five weeks, SNNPR, week 47,2016
.
Meningitis
In this week, Zero suspected outpatient and 17 suspected inpatient meningitis cases with Zero death were reported in the region. These
Top 15 woredas of Malaria Case in week 47,2016
S.No. Woreda week 47
1 Salamago 180
2 Sawla Town Administration 126
3 Abeshge 94
4 Uba Debretsahay 93
5 Basketo 91
6 Soro WoHO 91
7 West Badewacho WoHO 91
8 Cheha 82
9 kucha 78
10 Kemba 76
11 Kedida Gamela WoHO 75
12 Hawassa sub city 74
13 Daramalo WoHO 66
14 Welkite Town Ad. 65
15 Sawula HSP 61
Top 20 woreda for malaria case for last one month, wk 47, 2016 s.no. Woredas week
44 week
45 week 46 week
47 Total
1 Salamago 278 189 221 180 868 2 kucha 127 98 84 78 387 3 Arba Minch
taHO 143 110 84 37 374
4 Shone taHO 123 96 115 0 334 5 Uba
Debretsahay 146 87 117 93 443
6 Abeshge 125 81 91 94 391 7 Hawassa sub
city 108 127 117 74 426
8 Daramalo WoHO
120 66 93 51 330
9 Zalla WoHO 92 86 75 37 290 10 Cheha 107 98 87 82 374 11 Malie 67 45 40 32 184 12 Welkite Town
Ad. 96 65 42 65 268
13 Shashago WoHO
78 84 93 5 260
14 Konta 58 84 67 58 267 15 Amaro WoHO 58 69 69 196 16 Arba Minch
Zuria 71 90 57 9 227
17 Gena Bosa WoHO
129 107 50 60 346
18 East Badwacho WoHO
71 51 55 0 177
19 Damot Gale WoHO
59 45 34 51 189
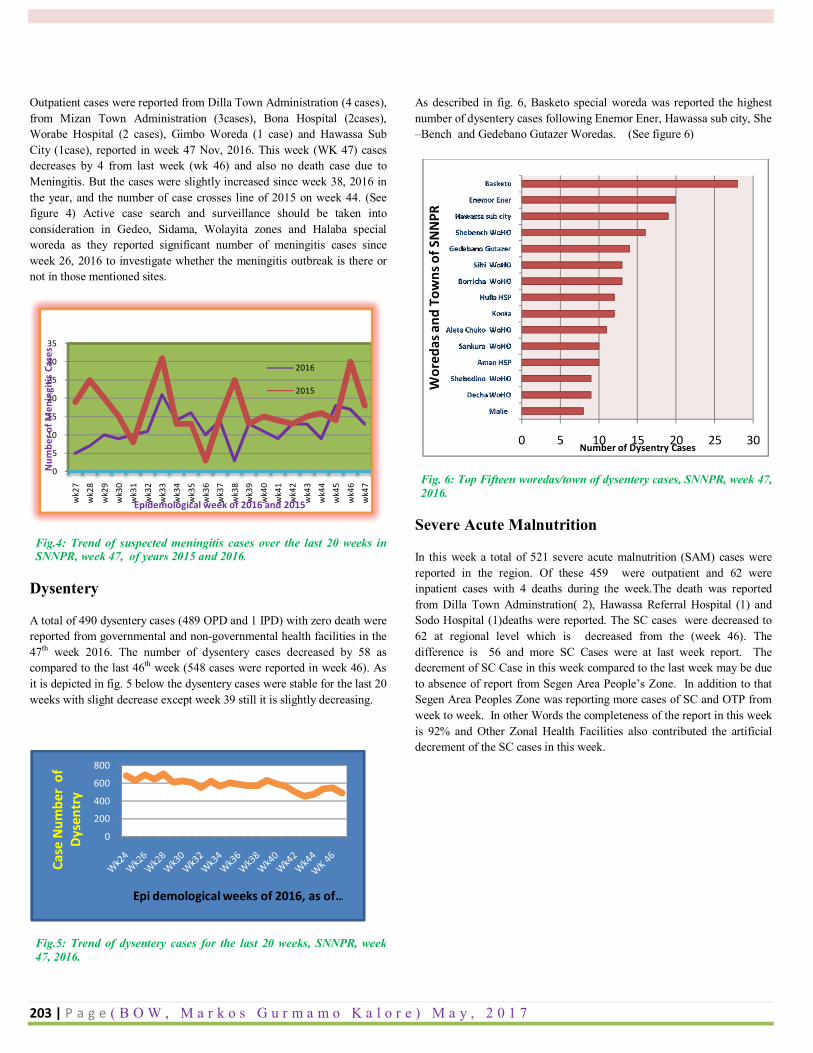
203 | P a g e ( B O W , M a r k o s G u r m a m o K a l o r e ) M a y , 2 0 1 7
Outpatient cases were reported from Dilla Town Administration (4 cases), from Mizan Town Administration (3cases), Bona Hospital (2cases), Worabe Hospital (2 cases), Gimbo Woreda (1 case) and Hawassa Sub City (1case), reported in week 47 Nov, 2016. This week (WK 47) cases decreases by 4 from last week (wk 46) and also no death case due to Meningitis. But the cases were slightly increased since week 38, 2016 in the year, and the number of case crosses line of 2015 on week 44. (See figure 4) Active case search and surveillance should be taken into consideration in Gedeo, Sidama, Wolayita zones and Halaba special woreda as they reported significant number of meningitis cases since week 26, 2016 to investigate whether the meningitis outbreak is there or not in those mentioned sites.
Fig.4: Trend of suspected meningitis cases over the last 20 weeks in SNNPR, week 47, of years 2015 and 2016.
Dysentery
A total of 490 dysentery cases (489 OPD and 1 IPD) with zero death were reported from governmental and non-governmental health facilities in the 47th week 2016. The number of dysentery cases decreased by 58 as compared to the last 46th week (548 cases were reported in week 46). As it is depicted in fig. 5 below the dysentery cases were stable for the last 20 weeks with slight decrease except week 39 still it is slightly decreasing.
Fig.5: Trend of dysentery cases for the last 20 weeks, SNNPR, week 47, 2016.
As described in fig. 6, Basketo special woreda was reported the highest number of dysentery cases following Enemor Ener, Hawassa sub city, She –Bench and Gedebano Gutazer Woredas. (See figure 6)
Fig. 6: Top Fifteen woredas/town of dysentery cases, SNNPR, week 47, 2016.
Severe Acute Malnutrition
In this week a total of 521 severe acute malnutrition (SAM) cases were reported in the region. Of these 459 were outpatient and 62 were inpatient cases with 4 deaths during the week.The death was reported from Dilla Town Adminstration( 2), Hawassa Referral Hospital (1) and Sodo Hospital (1)deaths were reported. The SC cases were decreased to 62 at regional level which is decreased from the (week 46). The difference is 56 and more SC Cases were at last week report. The decrement of SC Case in this week compared to the last week may be due to absence of report from Segen Area People’s Zone. In addition to that Segen Area Peoples Zone was reporting more cases of SC and OTP from week to week. In other Words the completeness of the report in this week is 92% and Other Zonal Health Facilities also contributed the artificial decrement of the SC cases in this week.
0
5
10
15
20
25
30
35
wk2
7w
k28
wk2
9w
k30
wk3
1
wk3
2w
k33
wk3
4
wk3
5w
k36
wk3
7
wk3
8w
k39
wk4
0w
k41
wk4
2
wk4
3w
k44
wk4
5
wk4
6w
k47
Num
ber o
f Men
ingi
tis C
ases
Epidemological week of 2016 and 2015
2016
2015
0
200
400
600
800
Case
Num
ber
of
Dyse
ntry
Epi demological weeks of 2016, as of …
0 5 10 15 20 25 30
Malie
Decha WoHO
Shebedino WoHO
Aman HSP
Sankura WoHO
Aleta Chuko WoHO
Konta
Hulla HSP
Borricha WoHO
Silti WoHO
Gedebano Gutazer
Shebench WoHO
Hawassa sub city
Enemor Ener
Basketo
Number of Dysentry CasesW
ored
as a
nd T
owns
of S
NN
PR
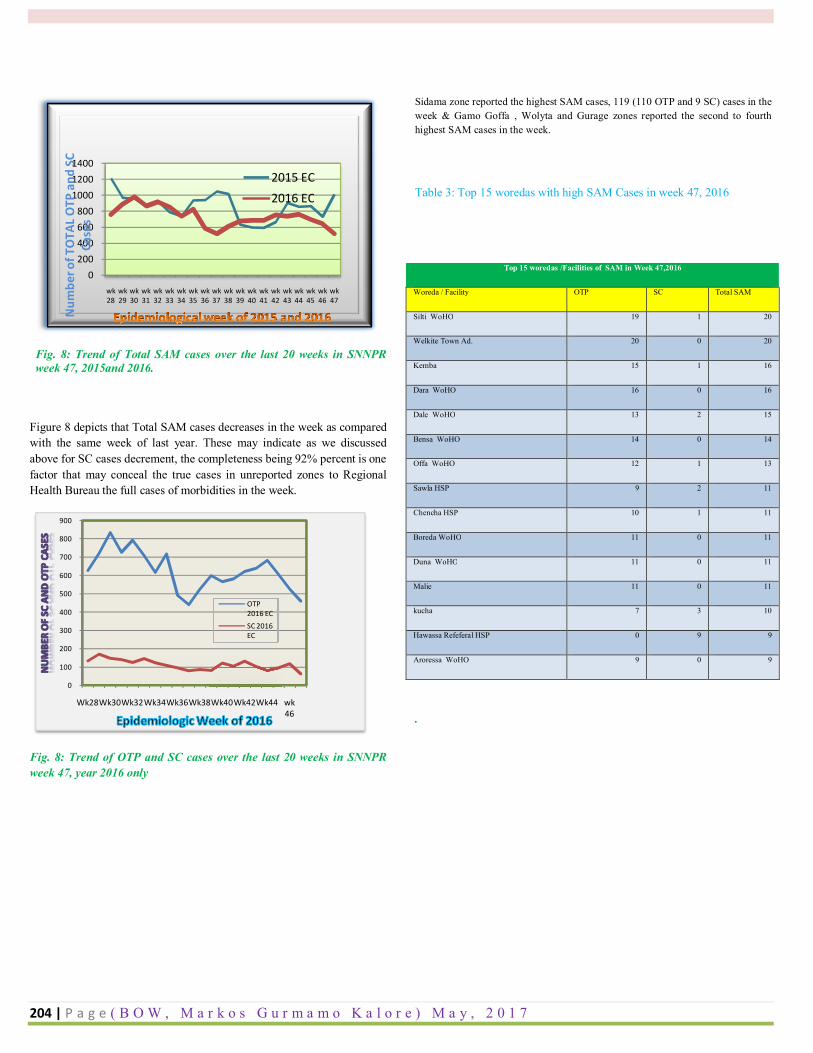
204 | P a g e ( B O W , M a r k o s G u r m a m o K a l o r e ) M a y , 2 0 1 7
Fig. 8: Trend of Total SAM cases over the last 20 weeks in SNNPR week 47, 2015and 2016.
Figure 8 depicts that Total SAM cases decreases in the week as compared with the same week of last year. These may indicate as we discussed above for SC cases decrement, the completeness being 92% percent is one factor that may conceal the true cases in unreported zones to Regional Health Bureau the full cases of morbidities in the week.
Fig. 8: Trend of OTP and SC cases over the last 20 weeks in SNNPR week 47, year 2016 only
Sidama zone reported the highest SAM cases, 119 (110 OTP and 9 SC) cases in the week & Gamo Goffa , Wolyta and Gurage zones reported the second to fourth highest SAM cases in the week.
Table 3: Top 15 woredas with high SAM Cases in week 47, 2016
.
0200400600800
100012001400
wk 28
wk 29
wk 30
wk 31
wk 32
wk 33
wk 34
wk 35
wk 36
wk 37
wk 38
wk 39
wk 40
wk 41
wk 42
wk 43
wk 44
wk 45
wk 46
wk 47
Num
ber o
f TO
TAL
OTP
and
SC
Case
s
2015 EC2016 EC
0
100
200
300
400
500
600
700
800
900
Wk28Wk30Wk32Wk34Wk36Wk38Wk40Wk42Wk44 wk 46
OTP 2016 ECSC 2016 EC
Top 15 woredas /Facilities of SAM in Week 47,2016
Woreda / Facility OTP SC Total SAM
Silti WoHO 19 1 20
Welkite Town Ad. 20 0 20
Kemba 15 1 16
Dara WoHO 16 0 16
Dale WoHO 13 2 15
Bensa WoHO 14 0 14
Offa WoHO 12 1 13
Sawla HSP 9 2 11
Chencha HSP 10 1 11
Boreda WoHO 11 0 11
Duna WoHO 11 0 11
Malie 11 0 11
kucha 7 3 10
Hawassa Refeferal HSP 0 9 9
Aroressa WoHO 9 0 9
205 | P a g e ( B O W , M a r k o s G u r m a m o K a l o r e ) M a y , 2 0 1 7
Table 3: Top fifteen highest malnutrition cases by zones/ Sp.woredas, SNNPR, week 47, 2016
.
Scabies
In week 47 a total of 9,281 new cases of Scabies were reported to the Regional Health Bureau.
Table5. Scabies cases in the region since November 26, 2009 EC
Zone/Sp. Woreda
Total Population
Scabies cases
New cases in the
wk
Total AR/100,000 populations
Basketo 70,299 217 - 217 309 Konta 113,792 5114 - 5,114 4,494 Gamo gofa
1,992,955 1337 156 1,493 75 Wolayta 1,882,833 11858 2,408 14,266 758 Dawro 609,719 10440 - 10,440 1,712 Gurage 1,609,908 731 - 731 45 Hadiya 1,573,841 11691 1,257 12,948 823 Kembata tembaro
857,375 1753 1,978 3,731 435 Halaba sp. 310,690 34271 - 34,271 11,031 Silite 937,007 254 - 254 27 Sidama 3,628,716 10679 3,482 14,161 390 Total 13,587,135 88,345 9,281 97,626 719
The total cases of the scabies in the region since the case started in 2016 are 97,626. When we see the week 47 cases the zones which contributed to this high number are Sidama Zone 3,482 new cases, Wolyta zone 2,408 new cases Kembata Tembaro Zone 1978 new cases
and Hadiya Zone 1,257 new cases were reported. Some Zones didn’t report to the Region the update in 47th week. Besides to this the attack rate per 100,000 population is 719 and in Halaba Special woreda is 11,031
which is maximum and the smallest Silte Zone in the region. And some Zones didn’t report the update should report the updates timely in order to facilitate logistics and intervention by RHB, Ministry of health and other stakeholders.
AFP
In the 47th week, 3 suspected AFP cases were reported in the region. The cases were reported from Hamer Zone of South Omo, Gedeb Zone of Gedio, Hawassa Referal Hospital Town Of Hawassa .
Measles cases
Totally 10 suspected measles cases were reported in this week. Wonago Woreda (4 cases), Kochore woreda(2 cases), Dilla Hospital hospital (1 case) and Hula Woreda ( case) and the rest (1) case is Reported from Durame Town Adminstration.
Epidemic Typhus
In the 47th week, totally 1834 outpatient and 42 inpatient epidemic typhus cases reported in the region. The number of cases decreased by 163 as compared to week 46 (2,018). Hawassa sub city 267, Yirgalem Hospital 155, Chencha Hospital 96 , and Tula Woreda 92 cases were the highest among the Reported Woredas and Health Facilities.
Typhoid Fever There were a total of 7,648 typhoid fever cases (7634 OPD and 14 IPD) were reported in this week with zero death report. The number of cases increased by 398 cases as compared to week 46, (8,046). Hawassa sub city (390), Enemor Ener woreda (260), Hossana Hospital (185), Dilla hospital (173) and Yirgale Hospital (161) were five highest typhoid fever reported areas.
AWD
AWD outbreak is ongoing in Tembaro woreda of Kembata Tembaro zone since Nov 24, 2016. As of December 05, 2016, a total of 94 AWD cases are reported through line list. Team composed of RHB & partners has been deployed and working out on respoce activities.
Besides, AWD outbreak rumor is reported from Halaba special woreda and investigation are underway to further assess the outbreak.
Maternal Death
Zero maternal death was reported in the region in this week.
NNT: One case or death of NNT from Dilla Town Administration reported and 10 Cases of dog bite reported (5) from Tercha and (5) from Dilla Hospital. No cases of yellow fever, Anthrax, AHI, SARS, Pandemic influenza, Viral Hemorrhagic Fever, Guinea worm and Smallpox were reporting period.
Cumulative SAM Cases in Week 47 by Zones and Special woredas Zones/ Sp.Woredas OTP SC
Total Sidama 110 9 119
Gamo Gofa 67 15 82
Wolayita 51 7 58
Gurage 58 0 58 Gedeo 35 6 41 Silite 31 6 37 Hadiya 29 0 29 South Omo 24 0 24
Dawuro 24 0 24 Kembata Tembaro 13 4 17 Hawassa Town 3 9 12 Halaba 6 1 7 Bench Maji 1 3 4 Konta 3 0 3
Basketo 2 1 3 Kefa 2 0 2 Sheka 1 0 1
Segen
Yem 0 0 0
Total of week 459 62 521
206 | P a g e ( B O W , M a r k o s G u r m a m o K a l o r e ) M a y , 2 0 1 7
Annexes 16 Declaration Statement
I, the undersigned, declare that this is my original work and has never been presented by another person in this or
any other University and that all the source materials and references used for this thesis have been duly
acknowledged.
Name: Markos Gurmamo Kalore
Signature: ______________________________
Place: ______________________________
Date of Submission: ______________________________
The thesis has been submitted for examination with my approval as a university advisor.
Name of advisor:
Signature: ______________________________
Date: ______________________________
Related Documents