Since 2007, the Joint Center for Housing Studies has projected short-term trends in home remodeling activ- ity with its quarterly Leading Indicator of Remodel- ing Activity, or LIRA. In recent years, the quality and reliability of the LIRA’s benchmark data series declined markedly, prompting a re-benchmarking of the LIRA to a measure of home improvement and repair spending based on estimates from the Department of Housing and Urban Development’s biennial American Housing Survey. The main difference between the former and re- benchmarked LIRA is that the former LIRA projected trends in home improvement spending only, whereas the re-benchmarked LIRA now tracks a broader re- modeling market that includes both improvements and maintenance and repair activity. For this reason, the re- benchmarked LIRA is somewhat less cyclical, but still anticipates turning points in the market well. JOINT CENTER FOR HOUSING STUDIES OF HARVARD UNIVERSITY Abstract Abbe Will Research Analyst, JCHS Re-Benchmarking the Leading Indicator of Remodeling Activity Research Note, April 2016 The Harvard Joint Center for Housing Studies advances understanding of housing issues and informs policy through research, education, and public outreach. © 2016 President and Fellows of Harvard College Any opinions expressed in this paper are those of the author(s) and not those of the Joint Center for Housing Studies of Harvard University or of any of the persons or organizations providing support to the Joint Center for Housing Studies. For more information on the Joint Center for Housing Studies, see our website at http://jchs.harvard.edu

Welcome message from author
This document is posted to help you gain knowledge. Please leave a comment to let me know what you think about it! Share it to your friends and learn new things together.
Transcript

Since 2007, the Joint Center for Housing Studies has projected short-term trends in home remodeling activ-ity with its quarterly Leading Indicator of Remodel-ing Activity, or LIRA. In recent years, the quality and reliability of the LIRA’s benchmark data series declined markedly, prompting a re-benchmarking of the LIRA to a measure of home improvement and repair spending based on estimates from the Department of Housing and Urban Development’s biennial American Housing Survey.
The main difference between the former and re-benchmarked LIRA is that the former LIRA projected trends in home improvement spending only, whereas the re-benchmarked LIRA now tracks a broader re-modeling market that includes both improvements and maintenance and repair activity. For this reason, the re-benchmarked LIRA is somewhat less cyclical, but still anticipates turning points in the market well.
J O I N T C E N T E R F O R H O U S I N G S T U D I E S O F H A R V A R D U N I V E R S I T Y
Abstract
Abbe Will Research Analyst, JCHS
Re-Benchmarking the Leading Indicator of Remodeling Activity
Research Note, April 2016
The Harvard Joint Center for Housing Studies advances understanding of housing issues and informs policy through research, education, and public outreach.
© 2016 President and Fellows of Harvard College
Any opinions expressed in this paper are those of the author(s) and not those of the Joint Center for Housing Studies of Harvard University or of any of the persons or organizations providing support to the Joint Center for Housing Studies.
For more information on the Joint Center for Housing Studies, see our website at http://jchs.harvard.edu

Joint Center for Housing Studies Harvard University
Re-Benchmarking the Leading Indicator of Remodeling Activity
Abbe Will April 2016
© by Abbe Will. All rights reserved. Short sections of text, not to exceed two paragraphs, may be quoted without explicit permission provided that full credit, including © notice, is given to the source. Any opinions expressed are those of the author and not those of the Joint Center for Housing Studies of Harvard University or of any of the persons or organizations providing support to the Joint Center for Housing Studies

1
Introduction
Since 2007, the Remodeling Futures Program of the Joint Center for Housing Studies has
produced a quarterly leading indicator for the national home improvement industry, called the
Leading Indicator of Remodeling Activity, or LIRA.1 This research note provides an explanation
of a change to the LIRA’s benchmark data series from the estimate of private residential
improvement spending in the U.S. Census Bureau’s Construction Spending Value Put in Place, or
C-30, to a Joint Center estimate based on owner improvement and repair spending from the
Department of Housing and Urban Development’s American Housing Survey (AHS).2 The main
motivations for re-benchmarking the LIRA are threefold:
(1) In recent years, the C-30 estimates of home improvement spending to owner-
occupied units have become increasing volatile and unreliable, subject to
unusually large revisions.3
(2) The C-30 has historically underestimated the size of the national home
improvement market in dollar volume when compared to the AHS. Not only are
improvement spending levels about 50% larger in the AHS, the AHS also provides
estimates of maintenance and repair spending allowing for a more comprehensive
market size definition.
(3) The housing and home improvement markets have gone through possibly the
most severe cycles in their recorded histories since the LIRA was first released,
necessitating a review of the original LIRA model and inputs for accuracy.
The Joint Center does not take re-benchmarking its LIRA lightly. However, the advantages of a
re-benchmarked LIRA representing a broader segment of the remodeling market and with
revised inputs that better predict post-Great Recession market trends were thought to far
outweigh any disadvantages of a re-benchmarking.
1 For documentation on the development of the original LIRA model see Bendimerad 2007. 2 This re-benchmarking occurs eight years after an initial re-benchmarking soon after the introduction of the LIRA that was necessitated by the abrupt discontinuation of its original benchmark series, the Census Bureau’s Survey of Residential Alterations and Repairs Statistics, or C-50 series. See Will 2008. 3 Most recently, the Census Bureau restated 10 years of C-30 data due to a long-standing processing error in the tabulation of data on private residential improvement spending: http://www.census.gov/construction/c30/news.html.
2
Purpose and Design of the LIRA
According to Joint Center estimates, the residential remodeling industry is closing in on
$350 billion annually in improvement and repair expenditures, yet the industry continues to
struggle for timely and consistent data on current market size and trends. The main purpose of
the LIRA is to provide the industry with a current estimate of national home improvement and
repair activity to owner-occupied properties, and, more importantly, to provide a near-term
projection of changes in activity that could signal major turning points in the remodeling cycle.
The LIRA is constructed as a weighted average of the annual rates of change in several key
economic indicators that typically influence remodeling activity. The LIRA relies on a benchmark
measure of remodeling spending both as a point of historical reference for levels of spending,
but more fundamentally as a means for estimating the LIRA model and weighting methodology.
The mechanics of the LIRA are thus: on a quarterly basis, the LIRA projects the annual, or
four-quarter moving, rate of change in national expenditure for home improvements and
repairs with a time horizon of four quarters. This is done by averaging the rates of change in
several economic indicators that strongly correlate with lagged remodeling spending. The input
components of the LIRA have differently timed relationships with remodeling spending so that
some are more highly correlated with spending with several quarters of lead time, while others
have a more coincident relationship with improvement spending. The input variables are
weighted in the LIRA model according to the strength of their correlation with historical
spending and the amount of deviation from their mean so that inputs with higher correlations
and lower variance or volatility will receive greater weight in calculating the LIRA output.
Again, as a leading indicator, the LIRA is designed to indicate oncoming upturns and
downturns in market activity, but forecasting is, of course, an imprecise science and for this
reason the LIRA is not expected to accurately predict exact rates of growth or decline so much
as the general trend of growth or decline in the near-term. The major difference between the
former and re-benchmarked LIRA is that the former LIRA projected trends in homeowner
improvements only, while the re-benchmarked LIRA projects combined owner improvement
and maintenance and repair activity. Because home improvement spending tends to be much
3
more cyclical than maintenance and repair spending over time, two separate LIRA models are
estimated, each using unique input variables, lead times and weights.
Motivations for Re-Benchmarking
The Remodeling Futures Program has relied on the improvements spending data from
the C-30 as a benchmark for the LIRA out of sheer necessity for a more frequent estimate than
the biennial data available from the American Housing Survey, for example. The monthly
publication and lengthy history of the C-30 (and its predecessor, the C-50) were critical for
designing a short-term leading indicator and the known limitations of the data were considered
to be of secondary importance by the Remodeling Futures Program. One limitation is that the
C-30 estimates of home improvement spending to owner-occupied units have always been
unusually volatile, likely due to small sample sizes and imprecision of the survey design for
collecting large and infrequent expenditures like a remodeling project.4 Figure 1 compares the
C-30 improvements data to retail sales of building materials at hardware stores and home
improvement centers. Although the C-30 data tends to trend in the same directions as retail
sales, the magnitude of the change is typically much more pronounced, suggesting the C-30 is
picking up considerable noise in its estimates and not entirely reflective of actual market
activity.
4 The improvements data in the C-30 is derived from the Bureau of Labor Statistics’ Consumer Expenditure Survey (CE), which is designed to collect comprehensive information on the everyday buying habits of American consumers, not home improvements and repairs specifically. The CE sample size is approximately 7,000 households per quarter including about 4,000 homeowners compared to about 30,000 homeowners surveyed as part of the American Housing Survey.

4
Also, due to the nature of data collection, the monthly residential improvement
estimates in the C-30 are based on partially reported data and forecasted data. Even the
routine monthly revisions are based on yet incomplete reporting by survey respondents. For all
of these reasons, the C-30 estimates have been subject to substantial revisions on both a
monthly and annual basis. But in recent years the C-30 improvements data have become
increasingly erratic and unreliable—as shown in Figure 2—and often subject to extraordinarily
large and oftentimes perplexing revisions that go counter to other major indicators for the
remodeling industry (Will 2013). The extreme nature of the data revisions over the past several
years led to difficult decisions by the Joint Center to delay releasing a regularly scheduled LIRA
in 2013 and to completely halt reporting of historical C-30 estimates as part of the LIRA releases
by mid-2014. Although the Census’ most recent major revision in January of this year corrected
what was found to be a longstanding data processing error in the improvements estimation,
the underlying volatility of the C-30 due to sample size, survey design and necessity of
forecasting remains.

5
6
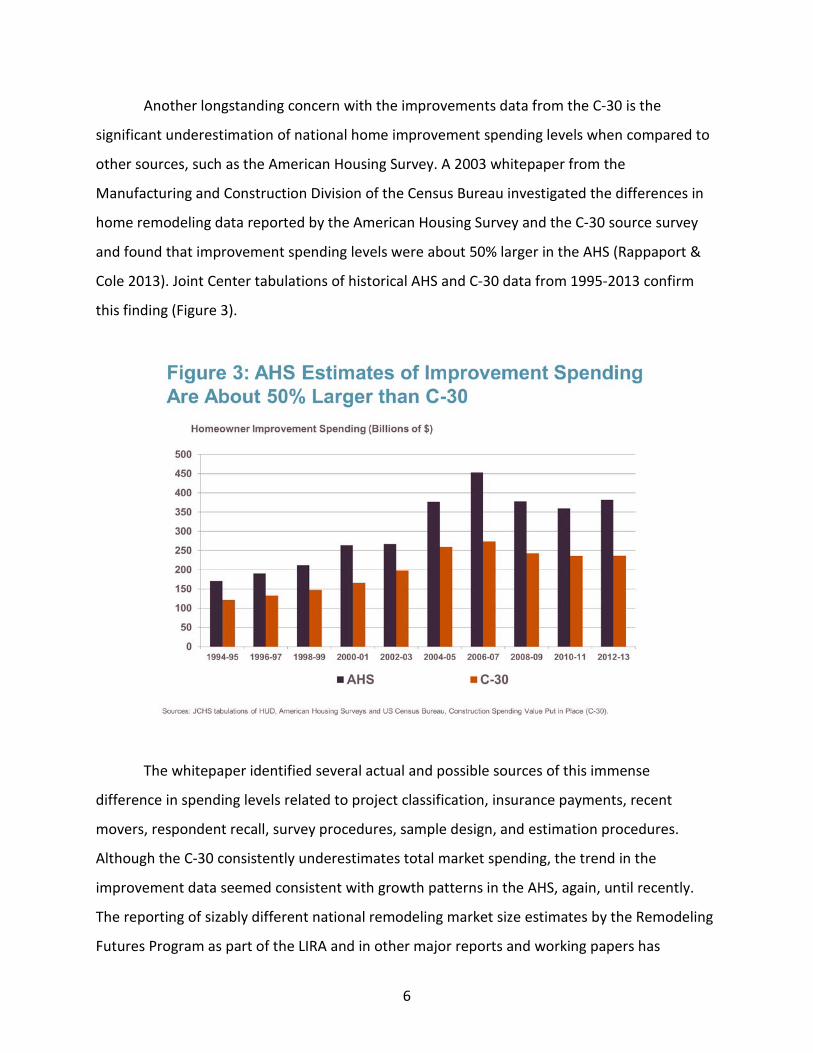
Another longstanding concern with the improvements data from the C-30 is the
significant underestimation of national home improvement spending levels when compared to
other sources, such as the American Housing Survey. A 2003 whitepaper from the
Manufacturing and Construction Division of the Census Bureau investigated the differences in
home remodeling data reported by the American Housing Survey and the C-30 source survey
and found that improvement spending levels were about 50% larger in the AHS (Rappaport &
Cole 2013). Joint Center tabulations of historical AHS and C-30 data from 1995-2013 confirm
this finding (Figure 3).
The whitepaper identified several actual and possible sources of this immense
difference in spending levels related to project classification, insurance payments, recent
movers, respondent recall, survey procedures, sample design, and estimation procedures.
Although the C-30 consistently underestimates total market spending, the trend in the
improvement data seemed consistent with growth patterns in the AHS, again, until recently.
The reporting of sizably different national remodeling market size estimates by the Remodeling
Futures Program as part of the LIRA and in other major reports and working papers has

7
undoubtedly been confusing for the industry. In addition to drastic underreporting of
improvement spending levels, the C-30 does not produce any estimates of home maintenance
and repair activity unlike the American Housing Survey. Re-benchmarking to an AHS-based
spending estimate would thus allow for a more comprehensive market size definition than is
capable using the C-30.
A final motivation for re-benchmarking the LIRA at this time is that the housing and
home improvement markets have gone through possibly the most severe cycles in their
recorded histories since the LIRA was first released, and a comprehensive review of the LIRA
model and its inputs for accuracy in projecting short-term trends is necessary. Although the
LIRA inputs have been checked annually for changing correlations with the C-30 that might
result in minor weight adjustments, it seems more fundamental changes have occurred in some
market relationships post-housing crash and Great Recession. Already in mid-2014, the
Remodeling Futures Program removed a financing input from the LIRA model due to a
breakdown in the traditional relationship between low financing costs and remodeling activity
during the downturn and recovery (Will 2014). Re-benchmarking the LIRA provides a good
opportunity to test for other changing relationships and replace any inputs that have lost
significant correlation with industry spending.
Creating Quarterly Series of Home Improvement and Repair Spending Based on Biennial
Estimates from the American Housing Survey
This section outlines the methods utilized in creating a non-seasonally adjusted
quarterly data series of nominal home improvement and repair spending based on the
spending totals available in the biennial American Housing Survey (AHS). Although the AHS has
been continuously conducted since the 1970s, a major overhaul of the home improvements
module occurred with the 1995 survey, thus limiting the creation of a benchmark series to
1995. At the time of this analysis, the 2013 AHS is the most recent survey available. The
benchmark series will be updated accordingly when the 2015 AHS is released later this year.
Until that time, LIRA model estimations will serve as historical estimates. Homeowner spending
for home improvements are recorded in the AHS for the prior two-year period, while
8
maintenance and repair spending is recorded for the prior year. The differentiation between
spending categorized as home improvement (which might include remodeling, renovation,
additions, major alterations or replacements of home components) is that improvement
projects add value to a home, whereas maintenance and repair projects simply preserve the
current value of the home.
In creating a quarterly home improvement data series, the first consideration is how to
distribute a two-year nominal spending total into annual levels. Typically, the Joint Center has
reported annual averages for national improvement spending from the AHS, assuming that half
of homeowners undertake projects in one year and half in the other year of the two-year
reporting period. This is, of course, a simplistic assumption and undoubtedly inaccurate
especially for two-year periods that include the peak or trough of a spending cycle. Assuming
zero annual market growth every two years is also problematic for correlating with industry
indicators that are collected monthly or quarterly and thus exhibit much more granular
variation across time periods.
It was decided that annual spending levels could be estimated by allocating the two-
year levels in the AHS according to the distribution of spending in a related indicator, one which
has historically correlated very highly with home improvement spending. An obvious candidate
is the Department of Commerce’s retail sales at building materials and supplies dealers, whose
four-quarter moving rate of change has a correlation coefficient of 0.73 with the rate of change
in the C-30 between 1994 and 2013.5 This strong positive correlation coefficient suggests retail
sales of building materials tend to move in the same direction as home remodeling spending
and should serve as a good proxy for allocating annual spending levels from the two-year AHS
figures. The results of such an allocation are reported in Table 1.
5 Other indicators were tested for high coincident correlation with the C-30, but retail sales had the highest correlation coefficient in addition to the closest theoretical relationship that retail sales of building materials are a fairly direct measure of remodeling spending.
9
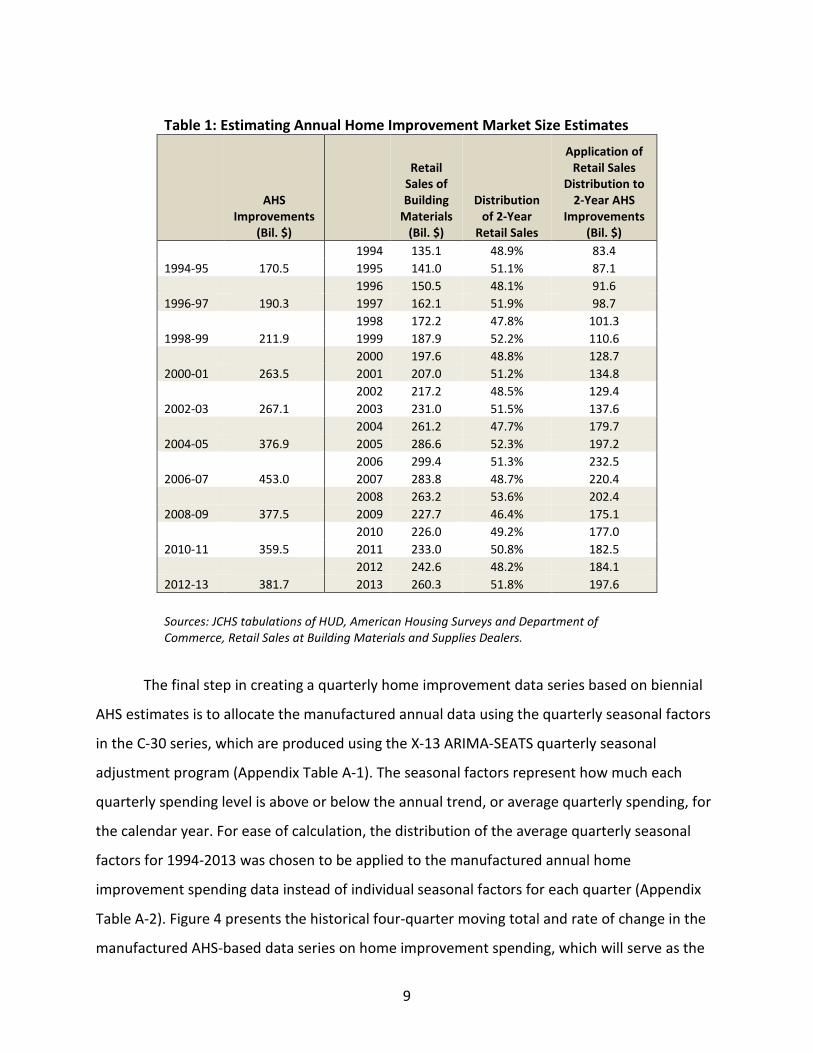
Table 1: Estimating Annual Home Improvement Market Size Estimates
AHS Improvements
(Bil. $)
Retail Sales of Building
Materials (Bil. $)
Distribution of 2-Year
Retail Sales
Application of Retail Sales
Distribution to 2-Year AHS
Improvements (Bil. $)
1994 135.1 48.9% 83.4 1994-95 170.5 1995 141.0 51.1% 87.1 1996 150.5 48.1% 91.6 1996-97 190.3 1997 162.1 51.9% 98.7 1998 172.2 47.8% 101.3 1998-99 211.9 1999 187.9 52.2% 110.6 2000 197.6 48.8% 128.7 2000-01 263.5 2001 207.0 51.2% 134.8 2002 217.2 48.5% 129.4 2002-03 267.1 2003 231.0 51.5% 137.6 2004 261.2 47.7% 179.7 2004-05 376.9 2005 286.6 52.3% 197.2 2006 299.4 51.3% 232.5 2006-07 453.0 2007 283.8 48.7% 220.4 2008 263.2 53.6% 202.4 2008-09 377.5 2009 227.7 46.4% 175.1 2010 226.0 49.2% 177.0 2010-11 359.5 2011 233.0 50.8% 182.5 2012 242.6 48.2% 184.1 2012-13 381.7 2013 260.3 51.8% 197.6
Sources: JCHS tabulations of HUD, American Housing Surveys and Department of Commerce, Retail Sales at Building Materials and Supplies Dealers.
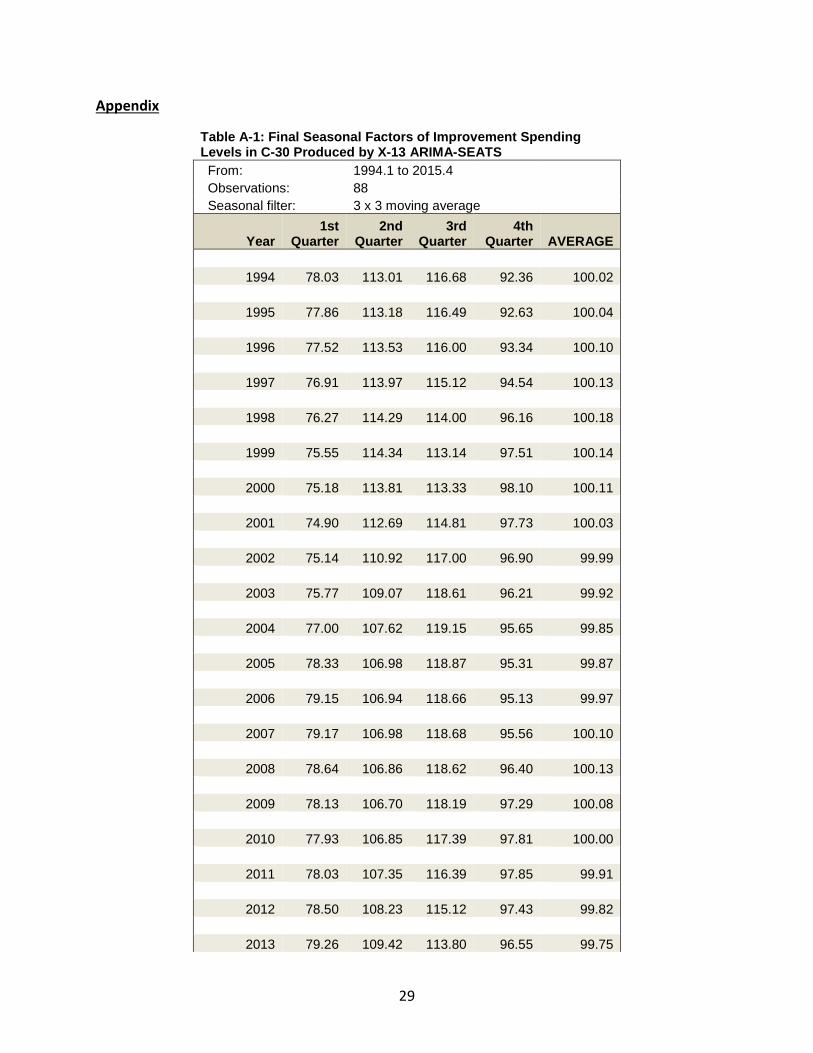
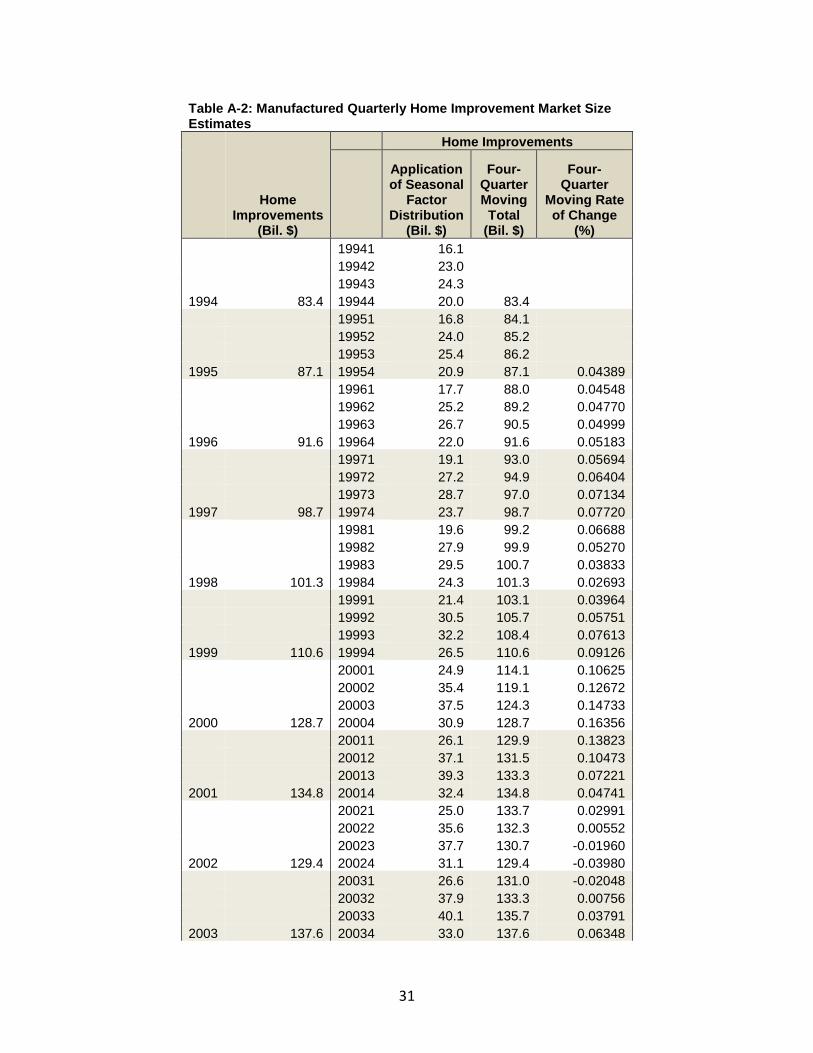
The final step in creating a quarterly home improvement data series based on biennial
AHS estimates is to allocate the manufactured annual data using the quarterly seasonal factors
in the C-30 series, which are produced using the X-13 ARIMA-SEATS quarterly seasonal
adjustment program (Appendix Table A-1). The seasonal factors represent how much each
quarterly spending level is above or below the annual trend, or average quarterly spending, for
the calendar year. For ease of calculation, the distribution of the average quarterly seasonal
factors for 1994-2013 was chosen to be applied to the manufactured annual home
improvement spending data instead of individual seasonal factors for each quarter (Appendix
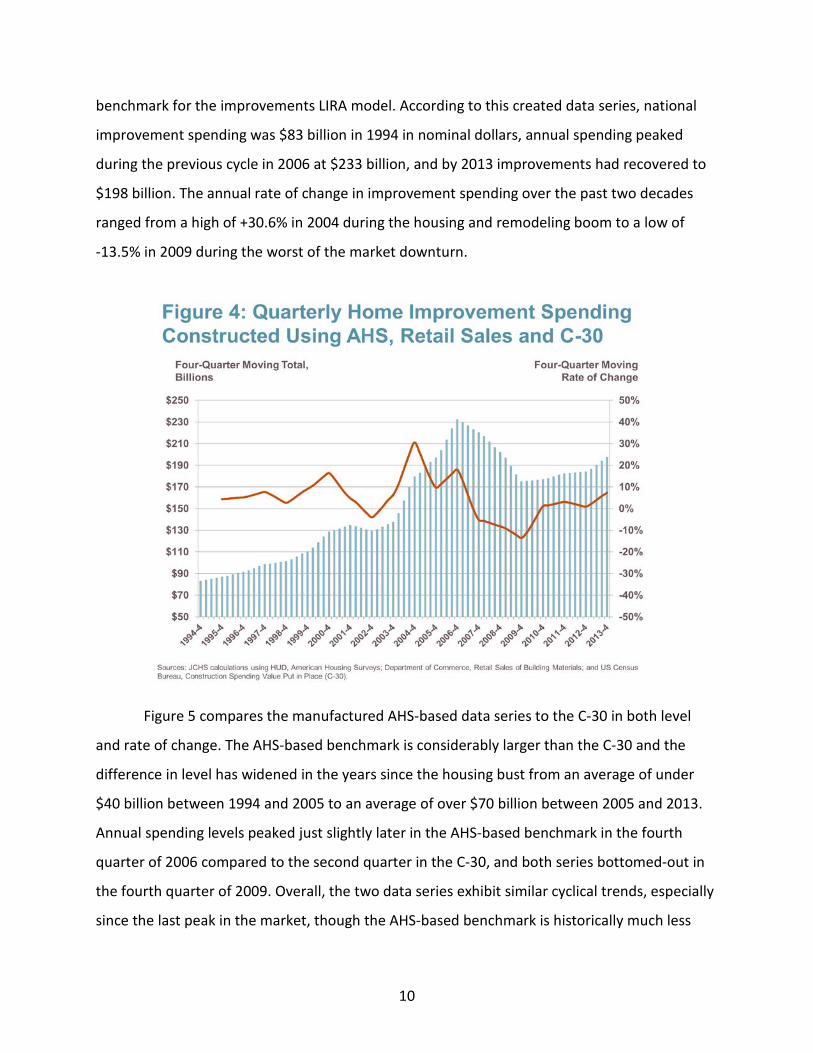
Table A-2). Figure 4 presents the historical four-quarter moving total and rate of change in the
manufactured AHS-based data series on home improvement spending, which will serve as the
10
benchmark for the improvements LIRA model. According to this created data series, national
improvement spending was $83 billion in 1994 in nominal dollars, annual spending peaked
during the previous cycle in 2006 at $233 billion, and by 2013 improvements had recovered to
$198 billion. The annual rate of change in improvement spending over the past two decades
ranged from a high of +30.6% in 2004 during the housing and remodeling boom to a low of
-13.5% in 2009 during the worst of the market downturn.
Figure 5 compares the manufactured AHS-based data series to the C-30 in both level
and rate of change. The AHS-based benchmark is considerably larger than the C-30 and the
difference in level has widened in the years since the housing bust from an average of under
$40 billion between 1994 and 2005 to an average of over $70 billion between 2005 and 2013.
Annual spending levels peaked just slightly later in the AHS-based benchmark in the fourth
quarter of 2006 compared to the second quarter in the C-30, and both series bottomed-out in
the fourth quarter of 2009. Overall, the two data series exhibit similar cyclical trends, especially
since the last peak in the market, though the AHS-based benchmark is historically much less

11
volatile than the C-30, exhibiting more stable growth or decline from quarter to quarter.
Spending through 2013 also recovered faster in the AHS-based data than the C-30.
A similar procedure was used to create a quarterly maintenance and repair expenditure
series based on the annual data available in the American Housing Survey. As in creating the

12
improvements series, trends in retail sales of building materials were used in estimating
maintenance spending for years in which AHS data is not available. However, since
maintenance data is only collected annually every other year, the objective was to annually
distribute two-year growth rates in maintenance and repair spending. This was accomplished
by applying the two-year distribution of absolute growth in the level of retail sales to the two-
year growth rate in the AHS repair spending levels (Table 2).
Table 2: Estimating Annual Home Maintenance and Repair Market Size
AHS Maintenance and Repair
(Bil. $)
2-Year Growth in Maintenance and Repair
Retail Sales of Building Materials
(Bil. $)
Absolute Annual
Change in Retail Sales
(Bil. $)
Distribution of 2-Year Absolute Growth in
Retail Sales
Application of Retail
Sales Distribution
to 2-Year AHS Growth
Application of
Annualized AHS Growth
to Maintenance and Repair
(Bil. $) 1995 23.0 141.0 23.0 1996 NA 150.5 9.4 44.8% 6.4% 24.4 1997 26.2 14.2% 162.1 11.6 55.2% 7.8% 26.2 1998 NA 172.2 10.1 39.2% 6.5% 27.9 1999 30.6 16.5% 187.9 15.7 60.8% 10.0% 30.6 2000 NA 197.6 9.7 50.9% 6.3% 32.5 2001 34.3 12.4% 207.0 9.4 49.1% 6.1% 34.3 2002 NA 217.2 10.2 42.4% 3.3% 35.5 2003 37.0 7.8% 231.0 13.8 57.6% 4.5% 37.0 2004 NA 261.2 30.2 54.3% 8.6% 40.2 2005 42.8 15.8% 286.6 25.4 45.7% 7.2% 42.8 2006 NA 299.4 12.8 45.1% 3.1% 44.2 2007 45.8 6.9% 283.8 15.5 54.9% 3.8% 45.8 2008 NA 263.2 20.7 36.8% 1.2% 46.4 2009 47.3 3.3% 227.7 35.5 63.2% 2.1% 47.3 2010 NA 226.0 1.7 19.6% 0.9% 47.8 2011 49.5 4.6% 233.0 7.0 80.4% 3.7% 49.5 2012 NA 242.6 9.7 35.3% 1.8% 50.4 2013 52.1 5.2% 260.3 17.7 64.7% 3.3% 52.1 Note: NA - not available. Sources: JCHS tabulations of HUD, American Housing Surveys and Department of Commerce, Retail Sales at Building Materials and Supplies Dealers.
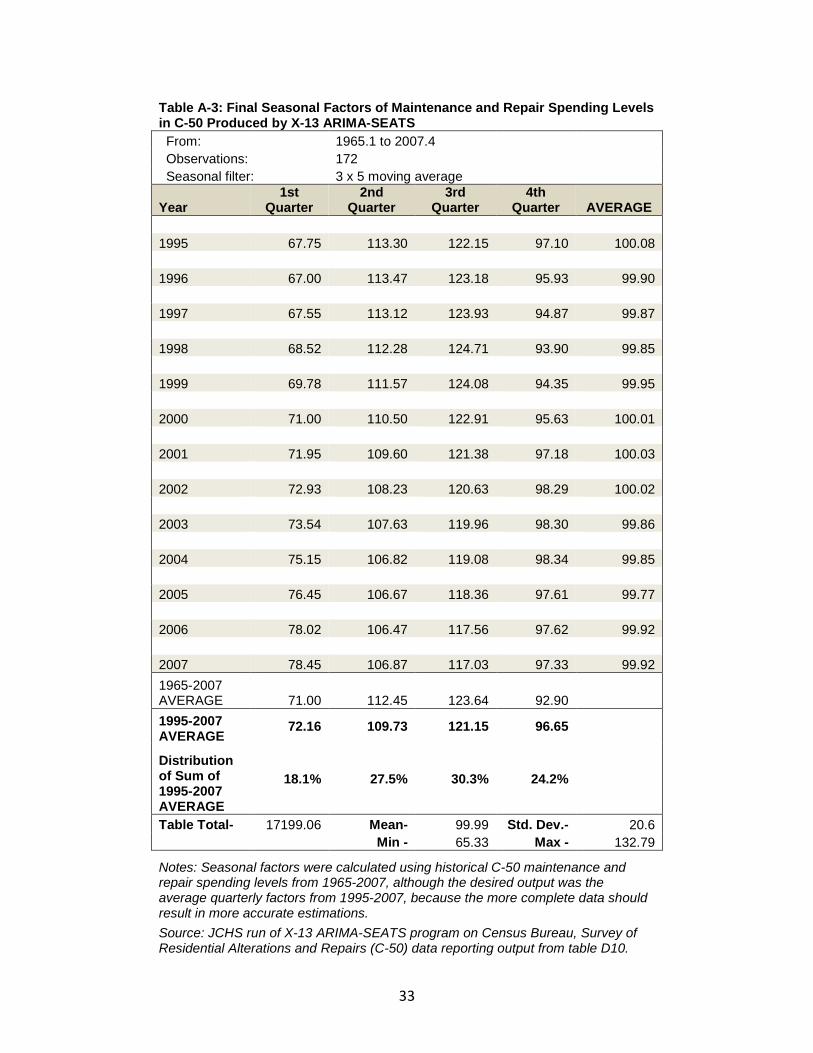
The manufactured annual maintenance and repair spending series was then allocated
into quarterly estimates using the same seasonal factors procedure as in allocating the annual
improvements data. The seasonal factors used for allocating maintenance and repair spending,
however, were produced using the Census Bureau’s historical maintenance and repair data
13
from the discontinued Survey of Residential Alterations and Repairs Statistics, or C-50 series
(Appendix Table A-3). Again for ease of calculation and because the C-50 was discontinued in
2007, the distribution of the average quarterly seasonal factors for 1995-2007 was chosen to be
applied to the manufactured annual home maintenance spending data instead of individual
seasonal factors for each quarter (Appendix Table A-4).
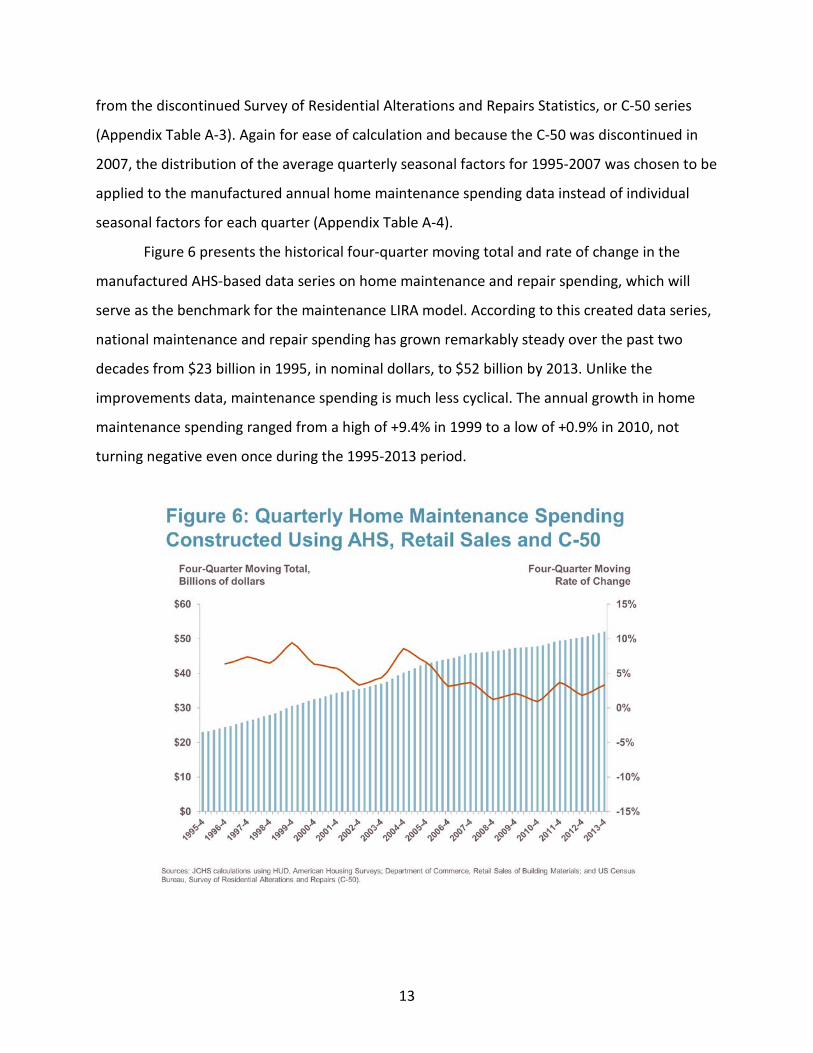
Figure 6 presents the historical four-quarter moving total and rate of change in the
manufactured AHS-based data series on home maintenance and repair spending, which will
serve as the benchmark for the maintenance LIRA model. According to this created data series,
national maintenance and repair spending has grown remarkably steady over the past two
decades from $23 billion in 1995, in nominal dollars, to $52 billion by 2013. Unlike the
improvements data, maintenance spending is much less cyclical. The annual growth in home
maintenance spending ranged from a high of +9.4% in 1999 to a low of +0.9% in 2010, not
turning negative even once during the 1995-2013 period.

14
Re-Benchmarked LIRA Models and Inputs
As noted in the previous section, home improvement activity differs from maintenance
and repair activity in meaningful ways, namely improvement spending adds to a home’s value,
while maintenance spending merely upholds the current value. For this reason, maintenance
spending tends to be for more frequent, smaller projects for most households, and therefore
very stable across time. Improvement spending, on the other hand, tends to be for larger and
more infrequent projects for most homeowners, and results in a much more cyclical trend over
time. Surely, some home improvement projects cannot be put off for too long, such as
replacing a worn out furnace or hot water heater, but many other projects could be postponed
for much longer time frames, such as kitchen or bathroom upgrades. With such different
trends, it is expected that improvement and repair spending will be influenced by somewhat
different economic indicators. This is the main reason two leading indicator models were
developed to project improvement and repair activity separately before combining the outputs
of the two models for a unified outlook of the broader improvement and repair market.
The LIRA models for home improvements and maintenance, respectively, are both
computed as weighted averages of the moving four-quarter rates of change of their input
components. A four-quarter, or annual, rate of change is the ratio that results when the total
activity in any given four-quarter period is divided by the total activity that occurred in the prior
four quarter period. This calculation results in a rate of change that measures annual (year-
over-year) changes in activity levels on a quarterly basis. The final inputs of the LIRA models
were determined by the strength of their correlations with the measures of homeowner
improvements and maintenance and repair expenditures created by the Remodeling Futures
Program based on data available in the American Housing Survey, as described in the previous
section. Inputs with strong and highly significant correlation coefficients received greater
weight, while inputs with high variability (as measured by the standard deviation) received
lesser weight. To be exact, inputs with strong correlation to the benchmark series, but low
variation received the greatest weight, while those with weaker correlation and higher variation
received the least weight in calculating the LIRA rates of change for improvements and
maintenance spending.

15
Description of Improvements Model:
The same procedures were followed in creating a LIRA model benchmarked to the AHS-
based estimates of homeowner improvement spending as were used when the C-30 was the
reference series. A variety of economic indicators that are thought to influence, or drive,
remodeling spending were identified and tested for correlation with the AHS-based data at
various lead times in number of quarters. As expected, many of the indicators previously
included in the LIRA model also exhibited strong correlation with the AHS-based data. However,
a couple inputs that formerly correlated well with the C-30 had much weaker associations to
the new benchmark series. These indicators were thus dropped from the LIRA model, including
the Institute of Supply Management’s Purchasing Managers’ Index and NAHB’s Remodeling
Market Index.6
About 45 economic variables were considered as potential inputs to the LIRA
improvements model, covering a variety of economic activity including remodeling market
conditions, housing industry conditions, house price appreciation and equity measures, broader
financial market conditions, consumer and professional confidence, and macroeconomic and
cyclical activity. Many input candidates were dismissed due to low correlation coefficients
(<0.50) and more were dismissed even with relatively high correlation due to extreme volatility,
limited data history for testing (in particular, history that did not cover a complete business
cycle or roughly less than 10 years), or extremely high cross-correlations with other potential
inputs. A description of the final input variables used to compute the re-benchmarked
improvements LIRA is found in Table 3. New additions to the model include CoreLogic’s House
Price Index, the Conference Board’s Leading Economic Index, NAR’s Existing Home Sales, and
BuildFax’ Residential Remodeling Permits.
6 NAR’s Pending Home Sales Index was also replaced, but with a very similar measure, existing home sales, which exhibited a stronger correlation with the same four-quarter lead.

16
Table 3: Description of Final Improvements LIRA Model Inputs Indicator Mnemonic Source Definition Remodeling Market Conditions
Residential Remodeling Permits Permits BuildFax Number of properties permitted for remodeling or repair. Housing Industry Conditions
Retail Sales of Building Materials Retail Census Value of retail sales of new building materials and supplies. Single-Family Housing Starts Starts Census New privately-owned single-family housing starts. Single-Family Existing Home Sales Sales National Association of
Realtors® Single-family existing home sales based on sample of MLS.
Financial Conditions House Price Index HPI CoreLogic Repeat-sales index of single-family homes.
Macroeconomic & Cyclical Conditions Leading Economic Index® LEI The Conference Board Composite economic index averaging trends in manufacturing
hours and new orders, unemployment claims, vendor performance, housing permits, stock prices, money supply, interest rate spread, and consumer expectations.
17
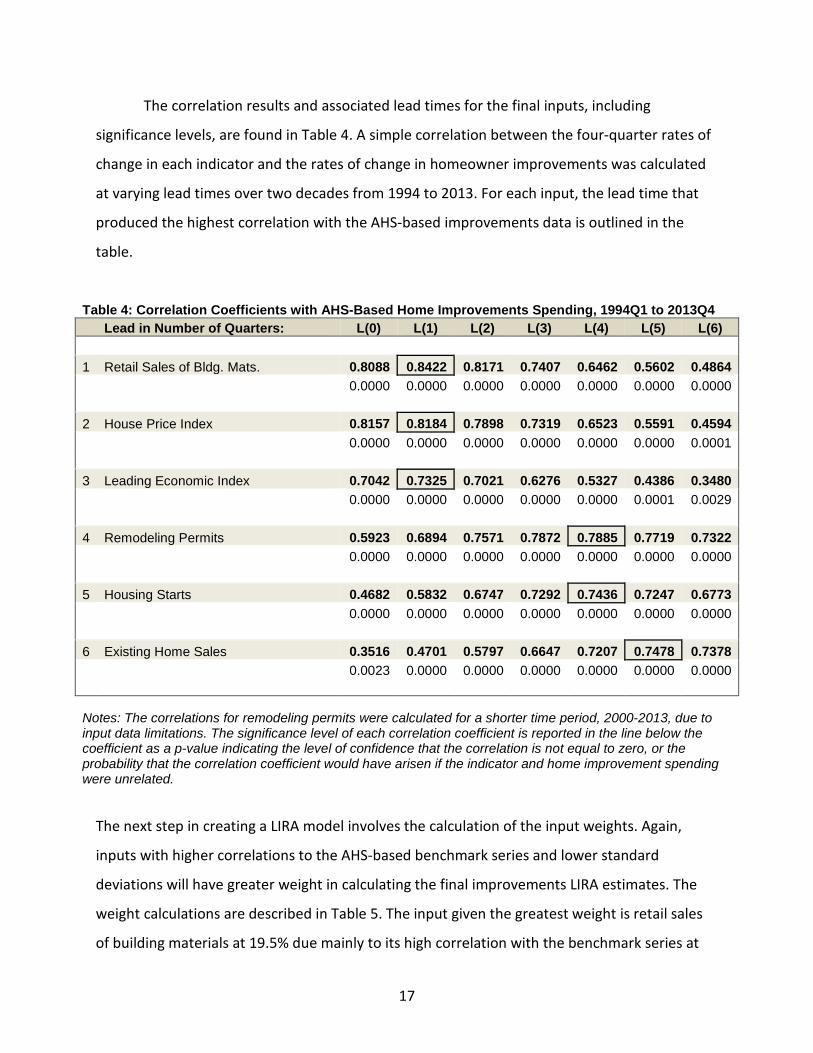
The correlation results and associated lead times for the final inputs, including
significance levels, are found in Table 4. A simple correlation between the four-quarter rates of
change in each indicator and the rates of change in homeowner improvements was calculated
at varying lead times over two decades from 1994 to 2013. For each input, the lead time that
produced the highest correlation with the AHS-based improvements data is outlined in the
table.
Table 4: Correlation Coefficients with AHS-Based Home Improvements Spending, 1994Q1 to 2013Q4 Lead in Number of Quarters: L(0) L(1) L(2) L(3) L(4) L(5) L(6) 1 Retail Sales of Bldg. Mats. 0.8088 0.8422 0.8171 0.7407 0.6462 0.5602 0.4864 0.0000 0.0000 0.0000 0.0000 0.0000 0.0000 0.0000 2 House Price Index 0.8157 0.8184 0.7898 0.7319 0.6523 0.5591 0.4594 0.0000 0.0000 0.0000 0.0000 0.0000 0.0000 0.0001 3 Leading Economic Index 0.7042 0.7325 0.7021 0.6276 0.5327 0.4386 0.3480 0.0000 0.0000 0.0000 0.0000 0.0000 0.0001 0.0029 4 Remodeling Permits 0.5923 0.6894 0.7571 0.7872 0.7885 0.7719 0.7322 0.0000 0.0000 0.0000 0.0000 0.0000 0.0000 0.0000 5 Housing Starts 0.4682 0.5832 0.6747 0.7292 0.7436 0.7247 0.6773 0.0000 0.0000 0.0000 0.0000 0.0000 0.0000 0.0000 6 Existing Home Sales 0.3516 0.4701 0.5797 0.6647 0.7207 0.7478 0.7378 0.0023 0.0000 0.0000 0.0000 0.0000 0.0000 0.0000
Notes: The correlations for remodeling permits were calculated for a shorter time period, 2000-2013, due to input data limitations. The significance level of each correlation coefficient is reported in the line below the coefficient as a p-value indicating the level of confidence that the correlation is not equal to zero, or the probability that the correlation coefficient would have arisen if the indicator and home improvement spending were unrelated.
The next step in creating a LIRA model involves the calculation of the input weights. Again,
inputs with higher correlations to the AHS-based benchmark series and lower standard
deviations will have greater weight in calculating the final improvements LIRA estimates. The
weight calculations are described in Table 5. The input given the greatest weight is retail sales
of building materials at 19.5% due mainly to its high correlation with the benchmark series at

18
0.84, which is expected since the two-year trend in retail sales was used to estimate the annual
improvement spending levels in the benchmark series. The input given the lowest weight is
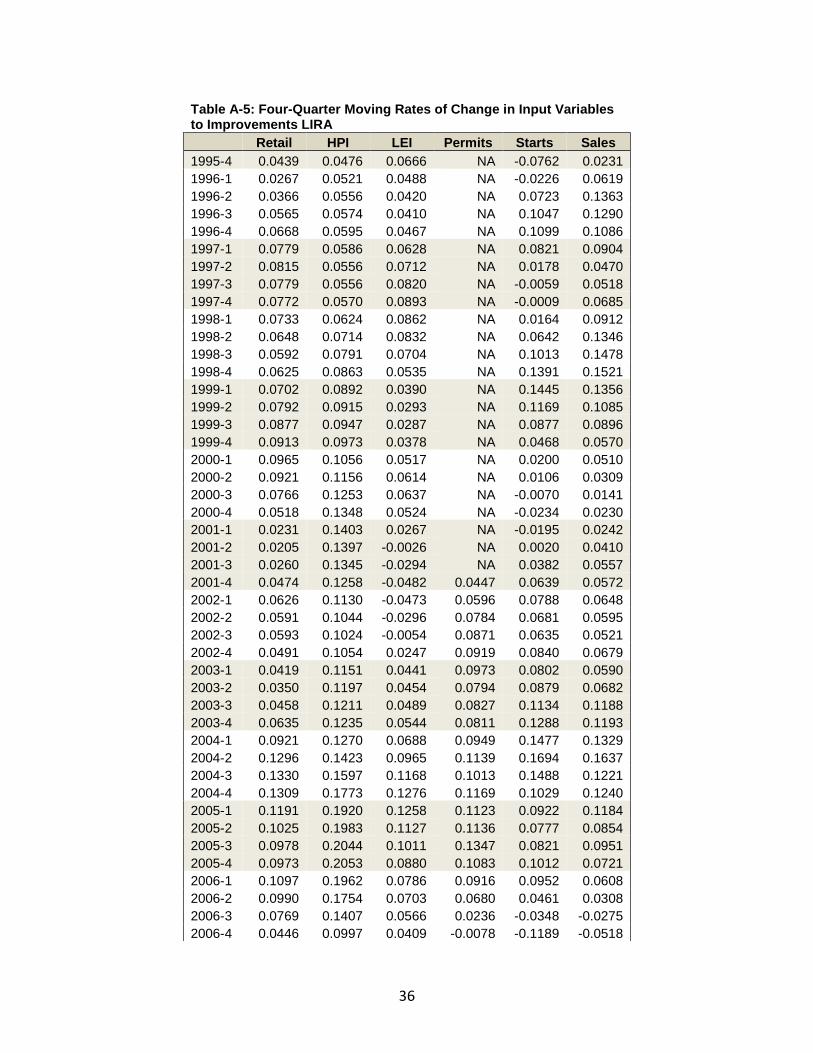
single-family housing starts at 12.0% mainly due to its relatively high standard deviation. See
Appendix Table A-5 for the historical four-quarter moving rates of change for each input
variable included in the improvements LIRA model.
Table 5: Calculation of Improvement LIRA Weights Retail HPI LEI Permits Starts Sales Lead over AHS-based Improvements Spending (number of quarters)
L(1) L(1) L(1) L(4) L(4) L(5)
Standard Deviation (SD) 0.064 0.084 0.062 0.070 0.167 0.095 1/SD 15.612 11.887 16.123 14.259 5.984 10.563 Share of Sum of 1/SD 21.0% 16.0% 21.7% 19.2% 8.0% 14.2% Correlation with AHS-based Improvements Spending
0.842 0.818 0.733 0.789 0.744 0.748
Share of Sum of Correlations 18.0% 17.5% 15.7% 16.9% 15.9% 16.0% Improvement LIRA Weights 19.5% 16.7% 18.7% 18.0% 12.0% 15.1%
Figure 7 compares the final improvements model inputs to the reference spending series at the
quarterly leads that produce the strongest correlation. Again, the weighted average of these
inputs produces the LIRA estimates and projections as seen in Figure 8 compared to the AHS-
based benchmark data series. The improvements LIRA tracks the reference series very closely,
but is significantly less volatile, especially during the previous industry boom. The LIRA and its
benchmark have a correlation coefficient of 0.85 (p-value of 0.00) and a simple regression of
the LIRA output on the benchmark spending series results in an R-squared value of 0.6955,
which suggests that 70% of the variation, or movement, in the improvements spending
benchmark can be explained by the LIRA model.

19

20
Description of Maintenance & Repair Model:
The maintenance and repair LIRA model was constructed in a similar way as the
improvements model. A simple correlation between the four-quarter rates of change in each
tested indicator and the rates of change in homeowner maintenance and repair spending was
calculated at varying lead times over two decades from 1995 to 2013. Several indicators
included in the improvements model also exhibited strong correlation with the AHS-based
home maintenance data. A description of the input variables chosen to compute the
maintenance LIRA is found in Table 6, and the correlation coefficients and associated lead times
for the inputs, including significance levels, are found in Table 7. Again, the lead time for each
input that produced the highest correlation with the AHS-based repair data is outlined in the
table.

21
Table 6: Description of Final Maintenance LIRA Model Inputs Indicator Mnemonic Source Definition Housing Industry Conditions
Retail Sales of Building Materials
Retail Census Value of retail sales of new building materials and supplies.
Single-Family Existing Home Sales
Sales National Association of Realtors® Single-family existing home sales based on sample of MLS.
Financial Conditions Median Sales Price Prices National Association of Realtors® Existing single-family homes.
Macroeconomic Conditions Gross Domestic Product GDP Bureau of Economic Analysis Value of gross domestic product. Leading Economic Index® LEI The Conference Board Composite economic index averaging trends in
manufacturing hours and new orders, unemployment claims, vendor performance, housing permits, stock prices, money supply, interest rate spread, and consumer expectations.
22
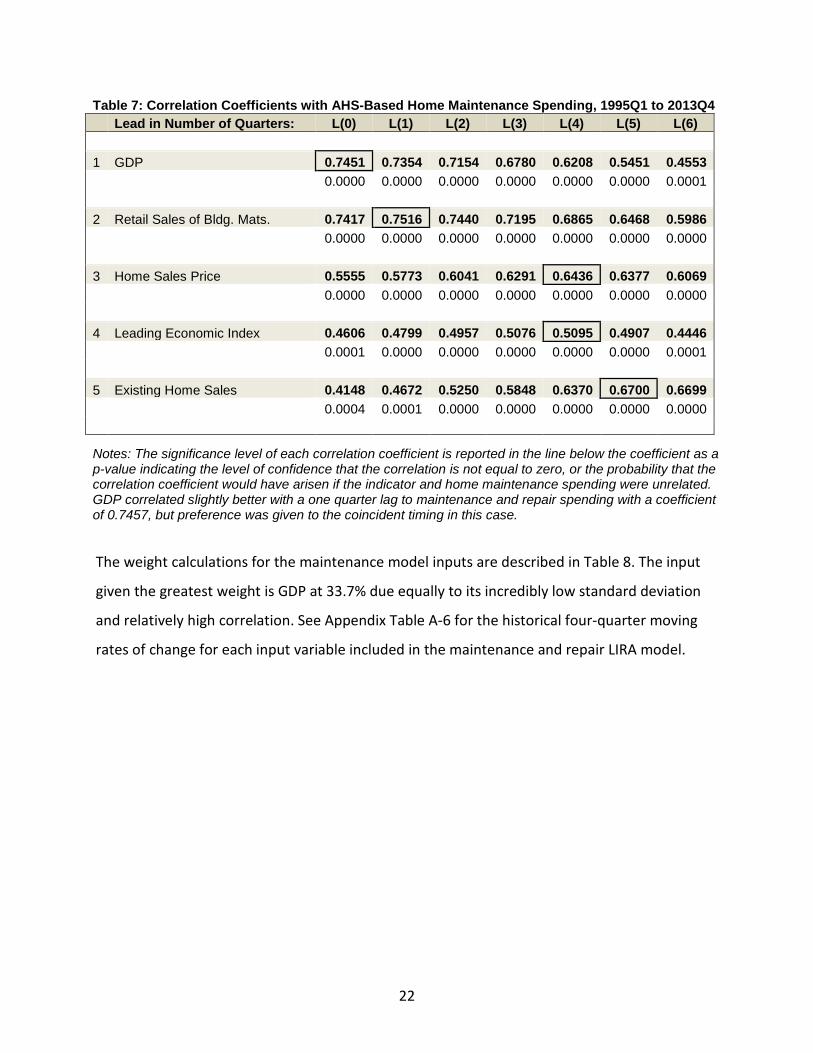
Table 7: Correlation Coefficients with AHS-Based Home Maintenance Spending, 1995Q1 to 2013Q4 Lead in Number of Quarters: L(0) L(1) L(2) L(3) L(4) L(5) L(6) 1 GDP 0.7451 0.7354 0.7154 0.6780 0.6208 0.5451 0.4553 0.0000 0.0000 0.0000 0.0000 0.0000 0.0000 0.0001 2 Retail Sales of Bldg. Mats. 0.7417 0.7516 0.7440 0.7195 0.6865 0.6468 0.5986 0.0000 0.0000 0.0000 0.0000 0.0000 0.0000 0.0000 3 Home Sales Price 0.5555 0.5773 0.6041 0.6291 0.6436 0.6377 0.6069 0.0000 0.0000 0.0000 0.0000 0.0000 0.0000 0.0000 4 Leading Economic Index 0.4606 0.4799 0.4957 0.5076 0.5095 0.4907 0.4446 0.0001 0.0000 0.0000 0.0000 0.0000 0.0000 0.0001 5 Existing Home Sales 0.4148 0.4672 0.5250 0.5848 0.6370 0.6700 0.6699 0.0004 0.0001 0.0000 0.0000 0.0000 0.0000 0.0000
Notes: The significance level of each correlation coefficient is reported in the line below the coefficient as a p-value indicating the level of confidence that the correlation is not equal to zero, or the probability that the correlation coefficient would have arisen if the indicator and home maintenance spending were unrelated. GDP correlated slightly better with a one quarter lag to maintenance and repair spending with a coefficient of 0.7457, but preference was given to the coincident timing in this case.
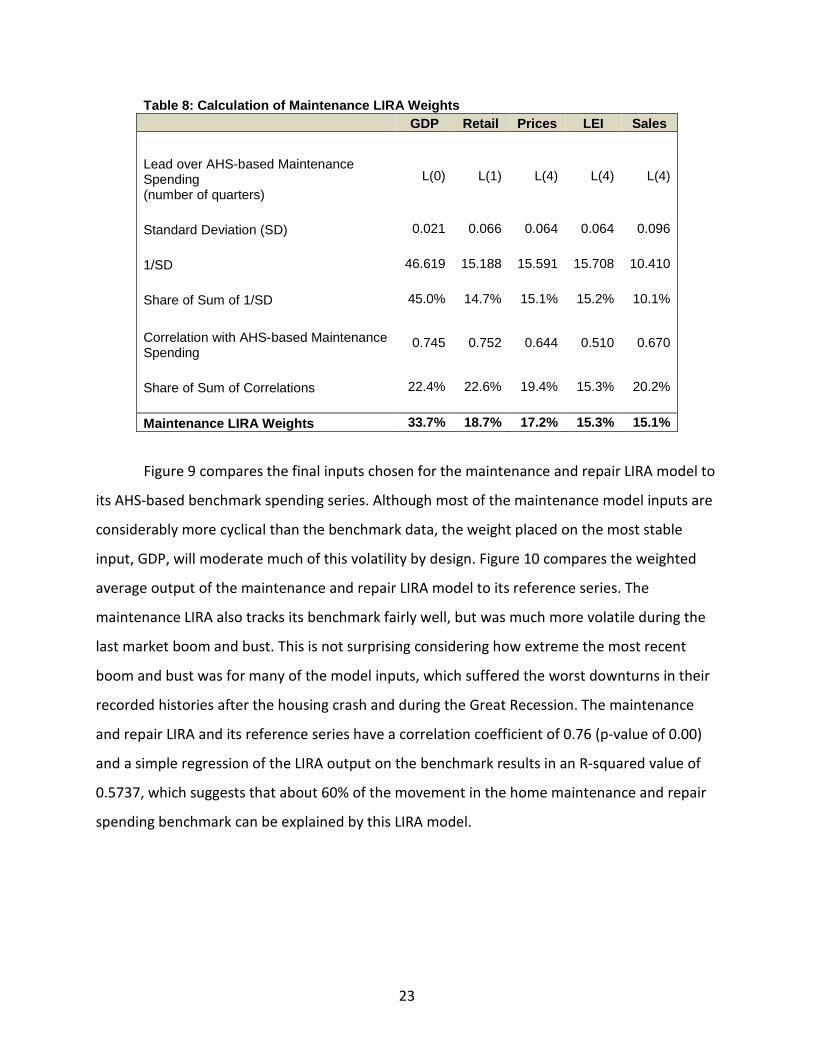
The weight calculations for the maintenance model inputs are described in Table 8. The input
given the greatest weight is GDP at 33.7% due equally to its incredibly low standard deviation
and relatively high correlation. See Appendix Table A-6 for the historical four-quarter moving
rates of change for each input variable included in the maintenance and repair LIRA model.
23
Table 8: Calculation of Maintenance LIRA Weights GDP Retail Prices LEI Sales Lead over AHS-based Maintenance Spending (number of quarters)
L(0) L(1) L(4) L(4) L(4)
Standard Deviation (SD) 0.021 0.066 0.064 0.064 0.096 1/SD 46.619 15.188 15.591 15.708 10.410 Share of Sum of 1/SD 45.0% 14.7% 15.1% 15.2% 10.1% Correlation with AHS-based Maintenance Spending
0.745 0.752 0.644 0.510 0.670
Share of Sum of Correlations 22.4% 22.6% 19.4% 15.3% 20.2% Maintenance LIRA Weights 33.7% 18.7% 17.2% 15.3% 15.1%
Figure 9 compares the final inputs chosen for the maintenance and repair LIRA model to
its AHS-based benchmark spending series. Although most of the maintenance model inputs are
considerably more cyclical than the benchmark data, the weight placed on the most stable
input, GDP, will moderate much of this volatility by design. Figure 10 compares the weighted
average output of the maintenance and repair LIRA model to its reference series. The
maintenance LIRA also tracks its benchmark fairly well, but was much more volatile during the
last market boom and bust. This is not surprising considering how extreme the most recent
boom and bust was for many of the model inputs, which suffered the worst downturns in their
recorded histories after the housing crash and during the Great Recession. The maintenance
and repair LIRA and its reference series have a correlation coefficient of 0.76 (p-value of 0.00)
and a simple regression of the LIRA output on the benchmark results in an R-squared value of
0.5737, which suggests that about 60% of the movement in the home maintenance and repair
spending benchmark can be explained by this LIRA model.

24

25

26
Comparison of Former and Re-Benchmarked LIRAs
As expected, combining the output from the re-benchmarked improvements and
maintenance and repair LIRA models results in an overall smoother trajectory compared to the
LIRA model benchmarked to improvements data alone from the C-30 (Figure 11).
The re-benchmarked LIRA improves upon the former LIRA in several ways including the ability
to now project trends in the broader national home improvement and repair market. The re-
benchmarked LIRA also projects trends with a time horizon of four quarters, whereas the
former LIRA was able to project out only three quarters. As presented in Figure 10, the newly
re-benchmarked LIRA anticipates strong growth for remodeling spending to the owner-
occupied housing stock moving into next year. After experiencing slowing growth through 2015,
the LIRA predicts national remodeling spending will increase 8.6% this year with further
acceleration of annual growth into the start of 2017. Home improvement and repair spending
levels are expected to reach nearly $325 billion by then.

27
Conclusion
The Leading Indicator of Remodeling Activity (LIRA) was first developed by the Joint
Center for Housing Studies to project near-term trends in home remodeling activity using the
Census Bureau’s C-30 and C-50 estimates as reference series. For many reasons, but mainly the
increasingly extreme revisions to the Census data in recent years, the Joint Center pursued a re-
benchmarking of the LIRA to a reference series based on improvement and repair spending
reported in the American Housing Survey (AHS). The former LIRA projected trends in home
improvement spending only, whereas the re-benchmarked LIRA now tracks a broader
remodeling market that includes both improvements and maintenance and repair activity. For
this reason, the re-benchmarked LIRA is overall somewhat less cyclical, but still appears to
anticipate turning points in the industry well. Ultimately, the re-benchmarked LIRA with
stronger inputs should produce projections that are more closely aligned with actual changes in
home improvement and repair activity.

28
References
Bendimerad, Amal. 2007. Developing a Leading Indicator for the Remodeling Industry. Joint
Center for Housing Studies of Harvard University Research Note N07-1. Rappaport, Barry A. and Tamara A. Cole. 2003. Research into the Differences in Home
Remodeling Data: American Housing Survey and Consumer Expenditure Survey/C50 Report. U.S. Census Bureau, Manufacturing and Construction Division. Available: http://www.census.gov/const/www/ahs_c50remodelingresearchpaper.pdf.
Will, Abbe. 2008. Addendum to Research Note N07-1: Re-Benchmarking the Leading Indicator of
Remodeling Activity. Joint Center for Housing Studies of Harvard University Research Note N08-1.
Will, Abbe. 2013. “Census Bureau Remodeling Data Revisions Out of Sync with Other Market
Indicators.” Web log post. Housing Perspectives. Joint Center for Housing Studies of Harvard University. 17 July. Available: http://housingperspectives.blogspot.com/2013/07/census-bureau-remodeling-data-revisions.html.
Will, Abbe. 2014. “Favorable Financing Costs Not Impacting Remodeling Activity During
Recovery.” Web log post. Housing Perspectives. Joint Center for Housing Studies of Harvard University. 17 April. Available: http://housingperspectives.blogspot.com/2014/04/favorable-financing-costs-not-impacting.html.
29
Appendix
Table A-1: Final Seasonal Factors of Improvement Spending Levels in C-30 Produced by X-13 ARIMA-SEATS From: 1994.1 to 2015.4 Observations: 88 Seasonal filter: 3 x 3 moving average
Year 1st
Quarter 2nd
Quarter 3rd
Quarter 4th
Quarter AVERAGE
1994 78.03 113.01 116.68 92.36 100.02
1995 77.86 113.18 116.49 92.63 100.04
1996 77.52 113.53 116.00 93.34 100.10
1997 76.91 113.97 115.12 94.54 100.13
1998 76.27 114.29 114.00 96.16 100.18
1999 75.55 114.34 113.14 97.51 100.14
2000 75.18 113.81 113.33 98.10 100.11
2001 74.90 112.69 114.81 97.73 100.03
2002 75.14 110.92 117.00 96.90 99.99
2003 75.77 109.07 118.61 96.21 99.92
2004 77.00 107.62 119.15 95.65 99.85
2005 78.33 106.98 118.87 95.31 99.87
2006 79.15 106.94 118.66 95.13 99.97
2007 79.17 106.98 118.68 95.56 100.10
2008 78.64 106.86 118.62 96.40 100.13
2009 78.13 106.70 118.19 97.29 100.08
2010 77.93 106.85 117.39 97.81 100.00
2011 78.03 107.35 116.39 97.85 99.91
2012 78.50 108.23 115.12 97.43 99.82
2013 79.26 109.42 113.80 96.55 99.75
30
2014 80.18 110.73 112.77 95.41 99.77
2015 80.91 111.73 112.30 94.50 99.86
1994-2015 AVERAGE
77.65 110.24 116.14 95.93
1994-2013 AVERAGE
77.36 110.14 116.50 96.02
Distribution of Sum of 1994-2013 AVERAGE
19.3% 27.5% 29.1% 24.0%
Table Total- 8799.07 Mean- 99.99 Std.
Dev.- 15.0 Min - 74.9 Max - 119.15
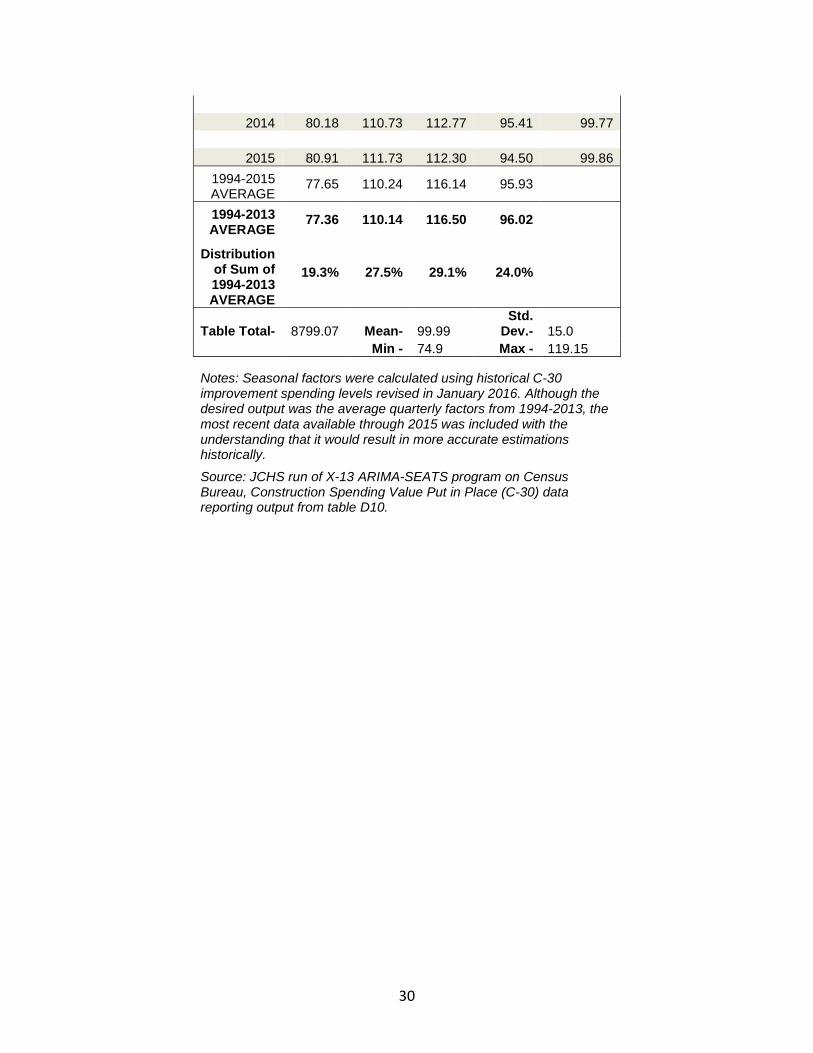
Notes: Seasonal factors were calculated using historical C-30 improvement spending levels revised in January 2016. Although the desired output was the average quarterly factors from 1994-2013, the most recent data available through 2015 was included with the understanding that it would result in more accurate estimations historically.
Source: JCHS run of X-13 ARIMA-SEATS program on Census Bureau, Construction Spending Value Put in Place (C-30) data reporting output from table D10.
31
Table A-2: Manufactured Quarterly Home Improvement Market Size Estimates
Home Improvements
(Bil. $)
Home Improvements
Application of Seasonal
Factor Distribution
(Bil. $)
Four-Quarter Moving
Total (Bil. $)
Four-Quarter
Moving Rate of Change
(%) 19941 16.1 19942 23.0 19943 24.3 1994 83.4 19944 20.0 83.4 19951 16.8 84.1 19952 24.0 85.2 19953 25.4 86.2 1995 87.1 19954 20.9 87.1 0.04389 19961 17.7 88.0 0.04548 19962 25.2 89.2 0.04770 19963 26.7 90.5 0.04999 1996 91.6 19964 22.0 91.6 0.05183 19971 19.1 93.0 0.05694 19972 27.2 94.9 0.06404 19973 28.7 97.0 0.07134 1997 98.7 19974 23.7 98.7 0.07720 19981 19.6 99.2 0.06688 19982 27.9 99.9 0.05270 19983 29.5 100.7 0.03833 1998 101.3 19984 24.3 101.3 0.02693 19991 21.4 103.1 0.03964 19992 30.5 105.7 0.05751 19993 32.2 108.4 0.07613 1999 110.6 19994 26.5 110.6 0.09126 20001 24.9 114.1 0.10625 20002 35.4 119.1 0.12672 20003 37.5 124.3 0.14733 2000 128.7 20004 30.9 128.7 0.16356 20011 26.1 129.9 0.13823 20012 37.1 131.5 0.10473 20013 39.3 133.3 0.07221 2001 134.8 20014 32.4 134.8 0.04741 20021 25.0 133.7 0.02991 20022 35.6 132.3 0.00552 20023 37.7 130.7 -0.01960 2002 129.4 20024 31.1 129.4 -0.03980 20031 26.6 131.0 -0.02048 20032 37.9 133.3 0.00756 20033 40.1 135.7 0.03791 2003 137.6 20034 33.0 137.6 0.06348

32
20041 34.8 145.8 0.11266 20042 49.5 157.4 0.18066 20043 52.3 169.6 0.25012 2004 179.7 20044 43.1 179.7 0.30555 20051 38.1 183.1 0.25589 20052 54.3 187.9 0.19406 20053 57.4 193.0 0.13784 2005 197.2 20054 47.3 197.2 0.09726 20061 45.0 204.0 0.11433 20062 64.0 213.7 0.13758 20063 67.7 224.0 0.16092 2006 232.5 20064 55.8 232.5 0.17924 20071 42.6 230.2 0.12829 20072 60.7 226.9 0.06139 20073 64.2 223.3 -0.00306 2007 220.4 20074 52.9 220.4 -0.05189 20081 39.1 217.0 -0.05742 20082 55.7 212.0 -0.06550 20083 59.0 206.7 -0.07430 2008 202.4 20084 48.6 202.4 -0.08176 20091 33.9 197.1 -0.09136 20092 48.2 189.6 -0.10557 20093 51.0 181.7 -0.12135 2009 175.1 20094 42.0 175.1 -0.13497 20101 34.2 175.5 -0.10989 20102 48.7 176.0 -0.07177 20103 51.6 176.6 -0.02802 2010 177.0 20104 42.5 177.0 0.01103 20111 35.3 178.1 0.01492 20112 50.3 179.6 0.02043 20113 53.2 181.2 0.02622 2011 182.5 20114 43.8 182.5 0.03097 20121 35.6 182.8 0.02659 20122 50.7 183.3 0.02046 20123 53.6 183.8 0.01408 2012 184.1 20124 44.2 184.1 0.00891 20131 38.2 186.7 0.02138 20132 54.4 190.4 0.03906 20133 57.5 194.3 0.05767 2013 197.6 20134 47.4 197.6 0.07293
Sources: JCHS tabulations of HUD, American Housing Surveys; Department of Commerce, Retail Sales at Building Materials and Supplies Dealers; and Census Bureau, Construction Spending Value Put in Place (C-30).
33
Table A-3: Final Seasonal Factors of Maintenance and Repair Spending Levels in C-50 Produced by X-13 ARIMA-SEATS From: 1965.1 to 2007.4 Observations: 172 Seasonal filter: 3 x 5 moving average
Year 1st
Quarter 2nd
Quarter 3rd
Quarter 4th
Quarter AVERAGE 1995 67.75 113.30 122.15 97.10 100.08 1996 67.00 113.47 123.18 95.93 99.90 1997 67.55 113.12 123.93 94.87 99.87 1998 68.52 112.28 124.71 93.90 99.85 1999 69.78 111.57 124.08 94.35 99.95 2000 71.00 110.50 122.91 95.63 100.01 2001 71.95 109.60 121.38 97.18 100.03 2002 72.93 108.23 120.63 98.29 100.02 2003 73.54 107.63 119.96 98.30 99.86 2004 75.15 106.82 119.08 98.34 99.85 2005 76.45 106.67 118.36 97.61 99.77 2006 78.02 106.47 117.56 97.62 99.92 2007 78.45 106.87 117.03 97.33 99.92 1965-2007 AVERAGE 71.00 112.45 123.64 92.90 1995-2007 AVERAGE
72.16 109.73 121.15 96.65
Distribution of Sum of 1995-2007 AVERAGE
18.1% 27.5% 30.3% 24.2%
Table Total- 17199.06 Mean- 99.99 Std. Dev.- 20.6 Min - 65.33 Max - 132.79
Notes: Seasonal factors were calculated using historical C-50 maintenance and repair spending levels from 1965-2007, although the desired output was the average quarterly factors from 1995-2007, because the more complete data should result in more accurate estimations. Source: JCHS run of X-13 ARIMA-SEATS program on Census Bureau, Survey of Residential Alterations and Repairs (C-50) data reporting output from table D10.

34
Table A-4: Manufactured Quarterly Home Maintenance Market Size Estimates
Home Maintenance and Repair
(Bil. $)
Home Maintenance and Repair
Application of Seasonal
Factor Distribution
(Bil. $)
Four-Quarter Moving
Total (Bil. $)
Four-Quarter
Moving Rate of Change
(%) 19951 4.1 19952 6.3 19953 7.0 1995 23.0 19954 5.6 23.0 19961 4.4 23.2 19962 6.7 23.6 19963 7.4 24.1 1996 24.4 19964 5.9 24.4 0.06362 19971 4.7 24.8 0.06554 19972 7.2 25.2 0.06837 19973 7.9 25.8 0.07139 1997 26.2 19974 6.3 26.2 0.07371 19981 5.0 26.5 0.07198 19982 7.7 27.0 0.06942 19983 8.5 27.5 0.06671 1998 27.9 19984 6.8 27.9 0.06463 19991 5.5 28.4 0.07024 19992 8.4 29.1 0.07853 19993 9.3 29.9 0.08735 1999 30.6 19994 7.4 30.6 0.09415 20001 5.9 30.9 0.08815 20002 8.9 31.4 0.07939 20003 9.8 32.0 0.07021 2000 32.5 20004 7.9 32.5 0.06323 20011 6.2 32.8 0.06210 20012 9.4 33.3 0.06043 20013 10.4 33.9 0.05864 2001 34.3 20014 8.3 34.3 0.05726 20021 6.4 34.5 0.05269 20022 9.7 34.9 0.04591 20023 10.8 35.2 0.03867 2002 35.5 20024 8.6 35.5 0.03306 20031 6.7 35.8 0.03498 20032 10.2 36.2 0.03785 20033 11.2 36.6 0.04097 2003 37.0 20034 9.0 37.0 0.04341 20041 7.3 37.6 0.05129 20042 11.0 38.5 0.06305 20043 12.2 39.4 0.07571

35
2004 40.2 20044 9.7 40.2 0.08559 20051 7.7 40.7 0.08186 20052 11.8 41.4 0.07639 20053 13.0 42.2 0.07065 2005 42.8 20054 10.4 42.8 0.06626 20061 8.0 43.1 0.05961 20062 12.1 43.5 0.04980 20063 13.4 43.9 0.03936 2006 44.2 20064 10.7 44.2 0.03132 20071 8.3 44.5 0.03235 20072 12.6 44.9 0.03391 20073 13.9 45.4 0.03559 2007 45.8 20074 11.1 45.8 0.03692 20081 8.4 45.9 0.03233 20082 12.7 46.1 0.02547 20083 14.1 46.2 0.01805 2008 46.4 20084 11.2 46.4 0.01225 20091 8.5 46.6 0.01381 20092 13.0 46.8 0.01616 20093 14.4 47.1 0.01875 2009 47.3 20094 11.4 47.3 0.02080 20101 8.6 47.4 0.01864 20102 13.1 47.5 0.01538 20103 14.5 47.7 0.01182 2010 47.8 20104 11.6 47.8 0.00902 20111 8.9 48.1 0.01406 20112 13.6 48.6 0.02170 20113 15.0 49.1 0.03009 2011 49.5 20114 12.0 49.5 0.03675 20121 9.1 49.7 0.03331 20122 13.8 49.9 0.02816 20123 15.3 50.2 0.02260 2012 50.4 20124 12.2 50.4 0.01824 20131 9.4 50.7 0.02091 20132 14.3 51.2 0.02494 20133 15.8 51.7 0.02935 2013 52.1 20134 12.6 52.1 0.03282
Sources: JCHS tabulations of HUD, American Housing Surveys; Department of Commerce, Retail Sales at Building Materials and Supplies Dealers; and Census Bureau, Survey of Residential Alterations and Repairs (C-50).
36
Table A-5: Four-Quarter Moving Rates of Change in Input Variables to Improvements LIRA Retail HPI LEI Permits Starts Sales 1995-4 0.0439 0.0476 0.0666 NA -0.0762 0.0231 1996-1 0.0267 0.0521 0.0488 NA -0.0226 0.0619 1996-2 0.0366 0.0556 0.0420 NA 0.0723 0.1363 1996-3 0.0565 0.0574 0.0410 NA 0.1047 0.1290 1996-4 0.0668 0.0595 0.0467 NA 0.1099 0.1086 1997-1 0.0779 0.0586 0.0628 NA 0.0821 0.0904 1997-2 0.0815 0.0556 0.0712 NA 0.0178 0.0470 1997-3 0.0779 0.0556 0.0820 NA -0.0059 0.0518 1997-4 0.0772 0.0570 0.0893 NA -0.0009 0.0685 1998-1 0.0733 0.0624 0.0862 NA 0.0164 0.0912 1998-2 0.0648 0.0714 0.0832 NA 0.0642 0.1346 1998-3 0.0592 0.0791 0.0704 NA 0.1013 0.1478 1998-4 0.0625 0.0863 0.0535 NA 0.1391 0.1521 1999-1 0.0702 0.0892 0.0390 NA 0.1445 0.1356 1999-2 0.0792 0.0915 0.0293 NA 0.1169 0.1085 1999-3 0.0877 0.0947 0.0287 NA 0.0877 0.0896 1999-4 0.0913 0.0973 0.0378 NA 0.0468 0.0570 2000-1 0.0965 0.1056 0.0517 NA 0.0200 0.0510 2000-2 0.0921 0.1156 0.0614 NA 0.0106 0.0309 2000-3 0.0766 0.1253 0.0637 NA -0.0070 0.0141 2000-4 0.0518 0.1348 0.0524 NA -0.0234 0.0230 2001-1 0.0231 0.1403 0.0267 NA -0.0195 0.0242 2001-2 0.0205 0.1397 -0.0026 NA 0.0020 0.0410 2001-3 0.0260 0.1345 -0.0294 NA 0.0382 0.0557 2001-4 0.0474 0.1258 -0.0482 0.0447 0.0639 0.0572 2002-1 0.0626 0.1130 -0.0473 0.0596 0.0788 0.0648 2002-2 0.0591 0.1044 -0.0296 0.0784 0.0681 0.0595 2002-3 0.0593 0.1024 -0.0054 0.0871 0.0635 0.0521 2002-4 0.0491 0.1054 0.0247 0.0919 0.0840 0.0679 2003-1 0.0419 0.1151 0.0441 0.0973 0.0802 0.0590 2003-2 0.0350 0.1197 0.0454 0.0794 0.0879 0.0682 2003-3 0.0458 0.1211 0.0489 0.0827 0.1134 0.1188 2003-4 0.0635 0.1235 0.0544 0.0811 0.1288 0.1193 2004-1 0.0921 0.1270 0.0688 0.0949 0.1477 0.1329 2004-2 0.1296 0.1423 0.0965 0.1139 0.1694 0.1637 2004-3 0.1330 0.1597 0.1168 0.1013 0.1488 0.1221 2004-4 0.1309 0.1773 0.1276 0.1169 0.1029 0.1240 2005-1 0.1191 0.1920 0.1258 0.1123 0.0922 0.1184 2005-2 0.1025 0.1983 0.1127 0.1136 0.0777 0.0854 2005-3 0.0978 0.2044 0.1011 0.1347 0.0821 0.0951 2005-4 0.0973 0.2053 0.0880 0.1083 0.1012 0.0721 2006-1 0.1097 0.1962 0.0786 0.0916 0.0952 0.0608 2006-2 0.0990 0.1754 0.0703 0.0680 0.0461 0.0308 2006-3 0.0769 0.1407 0.0566 0.0236 -0.0348 -0.0275 2006-4 0.0446 0.0997 0.0409 -0.0078 -0.1189 -0.0518

37
2007-1 -0.0104 0.0587 0.0247 -0.0474 -0.2008 -0.0862 2007-2 -0.0381 0.0245 0.0140 -0.0777 -0.2394 -0.1307 2007-3 -0.0487 -0.0009 0.0081 -0.0890 -0.2635 -0.1614 2007-4 -0.0519 -0.0214 0.0067 -0.0818 -0.2662 -0.2037 2008-1 -0.0490 -0.0407 -0.0007 -0.0733 -0.2720 -0.2182 2008-2 -0.0521 -0.0592 -0.0158 -0.0637 -0.3259 -0.2135 2008-3 -0.0570 -0.0739 -0.0368 -0.0496 -0.3502 -0.1772 2008-4 -0.0728 -0.0968 -0.0777 -0.0815 -0.3815 -0.1333 2009-1 -0.0844 -0.1205 -0.1208 -0.0983 -0.4134 -0.0986 2009-2 -0.1088 -0.1348 -0.1569 -0.1063 -0.4108 -0.0553 2009-3 -0.1347 -0.1410 -0.1740 -0.1041 -0.3739 -0.0265 2009-4 -0.1350 -0.1182 -0.1411 -0.0415 -0.2869 0.0520 2010-1 -0.1188 -0.0723 -0.0734 0.0030 -0.1068 0.0874 2010-2 -0.0785 -0.0260 0.0045 0.0513 0.0741 0.1469 2010-3 -0.0426 0.0048 0.0675 0.0681 0.1002 0.0791 2010-4 -0.0075 0.0097 0.0912 0.0681 0.0747 -0.0274 2011-1 0.0097 -0.0008 0.0899 0.0761 -0.0583 -0.0492 2011-2 0.0091 -0.0134 0.0852 0.0599 -0.1268 -0.1184 2011-3 0.0300 -0.0130 0.0859 0.0543 -0.0882 -0.0187 2011-4 0.0310 -0.0064 0.0846 0.0382 -0.0566 0.0541 2012-1 0.0505 0.0057 0.0790 0.0456 0.0346 0.0772 2012-2 0.0560 0.0223 0.0662 0.0474 0.1421 0.1414 2012-3 0.0410 0.0381 0.0528 0.0579 0.2169 0.1066 2012-4 0.0415 0.0601 0.0448 0.0717 0.2689 0.1124 2013-1 0.0199 0.0821 0.0381 0.0728 0.2903 0.1072 2013-2 0.0416 0.1012 0.0367 0.0914 0.2622 0.1133 2013-3 0.0689 0.1172 0.0401 0.1010 0.2105 0.1314 2013-4 0.0729 0.1255 0.0441 0.1100 0.1706 0.1019
Notes: NA - not available. The LIRA is computed as a weighted average of the nominal rates of change in its inputs. All of the LIRA inputs are real indicators (except for retail sales), which are converted to nominal with an adjustment by CPI-U. Source: JCHS tabulations of source data as described in Table 3.

38
Table A-6: Four-Quarter Moving Rates of Change in Input Variables to Maintenance LIRA GDP Retail Prices LEI Sales 1996-4 0.0569 0.0668 0.0522 0.0467 0.1086 1997-1 0.0615 0.0779 0.0449 0.0628 0.0904 1997-2 0.0616 0.0815 0.0385 0.0712 0.0470 1997-3 0.0633 0.0779 0.0446 0.0820 0.0518 1997-4 0.0628 0.0772 0.0505 0.0893 0.0685 1998-1 0.0611 0.0733 0.0553 0.0862 0.0912 1998-2 0.0588 0.0648 0.0597 0.0832 0.1346 1998-3 0.0556 0.0592 0.0575 0.0704 0.1478 1998-4 0.0558 0.0625 0.0541 0.0535 0.1521 1999-1 0.0571 0.0702 0.0506 0.0390 0.1356 1999-2 0.0597 0.0792 0.0448 0.0293 0.1085 1999-3 0.0621 0.0877 0.0424 0.0287 0.0896 1999-4 0.0629 0.0913 0.0391 0.0378 0.0570 2000-1 0.0626 0.0965 0.0367 0.0517 0.0510 2000-2 0.0659 0.0921 0.0356 0.0614 0.0309 2000-3 0.0670 0.0766 0.0382 0.0637 0.0141 2000-4 0.0646 0.0518 0.0411 0.0524 0.0230 2001-1 0.0609 0.0231 0.0434 0.0267 0.0242 2001-2 0.0508 0.0205 0.0511 -0.0026 0.0410 2001-3 0.0410 0.0260 0.0531 -0.0294 0.0557 2001-4 0.0328 0.0474 0.0582 -0.0482 0.0572 2002-1 0.0288 0.0626 0.0670 -0.0473 0.0648 2002-2 0.0270 0.0591 0.0690 -0.0296 0.0595 2002-3 0.0296 0.0593 0.0709 -0.0054 0.0521 2002-4 0.0335 0.0491 0.0756 0.0247 0.0679 2003-1 0.0349 0.0419 0.0711 0.0441 0.0590 2003-2 0.0378 0.0350 0.0710 0.0454 0.0682 2003-3 0.0419 0.0458 0.0770 0.0489 0.1188 2003-4 0.0486 0.0635 0.0730 0.0544 0.1193 2004-1 0.0563 0.0921 0.0755 0.0688 0.1329 2004-2 0.0641 0.1296 0.0799 0.0965 0.1637 2004-3 0.0667 0.1330 0.0766 0.1168 0.1221 2004-4 0.0664 0.1309 0.0813 0.1276 0.1240 2005-1 0.0668 0.1191 0.0864 0.1258 0.1184 2005-2 0.0652 0.1025 0.0980 0.1127 0.0854 2005-3 0.0662 0.0978 0.1163 0.1011 0.0951 2005-4 0.0667 0.0973 0.1280 0.0880 0.0721 2006-1 0.0658 0.1097 0.1272 0.0786 0.0608 2006-2 0.0654 0.0990 0.1009 0.0703 0.0308 2006-3 0.0617 0.0769 0.0602 0.0566 -0.0275 2006-4 0.0582 0.0446 0.0202 0.0409 -0.0518 2007-1 0.0526 -0.0104 -0.0049 0.0247 -0.0862 2007-2 0.0480 -0.0381 -0.0174 0.0140 -0.1307 2007-3 0.0466 -0.0487 -0.0206 0.0081 -0.1614 2007-4 0.0449 -0.0519 -0.0287 0.0067 -0.2037 2008-1 0.0417 -0.0490 -0.0435 -0.0007 -0.2182

39
2008-2 0.0372 -0.0521 -0.0590 -0.0158 -0.2135 2008-3 0.0300 -0.0570 -0.0763 -0.0368 -0.1772 2008-4 0.0166 -0.0728 -0.0916 -0.0777 -0.1333 2009-1 0.0042 -0.0844 -0.1080 -0.1208 -0.0986 2009-2 -0.0105 -0.1088 -0.1285 -0.1569 -0.0553 2009-3 -0.0229 -0.1347 -0.1345 -0.1740 -0.0265 2009-4 -0.0204 -0.1350 -0.1189 -0.1411 0.0520 2010-1 -0.0105 -0.1188 -0.0872 -0.0734 0.0874 2010-2 0.0069 -0.0785 -0.0428 0.0045 0.1469 2010-3 0.0266 -0.0426 -0.0131 0.0675 0.0791 2010-4 0.0378 -0.0075 0.0014 0.0912 -0.0274 2011-1 0.0421 0.0097 -0.0066 0.0899 -0.0492 2011-2 0.0422 0.0091 -0.0217 0.0852 -0.1184 2011-3 0.0392 0.0300 -0.0333 0.0859 -0.0187 2011-4 0.0370 0.0310 -0.0452 0.0846 0.0541 2012-1 0.0396 0.0505 -0.0354 0.0790 0.0772 2012-2 0.0407 0.0560 -0.0063 0.0662 0.1414 2012-3 0.0421 0.0410 0.0286 0.0528 0.1066 2012-4 0.0411 0.0415 0.0658 0.0448 0.1124 2013-1 0.0363 0.0199 0.0928 0.0381 0.1072 2013-2 0.0319 0.0416 0.1059 0.0367 0.1133 2013-3 0.0294 0.0689 0.1150 0.0401 0.1314 2013-4 0.0314 0.0729 0.1146 0.0441 0.1019
Notes: The LIRA is computed as a weighted average of the nominal rates of change in its inputs. Some of the LIRA inputs are real indicators (number of home sales and macroeconomic index), which are converted to nominal with an adjustment by CPI-U. Source: JCHS tabulations of source data as described in Table 6.
Related Documents


