Added Value of Open data sharing using examples from GenomeTrakr Marc W. Allard, PhD Senior Biomedical Research Services Officer Division of Microbiology FAO/GMI Seminar, May. 24, 2016

Welcome message from author
This document is posted to help you gain knowledge. Please leave a comment to let me know what you think about it! Share it to your friends and learn new things together.
Transcript
Added Value of Open data sharing using examples from GenomeTrakr
Marc W. Allard, PhDSenior Biomedical Research Services OfficerDivision of Microbiology
FAO/GMI Seminar, May. 24, 2016
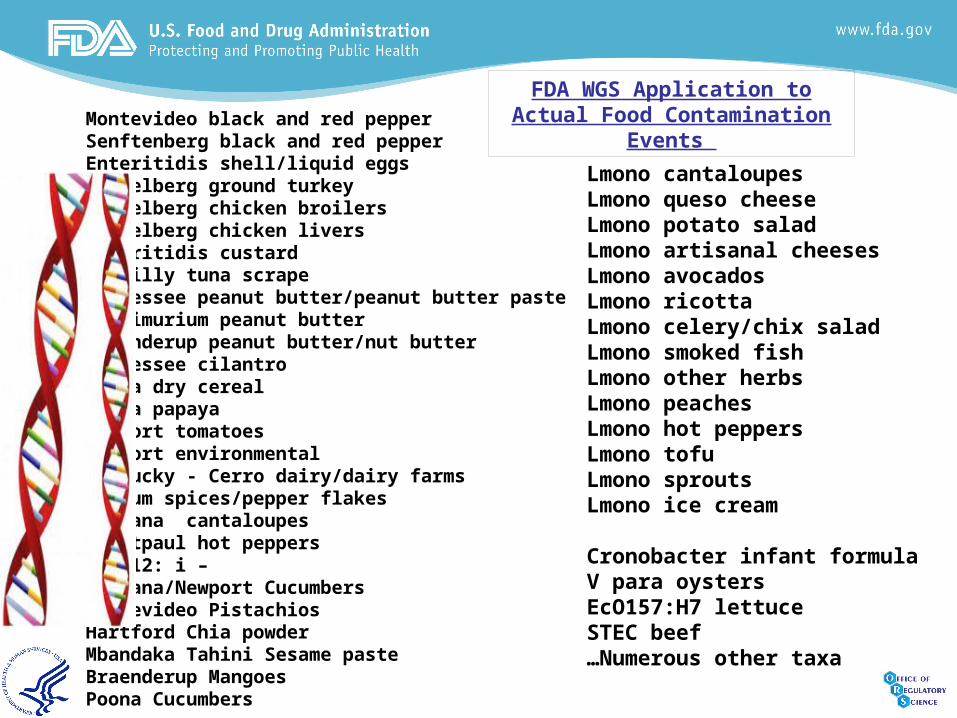
Montevideo black and red pepperSenftenberg black and red pepperEnteritidis shell/liquid eggsHeidelberg ground turkeyHeidelberg chicken broilersHeidelberg chicken liversEnteritidis custardBareilly tuna scrapeTennessee peanut butter/peanut butter pasteTyphimurium peanut butterBraenderup peanut butter/nut butterTennessee cilantroAgona dry cerealAgona papayaNewport tomatoesNewport environmentalKentucky - Cerro dairy/dairy farmsAnatum spices/pepper flakesJaviana cantaloupesSaintpaul hot peppers4,5,12: i – Javiana/Newport CucumbersMontevideo PistachiosHartford Chia powderMbandaka Tahini Sesame pasteBraenderup MangoesPoona Cucumbers
Lmono cantaloupesLmono queso cheeseLmono potato saladLmono artisanal cheesesLmono avocadosLmono ricottaLmono celery/chix saladLmono smoked fishLmono other herbsLmono peachesLmono hot peppersLmono tofuLmono sproutsLmono ice cream
Cronobacter infant formulaV para oystersEcO157:H7 lettuceSTEC beef…Numerous other taxa
FDA WGS Application to Actual Food Contamination Events
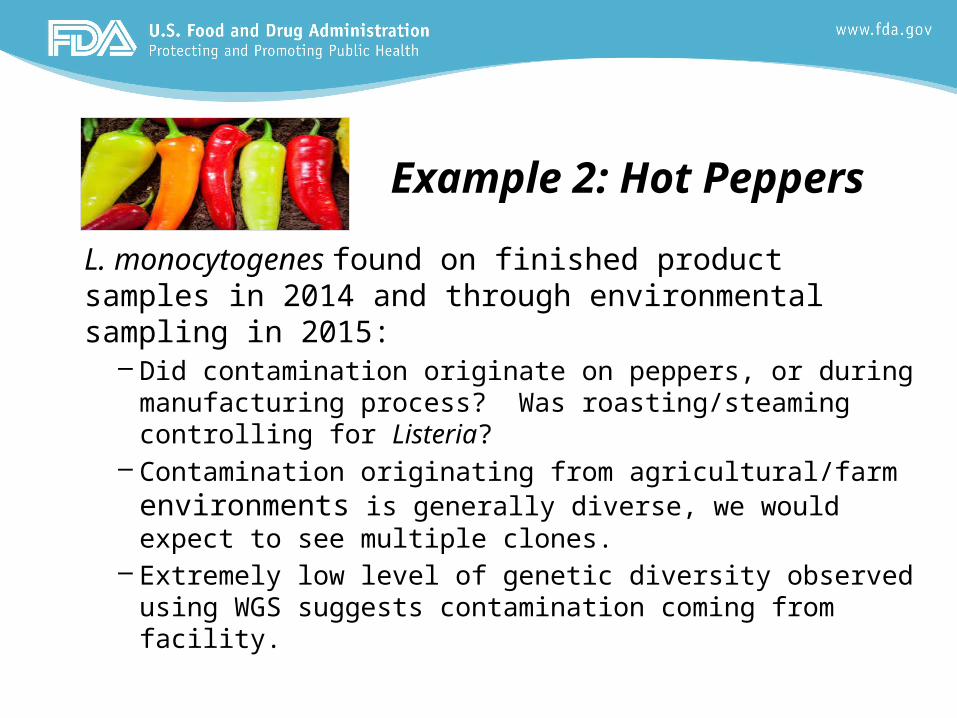
Example 2: Hot Peppers
L. monocytogenes found on finished product samples in 2014 and through environmental sampling in 2015:
– Did contamination originate on peppers, or during manufacturing process? Was roasting/steaming controlling for Listeria?
– Contamination originating from agricultural/farm environments is generally diverse, we would expect to see multiple clones.
– Extremely low level of genetic diversity observed using WGS suggests contamination coming from facility.
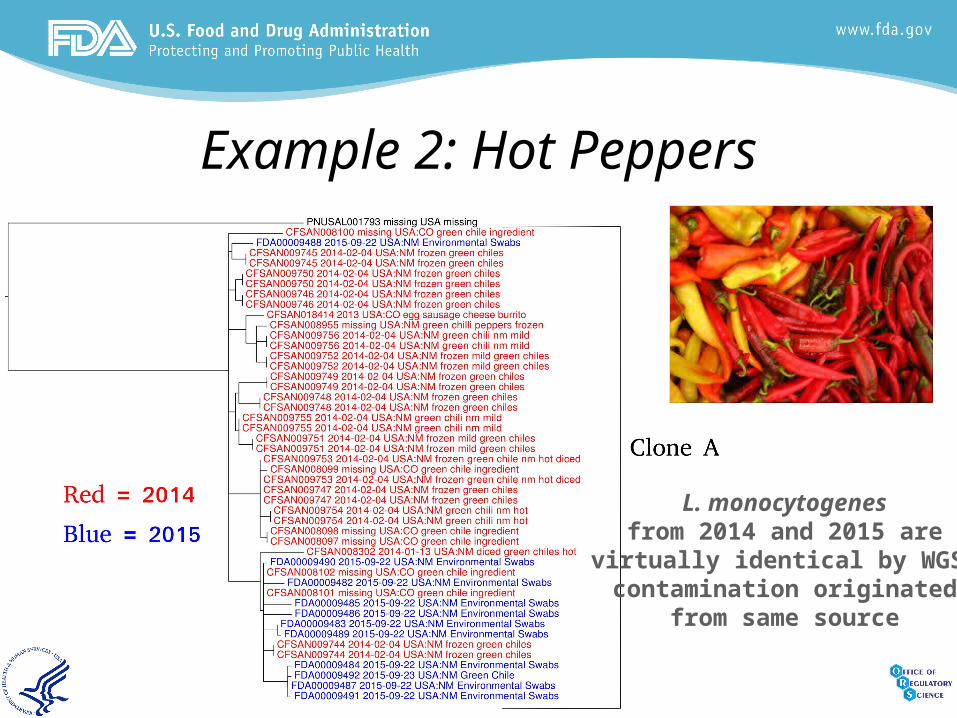
Example 2: Hot Peppers
L. monocytogenesfrom 2014 and 2015 are
virtually identical by WGS,contamination originated
from same source
Example 1: Smoked Fish
L. monocytogenes strains found on finished smoked fish
– Was fish contaminated before smoking, or was it contaminated during the production process?
– WGS was used to analyze Listeria monocytogenes isolate from environment and from product.
– Multiple clones found, likely that incoming fish was contaminated and additional contamination occurred during processing.
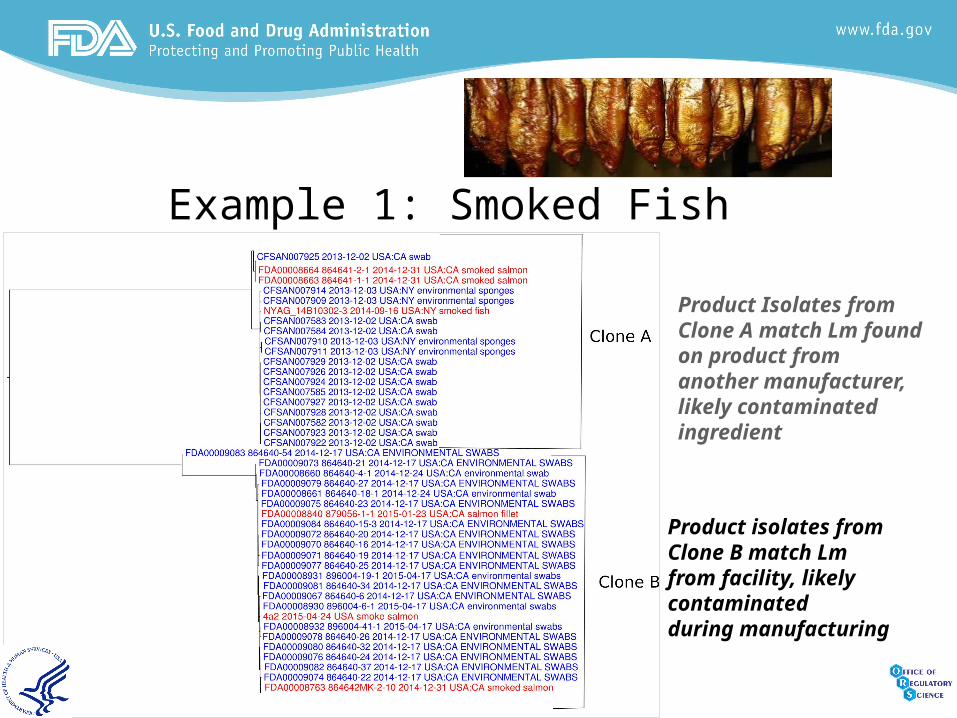
Example 1: Smoked Fish
Product Isolates from Clone A match Lm found on product from another manufacturer, likely contaminated ingredient
Product isolates from Clone B match Lmfrom facility, likely contaminatedduring manufacturing

7
Why is environmental sampling important.1)The GenomeTrakr database relies on a reference set of isolates from known foods and known geographic localities.2)A match of an unknown clinical to a known food or known geographic location provides an investigational clue for sourcetracking where the contamination has occurred.3)Knowledge of where a contaminant is coming from allows industry to fix the problem based on scientific evidence. This is research supporting preventative controls.4)If the root cause of the problem is left unresolved then it is likely to occur again at a later date.

Phylogenetic analysis of 35 isolates show ingredient source tracking
2009
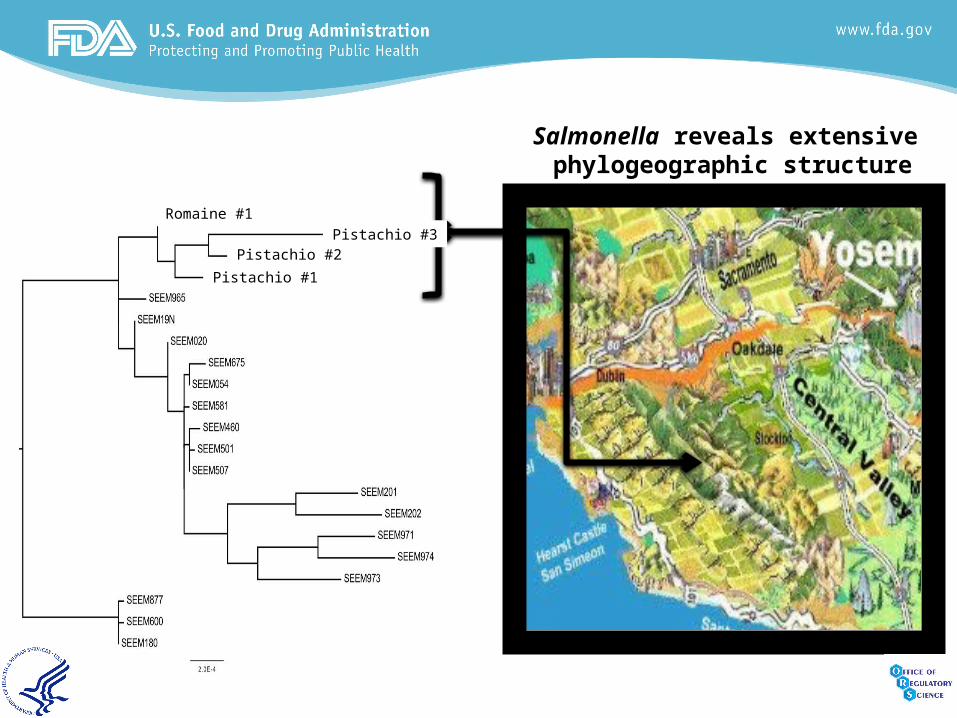
Salmonella reveals extensive phylogeographic structure
Romaine #1Pistachio #3
Pistachio #2Pistachio #1
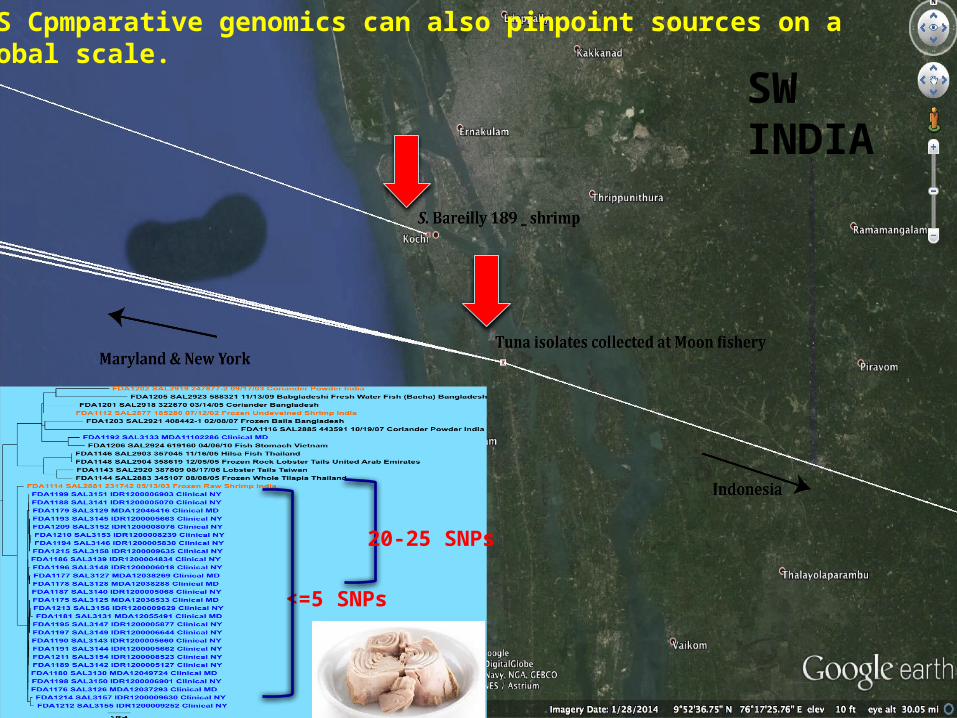
<=5 SNPs
20-25 SNPs
SWINDIA
WGS Cpmparative genomics can also pinpoint sources on a global scale.
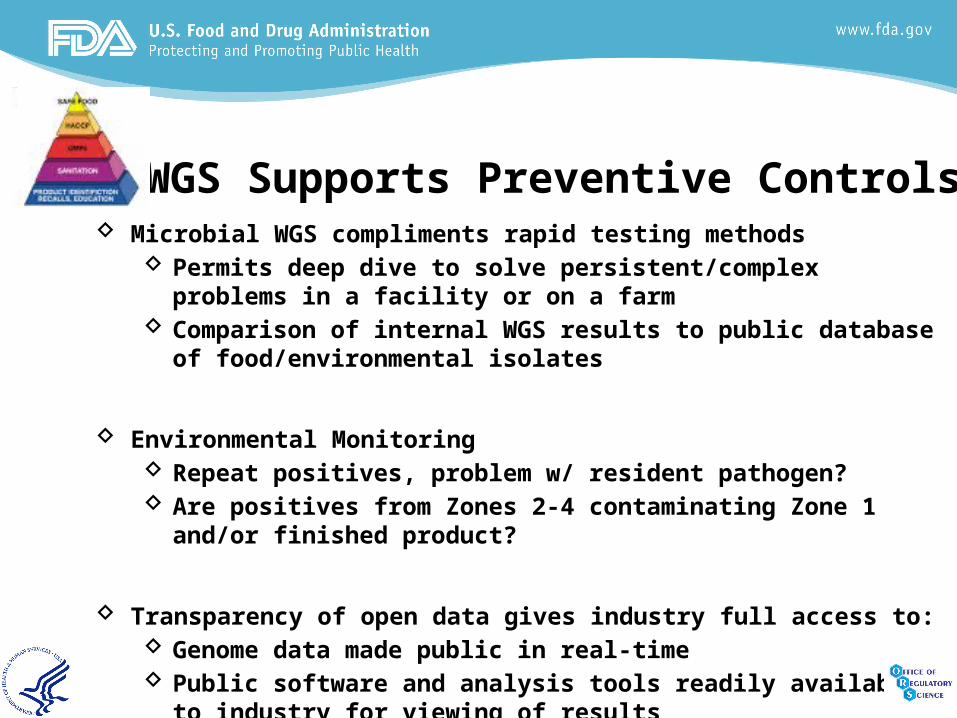
WGS Supports Preventive Controls Microbial WGS compliments rapid testing methods
Permits deep dive to solve persistent/complex problems in a facility or on a farm
Comparison of internal WGS results to public database of food/environmental isolates
Environmental Monitoring Repeat positives, problem w/ resident pathogen? Are positives from Zones 2-4 contaminating Zone 1 and/or finished
product?
Transparency of open data gives industry full access to: Genome data made public in real-time Public software and analysis tools readily available to industry for
viewing of results
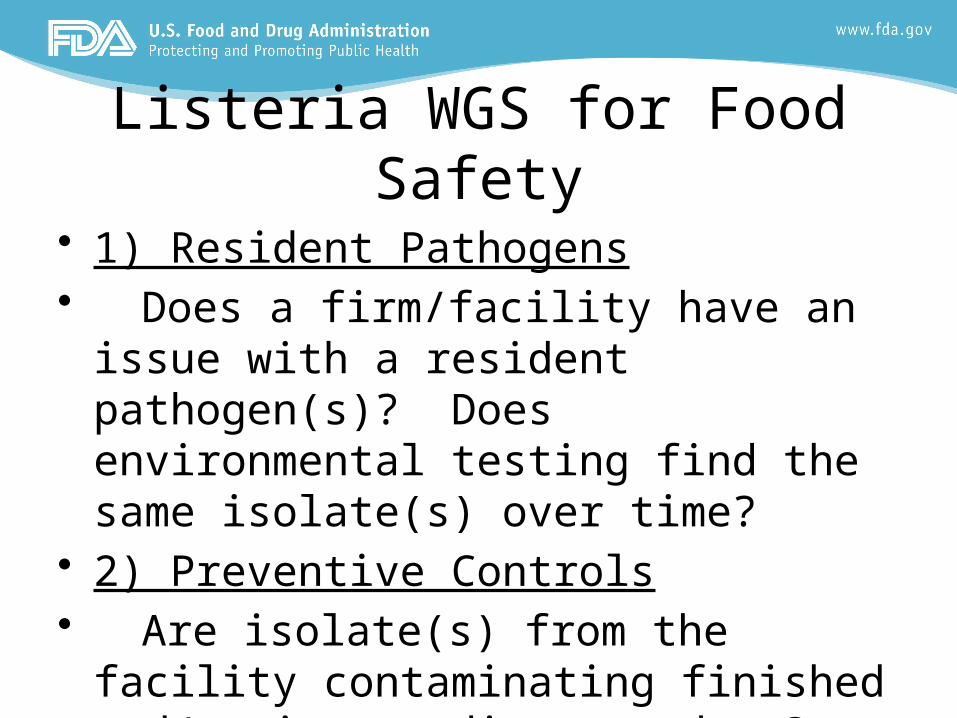
Listeria WGS for Food Safety• 1) Resident Pathogens• Does a firm/facility have an issue with
a resident pathogen(s)? Does environmental testing find the same isolate(s) over time?
• 2) Preventive Controls• Are isolate(s) from the facility
contaminating finished and/or intermediate product?
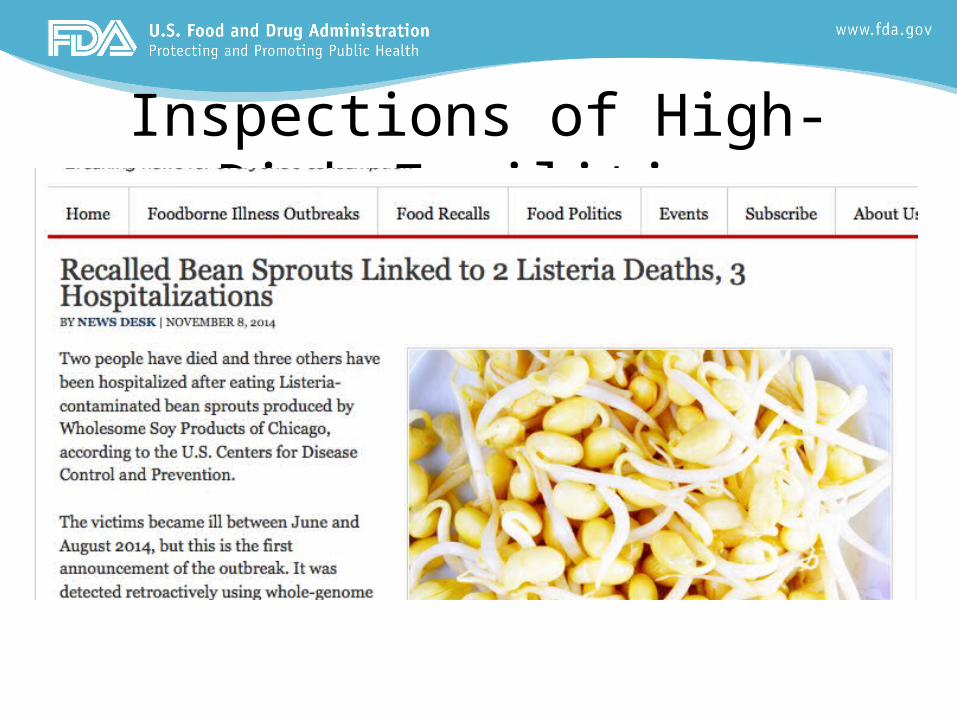
Inspections of High-Risk Facilities
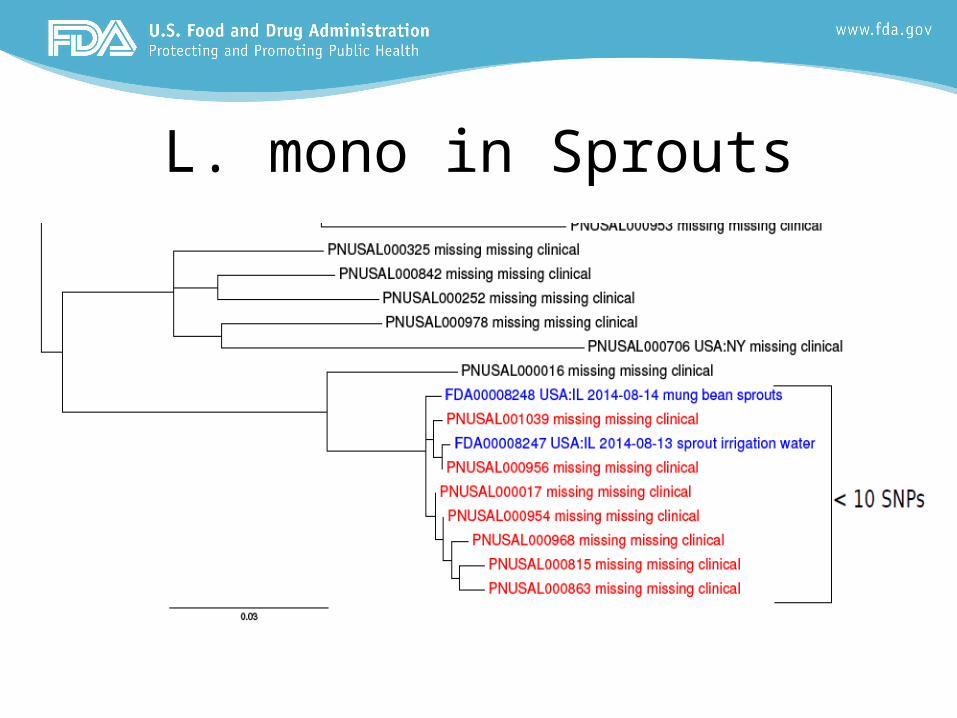
L. mono in Sprouts

L. mono in Sprouts
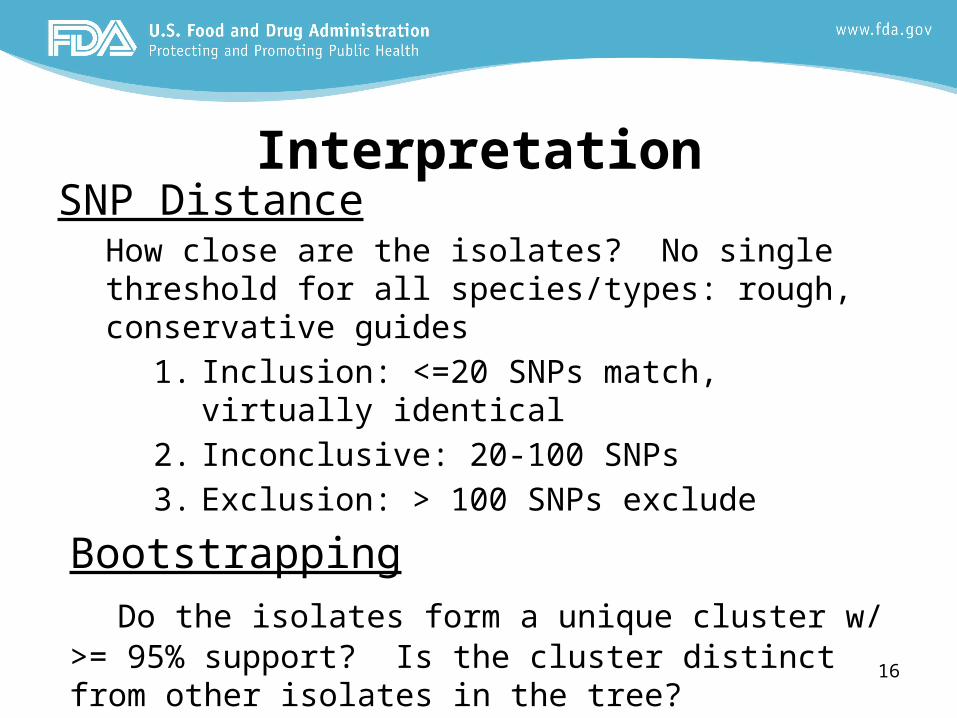
InterpretationSNP Distance
How close are the isolates? No single threshold for all species/types: rough, conservative guides
1. Inclusion: <=20 SNPs match, virtually identical2. Inconclusive: 20-100 SNPs3. Exclusion: > 100 SNPs exclude
BootstrappingDo the isolates form a unique cluster w/ >= 95%
support? Is the cluster distinct from other isolates in the tree?
16

Facility #3, Ice Cream
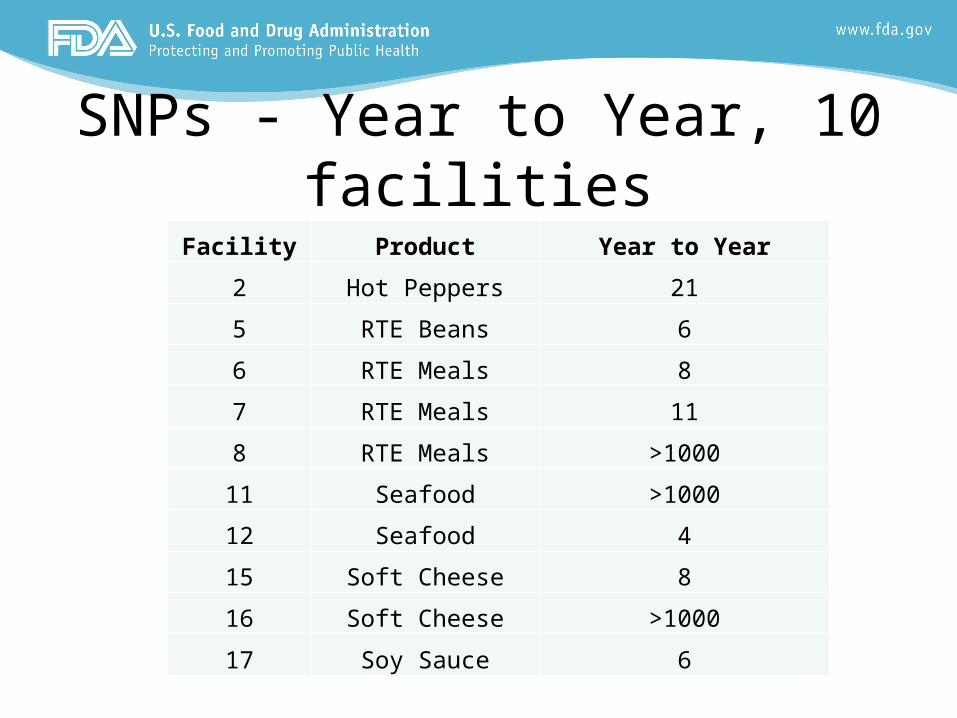
SNPs - Year to Year, 10 facilitiesFacility Product Year to Year
2 Hot Peppers 21
5 RTE Beans 6
6 RTE Meals 8
7 RTE Meals 11
8 RTE Meals >1000
11 Seafood >1000
12 Seafood 4
15 Soft Cheese 8
16 Soft Cheese >1000
17 Soy Sauce 6

Facility #2, Peppers
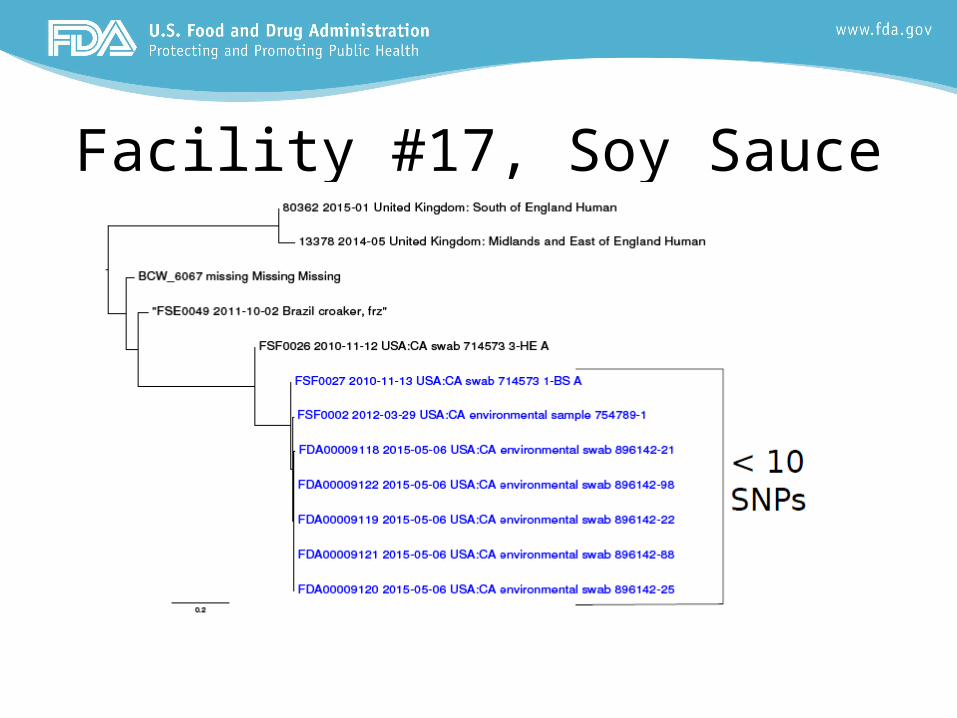
Facility #17, Soy Sauce
Applications of WGS in the Food Safety Environment
Delimiting scope and traceback of food contamination events (Track-N-Trace)Quality control for FDA testing and surveillance (enhanced confidence against type 1 and 2 error)Preventive control monitoring for compliance standardsID, geno/pheno typing schemes (AST,Serotyping, VP) (CVM,CDRH,CFSAN) – risk assessment and adaptive change in Salmonella and Listeria

Conclusions• Resident Pathogens – Over half of facilities
polyclonal, but clones persist year to year• Not new – TX facility1988 isolates match
2000 outbreak• Inclusion – 20 SNPs is probably conservative,
more data needed to develop probabilities/odds-ratios
• Inspections – Most facilities on a 3 to 5 year cycle, problematic facilities more often, more data on the way with statistical inferences
Related Documents