ASIAN DEVELOPMENT BANK Investing in a Prosperous, Inclusive, Resilient, and Sustainable Asia and the Pacific November 2020

Welcome message from author
This document is posted to help you gain knowledge. Please leave a comment to let me know what you think about it! Share it to your friends and learn new things together.
Transcript
ASIANDEVELOPMENTBANKInvesting in a Prosperous, Inclusive, Resilient, and Sustainable Asia and the Pacific
November 2020
Overview
Credit Profile
Funding Operations
Green Bond Framework
Appendices2
WHO WE ARE
• Founded in 1966• A multilateral development bank• Headquartered in Manila, Philippines• 40 field offices• 3,548 employees spanning 64 nationalities3
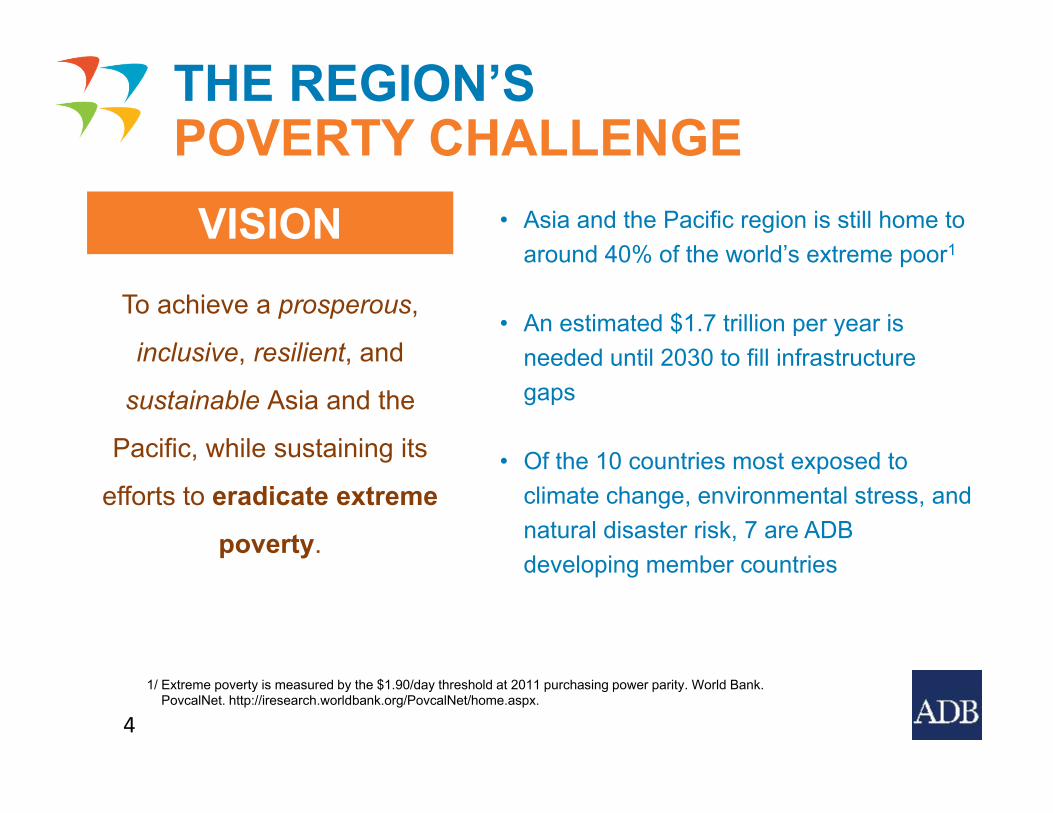
VISIONTo achieve a prosperous,
inclusive, resilient, and
sustainable Asia and the
Pacific, while sustaining its
efforts to eradicate extreme
poverty.
VISIONTo achieve a prosperous,
inclusive, resilient, and
sustainable Asia and the
Pacific, while sustaining its
efforts to eradicate extreme
poverty.
VISION • Asia and the Pacific region is still home to around 40% of the world’s extreme poor1
• An estimated $1.7 trillion per year is needed until 2030 to fill infrastructure gaps
• Of the 10 countries most exposed to climate change, environmental stress, and natural disaster risk, 7 are ADB developing member countries
THE REGION’SPOVERTY CHALLENGE
4
1/ Extreme poverty is measured by the $1.90/day threshold at 2011 purchasing power parity. World Bank. PovcalNet. http://iresearch.worldbank.org/PovcalNet/home.aspx.

CLIMATE CHANGE AND DISASTERS IN ASIA AND THE PACIFIC
5

6
Strengthening governance and institutional capacity
Fostering regional cooperation and integration
Addressing remaining poverty and reducing
inequalities
Accelerating progress in gender equality
Tackling climate change, building climate and disaster resilience, and enhancing
environmental sustainability
At least 75% of the number of committed operations by 2030
At least 75% of the number of committed operations by 2030, $80 billion from own resources from 2019–2030
Expanding private sector operations
Catalyzing and mobilizing financial resources for development
Strengthening knowledge services
$1 in private sector operations financing matched by $2.50 of cofinancing by 2030
Promoting rural development and food security
Making cities more livable
STRATEGY 2030OPERATIONAL PRIORITIES
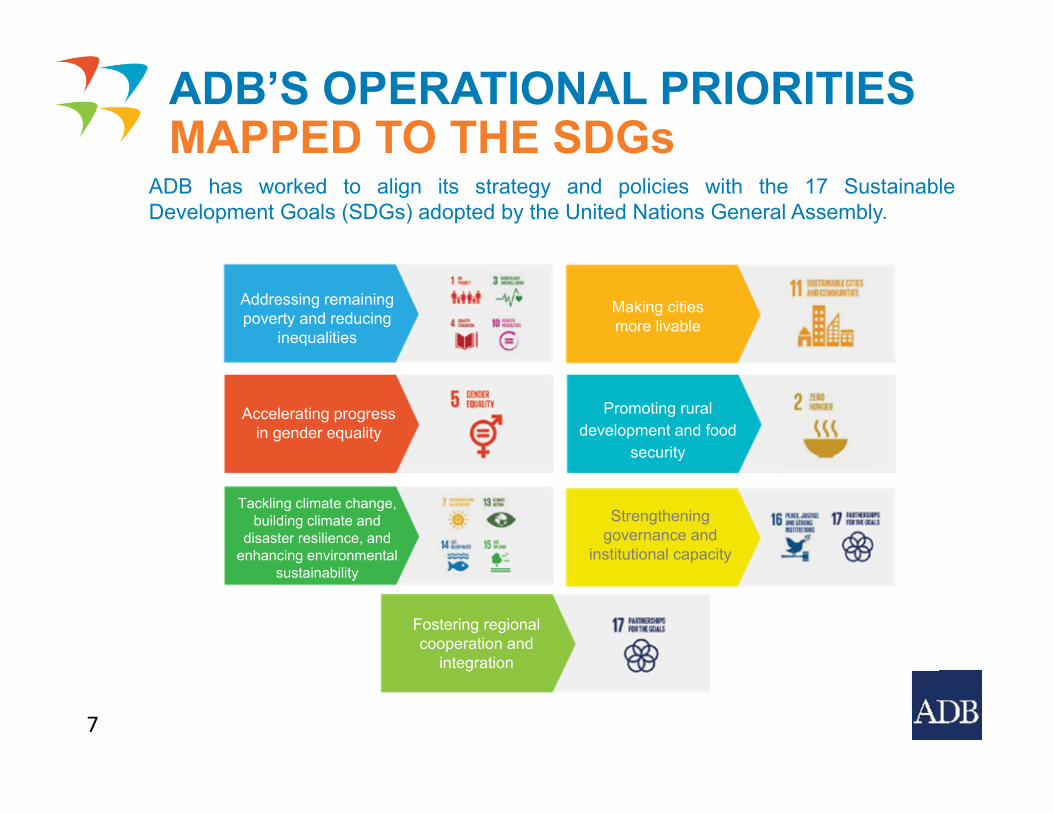
Making cities more livable
Promoting rural development and food
security
Strengthening governance and
institutional capacity
Addressing remaining poverty and reducing
inequalities
Accelerating progress in gender equality
Tackling climate change, building climate and
disaster resilience, and enhancing environmental
sustainability
Fostering regional cooperation and
integration
7
ADB has worked to align its strategy and policies with the 17 SustainableDevelopment Goals (SDGs) adopted by the United Nations General Assembly.
ADB’S OPERATIONAL PRIORITIESMAPPED TO THE SDGs
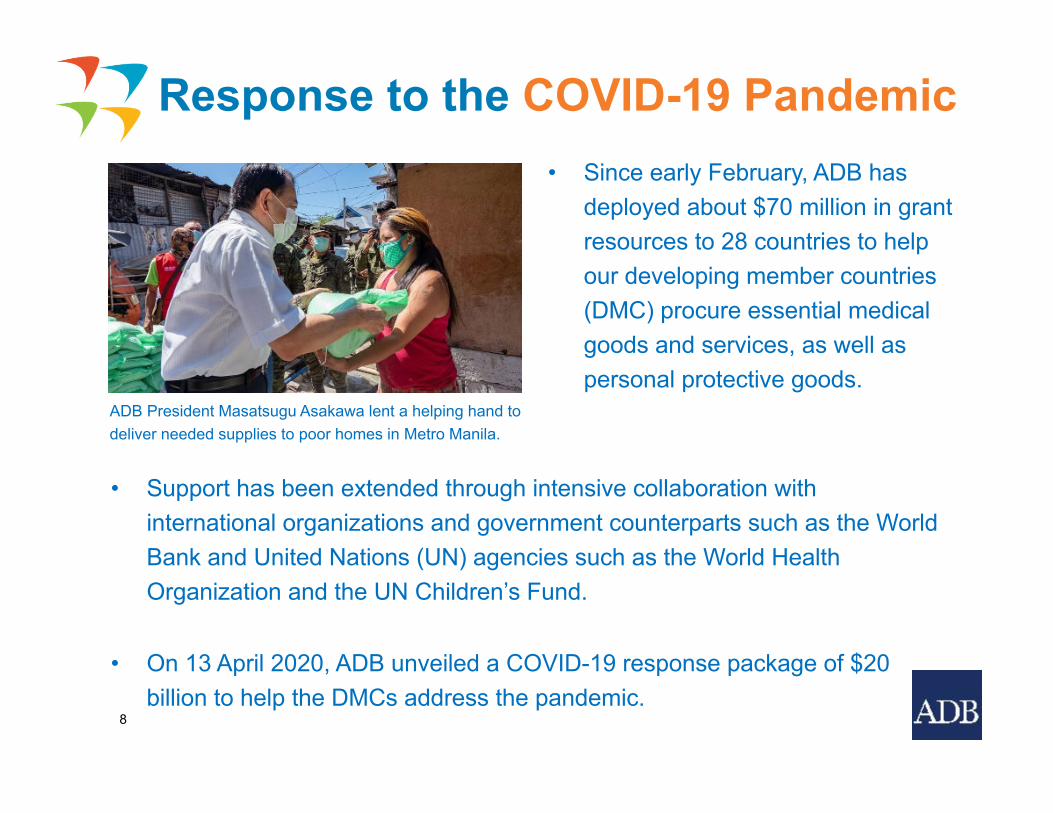
Response to the COVID-19 Pandemic• Since early February, ADB has
deployed about $70 million in grant resources to 28 countries to help our developing member countries (DMC) procure essential medical goods and services, as well as personal protective goods.
8
ADB President Masatsugu Asakawa lent a helping hand to deliver needed supplies to poor homes in Metro Manila.
• Support has been extended through intensive collaboration with international organizations and government counterparts such as the World Bank and United Nations (UN) agencies such as the World Health Organization and the UN Children’s Fund.
• On 13 April 2020, ADB unveiled a COVID-19 response package of $20 billion to help the DMCs address the pandemic.
Response to the COVID-19 Pandemic
• This builds on the $6.5 billion initial package announced on 18 March 2020 and expands it by adding $13.5 billion to help our DMCs counter the severe macroeconomic and health impact caused by COVID-19.
• The key features of the enhanced package are as follows: o Establishment of a COVID-19 Pandemic Response Option under
ADB’s Countercyclical Support Facilityo Allocation of about $2.5 billion in concessional and grant resourceso Making available some $2 billion for private sector operationso Adjustments to policies and business processes
9
10
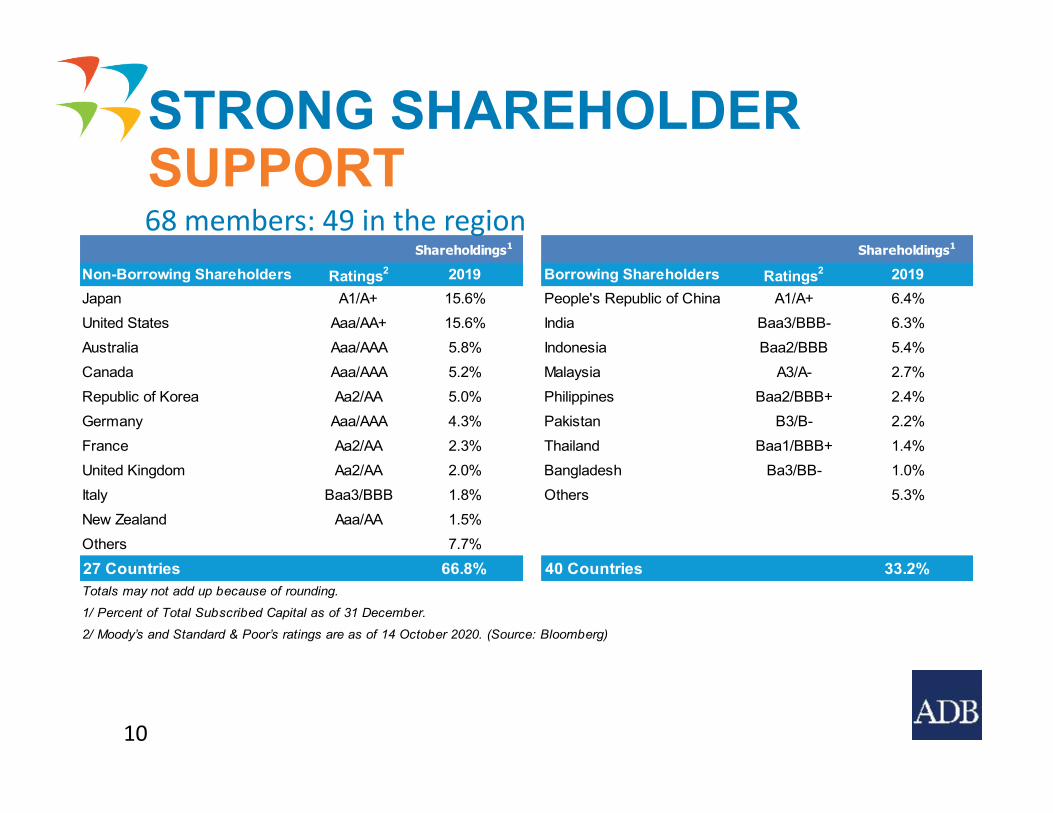
STRONG SHAREHOLDERSUPPORT
Shareholdings1 Shareholdings1
Non-Borrowing Shareholders Ratings2 2019 Borrowing Shareholders Ratings2 2019Japan A1/A+ 15.6% People's Republic of China A1/A+ 6.4%United States Aaa/AA+ 15.6% India Baa3/BBB- 6.3%Australia Aaa/AAA 5.8% Indonesia Baa2/BBB 5.4%Canada Aaa/AAA 5.2% Malaysia A3/A- 2.7%Republic of Korea Aa2/AA 5.0% Philippines Baa2/BBB+ 2.4%Germany Aaa/AAA 4.3% Pakistan B3/B- 2.2%France Aa2/AA 2.3% Thailand Baa1/BBB+ 1.4%United Kingdom Aa2/AA 2.0% Bangladesh Ba3/BB- 1.0%Italy Baa3/BBB 1.8% Others 5.3%New Zealand Aaa/AA 1.5%Others 7.7%27 Countries 66.8% 40 Countries 33.2%Totals may not add up because of rounding.
1/ Percent of Total Subscribed Capital as of 31 December.
2/ Moody’s and Standard & Poor’s ratings are as of 14 October 2020. (Source: Bloomberg)
68 members: 49 in the region
11
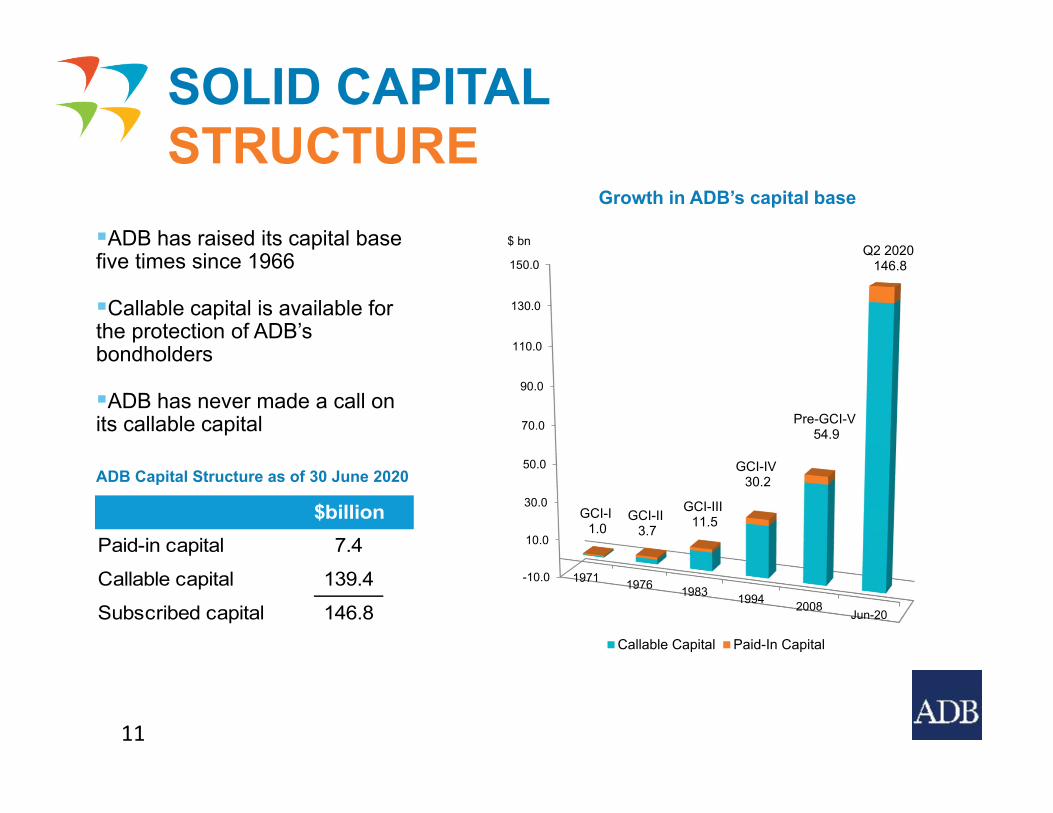
SOLID CAPITAL STRUCTURE
ADB has raised its capital base five times since 1966
Callable capital is available for the protection of ADB’s bondholders
ADB has never made a call on its callable capital
ADB Capital Structure as of 30 June 2020
$billionPaid-in capital 7.4
Callable capital 139.4
Subscribed capital 146.8
-10.0
10.0
30.0
50.0
70.0
90.0
110.0
130.0
150.0
1971 1976 1983 1994 2008Jun-20
GCI-I1.0
GCI-II3.7
GCI-III11.5
GCI-IV30.2
Pre-GCI-V54.9
Q2 2020146.8
$ bn
Callable Capital Paid-In Capital
Growth in ADB’s capital base
Overview
Credit Profile
Funding Operations
Green Bond Framework
Appendices12
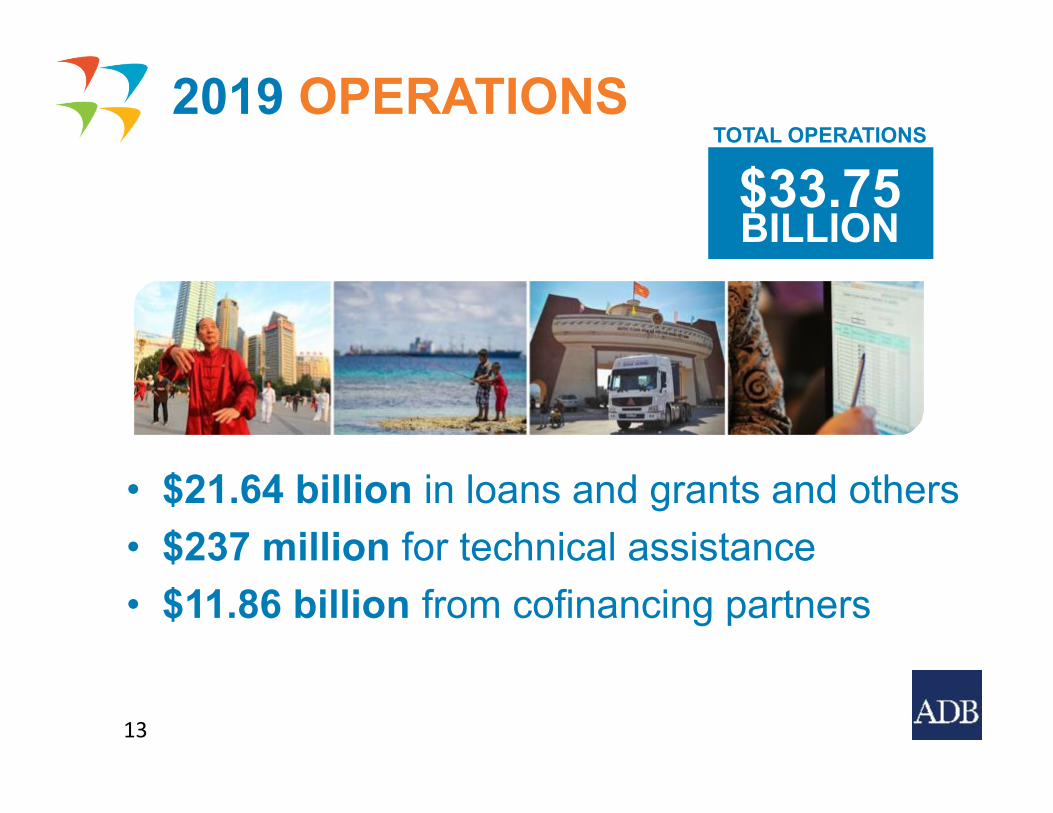
2019 OPERATIONS
• $21.64 billion in loans and grants and others• $237 million for technical assistance• $11.86 billion from cofinancing partners
$33.75BILLION
TOTAL OPERATIONS
13
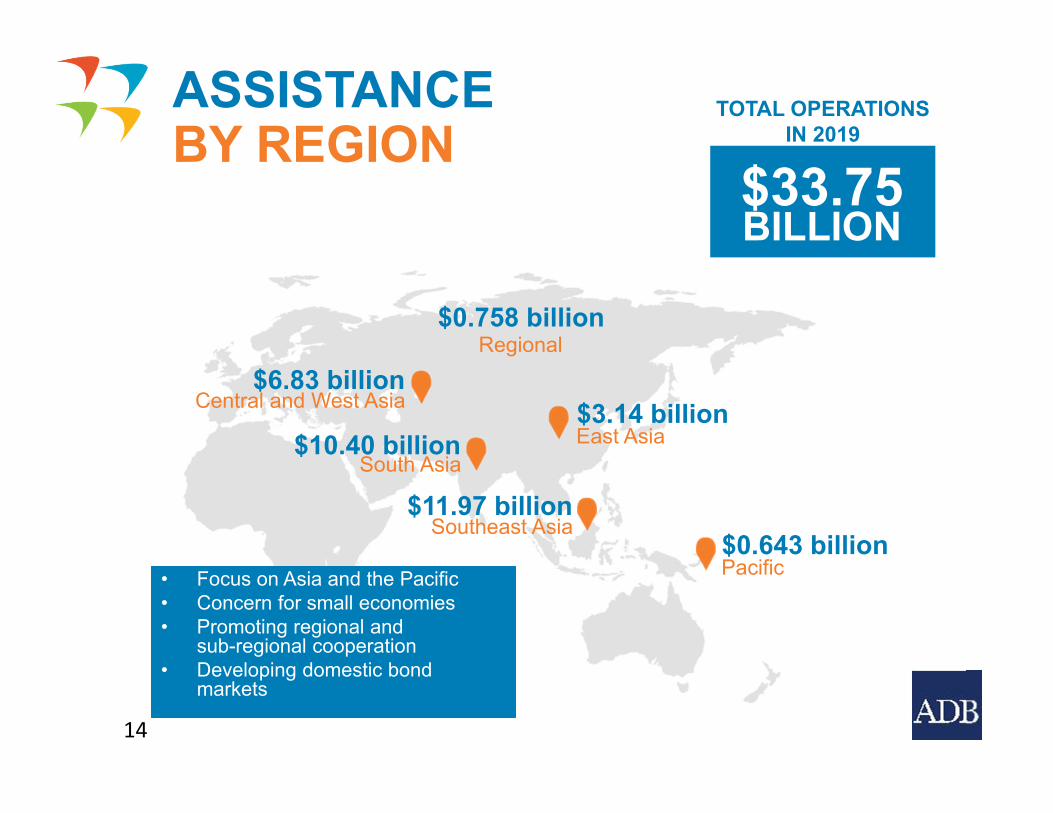
ASSISTANCEBY REGION
$6.83 billionCentral and West Asia
$10.40 billionSouth Asia
$11.97 billionSoutheast Asia
$3.14 billionEast Asia
$0.643 billionPacific
$33.75BILLION
TOTAL OPERATIONS IN 2019
$0.758 billionRegional
14
• Focus on Asia and the Pacific• Concern for small economies• Promoting regional and
sub-regional cooperation• Developing domestic bond
markets

15
APPROVED LOANS BY BORROWER
TOTAL – $300.3 billionCumulative OCR regular and concessional lending, as of 31 March 2020
Indonesia$38,320 mn
Papua New Guinea$2,944 mn
Fiji$589 mn
Nauru$5 mn
Federated States of Micronesia
$84 mn
Marshall Islands$93 mn
Regional$676 mn
Republic of Korea$6,338 mn
People’s Republic of China
$42,552 mn
Thailand$7,448 mn
Malaysia$1,998 mn
Lao PDR$1,929 mnIndia
$47,875 mn
Sri Lanka$9,896 mn
Pakistan$33,627 mn
Nepal$5,365 mn
Afghanistan$956 mn
Kazakhstan$5,574 mn
Uzbekistan$8,629 mn
Mongolia$2,868 mn
Azerbaijan$4,427 mn
Hong Kong, China$102 mn
Singapore$181 mn
Philippines$21,515 mn
Viet Nam$16,752 mn
Taipei,China$100 mnBangladesh
$23,718 mn
Cambodia$3,077 mn
Georgia$3,463 mn
Republic of the Maldives$163 mn
Bhutan $568 mn
Republic of the
Union of Myanmar $3,444 mn
Cook Islands$112 mn
Armenia$1,536 mn
Palau$85 mn
Turkmenistan$625 mn
Kyrgyz Republic$1,300 mn
Timor-Leste $272 mn
Tajikistan$493 mn
Kiribati$35 mn
Samoa$191 mn
Solomon Islands$172 mn
Tonga$69 mn
Tuvalu$8 mn
Vanuatu$98 mn
Legend:
$0 - $500 million $5,001 - $10,000 million
$501 - $2,000 million $10,001 - $15,000 million$2,001 - $5,000 million $15,001 million - and above

1/ Includes concessional loans that were transferred from ADF to OCR effective 1 January 2017.2/ OCR Committed Loans include Loans Outstanding at $120.5 billion (gross) and Undisbursed Effective Loans at $46.6 billion. Regular sovereign at $118.6 billion (71%), concessional sovereign at $39.4 billion (24%) and non-sovereign at $9.1 billion (5%).3/ ADB has a strict policy with regard to non-accrual loans. If a loan is overdue by i) 60 days – no new loans. ii) 90 days –suspension of disbursements, iii) 6 months – non-accrual status.
India
BySector
7.3%Philippines
8.8%Indonesia
9.5%Bangladesh
9.9%Pakistan
15.5%
People’s Republic of China
16.9%
25.1%Others 19.0%
Energy
13.1%
Public SectorManagement
9.7%
Water UrbanInfrastructure
8.5%
Agriculture andNatural Resources
7.7%Finance5.0%
Education
30.6%Transport
4.4%Others
2.2%Multi-Sector
Viet Nam7.1%
COMMITTED LOANS $167.1 BILLION1,2(As of 30 June 2020)
16
ByBorrower
As of 30 June 2020, there were three nonsovereignloans in non-accrual status with a total outstanding amount of $125 million, of which $6 million was overdue by more than 180 days. There were no outstanding sovereign loans in non-accrual status as of 30 June 2020.3
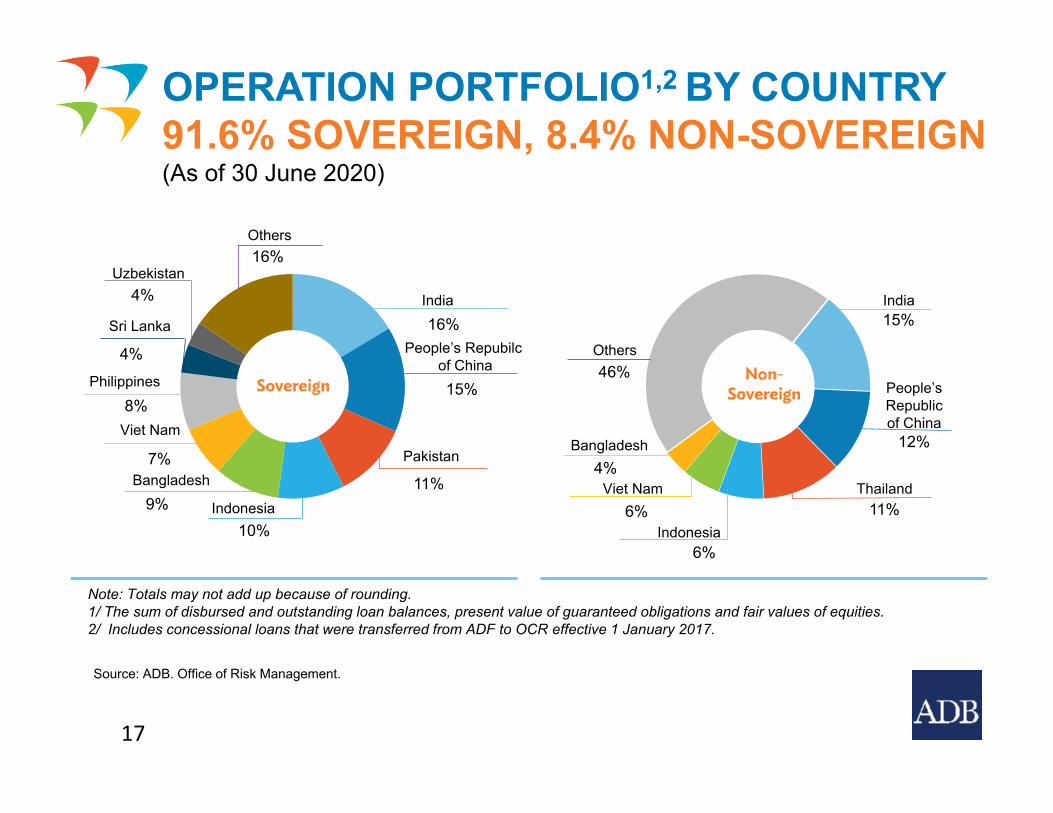
Uzbekistan
Note: Totals may not add up because of rounding. 1/ The sum of disbursed and outstanding loan balances, present value of guaranteed obligations and fair values of equities.2/ Includes concessional loans that were transferred from ADF to OCR effective 1 January 2017.
15%
People’s Repubilcof China
11%
Pakistan
10%Indonesia9%
Bangladesh
16%Others
16%India
46%Others
6%Indonesia
15%India
12%
People’sRepublicof China
11%Thailand
Viet Nam
7%
Philippines 8%
Sri Lanka
4%
4%
Viet Nam6%
Bangladesh4%
Source: ADB. Office of Risk Management.
OPERATION PORTFOLIO1,2 BY COUNTRY91.6% SOVEREIGN, 8.4% NON-SOVEREIGN(As of 30 June 2020)
17
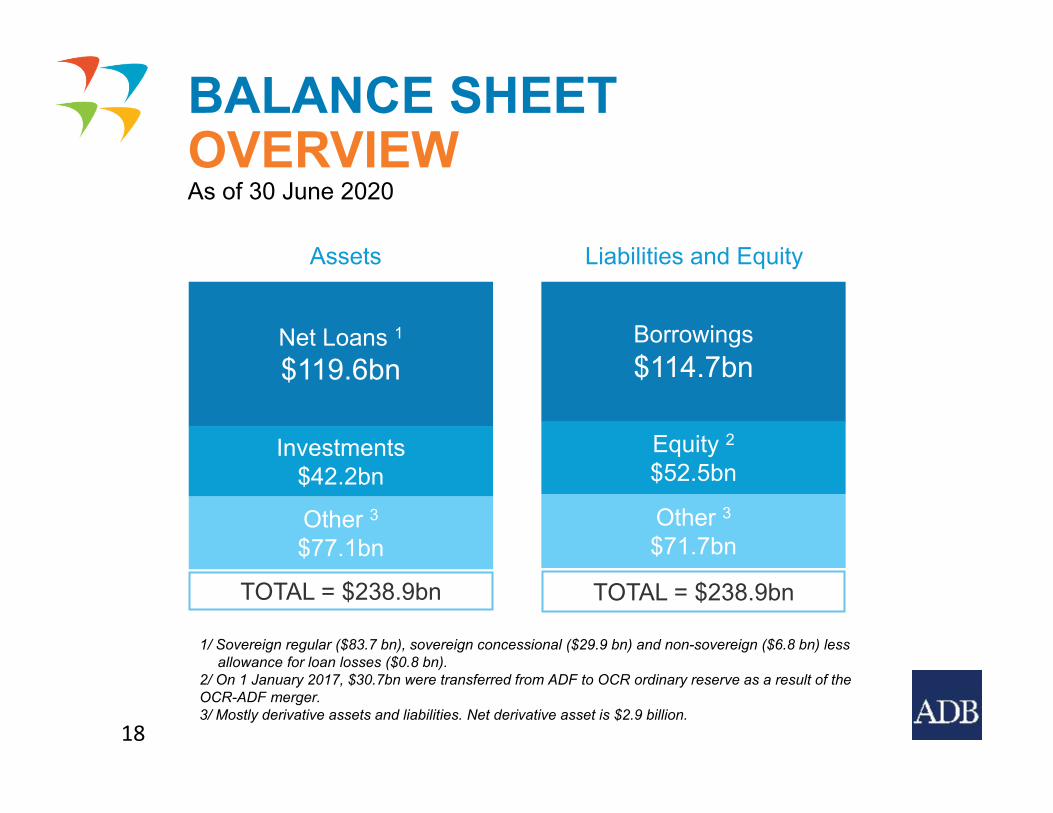
Net Loans 1
$119.6bn
Other 3$77.1bn
Investments $42.2bn
TOTAL = $238.9bn
Assets
Borrowings$114.7bn
Other 3$71.7bn
Equity 2$52.5bn
TOTAL = $238.9bn
Liabilities and Equity
1/ Sovereign regular ($83.7 bn), sovereign concessional ($29.9 bn) and non-sovereign ($6.8 bn) less allowance for loan losses ($0.8 bn).
2/ On 1 January 2017, $30.7bn were transferred from ADF to OCR ordinary reserve as a result of the OCR-ADF merger.3/ Mostly derivative assets and liabilities. Net derivative asset is $2.9 billion.
18
BALANCE SHEETOVERVIEWAs of 30 June 2020
CONTENTS
19
Overview
Credit Profile
Funding Operations
Green Bond Framework
Appendices
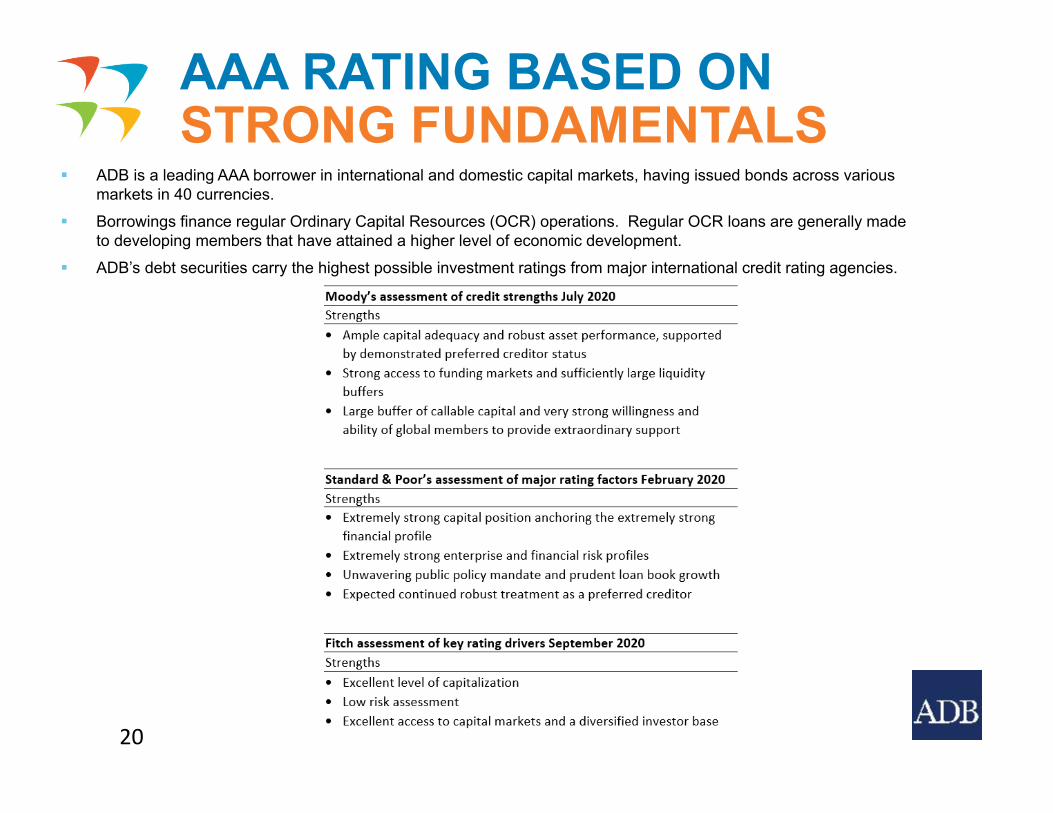
ADB is a leading AAA borrower in international and domestic capital markets, having issued bonds across various markets in 40 currencies.
Borrowings finance regular Ordinary Capital Resources (OCR) operations. Regular OCR loans are generally made to developing members that have attained a higher level of economic development.
ADB’s debt securities carry the highest possible investment ratings from major international credit rating agencies.
AAA RATING BASED ONSTRONG FUNDAMENTALS
20
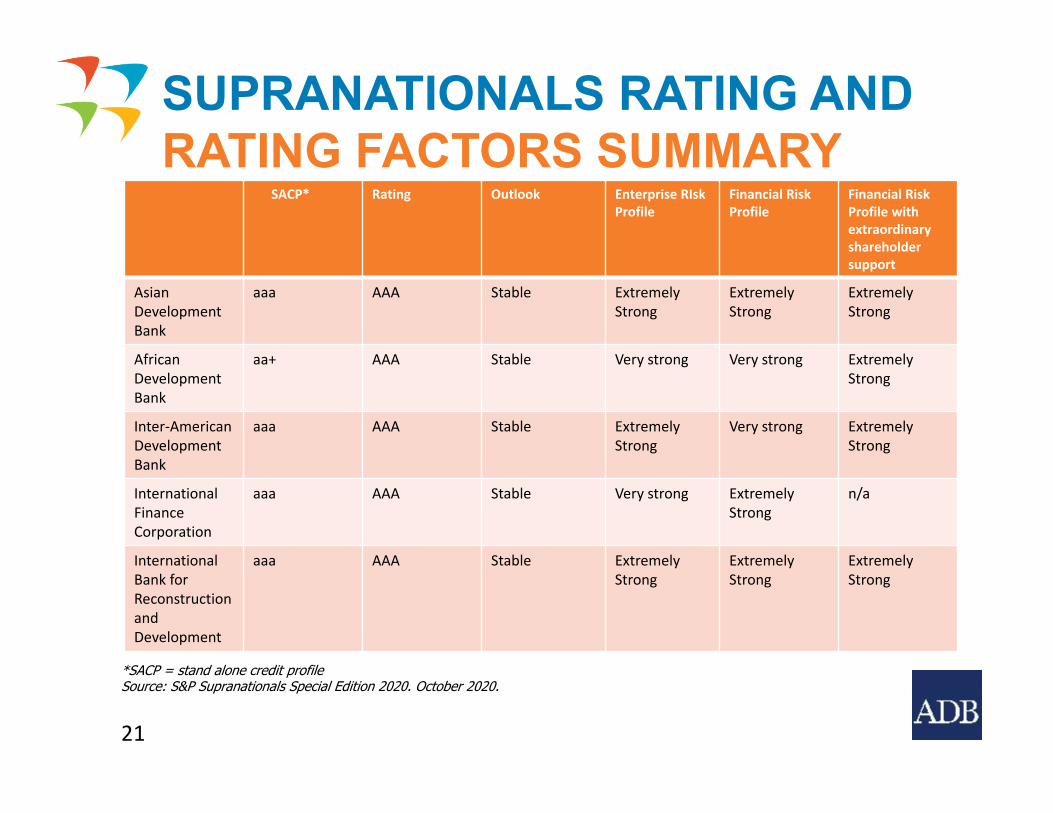
*SACP = stand alone credit profileSource: S&P Supranationals Special Edition 2020. October 2020.
SUPRANATIONALS RATING AND RATING FACTORS SUMMARY
SACP* Rating Outlook Enterprise RIskProfile
Financial Risk Profile
Financial Risk Profile with extraordinary shareholder support
AsianDevelopment Bank
aaa AAA Stable Extremely Strong
Extremely Strong
Extremely Strong
African Development Bank
aa+ AAA Stable Very strong Very strong Extremely Strong
Inter‐AmericanDevelopment Bank
aaa AAA Stable Extremely Strong
Very strong Extremely Strong
InternationalFinance Corporation
aaa AAA Stable Very strong Extremely Strong
n/a
International Bank forReconstruction and Development
aaa AAA Stable Extremely Strong
Extremely Strong
Extremely Strong
21
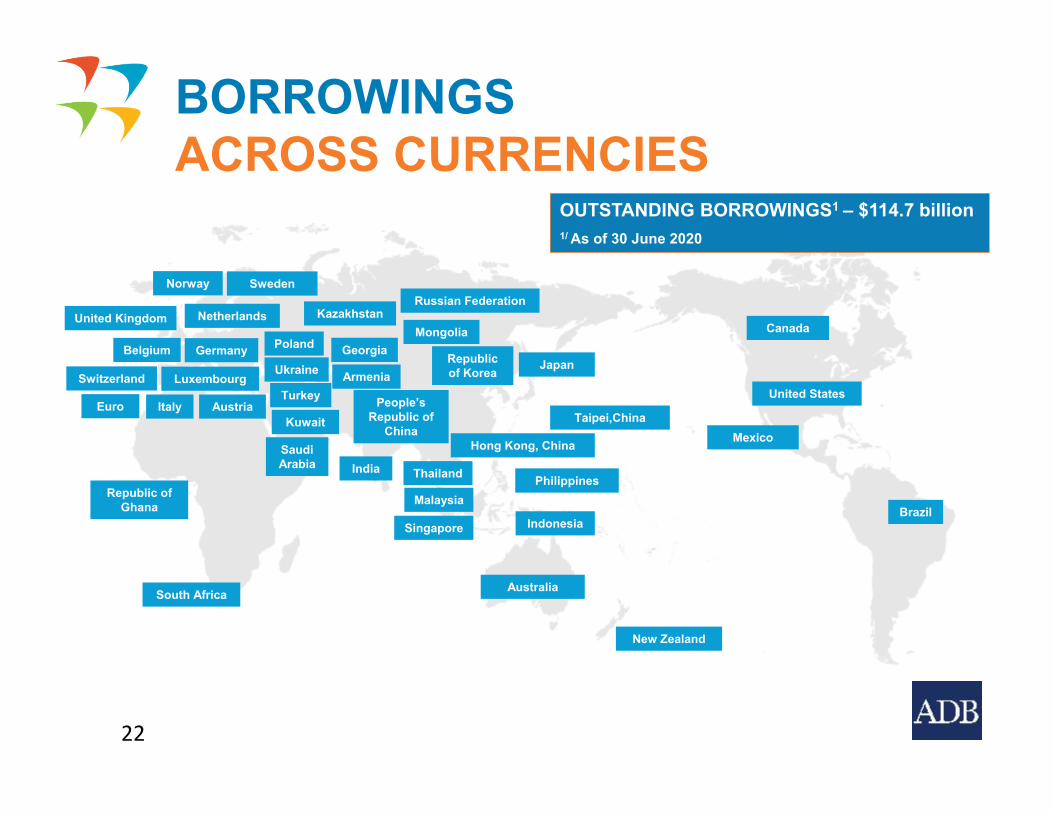
OUTSTANDING BORROWINGS1 – $114.7 billion1/ As of 30 June 2020
United States
Canada
Norway
United Kingdom Netherlands
Germany
LuxembourgSwitzerland
Italy
Belgium
AustriaKuwait
Saudi Arabia
Brazil
People’s Republic of
China
India Thailand
Malaysia
Singapore
Philippines
New Zealand
Australia
Japan
Hong Kong, China
Republic of Korea
Taipei,China
Kazakhstan
Mexico
South Africa
TurkeyEuro
Georgia
BORROWINGSACROSS CURRENCIES
Russian FederationSweden
Indonesia
Republic of Ghana
22
Armenia
MongoliaPoland
Ukraine
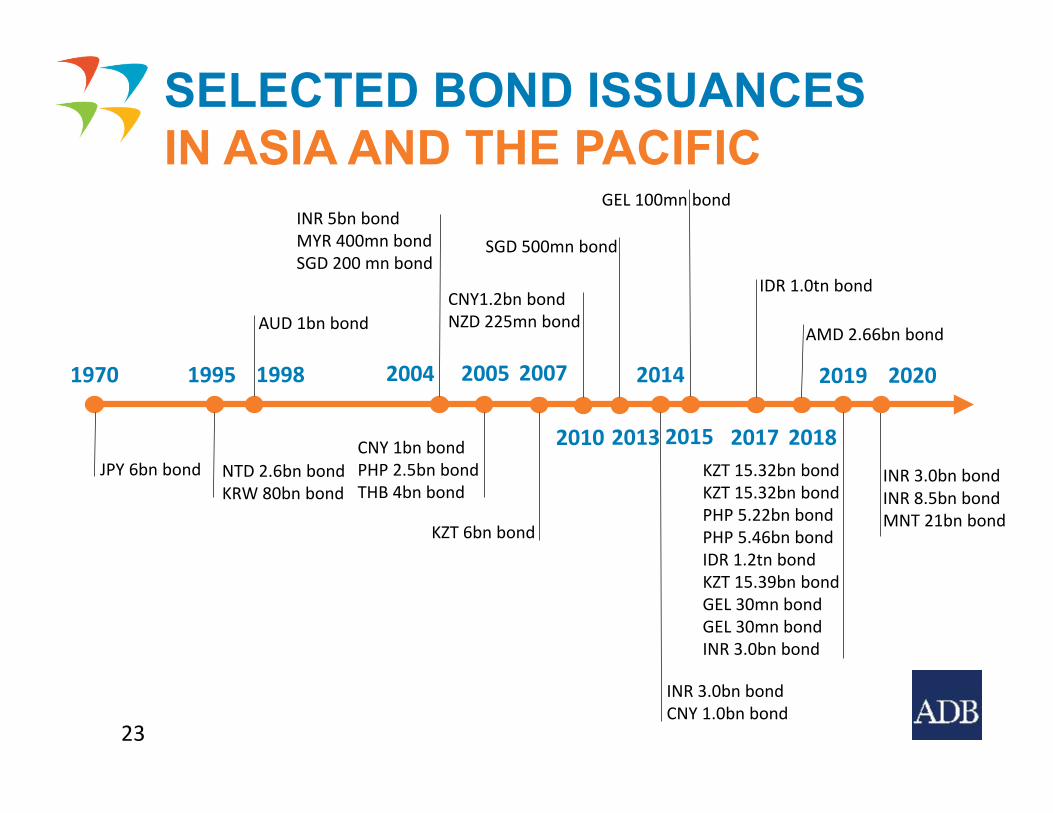
SELECTED BOND ISSUANCESIN ASIA AND THE PACIFIC
23
2017
IDR 1.0tn bond
1970 1995
NTD 2.6bn bondKRW 80bn bond
2007
KZT 6bn bond
20192014
INR 3.0bn bondCNY 1.0bn bond
2018
AMD 2.66bn bond
2004
INR 5bn bondMYR 400mn bondSGD 200 mn bond
1998
AUD 1bn bond
SGD 500mn bond
KZT 15.32bn bondKZT 15.32bn bondPHP 5.22bn bondPHP 5.46bn bondIDR 1.2tn bondKZT 15.39bn bondGEL 30mn bondGEL 30mn bondINR 3.0bn bond
2013 2015
GEL 100mn bond
2010
CNY1.2bn bondNZD 225mn bond
CNY 1bn bondPHP 2.5bn bondTHB 4bn bond
2005
JPY 6bn bond
2020
INR 3.0bn bondINR 8.5bn bondMNT 21bn bond
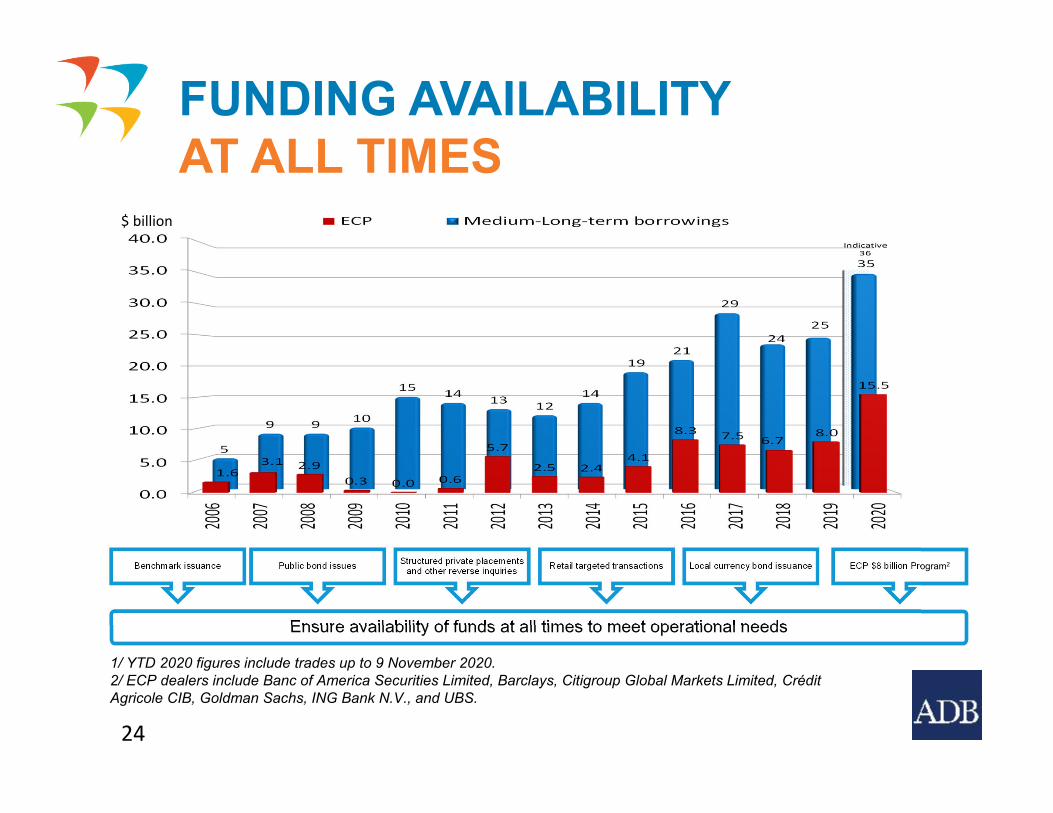
1/ YTD 2020 figures include trades up to 9 November 2020.2/ ECP dealers include Banc of America Securities Limited, Barclays, Citigroup Global Markets Limited, Crédit Agricole CIB, Goldman Sachs, ING Bank N.V., and UBS.
Ensure availability of funds at all times to meet operational needs
Benchmark issuance Public bond issues Structured private placements and other reverse inquiries Retail targeted transactions Local currency bond issuance ECP $8 billion Program2
FUNDING AVAILABILITYAT ALL TIMES
$ billion
24
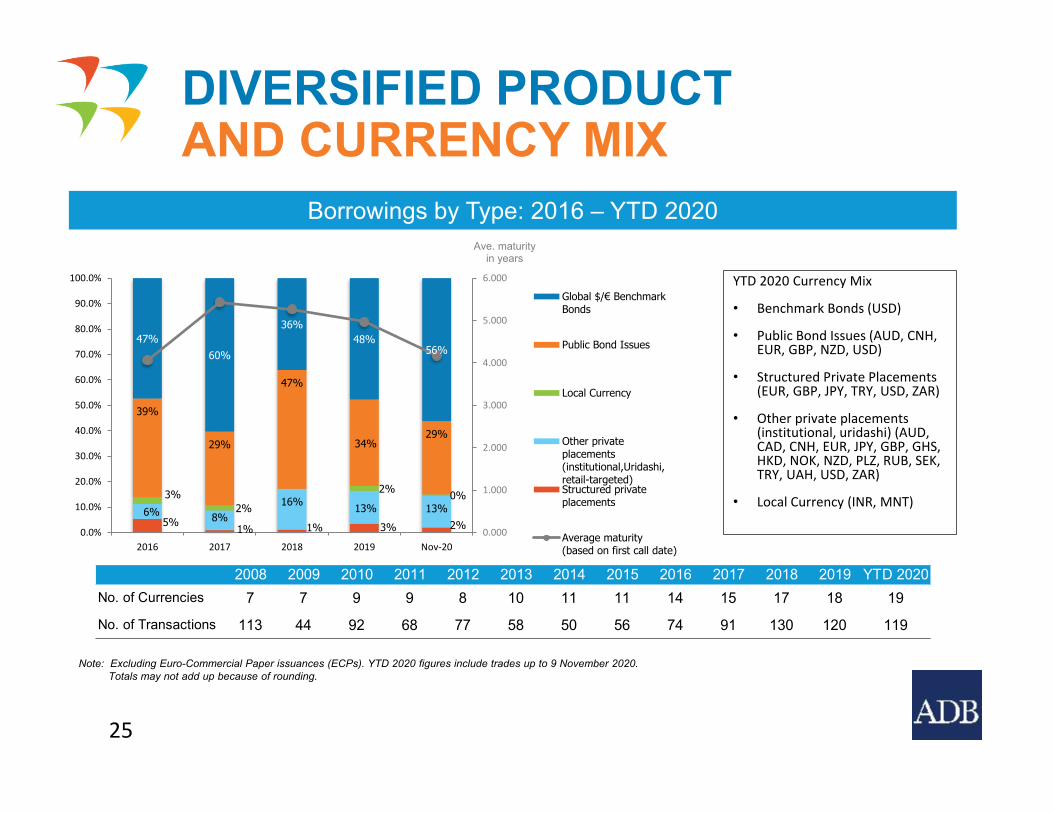
YTD 2020 Currency Mix
• Benchmark Bonds (USD)
• Public Bond Issues (AUD, CNH, EUR, GBP, NZD, USD)
• Structured Private Placements (EUR, GBP, JPY, TRY, USD, ZAR)
• Other private placements (institutional, uridashi) (AUD, CAD, CNH, EUR, JPY, GBP, GHS, HKD, NOK, NZD, PLZ, RUB, SEK, TRY, UAH, USD, ZAR)
• Local Currency (INR, MNT)
25
5% 1% 1% 3% 2%6% 8%
16% 13% 13%3%
2%
2% 0%
39%
29%
47%
34%29%
47%60%
36%48%
56%
0.000
1.000
2.000
3.000
4.000
5.000
6.000
0.0%
10.0%
20.0%
30.0%
40.0%
50.0%
60.0%
70.0%
80.0%
90.0%
100.0%
2016 2017 2018 2019 Nov‐20
Ave. maturity in years
Global $/€ Benchmark Bonds
Public Bond Issues
Local Currency
Other privateplacements(institutional,Uridashi,retail-targeted)Structured privateplacements
Average maturity(based on first call date)
2008 2009 2010 2011 2012 2013 2014 2015 2016 2017 2018 2019 YTD 2020No. of Currencies 7 7 9 9 8 10 11 11 14 15 17 18 19
No. of Transactions 113 44 92 68 77 58 50 56 74 91 130 120 119
Note: Excluding Euro-Commercial Paper issuances (ECPs). YTD 2020 figures include trades up to 9 November 2020.Totals may not add up because of rounding.
Borrowings by Type: 2016 – YTD 2020
DIVERSIFIED PRODUCTAND CURRENCY MIX

26 Confidential
DIVERSIFIED ISSUANCE CURRENCIESOUTSTANDING ISSUANCES
• Total principal of outstanding borrowings stood at $105.0 billion as of 31 December 2019 (2018: $90.4 billion). This includes accrued interest and commission. Reported at fair value except for unswapped borrowings which are reported at principal amount net of unamortized discount/premium.
$ million
Note: Percentages may not total 100% because of rounding.
651841201662232512763033374405115777858849021,2401,5792,606
5,7196,622
8,99472,320
AMDGELBRLKZTIDR
PHPMXNCHFRUBZARCNYNOKHKDTRYSEKINR
CADJPYNZDEURGBPAUDUSD
USD69%
AUD9%
GBP6%
EUR5%
NZD3%
Others8%
USD97%
Others4%
Currency Composition of Outstanding Borrowings
Before Swaps After Swaps
2019
2018 USD72%
AUD10%
EUR4%
GBP3%
NZD3%
Others8%
USD97%
JPY1%
Others3%
27
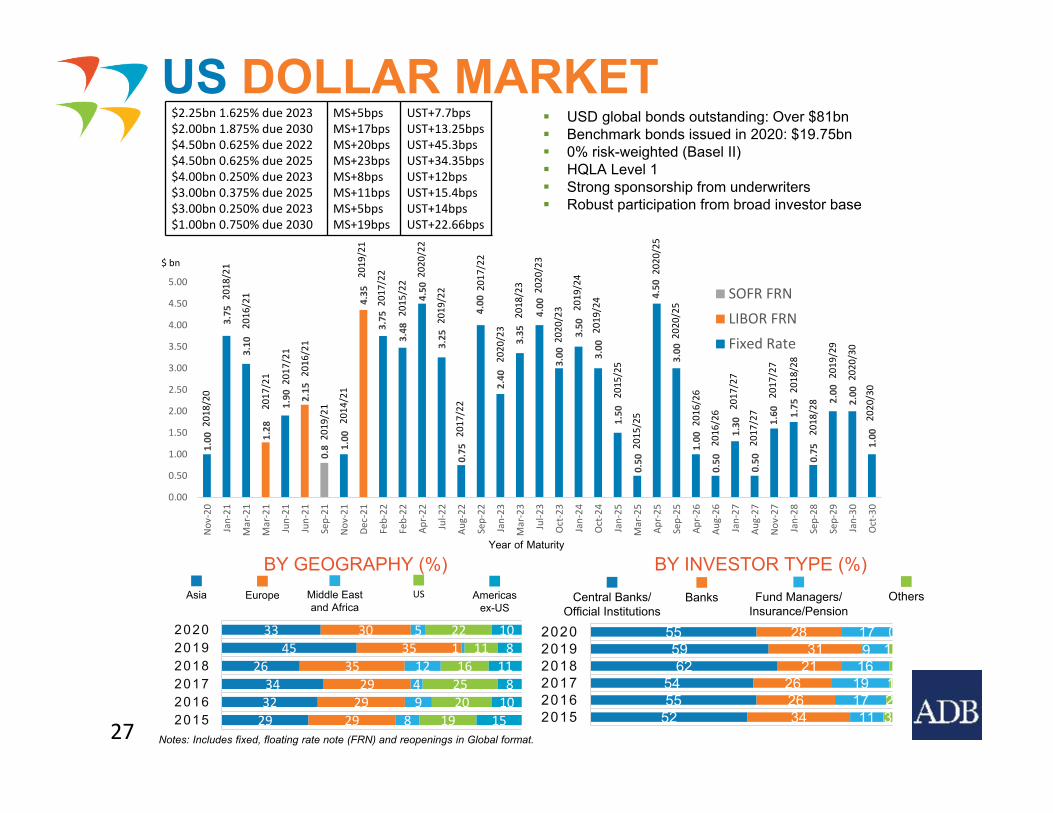
US DOLLAR MARKET$2.25bn 1.625% due 2023$2.00bn 1.875% due 2030$4.50bn 0.625% due 2022$4.50bn 0.625% due 2025$4.00bn 0.250% due 2023$3.00bn 0.375% due 2025$3.00bn 0.250% due 2023$1.00bn 0.750% due 2030
MS+5bpsMS+17bpsMS+20bpsMS+23bpsMS+8bpsMS+11bpsMS+5bpsMS+19bps
UST+7.7bpsUST+13.25bpsUST+45.3bpsUST+34.35bpsUST+12bpsUST+15.4bpsUST+14bpsUST+22.66bps
1.00
3.75
3.10
1.90
1.00
3.75
3.48
4.50
3.25
0.75
4.00
2.40
3.35
4.00
3.00
3.50
3.00
1.50
0.50
4.50
3.00
1.00
0.50
1.30
0.50
1.60 1.75
0.75
2.00
2.00
1.001.28
2.15
4.35
0.8
0.00
0.50
1.00
1.50
2.00
2.50
3.00
3.50
4.00
4.50
5.00
Nov
‐20
Jan‐21
Mar‐21
Mar‐21
Jun‐21
Jun‐21
Sep‐21
Nov
‐21
Dec‐21
Feb‐22
Feb‐22
Apr‐22
Jul‐2
2
Aug‐22
Sep‐22
Jan‐23
Mar‐23
Jul‐2
3
Oct‐23
Jan‐24
Oct‐24
Jan‐25
Mar‐25
Apr‐25
Sep‐25
Apr‐26
Aug‐26
Jan‐27
Aug‐27
Nov
‐27
Jan‐28
Sep‐28
Sep‐29
Jan‐30
Oct‐30
SOFR FRN
LIBOR FRN
Fixed Rate
Year of Maturity
$ bn
2019/22
2020/22
2020/25
2018/20
2018/21
2016/21
2017/21 2017/21
2016/21
2014/21
2017/22
2015/22
2017/22
2017/22
2018/23
2015/25
2015/25
2016/26
2016/26 20
17/27
2017/27
2017/27
2018/28
2019/29
2019/24
BY GEOGRAPHY (%) BY INVESTOR TYPE (%)
Notes: Includes fixed, floating rate note (FRN) and reopenings in Global format.
293234
2645
33
292929
3535
30
89412
15
19202516
1122
15108
11810
201520162017201820192020
Asia Europe Americasex-US
Middle Eastand Africa
US Central Banks/Official Institutions
Banks Fund Managers/Insurance/Pension
Others
525554
6259
55
342626
2131
28
11171916917
321
10
201520162017201820192020
USD global bonds outstanding: Over $81bn Benchmark bonds issued in 2020: $19.75bn 0% risk-weighted (Basel II) HQLA Level 1 Strong sponsorship from underwriters Robust participation from broad investor base
2019/21
2019/21
2018/28
2019/24
2020/23
2020/30
2020/23
2020/30
2020/25
2020/23
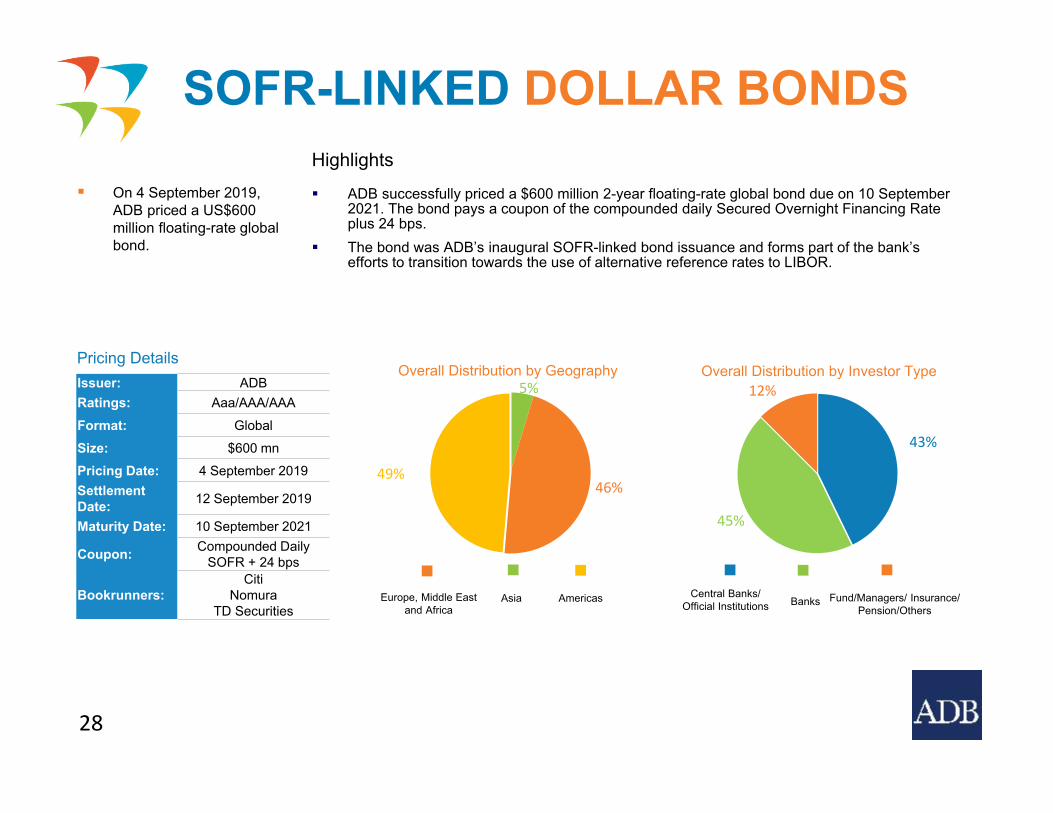
On 4 September 2019, ADB priced a US$600 million floating-rate global bond.
Overall Distribution by Geography Overall Distribution by Investor Type
SOFR-LINKED DOLLAR BONDS
AsiaEurope, Middle Eastand Africa
Central Banks/Official Institutions Banks Fund/Managers/ Insurance/
Pension/Others
Highlights
ADB successfully priced a $600 million 2-year floating-rate global bond due on 10 September 2021. The bond pays a coupon of the compounded daily Secured Overnight Financing Rate plus 24 bps.
The bond was ADB’s inaugural SOFR-linked bond issuance and forms part of the bank’s efforts to transition towards the use of alternative reference rates to LIBOR.
Pricing Details
28
Issuer: ADBRatings: Aaa/AAA/AAA
Format: GlobalSize: $600 mnPricing Date: 4 September 2019Settlement Date: 12 September 2019
Maturity Date: 10 September 2021
Coupon: Compounded Daily SOFR + 24 bps
Bookrunners:Citi
NomuraTD Securities
5%
46%49%
43%
45%
12%
Americas
37 37 26
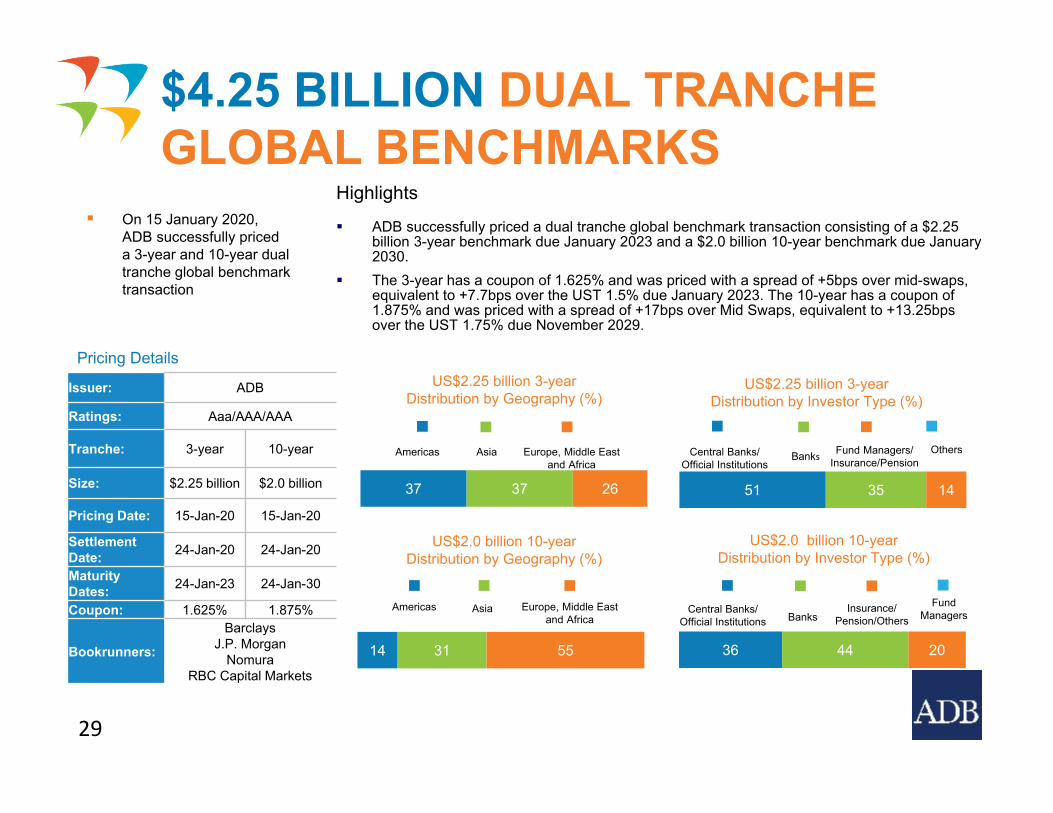
On 15 January 2020, ADB successfully priced a 3-year and 10-year dual tranche global benchmark transaction
US$2.25 billion 3-yearDistribution by Geography (%)
US$2.25 billion 3-yearDistribution by Investor Type (%)
$4.25 BILLION DUAL TRANCHE GLOBAL BENCHMARKS
Americas Asia Europe, Middle Eastand Africa
Central Banks/Official Institutions Banks
Insurance/Pension/Others
FundManagers
Highlights
ADB successfully priced a dual tranche global benchmark transaction consisting of a $2.25 billion 3-year benchmark due January 2023 and a $2.0 billion 10-year benchmark due January 2030.
The 3-year has a coupon of 1.625% and was priced with a spread of +5bps over mid-swaps, equivalent to +7.7bps over the UST 1.5% due January 2023. The 10-year has a coupon of 1.875% and was priced with a spread of +17bps over Mid Swaps, equivalent to +13.25bps over the UST 1.75% due November 2029.
US$2.0 billion 10-yearDistribution by Geography (%)
US$2.0 billion 10-yearDistribution by Investor Type (%)
Pricing Details
Americas Asia Europe, Middle Eastand Africa
Central Banks/Official Institutions
Banks Fund Managers/Insurance/Pension
Others
14 31 55
51 35 14
36 44 20
Issuer: ADB
Ratings: Aaa/AAA/AAA
Tranche: 3-year 10-year
Size: $2.25 billion $2.0 billion
Pricing Date: 15-Jan-20 15-Jan-20
Settlement Date: 24-Jan-20 24-Jan-20
Maturity Dates: 24-Jan-23 24-Jan-30
Coupon: 1.625% 1.875%
Bookrunners:
BarclaysJ.P. Morgan
NomuraRBC Capital Markets
29
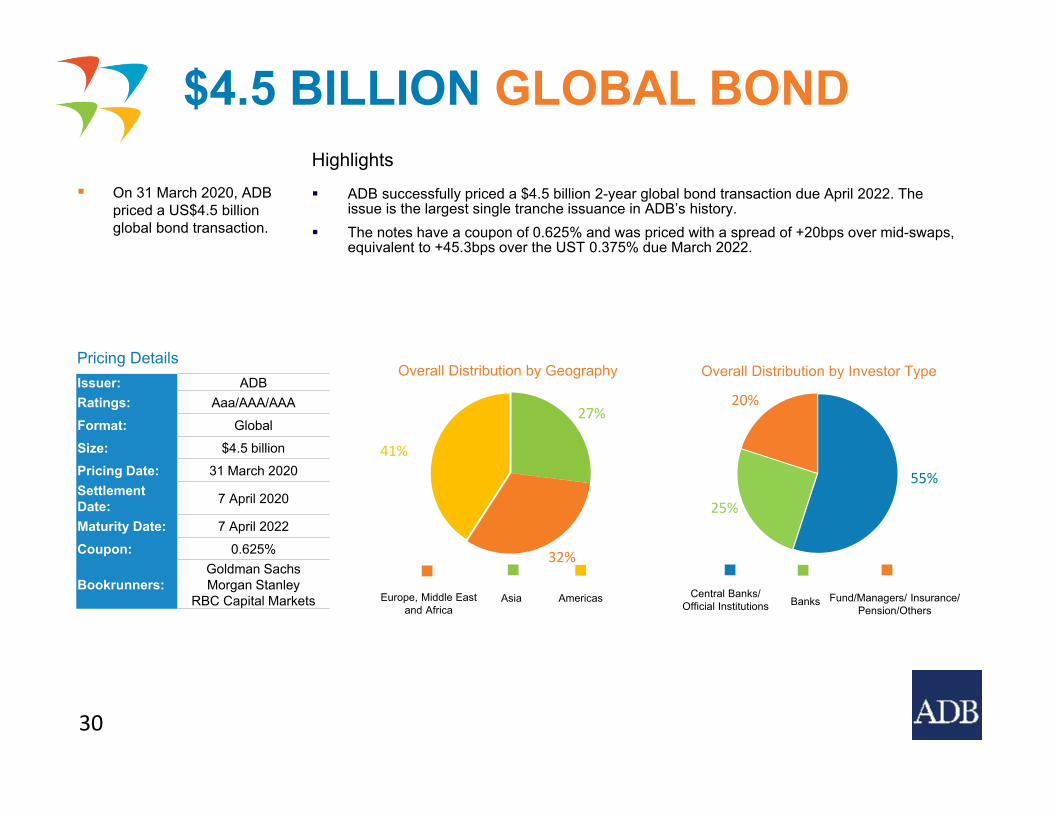
On 31 March 2020, ADB priced a US$4.5 billion global bond transaction.
Overall Distribution by Geography Overall Distribution by Investor Type
$4.5 BILLION GLOBAL BOND
AsiaEurope, Middle Eastand Africa
Central Banks/Official Institutions Banks Fund/Managers/ Insurance/
Pension/Others
Highlights
ADB successfully priced a $4.5 billion 2-year global bond transaction due April 2022. The issue is the largest single tranche issuance in ADB’s history.
The notes have a coupon of 0.625% and was priced with a spread of +20bps over mid-swaps, equivalent to +45.3bps over the UST 0.375% due March 2022.
Pricing Details
30
Issuer: ADBRatings: Aaa/AAA/AAA
Format: GlobalSize: $4.5 billionPricing Date: 31 March 2020Settlement Date: 7 April 2020
Maturity Date: 7 April 2022
Coupon: 0.625%
Bookrunners:Goldman SachsMorgan Stanley
RBC Capital Markets
27%
32%
41%
55%
25%
20%
Americas
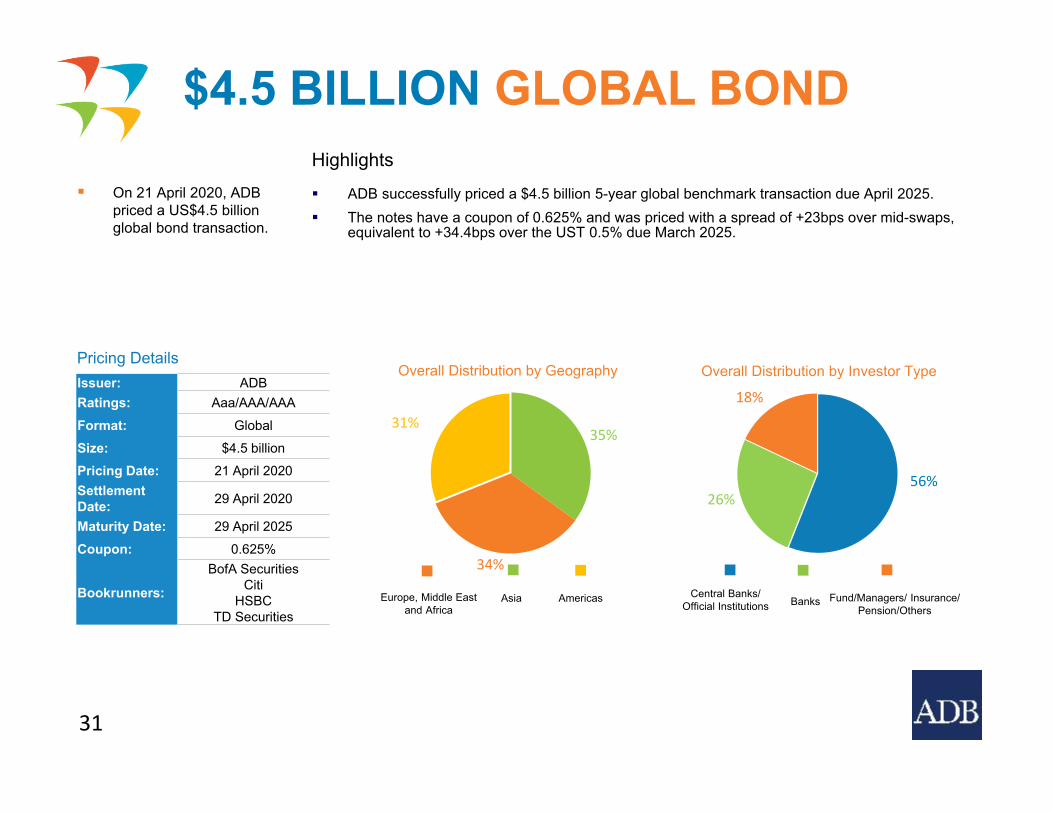
On 21 April 2020, ADB priced a US$4.5 billion global bond transaction.
Overall Distribution by Geography Overall Distribution by Investor Type
$4.5 BILLION GLOBAL BOND
AsiaEurope, Middle Eastand Africa
Central Banks/Official Institutions Banks Fund/Managers/ Insurance/
Pension/Others
Highlights
ADB successfully priced a $4.5 billion 5-year global benchmark transaction due April 2025. The notes have a coupon of 0.625% and was priced with a spread of +23bps over mid-swaps,
equivalent to +34.4bps over the UST 0.5% due March 2025.
Pricing Details
31
Issuer: ADBRatings: Aaa/AAA/AAA
Format: GlobalSize: $4.5 billionPricing Date: 21 April 2020Settlement Date: 29 April 2020
Maturity Date: 29 April 2025
Coupon: 0.625%
Bookrunners:
BofA SecuritiesCiti
HSBCTD Securities
35%
34%
31%
56%26%
18%
Americas
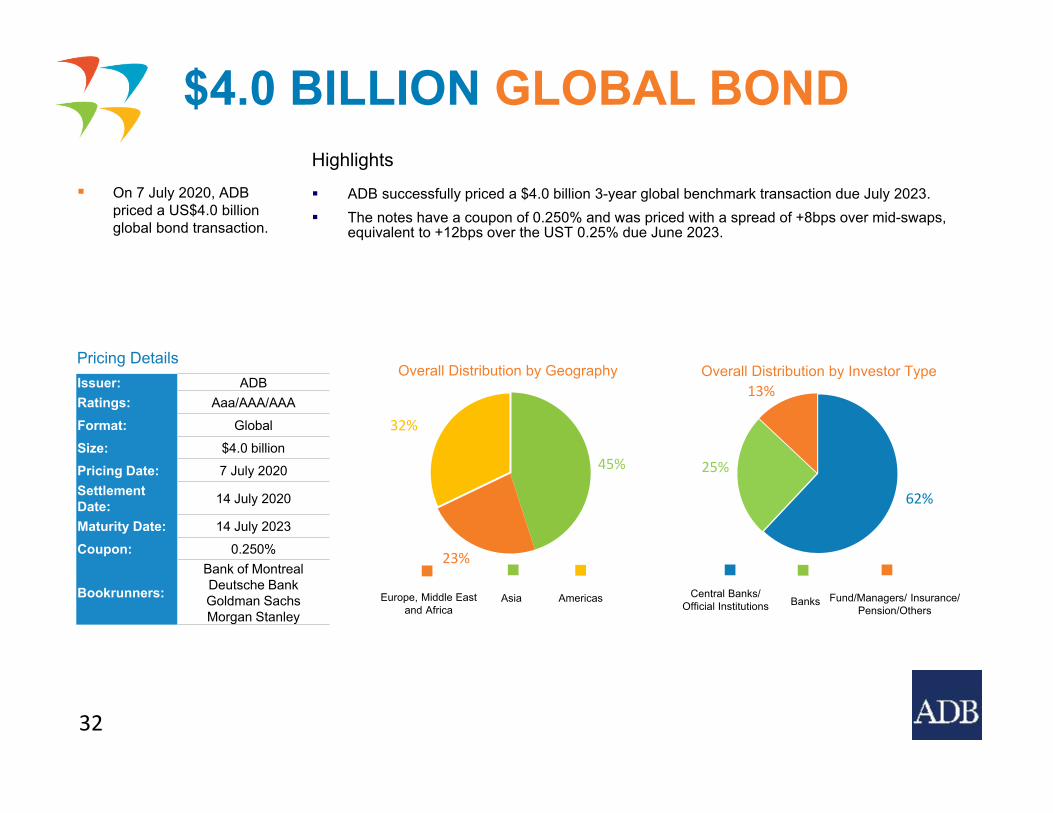
On 7 July 2020, ADB priced a US$4.0 billion global bond transaction.
Overall Distribution by Geography Overall Distribution by Investor Type
$4.0 BILLION GLOBAL BOND
AsiaEurope, Middle Eastand Africa
Central Banks/Official Institutions Banks Fund/Managers/ Insurance/
Pension/Others
Highlights
ADB successfully priced a $4.0 billion 3-year global benchmark transaction due July 2023. The notes have a coupon of 0.250% and was priced with a spread of +8bps over mid-swaps,
equivalent to +12bps over the UST 0.25% due June 2023.
Pricing Details
32
Issuer: ADBRatings: Aaa/AAA/AAA
Format: GlobalSize: $4.0 billionPricing Date: 7 July 2020Settlement Date: 14 July 2020
Maturity Date: 14 July 2023
Coupon: 0.250%
Bookrunners:
Bank of MontrealDeutsche BankGoldman SachsMorgan Stanley
45%
23%
32%
62%
25%
13%
Americas
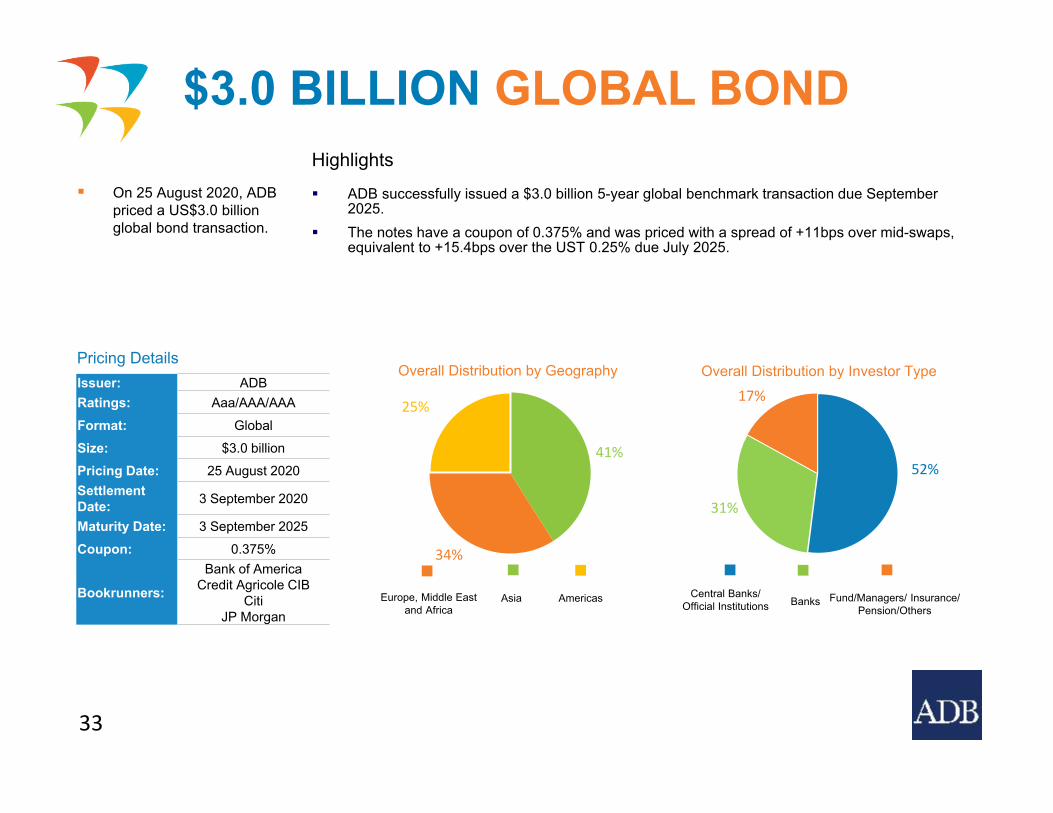
On 25 August 2020, ADB priced a US$3.0 billion global bond transaction.
Overall Distribution by Geography Overall Distribution by Investor Type
$3.0 BILLION GLOBAL BOND
AsiaEurope, Middle Eastand Africa
Central Banks/Official Institutions Banks Fund/Managers/ Insurance/
Pension/Others
Highlights
ADB successfully issued a $3.0 billion 5-year global benchmark transaction due September 2025.
The notes have a coupon of 0.375% and was priced with a spread of +11bps over mid-swaps, equivalent to +15.4bps over the UST 0.25% due July 2025.
Pricing Details
33
Issuer: ADBRatings: Aaa/AAA/AAA
Format: GlobalSize: $3.0 billionPricing Date: 25 August 2020Settlement Date: 3 September 2020
Maturity Date: 3 September 2025
Coupon: 0.375%
Bookrunners:
Bank of AmericaCredit Agricole CIB
CitiJP Morgan
41%
34%
25%
52%
31%
17%
Americas
35 36 29
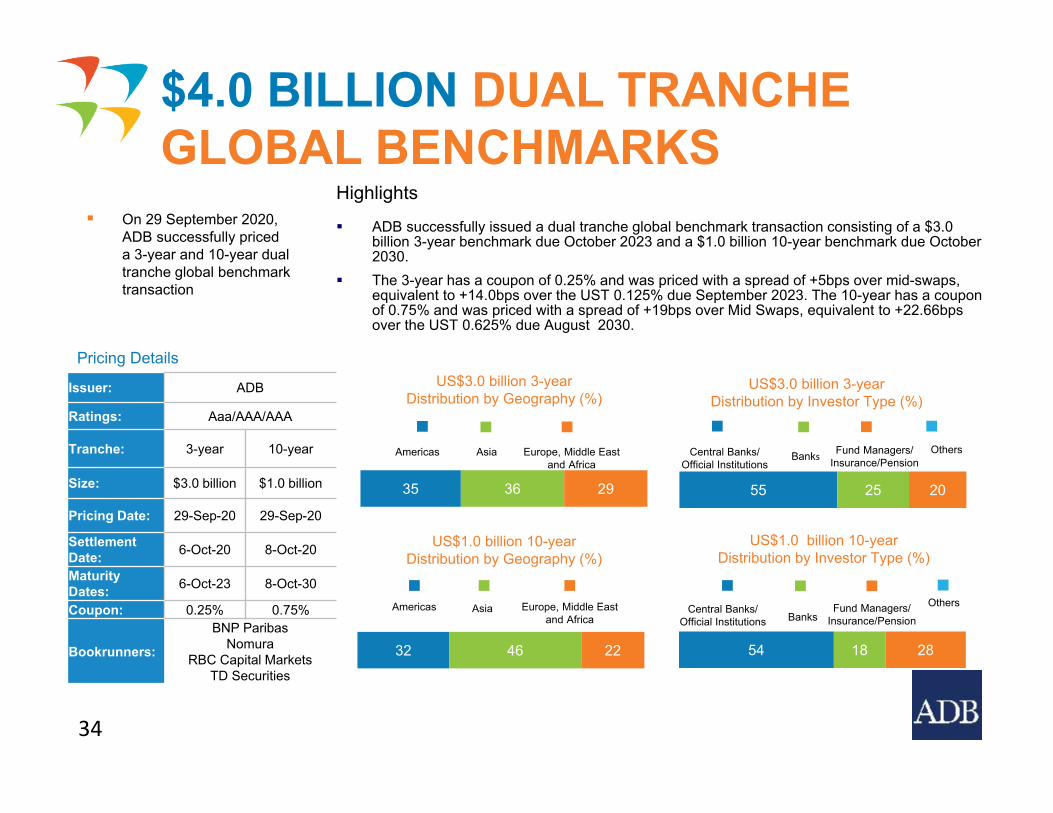
On 29 September 2020, ADB successfully priced a 3-year and 10-year dual tranche global benchmark transaction
US$3.0 billion 3-yearDistribution by Geography (%)
US$3.0 billion 3-yearDistribution by Investor Type (%)
$4.0 BILLION DUAL TRANCHE GLOBAL BENCHMARKS
Americas Asia Europe, Middle Eastand Africa
Central Banks/Official Institutions Banks
Fund Managers/Insurance/Pension
Others
Highlights
ADB successfully issued a dual tranche global benchmark transaction consisting of a $3.0 billion 3-year benchmark due October 2023 and a $1.0 billion 10-year benchmark due October 2030.
The 3-year has a coupon of 0.25% and was priced with a spread of +5bps over mid-swaps, equivalent to +14.0bps over the UST 0.125% due September 2023. The 10-year has a coupon of 0.75% and was priced with a spread of +19bps over Mid Swaps, equivalent to +22.66bps over the UST 0.625% due August 2030.
US$1.0 billion 10-yearDistribution by Geography (%)
US$1.0 billion 10-yearDistribution by Investor Type (%)
Pricing Details
Americas Asia Europe, Middle Eastand Africa
Central Banks/Official Institutions
Banks Fund Managers/Insurance/Pension
Others
32 46 22
55 25 20
54 18 28
Issuer: ADB
Ratings: Aaa/AAA/AAA
Tranche: 3-year 10-year
Size: $3.0 billion $1.0 billion
Pricing Date: 29-Sep-20 29-Sep-20
Settlement Date: 6-Oct-20 8-Oct-20
Maturity Dates: 6-Oct-23 8-Oct-30
Coupon: 0.25% 0.75%
Bookrunners:
BNP ParibasNomura
RBC Capital MarketsTD Securities
34
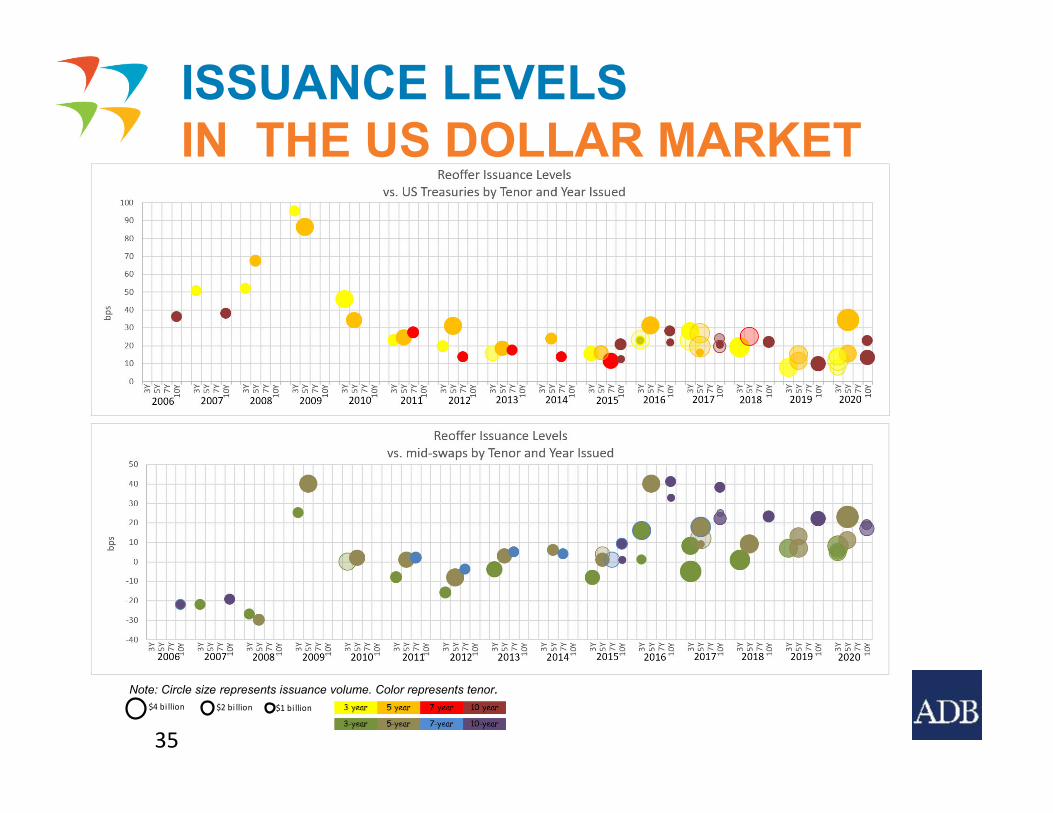
Note: Circle size represents issuance volume. Color represents tenor.
35
ISSUANCE LEVELS IN THE US DOLLAR MARKET
$4 bi llion $2 bi llion $1 bi llion
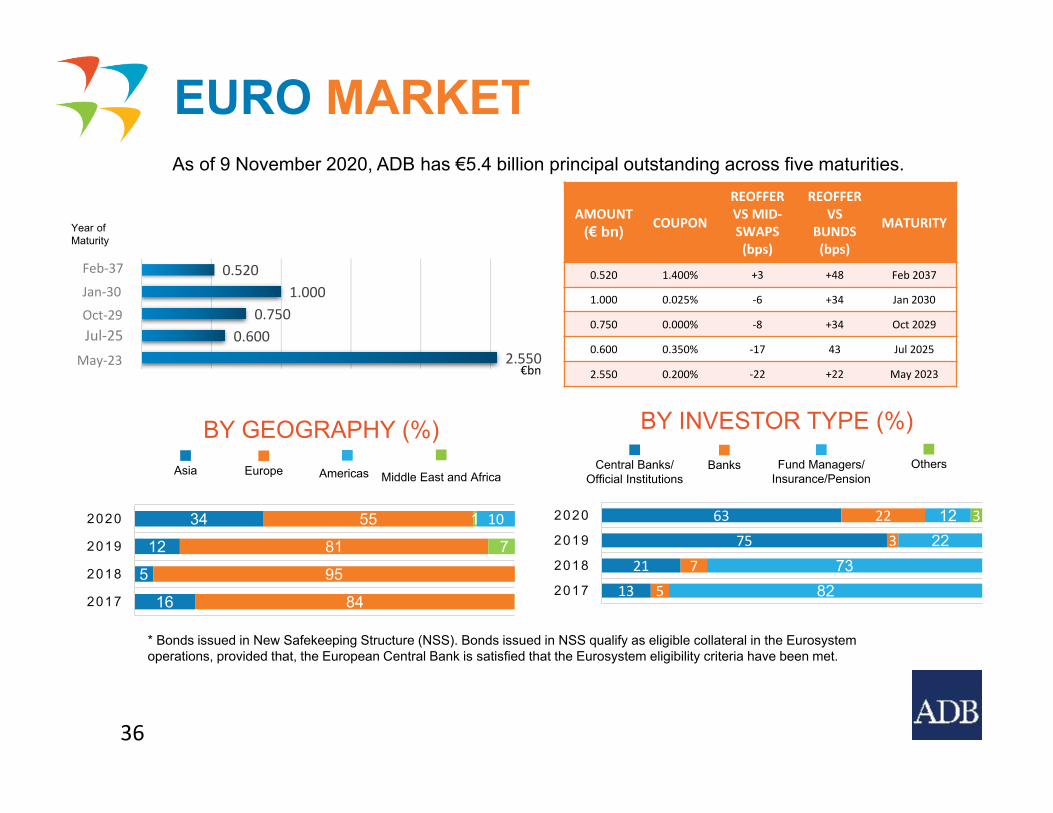
As of 9 November 2020, ADB has €5.4 billion principal outstanding across five maturities.
EURO MARKET
BY GEOGRAPHY (%) BY INVESTOR TYPE (%)
Asia Europe Middle East and AfricaAmericasCentral Banks/
Official InstitutionsBanks Fund Managers/
Insurance/PensionOthers
16
5
12
34
84
95
81
55
7
1 10
2017
2018
2019
2020
13
21
75
63
5
7
3
22
8273
2212 3
2017
2018
2019
2020
AMOUNT(€ bn) COUPON
REOFFER VS MID‐SWAPS (bps)
REOFFER VS
BUNDS (bps)
MATURITY
0.520 1.400% +3 +48 Feb 2037
1.000 0.025% ‐6 +34 Jan 2030
0.750 0.000% ‐8 +34 Oct 2029
0.600 0.350% ‐17 43 Jul 2025
2.550 0.200% ‐22 +22 May 2023
36
* Bonds issued in New Safekeeping Structure (NSS). Bonds issued in NSS qualify as eligible collateral in the Eurosystemoperations, provided that, the European Central Bank is satisfied that the Eurosystem eligibility criteria have been met.
2.5500.600
0.7501.000
0.520
Year of Maturity
€bn
Jul‐25May‐23
Feb‐37
Oct‐29
Jan‐30
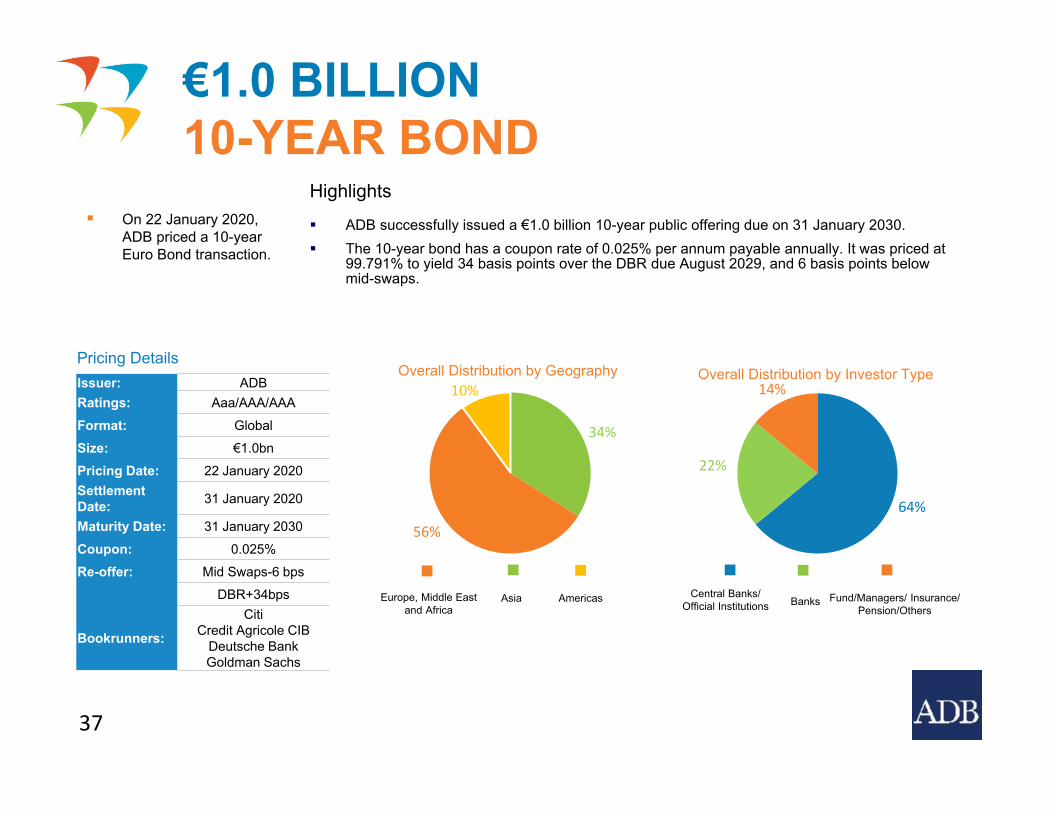
On 22 January 2020, ADB priced a 10-year Euro Bond transaction.
Overall Distribution by Geography Overall Distribution by Investor Type
€1.0 BILLION 10-YEAR BOND
AsiaEurope, Middle Eastand Africa
Central Banks/Official Institutions Banks Fund/Managers/ Insurance/
Pension/Others
Highlights
ADB successfully issued a €1.0 billion 10-year public offering due on 31 January 2030. The 10-year bond has a coupon rate of 0.025% per annum payable annually. It was priced at
99.791% to yield 34 basis points over the DBR due August 2029, and 6 basis points below mid-swaps.
Pricing Details
37
Issuer: ADBRatings: Aaa/AAA/AAA
Format: GlobalSize: €1.0bnPricing Date: 22 January 2020Settlement Date: 31 January 2020
Maturity Date: 31 January 2030
Coupon: 0.025%Re-offer: Mid Swaps-6 bps
DBR+34bps
Bookrunners:
CitiCredit Agricole CIB
Deutsche BankGoldman Sachs
34%
56%
10%
64%
22%
14%
Americas
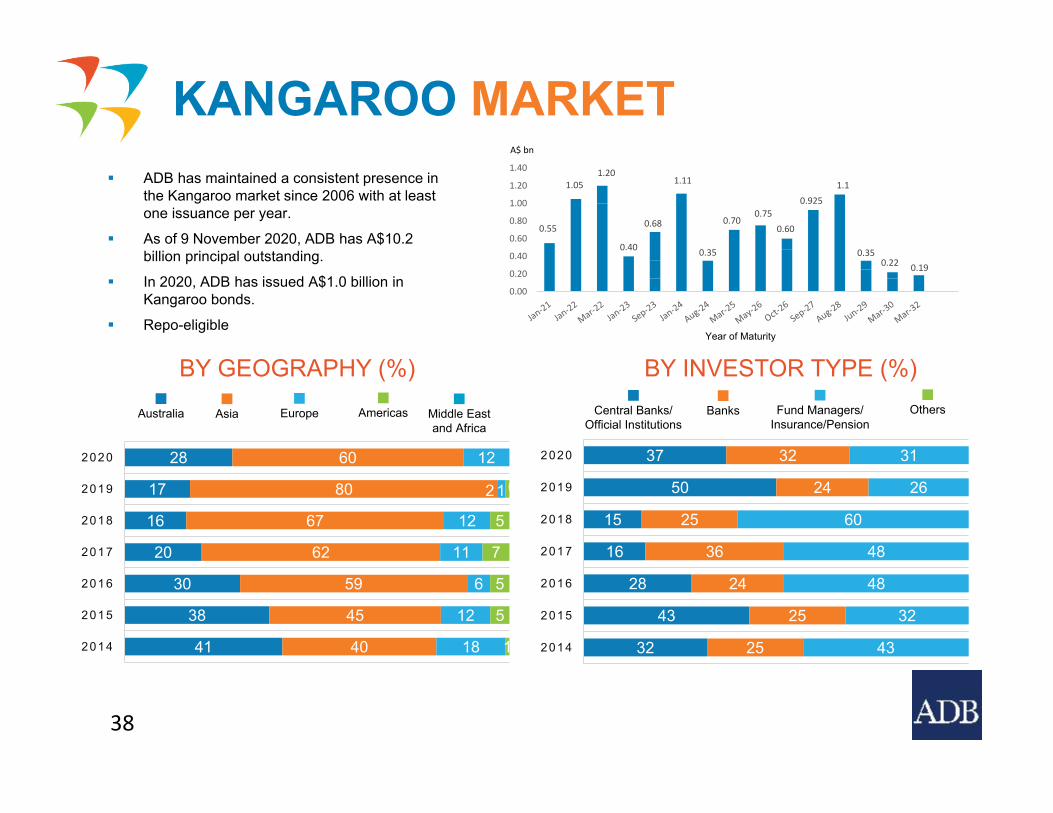
ADB has maintained a consistent presence in the Kangaroo market since 2006 with at least one issuance per year.
As of 9 November 2020, ADB has A$10.2 billion principal outstanding.
In 2020, ADB has issued A$1.0 billion in Kangaroo bonds.
Repo-eligible
KANGAROO MARKET
38
41
38
30
20
16
17
28
40
45
59
62
67
80
60
18
12
6
11
12
2
12
1
5
5
7
5
1 0
2014
2015
2016
2017
2018
2019
2020
32
43
28
16
15
50
37
25
25
24
36
25
24
32
43
32
48
48
60
26
31
2014
2015
2016
2017
2018
2019
2020
Australia Asia Middle Eastand Africa
Europe Americas
BY GEOGRAPHY (%)Central Banks/
Official InstitutionsBanks Fund Managers/
Insurance/PensionOthers
BY INVESTOR TYPE (%)
0.55
1.20
0.70
1.05
0.60
0.925
0.19
0.40
0.68
1.1
0.35
1.11
0.350.22
0.75
0.00
0.20
0.40
0.60
0.80
1.00
1.20
1.40
Year of Maturity
A$ bn
0.600
1.225
0.700
0.300
0.200
0.325
0.000 0.200 0.400 0.600 0.800 1.000 1.200 1.400
Apr‐21
Jan‐23
May‐24
Jan‐25
Apr‐26
Sep‐25
NZ$ bn
Year of Maturity
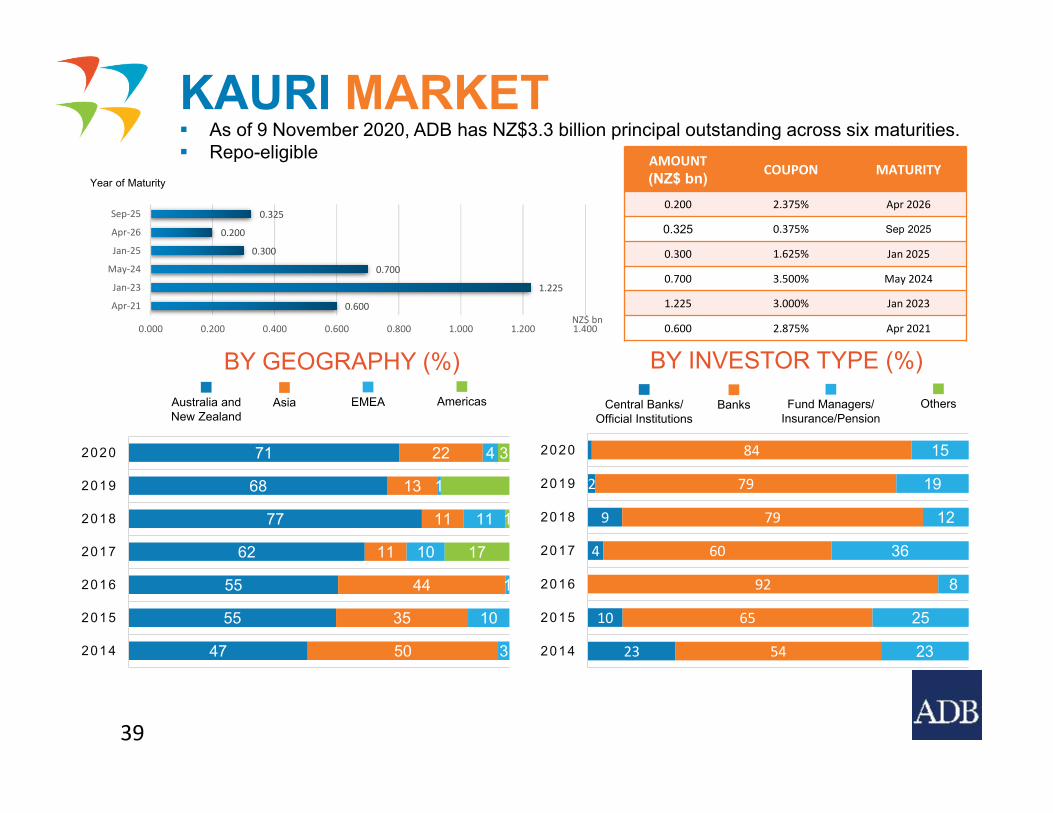
As of 9 November 2020, ADB has NZ$3.3 billion principal outstanding across six maturities. Repo-eligible
KAURI MARKET
BY GEOGRAPHY (%) BY INVESTOR TYPE (%)Australia andNew Zealand
Asia EMEA Americas Central Banks/Official Institutions
Banks Fund Managers/Insurance/Pension
Others
47
55
55
62
77
68
71
50
35
44
11
11
13
22
3
10
1
10
11
1
4
17
1
3
2014
2015
2016
2017
2018
2019
2020
23
10
4
9
2
54
65
92
60
79
79
84
23
25
8
36
12
19
15
2014
2015
2016
2017
2018
2019
2020
AMOUNT(NZ$ bn) COUPON MATURITY
0.200 2.375% Apr 2026
0.325 0.375% Sep 2025
0.300 1.625% Jan 2025
0.700 3.500% May 2024
1.225 3.000% Jan 2023
0.600 2.875% Apr 2021
39
0.5000.250
0.6000.800
0.9251.000
0.5000.575
0.2500.750
0.000 0.200 0.400 0.600 0.800 1.000 1.200
Feb 2022Mar 2022Dec 2022Oct 2023Dec 2023Mar 2024Mar 2025Dec 2025Sep 2026Oct 2027
£ bn
Year of Maturity
BY GEOGRAPHY (%)
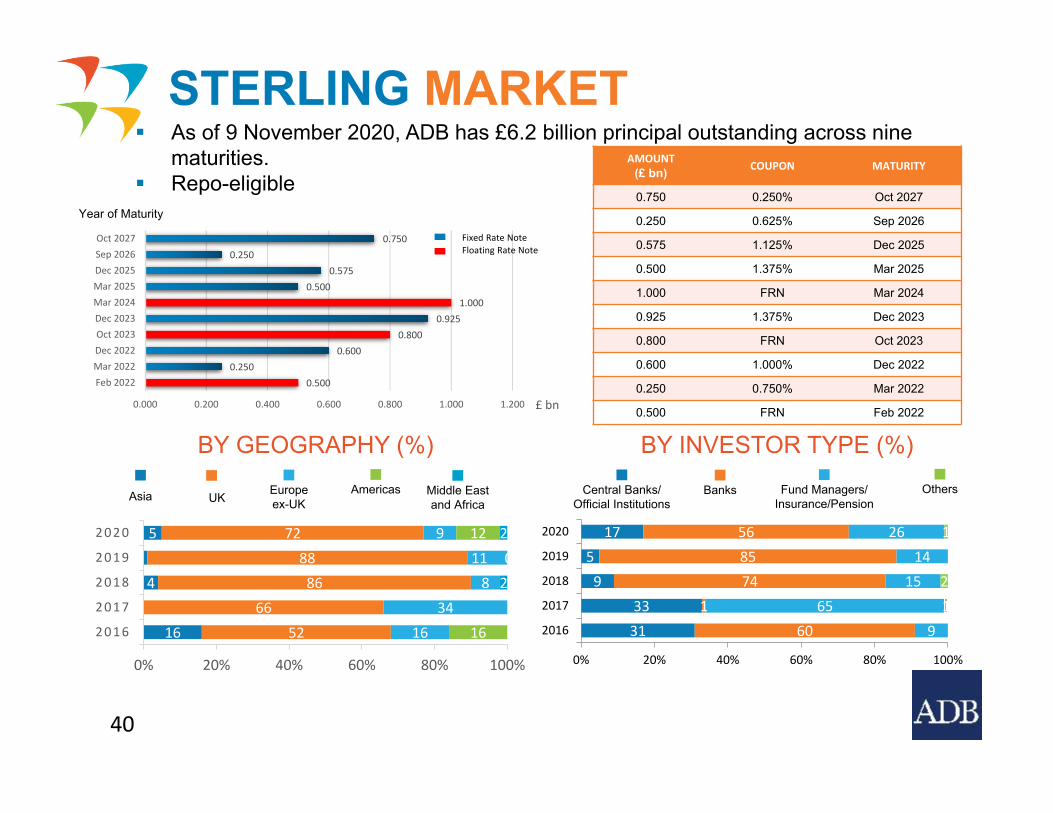
As of 9 November 2020, ADB has £6.2 billion principal outstanding across nine maturities.
Repo-eligible
STERLING MARKET
BY INVESTOR TYPE (%)
AMOUNT(£ bn) COUPON MATURITY
0.750 0.250% Oct 2027
0.250 0.625% Sep 2026
0.575 1.125% Dec 2025
0.500 1.375% Mar 2025
1.000 FRN Mar 2024
0.925 1.375% Dec 2023
0.800 FRN Oct 2023
0.600 1.000% Dec 2022
0.250 0.750% Mar 2022
0.500 FRN Feb 2022
Asia UK Middle Eastand Africa
Europeex-UK
Americas Central Banks/Official Institutions
Banks Fund Managers/Insurance/Pension
Others
16
4
5
5266
8688
72
1634
811
9
16
12
202
0% 20% 40% 60% 80% 100%
2016
2017
2018
2019
2020
3133
95
17
601
748556
965
1514
26
12
1
0% 20% 40% 60% 80% 100%
2016
2017
2018
2019
2020
40
Floating Rate NoteFixed Rate Note
Overall Distribution by Geography Overall Distribution by Investor Type
SONIA-LINKED STERLING BONDS
UKEurope ex-UK Central Banks/Official Institutions Banks Fund/Managers/ Insurance/
Pension/Others
Pricing Details
41
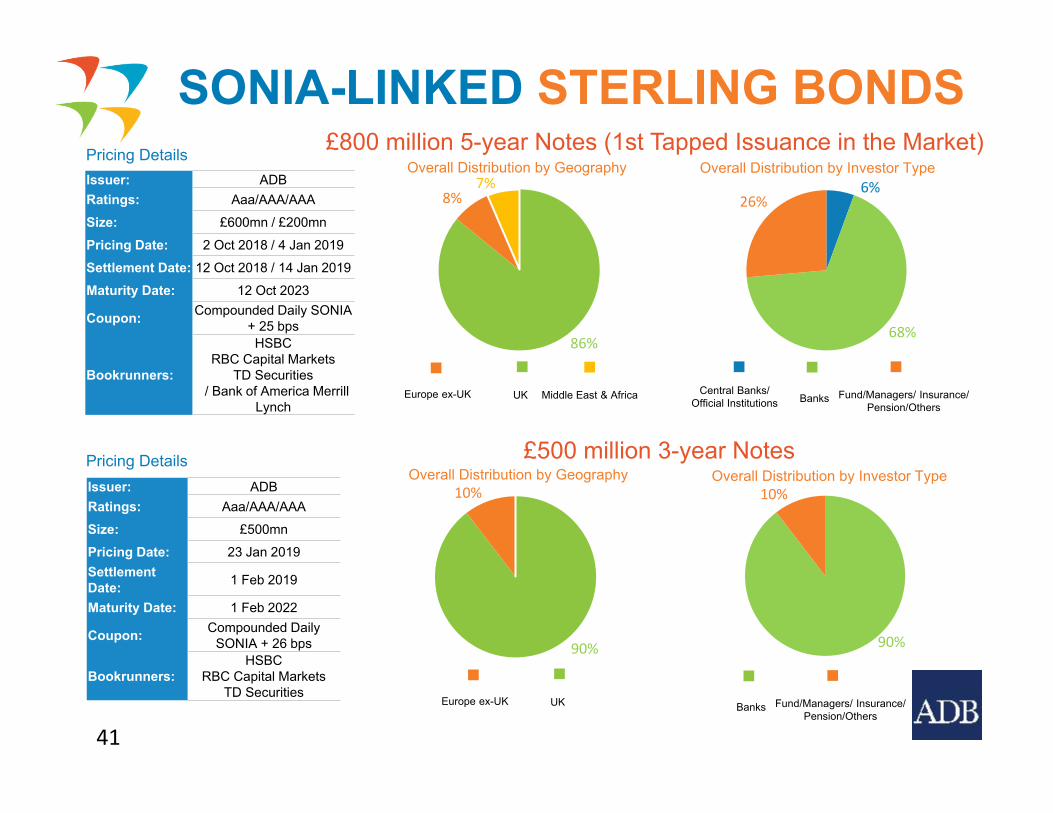
Issuer: ADBRatings: Aaa/AAA/AAASize: £600mn / £200mn
Pricing Date: 2 Oct 2018 / 4 Jan 2019Settlement Date: 12 Oct 2018 / 14 Jan 2019
Maturity Date: 12 Oct 2023
Coupon: Compounded Daily SONIA + 25 bps
Bookrunners:
HSBCRBC Capital Markets
TD Securities/ Bank of America Merrill
Lynch
86%
8%7% 6%
68%
26%
Middle East & Africa
Overall Distribution by Geography Overall Distribution by Investor Type
UKEurope ex-UK Banks Fund/Managers/ Insurance/Pension/Others
Pricing DetailsIssuer: ADBRatings: Aaa/AAA/AAASize: £500mnPricing Date: 23 Jan 2019Settlement Date: 1 Feb 2019
Maturity Date: 1 Feb 2022
Coupon: Compounded Daily SONIA + 26 bps
Bookrunners:HSBC
RBC Capital MarketsTD Securities
£800 million 5-year Notes (1st Tapped Issuance in the Market)
£500 million 3-year Notes
90%
10%
90%
10%
SONIA-LINKED STERLING BONDS
42
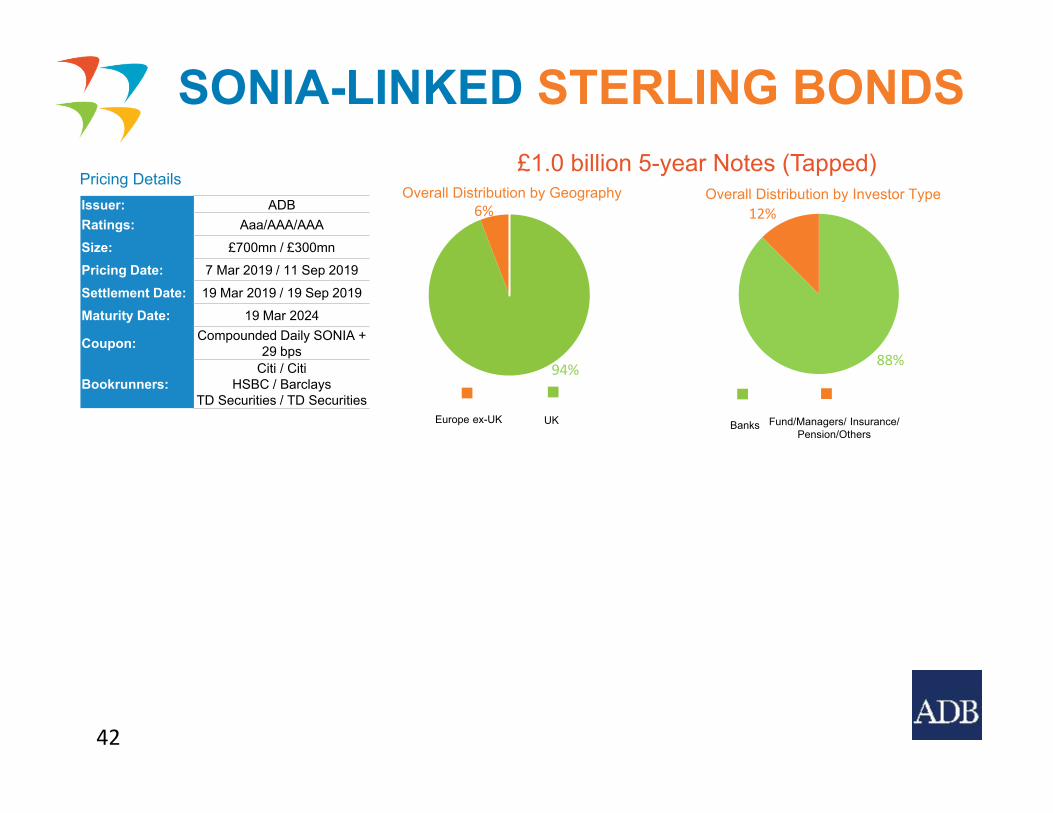
Overall Distribution by Geography Overall Distribution by Investor Type
UKEurope ex-UK Banks Fund/Managers/ Insurance/Pension/Others
Pricing DetailsIssuer: ADBRatings: Aaa/AAA/AAASize: £700mn / £300mnPricing Date: 7 Mar 2019 / 11 Sep 2019
Settlement Date: 19 Mar 2019 / 19 Sep 2019Maturity Date: 19 Mar 2024
Coupon: Compounded Daily SONIA + 29 bps
Bookrunners:Citi / Citi
HSBC / BarclaysTD Securities / TD Securities
£1.0 billion 5-year Notes (Tapped)
94%
6%
88%
12%
43
3.500
4.9000.250
0.5000.450
0.2400.500
0.380
0.000 1.000 2.000 3.000 4.000 5.000 6.000
Jun 2023Jul 2026Jan 2028Oct 2028Apr 2029Sep 2037Nov 2039Apr 2040
SEK bn
Year of Maturity
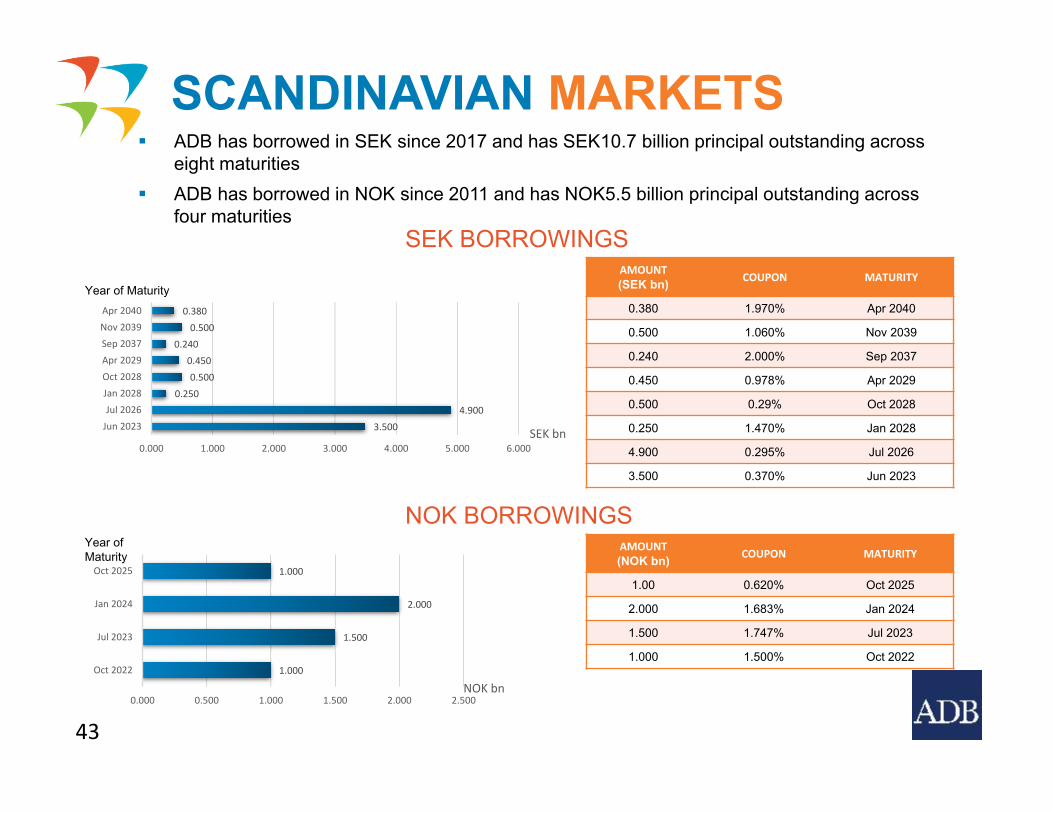
ADB has borrowed in SEK since 2017 and has SEK10.7 billion principal outstanding across eight maturities
ADB has borrowed in NOK since 2011 and has NOK5.5 billion principal outstanding across four maturities
SCANDINAVIAN MARKETS
AMOUNT(SEK bn) COUPON MATURITY
0.380 1.970% Apr 2040
0.500 1.060% Nov 2039
0.240 2.000% Sep 2037
0.450 0.978% Apr 2029
0.500 0.29% Oct 2028
0.250 1.470% Jan 2028
4.900 0.295% Jul 2026
3.500 0.370% Jun 2023
1.000
1.500
2.000
1.000
0.000 0.500 1.000 1.500 2.000 2.500
Oct 2022
Jul 2023
Jan 2024
Oct 2025
NOK bn
Year of Maturity
AMOUNT(NOK bn) COUPON MATURITY
1.00 0.620% Oct 2025
2.000 1.683% Jan 2024
1.500 1.747% Jul 2023
1.000 1.500% Oct 2022
NOK BORROWINGS
SEK BORROWINGS
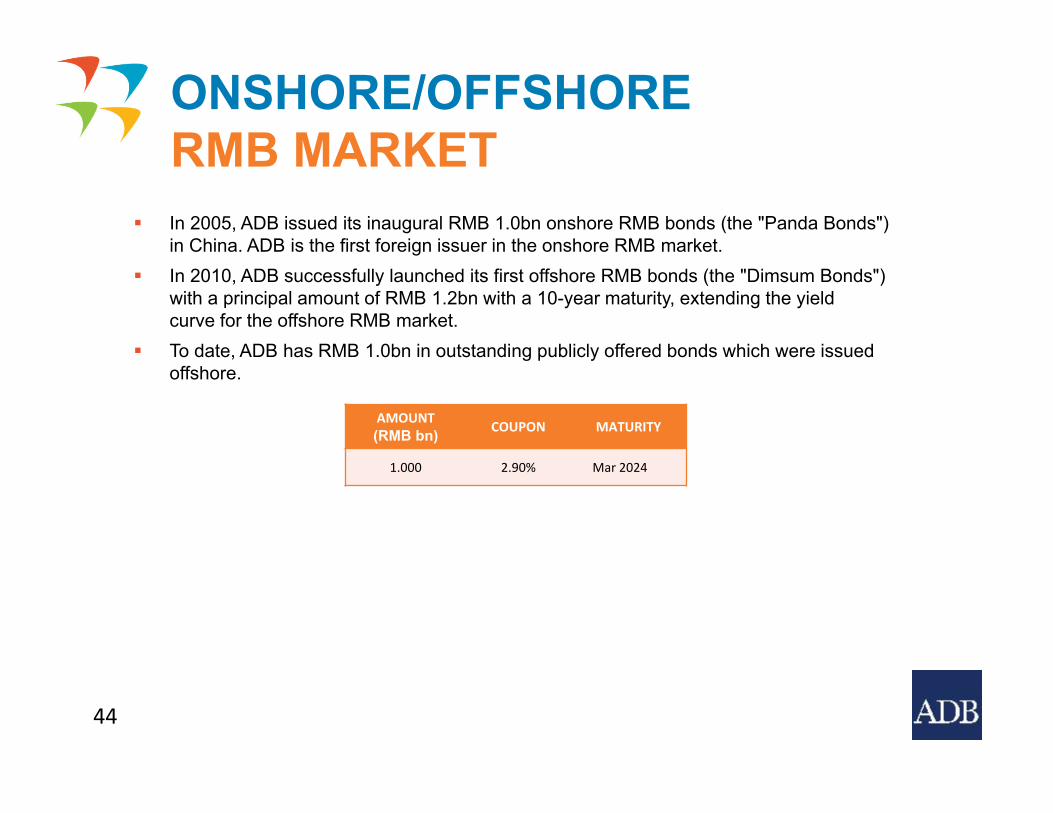
AMOUNT(RMB bn) COUPON MATURITY
1.000 2.90% Mar 2024
In 2005, ADB issued its inaugural RMB 1.0bn onshore RMB bonds (the "Panda Bonds") in China. ADB is the first foreign issuer in the onshore RMB market.
In 2010, ADB successfully launched its first offshore RMB bonds (the "Dimsum Bonds") with a principal amount of RMB 1.2bn with a 10-year maturity, extending the yield curve for the offshore RMB market.
To date, ADB has RMB 1.0bn in outstanding publicly offered bonds which were issued offshore.
ONSHORE/OFFSHORE RMB MARKET
44
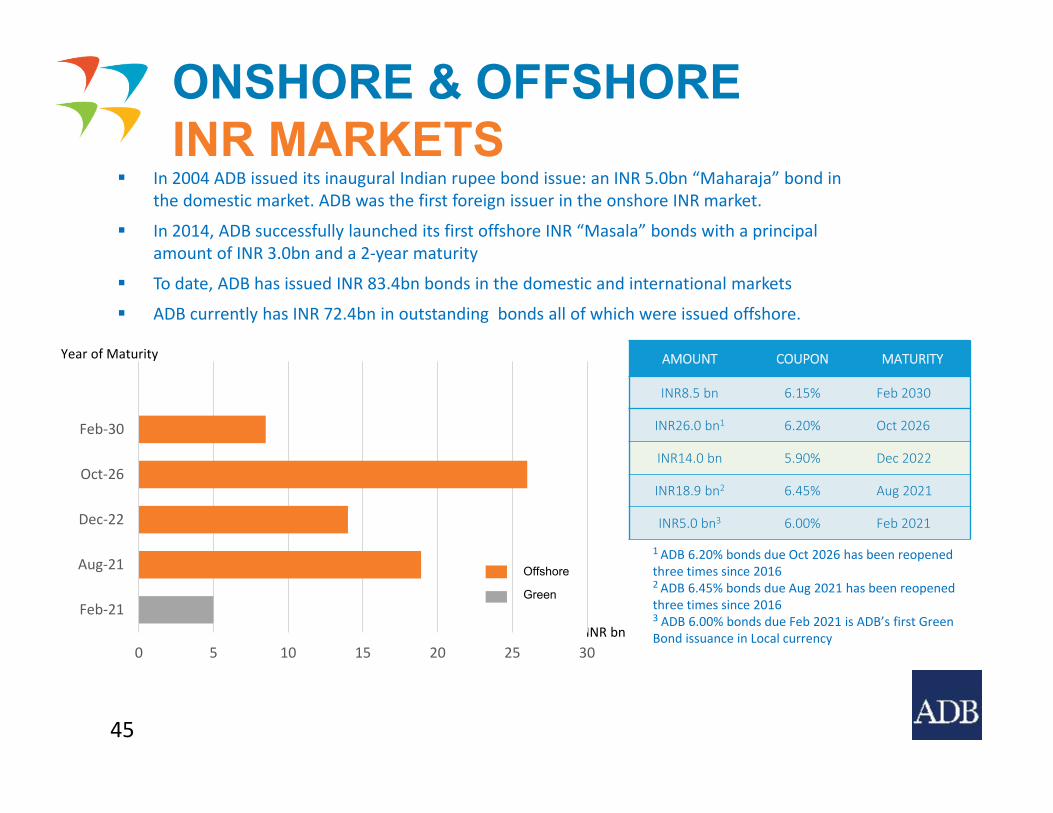
AMOUNT COUPON MATURITY
INR8.5 bn 6.15% Feb 2030
INR26.0 bn1 6.20% Oct 2026
INR14.0 bn 5.90% Dec 2022
INR18.9 bn2 6.45% Aug 2021
INR5.0 bn3 6.00% Feb 2021
In 2004 ADB issued its inaugural Indian rupee bond issue: an INR 5.0bn “Maharaja” bond in the domestic market. ADB was the first foreign issuer in the onshore INR market.
In 2014, ADB successfully launched its first offshore INR “Masala” bonds with a principal amount of INR 3.0bn and a 2‐year maturity
To date, ADB has issued INR 83.4bn bonds in the domestic and international markets
ADB currently has INR 72.4bn in outstanding bonds all of which were issued offshore.
ONSHORE & OFFSHOREINR MARKETS
Year of Maturity
INR bn
1 ADB 6.20% bonds due Oct 2026 has been reopened three times since 20162 ADB 6.45% bonds due Aug 2021 has been reopened three times since 20163 ADB 6.00% bonds due Feb 2021 is ADB’s first Green Bond issuance in Local currency
45
0 5 10 15 20 25 30
Feb‐21
Aug‐21
Dec‐22
Oct‐26
Feb‐30
Offshore
Green
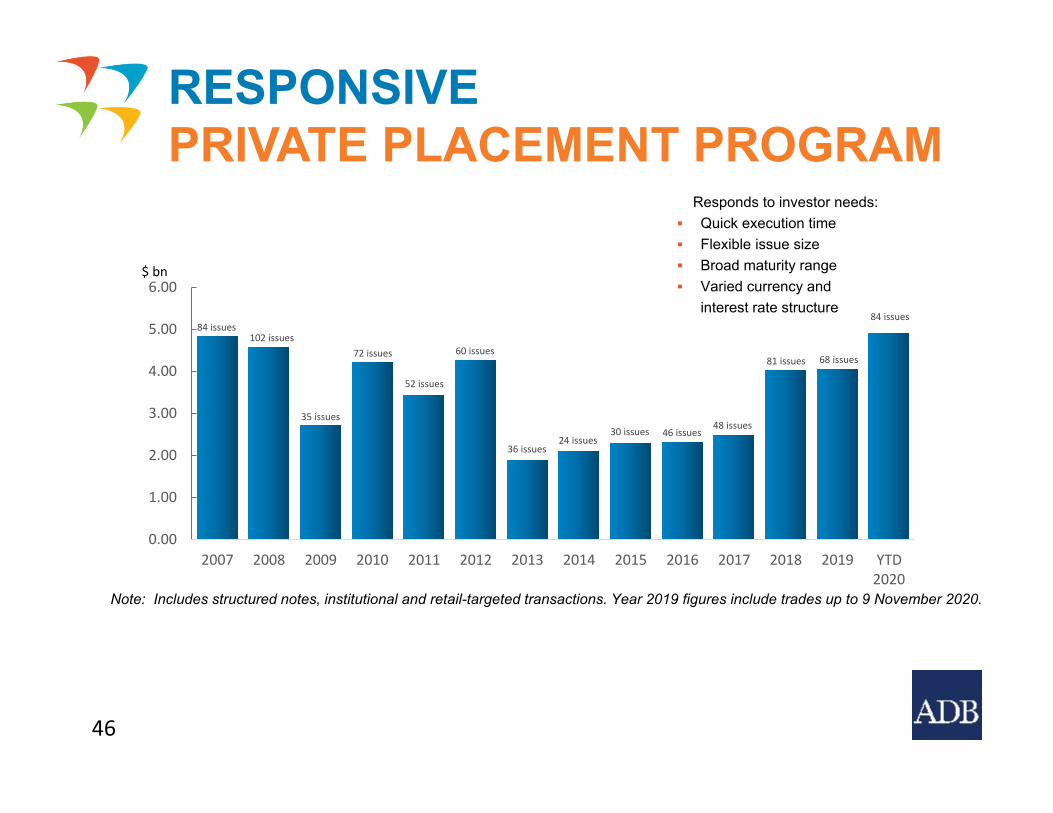
Responds to investor needs: Quick execution time Flexible issue size Broad maturity range Varied currency and
interest rate structure
Note: Includes structured notes, institutional and retail-targeted transactions. Year 2019 figures include trades up to 9 November 2020.
84 issues102 issues
35 issues
72 issues
52 issues
60 issues
36 issues24 issues
30 issues 46 issues48 issues
81 issues 68 issues
84 issues
0.00
1.00
2.00
3.00
4.00
5.00
6.00
2007 2008 2009 2010 2011 2012 2013 2014 2015 2016 2017 2018 2019 YTD2020
$ bn
RESPONSIVE PRIVATE PLACEMENT PROGRAM
46

Note: Based on notional amounts. Bonds with put and call options were considered maturing on the first put or call date. Includes ECPs.
OF OUTSTANDING BORROWINGSAs of 30 September 2020
REDEMPTION PROFILE
47
48
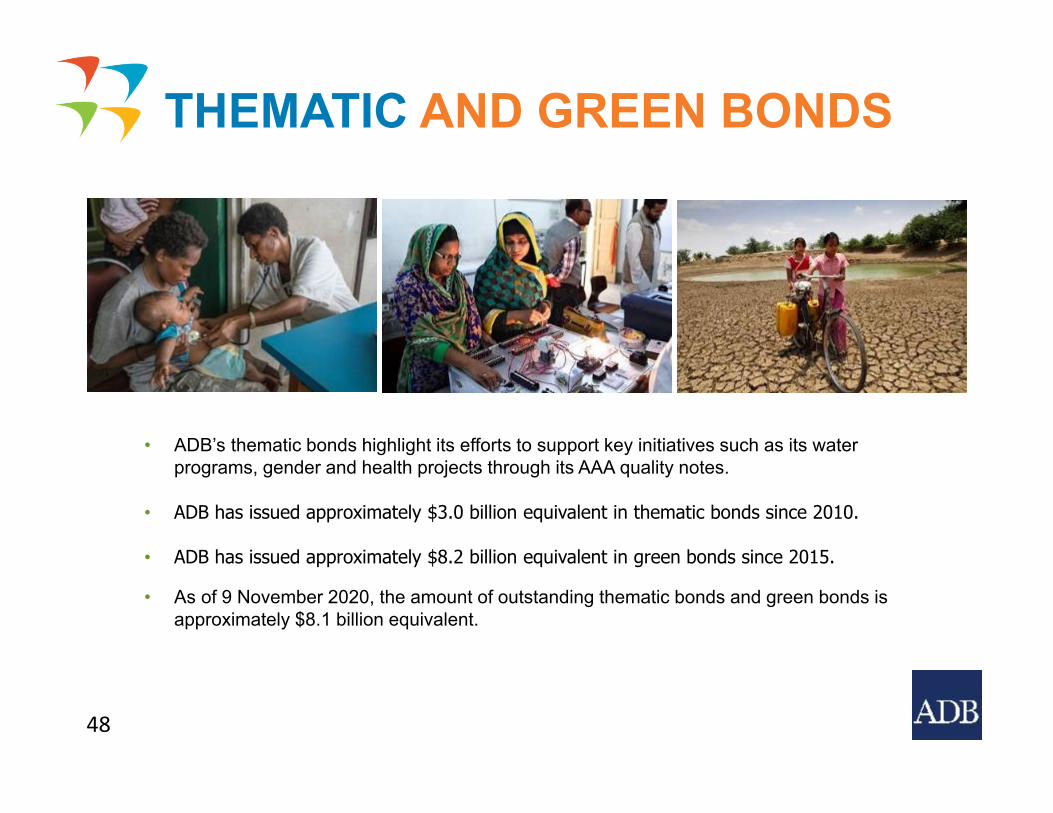
THEMATIC AND GREEN BONDS
• ADB’s thematic bonds highlight its efforts to support key initiatives such as its water programs, gender and health projects through its AAA quality notes.
• ADB has issued approximately $3.0 billion equivalent in thematic bonds since 2010.
• ADB has issued approximately $8.2 billion equivalent in green bonds since 2015.
• As of 9 November 2020, the amount of outstanding thematic bonds and green bonds is approximately $8.1 billion equivalent.
Year of Maturity
Proceeds in US$ mn
Year of Maturity
Proceeds in US$ mn
49
Year of Maturity
Proceeds in US$ mn
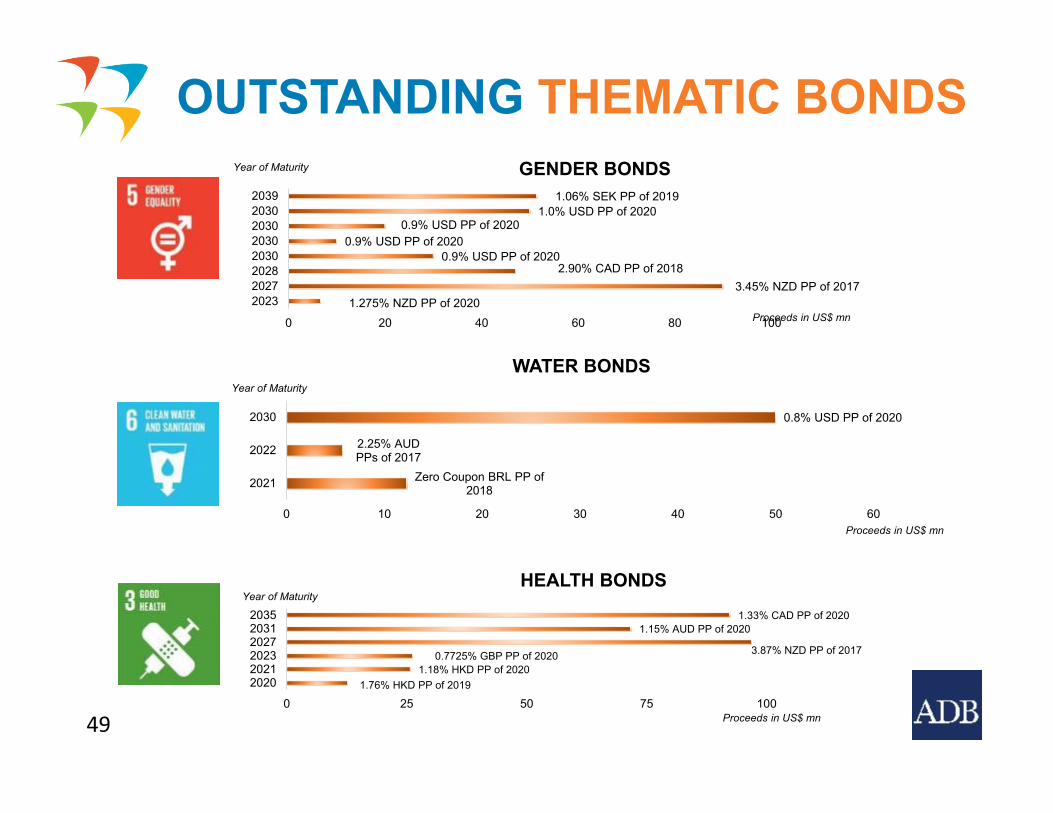
OUTSTANDING THEMATIC BONDS
Zero Coupon BRL PP of 2018
2.25% AUD PPs of 2017
0.8% USD PP of 2020
0 10 20 30 40 50 60
2021
2022
2030
WATER BONDS
1.275% NZD PP of 20203.45% NZD PP of 2017
2.90% CAD PP of 20180.9% USD PP of 2020
0.9% USD PP of 20200.9% USD PP of 2020
1.0% USD PP of 20201.06% SEK PP of 2019
0 20 40 60 80 100
20232027202820302030203020302039
GENDER BONDS
1.76% HKD PP of 20191.18% HKD PP of 2020
0.7725% GBP PP of 2020 3.87% NZD PP of 2017
1.15% AUD PP of 20201.33% CAD PP of 2020
0 25 50 75 100
202020212023202720312035
HEALTH BONDS
Year of Maturity
Proceeds in US$ mn
50
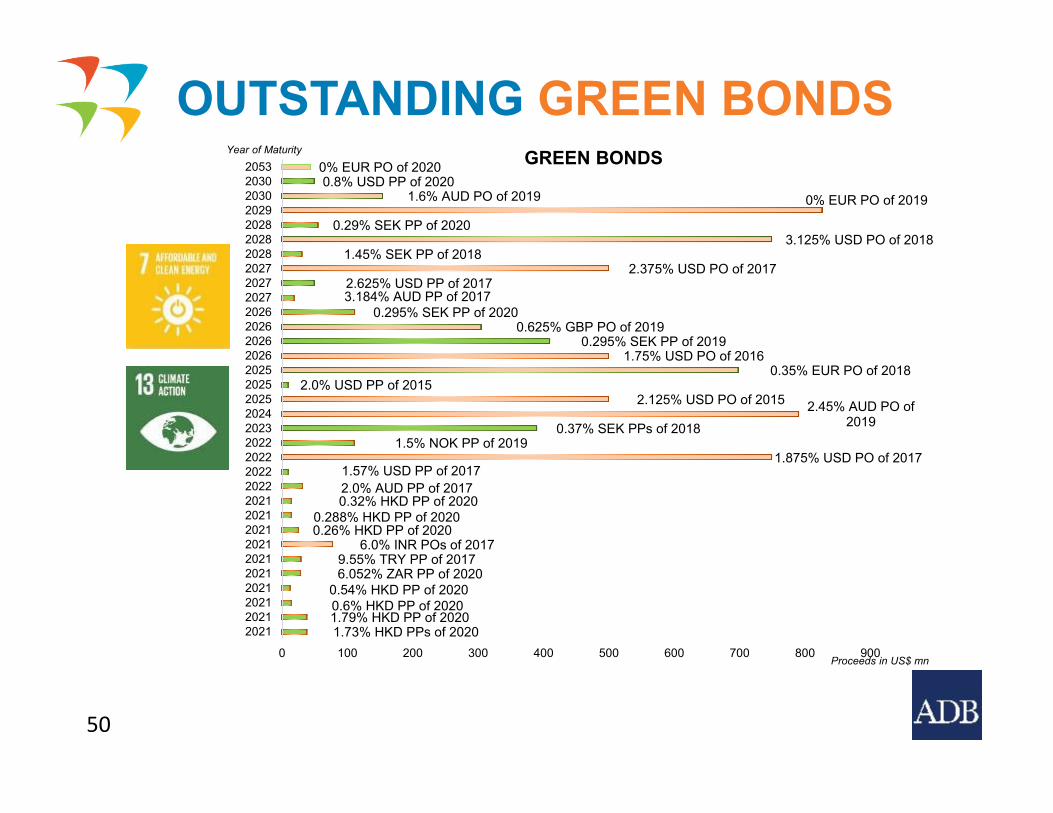
OUTSTANDING GREEN BONDS
1.73% HKD PPs of 20201.79% HKD PP of 20200.6% HKD PP of 20200.54% HKD PP of 2020
6.052% ZAR PP of 20209.55% TRY PP of 2017
6.0% INR POs of 20170.26% HKD PP of 20200.288% HKD PP of 2020
0.32% HKD PP of 20202.0% AUD PP of 20171.57% USD PP of 2017
1.875% USD PO of 20171.5% NOK PP of 2019
0.37% SEK PPs of 20182.45% AUD PO of
20192.125% USD PO of 2015
2.0% USD PP of 20150.35% EUR PO of 2018
1.75% USD PO of 20160.295% SEK PP of 2019
0.625% GBP PO of 20190.295% SEK PP of 2020
3.184% AUD PP of 20172.625% USD PP of 2017
2.375% USD PO of 20171.45% SEK PP of 2018
3.125% USD PO of 20180.29% SEK PP of 2020
0% EUR PO of 20191.6% AUD PO of 20190.8% USD PP of 2020
0% EUR PO of 2020
0 100 200 300 400 500 600 700 800 900
202120212021202120212021202120212021202120222022202220222023202420252025202520262026202620262027202720272028202820282029203020302053 GREEN BONDS
CONTENTSCONTENTS
51
Overview
Credit Profile
Funding Operations
Green Bond Framework
Appendices
Asia’s overall national infrastructure needs are estimated to be around $26 trillion over 2016-2030 or approximately $1.7 trillion per year.
Of the total investment needs over 2016-2030, $14.7 trillion will be for power and $8.4 trillion for transport.
ADB recognizes the importance of sustainable investments in the region and have been investing over $2 billion in clean energy projects each year since 2011.
In 2019, ADB reached its climate financing target of $6 billion by 2020 with $6.3 billion in approvals, of which $4.9 billion is for mitigation and $1.4 billion for adaptation.
ADB will ensure that 75% of the number of its committed operations will be supporting climate change mitigation and adaptation by 2030. Climate finance from ADB’s own resources will reach $80 billion cumulatively from 2019 to 2030.
BACKGROUND
52

PROVIDING DIRECTIONS
DMC = developing member country.Source: ADB.
In 2017, ADB approved its Climate Change Operational Framework, 2017-2030 (CCOF 2030) which will guide in enhancing resilience and strengthening climate actions in the Asia and Pacific region.
53
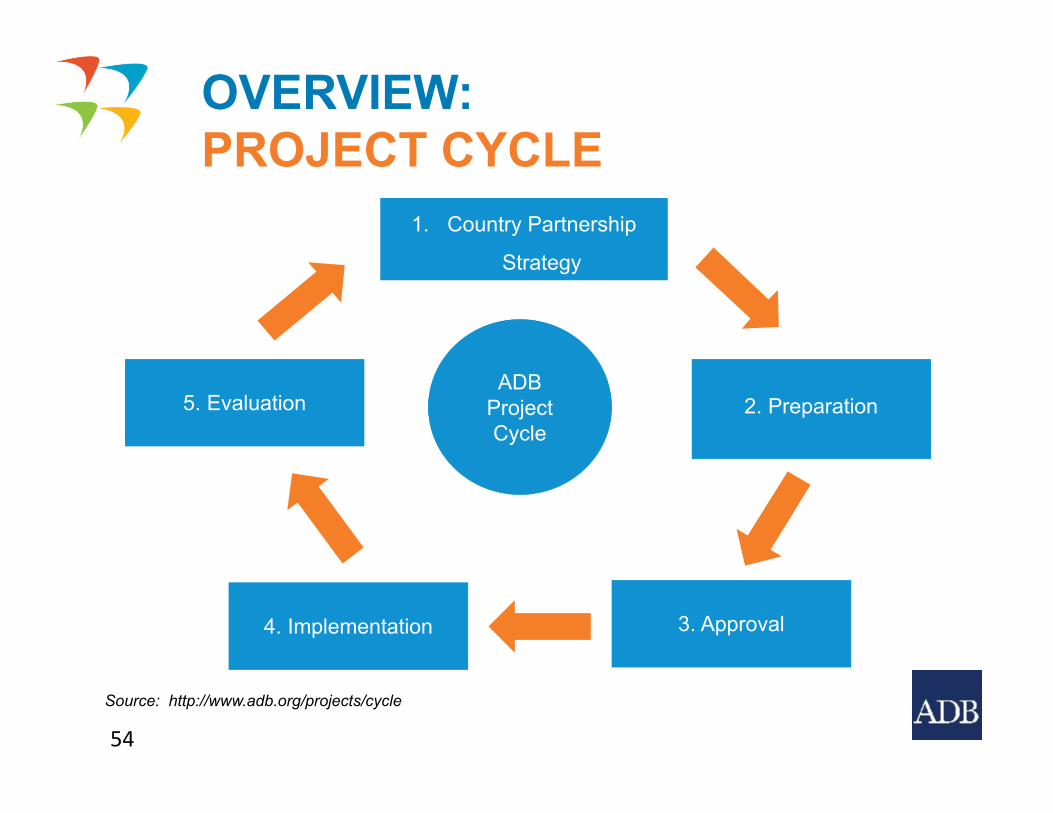
1. Country Partnership
Strategy
ADB Project Cycle
2. Preparation
3. Approval4. Implementation
5. Evaluation
Source: http://www.adb.org/projects/cycle
OVERVIEW:PROJECT CYCLE
54
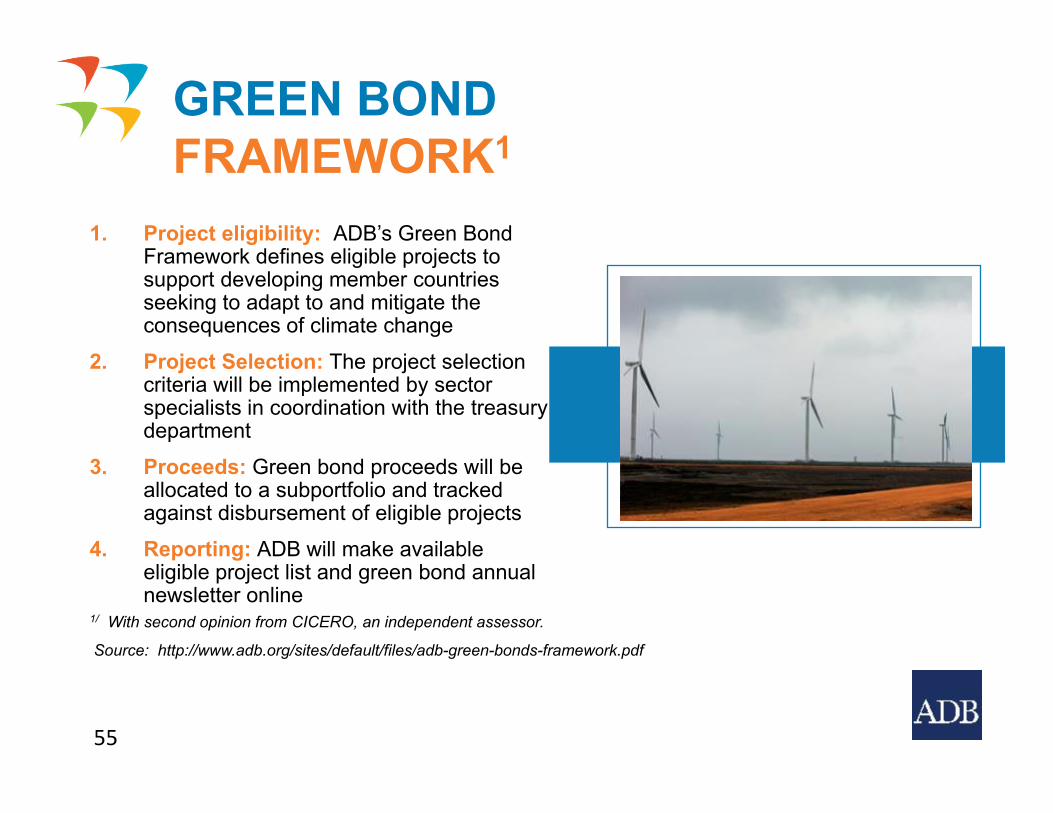
1. Project eligibility: ADB’s Green Bond Framework defines eligible projects to support developing member countries seeking to adapt to and mitigate the consequences of climate change
2. Project Selection: The project selection criteria will be implemented by sector specialists in coordination with the treasury department
3. Proceeds: Green bond proceeds will be allocated to a subportfolio and tracked against disbursement of eligible projects
4. Reporting: ADB will make available eligible project list and green bond annual newsletter online
1/ With second opinion from CICERO, an independent assessor.
Source: http://www.adb.org/sites/default/files/adb-green-bonds-framework.pdf
GREEN BONDFRAMEWORK1
55
ELIGIBLE PROJECT CRITERIA
56
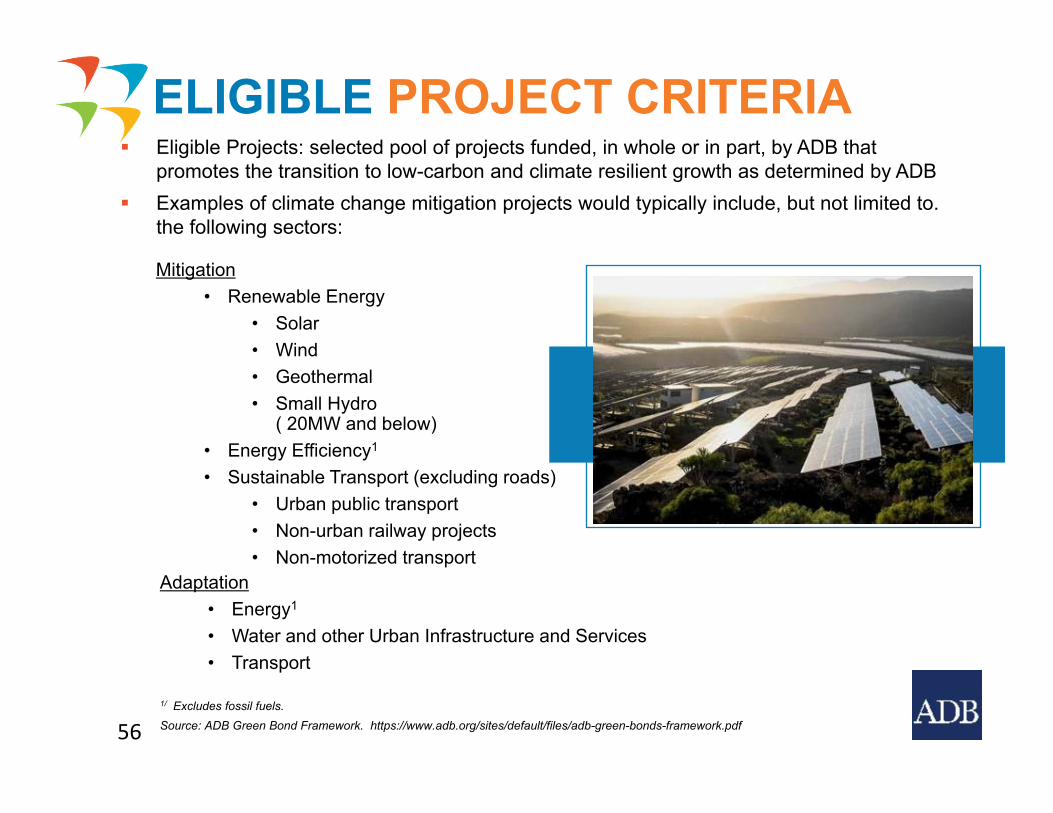
Eligible Projects: selected pool of projects funded, in whole or in part, by ADB that promotes the transition to low-carbon and climate resilient growth as determined by ADB
Examples of climate change mitigation projects would typically include, but not limited to. the following sectors:
Mitigation• Renewable Energy
• Solar• Wind• Geothermal• Small Hydro
( 20MW and below)• Energy Efficiency1
• Sustainable Transport (excluding roads)• Urban public transport• Non-urban railway projects• Non-motorized transport
Adaptation• Energy1
• Water and other Urban Infrastructure and Services • Transport
1/ Excludes fossil fuels.Source: ADB Green Bond Framework. https://www.adb.org/sites/default/files/adb-green-bonds-framework.pdf
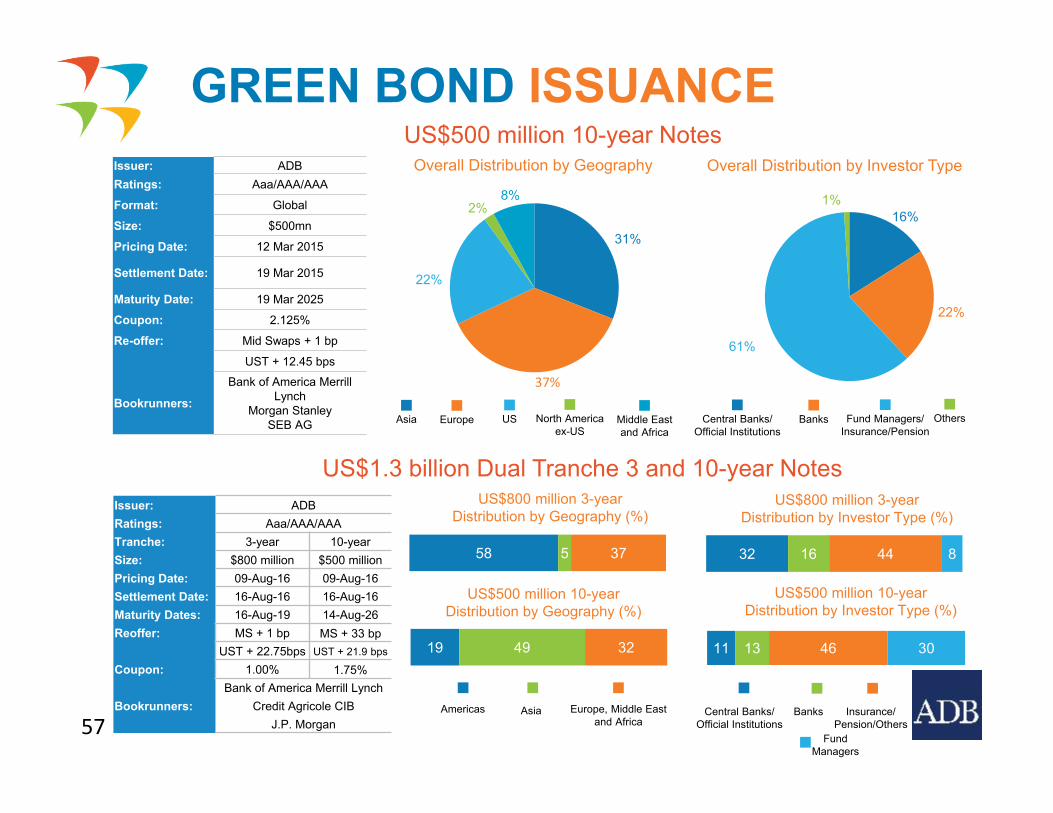
Overall Distribution by Geography Overall Distribution by Investor TypeIssuer: ADBRatings: Aaa/AAA/AAA
Format: Global
Size: $500mn
Pricing Date: 12 Mar 2015
Settlement Date: 19 Mar 2015
Maturity Date: 19 Mar 2025
Coupon: 2.125%
Re-offer: Mid Swaps + 1 bp
UST + 12.45 bps
Bookrunners:
Bank of America Merrill Lynch
Morgan StanleySEB AG
GREEN BOND ISSUANCE
Asia Europe Middle Eastand Africa
US North Americaex-US
Central Banks/Official Institutions
Banks Fund Managers/Insurance/Pension
Others
31%
37%
22%
2%8%
16%
22%
61%
1%
57
US$500 million 10-year Notes
US$1.3 billion Dual Tranche 3 and 10-year Notes
58 5 37
US$800 million 3-yearDistribution by Geography (%)
US$800 million 3-yearDistribution by Investor Type (%)
Americas Asia Europe, Middle Eastand Africa
Central Banks/Official Institutions
Banks Insurance/Pension/Others
FundManagers
US$500 million 10-yearDistribution by Geography (%)
US$500 million 10-yearDistribution by Investor Type (%)
19 49 32
32 16 44 8
11 13 46 30
Issuer: ADBRatings: Aaa/AAA/AAATranche: 3-year 10-yearSize: $800 million $500 millionPricing Date: 09-Aug-16 09-Aug-16Settlement Date: 16-Aug-16 16-Aug-16Maturity Dates: 16-Aug-19 14-Aug-26Reoffer: MS + 1 bp MS + 33 bp
UST + 22.75bps UST + 21.9 bps
Coupon: 1.00% 1.75%
Bookrunners:Bank of America Merrill Lynch
Credit Agricole CIBJ.P. Morgan57
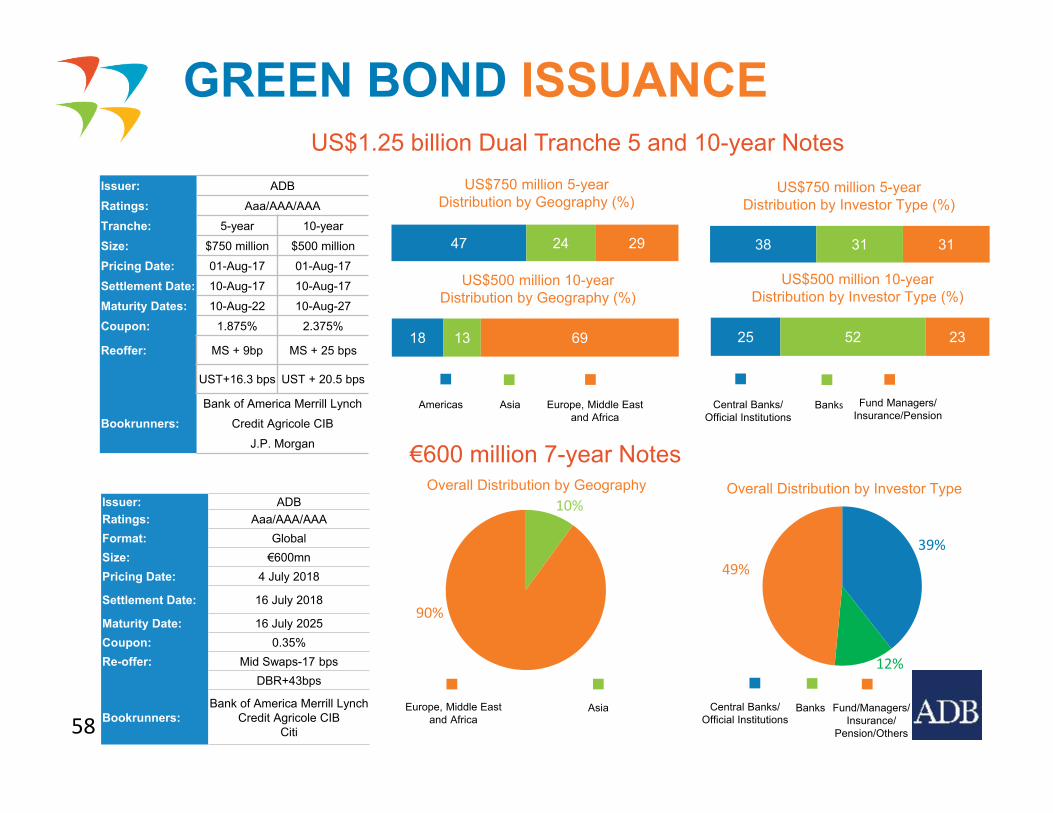
47 24 29
US$750 million 5-yearDistribution by Geography (%)
US$750 million 5-yearDistribution by Investor Type (%)
GREEN BOND ISSUANCE
US$500 million 10-yearDistribution by Geography (%)
US$500 million 10-yearDistribution by Investor Type (%)
Americas Asia Europe, Middle Eastand Africa
Central Banks/Official Institutions
Banks Fund Managers/Insurance/Pension
18 13 69
38 31 31
25 52 23
Issuer: ADBRatings: Aaa/AAA/AAATranche: 5-year 10-yearSize: $750 million $500 millionPricing Date: 01-Aug-17 01-Aug-17Settlement Date: 10-Aug-17 10-Aug-17Maturity Dates: 10-Aug-22 10-Aug-27Coupon: 1.875% 2.375%
Reoffer: MS + 9bp MS + 25 bps
UST+16.3 bps UST + 20.5 bps
Bookrunners:Bank of America Merrill Lynch
Credit Agricole CIBJ.P. Morgan
58
US$1.25 billion Dual Tranche 5 and 10-year Notes
Overall Distribution by Geography Overall Distribution by Investor Type
AsiaEurope, Middle Eastand Africa
Central Banks/Official Institutions
Banks Fund/Managers/Insurance/
Pension/Others
Issuer: ADBRatings: Aaa/AAA/AAAFormat: GlobalSize: €600mnPricing Date: 4 July 2018
Settlement Date: 16 July 2018
Maturity Date: 16 July 2025Coupon: 0.35%Re-offer: Mid Swaps-17 bps
DBR+43bps
Bookrunners:Bank of America Merrill Lynch
Credit Agricole CIBCiti
10%
90%
39%
12%
49%
€600 million 7-year Notes
Overall Distribution by Geography Overall Distribution by Investor Type
GREEN BOND ISSUANCE
Central Banks/Official Institutions Banks Fund Managers/Insurance/
Pension/Others
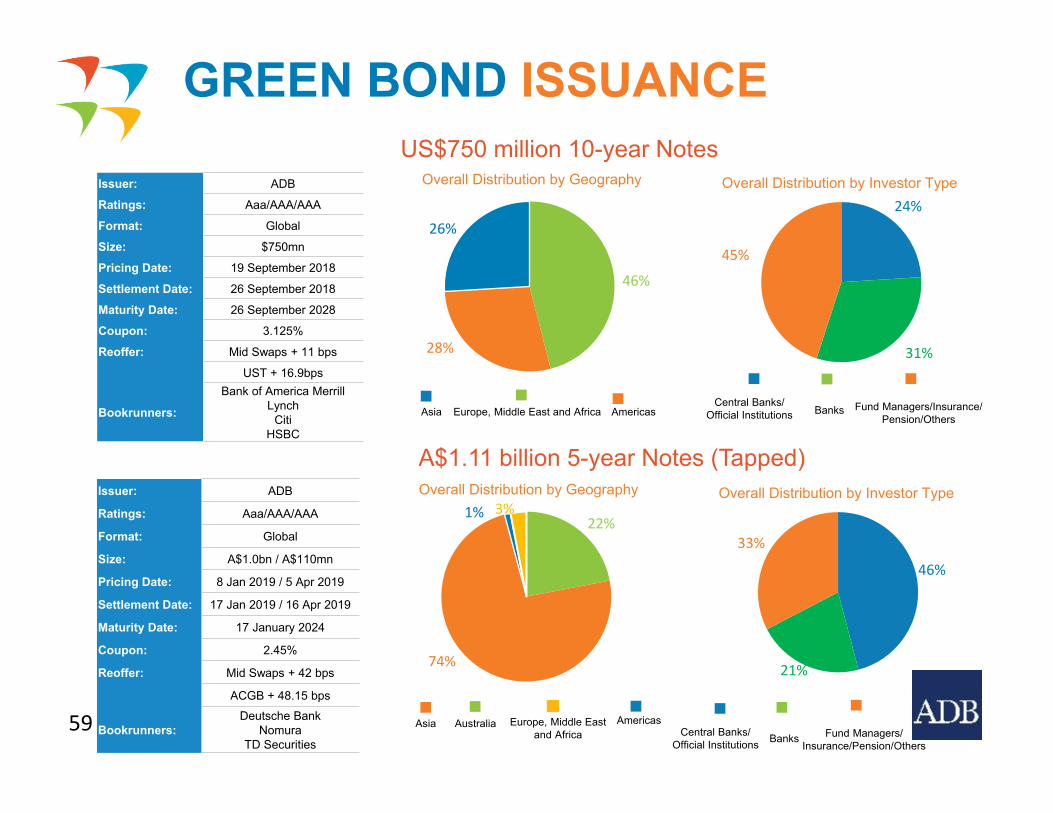
59
Issuer: ADB
Ratings: Aaa/AAA/AAA
Format: Global
Size: $750mn
Pricing Date: 19 September 2018
Settlement Date: 26 September 2018
Maturity Date: 26 September 2028
Coupon: 3.125%
Reoffer: Mid Swaps + 11 bps
UST + 16.9bps
Bookrunners:
Bank of America Merrill Lynch
CitiHSBC
46%
28%
26%
Asia Europe, Middle East and Africa Americas
24%
31%
45%
US$750 million 10-year Notes
Overall Distribution by Geography Overall Distribution by Investor Type
Central Banks/Official Institutions Banks Fund Managers/
Insurance/Pension/Others
Issuer: ADB
Ratings: Aaa/AAA/AAA
Format: Global
Size: A$1.0bn / A$110mn
Pricing Date: 8 Jan 2019 / 5 Apr 2019
Settlement Date: 17 Jan 2019 / 16 Apr 2019
Maturity Date: 17 January 2024
Coupon: 2.45%
Reoffer: Mid Swaps + 42 bps
ACGB + 48.15 bps
Bookrunners:Deutsche Bank
NomuraTD Securities
22%
74%
1% 3%
Asia Europe, Middle East and Africa
Americas
46%
21%
33%
Australia
A$1.11 billion 5-year Notes (Tapped)
GREEN BOND ISSUANCE
60
Overall Distribution by Geography Overall Distribution by Investor Type
AsiaEurope, Middle Eastand Africa
Central Banks/Official Institutions
Banks Fund/Managers/Insurance/
Pension/Others
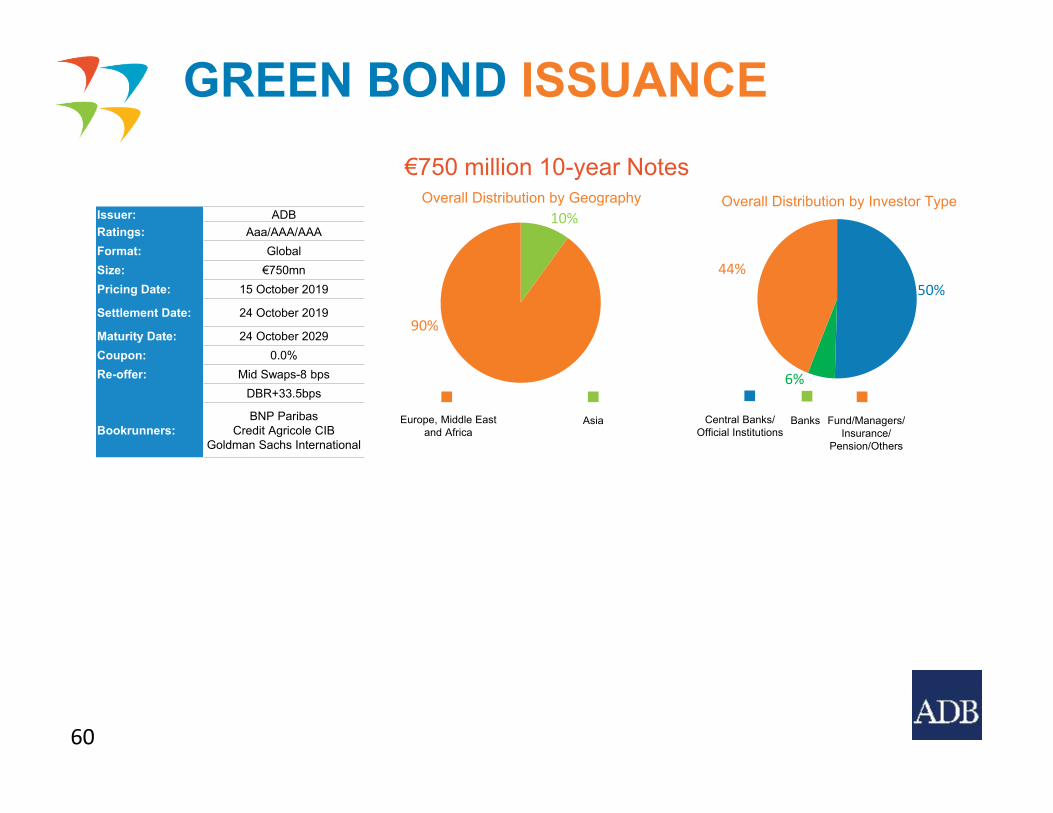
Issuer: ADBRatings: Aaa/AAA/AAAFormat: GlobalSize: €750mnPricing Date: 15 October 2019
Settlement Date: 24 October 2019
Maturity Date: 24 October 2029Coupon: 0.0%Re-offer: Mid Swaps-8 bps
DBR+33.5bps
Bookrunners:BNP Paribas
Credit Agricole CIBGoldman Sachs International
10%
90%
50%
6%
44%
€750 million 10-year Notes
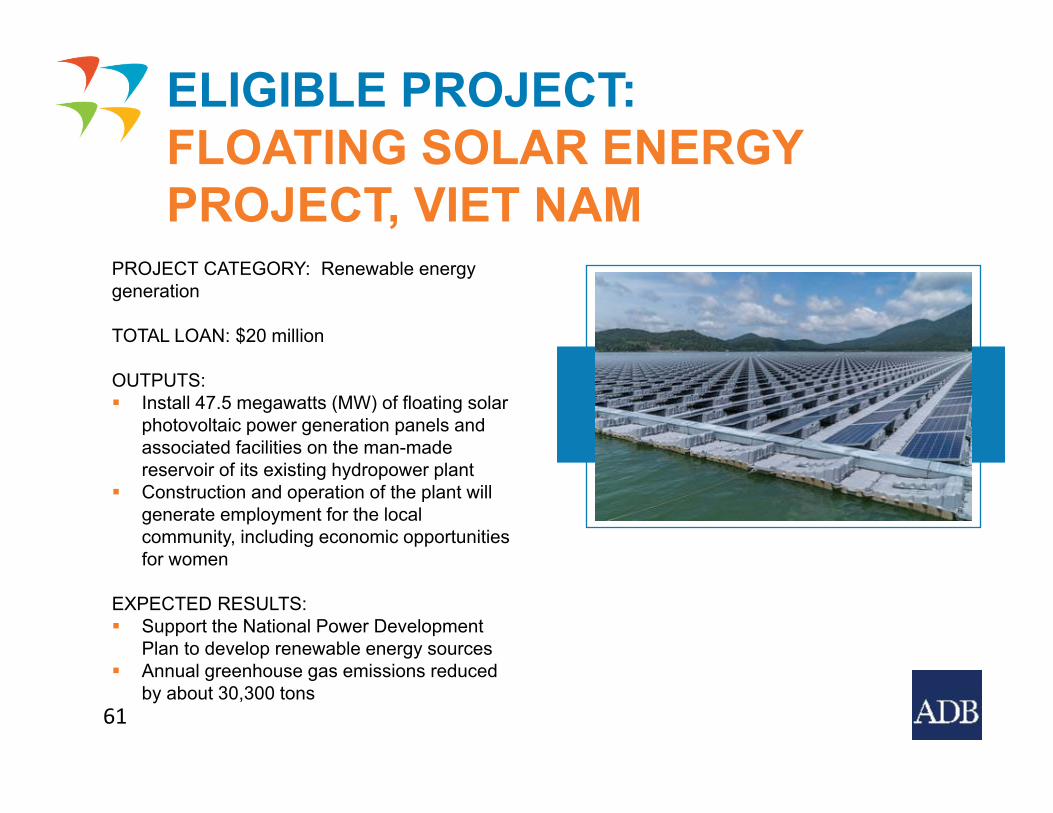
PROJECT CATEGORY: Renewable energy generation
TOTAL LOAN: $20 million
OUTPUTS: Install 47.5 megawatts (MW) of floating solar
photovoltaic power generation panels and associated facilities on the man-made reservoir of its existing hydropower plant
Construction and operation of the plant will generate employment for the local community, including economic opportunities for women
EXPECTED RESULTS: Support the National Power Development
Plan to develop renewable energy sources Annual greenhouse gas emissions reduced
by about 30,300 tons
ELIGIBLE PROJECT: FLOATING SOLAR ENERGY PROJECT, VIET NAM
61
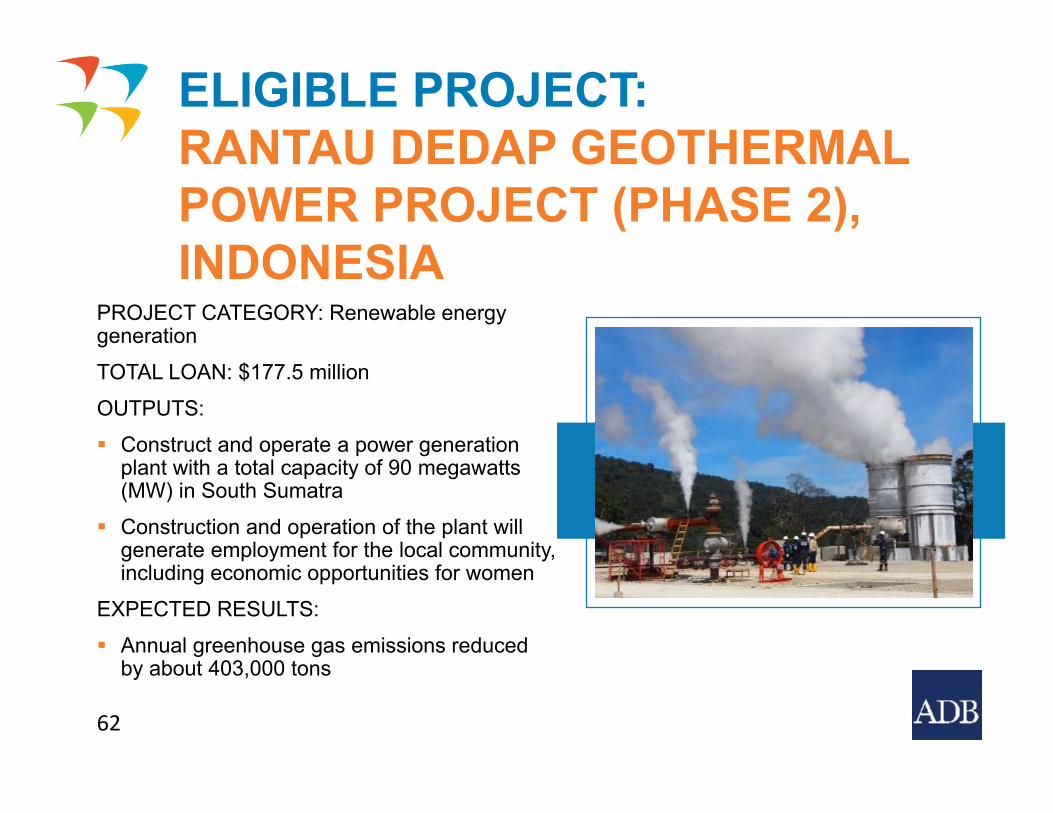
PROJECT CATEGORY: Renewable energy generationTOTAL LOAN: $177.5 millionOUTPUTS: Construct and operate a power generation
plant with a total capacity of 90 megawatts (MW) in South Sumatra
Construction and operation of the plant will generate employment for the local community, including economic opportunities for women
EXPECTED RESULTS: Annual greenhouse gas emissions reduced
by about 403,000 tons
ELIGIBLE PROJECT: RANTAU DEDAP GEOTHERMAL POWER PROJECT (PHASE 2), INDONESIA
62
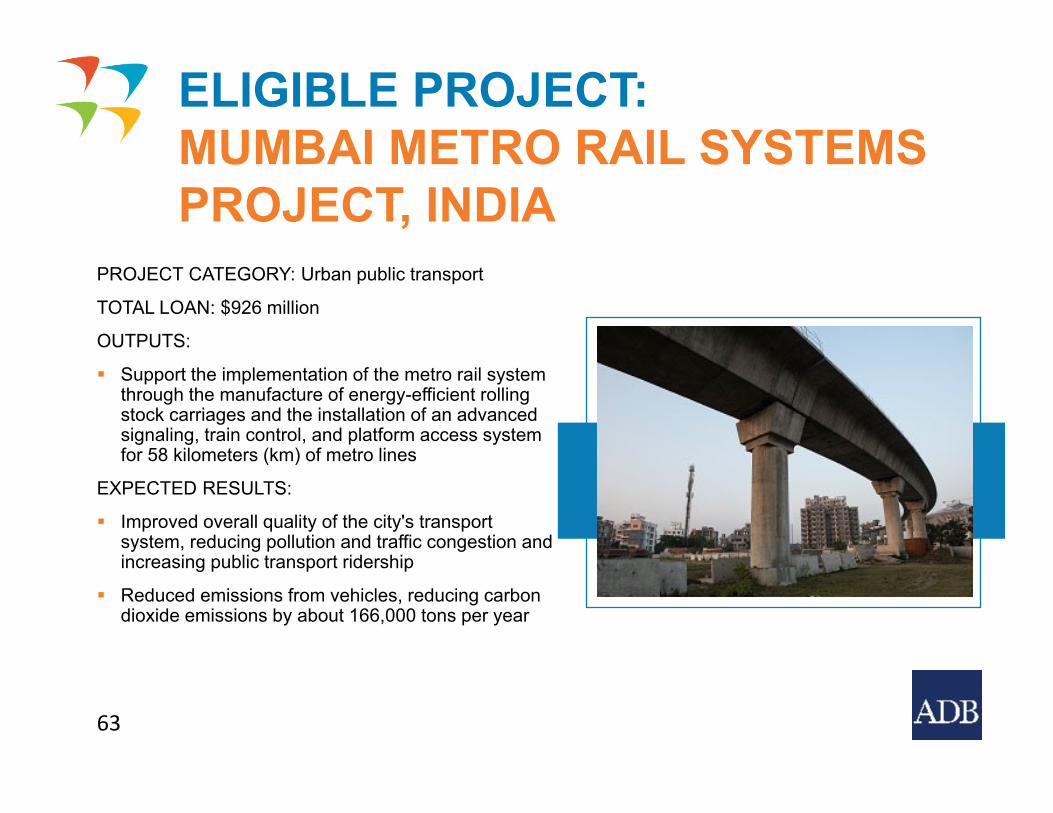
PROJECT CATEGORY: Urban public transport
TOTAL LOAN: $926 million
OUTPUTS:
Support the implementation of the metro rail system through the manufacture of energy-efficient rolling stock carriages and the installation of an advanced signaling, train control, and platform access system for 58 kilometers (km) of metro lines
EXPECTED RESULTS:
Improved overall quality of the city's transport system, reducing pollution and traffic congestion and increasing public transport ridership
Reduced emissions from vehicles, reducing carbon dioxide emissions by about 166,000 tons per year
ELIGIBLE PROJECT: MUMBAI METRO RAIL SYSTEMS PROJECT, INDIA
63
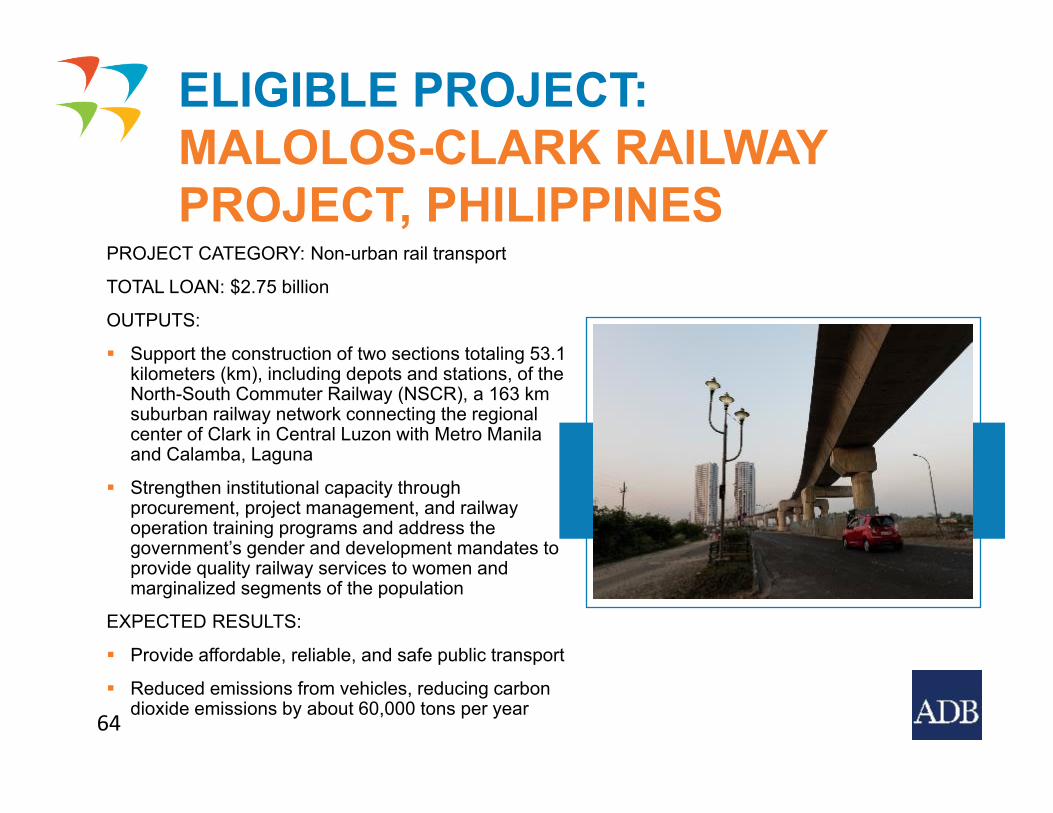
PROJECT CATEGORY: Non-urban rail transport
TOTAL LOAN: $2.75 billion
OUTPUTS:
Support the construction of two sections totaling 53.1 kilometers (km), including depots and stations, of the North-South Commuter Railway (NSCR), a 163 km suburban railway network connecting the regional center of Clark in Central Luzon with Metro Manila and Calamba, Laguna
Strengthen institutional capacity through procurement, project management, and railway operation training programs and address the government’s gender and development mandates to provide quality railway services to women and marginalized segments of the population
EXPECTED RESULTS:
Provide affordable, reliable, and safe public transport
Reduced emissions from vehicles, reducing carbon dioxide emissions by about 60,000 tons per year
ELIGIBLE PROJECT: MALOLOS-CLARK RAILWAY PROJECT, PHILIPPINES
64
65
Overview
Credit Profile
Funding Operations
Green Bond Framework
Appendices
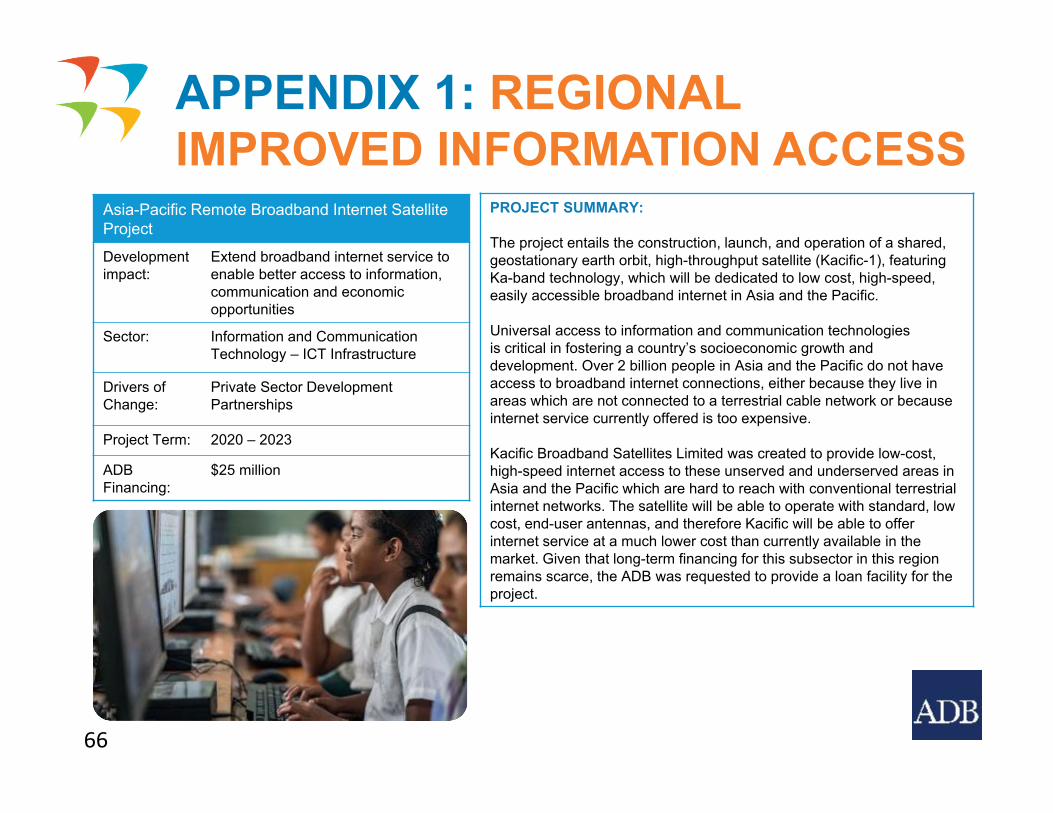
PROJECT SUMMARY:
The project entails the construction, launch, and operation of a shared, geostationary earth orbit, high-throughput satellite (Kacific-1), featuring Ka-band technology, which will be dedicated to low cost, high-speed, easily accessible broadband internet in Asia and the Pacific.
Universal access to information and communication technologiesis critical in fostering a country’s socioeconomic growth and development. Over 2 billion people in Asia and the Pacific do not have access to broadband internet connections, either because they live in areas which are not connected to a terrestrial cable network or because internet service currently offered is too expensive.
Kacific Broadband Satellites Limited was created to provide low-cost, high-speed internet access to these unserved and underserved areas in Asia and the Pacific which are hard to reach with conventional terrestrial internet networks. The satellite will be able to operate with standard, low cost, end-user antennas, and therefore Kacific will be able to offer internet service at a much lower cost than currently available in the market. Given that long-term financing for this subsector in this region remains scarce, the ADB was requested to provide a loan facility for the project.
Asia-Pacific Remote Broadband Internet Satellite Project
Development impact:
Extend broadband internet service to enable better access to information, communication and economic opportunities
Sector: Information and Communication Technology – ICT Infrastructure
Drivers of Change:
Private Sector DevelopmentPartnerships
Project Term: 2020 – 2023
ADB Financing:
$25 million
APPENDIX 1: REGIONALIMPROVED INFORMATION ACCESS
66
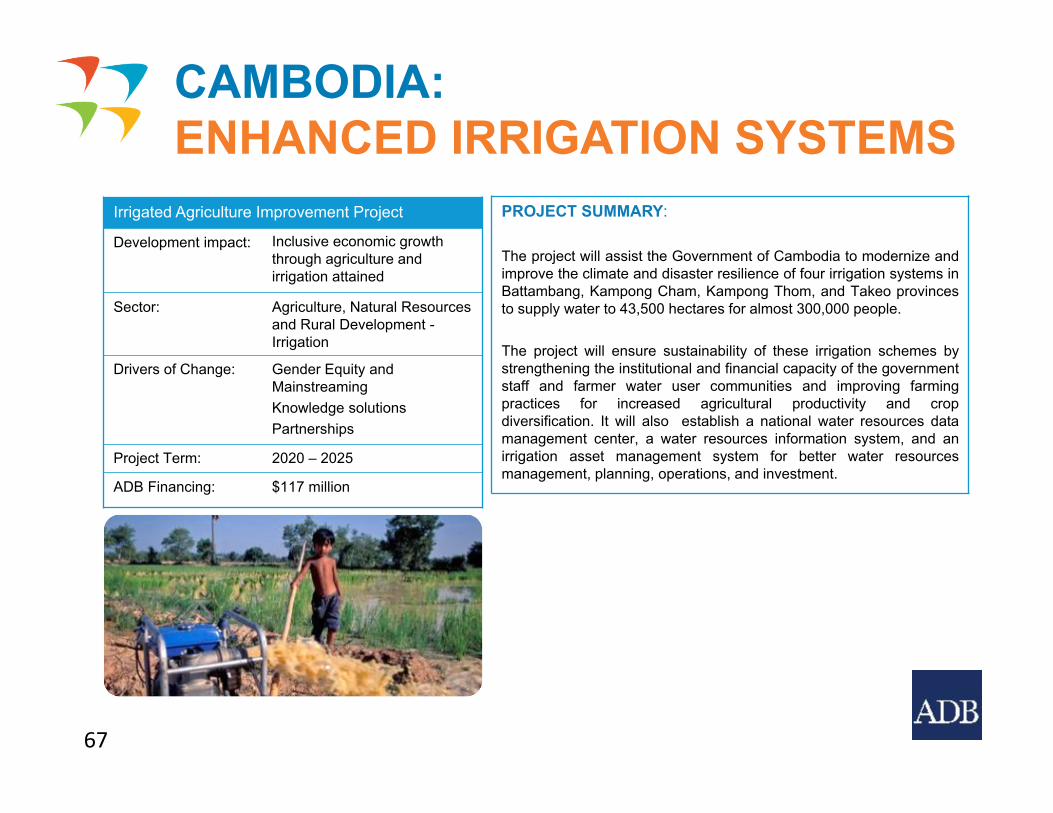
PROJECT SUMMARY:
The project will assist the Government of Cambodia to modernize andimprove the climate and disaster resilience of four irrigation systems inBattambang, Kampong Cham, Kampong Thom, and Takeo provincesto supply water to 43,500 hectares for almost 300,000 people.
The project will ensure sustainability of these irrigation schemes bystrengthening the institutional and financial capacity of the governmentstaff and farmer water user communities and improving farmingpractices for increased agricultural productivity and cropdiversification. It will also establish a national water resources datamanagement center, a water resources information system, and anirrigation asset management system for better water resourcesmanagement, planning, operations, and investment.
Irrigated Agriculture Improvement Project
Development impact: Inclusive economic growth through agriculture and irrigation attained
Sector: Agriculture, Natural Resources and Rural Development -Irrigation
Drivers of Change: Gender Equity and MainstreamingKnowledge solutionsPartnerships
Project Term: 2020 – 2025
ADB Financing: $117 million
CAMBODIA:ENHANCED IRRIGATION SYSTEMS
67
PROJECT SUMMARY:
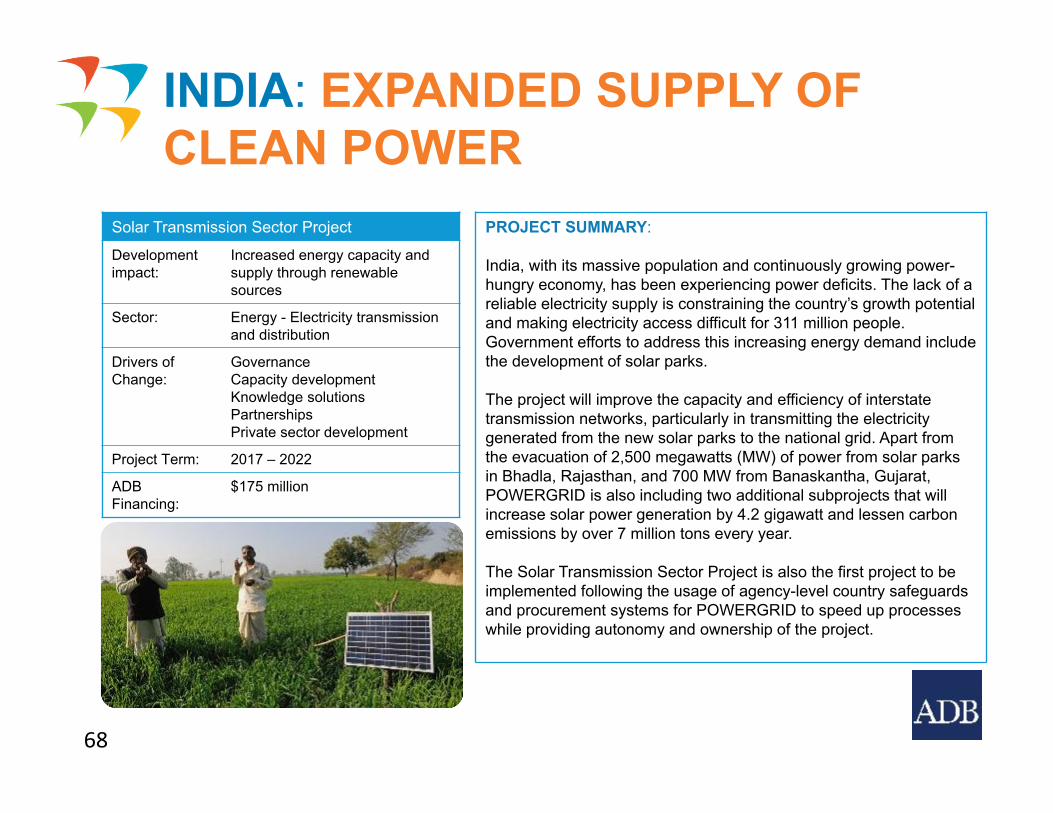
India, with its massive population and continuously growing power-hungry economy, has been experiencing power deficits. The lack of a reliable electricity supply is constraining the country’s growth potential and making electricity access difficult for 311 million people. Government efforts to address this increasing energy demand include the development of solar parks.
The project will improve the capacity and efficiency of interstate transmission networks, particularly in transmitting the electricity generated from the new solar parks to the national grid. Apart from the evacuation of 2,500 megawatts (MW) of power from solar parks in Bhadla, Rajasthan, and 700 MW from Banaskantha, Gujarat, POWERGRID is also including two additional subprojects that will increase solar power generation by 4.2 gigawatt and lessen carbon emissions by over 7 million tons every year.
The Solar Transmission Sector Project is also the first project to be implemented following the usage of agency-level country safeguards and procurement systems for POWERGRID to speed up processes while providing autonomy and ownership of the project.
Solar Transmission Sector Project
Development impact:
Increased energy capacity and supply through renewable sources
Sector: Energy - Electricity transmission and distribution
Drivers of Change:
GovernanceCapacity developmentKnowledge solutionsPartnershipsPrivate sector development
Project Term: 2017 – 2022
ADB Financing:
$175 million
INDIA: EXPANDED SUPPLY OF CLEAN POWER
68
PROJECT SUMMARY:
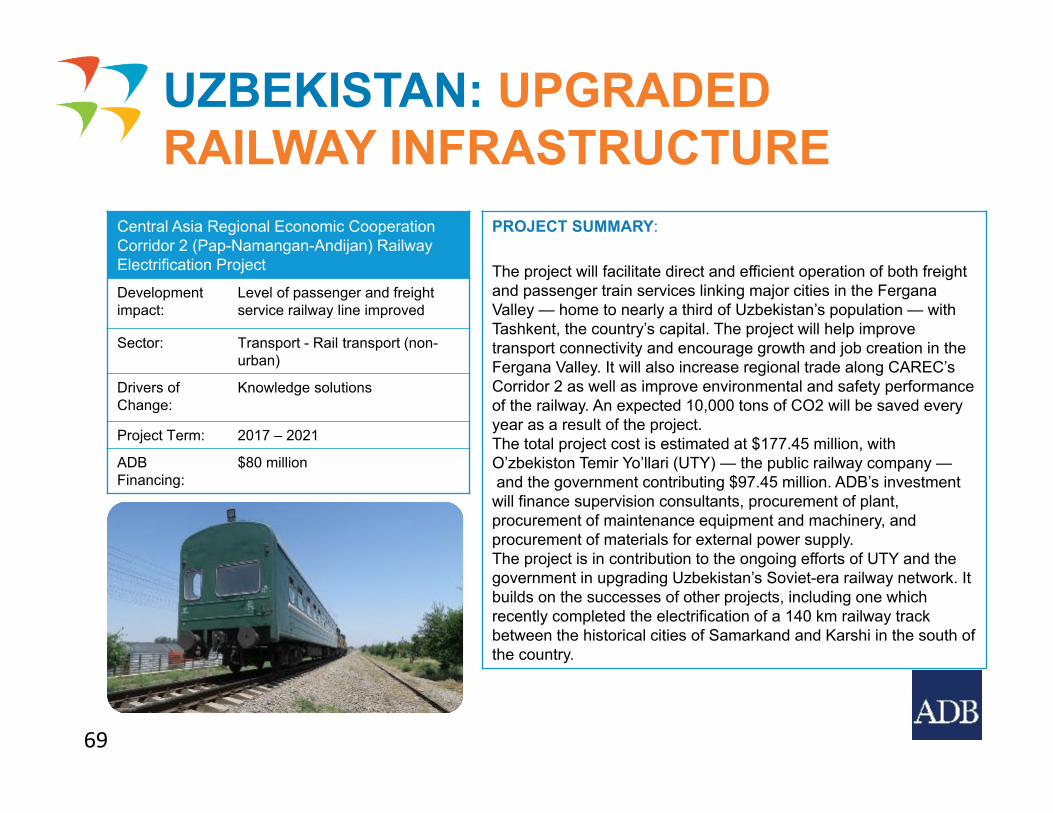
The project will facilitate direct and efficient operation of both freight and passenger train services linking major cities in the Fergana Valley — home to nearly a third of Uzbekistan’s population — with Tashkent, the country’s capital. The project will help improve transport connectivity and encourage growth and job creation in the Fergana Valley. It will also increase regional trade along CAREC’s Corridor 2 as well as improve environmental and safety performance of the railway. An expected 10,000 tons of CO2 will be saved every year as a result of the project.The total project cost is estimated at $177.45 million, with O’zbekiston Temir Yo’llari (UTY) — the public railway company —and the government contributing $97.45 million. ADB’s investment
will finance supervision consultants, procurement of plant, procurement of maintenance equipment and machinery, and procurement of materials for external power supply.The project is in contribution to the ongoing efforts of UTY and the government in upgrading Uzbekistan’s Soviet-era railway network. It builds on the successes of other projects, including one which recently completed the electrification of a 140 km railway track between the historical cities of Samarkand and Karshi in the south of the country.
Central Asia Regional Economic Cooperation Corridor 2 (Pap-Namangan-Andijan) Railway Electrification Project
Development impact:
Level of passenger and freight service railway line improved
Sector: Transport - Rail transport (non-urban)
Drivers of Change:
Knowledge solutions
Project Term: 2017 – 2021
ADB Financing:
$80 million
UZBEKISTAN: UPGRADED RAILWAY INFRASTRUCTURE
69
69
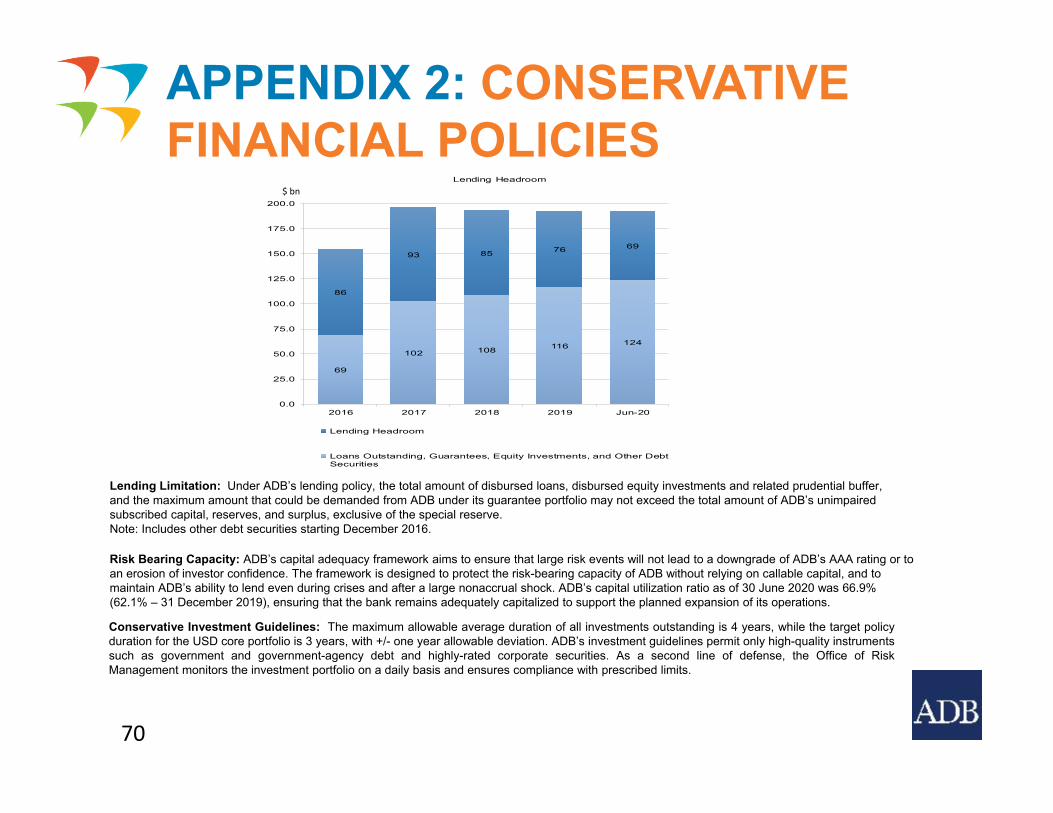
102 108 116 124
86
93 85 76 69
0.0
25.0
50.0
75.0
100.0
125.0
150.0
175.0
200.0
2016 2017 2018 2019 Jun-20
Lending Headroom
Lending Headroom
Loans Outstanding, Guarantees, Equity Investments, and Other DebtSecurities
Lending Limitation: Under ADB’s lending policy, the total amount of disbursed loans, disbursed equity investments and related prudential buffer, and the maximum amount that could be demanded from ADB under its guarantee portfolio may not exceed the total amount of ADB’s unimpaired subscribed capital, reserves, and surplus, exclusive of the special reserve.Note: Includes other debt securities starting December 2016.
APPENDIX 2: CONSERVATIVE FINANCIAL POLICIES
70
Risk Bearing Capacity: ADB’s capital adequacy framework aims to ensure that large risk events will not lead to a downgrade of ADB’s AAA rating or toan erosion of investor confidence. The framework is designed to protect the risk-bearing capacity of ADB without relying on callable capital, and to maintain ADB’s ability to lend even during crises and after a large nonaccrual shock. ADB’s capital utilization ratio as of 30 June 2020 was 66.9% (62.1% – 31 December 2019), ensuring that the bank remains adequately capitalized to support the planned expansion of its operations.
Conservative Investment Guidelines: The maximum allowable average duration of all investments outstanding is 4 years, while the target policyduration for the USD core portfolio is 3 years, with +/- one year allowable deviation. ADB’s investment guidelines permit only high-quality instrumentssuch as government and government-agency debt and highly-rated corporate securities. As a second line of defense, the Office of RiskManagement monitors the investment portfolio on a daily basis and ensures compliance with prescribed limits.
$ bn
Approved on 20 July 2009, the new Safeguard Policy Statement reaffirms and strengthens ADB’scommitment to ensuring that borrowers/clients meet ADB safeguard requirements to avoid, minimize,mitigate and/or compensate adverse impacts of ADB operations on the environment and project-affected people.
The policy commits ADB to assessing country safeguard systems, assisting borrowers/clients tostrengthen both their approaches and country capacity to manage environmental and social risks,and to increasing ADB oversight during implementation.
As a central part of ADB's mission to promote environmentally sustainable and inclusive economicgrowth, the new Safeguard Policy Statement consolidates and builds upon current ADB policies onEnvironment, Indigenous Peoples and Involuntary Resettlement that are already applied to all bank-supported projects in developing member countries (DMCs).
The policy ensures that ADB’s safeguards are harmonized with other multilateral development banksand remain relevant to the evolving needs of DMCs and private sector clients.
The policy contains new provisions on biodiversity conservation, community health and safety, andphysical cultural resources. Key features include emphasis on capacity development of borrowersand more attention to safeguard implementation and supervision.
The Safeguard Policy Statement became effective on 20 January 2010.
For further details, please see http://www.adb.org/site/safeguards/main
APPENDIX 3:SAFEGUARD POLICY STATEMENT
71
Developing good governance and fighting corruption are core ADB strategic objectives and are crucial to effective, transparent andaccountable aid, to which ADB committed by endorsing the Paris Declaration on Aid Effectiveness.
ADB’s Office of Anticorruption and Integrity (OAI), an independent body since October 2009, is the initial point of contact for allegations ofintegrity violations involving ADB-related activities or ADB staff. Its mission is to ensure ADB and its partners maintain the highest ethicaland professional standards, and prevent resources intended to improve the lives of the poor from being used to line the pockets of theunscrupulous.
Any party found to have committed fraudulent, corrupt, coercive, collusive, obstructive practices, or other integrity violations identified byADB risks being sanctioned with debarment. Debarred entities are ineligible to participate in ADB-financed, administered or supportedactivities. A debarred firm’s ineligibility extends to all employees and officers of a firm, and may extend to other principals and contractualemployees of the firm. Debarred individuals may not participate in ADB-related activity, as individuals or through nomination by an eligiblefirm, unless they have completely disassociated themselves with an ineligible firm.
Following the Harmonized Framework adopted by MDBs in 2006, the Agreement on Cross-Debarment was signed by ADB, the World BankGroup, the African Development Bank (AfDB), the Inter-American Development Bank (IADB) and the European Bank for Reconstruction andDevelopment (EBRD) in Luxembourg on 9 April 2010. An important global milestone in the fight against corruption, this Agreement allowsthat an entity debarred by one of the participating MDBs be subsequently cross-debarred by the other participating MDBs, and constitutes animportant step in strengthening global anticorruption efforts.
The base sanction for integrity violations is 3-year debarment. The Integrity Oversight Committee (IOC) may impose a greater or lesserdebarment period depending on the circumstances of each case. The IOC will be guided by the following ranges: 1) First debarments(including cases where a party has previously been given a reprimand) – 1 year to indefinite for individuals and 1 to 7 years for firms, 2)Second debarments – up to indefinite for individuals and up to 10 years for firms, 3) Subsequent debarments – up to indefinite for individualsand up to 20 years for firms.
In accordance with ADB’s Anticorruption Policy, ADB’s zero tolerance to corruption is linked to broader support for governance andimprovement in the quality and capacities of developing member countries (DMCs), with fraud and corruption detection training given togovernment agencies in several of these DMCs.
ADB also organizes knowledge support activities to improve integrity awareness and skills. Since 2010 it is mandatory for all ADB staff to bebriefed on the importance of fighting corruption and adherence to ADB’s Anticorruption Policy.
For further details, please see http://www.adb.org/site/integrity/main
APPENDIX 4: ANTICORRUPTION AND INTEGRITY POLICIES
72
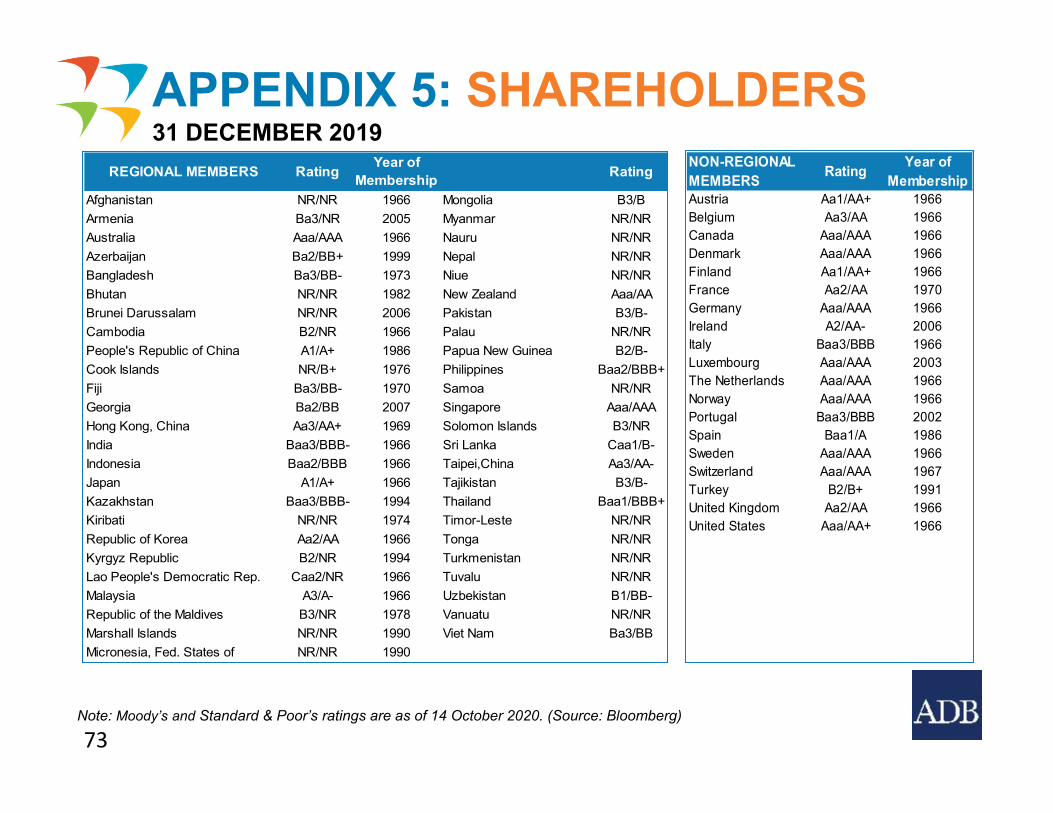
REGIONAL MEMBERS Rating Year of Membership Rating
Afghanistan NR/NR 1966 Mongolia B3/BArmenia Ba3/NR 2005 Myanmar NR/NRAustralia Aaa/AAA 1966 Nauru NR/NRAzerbaijan Ba2/BB+ 1999 Nepal NR/NRBangladesh Ba3/BB- 1973 Niue NR/NRBhutan NR/NR 1982 New Zealand Aaa/AABrunei Darussalam NR/NR 2006 Pakistan B3/B-Cambodia B2/NR 1966 Palau NR/NRPeople's Republic of China A1/A+ 1986 Papua New Guinea B2/B-Cook Islands NR/B+ 1976 Philippines Baa2/BBB+Fiji Ba3/BB- 1970 Samoa NR/NRGeorgia Ba2/BB 2007 Singapore Aaa/AAAHong Kong, China Aa3/AA+ 1969 Solomon Islands B3/NRIndia Baa3/BBB- 1966 Sri Lanka Caa1/B-Indonesia Baa2/BBB 1966 Taipei,China Aa3/AA-Japan A1/A+ 1966 Tajikistan B3/B-Kazakhstan Baa3/BBB- 1994 Thailand Baa1/BBB+Kiribati NR/NR 1974 Timor-Leste NR/NRRepublic of Korea Aa2/AA 1966 Tonga NR/NRKyrgyz Republic B2/NR 1994 Turkmenistan NR/NRLao People's Democratic Rep. Caa2/NR 1966 Tuvalu NR/NRMalaysia A3/A- 1966 Uzbekistan B1/BB-Republic of the Maldives B3/NR 1978 Vanuatu NR/NRMarshall Islands NR/NR 1990 Viet Nam Ba3/BBMicronesia, Fed. States of NR/NR 1990
NON-REGIONAL MEMBERS Rating Year of
MembershipAustria Aa1/AA+ 1966Belgium Aa3/AA 1966Canada Aaa/AAA 1966Denmark Aaa/AAA 1966Finland Aa1/AA+ 1966France Aa2/AA 1970Germany Aaa/AAA 1966Ireland A2/AA- 2006Italy Baa3/BBB 1966Luxembourg Aaa/AAA 2003The Netherlands Aaa/AAA 1966Norway Aaa/AAA 1966Portugal Baa3/BBB 2002Spain Baa1/A 1986Sweden Aaa/AAA 1966Switzerland Aaa/AAA 1967Turkey B2/B+ 1991United Kingdom Aa2/AA 1966United States Aaa/AA+ 1966
Note: Moody’s and Standard & Poor’s ratings are as of 14 October 2020. (Source: Bloomberg)
APPENDIX 5: SHAREHOLDERS31 DECEMBER 2019
73
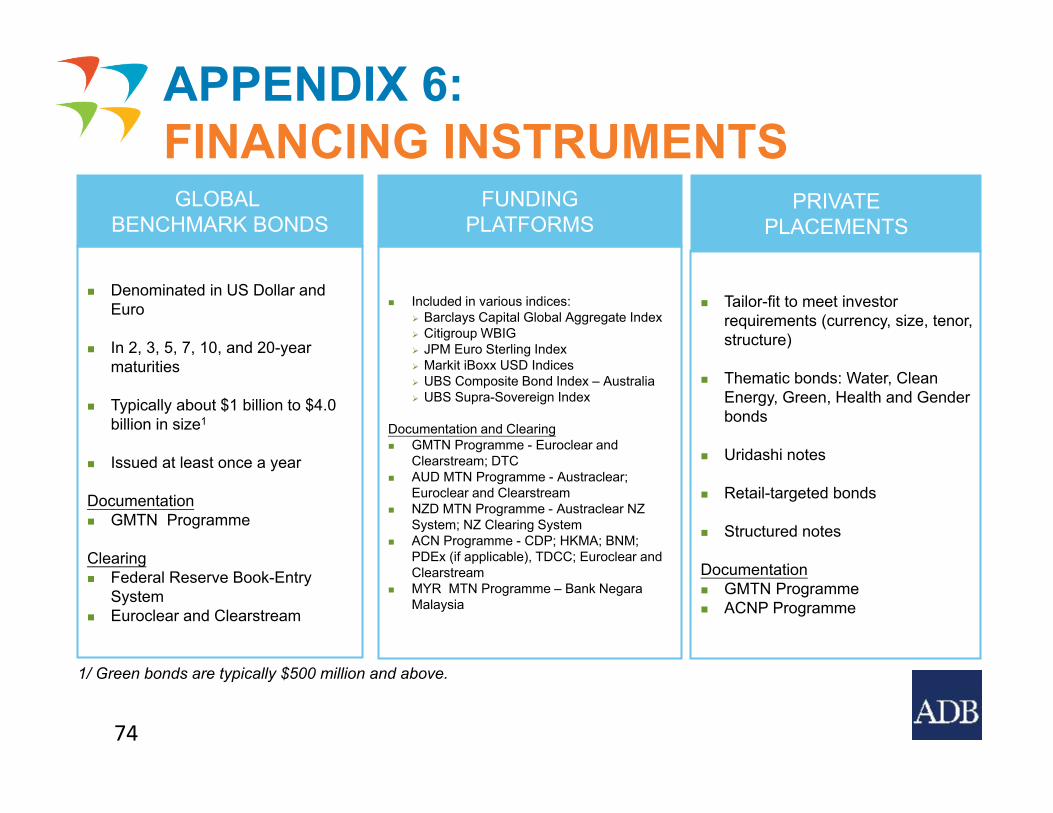
Denominated in US Dollar and Euro
In 2, 3, 5, 7, 10, and 20-year maturities
Typically about $1 billion to $4.0 billion in size1
Issued at least once a year
Documentation GMTN Programme
Clearing Federal Reserve Book-Entry
System Euroclear and Clearstream
GLOBAL BENCHMARK BONDS
Included in various indices: Barclays Capital Global Aggregate Index Citigroup WBIG JPM Euro Sterling Index Markit iBoxx USD Indices UBS Composite Bond Index – Australia UBS Supra-Sovereign Index
Documentation and Clearing GMTN Programme - Euroclear and
Clearstream; DTC AUD MTN Programme - Austraclear;
Euroclear and Clearstream NZD MTN Programme - Austraclear NZ
System; NZ Clearing System ACN Programme - CDP; HKMA; BNM;
PDEx (if applicable), TDCC; Euroclear and Clearstream
MYR MTN Programme – Bank Negara Malaysia
FUNDINGPLATFORMS
Tailor-fit to meet investor requirements (currency, size, tenor, structure)
Thematic bonds: Water, Clean Energy, Green, Health and Gender bonds
Uridashi notes
Retail-targeted bonds
Structured notes
Documentation GMTN Programme ACNP Programme
PRIVATE PLACEMENTS
APPENDIX 6: FINANCING INSTRUMENTS
1/ Green bonds are typically $500 million and above.
74
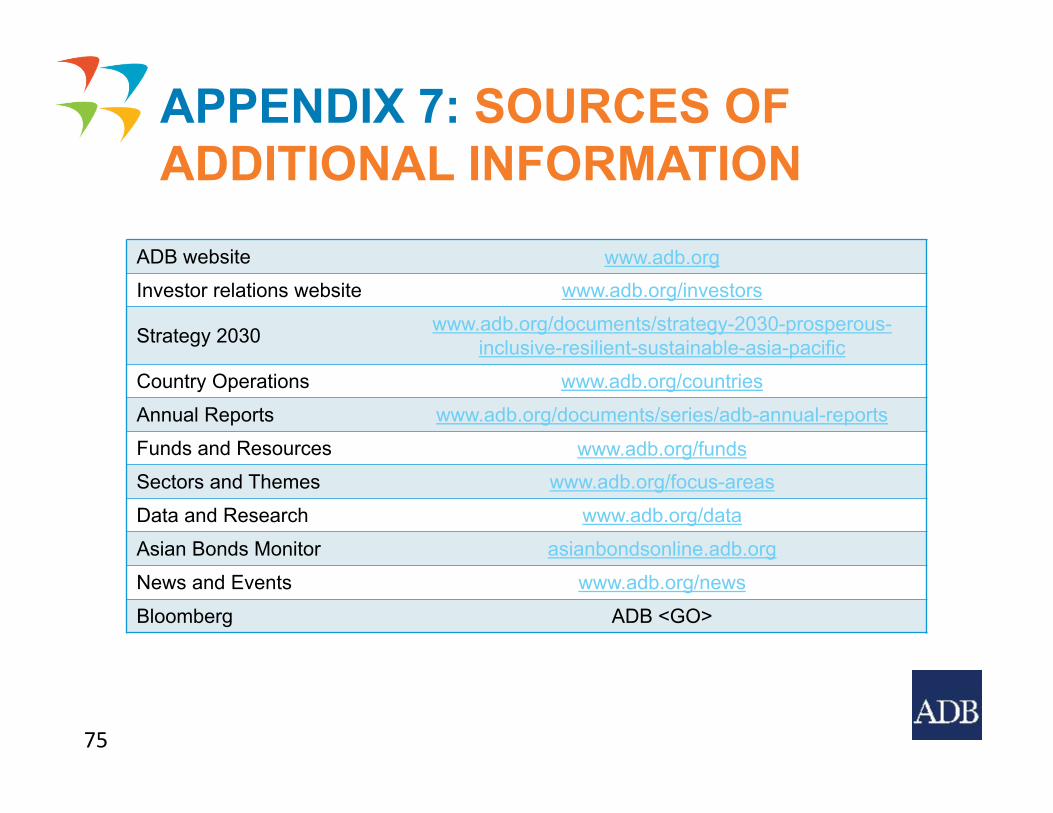
ADB website www.adb.orgInvestor relations website www.adb.org/investors
Strategy 2030 www.adb.org/documents/strategy-2030-prosperous-inclusive-resilient-sustainable-asia-pacific
Country Operations www.adb.org/countriesAnnual Reports www.adb.org/documents/series/adb-annual-reportsFunds and Resources www.adb.org/fundsSectors and Themes www.adb.org/focus-areasData and Research www.adb.org/dataAsian Bonds Monitor asianbondsonline.adb.orgNews and Events www.adb.org/newsBloomberg ADB <GO>
APPENDIX 7: SOURCES OF ADDITIONAL INFORMATION
75
This presentation is for informational purposes only and does not constitute an offer to sell or solicitation of an offer to buy any ADB securities in any jurisdiction to any person to whom it is unlawful to make such an offer or solicitation.
- The term “country”, as used in the context of ADB, refers to a member of ADB and does not imply any view on the part of ADB as to the member’s sovereignty or independent status.
- In this publication, $ refer to US dollars.
DisclaimerEvery effort has been made to ensure the accuracy of the data used in this publication. Variations in data in the Asian Development Bank (ADB) publications often result from different publication dates, although differences may also come from source and interpretation of data. ADB accepts no responsibility from any consequence of their use.
76
Fighting Poverty in Asia and the Pacific
Asian Development Bank Treasury DepartmentFunding Division6 ADB Avenue, Mandaluyong City1550 Metro Manila, Philippines
Email [email protected] Website www.adb.org/investorsBloomberg ADB <GO>Tel. No. +632 8683-1204Fax No. +632 8632-4120
All images are from the ADB Photo Library.
Related Documents