ADB Economics Working Paper Series Economic Growth in Asia: Determinants and Prospects Jong-Wha Lee and Kiseok Hong No. 220 | September 2010

Welcome message from author
This document is posted to help you gain knowledge. Please leave a comment to let me know what you think about it! Share it to your friends and learn new things together.
Transcript

ADB Economics Working Paper Series
Economic Growth in Asia: Determinants and Prospects
Jong-Wha Lee and Kiseok Hong No. 220 | September 2010


ADB Economics Working Paper Series No. 220
Economic Growth in Asia: Determinants and Prospects
Jong-Wha Lee and Kiseok Hong September 2010
Jong-Wha Lee is Chief Economist of the Asian Development Bank and Professor of Economics at Korea University. Kiseok Hong is Professor of Economics at Ewha Women’s University. This paper was prepared under the Asian Development Bank’s TA7470-REG: Long-term Projections of Asian GDP and Trade. The authors thank the participants in the workshops in Seoul and Hong Kong, China for helpful comments, and Lea Sumulong for excellent research assistance. The views expressed in this paper are those of the authors and do not necessarily reflect the views or policies of the Asian Development Bank or its Board of Governors or the governments they represent.

Asian Development Bank6 ADB Avenue, Mandaluyong City1550 Metro Manila, Philippineswww.adb.org/economics
©2010 by Asian Development BankSeptember 2010ISSN 1655-5252Publication Stock No. WPS102522
The views expressed in this paperare those of the author(s) and do notnecessarily reflect the views or policiesof the Asian Development Bank.
The ADB Economics Working Paper Series is a forum for stimulating discussion and eliciting feedback on ongoing and recently completed research and policy studies undertaken by the Asian Development Bank (ADB) staff, consultants, or resource persons. The series deals with key economic and development problems, particularly those facing the Asia and Pacific region; as well as conceptual, analytical, or methodological issues relating to project/program economic analysis, and statistical data and measurement. The series aims to enhance the knowledge on Asia’s development and policy challenges; strengthen analytical rigor and quality of ADB’s country partnership strategies, and its subregional and country operations; and improve the quality and availability of statistical data and development indicators for monitoring development effectiveness.
The ADB Economics Working Paper Series is a quick-disseminating, informal publication whose titles could subsequently be revised for publication as articles in professional journals or chapters in books. The series is maintained by the Economics and Research Department.

Contents
Abstract v
I. Introduction 1
II. Sources of Growth, 1981–2007 4
III. Determinants of Growth 10
IV. Estimation Results 14
V. Growth Projections, 2011–2030 17
A. Baseline Projections 17 B. Reform Scenario 20
VI. Comparison and Discussion of GDP Projections 24
VII. Conclusion 28
References 29

Abstract
Using a growth accounting framework, we find that developing Asia grew rapidly over the past 3 decades mainly due to robust growth in capital accumulation. The contributions of education and total factor productivity in the region’s past economic growth remain relatively limited. Our baseline projections based on the model of conditional convergence show that the gross domestic product (GDP) growth rates of the 12 developing Asian economies covered by this paper will be consistently lower for the next 2 decades than their historical performance. However, policy reforms in education, property rights, and research and development can substantially raise GDP growth in the region and partly offset the slowdown in growth caused by the convergence phenomenon. By expanding at robust rates, developing Asia will account for close to two thirds of the world economy in 2030, almost doubling the current 34% share of the region in 2009.

I. Introduction
Developing Asia weathered the global economic crisis of 2008/2009 well. It was the first region to emerge from the turmoil, helped by decisive and large-scale fiscal and monetary policy measures. Domestic demand has been resilient, especially in the region’s larger economies, and the economic cycle clearly suggests that economies have bottomed and begun to recover. A number of Asian economies even posted double-digit gross domestic product (GDP) growth in the first half of 2010.
Now, as recovery takes firm hold, the region faces a more crucial challenge for its sustained growth in the long run. The question is whether the economies in the region can return to the rapid growth of the past few decades.
Developing Asian economies1 have grown impressively over a period of nearly 30 years. The region’s real GDP in purchasing power parity (PPP) terms climbed from about $3.3 trillion in 1980 to an estimated $24.5 trillion in 2009. That is an increase of 7.5 times, compared with just three times for the world economy during the same period. Real per capita GDP expanded in excess of four times during the period, while average global income registered less than a two-fold increase. Such robust, prolonged growth has clearly raised incomes, lifted millions out of poverty, and expanded developing Asia’s global economic influence.
Per capita GDP in developing Asia remains below the global average, but is rapidly catching up. In 1980, the income of the average Asian was just over a quarter of the world average; by 2009, it had risen to nearly two thirds.
Several factors were responsible. While Asia’s economic growth had been considered a “miracle” in the 1990s (World Bank 1993, Lucas 1993), a number of empirical studies were able to explain the determinants. They highlight the role of investment, human resources, fertility, and institutional and policy variables. For example, Sachs, Radelet, and Lee (2001) find that East Asia’s rapid growth was due to its (i) large potential for catching up; (ii) favorable geography and structural characteristics; (iii) demographic dividend; and (iv) economic policies and strategy that were conducive to growth. The empirical studies show that the role of economic policies, particularly those relating to openness, played a highly significant role in the region’s sustained growth.
1 Developing Asia here includes the People’s Republic of China; Hong Kong, China; India; Indonesia; the Republic of Korea; Malaysia; Pakistan; the Philippines; Singapore; Taipei,China; Thailand; and Viet Nam. These economies account for about 95% of emerging Asia’s GDP, and are thus representative of regional trends.
The standard growth model, such as the extended version of the neoclassical growth model as described by Barro and Sala-i-Martin (2003), predicts the conditional convergence of income, in which a country with a low level of initial income relative to its long-run or steady-state level of potential income will tend to grow faster than a country that is already nearing its potential. Controlling for the factors that influence the long-run or steady-state income level, this implies that a poorer country is expected to grow faster than a higher income country. This is because in poorer countries, levels of physical and human capital and technological progress are farther from their long-run levels, and thus can accumulate capital and learn existing technology more quickly than more advanced economies. In other words, the greater potential for catching up among poorer countries allows them to grow more quickly.
Across developing Asia, growth rates in per capita income have varied in the past 3 decades. The People’s Republic of China (PRC), with the lowest initial level of income per capita in 1980, grew fastest at 8.2% between 1981 and 2007, allowing it to develop from an economically desolate country into a global powerhouse. In Hong Kong, China; the Republic of Korea; Singapore; and Taipei,China, with relatively higher levels of initial income per capita, average growth rates declined during the 3 decades. This generally supports the conditional convergence hypothesis in which poorer countries tend to grow faster and richer countries slower.
However, the more important question now is whether this rapid economic growth can continue in the next 2 decades. Does convergence imply that as income levels in Asian economies increase they can no longer achieve high rates of growth? This is definitely not the case. The conditional convergence theory predicts that the policies and institutional changes that can expand the long-run or steady-state level of potential income in an economy will shift its growth path higher by increasing the gap between initial income and the long-run target level of potential income. Other growth theories, such as the various models of endogenous growth, also predict that policies can have a permanent impact on an economy’s rate of growth.
Measures are thus needed to ensure developing Asia’s sustained growth in the coming decades. In considering the variations in the initial levels of income per capita across developing Asia, the challenge for the region ranges from closing the gap with the steady-state or long-run levels of potential income for low-income economies, to expanding the steady-state or long-run potential income levels for high-income economies. Lower-income economies have more opportunity for factor accumulation, and can thus focus on policies that encourage increases in human and physical capital, such as improvements in the quality and quantity of education and in the investment climate. Indeed, physical capital accumulation accounted for most of GDP growth in the less mature Asian economies until 2007. More mature economies with larger capital stocks, meanwhile, will be subject to diminishing returns to capital and must progressively rely on productivity increases to drive growth. Improvements in total factor productivity (TFP) were actually
2 | ADB Economics Working Paper Series No. 220
significant contributors to GDP growth in Hong Kong, China; the Republic of Korea; Singapore; and Taipei,China from 1981 to 2007.
But why is it important for Asia to sustain its growth beyond the crisis? Just as the last 30 years of growth in developing Asian economies brought large changes to the global and regional economies, Asia’s performance in the coming decades is also expected to substantially influence the global and regional landscape. Knowing how the region will evolve in the next few decades is crucial to how Asian policy makers prepare for their future role in the global community.
Today more than ever, Asia’s influence in the global economy has deepened dramatically as the region helps pull the global economy out of recession. Nonetheless, while it is generally expected that Asia’s economic expansion will carry on, it is unlikely that the economies that achieved very strong growth in recent years, such as the PRC, India, and Viet Nam will maintain such rapid growth rates in, say, the next 20 years. It would thus be interesting to know how Asia’s economic environment will be transformed in the 2 decades ahead.
In particular, we would like to find answers to the following questions: How will Asia’s growth likely pan out? Will a different group of economies take the helm in driving regional growth prospects? If so, what would be the impact on the global and regional economies? What will be the contribution of labor, human capital, physical capital, and technology diffusion to Asia’s future growth? How will Asia fare relative to the industrialized economies of the European Union (EU), Japan, and the United States (US)? What would be the impact of Asia’s continued growth in the global balance of power in the coming decades?
Section II briefly describes developing Asia’s performance from 1981 to 2007. Section III lays out the sources of growth for the 12 Asian economies using a growth accounting framework. Section IV analyzes the determinants of developing Asia’s growth using a system of equations. Section V presents the estimation results and projects GDP growth through 2030 for the developing Asian economies. Section VI compares our GDP growth projections with those of other existing studies and assesses the GDP shares of developing Asian economies in the global economy. Section VII concludes.
Economic Growth in Asia: Determinants and Prospects | 3

II. Sources of Growth, 1981–2007
The aggregate production function is used, and the level of output per labor is produced by combining productive inputs and TFP. We assume a Cobb-Douglas production function as2
Y AK hL= −α α( )1
(1)
where K denotes the stock of physical capital, h represents the amount of human capital per labor, L represents the number of laborers, and A denotes a measure of TFP. The production function can be rewritten in terms of output per labor, y Y L= / , i.e.,
y Ak h= −α α1
, (1')
where k is physical capital per labor.
Following the pioneering work of Solow (1957), the growth accounting method has long been used to break down the growth rate of aggregate output into contributions from the growth of inputs as well as the growth of productivity.
This method is applied to the Cobb-Douglas production function in equation (1):
∆ ∆ ∆ ∆ ∆ln ln ln ( ) ln ( ) lnY A K h L= + ⋅ + − ⋅ + − ⋅α α α1 1 (2)
This equation can be rewritten in per labor terms as:
∆ ∆ ∆ ∆ln ln ln ( ) lny A k h= + ⋅ + − ⋅α α1 (2’)
Following the above formula, the growth of output per labor is decomposed into growth rates of physical and human capital per labor and of TFP. This equation allows us to decompose the differences in GDP per labor across countries into the differences in the capital–labor ratio, the differences in human capital, as well as the differences in TFP.
To conduct the decomposition of output, the output per labor is measured by the level of GDP per labor force. GDP data is taken from the Penn-World Tables (PWT) 6.3 of Heston, Summers, and Aten (2009). The labor force is from the ILO Laborsta database. We do not have reliable data on the number of work hours for most countries.
Physical capital stock data is constructed using the perpetual inventory method, which is based on aggregate investment data in the PWT 6.3.3 Specifically, the capital stock in 2 Note that by assuming neutral technological progress, rather than labor-augmenting progress, our framework
considers the role of productivity more important.3 In computing initial capital stock, most researchers follow the approach of Harberger (1978), which assumes that
the economy is initially in a steady state. Recall that in the steady state, the growth rates of capital and output are the same ( dK K dY Y/ /= ). Since ( ) / ( / )K K K I Kt t t t t− = −− − −1 1 1 δ , then ( / )I K gt t − − =1 δ , where K is capital stock,
4 | ADB Economics Working Paper Series No. 220

time t is computed as follows: K K Ii t i t i t, , ,( )= − +−1 1 δ . The data comes from Barro and Lee (2010).
Regarding the capital share parameter, it is assumed that α is 0.4 and constant across countries.
Human capital per labor is assumed to have a relation to the number of years of schooling as follows (see Barro and Lee 2010):
h e s= φ ( ) (3)
In this equation, φ(s) measures the efficiency of a unit of labor, with s years of education being relative to one without any schooling. We further assume that φ(s) is linear,
h e s= θ (3')
In this equation, θ measures the average marginal return to an additional year of schooling. Barro and Lee (2010) find that, after controlling for the simultaneous determination of human capital and output, by using the 10-year lag of parents’ education as an instrumental variable (IV) for the current level of education, the estimated rate of return to an additional year of schooling is close to the typical Mincerian return estimates found in the labor literature. We assume θ = 8%.4
Table 1 reports the growth rates of output, factor inputs, and TFP for each of the 3 decades under review, i.e., 1981–1990, 1991–2000, and 2001–2007 and also for 1981–2007. Three countries stand out as having their GDP per labor rates steadily rising over the 3 decades—the PRC, Viet Nam, and the Philippines, respectively. GDP per labor in the PRC has increased, from just 5.8% in the first period, to 7.9% in the second, and 10.2% in the third. Viet Nam’s performance has been more modest, starting at 3.0% in the 1980s, rising to 4.4% in the 1990s, and then to 5.1% in the 2000s. The Philippines case is even more moderate, beginning with a 1.0% contraction in GDP per labor during 1981–1990, followed by a small 1.1% increase in 1991–2000, and a 2.6% rise in 2001–2007. The Republic of Korea and Taipei,China recorded gradual declines in growth of GDP per labor over the 3 decades.
I is capital flow or investment, δ is the depreciation rate, and g is the growth rate of output. Rearranging terms yields K I gt t− = +1 /( )δ . To control for short-term fluctuations in output, Harberger suggested the use of average growth rate of output centered around, say, a 3-year period. Nehru and Dhareshwar (1993), King and Levine (1994), Bernanke and Gurkaynak (2001), and Barro and Lee (2010) employed a modified version of this approach in computing for an initial capital stock estimate. The annual depreciation rate of physical capital is assumed to be constant at 0.06. We exclude the first 5 years of available capital stock observations generated by the perpetual inventory method.
4 Bernanke and Gurkaynak (2001) and Bosworth and Collins (2003) assume that the average marginal return to an additional year of schooling is 8%.
Economic Growth in Asia: Determinants and Prospects | 5

Table 1. Basic Growth Accounts, 1981–2030 (annual average growth rates)Actual Projections
1981–90 1991–2000 2001–07 1981–2007 2011–20 2021–30
China, People’s Rep. ofGDP 8.34 9.09 11.15 9.35 6.09 4.98GDP per labor 5.81 7.91 10.22 7.73 5.75 5.06Labor input 2.53 1.18 0.93 1.61 0.34 –0.08Education 0.70 1.19 0.83 0.91 0.65 0.15Capital per labor 5.93 8.72 9.16 7.80 7.50 7.02Total factor productivity 3.02 3.72 6.06 4.07 2.36 2.17
Hong Kong, ChinaGDP 6.24 3.85 4.67 4.95 4.40 2.83GDP per labor 4.59 2.16 3.33 3.36 3.88 3.44Labor input 1.65 1.69 1.34 1.58 0.52 –0.61Education 1.11 –0.08 0.92 0.62 0.72 0.48Capital per labor 5.62 4.71 1.79 4.29 5.62 4.86Total factor productivity 1.67 0.33 2.06 1.27 1.20 1.21
IndiaGDP 5.39 4.74 6.76 5.51 4.67 4.28GDP per labor 3.04 2.69 4.73 3.35 2.94 2.90Labor input 2.35 2.06 2.03 2.16 1.73 1.38Education 1.10 0.60 0.74 0.82 0.58 0.28Capital per labor 2.70 3.45 5.78 3.78 3.56 3.68Total factor productivity 1.30 0.95 1.97 1.34 1.16 1.26
IndonesiaGDP 5.68 4.11 4.51 4.80 4.66 4.12GDP per labor 2.64 1.53 2.58 2.21 3.16 3.08Labor input 3.04 2.58 1.93 2.58 1.50 1.04Education 0.09 0.80 0.79 0.54 0.46 0.28Capital per labor 5.69 3.11 -0.04 3.25 3.79 3.84Total factor productivity 0.31 –0.19 2.12 0.59 1.37 1.37
Korea, Rep. ofGDP 8.96 5.33 3.97 6.32 4.39 3.42GDP per labor 6.34 3.80 2.91 4.51 3.97 3.66Labor input 2.63 1.53 1.06 1.81 0.42 –0.24Education 0.85 1.37 0.64 0.99 0.33 0.29Capital per labor 7.52 7.32 3.61 6.43 4.08 3.93Total factor productivity 2.82 0.05 1.08 1.35 2.14 1.91
MalaysiaGDP 5.85 7.40 5.14 6.24 5.51 4.79GDP per labor 2.43 4.12 2.78 3.15 3.59 3.41Labor input 3.42 3.28 2.36 3.09 1.92 1.38Education 1.39 1.38 0.94 1.27 0.52 0.27Capital per labor 4.67 5.83 1.15 4.19 4.02 4.16Total factor productivity –0.27 0.96 1.76 0.71 1.67 1.58
continued.
6 | ADB Economics Working Paper Series No. 220

Actual Projections1981–90 1991–2000 2001–07 1981–2007 2011–20 2021–30
PakistanGDP 5.96 3.51 6.16 5.10 6.76 6.33GDP per labor 2.71 0.55 2.43 1.84 2.70 2.83Labor input 3.25 2.96 3.73 3.27 4.06 3.50Education 0.62 0.76 1.49 0.90 0.88 0.49Capital per labor 2.30 1.10 0.11 1.29 2.85 3.38Total factor productivity 1.42 -0.35 1.49 0.78 1.04 1.19
PhilippinesGDP 2.02 3.76 4.81 3.39 5.96 5.53GDP per labor -1.00 1.10 2.57 0.70 3.84 3.71Labor input 3.02 2.66 2.24 2.69 2.12 1.82Education 0.67 0.67 0.53 0.63 0.38 0.30Capital per labor 0.07 0.69 0.18 0.33 3.50 3.74Total factor productivity -1.43 0.42 2.18 0.19 2.21 2.03SingaporeGDP 7.00 7.84 4.86 6.76 5.24 3.28GDP per labor 3.80 4.93 2.71 3.94 3.65 3.34Labor input 3.20 2.91 2.15 2.82 1.59 -0.06Education 1.32 1.15 0.77 1.11 0.63 0.48Capital per labor 3.99 4.13 0.84 3.23 5.26 4.71Total factor productivity 1.42 2.59 1.92 1.98 1.17 1.17
Taipei,ChinaGDP 7.61 6.40 3.66 6.14 3.68 2.48GDP per labor 5.22 4.90 2.36 4.36 3.78 3.44Labor input 2.40 1.50 1.30 1.78 -0.09 -0.96Education 0.89 0.97 1.27 1.02 0.47 0.30Capital per labor 5.52 7.42 2.98 5.56 4.93 4.45Total factor productivity 2.48 1.35 0.41 1.52 1.52 1.48
ThailandGDP 7.54 3.71 4.85 5.42 4.01 3.58GDP per labor 4.30 3.05 3.34 3.59 3.87 3.64Labor input 3.24 0.65 1.51 1.84 0.15 -0.06Education 0.81 0.70 0.91 0.80 0.76 0.52Capital per labor 3.89 6.42 0.76 4.02 4.16 4.01Total factor productivity 2.26 0.06 2.48 1.50 1.74 1.72
Viet NamGDP 5.69 6.50 7.41 6.44 4.86 3.74GDP per labor 3.02 4.40 5.12 4.08 3.73 3.37Labor input 2.67 2.10 2.29 2.36 1.14 0.36Education -0.92 0.78 1.02 0.21 0.49 0.12Capital per labor 1.50 9.13 8.29 6.08 2.91 3.08Total factor productivity 2.98 0.29 1.19 1.52 2.27 2.07
GDP = gross domestic product.Note: The projections are based on the estimation results in column (2) of Table 2.Sources: Calculations from Heston, Summers, and Aten (2009); ILO (2010); Barro and Lee (2010).
Table 1: continued.
Economic Growth in Asia: Determinants and Prospects | 7

Figure 1 shows the contributions of the growth of each factor to the growth of output for the 12 Asian economies. We can see from Figure 1 that among the 12 economies in our sample, it is only in the PRC where TFP growth contributed the most to GDP growth between 1981 and 2007. Specifically, TFP in the PRC grew by an average of 4.1% from 1981 to 2007. Singapore recorded the second fastest growth in TFP, at about 2.0% during the same period. In the majority of the other economies, growth in physical capital accounted for the large part of the growth in GDP. In the PRC, capital stock per labor increased by an average 7.8% per year in 1981–2007. Growth in capital stock per labor was also rapid in the Republic of Korea and Viet Nam, at 6.4% and 6.1%, respectively. The Philippines and Pakistan are exceptions, as GDP growth in these economies was mainly driven by growth in the labor force. Education seems to be the least important contributor to growth among most of the Asian economies. Malaysia and the Philippines are exceptions, with TFP growth the smallest contributor to GDP growth. While the PRC stands out as the country with the highest growth rate, the Philippines’s growth is conspicuously slow. From Figure 1, we can see that it has the least commonality with the other economies in the region. We now go to a decadal view of the growth contributors for each economy.
Figure 1: Contributions to GDP Growth, 1981–2007 (percentage points)
0
1
2
3
4
5
6
7
8
9
10
PRC HKG IND INO KOR MAL PAK PHI SIN TAP THA VIE
Capital Labor EducationTotal Factor Productivity GDP
GDP = gross domestic product; PRC = People’s Republic of China; HKG = Hong Kong, China; IND = India; INO = Indonesia; KOR = Republic of Korea; MAL = Malaysia; PAK = Pakistan; PHI = Philippines; SIN = Singapore; TAP = Taipei,China; THA = Thailand; VIE = Viet Nam.
Sources: Calculations from Heston, Summers, and Aten (2009); ILO (2010); Barro and Lee (2010).
In the 1980s and 1990s, capital was the main source of GDP growth in the PRC. This changed in the 2000s, when TFP growth began to account for more than half of the growth in output. Since the 1980s, labor’s contribution to GDP growth has been on a declining trend. The contribution of education, meanwhile, remains small.
8 | ADB Economics Working Paper Series No. 220
The major sources of growth for Hong Kong, China follow the patterns recorded in the PRC—capital in the first 2 decades and TFP in the third—albeit with differing magnitudes. No definitive trends in labor and education are evident during the three periods reviewed.
In India, growth in capital stock was consistently the main growth driver in the 1980s, 1990s, and 2000s. In the first period, growth in labor and TFP accounted for almost the same rates of contribution to GDP growth, at about 25% each. In the second, the contribution of TFP growth declined to about 20%, allowing labor to shore up a greater share of GDP growth. In the final period, the situation was reversed, with TFP growth explaining a significantly larger share of growth in GDP (about 30%) than labor growth (about 18%). Across all three periods, education was the smallest contributor to growth.
Growth in capital stock explained more than half of the GDP growth in Indonesia in the 1980s and 1990s. By the 2000s, capital fell to third place as a growth contributor. Meanwhile, growth in labor input consistently maintained its rank as the second most important contributor to GDP growth. From being an almost noncontributor in the 1980s, education has emerged as a consistent source of GDP growth, accounting for more than 10% of total growth during the 1990s and 2000s.
In the Republic of Korea, capital has been the primary growth source for the last 3 decades. The share of labor has likewise been consistent, at about 16%–18% of GDP growth during the periods in review. The contributions of TFP growth and education, however, were unstable, ranging from 1% to 31% and 6% to 15%, respectively.
For Malaysia, labor and education were relatively stable sources of growth during the 1980s, 1990s, and 2000s. The share of labor has hovered between 27% and 35%, while that for education has ranged from 11% to 14%. Growth of capital stock has contributed steadily less to GDP growth over the 3 decades, while TFP growth has progressively explained a larger share of output growth.
Growth in capital stock and in labor has remained the top two GDP growth contributors in Pakistan in the three review periods. However, while capital stock growth dominated in the 1980s, growth in labor prevailed during the 1990s and 2000s. The share of education has been rising over the 3 decades, starting from just about 6% in the 1980s to about 15% in the 2000s. TFP growth contributed about 24% of GDP growth in the 1980s and 2000s, but reduced GDP growth by about 10% in the 1990s.
GDP growth in the 1980s in the Philippines was largely explained by growth in labor and capital. Education also contributed positively, but its share was relatively small. During that decade, TFP growth reduced growth. In the 1990s, labor and capital were still the top sources of GDP growth, jointly accounting for more than three quarters of the total. Education and TFP growth, meanwhile, each contributed about 11%. By the 2000s, TFP growth had gained the top spot among the sources of GDP growth, with a share of about
Economic Growth in Asia: Determinants and Prospects | 9

45%. Labor growth was still second, contributing 28% to the total. Capital was a close third, accounting for about 20%. Education barely contributed during the decade.
In Singapore, the share of capital stock growth in GDP growth has been steadily declining over the three growth periods, while the share of TFP growth has been steadily rising. The shares of labor and education have generally been stable at about 22%–27% and 9%–11%, respectively.
In the 1980s and 1990s, the ranking of the sources of GDP growth in Taipei,China was the same—capital stock, TFP, labor, and education. In the 2000s, capital stock growth was still the largest growth contributor, but labor and education tied for the number two spot. TFP growth fell to fourth place.
There is no evident pattern in the contributors to GDP growth in Thailand. In the 1980s, capital stock, TFP, and labor contributed from 26% to 38% of total growth. The share of education was just about 6%. In the 1990s, growth in capital stock explained more than three fourths of GDP growth. The shares of labor and education were about 11% each, while TFP growth was a mere 2%. By the 2000s, there was a drastic change in the ranking of the growth sources. TFP growth contributed more than half of GDP growth, while capital and labor shares were at 19% each. The share of education remained at 11%.
In Viet Nam, TFP growth was the primary contributor to GDP growth in the 1980s, with a share of about 52%. Growth of capital stock and labor were similar, at about 28%–29%. At that time, education subtracted from growth. In the two succeeding decades, capital stock growth was the major contributor to GDP growth. The shares of labor and education were similar during the last two periods, at 19% and 8%, respectively. The share of TFP growth, meanwhile, sharply increased from about 4% in the 1990s to 16% in the 2000s.
III. Determinants of Growth
Asia’s rapid growth path can be explained by an extended version of the neoclassical growth model that incorporates the role of human capital and technology catch-up (see Barro and Sala-i-Martin 2003; Sachs, Radelet, and Lee 2001). This model predicts “conditional convergence” of income (output) per capita: a country with low initial income per capita relative to its own long-run (or steady-state) potential level of income per capita will grow faster than a country that is already closer to its long-run potential level of output per capita. The farther an economy is located from its steady-state output level, the greater is the gap of reproducible (physical and human) capital and technical efficiency from their long-run levels. The gap of existing capital from the steady-state level encourages high rates of capital accumulation by providing higher rates of return
10 | ADB Economics Working Paper Series No. 220

to capital. The greater technology gap offers the chance for rapid technology “catch-up” via the diffusion of technology from more technologically advanced economies. Hence, the lower the initial level of per capita output relative to the steady state, the higher subsequent growth tends to be. This framework presumably helps to explain why an industrialized economy such as Japan, with its relatively large capital stock and with it already operating near the world’s technological frontier, grows more slowly than emerging Asian countries that are catching up with the leaders.
The “conditional convergence” framework implies that each country has its own steady-state levels of output per labor and productivity to which it is converging. Crucially, the long-term levels depend on various external environmental and policy variables. Countries with favorable economic policies and economic structure tend to have a higher steady-state level of income, and therefore faster growth at any given initial level of income.
The basic model is summarized in the following system of equations:
∆ ln ln( ) ln( )A A At Ass
t= − −β 1 (4)
∆ ln ln( ) ln( )k k kt kss
t= − −β 1 (5)
∆ ln ln( ) ln( )h h ht hss
t= − −β 1 (6)
∆ ∆ ∆ ∆ln ln ln ( ) lny A k ht t t t= + ⋅ + − ⋅α α1 (7)
∆ ln ln( ) ln( ) ln( ) ln( ) (y A A k kt Ass
t kss
t= − + ⋅ − + −− −β α β α1 1 1 )) ln( ) ln( )⋅ − −βhss
th h 1
where the growth of each component of GDP (i.e., A, k, and h) is explained by its convergence from initial level at time t to steady-state level (denoted by superscript ss). βA , βk , and βh denote the coefficients of the adjustment speed of components A, k, and h, respectively.
Figure 2 supports the convergence hypothesis. The PRC, which had the lowest initial level of GDP per labor, grew the fastest from 1981 to 2007. Singapore and Hong Kong, China, with significantly higher GDP per labor in 1980, registered relatively lower rates of growth. The Philippines tends to be the outlier, with relatively low initial GDP per labor level, yet recording the lowest growth rate during the 3-decade period. Convergence is more apparent in capital stock per labor and TFP, as shown by the steeper fitted lines in the figures. Note that this relationship holds without controlling for the determinants of the steady-state levels.
Economic Growth in Asia: Determinants and Prospects | 11
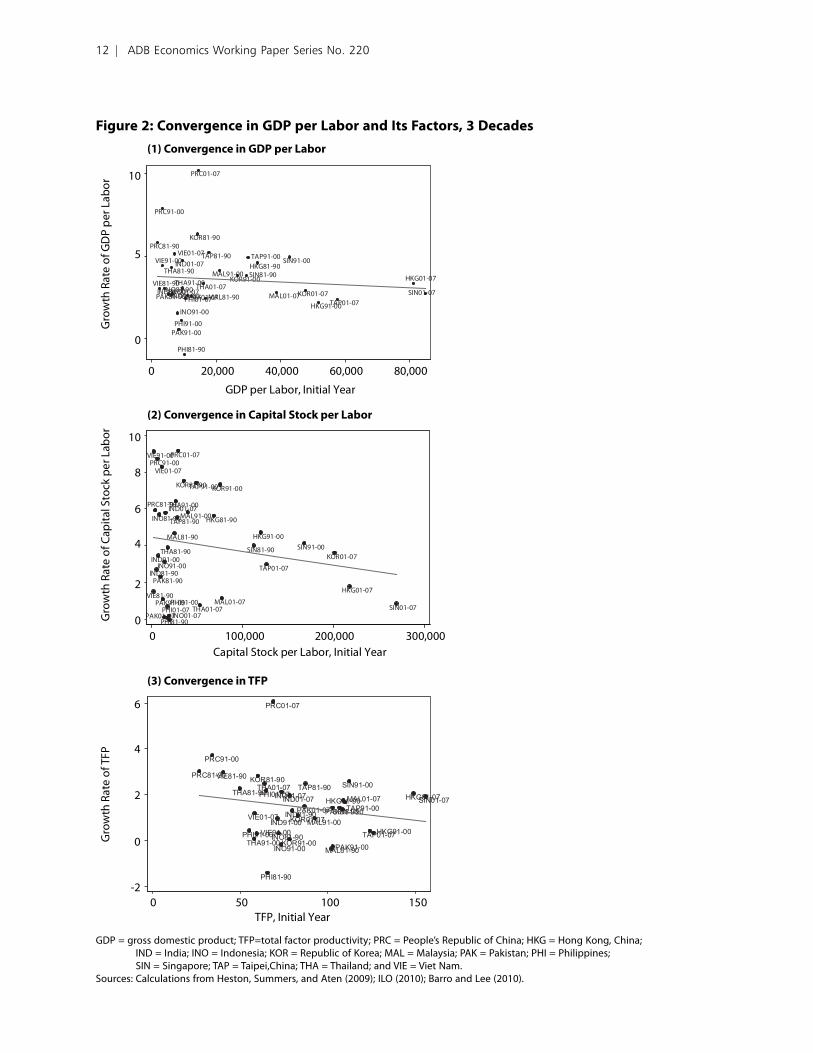
Figure 2: Convergence in GDP per Labor and Its Factors, 3 DecadesG
row
th R
ate
of T
FP
PRC01-07
HKG01-07IND01-07INO01-07
KOR01-07
MAL01-07PAK01-07
PHI01-07SIN01-07
TAP01-07
THA01-07
VIE01-07
PRC91-00
HKG91-00IND91-00
INO91-00KOR91-00
MAL91-00
PAK91-00
PHI91-00
SIN91-00
TAP91-00
THA91-00VIE91-00
PRC81-90
HKG81-90
IND81-90
INO81-90
KOR81-90
MAL81-90
PAK81-90
PHI81-90
SIN81-90
TAP81-90THA81-90
VIE81-90
-2
0
2
4
6
0 50 100 150TFP, Initial Year
PRC01-07
HKG01-07
IND01-07
INO01-07
KOR01-07
MAL01-07
PAK01-07PHI01-07 SIN01-07
TAP01-07
THA01-07
VIE01-07PRC91-00
HKG91-00
IND91-00INO91-00
KOR91-00
MAL91-00
PAK91-00PHI91-00
SIN91-00
TAP91-00
THA91-00
VIE91-00
PRC81-90
HKG81-90
IND81-90
INO81-90
KOR81-90
MAL81-90
PAK81-90
PHI81-90
SIN81-90
TAP81-90
THA81-90
VIE81-90
0
2
4
6
8
10
Gro
wth
Rat
e of
Cap
ital S
tock
per
Lab
or
0 100,000 200,000 300,000Capital Stock per Labor, Initial Year
PRC01-07
HKG01-07
IND01-07
INO01-07 KOR01-07MAL01-07PAK01-07PHI01-07SIN01-07
TAP01-07
THA01-07
VIE01-07
PRC91-00
HKG91-00IND91-00
INO91-00
KOR91-00MAL91-00
PAK91-00PHI91-00
SIN91-00TAP91-00
THA91-00
VIE91-00
PRC81-90
HKG81-90
IND81-90INO81-90
KOR81-90
MAL81-90PAK81-90
PHI81-90
SIN81-90
TAP81-90
THA81-90
VIE81-90
0
5
10
Gro
wth
Rat
e of
GD
P pe
r Lab
or
0 20,000 40,000 60,000 80,000
GDP per Labor, Initial Year
(1) Convergence in GDP per Labor
(2) Convergence in Capital Stock per Labor
(3) Convergence in TFP
GDP = gross domestic product; TFP=total factor productivity; PRC = People’s Republic of China; HKG = Hong Kong, China; IND = India; INO = Indonesia; KOR = Republic of Korea; MAL = Malaysia; PAK = Pakistan; PHI = Philippines; SIN = Singapore; TAP = Taipei,China; THA = Thailand; and VIE = Viet Nam.
Sources: Calculations from Heston, Summers, and Aten (2009); ILO (2010); Barro and Lee (2010).
12 | ADB Economics Working Paper Series No. 220

Considering the determinants of the steady-state levels of A, k, and h, the equations can be rewritten as (see the companion papers by Park 2010, Shioji and Vu 2010, and Lee and Francisco 2010):
∆ ∆ln (ln ,ln , ,ln , ln )A f A life h pop RNDt t t t t t= − − −1 1 1 (4’)
∆ ∆ ∆ln (ln , ln ,ln , , ln , ,k f k A ASY
pop open proprit t t tt
t t=
− −1 1 gghtt )
(5’)
∆ ∆ln ( , ),h f enrol shpopt j t t= −15 24
(6’)
where lnAt-1 denotes the log of the initial level of TFP; lnlifet-1 the log of the initial life expectancy at birth; lnpopt-1 the log of initial population; ΔlnRND t the growth rate of research and development (R&D) capital stock; lnkt-1 the log of the initial capital stock per worker; lnAt-1 the log of the initial level of TFP; (S/Y) t the saving rate; Δlnpop t the growth rate of population; opent a measure of openness defined as (exports + imports)/GDP; proprightt the Heritage Foundation’s “Property Rights” index; ∆ enrol j t, the change in enrollment rate for level j = primary, secondary, and tertiary; and shpopt
15 24− the share of population 15–24 years old to total population.5
As dictated by the convergence hypothesis, the growth of each component of GDP is specified as a function of the component’s initial level. Also, cross influences between the components are allowed, with the initial level and/or the growth rate of one component affecting the growth rate of another. For example, the initial level of educational attainment is related to TFP growth, and TFP growth is related to the growth rate of capital stock per worker. As additional determinants, initial life expectancy (due to its correlation with people’s overall health), population size (due to the nonrivalrous nature of technological innovation), and R&D investment (for obvious reasons) are considered for TFP growth. Population growth is expected to have a negative impact on capital accumulation as in the Solow model, while openness and the protection of property rights have a positive impact on capital accumulation. The accumulation of human capital is determined by the relative size and school enrollment of the young-age population.
SY t
is also endogenously determined as follows (see the companion paper by Horioka and Terada-Hagiwara 2010):
SY
f life ex dep young dep old y y labort
t t t t t
= ( _ , _ , _ ,ln , ln , _∆ ppart65) , (8)
5 The initial levels of TFP and life expectancy at birth can alternatively be defined as relative to levels in the United States, as in Park (2010). We obtain the same results regardless of how the initial levels are defined, because year dummies are included in all regressions.
Economic Growth in Asia: Determinants and Prospects | 13

where life_ext denotes life expectancy at birth; dep_youngt, the youth dependency ratio, which is defined as population aged 14 and below divided by population aged 15–64; dep_oldt,the old dependency ratio defined as population aged 65 and above divided by population aged 15–64; and labor_part65, the labor force participation rate of elderly people. A longer life span is expected to increase savings because people may want to save more in preparation for longer postretirement spans. Dependency ratios and the GDP growth rate are standard determinants of savings, according to the life-cycle hypothesis. In addition to the GDP growth rate, the level of per capita GDP may also be important for savings, according to the Keynesian consumption theory. Finally, a greater labor participation rate among the elderly may increase aggregate savings by lowering the proportion of dependents among the elderly.
IV. Estimation Results
Equations (4’), (5’), (8), and (7) provide a simultaneous equation system with three endogenous variables—ΔlnAt, Δlnkt, (S/Y)t —and one accounting identity about Δlnyt. All other variables are either exogenous or predetermined. We assume that Δlnht is exogenously determined because both its determinants, the enrollment rate and the age structure of population, are exogenous to our specification. Following the convention in the literature, we will assume that all equations are linear.
Since some of the equations contain endogenous variables among the explanatory variables, we need to use IV estimation to produce consistent estimates. Also, there may be contemporaneous correlation of errors across equations that should be taken into account to improve efficiency. For these reasons, we estimate the equation system using three-stage least squares (3SLS). While system methods are more sensitive to specification error than single equation methods, we find that our system estimation results are largely similar to equation-by-equation IV estimation results.
Our sample is an unbalanced panel that covers both developing and developed economies in 1981–1990, 1991–2000, and 2001–2007. From our initial data set with about 200 countries, we first excluded obvious outlier observations in some of the key variables.6 We then picked those countries that have no missing values in any of the variables used for at least two out of the three periods. This leaves us with 159 observations from 61 countries. We take the period average for all contemporaneous conditions and the beginning period values for all initial conditions. To control for possible time-fixed effects, period dummy variables are included in all regressions.
6 Specifically, we excluded the growth rate of R&D stock greater than 0.4, the growth rate of capital per worker greater than 0.1 or lower than –0.07, the population growth rate greater than 0.07, and the saving rate lower than –0.5.
14 | ADB Economics Working Paper Series No. 220

In addition to time-fixed effects, we control for Asia-fixed effects and PRC-fixed effects. In particular, we include the Asia dummy in each of equations (4’), (5’), and (8), and include the PRC dummy in equation (5’). This is intended to represent the view that developing Asia’s economic growth, particularly in the PRC, has been higher than can be explained by other economies’ experiences; and that the PRC has been most outstanding in its capital accumulation. We do not control for all country-fixed effects because while the fit of the model can improve greatly by the inclusion of individual country dummy variables, the issue of cross-country differences in growth will be largely unaddressed.7
Our estimation results are provided in Table 2. For a robustness check, we estimate the system both with and without the Asia and the PRC dummies. As columns (1) and (2) show, we obtain similar results in both specifications and the results are largely consistent with theoretical expectations. First, regardless of the specification used, convergence is strongly supported by the data. For both ΔlnAt and Δlnkt, the coefficient on the corresponding initial level is significantly negative. Second, there seem to be substantial interactions among endogenous variables. For example, in column (1), the saving rate in the Δlnkt equation and the GDP growth rate in the (S/Y)t equation each has a significantly positive coefficient. The coefficients remain positive in column (2), even if less significant and smaller than in column (1). Note that this is not caused by endogeneity biases because we used 3SLS in our estimation. Third, among other results, the positive effect of the level of TFP on Δlnkt and the positive effect of per capita GDP on (S/Y)t are particularly robust. Fourth, the Asia dummy and the PRC dummy are always positive, indicating that Asia in general and the PRC in particular have shown extraordinary performance in all the components that cannot be explained by the variables in the regression. The dummy variables are also statistically significant for the saving rate equation and the Δlnkt equation. Fifth, although not reported in that table, we find that the overall fit of the regression among the Asian economies is relatively low for Δlnkt and high for (S/Y)t.
7 Similar problems exist with time-fixed effects. All cross-period differences in growth are controlled away by period dummy variables. This problem can be particularly critical in making forecasts for future periods. See footnote 10.
Economic Growth in Asia: Determinants and Prospects | 15

Table 2: Estimation Results
(1) (2)
TFP growthlog(TFP) -0.0204
(-6.24)-0.0189
(-5.34)log(Life_expectancy) 0.0449
(3.17)0.0340
(2.19)Years of schooling 0.0006
(1.07)0.0012
(1.96)log(Population) 0.0019
(3.18)0.0007
(0.99)R&D stock growth 0.0498
(2.61)0.0409
(1.85)Asia dummy 0.0044
(1.29)
K/L growthlog(K/L) -0.0250
(-6.52)-0.0179
(-4.4)log(TFP) 0.0316
(3.73)0.0222
(3.00)TFP growth 1.2077
(4.42)0.3274
(1.21)Population growth -0.2696
(-1.05)-0.6857
(-2.79)Saving rate 0.1414
(4.97)0.0578
(1.79)Openness 0.0049
(1.19)0.0037
(0.97)Property right 0.0004
(4.77)0.0005
(5.84)Asia dummy 0.0149
(2.89)PRC dummy 0.0420
(3.27)
Saving RateLife expectancy 0.0029
(1.41)0.0029
(1.41)Old dependency -0.3876
(-2.31)-0.4597
(-2.65)Young dependency -0.1262
(-1.08)-0.2440
(-2.09)Elderly participation 0.2663
(3.97)0.2977
(4.3)GDP growth 3.0528
(3.45)1.3071
(1.33)log(GDP per capita) 0.1137
(5.23)0.1062
(5.13)Asia dummy 0.0560
(2.25)
Number of countries 61 61Observations 159 159
TFP = total factor productivity, R&D = research and development, K = physical capital, L = labor, GDP = gross domestic product. Note: Z-ratios are in parentheses. The system of equations is estimated by the 3SLS (Three-Stage Least Squares) method. Column
(1) shows results with the no dummy variable specification. Column (2) shows results for the specification with an Asia dummy for all equations and a PRC dummy for the K/L equation.
Source: Authors’ calculations.
16 | ADB Economics Working Paper Series No. 220

V. Growth Projections, 2011–2030
A. Baseline Projections
Once the equations are estimated, we can solve the system to derive reduced form equations for the endogenous variables where only exogenous and/or predetermined variables appear on the right hand side.8 This is straightforward because of the linearity of our system.
Using the reduced form equations in addition to the forecasts of exogenous variables, we can produce forecast series of the endogenous variables. Since historical data for the endogenous variables are currently available only up to 2007, while our projection period starts from 2010, we first need to fill in the gaps by assuming arbitrary numbers. We assume that, for each endogenous variable, the 2001–2007 historical average will hold for 2008 and 2009. We have alternatively used the 2001–2007 fitted values instead of the historical average and found that our results change only marginally. For exogenous variables, we take the forecasts provided by other sources—projections of L are from Kim (2010), while h forecasts are from Lee and Francisco (2010). Exceptions are the following: (i) we assume that R&D stock growth, openness, and property rights will remain constant in each country at their respective 2001–2007 average values for the next 2 decades; (ii) Viet Nam’s R&D stock growth is given by the average of the other Asian countries excluding the four newly industrialized economies of Hong Kong, China; the Republic of Korea; Singapore; and Taipei,China; and (iii) property rights in Taipei,China are assumed to be of the same level as in the Republic of Korea.
We use the estimation results in column (2) of Table 2 for our baseline projections. Although not reported here, similar results are obtained with column (1) of Table 2.9 Our baseline forecasts are provided in the last two columns of Table 1. The main results are as follows. Firstly, the forecasts of GDP growth are consistently lower than the historical averages over 1981–2007 across countries. In particular, forecasts for the PRC’s growth at 6.09% for 2011–2020 and 4.98% for 2021–2030 are substantially lower than the historical average of 9.35%. Only for Pakistan and the Philippines do the forecasts exceed the historical average. Secondly, the forecasts closely track the historical cross-country variation in GDP growth. The correlation between 2001–2007 average GDP growth and 2011–2020 average GDP growth as shown in Table 1 is 0.5. For GDP per labor growth, the correlation between the historical average and our forecast is 0.76. Thirdly, in all 12 economies, the GDP growth rate is projected to decrease between 2011–2020 and 2021–2030. This result is driven by the “convergence” in both factor accumulation and TFP growth.
8 In each estimated equation, the coefficients on year dummies do not exhibit a clear trend. Thus, we simply take the average of the coefficients on three period dummies and add it to the constant term.
9 The results are available from the authors upon request.
Economic Growth in Asia: Determinants and Prospects | 17
In general, the projected performance of the 12 Asian economies explains the cross-country catch-up phenomenon. The low-income economies of the region are generally expected to grow faster than the high-income economies. The model predicts that those that experienced fast growth over the last 3 decades would tend to grow slower in the future. These countries include Hong Kong, China; the Republic of Korea; Singapore; and Taipei,China. Meanwhile, the PRC, India, and Viet Nam, which have generally recorded rising growth rates over the past 3 decades, are projected to register slowing growth in the next 2 decades. However, countries that might have grown below their potential growth rates over the past decades would tend to expand more rapidly than their historical performance. Pakistan and the Philippines belong to this group.
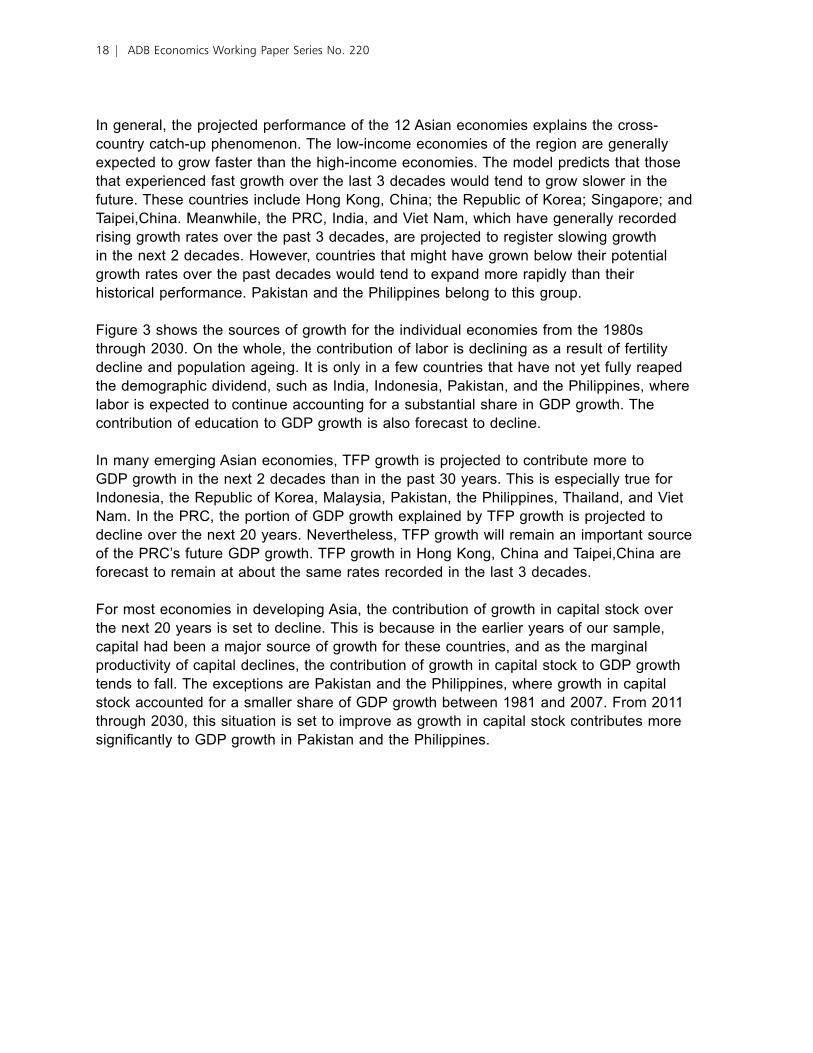
Figure 3 shows the sources of growth for the individual economies from the 1980s through 2030. On the whole, the contribution of labor is declining as a result of fertility decline and population ageing. It is only in a few countries that have not yet fully reaped the demographic dividend, such as India, Indonesia, Pakistan, and the Philippines, where labor is expected to continue accounting for a substantial share in GDP growth. The contribution of education to GDP growth is also forecast to decline.
In many emerging Asian economies, TFP growth is projected to contribute more to GDP growth in the next 2 decades than in the past 30 years. This is especially true for Indonesia, the Republic of Korea, Malaysia, Pakistan, the Philippines, Thailand, and Viet Nam. In the PRC, the portion of GDP growth explained by TFP growth is projected to decline over the next 20 years. Nevertheless, TFP growth will remain an important source of the PRC’s future GDP growth. TFP growth in Hong Kong, China and Taipei,China are forecast to remain at about the same rates recorded in the last 3 decades.
For most economies in developing Asia, the contribution of growth in capital stock over the next 20 years is set to decline. This is because in the earlier years of our sample, capital had been a major source of growth for these countries, and as the marginal productivity of capital declines, the contribution of growth in capital stock to GDP growth tends to fall. The exceptions are Pakistan and the Philippines, where growth in capital stock accounted for a smaller share of GDP growth between 1981 and 2007. From 2011 through 2030, this situation is set to improve as growth in capital stock contributes more significantly to GDP growth in Pakistan and the Philippines.
18 | ADB Economics Working Paper Series No. 220

Figure 3: Sources of GDP Growth, 1981–2030 (percentage points)
-2
0
2
4
6
8
10
12
-1
0
1
2
3
4
5
6
7
0
1
2
3
4
5
6
7
8
People's Republic of China
Hong Kong, China
India
-1
0
1
2
3
4
5
6
Indonesia
-2
0
2
4
6
8
10
Republic of Korea
-1
0
1
2
3
4
5
6
7
8
Malaysia
-1
0
1
2
3
4
5
6
7
8
Pakistan
-2
-1
0
1
2
3
4
5
6
7
Philippines
-10 123 456789
Singapore
-10123456789
Taipei,China
-1
0
1
2
3
4
5
6
7
8
Thailand
-1
0
1
2
3
4
5
6
7
8
Viet Nam
1981−90 1991−2000 2001−07 2011−20 2021−30
Total Factor ProductivityLabor Capital GDPEducation
1981−90 1991−2000 2001−07 2011−20 2021−30 1981−90 1991−2000 2001−07 2011−20 2021−30
1981−90 1991−2000 2001−07 2011−20 2021−30 1981−90 1991−2000 2001−07 2011−20 2021−30 1981−90 1991−2000 2001−07 2011−20 2021−30
1981−90 1991−2000 2001−07 2011−20 2021−30 1981−90 1991−2000 2001−07 2011−20 2021−30 1981−90 1991−2000 2001−07 2011−20 2021−30
1981−90 1991−2000 2001−07 2011−20 2021−30 1981−90 1991−2000 2001−07 2011−20 2021−30 1981−90 1991−2000 2001−07 2011−20 2021−30
GDP = gross domestic product.Sources: Authors’ own projections and calculations from Heston, Summers, and Aten (2009); ILO (2010); Barro and Lee (2010).
Economic Growth in Asia: Determinants and Prospects | 19

B. Reform Scenario
As mentioned above, our baseline projection assumes that R&D stock growth and property rights will remain constant at their historical means for the next 2 decades. Changes in the average years of schooling are based on the assumption that for the younger population (15–19 and 20–24 years old), primary, secondary, and tertiary enrollment rates continue to grow over time according to their respective historic trends and follow a similar logistic growth path toward the maximum enrollment rate.10 Population is assumed to grow according to the United Nations’ medium variant fertility rate assumption. The distribution of educational attainment among the older age groups (25 years and above11) is assumed to be the same as that of the age group 5 years younger 5 years ago. However, these variables may improve over time, particularly in countries with currently unfavorable conditions, because there is so much room for government policy reforms.
In order to examine the potential impacts of policy reforms on GDP growth, we consider a scenario where all three policy-oriented variables—years of schooling, R&D stock growth, and property rights—improve at the same time over the baseline case. First, the growth rate of R&D stock per worker is adjusted upward in proportion to the deviation of each country from the per-worker R&D level of the US. In particular, we assume that the R&D growth rate in country i increases by following a formula such as 0.02*(log of per worker R&DUS – log of per worker R&Di ). Our scenario assumes that R&D growth accelerates in each economy in a pattern consistent with Park (2010).12 For reforms in property rights, we consider full convergence by 2020 of the property rights index in each economy to 90, the 2009 level of the US; Hong Kong, China; and Singapore. For example, the PRC’s property rights index gains 6.1 points every year to increase from 29 in 2010 to 90 in 2020. The index remains constant after 2020. An education policy reform is assumed such that primary, secondary, and tertiary enrollment rates across all emerging Asian economies will continue to grow logistically over time and by 2030, converge to the best prevailing enrollment rates among them. The same reform will also result in convergence in primary, secondary, and tertiary completion rates among emerging Asian countries by 2030 to the best prevailing completion rates among them, also following a logistic growth time trend.
10 The enrollment rate at time t for level j = primary, secondary, and tertiary is enrol =
enrol
(1+e )j,tjmax
-a-bj •time , where enrol jmax
is the maximum enrollment rate (that is, 100); a and b are parameters of the logistic growth curve.11 For the population 65 years and over, educational attainment is adjusted following the assumption that mortality
rate is higher for the less educated.12 Park (2010) reports that, among OECD economies and the newly industrialized economies of Hong Kong, China;
the Republic of Korea; Singapore; and Taipei,China, the R&D growth rate is negatively correlated with the log of initial R&D stock relative to that of the US. When the R&D gap between the US and country i is negative, the R&D growth rate is set equal to the historical average.
20 | ADB Economics Working Paper Series No. 220

GDP growth projections under the reform scenario are reported in Table 3. As expected, gains from the policy reforms are most evident among less developed economies with low initial values of the policy variables. The increase in the GDP growth rate ranges from 1.2 to 1.8 percentage points in India, Indonesia, Pakistan, the Philippines, and Viet Nam; the gain typically accelerates between 2011–2020 and 2021–2030. For the four newly industrialized economies of Hong Kong, China; the Republic of Korea; Singapore; and Taipei,China, the increases are much smaller, with an average of 0.2 percentage point for 2011–2020 and 0.16 percentage point for 2021–2030. For the PRC, the GDP growth rate increases by about 1 percentage point in each decade.
The increases in GDP growth rates arising from policy reforms can be decomposed into the contributions of the resulting improvements in years of schooling, capital per labor, and TFP. Results from our reform scenario show that increases in TFP growth can contribute to GDP growth in developing Asian economies ranging from 0.02 to 0.49 percentage point. India, Indonesia, Pakistan, the Philippines, and Viet Nam are the major beneficiaries of higher TFP growth, raising their average GDP growth per year from 2011 to 2030 by at least 0.34 percentage point.
The extent of the contribution of education to GDP growth is very similar to that of TFP. GDP is forecast to grow by an additional 0.02 to 0.50 percentage point annually on account of higher years of schooling in the 12 Asian economies. The contribution of education to GDP growth is especially large for India, Pakistan, and Viet Nam, averaging 0.39 percentage point from 2011 to 2030.
The impact of increases in growth in capital per labor on GDP growth is more diverse across emerging Asian economies. Its contribution to GDP growth ranges from 0.01 to 1.14 percentage point per year over the next 20 years. The largest contribution is recorded in Viet Nam, with GDP growing by an additional 1.14 percentage points annually in 2011–2030. In the PRC, India, Indonesia, Pakistan, and the Philippines, higher growth in capital per labor contributes at least 0.60 percentage point to GDP growth.
These results suggest that through policy reforms, developing Asia can substantially increase its growth performance and partly offset the slowdown in growth caused by the convergence phenomenon.
Economic Growth in Asia: Determinants and Prospects | 21

Table 3: GDP Projections—Alternative Specifications
Baseline Projections Reform Scenario Projections
2011–20 2021–30 2011–20 2021–30
China, People’s Rep. ofGDP 6.09 4.98 7.00 6.23GDP per labor 5.75 5.06 6.66 6.31Labor input 0.34 -0.08 0.34 -0.08Education 0.65 0.15 0.85 0.30Capital per labor 7.50 7.02 8.93 9.75Total factor productivity 2.36 2.17 2.58 2.23
Hong Kong, ChinaGDP 4.40 2.83 4.62 2.92GDP per labor 3.88 3.44 4.10 3.53Labor input 0.52 -0.61 0.52 -0.61Education 0.72 0.48 0.86 0.55Capital per labor 5.62 4.86 5.68 4.90Total factor productivity 1.20 1.21 1.32 1.24
IndiaGDP 4.67 4.28 6.13 5.78GDP per labor 2.94 2.90 4.39 4.40Labor input 1.73 1.38 1.73 1.38Education 0.58 0.28 1.77 0.76Capital per labor 3.56 3.68 4.65 5.74Total factor productivity 1.16 1.26 1.47 1.65
IndonesiaGDP 4.66 4.12 6.16 5.82GDP per labor 3.16 3.08 4.66 4.78Labor input 1.50 1.04 1.50 1.04Education 0.46 0.28 1.14 0.54Capital per labor 3.79 3.84 5.26 6.55Total factor productivity 1.37 1.37 1.88 1.83
Korea, Rep. ofGDP 4.39 3.42 4.65 3.70GDP per labor 3.97 3.66 4.23 3.94Labor input 0.42 -0.24 0.42 -0.24Education 0.33 0.29 0.52 0.39Capital per labor 4.08 3.93 4.33 4.40Total factor productivity 2.14 1.91 2.19 1.94
MalaysiaGDP 5.51 4.79 6.24 5.59GDP per labor 3.59 3.41 4.32 4.21Labor input 1.92 1.38 1.92 1.38Education 0.52 0.27 0.92 0.45Capital per labor 4.02 4.16 4.86 5.72Total factor productivity 1.67 1.58 1.83 1.65
continued.
22 | ADB Economics Working Paper Series No. 220

Baseline Projections Reform Scenario Projections
2011–20 2021–30 2011–20 2021–30
PakistanGDP 6.76 6.33 8.42 7.97GDP per labor 2.70 2.83 4.36 4.47Labor input 4.06 3.50 4.06 3.50Education 0.88 0.49 2.03 0.62Capital per labor 2.85 3.38 4.36 6.22Total factor productivity 1.04 1.19 1.40 1.61
PhilippinesGDP 5.96 5.53 7.09 6.81GDP per labor 3.84 3.71 4.98 4.99Labor input 2.12 1.82 2.12 1.82Education 0.38 0.30 0.79 0.41Capital per labor 3.50 3.74 4.65 5.85Total factor productivity 2.21 2.03 2.64 2.40
SingaporeGDP 5.24 3.28 5.35 3.29GDP per labor 3.65 3.34 3.76 3.35Labor input 1.59 -0.06 1.59 -0.06Education 0.63 0.48 0.76 0.46Capital per labor 5.26 4.71 5.28 4.73Total factor productivity 1.17 1.17 1.19 1.18
Taipei,ChinaGDP 3.68 2.48 3.89 2.73GDP per labor 3.78 3.44 3.98 3.69Labor input -0.09 -0.96 -0.09 -0.96Education 0.47 0.30 0.59 0.39Capital per labor 4.93 4.45 5.17 4.90Total factor productivity 1.52 1.48 1.56 1.50
ThailandGDP 4.01 3.58 4.75 4.25GDP per labor 3.87 3.64 4.60 4.31Labor input 0.15 -0.06 0.15 -0.06Education 0.76 0.52 0.94 0.42Capital per labor 4.16 4.01 4.94 5.39Total factor productivity 1.74 1.72 2.06 1.91
Viet NamGDP 4.86 3.74 6.43 5.73GDP per labor 3.73 3.37 5.30 5.36Labor input 1.14 0.36 1.14 0.36Education 0.49 0.12 1.20 0.40Capital per labor 2.91 3.08 4.86 6.83Total factor productivity 2.27 2.07 2.63 2.39
GDP = gross domestic product.Source: Authors’ calculations.
Table 3: continued.
Economic Growth in Asia: Determinants and Prospects | 23

VI. Comparison and Discussion of GDP Projections
We now compare our projections with those generated by a number of other sources, such as Maddison (2007), Fogel (2007), and Goldman Sachs (Wilson and Stupnytska 2007). Maddison’s projections are not based on an econometrics model, but on an analysis of changes in the momentum of growth in different parts of the world economy and an assessment of the likelihood of their continuation or change. These were conceived as a likely continuation or deviation from the momentum of growth in 1991–2003. He assumed that for Western Europe, the US, and Japan, per capita GDP would advance at the same pace as in 1991–2003. Fogel’s forecasts were influenced by the forecasts of the CIA and The Economist. Goldman Sachs used a simple model of growth as a function of growth in the labor force, capital accumulation, and a process of convergence in technology with the developed markets that drives productivity growth performance. The speed of convergence is assumed to depend on an economy’s growth conditions, which is measured by their calculated Growth Environment Scores (GES). A higher GES implies more rapid catch-up with the income levels of the rich countries.
Table 4 presents our forecasts for GDP growth relative to the forecasts of the three other sources mentioned above. As before, we have two sets of projections: the baseline and the reform scenario. The baseline and the reform scenario forecasts correspond to the results shown in Table 3. As mentioned above, our reform scenario involves simultaneous changes in the three policy-oriented variables in our model, i.e., years of schooling, R&D stock growth, and property rights.
Table 4: Comparison of Projections of GDP Growth
Lee and Hong: Baseline,2011–30
Lee and Hong: Reform,2011–30
Maddison:2004–30
Fogel:2001–40
Goldman Sachs:
2008–30
China, People’s Rep. of 5.5 6.6 5.0 8.4 5.8Hong Kong, China 3.6 3.8India 4.5 6.0 5.7 7.1 6.2Indonesia 4.4 6.0 3.5 4.8Korea, Rep. of 3.9 4.2 2.6 3.2Malaysia 5.2 5.9Pakistan 6.5 8.2 5.0Philippines 5.7 7.0 5.2Singapore 4.3 4.3Taipei,China 3.1 3.3 2.8Thailand 3.8 4.5 2.9Viet Nam 4.3 6.1 7.0
GDP = gross domestic product.Sources: Authors’ own projections and calculations from Maddison (2007), Fogel (2007), Wilson and Stupnytska (2007).
24 | ADB Economics Working Paper Series No. 220

We find that our GDP growth forecasts are generally higher than Maddison’s projected GDP growth rates. As Table 4 shows, our baseline GDP growth forecasts are a little higher than Maddison’s for five countries—the PRC; Indonesia; the Republic of Korea; Taipei,China; and Thailand—and a bit lower for India. Our reform scenario provides higher projected GDP growth rates than Maddison’s for all six countries. Apart from the difference in the average level, however, our forecasts are highly correlated with Maddison’s: the correlation coefficient is 0.73 with our baseline projection and 0.80 with our reform scenario projection. Fogel’s GDP growth projections for the PRC and India are more optimistic than the results from both our baseline and reform scenarios. In contrast, GDP growth projections by Goldman Sachs are on average in between our baseline results and reform scenario results. The average value of Goldman Sachs’ forecasts for the seven Asian economies is 5.31%, while our average forecasts for the same countries are 5.0% under the baseline specification and 6.3% under the reform scenario. For individual countries, our GDP growth projections are always higher for the Republic of Korea, Pakistan, and the Philippines, but lower for India and Viet Nam compared to the Goldman Sachs projections. For the PRC and Indonesia, our forecasts from the two specifications encompass the Goldman Sachs forecast. The correlation between our forecasts and Goldman Sachs is not particularly high: the correlation coefficient is 0.1 for the baseline specification and 0.4 for the reform scenario specification. The patterns are similar for per capita GDP growth forecasts.
Table 5 presents per capita GDP and GDP in 2007 and our forecasts in 2030, both under the baseline and reform scenario. The PWT 6.3 provides per capita GDP series in PPP-converted US dollars using 2005 as the base year, for 1950–2007. By combining the per capita GDP value for 2007 with our growth forecasts, we extend the per capita GDP series up to 2030. Total GDP forecasts are simply per capita GDP forecasts multiplied by total population.
Table 5: GDP and Per Capita GDP Projections
GDP (2005 PPP billion $) Per capita GDP (2005 PPP $)
2007 Actual
2030 Baseline
2030 Reform
2007 Actual
2030 Baseline
2030 Reform
China, People’s Rep. of 11,250 44,300 54,984 8,511 30,291 37,596Hong Kong, China 301 587 606 43,121 71,756 73,978India 4,322 12,801 17,206 3,826 8,622 11,590Indonesia 1,217 3,025 4,166 5,186 11,142 15,346Korea, Rep. of 1,151 2,707 2,856 23,850 55,082 58,117Malaysia 444 1,346 1,568 17,891 38,149 44,442Pakistan 608 2,573 3,577 3,588 9,683 13,463Philippines 451 1,168 1,487 4,791 9,388 11,953Singapore 203 417 422 44,619 76,308 77,235Taipei,China 617 1,087 1,138 27,005 45,698 47,866Thailand 612 1,463 1,684 9,406 19,910 22,918Viet Nam 319 874 1,247 3,743 8,288 11,828
GDP = gross domestic product, PPP = purchasing power parity.Source: Authors’ calculations.
Economic Growth in Asia: Determinants and Prospects | 25

Under our baseline specification, the increase in GDP levels in the 12 developing Asian economies range from a low of 1.8 times in Taipei,China to a high of 4.2 times in Pakistan. The GDP levels of the PRC and India are expected to grow 3.9 times and 3.0 times, respectively, from 2007 to 2030. In particular, GDP in the PRC is forecast to increase from $11.25 trillion (in 2005 PPP terms) in 2007 to $44.3 trillion in 2030. In India, GDP is projected to rise to $12.8 trillion in 2030 from $4.32 trillion in 2007.
The expansion in per capita GDP levels across the region is likewise substantial. The PRC tops the list in terms of the largest increase in per capita GDP between 2007 and 2030. From $8,511 in 2007, per capita GDP in the PRC is projected to increase 3.6 times to $30,291 in 2030. Pakistan ranks second in terms of the extent of per capita GDP expansion, with its level expected to grow 2.7 times during the same period.
Under the reform scenario specification, the increase in GDP levels expands to 5.9 times in Pakistan ($608 billion to $3.58 trillion), 4.9 times in the PRC ($11.25 trillion $54.98 trillion), and 4.0 times in India ($4.32 trillion to $17.21 trillion). Meanwhile, per capita GDP levels in the PRC, Pakistan, and Viet Nam rise 4.4 times ($8,511 to $37,596); 3.8 times ($3,588 to $13,463); and 3.2 times ($3,745 to $11,828), respectively.
Using our GDP growth projections under the baseline specification, we estimate the share of the Asian economies in world GDP through 2030. For historical data from 1980 to 2007, we use real GDP in 2005 PPP terms from Summers, Heston, and Aten (2009). From 2008 to 2010, we use GDP growth rates from IMF (2010). From 2010 onward, we apply the projected GDP growth rates under our baseline specification for developing Asian economies, while we use Maddison’s forecasts for GDP growth for the world, the European Union, Japan, and the US.13
From Figure 4, we see that as of 2009 the PRC has become the largest economy in the world in 2005 PPP terms. In 2009, the PRC’s share in global output at 18.8% has surpassed the 17.7% share of the US and the 18.3% share of the European Union. As the PRC continues to grow at about 5.5% per year in the next 2 decades, it will remain the world’s largest economy, with its share in global GDP rising to 30.8% by 2030. In contrast, the shares of the US and the EU will decline to 15.4% and 13.3%, respectively.
13 A similar analysis has been done in a series of papers by Goldman Sachs. However, our results are not directly comparable with those of Goldman Sachs because Goldman Sachs uses the market exchange rate instead of the PPP exchange rate in converting each country’s GDP into common currency units. The discrepancy between the market exchange rate and the PPP exchange rate can be substantial. In the case of the PRC, the PPP exchange rate is about one fourth of the market exchange rate. Also, according to the Balassa-Samuelson effect, the discrepancy between the two exchange rates is negatively correlated with the income level. For example, Frankel (2005) shows that a 1% relative increase in real per capita GDP is associated with about 0.35% real appreciation of the market exchange rate. This implies that, when the market exchange rate is used for international comparisons of GDP, one needs to make adjustments for the real appreciation in accordance with income growth. Since our forecasts are based on constant PPP terms, there is no effect of real appreciation on the movement of the GDP share of each economy.
26 | ADB Economics Working Paper Series No. 220

As a whole, developing Asia will account for close to two thirds (61.6%) of the world economy in 2030. This is almost double the 34.3% share of the region in 2009. India’s share will also grow, but at a much more modest rate—from 6.9% in 2009 to 9.1% in 2030. Similarly, Pakistan will account for a larger share of world output in 2030. From 0.9% in 2009, Pakistan’s share will grow to 1.6% in 2030. The share of the five Southeast Asian economies of Indonesia, Malaysia, the Philippines, Thailand, and Viet Nam will also increase from 4.6% to 5.8% during the same period. Meanwhile, the share of the newly industrialized economies of Hong Kong, China; the Republic of Korea; Singapore; and Taipei,China will remain at about 3.3% through 2030.
Figure 4: Share of World GDP (percent, in 2005 PPP terms)
0
10
20
30
40
50
60
70
80
90
100
1980 1985 1990 1995 2000 2005 2010 2015 2020 2025 2030
NIEs ASEAN5 PRC IND PAK US JPN EU ROW
GDP = gross domestic product; PRC = People’s Republic of China; IND = India; PAK = Pakistan; US = United States; JPN = Japan; EU = European Union; ROW = rest of the world.
Note: The NIEs comprise Hong Kong, China; the Republic of Korea; Singapore; and Taipei,China. ASEAN5 comprises Indonesia, Malaysia, the Philippines, Thailand, and Viet Nam.
Sources: Authors’ own projections and calculations from Heston, Summers, and Aten (2009); IMF (2010).
If, instead, the GDP growth forecasts under our reform scenario specification prevail in the next 20 years, then the PRC’s share in 2030 will rise to 37.8% of world GDP. India’s share will grow to 12.1%, and Pakistan’s share will increase to 2.2%. The combined GDP of Indonesia, Malaysia, the Philippines, Thailand, and Viet Nam will account for 7.7%, while the four newly industrialized economies will account for 3.7%. Developing Asia will account for a total of 63.5%.
Economic Growth in Asia: Determinants and Prospects | 27

VII. Conclusion
The developing Asian region has grown strongly over the past 3 decades, but the pace has clipped twice: during the 1997/1998 Asian financial crisis and the 2008/2009 global financial crisis. Nevertheless, the region managed to rebound quickly from both.
Using a growth accounting framework, we examined the factors that contributed to developing Asia’s rapid economic performance from 1981 to 2007. We find that the region’s economic expansion has generally been marked by robust growth in capital accumulation. While labor input, education, and TFP have on the whole been positive as well, their contributions to GDP growth have been much more moderate.
We then generated baseline projections of GDP growth for our sample economies for 2011–2020 and 2021–2030 using exogenous values of labor input and human capital. We find that GDP growth projections for the next 2 decades tend to be lower than the historical performance of the 12 developing Asian economies. Only in Pakistan and the Philippines did GDP growth projections turn out to be higher than past figures. Forecasts for 2011–2020 also tend to be higher than those for 2021–2030, driven largely by the “convergence” phenomenon.
For Asia to continue growing strongly, economies should either increase their rates of factor accumulation or raise productivity. Authorities can implement various reforms to achieve these. However, the demographic dividend is likely to wane for most economies in the coming years, so there is not much room for reform in the area of labor inputs. Education was a small contributor to GDP growth between 1981 and 2007, particularly in economies where enrollment and completion rates have fallen short of best practice rates in the region and in the world. Reforms to lift enrollment and completion rates could thus raise the contribution of education to GDP growth in the next 20 years.
The majority of the 12 developing Asian economies have already registered high rates of capital accumulation in the past 3 decades, and the marginal productivity of capital is set to decline. But if the investment climate is kept attractive, such as through improvements in property rights protection, capital could continue to flow into the regional economies. In addition, improvements in productivity, such as through greater spending on R&D, could increase GDP growth in 2011–2030. Our simulation results confirm that improvements in government policy relating to education, property rights, and R&D can increase our projected GDP growth significantly.
Our reform scenario results also show that considerable gains could be achieved by less developed Asian economies with low initial values of the three policy variables. For instance, GDP growth will increase by more than 1 percentage point in the PRC, India, Indonesia, Pakistan, the Philippines, and Viet Nam. This suggests that policy reforms can substantially increase developing Asia’s growth performance and partly offset the slowdown in growth caused by the convergence phenomenon. If Asia adopts growth-friendly policies, it can continue to expand at robust rates in the next 20 years.
28 | ADB Economics Working Paper Series No. 220
ReferencesBarro, R., and J.-W. Lee. 2010. A New Data Set of Educational Attainment in the World,
1950–2010. NBER Working Paper No. 15902, National Bureau of Economic Research, Massachusetts.
Barro, R., and X. Sala-i-Martin. 2003. Economic Growth. Massachusetts: The MIT Press.Bernanke, B., and R. Gurkaynak. 2001. Is Growth Exogenous? Taking Mankiw, Romer and Weil
Seriously. NBER Working Paper No. W8365, National Bureau of Economic Research, Massachusetts.
Bosworth, B., and S. Collins. 2003. “The Empirics of Growth: An Update.” Brookings Papers on Economic Activity (34)2:113–206.
Fogel, R. 2007. Capitalism and Democracy in 2040: Forecasts and Speculations. Working Paper 13184, National Bureau of Economic Research, Massachusetts. Available: www.nber.org/papers/w13184.
Frankel, J. 2005. On the Renminbi: The Choice between Adjustment under a Fixed Exchange Rate and Adjustment under a Flexible Rate. NBER Working Paper No. 11274, National Bureau of Economic Research, Massachusetts.
Harberger, A. 1978. “Perspectives on Capital and Technology in Less Developed Countries.” In M. J. Artis and A.R. Nobay, eds., Contemporary Economic Analysis. London: Croom Helm.
Heston, A., R. Summers, and B. Aten. 2009. Penn World Table Version 6.3. Center for International Comparisons of Production, Income, and Prices, University of Pennsylvania.
Horioka, C. Y., and A. Terada-Hagiwara. 2010. The Determinants and Long-term Projections of Saving Rates in Developing Asia. ADB Economics Working Paper Series No. 228, Asian Development Bank, Manila. Forthcoming.
ILO. 2010. Laborsta Database. International Labour Office, Geneva. Available: laborsta.ilo.org/. Accessed 21 June 2010.
IMF. 2010. World Economic Outlook (April Database). International Monetary Fund, Washington, DC. Available: imf.org. Accessed 30 June 2010.
Kim, J. 2010. Past and Future of the Labor Force in Emerging Asian Countries. ADB Economics Working Paper Series, Asian Development Bank, Manila. Forthcoming.
King, R. G., and R. Levine. 1994. “Capital Fundamentalism, Economic Development, and Economic Growth.” Carnegie-Rochester Conference Series on Public Policy 40(1):259–92.
Lee, J.-W., and R. Francisco. 2010. Human Capital Accumulation in Emerging Asia 1970–2030. ADB Economics Working Paper Series No. 216, Asian Development Bank, Manila.
Lucas, R. E. 1993. “Making a Miracle.” Econometrica 61(2):251–72.Maddison, A. 2007. Contours of the World Economy, 1-2030 AD. New York: Oxford University
Press.Nehru, V., and A. Dhareshwar. 1993. “A New Database on Physical Capital Stock: Sources,
Methodology, and Results.” Rivista de Analisis Economico 8:37–59.Park, J. 2010. Projection of Long-term TFP Growth for 12 Asian Economies. ADB Economics
Working Paper Series, Asian Development Bank, Manila. Forthcoming.Sachs, J., S. Radelet, and J.-W. Lee. 2001. “Determinants and Prospects of Economic Growth in
Asia.” International Economic Journal 15(3):1–29.Shioji, E., and T. K. Vu. 2010. Projection of Investment and Capital Stock for Asia. ADB Economics
Working Paper Series, Asian Development Bank, Manila. Forthcoming.Solow, R. 1957. “Technical Change and the Aggregate Production Function.” Review of Economics
and Statistics 39(3):312–20.Wilson, D. and A. Stupnytska. 2007. The N-11: More Than an Acronym. Global Economics Paper
No. 153, Goldman Sachs Economic Research, New York. Available: www2.goldmansachs.com/ideas/global-economic-outlook/n-11-acronym-doc.pdf?bcsi_scan_7823DFCE46415F3E=yfE2dnU3ULgbeYezHeQ5ygEAAABZgooA&bcsi_scan_filename=n-11-acronym-doc.pdf.
World Bank. 1993. The East Asian Miracle: Economic Growth and Public Policy. New York: Oxford University Press.
Economic Growth in Asia: Determinants and Prospects | 29

About the PaperUsing a growth accounting framework, Jong-Wha Lee and Kiseok Hong find that developing Asia grew rapidly over the past 3 decades mainly due to robust growth in capital accumulation. The baseline projections based on the model of conditional convergence show that the gross domestic product (GDP) growth rates of the 12 developing Asian economies covered by this paper will be consistently lower for the next 2 decades than their historical performance. However, policy reforms in education, property rights, and research and development can substantially raise GDP growth in the region and partly offset the slowdown in growth caused by the convergence phenomenon.
About the Asian Development BankADB’s vision is an Asia and Pacific region free of poverty. Its mission is to help its developing member countries substantially reduce poverty and improve the quality of life of their people. Despite the region’s many successes, it remains home to two-thirds of the world’s poor: 1.8 billion people who live on less than $2 a day, with 903 million struggling on less than $1.25 a day. ADB is committed to reducing poverty through inclusive economic growth, environmentally sustainable growth, and regional integration. Based in Manila, ADB is owned by 67 members, including 48 from the region. Its main instruments for helping its developing member countries are policy dialogue, loans, equity investments, guarantees, grants, and technical assistance.
Asian Development Bank6 ADB Avenue, Mandaluyong City1550 Metro Manila, Philippineswww.adb.org/economicsISSN: 1655-5252Publication Stock No. WPS102522 Printed in the Philippines
< 0 1 0 2 5 2 2 4 >
Related Documents