REVISTA ROMÂ NĂ DE AUTOMATICĂ September2008 Volume XXI Number 3 ISSN 1454-9077 Published by the Research & Development, Engineering and Manufacturing for Automation Equipment and Systems PAPERS ADAPTIVE FUZZY SEGMENTATION STRATEGY FOR IDENTIFICATION AND ASSESSMEN OF CALCITE DEPOSITS ON CONCRETE DAM WALLS………………………………..... 2 Ovidiu Dancea, Ioan Stoian, Mihaela Gordan, Aurel Vlaicu HYBRID HYDRO-WIND ENERGY STRUCTURE – HIDROEOL……………………....... 13 Octavian Cǎpăţînă, Alina Călăraşu, Rareş Cazan, Alexandra Marichescu INTELLIGENT SENSOR NETWORK FOR WIND POTENTIAL ASSEMENT………….. 17 Octavian Capatina, Rares Cazan, Alexandra Marichescu, Sabolcs Balogh, Laurentiu Chirila SYSTEM FOR RIVERS WATER QUALITY MONITORING MODELING AND SIMULATION OF POLLUTANTS PROPAGATION...................................................................................... 21 Gicu Ungureanu, Ioan Stoian, Maria Mircea, Alin Corha, Z. Moldovan CERVICAL CANCER SCREENING WEB APPLICATION………………………………. 27 Teodora Sanislav, Dorina Căpăţînă, Ioan Stoian, Andrei Achimaş-Cădariu MONITORING OF THE ENVIRONMENTAL ISOTOPIC TRACERS IN AQUIFERS AND HYPORHEIC ZONES………………………………………………………………………. 34 Ioan Stoian, Eugen Stancel, Sorin Ignat, Magda Cadis, Victor Feurdean, Lucia Feurdean A NEW CONCEPT – PROACTIVE REGULATOR…………………………………….... 41 .........................................................................................................................Octavian Căpăţînă TELEHEPASCAN - TELE-SCREENING SYSTEM FOR THE SURVEILLANCE OF HEPATOCELLULAR CARCINOMA…………………………….……………………….. 43 Dorina Căpăţînă, Rareş Cazan, Ovidiu Dancea, Ioan Stoian FUTURE IMPLEMENTATIONS OF ADAPTIVE AND PROACTIVE REGULATORS… 51 Octavian Căpăţînă PANDEMIC SIMULATION – DISPLAYING LARGE IMAGES…………………………... 54 Ovidiu Ghiran, Vasile Prejmerean THE 17 th INTERNATIONAL CONFERENCE ON CONTROL SYSTEMS AND COMPUTER SCIENCE CSCS – 17………………………………………………………………………… 62 May 26 – 29, 2009, Bucharest, Romania Information for Authors Printed with the support of the Romanian Education and Research Ministry

Welcome message from author
This document is posted to help you gain knowledge. Please leave a comment to let me know what you think about it! Share it to your friends and learn new things together.
Transcript

REVISTA ROMÂNĂ DE AUTOMATICĂ
September2008 Volume XXI Number 3 ISSN 1454-9077
Published by the Research & Development, Engineering and Manufacturing for
Automation Equipment and Systems
PAPERS
ADAPTIVE FUZZY SEGMENTATION STRATEGY FOR IDENTIFICATION AND ASSESSMENT
OF CALCITE DEPOSITS ON CONCRETE DAM WALLS………………………………..... 2
Ovidiu Dancea, Ioan Stoian, Mihaela Gordan, Aurel Vlaicu
HYBRID HYDRO-WIND ENERGY STRUCTURE – HIDROEOL……………………....... 13
Octavian Cǎpăţînă, Alina Călăraşu, Rareş Cazan, Alexandra Marichescu
INTELLIGENT SENSOR NETWORK FOR WIND POTENTIAL ASSEMENT………….. 17
Octavian Capatina, Rares Cazan, Alexandra Marichescu, Sabolcs Balogh, Laurentiu Chirila SYSTEM FOR RIVERS WATER QUALITY MONITORING MODELING AND SIMULATION OF POLLUTANTS PROPAGATION...................................................................................... 21
Gicu Ungureanu, Ioan Stoian, Maria Mircea, Alin Corha, Z. Moldovan
CERVICAL CANCER SCREENING WEB APPLICATION………………………………. 27
Teodora Sanislav, Dorina Căpăţînă, Ioan Stoian, Andrei Achimaş-Cădariu
MONITORING OF THE ENVIRONMENTAL ISOTOPIC TRACERS IN AQUIFERS AND
HYPORHEIC ZONES………………………………………………………………………. 34
Ioan Stoian, Eugen Stancel, Sorin Ignat, Magda Cadis, Victor Feurdean, Lucia Feurdean
A NEW CONCEPT – PROACTIVE REGULATOR…………………………………….... 41 .........................................................................................................................Octavian Căpăţînă TELEHEPASCAN - TELE-SCREENING SYSTEM FOR THE SURVEILLANCE OF HEPATOCELLULAR CARCINOMA…………………………….……………………….. 43
Dorina Căpăţînă, Rareş Cazan, Ovidiu Dancea, Ioan Stoian
FUTURE IMPLEMENTATIONS OF ADAPTIVE AND PROACTIVE REGULATORS… 51
Octavian Căpăţînă
PANDEMIC SIMULATION – DISPLAYING LARGE IMAGES…………………………... 54
Ovidiu Ghiran, Vasile Prejmerean
THE 17th INTERNATIONAL CONFERENCE ON CONTROL SYSTEMS AND COMPUTER
SCIENCE CSCS – 17………………………………………………………………………… 62
May 26 – 29, 2009, Bucharest, Romania
Information for Authors
Printed with the support of the Romanian Education and Research Ministry
REVISTA ROMÂNĂ DE AUTOMATICĂ
2
Adaptive Fuzzy Segmentation Strategy for Identification and Assessment
of Calcite Deposits on Concrete Dam Walls
Ovidiu DANCEA, Ioan STOIAN
SC IPA SA CIFATT Cluj
Mihaela GORDAN, Aurel VLAICU Technical University of Cluj-Napoca
Abstract: Hydro dams are very important economical and social structures that have a great impact on the population living in surrounding area. Surveillance of dam status consists of a complex process which involves data acquisition and analysis techniques, implying both measurements from sensors and transducers placed in the dam body and its surroundings, and also visual inspection. In order to enhance the visual inspection process concerning large concrete dams, we propose a computer vision technique that allows detection and quantification of calcite deposits on dam wall surface; these calcite deposits are a clear sign that water infiltrates within the dam body; further, their intensity and extent could provide valuable information on severity degree of the infiltration. The proposed scheme for identification of calcite / non-calcite areas on the dam wall color image consists classifying the pixels into three classes, using a modified fuzzy c-means algorithm, which assigns an error penalty factor to membership degree, based on the distance between the classes’ centroids.
Keywords: dam safety, visual inspection, color image segmentation, fuzzy c-means
1. Introduction Surveillance and monitoring of dam behavior is a key element regarding essential aspects concerning economy, environment and population protection.
Various technical and scientific solutions are described in specialized literature, for every component of a monitoring and surveillance system for dam behavior. These solutions expand from data acquisition equipments (AUVs, automatic acquisition stations[1, 2]) to artificial intelligence techniques that aid engineers in knowledge extraction and data interpretation (real time data interpretation modules directly linked to acquisition systems, intelligent databases that offer support for off-line data management and interpretation [3-5]).
Visual inspection is a key element in dam monitoring process. It is one of the main methods for evaluating the dam’s state, allowing decisions to be made about dam behavior, based on direct observations.
Visual inspections complement the data analysis process concerning different sensors and transducers placed within the dam body and it’s surroundings, and the observations are filled in a standardized form describing the inspections concerning: reservoir, banks and slopes, concrete structure, downstream valley. This form records, for every feature observed, the procedures utilized during inspection as well as significant images illustrating the observations. Hence, once digital images of the inspected structure are available, a series of aspects are suitable for computerized image analysis: cracks on the dam wall, detection and quantification of calcite deposits, etc.
One important chapter in the visual inspection form is that concerning concrete structure’s joints state, wall surface, shotcrete. Any cracks, leakages, infiltrations or exfiltrations, organic or non-organic deposits must be carefully analyzed and recorded.
Most cracks in dam walls have calcite exuding from them, indicating that moisture traversed the cracks [6]. Movement of the
REVISTA ROMÂNĂ DE AUTOMATICĂ
3
soft water seeping through cracks leaves calcite deposits at the surface adjacent to the cracks. Porous areas between shotcrete layers would allow movement of water that would accelerate the leaching action. Seepage samples may be collected, analyzed and compared to reservoir water to help determine whether soluble minerals pose a structural safety problem [7]. Systematic measurements of calcite deposits are made by interdisciplinary teams (chemists, engineers, geologists) in order to estimate the volume of calcite at each site of calcite deposition. Estimating the volume of water required to precipitate the measured volumes of calcite in the unsaturated zone, seepage rates are estimated [8].
As calcite deposits are good indicators of rather significant/severe and time persistent water infiltrations, it gives a strong reason to record the calcite deposits on large concrete dams’ walls surfaces in the visual inspections form. Unfortunately, there are not reported any solutions / systems in the literature that will perform this task in an objective and automatic manner.
In this paper we describe a particular module of a more complex computerized visual inspection system, which semi-automatically generates and completes the visual inspection record concerning observations made on concrete dams. The purpose of this software module is to detect and quantify the calcite deposits on the downstream face of the concrete dam wall from digital images obtained with a digital camera. We present a novel segmentation technique, an adaptive fuzzy c-means segmentation strategy, which classifies the pixels into calcite deposits / non-calcite deposits, assigning an error penalty factor to membership degree, based on the distance between the classes’ centroids and color histogram skewness.
The c-means clustering algorithm was long used in computer vision as a form of image segmentation. A weighted distance measure utilizing pixel coordinates, RGB color, intensity, or texture is commonly used for
10] applied to image segmentation is a method of clustering which allows pixels to belong to two or more clusters / regions. Many variations of the FCM algorithm were successfully applied in image segmentation on various domains.
In [11], a methodology for the segmentation of color images by means of a nested hierarchy of fuzzy partitions is introduced, based on a measure of distance/similarity between colors. The proposed distance in the color space is employed to calculate fuzzy regions and membership degrees. Starting from an initial fuzzy segmentation, a hierarchical approach, based on a similarity relation between regions, is employed to obtain a nested hierarchy of regions at different precision levels.
An adaptive fuzzy clustering scheme (AFCS) for image segmentation is presented in [12]. The non-stationary nature of images is taken into account by modifying the prototype vectors as functions of the sample location in the image. The inherent high interpixel correlation is modeled using neighborhood information. A multi-resolution model is used for estimating the spatially varying prototype vectors for different window sizes. The fuzzy segmentations at different resolutions are combined using a data fusion process in order to compute the final fuzzy partition matrix.
Fuzzy sets of type 2 are applied in [13], for color images segmentation, that allows to take into account the total uncertainty inherent to image segmentation process.
In [14] a two step method for fuzzy segmentation based on spatial constraints is described. First, a spatial relationship among neighbors is derived from Peano scans. Second, a regularization term is incorporated to fuzzy c-means algorithm.
A three-step algorithm is described in [15], in order to segment oil spills from a marine background on SAR data. Fuzzy clustering is used in order to obtain a preliminary partition of the pixels on the basis of their grey level intensities. A very simple cluster validity
REVISTA ROMÂNĂ DE AUTOMATICĂ
4
cluster definition. Fuzzy c-means (FCM) [9,
criterion is tested to determine the optimal
number of clusters present in the data. In order to improve segmentation a final step involves a cluster merging procedure using edge information provided by a Sobel operator.
In [16], a fuzzy clustering algorithm is proposed, for automatically grouping the pixels of an image into different homogeneous regions when the number of clusters is not known a-priori. An improved differential evolution algorithm is used to automatically determine the number of naturally occurring clusters in the image as well as to refine the cluster centers.
A general case of clustering is discussed in [17], and a special case for color image processing is proposed. The clustering method is based on a likelihood measure in color fields. Based on this color clustering method, a fuzzy segmentation method is proposed. 2. Problem Formulation The purpose of our work is to identify in the visible spectrum image of the dam wall, the possible regions where calcite deposits are present. Calcite patches (deposits) are good indicators of rather significant/severe and time persistent water infiltrations; they are most likely to occur as being transported by the water infiltrations from concrete and this occurs only in the case of a repetitive water infiltration in a certain area of the dam. Therefore an accurate identification of the calcite deposits can be very important for the dam diagnosis and monitoring, since it is the crucial step in providing information about the localization and the evolution as size, shape and orientation of the infiltration in the concrete hydro-dam, as well as of the infiltration severity, through the thickness of the calcite crystals layer, which is proportional generally to the relative degree of white of the calcite deposit as compared to the hydro-dam wall grey shade. Leaving the interpretation and the numerical descriptors suitable to give quantitative information
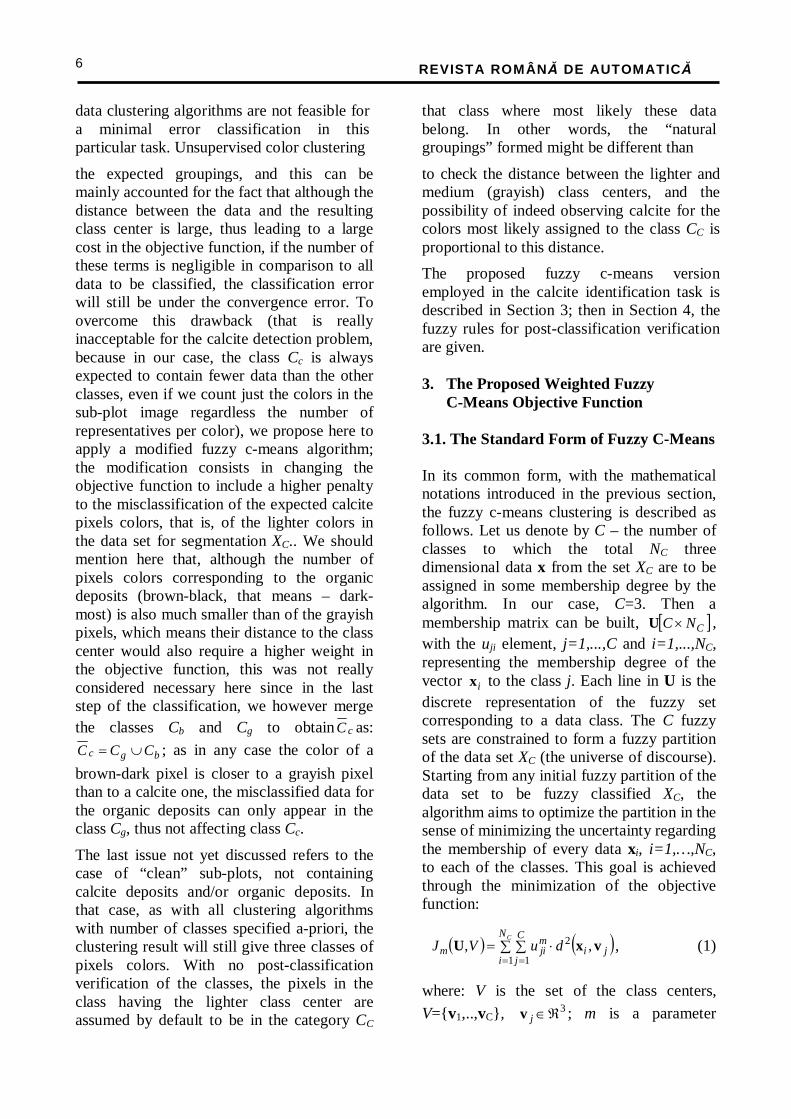
the concrete hydro-dam wall, with the goal to develop a visual identification scheme able to provide maximum accuracy despite the variability of appearance of calcite deposits, the variable lighting conditions on the portion of the wall (which is actually very significant – as shown in the Implementation and Results Section), without knowing in advance if calcite is or is not present in the current image, and if yes, in what amount. These aspects make the calcite identification and assessment a rather difficult image analysis problem: the significant variability of the calcite appearance makes almost impossible the derivation of a calcite appearance model to be used in the identification; model-free approaches seem more suitable, trying to identify natural groupings of the pixel data, if afterwards an interpretation of these groupings is done to identify if any represents calcite or not. The latter approach is a principled description of the method we propose here. 2.1. Mathematical Framework The calcite identification on the concrete hydro-dam wall can be treated as a pixel classification problem and mathematically described as such. Since no clear a-priori considerations can be made in respect of the shape of the calcite deposits, it is appropriate to consider as only significant features in the classification task – the color of the pixels in the image. Then again, since only the color is important, and since on the hydro-dam wall the area of the calcite deposits is significantly smaller than the area without calcite (see Fig. 1 as an example), considering as classification data all the pixels in the currently analyzed image would always result in a very unbalanced data set among the classes of interest. This is usually not a favorable situation in unsupervised classification (as well as in the training of supervised classifiers), being prone to more errors in the poor represented class. Therefore we prefer to define the classification data as
REVISTA ROMÂNĂ DE AUTOMATICĂ
5
about the hydro-dam deposits for a future work concern, we focus here on the problem of identification of the calcite formations on
the set of color appearances in the concrete dam wall image, each color being included only once (regardless the number of pixels
with that particular color). As color space, although many choices are possible, we prefer here the natural RGB representation, as it is as suitable as others for Euclidian distance based classifiers. Let us denote a generic data point in this 3-D feature space by the vector
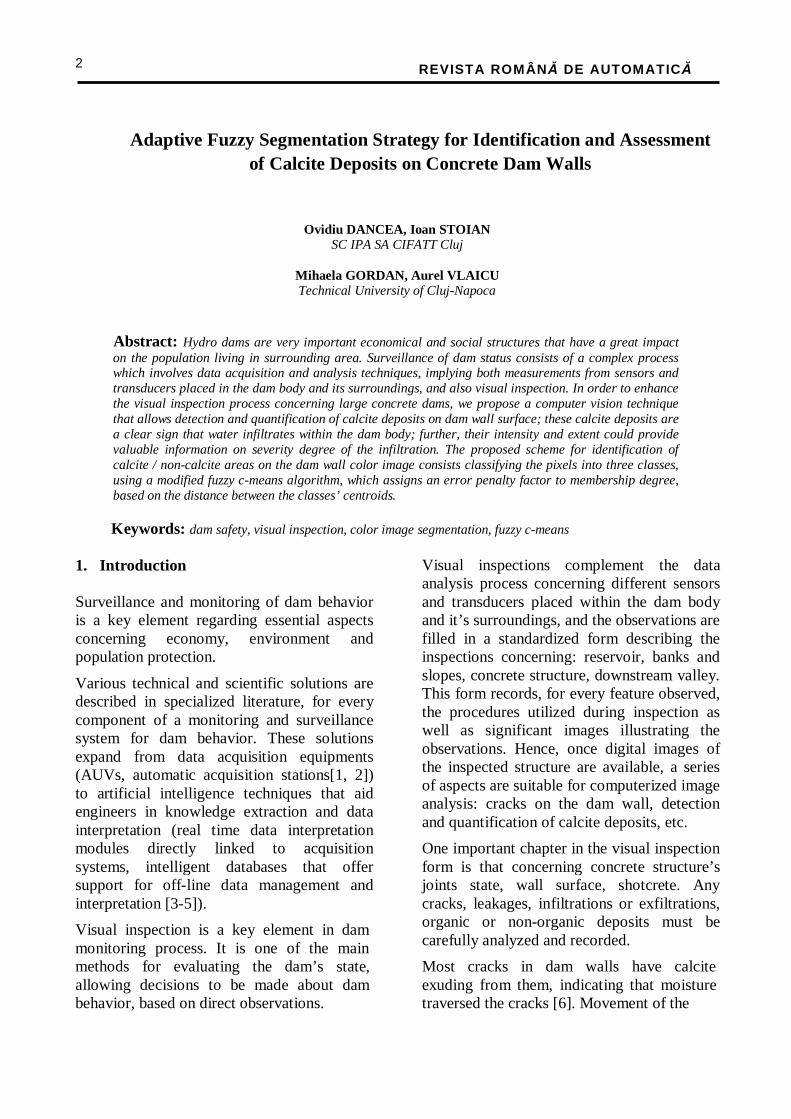
[ ]TBGR=x . The current image to be analyzed for the detection and localization of calcite deposits (input to our module) is a sub-plot image of a dam wall, obtained from a database of images specific to the hydro-dam, after its clipping (manual or semiautomatic) from a larger hydro-dam wall image, as shown in Fig. 1, thus the data set to be classified includes all the colors in this currently analyzed sub-plot color image. Let the number of unique RGB triples in this image be NC and the data set to be classified –
{ }.,...,2,1 CiC NiX == x Then the goal is to
classify/cluster the data in XC in one of two possible classes of interest: calcite deposit – denoted herein by Cc, and anything else but calcite – denoted here by cC (i.e. the complement of Cc).
Fig. 1 Dam wall image decomposition into sub-plots 2.2. Principled Description of our Approach According to the above formulation, our goal is to solve a binary classification problem – for which many solutions exist in the literature, but as explained before, learning based approaches or simple unsupervised
in only two classes will risk to be unable to appropriate group the colors corresponding to the class “anything else but calcite”, since these do not uniquely represent one color. Therefore a larger number of classes than two only will be needed in the initial clustering, one per dominant color. An examination of the sub-plots in Fig. 1 below (considering that in the analysis, strictly portions of walls without any additional elements are considered, i.e. an element like the one in the left corner in Fig. 1 will not be taken into account) shows that generally the class cC can be considered composed by at most two dominant color clusters: the grayish like color corresponding to the concrete and the brown-black color possibly corresponding to organic deposits. Thus instead of the 2-class clustering of the set XC, a 3-class clustering should be performed, the three classes being Cc, Cg (clean concrete surface) and Cb (organic deposits).
An efficient color clustering algorithm when the number of classes is known a-priori, which has been rather extensively used in image segmentation applications, is fuzzy c-means clustering [10]. As with all unsupervised data clustering method, this algorithm aims to find natural groupings of the data according to their similarity in respect to a selected distance metric in the feature space. In the end of an iterative objective function minimization process, the optimal class centers and membership degrees of the data in the data set XC to be clustered are found, with the optimality defined as the minimization of the classification uncertainty among the data in the three classes. The resulting classes always form a fuzzy partition of XC [10]. The drawback of using the standard fuzzy c-means clustering in the application addressed here is the fact that, in the case of a severely unbalanced number of samples estimated to appear in the classes, the expected fuzzy centroid of the class with fewest data can be rather different than the centroid obtained for
REVISTA ROMÂNĂ DE AUTOMATICĂ
6
data clustering algorithms are not feasible for a minimal error classification in this particular task. Unsupervised color clustering
that class where most likely these data belong. In other words, the “natural groupings” formed might be different than
the expected groupings, and this can be mainly accounted for the fact that although the distance between the data and the resulting class center is large, thus leading to a large cost in the objective function, if the number of these terms is negligible in comparison to all data to be classified, the classification error will still be under the convergence error. To overcome this drawback (that is really inacceptable for the calcite detection problem, because in our case, the class Cc is always expected to contain fewer data than the other classes, even if we count just the colors in the sub-plot image regardless the number of representatives per color), we propose here to apply a modified fuzzy c-means algorithm; the modification consists in changing the objective function to include a higher penalty to the misclassification of the expected calcite pixels colors, that is, of the lighter colors in the data set for segmentation XC.. We should mention here that, although the number of pixels colors corresponding to the organic deposits (brown-black, that means – dark-most) is also much smaller than of the grayish pixels, which means their distance to the class center would also require a higher weight in the objective function, this was not really considered necessary here since in the last step of the classification, we however merge the classes Cb and Cg to obtain cC as:
bgc CCC ∪= ; as in any case the color of a
brown-dark pixel is closer to a grayish pixel than to a calcite one, the misclassified data for the organic deposits can only appear in the class Cg, thus not affecting class Cc.
The last issue not yet discussed refers to the case of “clean” sub-plots, not containing calcite deposits and/or organic deposits. In that case, as with all clustering algorithms with number of classes specified a-priori, the clustering result will still give three classes of pixels colors. With no post-classification verification of the classes, the pixels in the class having the lighter class center are assumed by default to be in the category CC
to check the distance between the lighter and medium (grayish) class centers, and the possibility of indeed observing calcite for the colors most likely assigned to the class CC is proportional to this distance.
The proposed fuzzy c-means version employed in the calcite identification task is described in Section 3; then in Section 4, the fuzzy rules for post-classification verification are given. 3. The Proposed Weighted Fuzzy C-Means Objective Function 3.1. The Standard Form of Fuzzy C-Means In its common form, with the mathematical notations introduced in the previous section, the fuzzy c-means clustering is described as follows. Let us denote by C – the number of classes to which the total NC three dimensional data x from the set XC are to be assigned in some membership degree by the algorithm. In our case, C=3. Then a membership matrix can be built, [ ]CNC×U , with the uji element, j=1,...,C and i=1,...,NC, representing the membership degree of the vector ix to the class j. Each line in U is the discrete representation of the fuzzy set corresponding to a data class. The C fuzzy sets are constrained to form a fuzzy partition of the data set XC (the universe of discourse). Starting from any initial fuzzy partition of the data set to be fuzzy classified XC, the algorithm aims to optimize the partition in the sense of minimizing the uncertainty regarding the membership of every data xi, i=1,…,NC, to each of the classes. This goal is achieved through the minimization of the objective function:
( ) ( )∑ ∑ ⋅== =
CN
i
C
jji
mjim duVJ
1 1
2 ,, vxU , (1)
where: V is the set of the class centers,
V={v1,..,vC} , 3ℜ∈jv ; m is a parameter
REVISTA ROMÂNĂ DE AUTOMATICĂ
7
i.e. calcite, although there is no calcite on the sub-plot. This is a classification error; to avoid it, simple fuzzy rules have been adopted here
controlling the shape of the resulting clusters (typically m=2); d(·,·) is a distance norm in the RGB space between any two vectors. A
common choice for d, used in our approach as well, is the Euclidian distance. The minimization of ( )VJm ,U is done iteratively, starting from an initial fuzzy partition matrix U0 or an initial set of prototypical class centers V0. The values of uji and vj, j=1,...,C, are modified in each iteration to minimize ( )VJm ,U . It can be proven that uji which minimizes mJ for a given V and vj which minimizes mJ for a given U are given by [10]:
( )( )
1
1
1
2
,
,
−
=
−
∑
=
C
l
m
li
jiji d
du
vx
vx;
∑
∑=
=
=C
C
N
iji
N
iiji
j
u
u
1
1x
v . (2)
The iterative process ends when the change in either U or V is under a certain tolerance (error) (in theory, arbitrarily small; in practice – as small as possible to bring Jm very close to zero). 3.2. Proposed Weighted Objective Function As explained in principle in Section 2, we cannot afford misclassification for the possible calcite pixels (neither severe false detections nor severe false rejections); these pixels correspond to the lighter colors of the three classes, Cc. Although there is no a-priori association of the class index j, j=1,2 or 3, and the brightness of the colors in the class, we always know that the fuzzy class with light most colors is the fuzzy class whose center is the lightest:
[ ]( ).114.0587.0299.0arg3,2,1
jj
kC xmakCC v⋅===
(3)
Let wj, j=1,…,C, be a set of class-specific scalar positive weights (in our case, C=3), introduced to assign different relative importance to the distances of the data in XC
( ) ( )∑ ∑ ⋅⋅=
= =
CN
i
C
jjij
mjimw dwuVJ
1 1
2, ,, vxU , (4)
whose minimization is done again iteratively, as in the standard fuzzy c-means algorithm, using the same formula in (2) for the computation of the fuzzy class centers vj, but a different form for the fuzzy membership degrees uji, since the weights basically only affect the form of the distance function among the data from each class in the feature space:
( )( )
1
1
1
1
2
2
,
,
−
=
−
∑
⋅
⋅=
C
l
m
lil
jijji
dw
dwu
vx
vx. (5)
This approach can be regarded as a relative of a standard fuzzy c-means clustering with Mahalanobis distance in the feature space; however due to the difficulties in generating training data to be representative for the classes needed, it would be difficult to estimate accurately the covariance matrix. This is the reason for preferring the definition of the segmentation as above, with roughly estimated weights per class. The estimation of the three weights w1, w2 and w3 is done based on the shape of the histogram of the luminance component for the sub-plot image, using as histogram shape descriptor – its skewness [18]. The skewness of the histogram of N discrete samples is a measure of the asymmetry of the histogram, or, alternatively, a measure of the distribution of the samples to the left and right of their mean. Although implicitly our data is color data, we consider sufficient to estimate the skewness of the brightness of the data, since anyway we are mostly concerned on assigning the appropriate weight to the light-most class (which accounts for calcite as explained above), considering the other two classes weights fixed (because as explained earlier, a classification confusion between the classes Cb and Cg is not important – they will be
REVISTA ROMÂNĂ DE AUTOMATICĂ
8
to each of the classes. With these weights, we build our so-called fuzzy c-means weighted objective function in the following form:
merged anyway). Thus, our N samples set is formed by the brightness values of the pixels in the currently analyzed sub-plot, denoted
here as { }Nyyy ,...,, 21 ; the sample skewness, denoted by γ, can be estimated as the ratio between the third central moment of the sample and the cube of the sample’s standard deviation:
( )
( ).
1,
1
1
12
3
1
2
1
3
2
3
2
3 ∑=
∑ −
∑ −==
=
=
= N
ii
N
ii
N
ii
yN
y
yyN
yyN
µ
µγ (6)
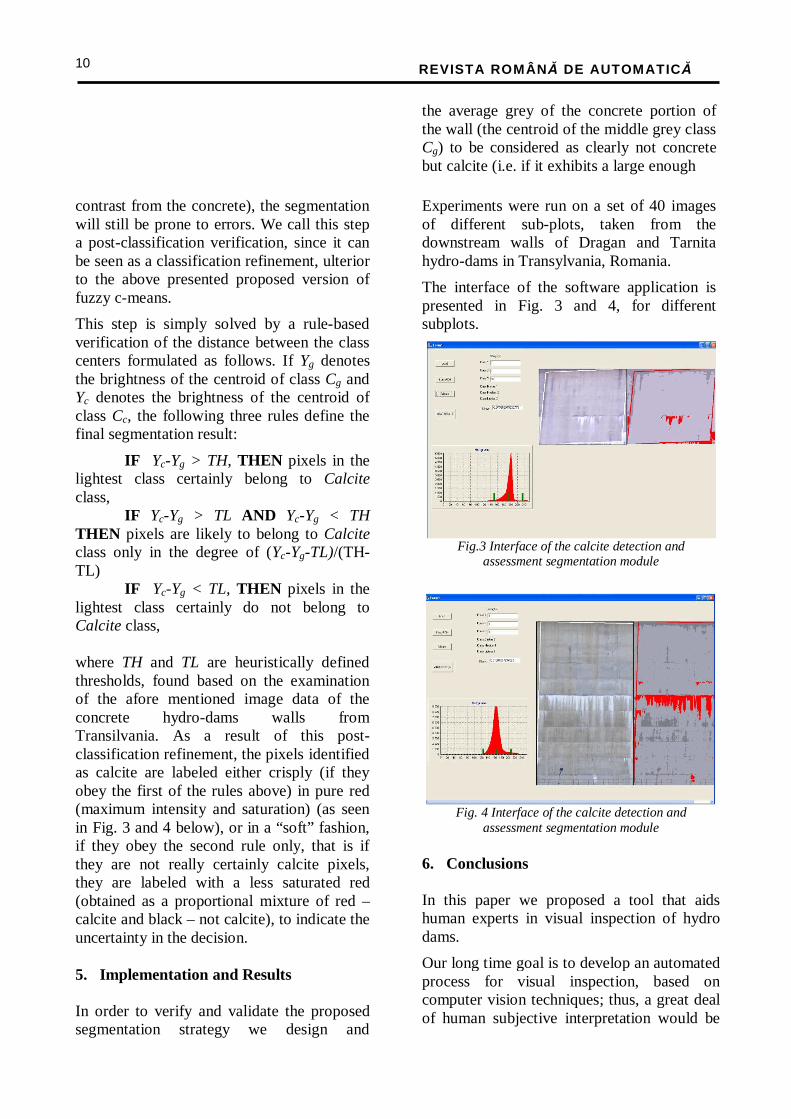
The rough meaning of the above equation is the following: for a unimodal histogram, if the gray levels are evenly distributed around the mode (which roughly corresponds to their mean), then the skewness is close to zero. Otherwise, if more darker pixels than brighter pixels are present in the examined image, the sum of cubes in Equation (6) is likely to be negative, and since the denominator is always a positive amount, the skewness γ will be negative. That is, if the brighter pixels are much fewer than the medium bright and darker pixels in the image, γ will be negative. On the opposite, if the brighter pixels are dominant and outnumber the darker ones, γ will be positive. Some illustrative examples for the skewness values for two such asymmetric histograms are presented in Fig. 3 and 4 in the Implementation and Results Section.
Qualitatively, assuming fixed (not adjustable) weights for the classes Cb and Cg, the correlation between skewness and the only adjustable weight – that of the class Cc, can be explained as follows. If the number of light pixels – accounted for calcite in our class of images – is large enough, then is reasonable to expect a positive skewness, and in that case, there is no need to enhance the importance of the class Cc in respect to the other two classes. Thus is reasonable to assume the three weights equal, and the algorithm reduces to the standard fuzzy c-means. However, if the areas of calcite are rather small as compared to the examined
in order to still have a correct classification of the pixels in the class Cc, one should assign an increased penalty to their misclassification, that is, a larger weight to the brighter pixels if they are fewer as compared to the others in the sub-plot, i.e. if the skewness γ of the histogram is negative or near zero. Intuitively, the more negative γ is, the larger the weight assigned to the lighter class Cc should be.
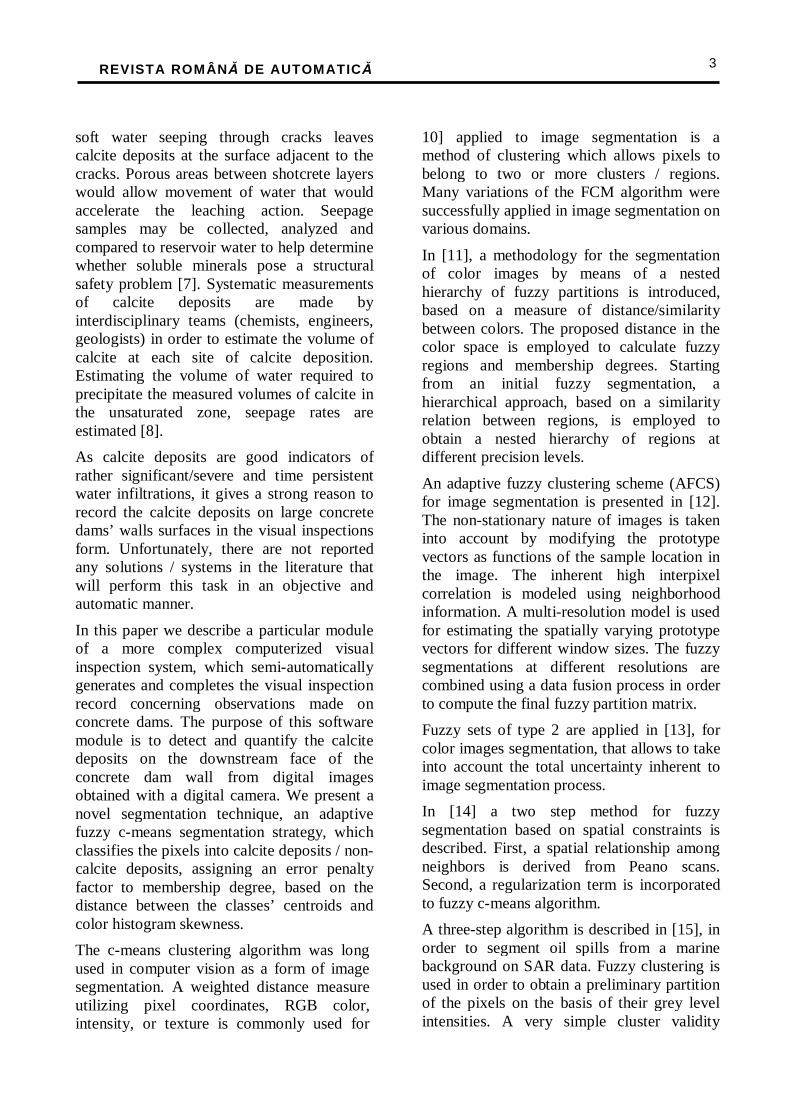
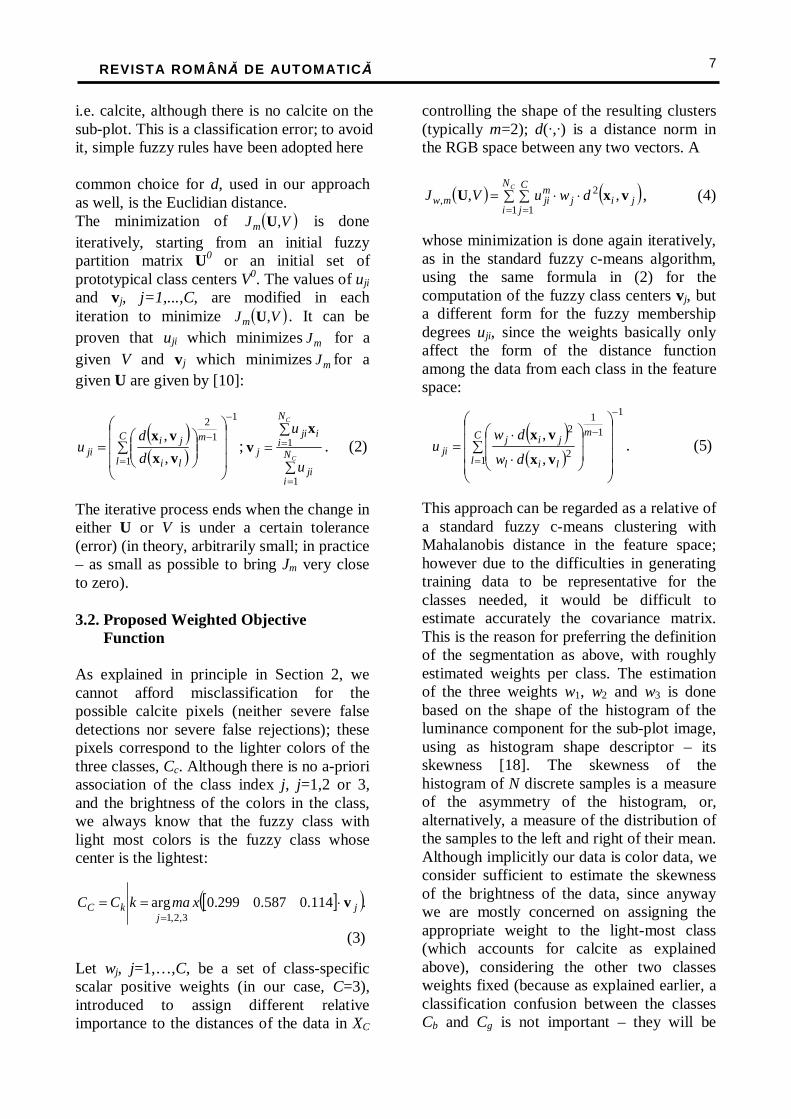
In In order to employ these considerations into our algorithm, a way to derive a numerical mapping between the range of values of the skewness γ and the range of values for the weight of the light-most, i.e. calcite pixels (corresponding to the class Cc) is needed. Let us denote that weight by wk, where k is given by Eq. (3). Since we are dealing with a practical mapping problem, to be used in this specific calcite detection application, a straightforward way to derive the desired mapping wk(γ) is to make use of training data, obtained by manually tuning the value of wk on a set of hydro-dam wall images – containing enough examples to be statistically significant and with enough variability in the examples considered in order to cover as many practical cases as possible. Such images have been taken from the Dragan and Tarnita hydro-dams sites in Transilvania, Romania. A set of 40 images of several sub-plots (20 from each hydro-dam), with different aspect, under different lighting conditions and with different amounts of calcite (from none to very severe) have been selected and manually analyzed in respect to optimizing the calcite class’ weight for the most accurate calcite identification. The skewness values in all 40 cases and the best manually selected weight values wk have been collected. These pairs of values specify the value of the mapping point-wise, and an interpolation procedure had to be afterwards applied to completely define in an automatic fashion the computation of the weight wk (assuming the other two weights “fixed” as references, to 1). Whereas many interpolation procedures can be applied, one of the most
REVISTA ROMÂNĂ DE AUTOMATICĂ
9
surface (still without being reasonable to consider it negligeable because it can be significant as local severity), as e.g. in Fig. 3,
suitable in the case of a relatively sparse set of data points is the fuzzy interpolation [19]. Fuzzy logic systems have successfully been
used many times as universal function approximators and function interpolators. Typically, fuzzy patches are defined to cover the data space of the input-output data, having as centers – the data points available in the space. The certain data points available from training constitute peaks of the fuzzy sets defined over the input and output, whereas the supports of the fuzzy sets are then defined to form fuzzy partitions of the input and output universes of discourse. However in our case, of 40 “training data points”, not all the input and output values are significantly different enough to define 40 fuzzy sets. Clustering the input data (the skewness values) and the output data (the weights wk) independently leads to a number of nine significant input values and six significant output values, thus requiring 9 input fuzzy sets and 6 output fuzzy sets. According to the observed skewness values in our images, the universe of discourse for the input is sufficient to be defined as [-2;2]. Similarly, the range of values for the weights wk is chosen to be [1;10]. The fuzzy sets have trapezoidal shapes for the extremes of the universe of discourse of the input and triangular for the inside region. The output fuzzy sets have triangular shape, except for the last one which is trapezoidal, to give a superior limit of the weight. The smaller number of output fuzzy sets is due to the fact that basically the optimal weight for any skewness between 0 and 0.9 (roughly representing the concept “slightly positive near zero” for the skewness, but represented by the selected pair of points by four input fuzzy sets) is around 2. The designed single input – single output fuzzy logic system for the generation of the suitable wk given γ employs Mamdani inference and centroid defuzzification [19]. The resulting mapping wk(γ) is graphically represented in Fig. 2.
Fig. 2 Histogram skew to class weight mapping
4. The fuzzy rules for post-classification verification Although the modified fuzzy c-means cost function proposed and presented in the previous section improves to a great extent the segmentation results in the meaning of guaranteeing sufficient significance/penalty to the misclassification of the most important data for our task – the brightest pixels, that is the calcite pixels, the simple histogram examination does not take into account a particular unwanted misclassification situation that might occur. That is, what will be the segmentation result assuming that the histogram is narrower, without calcite but without unwanted organic deposits (darker) as well? Will in this case the a-priori segmentation in three classes of the pixels be able to identify that actually the class identified as the brightest does not in fact correspond to calcite, but just to some brighter parts on the concrete as compared to its average?
The answer is obviously not, because so far, we just optimize the class assignment of the pixels, and afterwards we assign (in the segmentation stage) the pixels to the class where they most likely belong based on their memberships, without examining the brightness of the centroids of the each class. So unless we also examine if the brightest centroid is “white enough” as compared to
REVISTA ROMÂNĂ DE AUTOMATICĂ
10
the average grey of the concrete portion of the wall (the centroid of the middle grey class Cg) to be considered as clearly not concrete but calcite (i.e. if it exhibits a large enough
contrast from the concrete), the segmentation will still be prone to errors. We call this step a post-classification verification, since it can be seen as a classification refinement, ulterior to the above presented proposed version of fuzzy c-means.
This step is simply solved by a rule-based verification of the distance between the class centers formulated as follows. If Yg denotes the brightness of the centroid of class Cg and Yc denotes the brightness of the centroid of class Cc, the following three rules define the final segmentation result:
IF Yc-Yg > TH, THEN pixels in the lightest class certainly belong to Calcite class,
IF Yc-Yg > TL AND Yc-Yg < TH THEN pixels are likely to belong to Calcite class only in the degree of (Yc-Yg-TL)/(TH-TL)
IF Yc-Yg < TL, THEN pixels in the lightest class certainly do not belong to Calcite class,
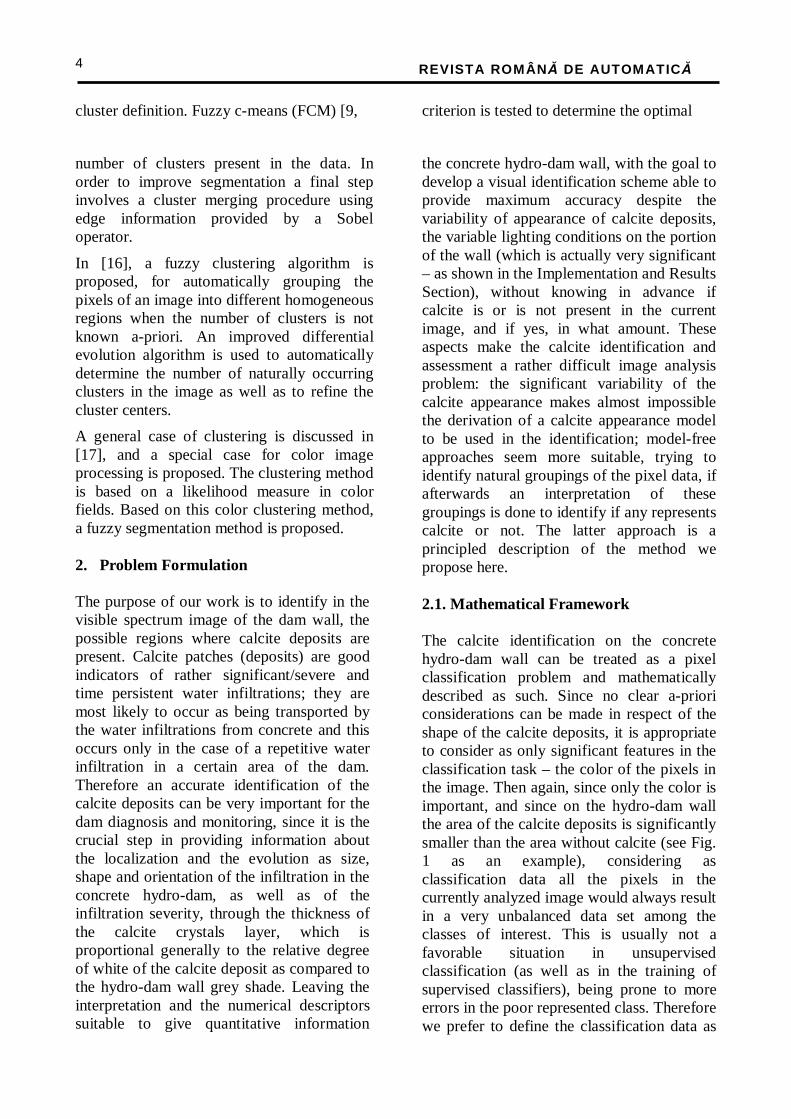
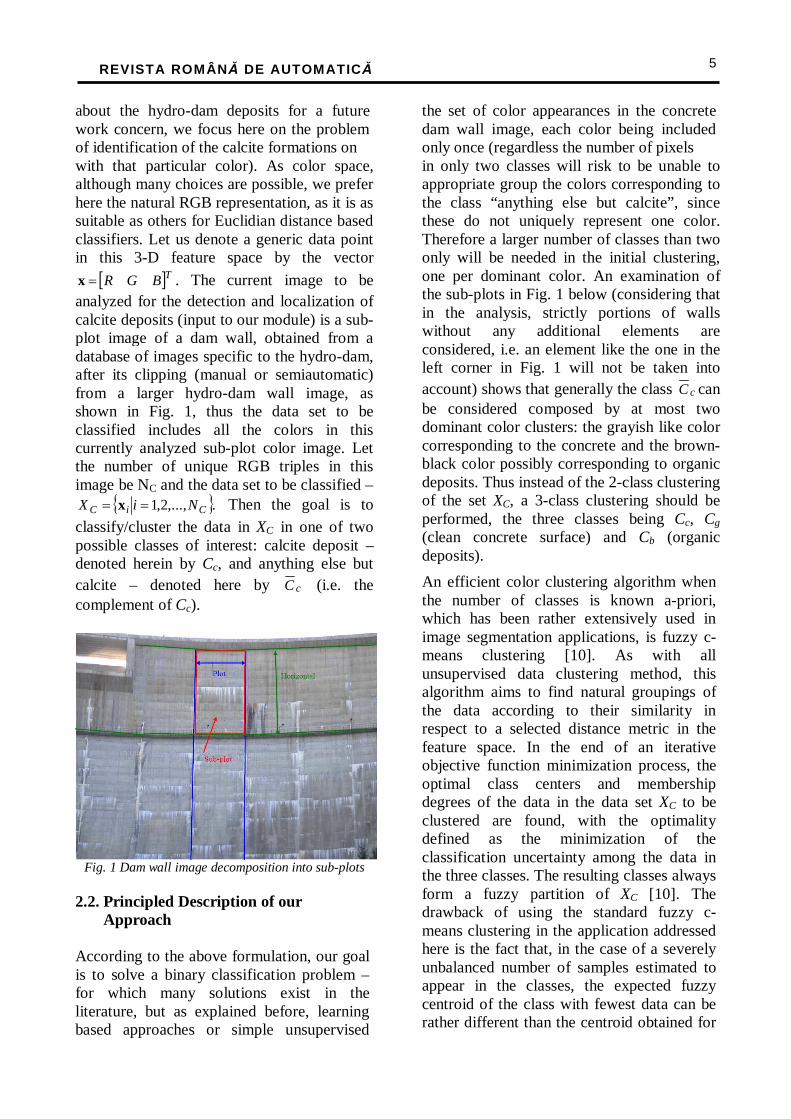
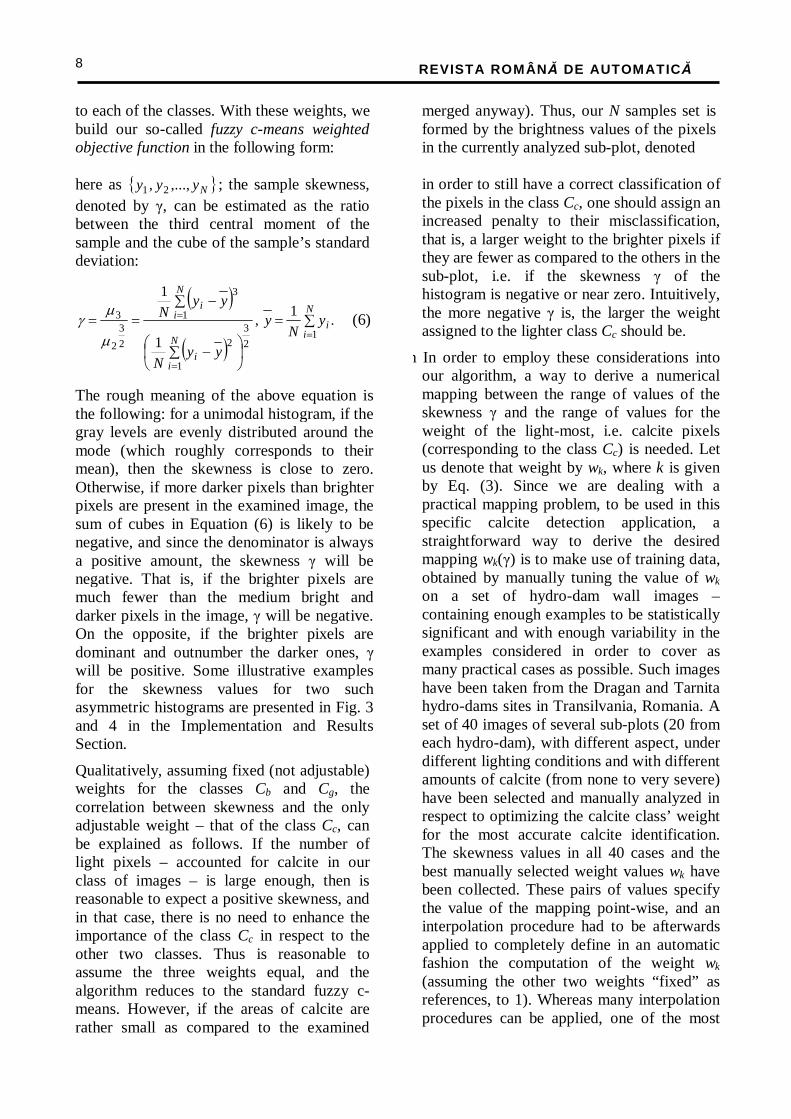
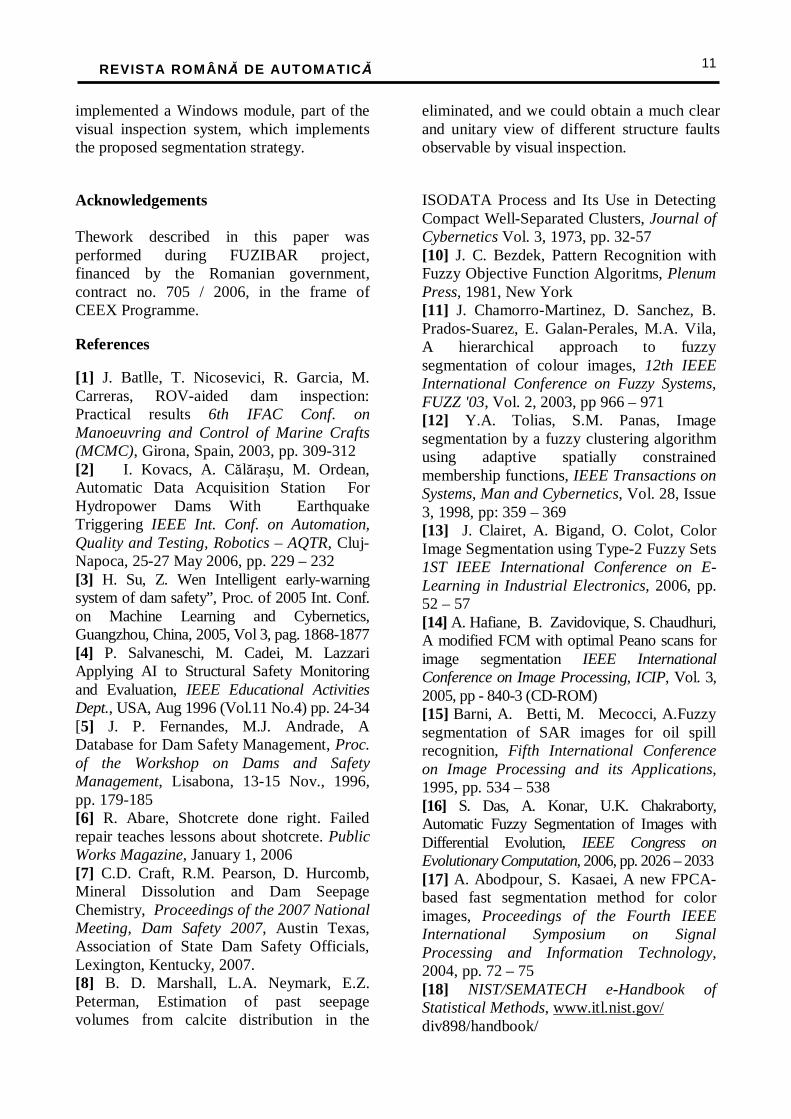
where TH and TL are heuristically defined thresholds, found based on the examination of the afore mentioned image data of the concrete hydro-dams walls from Transilvania. As a result of this post-classification refinement, the pixels identified as calcite are labeled either crisply (if they obey the first of the rules above) in pure red (maximum intensity and saturation) (as seen in Fig. 3 and 4 below), or in a “soft” fashion, if they obey the second rule only, that is if they are not really certainly calcite pixels, they are labeled with a less saturated red (obtained as a proportional mixture of red – calcite and black – not calcite), to indicate the uncertainty in the decision. 5. Implementation and Results In order to verify and validate the proposed segmentation strategy we design and
Experiments were run on a set of 40 images of different sub-plots, taken from the downstream walls of Dragan and Tarnita hydro-dams in Transylvania, Romania.
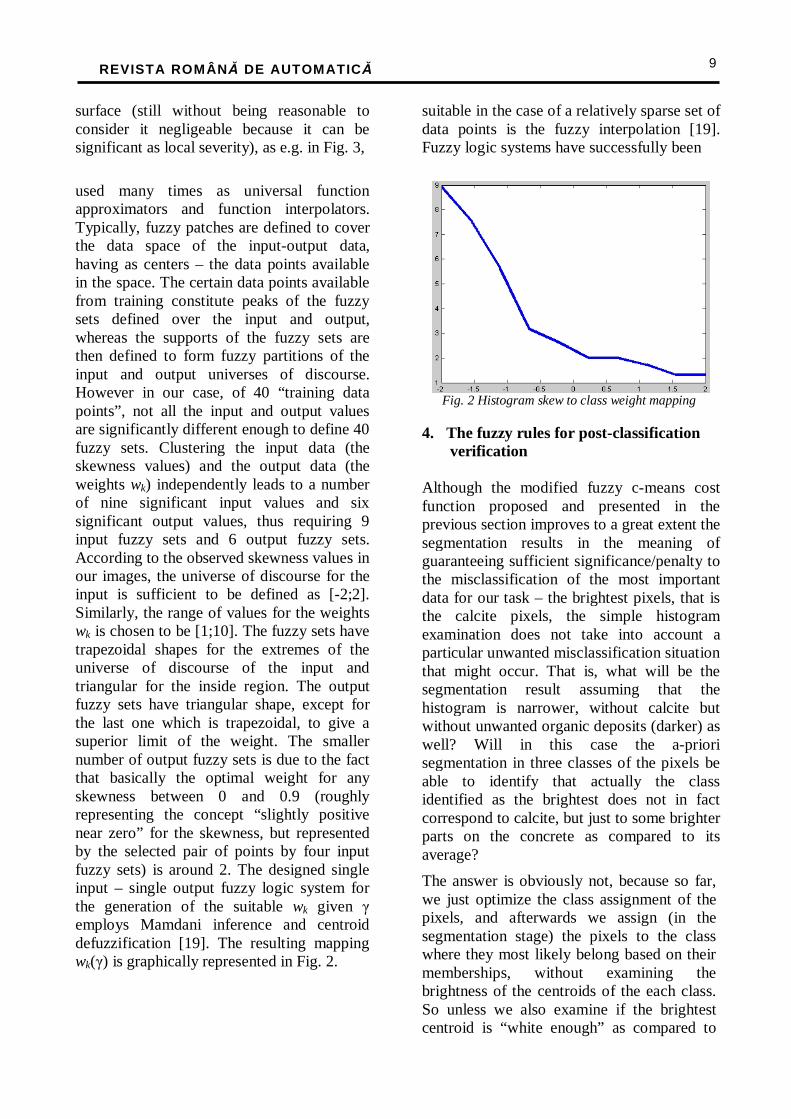
The interface of the software application is presented in Fig. 3 and 4, for different subplots.
Fig.3 Interface of the calcite detection and
assessment segmentation module
Fig. 4 Interface of the calcite detection and
assessment segmentation module 6. Conclusions In this paper we proposed a tool that aids human experts in visual inspection of hydro dams.
Our long time goal is to develop an automated process for visual inspection, based on computer vision techniques; thus, a great deal of human subjective interpretation would be
REVISTA ROMÂNĂ DE AUTOMATICĂ
11
implemented a Windows module, part of the visual inspection system, which implements the proposed segmentation strategy.
eliminated, and we could obtain a much clear and unitary view of different structure faults observable by visual inspection.
Acknowledgements Thework described in this paper was performed during FUZIBAR project, financed by the Romanian government, contract no. 705 / 2006, in the frame of CEEX Programme. References [1] J. Batlle, T. Nicosevici, R. Garcia, M. Carreras, ROV-aided dam inspection: Practical results 6th IFAC Conf. on Manoeuvring and Control of Marine Crafts (MCMC), Girona, Spain, 2003, pp. 309-312 [2] I. Kovacs, A. Călăraşu, M. Ordean, Automatic Data Acquisition Station For Hydropower Dams With Earthquake Triggering IEEE Int. Conf. on Automation, Quality and Testing, Robotics – AQTR, Cluj-Napoca, 25-27 May 2006, pp. 229 – 232 [3] H. Su, Z. Wen Intelligent early-warning system of dam safety”, Proc. of 2005 Int. Conf. on Machine Learning and Cybernetics, Guangzhou, China, 2005, Vol 3, pag. 1868-1877 [4] P. Salvaneschi, M. Cadei, M. Lazzari Applying AI to Structural Safety Monitoring and Evaluation, IEEE Educational Activities Dept., USA, Aug 1996 (Vol.11 No.4) pp. 24-34 [5] J. P. Fernandes, M.J. Andrade, A Database for Dam Safety Management, Proc. of the Workshop on Dams and Safety Management, Lisabona, 13-15 Nov., 1996, pp. 179-185 [6] R. Abare, Shotcrete done right. Failed repair teaches lessons about shotcrete. Public Works Magazine, January 1, 2006 [7] C.D. Craft, R.M. Pearson, D. Hurcomb, Mineral Dissolution and Dam Seepage Chemistry, Proceedings of the 2007 National Meeting, Dam Safety 2007, Austin Texas, Association of State Dam Safety Officials, Lexington, Kentucky, 2007. [8] B. D. Marshall, L.A. Neymark, E.Z. Peterman, Estimation of past seepage volumes from calcite distribution in the
ISODATA Process and Its Use in Detecting Compact Well-Separated Clusters, Journal of Cybernetics Vol. 3, 1973, pp. 32-57 [10] J. C. Bezdek, Pattern Recognition with Fuzzy Objective Function Algoritms, Plenum Press, 1981, New York [11] J. Chamorro-Martinez, D. Sanchez, B. Prados-Suarez, E. Galan-Perales, M.A. Vila, A hierarchical approach to fuzzy segmentation of colour images, 12th IEEE International Conference on Fuzzy Systems, FUZZ '03, Vol. 2, 2003, pp 966 – 971 [12] Y.A. Tolias, S.M. Panas, Image segmentation by a fuzzy clustering algorithm using adaptive spatially constrained membership functions, IEEE Transactions on Systems, Man and Cybernetics, Vol. 28, Issue 3, 1998, pp: 359 – 369 [13] J. Clairet, A. Bigand, O. Colot, Color Image Segmentation using Type-2 Fuzzy Sets 1ST IEEE International Conference on E-Learning in Industrial Electronics, 2006, pp. 52 – 57 [14] A. Hafiane, B. Zavidovique, S. Chaudhuri, A modified FCM with optimal Peano scans for image segmentation IEEE International Conference on Image Processing, ICIP, Vol. 3, 2005, pp - 840-3 (CD-ROM) [15] Barni, A. Betti, M. Mecocci, A.Fuzzy segmentation of SAR images for oil spill recognition, Fifth International Conference on Image Processing and its Applications, 1995, pp. 534 – 538 [16] S. Das, A. Konar, U.K. Chakraborty, Automatic Fuzzy Segmentation of Images with Differential Evolution, IEEE Congress on Evolutionary Computation, 2006, pp. 2026 – 2033 [17] A. Abodpour, S. Kasaei, A new FPCA-based fast segmentation method for color images, Proceedings of the Fourth IEEE International Symposium on Signal Processing and Information Technology, 2004, pp. 72 – 75 [18] NIST/SEMATECH e-Handbook of Statistical Methods, www.itl.nist.gov/ div898/handbook/

REVISTA ROMÂNĂ DE AUTOMATICĂ
12
Topopah Spring Tuff, Yucca Mountain, Nevada, Journal of contaminant hydrology, Elsevier Science, Amsterdam, vol. 62-63, 2003, pp. 237-247, [9] J. C. Dunn, A Fuzzy Relative of the
[19] J. L. Castro, M. Delgado. Fuzzy Systems with defuzzification are Universal Approximators. IEEE Transactions on System, Man and Cybernetics, Vol. 26(02),1996
AR3-1.doc
REVISTA ROMÂNĂ DE AUTOMATICĂ
13
Hybrid hydro-wind energy structure HIDROEOL
Octavian CǍPĂŢÎNĂ, Alina CĂLĂRAŞU, Rareş CAZAN, Alexandra MARICHESCU SC IPA SA CIFATT Cluj
Abstract: Considering both wind power drawbacks and the well known benefits and advantages of hydropower, and taking into account a general rule which states that the power of wind plant is a fraction (30%) of a wind power turbine, we proposed a hybrid hydro-wind system for large scale utility system as a fine solution that has an overall integrated capacity factor better than those that we could trust before and mentioned above (30%). We introduced a new efficiency factor for a better dimensioning expression of losses on dump loads in stand-alone wind power plant. Finally we searched for a national scale solution, where hydro power represents a small part, less than 10%, as in Romania.
Keywords: renewable energy, hydro-wind ensemble, pump station
The main objective of the Hidroeol project, contract number 21062/2006 (in the frame of National Program 2) is to contribute to the knowledge regarding the integration of wind resources in the existent energy system through:
i) establishing the limit to which wind energy can be added without deteriorating the quality of the energy system;
ii) establishing conditions, including preserving capacities, and computing the efficiency of integrating wind turbines and plants in the national energy system.
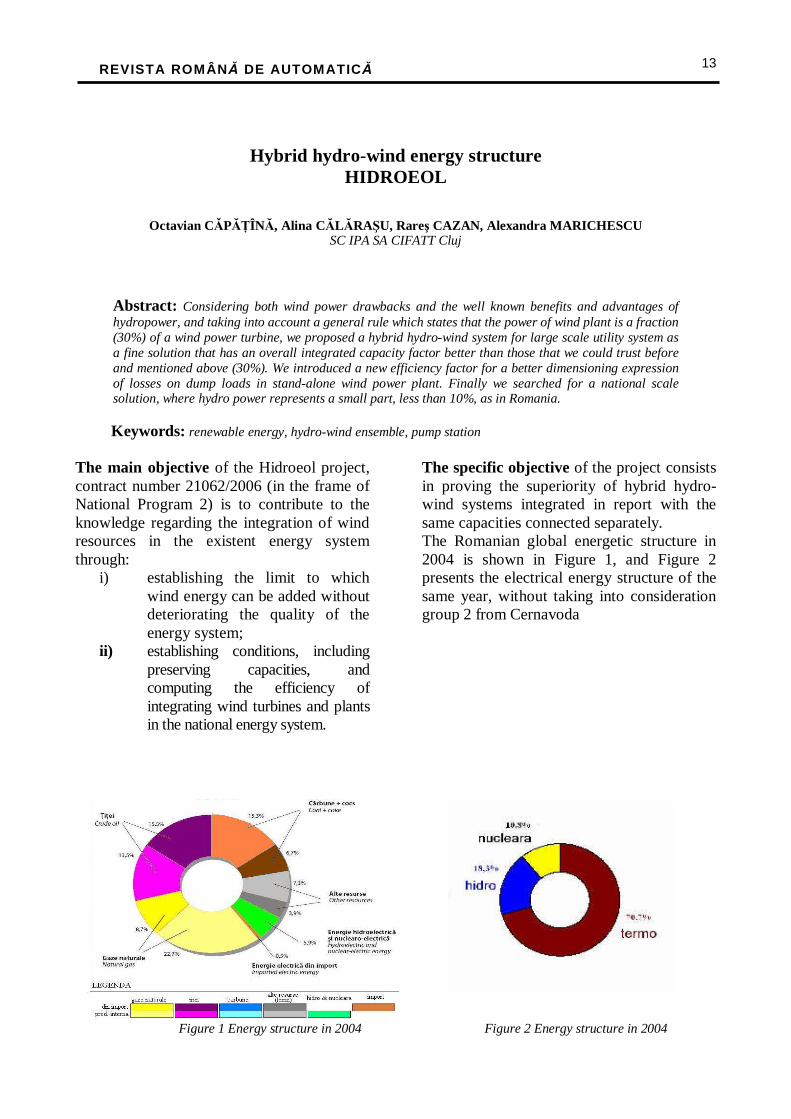
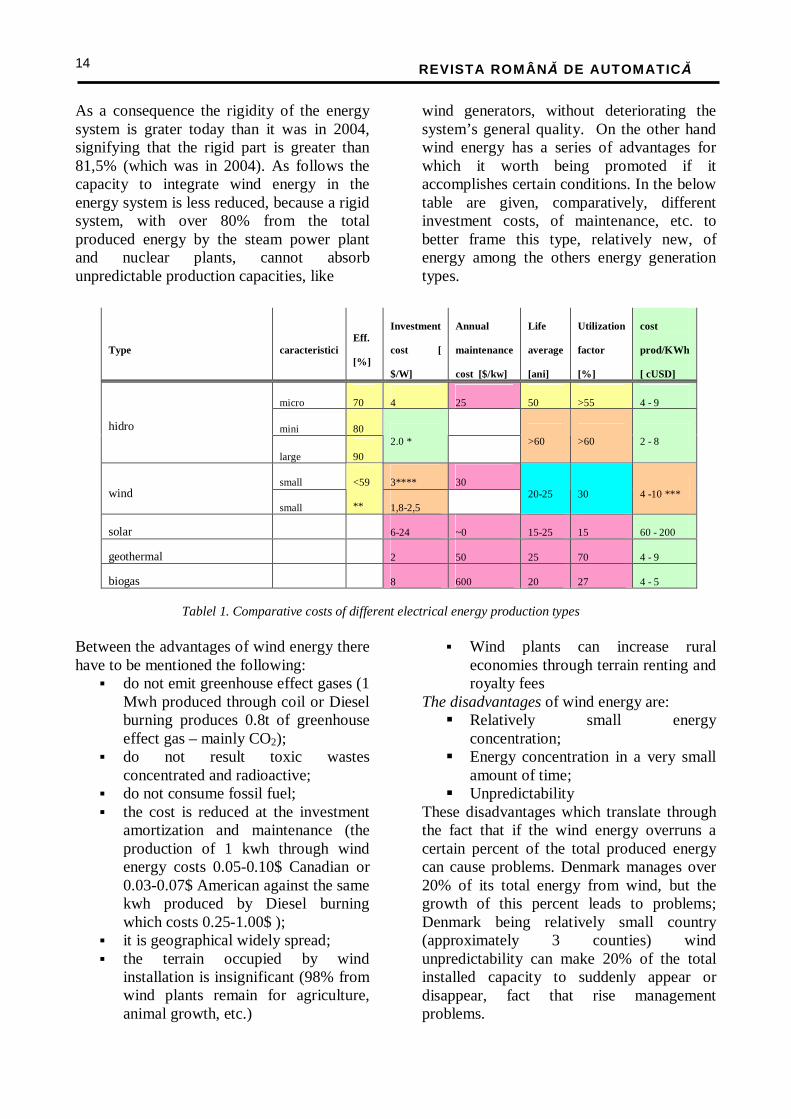
The specific objective of the project consists in proving the superiority of hybrid hydro-wind systems integrated in report with the same capacities connected separately. The Romanian global energetic structure in 2004 is shown in Figure 1, and Figure 2 presents the electrical energy structure of the same year, without taking into consideration group 2 from Cernavoda
Figure 1 Energy structure in 2004 Figure 2 Energy structure in 2004
REVISTA ROMÂNĂ DE AUTOMATICĂ
14
As a consequence the rigidity of the energy system is grater today than it was in 2004, signifying that the rigid part is greater than 81,5% (which was in 2004). As follows the capacity to integrate wind energy in the energy system is less reduced, because a rigid system, with over 80% from the total produced energy by the steam power plant and nuclear plants, cannot absorb unpredictable production capacities, like
wind generators, without deteriorating the system’s general quality. On the other hand wind energy has a series of advantages for which it worth being promoted if it accomplishes certain conditions. In the below table are given, comparatively, different investment costs, of maintenance, etc. to better frame this type, relatively new, of energy among the others energy generation types.
Tablel 1. Comparative costs of different electrical energy production types
Between the advantages of wind energy there have to be mentioned the following:
� do not emit greenhouse effect gases (1 Mwh produced through coil or Diesel burning produces 0.8t of greenhouse effect gas – mainly CO2);
� do not result toxic wastes concentrated and radioactive;
� do not consume fossil fuel; � the cost is reduced at the investment
amortization and maintenance (the production of 1 kwh through wind energy costs 0.05-0.10$ Canadian or 0.03-0.07$ American against the same kwh produced by Diesel burning which costs 0.25-1.00$ );
� it is geographical widely spread; � the terrain occupied by wind
installation is insignificant (98% from wind plants remain for agriculture, animal growth, etc.)
� Wind plants can increase rural economies through terrain renting and royalty fees
The disadvantages of wind energy are: � Relatively small energy
concentration; � Energy concentration in a very small
amount of time; � Unpredictability
These disadvantages which translate through the fact that if the wind energy overruns a certain percent of the total produced energy can cause problems. Denmark manages over 20% of its total energy from wind, but the growth of this percent leads to problems; Denmark being relatively small country (approximately 3 counties) wind unpredictability can make 20% of the total installed capacity to suddenly appear or disappear, fact that rise management problems.
Type caracteristici Eff.
[%]
Investment
cost [
$/W]
Annual
maintenance
cost [$/kw]
Life
average
[ani]
Utilization
factor
[%]
cost
prod/KWh
[ cUSD]
micro 70 4 25 50 >55 4 - 9
mini 80 hidro
large 90
2.0 *
>60 >60 2 - 8
small 3**** 30 wind
small
<59
** 1,8-2,5 20-25 30 4 -10 ***
solar 6-24 ~0 15-25 15 60 - 200
geothermal 2 50 25 70 4 - 9
biogas 8 600 20 27 4 - 5

REVISTA ROMÂNĂ DE AUTOMATICĂ
15
In a study financed by Minnesota state USA it is estimated that up to 25% of wind energy from the total amount of produced energy can be efficiently administrated at a low cost of 0.0045 $/kwh [8].
In another American study of the solar energy society it is estimated that up to 20% of the consumed energy can be taken from unpredictable sources without big difficulties and extra costs.
It does not exists a maximum limit generally accepted regarding the percent of wind energy in a given energy system. The maximum practical limit depends on several factors like the generation structure (hydro, nuclear, fossil fuel), forming mechanisms of the wells, storage capacity and costs, requirements, regulation costs and management extra costs.
Obviously, this limit can be increased if the energetic system has storage capacities. In all these kind of cases, which resides in the mentioned disadvantages, there are foreseen two principle solutions:
a) Interconnection with a greater energy system, so that the wind energy percent from the total number of the production diminish under a certain percent – safety threshold, and
b) Developing preservation capacities of wind energy
Solution a) can, and is something conceived as a diversity requirement of energy sources; a recent study of Kassel University proposed a hybrid wind-solar network spread over whole Germany. The wide spread of such a network would ensure the availability of a certain percent from the total installed capacities.
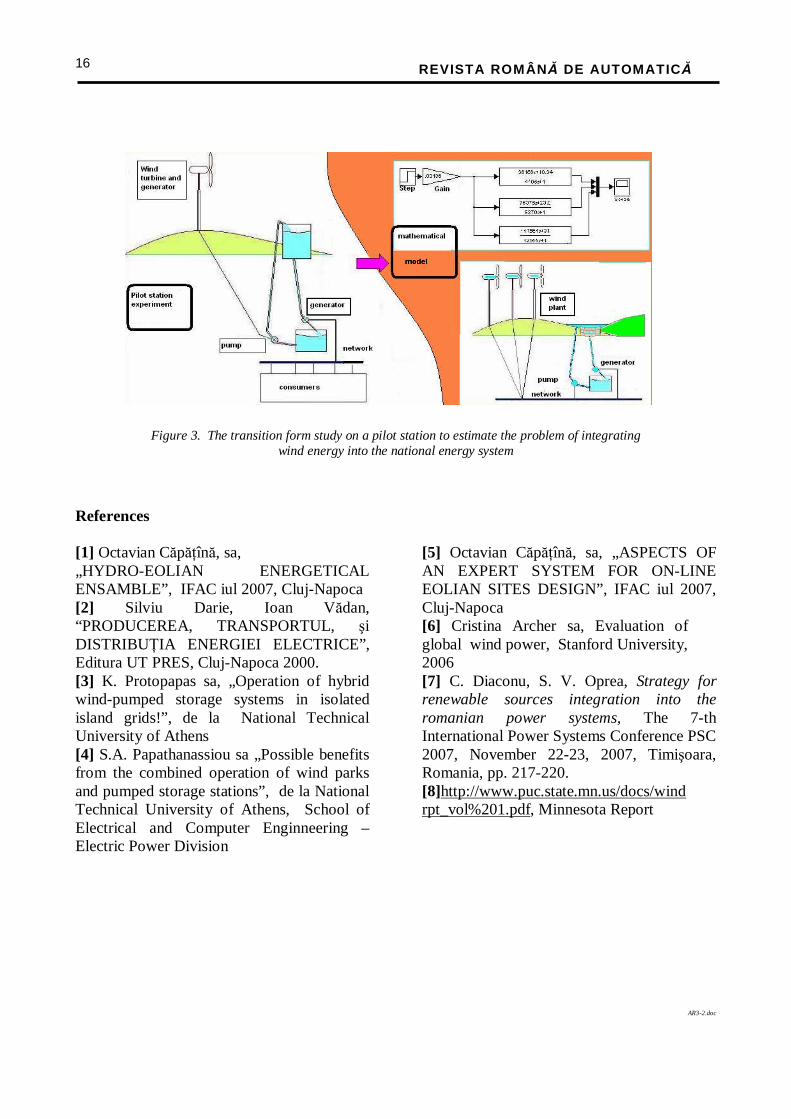
The purposes throughout the entire project, besides others, are to demonstrate based on:
i) pilot station which embodies a hydro and wind generator , a superior basin, a stilling basin and a pump;
ii) a wind data acquisition station, and iii) a SCADA system to monitor the two
components
that the hydro-wind ensemble is more efficient than the generator working separately.
The second important thing that we follow in the project is to define the maximum limit of the wind energy application in the specific system without the respective systems performance deterioration or loss. It will be modeled a national energy system based on public data to which we have access and we will propose new wind energy capacities interconnected to the network after which the whole ensemble will be studied. Approach strategy
The pilot station together with its control and surveillance system (SCADA) has the role to validate some mathematical models, analytically built, of a hydro-wind ensemble having conserving pumping. By validating these models, we can pass by extrapolation to different size wind ensembles, and by mathematical modeling to demonstrate that hydro-wind structures with pumping-accumulations are superior from the point of view of the efficiency to the same capacities without pumping accumulation. Beyond the thematic limit we have the ambitious objective to estimate some integration problems, on large scale, of wind energy in the national energy system. From experimental acquisition data by using SCADA system through mathematical regression we deduce the pilot station model- model which is compared to the built analytical models for the hydro turbine, wind turbine, pumping station. After these operations it is made the adjustments of analytical models, the adjusted analytical models being previously used for modeling new situations of hydro-wind ensembles. This represents a challenge, worldwide, in the energy field, to integrate wind energy beyond the so called “maximum limit”.
REVISTA ROMÂNĂ DE AUTOMATICĂ
16
Figure 3. The transition form study on a pilot station to estimate the problem of integrating wind energy into the national energy system
References [1] Octavian Căpăţînă, sa, „HYDRO-EOLIAN ENERGETICAL ENSAMBLE”, IFAC iul 2007, Cluj-Napoca [2] Silviu Darie, Ioan Vădan, “PRODUCEREA, TRANSPORTUL, şi DISTRIBUŢIA ENERGIEI ELECTRICE”, Editura UT PRES, Cluj-Napoca 2000. [3] K. Protopapas sa, „Operation of hybrid wind-pumped storage systems in isolated island grids!”, de la National Technical University of Athens [4] S.A. Papathanassiou sa „Possible benefits from the combined operation of wind parks and pumped storage stations”, de la National Technical University of Athens, School of Electrical and Computer Enginneering – Electric Power Division
[5] Octavian Căpăţînă, sa, „ASPECTS OF AN EXPERT SYSTEM FOR ON-LINE EOLIAN SITES DESIGN”, IFAC iul 2007, Cluj-Napoca [6] Cristina Archer sa, Evaluation of global wind power, Stanford University, 2006 [7] C. Diaconu, S. V. Oprea, Strategy for renewable sources integration into the romanian power systems, The 7-th International Power Systems Conference PSC 2007, November 22-23, 2007, Timişoara, Romania, pp. 217-220. [8]http://www.puc.state.mn.us/docs/windrpt_vol%201.pdf, Minnesota Report
AR3-2.doc
REVISTA ROMÂNĂ DE AUTOMATICĂ
17
Intelligent Sensor Network for Wind Potential Assement
Octavian CAPATINA, Rares CAZAN, Alexandra MARICHESC U Sabolcs BALOGH, Laurentiu CHIRILA
IPA Bucuresti, sucursala Cluj Napoca
Abstract: In the ReSI (Retea de Senzori Inteligenti) we developed some new approach for wireless SCADA projects, which comes as a response to market demands. One of these approaches is the to put together the sensors with an intelligent GPRS modem with “other glue” electronics like PLC.
Keywords: network, wireless, sensors
1. Introduction
Generally speaking, wind equipment emplacement comprises at least two distinct phases: i) established wind area, ii) accurate location of pillar generator. The first phase is referring to the gross emplacement, in a geographical area, limited by the coastal and hilly zones, and is not a problematic one. The second phase is referring to the final emplacement, meaning that we already know the area and we want to establish the foundation of the wind generator pillar. The current way of the wind potential assessment assumes many direct measurements in the
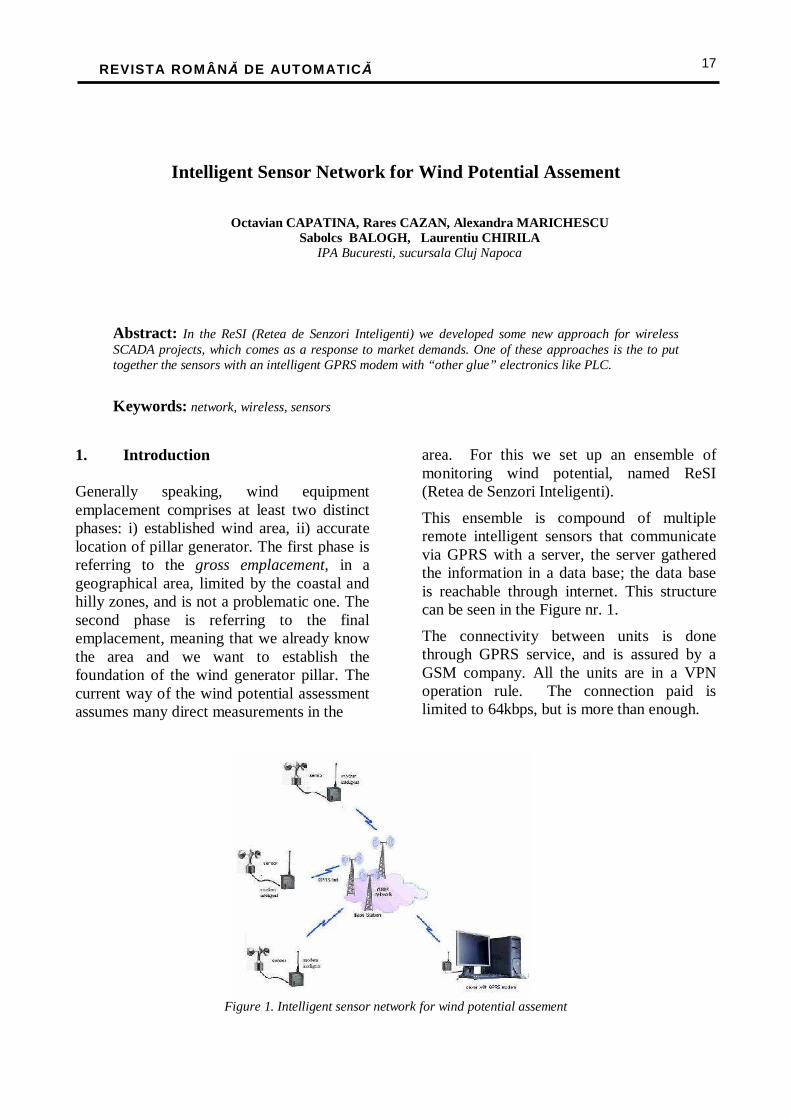
area. For this we set up an ensemble of monitoring wind potential, named ReSI (Retea de Senzori Inteligenti).
This ensemble is compound of multiple remote intelligent sensors that communicate via GPRS with a server, the server gathered the information in a data base; the data base is reachable through internet. This structure can be seen in the Figure nr. 1.
The connectivity between units is done through GPRS service, and is assured by a GSM company. All the units are in a VPN operation rule. The connection paid is limited to 64kbps, but is more than enough.
Figure 1. Intelligent sensor network for wind potential assement
REVISTA ROMÂNĂ DE AUTOMATICĂ
18
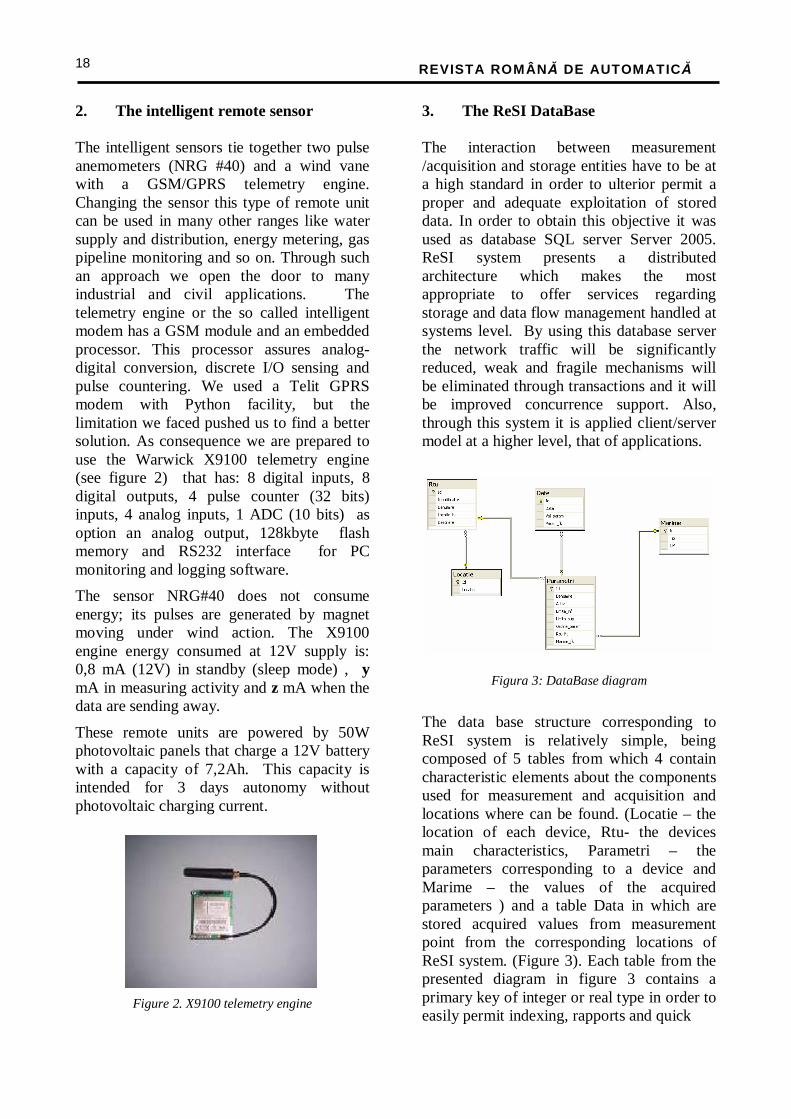
2. The intelligent remote sensor The intelligent sensors tie together two pulse anemometers (NRG #40) and a wind vane with a GSM/GPRS telemetry engine. Changing the sensor this type of remote unit can be used in many other ranges like water supply and distribution, energy metering, gas pipeline monitoring and so on. Through such an approach we open the door to many industrial and civil applications. The telemetry engine or the so called intelligent modem has a GSM module and an embedded processor. This processor assures analog-digital conversion, discrete I/O sensing and pulse countering. We used a Telit GPRS modem with Python facility, but the limitation we faced pushed us to find a better solution. As consequence we are prepared to use the Warwick X9100 telemetry engine (see figure 2) that has: 8 digital inputs, 8 digital outputs, 4 pulse counter (32 bits) inputs, 4 analog inputs, 1 ADC (10 bits) as option an analog output, 128kbyte flash memory and RS232 interface for PC monitoring and logging software.
The sensor NRG#40 does not consume energy; its pulses are generated by magnet moving under wind action. The X9100 engine energy consumed at 12V supply is: 0,8 mA (12V) in standby (sleep mode) , y mA in measuring activity and z mA when the data are sending away.
These remote units are powered by 50W photovoltaic panels that charge a 12V battery with a capacity of 7,2Ah. This capacity is intended for 3 days autonomy without photovoltaic charging current.
Figure 2. X9100 telemetry engine
3. The ReSI DataBase The interaction between measurement /acquisition and storage entities have to be at a high standard in order to ulterior permit a proper and adequate exploitation of stored data. In order to obtain this objective it was used as database SQL server Server 2005. ReSI system presents a distributed architecture which makes the most appropriate to offer services regarding storage and data flow management handled at systems level. By using this database server the network traffic will be significantly reduced, weak and fragile mechanisms will be eliminated through transactions and it will be improved concurrence support. Also, through this system it is applied client/server model at a higher level, that of applications.
Figura 3: DataBase diagram
The data base structure corresponding to ReSI system is relatively simple, being composed of 5 tables from which 4 contain characteristic elements about the components used for measurement and acquisition and locations where can be found. (Locatie – the location of each device, Rtu- the devices main characteristics, Parametri – the parameters corresponding to a device and Marime – the values of the acquired parameters ) and a table Data in which are stored acquired values from measurement point from the corresponding locations of ReSI system. (Figure 3). Each table from the presented diagram in figure 3 contains a primary key of integer or real type in order to easily permit indexing, rapports and quick
REVISTA ROMÂNĂ DE AUTOMATICĂ
19
and efficient data searches. Also each table contains fields which represent foreign keys through which it can be determined in any moment data corresponding to any type of RTU or the location from where RTU’s come.
At database level there are developed certain mechanisms such as stored procedures or views though which it is allowed the database exploitation to obtain the best results and also to ensure an ideal interaction between ReSI system application and database server. The system’s database design was realized in close connection with the specifications hat has to be met by ReSI application with the purpose of satisfying as accurate and efficient as possible the final user requirements.
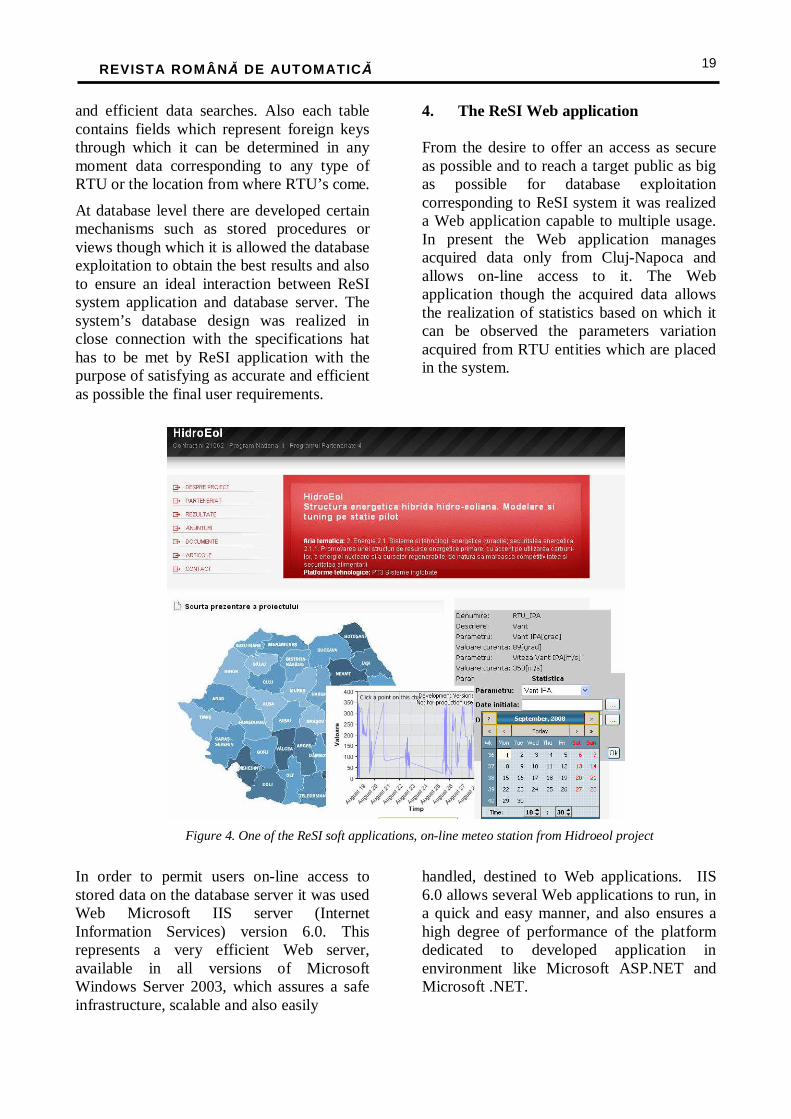
4. The ReSI Web application From the desire to offer an access as secure as possible and to reach a target public as big as possible for database exploitation corresponding to ReSI system it was realized a Web application capable to multiple usage. In present the Web application manages acquired data only from Cluj-Napoca and allows on-line access to it. The Web application though the acquired data allows the realization of statistics based on which it can be observed the parameters variation acquired from RTU entities which are placed in the system.
Figure 4. One of the ReSI soft applications, on-line meteo station from Hidroeol project
In order to permit users on-line access to stored data on the database server it was used Web Microsoft IIS server (Internet Information Services) version 6.0. This represents a very efficient Web server, available in all versions of Microsoft Windows Server 2003, which assures a safe infrastructure, scalable and also easily
handled, destined to Web applications. IIS 6.0 allows several Web applications to run, in a quick and easy manner, and also ensures a high degree of performance of the platform dedicated to developed application in environment like Microsoft ASP.NET and Microsoft .NET.
REVISTA ROMÂNĂ DE AUTOMATICĂ
20
In addition to the above presented facilitations, thorough Windows Server 2003 Service Pack 1 (SP1), IIS 6.0 dispose of the advantage of high compatibility, capabilities of log extension file generation, offers a high degree of security, having also other important characteristics. IIS (Internet Information Services) transforms a computer in a web server which offers publication services WWW (World Wide Web), FTP services (File Transfer Protocol), SMTP services (Simple Mail Transfer Protocol), and NNTP services (Network News Transfer Protocol).IIS can be used for web site hosting and management and also other Internet contexts once an IP address is obtained, it is registered the domain on a DNS server (Domain Name Server), and it is configured the network in an appropriate mode.
For the Web application which implements the functions described above, it was chosen Visual Studio .NET environment. In Visual Studio .NET development environment is allowed the implementation of .NET application, this being closely integrated with .NET Framework an run-time. The implemented Web .NET application is independent of the development environment which increases the portability of the application and also source code. The application that was developed, through its nature, is an open application which allows easy realization of modifications and improvements. .NET presents inter-language integration and exception handling, program debugging and forming, improved security, more efficient work with versions and a more efficient beneficiary installation. It offers a brand new model for interaction between components and class libraries - .NET Framework. .NET unifies the programming model, making from chosing a language a problem mainly of personal preference. At all .NET applications disposition there is a single library of classes, commune, coherent and elegant.
NET applications are realized with the help of ASP.NET and ADO.NET tools of the
.NET technology. The access and data presentation represents main functions which have to be implemented by a Web application. For that reason, taking into consideration that the application that was implemented has overtaking functions, and data visualization needs the usage of an infrastructure which offers automatic connection between data sources and application elements. In .NET, several efficient controls connected to data allow to associate easily data lines with HTML elements like list boxes or tables. The ASP.NET and ADO.NET capacities are obvious when using server controls in the context of Web application. The controls connected to data and code for data management is used in the same way independently of programming model. – Windows Forms, Web Forms or even Web services. This technology has many advantages for the programmer and also for final user. The main advantages which are presented to the user of a website implemented in ASP.NET are: enhanced functionality in database handling, more efficient and quicker web applications, protection against “memory leakage” and errors and support for a diversity of programming languages.
5. Conclusion
The opened way which is given by ReSI could be easily adopted in many other industrial applications like water supply, gas pipeline monitoring, energy metering, food and chemical process, meteorological and environments network.
Bibliography
[1] Octavian Capatana, Rares Cazan, Mihaela Dragan, „<Aspects Of An Expert System For On-Line Eolian Sites Design", IFAC, Cluj Napoca, 2007 [2] ***, Telemetry engine, Data sheets [3] ***, Telit modem, Data sheets
AR3-3.doc
REVISTA ROMÂNĂ DE AUTOMATICĂ
21
System for Rivers Water Quality Monitoring
Modeling and Simulation of Pollutants Propagation
Gicu UNGUREANU, Ioan STOIAN, Maria MIRCEA, Alin COR HA SC IPA SA CIFATT Cluj
Z. MOLDOVAN
INCDTIM - National Institute for R&D of Isotopic and Molecular Technologies
Abstract: Rapid environmental changes as well as potential risks for the human health call for water quality continuous surveillance and on-line decision making. Information and communication technologies can be valuable in these areas. In this paper we present an intelligent system for water quality assessment. Some models used for pollutants propagation, the system architecture, the functional description, the distributed acquisition subsystems are presented. The main concepts are the integration of distributed and diverse information resources through wide area networking methods, but with an easy-to-use interface that makes the technical complexity completely hidden for the user. Menu driven, graphical and supported by an embedded expert system, the interface makes interaction with complex models easy. The system provides a powerful, but simple tool for river water quality management, and decision making, according to European environmental policy, guidelines, and regulations.
Keywords: water quality, polluants, system architecture, acquisition subsystems.
I. INTRODUCTION
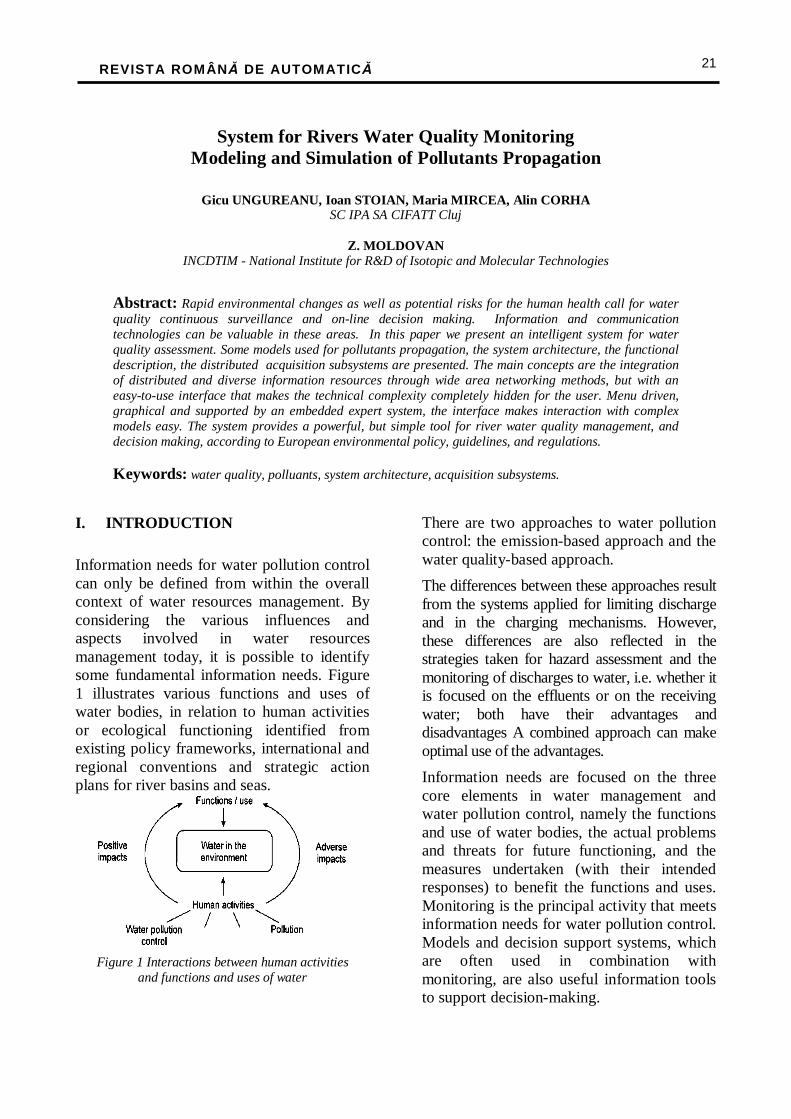
Information needs for water pollution control can only be defined from within the overall context of water resources management. By considering the various influences and aspects involved in water resources management today, it is possible to identify some fundamental information needs. Figure 1 illustrates various functions and uses of water bodies, in relation to human activities or ecological functioning identified from existing policy frameworks, international and regional conventions and strategic action plans for river basins and seas.
Figure 1 Interactions between human activities and functions and uses of water
There are two approaches to water pollution control: the emission-based approach and the water quality-based approach.
The differences between these approaches result from the systems applied for limiting discharge and in the charging mechanisms. However, these differences are also reflected in the strategies taken for hazard assessment and the monitoring of discharges to water, i.e. whether it is focused on the effluents or on the receiving water; both have their advantages and disadvantages A combined approach can make optimal use of the advantages.
Information needs are focused on the three core elements in water management and water pollution control, namely the functions and use of water bodies, the actual problems and threats for future functioning, and the measures undertaken (with their intended responses) to benefit the functions and uses. Monitoring is the principal activity that meets information needs for water pollution control. Models and decision support systems, which are often used in combination with monitoring, are also useful information tools to support decision-making.
REVISTA ROMÂNĂ DE AUTOMATICĂ
22
A monitoring and information system can be generally considered as a chain of activities. Essentially, the chain is closed with the management and control action of the decision-maker, whereas past schemes have shown a more top-down sequence of a restricted number of activities, starting with a sampling network chosen arbitrarily and ending up with the production of a set of data.
Building an accountable information system requires that the activities in the chain are sequentially designed, starting from the specified information needs. While monitoring is continuing, information needs are also evolving. The objective of an information system for water pollution control is to provide and to disseminate information about water quality conditions and pollution loads in order to fulfil the user-defined information needs. Information systems can be based either on paper reports circulated in defined pathways, or on a purely computerized form in which all information and data are stored and retrieved electronically. In practice, most information systems are a combination of these.
The main types of data to be processed in an information system are: • Data on the nature of the water bodies
(size and availability of water resources, water quality and function, and structure of the ecosystem);
• Data on human activities polluting the water bodies (primarily domestic wastewater and solid waste, industrial activities, agriculture and transport).
• Data on the physical environment (e.g. topography, geology, climate, hydrology).
The large dimension- covered surface – by a hydrographic basin, the multitude of main river tributary streams, creates the impossibility to equip the water basin with local stations for data acquisition for the entire area. Also, other parameters which modify on the monitoring surface (level differences on the streamline, different flow rates in time periods – winter/summer – different width from springs to outflow)
impose the usage of monitoring methods through the realization of mathematical models which permit the tracking by simulating the propagation of pollution agents and by attenuation of the concentration depending on their movement in the water basin.
The developing of an intelligent system for tracking and monitoring water quality and pollution agent propagation in surface waters of a hydrographic basin imposes the following: • Developing a hardware system (local
stations) located in the water basin in predefined points, which dispose of intelligent equipments of river’s real time data acquisition, processing, storing and transmitting at long distance the data.
• Developing at central level, an acquisition, storing and processing system, on a data server, a relational database MS SQL, which support a large number of application programming interfaces (API) which will be developed under the Microsoft Visual C++, Microsoft J++, Microsoft Visual FoxPro programming environments, which supports window opening of Microsoft and Web applications.
• Developing and validating mathematical models for the simulation of the propagation of pollution agents through simulation on the data server, for different values of input parameters and comparing the obtained results through model simulation with real values collected through stations, for adapting the models and realizing new ones for different periods of time and space of the water basin evolution.
• Validation of some methods for structural and quantitative specifications to main pollution compounds (derivates of carbon, sulphur, nitrogen, heavy metals – Pb, Cr- of fluoride, plastic materials, and pesticides).
REVISTA ROMÂNĂ DE AUTOMATICĂ
23
II. TECHNICAL APPROACH The intelligent tracking and monitoring device for water quality and pollution agents’ propagation in surface waters in a hydrographic basin, by its functions it proposes to realize the following objectives: • Developing experimental models to
determine de pollution compounds in the water environment following the European requests and regulations;
• Realizing real measurements of main pollutants in the water environment in preselected points;
• Developing an informational system for acquisition, storage and processing of experimental data at ecosystem level;
• Elaborating an informational system for modeling and simulating pollution dispersion in streams;
• Real data processing and predictive analysis rapport generation concerning the impact given by pollution over the environment;
• Evaluating the impact of pollution over population health;
• Provide decision with an effective tool for the mitigation of pollution (real data processing, predictive analysis reports generation on polluting consequences, emergency plans generation), and the local population with real and easily accessible information on current water quality conditions;
• Demonstrate the utility and applicability of the proposed solutions and methodologies through a pilot system implementation;
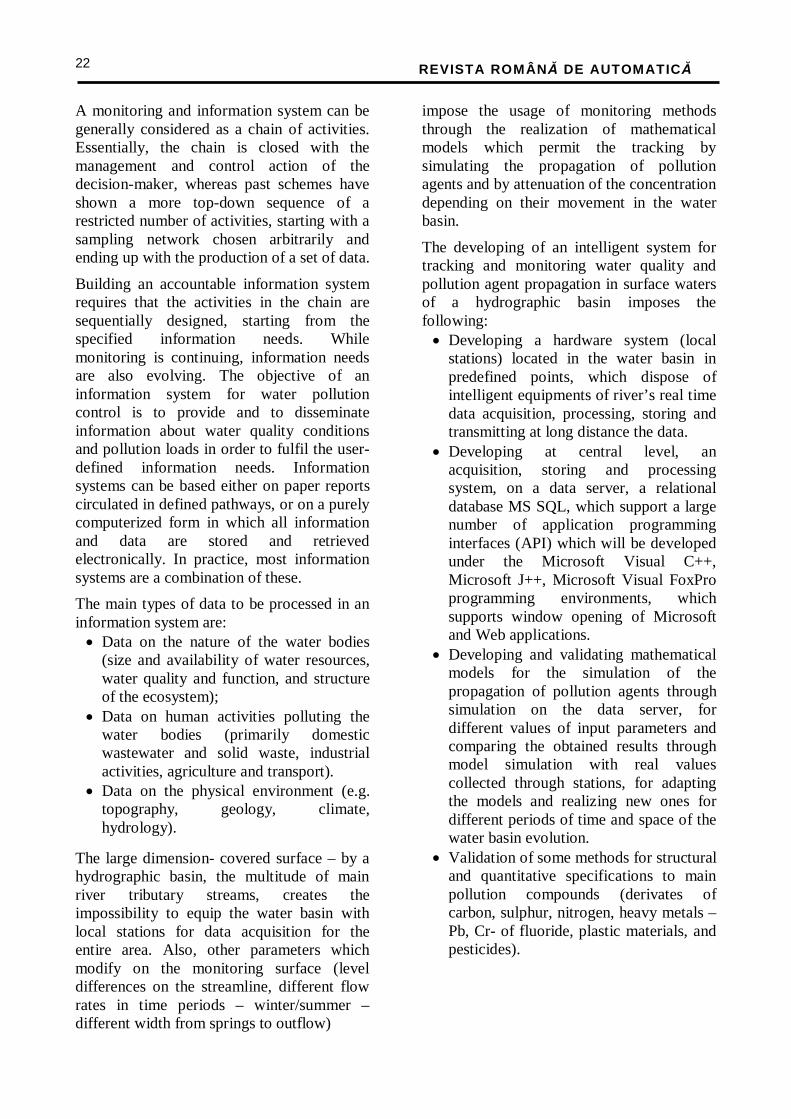
III. SYSTEM ARHITECTURE AND FUNCTIONALITY The basic architecture of the system is illustrated in Figure 2. From the hardware aspect the pilot system is a distributed system on multiple levels: • Central level – located at central
dispatching of the water basin • Level having the local stations of
acquisition and measurement, situated
• Local level- structured from the total number of sensors and transducers of physical measure acquisition which are characteristic to the system, with which are equipped the measurement points;
• Communication level - structured from the total number of elements which participate at data transfer, bidirectional, between local stations and central level – GPRS modems;
• Mobile station for configuration of the local station of acquisition and calibration of transducers with which are equipped local stations;
Local acquisition station, are developed around a Programmable Logic Circuit (PLC), to which are connected all process sensors and transducers. The stations communicate at central level through GPRS modems. The acquisition data taken from the measurement points refer to: data referring to the geometry of the basin, hydrological and meteorological and data referring to water quality (conductivity, pH, dissolved oxygen and reducing oxygen ORP/Redox).
Work station
Work station
Main server
Decision Support Tools- Water quality models- Data bases- Simulations andpredictive analysis
Data acquisitionData proccessingData transfer
Field equipment
Information collecting-stream geometry data-hydraulic data-water quality data- meteorological data
Intranet
Connectedto Internet
http server
Local client
Figure 2. Basic system architecture
The software architecture of the system is composed of the data acquisition modules for the workstations, data analysis and visualization tools, a library of water quality models, graphical user interfaces, relational data bases with display and editing functions for storing specific information the embedded rule-based expert system.
REVISTA ROMÂNĂ DE AUTOMATICĂ
24
in water basin’s area Software packages ensure the following functions: • specific area modeling, relieving the
parameters related to the polluting factors and storing them in data bases;
• storing information referring to the compounds known as risk factors for the population and warning when admissible limits are exceeded;
• stimulating the evolution of the river quality water for different values of the system entry parameters (pollutants kinetics);
• processing real data; • generating reports and graphs (the
historical evolution, forecast, impact on the environment and population);
• handling the information in the data bases.
IV. WATER QUALITY MODELING CONSIDERATIONS Water quality models are a valuable tool for water management because they can simulate the potential response of the aquatic system to such changes as the addition of organic pollution or nutrients, the increase or decrease in nutrient levels, or water abstraction rates and changes in sewage treatment operations. The potential effects of toxic chemicals can also be estimated using models.
Mathematical models are, therefore, useful tools for water quality management because they enable: forecasting of impacts of the development of water bodies; linking of data on pollution loads with data on water quality; provision of information for policy analysis and testing; prediction of propagation of peaks of pollution for early warning purposes; enhancement of network design.
In addition, and equally important, they enable a better understanding of complex water quality processes and the identification of important variables in particular aquatic systems.
Obtaining the data necessary for the construction or verification of models may require additional surveys together with data from the monitoring programs. If models are to be used routinely in the management of water quality, it is also important to check them and, for the model user, to be aware of the limitations of the models. Several models have been dedicated for the specific water quality management purposes such as environmental impact assessment, pre-investment planning of wastewater treatment facilities, emergency modeling and real-time modeling. The major distinctions between different models are the specific parameters and processes modeled, the equations used to describe each process, the numerical techniques used to solve the equations and whether the models are dynamic or steady-state. In spite of these differences, all models share many common features and require essentially the same types of information.
Basic Type of Information Used in Water
Models
The basic type of information are: stream geometry data (segment length, variation of channel width with depth, bottom slope, variation of wetted perimeter, etc); hydraulic data (velocities, flows, water depths); meteorological data (solar radiation, air temperature, relative humidity, wind speed, atmospheric pressure); water quality data (temperature, dissolved oxygen, carbonaceous BOD, phosphorus, ammonia, nitrite, nitrate, colliforms, total dissolved solids, total inorganic carbon, alkalinity, pH, inorganic suspended solids, and other specific chemical components under investigation). Based on a given semi-empirical nature of water quality models, it is necessary to collect data for the particular constituents and processes which are being evaluated, plus any other variables which significantly affect these constituents. Data are also necessary to setup, calibrate and validate any water quality model. After an initial estimate of the constituents and parameters which must be sampled in modeling, it is necessary
REVISTA ROMÂNĂ DE AUTOMATICĂ
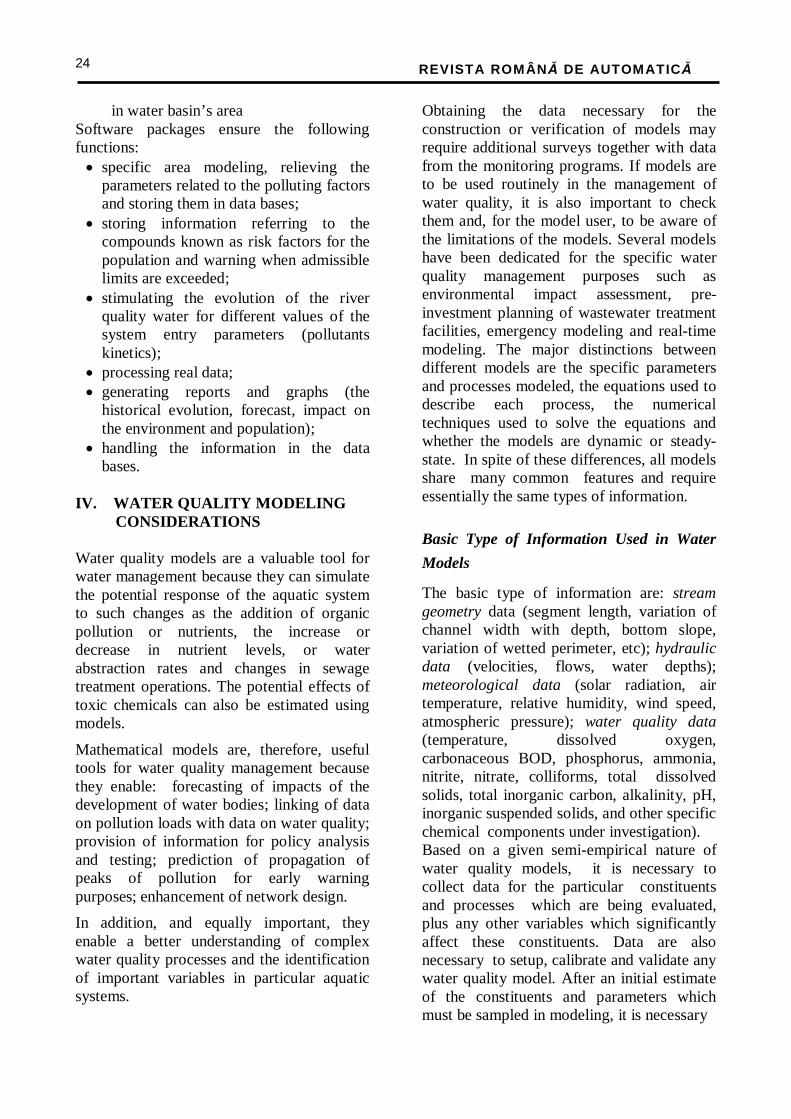
25
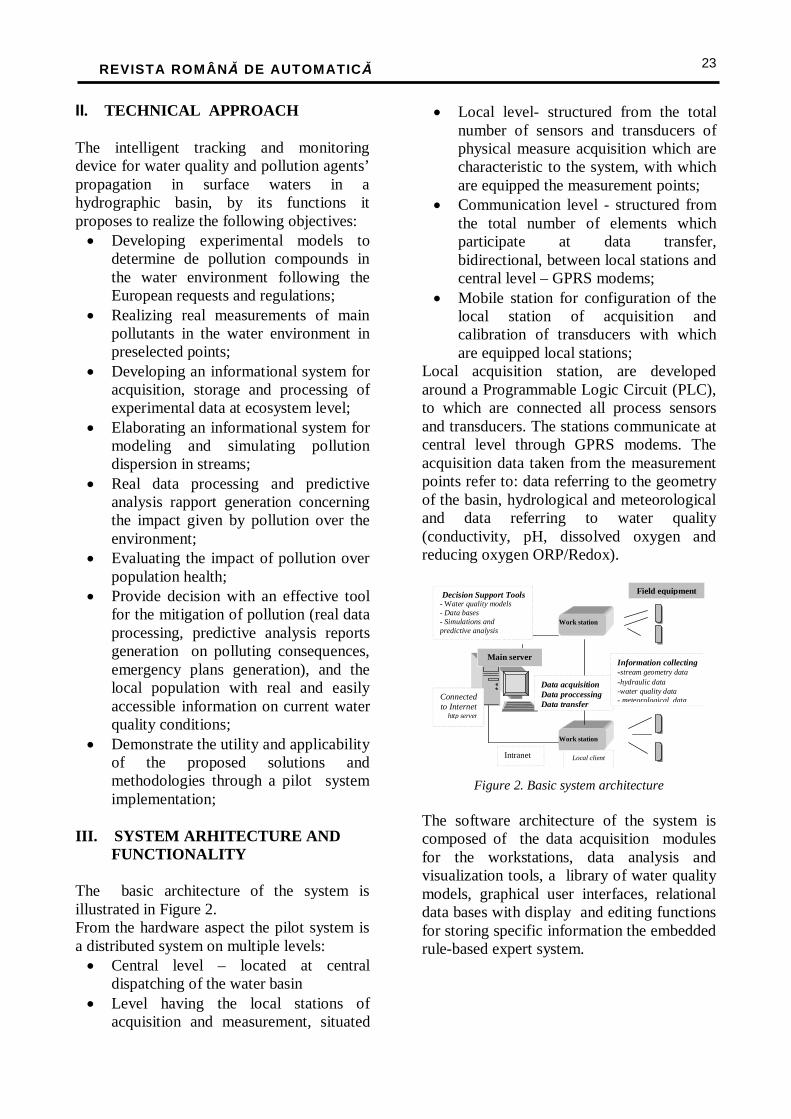
and important to determine where, when and how often the samples should be taken. Figure 3 illustrates the minimal recommended locations for a sampling program in a certain river area. The positions of the sampling location are based on the stream system configuration and waste discharge locations. The stations provide data to calibrate and to verify the ability of the model to predict important water quality variations.
1
2
3
45
6
Nonpointsource
7
8
Pointsource
Figure 3 Recommending locations for minimal
sampling.
Key: 1 = Upstream boundary 2 = Point source 3 = Upstream of point source 4 = Mouth of tributary 5 = Upstream of tributary 6 = Upstream of non point source 7 = downstream of non point source 8 = Downstream of end of studied area The duration and frequency of water quality sampling depends on the kind of model used: steady-state or dynamic. Because they are easier to apply and require less data, steady-state models are generally used. They compute water quality parameters assuming everything remains constant in time and simulate spatial (downstream) variations, but not temporal changes.
Model is capable of running in either a steady-state or a quasi-dynamic mode and simulates the following constituents: dissolved oxygen, biochemical oxygen demand, temperature, algae as chlorophyll, organic nitrogen, ammonia, nitrite, nitrate, organic phosphorus, dissolved phosphorus, colliforms, arbitrary non conservative constituent.
V. SYSTEM DEVELOPMENT
The intelligent system for river water quality was developed based on the main concept of distributed and diverse information resources integration through wide area networking methods, but with an easy-to-use interface that makes the technical complexity completely hidden from the user. Menu driven, graphical and supported by an embedded expert system, the interface makes interaction with complex models easy. The system provides a powerful, but simple tool for river water quality management, and decision making that complies with the European environmental policy, guidelines, and regulations. Within its framework, it links and integrates using a generic client server architecture, individual information resources such as measurements databases and water quality simulation models. The information system relies on a fully menu driven, graphical user interface with several options and configuration opportunities. VI. SUMMARY AND FUTURE WORK
In this paper we have presented a river water quality assessment system developed as a software decision support tool based on water quality models and intelligent user interfaces. Some aspects, referring to recommended sampling location for a certain river area were presented in order to correctly choose the equipment, to accomplish the measurements and to validate the adopted water quality model. The system will be implemented as a pilot case for a selected Somes river area. The future work will focus on expanding the used type of models, specially to dynamic models and on including geographic information system (GIS) facilities.
REVISTA ROMÂNĂ DE AUTOMATICĂ
26
The system was developed in the “SEPOL” project (ctr. nr. 612 / 2005) funded by Romanian Government in the frame of National R&D Program MENER-CEEX. References 1. Dogterom, J. and Buijs P.H.L. “Concepts for Indicator Application in River Basin Management”. Report 95.01. International Centre of Water Studies (ICWS), Amsterda, 1995 2. Water Pollution Control - “A Guide to the Use of Water Quality Management Principles.” © 1997 WHO/UNEP
3. Kachiashvili “et al” “The success of the mathematical methods and automated systems in solving practical problems in many respects depends on the adequacy of the models and the quality of the software used for the simulation of the real processes”, 2006 4. European Environment Agency EEA “Core Set of Indicators – Guide” No 1 /2005, Copenhagen 2005, ISBN 92-9167-757-4, ISSN 1725-2237 5. S.Himesh, Rao CVC, Mahajan AV “Calibration and Validation of Water Quality Model“ – Technical Report CSIR Center for Mathematical Modeling and Computer Simulation, 2002
AR3-4.doc
REVISTA ROMÂNĂ DE AUTOMATICĂ
27
Cervical Cancer Screening Web Application
Teodora SANISLAV, Dorina CĂPĂŢÎNĂ, Ioan STOIAN
SC IPA SA CIFATT Cluj
Andrei ACHIMA Ş-CĂDARIU “Iuliu Ha ţieganu” University of Medicine and Pharmacy from Cluj-Napoca
Abstract: This paper presents the main CANSCREEN (CEEX project – ctr. no. 125/2006) project team researches concerning an appropriate screening strategy for Romania in order to reduce cervical cancer incidence and mortality rates and to improve the quality of life for the patients. Many studies confirmed the efficiency of cervical cancer screening, and our work supports these studies by providing an organized framework, in line with European directives, for collection and validation of resulted screening data. For the management of the information and medical data referring the cervical cancer screening, the CANSCREEN relational database has been designed and implemented under a web application form, easy to use and manage.
Keywords: relational database, medical data management, cervical cancer screening, web technologies
1. Introduction Annually, in Romania, there are average 3001 new cases of cervical cancer. In 2000 were 1784 deaths by cervical cancer. The new cases of cervical cancer founded every year in our country increased from 2169 to 3001 (38, 35%) and the number of deaths from 1396 to 1795 (28, 58%). In 2000 Romania registered the highest incidence and mortality for cervical cancer in Europe after the estimated date of International Association of Cancer Registries. This situation is constantly in the last years.
All these mentioned above considerations demonstrate the necessity of a coherent and strategy of cancer early detection. This strategy represents the main objective of the CANSCREEN project, financed by Romanian Government, through Romanian National Research & Development Programme - CEEX 2006 (ctr. no. 125/2006).
The CANSCREEN project’s main objectives are presented in the following:
• development of a complex fail safe system which ensures the diagnosis and treatment quality according to EU Standards;
• design of a database which includes data related to tested women and also registers for high risk women;
• design of algorithms for individualized diagnosis and a protocol for subsequent therapeutics indications;
• improvement of the smears interpretation procedures;
• analysis and selection of smears containing cytological abnormalities;
• providing system’s quality by random selection of a percent of samples from the interpreted smears, and further transfer to an expert cytologist;
• smears distance transmission and assurance of their quality control;
• design of the cost-effectiveness study which allows the selection of the screening strategy with the lowest ratio of cost-effectiveness, using the Markov model.
•
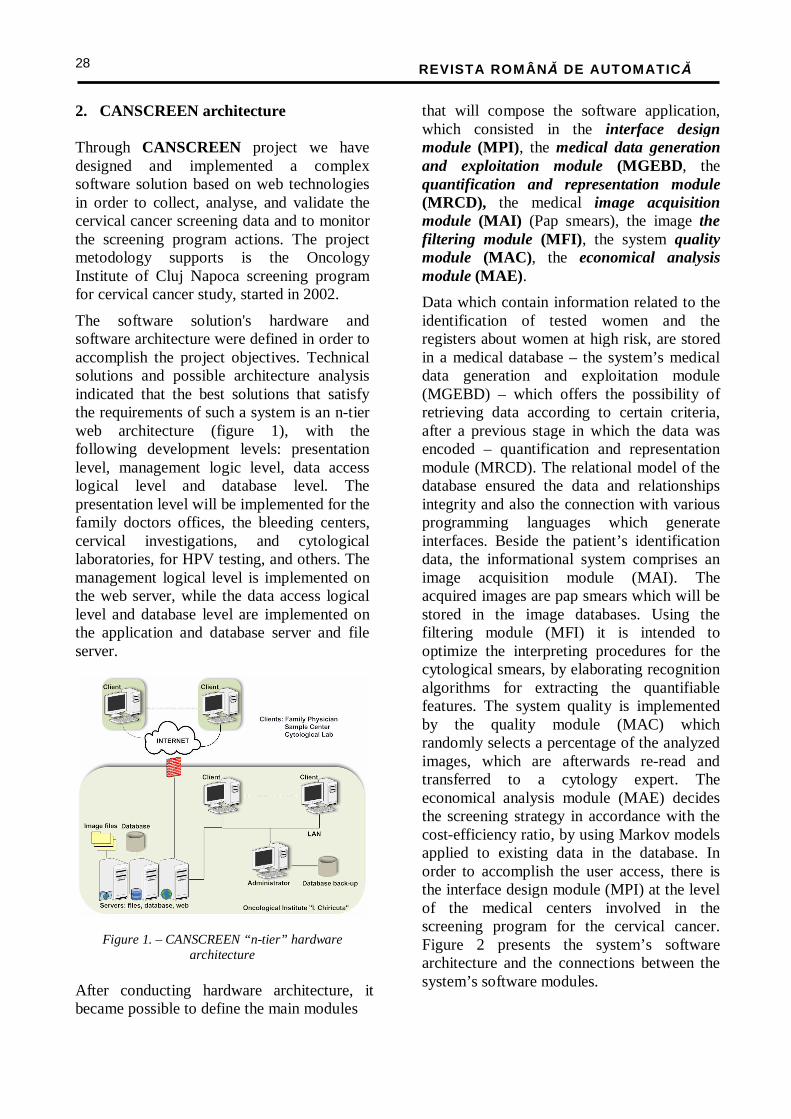
REVISTA ROMÂNĂ DE AUTOMATICĂ
28
2. CANSCREEN architecture Through CANSCREEN project we have designed and implemented a complex software solution based on web technologies in order to collect, analyse, and validate the cervical cancer screening data and to monitor the screening program actions. The project metodology supports is the Oncology Institute of Cluj Napoca screening program for cervical cancer study, started in 2002.
The software solution's hardware and software architecture were defined in order to accomplish the project objectives. Technical solutions and possible architecture analysis indicated that the best solutions that satisfy the requirements of such a system is an n-tier web architecture (figure 1), with the following development levels: presentation level, management logic level, data access logical level and database level. The presentation level will be implemented for the family doctors offices, the bleeding centers, cervical investigations, and cytological laboratories, for HPV testing, and others. The management logical level is implemented on the web server, while the data access logical level and database level are implemented on the application and database server and file server.
Figure 1. – CANSCREEN “n-tier” hardware architecture
After conducting hardware architecture, it became possible to define the main modules
that will compose the software application, which consisted in the interface design module (MPI) , the medical data generation and exploitation module (MGEBD , the quantification and representation module (MRCD), the medical image acquisition module (MAI) (Pap smears), the image the filtering module (MFI) , the system quality module (MAC) , the economical analysis module (MAE) .
Data which contain information related to the identification of tested women and the registers about women at high risk, are stored in a medical database – the system’s medical data generation and exploitation module (MGEBD) – which offers the possibility of retrieving data according to certain criteria, after a previous stage in which the data was encoded – quantification and representation module (MRCD). The relational model of the database ensured the data and relationships integrity and also the connection with various programming languages which generate interfaces. Beside the patient’s identification data, the informational system comprises an image acquisition module (MAI). The acquired images are pap smears which will be stored in the image databases. Using the filtering module (MFI) it is intended to optimize the interpreting procedures for the cytological smears, by elaborating recognition algorithms for extracting the quantifiable features. The system quality is implemented by the quality module (MAC) which randomly selects a percentage of the analyzed images, which are afterwards re-read and transferred to a cytology expert. The economical analysis module (MAE) decides the screening strategy in accordance with the cost-efficiency ratio, by using Markov models applied to existing data in the database. In order to accomplish the user access, there is the interface design module (MPI) at the level of the medical centers involved in the screening program for the cervical cancer. Figure 2 presents the system’s software architecture and the connections between the system’s software modules.
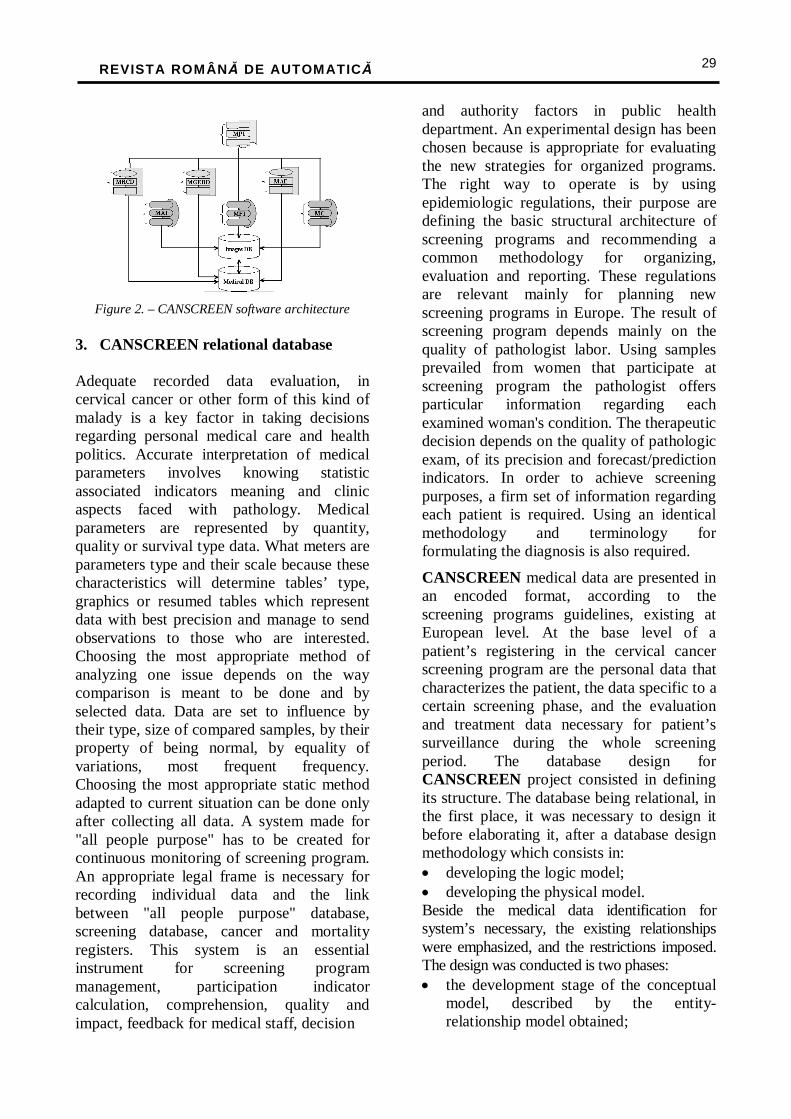
REVISTA ROMÂNĂ DE AUTOMATICĂ
29
Figure 2. – CANSCREEN software architecture
3. CANSCREEN relational database Adequate recorded data evaluation, in cervical cancer or other form of this kind of malady is a key factor in taking decisions regarding personal medical care and health politics. Accurate interpretation of medical parameters involves knowing statistic associated indicators meaning and clinic aspects faced with pathology. Medical parameters are represented by quantity, quality or survival type data. What meters are parameters type and their scale because these characteristics will determine tables’ type, graphics or resumed tables which represent data with best precision and manage to send observations to those who are interested. Choosing the most appropriate method of analyzing one issue depends on the way comparison is meant to be done and by selected data. Data are set to influence by their type, size of compared samples, by their property of being normal, by equality of variations, most frequent frequency. Choosing the most appropriate static method adapted to current situation can be done only after collecting all data. A system made for "all people purpose" has to be created for continuous monitoring of screening program. An appropriate legal frame is necessary for recording individual data and the link between "all people purpose" database, screening database, cancer and mortality registers. This system is an essential instrument for screening program management, participation indicator calculation, comprehension, quality and impact, feedback for medical staff, decision
and authority factors in public health department. An experimental design has been chosen because is appropriate for evaluating the new strategies for organized programs. The right way to operate is by using epidemiologic regulations, their purpose are defining the basic structural architecture of screening programs and recommending a common methodology for organizing, evaluation and reporting. These regulations are relevant mainly for planning new screening programs in Europe. The result of screening program depends mainly on the quality of pathologist labor. Using samples prevailed from women that participate at screening program the pathologist offers particular information regarding each examined woman's condition. The therapeutic decision depends on the quality of pathologic exam, of its precision and forecast/prediction indicators. In order to achieve screening purposes, a firm set of information regarding each patient is required. Using an identical methodology and terminology for formulating the diagnosis is also required.
CANSCREEN medical data are presented in an encoded format, according to the screening programs guidelines, existing at European level. At the base level of a patient’s registering in the cervical cancer screening program are the personal data that characterizes the patient, the data specific to a certain screening phase, and the evaluation and treatment data necessary for patient’s surveillance during the whole screening period. The database design for CANSCREEN project consisted in defining its structure. The database being relational, in the first place, it was necessary to design it before elaborating it, after a database design methodology which consists in: • developing the logic model; • developing the physical model. Beside the medical data identification for system’s necessary, the existing relationships were emphasized, and the restrictions imposed. The design was conducted is two phases: • the development stage of the conceptual
model, described by the entity-relationship model obtained;
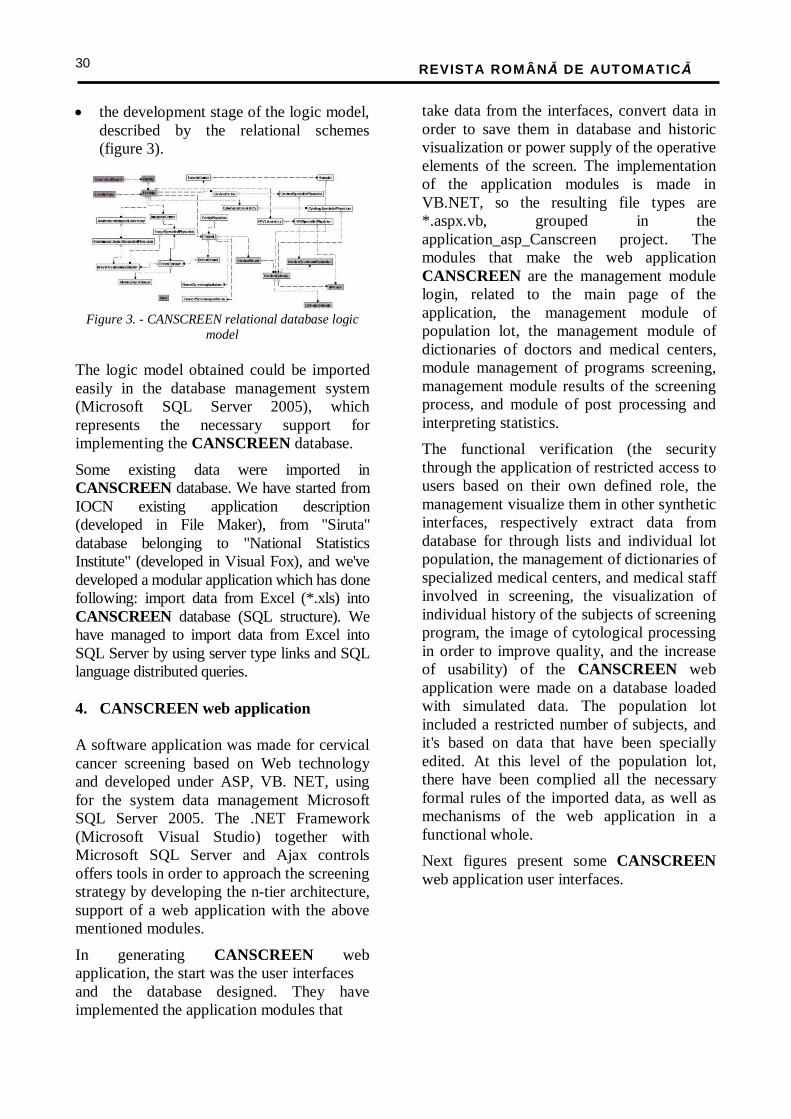
REVISTA ROMÂNĂ DE AUTOMATICĂ
30
• the development stage of the logic model, described by the relational schemes (figure 3).
Figure 3. - CANSCREEN relational database logic
model The logic model obtained could be imported easily in the database management system (Microsoft SQL Server 2005), which represents the necessary support for implementing the CANSCREEN database.
Some existing data were imported in CANSCREEN database. We have started from IOCN existing application description (developed in File Maker), from "Siruta" database belonging to "National Statistics Institute" (developed in Visual Fox), and we've developed a modular application which has done following: import data from Excel (*.xls) into CANSCREEN database (SQL structure). We have managed to import data from Excel into SQL Server by using server type links and SQL language distributed queries. 4. CANSCREEN web application A software application was made for cervical cancer screening based on Web technology and developed under ASP, VB. NET, using for the system data management Microsoft SQL Server 2005. The .NET Framework (Microsoft Visual Studio) together with Microsoft SQL Server and Ajax controls offers tools in order to approach the screening strategy by developing the n-tier architecture, support of a web application with the above mentioned modules.
In generating CANSCREEN web application, the start was the user interfaces and the database designed. They have implemented the application modules that
take data from the interfaces, convert data in order to save them in database and historic visualization or power supply of the operative elements of the screen. The implementation of the application modules is made in VB.NET, so the resulting file types are *.aspx.vb, grouped in the application_asp_Canscreen project. The modules that make the web application CANSCREEN are the management module login, related to the main page of the application, the management module of population lot, the management module of dictionaries of doctors and medical centers, module management of programs screening, management module results of the screening process, and module of post processing and interpreting statistics.
The functional verification (the security through the application of restricted access to users based on their own defined role, the management visualize them in other synthetic interfaces, respectively extract data from database for through lists and individual lot population, the management of dictionaries of specialized medical centers, and medical staff involved in screening, the visualization of individual history of the subjects of screening program, the image of cytological processing in order to improve quality, and the increase of usability) of the CANSCREEN web application were made on a database loaded with simulated data. The population lot included a restricted number of subjects, and it's based on data that have been specially edited. At this level of the population lot, there have been complied all the necessary formal rules of the imported data, as well as mechanisms of the web application in a functional whole.
Next figures present some CANSCREEN web application user interfaces.
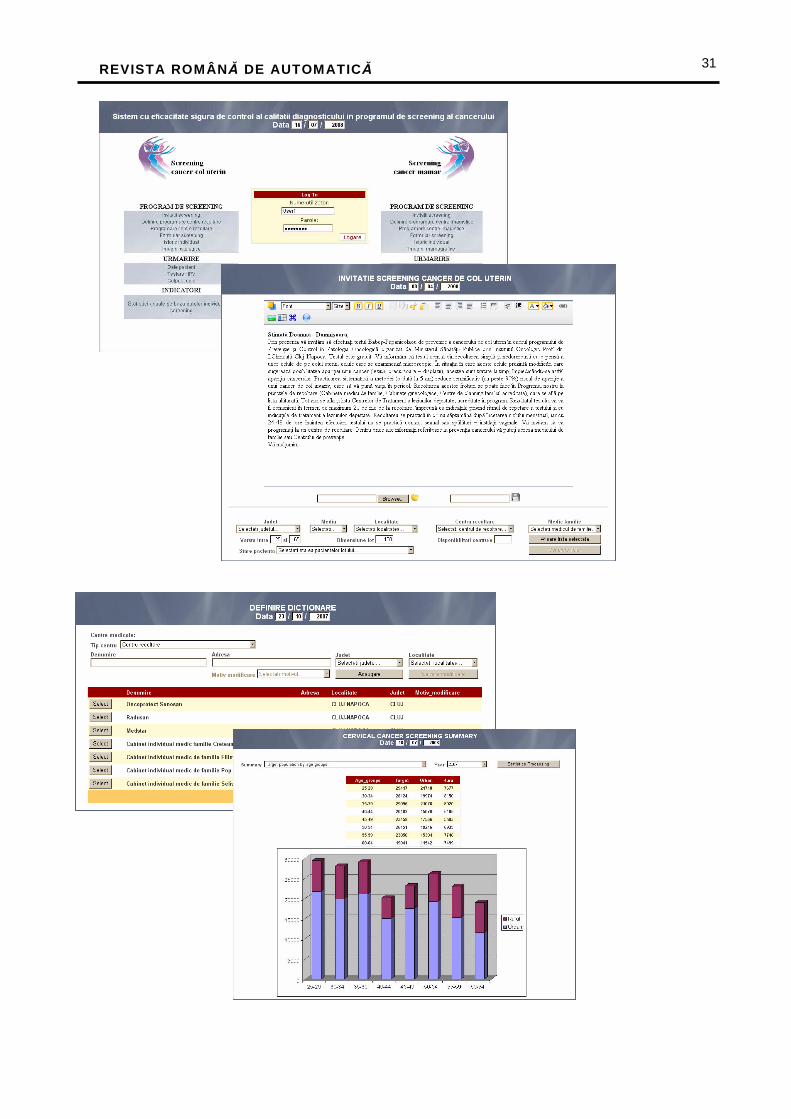
REVISTA ROMÂNĂ DE AUTOMATICĂ
31
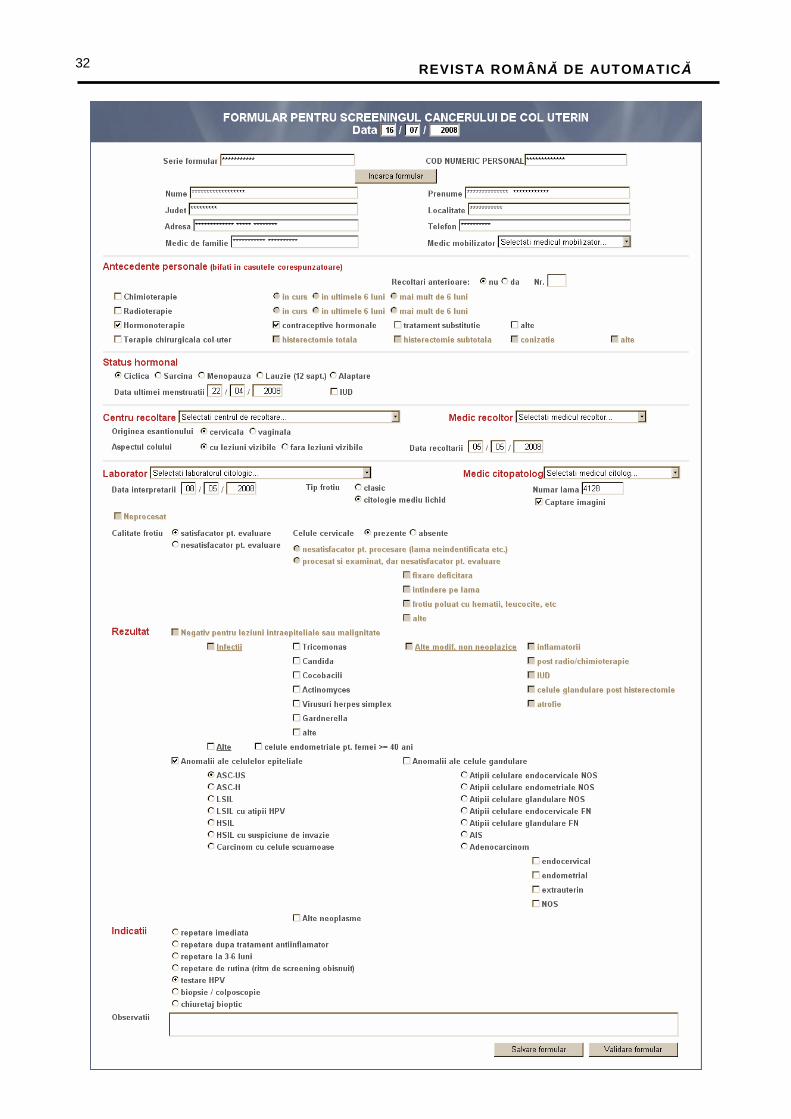
REVISTA ROMÂNĂ DE AUTOMATICĂ
32
REVISTA ROMÂNĂ DE AUTOMATICĂ
33
5. Conclusions and future work CANSCREEN web application permits the screening target population monitoring and calculates some statistic indicators, such as: the characteristics of the screening program (definition of the target population, invitational mode, protocol for cytological repeat) and the annual tabulations utilising individual screening data (invitations, invitational coverage, and status of target population in the cervical cancer screening programme, pap smear tests and population coverage with smear tests in the cervical cancer screening programme, results of all smears taken in the cervical cancer screening program, number of women recommended for repeat cytology in the cervical cancer screening programme, number of women referred to colposcopy in the cervical cancer screening programme, etc.). Based on these indicators the web application contributes to the screening program quality.
As future work, CANSCREEN web application through its database could facilitate the screening data and indicators export to other applications, such as national / regional cancer registry. Bibliography [1] http://www.iacr.com.fr/ [2] T. Sanislav, et.al., “Data Management
System for Cervical Cancer Screening - CanScreen”, in Acta Electrotehnica, vol. 48, pp. 43-46, ISSN 1841-3323, September 2007, Cluj-Napoca.
[3] K. Delaney, “Inside Microsoft SQL Server 2005: The Storage Engine”, 2005 Edition, Microsoft Press Publishing, Washington, 2007.
[4] S. Mitchell, et. al., “ASP .Net- Tips, Tutorials, And Code”, 201 West 103rd St., Indianapolis, Indiana, 46290 USA, 2001.
[5] D. Esposito, ”Soluţii Web cu ASP - ADO.NET”, Editura Teora, Bucuresti, 2003.
AR3-5.doc
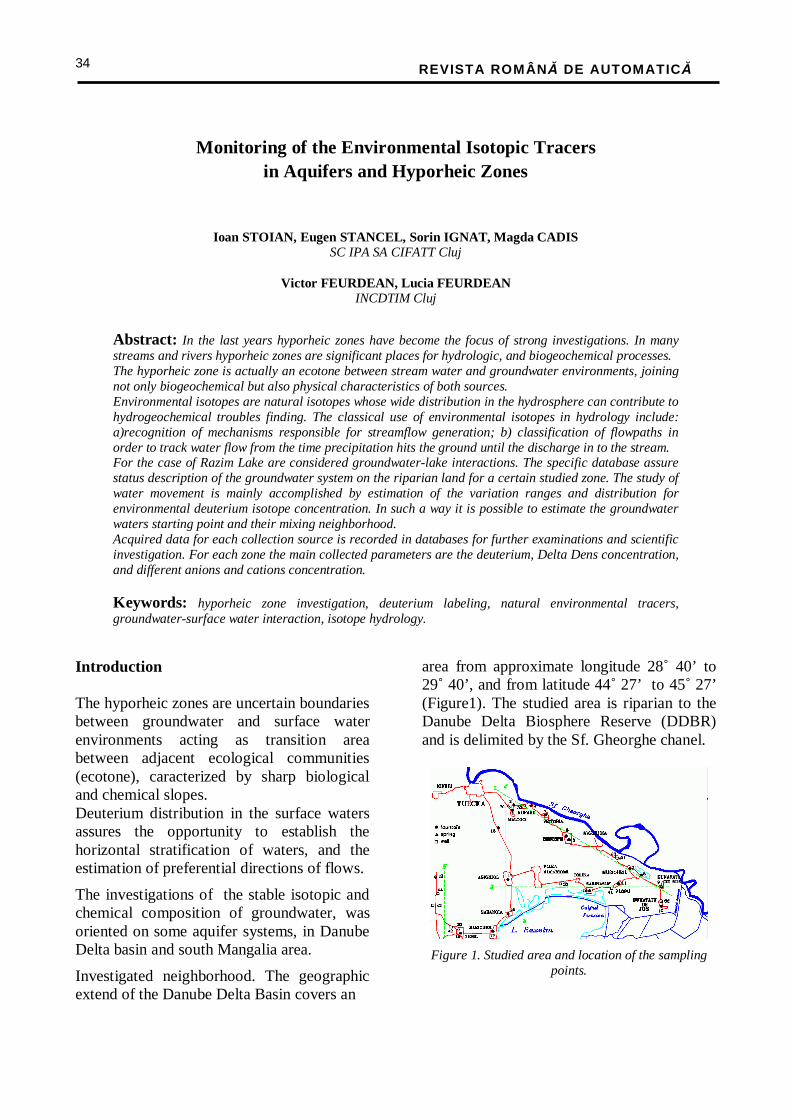
REVISTA ROMÂNĂ DE AUTOMATICĂ
34
Monitoring of the Environmental Isotopic Tracers
in Aquifers and Hyporheic Zones
Ioan STOIAN, Eugen STANCEL, Sorin IGNAT, Magda CADIS
SC IPA SA CIFATT Cluj
Victor FEURDEAN, Lucia FEURDEAN INCDTIM Cluj
Abstract: In the last years hyporheic zones have become the focus of strong investigations. In many streams and rivers hyporheic zones are significant places for hydrologic, and biogeochemical processes. The hyporheic zone is actually an ecotone between stream water and groundwater environments, joining not only biogeochemical but also physical characteristics of both sources. Environmental isotopes are natural isotopes whose wide distribution in the hydrosphere can contribute to hydrogeochemical troubles finding. The classical use of environmental isotopes in hydrology include: a)recognition of mechanisms responsible for streamflow generation; b) classification of flowpaths in order to track water flow from the time precipitation hits the ground until the discharge in to the stream. For the case of Razim Lake are considered groundwater-lake interactions. The specific database assure status description of the groundwater system on the riparian land for a certain studied zone. The study of water movement is mainly accomplished by estimation of the variation ranges and distribution for environmental deuterium isotope concentration. In such a way it is possible to estimate the groundwater waters starting point and their mixing neighborhood. Acquired data for each collection source is recorded in databases for further examinations and scientific investigation. For each zone the main collected parameters are the deuterium, Delta Dens concentration, and different anions and cations concentration. Keywords: hyporheic zone investigation, deuterium labeling, natural environmental tracers, groundwater-surface water interaction, isotope hydrology.
Introduction The hyporheic zones are uncertain boundaries between groundwater and surface water environments acting as transition area between adjacent ecological communities (ecotone), caracterized by sharp biological and chemical slopes. Deuterium distribution in the surface waters assures the opportunity to establish the horizontal stratification of waters, and the estimation of preferential directions of flows.
The investigations of the stable isotopic and chemical composition of groundwater, was oriented on some aquifer systems, in Danube Delta basin and south Mangalia area.
Investigated neighborhood. The geographic extend of the Danube Delta Basin covers an
area from approximate longitude 28˚ 40’ to 29˚ 40’, and from latitude 44˚ 27’ to 45˚ 27’ (Figure1). The studied area is riparian to the Danube Delta Biosphere Reserve (DDBR) and is delimited by the Sf. Gheorghe chanel.
Figure 1. Studied area and location of the sampling
points.
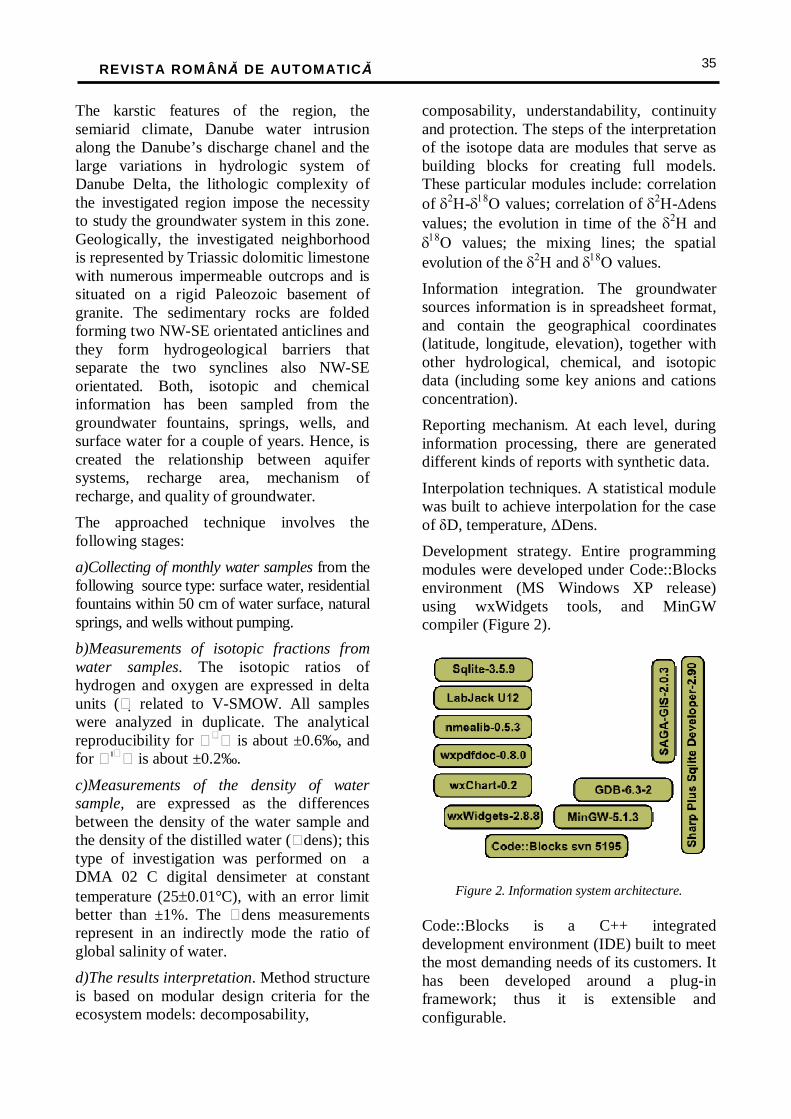
REVISTA ROMÂNĂ DE AUTOMATICĂ
35
The karstic features of the region, the semiarid climate, Danube water intrusion along the Danube’s discharge chanel and the large variations in hydrologic system of Danube Delta, the lithologic complexity of the investigated region impose the necessity to study the groundwater system in this zone. Geologically, the investigated neighborhood is represented by Triassic dolomitic limestone with numerous impermeable outcrops and is situated on a rigid Paleozoic basement of granite. The sedimentary rocks are folded forming two NW-SE orientated anticlines and they form hydrogeological barriers that separate the two synclines also NW-SE orientated. Both, isotopic and chemical information has been sampled from the groundwater fountains, springs, wells, and surface water for a couple of years. Hence, is created the relationship between aquifer systems, recharge area, mechanism of recharge, and quality of groundwater.
The approached technique involves the following stages:
a)Collecting of monthly water samples from the following source type: surface water, residential fountains within 50 cm of water surface, natural springs, and wells without pumping.
b)Measurements of isotopic fractions from water samples. The isotopic ratios of hydrogen and oxygen are expressed in delta units ( related to V-SMOW. All samples were analyzed in duplicate. The analytical reproducibility for is about ±0.6‰, and for is about ±0.2‰.
c)Measurements of the density of water sample, are expressed as the differences between the density of the water sample and the density of the distilled water (dens); this type of investigation was performed on a DMA 02 C digital densimeter at constant temperature (25±0.01°C), with an error limit better than ±1%. The dens measurements represent in an indirectly mode the ratio of global salinity of water.
d)The results interpretation. Method structure is based on modular design criteria for the ecosystem models: decomposability,
composability, understandability, continuity and protection. The steps of the interpretation of the isotope data are modules that serve as building blocks for creating full models. These particular modules include: correlation of δ2Η-δ18Ο values; correlation of δ2Η-∆dens values; the evolution in time of the δ2Η and δ18Ο values; the mixing lines; the spatial evolution of the δ2Η and δ18Ο values.
Information integration. The groundwater sources information is in spreadsheet format, and contain the geographical coordinates (latitude, longitude, elevation), together with other hydrological, chemical, and isotopic data (including some key anions and cations concentration).
Reporting mechanism. At each level, during information processing, there are generated different kinds of reports with synthetic data.
Interpolation techniques. A statistical module was built to achieve interpolation for the case of δD, temperature, ∆Dens.
Development strategy. Entire programming modules were developed under Code::Blocks environment (MS Windows XP release) using wxWidgets tools, and MinGW compiler (Figure 2).
Figure 2. Information system architecture.
Code::Blocks is a C++ integrated development environment (IDE) built to meet the most demanding needs of its customers. It has been developed around a plug-in framework; thus it is extensible and configurable.
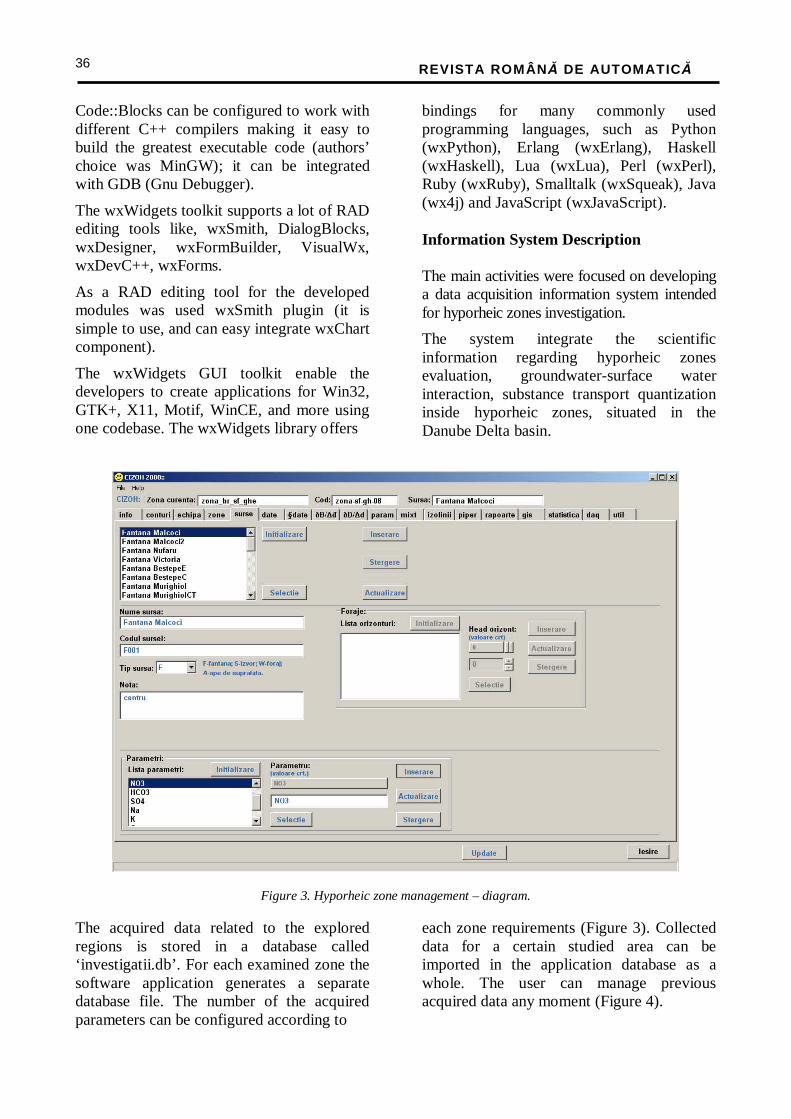
REVISTA ROMÂNĂ DE AUTOMATICĂ
36
Code::Blocks can be configured to work with different C++ compilers making it easy to build the greatest executable code (authors’ choice was MinGW); it can be integrated with GDB (Gnu Debugger).
The wxWidgets toolkit supports a lot of RAD editing tools like, wxSmith, DialogBlocks, wxDesigner, wxFormBuilder, VisualWx, wxDevC++, wxForms.
As a RAD editing tool for the developed modules was used wxSmith plugin (it is simple to use, and can easy integrate wxChart component).
The wxWidgets GUI toolkit enable the developers to create applications for Win32, GTK+, X11, Motif, WinCE, and more using one codebase. The wxWidgets library offers
bindings for many commonly used programming languages, such as Python (wxPython), Erlang (wxErlang), Haskell (wxHaskell), Lua (wxLua), Perl (wxPerl), Ruby (wxRuby), Smalltalk (wxSqueak), Java (wx4j) and JavaScript (wxJavaScript). Information System Description The main activities were focused on developing a data acquisition information system intended for hyporheic zones investigation.
The system integrate the scientific information regarding hyporheic zones evaluation, groundwater-surface water interaction, substance transport quantization inside hyporheic zones, situated in the Danube Delta basin.
Figure 3. Hyporheic zone management – diagram.
The acquired data related to the explored regions is stored in a database called ‘investigatii.db’. For each examined zone the software application generates a separate database file. The number of the acquired parameters can be configured according to
each zone requirements (Figure 3). Collected data for a certain studied area can be imported in the application database as a whole. The user can manage previous acquired data any moment (Figure 4).
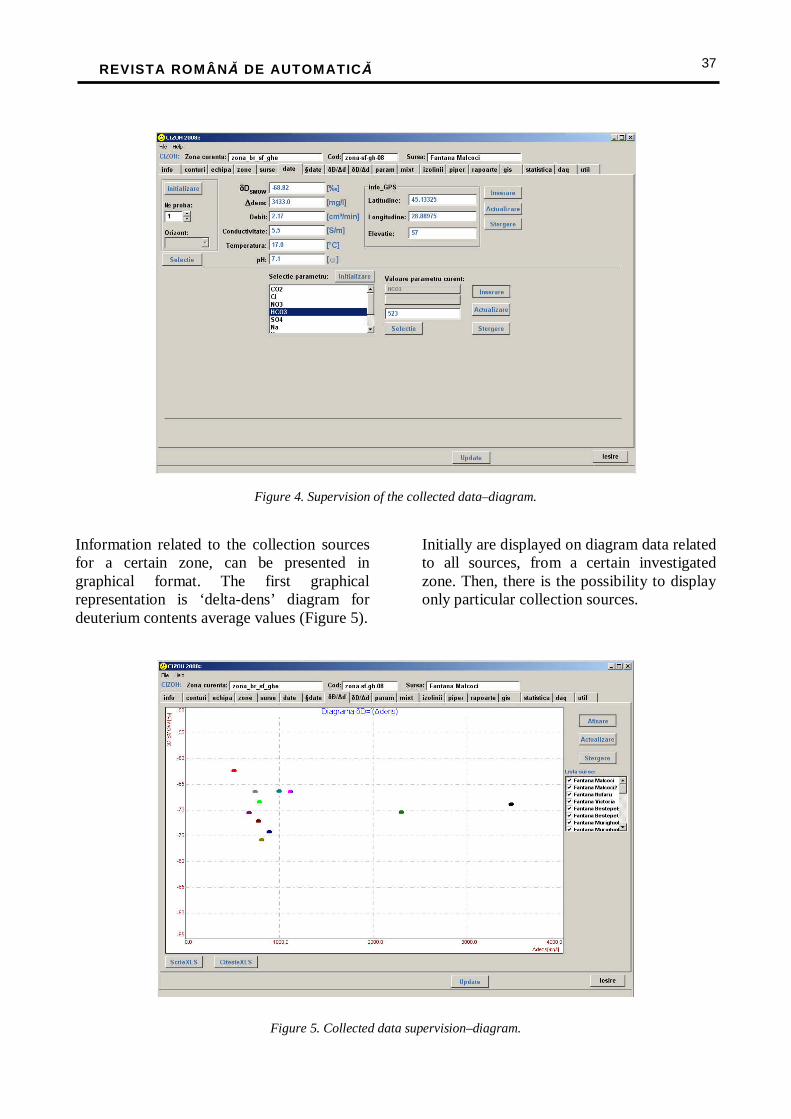
REVISTA ROMÂNĂ DE AUTOMATICĂ
37
Figure 4. Supervision of the collected data–diagram.
Information related to the collection sources for a certain zone, can be presented in graphical format. The first graphical representation is ‘delta-dens’ diagram for deuterium contents average values (Figure 5).
Initially are displayed on diagram data related to all sources, from a certain investigated zone. Then, there is the possibility to display only particular collection sources.
Figure 5. Collected data supervision–diagram.
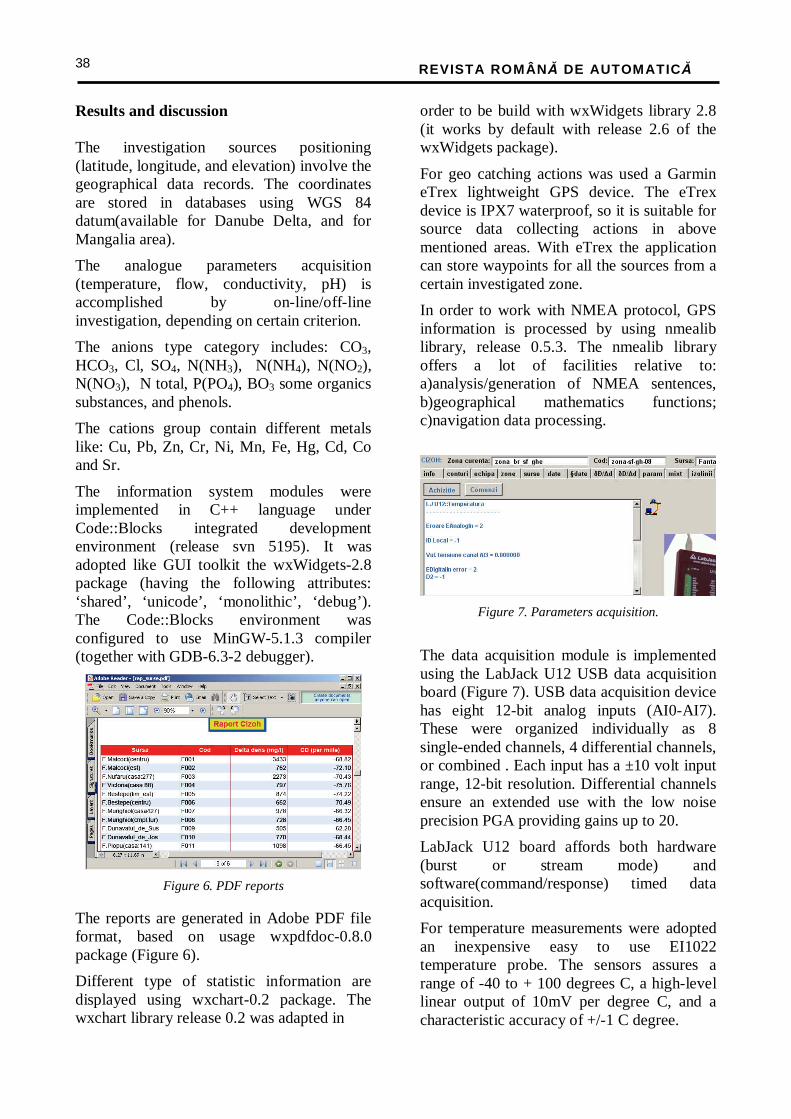
REVISTA ROMÂNĂ DE AUTOMATICĂ
38
Results and discussion The investigation sources positioning (latitude, longitude, and elevation) involve the geographical data records. The coordinates are stored in databases using WGS 84 datum(available for Danube Delta, and for Mangalia area).
The analogue parameters acquisition (temperature, flow, conductivity, pH) is accomplished by on-line/off-line investigation, depending on certain criterion.
The anions type category includes: CO3, HCO3, Cl, SO4, N(NH3), N(NH4), N(NO2), N(NO3), N total, P(PO4), BO3 some organics substances, and phenols.
The cations group contain different metals like: Cu, Pb, Zn, Cr, Ni, Mn, Fe, Hg, Cd, Co and Sr.
The information system modules were implemented in C++ language under Code::Blocks integrated development environment (release svn 5195). It was adopted like GUI toolkit the wxWidgets-2.8 package (having the following attributes: ‘shared’, ‘unicode’, ‘monolithic’, ‘debug’). The Code::Blocks environment was configured to use MinGW-5.1.3 compiler (together with GDB-6.3-2 debugger).
Figure 6. PDF reports The reports are generated in Adobe PDF file format, based on usage wxpdfdoc-0.8.0 package (Figure 6).
Different type of statistic information are displayed using wxchart-0.2 package. The wxchart library release 0.2 was adapted in
order to be build with wxWidgets library 2.8 (it works by default with release 2.6 of the wxWidgets package).
For geo catching actions was used a Garmin eTrex lightweight GPS device. The eTrex device is IPX7 waterproof, so it is suitable for source data collecting actions in above mentioned areas. With eTrex the application can store waypoints for all the sources from a certain investigated zone.
In order to work with NMEA protocol, GPS information is processed by using nmealib library, release 0.5.3. The nmealib library offers a lot of facilities relative to: a)analysis/generation of NMEA sentences, b)geographical mathematics functions; c)navigation data processing.
Figure 7. Parameters acquisition.
The data acquisition module is implemented using the LabJack U12 USB data acquisition board (Figure 7). USB data acquisition device has eight 12-bit analog inputs (AI0-AI7). These were organized individually as 8 single-ended channels, 4 differential channels, or combined . Each input has a ±10 volt input range, 12-bit resolution. Differential channels ensure an extended use with the low noise precision PGA providing gains up to 20.
LabJack U12 board affords both hardware (burst or stream mode) and software(command/response) timed data acquisition.
For temperature measurements were adopted an inexpensive easy to use EI1022 temperature probe. The sensors assures a range of -40 to + 100 degrees C, a high-level linear output of 10mV per degree C, and a characteristic accuracy of +/-1 C degree.
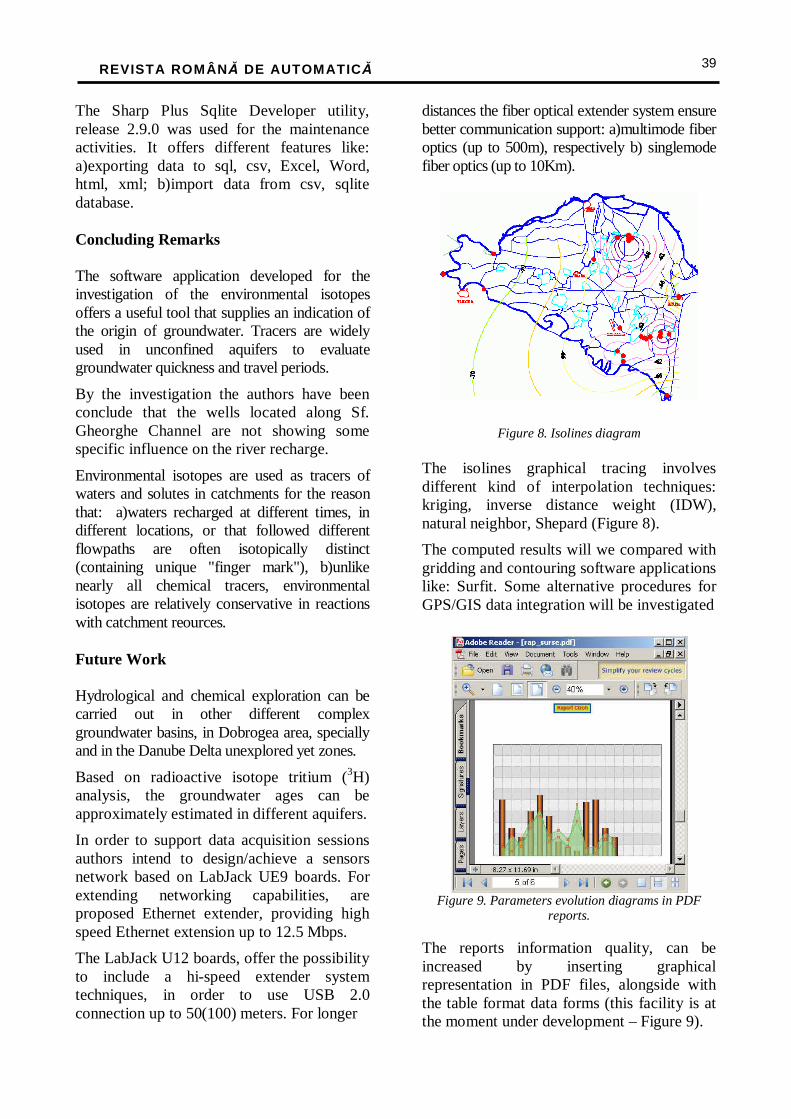
REVISTA ROMÂNĂ DE AUTOMATICĂ
39
The Sharp Plus Sqlite Developer utility, release 2.9.0 was used for the maintenance activities. It offers different features like: a)exporting data to sql, csv, Excel, Word, html, xml; b)import data from csv, sqlite database. Concluding Remarks The software application developed for the investigation of the environmental isotopes offers a useful tool that supplies an indication of the origin of groundwater. Tracers are widely used in unconfined aquifers to evaluate groundwater quickness and travel periods.
By the investigation the authors have been conclude that the wells located along Sf. Gheorghe Channel are not showing some specific influence on the river recharge.
Environmental isotopes are used as tracers of waters and solutes in catchments for the reason that: a)waters recharged at different times, in different locations, or that followed different flowpaths are often isotopically distinct (containing unique "finger mark"), b)unlike nearly all chemical tracers, environmental isotopes are relatively conservative in reactions with catchment reources. Future Work Hydrological and chemical exploration can be carried out in other different complex groundwater basins, in Dobrogea area, specially and in the Danube Delta unexplored yet zones.
Based on radioactive isotope tritium (3H) analysis, the groundwater ages can be approximately estimated in different aquifers.
In order to support data acquisition sessions authors intend to design/achieve a sensors network based on LabJack UE9 boards. For extending networking capabilities, are proposed Ethernet extender, providing high speed Ethernet extension up to 12.5 Mbps.
The LabJack U12 boards, offer the possibility to include a hi-speed extender system techniques, in order to use USB 2.0 connection up to 50(100) meters. For longer
distances the fiber optical extender system ensure better communication support: a)multimode fiber optics (up to 500m), respectively b) singlemode fiber optics (up to 10Km).
Figure 8. Isolines diagram The isolines graphical tracing involves different kind of interpolation techniques: kriging, inverse distance weight (IDW), natural neighbor, Shepard (Figure 8).
The computed results will we compared with gridding and contouring software applications like: Surfit. Some alternative procedures for GPS/GIS data integration will be investigated
Figure 9. Parameters evolution diagrams in PDF
reports. The reports information quality, can be increased by inserting graphical representation in PDF files, alongside with the table format data forms (this facility is at the moment under development – Figure 9).
REVISTA ROMÂNĂ DE AUTOMATICĂ
40
The future works will investigate different wxWidgets toolkit ‘contrib’ modules, as: ‘plot’,’svg’, and ‘gizmos’(‘led’).
The description of relative concentration of the most significant as well as some minor type ions in the water samples, will use the ternary and piper trilinear diagrams.
The piper diagrams will show the nature of a certain water sample, and will establish the relationship with some other samples. As a consequence the system can recognize the geologic areas with similar chemical water parameters, and also can support the identification of the water chemistry evolution along the flow path.
A distinct module for interactions with XLS files, by using facilities offered by wxWidgets toolkit will be developed including some mechanisms for loading hyporheic zones databases directly from spreadsheet files. And techniques for exporting different tables from databases in spreadsheet file format to improve the future investigations. References [1] Brian J. Gough, Richard M. Stallman. An Introduction to GCC for the GNU Compilers gcc and g++. Publiseh by Network Theory Limited, March 2004, Bristol, United Kingdom. [2] Julian Smart, Kevin Hock, Stefan Csomor. Cross-Platform GUI Programming with wxWidgets. Prentice Hall, July 2005. [3] Reynolds, J.F. and Acock, B., (1997). Modularity and genericness in plant and ecosystem models, Ecological Modeling, 94; 7-16.
[4] Robert Mecklenburg. Managing Projects with GNU Make. Publisher: O'Reilly Media, Inc.; 3 edition (November 19, 2004). [5] William von Hagen. The Definitive Guide to GCC. Apress, second edition (August 11, 2006), NY. [6] Bullen, T.D., Krabbenhoft, D.P. and Kendall, C., (1996). Kinetic and Mineralogic Controls on the Groundwater Chemistry and 87Sr/86Sr in a Sandy Silicate Aquifer, N Wisconsin. Geochem. et Cosmochim. Acta, 60: 1807-1821. [7] E. Stancel,I. Stoian, V. Feurdean, L. Feurdean, S. Ignat, M. Cadis, M. Mircea. AQTR 2008 – THETA 16 International Conference on Automation, Quality and Testing, Robotics. Cluj-Napoca, 22-25 may 2008. [8] Clark, Ian D, and Fritz, P., “Environmental Isotopes in Hydrogeology,” CRC Press, Boca Raton, 1997. [9] Feurdean, V., and Feurdean, L., “Determination of Deuterium Concentra-tions for the Study of Water Circulation in Danube Delta, in: Annual Sci-entific Symposium on the Danube Delta Biosphere Reserve (third edi-tion),” Tulcea (Romania), 24-26 May 1994. [10] Feurdean, L. and Feurdean, V., (1999). Deuterium as natural tracer in groundwater from neighbouring area of Danube Delta Biosphere Reserve. Isotopes Environ. Health Stud., 35, 183-211. [11] Payne, B. R. (1990). The use of stable isotope tracers for the estimation of the direction of groundwater flow. J. of Hydrology 112, 395-401. [12] Cook, P. G., and Herczeg, A. L. (Eds), “Environmental Tracers in Sub-surface Hydrology,” Kluwer, Boston, 2000.
AR3-6.doc
REVISTA ROMÂNĂ DE AUTOMATICĂ
41
A New Concept – Proactive Regulator
Octavian CĂPĂŢÎNĂ SC IPA SA CIFATT Cluj
Abstract: The paper present one idea about the next step after the adaptive regulator to come. It is a prediction, no more. The idea was workout on the last phase of the CONMEC project postponed by National Research Agency, in the frame of CEEX program.
Keywords: future, concept, controller
As part of the CONMEC thematic which approached a new line of research and development thorough models and modeling brought into attention the decrease in life of the development cycle of a complex electronic programmable product by ten times. It does not exist a “universal” formula for mathematical modeling or experimental identification, iteration method and verification and re-verifications is the method which is used in every modeling case with real and practical purposes.
Determining the model through experimental identification is the only solution which is considered outside the classroom and laboratory and into the real world works which is more complex, sophisticated, non-linear, not ideal or truncated. By analyzing the modeling problem and that of the models I have proposed an axiom, in fact a truism: „a single process multiple models”, multiple models, depending on the used modeling modality. It was used the „philosophy of designing and testing complex programmable electronic products based on virtual models”, in particular designing process regulators. There were defined and delimited the programmable electronic product, our regulator, from the process that has to be adjusted. It was defined the process simulation, through mathematical models, the necessity of a hard interface with the product and it was defined “the simulator” as a hard-soft product, an ensemble: mathematical
model, hard interface animated by a real time soft. I have defined as product, the simulator, machine, a device, etc. The emulation can be realized by a hybrid - part virtual, part real. The programmable electronic product, which is to be tested, has in front the physical inputs from certain sensors; the product “emits” signals (obviously real) acquired by the real inputs of certain actuators which are virtual.
These process inputs (real signal from the testing product) reach virtually in the mathematical model, model which considers and modifies its command towards real outputs from the simulator/emulator, outputs which reflects the real process behavior, but in the way it was encrypted in the model (outputs that will be the input of the tested product). There were described tools which concur to this approach put into order by Mathwork and dSpace and an interaction module. By studying different structures of adaptive regulators based on modern algorithms and imagining new technological implementations, it was developed a new concept: PROACTIVE REGULATORS, which would represent the next step in the field of process regulators. It is the step after the adaptive regulators, in real times. By adding data about the adaptive regulators and collaborating with the microelectronics fields developments (DSP, FPGA, ASIC) and the development in the numerical algorithms field- we can anticipate the apparition of a new class of regulators which can be named proactive in order to
highlight their main characteristic. The proactive regulators will be based on process
non-linearity, can be anticipated. The pre-synthesized command will suffer minor

REVISTA ROMÂNĂ DE AUTOMATICĂ
42
model, on data regarding the medium and also, current data within the medium and process and they will pre-synthesize the command or will anticipate the regulation control.
So the changes due to significant noises, which appear in the process outputs from the functioning area, and because of the strong
corrections in the current regulation step, depending on concrete data.
Biliography Octavian Capatina CONMEC Phase 4, „Algoritmi evoluati de control in structura sistemelor mecatronice”
AR3-7.doc
REVISTA ROMÂNĂ DE AUTOMATICĂ
43
TELEHEPASCAN - Tele-screening System for the Surveillance of
Hepatocellular Carcinoma
Dorina CĂPĂŢÎNĂ, Rareş CAZAN, Ovidiu DANCEA , Ioan STOIAN
SC IPA SA CIFATT Cluj
Abstract: The hepatocellular carcinoma (HCC) is recognized as the fifth cancer worldwide, in terms of both incidence and mortality rate. HCC accomplish the requirements to become the target of a close surveillance in a screening program: it is a frequent condition; it has a high rate of mortality; it affects a very well defined at risk population (chronic liver diseases patients). The patients at risk for HCC can be closely followed-up using a sensitive and easily accepted ultrasonography method (US). The improvement of the screening and surveillance system for this population is needed, so the early diagnosis is increased, as well as the chance for an efficient and curative therapeutic intervention. A possible choice would be a telemedicine network for the US screening of a large number of chronic liver disease patients for the early detection of HCC. In general practitioner office exists terminals where the US medical images are acquired. The central node is situated at the imaging expert medical center where the analysis and interpretation of echographic images take place and according with their results the software application manages screening steps. Keywords: ultrasound image, biomedical data, Web application, data security
1. Medical description and tele-screening system requirements A telemedicine-supported process that will monitor the hepatocellular carcinoma is both practical and advantageous. The objective of this paper is to describe the development of the tele-screening system and implementation of a Web application that allows efficient communication between general practitioners and ultrasound specialists, in order to support a telescreening programme for patients with HCC.
The screening process is performed according to the following steps: 1. The patients are called to the general practitioner and undergo a specific medical consultation comprising, among others, ultrasound examination. 2. The ultrasound images, acquired according to a specific screening protocol, are sent, together with the other medical data regarding the patient, to an expert diagnosis center.
3. At this level, the specialists analyze the images and the additional information and establish the existence of cancerous formations. 4. Based on the specialist evaluation, transposed into an electronic form, the system establishes a new date for the patients to present themselves to the general practitioner, in order to undergo a new examination. 5. The term for the new examination date appears to the general practitioner when the patient’s records are accesses. The application provides dedicated functionality for each user group identified: general practitioners, imaging specialists, database administrators. Epidemiology and risk factors The most important risk factors for HCC are hepatitis B virus (HBV), hepatitis C virus (HCV) and alcohol. The screening means testing of a large number of individuals designed to identify those with a particular genetic trait, characteristic, or biological condition. This has been proven to be the
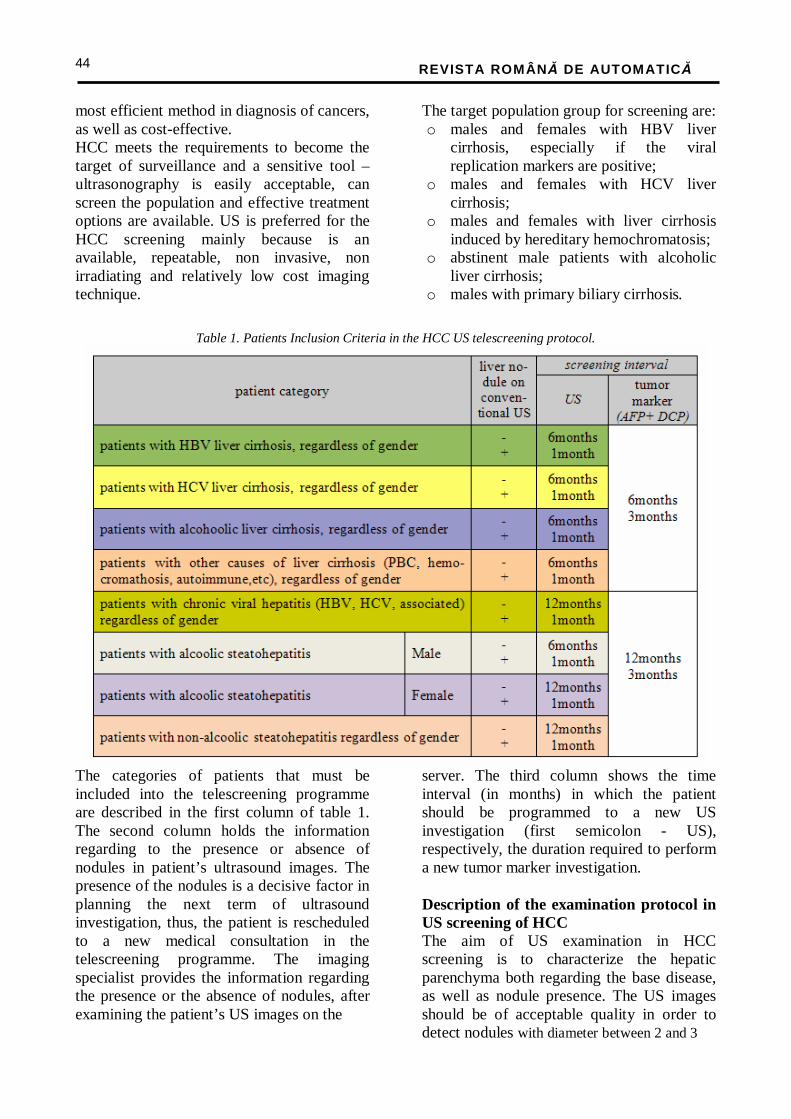
REVISTA ROMÂNĂ DE AUTOMATICĂ
44
most efficient method in diagnosis of cancers, as well as cost-effective. HCC meets the requirements to become the target of surveillance and a sensitive tool – ultrasonography is easily acceptable, can screen the population and effective treatment options are available. US is preferred for the HCC screening mainly because is an available, repeatable, non invasive, non irradiating and relatively low cost imaging technique.
The target population group for screening are: o males and females with HBV liver
cirrhosis, especially if the viral replication markers are positive;
o males and females with HCV liver cirrhosis;
o males and females with liver cirrhosis induced by hereditary hemochromatosis;
o abstinent male patients with alcoholic liver cirrhosis;
o males with primary biliary cirrhosis.
Table 1. Patients Inclusion Criteria in the HCC US telescreening protocol.
The categories of patients that must be included into the telescreening programme are described in the first column of table 1. The second column holds the information regarding to the presence or absence of nodules in patient’s ultrasound images. The presence of the nodules is a decisive factor in planning the next term of ultrasound investigation, thus, the patient is rescheduled to a new medical consultation in the telescreening programme. The imaging specialist provides the information regarding the presence or the absence of nodules, after examining the patient’s US images on the
server. The third column shows the time interval (in months) in which the patient should be programmed to a new US investigation (first semicolon - US), respectively, the duration required to perform a new tumor marker investigation.
Description of the examination protocol in US screening of HCC The aim of US examination in HCC screening is to characterize the hepatic parenchyma both regarding the base disease, as well as nodule presence. The US images should be of acceptable quality in order to detect nodules with diameter between 2 and 3
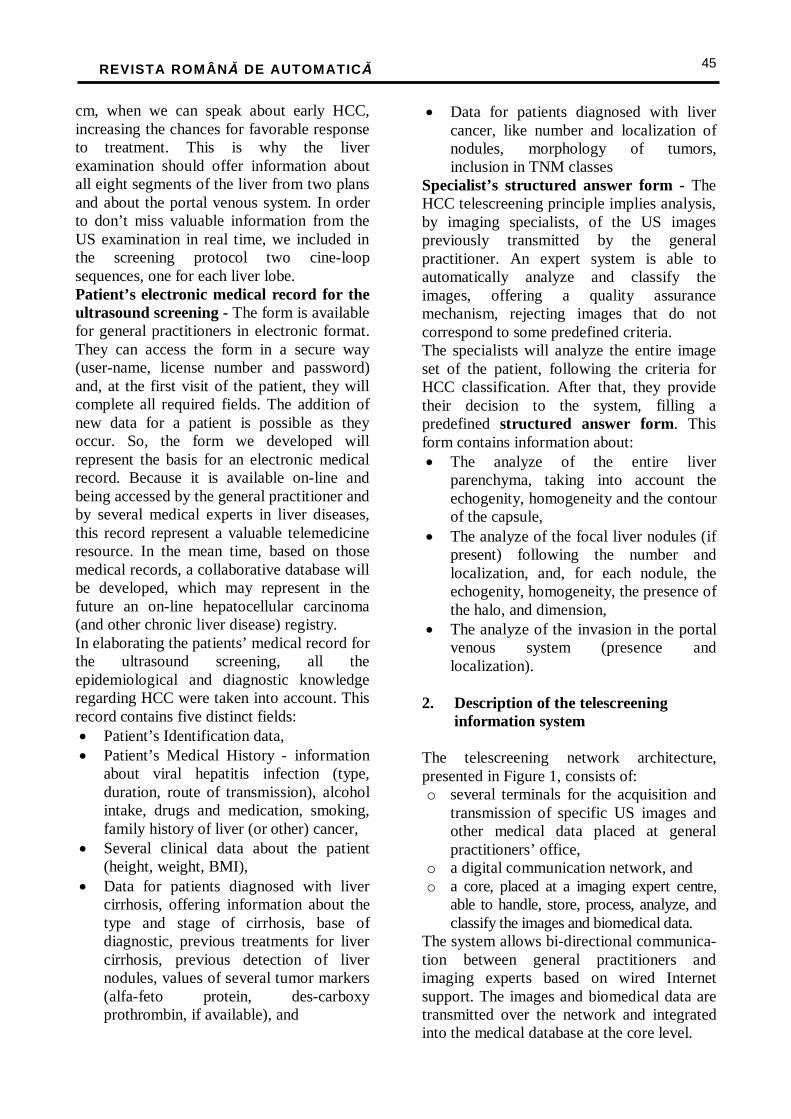
REVISTA ROMÂNĂ DE AUTOMATICĂ
45
cm, when we can speak about early HCC, increasing the chances for favorable response to treatment. This is why the liver examination should offer information about all eight segments of the liver from two plans and about the portal venous system. In order to don’t miss valuable information from the US examination in real time, we included in the screening protocol two cine-loop sequences, one for each liver lobe. Patient’s electronic medical record for the ultrasound screening - The form is available for general practitioners in electronic format. They can access the form in a secure way (user-name, license number and password) and, at the first visit of the patient, they will complete all required fields. The addition of new data for a patient is possible as they occur. So, the form we developed will represent the basis for an electronic medical record. Because it is available on-line and being accessed by the general practitioner and by several medical experts in liver diseases, this record represent a valuable telemedicine resource. In the mean time, based on those medical records, a collaborative database will be developed, which may represent in the future an on-line hepatocellular carcinoma (and other chronic liver disease) registry. In elaborating the patients’ medical record for the ultrasound screening, all the epidemiological and diagnostic knowledge regarding HCC were taken into account. This record contains five distinct fields: • Patient’s Identification data, • Patient’s Medical History - information
about viral hepatitis infection (type, duration, route of transmission), alcohol intake, drugs and medication, smoking, family history of liver (or other) cancer,
• Several clinical data about the patient (height, weight, BMI),
• Data for patients diagnosed with liver cirrhosis, offering information about the type and stage of cirrhosis, base of diagnostic, previous treatments for liver cirrhosis, previous detection of liver nodules, values of several tumor markers (alfa-feto protein, des-carboxy prothrombin, if available), and
• Data for patients diagnosed with liver cancer, like number and localization of nodules, morphology of tumors, inclusion in TNM classes
Specialist’s structured answer form - The HCC telescreening principle implies analysis, by imaging specialists, of the US images previously transmitted by the general practitioner. An expert system is able to automatically analyze and classify the images, offering a quality assurance mechanism, rejecting images that do not correspond to some predefined criteria. The specialists will analyze the entire image set of the patient, following the criteria for HCC classification. After that, they provide their decision to the system, filling a predefined structured answer form. This form contains information about: • The analyze of the entire liver
parenchyma, taking into account the echogenity, homogeneity and the contour of the capsule,
• The analyze of the focal liver nodules (if present) following the number and localization, and, for each nodule, the echogenity, homogeneity, the presence of the halo, and dimension,
• The analyze of the invasion in the portal venous system (presence and localization).
2. Description of the telescreening information system The telescreening network architecture, presented in Figure 1, consists of: o several terminals for the acquisition and
transmission of specific US images and other medical data placed at general practitioners’ office,
o a digital communication network, and o a core, placed at a imaging expert centre,
able to handle, store, process, analyze, and classify the images and biomedical data.
The system allows bi-directional communica-tion between general practitioners and imaging experts based on wired Internet support. The images and biomedical data are transmitted over the network and integrated into the medical database at the core level.
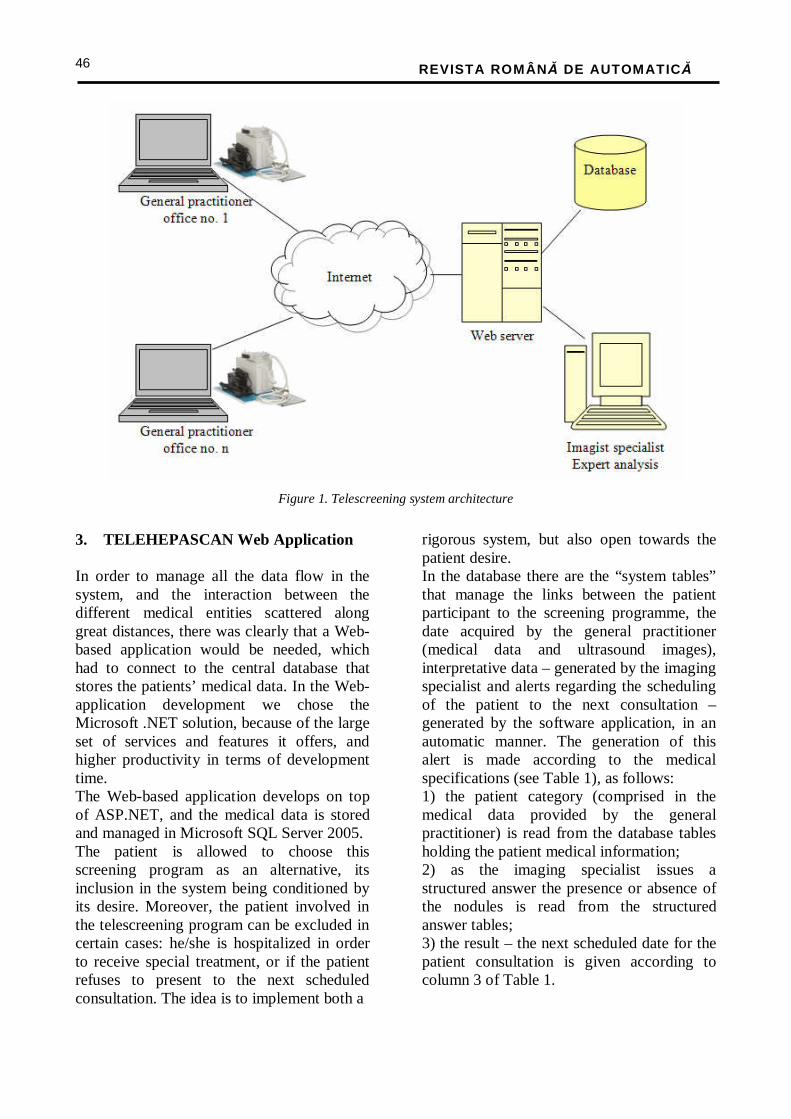
REVISTA ROMÂNĂ DE AUTOMATICĂ
46
Figure 1. Telescreening system architecture
3. TELEHEPASCAN Web Application In order to manage all the data flow in the system, and the interaction between the different medical entities scattered along great distances, there was clearly that a Web-based application would be needed, which had to connect to the central database that stores the patients’ medical data. In the Web-application development we chose the Microsoft .NET solution, because of the large set of services and features it offers, and higher productivity in terms of development time. The Web-based application develops on top of ASP.NET, and the medical data is stored and managed in Microsoft SQL Server 2005. The patient is allowed to choose this screening program as an alternative, its inclusion in the system being conditioned by its desire. Moreover, the patient involved in the telescreening program can be excluded in certain cases: he/she is hospitalized in order to receive special treatment, or if the patient refuses to present to the next scheduled consultation. The idea is to implement both a
rigorous system, but also open towards the patient desire. In the database there are the “system tables” that manage the links between the patient participant to the screening programme, the date acquired by the general practitioner (medical data and ultrasound images), interpretative data – generated by the imaging specialist and alerts regarding the scheduling of the patient to the next consultation – generated by the software application, in an automatic manner. The generation of this alert is made according to the medical specifications (see Table 1), as follows: 1) the patient category (comprised in the medical data provided by the general practitioner) is read from the database tables holding the patient medical information; 2) as the imaging specialist issues a structured answer the presence or absence of the nodules is read from the structured answer tables; 3) the result – the next scheduled date for the patient consultation is given according to column 3 of Table 1.
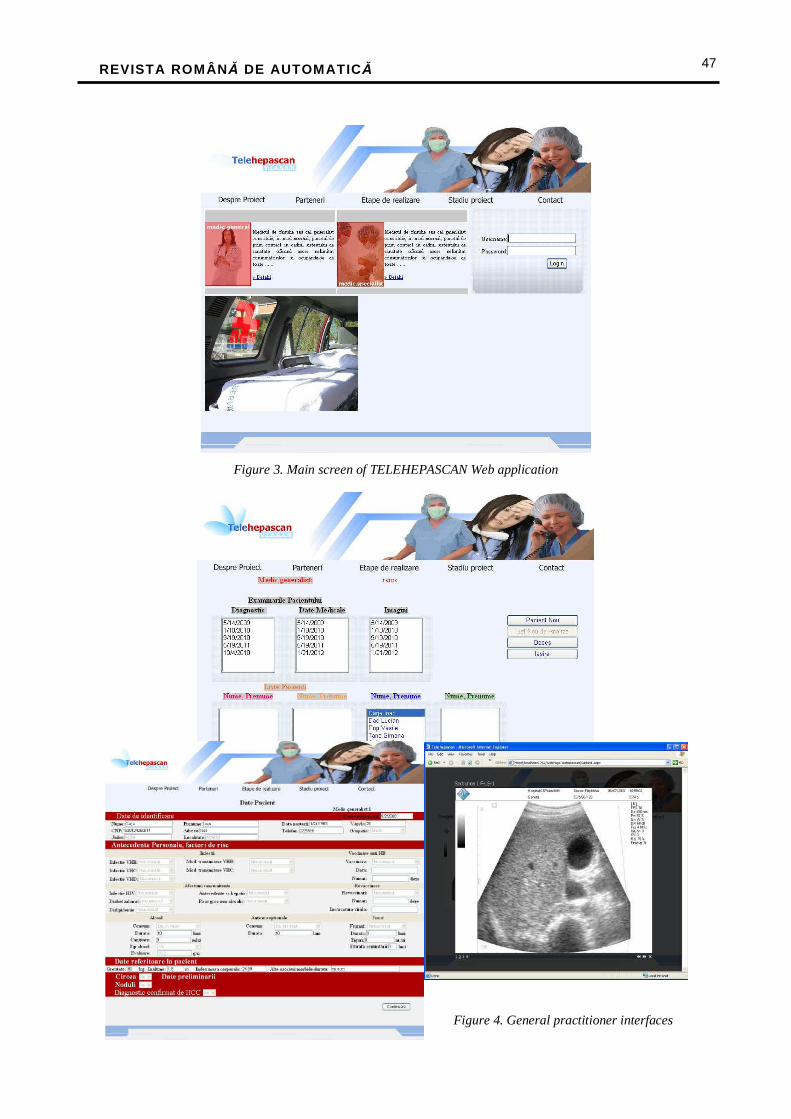
REVISTA ROMÂNĂ DE AUTOMATICĂ
47
Figure 3. Main screen of TELEHEPASCAN Web application
Figure 4. General practitioner interfaces
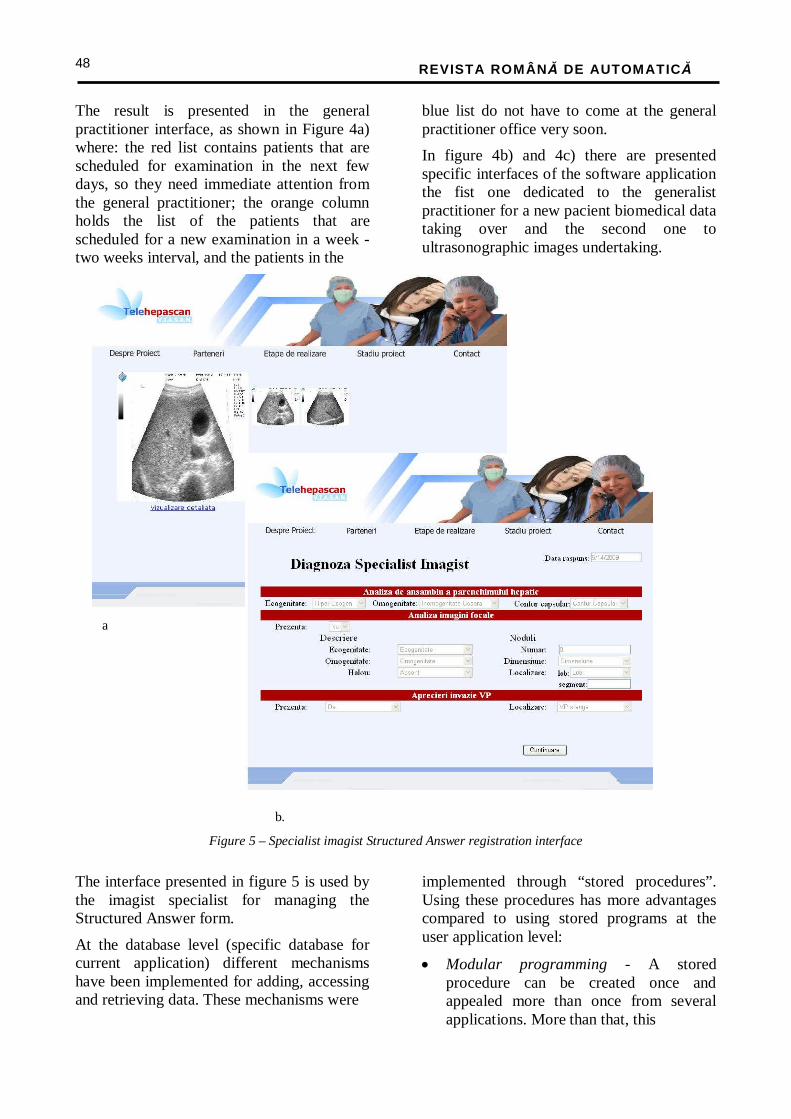
REVISTA ROMÂNĂ DE AUTOMATICĂ
48
The result is presented in the general practitioner interface, as shown in Figure 4a) where: the red list contains patients that are scheduled for examination in the next few days, so they need immediate attention from the general practitioner; the orange column holds the list of the patients that are scheduled for a new examination in a week -two weeks interval, and the patients in the
blue list do not have to come at the general practitioner office very soon.
In figure 4b) and 4c) there are presented specific interfaces of the software application the fist one dedicated to the generalist practitioner for a new pacient biomedical data taking over and the second one to ultrasonographic images undertaking.
a
b.
Figure 5 – Specialist imagist Structured Answer registration interface
The interface presented in figure 5 is used by the imagist specialist for managing the Structured Answer form.
At the database level (specific database for current application) different mechanisms have been implemented for adding, accessing and retrieving data. These mechanisms were
implemented through “stored procedures”. Using these procedures has more advantages compared to using stored programs at the user application level:
• Modular programming - A stored procedure can be created once and appealed more than once from several applications. More than that, this
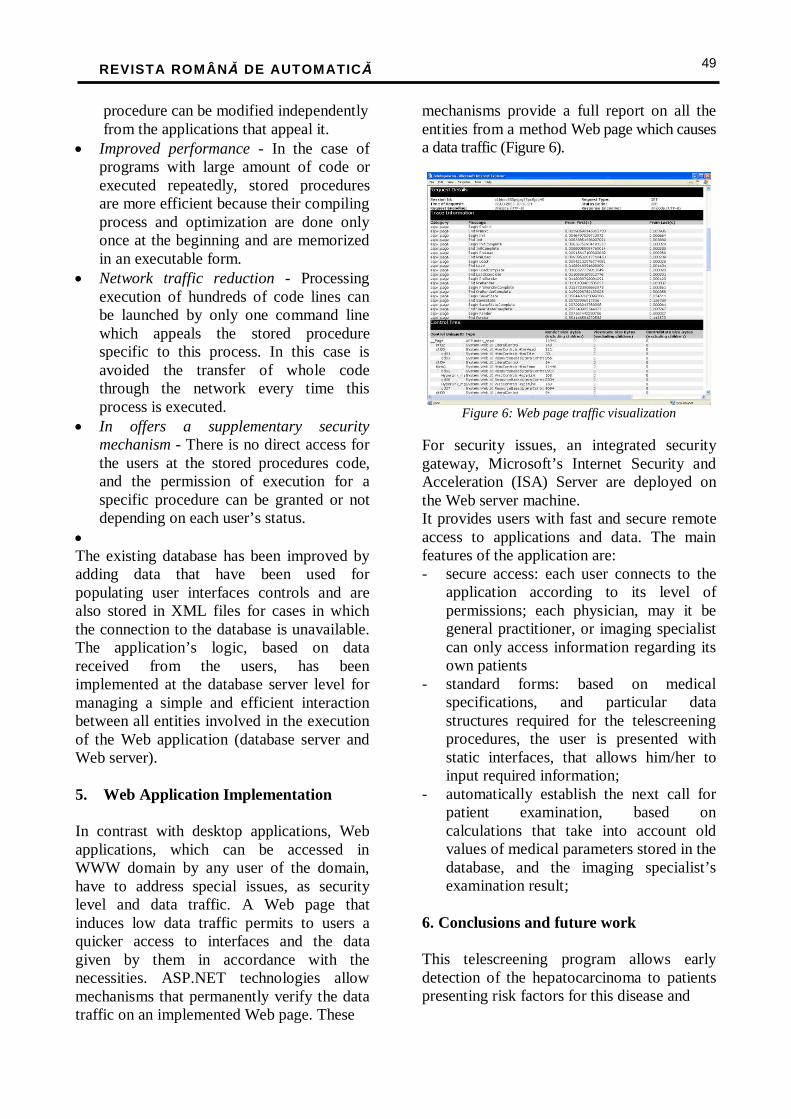
REVISTA ROMÂNĂ DE AUTOMATICĂ
49
procedure can be modified independently from the applications that appeal it. • Improved performance - In the case of
programs with large amount of code or executed repeatedly, stored procedures are more efficient because their compiling process and optimization are done only once at the beginning and are memorized in an executable form.
• Network traffic reduction - Processing execution of hundreds of code lines can be launched by only one command line which appeals the stored procedure specific to this process. In this case is avoided the transfer of whole code through the network every time this process is executed.
• In offers a supplementary security mechanism - There is no direct access for the users at the stored procedures code, and the permission of execution for a specific procedure can be granted or not depending on each user’s status.
• The existing database has been improved by adding data that have been used for populating user interfaces controls and are also stored in XML files for cases in which the connection to the database is unavailable. The application’s logic, based on data received from the users, has been implemented at the database server level for managing a simple and efficient interaction between all entities involved in the execution of the Web application (database server and Web server). 5. Web Application Implementation In contrast with desktop applications, Web applications, which can be accessed in WWW domain by any user of the domain, have to address special issues, as security level and data traffic. A Web page that induces low data traffic permits to users a quicker access to interfaces and the data given by them in accordance with the necessities. ASP.NET technologies allow mechanisms that permanently verify the data traffic on an implemented Web page. These
mechanisms provide a full report on all the entities from a method Web page which causes a data traffic (Figure 6).
Figure 6: Web page traffic visualization
For security issues, an integrated security gateway, Microsoft’s Internet Security and Acceleration (ISA) Server are deployed on the Web server machine. It provides users with fast and secure remote access to applications and data. The main features of the application are: - secure access: each user connects to the
application according to its level of permissions; each physician, may it be general practitioner, or imaging specialist can only access information regarding its own patients
- standard forms: based on medical specifications, and particular data structures required for the telescreening procedures, the user is presented with static interfaces, that allows him/her to input required information;
- automatically establish the next call for patient examination, based on calculations that take into account old values of medical parameters stored in the database, and the imaging specialist’s examination result;
6. Conclusions and future work This telescreening program allows early detection of the hepatocarcinoma to patients presenting risk factors for this disease and
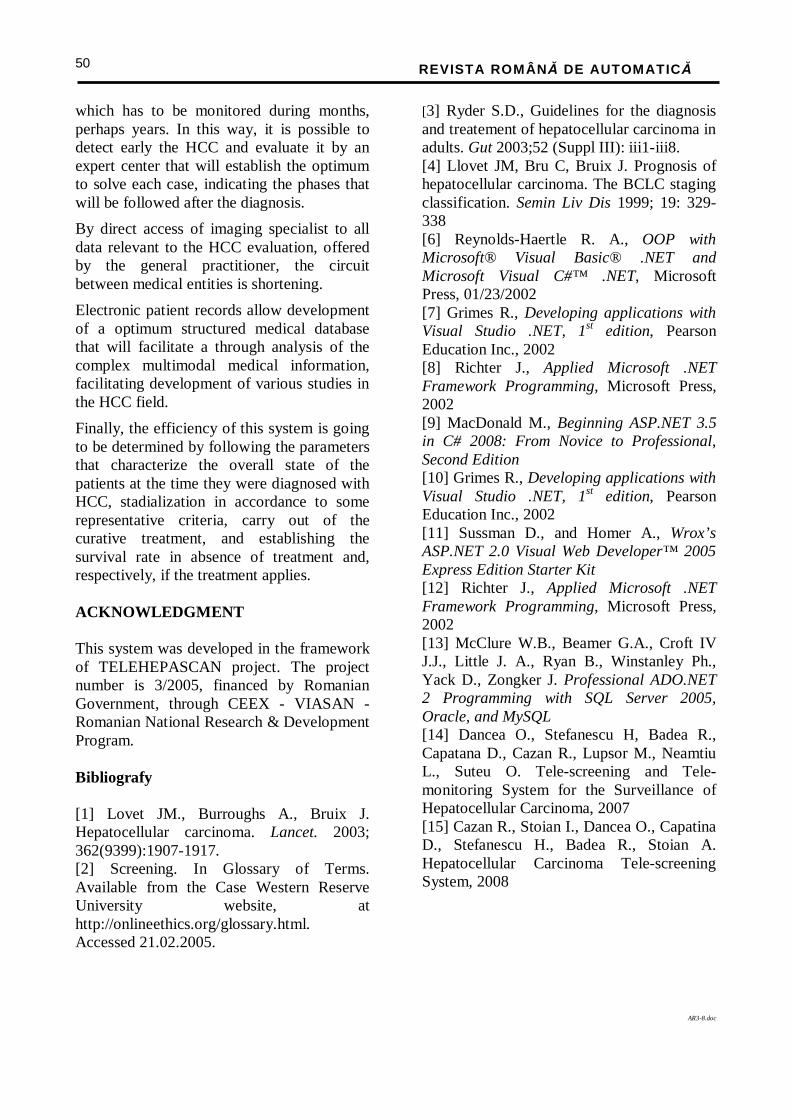
REVISTA ROMÂNĂ DE AUTOMATICĂ
50
which has to be monitored during months, perhaps years. In this way, it is possible to detect early the HCC and evaluate it by an expert center that will establish the optimum to solve each case, indicating the phases that will be followed after the diagnosis.
By direct access of imaging specialist to all data relevant to the HCC evaluation, offered by the general practitioner, the circuit between medical entities is shortening.
Electronic patient records allow development of a optimum structured medical database that will facilitate a through analysis of the complex multimodal medical information, facilitating development of various studies in the HCC field.
Finally, the efficiency of this system is going to be determined by following the parameters that characterize the overall state of the patients at the time they were diagnosed with HCC, stadialization in accordance to some representative criteria, carry out of the curative treatment, and establishing the survival rate in absence of treatment and, respectively, if the treatment applies. ACKNOWLEDGMENT This system was developed in the framework of TELEHEPASCAN project. The project number is 3/2005, financed by Romanian Government, through CEEX - VIASAN - Romanian National Research & Development Program. Bibliografy [1] Lovet JM., Burroughs A., Bruix J. Hepatocellular carcinoma. Lancet. 2003; 362(9399):1907-1917. [2] Screening. In Glossary of Terms. Available from the Case Western Reserve University website, at http://onlineethics.org/glossary.html. Accessed 21.02.2005.
[3] Ryder S.D., Guidelines for the diagnosis and treatement of hepatocellular carcinoma in adults. Gut 2003;52 (Suppl III): iii1-iii8. [4] Llovet JM, Bru C, Bruix J. Prognosis of hepatocellular carcinoma. The BCLC staging classification. Semin Liv Dis 1999; 19: 329-338 [6] Reynolds-Haertle R. A., OOP with Microsoft® Visual Basic® .NET and Microsoft Visual C#™ .NET, Microsoft Press, 01/23/2002 [7] Grimes R., Developing applications with Visual Studio .NET, 1st edition, Pearson Education Inc., 2002 [8] Richter J., Applied Microsoft .NET Framework Programming, Microsoft Press, 2002 [9] MacDonald M., Beginning ASP.NET 3.5 in C# 2008: From Novice to Professional, Second Edition [10] Grimes R., Developing applications with Visual Studio .NET, 1st edition, Pearson Education Inc., 2002 [11] Sussman D., and Homer A., Wrox’s ASP.NET 2.0 Visual Web Developer™ 2005 Express Edition Starter Kit [12] Richter J., Applied Microsoft .NET Framework Programming, Microsoft Press, 2002 [13] McClure W.B., Beamer G.A., Croft IV J.J., Little J. A., Ryan B., Winstanley Ph., Yack D., Zongker J. Professional ADO.NET 2 Programming with SQL Server 2005, Oracle, and MySQL [14] Dancea O., Stefanescu H, Badea R., Capatana D., Cazan R., Lupsor M., Neamtiu L., Suteu O. Tele-screening and Tele-monitoring System for the Surveillance of Hepatocellular Carcinoma, 2007 [15] Cazan R., Stoian I., Dancea O., Capatina D., Stefanescu H., Badea R., Stoian A. Hepatocellular Carcinoma Tele-screening System, 2008
AR3-8.doc
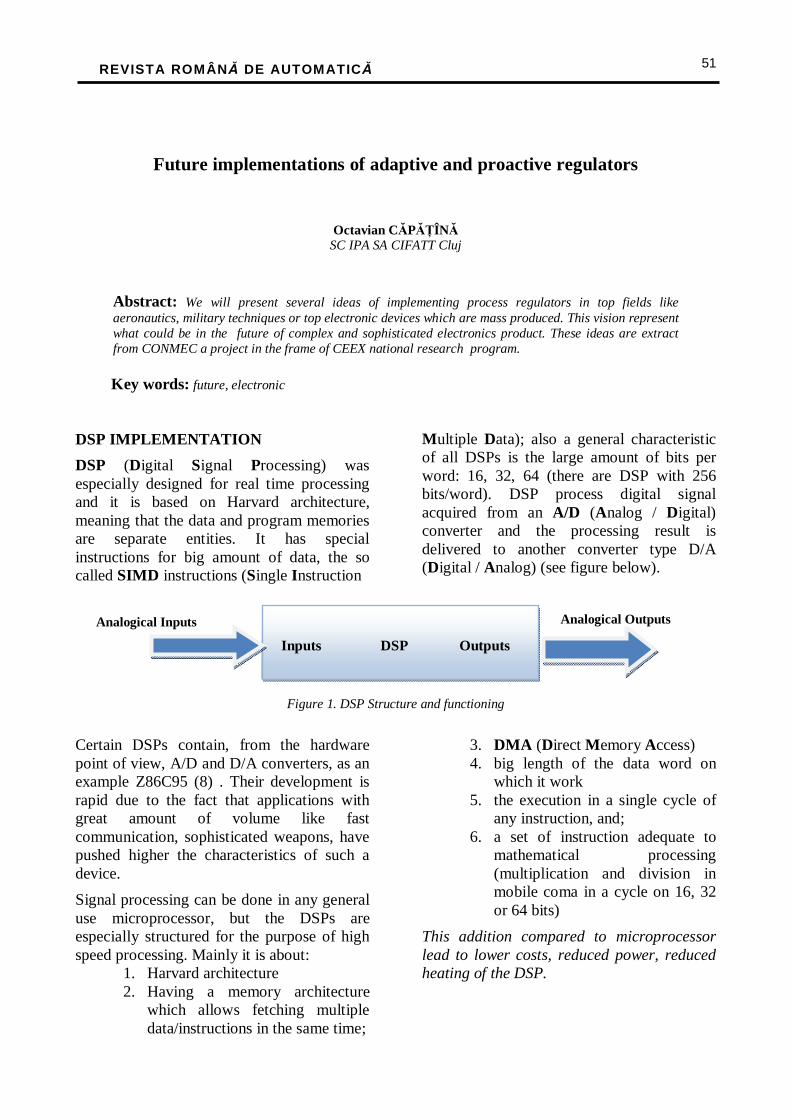
REVISTA ROMÂNĂ DE AUTOMATICĂ
51
Future implementations of adaptive and proactive regulators
Octavian CĂPĂŢÎNĂ SC IPA SA CIFATT Cluj
Abstract: We will present several ideas of implementing process regulators in top fields like aeronautics, military techniques or top electronic devices which are mass produced. This vision represent what could be in the future of complex and sophisticated electronics product. These ideas are extract from CONMEC a project in the frame of CEEX national research program.
Key words: future, electronic
DSP IMPLEMENTATION
DSP (Digital Signal Processing) was especially designed for real time processing and it is based on Harvard architecture, meaning that the data and program memories are separate entities. It has special instructions for big amount of data, the so called SIMD instructions (Single Instruction
Multiple Data); also a general characteristic of all DSPs is the large amount of bits per word: 16, 32, 64 (there are DSP with 256 bits/word). DSP process digital signal acquired from an A/D (Analog / Digital) converter and the processing result is delivered to another converter type D/A (Digital / Analog) (see figure below).
Figure 1. DSP Structure and functioning
Certain DSPs contain, from the hardware point of view, A/D and D/A converters, as an example Z86C95 (8) . Their development is rapid due to the fact that applications with great amount of volume like fast communication, sophisticated weapons, have pushed higher the characteristics of such a device.
Signal processing can be done in any general use microprocessor, but the DSPs are especially structured for the purpose of high speed processing. Mainly it is about:
1. Harvard architecture 2. Having a memory architecture
which allows fetching multiple data/instructions in the same time;
3. DMA (Direct Memory Access) 4. big length of the data word on
which it work 5. the execution in a single cycle of
any instruction, and; 6. a set of instruction adequate to
mathematical processing (multiplication and division in mobile coma in a cycle on 16, 32 or 64 bits)
This addition compared to microprocessor lead to lower costs, reduced power, reduced heating of the DSP.
Inputs DSP Outputs
Analogical Inputs Analogical Outputs
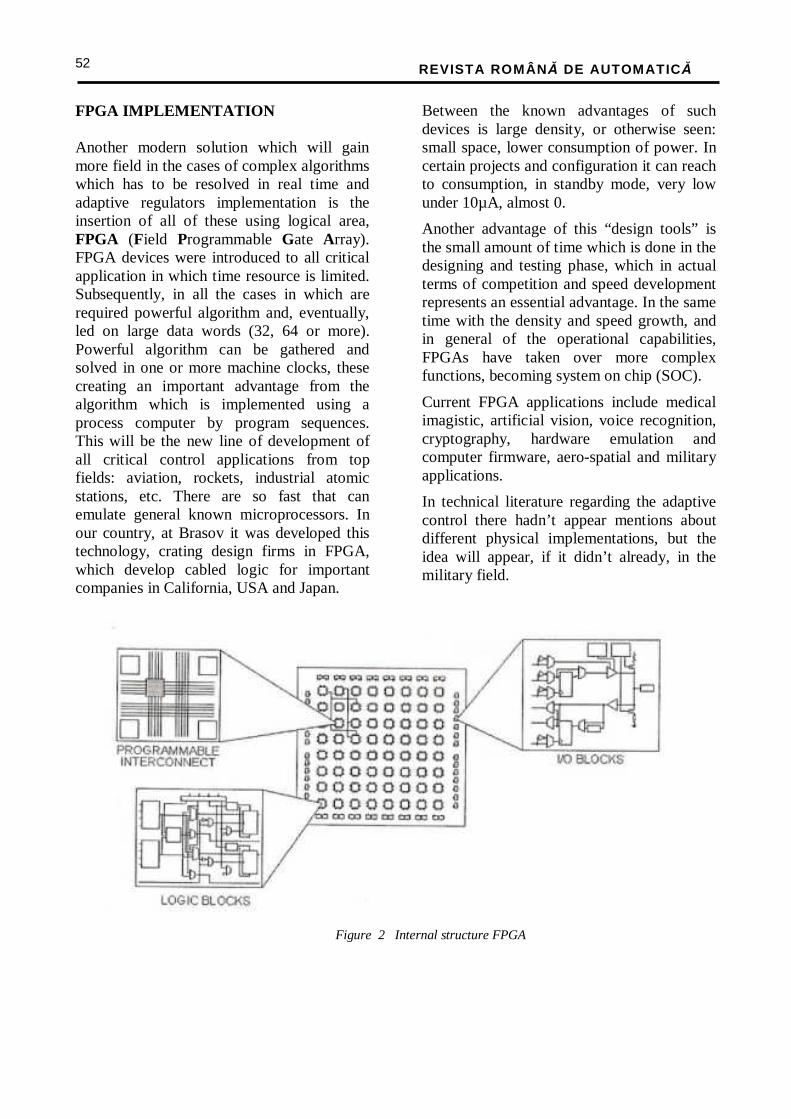
REVISTA ROMÂNĂ DE AUTOMATICĂ
52
FPGA IMPLEMENTATION Another modern solution which will gain more field in the cases of complex algorithms which has to be resolved in real time and adaptive regulators implementation is the insertion of all of these using logical area, FPGA (Field Programmable Gate Array). FPGA devices were introduced to all critical application in which time resource is limited. Subsequently, in all the cases in which are required powerful algorithm and, eventually, led on large data words (32, 64 or more). Powerful algorithm can be gathered and solved in one or more machine clocks, these creating an important advantage from the algorithm which is implemented using a process computer by program sequences. This will be the new line of development of all critical control applications from top fields: aviation, rockets, industrial atomic stations, etc. There are so fast that can emulate general known microprocessors. In our country, at Brasov it was developed this technology, crating design firms in FPGA, which develop cabled logic for important companies in California, USA and Japan.
Between the known advantages of such devices is large density, or otherwise seen: small space, lower consumption of power. In certain projects and configuration it can reach to consumption, in standby mode, very low under 10µA, almost 0.
Another advantage of this “design tools” is the small amount of time which is done in the designing and testing phase, which in actual terms of competition and speed development represents an essential advantage. In the same time with the density and speed growth, and in general of the operational capabilities, FPGAs have taken over more complex functions, becoming system on chip (SOC).
Current FPGA applications include medical imagistic, artificial vision, voice recognition, cryptography, hardware emulation and computer firmware, aero-spatial and military applications.
In technical literature regarding the adaptive control there hadn’t appear mentions about different physical implementations, but the idea will appear, if it didn’t already, in the military field.
Figure 2 Internal structure FPGA
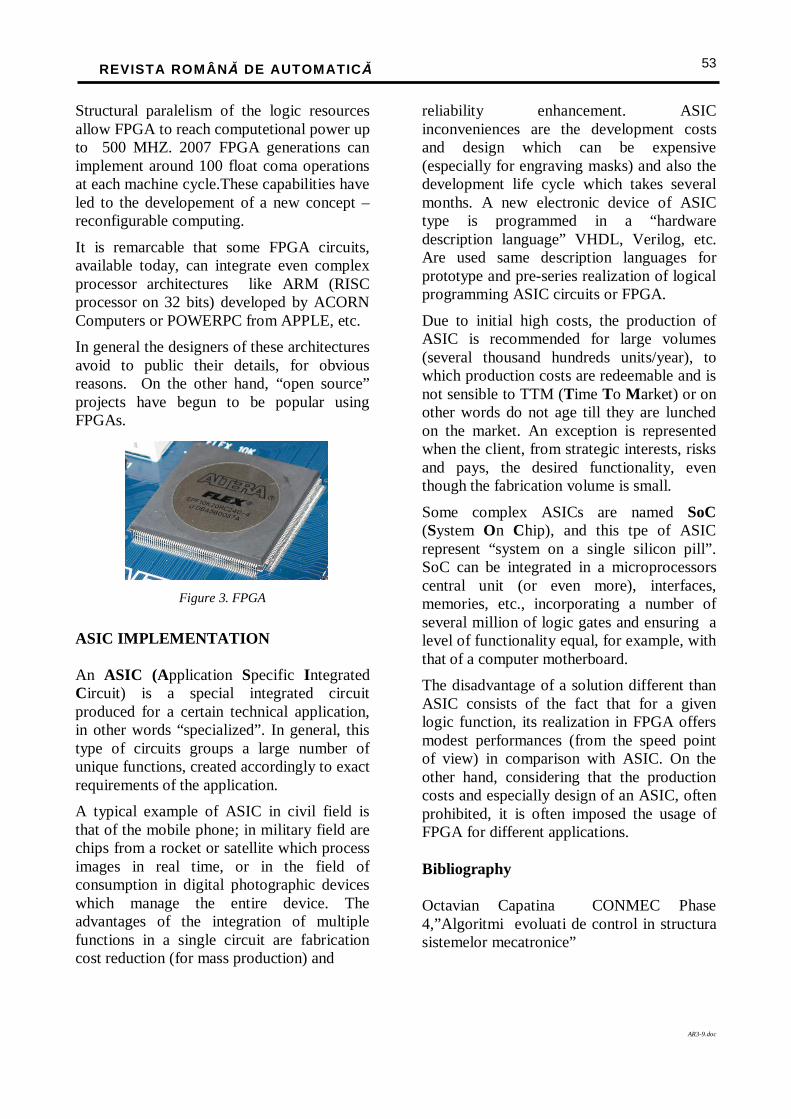
REVISTA ROMÂNĂ DE AUTOMATICĂ
53
Structural paralelism of the logic resources allow FPGA to reach computetional power up to 500 MHZ. 2007 FPGA generations can implement around 100 float coma operations at each machine cycle.These capabilities have led to the developement of a new concept – reconfigurable computing.
It is remarcable that some FPGA circuits, available today, can integrate even complex processor architectures like ARM (RISC processor on 32 bits) developed by ACORN Computers or POWERPC from APPLE, etc.
In general the designers of these architectures avoid to public their details, for obvious reasons. On the other hand, “open source” projects have begun to be popular using FPGAs.
Figure 3. FPGA
ASIC IMPLEMENTATION An ASIC (Application Specific Integrated Circuit) is a special integrated circuit produced for a certain technical application, in other words “specialized”. In general, this type of circuits groups a large number of unique functions, created accordingly to exact requirements of the application.
A typical example of ASIC in civil field is that of the mobile phone; in military field are chips from a rocket or satellite which process images in real time, or in the field of consumption in digital photographic devices which manage the entire device. The advantages of the integration of multiple functions in a single circuit are fabrication cost reduction (for mass production) and
reliability enhancement. ASIC inconveniences are the development costs and design which can be expensive (especially for engraving masks) and also the development life cycle which takes several months. A new electronic device of ASIC type is programmed in a “hardware description language” VHDL, Verilog, etc. Are used same description languages for prototype and pre-series realization of logical programming ASIC circuits or FPGA.
Due to initial high costs, the production of ASIC is recommended for large volumes (several thousand hundreds units/year), to which production costs are redeemable and is not sensible to TTM (Time To Market) or on other words do not age till they are lunched on the market. An exception is represented when the client, from strategic interests, risks and pays, the desired functionality, even though the fabrication volume is small.
Some complex ASICs are named SoC (System On Chip), and this tpe of ASIC represent “system on a single silicon pill”. SoC can be integrated in a microprocessors central unit (or even more), interfaces, memories, etc., incorporating a number of several million of logic gates and ensuring a level of functionality equal, for example, with that of a computer motherboard.
The disadvantage of a solution different than ASIC consists of the fact that for a given logic function, its realization in FPGA offers modest performances (from the speed point of view) in comparison with ASIC. On the other hand, considering that the production costs and especially design of an ASIC, often prohibited, it is often imposed the usage of FPGA for different applications. Bibliography Octavian Capatina CONMEC Phase 4,”Algoritmi evoluati de control in structura sistemelor mecatronice”
AR3-9.doc
REVISTA ROMÂNĂ DE AUTOMATICĂ
54
Pandemic Simulation – Displaying Large Images
Ovidiu GHIRAN
SC IPA SA CIFATT Cluj
Vasile PREJMEREAN
Babeş-Bolyai University of Cluj-Napoca, Faculty of Mathematics and Computer Science
Abstract: There are many ways a pandemic spreading of a disease is influenced. This paper focuses on simulation of the pandemic influenza and the graphic representation on the maps. The present article intends to present a revealing method for images on different representation levels. The idea is creating images of a certain dimension for each profoundness level. These images are decomposed in slices, are stored following a certain rule and represented on the screen. For representation we need to build maps by stitching the counties that contain cities and localities, the encoding of these elements using different colours on the map, the generation of the neighbour relationship, and finally the simulation. Keywords: large images, graphic representations, maps, pandemic simulation
I. INTRODUCTION The pandemic spread of some viruses depends on the spreading characteristics specific to the disease, the number and structure of the population, its dynamics, the existence of infection furnaces and/or risk factors (ex. animal farms or crowded people places with a high degree of insalubrities), the capacity of isolation for the infested area, the capacity to combat the disease’s effects (the existence of well equipped hospitals in the contaminated area), the climate factors [1].
Images have different dimensions. If these images represent maps, they could have big dimensions and they can’t be represented on a single screen. In this case a general manner of operation is working with image levels (there are wide images, with main elements presented in detail, which can’t include the whole ensemble but have the advantage of containing a lot of information).
The problem is how to organize this information in order to access it easily on horizontally and vertically [2]. In this article presents a matrix approach regarding the presentation of large images [3].
The idea is that for each representation level is another image, more and more detailed in
accordance with the depth level. These images have to be scaled according to the representation (level scale). After that the image is divided, for each level, in slices in order to track down in the reverse way the information as fast as possible [14]. A revealing mechanism follows for loading and revealing and will be presented the next paragraphs.
A system dedicated to study the current situation of a pandemic disease, and for a simulation of the pandemic spreading in a region needs a map of this region. For this reason the user needs a graphical interface which helps him to communicate with the system [17]. In this direction we will offer a mapping system that allows him: • To observe all the coloured counties
such that by indicating with the mouse the colour of a county to obtain its code • To dispose of the map of a county
with all coloured localities such that by indicating with the mouse the colour of a locality its code may be obtained. • To access a map of the entire country,
with all counties and localities, needed in the simulation of spread of the pandemic. It is useful when the pandemic extends over the border of a county. The infected localities
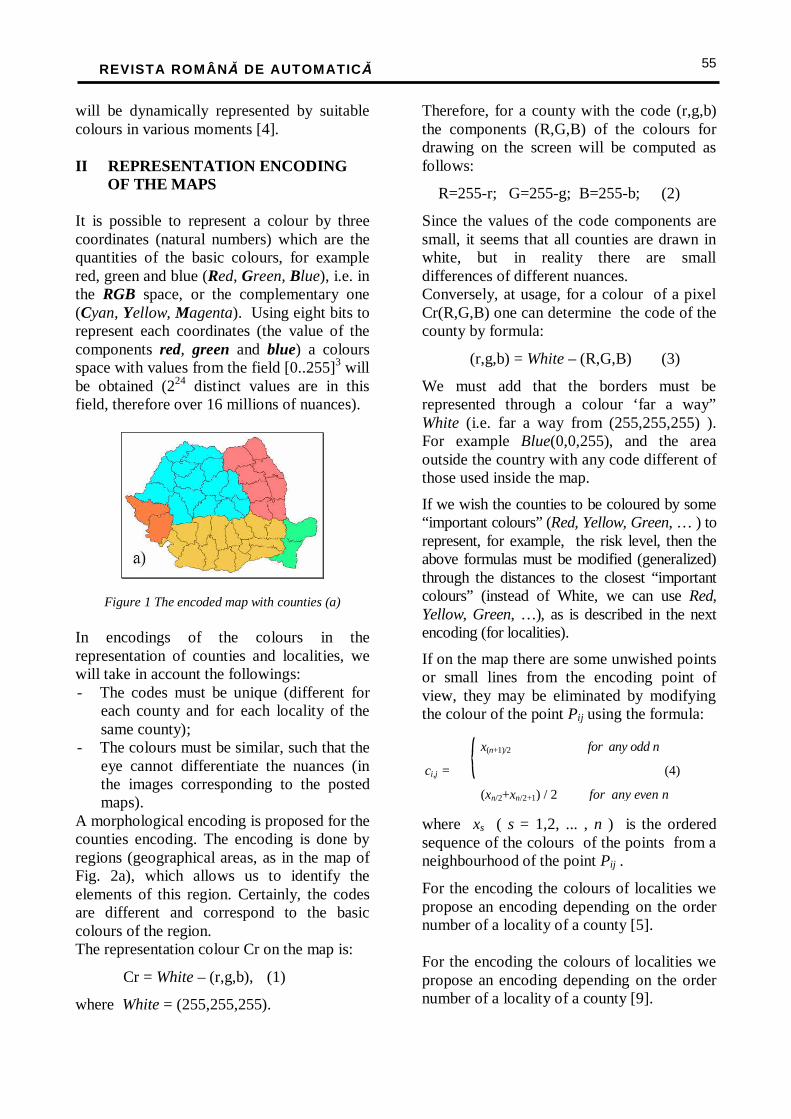
REVISTA ROMÂNĂ DE AUTOMATICĂ
55
will be dynamically represented by suitable colours in various moments [4]. II REPRESENTATION ENCODING OF THE MAPS It is possible to represent a colour by three coordinates (natural numbers) which are the quantities of the basic colours, for example red, green and blue (Red, Green, Blue), i.e. in the RGB space, or the complementary one (Cyan, Yellow, Magenta). Using eight bits to represent each coordinates (the value of the components red, green and blue) a colours space with values from the field [0..255]3 will be obtained (224 distinct values are in this field, therefore over 16 millions of nuances).
Figure 1 The encoded map with counties (a) In encodings of the colours in the representation of counties and localities, we will take in account the followings: - The codes must be unique (different for
each county and for each locality of the same county);
- The colours must be similar, such that the eye cannot differentiate the nuances (in the images corresponding to the posted maps).
A morphological encoding is proposed for the counties encoding. The encoding is done by regions (geographical areas, as in the map of Fig. 2a), which allows us to identify the elements of this region. Certainly, the codes are different and correspond to the basic colours of the region. The representation colour Cr on the map is:
Cr = White – (r,g,b), (1)
where White = (255,255,255).
Therefore, for a county with the code (r,g,b) the components (R,G,B) of the colours for drawing on the screen will be computed as follows:
R=255-r; G=255-g; B=255-b; (2)
Since the values of the code components are small, it seems that all counties are drawn in white, but in reality there are small differences of different nuances. Conversely, at usage, for a colour of a pixel Cr(R,G,B) one can determine the code of the county by formula:
(r,g,b) = White – (R,G,B) (3)
We must add that the borders must be represented through a colour ‘far a way” White (i.e. far a way from (255,255,255) ). For example Blue(0,0,255), and the area outside the country with any code different of those used inside the map.
If we wish the counties to be coloured by some “important colours” (Red, Yellow, Green, … ) to represent, for example, the risk level, then the above formulas must be modified (generalized) through the distances to the closest “important colours” (instead of White, we can use Red, Yellow, Green, …), as is described in the next encoding (for localities).
If on the map there are some unwished points or small lines from the encoding point of view, they may be eliminated by modifying the colour of the point Pij using the formula: where xs ( s = 1,2, ... , n ) is the ordered sequence of the colours of the points from a neighbourhood of the point Pij .
For the encoding the colours of localities we propose an encoding depending on the order number of a locality of a county [5]. For the encoding the colours of localities we propose an encoding depending on the order number of a locality of a county [9].
x(n+1)/2 for any odd n
ci,j = (4)
(xn/2+xn/2+1) / 2 for any even n
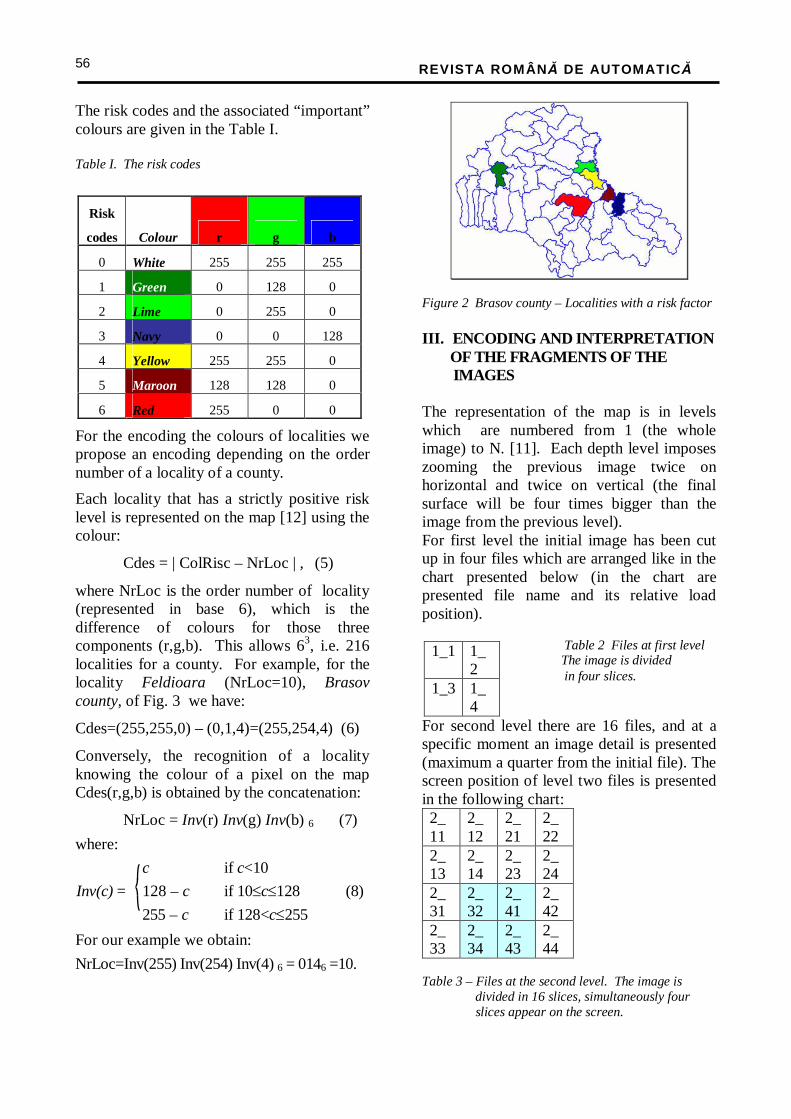
REVISTA ROMÂNĂ DE AUTOMATICĂ
56
The risk codes and the associated “important” colours are given in the Table I. Table I. The risk codes
For the encoding the colours of localities we propose an encoding depending on the order number of a locality of a county.
Each locality that has a strictly positive risk level is represented on the map [12] using the colour:
Cdes = | ColRisc – NrLoc | , (5)
where NrLoc is the order number of locality (represented in base 6), which is the difference of colours for those three components (r,g,b). This allows 63, i.e. 216 localities for a county. For example, for the locality Feldioara (NrLoc=10), Brasov county, of Fig. 3 we have:
Cdes=(255,255,0) – (0,1,4)=(255,254,4) (6)
Conversely, the recognition of a locality knowing the colour of a pixel on the map Cdes(r,g,b) is obtained by the concatenation:
NrLoc = Inv(r) Inv(g) Inv(b) 6 (7)
where:
For our example we obtain:
NrLoc=Inv(255) Inv(254) Inv(4) 6 = 0146 =10.
Figure 2 Brasov county – Localities with a risk factor III. ENCODING AND INTERPRETATION OF THE FRAGMENTS OF THE IMAGES The representation of the map is in levels which are numbered from 1 (the whole image) to N. [11]. Each depth level imposes zooming the previous image twice on horizontal and twice on vertical (the final surface will be four times bigger than the image from the previous level). For first level the initial image has been cut up in four files which are arranged like in the chart presented below (in the chart are presented file name and its relative load position).
1_1 1_2
1_3 1_4
For second level there are 16 files, and at a specific moment an image detail is presented (maximum a quarter from the initial file). The screen position of level two files is presented in the following chart: 2_11
2_12
2_21
2_22
2_13
2_14
2_23
2_24
2_31
2_32
2_41
2_42
2_33
2_34
2_43
2_44
Table 3 – Files at the second level. The image is divided in 16 slices, simultaneously four slices appear on the screen.
Risk
codes Colour r g b
0 White 255 255 255
1 Green 0 128 0
2 Lime 0 255 0
3 Navy 0 0 128
4 Yellow 255 255 0
5 Maroon 128 128 0
6 Red 255 0 0
c if c<10
Inv(c) = 128 – c if 10≤c≤128 (8)
255 – c if 128<c≤255
Table 2 Files at first level The image is divided in four slices.

REVISTA ROMÂNĂ DE AUTOMATICĂ
57
For the fourth level there are 256 files, and at a specific moment and at a specific moment only a very small portion of the initial image is presented (1/64 from the initial image). The screen position of level four files is presented in the chart nr. 5. From space issues, chart nr.5 is presented in four reduced tables which have the following positions:
Mini-chart 1 – NV corner
Mini-chart 2 – NE corner
Mini-chart 3 – SV corner
Mini-chart 4 – SE corner
Table 5- Fourth level – Mini-chart (where i is 1 at NV, 2 at NE, 3 at SV and 4 at SE)) Where i is the number of the mini-chart from above. At this point few observations can be made: - For reaching N level the image surface at this level has to be 880 x 614x 2(N-1) pixels
- For N level we’ll have 2(2*N) images, each of these of dimension 440 x 307 pixels.
4_i 111
4_i 112
4_i 121
4_i 122
4_i 211
4_i 212
4_i 221
4_i 222
4_i 113
4_i 114
4_i 123
4_i 124
4_i 213
4_i 214
4_i 223
4_i 224
4_i 131
4_i 132
4_i 141
4_i 142
4_i 231
4_i 232
4_i 241
4_i 242
4_i 133
4_i 134
4_i 143
4_i 144
4_i 233
4_i 234
4_i 243
4_i 244
4_i 311
4_i 312
4_i 321
4_i 322
4_i 411
4_i 412
4_i 421
4_i 422
4_i 313
4_i 314
4_i 323
4_i 324
4_i 413
4_i 414
4_i 423
4_i 424
4_i 331
4_i 332
4_i 341
4_i 342
4_i 431
4_i 432
4_i 441
4_i 442
4_i 333
4_i 334
4_i 343
4_i 344
4_i 433
4_i 434
4_i 443
4_i 444
IV. THE NAVIGATION BETWEEN DIFFERENT IMAGE PORTIONS The navigation is divided in two categories: on horizontal (on the same level) and on vertical (between levels) [15].
For horizontal navigation the user has 8 crossing directions (from top to bottom and from left to right): NV, V, NE, - V, E, - SV, S, SE.
Having at a specific moment a specific
map or portion of a map loaded, the user can shift his position horizontally by accessing some controls depending on the application.
Depending on the current level, accessing the shifting commands, determine the loading process on the new files corresponding to the required direction [16].
We can make some mathematical representations of the shifting directions. Considering the fact that at a specific moment, on the screen, is presented an image with (x, y) coordinates in the representation matrix, for the future sifting positions will be loaded the future cells:
Direc- tion
Which cell will be loaded after (x, y) position
Direc- tion
Which cell will be loaded after (x, y) position
N (x, y-1) NE (x+1,y-1) S (x,y+1) NV (x-1,y+1) E (x+1, y) SE (x+1,y+1) V (x-1,y) SV (x-1,y+1)
For third level there are 64 files, and at a specific moment and at a specific moment
1/16 from the initial image is presented. The screen position of level three files is presented in the chart nr. 4
3_111 3_112 3_121 3_122 3_211 3_212 3_221 3_222 3_113 3_114 3_123 3_124 3_213 3_214 3_223 3_224 3_131 3_132 3_141 3_142 3_231 3_232 3_241 3_242 3_133 3_134 3_143 3_144 3_233 3_234 3_243 3_244 3_311 3_312 3_321 3_322 3_411 3_412 3_421 3_422 3_313 3_314 3_323 3_324 3_413 3_414 3_423 3_424 3_331 3_332 3_341 3_342 3_431 3_432 3_441 3_442 3_333 3_334 3_343 3_344 3_433 3_434 3_443 3_444
Table 4 – Files at third level. – The image is divided in 64 slices, at a specific moment maximum four slices can appear on the screen.
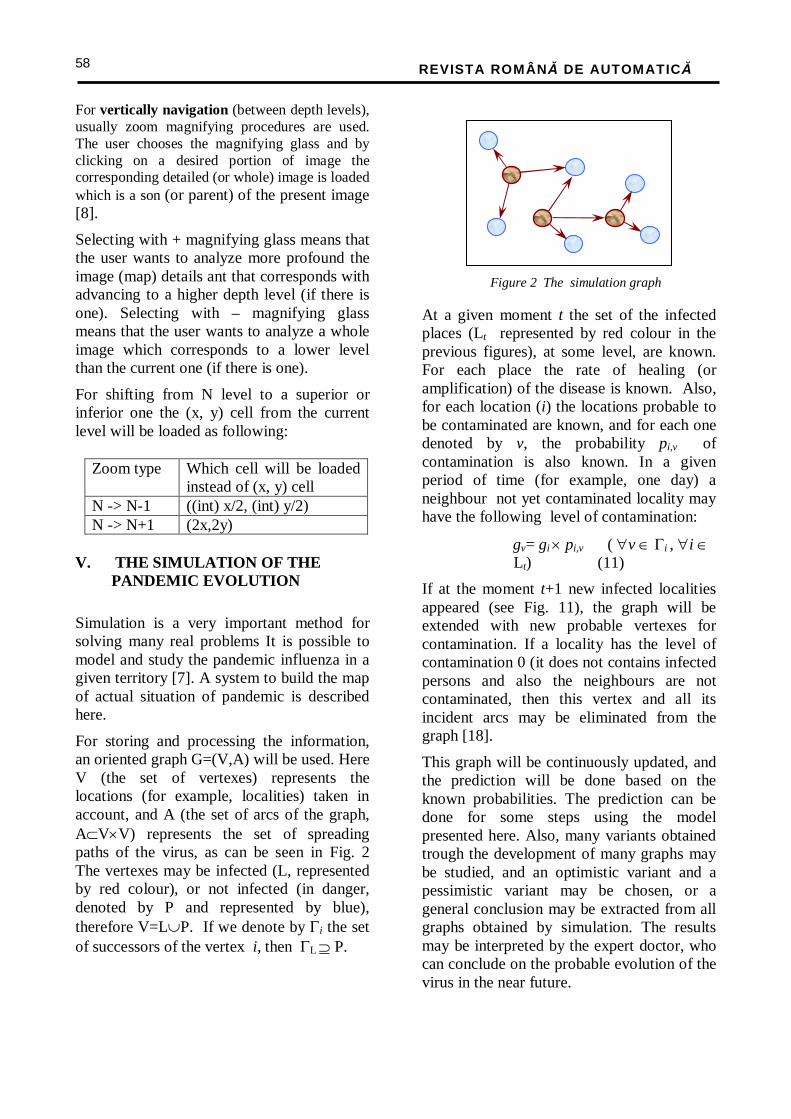
REVISTA ROMÂNĂ DE AUTOMATICĂ
58
For vertically navigation (between depth levels), usually zoom magnifying procedures are used. The user chooses the magnifying glass and by clicking on a desired portion of image the corresponding detailed (or whole) image is loaded which is a son (or parent) of the present image [8].
Selecting with + magnifying glass means that the user wants to analyze more profound the image (map) details ant that corresponds with advancing to a higher depth level (if there is one). Selecting with – magnifying glass means that the user wants to analyze a whole image which corresponds to a lower level than the current one (if there is one).
For shifting from N level to a superior or inferior one the (x, y) cell from the current level will be loaded as following:
Zoom type Which cell will be loaded instead of (x, y) cell
N -> N-1 ((int) x/2, (int) y/2) N -> N+1 (2x,2y)
V. THE SIMULATION OF THE PANDEMIC EVOLUTION
Simulation is a very important method for solving many real problems It is possible to model and study the pandemic influenza in a given territory [7]. A system to build the map of actual situation of pandemic is described here.
For storing and processing the information, an oriented graph G=(V,A) will be used. Here V (the set of vertexes) represents the locations (for example, localities) taken in account, and A (the set of arcs of the graph, A⊂V×V) represents the set of spreading paths of the virus, as can be seen in Fig. 2 The vertexes may be infected (L, represented by red colour), or not infected (in danger, denoted by P and represented by blue), therefore V=L∪P. If we denote by Γi the set of successors of the vertex i, then ΓL ⊇ P.
Figure 2 The simulation graph
At a given moment t the set of the infected places (Lt represented by red colour in the previous figures), at some level, are known. For each place the rate of healing (or amplification) of the disease is known. Also, for each location (i) the locations probable to be contaminated are known, and for each one denoted by v, the probability pi,v of contamination is also known. In a given period of time (for example, one day) a neighbour not yet contaminated locality may have the following level of contamination:
gv= gi × pi,v ( ∀v ∈ Γi , ∀i ∈ Lt) (11)
If at the moment t+1 new infected localities appeared (see Fig. 11), the graph will be extended with new probable vertexes for contamination. If a locality has the level of contamination 0 (it does not contains infected persons and also the neighbours are not contaminated, then this vertex and all its incident arcs may be eliminated from the graph [18].
This graph will be continuously updated, and the prediction will be done based on the known probabilities. The prediction can be done for some steps using the model presented here. Also, many variants obtained trough the development of many graphs may be studied, and an optimistic variant and a pessimistic variant may be chosen, or a general conclusion may be extracted from all graphs obtained by simulation. The results may be interpreted by the expert doctor, who can conclude on the probable evolution of the virus in the near future.
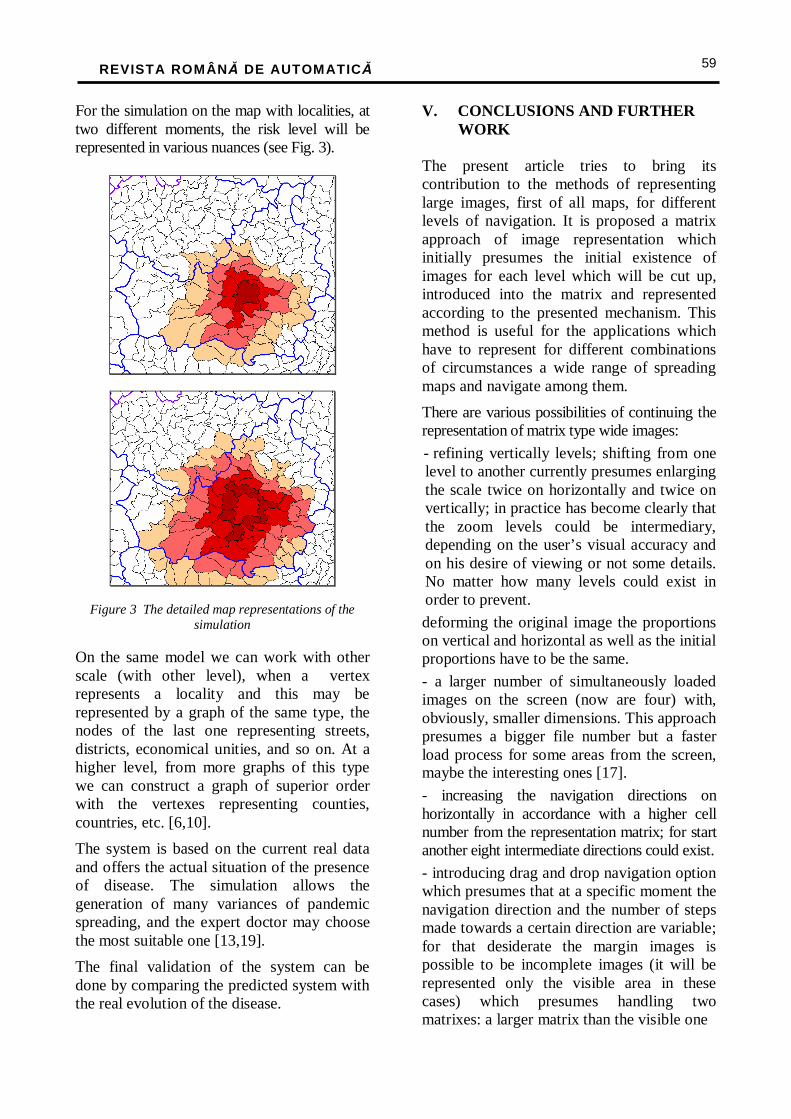
REVISTA ROMÂNĂ DE AUTOMATICĂ
59
For the simulation on the map with localities, at two different moments, the risk level will be represented in various nuances (see Fig. 3).
Figure 3 The detailed map representations of the simulation
On the same model we can work with other scale (with other level), when a vertex represents a locality and this may be represented by a graph of the same type, the nodes of the last one representing streets, districts, economical unities, and so on. At a higher level, from more graphs of this type we can construct a graph of superior order with the vertexes representing counties, countries, etc. [6,10].
The system is based on the current real data and offers the actual situation of the presence of disease. The simulation allows the generation of many variances of pandemic spreading, and the expert doctor may choose the most suitable one [13,19].
The final validation of the system can be done by comparing the predicted system with the real evolution of the disease.
V. CONCLUSIONS AND FURTHER WORK The present article tries to bring its contribution to the methods of representing large images, first of all maps, for different levels of navigation. It is proposed a matrix approach of image representation which initially presumes the initial existence of images for each level which will be cut up, introduced into the matrix and represented according to the presented mechanism. This method is useful for the applications which have to represent for different combinations of circumstances a wide range of spreading maps and navigate among them.
There are various possibilities of continuing the representation of matrix type wide images:
- refining vertically levels; shifting from one level to another currently presumes enlarging the scale twice on horizontally and twice on vertically; in practice has become clearly that the zoom levels could be intermediary, depending on the user’s visual accuracy and on his desire of viewing or not some details. No matter how many levels could exist in order to prevent.
deforming the original image the proportions on vertical and horizontal as well as the initial proportions have to be the same.
- a larger number of simultaneously loaded images on the screen (now are four) with, obviously, smaller dimensions. This approach presumes a bigger file number but a faster load process for some areas from the screen, maybe the interesting ones [17].
- increasing the navigation directions on horizontally in accordance with a higher cell number from the representation matrix; for start another eight intermediate directions could exist.
- introducing drag and drop navigation option which presumes that at a specific moment the navigation direction and the number of steps made towards a certain direction are variable; for that desiderate the margin images is possible to be incomplete images (it will be represented only the visible area in these cases) which presumes handling two matrixes: a larger matrix than the visible one
REVISTA ROMÂNĂ DE AUTOMATICĂ
60
in which tryouts are made and one as large as the screen is.
- image loading process adaptation to screen’s resolution; in this way all calculations have to be done regarding on the screen information; the disadvantage of this method is that in the case of high accuracy images (art) by modifying the dimensions is possible to decrease image quality.
- creating an automatic mechanism for cutting up images and naming cut up slices, depending on the matrix method of representation
By the conceived map visualization system a couple of objectives have been regarded: - the visualization of viruses spreading process history which offers the possibility of monitoring the disease from initiation to extinction;
- the visualization of some risk scenarios based on furnaces apparition and spreading patterns;
- the visualization of areas with potential spreading risk and area that have been artificial immunized (by vaccination) or naturally immunized (due to previous contact with the virus);
- the possibility of map tracking for each human establishment in order to facilitate the display of specific data. ACKNOWLEDGMENT This system was developed in the framework of SIMONPAN project: “Intelligent System of Monitoring and Early Warning upon Pandemic Spread of Viruses”. The project number is 128/2006, financed by Romanian Government, through CEEX - VIASAN - Romanian National Research & Development Program.
REFERENCES
[6] K.Aaby, R.L.Abbey, J.W.Herrmann,
M.Treadwell, C.S.Jordan, and K.Wood, Embracing Computer Modeling to Address Pandemic Influenza in the 21st Century, J.Public Health Management Practice, 2006, 12(4), 365-372.
[7] Akbay K., Using Simulation Optimization to Find the Best Solution, IIE Transactions, May 1996, 24-29.
[8] Ahmed M., T. Alkhamis, and M. Hasan, Optimizing discrete stochastic systems using simulated annealing and simulation, Computers and Industrial Engineering, 32, 823-836, 1997.
[9] Andres T., Sampling methods and sensitivity analysis for large parameter sets, Journal of Statistics Computation and Simulation, 57, 77-110, 1997.
[10] Bossel H., Modeling & Simulation, A. K. Peters Pub., 1994.
[11] Biggs, N.; Lloyd, E. & Wilson, R. Graph Theory, 1736-1936 Oxford University Press, 1986.
[12] Bulgren, W., Discrete System Simulation, Prentice-Hall, 1982.
[13] B.S. Cooper, R.J.Pitman, .J.Edmunds, N.J.Gay, Delaying the International Spread of Pandemic Influenza, PLoS Medicine, vol.3, issue 6, June 2006.
[14] A.Doyle, I.Bonmarin, D. Levy-Bruhl, Y. Le Strat, J.-C. Desenclos, Influenza pandemic preparedness in France: modelling the impact of interventions, J.Epidemiol Community Health, 2006, 60, 399-404.
[15] Chartrand, Gary, Introductory Graph Theory, Dover. ISBN 0-486-24775-9.
[16]Dudewicz E., and Z. Karian, Tutorial: Modern Design and Analysis of Discrete-Event Computer Simulations, IEEE Computer Society Press, Los Angeles, CA, 1985.
[17] T.C. Germann, K.Kadau, I.M.Longini jr., C.A.Macken, Mitigation strategies for pandemic influenza in the United States, PNAS, apr.11, 2006, vol.103, no.15, 5935-5940.
[18] Gould H., Introduction to Computer Simulation Methods, Addison Wesley Pub. Co., 1995
[19] Krauth J., and R. Schaback, An interactive system for simulation and graphic evaluation of discrete and continuous models, The First European Simulation Congress, 1983.

REVISTA ROMÂNĂ DE AUTOMATICĂ
61
[20] S. Merler, G.Jurman, C. Furlanello, C. Rizzo, et all, Strategies for containing an influenza pandemic: the case of Italy, ITC-irst Technical report T06-08-01.
[21] Paul E. Black and Paul J. Tanenbaum, "graph", in Dictionary of Algorithms and Data Structures, Paul E. Black, ed., U.S. National Institute of Standards and Technology. 18 October 2007.
[22] T. Pavlidis, Algorithms for Graphics and Image Processing, Springer-Verlag, Berlin-Heidelberg, 1982.Pelle, Stéphane (1996), La Théorie des Graphes, Saint-Mandé: École Nationale des Sciences Géographiques,
[23] Rubinstein R., and B. Melamed, Modern Simulation and Modeling, Wiley, 1998.
AR3-8.doc
REVISTA ROMÂNĂ DE AUTOMATICĂ
62
Related Documents