274 Section III: Recommendations for Optimal Industry Performance CHAPTER 8 PROMOTING EFFICIENT TREATMENT: NEW TECHNOLOGY AND HEALTH CARE COSTS Martti Kulvik – Ismo Linnosmaa – Joel Shalowitz – Raine Hermans 8.1 INTRODUCTION The previous chapters have dealt with companies’ responses to the contradictory government intentions of fostering innovation while seeking to hold down or reduce health care costs. This chapter shows how the interests of the stakeholders can be aligned by presenting a model which explains the links among technology pricing, efficiency of treatment, and long-term health care costs. These dimensions are contrasted with patient utilities received from acute and long-term care. In evaluating a new technology for approval, the U.S. Food and Drug Adminis- tration (FDA) requires evidence of safety and efficacy, but not its economic impact. Further, although the cost-benefit amalyses are common in the health economics literature, the measures they employ do not incorporate long-term social optima based on microeconomic principles. Accordingly, there is need for a theoretical model that can integrate the concepts of the cost structure of the entire health care sector and the non-monetary benefits of social optimization on order to evaluate the true cost-efficiency of new health care technologies. This chapter presents such a model by using clinical examples of two new clinical innovations. In explaining the framework, how implementation of these technologies affects the long-term cost structure as well as measures of patient utility is analyzed. The model can, therefore, serve as a publicly transparent tool for a health care planner as well as a pricing technique for health care providers and suppliers.

Welcome message from author
This document is posted to help you gain knowledge. Please leave a comment to let me know what you think about it! Share it to your friends and learn new things together.
Transcript

274 Section III: Recommendations for Optimal Industry Performance
ChaPteR 8
PROmOtIng effICIent tReatment: new teChnOlOgy and health CaRe COStS Martti Kulvik – Ismo Linnosmaa – Joel Shalowitz – Raine Hermans
8.1 IntroductIon
The previous chapters have dealt with companies’ responses to the contradictory government intentions of fostering innovation while seeking to hold down or reduce health care costs. This chapter shows how the interests of the stakeholders can be aligned by presenting a model which explains the links among technology pricing, efficiency of treatment, and long-term health care costs. These dimensions are contrasted with patient utilities received from acute and long-term care.
In evaluating a new technology for approval, the U.S. Food and Drug Adminis-tration (FDA) requires evidence of safety and efficacy, but not its economic impact. Further, although the cost-benefit amalyses are common in the health economics literature, the measures they employ do not incorporate long-term social optima based on microeconomic principles. Accordingly, there is need for a theoretical model that can integrate the concepts of the cost structure of the entire health care sector and the non-monetary benefits of social optimization on order to evaluate the true cost-efficiency of new health care technologies. This chapter presents such a model by using clinical examples of two new clinical innovations. In explaining the framework, how implementation of these technologies affects the long-term cost structure as well as measures of patient utility is analyzed. The model can, therefore, serve as a publicly transparent tool for a health care planner as well as a pricing technique for health care providers and suppliers.

275Promoting efficient treatment: new technology and health Care Costs
8.1.1 health care trends
When people buy pharmaceuticals, they do not primarily buy grams or other quantities. They buy pain release, cure, or some other effects. If there are many competitors for the same indications, the consumer purchases quantities of medi-cines. However, since the patients and physicians prefer the most efficient treat-ment over any substitute, the price level should be contrasted to the effectiveness of the pharmaceutical and not the unit price with the same logic as in other high technology industries.
The health care sector has reached a major crossroad in many Western coun-tries. In particular, advances in medical science, rising pressures from a growing elderly population, and the discovery of previously unknown disease mechanisms bring with them new and more effective treatments causing rapidly increasing cost pressures.
However, some recent technological applications are expected to spawn cost savings over the long run by, for example, making time-consuming diagnostic methods more efficient and facilitating more timely targeted therapy. Examples of diseases amenable to savings are strokes and schizophrenia, the former being a problem of the elderly population and the latter an illness affecting 1% of the entire world’s population. If more efficient ways can be found to make diagnoses and treat patients who would otherwise need long-term treatment, even relatively expensive methods can generate considerable cost savings.
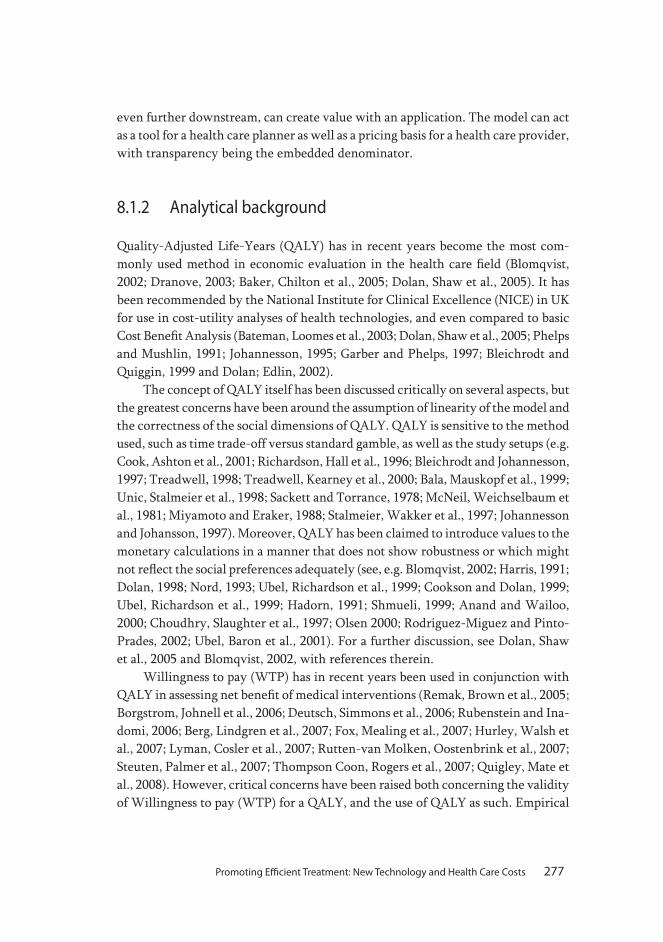
Figure 8.1 Drug development and drivers of health care markets

276 Section III: Recommendations for Optimal Industry Performance
Despite potential long-term advantages, technology approval regulation rarely considers future cost savings. For instance, the US, Food and Drug Administration (FDA) requires evidence on safety and efficacy, but no evaluation of the economic impacts. In other countries, cost-benefit decisions are made based on short-term factors, such as comparative costs of existing competing technologies. There are many reasons for this perspective and their relative importance varies by country. These reasons include culture (such as short-term versus long-term orientation) and economics (the ability to invest in the short term to gain long-term benefits).
Although there are many cost-benefit analyses in the health economics litera-ture, these measures do not usually assess or recommend a balance between costs and benefit to achieve a social optimum between acute intervention and long-term treatment. Therefore, there is a need for a theoretical model, which provides an analytical framework for addressing this issue and arriving at a rational resource allocation recommendation.
This chapter analyzes how the implementation of new technological applica-tions in acute treatment affects the long-term cost structure of health care and relates these measures to patient utility. It is assumed that the patient utility from getting cured in acute treatment is always higher than the patient utility resulting from any long-term treatment or death. This makes it possible to compare the monetary value of cost impacts of a new technology and relate these measures to the patient utility. To this end, the monetary cost impacts of the new technology can be separated and the price for any improvements in patient utility offered.
The model is applied to two rather different real-life cases. The empirical findings suggest two main conclusions. First, regarding a prevalent disease, even small improvements in efficiency of a new technology may result in the price of incremental patient utility to be negative, which implies that the health care payer can reduce total costs and increase the patient utility by adopting the new treatment. Second, regarding a rare disease, the similar outcome will occur only if the patient base is large enough, or the efficiency of the new technology is significantly higher than its conventional substitutes can provide, which signifies that the technology supplier can find a target level for pricing on a given level of treatment efficiency or vice versa. If the treatment efficiency proves to be lower than intended, the project can be cut even at an early stage. This would be the only way to act profitably as a part of a global value network.
A supplier has at every stage of a development process to consider the end-markets, that is, the needs of all distinctive stakeholders. The stakeholder-oriented view signifies that a product or service must add customer (stakeholder) value. Such strategic planning of marketing is already essential at the very initial development stages, and one should even consider how the customer’s customer, or stakeholders
277Promoting efficient treatment: new technology and health Care Costs
even further downstream, can create value with an application. The model can act as a tool for a health care planner as well as a pricing basis for a health care provider, with transparency being the embedded denominator.
8.1.2 analytical background
Quality-Adjusted Life-Years (QALY) has in recent years become the most com-monly used method in economic evaluation in the health care field (Blomqvist, 2002; Dranove, 2003; Baker, Chilton et al., 2005; Dolan, Shaw et al., 2005). It has been recommended by the National Institute for Clinical Excellence (NICE) in UK for use in cost-utility analyses of health technologies, and even compared to basic Cost Benefit Analysis (Bateman, Loomes et al., 2003; Dolan, Shaw et al., 2005; Phelps and Mushlin, 1991; Johannesson, 1995; Garber and Phelps, 1997; Bleichrodt and Quiggin, 1999 and Dolan; Edlin, 2002).
The concept of QALY itself has been discussed critically on several aspects, but the greatest concerns have been around the assumption of linearity of the model and the correctness of the social dimensions of QALY. QALY is sensitive to the method used, such as time trade-off versus standard gamble, as well as the study setups (e.g. Cook, Ashton et al., 2001; Richardson, Hall et al., 1996; Bleichrodt and Johannesson, 1997; Treadwell, 1998; Treadwell, Kearney et al., 2000; Bala, Mauskopf et al., 1999; Unic, Stalmeier et al., 1998; Sackett and Torrance, 1978; McNeil, Weichselbaum et al., 1981; Miyamoto and Eraker, 1988; Stalmeier, Wakker et al., 1997; Johannesson and Johansson, 1997). Moreover, QALY has been claimed to introduce values to the monetary calculations in a manner that does not show robustness or which might not reflect the social preferences adequately (see, e.g. Blomqvist, 2002; Harris, 1991; Dolan, 1998; Nord, 1993; Ubel, Richardson et al., 1999; Cookson and Dolan, 1999; Ubel, Richardson et al., 1999; Hadorn, 1991; Shmueli, 1999; Anand and Wailoo, 2000; Choudhry, Slaughter et al., 1997; Olsen 2000; Rodriguez-Miguez and Pinto-Prades, 2002; Ubel, Baron et al., 2001). For a further discussion, see Dolan, Shaw et al., 2005 and Blomqvist, 2002, with references therein.
Willingness to pay (WTP) has in recent years been used in conjunction with QALY in assessing net benefit of medical interventions (Remak, Brown et al., 2005; Borgstrom, Johnell et al., 2006; Deutsch, Simmons et al., 2006; Rubenstein and Ina-domi, 2006; Berg, Lindgren et al., 2007; Fox, Mealing et al., 2007; Hurley, Walsh et al., 2007; Lyman, Cosler et al., 2007; Rutten-van Molken, Oostenbrink et al., 2007; Steuten, Palmer et al., 2007; Thompson Coon, Rogers et al., 2007; Quigley, Mate et al., 2008). However, critical concerns have been raised both concerning the validity of Willingness to pay (WTP) for a QALY, and the use of QALY as such. Empirical

278 Section III: Recommendations for Optimal Industry Performance
estimates of WTP for QALY have yielded results ranging from 0.20 NOK (€ 0.03) to US$ 49 133 (€ 31 186) per QALY (Cunningham and Hunt, 2000; Blumenschein and Johannesson, 1998; Zethraeus, 1998; Bala, Wood et al., 1998; Olsen and Donaldson, 1998). Such a large diversity understandably casts doubt on the validity of using WTP for QALY. (For further discussions on using WTP for QALY, see (Blomqvist, 2002 and Baker, Chilton et al., 2005).
8.1.3 Overview of the modeling
This article investigates how the implementation of new technological applica-tions in acute treatment affects the long-term cost structure of health care. To this end, a formal theoretical apparatus is first constructed in which a new technology can be applied in acute intervention. This application, in turn, affects the number of patients requiring long-term treatment. The aim of the theoretical model is to show how the patient utility and monetary costs obtained from the adoption of new technology in acute intervention can be related to those for long-term treat-ment. For this article, long-term treatment is defined as the need for chronic use of medical products (such as pharmaceuticals and devices), medical services, as well as required social services (such as home or institutional care).
Following the discussion by Buxton, Drummond et al., 1997, the aim is to construct a model that will:
1. be kept as simple as possible,2. be as transparent as possible,3. be possible to generalize to several setups,4. offer an adequate comparison with current care(s),5. respect the quality of the data in the model, especially keeping the hard and soft data separated,6. allow assessing robustness with appropriate sensitivity testing.Finally, the model will be tested with empirical cases, preferably with highly different characters.The first empirical case measures the monetary impacts of the introduction
of a new technology for the treatment of strokes, the major cause of somatic dis-ability and the second leading cause of death, with a global burden of 6 million ischemic strokes per year and an estimated 4.4 million individuals dying annually as a result thereof. The second case concerns a relatively rare disease, glioblastoma multiforme, affecting approximately 9,000 patients annually. Glioblastomas are the most severe primary brain cancer type: less than 3% of the patients are alive 5 years

279Promoting efficient treatment: new technology and health Care Costs
after diagnosis. In other words, the first illness has huge impacts on overall health care costs, whereas the second case deals with severe disease with lesser effects at the macro level.
The remainder of this article is organized as follows. First it analyzes the choice of a technology in acute intervention. The choice depends on the prices and effectiveness of technologies. As an end point of theoretical setting, the model presents the social optimum for a basis of empirical analysis. Section 2 measures the monetary impacts of adoption of new technology and relates these figures to the marginal utility of a recovering patient in the two empirical cases. These cases represent concrete examples on how the health care payer can utilize the model as a tool for reconciling the non-monetary benefits with the cost-efficiency of the technology adoption. Appendix 8 presents the theoretical model.
8.2 EmpIrIcalcasEs
The model is tested on two real-life cases chosen from diseases treated at the Hel-sinki University Central Hospital. The first case represents the introduction of a new technology for the treatment of ischemic stroke, the major cause of somatic disability and the second leading cause of death, with a global annual incidence of 6 million cases causing an estimated 4.4 million deaths. (Murray and Lopez, 1997; Wardlaw, Zoppo et al., 2003).
The second case concerns a relatively rare disease, glioblastoma multiforme, affecting approximately 9,000 patients annually. However, glioblastomas are the most severe primary brain cancer type in humans: less than 3% of the patients are alive at 5 years after diagnosis (Ohgaki and Kleihues, 2005). Thus, there is an urgent need for more efficient therapy.
The acute intervention and long-term treatment in both cases are provided by Helsinki University Central Hospital (HUCH) and the regional hospitals, all serving under the Hospital District of Helsinki and Uusimaa (HUS).
8.2.1 Construction of an empirical model
The formal model presented in appendix 8 yields a two-part proposition, one for the case where the relative price increase of a new technology equals or is higher than the relative increase in effectiveness, and the other for an opposite situation. The outcome of this proposition can be modified as V(q) = v(q) – c(q). Thus, the

280 Section III: Recommendations for Optimal Industry Performance
inequalities can be rewritten as follows:
if pp
2
1
2
1
≥ ττ
, then technology 2 is socially optimal when
(8.1a) u v q p pn
c ql − ≥ −−
−( )( )
( )2 1
2 1τ τ,
technology 1 is optimal if
(8.1b) p p
nu v q p
nc ql
2 1
2 1
2
2
−−
> − ( ) ≥ − ( )( )τ τ τ
,
and the minimum care technology is socially optimal whenever
(8.1c) pn
c q n u v ql1
1τ− ≥ − ( ) ( ) .
Similarly, if ττ
2
1
2
1
1≥ >pp
, technology 2 is socially optimal whenever
(8.2) u v q pn
c ql − ≥ −( ) ( )2
2τ
and the minimum care technology 0 is socially optimal otherwise.
The criteria above guide to a social optimum by distinguishing the prices and benefits of the technologies implemented at acute intervention and the intensity of long-term care, respectively. This choice is discussed in detail in the last section, Conclusions and Discussion.
8.2.2 Stroke
Stroke is the most common type of cerebrovascular disease. It requires several days of acute treatment frequently followed by a long rehabilitation period, which has led to an increase in treatment costs. Patients suffering from stroke require an aver-age of about 2.5 years of treatment, which in the Helsinki region corresponds to a cost of approximately 100,000 € per patient (Kaste, Fogelholm et al., 1998; City of Helsinki, 2005a; City of Helsinki, 2005b; City of Helsinki, 2005c).
The Department of Neurology at the Helsinki University Central Hospital (HUCH) offers stroke patients ultra-acute thrombolysis, in which the critical blood
281Promoting efficient treatment: new technology and health Care Costs
clot is acutely dissolved. Thrombolysis is part of an efficient and costly treatment chain consisting of prompt patient screening, computer-aided neuro-imaging and diagnostics, thrombolytic therapy, and continued treatment in a specialized stroke unit. In order to be effective, the thrombolysis must be initiated within 4.5 hours after the first signs of a stroke (Hacke, Kaste et al., 2008). Alteplase, a glycoprotein produced utilizing recombinant DNA technology, serves as the thrombolytic agent, and the costs of the product alone exceed 1,000 euro per dose.
In the model, the acute intervention unit is represented by the Neuro-Emer-gency Unit (NEU) at HUCH, and the long-term treatment provider by the supporting hospitals to which HUCH refers the patient no longer in need of acute and most advanced treatment.
Technology 0 represents a situation where the patient is directly admitted to a supporting hospital, that is, no specific treatment is available. This situation is still a reality for patients such as elderly disabled people, who are directed primarily to the supporting hospitals. No further intensive interventions are implemented, and thus the patients do not incur costs for the acute intervention (representing low and high technology, technology 1 and 2, respectively); all costs are carried by the supporting hospitals.
Technology 1 consists of prompt diagnosis, specialized supportive acute treatment and early onset of intensive rehabilitation, all performed at HUCH and generating cost. The specialized supportive treatment consists of 24-hour surveil-lance, active monitoring and treatment of heart rate, blood sugar and blood pressure, pain, nausea, consciousness, and any new signs and symptoms of deterioration. Due to a more efficient treatment at the acute phase, the survival of stroke patients is higher and thus the patient stream to hospitals providing long-term treatment might increase (Audebert, Schultes et al., 2008). However, the patients usually require less assistance owing to the payoffs of early rehabilitation and a shorter total treat-ment time, leading to lower total costs for the sub-acute and long-term treatment (Audebert, Schultes et al., 2008).
Technology 2 introduction has required additional investments by HUCH, in order to implement a new treatment system. The strict 4.5 hour time window requires:
1. Short response times to emergency calls from patients 2. Efficient on-site diagnosis capability3. Sophisticated imaging techniques and advanced laboratory services avail- able within minutes from the arrival of patient4. Specially trained and certified staff for performing thrombolysis5. Resources available for high-intensive monitoring of patients that have received the therapy.

282 Section III: Recommendations for Optimal Industry Performance
Variable costs include expenses incurred from running the functions above, but particularly from the use of the thrombolytic drug.
With the introduction of thrombolytic therapy at NEU, the neurological wards at HUCH and the long-term treatment providers have benefited from significant savings due to a diminished stream of severely ill patients. This benefit is derived from those patients who are virtually cured at an early stage and need less subsequent support and rehabilitation interventions. In 2002, about 8% of the stroke patients coming to the HUCH neurological clinic received thrombolysis; by the end of 2003 the number had doubled. The time window for thrombolysis was extended from 3 to 4.5 hours at end of year 2008. As data is not yet available from the effects of the extended time period, our calculations are based on data from the earlier period with a 3 hour time window. The new extended time window will in future probably show as a further increased number of stroke patients receiving thromboysis.
About 60 % of the patients receiving thrombolysis fully recovered. The total cost savings with respect to the recovered patients have been estimated to be ap-proximately 84,000€ per patient (Kaste, Fogelholm et al., 1998; Lindsberg, Roine et al., 2000; City of Helsinki, 2005a; City of Helsinki, 2005b; City of Helsinki, 2005c) the savings represent over 80 % of the non-recovering patients’ total treatment costs (Lindsberg, Roine et al., 2000). Most of the savings comes from the costs after the first year (Kaste, Fogelholm et al., 1998), where health care personnel expenses constitute the most significant share of the costs.
defining the parameters for ischemic stroke
The regulator is the Hospital District of Helsinki and Uusimaa, HUS.The acute intervention is represented by the Department of Neurology at
HUCH and regional hospitals, all serving under HUS. As significant recovery can be seen especially during the first post-stroke year, the acute phase is here defined to include direct costs incurring from intensive treatment up to one year after the initial stroke incident.
The long-term treatment is provided by the regional hospitals of Helsinki and Uusimaa, all serving under HUS. The bulk of costs from long-term treatment incur after the first year from the initial stroke incident (Kaste, Fogelholm et al., 1998; Lindsberg, Roine et al., 2000).
The number of patients is 2,000 per annum (Lindsberg, Roine et al., 2000).Technology 0, t0, consists of supportive care given at the regional hospitals.
This care is a baseline treatment and does not incur additional costs; thus p0 = 0

283Promoting efficient treatment: new technology and health Care Costs
Technology 1, t1, is offered initially by the Stroke unit at HUCH and contin-ued up to 1 year after the stroke incident. It includes specialized acute-phase care after a stroke, as well as intensive rehabilitation both in HUCH and in the regional hospitals. The price increase when introducing technology 1 is derived from the diagnosis-related group (DRG) price for treating one uncomplicated stroke at the teaching university hospital1; p1 = 8.12 M€ (HUS, 2005b).2 The DRG price includes both intensified acute treatment as well as basic care; however, as an intensified acute treatment leads to a higher survival rate and thus increases total treatment given, it is assumed that the DRG price reflects sufficiently well the true total ad-ditional costs induced by technology 1.
Technology 2, t2, is employed over a series of events, beginning at the site of the stroke and ending either after a decision not to give thrombolytic therapy, or at the Stroke Unit after thrombolysis. The additional costs induced by the addition of thrombolytic therapy are offset by the savings resulting from reduced disability during the first year (Fagan, Morgenstern et al., 1998). Thus, the short-term price for treating one stroke with Alteplase (technology 2) is: p2 = 8.12 M€ (HUS, 2005).3
Severity of illness at referral to the acute intervention provider is defined as severe ischemic stroke yielding three or more points on the The National Institute of Health Stroke Scale (NIHSS).
The health care budget B is set by a regional political council with representa-tives from all communities in Helsinki and Uusimaa that refer patients to HUS. The total budget for stroke treatment in the Helsinki and Uusimaa region is approximated to be 80 million euro annually (Kaste, Fogelholm et al., 1998; Lindsberg, Roine et al., 2000; City of Helsinki, 2005a; City of Helsinki, 2005b; City of Helsinki, 2005c).
The share of budget allocation to acute intervention µ is set by HUS. Typi-cally, the acute and long-term sectors have separate budgets. HUS was established in order to facilitate coordinated budget allocation between acute interventions and long-term treatment. In this example, the initial costs of introducing technologies 1 and 2 were fully born by the acute intervention provider, but without a change in the budget allocation µ.
1 the 2005 dRg price was used to reflect the treatment costs since: 1) the 2005 dRg-price did not yet include the price of thrombolytic therapy, 2) patients that received therapy by technology 0 were treated outside hUCh and hence did not influence the dRg-price, and 3) virtually all patients entering hUCh received therapy with technology 1 (but not 0 or 2).
2 p1 = 4 060€ / patient * 2000 patients = 8.12 m€.
3 p2 = (4 060 € / patient * 1 900 patients) + (4 060 € / patient * 100 patients) = 8.12 m€.

284 Section III: Recommendations for Optimal Industry Performance
The obtained utility u(ah) and u(al) are defined as the end-points of high and low severity of disease after acute treatment, respectively. In this paper, the modified Rankin scale is used as a criteria for independence: a score of 0 – 2 is approximately equivalent to independence, and it corresponds to a score of > 18 on the Barthel Index (Wade, 1995). Consequently, a modified Rankin score of 0 – 2 demonstrates low severity of disease, and high severity is defined as a score of > 2. The obtained utility is evaluated at one year after the stroke as a function of the end-point and the probability of achieving that end-point.
For the acute intervention phase the utility from treatment is defined to be zero, ul = 0, when the Rankin score remains > 2; and with a score of 0 – 2 the patient experiences a positive utility from the treatment, and ul > 0.
The probability of having a low severity of disease, that is, having a modi-fied Rankin of 0 to 2 after receiving treatment at the acute intervention is 0 for the reference technology 0 (t0 = 0), 0.22 for technology 1 (t1 = 0.220) and 0.227 for technology 2 (t2 = 0.227) (Wardlaw, Zoppo et al., 2003; Cochrane, 2007).4
Slackness S is usually perceived as an unwanted way of allocating resources, and thus S is preferably minimized. The assumption holds also with all units in HUS.
The number of stroke patients is 2.000 annually; n=2000. Two parallel methods for counting the average cost c(q) of treating one Finn-
ish stroke patient with basic technology (p0) are utilized. The costs have originally been calculated with an extrapolation to 1991 (Kaste, Fogelholm et al., 1998). In the first calculation the same assumptions as in Kaste et al. are used, that is, a dis-count rate of 5% and an increase of productivity by 1.5%. This calculation yielded an average cost of 86,548 euro per patient for 2004. In the r second calculation the unitary costs of health care and social services needed in the treatment of stroke patients that were used as a basis for the calculations in 1987 were related to the corresponding costs in 2004 (Kaste, Fogelholm et al., 1998; City of Helsinki, 2005a; City of Helsinki, 2005b; City of Helsinki, 2005c). The second calculation yielded a cost of 75,682 euro per patient. The average of these two calculations yields as c(q) 81,115 euro per stroke patient treated with technology zero.
4 Proportion of eligible patients for thrombolytic therapy x risk reduction = 0.22+[0.05 x 0.14] = 0.227.
285Promoting efficient treatment: new technology and health Care Costs
8.2.3 Boron neutron capture therapy
Glioblastoma multiforme has eluded efficient therapy, with the most efficient available treatment offering roughly a doubling of the median survival time to ap-proximately 40 weeks after diagnosis (Andersen, 1978; Walker, Alexander et al., 1978; Walker, Green et al., 1980; Chin, Young et al., 1981; Kristiansen, Hagen et al., 1981). In an attempt to offer significant improvement to the prognosis of this deleterious disease, the Finnish Boron Neutron Capture Therapy (BNCT) project was launched in 1994. In this paper it is defined as technology 2.
BNCT is based on boron-10 atoms coupled to a carrier molecule with an af-finity towards malignant cells. Once inside the cancer cell, the boron-10 molecule (10B) is activated by neutrons and disintegrates quickly giving rise to closely spaced ionizing events with a high linear energy transfer (LET). The high LET irradiation induces injuries with little if any cellular repair, but only near to, on, or within the cells containing 10B atoms. Thus, the tumor cells are eliminated but the normal tissue is spared.
In basic treatment (technology 0) the patient is diagnosed and given sup-portive care, which includes neurosurgical removal of the visible tumor mass. In some cases the patient can be severely ill at time of diagnosis or the location of the tumor can inaccessible, contraindicating normal treatment measures; these patients are, however, exceptions.
A patient not presenting with specific contraindications is usually offered con-comitant radiation after the neurosurgical debulkment. Technology 1 is defined as consisting of 1. a neurosurgical operation with the aim of removing all malignant tissue, and 2. a full series of radiation therapy sessions, in addition to normal sup-portive procedures and therapy.
Technology 2 encompasses 1. a normal neurosurgical operation, followed by 2. BNCT-treatment as described above. The introduction of technology 2 has required major investments: extensive modifications of the nuclear research reac-tor FiR-1 in Espoo (Auterinen, Hiismäki et al., 1998), quality assurance measures thereof (Auterinen, Seren et al., 2004; Uusi-Simola, Seren et al., 2004), development of a boron measurement system (Laakso, Kulvik et al., 2001), preclinical safety testing (Kulvik, Vahatalo et al., 2004). and the complete development work from synthesis experimentation to clinical applications for the boron-carrier-complex (Kulvik, Vahatalo et al., 2003).
The patient treatments started in 1999 through a specific BNCT treatment company, and the treatments have been ongoing ever since (Joensuu, Kankaanranta et al., 2003; Kankaanranta, 2005; Pakkala, 2005).
286 Section III: Recommendations for Optimal Industry Performance
defining the parameters for glioblastoma treatments
The main treatment is always given in a University hospital, where the treatment costs are intercomparable. Additionally, because BNCT is performed only in HUCH, the interventions provided there are used as representing the whole country.
For the model the following parameters can be defined:• The regulator is the Hospital District of Helsinki and Uusimaa, HUS. However, there will still be only one BNCT treatment station in the fore- seeable future, and as glioblastomas are rare, the implementation will cover all of Finland.• The acute intervention is provided by the Departments of Neurology, Neurosurgery and Oncology at HUCH, serving under HUS. The acute phase is here defined to include direct costs that are additional to normal treat- ment costs for patients suffering from glioblastoma multiforme.• The long-term treatment is provided by HUCH and the regional hospitals of Helsinki and Uusimaa, all serving under HUS. As opposed to stroke, the bulk of long-term treatment is delivered during the first year following diagnosis.• The number of patients is approximately 150 per annum (Ohgaki and Kleihues, 2005).Technology 0, t0, consists of prompt diagnosis, acute intervention, a neuro-
surgical operation. and supportive care given initially at HUCH and later mainly at the regional hospitals. This is a baseline treatment and does not incur additional costs; thus p0 = 0.
Technology 1, t1, is offered by the Department of neurology at HUCH (di-agnosis and acute intervention), the Department of Neurosurgery at HUCH (neu-rosurgical debulkment and histological-pathological diagnosis of tumour), and the Department of oncology at HUCH (radiation therapy); of these, however, only the radiation therapy incurs additional cost when compared to technology 0. As the equipment is used mainly for the treatment of other, more frequently occurring, diseases, accrue initial fixed costs for the introduction of technology 1 are not ac-crued; the fixed costs are adequately included in the DRG price for glioblastoma multiforme. The price increase when introducing technology 1 is derived from the diagnosis-related group (DRG) price for treating one glioblastoma multiforme -pa-tient at HUCH; p1 = 2,420 euro / patient * 150 patients = 363,000 euro (Neurology, 2005; Neurosurgery, 2005; Oncology knowledge center Hospital District of Helsinki and Uusimaa, HUS 2005; HUS, 2005a). As an intensified acute treatment leads to a longer survival time, it is assumed that the DRG price adequately reflects the true total additional costs induced by technology 1.

287Promoting efficient treatment: new technology and health Care Costs
Technology 2, t2, consists of a series of events and interventions, starting with those of technology 1. The additional costs induced by technology 2 consist of allocated fixed and variable costs associated with BNCT therapy, less the price for giving a full series of conventional radiotherapy (which BNCT replaces). As several other brain cancer treatment modalities are under continuous research, and especially as accelerator based neutron sources are under intensive development, it is assumed that the effective life cycle for nuclear reactor based BNCT is 10 years, after which the technology has become too obsolete to be competitive (Blue and Yanch, 2003; Svensson and Moller, 2003; Kononov, Kononov et al., 2004; Lee, Han et al., 2004). The first patient in Finland was treated on May 1999, and by May 2005 42 brain tumour patients received BNC-treatment (Kankaanranta, 2005). Project-ing a steadily rising patient stream, it is somewhat optimistically assumed that 100 more patients will be treated in the next four years. It is additionally assumed that the increasing patient stream brings about savings due to a streamlining of the pro-cedures, which compensates for the impact of inflation on costs. Keeping the price for one treatment at the 2005 level, that is, 20,000 euro, a price for technology 2 is obtained: p2 = 890,120 euro.5
Severity of illness at referral to the acute intervention provider is defined as glioblastoma with clear symptoms of disease and a Karnofsky score below 70; the Karnofsky score will be discussed in more detail below.
The health care budget B is in principle set regionally by respective political councils or their equivalent. However, in the case of rare diseases with interventions centralized to university hospitals, the budget is set by the respective university hospitals. As BNCT is given solely at HUCH, the decisions are made by a political council with representatives from all communities in Helsinki and Uusimaa that refer patients to HUS. The total budget for treatment of glioblastoma multiforme in Finland to be 4,440 million euro annually (Neurological department Hospital District of Helsinki and Uusimaa HUS, 2005; Neurology, 2005; Neurosurgery, 2005; Neurosurgical department Hospital District of Helsinki and Uusimaa HUS, 2005; Oncology knowledge center Hospital District of Helsinki and Uusimaa HUS, 2005; City of Helsinki, 2005a; City of Helsinki, 2005b; City of Helsinki, 2005c)6.
5 Price for technology 2 p2 = (2,420 € / patient * 136 patients/year) + 2,000,000 €/10 years + 20,000 € / patient * 14.2 patients/year = 329,120 + 200,000 + 280,000 € = 890,120 €.
6 this consists of initial treatment costs of (2,400 € + 7,020 € + 2,420 €) = 11,840 / patient (diagnosis, initial treat-ment, neurosurgery and radiation therapy) and a three month late stage period totalling 16,200 €, where the patient is again in need of intensified support and treatment.

288 Section III: Recommendations for Optimal Industry Performance
The share of budget allocation to acute intervention µ is also in brain tu-mor treatment set by HUS. However, in contrast to treatment of stroke, only the initial costs of introducing technology 1 were born by the acute intervention. The establishment of the BNCT treatment station was strongly supported by the Na-tional Technology Agency of Finland and therefore HUCH incurred no additional costs. Te model intends, however, to take as broad a view as possible, and thus the fixed costs for technology 2 are also included in the calculations. As the funding is external, µ is not changed.
The obtained utility u(ah) and u(al) are defined as the end-points of high and low severity of disease, respectively. The Karnofsky Performance Scale combines the degree of disease with a person’s ability to care for themselves (Karnofsky, Abelmann et al., 1948). While it is widely used, it offers only a rather arbitrary assessment of severity of disease (Slevin, Plant et al., 1988; Murray, Nelson et al., 1995; Green, 1997). However, since it has been commonly used in clinical trials concerning brain tumor treatment, it is used for the purpose of this study. Conse-quently, a Karnofsky score of n u V q p
l −[ ] ≥( *) 2
2τ 70 (70 = Cares for themselves, unable to perform
normal activity or to do active work) is defined as demonstrating low severity of disease, and high severity is defined as a Karnofsky score of < 70.
The obtained utility is evaluated at one year after diagnosis as a function of the end-point and the probability tt = of achieving that end-point.
At the end of the acute intervention phase if a patient has a Karnofsky score of n u V q p
l −[ ] ≥( *) 2
2τ 70 this is defined as having experienced a positive utility from the treatment
u(al) > 0, -even if the patient started with a score > 70, the treatment can prevent deterioration. On the other hand, if the Karnofsky remains below 70, the utility: u(ah) = 0.
Slackness S is usually perceived as an unwanted way of allocating resources, and thus S is preferably minimized. The assumption holds also with all units in HUS.
150 patients are diagnosed annually with glioblastoma multiforme. The enhanced probability of having a low severity of disease after basic
treatment, that is, a Karnofsky score of n u V q pl −[ ] ≥( *) 2
2τ 70 at one year after diagnosis, is 0 for
technology 0 (t0 = 0), 0.082 for technology 1 (t1 = 0.082) (Kristiansen, Hagen et al., 1981; Laperriere, Zuraw et al., 2002)7. For BNCT, the developers strived for an enhancement of t by 50%8, yielding t2 = 0.123 (Kallio, Kulvik et al., 1997).
7 t1 was derived by combining 1. Performance data on glioblastoma patients after operation and radiotherapy
with or without chemotherapy, yielding an average 62% of patients not capable of caring for self at one year, with 2. Risk ratio for 1-year mortality of post-operative radiotherapy versus no radiotherapy = 0.81; these correspond to the terms s
t and d
t in equation (2), respectively.
8 the enhancement reflected anticipations of both a better survival for a subpopulation as well as a better quality of life as assessed by ability of caring for self.

289Promoting efficient treatment: new technology and health Care Costs
The average cost c(q) of treating one Finnish glioblastoma patient with reference technology 0(p0) is derived by combining several data sources. The DRG price 2,400 euro/patient reflects costs accrued from initial diagnosis and treatment (Neurological department Hospital District of Helsinki and Uusimaa HUS, 2005). The initial CT-scan has to be complemented by an MR-imaging and followed by neurosurgery, adding up to a total cost of 7,020 euro (Neurosurgical department Hospital District of Helsinki and Uusimaa HUS, 2005). Costs related to radiation therapy are excluded. With such treatment the weighted average median survival of patients is 18 weeks, with an initial improvement phase, a long phase of deteriora-tion, and concomitantly an increasing need of care with occasional visits to an acute intervention unit (Chin, Young et al., 1981; Laperriere, Zuraw et al., 2002). The sup-portive phase is about two thirds of the total survival time (Kristiansen, Hagen et al., 1981), and thus the average price of later stage treatment is approximated to 17,762 euro (City of Helsinki, 2005a; City of Helsinki, 2005b; City of Helsinki, 2005c).9 The reference technology yields a total average cost of 27,182 euro/patient.
8.3 rEsults
The derived values for stroke and glioblastoma multiforme, respectively are collected below (Tables 8.1 and 8.2).
Stroke
By entering these values into proposition 1, it can be seen that the three zero-slack allocations (s=0) result in the values {0, 0.1015, 0.1015}, indicating that for optimal treatment intensity, µ should get a value of 0 or 0.1015. As technology 2 incurs no additional costs compared to technology 1, the health care payer is initially indif-ferent between technologies 1 and 2.
Proposition 2 makes a distinction between whether pp
2
1
1 00= . is smaller than ττ
2
1
1 032= . or not.
As ττ
2
1
1 032= . and pp
2
1
1 00= . and hence ττ
2
1
2
1
> pp
, technology 2 accord-
ing to equation 19. Thus
9 the average treatment duration is 83 days and the daily cost 214 €.

290 Section III: Recommendations for Optimal Industry Performance
Glioblastoma Multiforme health care budget B 4.4 mill. technology t t
0 t
1 t
2
Patients n 150 1,501 50Price of technology p 0 363,000 890,120probability of having a low severity of disease τ 0 0.082 0.123average cost of treatment c(q) 27,182 Results Zero slack values s=0 0 0.082 0.2Severity of illness d l (low) h (high)Obtained utility v(q) u(al) > 0 u(ah) = 0 corresponding to Karnofsky ≥ 70 < 70 threshold for adopting new technology u v ql − ( ) ≥* 58,528
Table 8.2 The parameters for glioblastoma multiforme
Stroke health care budget B 80 mill.technology t t
0 t
1 t
2
Patients n 2,000 2,000 2,000Price of technology p 0 8,120,000 8,120,000probability of having a low severity of disease τ 0 0.220 0.227average cost of treatment c(q) c(q) 81,115 Results Zero slack values s = 0 0 0.1015 0.1015Severity of illness d l (low) h (high) Obtained utility v(q) u(al) > 0 u(ah) = 0 corresponding to Rankin d 0 - 2 > 2 threshold for adopting new technology u v ql − ( ) ≥* -63,230
Table 8.1 The parameters for stroke

291Promoting efficient treatment: new technology and health Care Costs
(8.3) u v ql − ( ) ≥* - 63,230 € / patient
The inequalities indicate that technology 2 should be chosen if the added value of a successful acute treatment as compared to optimal long-term treatment is appreciated to be an equivalent of -63,230 euro or more. The negative number denotes that technology 2 offers a direct economic advantage, and thus the choice between technologies seems evident. A graphical display of the analysis shows that the cost-efficiency frontier for technology 2 breaks the zero level if technology 2 required infrastructure investments of 1.2 m euro as an actual cash outflow in 2005 prices (Figure 8.2); with higher initial investments the treatement would induce an extra cost for each additional recovered patient.
In strict monetary terms, the results reflect the marginal/incremental utility of a successful acute treatment compared to optimal long-term treatment, and 63,230 euro is the monetary value above which the incremental utility should re-main in order for thrombolysis to be adopted. This finding is in concordance with the results obtained from traditional economic analyses: treatment of stroke with recombinant DNA based alteplase not only saves lives, but also incurs significant monetary savings for society.
Figure 8.2 The cost-efficiency frontiers in acute intervention treatment of stroke in increasing prices of thrombolytic therapy

292 Section III: Recommendations for Optimal Industry Performance
It should be noted, that all other things being equal, u – v should logically be n u V q p
l −[ ] ≥( *) 2
2τ 0, because long-term treatment can never be preferable to acute intervention if
their effect is equal; it would not be meaningful to keep the patient sick for a longer instead of a shorter time. Theoretically, a social dictator might purposely choose to promote long-term care, even at an additional cost, for example, in order to promote jobs in the sector. In this case, the dictator might choose to spend 63,230 euro/patient so that the hospital can be kept running.
The share of eligible patients for thrombolysis has been a central point in economic calculations concerning this therapy (Hankey and Warlow, 1999; Linds-berg, Roine et al., 2000). The model suggests that available data strongly support the rationale for adopting technology 2 irrespective of even significant changes in the achieved eligibility percentages: for eligibility percentages between 1 and 33%, technology 2 remains dominant, with only a marginal change in the achieved utility (Figure 8.3).
Finally, technology 2 remains economically competitive up to a direct addi-tional treatment cost of 15,416 euro, after which the same situation applies as with technology 1: other explanations defend a choice of technology 2 as compared to technologies 1 and 0, but always induce an economic burden for the health care payer.
Figure 8.3 The cost-efficiency frontiers in acute intervention: treatment of stroke with an increasing number of eligible patients for thrombolytic therapy

293Promoting efficient treatment: new technology and health Care Costs
glioblastoma multiforme
Proposition 1 yields three zero-slack allocations (s=0) with corresponding values of {0, 0.082, 0.200}, indicating that for an optimal treatment intensity µ should get a value of 0.082 or 0.200. Proposition 2 makes a distinction between whether
pp
2
1
1 00= . is smaller than τ
τ2
1
1 032= . or not. As
(8.4) pp
2
1
= 2.452 and ττ
2
1
= 1.500 and hence pp
2
1
2
1
> ττ
technology 2 should be optimal if
(8.5) n u a V q p pl[ ( ) ( )]− ≥ −−
2 1
2 1τ τ.
The right side of the inequality can be regarded as emphasizing the economic rationale of introducing a new technology, whereas the left side highlights other, non-monetary arguments in favor of an intensified acute phase treatment.
By plugging in the numbers yielding
(8.6) n u a V ql[ ( ) ( )]− ≥ 85,710€
or
(8.7) ⇔ − ≥u a v ql( ) ( ( *) 58,528€/patient
it can be seen that technology 2 should be chosen if the added value (or op-portunity cost) of a successful acute treatment compared to optimal long-term treatment is appreciated to be an equivalent of 58,528 euro or more. In other words, technology 2 does not offer any direct economic advantage, and thus the choice between technologies is ambiguous.
This situation is graphically displayed in Figure 8.4, where the cost-efficiency frontier for technology 2 does not break the zero level. High sunk costs (initial investment of 1.2 M euro) in development of the technology 2 can be overtaken either by enhancing the patient base and the size of units providing this kind of treatment, or by introducing a new technology with higher direct health effects

294 Section III: Recommendations for Optimal Industry Performance
or lower cost technology, that is, < 1.2 M euro. With the sunk costs that high, the cost-efficiency frontier for technology 2 breaks the zero level with recovery rates no less than 55%, as shown in Figure 8.5.
In the latter case, technology 2 is not economically competitive; however, it can be chosen on other grounds. Such arguments could be: an interest in the technology per se, a vision of a development of the technology to become more competitive, or a lower risk of death or dependency.
The results derived from the utilization of BNCT on glioblastoma-type brain cancers seem in economic terms to be almost opposite to the results of the stroke thrombolysis. The model suggests that the health care payer decides to adopt the BNCT technology as the main application in acute intervention if the payer values a single additional self-caring patient at 58,528 euro.
Figure 8.4 The costs associated with one recovered patient as a function of the probability of achieving good health with technologies 1 and 2

295Promoting efficient treatment: new technology and health Care Costs
8.4 conclusIonsanddIscussIon
This study analyses how the implementation of new technological applications in acute treatment affects the long-term cost structure of health care. The non-mon-etary utility is compared to cost-efficiency impacts of a new technology. A theoretical apparatus is constructed and utilized in two empirical cases: thrombolysis therapy for stroke, and Boron Neutron Capture Therapy (BNCT) on glioblastoma-type brain cancers. The empirical cases indicate how the monetary cost-efficiency of the new technologies can be related to the non-monetary patient utility.
The first empirical case shows, that the introduction of a new treatment tech-nology can induce direct savings for the health care payer. Critical factors are the probability of the treatment being effective, the incidence of the disease, as well as the costs of acute versus long-term treatment and the initial sunk costs. The introduction of the assessed technologies is clearly rational compared to baseline technology.
In the second empirical case, all critical factors are nearly opposite to the first case: it presents a rare disease with a low probability of recovery, high sunk costs
Figure 8.5 The costs associated with the probability of achieving good health with technologies 1 and 2

296 Section III: Recommendations for Optimal Industry Performance
as well as acute treatment costs, but relatively low long-term treatment costs due to the rapidly aggressive progression of the disease. A new technology showing low effect but high initial costs calls for a larger population base. This situation calls for cooperation across national borders.
Finally, four issues will be discussed, which can be dealt with from perspec-tives different than those above in the model. First, the non-monetary benefits are related to the monetary measures of cost-efficiency of the model. Second, the model provides an assumption on the zero-slackness in acute health care, which is questioned and discussed. Third, some perspectives on the risk profiles and pric-ing of new technologies especially at the early stage of development are adduced. Fourth, how the probability of the patient dying affects the cost-efficiency calculus will be discussed.
1. Non-monetary benefits vs. monetary cost-efficiency. The benefits from an adop-tion of new technology can be purely humanitarian, or they might involve economic impacts, typically secondary and indirect, that have not been taken into account in the conventional cost-benefit calculations. Examples of potential benefits are:
• the non-monetary value of avoiding deaths per se• the non-monetary value of an early recovery, leading to a better quality of life• a preponderance of new technology per se• potential secondary benefits from supporting a novel technology (e.g. ap- plications in other fields or further applications in the same field)• a preference towards labor intensive solutions.The above benefits are difficult to measure in monetary terms. The main idea of
the presented analysis is, however, that the model enables the comparison between the non-monetary utility and monetary cost-effectiveness. Accordingly, the model presents the non-monetary utility and the cost-effectiveness of acute intervention. The model enables the direct valuation of distinctive policy decisions. For instance, empirical comparison between the BNCT treatment and conventional radiation therapy resulted in the actual improvement in acute intervention efficiency being relatively costly without concomitant benefits after the adoption of BNCT technol-ogy. However, the model does not provide strict answers, about whether the payer should adopt of the new technology; instead, it relates the non-monetary benefits to the cost-efficiency of adopting the technology.
Stroke is a disorder plaguing the elderly population in particular and it is important to note that the development of effective and expensive comprehensive treatment applied at the right time has proven to generate significant savings from society’s perspective. Therefore, reasoning not to adopt the new technology would be based on a disutility of patient cure.

297Promoting efficient treatment: new technology and health Care Costs
Introducing a new technology frequently induces additional initial costs. A health care provider who is paid by a global budget has, therefore, an intrinsic bar-rier to introducing a costly new technology even if that technology is cost-saving in the long run. Additionally, there might be non-intentional factors hampering the introduction of a new technology. Examples of these factors include:
• system inertia (labor unions, sectoral thinking)• aversion to primary expenditure• ignorance concerning the positive effects of intensified acute interven- tion• reluctance towards new technologies.2. Organizational Slackness. From an operational point of view, slackness should
always be minimized as long as it incurs cost savings. In health care the importance of redundancy (also called excess capacity), is seemingly contradictory to operational efficiency. Redundancy is desirable, however, for public health reasons, such as potential widespread acts of terrorism and threats of SARS or bird flu-type pandem-ics. If a provider unit is running optimally in an economical sense, according to the above principles, it does not yield a profit or loss. However, such an operating unit can reallocate resources by, for example, shutting down a ward for a certain period, and thus it possesses in reality some discretionary power.
3. Risk profiles and pricing of new technologies. Companies developing health care technologies could use the model in setting their price. Utilisation of simula-tion techniques and probability distributions would assist the pricing and valuation procedures particularly in the early stage of the development procedures while the variables of the model are unknown or highly sensitive.
4. Probability that the patient dies (for clarity, e the risk of a patient dying will be denoted as d). The risk of death d for patients annually referred to the long-term treatment varies with the chosen technology as follows:
Technology 0: all patients access primarily long-term treatment, and thus nt0 = 2000. It is noteworthy, that only 62% of these patients will survive their stroke (Numminen, Kotila et al., 1996). Thus, d
0 = 0.38.
Technology 1: All patients are primarily treated at a specialized stroke unit, which enhances the survival rate by 11%; consequently, approximately 69% of the patients will survive the initial phase; d
0 = 0.31 and nt1 for the long-term treatment
equals 1,377 patients (Cochrane, 2007). Technology 2: A conservative approach suggests that 5% of all ischemic stroke
patients will receive thrombolytic therapy (Lindsberg, Roine et al., 2000). Of these, 17% will die (Numminen, Kotila et al., 1996; Hacke, Kaste et al., 1998; Lindsberg, Roine et al., 2000). However, one out of seven have been reported as regaining in-dependence after severe initial stroke, that is, the number-needed-to-treat (NNT)

298 Section III: Recommendations for Optimal Industry Performance
for avoiding dependence is 7 (Donnan, 1998) (see also Cornu, Amsallem et al., 2001; Donnan and Davis, 2001). In the catchment area of HUS 100 out of 2000 stroke patients will receive thrombolysis, with 83 patients surviving the treatment and 14 avoiding dependency; without thrombolysis, all 14 would be severely debilitated with a Rankin score above 2. Consequently, d
2 = 0.303 and nt2 = 1377 patients will
be remitted to long-term treatment.The technology-dependent risk of death could preferably be included in the
model by differentiating between the probabilities of dying or remaining severely ill, respectively. Death can decrease long-term treatment costs, sometimes even with a significant impact, but simultaneously the potential labor input of a patient of working age is lost. The concept of Quality-adjusted life-year (QALY) attempts to address the issue. In doing so, QALY combines non-monetary and monetary utilities (see, e.g. Dranove (2003) and citations therein).The intention with the presented model has been to keep the monetary and non-monetary utilities strictly separate [on opposite sides of equation], yet allowing each party to bring their ex-pertise into the assessment process and thereby initiate a solid discussion between the entities involved.
The presented model is built on a theoretically solid microeconomic foundation. The empirical background is from the area of health care, but can also be employed in analyses in other fields when decisions must be made concerning implementa-tion of a new technology.

299Promoting efficient treatment: new technology and health Care Costs
appEndIx8modElIngthEprIcIngofthEhEalthcarEInnovatIons
a8 the model
In order to analyze the choices made by health care payers and service providers, the strategic decision-making between the payer and acute intervention and long-term treatment providers is considered. Acute intervention refers to furnishing the initial treatment for patients; long-term treatment refers to treating patients not recovering after receiving acute intervention10. These activities can be located in the same or different hospitals. There are n patients in the acute intervention and patients can be treated using one of three treatments, treatment 0, 1, or 2. The set of available technologies is denoted as T = {0, 1,2}. Technology 0 refers to basic care in which all patients receive standard attention and are referred to the long-term treatment provider for further treatment. Since this technology is used as the reference point, it sets a standard cost for the acute intervention: the price of any other technology is compared to this cost. The prices of technologies 1 and 2 for the acute interven-tion are denoted as p1 and p2 . It is assumed throughout the text that technology 2 is more expensive but also more effective than technology 1 and p1 < p2 . Prices can measure lump-sum payments which the hospital has to pay for the use of tech-nologies or they can also measure total costs of applying technologies to a certain population of patients.
The severity of disease is denoted as d. Disease categories are divided into two classes, low, l, or high, h, severity. This division is made according to established, measurable criteria. For example, for the diseases discussed below, this distinction is made using the Karnofsky scale with a 70 score as the dividing line. In what fol-lows, a patient is also said to be mildly (that is,, d = l) or severely (that is,, d = h) ill. It is assumed that all patients entering the acute intervention have a high severity of disease and are in need of treatment. The probability that a patient has low sever-ity of disease after treatment at the acute intervention is given as tt = Prob(d = l |t). This probability is conditional on the chosen technology t. All patients that show a high severity of illness after the acute intervention will be referred for long-term treatment. It is assumed that technology 2 is the most effective11 and the minimum
10 for more standard definitions of long-term care and treatment, see norton (2000).
11 In what follows, effectiveness of a health care technology is defined in terms of probability tt.

300 Section III: Recommendations for Optimal Industry Performance
care technology is ineffective in a sense that 0 c a≤ t0 < t1 < t2 < 1. This effectiveness ranking means that the application of technology 2 maximizes the number of patients with only mild illness, and technology 1 offers results better than baseline therapy but inferior to technology 2. Although in reality a fraction of patients may die as a result of applying technology 1 or technology 2, it is assumed that this fraction is always sufficiently small to be ignored in the formal analysis.
Patients obtain utility levels ul and uh from being treated for their illness.It is assumed that a patient has obtained no utility if the severity of disease at the end-point is still high, that is, uh = 0, and the patient obtains a positive utility level in case the illness is only mild, that is,, ul > 0, after acute intervention. Therefore, a representative patient obtains expected utility t1 ul at the acute intervention. The aggregate expected utility for patients in the acute intervention is then
(A8.1) EU(t) = n t1 ul .
It is assumed that both providers operate under a zero-profit constraint (see Newhouse, 1970; Chalkey and Malcolmson, 2000). The objective of the acute intervention is to maximize aggregate expected utility obtained from alternative treatments subject to the constraint that the provider earns zero profit. The zero profit constraint for the acute intervention can be defined as mB - s - pt = 0, where mB is the share of expenses paid from health care payers’ budget to the provider. This concept is referred to below as health care budget. It is assumed that any resources which the provider obtains over and above the price of the chosen technology is spent on organizational slack, measured by the variable s. The term slack includes 1) pure technical inefficiency, 2) accumulating reserves, or 3) purposeful slackness (preparedness for unexpected events).
The total cost function of the long-term treatment is C(q,n) = c(q)n(t), where c(q) measures the average cost of treating one patient with treatment intensity q > 0 and n(t) is the number of patients treated in the long-term treatment provider. It is assumed throughout this paper that the unit cost function c(q) is a monotoni-cally increasing and continuous function of the long-term treatment intensity q and c(0) = 0.
This model creates a connection between treatment decisions at the acute intervention and the demand for and costs of long-term treatment. In particular, the number of patients in the long-term treatment can be defined as n(t) = (1-t1)n and depends on the health care technology chosen by the acute intervention unit. Consequently, the more effective the technology at the acute intervention, the fewer patients will need services in a long-term treatment facility.

301Promoting efficient treatment: new technology and health Care Costs
The revenue of the long-term treatment unit is determined purely by the health care payers’ budgetary decisions12. If the payer allocates fraction m of the budget to the acute intervention, the long-term treatment unit obtains a revenue of (1 - m)B. The payoff of the long-term treatment can be defined as
(A8.2) L q t B n c qt( , , ) ( ) ( ) ( )µ µ τ= − − −1 1
If for a given choice of treatment intensity L(q,m,t) > 0 the provider retains a profit, and if L(q,m,t) < 0, the health care payer has to supply the long-term treatment with more resources. However, as m and B are chosen by the health care regulator, and the probability of recovery is a function of technology choice made by the acute intervention, the long-term treatment provider can conform to the requirement of zero profits and adopt a treatment intensity q for which L(q,m,t) = 0.
It is assumed that each patient obtains a (monetary-equivalent) benefit v(q) from treatment intensity q at the long-term treatment. It is also assumed that v(0) = 0 and that the benefit function v(q) is increasing and continuous with treatment intensity [and marginal benefit gradually diminishes]. It is further assumed that treatment intensity is given and that there is a sufficiently large qmax such that q c a≤ qmax.
Decision-making occurs sequentially in three stages within the model (Figure A8.1). In the first date, Date 0, the health care payer selects a fraction m (1 - m) of the health care budget, B (B > 0), to be allocated for acute intervention and long-term treatment. The objective function of the health care regulator is defined more precisely in the following section.
In the second date, Date 1, the hospital providing the acute intervention makes a decision between the available technologies 0, 1 and 2 and recognizes the associated costs. The technology choice of the hospital is constrained by the budget allocated to acute care.
12 this is consistent with the way the demand for long-termlong-term treatment is modelled. as the hospital fac-es no patients paying for their care out of their own pockets, it is natural to think that all revenue the hospital earns comes from a health care authority, a payer in our case. a purely public hospital would be a good real-world example.
Figure A8.1 Sequence of decisions
302 Section III: Recommendations for Optimal Industry Performance
In the last date, Date 2, the long-term treatment provider selects the level of treatment intensity, given the number of severely ill patients and the budget share chosen by the health care regulator. After receiving care at the long-term treatment provider the patient has achieved maximum potential for recovery given the initial severity and effectiveness of the given technology. (that is,, patients have d = l).
Since decision-making occurs sequentially in the model and decisions in later dates depend on choices made in early dates, the principle of the backward induction is applied: the model is solved in a backward fashion by first considering decisions made at the long-term treatment provider.
a8.1 treatment intensity in the long-term treatment
The long-term treatment provider selects treatment intensity q(m,t), which yields zero monetary payoff L(q(m,t),m,t) = 0. The zero profit condition can be solved
with respect to unit cost as c q t Bnt
( ( , )) ( )( )
µµτ
= −−
11
. Since, by assumption, the unit cost function is monotonically increasing it has an inverse function c-1(z) for each positive average cost z. Hence the hospital will provide the level of treatment
intensity q t c Bnt
( , ) (( )( )
)µµτ
= −−
−1 11
and the associated total cost is given as c(q(m,t))(1-
tt)n. The treatment intensity in the long-term treatment provider decreases if the number of severely ill patients from the acute intervention, n(t), increases or if the budget share allocated to the acute intervention, m, grows. These results can be confirmed by taking partial derivatives of the zero-profit treatment intensity with respect to n(t) and m. As an example, consider the case in which the cost function is linear and c(q) = cq. This analysis yields optimal treatment intensity
q t Bnct
( , ) ( )( )
µµτ
= −−
11
, verifying the comparative static results of this example.
For a zero-profit provider operating under the fixed budget it is reasonable to assume that the provider decreases its long-term treatment intensity as the number of its patients increase. As the number of referred patients increase, the provider faces a higher cost but since a provider’s revenue is fixed, it has to reduce its total cost by decreasing per patient treatment intensity accordingly.

303Promoting efficient treatment: new technology and health Care Costs
a8.2 Selection of the acute intervention technology
The acute intervention provider’s selection of technology is determined by the budget share m chosen by the health care payer. If the payer selects a budget share which satisfies the condition p1 ( )n ≥ 0 mB ( )n ≥ 0 0, the acute intervention provider has no other choice but to use the minimum care technology and refer all its patients to the long-term treatment. The provider uses all its resources to generate organizational slack and s = mB. The efficacy of the intervention is at its minimum and the used technology is t0. In case the payer provides more resources for acute interventions and p2 ( )n ≥ 0 mB ( )n ≥ 0 p1, feasible technologies are technology 1 and the minimum care technology. Because 0 = t0 ul < t1 ul, the acute intervention provider maximizes its utility by choosing technology 1 and spends any additional resources on organiza-tional slack s = mB – p1 .
If the budget share for acute interventions satisfies mB ( )n ≥ 0 p2 any one of three technologies is feasible for the provider. The assumption 1 > t2 > t1> t0 ( )n ≥ 00 implies that n t2 ul > n t1 ul > n t0 ul ( )n ≥ 0 0 and the provider ends up using the most effective and the most expensive technology, that is, technology 2. In this case the organizational slack is given as s = mB - p2 .
a8.3 the health care payer: slackness and allocating the given budget
In order to see which technology and what level of treatment intensity the health care payer is willing to implement, the payer’s decision concerning the allocation of budget shares for the acute and long-term treatment at Date 0 is then analyzed. Three kinds of payers with different objective functions are considered. The first two payers are similar to each other as they both aim at minimizing the total cost of health care; the difference between the payers lies in their emphasis on different components of health care costs. The first type of payer aims at minimizing the total cost of health care, CI, defined as
(A8.3) CI p c q n st t= + − +( )( )1 τ
The cost-minimization problem turns out to be easy to solve because of zero-profit constraints. The zero-profit condition for the acute intervention implies that mB = s + pt. Moreover, as the long-term treatment provider also operates under the zero-profit condition and selects a treatment intensity which satisfies (1-m)B

304 Section III: Recommendations for Optimal Industry Performance
= c(q)(1-tt)n, the total cost to the health care payer for any budget allocation is mB + (1-m)B = B. This analysis suggests that the cost-minimizing payer is indifferent when it comes to allocating the health care budget between the acute intervention and long-term treatment units.
The second type of payer places a different weight on organizational slack than on other components of health care costs. A slack averse health care payer regards organizational slack as unproductive and attempts to root it out; a slack-inclined payer places special emphasis on promoting slackness.13
If the health care payer is slack-averse, it consequently aims to implement solu-tions for which organizational slack is as small as possible. This preference leaves the payer with three allocations to compare, namely budget allocations for which the acute intervention share m obtains one of the values 0, p1 /B, or p2 /B. In each such point, the total cost of health care is B implying that the payer is indifferent for such points, as well as between these points randomly.
The third type of payer treats different components of health care similarly, but it takes benefits of health care into account. It is further assumed that the payer’s goal is to maximize the difference between the health benefits and total costs of health care, to be called the net benefit of health care. As the organizational slack is a real cost-item for the payer it is included in the total cost of health care. The health utility from the acute intervention is given by the aggregate expected util-ity EU(t) = n tt ul and the total benefit of the long-term treatment can be defined as v(q)(1-tt)n. Consider a payer who selects budget shares of the acute intervention and long-term treatment by maximizing the net benefit of health care
(A8.4) NetBenefit n u v q n p c q n st l t t t= + − − + − +τ τ τ( )( ) ( ( )( ) )1 1
and shows no special preference for organizational slackness. By the zero-profit conditions it always holds true that pt + s = mB and c(q)(1-tt)n = (1- m)B and the total cost for the payer is B no matter how the budget shares are allocated between the acute intervention and the long-term treatment. Any differences that might arise between different allocations of the budget must come from differences in health benefits. In case the payer selects a budget share satisfying 0 c a≤ mB c a≤ p1, all patients are treated in the long-term treatment and the health care benefit is given as nv(q(m,0)), where q c B
n( , ) (( ) )µ
µ0 11= −− , and the net benefit is given as nv(q(m,0)) – B. On
13 an example of a slack-inclined payer is a government that wants to build excess capacity to guard against short-ages in event of a public health crisis.

305Promoting efficient treatment: new technology and health Care Costs
the other hand, if the budget share of the acute intervention satisfies p1 c a≤ mB c a≤ p2, then the net health benefit is n[t1ul + (1–t1)v(q(m,1))] – B, where
q c B
n( , ) (( )
( ))µ
µτ
1 11
1
1
= −−
−. Finally if p2 c a≤ mB, then the net benefit for the payer is
n[t2ul + (1-t2)v(q(m,2))] – B, where q c B
n( , ) (( )
( ))µ
µτ
2 11
1
2
= −−
− . Clearly, as the total cost of health care is always the same, the health care payer implements a technology and treatment intensity for which the per patient health benefit ttul + (1–tt)v(q(m,t)) is as high as possible. Based on the above analysis two proposition sets are offered.
Proposition 1: Because the providers operate under the zero-profit constraints, a) A payer interested in minimizing the total cost of health care is indifferent between different allocations of the health care budgetb) A slack-averse health care payer is indifferent between budget allocations yield- ing zero organizational slack, andc) A health care payer interested in the net benefit of health care bases the deci- sion-making on per patient health benefits only.
a8.4 Social optimum
The socially optimal health care technology and the level of treatment intensity is analyzed next. In order to do that, consideration is paid to a social planner who maximizes the welfare function
(A8.5) W t q n u nv q p nc qt l t t t( , ) ( ) ( ) ( ) ( )= + − − − −τ τ τ1 1
The welfare function takes into account the total health benefits and total cost of health care. As the organizational slack is basically a transfer of income from the regulator to the provider, the slack from the welfare analysis is ignored.
The social planner maximizes welfare by selecting a technology from the set of available technologies and the level of treatment intensity. A socially optimal technology and treatment intensity (t*, q*) must satisfy the condition
(A8.6) W t q W t q( *, *) ( , )≥
for all feasible treatment intensity and technology pairs ( , )t q T R∈ × .

306 Section III: Recommendations for Optimal Industry Performance
Assuming that socially optimal treatment intensity exists and is interior, it must satisfy the necessary condition for maximum
(A8.7) v q c q'( *) '( *)− = 0
Socially optimal treatment intensity equates patient level marginal benefit from the long-term treatment with the marginal cost. What is worth observing is that the socially optimal long-term treatment intensity is independent of the optimal acute intervention technology. A socially optimal acute intervention technology t* satisfies the condition
(A8.8) n u n v q p n c qt l t t tτ τ τ* * * *( ) ( *) ( ) ( *)+ − − − − ≥1 1 n u n v q p n c qt l t t tτ τ τ+ − − − −( ) ( *) ( ) ( *)1 1
where t is any feasible technology in the set of available technologies. The above condition can be rearranged as
(A8.9) n u V q p pl t t t t t t( ) ( *)( )* * *τ τ τ τ− + −[ ] ≥ −
where V(q*) = v(q*) - c(q*) is the net benefit from treating one patient in the long-term treatment, evaluated at the optimal treatment intensity q*.
The first part on the left hand side of the inequality (Equation 10) denotes the net benefit offered by the optimal technology as opposed to any alternative health care technology, where the benefit is described by a change in the probability t of having only a mild disease after an intervention with the optimal technology. The second part describes the marginal cost change induced by an optimal technology, where the cost change is described by a change in the number of severely ill patients entering long-term treatment after an intervention using optimal technology. The sum of these must be greater than the price of changing to optimal technology. It is to be noted that any of these terms can also be negative.
The above condition can be rewritten as
(A8.10) n u V q p pl t t t t−[ ] −( ) ≥ −( *) * *τ τ In the above inequality (Equation 11), the left-hand side measures the incre-
mental total benefits between the efficient technology t* and its alternative tech-nology t and the right-hand side of the inequality measures the incremental cost incurred from a change from technology t* to t. For example, if the more effective

307Promoting efficient treatment: new technology and health Care Costs
technology 2 is chosen instead of technology 1 (and the difference t2 - t1 > 0), the expected aggregate utility from acute intervention increases, and the number of severely ill patients being referred from the acute intervention to the long-term treatment will consequently be reduced.
The term ul -V(q*) denotes the total benefit a patient receives from health care. The reason why the net benefit V(q*) enters equation 11 with a negative sign is that a more effective acute intervention technology reduces the number of patients who would enjoy the net benefit V(q*) at the long-term treatment in case of a less effective technology.
For the sake of simplicity it is assumed throughout the following analysis that the patient utility of the acute intervention, ul, exceeds the net benefit of long-term treatment, V(q*), when evaluated at the optimum, or ul - V(q*) > 0. For notational streamlining only in the following analysis the total aggregate benefit from health care is denoted as n[ul - V(q*)] = W.
As a final step in the model the preconditions for each specific technology to be optimal technologies for society are derived.
Conditions for technology 2 to dominate First, the conditions under which the socially optimal health care technology is technology 2 are analyzed. This outcome occurs if technology 2 is better than tech-nologies 1 or 0. As t2 - t1 > 0, assuming14 here t0 = 0 and p0 = 0, the formal conditions for a social planner to choose technology 2 are given as
(A8.11) W p p≥ −−
2 1
2 1τ τdenoting the comparison against technology 1, and
(A8.12) Wp≥ 2
2τdenoting the comparison against technology 0.
Equation A8.12 says that the total aggregate health benefit exceeds the incre-mental cost-efficiency ratio between technologies 2 and 1, respectively, and the condition (13) does the same except that it compares technology 2 to technology 0.
14 we set t0 = 0 so that the model compares a new technology to a baseline technology, looking at incremental changes.

308 Section III: Recommendations for Optimal Industry Performance
Both conditions hold true simultaneously if the total aggregate health benefit exceeds both incremental cost-efficiency ratios, that is, the condition
W p p p= −
−
max ,2 1
2 1
2
2τ τ τ is satisfied. Now,
p p p2 1
2 1
2
2
−−
≥τ τ τ
holds true if and only if the condition
pp
2
1
2
1
1≥ >ττ
is satisfied. In this case a sufficient condition for the planner to prefer technology 2 is when W p p≥ −
−2 1
2 1τ τ. In case the condition
ττ
2
1
2
1
1≥ >pp
holds true, technology 2 should be chosen whenever the total health benefit exceeds the incremental cost-efficiency ratio for the minimum care tech- nology, or W p≥ 2
2τ.
Conditions for technology 1 to dominateThe situation in which technology 1 is socially optimal is considered next. Since t1 - t0 = t1 > 0 and t2 - t1 > 0, the conditions for technology 1 to dominate over other health care technologies occurs when conditions
(A8.13) W p≥ 1
1τ and
(A8.14) p p W2 1
2 1
−−
≥τ τ
are both satisfied. Technology 1 is optimal for society if and only if the total health benefit satisfies the condition
p W p p1
1
2 1
2 1τ τ τ≤ ≤ −
− that is, technology 1 is better
than technology 0 and technology 2. If
p p2 1
2 1
−−τ τ
is smaller than p1
1τ, the above
conditions cannot be satisfied and technology 1 cannot be socially optimal. This situation occurs if the condition
ττ
2
1
2
1
1> >pp
holds true.

309Promoting efficient treatment: new technology and health Care Costs
Conditions for technology 0 to dominateSince tt > 0 for t = 1,2, the social planner wants to select the minimum care technol-ogy at the acute intervention if and only if
(A8.15) W pt
t
≤τ
for t = 1,2. The above two conditions hold simultaneously when the condition W p p≤
min ,1
1
2
2τ τ holds true. Now
p p2
2
1
1τ τ≥ if and only if
pp
2
1
2
1
≥ ττ
.
Choosing the technologyThe relationship between the ratios
pp
2
1
and ττ
2
1
plays an important role in ranking the incremental cost-effectiveness ratios (ICER) for the technologies. The condition pp
2
1
2
1
≥ ττ
is crucial in ranking the cost-effectiveness ratios between different tech- nologies. The cost-effectiveness ratio for two technologies, t and s, are denoted as ICER p p
tst s
t s
= −−τ τ
. Under the condition pp
2
1
2
1
≥ ττ
it holds true that ICER10 c a≤ ICER20 c a≤ ICER21 , and
pp
2
1
2
1
< ττ
if the condition does not hold true and then ICER21 < ICER20 < ICER10 .
The following conclusions ensue:
1. If the relative price increase of switching from technology 1 to technology 2 is greater than the relative increase in probability of low severity, that is, the condition pp
2
1
2
1
≥ ττ
holds true, then the incremental cost-effectiveness ratios can be ranked as
p p p p2 1
2 1
2
2
1
1
−−
≥ ≥τ τ τ τ
. In this case, technology 2 is socially optimal if the total aggregate health benefit n u V ql −[ ]( *) exceeds the highest incremental cost-ef- fectiveness ratio p p2 1
2 1
−−τ τ
, technology 1 is socially optimal if

310 Section III: Recommendations for Optimal Industry Performance
p p n u V q pl
2 1
2 1
1
1
−−
> −[ ] >τ τ τ
( *) , and the minimum care technology is socially optimal in case
p n u V ql1
1τ≥ −[ ]( *) .
2. If the relative increase in probability of health offered by technology 2 is equal to, or higher than, the relative price increase albeit technology 2 is more expensive than technology 1, that is,
ττ
2
1
2
1
1> >pp
, then technology 1 is never socially optimal. Consequently, technology 2 is preferred by the social planner if
(A8.16) n u V q p n u V q pl l−[ ] ≥ ⇔ −[ ] ≥( *) ( *) ,2
22 2ττ
that is,, the total benefit offered by technology 2 is considered greater than its price. Technology 0, minimum care technology, is optimal otherwise. The following proposition summarizes the above discussion.
Proposition 2: If pp
2
1
2
1
≥ ττ
then technology 2 dominates under the condition,
n u V q p p
l −[ ] ≥ −−
( *) 2 1
2 1τ τ technology 1 dominates under the condition,
p n u V q p pl
1
1
2 1
2 1τ τ τ≤ −[ ] < −
−( *) and technology 0 dominates otherwise. If
ττ
2
1
2
1
1> >pp
, then technology 2 dominates under the condition n u V q pl −[ ] ≥( *) 2
2τ
and the minimum care technology, dominates otherwise.

311Promoting efficient treatment: new technology and health Care Costs
lItEraturE
anand, P. – wailoo, a. (2000): Utilities versus Rights to Publicly Provided goods: arguments and evidence from health Care Rationing. Economica, 67(268): 543-577.
andersen, a.P. (1978): Postoperative irradiation of glioblastomas. Results in a randomized series. Acta Radiol Oncol Radiat Phys Biol, 17(6): 475-84.
audebert, h.J. – Schultes, K. – tietz, V. – heuschmann, P.U. – Bogdahn, U. – haberl, R.l. – Schenkel, J. – writing Committee for the telemedical Project for Integrative Stroke, C. (2008): long-term effects of Specialized Stroke Care with telemedicine Support in Community hospitals on Behalf of the telemedical Project for Integrative Stroke Care (temPiS). Stroke: StROKeaha.108.529255.
auterinen, I. – hiismäki, P. – Serén, t. – Seppälä, t. (1998): Creating an epithermal neutron field for BnCt using a triga reactor and an aluminum-aluminum fluoride composite as neutron moderator. 1998 anS Radiation Protection and Shielding division topical Conference technologies for the new Century, nashville, tn, USa, american nuclear Society.
auterinen, I. – Seren, t. – Kotiluoto, P. – Uusi-Simola, J. – Savolainen, S. (2004): Quality assurance procedures for the neutron beam monitors at the fiR 1 BnCt facility. Appl Radiat Isot, 61(5): 1015-9.
Baker, R. – Chilton, S. – donaldson, C. – Jones-lee, m. – metcalf, h. – Shakcley, P. (2005): determining the societal value of a Qaly by surveying the public in england and wales: a research protocol. 64.
Bala, m.V. – mauskopf, J.a. – wood, l.l. (1999): willingness to pay as a measure of health benefits. Pharmacoeconom-ics, 15(1): 9-18.
Bala, m.V. – wood, l.l. – Zarkin, g.a. – norton, e.C. – gafni, a. – O’Brien, B. (1998): Valuing outcomes in health care: a comparison of willingness to pay and quality-adjusted life-years. Journal of Clinical Ppidemiology, 51(8): 667-76.
Bateman, I. – loomes, g. – mugford, m. – Robinson, a. – Smith, R. – Sproston, K. – Sugden, R. (2003): what is the Value to Society of a Qaly? Issues Raised and Recommendations for how to address them. Report for national Institute for Clinical excellence (nICe) and national Co-ordinating Centre for Research methodology (nCCRm). Retrieved Janu-ary 5th, 2009, from http://www.pcpoh.bham.ac.uk/publichealth/methodology/docs/publications/gl_Qaly_report_feb03.pdf.
Berg, J. – lindgren, P. – Spiesser, J. – Parry, d. – Jonsson, B. (2007): Cost-effectiveness of clopidogrel in myocardial infarction with St-segment elevation: a european model based on the ClaRIty and COmmIt trials. Clin Ther, 29(6): 1184-202.
Bleichrodt, h. – Johannesson, m. (1997): Standard gamble, time trade-off and rating scale: experimental results on the ranking properties of Qalys. Journal of Health Economics, 16(2): 155-75.
Bleichrodt, h. – Quiggin, J. (1999): life-cycle preferences over consumption and health: when is cost-effectiveness analysis equivalent to cost-benefit analysis? Journal of Health Economics, 18(6): 681-708.
Blomqvist, a. (2002): Qalys, standard gambles, and the expected budget constraint. Journal of Health Economics, 21(2): 181-195.
Blue, t.e. – yanch, J. C. (2003): accelerator-based epithermal neutron sources for boron neutron capture therapy of brain tumors. J Neurooncol, 62(1-2): 19-31.
Blumenschein, K. – Johannesson, m. (1998): Relationship between quality of life instruments, health state utilities, and willingness to pay in patients with asthma. Annals of allergy, asthma & immunology, 80(2): 189-94.
Borgstrom, f. – Johnell, O. – Kanis, J.a. – Jonsson, B. – Rehnberg, C. (2006): at what hip fracture risk is it cost-effective to treat? International intervention thresholds for the treatment of osteoporosis. Osteoporos Int, 17(10): 1459-71.
Buxton, m.J. – drummond, m.f. – Van hout, B.a. – Prince, R.l. – Sheldon, t.a. – Szucs, t. – Vray, m. (1997): modelling in economic evaluation: an unavoidable fact of life. Health Econ, 6(3): 217-227.
Chalkey, m. – malcolmson, J. (2000): government Purchasing of health Services. In Culyer, a.J. – newhouse, J.P., eds. (2000): Handbook of Health Economics. Volume 1A, handbooks in economics, vol. 17. amsterdam, new york and Oxford, elsevier Science.

312 Section III: Recommendations for Optimal Industry Performance
Chin, h.w. – young, a.B. – maruyama, y. (1981): Survival response of malignant gliomas to radiotherapy with or with-out BCnU or methyl-CCnU chemotherapy at the University of Kentucky medical Center. Cancer Treat Rep, 65(1-2): 45-51.
Choudhry, n. – Slaughter, P. – Sykora, K. – naylor, C.d. (1997): distributional dilemmas in health policy: large benefits for a few or smaller benefits for many? Journal of Health Services Research & Policy, 2(4): 212-6.
City of helsinki (2005a): Helsingin Kaupunki. Tilinpäätös 2004, helsingin kaupungin talous- ja suunnittelukeskus (helsinki City annual Report 2004), City of helsinki.
City of helsinki (2005b): Helsingin terveyslautakunta, Esityslista 5-2005, (health Committee agenda no 5/2005), City of helsinki, 47 pages.
City of helsinki (2005c): Terveyskeskuksen toimintakertomus vuodelta 2004 – Terveyttä Helsinkiläisille, (annual report of the health center in year 2004 – health for the citizens of helsinki), City of helsinki, 22 pages.
Cochrane (2007): Organised inpatient (stroke unit) care for stroke. Cochrane Database Syst Rev, (4): Cd000197.
Cook, K.f. – ashton, C.m. – Byrne, m.m. – Brody, B. – geraci, J. – giesler, R.B. – hanita, m. – Souchek, J. – wray, n.P. (2001): a psychometric analysis of the measurement level of the rating scale, time trade-off, and standard gamble. Social Science & Medicine (1982), 53(10): 1275-85.
Cookson, R. – dolan, P. (1999): Public views on health care rationing: a group discussion study. Health Policy (amster-dam, netherlands), 49(1-2): 63-74.
Cornu, C. – amsallem, e. – Serradj-Jaillard, a.a. (2001): thrombolytic therapy for acute ischemic stroke. Am J Cardio-vasc Drugs, 1(4): 281-92.
Cunningham, S.J. – hunt, n.P. (2000): Relationship between utility values and willingness to pay in patients under- going orthognathic treatment. Community Dental Health, 17(2): 92-6.
deutsch, P.a. – Simmons, m.S. – wallace, J.m. (2006): Cost-effectiveness of split-night polysomnography and home studies in the evaluation of obstructive sleep apnea syndrome. J Clin Sleep Med, 2(2): 145-53.
dolan, P. (1998): the measurement of individual utility and social welfare. Journal of Health Economics, 17(1): 39-52.
dolan, P. – edlin, R. (2002): Is it really possible to build a bridge between cost-benefit analysis and cost-effectiveness analysis? Journal of Health Economics, 21(5): 827-843.
dolan, P. – Shaw, R. – tsuchiya, a. – williams, a. (2005): Qaly maximisation and people’s preferences: a methodologi-cal review of the literature. Health Econ, 14(2): 197-208.
donnan, g. (1998): a meta analysis of three recent large trials of tPa in acute ischemic stroke. the third annual meet-ing of advances in acute Stroke management. Crete, quoted in: thrombolysis in the treatment of acute Ischemic Stroke. what are the likely Pharmacoeconomic Consequences? lindsberg, P.J. – Roine, R.O. – Kaste, m. CNS Drugs 2000 Jul; 14(1): 1-9.
donnan, g.a. – davis, S.m. (2001): thrombolysis in acute ischaemic stroke. J Clin Neurosci, 8(2): 112-5.
dranove, d. (2003): What’s Your Life Worth? Health Care Rationing... Who Lives? Who Dies? And Who Decides? Upper Sad-dle River, financial times Prentice hall.
fagan, S.C. – morgenstern, l.B. – Petitta, a. – ward, R.e. – tilley, B.C. – marler, J.R. – levine, S.R. – Broderick, J.P. – Kwiatkowski, t.g. – frankel, m. – Brott, t.g., et al. (1998): Cost-effectiveness of tissue plasminogen activator for acute ischemic stroke. nIndS rt-Pa Stroke Study group. Neurology, 50(4): 883-90.
fox, m. – mealing, S. – anderson, R. – dean, J. – Stein, K. – Price, a. – taylor, R. S. (2007): the clinical effectiveness and cost-effectiveness of cardiac resynchronisation (biventricular pacing) for heart failure: systematic review and eco-nomic model. Health Technol Assess, 11(47): iii-iv, ix-248.
garber, a.m. – Phelps, C.e. (1997): economic foundations of cost-effectiveness analysis. Journal of Health Economics, 16(1): 1-31.
green, S.B. (1997): does assessment of quality of life in comparative cancer trials make a difference? a discussion. Control Clin Trials, 18(4): 306-10.

313Promoting efficient treatment: new technology and health Care Costs
hacke, w. – Kaste, m. – Bluhmki, e. – Brozman, m. – davalos, a. – guidetti, d. – larrue, V. – lees, K.R. – medeghri, Z. – machnig, t. – Schneider, d., et al. (2008): thrombolysis with alteplase 3 to 4.5 hours after acute ischemic stroke. N Engl J Med, 359(13): 1317-29.
hacke, w. – Kaste, m. – fieschi, C. – von Kummer, R. – davalos, a. – meier, d. – larrue, V. – Bluhmki, e. – davis, S. – donnan, g. – Schneider, d., et al. (1998): Randomised double-blind placebo-controlled trial of thrombolytic therapy with intravenous alteplase in acute ischaemic stroke (eCaSS II). Second european-australasian acute Stroke Study Investigators. Lancet, 352(9136): 1245-51.
hadorn, d.C. (1991): Setting health care priorities in Oregon. Cost-effectiveness meets the rule of rescue. Jama, 265(17): 2218-25.
hankey, g.J. – warlow, C.P. (1999): treatment and secondary prevention of stroke: evidence, costs, and effects on individuals and populations. Lancet, 354(9188): 1457-63.
harris, J. (1991): Unprincipled Qalys: a response to Cubbon. Journal of Medical Ethics, 17(4): 185-8.
hurley, m.V. – walsh, n.e. – mitchell, h.l. – Pimm, t.J. – williamson, e. – Jones, R.h. – Reeves, B.C. – dieppe, P.a. – Patel, a. (2007): economic evaluation of a rehabilitation program integrating exercise, self-management, and active coping strategies for chronic knee pain. Arthritis Rheum, 57(7): 1220-9.
hUS (2005a): Hinnasto 2005, Osa 1: Tuotteistetut hinnat, (hUS Price list, part 1: total products). department of neurol-ogy, helsinki University Central hospital hUCh, helsinki hospitals, Unit for neurology, neurosurgery and eye- and ear-diseases, hospital district of helsinki and Uusimaa hUS: 37, norddrg 011.
hUS (2005b): Hinnasto 2005, Osa 1: Tuotteistetut hinnat, (hUS Price list, part 1: total products). department of neurol-ogy, helsinki University Central hospital hUCh, helsinki hospitals, Unit for neurology, neurosurgery and eye- and ear-diseases, hospital district of helsinki and Uusimaa hUS: 37, norddRg 014B.
Joensuu, h. – Kankaanranta, l. – Seppälä, t. – auterinen, I. – Kallio, m. – Kulvik, m. – laakso, J. – Vähätalo, J. – Kortes-niemi, m. – Kotiluoto, P. – Seren, t., et al. (2003): Boron neutron capture therapy of brain tumors: clinical trials at the finnish facility using boronophenylalanine. J Neurooncol, 62(1-2): 123-34.
Johannesson, m. (1995): the relationship between cost-effectiveness analysis and cost-benefit analysis. Soc Sci Med, 41(4): 483-9.
Johannesson, m. – Johansson, P.O. (1997): Is the valuation of a Qaly gained independent of age? Some empirical evidence. Journal of Health Economics, 16(5): 589-99.
Kallio, m. – Kulvik, m. – färkkilä, m. (1997): estimations of additional gain from BnC treatment for patients suffering from glioblastoma. Personal notes on expert meeting, m. K. helsinki.
Kankaanranta, l. (2005): Update on BnCt treatments in finland. Personal communication, m. K. helsinki.
Karnofsky, d.a. – abelmann, w.h. – Craver, l.f. – Burchenal, J.h. (1948): the Use of nitrogen mustards in the Palliative treatment of Carcinoma. with Particular Reference to Bronchogenic Carcinoma. Cancer, 1(november): 634-656.
Kaste, m. – fogelholm, R. – Rissanen, a. (1998): economic burden of stroke and the evaluation of new therapies. Public Health, 112(2): 103-12.
Kononov, O.e. – Kononov, V.n. – Bokhovko, m.V. – Korobeynikov, V.V. – Soloviev, a.n. – Sysoev, a.S. – gulidov, I.a. – Chu, w.t. – nigg, d.w. (2004): Optimization of an accelerator-based epithermal neutron source for neutron capture therapy. Appl Radiat Isot, 61(5): 1009-13.
Kristiansen, K. – hagen, S. – Kollevold, t. – torvik, a. – holme, I. – nesbakken, R. – hatlevoll, R. – lindgren, m. – Brun, a. – lindgren, S. – notter, g., et al. (1981): Combined modality therapy of operated astrocytomas grade III and IV. Confir-mation of the value of postoperative irradiation and lack of potentiation of bleomycin on survival time: a prospective multicenter trial of the Scandinavian glioblastoma Study group. Cancer, 47(4): 649-52.
Kulvik, m. – Vähätalo, J. – Buchar, e. – färkkilä, m. – Järviluoma, e. – Jääskeläinen, J. – Kriz, O. – laakso, J. – Rasilainen, m. – Ruokonen, I. – Kallio, m. (2003): Clinical implementation of 4-dihydroxyborylphenylalanine synthesised by an asymmetric pathway. Eur J Pharm Sci, 18(2): 155-63.
Kulvik, m.e. – Vähätalo, J.K. – Benczik, J. – Snellman, m. – laakso, J. – hermans, R. – Järviluoma, e. – Rasilainen, m. – färkkilä, m. – Kallio, m. e. (2004): Boron biodistribution in Beagles after intravenous infusion of 4-dihydroxyborylphe-nylalanine-fructose complex. Appl Radiat Isot, 61(5): 975-9.

314 Section III: Recommendations for Optimal Industry Performance
laakso, J. – Kulvik, m. – Ruokonen, I. – Vähätalo, J. – Zilliacus, R. – färkkilä, m. – Kallio, m. (2001): atomic emission method for total boron in blood during neutron-capture therapy. Clin Chem, 47(10): 1796-803.
laperriere, n. – Zuraw, l. – Cairncross, g. (2002): Radiotherapy for newly diagnosed malignant glioma in adults: a systematic review. Radiother Oncol, 64(3): 259-73.
lee, d.J. – han, C.y. – Park, S.h. – Kim, J.K. (2004): an accelerator-based epithermal neutron beam design for BnCt and dosimetric evaluation using a voxel head phantom. Radiat Prot Dosimetry, 110(1-4): 655-60.
lindsberg, P.J. – Roine, R.O. – Kaste, m. (2000): thrombolysis in the treatment of acute Ischaemic Stroke. what are the likely Pharmacoeconomic Consequences? CNS Drugs, 14(1): 1-9.
lyman, g.h. – Cosler, l.e. – Kuderer, n.m. – hornberger, J. (2007): Impact of a 21-gene Rt-PCR assay on treatment decisions in early-stage breast cancer: an economic analysis based on prognostic and predictive validation studies. Cancer, 109(6): 1011-8.
mcneil, B.J. – weichselbaum, R. – Pauker, S.g. (1981): Speech and survival: tradeoffs between quality and quantity of life in laryngeal cancer. The New England Journal of Medicine, 305(17): 982-7.
miyamoto, J.m. – eraker, S.a. (1988): a multiplicative model of the utility of survival duration and health quality. Journal of Experimental Psychology, 117(1): 3-20.
murray, C.J. – lopez, a.d. (1997): mortality by cause for eight regions of the world: global Burden of disease Study. Lancet, 349(9061): 1269-76.
murray, K.J. – nelson, d.f. – Scott, C. – fischbach, a.J. – Porter, a. – farnan, n. – Curran, w.J., Jr. (1995): Quality-adjusted survival analysis of malignant glioma. Patients treated with twice-daily radiation (Rt) and carmustine: a report of Radiation therapy Oncology group (RtOg) 83-02. Int J Radiat Oncol Biol Phys, 31(3): 453-9.
neurological department hospital district of helsinki and Uusimaa hUS (2005): Hinnasto 2005, Osa 1: Tuotteistetut hinnat, (hUS Price list, part 1: total products). hUCh, helsinki hospitals, Unit for neurology, neurosurgery and eye- and ear-diseases: 37, norddrg 011.
neurology, d. o. (2005): Hinnasto 2005, Osa 1: Tuotteistetut hinnat, (Price list, part 1: total products). hUCh, helsinki hospitals, Unit for neurology, neurosurgery and eye- and ear-diseases: 37, norddrg 011.
neurosurgery, d. o. (2005): Hinnasto 2005, Osa 1: Tuotteistetut hinnat, (Price list, part 1: total products). hUCh, helsinki hospitals, Unit for neurology, neurosurgery and eye- and ear-diseases: 37, norddRg 001a.
neurosurgical department hospital district of helsinki and Uusimaa hUS (2005): Hinnasto 2005, Osa 1: Tuotteistetut hinnat, (hUS Price list, part 1: total products). hUCh, helsinki hospitals, Unit for neurology, neurosurgery and eye- and ear-diseases: 37, norddRg 001a.
neurosurgical department hospital district of helsinki and Uusimaa hUS (2005): Hinnasto 2005, Osa 2: Suoriteperustei-set hinnat, (hUS Price list, part 2: activity based pricing). hUCh, helsinki hospitals, Unit for neurology, neurosurgery and eye- and ear-diseases.
newhouse, J. P. (1970): toward a theory of nonprofit Institutions: an economic model of a hospital. American Economic Review, 60(1): 64-74.
nord, e. (1993): the relevance of health state after treatment in prioritising between different patients. Journal of Medical Ethics, 19(1): 37-42.
numminen, h. – Kotila, m. – waltimo, O. – aho, K. – Kaste, m. (1996): declining incidence and mortality rates of stroke in finland from 1972 to 1991. Results of three population-based stroke registers. Stroke, 27(9): 1487-91.
Ohgaki, h. – Kleihues, P. (2005): epidemiology and etiology of gliomas. Acta Neuropathol (Berl), 109(1): 93-108.
Olsen, J.a. (2000): a note on eliciting distributive preferences for health. Journal of Health Economics, 19(4): 541-50.
Olsen, J.a. – donaldson, C. (1998): helicopters, hearts and hips: using willingness to pay to set priorities for public sector health care programmes. Social Science & Medicine (1982), 46(1): 1-12.
Oncology knowledge center hospital district of helsinki and Uusimaa hUS (2005): Hinnasto 2005, Osa 1: Tuotteiste-tut hinnat, (hUS Price list, part 1: total products). hUCh helsinki hospitals, Oncology knowledge center: 41, norddRg 011.

315Promoting efficient treatment: new technology and health Care Costs
Pakkala, S. (2005): Ongoing BnCt-trials in finland. Personal communication, m. K. helsinki.
Phelps, C.e. – mushlin, a.I. (1991): On the (near) equivalence of cost-effectiveness and cost-benefit analyses. Int J Technol Assess Health Care, 7(1): 12-21.
Quigley, m.m. – mate, t.P. – Sylvester, J.e. (2008): Prostate tumor alignment and continuous, real-time adaptive radia-tion therapy using electromagnetic fiducials: Clinical and cost-utility analyses. Urol Oncol.
Remak, e. – Brown, R.e. – yuen, C. – Robinson, a. (2005): Cost-effectiveness comparison of current proton-pump inhibitors to treat gastro-oesophageal reflux disease in the UK. Curr Med Res Opin, 21(10): 1505-17.
Richardson, J. – hall, J. – Salkeld, g. (1996): the measurement of utility in multiphase health states. International Journal of Technology Assessment in Health Care, 12(1): 151-62.
Rodriguez-miguez, e. – Pinto-Prades, J.l. (2002): measuring the social importance of concentration or dispersion of individual health benefits. Health Economics, 11(1): 43-53.
Rubenstein, J.h. – Inadomi, J.m. (2006): defining a clinically significant adverse impact of diagnosing Barrett’s esophagus. J Clin Gastroenterol, 40(2): 109-15.
Rutten-van molken, m.P. – Oostenbrink, J.B. – miravitlles, m. – monz, B.U. (2007): modelling the 5-year cost effective-ness of tiotropium, salmeterol and ipratropium for the treatment of chronic obstructive pulmonary disease in Spain. Eur J Health Econ, 8(2): 123-35.
Sackett, d.l. – torrance, g.w. (1978): the utility of different health states as perceived by the general public. Journal of Chronic Diseases, 31(11): 697-704.
Shmueli, a. (1999): Survival vs. quality of life: a study of the Israeli public priorities in medical care. Soc Sci Med, 49(3): 297-302.
Slevin, m.l. – Plant, h. – lynch, d. – drinkwater, J. – gregory, w.m. (1988): who should measure quality of life, the doctor or the patient? Br J Cancer, 57(1): 109-12.
Stalmeier, P. – wakker, P. – Bezembinder, t. (1997): Preference Reversals: Violations of Unidimensional Procedure Invariance. Journal of Experimental Psychology, Human Perception and Performance, (23): 1196-1205.
Steuten, l. – Palmer, S. – Vrijhoef, B. – van merode, f. – Spreeuwenberg, C. – Severens, h. (2007): Cost-utility of a disease management program for patients with asthma. Int J Technol Assess Health Care, 23(2): 184-91.
Svensson, h. – moller, t.R. (2003): developments in radiotherapy. Acta Oncol, 42(5-6): 430-42.
thompson Coon, J. – Rogers, g. – hewson, P. – wright, d. – anderson, R. – Cramp, m. – Jackson, S. – Ryder, S. – Price, a. – Stein, K. (2007): Surveillance of cirrhosis for hepatocellular carcinoma: systematic review and economic analysis. Health Technol Assess, 11(34): 1-206.
treadwell, J.R. (1998): tests of preferential independence in the Qaly model. Medical Decision Making, 18(4): 418-28.
treadwell, J.R. – Kearney, d. – davila, m. (2000): health profile preferences of hepatitis C patients. Digestive Diseases and Sciences, 45(2): 345-50.
Ubel, P.a. – Baron, J. – asch, d.a. (2001): Preference for equity as a framing effect. Medical Decision Making, 21(3): 180-9.
Ubel, P.a. – Richardson, J. – Prades, J.l. (1999): life-saving treatments and disabilities. are all Qalys created equal? International Journal of Technology Assessment in Health Care, 15(4): 738-48.
Unic, I. – Stalmeier, P.f. – Verhoef, l.C. – van daal, w.a. (1998): assessment of the time-tradeoff values for prophylac-tic mastectomy of women with a suspected genetic predisposition to breast cancer. Medical Decision Making, 18(3): 268-77.
Uusi-Simola, J. – Seren, t. – Seppälä, t. – Kosunen, a. – auterinen, I. – Savolainen, S. (2004): dosimetric comparison at fiR 1 using microdosimetry, ionisation chambers and computer simulation. Appl Radiat Isot, 61(5): 845-8.
wade, d.t. (1995): Measurement in Neurological Rehabilitation. Oxford, great Britain, Oxford University Press.

316 Section III: Recommendations for Optimal Industry Performance
walker, m.d. – alexander, e. Jr. – hunt, w.e. – macCarty, C.S. – mahaley, m.S. Jr. – mealey, J. Jr. – norrell, h.a. – Owens, g. – Ransohoff, J. – wilson, C.B. – gehan, e.a., et al. (1978): evaluation of BCnU and/or radiotherapy in the treatment of anaplastic gliomas. a cooperative clinical trial. J Neurosurg, 49(3): 333-43.
walker, m.d. – green, S.B. – Byar, d.P. – alexander, e. Jr. – Batzdorf, U. – Brooks, w.h. – hunt, w.e. – macCarty, C.S. – mahaley, m.S. Jr. – mealey, J. Jr. – Owens, g., et al. (1980): Randomized comparisons of radiotherapy and nitrosoureas for the treatment of malignant glioma after surgery. N Engl J Med, 303(23): 1323-9.
wardlaw, J.m. – Zoppo, g. – yamaguchi, t. – Berge, e. (2003): thrombolysis for acute ischaemic stroke. Cochrane Database Syst Rev, (3): Cd000213.
Zethraeus, n. (1998): willingness to pay for hormone replacement therapy. Health Economics, 7(1): 31-8.
Related Documents


