Adapting to Changing Markets Adapting to Changing Markets Annual Investor Conference December 3, 2007 Gramercy Capital Corp. Gramercy Capital Corp.

Welcome message from author
This document is posted to help you gain knowledge. Please leave a comment to let me know what you think about it! Share it to your friends and learn new things together.
Transcript
Adapting to Changing MarketsAdapting to Changing Markets
Annual Investor ConferenceDecember 3, 2007
Gramercy Capital Corp.Gramercy Capital Corp.
Safe HarborSafe HarborThis presentation contains “forward-looking statements” within the meaning of Section 27A of the Securities Act of 1933, as amended and Section 21E of the Securities Exchange Act of 1934, as amended. All statements other than statements of historical facts included in this presentation are forward-looking statements. All forward-looking statements speak only as of the date of this presentation. Such forward-looking statements involve known and unknown risks, uncertainties and other factors that may cause the actual results, performance, achievements or transactions of the Company or industry results to be materially different from any future results, performance, achievements or transactions expressed or implied by such forward-looking statements. Such risks, uncertainties and other factors relate to, among others, the strength of the commercial real estate property markets, competitive market conditions, unanticipated administrative costs, the effects of general and local economic conditions, interest rates, capital market conditions, bankruptcies and defaults of borrowers or tenants in properties securing the Company’s investments, approval of the merger between the Company and American Financial Realty Trust (“AFR”) by the stockholders of the Company and AFR, the satisfaction of closing conditions to such merger, difficulties encountered in integrating the companies, and other factors, which are beyond the Company’s control. Additional information or factors which could impact the Company and the forward-looking statements contained herein are included in the Company’s filings with the Securities and Exchange Commission. The Company assumes no obligation to update or supplement forward-looking statements that become untrue because of subsequent events.
Additional Information and Where to Find ItAdditional Information and Where to Find It
This presentation does not constitute an offer of any securities for sale. The Company has filed with the SEC a Registration Statement on Form S-4, which includes a joint proxy statement/prospectus of the Company and AFR and other relevant materials in connection with the proposed merger. The joint proxy statement/prospectus will be mailed to the shareholders of the Company and AFR. Investors and security holders of the Company and AFR are urged to read the joint proxy statement/prospectus and the other relevant materials when they become available because they will contain important information about the Company, AFR and the proposed merger. The joint proxy statement/prospectus and other relevant materials (when they become available), and any other documents filed by the Company or AFR with the SEC, may be obtained free of charge at the SEC’s web site at www.sec.gov. In addition, investors and security holders may obtain free copies of the documents filed with the SEC by Gramercy by contacting the Company’s Investor Relations at www.gramercycapitalcorp.com or via telephone at 212-297-1000. Investors and security holders may obtain free copies of the documents filed with the SEC by AFR at www.afrt.com or via telephone at 215-887-2280. INVESTORS AND SECURITY HOLDERS ARE URGED TO READ THE JOINT PROXY STATEMENT/PROSPECTUS AND THE OTHER RELEVANT MATERIALS WHEN THEY BECOME AVAILABLE BEFORE MAKING ANY VOTING OR INVESTMENT DECISION WITH RESPECT TO THE PROPOSED MERGER.
The Company and its respective directors and executive officers may be deemed to be participants in the solicitation of proxies from the shareholders of the Company and AFR in favor of the proposed merger. Information about the directors and executive officers of the Company and their respective interests in the proposed merger is set forth in the Company’s proxy statements for its 2007 annual meeting and will be available in the joint proxy statement/prospectus.
AFR and its respective directors and executive officers may be deemed to be participants in the solicitation of proxies from the shareholders of AFR and the Company in favor of the proposed merger. Information about the directors and executive officers of AFR and their respective interests in the proposed merger is set forth in AFR’s proxy statements for its 2007 annual meeting and will be available in the joint proxy statement/prospectus.

TodayToday’’s Speakerss Speakers
Marc Holliday
Chief Executive Officer
Bob Foley
Chief Financial Officer
Hugh Hall
Chief Operating Officer
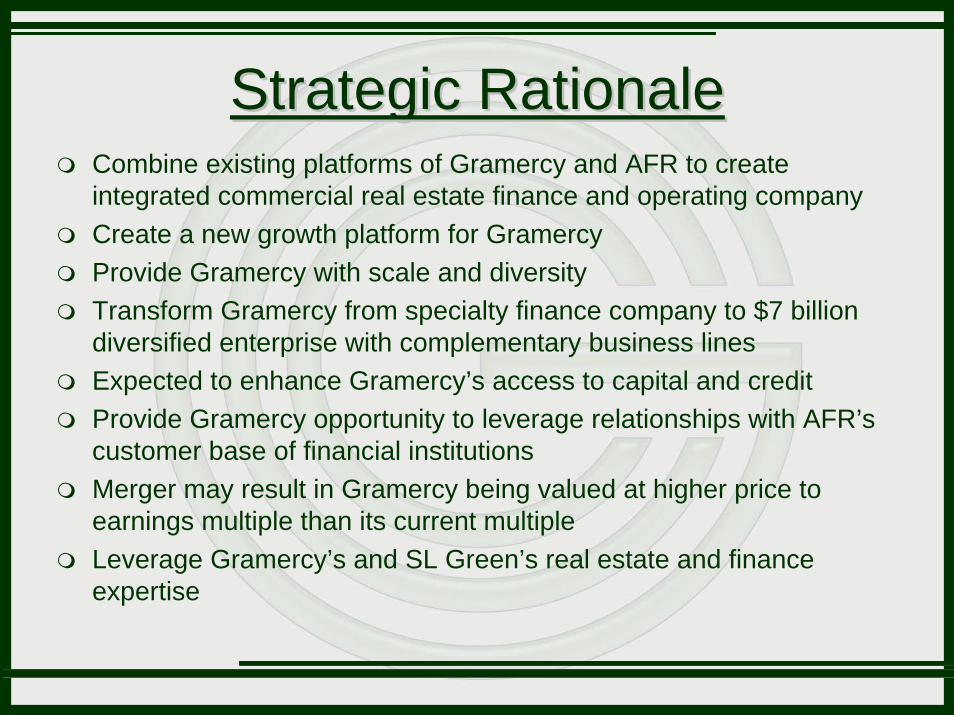
Strategic RationaleStrategic RationaleCombine existing platforms of Gramercy and AFR to create integrated commercial real estate finance and operating companyCreate a new growth platform for GramercyProvide Gramercy with scale and diversityTransform Gramercy from specialty finance company to $7 billion diversified enterprise with complementary business linesExpected to enhance Gramercy’s access to capital and creditProvide Gramercy opportunity to leverage relationships with AFR’scustomer base of financial institutionsMerger may result in Gramercy being valued at higher price to earnings multiple than its current multipleLeverage Gramercy’s and SL Green’s real estate and finance expertise
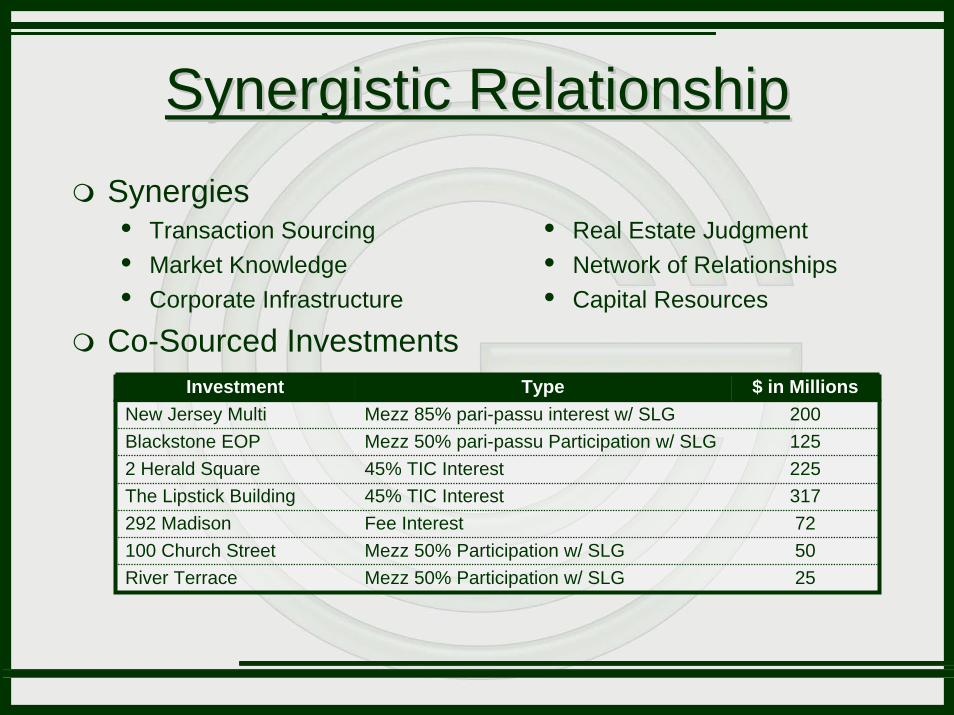
Synergistic RelationshipSynergistic RelationshipSynergies
Transaction SourcingMarket KnowledgeCorporate Infrastructure
Co-Sourced Investments
Real Estate JudgmentNetwork of RelationshipsCapital Resources
Investment Type $ in MillionsNew Jersey Multi Mezz 85% pari-passu interest w/ SLG 200Blackstone EOP Mezz 50% pari-passu Participation w/ SLG 1252 Herald Square 45% TIC Interest 225The Lipstick Building 45% TIC Interest 317292 Madison Fee Interest 72100 Church Street Mezz 50% Participation w/ SLG 50River Terrace Mezz 50% Participation w/ SLG 25
Bob FoleyChief Financial Officer
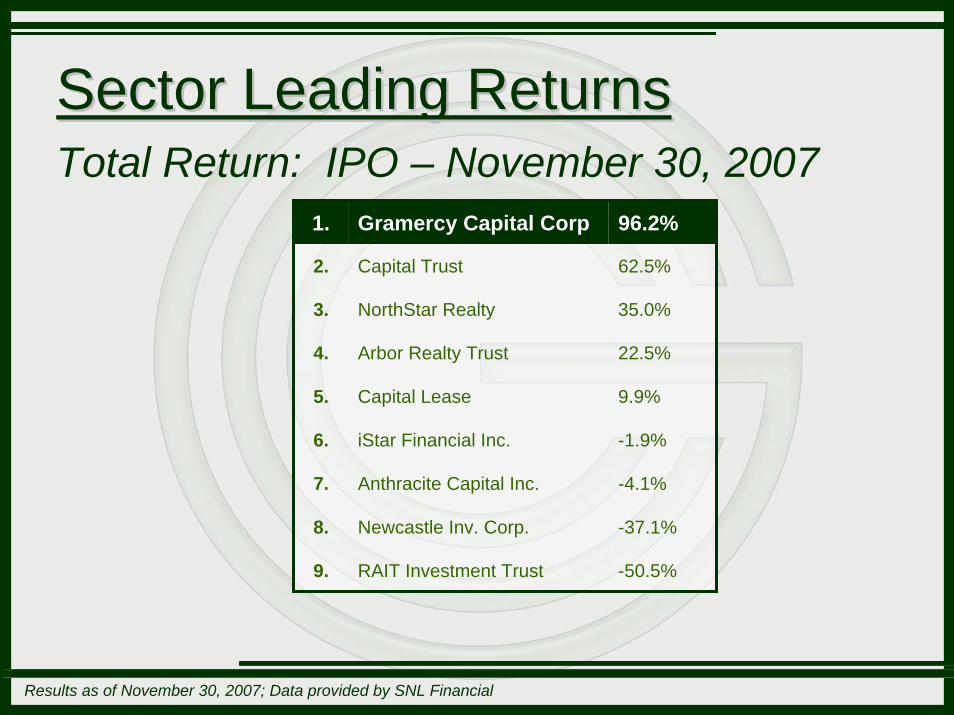
Total Return: IPO – November 30, 20071. Gramercy Capital Corp 96.2%
2. Capital Trust 62.5%
3. NorthStar Realty 35.0%
5. Capital Lease 9.9%
6. iStar Financial Inc. -1.9%
7. Anthracite Capital Inc. -4.1%
8. Newcastle Inv. Corp. -37.1%
9. RAIT Investment Trust -50.5%
4. Arbor Realty Trust 22.5%
Sector Leading ReturnsSector Leading Returns
Results as of November 30, 2007; Data provided by SNL Financial

11.9%
14.5%15.7% 15.7%
21.3% 22.1%
10.6%9.1%
10.4%
CapitalLease
CapitalTrust
GramercyCapital
iStarFinancial
Arbor RealtyTrust
NorthStarRealty
AnthraciteCapital Inc.
RAITInvestment
Trust
NewcastleInv. Corp
Div
iden
d Yi
eld
Market DifferentiationMarket DifferentiationFlight to Quality
Results as of November 30, 2007; Data provided by SNL Financial
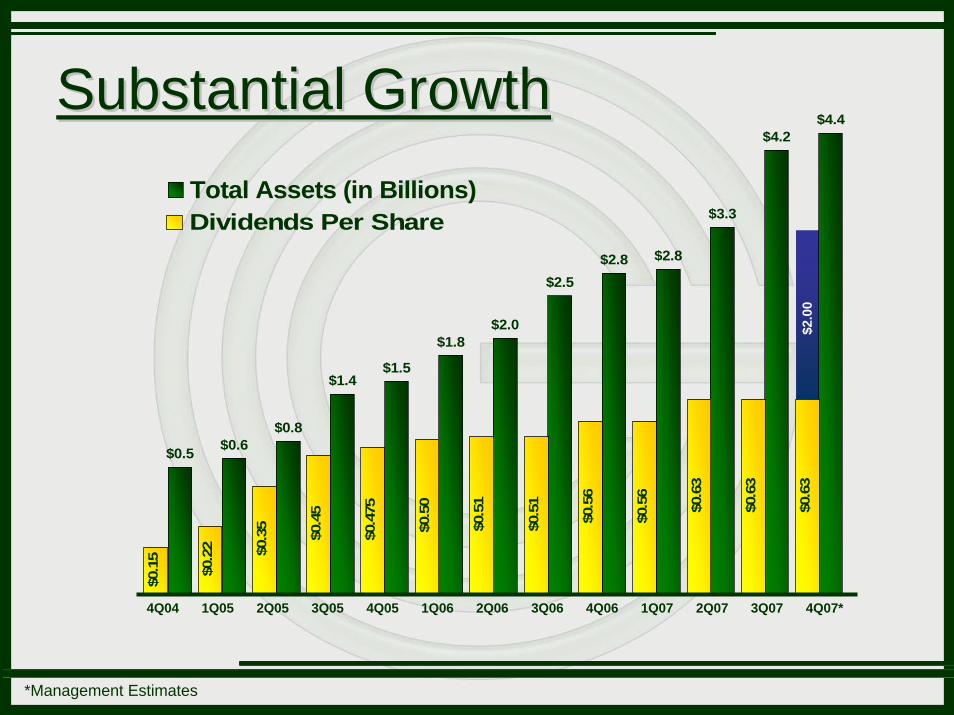
$0.5 $0.6$0.8
$1.4$1.5
$1.8$2.0
$2.5$2.8 $2.8
$3.3
$4.2$4.4
Total Assets (in Billions)
$0.5
1
$0.5
1
$0.5
0
$0.4
7 5
$0.4
5
$0.3
5
$0.2
2
$0.1
5
$0.5
6
$0.5
6
$0.6
3
$0.6
3
$0.6
3
Dividends Per Share
$2.0
0
Substantial GrowthSubstantial Growth
*Management Estimates
4Q04 1Q05 2Q05 3Q05 4Q05 1Q06 2Q06 3Q06 4Q06 1Q07 2Q07 3Q07 4Q07*

Integrated Business PlatformIntegrated Business PlatformMarc Holliday
Chief Executive Officer
Andrew Mathias Chief Investment Officer
Hugh HallChief Operating
Officer
Bob FoleyChief Financial
Officer
Greg HughesChief Credit
Officer
Andrew LevineCompliance Officer/
Corp. Secretary
Asset Manage-
ment
Andrew Falk
Bob Wirth
Capital Markets/
Syndications/CDO
Management
Shawn Townsend
Jeffrey Baevsky
Real Estate
Securities Group
(“RESG”)
Joe Romano
Transaction Counsel
Michael Kavourias
Finance & Accounting
Matt DiLiberto
Jon Clark
Investor Relations
Heidi Gillette
Origination
New YorkDavid Schonbraun
Peter TubesingJake Stahler
CaliforniaMichael NaginPhil Orosco
SL Green Gramercy

Building Capital StrengthBuilding Capital Strength
$ in Mil Type Comments
April 2007 $115.0 8.125% Pref Equity Bought Overnight at $25.00 per share gross
June 2007 $75.0 Unsecured Credit Facility
Upsized to $175 mm from $100 mm; added two new lenders; reduced WAS to 165 bps from 220 bps
August 2007 $1,100.0 Gramercy CDO 2007-1 Term Financing for RESG portfolio
September 2007 $126.7 Common Equity Bought Overnight at $26.25 per share gross
November 2007 $100.0 Common Equity PIPE with Morgan Stanley at $26.25 per share gross
Total $1,516.7
Proven access to debt and equity capital marketsTotal of $1.5 billion raised
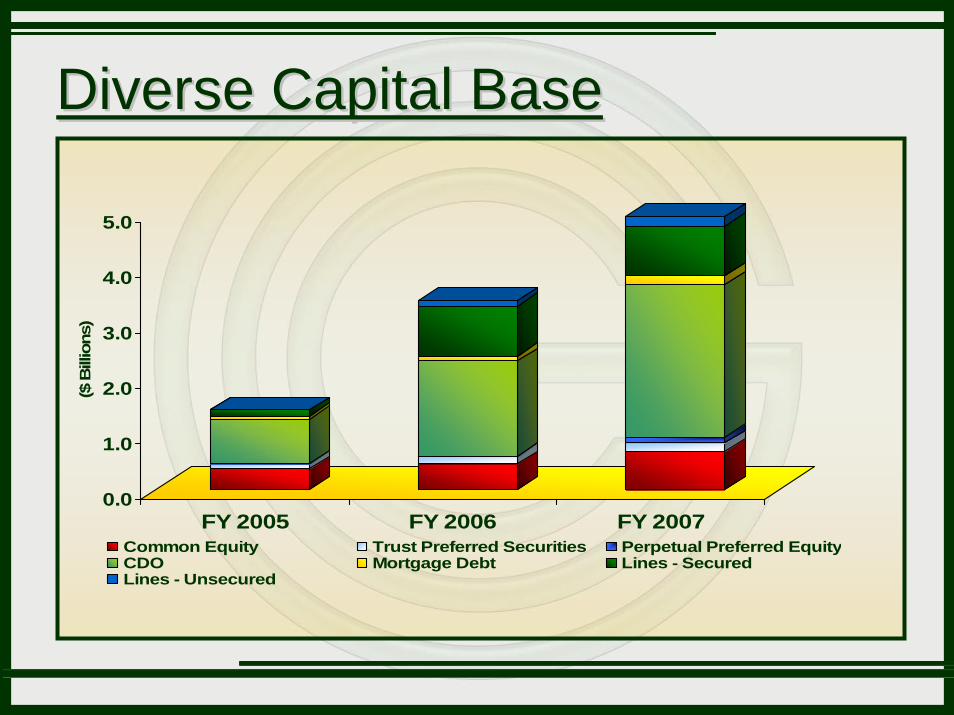
Diverse Capital BaseDiverse Capital Base
0.0
1.0
2.0
3.0
4.0
5.0
($ B
illio
ns)
FY 2005 FY 2006 FY 2007Common Equity Trust Preferred Securities Perpetual Preferred EquityCDO Mortgage Debt Lines - SecuredLines - Unsecured
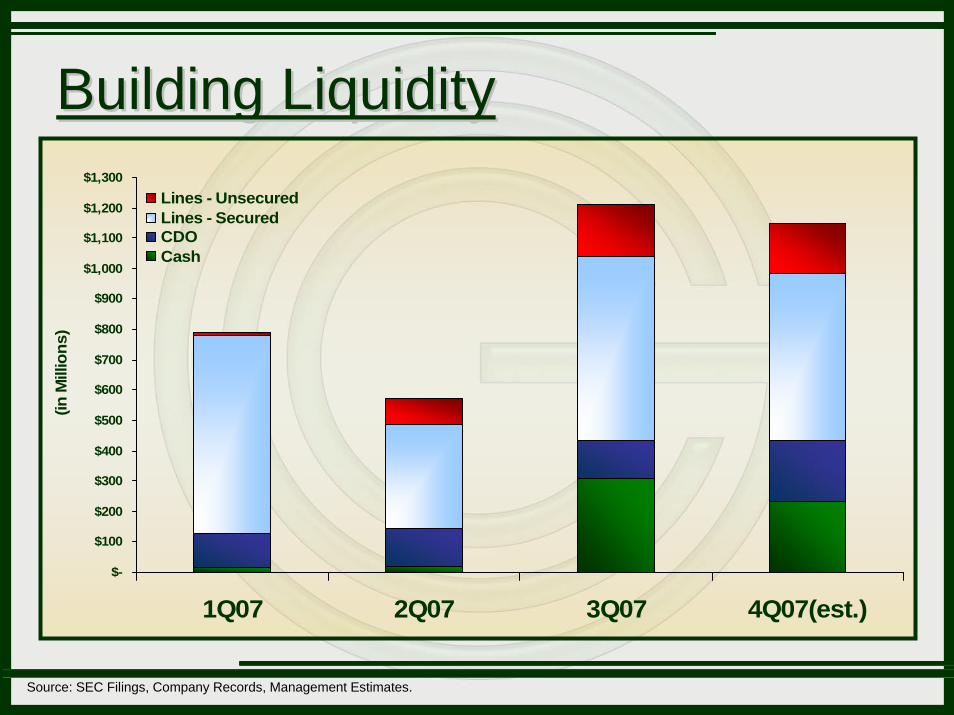
Building LiquidityBuilding Liquidity
$-
$100
$200
$300
$400
$500
$600
$700
$800
$900
$1,000
$1,100
$1,200
$1,300
1Q07 2Q07 3Q07 4Q07(est.)
(in M
illio
ns)
Lines - UnsecuredLines - SecuredCDOCash
Source: SEC Filings, Company Records, Management Estimates.
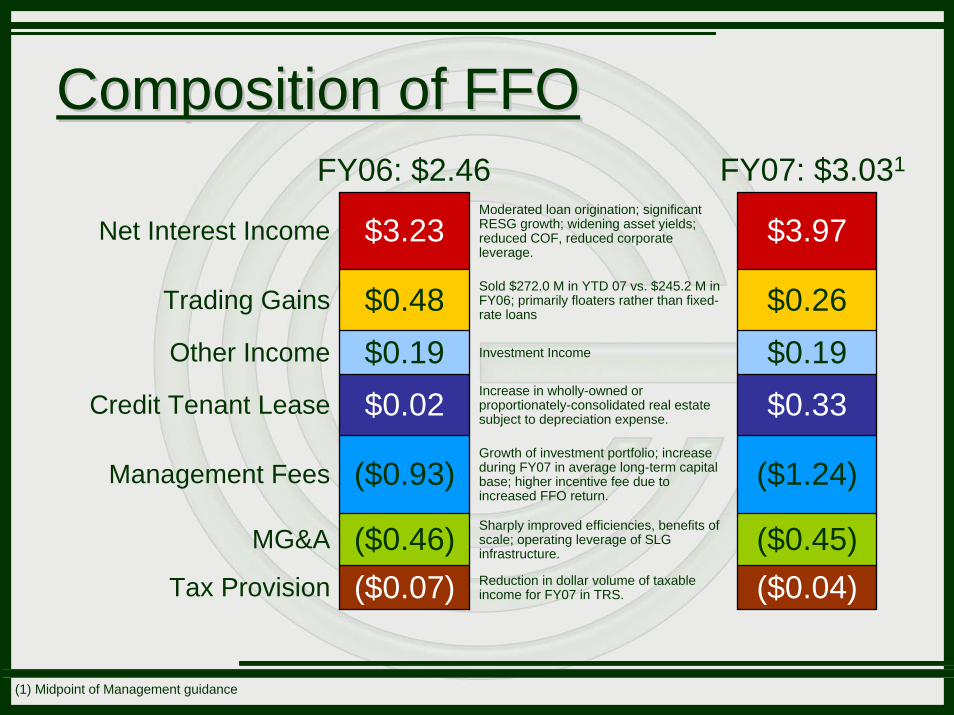
Composition of FFOComposition of FFO
(1) Midpoint of Management guidance
FY06: $2.46 FY07: $3.031
Net Interest Income $3.23Moderated loan origination; significant RESG growth; widening asset yields; reduced COF, reduced corporate leverage.
$3.97
Trading Gains $0.48 Sold $272.0 M in YTD 07 vs. $245.2 M in FY06; primarily floaters rather than fixed-rate loans $0.26
Other Income $0.19 Investment Income $0.19Credit Tenant Lease $0.02 Increase in wholly-owned or
proportionately-consolidated real estate subject to depreciation expense. $0.33
Management Fees ($0.93)Growth of investment portfolio; increase during FY07 in average long-term capital base; higher incentive fee due to increased FFO return.
($1.24)
MG&A ($0.46) Sharply improved efficiencies, benefits of scale; operating leverage of SLG infrastructure. ($0.45)
Tax Provision ($0.07) Reduction in dollar volume of taxable income for FY07 in TRS. ($0.04)
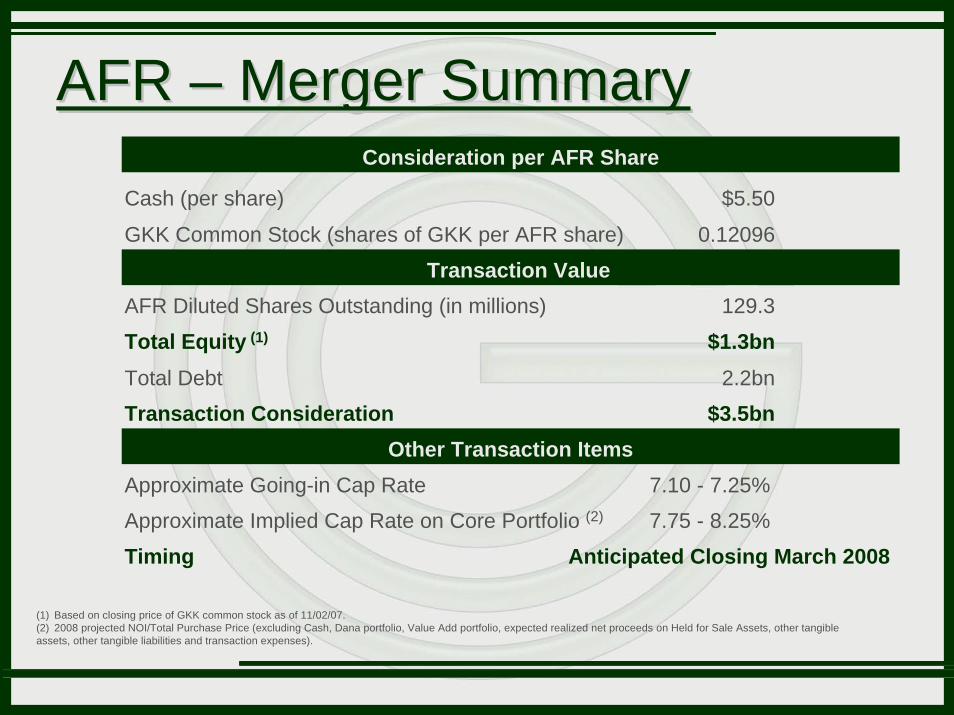
AFR AFR –– Merger SummaryMerger SummaryConsideration per AFR Share
Cash (per share) $5.50
Transaction Value
Other Transaction ItemsApproximate Going-in Cap Rate 7.10 - 7.25%
Approximate Implied Cap Rate on Core Portfolio (2) 7.75 - 8.25%
Timing Anticipated Closing March 2008
GKK Common Stock (shares of GKK per AFR share) 0.12096
AFR Diluted Shares Outstanding (in millions) 129.3
Total Equity (1) $1.3bnTotal Debt 2.2bn
Transaction Consideration $3.5bn
(1) Based on closing price of GKK common stock as of 11/02/07.(2) 2008 projected NOI/Total Purchase Price (excluding Cash, Dana portfolio, Value Add portfolio, expected realized net proceeds on Held for Sale Assets, other tangible assets, other tangible liabilities and transaction expenses).
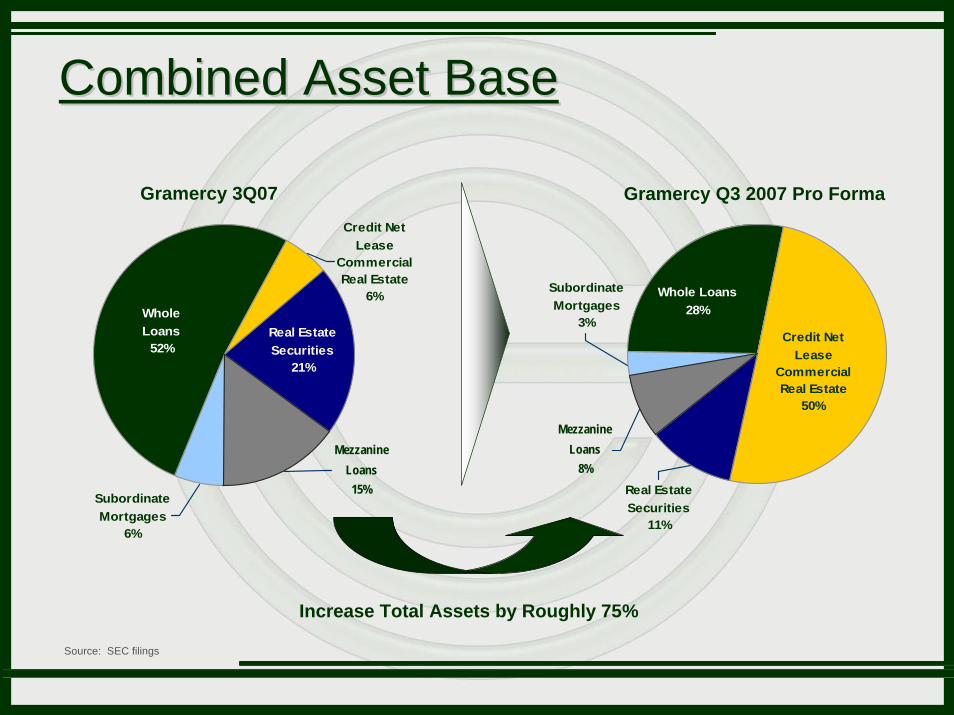
Combined Asset BaseCombined Asset Base
Gramercy 3Q07 Gramercy Q3 2007 Pro Forma
Source: SEC filings
Increase Total Assets by Roughly 75%
Whole Loans28%
Subordinate Mortgages
3%Credit Net
LeaseCommercial Real Estate
50%
Real Estate Securities
11%
Mezzanine Loans
8%Mezzanine
Loans15%
Real Estate Securities
21%
Credit Net Lease
Commercial Real Estate
6%
Subordinate Mortgages
6%
Whole Loans
52%
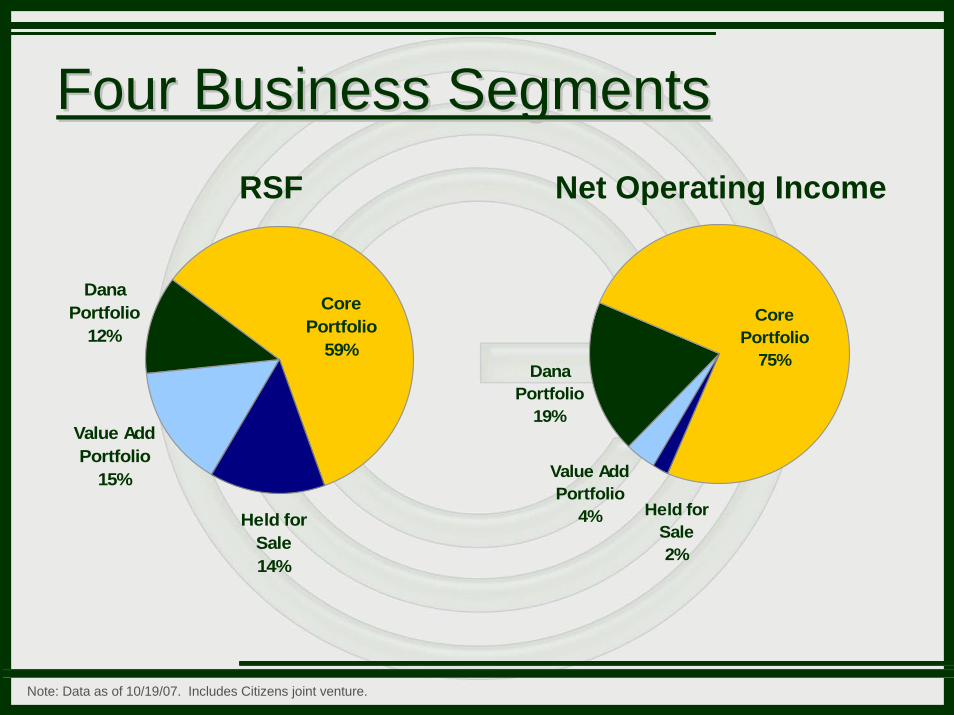
Four Business SegmentsFour Business Segments
Dana Portfolio
12%
Value Add Portfolio
15%
Core Portfolio
59%
Held for Sale14%
Note: Data as of 10/19/07. Includes Citizens joint venture.
Dana Portfolio
19%
Value Add Portfolio
4%
Core Portfolio
75%
Held for Sale2%
RSF Net Operating Income
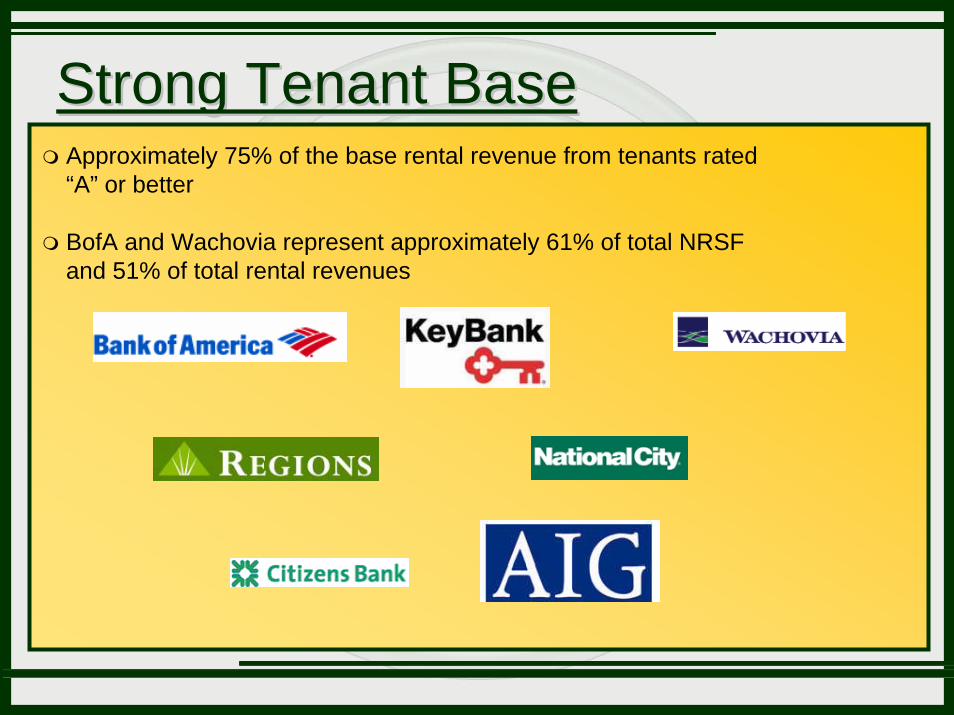
Strong Tenant BaseStrong Tenant BaseApproximately 75% of the base rental revenue from tenants rated “A” or better
BofA and Wachovia represent approximately 61% of total NRSF and 51% of total rental revenues
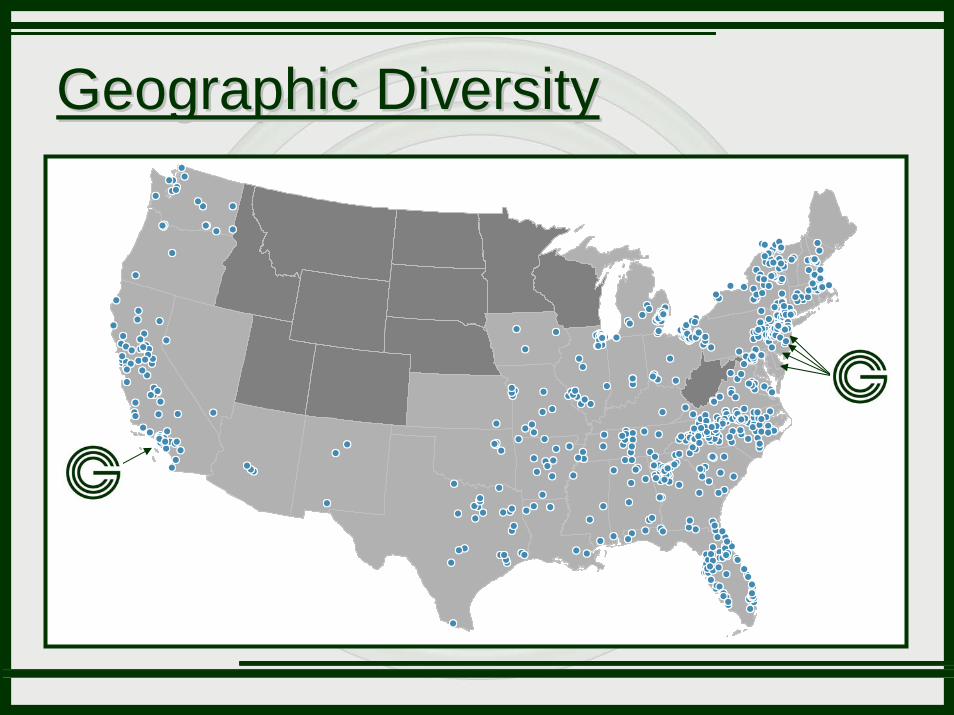
Geographic DiversityGeographic Diversity
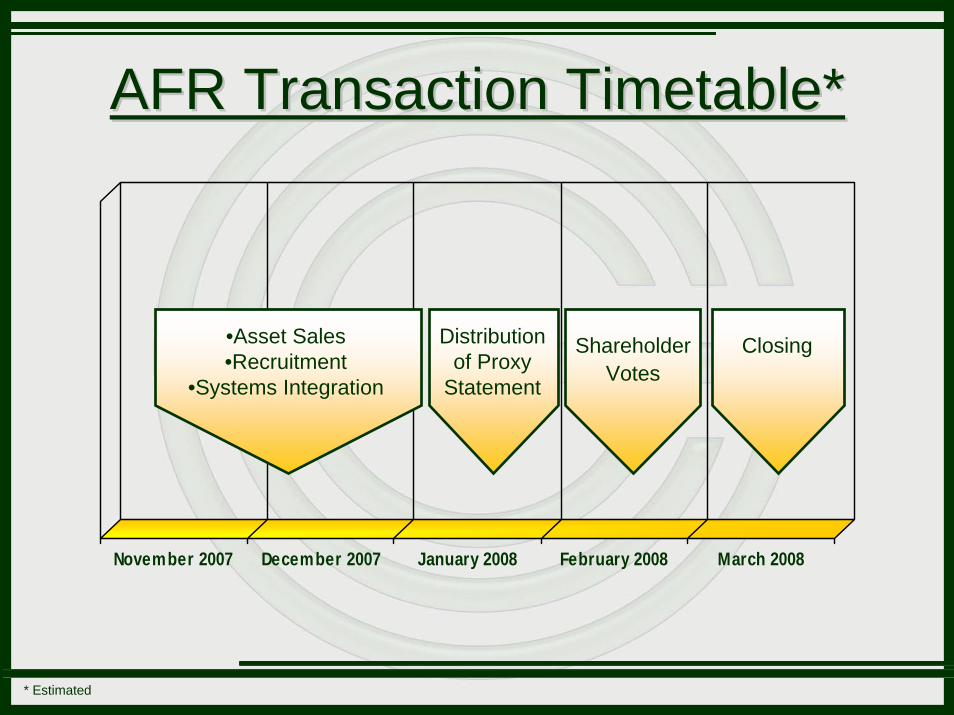
AFR Transaction Timetable*AFR Transaction Timetable*
November 2007 December 2007 January 2008 February 2008 March 2008
Distribution of Proxy
Statement
ShareholderVotes
Closing•Asset Sales•Recruitment
•Systems Integration
* Estimated
TodayToday’’s Speakerss Speakers
Hugh HallChief Operating Officer
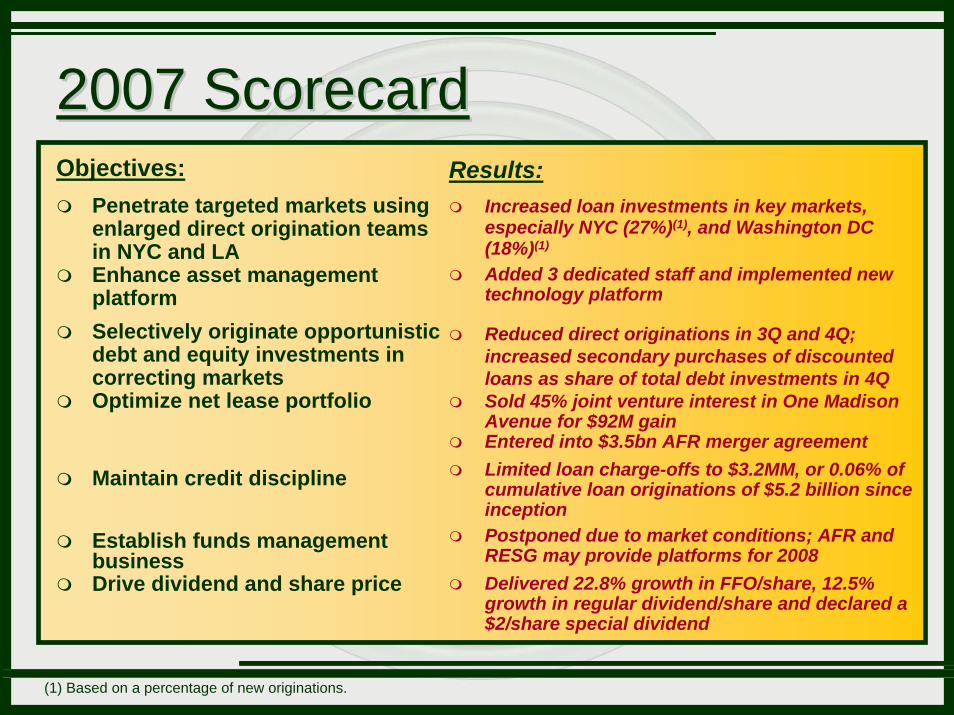
2007 Scorecard2007 ScorecardObjectives:
Penetrate targeted markets using enlarged direct origination teams in NYC and LAEnhance asset management platformSelectively originate opportunistic debt and equity investments in correcting marketsOptimize net lease portfolio
Maintain credit discipline
Establish funds management businessDrive dividend and share price
(1) Based on a percentage of new originations.
Results:Increased loan investments in key markets, especially NYC (27%)(1), and Washington DC (18%)(1)
Added 3 dedicated staff and implemented new technology platform
Reduced direct originations in 3Q and 4Q; increased secondary purchases of discounted loans as share of total debt investments in 4QSold 45% joint venture interest in One Madison Avenue for $92M gainEntered into $3.5bn AFR merger agreementLimited loan charge-offs to $3.2MM, or 0.06% of cumulative loan originations of $5.2 billion since inception Postponed due to market conditions; AFR and RESG may provide platforms for 2008Delivered 22.8% growth in FFO/share, 12.5% growth in regular dividend/share and declared a $2/share special dividend

Additional 2007 HighlightsAdditional 2007 Highlights
Entered into Merger Agreement with AFR
Raised $340 Million of Equity
Issued $1.1 Billion CDO at +45 COF in July
Launched RESG to Tap Correcting Market
Enhanced Credit Facilities in June
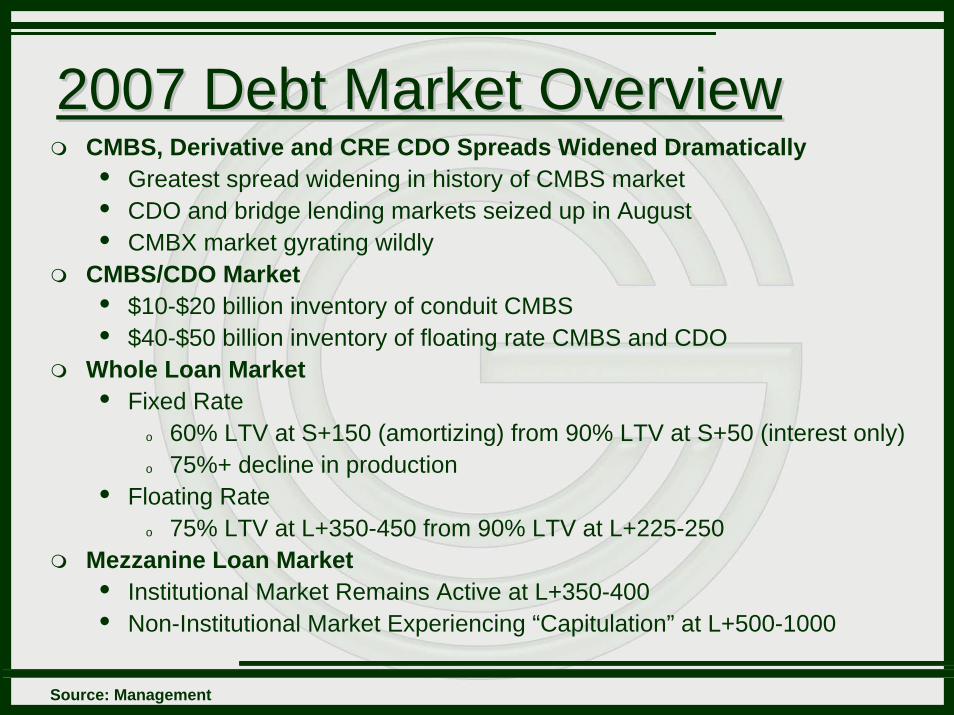
2007 Debt Market Overview2007 Debt Market OverviewCMBS, Derivative and CRE CDO Spreads Widened Dramatically
Greatest spread widening in history of CMBS marketCDO and bridge lending markets seized up in AugustCMBX market gyrating wildly
CMBS/CDO Market$10-$20 billion inventory of conduit CMBS$40-$50 billion inventory of floating rate CMBS and CDO
Whole Loan MarketFixed Rate
o 60% LTV at S+150 (amortizing) from 90% LTV at S+50 (interest only)o 75%+ decline in production
Floating Rateo 75% LTV at L+350-450 from 90% LTV at L+225-250
Mezzanine Loan MarketInstitutional Market Remains Active at L+350-400Non-Institutional Market Experiencing “Capitulation” at L+500-1000
Source: Management
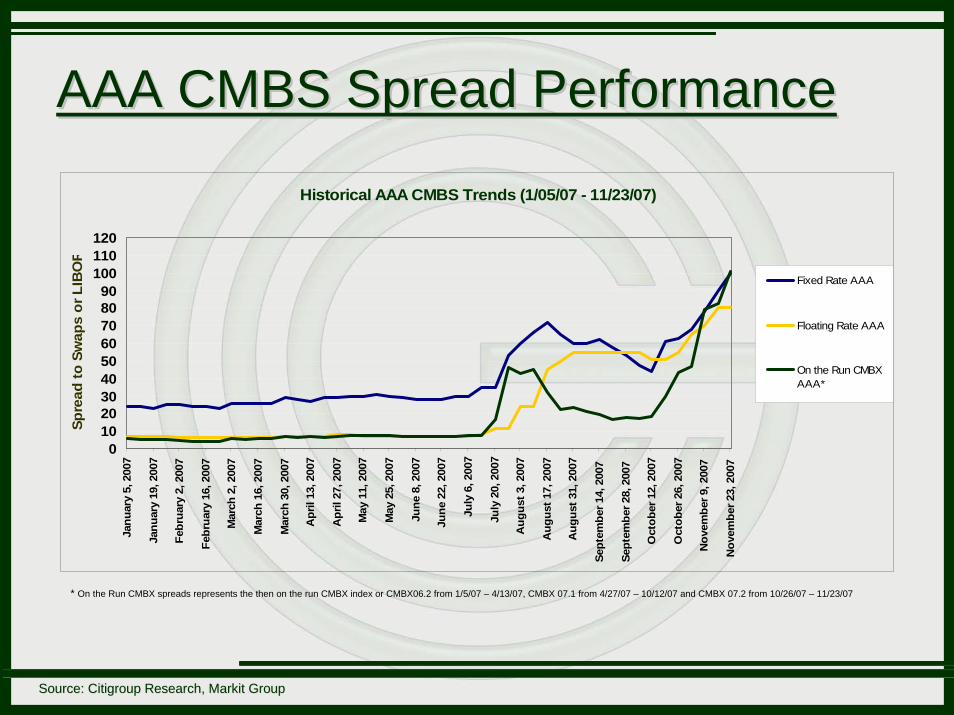
AAA CMBS Spread PerformanceAAA CMBS Spread Performance
Source: Citigroup Research, Source: Citigroup Research, MarkitMarkit GroupGroup
Historical AAA CMBS Trends (1/05/07 - 11/23/07)
0102030405060708090
100110120
Janu
ary
5, 2
007
Janu
ary
19, 2
007
Febr
uary
2, 2
007
Febr
uary
16,
200
7
Mar
ch 2
, 200
7
Mar
ch 1
6, 2
007
Mar
ch 3
0, 2
007
Apr
il 13
, 200
7
Apr
il 27
, 200
7
May
11,
200
7
May
25,
200
7
June
8, 2
007
June
22,
200
7
July
6, 2
007
July
20,
200
7
Aug
ust 3
, 200
7
Aug
ust 1
7, 2
007
Aug
ust 3
1, 2
007
Sept
embe
r 14,
200
7
Sept
embe
r 28,
200
7
Oct
ober
12,
200
7
Oct
ober
26,
200
7
Nov
embe
r 9, 2
007
Nov
embe
r 23,
200
7
Spre
ad to
Sw
aps
or L
IBO
R
Fixed Rate AAA
Floating Rate AAA
On the Run CMBXAAA*
* On the Run CMBX spreads represents the then on the run CMBX index or CMBX06.2 from 1/5/07 – 4/13/07, CMBX 07.1 from 4/27/07 – 10/12/07 and CMBX 07.2 from 10/26/07 – 11/23/07
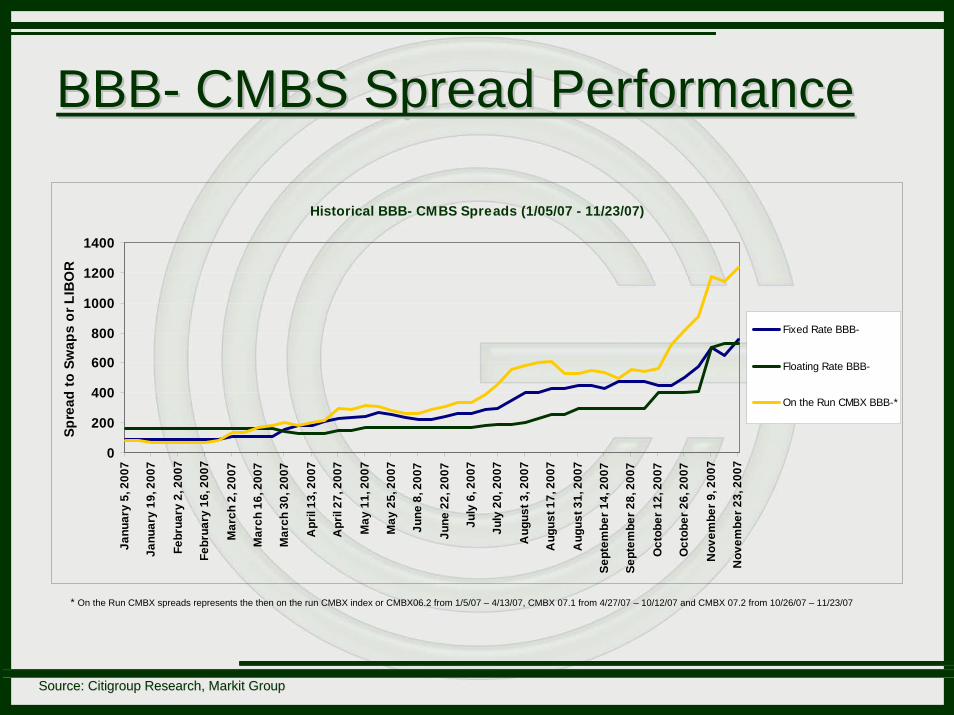
BBBBBB-- CMBS Spread PerformanceCMBS Spread Performance
Source: Citigroup Research, Source: Citigroup Research, MarkitMarkit GroupGroup
* On the Run CMBX spreads represents the then on the run CMBX index or CMBX06.2 from 1/5/07 – 4/13/07, CMBX 07.1 from 4/27/07 – 10/12/07 and CMBX 07.2 from 10/26/07 – 11/23/07
Historical BBB- CMBS Spreads (1/05/07 - 11/23/07)
0
200
400
600
800
1000
1200
1400
Janu
ary
5, 2
007
Janu
ary
19, 2
007
Febr
uary
2, 2
007
Febr
uary
16,
200
7
Mar
ch 2
, 200
7
Mar
ch 1
6, 2
007
Mar
ch 3
0, 2
007
Apr
il 13
, 200
7
Apr
il 27
, 200
7
May
11,
200
7
May
25,
200
7
June
8, 2
007
June
22,
200
7
July
6, 2
007
July
20,
200
7
Aug
ust 3
, 200
7
Aug
ust 1
7, 2
007
Aug
ust 3
1, 2
007
Sept
embe
r 14,
200
7
Sept
embe
r 28,
200
7
Oct
ober
12,
200
7
Oct
ober
26,
200
7
Nov
embe
r 9, 2
007
Nov
embe
r 23,
200
7
Spre
ad to
Sw
aps
or L
IBO
R
Fixed Rate BBB-
Floating Rate BBB-
On the Run CMBX BBB-*
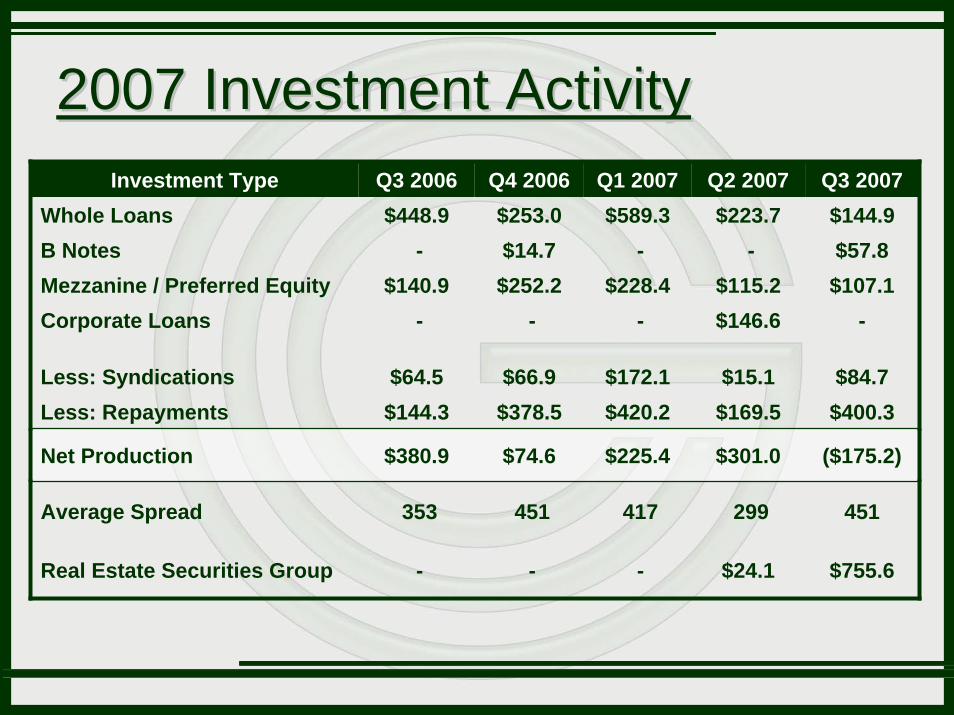
2007 Investment Activity2007 Investment ActivityInvestment Type Q3 2006 Q4 2006 Q1 2007 Q2 2007 Q3 2007
Whole Loans $448.9 $253.0 $589.3 $223.7 $144.9$57.8$107.1
-
$84.7$400.3
($175.2)
451
$755.6
B Notes - $14.7 - -Mezzanine / Preferred Equity $140.9 $252.2 $228.4 $115.2 Corporate Loans - - - $146.6
Less: Syndications $64.5 $66.9 $172.1 $15.1 Less: Repayments $144.3 $378.5 $420.2 $169.5
Net Production $380.9 $74.6 $225.4 $301.0
Average Spread 353 451 417 299
Real Estate Securities Group - - - $24.1
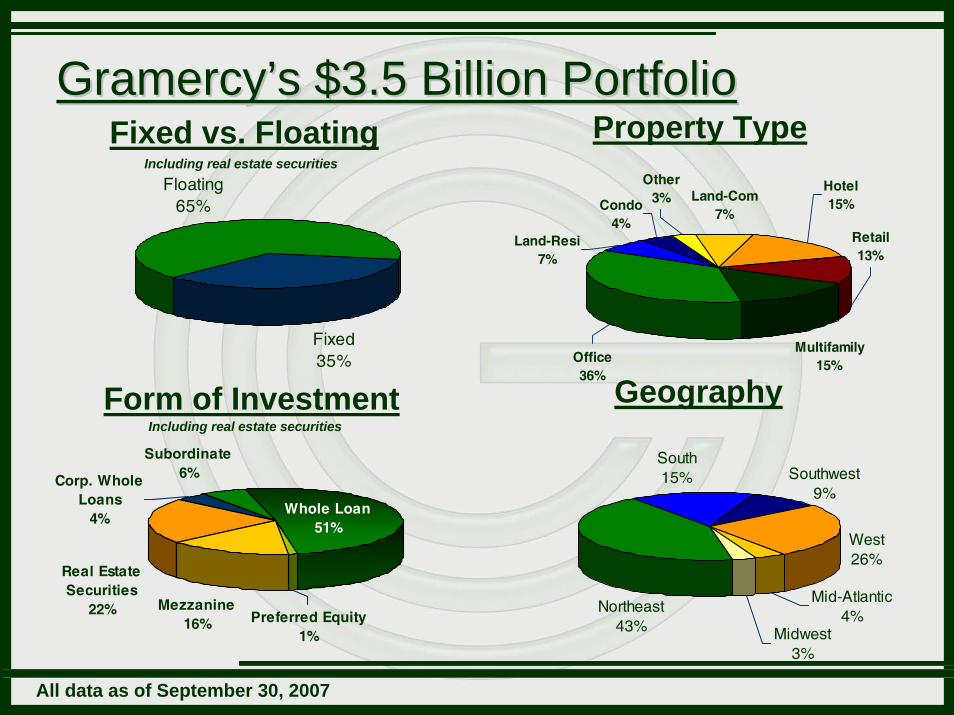
GramercyGramercy’’s $3.5 Billion Portfolios $3.5 Billion Portfolio
Whole Loan51%
Subordinate6%Corp. Whole
Loans4%
Real Estate Securities
22% Mezzanine16% Preferred Equity
1% Midwest3%
Mid-Atlantic4%
West26%
Southwest9%
South15%
Northeast43%
Fixed35%
Floating65%
Multifamily15%
Retail13%
Hotel15%
Land-Com7%
Other3%Condo
4%Land-Resi
7%
Office36%
Property Type
Geography
Fixed vs. Floating
Form of Investment
All data as of September 30, 2007
Including real estate securities
Including real estate securities
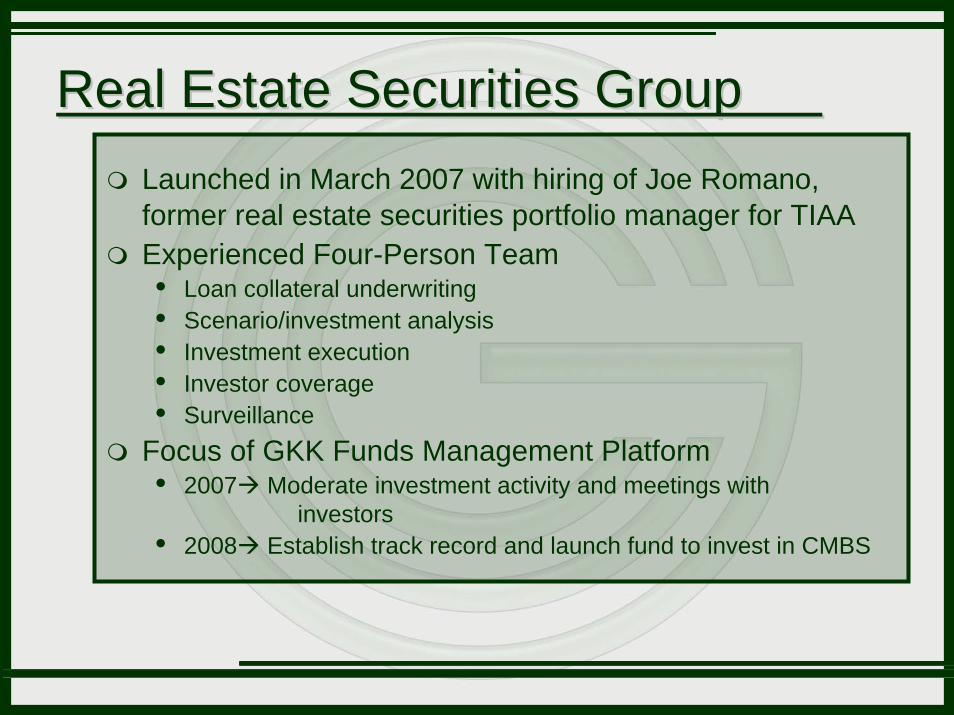
Real Estate Securities Group Real Estate Securities Group Launched in March 2007 with hiring of Joe Romano, former real estate securities portfolio manager for TIAAExperienced Four-Person Team
Loan collateral underwritingScenario/investment analysisInvestment executionInvestor coverageSurveillance
Focus of GKK Funds Management Platform2007 Moderate investment activity and meetings with
investors 2008 Establish track record and launch fund to invest in CMBS
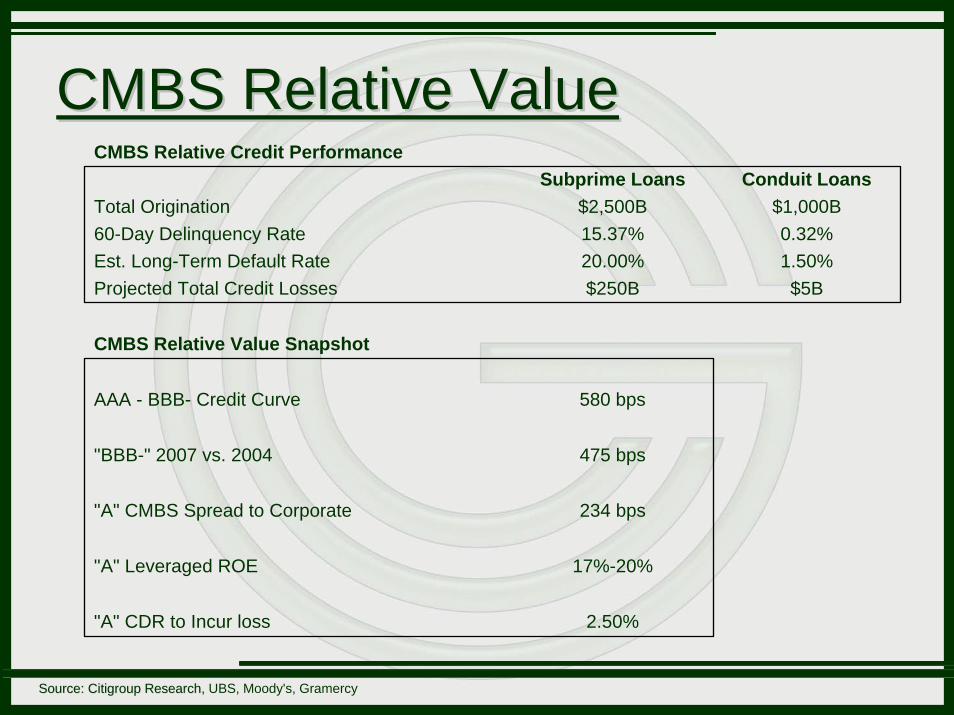
CMBS Relative ValueCMBS Relative Value
Source: Citigroup Research, Source: Citigroup Research, UBS, Moody's, Gramercy
CMBS Relative Credit PerformanceSubprime Loans Conduit Loans
Total Origination $2,500B $1,000B60-Day Delinquency Rate 15.37% 0.32%Est. Long-Term Default Rate 20.00% 1.50%Projected Total Credit Losses $250B $5B
CMBS Relative Value Snapshot
AAA - BBB- Credit Curve 580 bps
"BBB-" 2007 vs. 2004 475 bps
"A" CMBS Spread to Corporate 234 bps
"A" Leveraged ROE 17%-20%
"A" CDR to Incur loss 2.50%

Types of Securities InvestmentsTypes of Securities InvestmentsFixed Rate High-Grade CMBS (AA+ to A-)
Pro: Attractive returns compared to historical spreads; potential trading gains in a recovering marketCon: No matched term financing structures and increases credit losses
GKK Strategy: Closed $663.7 MM GSMS 2007-GKK1 and $1.1 B GKK 2007-1
Floating Rate Investment Grade CMBS (A+ to BBB-)Pro: Attractive risk-adjusted returns compared to mezz loans and b notesCon: Pools lack diversity
GKK Strategy: Analyzing bonds for year-end dealer “relief”Synthetic CMBS Investments (CMBX, CDS, TRS)
Pro: Structurally leveraged high grade investmentsCon: High Volatility
GKK Strategy: Invested $25.8 MM in NSCR 2007-4 and NSCR 2007-7High-Grade CRE CDO Bonds (AA to A-)
Pro: Distressed selling by ABCP vehicles and failed CDO issuersCon: Limited liquidity
GKK Strategy: Invested $22.75 MM buying GKK-issued bonds

2008 Goals & Objectives2008 Goals & ObjectivesClose and Integrate the AFR MergerUse AFR Platform for Net Lease Investments with Financial Services Companies Raising CapitalIdentify Alternate Sources of Growth CapitalSyndicate Low Margin Loans for RedeploymentAcquire Discounted Secondary Market PaperPursue High Margin Direct OriginationsContinue Development of RESG Platform Continue Conservative Approach to Loan Loss ReservesMaintain Dividend and Increase Retained EarningsIncrease FFO to $3.05 - $3.10
Annual Investor ConferenceDecember 3, 2007
Gramercy Capital Corp.Gramercy Capital Corp.
Related Documents