Adaptation to stimulus contrast and correlations during natural visual stimulation Nicholas A. Lesica 1,*,4 , Jianzhong Jin 2 , Chong Weng 2 , Chun-I Yeh 2,3 , Daniel A. Butts 1 , Garrett B. Stanley 1 , and Jose-Manuel Alonso 2 1 School of Engineering & Applied Sciences, Harvard University, Cambridge, MA 02138 2 Department of Biological Sciences, State University of New York, State College of Optometry, New York, NY 10036 3 Department of Psychology, University of Connecticut, Storrs, CT 06269 Summary In this study, we characterize the adaptation of neurons in the cat lateral geniculate nucleus to changes in stimulus contrast and correlations. By comparing responses to high and low contrast natural scene movie and white noise stimuli, we show that an increase in contrast or correlations results in receptive fields with faster temporal dynamics and stronger antagonistic surrounds, as well as decreases in gain and selectivity. We also observe contrast- and correlation-induced changes in the reliability and sparseness of neural responses. We find that reliability is determined primarily by processing in the receptive field (the effective contrast of the stimulus), while sparseness is determined by the interactions between several functional properties. These results reveal a number of novel adaptive phenomena and suggest that adaptation to stimulus contrast and correlations may play an important role in visual coding in a dynamic natural environment. Introduction One of the biggest challenges facing the early visual pathway is the variability in the statistical properties of the natural environment. For example, the contrast in a particular area within the visual field is constantly changing due to local variations across the scene and global changes in overall viewing conditions. Similarly, while the stereotypical spatial and temporal correlations evident in the power spectra of natural visual scenes have been widely studied (power decreases with increasing frequency as 1/f α , with α typically between 1 and 3 (Field, 1987; Dong and Atick, 1995)), these correlations can vary dramatically depending on the specifics of the current environment. The variability of the natural environment requires that the early visual pathway employ an adaptive strategy, continuously changing its response properties to match the statistical properties of the current stimulus. Thus, in order to understand the function of the early visual pathway under natural viewing conditions, we must first understand its adaptive mechanisms. Adaptive mechanisms are prominent in the early visual pathway. For example, a change in the contrast of the stimulus can evoke changes in the temporal dynamics and gain of neurons in *Correspondence: [email protected]. 4 Current Address: Department of Biology II, Ludwig-Maximilians-University Munich, 82152 Martinsried, Germany Publisher's Disclaimer: This is a PDF file of an unedited manuscript that has been accepted for publication. As a service to our customers we are providing this early version of the manuscript. The manuscript will undergo copyediting, typesetting, and review of the resulting proof before it is published in its final citable form. Please note that during the production process errors may be discovered which could affect the content, and all legal disclaimers that apply to the journal pertain. NIH Public Access Author Manuscript Neuron. Author manuscript; available in PMC 2008 August 2. Published in final edited form as: Neuron. 2007 August 2; 55(3): 479–491. NIH-PA Author Manuscript NIH-PA Author Manuscript NIH-PA Author Manuscript

Welcome message from author
This document is posted to help you gain knowledge. Please leave a comment to let me know what you think about it! Share it to your friends and learn new things together.
Transcript
Adaptation to stimulus contrast and correlations during naturalvisual stimulation
Nicholas A. Lesica1,*,4, Jianzhong Jin2, Chong Weng2, Chun-I Yeh2,3, Daniel A. Butts1,Garrett B. Stanley1, and Jose-Manuel Alonso2
1 School of Engineering & Applied Sciences, Harvard University, Cambridge, MA 02138
2 Department of Biological Sciences, State University of New York, State College of Optometry, New York,NY 10036
3 Department of Psychology, University of Connecticut, Storrs, CT 06269
SummaryIn this study, we characterize the adaptation of neurons in the cat lateral geniculate nucleus to changesin stimulus contrast and correlations. By comparing responses to high and low contrast natural scenemovie and white noise stimuli, we show that an increase in contrast or correlations results in receptivefields with faster temporal dynamics and stronger antagonistic surrounds, as well as decreases in gainand selectivity. We also observe contrast- and correlation-induced changes in the reliability andsparseness of neural responses. We find that reliability is determined primarily by processing in thereceptive field (the effective contrast of the stimulus), while sparseness is determined by theinteractions between several functional properties. These results reveal a number of novel adaptivephenomena and suggest that adaptation to stimulus contrast and correlations may play an importantrole in visual coding in a dynamic natural environment.
IntroductionOne of the biggest challenges facing the early visual pathway is the variability in the statisticalproperties of the natural environment. For example, the contrast in a particular area within thevisual field is constantly changing due to local variations across the scene and global changesin overall viewing conditions. Similarly, while the stereotypical spatial and temporalcorrelations evident in the power spectra of natural visual scenes have been widely studied(power decreases with increasing frequency as 1/fα, with α typically between 1 and 3 (Field,1987; Dong and Atick, 1995)), these correlations can vary dramatically depending on thespecifics of the current environment. The variability of the natural environment requires thatthe early visual pathway employ an adaptive strategy, continuously changing its responseproperties to match the statistical properties of the current stimulus. Thus, in order to understandthe function of the early visual pathway under natural viewing conditions, we must firstunderstand its adaptive mechanisms.
Adaptive mechanisms are prominent in the early visual pathway. For example, a change in thecontrast of the stimulus can evoke changes in the temporal dynamics and gain of neurons in
*Correspondence: [email protected] Address: Department of Biology II, Ludwig-Maximilians-University Munich, 82152 Martinsried, GermanyPublisher's Disclaimer: This is a PDF file of an unedited manuscript that has been accepted for publication. As a service to our customerswe are providing this early version of the manuscript. The manuscript will undergo copyediting, typesetting, and review of the resultingproof before it is published in its final citable form. Please note that during the production process errors may be discovered which couldaffect the content, and all legal disclaimers that apply to the journal pertain.
NIH Public AccessAuthor ManuscriptNeuron. Author manuscript; available in PMC 2008 August 2.
Published in final edited form as:Neuron. 2007 August 2; 55(3): 479–491.
NIH
-PA Author Manuscript
NIH
-PA Author Manuscript
NIH
-PA Author Manuscript
the retina and thalamus (Shapley and Victor, 1979; Smirnakis et al., 1997; Solomon et al.,2004; Mante et al., 2005), and there is evidence that such changes are necessary to maintainthe flow of visual information (Brenner et al., 2000; Fairhall et al., 2001). A recent studyreported that changes in dynamics can also be evoked by specific stimulus patterns, indicatingthat visual neurons can also adapt to correlations in a manner that enhances sensitivity to novelstimuli (Hosoya et al., 2005). While some adaptive changes in the functional properties of theearly visual pathway have been widely studied, there are a number of contrast- and correlation-induced effects that have not yet been characterized.
In this study, we examine the effects of adaptation to changes in stimulus contrast andcorrelations on the properties of neurons in the lateral geniculate nucleus (LGN) of thethalamus. To characterize adaptation in a functional context, we utilize the framework of alinear-nonlinear (LN) model. The LN model maps stimulus to firing rate through a cascade ofa linear receptive field (RF) and a rectifying static nonlinearity (NL) with a gain and offset.While there are a number of similar models that provide a suitable functional description ofvisual encoding, we use this particular LN structure because its components can be related tofunctional properties such as spatial integration and temporal dynamics (RF) and selectivity(offset), or to underlying physiological properties such as conductance (gain) and baselinemembrane potential (offset) (Brown and Masland, 2001; Baccus and Meister, 2002; Manookinand Demb, 2006; Beaudoin et al., 2007). Furthermore, this model has already been usedsuccessfully to characterize several of the functional and physiological changes associated withadaptation in the early visual pathway (Chander and Chichilnisky, 2001; Kim and Rieke,2001; Zaghloul et al., 2005).
In this study, we fit LN models from responses to high and low contrast natural scene movieand white noise stimuli, and characterize the contrast- and correlation-induced changes in thespatiotemporal RFs and NLs. In addition to confirming that several previously reportedadaptive phenomena are evident during natural stimulation, our results reveal a number ofnovel phenomena including contrast-induced changes in spatial integration and correlation-induced changes in selectivity. Through further analysis within the LN framework, we relatethe functional properties of LGN neurons to the reliability and sparseness of their responses.The results suggest that it is not the overall stimulus contrast that determines LGN responseproperties, but the ‘effective contrast’ (the extent to which a stimulus contains the features towhich the RF is sensitive). The results of this study provide a comprehensive characterizationof adaptation in the early visual pathway and suggest that this adaptation may serve to maintainthe reliability and sparseness of the neural code under natural stimulus conditions.
ResultsThe functional properties of LGN neurons adapt to changes in stimulus contrast andcorrelations
We presented a series of complex visual stimuli to anesthetized cats while single-unit responseswere recorded in the LGN with a multi-electrode array. Examples of the stimuli, which includedhigh contrast (HC) and low contrast (LC) versions of natural scene movies (NS) andspatiotemporal white noise (WN), along with the corresponding responses of a typical neuronare shown in Figure 1. Across the sample of 31 cells for which we recorded responses to allfour stimuli, the mean firing rates during HC stimulation (NS: 10.5 ± 4.8 Hz, WN: 8.2 ± 3.7Hz) were significantly higher than those during LC stimulation (NS: 6.5 ± 3.4 Hz, WN: 5.7 ±3.1 Hz) for both NS and WN (paired t tests, p < 0.001).
We designed the stimuli to allow a systematic study of adaptation to changes in stimuluscontrast and correlations. To examine the effects of a change in stimulus contrast, we comparedresponses to the HC and LC versions of each stimulus, as they were identical aside from the
Lesica et al. Page 2
Neuron. Author manuscript; available in PMC 2008 August 2.
NIH
-PA Author Manuscript
NIH
-PA Author Manuscript
NIH
-PA Author Manuscript
difference in contrast. To examine the effects of a change in stimulus correlations, we comparedresponses during stimulation with low contrast NS (strong spatiotemporal correlations) andlow contrast WN (no spatiotemporal correlations), as the mean firing rates for these stimuliacross the sample of 31 cells were not significantly different (paired t tests, p > 0.2).
To characterize the effects of changes in stimulus contrast and correlations on the functionalproperties of LGN neurons, we fit the components of an LN model from responses to each ofthe four stimuli. The LN model consists of a linear spatiotemporal RF followed by a static NL,as shown in Figure 2A. To estimate RFs, a least-squares technique was used which accountedfor the correlations in the natural stimuli and prevented them from biasing the RF estimate (seeExperimental Procedures). To estimate NLs, the stimulus was convolved with the estimatedRF (after normalizing the RF to have unit variance) and the resulting filtered stimulus wascompared to the actual firing rate response. Across the sample of 26 cells for which we recordedresponses to repeated identical segments of the HC and LC natural stimuli for crossvalidation,the LN model provided accurate predictions of the LGN responses to novel natural stimuli,with correlation coefficients of 0.7 ± 0.07 for HC and 0.76 ± 0.07 for LC (for firing rate in 8ms bins).
The RFs and NLs of a typical cell as estimated from responses to the four stimuli are shownin Figures 2B–D. Figure 2B shows the spatiotemporal RFs (note that because the RFs areradially symmetric, space has been collapsed to a single dimension for plotting). There areclear differences evident in both the spatial and temporal properties of the RFs across stimuli.For example, a comparison of the high contrast natural scene RF (HC NS, top) with the lowcontrast white noise RF (LC WN, bottom) shows a change in the relative strength of thesurround, and well as in the temporal dynamics. These changes are also evident in the temporalprofiles of the RF center and surround, as shown in Figure 2C. The temporal profile of the highcontrast natural scene RF (red) shows the strongest surround and fastest temporal dynamics,while the temporal profile of the low contrast white noise RF (gray) shows the weakest surroundand the slowest temporal dynamics.
The effects of changes in stimulus contrast and correlations are also evident in the NLs of thecell, as shown in Figure 2D. For all stimuli, the NLs resemble half-wave rectifiers, producingzero output for negative inputs and positive output for positive inputs. However, there are alsoclear differences in the gain (slope) of the NLs for large positive inputs, as well is in the offset(the input required to evoke a non-zero response). For example, the gain of the low contrastwhite noise NL (gray) is the largest, while its offset is the smallest. Note that although the offsetof the NL can be viewed as a threshold, we refer to it as an offset to avoid confusion with thephysiological spike generation threshold.
To quantify the effects of changes in stimulus contrast and correlations on the functionalproperties of LGN neurons, we measured several properties of the RFs and NLs and comparedthe results across different stimulus conditions. To quantify changes in RFs, we measured thewidth of the spatial RF center, the relative strength of the surround and the width of the temporalprofile of the RF center, as illustrated in Figure 3A. Across the sample of 68 cells for whichwe recorded responses to HC and LC natural stimuli, and the subset of 31 cells for which wealso recorded responses to HC and LC white noise stimuli, decreases in contrast had nosignificant effect on the width of the spatial RF, as shown in Figure 3B. However, across thesample of 31 cells for which we recorded responses to both NS and WN stimuli, a decrease incorrelations caused an average decrease of 20% in the width of the spatial RF center.
Both the relative strength of the surround and the width of the temporal pro- file of the RFcenter adapted to changes in both contrast and correlations, as shown in Figures 3C–D. Therelative strength of the surround was decreased by a decrease in contrast during both NS (17%)
Lesica et al. Page 3
Neuron. Author manuscript; available in PMC 2008 August 2.
NIH
-PA Author Manuscript
NIH
-PA Author Manuscript
NIH
-PA Author Manuscript
and WN (18%) stimulation, as well as by a decrease in correlations (34%), while the width ofthe temporal profile of the RF center was increased by a decrease in contrast during both NS(16%) and WN (15%) stimulation, as well as by a decrease in correlations (15%). Thesecontrast- and correlation-induced changes in spatial and temporal RF properties werecorrelated. For example, the correlation coefficient between the relative strength of thesurround and the width of the temporal profile of the RF center during HC and LC naturalstimulation was −0.5 (p < 0.001). The correlations between all changes in RF and NL propertiesare shown in Supplementary Figure 1.
To quantify changes in NLs, we measured the gain (α) and offset (θ) as illustrated in Figure4A. The gain adapted to changes in both contrast and correlations. The gain was increased bya decrease in contrast during both NS (89%) and WN (148%) stimulation, as well as by adecrease in correlations (296%), as shown in Figure 4B. The offset adapted to a change incontrast, but not to a change in correlations. As shown in Figure 4C, the offset was decreasedby a decrease in contrast during both NS (56%) and WN (59%) stimulation, but a decrease incorrelations had no effect.
Since the stimuli have different contrasts and the RFs are normalized to have unit variance, thesizes of the filtered stimuli (the inputs to the NLs) will vary. Because of these variations, thevalue of offset is only meaningful relative to the size of the corresponding filtered stimulus.Thus, rather than specify the absolute value of the offset, it is more informative to normalizeit, giving a value for the neuron’s selectivity relative to the standard deviation of the filteredstimulus. Comparing the normalized offsets across stimulus conditions reveals changes thatare quite different from those observed for the absolute offsets shown in Figure 4C. As shownin Figure 4D, the normalized offset was increased by a decrease in contrast during both NS(14%) and WN (24%) stimulation, as well as by a decrease in correlations (90%).
The above results rely on steady-state responses to stimuli with different contrasts andcorrelations. However, under truly natural conditions, the statistics of the visual stimulus canvary over time. To verify that the changes in the functional properties of LGN neuronsdescribed above are also observable under conditions where the stimulus contrast changesdynamically, we investigated whether similar changes in RFs and NLs were evident within asingle presentation of the high contrast NS stimulus. Figure 5A shows the contrast within thespatial RF of a cell as it varies over time during a segment of the HC movie, reaching valuesas high as 0.43 and as low as 0.27.
We estimated separate RFs and NLs for those periods during which the contrast within the RFwas within either the top or bottom third of all values for this cell (denoted by the gray bands).As shown in Figures 5B–D, the changes evident in the surround strength and temporaldynamics of the RF, and gain and offset of the NL are similar to those described above. For asecond cell with its RF in a different location within the visual stimulus, the contrast is muchhigher and varies over a smaller range, as shown in 5E. As shown in Figures 5F–H, the RFsand NLs estimated from the highest and lowest contrast periods of the stimulus for this cell arenearly identical. These examples suggest that the characterization of the effects of changes instimulus contrast and correlations on the functional properties of LGN neurons achievedthrough our analysis of steady-state responses to HC and LC natural and white noise stimulimay also be applicable under more dynamic natural conditions.
Contrast- and correlation-induced changes in the reliability and sparseness of LGNresponses
The results described in the previous section provide a characterization of the functionalproperties of LGN neurons within the LN framework. Through further examination of theseresults, we can relate these functional properties to contrast- and correlation-induced changes
Lesica et al. Page 4
Neuron. Author manuscript; available in PMC 2008 August 2.
NIH
-PA Author Manuscript
NIH
-PA Author Manuscript
NIH
-PA Author Manuscript
in the LGN responses. To quantify the effects of changes in stimulus contrast and correlationson LGN responses, we measured the reliability and sparseness of responses to repeatedidentical stimuli and compared the results across different stimulus conditions. We de- finedreliability as the signal to noise ratio for firing rate responses in 8 ms bins, and we measuredsparseness on a scale from 0 to 1, with 0 corresponding to a response that is the same duringevery bin, and 1 corresponding to a response that is non-zero only in a single bin (seeExperimental Procedures).
Across the sample of 31 cells from which we recorded responses to all four stimuli, a decreasein contrast during natural stimulation caused an average decrease of 54% in reliability, as shownin Figure 6A. Similar decreases in reliability were caused by a decrease in contrast during whitenoise stimulation (74%), and by a decrease in correlations (68%). As shown in Figure 6B, adecrease in contrast during natural stimulation caused only a small decrease in sparseness (4%),but larger decreases in sparseness were evident for a decrease in contrast during white noisestimulation (16%), and for a decrease in correlations (14%).
To relate the functional properties of LGN neurons to these contrast- and correlation-inducedchanges in reliability and sparseness, we created a generic LN model for each of the fourstimuli. The RFs for each model were obtained by averaging the estimated RFs across thesample of cells (with a sign reversal for OFF-center cells). The average RFs, shown in Figure7A, display the same adaptive effects that were evident in the single cell example shown inFigure 2. NLs for each model were perfect half-wave rectifiers (zero output for inputs that wereless than the offset, linear output for inputs that were greater than the offset), with gains andoffsets determined by the average values across the sample of cells (see below in Figure 8A).Using the generic models, we can simulate the firing rate response to each stimulus and relatethe processing that takes place in the RFs and NLs to reliability and sparseness.
We examined the effects of spatiotemporal integration under each stimulus condition bycomparing the contrast of the stimulus before and after processing in the RF, as illustrated inFigure 7B. Figure 7C shows the RMS contrast (standard deviation) of the four stimuli alongwith the standard deviation of the corresponding filtered stimuli, which we denote ‘effectivecontrast’. Because the RFs are normalized to have unit variance, the difference between theoriginal and effective contrasts is a direct measure of the extent to which a stimulus containsthe features to which the corresponding RF is sensitive. As is evident in Figure 7C,spatiotemporal integration in the RF results in an increase in the effective contrasts of the NSstimuli relative to those of the WN stimuli, indicating that the NS stimuli contain more of thefeatures to which the RF is sensitive. As shown in Figure 7D, a comparison of the effectivecontrasts of the four stimuli (line) with the experimentally observed reliability in the LGNresponses (circles) reveals a strong correspondence (note that, because of the difference in theunits of reliability and effective contrast, both sets of values are normalized to their values forhigh contrast NS). This suggests that it is not the overall contrast of the stimulus, but its effectivecontrast that determines the reliability of LGN responses.
To understand the contrast- and correlation-induced changes in the sparseness of LGNresponses, we must consider both the properties of the filtered stimulus as well as the additionalprocessing that takes place in the NL. Figure 8A shows the probability distributions of thestimuli after filtering in the generic RFs (thick lines), normalized to have unit standard deviationand the same peak value, along with the corresponding normalized offsets of the generic NLs(thin lines). The distributions of the filtered NS stimuli (red and blue) have relatively heavytails (and, therefore, high sparseness), indicated by a high kurtosis (k = 4.06), while those ofthe filtered WN stimuli (black and gray) are Gaussian (k = 3.01). The high kurtosis in thedistributions of the filtered NS stimuli disappears when the frames of the stimuli are shuffledbefore spatiotemporal integration in the RF (green), indicating that the increased kurtosis is
Lesica et al. Page 5
Neuron. Author manuscript; available in PMC 2008 August 2.
NIH
-PA Author Manuscript
NIH
-PA Author Manuscript
NIH
-PA Author Manuscript
due primarily to the temporal correlations in the NS. The kurtosis of the filtered stimulus affectsthe sparseness of the overall response, as the sparseness of the response of the generic LNmodel (with high contrast natural scene RF and NL) to the original high contrast NS stimulusis 0.86 and shuffling the frames of the stimulus decreases this value to 0.83.
Sparseness is also dependent on the offset of the NL, as only those filtered stimuli which aregreater than the offset can evoke a response. Thus, one expects the sparseness of the modelresponses to increase as the normalized offset is increased, with the lowest sparseness for highcontrast NS responses and the highest sparseness for low contrast WN responses. Indeed, asshown in Figure 8B, the sparseness of the model responses (line) increases as contrast andcorrelations are decreased. However, this is the opposite of what is observed in the experimentalresponses (circles), where decreases in contrast and correlations evoke a decrease in sparseness.While the sparseness of the model responses to high contrast NS stimuli matches that observedexperimentally, the correspondence between model and experiment for low contrast WN isrelatively weak.
The differences in the sparseness of the model and experimental responses shown in Figure8B can be reconciled by adding noise to the filtered stimulus in the LN model, as illustrated inFigure 8C. This added noise increases the variability of responses to identical stimuli and,therefore, decreases the sparseness of the response. Because the filtered stimuli have differenteffective contrasts, a fixed level of noise will have a different effect on each stimulus, causinga relatively small decrease in the sparseness of the high contrast NS response and a relativelylarge decrease in the sparseness of the low contrast WN response. As shown in Figure 8D, asthe noise level is increased, the sparseness of the model responses is decreased, with thestrongest decreases for the low contrast WN responses. When there is no noise (figure 8D,yellow bar), the sparseness is highest for the low contrast WN response and lowest for the highcontrast NS response, as was shown in Figure 8B (green line). As the noise level is increasedand the sparseness of the responses decrease at different rates, there is a certain noise level(figure 8D, green bar) at which the sparseness of the model and experimental responses are inclose agreement, as shown in Figure 8E. These results suggests that the sparseness of LGNresponses is determined by a number of factors, including the sparseness and effective contrastof the filtered stimulus, noise, and the offset of the NL.
DiscussionBy comparing responses to high and low contrast natural scene movie and white noise stimuli,we have shown that the functional properties of LGN neurons adapt to changes in stimuluscontrast and correlations. In response to a decrease in contrast, we observed changes inspatiotemporal integration, evidenced by an decrease in the surround strength and a slowingof the temporal dynamics of the RF. A decrease in contrast also evoked increases in gain (agiven stimulus caused a larger response) and selectivity (a larger stimulus was required toevoke a response), evidenced by increases in the gain and normalized offset of the NL. Adecrease in correlations evoked similar changes, as well as a decrease in the spatial extent ofthe RF center. These results reveal a number of novel adaptive phenomena and provide acomprehensive characterization of the effects of changes in stimulus contrast and correlationson LGN response properties.
Relation to previous studies of contrast adaptationOur results regarding the effects of contrast adaptation on temporal dynamics, gain, and offsetare consistent with those of previous studies in the early visual pathway. The first studies ofcontrast adaptation in the retina reported changes in gain and temporal dynamics similar tothose observed in our results (Shapley and Victor, 1978, 1981). As the contrast of a gratingstimulus was increased, the temporal frequency responses of retinal ganglion cells showed a
Lesica et al. Page 6
Neuron. Author manuscript; available in PMC 2008 August 2.
NIH
-PA Author Manuscript
NIH
-PA Author Manuscript
NIH
-PA Author Manuscript
decrease in overall gain, a phase advance, and a shift in tuning toward higher temporalfrequencies (corresponding to the decrease in gain and transition to faster dynamics in ourresults). These changes were well predicted by a model in which ganglion cell dynamics weredependent on a measure of ‘neural contrast’ similar to the measure of effective contrast usedhere (Victor, 1987). More recent studies using white noise stimuli and LN model-basedanalyses have reported similar changes (Smirnakis et al., 1997; Chander and Chichilnisky,2001; Kim and Rieke, 2001; Brown and Masland, 2001). Studies of contrast adaptation in theretina using intracellular recordings have also reported changes in baseline membrane potential(Baccus and Meister, 2002; Zaghloul et al., 2005). Following an increase in the contrast of thestimulus, the steady-state baseline membrane potential of retinal ganglion cells decreased(corresponding to the increase in normalized offset in our results). Recent studies in the LGNhave used gratings of different contrasts to demonstrate similar effects on gain and temporaldynamics (Mante et al., 2005), as well as baseline membrane potential (Solomon et al.,2004). Our results verify that these changes in temporal dynamics, gain, and offset are alsoevident under more natural stimulus conditions.
It is likely that the adaptive changes that we observe in the LGN originate in the retina. Contrast-induced changes in temporal dynamics, gain, and offset are already evident in bipolar cells(Kim and Rieke, 2001; Rieke, 2001; Manookin and Demb, 2006; Beaudoin et al., 2007) andare enhanced during spike generation in ganglion cells (Kim and Rieke, 2001; Zaghloul et al.,2005; Beaudoin et al., 2007). The mechanisms that underlie these changes are activitydependent (Rieke, 2001; Kim and Rieke, 2003; Manookin and Demb, 2006; Beaudoin et al.,2007), suggesting that the level of adaptation is determined by the effective contrast of stimulus(not the RMS contrast), which is consistent with our results.
Our results also demonstrate that an increase in contrast during both natural and white noisestimulation causes an increase in the strength of the RF surround and has no effect on the sizeof the RF center. There have been several studies of the effects of stimulus contrast on thespatial RFs of LGN neurons using disk and grating stimuli, but explicit comparison of ourresults with those of these studies is difficult. One study using concentric disks to stimulatethe center and surround separately found that increasing the contrast of the surround stimuluscaused an increase in surround strength (Kremers et al., 2004), which is consistent with ourresults. Another study using disk stimuli reported a change in the size of the RF center, but nochange in the relative strength of the classical RF surround (Nolt et al., 2004). However, thestimuli used in this study were spatially uniform (only the temporal contrast was changed), andit is possible that the changes in surround strength that we observe are due to changes in spatialcontrast that were not present in the disk stimulus. Finally, a recent study using grating stimulireported that an increase in contrast caused an increase in the strength of the ‘suppressivefield’ (Bonin et al., 2005). Any differences between our results and the results of these studiesare likely due to the properties of the stimuli used in each study, but further study is necessaryto fully clarify this issue.
Relation to previous studies of adaptation to correlationsTo our knowledge, there is only one other study in the early visual pathway with which tocompare our results on adaptation to stimulus correlations. Hosoya and colleagues (2005)showed that the RFs of retinal ganglion cells adapt to predictable spatial and temporal patternsin a manner that facilitates the detection of novel stimuli. These results are consistent with ourobservations of the differences in the RFs estimated from responses to natural and white noisestimuli at the same contrast. For example, natural stimuli contain strong spatial correlationsand the increased strength of the RF surround during natural stimulation decreases thesensitivity of the neuron to these correlations while increasing its sensitivity to novel stimulisuch as edges. This interpretation is also consistent with the results of a recent study in the
Lesica et al. Page 7
Neuron. Author manuscript; available in PMC 2008 August 2.
NIH
-PA Author Manuscript
NIH
-PA Author Manuscript
NIH
-PA Author Manuscript
visual cortex which demonstrated that changes in spatial frequency tuning evoked by changesin stimulus correlations increase the information in the neural response (Sharpee et al., 2006).We also observed differences in the gains and normalized offsets of the NLs estimated fromresponses to NS and WN stimuli at the same overall contrast, but as of yet there are nocomparable studies of these phenomena.
The effects of contrast and correlations on reliability and sparsenessOur results suggest that the reliability and sparseness of LGN responses are determined not bythe overall contrast of the stimulus, but by its effective contrast (the standard deviation of thestimulus after filtering in the RF). Effective contrast is a direct measure of the extent to whicha stimulus contains the features to which the RF is sensitive, and is similar to other measuresof local contrast that have been used previously (Victor, 1987; Tadmor and Tolhurst, 2000).Effective contrast can be viewed in the frequency domain as the extent to which the frequencycontent of the stimulus and the frequency tuning of the neuron overlap. From this perspective,it is apparent why the effective contrast of NS stimuli is higher than that of WN stimuli witha similar overall contrast (see Figure 7C), as the power in NS stimuli is concentrated at lowfrequencies to which the system is most sensitive, while power in WN stimuli is spread evenlyacross all frequencies.
In examining the effects of stimulus correlations on LGN responses, we chose to compare lowcontrast NS and WN responses because these stimuli had similar RMS contrasts and evokedresponses with similar mean firing rates. However, because these stimuli also have differenteffective contrasts, it is possible that the observed differences in the reliability and sparsenessof low contrast NS and WN responses are not due to the change in correlations per se, butinstead to the change in effective contrast that results from the change in correlations. If thiswere true, then the reliability and sparseness of responses to low contrast NS and high contrastWN, which have different correlations but similar effective contrasts, should be similar. Indeed,when comparing responses to low contrast NS and high contrast WN stimuli, the decreases inreliability and sparseness corresponding to the decrease in correlations are no longer evident(see Figures 6A and B). In fact, the reliability and sparseness of the high contrast WN responsesare slightly higher than those of the low contrast NS responses. This suggests that, whilestimulus correlations have an indirect effect on reliability and sparseness, these responseproperties are determined primarily by effective contrast.
Adaptation to stimulus correlationsGiven that it is not correlations themselves, but their impact on the effective contrast of thestimulus that underlies the differences in the reliability and sparseness of low contrast NS andWN responses, one might also expect that the adaptive changes evident in the comparison ofthe low contrast natural scene and white noise RFs and NLs are also driven by the change ineffective contrast, not the change in correlations. If this were true, then these changes, likethose in reliability and sparseness, would no longer be evident in a comparison between theRFs and NLs for NS and WN stimuli with similar effective contrasts. However, nearly all ofthe observed differences between low contrast natural scene and white noise RFs and NLs(spatial width, surround strength, gain, and normalized offset) are still significant when RFsand NLs are compared across low contrast NS and high contrast WN. This suggests that theseeffects are indeed adaptations to stimulus correlations, as they are evident when the naturalscene and white noise RFs and NLs are compared at similar overall and effective contrasts.Thus, while reliability and sparseness are similar for stimuli with different correlations (andsimilar effective contrasts), the underlying RFs and NLs are different, indicating that theobserved changes in RFs and NLs reflect adaptive mechanisms designed to preserve reliabilityand sparseness.
Lesica et al. Page 8
Neuron. Author manuscript; available in PMC 2008 August 2.
NIH
-PA Author Manuscript
NIH
-PA Author Manuscript
NIH
-PA Author Manuscript
The functional mechanisms underlying reliability and sparsenessOur results suggest that reliability is dependent primarily on the effective contrast of thestimulus (see Figure 7), while sparseness is determined by a number of factors including thesparseness and effective contrast of the filtered stimulus, noise, and the offset of the NL (seeFigure 8). Because filtered NS stimuli are more sparse than filtered WN stimuli (as measuredby kurtosis), responses to NS (with a fixed NL) will be more sparse than responses to WN atthe same effective contrast. Sparseness is also influenced by the relative sizes of the stimulus-dependent neural activity (effective contrast) and the stimulus-independent neural activity(noise). For stimuli with a high effective contrast, the neuron will respond reliably to thefeatures of the stimulus to which it is sensitive, with high sparseness (constrained by thesparseness of the stimulus). For stimuli with a low effective contrast, the response of the neuronwill be a maintained discharge driven primarily by noise, with equal probability of responseat all times and, thus, low sparseness. Our data suggest that the offset of the NL adapts tochanges in stimulus sparseness (as determined by correlations) and effective contrast tomaintain the sparseness of the response. For example, the offsets for low contrast NS and highcontrast WN (stimuli with different sparseness and similar effective contrast) are dramaticallydifferent while the sparseness of LGN responses to these stimuli are similar.
The coding of natural stimuli in the LGNOur results show that natural stimuli are coded with greater reliability and sparseness thanwhite noise stimuli in the LGN, and suggest that these differences are due to differences ineffective contrast. For stimuli with similar overall contrasts, the reliability and sparseness ofresponses to natural stimuli were higher than those of responses to white noise (see Figures6A and B). Furthermore, the sparseness of LGN responses was far more robust to a change incontrast during natural stimulation than during white noise stimulation. While a decrease incontrast caused a small decrease in sparseness during natural stimulation, the decrease wasmuch larger during white noise stimulation. Thus, the mechanisms that produce a sparseresponse in the LGN may be effective over the range of effective contrasts that are typicalduring natural stimulation, but are unable to maintain sparseness at the very low effectivecontrast of the low contrast WN stimulus. This suggests that the adaptive changes that we havecharacterized here may be optimized for the processing of visual stimuli with statisticalproperties that are typical of the natural environment.
Experimental ProceduresRecordings from cat LGN
The surgical and experimental preparations used for this study have been described in detailpreviously (Weng et al., 2005). Briefly, cats were initially anesthetized with Ketamine (10 mg/kg, intramuscular) followed by thiopental sodium (surgery: 20 mg/Kg, intravenous; recording:1–2 mg/Kg/hr, intravenous; supplemented as needed). A craniotomy and duratomy were madeto introduce recording electrodes into LGN (anterior: 5.5; lateral 10.5). Animals were paralyzedwith Atracurium Besylate (0.6–1 mg/kg/hr, intravenous) to minimize eye movements andartificially ventilated. All surgical and experimental procedures were performed in accordancewith United States Department of Agriculture (USDA) guidelines and were approved by theInstitutional Animal Care and Use Committee (IACUC) at the State University of New York,State College of Optometry. LGN responses were recorded extracellularly within layer A.Recorded voltage signals were conventionally amplified, filtered, and passed to a computerrunning the RASPUTIN software package (Plexon Inc., Dallas, TX). For each cell, spikewaveforms were identified initially during the experiment and verified carefully off-line byspike sorting analysis. Cells were classified as X or Y according to their responses tocounterphased sine wave gratings (Hochstein and Shapley, 1976). All cells included in thisstudy were non-lagged cells.
Lesica et al. Page 9
Neuron. Author manuscript; available in PMC 2008 August 2.
NIH
-PA Author Manuscript
NIH
-PA Author Manuscript
NIH
-PA Author Manuscript
Natural scene movie and white-noise stimuliMovie sequences were recorded by members of the laboratory of Peter König (Institute ofNeuroinformatics, ETH/UNI Zürich) using a removable lightweight CCD-camera mounted tothe head of a freely roaming cat in natural environments such as grassland and forest (Kayseret al., 2003). It is important to note that while these movies provide an approximation of theactual stimulus that the cat receives in the natural environment, they do not capture the effectsof saccades and fixational eye movements, which can have significant effects on the statisticsof the visual input (Rucci and Casile, 2005). Movies were recorded via a cable connected tothe leash onto a standard VHS-VCR (Pal) carried by the human experimenter and digitized ata temporal resolution of 25 Hz. Each frame of the movies consisted of 320 × 240 pixels and16 bit color depth. For this study, the movies were converted to 8-bit gray scale and a 48 × 48section of each frame was used. To improve temporal resolution, movies were interpolated bya factor of 2 (to a sampling rate of 50 Hz) using commercial software (MotionPerfect, DynapelSystems Inc.). Following interpolation, the intensities of each movie frame were rescaled tohave a mean value of 125 (possible values were 0–255) for presentation. For all analyses inthis study, the stimuli were scaled to have zero mean and possible values between −106 and106. To create high and low contrast versions of the movies, each frame was rescaled to havean RMS contrast of 0.40 (high contrast) or 0.15 (low contrast). Aside from the difference incontrast, the high and low contrast movie segments were identical, and the contrasttransformations did not affect the mean intensity of the stimulus. Thus, within the RF of anyparticular neuron, the mean intensity of the high and low contrast movies was the same. Duringexperimental presentation, movies were shown on a 20-inch monitor with a refresh rate of 120Hz, with pixel intensities updated every other refresh so that playback approximated theintended temporal resolution of the interpolated movies. The spatial resolution of the stimuluswas such that each pixel was a square measuring 0.2° (RF center width, when measured asdescribed below, was typically between 0.5 – 0.7°).
For all cells in this study, a single 15 min movie segment was shown at high and low contrastfor RF and NL estimation. For analysis of the single 15 min movie segments, only those cellsfor which the peak of the RF estimate was at least 10 times larger than the noise (standarddeviation of RF estimated from shuffled responses) were included. This sample included 68cells: 44 cells that were ON-center (19 X cells, 19 Y cells, and 6 cells that were not classifiedbecause responses to counterphased sine wave gratings were not recorded) and 24 cells thatwere OFF-center (11 X cells, 8 Y cells, and 5 cells that were not classified). For a subset of 26cells, 24 repeated trials of a different 90 s movie segment were also shown at high and lowcontrast for cross-validation of the RFs and NLs. For a subset of 31 cells, a 6 min segment ofa spatiotemporal binary white noise stimulus was also shown at high and low contrast, alongwith 120 repeated trials of different 12 s segments of natural scene movie and white noisestimuli at high and low contrast. For the white noise stimulus, each frame was rescaled to havean RMS contrast of 0.55 (high contrast) or 0.20 (low contrast). The spatial resolution andrefresh rate of the white noise stimulus were the same as those of the movies.
Measurement of reliability and sparsenessReliability and sparseness were measured from responses to repeated identical stimuli.Reliability was measured as the signal to noise ratio (for firing rate in 8 ms bins) as describedby Borst and Theunissen (Borst and Theunissen, 1999). First, the signal spectrum is obtainedby computing the power spectrum of the response after averaging across all trials. Next, toobtain the noise power, the response from each trial is subtracted from the average responseand the power spectrum of this difference is computed. These difference spectra are averagedover all trials to yield the overall noise spectrum. Finally, the signal to noise ratio is given bythe ratio of the total power of the signal and noise spectra.
Lesica et al. Page 10
Neuron. Author manuscript; available in PMC 2008 August 2.
NIH
-PA Author Manuscript
NIH
-PA Author Manuscript
NIH
-PA Author Manuscript
Sparseness was measured as defined by Vinje and Gallant (Vinje and Gallant, 2000):
1 − ( μ 2
μ 2 + σ 2)
1 − ( 1n )where μ is the mean firing rate, σ is the standard deviation of the firing rate, and n is the numberof time bins. For a response that is the same in every time bin (flat PSTH), the sparseness is 0.For a response that is zero in all but one time bin, the sparseness is 1.
Estimation of receptive fieldsIn order to estimate receptive fields from responses to correlated natural stimuli, an estimationprocedure which accounts for the auto-correlation structure of the stimulus must be employed.We have previously developed a recursive least-squares (RLS) algorithm to estimate RFs fromresponses to natural scene movies (Lesica and Stanley, 2006). Importantly, through recursivecomputation, RLS avoids the explicit inversion of the stimulus auto-correlation matrix,resulting in a convergence rate that is independent of the eigenvalue spread of the stimulusauto-correlation matrix (Haykin, 2002). This is especially important when estimating RFs froma limited presentation of correlated stimuli.
We denote the visual input as the spatiotemporal signal s[p, n]. For our computer driven stimulidiscretized in space-time, p represents the grid index of a stimulus pixel on the screen and n isthe time sample. We denote the RF as g[p,m], representing P (total pixels in stimulus) separatetemporal RFs, each with M (length of temporal RF) lags. To generate a linear prediction of theLGN response, the stimulus is convolved with the RF: y[n] = sn * gn, If s and g are organizedappropriately into the column vectors sn and gn, then this discrete time integration in space andconvolution in time can be written as a vector multiplication y[n] = sn
Tgn, where sn and gn arethe column vectors:
sn = s P, n − M + 1 , s P − 1, n − M + 1 , … s 1, n − M + 1 , s P, n − M + 2 , … s 1, n T
gn = gn P, M , gn P − 1, M , … gn 1, M , gn P, M − 1 , … gn 1, 1 T
and T denotes matrix transpose. At each time step, the RF estimate computed from previousdata ĝn|n−1 is used to generate a linear prediction of the response of the neuron to the newstimulus (the subscript n|n − 1 denotes an estimate at time n given all data up to and includingtime n − 1). This prediction is compared with the actual response r[n] to yield the predictionerror: e[n] = r[n] − sn
T ĝn|n−1. The RF estimate is updated by scaling the error by a gain factorrelated to the correlation structure of the stimulus: ĝn+1|n = ĝn|n−1 + Gn e[n]. The gain iscomputed each time step as follows:
Gn =Kn|n−1sn
snT Kn|n−1sn + 1
where Kn+1|n = Kn|n−1 − GnsnT Kn|n−1
To initialize the algorithm, the initial conditions ĝ0|−1 = 0 and K 0|−1 = Δ × I are used. Theregularization parameter Δ affects the convergence properties and steady state error of the RLSestimate. Estimating an RF using a least-squares method requires the inversion of the stimulusauto-correlation matrix (although in RLS, explicit inversion is avoided via recursive solution).If the stimulus is correlated, the eigenvalue spread of the auto-correlation matrix can becomerather large, and the inversion may be ill-conditioned. Regularization of this matrix can reduceits condition number (ratio of largest to smallest eigenvalue) by adding a constant to all of the
Lesica et al. Page 11
Neuron. Author manuscript; available in PMC 2008 August 2.
NIH
-PA Author Manuscript
NIH
-PA Author Manuscript
NIH
-PA Author Manuscript
elements along the diagonal (Haykin, 2002). However, this manipulation of the diagonalelements of the stimulus auto-correlation matrix also introduces a bias into the RF estimate.Thus, regularization is a tradeoff between error avoided by decreasing the condition numberof the stimulus auto-correlation matrix and error introduced by biasing the RF estimate. A setof rules for choosing this value based on the signal to noise ratio in the system has beendeveloped (Haykin, 2002). For this study, the value of Δ which produced the RF estimates thatprovided the most accurate predictions of responses to natural scene movies was used (Δ =0.001).
In addition to having strong spatial and temporal correlations, natural stimuli are often alsospherically asymmetric (Simoncelli et al., 2003), and this asymmetry can bias RF estimatesobtained using least-squares techniques such as the one described above. To examine the effectsof spherical asymmetry in our RF estimates, we simulated LGN responses using the LN modelwith a known RF and NL as described below. We estimated the RF from simulated responsesto both Gaussian white noise stimuli and the movie stimuli used in this study and found thatthe estimates were not significantly different, which suggests that the spherical asymmetry ofthe movies used in this study did not cause a large bias in the experimental RF estimates.
For RF estimation, spike times were binned at 128 Hz to give an estimate of the firing rate.Thus, each spatiotemporal RF estimate consisted of 441 spatial points (21 × 21 grid) spacedat 0.2 cycles per degree each with 24 temporal points spaced at 8 ms. RF estimates for a givencell were estimated using the same number of spikes for high and low contrast responses. Eachresponse was broken into 9 segments and RFs were calculated separately for each segment.The mean of these 9 RFs was used for measuring RF properties and in the LN model to predictthe response of the neuron to novel stimuli. The error bars on the RF estimates represent ± onestandard deviation of the 9 RF estimates.
Definition of center and surroundRFs were separated into center and surround components using the following method (Lesicaand Stanley, 2004): First, the point with the largest amplitude (maximal point) in thespatiotemporal RF was determined. Next, the center of the RF was defined as those spatialpoints at the same latency as the maximal point that 1) formed a contiguous region with themaximal point and other center pixels and 2) had an amplitude with the same sign as themaximal point and a value that was above the error level for that neuron. The error level foreach neuron was based on the RF estimate from randomly shuffled responses. The standarddeviation of this estimate (equal to zero in an ideal setting with infinite data) provides a measureof the uncertainty in the actual RF estimate. The surround was defined as a ring around thecenter region, a maximum of 4 pixels wide.
Estimation of static nonlinearitiesThe static nonlinearities for each cell were calculated by convolving the stimulus with thespatiotemporal RF to yield the filtered stimulus and comparing it with the actual response ofthe neuron (firing rate in 8 ms bins). Before convolution, the mean of each stimulus was set tozero and each RF was normalized to have unit variance. The values of the filtered stimuluswere sorted into ascending order and separated into groups of 250 values. For each group, themean values of the filtered stimulus and corresponding actual firing rates were used to definethe static nonlinearity. As described above for the calculation of RFs, each response was brokeninto 9 segments and NLs were calculated separately for each segment. The mean of these 9NLs was used for measuring NL properties and in the LN model to predict the response of theneuron to novel stimuli. The error bars on the NL estimates represent ± one standard deviationof the 9 NL estimates.
Lesica et al. Page 12
Neuron. Author manuscript; available in PMC 2008 August 2.
NIH
-PA Author Manuscript
NIH
-PA Author Manuscript
NIH
-PA Author Manuscript
Measurement of receptive field and nonlinearity propertiesTo quantify the effects of adaptation to changes in stimulus contrast and correlations, wemeasured several properties of the estimated RFs and NLs. To measure the width of the spatialRF, the spatial profile of the RF (at the latency of the peak) was fit with a symmetric two-dimensional difference of Gaussians function. The width of the spatial RF was defined as thewidth of this function at half of its peak value. The surround/center ratio and temporal widthof the RF were measured directly from the raw RF estimates. The sur- round/center ratio ofthe RF was defined as the absolute value of the peak of the temporal profile of the RF surrounddivided by the peak of the temporal profile of the RF center. The width of the temporal RF wasdefined as the width of the primary phase of the temporal profile of the RF center at half of itspeak value. Changes in contrast and correlations also had significant effects on the latency(time to peak) of the temporal profile of the RF center, but not on the biphasic ratio (the absolutevalue of the peak of the primary phase of temporal profile of the RF center divided by the peakof the secondary phase of temporal profile of the RF center).
To measure gain (α) and offset (θ), the static nonlinearities were fit with a half-wave rectifier:
f (x) = {α(x − θ), x ≥ θ0 , x < θ
The only RF or NL parameter value that was significantly different across animals for a givenstimulus condition was θ. This is likely due to the different anesthesia requirements of eachanimal, as θ is reflective of the baseline membrane potential (Baccus and Meister, 2002;Zaghloul et al., 2005). To account for this difference, the values of θ for each stimulus conditionwere adjusted to have the same mean value for each animal.
Across cell types (X/Y, ON/OFF), there were several significant differences between RF andNL parameters. The width of the spatial RF was significantly larger for Y cells than for X cellsduring both high contrast (X: 0.63 ± 0.16 deg., Y: 0.75 ± 0.18 deg.) and low contrast (X: 0.63± 0.14 deg., Y: 0.73 ± 0.15 deg.) natural stimulation (t tests, p < 0.01), the relative strength ofthe surround was significantly larger for Y cells than for X cells during high contrast naturalstimulation (X: 0.13 ± 0.04, Y: 0.16 ± 0.06, t test, p < 0.05), and the width of the temporalprofile of the RF center was significantly larger for OFF cells than for ON cells during lowcontrast white noise stimulation (ON: 25 ± 0.4 ms, OFF: 29 ± 0.4 ms, t test, p < 0.01). Also,the correlation coefficients between LN model predictions and experimental responses torepeated identical segments of novel NS stimuli (for firing rate in 8 ms bins) were higher forX cells than for Y cells at both HC (X: 0.73, Y: 0.69) and LC (X: 0.78, Y: 0.75), but thesedifferences were not significant (t tests, p > 0.1).
Supplementary MaterialRefer to Web version on PubMed Central for supplementary material.
Acknowledgements
NAL, DAB, and GBS were supported by National Geospatial-Intelligence Agency Grant HM1582-05-C-0009. JJ,CW, CIY, and JMA were supported by National Eye Institute Grant EY-05253 and Research foundation at StateUniversity of New York. The authors would like to thank C. Kayser and the members of the laboratory of Peter Königfor providing the natural scene movies, and C. Leibold and C. Machens for helpful discussions.
ReferencesBaccus SA, Meister M. Fast and slow contrast adaptation in retinal circuitry. Neuron 2002;36:909–919.
[PubMed: 12467594]
Lesica et al. Page 13
Neuron. Author manuscript; available in PMC 2008 August 2.
NIH
-PA Author Manuscript
NIH
-PA Author Manuscript
NIH
-PA Author Manuscript
Beaudoin DL, Borguis BG, Demb JB. Cellular basis for contrast gain control over the receptive fieldcenter of mammalian retinal ganglion cells. J Neurosci 2007;27:2636–2645. [PubMed: 17344401]
Bonin V, Mante V, Carandini M. The suppressive field of neurons in lateral geniculate nucleus. J Neurosci2005;25:10844–10856. [PubMed: 16306397]
Borst A, Theunissen FE. Information theory and neural coding. Nat Neurosci 1999;2:947–957. [PubMed:10526332]
Brenner N, Bialek W, de Ruyter van Steveninck R. Adaptive rescaling maximizes informationtransmission. Neuron 2000;26:695–702. [PubMed: 10896164]
Brown SP, Masland RH. Spatial scale and cellular substrate of contrast adaptation by retinal ganglioncells. Nat Neurosci 2001;4:44–51. [PubMed: 11135644]
Chander D, Chichilnisky EJ. Adaptation to temporal contrast in primate and salamander retina. J Neurosci2001;21:9904–9916. [PubMed: 11739598]
Dong DW, Atick JJ. Statistics of time-varying images. Network: Comput Neural Syst 1995;6:345–358.Fairhall AL, Lewen GD, Bialek W, de Ruyter van Stevenick RR. Efficiency and ambiguity in an adaptive
neural code. Nature 2001;412:787–790. [PubMed: 11518957]Field DJ. Relations between the statistics of natural images and the response properties of cortical cells.
J Opt Soc Am A 1987;4:2379–2393. [PubMed: 3430225]Haykin, S. Adaptive Filter Theory. 4. New Jersey: Prentice Hall; 2002.Hochstein S, Shapley RM. Quantitative analysis of retinal ganglion cell classifications. J Physiol
1976;262:237–264. [PubMed: 994039]Hosoya T, Baccus SA, Meister M. Dynamic predictive coding by the retina. Nature 2005;436:71–77.
[PubMed: 16001064]Kayser C, Einhauser W, Konig P. Temporal correlations of orientations in natural scenes.
Neurocomputing 2003;52:117–123.Kim KJ, Rieke F. Temporal contrast adaptation in the input and output signals of the salamander retinal
ganlgion cells. J Neurosci 2001;21:287–299. [PubMed: 11150346]Kim KJ, Rieke F. Slow na+ inactivation and variance adaptation in salamander retinal ganglion cells. J
Neurosci 2003;23:1506–1516. [PubMed: 12598639]Kremers J, Kozyrev V, Silveira LC, Kilavik BE. Lateral interactions in the perception of flicker and in
the physiology of the lateral geniculate nucleus. J Vis 2004;4:643–663. [PubMed: 15330708]Lesica NA, Stanley GB. Encoding of natural scene movies by tonic and burst spikes in the lateral
geniculate nucleus. J Neurosci 2004;24:10731–10740. [PubMed: 15564591]Lesica NA, Stanley GB. Decoupling functional mechanisms of adaptive encoding. Network 2006;17:43–
60. [PubMed: 16613794]Manookin MB, Demb JB. Presynaptic mechanism for slow contrast adaptation in mammalian retinal
ganglion cells. Neuron 2006;50:453–464. [PubMed: 16675399]Mante V, Frazor RA, Bonin V, Geisler WS, Carandini M. Independence of luminance and contrast in
natural scenes and in the early visual system. Nat Neurosci 2005;8:1690–1697. [PubMed: 16286933]Nolt MJ, Kumbhani RD, Palmer LA. Contrast-dependent spatial summation in the lateral geniculate
nucleus and retina of the cat. J Neurophysiol 2004;92:1708–1717. [PubMed: 15128751]Rieke F. Temporal contrast adaptation in salamander bipolar cells. J Neurosci 2001;21:9445–9454.
[PubMed: 11717378]Rucci M, Casile A. Fixational instability and natural image statistics: implications for early visual
representations. Network 2005;16:121–138. [PubMed: 16411492]Shapley RM, Victor JD. The effect of contrast on the transfer properties of cat retinal ganglion cells. J
Physiol 1978;285:275–298. [PubMed: 745079]Shapley RM, Victor JD. The contrast gain control of the cat retina. Vision Res 1979;19:431–434.
[PubMed: 473613]Shapley RM, Victor JD. How the contrast gain control modifies the frequency responses of cat retinal
ganglion cells. J Physiol 1981;318:161–179. [PubMed: 7320887]Sharpee TO, Sugihara H, Kurgansky AV, Rebrik SP, Stryker MP, Miller KD. Adaptive filtering enhances
information transmission in visual cortex. Nature 2006;439:936–942. [PubMed: 16495990]
Lesica et al. Page 14
Neuron. Author manuscript; available in PMC 2008 August 2.
NIH
-PA Author Manuscript
NIH
-PA Author Manuscript
NIH
-PA Author Manuscript
Simoncelli, E.; Paninsky, L.; Pillow, J.; Schwartz, O. The Cognitive Neurosciences. 3. MIT Press; 2003.Characterization of neural responses with stochastic stimuli.
Smirnakis SM, Berry MJ, Warland DK, Bialek W, Meister M. Adaptation of retinal processing to imagecontrast and spatial scale. Nature 1997;386:69–73. [PubMed: 9052781]
Solomon SG, Pierce JW, Dhruv NT, Lennie P. Profound contrast adaptation early in the visual pathway.Neuron 2004;42:155–162. [PubMed: 15066272]
Tadmor Y, Tolhurst DJ. Calculating the contrasts that retinal ganglion cells and LGN neurones encounterin natural scenes. Vision Res 2000;40:3145–3157. [PubMed: 10996617]
Victor JD. The dynamics of the cat retinal x cell centre. J Physiol 1987;386:219–246. [PubMed: 3681707]Vinje WE, Gallant JL. Sparse coding and decorrelation in primary visual cortex during natural vision.
Science 2000;287:1273–1276. [PubMed: 10678835]Weng C, Yeh CI, Stoelzel CR, Alonso JM. Receptive field size and response latency are correlated within
the cat visual thalamus. J Neurophysiol 2005;93:3537–3547. [PubMed: 15590731]Zaghloul KA, Boahen K, Demb JB. Contrast adaptation in subthreshold and spiking responses of
mammalian y-type retinal ganglion cells. J Neurosci 2005;24:860–868. [PubMed: 15673666]
Lesica et al. Page 15
Neuron. Author manuscript; available in PMC 2008 August 2.
NIH
-PA Author Manuscript
NIH
-PA Author Manuscript
NIH
-PA Author Manuscript
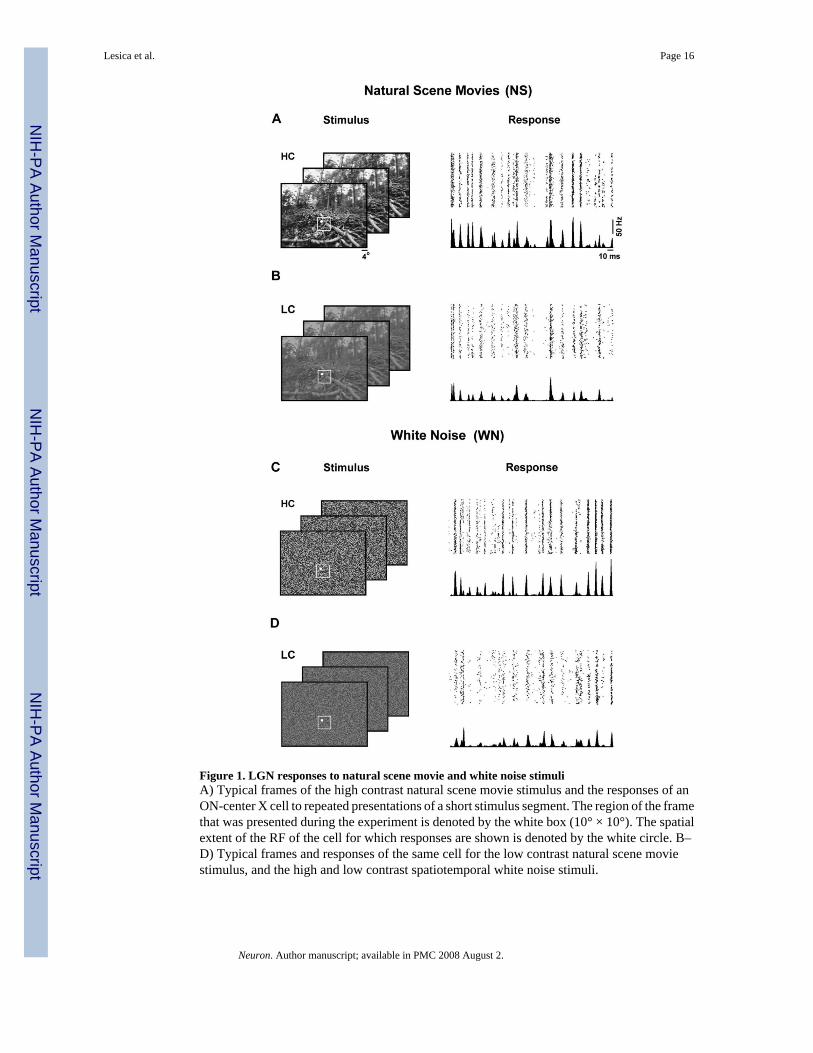
Figure 1. LGN responses to natural scene movie and white noise stimuliA) Typical frames of the high contrast natural scene movie stimulus and the responses of anON-center X cell to repeated presentations of a short stimulus segment. The region of the framethat was presented during the experiment is denoted by the white box (10° × 10°). The spatialextent of the RF of the cell for which responses are shown is denoted by the white circle. B–D) Typical frames and responses of the same cell for the low contrast natural scene moviestimulus, and the high and low contrast spatiotemporal white noise stimuli.
Lesica et al. Page 16
Neuron. Author manuscript; available in PMC 2008 August 2.
NIH
-PA Author Manuscript
NIH
-PA Author Manuscript
NIH
-PA Author Manuscript
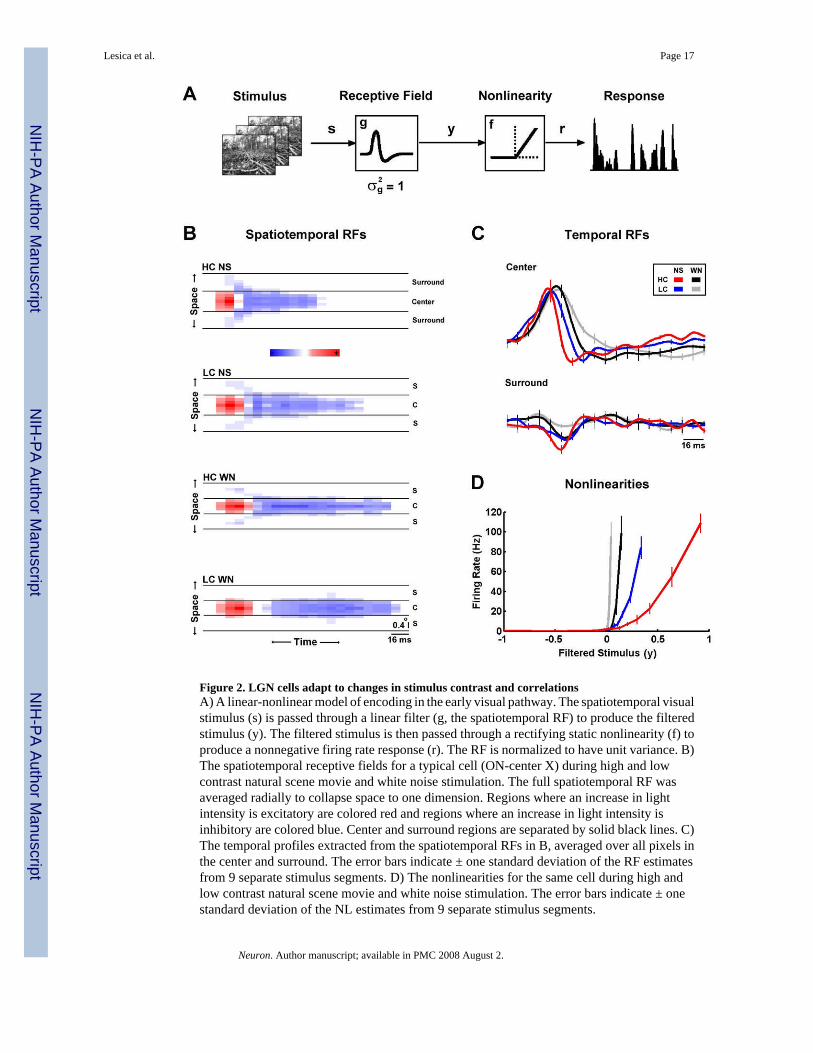
Figure 2. LGN cells adapt to changes in stimulus contrast and correlationsA) A linear-nonlinear model of encoding in the early visual pathway. The spatiotemporal visualstimulus (s) is passed through a linear filter (g, the spatiotemporal RF) to produce the filteredstimulus (y). The filtered stimulus is then passed through a rectifying static nonlinearity (f) toproduce a nonnegative firing rate response (r). The RF is normalized to have unit variance. B)The spatiotemporal receptive fields for a typical cell (ON-center X) during high and lowcontrast natural scene movie and white noise stimulation. The full spatiotemporal RF wasaveraged radially to collapse space to one dimension. Regions where an increase in lightintensity is excitatory are colored red and regions where an increase in light intensity isinhibitory are colored blue. Center and surround regions are separated by solid black lines. C)The temporal profiles extracted from the spatiotemporal RFs in B, averaged over all pixels inthe center and surround. The error bars indicate ± one standard deviation of the RF estimatesfrom 9 separate stimulus segments. D) The nonlinearities for the same cell during high andlow contrast natural scene movie and white noise stimulation. The error bars indicate ± onestandard deviation of the NL estimates from 9 separate stimulus segments.
Lesica et al. Page 17
Neuron. Author manuscript; available in PMC 2008 August 2.
NIH
-PA Author Manuscript
NIH
-PA Author Manuscript
NIH
-PA Author Manuscript
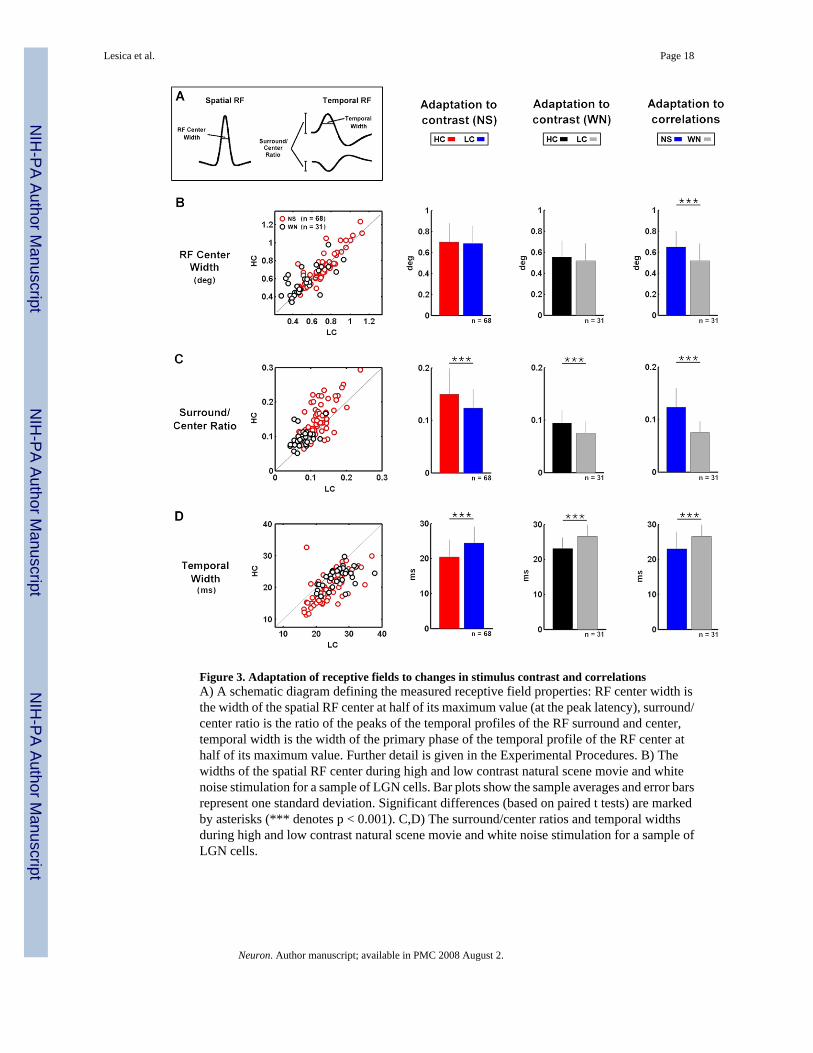
Figure 3. Adaptation of receptive fields to changes in stimulus contrast and correlationsA) A schematic diagram defining the measured receptive field properties: RF center width isthe width of the spatial RF center at half of its maximum value (at the peak latency), surround/center ratio is the ratio of the peaks of the temporal profiles of the RF surround and center,temporal width is the width of the primary phase of the temporal profile of the RF center athalf of its maximum value. Further detail is given in the Experimental Procedures. B) Thewidths of the spatial RF center during high and low contrast natural scene movie and whitenoise stimulation for a sample of LGN cells. Bar plots show the sample averages and error barsrepresent one standard deviation. Significant differences (based on paired t tests) are markedby asterisks (*** denotes p < 0.001). C,D) The surround/center ratios and temporal widthsduring high and low contrast natural scene movie and white noise stimulation for a sample ofLGN cells.
Lesica et al. Page 18
Neuron. Author manuscript; available in PMC 2008 August 2.
NIH
-PA Author Manuscript
NIH
-PA Author Manuscript
NIH
-PA Author Manuscript
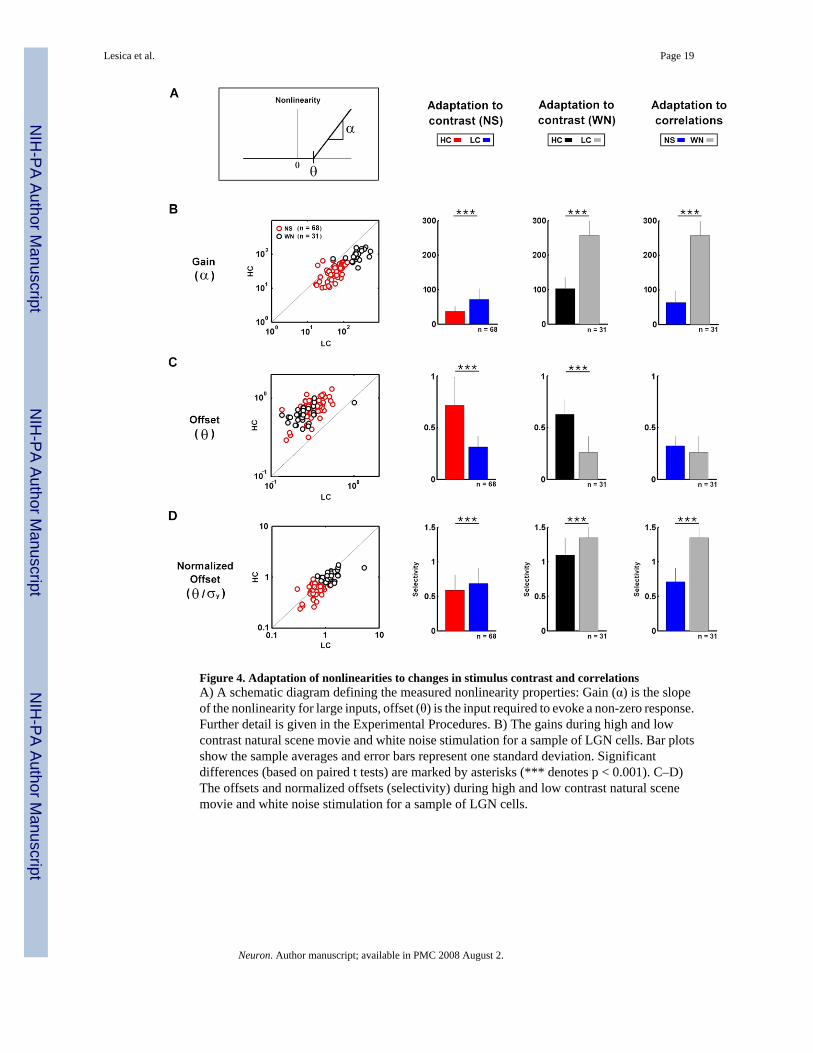
Figure 4. Adaptation of nonlinearities to changes in stimulus contrast and correlationsA) A schematic diagram defining the measured nonlinearity properties: Gain (α) is the slopeof the nonlinearity for large inputs, offset (θ) is the input required to evoke a non-zero response.Further detail is given in the Experimental Procedures. B) The gains during high and lowcontrast natural scene movie and white noise stimulation for a sample of LGN cells. Bar plotsshow the sample averages and error bars represent one standard deviation. Significantdifferences (based on paired t tests) are marked by asterisks (*** denotes p < 0.001). C–D)The offsets and normalized offsets (selectivity) during high and low contrast natural scenemovie and white noise stimulation for a sample of LGN cells.
Lesica et al. Page 19
Neuron. Author manuscript; available in PMC 2008 August 2.
NIH
-PA Author Manuscript
NIH
-PA Author Manuscript
NIH
-PA Author Manuscript
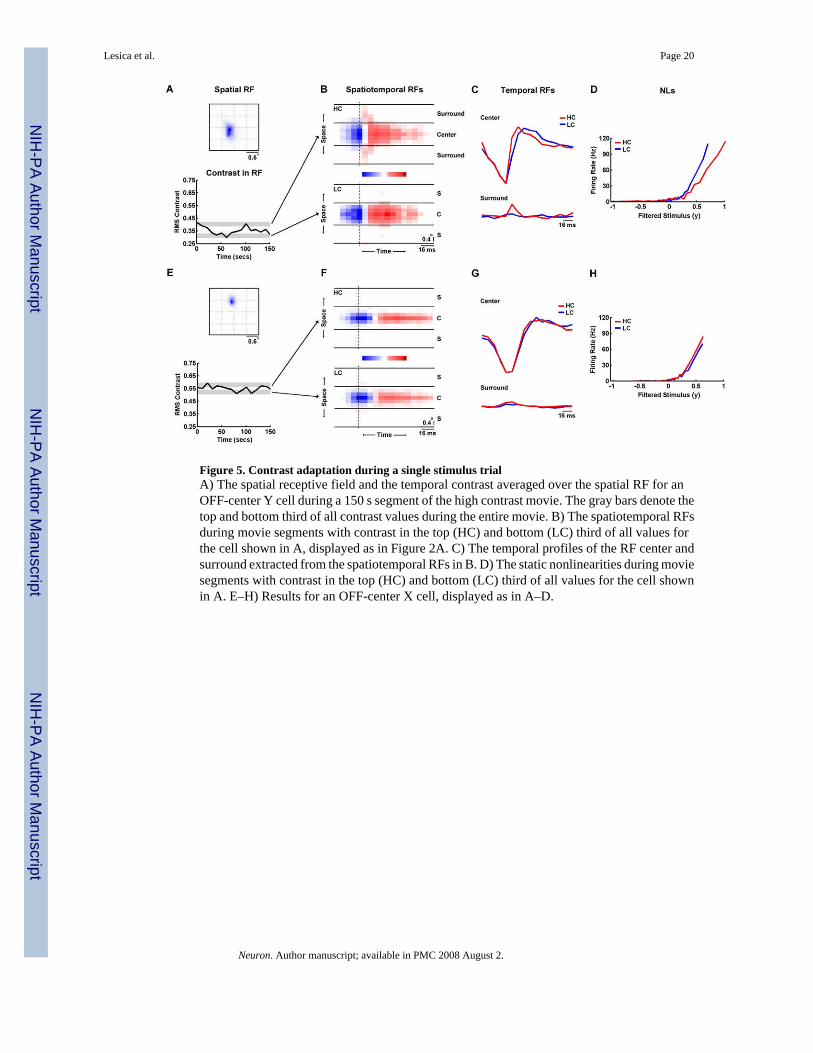
Figure 5. Contrast adaptation during a single stimulus trialA) The spatial receptive field and the temporal contrast averaged over the spatial RF for anOFF-center Y cell during a 150 s segment of the high contrast movie. The gray bars denote thetop and bottom third of all contrast values during the entire movie. B) The spatiotemporal RFsduring movie segments with contrast in the top (HC) and bottom (LC) third of all values forthe cell shown in A, displayed as in Figure 2A. C) The temporal profiles of the RF center andsurround extracted from the spatiotemporal RFs in B. D) The static nonlinearities during moviesegments with contrast in the top (HC) and bottom (LC) third of all values for the cell shownin A. E–H) Results for an OFF-center X cell, displayed as in A–D.
Lesica et al. Page 20
Neuron. Author manuscript; available in PMC 2008 August 2.
NIH
-PA Author Manuscript
NIH
-PA Author Manuscript
NIH
-PA Author Manuscript
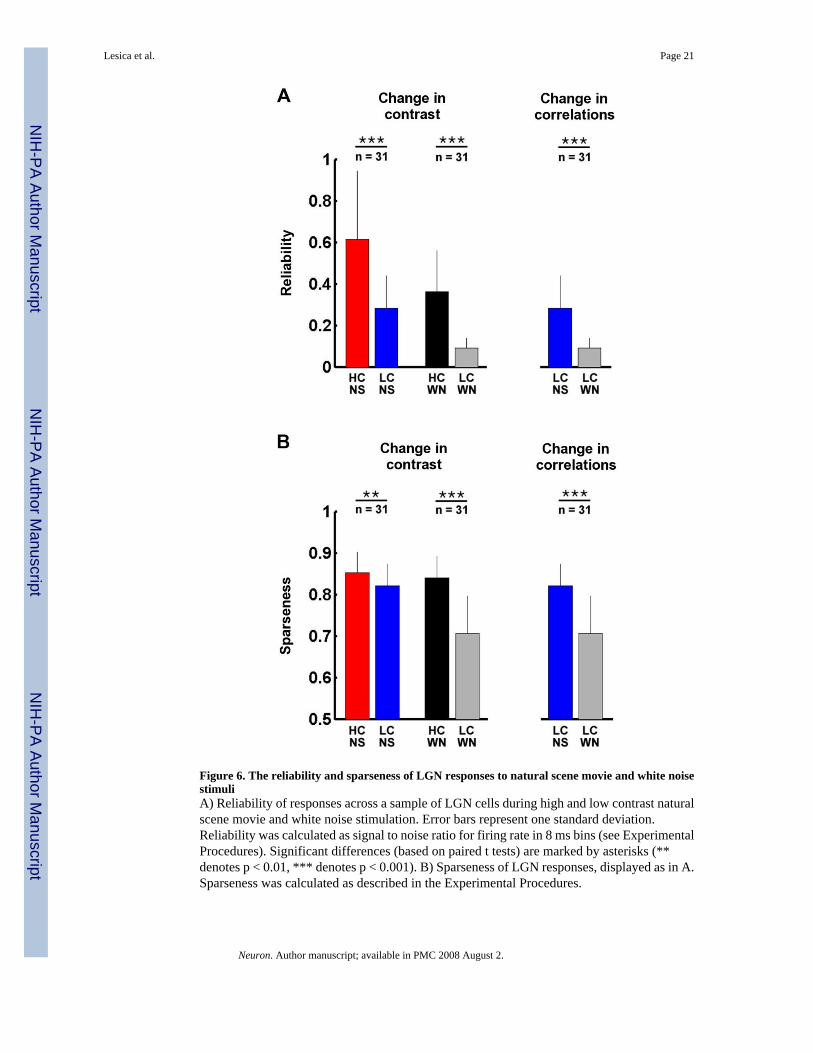
Figure 6. The reliability and sparseness of LGN responses to natural scene movie and white noisestimuliA) Reliability of responses across a sample of LGN cells during high and low contrast naturalscene movie and white noise stimulation. Error bars represent one standard deviation.Reliability was calculated as signal to noise ratio for firing rate in 8 ms bins (see ExperimentalProcedures). Significant differences (based on paired t tests) are marked by asterisks (**denotes p < 0.01, *** denotes p < 0.001). B) Sparseness of LGN responses, displayed as in A.Sparseness was calculated as described in the Experimental Procedures.
Lesica et al. Page 21
Neuron. Author manuscript; available in PMC 2008 August 2.
NIH
-PA Author Manuscript
NIH
-PA Author Manuscript
NIH
-PA Author Manuscript
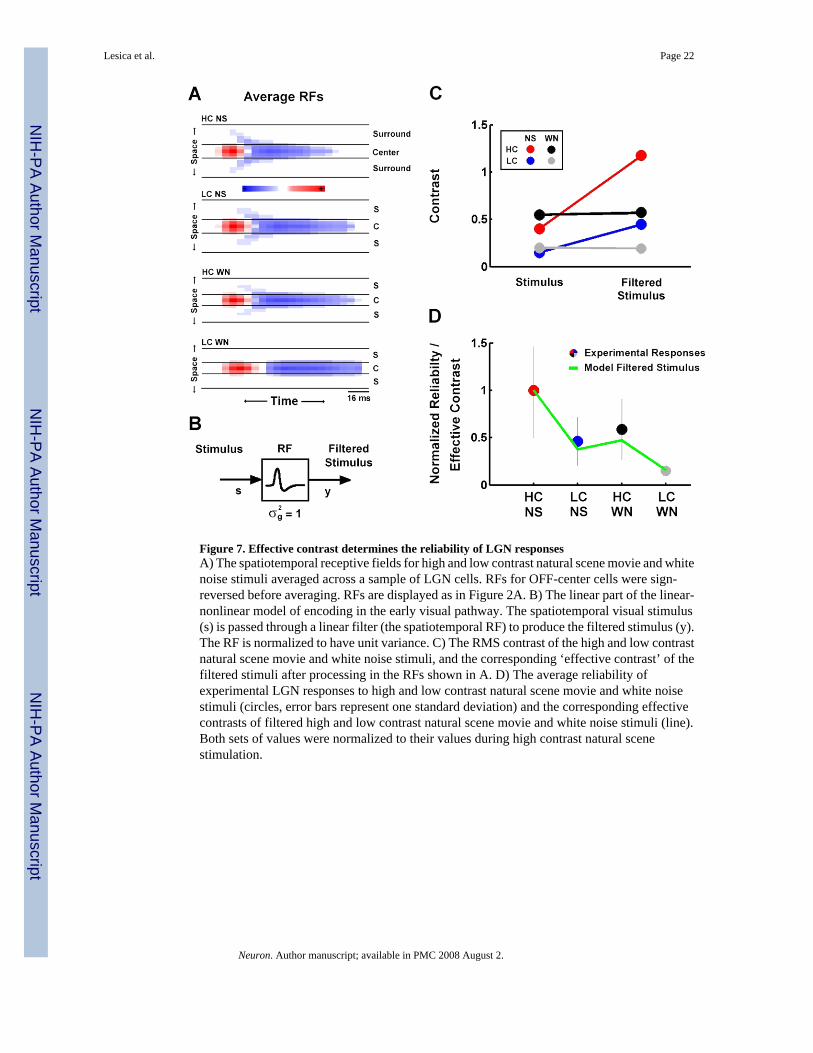
Figure 7. Effective contrast determines the reliability of LGN responsesA) The spatiotemporal receptive fields for high and low contrast natural scene movie and whitenoise stimuli averaged across a sample of LGN cells. RFs for OFF-center cells were sign-reversed before averaging. RFs are displayed as in Figure 2A. B) The linear part of the linear-nonlinear model of encoding in the early visual pathway. The spatiotemporal visual stimulus(s) is passed through a linear filter (the spatiotemporal RF) to produce the filtered stimulus (y).The RF is normalized to have unit variance. C) The RMS contrast of the high and low contrastnatural scene movie and white noise stimuli, and the corresponding ‘effective contrast’ of thefiltered stimuli after processing in the RFs shown in A. D) The average reliability ofexperimental LGN responses to high and low contrast natural scene movie and white noisestimuli (circles, error bars represent one standard deviation) and the corresponding effectivecontrasts of filtered high and low contrast natural scene movie and white noise stimuli (line).Both sets of values were normalized to their values during high contrast natural scenestimulation.
Lesica et al. Page 22
Neuron. Author manuscript; available in PMC 2008 August 2.
NIH
-PA Author Manuscript
NIH
-PA Author Manuscript
NIH
-PA Author Manuscript
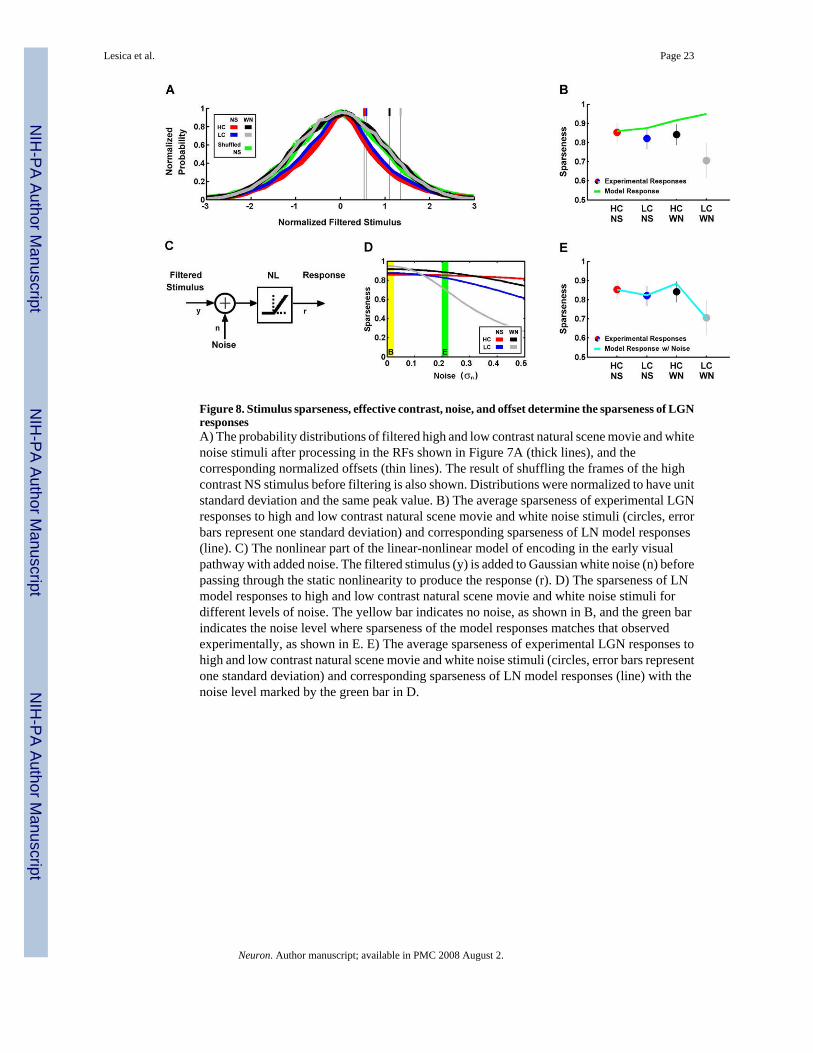
Figure 8. Stimulus sparseness, effective contrast, noise, and offset determine the sparseness of LGNresponsesA) The probability distributions of filtered high and low contrast natural scene movie and whitenoise stimuli after processing in the RFs shown in Figure 7A (thick lines), and thecorresponding normalized offsets (thin lines). The result of shuffling the frames of the highcontrast NS stimulus before filtering is also shown. Distributions were normalized to have unitstandard deviation and the same peak value. B) The average sparseness of experimental LGNresponses to high and low contrast natural scene movie and white noise stimuli (circles, errorbars represent one standard deviation) and corresponding sparseness of LN model responses(line). C) The nonlinear part of the linear-nonlinear model of encoding in the early visualpathway with added noise. The filtered stimulus (y) is added to Gaussian white noise (n) beforepassing through the static nonlinearity to produce the response (r). D) The sparseness of LNmodel responses to high and low contrast natural scene movie and white noise stimuli fordifferent levels of noise. The yellow bar indicates no noise, as shown in B, and the green barindicates the noise level where sparseness of the model responses matches that observedexperimentally, as shown in E. E) The average sparseness of experimental LGN responses tohigh and low contrast natural scene movie and white noise stimuli (circles, error bars representone standard deviation) and corresponding sparseness of LN model responses (line) with thenoise level marked by the green bar in D.
Lesica et al. Page 23
Neuron. Author manuscript; available in PMC 2008 August 2.
NIH
-PA Author Manuscript
NIH
-PA Author Manuscript
NIH
-PA Author Manuscript
Related Documents