Adaptation of Russian energy companies to a changing Arctic Produced by: John Morrow, Peishan Wang, and Mercedes Brown In Partnership With: Alexey Dokuchaev, Ekaterina Tertyshnaya, Kseniya Laktionova Project Advisor: Svetlana Nikitina Project Sponsor: Ernst & Young (CIS) B.V., Moscow Branch, Kirill Kharlashkin Project Location: Moscow Project Center, Fall 2013

Welcome message from author
This document is posted to help you gain knowledge. Please leave a comment to let me know what you think about it! Share it to your friends and learn new things together.
Transcript
Adaptation of Russian energy companies to a changing Arctic
Produced by: John Morrow, Peishan Wang, and Mercedes Brown
In Partnership With: Alexey Dokuchaev, Ekaterina Tertyshnaya, Kseniya Laktionova
Project Advisor: Svetlana Nikitina
Project Sponsor: Ernst & Young (CIS) B.V., Moscow Branch, Kirill Kharlashkin
Project Location: Moscow Project Center, Fall 2013
2
Abstract
Russian energy companies are unprepared for a climate-changed future in the Arctic. Their
lack of preparation leads to unsustainable business practices that are not economically viable.
This project gives energy companies a glance ahead at what their unsustainable business
practices will lead to. In addition, the project explores existing adaptation solutions to the worst
climate change impacts, as well as provides a framework for energy companies to follow to
develop their own adaptations. We believe that giving companies a glance ahead at what their
unsustainable business practices will result in will increase their awareness of their activities
and encourage them to find adaptation solutions.
3
Table of Contents
Abstract....................................................................................................................................... 2
1. Introduction ............................................................................................................................. 6
1.1 Overview of the Energy Sector in the Russian Arctic ........................................................ 7
1.2 Policy Context: frameworks, strategies and legislation on the Arctic ............................... 10
2. Methodology ......................................................................................................................... 12
2.1 Outline of the method used to assess risks ..................................................................... 12
2.2 Project approach ............................................................................................................ 13
2.2.1 Content analysis ..................................................................................................... 13
2.2.2 Interviews ................................................................................................................ 13
2.2.3 Econometric Modeling ............................................................................................. 13
3. Changes in the Arctic climate ................................................................................................ 15
3.1 Changes in Temperature ................................................................................................ 15
3.2 Changes in Precipitation ................................................................................................. 20
3.3 Changes in Sea Level..................................................................................................... 22
3.4 Changes in Ice/Snow/Permafrost ................................................................................... 23
3.4.1 Sea Ice .................................................................................................................... 24
3.4.2 Arctic Snow Coverage ............................................................................................. 26
3.4.3 Arctic Permafrost Coverage .................................................................................... 27
3.5 Summary ........................................................................................................................ 28
4. Risks from Arctic Climate Change ......................................................................................... 29
4.1 Risks driven by changes in temperatures ....................................................................... 29
4.2 Risks driven by changes in precipitation ......................................................................... 30
4.3 Risks driven by changes in sea level .............................................................................. 32
4.4 Risks driven by changes in ice coverage/snow/permafrost ............................................. 33
4.4.1 Ice levels ................................................................................................................. 33
4
4.4.2 Snow Cover ............................................................................................................ 36
4.4.3 Permafrost .............................................................................................................. 37
4.5 Summary ........................................................................................................................ 40
5. Priority Risks ......................................................................................................................... 40
5.1 Description of method used to choose priority risks ........................................................ 41
5.2 Results ........................................................................................................................... 41
5.2.1 Priority Risks of the Present .................................................................................... 41
5.2.2 Future prioritized risks ............................................................................................. 44
6. Adaptation Solutions ............................................................................................................. 45
6.1 Description of Solution Assessment ................................................................................ 45
6.2 Solutions to Permafrost Thaw ......................................................................................... 45
6.2.1 Thermosiphons ....................................................................................................... 45
6.2.2 Foundation Leveling ................................................................................................ 46
6.2.3 Modified Pile Foundations ....................................................................................... 47
6.2.4 Increased building air circulation ............................................................................. 48
6.3 Solutions to Flooding ...................................................................................................... 48
6.3.1 Hinged Flood Gates ................................................................................................ 49
6.3.2 Concrete Moats ....................................................................................................... 50
6.3.3 Polymer Foam ......................................................................................................... 50
7. Roadmap .............................................................................................................................. 52
7.1 Overview of Roadmap .................................................................................................... 52
7.2 Description of Roadmap ................................................................................................. 52
Step 1: Pre-adaptation assessment ................................................................................. 52
Step 2: Impact Consideration ........................................................................................... 53
Step 3: Risk Prioritization ................................................................................................. 53
Step 4: Adaptation Solution .............................................................................................. 54
5
Step 5 and 6: Pilot Trial and Full-scale Implementation .................................................... 54
Summary .................................................................................................................................. 56
References ............................................................................................................................... 58
Appendix 1: Blank Survey ......................................................................................................... 63
Appendix 2: Prioritization Matrix ................................................................................................ 75
Appendix 3: Oxford Survey Answers ......................................................................................... 77
1. Introduction
Due to its harsh climate the Russian Arctic (also known as the Extreme North) remains
mainly uninhabited and an untapped resource. Since the middle of the 20th century, state ener-
gy companies led by Soviet ministries have begun to venture into the Extreme North looking for
energy resources (such as oil and gas), building drilling rigs, large power plants, and transmis-
sion lines. Today, as they move towards the North, state and private energy companies are
claiming an increasing amount of the previously untouched land. Coincidentally, the Extreme
North, the area of the Arctic with the most extreme conditions, is changing due to climate
change trends. As energy companies move northward, they continue to use the same business
practices as before. The problem is that these practices are no longer relevant in the climate-
changed Arctic. Thus, companies already in the Arctic, such as Gazprom and Rosneft, are un-
prepared for the changes that are occurring in the region. But how unprepared are they?
According to the Carbon Disclosure Project (CDP), an international organization that pub-
lishes worldwide reports on climate change, Russian energy companies are lagging behind all
the others in awareness to climate change. In CDP’s recent energy sector rankings, Gazprom,
the highest rated Russian energy company, was rated at a 62, Novatek, a Russian natural gas
company, was rated at a 40. Surgutneftegas, a large Russian oil and gas company, held the
lowest score in the energy sector, a 23, while Statoil, a Norwegian oil and gas company, was
rated at an 86. Thus, key Russian energy companies are unaware of the key problems of cli-
mate change and the risks linked to its effects in the Arctic (PWC 2013, PWC 2013).
The purpose of this project is to fix this issue by providing adaptation solutions to Russian
energy companies. This will be accomplished by an outline of impacts that Arctic climate change
has on energy companies, an assessment of the greatest impacts, a recommendation of exist-
ing solutions to adaptation, and the development of a roadmap for companies to follow to devel-
op their own adaptation solutions. Prior to the outline of key climate change impacts in the Arc-
7
tic, an inventory of Russian energy companies and their assets in the Arctic will be done, fol-
lowed by the brief outline of the Russian government policies in the area.
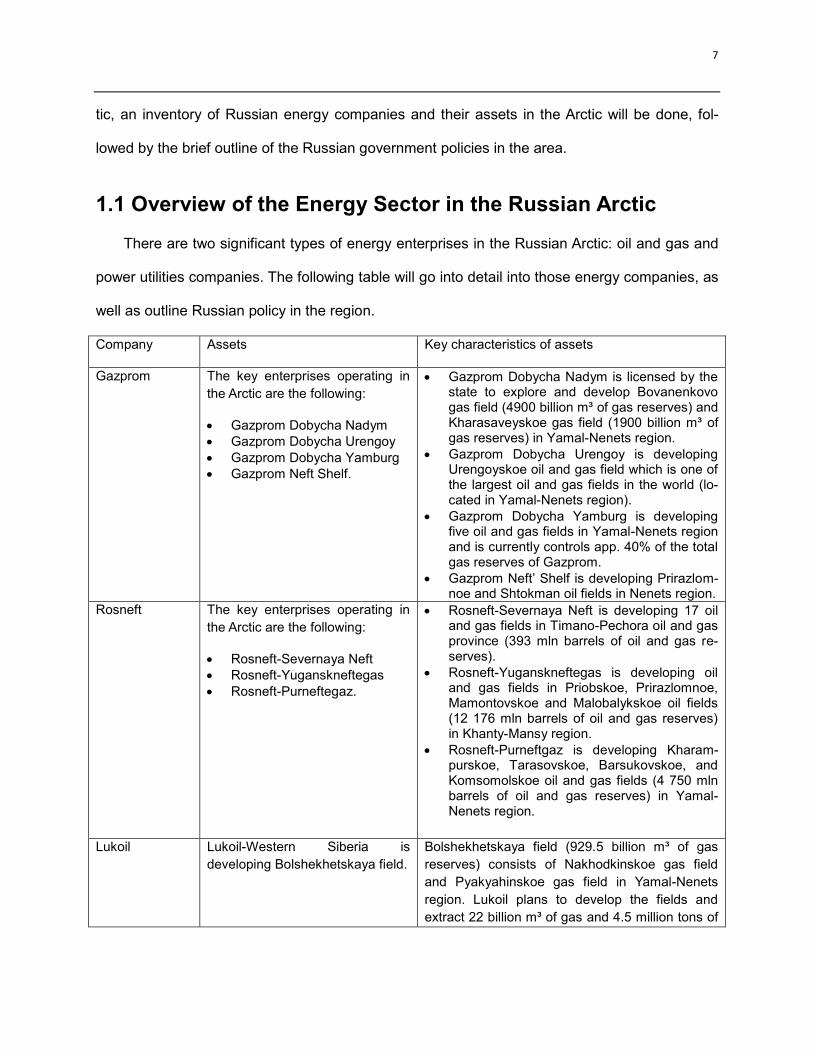
1.1 Overview of the Energy Sector in the Russian Arctic
There are two significant types of energy enterprises in the Russian Arctic: oil and gas and
power utilities companies. The following table will go into detail into those energy companies, as
well as outline Russian policy in the region.
Company Assets Key characteristics of assets
Gazprom The key enterprises operating in
the Arctic are the following:
Gazprom Dobycha Nadym
Gazprom Dobycha Urengoy
Gazprom Dobycha Yamburg
Gazprom Neft Shelf.
Gazprom Dobycha Nadym is licensed by the state to explore and develop Bovanenkovo gas field (4900 billion m³ of gas reserves) and Kharasaveyskoe gas field (1900 billion m³ of gas reserves) in Yamal-Nenets region.
Gazprom Dobycha Urengoy is developing Urengoyskoe oil and gas field which is one of the largest oil and gas fields in the world (lo-cated in Yamal-Nenets region).
Gazprom Dobycha Yamburg is developing five oil and gas fields in Yamal-Nenets region and is currently controls app. 40% of the total gas reserves of Gazprom.
Gazprom Neft’ Shelf is developing Prirazlom-noe and Shtokman oil fields in Nenets region.
Rosneft The key enterprises operating in
the Arctic are the following:
Rosneft-Severnaya Neft
Rosneft-Yuganskneftegas
Rosneft-Purneftegaz.
Rosneft-Severnaya Neft is developing 17 oil and gas fields in Timano-Pechora oil and gas province (393 mln barrels of oil and gas re-serves).
Rosneft-Yuganskneftegas is developing oil and gas fields in Priobskoe, Prirazlomnoe, Mamontovskoe and Malobalykskoe oil fields (12 176 mln barrels of oil and gas reserves) in Khanty-Mansy region.
Rosneft-Purneftgaz is developing Kharam-purskoe, Tarasovskoe, Barsukovskoe, and Komsomolskoe oil and gas fields (4 750 mln barrels of oil and gas reserves) in Yamal-Nenets region.
Lukoil Lukoil-Western Siberia is
developing Bolshekhetskaya field.
Bolshekhetskaya field (929.5 billion m³ of gas
reserves) consists of Nakhodkinskoe gas field
and Pyakyahinskoe gas field in Yamal-Nenets
region. Lukoil plans to develop the fields and
extract 22 billion m³ of gas and 4.5 million tons of
8
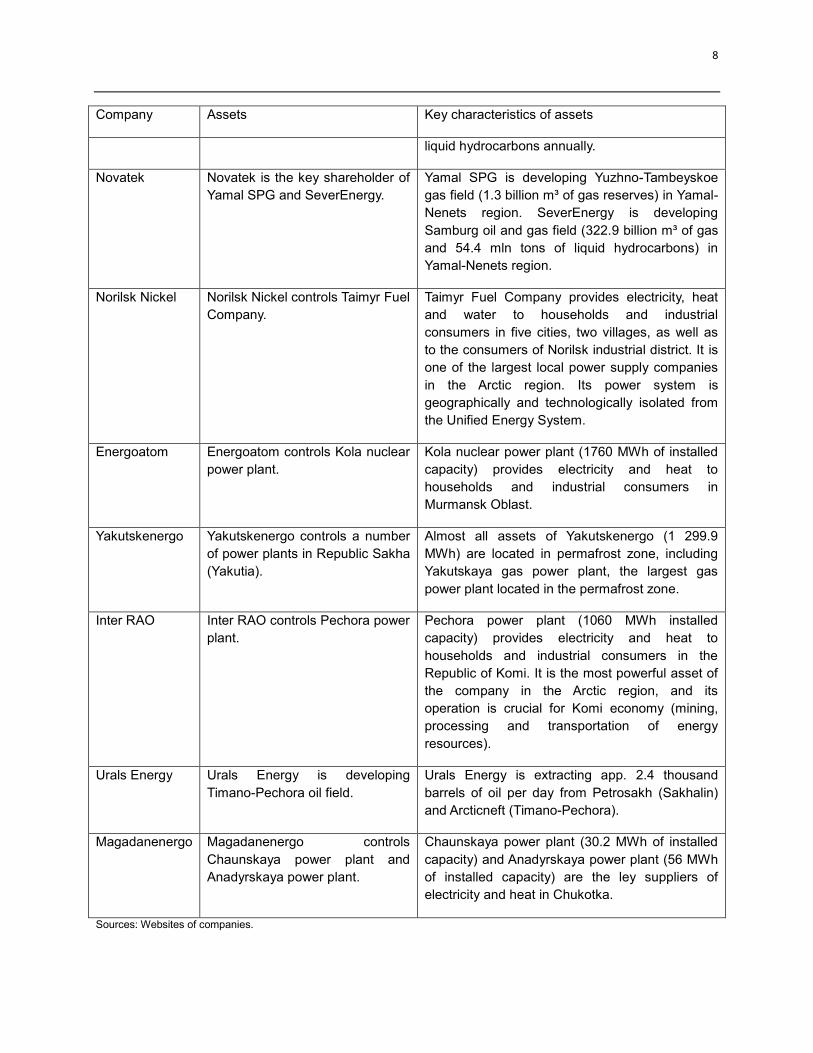
Company Assets Key characteristics of assets
liquid hydrocarbons annually.
Novatek Novatek is the key shareholder of
Yamal SPG and SeverEnergy.
Yamal SPG is developing Yuzhno-Tambeyskoe
gas field (1.3 billion m³ of gas reserves) in Yamal-
Nenets region. SeverEnergy is developing
Samburg oil and gas field (322.9 billion m³ of gas
and 54.4 mln tons of liquid hydrocarbons) in
Yamal-Nenets region.
Norilsk Nickel Norilsk Nickel controls Taimyr Fuel
Company.
Taimyr Fuel Company provides electricity, heat
and water to households and industrial
consumers in five cities, two villages, as well as
to the consumers of Norilsk industrial district. It is
one of the largest local power supply companies
in the Arctic region. Its power system is
geographically and technologically isolated from
the Unified Energy System.
Energoatom Energoatom controls Kola nuclear
power plant.
Kola nuclear power plant (1760 MWh of installed
capacity) provides electricity and heat to
households and industrial consumers in
Murmansk Oblast.
Yakutskenergo Yakutskenergo controls a number
of power plants in Republic Sakha
(Yakutia).
Almost all assets of Yakutskenergo (1 299.9
MWh) are located in permafrost zone, including
Yakutskaya gas power plant, the largest gas
power plant located in the permafrost zone.
Inter RAO Inter RAO controls Pechora power
plant.
Pechora power plant (1060 MWh installed
capacity) provides electricity and heat to
households and industrial consumers in the
Republic of Komi. It is the most powerful asset of
the company in the Arctic region, and its
operation is crucial for Komi economy (mining,
processing and transportation of energy
resources).
Urals Energy Urals Energy is developing
Timano-Pechora oil field.
Urals Energy is extracting app. 2.4 thousand
barrels of oil per day from Petrosakh (Sakhalin)
and Arcticneft (Timano-Pechora).
Magadanenergo Magadanenergo controls
Chaunskaya power plant and
Anadyrskaya power plant.
Chaunskaya power plant (30.2 MWh of installed
capacity) and Anadyrskaya power plant (56 MWh
of installed capacity) are the ley suppliers of
electricity and heat in Chukotka.
Sources: Websites of companies.

9
10
1.2 Policy Context: frameworks, strategies and legislation on the Arctic
Today the Russian government considers maritime transportation, resource extraction, and
infrastructure development as its most important activities in the Arctic.
Global climate change has created new possibilities for the development of northern sea
routes. Currently, about 1.5 mln tons of cargo is being transported each year along the Northern
Sea Route alone. By 2020, this number is expected to increase twofold. More extensive trade
will require the improvement and construction of new infrastructure sites, particularly seaports
(especially, in Yamal-Nenets and Nenets districts).
The Russian government is also working on oil and gas extraction, providing licenses to the
extraction companies that would develop their operations in the Arctic (Lukoil, Gazprom, Ros-
neft, Novatek etc.). Today the government reduces taxes for oil and gas companies, subsidizes
the development of Arctic oil and gas companies, and supports investments in exploration and
research in the Extreme North (exploration of resource-rich shale areas, construction of floating
research stations, seismic scanning, geological scouting etc.).
Another important direction of the government activities is the development of infrastructural
“mega-projects”, such as the “Ural Arctic – Ural Industrial” and “Belkomur” railroads, which will
strengthen infrastructure and allow extraction industries to transport the resources to the con-
sumers. There is also a promising project of intercontinental railroad through the Bering Strait.
Another example is the “Academic Lomonosov” floating nuclear power plant, which is expected
to go into operation in 2017. It is one of the eight floating nuclear power plants that are to be
constructed for energy supply of oilrigs and coastal towns (RT news, 2013).
Moreover, the Russian government has recently promised that protection of the Arctic envi-
ronment and adaptation to possible climate change would be one of its priorities in the region.
Solutions to this problem could be the development of more environment-friendly technologies

11
in the Arctic, social and economic partnership with non-governmental organizations and indige-
nous people, international cooperation with other Nordic countries (e.g. via the Arctic Council),
as well as initiation of interregional and intergovernmental projects.
However, today the Russian government fails to consider some of the important impacts of
the climate change in the Arctic. Namely, the ice melting can provide not only benefits, but also
threats. If the ocean level rises, some inhabited areas of the Extreme North may be flooded, and
infrastructure may be destroyed. The government response to this possible impact may be con-
struction of dams and reinforcement of buildings, though the government’s stance on these so-
lutions is still unclear. The government has mostly ignored the possible negative effects of cli-
mate change. Recently, Russia refused to participate in the next round of Kyoto Protocol – an
international treaty that tries to reduce adverse effects of climate change by reducing green-
house gas emissions – and may even consider exiting it. Moreover, there’s still too little that is
actually being done by the government. Most of the proposed actions are still in the project
stage. Climate change policy is definitely not one of Russia’s top priorities – and that may have
contributed to its unpreparedness.
In sum, the Russian government takes into the consideration the benefits that the global
warming in the Arctic may provide, but not its threats. As there are estimated to be more than
160 billion barrels of oil in the Arctic, it’s only natural that the government will focus further on
the potential gains of climate change instead of its costs. However, this means that the energy
companies that want to operate in the Arctic will have to raise their awareness, preparedness,
and sustainability by themselves in order to avoid large-scale negative effects of climate change
later (Dobrovidova, 2013) (Dobrovidova, 2012 ). They will have to rely less on government and
think more about the climate change risks rather than possible benefits.
12
2. Methodology
This section details the methodology of the project.
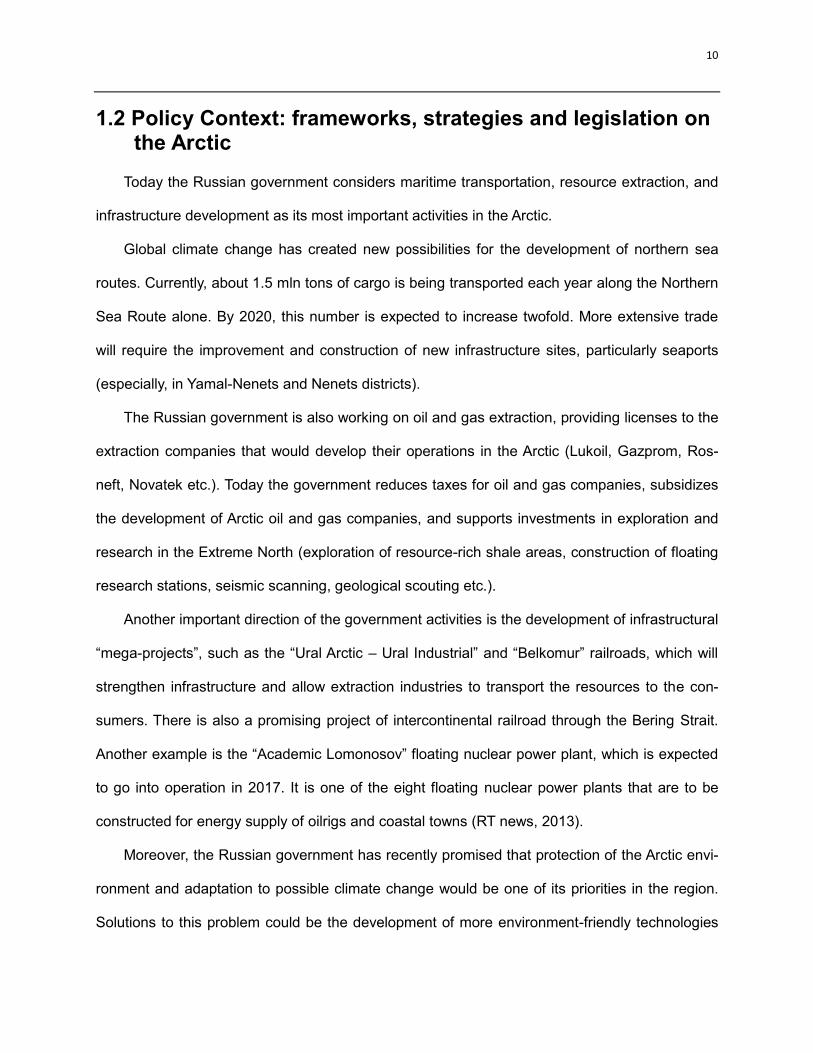
2.1 Outline of the method used to assess risks
To provide adaptation strategies to energy companies, we first did desk research on Arctic
climate change effects, trends and their potential impacts. Two main methods were used in the
first step: content analysis through searching required information from intergovernmental re-
ports and scientific articles and an interview with a Civil Engineering professor from Worcester
Polytechnic Institute. Next, we prioritized the risks and focused on existing adaptation solutions
to the top two by using econometric modeling and content analysis. Finally, we developed an
adaptation roadmap for companies to follow to develop their own adaptation solutions.
Figure 1: Methodology of the project
Figure 1 organizes the previous paragraph's explanation into an easy to read diagram. The

13
methods used in each step will be described in the following sections.
2.2 Project approach
2.2.1 Content analysis
Content analysis is used at each step of our research since it helps to understand a topic-
related material (Berg & Lune, 2011). Content analysis can be conducted in multiple ways, by
close examination of books, newspapers, the Internet, speeches, or any other occurrence of
communicative language. The information that we get from this can be used to make
conclusions and inferences to further our knowledge of the material. We apply content analysis
for searching background information through the Internet, reading published reports by energy
companies and intergovernmental organizations, and conducting interviews with the professor.
After that, based on the analysis of the information, our team can make informed adaptation
solutions and roadmap for ECU companies’ development in the Arctic region. (Berg & Lune,
2011)
2.2.2 Interviews
Interviews are used at the second and the final steps of the research. Interviews are one of
the most controlled options since we can get our expected detailed information directly. The
purpose of interview is to use the recommendations of interviewed experts in order to help us
create a base for our project. This base is used to provide more background information for our
research and create adaptation strategies for ECU companies. Our team uses the results of the
interviews with Okumus Pinar, WPI Civil Engineering professor, and Sergey Dayman, EY
Cleantech and Sustainability Manager.
2.2.3 Econometric Modeling
Econometric modeling is used in social and managerial sciences for analysis of existing
14
trends and interrelations, as well as for forecasting and planning. This can be done by
combining the data, exercising tests, confirming the hypothesis about the interdependence of
variables and finding out the strength of this interconnection.
In the research, due to the restriction of available data, panel data analysis has been chosen
to help with finding whether there are any relationships between climate change effects (11
effects) and economic indicators (3 indicators, including operating revenue, cost of goods sold
or COGS and gross profit) of companies located in the Russian Arctic.
The econometric modeling used in the research consists of the following steps:
1. Construction of database;
2. Identification of dependent and independent variables;
3. Identification of the interdependence between variables;
4. Specification of equations;
5. Evaluation;
6. Result description.
The model is based on data obtained from Russian data resource called “RUSLANA” and
international source www.tutiempo.net. MS Excel and RStudio are used as research tools.

15
3. Changes in the Arctic climate
In order to understand the impact that current climate trends have on these energy
companies, the trends themselves need to be understood. What follows is a description of the
various changes in the environment and their current and projected trends.
3.1 Changes in Temperature
Possibly the best known global climate change trend is the rising global temperatures. There
are regional differences due to terrain, atmospheric winds and ocean currents, but for the Arctic
as a whole, temperature is experiencing a positive trend. In fact the Arctic temperature has
increased at almost twice the rate of global mean temperature over the past few decades,
confirmed by the Arctic Climate Impact Assessment (ACIA) and the International Programme on
Climate Change (IPCC). This phenomenon has been named “polar amplification” by experts.
(“Impacts of a Warming Arctic”, 2004) (Hamilton & Sommerkorn, 2008)
Polar amplification which is also known as Arctic amplification refers to the greater
temperature increases in the Arctic compared to the earth as a whole due to the effect of climate
feedbacks and other processes. (Climate Change Adaptation Report) The ACIA gives several
explanations to Arctic amplification. As Arctic snow and ice melt, the uncovered darker land and
ocean surfaces absorb more solar energy. More of the extra trapped energy from increasing
concentration of greenhouse gases goes directly into warming the atmosphere. The
atmospheric layer that has to warm in order to warm the surface is shallower in the Arctic. As
sea ice retreats, solar heat absorbed by the oceans is more easily transferred to the
atmosphere. Alternation in atmospheric and oceanic circulation can increase warming. (“Impacts
of a Warming Arctic”, 2004)
According to the ACIA, temperatures in winter are rising more rapidly in most places.
16
(“Impacts of a Warming Arctic”, 2004) Recent warming has been shown to be strongest in
autumn and spring, as reported by SWIPA. (Dicks & Symon. 2012) However, the best indicators
of change are the data on annual temperature difference and on the temperatures in the winter.
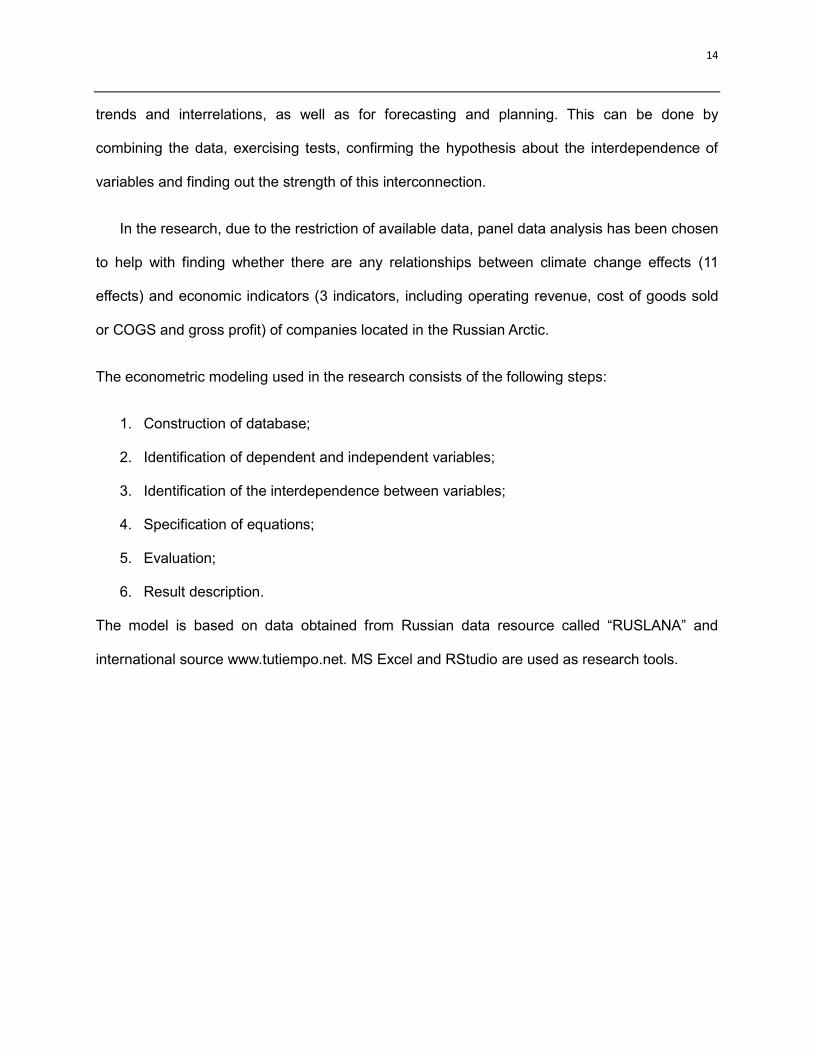
The ACIA has divided the Arctic into four regions as shown in Figure 2. The ACIA gives data
corresponding to each of these regions. In addition to current climate data, they have also given
projections into the future. (“Impacts of a Warming Arctic”, 2004)
Figure 2: ACIA’s four regions
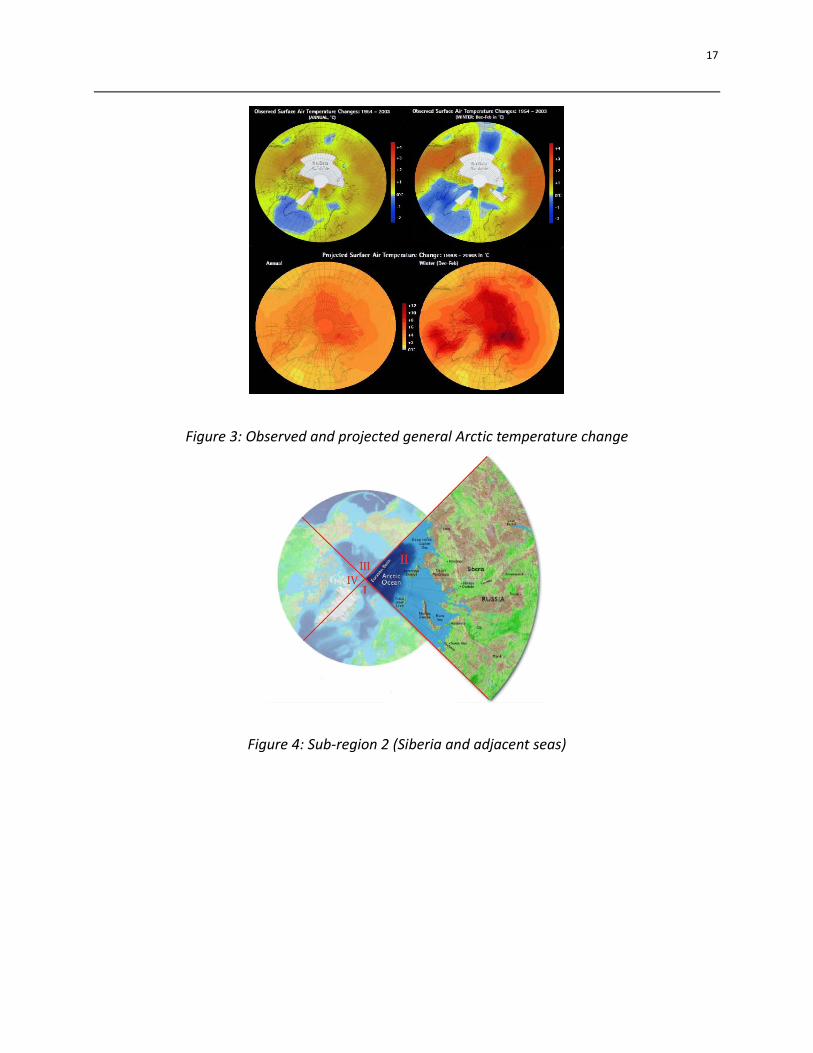
General Arctic temperature has increased 1-3 ℃ in the past five decades and will continue
to rise rapidly, estimated to about 6 ℃, in the future shown in Figure 3 on the next page. The
Russian Arctic is located in sub-region two and three, which are shown in detail in Figures 4 and
5 on the next pages. (“Impacts of a Warming Arctic”, 2004).
17
Figure 3: Observed and projected general Arctic temperature change
Figure 4: Sub-region 2 (Siberia and adjacent seas)

18
Figure 5: Sub-region 3 (Chukotka, Alaska, Western Canadian Arctic, and adjacent seas)
Based on the records provided by the ACIA, annual temperatures around Siberia and
Russia increased 1-3℃ in the past 50 years. Also, warming happens mostly in some inland
areas during winter, where temperatures rose about 3-5 ℃. Since the duration of inland snow
cover has reduced, temperature has increased. Projected by their simulation model, annual
temperature increase over land will be around 3-5℃ by the 2090s. Increases of 3-7℃ over land
and 10℃ or more over the adjacent ocean areas during wintertime are projected as well.
(“Impacts of a Warming Arctic”, 2004)
19
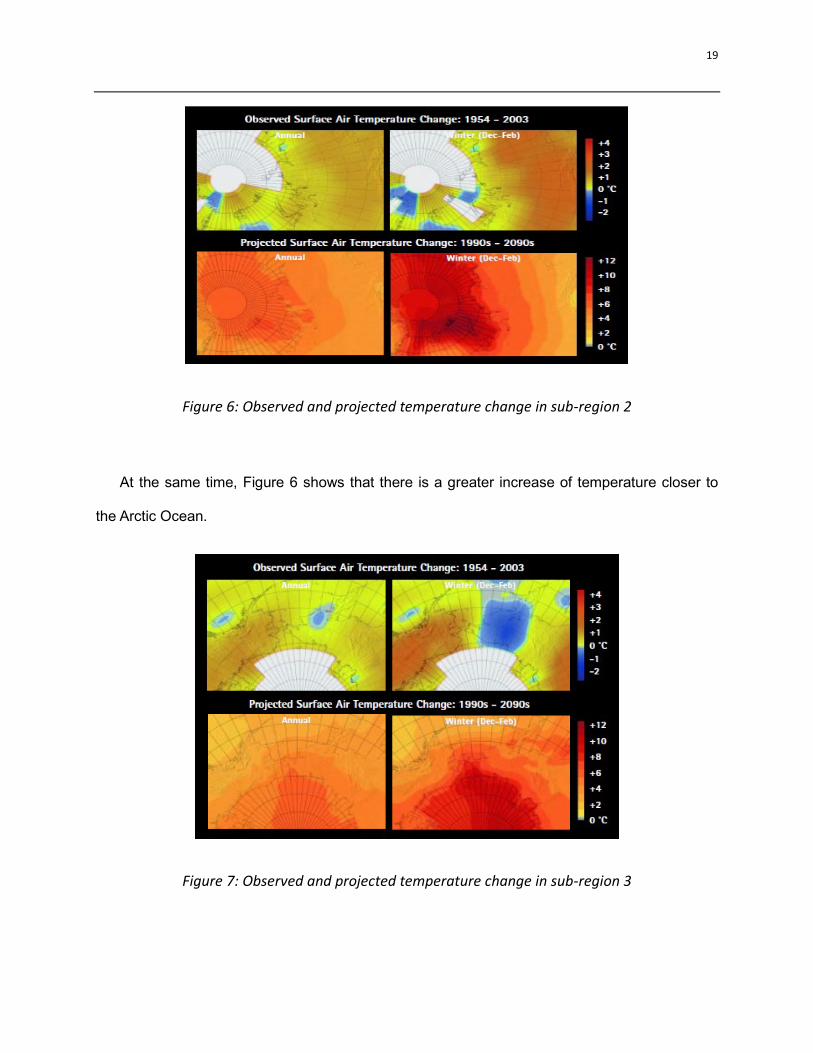
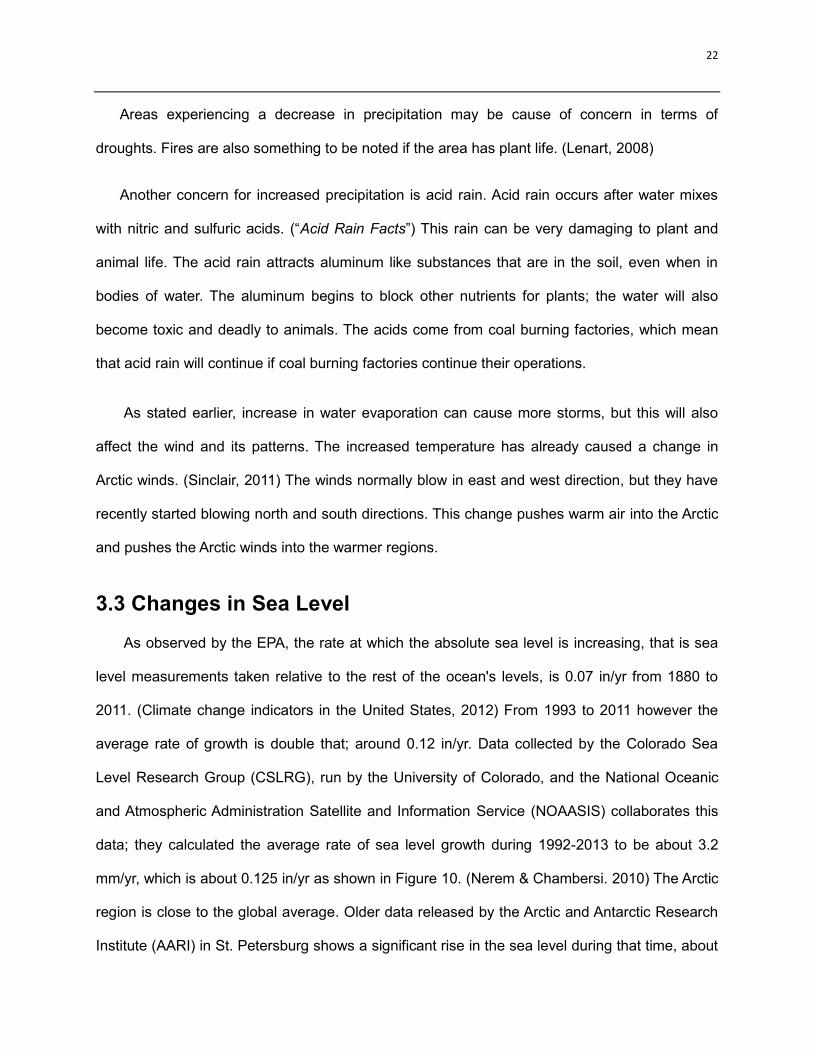
Figure 6: Observed and projected temperature change in sub-region 2
At the same time, Figure 6 shows that there is a greater increase of temperature closer to
the Arctic Ocean.
Figure 7: Observed and projected temperature change in sub-region 3

20
We can get similar findings from Figure 7, except the observed data shows that the
temperature of the Chukotka region decreased, especially in winter got 1-2℃ colder.
3.2 Changes in Precipitation
The National Snow and Ice Data Center show that precipitation patterns, mainly around the
Arctic region, are beginning to change. (“All about Arctic Climatology and Meteorology”) Figure 8
shows which areas have changed and their recorded results based on past results.
Figure 8: Precipitation trends observed in winter and summer
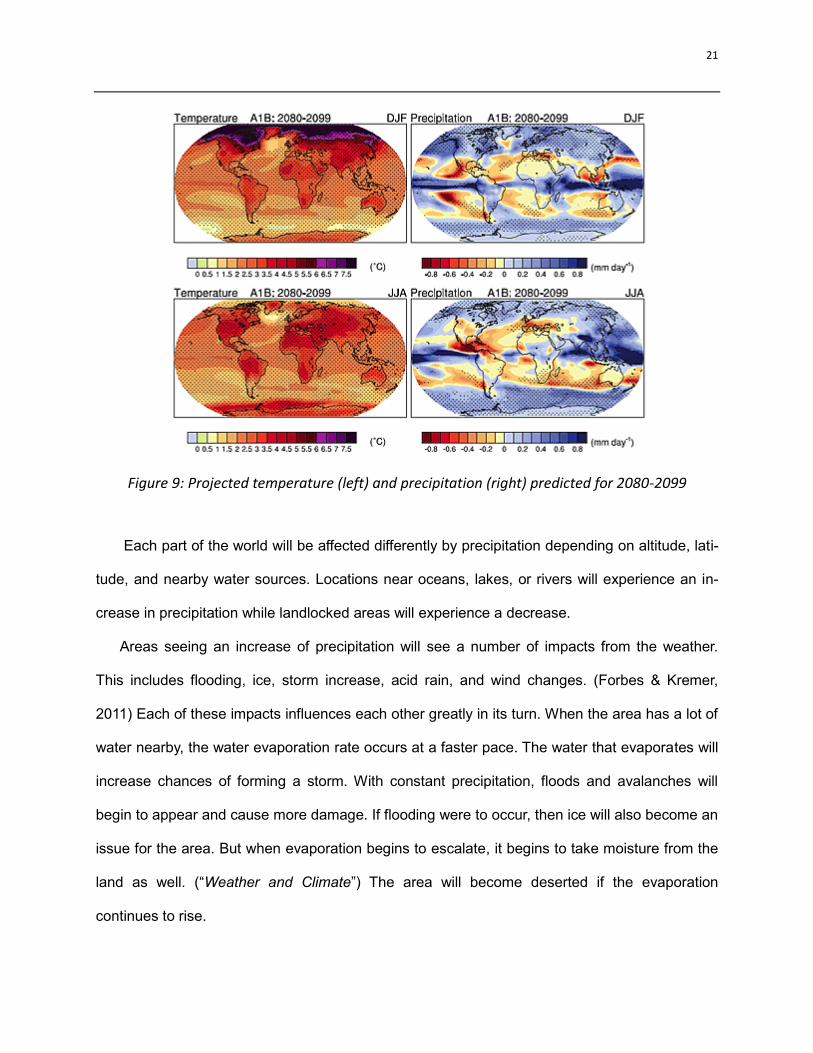
Figure 9 uses the temperature and sea level measurements in order to gauge the meas-
urement of precipitation. A report done at the Arctic Monitoring and Assessment Programme
writes that precipitation in the Arctic could increase from 5 to 70% by 2100. (Dicks & Symon,
2012).
21
Figure 9: Projected temperature (left) and precipitation (right) predicted for 2080-2099
Each part of the world will be affected differently by precipitation depending on altitude, lati-
tude, and nearby water sources. Locations near oceans, lakes, or rivers will experience an in-
crease in precipitation while landlocked areas will experience a decrease.
Areas seeing an increase of precipitation will see a number of impacts from the weather.
This includes flooding, ice, storm increase, acid rain, and wind changes. (Forbes & Kremer,
2011) Each of these impacts influences each other greatly in its turn. When the area has a lot of
water nearby, the water evaporation rate occurs at a faster pace. The water that evaporates will
increase chances of forming a storm. With constant precipitation, floods and avalanches will
begin to appear and cause more damage. If flooding were to occur, then ice will also become an
issue for the area. But when evaporation begins to escalate, it begins to take moisture from the
land as well. (“Weather and Climate”) The area will become deserted if the evaporation
continues to rise.
22
Areas experiencing a decrease in precipitation may be cause of concern in terms of
droughts. Fires are also something to be noted if the area has plant life. (Lenart, 2008)
Another concern for increased precipitation is acid rain. Acid rain occurs after water mixes
with nitric and sulfuric acids. (“Acid Rain Facts”) This rain can be very damaging to plant and
animal life. The acid rain attracts aluminum like substances that are in the soil, even when in
bodies of water. The aluminum begins to block other nutrients for plants; the water will also
become toxic and deadly to animals. The acids come from coal burning factories, which mean
that acid rain will continue if coal burning factories continue their operations.
As stated earlier, increase in water evaporation can cause more storms, but this will also
affect the wind and its patterns. The increased temperature has already caused a change in
Arctic winds. (Sinclair, 2011) The winds normally blow in east and west direction, but they have
recently started blowing north and south directions. This change pushes warm air into the Arctic
and pushes the Arctic winds into the warmer regions.
3.3 Changes in Sea Level
As observed by the EPA, the rate at which the absolute sea level is increasing, that is sea
level measurements taken relative to the rest of the ocean's levels, is 0.07 in/yr from 1880 to
2011. (Climate change indicators in the United States, 2012) From 1993 to 2011 however the
average rate of growth is double that; around 0.12 in/yr. Data collected by the Colorado Sea
Level Research Group (CSLRG), run by the University of Colorado, and the National Oceanic
and Atmospheric Administration Satellite and Information Service (NOAASIS) collaborates this
data; they calculated the average rate of sea level growth during 1992-2013 to be about 3.2
mm/yr, which is about 0.125 in/yr as shown in Figure 10. (Nerem & Chambersi. 2010) The Arctic
region is close to the global average. Older data released by the Arctic and Antarctic Research
Institute (AARI) in St. Petersburg shows a significant rise in the sea level during that time, about

23
a sea level rise of about 1.8 mm/yr. The highest observed reading is 3.2 mm/yr and the lowest is
0.9 mm/yr. (Proshutinsky & Pavlov, 2001)
Figure 10: UC sea level data taken by 3 satellites (Topex, Jason-1, Jason-2) over two decades.
(Nerem & Chambersi. 2010)
In 2050 sea levels are forecasted to rise about 0.32-0.38m. By 2100 the global sea level is
estimated to have risen 0.57 to 1.1m depending on what RCP scenario is used. (Jevrejeva &
Moore, 2012) There are four RCP scenarios and each one is a plausible carbon concentration
trajectory. The main difference between each scenario is a different carbon emission future.
Not only does the sea level rise, but river levels do too. Each year since 1935 the total
amount of water flowing out of the six largest rivers in the Eurasian Arctic has increased by
about 10%. (Dicks & Symon. 2012)
3.4 Changes in Ice/Snow/Permafrost
The following sections will describe the changes in ice, snow, and permafrost in the
24
Arctic.
3.4.1 Sea Ice
In the past decade the sea ice levels have continued to set record lows. According to the
National Snow and Ice Data Center (NSIDC), Arctic sea ice area reached a new record low of
3.41 million square kilometers at the end of the summer season. According to their past data,
this new record low is 44% below their 1981-2010 average. This level is also 17% lower than
the previous record set in 2007. (“SOTC: Overview”, 2013)
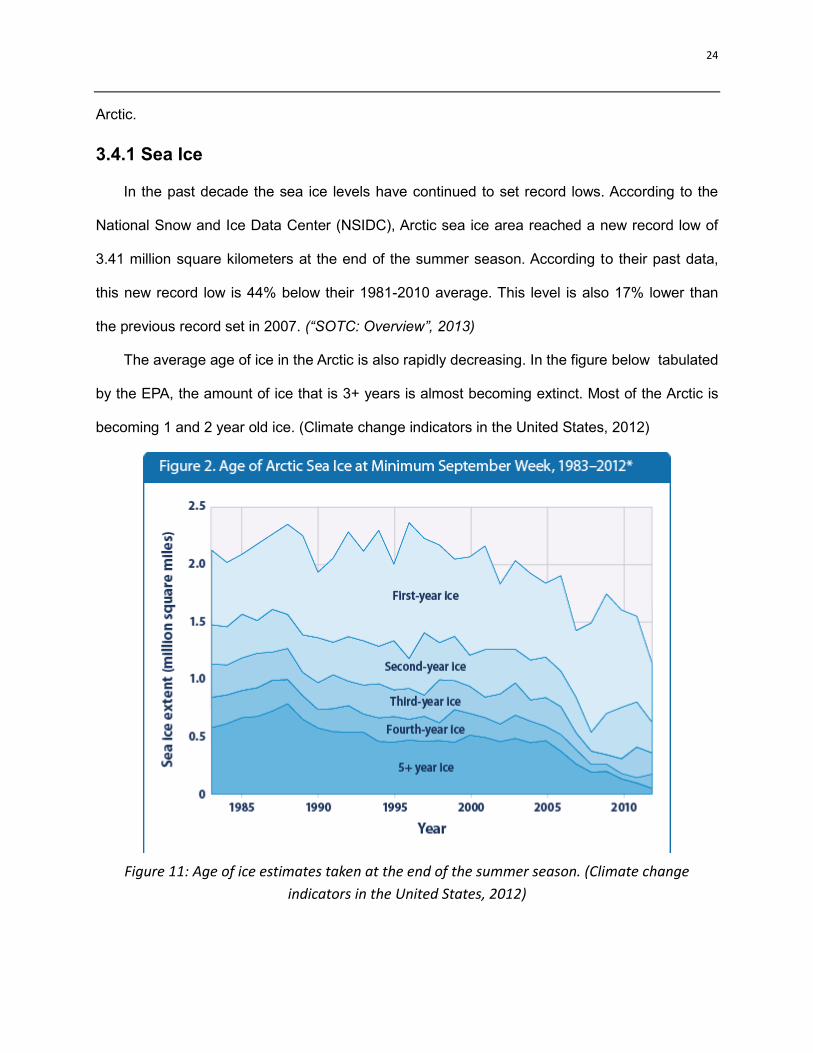
The average age of ice in the Arctic is also rapidly decreasing. In the figure below tabulated
by the EPA, the amount of ice that is 3+ years is almost becoming extinct. Most of the Arctic is
becoming 1 and 2 year old ice. (Climate change indicators in the United States, 2012)
Figure 11: Age of ice estimates taken at the end of the summer season. (Climate change
indicators in the United States, 2012)
25
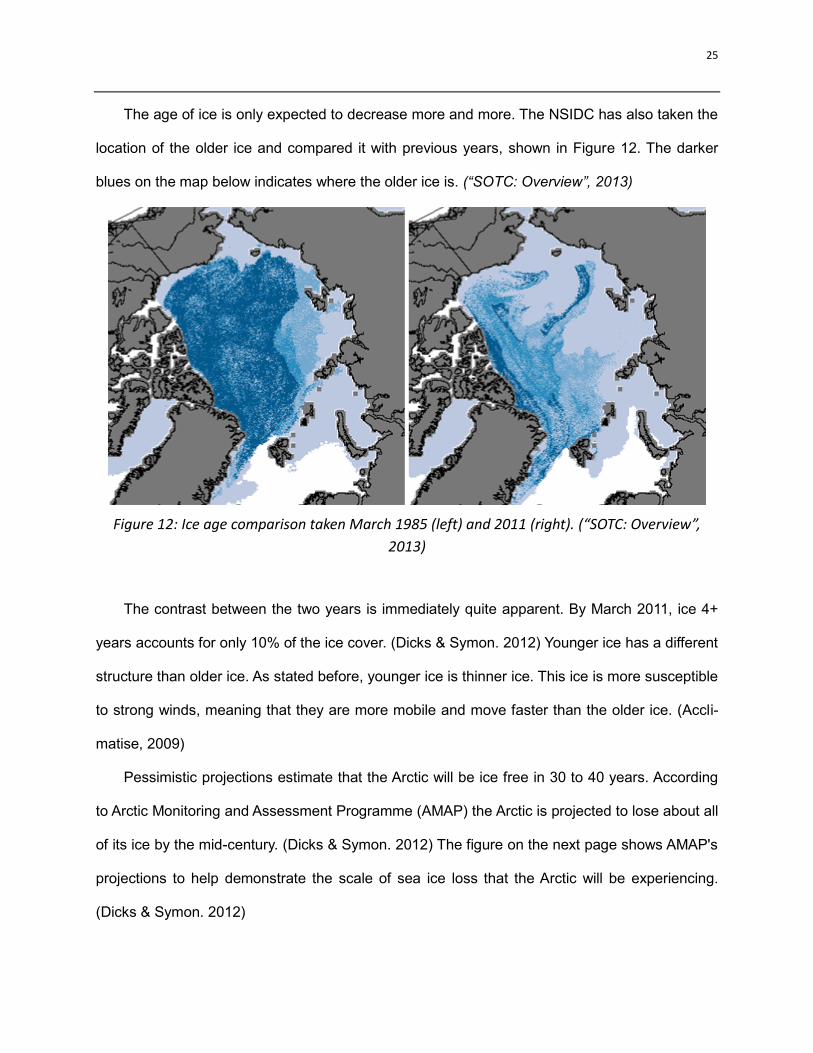
The age of ice is only expected to decrease more and more. The NSIDC has also taken the
location of the older ice and compared it with previous years, shown in Figure 12. The darker
blues on the map below indicates where the older ice is. (“SOTC: Overview”, 2013)
Figure 12: Ice age comparison taken March 1985 (left) and 2011 (right). (“SOTC: Overview”,
2013)
The contrast between the two years is immediately quite apparent. By March 2011, ice 4+
years accounts for only 10% of the ice cover. (Dicks & Symon. 2012) Younger ice has a different
structure than older ice. As stated before, younger ice is thinner ice. This ice is more susceptible
to strong winds, meaning that they are more mobile and move faster than the older ice. (Accli-
matise, 2009)
Pessimistic projections estimate that the Arctic will be ice free in 30 to 40 years. According
to Arctic Monitoring and Assessment Programme (AMAP) the Arctic is projected to lose about all
of its ice by the mid-century. (Dicks & Symon. 2012) The figure on the next page shows AMAP's
projections to help demonstrate the scale of sea ice loss that the Arctic will be experiencing.
(Dicks & Symon. 2012)
26
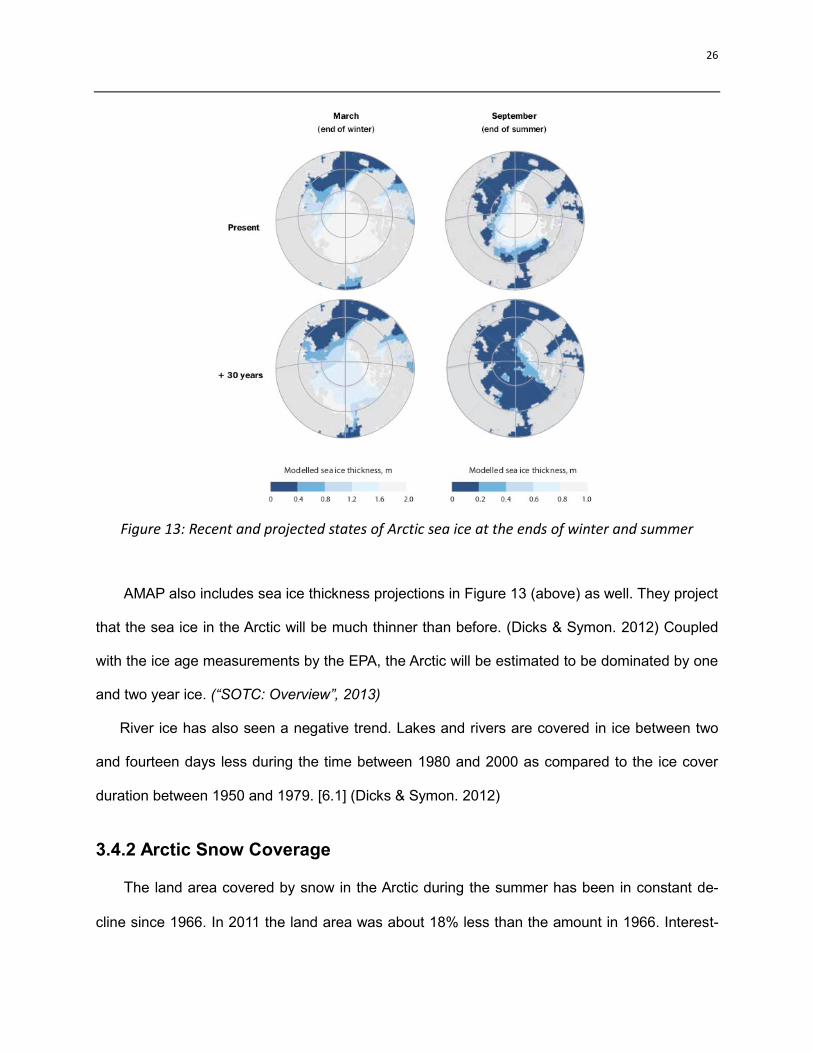
Figure 13: Recent and projected states of Arctic sea ice at the ends of winter and summer
AMAP also includes sea ice thickness projections in Figure 13 (above) as well. They project
that the sea ice in the Arctic will be much thinner than before. (Dicks & Symon. 2012) Coupled
with the ice age measurements by the EPA, the Arctic will be estimated to be dominated by one
and two year ice. (“SOTC: Overview”, 2013)
River ice has also seen a negative trend. Lakes and rivers are covered in ice between two
and fourteen days less during the time between 1980 and 2000 as compared to the ice cover
duration between 1950 and 1979. [6.1] (Dicks & Symon. 2012)
3.4.2 Arctic Snow Coverage
The land area covered by snow in the Arctic during the summer has been in constant de-
cline since 1966. In 2011 the land area was about 18% less than the amount in 1966. Interest-
27
ingly enough the snow depth in the Russian Arctic has increased, however the warmer climates
and more frequent winter thawing are making the snow pack differently than before. The dura-
tion of snow cover has decreased from 4 to 9 days per decade. (Forbes & Kremer, 2011)
In Russia the snow cover is following a positive trend. In Siberia snow cover duration has
been decreasing since 1980, but the snow depth follows no consistent negative trend. Snow is
settling earlier in autumn in northern Russia, which has lengthened snow cover duration by two
to four days since 1972. Snow depth has also seen a positive trend as well, the number of days
when the snow is more than 20 cm deep in Russia has increased between 1966 and 2007.
(Biancamaria & Cazenave, 2011)
Snow depth is projected by AMAP to increase in some areas, including Russia, however the
duration that snow is on the ground is expected to decrease. In Siberia snow depth is projected
to increase 15 to 30% in the next 50 years. Across the Arctic snow duration is expected to drop
10-20% by 2050. Siberia is expected to lose the least at about 10%. (Dicks & Symon. 2012)
3.4.3 Arctic Permafrost Coverage
The lower boundary of permafrost in the Russian Arctic has moved northward 30 to 80 km
between 1970 and 2005. In addition to the northward migration of the southern border, tempera-
tures have typically risen 2 degrees in Arctic permafrost. (Forbes & Kremer, 2011)
AMAP projects ground temperature to increase from 0.6 to 1 degree C by 2020. In other
parts of the world the top 2 to 3 meters of permafrost is expected to decrease 16-20% across
land with permafrost in Canada and 57% in Alaska. (Dicks & Symon. 2012) The following fig-
ures give a clear look at the northward progression of permafrost in the span of seven years
(1998-2005).
28
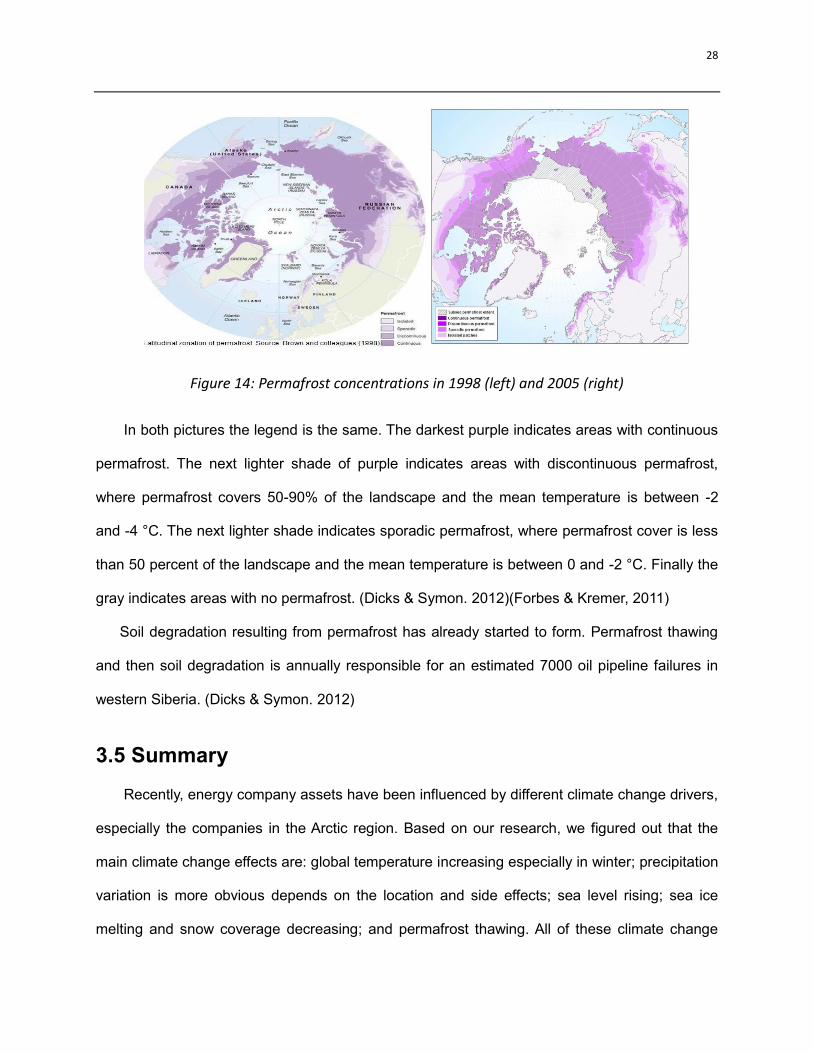
Figure 14: Permafrost concentrations in 1998 (left) and 2005 (right)
In both pictures the legend is the same. The darkest purple indicates areas with continuous
permafrost. The next lighter shade of purple indicates areas with discontinuous permafrost,
where permafrost covers 50-90% of the landscape and the mean temperature is between -2
and -4 °C. The next lighter shade indicates sporadic permafrost, where permafrost cover is less
than 50 percent of the landscape and the mean temperature is between 0 and -2 °C. Finally the
gray indicates areas with no permafrost. (Dicks & Symon. 2012)(Forbes & Kremer, 2011)
Soil degradation resulting from permafrost has already started to form. Permafrost thawing
and then soil degradation is annually responsible for an estimated 7000 oil pipeline failures in
western Siberia. (Dicks & Symon. 2012)
3.5 Summary
Recently, energy company assets have been influenced by different climate change drivers,
especially the companies in the Arctic region. Based on our research, we figured out that the
main climate change effects are: global temperature increasing especially in winter; precipitation
variation is more obvious depends on the location and side effects; sea level rising; sea ice
melting and snow coverage decreasing; and permafrost thawing. All of these climate change
29
effects are interrelated and has been projected to change much greater in the future to affect
the energy companies. To provide better solutions of how energy companies could adapt to the
vicious circular climate change, we will analyze these climate drivers main impacts to energy
sector in Russia in the next section.
4. Risks from Arctic Climate Change
The following sub-sections describe the impacts associated with the risks described in the
previous section.
4.1 Risks driven by changes in temperatures
Global temperatures rise and accelerated ice melt has many effects on the Oil & Gas
companies. Offshore oil and gas exploration will be enhanced by the reduced ice. (“Impacts of a
Warming Arctic”, 2004)(Doggett, 2004)(Ball & Breed) At the same time, onshore resources
extraction will be hampered due to the shortened ice frozen season during which the ground is
better for travel (Clement & Bengston, 2013) (Ball & Breed). Besides the marine and land
exploration, transportation is also greatly influenced by global warming. The Eurasian Arctic has
been projected to be relatively ice-free region in a few decades during the summertime which
could provide more Northern sea shipping routes to shorten the time, distance and cost.
(“Impacts of a Warming Arctic”, 2004) All of these effects will be discussed in detail in sections
4.4 and 4.5.
Electricity companies will also be affected by the temperature rise, which mostly affects
power generation, making it less efficient. Global warming makes the soil drier and warmer
which in turn will make any underground cables lose their thermal conductivity and heat
capacity. When building a power plant, one of the first things set is the maximum temperature of
the plant. This ensures that the plant won't adversely affect the environment. From the set
30
maximum temperature, the amount of current that the plant can carry could be planned. If the
surrounding temperature increases, the available temperature rise will decreases and the
maximum current rating will be reduced, which will make thermal generation less efficient. (Wills
& Power, 1975) Especially during summertime, air conditioning demand and load is likely to
increase. (Ball & Breed)
4.2 Risks driven by changes in precipitation
The change in precipitation patterns could be devastating to all areas that are unable to
adapt. The areas that are expected to see an increase in precipitation are at risks of flooding.
Flooding will require assistance from the government and will also cause citizens to relocate to
areas that are very likely already overpopulated. The areas that are expected to see a decrease
in precipitation are more prone to droughts and fires.
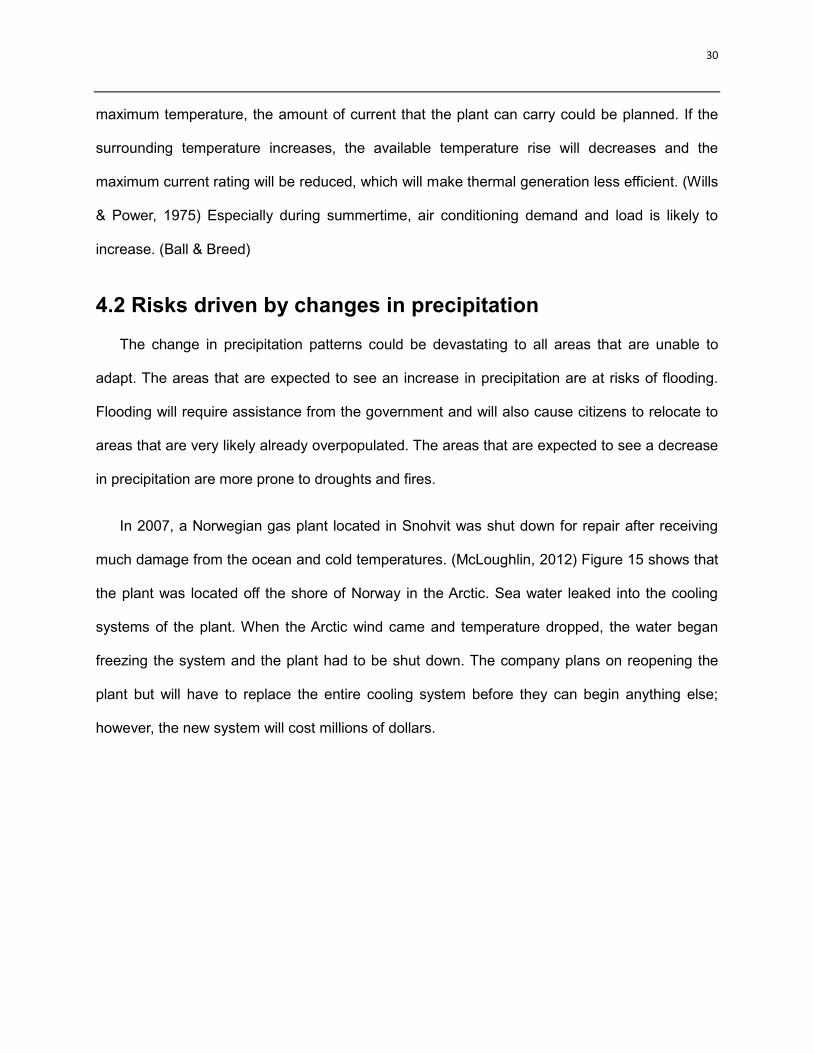
In 2007, a Norwegian gas plant located in Snohvit was shut down for repair after receiving
much damage from the ocean and cold temperatures. (McLoughlin, 2012) Figure 15 shows that
the plant was located off the shore of Norway in the Arctic. Sea water leaked into the cooling
systems of the plant. When the Arctic wind came and temperature dropped, the water began
freezing the system and the plant had to be shut down. The company plans on reopening the
plant but will have to replace the entire cooling system before they can begin anything else;
however, the new system will cost millions of dollars.
31
Figure 15: Location of Snohvit oil rig
Acid rain can also cause damage to coatings of automobiles and factories. The damage
witnessed in previous studies shows that it is permanent and can only be repaired by applying
new coats of paint, water resistant coating, etc. (Forbes & Kremer, 2011)
Increase in storm incidence will also affect industry. The plant in Snohvit was shut down for
an ice storm and once again during a snow storm because it lost power. Storms can also delay
transportation and push back deadlines. With increasing demands, delay is something a gas
plant can’t afford.
One thing that will be greatly affected by these impacts is transportation. The change in
precipitation increases chances of storms. The plant was already destroyed by an ice storm and
the damage it sustained is going to be a costly one. But sea transportation and exportation
could become more difficult with increasing storm lengths. Changing winds can also greatly
affect these modes of transportation. (Skjaerseth & Skodvin. 2001) Roads are an option but with
32
increased chances of flooding and ice, it will be very difficult to navigate.
4.3 Risks driven by changes in sea level
According to the EPA, rising sea levels can cause a higher frequency of coastal flooding
and erosion. Coastal infrastructure would face increased vulnerability to coastal storms. The
loss of snow and ice in the Arctic would cause the cooling effects of the Arctic to disappear,
causing an increased global warming. (Climate change indicators in the United States, 2012)
AMAP estimates that about 200 million people inhabit areas less than one meter above sea
level globally. A higher average sea level and a higher frequency of storm surges increase the
risk of flooding in these areas. Storm frequency has not been formally measured in the Arctic,
but reports in Alaska indicate that the frequency has been increasing. (Dicks & Symon. 2012) As
reported in section 3.3, pessimistic projections of sea level by 2100 are around 1.1 m. If this is
the case, those 200 million people will have to move inland. (Jevrejeva & Moore, 2012)
Concerning oil and gas companies, sea level rise alone won't have much impact unless
there are installations that are close enough to sea level to be affected. Harbors will be affected
the most, but only when the rising sea level is coupled with the extreme weather that result from
the melting sea ice. (Rottem & Moe. 2007) In addition, sea level rise can destroy refineries and
threaten the safety and reliability of operations near the coast. This can only happen during
extreme weather events, but a higher sea level will increase the chance of such events
happening. (Martikainen & Holttinen, 2005)
A higher sea level will change how certain resources are accessed. Access and exploration
of oil and gas in the oceans will be enhanced; however, increased wave forces and mobile sea
ice will force companies to invest more in stronger equipment. (Martikainen & Holttinen, 2005)
Regarding energy companies, given the fact that Arctic power stations are on land, there
33
should be no negative effects from sea level rise. Plants on the coast however are potentially in
danger of flooding. RosAtom currently has two plants near the coast, its Bilibino and Kolsky
plants, which could be affected. (2011 Public Annual Report, 2012) For nuclear power plants in
particular, storm events may raise the sea level in large increments. In Finland, a storm in
January 2005 raised the sea level of the Gulf of Finland approximately 2 m, which prompted the
closure of the Loviisa nuclear power plant. (Martikainen & Holttinen, 2005)
Hydro-electric plants in Russia would benefit from the increased water flow in rivers that
would result from a higher sea level. It is estimated that hydro-electric power in northern Russia
will see a 15-30% increase in hydro-electric potential. (Martikainen & Holttinen, 2005)
Russia's nuclear-powered utility ships, named the Akademik Lomonosov, indicate its
deployment in 2016. (RT News, 2013) If they are implemented en masse, these ships would be
immune to any adverse effects from sea level rise.
4.4 Risks driven by changes in ice coverage/snow/permafrost
As before, each climate change driver's risks will be detailed in their own respective subsec-
tions.
4.4.1 Ice levels
Reduced ice levels will affect private and public enterprise in the Russian Arctic heavily. The
decrease in ice age will make the oceans full of icebergs and smaller ice chunks. Older ice has
different properties than the newer ice. Older ice is 'stiffer' which is harder for ice-breakers to
break through. The younger ice might make things easier for the Arctic shipping industry,
because shipping routes will be open longer; however, the relative shallowness of the Siberian
coast will still limit the size of ships that can be utilized. The shipping industry is not the only
industry that will experience the benefit of the melting sea ice, the tourism industry will also be
34
able to utilize the longer summer season to its advantage by increasing cruise activity in that
area. (Dicks & Symon. 2012)
However the Arctic waters will not be devoid of danger. Despite a longer summer season to
ship cargo around the Arctic, the icebergs and storms, maintain the current levels of risk
associated with this type of transportation. Currently Canada is trying to handle transportation
through the Northwest passage in the Arctic archipelago, located in the Canadian extreme
north. So far they have not found a way to ensure a safe, cost-effective and predictable passage
through the Northwest passage. (Prowse & Furgal. 2009) Ships will have to deal with icebergs
with increased speed; less sea ice also gives icebergs more mobility in the waters. Not only do
ships need to look out for this new danger, but oil platforms as well. Icebergs have been known
to cause structural damage to oil rigs. (Dicks & Symon. 2012)
On the contrary, a shipping lane near Greenland, dubbed “Iceberg Alley” is now ice-free
during the summer months, increasing ship travel. (Harsem & Eide. 2011)
Another danger is the formation of fog over the open water as the summer ice melts. This
can make navigation more difficult and potentially freeze up the ships as well. Higher ship traffic
through the Arctic would also require the expansion of search and rescue operations because of
the higher traffic of the area. (Dicks & Symon. 2012)
Lower ice levels also mean that ice roads will not be able to be used or relied on as often. In
Canada about 2500 shipments to 30,000 natives are made on Canadian ice road networks.
With these ice roads thawing, an increasing number of transport vehicles are stranded on these
thawing roads. In the 2009/10 Canadian winter, a 2200 km portion of a ice road network was
shut down due to thawing of ice roads. Similarly, a state of emergency was declared in 11
communities in the Canadian Arctic for the same reason. (Dicks & Symon. 2012) This trend is
only expected to continue. This will force a reliance on water; transportation of the same
35
shipments through use of rivers or other waterways.
Transport vehicles aren't the only things that need to be wary of the melting ice on land. The
thawing of underground ice and the resulting craters made, called a thermokarst, can cause a
lot of damage to cities and towns caught in the way. In Yakutsk, Russia in 2006, several cars fell
into a huge thermokarst crater that had formed under a car park. (Dicks & Symon. 2012)
This melted ice water can also cause flooding in low lying coastal areas. (Forbes & Kremer,
2011) East Siberian rivers already experience extreme flooding. After catastrophic flooding of
the Lena River in 2001, the city of Lensk was damaged so badly that it had to be rebuilt. Flash
floods and mud flows can also occur from the melt water. (Dicks & Symon. 2012)
Wind can push ice chunks onto the coast, sometimes even 100 meters in just hours. These
chunks are and will remain a hazard for coastal communities as well. (Dicks & Symon. 2012)
Offshore drilling platforms will have to adapt themselves to the decreasing amount of sea
ice. (Prowse & Furgal. 2009) If the sea ice disappears, platforms will have to adapt to handle an
increased frequency and severity of waves and storm surges. Already, storms in the North Sea
have resulted in Norwegian oil production being cut by 10% in companies with older unprepared
assets, which is estimated at around 220,000 barrels per day. At the very least, companies will
have increased operational costs when working in the Arctic sea area. (Firth, 2009)
A perfect example of the difficulty of building in the Arctic seas is Gazprom's attempt to
develop an oil rig at the Shtokman oil field in the Barents Sea. One of the main reasons that the
project failed was because of the dangers that plagued the area, and the cost to develop
solutions to those dangers. When designing the oil rig, designers came upon one big problem in
particular, that of gigantic icebergs that would move through the area. Some of these icebergs
could be 100 km long and equal the total area of Jamaica. Some of these icebergs were also
deep enough to scrape along the 600 m deep sea floor. (Pitt, 2007) In addition to this problem,
36
ocean freezes and violent storms take development one step further. (Pitt, 2007)(Zhdannikov,
2007) Norway's Snohvit oil field was built in the same conditions, and although it was a
relatively small rig, it cost upwards of $10 billion. (Pitt, 2007) The platform Hibernia has been
built to withstand one million ton icebergs without damage. (Harsem & Eide. 2011) That
structure cost $4-6 billion alone, development and exploration costs aside. (Morozov. 2012) If
the current climate change trends hold, there will be more cases like Shtokman and Snohvit in
the Russian Arctic. When developing plans for the Sakhalin-1 project off the coast of Russia,
industry reports indicate that it took about 10 years for planners to gather reliable enough data
to plan the rig. (Harsem & Eide. 2011) In order to succeed in the Arctic, companies need to pay
big to have the right precautions taken. Otherwise their projects will fail.
With respect to utilities companies, thermal plants will get hit the worst. Abundant sea ice
chunks that flow down rivers, a common occurrence in the Russian Arctic, can disrupt the
effective capacity of the thermal plants. If intake structures are blocked, energy production of the
power plant goes down and the operational costs of the plant rise. For the remote facilities all
over the Russian Arctic, monitoring and fixing such problems can be an issue. (Prowse &
Alfredsen. 2011)
Hydro-electric plants will benefit from the melting sea ice. Reservoir ice will only get thinner
and weaker, meaning that the plants can use more of the reservoir water during winter, when
electricity demand is high. In addition, reservoir structures won't have to be as costly as they are
now because there will be less ice, and there is less risk of flooding when the reservoir ice melts
at the end of winter. (Prowse & Alfredsen. 2011)
4.4.2 Snow Cover
Snow is a great reflector especially of the sun's energy. Cold snow reflects about 85% of
the sun's energy, and wet snow reflects about 75%. For comparison, open water reflects about
37
7% of the sun's energy. If more snow melts, less of the sun's energy will be reflected meaning
that the earth will absorb more heat from the sun. (Dicks & Symon. 2012)
Larger snow depth will also be a danger to buildings and infrastructure. Building strength is
determined on snow loads of previous years, but with the snow loads increasing each year
buildings will need to be continually re-assessed and strengthened until a new maximum limit
has been reached. People have already died in Quebec in the winter of 2007/08 in building col-
lapses. (Dicks & Symon. 2012)
The increasing amounts of precipitation in the Arctic, coupled with the melting of ice roads,
will further limit transportation by land. (Prowse & Furgal. 2009) Operational costs will rise at
various plants across the Arctic due to the increased amount of snow, however due to the short-
er winter season, the adverse effects of snow coverage to oil and gas and energy companies is
minimized.
4.4.3 Permafrost
Permafrost thaw will also be another significant danger to buildings and infrastructure. Many
oil pipelines and communities, even some large cities, are built on permafrost. Foundation sta-
bility of buildings will be challenged when permafrost thaws; when permafrost thaws the ground
becomes softer. The ground won't be as supportive when that happens and buildings could also
begin to sink or tilt as the ground beneath them literally sags from the weight of the building.
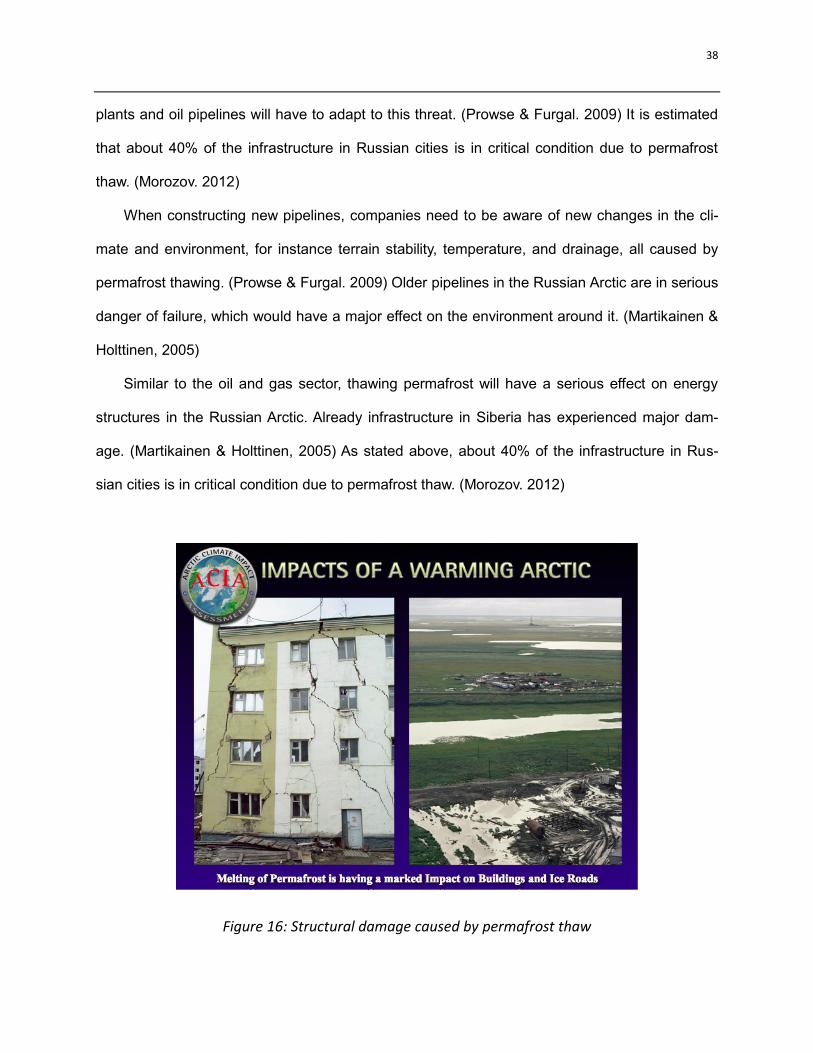
Buildings could crack or even tear themselves apart if this goes unchecked, as shown in Figure
16 on the next page. To ensure continued structural stability, buildings will need to be main-
tained more frequently or they could become uninhabitable. (Dicks & Symon. 2012)
More permanent structures will also have to adapt to the thawing permafrost. Most buildings
in the Arctic are built relying on the permafrost as a foundation. If this foundation were to thaw,
these buildings would lose their structural stability. In addition to that, thawing permafrost warps
the ground, further wrecking what structural stability buildings might have left. Many processing
38
plants and oil pipelines will have to adapt to this threat. (Prowse & Furgal. 2009) It is estimated
that about 40% of the infrastructure in Russian cities is in critical condition due to permafrost
thaw. (Morozov. 2012)
When constructing new pipelines, companies need to be aware of new changes in the cli-
mate and environment, for instance terrain stability, temperature, and drainage, all caused by
permafrost thawing. (Prowse & Furgal. 2009) Older pipelines in the Russian Arctic are in serious
danger of failure, which would have a major effect on the environment around it. (Martikainen &
Holttinen, 2005)
Similar to the oil and gas sector, thawing permafrost will have a serious effect on energy
structures in the Russian Arctic. Already infrastructure in Siberia has experienced major dam-
age. (Martikainen & Holttinen, 2005) As stated above, about 40% of the infrastructure in Rus-
sian cities is in critical condition due to permafrost thaw. (Morozov. 2012)
Figure 16: Structural damage caused by permafrost thaw
39
Thawing permafrost will impact oil and gas exploration the most. Increased snow cover and
the thawing permafrost will first force companies to use low-impact vehicles and/or change the
timing of their exploration endeavors. With the unpredictability of the winter ice road system,
transportation and exploration will take a significant hit. (Prowse & Furgal. 2009)
Transportation over land will also take another major hit as the permafrost thaws. Large
scale transportation is also impossible in the marshy land which the permafrost is yielding to.
This forces on-land transportation to increasingly rely on the shortening winter season. (Harsem
& Eide. 2011) Coupled with ice road failure described above, this is spelling disaster for the on-
land transportation services. Because of weakened soil strength, construction work is expected
to be more difficult with present vehicles. Higher utility costs will arise from the need for new ve-
hicles. (Martikainen & Holttinen, 2005)
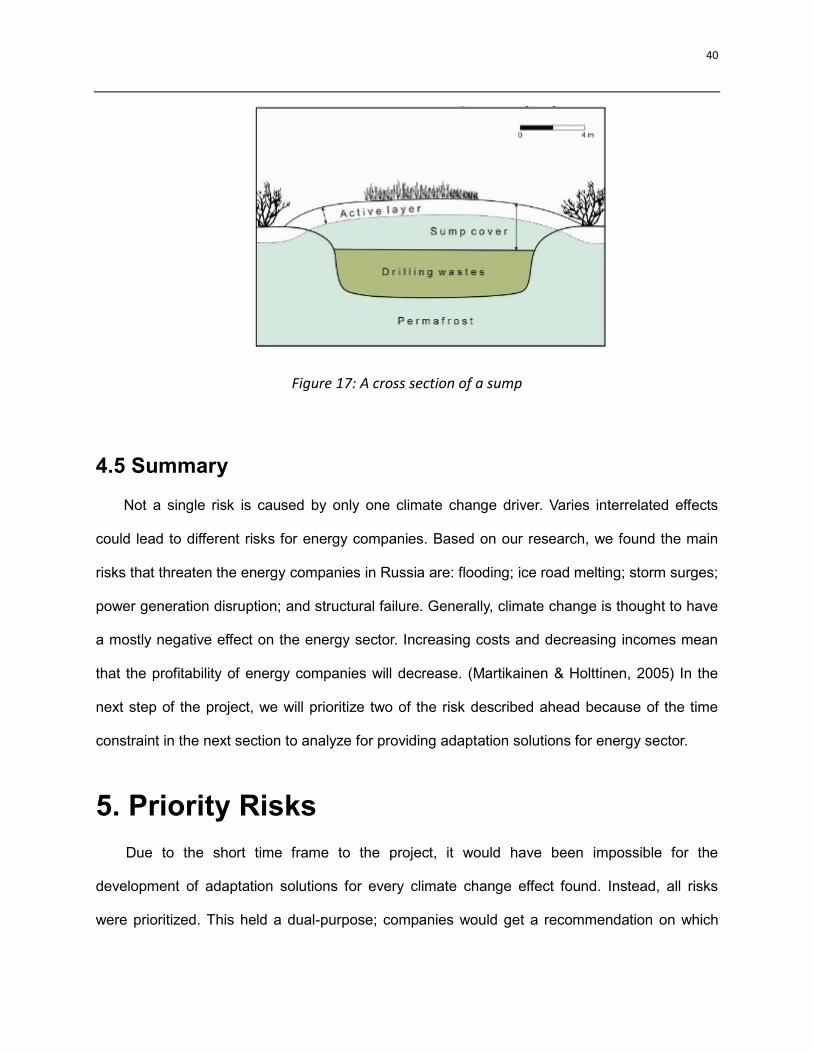
Permafrost thaw will also adversely affect exploratory drilling. When performing exploratory
drilling, prospectors dispose of the drill cuttings and fluids are disposed of in sumps, small exca-
vations that are made next to the drill site for disposal. These sumps are covered with excavat-
ed material. Utilizing the permafrost, drilling waste is trapped between the permafrost and the
layer of sediment covering it as shown in Figure 17. As long as excavators take the time to
freeze the drilling waste before covering it, this is an effective way to dispose of the waste. (Ko-
keli. 2002) However, if the permafrost thaws, the permafrost becomes a much less effective
container and the potential for contamination is greatly increased. (Kanigan & Kokeli. 2010)
40
Figure 17: A cross section of a sump
4.5 Summary
Not a single risk is caused by only one climate change driver. Varies interrelated effects
could lead to different risks for energy companies. Based on our research, we found the main
risks that threaten the energy companies in Russia are: flooding; ice road melting; storm surges;
power generation disruption; and structural failure. Generally, climate change is thought to have
a mostly negative effect on the energy sector. Increasing costs and decreasing incomes mean
that the profitability of energy companies will decrease. (Martikainen & Holttinen, 2005) In the
next step of the project, we will prioritize two of the risk described ahead because of the time
constraint in the next section to analyze for providing adaptation solutions for energy sector.
5. Priority Risks
Due to the short time frame to the project, it would have been impossible for the
development of adaptation solutions for every climate change effect found. Instead, all risks
were prioritized. This held a dual-purpose; companies would get a recommendation on which
41
risks had the most impacts on their assets, and there would only be a need to research
adaptation solutions for the most important effects.
5.1 Description of method used to choose priority risks
There were three methods used to prioritize risks. The first and the second methods in-
volved the econometric modeling and surveys detailed in the methodology section to prioritize
current and future risks. The results of the surveys were insufficient, so another method was
needed for risk prioritization.
The next approach to prioritize risks involved the development of an impact chart. This im-
pact chart identified which climate change effects impacted which type of asset. Priority was as-
sessed on which risks affected the most assets. The survey we designed and impact charts for
Oil & Gas and Utility company assets are provided in Appendices 1 and 2 respectively.
5.2 Results
What follows are the risks found to have the most impact in the present and the future.
5.2.1 Priority Risks of the Present
By using the econometric modeling method describe previously, we prioritized the current
risks that affect economic indicators (gross profit, cost of goods sold, and operating revenue) of
energy companies located in Russian Arctic. We analyzed a number of Russian companies
which operate in the Arctic region: Belomorskaya Neftebaza (in Kandalaksha),
Arkhangelsknefteproduct (in Arkhangelsk), Commandit Service (in Murmansk), Taymyrskaya
Fuel Company (in Krasnoyarsk) and Yakutskenergo OJSC (in Yakutia-Sakha / Bukhta Tiksi).
According to our approach, X1, X2, ……, X11 are independent and exogenous random vari-
ables: annual average temperature (°C), annual average maximum temperature (°C), annual
42
average minimum temperature (°C), total annual precipitation of rain and / or snow (mm), annu-
al average wind speed (Km/h), total days with rain during the year, total days with snow during
the year, total days with thunderstorm during the year, total days with fog during the year, total
days with tornado or funnel cloud during the year, total days with hail during the year, Y1, Y2,
and Y3 are dependent and endogenous random variables: gross profit, cost of goods sold, and
operating revenue.
5.2.1.1 Gross profit
To determine the risks with the most impact on gross profit, assume X1, X2... X11 are weath-
er conditions (such as temperature, precipitation, etc.) and Y1 is gross profit. The results of the
modeling are as follows:
R2 = 0.8104 means that Var(X1) describes Var(X2) by approximately 81.04%. R2 coefficient
is close to 1, which means that our model has good specification quality. Adjusted R2 = 0.7294
means that the model explains 73% of all observations in the dataset. To verify the significance
of the coefficients, the T-test was carried out. This test demonstrated that wind and snow are
significant coefficients that have impact on gross profit of Russian companies in the Arctic re-
gion. DW-test showed absence of autocorrelation.
Based on the analysis, only two out of eleven climate variables have direct influence on
gross profit. These variables are annual average wind speed (Km/h) and total number of days
with snow during the year. Other set of variables such as maximum temperature, precipitation,
wind, rain, snow, thunderstorm, fog, tornado or hail showed no correlation with gross profit.
5.2.1.2 Cost of Goods Sold
To determine the risks with the most impact on costs of goods sold, assume X1, X2… X11
are weather conditions (such as temperature, precipitation, etc.) and Y2 is Costs of Goods Sold
(COGS). The results of the modeling are as follows:
43
R2 = 0.06771 means that Var(X1) describes Var(X2) by approximately 6.77%. Adjusted R2 =
0.06094 mean that the model correctly explains only 6.09% of all observations. Nevertheless, in
order to determine influence of the related coefficients, T-test was checked. It displayed that
wind and snow are not very significant variables, but still there is influence of temperature indi-
cators on COGS of Russian companies in the Arctic region. DW-test showed absence of auto-
correlation.
According to the tests that have been done, we got the same findings: annual average wind
speed (Km/h) and total days with snow during the year are the only two variables that would
have impact on COGS.
5.2.1.3 Operating revenue
Finally, to determine the risks with the most impact on operating revenue, assume X1, X2…
X11 are weather conditions (such as temperature, precipitation, etc.) and Y3 to be operational
revenue. The results of the modeling are as follows:
R2 = 0.90157 means that Var(X1) describes Var(X2) by approximately 90.15%.R2 is very
close to 1 and regression line doesn’t miss any points in the dataset. Adjusted R2 = 0.81142
proves that the model explains 81% of all observations. The T-test showed that wind and snow
are significant coefficients that have impact on operational revenue of Russian companies in the
Arctic region. DW-test showed absence of autocorrelation. Thus, annual average wind speed
(Km/h)) and total number of days with rain during the year are the two variables that have influ-
ence on operational revenue.
5.2.1.4 Conclusion
To conclude, the panel data analysis carried out for four energy companies in the Russian
Arctic shows that wind speed has correlation with gross profit, COGS, and operational revenue.
Also, all checked econometric tests prove that there is powerful dependence between all varia-
44
bles. Russian companies that operate in the Arctic region have certain risks associated with
their activity because climate changes (like changing wind speed) could cause unpredicted
costs for these companies.
5.2.2 Future prioritized risks
Based on the impact charts that can be found in Appendix 2, permafrost thaw and flooding
were found to have the most impact on the Arctic energy companies in the future.
These findings correlate with the survey response given to us by a professor at Oxford Uni-
versity. To respect their privacy, their name will not be used. In their response, they echoed the
findings from the impact chart, stating that permafrost thaw had the most significant impact that
energy companies need to consider. In relation to the damage to infrastructure, they gave high
scores to significance and impact. They also added commentary on the level of unpredictability
that comes with permafrost thaw. They argued that in order for existing company infrastructure
to have any benefit from the adaptation solutions they will need to solve their issues with trans-
portation and increase local energy in the area. Contrary to our conclusions, the second risk
with the most impact on the energy sector they felt was the melting of ice and the disruption it
would have on Arctic transportation. The Oxford professor’s response is included in Appendix 3.
Due to the nature of impacts of the future priority risks, as well as the Oxford professor’s
survey answers, solution focus was placed on the future priority risks.
45
6. Adaptation Solutions
This section details the adaptation solutions found for the two priority risks found in the
previous section: permafrost thaw and flooding. Research was performed to find existing so-
lutions to these issues developed by other companies and countries.
6.1 Description of Solution Assessment
The criteria for adaptation solutions are the following:
An adaptation solution should lessen the effects of the climate change impact that it was
supposed to “solve”;
An adaptation solution needs to concern some sort of change or addition to current op-
erations in the Arctic.
Moreover, solutions were only considered if they were a proven solution. In order to be
proven, these solutions needed to be implemented by countries or companies already in an
arctic setting. Given below are the brief descriptions of the solutions found for the two priority
risks.
6.2 Solutions to Permafrost Thaw
The main impact associated with permafrost thaw is structural failure. Adaptation solu-
tions researched for permafrost thaw were focused on solving this problem.
6.2.1 Thermosiphons
Permafrost thaw occurs when the temperature in the permafrost rises above 0 degree
Celsius. A thermosiphon is an adaptation solution that tries to keep the temperature in the
permafrost below 0. They were developed in Alaska in 1965 (Holubec, 2008) ("Infrastructure
in permafrost: a guideline...", 2010).
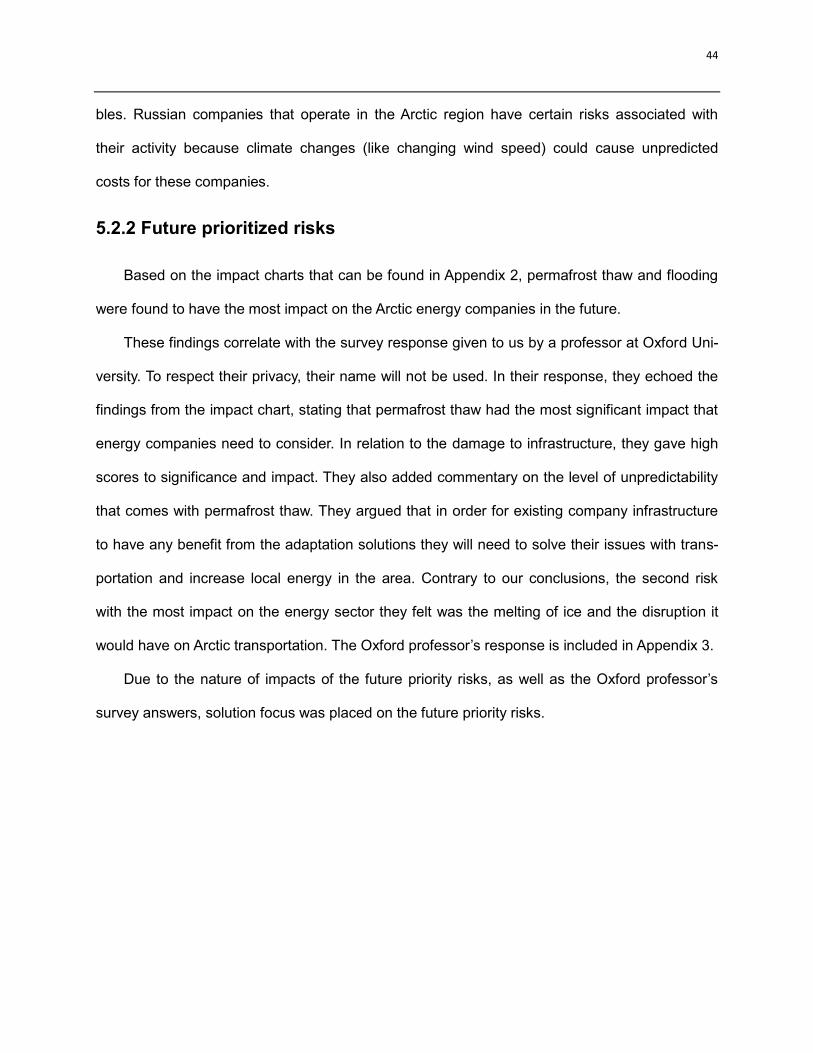
Thermosiphons are hollow tubes with gas inside of them. The gas absorbs the heat in
the permafrost and rises to the top. At the top, the heat is released through a radiator and
46
the now cool gas falls to the bottom of the tube. (Holubec, 2008) Figure 18 shows them be-
ing used to protect building foundations. The thermosiphons are the tubes that stick out of
the ground next to the building. Gazprom is already using this method in their Bovanenkovo
field in the Yamal-Nenets region as well as other fields. (“Bovanenkovo”, 2013)
Figure 18: Thermosiphons used in building foundations
This method is good for maintaining the status quo. It is already employed at roadbeds
and other installations in the Arctic, mostly in America and Canada (Wagner & others, 2010).
As the general Arctic temperature rises, the thermosiphons need to work harder. It is
unknown whether or not thermosiphons will become ineffective if the temperature rises or
not, but this should still be considered when implementing thermosiphons.
6.2.2 Foundation Leveling
Especially for pre-existing buildings, sometimes permafrost thaw is very hard to avoid
and damage occurs. Leveling a foundation is a reactionary measure to fix any damage
caused by permafrost thaw to a building's foundation.
47
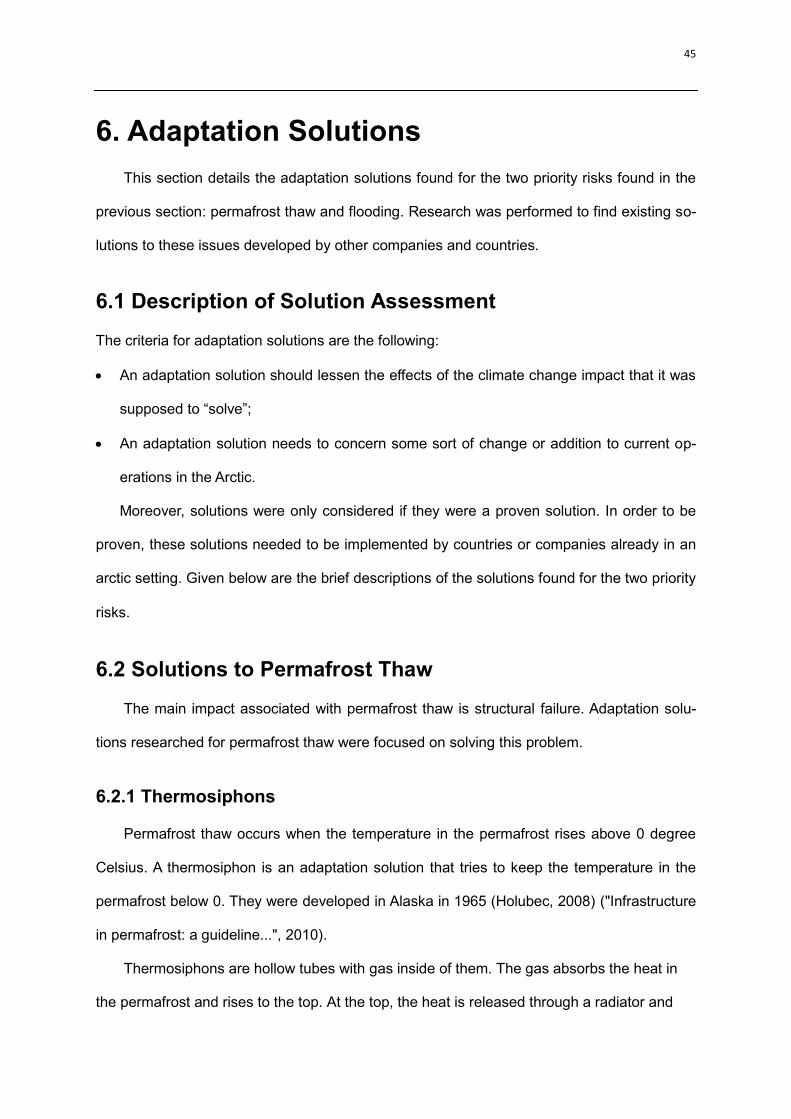
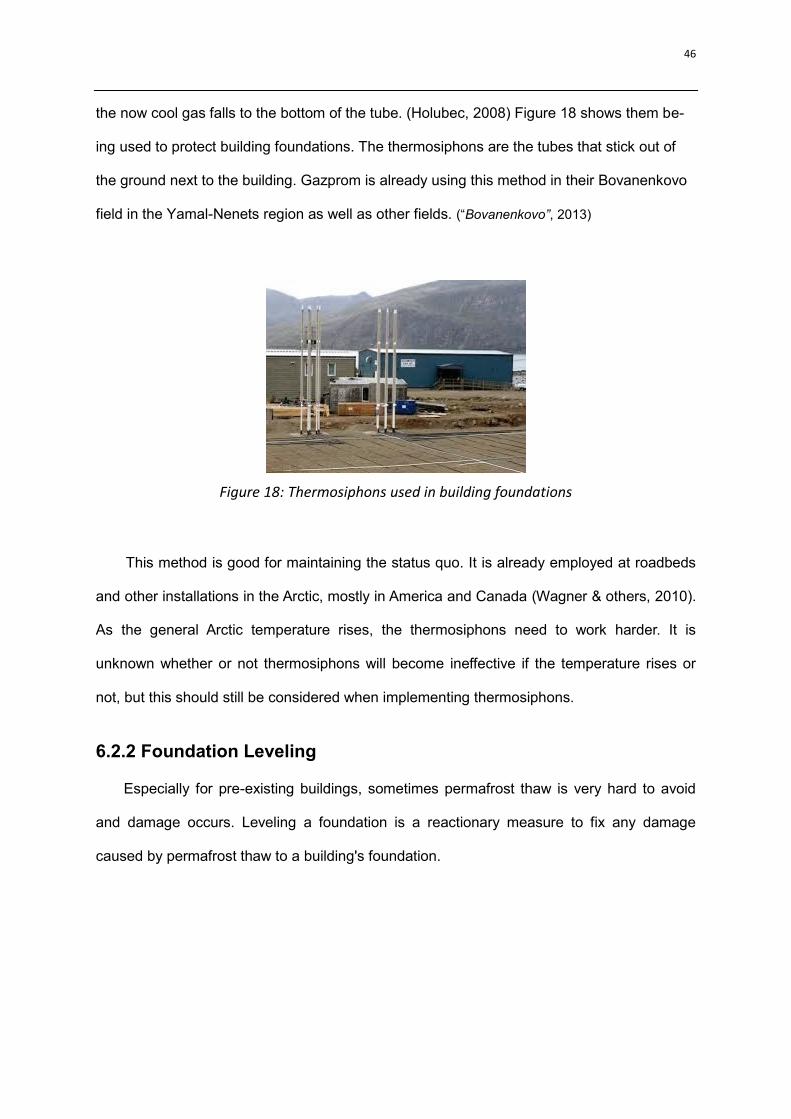
Figure 19: Depiction of a foundation leveling
Leveling a foundation is a standard practice; however there is still room for error.
Depending on the damage, different types of piers, anchors, or lifts are used to move and
hold the foundation into place, as shown in Figure 19 (“Methods of Foundation Repair”).
6.2.3 Modified Pile Foundations
A pile is a long support placed in the ground that will support a structure above. They are
usually made out of wood, steel, or concrete (McFadden, 2001).
Wood and steel piles need to be treated for rot and corrosion respectively. Concrete
piles are used mostly in Russia. There are several things that can go wrong with concrete
piles. First off, when poured into a hole on site, if the pile is big enough the heat of hydration
could thaw the permafrost itself. The problem is that concrete piles casted on-site need to be
big so that the soil from the ground does not damage the curing concrete. Concrete piles
that are pre-casted are very heavy and unwieldy. It is hard to install pre-cast concrete piles
without damaging them first. (McFadden, 2001)
Piles are considered to be the most effective foundational type when building on perma-
frost. However, many piles are based on the permafrost for support. If the permafrost is not
thawing, then this is considered an effective foundation. However if the permafrost was in-
deed thawing, like it is in a good portion of the Russian Arctic, this foundation quickly loses
this effectiveness. Although it is incredibly difficult, especially when modifying existing piles,
extending the piles past the permafrost onto the bedrock below seems to be the best way to
48
ensure structural stability (McFadden, 2001) ("Infrastructure in permafrost: a guideline...",
2010).
6.2.4 Increased building air circulation
This method was actually developed in Russia, but it was expanded upon and improved
in the USA. The idea behind increased air circulation is to intercept any heat from the build-
ing before it reaches the permafrost active layer. To facilitate this, buildings are raised on
piles. Cold winter air will be able to circulate under the building and remove any heat that es-
capes from the building. It is used hand in hand with the pile methods mentioned above
(McFadden, 2001) (McFadden, 2000) ("Infrastructure in permafrost: a guideline...” 2010).
The bottom of the raised building also needs to be properly insulated to ensure that not
that much heat can escape from the building. This will also ensure that the floor is not cold
(McFadden, 2001) (McFadden, 2000) ("Infrastructure in permafrost: a guideline...” 2010).
How much a building should be raised depends on the size and heat output of the build-
ing. The required airspace depends heavily on wind strength and typical snow depth of the
area. An average rule given by the Design manual for stabilizing foundations on permafrost
is that the “Aspect ratio defined by the minor dimension of the building divided by the clear-
ance height above the ground should be less than 10.” It is necessary that the airspace un-
derneath be as open as possible, otherwise the air underneath the building will heat up and
warm the underlying ground and permafrost even more (McFadden, 2001). Construction
wisdom has taught contractors that the minimum distance that a building can be without its
heat affecting the ground is two feet (McFadden, 2000).
It is important that the space underneath the building is not used for any storage pur-
poses. As stated before, air flow in this space is of optimal importance (McFadden, 2000).
6.3 Solutions to Flooding
The main impact associated with flooding is flash floods, high volume of water, and little
warning time associated with them. Adaptation solutions researched for flooding were
49
focused on solving this problem.
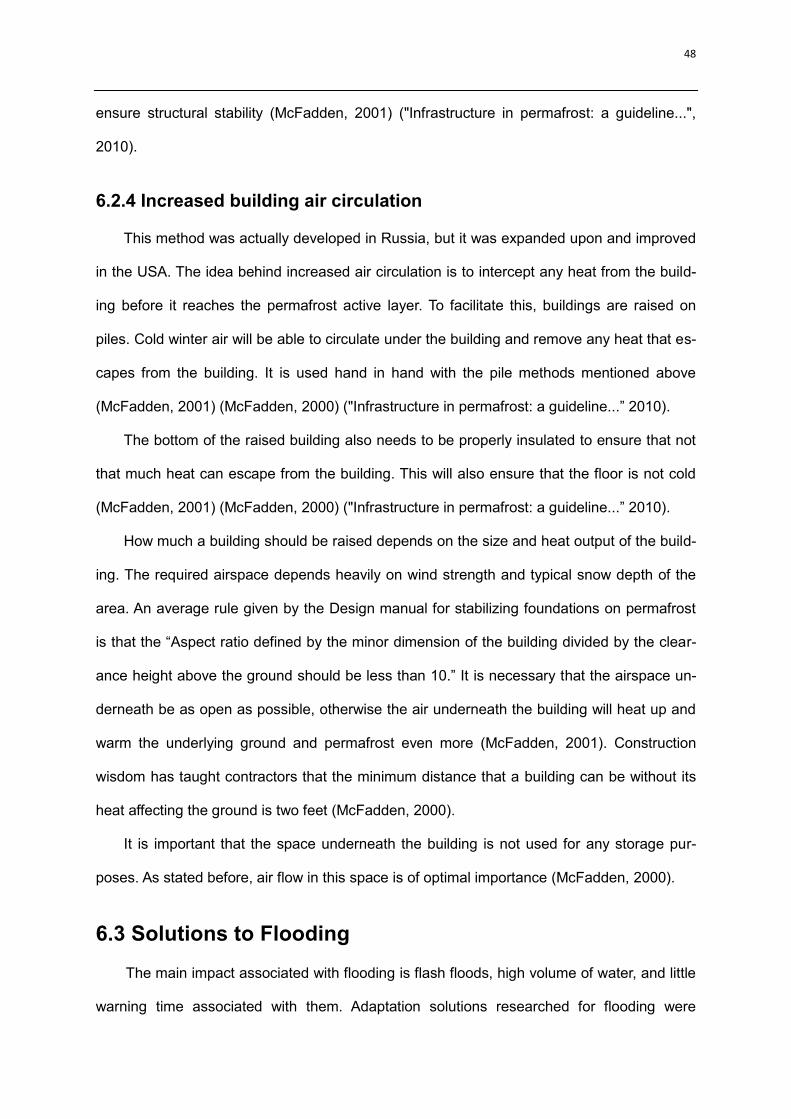
6.3.1 Hinged Flood Gates
One of the strategies for flooding that was discovered was hinged flood gates. These
flood gates can be used to protect either a large general area, or can be fitted to protect
sensitive equipment. It is a small aluminum gate that can be installed and removed easily.
The gate can be put in before floods hit and can be removed once the area is safe again.
The anchors of the gate are secured to the wall using compression gaskets to create a wa-
tertight seal.
There are two designs of the gate: one is an insert and the other is hinged like a door.
The insert is a sheet of aluminum that is fitted to the anchors of the gate.
Figure 20: Hinged flood gate examples
The hinged door is hinged to the anchor and acts as a metal door. Both of these designs
are customizable to be as long or as tall as seen fit, as detailed in Figure 20.
Companies such as Exxon Mobil, Chevron Texaco, Conoco Phillips, and GE Oil and Gas are
using gates to prevent such damage. This is one of the easier solutions because it is
customized to needs and current setup which will not require any alterations to the asset’s
50
setup.
6.3.2 Concrete Moats
Another strategy is concrete moats. These are trenches that are lined with concrete to
catch overflow from floods and prevent them from entering facilities. These moats can be
customized on location as well as size to fit the company’s needs.
In addition to protecting the asset from floodwater, the moat also acts as a barrier be-
tween the oil and the water. If oil were to spill from an asset, the moat would prevent the oil
from ever reaching any water and the spill will be contained for easier cleaning and removal.
One company that uses moats is Entergy. In 2010, one of Entergy’s plants located in
New York experienced a fire and the plant began to leak oil into the Hudson River. The origi-
nal purpose was to create something that will prevent oil spill, but this also resulted in the
benefit that the section for oil production has also been protected by any flood water that
could possibly damage the section.
Water pumps would be used to remove water from the moats. Though it is a timely process,
it is easier and less expensive than cleaning up an oil spill.
6.3.3 Polymer Foam
The last strategy to be discussed is polymer foam. Polymer is a chemical agent that is
both water resistant and waterproof. The polymer can be applied as a coating for walls or
pipes to seal any cracks found and prevent flood water from leaking into other areas. The
foaming agent can also be used to fill pipes to act as a barrier between the water and wires
or other equipment. The polymer will keep the cables dry without disrupting their activity or
performance. Polymer coating has also been shown to prevent corrosion and protect against
rust (“Kraton Polymers…”).
51
Figure 21: Polymer foam use example
Another form of polymer that has been discovered and is currently being used is pipes
that are already lined with polymer. Manufacturing companies have already created pipes
that are lined with sheets of polymer. These pipes come with added benefits as they are re-
sistant to water, electricity, shock, extreme temperatures, and show no signs of wear or
cracking. These pipes are also flexible and can be used to fit any type of wiring or cables just
as it is done in Figure 21. It is also safe enough to use them as gas lines with no concerns of
leakage (“Kraton Polymers…”).
The physical polymer is a quicker solution to the pipes because it can be applied
without installing or reworking present conditions. However, the pipes have a longer lasting
effect, but they require re-piping the asset which would cost more (“Kraton Polymers…”).
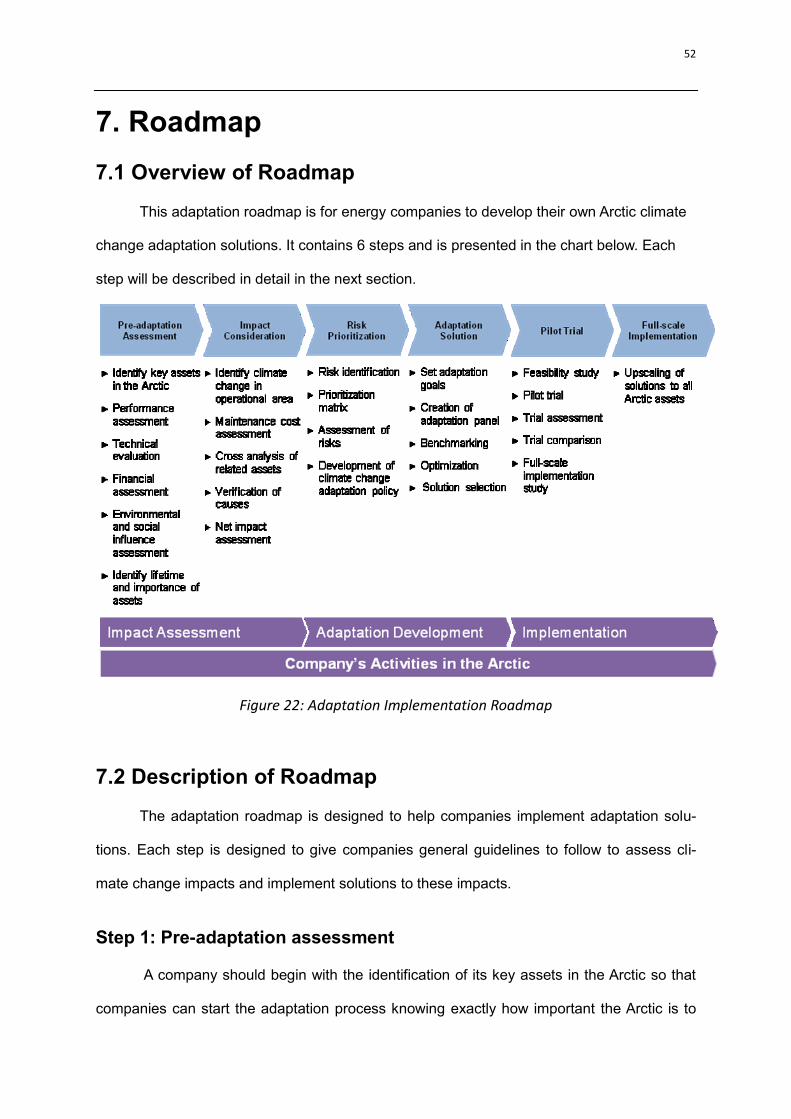
52
7. Roadmap
7.1 Overview of Roadmap
This adaptation roadmap is for energy companies to develop their own Arctic climate
change adaptation solutions. It contains 6 steps and is presented in the chart below. Each
step will be described in detail in the next section.
Figure 22: Adaptation Implementation Roadmap
7.2 Description of Roadmap
The adaptation roadmap is designed to help companies implement adaptation solu-
tions. Each step is designed to give companies general guidelines to follow to assess cli-
mate change impacts and implement solutions to these impacts.
Step 1: Pre-adaptation assessment
A company should begin with the identification of its key assets in the Arctic so that
companies can start the adaptation process knowing exactly how important the Arctic is to
53
their company. Companies need to assess the current performance of their Arctic assets in
addition to performing technical evaluations and financial assessments to ensure maximum
understanding of any impacts on these assets later in the next step. In addition, companies
should keep in mind the social and environmental influences that their assets have in the
surrounding area. The final part in the first step is for companies to determine the estimated
lifetime of their assets in the Arctic. This final step will be expanded upon in later steps.
Step 2: Impact Consideration
After having a comprehensive understanding of company activities in the Arctic, the
company needs to identify what impacts may influence its Arctic assets. First, companies
need to establish how the climate has changed in the asset’s operational area. Focus should
be placed on rises in maintenance or other operational costs. In order to prevent further
damage, a comprehensive analysis should also include a cross analysis of the impacts on
any related assets. Some assets might be experiencing impacts that others will experience
later. It is better to be prepared. Since most assets usually have interrelations with each oth-
er, the damage of one asset could interfere with the normal operation of other assets. To
provide better solutions in the later steps, causes should be verified and also the net impact
assessment can be determined. Not all impacts are damaging, some have benefits that can
help the asset. The net impact can be either beneficial or detrimental, once the cause is
classified, the asset can determine whether or not a solution needs to be found.
For each impact, companies should define an “onset time”, which is a time estimation
when an impact will reach its greatest impact on company activities.
Step 3: Risk Prioritization
Once impacts have been identified and verified, the next step is prioritization of risks.
In order to do this, we recommend constructing a prioritization matrix, a chart that organizes
impacts. This matrix would determine which impacts are most relevant to them. Companies
should make sure to compare asset lifetimes with the onset times of impacts. If an onset
54
time falls outside of the operational lifetime of an asset, then in most cases that impact
should be given an extremely low priority.
Afterwards, the risks need to be assessed. Questions such as "How damaging are
these risks?", "What are these risks damaging?" and "How are these risks impacting our per-
formance?" will be asked here. Once the risks and their effect are determined, it is recom-
mended that companies create an adaptation policy for their companies to increase aware-
ness of the issue and increase response time to any unforeseen climate change impacts that
can arise. By having a unified company policy on the matter, it could facilitate further adapta-
tions later.
Step 4: Adaptation Solution
Companies can then begin researching and developing solutions for the highest pri-
ority impacts. Companies should start with a quantifiable goal for adaptations to specific as-
sets This will enable companies to assess solutions they find or develop more efficiently. The
company should create an adaptation panel which consisting of experts in various fields
themselves to increase the chances of finding a solution. The panel will find various solu-
tions which should be optimized and benchmarked. Once the short list of the most viable so-
lutions is created, the selection process can begin. The solutions should be studied more in
depth and tested to determine which is the best.
Step 5 and 6: Pilot Trial and Full-scale Implementation
Based on the ideal solutions, we need to test whether these solutions are practical
and useful for the energy companies. Also in reality some solutions might differ from what
was expected of them in theory. The only way to figure out if a solution works is to test it.
That’s why we suggest a pilot trial to be performed on all viable solutions. Each adaptation
solution should be implemented on an asset of low importance in the Arctic, to accurately
measure its effects. During this pilot trial, the company can begin to look at the feasibility of
the solution for further consideration. The trial should be monitored at all times to determine

55
effectiveness and efficiency. Once this assessment is completed, each trial’s results should
be compared to determine which trial was most effective, feasible, and efficient. When the
solution has been chosen, the company can begin working on full scale implementation.
56
Summary
Russian energy companies are unaware of the strong influence they have over the Arc-
tic and of the struggles that they also create for themselves in the future. Current energy
company practices contribute to detrimental climate change effects that are causing changes
in the Arctic, which negatively affect their own operations in that area.
These damaging effects are the reason a company should look to adaptive solutions.
Through our research we found that an energy company that does not adapt will sustain
damages, some that will be very costly and could potentially disrupt any advances that the
company hopes to achieve. Energy companies seem to focus on the present, which our re-
search has proven not to be an effective company standpoint. The project looked into the
effects that had the most impact on energy company operations; priority was given to effects
that were believed to be the most harmful to energy companies. We placed priority on per-
mafrost thaw, which would result in permanent structure failure, and flooding, which would
disrupt general operations.
To aid energy companies further with starting solution implementation, the project lists
adaptation solutions already used by other companies and countries to combat our priority
risks. We believe that the solutions we provided will ultimately help companies prevent cata-
strophic events if implemented soon.
The road map provides steps for a company that has heeded our warning and wishes to
implement their own adaptations. From beginning to end, the roadmap gives developed in-
structions to implement adaptations on a full scale.
In general, rather than focus on the standpoint of the environment, this paper also fo-
cused on the standpoint of an energy company with regards to climate change. We under-
stand that Russian energy companies will expand their operations in the Russian Arctic re-
gardless of what pro-Arctic non-governmental organizations and indigenous people say. Our
goal was not to stunt the progress of these companies, but to enable their progress uninhib-
ited by future environmental concerns. The secret to profit in this changing environment does
57
not lie in aggressive expansion. Rather, controlled expansion with proper precaution taken
will prove to be the most profitable in the future.
This project aimed to find the best of both worlds: a working relationship between
company operations and a thriving environment due in thanks to adaptation solutions. We
feel that this unique perspective should be taken seriously for that reason: there are no other
ulterior motives to consider. The motivation of this paper is to promote sustainable business
practice with viable commercial reasoning. Companies can only be persuaded for climate
change adaptation if they can see how climate change affects their own motivators,
particularly profit, which we feel our paper addresses. Companies need to be made aware of
climate change, conscious of the results of their methods, and have the motivation to
implement those solutions. It is our hope that companies will actively pursue climate change
adaptation to protect their own interests in the future.
58
References
2011 Public Annual Report (2012). -RosAtom. Retrieved September 12, 2013, from:
http://www.rosatom.ru/en/resources/2aabb8004ed9b097878e8f08a49b1a70/anrep_2011_eng.pdf
Acclimatise (2009). Carbon Disclosure Project Report 2008: ‘Building Business Resilience to Inevitable Climate Change’. -CDP. Retrieved September 10, 2013, from: http://cssa.asu.edu/sites/default/files/IBM%20Carbon%20Disclosure%20Project%20Report%20Oil%20and%20Gas.pdf
Acid Rain Facts, Acid Rain Information, Acid Rain Pictures, Acid Rain Effects - National Geographic. (n.d.). Retrieved September 12, 2013, from http://environment.nationalgeographic.com/environment/global-warming/acid-rain-overview
All About Arctic Climatology and Meteorology - The Arctic :: NSIDC. (n.d.). Retrieved September 10, 2013, from http://nsidc.org/cryosphere/arctic-meteorology/factors_affecting_climate_weather.html#precipitation
Assessment, A. C. I. (2004). Impacts of a Warming Arctic-Arctic Climate Impact Assessment. Impacts of a Warming Arctic-Arctic Climate Impact Assessment, by Arctic Climate Impact Assessment, pp. 144. ISBN 0521617782. Cambridge, UK: Cambridge University Press, December 2004., 1.
Ball, R., Breed, W. S., & Hillsman, E. Industry, Energy, and Transportation: Impacts and Adaptation.
Biancamaria, S., Cazenave, A., Mognard, N. M., Llovel, W., & Frappart, F. (2011). Satellite-based high latitude snow volume trend, variability and contribution to sea level over 1989/2006. Global and Planetary Change, 75(3), 99-107.
Bovanenkovo (2013) –Gazprom. Retrieved October 8, 2013 from: http://www.gazprom.com/about/production/projects/deposits/bm/
Cavalieri, D. J., & Parkinson, C. L. (2012). Arctic sea ice variability and trends, 1979-2010. The Cryosphere, Volume 6, Issue 4, 2012, pp. 881-889, 6, 881-889.
Clement, J. P., Bengston, J. L., & Kelly, B. P. (2013). Managing for the future in a rapidly changing arctic: A report to the President. Washington, D.C: Interagency Working Group on Coordination
of Domestic Energy Development and Permitting in Alaska.
Climate Change Adaptation Report (n.d.). -Northern Powergrid. Retrieved September 18, 2013 from:
http://www.northernpowergrid.com/som_download.cfm?t=media:documentmedia&i=1461&p=file
Climate change indicators in the United States. (2012). United States Environment Protection Agency.
Cronin, T. M. (2012). Rapid sea-level rise. Quaternary Science Reviews, 56, 11-30.
Dicks, L. & Symon, C. (2012). Arctic Climate Issues 2011 : Changes in Arctic Snow, Water, Ice and Permafrost. Oslo: AMAP Arctic Monitoring and Assessment Programme.
Dobrovidova, O. (2012, October 25). Comment: Think you know Russia's position on climate change? Think again. Retrieved October 13, 2013, from http://www.rtcc.org/2012/10/19/comment-think-you-know-russias-position-on-climate-change-think-again/
Dobrovidova, O. (2012, September 25). Comment: Why Russia's climate change policy is like a cargo cult. Retrieved October 13, 2013, from http://www.rtcc.org/2012/09/21/comment-why-russias-climate-change-policy-is-like-a-cargo-cult/
Dobrovidova, O. (2013, June 6). Climate change fails to make Russia's top 50 development priorities. Retrieved October 13, 2013, from http://www.rtcc.org/2013/06/05/climate-change-fails-to-make-russias-top-50-priorities/
Doggett, T. (2004, November 9). Global Warming Exposes Arctic to Oil, Gas Drilling. Retrieved from
59
http://www.commondreams.org/headlines04/1109-06.htm
Ericson, J. P., Vörösmarty, C. J., Dingman, S. L., Ward, L. G., & Meybeck, M. (2006). Effective sea-level rise and deltas: causes of change and human dimension implications. Global and Planetary Change, 50(1), 63-82.
Evonik Industries - Polyamide 12 and PEEK for oil & gas applications - Offshore Technology. (n.d.). Retrieved October 14, 2013, from http://www.offshore-technology.com/contractors/lubricants/evonik-industries-polymers-energy
Field, C. B., Barros, V., Stocker, T. F., & Dahe, Q. (Eds.). (2012). Managing the Risks of Extreme Events and Disasters to Advance Climate Change Adaptation: Special Report of the Intergovernmental Panel on Climate Change. Cambridge University Press.
Firth, J. (2009). Oil and gas Understanding the investment implications of adapting to climate change.
Acclimatise.
Flood protection with lightweight aluminum flood panels, flood barriers. (n.d.). Retrieved October 6,
2013, from http://www.floodbarriers.net/hinged.htm
Forbes, D. L., Kremer, H., Lantuit, H., Rachold, V., & Reiersen, L. O. (2011).State of the Arctic Coast 2010: Scientific Review and Outlook. Land-Ocean Interactions in the Coastal Zone, Institute of
Coastal Research.
Hamilton, N. & Sommerkorn, M. (2008). Arctic climate impact science an update since ACIA. Oslo,
Norway: WWF International Arctic Programme.
Harsem, Ø., Eide, A., & Heen, K. (2011). Factors influencing future oil and gas prospects in the Arctic. Energy policy, 39(12), 8037-8045.
Hennegriff, W., Kolokotronis, V., Weber, H., & Bartels, H. (2006). Climate Change and Floods–Findings and Adaptation Strategies for Flood Protection.KA-Abwasser, Abfall, 53.
Holubec, I. (March 2008). Flat loop thermosyphon foundations in warm permafrost. Retrieved
October 7, 2013 from:
http://www.pws.gov.nt.ca/pdf/publications/Thermosyphon%20Foundations%20in%20warm%20pe
rmafrost%20.pdf
Infrastructure in permafrost: A guideline for climate change adaptation. (2010). -Canadian Standards
Association. Retrieved October 8, 2013 from: http://shop.csa.ca/en/canada/infrastructure-and-
public-works/plus-4011-1st-ed-pub-2010/invt/27030762010
Irwin, J. (2012). Oil and Gas Elastomers | DuPont Polymers. Retrieved October 14, 2013, from http://www2.dupont.com/Plastics/en_US/Knowledge_Center/engg_design_mag/edmag2012_ed02/edmag2012_ed02_01.html
Issue Overview of IPEC Transformer – Indianpoint Website. (2012). Retrieved October 14, 2013, from http://www.safesecurevital.com/issue-overview-of-ipec-transformer.html
Jevrejeva, S., Moore, J. C., & Grinsted, A. (2012). Sea level projections to AD2500 with a new generation of climate change scenarios. Global and Planetary Change, 80, 14-20.
Kanigan, J., & Kokelj, S. V. (2010). Review of current research on drilling-mud sumps in permafrost terrain, Mackenzie Delta region, NWT, Canada. In GEO2010: 63rd Canadian Geotechnical Conference & 6th Canadian Permafrost Conference (Vol. 6, pp. 1473-1479).
Kokelj, S. V. (2002). Drilling Mud Sumps in the Mackenzie Delta Region: Construction, Abandonment and Past Performance. GeoNorth Limited.
Kraton Polymers - Giving Innovators Their Edge. (n.d.). Retrieved October 14, 2013, from
http://www.kraton.com/products/coatings/coatings_roof.php (Polymers in Extreme Environments)
http://www.pws.gov.nt.ca/pdf/publications/Thermosyphon%20Foundations%20in%20warm%20permafrost%20.pdf
60
Lenart, M. (2008, September 14). Southwest Climate Change Network. Retrieved September 12,
2013, from http://www.southwestclimatechange.org/node/790
Martikainen, A., Holttinen, H., Savolainen, I., Auvinen, O., & Syri, S. (2005).Impacts on the energy sector and adaptation of the electricity network business under a changing climate in Finland.
Finnish Environment Institute.
Matishov, G. G., & Dzhenyuk, S. L. (2012). Arctic challenges and problems of polar science. Herald of the Russian Academy of Sciences, 82(5), 355-362.
McFadden, T. (July 2001) Design Manual for Stabilizing Foundations on Permafrost. Retrieved
October 3, 2013 from: http://www.uaf.edu/ces/energy/housing_energy/resources/Permafrost-
design-manual.pdf
McFadden, T. (September, 2000) Design Manual for New Foundations on Permafrost. Retrieved
October 3, 2013 from:
http://www.uaf.edu/ces/energy/housing_energy/resources/PermafrostNewFoundations.pdf
McLoughlin, P. (2012, November 19). Norway's Statoil shuts in output at Snohvit LNG processing plant - Natural Gas | Platts News Article & Story. Retrieved September 12, 2013, from http://www.platts.com/latest-news/natural-gas/London/Norways-Statoil-shuts-in-output-at-Snohvit-LNG-6820229
Methods of Foundation Repair. (n.d.). Retrieved October 2, 2013, from http://www.myfoundationrepairs.com/Methods_of_Foundation_Repair.asp
Morozov, Y. (2012). Arctic 2030: What are the consequences of climate change? The Russian response. Bulletin of the Atomic Scientists, 68(4), 22-27.
National Snow and Ice Data Center (2013, July 9). SOTC: Overview. Retrieved September 4, 2013 from: http://nsidc.org/cryosphere/sotc/
Nerem, R. S., Chambers, D. P., Choe, C., & Mitchum, G. T. (2010). Estimating mean sea level change from the TOPEX and Jason altimeter missions. Marine Geodesy, 33(S1), 435-446.
Olsen, M. S., Callaghan, T. V., Reist, J. D., Reiersen, L. O., Dahl-Jensen, D., Granskog, M. A., ... & Walsh, J. (2011). The changing arctic cryosphere and likely consequences: an overview. Ambio, 40(1), 111-118.
Pitt, A. (2007, April 27). 'Iceberg threat' looms over Shtokman -Upstreamonline.com. Retrieved
September 8, 203, from http://www.upstreamonline.com/incoming/article1140023.ece
Polar amplification. (n.d.). In Wikipedia, the free encyclopedia. Retrieved October 13, 2013, from
http://en.wikipedia.org/wiki/Polar_amplification
Polymers in Extreme Environments. (n.d.). Retrieved October 14, 2013, from http://www.twi.co.uk/technologies/material-properties/non-metallic/polymers-in-extreme-environments/
Post Sandy Enhancement Plan. (2013). Retrieved from
http://www.coned.com/publicissues/PDF/post_sandy_enhancement_plan.pdf
Proshutinsky, A., Pavlov, V., & Bourke, R. H. (2001). Sea level rise in the Arctic Ocean. Geophysical Research Letters, 28(11), 2237-2240.
Prowse, T. D., Furgal, C., Chouinard, R., Melling, H., Milburn, D., & Smith, S. L. (2009). Implications of climate change for economic development in northern Canada: Energy, resource, and transportation sectors. AMBIO: A Journal of the Human Environment, 38(5), 272-281.
Prowse, T., Alfredsen, K., Beltaos, S., Bonsal, B. R., Bowden, W. B., Duguay, C. R., ... & Weyhenmeyer, G. A. (2011). Effects of changes in arctic lake and river ice. Ambio, 40(1), 63-74.
http://www.twi.co.uk/technologies/material-properties/non-metallic/polymers-in-extreme-environments/
61
PWC (2013, September 12). Global 500 Climate Change Report 2013. -CDP. Retrieved October 9, 2013, from: https://www.cdproject.net/CDPResults/CDP-Global-500-Climate-Change-Report-2013.pdf
PWC (2013, September 23). CDP S&P 500 Climate Change Report 2013. -CDP. Retrieved October 9,
2013, from: https://www.cdproject.net/CDPResults/CDP-SP500-climate-report-2013.pdf
Richter-Menge, J., Overland, J., Proshutinsky, A., Romanovsky, V., Bengtsson, L., Brigham, L., ... & Walsh, J. (2006). State of the Arctic Report. NOAA OAR Special Report, NOAA/OAR/PMEL, Seattle, WA.
Rottem, S.V.; Moe, A. Climate Change in the North and the Oil Industry; Fridtjof Nansens Instituit rapport 9/2007, 2007. Available online: http://www.fni.no/doc&pdf/FNI-R0907.pdf (accessed on 17 August 2012).
Schuur, E. A., Bockheim, J., Canadell, J. G., Euskirchen, E., Field, C. B., Goryachkin, S. V., ... & Zimov, S. A. (2008). Vulnerability of permafrost carbon to climate change: Implications for the global carbon cycle. BioScience, 58(8), 701-714.
Sinclair, P. (2011, December 5). NOAA: Arctic Report Card 2011 | Climate Denial Crock of the Week. Retrieved September 12, 2013, from http://climatecrocks.com/2011/12/05/noaa-arctic-report-card-2011/
Skjærseth, J. B., & Skodvin, T. (2001). Climate change and the oil industry: Common problems, different strategies. Global Environmental Politics, 1(4), 43-64.
Wagner, A. M., Zarling, J. P., Yarmak, E., Long, E. L. (2010). Unique Thermosyphon Roadway Test
Site Spanning 11 years. Retrieved October 3, 2013 from: http://pubs.aina.ucalgary.ca/cpc/CPC6-
1770.pdf
Wald, M. L. (2012, March 27). $1.2 Million Fine for Indian Point Fire [Web log post]. Retrieved from green.blogs.nytimes.com/2012/03/27/1-2-million-fine-for-indian-point-fire/?_r=1 (Wald, 2012)
Warning Arctic oil and gas drilling is too risky | Herald Scotland. (2013, July 27). Retrieved September 10, 2013, from http://www.heraldscotland.com/news/environment/warning-arctic-oil-and-gas-drilling-is-too-risky.21715498
Weather and Climate | Climate Change | US EPA. (n.d.). Retrieved September 12, 2013, from
http://www.epa.gov/climatechange/science/indicators/weather-climate
Willis, W. O., & Power, J. F. (1975). Soil temperature and plant growth in the northern Great Plains. In M. K. Wali (Ed.), Prairie: A multiple view(pp. 209-220). Grand Forks: University of North Dakota
Press.
World’s first floating nuclear power plant to begin operating in Russia in 2016 — RT News. (2013, July
7). Retrieved September 9, 2013, from http://rt.com/news/floating-nuclear-plant-russia-759/
Zellen, B. S. (2009). Arctic doom, Arctic boom. ABC-CLIO.
Zhang, T. (2005). Influence of the seasonal snow cover on the ground thermal regime: An overview. Reviews of Geophysics, 43(4), RG4002.
Zhdannikov, D. (2007, June 15). Shtokman Field Under Icy Threat | The St. Petersburg Times | The leading English-language newspaper in St. Petersburg. Retrieved September 9, 2013, from
http://www.sptimes.ru/index.php?action_id=2&story_id=22001
Additional sources:
[1] URL: https://ruslana.bvdep.com/version-2013924/home.serv?product=ruslana [2] URL: http://www.tutiempo.net [3]URL: http://www.tutiempo.net/en/Climate/ARHANGELSK/225500.htm

62
[4] URL: http://www.tutiempo.net/en/Climate/KANDALAKSA/222170.htm [5] http://www.tutiempo.net/en/Climate/Murmansk/221130.htm [6] http://www.tutiempo.net/en/Climate/KRASNOJARSK/295740.htm [7] http://www.tutiempo.net/en/Climate/Yakutia-Sakha_Bukhta_Tiksi_Ice_Strip/218240.htm
63
Appendix 1: Blank Survey
What follows is the blank survey template sent to experts to help prioritize risks:
“Dear <insert name here>,
We are the students from Worcester Polytechnic Institute working together with EY
Cleantech and Sustainability Services (Moscow, Russia) on a non-commercial project on
adaption of Russian energy companies to Climate Change in the Arctic. We believe that with
global climate trends as they are, the Russian Arctic is a changing place; many companies,
especially Russian ones, need to adapt to the changing climate trends and their effects. We
wish to explore different adaptation measures that companies could perform to minimize
climate change risks that occur in the Arctic.
In order to complete this project, we need your assistance. We hope to use your answers to
the following survey to find out which effects should be considered the most influential and
then work from that shorter list. By default, your answers will be kept confidential. If you want
us to indicate your name in the report, please mention it in your response.
If you agree to participate in the survey, we kindly ask you to complete the survey and send
it back to us till October 10, 2013.
This survey is in open-ended form. Please answer each question to the best of your ability,
and with as much detail as you would like. If you are fine with potentially receiving a follow-
up email with questions about your answers, please indicate that by marking in the box
below:
[] I am fine with a follow-up email.
Thank you for your time and giving us the much-needed input for our project,
John Morrow, Mercedes Brown, Peishan Wang
Worcester Polytechnic Institute “Team Arctic”
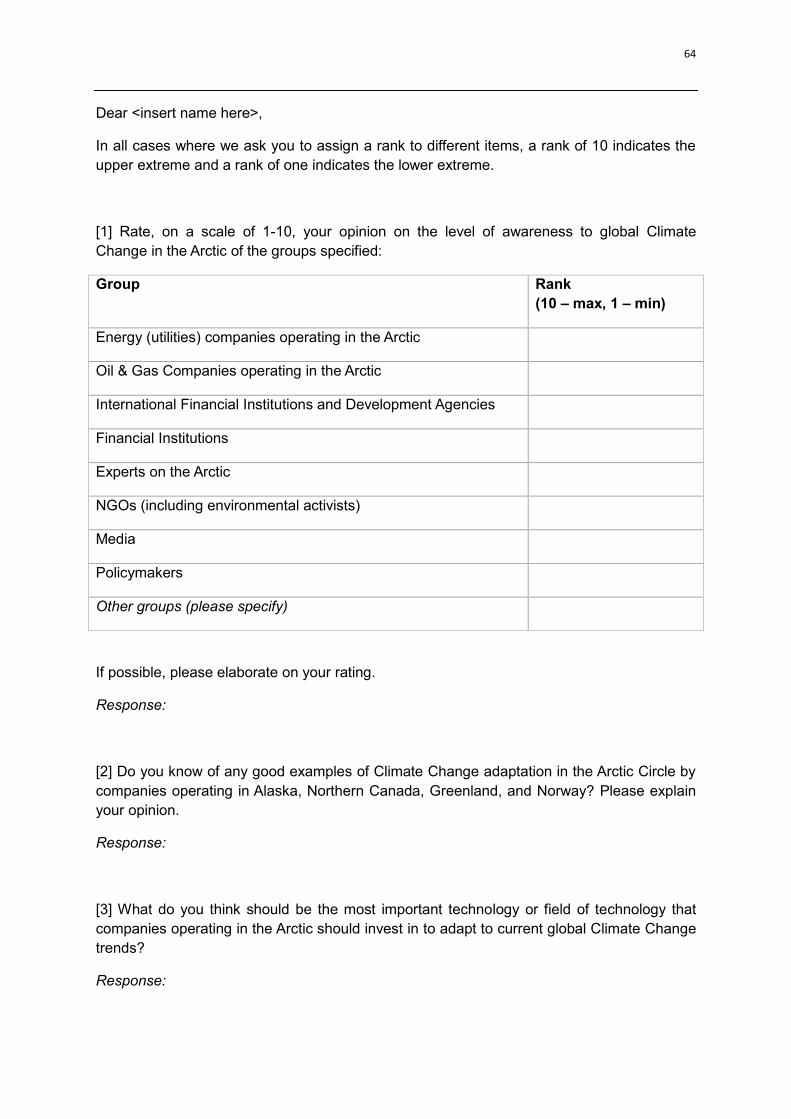
64
Dear <insert name here>,
In all cases where we ask you to assign a rank to different items, a rank of 10 indicates the
upper extreme and a rank of one indicates the lower extreme.
[1] Rate, on a scale of 1-10, your opinion on the level of awareness to global Climate
Change in the Arctic of the groups specified:
Group Rank
(10 – max, 1 – min)
Energy (utilities) companies operating in the Arctic
Oil & Gas Companies operating in the Arctic
International Financial Institutions and Development Agencies
Financial Institutions
Experts on the Arctic
NGOs (including environmental activists)
Media
Policymakers
Other groups (please specify)
If possible, please elaborate on your rating.
Response:
[2] Do you know of any good examples of Climate Change adaptation in the Arctic Circle by
companies operating in Alaska, Northern Canada, Greenland, and Norway? Please explain
your opinion.
Response:
[3] What do you think should be the most important technology or field of technology that
companies operating in the Arctic should invest in to adapt to current global Climate Change
trends?
Response:
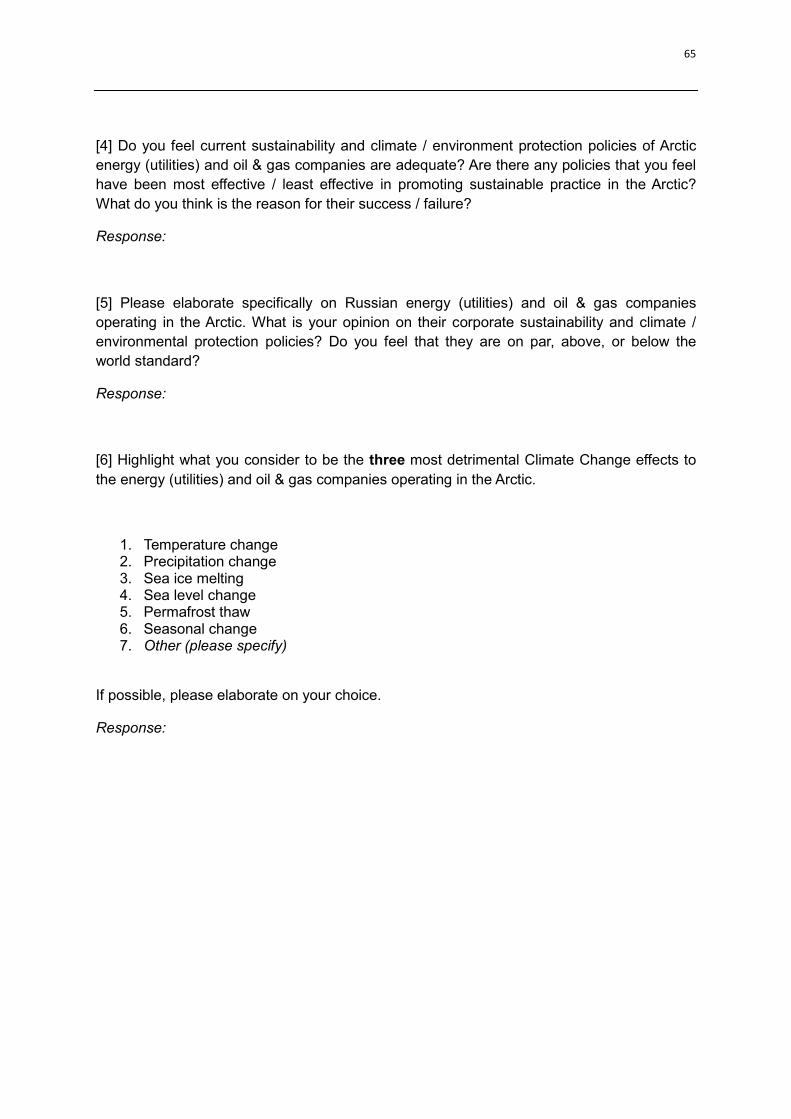
65
[4] Do you feel current sustainability and climate / environment protection policies of Arctic
energy (utilities) and oil & gas companies are adequate? Are there any policies that you feel
have been most effective / least effective in promoting sustainable practice in the Arctic?
What do you think is the reason for their success / failure?
Response:
[5] Please elaborate specifically on Russian energy (utilities) and oil & gas companies
operating in the Arctic. What is your opinion on their corporate sustainability and climate /
environmental protection policies? Do you feel that they are on par, above, or below the
world standard?
Response:
[6] Highlight what you consider to be the three most detrimental Climate Change effects to
the energy (utilities) and oil & gas companies operating in the Arctic.
1. Temperature change 2. Precipitation change 3. Sea ice melting 4. Sea level change 5. Permafrost thaw 6. Seasonal change 7. Other (please specify)
If possible, please elaborate on your choice.
Response:
Questions 7 to 9 pertain to specific Climate Change drivers in the Arctic and their effect on
energy and oil & gas companies in the Arctic. These questions are optional; please provide
responses as per your convenience.
[7] There are significant amount of oil & gas resources stored in the Russian Arctic. Temperature
rising causes decreases of ice thickness that provide both benefits and weaknesses to offshore
/ onshore exploration and transportation. What is the current method and technology applied by
oil & gas companies to deal with the decreased thickness of ice?
Response:
[8] With increasing possibilities of negative effects of the Arctic weather (storms, floods etc.), will
energy (utilities) and oil & gas companies be able to properly prepare for these changes? If yes,
will they need to make any changes in their activities?
Response:
[9] Changes in sea ice, permafrost thaw, and snow cover have led to some detrimental effects
on both the land and sea transportation sectors, and general infrastructure of the Arctic. Do you
think that the infrastructure and transportation routes already in place can be adapted to the
current Climate Change trends, or do you feel that they are irrecoverable? What would you
propose be the best solution to adaptation to these effects?
Response:

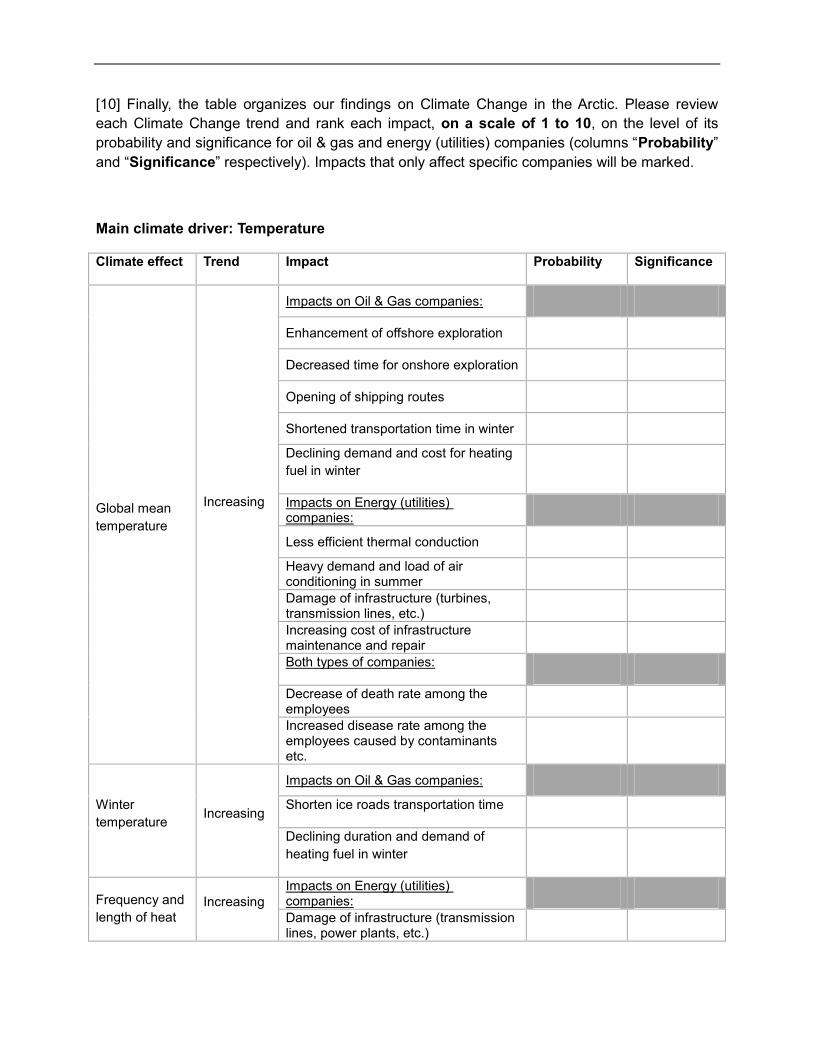
[10] Finally, the table organizes our findings on Climate Change in the Arctic. Please review
each Climate Change trend and rank each impact, on a scale of 1 to 10, on the level of its
probability and significance for oil & gas and energy (utilities) companies (columns “Probability”
and “Significance” respectively). Impacts that only affect specific companies will be marked.
Main climate driver: Temperature
Climate effect Trend Impact Probability Significance
Global mean
temperature
Increasing
Impacts on Oil & Gas companies:
Enhancement of offshore exploration
Decreased time for onshore exploration
Opening of shipping routes
Shortened transportation time in winter
Declining demand and cost for heating
fuel in winter
Impacts on Energy (utilities) companies:
Less efficient thermal conduction
Heavy demand and load of air conditioning in summer
Damage of infrastructure (turbines, transmission lines, etc.)
Increasing cost of infrastructure maintenance and repair
Both types of companies:
Decrease of death rate among the employees
Increased disease rate among the employees caused by contaminants etc.
Winter
temperature Increasing
Impacts on Oil & Gas companies:
Shorten ice roads transportation time
Declining duration and demand of
heating fuel in winter
Frequency and
length of heat Increasing
Impacts on Energy (utilities) companies:
Damage of infrastructure (transmission lines, power plants, etc.)

waves Increasing cost of infrastructure maintenance and repair
If possible, please elaborate on your rating.
Response:
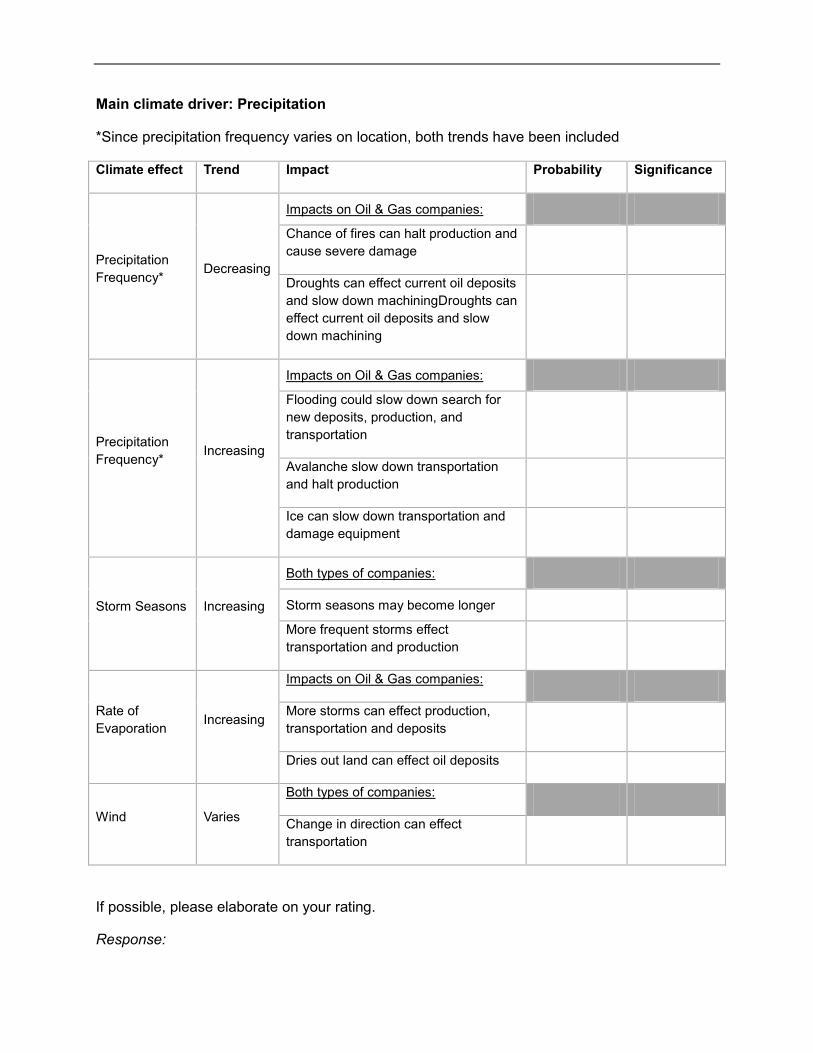
Main climate driver: Precipitation
*Since precipitation frequency varies on location, both trends have been included
Climate effect Trend Impact Probability Significance
Precipitation
Frequency*
Decreasing
Impacts on Oil & Gas companies:
Chance of fires can halt production and
cause severe damage
Droughts can effect current oil deposits
and slow down machiningDroughts can
effect current oil deposits and slow
down machining
Precipitation
Frequency* Increasing
Impacts on Oil & Gas companies:
Flooding could slow down search for
new deposits, production, and
transportation
Avalanche slow down transportation
and halt production
Ice can slow down transportation and
damage equipment
Storm Seasons Increasing
Both types of companies:
Storm seasons may become longer
More frequent storms effect
transportation and production
Rate of
Evaporation Increasing
Impacts on Oil & Gas companies:
More storms can effect production,
transportation and deposits
Dries out land can effect oil deposits
Wind Varies
Both types of companies:
Change in direction can effect
transportation
If possible, please elaborate on your rating.
Response:
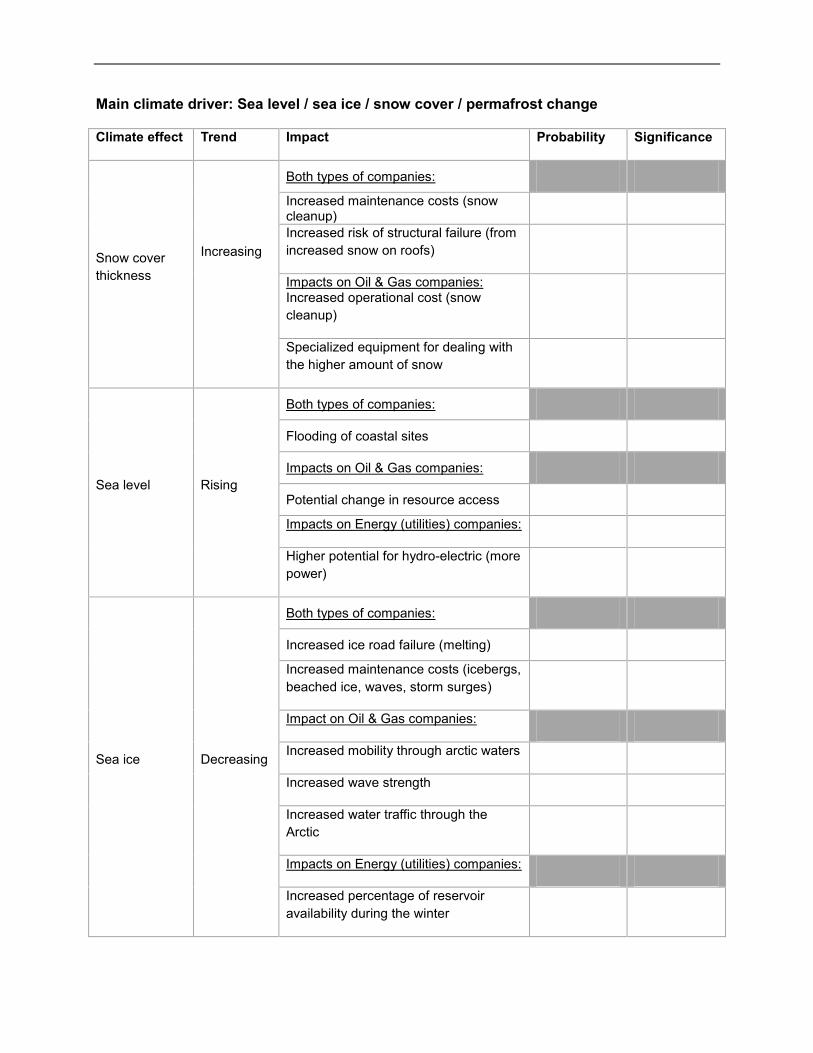
Main climate driver: Sea level / sea ice / snow cover / permafrost change
Climate effect Trend Impact Probability Significance
Snow cover
thickness
Increasing
Both types of companies:
Increased maintenance costs (snow cleanup)
Increased risk of structural failure (from
increased snow on roofs)
Impacts on Oil & Gas companies: Increased operational cost (snow
cleanup)
Specialized equipment for dealing with
the higher amount of snow
Sea level Rising
Both types of companies:
Flooding of coastal sites
Impacts on Oil & Gas companies:
Potential change in resource access
Impacts on Energy (utilities) companies:
Higher potential for hydro-electric (more
power)
Sea ice Decreasing
Both types of companies:
Increased ice road failure (melting)
Increased maintenance costs (icebergs,
beached ice, waves, storm surges)
Impact on Oil & Gas companies:
Increased mobility through arctic waters
Increased wave strength
Increased water traffic through the
Arctic
Impacts on Energy (utilities) companies:
Increased percentage of reservoir
availability during the winter
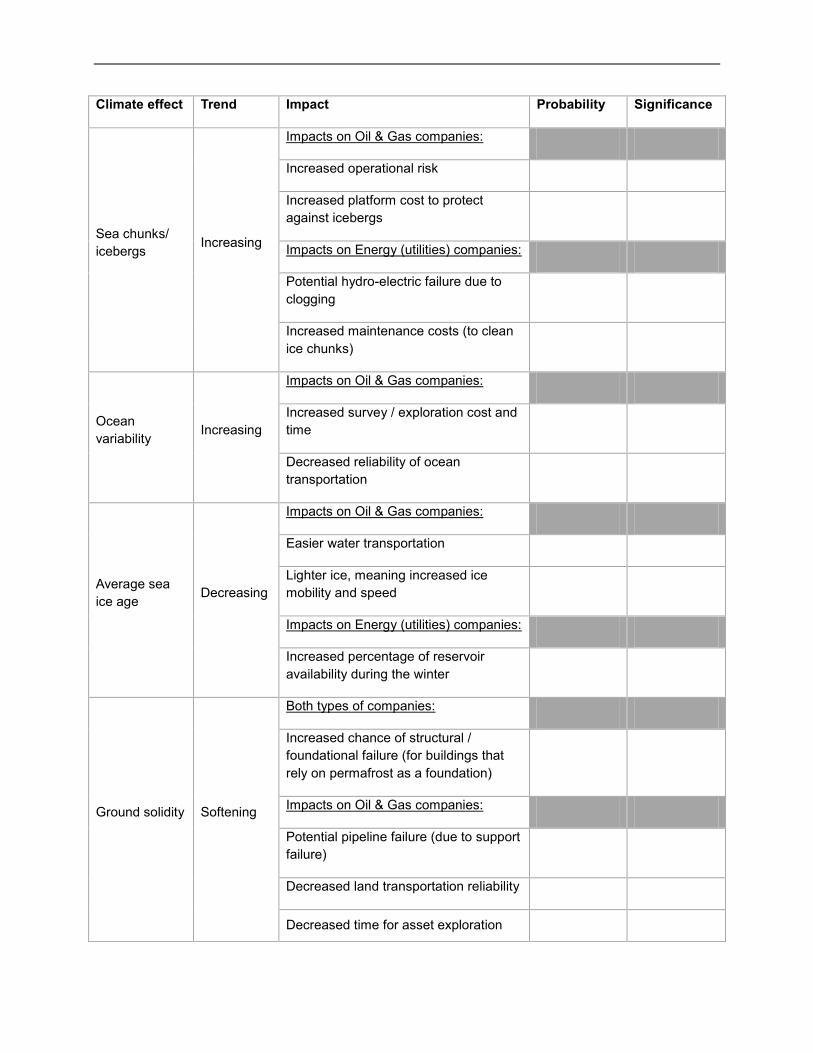
Climate effect Trend Impact Probability Significance
Sea chunks/
icebergs Increasing
Impacts on Oil & Gas companies:
Increased operational risk
Increased platform cost to protect
against icebergs
Impacts on Energy (utilities) companies:
Potential hydro-electric failure due to
clogging
Increased maintenance costs (to clean
ice chunks)
Ocean
variability Increasing
Impacts on Oil & Gas companies:
Increased survey / exploration cost and
time
Decreased reliability of ocean
transportation
Average sea
ice age Decreasing
Impacts on Oil & Gas companies:
Easier water transportation
Lighter ice, meaning increased ice
mobility and speed
Impacts on Energy (utilities) companies:
Increased percentage of reservoir
availability during the winter
Ground solidity Softening
Both types of companies:
Increased chance of structural /
foundational failure (for buildings that
rely on permafrost as a foundation)
Impacts on Oil & Gas companies:
Potential pipeline failure (due to support
failure)
Decreased land transportation reliability
Decreased time for asset exploration
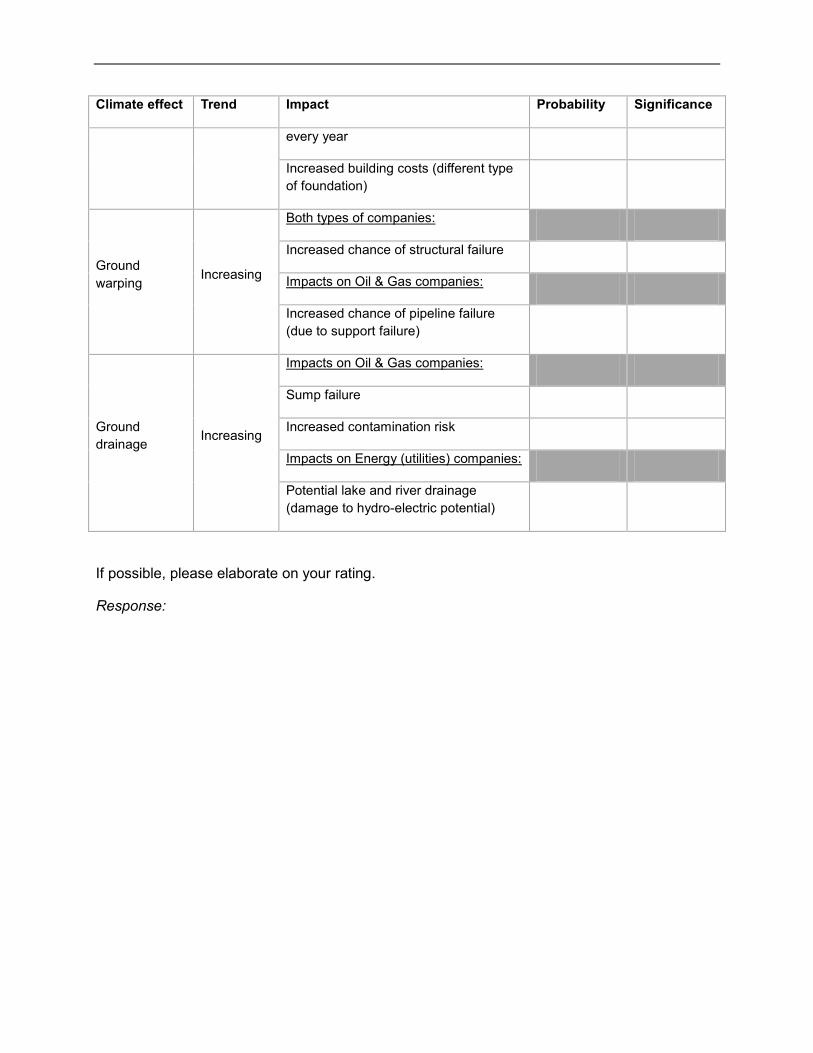
Climate effect Trend Impact Probability Significance
every year
Increased building costs (different type
of foundation)
Ground
warping Increasing
Both types of companies:
Increased chance of structural failure
Impacts on Oil & Gas companies:
Increased chance of pipeline failure
(due to support failure)
Ground
drainage Increasing
Impacts on Oil & Gas companies:
Sump failure
Increased contamination risk
Impacts on Energy (utilities) companies:
Potential lake and river drainage
(damage to hydro-electric potential)
If possible, please elaborate on your rating.
Response:

[10] Is there anything that you think we missed, or want to go further into detail? If so, please
describe it below.
Response:
Thank you very much for your time. Have a nice day!”
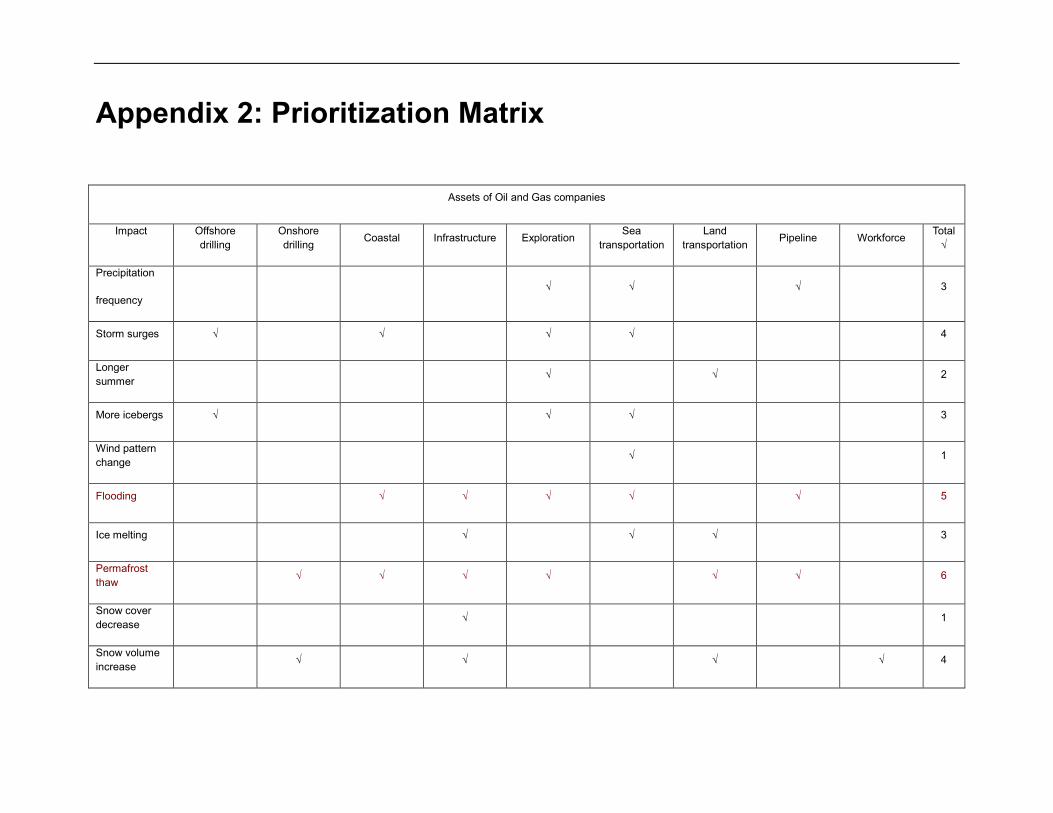
Appendix 2: Prioritization Matrix
Assets of Oil and Gas companies
Impact Offshore
drilling
Onshore
drilling Coastal Infrastructure Exploration
Sea
transportation
Land
transportation Pipeline Workforce
Total
√
Precipitation
frequency
√ √ √ 3
Storm surges √ √ √ √ 4
Longer
summer √ √ 2
More icebergs √ √ √ 3
Wind pattern
change √ 1
Flooding √ √ √ √ √ 5
Ice melting √ √ √ 3
Permafrost
thaw √ √ √ √ √ √ 6
Snow cover
decrease √ 1
Snow volume
increase √ √ √ √ 4
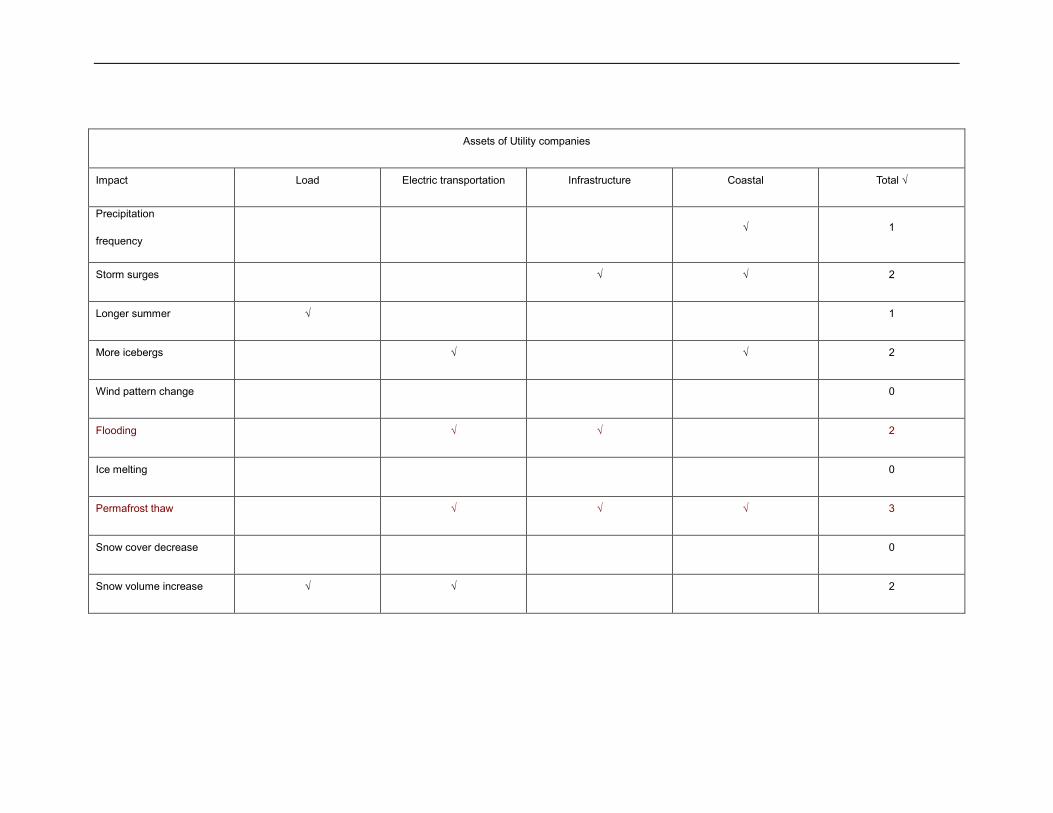
Assets of Utility companies
Impact Load Electric transportation Infrastructure Coastal Total √
Precipitation
frequency
√ 1
Storm surges √ √ 2
Longer summer √ 1
More icebergs √ √ 2
Wind pattern change 0
Flooding √ √ 2
Ice melting 0
Permafrost thaw √ √ √ 3
Snow cover decrease 0
Snow volume increase √ √ 2

Appendix 3: Oxford Survey Answers
“In all cases where we ask you to assign a rank to different items, a rank of 10 indicates the
upper extreme and a rank of one indicates the lower extreme.
[1] Rate, on a scale of 1-10, your opinion on the level of awareness to global Climate Change in
the Arctic of the groups specified:
Group Rank
(10 – max, 1 – min)
Energy (utilities) companies operating in the Arctic 8
Oil & Gas Companies operating in the Arctic 6
International Financial Institutions and Development Agencies 9
Financial Institutions
Experts on the Arctic 9
NGOs (including environmental activists) 9
Media 8
Policymakers 6
Other groups (please specify) Indigenous peoples 10
If possible, please elaborate on your rating.
Response:
[2] Do you know of any good examples of Climate Change adaptation in the Arctic Circle by
companies operating in Alaska, Northern Canada, Greenland, and Norway? Please explain your
opinion.
Response: There are some interesting engineering/architectural (to combat less stable
permafrost, etc.), energy (geothermal, small hydro, wave, biomass, and wind generation) and
transport (portable boat/sleds to contend with less predictable/stable ice) responses to climate
change in the arctic but the real adaptation must be to lower carbon and other GHG emissions
so as to mitigate the anthropogenic cause of climate change. This means moving away from
fossil fuel development, which is NOT happening in the arctic.
[3] What do you think should be the most important technology or field of technology that
companies operating in the Arctic should invest in to adapt to current global Climate Change
trends?
Response: Low cost, localized energy generation (solar/wind/geothermal, etc. with local
storage). Improved, low carbon, fuel efficient transport systems..
[4] Do you feel current sustainability and climate / environment protection policies of Arctic
energy (utilities) and oil & gas companies are adequate? Are there any policies that you feel
have been most effective / least effective in promoting sustainable practice in the Arctic? What
do you think is the reason for their success / failure?
Response: No. Energy utilities have to be regulated and incentivized toward transition. The oil
and gas companies appear to be in a race to extract all the fossil fuels that can profitably be
extracted. From the standpoint of climate/environment protection, this is madness. The Arctic
Council, created to promote sustainable development and environmental protection should lead
on this. Slow down and phase out arctic fossil fuel development (unless emission capture
becomes economical) and insure that what does take place follows the strictest environmental
protocols to avoid contamination, etc. to fragile arctic terrestrial and marine ecosystems and the
people who depend on them.
[5] Please elaborate specifically on Russian energy (utilities) and oil & gas companies operating
in the Arctic. What is your opinion on their corporate sustainability and climate / environmental
protection policies? Do you feel that they are on par, above, or below the world standard?
Response: In Russia, it seems that there is an oligopoly controlling oil development and local
communities have no choice but to accept their terms and can only negotiate minor
environmental mitigation and social development plans, according to the law. And the law is
often under-implemented and under-enforced. This leaves local communities relatively
powerless in the process and potential victims of the fallout from rapid fossil fuel development
both onshore and offshore.
[6] Highlight what you consider to be the three most detrimental Climate Change effects to the
energy (utilities) and oil & gas companies operating in the Arctic.
1. Temperature change 2. Precipitation change 3. Sea ice melting 4. Sea level change 5. Permafrost thaw 6. Seasonal change 7. Other (please specify)
If possible, please elaborate on your choice.
Response: The combination of all these factors means that the “Earth is Faster Now” (title of
book on climate change impacts in the arctic, translating an Inuit phrase), and less predictable.
In terms of catastrophic short term impacts, changing sea-ice and permafrost thawing are huge,
but both are obviously triggered by temperature change (warming).
Questions 7 to 9 pertain to specific Climate Change drivers in the Arctic and their effect on
energy and oil & gas companies in the Arctic. These questions are optional; please provide
responses as per your convenience.
[7] There are significant amount of oil & gas resources stored in the Russian Arctic. Temperature
rising causes decreases of ice thickness that provide both benefits and weaknesses to offshore
/ onshore exploration and transportation. What is the current method and technology applied by
oil & gas companies to deal with the decreased thickness of ice?
Response: Platform drilling
[8] With increasing possibilities of negative effects of the Arctic weather (storms, floods etc.), will
energy (utilities) and oil & gas companies be able to properly prepare for these changes? If yes,
will they need to make any changes in their activities?
Response: I doubt it. And we know less about how the impacts will affect the marine ecosystem
than in the Gulf of Mexico (where our better knowledge still produced the huge Horizon
disaster).
[9] Changes in sea ice, permafrost thaw, and snow cover have led to some detrimental effects
on both the land and sea transportation sectors, and general infrastructure of the Arctic. Do you
think that the infrastructure and transportation routes already in place can be adapted to the
current Climate Change trends, or do you feel that they are irrecoverable? What would you
propose be the best solution to adaptation to these effects?

Response: It will take a huge investment, which in the long-run may be unsustainable without
local energy and transport solutions that are energy efficient and climate friendly. I
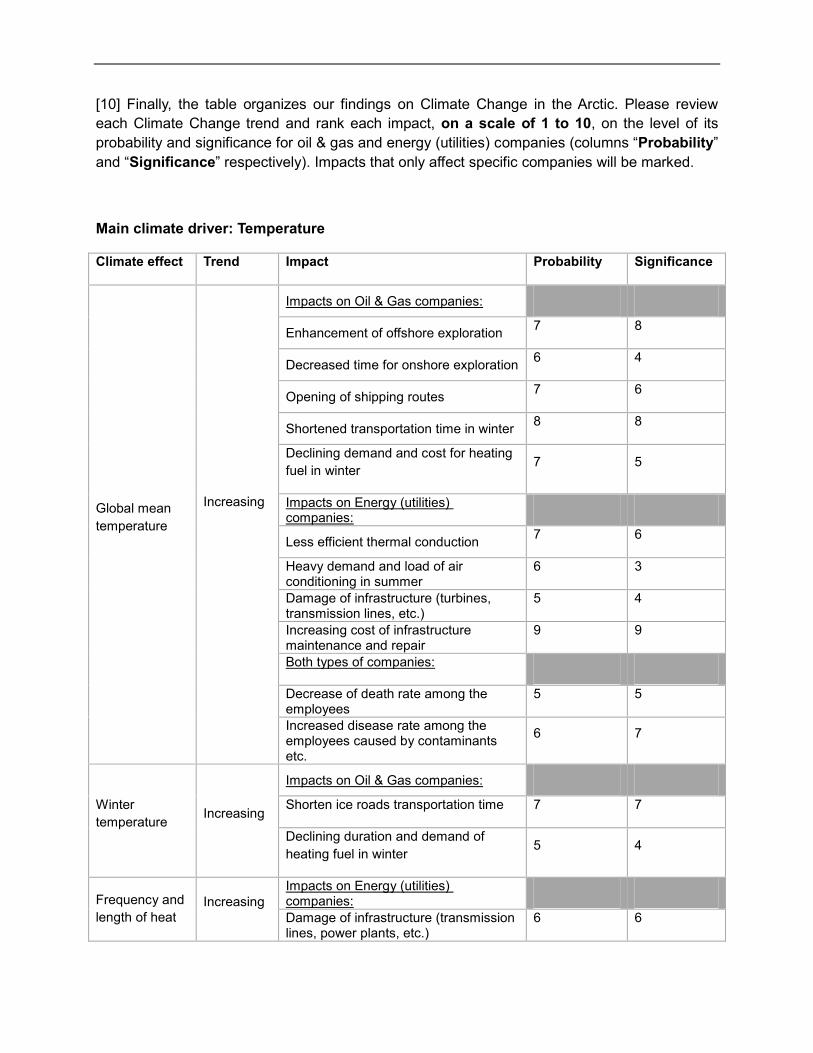
[10] Finally, the table organizes our findings on Climate Change in the Arctic. Please review
each Climate Change trend and rank each impact, on a scale of 1 to 10, on the level of its
probability and significance for oil & gas and energy (utilities) companies (columns “Probability”
and “Significance” respectively). Impacts that only affect specific companies will be marked.
Main climate driver: Temperature
Climate effect Trend Impact Probability Significance
Global mean
temperature
Increasing
Impacts on Oil & Gas companies:
Enhancement of offshore exploration 7 8
Decreased time for onshore exploration 6 4
Opening of shipping routes 7 6
Shortened transportation time in winter 8 8
Declining demand and cost for heating
fuel in winter 7 5
Impacts on Energy (utilities) companies:
Less efficient thermal conduction 7 6
Heavy demand and load of air conditioning in summer
6 3
Damage of infrastructure (turbines, transmission lines, etc.)
5 4
Increasing cost of infrastructure maintenance and repair
9 9
Both types of companies:
Decrease of death rate among the employees
5 5
Increased disease rate among the employees caused by contaminants etc.
6 7
Winter
temperature Increasing
Impacts on Oil & Gas companies:
Shorten ice roads transportation time 7 7
Declining duration and demand of
heating fuel in winter 5 4
Frequency and
length of heat Increasing
Impacts on Energy (utilities) companies:
Damage of infrastructure (transmission lines, power plants, etc.)
6 6

waves Increasing cost of infrastructure maintenance and repair
8 8
If possible, please elaborate on your rating.
Response: The infrastructure effects and costs are the most dramatic ones and may be hard to
predict. Actual energy consumption will probably not go as dramatically in terms of everyday use
in relation to rising temperature.
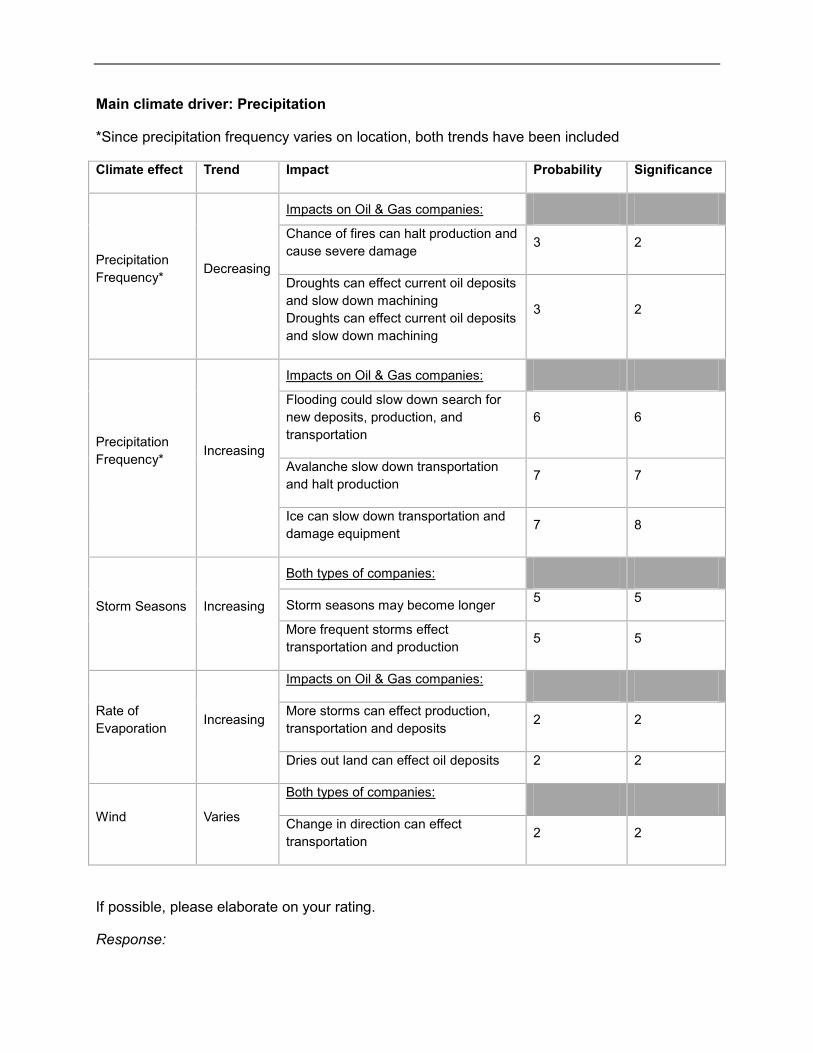
Main climate driver: Precipitation
*Since precipitation frequency varies on location, both trends have been included
Climate effect Trend Impact Probability Significance
Precipitation
Frequency*
Decreasing
Impacts on Oil & Gas companies:
Chance of fires can halt production and
cause severe damage 3 2
Droughts can effect current oil deposits
and slow down machining
Droughts can effect current oil deposits
and slow down machining
3 2
Precipitation
Frequency* Increasing
Impacts on Oil & Gas companies:
Flooding could slow down search for
new deposits, production, and
transportation
6 6
Avalanche slow down transportation
and halt production 7 7
Ice can slow down transportation and
damage equipment 7 8
Storm Seasons Increasing
Both types of companies:
Storm seasons may become longer 5 5
More frequent storms effect
transportation and production 5 5
Rate of
Evaporation Increasing
Impacts on Oil & Gas companies:
More storms can effect production,
transportation and deposits 2 2
Dries out land can effect oil deposits 2 2
Wind Varies
Both types of companies:
Change in direction can effect
transportation 2 2
If possible, please elaborate on your rating.
Response:

Main climate driver: Sea level / sea ice / snow cover / permafrost change
Climate effect Trend Impact Probability Significance
Snow cover
thickness
Increasing
Both types of companies:
Increased maintenance costs (snow cleanup)
4 4
Increased risk of structural failure (from
increased snow on roofs) 5 5
Impacts on Oil & Gas companies: Increased operational cost (snow
cleanup)
5 5
Specialized equipment for dealing with
the higher amount of snow 5 5
Sea level Rising
Both types of companies:
Flooding of coastal sites 6 6
Impacts on Oil & Gas companies:
Potential change in resource access 7 7
Impacts on Energy (utilities) companies:
Higher potential for hydro-electric (more
power) 5 5
Sea ice Decreasing
Both types of companies:
Increased ice road failure (melting) 8 8
Increased maintenance costs (icebergs,
beached ice, waves, storm surges) 8 8
Impact on Oil & Gas companies:
Increased mobility through arctic waters 6 7
Increased wave strength 6 7
Increased water traffic through the
Arctic 8 5
Impacts on Energy (utilities) companies:
Increased percentage of reservoir
availability during the winter 5 5
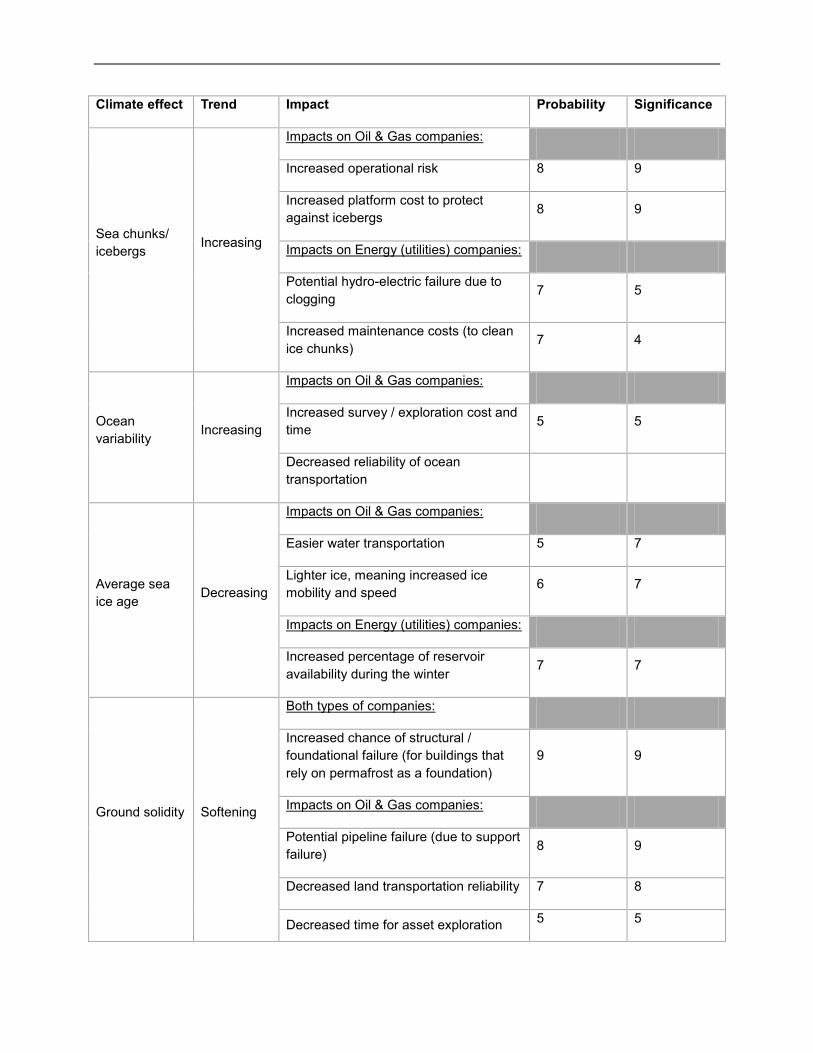
Climate effect Trend Impact Probability Significance
Sea chunks/
icebergs Increasing
Impacts on Oil & Gas companies:
Increased operational risk 8 9
Increased platform cost to protect
against icebergs 8 9
Impacts on Energy (utilities) companies:
Potential hydro-electric failure due to
clogging 7 5
Increased maintenance costs (to clean
ice chunks) 7 4
Ocean
variability Increasing
Impacts on Oil & Gas companies:
Increased survey / exploration cost and
time 5 5
Decreased reliability of ocean
transportation
Average sea
ice age Decreasing
Impacts on Oil & Gas companies:
Easier water transportation 5 7
Lighter ice, meaning increased ice
mobility and speed 6 7
Impacts on Energy (utilities) companies:
Increased percentage of reservoir
availability during the winter 7 7
Ground solidity Softening
Both types of companies:
Increased chance of structural /
foundational failure (for buildings that
rely on permafrost as a foundation)
9 9
Impacts on Oil & Gas companies:
Potential pipeline failure (due to support
failure) 8 9
Decreased land transportation reliability 7 8
Decreased time for asset exploration 5 5

Climate effect Trend Impact Probability Significance
every year
Increased building costs (different type
of foundation) 7 8
Ground
warping Increasing
Both types of companies:
Increased chance of structural failure 6 7
Impacts on Oil & Gas companies:
Increased chance of pipeline failure
(due to support failure) 7 8
Ground
drainage Increasing
Impacts on Oil & Gas companies:
Sump failure 6 6
Increased contamination risk 7 8
Impacts on Energy (utilities) companies:
Potential lake and river drainage
(damage to hydro-electric potential) 7 8
If possible, please elaborate on your rating.
Response: I know less about these probabilities

[10] Is there anything that you think we missed, or want to go further into detail? If so, please
describe it below.
Response: Alternative energy and other sustainable development? “
Related Documents


