City of Fresno Retirement Systems Customized Separate Account January 24, 2018 Presented by: Gary Fencik and Miguel Gonzalo, CFA

Welcome message from author
This document is posted to help you gain knowledge. Please leave a comment to let me know what you think about it! Share it to your friends and learn new things together.
Transcript

City of Fresno Retirement Systems Customized Separate Account
January 24, 2018
Presented by: Gary Fencik and Miguel Gonzalo, CFA
Tracygo
Text Box
Agenda Item: 1:05 PM Joint Meeting of the Retirement Boards Meeting Date: January 24, 2018

2
Confidentiality Statement and Other Important Considerations
Adams Street Partners has provided this presentation (the “Presentation”) to the recipient on a confidential and limited basis. This Presentation is not an offer or sale of any security or investment product or investment advice. Offerings are made only pursuant to a private offering memorandum containing important information regarding risk factors, performance and other material aspects of the applicable investment; the information contained herein should not be used or relied upon in connection with the purchase or sale of any security.
Statements in the Presentation are made as of the date of the Presentation unless stated otherwise, and there is no implication that the information contained herein is correct as of any time subsequent to such date. All information with respect to primary and secondary investments of Adams Street Partners funds (the “Funds”) or Adams Street Partners’ managed accounts (collectively, the “Investments”), the Investments’ underlying portfolio companies, Fund portfolio companies, and industry data has been obtained from sources believed to be reliable and current, but accuracy cannot be guaranteed.
The Presentation contains highly confidential information. In accepting the Presentation, each recipient agrees that it will (i) not copy, reproduce or distribute the Presentation, in whole or in part, to any person or party (including any employee of the recipient other than an employee or other representative directly involved in evaluating the Funds) without the prior written consent of Adams Street Partners, (ii) keep permanently confidential all information not already public contained herein, and (iii) use the Presentation solely for the purpose set forth in the first paragraph.
The Presentation is not intended to be relied upon as investment advice. The contents herein are not to be construed as legal, business or tax advice, and each investor should consult its own attorney, business advisor and tax advisor as to legal, business and tax advice.
The internal rate of return (IRR) data and multiples provided in the Presentation are calculated as indicated in the applicable notes to the Presentation, which notes are an important component of the Presentation and the performance information contained herein. IRR performance data may include unrealized portfolio investments; there can be no assurance that such unrealized investments will ultimately achieve a liquidation event at the value assigned by Adams Street Partners or the General Partner of the relevant Investment, as applicable. References to the Investments and their underlying portfolio companies and to the Funds should not be considered a recommendation or solicitation for any such Investment, portfolio company, or Fund.
Past performance is not a guarantee of future results. Projections or forward looking statements contained in the Presentation are only estimates of future results or events that are based upon assumptions made at the time such projections or statements were developed or made. There can be no assurance that the results set forth in the projections or the events predicted will be attained, and actual results may be significantly different from the projections. Also, general economic factors, which are not predictable, can have a material impact on the reliability of projections or forward looking statements.

3
Introduction
Miguel Gonzalo, CFA Gary Fencik
Partner & Head of Investor Relations, Chicago
Education: Yale University, BA
Northwestern University Kellogg School of Management, MBA
Years of Investment/ Operational Experience: 30
Partner & Head of Investment Strategy and Risk Management, Chicago
Education: University of Notre Dame, BA
Northwestern University Kellogg School of Management, MBA
Years of Investment/ Operational Experience: 23

What We Will Highlight Today
4
■ Who we are
■ Why portfolio construction matters
■ Selecting the best managers
■ Our investment strategy and outlook
■ Customized Client Case Study: U.S. Public Fund

Overview
5

Investing with Adams Street Partners
6
Global Private Markets Investment Manager ■ 100% Employee-owned ■ 45 years of experience ■ $32B AUM Robust Investment Process ■ Integrated and disciplined investment process ■ Top-down, bottom-up portfolio construction ■ Consistent outperformance through market cycles
Exemplary Client Service ■ Deep understanding of institutional client needs ■ Commingled products and separately managed accounts ■ Industry-leading analytical tools and data
We have never lost capital for any client in any investment program since our inception in 1972

Deep Expertise Around the World
7
Mike Zappert
Menlo Park
Troy Barnett
Chicago
Joe Goldrick Chicago
Greg Holden London
Pinal Nicum
London
Kristof Van
Overloop London
SECONDARY
Kelly Meldrum Head of Primary
Investments Menlo Park
Jeff Burgis
Chicago
Adam Chenoweth
Chicago
Arnaud de
Cremiers London
Doris (Yiyang)
Guo Beijing
PRIMARY
Sachin Tulyani London
Craig Waslin
Chicago
Benjamin Wallwork
London
Bon French Chairman
Chicago
Terry Gould Head of
Venture/Growth Investments
Chicago
VENTURE/GROWTH CO-INVESTMENTS
FUND INVESTMENTS
Tom Bremner Chicago
Jeff Diehl
Chicago
Robin Murray
Menlo Park
Jeff Diehl Managing Partner &
Head of Investments Chicago
INVESTMENT STRATEGY AND RISK MANAGEMENT
DIRECT INVESTMENTS
Bill Sacher Head of
Private Credit New York
Shahab Rashid
New York
PRIVATE CREDIT
Dave Brett Head of
Co-Investments Chicago
Sergey Sheshuryak
London
Sunil Mishra
Singapore
Ross Morrison
London
Saguna Malhotra
Menlo Park
Morgan Holzaepfel
Boston
Ling Jen Wu
Singapore
Fred Wang Menlo
Park
Yar-Ping Soo
Singapore
Jim Korczak Chicago
Alex Lesch
Chicago
Brijesh Jeevarathnam
Menlo Park
Thomas Petty
New York
Fred Chung
New York
Emily Shiau
New York
Jeff Akers Head of
Secondary Investments
Chicago
Michael Taylor Menlo
Park
Matt Autrey
Chicago
Justin Lawrence New York
Alex Kessel
Chicago
Miguel Gonzalo Head of Investment Strategy
and Risk Management Chicago
Jian Zhang
Chicago
Toby True
Chicago
Jana Tortora Chicago
Alex Storer
Chicago
Andy Wang Beijing

We Have a Global Footprint
8
170+ PEOPLE
30+ NATIONS INVESTED
10 OFFICES
= 1400+ QUALITY OPPORTUNITIES
REVIEWED ANNUALLY
CHICAGO 1972 MENLO PARK
2006
LONDON 1997
SINGAPORE 2006
TOKYO 2014
BEIJING 2011 NEW YORK
2016
BOSTON 2016
MUNICH 2017
SEOUL 2017

8.0%^
10.1%^
6.8%
9.9%^
7.1%^
9.8%
21.0%
26.1%
13.2%
19.4%
15.5%
21.2%
0%
5%
10%
15%
20%
25%
30%
Primary Only 4 Primary Venture Capital ⁴
Primary Buyout 5 Secondary Only 6 Direct Funds 7 Co-Investment Funds8
9
All Strategies1 Exceed Public Market Equivalents by 400 bps*
As of June 30, 2017
Outperformance Since Inception
Public Market Equivalent 4
Since Inception
Primary Only 5
Secondary Only 2,7
Primary Venture Capital 5
Primary Buyout 6
Venture/ Growth8
Co-Investment Funds 9
Sin
ce In
cept
ion3
Net
IRR
The page entitled “Notes to Performance: All Strategies1 Outperform Public Market Equivalents by 400 bps*,” included in this presentation, is an important component of this performance data.

Constructing a Private Equity Portfolio
10

Source: Cartoon Stock 11

What’s on Investors’ Minds
12
How do I construct a portfolio that:
Hits my return targets?
Protects me from a market correction?
Provides access to the best investments?
Maximizes return per unit of risk?

Risk Analysis and Portfolio Construction
13
Portfolio Construction and Risk Analysis Multi-faceted approach
Macroeconomic input
Investment strategy
Manager specific factors
Qua
rter
ly IR
R
Qua
rter
ly C
ash
Flow
s
Capital Calls Distributions Ending NAV
Distribution of Final Outcomes
Freq
uenc
y (%
)
Portfolio TVPI (Net)
Fundamental Investment Analysis
Liquidity and Cash Flow Projections
Interim Period Volatility

14
Portfolio Construction Basics
A well-constructed portfolio can lead to 50-500+ bps of annual outperformance!
IMPORTANT
Strategy
Subclass
Geography
Investment Selection
CRITICAL
Time Diversification
DEPENDS ON RISK TOLERANCE
# of Investments
Sector Exposure
Company Size

Actual allocations will differ once the Program is fully invested. 15
Case Study: Constructing a Private Equity Portfolio Helping determine risk appetite for U.S. Public Fund Client
Other 10-25%
Venture 10-20%
Buyout 60-80%
Subclass
North America 55-65%
Europe 20-30%
Asia 15-25%
■ Assumed Size: $280 million ■ Investment Period: 4-5 Years ■ Net Return Target: Public Markets + 3%
Small 30-50%
Large 50-70%
Buyout Fund Size
Primaries 70%
Co-Investments 10%
Secondaries 20%
Strategy

* Actual allocations will differ once the Program is fully invested. ** The targeted annual net return (after Adams Street Partners’ fees, expenses and carried interest) is only a target. There can be no guarantee that the 2018 Global Private Equity Program will
achieve returns in the targeted range. 1. MSCI ACWI (All Country World Index) captures large and mid cap representation across Developed and Emerging Markets countries. 16
Building Value While Maximizing IRR Constructing a Private Equity Portfolio
■ Longer duration ■ Builds value over time ■ Consistent weighting
per fund
■ Shorter duration ■ Earlier cash flows ■ Exploit market inefficiencies ■ Focus on minimizing j-curve ■ Reduce fees
Target Net Return: MSCI ACWI1 + 400 bps**
33-40% Tactical Strategies
60-67% Primary Strategies
Strategy*
Primary 60-67%
Direct Venture/ Growth
Up to 10%
Secondary 18-25%

17
Case Study: Constructing a Private Equity Portfolio Helping determine risk appetite for U.S. Public Fund Client
The following represents four risk-return profile scenarios.
Scenario 1 Scenario 2 Scenario 3 Scenario 4
Primary Small Market Buyout 0% 10% 29% 30%
Primary Large Market Buyout 55% 43% 29% 7%
Primary Venture Capital 5% 10% 15% 28%
Secondaries 20% 20% 20% 20%
Co-Investments 5% 7% 7% 15%
Private Credit 15% 10% 0% 0%
Increasing Return, Risk & Illiquidity

1. The absolute levels of return are the result of the input data that was used and are not a reflection of Adams Street Partners’ expectation for returns going forward. The return data presented herein is simulated, hypothetical fund-level return data based on actual historical returns of companies in the historical portfolio company sample. This return data is for illustrative purposes only. It does not reflect actual performance of any Adams Street Partners fund or any private equity fund in which an Adams Street Partners fund of funds invests. There can be no guarantee that a fund of funds constructed in a manner similar to the simulation presented herein will achieve returns in the ranges of the hypothetical fund of funds performance presented herein. Portfolio company returns are measured as the ratio of value at liquidation to initial cost of the GP’s investment in the portfolio company and are gross of all fees, expenses and carried interest. Past performance is not a guarantee of future results. For this exercise the IRR estimates were calculated as the time-weighted rate of return that generates the corresponding TVPI multiple (net of estimated Adams Street Partners and underlying general partner fees, expenses and carried interest) over a 4.3 year period (at portfolio level, net of estimated underlying general partners’ and Adams Street Partners’ fees, carried interest and expenses). Underlying general partner’s fees, carried interest and expenses are estimated based upon historical gross/net spreads that Adams Street Partners has realized on its fund of funds investments; the estimated general partner fees, carried interest and expenses, as well as applicable Adams Street Partners fees and carried interest and estimated expenses, are deducted. The 4.3 year investment duration represents the average length of time that a given dollar remains invested in an underlying company, and is different from the concept of total investment life which is defined as the length of time from the first cash flow to the final liquidation. Adams Street Partners has found 4.3 years to be a close approximation for average duration based on a large sample of historical partnership investment data.
18
Case Study: Constructing a Private Equity Portfolio Distribution of simulated portfolio IRRs
0.0%
2.0%
4.0%
6.0%
8.0%
10.0%
12.0%
5.75% 9.50% 13.25% 17.00% 20.75% 24.50%
Freq
uenc
y (%
)
Portfolio IRR (Net)
Simulated Portfolio IRR1
Scenario 1 Scenario 2 Scenario 3 Scenario 4
Scenario 1 Scenario 2 Scenario 3 Scenario 4Median 12.8% 13.5% 14.3% 15.0%
Mean 12.9% 13.6% 14.7% 15.3%
StDev 1.5% 1.8% 2.1% 3.5%
P(>0%): 100.0% 100.0% 100.0% 100.0%
P(>8%): 99.9% 100.0% 100.0% 99.5%
P(>11%): 89.3% 93.5% 96.6% 91.6%
P(>15%): 8.3% 21.3% 36.9% 50.1%
P(>18%): 0.1% 1.7% 5.9% 19.4%
P(>21%): 0.0% 0.1% 0.5% 6.2%

0.0%
1.0%
2.0%
3.0%
4.0%
5.0%
6.0%
Freq
uenc
y (%
)
Simulated Portfolio IRR1
The absolute levels of return are the result of the input data that was used and are not a reflection of Adams Street Partners’ expectation for returns going forward. The return data presented herein is simulated, hypothetical fund-level return data based on actual historical returns of companies in the historical portfolio company sample. This return data is for illustrative purposes only. It does not reflect actual performance of any Adams Street Partners fund or any private equity fund in which an Adams Street Partners fund of funds invests. There can be no guarantee that the 2017 Global portfolio or any fund of funds constructed in a manner similar to the simulation presented herein will achieve returns in the ranges of the hypothetical fund of funds performance presented herein. Portfolio company returns are measured as the ratio of value at liquidation to initial cost of the GP’s investment in the portfolio company and are gross of all fees, expenses and carried interest. Past performance is not a guarantee of future results. For this exercise the IRR estimates were calculated as the time-weighted rate of return that generates the corresponding TVPI multiple (net of estimated Adams Street Partners and underlying general partner fees, expenses and carried interest) over a 4.5 year period for primary investments (at portfolio level, net of estimated underlying general partners’ and Adams Street Partners’ fees, carried interest and expenses) and a 3 year period for secondary and mezzanine investments. Underlying general partner’s fees, carried interest and expenses are estimated based upon historical gross/net spreads that Adams Street Partners has realized on its fund of funds investments; the estimated general partner fees, carried interest and expenses, as well as applicable Adams Street Partners fees and carried interest and estimated expenses, are deducted. The investment duration assumptions of 4.5 years and 3 years represent the average length of time that a given dollar remains invested in an underlying company, and is distinct from the concept of total investment life which is defined as the length of time from the first cash flow to the final liquidation.
19
Case Study: Global Portfolio Distribution of simulated portfolio IRRs
Probability = 32.6%
Probability = 82%
Probability = .5%
Probability = 7.1%
Median: 14.0% Mean: 14.2% Dispersion: 2.6%
Simulated Portfolio Net IRR
0% 15% 18% 25% 30% 12%
See “Methodology: Simulated Portfolio IRR” at the end of this presentation for important information.

0.0%
1.0%
2.0%
3.0%
4.0%
5.0%
6.0%
Freq
uenc
y (%
)
Simulated Portfolio IRR1
The absolute levels of return are the result of the input data that was used and are not a reflection of Adams Street Partners’ expectation for returns going forward. The return data presented herein is simulated, hypothetical fund-level return data based on actual historical returns of companies in the historical portfolio company sample. This return data is for illustrative purposes only. It does not reflect actual performance of any Adams Street Partners fund or any private equity fund in which an Adams Street Partners fund of funds invests. There can be no guarantee that the 2017 Global portfolio or any fund of funds constructed in a manner similar to the simulation presented herein will achieve returns in the ranges of the hypothetical fund of funds performance presented herein. Portfolio company returns are measured as the ratio of value at liquidation to initial cost of the GP’s investment in the portfolio company and are gross of all fees, expenses and carried interest. Past performance is not a guarantee of future results. For this exercise the IRR estimates were calculated as the time-weighted rate of return that generates the corresponding TVPI multiple (net of estimated Adams Street Partners and underlying general partner fees, expenses and carried interest) over a 4.5 year period for primary investments (at portfolio level, net of estimated underlying general partners’ and Adams Street Partners’ fees, carried interest and expenses) and a 3 year period for secondary and mezzanine investments. Underlying general partner’s fees, carried interest and expenses are estimated based upon historical gross/net spreads that Adams Street Partners has realized on its fund of funds investments; the estimated general partner fees, carried interest and expenses, as well as applicable Adams Street Partners fees and carried interest and estimated expenses, are deducted. The investment duration assumptions of 4.5 years and 3 years represent the average length of time that a given dollar remains invested in an underlying company, and is distinct from the concept of total investment life which is defined as the length of time from the first cash flow to the final liquidation.
20
Case Study: 6 Buyout Funds Distribution of simulated portfolio IRRs
Median: 11.6% Mean: 11.9% Dispersion: 5.4%
Simulated Portfolio Net IRR
See “Methodology: Simulated Portfolio IRR” at the end of this presentation for important information.
Probability = 27.2%
Probability = 1.1%
Probability = 13.2%
0% 15% 18% 25% 30% 12%
Probability = 47%

Adams Street Partners maintains cash flow projection models for various strategy and subclass investment combinations. Each model reflects a combination of expected cash flows going forward and the historical cash flow patterns observed by Adams Street Partners. This slide combines these models based on the proposed portfolio allocation and illustrates the resulting general long-term cash flow projection. The models do not capture the impact of short term events specific to underlying investments. There can be no guarantee that the projected cash flows and NAVs shown above will be achieved. 21
Case Study: Global Portfolio Cash Flow Projection based on a $100 million total commitment
Years 1-3: Capital Calls total $38 million and Distributions total $9 million
$(40)
$(20)
$-
$20
$40
$60
$80
Year 1 Year 2 Year 3 Year 4 Year 5 Year 6 Year 7 Year 8 Year 9 Year 10 Year 11 Year 12 Year 13 Year 14 Year 15
Cash Flow Projection
Capital Calls Distributions Ending NAV
Year 1 Year 2 Year 3 Year 4 Year 5 Year 6 Year 7 Year 8 Year 9 Year 10 Year 11 Year 12 Year 13 Year 14 Year 15
Capital Calls (5.0)$ (15.7)$ (16.9)$ (13.1)$ (26.9)$ (8.3)$ (5.5)$ (3.8)$ (2.0)$ (0.9)$ (0.5)$ (0.4)$ (0.4)$ (0.3)$ (0.2)$
Distributions 1.0$ 2.6$ 5.1$ 7.3$ 9.6$ 17.8$ 21.4$ 22.2$ 21.2$ 18.9$ 15.7$ 12.9$ 9.9$ 7.1$ 3.4$
Net Cash Flow (4.0)$ (13.1)$ (11.8)$ (5.8)$ (17.3)$ 9.5$ 15.9$ 18.4$ 19.2$ 17.9$ 15.2$ 12.4$ 9.6$ 6.9$ 3.2$
Ending NAV 4.4$ 19.2$ 34.8$ 46.8$ 72.7$ 74.4$ 69.4$ 60.8$ 49.8$ 38.1$ 27.3$ 17.7$ 9.9$ 4.1$ 1.2$

Adams Street Partners maintains cash flow projection models for various strategy and subclass investment combinations. Each model reflects a combination of expected cash flows going forward and the historical cash flow patterns observed by Adams Street Partners. This slide combines these models based on the proposed portfolio allocation and illustrates the resulting general long-term cash flow projection. The models do not capture the impact of short term events specific to underlying investments. There can be no guarantee that the projected cash flows and NAVs shown above will be achieved. 22
Case Study: 6 Buyout Funds Cash Flow Projection based on a $100 million total commitment
Years 1-3: Capital Calls total $30 million and Distributions total $1 million
$(30)
$(20)
$(10)
$-
$10
$20
$30
$40
$50
$60
$70
$80
Year 1 Year 2 Year 3 Year 4 Year 5 Year 6 Year 7 Year 8 Year 9 Year 10 Year 11 Year 12 Year 13 Year 14 Year 15
Cash Flow Projection
Capital Calls Distributions Ending NAV
Year 1 Year 2 Year 3 Year 4 Year 5 Year 6 Year 7 Year 8 Year 9 Year 10 Year 11 Year 12 Year 13 Year 14 Year 15
Capital Calls (3.9)$ (9.7)$ (16.2)$ (17.2)$ (14.7)$ (10.9)$ (8.2)$ (6.5)$ (5.2)$ (3.9)$ (2.3)$ (1.0)$ (0.2)$ (0.1)$ (0.0)$
Distributions -$ 0.2$ 1.2$ 3.5$ 6.8$ 10.8$ 14.5$ 17.3$ 18.7$ 18.7$ 17.8$ 16.1$ 13.9$ 11.5$ 8.7$
Net Cash Flow (3.9)$ (9.5)$ (15.0)$ (13.7)$ (7.9)$ (0.1)$ 6.3$ 10.8$ 13.5$ 14.8$ 15.5$ 15.0$ 13.7$ 11.4$ 8.7$
Ending NAV 3.5$ 12.6$ 27.7$ 43.4$ 56.0$ 63.4$ 66.0$ 64.4$ 59.5$ 52.1$ 42.5$ 32.0$ 21.5$ 12.5$ 5.5$

23
Selecting the Right Manager – It Matters!
1. Source: The Burgiss vintage years 2002-2017. Performance as of March 31, 2017. 2. Internal Adams Street Partners Research 2017
10%-15%
Performance difference between first and third quartile1
42-45%
Probability of a top quartile fund repeating2

Changing Consumer Preferences
Software and Technology Enabled Services
Current Investment Themes Drive our Manager Selection
24 A complete list of Adams Street Partners’ primary fund investments is available upon request.
Engineering and Manufacturing
Healthcare 2025

■ Venture: overweight, early/mid-stage tech and healthcare
■ Growth: overweight, huge markets, category leader potential
■ Buyout: overweight SMB with modest leverage; underweight mega/large
■ Credit: favorable risk-adjusted returns; focus on senior secured
Investment Outlook
25

Client Case Study Summary: U.S. Public Fund Client
26

For illustrative purposes only.
U.S. Public Pension Case Study
27
Transfer knowledge of the market, private equity, and relationships to the pension staff
Objective: Exceed Global Private
Equity Pooled IRRs
Client Profile
Investor type: Pension
Geography: United States
Date of first investment: 2014
Plan Assets: $2.5B
Mandate Size: $280M
Investment Mandate: Comprehensive Private Equity Solution Strategy: Primary, Secondary, Co-Investment and Venture/Growth investments Subclass: Diversified across venture, growth, buyouts and other Geography: Global Time: Primary – Broadly diversified by vintage year with a target deployment of 4 years. Secondary – Opportunistically front-load Secondary investments in the first 2
years Other: Work in tandem with client to make sure time, subclass, and geography are within
desired ranges as client evolves investment objectives Provide monitoring oversite, reporting and cash managment for legacy portfolio Transparent, cost effective and administrative ease
Expanded relationship: Re-up for $280M signed January 2018

28
Consolidated Reporting: ASP Portfolio & Legacy Funds Portfolio performance as of September 30, 2017
ASP Portfolio, as of 9/30/2017
Combined Private Equity Portfolios, as of 9/30/2017
Performance early in a fund's life is not generally meaningful due to fee drag and immature investments.
SubscriptionInvestment
CommitmentsAmountDrawn
AmountUnDrawn
MarketValue
DistributionsReceived
TotalValue
Gross IRRSince
Inception
Net IRRSince
InceptionInception
Date
TotalValue /AmountDrawn
ASP Portfolio $280,000,000 $246,145,677 $105,722,020 $174,277,980 $123,830,184 $1,444,051 $125,274,235 14.94% 12.12% 10/2014 1.18x
Legacy Funds $121,861,700 $121,861,700 $124,714,496 $(2,852,797) $18,634,867 $129,000,581 $147,635,448 3.79% 3.79% 6/2003 1.18x
Combined $ 401,861,700 $ 368,007,377 $230,436,516 $ 171,425,183 $ 142,465,051 $130,444,632 $272,909,683 5.48% 5.09% 1.18x
SubscriptionInvestment
CommitmentsAmountDrawn
AmountUnDrawn
MarketValue
DistributionsReceived
TotalValue
Gross IRRSince
Inception
Net IRRSince
InceptionInception
Date
TotalValue /AmountDrawn
Adams Street Primary $205,000,000 $171,283,885 $55,176,507 $149,823,493 $62,685,982 $0 $62,685,982 10.42% 8.90% 12/2014 1.14x
Adams Street Secondary $50,000,000 $49,861,792 $32,868,000 $17,132,000 $41,869,328 $0 $41,869,328 18.49% 16.10% 2/2015 1.27x
Adams Street Direct $25,000,000 $25,000,000 $17,677,513 $7,322,487 $19,274,874 $1,444,051 $20,718,925 20.81% 13.03% 10/2014 1.17x
ASP Portfolio $280,000,000 $246,145,677 $105,722,020 $174,277,980 $123,830,184 $1,444,051 $125,274,235 14.94% 12.12% 1.18x

29
ASP Portfolio Summary of current investments Total portfolio as of October, 2017
Strategy $ Amount % Primaries $ 183,006,788 74%
Secondaries $ 50,385,973 20%
Co-Investments $ 15,000,000 6%
Totals $ 248,392,761 100%
% of Subscription Committed So Far $ Amount % Closed Commitments $ 248,392,761
Subscription $ 280,000,000
% Committed 89%
2014 Commitments $ 55,000,000 20%
2015 Commitments $ 65,391,382 23%
2016 Commitments $ 87,445,013 31%
2017 Commitments $ 40,556,367 14%
Totals $ 248,392,761 89%
The commitment pace is on plan and within the established diversification guidelines.
30
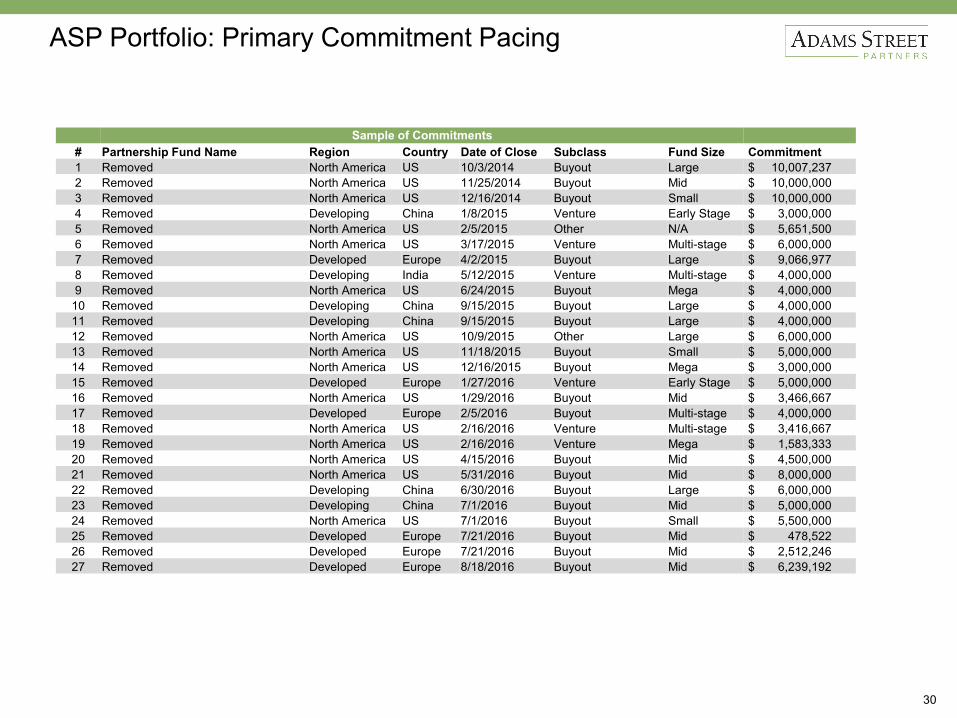
ASP Portfolio: Primary Commitment Pacing
Sample of Commitments # Partnership Fund Name Region Country Date of Close Subclass Fund Size Commitment 1 Removed North America US 10/3/2014 Buyout Large $ 10,007,237 2 Removed North America US 11/25/2014 Buyout Mid $ 10,000,000 3 Removed North America US 12/16/2014 Buyout Small $ 10,000,000 4 Removed Developing China 1/8/2015 Venture Early Stage $ 3,000,000 5 Removed North America US 2/5/2015 Other N/A $ 5,651,500 6 Removed North America US 3/17/2015 Venture Multi-stage $ 6,000,000 7 Removed Developed Europe 4/2/2015 Buyout Large $ 9,066,977 8 Removed Developing India 5/12/2015 Venture Multi-stage $ 4,000,000 9 Removed North America US 6/24/2015 Buyout Mega $ 4,000,000
10 Removed Developing China 9/15/2015 Buyout Large $ 4,000,000 11 Removed Developing China 9/15/2015 Buyout Large $ 4,000,000 12 Removed North America US 10/9/2015 Other Large $ 6,000,000 13 Removed North America US 11/18/2015 Buyout Small $ 5,000,000 14 Removed North America US 12/16/2015 Buyout Mega $ 3,000,000 15 Removed Developed Europe 1/27/2016 Venture Early Stage $ 5,000,000 16 Removed North America US 1/29/2016 Buyout Mid $ 3,466,667 17 Removed Developed Europe 2/5/2016 Buyout Multi-stage $ 4,000,000 18 Removed North America US 2/16/2016 Venture Multi-stage $ 3,416,667 19 Removed North America US 2/16/2016 Venture Mega $ 1,583,333 20 Removed North America US 4/15/2016 Buyout Mid $ 4,500,000 21 Removed North America US 5/31/2016 Buyout Mid $ 8,000,000 22 Removed Developing China 6/30/2016 Buyout Large $ 6,000,000 23 Removed Developing China 7/1/2016 Buyout Mid $ 5,000,000 24 Removed North America US 7/1/2016 Buyout Small $ 5,500,000 25 Removed Developed Europe 7/21/2016 Buyout Mid $ 478,522 26 Removed Developed Europe 7/21/2016 Buyout Mid $ 2,512,246 27 Removed Developed Europe 8/18/2016 Buyout Mid $ 6,239,192

31
Legacy Investments Through 6/30/2017
Partnership Fund Name Commitment Date of Investment
Amount Invested Valuation
Cumulative Distributions Received
Total Value IRR (6/30/17)
IRR (3/31/17)
Multiple as of 6/30/17
Removed $10,000,000 3/31/2006 $9,718,270 $3,635,710 $13,576,765 $17,212,475 11.52% 11.40% 1.77x Removed $5,000,000 10/31/2007 $5,520,546 $2,342,831 $2,995,615 $5,338,446 -0.69% 0.38% 0.97x Removed $16,839,260 10/14/2005 $17,097,891 $173,395 $14,941,292 $15,114,687 -2.91% -2.92% 0.88x Removed $7,500,000 6/20/2013 $6,412,500 $5,180,235 $3,921,132 $9,101,367 22.47% 23.56% 1.42x Removed $12999,996 1/25/2007 $12,999,996 $1 $9,574,085 $9,574,086 -3.48% -3.48% 0.74x Removed $3,690,000 10/27/2006 $3,595,200 $421,375 $0 $421,375 -24.70% -20.05% 0.12x Removed $15,000,000 12/15/2005 $17,160,000 $1,205,529 $21,880,268 $23,085,797 7.54% 7.64% 1.35x Removed $10,000,000 6/2/2006 $11,321,299 $1,489,793 $12,516,230 $14,006,023 6.47% 6.24% 1.24x Removed $10,000,000 7/25/2006 $9,319,460 $3,198,781 $12,104,394 $15,303,175 12.00% 12.20% 1.64x Removed $15,000,000 12/31/2006 $15,270,157 $141,122 $16,995,984 $17,137,106 2.92% 2.95% 1.12x Removed $15,000,000 9/30/2005 $15,348,661 $362,483 $19,963,758 $20,326,241 7.64% 7.60% 1.32x Investment Total $121,029,256 $123,763,980 $18,151,255 $128,469,523 $146,620,778 3.54% 4.10% 1.15x
Legacy Portfolio Summary of “Fund” investments

Assumptions
Plan Size$2.7B
Annual Growth Rateof Total Plan
5.0%
Private Equity Target9.0%
Projected Cash Flows and NAVs (Dollars in Millions)2014 2015 2016 2017 2018 2019 2020 2021 2022 2023 2024 2025 2026 2027 2028
Subscription 55$ 65$ 87$ 55$ 60$ 60$ 65$ 65$ 65$ -$ -$ -$ -$ -$ -$
Capital Calls (7)$ (29)$ (48)$ (55)$ (57)$ (62)$ (64)$ (61)$ (57)$ (48)$ (37)$ (24)$ (14)$ (8)$ (4)$ Distributions 13$ 13$ 7$ 20$ 33$ 47$ 59$ 72$ 84$ 94$ 104$ 111$ 102$ 86$ 71$
Net Cash Flows 6$ (16)$ (41)$ (35)$ (24)$ (15)$ (5)$ 11$ 27$ 46$ 67$ 87$ 88$ 79$ 67$
Net Asset Value 38$ 35$ 85$ 135$ 183$ 230$ 272$ 305$ 324$ 326$ 308$ 269$ 222$ 178$ 136$ Est. Plan Size ($B) 2.3$ 2.4$ 2.5$ 2.7$ 2.8$ 3.0$ 3.1$ 3.3$ 3.4$ 3.6$ 3.8$ 4.0$ 4.2$ 4.4$ 4.6$ NAV / Plan Size 2% 1% 3% 5% 6% 8% 9% 9% 9% 9% 8% 7% 5% 4% 3%
($250)
($150)
($50)
$50
$150
$250
$350
$450
2014
2015
2016
2017
2018
2019
2020
2021
2022
2023
2024
2025
2026
2027
2028
Dolla
rs in
Mill
ions
Capital Calls Distributions Projected NAV
32 * 2018 consists of commitments from original plan and new proposed commitments Note: Projected cash flows include assumptions for NAV of non-Adams Street Partners private equity commitments.
Projected Cash Flows (w/ additional commitments)
*
Beyond 2018, client will need to commit assets to reach and maintain the 9% target allocation to Private Equity.

Relationship Summary
33
■ Quarterly phone calls with client include: - Updates on new investments - Investment memo reviews
- Cash activity reconciliation - Customized reporting adjustments
■ Other touch points with client: ‒ 10 trips to the client’s offices since October of 2014
‒ Semi-annual deep dives into portfolio with Portfolio Manager
‒ Annual review for full committee, including ASP Portfolio Manager and Executive
‒ Staff has spent time in ASP’s U.S. and Non-U.S. offices
‒ Participated in GP meetings and had introductions to GPs in the ASP network
‒ One-on-one training, including staff member spent a week in Chicago to shadow investment and operations teams to gather best practices
■ Value-added services: ‒ Commitment pace modeling and cash forecasting
‒ Benchmarking analytics and assisting investment consultant
‒ Transparency of reporting
‒ Estimated portfolio valuations quarterly
‒ Audit services with KPMG, volume pricing
‒ Share market reports/data for client education
Dedicated Investor Relations, Portfolio Manager and Client Service professional provide core of day to day relationship with client staff, their investment consultant and all other service providers.

Appendix
34

Methodology: Simulated Portfolio IRR
1. The data set consists of 21,745 investments from 772 partnership funds and 271 different General Partners in Adams Street Partners’ database; includes portfolio companies of funds in which Adams Street did not invest. Partnership funds are from vintage years 1980-2017. 35
■ To estimate the portfolio’s distribution of simulated final outcomes, returns were simulated using historical company data maintained by Adams Street
■ Output: ‒ TVPI, based on TVPI of the companies in the underlying historical data set ‒ IRR, estimated from TVPI and the average historical investment duration of the data set.
IRR must be estimated because company-level cash flow data is not available. ‒ TVPI and IRR are estimated net of fees, carried interest, and expenses from the General Partner
as well as Adams Street Partners.
20,000 Iterations
Simulated Partnership Funds Partnerships consisting of n=20 underlying investments clustered around common initial investment dates.
Historical Company Level Data1
Company-level investment data from ASP's investment database, for investments in strategies relevant to the proposed portfolio. Data is as of 9/30/2017.
20,000 Iterations
Simulated Investment Strategies Portfolios representing the allocation of the proposed portfolios according to strategy, subclass, geography, fund size, etc
Omit companies which are not mostly realized (defined as having realized value greater than or equal to unrealized value).
Historical Partnership Level Data When applicable, partnership fund level data is used to represent returns for Secondary Investments, Credit, Mezzanine, Real Estate, and other strategies for which ASP has a limited data set at the deal level.
20,000 Iterations
Methodology: Simulated Portfolio IRR
36
■ Uses historical company level data to create an estimated risk/return profile ■ The simulation estimates the portfolio’s risk/return profile, including:
‒ Dispersion of returns ‒ Impact of the number of underlying partnerships and investments ‒ Interaction of different PE strategies, investment subclasses, and regions ‒ Tradeoff between a higher expected return and a greater uncertainty of future returns
■ The mean return to the simulated strategy will not necessarily represent the strategy’s expected return going forward

*Environmental, Social and Governance (“ESG”) Considerations 37
ESG Considerations ■ Adams Street became a signatory to the United Nations Principles for
Responsible Investment (“UNPRI”) in October 2010 ■ The Firm adopted an ESG Policy, established an ESG Committee and
conducted firm-wide training regarding integration of ESG considerations into the investment process
■ The Firm integrates ESG Considerations into the investment process using the below criteria to evaluate prospective investments:
‒ Character and integrity of the leadership of the fund or portfolio company
‒ The quality, sustainability and transparency of operations
‒ Impacts of the fund’s investments or portfolio company’s business (e.g., human rights and environmental impacts)
Diversity, Inclusion and ESG* Considerations at Adams Street
Our Diversity and Inclusion Initiative’s mission is to increase access, contribute to education and engage staff in outreach opportunities designed to raise awareness and bring greater numbers of women and men of diverse backgrounds into the industry.

38
Notes to Performance: All Strategies Outperform Public Market Equivalents by 400 bps*
* The strategies listed exceeded public market equivalents by 400 bps based on the composite, since inception IRR for each strategy as described herein.
1. With respect to the strategies Primary Only, Primary Venture Capital, Primary Buyout, ASP Capital Funds and Co-Investment Funds, this chart, in USD, shows composite performance of private equity fund investments in Adams Street Partners “Core Portfolios” which are funds and separate accounts (excluding special mandate funds and non-discretionary separate accounts) of which Adams Street Partners is the general partner, manager or investment adviser (as applicable) and for which Adams Street Partners makes discretionary investments in private equity. For each of these strategies in the chart, performance is shown on a composite basis for all investments in Core Portfolios that are within that strategy.
2. With respect to the strategy Secondary Only, this chart, in USD, shows composite performance by year of legal closing and transfer of assets of secondary investments (including interests purchased pursuant to a right of first refusal); it includes all secondary investments from 1986 through current period in all funds or other portfolios over which Adams Street Partners exercises investment discretion (including separate accounts no longer with Adams Street Partners).
3. With respect to Adams Street Partners primary and secondary investments, IRRs are net of fees, carried interest and expenses charged to the underlying private equity funds, but are gross of Adams Street Partners’ fees, carried interest and expenses, which reduce returns to investors. For the effect of Adams Street Partners’ fees, carried interest and expenses on Adams Street Partners’ fund returns to investors, please see Adams Street Partners Net Performance chart in the notes section of this presentation. There can be no guarantee that unrealized investments will ultimately be liquidated at the values reflected in this return data. With respect to Adams Street Partners direct and co-investment funds included in this data, performance is net of Adams Street Partners’ fees, carried interest and expenses. The returns presented in this chart do not represent returns achieved by any particular Adams Street Partners fund or any investor in an Adams Street Partners fund.
4. Public Market Equivalent (PME) is calculated using the MSCI All Country World Index. For some periods, it was not possible to calculate traditional PME because the pace of distributions would have created a short position in the public index. In these cases, denoted by the symbol “^”, the PME is calculated using the “Direct Alpha” PME methodology (Gredil, Griffiths, Stucke, “Benchmarking Private Equity: The Direct Alpha Method,” 2014). Mathematically, Direct Alpha PME is equal to the IRR of the future value of cash flows, where future value is based on the return of the benchmark index, less than the IRR of the actual value of the cash flows.
5. Inception date as of November 1, 1979.
6. Inception date as of February 21, 1985.
7. Inception date as of August 29, 1986.
8. Inception date as of March 1, 1989. Composite since inception IRR is net of Adams Street Partners’ fees, carried interest and expenses. IVCF II, a component of this composite, charged only management fees and expenses. Includes IVCF II (invested in both partnerships and direct portfolio companies), IVCF III, BVCF IV, AS V, AS 2006, AS 2007, AS 2008, AS 2009, AS 2010, AS 2011, AS 2012, AS 2013, AS 2014, AS 2015, AS 2016, AS 2017 and AS Venture/Growth VI.
9. Inception date as of July 8, 1992. Co-Investment Funds includes a separate account (1992-1998), Co-Investment I (2006), II (2009) and III (2014).
Past performance is not a guarantee of future results.
As June 30, 2017

The page entitled “Notes to Performance: Adams Street Partners Net Performance.” included on the following page of this presentation, is an important component of this performance data. Past performance is not a guarantee of future results.
Gross IRR Net IRR Net MultipleBrinson Partnership 1996 Subscription 16.92% 14.21% 6.80% ^ 1.69xBrinson Partnership 1997 Subscription 15.07% 12.12% 3.39% ^ 1.62xBrinson Partnership 1998 Subscription 6.85% 5.01% 3.12% ^ 1.35xBrinson Partnership 1999 Subscription 7.62% 5.76% 4.27% ^ 1.41xBrinson Partnership 2000 Subscription 9.36% 7.30% 5.36% ^ 1.50xBrinson Partnership 2001 Subscription 10.85% 8.62% 6.61% ^ 1.58xAdams Street Partnership Fund - 2002 Non-U.S. Fund, LP 14.07% 11.62% 7.97% ^ 1.72xAdams Street Partnership Fund - 2002 U.S. Fund, LP 10.62% 8.56% 6.88% ^ 1.64xAdams Street Partnership Fund - 2003 Non-U.S. Fund, LP 12.19% 9.71% 5.43% ^ 1.58xAdams Street Partnership Fund - 2003 U.S. Fund, LP 9.83% 7.91% 6.66% 1.58xAdams Street Partnership Fund - 2004 Non-U.S. Fund, LP 8.06% 6.08% 3.49% 1.40xAdams Street Partnership Fund - 2004 U.S. Fund, LP 8.82% 7.06% 7.10% 1.51xAdams Street Partnership Fund - 2005 Non-U.S. Fund, LP 6.66% 5.08% 2.96% 1.36xAdams Street Partnership Fund - 2005 U.S. Fund, LP 8.49% 6.89% 8.25% 1.50xAdams Street 2006 Direct Fund, L.P. 11.14% 7.78% 7.63% 1.85xAdams Street Partnership Fund - 2006 Non-U.S. Fund, LP 7.39% 5.82% 3.71% 1.39xAdams Street Partnership Fund - 2006 U.S. Fund, LP 8.84% 7.15% 9.10% 1.47xAdams Street 2007 Direct Fund, L.P. 15.36% 11.12% 8.97% 2.03xAdams Street Partnership Fund - 2007 Non-U.S. Fund, LP 9.49% 7.63% 4.93% 1.44xAdams Street Partnership Fund - 2007 U.S. Fund, LP 13.83% 11.75% 11.11% 1.70xAdams Street 2008 Direct Fund, L.P. 20.51% 15.12% 12.64% 2.18xAdams Street Partnership Fund - 2008 Non-U.S. Fund, L.P. 12.71% 10.16% 5.94% 1.47xAdams Street Partnership Fund - 2008 U.S. Fund, L.P. 18.05% 15.37% 13.26% 1.77xAdams Street 2009 Direct Fund, L.P. 20.51% 14.17% 14.59% 1.77xAdams Street Partnership Fund - 2009 Non-U.S. Developed Markets, L.P. 13.89% 10.50% 6.76% 1.37xAdams Street Partnership Fund - 2009 Non-U.S. Emerging Markets Fund, L.P. 11.47% 9.22% 3.69% 1.41xAdams Street Partnership Fund - 2009 U.S. Fund, L.P. 16.28% 13.27% 13.73% 1.55xAdams Street 2010 Direct Fund, L.P. 18.36% 12.20% 13.42% 1.59xAdams Street Partnership Fund - 2010 Non-U.S. Developed Markets Fund, L.P. 13.69% 10.38% 6.85% 1.34xAdams Street Partnership Fund - 2010 Non-U.S. Emerging Markets Fund, L.P. 12.51% 10.34% 4.15% 1.39xAdams Street Partnership Fund - 2010 U.S. Fund, L.P. 16.96% 13.87% 13.29% 1.51xAdams Street 2011 Direct Fund LP 24.49% 17.01% 12.72% 1.74xAdams Street 2011 Emerging Markets Fund LP 13.40% 11.16% 3.87% 1.43xAdams Street 2011 Non-US Developed Markets Fund LP 14.31% 11.11% 7.27% 1.32xAdams Street 2011 US Fund LP 15.63% 12.82% 13.45% 1.40xAdams Street 2012 Developed Markets Fund LP 14.91% 11.53% 5.91% 1.28xAdams Street 2012 Direct Fund LP 14.47% 7.07% 12.04% 1.19xAdams Street 2012 Emerging Markets Fund LP 10.61% 7.94% 6.44% 1.20xAdams Street 2012 Global Fund LP 12.13% 8.45% 8.61% 1.22xAdams Street 2012 US Fund LP 11.15% 8.12% 11.60% 1.20xAdams Street 2013 Developed Markets Fund LP 14.42% 11.32% 6.18% 1.22xAdams Street 2013 Direct Fund LP 7.55% 1.86% 11.80% 1.04xAdams Street 2013 Emerging Markets Fund LP 11.82% 9.03% 8.95% 1.17xAdams Street 2013 Global Fund LP 10.81% 7.54% 8.81% 1.16xAdams Street 2013 US Fund LP 10.61% 7.72% 11.17% 1.16xAdams Street 2014 Developed Markets Fund LP 12.23% 7.89% 7.67% 1.11xAdams Street 2014 Direct Fund LP 15.34% 7.07% 11.09% 1.11xAdams Street 2014 Emerging Markets Fund LP 13.19% 9.55% 10.87% 1.14xAdams Street 2014 Global Fund LP 11.75% 7.72% 9.30% 1.13xAdams Street 2014 US Fund LP 11.08% 7.98% 11.20% 1.14x
PME*
Adams Street Partners Net Performance As of June 30, 2017
39

40
Notes to Performance: Adams Street Partners Net Performance As of June 30, 2017
Note: Brinson Partnership Subscription gross and net IRR presents representative subscription performance of a subscriber that followed Adams Street Partners’ recommended allocation and pays the highest fees. For Adams Street Funds, actual commingled fund performance gross and net IRR are presented. Gross IRRs are net of management fees, carried interest and expenses charged to the underlying private equity funds, in the case of primary and secondary funds, but gross of Adams Street Partners’ management fees and carried interest, which reduce returns to investors. Net IRRs are net of Adams Street Partners’ management fees, carried interest and expenses as well as net of management fees, carried interest and expenses charged to the underlying private equity funds (in the case of primary and secondary funds). Capital-weighted annualized returns from inception through quarter end. There can be no guarantee that unrealized investments will ultimately be liquidated at the values reflected in this return data. Each Brinson Partnership Subscription includes fund allocations made within a series of pooled investment vehicles. Performance for vintage years later than 2014 is not shown because performance early in a fund’s life is not generally meaningful due to fee drag and immature investments. Past performance is not a guarantee of future results. *Public Market Equivalent (PME) is calculated using the S&P 500 Index for Brinson Partnership Subscription, US Funds and Direct Funds; MSCI EAFE (Europe, Australasia, Far East) for Non-US and Non-US Developed Funds; MSCI Emerging for Emerging Markets Funds; and MSCI All Country World for Global Funds. The PME calculation is based on the Net IRR cash flows which reflects the payments of fees, carried interest and expenses. ̂During some periods in which Adams Street Partners investments outperformed the benchmark by a substantial margin, PME could not be calculated because the tracking position in the underlying
benchmark index would have resulted in a short position. In these cases, the PME is calculated using the “Direct Alpha” PME methodology (Gredil, Griffiths, Stucke, “Benchmarking Private Equity: The Direct Alpha Method,” 2014). Mathematically, Direct Alpha PME is equal to the IRR of the future value of the cash flows underlying the IRR calculation, where future value is based on the return of the benchmark index, less the IRR of the actual value of the cash flows.

41
Gary Fencik Partner & Head of Investor Relations, Chicago
■ As a Partner and Head of Investor Relations, Gary’s responsibilities focus on the development of institutional client and consultant relationships and working with other members of the investor relations team to serve the needs of Adams Street Partners’ clients. He is also involved in prioritizing the strategic initiatives of the Firm.
■ Gary joined Adams Street Partners in 2001 after five years as Managing Director of Business Development at Brinson Partners/UBS Global Asset Management where he was responsible for business development in North America and consultant relationships on a global basis.
■ Gary spent twelve seasons with the Chicago Bears football club and was co-captain of the 1985 Super Bowl Championship Team.
■ Gary is a member of the Adams Street Partners Executive Committee.
EDUCATION: Yale University, BA Northwestern University Kellogg School of Management, MBA YEARS OF INVESTMENT/ OPERATIONAL EXPERIENCE: 30

42
Miguel Gonzalo, CFA Partner & Head of Investment Strategy and Risk Management, Chicago ■ Miguel collaborates with investors to formulate strategies that leverage Adams
Street Partners’ global investment capabilities. He is responsible for setting investment strategy and overseeing the firm’s risk management and performance reporting and analysis functions.
■ Miguel has worked closely with investors in the management of their portfolios, including the development and ongoing monitoring of their private market programs since 2000. He is actively involved in the portfolio construction and monitoring of our various fund of funds programs and separate accounts. In addition, he maintains relationships with investment consultants to ensure continuity with client objectives.
■ Prior to joining the Private Equity Group in 2000, Miguel was Head of the Performance Analysis Group in the Asset Allocation/Currency Group of Brinson Partners where he oversaw the design and management of the Firm's performance attribution and analytics systems.
■ Miguel is a member of the Adams Street Partners Portfolio Construction Committee, the CFA Society of Chicago and the CFA Institute.
EDUCATION: University of Notre Dame, BA Northwestern University Kellogg School of Management, MBA YEARS OF INVESTMENT/ OPERATIONAL EXPERIENCE: 23
Related Documents