ADAMA SCIENCE AND TECHNOLOGY UNIVERSITY School of Mechanical, Chemical and Materials Engineering DESIGN AND DEVELOPMENT OF BREATH ALCOHOL DETECTION SYSTEM FOR PREVENTION OF VEHICLE ACCIDENTS The Project Submitted in Partial Fulfillment of the Requirements for the Award of Degree of Master of Science in Automotive Technology By Abdu Fentaw --------------------------- GSR/0022/07 Alemayehu Asefa ---------------------- GSR/5324/06 Munira Abdurahim-------------------- GSR/0016/07 Samuel Taddese------------------------- GSR/0020/07 Advisor: Dr. Chul-Ho Kim, Ph.D. Mechanical Systems and Vehicle Engineering Program JUNE 2016 ADAMA

Welcome message from author
This document is posted to help you gain knowledge. Please leave a comment to let me know what you think about it! Share it to your friends and learn new things together.
Transcript

ADAMA SCIENCE AND TECHNOLOGY UNIVERSITY
School of Mechanical, Chemical and Materials Engineering
DESIGN AND DEVELOPMENT OF BREATH ALCOHOL
DETECTION SYSTEM FOR PREVENTION OF VEHICLE
ACCIDENTS
The Project Submitted in Partial Fulfillment of the Requirements for the
Award of Degree of Master of Science in Automotive Technology
By
Abdu Fentaw --------------------------- GSR/0022/07
Alemayehu Asefa ---------------------- GSR/5324/06
Munira Abdurahim-------------------- GSR/0016/07
Samuel Taddese------------------------- GSR/0020/07
Advisor: Dr. Chul-Ho Kim, Ph.D.
Mechanical Systems and Vehicle Engineering Program
JUNE 2016
ADAMA

ADAMA SCIENCE AND TECHNOLOGY UNIVERSITY
School of Mechanical, Chemical and Materials Engineering
DEPARTMENT OF MECHANICAL SYSTEMS AND VEHICLE
ENGINEERING PROGRAM
DESIGN AND DEVELOPMENT OF BREATH ALCOHOL
DETECTION SYSTEM FOR PREVENTION OF VEHICLE
ACCIDENTS
By
Abdu Fentaw
Munira Abdurahim
Alemayehu Asefa
Samuel Taddese
APPROVAL BY THE EXAMINING BOARD
Chairman, Department Graduate Signature Date
Committee
Advisor Signature Date
Internal Examiner Signature Date
External Examiner Signature Date

CANDIDATE’S DECLARATION
I hereby declare that the study project work which is being presented in the paper
entitled “Design and Development of Breath Alcohol Detection System for
Prevention of Vehicle Accidents” in partial fulfillment of the requirements for the
award of the degree of master of science in automotive technology is an authentic
record of my own work carried out from February 2016 to June 2016 under the
supervision of : Dr. Chul-Ho Kim ( Ph.D) and Ato Alemayehu Wakjira (MSc),
Department of Mechanical and Vehicle Engineering, Adama Science and Technology
University, Ethiopia.
The matter embodied in this paper has not been submitted by us for the award of any
other degree or diploma. All relevant resources of information used in this paper have
been duly acknowledged.
Student Name Signature Date
ABDU FENTAW __________________ _________________
AIEMAYEHU ASEFA __________________ _________________
MUNIRA ABDURAHIM __________________ _________________
SAMUEL TADEDESE __________________ _________________
This is to certify that the above statement made by the candidates is correct to the best
of my knowledge and belief. This project has been submitted for examination with my
approval.
Name __________________ ________________ ________________ Advisor Signature Date

i
ACKNOWLEDGEMENT
First, and foremost we would like to thank the superior of the entire’ God/Allah’ who
helps us in all directions and we would like to thank our project advisor
Chul Ho Kim (PhD) for all his knowledge, guidance, comments, technical and moral
advice to make this project meaningful and to complete it on time.
Also we express our gratitude to Ato Alemayehu Wakjira (MSc), who has provided
us the skills and wisdom needed to use in our project work as co-advisor. In addition,
we would also like to thank Benin (PHD).We also would like to thank our parents for
all their support. Without them we would not be able to experience and take part in this
project. They have helped us realize how important our education is, as well as how
essential it is to the rest of our lives.
Finally, thanks to all individuals who helped us with their idea, skills and labor in this
project work.

ii
TABLE OF CONTENTS
Content Page
ACKNOWLEDGEMENT ..................................................................................................... i
TABLE OF CONTENTS ....................................................................................................... ii
LIST OF FIGURES ............................................................................................................... v
LIST OF TABLES .............................................................................................................. vii
ACRONYMS AND ABBREVIATIONS ............................................................................ viii
ABSTRACT ....................................................................................................................... viii
1. INTRODUCTION ............................................................................................................1
1.1. Background of the study .........................................................................................1
1.2. Problem Statement ..................................................................................................4
1.3. Project Objectives ...................................................................................................5
1.3.1. General objective ..........................................................................................5
1.3.2. Specific objectives ........................................................................................5
1.4. Project scope ..........................................................................................................5
1.5. Significance of project ............................................................................................6
1.6. Application .............................................................................................................6
1.7. Agreement ..............................................................................................................6
1.8. Limitations of the study ..........................................................................................7
1.9. Organization of the Study .......................................................................................7
2. LITERATURE REVIEW ..................................................................................................8
2.1. General Overview ...................................................................................................8
2.2. Review on previous work .......................................................................................8
2.2.1. Breath alcohol detector model.......................................................................9
2.2.1.1. Semiconductor model .............................................................................9
2.2.1.2. Fuel Cell .............................................................................................. 10
2.2.1.3. Infrared Spectroscopy Model................................................................ 11
2.2.1.4. Gas Chromatography Model................................................................. 12
2.2.2. Alcohol compound ..................................................................................... 12
2.2.3. Alcohol in breath ........................................................................................ 12
2.2.4. Blood alcohol concentration ....................................................................... 13
2.3. Breathalyzer enabled Ignition Switch System ....................................................... 14
2.4. Alcohol Detection System .................................................................................... 15
iii
2.6.1. Alcohol sensor ............................................................................................ 17
2.6.2. Microcontroller ........................................................................................... 17
2.6.3. Liquid Crystal Display ................................................................................ 21
2. 6. 4. Ignition system ......................................................................................... 23
2.6.5. Power supply and voltage regulator ............................................................ 24
2.6.6. Buzzer ........................................................................................................ 24
2.6.7. DC Motor ................................................................................................... 24
2.6.8. Capacitor .................................................................................................... 25
2.6.10. Transistor ................................................................................................. 27
2.6.11.11 Development of Control Software ......................................................... 27
3. METHODS and MATERIALS ....................................................................................... 33
3.1. Methods................................................................................................................ 33
3.2. Data Analysis ....................................................................................................... 34
3.3. Required Materials ............................................................................................... 34
3.3.1. Hardware Components ............................................................................... 34
3.3.2. Software Components ................................................................................. 35
3.4. System Block Diagram ......................................................................................... 36
3.5. System Flow Chart ............................................................................................... 37
3.6. System description ................................................................................................ 38
3.6.1. LM7805 voltage regulator .......................................................................... 38
3.6.2. Alcohol Detecting Sensor ........................................................................... 39
3.6.3. Main circuit ................................................................................................ 40
3.6.4. Interface LCD (2 x 16 Characters) with PIC16F877 .................................... 41
3.6.5. PIC 16F877A Circuit Components ............................................................. 42
3.5.6. Buzzer ........................................................................................................ 42
3.7. Software Implementation ...................................................................................... 44
3.7.1. Program flow chart ..................................................................................... 45
3.7.2. Proteus software ......................................................................................... 46
3.8. Analog to Digital Converter .................................................................................. 46
3.9. Integration of the System ...................................................................................... 47
3.10. System Testing and Calibration .......................................................................... 47
4. RESULT AND DISCUSSIONS ...................................................................................... 49
4.1. Simulation ............................................................................................................ 49

iv
4.2. Hardware .............................................................................................................. 51
4.2.1. Voltage regulator ........................................................................................ 51
4.2.2. Sensor driver .............................................................................................. 53
5. CONCLUSION AND RECOMMENDATION ............................................................... 58
5.1. Conclusion ........................................................................................................... 58
5.2 Recommendation and future suggestions ............................................................... 59
5.3. Cost of construction analysis ................................................................................ 59
5.4. Educational implication ........................................................................................ 60
REFERENCES ................................................................................................................... 61
APPENDIX A .................................................................................................................... 63
APPENDEX B ................................................................................................................... 66
APPENDEX C ................................................................................................................... 67
APPENDEX D ................................................................................................................... 68
v
LIST OF FIGURES
Figure Description Page
Figure 2:1 Schematic design of breath alcohol detector ................................................... 9
Figure 2:2 Chemical Reaction Process in Semiconductor................................................. 9
Figure 2:3 Chemical Reaction Process in Fuel cell ........................................................ 10
Figure 2:4 Detecting Process in Intoxialyzer .................................................................. 11
Figure 2:5 Molecular Structure of Alcohol compound ................................................... 12
Figure 2:6 Alcohol Concentration in the Lung ............................................................... 13
Figure 2:7 Effect of likelihood of causing a accident ..................................................... 14
Figure 2:8 Block diagram of IID device operation ......................................................... 15
Figure 2:9 Photo of a MQ-3 Alcohol Sensor .................................................................. 17
Figure 2: 10 Photo of a PIC16F877A Microcontroller ................................................... 19
Figure 2:11 Internal Block Diagram of PIC16F877A Microcontroller ........................... 19
Figure 2:12 Labeled Pin Out Array of PIC16F877A ...................................................... 20
Figure 2:13 The Pin Out Array of the Model LCD Pannel ............................................. 22
Figure 2:14 Photo of the JHD162A LCD Pannel ........................................................... 23
Figure 2:15 Electric Circuit Diagram of the Ignition system .......................................... 24
Figure 2:16 Photo of the buzzer ..................................................................................... 24
Figure 2:17 Photo of the Geared Electric Motor............................................................. 25
Figure 2:18 Photo of the Relays ..................................................................................... 26
Figure 2: 19 Circuit Diagram of Interfacing buzzer to Microcontroller .......................... 27
Figure 2:20 The Model Transistor and Its Performance Curve ....................................... 27
Figure 2:21 Software Development ............................................................................... 28
Figure 3:1 Process and Methodology of the project ....................................................... 33
Figure 3:2 Block Diagram of the System Electric Circuitry ........................................... 36
Figure 3:3 System flow chart ......................................................................................... 37
vi
Figure 3:4 Photo of a Sample of the Voltage Regulator ................................................. 38
Figure 3:5 Electric Circuit Diagram of the Voltage Regulator ........................................ 38
Figure 3:6 Electric Circuit Diagram of the MQ-3 Sensor ............................................... 39
Figure 3:7 Main circuit schematic diagram .................................................................... 40
Figure 3:8 Main circuit schematic diagram .................................................................... 41
Figure 3:9 NPN Transistor symbols ............................................................................... 42
Figure 3:10 Buzzer's photo and symbols ........................................................................ 43
Figure 3:11 Relay internal connection ........................................................................... 44
Figure 3:12 Main circuit schematic diagram .................................................................. 44
Figure 3:13 Flow chart of the program........................................................................... 45
Figure 3:14 A/D block diagram ..................................................................................... 46
Figure 3:15 Flowchart of the Integration of the System.................................................. 47
Figure 4:1 Regulator circuit simulation result ................................................................ 49
Figure 4:2 System simulations under normal condition .................................................. 50
Figure 4:3 System simulation result under influence of alcohol ..................................... 50
Figure 4:4 Reset effects on the microcontroller .............................................................. 51
Figure 4:5 Regulator Circuit Testing.............................................................................. 52
Figure 4:6 MQ-3 Alcohol sensor driver ......................................................................... 53
Figure 4:7 Testing prototype with potentiometer (Vin<2V) ........................................... 54
Figure 4:8 Testing Prototype with potentiometer (Vin>2V) ........................................... 55
Figure 4:9 Testing prototype with potentiometer (Vin<2V) ........................................... 56
Figure 4:10 Condition when Alcohol does not detected by sensor .................................. 56
Figure 4:11Condition when Alcohol does not detected by sensor................................... 57

vii
LIST OF TABLES
Table Description Page
Table 1.1 Statistics of lawbreakers .................................................................................4
Table 2:1 PIC16f877 A feature ......................................................................................20
Table 2:2 The Pin Function of the LCD Pannel .............................................................22
Table 2:3 Parameters of the JHD162A LCD Pannel.......................................................23
Table 3.1 Concentration of alcohol in breath and their corresponding BAC................... 40
Table 3.2 LCD connection circuit ..................................................................................41
Table 4:1 Input and output values of voltage regulator .................................................. 52
Table 4:2 Input and output of voltage regulator .............................................................52
Table 4:3 Input and output value of sensor ....................................................................53
Table 4:4 Input and output value of sensor ....................................................................54

viii
ACRONYMS AND ABBREVIATIONS
A Ampere
AC Alternative Current
BAC Blood Alcohol Content
DC Direct Current
PIC Peripheral Interface Controller
PS Power Supply
DWI Drunk while under the influence of alcohol
R/W Read/ Write Signal
Rl Load Resistor
Rs Sensor Resistor
Rv Variable Resistor
BAIID Breath alcohol ignition interlock device
I/O Input/output
Vref Reference Voltage
Vss Negative Power Supply
LED Light Emitting Diode
LCD Liquid Crystal Display
PCB Printed Circuit Board
V Voltage
VAPS Vehicle Accident Prevention System

viii
ABSTRACT
Driving the vehicles by drunken drivers is one of the major reasons causing vehicle
collisions which is increasing day by day affecting economically the society and the
country as a whole. In this connection to minimize the collisions caused by the drunken
drivers, it is aimed to design and develop a system which detects the alcohol content in
the air exhaled by the driver in the vehicle and automatically turns off the car if alcohol
percentage exceeds the limit avoiding to drive the vehicle. The design of this project
includes the development of hardware and software as the device modules. Hardware part
includes the sensor circuit, the PIC16F877A Microcontroller circuit, LCD circuits and
Buzzer as the alarm & relay circuit. The alcohol sensor was used in this project to detect
the of alcohol content in the air exhaled by the driver. A program is developed using C
program and embedded in to a microcontroller PIC16F877A, for receiving analog data
from alcohol sensor, analyzing it and controlling ignition system. PIC microcontroller
compares the data which it receives from alcohol sensor, compares it with the threshold
values and if the value is beyond the limit it takes appropriate action like turning off the
ignition system to avoid the driver from driving the vehicle. An electro mechanical relay
is used to control the ignition system. Based on the values that were detected the system
also gives waning to the drunken drivers via alarm from buzzer, LCD and finally disables
the ignition switch to stop from driving the vehicle. The developed system was tested for
its functionality and it is observed that the system is working as per expectations.
Keywords: Drunk driving, ignition system, Alcohol gas sensor (MQ-3), Microcontroller.

1
1. INTRODUCTION
1.1. Background of the study
Transportation is one of the basic requirements for the proper functioning of societies as its
demand is highly related to the movement of people from one place to another. It is difficult to
conceive of a situation where transport does not play a major role in the life of an individual. It is
an accepted fact that of all modes of transportation, road transport is the nearest to people out of
all other transportation systems. And its major advantage compared with others, its flexibility,
which allows it to operate from door-to door over short distance at the most competitive prices.
In Africa over 80% of goods and peoples are transported by roads where as in Ethiopia road
transport accounts for over 90%of all the inter-urban freight and passenger movements in the
country. Therefore, transportation has accident on the day-to-day activities of the people,
especially in large cities where the drunk driving the vehicle. Cities in developing nations are not
only showing a rapid population growth, but also a change in their resident’s way of life. Vehicle
accident occurs due to drunk driving, slow road construction and maintenance, over speed,
shortage of parking space in the narrow streets, driving vehicle without safety such as seat belt,
using mobile during driving vehicle, technical problem, as well as in effective management and
enforcement.
Worldwide, about 1.2 million persons were killed on the roads and an additional 20-50 million
were injured. Drunk driving was the leading cause of death. Only 28 countries, representing 449
million people (7% of the world’s population), have adequate laws that address five risk factors
(speed, drink driving, helmets, seat belts and child restraints). High income countries reduced
fatalities from road traffic accidents by more than 25% during 1968-1998 and other drop of 30 %
has been recorded by 2020. While in low and middle income countries, where 81 % of the
world’s population live and own about 20%of the world’s vehicles. However, less than 35% of
low and middle income countries have policies in place to protect this road users [1] .Today
every country is facing serious problem with drunk drivers. The European Union has recognized
drunken driving, as a priority area, due to the fact that the loss due to death alone is 10,000 [1] of
the GDP of EU. In USA due to the drink and driving every year 1,393 people were dead, which
meant nearly four fatalities every day of the year [2].In India every year nearly 130,000 people
were being killed in drunk and driving road accidents, overtaking China and now have the worst

2
road traffic accident rate worldwide [3].According to World Health Organization (WHO) report,
70% of total road fatalities were caused under the influence of alcohol. In India alone the death
toll rose to 14 per every hour. The risk of a driver under the influence of alcohol being killed was
at least eleven times [4] that of a person with no alcohol.
To prevent this problem, many states have certain motor vehicle codes which specify that a
person was illegally intoxicated and presumptively an able of operating an automobile if his
blood alcohol level exceeds the normal level. Blood alcohol is measured as a function of the
percentage of alcoholic vapor in the air exhaled by drunk driver relatively accurate reading of
blood alcohol level through analysis of breath samples [7]. Alcohol detection from a person has
been examined by the device through an alcohol sensor, checks alcohol content and displays
output in unit of blood alcohol concentration (BAC). The detected amount was shown by means
of BAC percentages through LCD display or seven segments decode [8]. Initially, alcohol
detection was limited, only being utilized in purpose to detect and display blood alcohol
concentration only. However, as the number of drunk driving causes increased in recent years,
extensive researches and developments have been done in applying these devices in vehicles in
effort to prevent individuals who consumed excess alcohol beverages from driving vehicles.
Subsequently, in the United States , which its nation’s drunk driving related accident causes has
reached concerning level, drunk driving offenders are required to install an alcohol detection
system in their vehicles [9].
Ethiopia has experienced high rates of road traffic accidents, as the road was the major means of
transportation. From 2001/02-2004/05, the traffic accident death rate was in the range of 129 and
145 per ten thousand motor vehicles [5].
The main purpose behind this project is “Drunk driving detection”. Thus Drunk and driving is a
major reason of accidents in almost all countries all over the world. Absorption of alcohol into
the blood stream affects people by making them intoxicated. Technically it is determined by the
driver's blood alcohol level called the ‘blood alcohol concentration’ (BAC), which indicates the
degree of intoxication. In most countries 0.08 grams of alcohol per 100 mL of blood (BAC 0.08)
is set as the legal limit beyond which the driver is considered to be legally drunk. Any driver
with BAC > 0.08 can be considered to be driving under the influence of alcohol (DUI) or driving

3
while intoxicated (DWI) and should not be allowed to drive, because, it affects the central
nervous system of a person which instable the driver's ways of thinking [2& 5].
This project should be fitted / installed in the vehicle as well as the system should be integrated
with ignition switch in order to automatically disconnect the circuit when the car driver is
intoxicated. As a result the ignition system is deactivated and the car will be stopped.
The system was made from a compact circuitry built around PIC microcontroller, which outputs
the blood alcohol content (BAC) from the breath using MQ-3 alcohol sensor. The presence or
absence of alcohol is displayed on LCD.
The main intention of this system is to avoid the rate of accidents used ignition interlock device
technology which is normally happened due to drunkenness of driver. This system detection of
the drunkenness of driver and prevents them from driving. So there is a need for an effective
system to check drunk driver. In this project, alcohol detection content in the air exhaled by the
drunk driver which controls the ignition switch used microcontroller have been developed.
Instead of just indicated and displayed the BAC percentage, the tester has been programmed to
control the ignition switch, as well as an alarm and a number LCDs. The fundamental
components of this system were the MQ-3 alcohol sensor, PIC16F877A microcontroller unit, is
Analog to Digital Converter: We Know That System Understands Only Boolean Data and the
Output of the regulator is Analog Value that converts a continuous physical quantity (usually
voltage) to a digital number that represents the quantity's amplitude. The result is a sequence of
digital values that have converted a continuous-time and continuous-amplitude analog signal to a
discrete-time and discrete-amplitude digital signal and 2x16 characters LCD alphanumeric
display, buzzer and ignition switch circuit. Compared to the already available detectors in the
market, this system offers simplicity with extensive features and at a minimal cost of production.
In Adama City Administration currently we have observed many traffic accidents due to problem
of drunk drivers. Most vehicles in the city are not currently using modern technology to check
drunk drivers to prevent accidents. Therefore, we are interested to apply/implement this project
to avoid traffic vehicle accidents in Adama City Administration. The Statistics of law breakers is
depicted in table 1.1 given below.

4
Table 1.1 Statistics of lawbreakers
Law Breakers
Two wheelers
Four wheelers
Signal jumping
2,20,859
1,46,945
Drunken driving
36,727
17,237
1.2. Problem Statement
Vehicle accident is the major alarming issue in the world. This problem making the citizens
afraid of their journey. This is because during any vehicle accident, there was at least one death
or injury. In developing countries the death rates per vehicle are in the order of 50 times that of
European countries [10]. Currently Ethiopia, one of the developing countries in the world, loses
around 400 million Birr in each year due to vehicle accident [11]. One of the major reasons for
vehicle accidents is drunk driving. The Road Safety Council estimates that 30 percent of road
accidents nationwide were caused by drinking and driving [12].Drivers have 24 hours within
which to report a crash caused a likely under reported of drunk driving accident. So that the
proportion of alcohol in the breath blood or urine exceeds the prescribed limit set could
punished with imprisonment for a term not less than three years and not more than ten years, a
fine of not less than eight thousand dollars and not more than twenty thousand dollars [13]. The
main reason for driving during drunk are: The alcohol lowers inhibitions, make driver difficult to
make rational decisions, drunk driver still driving the vehicles, when the drunk drivers drive
alone no one has been give warning to them, the drunk drivers always drive alone especially
during late night with situation unconsciousness and they loss their rationalism & drunk
driver itself chooses not to follow any safety. A common example of supervised blood alcohol
concentration test occur when a police officer administers test a subject of operating motor
vehicle under the influence of alcohol [14].So, a systematic and effective approach in effort to
prevent alcohol impaired driving is definite necessity [15].

5
Based on the above statements of problems, we are interested to design and implement alcohol
detection system in the vehicle to avoid car accidents from Adama City Administration Roads,
moreover implement to all country of Ethiopia.
1.3. Project Objectives
1.3.1. General objective
The general objective of this project is to design and development of breath alcohol detection
system with the featuersofwarningdriverandengineignitionlockingforperventingvehicleaccidents.
1.3.2. Specific objectives
The specific objectives for this project are:
To Prepare a circuit layout of alcohol detection system with required features
To produce a program coding and embed in PIC microcontroller
To construct a prototype
To Test the prototype for its functionality
1.4. Project scope
There are many parameters which may cause vehicle collisions. But this project delimited only
to minimize collisions by avoiding the drunken drivers from driving.
The project scope is essential in insuring the project to conduct within its intended boundaries
and remains in the right directions to achieve its objectives.
The intended boundaries of this project are:
Development of hardware
Development of software,
Disabling ignition system.
Construction of small casing for mounting developed alcohol detection system.
It can be used or placed in any vehicle and easy to use.
6
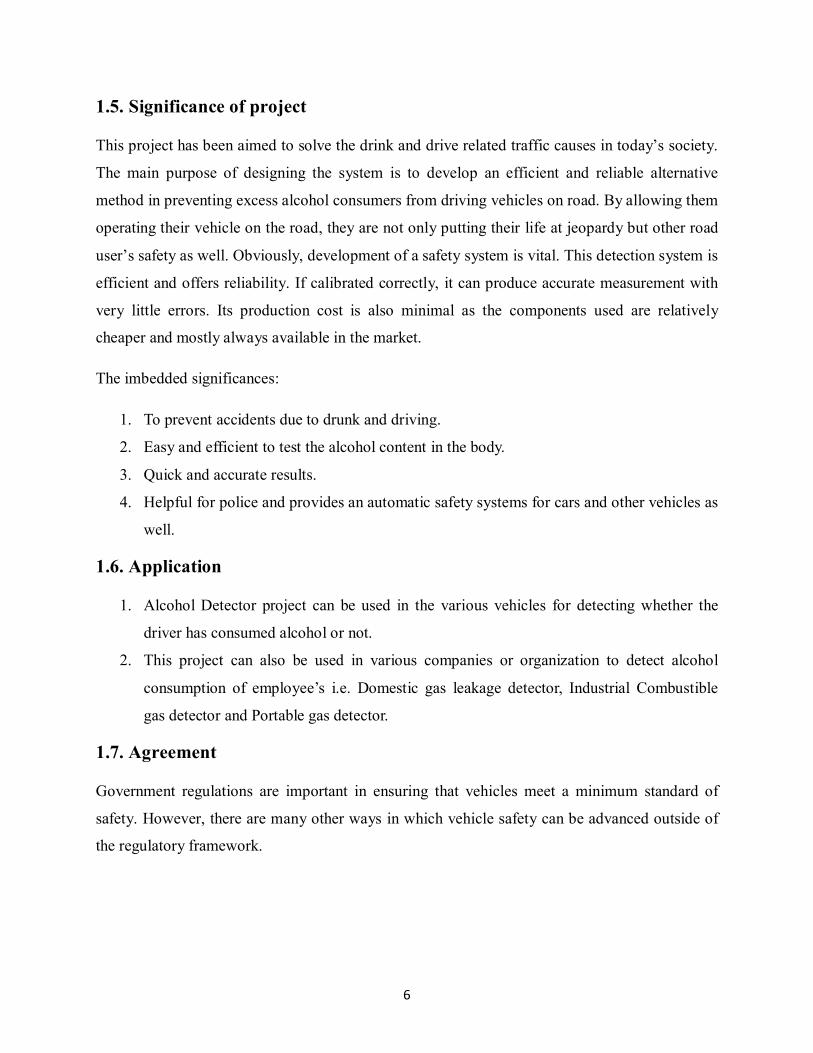
1.5. Significance of project
This project has been aimed to solve the drink and drive related traffic causes in today’s society.
The main purpose of designing the system is to develop an efficient and reliable alternative
method in preventing excess alcohol consumers from driving vehicles on road. By allowing them
operating their vehicle on the road, they are not only putting their life at jeopardy but other road
user’s safety as well. Obviously, development of a safety system is vital. This detection system is
efficient and offers reliability. If calibrated correctly, it can produce accurate measurement with
very little errors. Its production cost is also minimal as the components used are relatively
cheaper and mostly always available in the market.
The imbedded significances:
1. To prevent accidents due to drunk and driving.
2. Easy and efficient to test the alcohol content in the body.
3. Quick and accurate results.
4. Helpful for police and provides an automatic safety systems for cars and other vehicles as
well.
1.6. Application
1. Alcohol Detector project can be used in the various vehicles for detecting whether the
driver has consumed alcohol or not.
2. This project can also be used in various companies or organization to detect alcohol
consumption of employee’s i.e. Domestic gas leakage detector, Industrial Combustible
gas detector and Portable gas detector.
1.7. Agreement
Government regulations are important in ensuring that vehicles meet a minimum standard of
safety. However, there are many other ways in which vehicle safety can be advanced outside of
the regulatory framework.

7
1.8. Limitations of the study
Since as it is a new technology to our country, very few studies (almost no) had conducted by
Ethiopian scholars concerning the field (drunk driving alcohol detection system using
microcontroller), getting information is very hard. Moreover, electronic components required for
the project are not easily accessible so that we had to find alternatives; in the course of finding
the best alternatives we have faced considerable time and financial constraints.
1.9. Organization of the Study
This project consists of five chapters. The first chapter is an introduction part and discusses about
the overview of project, statements of the problem and its magnitude, objective of the research-
general and specific objectives, significance of the study, scope of the project, and limitation of
the study. Chapter two refers the review of related literature and it contains a detailed description
of vehicle accident system. It explains about the concept of semiconductor model system, Blood
Alcohol Concentration (BAC) and alcohol detection system the application of this system and
the involved components in this project. Chapter three includes the project methods and
materials and it explains how the project is organized and the flow of process in completing this
project. Also this topic discusses the methods of the system, circuit design, hardware and
software design Chapter four is about findings and analysis and it contains detailed description
about hardware development. It explains more detail about the electronic component that had
been used and the method used to develop hardware. This chapter includes the software method
of model and simulation. This project was discussed more about the software that had been used
to design programming for the whole project and the software that had been used to design a
Printed Circuit Board (PCB). Chapter five consists of more about the result and discussion and
shows the result of the project step by step. This chapter also describes about summary,
conclusions and recommendations. It summarizes and concludes the whole project and gives
future recommendations to make the project perfect and improve its quality. Finally, references
of the sources cited in the project and appendices containing any other relevant material used
for the study and sample of the programming codes are attached at the end of the paper.
8
2. LITERATURE REVIEW
2.1. General Overview
In recent years, there a lot of inventions have been created to detect the alcohol in person blood
stream. In this chapter will be discussed in detail about the hardware development and explains
about the sensing system and the output system of the project. It also touches about the software
that will be used for the programmed, which were PIC microcontroller. Beside that there were a
couple of past related works presented contain useful information about the development of
breathalyzer will be discussed.
This system detects the content of alcohol in the breath and it attempts to clamp down alcoholics.
This system uses PIC16F877A, LCD display, MQ-3 gas sensor, relay and buzzer. The output of
the sensor is directly proportional to the content of alcohol consumed. Now days alcohol sensor
play a significant role in our society and it has vast applications. This type of sensors in cars is a
great safety factor which can be embedded in the steering of the cars. When the driver starts the
ignition, sensor measures the content of the alcohol in his breath and automatically switches off
the car which will stop the drink driving offenders. Thus we can reduce alcohol related road
accidents and hence these kinds of detectors have a great relevance. It can also be used in
schools, colleges, offices and some public places such as hospitals, libraries etc. [26].
2.2. Review on previous work
The breath alcohol detector in current market, which is require a blowing through a mouthpiece,
usually have some limitation because of requirement of mouthpiece and requirement of a long
hard blowing from more than five second. Mouthpiece in alcohol detector is to prevent the
expiration being diluted with ambient air and to make the expiration certainly reach detector and
five second blowing is to get an exhaled air sample deep from the alveolar air and lung, which is
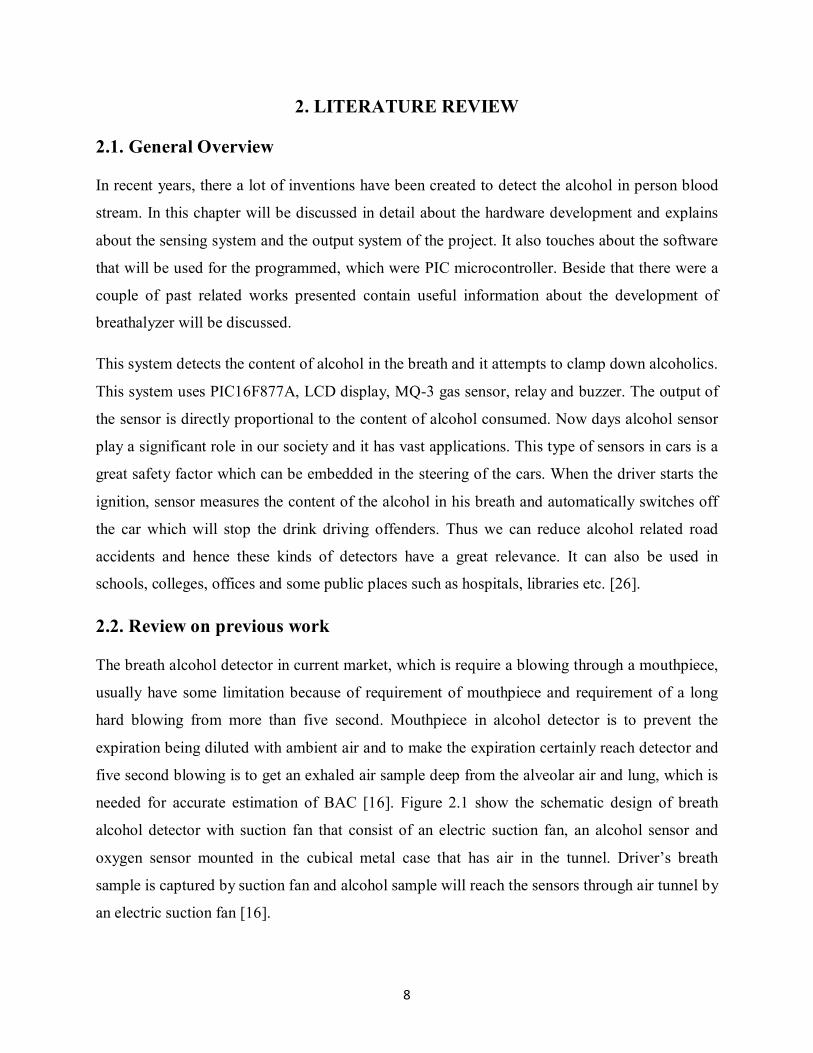
needed for accurate estimation of BAC [16]. Figure 2.1 show the schematic design of breath
alcohol detector with suction fan that consist of an electric suction fan, an alcohol sensor and
oxygen sensor mounted in the cubical metal case that has air in the tunnel. Driver’s breath
sample is captured by suction fan and alcohol sample will reach the sensors through air tunnel by
an electric suction fan [16].
9
Figure 2:1 Schematic design of breath alcohol detector
2.2.1. Breath alcohol detector model
Basically there are four type of breath alcohol sensor which is semiconductor model, fuel cell
model, infrared ray (IR) spectroscopy model and gas chromatography model. These models are
used to detect alcohol concentration and produce the output to reader.
2.2.1.1. Semiconductor model
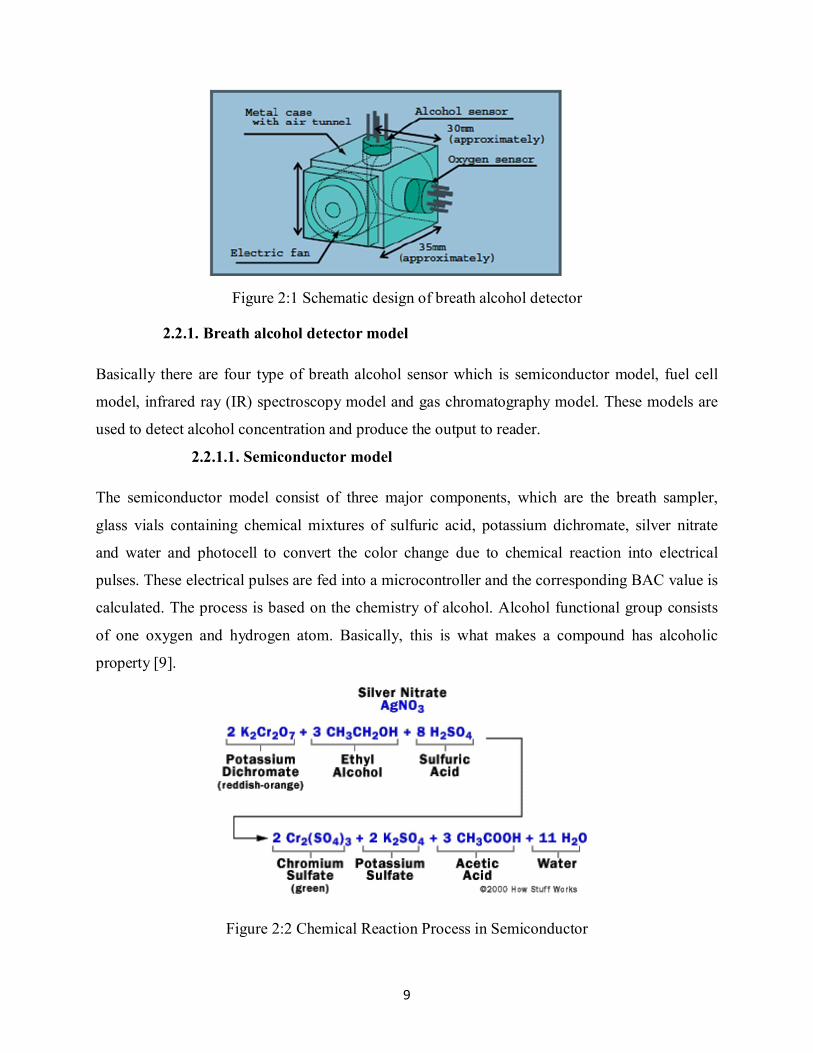
The semiconductor model consist of three major components, which are the breath sampler,
glass vials containing chemical mixtures of sulfuric acid, potassium dichromate, silver nitrate
and water and photocell to convert the color change due to chemical reaction into electrical
pulses. These electrical pulses are fed into a microcontroller and the corresponding BAC value is
calculated. The process is based on the chemistry of alcohol. Alcohol functional group consists
of one oxygen and hydrogen atom. Basically, this is what makes a compound has alcoholic
property [9].
Figure 2:2 Chemical Reaction Process in Semiconductor
10
These models have the main advantage of being relatively inexpensive compared to other. Many
semiconductor models are available and their use has increased rapidly. They have always been
the tester of choice in law enforcement because of their reliability and non-invasive tool of
forensic alcohol analysis [9].
2.2.1.2. Fuel Cell
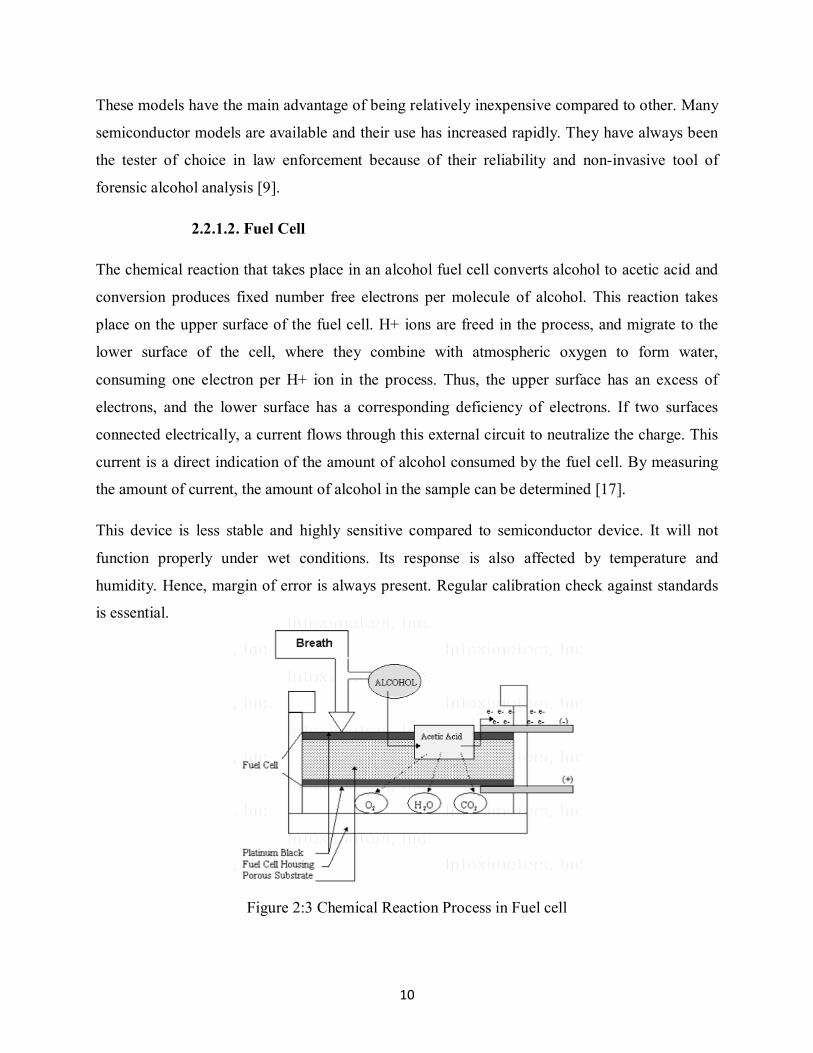
The chemical reaction that takes place in an alcohol fuel cell converts alcohol to acetic acid and
conversion produces fixed number free electrons per molecule of alcohol. This reaction takes
place on the upper surface of the fuel cell. H+ ions are freed in the process, and migrate to the
lower surface of the cell, where they combine with atmospheric oxygen to form water,
consuming one electron per H+ ion in the process. Thus, the upper surface has an excess of
electrons, and the lower surface has a corresponding deficiency of electrons. If two surfaces
connected electrically, a current flows through this external circuit to neutralize the charge. This
current is a direct indication of the amount of alcohol consumed by the fuel cell. By measuring
the amount of current, the amount of alcohol in the sample can be determined [17].
This device is less stable and highly sensitive compared to semiconductor device. It will not
function properly under wet conditions. Its response is also affected by temperature and
humidity. Hence, margin of error is always present. Regular calibration check against standards
is essential.
Figure 2:3 Chemical Reaction Process in Fuel cell
11
2.2.1.3. Infrared Spectroscopy Model
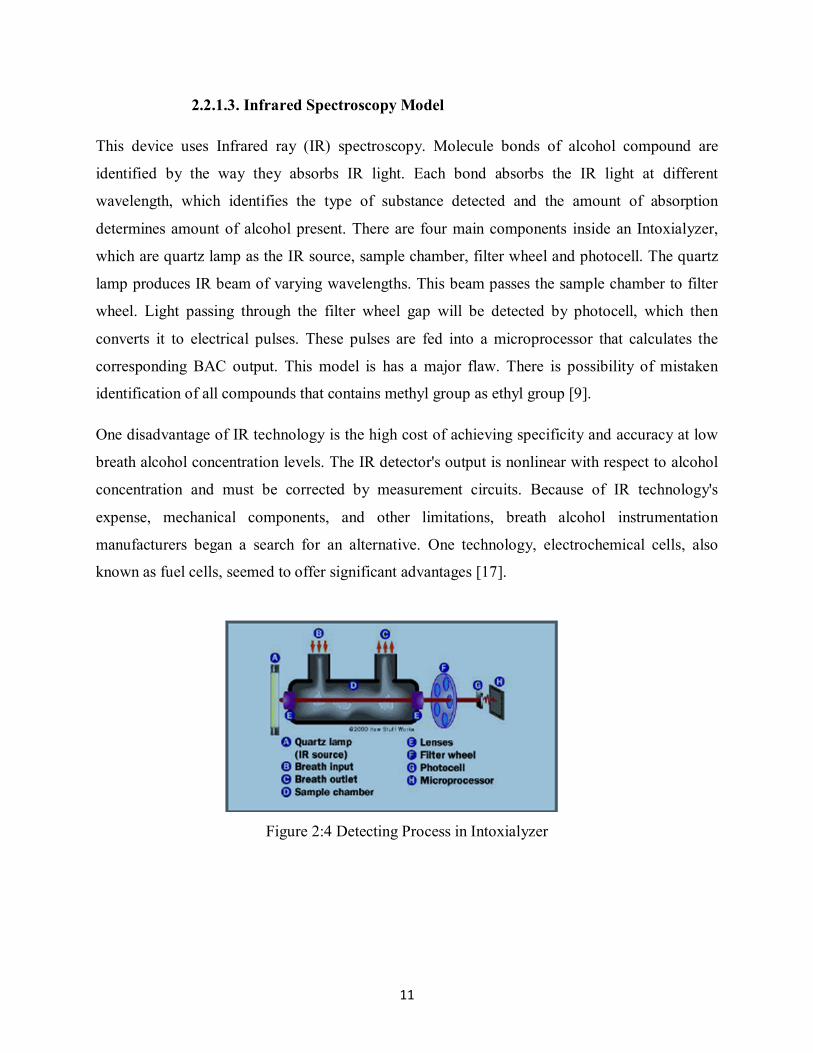
This device uses Infrared ray (IR) spectroscopy. Molecule bonds of alcohol compound are
identified by the way they absorbs IR light. Each bond absorbs the IR light at different
wavelength, which identifies the type of substance detected and the amount of absorption
determines amount of alcohol present. There are four main components inside an Intoxialyzer,
which are quartz lamp as the IR source, sample chamber, filter wheel and photocell. The quartz
lamp produces IR beam of varying wavelengths. This beam passes the sample chamber to filter
wheel. Light passing through the filter wheel gap will be detected by photocell, which then
converts it to electrical pulses. These pulses are fed into a microprocessor that calculates the
corresponding BAC output. This model is has a major flaw. There is possibility of mistaken
identification of all compounds that contains methyl group as ethyl group [9].
One disadvantage of IR technology is the high cost of achieving specificity and accuracy at low
breath alcohol concentration levels. The IR detector's output is nonlinear with respect to alcohol
concentration and must be corrected by measurement circuits. Because of IR technology's
expense, mechanical components, and other limitations, breath alcohol instrumentation
manufacturers began a search for an alternative. One technology, electrochemical cells, also
known as fuel cells, seemed to offer significant advantages [17].
Figure 2:4 Detecting Process in Intoxialyzer

12
2.2.1.4. Gas Chromatography Model
This model is mainly based on chromatographic separation principle. Alcohol Peak is detected
and its intensity is determined.
2.2.2. Alcohol compound
Alcohol is defined as any of a class of organic compounds characterized by one or more
hydroxyl (−OH) groups attached to a carbon atom of an alkyl group (hydrocarbon chain).
Alcohols may be considered as organic derivatives of water (H2O) in which one of the hydrogen
atoms has been replaced by an alkyl group, typically represented by R in organic structures. For
example, in ethanol (or ethyl alcohol) the alkyl group is the ethyl group, −CH2CH3 [18].
Figure 2:5 Molecular Structure of Alcohol compound
2.2.3. Alcohol in breath
Alcohol is volatile and as a result, an amount of alcohol which is proportion to the concentration
in the blood, transfers from the blood into the alveolar air sacs in the lungs. This also happens
when carbon dioxide leaves the alveolar blood and enters the lungs for exhalation from the body.
So, it is possible to analyze an alveolar breath sample, breath alcohol concentration (BAC) can
determine and high degree of accuracy can be predict, the blood alcohol concentration at that
same point in time [18].

13
Figure 2:6 Alcohol Concentration in the Lung
2.2.4. Blood alcohol concentration
Blood alcohol concentration (BAC) is defined to be percentage of alcohol in gram per 100mL of
blood. It indicates degree of intoxication. Therefore, 0.08% BAC is equivalent to 80mg of
alcohol in 100mL of blood. The alcohol sensor has been detected the amount of alcohol in
atmosphere, not in blood. Hence, correlation between breath and blood is needed and the
scientifically agreed ratio is 2100:1, provided with deep lung breath sample produced. Different
BAC level affects human differently. The amount of alcohol BAC considered to be legally
impaired varies according to country. In Malaysia, the legal limit of BAC is 0.08% [4]. There are
also countries that preferred a legal BAC limit of 0%, which means once alcohol is detected, the
person is considered drunk. Each breathalyzer device is individually pre-calibrated. Hence, the
calibration method is independent of breathalyzer models used [19].
BAC refers to the amount of alcohol contained in a person's blood. It is measured as weight per
unit of volume. Typically this measurement was converted to a percentage such as 0.06%, which
indicates that one-six of a percent of a person's blood is alcohol. Because alcohol in the blood
travels directly to the brain, cognitive functioning is affected and increased risk of many kinds of
injuries. Most significant among these was the risk of a motor vehicle accident when a person
drives with too great a concentration of alcohol in his or her system [20].
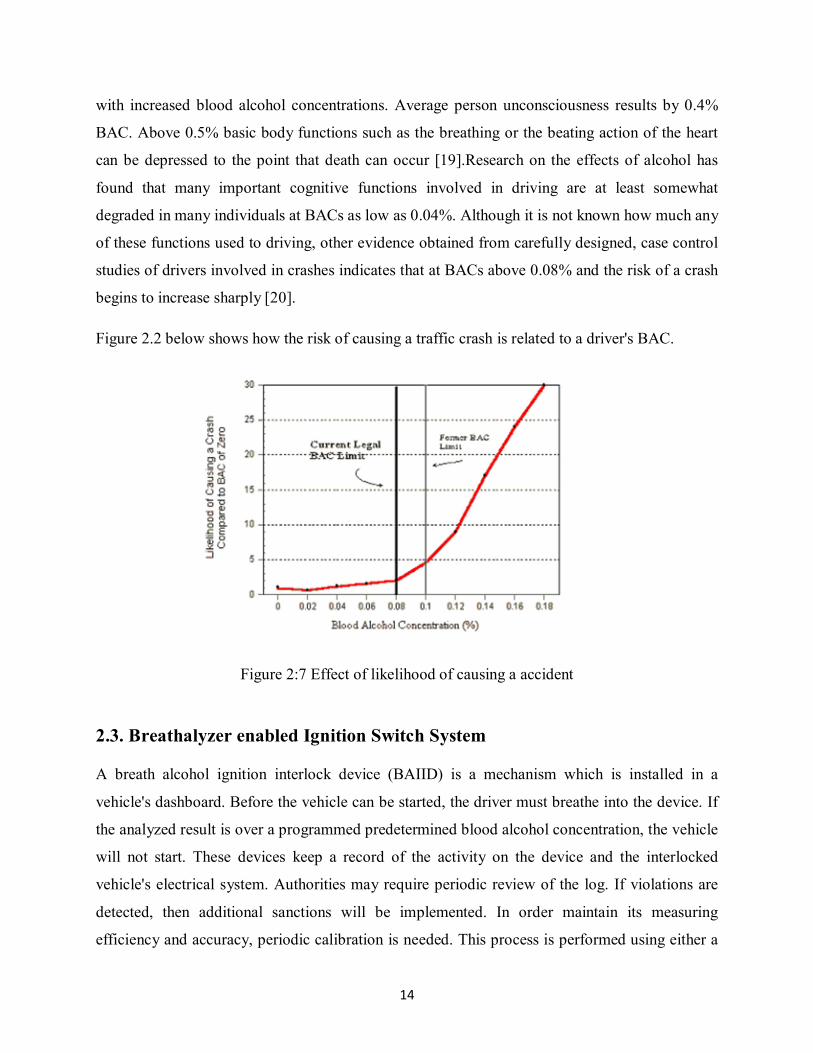
Impairment from alcohol poisoning was originally defined by blood alcohol levels. It was
observed that most people showed measurable mental impairment at around 0.05% blood alcohol
concentration. Above this level it has been found that motor functions deteriorate progressively
14
with increased blood alcohol concentrations. Average person unconsciousness results by 0.4%
BAC. Above 0.5% basic body functions such as the breathing or the beating action of the heart
can be depressed to the point that death can occur [19].Research on the effects of alcohol has
found that many important cognitive functions involved in driving are at least somewhat
degraded in many individuals at BACs as low as 0.04%. Although it is not known how much any
of these functions used to driving, other evidence obtained from carefully designed, case control
studies of drivers involved in crashes indicates that at BACs above 0.08% and the risk of a crash
begins to increase sharply [20].
Figure 2.2 below shows how the risk of causing a traffic crash is related to a driver's BAC.
Figure 2:7 Effect of likelihood of causing a accident
2.3. Breathalyzer enabled Ignition Switch System
A breath alcohol ignition interlock device (BAIID) is a mechanism which is installed in a
vehicle's dashboard. Before the vehicle can be started, the driver must breathe into the device. If
the analyzed result is over a programmed predetermined blood alcohol concentration, the vehicle
will not start. These devices keep a record of the activity on the device and the interlocked
vehicle's electrical system. Authorities may require periodic review of the log. If violations are
detected, then additional sanctions will be implemented. In order maintain its measuring
efficiency and accuracy, periodic calibration is needed. This process is performed using either a
15
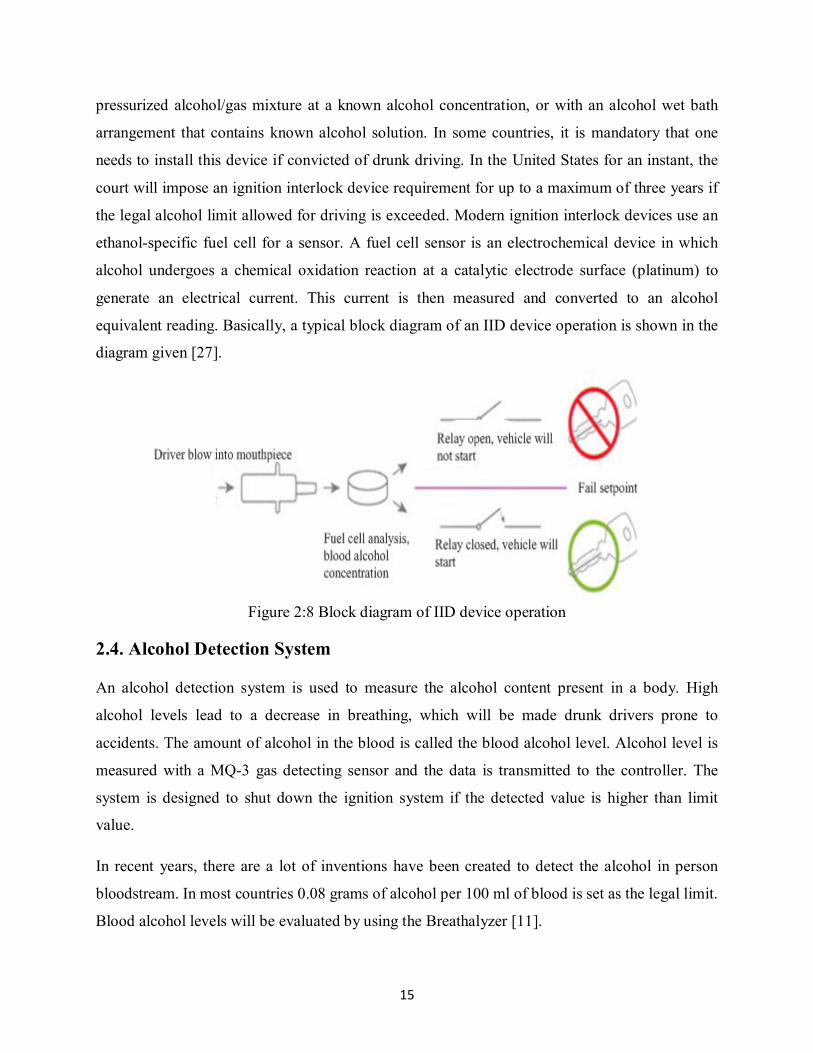
pressurized alcohol/gas mixture at a known alcohol concentration, or with an alcohol wet bath
arrangement that contains known alcohol solution. In some countries, it is mandatory that one
needs to install this device if convicted of drunk driving. In the United States for an instant, the
court will impose an ignition interlock device requirement for up to a maximum of three years if
the legal alcohol limit allowed for driving is exceeded. Modern ignition interlock devices use an
ethanol-specific fuel cell for a sensor. A fuel cell sensor is an electrochemical device in which
alcohol undergoes a chemical oxidation reaction at a catalytic electrode surface (platinum) to
generate an electrical current. This current is then measured and converted to an alcohol
equivalent reading. Basically, a typical block diagram of an IID device operation is shown in the
diagram given [27].
Figure 2:8 Block diagram of IID device operation
2.4. Alcohol Detection System
An alcohol detection system is used to measure the alcohol content present in a body. High
alcohol levels lead to a decrease in breathing, which will be made drunk drivers prone to
accidents. The amount of alcohol in the blood is called the blood alcohol level. Alcohol level is
measured with a MQ-3 gas detecting sensor and the data is transmitted to the controller. The
system is designed to shut down the ignition system if the detected value is higher than limit
value.
In recent years, there are a lot of inventions have been created to detect the alcohol in person
bloodstream. In most countries 0.08 grams of alcohol per 100 ml of blood is set as the legal limit.
Blood alcohol levels will be evaluated by using the Breathalyzer [11].

16
There are lots of cause of accident of car and they are drunkenness of driver, drowsiness of
driver, unconsciousness of driver and many time what happen driver was not responsible for
accident but their neighboring car behavior have made role to enforce accident. There are some
system have been implemented to avoid accident but that do not give proper solution to
implement in car to avoid various accidents that they are normally being happen. For example
when driver at speed suppose 80 km/h suddenly stop ignition system may lead to chances of
dangerous accident. In [21], they had use PIC 16F877A controller, Alcohol sensor, LCD Display
and alarm system to notify driver only and ignition system was after some second off when
detected alcohol.
Blood Alcohol Content (BAC) is usually expressed as a percentage of alcohol in the blood. High
BAC of the drunken driver has been affecting their behaviors likes’ unconsciousness, emotional
swings and anger or sadness. There is the research about Blood Alcohol Concentration (BAC)
with 0.2mg/l and above (measured in mg of alcohol per 100ml of blood, or mg/l) the judgment,
coordination and sensory perception are impaired, reaction time slows, performance in
intellectual tests falls and eyesight is weakened [22].
If the amount of alcohol consumed is small, the amount could verify. Generally PIC micro
controller uses 5V of electricity to process a detected value that is less than the limit value and a
signal sent to the relay switch. The relay circuit converts 5V into 230V, which makes the switch
turn off. When this happens the DC motor of the vehicle turns on. If the driver consumes a lot of
alcohol not happy, the supplied value not enough to turn on the controller and the relay switch.
The ignition of the vehicle and DC motor is not activated. An alarm goes off to inform the
authorities. This system checks drivers for alcohol consumption and prevents drunk drivers from
committing crashes or accidents. Devices for the determination of breath alcohol concentration
(BAC) are commercially available for screening and evidential purposes, and alcohol interlocks
are being increasingly used [26].
Alcohol detection system includes hardware and software. The major components for alcohol
detection system are the following.
17
2.6.1. Alcohol sensor
The alcohol sensor is used to analyze breath to determine alcohol consumption. Here the
transmitted analog signal converted into digital and transmitted to the microcontroller circuit.
The alcohol sensor has been detected the alcohol content depending on drunk driver breath in air
and the signal has been send data to PIC16F877A as a controller to other circuits. The result of
alcohol content in human breath that has been detected from alcohol sensor displayed on the
LCD 16 x 2 displays.
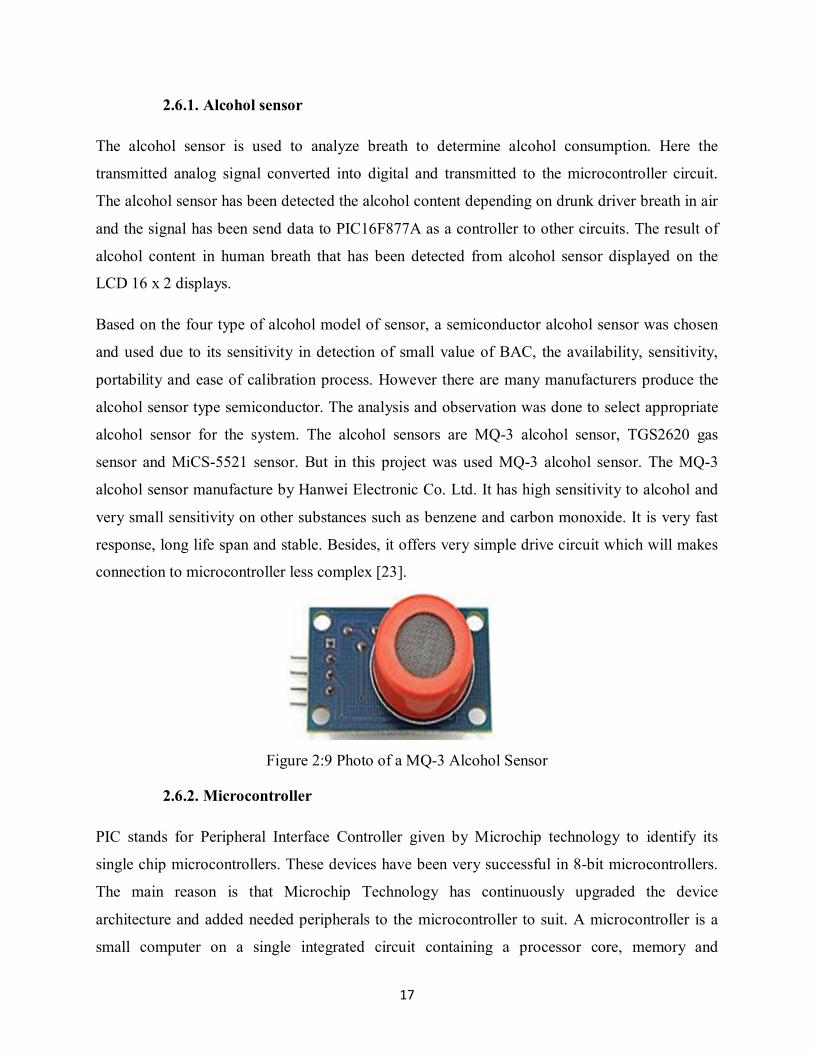
Based on the four type of alcohol model of sensor, a semiconductor alcohol sensor was chosen
and used due to its sensitivity in detection of small value of BAC, the availability, sensitivity,
portability and ease of calibration process. However there are many manufacturers produce the
alcohol sensor type semiconductor. The analysis and observation was done to select appropriate
alcohol sensor for the system. The alcohol sensors are MQ-3 alcohol sensor, TGS2620 gas
sensor and MiCS-5521 sensor. But in this project was used MQ-3 alcohol sensor. The MQ-3
alcohol sensor manufacture by Hanwei Electronic Co. Ltd. It has high sensitivity to alcohol and
very small sensitivity on other substances such as benzene and carbon monoxide. It is very fast
response, long life span and stable. Besides, it offers very simple drive circuit which will makes
connection to microcontroller less complex [23].
Figure 2:9 Photo of a MQ-3 Alcohol Sensor
2.6.2. Microcontroller
PIC stands for Peripheral Interface Controller given by Microchip technology to identify its
single chip microcontrollers. These devices have been very successful in 8-bit microcontrollers.
The main reason is that Microchip Technology has continuously upgraded the device
architecture and added needed peripherals to the microcontroller to suit. A microcontroller is a
small computer on a single integrated circuit containing a processor core, memory and

18
programmable input/output peripherals. Program memory in the form of Ferroelectric RAM,
NOR flash or OTP ROM are included on chip. Microcontrollers are designed for embedded
applications, in contrast to the microprocessors used in personal computers or other general
purpose applications consisting of various discrete chips.
Microcontrollers are used in automatically controlled products and devices such as automobile
engine control systems, implantable medical devices, remote controls, office machines,
appliances, power tools, toys and other embedded systems. By reducing the size and cost
compared to a design that uses a separate microprocessor, memory, and input/output devices,
microcontrollers make it economical to digitally control even more devices and processes.
Microcontroller programmed to measure the processed value against predefined limit values that
is divided into: low, medium and high. If the detected value is higher than the limit value a signal
sent to set the alarm inside the vehicle.
Selection of Microcontroller
As we know that there are so many types of micro controller families that are available in the
market.
These are:
8051 Family
AVR microcontroller Family
PIC microcontroller Family
ARM Family
Basic PIC family is the best controller and easily available in the market with low cost as well as
easily interfaced with programmed. Due to these basic reasons, PIC16F877A controller has been
selected inbuilt ISP (in system programmer) option.
There are minimum six requirements for proper operation of microcontroller.
Those are:
1. Power supply section
2. pull-ups for ports (it is must for PORT0)
3. Reset circuit
4. Crystal circuit
19
5. ISP circuit (for program dumping)
6. EA/VPP pin is connected to VCC.
PORT0 is open collector that’s why we are using pull-up resistor which makes PORT0 as an I/O
port. Reset circuit is used to reset the microcontroller. Crystal circuit is used for the
microcontroller for timing pluses.
Figure 2: 10 Photo of a PIC16F877A Microcontroller
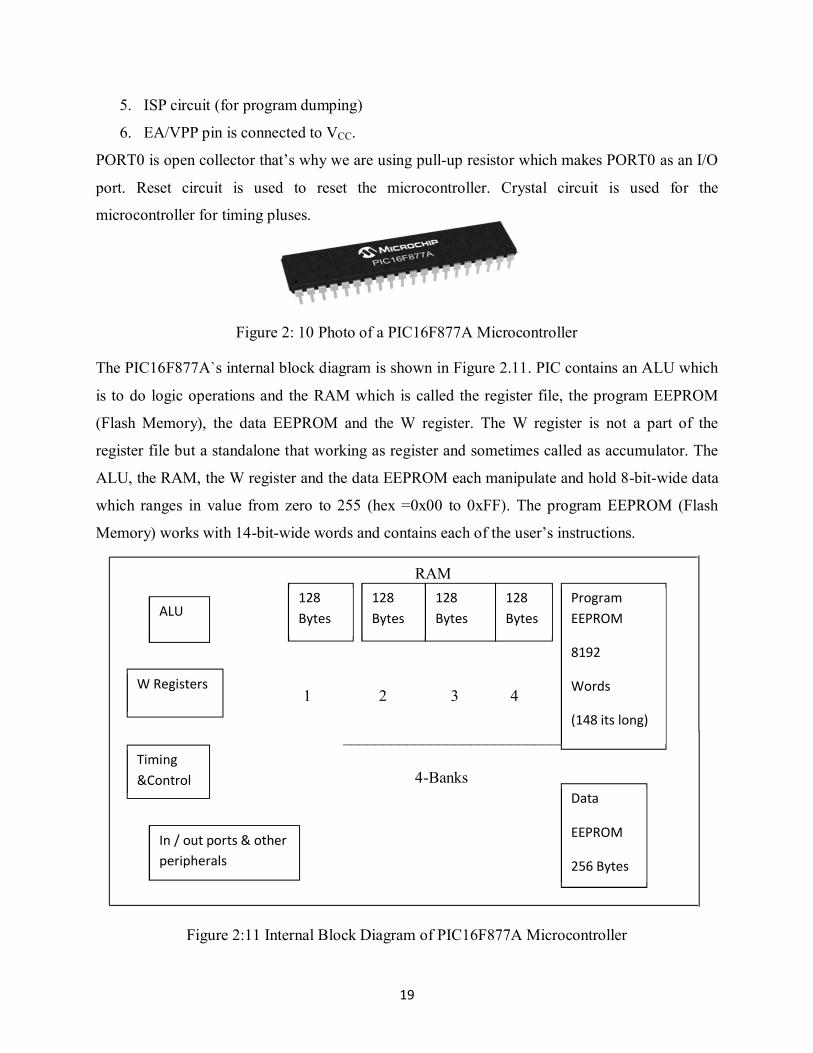
The PIC16F877A`s internal block diagram is shown in Figure 2.11. PIC contains an ALU which
is to do logic operations and the RAM which is called the register file, the program EEPROM
(Flash Memory), the data EEPROM and the W register. The W register is not a part of the
register file but a standalone that working as register and sometimes called as accumulator. The
ALU, the RAM, the W register and the data EEPROM each manipulate and hold 8-bit-wide data
which ranges in value from zero to 255 (hex =0x00 to 0xFF). The program EEPROM (Flash
Memory) works with 14-bit-wide words and contains each of the user’s instructions.
RAM
1 1 2 3 4
_____________________________
4-Banks
Figure 2:11 Internal Block Diagram of PIC16F877A Microcontroller
ALU 128
Bytes
128
Bytes
128
Bytes
128
Bytes
Program
EEPROM
8192
Words
(148 its long)
W Registers
Timing
&Control
In / out ports & other
peripherals
Data
EEPROM
256 Bytes

20
Microcontrollers usually have different sizes of memory data and program memory (in the PIC:
8-bits for data and 14-bits for program words). Besides that, the key is that the data and program
memories occupy separate spaces allows access to each at the same time. The PICRAM
addresses range from zero to 511 but the user can only access a RAM byte in a set of four banks
of 128 bytes each and only one bank at a time. Not all RAM is available to the user as read write
memory. However, many addresses are assigned to special functions within the processor but
they look like RAM and are accessed the same way.
Table 2.1 show below the PIC16F877A feature
Table 2:1 PIC16f877 A feature
Parameter name Value
Program memory type Flash program
Program Memory size(Kbytes) 14
RAM (bytes) 368
Data EEPROM(bytes) 256
I/O 33
PIC16F877A pin Layout
Figure 2:12 Labeled Pin Out Array of PIC16F877A

21
I/O Pins
There are 40 pins on PIC 16F877A. Most of them can be used as an I/O pin. Others are for
specific functions.
VSS and VDD
These are power supply pins .VDD is the positive supply and VSS is the negative supply or
0V.The maximum supply voltage that you can use is 6V and the minimum is 2V.
2.6.3. Liquid Crystal Display
Liquid crystal display (LCD) is a display unit that has the ability to display numbers, letters,
words and all manners of symbols. Its features make it a good deal more versatile than a familiar
7-segment light emitting diode (LED) displays. Although it is more expensive than an ordinary
seven segment decoders, but it has significant advantages compared other cheaper display units
when applied in sophisticated electronic display projects. LCD comes in a variety of sizes and
shapes. Line lengths of 8, 16,20,24,32 and 40 characters are all standard in one, two and four line
versions. Two types of connections can be done to a microcontroller unit either in series or in
parallel. Connections in series require additional components to interface a microcontroller to the
display unit. Most of the LCDs need a supply voltage of about 5V to operate. Some of them also
have backlights so that they can be viewed in dimly-light conditions. Major features of LCD are
its light weight construction, its portability, and its ability to be produced in much larger screen
sizes than are practical for the construction of cathode ray tube (CRT) display technology. Its
lower electrical power consumption enables it to be used in battery powered electronic
equipment.

22
Table 2:2 The Pin Function of the LCD Pannel
Pin No. Name Function
1 VSS Ground
2 VDD Positive supply
3 VEE Contrast
4 RS Register select
5 R/W Read/Wright
6 E Enable
7 D0 Data bit 0
8 D1 Data bit 1
9 D2 Data bit 2
10 D3 Data bit 3
11 D4 Data bit 4
12 D5 Data bit 5
13 D6 Data bit 6
14 D7 Data bit 7
Figure 2:13 The Pin Out Array of the Model LCD Pannel
Note: Pin no.15 and 16 is for back light power supply Pin out view
In this project, the output of blood alcohol concentration (BAC) has been displayed at LCD
panel. This is better choice of displaying the output rather using the LED as the output. LCD
output will provide the fast and correct reading and avoid human error while read the output. The
input of this LCD has been connected to the microcontroller that has been produced the reading
and displaying to LCD after do some logical operation.
23
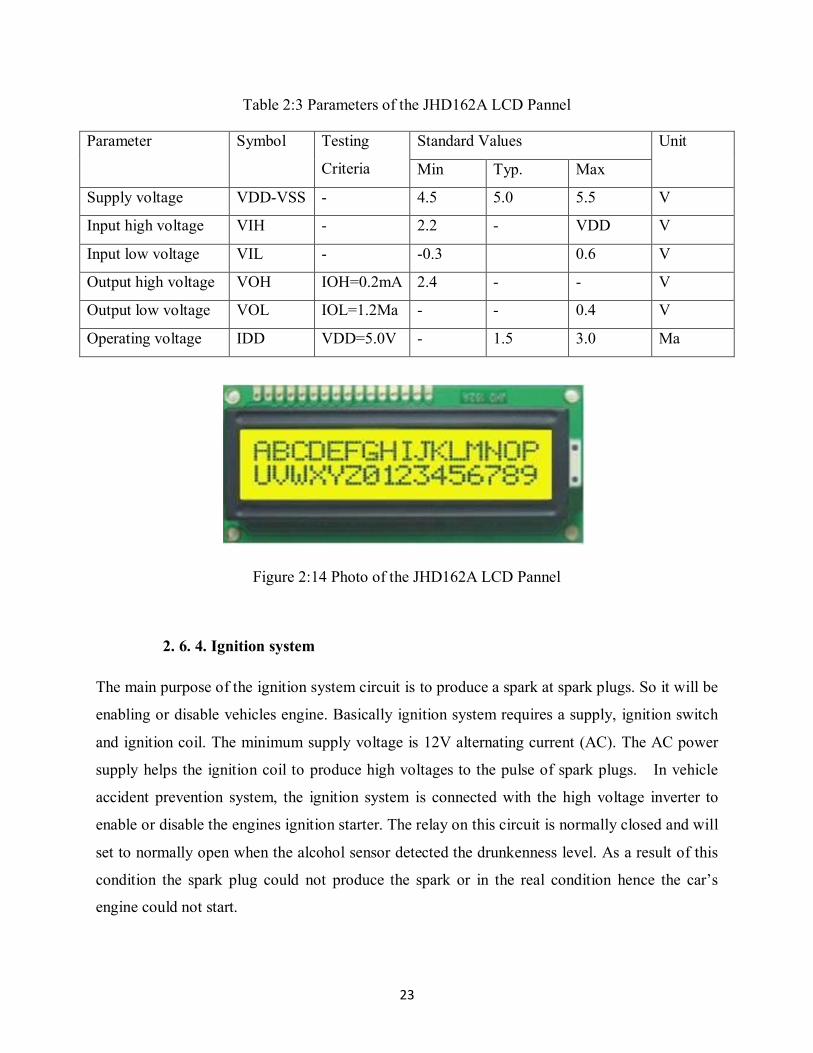
Table 2:3 Parameters of the JHD162A LCD Pannel
Parameter Symbol Testing
Criteria
Standard Values Unit
Min Typ. Max
Supply voltage VDD-VSS - 4.5 5.0 5.5 V
Input high voltage VIH - 2.2 - VDD V
Input low voltage VIL - -0.3 0.6 V
Output high voltage VOH IOH=0.2mA 2.4 - - V
Output low voltage VOL IOL=1.2Ma - - 0.4 V
Operating voltage IDD VDD=5.0V - 1.5 3.0 Ma
Figure 2:14 Photo of the JHD162A LCD Pannel
2. 6. 4. Ignition system
The main purpose of the ignition system circuit is to produce a spark at spark plugs. So it will be
enabling or disable vehicles engine. Basically ignition system requires a supply, ignition switch
and ignition coil. The minimum supply voltage is 12V alternating current (AC). The AC power
supply helps the ignition coil to produce high voltages to the pulse of spark plugs. In vehicle
accident prevention system, the ignition system is connected with the high voltage inverter to
enable or disable the engines ignition starter. The relay on this circuit is normally closed and will
set to normally open when the alcohol sensor detected the drunkenness level. As a result of this
condition the spark plug could not produce the spark or in the real condition hence the car’s
engine could not start.

24
Figure 2:15 Electric Circuit Diagram of the Ignition system
2.6.5. Power supply and voltage regulator
Output power supply unit dc is given to the controller, input and output system. The primary
purpose of the regulator is to rectifier and filter circuit in providing a constant dc voltage to the
device. Power supplies without regulators have an inherent problem of changing dc voltage
values due to variations in the load or fluctuations in the input voltage [24].
2.6.6. Buzzer
A buzzer is an audio signaling device which may be mechanical, electromechanical or
piezoelectric. Typical uses of buzzer include alarm devices; timers and confirmation of user
input such as a mouse click [25].
Figure 2:16 Photo of the buzzer
2.6.7. DC MOTOR
It is used as a dummy for indicating the engine locking facility whenever alcohol is detected.
Geared motors are complete motive force systems consisting of an electric motor and reduction
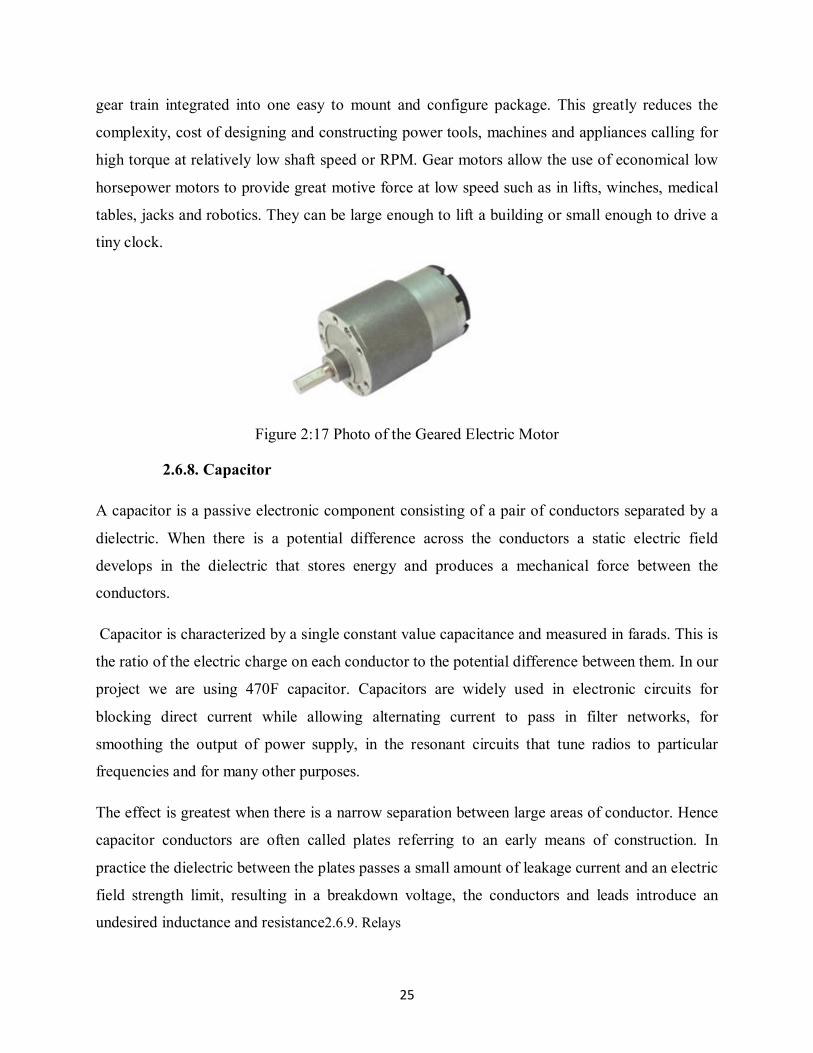
25
gear train integrated into one easy to mount and configure package. This greatly reduces the
complexity, cost of designing and constructing power tools, machines and appliances calling for
high torque at relatively low shaft speed or RPM. Gear motors allow the use of economical low
horsepower motors to provide great motive force at low speed such as in lifts, winches, medical
tables, jacks and robotics. They can be large enough to lift a building or small enough to drive a
tiny clock.
Figure 2:17 Photo of the Geared Electric Motor
2.6.8. Capacitor
A capacitor is a passive electronic component consisting of a pair of conductors separated by a
dielectric. When there is a potential difference across the conductors a static electric field
develops in the dielectric that stores energy and produces a mechanical force between the
conductors.
Capacitor is characterized by a single constant value capacitance and measured in farads. This is
the ratio of the electric charge on each conductor to the potential difference between them. In our
project we are using 470F capacitor. Capacitors are widely used in electronic circuits for
blocking direct current while allowing alternating current to pass in filter networks, for
smoothing the output of power supply, in the resonant circuits that tune radios to particular
frequencies and for many other purposes.
The effect is greatest when there is a narrow separation between large areas of conductor. Hence
capacitor conductors are often called plates referring to an early means of construction. In
practice the dielectric between the plates passes a small amount of leakage current and an electric
field strength limit, resulting in a breakdown voltage, the conductors and leads introduce an
undesired inductance and resistance2.6.9. Relays

26
Relay is a common simple, application of electromagnetism. It uses an electromagnet meet from
an iron rod bound with hundreds of fine copper wires. When electricity is applied to the wire, the
rod becomes magnetic. A movable contact arm above the rod is then pulled towards the rod until
it closes a switch contact. When the electricity is removed, a small spring pulls the contact arm
away from the rod until it closes the second switch contact. By means of relay, a current circuit
can be broken or closed in one circuit as a result of a current in another circuit. Relays have
several poles and contact. The types of contacts could be normally open and normally closed.
One closure of the relay can turn on the same normally open contacts; can turn off the other
normally closed contacts. Relay requires a current through their coils, for which a voltage is
applied. This voltage for a relay can be dc low voltages upto 24volt or could 240-volt ac.
Figure 2:18 Photo of the Relays
Interfacing Relays: Fig. 14 shows how to interface the Relay to microcontroller. There are 2
input channels. Each input is connected to the triggering coil of the respective relay. There are 2
output channels that each correspond to an input. When the input is energized, the relay turns on
and the '+' output is connected to +12v. When the relay is off, the '+' output is connected to
Ground. The '-' output is permanently wired to Ground.

27
Figure 2: 19 Circuit Diagram of Interfacing buzzer to Microcontroller
2.6.10. Transistor
Transistor applications: As a switch and amplifier.
Figure 2:20 The Model Transistor and Its Performance Curve
2.6.11.11 Development of Control Software
Software development as a general to develop embedded software required to be integrated and
controlled with the hardware development. Software development is an activity on the computer
programming required to construct a circuit as a simulation before doing a fabrication to
construct a real physical hardware development.
28
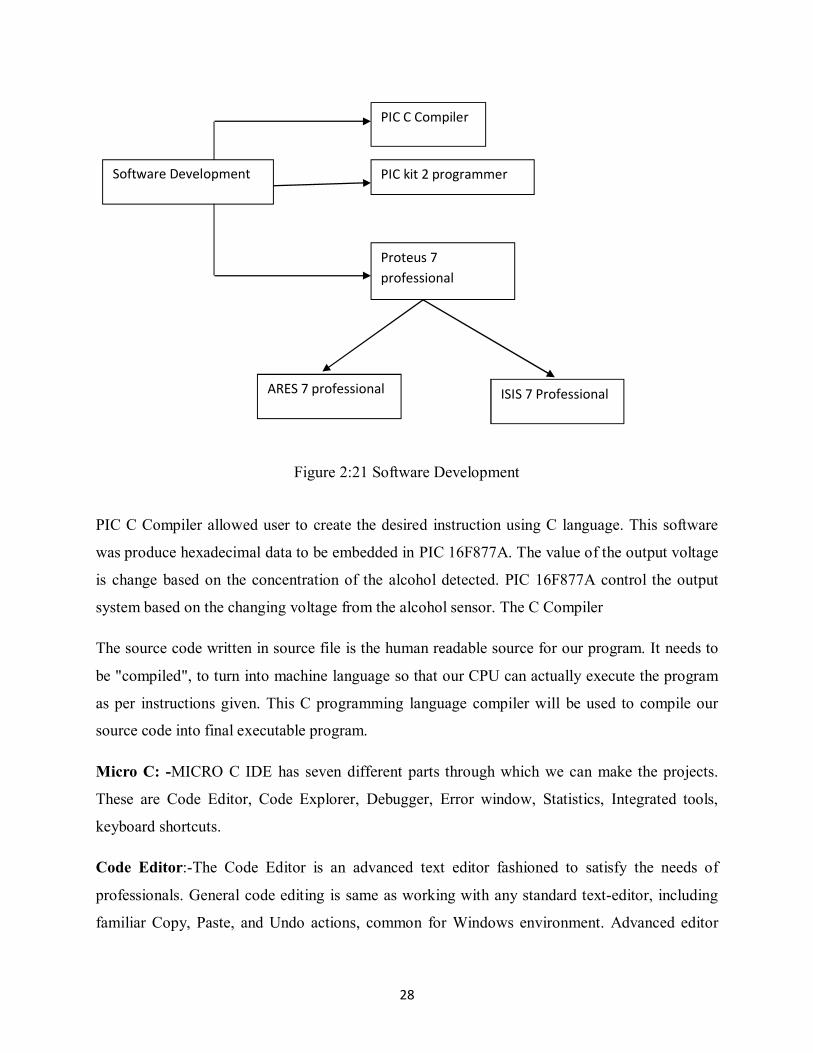
Figure 2:21 Software Development
PIC C Compiler allowed user to create the desired instruction using C language. This software
was produce hexadecimal data to be embedded in PIC 16F877A. The value of the output voltage
is change based on the concentration of the alcohol detected. PIC 16F877A control the output
system based on the changing voltage from the alcohol sensor. The C Compiler
The source code written in source file is the human readable source for our program. It needs to
be "compiled", to turn into machine language so that our CPU can actually execute the program
as per instructions given. This C programming language compiler will be used to compile our
source code into final executable program.
Micro C: -MICRO C IDE has seven different parts through which we can make the projects.
These are Code Editor, Code Explorer, Debugger, Error window, Statistics, Integrated tools,
keyboard shortcuts.
Code Editor:-The Code Editor is an advanced text editor fashioned to satisfy the needs of
professionals. General code editing is same as working with any standard text-editor, including
familiar Copy, Paste, and Undo actions, common for Windows environment. Advanced editor
Software Development
PIC C Compiler
PIC kit 2 programmer
Proteus 7
professional
ISIS 7 Professional ARES 7 professional

29
Features include: Adjustable Syntax Highlighting, Code Assistant, Parameter Assistant, Code
Templates (Auto Complete), Auto Correct for common types, Bookmarks and Go to Line.
Customize these options from the Editor Settings dialog. To access the settings, choose Tools >
Options from the drop-down menu, or click the Tools icon.
Code Explorer:-The Code Explorer is placed to the left of the main window by default, and
gives a clear view of every declared item in the source code. It is possible to jump to a
declaration of any item by clicking it, or by clicking the Find Declaration icon. To expand or
collapse tree view in Code Explorer, use the Collapse/Expand all icon. Also, two more tabs are
available in Code Explorer. Q Help Tab lists all the available built-in and library functions, for a
quick reference. Double-clicking a routine in Q Help Tab opens the relevant Help topic.
Keyboard Tab lists all the available Collapse/Expand keyboard shortcuts in MICRO C.
Proteus 8.0 (ISIS) Professional
It is very famous software in electrical, electronics, computer and telecom engineering students
for simulation of electrical, electronics and microcontrollers based circuits. Proteus is simulation
software for electric circuits provided by Lab center electronics. Proteus provides three types of
plat forms for simulation and designing of electric circuits. Main platform of Proteus is
intelligent schematic input system (ISIS). ISIS is used for simulation of electrical, electronics,
embedded system and microcontrollers based circuits. Proteus VSM is complete software to
learn microcontrollers. Proteus 8.0 is a Virtual System Modeling (VSM) that combines circuit
simulation, animated components and microprocessor models to co-simulate the complete
microcontroller based designs. This is the perfect tool for engineers to test their microcontroller
designs before constructing a physical prototype in real time. This program allows users to
interact with the design using onscreen indicators and/or LED and LCD displays and, if attached
to the PC, switches and buttons.
Procedures to work on Proteus 8.0 (ISIS) Professional windows
The Home Page is a new application module in Proteus 8 which makes it easy to get started with
a project and also performs some system tasks The Start Panel on the screen control project
opening and creation while the News Panel includes general information, integrated update
manager and crash dump reporting.
30
Opening, Creating & Importing Projects
In Proteus 8, the relationship between Schematic Design and PCB Layout involves a shared
database and is far more integrated. We therefore have a single project file rather than separate
design and layout files. You can create a new project or import a legacy schematic/layout via the
options on the home page.
Opening Projects
Existing projects can be opened via the button on the home page or, in the case of recent
projects, directly from the recent projects list. Finally, you can browse and open our extensive
sample design libraries via the Open Sample button at the right of the Start Panel.
Creating New Projects
This wizard guides you through the setup of your next Proteus 8 project. There is a start page in
which you specify the project name and destination directory and then potentially three main
screens for schematic, PCB and firmware.
Schematic
When we create a schematic we have to check the box at the top of the screen and then select the
template on which we want to base the schematic. Those provided by Lab center basically
contain different sizes of work area, although we can customize and save our own templates
from within the schematic capture module.
PCB Layout
If we are creating a PCB we check the box at the top of the screen and select from the available
templates. PCB templates contain pre-defined board edges; mounting holes and a full set of
technology data (design rules, layers in use, default units, etc.) As with schematic, we can
customize and save our own templates from within the PCB layout module.
Introduction to Micro C
MICRO C is a powerful, feature rich development tool for PIC micros. It is designed to provide
the customer with the easiest possible solution for developing applications for embedded
systems, without compromising performance or control. MICRO C provides a successful match
featuring highly advanced IDE, ANSI compliant compiler, broad set of hardware libraries,

31
comprehensive documentation, and plenty of ready-to-run examples. PIC and C fit together well:
PIC is the most popular 8-bit chip in the world, used in a wide variety of applications, and C,
prized for its efficiency, is the natural choice for developing embedded systems. It develops
applications quickly and easily with the world's most intuitive C compiler for PIC
Microcontrollers (families PIC12, PIC16, and PIC18). Highly sophisticated IDE provides the
power which is needed with the simplicity of a windows based point-and-click environment.
With useful implemented tools, many practical code examples, broad set of built-in routines, and
a comprehensive Help, MICRO C makes a fast and reliable tool.
Micro C allows developing and deploying complex applications:
Write C source code using the highly advanced Code Editor.
Use the included MICRO C libraries to dramatically speed up the development: data
acquisition, memory, displays, conversions, and communications.
Monitor program structure, variables, and functions in the Code Explorer.
Generate commented, human-readable assembly, and standard HEX compatible with all
programmers.
Inspect program flow and debug executable logic with the integrated Debugger. Get
detailed reports and graphs on code statistics, assembly listing, calling tree…
The C programming language
The C programming language is a general-purpose, at was originally developed by Dennis M.
Ritchie to develop the UNIX operating system at Bell Labs. C was originally first implemented
on the DEC PDP-11 computer in 1972. In 1978, Brian Kernighan and Dennis Ritchie produced
the first publicly available description of C, now known as the K&R standard. The UNIX
operating system, the C compiler, and essentially all UNIX applications programs have been
written in C. The C has now become a widely used professional language for various reasons.
Easy to learn
Structured language
It produces efficient programs.
It can handle low-level activities.

32
It can be compiled on a variety of computer platforms.
C was initially used for system development work, in particular the programs that make up the
operating system. C was adopted as a system development language because it produces code
that runs nearly as fast as code written in assembly language.
Some examples of the use of C might be:
Operating Systems
Language Compilers
Assemblers
Text Editors
Print Spoolers
Network Drivers
Modern Programs
Databases
Language Interpreters
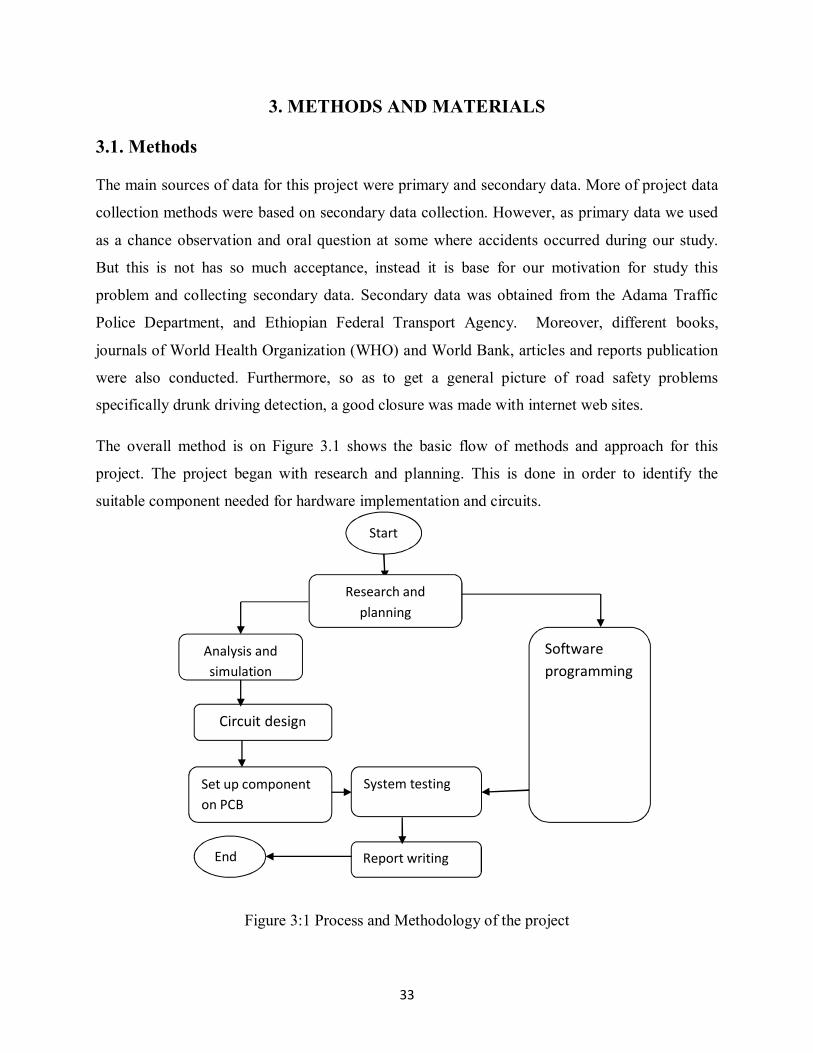
33
3. METHODS AND MATERIALS
3.1. Methods
The main sources of data for this project were primary and secondary data. More of project data
collection methods were based on secondary data collection. However, as primary data we used
as a chance observation and oral question at some where accidents occurred during our study.
But this is not has so much acceptance, instead it is base for our motivation for study this
problem and collecting secondary data. Secondary data was obtained from the Adama Traffic
Police Department, and Ethiopian Federal Transport Agency. Moreover, different books,
journals of World Health Organization (WHO) and World Bank, articles and reports publication
were also conducted. Furthermore, so as to get a general picture of road safety problems
specifically drunk driving detection, a good closure was made with internet web sites.
The overall method is on Figure 3.1 shows the basic flow of methods and approach for this
project. The project began with research and planning. This is done in order to identify the
suitable component needed for hardware implementation and circuits.
Figure 3:1 Process and Methodology of the project
Start
Research and
planning
Software
programming
Analysis and
simulation
Circuit design
Set up component
on PCB
System testing
Report writing End

34
3.2. Data Analysis
In order to systematically solve the problems, the quantitative research method was used in this
study. This type of research method was used to generate the road accident statistics from the
traffic police and part from the respondents.
The development was divided into three phase:
Phase1: Review, Data collection and Analysis
Data was collected from different sources including general literature, website,
international journals, different books, You Tubes and online information.
Phase2: Project design, model development and simulation.
Based on the collected data and information the drunk driving detection and automatic
engine locking system circuit was developed and simulation is carried out by using
Proteus software and Micro C PRO compiler.
Phase3: Hardware development and test.
Appropriate materials and components used for system were supplied.
The model was designed on bridge board and tested for realization.
The prototype of the project was carried out on PCB board.
The constructed prototype was tested by using LCD, Buzzer, and relay switch.
3.3. Required Materials
3.3.1. Hardware Components
In hardware designing, different types of components have been selected according to their
specifications and connected together to build the complete system. For this reason to
development of the hardware design in this project, we have used the following basic
components:-

35
1. Power supply( 12v DC)
2. Alcohol sensor-MQ3
3. Microcontroller (PIC16F877A)
4. Buzzer 12VDC
5. Regulator-7805
6. Relay 12VDC ,5pins
7. Diode 1N4004
8. LED (Green & Red)
9. Transistors (NPN)
10. LCD 16x2
11. Ignition switch
12. Resistors(Metal film & potentiometer)
13. Capacitor22pF & 0.1µF(ceramic type),
14. Crystal 8MHz
3.3.2. Software Components
1. Proteus
2. Micro C PRO compiler
A detailed review of the components for the development of this system has been done in
the theoretical study in the previous chapter. From the review, type of components needed
for the hardware development has been identified. The table below shows the components
needed.
The construction of this system consists of two parts which was hardware development
and software development. Hardware development involved the designing the circuit of
the project and setup on printed circuit board (PCB). While the software developments
were focused on simulating the circuit before test to the real components and also
designed code to be embedded in the hardware. After both parts have been completed, the
testing and calibration have been taken place. The result for each experiment has been
discussed and recorded. Each part of the project has been discussed in detailed in the
following system block diagram section.

36
3.4. System Block Diagram
The block diagram below shows the interconnection of the hardware of this system.
Block diagram description
Figure 3:2 Block Diagram of the System Electric Circuitry
Based on the block diagram above the entire components are driven by DC power supply
of 5V. If the supply is not 5V DC the voltage regulator needs to be installed to convert the
supply of 5V DC and supply to the sensor circuit, PIC microcontroller, buzzer, LCD, but
for relay circuit 12V. The heart of the system is the microcontroller. All the input and
output has been connected to the microcontroller.
The flow of circuit began when the sensor detect blood alcohol concentration. Then the
sensor drive circuit has been produced the output voltage due to the change in resistance
of semiconductor. The higher alcohol substance detected, the lower resistance will be
produced. Hence, the output voltage will be higher. This output voltage will be measured
by the microcontroller. The calibration of the sensor need to be done before the value of
BAC should be set with the corresponding output voltage of the sensor. The
microcontroller will be performed some logical operation, calculate the output and
determine the result.
12v dc
/battery /
PIC16F877A
M/CNTROLER
ECU
Ignition
system
Converter
Alcohol
sensor
Crystal
Relay
Relay driver
Buzzer
LCD
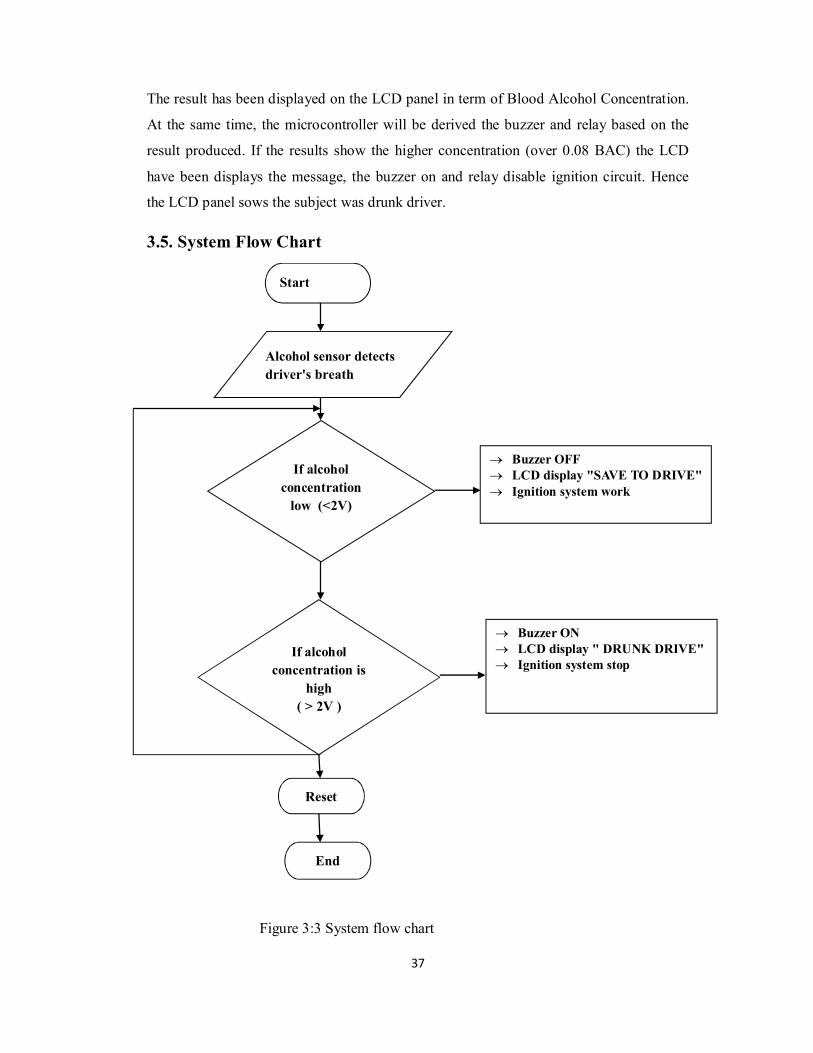
37
The result has been displayed on the LCD panel in term of Blood Alcohol Concentration.
At the same time, the microcontroller will be derived the buzzer and relay based on the
result produced. If the results show the higher concentration (over 0.08 BAC) the LCD
have been displays the message, the buzzer on and relay disable ignition circuit. Hence
the LCD panel sows the subject was drunk driver.
3.5. System Flow Chart
Figure 3:3 System flow chart
Start
If alcohol
concentration
low (<2V)
Alcohol sensor detects
driver's breath
If alcohol
concentration is
high
( > 2V )
Buzzer OFF LCD display "SAVE TO DRIVE" Ignition system work
Buzzer ON LCD display " DRUNK DRIVE" Ignition system stop
End
Reset
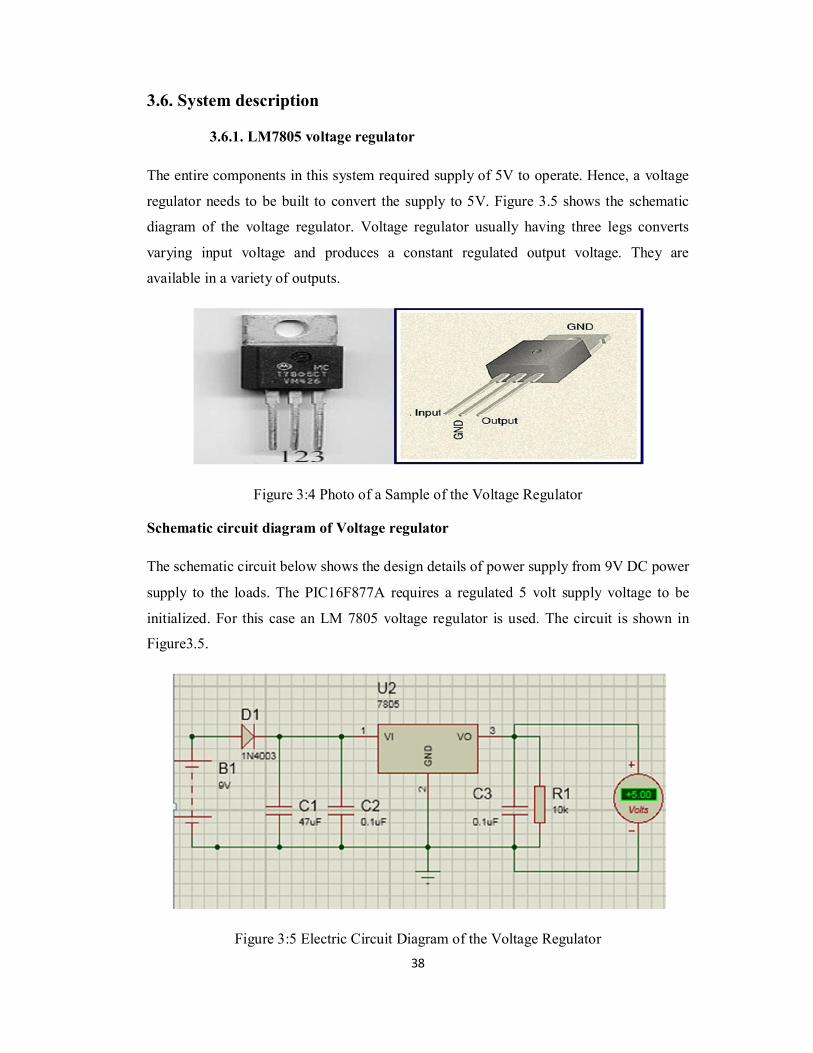
38
3.6. System description
3.6.1. LM7805 voltage regulator
The entire components in this system required supply of 5V to operate. Hence, a voltage
regulator needs to be built to convert the supply to 5V. Figure 3.5 shows the schematic
diagram of the voltage regulator. Voltage regulator usually having three legs converts
varying input voltage and produces a constant regulated output voltage. They are
available in a variety of outputs.
Figure 3:4 Photo of a Sample of the Voltage Regulator
Schematic circuit diagram of Voltage regulator
The schematic circuit below shows the design details of power supply from 9V DC power
supply to the loads. The PIC16F877A requires a regulated 5 volt supply voltage to be
initialized. For this case an LM 7805 voltage regulator is used. The circuit is shown in
Figure3.5.
Figure 3:5 Electric Circuit Diagram of the Voltage Regulator

39
As mentioned above, the component has three legs: Input leg which should be hold up to
36VDC common leg (GND) and an output leg with the regulator's voltage. For maximum
voltage regulation, added a capacitor in parallel between the common leg and the output
was usually recommended. Typically 0.1μF capacitor is used. This eliminates any high
frequency AC voltage that could otherwise combine with the output voltage. If the input
voltage is unnecessarily high, the regulator will overheat. Unless sufficient heat
dissipation is provided through heat sinking, the regulator will shut down [24]. The diode
D2 is used to protect the circuit from wrong polarity of supply. The LED D1 is the
indicator of the power status of the circuit. The resistor R1 connected to this LED protects
it from over current.
3.6.2. Alcohol Detecting Sensor
In this project, MQ-3 type of alcohol sensor used which is making from Hanwei
manufacturer. It is suitable in develops alcohol detection system because it has high
sensitivity of alcohol, stable and long life span compared to the other models. As mention
before, the semiconductor sensor act like potentiometer and produce the output based on
change of resistance. However, the sensor cannot operate if it doesn’t have driven circuit.
The driver circuit needs in order to make the sensor operated and produced the output
voltage. The driver circuit was shown in figure below.
Figure 3:6 Electric Circuit Diagram of the MQ-3 Sensor
This sensor has different resistance values based on the various kinds and concentration
of gases. In order to get accurate result, it is recommended to calibrate the alcohol sensor
and sensitivity adjustments are necessary. The calibration is set to the 0.4mg/L of alcohol

40
concentration in the air and use value of load resistance of RL about 10kΩ.It is better if
the calibration taken at same humidity and temperature because semiconductor type
sensor are affected by humidity and temperature. The MQ-3 sensor is time dependent. So
when it exposure to the ethanol gases, the sensor will be taken some time (about a minute)
to produce the output value. For this project, the procedure of tested were fixed like the
distance from mouth to sensor and the time taken for hard blowing.
Table 3.1 Concentration of alcohol in breath and their corresponding BAC
Concentration of alcohol in breath(mg/l) BAC
0.00 0.00 %
0.0095 0.02 %
0.019 0.04 %
0.028 0.06 %
0.038 0.08 %
0.047 0.10 %
0.057 0.12 %
0.095 0.20 %
3.6.3. Main circuit
The main circuit is the main part of this project. The main circuit is as given in the figure
below.
Figure 3:7 Main circuit schematic diagram
R A 0/A N 02
R A 1/A N 13
R A 2/A N 2 /V R E F - /C V R EF4
R A 4/T 0 C K I/C 1O U T6
R A 5/A N 4 /S S /C 2O U T7
R E 0/A N 5 /R D8
R E 1/A N 6/W R9
R E 2/A N 7 /C S10
O S C 1 /C L K IN13
O S C 2 /C L K O U T14
R C 1 /T 1 O S I/C C P21 6
R C 2/C C P11 7
R C 3 /S C K /SC L1 8
R D 0 /PS P01 9
R D 1 /PS P12 0
R B 7 /PG D4 0
R B 6 /PG C3 9
R B53 8
R B43 7
R B 3 /P GM3 6
R B23 5
R B13 4
R B 0 / IN T3 3
R D 7 /PS P73 0
R D 6 /PS P62 9
R D 5 /PS P52 8
R D 4 /PS P42 7
R D 3 /PS P32 2
R D 2 /PS P22 1
R C 7 /R X /D T2 6
R C 6 /T X /C K2 5
R C 5/S D O2 4
R C 4 /S D I /S D A2 3
R A 3/A N 3 /V R EF +5
R C 0 /T1 O S O/T 1 C K I1 5
M C L R /V p p /T H V1
U 1
P IC 1 6 F 87 7A
D7
14
D6
13
D5
12
D4
11
D3
10
D2
9D
18
D0
7
E6
RW
5R
S4
VS
S1
VD
D2
VE
E3
L C D 1L M 01 6L
+ 5 v
B U Z 1
B U Z Z ER
Q 1B C 54 7
Q 2B C 5 47
D 11 N 4 00 7
D 21 N 4 00 7
R L 112 V
R L 212 V
+ 1 2 vX 1C R Y S TA L
C 1
2 2p F
C 2
2 2p F
R 2
1 k
R 31k
+ 5 v
77
%
R V1
5k
R 51k
Vo lt s
+ 2 .67
D 3LE D -G R E EN
D 4L E D -R E D
R 11 0 R 4
10
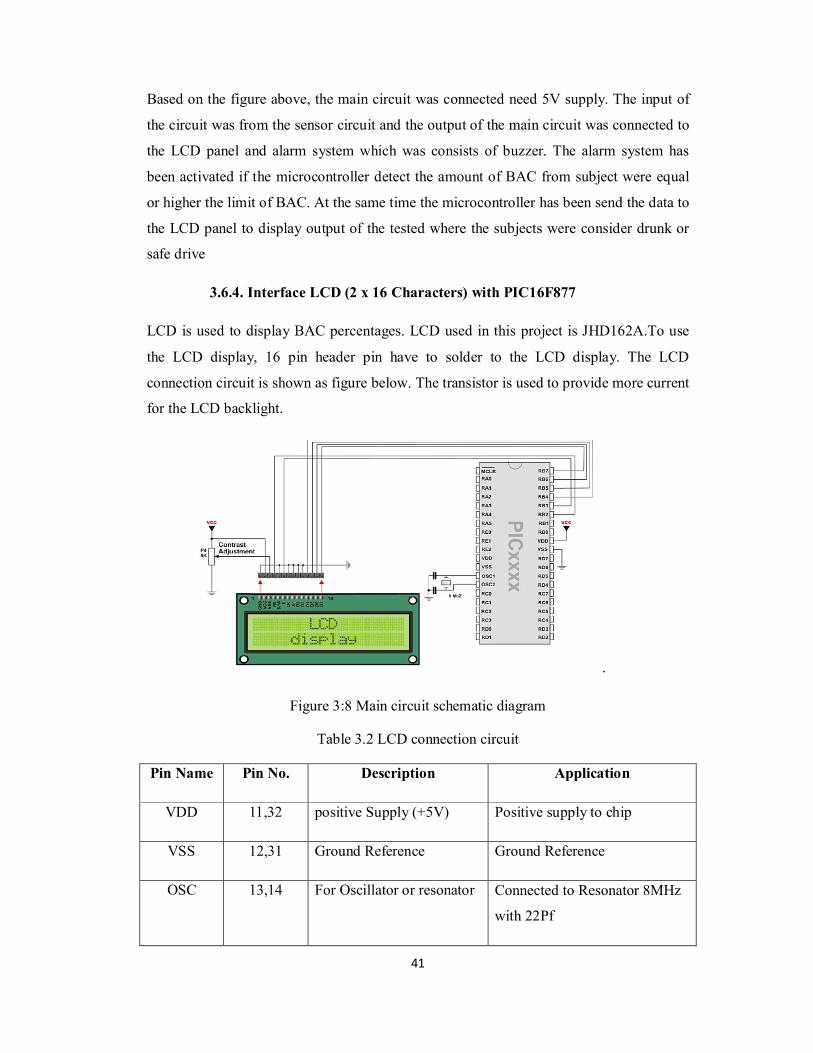
41
Based on the figure above, the main circuit was connected need 5V supply. The input of
the circuit was from the sensor circuit and the output of the main circuit was connected to
the LCD panel and alarm system which was consists of buzzer. The alarm system has
been activated if the microcontroller detect the amount of BAC from subject were equal
or higher the limit of BAC. At the same time the microcontroller has been send the data to
the LCD panel to display output of the tested where the subjects were consider drunk or
safe drive
3.6.4. Interface LCD (2 x 16 Characters) with PIC16F877
LCD is used to display BAC percentages. LCD used in this project is JHD162A.To use
the LCD display, 16 pin header pin have to solder to the LCD display. The LCD
connection circuit is shown as figure below. The transistor is used to provide more current
for the LCD backlight.
.
Figure 3:8 Main circuit schematic diagram
Table 3.2 LCD connection circuit
Pin Name Pin No. Description Application
VDD 11,32 positive Supply (+5V) Positive supply to chip
VSS 12,31 Ground Reference Ground Reference
OSC 13,14 For Oscillator or resonator Connected to Resonator 8MHz
with 22Pf
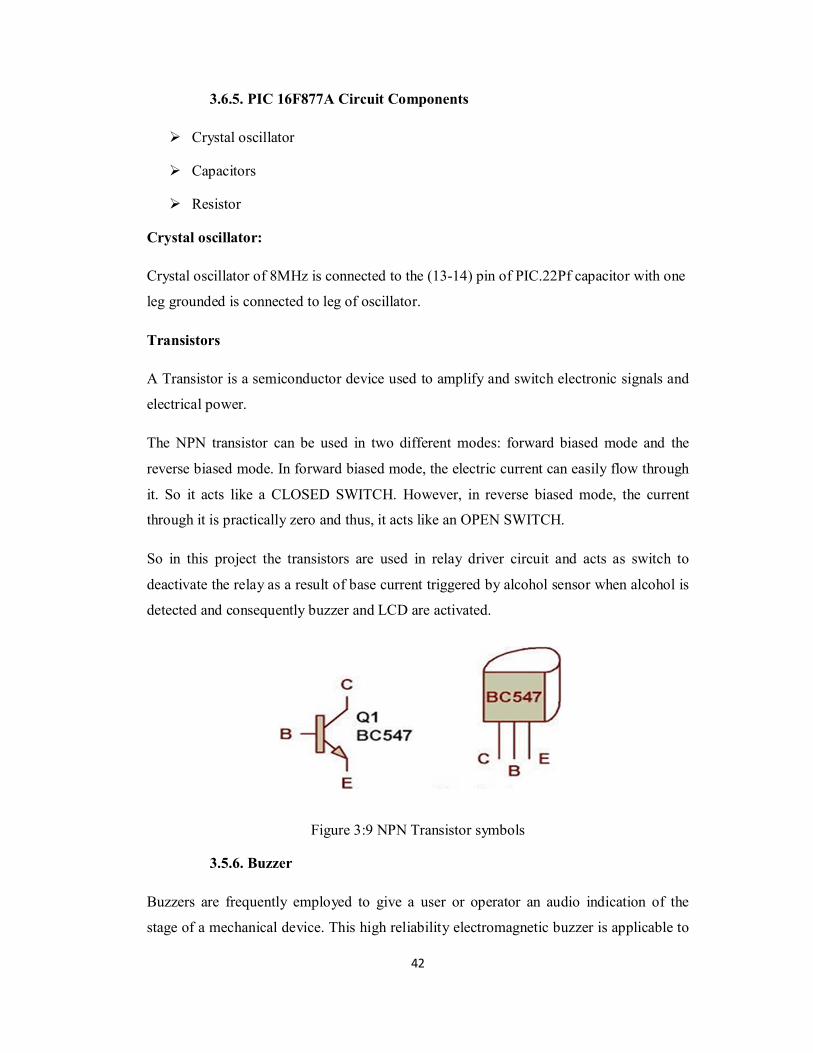
42
3.6.5. PIC 16F877A Circuit Components
Crystal oscillator
Capacitors
Resistor
Crystal oscillator:
Crystal oscillator of 8MHz is connected to the (13-14) pin of PIC.22Pf capacitor with one
leg grounded is connected to leg of oscillator.
Transistors
A Transistor is a semiconductor device used to amplify and switch electronic signals and
electrical power.
The NPN transistor can be used in two different modes: forward biased mode and the
reverse biased mode. In forward biased mode, the electric current can easily flow through
it. So it acts like a CLOSED SWITCH. However, in reverse biased mode, the current
through it is practically zero and thus, it acts like an OPEN SWITCH.
So in this project the transistors are used in relay driver circuit and acts as switch to
deactivate the relay as a result of base current triggered by alcohol sensor when alcohol is
detected and consequently buzzer and LCD are activated.
Figure 3:9 NPN Transistor symbols
3.5.6. Buzzer
Buzzers are frequently employed to give a user or operator an audio indication of the
stage of a mechanical device. This high reliability electromagnetic buzzer is applicable to
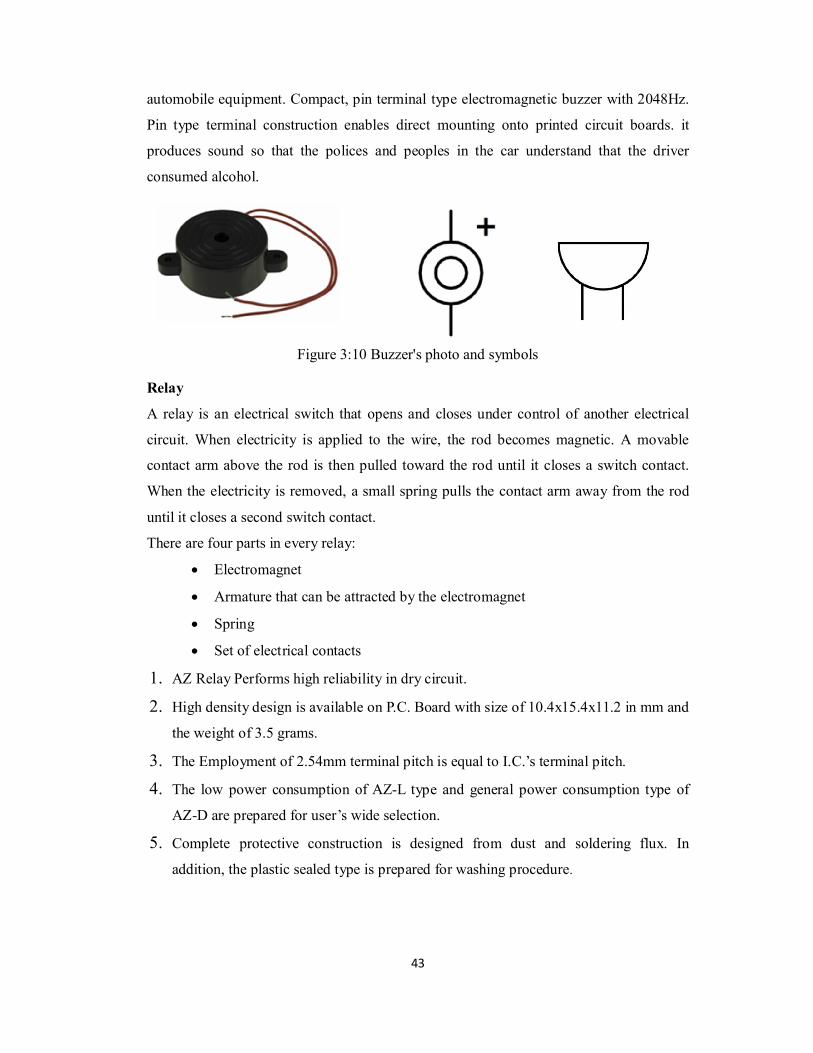
43
automobile equipment. Compact, pin terminal type electromagnetic buzzer with 2048Hz.
Pin type terminal construction enables direct mounting onto printed circuit boards. it
produces sound so that the polices and peoples in the car understand that the driver
consumed alcohol.
Figure 3:10 Buzzer's photo and symbols
Relay
A relay is an electrical switch that opens and closes under control of another electrical
circuit. When electricity is applied to the wire, the rod becomes magnetic. A movable
contact arm above the rod is then pulled toward the rod until it closes a switch contact.
When the electricity is removed, a small spring pulls the contact arm away from the rod
until it closes a second switch contact.
There are four parts in every relay:
Electromagnet
Armature that can be attracted by the electromagnet
Spring
Set of electrical contacts
1. AZ Relay Performs high reliability in dry circuit.
2. High density design is available on P.C. Board with size of 10.4x15.4x11.2 in mm and
the weight of 3.5 grams.
3. The Employment of 2.54mm terminal pitch is equal to I.C.’s terminal pitch.
4. The low power consumption of AZ-L type and general power consumption type of
AZ-D are prepared for user’s wide selection.
5. Complete protective construction is designed from dust and soldering flux. In
addition, the plastic sealed type is prepared for washing procedure.
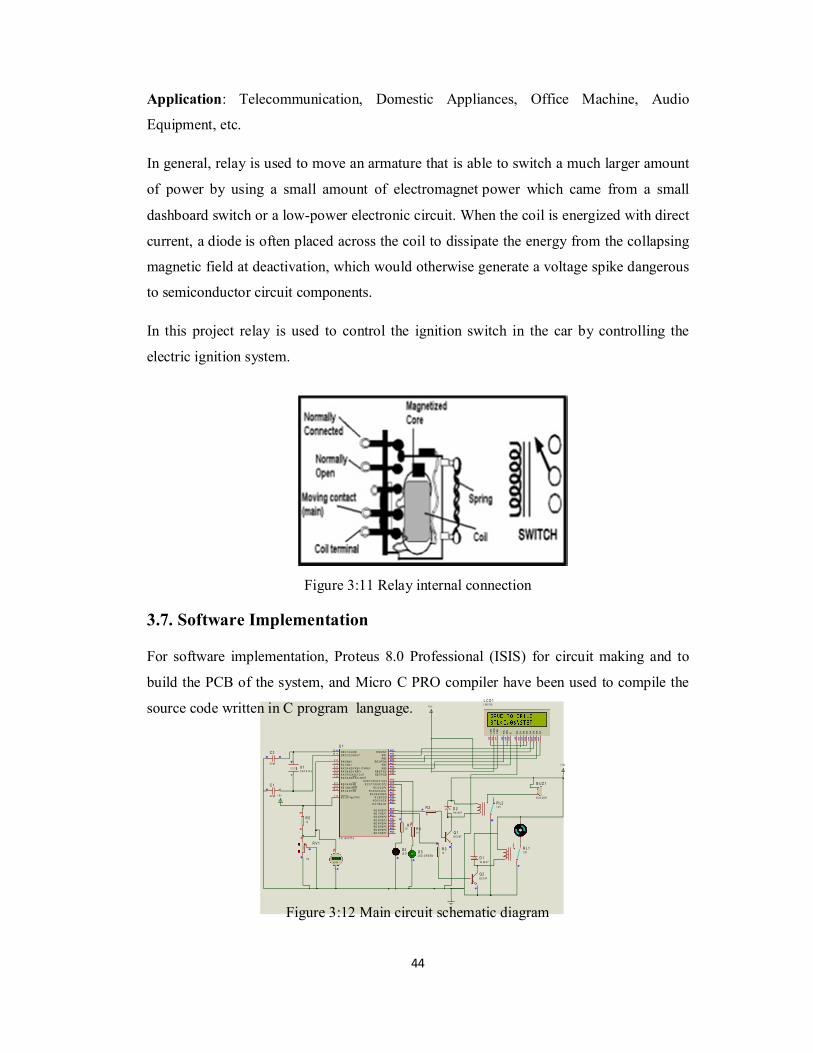
44
R A 0 /AN 02
R A 1 /AN 13
R A 2 /A N 2 /V R E F - /C VR E F4
R A 4 /T 0 C K I/C 1 O U T6
R A 5 /A N 4 /S S /C 2O U T7
R E 0 /A N 5/ RD8
R E 1 /AN 6 /W R9
R E 2 /A N 7/ CS10
O S C 1 / C L KIN13
O S C 2 / C L KO U T14
R C 1 /T 1 O S I/C C P2 16
R C 2/ C C P117
R C 3 /S C K /S CL18
R D 0/ PS P019
R D 1/ PS P120
R B 7 /P G D40
R B 6 /P G C39
R B538
R B4 37R B 3 /P G M
36R B2
35R B1
34R B 0/ IN T
33
R D 7/ PS P7 30R D 6/ PS P6
29R D 5/ PS P5
28R D 4/ PS P4
27R D 3/ PS P3
22R D 2/ PS P2 21
R C 7 /R X / DT26
R C 6 /T X /C K 25R C 5 /S D O
24R C 4 /S D I /SD A
23
R A 3 /A N 3 /V R EF +5
R C 0 /T 1 O S O /T 1 C K I 15
M C L R / Vp p /T H V1
U 1
P IC 1 6 F 8 77 A
D7
14
D6
13
D5
12
D4
11
D3
10
D2
9D
18
D0
7
E6
RW
5R
S4
VS
S1
VD
D2
VE
E3
L C D 1L M 0 1 6L
+ 5 v
B U Z 1
B U Z Z ER
Q 1B C 5 47
Q 2B C 5 47
D 11N 40 0 7
D 21 N 4 0 07
R L 11 2V
R L21 2 V
+ 1 2vX 1C R Y S TA L
C 1
2 2 pF
C 2
2 2 pF
R 2
1k
R 31 k
+ 5 v
77%
R V 1
5 k
R 51 k
Vo lts
+ 2 .67
D 3L ED -G R E EN
D4LE D -R ED
R 110 R 4
10
Application: Telecommunication, Domestic Appliances, Office Machine, Audio
Equipment, etc.
In general, relay is used to move an armature that is able to switch a much larger amount
of power by using a small amount of electromagnet power which came from a small
dashboard switch or a low-power electronic circuit. When the coil is energized with direct
current, a diode is often placed across the coil to dissipate the energy from the collapsing
magnetic field at deactivation, which would otherwise generate a voltage spike dangerous
to semiconductor circuit components.
In this project relay is used to control the ignition switch in the car by controlling the
electric ignition system.
Figure 3:11 Relay internal connection
3.7. Software Implementation
For software implementation, Proteus 8.0 Professional (ISIS) for circuit making and to
build the PCB of the system, and Micro C PRO compiler have been used to compile the
source code written in C program language.
Figure 3:12 Main circuit schematic diagram

45
3.7.1. Program flow chart
The flowchart of the program for the system was given as in the figure below:
Figure 3:13 Flow chart of the program
Configure LCD connections
and initialize
Delay few seconds
Save driver
Begin
End1
Configure ports
Configure A/D convertors
Display start messages
Start conversion
Display BAC
Buzzer OFF, LCD OFF
Save driver
BAC=0?
0.02< BAC < 0.08?
Conversion ends
BAC>0.08
Buzzer ON, LCD ON
Drunk driver
Enable ignition and switch on
LED green, LCD ON
Disable ignition and switch,
LCD, Buzzer, LED red and
buzzer on
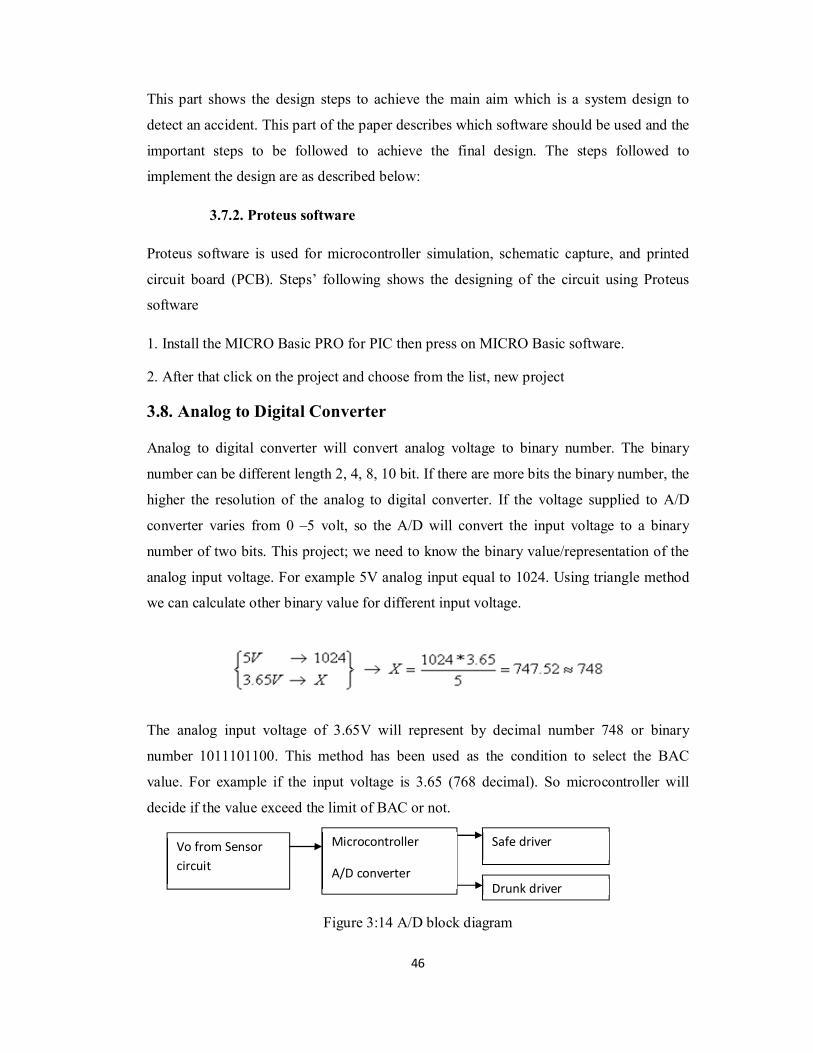
46
This part shows the design steps to achieve the main aim which is a system design to
detect an accident. This part of the paper describes which software should be used and the
important steps to be followed to achieve the final design. The steps followed to
implement the design are as described below:
3.7.2. Proteus software
Proteus software is used for microcontroller simulation, schematic capture, and printed
circuit board (PCB). Steps’ following shows the designing of the circuit using Proteus
software
1. Install the MICRO Basic PRO for PIC then press on MICRO Basic software.
2. After that click on the project and choose from the list, new project
3.8. Analog to Digital Converter
Analog to digital converter will convert analog voltage to binary number. The binary
number can be different length 2, 4, 8, 10 bit. If there are more bits the binary number, the
higher the resolution of the analog to digital converter. If the voltage supplied to A/D
converter varies from 0 –5 volt, so the A/D will convert the input voltage to a binary
number of two bits. This project; we need to know the binary value/representation of the
analog input voltage. For example 5V analog input equal to 1024. Using triangle method
we can calculate other binary value for different input voltage.
The analog input voltage of 3.65V will represent by decimal number 748 or binary
number 1011101100. This method has been used as the condition to select the BAC
value. For example if the input voltage is 3.65 (768 decimal). So microcontroller will
decide if the value exceed the limit of BAC or not.
Figure 3:14 A/D block diagram
Vo from Sensor
circuit
Microcontroller
A/D converter
Safe driver
Drunk driver

47
3.9. Integration of the System
In this stage, the hardware of the system with that of the software of the system have been
integrated or interfaced for the successful implementation of the project. The following
figure shows the integration of the System.
No
Yes
Figure 3:15 Flowchart of the Integration of the System
3.10. System Testing and Calibration
The whole system will malfunction if the power supply fails. Hence, proper testing of the
voltage regulator is essential. The completed circuit of the voltage regulator is tested
using LED as load and the corresponding output voltage across the LED is measured
using multimeter. The most important task in this section is the calibration of the alcohol
sensor. The input voltage is fed into the microcontroller not entirely linear over all
concentrations of ethanol. Hence, careful attention had to be placed so that calibration
was over the linear or near linear region. Attention was also paid to the possibility of
saturated or even damaged the sensor if too high a concentration was placed on the
sensor. Each prepared ethanol concentration was placed against the sensor and the voltage
level was viewed on the multimeter and recorded. An average value for each respective
concentration is taken. First, the completed circuit without the alcohol sensor was put
through functional testing. The sensor voltage was replaced by a DC voltage source that
was varied from 0V to 5V at increments of 0.5V. Once this calibration was done the
Hardware Testing
PCB
Software
Implementing
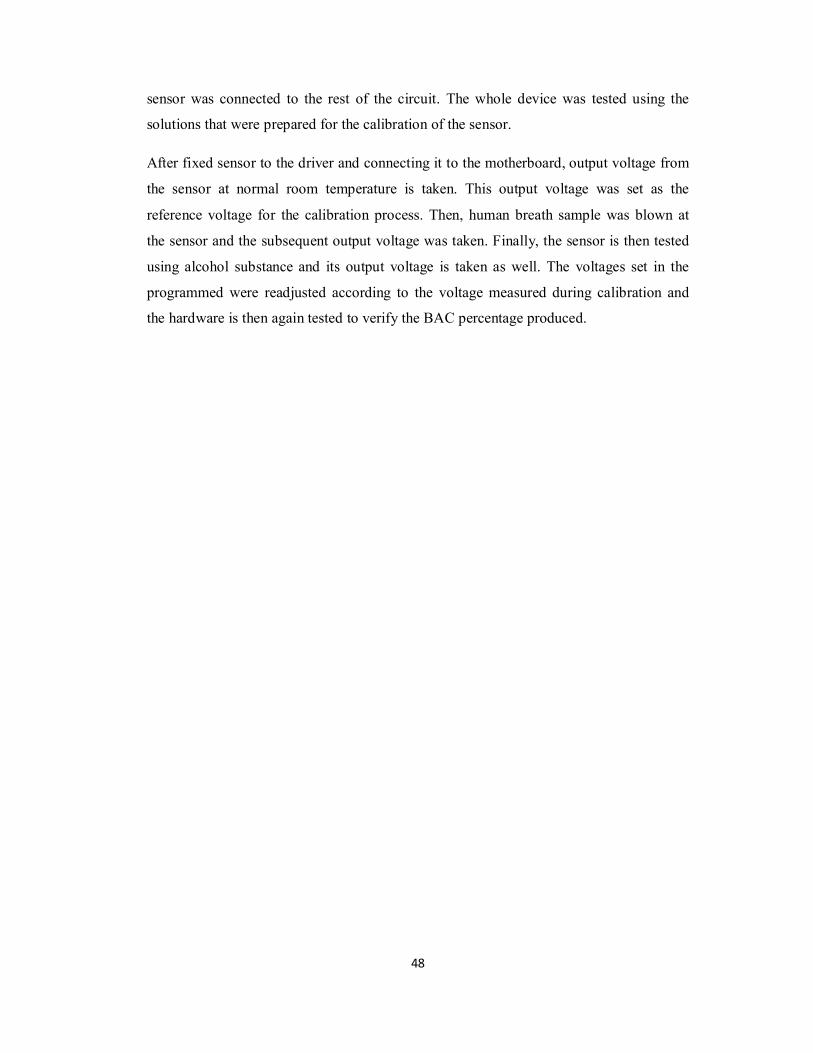
48
sensor was connected to the rest of the circuit. The whole device was tested using the
solutions that were prepared for the calibration of the sensor.
After fixed sensor to the driver and connecting it to the motherboard, output voltage from
the sensor at normal room temperature is taken. This output voltage was set as the
reference voltage for the calibration process. Then, human breath sample was blown at
the sensor and the subsequent output voltage was taken. Finally, the sensor is then tested
using alcohol substance and its output voltage is taken as well. The voltages set in the
programmed were readjusted according to the voltage measured during calibration and
the hardware is then again tested to verify the BAC percentage produced.
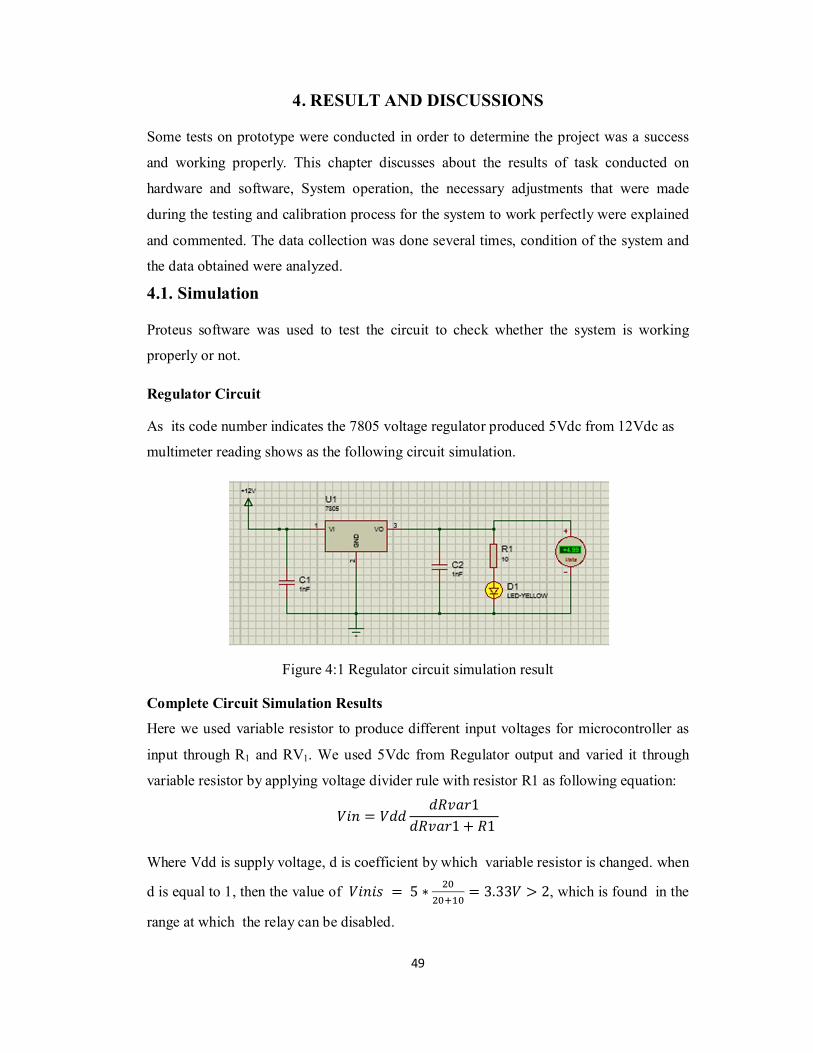
49
4. RESULT AND DISCUSSIONS
Some tests on prototype were conducted in order to determine the project was a success
and working properly. This chapter discusses about the results of task conducted on
hardware and software, System operation, the necessary adjustments that were made
during the testing and calibration process for the system to work perfectly were explained
and commented. The data collection was done several times, condition of the system and
the data obtained were analyzed.
4.1. Simulation
Proteus software was used to test the circuit to check whether the system is working
properly or not.
Regulator Circuit
As its code number indicates the 7805 voltage regulator produced 5Vdc from 12Vdc as
multimeter reading shows as the following circuit simulation.
Figure 4:1 Regulator circuit simulation result
Complete Circuit Simulation Results
Here we used variable resistor to produce different input voltages for microcontroller as
input through R1 and RV1. We used 5Vdc from Regulator output and varied it through
variable resistor by applying voltage divider rule with resistor R1 as following equation:
��� = ��������1
�����1+ �1
Where Vdd is supply voltage, d is coefficient by which variable resistor is changed. when
d is equal to 1, then the value of ����� = 5 ∗��
�����= 3.33� > 2, which is found in the
range at which the relay can be disabled.
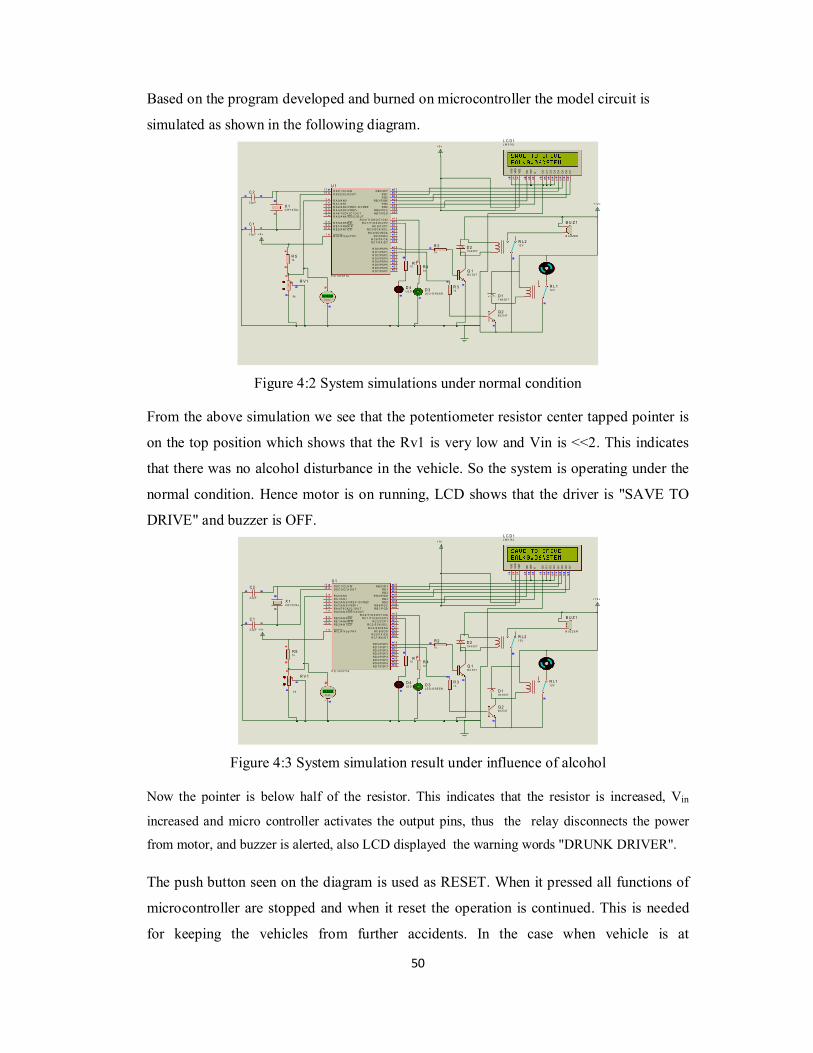
50
Based on the program developed and burned on microcontroller the model circuit is
simulated as shown in the following diagram.
Figure 4:2 System simulations under normal condition
From the above simulation we see that the potentiometer resistor center tapped pointer is
on the top position which shows that the Rv1 is very low and Vin is <<2. This indicates
that there was no alcohol disturbance in the vehicle. So the system is operating under the
normal condition. Hence motor is on running, LCD shows that the driver is "SAVE TO
DRIVE" and buzzer is OFF.
Figure 4:3 System simulation result under influence of alcohol
Now the pointer is below half of the resistor. This indicates that the resistor is increased, Vin
increased and micro controller activates the output pins, thus the relay disconnects the power
from motor, and buzzer is alerted, also LCD displayed the warning words "DRUNK DRIVER".
The push button seen on the diagram is used as RESET. When it pressed all functions of
microcontroller are stopped and when it reset the operation is continued. This is needed
for keeping the vehicles from further accidents. In the case when vehicle is at
R A 0/A N 02
R A 1/A N 13
R A 2/A N 2 /V R E F - /C V R EF4
R A 4/T 0 C K I/C 1O U T6
R A 5/A N 4 /S S /C 2O U T7
R E 0/A N 5 /R D8
R E 1/A N 6/W R9
R E 2/A N 7 /C S10
O S C 1 /C L K IN13
O S C 2 /C L K O U T14
R C 1 /T 1 O S I/C C P2 1 6
R C 2/C C P1 1 7
R C 3 /S C K /SC L 1 8
R D 0 /PS P01 9
R D 1 /PS P12 0
R B 7 /PG D 4 0R B 6 /PG C 3 9
R B5 3 8R B4 3 7
R B 3 /P GM 3 6R B2 3 5R B1
3 4R B 0 / IN T
3 3
R D 7 /PS P73 0
R D 6 /PS P62 9
R D 5 /PS P52 8
R D 4 /PS P42 7
R D 3 /PS P32 2
R D 2 /PS P22 1
R C 7 /R X /D T2 6
R C 6 /T X /C K2 5
R C 5/S D O2 4
R C 4 /S D I /S D A2 3
R A 3/A N 3 /V R EF +5
R C 0 /T1 O S O/T 1 C K I 1 5
M C L R /V p p /T H V1
U 1
P IC 1 6 F 87 7A
D7
14
D6
13
D5
12
D4
11
D3
10
D2
9D
18
D0
7
E6
RW
5R
S4
VS
S1
VD
D2
VE
E3
L C D 1L M 01 6L
+ 5 v
B U Z 1
B U Z Z ER
Q 1B C 54 7
Q 2B C 5 47
D 11 N 4 00 7
D 21 N 4 00 7
R L 112 V
R L 212 V
+ 1 2 vX 1C R Y S TA L
C 1
2 2p F
C 2
2 2p F
R 2
1 k
R 31k
+ 5 v
77%
R V1
5k
R 51k
Vo lt s
+ 2 .67
D 3LE D -G R E EN
D 4L E D -R E D
R 11 0 R 4
10
R A 0/A N 02
R A 1/A N 13
R A 2/A N 2/V R E F - /C V R EF4
R A 4/T 0 C K I/C 1O U T6
R A 5/A N 4/S S /C 2 OU T7
R E 0/A N 5/R D8
R E 1/A N 6/W R9
R E 2/A N 7/C S10
OS C 1/C L K IN13
OS C 2/C L K O U T14
R C 1 /T 1 O SI /C C P 2 16
R C 2/C C P 1 17
R C 3 /S C K /SC L 18
R D 0 /P SP 019
R D 1 /P SP 120
R B 7 /P GD 40R B 6 /P GC 39
R B 5 38R B 4 37
R B 3/P GM 36R B 2 35R B 1
34R B 0 / IN T
33
R D 7 /P SP 730
R D 6 /P SP 629
R D 5 /P SP 528
R D 4 /P SP 427
R D 3 /P SP 322
R D 2 /P SP 221
R C 7 /R X /D T26
R C 6/T X /C K25
R C 5/S D O24
R C 4 /S D I/S D A23
R A 3/A N 3/V R EF +5
R C 0 /T 1 O S O/T 1 C K I 15
M C L R /V p p /T H V1
U 1
P IC 1 6 F 8 77A
D7
14
D6
13
D5
12
D4
11
D3
10
D2
9D
18
D0
7
E6
RW
5R
S4
VS
S1
VD
D2
VE
E3
L C D 1L M 0 16 L
+ 5v
B U Z 1
B U Z Z E R
Q 1B C 54 7
Q 2B C 5 47
D 11N 40 07
D 21 N 4 00 7
R L 11 2V
R L 21 2V
+ 1 2 vX 1C R YS TA L
C 1
2 2p F
C 2
2 2p F
R 2
1k
R 31 k
+ 5v
77%
R V 1
5 k
R 51k
Vo lts
+ 2.67
D 3L E D -G R E EN
D 4LE D -R ED
R 110 R 4
10
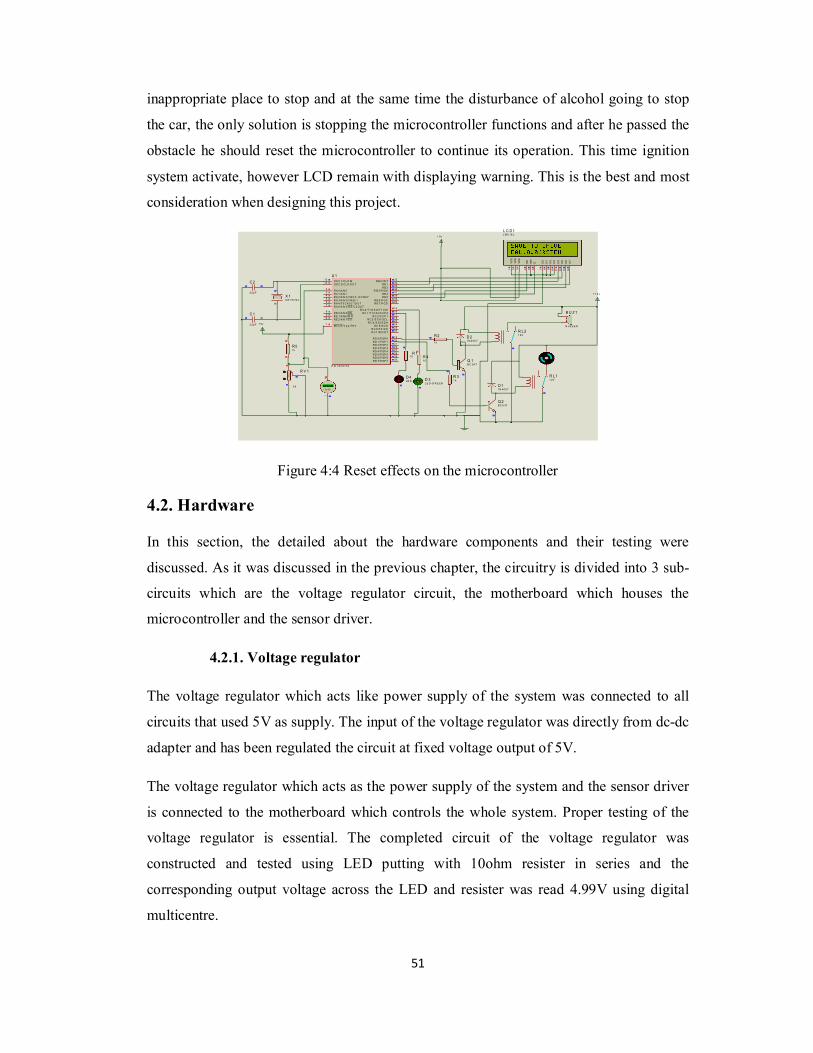
51
inappropriate place to stop and at the same time the disturbance of alcohol going to stop
the car, the only solution is stopping the microcontroller functions and after he passed the
obstacle he should reset the microcontroller to continue its operation. This time ignition
system activate, however LCD remain with displaying warning. This is the best and most
consideration when designing this project.
Figure 4:4 Reset effects on the microcontroller
4.2. Hardware
In this section, the detailed about the hardware components and their testing were
discussed. As it was discussed in the previous chapter, the circuitry is divided into 3 sub-
circuits which are the voltage regulator circuit, the motherboard which houses the
microcontroller and the sensor driver.
4.2.1. Voltage regulator
The voltage regulator which acts like power supply of the system was connected to all
circuits that used 5V as supply. The input of the voltage regulator was directly from dc-dc
adapter and has been regulated the circuit at fixed voltage output of 5V.
The voltage regulator which acts as the power supply of the system and the sensor driver
is connected to the motherboard which controls the whole system. Proper testing of the
voltage regulator is essential. The completed circuit of the voltage regulator was
constructed and tested using LED putting with 10ohm resister in series and the
corresponding output voltage across the LED and resister was read 4.99V using digital
multicentre.
R A 0/A N 02
R A 1/A N 13
R A 2/A N 2/V R E F - /C V R EF4
R A 4/T 0 C K I/C 1O U T6
R A 5/A N 4/S S /C 2 OU T7
R E 0/A N 5/R D8
R E 1/A N 6/W R9
R E 2/A N 7/C S10
OS C 1/C L K IN13
OS C 2/C L K O U T14
R C 1 /T 1 O SI /C C P 216
R C 2/C C P 117
R C 3 /S C K /SC L18
R D 0 /P SP 0 19
R D 1 /P SP 1 20
R B 7 /P GD40
R B 6 /P GC39
R B 538
R B 437
R B 3/P GM36
R B 235
R B 134
R B 0 / IN T33
R D 7 /P SP 7 30R D 6 /P SP 6 29R D 5 /P SP 5 28R D 4 /P SP 4 27R D 3 /P SP 3 22R D 2 /P SP 2 21
R C 7 /R X /D T26
R C 6/T X /C K25
R C 5/S D O24
R C 4 /S D I/S D A23
R A 3/A N 3/V R EF +5
R C 0 /T 1 O S O/T 1 C K I15
M C L R /V p p /T H V1
U 1
P IC 1 6 F 8 77A
D7
14
D6
13
D5
12
D4
11
D3
10
D2
9D
18
D0
7
E6
RW
5R
S4
VS
S1
VD
D2
VE
E3
L C D 1L M 0 16 L
+ 5v
B U Z 1
B U Z Z E R
Q 1B C 54 7
Q 2B C 5 47
D 11N 40 07
D 21 N 4 00 7
R L 11 2V
R L 21 2V
+ 1 2 vX 1C R YS TA L
C 1
2 2p F
C 2
2 2p F
R 2
1k
R 31 k
+ 5v
77%
R V 1
5 k
R 51k
Vo lts
+ 2.67
D 3L E D -G R E EN
D 4LE D -R ED
R 110 R 4
10

52
Figure 4:5 Regulator Circuit Testing
The input and output of the voltage and current values are shown in the table 4.1 below.
The input voltage is 12V and the input current is 100mA. Meanwhile the output voltage
and current are 4.96V and 50mA respectively.
Table 4:1 Input and output values of voltage regulator
Parameter Voltage(V) Current (mA)
Input 12 100.00
Output 4.01 50.00
Table 4:2 Input and output of voltage regulator
Symbol Parameter Technical condition
VC Circuit voltage 5V
VH Heating voltage 5V
RS Sensing resistance 1M-8Mohom
RL Load resistance 10Kohm

53
4.2.2. Sensor driver
The image of the sensor driver built was shown in the figure 4.3 below.
Figure 4:6 MQ-3 Alcohol sensor driver
The sensor circuit which consists of MQ-3 alcohol sensor and load resistance. The sensor
resistance changes due to the detected alcohol substance. If the sensor detects more
alcohol the resistance of the sensor drops, hence the voltage output increases. The input of
this sensor circuit is 5V and the output varies from 0 V to 4.75 V. The specifications of
the sensor circuit are shown in Table 4.2. The voltage and current values of the sensor are
given in the table below. The input voltage and current for the sensor driver are 5V and
25mA respectively while the output voltage varies from 0V to 4.75V and the output
current for the sensor driver is same as input current which is 25mA. There is only small
current value in order to protect the sensor from damage.
Table 4:3 Input and output value of sensor
Parameter Voltage(V) Current(Ma)
Input 5 25
Output 0 to 4.75 25
The input voltage that was fed into the microcontroller was not entirely linear over all
concentrations of ethanol. Hence, careful attention had to be placed so that calibration
was over the linear, or near-linear, region. Attention was also paid to the possibility of
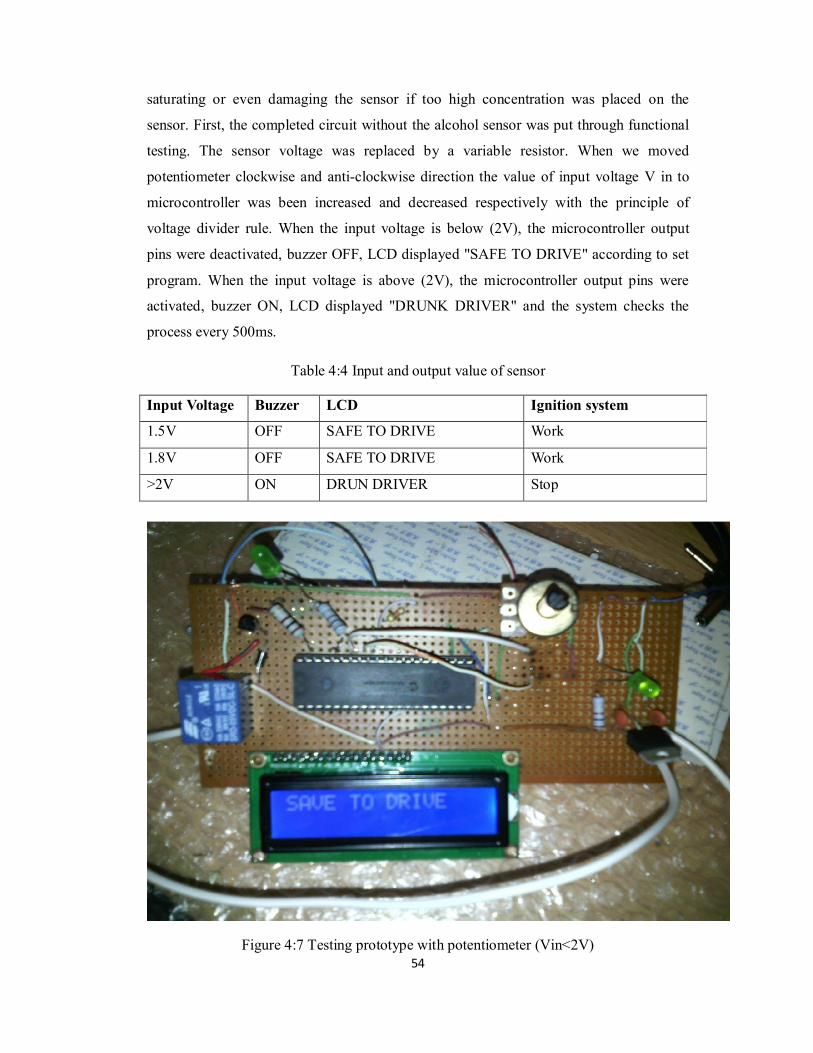
54
saturating or even damaging the sensor if too high concentration was placed on the
sensor. First, the completed circuit without the alcohol sensor was put through functional
testing. The sensor voltage was replaced by a variable resistor. When we moved
potentiometer clockwise and anti-clockwise direction the value of input voltage V in to
microcontroller was been increased and decreased respectively with the principle of
voltage divider rule. When the input voltage is below (2V), the microcontroller output
pins were deactivated, buzzer OFF, LCD displayed "SAFE TO DRIVE" according to set
program. When the input voltage is above (2V), the microcontroller output pins were
activated, buzzer ON, LCD displayed "DRUNK DRIVER" and the system checks the
process every 500ms.
Table 4:4 Input and output value of sensor
Input Voltage Buzzer LCD Ignition system
1.5V OFF SAFE TO DRIVE Work
1.8V OFF SAFE TO DRIVE Work
>2V ON DRUN DRIVER Stop
Figure 4:7 Testing prototype with potentiometer (Vin<2V)

55
Figure 4:8 Testing Prototype with potentiometer (Vin>2V)
Once this calibration was done the sensor was connected to the rest of the circuit. After
fixing the sensor to the driver and connecting it to the motherboard, the output voltage
from the sensor at normal room temperature was taken. This output voltage was set as the
reference voltage for the calibration process. Then, human breath sample was blown at
the sensor and the subsequent output voltage was taken. Finally, the sensor was then
tested using alcohol substance and its output voltage was taken as well. The voltages set
in the programming were adjusted according to the voltage measured during calibration
and the hardware was again tested to verify the BAC percentage produced.
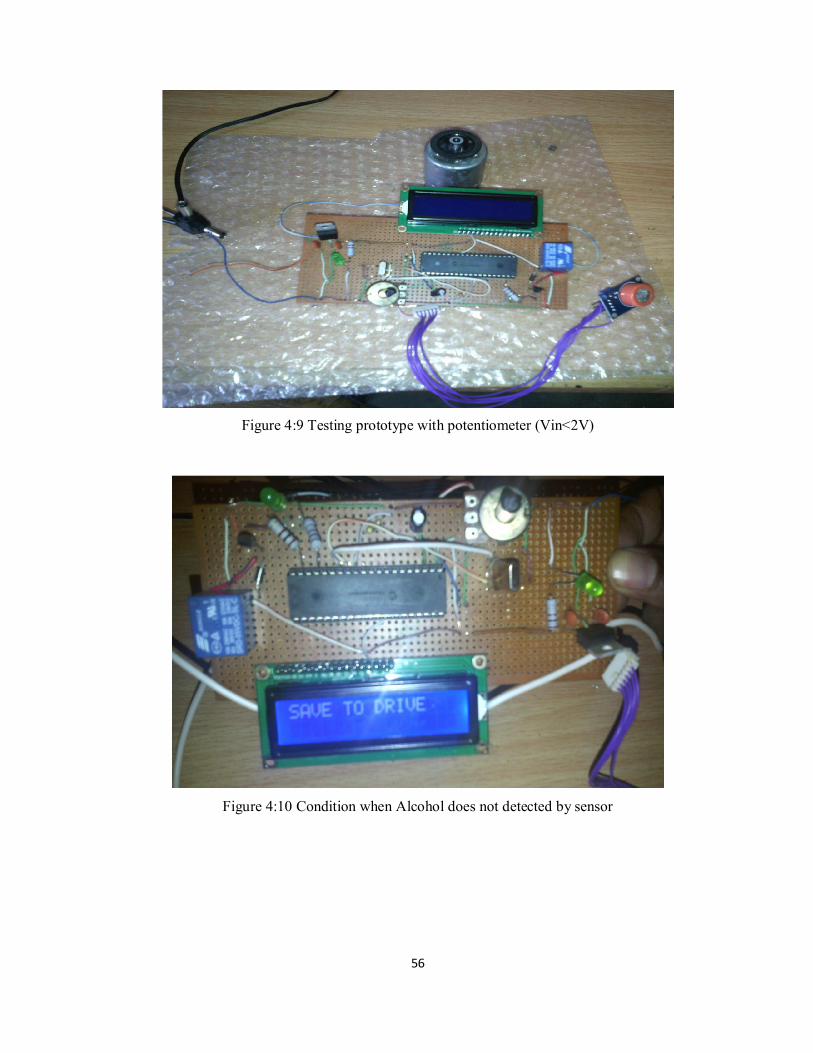
56
Figure 4:9 Testing prototype with potentiometer (Vin<2V)
Figure 4:10 Condition when Alcohol does not detected by sensor

57
Figure 4:11Condition when Alcohol does not detected by sensor
When the program was start up, LCD has been display “DRUNK DRIVER DETECT
SYSTEM” and then the system was in standby mode while displaying “DRUNK
DRIVER (BAC>0.08...”.
When drunk driver exhale alcohol in air from breath sample was detected (without
alcohol consumption), LCD has been displayed “safe driver” BAC = 0.00%,. At the same
time has been ON and buzzer has been OFF.
58
5. CONCLUSION AND RECOMMENDATION
5.1. Conclusion
An efficient system of vehicle accident prevention system embedded by alcohol detector
has been proposed. It consists of PIC 16F876A as the main controller, alcohol sensor as
the input and three output such as ignition system, LCD display and alarm system. The
sensor was able to measure the detected blood alcohol concentration in the exhale of
drunk driver in atmosphere and PIC microcontroller has been controlled the output based
on analog input from the sensor circuit. The result was displayed at LCD panel (in BAC
%) and the alarm system was activated based on the result obtained.
The sensitivity of the sensor toward alcohol is much higher than other substance such as
benzene and very reliable as alcohol detecting device compared to other model. The time
response of the sensor was fast, however the sensor need preheat time before the test has
been conducted. This is to ensure the sensor in stability and produce accurate result. This
system capable to alert the driver about the level of drunkenness by indicating the
condition on LCD display. The concentration is displayed in terms of Blood Alcohol
Concentration or BAC (%) and the legal limits were different between countries to
countries. For most countries the legal limit is 0.08% BAC and person who was caught
over 0.08 % BAC is driving are against the law and can be fined. So it is important to
check the alcohol concentration before to decide whether the driver can drive or not.
It also produced an alarm from buzzer to make the driver aware their own condition and
to observant other people in surrounding area. The most safety element provided by this
system the driver in high level of drunkenness is not allowed to drive a car as the ignition
system will be deactivated. Ultimately, this system help to prevent the driver to drive in
risky situation and will avoid accident occur on the road.
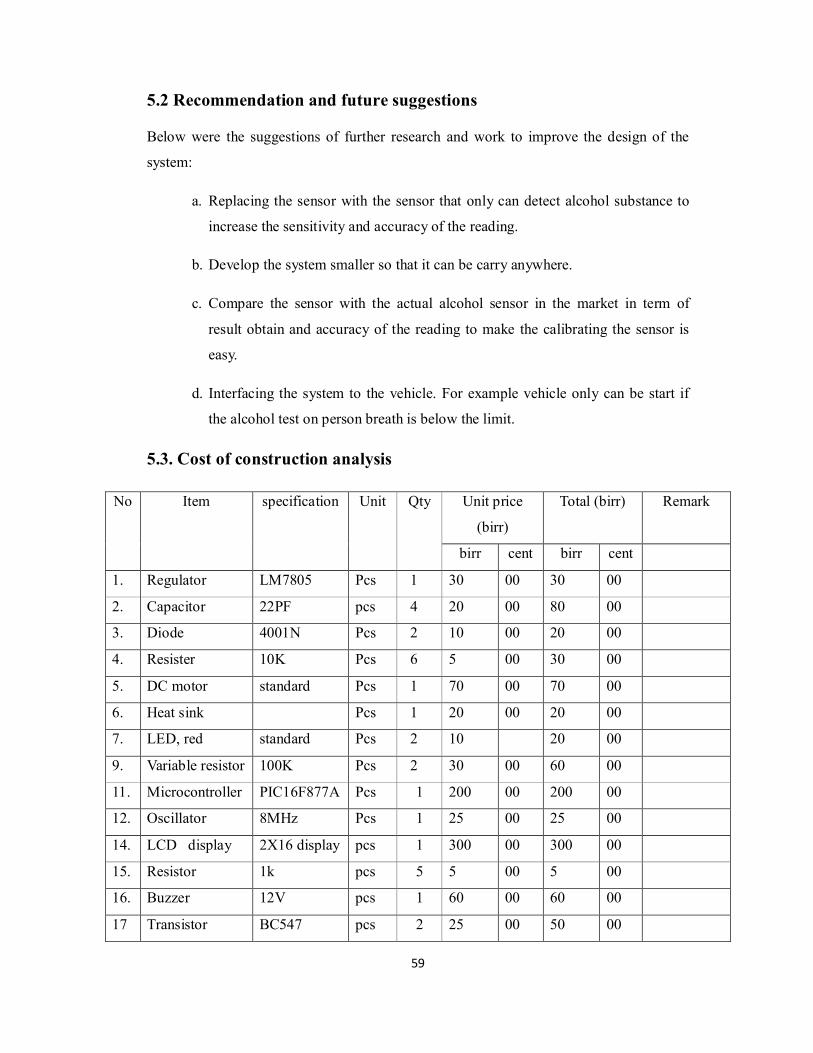
59
5.2 Recommendation and future suggestions
Below were the suggestions of further research and work to improve the design of the
system:
a. Replacing the sensor with the sensor that only can detect alcohol substance to
increase the sensitivity and accuracy of the reading.
b. Develop the system smaller so that it can be carry anywhere.
c. Compare the sensor with the actual alcohol sensor in the market in term of
result obtain and accuracy of the reading to make the calibrating the sensor is
easy.
d. Interfacing the system to the vehicle. For example vehicle only can be start if
the alcohol test on person breath is below the limit.
5.3. Cost of construction analysis
No Item specification Unit Qty Unit price
(birr)
Total (birr) Remark
birr cent birr cent
1. Regulator LM7805 Pcs 1 30 00 30 00
2. Capacitor 22PF pcs 4 20 00 80 00
3. Diode 4001N Pcs 2 10 00 20 00
4. Resister 10K Pcs 6 5 00 30 00
5. DC motor standard Pcs 1 70 00 70 00
6. Heat sink Pcs 1 20 00 20 00
7. LED, red standard Pcs 2 10 20 00
9. Variable resistor 100K Pcs 2 30 00 60 00
11. Microcontroller PIC16F877A Pcs 1 200 00 200 00
12. Oscillator 8MHz Pcs 1 25 00 25 00
14. LCD display 2X16 display pcs 1 300 00 300 00
15. Resistor 1k pcs 5 5 00 5 00
16. Buzzer 12V pcs 1 60 00 60 00
17 Transistor BC547 pcs 2 25 00 50 00
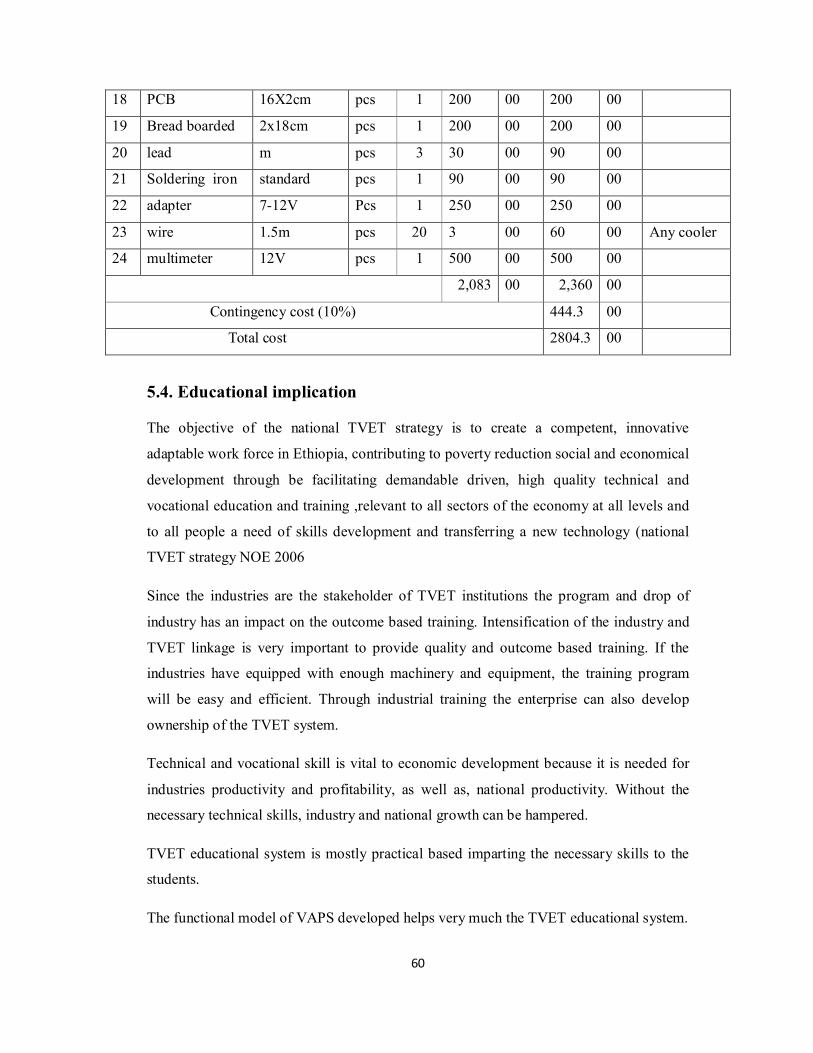
60
5.4. Educational implication
The objective of the national TVET strategy is to create a competent, innovative
adaptable work force in Ethiopia, contributing to poverty reduction social and economical
development through be facilitating demandable driven, high quality technical and
vocational education and training ,relevant to all sectors of the economy at all levels and
to all people a need of skills development and transferring a new technology (national
TVET strategy NOE 2006
Since the industries are the stakeholder of TVET institutions the program and drop of
industry has an impact on the outcome based training. Intensification of the industry and
TVET linkage is very important to provide quality and outcome based training. If the
industries have equipped with enough machinery and equipment, the training program
will be easy and efficient. Through industrial training the enterprise can also develop
ownership of the TVET system.
Technical and vocational skill is vital to economic development because it is needed for
industries productivity and profitability, as well as, national productivity. Without the
necessary technical skills, industry and national growth can be hampered.
TVET educational system is mostly practical based imparting the necessary skills to the
students.
The functional model of VAPS developed helps very much the TVET educational system.
18 PCB 16X2cm pcs 1 200 00 200 00
19 Bread boarded 2x18cm pcs 1 200 00 200 00
20 lead m pcs 3 30 00 90 00
21 Soldering iron standard pcs 1 90 00 90 00
22 adapter 7-12V Pcs 1 250 00 250 00
23 wire 1.5m pcs 20 3 00 60 00 Any cooler
24 multimeter 12V pcs 1 500 00 500 00
2,083 00 2,360 00
Contingency cost (10%) 444.3 00
Total cost 2804.3 00
61
REFERENCES
[1] https://en.wikipedia.org/wiki/List_of_countrcou_by_traffic related death rate
[Date of ac
[2] US Department of Health & Human services. (2004, October 1st). National Institute
on Alcohol Abuse and Alcoholism Publications Distribution Center Nat0ional
Institute on Alcohol Abuse and Alcoholism Publications Distribution Center
Retrieved October 12th, 2014, from
http://pubs.niaaa.nih.gov/publications/aa63/aa63.html
[3] U.S Department of transportation, National highway traffic safety Administration,
FARS. (April, 2012). Table of comparing alcohol related and non-alcohol related
highway accidents. U.S Department of transportation
[4] Accident Avoiding Future Vehicle (IJIRST/ Volume 2 / Issue 11/ 086)All rights
reserved by www.ijirst.org487
[5] IEEE, 2004 Segno G.Causes of road traffic accidents and possible counter measures
on Addis Ababa-Shashemeneroad. [MA Thesis]; Addis Ababa University,
2007cess: Sept 10, 2015].
[6] Segno G. Causes of road traffic accidents and possible counter measures on Addis
Ababa-Shashemene road. [MA Thesis]; Addis Ababa University, 2007
[7] Verne R. Brown, Ann Arbor, March (1973).Breath Alcohol Detector and Automotive
Ignition Interlock Employing Same. (United States Patent 3,780,311)
[8] Win, David Tin. Breath Alcohol Testers. Prevent Road Accidents. Faculty of Science
and Technology, Assumption University Bangkok, Thailand, 2006.
[9] H. Abdul Rahim, S.D.S Hassan. Breathalyzer Enabled Ignition Switch System.
Faculty of Electrical Engineering, University Technology Malaysia, Malaysia,
2010.
[10] E. road authority, “Federal road transport authority reports, ”Addis Ababa:, 2014.
[11] F. Samson, “Analysis of Traffic Accident in Addis Ababa: traffic Simulation,” p. 84,
June 2006.
[12] Derek Rutherford, Andrew McNeill, Andrew Farley. The Globe.

62
[13] Undang-undang Malaysia, Akta A1065, Akta Pengankutan Jalan (Pindaan 1999).
[14] Patrick J. Conner’s, Lawrence R. Stevens, Don R. Gazer, Frank C. Penny packer
(1991). Breathe Alcohol Testing System. (United States Patent 4,996,161)42
[15] Jabatan Pengangkutan Jalanraya. www.jpj.gov.my. [Online] 2002.
[16] Kiyomi Sakakibara, Toshiyuki Taguchi, Atsushi Nakashima. Development of a
Breath Alcohol Detector without Mouthpiece to Prevent Alcohol-Impaired
Driving. Toyota Central R&D Labs.Inc, Japan, 2008.
[17] Fuel cell detector model. http://www.intox.com/fuel_cell_explanation.asp
[18] Alcohol compound http://www.britannica.com/EBchecked/topic/13366/alcohol
[19] Alcohol testing (blood alcohol concentration)
http://www.intox.com/about_alcohol_testing.asp
[20] Blood alcohol concentration (BAC)
[21] MQ-3 Alcohol Sensor Datasheet
[22] M.H. Mohammad, Mohammed Amin BinHasanuddin, MohdHafizzie Bin Ramli
“Vehicle Accident Prevention System Embedded with Alcohol Detector”,
IJRECE, Volume 1 Issue 4 October
[23] M.H. Mohammad, Mohammed AminBin Hasanuddin, Mohammed Hafizzie Bin
Ramli “Vehicle Accident Prevention System Embedded with Alcohol Detector”,
IJRECE, Volume 1 Issue 4 October
[24] Voltage Regulator http://www.eidusa.c
[25]"Buzzer - definition of buzzer by The Free Dictionary" Retrieved 22 May 2015.
[26] Harding P, Zett l R (2008) Methods for breath analysis (Chapter 7). Garrett JC (Ed.)
Marriott’s Medico legal Aspects of Alcohol (5th Ed.). Lawyers & Judges
Publishing Company, Tucson, AZ. p. 229-253.
[27] Todd Borrow man, Robert Wilson. Breathalyzer Enabled Ignition Switch Proposal
(Online), 2004.
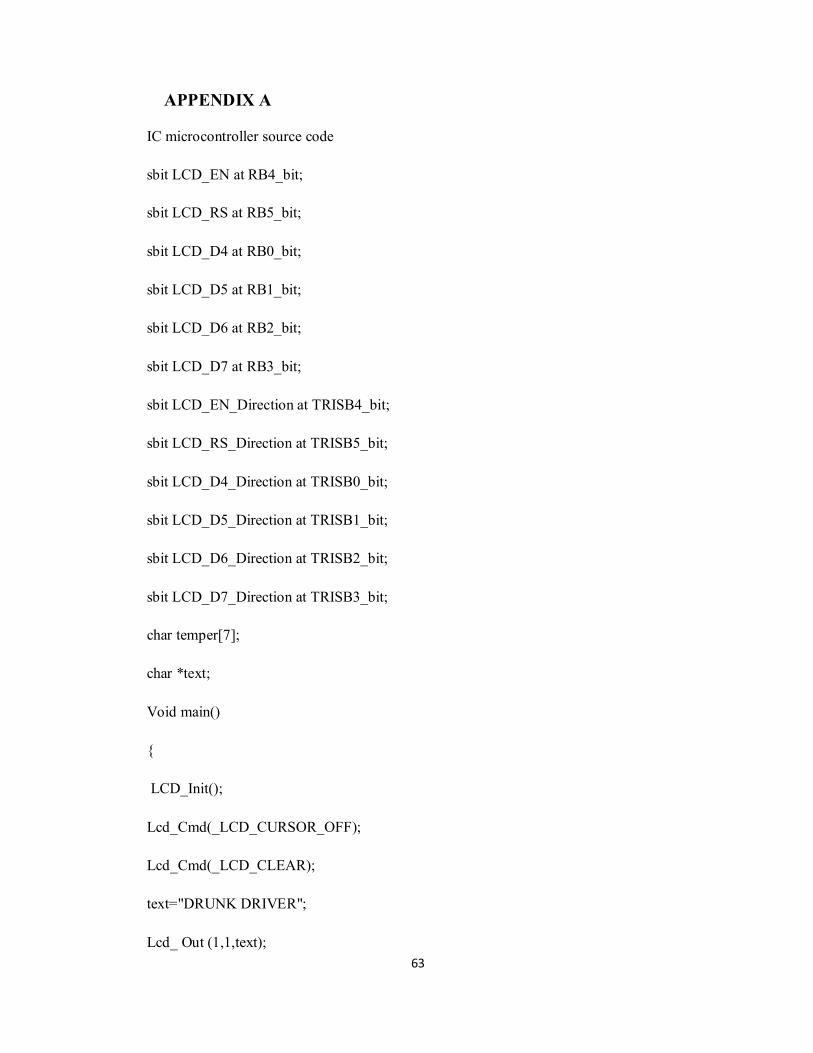
63
APPENDIX A
IC microcontroller source code
sbit LCD_EN at RB4_bit;
sbit LCD_RS at RB5_bit;
sbit LCD_D4 at RB0_bit;
sbit LCD_D5 at RB1_bit;
sbit LCD_D6 at RB2_bit;
sbit LCD_D7 at RB3_bit;
sbit LCD_EN_Direction at TRISB4_bit;
sbit LCD_RS_Direction at TRISB5_bit;
sbit LCD_D4_Direction at TRISB0_bit;
sbit LCD_D5_Direction at TRISB1_bit;
sbit LCD_D6_Direction at TRISB2_bit;
sbit LCD_D7_Direction at TRISB3_bit;
char temper[7];
char *text;
Void main()
{
LCD_Init();
Lcd_Cmd(_LCD_CURSOR_OFF);
Lcd_Cmd(_LCD_CLEAR);
text="DRUNK DRIVER";
Lcd_ Out (1,1,text);

64
text="DETECT SYSTEM";
Lcd_Out(2,1,text);
Delay_ms(200);
TRISC=0xff;
TRISB=0;
TRISD=0;
PORTD=0;
do
{
Lcd_Cmd(_LCD_CURSOR_OFF);
Lcd_Cmd(_LCD_CLEAR);
{
If(PORTC==1)
{
PORTD.F0=1;
Delay_ms(200);
LCD_Out(1,1,"DRUNK DRIVER");
LCD_out(2, 1,"BAC>0.08%");
Delay_ms(1000);
PORTD.F1=1;
}
Else
{

65
LCD _Out(1,1,"SAVE TO DRIVE");
PORTD.F0=0;
PORTD.F1=0;
}
Delay_ms(10);
}
}while(1);

66
R A 0/ A N0R A 1/ A N1R A 2/ A N 2 /V R E F -/CV R EF
R A 4/ T0 C K I/C 1 O U TR A 5/ A N 4 /S S / C 2O U T
R E 0/ A N 5/R DR E 1/ A N6/W RR E 2/ A N 7/C S
O S C 1 /C LK INO S C 2 /C LK O UT
R C 1/ T1 O S I/C C P 216
R C 2 /C C P 117
R C 3 /S C K /S C L18
R D 0/ P S P 019
R D 1/ P S P 120
R B 7 /P G D40
R B 6 /P G C39
R B 538
R B 437
R B 3 /P G M36
R B 235
R B 134
R B 0 /IN T33
R D 7/ P S P 730
R D 6/ P S P 629
R D 5/ P S P 528
R D 4/ P S P 427
R D 3/ P S P 322
R D 2/ P S P 221
R C 7 /R X /D T26
R C 6/ TX /C K25
R C 5 /S DO24
R C 4/ S D I/S D A23
R A 3/ A N 3 /V R E F+
R C 0 /T 1O S O / T 1C K I15
M C L R /V p p / THV
P IC 1 6F 877A
D7
14D
613
D5
12D
411
D3
10D
29
D1
8D
07
E6
RW5
RS
4
VSS
1
VD
D2
VEE
3
+ 5v
APPENDEX B
The sub system circuit diagram of (PIC16F877A) Micro Controller based Alcohol
Detection System
Circuit diagram of the power supply of microcontroller based alcohol detection system
Interfacing circuit diagram of LCD with microcontroller: interfacing circuit diagram of
buzzer, LCD& motor with microcontroller
R A 0/A N 02
R A 1/A N 13
R A 2/A N 2 /V R E F - /C V R EF4
R A 4/T 0 C K I/C 1O U T6
R A 5/A N 4 /S S /C 2O U T7
R E 0/A N 5 /R D8
R E 1/A N 6/W R9
R E 2/A N 7 /C S10
O S C 1 /C L K IN13
O S C 2 /C L K O U T14
R C 1 /T 1 O S I/C C P21 6
R C 2/C C P11 7
R C 3 /S C K /SC L1 8
R D 0 /PS P01 9
R D 1 /PS P1 2 0
R B 7 /PG D4 0
R B 6 /PG C3 9
R B53 8
R B43 7
R B 3 /P GM3 6
R B2 3 5R B1 3 4
R B 0 / IN T 3 3
R D 7 /PS P7 3 0R D 6 /PS P6 2 9R D 5 /PS P5 2 8R D 4 /PS P4 2 7R D 3 /PS P3 2 2R D 2 /PS P2 2 1
R C 7 /R X /D T2 6
R C 6 /T X /C K2 5
R C 5/S D O2 4
R C 4 /S D I /S D A2 3
R A 3/A N 3 /V R EF +5
R C 0 /T1 O S O/T 1 C K I1 5
M C L R /V p p /T H V1
U 1
P IC 1 6 F 87 7A
D7
14
D6
13
D5
12
D4
11
D3
10
D2
9D
18
D0
7
E6
RW
5R
S4
VS
S1
VD
D2
VE
E3
L C D 1L M 01 6L
+ 5 v
B U Z 1
B U Z Z ER
Q 1B C 54 7
Q 2B C 5 47
D 11 N 4 00 7
D 21 N 4 00 7
R L 112 V
R L 212 V
+ 1 2 vX 1C R Y S TA L
C 1
2 2p F
C 2
2 2p F
R 2
1 k
R 31k
+ 5 v
77%
R V1
5k
R 51k
Vo lt s
+ 2 .67
D 3LE D -G R E EN
D 4L E D -R E D
R 11 0 R 4
10
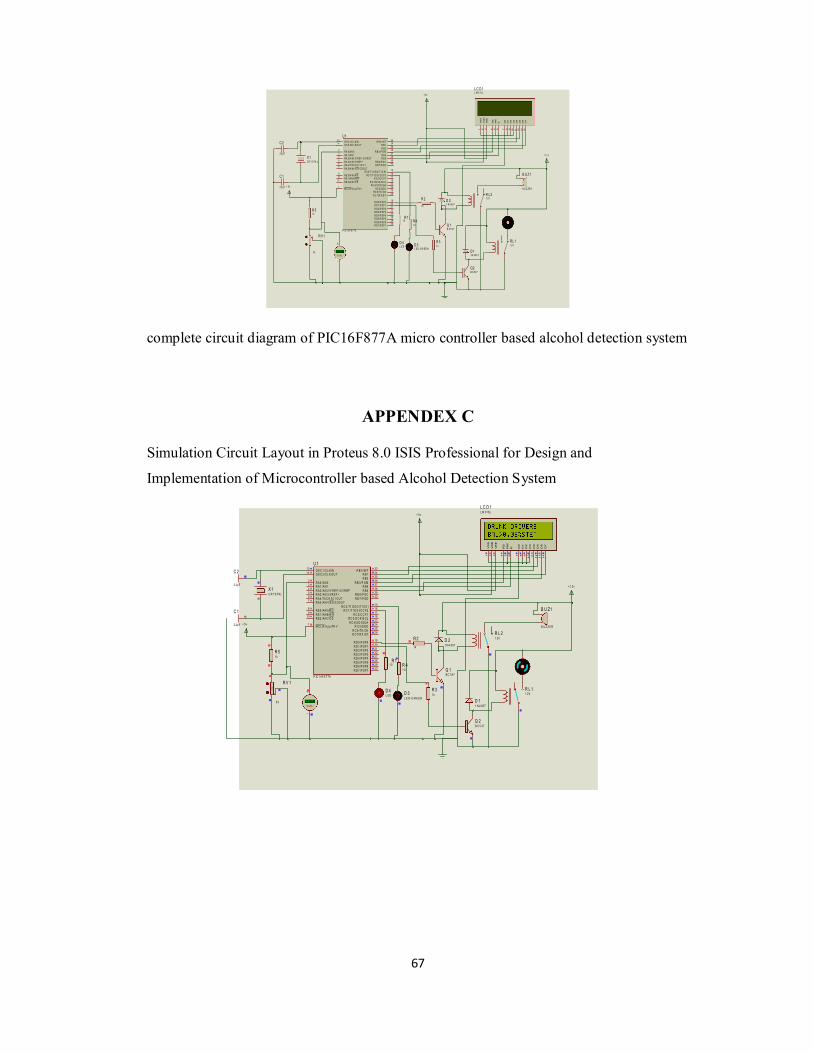
67
complete circuit diagram of PIC16F877A micro controller based alcohol detection system
APPENDEX C
Simulation Circuit Layout in Proteus 8.0 ISIS Professional for Design and
Implementation of Microcontroller based Alcohol Detection System
RA 0/A N 02
RA 1/A N 13
RA 2/A N2 /V R E F -/C V R E F4
RA 4/T 0C K I/C 1O U T6
RA 5/A N4 /S S / C2O UT7
RE 0/A N5/R D8
RE 1/A N 6/W R9
RE 2/A N7/C S10
O S C 1/C LK IN13
O S C 2/C LK O U T14
RC 1/T 1O S I/ CC P 216
R C2 /C C P 117
R C 3/S CK /S CL18
R D0 /P S P 019
R D1 /P S P 120
R B 7 /P G D40
R B 6 /P G C39
R B 538
R B 437
R B 3 /P G M36
R B 235
R B 134
R B 0 /IN T33
R D7 /P S P 730
R D6 /P S P 629
R D5 /P S P 528
R D4 /P S P 427
R D3 /P S P 322
R D2 /P S P 221
R C 7/R X /D T26
RC 6/ TX / CK25
RC 5/ S DO24
RC 4/ S DI/ S DA23
RA 3/A N3 /V RE F+5
R C0 /T1 O S O /T 1C K I15
M C LR /V p p/TH V1
U 1
P IC 1 6F 877A
D7
14
D6
13
D5
12
D4
11
D3
10
D2
9D
18
D0
7
E6
RW
5R
S4
VS
S1
VD
D2
VE
E3
L C D 1L M 0 16L
+ 5v
B U Z 1
B U Z ZE R
Q 1B C5 47
Q 2B C 547
D 11N 400 7
D 21 N4 007
R L112V
R L21 2V
+ 12 vX1CR Y S TA L
C 1
22 pF
C 2
22 pF
R 2
1k
R 31k
+ 5v
77%
R V1
5k
R 51k
+ 88.8
V o lts
D 3L E D -G R E E N
D 4L E D -RE D
R 110 R 4
10
R A0 /AN 02
R A1 /AN 13
R A2 /AN 2/V R E F -/C VR EF4
R A4 /T0 C K I/C 1 O U T6
R A5 /AN 4/S S /C 2O UT7
R E0 /AN 5/R D8
R E1 /AN 6/W R9
R E2 /AN 7/C S10
O S C 1/C L K IN13
O S C 2/C L K O U T14
R C 1 /T 1O S I/C C P216
R C 2/C C P117
R C 3 /S C K /S CL18
R D 0 /P SP019
R D 1 /P SP120
R B 7 /P G D40
R B 6 /P G C39
R B538
R B437
R B 3/P G M36
R B235
R B1 34R B 0 / IN T
33
R D 7 /P SP730
R D 6 /P SP6 29R D 5 /P SP5
28R D 4 /P SP4 27R D 3 /P SP3
22R D 2 /P SP2 21
R C 7/R X /DT26
R C 6 /TX /CK25
R C 5/S DO24
R C 4/S D I/S DA23
R A3 /AN 3/VR EF +5
R C 0 /T1 O S O /T 1C K I15
M C L R /V p p/TH V1
U 1
P IC 1 6F 8 77A
D7
14
D6
13
D5
12
D4
11
D3
10
D2
9D
18
D0
7
E6
RW
5R
S4
VS
S1
VD
D2
VE
E3
L C D 1LM 016L
+ 5v
B U Z1
B U Z Z ER
Q 1BC 547
Q 2B C 5 47
D 11 N 4 007
D 21 N 4 007
R L 11 2V
R L 21 2V
+ 1 2vX 1C R YS TA L
C 1
2 2pF
C 2
2 2pF
R 2
1k
R 31k
+ 5v
0%
R V 1
5 k
R 51k
V o lts
+ 4 .17
D 3L E D -G R EEN
D 4L ED -RE D
R 110 R 4
1 0

68
APPENDEX D
Sensitivity characteristic curve
Sensitivity Characteristics of the MQ-3
The above figure is shows the typical dependence of the MQ-3 on temperature and
humidity.
Ro: sensor resistance at 0.4mg/L of Alcohol in air at 33%RH and 20 °C
Rs: sensor resistance at 0.4mg/L of Alcohol at different temperatures and humidifies.
Related Documents