AGARD-1-7 12 AGARD REPORT No. 712 Special Course on Subsonic/ Transonic Aerodynamic Interference for Aircraft, ThI idoha 1 ~ OCT 1 71983 LM I- C:) DISTRIBUTION AND AVAILA"OiLITY ON BACK COVER

Welcome message from author
This document is posted to help you gain knowledge. Please leave a comment to let me know what you think about it! Share it to your friends and learn new things together.
Transcript
AGARD-1-7 12
AGARD REPORT No. 712
Special Course onSubsonic/ Transonic Aerodynamic
Interference for Aircraft,
ThI idoha 1 ~ OCT 1 71983
LM I-C:)
DISTRIBUTION AND AVAILA"OiLITYON BACK COVER

DISCLAIMER NOTICE
THIS DOCUMENT IS BEST QUALITYPRACTICABLE. THE COPY FURNISHEDTO DTIC CONTAINED A SIGNIFICANTNUMBER OF PAGES WHICH DO NOT.REPRODUCE LEGIBLY.
AGARD-R-7 12
NORTII ATLANTIC TREATY ORGANIZATION
ADVISORY CROUP FOR AEROSPACE RESEARCH AND DEVELOPMENT
(OR( ANISATION DU TRAITE DE L'ATLANTIQUE NORD)
AGARD Report No.712
SPECIAL COURSE ON SUBSONIC/TR PNSONIC AERODYNAMIC INTERFERENCE
FOR AIRCRAFT
The material assembled in this book was prepared under the combined sponsorship of theFluid Dynamics Panel, the von Kirmdin Institute and the Consultant and Exchange Program of
AGARD and was presented as an AGARD Special Course at the von Kdirmdn Institute,Rhode-St-Gen~se, Belgium on 2-6 May 1983 and at Wright-Patterson AFB, Dayton Ohio,
on 16-20 May 1983.
THE MISSION OF AGARD
The mission of AGARD is to bring together the leading personalities of the NATO nations in the fields of scienceand technology relating to aerospace for the following purposes:
- Exchanging of scientific and technical information;
- Continuously stimulating advances in the aerospace sciences relevant to strengthening the coir.ion Jefenceposture;
- Improving the co-operdtion among member nations in aerospace research and development;
- Providing scientific and technical advice and assistance to the North Atlantic Military Committee in the fieldof aerospace research and development;
- Rendering scientific and technical assistance, as requested, to other NATO bodies and to member nations inconnection with research and development problems in the aerospace field;
- Providing assistance to member nations for the purpose of increasing their scientific and technical potential;
- Recommending effective ways for the member nations to use their research and development capabilities forthe common benefit of the NATO community.
The highest authority within AGARD is the National Delegates Board consisting of officially appointed seniorrepresentatives from each member nation. The mission of AGARD is carried out through the Panels which arecomposed of experts appointed by the National Delegates, the'Consultant and Exchange Programme and the AerospaceApplications Studies Programme. The results of AGARD work are reported to the member nations and the NATOAuthorities through the AGARD series of publications of which this is one.
Participation in AGARD activities is by invitation only and is normally limited to citizens of the NATO nations.
The content of this publication has been reproduceddirectly from material supplied by AGARD or the authors.
Published July 1983 11
Z.'; Copyright 0 AGARD 1983All Rights Reserved
ISBN 92-835-0332-5
Printed by Speciallsed Printing Services Limited40 Ciiigwell Lane, Loughton. Essx IGIO 3TZ
!I

PREFACE
The'course was a follow-up to all AGARD Fluid Dynamics Panel Syposium on Subsonic!'rransonic Configuration Aerodynamicsjield in Neubiberg (Munich) in May 1980. As in thesymposwm the emphasts of the course was on the configuration optimization in the transonicregime where both mihtary and commercial aircraft must cruise efficiently and where militaryaircraft must maneuver in an agile but stable manner. The course material was updated andpresented in a more struktured fashion emphasizing the fluid dynamic interference mechanismsthat are the keys to the optimization. In addition, some aspects of subcritical interferencewere also covered, including those arising in the takeoff and landing phase of the flight withhigh lift devices deployed. -
iii

SPECIAL COURSE STAFIF
Special Course I)i-.,ctor D~r I l.YoshiharaiBoeing Company, \I/S 3N- V)P.O. Box 3707SeattleWashington 981 24USA
LECTURERS
Professor A.Jameson \1r A. B. I laines57 1lkmlock Circle Chief ExecutivePrinceton Aircraft Research AssociationNew Jersey 08540 Mlanton Lane Bedford MK41 7PFUSA UK
Mr J.Slooff DipI. lng. G.KrtnizNLR V FW-G in ll1
Anthony Fokkerweg 2 Ilunefelstr. 1 51059 CIM Amsterdam D)-2800 Bremen INetherlands Germany
Mr A.VintDr R.Whitcomhb Principal Aerodynamnicist46 Lakeshore D~rive Apt. I B British Aeroslace PL-CI lampton Wffarlon D~ivisionVirginia 23666 Preston, LancashireUSA UK
Mr I. Rettie NMr Phl.Poisson-QuintonBoeing Company, M/S 7093 lDirectot, International Cooperat ioilsP.O.Box 3707 ONFRASeattle 29 Avenue de Ia D~ivision LeclercWashington 98124 92320 CkitillonUISA France
LOCAL COORDINATOR
Professor I.WendtVon Ktinmiin Institute for Fluid D~yn~amicsCliaus.&~ de Waterloo 72B- 1640 Rbode-Saint-Gen~seBelgiumil
AGARD REPRESENTATIVE
Mr R.lI.Rollins, 11Fluid Dynamics Panel ExecutiveAGARD7 rue Ancclle92200 Neuilly-sur-ScineFrance
iv

CONTENTS
Page
PREFACE iii
SPECIAL COURSE STAFF iv
Reference
4 SUBSONIC/TRANSONIC AERODYNAMIC INTERFERENCE FOR AIRCRAFT,-INTRODUCTORY REMARKS
by II.Yoshilhar I
REVIEW - INVISCIl) COMPUTATIONAL METIIODS*by A.Jaimeson
COMPUTATIONAL METHODS FOR SUBSONIC AND TRANSONIC AERODYNAMICDESIGN, -
by J.W.Slooff 3
SUBSONIC/TRANSONIC VISCOUS INTERACTIONSby H.Yoshihara 4
TRANSONIC AIRFOIL I)EVELOPMENTby R.T.Whitcomb 5
AERODYNAMIC DESIGN FOR OVERALL VEHICLE PERFORMANCEby lI.tRettle 6
APPLICATION OF COMPUTATIONAL PROCEDURES IN AERODYNAMIC DESIGNby J.W.Slooff 7
TRANSONIC EMPIRICAL CONFIGURATION DESIGN PROCESSby R.T.Whitcomb 8
AERODYNAMIC INTERFERENCE - A GENERAL OVERVIEWby A.B.Haines 9
TRANSONIC CONFIGURATION DESIGNby G.Krenz 10
TRANSONIC CONFIGURATION DESIGN (FIGHTER)by D.E.Shaw I I
'EXTERNAL S rORES INTERFERENCEby A.B.Haincs - 12
INTERFERENCE PROBLEMS IN AIRCRAFT DESIGNby I.H.Rettic 13
- NGINE/AIRFRAME INTERFERENCE ,by G.Krenz 14
ENGINE - AIRFRAME INTERFERENCE EFFECTSby A.Vint 15
IDEES NOUVELLES POUR LA CONCEPTION D'AVIONS FUTURSpar Ph.Poisson-Quinton 16
* Paper not available at time of printing.
v
I-I
SUBSONIC/TRANSONIC AERODYNAMIC INTERFERE1CE FOR AIRCRAFT-INTRODUCTORY REMARKS
byH. Yoshihara .
The Boeing CompanyP. 0. Box 3707, M/S 3N-19
Seattle, WA 98124 hECEDING P)LE BLANK-NOT FIUMUSA
SUMMARY
These introductory remarks provide examples of important subsonic and transonicfluid dynamic mechanisms that make up interference concepts used in aircraftoptimization. The rationale for the lecture topic selection and the course outline arethen given.
1.. INTRODUCTION
Aerodynamic interference in aircraft is defined as the change in the flow overgiven elements of the configuration due to the presence of one or more of the otherelements. Interference can arise, for example, locally between the aft camber portionof an airfoil and the forward portion, or more globally between the nacelle/pylon andthe wing. In practice interfcrence considerations are tied closely to the optimizationof aircraft. Of particular importance is the transonic regime where crucialperformance requirements arise for both military and commercial aircraft. Hereinterference effects are magnified by the sensitivity of the flow to perturbations,particularly with shock waves present. Unfavorable interference in the transonicregime can have intolerable consequences, but also skillful design can lead tofavorable interference.
Aerodynamic interference is however pervasive over the entire operating spectrum ofthe aircraft. In the present lectures, in addition to the transonic interference, weshall consider some aspects of subcritical interference arising for example in thetakeoff and landing phase of the flight with high lift devices deployed. There areimportant interference effects in the supersonic regime, but we shall not considerthese in the present lectures.
In the remaining portion of these introductory remarks, we shall first brieflyreview an important fluid dynamic ingredient in interference; namely, the manner inwhich perturbations propagate within the flow field. Examples of importantinterference are next given starting from the optimization of airfoils and extending toaircraft configurations which will be covered more thoroughly in the lectures. Theorganization nf the lecture course is then briefly outlined.
2. PROPAGATION OF PERTURBATIONS
A key element in interference is the manner in which a perturbation introduced atone point on the configuration propagates and influences the flow at other points. Thenature of the propagation of disturbances is well known in subsonic and supersonicflow. In a subsonic flow a perturbation introduced for example at a point on a planarairfoil will influence the flow at all other points, the magnitude of the influencegeometrically attenuating in the well known fashion. In the supersonic case such aperturbation is confined to the downwind Mdch WdVe along whici the disturbanice isunattenuated.
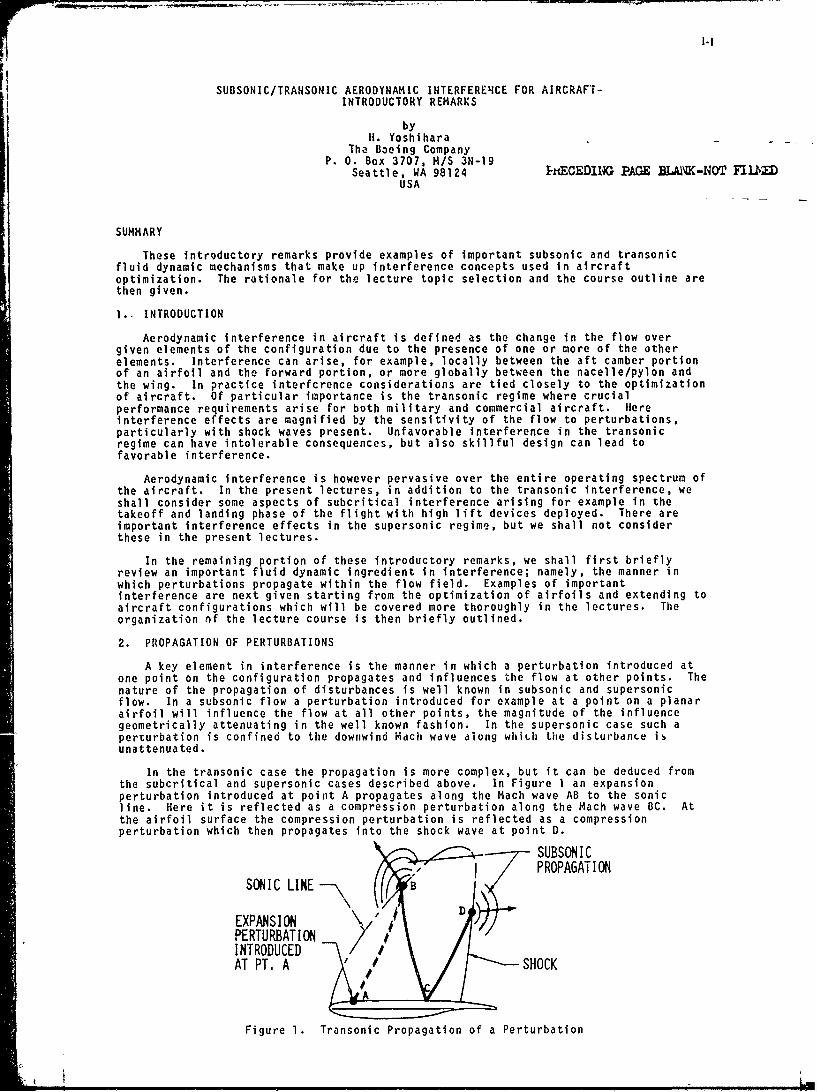
In the transonic case the propagation is more complex, but it can be deduced fromthe subcritical and supersonic cases described above. In Figure I an expansionperturbation introduced at point A propagates along the Mach wave AB to the sonicline. Here it is reflected as a compression perturbation along the Mach wave BC. Atthe airfoil surface the compression perturbation is reflected as a compressionperturbation which then propagates into the shock wave at point D.
SUBSONICSONIC LINE B ,PROPAGATION
EXPANSION \DERTURBATIONINTRODUCEDAT PT. A SHOCK
Figure I. Transonic Propagation of a Perturbation
4 t m l m

1-2
At point C the perturbation magnitude is doubled by the reflection. At poirts Band D where the perturbation impinges on the sonic line and the shock wave, subcriticaldisturbances are excited which then propagate, though weakly, to all points of the flowincluding points along the airfoil upstream of the original perturbation point A. Theoriginal expansion perturbation has thus resulted in a compression perturbation ofdouble strength at a downstream point ', and a perturbation of the shock at point D, andtherefore to its displacement.
The propagation of perturbations in the three dimensional case as for a swept wingwould follow generally that described above for the planar case with however solemodification of the attenuation and the region of influence of the perturbation due tothe additional dimension.
Thus consider the case of the swept wing of constant chord. On the left side ofFigure 2 is first shown the case of a yawed wing of infinite span where the flow isplanar in planes normal to the leading edge. On the right side of Figure 2 is shown aswept wing of finite span formed by truncating the yawed wing and imposinj a plane ofsymmetry. Here the planar flow shock has distorted to the forward shock, and a newshock, the rear shock, has appeared. The latter is a product of the interference dueto the forcing of the yawed wing streamlines to be aligned with the symmetry wall. Atthe wing surface this distortion of the streamline has generated compressionbicharacteristics which have coalesced to form the rear shock. Inversely one catconsider a contouring of the symmetry wall guided by the yawed uing streamlines tolargely eliminate the rear shock. Such far-reaching influence as seen here is animportant element in transonic interference.
STREAMLINE
PLANE %F SY.IKIRYPLANAR SHOCK swEPT WIS
FORWARD SHOCK (2D SHOCKJ
N REAR SHOCK
NN RESI (ENVELOPE OfPYAWED WINE ..I WAVES)
Cp PRFSSUREDISTRIBUTIO(NN) BICHARACIERISUCS
0 FAR-REACHING SP&SWISE INTERFERENCEVIA HARACTERISTICS
Figure 2. A Spanwise Interference
There is another mode of propagation of strictly three dimensional charactercarried out via the trailing vortex system. Here a perturbation at a given pointalters the span loading. This in turn changes the downwash and therefore the effectiveangle of attack at neighboring span stations leading to a pressure distributionchange. We shall give a number of examples in the next section where this mechanismarises.
3. EXAMPLES OF INTERFERENCE
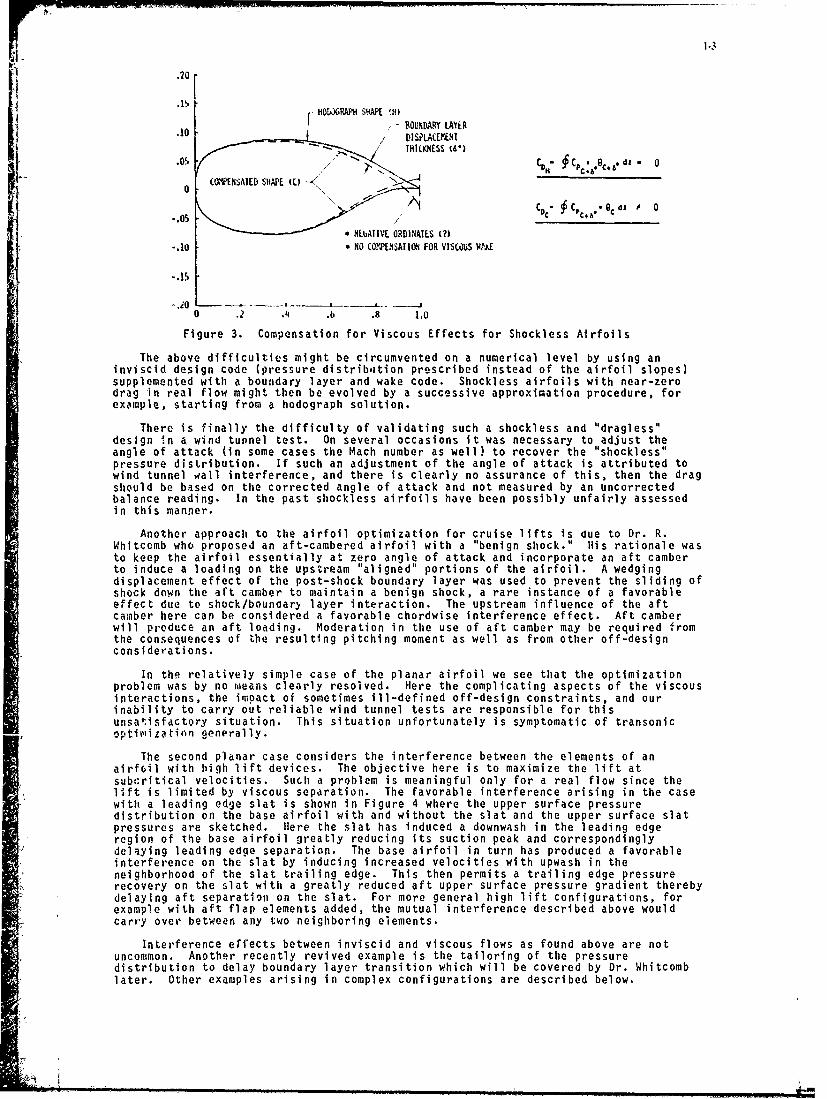
In this section selected cases of interference at subsonic and transonic Machnumbers will be given to illustrate the wide variety of fluid dynamic phenomena thatenter practical interference considerations. Consider first the simplest case of anisolated planar airfoil addressing the problem of minimizing the drag for a given liftand thickness ratio. From the inviscid point of view the formal solution to thisoptimization problem is well known; namely, a shockless airfoil derived for examplefrom a hodograph solution. To be useful the resulting shockless airfoil must bemodified to compensate for viscous effects. The difficulty is that this cannot beaccomplishea by simply compensating for the displacement thickness of the boundarylayer. Let us first recall that the drag is the integral over the profile of thepressure times the local slope. In the above case the pressure is generated by thecompensated shape plus the displacement thickness that is by the original hodographshape. The dilemma is that the shockless pressures act not on the above hodographshape, but on the compensated shape underlying the displacement thickness (Figure 3).The drag is therefore not zero. There is of course the further difficulty thatnegative ordinates for the compensated airfoil will arise near the trailing edge, andthere is no direct way to compensate for the effects of the near-wake.
.20
.o . KcRAPI S eAP1 W.10 -BOUNDARY LAYER.1 DISPLACKYNI
-~ ~- 1HICKNESS W6).05 CD §CPCO96.ed, 00 CO MI"NSAIED SHAPE (C) -
N -Dc C0 aooG c dl o-.05
C/C PC C i 0
SNLbAIIVE ORDINATES (7)
-.10 .NOCOMPNSATIONFOR VISCM WAA
-.io0 .2 .4 .6 .8 1.0
Figure 3. Compensation for Viscous Effects for Shockless Airfoils
The above difficulties might be circumvented on a numerical level by using aninviscid design code (pressure distribition prescribed instead of the airfoil slopes)supplemented with a boundary layer and wake code. Shockless airfoils with near-zerodrag in real flow might then be evolved by a successive approximation procedure, forexample, starting from a hodograph solution.
There is finally the difficulty of validating such a shockless and "dragless"design in a wind tunnel test. On several occasions it was necessary to adjust theangle of attack (in some cases the Mach number as well) to recover the "shockless"pressure distribution. If such an adjustment of the angle of attack is attributed towind tunnel wall interference, and there is clearly no assurance of this, then the dragshould be based on the corrected angle of attack and not measured by an uncorrectedbalance reading. In the past shockless airfoils have been possibly unfairly assessedin this manner.
Another approach to the airfoil optimization for cruise lifts is due to Dr. R.Whitccmb who proposed an aft-cambered airfoil with a "benign shock." His rationale wasto keep the airfoil essentially at zero angle of attack and incorporate an aft camberto induce a loading on the upstream "aligned" portions of the airfoil. A wedgingdisplacement effect of the post-shock boundary layer was used to prevent the sliding ofshock down the aft camber to maintain a benign shock, a rare instance of a favorableeffect due to shock/boundary layer interaction. The upstream influence of the aftcamber here can be considered a favorable chordwise interference effect. Aft camberwill produce an aft loading. Moderation in the use of aft camber may be required fromthe consequences of the resulting pitching moment as well as from other off-designconsiderations.
In the relatively simple case of the planar airfoil we see that the optimizationproblem was by no means clearly resolved. Here the complicating aspects of the viscousinteractions, the impact of sometimes ill-defined off-design constraints, and ourinability to carry out reliable wind tunnel tests are responsible for thisunsatisfactory situation. This situation unfortunately is symptomatic of transonicoptimization generally.
The second planar case considers the interference between the elements of anairfoil with high lift devices. The objective here is to maximize the lift atsubc:ritical velocities. Such a problem is meaningful only for a real flow since thelift is limited by viscous separation. The favorable interference arising in the casewith a leading edge slat is shown in Figure 4 where the upper surface pressuredistribution on the base airfoil with and without the slat and the upper surface slatpressures are sketched. Here the slat has induced a downwash in the leading edgeregion of the base airfoil greatly reducing its suction peak and correspondinglydelaying leading edge separation. The base airfoil in turn has produced a favorableinterference on the slat by inducing increased velocities with upwash in theneighborhood of the slat trailing edge. This then permits a trailing edge pressurerecovery on the slat with a greatly reduced aft upper surface pressure gradient therebydelaying aft separation on the slat. For more general high lift configurations, forexample with aft flap elements added, the mutual interference described above wouldcarry over between any two neighboring elements.
Interference effects between inviscid and viscous flows as found above are notuncommon. Another recently revived example is the tailoring of the pressuredistribution to delay boundary layer transition which will be covered by Dr. Whitcomblater. Other examples arising in complex configurations are described below.

CD "-> , - UPPER SURFACE PRESSURESSUCTION W~1ITHOUT SLAT
REDUED AFT- UPPER SURFACE PRESSURESGRADIENT
E II'G VE. LOCI 1 TY
Figure 4. Favorable interference for a Slatted Airfoil
Consider now the interference problems arising for a high aspect ratio swept wingin the transonic regima. At the cruise lift it is relatively straightforward to avoidsevere unfavorable interference and achieve reasonably good lift to drag ratios byeliminating significant isobar and shock unsweeplng by appropriate wing washout andthickness and camber varlationi.
Difficulty with such swept wings however arises at lifts beyond the cruise valuewhere the tendency of swept and tapered wings to load up in the outboard regioncontinues to persist leading to outboard shock-induced separations. For a given liftthe appearance of extensive separation in the outboard region will shift the wingloading to the inboard more upstream portion of the wing generating a noseup pitchingmoment. In addition the resulting increased wake downwash downstream of the inboardwing leads to a more negative lift on the tail and to a further increase in the nose-upmoment. This combination leads to pitchup which results in an undesirable stick-forcelightening and in more severe cases to a Irngitudinal instability of the aircraft.
The cure for pitchup in principle is clear. One simply prevents the above lateralshift of the spanwise loading by either delaying outboard separation or by hasteninginboard separation. The challenge is to implement this without undesirable sideeffects.
In connection with the outboard separation, a subtle but frequently occurringinterference mechanism arises at the inboard edge of the separated region through thelocal reduction of the spanwise loading by the separation. Here trailing vortices aregenerated which decrease the effective angle of attack inboard of the separation andincreases it outboard. This then stabilizes the separation pattern, delaying itsspread inbo7rd. Inversely if the separation is eliminated for example by vortexgenerators, the above trailing vortices will be removed, bringing back separation onthe inboard side.
As the final example let us consider the interference of the nacelle/pylon andpowered jet on the wing/fuselage. Such interference has recently been aggravated inthe case of an underwing installation of large diameter high bypass turbofan engines.Here considerations of landing gear length, center of gravity positioning, andnacelle/pylon flutter have necessitated mounting of the engines in much closerproximity to the wing than for previous smaller less fuel-efficient and noisier engines.
In all engine installations an important interference effect is the local loss ofthe loading. In the transonic case this will lead to a drag increase when the angle ofattack is increased to make up the lift loss. The resulting bucket in the spanwiseload distribution can have a favorable interference effect. Here the alteration of thetrailing vortices will result in a reduction of the local effective angle of attack oneither side of the lift-loss bucket moderating any adverse shock-induced separationspresent.
In the transonic case there is another important consequence of the close coupling,namely, the choking of the flow between the nacelle/pylon/powered jet and the winglower surface giving rise to detrimental shocks and shock/boundary layer interactions.Proper contouring of the configuration therefore assumes increased importance not onlyin the shaping of the nacelle/pylon, but in the local redesigning of the wing.
In the past it was sufficient to contour the nacelle and pylon to fit thesubscritical streamlines of the wing/fuselage without modifying the wing. In thetransonic case with closely coupled engines, the above procedure is no longeradequate. Unfortunately, the necessary transonic computer code to handle the completeconfiguration with a powered jet exhaust plume is still in development. The presentalternative is therefore to start with the streamline fitted configuration, withhowever the streamlines determined by an available transonic wing/fuselage code, andthen refine this baseline design in the wind tunnel. Here local leading and trailingedge camber modifications must be considered.

The large turbofan engines , also led to unfavorable interference at subcriticalhigh lift conditions with high lift devices deployed. In the case that the leadingedge slat is sealed against the naLelle and pylon a significant reduction of themaximum lift results. It is caused by the contamination of the boundary layer in theforward regions of the wing by the separated flow from the nacelle and pylon channelingup the corner formed by the slat, pylon, and nacelle (see Figure 5). The contaminationthen leads to a premature stall of the wing.
NACELLE LIP SEPARAIM
I NACELLE (ROSS-FLOV SEPARAIION TIN B LRTEX
SLAT ill1111.,l
SLAT SEALED TO, SLATtNACLLLLIPY t IGNS DILNINhM
1 -(CaAMINAILD
WING SEPARAT104~
" LIP SEPARAIkN~" NACLUE CRO&S-FLOW SEPARAI WN CLA.MINAMLS WING 8.1." JU3NCTURE SEPARATION I
Figure 5. Adverse Viscous Interference at Subcritical High-Lift Conditions
A satisfactory cure for the above difficulty is the addition of a strake at anappropriate location on the nacelle (Figure 5). Such a strake generates a powerfulleading edge vortex which siphons off the low energy boundary layer flow on thenacelle, pylon, and slat transporting it downstream well above the wing upper surface.
The above examples are but a sampling of important interference effects arising attransonic speeds. Omitted, for example, is a whole class of interferences which arisein fighters at maneuver lifts where vortices generated upstream by separations on thefuselage, canards, or strakes interact with the wing or tail to cause both favorableand unfavorable interference. These cases will be covered in the lectures.
4. ORGANIZATION OF THE LECTURES
As in the examples of the last section, interference effects to be covered in thepresent lecture series will be linked closely to specific aircraft performanceobjectives. Considerations of interference in the optimization process will thereforebe undertaken constrained by overall vehicle requirements.
Important interference effects were seen to envolve fluid dynamic phenomena far toocomplex to be analyzed by existing computational methods. A direct optimization isthereforc out of reach. Optimal configurations must be sought by a search processwherein experience is used both to eliminate detrimental gross fluid dynamic featuresas strong shocks and boundary layer separations and to promote favorable interference.It is therefore not surprising that the end design is not unique.
The lecture course has been divided into three parts. The first part (Lectures 1to 5) forms background material describing the computational and testing tools. Indescribing the numerical methods complex algebraic details are omitted whenever theydistract from the essential features of the methods. The first part concludes with areview of the overall design process where the compromised gross features of theaircraft are evolved, based upon its overall performance requirements, which definesthe starting point for the optimization.
Lectures 6 to 14 cover the wide range of interference phenomena arising in theoptimization of both military and commercial aircraft. Here the emphasis will be ondescribing the relevant fluid dynamic mechanism that drives the optimization. Lectureshere are intentionally duplicative, so that alternative approaches toward a givendesign goal can be demonstrated.
The third part on the last day will cover advanced innovative interference conceptsin aircraft design. The near-term applications will be for military aircraft wheresuch concepts are pioneered and thoroughly developed before being applied to commercialaircraft. Such subjects as powered lift, aeroelastic tailoring, swept forward wings,variable geometry and novel weapons carriage will be among the topics to be discussed.
3-1
COMFUTATIONAL MEtIROIO; FOI -SUPOONIC AND TRA.XONIC ABFiODYN;AIIC LL;ZIGN
by
JY.W. Slooff
Ifead, Th.oretical Aerodynamic- Irpt.,National Aerospace ILboratory NLF
Arsterdam
The Netherland.-
SUM,4ARY
An overview is provided of computational methods that .an be used in solvine the design problem ofaerodynamics; i.e. the problem of finding the detailed shape of (parts of) configurations of which thegross geometric characteristics have already been determined in a preliminary, overall design frocess, andthat, subject to certain constraints, have to meet given aerodynamic requirements.Attention is focussed on methods for solving the classical inverse problem of aerodynamics and on
approaches using optimization techniques. Both methods limited to subsonic flow utilizing panel method
technology as well as methods based on finite difference/volume formulations for compressible, tranconicflow are covered.In conclusion a discussion is presented of the relative merits of the various computational approaches tothe problem of aerodynamic design.
PRECEDING PAGE BLANK-NOT F1M

3 2
CONTENTS
1. INTRODUCTION
2. CLASSIFICATION OF COMPUTATIONAL AERODYNAMIC DESIGN METHODS
3. INVERSE METHODS3.1 General aspects3.2 Methods babed on thin airfoil theory3.3 Iterative methods utilizing Dirichlet-type boundary conditions3.4 Residual-correction or iterative Neumann-type methods3.5 Non-linear boundary value problem formulations
4. DIRECT DESIGN BY MEANS OF (NUMERICAL) OPTIMIZATION
5. SPECIAL METHODS- FICTITIOUS GAS CONCEPT
6. CONCLUDING REMARKS
7. REFERENCES
3 Tatles37 Figures
1. INTRODUCTION
In the process of aerodynamic design one can, traditionally, distinguish two phases (Fig. 1). Thefirst phase, that of PRELIMINARY DESIGN, consists of i parametric study in which the major 1esign variablessuch as general dimensions, wing loading (CL), basic wing planform, etc. are fixed. During he secondphase, that of DESIGN DEVELOPMENT or DETAILED DESIGN the geometry of the wing and other configuration partsis worked out in detail.
It is primarily this second phase that represents the market for tte now decade-old technical/scientific discipline tl'at we call COMPUTATIONAL FLUID DYNAMICS (CFD). However, it must be expected that,%ith computing speeds and algorithm efficiency still increasing continuously, computational aerodynamicmethods will also intrude gradually in the phase of preliminary design.
By far the greater part of the effort invested in CFD over the past 10 to 15 years has been indeveloping methods and computer codes that solve the direct problem of aerodynamics, i.e. the problem ofdetermining the flow about a given shape at given incidence, Mach and Reynolds number. This has greatlyimproved the possibilities for the early, but admittedly approximate, aerodynamic ANALYSIS of airplaneconfigurations. However, the greatest potential of CFD, when suitably adapted, is probably in the possi-bility of directly computing shapes that will produce prescribed aerodytiamic characteristics. In thisDESIGN mode, computational aerodynamic methods are really complementary to wind-tunnel testing, (1].
The purpose of this lecture is to review such design-type of computational methods for subsonic andtransonic flow. The review will be limited to methods that can be used or, at least in principle can beextended for use in situations involving aerodynamic intsrference. For this reason methods for singleairfoils based on eonformal mapping principles w,l hod 6raph methods will not be covered. For thoseinterested in conformal mapping methods references [2] to [51 provide siitable entry. A review of designmethods for transonic flow, including hodograph methods, has recently bt en given in chapter 5 of (6] and(7].
In the following sections we will first ,-e'.ent a classification of computational aerodynamic designmethods. This will facilitate a systematic description of the various methods that can be found in theliterature. The most important of these, (from the point of view of this author) will be discussed in somedetail. The discussion will be concluded by a comparison of the possibilities and limitations of thevarious approachc, lcading to ccrtain suggestions for irnrpovin the applicability and efficiency ofaerodynamic design methods.
For a good understanding of the material presented it is essential that the reader be familiar withat least the principles of current CFD techniques for subsonic and t ansonic flow. It will also be helpfulif he is familiar with the principles of the calculus of variations and oDtmization techniques.
2. CLASSIFICATION OF COMPUTATIONAL AERODYNAMIC DESIGN METHODS
Computational aerodynamic design methods can be categorized according to various criteria correspond-ing with different viewpoints. The aerodynamic designer will be inclined to distinguish by the flow regime(subsonic, transonic) in which the methods are applicable as well as by the geometrical capabilities(2-D airfoils, wings, bodies, etc.). A matrix of existing computational aerodynamic design methodsfollowing this classification, with numbers of listed references, is given in table 1. Note that there areseveral "holes in the market".
With respect to geometric capabilities an important aspect of design methods is the extent to whichdirect control can be executed over the geometry (in addition to the indirect control that can beexcercised through e.g. the pressure distribution). Because design methods can give rise to the problemthat the geometry required to realize given aerodynamic characteristics may not be acceptable from thepoint of view of the structural engineer, some form of explicit control over the geometry is highlydesirable. This, ofcourse, is particularly important in the case of airplane modification studies, wherecertain parts of the geometry may be modified and others must be kept fixed. It is indicated in table 1which of the existing methods offer the possibility of excercising direct control over the geometry.Distinction is made between the possibility to keep parts of the geometry fixed (mixed analysis/designproblem) and the possibility to allow the geometry to vary only within certain constraints.

3-3
Next let us have a look at design methods from the point of view of the cvmpu.ational aerodynamicist.We may then distinguishes three classes of formulations viz. (Tab. 2):1. Inverse methods This category contains methods for solving the classical inverse problem of aerc-
dynamics, i.e. that of determining the detailed shape of a body that will produce a given pressuredistribution.
2. Indirect methods Indirect methods are characterized by the fact that, in principle, the designer hasdirect control over neither ae-odynamic quantities such as lift, pitching mment and pressure distribu-tion nor over the geometry. Rather than specifying such quantities directly, the designer has tomanipulate a number of (generally nun-physical) parameters and see what comes out of it. The hvdographand fictitious gas methods are in this category. In this lecture we will consider the rictitious gasmethod only.
3. Aerodynamic optimization methods This category is characterized by the use of automated design proce-dures in which an optimization algorithm and a fluid dynamics solver are linked together to, directly,minimize a given aerodynamic object function, such as drag.
Another possible division of design methods is by the mathematical and numerical flow model that isused. The present discussion will be essentially limited to inviscid, potential flows. The modeling ofviscous effects will be touched upon whenever appropriate, but will be discussed in more detail inanother lecture of this series. The p,.tential flow model is usually adequate lor design calculations,which generally involve no, or only wzak shock waves. Methods based on the Euler equations, to the author'sknowledge, are not (yet) used in design-type calculations.
Potential flow methods restricted to subsonic flows that can be described by the linear Laplace orPrandtl-Glauert .equation are generally of the PANEL HETHOD varietye. I.e. they use discretized surfacedistributions of sources, doublets, vorticity etc. Methods that can also deal with (non-linear) transonicflow situations utilize Finite Difference (FD), Finite Element (FE) or Finite Volume (FV) discretizationsof the flow field.
Because aerodynamic design problems are non-linear by neture, at least in the boundary conditions,they must be solved by iteration. Hence, aerodynamic design methods, inverse methods in particular, canalso be distinguished by the way in which the problem is linearized in each iteration step. In thisrespect we may distinguish between methods in which the problem is linearized analytically and, from theoutset, is formulated as a sequence of linear boundary value problems (b.v.p.) and methods which directlyaddress the full non-linear boundary value problem. With the iterative linear b.v.p. formulations numericaldiscretization takes place after the (analytical) linearization of the problem. With the non-linear b.v.p.formulation the full non-linear problem is discretized, resulting in a system of non-linear algebraicequations. The latter are then solved by means of some standard (iterative) solution method for non-linearalgebraic equations (9].
Although the non-linear b.v.p. approach, in principle, is the most general of the two, most existingmethodz -'ploy the iterative linear b.v.p. formulation. Reasons for this are:1. The fact that the conditions for uniqueness and solubility of linear b.v. problems are generally better
known than those of non-linear problems.2. Methods and computer codes for linear b.v. (flow) problemz are already available in most cases and can
readily be implemented in program systems for the iterati'e linear approach.
In the following sections we will describe the main characteristics of a fairly large number ofaerodynamic design methods that are known to the author. Some of these cannot (yet) be found in theliterature. The purpose of this description is to provide the back-ground for a discussion of the possibil-ities and limitations of the various approaches. Since these (the possibilities and limitations) are adirect consequence of the way in which the design problem is formulated it is most convenient to follow theclassification of table 2.
3. INVERSE METHODS
3.1 General aspects
In the inverse problem of aerodynamics the detailed shape is to be determined of a body of which thegrors gcometrical and main load chara ctriaticz arc alrcady 'known from a preliminary desu 4detailed geometry is to be determined such that, for a given Mach number, the body will produce a givenpressure distribution. This "target" pressure distribution is chosen in agreement with the main loadcharacteristics adopted in the preliminary design process. Because the shape of fuselage-type bodies isgenerally determined by other than aerodynemic requirements, inverse methods are usually directed towardsobtaining the detailed shape of airfoil or wing-like bodies.
In incompressible or (linear) subsonic flow the inverse problem is non-linear in the boundary condi-tions only. In transonic flow the problem is non-linear in both the boundary conditions and the flowequations. Due to the non-linearity of the boundary conditions, the inverse problem is fundamentally morecomplicated than the analysis problem. This is already so in the case of 2-D incompressible flow, aspointed out by LighthillC and Woods 1 , and more recently by Volpe and Melnik 12 . In particular it has beendemonstrated by Lighthill, using conformal mapping techniques, that a unique and correct solution to theinverse problem of 2-D, incompressible flow dues not exist unless a number of additional conditions in theform of certain integral constraints are satisfied. Lighthill formulated these integral constraints interms of the zero lift velocity distribution (qo) and the angular coordinate 0 in the plane obtained byconformally mapping the airfoil to a circle, viz.
f log q d 0 =0(31)-n
f log qo cos 0 dO = 0 (3.2)-0
3-4
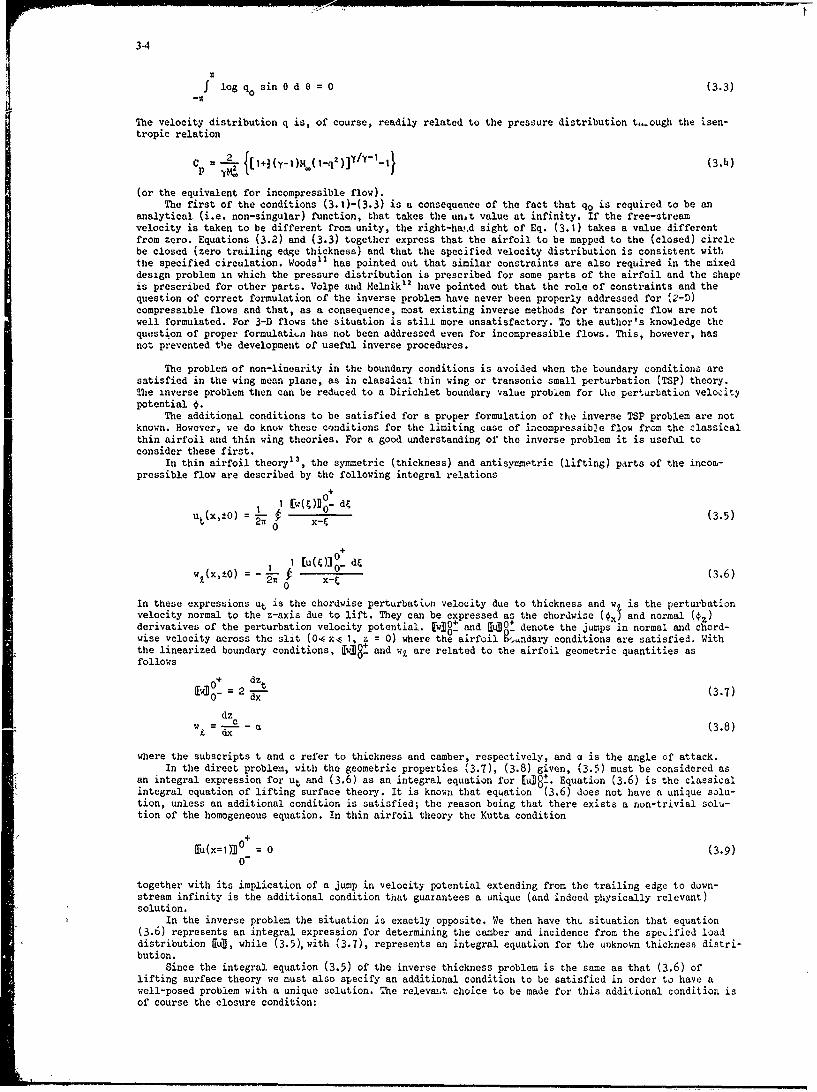
f log qo sin 0 d O = 0 (3.3)
The velocity distribution q is, of course, readily related to the pressure distribution t..ough the isen-tropic relation
cp = -kL J[+~-)L1q)Y_-_ (3.4)Cp YM
(or the equivalent for incompressible flow).The first of the conditions (3.1)-(3.3) is a consequence of the fact that qo is required to be an
analytical (i.e. non-singular) function, that takes the unit value at infinity. If the free-streamvelocity is taken to be different from unity, the right-ha*.d sight of Eq. (3.1) takes a value differentfrom zero. Equations (3.2) and (3.3) together express that the airfoil to be mapped to the (closed) circlebe closed (zero trailing edge thickness) and that the specified velocity distribution is consistent withthe specified circulation. Woods has pointed out that similar constraints are also required in the mixeddesign problem in which the pressure distribution is prescribed for some parts of the airfoil and the shapeis prescribed for other parts. Volpe and Melnik1 2 have pointed out that the role of constraints and thequestion of correct formulation of the inverse problem have never been properly addressed for (2-D)compressible flows and that, as a consequence, most existing inverse methods for transonic flow are notwell formulated. For 3-D flows the situation is still more unsatisfactory. To the author's knowledge thequestion of proper formulati.n has not been addressed even for incompressible flows. This, however, hasnot prevented the development of useful inverse procedures.
The problem of non-linearity in the boundary conditions is avoided when the boundary conditions aresatisfied in the wing mean plane, as in classical thin wing or transonic small perturbation (TSP) theory.The inverse problem then can be reduced to a Dirichlet boundary value problem for Lhe perturbation velocitypotential 4.
The additional conditions to be satisfied for a pruper formulation of the inverse TSP problem are notknown. However, we do know these conditions for the limiting case of incompressible flow from the classicalthin airfoil and thin wing theories. For a good understanding of the inverse problem it is useful toconsider these first.
In thin airfoil theory13 , the symmetric (thickness) and antisymmetric (lifting) parts of the incom-pressible flow are described by the following integral relations
ut(x,°) = x- (3.5)2wTr0 X-C
0 C
In these expressions ut is the chordwise perturbation velocity due to thickness and w is the perturbationvelocity normal to the z-axis due to lift. They can be expressed as the chordwioe (4x) and normal (4z)derivatives of the perturbation velocity potential. [wl and EuJj denote the jumps in normal and chord-wise velocity across the slit (0< x< 1, z = 0) where the airfoil 9o.ndary conditions are satisfied. Withthe linearized boundary conditions, [fwl8 and wt are related to the airfoil geometric quantities asfollows
0 + dz t0 _ = 2 (3.7)
dzw, dx c (3.8)
where the subscripts t and c refer to thickness and camber, respectively, and a is the angle of attack.In the direct problem, with the geometric properties (3.7), (3.8) given, (3.5) must be considered as
an integral expression for ut and (3.6) as an integral equation for [J8. Equation (3.6) is the classicalintegral equation of lifting surface theory. It is known that equation (3.6) does not have a unique solu-tion, unless an additional condition is satisfied; the reason being that there exists a non-trivial solu-tion of the homogeneous equation. In thin airfoil theory the Kutta condition
0+
[u(x=1TX + = 0 (3.9)0-
together with its implication of a jump in velocity potential extending from the trailing edge to down-stream infinity is the additional condition that guarantees a unique (and indeed physically relevant)solution.
In the inverse problem the situation is exactly opposite. We then have th. situation that equation(3.6) represents an integral expression for determining the camber and incidence from the specified loaddistribution flul, while (3.5),with (3.7), represents an integral equation for the unknown thickness distri-bution.
Since the integral equation (3.5) of the inverse thickness problem is the same as that (3.6) oflifting surface theory we must also specify an additional condition to be satisfied in order to have awell-posed problem with a unique solution. The relevait choice to be made for this additional condition isof course the closure condition:

~3-5
I m(l)]- d, C (3.10)0
requiring that the airfoil be clsed (C = 0) or have a given trailing edge thickness (C > o). lith C > 0there is a net source flow trailing behind the airfoil.
It can be shown that in the mixed boundary value problem, in which the velocity distribution iuprescribed over part of the slit and the geometry over the remainder, both a condition fixing the circula-tion and the closure condition must be enforced in order to obtain a Droblem with a unique solution. It isemphasized that without satisfying, either explicitly cr implicitly, the necessary additional condition(s)any numerical scheme is bound to fail. Corresponding additional conditions must be satisfied in the caseof 3-D (thin) wing flow. Note, that in thin airfoil theory as described above the airfoil shape can bedetermined directly, without iteration.
At this point it is instructive to notice that the Kutta condition (3.8) together with the closurecondition (3.9) represent the equivalent in thin airfoil theory of Lighthill's constraints (3.2) and (3.3.While these conditions are necessary and sufficient for a unique solution they do not guarantee a validsolution. For a uniformly valid (that is non-singular, (i) solution in thin airfoil theory, the airfoilmust be cusped at both ends. In other words, the additional constraint
w(x = 0,I) = 0 (3.11)
must be imposed on the solution of the inverse thickness problem. Evidently (3.11) is the thin airfoilequivalent of Lighthill's constraint (3.1). We will call equations (3.1), (3.11) the regularity condition.
As pointed out by Volpe and Melnik' 2 , Lighthill's constraints, or rather the equivalent of those,must also be satisfied when the boundary conditions are linearized about a given (non-planar) approxima-tion of the airfoil that is being sought. In the latter case the inverse problem can be solved as asequence of Dirichlet boundary value problems for the velocity potential with the geometry updated throughthe normal velocity W resulting after each Dirichlet step (Fig. 2a).
The distribution of the surface potential required for the Dirichlet boundary condition is obtainedby integration of the target velocity distribution, i.e.
s
0 (s = 0) + f q(s')ds' (3.12)s=O
The constant of integration %, in (3.12), fixes the average level of the potential at the airfoilrelative to that at infinity and through this the total net mass flux from the airfoil to infinity. Hence4o can be used to satisfy the equivalent, for thick airfoils, of the closure condition (3.10).
At this point a remark must be made with respect to the boundary conditions at infinity. For panelmethods these are of little concern because they are satisfied implicitly by the elementary source anddoublet/vortex solution. In transonic FD/FE/FV methods they must be imposed explicitly at the outerboundary of the computational domain. For a properly formulated analysis method with Ueumann boundary condi-tions in the near-field, (airfoil surface), the far-field boundaty condition must be of the Dirichlet type,with allowance for a jump in potential corresponding with the circulation around the airfoil. Conversely,methods utilizing Dirichlet-type near-field boundary conditions should have Neumann-type far-field boundaryconditions, with allowance for an integral mass flux constraint corresponding with the required amount oftrailing edge openness of the airfoil. In none of the transonic inverse methods that can be found in theliterature this point is dealt with adequately. It was, however, (partly?) recognized by Volpe andMelnik .
Volpe and Melnik also argue, that in order to obtain a proper stream surface, we must require thesolution to contain a branch point or dividing streamline. This, in general, requires a stagnation point.This last requirement can also be brought-up as follows. Note, that since
q2 = U2 + W2 (3.13)
the normal velocity W resulting from the solution of the Dirichlet proolem, must be small with respect toU (and a), or, in other words
W << U,q (3.14)
This implies the requirement
W(so) = 0 (3.15)
where so = s(U= 0). Equation (3.15), of course, is the equivalent of the regularity condition (3.11). Asdiscussed in (12], the implication of this requirement is that a free parameter such as the magnitude ofthe free stream or a free parameter in the target pressure distribution must be introduced.
In three dimensions the question of well-posedness of the inverse problem does not seem to have beenaddressed properly even for incompressible flow. One aspect is that the 3-D equivalents of Lighthill'sconstraints have not been formulated. Apart from this there are strong indications that the 3-D inverseproblem is ill-posed, in the sense that small differences in specified pressure distribution may lead tolarge differences in geometry. The point was first noted in [1]. An example taken from [55) has beenreproduced in figure 3.
Related aspects of the 3-D inverse problem, in particular when formulated in terms of a sequence ofDirichlet problems with geometry corrections based on calculated normal velocity distributions, are thefollowing:The conversion of specified pressure or velocity distribution into specified velocity potential is funda-mentally more complicated than in 2-D flow. Assuming the normal velocity to be sufficiently smali theconversion is described by the equation
+ , = q2 (c,n) (3.16)
3-6
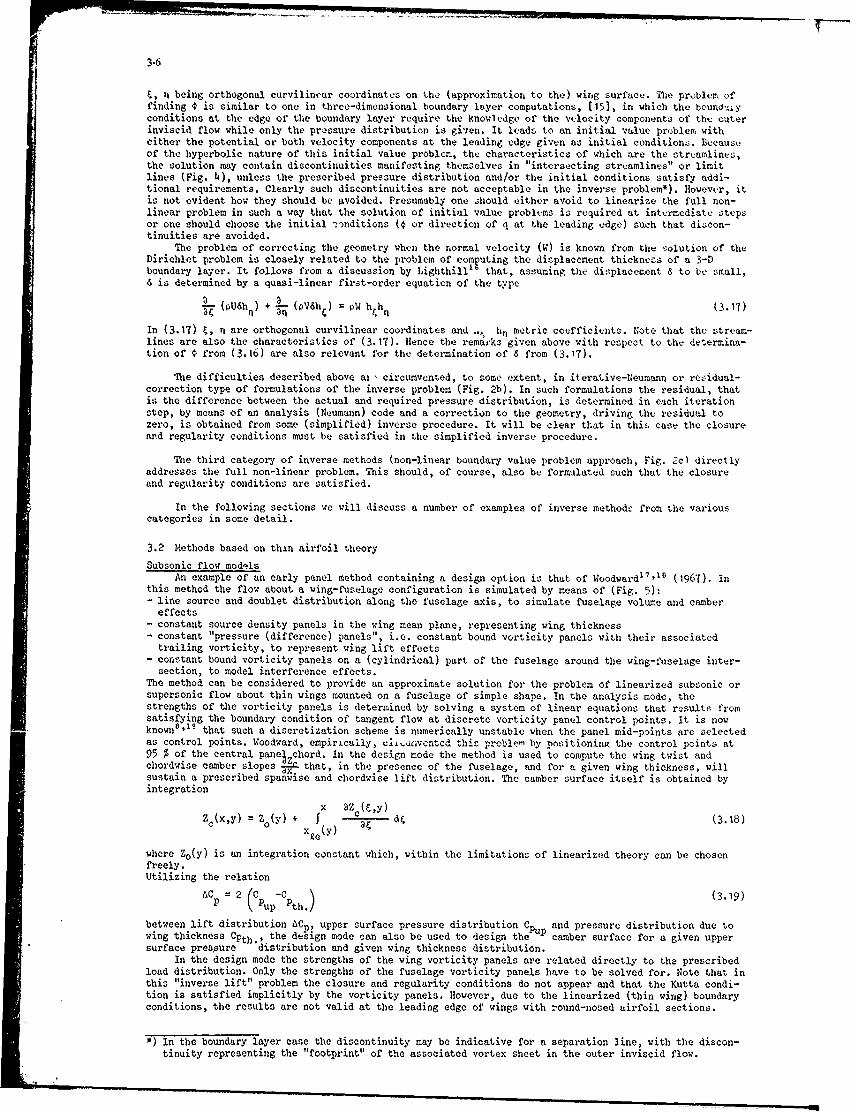
, ii being orthogonal curvilinear coordinates on the (approximation to the) wing surface. The problem offinding * is similar to one in three-dimensional boundary layer computations, [15], in which the boundaryconditions at the edge of the boundary layer require the knowledge of the velocity components of the outerinviscid flow while only the pressure distribution is given. It leads to an initial value problem witheither the potential or both velocity components at the leading edge given as initial conditions. Becauseof the hyperbolic nature of this initial value problem, the characteristics of which are the streamlines,the solution may contain discontinuities manifesting themselves in "intersecting streamlines" or limitlines (Fig. 14), unless the prescribed pressure distribution and/or the initial conditions satisfy addi-tional requirements. Clearly such discontinuities are not acceptable in the inverse problem*). However, itis not evident how they should be avoided. Presumably one should either avoid to linearize the full non-linear problem in such a way that the solution of initial value problems is required at intermediate stepsor one should choose the initial ionditions (€ or direction of q at the leading edge) such that discon-tinuities are avoided.
The problem of correcting the geometry when the normal velocity (W) is known from the solution of theDirichlet problem is closely related to the problem of computing the displacement thickness of a 3-Dboundary layer. It follows from a discussion by Lighthilllb that, assuming the displacement 6 to be small,6 is determined by a quasi-linear first-order equation of the type
( h + an (pV61) = PW hh n (3.17)
In (3.17) t, n are orthogonal curvilinear coordinates and .., h. metric coefficients. Note that the stream-lines are also the characteristics of (3.17). Hence the remarks given above with respect to the determina-tion of 0 from (3.16) are also relevant for the determination of 6 from (3.17).
The difficulties described above ai, circumvented, to some extent, in iterative-Neumann or residual-correction type of formulations of the inverse problem (Fig. 2b). In such formulations the residual, thatis the difference between the actual and required pressure distribution, is determined in each iterationstep, by means of an analysis (Neumann) code and a correction to the geometry, driving the residual tozero, is obtained from some (simplified) inverse procedure. It will be clear that in this case the closureand regularity conditions must be satisfied in the simplified inverse procedure.
The third category of inverse methods (non-linear boundary value problem approach, Fig. 2c) directlyaddresses the full non-linear problem. This should, of course, also be formulated such that the closureand regularity conditions are satisfied.
In the following sections we will discuss a number of examples of inverse methods from the variouscategories in some detail.
3.2 Methods based on thin airfoil theory
Subsonic flow modelsAn example of an early panel method containing a design option is that of Woodward17 1 (1967). In
this method the flow about a wing-fuselage configuration is simulated by means of (Fig. 5):- line source and doublet distribution along the fuselage axis, to simulate fuselage volume and cambereffects
- constant source density panels in the wing mean plane, representing wing thickness- constant "pressure (difference) panels", i.e. constant bound vorticity panels with their associatedtrailing vorticity, to represent wing lift effects
- constant bound vorticity panels on a (cylindrical) part of the fuselage around the wing-fuselage inter-section, to model interference effects.
The method can be considered to provide an approximate solution for the problem of linearized subsonic orsupersonic flow about thin wings mounted on a fuselage of simple shape. In the analysis mode, thestrengths of the vorticity panels is determined by solving a system of linear equations that results fromsatisfying the boundary condition of tangent flow at discrete vorticity panel control points. It is nowknown6 ,'9 that such a discretization scheme is numerically unstable when the panel mid-points are selectedas control points. Woodward, empirically, Cii.umfvcntcd thic problem by positioninR the control points at95 % of the central panelZchord. In the design mode the method is used to compute the wing twist andchordwise camber slopes j that, in the presence of the fuselage, and for a given wing thickness, willsustain a prescribed spanwise and chordwise lift distribution. The camber surface itself is obtained byintegration
Z0 (x,y) = Z (y) + x -- df (3.18)xye(y)
where Zo(y) is an integration constant which, within the limitations of linearized theory can be chosenfreely.Utilizing the relation
ACp = 2 (Cpup-Cpth.) (3.19)
between lift distribution ACP, upper surface pressure distribution Cu and pressure distribution due towing thickness CPth , the design mode can also be used to design the up camber surface for a given uppersurface pressure distribution and given wing thickness distribution.
In the design mode the strengths of the wing vorticity panels are related directly to the prescribedload distribution. Only the strengths of the fuselage vorticity panels have to be solved for. Note that inthis "inverse lift" problem the closure and regularity conditions do not appear and that the Kutta condi-tion is satisfied implicitly by the vorticity panels. However, due to the linearized (thin wing) boundaryconditions, the results are not valid at the leading edge of wings with round-nosed airfoil sections.
*) In the boundary layer case the discontinuity may be indicative for a separation line, with the discon-tinuity representing the "footprint" of the associated vortex sheet in the outer inviscid flow.

3-7
nesign options similar to those described above are also available in the early Boeing subsonicwing-fuselage code A236, as communicated briefly by Rubbert in (8]. /n example of application can befound in (18]. A summary of the capabilities is repruduced in figure 6. The method differs from Wovdward'sin the sense that on the fuselage, which can be of arbitrary shape, the exact boundar; conditions aresatisfied. This is realized through constant density source panels on the fuselage surface. Wing lifteffects are modeled by the vortex lattice variant (Fig. 7) of constant density (normal) doublet panels.
According to [8], the method also contains the option to do the inverse thickness problem. However,in the present author's experience, the discretization scheme used (constant density source panels) isLnstablt, in the sense of (191, when tangential velocity boundary conditions are applied. This would be soeven if a closure condition were enforced, which is not mentioned. Hence, there is some doubt whether thisoption is useable.
A further notable feature of the method is that it contains a Riegels type of leading edge correction.The purpose of such correction is to remove the singularity of solutions of thin-wing theory at the leadingedge of wings with round-nosed airfoil sections. For background of the Riegels type of leading edge correc-tion see, e.g., Weber 21 or Van Dyke14.
The NLR linear subsonic inverse code, [22] combines several features of the Loodward I and Boeing A230codes, as indicated in figure 8. As in the Boeing code, the fuselage surface is covered with constantdensity source panels. Wing lift effects are modeled through Woodward constant pressure panels with,however, the control points at the panel centers. This discretization scheme, while unstable in combinationwith analysis-type boundary conditions, is stable (in the sense of (8], [19]) in combination with thedesign-type boundary conditirns utilized here.
Wing thickness effects are modeled through constant density x-doublet panels (doublet axis in freestream direction). It can be shown, (2-], that this is equivalent to line source/sink begments with equalbut opposite strength along the leading and trailing edges of a panel. In analogy with the vortex latticemethod this is called a sourcL lattice method. In contrast with the constant source density panel, thisdiscretization scheme is stable in combination with design type boundary conditions at panel centercontrol points. A further attractive feature of the scheme is that the closure condition (3.10) is satis-fied implicitly for each chordwise strip of panels.
A unique feature of the NLR code is that it also contains means for explicit control over thegeometry, in particular with respect to wing twist, (maximum) thickness, leading edge radius and trailingedge angle. Required values for these quantities may be specified at all span stations. The extra equationsmodeling these geometric requireme.ts are added to the system that represents the pure aerodynamic problem.The resulting total system of equations is over-determined and is solved in a weighted least squares senseutilizing the formulation of transposed matrices. The designer may choose different weights for the upperand lower surface pressure distributions and geometry requirements. The option may be used to satisfy theregularity condition or, more in general, to avoid shapes that are undesirable from the point of view offull scale wing structures. It may also be used to satisfy wing thickness requirements resulting frommulti-disciplinary, preliminary design considerations.
In NLR practice the code is never used in stand-alone mode but is part of a more comprehensivecomputer-program system for the design of thick wings through a residual-correction formulation. Thelatter will be discussed in section 3.4.
Apart from the thin-wing type methods discussed above, the literature also contains a number ofmethods, (23], (24] which, utilizing vortex lattice modeling, are directed towards optimizing the twibt andcamber of thin lifting surfaces for minimum induced drag. These lifting surfaces may be multiple andmutually interfering. Fuselage effects, however, are not modeled. While such methods are not inversemethods in the actual sense of the word they do allow or even require the specification of chordwise liftdistributions, the spanwise distributions being determined by means of an optimization process (see alsosection 4).
Transonic flowTransonic flow with thin-wing boundary conditions is, classically, described by means of transonic
small perturbation (TSP) theory. As we shall see in the following survey inverse TSF methods are generallyless well developed than their subsonic counterparts. This is reflected in particular in the limitedgeometric capabilities and the almost common lack of control over closure. The situation is primarily arePAlt Of the Net tbRt, diie tn the non-1 inPAity Of the TSP !Ow equations, the surfacc as vroll az th.space around the configuration must be discretized. In addition, the lift and thickness problems can nulonger be dealt with separately.
Early work on a mixed direct/inverse method for transonic airfoil design, based on transonic smallperturbation theory and utilizing a relaxation type of finite difference technique has been reported bySteger and Klineberg25 . These authors have studied the problem of an airfoil in transonic flow with givenleading-edge geometry with the pressure distribution specified over the remaining portion of the chord. Aperturbation velocity potential formulation was used in the leading-edge region and a first-order equationsystem
3F + w+ - = 0 (continuity) (3.20)
u_ . = 0 (irrotationality) (3.2|)z x
in the remainder of the flow field (Fig. 9). F was chosen according to the Guderley-Von Karman formulationof TSP theory. Steger and Klineberg do not mention and, apparently, do not explicitly batisfy the necessaryadditional condition (closure) required for uniqueness. However, at the same time, rather than specifyingu directly as a boundary cvndition in the finite difference relaxation process, they utilize an iterativeprocedure in which, successively,i) a complete relaxation sweep is performed with direct (analysis) boundary conditions for an estimate of
the required geometryii) an improved estimate for the geometry is obtained from the irrotationality condition (5.C1) by, succes-
sively;ii.1) replacing u(z = 0), on the slit (Fig. 9) in the finite difference expression for (z = 0), by
the required surface value of u.

3-8
ii.2) chordwise integration of to yield
dZ, X aww = Tx (,z = ±O)d + C,
xI
= Tf (&,z = !O)d + C1 (3.22)
andx
= f wdx + C2 (323)xl
dZ
the constants of integration C, and C2 being used to enforce continuity in Z and at x,, wherethe new shape is joined to the fixed leading-edge geometry.
Although a convergence proof for the procedure is not given, the process doe3 converge apparently. Not inthe least, according to the authur.,because they maintained consistency between the numerical formulationof direct and inverse boundary conditions, and presumably also because a Neumann type boundary conditionis satisfied in each relaxation sweep. Note, that there is no control over the trailing-edge gap, and thatthe angle betwepn the free stream and the reference coordinate system is held fixed (Fig. 9), implyingthat the orientation of the given leading-edge geometry with respect to the free stream is also fixed.
While the examples presented by Steger and Klineberg are of a fairly academic nature, Langley2 s ofARA, utilizing a similar iterative procedure, but a (non-conservative) Murman and Krupp2 7 type perturba-tion velocity potential formulation through the entire flow field, succeeded in carrying the inverse TSPmethod to appreciably more practical levels of application. The latter is reflected in the fact thatLangley arranged his program to have various options. For example the upper surface and lower surface, aftof a fixed leading-edge geometry, may be altered simultaneously or separately; alternatively the pressuredistribution may be specified over the upper surface and the thickness distribution may be kept constant.The latter option was incorporated in order to avoid problems like negative or too large trailing-edgethickness which, as in the Steger/Klineberg approach, may result from the absei,ce of control over airfoilclosure. It is interesting to note that Langley, in [26], reports the failure of attempts to solve theinverse problem directly by enforcing the Dirichlet boundary condition for
x
*(x) = f u(E)d + (xd) (3.24)x I
on the slit (reason why he switched to the "indirect" inverse approach in which successive analysis-typecalculations are made with regular updating of the airfoil shape through the irrotationality condition).The additional conditions associated with the inverse problem are not mentioned in [26]. Hence, it seemslikely that the failure was caused by not satisfying the necessary additional conditions, resulting in awrongly posed problem.
Both Steger and Klineberg2 5 and Langley26 stress that the crux of the design problem is the t-eatmcntof the airfoil boundary conditions. In Langley's method the Neumann boundary condition is implemented bysubstituting the given surface slope E for z in the finite difference expression
dx
( zz)i,j (z) 2 (i,+I - li,j - Z(lz)i,j)
for *zz at the (jth) mesh line coinciding with the slit (Fig. 9). The cross-derivative z = a in theexpression (3.22) for the geometry update is approximated by x 3z
(')s . = - 0) + 4(- (xi (3.26)
with (%x)i- replaced by the required velocity.It should De noted that the geometry update procedure, equation (3.26) in particular, implies continuityof *x in the z-direction, but not necessarily in the x-direction. In terms of the general discussion ofsection 3.1 this means that the regularity condition is not satisfied. The analysis calculetion on theother hand does imply continuity of *x because of the finite difference approximation for xx" Thisnumerical inconsistency could, presumably, have a negative effect on the convergence of the iterationprocess and, apparently, shows up as a local oscillation in the resulting pressure distribution at thepoint x, where the fixed leading edge geometry meets the remaining, nfw shape (Fig. 10).
It is further worth noting that Langley reports that substantial underrelaxation (0.1 to 0.3) isrequired in updating the surface slopes through the irrotationality condition and that 150-300 fine griditerations, preceeded by a similar amount on two successive coarser grids are required for convergence.
In a later effort at ARA by Forsey and Carr briefly reported by Lock 8, the problem of not being ableto successfully enforce the Dirichlet-type boundary condition was apparently overcome. At the same timethe method was extended to 3-D wings. An example of application is given in figure 11.
Use of the "indirect'inverse technique (as well as failure of the "Dirichlet technique") has alsobeen mentioned by Schmidt et al.2 9 and Schmidt and Hedman 30. In the latter paper the closure problem iscrudely disposed off by rotating the lower surface around the airfoil section leading-edge point.
Inverse methods based on TSP formulation which do utilize Dirichlet boundary conditions (except,again, in the leading-edge region, where a fixed shape is assumed), have been studied byShankar et al.3 1',3 . In [31], a non-conservative, transonic similarity form
[K - (y+1)Ox xx + 0 = 0 (3.27)
of the 2-D Guderley-Von Karman TSP equation is used. K being a transonic similarity parameter and 2
U
3.9
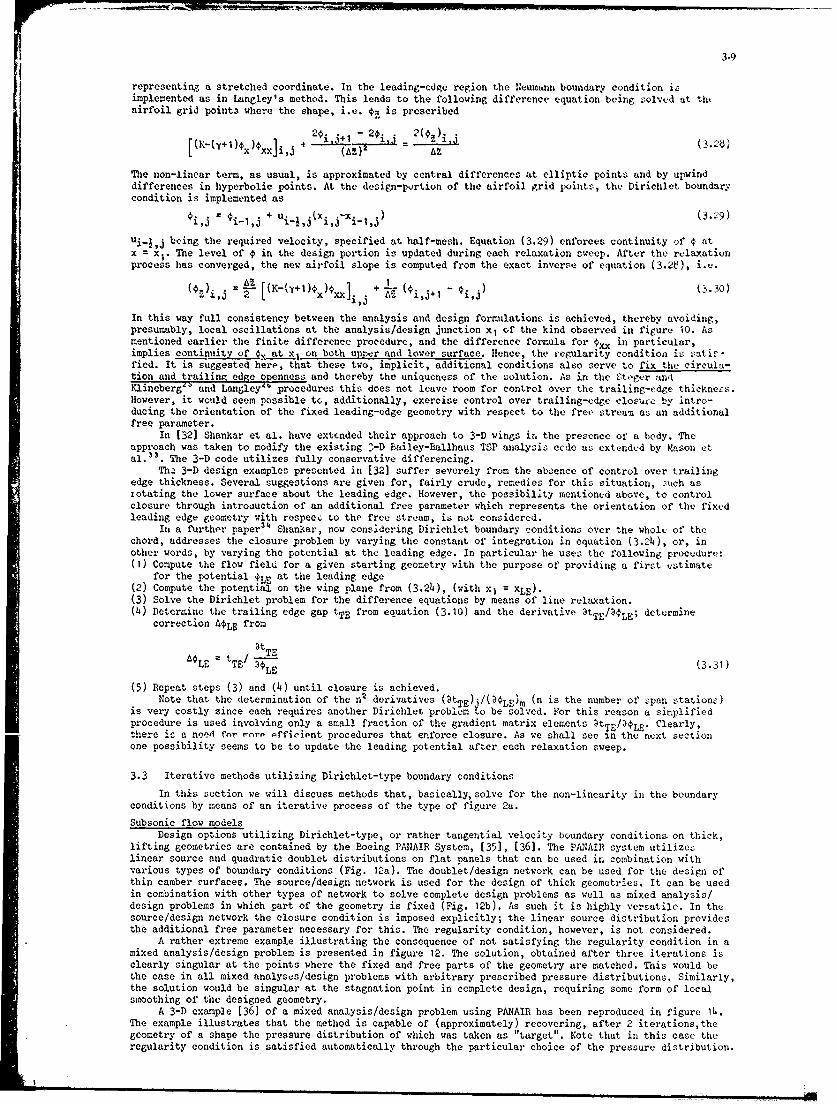
representing a stretched coordinate. In the leading-edge region the Neumann boundary condition isimplemented as in Langley's method. This leads to the following difference equation being solved at thtairfoil grid point3 where the shape, i.e. 4z is prescribed
[(-Ylx xx~i,j ~ 4 ij1 - (3.28)67
The non-linear term, as usual, is approximated by central differences at elliptic points and by upwinddifferences in hyperbolic points. At the design-portion of the airfoil grid points, the Dirichlet boundarycondition is implemented as
€i,j = €i-I,j + ui-i,j (x i,j-xi-l,j)(.)
ui_ ,j being the required velocity, specified at half-mesh. Equation (3.29) enforces continuity of € atx = X). The level of 4 in the design portion is updated during each relaxation sweep. After the relaxationprocess has converged, the new airfoil slope is computed from the exact inverse of equation (3.28), i.e.
* ) -i, I ) (3.30)2%i~ = ~ -i~
In this way full consistency between the analysis and design formulations is achieved, thereby avoiding,presumably, local oscillations at the analysis/design junction x, of the kind observed in figure WO. Asmentioned earlier the finite difference procedure, and the difference formula for xx in particular,implies continuity of a._at x, on both upper and lower surface. Hence, the regularity condition is satir-fied. It is suggested here, that these two, implicit, additional conditions also serve to fix the circula-tion and trailing edge oeenness and thereby the uniqueness of the solution. As in the Steger anIKlineberg' and Langley5 procedures this does not leave room for control over the trailing-edge thickness.However, it would seem possible to, additionally, exercise control over trailing-edge closucc by intro-ducing the orientation of the fixed leading-edge geometry with respect to the fret' stream as an additionalfree parameter.
In (32] Shankar et al. have extended their approach to 3-D wings in the presence of a body. Theapproach was taken to modify the existing 2-D Bailey-Ballhaus TSP analysis cede as extended by Mason eta.13. The 3-D code utilizes fully conservative differencing.
Tha 3-D design examples presented in [32] suffer severely from the absence of control over trailingedge thickness. Several suggestions are given for, fairly crude, remedies for this situation, such asrotating the lower surface about the leading edge. However, the possibility mentioned above, to controlclosure through introsuction of an additional free parameter which represents the orientation of the fixedleading edge geometry with respect to the free stream, is not considered.
In a further paper 34 Shankar, now considering Dirichlet boundary conditions over the whole of thechord, addresses the closure problem by varying the constant of integration in equation (3.2h), or, inother words, by varying the potential at the leading edge. In particular he uses the following procedure:(1) Compute the flow field for a given starting geometry with the purpose of providing a first estimate
for the potential LE at the leading edge(2) Compute the potential on the wing plane from (3.2;), (with x1 = xLE).(3) Solve the Dirichlet problem for the difference equations by means of line relaxation.(4) Determine the trailing edge gap tTE from equation (3.10) and the derivative 3tTE/n4LE; determine
correction ALE from
atTE
LE tTEI3 LE (3.31)
(5) Repeat steps (3) and () until closure is achieved.Note that the determination of the n2 derivatives (3tT)h/( aLEm (n is the number of span stations)
is very costly since each requires another Dirichlet problem to be solved. For this reason a simplifiedprocedure is used involving only a small fraction of the gradient matrix elements tTE/aELg. Clearly,there is a need for more effieient procedures that enforce closure. As we shall see in the next sectionone possibility seems to be to update the leading potential after each relaxation sweep.
3.3 Iterative methods utilizing Dirichlet-type boundary conditions
In this section we will discuss methods that, basically, solve for the non-linearity in the boundaryconditions by means of an iterative process of the type of figure 2a.
Subsonic flow modelsDesign options utilizing Dirichlet-type, or rather tangential velocity boundary conditions on thick,
lifting geometries are contained by the Boeing PA1AIR System, [35], (36]. The PA1AIR system utilizeslinear source and quadratic doublet distributions on flat panels that can be used in combination withvarious types of boundary conditions (Fig. 12a). The doublet/design network can be used for the design ofthin camber surfaces. The source/design network is used for the design of thick geometries. It can be usedin combination with other types of network to solve complete design problems as well as mixed analysis/design problems in which part of the geometry is fixed (Fig. 12b). As such it is highly versatile. In thesource/design network the closure condition is imposed explicitly; the linear source distribution providesthe additional free parameter necessary for this. The regularity condition, however, is not considered.
A rather extreme example illustrating the consequence of not satisfying the regularity condition in amixed analysis/design problem is presented in figure 12. The solution, obtained after three iterations isclearly singular at the points where the fixed and free parts of the geometry are matched. This would bethe case in all mixed analyses/design problems with arbitrary prescribed pressure distributions. Similarly,the solution would be singular at the stagnation point in complete design, requiring some form of localsmoothing of the designed geometry.
A 3-D example [36] of a mixed analysis/design problem using PANAIR has been reproduced in figure lb.The example illustrates that the method is capable of (approximately) recovering, after 2 iterations,thegeometry of a shape the pressure distribution of which was taken as "target". Note that in this case theregularity condition is satisfied automatically through the particular choice of the pressure distribution.

3-10
In the example of figure 14 the problem, mentioned in section 3. 1, of converting the given pressuredistribution into a distribution of velocity potential or velocity components was circumvtnt.,d byspecifying the tangential velocity components to have the direction o1 the velocitie., of the modified(starting) geometry and the magnitudes of the velocities of the original geometry (which i., to bLrecovered). A consequence of this choice iz that the original geonetry cannot have been recovered exacly,unless the velocity directions on the modified and original geometries were identical.
References (35), [3b] do not provide detoil. about the procedurc utilized for updating the ,eonctryfrom the normal velocity components in each iteration.
A method for the design of multiple airfoils with given pressure distribution has been do:crit.d byOrmsbee and Chen3 7. The method, based on earlier work of OellersO, differs from the majority of invr.,t,methods in the sense that a formulation in terms of stream function , rather than velocity rotential i-utilized. As a consequence the approach is fundamentally limited to two-dimenoional flows.
The integral equation to be solved in this method is of the type
z(s)u cos a - x(s)U sin a - 0 (s')tn r(s,s')d'
= constant L3.32)
where s is the arc length along the airfoil, z(s) and x(s) are the airfoil coordinates and j(s') representsa surface vorticity distribution. In the iterative process chosen 1(s') is set equal to the local(prescribed) velocity (as it should be in the converged solution) and z(s) is calculated directly forfixed x(s) in each iteration ztep. The discretization scheme chosen employs flat panels with constantvorticity. Control points are chosen at panel centers.
It is worth noting that the use of vorticity distributions-only implies that the closure conditionis satisfied implicitly. Another consequence is that only airfoils with zero trailing edge thickness areadmitted. The stream function formulation, presumably, implies that also the regularity condition isimplicitly satisfied. This might explain the authors' remark that "specificat )n of 1 on the entire airfoilresults in overspecification of the problem and reasonable answers may not be obtaired". They also commu-nicate the experience that "special care is (must be?) taken in specifying the velocities near the leadingand trailing edges". This suggests that the method may not be fully properly fornulated in the mathematical/numerical sense.
The method can be used for the design of single as well as multiple airfoils with fixed gap andoverlap between components. The latter, according to the authors, "can cause a nonconverging iterativeprocess if the specified velocity at the trailing edge of the forward element is inconsistent with thehigh velocity peak on tho flap".
Examples of single and two-element airfoils designed for high lift with attached flow have beenreproduced in figure 15.
Transonic flowThe first reported effort to solve the full potential transonic lifting 2-D inverse airfoil problem iz
that of Tranen". Broadly speaking Tranen's method can be considered as a version of the Garabedian-Korn"analysis method with the Neumann boundary condition on the airfoil surface replaced by a Dirichlet boundarycondition. In the Garabedian-Korn method the quasi-linear form of the full potential equation is solved inpolar coordinates w,r in a computation plane obtained by mapping the region exterior to the airfoil ontothe interior of a unit circle. Non-conservative differencing with simple upwind bias in the supersonic zoneis used and the resulting non-linear system of equations is solved by means of SLOR.
The distribution of the surface potential required for the Dirichlet boundary condition in Tranen'smethod is obtained by integration of the target velocity distribution, viz. Eq. (3.12). While in theoriginal analysis method the velocity components are calculated by means of central differences at themesh points themselves, Tranen, in specifying the surface potential in the Dirichlet problem, found thatfor a stable dircretization it is necessary to specify the pressure (velocity) at half-mesh and todetermine * through integration, using an expression of the type
= i-1 + (U.f).H Aw (3.33)
f being the mapping modulus. (Note that a similar strategy was followed by Shankar3, see Section 3.2.) InTranen's method the constant of integration determining tne level of the buifaCc ...... aican eithesr befixed or can be used to control closure. In the latter case a correction 600 to the surface potentiallevel is applied after each relaxation sweep. The magnitude of this correction is taken to be proportionalto the net mass flux Q (transpiration) through the airfoil surface, i.e.
o .Q (3.34)
with
maxQ f pV ds (3.35)
0
where V is the velocity component normal to the surface (radial direction). The value of the proportional-ity constant has been determined empirically. However, utilizing the fact that the potential of a source(in incompressible flow) equals Q Zn P (P being the distance to the source in the physical plane) it shouldalso be possib~e to determined c theoretically.
Tranen's way to control closure is probably more efficient than that of Shankar34 , described in thepreceding section; the reason being that Tranen's procedure does not require the numerical determination,through additional Dirichlet problems, of the derivative atTE/aCLE prior to update of the potential butcorrects the potential after each relaxation sweep.
It can be argued ([12], see also section 3.1) that the Dirichlet problem in Tranen's method is notproperly posed because of the far-field boundary condition that is used and that the inverse problem as awhole is not well forimulated because the regularity condition at the stagnation point is not imposed. Thelatter is reflected in the way the new airfoil shape is determined. The latter problem requires two steps:i. determination of the normal velocity V from the Dirichlet solution
ii. determination of the displacement of the stagnation streamline (integration of new surface slopes).

3-II
In determining the norral velocity V at the surface mesh rointo from thc Dirichlet ,vlutlon ran, 3
utilizes the usual -entral difference expression, (O]
vi = i " i - o .
with the potential in the dumy point (i,O), inside the airfoil (outside the unit circle in the coeputa-tional plane) determined by satisfying the difference forn of the flow equetions in the surface r.vohpoints. As described in the preceding section a similar procedure was adopted by Fhankar' 2 for thi TOPequation.
The fact that Tranen does not enforce proper branching of the surface streamline i reflect 1 inparticular in the procedure for the determination of the displacement of the "stagnation streadine", Thdisplacement 4 of the new surface, relative and normal to tht old shape is determined by luoarature usicn,the mass conservation expression
4 1 p U. 4. + CV jPi..IV 11i i [i-I i-I 2-i-I
Ui, Vi etc. are determined by means of central differences of the type (3.36). However, at the truilingedge V is set equal to zero by ertrapolation from upstream grid pointo. At the sure timc soe smoothingprocedure is required at the grid points nearest to the "stagnation point" (i.e. the point where U, butnot necessarily V, is equal to zero) where the integration is started.
As a result of the improper formulation of tho inverse problem and the necessar::y required adjust-ments to the surface displacement Tranen requires a direct (= analysis) calculation to check the roultingpressure distribution. A flow chart of the complete design procedure is reproduccd in figure l. Notk. thatthe procedure exhitits aspects of a residual-correction type of formulation (Fig. 2b .
Convergence 13 considered to be obtained when the pressure distribution output by the analysir programis sufficiently close to the prescribed pressure distribution from the previous inverse ea o. Althmaghconvergence in the proper mathematical sense is not guaranteed in Tranen's procedure, examples such asreproduced in figure 17 sugges. that engineering requirements can be met in two or three inverse - lirectiterations.
Approaches similar to Trenen's have been followed by Volpe"1 and Arlinger" in developing inversemethods for two-element airfoil systems in two-dimensional transonic flow. Method, of this type areuseful in the design of transonic manoeuvre devices.
In both methods the infinite physical domain is mapped into a computational domain convisting of thefinite annular region between two concentric circles. In this plane the main airfoil iL mappl into acircle of unit radius and the slat or flap into a circle with smaller radius. In this computational plantfinite differences and SLOR are used to solve the full potential equation. The relative position of theelements is fixed during the iteration cycles.
In Volpe's'1 method Dirichlet boundary conditions must be applied on the entirety of both or eitherone of the airfoil elements. The level of the potential on each of the elements is taken fron an analysissolution for a starting geometry. The resulting trailing edge gap must be accepted as it is or can becorrected "manually". As in Tranen's method the regularity condition is not imposed.
Arlinger's 2 method accepts mixed Neumann/Dirichlet boundary conditions in much the same way as inShankar'sP inverse TSP method, discussed in section 3.2. As in [31] the regularity condition is satisfiedat the junction of the fixed and free parts of the geometry, but there is no control over clocure.
A more fundamental (but not necessarily more practical) approach to the 2-D inverse single airfoilproblem for the full potential equation has been taken by Volpe and Melnik in [12]. The fundamental differ-ence with Tranen's3 9 procedure is that Volpe and Melnik satisfy the regularity condition, i.e. theirsolutions represent proper stream surfaces. They do so by allowing the magnitude q. of the free stream tovary in such a way that, in Tranen's terminology, V = 0 where U is specified to be zero. In this way theysucceed in solving the "pure" inverse problem by a sequence of Dirichlet problems with no need, at anystage, for a.direct solution over the current airfoil contour. However, they do not control closure in thesense that a given trailing edge thickness is designed for.
The formulation and solution of the viricnlet probica in VU.' cth difCr "rom Tranen's innumber of technical but not insignificant details. The most important of these are:- the "circle plane" finite difference technique is based on Jameson's' (non-conservative) rotateddifference scheme and mapping procedure rather than those of the Garabedian-Korn method40
- the constant of integration fixing the surface potential is chosen arbitrarily but a source term ro tn ris subtracted from the potential. The source term is also represented in the far-field boundary condi-tion and allows for a net mass flow through the boundary as well as for mass generation at shoc 4avezintroduced by the non-conservative differencing.
- After each relaxation sweep both the free stream velocity q and the source term o are corrected inorder to enforce V = 0 at the leading edge stagnation point and at the trailing edge. Hence there is noroom for control of closure and whatever trailing edge gap results from the computation is accepted.
- After each Dirichlet problem the perturbation slope
V.60 ie,j=! M tan-' U (3.38)
i,j=I
is used to determine the corrections to the mapping modulus that will drive the approximate airfoilsurface to become a streamline. Upon convergence the inverse mapping from the unit circle to the convergedairfoil shape is carried out using the known mapping modulus and airfoil slopes.
A point of concern with respect to Volpe's method is that substantial underrelaxation must be appliedto the changes in airfoil shape in order to ensure convergence of the design process. In spite of this thenumber of Dirichlet cycles required for convergence is fairly large, being of the order of 15. This shouldbe compared with the 2 to 3 cycles, which, apparently, are required in Tranen's approach. We will returnto this point shortly.
A remark must be made first with respect to the treatment of the trailing edge. It is recalled thatthe target surface pressure (velocities) are specified at half-mesh and the circulation fixed by integra-tion. At the same time, after satisfying the difference equations, the velocity components are calculated

3-12
at tne mesh points themselve., by means of central differencee. As a result, U at the trailing edge is not
necessaril. z.ero. Hence there is no complete ccnsctency with the direct solution where tile circulation isfixtd by requiring U to be zero at the trailing edge. In the inverse method a small correction to thecirculation of O(h 2 ), h being the '-uh width, will in general be sufficient to drive U exactly to zro atthe trailing edge.
Having noticed that in general, U * U at tne trailing edge one may conclude that 60 (equation (36))will lco in general remain bounded. Hence the question arises whether the source term o zhould be used tQdlrve J * 0 at the trailing edge. An interesting alternative would seem to be to use o for control overthe trailing edge gap ins teali. Some control, if necessary at all, over tile boundednesz of S0 at thetrailing edge could be ,xarc:sed through a ctrall) correction of O(h2 ) to the circulation. There i. reaonto beleve that the u.s of tile source term o to control closure might also improvw the convergence charac-teristics. The arg'ument being that the value of o ij completely determined by the total integrated netmas, flux through the surface aMd depends only very weakly on the norrl velocity in one particular (tiletrailing edge) point.
P dkstinctiy different approach to (2-0) transonic flow cmputations (both analysis and decign) has
beer. taken by Carlson".. Instead of using a body conforming finite difference mesh in the circle plane,Carlon uses (stretched) Cartesian coordlnate , in the physical plane. As a consequence special complicateddifference *,ormalav must be uzed to .atisfy the airfoil boundary condition.3 in both the analysis, anddesign rod-.
From the design point of view Carlson's mtthod, while based on full potential theorytnon-con;ervative), is very similar to the small perturbation formulation of 'hankar' . In both rethodL amixed boundary value problem is solved with the leading edge shape or a greater portion of the airfoilfixed and tile pressure prescribed over the remaining portion (xlc > .Oo). As in Ohanker's rethod theorientation of tile given leading edge shape with respect to the free stream is fixed and there is noactual control over airfoil closure. Clssure can be obtained only by adopting a sharper or blunttr noseshape.
From the numerical point of view the analysis and design formulations of Carloon are not completelyequivalent. A., a result there is no perfect agreement between direct and inverse calculations.
A point worth mentioning is further that, rather than determining the new geometry after convergenceof the mixed boundary value problem, the geometry is updated after every ten relaxation sweeps. In combi-nation with successive grid refinement Carlson found this to be the most economic procedure.
Mhe first inverse method for 3-D transonic potential flows is that of Henne"'. Henne's method can beconsidered as the 3-D equivalent of Tranen's" -D method. The Jameson-Caughey FLO22 wing codet has beenmodified to accept Dirichlet boundary conditions. Figure 18 presents a simplified chere uf the prvcedurt.
fienne does not address the complete 3-D problem of determining tile velocity components, and hence thtsurface potential, a5 mentioned in section 3.1. Instead, the surface value for the potential in theDirichlet problem is obtained by "streamwise integration of the velocity at constant span itationo". Thicould mean that tile contribution of the spanwise velocity component to the Lurface pre.sure i. neglected.Tie spanwii,, variation of the surface potential at tile leading edge is reported to be used as a parameterfor trailing edge closure. However, [1,5] does not provide details. Details about the determination of thesurface displacement from the normal velocities are given neither. Nor is mention made of any additional(regularity) conditions enforcing proper branching of the stream surface at the leading edge.
As in Tranen'sq case Henne's method requires direct analysis computations to check whether tiledesign goal has been achieved. Similarly it is doubtful whether the scheme will converge in tht propermathematical sense. However, the examples of application presented in [45], one of which is reproduced infigure 19, indicate that convergence in an engineering sense can be obtaired in .2 to 6 inverse cycle.. Tothis author's knowledge the method is probably the only 3-D transonic inverse method that has beer used ina production-type environment.
A somewhat unusual scheme for the 3-D conversion of a given pressure into a Dirichlet-type boundarycondition is utilized by Shankar"' in an effort to modify the FL030 finite volume wing-fuselage analysiscode e into a desvgn code. Starting out from the analysis solution for a suitable estimate of the rtquiredgeometry Shanftai applies a correction to the surface value of the potential in each relaxation weep. Tiscorrection it determined from the isentropic relation for the density
1 , :-' M(q2_1) ] Y- 0 .39)
This is linearized to read
do = mj2-YM2.jIql.dlq (3.140)
or
((n+1)-o(n) = ) (3.40
Utilizing the isentropic relation
{C + 1~ (3.4a)Sp = fCp , 2+11 .2
equation (41) can, in general curvilinear coordinates, be rewritten as
(n .+v ,,) So M [(n) - {C +~ ] 3-70. ] IP
In (3.43) U and V are the contravariant surface velocity components. Cpt is tile "ta'get" Cp-distribution.Equation(3.43), in discretizt-d form, is solved for the correct,-n 60 to the surface potential. Note thatthe procedure is related but not identical to one in which the direction of the surface velocity is keptfixed but the magnitude updated.
Using the contravariant velocity component W, computed at half a mesh from the wing surface, the

3-13
geometry is corrected, without control over cloture, after each relaxation sweep. Tht author of [47] ionot very clear, however, on the preci., procedure and communicates the opinion that a better procedure toupdate the wing coordinates, including control over closure should be included.
Remrks like the latter seem to indicate tlat we have only just begun to tackle tle i-D inverceproblem for transonic flow. Considerable effort will be required before we will arrive at well founded,reliable engineering tools of practical significance.
3.4 Residual-correction or iterative Neumann-type methods
In thic section mthods are described that are based on an iterative process of the type depicted byfigure 2b.
Subsonic flowAn engineering type of inverse method directed in particular towards nulti-element high-lift airfoil
design has been described by Peatty and Narraore, The method is based on the Douglas- Neumann ess)second-order potential flow method with parabolic surface elements and linear source and vorticity distri-butions. Tile earlier idea of Wilkinson"1 is used of determining the (additional) vorticity distributionalong the mean line of the airfoil (element) that is necessary to remove the difference between the actualand required upper surface velocities (Fig. 20a). This vorticity distribution is used to calculate therequired change in slope of the mean-line elements. The original thickness is then wrapped around the newcamberline to determine the new configuration. The latter, in turn is analyzed with the direct mode of theprogram. A sirplified flow chart is reproduced in figure .?Cb. According to [4,], between 1 and 15iterationj are needed for convergence which is considered in an engineering sense only.
The method is capaole of dealing with configurations on which the upper surface pressure distributionis specified on one or more elements and the geometry of tile remaining elements is cpecified. The lowersurface pressure distribution must always be accepted as it ic. The relative location of the leading edgeof each airfoil element remains fixed with respect to the trailing edge of tile airfoil ir-mediatelyupstream. An example oe application is reproduced in figure 20c.
Tie method also has limited capabilities for solving the mixed boundary condition problem that istypical for high-lift system design. When used as such, changes in the mean-line in the region where the,hape must be kept fixed are simply disregarded. Also the change in lower surface shape absociated withthe change in mean-line is disregarded.
An approach similar to that described above has been u.ed by Fornaoier$ 2 in conctructlng a programsystem for the design of 3-D wings with given thickness and given upper surface pressure di.tributions.The system contains a vortex lattice method for calculating the required change in camber surface and theMBB Panel Method" * for checking whether tile actual upper surface pressure distribution is sufficientlyclose to the desired one.
A residual-correction formulation for 3-D wings, [22!,emtloying the thin wing inverse method of Frayand Slooff described in section 3.2 and the NLR Panel Hethods for arbitrary (thick) configurations hasbeen in use at ILR since 1974. A flow diagram of the method has been reproduced in figure 21. The linear(thin wing) inverse method is used to determine the geometry corrections that are needed to drive thedifference 6Up between the actual and required pressure distribution to zero. The thick wing panel methodis used for determining the residual 6.Cp
The method is used for the dezign of thick wings with given pressure distribution on both upper andlower surface in the presence of a fuselage and/or other configuration elements of fixed geometry. Anessential feature for convergence is the Weber/Riegels leading edge correction. A unique feature, asmentioned already in section 3.2, is that explicit control can be exercised over the geometry whileapproaching the required pressure distribution as close as possible. This option has proven to be ofgreat value for avoiding undesirable geometries.
An example of application of the method is given in figure 22. Shown is the result of the redesignwith and without geometry constraints of the (inner) wing of a wing-fuseiagv configuration. The startinggeometry of the win6 was obtained by a wing-alone design for the same target pressure distribution, other-xamples may be found in (55].
An approach to the mixed analysis/design problem that, in principle, can be used for general _i-Dconfigurations or parts thereof has been studied by Malone . Malone formulates the problem in terms ofminimizing the least squares object function
,n /\2
E = wiC pt-Cp) , i = 1(1)n (3.! )
through variation of the normal velocity Wj, j =(1)m,at a selected number of surface points. The minimi-zation of E through variation of the Wi is done numerically by means of a steepest descent method (57].For this purpose the problem is first linearized around a starting geometry, providing starting valuesE(°) and Ce° Then, a vector is constructed with components. 6Wj suh that Ek
° ) + 6E = E(o) + Z . takespi 3aWj J
a minimum value. This requires the determinetion of the derivatives T_-. These derivatives are determinednumerically by means of finite differences and an analysis type panel J method. The panel method, Hess' s
method in this case, is used to compute the variations 6 p due to a sequential perturbation 614 of tlenormal velocity at panel centers. This requires in panel me hod solutions with fixed influence coefficients.The derivatives are used to construct the gradient vector representing the direction in tile design-variablespace in which the decrease of the object function is maximal. The optimization algorithm then determinesthe step-length in this direction that will minimize E, after which a new gradient and step-length searchis executed. This sequence is repeated (of the order of 5 times) until a further decrease of E is no longersignificant. Then the Wj are used to correct tile geometry in a 2-D, stripwise fashion, after which thewhole process is repeated (Fig. 23) for the new estimate of the geometry. About six "outer" iterations areneeded for "reasonable" convergence.
As described in (56], the method does not have control over closure and the regularity condition isnot satisfied. This might be one reasone for tile fact that tile author of [,6] observes that "local pressure

3-14
deviations near the leading and trailing edge are evident". It would :eem oosible, however, to i.mprovwthe method in this respect by imposing constraints on Wi in the minimization problem through the intro-duction of feas-'ible directions.
The approach, as sketched, is interesting because (whun the cloture problem ha. been olvvd) it i.one of the few that offers a possibility for the design of local regioL, of aircraft geor'try, ouch a.wing-body fillets or landing gear pods. It also ha- the advantage that the analyci., code can be replacedrelatively easily by a better one if it cc-v., available. A drawback, shared with other rethodc utiliziiignumerical optimization (section 10 is that the method is relatively costly; about 30 x K pare rethodsolutions being required if K is tht number of dvesign variableu.. Note, however, that only about u of the:erequire the calculation of new influence coefficients, the mo;t costly part of panel methods.
Transonic flowA simple, but apparently efftctivw re~idual-correction type of approach toward, the s-V tran.ciic
inver~c airfoil problhm has been described by ravis . In thl- rethod the FL'O anysis cod [to] i..utilized to determine the actual pressure distribution for the latst gtomvtry. 11t re..idual Cp i: thedriver for a -implv, perturbation type of ourface modification (invcr.,e) routine. For the latter Iavis ha:taken transonic wavy-wall formulae. These relate the required change in pressure to a change in surfacucurvature when the local Mach number is -1 and to a change in surface :Iore When X'oc >l . Thu perturbutionslores ard curvatures are then integrated to yield ordinate modifications.
Due to the local perturbation character of the wavy-wall formula the rethod can be used only forlocal modifications to the pressure distribution of an exi.>ting airfoil. [59] presents re.ult5: for upptrsurface contour modifications only, with no control over the trailing edge gap. About 20 iterativv cycleu.are needed for convergence.
While, from the design point of view, the poovbilities of DaviL' method are limited to local rmdifi-cations, an advantage of his approach is that only m.odest development .fforts are needt d to ottain aworking code; the reason being that the (cQmplicated) ans.i;s code is retaineu in its original form andonly the ( girplo) geometry correction package must be developed.
An approach related to tL, of Pavis , but with appreciably wider deoign capabilities ha beenrealized in the NLR INTRAH, program ;tcm, [iso). This ,ysten combines the 2-D vers'ion of the subsonicthin wing inveroe code of [22] and an inverc supersonic wavy-wall formula with the ier'toel IRAFO fa.tsolver analysis code. A flow diagram is depicted in figure 24. The method can be u.ed for the Complete
design with full closuro control of 2-D airfoils in transonic flow, with or without hiock-wave.. A, aunique feature it retain. the ross ibilitie--> of [21 for explicit Control over leading-dge radius,(maximum) thickness and trailing-edge angle.
Figure 25 presents an example of the design of an airfoil with a weak hock, .tarting out from theNACA 0O12 airfoil. Ccnvergence to engineering accuracy is obtained after about 10 iterations. Thtexperience is that shock-free airfoilo may require upto .25 iterations before convergence is obtained interms of pre-sure distribution, but appreciably le7 when wave drag L, aken as the critrium.
Another possibility for solving the inverse problem through the use of an analy.eil, method, has beenstudied by McFadden". In (63] a modified verzion of the Pauer-Carabedian-Korn-Jameoon b KJ) circle plane:relaxation program" $ with non-conservative rotated differnce cheme, and a functional relations'hipinvolving the napping and the velocity distribution along the airfoil surface in the physical andcomputational planes are used in an iterative sequence. In each iteration a functional relationship of thetype
d( n + i I (n)
-LsT (w,r =I
is used to obtain a better approximation to the mapping function of the required airfoil. In (3.4 ) s isthe arc length along the airfoil and ,- the angular coordinate in the circe plane; tht mapping is essen-tially determined by d. q (s) is the required velocity distribution and (n) is the potential on theairfoil surface as obtined from the preceding BGKJ relaxation solution.
Note that, upon convergence, equation (3.45) leads to the identity
q[3) .21 = (w = I)d' (3.4b)
Note also that the procedure bears some resemblance to the "indirect" inverse TOP formulation;, di5cu.,esin section 3.2. In the latter, the irrotationality condition (3.2) plays the same role as equations(3.45)/(3.46) in McFadden's approach.
Further noteworthy features of McFadden's rethod are that- the (iterative) relaxation process and the outer iterations for the geometry are intermingled- on fine meshes an additional artificial viscosity term that suppresses the formation of shock wavec ib
required for convergence (which takes 200-700 relaxation cycles). As discussed in [E3] the undvirableeffects of this limitation can be overcome largely by a suitable design strategv
- in order to avoid singular behaviour of (3.145) at the stagnation point (q = 0) a special treatment,implying modification of (n), is incorporated
- while the analysis routine requires M_ and q. to be given (the latter is set equal to unity) thecritical velocity c* must be chosen in the design program. M. is determined from the isentropic relation
= ~ (-1)M~(3.47)
- instead of setting q. equal to unity, the free stream velocity, as in Volpe's12 method, comes out as aresult of the design calculations. However, rather than using q. to eliminate the stagnation pointsingularity, q., in McFadden's approach, is used to minimize the functional
i2v (n))2 - a.S ] 2
dW .46)
I 0 n(
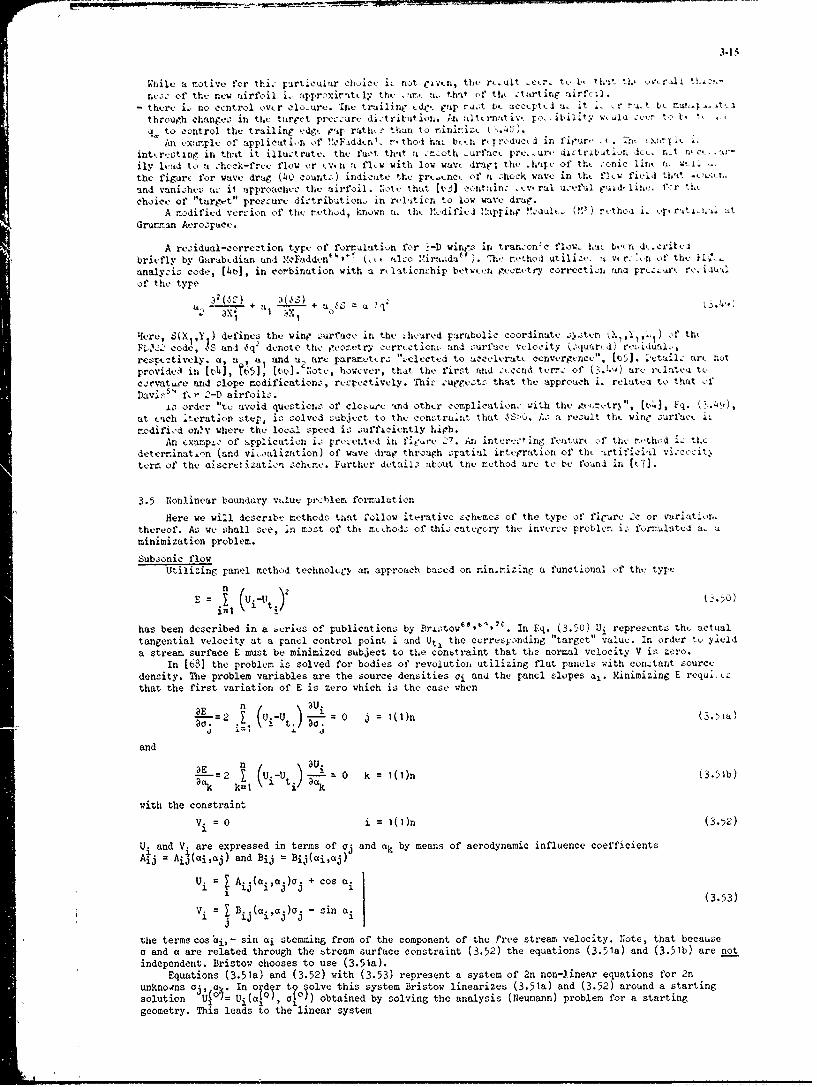
3-15
'hilv a rotive for thi. particular choice i not r'ivtn, thue r .ult -,r. to L, that th-, owrll 1.s,-ness of the new airfoil i. approxirattly thv .it u. thaV of thu -tarting air'cll.
- thur, i. no ccntrol ovkr clo-ure. Thu trailinr tdu gap ra.-t bt acccptd a. it .. r ru.t t1 n5*.3- ,
through changes in thu target precure distribution. Axn : ttrn:itivt to-.ibilit. wiala ser to t- t, .q to control the trailing udgk gap ruth, r than to rini iztu (3.h8).
An uxanple of applicution of !"cFIddn'. rkthod ha%. ben rtrroduck d in firurc t.. -as .'i le i.inttreStine in that it illu.trtu the fact that a :rcoth urfac prue urt dictribution dci. n-t ....,r-
ily l cad to a shock-free flow or even a fl~w with low wave drag; the .hap, of the -cnic lin ,. w l, Il
the figur for wave drag (40 count.) indicate the prt.enct. of a -hock wave in the fl w fiuld thavt .e-n.and vanishes ac it approachuc the airfoil. :ote that (C5] contains" ,,v' ral u.suful uidtlin- - c,:r the
choice of "target" pretcure dis tribution, in rultin to low wave drua.A modified version of thu nethod, known a. the 1!vdifitd !!apying " (0) rth L r Lt
Grurran Aerospace.
A rezidual-correction type of formulation for --D wine. in trans:onc flow, haU been d'.critabriefly by Garabudian and McFadden* ' ! ( , alo .'ira.idat f). Thu nethod utili-e- a vtrs ,n of thu k[l'-analysvis code, (b],) in corbination with a r~litionship bu'twten gUetCry correction ans prure rusisual
of the typea0 a() + a S a a q
'[ere, S(X1 ,Y ) defines the wine ouracc in the thcarvd Farabolic coordinatc .o.tur, t,, 1 ,,) of theFL2- code, JS and 6q2 denote the geo.try corrections, and zsurface velocity (squared) re.iduaL,resp:tively. a, a ,a and a, are pararvttrs " electcd to ucclcrate convergvnce", lt5]. ictails ar, notprovide. in [v], N5], []. :otv, however, that the first and seccnd tur s of (3.4u) are relatua tocsrvat.re and slope modification., revrectively. Thi- surge.ts that the approach i. relatea to that ofDavi s " f,- 2-D airfoils.
iL order "to avoid questions of clo;,ure ind other cenplication, with the ltrotr.", Eq4] IA. .4 .),at tach iteration step, is solved subj.ct to the conctrua.t that 6S>6.. As a result the wine surface i.modifid ornv where the lee.! speed is sufficiuntly high.
An examps,_ of Npplication is presented in fieore 27. An interusting feature of the nethod i. thedeterminaton (and vi-talization) of wave drag through spatial irte ration of the .artificial viscosityterm of the aiscrclizatisa schene. Further details about the method arc to be found in [tT].
3.5 Nonlinear boundary value prshlem formulation
Here we will describe methods t.,at follow iterative :ch ez of the type of firurc -2c or variation.thereof. As we shall see, in most of tht meLhods of this categor the inverse problem is formulatcd a- aminimization problem.
Subsonic flowUtilizing panel method technoloC., an approach based on ninimizing a functional of the type
E = Ui-U o50)
has been described in a ,eries of publications by Bristow" b ' 0. In Eq. (3.50) U; represents tht actualtangential velocity at a panel control point i and Ut, the corresponding "target" value. In order to yielda stream surface E must be minimized subject to the constraint that the normal velocity V is zero.
In [68] the problem is solved for bodies of revolution utilizing flat panels with constant oourcedensity. The problem variables are the source densities ci and the panel slopes a!. Minimizing E requ!.os
that the first variation of E is zero which is the case when
aE n2 W U-t) Uii
7 (U -U ) = 0 j = I()n
and
2 (1 U .-U~ t 0 k = 1(1)n (3.51b)
with the constraint
V. = 0 i = 1(1)n (3.52)
U. and V. are expressed in terms of a and 0k by means of aerodynamic influence coefficientsAil = Ai4(ai,a ) and Bij = Bij(ai,aj)
Ui = . A. .(a.,a.)o. + cos ai1 (3.53)
Vi = Bi (ai,aj)o. - sin ai
the terms cos ai,- sin ai stemming from of the component of the free stream velocity. Note, that because
a and a are related through the btream surface constraint (3.52) the equations (3.51a) and (3.51b) are notindependent. Bristow chooses to use (3.51a).
Equations (3.51a) and (3.52) with (3.53) represent a system of 2n non-linear equations for 2nunknowns o, ak. In otdir t9 olve this system Bristow linearizes (3.51a) and (3.52) around a startingsolution u(Oh Ui (aj, o?
°J) obtained by solving the analysis (Neunann) problem for a starting
geometry. This leads to the linear system

3-16
( UV i s u 0 U
whereA.. (o) (o)
6 i A ) 6o • - o - sin a. A. 3.5)
and(o) GB.. (o) (o)
6Vi B B s o. + s._ j 0 + Cos a 601 (3.-6)
The influence cofficients and their derivatives art calculated analytically. After solving (3.54) for 60and Sa the geometry is updated through 6a and a new starting .olution iz created through the solution ofa Neumann problem for the corrected geometry. Hence, the iterative process can also be considered to beof the type of figure 2b.
It is worth mentioning that Bristow, through further approximations, manages to eliminate 6 fronthe system (3.54). This, although of peactical importance, is not essential. Of more fundamental importanceis tie fact, that with thc constant source density and mid-panel control point discretization the (square)system of equations (3.54) does not leave room for imposing the closure condition. Moreover, as we haveseen earlier, this discretization scheme is basically unstable in the sense of [19]. The first problem,i.e. that of closure, is solved by Bristow by introdicing the closure condition as an additional constraintto the minimization problem through the technique of Lagrangt Multipliers. The problem of instability isovercome by means of an elaborate smoothing operation involving the use of "subtitute elements". In spiteof this the author reports that "an inability to converge" may be apparent. This might also be due to thefact that Bristow does not address the regularity condition. Underrelaxation in updating the geometry isused to improve convergence. As indicated by the example reproduced in figure 27 about 10 iterations areneeded for convergence.
Basically the same approach was used by Briztow6 9 ,70 in developing an inverse method for 2-D multiple-element airfoils, culminating in the MAAD progrum system, 170]. The main differences with the precedingmethod for axisymmetric flow are the following.- The method utilizes constant or, optionally, linear source distributions and iinear vorticity distribu-
tions on flat panels. The source and vorticity distributions are related according to Green's thirdidentity [711). 'his implies that the source strength is directly related to the normal velocity through
Vi = oi - sin ai (3.57)
and the vorticity strength to the tangential velocity through
Ui = cos ai 4 lyi (3.58)
This greatly facilitates the analytical elimination of the 6Yi and Soi from the final system of equations(the equivalent o: (3.51)) that is to be solved; only the 6ai's remaining as independent variables.
- The squared residuals in the object function (3.50) are weighted through the arc length of the relevantpanel.
- Both complete inverse and mixed analyses/design problems, with the shape of certain parts of thegeometry fixed, can De dealt with.
An example of application of the MAAD program has been reproduced in figure 29. Shown is the recon-structioi, in 5 iterations, of the so-called Williams flap (a configuration obtained through a conformalmapping procedure).
The multinle airfoil mixed analysis/design problem has also been studied by Labrujbre72, 7
3,74
.
Labruj4re formulated the problem in terms of minimizing a lunctional oU 'h= tsp
n { ( U 2 + w V. + w Z _ . (3.59)t p,i np,i P,p=1 )= g~ ~l 9p,i\( pti p,i)/ : p,i
In (3.59) U and V, again, represent the tangential and normal velocity, respectively. The Z0 i's representcoordinates, in a local coordinate system, of the pth airfoil element geometry that is bein solved forand the Z iN represnt a starting or "target" geometry. The wt ., wnp. and w represent (positive)
weighting coefficients. ASp i represents the panel length.
Surface doublet distributions Pi only are used to model t e flow. Note that this implies that the closurecondition is satisfied implicitly, but that the airfoil elements must have zero trailing edge thickness.
E, Eq. (3.59), is minimized by varying:- the doublet strengths up i,and, as far as required ana admitted by the designer,- the angles a between the local and reference coordinate systems (Fig. 30)- the coordinates of the origins of all but one of the local coordinate iystems- the Z i's.The system of non-linear equations resulting from setting the first variation of E equal to zero issolved by means of Newton's method. The aerodynamic influence coefficients and their derivatives withrespect to the geometry variables are calculated analytically. For the latter purpose use is made of thesmall curvature expansion technique of Hess so.
The choice (3.59) for the object function and in pFrticular the possibility to manipulate theweighting coefficients wt, wn and wg has a number of interesting congequences.1. By choosing wt n 0 the problem reduceg io a Neumann problem for Zk°!
2. With wn a 0 a Dirichlet problem for Z1 is obtained.
4) A different choice was made in (69]
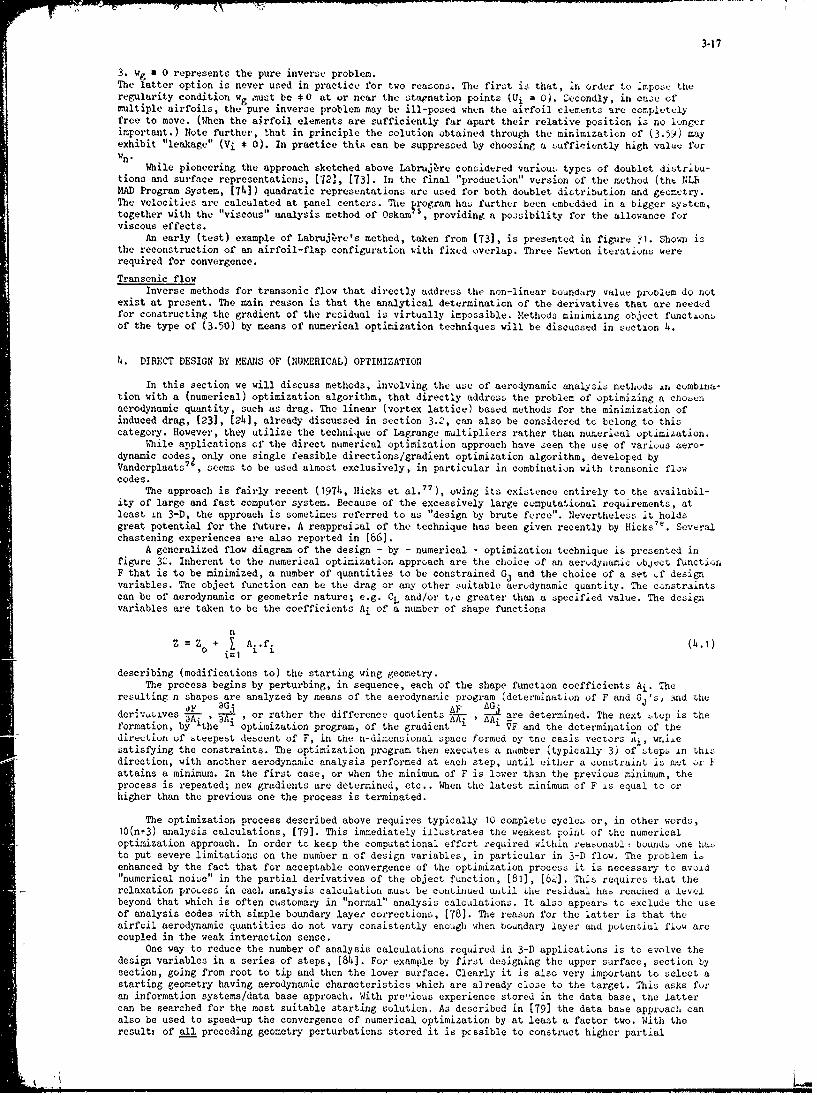
3-17
3. w. a 0 represents the pure inverse problem.The latter option is never used in practice for two reasons. The first is that, in order to impose theregularity condition Wg ,,uet be *0 at or near the stagnation points (Ui = 0). Zecondly, in case ofmultiple airfoils, the'pure inverse problem may be ill-posed when the airfoil elements are completelyfree to move. (When the airfoil elements are sufficiently far apart their relative position iz no longerimportant.) Note further, that in principle the solution obtained through the minimization of (3.59) mayexhibit "leakage" (Vi * 0). In practice thi.s can be suppressed by choosing a sufficiently high value forwn•
While pioneering the approach sketched above Labru~jLre considered variou. types of doublet distribu-tions and surface representations, [72], [73]. In the final "production" version of the method (the NLhMAD Program System, [74]) quadratic representations are used for both doublet distribution and geometry.The velocities are calculated at panel centers. The program has further been embedded in a bigger system,together with the "viscous" analysis method of Oskamvs, providing a posibility for the allowance forviscous effects.
An early (test) example of Labrujbre's method, taken from (731, is presented in figure ?1. Shown isthe reconstruction of an airfoil-flap configuration with fixed overlap. Three Newton iterations wererequired for convergence.
Transonic flowInverse methods for transonic flow that directly address the non-linear boundary value problem do not
exist at present. The main reason is that the analytical determination of the derivatives that are neededfor constructing the gradient of the residual is virtually impossible. Methods minimizing object functionsof the type of (3.50) by means of numerical optimization techniques will be discussed in section 4.
4. DIRECT DESIGN BY MEANS OF (NUMERICAL) OPTIMIZATION
In this section we will discuss methods, involving the use of aerodynamic analysis methods in combina-tion with a (numerical) optimization algorithm, that directly address the problem of optimizing a cho enaerodynamic quantity, such as drag. The linear (vortex lattice) based methods for the minimization ofinduced drag, (23], (24], already discussed in section 3.2, can also be considered to belong to thiscategory. However, they utilize the technique of Lagrange multipliers rather than numerical optimization.
While applications of the direct numerical optimization approach have seen the use of various aero-dynamic codes, only one single feasible directions/gradient optimization algorithm, developed byVanderplaats7 G, seems to be used almost exclusively, in particular in combination with transonic flowcodes.
The approach is fairly recent (1974, Hicks et al.77 ), owing its existence entirely to the availabil-ity of large and fast computer system. Because of the excessively large computational requirements, atleast in 3-D, the approach is sometimes referred to as "design by brute force". Nevertheless it holdsgreat potential for the future. A reappraisal of the technique has been given recently by Hicks7". Severalchastening experiences are also reported in [86].
A generalized flow diagram of the design - by - numerical - optimization technique is presented infigure 32. Inherent to the numerical optimization approach are tle choice of an aerodynamic object functionF that is to be minimized, a number of quantities to be constrained G, and the choice of a set .f designvariables. The object function can be the drag or any other suitable aerodynamic quantity. The constraintscan be of aerodynamic or geometric nature; e.g. CL and/or t/c greater than a specified value. The designvariables are taken to be the coefficients Ai of a number of shape functions
nZ =Z A..f. (4.1)
i=1
describing (modifications to) the starting wing geometry.The process begins by perturbing, in sequence, each of the shape function coefficients Ai. The
resulting n shapes are analyzed by means of the aerodynamic program (determination of F and Gj's) and the
derivatives 1L 3G, ,or rather the difference quotients A A. are determined. The next step is theformation, by ithe 1 optimization program, of the gradient 1 VF and the determination of thedirection of ,teepesb descent of F, in the n-dimensionai space formed oy tne oasis vectors ii, wniiesatisfying the constraints. The optimization program then executes a number (typically 3) of bteps in thisdirection, with another aerodynamic analysis performed at each step, until either a constraint is met or Fattains a minimum. In the first case, or when the minimum of F is lower than the previous minimum, tleprocess is repeated; new gradients are determined, etc.. When the latest minimum of F is equal to orhigher than the previous one the process is terminated.
The optimization process described above requires typically 10 complete cycles or, in other words,10(n+3) analysis calculations, [79]. This immediately illustrates the weakest point of the numericaloptimization approach. In order to keep the computational effort required within rtaornabl! bounds one hato put severe limitations on the number n of design variables, in particular in 3-D flow. The problem isenhanced by the fact that for acceptable convergence of the optimization process it is necessary to avoid"numerical noise" in the partial derivatives of the object function, [81], [82]. This requires that therelaxation pro-ess in each analysis calculaLiou mub be continued unt il the residual ha. reached a leveibeyond that which is often customary in "normal" analysis calculations. It also appears to exclude the useof analysis codes with simple boundary layer corrections, [78]. The reason for the latter is that theairfoil aerodynamic quantities do not vary consistently enough when boundary layer and potential flow arecoupled in the weak interaction sense.
One way to reduce the number of analysis calculations required in 3-D applications is to evolve thedesign variables in a series of steps, [84]. For example by first designing the upper surface, section bysection, going from root to tip and then the lower surface. Clearly it is also very important to select astarting geometry having aerodynamic characteristics which are already close to the target. This asks foran information systems/data base approach. With pre,!ious experience stored in the data base, the lattercan be searched for the most suitable starting solution. As described in [79] the data base approach canalso be used to speed-up the convergence of numerical optimization by at least a factor two. With theresulti of all preceding geometry perturbations stored it is pcssible to construct higher partial

3-18
derivatives of the object function and utilize higher order gradient methods.With the severe limitations on n, the choice of the shape functions is of utmost importance. Tle
choice should be directed towards describing a sufficiently wide class of practical oolutions. Whilesimple polynomial expressions were used in early applications (77], [801, of the numerical optimizationconcept, a more sophisticated class of shape functions describing more local georetry modifications wasused in later applicutions, (81], (82], [83]. However, as discussed in [84], there is a need for stillbetter shape functions with even more localized curvature variations. In fact i, can be argued, followingarguments similar to those used by Daviq59 in selecting the geometry correction formulae in his residual-correction type of inverse method, that while curvature based shape functions are suitable for areas withsubcritical flow, slope based 6hape functions might be more appropriate in areas with locally supersonicflow. In general it can be stated that the design variables must be chosen carefully for each individualoptimization problem. Not in the least because the choice also affects the convergence of tho optimizationprogress, [79].
While the choice of the design variables is of great practical sienificance, the choice of the objectfunction, in conjunction with the choice of the aerodynamic and geometric constraints, is of morefundamental interest. In two-dimensional transonic applications, (77], [79], [80], [81], it has beencustomary to select the wave drag as the quantity to be minimized, subject to constraints on, e.g.,airfoil thickness or volume, lift and/or pitching moment. Although it is clear that constraints arenecessary in a seaningful drag minimization problem it is by no means clear how exactly the problem shouldbe formulated in order to guarantee a unique solution. The problem is illustrated by figure 33, taken from[79). Shown are the results of two drag minimization runs with identical free stream conditions andidentical constraints on lift and airfoil volume. Only the starting solutions differ. As illustrated bythe figure the iwo resulting airfoils are totally different in shape. Clearly the problem, as formulated,has more than one, local minimum and neither of the two necessarily represents the absolute minimum.
Figure 33, the airfoil on the right in particular, also illustrates another problem of direct(inviscid) wave drag minimization. In the absence of (direct) control over the pressure distribution thesolution may acquire unrealistically high pressure gradients, such as near the upper surface trailing edge.
A strong point of the numerical optimization approach is the possibility of selecting object functionsand constraints suitable for multi-point designs. An example of a two-point design problem directed towardsthe design of airfoils with low drag cree- can be found in [81]. Low speed airfoil design applications areconsidered in [851. It is also entirely sible to consider, e.g. transonic drag minimization and low-speed stall requirements simultaneously.
While the direct minimization of (inviscid) wave drag is feasible in two dimensions, it is not, atpresent, in the case of three-dimensional wings. Several unsuccessful attempts in this direction can befound in the literature, [82], (83], [84]. The main reason for this failure is the lack of accuracy in thedetermination of the pressure drag with the currently available 3-D codes and the limited number of meshpointb. Another problem would seem to be that the problem of uniqueness in three dimensions is even moresevere than in tuo dimensions. The accuracy problem might be overcome when more efficient algorithmsand/or more computer power (vwctor machines) allow the number of mesh points to be increased. The unique-ness problem would probably r.!quire the introduction of more constraints or more sophisticated objectfunctions.
Because of the difficulties just mentioned most 3-D applications [83], (84], of design-through-numerical-optimization have seen the use of the pressure distribution type of object function
N f \F I C C-C(42i=O (CPPtarget)
When used in this mode, design-by-numerical-optimization is an extremely expensive ,ubstitute for theinverse approach described in the preceding section. While the latter is absolutely feasible on currentlyavailable general main frame compulerb, the fvrzci , lequi iig at, ordei of magnitud more computer time, isabsolutely not, at least in an industrial environment. On the other hand, inverse design through numericaloptimization does have the advantage that direct control over the geometry can be excercised through theapplication of constraints. The latter possibility is absent in most of the inverse methods discussed insection 3, at least for transonic flow.
The technique of numerical optimization has also been used by Lamar8 7 in the exploratory design ofoptimal camber surfaceb fvi lendcr (low aspect ratio) wings with IpAdine edge separation. For thispurpose the CONMIN optimization code7 6 was coupled with a vortex lattice method supplemented with theleading edge suction analogy of Polhamus8s .
Summarizing the discussion on design by numerical optimization, it may be said that the potentialpossibilities of the approach are enormous with, at present, unique capabilities such as multi-point andconstrained design. However, the approach is also unique in terms of required computer resources.Substantial improvements in both flow optimization code algorithms and/or computer efficiency, relative tocurrent general standards, are required before numerical optimization in 3-D wing design can be used on aroutine basis.
5. SPECIAL METHODS: FICTITIOUS (YAS CONCEPT
A special class of methods, directed in particular towards the modification of existing shapes forthe purpose of elimiuating transonic wave drag, is formed by those based on Sobieczky's fictitious gabconcept, [90]. As diszussed in [89], the fictitious gas methods are closely related to the Sobieczky-Eberlehodograph methods. Both are based on the concept of the elliptic continuation of the subsonic part of amixed subsonic/supersonic flow field into the supersonic zone by modifying the pressure-density (orvelocity - density) relation. However, instead of working in the hodograph plane the fictitious gas methodutilizes a direct (aalysis) transonic potential flow method in which the pressure (velocity)-densityrelation is modified locally whenever Mlocal > 1.
The modified analysis code is used to compute the fictitious gas flow about a given base configura-tion, the transonic wave drag characteristics of which, at given angle of attack and Mach number, have tobe improved. When the solution to the fictitious ges flow problem is known, the correct supersonic flowfield inside the sonic surfaces is determined by solving an initial value problem with the initial datagiven on the sonic surface. The new correct flow inside the sonic "umbrella" defines a new stream surfacethat is tangent to, and has the same curvature as, the stream surface (contour) at the intersection of the

3-19
sonic surface and the original body. In this way a part of the original body is modified and indeed in
such a way that, at the same conditions of Mach number and angle of attack a transonic shock-free flow ioobtained. Hence, the fictiti( - gas method should be considered as a shock-free redesign method"'.
An appealing feature of the fictitious gas method is that, in principle, any available 2-D or 3-Danalysis code may be modified and used to solve the elliptic part of the problem. In 2-D, Sobieczky etal.90 use Jameson's FL06 codezo, while in another application of the concept Eberle" uses a 2-D versionof his finite element method. Applications in 3-D have seen the use9 0'53 of a Bailey-Ballhaus type oftransonic small perturbation code as well as (91], (94] the more advanced Jameson-Caughey full potentialFLO22 and FLO27 codes. As demonstrated in [95], (96] it is also possible to utilize analysis codesincluding viscous-inviscid interactions.
In two dimensions 9 l,92 the initial value problem in the supersonic part of the flow field may besolved by means of either a characteristics methods in a hodograph-like working plane or by a finitedifference marching procedure 97 . In 3-D a marching procedure is used, going inward from the sonic surfaceby successive surfaces of constant density for the full potential eluation or constant longitudinal flowspeed u for tne small perturbation equation.
An importan, point to note is that the (re)design problem as sketched above Ooes not always have auseful solution. This is associated with the character of the initial value problem to be solved in thesupersonic part of the flow field. In the 2-D hodograph plane the problem is well posed and the solutionis readily found. However, as mentioned earlier, the solution may not be useful because of the appearanceof limit lines in the transformation from the hodograph to the physical plane. Limit lines or surface. mayalso appear directly when the marching procedure is used . If they appear, a next attempt towards aphysically meaningful solution may be made by using a "more elliptic" fictitious gas law. An additionalcomplication in 3-D is that the initial value problem for the supersonic domain seems to be ill-posed"';
i.e. small changes in the initial data will cause large changes in the solution el~ewhere. As a consequencethe marching procedure, or, indeed, any numerical method, is unstable in principle. However, the instabil-ity appears to be manifest only when spanwise §radients are large, and, apparently, is of little conse-quence for moderate to high aspect ratio wings . Note that as discussed in section 3.1 the 3-D invexseproblem is also "ill-posed".
Some examples of application of the fictitious gas method are reproduced in figures 314 and 35.Figure 34, taken from (90], shows the (inviscid) shock-free redesign of the NACA b4A1O airfoil at a Machnumber of 0.72 and 0.4 degrees angle of attack. Note that the modified airfoil i. somewhat thinner and hasa 10 % lower lift coefficient. An illustrative 3-D example, taken from [95] has been reproduced infigure 35. Shown is the result of the shock-free redesign of a 15.7' swept wing built-up from GA(W)-2 typeairfoil jections. This type of airfoil is known to have good low speed CLmax characteristics, but asindicated by the figure, the high speed characteristics at M = 0.8 are poor. Also shown is the resu"t of ashock-free redesign at M = 0.8 which has not affecteu the first 9 % of the airfoil chord. Because of thelatter it can be expected that the new wing will also have a good low speed CLmax.
Examples such as this serve to illustrate the point that the fictitious gas method is a viable toolfor the shock-free redesign of a given wing in the final tages of the aerodynamic design process. However,because of the fact that a suitable basic shape is required from the outset, additional tools such asthose described in the preceding sections are required if the complete aerodynamic design of a wing orairfoil is the objective.
It seems approprinie at this point to comment on the, apparently, still wide-spread misconceptionthat, from an engineering point of view, shock-free flows are less interesting than other supercriticalairfoil flows. This is so, it is argued, because the best L/D for a given Mach number is always obtainedwith a weak shock present and also because of the large aerodynamic center shifts that would be producedby shoeks occurring at slightly off-design conditions.
Although the statement that (L/D)max is obtained when a weak shock is present is correct, at least fora given geometry, this does not necessarily make "shock-free" designs less attractive. Thiu is so first ofall because the problem of aerodynamic design is generally to find a shape that, subject to certain con-straints, maximizes L/D (or rather minimizes D) for given lift. his is a different optimization problemthan LhaL of fixidlie, the best L/D f a ivcn shapC. A Zcondrcacon i that "-bock-free " , g rseldom turn out to be really sho'k-free in practice. Due to inappropriate boundary layer modelling, windtunnel wall interference and aeroelastic distorsion, most if not all shock-free designs exhibit weak shockwaves at and around the design CL and Mach number in the wind tunnel or atmospheric flight environment.Shock-free designing must therefore be viewed as one (of several) possible means to design for flows withsmall or negligible wave drag for a certain range in CL and Mach number. The reader is referred to theRound Table Discussion contained by [98] for a recent discussion on the issue. The possible problem ofrapid shifts with Mach number of the aerodynamic center is not confined to shock-free designs. Iuch rapidshifts occur on most advanced and many conventional airfoils in transonic flow. Airplane designers havelearned to live with it, with Mach trim compensators found on most commercial jtt transport:.
6. CONCLUDING REMARKS
Having discussed the possibilities and limitations of several approaches in aerodynamic design, thequestion may be raised which, if any, of the various techniques is to be preferred. As usual with suchquestions a general and definitive answer cannot be given. The answer will depend on the particular circum-stances that apply and will vary from case to case.
There also appears to be divergence of opinion on the matter: In [8b] one author states (p. 383) that"Because of their relative simplicity and computational efficiency, coupled with (these) weaknesse ,inverse methods seem best suited for initial wing design. Some other technique is then required to producean optimized design". Another author communicates the opinion (p. 439) that "Direct optimization appearsto be well suited for early design iterations involving large geometry changes subject to design constraint.Later refinements can probably be accomplished more efficiently with an inverse solution". Who is right?
If a choice between the various possibilities is to be made ,able 3 may be of some help. The tableillustrates the point that if a general design method for complete wings is required the fictitious gas

3-20
method does not suffice. Neither do, of course, residual-correction type of inverse methods with onlylocal redesign capabilities, such as [59], (b4]. In this author's opinion an inverse approach allowingglobal wing design as well as local design modifications is, at present, the best compromise, numericaloptimization being to expensive. Subsonic codes having this caVbility are those of (St)], [70], [4] and(poscibly) that of (35]. To the author's knowledge they do not exist for t-r-nsonic flow, with the po-5,ibleexception of [42].
The most serious limitation of most existing inverse methods iL. that it ic not possible to imposeconstraints on the geometry. Efforts should be directed towards developing inverse codes having suchcapability, in particular for transonic flow. Existing codes having this capability are those of [a],[61], (72-74], and to some extent, [70], (see table 1).
Another problem with inverse methods is that the specification of the target pressure distributionputs a heavy burden on the aerodynamicist. As an example, for transport aircraft, the target pressuredistribution must be chosen such that, at least at the design condition, boundary layer separation isavoided and that drag is minimized while obtaining an acceptable geometry. At the zame time the choiceshould lead to acceptable off-design characteristics.
That the problem is not at all trivial, e.g. in relation to wave drag minimization, is illustratedby figure 26, showing that a suitably looking shock-free surface press, e distribution may not be suitablefor the minimization of wave drag. Another example of this kind is presened in) figure 3b which was taktnfrom (64]. The figure on the right presents the result of an inverse (McFaoden's) method; the resultingairfoil carries a wave drag of 38 counts. The figure on the left, on the othe" hand, presents the nearestshock-free solution (zero wave drag) as obtained with a hodograph method. Note that the latter rciuitcould also be obtained by means of the fictitious gas method. As mentioned, the fictitious gas could be auseful tool for the final elimination of the ware drag from a design that has already been taylored in allother respects.
It is conjectured that most if not all of the limitations of inverse methods could be avoided throughan approach which we will call inverse numerical optimization. In this conjectu:'al scheme (Fig. 37, thtdesign variables are parameters describing the pressure distribution rather than the geometry. The optimi-zation algorithm is used to optimize a target pressure distribution, e.g. with the objective to minimizethe drag. Using the latest available estimate of the geometry this can be done relatively cheap through aninduced drag (Trefftz plane, (91]) routine, a boundary layer code and a pressure drag routinL. With thetarget Cp-distribution established the new geometry can be determined by means of an inverse code. Subse-quently the off-design characteristics can be determined by means of an analysis codt. The process isrepeated when the new geometry differs significantly from the previous one or when a geometry or off-designconstraint is met. In the latter cases (new) constraints will have to be imposed on the values of theparameters describing the pressure distribution. Information from all the previous iterations can be usedto determine these new values.
It is the author's opinion that an approach of the type sketched above, is worthy of further investi-gation, in particular when embedded in an information systems/data base approach, [100].
7. REFERENCES
1. Slooff, J.W.; "Wind-tunnel tests and aerodynamic computations, thoughts on their use in aerodynamicdesign", AGARD CP. No.210, Paper 11, 1976.
2. Eppler, R.; "Direkte Berechnung von TragflUgelprofilen aus der Druckverteilung", Ingenieur-ArchivXXV, Band 1957, pp. 32-57.
3. Van Ingen, J.L.; "A program for airfoil section design utilizing computer graphics", AGARD/VKILecture Series, 1969.
4. Arlinger, B.; "An exact method of two-dimensional airfoil design", SAAB TN67, 1970.5. Strand, T.; "Exact method of designing airfoils with given velocity distribution in incompressible
flow", J. Aircraft, Vol. 10, pp. 651-659, 1973.6. Holst, T.L., Slooff, J.W., Yoshihara, H., Ballhaus Jr., W.F.; "Applied computational transonic
aerodynamics", AGARD-AG-266, 1982.7. Slooff, J.W.; "Computational procedures in transonic aerodynamic design", Lecture presented at ICTS
Short Course on Computational Methods in Potential Aerodynamics, Amalfi, Italy, 1982.(Also NLR MP 820?0 U).
8. Hess, J.L., Johnsson, F.T., Rubbert, P.E.; "Panel methods", Notebook, AIAA Professional Study Series,.1978.
9. Ortega, J.M. and Rheinboldt, W.C.; "Iterative solutions of nonlinear equations in several variables",Academic Press, N.Y., '970.
10. Lighthill, M.J.; "A new method of two-dimensional aerodynamic design, ARC R&M 2112, 1945.11. Woods, L.C.; "The design of two-dimensional airfoils with mixed boundary conditions, Quart. Appl.
Math. Vol. 13, pp. 139-1h6, 1955.12. Volpe, 0. and Melnik, R.E.; "The role of constraints in the inverse design problem for transonic
airfoils, AIAA Paper No.81-1233, 1981.13. Ashley, H. and Landahl, M.T.; "Aerodynamics of wings and bodies", Addison-Wesley Publ. Company, Inc.,
Reading, Mass., 1965.14. Van Dijke, M.; "Perturbation methods in fluid mechanics", Academic Press, N.Y., 1964.15. Der Jr., K. and Raetz, G.S., "Solution of general three-dimensional laminar boundary layer problem
by an exact numerical method", IAS Paper No. 62-70, 1962.16. Lighthill, M.J.; "On displacement thickness", J. Fl. Mech. 4, p. 383, 1958.17. Woodward, F.A.; "Analysis and design of wing-body combinations at subsonic and supersonic speeds",
J. Aircraft, Vol. 5, No. 6, pp. 528-534, December 1968.18. Woodward, F.A., Tinoco, E.N. and Larsen, Y.W.; "Analysis and design of supersonic wing-body
combinations, including flow properties in the near field - Part I - "Theory and Application",NASA CR-73106, August 1967.
19. Oskam, B.; "Stability analysis of panel methods", unpublished NLR Memorandum (AT-82-002 U), 1982.20. Rubbert, P.E. and Saaris, G.R.; "Review and evaluation of a three-dimensional lifting potential flow
analysis method for arbitrary configurations", AIAA Paper 72-188, January 1972.21. Weber, J.; "The calculation of the pressure distribution on the surface of thick, cambered wings and
the design of wings with given pressure distribution", ARC R&M 3026, 1957.
I i I i I i II I oll I II I ! lll l ~ l I .. .... _ =

3-21
22. Fray, J.M.J. and Slooff, .W.; "A constrained inverse method for the aerodynamic design of thick
wings with given pressur. distribution in subsonic flow", AGARD CP. No. 285, paper 16, 1980.23. Feifel, W.M.; "Optimization and design of three-dimensional aerodynamic configurations of arbitrary
shape by a vortex lattice method", NASA SP-405, 1976, pp. 71-88.24. Lamar, J.E.; "A vortex-lattice method for the mean camber shapes of trimmed noncoplarar plaeAforms with
minimum vortex drag", NASA TN D-8090, June 197b.25. Steger, J.L. and Klineberg, J.M.; "A finite difference method for transonic airfoil design",
AIAA J., Vol. 11, No.5, pp. 628-b35, May 1973.26. Langley, M.J.; "Numerical methods for two-dimensional and axisymmetric transonic flow, ARA Memo 143,
1973.27. Murman, E.M. and Krupp, J.A.; "The numerical calculation of steady transonic flow -c thin lifting
aerofoils and slender bodies", AIAA Paper No. 71-566, 1971.28. Lock, R.C.; "Research in the U.K. on finite difference methods for computing steady transonic flow"
in: Symposium transonicum II, Springer Verlag, 1976.29. Schmidt, W., Rohlfs, S. and Vanino, R.; "Some results using relaxation methods for two- and three-
dimensional transonic flow", Lecture Notes in ihysics, Vol. 35, pp. 364-372, 1975.30. Schmidt, W. and Hedman, S.; "Recent explorations in relaxation methods for three-dimensional
transonic potential flow", ICAS Paper 76-22, 1976.31. Shankar, V., Malmuth, N.D. and Cole, J.D.; "Computational transonic airfoil design in free air and
a wind tunnel, AIAA Paper No.78-103, 1978.32. Shankar, V., Malmuth, N.D. and Cole, J.D.; "Computational transonic design procedure for three-
dimensional wings and wing-body combinations, AIAA Paper No.79-0344, 1979.33. Mason, W., McKenzie, D.A., Stern, M.A. and Johnson, J.K.; "A numerical three-dimensional viscous
transonic wing-body analysis and design tool", AIAA Paper No. 78-101, 1978.34. Shankar, V.; "Computational transonic inverse procedure for wing design with automatic trailing edCe
closure", AIAA Paper No. 80-1390, 1980.35. Johnson, F.T.; "A general panel method for the analysis and design of arbitrary configurations in
incompressible flows", NASA CR3079, May 1980.36. Johnson, F.T. and Rubbert, P.E.; "Advanced panel-type influence coefficient methods applied to
subsonic flows", AIAA Paper 75-50, January 1975.37. Ormsbee, A.I. and Chen, A.W.; "Multi-element airfoils optimized for maximum lift coefficient",
AIAA J., Vol. 10, No. , pp. 1620-1b21h, December 1972.38. Oellers, H.J.; "Die Inkompressibelen Potentialstr5mung in der ebener Gitterstufe",
Jahrbuch 1962 WGLR, pp. 349-353.39. Tranen, T.L.; "A rapid computer aided transonic airfoil design method", AIAA Paper No. 74-501, 197h.40. Bauer, F., Garabedian, P. and Korn, D.; "Supercritical wing sections", Springer Verlag, 1972.41. Volpe, G.; "Two-element airfoil systems design: An inverse method", AIAA Paper No. 78-1226, 1978.h2. Arlinger, B. and Schmidt, W.; "Design and analysis of slat systems in transonic flow", ICAS paper,
1978.43. Bauer, F., Garabedian, P., Korn, D. and Jameson, A.; "Supercritical wings sections II",
Springer Verlag, 1975.44. Carlson, L.A.; "Transonic airfoil analysis and design using Cartesian coordinates", J. Aircraft,
Vol. 13, pp. 369-356, May 1976.145. Henne, P.A.; "An inverse transonic wing design method", AIAA Paper No.80-0330, 1980.46. Jameson, A. and Caughey, D.; 'Numerical calculation of the transonic flow past a swept wing",
ERDA R&D Rept. COO-3077-1140, Courant Institute, New York University, 1977.h7. Shankar, V.; "A full potential inverse method based on a density linearization scheme for wing
design", AIAA Paper No.81-1234, 1981.48. Caughey, D. and Jameson, A.; "Progress in finite volume calculation for wing-body combinations",
AIAA J., Vol. 18, No. 11, November 1980, pp. 1281-1288.149. Beatty, T.D. and Narramore, Y.C.; "Inverse method for the design of multi-element high-lift systems",
J. Aircraft, Vol. 13, ':o. 6, June 1976.50. Hess, J.L.; "Higher order numerical solution of the integral equation for the two-dimersional
Neumand problem", Comp. Meth. Appl. Mech. Eng., Vol. 2, 1973, pp. 1-15.51. Wilkinson, D.H.; "A numerical solution of the analysis and design problems for the flow past one or
more aerotoils or cascades", ARC, R&M 3545, 1967.52. Fornasier, L.; "Wing design process by inverse potential flow computer programs", in: The Use of
computers as a design tool, AGARD CP. No. 280, 1979.53. Kraus, W. and Sacher, P.; "Das Panelverfahren zur Berechnung der Druckverteilung von Flugk6rpern in
Unterschallbereich", ZFW, Heft 9, September 1973, pp. 301-311.54. Labrujbre, Th.E., Loeve, W. and Slooff, J.W.; "An approximate method for the calculation of the
pressure distribution on wing-body combinations at subcritical speeds", AGARD CP. No. 71, Paper 11,1970.
55. Slooff, J.W. and Voogt, N.; "Aerodynamic design of thick supercritical wings through the concept ofequivalent subsonic pressure distribution", NLR MP 78011 U, 1978.
56. Malone, J.B.; "An optimal-surface-transpiration subsonic panel-method for iterative design ofcomplex aircraft configurations", AIAA Paper No. 81-1254, 1981.
57. Aoki, M.; "Introduction to optimization techniques", McMillan, New York, 1971.58. Hess, J.L.; "A fully automated potential-flow boundary-layer procedure for calculating viscous
effects on the lifts and pressure distributions of arbitrary three-dimensional configurations",NSRDC Rept. No. MDC J7491, 1977.
59. Davis Jr., W.H.; "Technique for developing design tools f m the aualy3is methods of computationalaerodynamics", AIAA Paper No. 79-1529, 1979.
60. Jameson, A.; "Accelerated iteration schemes for transonic flow calculations using fast Poissonsolvers", ERDA R&D Rept. COO-3077-82, Courant Inst. Math. Sci., N.Y. Univ., 1975.
61. Fray, J.M.J., Slooff, J.W., Boerstoel, J.W. and Kassies, A.; "Design of transonic airfoils withgiven pressure distribution, subject to geometric constraints", NLR, to be published.
62. Boerstoel, J.W.; "Numerical modelling and fast-solver calculation of approximately normal shocks",NLR MP 82026 U, 1982.
63. McFadden, G.B.; "An artificial viscosity method for the design of supercritical airfoils",Ph.D. Thesis, N.Y. University, 1979.

3-22
64. Garabedian, P., McFadden, G.; "Design of supercritical swept wings", proceedings of the 1980 ArmyNumerical Analysis and Computers Conference, ARO Report 80-3, 1980.
65. Garabedian, P. and McFadden, G.; "Computational fluid dynamics of airfoils and wings", proceedingsof Symposium on Transonic, Shock and Multi-dimensional flows, University of Wisconsin, Madison(1981); Academic Press Inc. 1982, pp. 1-16.
66. Miranda, L.R.; "A perspective of computational aerodynamics from the viewpoint of airplane designapplications", AIAA Paper 82-0018, January 1982.
67. Garabedian, P. and McFadden, 0.; "Design of supercritical swept wings", toeublished.68. Bristow, D.R.; "A solution to the inverse problem for incompressible axisyrmetric potential flow",
AIAA Paper 74-520, June 197h.69. Bristow, D.R.; "A new surface singularity method for multi-element airfoil analysis and design",
AIAA Paper 76-20, January 1976.70. Bristow, D.R.; "Development of panel methods for subsonic analysis and design", NASA CR 3234, 1980.71. Kellogg, O.D.; "Foundations of potential theory", Dover Publications, Inc., 1953.72. Labruj~re, Th.E.; "Airfoil design by the method of singularities via parametric optimization of a
geometrically constrained least squares object function", NLR MP 76139 U, 1976.73. LabrujLre, Th.E.; "Multi-element airfoil design by optimization", NLR MP 78023 U, 1978.74. Labrujbre, Th.E.; NLR Report to be published.75. Oskam, B.; "A calculation method of the viscous flow around multi-component airfoils",
NLR TR 79097 U, 1979.76. Vanderplaats, G.N.; "CONMIN - A FORTRAN program for constrained function minimization", NASA TM X-62,
282, 1973.77. Hicks, R.M., Murman, E.M. and Vanderplaats, G.N.; "An assessment of airfoil design by numerical
optimization, NASA TM X-3092, 1974.78. Hicks, R.M.; "Transonic wing design using potential flow codes - Successes and failures", SAE
Paper 810565, 1981.79. Vanderplaats, G.N.; "An efficient algorithm for numerical airfoil optimization, AIAA Paper
No. 79-0079, 1979.80. Hlicks, R.M., Vanderplaats, G.N., Murman, E.M. and King, Rosa T.; "Airfoil section drag reduction at
transonic speeds by numerical optimization, SAE Paper 760477, 1976.81. Hicks, R.M. and Vanderplaats, G.N.; "Application of numerical optimization to the design of super-
critical airfoils without drag-creep", SAE Paper 7701440, 1977.82. Hicks, R.M. and Henne, P.A.; "Wing design by numerical optimization", AIAA Paper No. 77-1247, 1977.83. Haney, H.P., Johnson, R.R. and licks, R.M.; "Computational optimization and wind tunnel test of
transonic wing designs", AIAA Paper No. 79-0080, 1979.84. Lores, M.E., Smith, P.E. and Large, R.A.; "Numerical optimization: an assessment of its role in
transport aircraft aerodynamic de.'ign through a case study", ICAS-80-1.2, 1980.85. Hicks, R.M. and Vanderplaats, G.N.; "Design of low-speed airfoils by numerical optimization",
SAE Paper 75052, 1975.86. Nixon, D. (editor); "Transonic aerodynamics", Progress in Astronautics and Aeronautics, Vol. 81,
AIAA, N.Y., 1982.87. Lamar, J.E.; "Subsonic vortex-flow design study for slender wings", J. Aircraft, Vol. 15, No. 9,
September 1978.88. Polhamus, E.C.; "A concept of the vortex lift of sharp-edge delta wings based on a leading edge
suction analogy, NASA TN D-3767, 1966.89. Sobieczky, .; "Related analytical, analog and numerical methods in transonic airfoil design", AIAA
Paper No. 79-1556, 1979.90. Sobieczky, H., Fung, K.Y. and Seubass, A.R.; "A new method for designing shock-free transonic
configurations", AIAA Paper No. 78-1114, 1978.91. Yu, N.J.; "Efficient transonic shock-free wing redesign procedure using a fictitious gas method",
AIAA Paper No. 79-0075, 1979.92. Eberle, A.; "Transonic flow computations by finite elements: Airfoil optimization and analysis",
in: Recent developments in theoretical and experimental fluid mechanics, Springer Verlag, 1979.93. Fung, K.Y., Sobieczky, H. and Seebass, R.; "Shock-free wing design", AIAA Paper No. 79-1557, 1979.94. Rai, P., Miranda, L.R. and Seebass, A.R.; "A cost-effective method for shock-free supercritical
wing design", AIAA Paper No. 81-0383, 1981.95. Fung, K.Y., S=bass, A.R., Dickson, L.J. and Ppnron, C.F.; "An effective algorithm for shock-free
wing design", AIAA Paper No. 81-1236, 1981.96. Nebeck, H.E., Seebass, A.R. and Sobieczky, H.; "Inviscid-viscous interaction in the nearly direct
design of shock-free supercritical airfoils", AGARD CP-291, 1980.97. Sobieczky, I.; "Die Berechnung lokaler riiumlicher Ueberschallfelder", ZAMM 58T, 1918.98. Subsonic/transonic configuration aerodynamics, Round Table Discussion, AGARD CP-285, 1980.99. Van den Dam, R.F.; "SAMID, An interactive system for the analysis and constrained minimization of
induced drag of aircraft configurations", AIAA Paper 83-0095, January 1983.100. Narramore, J.C. and Yeary, R.D.; "Airfoil design and analysis using an information system approach",
AIAA Paper No. 80-144, 1980.

3-23
C - +O
$10-1 0 0_:
(d
ON S 7 c .00-
t- \0 0ot\ t - '41;~~~ ~ ~ 'Al Cd3 ON+ -14rC 0
Cd H '.'' x U tCd- t t
0l Ct- .14 Q\ -- ,. Sc\- Cd- Cd.-'m ' , d ' Cd- -4 t-0 - -d. 2' S., d~ 030 rd .C 4 :K- c- CdH a-
.0 :v1
0 1-4 -
to .-4
10 0
.0i - 00' 1..
P. a.1 4 C; 9 0\aj c40 \0 Ir
7 c"4 4
a 0. .00 4
04 p 0Cj CA 'A >
H A
o. C -. w' + "4
\C' 04 0\ 01 -\ 0) 0\ M a a01 U4\ Cd 3.. toC (a C
Cd~~C 0.) >J-d0*0
k od' d- ~ Cd0 0l "410'.4E- Q' X5 >-0 z.C - .
4-4 05 >W' 00 ' ~ F-4
00 a 0 to 0 4.0 0.. '4. d CCd Cd. .04 toCd

3-24
I 43 C.0' C4 0
.Ao0 H .,4H
43 43t. I 4 4
00
5' . .' 0
0 0 0 + 0'.o ~ 03).4
.,4 P4.
C14 C4 .
4 4) ;4 C'0 0
a .,4H ;: 94 g' UN.5'.~~~.0 ILI0' ~ ) 0
r. 4 C3 :3 '.N4." 4 ' .- )- )~ .CO 4)-e 4)' (' C5(S 0 40 4 O". C.4) 2 341)0 "(5.\A 0 .'A 3 S CO'D
4)- 0\ t--l
$.. a) -C - 0 o4 "' 1- C.- U-1 0'.
W .14 Q) U0 0\'.4)O *d',.4 U- 0''3I ' -:7 21.' ( -
I - 0 ''- 0'
0 0s U~ l 4).12 -
4. N 0 2 ;-f+ 0 0_ _ _ _ _ __ _ _ _ _
El
. 10, 0 0)
$-. 0 05Pl.
4or

0 0
-4 4) t)O)4 C 4 04 4) 0
4-44
0 .
t44 .0 .0 +).
0 ) V >)*44
0 4) bo.04>1 4) 4).04
> . k Q, 0 C£14. 0)C 4C
0 4 0 .
0 4JC-
.- 4 to4 0 0>0 0 S
4).,A
Q4 0 0 0 0
0.~~~~1 0. )*. ) 4
4.. 0 0 ) 0 4 >0 1k0 02 0
0 >) U £0 W4 ___
04c3
o3 04 0 0 0'0 0 r- +- 0 090 10 0 0 4 0 W H O
0 ~~ ~ 14 .140
1440 In 03 0- r-4
u) El 1>0 m2 00 014 4) 0 0to. 0o >' > 0 >4 4
k -44 0 , 3 104 10 13cE- 0 0 l 0 (a
43i 01 >W 0) 4)1 4. 44) 0r H0 0 0>
0~ 0 P4 .. 0 >
0
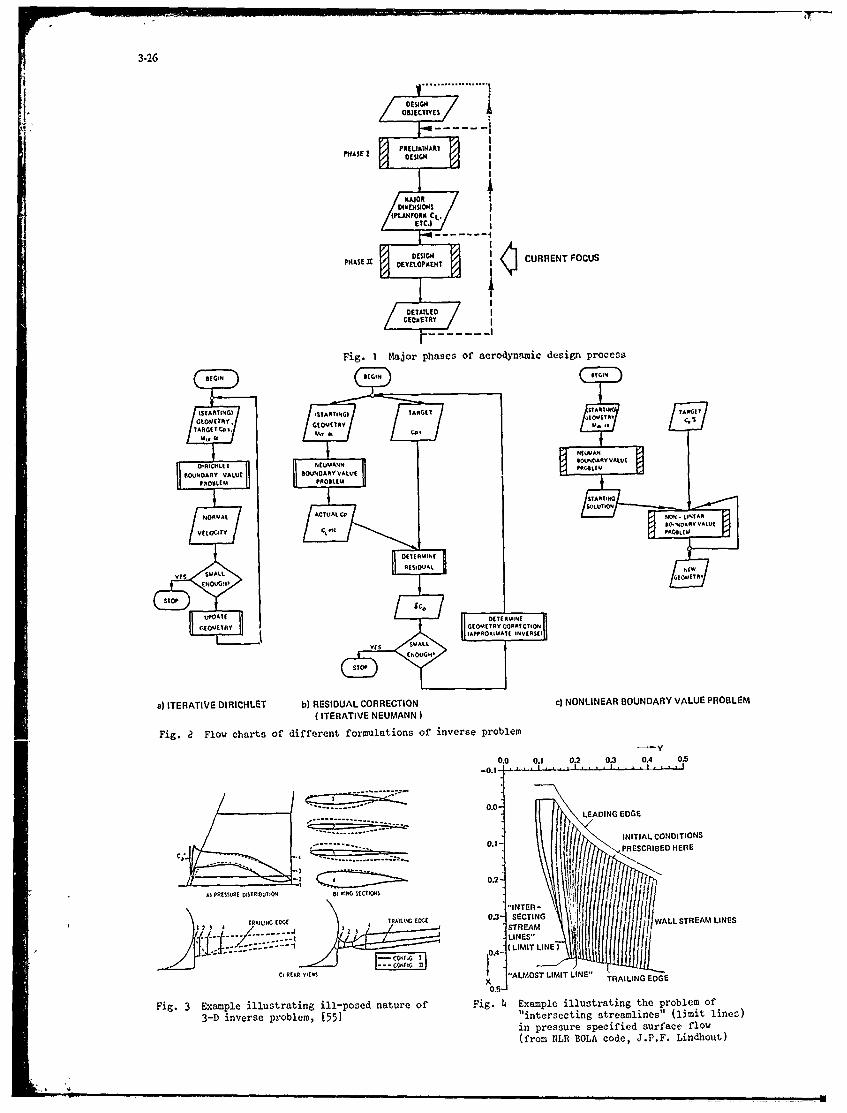
3-26
PH~ASE I PAU.IMINAKIDESIGNI
(PLANrORS CL-ETC.
PHASE 3z DESIG CURRENT FOCUS
DETLPED I
Fig. I ajor phases of aerodynamic design process
ISYARTIN0I ~ 1RsG TARGET STANT TAROT
G.OMETRY. I (OqtTRV .
TARtGtTC,, 1.M. a
BO U N DA RYW 0 AR VAUALVEDRY VA UWPCHUTE PROBLE
I... VALUE
PROE ATIE
)ITRTVEORCLE b)RSDCOETION c)NNLNARBUNAY(U PRO BLEM
ITERATIDETNEUMNE
UPDLAAIN DEDEMIE
OIOER .... E 0.1 ., INTILCODTIN
a)IR TIV E IRIBLEUTI* B) 0.2ULCRETONc OLNA ONDR AU RBE
(ITERATIV INUMER-
01 0.1 0. LINES0.
- --- -- ------ 0.4 -
0 EELSVIL~ ALMOSTLIMITLEA TIING EDGE
0.5-PECIBDHR
Fig 3 xamle llutraingillposd ntur ofFig...Exapleill.trtin.th.prbl..o
L- ines rbe, (55] 0 itretigsralie"(2-tlnsA$~~~i pressur specifiedtO surac flowCIO$.NTR
TRAILING ED(fro TRALIN EDGE code, J..F.WLLSTEA L INESt
123 'TRA

3-27
z ONRLPOINT LINE VORTICES
TAILINGE
~y : VORTEX SHEET
CONCTANT PRESSURE ( VORTICITY I "PANELS
X LINE SOURCE
+ DOUBLET SOURCE PANELS
INPUT WING PLANFORM, W WING CAMBER. TWIST OTUTHICKNESS, LIFT
Fie". , Dcirn option of Weed -ard I (19t,7) n,1 , nctho, [II,]
Constant Strength Source Panelson Fuselage Surface - ExactBoundary Conditions
Rieqes jRule at- ITREFFTZ Plane InducedLe2ding Edge Drag Calculation
LULinearized Wing Boundary Conditions- Constant Strength Source Panels for Thickness
Vortex Lattice for Lift
WING BOUNDARY CONDITIONS OPTIONS
Specify I Calculate
Camber Thickness C upper C lower
CC o Camber Thickness / UNSTABLE?P P clowerC upper Thickness C Camber
P. P.
etc. DESIGN OPTIONS
S Span" Pressure IAirfoils Loading Twist Dist. Dist l
Airfoils Twist Dist. Cupper lower
Fig. 6 Design options of early Boeing subsonic wing/body code (A236, 1968)
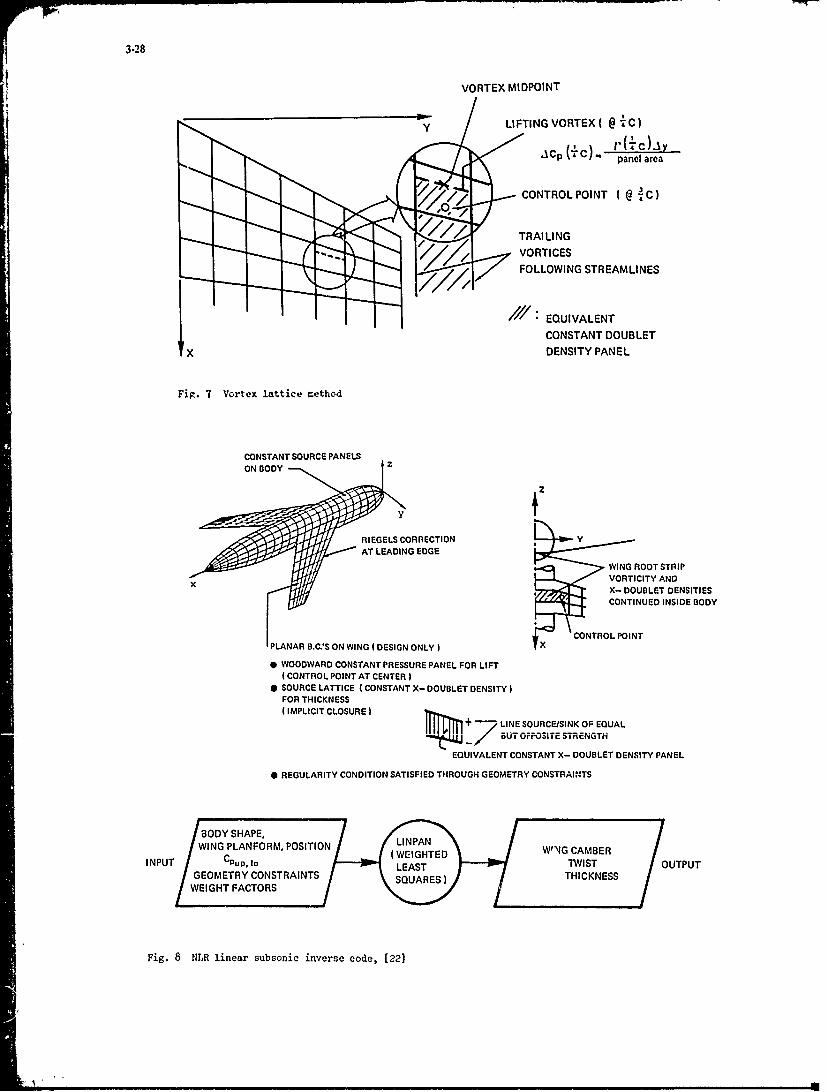
3-28
VORTEX MIDPOINT
Y LI FTI NG VORTEX( @ C)
',C,, (+C) rl(-c) "Ypanel area
CONTROL POINT ( 2 C)
TRAILINGVORTICES/7 FOLLOWING STREAMLINES
EQUIVALENT
CONSTANT DOUBLETX DENSITY PANEL
Fig. 7 Vortex lattice method
CONSTANT SOURCE PANELSON BODY
RIEGELS CORRECTION YAT LEADING EDGE
WING ROOT STRIPx VORTICITY AND
IN
X- DOUBLET DENSITIES
CONTINUED INSIDE BODY
CONTROL POINTPLANAR B.C.S ON WING (DESIGN ONLY )
" WOODWARD CONSTANT PRESSURE PANEL FOR LIFT
(CONTROL POINT AT CENTER)" SOURCE LATTICE (CONSTANT X- DOUBLET DENSITY )
FOR THICKNESS(IMPLICIT CLOSURE )
+-" LINE SOURCEISINK OF EQUALBUT OPPOSITE STR ENGTH
EQUIVALENT CONSTANT X- DOUBLET DENSITY PANEL
* REGULARITY CONDITION SATISFIED THROUGH GEOMETRY CONSTRAINTS
/W NG P.ANFORM POSITION / / i w ',',P EO\/A'NCA ,EINPUT Cpup, 10 LEAST TWIST UTPUTGEOMETRY CONSTRAINTS SQUARES ) ,/ ITHICKNESS
/WEIGHT FACTORS / /
Fig. 8 NLR linear subsonic inverse code, [22]

3-29
Zt COMPRESSIBLE W 0AS %tU
VORTEX .VOAISOLUTION Valk U. OMI
*DOMAIN
1-2 U~ U RU~PPER
Val- OR UGIVEN
u*V=0 0 ROoNDARYOcOITIONS ILINIIAR VORIOTYI
X1X SP(CIAL I'ICCRAL CON.)NTkOkS
Fig. 9 aetch of field subdivision in a) ANALYSIS DESIGN NETWORKS
Steger/Klineberr 21 inverse method (2-D)
SIoepressure dtstnbutiontoje specified
CpL
-10. s C(ALTO
MOVSE SOLTION 0110RS StIEOFIATION Of IIOtE0,LNTtNSWtRCC ,0LsIN NEIIORC
-08. I, *XTAACONDITIONAVAIIAILEJt ON SOURCE, CSAG hETAOPK NECESSARY FRORE
NACA 012-06 Ma074I
0~2* I~ Stortwq Sol"
Targe 4. %jr.
WI THICK WING DESIGN OPTION
Fig. 12 PA1NAIR dezign option-,
0
Lower surface shape fixed (a) Geometry
- STARTING GEOMETRY0 41 AND PRESSURE------------------------------------------------------------- DESIGNED GEOMETRY
AND PRESSURE
061 13ITERATIONS)
Fig. 10 Example of AR~A inverse method (2-D)), [26] v/C
.10r
26 0
00
Os~OS\NN.I deig (b)0 S Pressuie Distinbution
0LWE SURFACE)C
-10 0O0 - O IFE8HA E -
a I

3-30
(a) Paneling of Design Model A I ORMSIEEANDA W, CHEN
* STREAM FUNCTION FORMULATION (2-D)
- CONSTANT VORTICITY PANELS,1-4 CONTROL POINTS AT PANEL CENTERS
NOT PROPERLY FORMULATED ?
004r-4 02
(b) Wing-Pressure Profiles-Analysis Mode -4.0
STRI SrSTRI
too
"SI WN 10
C, 4 4 4 o e EM
4 t 4 4 S $t
STRIP 1 STRIP 2iS is00
ep 0
0 0A 0
a 10 2 2 4 It 04C4
' EXAMPLE OF SINGLE - ELEMENT HIGH LIFTSTRIP 3 STRIP 4 AIRFOIL FOR Re0 5 x 10⁶ ,a= 17.30, CL =1.91
(c) Wing Geometry
2y/b *
00
40
2y/b 206-3.0
-2.0p
2y/b* 0.303C
0.0
2y b .40O 0.0 0.2 0.4 0.6 0.8 1.0 1.2 1.4
2y/b - 0500oEXAMPLE OF TWO - ELEMENT HIGH LIFT AIRFOILFOR Reo0 =5x10⁶ AND Re02 = 106,a= 11.250, CL =2.32.
ACTUAL GEOMETRY
.... MODIFIED GEOMETRYDESIGNED 3EOMETRY
(2 ITERA rIONS )
Fig. 114 PANAIR wing (re-)design, [36) Fig. 15 Stream function inverse method of
Ormsbee and Chen, [37]
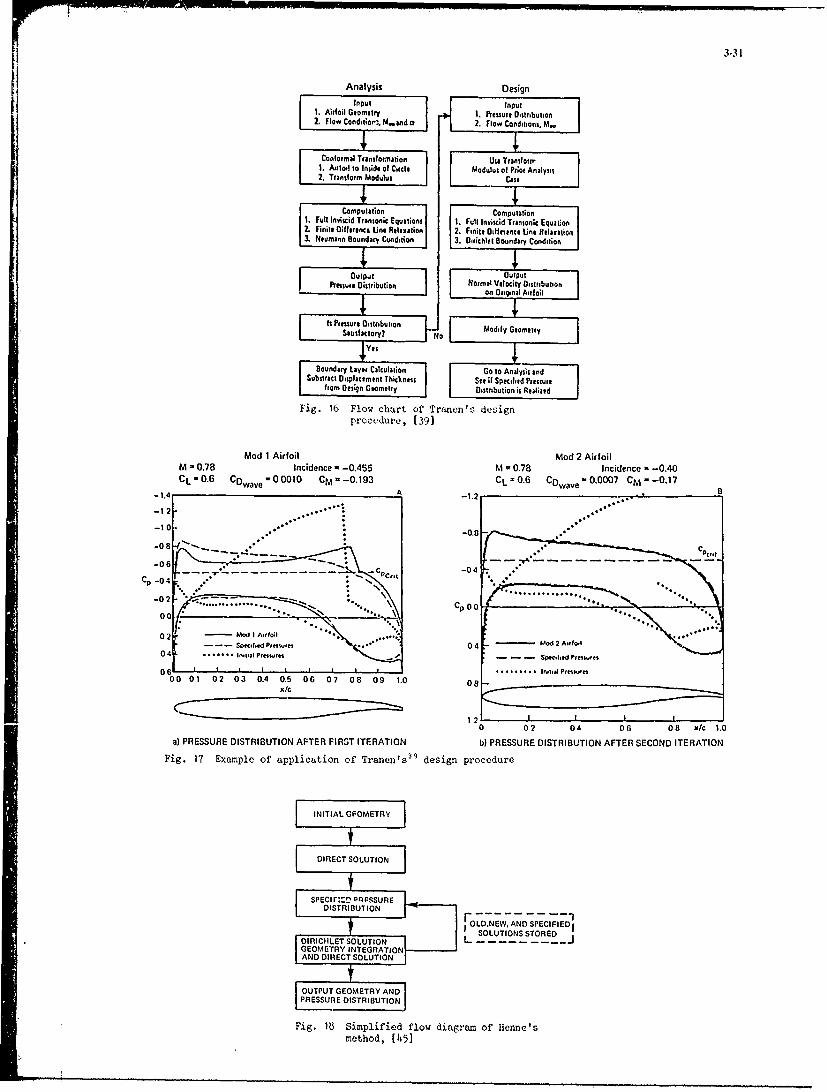
3-31
Analysis DesignInput Input
I. Airfoil Geometry I. Pressure Ciatribution2. flow Conditiasi. M..auda 2. Flow Conditions, li..
Contoimal Transfoermations Use Translotr1. Airfoil to Inside of Circle Modulus of Prior Analysis2. Transform Modulus Casa
Computation Computation1. Full Inviscid Transonic Equations 1. Full Inuiscid Transonic Equation2. Fiil. C illurence Line Relaxation 2. Finite Ditfirice Line Relaxation3. Neumanin Boundary Cundiion 13. Ciricltt Boundary Condition
Output OutputPriessuit Distribution Normal Velocity Distribution
an Original Airfoil
It Pressure DistributionSatisfactory? No Modify Geometry
Boundary Layer Calculation Go to Analysis andSubstract Displacement Tlsiclnes See if Spec lird Pressure
fromn 0Otsn Geometry DiOstribution is Realized
Fig. 16 Flow chart of Tranenis designprocedure, (39]
Mod 1 Airfoil Mod 2 AirfoilM 0.78 Incidence a -0.455 M - 0.78 Incidence *-0.40
CL -O.6 CDwave =00010 CM -- 0.193 CL -O06 C0 aveO.0007 CM--017-1. _____________________A -1.2___________________
-12-
-0801 -..
-06 * *'
-06
0 02 04 06004c .
2~L NEW4'-P-t SPECIFD2A04~~ SOLUTIONS SOEI~d Pn
0IIIE SOUTO .........---
Fig 17 Exapleof pplcF i on of Simlifed flw dig rmofere
I ethod, GFOET ]
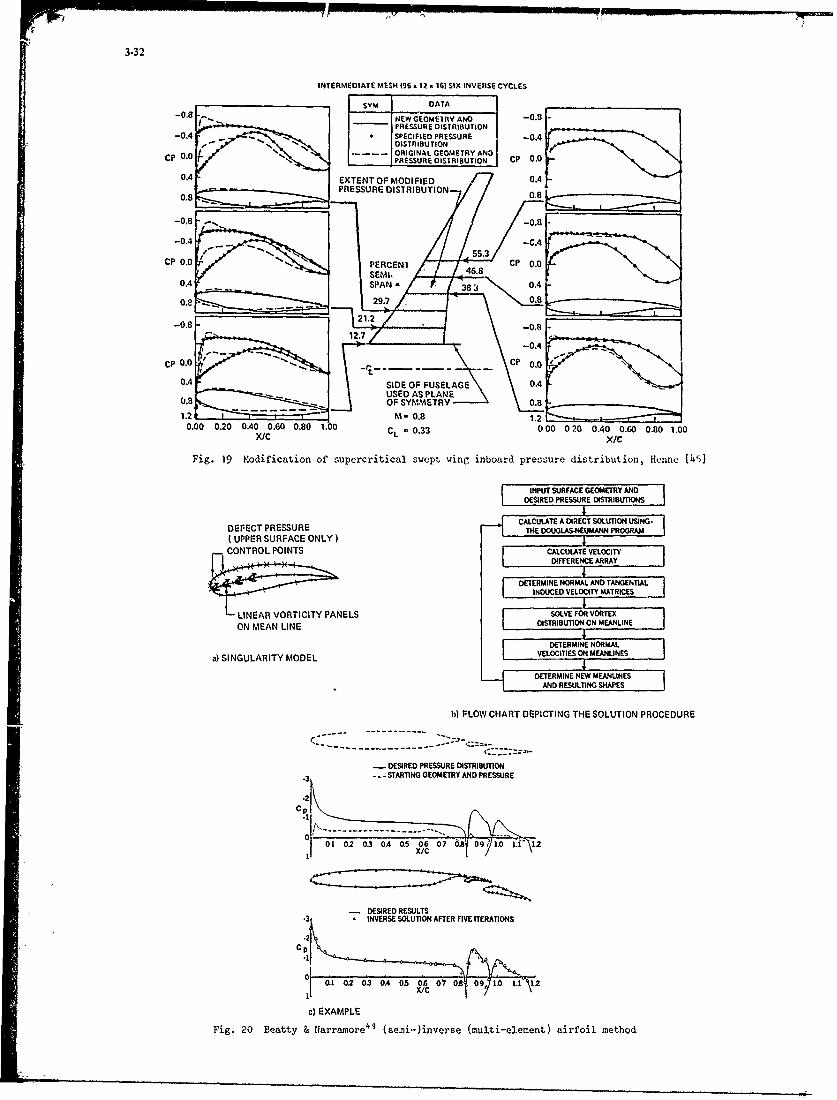
3-32INTERMEDIATE
MESH (96 x 12 x 16) SIX INVERSE CYCLES
-08 J- . NE. w G EOMETRYA O-0.8SYM DATA
PRESSURE DISTRIBUTION-04 SPECIFIED PRESSURE -0.4
DISTRIBUTION
CP 0.0 - ORIGINAL GEOMETRY ANDPRESSURE DIST'RIBUTION CP 0.0
0.4 EXTENT OF MODIFIED 0.4
0.8PRESSURE DISTRIBUTION 0.8
-0.8 -0.8
-0.4
55.3 -C.4
CP 0.0 " " PERCECP 0.0SEMI.
O.4 SPAN - 04.-,,e 0 .88
0 . 4 .
2 0.0 0.8
0 ,4 S l O 2 1 . 2 9S L A G 0 .80.8,O 210..
C 0.0 0 0.2 0.0 0,.080 1 3
X/ 00
00.4 1SIDE OFUEAE0.40.8
1.2 M -D8 1.20.00 0.20 0.40 0.60 0.80 100o CL - 0.33 0 00 0 20 0.40 0.60 0.80 1.00
Fig. 19 Modification of supercritical swept wing inboard pressure distribution, Henne (45]
INPUT SURFACE GEOMETRY ANDDESIRED PRESSURE DISTRIBUTIONS4
CALCULATE A DIRECT SOLUTION USING-DEFECT PRESSURE THE DOUGLASNEUMANN PROGRAM( UPPER SURFACE ONLY) ICONTROL POINTS CALCULATE VELOCITY
DIFFERENCE ARRAY
DETERMINE NORMAL AND TANGENTIALINDUCED VELOCITY MATRICES
LINEELS SOLVE FOR VORTEX
ON MEAN LINE OISTRIBUTION CN MEANLINE4DETERMINE NORMAL
a) SINGULARITY MODEL VELOCITIES ON MEANLINES
DETERMINE NEW MEANLINESAND RESULTING SHAPES
b) FLOW CHART DEPICTING THE SOLUTION PROCEDURE
------ ---- -- -------
- DESIRED PRESSURE DISTRIBUTlON• 3 - STARTING GEOMETRY AND PRESSURE
C
01 0.2 03 OA 05 06 07 63 01W| 1. 21 X/C
- DESIRED RESULTS, INVERSE SOLUTION AFTER FIVE ITERATIONS
0.1l 0.2 0.3 0 A 05 04 07 0 1 0 11111 X/C
c) EXAMPLE
Fig. 20 Beatty & Narramore49 (semi-)inverse (multi-element) airfoil method

3-33
BEGIN
I
START. CEOm.[CPTARGET
*EIGHT FACTORS LAIGEG
CORRECTIONRoNPLANAR I
_T PROGRAM
DEERIATO UPDATEI~ii±.
,TARGET . , P GEOMETRY
NO NEWO.K No Om
YES LINEAR O.K.) OEND M4ERY E AJSAETIICD 'WIH
LI;1~tE ADv, US, ,NT FACTORS
a) (OUTER) ITERATION PROCESS b) LINEAR (THIN WING) INVERSE METHOD
Fig. 21 Flow diagrams of NLR 3-D subsonic inverse method, [22]
a) TOP AND FRONT VIEW AND PANEL ARRANGEMENT OF WING-BODY CONFIGURATION(BODY AT ZERO ANGLE OF ATTACK)
Fig. 22 Example of application of NLR 3-D subsonic inverse method
....... STARTING GEOMETRY/PRESSURE DISTR. CLNET ..494 ...... STARTIRG GEOMETRY/PRE SURE DISTR. CLN'E 1(WING ALONF DLSIGN) .T - ( FINAL RCSULT or IG. b.1 NCLET
TARGET PRESSURE DISTRIBUTION CLNET TARGET PRESSURE DISTRIBUTION CLNET "
- FINAL RESULT (3 ITERATIONS Cp - Cp* CLNET l .511 FINAL RESULT (2 ITERATIONS) Cp C, CLNET .Soo
K1N I1ETT .84) IETT . .847
. ., C C, !"
' ET T - ------ ------ 'NETT " 57
- --- "--C e-F -CTOT'FC CH' R!t ANTIC(:E:,;il;
" ZERO WEIGHT ON THICKNESS AND TWIST
Fig. 22 Continued b) RESULTS FOR WING-BODY CONFIGURATION (Moo =0.7)
Fi. 2 oninec

3-34
WITHOUT CONSTRAINTS ON THICKNESS AND TWIST
c) FRONT VIEW OF WINGS OF WING-BODY CONFIGURATIONS (Z-SCALE ENLARGED 5x)
Fig. 22 Continued
START
INITIALGEOMETRY
DEFINE DESIGNPARAMETERS(D TARGET Cp'-(J VARIABLES Wj
HESS 3.D METHOD, t581
A AIC PANEL METHOD CONSTANTSURFACE SOURCE
MATRX ANLYSIDENSITIES M FIXED SURFACE VORTICITY(SHAPE FUNCTION
B.L. SURFACE OUTER
TRANSPIRATION LAYER LOOP
DRSTRIBUTSON OJCFUTI
CA PROC EDNONE COTO OVRHLOUR
ANALYSIS DISTRIBUTION
--.NO INNER .LEAST SQUARES
SLOOP PRESSURE OBJECT FUNCTION
AOPTIMIZATION I STEEPEST DESCENT
I PROCEDURE NO CONTROL OVER CLOSURE
F OPTIMUISURFACE
/TRANSPIRATION/DISTRIBUTOL
SRELOFT
GEOMETRY
Fig. 23 Flow chart of Malone'ss G numerical optimization type inverse method

3-35
.0.
Akp YES
ACTUA .8 SHOCK WAVt
1.2CD's NOSENNYROPIC
REC OMP H FSSION
ZVISCOUSIOSGN M.N160.30 NCY-700 EPSI,050
- ART. VISC. M..775 ALP.0.00 CL-.639 C0=.0040a, INPUTCP T/C . 17 0O.,38E-02 DP1 .. SSE -04
Fig. 26 Example of shock-frce presrlire distributionleading to shock wave in flow field with
significant wave drag (McFaddenE C)
CORRECTEDGEOMETRY
AIR'FjOIL
Fig. 24+ Flow diagram of NLR INTRAFS system(2-D transonic airfoil design), (57]
TARGET
UPPER SURFACE PRESSURE 14ING AND SHIOCKS
-H = .83, CIL .40, COH .0011. A 6.0
a) ORIGINAL WING
O1ITERATIONS 0-1
ARGET
UPPER SURFACE PRESSURE WING AND SHOCKS
H = .83. CL = .40. COW .0005. A = 6.0
Fig. 25 Iteration history for transonic airfoil b) REDESIGNED WINGdesign (M = .77) with weak shock Fig. 27 Example of application of Garabedian/(NLR INTRAFS), (61] McFadden inverse redesign method, (65]

3-36
BRISTOWS METHOD (1)" MINIMIZATION OF VELOCITY FUNCTIONAL ( LEAST SQUARES)
E= 1: (Ui-Ut)'
* CLOSURE THROUGH LAGRANGE MULTIPLIERS
* DERIVATIVES DETERMINED ANALYTICALLY
* DISCRETIZATION SCHEME ( CONSTANT SOURCE DENSITY)BASICALLY UNSTABLE; ELABORATE SMOOTHING OPERATION
0.4
Elthpsod of Revolution0. 0 Iter:aton 0 (Initial Geometry)
B T Iteration Rr/c 0.2 -
01
0 0.1 0.2 0.3 0.4 0.5 0.6 0.7 0.8 0.9 1.0x/c
EXAMPLE: RECONSTRUCTION OF ELLIPSOID
Fig. 28 Characteristics of bristow's"8 inverse
method for bodies of revolution
BRISTOW 11 ( MAAD PROGRAM )
* LEAST SQUARES FUNCTIONAL AS IN BRISTOW I (FIG. 28)* CONSTANTLINEAR SOURCE PLUS LINEAR VORTICITY
ON FLAT PANELS (GREEN'S THIRD IDENTITY)
* MIXED ANALYSIS/DESIGN
* RELATIVE POSITION OF AIRFOIL ELEMENTS FIXED
v -" Main Elemento % f36 Panels) Fla_--;=_ _._ . . p .- ~ ~:2. (3 P-I'- ~ anels)
Symbol Method C c -- Exact (Williams) 2.03 0.0000
0 MAADProgram 2.04 00002 -1.o-0-.4.0C
CP L
-20AIRFOIL --2.0 -
C- -0 0.2 0.4 0.6 0.8 1.0
FRACTIONCHORD
0 0.2 0.4 0.6 0.8 1.0FRACTION CHORD
Two-Element Airfoil Analysis Solution
Prescribed Points. for Fixed Goo
V_
Starting Geometry Prsrie Points~
After 2 IterationsPrescribed Points
V_
After 5 Iterations(Indistinguishable from Target Geometry)
EXAMPLE : RECONSTRUCTION OF THE "WILLIAMS FLAP"
Fig. 29 Characteristics of the MAAD program system (Bristow1")

3.37
XO. 2 -Zo,2
DOUBLETDISTRIBUTION/I
Zref a
X O.O14
Xref
* MINIMIZATION OF FUNCTIONAL
E=14 wt ( ..U 1 + W.V'+ Wg (z j Z() Isl
* QAUDRATIC REPRESENTATIONS FOR DOUBLET DISTRIBUTIONSAND GEOMETRY
* VARIABLES /1, Z,(', X0, Z0* NEWTON LINEARIZATION
* MIXED ANALYSIS / DESIGN(THROUGH CHOICE OF LIMITING THE NUMBER OF VARIABLES Z,0. X0 . Zo )
* FREE OR FIXED GAPS AND OVERLAPS
REGULARITY AND GEOMETRY CONSTRAINTS THROUGH W9
Fig. 30 Characteristics of NLR MAD system,(Labruj re74)
CONVERGED GEOMETRY 3- u
2/
ITERATION STEP 2 1
0 TAU-
c -1,
ITERATION STEP 1
/1 CALCULATED UPPER SIDE+CALCULATED LOWER SIDE- PRESCRIBED
STARTING GEOMETRY
3) AIRFOIL SHAPES b) VELOCITY DISTRIBUTION
Fig. 31 Early (test) example of Labrujere' 37 method: reconstruction of an airfoil-flap configuratiur,
with fixed overlap

3-38
CHOOSE OBJECT FUNCTION F CONSTRAINTS C, > 03
0 A.00 075
DEIGIEOALR)o1RALEA - INITIAL DESIGN
NUTSTARTING GEO)METRY PERTURB EACH C. :r0AIRFOIL SHAPE
(DTRIN , A. OA, I/ 0
0 .2 A.4 1 .6 .8 10
IFADBEER1ECTO Example 3A-drag minimization. M 0.75,PERTURBATION VECTOR~ A 00. beginning witit analysis No. 27.
FOR STEEPEST DhCENT CONSTRAINTS CL > 0.30 A >0 015
COSRIT O-I - INITIAL DESIGN
PRESSUREOO DISRIBTIO
YES AlAIRFOIL SHAPE
Fig. 32 Flow chart of design by direct numericaloptimization Yje 0
0 .2 .4 .6 .8 10ole
Example 311-drag minirmiza~ion, m - 0.75,a - 0*, beginning wih~l analysis No. 48.
Fig, 33 Example of non-uniqueness of wave dra'minimization problem, [791
COMPRR[SON OF NUMERICRL RNRLYSIS RESULTSFOR ORIG[NRL RNO SHOCK-FREE R[RFOI1L
(BASE.LINL HRFeUEL NRCN t)4H4101
a cc VCH = .720 ALPHA 0.40
0 RECESICII I * ORIGINAL 1 0......... CL 0.7029 0.7799
- CO 0.00C0 0.006400Ch -. 1397 -. 1601
I?oD
4D
Fi.3 xml faroi hc-rerdsg
by eas f icttiusga meho, 88

3-39
NtWWING CL 04414,CD 00021 CM 01331
Y OLDWING CL. 04533 C0 0002 CU -0 1455
8
CI,
-0435 -- C.
0715 8Ol94tb"AC 0"+" S S .04"', " AIt 04100
YAW 0000
N(WWIN CL 04266 CO -00042 CM -01294OL A-NG CIL 042M4 Co -00012 CM 0 1368 0
8
-045o,
01PAt 04000
S .MACN 09000YAW 00008
o- b)
SNtWWiC CL0 01098 CO 001% CM 0I299
,lX x OLOW4G 5C 0C366 C 0 00104 CM 0 IM
S8
~CP
042053 Co. CP
MAC.I00 09000AL "A 0 4008
N eVVWING CL. 045 10 CO 0006S CM 0IS98 AW 000
% k N OLDO WING CL. 0 4579 CO 0 0007 CM 0 174$
8 8CP -" .
2
°'5EIZ'. Z.'.__
0 - . - -_ - c*8 , M A O , + 0 9 0 0 0~ALe1iA 0 40
C) Fig. 35 Pressures and wing section shapes for a wing derived frov,the GA(W)-2T airfoil and a shock-free debign that resultsfrom this airfoil when used as a base line.The lift coefficient of the non-shock free wing is 0.430and the wing root is 11.7 per cent thick.The lift coefficient of the shock-free wing is 0.634 andthis wing is About 11.14 per cent thick.Mach = 0.8, ax = -0.110 , [95]
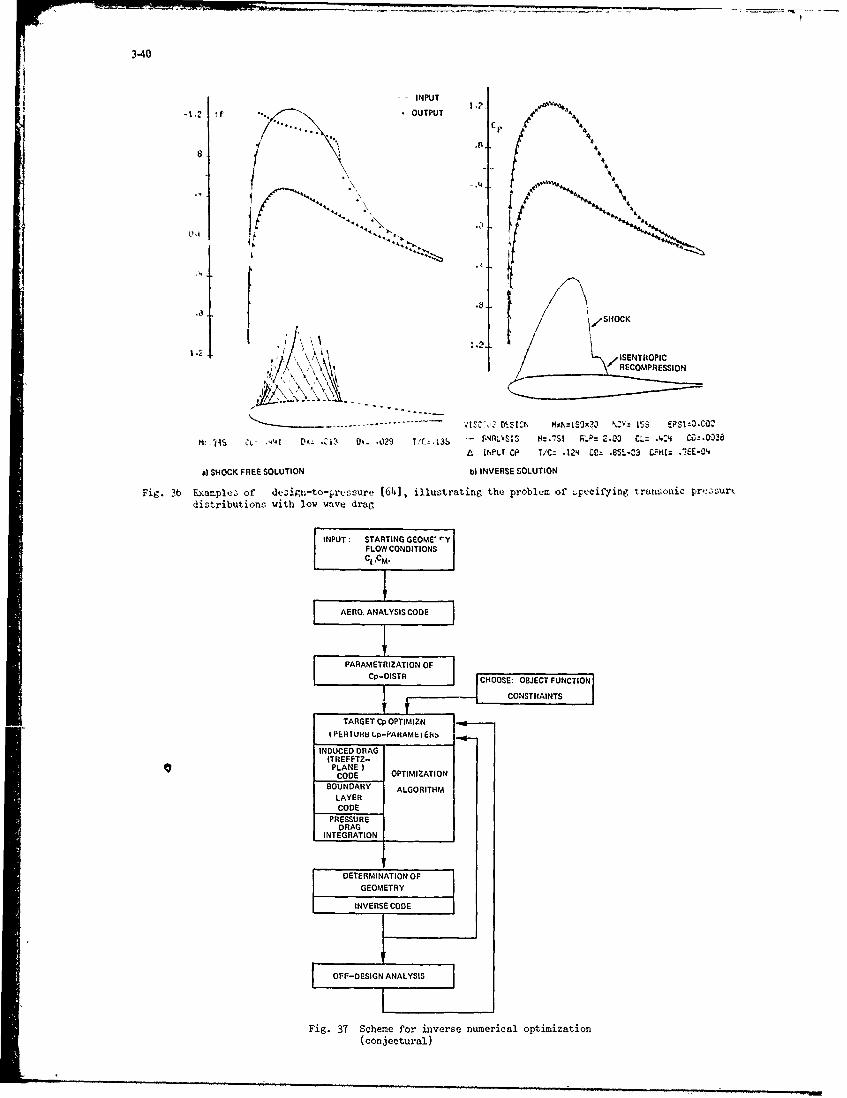
3-40
-- INPUT-t,2 1F " • OUTPUT 'iicr i" %
04 t
l\ \' \, 7 SHOCK
1- 4.i ', ki'tISENTROPIC-\,RECOMPRESSION
vID.:,.7 I HI',=S------,-------SI--O CO
W .74S CL- ,44I Dx ,3 Ow- -029 ,'.135 - SIS H=.7SI .P: C..03 CL: ,.',: CO:,O-36
A INPLT CP T/C-- .124 CO- .IBS-C3 CPHI: ,E=-C
a) SHOCK FREE SOLUTION b) INVERSE SOLUTION
Fig. 3b Extaplez of dezign-to-pressure [64'], illustrating the problem of :,puci1'ying transonic prc.,surk
distributions with low wave drag,
INPUT STARTING GEOME' ry
FLOW CONDITIONSCL.CM.
AERO. ANALYSIS CODE
PARAMETRIZATION OF
Cp-DSTR ICHOOSE. OBJECT FUNCTION
!E2 ' I CONSTRAINTS
TARGET Cp OPTIMIZNI PFIHiU 1LF-PAHAME:IERS
INDUCED DRAG(TREFFTZ-
PLANE ICODE OPTIMIZATION
BOUNDARY ALGORITHMLAYERCODE
PRESSUREDRAG
INTEGRATION
DETERMINATION OFGEOMETRY
INVERSE CODE
Fig. 37 Scheme for inverse numerical optimization(conjectural)
~4-1
Subsonic/Transonic Viscous Interactions
by
Ii. YoshiharaBoeing CompanySeattle, WA
98124 U.S.A.
SUMMARY
Significant viscous interactions arising at transonic cruise and maneuverconditions and low speed/high lift conditions are described for airfoils and sweptwings. Consequences on the performance and stability of fighter and airlift aircraftare briefly sketched. Computational methods using the integral boundary layer/wdkeequations are then described in a narrative fashion.
1. INTRODUCTION
In transonic flow the forces and moments on an airfoil or wing cannot be predictedviably without incorporating the effects of viscosity. This is primarily due to thepresence of shock waves on the configuration which interact with tle boundary layer todistort the inviscid pressure distribution.
Important effects of viscosity also arise at low speed high lift conditionsoccurring for example during takeoff and landing. Of particular importance are theeffects of viscosity on configurations with high lift devices where the maximum liftis limited by the appearance of severe separation.
Viscous interactions will accordingly play an essential role in the fluid dynamicinterference mechanisms, key to the configuration optimi~ition in both the transonicand subsonic flow regimes.
In the following we shall first describe the nature of the viscous interactionsthat arise for airfoils and swept wings as well as their consequences on theperformance and stability of the aircraft. This is followed by a brief review ofcomputational methods for two and three dimensional viscous flows where the viscousflow is modeled by the integral boundary layer/wake method which has received wideattention in the transonic case.
2. NATURE OF THE VISCOUS INTERACTIONS IN TRANSONIC FLOWS
Let us first consider the case of a typical aft-cambered airfoil at a highsubsonic free stream Mach number at a cruise lift and a higher lift where the airfoilis in buffet. In Figure 1 are sketched side-by-side tile flow patterns for theinviscid and viscous cases at the cruise lift together with a comparison of theirpressure distributions. In the inviscid case it is seen that the shock wave islocated at the trailing edge. The shock at lower free stream Mach numbers formsfurther upstream and displaces downstream as the Mach number is increased. When theshock reaches a point just upstream of tile 1dr'e f.UUVX Surface cuvvature, a smallfurther increase in the Mach number will displace the shock abruptly to the trailingedge. This behavior is typical of aft-cambered airfoils and is due to the fact thatas the shock moves onto the aft camber region, the supersonic flow upstream of theshock is exposed to the high surface convexity. The result is a rapid expansion ofthe flow increasing the Mach numbers upstream of the shock. The resultingstrengthened shock then displaces downstream further compounding the above effectsuntil the shock reaches the trailing edge.
In Figure I the tffects of viscosity are seen to modify significantly tile aboveinviscid picture. Here as the shock displaces onto the aft camber region, thestrengthened shock representing a severe adverse pressure gradient causes an abruptthickening of the boundary layer. This wedging displacement at the base of the shockfirst impedes and finally halts the downstream movement of the shock thereby avoidinga strong shock. The shock/boundary layer interaction here has altered the normalshock in the inviscid case to an oblique shock with a greatly reduced pressure rise.
The viscous interactions as described above for the aft cambered airfoil aredramatic. The effects are less dramatic in the case of more conventional airfoils,but they are nevertheless still of significance.
Another significant effect of the viscous interaction is the reduction of theeffective aft camber resulting from the difference of the boundary layer displacementon the uppci and lower surfaces. This leads to the reduction of the plateau loadingshown in Figure 1. Finally the effects of the near-wake modify the pressuredistribution primarily in the trailing edge region.

4-2
For thick airfoils and for thinner airfoils at moderate lifts, an importantsynergistic viscous Interaction can arise identified by Pearcey, Osborne, and Haines(Ref. 1). They labeled it as a Type B interaction, distinguishing it from the morefamiliar type A interaction where this synergism is absent. Such a case arises whenthe boundary layer encounters two successive adverse pressure gradients of sufficientstrength, as for example the shock pressure rise followed by the trailing edgepressure recovery. After encountering a strong shock pressure rise, the boundarylayer abruptly thickens, and its velocity profile loses its customary turbulentfullness. If the boundary layer then encounters the second adverse pressure gradientin this vulnerable state, it is less able to remain unseparated. The result isusually a sudden severe separation which extends from the shock to a point downstreamof the trailing edge. The flow is especially susceptible to a severe Type Binteraction if both a local shock-induced separation bubble and a trailing edgeseparation are present as shown in Figure 1.
A case with severe separation is sketched in Figure 2 where the airfoil is inbuffet. Here buffet on the rigid airfoil is characterized by broad-band fluctuationsof the lift and moment caused by the unsteadiness of the severely separated boundarylayer. Here the unsteadiness produces fluctuations of both the aft pressures as wellas the shock location. Buffet onset occurs when the shock-induced separation nolonger reattaches on the airfoil but at some point downstream of the trailing edge asshown in Figure 2. It is characterized by a sudden drop in the trailing edge pressure.
Buffet as described above must not be confused with the flutter phenomena wherethe unsteady aerodynamic driving force is produced by the aeroelastic deformations ofthe wing.
For future reference it will be appropriate to comment here or the role of theKutta condition at the airfoil trailing edge in establishing the circulation and hencethe lift on the airfoil. Circulation is in general a global feature of the flowdetermined by the relative apportio.ient of the free stream into the portions passingabove or below the airfoil. For shdrp trailing edges this apportionment isestablished by postulating the flow to stream smoothly off the airfoil trailing edge,a model consiLtent with experimental observations. At a subsonic trailing edge, asthe trailing edge is approached along the upper and lower surfaces of the airfoil andalong the rear stagnation streamline, the pressure must then tena to a common valuewhich in the case of a finite trailing edge angle must be the stagnation pressure.That is, the Kutta condition must be satisfied.
In the case of the high subsonic flow of Figure 2 with the terminating shocks atthe trailing edge, the Kutta condition no longer plays a role in establishing thecirculation. Here the match of the pressure and the flow direction just downstream ofthe trailing edge is achieved, independent of the circulation on the airfoil, by theadjustment of the obliqueness of the two trailing edge shocks. In this case thecirculatiun is determined by the relative mass flux impedance (choking) of the spaceabove (or below) the airfoil measured by the "throat" geometry at the shoulder of theairfoil.
At lower free stream Mach numbers than represented in Figure 2 where the shockwave is located upstream of the trailing edge, one must also expect a reduced role ofthe Kutta condition and a dominant role of the choking at the airfoil "throat" inestablishing the circulation. That is, a relaxation of the Kutta condition in such aflow for example tiould aftect the pressures near the trailing edge but notsignificantly distort the overall circulation.
Let us consider next the case of a swept wing of moderate sweep. In Figure 3 areshown the shock wave and separation patterns for two Mach numbers in the high subsonicrange. In the upper sketch for the lower free stream Mach number the forward shockshown is the counterpart of the airfoil shock and is usually the first to appear asthe flow becomes supercritical. The rear shock is formed at a higher Mach number bythe coalescence of compression waves generated along the plane of symmetry of thewing. As the Mach number is further increased (the lower sketch), the rear shockstrengthens and extends in the inboard direction. The forward shock assumes a greatersweep (at approximately the local Mach angle) eventually intersecting the rear shock.The shock outboard of the point of intersection, labeled the outboard shock, isusually the strongest of the shocks. Shock-induced separation first appearsdownstream of this shock. As the shock-induced separation worsens, it contaminatesthe trailing edge separation usually present, resulting in the compound (Type B)interaction described earlier. The separated region shown in Figure 3 then spreads tothe tip and extends inward as the rear shock becomeL stronger.
The part-span vortices shown in Figure 3 are the free trailing vortices that arethe continuation of the bound vortices that terminate on the wing (see KUchemann, Ref.2). They must be consistent with the corresponding span load distribution.
The separated region in Figure 3 has extended downstream of the trailing edge.The flow therefore is in buffet locally. Intensity of the overall wing buffet wouldthen depend upon the extent of the wing span that is in buffet. In a wind tunnel testthe output of the balance would indicate the expected broad band frequency spectrum,but it would also show discrete spikes. The latter are due to the unsteady loadsgenerated by the excitation of the natural structural modes of the elastic wing by thebuffet.

4-3
The swept wing considered above is characteristic of an airlift or commercialtransport aircraft with wing sweeps of the order of 30" and aspect ratios of the orderof eight. Fighter wings, on the other hand, are of considerably smaller aspect ratioof the order of four for swept wings with 40 -50 sweep and of even lower aspect ratiofor delta or arrow wings with leading edge sweeps in excess of 60". There is anessential maneuverability requirement for fighters to operate in the high subsonicregion at lifts considerably beyond buffet onset. In such cases the viscousinteractions become highly complex with the flow becoming unsteady.
Consider the case of a fighter swept wing shown in Figure 4 from Ref. 3. On theleft side of the figure is shown the shock and separation patterns to be expected inthe region between drag divergence and buffet onset. The flow configuration here ismuch the same as for the higher aspect ratio case of Figure 3. On the right side ofthe figure is a sketch of a "frozen" flow visualization picture prepared by Moss (Ref.3) at a much higher angle of attack where not only buffet intensity is of seriousconcern but where catastrophic lateral instabilities can also arise. Here the strongoutboard shock has unswept to an extent that it has reached the wing leading edqe.The wing is stalled in the entire outboard region of the wing.
The second case is for a delta wing with a leading edge sweep in excess of 60" ata high subsonic Mach number. Here the wing has sufficient sweep that strong shocks,and therefore severe shock/boundary layer interactions, do not arise. Such wings,designed for high supersonic performance, have sharp leading edges. At large anglesof attack, leading edgt separation will arise as shown in Figure 5. Such a separationrepresents a free shear layer separation, a class of separations that is unique tothree dimensional flows. Here the boundary layer air ca both surfaces approaching theleading edge is convected away frem the surface in a free vortex "sheet" whicheventually spirals into a line vortex. Such a separation is in contrast to the bubbletype separation shown earlier in Figure 3, where the low energy separated fluid istrapped in a bubble at the configuration surface. In the case of wings with sharpleading edges where the flow separates at the leading edge, the above free shear layerseparation is essentially an inviscid phenomenon. The case of a blunt leading edgediffers only in that the separation line on the leading edge along which the freeshear layer leaves the surface must be determined from a viscous flow analysis.
Further examples of free shear layer separations as those arising in the case of
lifting bodies are given in Ref. 4.
3. THE LOW SPEED/HIGH LIFT CASE
It is clear that an airfoil placed at large angles of attack at low speeds issusceptible, not only to leading and trailing edge separations, but to a Type Binteraction between the two separations. It is also well known that leading andtrailing edge devices significantly delay these difficulties. The case of the leadingedge slat was described in an earlier lecture. Here it was found that the leadingedge slat greatly reduced the leading edge suction peak on the main element while thelatter induced a lower pressure at the trailing edge of the slat thereby greatlyreducing the slat aft pressure recovery. These effects significantly delay leadingedge separation on the main element and trailing edge separation on the slat.
A similar favorable interference with regard to alleviating the viscous effectsfor the case of an aft flap is shown in Figure 6 from Ref. 5. Here the favorableinterference is shown at both a fixed lift and a fixed angle of attack.
In designing multi-element airfoils confluent boundary layers must be avoidedwhere the low energy wake or an upstream element becomes entrained into the boundarylayer of the following element to deteriorate the flow.
In a commercial transport configuration, leading edge slats or Kruger flaps areinstalled along essentially the entire span to protect the wing from leading edgeseparation. Spanwise gaps in the aft flap installations, however, are more difficultto avoid. Here an outboard gap is provided for low speed ailerons, while flaps arenot deployed downstream of the engines to avoid jet impingement on the flap. InFigure 7 are shown an oil flow picture and a corresponding sketch pointing out theconsequences of the above missing flap segments. Understandably trailing edgeseparation is present in the unprotected outboard span stations. Along the inboardgap the separation is significantly milder due to the unloading of this segment of thewing by the nacelle. Severe outboard separation is particularly undesirable since itwill deteriorate the aileron effectiveness as well as contribute to pitchup.
2.3 PERFORMANCE CONSEQUENCES OF VISCOUS INTERACTIONS
In the present section the consequences of the transonic viscous interactions onthe vehicle performance are briefly reviewed in order of increasing severity of tileinteraction. The discussion will be confined to the case of fighters or airliftaircraft with swept wings.
At the cruise condition the wing design is such that the shocks arising aresufficiently weak that their entropy losses are negligible. The shock/boundary layerinteraction however, still modifies the shock location and thickens the post-shockbodndary layer thus affecting the forces and moments on the wing. In the case of altcambered airfoils the shock/boundary layer interaction had in fact a beneficial effe,.t

in preventing a strengthening of the shock by halting its displacement onto the afthigh convexity region.
At greater lifts both shock-induced and trailing edge separations worsenparticularly downstream of the outboard shock, spreading first outboard to the tip andthen inboard. Buffet will then occur, its intensity increasing with lift. Buffet isof concern for its effect on the fatigue life of the aircraft structure. Potentially
more severe however is the possibility of tail flutter excited by the wake of thebuffeting wing flow.
With the tip region of the swept wing severely separated, an undesirablelongitudinal instability, pitchup, will arise. The responsible nose-up pitchingmoment is due in part to the inboard (and therefore an upstream) shift of the loadingon the wing and to the resulting increased inboard wing downwash which induces anadded download on the tail. Pitchup is an undesirable inherent feature of high aspectratio sweep wings that must be avoided.
In fighter aircraft usable lift for transonic maneuverability is icsually limited,not by buffet, but by the appearance of severe lateral instabilities. Suchinstabilities a-e caused by lateral differences of the wing separation or by theblanketing of the tail by the separated wing wake. Lateral rigid body divergences aswing drop and nose slice are of major concern.
The above examples by no means exhaust the important viscous interactions thatimpact performance. Omitted, for example, are viscous effects on the fuselage as theaft-fuselage drag, and other complex interactions of vortices and wakes generated byupstream configuration components with the downstream components.
3. FORMULATION OF THF VISCOUS FLOW PROBLEM
In the present section the problem of the viscous flow over wings in the transonicregime is formulated. The class of applicable flows is restricted here to those atlarge Reynolds numbers where the boundary layer is predominantly turbulent andattached with possible locil regions of separation near the trailing edge ordownstream of shocks. The scope of flows is thus restricted to only the simplest ofviscous flows described in the previous section.
In Figure 8 is first shown the hierarchy of flow equations to treat real flowsstarting from the Boltzmann equation which gives a statistical accounting on amolecular scale. Averaging of this equation over the molecular velocities thenresults in the unsteady "Navier-Stokes" equations which in principle govern bothlaminar and turbulent flows. If such equations could be solved, they could handle allof the complex flows described in the previous section. If one now averages theseequations in a suitable macroscopic fashion, the simpler steady Reynolds equations areobtained, but at the cost of having to provide an empirical modeling of the Reynoldsstresses (the closure problem). An asymptotic expansion of these equations for largeReynolds numbers yields the thin layer viscous equations, which to first ordersimplify to Prandtl's boundary layer equations. "Averaging" of the boundary layerequations across the layer results finally in the integral boundary layer equationswhich we shall consider. The viscous equations in the thin layer approximation arevalid only for the mildest viscous interactions described in the previous section,perhaps covering the region of drag divergence, but possibly stretched with additionalenpirical modeling tu the buffet onset region.
At the level of the thin layer approximation, the problem is divided into twoparts, that for the outer inviscid flow and the thin viscous layer adjacent to theconfiguration and in the downstream wake. A coupling of the two flows must then bedevised. In the following we shall first comment only briefly on the inviscid flowmethods, a detailed lecture having been given earlier by Dr. Jameson. Boundarylayer/wake methods are then described followed by a description of theinviscid/viscous flow coupling procedures.
3.1 THE INVISCID FLOW PROBLEM
For most applied transonic problems th exact potential methods are best suitedand most widely used. The potential approximation is valid so long as the totaltemperature is uniform, and the shock waves occurring within the flow are sufficientlyweak. Here the shock strength is measured, for example, by the quantity Mn - 1where Mn is the component of the Mach number normal to the shock upstream of theshock. The entropy change across the shock is then proportional to (Mn - 1)3, aweak function of the shock strength. In a well-designed swept wing, the twist andcamber are chosen such that at the design point the shock waves are adequately swept.At off-design conditions shock unsweeping can arise, for example at increased lift,but the resulting shock/boundary layer interaction as described earlier will inclinethe shock to an oblique shock. Both the sweep and obliqueness will weaken the shocksufficiently that the potential approximation will be valid.
Thus methods with the more complex Euler equations are not warranted with theirincreased computer costs and memory requirements. Small disturbance methods areinadequate, and they offer no reduction in computer costs.

4-5
3.2 BOUNDARY LAYER METHODS
Widely used viscous equations in the transonic problem are the integral boundarylayer equations. Potentially more general formulations have been unable to treat anybetter the complexities arising in transonic flow due for example to shock waves.More complex differential equation methods for example have not only not yieldedsuperior results but required more than an order of magnitude greater computing timethan integral methods.
In the case of planar turbulent boundary layers, a representative integral methodis that developed by Green (Ref. 6). It is composed of a set of three first orderordinary differential equations derived from the continuity equation, streamwisemomentum equation, and the Bradshaw/Ferriss turbulent energy equation. Dependentvariables arising in these equations are the momentum thickness e, the form factorH = 6*/a where 6* is the displacement thickness, the entrainment function Cemeasuring the rate at which the inviscid flow enters the boundary layer, and Ue thevelocity at the edge of the boundary layer. The system of three equations with fourunknowns is made determinate by considering one of the unknowns as a prescribed inputfunction to be furnished from the inviscid flow, for example Ue in the case ofattached flow (the direct problem). It will be seen later that for the separatedcase, the proper input function is the displacement thickness (the inverse problem).
In the three dimensional case, analogous integral boundary layer equations arethose derived for example by Smith (Ref. 7). They form a set of four first orderpartial differential equations expressing the conservation of mass, streamwise andstream-normal momenta, and Green's lag entrainment equation in the streamwisedirection. The unknowns are the streanwise momentum thickness eli, the streamwiseform factor 61/e11 where 61 is the streamwise displacement thickness, theentrainment function Ce, the angle o between the outer and limiting streamlines (thelatter forming the skin friction lines), and Ue and a the magnitude and direction ofthe velocity vector at the edge of the boundary layer. Here again two of the sixdependent variables must be taken as input functions, for example in the case ofattached flow Ue and x.
In the case of attached flows with Ue and a as inputs, the above system ofequations is fully hyperbolic where the characteristics are the outer inviscid flowstreamlines (double family), the limiting streamlines, and a family lying between theabove two. With the problem fully hyperbolic in the direct case, the formulation andsolution of the problem are straightforward. Here the method of characteristics formsa reliable guide. Thus initial or starting conditions must be furnished along aspace-like line near the wing leading edge where the values of the dependent variablesmust be prescribed. Additionally boundary conditions must be prescribed alongtime-like boundariez as along the wing centerline or the tip chord when the range ofinfluence of these boundary points falls onto the wing. Here the number of data to beprescribed equals the number of characteristics pointing into the planform.
As in all hyperbolic systems, weak solutions containing flow discontinuities arepossible. The physical nature of these discontinuities cannot be determined until theset of equations are expressed in proper conservation form so that jump conditions canbe derived. It is to be noted that if other pairs of dependent variables are taken asinput functions, the character of the equations will be different (see Ref. 8).
Both the two and three dimensional integral equations described above have alsobeen applied to the wake by setting the skin friction equal to zero and adjusting thedissipation length scale parameter to be consistent with the asymptotic far-field wake.
A review of the three dimensional integral boundary layer/wake methods as well db
differential equation methods was recently given by Smith (Ref. 9).
3.3 FORMULATION OF THE REAL FLOW PROBLEM - VISCID/INVISCID FLOW COUPLING
For the formulation of the real flow problem, we shall first introduce the conceptof an equivalent inviscid flow. In such a flow the airfoil boundary condition ismodified such that the flow outside the boundary layer in the real flow isreproduced. Within the thin layer approximation, this is accomplisned by displacingthe airfoil surface by the boundary layer displacement thickness or alternatively byimposing a transpiration velocity at the surface of the airfoil (Ref. 10). Here,analogous to the relationship of the airfoil thickness to the source strength in thinairfoil theory, the transpiration velocity is related to suitable derivatives of thedisplacement thicknesses.
The formulation of the real flow problem follows directly from the introduction ofthe equivalent inviscid flow. The boundary layer equations, defining the necessarydisplacement thickness, constitute auxiliary relations that complete the definition ofthe airfoil viscous tangency condition for the equivalent inviscid flow. Since thepressure is assumed to be constant across the boundary layer, the surface pressures asdetermined in the equivdlent inviscid flow will therefore yield the desired airfoilpressures in the real flow.
The highly implicit formulation of the real flow problem described Above makes adirect numerical solution difficult. Iterative methods will be a necessity, and theseare now described.
4-6
In the classical weak coupling procedure, for example in the case of an airfoilwith an dttached flow, both the inviscid and boundary layer/wake flows are posed inthe direct form. First, the inviscid flow over the airfoil is computed yielding the(inviscid) pressure distribution. The latter is then inputted into the boundarylayer/wake code, which in turn yields the displacement thickness or its equivalent thetranspiration velocities. The latter forms an upgraded effective surface shape withwhich the above process is repeated. In tle case of attached flow the above procedurehas been found to be convergent even with shock waves present (see for example Refs.11 and 12).
If the boundary layer is,,separated, Green's integral boundary layer equations inthe direct form become"stiff that is, the coefficients of the equations become suchthat a small error in the pressure gradient input leads to a large error in thedisplacement thickness. The above classical coupling procedure then ceases toconverge.
A coupling procedure to circumvent this difficulty has been proposed by Le Balleur(Ref. 13), that is, the semi-inverse method, where tile inviscid flow is posed in thedirect form, but the boundary layer flow is posed in the inverse form to avoid theabove stiffness. With tne displacement thickness inputted to both flows, each willresult in a pressure distribution which in general will not match. An update schemeis then used which yields a correction to the input displacement thickness to reducethe pressure distribution mismatch. The above update scheme is based on the solutionto a simplified boundary value problem where the small disturbance potential equationis used together with a linearized Green's equation (see Ref. 14).
The above semi-inverse procedure has yielded convergent solutions for theunseparated cases (Ref. 13), but as yet satisfactory results have not been achievedfor the separated cases for which the method was developed. Posing the boundary layerproblem in the inverse form has eliminated the stiff character of the equations, butit appears that the update procedure is inadequate in the shock region. Research iscontinuing in this area, but the scarcity of reliable experimental data for separatedflows has impeded the progress.
Coupling of the inviscid and boundary layer/wake flows in the three dimensionalcase as for a swept wing dre in tile early stages of oevelopment. For the attachedcase both the classical weak interaction and the semi-inverse procedures can be used(Ref. 8).
In the semi-inverse procedure, the streamwise form factor and the inviscid flowangle a, for example, can be used as input functions for the boundary layer equationswhich will retain a fully hyperbolic character. Coupling procedures for the threedimensional separated cases are still in development.
3.4 HIGHER ORDER BOUNDARY LAYER EFFECTS
In the previous section the equivalent inviscid flow was defined. Here a modifiedairfoil tangency condition was used which yielded the real flow exterior to theboundary layer, in particular the pressure distribution at tle edge of the boundarylayer. Since the pressure was assumed to be invariant across the boundary layer, theairfoil surface pressures calculated in the equivalent inviscid flow would then yieldthe desi,.ed surface pressures for the real flow.
In the neighborhood of the shock and the trailing edge the invariance of thepressures across the boundary layer ceases to be valid. The surface pressures ascalculated in the equivalent inviscid flow are no longer the desired surface pressuresfor the viscous flow in these regions. Fultilling the Kutta condition in theequivalent inviscid flow for example would not satisfy the Kutta condition in the realflow leading to concern in the determination of the circulation.
In a subcritical flow a mismatch of the trailing edge pressures would clearly beof concern since the circulation is significantly affected by the Kutta condition. Inthe high subsonic region, however, it was pointed out earlier that the Kutta conditionlosses its significance in establishing the circulation with a greater role played bychoking considerations. A mismatch of the trailing edge pressures caused by thefailure of the first order boundary layer theory would therefore not affectsignificantly the overall circulation.
The real flow about the trailing edge is a strong interaction flow. That is, thepresence of the boundary layer significantly alters the inviscid flow in theseregions. The analysis of the boundary layer flow about the trailing edge thereforecannot be carried out by isolating it and imposing the inviscid flow conditions at itsouter edge.
There have been a number of investigations deriving higher order boundary layerequations. Thus for example Nakayama, Patel and Landweber (Ref. 15) added asimplified transverse momentum equation in lieu of the transverse pressureinvariance. The improved method added only minor complications to the first ordertheory. The importance of the remaining significant higher order effects notconsidered above however remains unresolved.
4-7
The strong interaction at the shock wave on the other hand is significantly moredifficult. Usable theories cannot be expected in the near future. For the near-termone must use first order methods adjusting them phenomenologically to yield acceptablesolutions in a consistent fashion.
4. EXAMPLES
In the present section computational examples are given which illustrate bothrecent advances as well as highlight significant shortcomings still unresolved.
In the case of airfoil flows with attached boundary layers, there have beennotable contributions for example for the RAE 2822 airfoil for which test results areavailable (Ref. 16). In Figure 9 is shown the test/theory comparison of the pressuredistribution and the displacement and momentum thickness obtained by Collyer and Lock(Ref. 11). Here an exact potential method was coupled to Green's lag entrainmentintegral method using the weak interaction procedure. A partially non-conservativeshock capture was employed "to compensate" for the error in the entropy rise acrossthe shock. A check of the normal Mach number upstream of the shock would show thatsuch compensations are not needed in this case (n 1.15, total pressure loss of0.3%). A simple curvature effect was incorporated into the wake contact jumpconditions. In the calculations the angle of attack was adjusted by +0.55. to matchthe measured lift.
Figure 10 shows the test/theory comparison for the pressure distribution obtainedby Le Balleur (Ref. 13). An exact potential method is coupled to an integral boundarylayer/wake code, developed by Le Balleur, using the semi-inverse procedure describedearlier. Here the free stream Mach number was raised by 0.002 and the angle of attackdecreased by 0.19, both relative to the test values.
In Figure 11 is another set of test/theory comparisons, still for the RAE 2822airfoil. One result is due to Longo, Schmidt, and Jameson (Ref. 12) who coupled theexact potential code with Horton's integral boundary layer/wake method in the weakcoupling mode. The free stream Mach number in the calculation was increased by 0.004,while the angle of attack was decreased by 0.870 to match the measured lift. Anothercalculation shown in Figure 11 is due to Melnik (Ref. 17) who coupled the exactpotential method with Green's lag entrainment method in the weak interaction mode.The Mach number here was increased by 0.003 while the angle of attack was decreased by0.57 ° to match the measured lift. Finally the results with the Euler equationscoupled with the integral boundary layer/wake method obtained by Schmidt, Jameson, andWhitfield (Ref. 18) are shown in Figure 11. Here only the Mach number was adjustedincreasing it by 0.004. In the above case the normal Mach number upstream of theshock is approximately 1.16 corresponding to a total pressure loss across the shock ofless than 0.4%. The entropy increase across the shock is therefore negligibleremoving any theoretical differences between the Euler and exact potentialformulations.
The noteworthy feature of the above test/theory comparisons is the excellentagreement obtained in the pressure distributions and in the displacement and momentumthicknesses. The confusing aspect is that the merits of the refinements in thevarious methods have been masked by the widely varying adjustments of the free streamMach number and angle of attack. Such adjustments, intended primarily to correct forthe wind tunnel wall interference, have in some cases inadvertently compensated forshortcomings of the numerical solutions. This points to the need for reliableexperimental results where the wall interference is suitably defined for example interms of wall pressure measurements. Inputting the latter into the calculations wouldthen preclude the need to adjust the frue stream M.ach number and angle of attack.
In the three dimensional case the development of real flow proceduresunderstandably lags the planar case. Although there are ongoing activities incoupling the exact potential code with the three dimensional boundary layer/wakecodes, no published accounts are presently available.
There are however interesting results published exercising the three dimensionalintegral boundary layer codes where the necessary input data are furnished fromexperiments. One case is the flow in the inboard region of a swept wing at low speedstested by Lindhout, Elsenaar, and van den Berg (Ref. 19). A sketch of a flowvisualization picture from Ref . 19 is shown in Figure 12 in welrh trailing edgeseparation is indicated.
In Figure 13 is shown the calculated limiting streamlines obtained by Cousteix andHoudeville (Ref. 20). Here the boundary layer problem was posed in the direct modeinputting the measured speed and flow direction of the outer inviscid flow. Amarching in the streamwise direction was carried out using an explicit differencescheme, terminating the marching when the streamwise skin friction vanished. Theenvelope of limiting streamline characteristics suggested ;n Figure 13 would thencorrespond to a separation line. However with the boundary layer equations recast asa system of ordinary differential equations by the explicit marching procedure, astiffness of the equations occurs in the vicinity of the envelope invalidating thesolution in that neighborhood.

4-8
The above flow was calculated by a number of other investigators using integral aswell as differential equation methods, and their results are summarized in Ref. 19.The results from most methods were found to be in reasonable agreement.
Another interesting set of calculations is for the case of the infinite yawed wingat low speeds tested by Elsenaar, van den Berg, and Lindhout (Ref. 21). This case wascalculated by a number of investigators using both the integral and differentialequation methods, and the results are reported in Ref. 22. One interestingcalculation is due to Stock (Ref. 23). Since the experiments indicated trailing edgeseparation, an inverse formulation of the integral boundary layer method was usedwhere the input function was the measured displacement thickness in the directionnormal to the leading edge. In this formulation the explicit marching could becarried out through the separated region, yielding results that compare reasonablywith experiments (see Figure 14). In the case of the infinite yawed wing where thespanwise derivatives are zero, the inverse formulation, behaves, perhaps notsurprisingly, as in the planar case without stiffness difficulties. Such a behaviorshould not however be expected to carry over to the general three dimensional caseformulated in a comparable inverse mode inputting the displacement thicknesses.
5. CONCLUDING REMARKS
Our primary objective has been to convey an appreciation of the significanteffects of viscosity in transonic flows. Here key fluid dynamic mechanisms weredescribed that make up the inviscid/viscous flow interactions. Performanceconsequences were also described ranging from the mild effects at cruise conditions,affecting the lift to drag ratio, to severe interactions leading to catastrophicflutter and rigid body instabilities.
Numerical methods were described to treat the real flow, but they were restrictedto the mildest of strong interactions. Even within this limited scope, substantialfurther effort is needed to model the shock/boundary layer interaction in a reliablemanner and to develop viscous equations and inviscid/viscous flow coupling procedurescapable of treating three dimensional separated flows. Here it would be desirable tohave a procedure capable of predicting buffet onset. Finally accurate and completeexperimental data for transonic separated flows are needed for both airfoils and wingsfor the validation of computational methods.
REFERENCES
1. Pearcey, H., Osborn, J., and Haines, A. B., The Interaction between Local Effectsat the Shock and Rear Separations, AGARD CP No. 35, 1968.
2. KUchemann, D., Types of Flow on Swept Wings, J. Roy. Aero. S., Vol. 57, November1953.
3. Moss, G. F., Some UK Research of the use of Wing-Body Strakes on Combat AircraftConfigurations at High Angles of Attack, AGARD CP No. 247, 1978.
4. Peake, D. J., and Tobak, M., Three Dimensional Flows about Simple Components atAngle of Attack, NASA TM 84226, 1982.
5. Smith, A. M. 0., Remarks on Fluid Mechanics of Stall, AGARD-LS-74, 1975.
6. Green, J., Weeks, D., and Brooman, J., Predictions of Turbulent Boundary Layersand Wakes in Compressible Flow by Lag-Entrainment Method, ARC R and M 3791, 1973.
7. Smith, P. D., An Integral Prediction Method for Three-Dimensional CompressibleTurbulent Boundary Layers, ARC R and M 3739, 1972.
8. Wigton, L., and Yoshihara, H., Viscous-Inviscid Interactions with a Three-Dimensional Inverse Boundary Layer Code, Boeing Report D6-51713, 1982 (Also to bepresented at the Second Symposium on Numerical and Physical Aspects of AerodynamicFlows, 17-20 January 1983 at California State University (Long Beach)).
9. Smith, P. D., The Numerical Computation of Three-Dimensional Turbulent BoundaryLayers, RAE TM (Aero) 1945, 1982.
10. Lighthill, M. J., On Displacement Thickness, J. Fluid Mech, Vol. 4, 1958.
11. Collyer, M. R., and Lock, R. C., Predictions of Viscous Effects in SteadyTransonic Flow Past an Aerofoil, Aero Q. Vol. XXX, 1979.
12. Longo, J., Schmidt, W., and Jameson, A., Viscous Transonic Airfoil FlowSimulation, ICAS Proceedings, 1982.
13. Le Balleur, J. C., Strong Matching Methods for Computing Transonic Viscous FlowsIncluding Wakes and Separations, La Recherche Aerospatiale, 1981.
14. Wigton, L., and lolt, M., Viscous-Inviscid Interaction in Transonic Flow, AIAAPaper 81-1003-CP, June 1981.
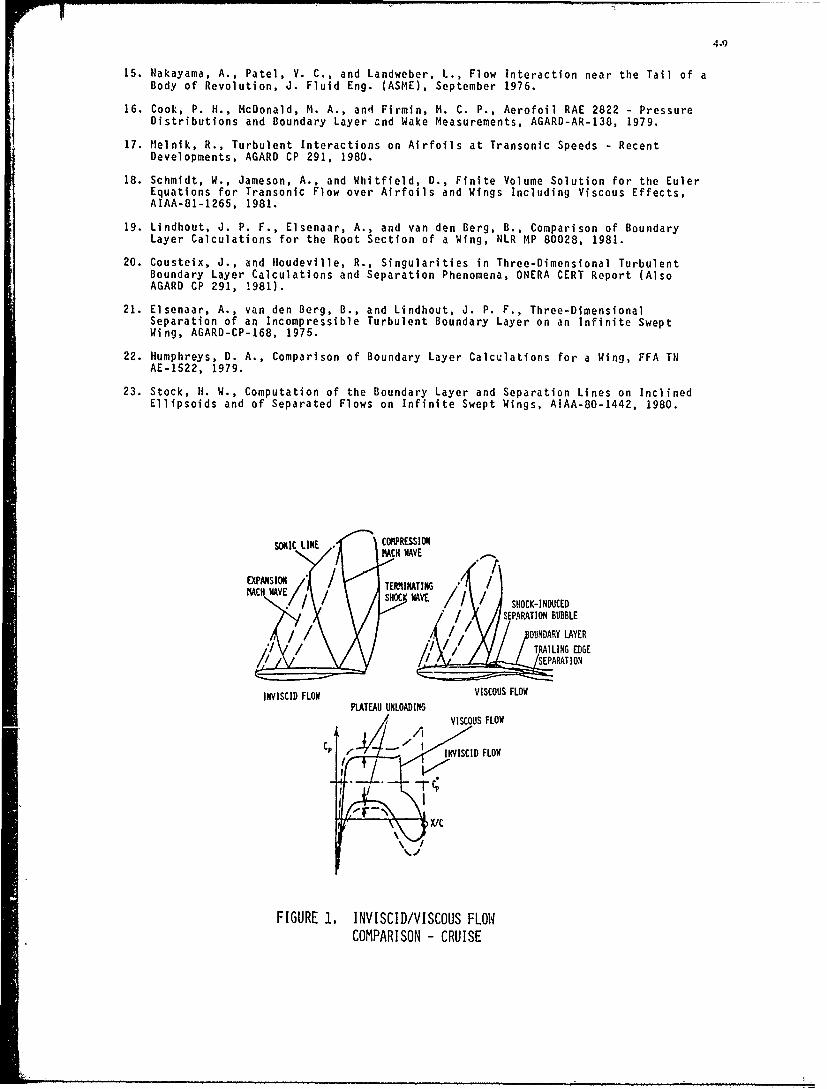
4-9
15. Nakayama, A., Patel, V. C., and Landweber, L., Flow Interaction near the Tail of aBody of Revolution, J. Fluid Eng. (ASME), September 1976.
16. Cook, P. H., McDonald, M. A., and Firmin, M. C. P., Aerofoil RAE 2822 - PressureDistributions and Boundary Layer cnd Wake Measurements, AGARD-AR-138, 1979.
17. Melnik, R., Turbulent Interactions on Airfoils at Transonic Speeds - RecentDevelopments, AGARD CP 291, 1980.
18. Schmidt, W., Jameson, A., and Whitfield, D., Finite Volume Solution for the EulerEquations for Transonic Flow over Airfoils and Wings Including Viscous Effects,AIAA-81-1265, 1981.
19. Lindhout, J. P. F., Elsenaar, A., and van den Berg, B., Comparison of BoundaryLayer Calculations for the Root Section of a Wing, NLR MP 80028, 1981.
20. Cousteix, J., and Houdeville, R., Singularities in Three-Dimensional TurbulentBoundary Layer Calculations and Separation Phenomena, ONERA CERT Report (AlsoAGARD CP 291, 1981).
21. Elsenaar, A., van den Berg, B., and Lindhout, J. P. F., Three-DimensionalSeparation of an Incompressible Turbulent Boundary Layer on an Infinite SweptWing, AGARD-CP-168, 1975.
22. Humphreys, D. A., Comparison of Boundary Layer Calculations for a Wing, FFA TNAE-1522, 1979.
23. Stock, H. W., Computation of the Boundary Layer and Separation Lines on InclinedEllipsoids and of Separated Flows on Infinite Swept Wings, AIAA-80-1442, 1980.
SONIC LINE . COMPRESSION
PACH WAVE
EPMSION / 1EMIATINGM ACH VE / SOC WAVE SHOCK-INDUCED
/EART OSEPARATION BUBBLE
/ / / /OUNDARY LAYER
__- -SEPARATION
/ /' / iTRAILING GE
INVISCID FLOW VISCOUS FLOWPLATEAU UNLOADING
VISCOUS FLOWC , - INVISCID FLOW
FIGURE 1. INVISCID/VISCOUS FLOWCOMPARISON - CRUISE
!KL"I
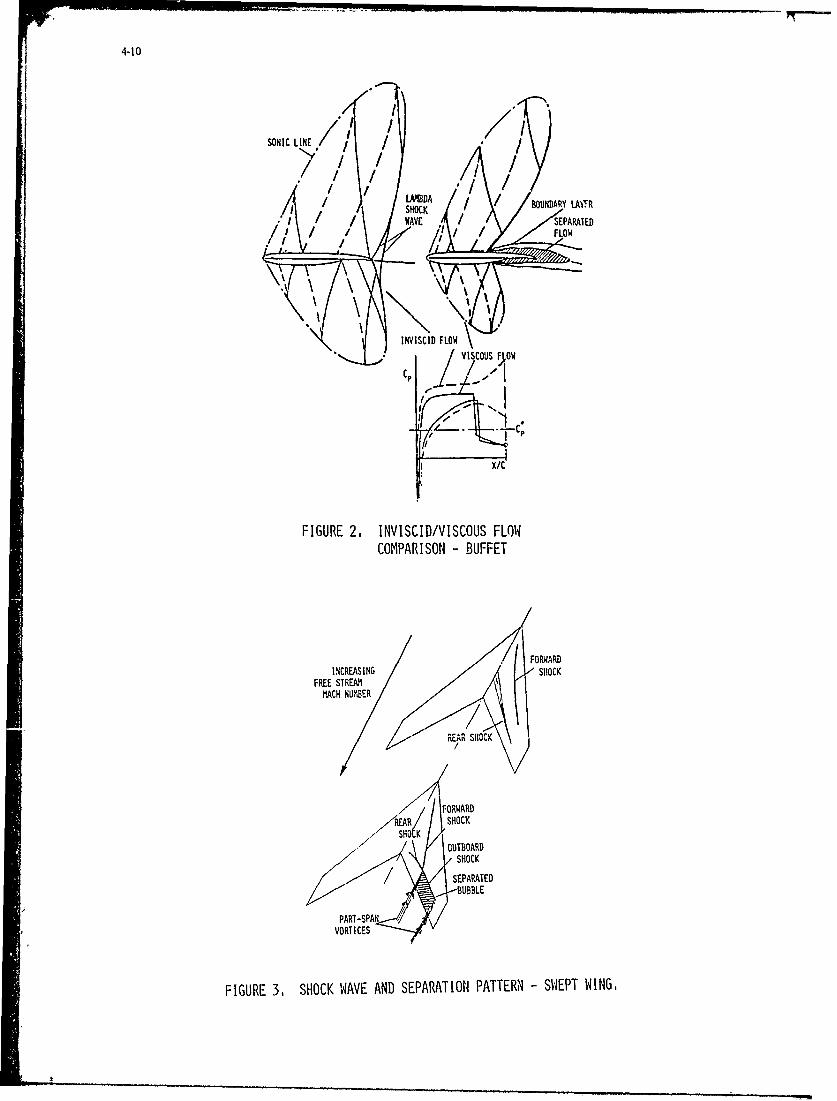
4-10
SONIC LINE,
/ /ISi SHCK BOUNDARY LAITR
/ / WAVE /SEPARATED/ A / i FLOW
IVSVISCD FLOW/viscous 5oW
Cp --
X/C
FIGURE 2, INVISCID/VISCOUS FLOWCOMPARISON - BUFFET
FORWARDINCREASING SHOCK
FREE STREA.iM~ACH NUMBER
REAR SHOCK
FORWARD
OUTBOARD! SHOCK
SEPARATED
PART-SPANVORTICES
FIGURE 3, SHOCK WAVE AND SEPARATIONt PATTERN' SWEPT WING.

4-11
FORWARDISHOCK "CRUISE" LIFT
OUTBOARD INBOARD
SHOCK- INDUCED FORWARDSEPARATION SHOCK
OUTBOARD
FREE SHEAR LYER S
SEPARATION
MANEUVER LIFT l,,
FROM MOSS REF,3 REAR SHOCKSHOCK-INDUCEDSEPARATION
M.= 0.9 c= 8,30
FIGURE 4, SHOCK WAVE AND SEPARATION PATTERN - FIGHTER WING,
Figure 5. Leading Edge Separation Vortex.

4-12
8--PLAIN AIRFOIL
I - --- AIRFOIL WITH FLAP
CL=313 Ua-8U, cP- 1
U, ;
__ - upER \, -- UPPER
0 0 "". .
0 05 Uc 10 0 5 c 10
Figure 6. Aft Flap Favorable Viscous Interference (Smith Ref. 5).
-i
OFF-SURrACE VORTEX
Figure 7. Flow Visualization Picture with lHiqh Lift Devices.
(Courtesy of Dr. J. McMasters, Boeing Co.)
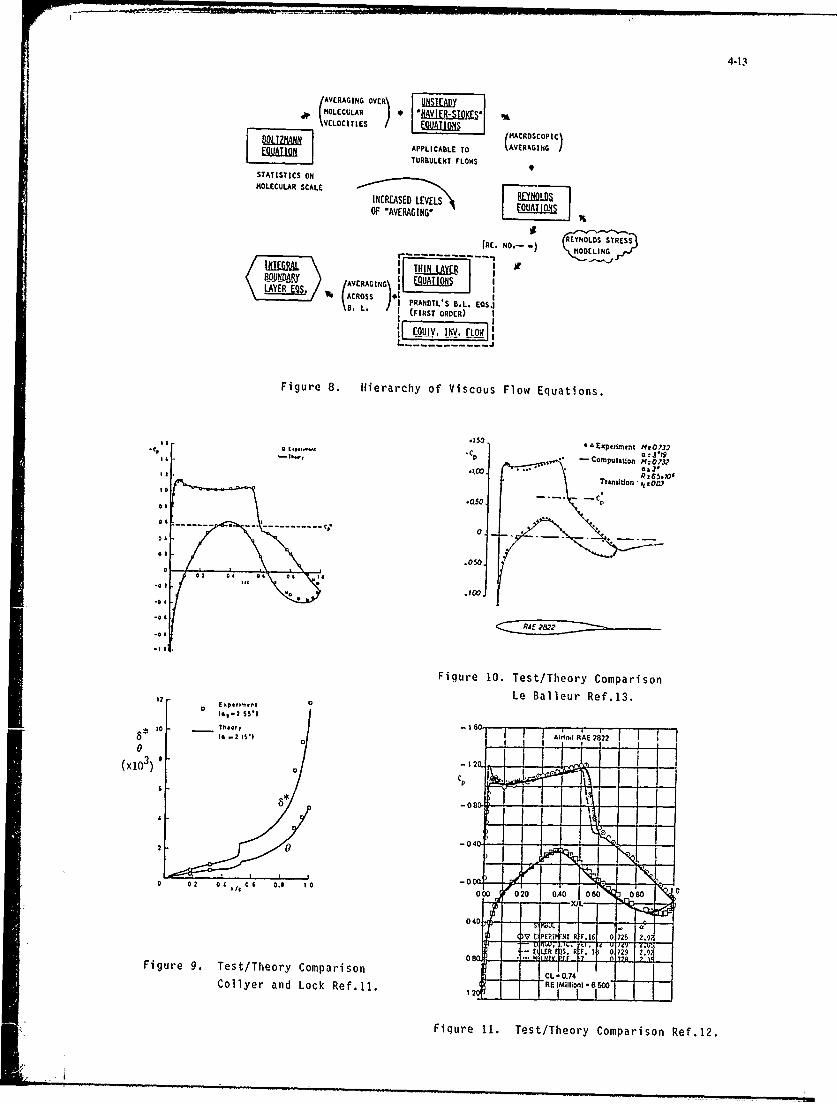
4-13
/AVERAGI G OVER\ W ]HMOLECULAR V -A"t i "
\VELOCITIES )/ EA
EU I APPLICABLE TO (AVER ICG
TURBULENT FLOWSSTATISTICS ONMOLECULAR SCALE i - iD .
INCREASED LEVELSOF 'AVERAGING' 0 LOS
IRE. NO.- ) REYNOLDS STRES
r - - -- -- -- -MODELING
1ti~t~RALTHIN LAYER
E {ACROSSB L, PRANDTL' S B.,L, EQSJ
\BL, (FIRST GRIER) I
Figure 8. Hierarchy of Viscous Flow Equations.
4 i..30 * NExper0ment 71
Computation M:O0'3.
iooto a -.3... . Rt01.
-.- _Co'
---------- .050
.000
-is
Figure 10. Test/Theory Comparison, Le Balleur Ref.13.
o2 *'t- 0S
-oA id n R A E 2 82A p 2
"0 3 12
I(x10-
--I 0
-040
0V ?0.1 0 1 0.0l XN L R r160 0805.9
_-_ Fgure . Figureeoy10omaTest/Theory74 CoprioCollyr andLock ef~ll 1 Le BilleuroRe-S1O0
04- - I -F
0I W E!!!!! et Th NIr s Ref.12.
El LER I[ . 2 290 0- l
Fi ur 0 . Te t/ he r Co p ri o 0. 20C 07 1 '
Collyer and Lock Ref.11.I2EE(hflon 610
Figure 11. rest/Theory Comparison Ref.12.
- ------

4-14
Si, S2 NODAL POINTS
Z1 , Z, SADDLE POINTS
ztz
I ENVELOPE
Figure 12. Limiting Streamlines I REGION
(Experiments: Lindnout, r..
Elsenaar, and van den Berg
Ref. 19) Figure 13. Limiting Streamlines (Calculated:
Cousteix and Houdeville Ref. 20)
10 U _'! --- f
10 - 23
IIld
Aso - a 43 3 m
C-4
06 08 10 1.2 X(m, 14
25 . . . .
cf. 1032-E j
c103 fy A
10-0
to 02mm Ptot ,
Figure 14. Test/Theory Comp~arison, Infinite Yawed Wing.

5-1
TRANSONIC AIRFOIL DEVELOPMENT
by Richard T. WhitcombDistinguished Research Associate
Langley Research Center, NASAHampton, Virginia 23665
U.S.A.
SUMMARY
This lecture consists of three parts, in which discussions are presented of thecurrent state of development of transonic or supercritical airfoils designed for fullyturbulent boundary layers on the surfaces, previous research on subcritical airfoilsdesigned to achieve laminar boundary layers on all or parts of the surfaces, and currentresearch on supercritical airfoils designed to achieve laminar boundary layers. In thefirst part the use of available two dimensional computer codes in the development ofsupercritical airfoils and the general trends in the design of such airfoils withturbulent boundary layers are discussed. The second part provides the necessarybackground on laminar boundary layer phenomena. The last part, which constitutes themajor portion of the lecture, covers research by NASA on supercritical airfoilsutilizing both decreasing pressure gradients and surface suction for stabilizing thelaminar boundary layer. An investigation of the former has been recently conducted inflight using gloves on the wing panels of the U.S. Air Force Fill TACT airplane,research on the later is currently being conducted in a transonic wind tunnel which hasbeen modified to greatly reduce the stream turbulence and noise levels in the testsection.
SYMBOLS
CD drag coefficient, Drag/qS
CL lift coefficient, Lift/qS
Cp pressure coefficient, pt - p /qS
Hz cycles per second
M free stream Mach number
n disturbance amplitude ratio
p local static pressure
p free stream static pressure
q free stream dynamic pressure
Rn Reynolds number
S wing area
A sweep angle
SUPERCRITICAL AIRFOILS DESIGNED FOR TUBULENT BOUNDARY LAYERS
The first airfoils designed specifically to delay drag rise by improving thetransonic or supercritical flow above the upper surface were the "peaky" airfoilsdeveloped experimentally by by Pearcy (Ref. 1). They provide an isentropicrecompression of the supercritical flow ahead of the shock wave located on the forwardregion of the airfoil. These airfoils provide approximately a .02 to .03 delay in thedrag rise compared with NACA 6 series airfoils which had been used for many of the firstgeneration of subsonic jet aircraft. These improved airfoils or their derivatives wereused on many of the second generation of such aircraft. During the middle 1960'stransonic airfoils with drag rise Mach numbers substantially higher than the "peaky"airfoils were developed experimentally at NASA Langley. These airfoils hadsupercritical flow over a major portion of the upper surface and therefore were namedNASA supercritical airfoils. This work was classified until the early 1970's. Anunclassified summary of this work is presented in reference 2. Following the work atNASA other organizations in the United States and Europe also developed similarsupercritical airfoils (Ref. 3 for example).
The experimental development of such su ercritical airfoils is extremely tedious,time consuming, and expensive. Therefore, theories and associated numerical codes tocalculate the characteristics of supercritical airfoils were developed by several

orvanizations in the Unitad States and Europe. One of the most successful of theseef orts was that by the team at New York University under the direction of Garabedian.(Ref. 4.) Numerous comparisons between the pressure distributions and drag coefficientcalculated using the NYU code and experimental results have indicated very goodagreement. A typical example of the agreement for a pressure distribution is shown infigure 1. An example of the agreement for drag coefficient is shown in figure 2. Theagreement for drag at higher lift coefficients is not as satisfactory. With theavailability of such reliable computational methods the need for wind tunnelinvestigations of supercritical airfoils is greatly reduced. In fact, the differencesbetween the calculated and experimental results are usually less than those between themeasured two dimensional airfoils and three dimensional wing results. Therefore, duringwing development at Langley the airfoils designed using the theory are applied directlyto the three dimensional models.
Using the numerical codes, t, e various research and industrial organizations havedesigned many different supercritical airfoils, each to meet the specific requirementsof various applications. However, most of these airfoils usually have certain commonfeatures which will now be discussed. A generalized design pressure distribution on arepresentative supercritical airfoil, together with the associated airfoil shape arepresented in figure 3. Considering the upper surface first, numerous investigators havefound a gradually decreasing velocity in the supercritical flow region usually resultsip the highest drag rise Mach number for a given design lift coefficient. Also, thehighest usable drag rise or lift coefficient is generally obtained with a weak shockwave at the end of the supercritical region. Further, it is important that the finalpressure recovery to trailing edge be sufficiently gradual to prevent local separationnear the trailing. With respect to the lower surface, the design feature which is themost controversial and thus varies the most among the airfoils designed by variousorganizations is the concave region near the trailing edge together with the positivepressures associated with it. Both experimental and calculated results have indicatedthat these positive pressures are important in achieving a high drag rise Mach numberfor the usual design lift coefficient. However, the pressures result in an undesirablenegative pitching moment and increased hinge moments, while the physical concavityreduces the structural depth of the flap or aileron. Therefore, the depth of theconcavity must be a compromise based on a number of considerations. It is obvious whenone compares the concavity of the supercritical airfoils designed by various groups thatthese groups have substantially different ideas as to the most satifactory compromise.
Generally, for the outboard region of a high aspect ratio wing the mostsatisfactory pressure distributions and airfoil shapes are similar to those determinedusing two dimensional calculations. However, because of the strong three dimensioneffects at supercritical Mach numbers the airfoil shape for the inboard sections ofswept wings usual deviate substantially from the two dimensionally derived shapes. Theshape developed for the inboard region a supercritical wing demonstrated in flight on aU.S. Navy F8 test bed will be discussed in my second lecture. The airfoil shapesdeveloped for other configurations by other groups will probably be discussed by otherlecturers.
PREVIOUS RESEARCH ON AIRFOILS DESIGNED FOR LAMINAR BOUNDARY LAYERS
Since the time of Prandl, at least, it has been recognized that the skin frictiondrag could be substantially reduced by achieving a laminar rather than a turbulentboundary layer on the surface of an aircraft component. However, results of early windtunnel research on flat plates indicate that transition from a laminar to a turbulentcondition occurred at elatively low critical Reynolds numbers, roughly 500,000. (Ref.5). In the mid 1930's it was found that this value could be increased to about1.5x10 6 by providinq a decreasing pressure gradient on the surface (Ref. 6, forexample). In 1938 B. M. Jones demonstrated that critical Reynolds numbers substantiallyhigher than those determined in the wind tunnels could be achieved in flight (Ref. 7).The low wind tunnel values were associated with turbulence in the tunnel test sections.These flight results greatly encouraged world-wide research on configurations designedto achieve extensive regions of laminar flow at high Reynolds numbers. This workrequired the development of wind tunnels with turbulence levels much lower than those ofprevious tunnels.
Included among these new facilities was the Low Turbulence Pressure Tunnel at NACALangley. Using this tunnel NACA developed a family of airfoils intended to haveextensive regions of laminar flow at flight Reynolds numbers. These airfoils, known as6 series, had decreasing pressures over the forward regions of the surfaces. The designpressure distribution for a typical airfoil of this family, is shown in figure 4.Investigation of these airfoils indicated that laminar flow could be maintained as farrearward as 60% of the chord on airgoils with reasonable thickness ratios for chordReynolds numbers up to about 9.OxlOU (Ref. 8). However, this was achieved only whenthe model surfaces were glass smooth. Flight tests of a wing incorporating such anairfoil and with extremely smooth surfaces indicated that extents of laminar flowsimilar to these measured in the wind tunnel could be achieved on an airplane (Ref. 9).However, r1,', luist production airplanes incorporating these airfoils little or no laminarflow was achieved, since the surfaces were not smooth enough. It should be noted,however, that these airfoils were used in the design of the first generation of UnitedStates jet aircraft since they had significantly higher critical Mach numbers than didthe airfoils previously used.

In about 1940 it was proposed that the laminar boundar, layer could be greatlyrrT stabilized and significant extents of laminar flow might be achieved by the removal ofthe lower part of the boundary layer by suction through slots or holes (Refs. 10 and
11). With this approach the extent of the laminar layer is not limited as with the useof favorable pressure gradients but can be extended to near the trailing edge.Pfenninger, in particular, (Ref. 12) and others conducted extensive wind tunnel andflight investigation on this approach over several decades. This research leached itsculmination in the flight investigation of the X21 in the early 1960's (Figure 5). Theresults of this work indicated that laminar boundary layers could be maintained overmost of this swept wing at very high Reynolds numbers. For the inboard sections acritical Reynolds number of 47.5x10 6 was achieved. However, because of the cost andcomplexities associated with providing and maintaining the systems and the surfacesmoothness required, work on laminar flow control in the United States was temporarilyabandoned in the United States in 1966.
During the research on laminar flow control during the 1950's several importantbasic aerodynamic problems were uncovered. First, it was found that on swept wingsinstabilities in the laminar boundary develop due to the spanwise pressure gradients onsuch wings (Ref. 13). These effects, called cross flow instabilities, have beenanalyzed theoretically (Ref. 14, for example). Also, on wings with sufficient sweepturbulent flow which may develop on the leading edge of the inboard stations movesoutboard in the stagnation region or attachment line at the leading edge and causestransition on the outer parts of the wing. This effect, called leading edgecontamination, is discussed in reference 15. Further, it was found that the sensitivityto surface roughness is strongly dependent on the unit Reynolds number, that is, theReynolds number per unit length (Ref. 16). Therefore, to maintain laminar flow forpractical surfaces this unit value as well as the total Reynolds number must belimited. A summary of research on laminar boundary layer control to approximately 1958is presented in reference 17 and a bibliography of reports on this subject to 1978 ispresented in reference 18.
CURRENT NASA RESEARCH ON SUPERCRITICAL AIRFOILS DESIGNED FOR LAMINAR BOUNDARY LAYERS
With the recent large increase in the price of jet fuel, the economic value ofreducing the skin friction has greatly increased and the complexities and costsassociated with achieving laminar boundary layers might now be justified. Also newconstruction methods, such as composite materials, should greatly aid in the achievementof the required surface smoothness. Therefore, NASA, as part of a broad program calledAircraft Energy Efficiency (ACEE) undertook a reexamination of the technics forobtaining such boundary layers. This effort involves wind tunnel and flightinvestigations and extensive systems studies. One might ask why a new research programis needed since the subject had received so much attention in the past. The earlierwork was all conducted at essentially subcritical conditions while the present researchis involved primarily with supercritical conditions. Many of the phenomena associatedwith these new conditions are quite different than those studied in the past. In thiseffort both decreasing pressure gradients and suction as means for stabilizing thelaminar boundary layer are being studied. In the present lecture the basic experimentalresearch on transonic airfoils designed to exploit these two approaches will bediscussed.
Stabilization by Decreasing Pressure Gradient
Since the stability of laminar flow is so strongly dependent on the Reynolds numberany meaningful research must be conducted at near flight Reynolds numbers. Therefore,the initial exploratory research on a supercritical airfoil designed to obtain extensivelaminar flow by decredsing pretsute giddieit~, wat -.ondutted in flight at the ,I"'"JA DrydenResearch Center. Partial span gloves were added to the wing panels of the United StatesAir Force TACT airplane (figure 6). This airplane is an F 111 retrofitted with a NASAsupercritical wing. The use of theis airplane, with a variable sweep capability,allowed a systematic study of the crossflow instabilities described earlier. The shapeof the new airfoil is substantially different from that on the TACT wing so that anextension of the glove forward and rearward of the original leading and trailing edgewas required (fig. 7). In particular, the leading edge radius and the aft camber forthe new airfoil are significantly less than those for TACT wing. The gloves, coveredthe middle regions of the panels. Because of the strong lateral spread of disturbancesat superceitical speeds it was required that the shape of the upper surfaces of thepanels inboard of the gloves be modified to achieve the desired pressure distributionson the gloves for such conditions. These changes were developed experimentally at theLangley 8-Foot Transonic Pressure Tunnel.
The airtoil for the flight investigation was developed at NASA Langley using theNYU code (Ref. 4) and an unpublished two dimensional laminar boundary layer stabilitycode. The calculated pressure distribution for the supercritical design condition isshown in figure 8. The upper surface has a favorable pressure gradient from the leadingedge to the 60% chord station followed by a weak shock and a gradual subsonic recovery.The lower surface has a favorable pressure gradient from the leading edge to the 50%chord followed by a recovery into a region of positive pressures characteristic of aftloaded supercritial airfoils. Obviously, the pressure distribution on the upper surfacedeviates substantially from that found to be most satisfactory when considering fullyturbulent boundary layers, as discussed earlier. As a result, the drag rise Mach numberfor this airfoil is about 0.015 less than that for an airfoil designed for turbulentboundary layers with the same thickness ratio and design lift coefficient.

54
Laminar stability calculations for this airfoil, including the effects ofcompressibility and sweep were conducted for NASA at Boeing (Ref. 19). Representativeresults are presented in figure 9. Shown are variations of the growth of theTollmien-Schlichting disturbances, that is those associated with longitudinal flowtRef. 5), along the chord for a disturbance frequency of 2775 Hz for the design pressuredistribution at a Reynolds number of 25x106. Of particular importance is the factthat the effects of compressibility for this condition reduces the growth of thedisturbances by more than 50%. This effect greatly enhances the possibility ofobtaining extensive regions of laminar flow at flight Reynolds numbers. Thecompressibility also reduces the crossflow instabilities, but to a much lesser degree.Predictions based .r the compressible flow calculations (fig. 10) suggest that laminarflow should be achieved to the 60% chord station on the upper surface and 50% chord onthe lower for 100 of sweep and c chord Rn of 35xIO6. For wing sweep angles greaterthan about 22° leading edge contamination, as described earlier, should cause transitionnear the leading edge. The instrumentation for this flight investigation wds limited towake survey probes. As a result relatively little information of a basic nature wasobtained. However, the wake survey results indicate that substantial regions of laminarflow were achieved.
Stabilization by Suction
Because of the high cost of conducting flight research on advanced supercriticalairfoils with the laminar boundary suction, the initial research on such airfoils iscurrently being carried out in a wind tunnel. Wind tunnel investigations ofsupercritical laminar flow airfoils require a large transonic tunnel with very lowstream turbulence and noise levels. To provide such a facility the Langley 8-FootTransonic Pressure Tunnel has been modified substantially (Ref. 20). To reduce streamturbulence five creens and honeycomb have been installed in the settling chamber of thetunnel. To eliminate the noise associated with mixing in the slots, the investigationis conducted with the slots closed. To greatly reduce the movement of noise from thediffuser into the test region variable choke plates have been installed between the testregion and the diffuser. The stream turbulence and noise levels achieved are about .04%at a Mach number of 0.8.
To provide the required near full scale Reynolds numbers with acceptable unitReynolds numbers, the chord of the model was made quite large, 2.15 meters. A largechord also facilitates the installation of the ducting in the model required forsuction. With this large a model in a closed, unmodified test section the wallinterference would be prohibitively large. To eliminate such interference the wallsopposite the upper and lower surfaces have been contoured to the calculated streamlilesof the flow about the model at the wall for the design condition. rurther, to study thecross flow instabilities described earlier 230 of sweep was incorporated into theairfoil. To eliminate wall interference at the ends of the model these walls werecontoured to the calculated cross flows due to this sweep. The model and contouredtunnel walls installed in the test region of the tunnel are shown in figures 11 and 12.The computational design of the shapes of the tunnel walls is described in reference 21.
The airfoil shape and associated pressure distributions for the model of thisinvestigation were developed by W. Pfenninger using the NYU code of reference 4 andboundary layer stability analyses (Ref. 23). The chordwise pressure distributions andsonic lines for the design condition and an off-design condition together with theairfoil shape are shown in figure 13. The areas where various types of instabilitiespredominate are also indicated. In the supercritical flow region above the uppersurface the pressure distributions have adver,c gradients similar to that on mostsupercritical airfoils designed for turbulenc,. boundary layers, as discussed earlier.The suction can readily maintain laminar flow through this gradual gradient since theinstabilities are of the Toiimien-SLh'iiLhti11g type. The adverse gradients along the aftregion of the airfoil are substantially greater than that used for most airfoilswith turbulent boundary layers. The suction should maintain unseparated laminarboundary layers through these gradients even though the predominant disturbances are ofthe more critical cross flow type. However, substantially greater amounts or boundarylayer removal are required than on the less critical region farther forward. Near theleading edge crossflow instabilities are particularly critical because of the pronouncedpressure gradient.
The pressure distributions on the lower., face are markedly different from that onthe usual supercritical airfoil with a turbulent boundary layer. The forward regions ofpositive, roughly uniform pressures, provides an area with reduced crossflow instabilitywhere a movable Kreuger flap type leading edge device could be incorporated. However,the concavity in the lower surface contour near the 15% chord associated with thesepressure distributions leads to 'iylor-Goertler instabilities (Ref. 5). The velocitiesalong the middle region of the lower surface are nearly sonic. The recovery into theaft positive pressure region is significantly steeper than on airfoils with turbulenceboundary layers. As for the upper surface the suction allows this steeper gradient. Atthe higher-lift off-design condition the pressure distributions are approximately thesame as for design con"ition except for the development of a weak shock near the 65%chord station on the upper surface. This desired situation is achieved by providing theincreased lift with the deflection of a 11% chord trailing edge flap (figure 14) ratherthan by increasing the angle of attack. Because of the steeper adverse gradientsallowed with boundary layer suction the design Mach for this airfoil can be made

slightly greater than that for a comparable airfoil designed for a turbulent boundarylayer. The suction system utilized to stabilize the laminar flow on the surfaces of theairfoil shown in figure 14. Very narrow slots are connected to a number of separateducts in which the suction pressure can be varied individually. The spacing of theslots is closest where the boundary layer instabilities are the greatest.
Following the completion of the investigation other approaches to laminar flowcontrol will be investigated in the modified Langley 8-Foot Transonic Pressure Tunnelusing similar sized models and the contoured test section. Also, basic research atseveral United States aircraft companies on various methods for laminar flow controlwill continue. A large part of this research will be associated with airfoilsincorporating hybrid boundary layer control systems, that is, systems utilizing bothdecreasing pressure gradients and limited suction. Much of this work will beexperimental since the theoretical methods available ar. still not definitive enough toexactly predict transition (Ref. 19). In addition to this basic work, research directedtoward solutions of the practical problems associated with achieving laminar boundarylayers, such as insect contamination on the leading edge, will continue. A bibliographyof publications on laminar flow control wor% for the years 1976 to 1982 is presented inreference 22.
REFERENCES
1. Pearcey, H. H.: The Aerodynamic Design of Section Shapes for Swept Wings.Advances in Aeronautical Sciences, Vol. 3, P. 277, Pergamon Press, 1962.
2. Whitcomb, R. T.: Review of NASA Supercritical Airfoils. ICAS Paper No. 74-10,Aug. 1974.
3. Procedings of the Ninth Congress of the International Council of the AeronauticalSciences. Haifa, Israel, Aug. 1974.
4. Bauer, F.; Garabedian, P.; Korn, D.; and Jameson. A.: Supercritical Wing SectionsII. Volume 108 of Lecture Notes in Economics and Mathematical Systems,Springer-Verlag, 1975.
5. Schlichting, H.: Boundary Layer Theory, Sixth Edition, New York, McGraw Hill,1968, Chapter 16.
6. Dryden, H. L.: Airflow in the Boundary Layer Near a Plate. NACA Rep. 562, 1936.
7. Jones, B. Melvill: Flight Experiments on the Boundary Layer. Journ. Aero. Sci.,Vol. 5, No. 3, Jan. 1938, pp. 81-94.
8. Abbott, I; Von Doenhoff, A.; and Stivers, L.: Summary of Airfoil Data.NACA Rep. 824, 1945.
9. Gray, W. E.; and Fullam, P.: Comparison of Flight and Tunnel Measurements ofTransition on a Highly Finished Wing (King Cobra). RAE TN Aero. 2383, 1950.
10. Holstein, H.: Messungen zur Laminarhaltung der Grenzchicht an elnem Flugel.Lilenthal-Bericht S 10, 17-27, 1940.
11. Ackeret, J.; Ras M.; and Pfenninger, W.: Verhinderung des Turbulentwerdens einerReibungsschicht durch Absaugung. Naturwissenschaften, 62?. 1941.
12. Pfenninger, W.: Laminar Flow Control, laminarization. AGARD-R-654. von KarmanInstitute, Belgium, 1977.
13. Gregory, N.; Stuart, J. T.; and Walker, W. S.: On the Stability of 3-DimensionalBoundary Layers witn Application to the Flow Due to a Rotating Disc. Phil. Trans.Roy. Soc. London, Series A, No. 943, Vol. 248, 1955, pp. 155-199.
14. Brown, W. B.: A Stability Criterion for Three-Dimensional Laminar BoundaryLayers. Boundary Layer and Flow Control, G. V. Lachmann, Editor, Vol. 2, 1961.
15. Gray, W. E.: The Effect of Wing Sweep on Laminar Flow. RAE TM Aero. 255, 1952.
16. von Doenhoff, A. E.; and Braslow, A. L.: The Effect of Distributed SurfaceRoughness on Laminar Flow. Boundary Layer and Flow Control, G. V. Lachmann,Editor, Vol. I, 1961, p. 657.
17. Lachmann, G. V. (Editor): Boundary Layer and Flow Control, Vol. 2, Pergamon Press,1961.
18. Bushnell, Dennis M.; and Tuttle, Marie H.: Survey and Bibliography on Attainmentof Laminar Flow Control in Air Using Pressure Gradient and Suction. Vol. I.NASA RP-1035, Sept. 1979.
19. Runyan, J. and Steers, L.: Boundary Layer Stability Analysis of a Natural LaminarFlow Glove on the F111 TACT Airplane. Viscous Flow Drag Reduction, H. G. Hough(Editor), AIAA C 19C0, pp. 17-32.

5.6
20. Harvey, W. and Pride, J.: The NASA Langley Laminar Flow Control AirfoilExperiment. AIAA Paper No. 82-0567, 1982.
21. Newman, Perry A.; Anderson, E. Clay; and Peterson, John B., Jr.: Numerical Designof the Contoured Wind-Tunnel Liner for the NASA Swept-Wing LFC Test.AIAA Paper No. 82-0568, March 1982.
22. Pfenninger, W.; Reed, H. L.; and Dagenhart, J. R.: Design Considerations ofAdvanced Supercrltlcal Low Drag Suction Airfoils. Viscous Flow Drag Reduction, G.R. Hough (Editor), AIAA C.1980, pp. 249-271.
23. Tuttle, M. and Maddalon, D.: Laminar Flow Control (1976-1982). NASA TM 84496,1982.

5-7
-- C pSONIC-. 5 --
C SONI F p OI
Cp 0 Cp 0
.5 0 EXPERIMENT+
0 20 40 60 80 100PERCENT CHORD
Figure 1- Comparison of experimental I _ I Iand calculated pressure 0 20 40 60 80 100
distributions for PERCENT CHORDrepresentative NASAsupercritical eirfoil. Figure 3.- Generalized pressure
distribution and airfoilshape for supercriticalairfoils.
-. 4
.0160 EXPERIMENTAL Cp
.012 -- CALCULAE
C d .008 - O- .4L
.58 .62 .66 .70 .74 .78 .82 0 20 40 60 80 100
M PERCENT CHORD
Figure 2.- Comparison of experimental Figure 4.- Calculated pressureand calculated drag charac- distribution and chordwiseteristics for representative thickness distribution forNASA supercritical airfoil at representative NACA 65 seriesCL = 0.50. airfoil.
--.

-8
Cp
Figure 5.- U.S. Experimental X-21airplane with suction slotsto stabilize laminar boundaryI I I
layer. 0 20 40 60 80 100PERCENT CHORD
Figure 8.- Calculated pressuredistribution and sonic linefor supercritical laminarflow airfoil, M 0.77,CL = 0.50.
DISIURBANCE INCOMPAMPLITUDE
AK , RATIO.
COMPRESSIBLE
0 20 40 60O 60PERCENT CHORD
Figure 9.- Calculated growth ofdisturbance amplitude ratiofor supercritical laminarflow airfoil,
Figure 6.- U.S. Air Force FIll TACT with frequency - 2775 Hzsupercritical laminar flowairfoil gloves.
LEADING EDGECONTAMINATION
TURBULENT20
AL.E. dog \ UPPER
LOWER I
LAMINAR
0 20 40 60 DOPERCENT CHORD
Figure 10.- Predicted location of fullyturbulent flow for
Figure 7.- Cross section of supercritical laminar flowsupercritical flow airfoil airfoil, compressibleglove on U.S. Air Force Fill stability, transitionTACT airplane. amplification factor = e1 2 .

5-9
M= 0V55 Ilap 00 hM- 0.750 ap 20ct=0.550 c I 0.780
LI ER c-. S IOVE 70U ,EN-CHnLCH % N
CHOKE PLATES
FLOW M ,'ODEL SHELF XC/ ~lop
CROSS- FLOW
TOP END PIA11 AYO-GORLR
S IDE WALL - .
Figure 11.- Schematic drawing ofcontoured test section linerand airfoil model in NASA Figure 13.- Calculated pressureLangley 8-Foot Transonic distributions and sonic linesPressure Tunnel. for supercritical airfoil
designed for laminar flow
control by suction.
Figure 14.- Suction system forsupercritical laminar flow
t , control airfoil.
Figure 12.- Photograph of contoured testsection and model.
/
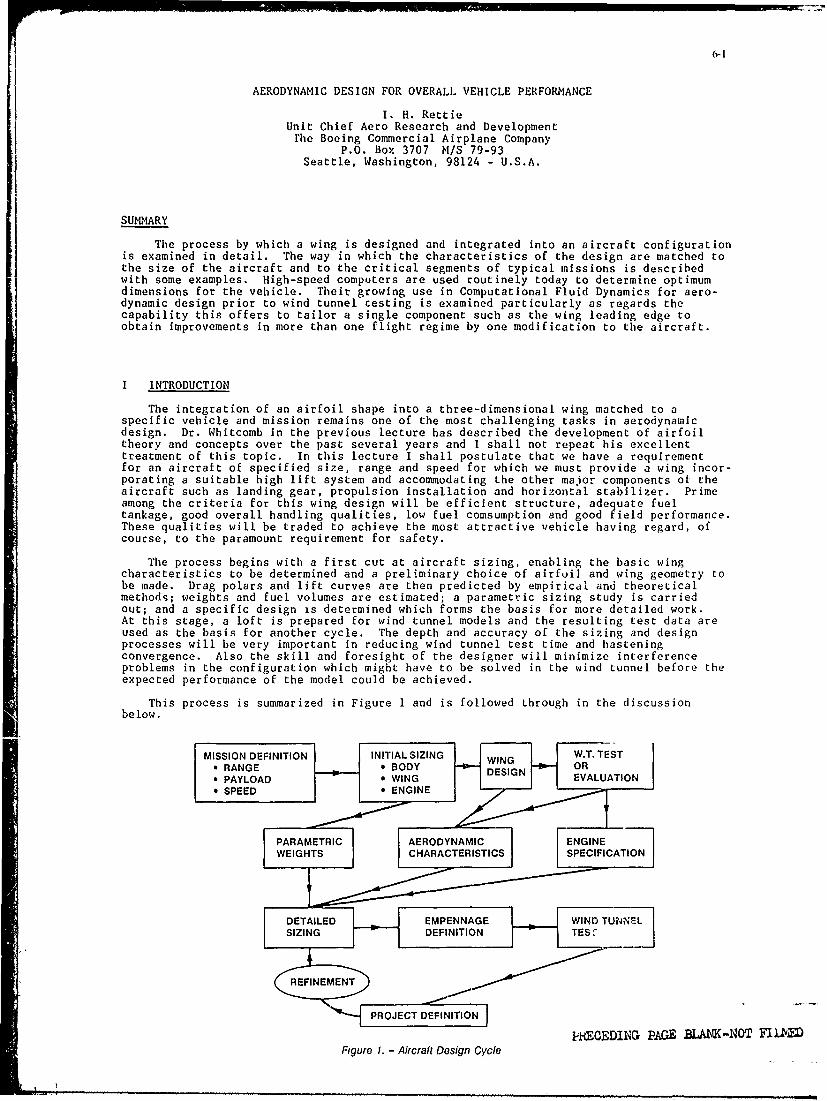
6-1
AERODYNAMIC DESIGN FOR OVERALL VEHICLE PERFORMANCE
I. H. RettieUnit Chief Aero Research and Developmentrhe Boeing Commercial Airplane Company
P.O. Box 3707 M/S 79-93Seattle, Washington, 98124 - U.S.A.
SUMMARY
The process by which a wing is designed and integrated into an aircraft configurationis examined in detail. The way in which the characteristics of the design are matched tothe size of the aircraft and to the critical segments of typical missions is describedwith some examples. High-speed computers are used routinely today to determine optimumdimensions for the vehicle. Their growing use in Computational Fluid Dynamics for aero-dynamic design prior to wind tunnel cesting is examined particularly as regards thecapability this offers to tailor a single component such as the wing leading edge toobtain improvements in more than one flight regime by one modification to the aircraft.
I INTRODUCTION
The integration of an airfoil shape into a three-dimensional wing matched to aspecific vehicle and mission remains one of the most challenging tasks in aerodynamicdesign. Dr. Whitcomb in the previous lecture has described the development of airfoiltheory and concepts over the past several years and I shall not repeat his excellenttreatment of this topic. In this lecture I shall postulate that we have a requirementfor an aircraft of specified size, range and speed for which we must provide a wing incor-porating a suitable high lift system and accommodating the other major components of theaircraft such as landing gear, propulsion installation and horizontal stabilizer. Primeamong the criteria for this wing design will be efficient structure, adequate fueltankage, good overall handling qualities, low fuel comsumption and good field performance.These qualities will be traded to achieve the most attractive vehicle having regard, ofcourse, to the paramount requirement for safety.
The process begins with a first cut at aircraft sizing, enabling the basic wingcharacteristics to be determined and a preliminary choice of airfuil and wing geometry tobe made. Drag polars and lift curves are then predicted by empirical and theoreticalmethods; weights and fuel volumes are estimated; a parametric sizing study is carriedout; and a specific design is determined which forms the basis for more detailed work.At this stage, a loft is prepared for wind tunnel models and the resulting test data areused as the basis for another cycle. The depth and accuracy of the sizing and designprocesses will be very important in reducing wind tunnel test time and hasteningconvergence. Also the skill and foresight of the designer will minimize interferenceproblems in the configuration which might have to be solved in the wind tunnel before theexpected performance of the model could be achieved.
This process is summarized in Figure 1 and is followed Lhrough in the discussionbelow.
MISSION DEFINITION INITIAL SIZING WIGW.T. TESTa BODY OR" R A N G E D E I G NU" PAYLOAD * WING tEVALUATION" SPEED 9 ENGINE I
WEIGHTS CHARACTERISTICS SPECIFICATION
DETAILED EMPENNA1GE WIND "UNNEL]
SIZING DEFINITION TES"
PIPECEDING PAG BLAM-NOT FIUV/Figure 1. - Aircraft Design Cycle

6-2
11 INITIAL SIZING
This will normally be accomplished either by direct reference to a previous study or
by construction of simplified charts based upon existing configurations and guided by the
Breguet range equation,
R = K V L logn IE Dw 2
V L = Range FactorsTfc D
The factor K will depend on mission rules. Lift-to-drag ratio (L/D) can be relatedto span and total wetted area from the well known drag formula,
CL2CD = CDO + CL
A
A = Aspect Ratio
It can be verified by simple differentiation that maximum L/D occurs when the induceddrag equals the zero-lift drag and the relationship shown in Figure 2 is easily derived.As a matter of fact, most current aircraft lie on a line corresponding to 85% of thetheoretically achievable peformance. Such a "rule of thumb" can be used in the initialestimate of performance.
25 -
20 - CDO CL2
(L/D)M ax 15 - 4 Aif-' A E
AT (M L/D)Max 85% : 1 60
10 -,2 09Y JT40)
K= Cf.003 i4- Cf FRICTION COEFFICIENT 0" o
O 1CIO 10INCLUDING SHAPE AND O CIo 140ROUGHNESS EFFECTS 1011'
A V)0t34
0 I - I I I
.9 1.0 1.1 1.2 1.3 1.4 1.5 1.6SPANMRWet
Figure 2. - Aerodynamic Efficiency at (M L D) MAX
The first step in aircraft sizing is normally to construct a body appropriate to thedesired payload and, from existing data, to determine the probable gross weight of theaircraft. An existing or proposed engine will be used and its weight and specific fuelcomsumption will be known. From the Range Equation, a chart such as Figure 3 can beconstructed relating Zero Fuel Weight (ZFW), Gross Weight and Range Factor. Also, fromexisting data, an estimate of ZFW can be made for several wing areas in the probablerange. For each wing area, the total wetted area can be computed (allowing for theempennage, of course) and an L/D estimated. Combined with the known value of engine sfc,this provides a range factor for each value of ZFW. The most appropriate value of wingarea must then be selected on the base of three considerations,
1) Packaging of wing structure, system and high lift devices2) Cruise lift coefficient3) Approach speed
The decision must be partly judgmental at this juncture. A typical high lift system(say, leading edge slats and double-slotted trailing edge flaps) will be chosen and anestimate of maximum lift capability on the approach to an airfield can be made assumingan approach speed in the range 125 kts (for a short range aircraft) to 135 kts (for along range aircraft). From this a required wing area can be identified and an evaluationof packaging problems can be made which might result in change to the area the spanwisethickness grading or the taper ratio, for example. The groundwork done in creating

6-3
Figure 3 will then identify approximate weights for the aircraft. A check must be madeof cruise lift coefficient and engine thrust match. If the lift coefficient in cruise istoo high for a reasonable high speed design, the wing area must be increasedaccordingly. If the cruise thrust match is deficient, the engine size must beincreased. At this point an initial sizing has been accomplished.
Such a procedure obviously involves a fair degree of experience and expertise.Existing data such as component weights of aircra ft will be used throughout. The lessexperienced designer will have to repeat the cycle several times in order to obtain abalanced design. A layout drawing of the aircraft will now be created, fuel volumechecked and the cycle repeated with improved weight estimating.
20
0
18- OF
10 AREA F -
ACCEPTABLE17 WING SIZE
CRUISEO , W S
RANGEFACTOR 16-
0
(1,000 n mlI) ,, -t
14
13-
500 510 520 530 540 550 560 570GROSS WEIGHT
Figure 3. - Weight and Range Factor Relationships
III AIRFOIL SELECTION
Airfoil selection will be guided primarily by the requirements for cruise Mach numberand fuel volume. These will enable a selection of sweep angle and maximum thickness tobe made considering the outer wing as effectively a swept cylinder of unlimited spanincorporating a section compatible with today's airfoil technology. The designer willchoose as a basis a section defined by the available library of experimental andtheoretical results. This will display the characteristics of supercritical flow,relatively aft, weak shock and aft loading described by Dr. Whitcomb. Two-dimensionalcomputer codes are today so powerful and accurate that testing of airfoils is rarelyrequired particularly if the modifications to an existing design are not too extensive.These modifications will be required to obtain a satisfactory supercritical pressuredistribution of the type shown in Figure 4 at tne thickness and lift coefficientindicated as in section II above. Care should be taken to avoid large adverse pressuregradients on the aft part of the airfoil and high maximum Mach numbers on the lowersurface particularly if an underwing engine nacelle installation is intended.
MODERATE LEADING AFRESTEDGE RADIUS
RAPID EXPANSION AT LEADING EDGE AFCOAVTSSUPERSONIC WEAK, AFT SHOCK
-1.2 // ROOFTOP..... _ MLOCAL. 12ROTP- MLOCAL 1 1
- MLOCAL 10
-.4
.1 .2 .3 .4 .5 .6 .7 .8 .9 1.0
Figure 4. - Typical Supercritical Airfoil

6.4
~~k.,
*Z -
Figure 5. - Typical Wing Isobar Pattern
This basic airfoil section must then be blended across the span of the wing to obtainthe chosen pressure distribution at every spanwise section in cruise. This is thecondition known as "straight isobars" which will ensure a constant shock strength andposition across the span. in fact, this condition is not an absolute requirement. Inpractice, the shock strength will decrease inboard towards the body side allowing someclosure of the isobars there as shown in a typical successful isobar pattern in Figure5. The outboard wing tends towards a peaky pressure distribution thereby gaining someadditional lift. Inboard the pressure distribution is strictly roof-top. What is to beavoided is an unsweeping of the shock inboard which would result in a relatively strongshock normal to the flow fairly far aft on the body side section where the boundary layerwould be prone to separation. Unsweeping of the shock can also occur near the wing tip,but here its effects are not severe. A useful way to avoid it is to round off theleading edge in plan view just inboard of the wing tip.
Some small modification to the section will be necessary to account for taper of thewing planform. The taper is usually incorporated to increase chord and thickness inboardwhere structural bending moments are high and requirements exist for stowage of landinggears and aircraft systems. The most significant challenge, however, is the section atthe body side where the wing effectively "reflects" in the body providing conditionsequivalent to those at the apex of a swept wing. As Figure 6 shows, the pressuredistribution at this station is determined by systems of kinked source and vortex orsource and doublet lines. A typical effect of the kink is shown in Figure 7 which is theresult of a simple calculation of vortex lines. It is shown that the local lift curveslope is lower at the apex than on the outer wing. This is a result which will later beimportant in discussing the development of the wing pressure distribution at lift levelshigher than the design point. Compared to conditions on the outer wing these kinkedlines of singularities result in a pressure distribution at the apex with lower peaksuctions situated farther back on the section. To correct for this we may take one ormore of the following actions,
a) Increase section thickness,b) Move section maximum thickness forward,c) Increase section camber,d) Move maximum camber point forward,e) Introduce some negative camber.
SINGULARrIY~ELEMENTS
SOURCE AND VORTEX ORDOUBLET DISTRIBUTIONS
Figure 6. - Elementary Computation of Kink Effect
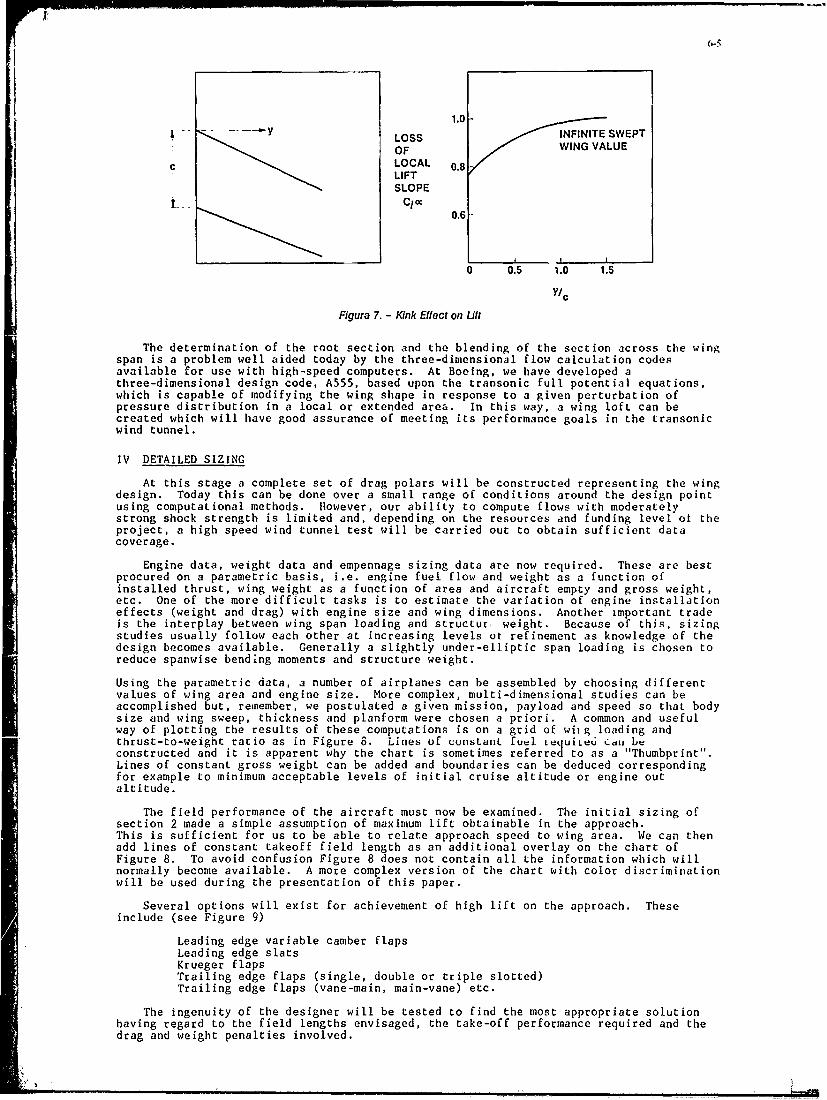
6-5
1.0
__- LOSS 1.-INFINITE SWEPTOF WING VALUE
C LOCAL 0.LIFTSLOPE
c 0.6 -
0 0.5 1.0 1.5
Y/c
Figure 7. - Kink Effect on Lift
The determination of the root section and the blending of the section across the wingspan is a problem well aided today by the three-dimensional flow calculation codesavailable for use with high-speed computers. At Boeing, we have developed athree-dimensional design code, A555, based upon the transonic full potential equations,which is capable of modifying the wing shape in response to a given perturbation ofpressure distribution in a local or extended area. In this way, a wing lofL can becreated which will have good assurance of meeting its performance goals in the transonicwind tunnel.
IV DETAILED SIZING
At this stage a complete set of drag polars will be constructed representing the wingdesign. Today this can be done over a small range of conditions around the design pointusing computational methods. However, our ability to compute flows with moderatelystrong shock strength is limited and, depending on the resources and funding level of theproject, a high speed wind tunnel test will be carried out to obtain sufficient datacoverage.
Engine data, weight data and empennage sizing data are now required. These are bestprocured on a parametric basis, i.e. engine fuel flow and weight as a function ofinstalled thrust, wing weight as a function of area and aircraft empty and gross weight,etc. One of the more difficult tasks is to estimate the variation of engine installationeffects (weight and drag) with engine size and wing dimensions. Another important tradeis the interplay between wing span loading and structur, weight. Because of this, sizingstudies usually follow each other at increasing levels ot refinement as knowledge of thedesign becomes available. Generally a slightly under-elliptic span loading is chosen toreduce spanwise bending moments and structure weight.
Using the parametric data, a number of airplanes can be assembled by choosing differentvalues of wing area and engine size. More complex, multi-dimensional studies can beaccomplished but, remember, we postulated a given mission, payload and speed so that bodysize and wing sweep, thickness and planform were chosen a priori. A common and usefulway of plotting the results of these computations is on a grid of witg loading andthrust-to-weight ratio as in Figure 8. Lines of consLanL fuel nquiLe6 Cdi beconstructed and it is apparent why the chart is sometimes referred to as a "Thumbprint".Lines of constant gross weight can be added and boundaries can be deduced correspondingfor example to minimum acceptable levels of initial cruise altitude or engine outaltitude.
The field performance of the aircraft must now be examined. The initial sizing ofsection 2 made a simple assumption of maximum lift obtainable in the approach.This is sufficient for us to be able to relate approach speed to wing area. We can thenadd lines of constant takeoff field length as an additional overlay on the chart ofFigure 8. To avoid confusion Figure 8 does not contain all the information which willnormally become available. A more complex version of the chart with color discriminationwill be used during the presentation of this paper.
Several options will exist for achievement of high lift on the approach. Theseinclude (see Figure 9)
Leading edge variable camber flapsLeading edge slatsKrueger flapsTrailing edge flaps (single, double or triple slotted)Trailing edge flaps (vane-main, main-vane) etc.
The ingenuity of the designer will be tested to find the most appropriate solutionhaving regard to the field lengths envisaged, the take-off performance required and thedrag and weight penalties involved.
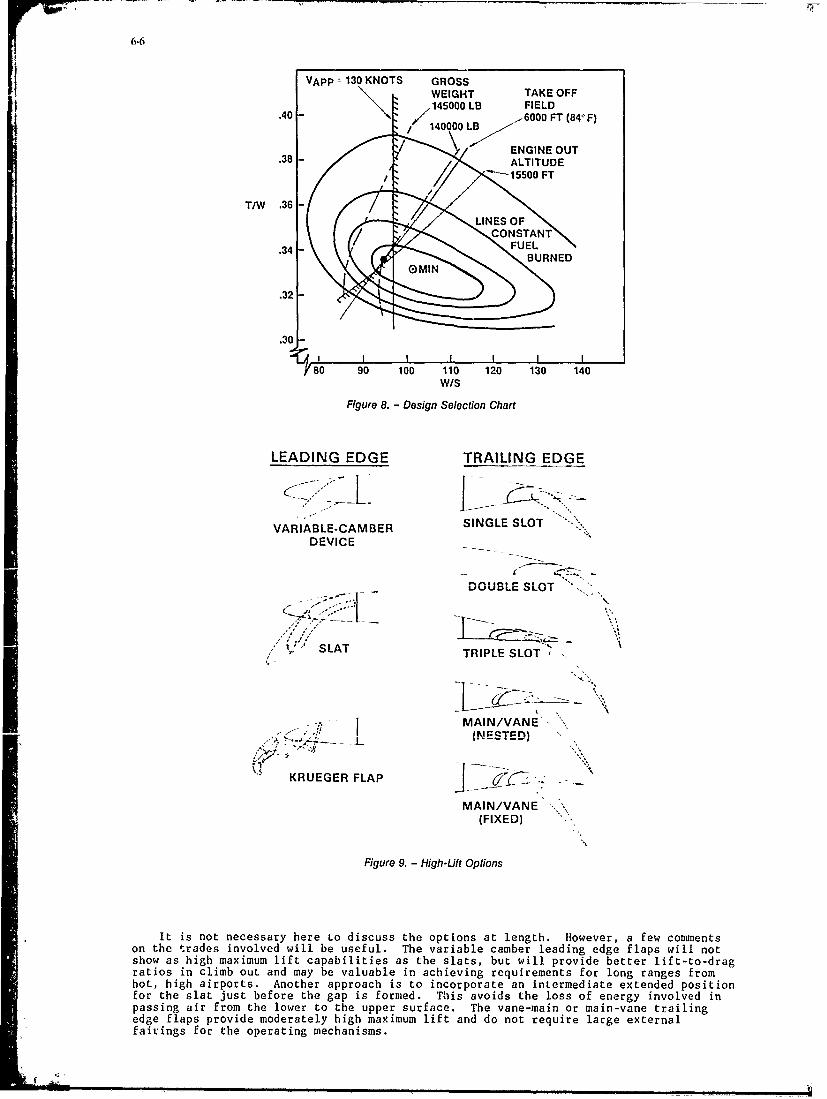
6-6
r VAPP 130 KNOTS GROSS
WEIGHT TAKE OFF.4 145000 LB FIELD
.40 - ." 6000 FT (84-F)•/140000 LB
.38
T/W .36
.34 FBUND
OMIN
.32
.30 -
80 90 100 110 120 130 140W/S
Figure 8. - Design Selection Chart
LEADING EDGE TRAILING EDGE
VARIABLE-CAMBER SINGLE SLOTDEVICE
DOUBLE SLOT
SLAT TRIPLE SLOT
MAIN/VANE'"_ _j_(NESTED)
KRUEGER FLAP : -
MAIN/VANE ' '
(FIXED) ,
Figure 9. - High-Lift Options
It is not necessary here to discuss the options at length. However, a few commentson the trades involved will be useful. The variable camber leading edge flaps will notshow as high maximum lift capabilities as the slats, but will provide better lift-to-dragratios in climb out and may be valuable in achieving requirements for long ranges fromhot, high airports. Another approach iS to incorporate an intermediate extended positionfor the slat just before the gap is formed. This avoids the loss of energy involved inpassing air from the lower to the upper surface. The vane-main or main-vane trailingedge flaps provide moderately high maximum lift and do not require large externalfairings foc the operating mechanisms.
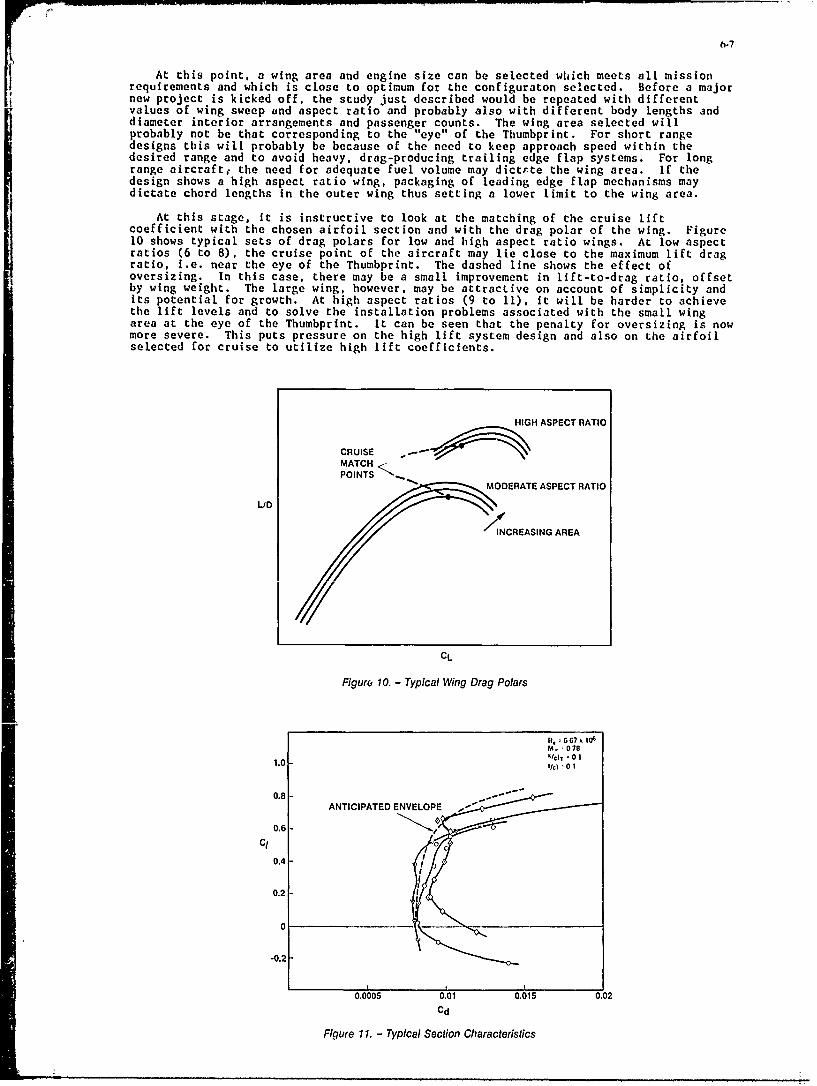
h.7
At this point, a wing area and engine size can be selected which meets all missionrequirements and which is close to optimum for the configuraton selected. Before a majornew project is kicked off, the study just described would be repeated with differentvalues of wing sweep and aspect ratio and probably also with different body lengths anddiameter interior arrangements and passenger counts. The wing area selected willprobably not be that corresponding to the "eye" of the Thumbprint. For short rangedesigns this will probably be because of the need to keep approach speed within thedesired range and to avoid heavy, drag-producing trailing edge flap systems. For longrange aircrafte the need for adequate fuel volume may dictrte the wing area. If thedesign shows a high aspect ratio wing, packaging of leading edge flap mechanisms maydictate chord lengths in the outer wing thus setting a lower limit to the wing area.
At this stage, it is instructive to look at the matching of the cruise liftcoefficient with the chosen airfoil section and with the drag polar of the wing. Figure10 shows typical sets of drag polars for low and high aspect ratio wings. At low aspectratios (6 to 8), the cruise point of the aircraft may lie close to the maximum lift dragratio, i.e. near the eye of the Thumbprint. The dashed line shows the effect ofoversizing. In this case, there may be a small improvement in lift-to-drag ratio, offsetby wing weight. The large wing, however, may be attractive on account of simplicity andits potential for growth. At high aspect ratios (9 to 11), it will be harder to achievethe lift levels and to solve the installation problems associated with the small wingarea at the eye of the Thumbprint. It can be seen that the penalty for oversizing is nowmore severe. This puts pressure on the high lift system design and also on the airfoilselected for cruise to utilize high lift coefficients.
HIGH ASPECT RATIO
CRUISEMATCHPT MODERATE ASPECT RATIO
DINCREASING
AREA
CL
Figure 10.- Typical Wing Drag Polars
R, 66?.106M,. 078/¢)l - 0 I
1.0 tic)l 0 t
0.8 -ANTICIPATED ENVELOPE -
0.6-Cj 0
0.4 -
0.2
0
-0.2
0.0005 0.01 0.015 0.02
Cd
Figure 11. - Typical Section Characteristics

Figure 11 explains the options available for cruise airfoil sections. A family ofsection drag polars can be obtained from variation of section shape. From this anenvelope of capability can be inferred in terms of section lift-to-drag ratio as afunction of section lift coefficient. The higher "spect ratio wing being studied today
require airfoil sections biased towards operation in cruise at relatively high liftcoefficients. The current development towards more efficient structural materials suchas composites will probably accentuate this trend.
V OFF-DESIGN CHARACTERISTICS
To be acceptable a design must not only achieve its performance goals, but it mustalso have good characteristics in upsets from normal flight conditions. We shall examinehere some upset maneuvers from the cruise point. The problems at low speed6 are similar,but more complex because of the various flap settings which have to be considered.
Figure 12 shows a typical variation of cruise lift coefficient with Mach number.From a given cruise point, we have to consider changes in altitude and speed. Both ofthese will cause lower pressures on the upper surface of the wing, strong shocks andpossibly severe shock-boundary-layer interactions. The most common symptom of this isbuffet, which usually arises from tdrbulent flow in the wing wake impinging on thehorizontal stabilizer. A buffet boundary is established from wind tunnel test data, forexample, by detecting the incidence at which the trailing edge pressures on the wingdepart from linearity. A margin of at least 30% above the cruise lift coefficient tobuffet is normally requirei. The margin in terms of speed is determined by calculationof upset maneuvers.
0.9- INITIAL
0.8
CL
0.7
0.6
0.5
0.4I I
0.6 0.65 0.70 0.75 0.80
MACH
Figure 12. - Typical Buffet Margin
Another off-design requirement is for stability in terms of aircraft handling. Inresponse to an increase in altitude, the aircraft should tend to nose-down rather thanup. In response to an increase in speed the aircratt should tend to nose-up in order toincrease drag and offset the speed increment. This requires an examination of how thewing flow develops beyond the design point, the way in which it breaks down and theeffect of this on downwash at the horizontal stabilizer.
Consider first an increase in attitude. If the flow breaks down over the outer wingthis will lead to a forward movement of the center-of-lift which is destabilizing.Futhermore, the concentration of lift over the inboard wing will increase downwash at thestabilizer and cause a part-span vortex from the wing which may interact with the tip ofthe stabilizer. The resultant loss of tail lift is a common cause of pitch-up.
In response to an increase in speed, a loss of lift on the outer wing is favorablesince it will tend to push the aircraft into a high drag condition. On the other hand, agradual breakdown all across the wing with an overall reduction in lift and downwash willcause the aircraft to tuck and tend to nose into a dive.
Figure 13 shows the ideal situation. The outer wing should be protected against flowbreakdown in case of increased attitude. Breakdown should initially occur over as wide asection of span as practicable. On the other hand in the case of increased speed, theinboard wing should be tolerant and breakdown should initially occur outboard.
Returning to Figure 7 for a moment note the effect of sweep on the lift curve slopeon the inboard wing. At high angles of sweep it is much reduced making the inboard wingtolerant of increases in altitude. If can be seen therefore that wings of high sweepwill be prone to pitch-up and wings of low sweep to Mach tuck. This tendency is oftenexagerated by the spanwise drift in the boundary layer on the upper surface which canlead to lift loss on the outer wing.
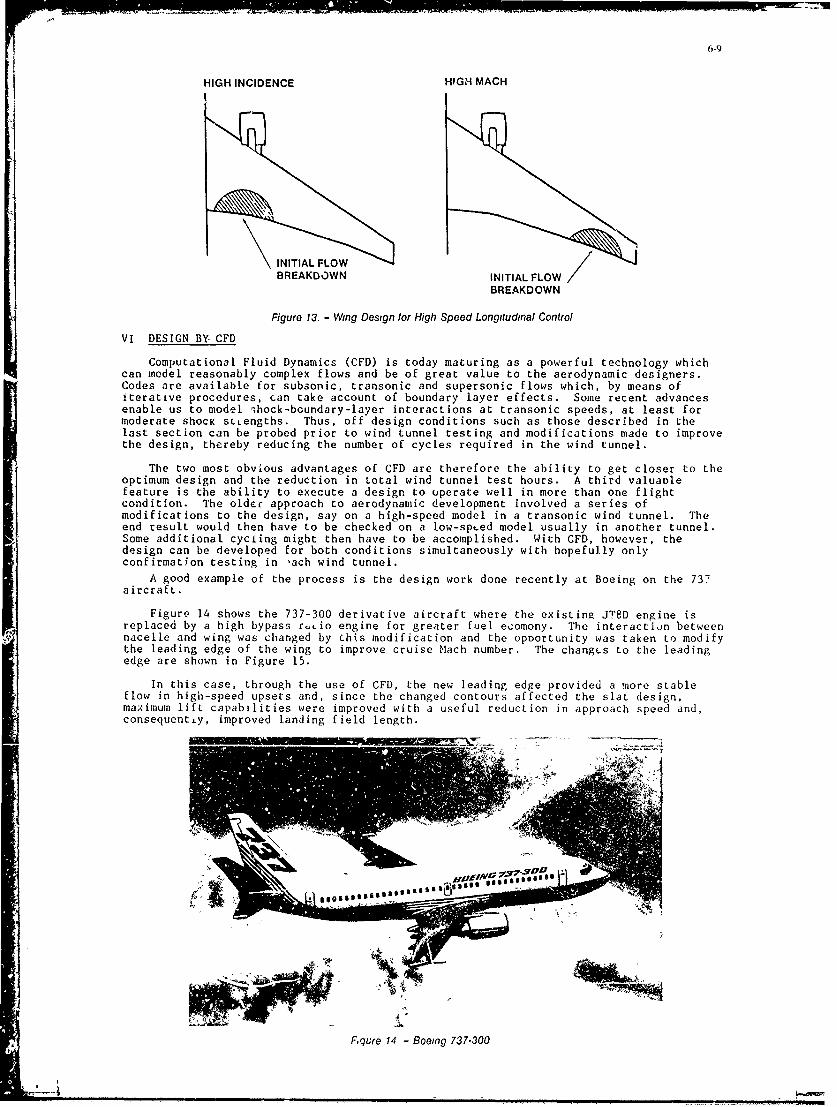
6-9
HIGH INCIDENCE HIGM MACH
INITIAL FLOWBREAKDOWN INITIAL FLOW
BREAKDOWN
Figure 13. - Wing Design for High Speed Longitudinal Control
VI DESIGN BY CFD
Computational Fluid Dynamics (CFD) is today maturing as a powerful technology whichcan model reasonably complex flows and be of great value to the aerodynamic designers.Codes are available for subsonic, transonic and supersonic flows which, by means ofiterative procedures, can take account of boundary layer effects. Some recent advancesenable us to model ihock-boundary-layer interactions at transonic speeds, at least formoderate shock sLtengths. Thus, off design conditions such as those described in thelast section can be probed prior to wind tunnel testing and modifications made to improvethe design, thereby reducing the number of cycles required in the wind tunnel.
The two most obvious advantages of CFD are therefore the ability to get closer to theoptimum design and the reduction in total wind tunnel test hours. A third valuablefeature is the ability to execute a design to operate well in more than one flightcondition. The older approach to aerodynamic development involved a series ofmodifications to the design, say on a high-speed model in a transonic wind tunnel. Theend result would then have to be checked on a low-spted model usually in another tunnel.Some additional cycling might then have to be accomplished. With CFD, however, thedesign can be developed for both conditions simultaneously with hopefully onlyconfirmation testing in ,ach wind tunnel.
A good example of the process is the design work done recently at Boeing on the 737aircraft.
Figure 14 shows the 737-300 derivative aircraft where the existing JT8D engine isreplaced by a high bypass .L io engine for greater fuel ecomony. The interaction betweennacelle and wing was changed by this modification and the OpDortunity was taken to modifythe leading edge of the wing to improve cruise Mach number. The changcs to the leadingedge are shown in Figure 15.
In this case, through the use of CFD, the new leading edge provided a more stableflow in high-speed upsets and, since the changed contours affected the slat design,ma;imum lift capabilities were improved with a useful reduction in approach speed and,consequentiy, improved landing field length.
Fqure 14 - Boeing 737.300
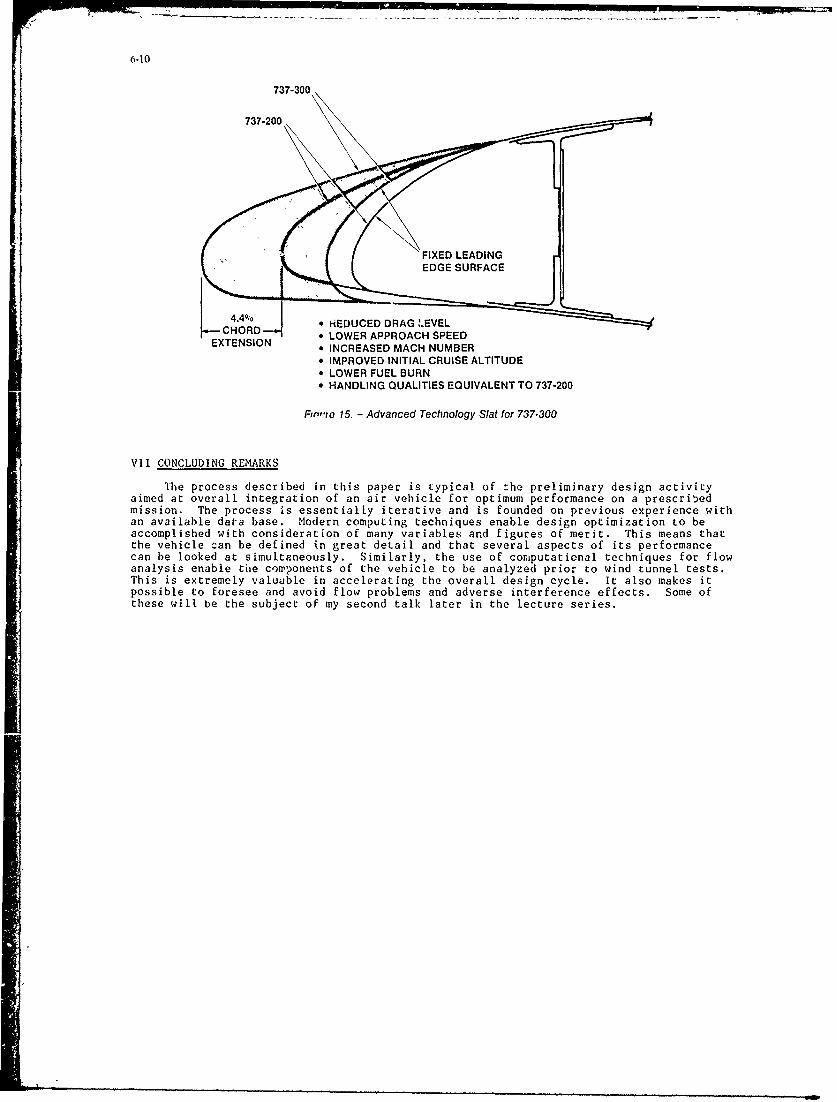
6-10
737-300
737-200.
4.40o 9 HEDUCED DRAG LEVELCHORD. * LOWER APPROACH SPEED
EXTENSION * INCREASED MACH NUMBER* IMPROVED INITIAL CRUISE ALTITUDE• LOWER FUEL BURN* HANDLING QUALITIES EQUIVALENT TO 737-200
Fin, re 15. - Advanced Technology Slat for 737-300
VII CONCLUDING REMARKS
The process described in this paper is typical of the preliminary design activityaimed at overall integration of an air vehicle for optimum performance on a prescribedmission. The process is essentially iterative and is founded on previous experience withan available data base. Modern computing techniques enable design optimization to beaccomplished with consideration of many variables and figures of merit. This means thatthe vehicle can be defined in great detail and that several aspects of its performancecan be looked at simultaneously. Similarly, the use of computational techniques for flowanalysis enable the cowponents of the vehicle to be analyzed prior to wind tunnel tests.This is extremely valuable in accelerating the overall design cycle. It also makes itpossible to foresee and avoid flow problems and adverse interference effects. Some ofthese will be the subject of my second talk later in the lecture series.

7-1
APPLICATION OF COMPUTATIONAL PROCEDURESIN AERODYNAMIC DESIGN
by
J.W. SlooffNational Aerospace Laboratory NLR
Amsterdam, The Netherlands
SUMMARY
Examples are discussed of the application of computational methods in aerodynamic design problemsinvolving interference. is-ongst these are: subsonic wing-body, sting support, pylon-nacelle and pylon-store interference, high-lift devices, induced drag minimization through ronstrained optimization in theTrefftz-plane and transonic wing-fuselage design and analysis. In addition a discussion is given on *heproblem of optimal usage of aerodynamic soft-ware in analyses and design, requiring an integrated systemsapproach.
CONTENTS
1. Introduction
2. "Optimal" usage of aerodynamic software: a systems integration problem
3. Examples of application of computational methods in aerodynamic analysis and design3.1 Panel methods; work horse for computational assessment of aerodynamic interference
effects3.2 Where interference is crucially important: slat and flap design3.3 Configuration induced drag minimization utilizing constrained optimization
techniques in the Trefftz-plane3.h Teansonic wing design and analysis3 .4.I Design of transonic wings by means of 2D transonic and 3D subsonic theory3.4.2 Wing-fuselage transonic aerodynamic analysis
4. Concluding remarks
5. References
1. INTRODUCTION
In the preceeding lectures of this series [1], [2], (3], reviews were presented of the computationalmethods for aerodynamic analysis and design that are currently available to the aerodynamic designer. Wehave also seen how Computational Fluid Dynamics (CFD) is being used by the aircraft industry [141. In thislecture a discussion will be presented on the use of CFD in aerodynamic design problems involvingaerodynamic interference, as seen from the viewpoint and with the experience of the aeronautical researchlaboratory in its role as consultant to the aircraft industry.
First of all attention will be drawn to the point that, for optimal use of CFD, aerodynamic designprocedures and the associated organizational structure of the design office must be adapted to the code,thnt nre nvn]ijble and vice versa. The point will be stressed that with the continuouslv increasing numberof codes that become available to the designer it is increasingly desirable to integrate the individualcapabilities of these codes into Computer Program Systems. This, together with the increasing computerpower available and increasing algorithm efficiencies, evntually, leads to the concept of Inforalic-Infra-Structure, [-].
The second part of this presentation will provide some exarples of the use of CH) mithil. in a nuMerof aerodynamic design and analysis problems involvinf aerodynamic interference. This survey 1 by no m-ryjintended to be complete and merely serves the purpori' of illu-tratnfg .or of the currnt ros, ibilities ,fcomputational aerodynamics.
In conclusion some remarks will be presented on the kcy issu7, for future dcvvlojmeits in rompP 'ti ad
aerodynamic analysis and design.
2. "OPTIMAL" USAGE OF AERODYNtZWIC d OFTWARE: A SYSTEMS INTEGRATI C Ut' Of.F
On the general time scale of the aeronauticl sciences CFD isa youn' dieipl inc. It'. pr-tsent ,tiof evolution may, probably, be compared with moving from infancy into childhood, or into puberty 0 a ,t .Such growing processes require adaptability from both the developint individual f. w, 31 as the eormunity.This applies also to CFD.
It is probably fair to say that the majori ty of CFD codes that sre in us cui rent ly ias r, v, r r- fch-ibeyond the "pilot code" stage. That is, the code- were developed , athematical rodel end algorithmdemonstrators rather than as piees of software that have to fit into a structured sy,:tem for computeraided aerodynamic design. This is n-1. necessarily to blame on the designo r of 4hf-s code,; in i, -ti Iy
days of CFD code development firm ideas about software requirements, design and manapement probaUib hai ilv
existed. Neither can it be blamed on the aerodynamic design office manager who was (and indeod 'ould be)hardly atwars of the possioilities, limitations and requlrcm(nts of CK) as a (developingr) tfl for his
7-2
design work. Indeed, the emerging new discipline of I ,A is required for optiral lntcgratiun of tih,
existing and evolving capabilities of CFD into structured systems for computer aided a-rodynamie de. ign.It is the responsability of both the informatics specialist ani the aerodynamic de ign'r that the cent a'and structure of the aerodynaic, irformation ,ystem and the tasks and uranizational .truclure of thaerodynamic design office are tuned to, each other.
As an introduction to a sketch of what an information ytem for ccmputer aidel aerodynimic designcould look like let usi consider the derign process depicted in figure 1. rhe process i. thought to b-representative of a situation in which methods for both aerodynamic design an,4 an.alys-is are ,vailablNote tile man-in-the-loop at dec.Lion point, and the rsin(men)-bcside-the-loop axucutinr the -,b-)pr',. (.
Figure 2' shows a poe sible architecture (Loev, []) for the infrmation ,y..tem that i. ces, sary tOexecute the design proces, of figurt 1 and to control the flow of inforrration. 4n informati.-n sv.tr withth1s architecture is (partly) ol"rational and bing further dvele pt at 71,7,. Key f, ature of th,, _y.-tem isthe NIR Engineering Pata interact ive Presextat ion and Analys-,is, lystem bl'A&1, [t]) and in part icular th,Control Data IMF data base managetent part of it. Communication between the various proc.. (.ub-) systm,is in the form of (data iae) files whenever )ossible. In thit, way existing (,tnd other) 3oftwaru can b,coupled with tile system, and through this, with other codes, with relatively little effort. If coupling, ,favailable codes on file baois ib not possible or not desirable, It.g. because the rathemat ical and,'crnumerical modeling require coupling on algorithm balzs) the code, are intcgrat,_d into biggtr unit., pri,rto attachement to thu overall inforration vsst em.
It must be revarked that a signifLiant number of the e.amples of application of cc, mpul<la !on' laerodynamic software to be discussed in the following ,'cton. was produced bfor, the -y-tum of figurtwas in operation. This, ofcourse, doe. not affect the Importanck, of the result in th, t- rotynamic :ene.It means, however, that nowadays, the same result could be obtatined at a fraction e" the t ime "ud co.tof the original effort.It is also noted that some of the results were obtained with "isolated" codes whil, other, were producedIwith integrated code systems. The latter will be described to some extent whenever this is rtlevant.
3. EXAMPLF0 OF APPLICATION OF CoMPUTATIONAL METHOD IN AERODYNAMIC ANAIYC10 AND DFCICiN'
3.1. Panel Methods ; Work liorse for t'omputat inal s' .n,,n1 of Aer ,iy 'is t erfnr, he t ff. t
During tile past decade and a half panel method, hatve tbn in lke a10 rst tveryhc r in raCcommunity and an enor-.ouo amount of experience has been collected through applications to all kind" ofsubsonic (and supersonic) interference problem. The literature on the subject i-t. abundant and we will no tattempt to cover it here. Instead, we will discuss" some of the, hopefully, tore interesting applicativt.from the immediate vicinity of the present author. Entry to the literature may, e.g., Oe obtained thriughreferences [7] - [9].
Computational assessment of wing-fuLelage interfertnce has probably been onc- of the, major 1sotiv', f'rpanel method development. The "paLsive" assessment of the effect of the fuselalgo on, e.g., the winpressure distribution is, ofcourse, one possibility. Another approach to the problem is-. the .hapinr of thewing-fuselage fairing with the objective of influencing the wing preso-are distribution in a favourablesense. Conversely, the fairing shape can be used to influence the wing, section geometry that would berequired for a given wing pressure distribution.
Figure 3 provides an example of the utilization of the NLR Panel Method, [10], for the purpos.e jutdescribed. As illustrated by the figure an area-ruled fairing can be used to reduce the super-velocity overa significant part of the inner wing. For more details on this kind of application, see Voogt and Van derKolk, [11]. We will return to the subject of (transonic) wing-fuselage design and analysis in section 3.14.
A second subject where panel methods have, gratefully, been used i. interference involving enginenacelles. A simple example, taken from [8], concerning rear-mounted nacelle-wing interference, is presentedin figure 4. Shown is the effect of the presence of the nacelle (modeled as a coarsely paneled ring-wing)on the spanwise aistrioution of tne wing iii'L ad withA,, cofamillrss cil! tra-rcp'3f' tcruise condition. Note that in spite of the extremely simple modeling, involving a "dummy" plane of" symmetryat the side of the body, the agreemen, between calculated and measured effect of the nacelle is quite good.The discrepancy in the level of the section pitching moment on the inner wing is caused by the fact thatthe fuselage has not been modeled in these calculations.
Figure 5 shows the result of a similar study for a take-off configuration with deflected flap, [P"].The particular effect studied in this case is that of engine mass flow ratio on the wing lift. As indicatedby the figure the effect is appreciable.
A final example involving rear-mounted nacelle interference is depicted in figure 6,13a]. Shown arethe results of adverse interference minimization studies for a high-bypass ratio nacelle + stubwing. Theexample illustrates the usefullness of the panel method in (re)shaping nacelle, stubwing and rear fuselagewith the objective of minimizing supervelocities (and, through that, of avoiding chock waves) in the passagebetween nacelle and fuselage. As indicated by figure 6c the predicted results were fully confirmed bywind-tunnel tests.
An example of an application to the underwing pylon/nacelle/jet interference problem,[13b] is coveredby figure 7. In tile particular case considered the greater part of tile calculations was done for theconfiguration labeled "FLIGHT" in figure 7a. Wind-tunnel test were performed on a half model configurationof the type depicted in the lower picture of figure 7a. Note the faired inlet and the strut/supportcontaining the compressed air supply for blown jet simulation. Figures 7b-d present vcmpier-on:s ofcalculated and measured pressure distributions on tile wing lower surface, pylon and nacelle cowl. Note thatthe calculated results were obtained for the "FLIGHT" configuration.
It can be noticed, that although the agreement between theory end experiment is generally fair, adistinct local discrepancy can be noticed on the outboard facing side of the pylon and in the adjacent wing,lower surface pressure distribution. The reason for this could not be traced, although it could be explainedpartly, but by no means completely, by the effect of the strut and inlet fairing in the exeriment and by

7-3
improper modeling of compressibility effects in the cliculations.
A further subject for which the application of panels methods can be very useful io windtunntl watlland model support interference. Figure 8 presents an example taken from a study, [i1], on the interferencecaused by various types of sting support. A comparison of calculated and measured interference, in termof errors in lift and pitching morrent is given in figure 8b. Note that the experimental results wereobtained with and without dummy stings while the model was supported by a third, vertical strut (Fig. Sc).
As a final example we consider airplane-store interference for a fighter-type configuration, [1. Inthe particular example (Fig. 1) the panel method was used to calculated the part due to interference of theforces and moments on the store for several positions and attitude,- below the wing. These data, togetherwith windtunnel data for the isolated store were fed into a store trajectoey prediction program. Figure 44presents a comparison of tile predicted store depth and attitudt , as a function of time-since-release, withflight test data. Applications such as this serve to improve safety in weapon certification.
3.2. Where Interfernc is rl'ioially Iporttant: ,'latt and aT', ", .in
As described so illustratively by A.M.O. Omith in hic famous lecture on high-lift aerodynamics, (It,]$aerodynamic interference is' pr'obably nowh,,'r, a. iportant at in the e igln f l iih-lift devit,,. In th,folewing," we will consider an exampte of the applicati,n of c<,mputaf lonal rr t hd.- ti, th,, probhl , of lwidlinretdge slat design for low 1,ted. 'ie particular application f,,r ed part 'f a pro'ram 4 validatii of th,MAD computer"prnoram ,ystem [17) , for th, a, rodynam lc 1, ,i, of mist i -el,-rcnt a foil . mh t hodnols'yunderlying, the MAD sys'tem w, briefly dicussed in [21.
The design problem is illustrated by figure 10. The objective [18] was to (re) design the slat of aconventional airfoil-slat configuration with the ourpose of reducing the drag, without affecting themaximum lift, at conditions representative for take-off. The design parameters in such a problem are theshape of the intersection separating the slat and the mwain airfoil (for a given slat chord), gap andoverlap of the slat and the incidence of both slat and main airfoil.
Starting point for the design study was the conventional slat cunfiguration of figure 10a. Figurt 10bshows measured and potential flow pressure distributions for this configuration. Note that the uppersurface boundary layer on the main airfoil separates at about 70 " chord.
The potential flow presure distribution, ienerated by the analys t,' od, cl the 'AD Yst-m, was, u
as a basis for specifyin'- a new "target" pre;sutre distributin. Not that tIL .tntial flew pres urdistribution was obtained for a slat geometry incorporating a simulation of the separation bubble ol thelower surface. Tie shape of this bubble had been determined through an earlier mixed analycis/dvtign mod-application of thb MAD System with the experimental "bubble" pressure as input. The incidence for tilecalculation was chosen to lead to, approximately, the same oicti,,n peaks as in the experiment. We may callthis potential flow pressure distribution ol "equivalent invi~cid" pressure distribution.
With the objective of reducing the dra,, without effecting rraximum lift, the equivalent inviscidpressure distribution was modified in the scnoe indicated in figure 1Ob, implyingI - r-,duced otion peak level of the main airfoilII - more rapid expansion of the flow around the leading edge of the main airfoil, allowingIll- a higher "dumping" velocity at the slat trailing edgeIV - high "bubble pressure" level on the slat lower surface. (Whether this will be realized in tht real
flow is, ofcourse, highly questionable, since the real level will be determined by vi,,cous rather thanpotential flow phenomena.Tie potential flow pressure distribution, modified as described above was u-ed as input foi the MAII
System. In the design calculations only the intersection between slat and main airfoil, tile slat angle,gap and overlap and the incidence were allowed to vary. In addition a lower bound was imposed on the slattrailing edge angle. Figure 10c presents a comparison of "target" and obtained pressure di~L bt ,a,ra function of arc length. The resulting slat geometry is given in figure 1Od.
Experimental results for the new slat are present in figure 11, in comparison with those of thrconventional (starting) configuration. Pressure distributions at. a condition representative fur takc-uffare compared in figure 11a. It can be noticed that the objectives I-Ill have, indeed, been realized. Not,ou'.prsinglv, ,a ig) - level er the qlt 1., r inue'(nce "bubble pressure" has not been achieved. Notefurther that there is a signif cant rearwaru snift of the separation point on the upper surface of themain airfoil.
The consequcices of the new slat shape in terms of lift and drag are evident from figure lb. It canbe observed that tile design objective of reduced drag at coditons (0.T C£ ) representative for take-off,
without effecting C, , has been achieved indeed. max
maxThe example discussed above is somewhat academic in the sense that in real design practice trailing-
edge flap deflection would be an additional design variable to consider. Nevertheless, in the author'sopinion, it illustrates that potential flow inxerse methods can even be helpful in situations with complex
viscous interference.
3.3. Configuration Induced Drag Minimization Utilizing Constrained Uptimization Techniques in the Trefftz-plane
It has been (and perhapr still generally is) common practice in aircraft analysis and design todecompose the airplane drag in components like zero lift drag, lift dependent drag and cumpresbibilitydrag. While this has been a useful, and perhaps the only viable way for drag breakdown ill a situatien that
only the total drag could be determined from windtunnel tests, computational fluid dynamics have createdpossibilities for drag breakdown and analysis that are based on physical rather than phenomenligi a)principles (see also section 3.14). In such a breakdown it is convenient to distinguish between vi;cous,(boundary layer) drag, induced (or vortex) drag and wave drag. Tllis latter drag breakdown offers aframework that may be used for drag minimizatiLon studies. It place, induced drag minimizati-,n in a u,,efulperspective.
Induced drag is all inevit,tle phenomenon asiol'iat'd with lifting configuration. ,r fnit, o-tin, ,, T.
7.4
However,the precise level of the induced drag is governed by interference between the lifting part, uf theconfiguration. 19
According to Munk's theorem , the induced drag of an aircraft configuration is only a function ofit's spanwise loading and independent of it's chordwise loading. This allows the induced drag to bedetermined from the downwash (and sidewash) in the so-called Trefftz-plane, infinitely Vir downstream fthe configuration. In the Trefftz-plane the downwash is a function of the spanwise loading only.
At NLR a computer program has been developed for determining the optin.al Fpans-se loaling, of thtvarious interfering lifting parts of multiple, non-planar configurations, [o. Tnt program utilizes,constrained optimization techniques and panel method "technology" in the Irefftz-rlenu. It is, capable ufdealing with pitching moment (trimmed situation) and bending moment constraints.
The input required by the program is summarized in figure 12. It comprises general georr-tricconfiguration data, position of the center of gravity, required (trimmed) lift coefficient, wing, body ardtail pitching moment and drag data.
A typical example of the capabilities of the program i presented in figure 1. ligure 13a illustratesthe type of configuration considered, with various vertical positions of the horizontal tail.
Optimum spanwise load distributions for a high and a low positioned horizontal tail for a given wing-body pitching moment and 30 5 MAC c.g. location are compared in figure 13b. It illustrates the point thatoptimal wing design cannot be achieved without taking account of the tail con~iiguration.
Minimum induced drag span loads for two different levels of wing-body pitching moment for a low tailconfiguration are compared in figure 13c. Figs 13d en o illustrate the point that the minimum trimmedinduced drag of high tail corfigurationo is much ore sensitive to variations n wing-body pitchiig z.-mtntand e.g. positions than that of low tail configurations. -nis, however, does not ncesarlly imply that alow tail configuration is to be preferred; there ray be other design criteria that dominate thi., choice.
In conclusion, figure 13f presents the optimum span load for a configuration which utilizes "active"loading of nacelle/pylon and flap r'iil fairings. In the particular example a I.' ' reduction " the minurmsrtrimmed induced drag can be realized by "active" rather than "passive" (streamline) haping of pylons andflap rail fairings.
Programs such as just described can be very helpful in the conceptual and preliminary design ofaircraft. They are also used for creating the starting point for the specification of "target" prcsurtdistributions in the detailed aerodynamic design of wings by means of inverse mthods of the type describedin [.
3.4. Transonic Wing Design and Analysis
In this section some experiences will be communicated in the use of methods and program systems forsub/transonic wing design and analyses for transport type configurations. In terms of the scheme of figurt Iwe will discuss examples of application of the processes labelled I and I.
3.4.1. Design of transonic wings by means of 2D transonic and 2D subsonic theory
As may have become clear from the preceeding lectures in this series, [2] in particular, "design"methods for three-dimensional transonic flow ar- not (yet) generally available. At NLR as well as,presumably, in many other places, we have learn d to live with this situation. With "design" (inversemethods available for two-dimensional transonic and three-dimensional subsonic flow, he following procudsrcwas found to be effective, [21].
The first step is the design (or selection) of one, or several, basic airfoils, for selected spanstations, 2 y means of transonic theory for two-dimensional flow. Originally th- hodograph method ofBoerstoel was used for this purpose. More recently, the more flexible contrainei .nversu method of [c 5 )(see also section 3.4 of [], has becom, available. ; he bas ic airfoils may al. b , ] et,, f",suitable transonic airfoil data oase, if available.
When the basic 2D airfoils have been obtained tne next step is to construct an "tquivalent ,ubonctarget pressure distribution" (ESPD) for the 3D win;. For this purpose analyses calculation-, are ptrforn.1for each of the basic 2D airfoils atthcir transonic (or subsonic) "design" conditions*) by m-ans of asuosonic panel metnod, (w]. wnile tnese equivalent _uosonic pressure distrioutions art, of no physicalsignificance they may serve to construct a target pressu.-e distribution fur D ubsonic inverse calculatiuoi(Fig. 14). For this purpose the 2D equivalent subsonic pressure distributions for the selected opanstatins are transformed into pressure dist.sibut ions for the 3D wing by means of an extended form, due t,Lock , of simple sweep theory. Constiuction of the "target ESPT" for the 31 wing is completed by spanwt ,einterpolation and extension towards the root and tip. ;n this process the lower surface° pressure level i,,adjusted so as to conform to the required sparwise loa( distribution. Purther details of the proce ,smay be found in (O1] and (11].
With the (equivalent subsonic) target pressure d&stribution established, the final step is, to findthe sectional geometry of the wing that will generate this pressure distribution in the presence of thefuselage (and, if necessary, of other parts of fixed geometry). This is accomplished by means of thesubsonic inverse method, with geometry constraints, (f (25], (see also section 3.4 of [2]).
While a situation of having to design for transo-ic flow by means of subsonic methods is far fromideal, the procedure described above has nevertheless 'roved successful. An example. in the form of acomparison between "expected"*)Unviscid, shock-free) and measured pressure distributions for an aspectratio 11 wing is given in figure 1'. Further examples may he found in (i], [i], [26].
It is worth mentioning that efforts are underway to e~tend the capabilities of the constrained
*) The "design" condition, in this context, is not necessazily a transonic "shock-free" condition. Hereis, rather, the (local) condition at which the airfoil is required to operate at the specific spanstation of the 3D wing. Off-design considerations may require that this local conditior repres.ents a Cand Mach numter beLow that for "optimal" supercritical (shock-free) flow of the basic airfoil section.
*)The "expected" pressur, distribution was obtained by correcting the equivalent subsonic pressur,d istribut i, n of the 31) w ing for th. d If fr.'nce bvtw,' n th exact. trazsn I c tild I -u I V11 .I i "nil
pressqure distribution: of th,' basic "D a irfoil i.

7-5
residual-correction type of inverse method of (2t] to transonic flow. It is expected that, similar as in2D, [23], (see also section 3.4 of (2]), this can be realized by replacing the subsonic panel method [ V,],which forms part of the system, by a 3D transonic code and by adding a ouperoonic (local) georetry correctlscn
module.
3.4.2. Wing-Paselagetransonic aerodynamic analyi:
A typical example of the integrated use of aerodynamic software, in the sense of the discussion of
section 2, is formed by the NLR XFL022 (program) CYSTEM for the aerodynamic analysis of wing-fuselageconfigurations in transonic flow, [27]. The system comprises an extended version of tht Jamtson-Cauhe-yFL022 wing alone code, [28], the NLR subbonic PANEL METHOD, [10] and the 3D turbulent boundary Iay, r cseaBOLA, (29], as well as several auxiliary ri-dules (Fig. 16). The wdifi ations and txttnsion3 to thecode include a modified boundary condition in tne plane (of symmetry) at the wing root, allowing themodeling of wing-fuselage interference through the prescription of a non-zero spanwise velocity component.The manitude of the latter is obtained from a panel method calculation for the complete configuration.
The XFLO22 SYSTEM is used to check the design of wings obtained through the "equlvalent s,%!,"approach described in section 3.4.1, and for estimating the transonic off-design characteriztics of thuue(and other) wings. For such purposes it is necessary to perform comput tions for 20 to 25 angle-of-attackMach-number combinations within, preferably, one, or at most two succc lve overnight batch rode runs (pro-and post-processing being executed inte.'actively). In the absence of acctes to a class VI computer such a5the CRAY I or Cyber 205 this requires a fast transonic code.Computational speed was the main motive for chcin , the (X)FL022 code. In it's present NLP version it i-almost 3.5 times faster than FL027 and almost 10 times faster than the more sophisticated FL028 and FLO sO
finite volume codes. The system has, nevertheless, been constructed such that the XFL022 code can bereplaced by a faster and/or geometrically more versatile one when it becomes available.
Some of the possibilities of the system are illustrated by figs 17, 18, 19. Figure 17 presentsexamples o2 standard graphics output; pressure distributions and isobar patterns, boundary layer surfasestreamlines and momentum thickness. Figure 18 illustrates the improved pressure prediction capability ofthe system relative to the original FLU2,. The improvement is jarticularly noticeable near the wing roUt.
The drag prediction capability of the system is illustrated by figure 19. Figure 19a presents acomparison of calculated and measured drag polars for a narrow-body type subsonic transport at a Cub-critical and a supercritical Mach number. The drag at constant lift is presented in figure 19b. Furtherexamples may be found in [27].
Examples such as those given above serve to illustrate the point that the capabilities of a suitablyintegrated aerodynamic software system far exceed the bum of the capabilities of the individual components.As far as the XFL022 SYSTEM is concerned this is particularly true for the drag prediction capabilities.The diagnostic means provided by the latter have proven to be extremely valuable in drag minimizationstudies.
4. CONCLUDING REMARKS
In the preceeding sections examples have been discussed of the application of computational method.in aerodynamic design and analyscs. Also some general remarks have been given with respect to requirement-for "optimal" usage of computational aerodynamic software in the research/design sulsport environment ofthe aeronautical research laboratory in it's role as consultant to the aircraft industry.
While the examples show that much has ben achieved in the field of prediction of aerodynamicinterference effects and the computational design of configurations with the allowance for or the activeutilization of interference, there re7,ins far more to be done. This is narticularly true for iht -fcdominated by viscous effects, and, perhaps to a lesser extent, for transonic interference involvingcomplicated gecmetrical configurations. With the former, even the modelling of the physics (turbulence!)still poses foriidable problems. For the latter, spatial grid generation is, ofcourse, the pacing item.Depending, to some extent, on the computer power available,the development of "robust" fast solvers isanother subject of importance.
Regardless of the "progress-in-depth" in computational fluid dynamics, "progress-in-breadth", in theform. .f intcgrated cft.are iytems, . ,&1y Aeirbi in order to be abl to make optimal usage ofdevelopments in CFD. The same is true, ofcourse, for the other disciplines in aircraft design, not tomention the "altimate" integration problem of multi-disciplinary design!.
5. REFERENCES
1. Jameson, A.; "Review: Inviscid Computational Methods", Lecture presented at AGARD-FDP-VKI Specialcourse on "Subsonic/Transonic Aerodynamic Interference for Aircraft", May 1983.
2. Slooff, J.W.; "Computational Methods for Subsonic and Transonic Aerodynamic Design", idem.3. Yoshihara, H; "Review: Viscous Interactions", idem.4. Rettie, I; "Aerodynamic Design for Overall Vehicle Performance", idem.5. Loeve, W.; "An Infrastructure for Computational Fluid Dynamics to Serve Computer Aided Design",
Invited paper (in Dutch) presented at symposium for users of finite element methods, Delft Universityof Technology, Sept. 3, 1982 (NLR MP 820)6).
6. teerema, F.J., and Vaxi Hedel, H.; "An Engineering Data Management System for Computer Aided Design",NLR MP 82050 U, 1982.
7. Rubbert, P.E., and 3aaris, G.R.; "Review and Evaluation of a Three-Dimensional Lifting Potential Flowhnalysis Method for Arbitrary Configurations", AIAA Paper No. 73-188, Jan. 1972.
8. Labrujere, Th. F., and Sytsma, H.A.; "Aerodynamic Interference Between Aircraft Components: Illustrationof tbe Possibility for Prediction", ICAS Paper, 1972, also NLR MP 72020 U.
9. Tinoci, E.N., and Rubbert, P.E.; "Panel Methods: PAN AIR", Paper presented at Interntinal Center forTransportation Studies (ICTS) Short Course on "Computational Methods in Potential Aerodynamics", Ama ifi,Italy, Mqy/June 1982.
10. Labrujere, Th. E., Loeve, W., and Sloof", J.V.; "An Approximate Method for the Calculation of thePressure Distribution on Wing-Body Combination at Sub-critical Speeds", AGARD CP. No. 71, Paper 11,1970.

7-6
11. Voogt, N., and van der Kolk, J. Th.; "Design Study for the Inner Wing of a Transonic Wing-BodyCombination of Aspect Ratio 8", AGARD CP. No. 285, Paper 25, 1980.
12. Joosen, C.J.J., and Sytsma, II.A.; "Calculation of Some Aerodynamic Aspects of Rear-Mounted High-Bv-Fa1&-Ratio Engines", Unpublished NLR Report, 1977.
13a. Voogt, N., van Hengst, J., van der Kolk, J.Th;"Aerodynamic Aspects of a High By-pass Ratio EngineInstallation on a Fuselage Afterbody", AGARD CP. No. 301, paper 29, 1981
13b.Sytsma, II.A.; Unpublished NLR Report.114. Rip, C.ll.; NLR unpublished work15. Sytsma, H.A., Slooff, J.W., Jans.en, Th., and Nijhuis, G.N.; "Theoretical rtermination of Aerodyntrdc
Aircraft-Store Interference for a Fighter Aircraft with Underwing Store", "LR TR 77026 U, 1977.16. Smith, A.M.O.; "High-Lift Aerodynamics"; J. Aircraft, Vol. 12, No. 6, June 1975.17. Labrujere, Th. E.; NLR Report to be published.18. Van Egmond, J.E., v.d. Betrg, B., and Labrujere, Th. F.; NLR Report to be published.19. Munk, M.M.; "The Minimum Induced drag of Airfoil", NACA Report 121, 1921.20. van den Dam, R.F.; "SA.MID, An Interactive System for the. Analy .ij and Constrained Minirrizt ion of
Induced Drag of Aircraft Configuration", AIAA Paper 83-0095, Jan. ,O83.21. Slooff, J.W., and Voogt, N.; "Aerodynamic DVsign of Thick, Supercritical Wings through the Concept of
Equivalent Subsonic Pressure Distribution", NLR MP 78001 Uy, June i8.22. Boerstoel, J.W.; "Design and Analyses of a Hodograph Method for the Calculation of -up-,rcritical Thock-
Free Aerrfoils", NLR TR 77046 U, 1977.23. Fray, J.M.J., Slooff, J.W., Poerstoel, J.W., and Kasoies, A.; "Design of Transonic Airfoils; With Given
Pressure Distribution, Subject to Geometric Constraintz", L'R Report, to be published.24. Lock, R.C.; "An Equivalence Law Relating Three- and Two-dinensionatl ressure Distributions",
ARC R&M 3346, 1962.25. Fray, J.M.J., and Slooff, J.W., "A Constrained Inverse Method for the Aerodynamic Design uf Thick Wing-
with Given Pressure Distribution in Subsonic Flow", AGARD CP. No. 285, raper 16, 1980.26. Voogt, N., and Slooff, J.W., "Advanced Aerodynamic Wing Design fur Corsercial Transport-Review of a
Technology Program in the Netherlands", ICAS Paper 82-5.6.1, 1982.27. van de' Vooren, J., van der Kolk, J. Th., and Slooff, J.W.; "A System for the Numerical Simulation of
Sub- and Transonic Viscous Attached Flowr Around Wing-Body Configurations", AI A; piq r 8, -uj- , 1 .28. Jameson, A., and Caughey, D.A. ; "Numerical Calculation of Transonic Flow Past a Swept Wing", ERA
Report COO-3077-1)40, Courant Institute of Mathematical Sciences, N.Y. University, 1977.29. Lindhout, J.P.F., Moek, G., de Boer, E. and van den Berg, B; "A method for the Calculation of i-D
Boundary Layers on Practical Wing Configurations", Transaction of the ASME, March 1981. AlsoNLR MP 79003 U, 1979.

- 7-
7.7
PERFORMANCE GOALS,/PCONSTRAINTS
1NMAN-IN-THE-LOOP
CONSTRAITS -A -I
ERODYNAMICICONTROL TS
PROCESS CONOL
EMETRYOXEAERODYNAMIC BAIE
Pig 1 ypiAN1,wArtfS oyImcdeSnprcs

7.8
WNDTNELSNTESTING ~' DSGL~ J ~~ __ ___ ____ ___ SYSTEM I
EDIPAS
MODEL IMFMANUFACTURINGV*... DATA BASES
GEOMETRY IEXPMVISYSTEMrGEOETY AEROI DA AEROIr---'IDPROCESSINGATA DATA
S(SIGMA) . I
(INFORMATION MANAGEMENT FACILITY)
GRID (" (ENGINEERING DATA INTERACTIVE PRESENTATION AND 'r AERO
GENERATION ANALYSIS SYSTEM) SNYSMIS
/ INTERACTIVEr----1 -, CONTROL
I OTHER 1,A' All II DISCIPLINES i I I
J !J
Fig. 2 Architecture for an aerodynamic information system
4'

a) GEOMETRY OF ACTIVE WING - BODY FAIRING
Ma .4 cp
- original farn
cp -- active fi n
II #f ter" Pi.-j X/C
1) EFFECT OF "ACT!VE "FAIRING ON INNER WING PRESSURE DISTRIBUTION
Fig. 3 "ACTIVE" sliaping of wing-fuselage fai ring b~y means of panel method, IIII
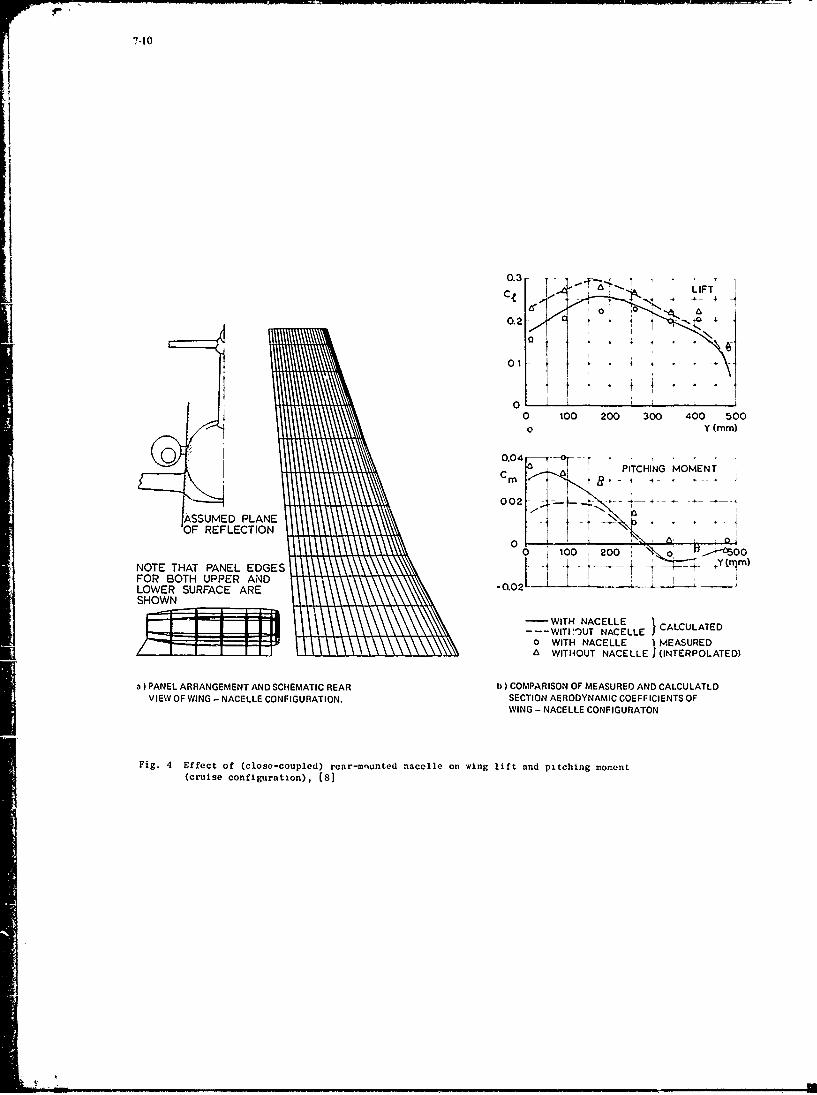
7-10
0.3 ..- % ,L T . .Ct " • ' : , LIFT ]
I0
01
0 100 200 300 400 500o Y (rnm)
SC a PITCHING MOMENT
002 7 -
IASSUMED PLANEOF REFLECTION
0 100 200 : or,-SO O
NOTE THAT PANEL EDGES rFOR BOTH UPPER AND .0.02L 1 ILOWER SURFACE ARESH OWN MX\\\}A
- WITH NACELLE---- WITP'UT NACELLE CALCULATED
o WITH NACELLE I MEASURED& WITHOUT NACELLE I (INTERPOLATED)
a) PANEL ARRANGEMENT AND SCHEMATIC REAR b) COMPARISON OF MEASURED AND CALCULATLDVIEW OF WING - NACELLE CONFIGURATION. SECTION AERODYNAMIC COEFFICIENTS OF
WING - NACELLE CONFIGURATON
Fig. 4 Effect of (close-coupled) rear-mnunted nacelle on wing lift and pitching moment(cruise configuration), [8)
= -

7!1
a ) CONFIGURATION PANELING
Ct x NACELLE OFFA m.f.r. 2.3 NACELLEo m.f.r. 0.4 ON
2.5 .____ _ m.f.r. = MASS FLOW RATIO
it\
2.\0
b ) SPAN WISE LIFTDISTRIBUTION }_\CENTRE-LINE NACELLE
0 .2 .4 .6 .8 1.0tj
Fig. 5 Effect of nacelle flow on lift (take-off configuration, a = 180), (121
I

7.12
BODYCONTOURING
I GiOMETRI, UF CONFIGURATION
AORIGINAL I
.( CONTOURED)
b EFFECT Of BODY CONTOURING ON PRESSURE DISTRIBUTION
Ic I ,n- measured MB ,5 rai 0
A wpp-P
-fr-C
6.g
A A A A
c )COMPARISON OF MEASURED AND CALCULATED PRESSURES
Fig. 6 Rear-mounted high-bypass ratio nacelles; a local interference problem

7-13
FLIGHT" CONF.
CP
a ) CONFIGURATION PANELING
u 0
q=3 CP
£ 0 1.0
=.5X5:IC
IORAD
CpP
o. f/ .5 10 XI
Cp/
__ _1 =.25
b) 1.0G LOEXI RAEPRSUE
Fi. Ude-in plo/acll itefrecestd

7-14
C
-01 0
06
0 jM~ ?'
200, 00 XA
-2I
olRIO
02
0
00 000
00 0?800 0
'-2 0
R02 R05,
F104 R0R180 ns F
A05 807
1lVAR VIEWOF NACELLE(STARBOARD)
d) NACELLE PRESSURES
Fig. 7 Continued

7-15
A'Y7 CON VENTIONAL STING
i j .... . - 4-.. - .- - -
IX -h BLADE STING
a) PANEL, ARRANGEMENTS
P1I AD[ StING CONJ\rNTIONAL STING
0
-.02-
AoEXPERIMENT
-THEORY
AC J .0A
-2 0 CL
b)I COMPARISON OF MEASURED AND .ALCULATED MODELSUPPORT INTERFERENCE
IWINDTUNNEL h'JDEL SUPPORTED BY VERTICAL STRUT WITH DUMMY STINGS
Fig. 8 Assessment of sting support interference
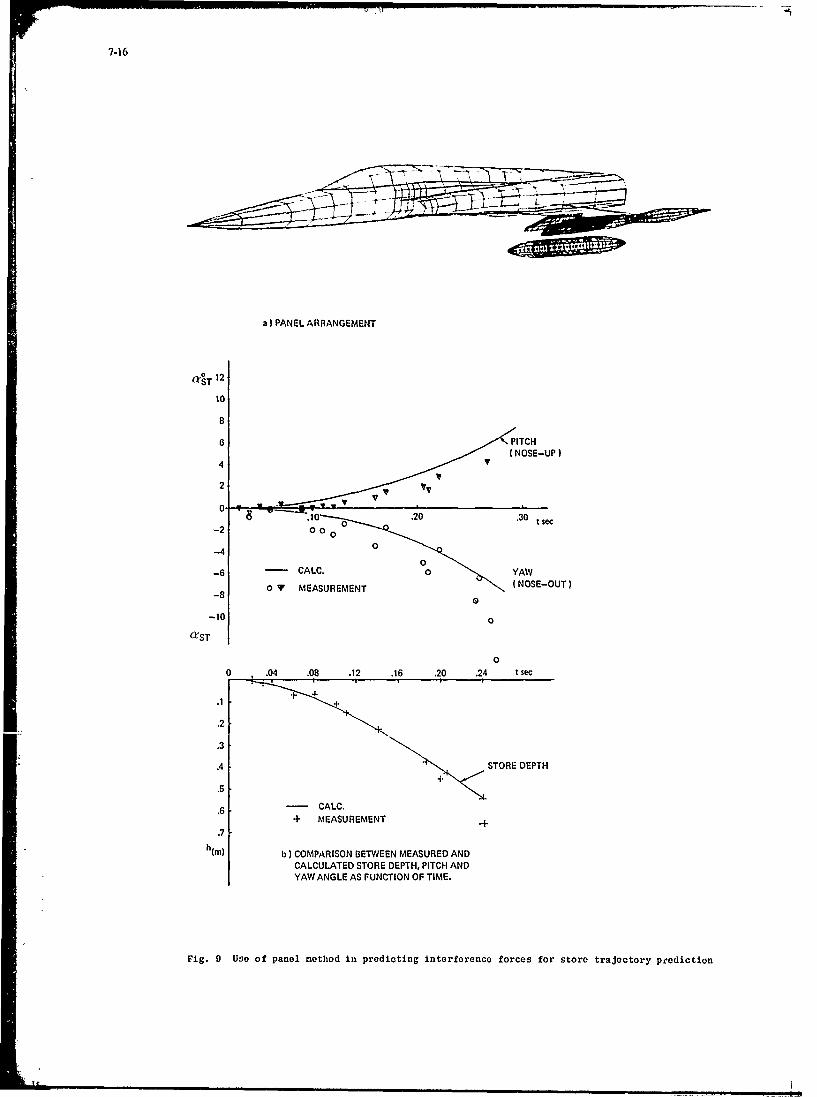
7-16
a) PANEL ARRANGEMENT
aT 12
10
8
6 PITCH4
• (,NOSE-UP)
4
2
0-00 7 v- - .10 o---" ^ .20 .30 c
-2 000O
-4 C0
0-6 CALC. 0 YAW
0 Y MEASUREMENT (NOSE-OUT)
-8
(ST
00 .04 .08 .12 .16 .20 .24 t sec
.1
.2
.3
.4 STORE DEPTH
.5
.6 - CALC.+ MEASUREMENT 4
.7
h(m) b) COMPARISON BETWEEN MEASURED AND
CALCULATED STORE DEPTH, PITCH ANDYAW ANGLE AS FUNCTION OF TIME.
Fig. 9 Use of panel method in predicting interference forces for store trajectory prediction
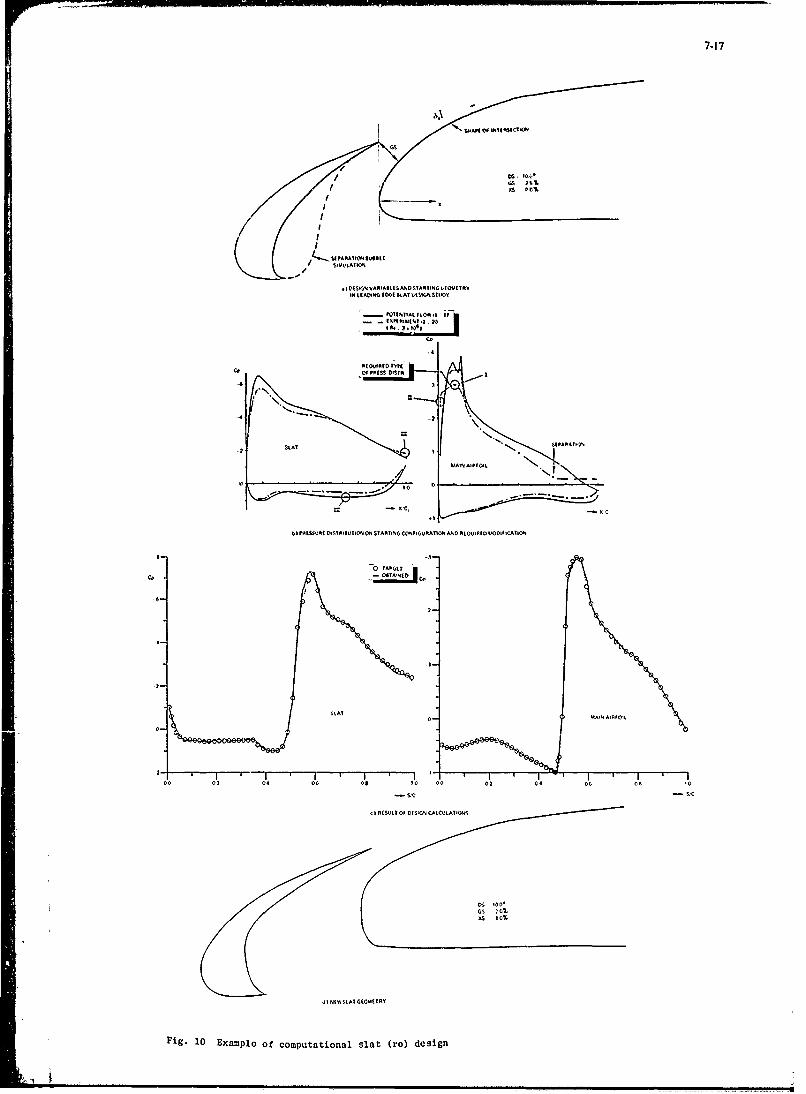
7-17
I-- $PARAIYMk4Lt
IN ttANG (Mt SCAT OtSAG44SUIDY
- ?OII.?,A I IOWI-
C..
M(WA(O-2
14 PLS~T ~TAIV1~~ Tls D'ST ATO ','Iu12R2,A~
UA APAAT
rk"AMNAIM1OIk
00 02 04 00 08 0$ 0 '00 02 04 06 0$ to
SI SIC
I3 86606? Of O(VGN1 CAtC 66110140
M$ t00*GS 20%
Fig. 10 Example of computational slat (re) design

7-18
4 (.
-SCO
01 v n 0 I v
L L -
WOTASODAM
Fig. 11 Experimental results for computationally designed slat of figure 10 (Rie =3x10 6

7-19
bT(a ROETINONOTH REFZ LN
TYY01 h 'T h
0 W/B
1/4 m~a1/4
g()SOVIEW
Fig.3 12SLTyo nu aaeosfr rme nue rgmnmzto

7-20
a) SKETCH OF AIRCRAFT CONFIGURATION
?T
N.1
-
+
• i + , , i • + i r , , . .- 1 .. . ..
b) BOUND-CIRCULATION FOR C G AT c) BOUND-CIRCULATION DISTRIBUTION FOR TWO30%MAC (CMw -0 09) DIFFERENT VALUES OF THE WING-PITCHING
W/o MOMENT CGEFFICIENT I LOW-TAIL CONFIGURATION,CG AT 25%MACI
w7 2
OF 10_, ...1 WI -
d)INLENE FTHE WING/IBODY PITCHING MOMENT e) EFFECTS OF THE LOCATION OF CENTER OF GRAVITY
COEFFICIENT C". ON THE MINIMUM TRIMMED AND THlE TAIL HEIGHT RELATIVE TO THE WING_W/B ON THE MINIMUM TRIMMED INDUCED-DRAG
INDUCED-DRAG (CM6 0 007; C.G. AT 25%MAC) C MI -0 09
C • , , +( 992 ]
. + +,++- ++ ,+t o 0(07
o .
°0 *1 02 02' 04 o' *4 o
t"A7OAM CO 07017.01%
f THE AIRCRAFT CONFIGURATION WITH PYLON/NACELLEAND FLAP-RAIL FAIRINGS, DESIGNED FOR MINIMUMTRIMMED INDUCED DRAG (C G. ATN32%MAC I
Fig. 13 Examples of trimmed induced drag minimization studies

7.21
I transonicI ~exact
I~ U~ equvalent
irvtially estimated
Vying geoiretry
30 target presuedistribution
eqiuyalent aubseiiocNi1dyss ; /NLR Panel method
3 D
designiverse panel met
with gemtic constraints
Fig. 14 Transonic wing design through equivalent subsonic pressure distribution
-EXPECTED'b'Zbe- _CP -o. MEASURED M .7
CL .45
Fig. 15 Comparison of expected and measured pressure distribution in transonic flowC for wing designed by means of 2D transonic and 3D subsonic theory
CPADNEL MEHO .FOT C0
(BIN DOWBEINGRGIDpIMPIERINAE) IPEETD
Fig. ~ ~ ~ ~ ~ PA 16 Sc ai ofNRXL2 ytmfrte nlsso igfslgconfigurtions in tanoncfo
TRMPOCDR

7-22
a) SOBR PTTEN AD SCOPRUE I STIUON
- "f %P LS U 3~?~ l~'%sS 31Ut 0 *tINl
<7A.
-r--r-7~ .l..i/- PAis/
b)~~~~~ ~ ~ ~ ~ "NMRCLSRAEOLFO ITRE )"UEIA AERK AA
Fig.___ 179 ' F02wn-uslg rnoi aayi ytmexample of 7t r grphc oupu
&.

7-23
TIP CUTOFF SA DATAFL2 M 75]IN CALCULATION ~XFL4t,22 NLR (1 -0 1,
Lz 0.7720
z 0.3-132
%
0.1287b)
Fig. 18 Ex-l o- prssr prdcto ca-ilt of-RX sse
exermet.0S0
ne~~Re.. 25 10.5 fixed:.nt~rdI~c
c 0 , ~ boexperimentglHST
Iwn /o nda*rxucy l nue drag-IF L4 22 N O22I
co...... ex wing' bodya L S W L L one
Re .00 2 5 0! rnito oxda 5 hr
C) D~O6 .b ii M1 .75(mesued
a)RAGCRATO waT CONTNAHNME0.5od 0. 0. 0.8tod. :c
(etto 1Fi 19 N2 XZ;;tLO221 rag 2 anleor arwbd2rnpr ofgrto
I- L ro

i( 8.1
TRANSONIC EMPERICAL CONFIGUPATION DESIGN PROCESS
by Richard T. WhitcombDistinguished Research Associate
Langley Research Center, NASAHampton, Virginia 23665
U.S.A.
1EaCEDING Pa BLAW-NOT FlIUMSUMMARY
This lecture describes some of the experimental research pertaining to transonicconfiguration development conducted by the Transonic Aerodynamics Branch of the NASALangley Research Center. Discussions are presented of the following: use of florescentoil films for the study of surface boundary layer flows; the severe effect of windtunnel wall interference on the measured configuration drag rise near the speed of soundas determined by a comparison between wind tunnel and free air results; the developmentof a near sonic transport configuration incorporating a supercritical wing and anindented fuselage, designed on the basis of the area rule with a modification to accountfor the presence of local supersonic flow tbove the winq; a device for improving thetransonic pitch up of swept wings with very little added drag at the cruise condition; ameans for reducing the large transonic aerodynamic interference between the wing,fuselage, nacelle and pylon for a fuselage mounted nacelle having the inlet above thewing; and methods for reducing the transonic interference between flows over a wingletand the wing.
SYMBOLS
c mean aerodynamic chord
CD drag coefficient, Drag/qS
CL lift coefficient, Lift/qS
CM pitching moment coefficient, pitching moment/qSc
Cp pressure coefficient, pt - p./qS
M Mach number
pk local static pressure
pW free stream static pressure
q free stream dynamic pressure
INTRODUCTION
Before the recent development of numerical codes for three dimensional transonicflow, such as these described in several preceding lectures, the development ofconfigurations intended for operation at transonic speeds was primarily an empericalprocess. Most of the designs were based on extensive wind tunnel data from systematicinvestigations and tests of specific configurations. These new analysis methods havegreatly improved the design process. The transonic characteristics of liftingwing-fuselage combinations, including the effects of unseparated boundary layers can nowbe calculated quite well. However, the theoretical methods generally available stillcannot handle conditions with separated boundary layers or complex configurations suchas these with nacelle-pylon arrangements or external stores. Resort must still be madeto the wind tunnel to develop the most satisfactory overall configuration for thecomplete operating envelope of an airplane. In other lectures presented here, resultsof a number of experimental programs in Europe and the United States will be presented.In this lecture the discussion will be limited to experimental research carried out atthe Transonic Branch of the NASA - Langley Research Center. Consideration will be givento the technics used to guide configurations development, a wind tunnel wallinterference problem, some of the configuration design problems encountered and selectedsolutions to these problems.
EXPERIMENTAL TECHNICS
The experimental development of transonic configurations need not be blind cut- andtry. Various experimental technics have been developed over the years which greatly aidin the determination of the actual flow over a configuration and thus provide the basisfor the rational development of the configuration. The most used and probably the mostvaluable technic is the measurement of pressure distributions. Also, at condition forwhich extensive shock waves are present schlieren pictures can be quite helpful. Sincemost aerodynamicists are familiar with these technics no further discussion is needed.
-t I - j r Il£ - t-- - r *

A very important tool for locating some of the sources of aerodynamic problems is a
means for indicating visually the airflow In the boundary layer. Several methods areavailable. Tufts have been used for years to indicate boundary layer flow for subsonictype configurations. However, for transonic configurations the tufts available untilrecently caused unacceptable interference effects on the flow being observed. Recently,Iiowever, very fine florescent tufts have become available (Ref. 1) which provide goodIndication of the boundary layer flow without interfering with it. These tufts, whichare being used by several organizations in the United States, are especially useful forindicating massive separation. The method used extensively by the author and others tovisualize the boundary layer Is the florescent oil film technic (Ref. 2). In thismethod, a lubricating oil with a florescent power added is coated on the model surfaceand illuminated with ultraviolent light. With airflow over the model the oil moves toconform with boundary layer flow at the surface of the model. Numerous experiments haveindicated that the presence of the oil has no measurable effect on the aerodynamiccharacteristic of the model. This technic, while inferior to the fine florescent tuftsfor indicating massive separation, can indicate laminar boundary layer transition,incepient separation, boundary layer thickening before separation, shock bourdary layerinteraction and separation bubbles which the tufts cannot. For moderate separation thetwo methods are arguable of equal usefulness.
To illustrate the indications provided by this oil film technic several typicalphotographs will be discussed. The oil film on a high aspect ratio NASA supercriticalwing at the design Mach number and lift coefficient is presented in figure 1. Tosimulate full scale Reynolds numbers the transition trip is located at the 35% chord onthe outer panel (Ref. 3). It is angled forward inboard so as to be ahead of the obliqueshock eminating from near the leading edge of the wing-fuselage juncture. Thetransition at the trip is indicated by the fine lines of oil behind th.? trip. The shockwave is indicated by the spanwise line at about the 70% chord line. 1,1e boundary layerdeceleration as it moves through adverse pressure gradient att of the 90% chord line isshown by the thickening of oil in this region. A small region of separation near theiaiiing edge just outboard of the planform trailing edge break is indicated by the
accumatlon of oil in this region. The oil film on the same wing at a higher liftcoefficient is shown in figure 2. The oil film indicates a significant region ofboundary layer separation on the aft part of the wing outboard the trailing edgeplanform break. The outward flow of the boundary layer in the separated region also canbe seen.
WIND TUNNEL WALL INTERFERENCE NEAR MACH NUMBER OF 1.0
Transonic wind tunnel wall interference effects has been studied extensively overthe years. Reasonably reliable methods for calculating these effects at primarilysubsonic or supersonic conditions have been available for some time. However, forconditions where the flow field in the tunnel is primarily supercritical, that is with alarge region of supersonic flow immersed in a subsonic field, methods for thecalculation of the wall interference effr, t hase only recently become available (Ref. 4for example).
As part of the overall development program of a near-sonic transportconfigurations, to be discussed in the next section, the problem of supercritical wallinterference near a Mach number of 1.0 .as explored experimentally. The free air dragrise for a supercritical body of revolutlon, as developed in a wind tunnel, wasdetermined using a freely falling body (Ref. 5). The test configuration is shown infigure 3. The results of this investigation were much more accurate than those of amuch earlier in estigation (Ref. 6). The drag rise characteristics for the same finnedconfiguration was also measured in the Langley 8' and 16' transonic tunnels. Acomparison of the results of these investigations is presented in figure 3. At Machnumbers below the drag rise the drag creep for the body in the 16' tunnel is roughly thesame as that mesaured in free air. However, that for the body in the 8' tunnel issubstantially greater due to larger conventional wall blockage in this tunnel. The dragrise Mach number measured in the two wind tunnels i, approximately the same, 0.99.However, the drag rise measured in free air is only 0.98. At higher Mach numbers thedrag rise for the body in the 8' tunnel is substantially less than that in the 16'tunnel. Obviously these blockage effects measured near the speed of sound are oppositeto those usually measured or calculated at lower Mach numbers. Pressure distributionsmeasured on the tunnel wall indicate that they are associated with an expansion of thesupercritical flow region to the tunnel wall.
To evaluate the magnitude of this blockage problem a series of supercritical bodiesof different size were investigated in the Langley 8' and 16' tunnels (Ref. 7). Some ofthe results are presented in figure 4. Drag rise characteristics which approximatedthose for free air were not achieved until the blockage rate was reduced to .00017.However, a reasonable indication of the drag rise Mach number was achieved for ablockage ratio of .00034. These blockage values ere associated with much smaller mudelsthan those generally utilized in transonic investigations. Results for models with suchlow blockage ratios would be severely distorted by Reynolds number effects. Also, theywould generally be too small to incorporate pressure tubing. Therefore, it would not bereasonable to make models this small. Since these effects are associated primarilywith flow phenomena at a significant lateral distance from the mndel it is probable thatthey are primarily a function of the longitudinal area developmunt for the model. Thus
irl
8-3
a reasonable procedure for investigations in this Mach number range should be to usemodels of rat ional size to investigate the details of a configuration and then correctthe drag rise characteristics by the drag increments between those measured for twoequivalent bodies of the configurations. One body would have the blockage area of theactual model and another an area of roughly .0002. This is the procedure which was usedin the development of near sonic transport configuration to oe discussed in the nextsection.
DEVELOPMENT OF A NEAR SONIC TRANSPORT CONFIGURATION
Following the initial development of the NASA supercritical airfoil several UnitedStates government agencies undertook an extensive research and development program toexploit the various applications of this concept. As part of this program Langleyinitiated the development of a transport configuration with substantially higher cruiseMach numbers than those for the then current designs since the historic trend had beento continually higher speeds for each newer generations of such vehicles. Specificallythe configuration was desig ed to achieve a cruise speed as close to the speed of soundas possible utilizing both the new airfoil and an uncompromised application of the arearule. This research involved the solution of a number of challenging interferenceproblems and a summary of this work should be pertinent to the subject of thisconference.
The wing developed for this configuration is shown in figure 5. The NASAsupercritical airfoil would provide a major part of the desired increase in the designspeed of the wing, however, not all of it. Therefore, the quarter chord sweep of thewing was increased to 420 from the 350 to 370 of the then current configurations. Theaspect ratio was made similar to the then current practice, 7.0. Wing section thicknessratios somewhat greater than those for the then current configurations weie incorporatedto eliminate the structural weight penalty associated with the increased sweep. Thethick forward glove provided an extension of the longitudinal area development for thewing, which would allow a more gradual indentation of the fuselage as defined by theArea Rule. The airfoil shapes shown were developed emperically. The airfoils for theoutboard region are quite similar to those developed earlier in a two dimensional'yinvestigation (Ref. 9). However, at the wing fuselage juncture the airfoil deviatedsubstantially from sections developed two dimensionally. Pressure distributionmeasurements, oil film studies and wake surveys indicated that a drag rise Mac F of 0.99was achieved for the wing.
Even with the most ideal functioning of the area rule the drag rise Mach number fora total configuration cannot be greater than that for the equivalent body. Therefore,to achieve a total configuration with the best possible drag rise Mach number theequivalent body must also have a superior drag rise. Using the principles arrived atduring the development of the NASA supercritical airfoil a supercritical body ofrevolution was developed (figure 6). The area development for this body is also shown,For the forward part of this body the second derivation of the area variation isinversely proportional to the area. For the aft part the second derivative of the areavariation is constant. A fineness ratio of 9.0 was selected to provide a reasonablefineness ratio for the fuselage when the cross sectional area equivalent to that for thewing is removed. The pressure coefficients pressure measured on this body at a Machnumber of 0.98 are approximately constant from 10% to 80% of the length. As discussedin the previous section the free air drag rise Mach number is 0.98. A numerical code isnow available for calculating the supercritical flow on a body of revolution near thespeed of sound (Ref. 10).
The total configuration is shown in figure 8. It incorporated two nacelles mountedon the sides of the fuselage and one in the vertical tail. The horizontal tail waslocated at the top of vertical surface. The fuselage was initially shaped on the basisof the simple linear area rule to provide the overall area development of thesupercritical body of revolution described previously. The initial investigations ofthe configuration without nacelles or tail surfaces indicated that for the cruise liftcoefficient the drag rise occurred earlier than for an equivalent body wth the same windtunnel blockage. The flow surveys obtained for the wing, as mentioned earlier, hadindicated that this premature drag rise was not associated with local rFod conditions onthe wing. Schlleren photographs indicated that this excessive drag was associated withextensive normal shock waves located longitudinally near the leading edge of the root ofthe wing and near the wing tip. At the zero lift condition the shock waves disappearedand the drag rise for total configuration was much closer to that for the equivalentbody. These results indicated that the effective cross sectional area for a wingincreases with the addition of lift at least for supercritical wings near the speed ofsound. This increase is associated with stream tube expansion in the local region ofsupersonic flow just above the wing for these lifting conditions. For the flow fieldsat greater distances from wing this expansion is equivalent to a greater physical crosssectional area.
On the basis of two dimensional calculations of local supersonic flow fielexpansion and wind tunnel experiments the fuselage cross sectional area was moditied asshown in figure 7. The extraneous shock waves at lifting conditions disappeared and thedrag rise approached that for the equivalent body (Ref. 11). Since the experimentalwork just described analytic procedures have been developed which provide at least anapproximation of the modifications required in the area equivalent for the wing at lift

8-4
conditions (see Ref. 12, for example). However, the extreme sensitivity of the flowover the wing to detail in the fuselage shaping will probably still require that themodification be refined on the basis of wind tunnel investigations.
Following the development of this near sonic transport configuration, three UnitedStates transport manufacturers made design studies of actual transports based on thisdesign. However, follwing of the abrupt increase in fuel prices in 1974 all work on anear sonic transport configuration was stopped. At that time the airlines became farmore interested in increasing fuel efficiency than in greater speed.
A MEANS FOR PITCH-UP IMPROVEMENT
The supercritical wing used for the near sonic transport described in the precedingsection was demonstrated in flight using the U.S. Navy F8 as a test bed. The initialdevelopment of the wing was done on the wind tunnel model of this flight configuration(Ref. 13). Initial results from this investigation indicated a severe pitch up problemassociated with the increased sweep of the wing. This is illustrated by the results forM = 0.95 presented in figure 9. The slope of the pitching moment curve breaks upward ata lift coefficient of 0.8. To achieve an acceptable wing configuration and, moreimportantly, to assure pilot safety during the flight program it was required that thispitch up be eliminated. An oil film study of the boundary layer flow on the uppersurface of the wing for a Mach number of 0.95 and a lift coefficient of 0.92 (fig. 10)indicates that the outboard region is completely stalled. In addition there is strongoutward flow of the boundary in the midspan part of the wing toward the separatedregion, as has been noted during many previous flow studies on swept wing for similarconditions. As has been noted by previous investigators, this outward flow greatlythicIens the boundary layer on the outboard region which s~verely aggravates theseparation problem there.
In the past, various devices such as large fences and leading edge notches havebeen investigated as mearps to reduce the spanwise flow. However, these usuailly causedsubstantial increases in drag at high subsonic speed cruise conditions. To greatlyreduce the pitch up without a signficant drag increase we turned to a device invented atthe Douglas Aircraft Company which they calved a vortelon. It consists of a wing likesurface which extends downward below the leading edge of the wing at about the 30%semispan station. It significantly improved the deep stall problem for the DC9, but hadlittle effect oai pitch up. For the F8 pitch up problem a surface simlar to the vortelonwas placed below the leading edge at the 60% semispan station (figure 11). It iscambered with curvature outwaid. With this surface installed the pitch up was greatlyreduced for all Mach numbers (figure 9, for example). Also the pilot experienced nopitch up problems during the flight tests.
An oil film study of the boundary layer flow on the upper surface of the F8 wingwith this surface installed for the same conditions as those of figure 10 is presentedin figure 12. A distinct line In the oilflow eminates rearward from the position ofauxiliary sirface. At the line, the spanwise flow of the boundary layer is stopped andthe outboard separation is greatly reduced. The surface produces a discontinuity ofcirculation around the swept leading edge which results in a vortex above the uppersurface. The rotation of this vortex is such that at the surface the flow is inward.This inward flow of higher energy air drawn from outsideboundary layer by the vortex stops the outward flow of the lower energy air in theboundary layer. The action is quite similar to that produced by a notch of the leadingedge as has been used on previous wings. HowevLr, the present surface, called a lowersurface vortex generator, caused an increase in the dr'ag coefficient at the cruisecondition of only .0003.
A substantial delay in the break of the lift coefficient versus angle-of-attack anda large reduction in the high lift drag were also associated with addition of theauxiliary surface. It would be expected that it also reduces buffet at high liftcoefficients. More complete results from the wind tunnel investigation are presented inreferences 14 and 15. Similar surfaces can also be used to improve the high liftcharacteristics of wings with lower sweep but with higher aspect ratios. Also they canbe used to improve the characteristics of swept fighter winigs. However, they must bedeveloped emperically using the observed boundary layer flow phenomena as a guide.Since the surface produces the favorable effect by reducing the spanwise flow in theboundary layer it is important that it be placed at the spanwise station where this flowis greatest, not where the separation is greatest.
FUSELAGE MOUNTED NACELLE INTERFERENCE
Among the areas of transonic aerodynamics that still cannot be handled adequatelyby generally available numerical methods is the flow interference between enginenacelles and wings. The interference for underwind mounted nacelles is considered inother lectures. The interference between fuselage mounted nacelles and thewing-fuselage combination will be discussed here. For larger transport type airplanewith fuselage mounted nacelles, the nacelles are t-sually located sufficiently far behindthe wing so that the flow interference between the two components is insignificant.However, for smaller business jet size aircraft the balancing of the airplane usuallyrequires that the nacelle be placed close to the wing. Wind tunnel information has beenobtained for a number of such aircraft. While much of this information is proprietary,a number of business jets have been investigated in NASA facilities during cooperativeprograms so that the results are generally available. Some of these will be discussed.
Generally, it has been found that the most important factor determining theinterference between the nacelle wing and fuselage is the longitudinal location of thenacelle with respect to the wing. For configurations with swept wings and the inlet ofthe nacelle at or just aft of the inboard wing trailing the transonic interference canbe favorable, the drag rise for the wing fuselage nacelle comoination being higher thanthat for the wing-fuselage. The nacelle, operating at the normal cruise mass flowratio, produces a significant postive pressure field ahead of it. This pressure fieldmoves the shock location on the inbord region of the wing forward of that for thewing-fuselage along. As a result the sweep of shock on the critical middle region ofthe wing is increased and the drag rise for that region is improved.
For configurations with the forward region of the nacelle overlapping the aftportion of the wing, the interference can be very adverse. This arrangement, which isusually required to balance configurations with unswept wings, is illustrated in figure13. To indicate the causes of this adverse interference for such arrangements and toillustrate how it can be substantially reduced, the results of a wind tunnelinvestigation of this configuration (Ref. 16) will be discussed. The configurationincorporated a replacement NASA supercritical wing which had the same planform and waslocated longitudinally at the same location as the original wing. The supercriticalwing as first tested was designed by the sponsoring company with very littleconsideration of the effects of the nacelle. The pressure distribution on the side ofthe fuselage of the configuration as first tested for the near design condition is shownin figure 14. Ar. extreme negative pressure peak corresponding to a local Mach number of1.4 occurs at a longitudinal location just forward of the wing trailing edge. The peakresults in a strong local shock wave which caused local boundary layer separation on theside of the fuselage and on the pylon. As indicated in figure 15 these effects rdsultedin a severe drag creep for the configuration
To reduce the pressure peak the upper surface of the wing and the pylon weremodified as shown in figure 16. In particular the wing surface was made concave at thelocation of the negative pressure peak. The added wing depth and length of the nacellewas required to achieve the desired concavity without cutting into the rear spar of thewing. (It also resulted in a desired increase of the fuel volume.) The concavitygreatly improved the local longitudinal area development for the channel defined by theupper surface of the wing, the fuselage, the lower surface of the pylon, and the lower,inner quarter of the nacelle. The change reduced the local pressure peak (figure 14)with a resulting reduction of the local shock strength and the associated boundary layerseparation. The drag coefficient at a Mach number of 0.80 was reduced by .0080 (figure15). This channel area rule concept was used intially to overcome a very severewing-nacelle-pylon interference problem for the Convair 990 and has been used over theyears to solve the problem on other configurations. However, this may be the first casein which the wing was modified rather than the nacelle or pylon as has been done forprevious problems.
WINGLETS
Winglets, small approximately vertical wing like surfaces placed at the tips ofwings, have now been applied to a number of aircraft. They are incorporated onproduction versions of several business jets for example and have been flight tested onthe U.S. Air Force KC 135, and Douglas DC 10 (figure 17). In most cases t ey weredesigned following the procedures described in reference 17. While a reascnable closeapproximation of the most satisfactory configuration can be achieved withot.t resort towind tunnel tests, the tuning of the final still requires some experiments. Inparticular, tlie optimum toe in must be determined by a systematic test. Also forapplications intended for high speeds the problems associated with the interferencebetween supercritical flow fields over the inner surface of the winglet and the uppersurface of the wing must be solved experimentally. This interference can cause a strongshock wave at the juncture of the winglet and wing whcih results in boundary layerseparation in the juncture region. In several cases this problem has been eliminated byindenting the upper surface of the wing in the vicinity of the winglet. As for the caseof the fuselage mounted nacelle described earlier, this is essentially a localapplication of the area rule. This special shaping is particularly important forapplications to configurations with supercritical airfoils since the use of suchairfoils results in supercritical flow velocities above the wing farther aft on thechord.
REFERENCES
1. Crowder, J. P.: Florescent Mini Tufts for Non-Intrusive Flow Visualization.MDC-J7374, McDonald Douglas Company, 1977.
2. Loving, Donald; and Katzoff, S.: The Florescent-Oil Film Method and OtherTechniques for Boundary-Layer Flow Visualization. NASA MEMO 3-17-59L, 1959.
3. Blackwell, James A.: Preliminary Study of Effects of Reynolds Number andBoundary-Layer Transition Location on Shock-Induced Separation. NASA TN D-5003,1968.
4. AGARD Fluid Dynamics Panel Specialists' Meeting on Wall Interference in WindTunnels. AGARD CP 335, 1982.

8.6
5. Thompson, Jim Rogers: Measurements of the Drag and Pressure Distribution on a Bodyof Revolution Throughout Transition From Subsonic to Supersonic Speeds. NACA RML9J27, 1950.
6. Usry, J. W.; and Wallace, John W.: Drag of a Supercritical Body of Revolution inFree Flight at Transonic Speeds and Comparison with Wind-Tunnel Data.NASA TN D-6580, 1971.
7. Couch, Lana M.; and Brooks, Cuyler W., Jr.: Effect of Blockage Ratio on Drag andPressure Distributions for Bodies of Revolutions at Transonic Speeds.NASA TN D-7331, 1973.
8. Whitcomb, Richard T.: A Study of the Zero-Lift Drag-Rise Characteristics ofWing-Body Combinations Near the Speed of Sound. NACA Rep. 1273, 1956.
9. Whitcomb, R. T.: Review of NASA Supercritical Airfoils. The Ninth Congress of theInternational Council of the Aeronautical Sciences, Haifa, Israel,Paper No. 74-10, 1974.
10. South, J. C., Jr.; and Jameson, A.: Relaxation Solutions for Inviscid AxisymmetricTransonic Flow over Blunt or Pointed Bodies. Proceedings of AIAA ComputationalFluid Dynamics Conference, July 19-20, i73, pp. 8-17.
11. Langhans, Richard A.; and Flechner, Stuart G.: Wind-Tunnel Investi gation at MachNumbers from 0.25 to 1.01 of a Transport Configuration Designed to Cruise atNear-Sonic Speeds. NASA TM X-2622, 1972. (Declassified)
12. Barnwell, Richard W.: Approximate Method for Calculating Transonic Flow aboutLifting Wing-Body Configurations. NASA TR R-452, 1976.
13. Bartlett, Dennis W.; and Re, Richard J.: Wind-Tunnel Investigation of BasicAerodynamic Characteristics of a Supercritical-Wing Research AirplaneConfiguration. NASA TM X-2470, 1972. (Declassified)
14. Harris, Charles D.; and Bartlett, Dennis W.: Wind-Tunnel Investigation ofEffects of Underwing Leading-Edge Vortex Generators on a Supercritical-WingResearch Airplane Configuration. NASA TM X-2471, 1972. (Declassified)
15. Bartlett, Dennis W.; Harris, Charles D.; and Kelly, Thomas C.: Wind-TunnelDevelopment of Underwing Leading-Edge Vortex Generators on a NASASupercritical-Wing Research Airplane Configuration. NASA TM X-2808, 1973.(Decl assi fied)
16. Bartlett, Dennis W.: Application of a Supercritical Wing to an Executive-Type JetTransport Configuration. NASA YM X-3251, 1975. (Declassified)
17. Whitcomb, Richard T.: A Design Approach and Selected Wind Tunnel Results at HighSubsonic Speeds for Wing-Tip Mounted Winglets. NASA TN D-8260, 1976.

Z( ,L[ 7<7t .'
t ObNAGA bl COU ACGL /V? IOU f|iA1 /
Figure 4.- Comparison of drag rischaracteristics for super-
Figure 1.- Oil film study on high aspect critical bodies of revolutionratio NASA supercritical wing with various wind tunnelat near cruise condition, blockage ratios.
/ ///
// /
/ /
/ // / /
/ /
/ /
Figure 2.- Oil film study on high aspect Figure 5.- Airfoil shapes forratio NASA supercritical wing supercritical wing on nearat lift coefficient above sonic transport.cruise value.
BtOCKAGERATIO K K.08 FLIGHT 0 A" A P A
16It.T .0 8 maCD MCDM= 0.90 8It. IPI .0O80
/7 A
0 - -AmaxI t ... .. I I
.90 .92 .94 .% .98 1.00 1.02M =
5 1.0Figure 3.- Comparison of drag rise
characteristics for super- maxcritical body of revolution asmeasured in free flight and in Figure 6.- Supercritical body ofwind tunnels. revolution.

8.8
-IA o ZRO-LtI SIKAPt
¢ROS ~ ~ ~ f~ -, t8)l¢lIt l
AREA
Figure 7,- Second order area-ruleconsiderations.
Figure 10,- Oil film study on wing uppersurface without leading edgevortex generators at14 = 0.95.
WING CROSS SECTION
Figure 8.- Near sonic transportconfiguration.
VORTEX-GENERATOR CROSS SECTION
Figure 11.- Sketch of leading-edge vortexgenerator.
.24-VORTEX GENERATORS
1 -ON.16 /- - OFF Vortex je rierato
Cm0
-.08 /
-.16
- .24 I I I" 1.2 -. 8 -. 4 0 .4 .8 1.2 .
C L
Figure 9.- Effect of leading edge vortexgenerators on pitching momentcharacteristics of Figure 12.- Oil film study on wing uppersupercritical wing at surface with leading edgeM = 0.95. vortex generator at M = 0.95.

tNACEtWINLT1
CONVIGURATION\FIN.ALINITIAL P YLON
le ~LO'.ER SURFACES
Figure 16.- Wing-root airfoil andipylonmo difications for businessjet.
Figure 13.- Model of business jet withsupercritical wing.
-1.2
-.8 -0 ORIGINAL0 41ODiFIED
C ____ - -- C SONIC
0
.72 .76 .80 .84 .88 .92 Fgr 7-M~nelDulsD-DwtFUSELAGE STATION Fgr 7-M~nelDulsO-0wt
I wi ngl ets.
Figure 14.- Pressure distributions onside of fuselage of businessjet, MN 0.80.
.012ACD =CD, MCD. M=0.60
INITIAL PYLONS, AND
NAACESO INITIAL PYLONS
FINAL PYLONS, AND ADNCLENACELLES ON CE S0OFF
.0 .65 .70 .75 .80 .85MACH NUMBER. M
Figure 15.- Effects of wing-root andpylon modifications on dragrise characteristics forbusiness Jet, CL = 0.25.

9.
AERODYNAMIC INTERFERENCE - A GENERAL OVERVIEW
A B HainesChief Executive
Aircraft Research Association Ltd .....Manton Lane, Bedford, UK
I-.ECE-DI14G PAGE BLANK-NOT FM M
SUMMARY
This lecture contains a general survey of the sources of aerodynamic interference and shows how adverseinterference can be avoided and favourable interference exploited in the optimisation of the design ofcomplete configurations for modern civil transport and military combat aircraft. The survey is wide ranging,many concepts are introduced with suitable examples in the expectation that these will be discussed in moredetail in subsequent lectures. The basic nature of wing-body interference is however discussed at somelength since these effects are at the root of much of what is to follow. Naturally, there is considerableemphasis on means to reduce profile, vortex and transonic wave drag but it is also stressed that favourableinterference concepts can be employed to improve usable lift for manoeuvre and to optimise stability andcontrol characteristics at high incidence.
1 INTRODUCTION
The previous lectures in this course have reviewed the present state-of-the-art in advanced theoreticalmethods for the design of aircraft for high subsonic and transonic speeds, and have shown how to design two-dimensional wing sections and three-dimensional wings in isolation. We now turn however to the more complextask of optimising the design of a complete aircraft configuration with full regard for the aerodynamicinterference between the flow over different components of the aircraft. This lecture contains a generalsurvey of how interference can arise, the emphasis being on the physical nature of the interference ratherthan on the methods for calculating the flow. It is hoped that in this way, the lecture will serve to focusattention on ideas and concepts that will enable the designer to avoid adverse interference and to exploitfavourable interference.
The lecture starts by considering the simplest case - the interference between a wing and fuselage ininviscid, incompressible flow. Viscous effects are then introduced and then, the effects in transonic,supercritical flow when the interference is no longer confined to the immediate vicinity of the wing-fuselage junction. Examples are included to show how, at high subsonic and transonic speeds, the flow overthe entire wing can be affected significantly by interference from the fuselage. Adverse interference canbe avoided or at least alleviated by appropriate shaping of the fuselage, by applying area rule principles,dnd by the use of suitable fairings in the wing-fuselage junction.
The lecture then considers other examples of aerodynamic interference in a complete aircraft configuration,eg
(i) between the wing and pylon-mounted nacelles or external stores,(ii) between the wing and nacelles mounted on the rear fuselage,
(iii) between bodies in close proximity as for example, in an array of external stores,(iv) in non-planar configurations such as a wing fitted with winglets or sails,(v) between the flow over the wing and the flow field of a forward surface such as a canard or strake.
The lecture emphasises that for flight at high subsonic and transonic speeds, favourable interference is areal possibility. In other words, the interference between different flow fields can be exploited to produce
(a) a more highly swept isobar pattern over a given planform,(b) more lift in regions where there is little risk that this will lead to more profile drag or wave drag,(c) less lift-dependent drag(d) less wave drag(e) a more acceptable flow breakdown at high CL and more usable lift
than would be achieved with the best possible wing design in isolation.
Many of the examples are drawn from the author's own experience. This is consistent with the aims of thelecture series; the author is well aware that similar examples could have been drawn from other sources, aswill be evident in later lectures.
2 WING-BODY INTERFERENCE: INVISCID, INCOMPRESSIBLE
In the classical concept of aircraft design, the wings provide lift and the fuselage provioes volume.Originally, it was believed that these functions could be discharged independently. This principle wasfirst enunciated by Sir George Cayley [1] in 1810 and apparently confirmed in papers by Lennertz [21 andVandrey [3) in 1927 and 1937 who claimed that the lift on an unswept wing mounted centrally on a simplefuselage treated as a sphere would be the same as on the wing without the fuselage. However, it has nowbeen knoun for more than 30 years, that these early analyses are oversimplified and indeed, misleading.Interference effects are in fact present even in the simplest case. incompressible, inviscid flow past awing mounted centrally on a fuselage of circular cross-section. Clearly, the effects are largest in theactual wing-fuselage junction and they decay rapidly with distance out along the span. They have beendescribed in depth by KUchemann [4,51 but for the sake of completeness, some of his quoted results arereproduced here in Figs 1-4.
Let us consider first displacement effects at zero lift ignoring for simpliuity the flow around the fuselagenose. For an unswept wing of finite thickness t mounted in a mid position on a fuselage of radius R,assuming that R is not dramatically greater than t, the wing-fuselage intersection will be waisted and as aresult, even in inviscid flow, the velocities in the junction will be reduced relative to the values furtherout on the span. These interference effects could now be calculated for any specific case by means of

q-2
computer programs based on one of the several available panel methods but the calculated results presentedby Kichemann [51 were obtained by the earlier method j7[ of Weber in which sources were placed inside thebody (and wing) and correcting sources were then introduced on the surface of the body in order to ensurezero velocity normal to the body surface. Approximate second-order numerical solutions of the resultingintegrals were developed and results for two wing-fitselage configurations are shown by curves 1 in Fig 1.These predicted results for inviscid flow cannot be compared directly with the experimental measurementsof Krner. t6, However, by adding the predicted inviscid interference to KUrner's measured results for thewing mounted on a flat plate (curves 2), one obtains curves 3 which, as can be seen, are in reasonableagreement with the measured results for the wing-fuselage. This serves to confirm the predictions for theinterference on the reasonable assumption tlat at zero lift, the viscous effects are similar for the twocases (wing-plate and wing-fuselage). As would be expected from the association with the curvedintersection lines in the wing-fuselage junctions, the reduction in velocity in the junction is greater rorthe case with the smaller fuselage. Two important conclusions for wing-fuselage design can already bedrawn from these simple examples:
(i) it is likely that this form of wing-body interference will permit an increase in wing thicknessichordratio in the junction,
(ii) the velocities on the wing upper surface will tend to be lower for high wing than for low wing layouts.
Similar calculations J71 showed that this interference velocity increment (strictly, decrement) in thejunction varies with wing sweep as shown in Fig 2a, ie in a manner broadly similar to the effect ofsweepback on the velocity distribution at zero lift at the centre section of a syimnetrical three-dimensionalwing. Fig 2b contrasts these two effects for an example where calculations [8,91 and experimentalmeasurements [lO; were made for a tapered wing of 30 midchurd sweepback, aspect ratio 6 and a 9, thickRAE section, tested either as a wing-alone or mounted on a fuselage with R/c - 2/9. The chordwise pressuredistribution at 0.4 x semi-span is little affected by the wing-body interference but in the junction, aswith th, unswept wing of Fig 1, the velocities are again reduced. However, in this simple case with asweptback wing, of constant section shape across the span, mounted on a fuselage with no change in cross-sectional radius opposite the wing, the wing-body interference accentuates the distortion in shape of thechordwise pressure distribution in the junctinn. In passing, it is worth noting that Fig 2b contains acomparison between results calculated by an early version of the RAE standa-d method subsequentlypubli~hed [9[ by ESOU and by the panel method of Hess and A H 0 Smith. k10; Better results would probablybe achieved by modern panel and transonic methods particularly at H = 0.8 bearing in mind that onlyapproximate allowance for compressibility effects was included in these early calculations.
KUchemann [5] pointed out that it was convenient to think of the velocity in the junction being expressedin the form
Vj(x) = VO + vB + vJ + vS +vC (1)
where Vo = freestream velocityv8 z contributions from forebody and afterbodyvj = wing-body interference contribution being discussed herevS = velocity increment over infinite sheared wingvC = velocity increment due to centre effect.
As we have seen, vj is negative for a body with no special shaping but equation (1) is an easy way ofdemonstrating how shaping of the body and thus, modifying the interference effects can be turned to positiveadvantage. For example, choosing the fuselage to give vj -vC will restore the pressure distribution tobe the same as on the infinite sheared wing in the presence of the forebody and afterbody. Since vj isgenerally negative and vB positive, one might achieve vj + vB + vC , 0 and thus, a flow near the junctionthat has more effective sweep than on the corresponding infinite sheared wing of constant section. Theseremarks serve as a simple introduction to the concepts of favourable wing-body interference developed inmore detail later in the lecture.
Turning now to the lifting effects in inviscid, compressible flow, Weber i11] was one of the first to givean explanation for the mistaken concept of zero interference referred to earlier. The wing flow is modifiedby the velocity field of the sources representing the fuselage, this field induces zero downwash at anygiven line vortex but (and this is the essential point) the downwash distribution does not approach zeroas the line vortex-T approached from either side. Therefore, representing the wing loadng by a chordwisedistribution of bound line vortices leads to a non-zero change in the chordwise and spanwise loading due tothe wing-body interference. The effects on the spanwise loading for an unswept rectangular wing mounted ona cylindrical fuselage are shown in Fig 3; it is clear that the interference effects as calculated by Weber[11] are in close agreement with the measured results of KOrner. [6] The interference can be termed'adverse' in the sense that if no change is made to the wing or body design, the region of the wing nearthe junction will not carry its fair share of the total lift; allowance for the effects should be made whenchoosing the camber and twist for the wing design or to put the conclusion in the language of moderntransonic theory, wings should be designed by wing-body programs or at least, wing-alone programs withboundary conditions at the root representing the flow past the fuselage.
3 WING-BODY INTERFERENCE: VISCOUS EFFECTS
It is likely that most newcomers to the subject of aerodynamic interference think first of the adverseviscous effects which are frequently observed when a wing is mounted on a body. All readers will have seenpictures showing the flow over an inner wing disturbed by interference from a relatively thick boundarylayer on the side of the fuselage, and vortices forming ahead of the wing root leading edge and trailingalong the side of the fuselage above or below the wing. Such pictures emphasise the need for fairings toeliminate these potential sources of interference drag.
To begin with a simple example, let us return to Fig I which presents some measured results (curve 2) fora wing mounted on a flat plate. In the junction, the pressure coefficients are only about 80% of thevalues on the wing well away from the junction. This reduction must be related to a viscous effect that ismore complex than just a local thickening of the wing boundary layer. Secondary flows can develop [121 in
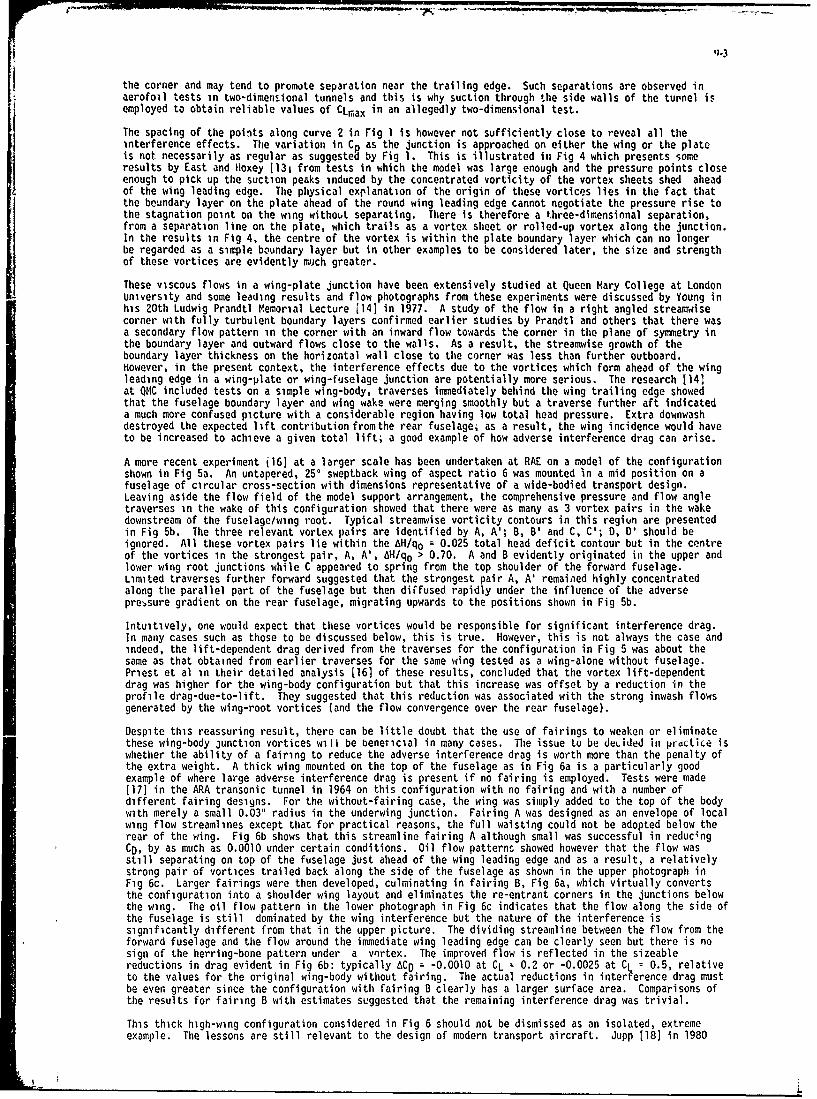
the corner and may tend to promote separation near the trailing edge. Such separations are observed in
aerofoil tests in two-dimensional tunnels and this is why suction through the side walls of the turnel isemployed to obtain reliable values of CLmax in an allegedly two-dimensional test.
The spacing of the points along curve 2 in rig i is however not sufficiently close to reveal all theinterference effects. The variation in C, as the junction is approached on either the wing or the plateis not necessarily as regular as suggested by Fig 1. This is illustrated in Fig 4 which presents someresults by East and Hoxey il31 from tests in which the model was large enough and the pressure points closeenough to pick up the suction peaks induced by the concentrated vorticity of the vortex sheets shed aheadof the wing leading edge. The physical explanation of the origin of these vortices lies in the fact thatthe beundary layer on the plate ahead of the round wing leading edge cannot negotiate the pressure rise tothe stagnation point on the wing without separating. There is therefore a three-dimensional separation,from a separation line on the plate, which trails as a vortex sheet or rolled-up vortex along the junction.In the results in Fig 4, the centre of the vortex is within the plate boundary layer which can no longerbe regarded as a simple boundary layer but in other examples to be considered later, the size and strengthof these vortices are evidently much greater.
These viscous flows in a wing-plate junction have been extensively studied at Queen Mary College at LondonUniversity and some leading results and flow photographs from these experiments were discussed by Young inhis 20th Ludwig Prandtl Memorial Lecture 1141 in 1977. A study of the flow in a right angled streanraisecorner with fully turbulent boundary layers confirmed earlier studies by Prandtl and others that there wasa secondary flow pattern in the corner with an inward flow towards the corner in the plane of symmetry inthe boundary layer and outward flows close to the walls. As a result, the streamwise growth of theboundary layer thickness on the horizontal wall close to the corner was less than further outboard.However, in the present context, the interference effects due to the vortices which form ahead of the wingleading edge in a wing-plate or wing-fuselage junction are potentially more serious. The research I141at QMC included tests on a simple wing-body, traverses immediately behind the wing trailing edge showedthat the fuselage boundary layer and wing wake were merging smoothly but a traverse further aft indicateda much more confused picture with a considerable region having low total head pressure. Extra downwashdestroyed the expected lift contribution fromthe rear fuselage; as a result, the wing incidence would haveto be increased to achieve a given total lift; a good example of how adverse interference drag can arise.
A more recent experiment j16] at a larger scale has been undertaken at RAE on a model of the configurationshown in Fig Sa. An untapered, 25' sweptback wing of aspect ratio 6 was mounted in a mid position on afuselage of circular cross-section with dimensions representative of a wide-bodied transport design.Leaving aside the flow field of the model support arrangement, the comprehensive pressure and flow angletraverses in the wake of this configuration showed that there were as many as 3 vortex pairs in the wakedownstream of the fuselage/wing root. Typical streamwise vorticity contours in this regiun are presentedin Fig 5b. The three relevant vortex pairs are identified by A, A'; B, B' and C, C'; D, D' should beignored. All these vortex pairs lie within the AH/q0 = 0.025 total head deficit contour but in the centreof the vortices in the strongest pair, A, A', AH/qo > 0.70. A and B evidently originated in the upper andlower wing root junctions while C appeared to spring from the top shoulder of the forward fuselage.Limited traverses further forward suggested that the strongest pair A, A' remained highly concentratedalong the parallel part of the fuselage but then diffused rapidly under the influence of the adverseprebsure gradient on the rear fuselage, migrating upwards to the positions shown in Fig 5b.
Intuitively, one would expect that these vortices would be responsible for significant interference drag.In many cases such as those to be discussed below, this is true. However, this is not always the case andindeed, the lift-dependent drag derived from the traverses for the configuration in Fig 5 was about thesame as that obtained from earlier traverses for the same wing tested as a wing-alone without fuselage.Priest et al in their detailed analysis [16] of these results, concluded that the vortex lift-dependentdrag was higher for the wing-body configuration but that this increase was offset by a reduction in theprofile drag-due-to-lift. They suggested that this reduction was associated with the strong inwash flowsgenerated by the wing-root vortices (and the flow convergence over the rear fuselage).
Despite this reassuring result, there can be little doubt that the use of fairings to weaken or eliminatethese wing-body junction vortices will be beneticial in many cases. The issue to be deLided in practice iswhether the ability of a fairing to reduce the adverse interference drag is worth more than the penalty ofthe extra weight. A thick wing mounted on the top of the fuselage as in Fig 6a is a particularly goodexample of where large adverse interference drag is present if no fairing is employed. Tests were made[171 in the ARA transonic tunnel in 1964 on this configuration with no fairing and with a number ofdifferent fairing designs. For the without-fairing case, the wing was simply added to the top of the bodywith merely a small 0.03" radius in the underwing junction. Fairing A was designed as an envelope of localwing flow streamlines except that for practical reasons, the full waisting could not be adopted below therear of the wing. Fig 6b shows that this streamline fairing A although small was successful in reducingCD, by as much as 0.0010 under certain conditions. Oil flow patterns showed however that the flow wasstill separating on top of the fuselage just ahead of the wing leading edge and as a result, a relativelystrong pair of vortices trailed back along the side of the fuselage as shown in the upper photograph inFig 6c. Larger fairings were then developed, culminating in fairing B, Fig 6a, which virtually convertsthe configuration into a shoulder wing layout and eliminates the re-entrant corners in the junctions belowthe wing. The oil flow pattern in the lower photograph in Fig 6c indicates that the flow along the side ofthe fuselage is still dominated by the wing interference but the nature of the interference issignificantly different from that in the upper picture. The dividing streamline between the flow from theforward fuselage and the flow around the immediate wing leading edge can be clearly seen but there is nosign of the herring-bone pattern under a vnrtex. The improved flow is reflected in the sizeablereductions in drag evident in Fig 6b: typically ACD m -0.0010 at CL = 0.2 or -0.0025 at CL = 0.5, relativeto the values for the original wing-body without fairing. The actual reductions in interference drag mustbe even greater since the configuration with fairing B clearly has a larger surface area. Comparisons ofthe results for fairing B with estimates suggested that the remaining interference drag was trivial.
This thick high-wing configuration considered in Fig 6 should not be dismissed as an isolated, extremeexample. The lessons are still relevant to the design of modern transport aircraft. Jupp [181 in 1980

emphasised that the present trend towards exploiting advanced wing technology In terms of greater wingthickness/chord ratio particularly at the wing root, has accentuated the need for, and value of, wing rootfillets. Jupp contrasted t . ..;perience with the A3UO and A310. Fig 7a shows the wing root section of t0eA310 with the outlines of tie root fillets incorporated on the A300 and A310. Developing a leading edgefillet completely to suppres, the vortex pair ahead of the root leading edge gave a reduction of 1.5 inthe cruise drag of the A310 iith its relatively thick root section compared with only 0.5 for the A300and the reductions in draq achieved on the A310 with the larger A310 fillets compared with those for theA300 are quoted on Fig 7a. The smooth flow on the A310 leading edge fillet is shown in Fig 7b.
Other examples could doubtless be adduced and clearly, for transport aircraft it. particular, the art offillet design should not be forgotten as a means of eliminating adverse interference drag. The word 'art'is used advisedly. -d generation techniques and methods for allowing for viscous effects, eg Eulersolutions, will have to advance much further before the design of fillets and fairings can be handledsolely by a theoretical approach. At present, the best results are still obtained by the experiencedexperimental aerodynamicist who has a feel for what constitutes a 'good shape' and a 'smooth flow'. Hisaim will be to
Eliminate flow separations including those that lead to stand-off vortices,Alleviate strong cross-flows in the boundary layer,Merge different airstreams as smoothly as possible,Avoid gross thickening of different boundary layers and wakes.
Much can be achieved in a low speed tunnel or even in a water tunnel. 119; A good general rule is thatalthough in a poor junction or on an unsatisfactory fairing, flow separations are often observed at therear, the trouble spot to be tackled by the designer will be at the front.
It should be noted that fairings and fillets can be - and often are - used not merely to eliminate adverseinterference as above but also as a means of introducing favourable interference. The flow field roundthem can serve to induce extra lift on the wing in regions where otherwise, the local velocities are low.As a result, the critical section of the wing can be unloaded for a given overall CL, and drag-rise andbuffet boundaries improved. Flap track fairings are a good illustration. These are also discussed byJupp [181 who showed that for both the A300 and A310, it was possible to design flap track fairings thatwere successful in delaying the wing drag-rise with Mach number to an extent that within the cruise flightenvelope, addition of the fairings actually reduced the total aircraft drag. In both cases, the successfulfairings increased CL at a given incidence and Jupp concludes 1171 that this favourable effect iscritically dependent on the size and shape of the fairings near the wing trailing edge. It is intriguingthat an optimised configuration is not necessarily the one that succeeds in hiding its flap supports withinthe wing!
4 WING-BODY INTERFERENCE: EFFECTS AT TRANSONIC SPEEDS
4.1 Influence of Body on Wing Flow
The general aims of many high speed wing designs can be summarised as follows:
(i) for a transport aircraft, to carry the required lift in the cruise with as little wave, viscous andvortex-induced drag as possible, with an adequate margin to buffet while meeting all practicalconstraints,
(ii) for a military combat aircraft, to carry as much lift as possible on the sustained manoeuvreboundary as defined by a certain level of wave drag, and on the instantaneous manoeuvre boundarybeyond which the flying qualities create problems, or in other words, high CL for both a certainlevel of wave drag and separation onset and a reasonable stall development beyond separation onset.
The wing-body interference effects already discussed remain relevant. In principle, the effects werepresent even in low speed flow but their consequences can be far greater at high speeds. Any reduction inlift or effective sweepback due to an interference effect near the wing-body junction, if uncorrected inthe design process, would tend to degrade the wing design performance as described above but the changeswith Mach number are not just a question of aegree. When the flow is LrdfiWuiih, frrtLL which wereconfined near the junction at subcritical speeds, can propagate laterally and affect the flow over thecomplete wing - even a high aspect ratio wing of a typical transport layout. The presence of the bodyclearly modifies the flow over the wing near the root and as appreciated rapidly by every theoreticaldesigner of a sweptback wing, conditions near the root rapidly modify the flow over the rest of the wing.It is now generally accepted that advanced wings should be designed whenever possible by wing-body progrdmsand it has been an urgent need in recent years to develop programs capable of handling complex body shapesand arbitrary wing-body settings and positions.
Many examples could be quoted at this point but two should suffice; first, a simple case shown in Fig 8and second, a more realistic combat aircraft design in Fig 9. To consider Fig 8 first, tests were made inthe ARA 9ft x 8ft transonic tunnel on a half-wing model, 25^ sweptback, untapered, the same section shapethroughout and mounted on a parallel half-fuselage with the nose section sufficiently far ahead that itsinfluence on the wing flow can be safely ignored. Calculations of the pressure distribution for thestation marked r = 0.37 at M = 0.86, a a 4.20 were made by the Forsey wing-alone 1201 and wing-body [211full potential programs and compared with experimental data. Good agreement is shown in Fig 8 with thewing-body calculations, both calculation and experiment showing forward and rear shocks but thesupercritical development is quite different in the wing-alone calculations irrespective of whether thewing is treated as a nett wing or a gross wing. Arguably, the gross wing results can be dismissed simplyon the grounds that the wing root is clearly not at the model centre line but the change to the nett wingassumption was found to make little difference. One is left with the conclusion that the experimental dataare significantly affected by wing-body interference, viz a lack of full reflection effect at the wing root.Whether the interference in this case should be regarded as adverse or favourable is not obvious.
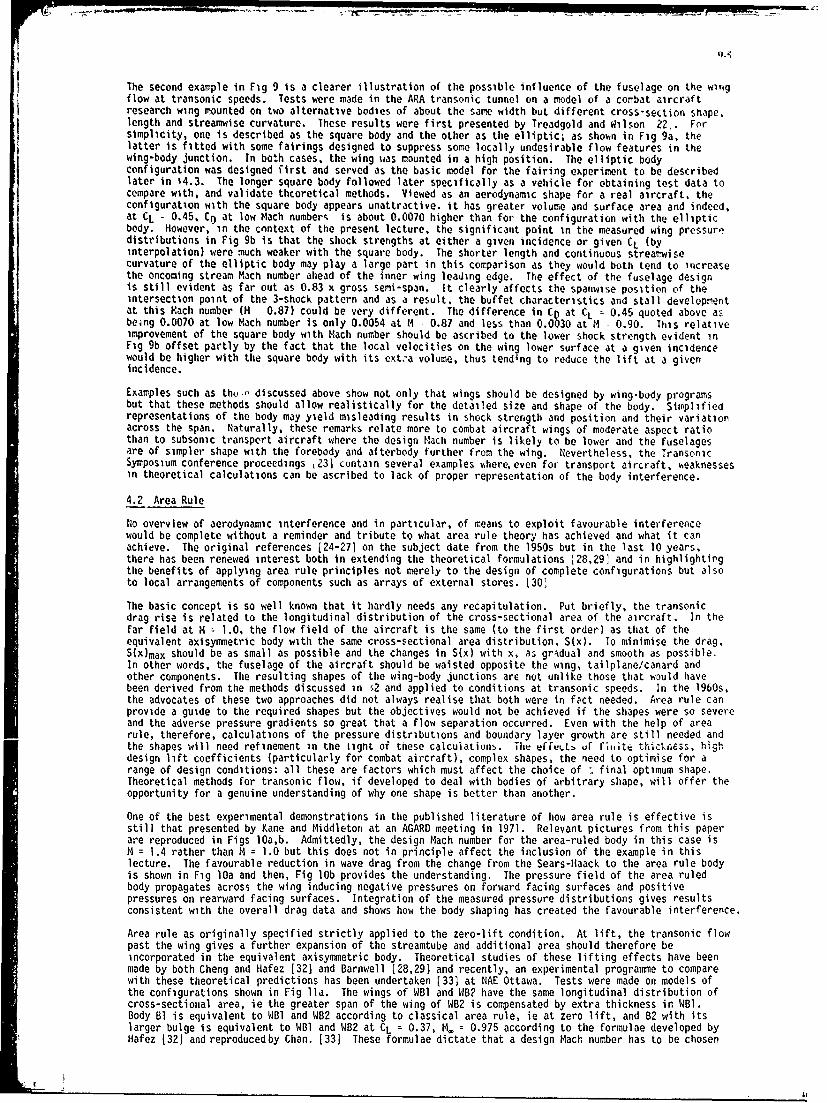
Q.
The second example in Fig 9 is a clearer illustration of the possible influence of the fuselage on the wingflow at transonic speeds. Tests were made in the ARA transonic tunnel on a model of a combat aircraftresearch wing mounted on two alternative bodies of about the same width but different cross-section shape,length and streamwise curvature. These results were first presented by Treadgold and Wilson 22,. Forsimplicity, one is described as the square body and the other as the elliptic, as shown in Fig 9a, thelatter is fitted with some fairings designed to suppress some locally undesirable flow features in thewing-body junction. In both cases, the wing was mounted in a high position. The elliptic body
configuration was designed first and served as the basic model for the fairing experiment to be describedlater in $4.3. The longer square body followed later specifically as a vehicle for obtaining test data tocompare with, and validate thcoretical methods. Viewed as an aerodynamic shape for a real aircraft, theconfiguration with the square body appears unattractive, it has greater volume and surface area and indeed,at CL 0.45, Co at low Mach number is about 0.0070 higher than for the configuration with the ellipticbody. However, in the context of the present lecture, the significant point in the measured wing pressuredistributions in Fig 9b is that the shock strengths at either a given incidence or given CL (byinterpolation) were -much weaker with the square body. The shorter length and continuous streamwisecurvature of the elliptic body may play a large part in this comparison as they would both tend to increasethe oncoming stream Mach number ahead of the inner wing leading edge. The effect of the fuselage designis still evident as far out as 0.83 x gross semi-span. It clearly affects the spanwise position of theintersection point of the 3-shock pattern and as a result, the buffet characteristics and stall developmentat this Mach number (M - 0.87) could be very different. The difference in CD at CL 0.45 quoted above asbeing 0.0070 at low Mach number is only 0.0054 at 4 M 0.87 and less than 0.0030 at H 0.90. This relativeimprovement of the square body with Mach number should be ascribed to the lower shock strength evident inFig 9b offset partly by the fact that the local velocities on the wing lower surface at a given incidencewould be higher with the square body with its ext.'a volume, thus tending to reduce the lift at a givenincidence.
Examples such as thuo discussed above show not only that wings should be designed by wing-body programsbut that these methods should allow realistically for the detailed size and shape of the body. Simplifiedrepresentations of the body may yield misleading results in shock strength and position and their variationacross the span. Naturally, these remarks relate more to combat aircraft wings of moderate aspect ratiothan to subsonic transport aircraft where the design Mach number is likely to be lower and the fuselagesare of simpler shape with the forebody and afterbody further from the wing. Nevertheless, the TransonicSymposium conference proceedings 231 contain several examples %here, even for transport aircraft, weaknessesin theoretical calculations can be ascribed to lack of proper representation of the body interference.
4.2 Area Rule
No overview of aerodynamic interference and in particular, of means to exploit favourable interferencewould be complete without a reminder and tribute to what area rule theory has achieved and what it canachieve. The original references [24-271 on the subject date from the 1950s but in the last 10 years,there has been renewed interest both in extending the theoretical formulations 28,291 and in highlightingthe benefits of applying area rule principles not merely to the design of complete configurations but alsoto local arrangements of components such as arrays of external stores. [30J
The basic concept is so well known that it hardly needs any recapitulation. Put briefly, the transonicdrag rise is related to the longitudinal distribution of the cross-sectional area of the aircraft. In thefar field at M 1.0, the flow field of the aircraft is the same (to the first order) as that of theequivalent axisymmetric body with the same cross-sectional area distribution, S(x). To minimise the drag,S(x)max should be as small as possible and the changes in S(x) with x, as gradual and smooth as possible.In other words, the fuselage of the aircraft should be waisted opposite the wing, tailplane/canard andother components. The resulting shapes of the wing-body junctions arc not unlike those that would havebeen derived from the methods discussed in Q2 and applied to conditions at transonic speeds. In the 1960s,the advocates of these two approaches did not always realise that both were in fzict needed. Area rule canprovide a guide to the required shapes but the objectives would not be achieved if the shapes were so severeand the adverse pressure gradients so great that a flow separation occurred. Even with the help of arearule, therefore, calculations of the pressure distributions and boundary layer growth are still needed andthe shapes will need refinement in the tight of these calcuiatiunb. The efr" Lb uf fiite thickness, highdesign lift coefficients (particularly for combat aircraft), complex shapes, the need to optimise for arange of design conditions: all these are factors which must affect the choice of - final optimum shape.Theoretical methods for transonic flow, if developed to deal with bodies of arbitrary shape, will offer theopportunity for a genuine understanding of why one shape is better than another.
One of the best experimental demonstrations in the published literature of how area rule is effective isstill that presented by Kane and Middleton at an AGARD meeting in 1971. Relevant pictures from this paperare reproduced in Figs lOa,b. Admittedly, the design Mach number for the area-ruled body in this case isM = 1.4 rather than M = 1.0 but this does not in principle affect the inclusion of the example in thislecture. The favourable reduction in wave drag from the change from the Sears-Haack to the area rule bodyis shown in Fig lOa and then, Fig lOb provides the understanding. The pressure field of the area ruledbody propagates across the wing inducing negative pressures on forward facing surfaces and positivepressures on rearward facing surfaces. Integration of the measured pressure distributions gives resultsconsistent with the overall drag data and shows how the body shaping has created the favourable interference.
Area rule as originally specified strictly applied to the zero-lift condition. At lift, the transonic flowpast the wing gives a further expansion of the streamtube and additional area should therefore beincorporated in the equivalent axisymmetric body. Theoretical studies of these lifting effects have beenmade by both Cheng and Hafez [32] and Barnwell [28,29) and recently, an experimental programme to comparewith these theoretical predictions has been undertaken [33) at NAE Ottawa. Tests were made on models ofthe configurations shown in Fig lla. The wings of WBl and 118? have the same longitudinal distribution ofcross-sectional area, ie the greater span of the wing of WB2 is compensated by extra thickness in WB1.Body Bl is equivalent to WBI and WB2 according to classical area rule, ie at zero lift, and B2 with itslarger bulge is equivalent to WB1 and WB2 at CL m 0.37, M. = 0.975 according to the formulae developed byHafez [32] and reproducedby Chan. [33] These formulae dictate that a design Mach number has to be chosen

!! o.6
but the change in body shape with design Mach number is small, the variation in Smax with a change fromM = 0.8 to M 1.1 being only 10 .
Comparisons of the measured drag from these tests are presented in Figs llb,c. They are encouraging. Atzero lift in the upper picture, the variation of the wave drag coefficient, ACDo with 14. for WB2 with its4.4 thick wing is almost identical with that of the equivalent body B1; for WB1 with its 8 thick wing,the transonic drag rise is about 10, greater, presumably because of the stronger shock on the thicker wing.The corresponding comparison for CL z 0.37 in the lower picture is broadly similar although numerically,not as good because the wave drag of B2 is less than that of W12 as well as WBI. Chan concludes howeverthat these results do not invalidate the fermulae for the lifting effects; rather, he ascribes the lowerwave drag of B2 to the observed presence of a flow separation on the rear of the larger bulge which hasserved to weaken the shock on 02 relative to WB1 and WB2.
The results of these basic research experiments therefore provide experimental support for area rule buteven for the simple configurations in Fig 11, viscous effects are already intruding into the comparisons.The next section, s4.3, extends the discussion to *he effects of bed; shaping for configurations closer toa real aircraft,
4.3 Favourable Inter'erence from Body Waistin.
Only limited opportunities for exploiting favourable interference through body shaping can be found insubsonic transport aircraft design. First, the design cruise Mach numbers have rarely exceeded M 0.80and second, the requirements for a pressurised cabin obviously rule out any idea of an indented fuselage.To add bulges to the fuselage opposite the wing leading and trailing edges will only give a nett benefitif the favourable interference outweighs the extra profile drag associated with the increased surface area.Nevertheless, the fillets and fairings discussed earlier as a means of alleviating adverse viscous effectsand inducing extra lift on 'safe areas of the wing surface' frequently improve the aircraft areadistribution and thus, weaken the shock on the inner wing. If, however, design cruise Mach numbers hadincreased to nearer M = 1.0 - as was expected in the early 1970s ahead of the first fuel crisis - a shapedfuselage would probably have been an essential element of any viable transport design. Results 1341 forsuch a configuration are presented in Fig 12.
The plan geometry of this near-sonic transport design is shown in Fig 12a. A complete model was firsttested in the ARA transonic tunnel with a simple parallel fuselage and the CD - 14 curve in Fig 12b fallswell short of the design target of cruising efficiently at M = 0.95. If the three-dimensional wing designhad been successful in achieving the performance of the equivalent two-dimensional section convertedmerely on the basis of the mid-chord sweepback, a cruise Mach number of more than M = 0.96 would have beenpossible. A shortfall of this magnitude would not necessarily occur if this design exercise were repeatedin 1983. This particular three-dimensional wing was designed in 1972 before any of the present methodsfor transonic flow calculations became available. The model with the parallel fuselage was tested in 1974and by then, the first transonic small perturbation (TSP) method had been developed at RAE. [35] Thisprovided an opportunity to improve the configuration. It was still felt that any revised wing design wouldbe in difficulty meeting the ambitious design target. It was feared that extreme and unacceptable changesin geometry would be needed if all the treatment was confined to the wing. The more attractive option wasto study what could be achieved with a shaped fuselage - described in Fig 12 as a 'waisted fuselage' but inreality, including bulges fore and aft of the wing with a concave region in between as shown in Fig 12a.The longitudinal distribution of the cross-sectional area of the configuration with the waisted fuselage isnot smooth in a detailed sense but is clearly mrre uniform than the distribution for the original wing +fuselage. On area rule principles, it should have less wave drag near M 1.0 than the original, despitethe increase in Smax . The measured drag results plotted in Fig 12b confirmed these hopes: the 1 4 0.95target was achieved at the expense of an increase in drag at lower Mach numbers such as M = 0.90(accentuated at higher CL, not shown in Fig 12b).
Despite present lack of interest in a near-sonic transport, it is worth discussing this example in moredetail as it illustrates some useful general points. First, some comments on the design of the fuselagebulges. Calculations were first made of the flow field around the isolated body and the local streamdire~tiuii rio, this calculation -ere specified as boundary conditinnq at grid points used bv the TSPprogram for calculation of the flow over the wing treated as a nett wing alone: a useful expedientparticularly in 1974 when there were no wing-body programs and even now, perhaps useful in gaining anappreciation of the effects of small changes in body shape. Comparison of these results with thosecalculated with zero slope boundary conditions in the root reflection plane, ie for the low wing on theparallel fuselage, suggested that the waisted fuselage would succeed in its main design aims to weaken andmove forward the aft shock on the inner wing. The measured results for M z 0.95 presented in Fig 12cconfirm that these aims have been achieved. At M = 0.90, however, the corresponding results in Fig 12dshow that the strength of the shock wave on the forward inner wing has been increased by the flow fieldinduced by the forward bulge - hence, the somewhat greater wave drag in this concition. Several flow fieldcalculations and iterations of shape had to be performed for the body alone, primarily to obtain asatisfactory flow over the rear bulge.
The general lessons from this exercise include the following:
1) Area rule can provide a general guide to the shape of body that will give favourable interference -substantial in this particular case but calculdtions of tie transonic flow over both the body aloneand the wing-body combination are needed to refine the shape.
2) When the flow is supercritical, the body flow field propagates much further out (and rearward whenthe wing is sweptback) than would be expected simply from the body-alone calculations.
3) Even with a wing of high aspect ratio, the body effects can therefore extend out to near the wing tip:in the present case, a forward movement of the shock from about 0.65c to about 0.55c was observed at0.9 x semi-span at M = 0.95.
4) The benefits of the fuselage shaping can vary with M (and CL) and the benefits and indeed, possiblepenalties in different conditions have to be assessed against the aircraft requirements. The
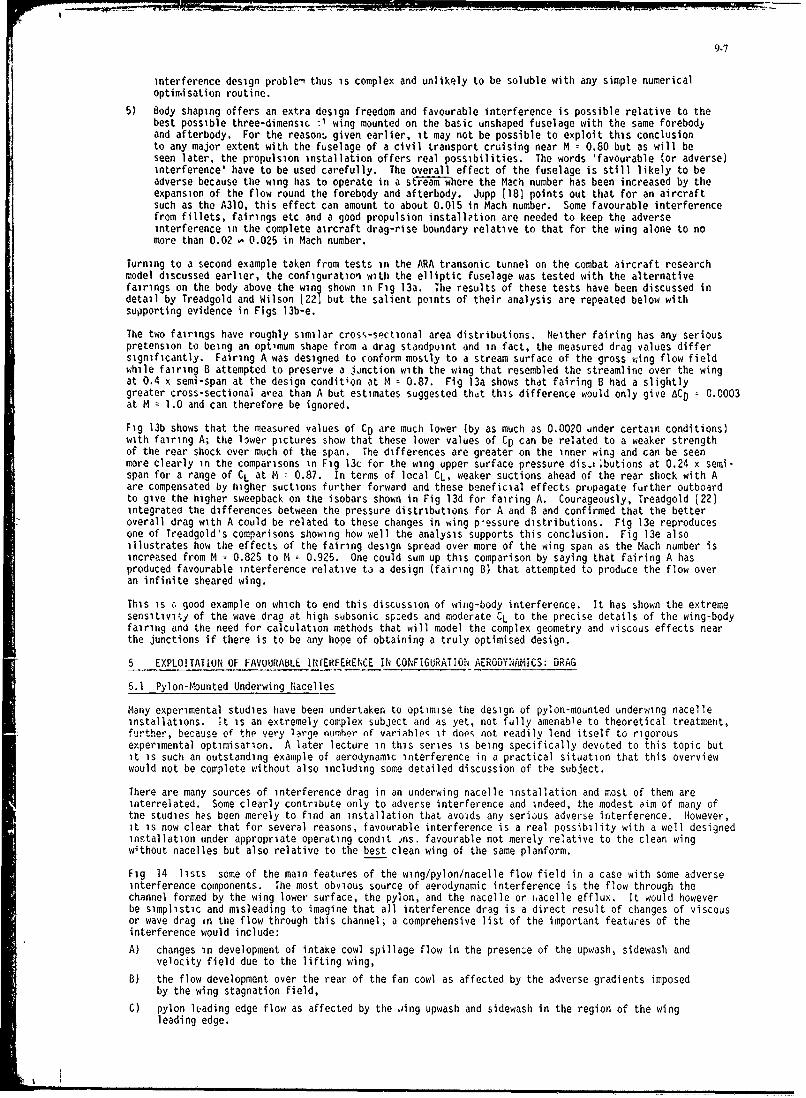
interference design problem thus is complex and unlikely to be soluble with any simple numerical
optimisation routine.
5) Body shaping offers an extra design freedom and favourable interference is possible relative to thebest possible three-dimensic :1 wing mounted on the basic unshaped fuselage with the same forebod)and afterbody. For the reason. given earlier, it may not be possible to exploit this conclusionto any major extent with the fuselage of a civil transport cruising near M m 0.80 but as will beseen later, the propulsion installation offers real possibilities. The words 'favourable (or adverse)interference' have to be used carefully. The overall effect of the fuselage is still likely to beadverse because the wing has to operate in a stiream'-where the Mach number has been increased by theexpansion of the flow round the forebody and afterbody. Jupp 1181 points out that for an aircraftsuch as the A310, this effect can amount to about 0.015 in Mach number. Some favourable interferencefrom fillets, fairings etc and a good propulsion installation are needed to keep the adverseinterference in the complete aircraft drag-rise boundary relative to that for the wing alone to nomore than 0.02 , 0.025 in Mach number.
Turning to a second example taken from tests in the ARA transonic tunnel on the combat aircraft researchmodel discussed earlier, the configuration with the elliptic fuselage was tested with the alternativefairings on the body above the wing shown in Fig 13a. The results of these tests have been discussed indetail by Treadgold and Wilson [221 but the salient points of their analysis are repeated below withsupporting evidence in Figs 13b-e.
The two fairings have roughly similar cros--sectional area distributions. Neither fairing has any seriouspretension to being an optimum shape from a drag standpuint and in fact, the measured drag values differsignificantly. Fairing A was designed to conform mostly to a stream surface of the gross wing flow fieldwhile fairing 8 attempted to preserve a jinction with the wing that resembled the streamline over the wingat 0.4 x semi-span at the design condition at M z 0.87. Fig 13a shows that fairing B had a slightlygreater cross-sectional area than A but estimates suggested thdt this difference would only give ACD 0.0003at M 1.0 and can therefore be ignored.
Fig 13b shows that the measured values of CD are much lower (by as much as 0.0020 under certain conditions)with fairing A; the lower pictures show that these lower values of CD can be related to a weaker strengthof the rear shock over much of the span. The differences are greater on the inner wing and can be seenmore clearly in the comparisons in Fig 13c for the wing upper surface pressure disr;butions at 0.24 x semi-span for a range of CL at M z 0.87. In terms of local CL, weaker suctions ahead of the rear shock with Aare compensated by higher suctions further forward and these beneficial effects propagate further outboardto give the higher sweepback on the isobars shown in Fig 13d for fairing A. Courageously, Treadgold 122)integrated the differences between the pressure distributions for A and B and confirmed that the betteroverall drag with A could be related to these changes in wing p-essure distributions. Fig 13e reproducesone of Treadgold's comparisons showing how well the analysis supports this conclusion. Fig 13e alsoillustrates how the effects of the fairing design spread over more of the wing span as the Mach number isincreased from M = 0.825 to M 0.925. One could sum up this comparison by saying that fairing A hasproduced favourable interference relative to a design (fairing B) that attempted to produce the flow overan infinite sheared wing.
This is . good example on which to end this discussion of wing-body interference. It has shown the extremesensitivity of the wave drag at high subsonic sp-eds and moderate CL to the precise details of the wing-bodyfairing and the need for calculation methods that will model the complex geometry and viscous effects nearthe junctions if there is to be any hope of obtaining a truly optimised design.
5 EXPLOITATION OF FAVUURABLE INfERFERENCE IN CONFIGURATION AERODYNAMICS: DRAG
5.1 Pylon-Mounted Underwing Nacelles
Many experimental studies have been undertaken to optimise the design of pylon-mounted underwing nacelleinstallations. It is an extremely complex subject and as yet, not fully amenable to theoretical treatment,further, because of the very large numher nf variahle, it doe- not readily lend itself to rigorousexperimental optimisation. A later lecture in this series is being specifically devoted to this topic butit is such an outstanding example of aerodynamic interference in a practical situation that this overviewwould not be complete without also including some detailed discussion of the subject.
There are many sources of interference drag in an underwing nacelle installation and most of them areinterrelated. Some clearly contribute only to adverse interference and indeed, the modest aim of many ofthe studies hes been merely to find an installation that avoids any serious adverse interference. However,it is now clear that for several reasons, favourable interference is a real possibility with a well designedinstallation under appropriate operating condit ins. favourable not merely relative to the clean wingwithout nacelles but also relative to the best clean wing of the same planform.
Fig 14 lists some of the main features of the wing/pylon/nacelle flow field in a case with some adverseinterference components. The most obvious source of aerodynamic interference is the flow through thechannel formed by the wing lower surface, the pylon, and the nacelle or nacelle efflux. It would howeverbe simplistic and misleading to imagine that all interference drag is a direct result of changes of viscousor wave drag in the flow through this channel; a comprehensive list of the important features of theinterference would include:
A) changes in development of intake cowl spillage flow in the presenze of the upwash, sidewash andvelocity field due to the lifting wing,
B) the flow development over the rear of the fan cowl as affected by the adverse gradients imposedby the wing stagnation field,
C) pylon leading edge flow as affected by the ,ing upwash and sidewash in the region of the wingleading edge.

8
D) channel flow regions Inboard and outboard where the flow can be supercritical with a strong shockwave and where ,ixing, entrainment and possible separation effects can be present,
E) non-planar lifting surface effects on drag as influenced by nacelle 'lift', pylon 'side lift' andwing lift,
F) local lift pocket at nacelle station and its influence on lift-induced drag and the wave dragand viscous drag from the upper surface,
G) changes in the supercritical flow development and viscou. effects on thp wing upper surface as aresult of lift shedding and/or volume effects arising from the gross presence of the nacelle/pylon,
H) possible regions of over-expanded fan jet flow over the conical or curved afterbody with associatedincreased 'friction' drag and 'strong' terminal shock leading to wave ar.d form drag increases incowl/pylon base region.
Design structural weight considerations are, as always, present in the selection of suitable cases foraerodynamic study; also the important relationship between the aeroelastir behaviour of the wing/pylon/nacelle and the relative location of the wing and engine nacelle. Furthermore, the optimisation of nacelleinstallation design clearly includes study of the structural weights of all components necessary to cowlthe bare engine as well as pylon and wing weight variations due to the presence of contending nacelle/pylondesigns as well as of nacelle perforrim.ce variations.
It is particularly important to recognise that, aerodynamically, the presence of the nacelle/pylon hassignificant effects on the overall wing flow field and lift development since the pylon/nacelle 'end plate'effect is propagated laterally across both the wing upper and lower surfaces with flow consequences thatdepend on the wing planform, section design, nacelle size and fuselage proximity as well as on the localwing/pylon/nacelle channel region. Before discussing some of the aerodynamic features in more detail, itmust be noted that the changes in the flow over the wing arising dirEctly from the presence of the pylon/nacelle should not, as in some earlier repo-ts on this subject, be dismissed as trivial; these changes canbe important, as will be seen below, and may be adverse or favourable.
To explain the nature of the interference due to the presence nf a nacelle in more detail, let us considersome results presented in Figs 15a-c. These are taken from some research tests in the ARA transonic tunnelusing a single-body through-flow nacelle. Although the simulation did not include the important jet flowfeatures it is considered that many of the results are reasonably representative of physical pylon/nacellebody effects on modern transport aircraft designs. The following comments relate to an unpowered pylon/nacelle simulation; the additional jet flow effects of interference will be discussed later.
Fig 15a shows the two fore-and-aft positions of the nacelle relative to the wing (A and B); nacelle-to-wingvertical spacing was fixed at a level non-dimensionally similar to some modern designs. Fig 15b indicateshow the nacelle installation drag increment for these two positions varies with Mach number at a typicalcruise CL and how it varies with CL at a typical cruise Mach number, and also, shows how the drag-rise CL - Mboundaries compare with the boundary for the clean wing-body without nacelles. Finally, Fig 15c comparesthe wing pressure distributions, with nd without the pylon/nacelle in the further aft position B at threestations on the wing at the two values of CL marked on the boundaries. The nacelle is mounted at n = 0.285,ie at 0.285 x nett semi-span and so, the pressure distributions are givea for two stations inboard andoutboard of the pylon (n z 0.265 and 0.30) and one further out station (n 0.45). It is also worth notingthat the wing has a crank in the planform at n 0.319 (no crank in the leading edge but an unswept trailingedge inboard of this station).
The direct effect of the flow through the channel can be seen most clearly in the pressure distributionsfor the lower CL at n
= 0.265 with the nacelle in the aft position B. The nacelle exit plane is then at0.25 x local wing chord and Fig 15c shows that at n 0.265, the suctions on the wing lower surface areincreased aheau of 0.2c by the addition of the nacelle installation. In the manner suggested by Yoshihara137,38), these effects can be accentuated when the local flow is supersonic - the expansion waves in theforward channel are not reflected as compression waves from a sonic line but as expansion waves from theopposite solid surface. As a result, a shock wave is present inboard of the nacelle - near 0.2c at n 0.265and in results not shown, at about 0.25c at n = 0.18. Outboard of the nacelle, because of the wingsweepback, the flow field is propagated laterally to a region further forward on the chord: at n z 0.30,the extra suctions due to the channel flow, when added to the low suctions near the leading edge of theclean wing, are not sufficient to create a local supersonic flow. Aft of the nacelle, the suctions arereduced by the addition of the nacelle; this effect can be observed aft of 0.2c at n = 0.265 and over mostof the chord at n = 0.3; it is still evident at n = 0.45.
The adverse effects in the forward channel are most pronounced at low CL. Fig 15c shows that the localsupersonic region has disappeared at the higher CL but the increase in suctions fc'lowed further aft by adecrease can still be observed. At the higher CL, the flow is supercritical over the wing upper surfaceand the addition of the nacelle installation has an effect, similar in nature but smaller in magnitude trthat over the wing lower surface. The suctions and shock strength on the wing upper surface are increasedinboard of n = 0.2 where the shock is ahead of 0.25c but for the stations shown in Fig 15c, the strengthof the wing upper surface shock situated downstream of the nacelle is reduced, this effect beingparticularly pronounced outboard of the nacelle, ie near the wing crank station.
Having now drawn attention to some of the main features of the pressure distributions, let us turn to adiscussion and interpretation of the drag data in Fig 15b. Ia this summary, it is not possible to refer toall aspects of the interference but the main features are as follows:
i) the high drag increment implying considerable adverse interference at low CL particularly with thenacelle in the aft position B which is related to the extra Wave drag on the wing, pylon and nacelleafterbody associated primarily with the shock wave in the flow field inboard of the nacelle,
(ii) the rapid decrease in ACD with CL at low and moderate CL which relates primarily to the disappearanceof this local supercritical region,

'9.9
(iii) the more gradual decrease in ACD with CL at higher CL , and for the further forward nacelle positionwhich can be interpreted in various ways, eg
a) reduced viscous drag on the wing and pylon due to the disappearance of the high suction regionand succeeding adverse pressure gradient in the forward part of the channel,
b) redLced fia. velocities and local Mach numbers over the nacelle, thus leading to a decrease inthe nacelle form drag and possibly, nacelle wave drag,
c) an endplate effect from the pylon on the wing, thus reducing the vortex-induced drag 1391associated with
d) an increased side load on the pylon having a component relative to the free stream flow, in thethrust direction [40), or
e) a change in the nacelle drag also induced by the change in sidewash with incidence below thesweptback wing.
(iv) ultimately, at high CL and particularly at high Mach number, a more rapid decrease in ACD witheither CL or M which can be related to the favourable effects on the flow over the wing upper surface,
(v) an increase in ACD with M at a given CL which can be largely associated with the development of asupercritical flow in the channel, and
(vi) a reduction in ACD with M at high Mach number which occurs for all except the worst installationsand which can be due to favourable effects on both the wing upper and lower surfaces. With somearrangements, the favourable effects on the upper surface at high Mach number are due to the factthat a single strong shock wave has been replaced outboard of the pylon by a weak, highly sweptforward shock originating at the wing-pylon junction followed by a relatively weak rear shock.Favourable effects on the lower surface can arise when the increased pressures aft of the nacelleare effective in restraining the rearward movement of the main lower surface shock wave. Thisinterference can be very beneficial in minimising reductions in longitudinal stability at high Machnumber and low CL which are generally caused, if they occur, by relative shock movements on wingupper and lower surfaces with the shock on the lower surface showing a strong tendency to moverapidly far aft with increasing Mach number.
Clearly, the adverse effects can be relieved by a forward movement of the nacelle as shown in Fig 15b.Changes in the shape of the pylon and nacelle can also be introduced [41] to improve the area distributionof the channel viewed as a channel or to improve the cross-sectional area distribution of a limited regionof local wing, pylon and nacelle. These ideas were first used to advantage on the Convair 990 by Kutney141j. It is possible that the shape of the resulting area distribution is in fact better than for theclean wing. This is therefore one method of obtaining favourable interference, other methods include thefollowing:
1) the increase in pressure on the wing lower surface aft of the nacelle, particularly outboard ofthe nacelle can te exploited to advantage as a means of offsetting the high peak suctions whichtend to occur near 0.6c on the lower surface with modern advanced wing sections. In practicalterms, this could mean that the wing sections could be thickened near the rear spar,
2) the effects on the wing upper surface can be exploited to advantage by relieving conditions at,for example, a crank station outboard of the nacelle where wing designers often have difficultyin reducing the suctions and shock strengths to an acceptable level,
3) the favourable effects from the pylon described under (c,d) above.
The values of interference drag can depend on many detailed points, eg
(i) whether tne forecowi can cope witn tne asymmetric flow field ahead of the wing leading edge,
(ii) whether the boundary layer over the rear of the fan cowl can accept the extra adverse pressuregradient induced by this flow field,
(iii) whether the leading edge shape of the pylon can cope with the sidewash of this flow field,
(iv) whether the pylon is cambered and whether it is the mean line or the inboard surface of the pylonthat follows the streamlines of the wine flow field or whether some other philosophy is adootedto exploit the side load on the pylon.
No clear general rules can be tabled because the design of an optimum nacelle installation cannot bedivorced from that of the parent wing. For example, the question of whether and how the pylon should bewrapped round the wing leading edge will depend on the type of wing design pressure distribution that hasbeen chosen. One general rule can however be given: if the nacelle drag increment i increasing with Machnumber at the design cruise Mach ',umoer, the package has not been optimised successfully. either the wingdesign has not recongised the nued to accommodate the nacelle or there is some weakness in the nacelleinstallation.
The results discussed above were obtained with free-flow nacelles and therefore did not include any effectsof the pressurised jet. These can be very significant, particularly for the fan jet. All civil aircraftdesigners now appreciate the paramount importance of testing with either blown nacelles, ejector nacelles,or turbine powered simulators (TPS units). In the UK great strides [424344] hdve been made in the past decade inthe ability to obtain very accurate and repeatable interference drag daLa through the use of TPS units.All of the results are subject to commercial constraints; however, we may draw on some published evidence.
The level of interferenre drag may be dominated by the presence of the thrust-produoing fan jet/nacelleafterbody. For example, it is possible that experiments undertaken with free-flow nacelles such as thatdescribed above may provide totally misleadiig answers. In particular, the mutual development of the flowsin the channel and in the fan jet may prove decisive for certain installations. Bagley [45) has shown thatthe jet will produce an increase in the wing lower surface suction peak in the channel; this is typical,but the incremental increase is clearly a function of local geometric features as well as free stream andjet conditions.

1).l 0
The interaction between the in-jet and in-channel flows is subtle and complex; as discussed by Yoshihara137,381 and above, the sonic line, or surface, in the channel flow is followed by a series of expansionwaves, including those from the curved wing lower surface. As illustrated by the flow photogiaph in Fig 16,many complex three-d' isional flow fields can develop, eg
a) the reductions of channel flow pressure are 'read' at the fan jet boundary leading to furtherexpansion within the fan jet; this expansion further throttles the channel flow leading to aset ot compression waves or more likely a shock,
b) on the other hand, reductions of channel flow pressure and consequent over-expansion of the fanjet may, due to the wing and fan stream relative inclination, lead to an extension of the channelflow supercritical region causing further fan jet over-expansion, higher channel flow Mach numbersand, in both streams, stronger terminal shocks. These shocks may result in additional viscous andwave drag and since they may well lie in the all important thrust producing fan stream, could bevital to the thrust/drag balance.
In the presence of the curved wing, pylon and nacelle physical components, it is not difficult to see thatsuch flow characteristics as those discussed above may also result in substantial interference lift. Hence,at a given lift, changes in lift-induced drag (viscous and wave) could be present. It is also clear thatthe thrust performance of the nacelle afterbody components may be appreciably mdlified in the installedcase and these thrust changes are accounted as interference drag changes in most studies. Control of theseflow mechanisms is an obvious target for further study; exploitation seems to be further away but a fullappreciation of these flow features could lead to avoidance of significant adverse drag effects.
If the nacelle is mounted well forward, early NASA results 140! showed that the jet could contributesubstantia' favourable interference. Patterson [401 interpreted this in terms of an increased side load onthe pylon, thus strengthening the favourable interference effects (c,d) in the list above. Measuredpressure distributions on the pylon showed that when the jet was unpressurised some of the pressure fieldon the inboard side of the pylon leaked forward through the subsonic fan jet round to the outboard sidewhereas when the jet was pressurised, this leakage was inhibited by the choked jet stream. Thesefavourable effects are more apparent at high values of cruise lift coefficient, ie they give a reductionin the drag-due-to-lift. Patterson's explanation for these results is not universally accepted and it isperhaps notable that there has been no consistent trend in transport aircraft design to mount the nacelleson longer (ie deeper) pylons, which at first sight would be a means of further strengthening effects (c,d).Naturally, even if longer pylons genuinely contribute favourdble aerodynamic interference, the benefitswould have to be asseassed against the likely weight penalties which could well be more important. Also,tests of military stores suggest (49) that at high subsonic and transonic speeds, increasing the depth ofthe store below the wing does not necessarily reduce the aerodynamic interference as would be expected atlow speeds. There is a fair amount of evidence indicating that when the flow is supercritical, the adverseinterference first increases with store depth before starting to decrease. Oil flow tests and pressureplotting measurements with military stores have shown that with a longer pylon, the flow separations in thewing-pylon junctions cin be more severe. In a tightly constrained channel, the flow does not expand to sucha high local Mach number, the shock across the channel is therefore both shorter in extent and weaker.Reverting to engine nacelles, the vertical depth of the nacelle below the wing is therefore a majorparameter but it is difficult to quote any general rule; the interference will depend on detailed featuresof the nacelle and wing design as well as on the fore-and-aft position of the nacelle.
The development of a reliable theoretical method [38,47) for calculating the transonic flow over a wing-fuselage-pylon-nacelle with full allowance for intake and pressurised jet effects, must be considered apriority task. Even then, however, there will still be a continuing need for careful experiments since itis already clear that the interference drag can be sensitive to small changes in shape of nacelle and pylon -changes that may be difficult to model in any refined theory. One last comment - in a practical aircraftdesign, the best nacelle installation may not be the layout that gives optimum aerodynamic interference;the best layout will always be a compromise between the aerodynamics in various conditions, and betweenaerodynamic drag and structure weight.
5.2 Overwing Nacelles
On present knowledge, it seems unlikely that a nacelle installation could be mounted above a wing andobtain any favourable interference at high subsonic speeds. However, the results presented (381 by Wai,Sun and Yoshihara show that by contouring the nacelle, the large adverse interference obtained with asymmetric nacelle can be substantially reduced. Fig 17a shows the configuration tested and the nature ofthe interference with the symmetric nacelle; a very strong shock wave was observed inboard of the nacellewhich is positioned at n = 0.31. Fig 17b contrasts the pressure distributions measured at n = 0.15 on thewing upper surface in the presence of the symmetric and contoured nacelles. The value of (-Cu) ahead ofthe shock was reduced from about 1.14 to 1.02; assuming no sweepback of the shock front, this correspondsto a reduction of the shock upstream Mach number from about 1.4 to 1.3. This improvement inboard of thecontoured nacelle is partially offset by a deterioration outboard but as shown in Fig 17a, there is adramatic reduction in the nacelle ins:allation drag increment from ACD = 0.0140 to ACD = 0.0090 at thecruise CL. The shape of the drag prlars suggests however that even with the contoured nacelle, there isstill considerable adverse interference.
5.3 Nacelles mounted on the Rear Fuselage
The interpretation of measured drag increments due to nacelles mounted on the rear fuselage can be evenmore difficult than for wing-mounted nacelles. There is plenty of scope for aerodynamic interference onthe rear fuselage and nacelle assembly itself but as with wing-mounted nacelles, the effects on the flowover the wing are likely to be the dominant factor, particularly at transonic speeds.
Early UK experience with the VCIO apd BAe 1-11 was reviewed (491 by Williams and Stewart at the AGARD 1971conference on interference. They identified various sources of interference, eg

(i) extra profile drag on the rear fuselage and nacelle. Clearly, the afterbody-pylon junction andthe channel between rear fuselage and nacelle are regions where one would expect to find theviscous interference effects discussed in 3. Fairings are likely to be needed [50) to weakenor eliminate stand-off vortices originating ahead of the pylon leading edge, to reduce theexpansion and subsequent compression in the con-di channel and to prevent strong cross-flowsor flow separations on the boattailed afterbody immediately behind the pylon trailing edge.With a 4-nacelle (ie 2 per side) installation, there may be further problems in the gullybetween the two nacelles: on the VClO, these were relieved by the introduction of a 'Beavertail' fairing,
(ii) extra wave drag on the rear fuselage and nacelle assembly. This can be alleviated by theapplication of area-rule principles to thi; local region. The fairings mentioned under (i)should be designed with this in mind,
(,ii) changes in the lift-dependent drag on the wing and tailplane as a result of lift changes on thewing and tailplane in order to maintain a given trimmed overall CL in the presence of a non-zero(in general) lift contribution from the nacelle. Thi, interference can be adverse or favourabledepending on the nacelle setting and the relative efficieocy of the wing and nacelle assembly asa producer of lift with low drag. General rules may be dar.erous but it is probable that whenthe flow over the wing is subcritical, it will be better to carry the lift on the wing than onthe low aspect ratio nacelle assembly but at typical cruise cor.ditions, it may be preferable tocarry some positive lift on the nacelle assembly where the flow is likely to be subcritical,thus reducing the wing CL for a given overall CL and easing the task of the wing designer,
(iv) reduction of the drag of the inner wing sections as a result of the buoyancy effect of theforward pressure field of the nacelles. In inviscid, subcritical flow, this would be cancelledby an equal and opposite effect on the rear of the aircraft but in the real flow, this couldlead to significant changes in profile drag, wave drdg and vortex-induced drag which would notbe cancelled at the rear. These effects can be adverse or favourable depending on the wingdesign and will be discussed in more detail below,
(v) reduction of the wing drag through a rotation of the lift vector. This applies when the nacellesare contributing positive lift and thus, there is an induced upwash over the wing, and
(vi) exit jet interference on the empennage and rear fuselage.
Many of the above effects will also change the pitching moment for a given lift. Untrimmed drag data cantherefore be misleading.
In the development of a new aircraft with engines mounted on the rear fuselage, extensive wind tunnel testprogrammes have generally been undertaken to choose the optimum nacelle settings in pitch and yaw, and torefine the installation to avoid adverse interference but the main lesson from the data bank is that toexploit favourable interference, the wing-fuselage-nacelle installation should be designed as an entity.This was graphically illustrated in the paper [51] presented by Laugher at the AGARD 1981 conference on theaerodynamics of power plant installation. Laugher noted that in all cases, whatever the wing design, theaddition of a rear nacelle assembly reduces the suctions on the aft surfaces of the inner wing and when thenacelles are mounted above the wing cho-d plane (as is usual with a subsonic transport), the loss of lifton the inner wing has to be recovered by an increase in wing incidence. The wing design and in particular,the variation of shock strength across the span and the nature of the pressure distribution ahead of theshock determines whether the nett interference is adverse or favourable. For the interference to befavourable, the shock on the inner wing in the absence of the nacelle has to be relatively strong; thisensures that the reduction in wave or profile drag from the direct effect of the nacelles on the flow overthe inner wing more than offsets any increase in drag due to the increase in incidence.
Figs 18ab reproduced from Laugher's paper [51) contrast two cases where the interference is adverse (Fig18a) or favourable (Fig 18b). In the first case, the nacelle intake plane is coincident with the winglocal trailing edge. The effect of the nacelle in destroying lift on the inner wing is clearly substantialand has to be offset by an increase in incidence of 1.40. As a result, the comparison at a given CLindicates that when the nacelles are present, there is a major increase in shock strength at all stationsacross the wing. Admittedly, this adverse interference could probably have been relieved by an increase inthe pitch setting of the nacelles but it seems unlikely that this would be sufficient to change the sign ofthe interference. The advanced wing design that appeared so attractive in the absence of the nacelle (egan extensive supersonic region terminated by a relatively weak shock, a near-isentropic recompression onthe inner wing, su.tions decreasing progressively towards the root giving highly swept isobars aft of thepeak suction line) is clearly an unsuitable design if an aft nacelle has to be mounted at this position.With the nacelle present, not only is there a strong shock across the span, the position of this shock ismuch further forward than on the clean wing - by about 0.4c on the inner wing and 0.3c out at ri 0.534 xsemi-span.
It follows that the design aim should be to obtain a favourable supercritical development on the wing inthe presence of the nacelles, ie to adopt a geometry that would probably be unacceptable as a clean wing.This was the aim of a uesign exercise undertaken by BAe in 1978 and Fig 18b presents some pressuredistributions from tests in the ARA transonic tunnel on a model of this design. The nacelle in this caseis mounted somewhat further aft than for the example in Fig 18a and so the nacelle interference on the wingflow would have been less adverse even if the same wing design as in Fig 18a had been used. However, themain reason for the favourable interference shown in Fig l8b lies in the new wing design. Measured pressuredistributions are shown for a wing station just outboard of the nacelles. A near-isentropic recompressionis achieved on the wing in the presence of the nacelles whereas on the clean wing, the pressuredistributions in the two cruise conditions expand again at the rear of the supersonic region leading to astrong shock at respectively, 0.6c and 0.7c in the two conditions, and a rear separation in the high speedcruise. Fig 18b certainly implies favourable interference relative to the wing without nacelles (less wavedrag and viscous drag) but the important point to note is that the wing design and wing flow for such aconfiguration are possibly better than could be achieved for any wing of this planforin, nacelles-off.Laugher noted [511 that the wing geometry that gave the pressrFe distributions in Fig 18b, nacelles-on

q-12
would have 2.5% more fuel volume compared with the wing that would give similar pressure distributions,nacelles-off.
The results quoted by Laugher therefore validate the concept of obtaining favourable interference with theaid of a rear nacelle installation. They were obtained by a technique in which the nacelle effect on thesupercritical flow development over the wing was simulated by means of an 'equivalent interfering body'.This proved very cost-effective but in future, better results should be possible when methods forcalculating the transonic flow over a complete configuration are available.
5.4 Interference between Adjacent Bodies
The interaction between the flow fields of adjacent bodies in close proximity is another source of adverseaerodynamic interference on some aircraft, notably combat aircraft carrying many external stores. Theadverse interference is not inevitable; with the right shape and relative position for the bodies,favourable interference can be obtained when the bodies are staggered or are in tandem or when the bodiesare used to improve the longitudinal distribution of aircraft cross-sectional area.
The first example of this type of interference is not taken from a test on a model of a combat aircraft butfrom results for the high wing transport [17] whose wing-fuselage interference was discussed in $3 andillustrated in Fig 6. Fig 19a shows two versions of the complete layout (without empennage). It is a4-engined aircraft with 2 engine nacelles pylon-mounted below each inner wing and the test data revealedthat the proximity of the inner nacelle to the protruding undercarriage fairing on the fuselage was a majorpotential source of interference. Adding the undercarriage blister with the nacelles already fitted to thepoorer configurationA gave a drag increment an order greater than the predicted profile drag of the fairing.Configuration B is less prone to adverse interference than A because(a) the pylon is more swept and longer, thus placing the nacelle significantly further forward relative
to Lhe undercarriage fairing, and(b) the width of the undercarriage fairing is less at a depth opposite the nacelle and more of the volume
of the fairing is concentrated below the fuselage. The plan view in Fig 19a in particular shows howthe change from A to B relieves the passage between the fairing and the inner nacelle but one wouldexpect that the interference drag has been reduced at the expense of extra profile drag on accountof the greater surface area of the pylons and fairing in B. The measured differences in CD betweenA and B are plotted as a function of Mach number and CL in Fig 19b. The differences are very largebeing always greater than ACD = 0.0020 and being about ACD z 0.0050 at a likely cruise condition,M = 0.71, CL = 0.5 or 14% of the total CD for the better layout B in this condition. The extrainterference drag increases significantly with CL and this trend can be related to a reduction in CLat a given incidence of about 0.07 for A relative to B near M = 0.71, CL = 0.5. The increase in tC0with CL and M can be interpreted as follows: high suctions in the passage between the undercarriageblister and the inner nacelle destroys considerable lift on the inner wing and thus: extra incidencefor a given CL and extra wave drag from the wing upper surface - probably on the outer wing well awayfrom the source of the effect.
The layout in Fig 19, particularly with its external undercarriage blister, may be thought somewhat unusualbut plenty of evidence of this type of interference can be found in test data [48,52,53,54,551 for externalstore installations. These will be discussed in detail in a later lecture but it is appropriate to includesome examples in this overview lecture. Fig 20a contrasts the adverse interference observed at low CL whenseveral stores are carried on separate pylons under a 40' sweptback wing and the favour-ble interferencepossible when a number of stores are mounted in an array below a fuselage. If expressed as an installationdrag factor, the drag increment for the 3 pylon-mounted underwing stores reaches about 5 at M - 0.90 but itis more sensible to relate such results to the drag characteristics of the clean aircraft. In other words,the increase in ACD with M for the single underwing store can be interpreted simply as a reduction of thedrag-rise Mach number of the wing-pylon-store relative to the clean wing whereas the multiple arrangementwith 3 pylon-mounted stores introduces a significant drag creep ahead of the steep drag-rise because it hascompletely modified the nature of the flow over the wing lower surface. The oil flow pictures included inthe later lecture show that with 3 pylon-mounted underwing stores disposed in a standar-d sensiblearrangement related to the aircraft centre of gravity, a strong unswept shock tends to appear prematurelyin the passages between the pylons. The resulting wave drag and local shock-induced separations accountfor the drag creep and the potential benefits of wing sweepback have been partly lost on the wing lowersurface.
Turning to the right hand side of Fig 20a, the upper picture has been used in several previous papers; itis repeated here because it is such a dramatic example of favourable interference. It shows the resultsof tests in which 4 rows of 5 small stores with flat bases were mounted on a pallet below a flat-bottomedfuselage. Above about M z 0.92, the total drag increment for the 20 stores is smaller than the incrementfor a single row of 5 stores: to reitft-af, the total drag increment and not just the drag per store. Itmay be argued that this very favourable result is simply due to the fact that they are small storesmounted tangentially and mostly immersed in the fuselage boundary layer. However, the stores in the lowerpicture are comparable with those for the underwing installation on the left. Tests were made in the RAE8ft x 6ft tunnel on an array of 6 large boattailed stores again mounted taigentially on a pallet below anaircraft fuselage. It will be seen that even in this cas, where the stores are much larger in relation tothe size of the aircraft, the drag increment for the array .onsisting of 3 rows of 2 stores is generally,particularly at high subsonic speeds, less than the sum of the free-air drag of the stores in isolation.This implies that the favourable effects of tandem carriage have more than offset the adverse effects inside-by-side carriage.
Fig 20b has been included to show the potential favourable effects of store stagger and tandem carriagemore explicitly. These results were obtained 1561 in tests in the 2ft x l.ft tunnel at RAE rarnborough inwhich drag measurements were made on various arrays of stores mounted just clear of the tunnel roof boundarylayer; in effect, the stores were being tested close to a reflection plane simulating the surface of a wingwith zero thickness. Results are shown for two types of store, one with a pointed nose and one with a bluffnose. It will be seen that at say, M = 0.9, staggering 2 stores fore-and-aft by six calibres reduces the

9-13
drag by about 10% relative to 2 x the drag of a store in isolation whereas positioning the stores directlyopposite each other at the same lateral spacing increases the drag by 40-60%. The more detailed informationin the later lecture shows that even staggering the stores by one calibre, ie sufficient to displace thepeak suctions on the stores but not sufficient to introduce any significant tandem effect, gives about halfthis improvement, ie Kst = 1.2. Finally, the results in Fig 20b show that carrying stores in tandem is avery powerful method of obtaining favourable interference, particularly with bluff-nose stores. If thestores are virtually nose-to-tail, ie XT a 0.005 calibres, the reduction in overall drag for a column of 2stores amounts to about 30% near M z 1.0 for the bluff nose and 20% for pointed nose stores; even at aseparation of 3 calibres, the same test series showed that the figures were 20% and 15% respectively. Themechanisms by which tandem carriage achieves such large favourable effects are listed in detail in thelater lecture.
5.5 Non-Planar Configurations
To quote from papers [39,57] by Whitcomb, it has been recognised for many years that a nonplanar liftingsystem should have less induced drag than a planar wing. Theoretical studies suggested and experimentaltests confirmed that reductions in induced drag could be obtained by mounting vertical surfaces or endplatesat the wing tips but the overall benefits were generally small as the reductions in induced drag were onlymarginally greater than the profile drag of the endplates. It is only within the past decade that the realpotential of tip devices has been fully realised. Whitcomb was the first to emphasise that to be effective,the vertical Surfaces at the tip must be designed to produce a significant side force. The vertical surfaceor winglet should be designed as a lifting wing required to perform efficiently over a wide range ofoperating conditions. Flow surveys [581 behind a wing tip with and without a winglet fitted showed thatthe basic physical effect of a winglet can be interpreted as a vertical diffusion of the tip vortex flowimmediately downstream of the wing tip; this is the source of the reduced vortex-induced drag. Anotherinterpretation is that the inward side force on the winglet normal to the local flow direction (inflowabove the wing tip) when resolved in the free-stream direction yields a significant thrust component.
The pioneering research [57,58] of Whitcomb et al established some guidelines for the design of asuccessful winglet. The primary winglet should be mounted above the rear, say 60 of the wing-tip uppersurface and
(i) should have a height roughly equal to the wing tip chord,(ii) should be canted out at an angle of about 200 to the vertical,
(il) should be toed-out but cambered and possibly twisted to produce an inward side force in the cruisewhich, when expressed as a coefficient based on winglet area, is comparable with the wing liftcoefficient.
Theoretical analyses suggested [591 that winglets should be mote effective when fitted to wing designsthat are relatively highly loaded on the outer wing sections. Some aerodynamicists have therefore arguedthey are only likely to be effective when fitted retrospectively on early wing designs such as the KC-135(the subject of the first tests) or on the relatively simple wings that have been used on commuter orsmall executive jet aircraft (for which winglets have already been used in practice). However, the testdata for both the first generation [57] and second generation [58] US transport wings showed that in bothcases, an effective winglet gave a larger drag reduction for a given wing root bending moment than thecorresponding span extension. Looking to the future, it is arguable that for a new transport aircraft,one should design a wing-winglet combination with the wing geometry deliberately chosen to suit theaddition of a winglet - just as on combat aircraft, it is becoming standard practice to carry weapons atthe wing tip to obtain, in principle at least, similar beneficial effects [48,52]. Such wing-wingletcombinations could have a better performance than the best corresponding wing-alone even when dueallowance is made for the winglet weight and added engineering complexity.
Various aspects of winglet design can be described as either exploiting favourable or minimising adverseinterference. For example,
(i) mounting the winglet above the rear of the wing-tip upper surface ensures that there is no adverseinterference with the development of the supercritical region over tie forward upper surface,
(ii) MouhLilig an additUildl willylUt btliuw Litt I'uiwaid lower surface controls thc anglc of flo-. ahcad ofthe leading edge of the upper winglet at high incidence; an example of favourable interferencebetween two surfaces,
(il) the winglet derives some of its benefit from the loading it induces on the extreme outer wing.This extra lift will serve to reduce the maximum local lift on the wing for a given overall liftand there is thus, the possibility that at high Mach number, there will be a reduction of wingwave drag as well as vortex-induced drag: again, favourable interference,
(iv) the essential art in designing an effective winglet lies in the blending of the junction betweenwing and winglet to avoid adverse viscous interference effects.
The list could doubtless be extended but as an illustration of the last point (iv), Fig 21 compares twoviews of the winglet (A) used in the US tunnel tests [58] on the second-generation transport with a morerecent layout (B) developed in UK research on a relatively advanced wing design. In this case, greatefforts were made to blend the region from 0.985 x basic wing semi-span up to about 0.2 x winglet height.When 'unwrapped', the winglet in both plan and section shape development was blended neatly into the startof a basic wing tip design involving a curved leading edge as advocated many years ago by KUchemann. Itwill be noted that winglet B is smaller than winglet A; the winglet area for B was in fact only about 1.5%of the half-wing area but even so, the reduction in drag-due-to-lift amounted to about 12.5% and possiblymore at high Mach number. Such reductions would clearly more than offset the profile drag of such a smallwinglet.
Further improvements in winglet design may be possible when the transonic theoretical methods are fullydeveloped [60] to be used ab a design tool for wing-winglet design. The present author feels that much ofthe evidence in the published literature could give a pessimistic idea of the effectiveness of a good
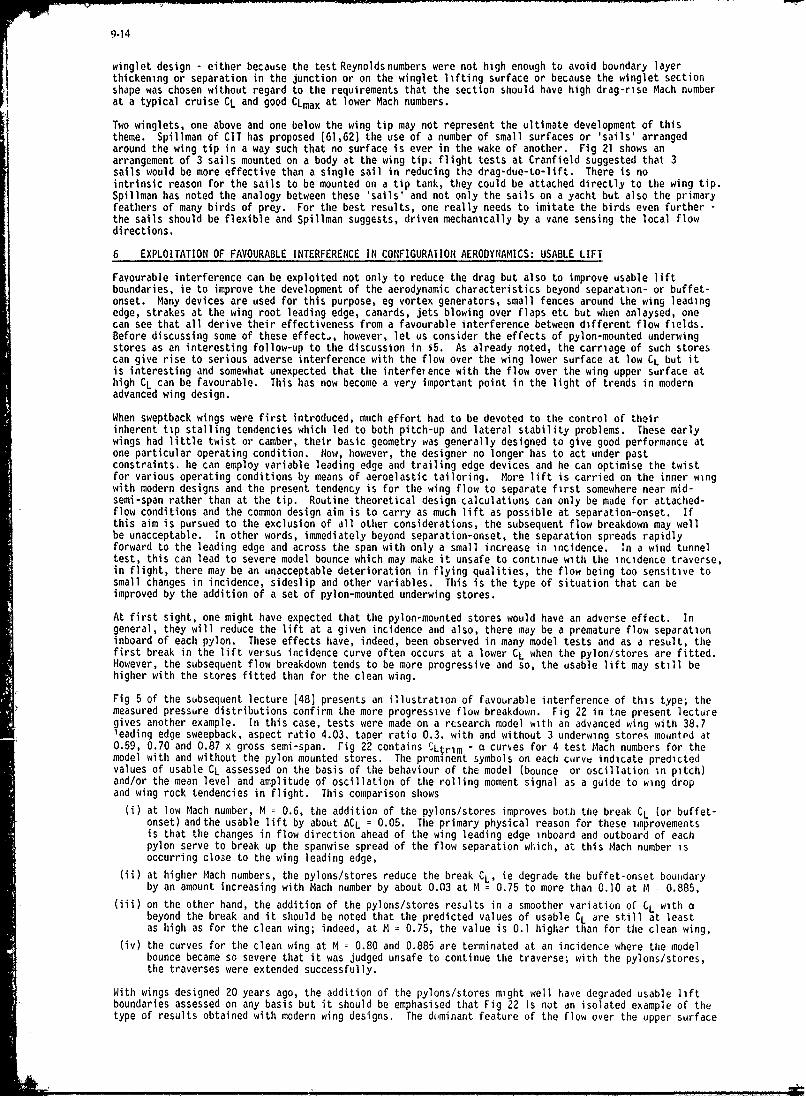
9-14
winglet design - either because the test Reynoldsnumbers were not high enough to avoid boundary layerthickening or separation in the junction or on the winglet lifting surface or because the winglet sectionshape was chosen without regard to the requirements that the section should have high drag-rise Mach numberat a typical cruise CL and good CLmax at lower Mach numbers.
Two winglets, one above and one below the wing tip may not represent the ultimate development of thistheme. Spillman of CIT has proposed [61,62] the use of a number of small surfaces or 'sails' arrangedaround the wing tip in a way such that no surface is ever in the wake of another. Fig 21 shows anarrangement of 3 sails mounted on a body at the wing tip; flight tests at Cranfield suggested that 3sails would be more effective than a single sail in reducing the drag-due-to-lift. There is nointrinsic reason for the sails to be mounted on a tip tank, they could be attached directly to the wing tip.Spillman has noted the analogy between these 'sails' and not only the sails on a yacht but also the primaryfeathers of many birds of prey. For the best results, one really needs to imitate the birds even further -the sails should be flexible and Spillman suggests, driven mechanically by a vane sensing the local flowdirections.
6 EXPLOITATION OF FAVOURABLE INTERFERENCE IN CONFIGURATION AERODYNAMICS: USABLE LIFT
Favourable interference can be exploited not only to reduce the drag but also to improve usable liftboundaries, ie to improve the development of the aerodynamic characteristics beyond separation- or buffet-onset. Many devices are used for this purpose, eg vortex generators, small fences around the wing leadingedge, strakes at the wing root leading edge, canards, jets blowing over flaps etc but when anlaysed, onecan see that all derive their effectiveness from a favourable interference between different flow fields.Before discussing some of these effects, however, let us consider the effects of pylon-mounted underwingstores as an interesting follow-up to the discussion in s5. As already noted, the carriage of such storescan give rise to serious adverse interference with the flow over the wing lower surface at low CL but itis interesting and somewhat unexpected that the interference with the flow over the wing upper surface athigh CL can be favourable. This has now become a very important point in the light of trends in modernadvanced wing design.
When sweptback wings were first introduced, much effort had to be devoted to the control of theirinherent tip stalling tendencies which led to both pitch-up and lateral stability problems. These earlywings had little twist or camber, their basic geometry was generally designed to give good performance atone particular operating condition. Now, however, the designer no longer has to act under pastconstraints, he can employ variable leading edge and trailing edge devices and he can optimise the twistfor various operating conditions by means of aeroelastic tailoring. More lift is carried on the inner wingwith modern designs and the present tendency is for the wing flow to separate first somewhere near mid-semi-span rather than at the tip. Routine theoretical design calculations can only be made for attached-flow conditions and the common design aim is to carry as much lift as possible at separation-onset. Ifthis aim is pursued to the exclusion of all other considerations, the subsequent flow breakdown may wellbe unacceptable. In other words, immediately beyond separation-onset, the separation spreads rapidlyforward to the leading edge and across the span with only a small increase in incidence. In a wind tunneltest, this can lead to severe model bounce which may make it unsafe to continue with the incidence traverse,in flight, there may be an unacceptable deterioration in flying qualities, the flow being too sensitive tosmall changes in incidence, sideslip and other variables. This is the type of situation that can beimproved by the addition of a set of pylon-mounted underwing stores.
At first sight, one might have expected that the pylon-mounted stores would have an adverse effect. Ingeneral, they will reduce the lift at a given incidence and also, there may be a premature flow separationinboard of each pylon. These effects have, indeed, been observed in many model tests and as a result, thefirst break in the lift versus incidence curve often occurs at a lower CL when the pylon/stores are fitted.However, the subsequent flow breakdown tends to be more progressive and so, the usable lift may still behigher with the stores fitted than for the clean wing.
Fig 5 of the subsequent lecture [48] presents an illustration of favourable interference of this type; themeasured pressure distributions confirm the more progressive flow breakdown. Fig 22 in the present lecturegives another example. In this case, tests were made on a research model with an advanced wing with 38.7leading edge sweepback, aspect ratio 4.03. taper ratio 0.3, with and without 3 underwing stores mounted at0.59, 0.70 and 0.87 x gross semi-span. Fig 22 contains Ltrim - a curves for 4 test Mach numbers for themodel with and without the pylon mounted stores. The prominent symbols on each curve indicate predictedvalues of usable CL assessed on the basis of the behaviour of the model (bounce or oscillation in pitch)and/or the mean level and amplitude of oscillation of the rolling moment signal as a guide to wing dropand wing rock tendencies in flight. This comparison shows
(i) at low Mach number, M z 0.6, the addition of the pylons/stores improves both the break CL (or buffet-onset) and the usable lift by about ACL = 0.05. The primary physical reason for these improvementsis that the changes in flow direction ahead of the wing leading edge inboard and outboard of eachpylon serve to break up the spanwise spread of the flow separation which, at this Mach number isoccurring close to the wing leading edge,
(ii) at higher Mach numbers, the pylons/stores reduce the break CL, ie degrade the buffet-onset bouiidaryby an amount increasing with Mach number by about 0.03 at M = 0.75 to more than 0.10 at M 0.885,
(iii) on the other hand, the addition of the pylons/stores resilts in a smoother variation of CL with abeyond the break and it should be noted that the predicted values of usable CL are still at leastas high as for the clean wing; indeed, at M = 0.75, the value is 0.1 higher than for the clean wing,
(iv) the curves for the clean wing at M = 0.80 and 0.885 are terminated at an incidence where the modelbounce became so severe that it was judged unsafe to continue the traverse; with the pylons/stores,the traverses were extended successfully.
With wings designed 20 years ago, the addition of the pylons/stores might well have degraded usable liftboundaries assessed on any basis but it should be emphasised that Fig 22 is not an isolated example of thetype of results obtained with modern wing designs. The dominant feature of the flow over the upper surface

9-15
of such wings at high subsonic speeds prior to buffet-onset is the well known 3-shocK pattern, viz ahighly swept forward inboard shock, an inboard rear shock and a single outboard shock. Separation tendsto occur first just outboard of the point of intersection of these 3 shocks and it then spreads rapidlyover the entire outer wing: this is the explanation for the abrupt stall on the clean wing. When thepylon-mounted stores are fitted, the flow pattern prior to separation onset can be more complex, egadditional highly swept forward shocks may originate from each pylon-wing leading edge junction. Putcrudely, , - flow breakdown no longer occurs suddenly over a large part of the span; instead, there aresuccessive flow breakdowns over 4 segments of smaller spanwise extent. This is a likely but notnecessarily the only explanation of the more progressive flow breakdown. The results certainly suggestthat a viable design approach for a combat aircraft wing at the present time is to design a clean wingthat gives the best possible CL for separation-onset and then to assume that the underwing pylons willease the buffet penetration at the expense of some acceptable worsening of the buffet-onset boundary.Hopefully, in the future, it will be possible to design the wing/pylons as an entity and then, one couldobtain good buffet penetration with less reduction of the buffet-onset boundary.
One possible explanation for the beneficial effects of the pylons;stores at the lower Mach numbers such asM z 0.6 is that the pylons are acting in the same manner as small fences wrapped around the wing leadingedge. Such fences have been used with great effect on some aircraft, eg the Harrier. Some research wasundertaken in the ARA transonic tunnel to establish the underlying physical mechanism for theireffectiveness. The flow patterns induced by the fences were very complex but some discussion of theseresults is worthwhile because they provide a good illustration of favourable interference between differentflow fields.
Some features of the model geometry and test results are presented in Figs 23a,b. A large half-wing modelof a sweptback wing-fuselage was tested in the ARA transonic tunnel with and without various alternativedesigns of small leading edge fence mounted at 81.5% semi-span, two of the fences are shown in Fig 23a.In addition to overall force and moment measurements, the wing was extensively pressure plotted and Figs23a,b include some results for the four stations A-D, A being just inboard and B,C,D outboard of the fence.
The results presented in Fig 23 were obtained at a test Mach number of M = 0.6. Two types of flowseparation were observed on the clean wing as the incidence was increased, first, a leading edge separationinitiated near the tip at about a = 6* and extending in to about 75% semi-span at a 10' and second, arear separation appearing first at a 4' near the trailing edge at about 75% semi-span and then spreadingforward and inward, the two separations merging above about a = 100. The overall CL -a curve in Fig 23asuggested that the fences had little effect on the overall characteristics until about a 13' but themeasured pressures showed that local effects close to the fence were present even at a 4. At lowincidence, the peak suctions close to the leading edge is reduced outboard of, and increased inboard ofthe fence: the expected result in subcritical, inviscid flow at effectively the root and tip of a sweptbackwing. This leads to a premature separation inboard of the fence but as with the basic leading edgeseparation spreading in from the tip, this rolls up to form a part-span vortex. There is no significantloss in lift from this separation and indeed, at a z 9.75', as shown by the pressure distributions forstation A in Fig 23b, the region close to the leading edge inboard of the fence carries more lift at thisincidence when the fence is fitted. There is therefore no serious adverse interference inboard of the fence.
Turning now to the flow outboard of the fence which creates the favourable interference above a 13 , thisis a complicated story. The trigger for the flow development is the fact that with the large fence 1, thefence interrupts the spanwise flow along the attachment line and even with the smaller fence 2, itinterrupts the flow just ahead of this line, ie the flow that is about to stream over the upper surface.The fences therefore cause this flow to separate and in the case of the large fence 1, two primary stand-offvortices (see §3) form, one rotating in an anti-clockwise sense looked at from upstream and streaming overthe lower surface, and the other rotating in a clockwise sense and streaming over the upper surface; withthe smaller fence 2, only the upper vortex was observed in the flow patterns. At moderate incidences, whenthe flow close to the leading edge immediately outboard of this vortex is attached, the vortex streams backover the upper surface crossing stationC (see Fig 23a) aft of the short line of pressure tappings whichdoes not extend beyond 10% chord. This flow pattern is illustrated in sketch i) in Fig 23b. At higherincidences, when the separation close to the leading edge initiated near the tip has spread to the vicinityof the fence and primary vortex, the air in this three-dimensional separation is drawn into a secondaryanti-clockwise vortex lying forward and outboard of the primary vortex: see sketch (ii) in Fig 23b. Assoon as this secondary vortex is established, its origin appears to move forward almost to the source ofthe primary vortex, ie almost to the leading edge attachment line. This allows the secondary vortex to befed by high energy air and then, with increasing incidence, the vortex grows in strength. The high suctionregion under this secondary vortex can be seen in the measured pressure distributions for a = 13.2 atstations B,C,D in Fig 23b and in the variation of Cp at 1% chord with a for these stations in Fig 23a.Clearly, the contribution from the secondary vortex i. the main factor responsible for the reasonableoverall lift-curve slope above a = 13', fence on and hence for the increase due to the fence in thepredicted usable lift. Fig 23a shows that the smaller fence 2 gives a slightly better result than fence 1suggesting that it is preferable for the fence not to intersect the attachment line. Other tests in thisseries showed that a certain minimum fence height (smaller than for fence 2) was required to maintain thevortices in a stable state close to the wing surface at high incidence.
The effect of these fences has been described in some detail as an example of where a form of wing-bodyinterference has been exploited to produce a favourable result. The significant point is that thefavourable result would not have been obtained if there had not been an interaction between the fence stand-off vortices and the leading edge separation of the stall of the clean wing. This interpretation of theresults was further confirmed in tests on a related model which showed that when the fence was moved in to71% semi-span, it was completely ineffective, the significant point being that at this station, on theclean wing, the flow no longer separated from near the leading edge. (As noted at the beginning of thisdiscussion, the stall inboard of 75% semi-span was dictated by a rear separation spreading forward fromnear the trailing edge).
It is now well known that much larger benefits in usable lift can be obtained through the use of sharp-edged strakes ahead of the wing leading edge at the wing root. Fig 24 presents some results showing the

effect of such strakes on the wing buffeting and unsteady rolling moment characteristics for a model otthe Harrier aircraft. This figure is taken from a paper [621 by Moss which gives various examples of tilebenefits of wing-root strakes. Moss notes that the strakes were designed to be compatible with theaircraft structure and basic stability requirements in flight. The results in Fig 24 show that in themodel tests, tile strakes gave dramatic improvements in lift at high incidence, the rolling moment behaviourat zero sideslip and in the steadiness of wing-root bending moment at high incidence. In explanation of
the rolling moment plots, a large mean value of Ce in the model tests has been found to correlatereasonably with wing dropping in flight and the spread between tile upper and lower bounds of the sigial inthe model tests is a guide to whether 'wing rock' is likely to occur in flight. The improvements shtwn inFig 24 were subsequently confirmed in flight tests.
Various factors contribute to the beneficial effects of the strakes. Clearly, as on a slender wing, avortex is shed from the leading edge of the strake. Direct effects of this vortex include an extra non-linear lift contribution, and improved flow and a thinner boundary layer over tile rear upper surface ofthe inner wing. However, the indirect effects are perhaps more important; the benefits at high incidencecan be traced at least partly to the ability of a strake and its vortex flow to control the flow breakdownon the outer wing panel. At low and moderate subsonic speeds, the feature of the flow that exercises thiscontrol is a second strake induced vortex that springs from the strake-wing leading edge intersection.This vortex is present because, as shown in numerous oil flow patterns on many sweptback wings, the strakereduces the angle of incidence at which a flow separation occurs near the leading edge of the outer paneljust outboard of the strake-wing leading edge junction. Fiddes and Smith have explained 1631 thisobservation in terms of two consequences of the presence of the main strake vortex viz
(i) an increase in the effective angle of sweep of the leading edge of the outer panelnear the strake-wing intersection, and
(ii) an increase in the effective incidence of the outer panel.
The outflow under this second vortex reduces the boundary layer thickness on the rear upper surface nearmid-semi-span, thus reducing any tendency to a rear separation and also serves to limit the rearwardextension of any separation bubble near the leading edge of the outer wing. The last effect is often themost important and it is frequently noted in low speed tests that a separation on the forward outer wingwhich, in the absence of the strake, would develop to cause a complete flow breakdown over the uppersurface, starts to extend rearward with increasing incidence but then retreats forward under the influenceof the strengthening of the strake-induced vortices.
At higher subsonic speeds ulhen the flow over the wing upper surface is supercritical, the addition of thestrake results in the inner forward shock of the 3-shock pattern originating from th~e strake-wing leadingedge junction rather than from the wing-body junction. It follows that the outboard shock which usuallyinduces the flow breakdown is shorter in spanwise extent and the supercritical region ahead oi the forwardshock is shorter in chordwise extent at a given incidence. These two effects tend to offset each other: thefirst reduces the extent of any shock-induced separation if present and hence is beneficial; the secondreduces CL at a given incidence and so could be adverse although it may be more than compensated by theextra lift from the vortex off the strake. No general conclusion can therefore be drawn as to whether theoverall effect will be favourable or adverse. It is howeve, likely that the benefits from adding a strakewill tend to decrease with Mach number above say, M = 0.80 o 0.85 for a 40' sweptback wing.
The flow field from a forward canard surface can have a similar effeit to that of a strake at high subsonicspeeds and high incidence. This is illustrated by the flow patterns in Fig 25. The canard at 0"deflection clearly unloads the inner wing and the supercritical region on tile outer wing is reduced in thesame manner as described above for a strake. The forward shock originates from near the intersection ofthe edge of the canard wake and the wing leading edge. It is interesting to note that the overall CL atthis incidence was only 0.015 less when the canard was fitted, ie the lift on the canard almost compensatesfor the lift deficit on the wing. The interference in this case can therefore be classed as favourable;for other positions and deflections of the canard, it could be adverse or non-existent either for examplebecause the wake from a stalled canard disturbs the flow on the inner wing or because the canard wake passeswell above or below the wing: again, this is a case where the configuration has to be carefully designedto exploit the favourable interference.
The limited results with pylons/stores, fences, strakes and a canard surface have been included toillustrate that interference between components and between different flow fields can improve tile usablelift at both low and high subsonic speeds. Another possibility that will undoubtedly be exploited to agreater extent in the future is to cbtain extra lift from favourable jet-wing interference. This will bediscussed in a later lecture in this series but an early idea of what this might achieve for a combataircraft was given by Vint {64] in a paper at the AGARD FDP 1980 conference. Vint described thedevelopment of a theoretical prediction technique which suggested that a conventional propulsive jet atthe wing trailing edge could give a significant improvement in the high lift characteristics of the wingif jet deflections up to 300 could be used. The research indicated that the best results in practicewould be obtained if these ideas were applied to a configuration with a canard surface. A iropulsive jetat the trailing edge would avoid the complexity of a blown flap which has of course been used for manyyears on some aircraft, eg the Buccaneer. This whole subject deserves however a full lecture in its ownright and it will not be considered further here.
7 CONCLUDING REMARKS
This lecture has reviewed the main sources of aerodynamic interference at high subsonic and transonicspeeds. Examples have been given of when favourable interference between different aircraft componentsand different flow fields have been exploited
(i) to reduce wave drag, profile drag and/or vortex-induced drag,(ii) to improve tile flow development beyond separation-onset and hence, the usable lift.
The white streaks ahead of the shock are due to the fact that in this particular test, transition wasfixed by strips round the leading edge.

Q-17
Wing-body interference and also the interference due to nacelle installations mounted either on the wingor on the rear fuselage, and wing-tip devices have been treated in some detail. In other areas, ideas havebeen introduced with some illustrative examples; they will be developed further in later lectures.
Jet-wing interference is an important area that has not been discussed except in the context of underwing
nacelle installations.
8 ACKNOWLEDGEMENTS
The author gratefully acknowledges the help from colleagues at the Aircraft Research Association Ltd inpreparing this lecture and for permission by MOD (Procurement Executive) to use some of the material inthe lecture, mostly from tests in the ARA tunnel undertaken under MOD(PE) research contracts.
REFERENCES
1 Cayley, Sir G, On aerial navigation 1809-10, 1962, Reprinted in Sir George Cayley's Aeronautics1796-1855, HMSO London, C H Gibbs-Smith.
2 Lennertz, J, Beitrag zur theoretischen Behandlung des gegenseitigen Elnflusses von Tragflche undRumpf, 1927, ZAMM 7, 249.
3 Vandrey, F, Zur theoretischen Behandlung des gegenseitigen Einflusses von TragflUgel und Rumpf, 1937,LF 14, 347.
4 KUchemann, 0, The aerodynamic design of aircraft, 1978, Pergamon Press.5 KUchemann, D. Some remarks on the interference between a swept wing and a fuselage, 1971, Paper no 1,
AGARD CP-71-71.6 K~rner, H, Untersuchungen zur Bestinmung der Druckverteilung an FlUgel-Rumpfcombinationen, Teil 1
Messergebnisse fUr Mitteldeckeranordnung aus dem 1,3 m Windkanal, 1969, DFVLR Bericht fr 0562.7 KUchemann, 0, Weber, J, The subsonic flow past swept wings at zero lift, without and with body, 1956,
ARC R&M 2908.8 Hess, J L, Smith, A M 0, Calculation of potential flow about arbitrary bodies, 1967, Prog in
Aeronautical Sciences 8, 1.9 Method for predicting the pressure distribution on swept wings with subsonic attached flow, 1973,
ESDU TOM 73012.10 Treadgold, 0 A, Jones, A F, RAE unpublished work.11 Weber, J, Interference problems on wing-fuselage combinations, Part I, Lifting unswept wing attached
to a cylindrical fuselage at zero incidence in mid wing position, 1969, RAE TR 69150.12 Young, A D, Zamir, M, Experimental investigation of the boundary layer in a streamwise corner, 1970,
A Qu 21, 313.13 East, L F, Hoxey, R P, Boundary layer effects in an idealised wing-body junction at low speed, 1968,
RAE TR 68161.14 Young, A D, Some special boundary layer problems, 1977, Zeitschrift fur Flugwissenschaften und
Weltraumforscnung 1, Heft 6, 401-414.15 Mojola, 0 0, Young, A 0, An experimental investigation of the turbulent boundary layer along a
strearawise corner, 1971, AGARD Conf Proc 93, Turbulent Shear Flows, Paper no 12.16 Priest, A J, Dobney, D G, Hill, R P, Measurements in the near-wake of a transport model, to determine
the lift, drag and drag components using Maskell's analysis, 1981, RAE TR 8012.17 Hutton, P G, Lift, drag and pitching moment results from a 1/20 scale model of the AW 681 in the ARA
9ft x 8ft transonic tunnel: body alone and wing + body with and without wing-body fairings andundercarriage blisters, 1964, ARA Model Test Note H14/1.
18 Jupp, J A, Interference aspects of the A310 high speed wing configuration, 1980, Paper no 11, AGARD-CP-285.
19 Bowes, G M, Aircraft lift and drag prediction and measurement, 1974, Paper no 4, AGARD Lecture SeriesNo 67, 36,37.
20 Forsey, C R, Carr, M P, The calculation of transonic flow over three-dimensional swept wings using theexact potential equation, 1978, DGLR Symposium Transonic Configurations, Bad Harzburg.
21 Baker, T J, Forsey, C R, A fast algorithm for the calculation of transonic flow over wing-bodycombinations, 1981, A!AA Paper 81-1015.
22 Treadgold, D A, Wilson, K H, Some aerodynamic interference effects that influence the transonicperformance of combat aircraft, 1980, Paper no 24, AGARD-CP-285.
23 Transonic Aerodynamics, 1982, Vol 81, Progress in Astronautics & Aeronautics, AIAA, ed D Nixon.24 Whitcomb, R T, A study of the zero lift drag rise characteristics of wing-body combinations near the
speed of sound. 1956, NACA Report 1273.25 Heaslet, M A, Lomax, H, Spreiter, J R, Linearised compressible flow theory for sonic flight speeds,
1950, NACA Report 956.26 Sheppard, L M, Methods for determining the wave drag of non-lifting wing body combination, 1958,
ARC R&M 3077.27 Lomax, H, The wave drag of arbitrary configurations in linearised flow as determined by areas and
forces in oblique planes, 1955, NACA RMA55A18.28 Barnwell, R W, Analyses of transonic flow about lifting wing-body configurations, 1975, NASA TR R-440.29 Barnwell, R W, Approximate method for calculating transonic flow about lifting wing-body configurations,
1976, NASA TR R-A"'.30 Drag and other aerodynamic effects of external stores, 1977, AGARD-AR-107.31 Kane, E J, Middleton, W D, Consideration of aerodynamic interference in supersonic airplane design,
1971, Paper no 3, AGARD-CP-71-71.32 Cheng, H K, Hafez, H M, Transonic equivalence rule: a nonlinear problem involving lift, 1975, Vol 72,
Part 1, J Fluid Mech, 161-187.33 Chan, Y Y, An experimental study of the transonic equivalence rule with lift, 1982, NRC Aeronautical
Report LR-609.34 Bocci, A J, Aerodynamic research on near-sonic transports: experimental results and analysis, ARA
report to be published.35 Albone, C M, Hall, M G, Joyce, Gaynor, Numerical solutiosn for transonic flows past wing-body
combinations, 1975, IUTAM Sympnsium Transsonicum II, Gdttingen.

i 0.18
36 Baker, T J, Ogle, Mrs F A, A computer program to compute transonic flow over an axisymmetric solid body,1977, ARA Memo 197.
37 Yoshihara, H, Introductory lecture to AGARD/VKI course in Subsonic/Transonic Aerodynamic Interferencefor Aircraft, 1983, AGARD-FDP-VKI Special Course.
38 Wai, J C, Sun, C C, Yoshihara, H, Transonic perturbation analysis of wing-fuselage-nacelle-pylonconfigurations with powered jet exhausts, 1982, NASA CR 165852.
39 Whitcomb, R T, Methods for reducing subsonic drag due to lift, 1977, AGARD/VKI Special Course on Conceptsfor Drag Reduction.
40 Patterson, J C Jr, A wind tunnel investigation of a high bypass engine on wing-nacelle interferencedrag of a subsonic transport, 1968, NASA TN D-4693.
41 Kutney, J T, Plszkin, S T, Reduction of drag rise on the Convair 990, 1963, AIAA 63-276, 1964, Vol 1,J Aircraft No 1.
42 Harris, A E, Pauley, G I, Simulation techniques for pylon-mounted turbofan engines, 1975, ARA Report 36.43 Harris, A E, Carter, E C, Wind tunnel test and anslysis techniques using powered simulators for civil
nacelle installation drag assessment, 1981, Paper no 24, AGARD-CP-301, Aerodynamics of Power PlantInstallation.
44 Pugh, G, Harris, A E, Establishment of an experimental technique to provide accurate measurement of theinstalled drag of close coupled civil nacelle/airframe configurations, using a full span model withturbine powered engine simulators, 1981, Paper no 25, AGARD-CP-301, Aerodynamics of Power PlantInstallation.
45 Bagley, J A, Wind tunnel experiments on the interference between a jet and a wing at subsonic speeds,1968, Paper no 22, AGARD-CP-35.
46 Yu, N J, Transonic flow simulations for complex configurations with surface-fitted grids, 1981, AIAAPaper 81-1258.
47 Forsey, C R, An extension of the transonic wind-body code to include underwing pylcn nacelle effects,ARA paper to be published.
48 Haines, A B, Prospects of exololting favourable and minimising adverse aerodynamic interference inexternal store installations, 1980, Paper no 5, AGARD-CP-285, 1983, AGARD Lecture Series.
49 Williams, P R G, Stewart, 0 J, The complex aerodynamic interference pattern due to rear fuselage mountedpower plants, 1971, Paper no 24, AGARD-CP-71-71.
50 Haines, A B, Wingfield, J G, Results of a test programme designed to exploit the favourable, andalleviate the unfavourable interference effects of an aft-fuselage nacelle installation (includingwing-mounted bodies and changes to the fuselage cross-sectional shape), 1970, ARA Report 13.
51 Laugher, R D, The influence of close-coupled rer fuselage mounted nacelles on the design of an advancedhigh speed wing, 1981, Paper no 28, AGARD-CP-301.
52 Drag and other aerodynamic effects of external stores, 1977, AGARD-AR-107.53 Haines, A B, Drag of external stores: present standards and possibilities for reduction, 19'5, ARA
Report 40.54 Haines, A B, The reduction of the installed drag of multiple store carriers, 1975, Paper no 7, JTCG
Aircraft/Stores Compatibility Symposium Proceedings, Arlington.55 Evaluation of the conformal carriage concept on the performance and basic static longitudinal stability
of the F-4E aircraft, 1971, AFATL-TR-71-76.56 Lee, P, Drag measurements at transonic speeds of individual stores within multiple store arrangements,
Unpublished RAE memo.57 Whitcomb, R T, A design approach and selected wind tunnel results at high subsonic speeds for wing-tip
mounted winglets, 1976, NASA TN D-8260.58 Flechner, S G, Jacobs, P F, Whitcomb, R T, A high subsonic speed wind-tunnel investigation of winglets
on a representative second-generation jet transport wing, 1976, NASA TN 0-8264.59 Lundry, J L, A numerical solution for the minimum induced drag and the correspondin. loading of non-
planar wings, NASA CR 1218.60 Boppe, C W, Aidala, P V, Complex configuration analysis at transonic speeds, 1980, Paper no 26, AGARD-
CP-285.61 Spillman, J, Riding on air, 1982, C of A Note 8113, Inaugural Professorial Lecture, Cranfield College
of Aeronautics.62 Spillman, J, The use of wing-tip sails to reduce vortex drag, 1978, JRAeS.53 Mess, G F, Some UK research tudip- of thn ue of wing-body strakes on combat aircraft configurations
at high angles of attack, 1978, Paper no 4, AGARD-CP-247.64 Fiddes, S P, Smith, J H B, Strake-induced separation at moderately swept leading edges, 1977, RAE TR
77128.65 Vint, A, Jet-wing interaction to give improved combat aircraft performance, 1980, Paper no 17, AGARD-
CP-285.

rot1
FIG. 1
00-2 0.406 .R 10
1R/0 1 1t.t= 018
IIV&S Int
0-6-1 ItR
.Junction
1* 0 0 .2 0 4 0 6 -1 .
()"'3 R/c 0-34.t/ R 0.27
Int 0,1 calculated for inviscid flow0.8 - measured for wing-plate-t-2 curve drawn throug
Ais ~~o measured for wing-tuselagethsmeurdpis
3 predicted for wing f vselcigefrornl1,2
0-7
0= 0 Re =0-3 X10 6
FIG.1 PRESSURE DISTRIBUTIONS ALONG THE SPAN OFA RECTANGULAR WING AT ZERO LIFT. TESTS BY KORNER 6

FIG. 2(ab
0025 --- -
PAC 101 SECTIONd
P.0c t * 01
0020 /R*
FIG 2(a) EFFECT OF SWEEPBACK ON4 BODY- INDUCED 0015 V
JUNCTION V~ELOCITIES AT ZERO LIFT 6
001
0 0 .2 0' 0 6 0 -6 \I0
WING-BODY ,Y/s: = 1IC
- 0005
'* K." WING ALONE, Y/s-5 00056 .00
PROBABLE LIMIT OF
-02 ACCURACY OF THET EXPERIMENTAL 10 DATA
0
0-2 014 0.6 OC' 0 10
01 -0-3 -WING-BODY, l-O
0-2 -0-2WING ALONE , Y/s 0-0056
/ WING-BODY
00.2 0.4 0. / 0.8 1.0
0.1 A Experimentall win g.body Y/s %0.401 Everimenta
1 0 wing atone Y/s = 0-0056
(j wing. body )unction
2R/C~ 2/9 , R = body radi us , Cip =root chordRe :10' Transition fixed, unflagged symbols
Y ~ Re _3-7x10 & Transition fixed, flogged symbols
-RAE standard method9
S ource panel method ot AMD. Smith8
FIG.2(b) CHOROWISE PRESSURE DISTRIBUTIONSON A SWEPT WING AT ZERO LIFT
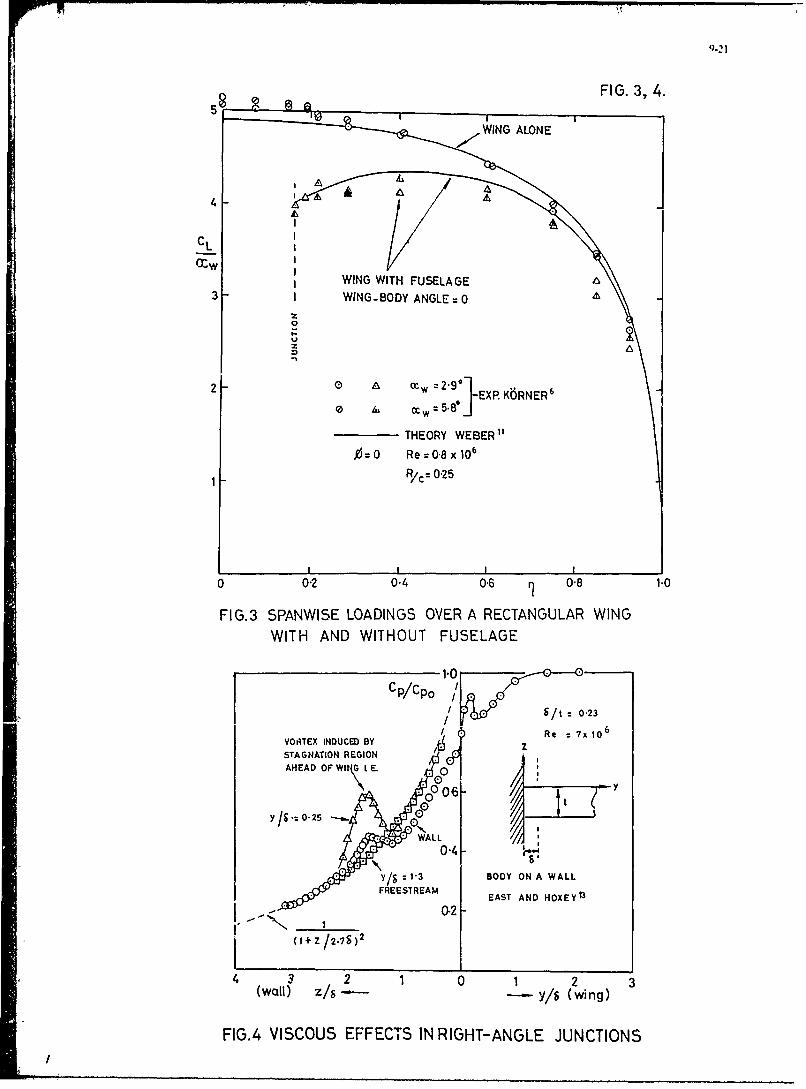
FIG. 37 4.5
~WING ALONEJ
WING WITH FUSELAGE3 1 WING- BODY ANGLE= 0
z0
2 0 A Ocw =-EXP. KbRNER6
0 & c ~5.8! 1-~THEORY WEBER"
0=0o Re = 08 x106
1 ~R/C= 0-25
0 0.2 0.4 0.6 0-81.
FIG.3 SPANWISE LOADINGS OVER A RECTANGULAR WINGWITH AND WITHOUT FUSELAGE
1.0Cp/Cp0
6/t 0,23
VOR~TEX INDUCED BY Re:x 0STAGNATION REGION cAHEAD OF WIt GL E. .0
0
Y -0-25 X
WALL
0.4* / 1-3 BODY ON A WALL
FREESREAM EAST AND HOXEY13
(1+Z/.IS)2 0-2-
43 2 1 0 1 2 3(wall) Z/8 - y/s (wing)
FIG.4 VISCOUS EFFECTS IN RIGHT-ANGLE JUNCTIONS

CT F IG. 5 (ab)
/1 Planeof woketraverse
z=0, trailing-edge plane
WING HAS NO DIHEDRAL OR TWIST
(a) G.A. of model and wake traverse plane
0-4r
-0.1
02' .0A1
- 0 -055 00. . 0 0 -010
(b0)0 Is-01tit Botuscntn .20 in pln0fwketaesdownsreamof fuelag
FIG.5 ~ ~ ~ ~ ~~ .3D1 WAETAVRETST.0RE5O PEDTNE
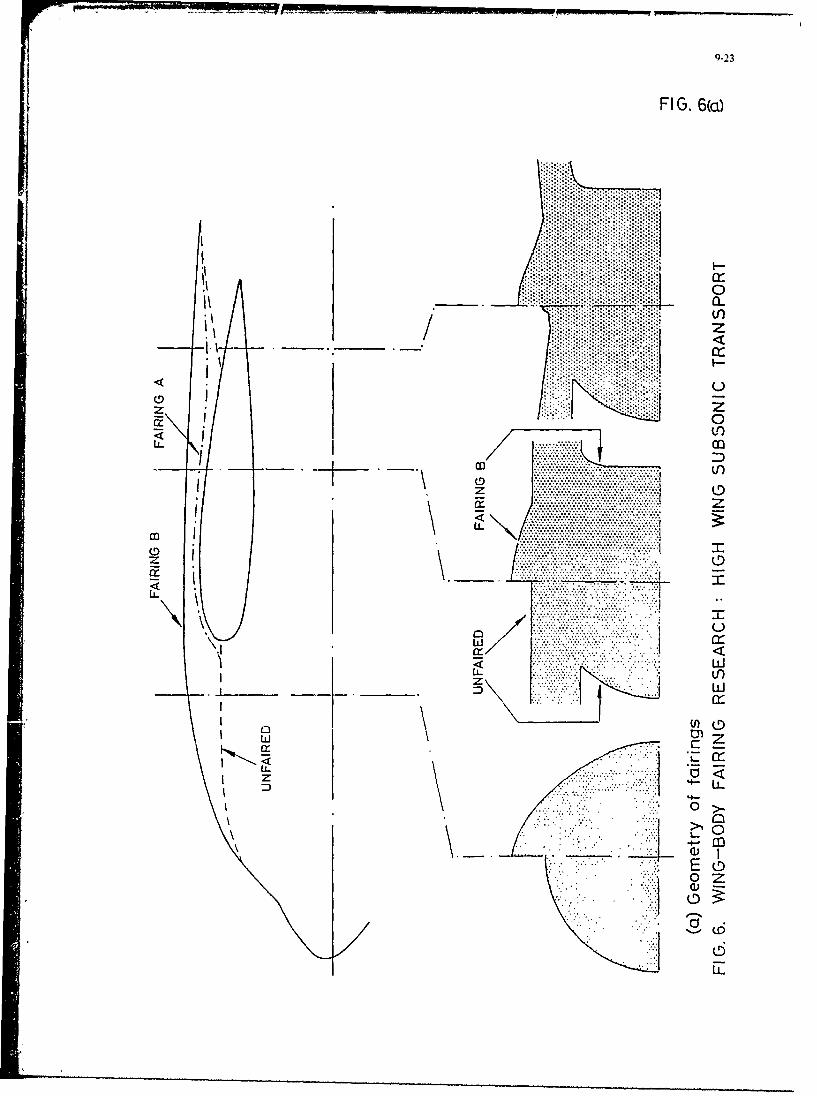
9-23
FIG. 6(a)
cr
___ 0
U- co
.... .... 0
... I .... . .
LL ..... .......
LIL
0)
IL L
ILL
I> Z
E>
- .D
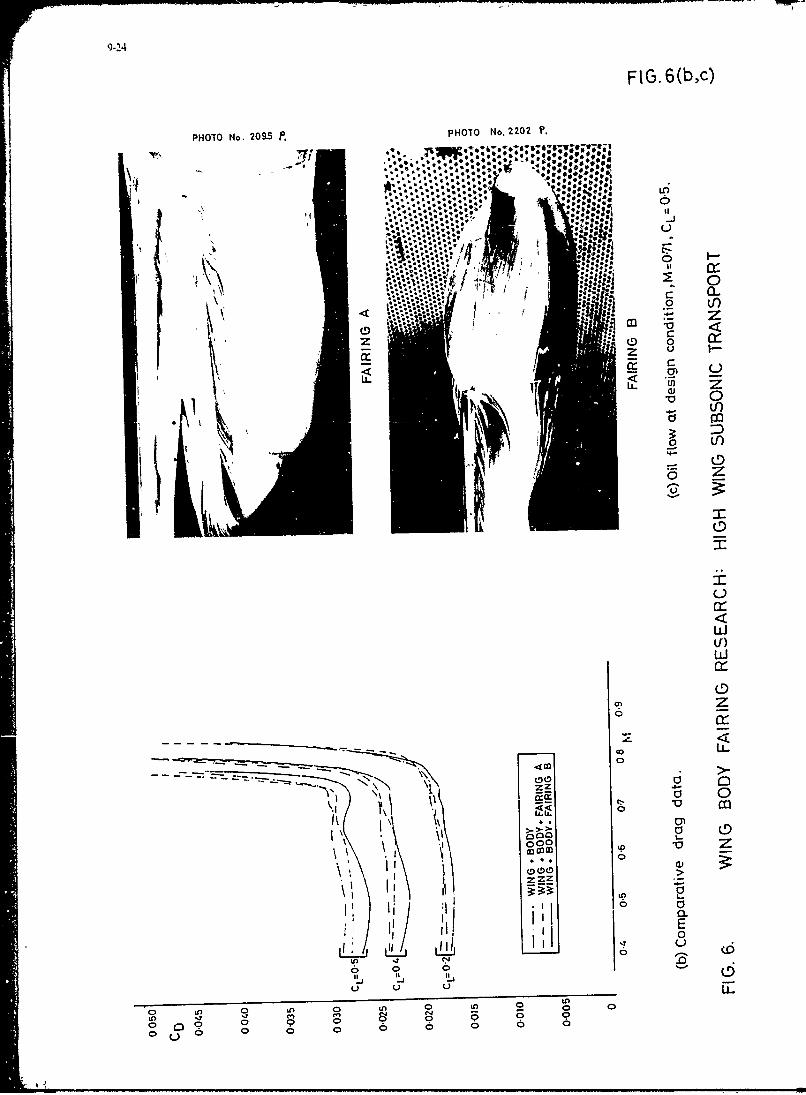
9-24
F IG. 6(b,c)
PHOTO No. 2095 P.PHOTO No. 2202 P.
/ I;;
:~::0 bL. f)
z0
< Z1I) 0V (V
Lii
If)
LI-
zz
'I000 IP
I 0
V>
o 0 0
L)000 0

FIG. 7 (a,b)
RELATIVE DRAG RELATIVE DRAGSAVING 11/3%* SAVING 2/3%~
A31O FILLETS 1 FUSELAGE/FILLET
- "- A300 TYPE"FILLETSJ I NTERSECTION LIKE
(ci)Drag improvements relative to "A300 typ ' fillets
(b) Surface flow over leading edge f illet
FIG.7 WING-BODY FILLET ACHIEVEMENTS: A 310

9-26
FIG. 8
-- WING/BODY THEORY C=4.2 °
-o WINGALONETHEORY (L=420
Cp O. 0 WiNG/BODY EXPT (L46"
, 0 WING/BODY EXPT CL=37"-08.0 0
". "q =0,37
\ M= 086i -06
0 o
-0 0 0
0
-0,2
-,
0 -_ _ ,
0.2 04 06 0.8 X.
02
, 4
06
0,4 -10o37
0.8
0
FIG. 8 INFLUENCE OF BODY ON FLOWOVER SIMPLE SWEPT-BACK WING
LJ m• tw •ii

9-27
FIG. 9(a,b)
X 0O 25 PRESSURE PLOTTED
ALE=40o n- 40SECTIONS
A 13, 4ATE 'n=0.24
SQUARE BODY ELLIPTIC BODY
(a) Model geometry
:07 4' -
:Q 040 /
I0.8.1 .
M-0 87
---- SOUARE 80DY CL - 4
I.0 -'C -0 45
1x- ELLIPTIC BODY a. -4 10
C +4 L -0 42
xx 'tx'X, -- ... ELLIPTIC BODY a - 5 20
0o CL -0 53
-- \ X
.+ / ~~ 1- \ 2os
: ;L+++, k\ x/,+ X'x'× , + '. .\"
C_ 4 --x.\± \ TI0 40_~~~~ I ' <-
X/c to0
(b) Pressures at design Mach number, M= 087
FIG. 9 EFFECT OF BODY DESIGN ON WING PRESSURES:
COMBAT AIRCRAFT RESEARCH MODEL
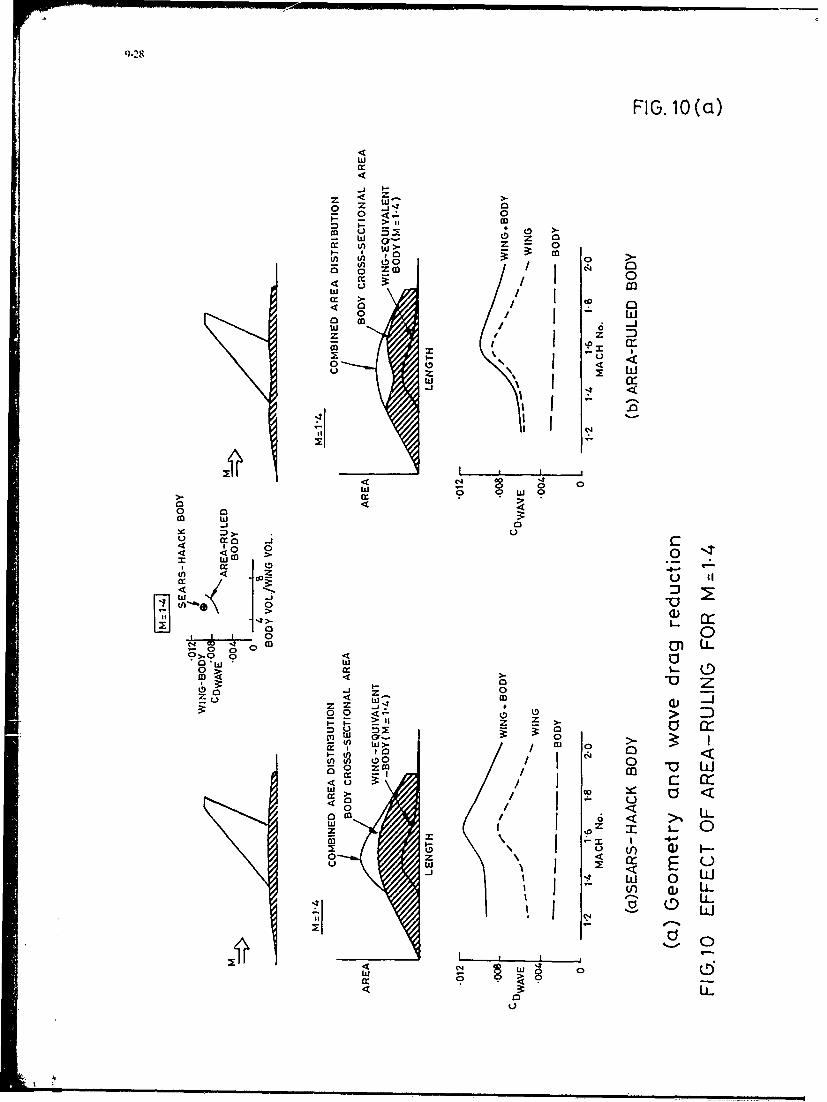
9-28
FIG. 10(a
4
z z
0 z~)Z 0
W, 00
L/ Iw
m~
a cao 0co
< 00
0 U0o W0 0ra -
100W Co >~m 0
> d)40
40 r (D
u~ 0oz Z W,
0 0 .4- >) i
0 D 0
: p I-
u 4

9-29
FIG. 10 (b)
CDISOL WING- .0059
CD ISOL. BODY = 0 0 26 CDWING BODV",009 (CDINTERFERENC .0011 )
--
OYAV.WIGPRSUR . o
PRESSURE ACTING ON BODY F- m .
(a) SEARS HAACK BODY
CDISOL.WING: .0063CDISOL BODY 0028 C DWING. BODY :0068 (C DINTERFERENCE -0023)
0
go (x
-D
-w
AVG.0 WIN PRSUR
PRESSURE ACTING ON BOY P<"' "
-'1
(b) AREA RULED BODY
(b) Interference pressure fields
F . E

9_30
FIG. 11 (a)
L1750"DI A.
DI A.
BOD BiEQUIVALENT TO W1BI ADWBATZO LIFT -750
BODY B2 EQUIVALENT TO WB1 AND W132 AT OC=5 0,CL:_O37,M=O975 -1.812"BASE DIA.
(a) Geometry of model tested at NAE ,Ottawa
FIG. 11 EXTENSION OF AREA-RULE TO A LIFTING CONDITION

q-31
FIG.11(b c)
00- -e--WING BODY WB1-15
ACDo - WING BODY WB 2
LC Do - EQUIVALENT BODY BI
0.15 / S
-10
0.10-
I :FUSELAGE LENGTH
Sc=MAXIMUM GEOMETRICCROSS-SECTIONAL AREA
0.0. CD-C DRAG AT ZERO LIFT
0"8 0.9 M 1.0 1.10 J., _-,I.
-20 -15 -10 -5 0 Kb 1 hi
(b) Drag comparison' zero lift
CL- 037
is -- WING BODY WBI
AD -- WING BODY WB2 "
Sc --o--EOUIVALENT BODY B2t)
/
;o !
CD=C- CDmin.- 'Zb: BODY SLENDERNESS RATIO DMA/t j
M2 -1 /Kb- (y+1) M2 Cb //
- M 1.001-20 -Is -to -5 0 Ab 5 10
(c) Drag comparison: design lifting condition
FIG 11 EXTENSION OF AREA-RULE TO A LIFTING CONDITION

300 bdwigFIG.12(al,b)crosssectionalarea (sq. ins.)
250
200Ol
body alone
150
/ ~- ..parallel fuselage100___waisted fuselage
0 . ..
(a) Model geometry
CD0.002
Design M
0-84 0.86 0-88 0.9 G92 0.94 0.96
(b) Overall drag at cruise
FI G. 12 NEAR-SONIC TRANSPORT:
EFFECT OF WAISTED FUSELAGE

F1rG.12 (c,d)
C3C
If 0
'nwn
2 0-
LOi
0a_
p Vf)z
0 CP
I 4 0
N I II
oC0W W C40
0 I,
u'
0 * ~CwU. -J L
0 01 !§w QI
o '
5R C4 ~ .9 0
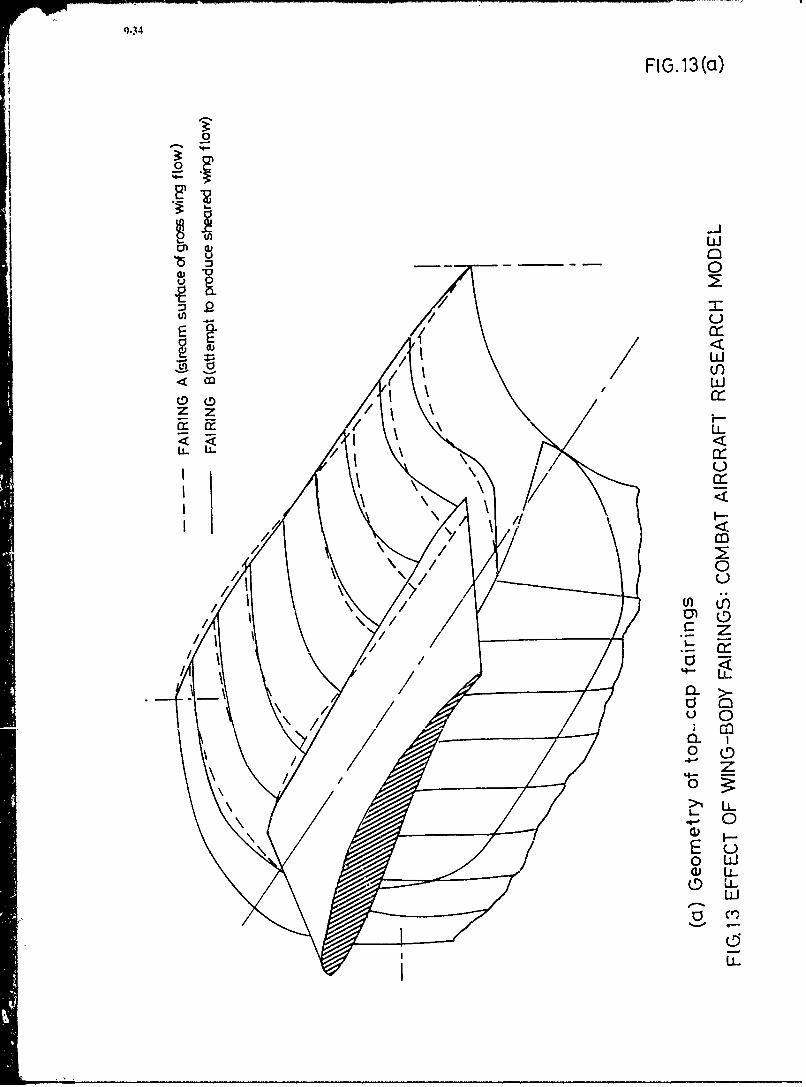
9.34
FIG. 13 (c)
Lucu < _ -
0
(9D (Dcr
/ILti~LL ~1 <
/ 0
z
S0
004~z
>t LL40
Eu
0
U -
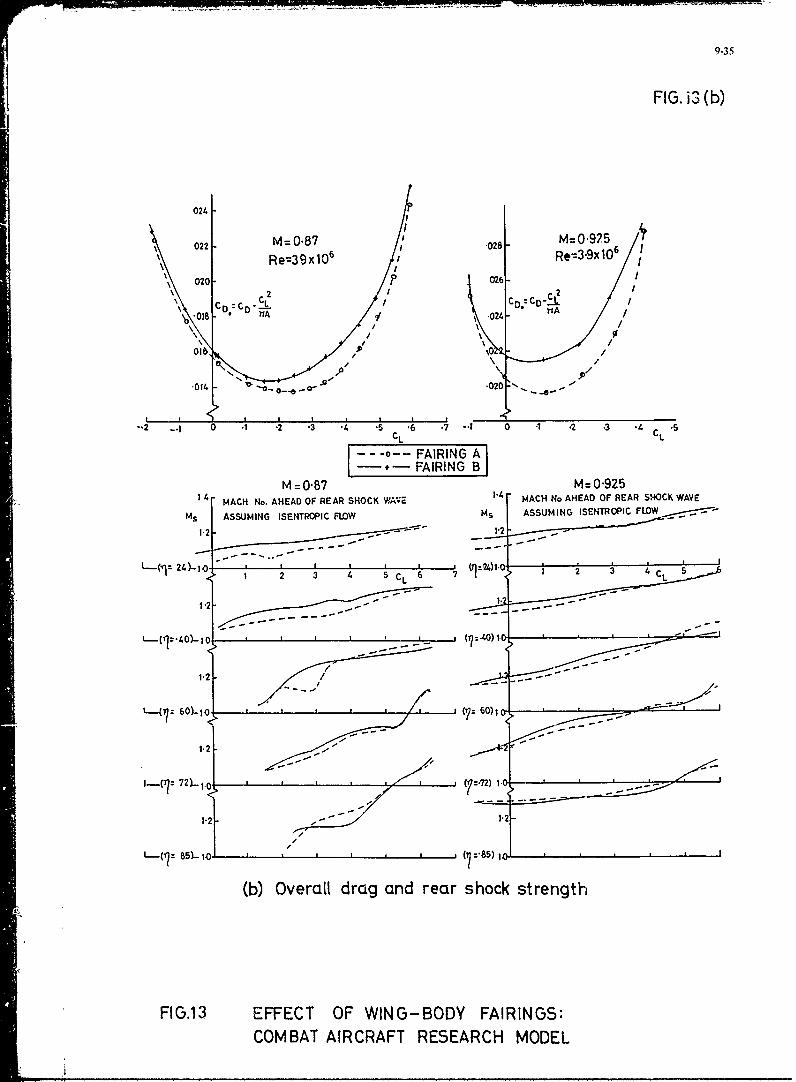
9.35
FIG. i'0 (b)
021.
022 - M=087 028 - RM=-975O6 1Re-=39 X10 6 Re39l
020- C, 026- C0CCOM6
\boBCD0 :CD- - /1 r02t
N 'o
020'
-- . ~ 0 * 2 3 4 5 6L .76 -7 0 1 .2 -3.3
o-- IRING A
M=0-87 M=0-925MACH No. AHEAD OF REAR SHOCK WA7 ~ 1 MACH No AHEAD OF REAR SH4OCK WAVE
Ms ASSUMING ISENTROPIC FLOW MS ASSUMING ISEMTOPIC FLOW
1-2 - 1-2 - - -
(1 ; 4 5) 6 ;-:241. 2 3 C
P2 2 3 - 5- C 6- : ::
L2 L
1-2/
1.2 -
1-2 -
85)-,.0 (7 ='85) io
(b) Overall drag and rear shock strength
FI G.1 3 EFFECT OF WING-BODY FAIRINGS:COMBAT AIRCRAFT RESEARCH MODEL
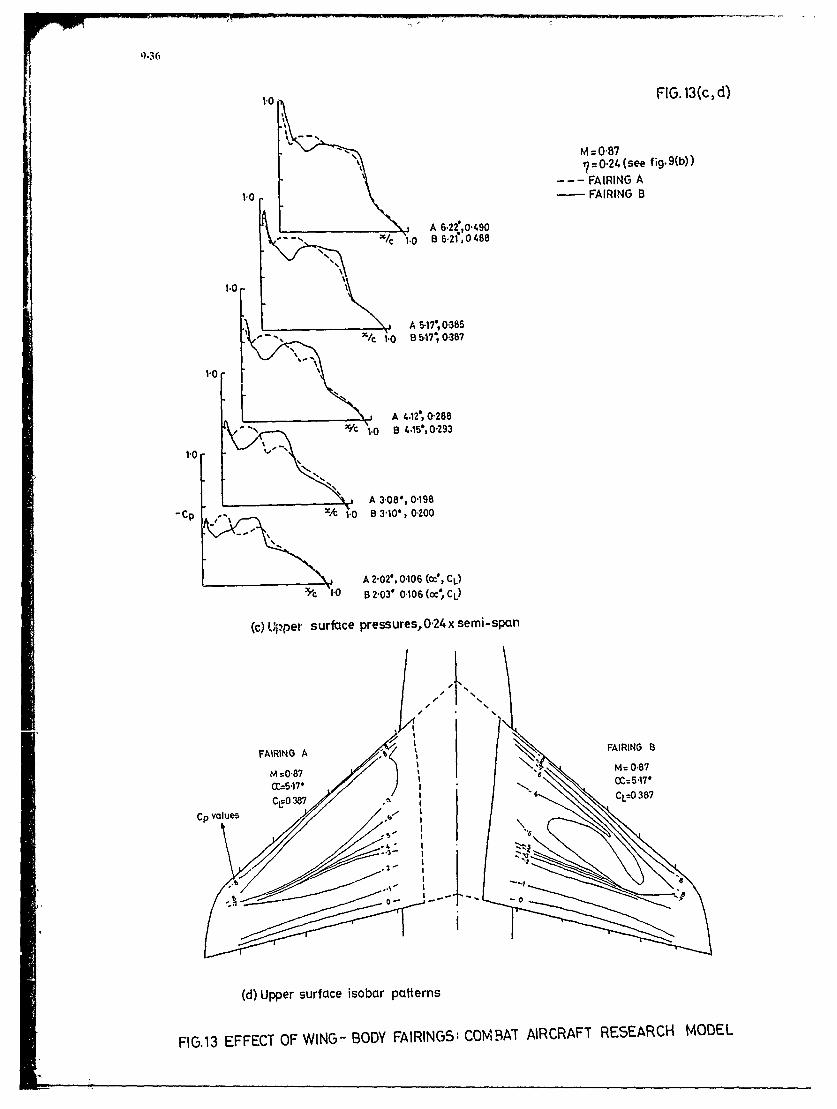
9 - 61 0 F I G . 1 3 ( c , d )
M =O0879 =O024 (see f ig.9(b))-FAIRING A
10 -FAIRING B
A 16-22*,0490
).c 8oB6.2f.,0488
A 5-17', 0385- -' X/C 10o B 517', 0387
A 4.120, 0288- N '/C 10 B 4.15', 0293
1.0 -
A 308', 0-198-CP -A 1.0 B 310*, 0-200
A 202, 0106 (Ce, CO)" c IO 8 2-03 0-106 (Oo, CL)
(c) U3pper surface pressures.0-24 x semi-span
FAIRING A I tFAIRING B
Ni 0-87 M 0-87crC=5*17'
CL!O 387 ~COBCp values
0- 0
(d) Upper surface isobar patterns
FIG13 EFFECT OF WING- BODY FAIRINGS: COMBAT AIRCRAFT RESEARCH MODEL
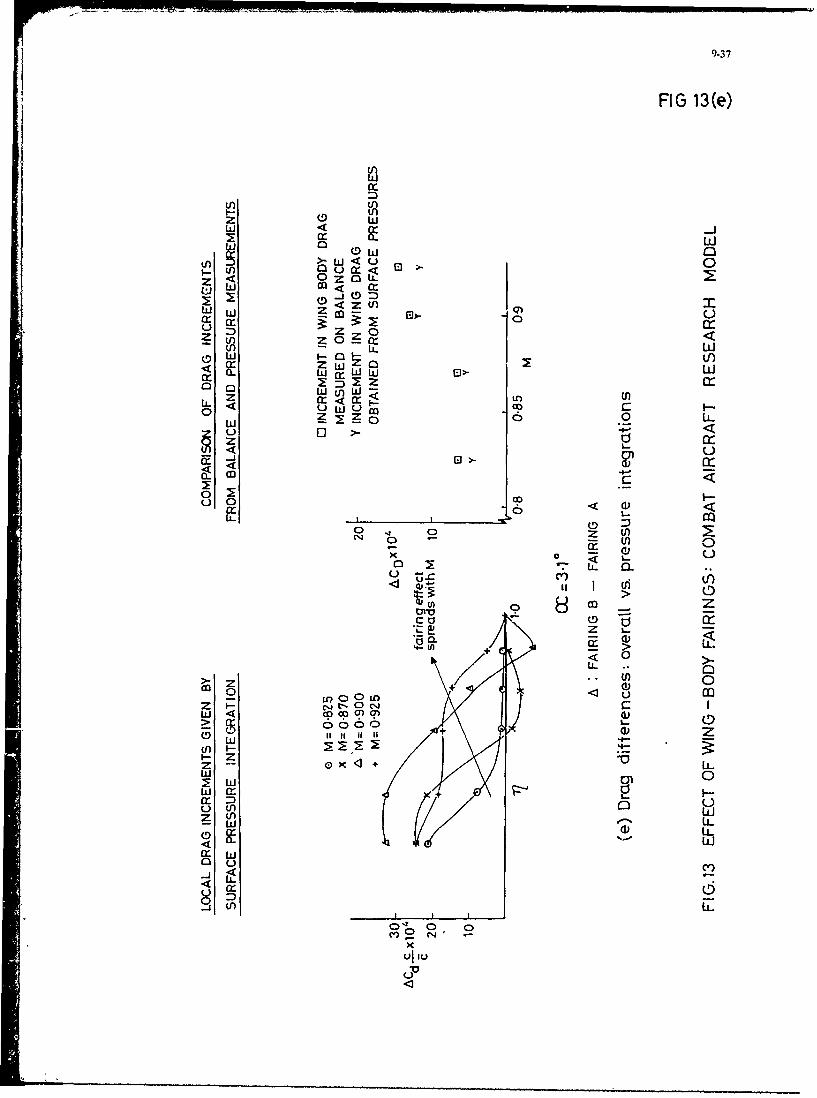
9-37
FIG 13(e)
w
zww
-
(D W 0if< ) Q >
z < 0OZ 0LL
2 L) 1 D =)
W ) -a:. Ww )
WZ W Lii
C3 z
(.. K0 C
0 0 <(N o ZU
00
0. CD L.
.Li.
~c> CDI
co z
W ~ 0)
00U) II- t-0 i
(D~i ii, La.
w i
(n*
F- :
u U')
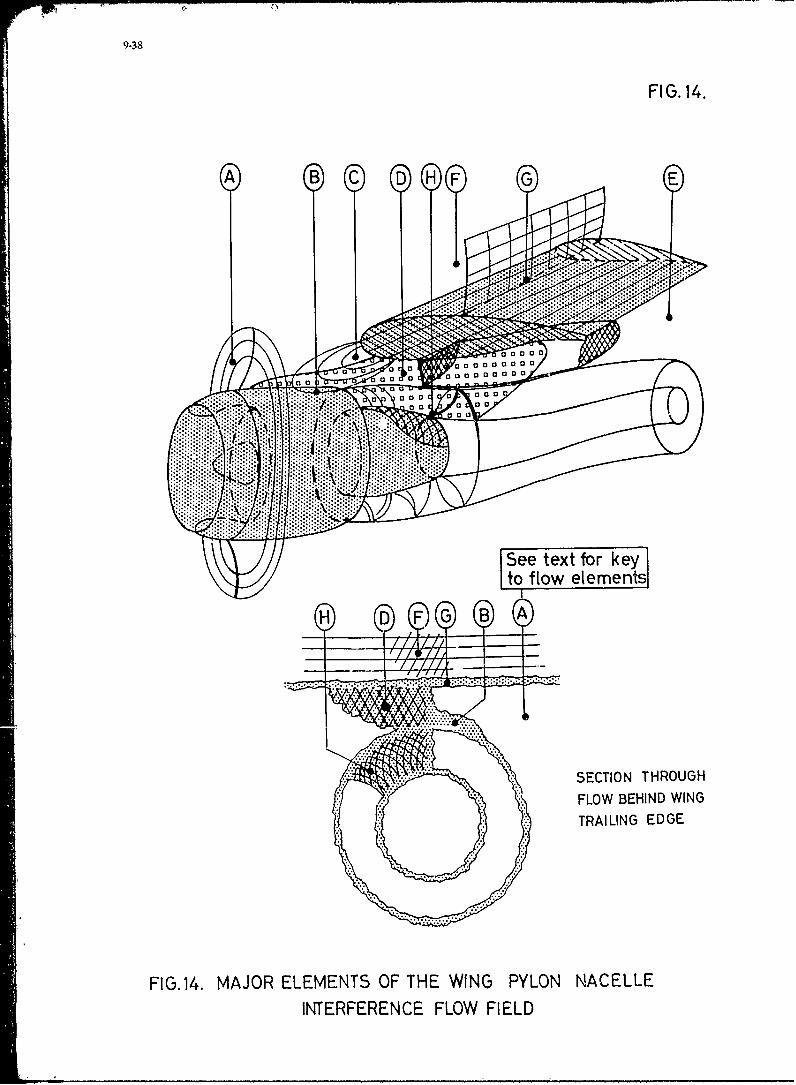
9-38
FI G. 14.
See text for keyto fltow elementsl
SECTION THROUGH
FLOW BEHIND WINGTRAILING EDGE
FIG.14. MAJOR ELEMENTS OF THE WING PYLON NACELLEINTERFERENCE FLOW FIELD

FIG. 15(a~b)
(a) Model geometry
t- If-
B
ACD -4CLF 0-2INCDrP-
0.001 0.1
AT CRUISE M \AA RIEC
A&CD=NACELLE DRAG INCREMENT
+ CLEAN WINGWITH NACELLE A
oWIT H NACELLE 3
M 0-02./
(b) Drag rise boundaries
FIG.15. EFF.ECT OF UINDERWING NACELLE POSITION ON INTERFERENCE

9.40
FIG 15 (c, d)
w w
Z L) to
D u zcrzO 0 /L
4W
U~3cw 6z6
'4'- 0 i
z
It D 111/U
fLL 1 0) -
-c 0)4 L
*L z
z
-
+D I, IfCD // Li.
II '7C-' -, + I.O

FIG. 16
z
LL
zLii
LU-
L
LL

9-42
FIG. 17 (ab,c)
WING .NACELLE /PYLON IGFSLE_______________WING!U
NUELGE
MODERATE - CONTOURED
OUTBOARD - 'SYMMETRIC
SHOCK SEVERE SHOCK-INDUCED 1-0 (See fig.17(c))
SEPARATION ONPYLON AND WING CL -
0-8-
VERY STRONG 03 .7A~ 00 t
INBOARD SHOCK 'a / O~u
WEAK 02 ~SHOCK 0
WING ALONE 0 002 &O04 006 0O8 CD0 10
(a)Flow pattern with symmetric nacelle. (b)Drag comparison:-
symmetric versus contoured nacelle.
EDGEE
-- ,-- UPPER SURACEL SYMMETRIC-. 6-- LONER SURFAcEJ NACELLE
-1--2 UPPER =SAC CONTOURED~1
Cp- -.- LOWER SURFACEJ NACELLE C
-0
0 0-2 :C 0'4 06 08 1.0 0 0-2 I/C0-4 0-6 08B 10
0 4j = 0 1 5 r-4 0 3 3
(c)Pressure distribution comparison: contoured versus symmetric
FI G. 17 INTERFERENCE FOR OVERWING NACELLE INSTALLATION

9.43
FIG. 18 (a, b)
00
uuE
_~~ 0 'J6 P17 C 0 L.
0 o c0
0 0 0
w U)
z z DZ
z z
UL))
0o N -
11 -J -jo~~ Lij L < d
Uf 4 0 Ur6 Zz.. 0
I <~ L
z 00
N --
~ 0 0
-0 I 0-
066- - -- .~...
- / 4-

9-44
FI G. 19 (ab)
•. ;-.:7:" ......,....
UNDERCARRIAGE
FAIRINGS
SUNDERWING
NACELLES ---- b -
CONFIGURATION A CONFIGURATION B
(a) Aircraft geometry
-o- CL= 0"5
-A-. CL= 04
0008 -- x-- CL= 02
ACD
0-006
0-004.- Al
o~o - - 't'
/P
0"002
00.5 0.6 0.7
M
ACD =(CDfor A)- (CDforB)
(b) Comparison showing extra interferencedrag with configurationA(see fig.19(a))
F1G.19..EXAMPLE OF INTERFERENCE BETWEEN AIRCRAFT COMPONENTS

9.45
FIG. 20(a,b)
w
00
M x
M~ 0
0 -0JC
E 20
a) 0) L
tn LDa) J~
o .-
- cotU-
0 cc.L ) D
T,1 a) 0L.0 0>
o 0 to
C)0 0 UL
0) 0
C z
CL
L-
CL L:0) 0 0
0- cU0.-(7) a) <
<mu c~* (n 0
>0 >o~
0 0 CN<
(D 4LQU)

9.46
FIG.20 (c)
BLUFF-NOSE STORE POINTED NOSE STORE
/
K s ,t K s
1,2 xt: 1.2
10 . ._. .. y =0"25 calibres 1.0
\ ~~~Axial stagger..... ." x t store calibres
"-" 5\ ,' "". 0 . ." .. "
0'8 0j - -8
6 -
0.6 08 10 M 1"2 0"6 0.8 1.0 M 1.2STAGGER
1- 06 0'8 1'0 M 1"2 1W 0"6 0"8 1.0 M 1"2
KKT Drag of 2store array
2xdrag of isolated store KT
% /I\/ -
0"9 I %)\I - \ i"%
/,- -.• ' I
XT-
o.\' '. \ /'\ ./0' --,.8 0.8 . .,
Axial separationXT store calibres0005 ..
073000 . 0 7
TANDEM CARRIAGE
(c) Favourable interference concepts: multiple store arrays
FIG.20 EXAMPLES OF FAVOURABLE AND ADVERSE INTERFERENCEFOR MULTIPLE STORE CARRIAGE

9-47
FIG.21
REARVIEW
WINGLET A
REARVIEW Z u
WINGLET B
SAILS MOUNTED ON WING-TIP BODY
FIG.21 WING-TIP DEVICES

9-48
FIG.22.
JM= 0.6
CLTI CLT~t f / M=0.75
M=o885
SWITHOUT STORESx -- WITH STORESoX USABLE UFT
WING L.E.SWEEP 38.70ASPECT RATIO 4.03TAPER RATIO 0.3
STORES MOUNTED UNDERWING AT 0.59,070, 0.87 SEMI-SPAN
FIG.22. EFFECTS OF UNDERWING PYLONS/ STORESON USABLE LIFT

9-49
FIG 23(a)C D
L.EFENCE
STN. A if - jO24c
0.05c
FENCE 1 FENCE 2
FENCE I ON.... FENCE OFF 1
3
X 0~Cp 1%1
x 2
XX 0
0-- FENCE OFF Jx G>
O FENCE IXFENCE2I 2e . ..
A 0 STN . Bx 0
x 4 8 12 cc' 163
X
CL tX 20"02 x
STN. Cx 0. 4 8 12 O 16
3
00V IV 12 1,6"8oo204 8 12a1
,/, \
JA
0 1
F. 2STN. DS10 12 14 16 18 t,.o 20 8 12 Co 16
- (a) Overall CL-" cC and pressures near Ieaatng edge.
"J ,FIG. 23. EFFECT OF LEADING EDGE FENCES ON USABLE LIFT
K,

9-50
FIG 23 (b)
0
8~ I
NIUE NI Li
00
00 Q In 0
0 I 0
000ix w ul Gl
ox z z Lzw w w 001- bLL L
0 00
q I W 0
0
1-L
"a L
0)z Uf
CDN
- - . (~)

9-SI
FIG 24
FMO=- -6 1M=08
CL WITH CL WITHSTRAKES STRAKES x O
0-2 A NO 0.21 NOI STRAKES /STRAKES
/
T
A
E
4-/
10 t
5 - 1 3C4o:0 f 5 0C 5 is O* 2
ROLLING MOMENT
WITH STRAKES WITH TRAKES
NO STRAKES NO STRAKES
Ce CB6- RMS WING-ROOT 6.
BENDING MOMENT
4 NOCe ST AKESSTRAKES
AWITH
,-X*-X ITHST RA KESS TRAK ES
0 ~0 Ax
0.2 C~rim d0-2 CLtrimmed
FIG 24 EFFECT OF STRAKES ON WING BUFFETINGAND UNSTEADY ROLLING

FI G. 25
0*** Ar
4 6
**e Lov . .404n* * -*. 00-st o a o t, a * '*o * .4 .6 .
.0600 00*00
saV
a*.**
0- l b 4
boos 96 *V *.
0 0
0. .as -
0 ;%a
/)
CAAR AT, ZOO DEFECIOIoFIG25~a EXAMPLe$ OF INEFEECaFOsCNR
FLO FIELD AT MV O8 Q7
.......
I0-I
TRANSONIC CONFIGURATION DESIGN
by
G. KrenzMBB / Vereinigte Flugtechnische Werke GmbH
D 2800 BremenGermany
SUMMARY
The progress in aerodynamics during the last decade has immensely improved fuel efficiency of commer-cial transport aircraft, one major part being the transonic configuration design. The wing contributes inthe order of two-thirds to the total aircraft drag in cruise flight and hence is the main objective of thepresent paper. General designaspectsas well as specific criteria for a transonic wing lay-out are des-cribed and some special problems inherent in any transonic wing design are discussed on the basis of wind-tunnel measurements. Aerodynamic wing concepts are considered, following two different design strategiesby model tests in the transonic wind-tunnel. - It was found that the shock development on the upper wingsurface has a strong effect on both the design and off-design performance of the wing in terms of L/D.
The progress in transonic copfiguration design is partially based on the tremendous efforts made incomputational aerodynamics and basic theories are being discussed during the current VKI-Lecture Series.Two simpler potential flow methods used in actual transonic wing designs at MBB/VFW are presented in thispaper. Major obstacles for proper wing design and aircraft performance predictions in the transonic flightregime by either calculations or wind-tunnel measurements are shock-boundary layer interaction and viscid-inviscid flow interference at the trailing edge. For several years our work in the field of calculatingand testing boundary layers is therefore concentrdted on these two subjects, and the present paper containsmain results we received with modern transonic aerofoils.
The lack of knowledge which still exists in these areas of viscid-inviscid flow interference is limit-ing the acuracy of performance predictions for modern transonic wing with a large amount of rear loading.-One concept followed at MBB/VFW to improve the predictions of full scale aircraft data is discussed in thepresent paper.
LIST OF SYMBOLS
AR aspect ratio SFC specific fuel consumption
c chord nondimensional s~reamwisp coordinate
mean aerodynamic chord t/c thickness chord ratio
CD drag coefficient u boundary layer velocity
Cf friction coefficient v velocity
Cp pressure coefficient w weight
C* critical pressure coefficient forM= 1.0 x/c relative chord positionp
CL lift coefficient
cts counts; I ct = 0.0001 CD GREEK SYMBOLS
D drag c angle of attack
L lift 6 boundary layer thickness
L/D lift/drag ratio 61 displacement thickness
M Mach number 5P viscous sublayer thickness
M x L/D performance parameter 6CDM drag rise due to compressibility
n normal coordinate ACDM = CD " CDiO 6
RN, Re Reynolds number 1 relative wing span
s streamwise coordinate A 25 wing sweep at 25 % chord
10-2
1. INTRODUCTION
Tremendous efforts were made during the last years in aerodynamic design to increase cruise perfor-mance efficiency, and qualified teams at different places of the world are working and competing for furtherimprovements in aerodynamics.
The basic technologies contributing to future improvements of fuel efficient transport aircraft areshown in FIG. 1. The main disciplines are aerodynamics, materials & structures and systems, the latter beingstrongly dependent on the efforts of the system manufacturers. The main technological progress is to be ex-pected where the disciplines are connected. As an example, the further increase of aspect ratio for betterL/Dis eased by materials with higher stiffness and improved fatigue oehavior than aluminium alloys as carbonfibre structures. Also, the aerodynamic impact of unsteady movable wing parts like flaps, spoilers or aileronson the load alleviation effects is a typical result of combined efforts of a combination of aerodynamics wthsystems technology. Considerable fuel redLction can be expected from the engine manufacturers, their progrksspartially being associated with improved transonic design of the compressor blades of the advanced engines.
What are the sources and reasons for the dramatic progress in aerodynamic design? - One, of course,is the rapid progress in computer technology and its use in computational aerodynamics. The progress in ex-perimental research and methods is less spectacular, because here we are waiting for the new facilities atNTF in the USA and ETW in Europe in opposition to the big computers.
Another source of substantial progress in aerodynamics is the development of new concepts and confi-gurations and the men standing behind them with their ideas and their toughness to realise them. - Ad-vanced transonic wing technology, now being introduced in the new airplanes of Europe and the USA, and pro-pulsion-airframe concepts, investigated in the AMST-programme with the YC 14 and YC 15 aircraft, are exam-ples.
A further motive for the tremendous progress in aerodynamics is the economic necessity for a reductionin fuel consumption, especially as far as commercial transport aircraft are concerned. FIG. 2 presentsthe increase of fuel price valid for the USA and taken from Boeing [I] . The dotted line gives the realprice increase up to the end of 1982. After a strong increase we see a stagnation and even a small decreaseduring the last 1 1/2 years, but until today the price is rather within the predicted area. The rapid fuelprice increase considerably effects the direct operating costs D.O.C. directly and contributes to the dis-proportionate increase of the fuel costs in the D.O.C. FIG. 3 shows the cost development as estimated byAirbus Industry in 1979 [21 . From the different methods used in this forecast only the results from Boeingare shown because of its simplicity (4 parameters), and it strongly reflects the fuel costs within theD.O.C. In the EURAC method however, the fuel costs represent about 2/3 of the Boeing estimate. The fuelcost price development corresponding to FIG. 3 is based on the lower broken curve in FIG. 2.
A proportionate change within the cost items of the D.O.C., as shown in FIG. 3, has a considerableeffect on aircraft design. To elaborate this, the fuel consumption as determined by the main aircraft andengine parameters have to be analysed. FIG. 4 contains a simplified basic formula for mission fuel effi-ciency, defined as trip fuel burned per distance. The first term, the ratio of specific fuel consumptionto cruise speed is defined as propulsive efficiency, and the second term is the airframe efficiency withaircraft weight to lift/drag ratio. Considering the latter, L/D to weight ratio must be as large aspossible for fuel efficient flight.
2. AIRCRAFT DESIGN FOR CRUISE FLIGHT AT TRANSONIC SPEED
2.1 Overall design aspects
One domirant desiqn qoal for commercial transport aircraft at cruise is low fuel consumption, as shownin the formula for the trip fuel given by the performance parameter M x L/D. FIG. 5 shows the characteris-tics of commercial transport airplanes of technology level achievable today. The M x L/6 iocreases toan optimum up to a Mach number where the drag rise due to wave drag is equal to the Mach number increase.The optimal cruise Mach number is in the range of O.75*M-1O.82 depending on the design and is very closeto the Mach number for maximum M x L/Dmax. This derives from trade-off studies for the main parameters de-termining the D.O.C. as fuel consumption, maintenance crew costs and aircraft price. The fuel consumptionpart reduces the optimum Mach number, because of the improved engine efficiency in cruise flight at lowerMach number, the other parts decrease with increasing Mach number as typical time-dependent costs. Thusthe overall optimum is often about 99-percent of the maximum value. The amount of maximum M x L/D and theshape of the curve is dependent on the quality of the aerodynamic design and on the specific desigr re-quirements. Fuselage and above all the wing geometry with their basic parameters: area, span, sweep andrelative thickness determine the M x L/D characteristics to a certain degrec, as given by the overall pro-ject design, however, the aerodynamic lay-out based on the same project wing design can infuence the M x L/Dcurves considerably. Our experience is that different design teams arrive at different M x L/D characteris-tics and standards even in case they work on comparable technology standards. Therefore it is extremelydesirable to lower the development and production risk to perform the design - and here especially the wingdesign - in a strong and serious competition.
The wing contribution to the drag is the main pait, and thus aircraft design above all means wingdesign. This is demonstrated in FICi. 6 with the breakdown for a typical commercial transport aircraft at

10-3
cruise flight conditions. We see that about two-thirds of the total aircraft drag is contributed by thewing; but even this convincing figure does not sufficiently explain the major importance the wing has inan aerodynamic design. Two more factors among others must be mentioned:
1. The compressibility drag of about five percent is a rather low figure and, in comparison with the otherdrag parts, mainly the parasitic and lift dependent drag, seems to be less important. The drag breakdownhere gives a wrong impression about the importance of the compressibility drag component, which is con-nected with the wing flow, because in a commercial airplane design it sets the boundary up to where fuelefficient flight can be performed. FIG. 7 shows the boundaries defined as drag-rise in the well knownCL-M-diagram. Due to the supercritical aerofoils with their increased lift capability as sketched in thepicture the drag-rise boundaries are shifted to considerably higher lift coefficients for a modern tran-sonic wing design. As the benefits of the advanced aerofoils are mostly used to increase the wing thick-ness without changing the design Mach number, a reduction of the drag-rise boundary at low CL-valuesoutside the design range occurs. The improvements at higher lift coefficients are equivalent to a per-formance advantage for the aerodynamic design as well as for the fuel consumption when the aircraft canbe operated at higher altitudes.
2. The other dominating aerodynamic performance parameter next to M x L/D is the buffet boundary which ismore or less completely associated with the wing design. Buffet arises as structural response to flow se-paration on the wing, and FIG. 8 shows how the buffet boundary is limiting the maximum cruise liftcoefficient. A 1.3 g margin during flight to the buffet onset boundary is required to enable a pilot tofly a 350 bank'angle and have sufficient margin against flow separation occuring in a heavy gust. A toolow limitation of the desired cruise lift coefficient leads to reduced fuel efficiency, because the spe-cific fuel consumption of the engine increases with lower altitude flight.
Thus the large emphasis to be made on the aerodynamic wing design at transonic speeds for a commercial trans-port airplane is obvious: Two-thirds of the total cruise drag and the whole compressibility drag limitingthe fuel efficient flight of the airplane are attributed to the wing, and furthermore the buffet boundarydetermined by the wing lay-out limits the maximum cruise lift coefficient and thereby fuel efficient oper-ating of the engines. The following chapters will mainly cover wing design aspects.
2.2 Design targets for cruise flight at transonic speeds
In general a research institute places other design objectives than an industrial company that has tosell commercial airplanes. In pure research main emphasis is put to better pysical mathematical understand-ing and to elaborate fundamental theoretical and experimental methods as powerfull tools for wing design.A large number of wind-tunnel models with different wing shapes is tested therefore and the comparison ofmeasurements and theory leads to improved theoretical and experimental methods. The main work is concentrat-ed at low Reynolds numbers, roughly 1/10 of the full scale Reynolds muumber as can be reached in the presentwind-tunnels. An industrial team has to design a wing for specific economic criteria with penalising re-strictions. The design must be made for full-scale Reynolds numbers and aircraft performance and load datapredictions are dominant compared to the methods used to achieve them. The reliable data basis fnr a winglay-out and aircraft performance predictions dntil today are the knowledge of former aircraft configurationsas well as wind-tunnel tests of the the new wing to be designed. The theoretical work is primarily done to limit thenumber of wing shapes to be tested up to the desired performance data and to estimate the Reynolds number effectsin case they are different due to changes in aerodynamic characteristics of the new design compared to the flyingairplane. In the following presentation the industrial aspects during a wing design will dominate.
Some general design criteria to be fulfilled in a transonic wing design are:
- high M x L/Dmax with good M x L/D characteristic for the entire design range;for short/medium range aircraft 0.7*Mz 0.8; 0.3%CL 0.6
- high buffet boundary to allow for high cruise design lift coefficients
- no pitch-up near btdll Mid buffet onset
- sufficient space (wing thickness) to house the undercarriage, the required fuel volume andmovable parts of the wing
- sufficient thickness in areas like fuselage junction, planform crank, outboard aileron to keepthe structural weight low, increase flutter speed and maintain control effectiveness.
One overall design aspect is that the wing geometry should be as simple as possible to keep productionand maintenance costs low. FIG. 9 shows the wing planform of a typical transport configuration, which wastested in a research programme. The dashed lines indicate areas of double curvature on the wings upper andlower surface. The criterion of 30 m curvature radius for shotpeening the panels without difficulties andextra manufacturing costs led to small areas of double curvature as shown here. The other part of the wingwas designed by linear lofting and thus gave a quite simple geometry. The aerodynamic '.ama,t.ristics aspresented by the pressure distribution in FIG. 10 were encouraging. The flow is rather .hnok free at thedesign point and increasing CL and Mach number leads to nearly constant chord shock -os.tmos maintainingstraight isobar lines following the wing sweep.
Another point of interest and often of controversial discussion regarding the wing planform is thecrank at the trailing edge, which is designed to increase the chord of the inner wing to receive space forthe undercarriage housing, see FIG. 11. An elliptical lift distribution for low induced drag is hardly torealize because the large wing chord of the inner wing section does not coincide with the requirement foracceptable stall characteristics. Designs we made and tested for different trailing edges as shown in thefigure - the aim was a more elliptical load distribution by softer cranks - gave no improvements in thetotal drag at cruise. It must be considered that the lift dependent drag in transonic flow does not onlydepend on the lift distribution along the wing span and hence on the vortex drag but is influenced by thedevelopment of viscous and wave drag in the transonic flow at the individual aerofoil sections.
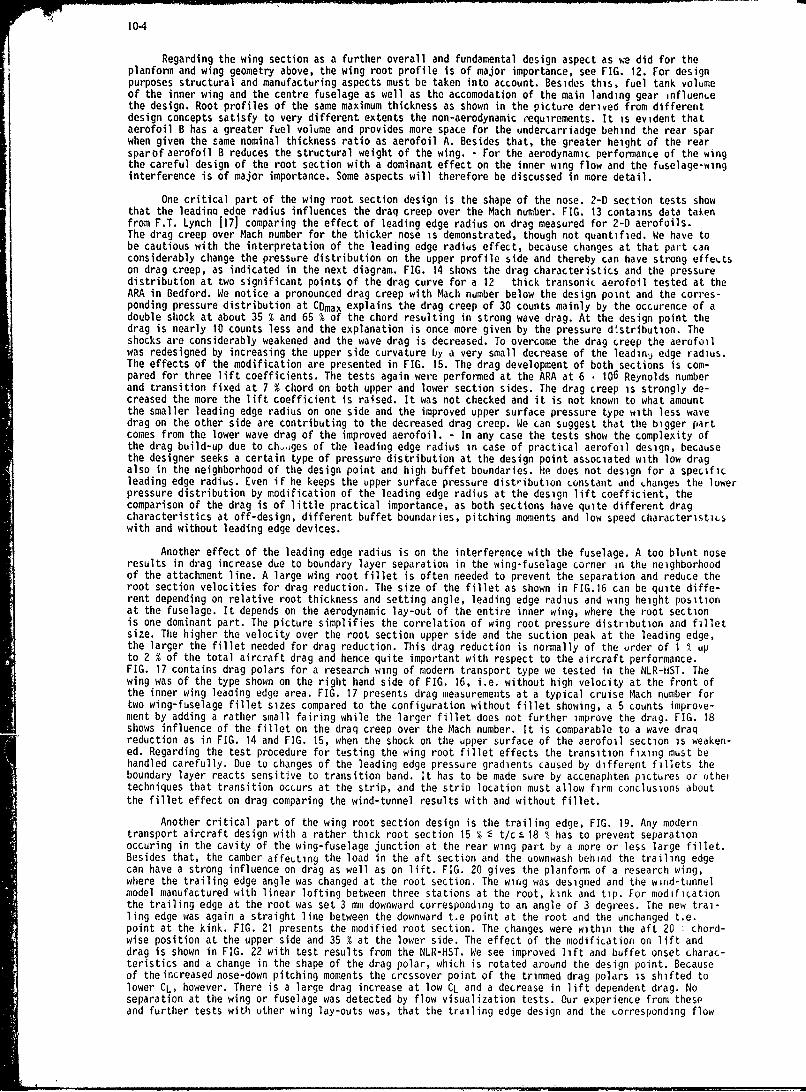
104
Regarding the wing section as a further overall and fundamental design aspect as %e did for theplanform and wing geometry above, the wing root profile is of major importance, see FIG. 12. For designpurposes structural and manufacturing aspects must be taken into account. Besides this, fuel tank volumeof the inner wing and the centre fuselage as well as the accomodation of the main landing gear influen.ethe design. Root profiles of the same maximum thickness as shown in the picture derived from differentdesign concepts satisfy to very different extents the non-aerodynamic requirements. It is evident thataerofoil B has a greater fuel volume and provides more space for the undercarriadge behind the rear sparwhen given the same nominal thickness ratio as aerofoil A. Besides that, the greater height of the rearsparof aerofoil B reduces the structural weight of the wing. - For the aerodynamic performance of the wingthe careful design of the root section with a dominant effect on the inner wing flow and the fuselage-winginterference is of major importance. Some aspects will therefore be discussed in more detail.
One critical part of the wing root section design is the shape of the nose. 2-D section tests showthat the leading edge radius influences the draq creep over the Mach number. FIG. 13 contains data takenfrom F.T. Lynch [17] comparing the effect of leading edge radius on drag measured for 2-D aerofoils.The drag creep over Mach number for the thicker nose is demonstrated, though not quantified. We have tobe cautious with the interpretation of the leading edge radius effect, because changes at that part canconsiderably change the pressure distribution on the upper profile side and thereby can have strong effectson drag creep, as indicated in the next diagram. FIG. 14 shows the drag characteristics and the pressuredistribution at two significant points of the drag curve for a 12 thick transonic aerofoil tested at theARA in Bedford. We notice a pronounced drag creep with Mach number below the design point and the corres-ponding pressure distribution at CDmax explains the drag creep of 30 counts mainly by the occurence of adouble shock at about 35 % and 65 % of the chord resulting in strong wave drag. At the design point thedrag is nearly 10 counts less and the explanation is once more given by the pressure distribution. Theshocks are considerably weakened and the wave drag is decreased. To overcome the drag creep the aerofollwas redesigned by increasing the upper side curvature by a very small decrease of the leadinv edge radius.The effects of the modification are presented in FIG. 15. The drag development of both sections is com-pared for three lift coefficients. The tests again were performed at the ARA at 6 • 106 Reynolds numberand transition fixed at 7 % chord on both upper and lower section sides. The drag creep is strongly de-creased the more the lift coefficient is raised. It was not checked and it is not known to what amountthe smaller leading edge radius on one side and the improved upper surface pressure type with less wavedrag on the other side are contributing to the decreased drag creep. We can suggest that the bigger partcomes from the lower wave drag of the improved aerofoil. - In any case the tests show the complexity ofthe drag build-up due to ch .,ges of the leading edge radius in case of practical aerofoil design, becausethe designer seeks a certain type of pressure distribution at the design point associated with low dragalso in the neighborhood of the design point and high buffet boundaries. He does not design for a specificleading edge radius. Even if he keeps the upper surface pressure distribution constant dnd ihanges the lowerpressure distribution by modification of the leading edge radius at the design lift coefficient, thecomparison of the drag is of little practical importance, as both sections have quite different dragcharacteristics at off-design, different buffet boundaries, pitching moments and low speed characteristicswith and without leading edge devices.
Another effect of the leading edge radius is on the interference with the fuselage. A too blunt noseresults in drag increase due to boundary layer separation in the wing-fuselage corner in the neighborhoodof the attachment line. A large wing root fillet is often needed to prevent the separation and reduce theroot section velocities for drag reduction. The size of the fillet as shown in FIG.16 can be quite diffe-rent depending on relative root thickness and setting angle, leading edge radius and wing height positionat the fuselage. It depends on the aerodynamic lay-out of the entire inner wing, where the root sectionis one dominant part. The picture simplifies the correlation of wing root pressure distribution and filletsize. The higher the velocity over the root section upper side and the suction peak at the leading edge,the larger the fillet needed for drag reduction. This drag reduction is normally of the urder of I upto 2 % of the total aircraft drag and hence quite important with respect to the aircraft performance.FIG. 17 contains drag polars for a research wing of modern transport type we tested in the NLR-HST. Thewing was of the type shown on the right hand side of FIG. 16, i.e. without high velocity at the front ofthe inner wing leaoing edge area. FIG. 17 presents drag measurements at a typical cruise Mach number fortwo wing-fuselage fillet sizes compared to the configuration without fillet showing, a 5 counts improve-ment by adding a rather small fairing while the larger fillet does not further improve the drag. FIG. 18shows influence of the fillet on the draq creep over the Mach number. It is comparable to a wave draqreduction as in FIG. 14 and FIG. 15, when the shock on the upper surface of the aerofoil section is weaken-ed. Regarding the test procedure for testing the wing root fillet effects the transition fixing must behandled carefully. Due to changes of the leading edge pressure gradients caused by different fillets theboundary layer reacts sensitive to transition band. It has to be made sure by accenaphten pictures or uthertechniques that transition occurs at the strip, and the strip location must allow firm conclusions aboutthe fillet effect on drag comparing the wind-tunnel results with and without fillet.
Another critical part of the wing root section design is the trailing edge, FIG. 19. Any moderntransport aircraft design with a rather thick root section 15 % S t/cs 18 % has to prevent separationoccuring in the cavity of the wing-fuselage junction at the rear wing part by a more or less large fillet.Besides that, the camber affecting the load in the aft section and the uownwash behind the trailing edgecan have a strong influence on drag as well as on lift. FIG. 20 gives the planform of a research wing,where the trailing edge angle was changed at the root section. The wing was designed and the wind-tunnelmodel manufactured with linear lofting between three stations at the root, kink and tip. For modificationthe trailing edge at the root was set 3 mm downward corresponding to an angle of 3 degrees. The new trai-ling edge was again a straight line between the downward t.e point at the root and the unchanged t.e.point at the kink. FIG. 21 presents the modified root section. The changes were within the aft 20 chord-wise position at the upper side and 35 X at the lower side. The effect of the modification on lift anddrag is shown in FIG. 22 with test results from the NLR-HST. We see improved lift and buffet onset charac-teristics and a change in the shape of the drag polar, which is rotated around the design point. Becauseof the increased nose-down pitching moments the crcssover point of the trimmed drag polars is shifted tolower CL, however. There is a large drag increase at low CL and a decrease in lift dependent drag. Noseparation at the wing or fuselage was detected by flow visualization tests. Our experience from theseand further tests with uther wing lay-outs was, that the trailing edge design and the uorresponding flow

10-5
in this area sensitively effects the drag and lift development in the transonic flight regime of a trans-onic aircraft wing, and as a consequence we found that only limited loads on the rear part of the rootsection can be allowed in a high performance transport aircraft wing design.
Besides the root section, the basic aerofoil profile, designed for the major part of the wing, un-disturbed by the fuselage and tip, is dominant for the transonic wing performance, FIG. 23. A large effortin transonic aerofoil design was made during the last ten to fifteen years and the theoretical methodsfor flow calculations around such aerofoils are well advanced today. The 2-D wind-tunnels in the USA andCanada allow for tests up to 30 • 106 :5 RN s 40 • 106 per meter and this improves the experimental basisfor a transonic wing, to be designed for a full-scale Reynolds number of 40 million based on mean aero-dynamic chord in case of a transport aircraft like the Airbus. There is still a scatter in the test dataof comparable wind-tunnels - more or less pronounced - but testing a new aerofoil for a new wing designin comparison with well known basic 2-D sections of existing aircraft tested in the same tunnel gives asound design basis.
Important aerodynamic goals for the basic aerofoil design are:
- high CLmax and Buffet Onset Limits for the wholeflight regime
- delayed Drag Rise over the Mach number without apronounced "Drag Creep" at the lowest possible drag level
- smallest possible Zero Pitching Moment
- good Off-Design Characteristics.
These objectives characterize the type of design pressure distribution, e.g. with respect to
- extent and strenght of supersonic region andrecompression gradient
- quasi shockfree conditions for the design point
- stable shock development as far as possible underoff-design conditions
- separation beginning at the trailing edge
- strength of "Rear Loading".
The aerodynamic realization of these objectives must consider requirements from other fields such asstructures, engineering design and production:
- the forward part of the profile up to the wing-boxshould allow a favourable shape for the leadingedge flaps - a flattening of the aerofoil lower sidein this region which is sometimes introduced in orderto increase the load at the nose part may be detrimen-tal to the design of high CLmax and favourable leadingedge devices.
- The aerofoil part behind the wing box must have thespace and the shape for accomodating effectivetrailing edge flaps - too thin rear aerofoil regionslead to structural difficulties, especially in the regionof the spoilers.
- The middle part of the aerofoil must be as thick aspossible, in order to allow tne use of a big box. Ahigh rear spar reduces the structural weight of thewing box.
2.3 Considerations about the wing design concept
Referring to the general wing planform of today's transonic transport aircraft as shown in FIG. 20,the importance of the basic aerofoil section characteristics is much greater than for older conventionalaircraft designs. This results from the increased wing aspect ratio leading to a larger wing portionwhere the flow is not influenced by the tip or the root of the wing, respectively. On the other handthe section itself is much more advanced and to a higher degree imposes its characteristics on the wing.
Concerning the 3-D wing design, the flow development at the inner wing portion determines the spanregion over which mainly one type of flow appears on the wing, see FIG. 24. At design conditions the flowmust be shockless as far as possible, but when CL or Mach number increases different types of shock con-figurations can develop depending on the design concept as shown in the picture. A shock e.g. extendingin the region outside the wing planform crank changes position and strength with variations in flow con-ditions and thus the characteristics of the wing aerodynamics. Fully developed twin-shock configurationsoften arise under off-design conditions associated with strong drag creep when the design point is shock-free. Such a low-loss pressure distribution can also be achieved at the design point if the double shockdevelopment at off-design is restricted to the inner wing portion and in addition is of weak intensity.In this case the wing has one dominant flow type, with the character of a quasi 2-D section flow changingrather continuously with Mac number and incidence. Hence the governing impact of the aerofoil characte-ristics on the wing is evident and the 3-D effects including the 3-D boundary layer influence are lesspronounced. - For computational treatment of the wing and specific wing sections this type of transonicflow concept is a simplification, as will be described in the chapter "theoretical methods".

10-6
Following those two design concepts mentioned above a transonic wing design with the aid of wind-tunnel tests at the NLR-HST will be considered. FIG. 25 and FIG. 26 present the pressure distributionstested at RN = 2.5 106 with fixed transition at 7 chord on the upper and lower wing side. In FIG. 25 athe double-shock wing is shown at the design point, the shocks already appearing rather strong. In FIG. 25 b,for increased angle of attack, the forward shock is stronger and extends outboard the planform crank whichis at 40 % semispan. The second wing lay-out was aimed at decreasing the forward shock strength, withoutloosing suction in the forward region of the wing up to the crest. In FIG. 26 a only a weak for.ard shockup to 25 % halfspan is recognized. At design conditions we can see that a somewhat stronger shock onlyoccurs near the kink position of the wing at the pressure measurement phase 7 = 0.415. Increasing the angleof attack in FIG. 26 b the forward shock has disappeared almost completely. Thus we have reached a similarflow development over about 80 % wing half span as in case of the exposed wing. At the outboard sectionthe extension and the strength of the supersonic flow was decreased to prevent this wing part to initiatethe high speed stall and to maintain outboard aileron effectiveness.
A comparison of the drag characteristics of both wings at the design lift coefficient is demonstratedin FIG. 27. The decrease in drag is about 5 counts at the design Mach number for wing 2, however, there isan even higher improvement at off-design Mach numbeis. The rather strong drag creep for the first wing isassociated with compressibility drag as far as can be concluded from the corresponding pressure distribu-tion. The twin shock of this wing strongly influences the wave drag leading at N = 0.75 to about 8 countsdrag increase. Near the design Mach number, at M = 0.78 the drag rise is softer and the difference betweenboth wings decreases to 5 counts due to the improved pressure distribution with weaker shocks. The designlift coefficient for the wings studied at an early Atage of our ZKP research programnme was CL = 0.5 atM = 0.78. We then found the best characteristics with respect to pressure distribution, and buffet onsetto be at CL = 0.47. This was taken as the actual design lift coefficient for the wings. Further designsfor CL = 0.5 were performed on the basis of slightly decreased wing thickness at the planform crank stationand at the outer wing portion.
The drag creep occuring for a transonic wing is one feature, where the designer has to work withgreat emphasis and care. The reason is, that sometimes a large part of this drag can worsen the wingdesign considerably. Not only that the design is no longer competive, but also a serious estimation of theexpected drag creep for the full scale aircraft is extremely difficult. In chapter 2.2 describing someaerofoil characteristics we did recognize already the complexity of this drag feature being dependent onthe leading- and trailing-edge shape of the aerofoil as well as on the shock development over the uppersurface. From our experience, mistakes can be made when all efforts are directed towards the minimum wavedrag. This is often done, because one main task of transonic aerodynamics for any designer is to producea favourable pressure distribution - shockless if possible - at the design point to keep the wave draglow. We made promising lay-outs regarding the upper and lower surface pressure distribution and the dragcreep was still 15 counts and more. Hence we had to conclude that designing for a favourable pressuretype is not sufficient for a high performance transonic wing design. - It is one fundamental condition anddesign aid, but no prove, that the drag characteristics are adequate. Another remarkable part contributingto the drag creep can be caused by the viscous flow due to boundary layer thickening without or with se-paration.
The above described drag development is most uncertain already in two dimensional flow, as discussedpreviously, and therefore is the most risky component in a transonic wing design. The reason is a limita-tion by the low maximum Reynolds numbers which can be tested in the wind-tunnels (Reemax - 8 • 106 comparedto ReC%. 40 . 106 for the Airbus) and the lack of theoretical methods.
Two features are predominant for properly calculating and testing the transonic flow: The shock-boundary layer interaction and the viscid-inviscid flow interaction at and behind the trailing edge. Thesephenomena are basically two-dimensional and nearly all our work at MBB/VFW concerning boundary layer cal-culation and testing is concentrated since several years on these problems. - In chapter 3.2.3 theoreticaland experimental results are presented.
As is generally known, the real effects are of three-dimensional character as indicated by transonicwind-tunnel tests showing severe cross-flow at the trailing edge of the models. The flow over a swept wingtitted to a tuselage is turthermore compiicatea by crossfiow effects dt the leddily edge,due Lu ru.ldUcontamination, but these stability effects are connected with low Reynolds number tests we are limitedto in the current wind-tunnels. FIG. 28 represents a characteristic picture of the problems enhanced withthe crossflow instability at the wing leading edge. This picture we derived from a transonic research wingat cruise conditions of modern transport aircraft. Re is the Reynolds number for the boundary layer alongthe attachment line calculated with the momentum thickness, incorporating the leading edge sweep angle.The critical Reynolds number, where turbulent flow starts from the attachment line, is found to exist attwo different boundaries, one 240 - Rs 280 for natural transition on a clean edge, the other 1005 Re9. 120when contamination by the fuselage boundary layer ahead of the wing leading edge exists 131 . The diagram showsthat, we have to expect laminar boundary layer flow at the attachment line over the full wing span atlow Reynolds numbers, however, substantially mixed laminar-turbulent flow at so called high Reynolds numbertests regarding the measurements in the European wind-tunnels. From this we can conclude that, testing inthe lower Reynolds number range 2.5 . 106 < Rea < 3 • 106, is most reliable. It keeps the leading edgeflow laminar up to the transition band and, when by means of acenaphthene pictures the flow behind the bandis observed to be turbulent, one has distinct areas of laninar and turbulent flow on the wing surface. Thismay be related to the aircraft in flight, where the entire flow is turbulent downstream from the attachmentline. - However, there are other flow phenomena changing at higher Reynolds number, either improving orsometimes deteriorating the wing design. Trailing edge separation due to excessive adverse pressure gradientsoften is cured byincreasing thg Reynolds number. When interpreting the test results in the availablerange 2.5 • 106<Rec - 6.5 • 10 for complete models in our wind-tunnels, and, making predictions for theaircraft in flight, we have to be cautious. Surface irregularities, sometimes much stronger on the aircraftwing surface than on the wind-tunnel model can overrule the benefits of increasing Reynolds number takenfrom model tests. Furthermore, the trailing edge flow of transonic wings with a high degree of rear loadingis more difficult to predict for full-scale Reynolds number, because the flow over the lower surface ofthe wing can influence the trailing ege separation considerably. So far the development of viscid-inviscidflow interaction at the trailing edge and in the wake is not fully understood.

For these reasons one can follow a simple rule in a transonic wing design to avoid any risk for theaircraft with flow separation at the trailing edge. To avoid any separation at any model tested in theappropriate transonic wind-tunnels, in the whole design range of cruise flight, and, in the whole rangeof Reynolds numbers, typical for tests at cruise conditions. In Europe the range is 2.5.106Red:.6.5.106with respect to Airbus scale.
3. DESIGN PROCEDURE FOR TRANSONIC WINGS
3.1 Objectives for theoretical and experimental work
Wing design in industry is very closely connected with the experience of previous wing developmentfor aircraft built and flight tested by the company. The predecessor, for example the A 310 following theA 300 B, has in most cases a significant influence on the new design efforts. The experience with existingdesigns of flying aircraft and the risk involved with the next technological step determine the approachin industry.
With respect to the aerodynamic design, wind-tunnel testing in a reliable tunnel is still the fun-damental working basis. - Intensive transonic tests were conducted e.g. in the tunnels of ARA and RAEin England and also in the NLR-HST in Amsterdam during the A 300 development, FIG. 29. The analysis ofthe measurements and the correlation with flight-tests, also repetitions and intensifications of thesetest series have formed the basis of new developments, as was done earlier in the same tunnels in case ofnew design like the A 310. Then the question arises Loncerning specific differences between wind-tunnel andflight test results of flying aircraft on one side and the results of the new design measured in the same tun-nels on the other side. Due to retaining the flight Mach number of the new aircraft generation this questionin mainly reduced to the influence of the Reynolds number, FIG. 30. Since new transonic wind-tunnels for three-dimensional measurements have iiot been built in Europe since the development of the Airbus and the Reynoldsnumbers have remained unchanged in existing tunnels, the evaluation of new designs and characteristicsat higher Reynolds numbers is limited to two-dimensional testing. Reynolds numbers per meter up to 15 106in Europe and 30 • 106 up to 40 • 100 in the USA and Canada are possible. (ReeZ40 • 106 for the A 310).Because of the higher impact of the aerofoil characteristics on a modern transonic wing design describedin chapter 2.3, the 2-D tests at high Reynolds numbers are helpful to support the prediction of the aero-dynamic characteristics of the new aircraft design.
As the prediction of the aircraft performance - as far as the aerodynamic part is concerned - isbased on wind-tunnel data, the theoretical work in industry is concentrated on some main objectives:
a) The first approach in transonic wing design must meet the desired aerodynamic efficiency asclosely as possible. This alone is a difficult task, because in a first step several parametershave to be weighed in trade studies leading to a basic wing design. As a minimum we have as
Main Parameters for Basic Wing Design--------------------------------------
- area - thickness
- planform - design Mach number
- aspect ratio - design lift coefficient
- sweep angle - weight
- taper ratio - low speed performance
The design method must be powerfull, allowing the designer to evaluate the best basic design inan optimization study. As a number of additional parameters are included in the trade studies,in most practical cases we arrive at more than one basic wing design, all competing against eachother. However, the advances in transonic computational techniqies have considerably improved thedesign method and reduced the cycles for an optimized bdbiL debiy,,.
The second step is to optimize the aerodynamic efficiency of the basic wing design given byplanform, area, aspect- and taper-ratio, sweep angle and relative thickness at some spanwisestation like root crank, and tip. The design variables for this task are for
Optimization of Aerodynamic Efficiency--------------------------------------
- aerofoil shapes - load distribution vs span
- thickness distribution - L/D (CL, Mach number)
- twist distribution - buffet boundary (M)
- wing setting angle - pitching moment
- dihedral vs span - stall characteristics
- space for fuel, systems - aileron effectiveness
main landing gear
The quality of the design method to a large extent contributes to the aerodynamic efficiency ofthe wing design.

1O.
b) A further objective of the theoretical work is to linit the number of wind-tunnel odcls, ncedcofor testing up to the final wing design stage. Model tests are time and money consuming and thedesign process can be laborious and inefficient if the theoretical methods are not powerfulenough. It must be realized, that several features like fillets, fairings and local shape changescan only be optimized in the experiment and require extensive wind-tunnel testing. Thus the de-sign of the clean wing has to be established in a limited number of improving steps. Today themodel shop needs six weeks for the manufacture of a high speed wing and three months for a wingwith pressure orifices. Hence no more than two up to three design steps can be tested per year,including the design process and analysis of wind-tunnel test results. Following different designconcepts simultaneously the number of tests can be increased. The theoretical methods used shouldbe capable of improving the wing performance in only a few steps up to the design target.
c) Another objective of the theoretical work is to estimate the Reynolds number influence on theaerodynamic performance in the range between model tests and aircraft flight. One part of thiswork is the understanding of wind-tunnel test results and the definition of test proceduresas willbe discussed in chapter 4.
The objectives have to be fulfilled with suitable theoretical methods which will be discussed inthe next chapters.
3.2 Wing design methods
The evaluation of the optimum basic wing geometry, for which the main optimization parameters aredescribed in the previous section, is considerably improved by the assistance of appropriate transoniccomputational methods. Voogt and Slooff, ICAS paper 82-5.6.1, have shown that the drag characteristicsversus Mach number can be very well calculated by the NLR-method. The shape of the drag curve versus Machnumber is excellent and the drag level seems good enough for optimization of basic wing geometry.
Moreover, as Voogt and Slooff have shown, the method is well applicable for design purposes and cal-culations of target pressure distributions of wing-body configurations in transonic flow. The central partof the computer programme system consists of Jameson's FLO 22. Hence it is a reliable tool to optimizethe aerodynamic efficiency of a transonic wing in connection with W/T-measurements. There are severalother methods, discussed at the present VKI Lecture Series and described in the literature, which are basedone 3-D full potential transonic flow calculation combined with 3-D or 2-D boundary layer codes. - In in-dustrial wing design we have good experience with simpler methods, which will be described in the follo-wing chapter.
3.2.1 Analogy method for transonic wing design
A well tested procedure which we call "analogy method" to design a transonic wing for transport air-craft is shown in FIG. 31. It is used to calculate the transonic pressure distribution over a wing includingwing/body interferences. The calculation starts with subsonic pressure distributions at different spanwisestations of the wing taken from experiment or 3-D panel calculations. Thus it takes advantage of the cheaper,more exact and easier handling of theory and experiments in the subsonic flow regime, together with thegreater experience compared to the transonic flow regime. In the second step analogous profiles, Mach num-bers and angles of attack are determined for the desired wing sections. This is done by starting from the3-D pressure distribution at one station and applying an inverse 2-0 method to obtain an equivalent sectionprofile generating the 3-D pressure distribution. This "analogous profile"is now handled with an accurate2-D transonic method including boundary layer effects. FIG. 32 contains results for a research wing. Inthis method of approach the differences between subsonic and transonic 3-D effects are neglected for theinvestigated wing section. However, this method delivers adequate results for the desired spanwise pressuredistribution and its transonic development. FIG. 33 shows a comparison of calculated and tested pressuredistributions near the fuselage.
3.2.2 A hybrid method for transonic wing design
A special combination of a panel method and a finite difference method was developed for transonic
wing design. This hybrid method, in contrast to the analogy method, requires
no analogous profile
no analogous Mach number
no analogous angle of attack.
The first point is of great practical importance, because in many cases it is laDorious even for askilled designer to determine an analogous profile. The second point is substantially significatit, becausethe analogy method is by definition not able to calculate the correct shock strength due to the low analo-gous Mach number. The last point will become important as soon as 3-D boundary layer effects can be includedin a satisfactory manner. At present the local lift coefficient must be adjusted according to the analogymethod. Summing up, a designer using the hybrid method instead of the analogy method needs less experiencein practical wing design.
When using the hybrid method the transonic wing flow is solved in spanwise sections, similar to theanalogy method. However, in contrast to the latter, 3-D flow effects are taken into account by calculatingthe cross flow using a 3-D panel method for each wing section. This procedure is based on the assumption
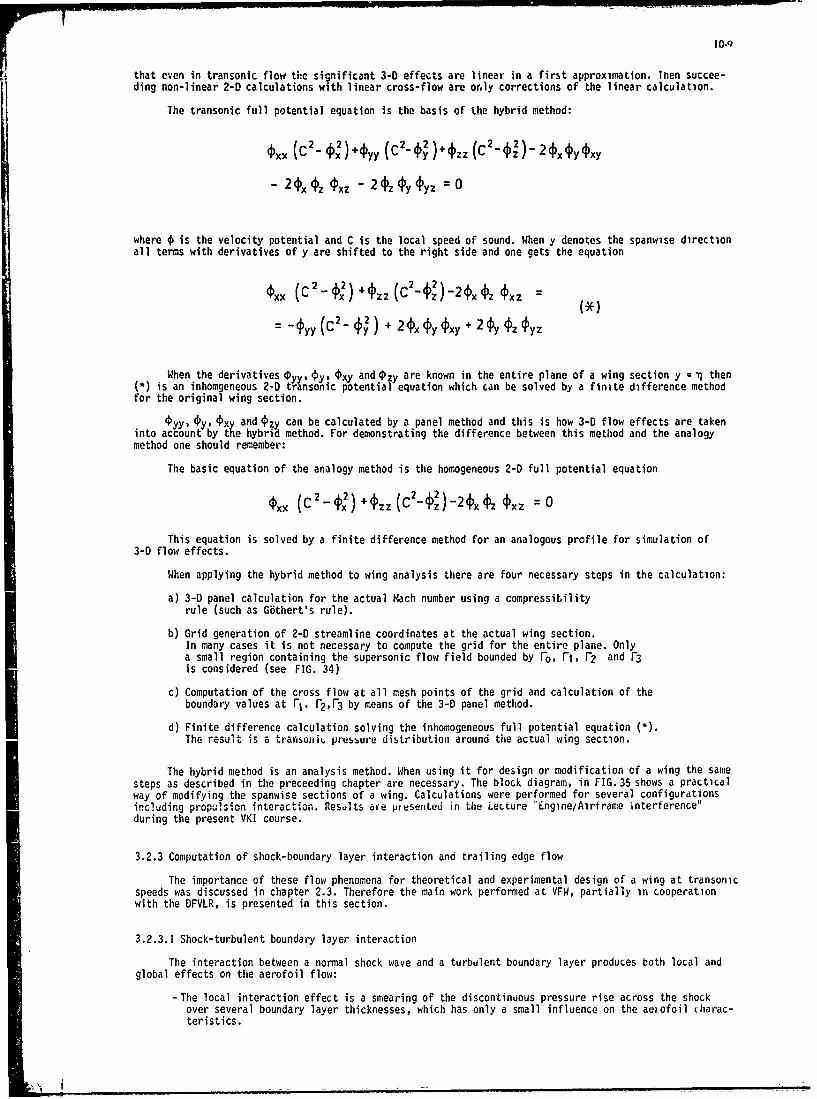
i O.Q
that even in transonic flow the significant 3-0 effects are linear in a first approximation. Then succee-ding non-linear 2-0 calculations with linear cross-flow are orly corrections of the linear calculation.
The transonic full potential equation is the basis of the hybrid method:
xx (cl- 1) + ,y (c2_ 2)+ =z (C2-,2)- _~ yx
- 2x OZ Oxz - 2 z y yz :0
where 4 is the velocity potential and C is the local speed of sound. When y denotes the spanwise directionall terms with derivatives of y are shifted to the right side and one gets the equation
xx (C I- x) + zz (C -z() -2 x z xz(*)
=_-€ (C2_ 2 ) + 2 x y xy+ 2, yz Oyz
When the derivatives Pyy, 4 y, oxy and Pzy are known in the entire plane of a wing section y = then(*) is an inhomgeneous 2-0 transonic potential equation which can be solved by a finite difference methodfor the original wing section.
in 0yy, yx and 4 zy can be calculated by a panel method and this is how 3-D flow effects are taken
into account by te hybrid method. For demonstrating the difference between this method and the analogymethod one should remember:
The basic equation of the analogy method is the homogeneous 2-D full potential equation
xx (C - z z (C -') -2 x z x = 0This equation is solved by a finite difference method for an analogous profile for simulation of
3-0 flow effects.
When applying the hybrid method to wing analysis there are four necessary steps in the calculation:
a) 3-D panel calculation for the actual Mach number using a compressibilityrule (such as Githert's rule).
b) Grid generation of 2-D streamline coordinates at the actual wing section.In many cases it is not necessary to compute the grid for the entire plane. Onlya small region containing the supersonic flow field bounded by Fo, Fl, F2 and F3is considered (see FIG. 34)
c) Computation of the cross flow at all mesh points of the grid and calculation of theboundary values at Fi. F2,F3 by means of the 3-0 panel method.
d) Finite difference calculation solving the inhomogeneous full potential equation (*).The result is a transonic pressure distribution around the actual wing section.
The hybrid method is an analysis method. When using it for design or modification cf a wing the samesteps as described in the preceeding chapter are necessary. The block diagram, in FIG. 35 shows a practicalway of modifying the spanwise sections of a wing. Calculations were performed for several configurationsincluding propulsion interaction. Results are presented in the Lecture Engine/Airfrae Interference"during the present VKI course.
3.2.3 Computation of shock-boundary layer interaction and trailing edge flow
The importance of these flow phenomena for theoretical and experimental design of a wing at transonicspeeds was discussed in chapter 2.3. Therefore the main work performed at VFW, partially in cooperationwith the DFVLR, is presented in this section.
3.2.3.1 Shock-turbulent boundary layer interaction
The interaction between a normal shock wave and a turbulent boundary layer produces both local andglobal effects on the aerofoil flow:
-The local interaction effect is a smearing of the discontinuous pressure rise across the shockover several boundary layer thicknesses, which has only a small influence on the aetofoil charac-teristics.

lO-tO
- An important global effect arises from the substantial thickening of the boundary layer by theshock, FIG. 36, which significantly increases the boundary layer thickness at the trailing egde,directly affecting the Kutta condition responsible for the aerofoil circulation and consequentlyalso for the shock strength and position.
The influence of a normal shock wa e on the turbulent bounacy layer characteristics is evident fromthe measurements of Stanewsky (4) at DF'LR on a CAST 10-2 supercritical aerofoil at various angles ofattack, FIG. 37.
The diffraction of the shock wave by the nonuniform flow within the boundary layer leads to signifi-cant normal pressure gradients and to a breakouwn of the boundary layer approximations. Nevertheless, inthe available viscid-inviscid weak interaction aerofoil flow prediction methods, the boundary layer charac-teristics across the shock wave are calculated by first order boundary layer methods, ignoring the stronginteraction feature of the shock regioat. The m in problem of this approach is the inability of the invisc,dtransonic flow methods to smear the pressure rise of the shock over a much greater chordwise distance thanaitually occurs (depending on the computational mesh usea). This spread can easily rise ip to 20 localboundary layer thicknesses instead of 5 to 6 thicknesses experimentally observed.
FIG. 38 shows the effect of the shock pressure gradient smearing on the calculated boundary layercharacteristics at the rear part of a VFW supercritical aerofoil, calculated by the VFW 2-D finite-diffe-rence method [5] . The Mach number just ahead of the shock Ms = 1.288 is close to the value for which ashock-induced separation bubble will occur at the foot of the shock. Prescribing the experimental pressuredistribution but with the shock smeared over about 20 boundary layer thicknesses, the predicted skin frictioncoefficient indicates attached flow at the end of the shock and the predicted boundary layer thickeningthrough the shock is only 70 percent of that measured in the experiments. With a realistic shock smearingover 6 boundary layer thicknesses, the predicted boundary layer is just approaching separation behind theshock as expected, and the predicted displacement thickness behind the shock is in good agreement with theexperimental data. This difference in the calculated boundary layer characteristics behind ti. shock in-fluences the boundary layer behaviour at the trailing edge especially when the flow is close to separation.
To overcome the d.'awbacks of the first order boundary layer approach we will use the shock-turbulentboundary layer interaction model of Bohning and Zierep [ 6] in the future. This analytical strong interactionmodel is based on a triple deck solution, FIG. 39 , first introduced by Lighthiil and consisting of
- a viscous sublayer formulation
- an inviscid but rotational shear layer solution
- and an outer inviscid transonic flow solution.
With closed form solutions in the 3 regions coupled iteractively, the velocity and pressure field is obtainedin the strong interaction region, taking into account also the aerofoil wall curvature in this area.
As a typical example, FIG. 40 shows some details of the shock-boundar) layer interactive solutionof Bohning and Zierep. The calculated flow field structure given on top is represented by the lines ofconstant Mach number. The influence of the snack extends over 2 - 3 boundary layer thicknesses upstreamof the shock, resulting in a lifting of the isolines. In consequence of both the flow field curvature andthe boundary layer thickening in the zhock region the interaction model predicts a post-shock expansion atthe boundary layer edge just behind the shock as observed in the actual flow. The total length of the in-teraction region is Pbout 6 boundary layer thicknesses. On the bottom, predicted pressure distributionswithin the interaction region are plotted for various wall distances. The pressure distribution at theboundary layer edge shows the typical singular behaviour at x -- 0 and the following post-shock expansion.In contrast, the wall pressure distribution is smoothed across the shock, and the difference of both de-monstrates the strong normal pressure gradient in the shock region. Corresponding to the wall pressure risethe wall shear stress decreases in the shock region. Ahead of the shock at higher Mach numbers than consi-dered in FIG. 40 , shock-induced separation can occur. With the condition of vanishing wall shear stress,acriterion for thc beginning nf the shock induced separation is included n the interaction madel.
FIG.41 shows a comparison between results obtained with the interaction model and experimental databy Stanewsky [ 7) of a CAST 10-2 supercritical aerofoil. Both the predicted wall pressure and the displace-
ment thickness distribution in the shock region are in excellent agreement with the measurements.
In order to incorparate the interaction model of Bohning and Zierep into a global iterative pre-diction method for transonic aerofoil flows the wall curvature, which has to be prescribed, can serve asan adaptive parameter.
3.2.3.2 Trailing edge flow
The flow near the trailing edge also involves a strong viscid-inviscid interaction problem. Thehighly curved streamlines at the trailing edge and in the near wake generate large static pressure varia-tions across the boundary layer and the wake that are at least of the same order than those induced bydisplacement effects, FIG.42 . As in the shock region, the strong interaction and the large normal pressuregradients lead to a failure of the boundary layer approximations in the trailing edge region, which direct-ly effects the Kutta condition, largely responsible for the aerofoil characteristics.
In c.se of a supercritical aerofoil,FIG.43,demonstrates, that the viscous liftloss is significantlyunderpredicted by the standard first order boundary layerapproach. In particular, themeasured pressure distri-bution on the upper surface shows considerable deviations from an inviscid calculation, wherein the mea-sured boundary layer displacement thickness is superimposed to the aerofoil contour.
Therefure, it is apparent that for a completely satisfactory description of viscous effects on aero-foils at transonic speeds with a higher order boundary layer type method we have to account for:

IO-li
-displacement eftf',ts on the aerofoil and in the wake,
-normal pressure gradient effects in the trailing Ldge region (aerofoil and near waka),
-strong interaction at shocks and at the trailin edge.
The appropriate viscous flow model is shown in FIG.44 . For simulation of viscous effects the cqui-valent surface mass flow concept is used. In case of aerofoil flow calculations with an iterative globalprocedure, this concept is most effective, using only modified boundary conditions but with an unmodifiedaerofoil shape during the iteration. The boundary conditions, which simulate the viscous effects, are
-a normal velocity distribution prescribed on the aerofoil contour
-and normal and tangential velocity jump distributions prescribed at the wake centerline.
io complete the viscous solution, the static pressure variations across th, oundary layer and thewake must be added to the inviscid solution. This concept forms the basis for the incorporation of thestrong trailing edge interaction into the viscous aerofoil solution.
For iterative coupling of both the boundary layer solution and the inviscd [low solutio.,, the directmatching technique is normally adopted for aerofoil flow predictions, which cL'iverges fast z4 long as theinviscid flow dominates over the boundary layer flow. However, approaching the trailing edge, convergencydifficulties arise due to the increasing interaction between the bounaary layer and the inviscid flow. Inorder to avoid these difficulties, the semi-inverse matching technique, coupling iteratively an inverseboundary layer solution with a direct potential flow solution, may be applied in the trailing edge region.Here, the inverse boundary layer approach (prescribing the displacement thickness and treating the pressureas dependend variable) removes the Goldstein singularities at the separation and reattachment point, sothat separated flow regions can be included.
FIG. 4S shows the flow chart of the semi inverse matching procedure. Here, from a given displacementthickness tie boundary layer edge velocity is computed simultaneously by the direct potential flow method,modified to incorporate the appropriate viscous boundary conditions, and by the inverse boundary layermethod. The resulting edge velocities of both solutions are used to adjust the displacement thickness forthe next iteration cycle by the matching condition of Carter [61 . Using a relaxation factor control thesolution has a high convergency rate.
The inverse boundary layer method, developed at MBB/VFW [ 91 , solves the moment and the moment ofmomentum integ al equations for steady 2-D compressible flows. The relations for laminar velocity profilesare deduced from similar solutions of Stewartson including the lower-branch solutions for reverse flowvelocity profiles. In the turbulent case the relations of the Walz method are incorporated in the attachedflow regime, while for separated flow similar solutions of Alber are taken as a basis. In the near wakethe profiles of Reeves and Lees are used, whereas the far wake profiles are approximated by the cosinus-profile. Deviations from the equilibrium condition are considered by an empirical dissipation law. Withthese relations, the integral equations are solved with a prescrioed displacement thi.kness by a standardRunge-Ku:ta integration.
The semi-inverse matching technique, which provides a highly efficient computation of strong viscid-inviscid interactions, wis applied to attached and separated trailing edge flows of r-ar-loaded aerofoilsincluding the wake, and presents a substantial improvement of aerofoil flowprediction methods. First aglobal method for subsonic aerotoil flows was developed [10] , switching from a conventional weak inter-action analysis to the present approach for strong trailing edge interaction. In this case, the inviscidflow is solved by the MBB/VFW panel method [11] modified to incorporate the viscous boundai, conditiors.
FIG. 46 shows viscid-inviscid flow predictions over a VFW rear-loaded aerofoil at high incioence. Forcomparision with the experiments[12] three different calculations have been performend:
- inviscid mode
- viscous mode (with boundary layer and wake tickness terms only)
- full viscous mode (including curvature terms).
An excellent agreement between the predicted and mea:ured pressure distribution is achieved with thefull viscous solution. For the different calculation modes the cunvergenc of the lift coefficient is alsoshown in FIG. 46 . The viscous lift loss is significantly underpredicted, when curvature terms are nottaken into consideration.
As a detail of this solution, FIG.47 shows the streamline slope of the full viscous solution withinthe trailing edge region in comparison to the inviscid result. The discontinuity at the trailing edgeobtaiaed in the inviscid flow simulation is completely removed by the full viscous solution.
In FIG. 48 predicted lift, moment and drag polars of a NLR rear-loaded aerofoil are compared with ex-perimental data [131 . Beyond 6 degrees incidence the flow on the upper surface separates near the trailingedge. With exception of the drag coefficient at high incidence, where also large spanwise scatter wasmeasured, the full viscous predictions agree remarkably well with the measurements for both attached andseparated flo;, cases.
In FIG.49 compressible flow quantitie. 'pressure distribution and boundary layer data) over a RAErear naded aerofoil are presented. Also this compressible test case shows generally good agreement be-tween the p.edicted results and the experimental data of Cook et al [141
The results obtained for subsonic aerofoil flow cases show significant improvements in the trailingedge region, leading to an improved global prediction of the wing section characteristics compared to

10-12
standard methods. Therefore, the application of the strong trailing edge interaction mode for transonicaerofoil flow predictions is under development at MBBVFW.
4. PREDICTION OF AIRCRAFT PERFORMANCE
In chapter 3.1 it was explained that the estimation of aircraft performance as far as aerodynamicsis concerned relies on proper wind-tunnel testing and from there objectives for the evaluation of theore-tical methods and their application were derived. The process of transforming wind-tunnel test results tofull scale aircraft performance data in the transonic flight regime is one of the main and most difficulttasks of the designer in industry. Errors in the prediction of cruise drag can have serious cinsequencesfor the manufacturer, because of the stringent performance data he must guarantec to be competitive. Inthe following we concentrate on performance estimates, but in addition the most accurate determinaticn ofthe aerodynamic loadings has laige effects on the structural weight and hence on the fuel consumption.Because of the compensating effect of intertia and aerodynamic loads, a relatively small error in aerody-namics can become a major structural design problem. Conservatism in load prediction leads to unnecessarystructural weight, while optimism can request structural redesign and perhaps catastrophic failures. To-day's use of more exotic materials, higher stress levels, and elaborate manufacturing techniques to achievehighly efficient, light weight structures has magnified the degree of accuracy needed in predicting full-scale aerodynamic loads.
The aerodynamic problem is focused on the Reynolds number influence. As the modern transonicwing sections excessively stress the boundary layer flow with a large amount of rear loading, strongboundary layer-shock interaction and high pressure gradients at the upper and lower side of the trailingedge, the full-scale estimates are considerably complicated. - Here is another reason why at MBB/VFW weconcentrate on the two subjects discussed in the previous section namely the shock-turbulent boundarylayer interaction and the viscid-inviscid interaction including separation at the aerofoil trailing edge.
For full-scale aircraft performance predictions deduced from wind-tunnel measurements we work withbasically two approaches, the direct scaling method and the reference method.
4.1 The direct scaling method
The wind-tunnel data are used to establish the absolute drag level of a model,and with an understand-ing of Reynolds number effects the full-scale drag level can be predicted.
The drag components which together comprise the total cruise drag are
CD = CDp + CDi + CDC + CDTrim
A typical drag break-down was shown in FIG. 6 . Besides friction and pressure drag the parasiticdrag then contains
- interference drag = influence of supervelocities on various components
- intersection drag = interference in junctions
- excrescences = steps, gaps, rivests, base areas
- protuberances antennas, canopy, lights, vents
- ventilation drag = air conditioning, cooling
- fuselage up sweep drag
All of these drag increments may be subject to Reynolds number effects, however, only the skin fric-tion drag is adequately documented. But even in this area, there are a number of empirically derived equa-tions for smooth turbulent flat plate skin friction coefficients and their variation with Reynolds number.This is shown in FIG. 50 for three establi-hed skin friction laws in the Reynolds number range from106 to 109 . The ct is varying about 4 % at 106, 5 % at 108 and 7 % at 109. For typical current jet trans-pcrts with a range 30 - 106 S Re s 60 • 106 an error of 5 % in the profile drag estimate possibly leadsto about 2.5 % total drag error. Correcting wind-tunnel data to full scale Reynolds number by deductingfrom the wind-tunnel measured model dra5 the difference between the estimated profile drags at full and modelscale Reynolds number then, the errors can be 1 % on full-scale profile drag or 0.5 % on full-scale totaldrag. The factors available in Hourner ar.1 R.Ae.S data sheets were empirically derived from wind-tunneltests with conventional aerofoil sections of varying thickness. They are less accurate for transonicaerofoils with rear loading.
The effect of Reynolds number on all other drag components is even less known. For this reason, inaddition to the direct scaling metnod, we base the prediction for the aerodynamic characteristics of anew design on the so called reference method. A detailed description of the direct scaling method is givenin (15] which is quite similar to the method we use at MBB/VFW.
4.2 The reference scaling method
This method utilizes all the experience inside a company obtained in wind-tunnel and flight tests.Best use can be -nade mainly in case when the new aircraft configuration is in many aspects similar to anearlier one, built and tested in the whole range of Reynolds numbers up to flight conditions. The fuselagefor example often keeps quite a similar shape in an aircraft family concept as with the Airbus. This is agreat advantaue during wind-tunnel tests, because the same model supports and force balances can be em-ployed with the same model connection. Hence the relative accuracy of wind-tunnel corrections is extremly

10-13
high, in contrary to the direct scaling where the absolute accuracy of the tunnel corrections needed is nor-mally of comparable low standard.
The basic concept of the reference scaling method is simple and sketched in FIG. 51. The changes ofaerodynamic characteristics between wind-tunnel and flight test of a known aircraft are transfered to thenew design. The model tests for the reference aircraft and for the new design have to be performed for thesame configuration, i.e. wing-fuselage - vertical tail at the same test conditions as sting support,transition fixing etc. A detailed description of the method is not the task here, because it has beenalready discussed earlier by Pelagatti, Pilon, Bardaud [16] , but there is one mjor problem inherent.If the wing section characteristics are changed - as in case from conventional to supercritical aerofoils -the method is not accurate. This will be discussed in the following section.
FIG. 52 contains the pressure distribution of t%o aerofoil sections, where mainly the shock positionand rear loading at higher Mach numbers above the design point are different. For these sections the b.l.displacement thickness on the upper surface was calculated at model and full-scale Reynolds numbers belowand above the design Mach number and is presented in FIG. 53. Transition from laminar to turbulent boun-dary layer was assumed at the leading edge and at 15 % chord for full-scale and model Reynolds numberrespectively. All changes in b.l. thickness at lower Mach numbers are smOOt.;and not very different formodel and full-scale Reynolds numbers though at the trailing edge the boundary layer as expected is thinnerfor the high Reynolds number. This changes with increasing Mach number due to the appearence of shocks andhigher adverse pressure gradients and the Reynolds number effect is more pronounced for the projected air-craft with more .ft shock positions and steeper pressure gradients towards the trailing edge. The b.l.thickness at model scale Reynolds number increases so strongly that an overestimation must be expectedwith respect to main aerodynamic characteristics like separation leading to buffet onset and lift/dragratio during the low Reynolds number wind-tunnel tests.
Employing the reference method for scaling wind-tunnel data to full-scale results the predictionsfor advanced wings based on conventional aircraft data lead to pessimistic performances when the modeltests were conducted applying the same transition fixing position.
An improvement of the reference method is outlined in FIG. 54. In addition to the test data transfor-mation, calculations have to be performed for the reference and projected aircraft at model as well asfull-scale Reynolds numbers. The theoretical corrections for the reference aircraft are soundly based onthe correlation of wind-tunnel and flight test data which improves the corrections for the projected air-craft. The main advantage of the higher order corrections is the allowance for more realistic test condi-tions. In the example discussed above, a more aft transition fixing at high Mach numbers for the projectedaircraft results in the effect, that the boundary layer thickness is less increased not only across theshock but also by the adverse pressure gradient. Thus, an improved numerical simulation of the viscouseffects mainly in the shock and trailing edge regions allows for the future both
- a more consolidated transition fixing on the wing in wind-tunnel measurements- and a more reliable scaling of the wind-tunnel data to full-scale conditionsin the case of different aerofoil types of the references and the projectedaircraft.
Therefore, at MBB/VFW an impr)ved viscous supercritical aerofoll flow prediction code is under development,taking into account the stron shock-boundary layer and trailing edge interactions especially.
REFERENCES
I J.W. Swihart A fresh look at aviation fuel pricesJ.I. Minick AIAA, March 1980
2 J. Thomas Future technology to comply with changing design requirements.A!/TD-160/79, ATA 1979, Engineering and Maintenancc Forum, Oct. 31-ov.11,1979
3 D.I.A. Poll Transition in the infinite swept attachment line boundary layer. College ofAeronautics, Cranfield Institute of Technology, March 1979
4 E. Stanewsky Wechselwirkung zwischen AuBenstrdmung und Grenzschicht an transsonischenProfilen.Dissertation TU Berlin, 1981
5 E. Elsholz Non-equilibrium boundary layer flow prediction.4. Int. Symp. on "Turbulent Shear Flows", Karlsruhe, Sept. 1983
6. R. Bohning, Normal shock-turbulent boundary layer interaction at a curved wall.J. Zierep AGARD-CP-291, Febr. 1981
7. E. Stanewsky, The coupling of a shock-boundary layer interaction module with a viscous-M. Nandanan, invisciO computation method.G.R. Inger AGARD-CP-291, Febr. 1981
8. J.E. Carter A new boundary-layer inviscd interaction technique for separated flow.AIAA-Paper 79-1450, 1979
9. P. Thiede Ein inverses Integralverfahren zur Berechnung abgelbster turbulenter Grenz-schichten.DLR-rB 77-16, 1977

10-14
i0 P. Thiede, Viscid-inviscid interaction analysis on aerofoils with an inverse boundaryG. Dargel, layer approach.E. Elsholz In "Recent Contributions to Fluid Mechanics", ed. by W. Haase, Springer-
Verlag, 1982
11. H. Jakob Erweiterung eines 2-D Panelverfahrens auf Profile mit dicken Hinterkantenund Kopplung des Verfahrens mit einem Grenzschichtverfahren.VFW-Report Ef 612, 1976, not published
12 R.D. Boehe Ergebnisse der Windkanalmessungen WX 77-1.VFW-Report Ef 2-12/77, 1977, not published
13 C.J.J. Joosen, 2-D low-speed wind-tunnel investigation on a NLR 73-108-10 aerofoil withC.G. Kho fowler type flap, part 1.
NLR TR 74058 C, 1975
14 P.H. Cook, Aerofoil RAE 2822-pressure distributions, boundary layer, and wake measure-M.A. Mc Donald, ments.M.C.P. Firmin AGARD-AR-138, 1979
15 J.H. Paterson, A survey of drag prediction techniques applicable to subsonic and transonicD.G. Mc Wilkinson, aircraft design.W.T. Blackerby AGARD-CP-124, April 1973
16 C. Pelagatti, Analysis critique des comparaisons des resultats de vol aux previsions deJ.C. Pilon, soufflerie pour des avions de transport subsonique et supersonique.J. Bardaud AGARD-CP-No. 187, June 1975
17 F.T. Lynch Commercial transports-aerodynamic design for cruise performance efficiency.Transonic Perspective Symposium, NASA Ames Res. Ctr. Feb. 1981, alsoDouglas Paper 7026
18 G. Krenz Transonic wing design for transport aircraft.AIAA Atlantic Aeron. Conf. "Advancing Technology", Williamsburg, Virginia,March 1979
19 G. Krenz, Aerodynamic concepts for fuel-efficient transport aircraft.R. Hilbig ICAS proceedings, Seattle, Aug. 1982
20 G. Krenz, Transonic wing technology for transport aircraft.B. Ewald AGARD-CP-285,Munich, May 1980
21 R.Hilbig Transsonischer Profilentwurf Va 2.ZKP-FB-W80-023. Sept. 1980
22 R. Hilbig Transsonischer FlUgelentwurf.ZKP-FB W80-021, Sept. 1980
23 G. Redecker Aerodynamischer Entwurf von subsonischen Transportflugzeugen.Carl Cranz Gesellschaft Lecture Series: "Aerodynamik des Flugzeugentwurfs"F6.01, Braunschweig, Sept. 1981
24 S. Rohlfs Transsonisches Profil Va 2-4, Entwurf und Ergebnisanalyse.Ergebnisbericht ZKP "IFAS" Nr. 3, VFW, Bremen, April 1980
25 Whitcomb, R.I. Review of NASA supercritical aerofoils.ICAS Paper 74-10, 1974
26 Pfenninger, W., Design considerations of advanced supercritical low drag suction aerofoils.Reed, H.L. Symp. on Viscous Drag Reduction, Dallas, Tex., 1979Degenhardt, J.R.
27 Kessler, K. Aerodynamische Entwurfsmerkmale der transsonischen TragflUgel in Tief- undHochdeckeranordnung.ZTL 1-AbschluBbericht:"Konzeptuntersuchungen zu einem MR-TransporterVFW-Fokker, 1.26-3, 1979
28 N. Voogt, Advanced aerodynamic wing design for commercial transports - review of aJ.W. Slooff technology program in the Netherlands.
ICAS Paper 82-5.6.1
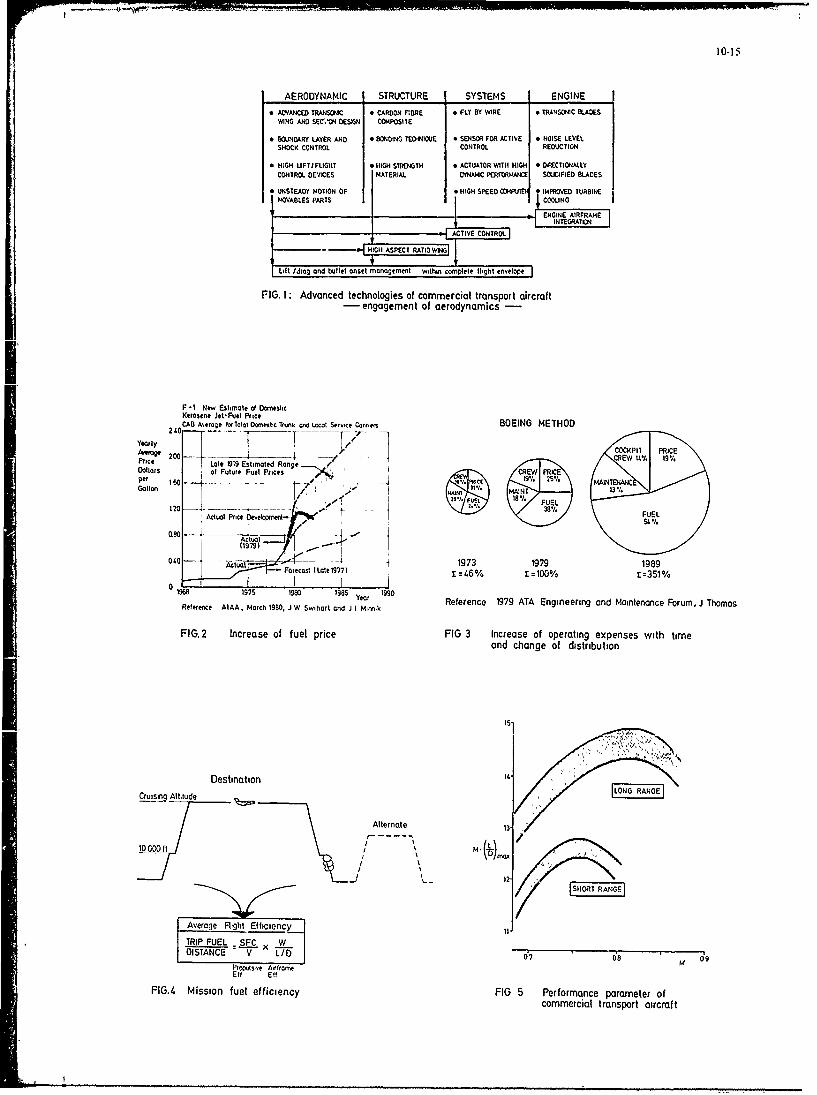
10-15
AERODYNAMIC STRUCTURE SYSTEMS ENGINE" ADVANCED TRANSOIC * CARBON FIBRE e FLY BY WIRE * TRANSONIC BLADES
WING AND SEC'ON DESIGN COMPOSITE
" WOAIDARY LAYER AND 0 BONDING TEOHNIOUE * S04SOR FOR ACTIVE e NOISE LEVELSHOCK CONTROL CONTROL REDUCTION
" H;GH UFTIFLIGHT 9 HIGH STRENGTH * ACTUATOR WITH HIGH * I)XICTI AL.LYCONTROL oEVIES MATERIAL OYNAHC PER JI.MANCE SCUCIFIED BLADES
* UNSTEADY NOTION OF * HIGH SPEED PHFROVED TURBINEHOVABLES PARTS CCOLING
ENGINE AIRFRAMEINTERM P
ACTIVE CONTRl
- HI H A PET RATIO WI
Lilt Idrag and bullet onset management withr- complete flight envelope
FIG. 1: Advanced technologies of commercial transport aircraft- engagement of aerodynamics
F - New Estimate d DomesticKerosene Jet-Fuel PriceCAB Aseroge fto Trotl o. t, Trunk id Local Setce Comems BOEING METHOD
Yearly -~COCKOPIT PRICEAlOW 200 O-EW 1% 19%-Price Late 1979 Estimated Range ,Ooltlars of Future Fuel Prices CREVY IICE
I(A ~ .WIE~ MAINTOWCPGallon ]4ANT 13%
ll/ OL 18% FUEL
-,Actual Price Devei~sd 38% FUEL
Actual(1979)
oE A - -Late 1973 1979
0 11989IS.% 1975 199 198s 1990and Reference 1979 ATA Engineering and Maintenance Forum, J Thomas
Referenice AIAA * March 1980, I W Swihart and JI Mrerih
FIG. 2 Increase of fuel price FIG 3 Increase of operating expenses with timeand change of dtstribution
is 15V
Destination t
Cruising Altitude I, ANGE
Alternate 131oo; - ... /
it M . L DI
I SHR RNE
Average Flight Efticiency ft
TRIP FUEL SFC , WDI-TANCE -v LID 67 08 09
Pr~~r swe Airrne
FIG.4 Mission fuel efficiency FIG 5 Performance parameter ofcommercial transport aircraft
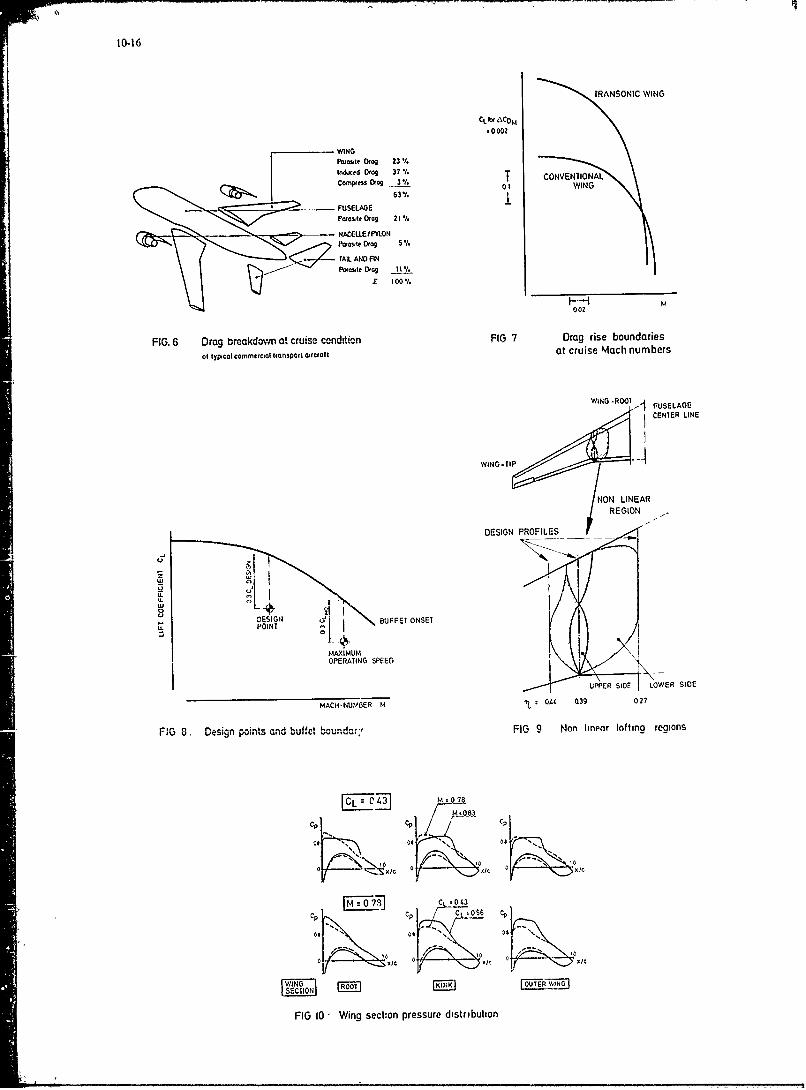
10-16
ARANSONiC WING
-0002
WING
Pornsite Otog 23 .
Induce Drag 37%1
1 i ed ~og 7 ". T CONVEN71ONALICompress Drag -I/ TOVN7A
.. 6 FUSELAGE
0000.
NANO FUSELAGE
Ii CENTER LINE
WINO-TIP-'
TA/NL LINEFIR
~REGION
OPERATNG ,afVED
UPPER SIOF LOWER SIDE
tACH-NUtMAER M 0U OJ 039 027
FlG 8. Design points and buffet ,bou.,,d .a .. FIG 9 Non hineor lofting regions
M.Oga
/ i -kX.o S.
S002
I10 ROOT WigINoCpN OULt
REGIO
FIG ~ ~ ~ ~ ~ ESG PRWigsOFInprssrLdstiuto

10-17
ROOT
M~CNT1 4PAR
lip ~ - ..- 1W PRIAGE
TCRANK FRONT SPAR REAR SPARREAR SPAR--
/ Pitod A
4 \OFT CRANK - 4equal max thickness space for undercarriage
FIG. 12 Root section comparison
DOL OurE CRANK
FIG Wi Trailing edge crank to incroase spacefor undeicarriage housing
TESTS AT ARA -BEDFORDRN=6 1O Trans at 7 /7%. chord
2-D AIRFOIL TEST RESULTS02tlc~ll% RNA145106 c1 &06O 010
6 7 8M
CDC
L AIS 2 L TEST CTARA-E0F0R
08-8
L M ICk
Co t
Setionrr I , 61P rnsa 1 hr
::i 6 I 10 M 7 0FIG 1isa oprsn o w eool

10-18
ROOT SECTION AT CRUISE M.ACH NUMBERIC *--WTHOUT FILLET
SCe CIP
LARGE RCO. ILE FL.TFLFILLET FI
WING WN
FIG 16 Correlation of fillet size rind pressure distribution
WIND-TUNNEL TESTS ATNLR-HST RN. 2 5O IS 7/7%.c, M -078 WIND-TUNNEL TESTS At NLR-HST RN-25 iO0, TS 7I7I/.c,M-O78
025 ~WITHOUT FLE
CL-05
05 3 - -
02 c0 06 065 0'7 0'75 08 M 8
FIG. 17 Effect of wing-fusellage fillet on drag fora FIG. 18 Effect of wing-fuselage fillet on dragresearch wing of Airbus-type
sect-OAS ustd to, slfiPIIssuC m -touremeAtnt
n.0 015S 025 033700 0 012
0 I0
FIG 19 Large wing root fillet FIG 20 Typical planform and thickness distributionof transport aircraft

10-19
W/T TESTS NLR.HSI
CL RN.25lO6,Trns7I7*/c, M_78
CLrg b-n
Wng 2
FRONT SPAR REAR SPAR
typical toot section
2 3
Yp~cl lot Se::::[ 3CL
changed 100i Section
FIG. 21 Root sectici change W 02 2*
Aco. 20 (s CD
FIG.22 Effect of root trailing edge comber
Conventioao Aerofoil
flat upperincreased nose radrus Surface cambered rear port
New Rear Cambered Acrafoil
FIG 23 Changes of aerofoil geometry FIG 24. Wing shock systemsat o ff-design conditions
WIT TESS NLR-H-Sl Trans 7/7. % hord WIT TESTS NLR-HST,Tlions 7/7V %chord
-MO8] LRN.2s too aa.
'013 0-I- s0o 0-
IC 10 0
C 00 0 00 1 0'
CP 04130 P 0650 1s 33 Et00
'0 10 G
at wing I awig I

10-20
Wit TESTS NLR-HSITrons 717% chord WIT TESTS NLR-HSI, Trans 7/7 % chord
NI 0 78j r . .o,- i 5o Lo oor- - o, o
1 L L _
M. -) 7C -i 5lt- -5
FI.60 eeom n o prsuedsnuo I.6 eelp eto rsueds btoa~i win 2tIngQ
P 'CRUS CP C OI
o CoM, 10 .V U -t
0 C C 10Ic 0 1
~a win 2.... at wing...
RNNOO
FIG m 2 WrIg co TErSTS wnL -HSI AMSTRDAM RN de 2g 5 10 FI LE8A Ntc m n 1.n Re nod nuIMeT 03S /
I E LI
FI029 T m nransoc wnd-atnn%
at win 20 atwig7
W0 CRUAMNA ISE N ODII
100
60 0rn toe 2b W/ hrN080/
researc wing ofArustp
FIG 29 Airbus model in the transonic wind-tunnel af NLR
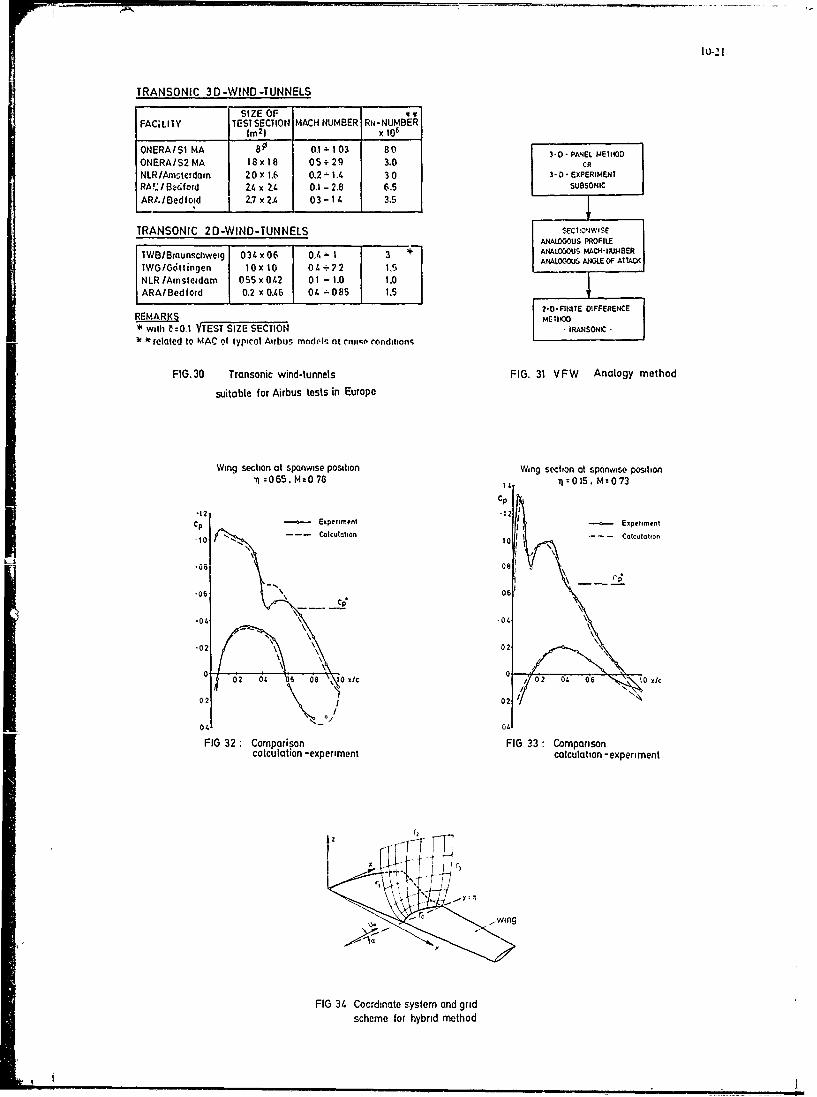
TRANSONIC 3D-WIND-TUNNELS
SIZE OFFACIITY TESISECIION MACH NUMBER RN-NUMBER
(in2
) x_____ x106
ONERAISi MA 80 0.1 -103 80 3 -0DPANEL METHODONERA/S2 MA 18 x18 05+29 3.0 CR
NL.R/Arnste-dam 20 x 1,6 0.2-1.14 30 3 -0- EXPERIMENT
RA./Befoid Z4 x 2,4 0.1 - 2.8 6.5 SUBSONIC
AR4IBedford 2.7 x 2.4 03-14 3.5
TRANSONIC 20-WIND-TUNNELS $EC;IOJWISE
______________ _________ __________ _______ANALOGOUS PROFILETWB/Brounschweig 03 x 06 0.1, 3 ANALOGOUS MACXFOJMBER
TWG/i~ttirgen lox 10 0 4 -2 I' AAOGOUS ANGLE OF AltAO(
NLR IAmnstefdam 055 x 042 01 - 1.0 1.0ARA/Bedford 0.2 x 0.46 04. -085 1.5
2-0-FINITE DIFFERENCEREMARKS MElHOO* with C:0.1I bTEST SIZE SECTION -'IRANSOI
)k related to MAC of typical Airbus maidel at criIp conditions _ -
FIG, 30 Transonic wind-tunnels FIG. 31 VFW Analogy method
suitable for Airbus tests in Europe
Wing section at Spanwise position Wing section at spanwise position0 065. M 0 78 4 101.M-07
CP-12 2
Cp - Experimeint-- Experiment
-10~ Calculation 10 Calculation
-08 p 06
-02 06
C,
-02 02 1/0
FIG 32 Comparito FIG 33: Comparisoncalculation -experiment calculation -experiment
FIG 34. Coordinate system and grid
scheme for hybrid method

10-22
3 i 0 .P1 ,_
, y' /t
M1I / M>i(
,, /o= / .o b 8O.,N0AR LAYER/ / INIEIRAC TION -N
FIG 35 Wing modification concept FIG.36 Shock-turbulent boundary layer interactionon a supercritical airfoil in transonic flow
AIRFOIL CAST 10-2 EXPERIMENIS OFSTANEWSKY 12 MS.I288
SM.0765 MS-* UC MA~t "Cp IR AI\OIVFV
TRASUIN A 7ic 08 uPPER SIDE
., RN~ IN l?/€ a 32* 3 Cp* M=0" 75 ' C,
OX° ' 0l, , 0- RN=21. 106
,~ ~ M-,1 l
001 -- - 10!
b. 1.
I, setoSI. e
ex ---. -02- -
SFIG. 37 Measured boundary layer characteristics FIG. 38 Effect of shock pressure gradient smearing on
in the shock region at different calculated boundary layer characteriocs
angles of attack
onasprrtclarfintasncfo
AIFI CA T1- XEIET F'TNWK 2M.18

LINES OF CONSTANT MACH NUMBER
,HOCK--
M1 OUIER IVISCIDM.1 M. I ~ RANSONIC FLOW
PRESSURE OISIRIBUTION IN THE BOUNDARY LAYER
IOUER FLO
R'+' ',0,_ a.
-02
FIG.39 Triple deck shock-turbulent FIG. 40 Details of the shock-turbulent
boundary layer interaction model boundary layer interaction model
nf BohninglZierep of Bohning/Zierep
AiRFOIL CAST 10-2 -- tNERACIION I IOIEL AIRFOIL WAKE
MZ0765 RN x 2 35 106 OF BOHNINGIZIEREPIS %C 0 MEASU :ENTS WAKE CEN ERLNECp OF STANEWVSKY
aS TRAUN0 ILYVI$)
STREAMLONE
S 0 5 10 S0 AIPFOIL WAKE
06 UPPER S URFACE
as LOWER SIDE
03R ,,, I
0 .2 ( v qo , S T R A M U N E
a t1 LO W E R S U R FA C E I . . V ., K O
-S 0 5 20 S16
FIG. 41 Comparison of the shock-boundary layer FIG. 42 Trailing edge flow
interaction model with measurements

10-24
AIRFOIL V-W VA2
RN.24 106
FIX'O IRANSITION 301 25. 220K
0 o M.ASUREMENIS M. 75 cg'2 S
* CL -,3
- ORIGINAL- VISCOUS FLOW MODELCON1OUR INVISCiD M c., 8Ott ',.
-- SPLACM, I SOLUIIGN CL' 6 6 7
CONITOUDISPLAC CENI CO dIOUREVALLtAIEO FROM
CpB DL MEASUREMENlIS-= CpcRIrS-_ _ .~.- .. VSCOUS FLOW SIMULATION
ViC OUS 0OUNVARY ¢O' IMONS
/"I 00*W, |/zzA2 wI -
CIL
PI U S40E An, -x i .- X-2.-) x-
e;;NORMAL PRESSURE VARIAI.OX A1OS 8 L AND VA-E
CF.. =_m,, '
LOWER $SI'E APO,, I., "eN -x .. v( .6,
xl/C
FIG. 13 Comparison of the boundary layer FIG 44 Simulation of viscous effectsdisplacement concept with for airfoil flaysmeasurement ,oy surfacr, mass flow concept
INU R. M AIRFOIFW VA]M~ IN0 Re .10' cr,9
2 0 AE IC'k ENY -RC4INT EZ?
It"-,NT I'TH10 2
+ %... ,-'NI'NY
POTENTIAL FLOW BOUNDARY (AYiRDIRECT
MAtCHIN, CONDITION I,
ST
FIG415 Semi-inverse matching FIG .6 Viscous /inviscid flow predictionprocedure over a rear -loaded airfol
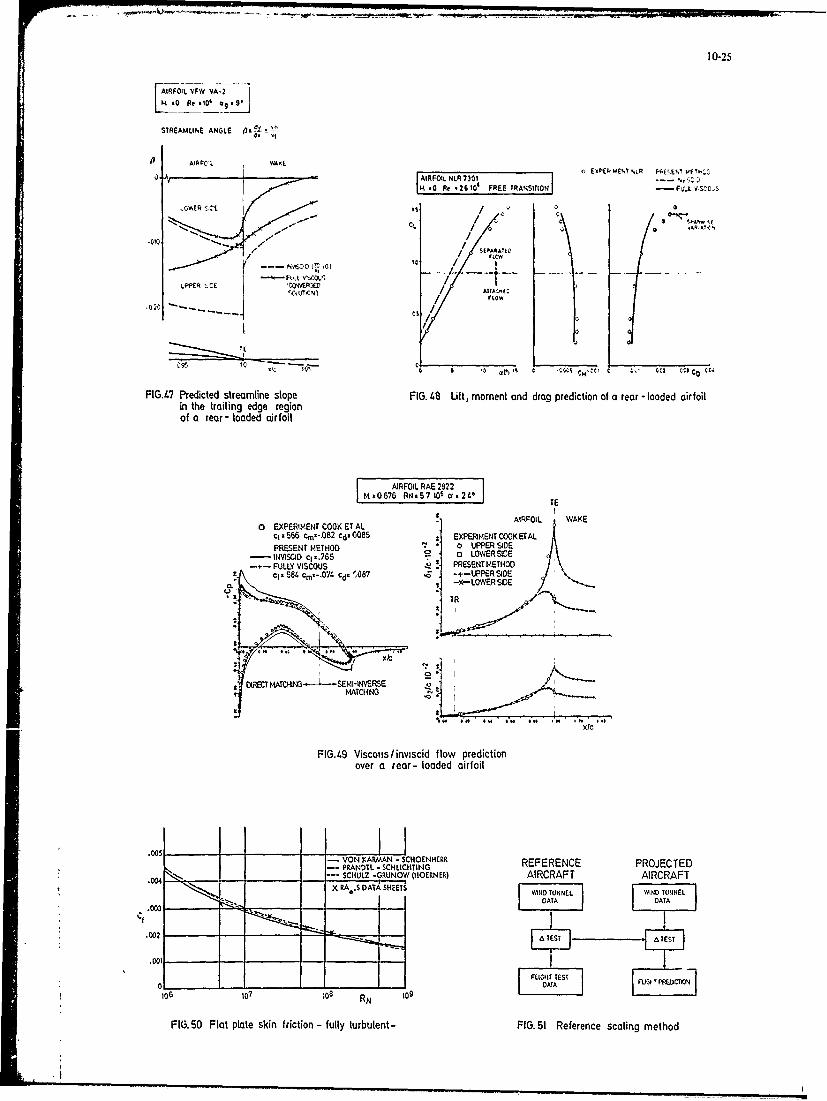
I0-25
E AjRFOL VFW VA-2
1 .0 Re .101 @.9
STREAMLINE ANGLE 1). -"
/ARFI NLR I 7301
S0ft. 260lFREERANSITON -FV.L VSCOM$
Y. - , s/s.,,-
- -, IS
of ra- lode /ifi
At1
0M WA1E
k'PE -C UPPE EP /M
-- S I ' 0 M$ 0mce 0" cu cc) CO CZ
FIGJ.. Predicted streamline slope FIG. .8 Lift, moment and drag prediction of a rear - loaded airfoilin the trailing edge regionof a rear- loaded airfoil
AIROLRAE 282
-- AIRFOIL WAKEIn EXPERIMENT COOK ET AL
c, .C566 cmGU2 Cd' 0085 2 EXPERIMENT COOK A EAL
PRESENT METHOD a UPPER SIDE-INVISCID C. 065 S a LOWERSIE
FULLY VISCOUST PRESENT METHODcl. 58. C%-.074 Cd- 0A7 . +-PER SIDE
-_LOE SIDE
R
DIRMTMACI- --- SEMNVERS -
I MATCHING
TIC
FIG.49 Viscoius/inviscid flow predictionover a rear- loaded airfoil
.0 1008 R 10
ON- N KAReAN - FCHOENHERRFERENCE PRig etd-- PRANDTL - SCHLICHTI14GRE RNCPOJ TD
.04SCHULZ -GRUNOW (WOERNER) AIRCRAFT AIRCRAFTX RA .S DATA SHEETS WIND TUNNEL YTND O WNL
DATA OATA
.002 a TEST A TEST
FIGfif TEST FG PCCIi
0____ 1____ _____ATA RD-
FIG. SO Flat plate skin friction - fully turbulent - FIG. 51 Reference scaling method

10-26
-- -REFERENC AIRCRAFT LCLs, R- PROJECTEDAICAT cLC tS. ,R 0.X
. M' MCfSN .CP
\ C----
RE E E CE A R R FT C -CLESi
RN0 \ 0 m 0
// x~c
FIG.S Representative ingar setinpraesue ditibunionbond aboe dingn Murachume
~~~~REFERENCE AIRCRAFT POETDARRF
W WN?4ONL UI TEDMO COM M OU E /IDU
DAAAROR AA I AIFI OTR OAT
RE IR REFAIRR I PRO' ARCRO PRJ R
-. -
RR I Ck IC AIRCRAF ARJETE ARCRA
FLNIHTNELST ~ l4UEDND I COM CPPROED.I ITNED
DAAI AIRFOIL DATA 1 1AIRFOIL DATA DATARREF AIR CR EFE. AIC R J AIER PROJ AIRCR,
FI..-5-------------------------------
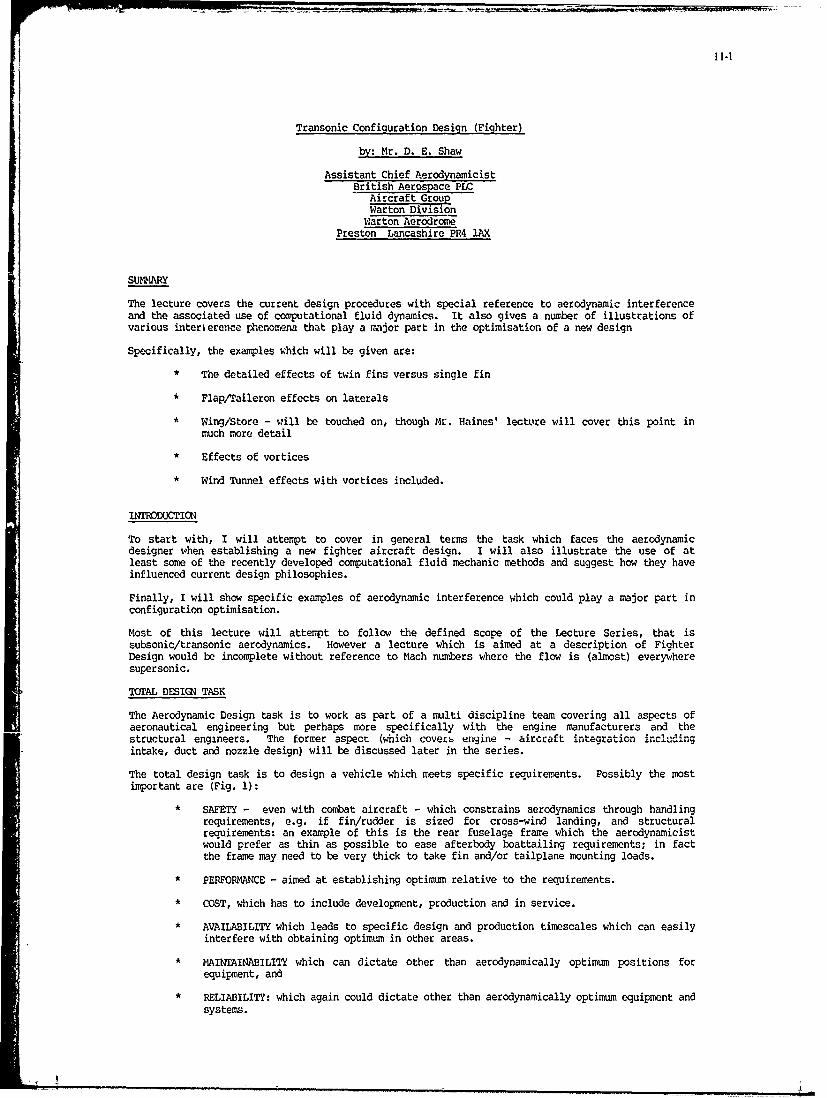
1I-I
Transonic Configuration Design (Fighter)
by: Mr. D. E. Shaw
Assistant Chief AerodynamicistBritish Aerospace PLC
Aircraft GroupWarton DivisionWarton Aerodrome
Preston Lancashire PR4 lAX
SU ZIARY
The lecture covers the current design procedures with special reference to aerodynamic interferenceand the associated use of computational fluid dynamics. It also gives a number of illustrations ofvarious intern ereice phenomena that play a major part in the optimisation of a new design
Specifically, the examples which will be given are:
* The detailed effects of twin fins versus single fin
Flap/Taileron effects on laterals
Wing/Store - will be touched on, though Mt. Haines' lectu're will cover this point inmuch more detail
* Effects of vortices
* Wind Tunnel effects with vortices included.
INTRODUCTICN
To start with, I will attempt to cover in general terms the task which faces the aerodynamicdesigner v hen establishing a new fighter aircraft design. I will also illustrate the use of atleast some of the recently developed computational fluid mechanic methods and suggest how they haveinfluenced current design philosophies.
Finally, I will show specific examples of aerodynamic interference which could play a major part inconfiguration optimisation.
Most of this lecture will attempt to follow the defined scope of the Lecture Series, that issubsonic/transonic aerodynamics. However a lecture which is aimed at a description of FighterDesign would be incomplete without reference to Mach numbers where the flow is (almost) everywheresupersonic.
TOIAL DESIGN TASK
The Aerodynamic Design task is to work as part of a multi discipline team covering all aspects ofaeronautical engineering but perhaps more specifically with the engine manufacturers and thestructural engineers. The former aspect (which covers engine - aircraft integration includingintake, duct and nozzle design) will be discussed later in the series.
The total design task is to design a vehicle which meets specific requirements. Possibly the mostimportant are (Fig. 1):
SAFETY - even with combat aircraft - which constrains aerodynamics through handlingrequirements, e.g. if fin/rudder is sized for cross-wind landing, and structuralrequirements: an example of this is the rear fuselage frame which the aerodynamicistwould prefer as thin as possible to ease afterbody boattailing requirements; in factthe frame may need to be very thick to take fin and/or tailplane mounting loads.
PERFORMANCE - aimed at establishing optimum relative to the requirements.
COST, which has to include development, production and in service.
AVAILABILITY which leads to specific design and production timescales which can easilyinterfere with obtaining optimum in other areas.
MAINTAINABILITY which can dictate other than aerodynamically optimum positions forequipment, and
RELIABILITY: which again could dictate other than aerodynamically optimum equipment andsystems.

11-2
Let us consider two of these aspects in more detail. First safety - obviously vital. Here thereare 4 interconnecting aspects (Fig. 2):
- Vehicle stability and control must be acceptable
- Structural strength must be adequate
- Aeroelastic characteristics, that is static stiffness must be acceptable
- Flutter free, that is structural dynamics must be stable.
All these criteria must be satisfied throughout the total required flight envelope.
Performance however warrants a more detailed study.
Performance parameters rr-ult from a blend of aircraft requirements and weapon load carryingcapabilities within a r,,uired flight envelope of speed and altitude. The simplest approach is toregard these as vario.t mission range and agility requirements. These in turn can be furthersinplified into (Fig. l;.
- Cruise Range: Airmile per lb of fuel used
- Specific excess power or the ability to accelerate or climb
- Manoeuvrability or the ability to turn without losing speed (sustained turn rate) orallowing a transient drop of speed (attained turn rate), and also
Field Performance - take off and landing distances - note military aircraft in generalhave very high T/W ratios though coupled with relatively high wing loadings - as aresult, meeting T/O requirements is normally much easier than meeting landingrequirements.
These would be specified at various critical points within the flight envelope for the aircrartcarrying specific weapon loads. These points, along with total list of weapons which the aircrafthas to carry and any specific manoeuvre requirements, allow the design to settle down to a fixedinitial freeze.
The objective of designing a configuration so that a number of (frequently conflicting) designpoints are met requires a careful selection of the design parameters involved. Take the wing forexample. Here is shown the very basic steps in wing design (Fig. 4) - these will be dealt with inslightly more detail later. First we have to examine requirements in detail:
* Is the A/C to be supersonic as well as subsonic
* What is the mix of low/high altitude flying
What about manoeuvrability - is the aircraft to be a bomb truck or a fighter - though
note that the tendency is to go for a high performance in all areas though biassed to aprimary role
* Special requirements - short field or V/STOL
Having examined these requirements the basic design can begin to take shape:
First the wing loading and hence area coupled with span loading and hence span andaspct ratio.
Fixed or variable sweep - variable sweep offers a lot of aerodynamic advantages for amulti-role A/C, Example is Tornado shown here with wings forward for low speedmanoeuvrability (Fig. 5).
- Taper ratio must be selected.
- Would any overall benefit be obtained from strakes or LE?
Need to define sections to meet the required wing performance including:
* Thickness to chord* Twist* Camber
Do we need to use camber changing , that is high lift, devices on the L.E.:
* Slat* Droop - Plain L.E Flap
- Varicam
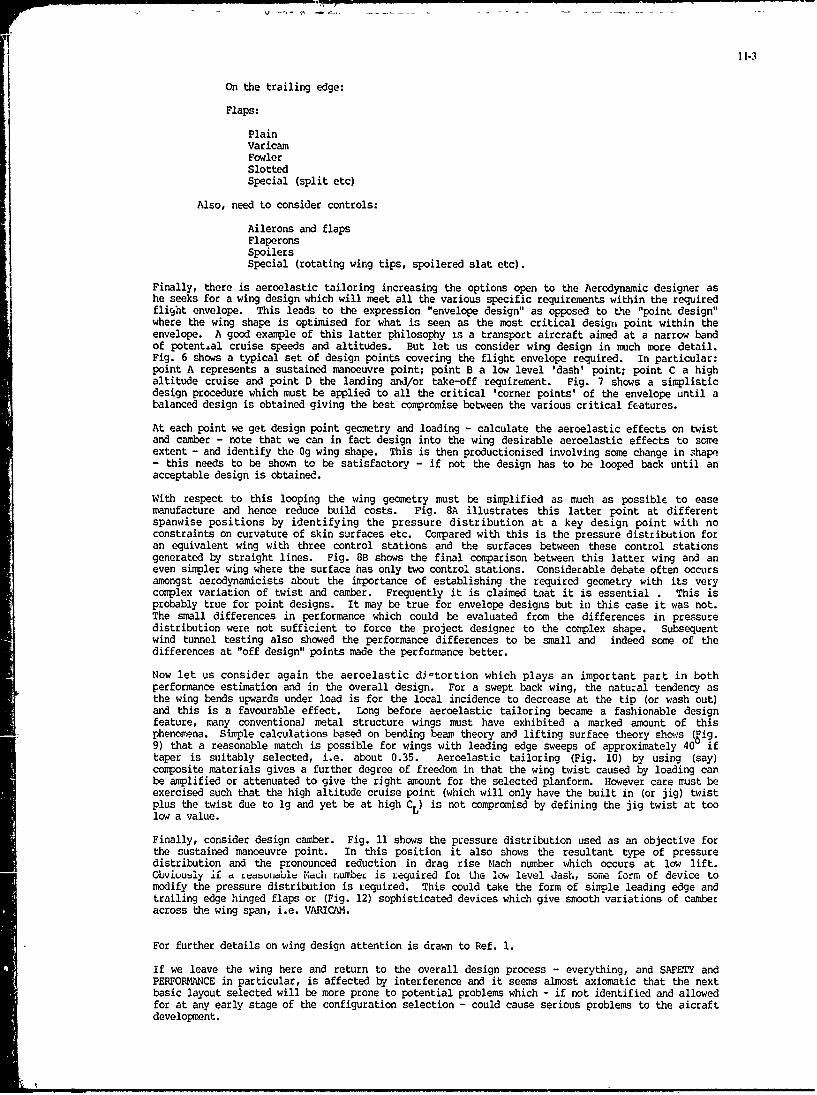
11-3
On the trailing edge:
Flaps:
PlainVaricamFowlerSlottedSpecial (split etc)
Also, need to consider controls:
Ailerons and flapsFlaperonsSpoilersSpecial (rotating wing tips, spoilered slat etc).
Finally, there is aeroelastic tailoring increasing the options open to the Aerodynamic designer ashe seeks for a wing design which will meet all the various specific requirements within the requiredflight envelope. This leads to the expression "envelope design" as opposed to the "point design"where the wing shape is optimised for what is seen as the most critical design point within theenvelope. A good example of this latter philosophy is a transport aircraft aimed at a narrow bandof potental cruise speeds and altitudes. But let us consider wing design in much more detail.Fig. 6 shows a typical set of design points covering the flight envelope required. In particular:point A represents a sustained manoeuvre point; point B a low level 'dash' point; point C a highaltitude cruise and point D the landing and/or take-off requirement. Fig. 7 shows a simplisticdesign procedure which must be applied to all the critical 'corner points' of the envelope until abalanced design is obtained giving the best compromise between the various critical features.
At each point we get design point geometry and loading - calculate the aeroelastic effects on twistand camber - note that we can in fact design into the wing desirable aeroelastic effects to someextent - and identify the Og wing shape. This is then productionised involving some change in shape- this needs to be shown to be satisfactory - if not the design has to be looped back until anacceptable design is obtained.
With respect to this looping the wing geometry must be simplified as much as possible to easemanufacture and hence reduce build costs. Fig. 8A illustrates this latter point at differentspanwise positions by identifying the pressure distribution at a key design point with noconstraints on curvature of skin surfaces etc. Compared with this is the pressure distribution foran equivalent wing with three control stations and the surfaces between these control stationsgenerated by straight lines. Fig. 8B shows the final comparison between this latter wing and aneven simpler wing where the surface has only two control stations. Considerable debate often occursamongst aerodynamicists about the importance of establishing the required geometry with its verycomplex variation of twist and camber. Frequently it is claimed tnat it is essential . This isprobably true for point designs. It may be true for envelope designs but in this case it was not.The small differences in performance which could be evaluated from the differences in pressuredistribution were not sufficient to force the project designer to the complex shape. Subsequentwind tunnel testing also showed the performance differences to be small and indeed some of thedifferences at "off design" points made the performance better.
Now let us consider again the aeroelastic di-tortion which plays an important part in bothperformance estimation and in the overall design. For a swept back wing, the natural tendency asthe wing bends upwards under load is for the local incidence to decrease at the tip (or wash out)and this is a favourable effect. Long before aeroelastic tailoring became a fashionable designfeature, many conventional metal structure wings must have exhibited a marked amount of thisphenomena. Simple calculations based on bending beam theory an3 lifting surface theory shows (1ig.9) that a reasonable match is possible for wings with leading edge sweeps of approximately 40 iftaper is suitably selected, i.e. about 0.35. Aeroelastic tailoring (Fig. 10) by using (say)composite materials gives a further degree of freedom in that the wing twist caused by loading canbe amplified or attenuated to give the right amount for the selected planform. However care must beexercised such that the high altitude cruise point (which will only have the built in (or jig) twistplus the twist due to lg and yet be at high CL) is not compromisd by defining the jig twist at toolow a value.
Finally, consider design camber. Fig. 11 shows the pressure distribution used as an objective forthe sustained manoeuvre point. In this position it also shows the resultant type of pressuredistribution and the pronounced reduction in drag rise Mach number which occurs at low lift.obviuu~ly if L L b Culbl L" acha n umbef is required foL the low level dash, soe,- form of device tomodify the pressure distribution is required. This could take the form of simple leading edge andtrailing edge hinged flaps or (Fig. 12) sophisticated devices which give smooth variations of camberacross the wing span, i.e. VARICAM.
For further details on wing design attention is drawn to Ref. 1.
If we leave the wing here and return to the overall design process - everything, and SAFETY andPERFORANCE in particular, is affected by interference and it seems almost axiomatic that the nextbasic layout selected will be more prone to potential problems which - if not identified and allowedfor at any early stage of the configuration selection - could cause serious problems to the aicraftdevelopment.
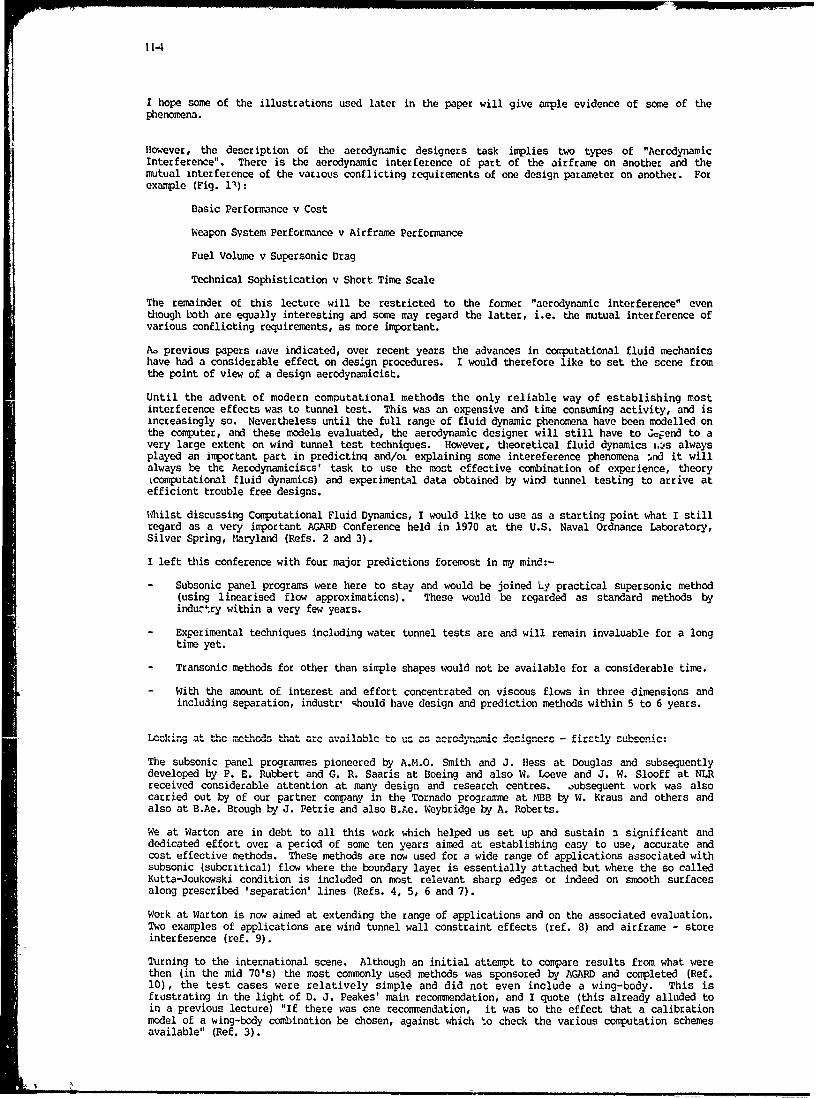
POO.4T 11-4
1 hope some of the illustrations used later in the paper will give ample evidence of some of thephenomena.
However, the description of the aerodynamic designers task implies two types of "AerodynamicInterference". There is the aerodynamic interference of part of the airframe on another and themutual interference of the various conflicting requirements of one design parameter on another. Forexample (Fig. lA):
Basic Performance v Cost
Weapon System Performance v Airframe Performance
Fuel Volume v Supersonic Drag
Technical Sophistication v Short Time Scale
The remainder of this lecture will be restricted to the former "aerodynamic interference" eventhough both are equally interesting and some may regard the latter, i.e. the mutual interference ofvarious conflicting requirements, as more important.
A. previous papers ijave indicated, over recent years the advances in computational fluid mechanicshave had a considerable effect on design procedures. I would therefore like to set the scene fromthe point of view of a design aerodynamicist.
Until the advent of modern computational methods the only reliable way of establishing mostinterference effects was to tunnel test. This was an expensive and time consuming activity, and isincreasingly so. Nevertheless until the full range of fluid dynamic phenomena have been modelled onthe computer, and these models evaluated, the aerodynamic designer will still have to Zeiend to avery large extent on wind tunnel test techniques. However, theoretical fluid dynamics i.:is alwaysplayed an important part in predictinq and/ot explaining some intereference phenomena ;nd it willalways be the Aerodynamicists' task to use the most effective combination of experience, theorytcomputational fluid dynamics) and experimental data obtained by wind tunnel testing to arrive atefficient trouble free designs.
Whilst discussing Computational Fluid Dynamics, I would like to use as a starting point what I stillregard as a very important AGARD Conference held in 1970 at the U.S. Naval Ordnance Laboratory,Silver Spring, Maryland (Refs. 2 and 3).
I left this conference with four major predictions foremost in my mind:-
- Subsonic panel programs were here to stay and would be joined Ly practical supersonic method(using linearised flow approximations). These would be regarded as standard methods byinductry within a very few years.
- Experimental techniques including water tunnel tests are and will remain invaluable for a longtime yet.
- Transonic methods for other than simple shapes would not be available for a considerable time.
- With the amount of interest and effort concentrated on viscous flows in three dimensions andincluding separation, industr, should have design and prediction methods within 5 to 6 years.
Lookirng at thc micthods that arc availablc to us as acrodynamic dezigncrs - firstly subsonic:
The subsonic panel programmes pioneered by A.M.O. Smith and J. Hess at Douglas and subsequentlydeveloped by P. E. Rubbert and G. R. Saaris at Boeing and also W. Loeve and J. W. Slooff at NLRreceived considerable attention at many design and research centres. .ubsequent work was alsocarried out by of our partner company in the Tornado progranme at MBB by W. Kraus and others andalso at B.Ae. Brough by J. Petrie and also B.Ae. eybridge by A. Roberts.
We at Warton are in debt to all this work which helped us set up and sustain 3 significant anddedicated effort over a period of some ten years aimed at establishing easy to use, accurate andcost effective methods. These methods are now used for a wide range of applications associated withsubsonic (subcritical) flow where the boundary layer is essentially attached but where the so calledKutta-Joukowski condition is included on most relevant sharp edges or indeed on smooth surfacesalong prescribed 'separation' lines (Refs. 4, 5, 6 and 7).
Work at Warton is now aimed at extending the range of applications and on the associated evaluation.Two examples of applications are wind tunnel wall constraint effects (ref. 8) and airframe - storeinterference (ref. 9).
Turning to the international scene. Although an initial attempt to compare results from what werethen (in the mid 70's) the most commonly used methods was sponsored by AGARD and completed (Ref.10), the test cases were relatively simple and did not even include a wing-body. This isfrustrating in the light of D. J. Peakes' main reconmendation, and I quote (this already alluded toin a previous lecture) "If there was one recommendation, it was to the effect that a calibrationmodel of a wing-body combination be chosen, against which to check the various computation schemesavailable" (Ref. 3).
'I m

Turning now to the state of the art of the linearised supersonic flow models. Considerabledevelopments have taken place. F. A. Woodward's work is well known in Europe and many firms arefamiliar with his methods. We are all very much in debt to this pioneering work and many prograrrmnescurrently in use are direct developments. For example B.Ae. Warton still use one of his laterprograms with only limited development and linked with the structural stiffness model for earlyproject aeroelastic evaluations. However, as with the subsonic methodoloqy, many organisations havedeveloped second or third generation methods to replace Woodward's original work. Warton is noexception and I hope we will have the opportunity of presenting our new developments to aninternational audience in the near future (Reference 11).
To summarise - BAe and, I assume, most other companies not only have both subsonic and supersonic"panel" methods but use them as standard every day design and prediction tools.
Turning to the transonic theoretical methods. The situation is reviewed in Ref. 13 and is i-ichfurther advanced than I thought possible in 1970. The computer programs developed by such workersas Charles Boppe in the States (Ref. 14) and Clive Albone in the U.K. (Ref. 15) using the smallperturbation equations which approximate the shape and the flow to an accuracy which gives veryuseful results for quite complex shapes has already given significant improvements in designcapabilities. The more accurate representation of the shape offered by full potential flowsolutions of Tony Jameson in the States (Ref. 16) and Malcolm Carr of ARA (Ref. 17) are as yetlimited to wing body combinations. These, along with the possibility of usable Euler solutions withthe associated advantage of proper shock modelling, indicate that, even in the transonic regime,computational fluid mechanics should assist in the aLt of design and prediction.
However all is not solved yet - by a long way taking the more pessimistic view of what has been saidin the previous lectures - the mere major outstanding items are boundary layer and separated flowprediction methods. I accept there are three dimensional boundary layer methods available. HoweverI suspect we have not got rh1iiiu Lijht at the trailing cdge - or i.-eed any edge with separation.In addition have we got a reliable method to cope with junction flow? From the previous papers itwould appear not. Obviously more attention is required to produce methods to deal with theseregions.
Moving on to experimental techniques. Looking back to the hopes of ten and more years ago, it nowseems that, for all the theoretical method development that has occurred, the configurations we arenow creating are of such a type that the gap between what theory can model and what the aerodynamicdesigner is interested in is actually greater. it is certainly true that we seem to spend more timetesting in the water tunnel or using flow visualisation techniques in the air tunnels now than wedid ten years ago. D. Kachemann would possibly approve. He was only half joking when he suggestedthat perhaps a water tunnel should be delivered with every large computer "so that a reliablephysical flow model could be developed on which to finally base a computer program" (Ref. 3).
Even if the gap closes - we will remain very dependent on wind tunnels to allow us to do just whatKchemann proposed. It seems even more relevant when one hears the problems associated with NavierStokes solutions and Turbulence Modelling etc. (reference 12). Obviously the need to establish a"reliable physical flow model" before a mathematical model can be developed is self evident.
To sumnarise:
We continue to depend on Wind Tunnel facilities for a large range of design and prediction tasks.However the computational fluid mechanic methods are now so powerful that (for at least thesituation of attached flow) we can undertake a considerable part of the design procedure and manyproduction tasks on the computer in a very much shorter time scale than was possible (say) 13 yearsago in 1970. These advances in Inviscid modelling would be considerably enhanced if the threedimensional viscous effects could be coupled in: this is an important point as many interferencephenomena are caused by viscous effects.
These developments of inviscid computational fluid mechanics have allowed advances in design whererange and/or manoeuvrability have been improved considerably by judicious use of the methodsavailable and by careful selection of target pressure distributions at various points of the flightenvelope (see for example Ref. 1).
However the methods have allowed a more scientific approach to be used for many phenomenacomplicated by interference effects.
The remainder of the paper will illustrate this point with a number of examples. The first of thesewill be concerning the choice between twin fins and single fins. This dilemma has been on our mindssignificantly at Warton recently and I would like to show you some of the results of theinvestigations.
The basic phenomena have been known for a number of years. Indeed there are NACA reports by Nielsenat al written in the mid to late 50's which used the basic approach still given in DATC0M. (See forexample Ref. 18). With the advent of the supersonic panel program it is now possible to estimatequickly and cheaply the tailplane to fin interference or, in the case of twin fins, the mutualinterference. Both theory and experiment show that the mutual interference has a significant effecton fin efficiency giving a marked reduction at low supersonic Mach numbers (Fig. 14). It is notunusual for fins to be sized at the aircraft maximum Mach number - this is generally where the fincontribution to directional stability and as a result, total aircraft directional stability are aminimum. With twin fins this may not be the case and the total supersonic range must be checked -including the effects of aeroelastics.

One important aspect which is not adequately covered by either subsonic or supersonic theory is theeffect of front fuselage configuration and canopy layout in particular. High canopies are requiredfor modern fighter designs to give good all round pilot view. The increased fin contribution tooffset the increased instability introduced by the canopy height is relatively easy to estimate(Fig. 15). What is difficult to estim&le is the effect of the canopy on fin effectiveness. For amodern fighter canopy the effect could be negligible at subsonic speeds for both single and twinfins and ma y vary from small to up to 10% for twin fins and 15% for single fins across thesupersonic speed range (Fig. 16). In addition incidence effects which have vortical flow and/orseparations etc are not amenable to calculation.
Fig. 17 shows directional stability as a function of incidence at H = 1.4 and 2.0. clearly showingthat both single and twin configurations are adversely affected, the single more so than the twin.
The selection of fin configuration is not of course limited to consideration of supersonics - lowbp ced rudder and fin effectiveness especially over the high incidence range must also be considered.Fig. 18 shows at the top a comparison of rudder effectiveness for the sinkle and twin finshighlighting the marked reduction for twin fins as incidence increases to higher values whereas therudder on the single fin maintains its effectiveness throughout.
The lower figure compares single and twin fin effectiveness as a function of incidence. Here it canbe seen that at low incidence the single fin is slightly better - at high incidence however we get across-over such that the twin fin is now better though still at a very low value.
The loss at high incidence for the single fin can be explained by examination of the effects ofvortices generated upstream for instance by strakes or highly swept foreplanes.
Fig. 19 shows the effect of the high incidence assymetric vortex pattern to be a destabilisingpressure field giving the reduction in Cn for the single relative to the twin.In
But there is a further effect - this time on performance - due to the effect of the vortices on thetwin fin configuration. If we examine the lower part of Fig. 19 we can see that the vortex gives asuction on the "lower side" of the outwardly inclined fins coupled with an increased pressurebetween the fins - the result, as can be seen from the graph, is a significant reduction in C ofabout 10%. This phenomenon was studied in some depth at Warton using: existing computYfnalmethods; water tunnel testing in the small Warton facility (for an excellent paper reviewing watertunnel techniques etc. I recommend M. Werle paper which describes work undertaken at ONERA in asimilar facility see reference 20); and also using pressure plot results and smoke flowvisualisation in the Warton 18' L.S.T. A fundamental understanding was obtained - but only by agood deal of detective work and by cross checking experimental and theoretical evidence.
Thus it can be seen that the selection of the fin configuration requires considerable work before anoptimum selection can be made. Computational fluid mechanics assist in selecting cant and toe angleas well as planform if twin fins are shown to offer an advantage over a single fin configuration.The basic lesson is - there is no evidence to support a simplistic conclusion that one fin is right(or wrong) whereas twin fins are wrong (or right). It is equally evident that fashion should notprejudice the designers choice. This, as will be seen, is true of almost all aspects illustrated.
To continue however:
Roll Control:
The strong supersonic aerodynamic interference discussed earlier is evident in many phenomena. Iwill restrict this paper to oie other example.
When supersonic roll control is obtained from either inboard ailerons or flaps or from moving thetotal surfaces (eg. differential tailplane) then the pressure field generated impinges on adjacentvertical surfaces (eg. fins or the side of the fuselage) (Fig. 20).
The results of this for a specific example taken from the same configuration as the previous casewith twin fins and inboard ailerons that are almost inline with these fins shows that theinteference mechanism produces a reduction in the rolling power (Fig. 21) along with an associated(proverse) yawing moment (Fig.22).
Wave Drag:
As an aside these supersonic interference effects are very important when optimising for supersonicdrag. The well known (far field methods) which use equivalent axisymetric bodies (e.g. supersonicarea rule) are not capable of allowing for the interference effects in anything like a rigorousmanner. How could they as the local details of the geometry and their associated local pressuredistributions and the resultant interference are not modelled. For complex shapes where theinterferences are equally complex the total interference predicted by the far field methods can beof the wrong sign. This situation again amphasises the importance of the supersonic panel programs.Although even these have to be used with caution due to the use of the linearised flowapproximations.
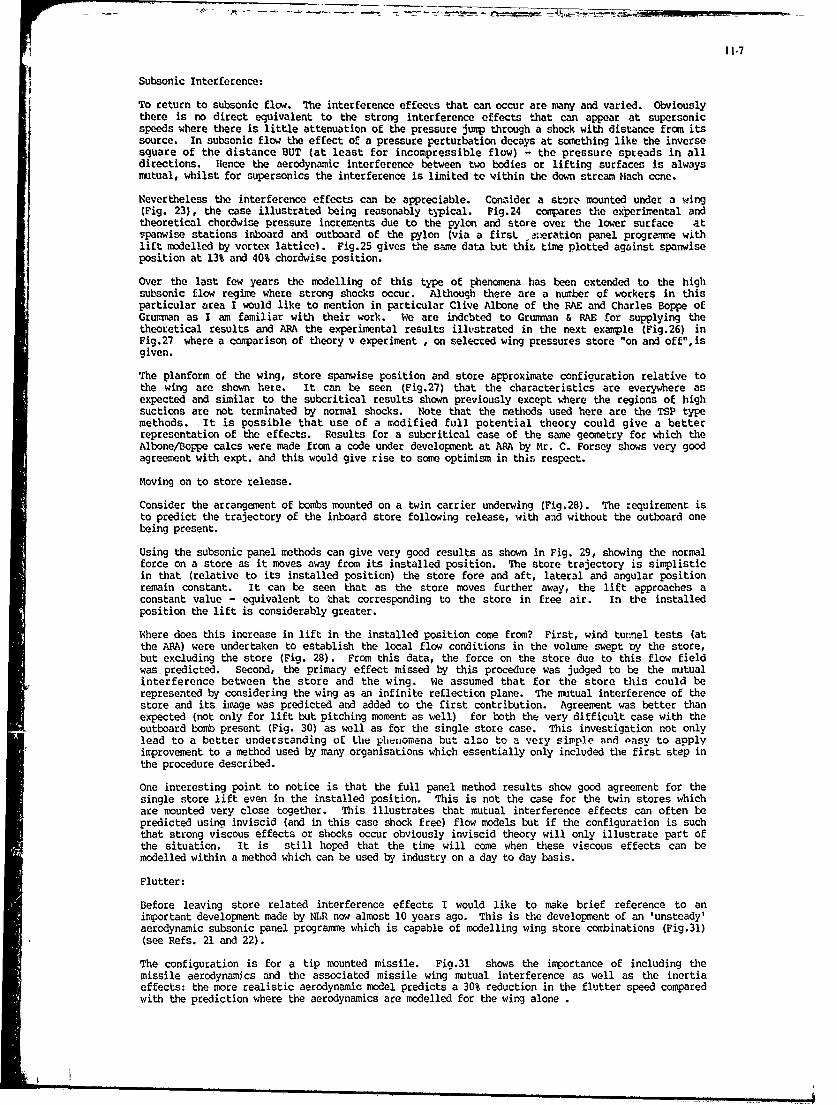
I 1-7
Subsonic Interference:
To return to subsonic flow. The interference effects that can occur are many and varied. Obviouslythere is no direct equivalent to the strong interference effects that can appear at supersonicspeeds where there is little attenuation of the pressure jump through a shock with distance from itssource. In subsonic flow the effect of a pressure perturbation decays at something like the inversesquare of the distance BUT (at least for incompressible flow) - the pressure spreads in alldirections. Hence the aerodynamic interference between two bodies or lifting surfaces is alwaysmutual, whilst for supersonics the interference is limited to within the down stream Mach cone.
Nevertheless the interference effects can be appreciable. Consider a staro, mounted under a wing(Fig. 23), the case illustrated being reasonably typical. Fig.24 compares the experimental andtheoretical chordwise pressure increments due to the pylon and store over the lower surface atspanwise stations inboard and outboard of the pylon (via a first a:eration panel progranme withlift modelled by vortex lattice). Fig.25 gives the same data but this time plotted against spanwiseposition at 13% and 40% chordwise position.
Over the last few years the modelling of this type of phenomena has been extended to the highsubsonic flow regime where strong shocks occur. Although there are a number of workers in thisparticular area I would like to mention in particular Clive Albone of the RAE and Charles Boppe ofGrumnan as I am familiar with their work. We are indcbted to Grumman & RAE Kor supplying thetheoretical results and ARA the experimental results illhstrated in the next example (Fig.26) inFig.27 where a comparison of theory v experiment , on selected wing pressures store "on and off",isgiven.
The planform of the wing, store spanwise position and store approximate configuration relative tothe wing are shown here. It can be seen (Fig.27) that the characteristics are everywhere asexpected and similar to the subcritical results shown previously except where the regions of highsuctions are not terminated by normal shocks. Note that the methods used here are the TSP typemethods. It is possible that use of a modified full potential theory could give a betterrepresentation of the effe.ts. Results for a subcritical case of the same geometry for which theAlbone/Boppe calcs were made from a code under development at ARA by Mr. C. Forsey shows very goodagreement with expt. and this would give rise to some optimism in this respect.
Moving on to store release.
Consider the arrangement of bombs mounted on a twin carrier underwing (Fig.28). The requirement isto predict the trajectory of the inboard store following release, with and without the outboard onebeing present.
Using the subsonic panel methods can give very good results as shown in Fig. 29, showing the normalforce on a store as it moves away from its installed position. The store trajectory is simplisticin that (relative to its installed position) the store fore and aft, lateral and angular positionremain constant. It can be seen that as the store moves further away, the lift approaches aconstant value - equivalent to that corresponding to the store in free air. In the installedposition the lift is considerably greater.
Where does this increase in lift in the installed position come from? First, wind tunel tests (atthe ARA) were undertaken to establish the local flow conditions in the volume swept by the store,but excluding the store (Fig. 28). From this data, the force on the store due to this flow fieldwas predicted. Second, the primary effect missed by this procedure was judged to be the mutualinterference between the store and the wing. We assumed that for the store this could berepresented by considering the wing as an infinite reflection plane. The mutual interference of thestore and its image was predicted and added to the first contribution. Agreement was better thanexpected (not only for lift but pitching moment as well) for both the very difficult case with theoutboard bomb present (Fig. 30) as well as for the single store case. This investigation not onlylead to a better understanding of the phenomena but also to a very simple and easy to applyimprovement to a method used by many organisations which essentially only included the first step inthe procedure described.
One interesting point to notice is that the full panel method results show good agreement for thesingle store lift even in the installed position. This is not the case for the twin stores whichare mounted very close together. This illustrates that mutual interference effects can often bepredicted using inviscid (and in this case shock free) flow models but if the configuration is suchthat strong viscous effects or shocks occur obviously inviscid theory will only illustrate part ofthe situation. It is still hoped that the time will come when these viscous effects can bemodelled within a method which can be used by industry on a day to day basis.
Flutter:
Before leaving store related interference effects I would like to make brief reference to animportant development made by NLR now almost 10 years ago. This is the development of an 'unsteady'aerodynamic subsonic panel programme which is capable of modelling wing store combinations (Fig.31)(see Refs. 21 and 22).
The configuration is for a tip mounted missile. Fig.31 shows the importance of including themissile aerodynamics and the associated missile wing mutual interference as well as the inertiaeffects: the more realistic aerodynamic model predicts a 30% reduction in the flutter speed comparedwith the prediction where the aerodynamics are modelled for the wing alone
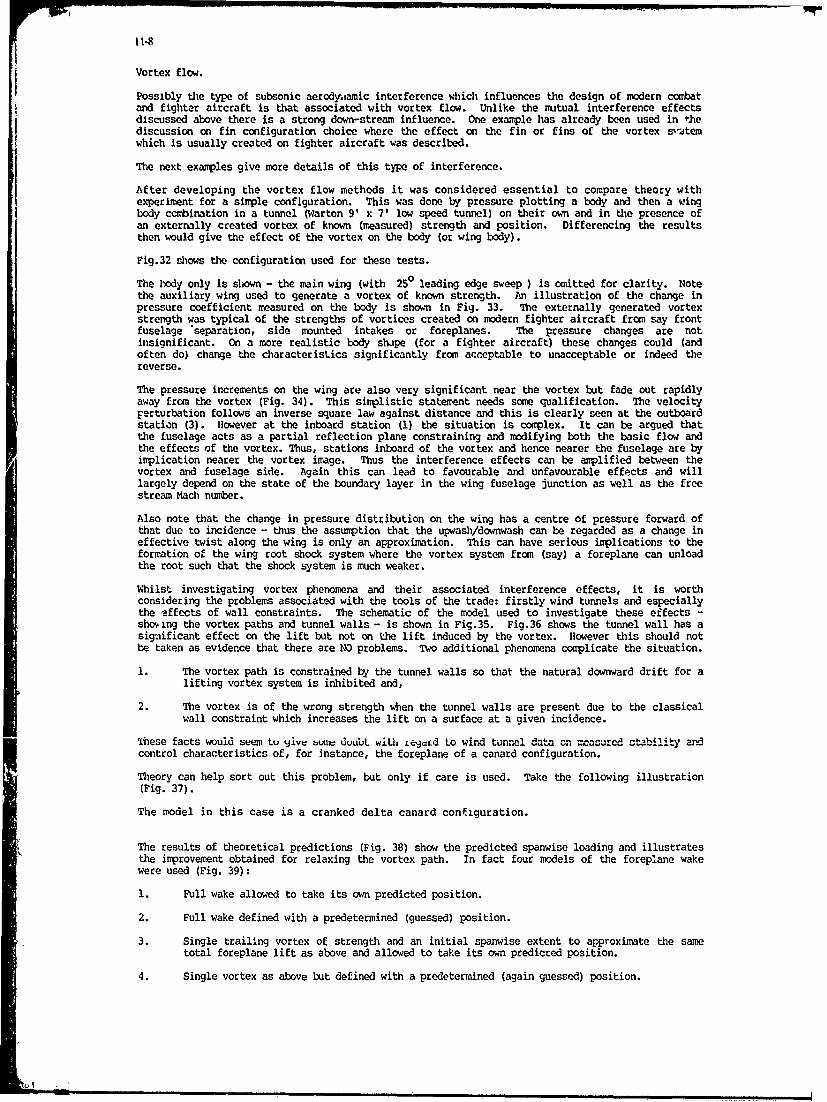
Vortex flow.
Possibly the type of subsonic aerody.amic interference which influences the design of modern combatand fighter aircraft is that associated with vortex flow. Unlike the mutual interference effectsdiscussed above there is a strong down-stream influence. One example has already been used in thediscussion on fin configuration choice where the effect on the fin or fins of the vortex sv'temwhich is usually created on fighter aircraft was described.
The next examples give more details of this type of interference.
After developing the vortex flow methods it was considered essential to compare theory withexperiment for a simple configuration. This was done by pressure plotting a body and then a wingbody ccbination in a tunnel (Warton 9' x 7' low speed tunnel) on their own and in the presence ofan externally created vortex of known (measured) strength and position. Differencing the resultsthen would give the effect of the vortex on the body (or wing body).
Fig.32 shows the configuration used for these tests.
The body only is shown - the main wing (with 250 leading edge sweep ) is omitted for clarity. Notethe auxiliary wing used to generate a vortex of known strength. An illustration of the change inpressure coefficient measured on the body is shown in Fig. 33. The externally generated vortexstrength was typical of the strengths of vortices created on modern fighter aircraft from say frontfuselage separation, side mounted intakes or foreplanes. The pressure changes are notinsignificant. On a more realistic body shipe (for a fighter aircraft) these changes could (andoften do) change the characteristics significantly from acceptable to unacceptable or indeed thereverse.
The pressure increments on the wing are also very significant near the vortex but fade out rapidlyaway from the vortex (Fig. 34). This simplistic statement needs some qualification. The velocityFerturbation follows an inverse square law against distance and this is clearly seen at the outboardstation (3). However at the inboard station (1) the situation is complex. It can be argued thatthe fuselage acts as a partial reflection plane constraining and modifying both the basic flow andthe effects of the vortex. Thus, stations inboard of the vortex and hence nearer the fuselage are byimplication nearer the vortex image. Thus the interference effects can be amplified between thevortex and fuselage side. Again this can lead to favourable and unfavourable effects and willlargely depend on the state of the boundary layer in the wing fuselage junction as well as the freestream Mach number.
Also note that the change in pressure distribution on the wing has a centre of pressure forward ofthat due to incidence - thus the assumption that the upwash/downwash can be regarded as a change ineffective twist along the wing is only an approximation. This can have serious implications to theformation of the wing root shock system where the vortex system from (say) a foreplane can unloadthe root such that the shock system is much weaker.
Whilst investigating vortex phenomena and their associated interference effects, it is worthconsidering the problems associated with the tools of the trade: firstly wind tunnels and especiallythe effects of wall constraints. The schematic of the model used to investigate these effects -shoiing the vortex paths and tunnel walls - is shown in Fig.35. Fig.36 shows the tunnel wall has asignificant effect on the lift but not on the lift induced by the vortex. However this should notbe taken as evidence that there are NO problems. Two additional phenomena complicate the situation.
1. The vortex path is constrained by the tunnel walls so that the natural downward drift for alifting vortex system is inhibited and,
2. The vortex is of the wrong strength when the tunnel walls are present due to the classicalwall constraint which increases the lift on a surface at a given incidence.
These facts would seem to yive bule doubt wili Legecd to wind tunnel data on mzrasured stability andcontrol characteristics of, for instance, the foreplane of a canard configuration.
Theory can help sort out this problem, but only if care is used. Take the following illustration(Fig. 37).
The model in this case is a cranked delta canard configuration.
The results of theoretical predictions (Fig. 38) show the predicted spanwise loading and illustratesthe improvement obtained for relaxing the vortex path. In fact four models of the foreplane wakewere used (Fig. 39):
1. Full wake allowed to take its own predicted position.
2. Full wake defined with a predetermined (guessed) position.
3. Single trailing vortex of strength and an initial spanwise extent to approximate the sametotal foreplane lift as above and allowed to take its own predicted position.
4. Single vortex as above but defined with a predetermined (again guessed) position.

If the strength of the equivalent vortex is known and that implies knowing the foreplane lift in thepresence of the wing upwash (another interesting interference phenomena that can affect the stressloading cases on foreplane by a significant amount) - then the single vortex with a relaxed pathlooks very good compared with the nominally exact solution with the relaxed wake. With thepredetermined position both the full wake and single vortex models are poor giving misleadingresuls.
So now to conclude:
The illustrations shown and examples given have attempted to give some indication of the scope of"aerodynamic interference". Obviously only a very narrow spectrum has been covered. There are manyother types of interference than those described and some could be regarded as of primaryimportance.
For example (Fig. 40):
- separated boundary layer phenomena where control surfaces are "buried" in low energy air andhence lose their effectivness.
- air data sensors used to measure pitot-static pressures, incidence, etc. influenced byspurious effects such as the movement of a nearby control surface or change in engine massflows.
- distortion of the flow entering the intake by upstream parts of the aircraft.
- the interference effects of fins, tailplanes etc. on the rear fuselage.
- the interference effects of secondary flow outlets for intake boundary bleed systems, andair coolers etc. and for the latter, inlets as well.
The list seems endless. There are few aspects of aerodynamic design where interference effects arenot of primary importance. This is especially true of mo'ern fighter aircraft. As avionic systemsbecome more conpact and as engine fuel consumption and also thrust/engine size improve the basicairframe becomes smaller and more compact. On the other hand size of stores to carry seem to getbigger as do cockpits with the requirements for all round vision. The result tends to be verycopact airframes with the various components very close together. The days of design which wereconsidered as a collection of separate parts are long gone. Now aerodynamic interference is aressential if not the essential design consideration.
REFERENCES
1) D. R. HOLT & B. PFOBERr, BAe WartonSome particular configuration effects on a thin supercritical variable camber wing.Paper 15 of AGARD F.D. Panel Symposium on Siibsonic/Transonic Configuration Aerodynamics.AGARD CP 285.
2) Aerodynamic InterferenceAGARD CP 71-71, September 1970.
3) D. J. PEAMETechnical evaluation report on AGARD specialist meeting on "Aerodynamic Interference"AGARD-AR-34-71.
4) B. HUNT, PAe WartonThe panel method for subsonic flows: a survey of mathematical formulations and numericalmethods and an outline of the new British Aerospace Scheme.Von Karman Institute for Fluid Dynamics, Lecture Series 1978-4(Computational Fluid Dynamics, March 1978).
5) S. A. JEPPS, BAe WartonThe computation of vortex flow by panel methods.Von Karman Institute for Fluid Dynamics Lecture Series 1978-4(Computational Fluid Dynamics, March 1978).
6) B. HUNT, BAe WartonRecent and anticipated advances in the panel method, the key to generalised fieldcalculations.Von Karman Institute for Fluid Dynamics Lecture Series 1980-5(Computational Fluid Dynamics, March 1980).Including an appendix by D. J. Butter (BAe Manchesterl on "viscous flcw modelling in panelmethods".
7) W. G. SEMPLE, BAe WartonAn economic and versatile panel method for aircraft and aircraft/store configurations. Anoutline of the principal features of the mathematical modelling and numerical implementationof the British Aerospace (Warton) Mk.II panel method.Von Karman Institute for Fluid Dynamics Lecture Series 1980-5(Computational Fluid Dynamics, March 1980).

11-10
8) B. HUNT and D. R. HCLT, BAeThe use of panel methods for the evaluation of subsonic wall interference.Paper 2 Wall Interference in Wind Tunnels AGARD Conference 335, May '82.
9a) B. HIM, BAe WartonThe prediction of external store characteristics by means of the panel metho.RAe Warton Eeport Ae/372, January 1977.
9b) Airload prediction by C. B. Mathews (Editor), R. Deslandes, R. A. Grow, B. Hunt. F. W. Martinand J. N. Nielson.Paper 4 "Drag and other aerodynamic effects of external stores" Unclassified paper.AGARD Advisory Report No. 107 (NAIO Restricted), November 1977.
10) H. S. SYTS'A (NLR), B. L. HEWITT (BAe), P E RUBBERT (Boeing)A conparison of panel methods for subsonic flow conmtation.February 1978, AGARD AG 241.
11) W. R. MARCHEK, J. A. QLEY, B. L. IIEWITr - RAe WartonDevelopment of a supersonic panel program at PAe Wartcn.Company Confidential report, November 1980.
12) A. B. HAINESTurbulence Modelling.Report of a working party edited by the Chairman, A. B. HainesThe Aeronautical Journal of the Royal Aeronautical Society, August/September 1982.
13) H. G. HAMAdvances and shortcomings in the calculation of inviscid flows with shock waves.Paper presented at the IMA conference on numerical methods in Aeronautical Fluid Dynamics,March and April, Reading.RAE Tech Memo Aero 1913, October 1981.
14) C. W. DOPPE and M. A. STERNSimulated transonic flows for aicraft with nacelles, pylons and winglets.AIAA 80-0130, Pasadena, California, 1980.
15) C. M. ALBCE, M. G. HALL & JOYCE GAYNORNumerical solutions for transonic flows past wing-body configurations.Symposium Transsonicum II, GottingenSpringer and Verlay (1976)(and subsequent developments).
16) A. JAMESONIterative solution of transonic flows over airfoils and wings, including flows at Mach 1.Comm. Pure Appl. Math, Vol. 27, 283 - 309 (1974).
17) C.R. FORSEY and M. P. CARRThe calculation of transonic flow over three-dimensional swept wings using the exactpotential equationDGLR Symposium Transonic Configurations, Bad Harzburg (1978).
18) B. R. A. BURNS & K. CARR, PAe WartonTransonic/Supersonic lateral aerodynamic derivativesVon Karman Institute for Fluid Dynamics Lecture Series 76-77 No.8Aerodynamic irputs for problems in aircraft dynamics.
19) B. HUNT, BAe WartonThe role of computational fluid dynamics in high angle-of-attack aerodynamics.Paper 6, AGARD Lecture Series No. 121High Angle of Attack Aerodynamics, March 1982.
20) H. %ERLE, ONERAFlow visualisation techniques for the study of high incidence aerodynamics.Paper 3, AGARD Lecture Series No. 121High Angle of Attack AerodynamicsMarch 1982.
21) R. ROSS, B. BENNEXERS and R. J. ZWAAN (NLR)A calculation method for unsteady subsonic flow about harmonically oscillating wing-bodyconfigurations.AIAA Paper 75-864.
22) B. BENNEKERS, R. ROSS and R. J. ZWAAN (NLR)Calculations of aerodynamic loads on oscillating wing/store combinations in subsonic flow.NLR MP 74028 (1974)or AGARD-CP-162 Lecture No. 4 (1974).

I I-I I
23) J. FLEtCHERForward swept wings at British Aerospace, Warton - an overview.Bristol International Conference on Forward Swept Wing AircraftMarch 1982, To be published.
24) D. E. SHAWExperimental investigations into forward swept wings.Bristol International conference on Forward Swept Wing AircraftMarch 1982, To be published.
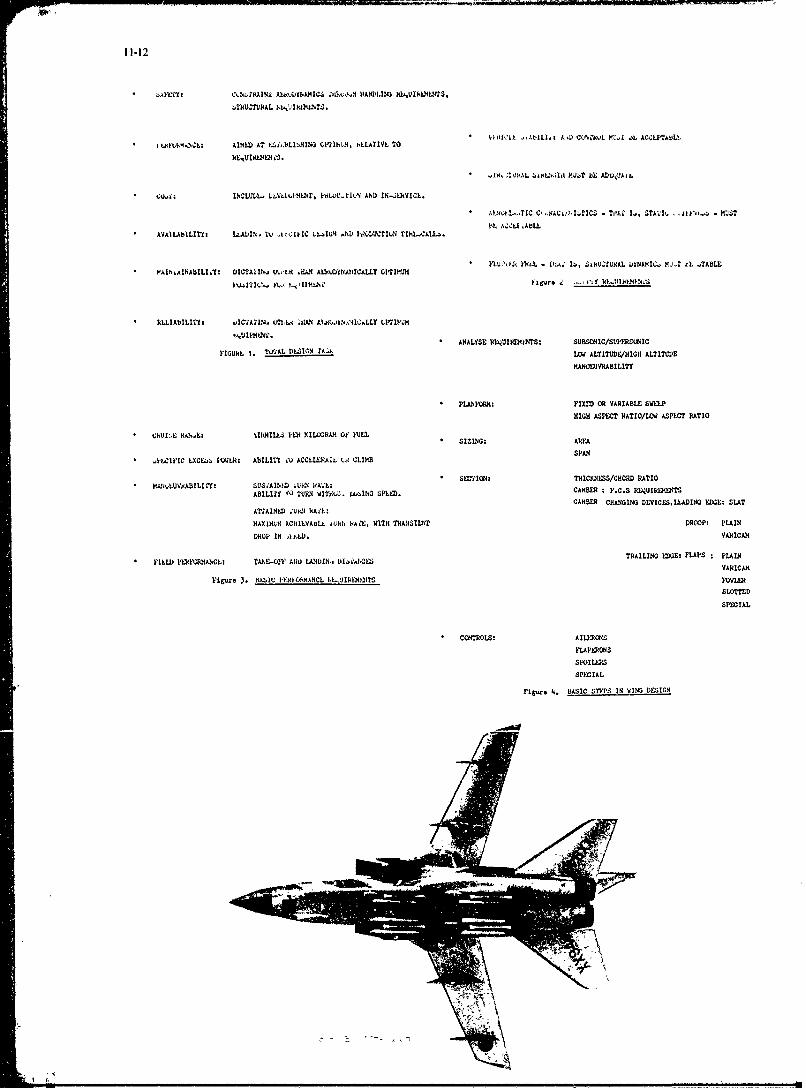
11-12
b-ThUTVPAL k'T .
i wk4Isa AIMED AT 3.d1,bLIAIN.- clI'Ilb , F±LATIVL TO
* .dX ~4 4 ,eLNT NU) t bL ADL~A(VAA
* C.J.~3.:INCLYLL. LN3i)4NkR, PiwVIXNQ AND IN-.;)VICL.
* A.j...TC C,Nk4olir))ICS - TtmAj 1.1. STAT'L MUJST
* AVALAbILITYI LAL)I% jlU jr;IkIC L IG4 ND) PZOL4,=I4. TI1LCA"..
MV0.k M.L - fliYl l5, S,kUY:TUAL LAN1MC MJ-L tL . YABLL* lAINIAdNABlLI.Yz XJ UTAIIN *HW. AL]RWYJAH)ICALLY GIIMUH
R LLIAbILITY: VIIAEO. IflLl liAN At t).IIM'4.LLY LIIPA
* ANALYSE RiqUIREMETS: SIRSONIC/sUPERSO.RIC
FIGURIL 1. TIRl, ILSIGN ZtA.A L~d ALTITUDE/HIGH ALTITUDE
KANOEUJVRABIL1TY
* PLANFORK: YUI) OR VARIABLE SVELP
HIGH ASPECT RATIG/Whi ASPE-CT PATIO
(*'I -.-IM~ E l RHO 1E SIZINGi AME
SPAN1%~cfl I-ACE44 tQJ3.: ABILITY To ACCLLERAIL Lit CLIMB
* ?WLURAHLII: S~gAII) UANNA'L * sIwhON: THICRYNiSS/CHORD RATIO
ABILIE *11 TURNN WlTli[UJ Lu.4IlG SPL0. CAMBER F.C.S RlUIRk)(IMTCAMBER CHANGING DEVICELILADING EW~E: SLAT
A~rAINtW . Ukd iAiL.
NAXIHLY ACLIILVAULL tol~d, ?)A.E. WITH 70NSII)T DROOP: PLAIN
DROP IN AtlD. VANICAR
F ILLW I)pakwNANCL; TAKE-01? Atio LANDIN,. U)I.C.CS TRAILING EDGE: FLAPIS :PLAINVARICAM,
D'Aeure 3. tAbIC P)'Y?0A34ANCL PLJINEMETS FWE
SLOTTED
SPECIAL
* CONTrROL.S: AILERONS
FLAPaOHS
SPOILERS
SPECIAL
rigure I. Bsic s "Ps IN WING DEIXGN
1' V.

SSUSTAINED Orgda PrsueMANOEUVREanGoer
S1 'g FLIGHT
DATTAIN ED Pl
CLC
1.0MACH NUMBER Cl
Fio. 6
Typical Design Requirements C
R 9 . 7 Design~ Procedu~re
Fig. 8~ Comparison of Pressures

[ I1t-14
1REQUIRED AT DESIGN POINTAEROLASTIC TWIST AT ni (CONVENTIONAL STRUCTURE)
14" A-=33 t/c= 5% A=45% = 75%
12-
iO0. 0 _3 45o 03 450
L /ALE 0-3 A' 4 42;/$A L E0. .
83 0-4 054 52 .6 TIP TWIST 0. 0.4 45*
(NOSE DOWN) 0.4 42
420 450 0.5 ALE
40 . /ALE
2t 03- 5 MATCHED PLANFORM A=O345=0-37- 42: FOR A= 0-36-42*
0j r1- CLD EQUIVALENCE
9 Comparison of Required Twist and AeroelasticDue to Bending
AR = 33 AR = 45X =0"4 X =0"4
(ONLY SMALL CHANGE WITH AR)
iou- 100""
TIP TWIST(NOSE DOWN) ,
I, 1
SPAN 10
POSSIBLE RANGE WITH TAILORING
Fi9. i0 Effect of Aspect Ratio on AerolasticTailoring Boundaries

pow- -- IN
-a60'S TECHNOLOGYADVANCED TECHNOLOGY
POINT ACD REDUCED
EQUAL CL WAVE DRAG
080- 'etSTRONG SHOCK-11- 4 * V *02 OLD
NEW
INCREASED REAR LOADING
POINT B
CL DRAG RISEC~xO BOUNDARY
LOWER SURFACE SHOCK
PRONOUNCED* REDUCTION OF
MD
T _ -MACH
LARGE PRESSURE GRADIENT
Fig. ii Main Flow Features
-EADN ---- F-7RIICFD
Fig. 12 Vorioble Comber Devices

IdL&IS SYSTlIN NNF)FMACL VUk.Aj ~ AIl(k"I'llilUANCE
iILkL VCLOHLU VLNIbS %I~t6WC DRAG
1,%ICAL SOPI'ISTICAT10:N Vri Wuz Slion TII- SCALE
AC-
* LOW 4
SINGLE0
TWIN 0"
FINS OFF
NONE
EXPERIMENT SMALL
*THEORY (NO WINGS)
I. ARGE
1 0 1 5 NACH 46 2 0 FIG 15 VARIATION OF CnS WITH CANOPY
FIG14 EFFECT OF MUTUAL INTERFERENCE SIZE (EXPERIMENT)
W:TH TWIN FINS
~~AC
MEN -SIN-GLE OR TWIN FINS
SSINGLE
TWIWICNN
TWIN MC
REDUCING CANOPY HEIGHT tN MC20
SINGLE
1 0 1 S MACH No 2 0
FIG 16 EFFECT OF CANOPY SIZE ON FIN FIG 17 INCIDENCE EFFECTS ON FIN CONTRIBUTION
CONTRIBUTION TO Cvip TO CnO (EXPERIMENT]

11-17
CI RUDDER EFFECTIVENESS SINGLE OR TWIN FINS
SINGLE c
\1 TWIN
OESTA BILl SING
CL
10%FIN EFFECTIVENESS - SINGLE*Ve ac TWIN
TWIN LOSS OF LIFTSINGLE FIG 19 VORTEX INTERFERENCE @ HIGH oc
oO MACN No 1-
FIGIB INCIDENCE EFFECTS ON FIN AND RUDDER
(LOW SPEED EXPERIMENT)
SI I
LOWcl
FIG. 21AILERON ROLL CONTROL POWER (EXPERIMENT)
AREA OF FIN INFLUENCED BY
FL APERONS
FIG.20 SUPERSONIC INTERFERENCE
10 SMACH No I
FINS OFF
LOWd
FIG. 22 AILERON YAW MOMENTS (EXPERIMENT)
FIG. 23 GROSSWING *STORE
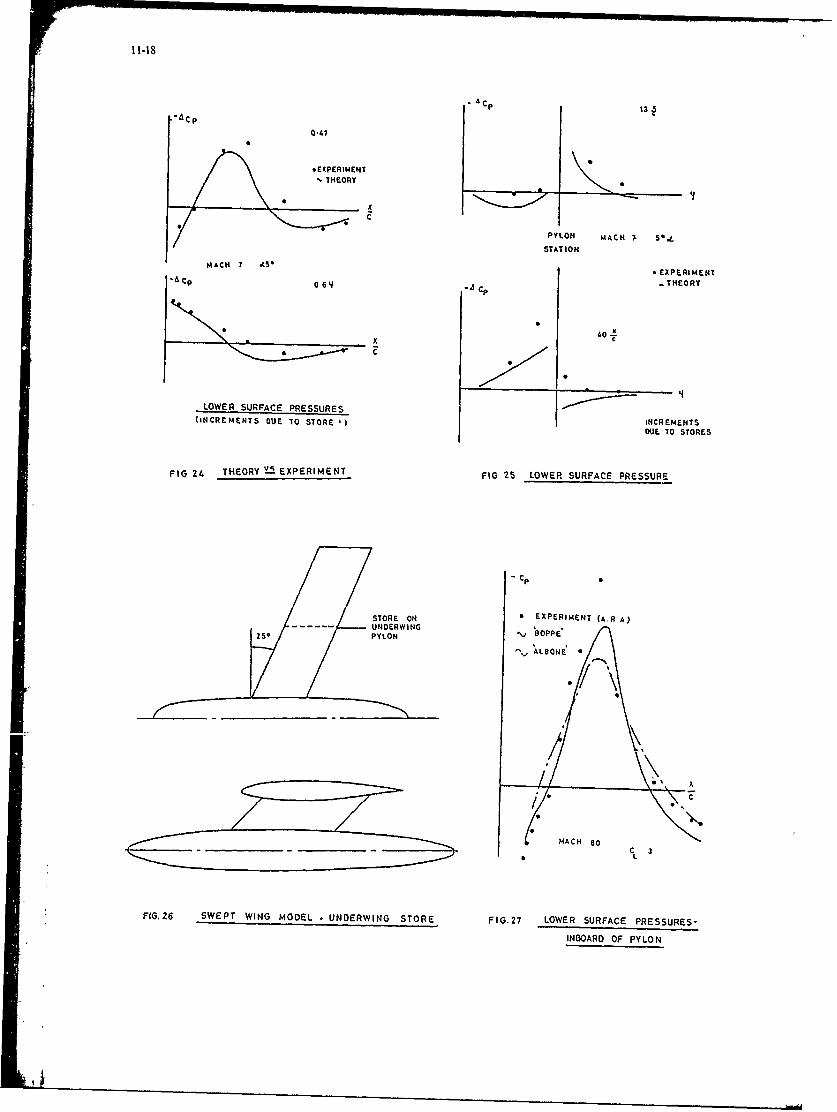
PYLON MACH 50,
STAT ION
MACH L56 EXPERIMENT.&C P 06 4 CP - THEORY
X c
LOWER SURFACE PRESSURES(INCEMENS OU TO TORE1) NCR EMENTS(INC EME TS DE T STO ES)DUE. TO STORES
FIG 21. THEORY t EXPERIMENT FIG 25 LOWER SURFACE PRESSURE
-CP
STORE ON *EXPERIMENT (AR A)UNDERWING
2 5 PYLON
.GOPPE
C 3S L
Ff6. 26 SWEPT WING MODEL UNDERWING STORE FIG.27 LOWER SURFACE PRESSURES-
INBOARD OF PYLON

L - -- - - -F L O F IE-L
L MEASUREMENTS
FIG.28 GEN1ERAL ARRANGEMENT
C, MACH 6 3.
OUTBOAR BOMB ISTALLEDCN AC
~~~OUTBOARD BOMB INSTALLEDMCH6 4
INTALEOLCAIO
DIISTANCE FROMCN INSTALLED LOCATION
CONFIG~~JRAT~o OMB (EFFCT OFI NLUANGIAGS
USI FOW ,NGLAISTANC DATA
FIGH2 NORMAL FORCE ON RELEASED M
FLU77CAR
SPEED CLEAN WING
O~t P) ssl C N FLUTTER
FLUTTER
WITHIN
-. I. ~ENVELOPE41Z?gD- I --
MISSILE CENTREOF MASS
FIG,31 EFFECT OF TIP MISSILE ON WING FLUTTER

1'£1 11-20
WING TO 04NERATE
V O R TIC E S I
DISTANCE FROM SURFACE
AIR FLOWVORTEX PATH
& A
-THEORY
EXPERIMENT* SlOE
PLA N VIEW Acp
A A'
DISTANCE FROM SURFACE
FIG 33 EXPERIMENT isTHEORY
FIG. 32 'SCHEME OF MODEL
TUNNEL WALLS
VORTEX PAIRS
(D WING -BODY MODEL
IX
BODY77 7777777~&P EXPERIMENT /
1 2 WI G TH O R YF IG 3 5 W IN G - B O D Y MODEL IN WIND -TU N N E L
VORTICES
X
FIG 34 INCREMENTAL WING SURFACE PRESSURES DUE
TO VORTEX

11-21I
CL
APPROXIMATEVORTEX PATH
IN TUNNEL
- FREESTREAN
VORTEX TO WING SPACING
FIG 36 EFFECT OF TUNNEL WALL CONSTRAINT
CLI. C
RIG ID
WING ALONE *FIG 37 PLANFORM VIEW OF WING
/ C cRIGIDU C
WING~~( NUCNAMBO ERTS REFER 2'®"
~~~-WING CANARDEXI2D3
CAN PDAN
FIG 38 EFFECT OF RELAXING VORTEX_________ _______________
Z5SPAN so
FIG 39 DIFFERENT VORTEX MODELS
* A I~ -- "lI) bVAif I.AYL 11N ~tiki~*A, WHERE{ C(Affifol, ..UHFACLW AREk 41BURILD"
INi LVVI *.K. Alit, ANDI Mi2ck: Lw.k THEIR LFCIevkjit..
.I t lhrA SIM.UsS, USZ It) ML'AIJNI FITO-STATIC PL!URES, MI~IDEC,VmT.,
U.INIk'ik4) AX bl'UHIVUJS LFl~.C :;UCiI AS fl iE HOWCk2i' OF NiARB(Y COAXROL
SUHAFACY 6, (M Chk' AJLS INl IG*N MASS F1.d.
D* Ixldl(N OF' 7111. FlAiM ZEi'LHING 'Ii1L I~cAYX BY UI'..fIu'% P'ARTS OF TIII
* It (~iJ0.Tt?. k-W. OF~J A FINS, TAII.11Ak.S, D1C. V3 iAI HEAR FUS~LLAGE.
*IN1Kk1.H1CL 11.l1^ OF SECONIDARY FLWl INLLTS AND U,) AJLL?3 SUCH AS
IN:'.ALk L*1AI~d)thY LAYkR SYSTEMS, OR RAT (CHN.NLAh Y,'TM2S.
Flhf. 40. F111<1 1. 14 IXAI'lJ OF A(NANIC INTM1k.1401;

rt !12ol
EXTERNAL STORES INTERFERENCE
A B HainesChief Executive
Aircraft Research Association LtdManton Lane, Bedford, UK
SUMMARY
External store installations are frequently a source of considerable adverse aerodynamic interferencegiving large Incroases in drag, reductions in usable lift and poor store release characteristics. Researchhas however show, how this adverse interference can be greatly alleviated or even transformed intofavourable interference. This lecture reviews some of the available evidence for a wide variety ofarrangements. The nature of the interference, both adverse and favourable, is described, particularemphasis being placed on the major adverse interference in standard multiple carriers and in some underwinginstallations. The possible benefits of wing tip carriage and carefully arranged underfuselage arrays arenoted. Throughout, stress is laid on the fact that dramatic improvements might be possible by adopting aradical approach to store carriage.
1 INTRODUCTION
The main theme of this lecture series is optimisation. how should we optimise a configuration to minimiseadverse aerodynamic Interference and exploit favourable interference. Nowhere is this more important thanin the design and mounting of external store installations. The traditional approach followed for manyyears was to mount the stores either separately on underwing pylons or on standard multiple (triple or twin)carriers. Many papers Jl,2,3; inthe mid-1970s stressed that this was a recipe for serious adverseinterference. One could design a highly efficient clean airframe and then lose all the benefits of advanceddesign when the stores were added. Examples were quoted where the installed drag increment due to carryingsay, six stores was greater thdn the drag of the clean aircraft. Noting this situation, the AGARD FD Panelin 1974 set up a Working Party to consider 'Drag and Other Aerodynamic Effects of External Stores'. Thisgroup reported J4] in late 1977 and some of the evidence and their conclusions were included and updated ina paper [5] presented at the AGARD 1980 conference on 'Configuration Aerodynamics at Transonic Speeds'.These papers did more than just identify the sources of the interference; they showed that adverseinterference was not inevitable, favourable interference was a real possibility and the performance gainsrelative to standard practice could be substantial. Various recommendations were put forward as to howthese improvements might be achieved, eg
(i) carry as many stores as possible in conformal arrays below the fuselage, these arrays being arrangedto exploit the benefits of store stagger and tandem carriage,
(ii) for aircraft where stores have to be carried under the wing, design the wing with due allowance forthe presence of the stores or at least, treat the design of the wing and underwing pylons as a singleoperation,
(iii) apply area-rule principles both to the complete configuration and to the local store assemblies,
(iv) exploit the benefits of wing-tip carriage for missiles,
(v) for cases where multiple carriers have to be used, develop carriers of improved aerodynamiccleanliness and if possible, including the benefits of store stagger, tandem carriage and optimumlateral spacing of the stores,
(vi) wherever possible, adopt a radical approach.
It must be admitted that some of these recommendations are difficult to implement retrospectively on pastaircraft designs. There is also the natural reluctance to abandon the stocks of standard equipment. Ithas therefore been difficult for research workers to advance their arguments for radical change. Progresshas been slow and there have been many disappointments where promising ideas have been rejected in practiceo non-tuchnical grounds. Nc,,crthelcss, thcrc havc bccn somc notable advanccs particularly in France andit is to be hoped that new aircraft designs will take advantage of what has been learnt in extensiveresearch testing. One cannot emphasise too strongly that the possible advances relative to the interferenceimplicit in the installations of the 1970s are very great - not only in terms of reduced drag and betterperformance but also as less buffet, smaller installed loads and better release characteristics.
This lecture is an abbreviated and slightly modified version of the paper [5] presented at the 1980conference. Some of the earlier examples have been omitted on the grounds that they have already beenpublished in several documents [1,2,3,4,5]. The emphasis throughout is on the understanding of the adverseor favourable interference.
2 UNDERWING FUEL TANKS AT LOW CL
it seems appropriate to start the detailed discussion by considering the interference effects due to thecarriage of external fuel tanks. A fuel tank is the simplest and probably the cleanest type of store.Fuel tanks are generally carried on pylons below the wing or fuselage. It is far more efficient to carrythem under the fuselage. For example, in model tests [6] at AEDC for the F-4C, it was found that carryingfuel in a 2264 litre (600 gal) tank under the fuselage was more than 4 times as efficient at N = 0.7 andalmost 3 times as efficient at M = 0.9 as carrying fuel in 1396 litre (370 gal) tanks under the wing,efficiency being defined as the ratio ot fuel capacity divided by the installed drag. Nevertheless, onmany aircraft there are practical reasons why the fuel tanks have to be carried underwing and Fig lapresents results for 15 different aircraft/fuel tank combinations. In all cases the tanks were pylon-mountedunder the wing near mid-semi-span; except for the curves marked A and B, this figure was included in theWorking Party report [4] . The graph shows the variation with Mach number at CL 0 of a 'figure-of-merit'or inverse efficiency,
PaECEDING PAGE RUM1 - M )

12-2
Measured installed drag increment (or dra in isolation)Esti ated profile drag for tank/pylon at low 1ach number
te assuming the estimate in the denominator is correct, Al - 1.0 implies zero net drag contributions fromflow separations, base drag, bluffness drag, excrescence drag, wave drag and interference within theassembly and between the assembly and the aircraft.
The results for a typical fuel tank in isolation are included for comparison. The figure clearlyillustrates that mst of the drag increment is related to the installation interference effects. For thetank in isolation, %, is less than 1.1 up to M 0.94 hut for the installed tank assemblies, values of kIranging from 1.2 to 3.5 are obtained even at H 0.6; rapid increases in I with Mach number are alreadyoccurring at M = 0.6 in the worst case but not to beyond M 0.86 in the best case. At first sight, it mayappear an impossible task to predict or interpret this figure but certain trends can be deduced. First andforemost, as shown in Fig lb, there is a trend for both xI at M - 0.6 and PDs, the Mach number for the startof the rapid increase in ki, to improve in sympathy with the drag-rise Mach number MD of the clean wing.This is only to be expected. an increase in MD will generally imply a reduction in wing thickness/chordratio and/or an increase in wing sweepback and thus, a reduction in the suctions below the wing lowersurface and a later appearance of a shock wave in the channel between the wing and tank. Research has shownthat the appearance of this shock wave generally collates with MD With tanks of a standard shape,therefore, it may be difficult to obtain notably better results tan those implied by the dashed lines inFig lb but the significant point is that there are a fair number of installations where the interference issuch that the results do not approach this norm.
'et us consider two of these examples. First, Fig lc compares 3] configurations 6 and 11. For both cases,the installed drag values for CL - 0 lie above the norm, Figs la,b, but the excess is far greater for case 6;even at CL 0.4 where one would expect some improvement, the results are still poor. Looking at thegeometry, it will be seen that in case 6, the tank is larger relative to the aircraft. Partly because thepylon is relatively thin (71 thick comapred with 13 thick for case 11), the crutch arms are exposed andunfaired. A simp;c estimate suggests that the drag of these crutch arms treated as isolated excrescenceswould be about the same as the extra drag of the thicker pylon in case 11 but it has generally been foundthat such excrescences can induce serious interference if the flow downstream of the excrescences encountersa region of high adverse pressure gradient. This would be true in the present case. The major weaknesshowever with configuration 6, is the rapidly diverging channel at the rear. All three surfaces, ie wing,pylon and tank contribute to this divergence. One could say that the installation could not have beentailored better to produce a shock across the channel at a relatively low Mach number, or to produce a flowseparation on one or all of the rear surfaces! Extra viscous drag and early wave drag are therefore onlyto be expected. Fig Ic shows a revised configuration for which the interference would be expected to beless; the Al curve for this revised configuration is a speculative estimate, no tests have been made onthis layout.
Second, Fig ld presents a comparison between cases A and B. These results are for the same tank mounted onthe same pylon at the same spanwise position on two wings A and B of the same planform but which differ insection shape. The section of wing B is thicker and is designed to give more rear loading. Strictly, theresults for A and B are not comparable with the other cases in Fig la because two additional bare pylonswere present on the inner and outer wing and thus it is probable that the values of Al have been increasedby the aerodynamic interference between the tankpylon and these other pylons. However, it is still fairto compare A and B and Figs la,b show that the values of Ni and MD are much poorer for wing B. Thesedifferences can be explained qualitatively in terms of the measureg pressure distributions uver the winglower surface. These are shown in Fig Id for H z 0.80 for a station at 0.4 x semi-span, ie inboard of thetank. These distributions can be described as follows:
A BClean wing Subcritical SubcriticalWing with 3 pylons Subcritical Strong shock, no separationWing with 3 pylons and tank Strong shock, no separation Shock-induced separation*
Indicated by the lower pressures downstream of the shuck relative to the other cases and by the partialcollapse of the supersonic region ahead of the shock.
One can therefore forecast from the pressitie distributions that both the wave drag and the viscous drag willbe higher with the tank mounted on wing B. The greater interference for a given 'dch number and CL is aconsequence of the different pressure distributions over the clean wings. The significant features arethat near 0.35c the suctions are about 70. higher on wing B than on wing A and that the subsequent adversepressure gradient is about twice as great.
It would be wrong to conclude however that the greater interference with wing B is an inevitable consequenceof attempting tu carry the tank on a more advanced, thicker wing. For example, as with configuration 6 inFig 1c, one could either
(i) move the tank forward or aft in an attempt to separate longitudinally the peak suctions on thewing and the tank,
or (ii) change the shape of the tank to one with a parallel centre section opposite the peak suction onthe wing,
or (ii) reshape the rear of the tank with either a longer, less tapered boattail or a raised upper line,ie a banana-shaped tank,
or (iv) modify the pylon design,
or (v) change the wing camberline to produce a more suitable shape of lower surface pressure distribution.
It is worth noting that concept (ii) was introduced more than 30 years ago on an early jet fighter toeliminate flow separation and buffeting problems that had resulted from the underwing carriage of a tankhaving a continuous longitudinal variation in cross-sectional area. The problem was solved by changingthe tank shape to one with a forward, parallel mid and tapered aft section mounted in such a position that
4.

12-,
the peak suctions at the junctions between the three sections were displaced fore and aft of the peaksuction in the clean wing flow field. Now, when the need for care in eliminating adverse interference iseven greater with modern wing designs, the concept is rarely used. This is not true of configuration 6discussed above but in this case, for practical reasons, the concept was misapplied as will be realisedfrom the sketch in Fig lc. Logistically, it may be unattractive to think in terms of a different tankshape for different aircraft and to some extent, one could argue that (i-iv) should be regarded aspalliatives for a situation that should not have arisen. The real lesson - and this will become evenclearer in section 4 below - is that wings should be designed with store carriage in mind from the outset.At the very least, one should design a wing/pylon combination rather than a clean wing.
3 UNDERWING STORES: FACTORS AFFECTING INTERFERENCE DRAG AT LOW CL
3.1 Store Shape
It should be apparent from the discussion of the fuel tank examples in Fig I that the aerodynamicinterference with underwing mounted stores is likely to be proportionately more serious for cleanstreamlined stores than for parallel or dirty stores. Even rela'ively small changes to the shape of thestore can have a significant effect on the interference. This is shown by the comparison in Fig 2a. Twoalternative stores X and Y were mounted (8) on wing A, Fig 2d, on the same underwing pylon at 0.55 x semi-span. The two stores have about the same overall dimensions but a somewhat different shape, store Y havinga bluffer nose, a longer parallel centre section anda shorter boattail. The free air drag and indeed, theinstalled drag increment was much greater for store Y but as shown in Fig 2a, the interference contributionACDi to the drag increment,
ie ACo i = COinstalled -CDisolated
is generally somewhat less for store Y, particularly in the range M z 0.80-0.85. There are two possiblequalitative interpretati-'i" of this result. Either it is an example of a general trend that when the storeshape is such that there is poor flow over thelsfotore afterbody even under free-air conditions, there isless chance that the interference with the wing flow field will further degrade the flow over the afterbody.Or the shape and position of store D are such that the interference increases the wing wave and/or viscousUrFag. Oil flow patterns for M = 0.85, CL = 0 suggested that the second interpretation is more likely inthis case. The main features of these flow patterns are reproduced in the sketch in Fig 2a:(i) with store Y, the shock is further aft - consistent with the position of the start of the afterbody,
(ii) with store X, the sweepback of the shock both outboard and inboard of the store is somewhat lessthan with store Y, and
(iii) with store X, the change in flow direction through the shock is notably more acute, thus implyinga stronger shock.
It is thought that (iii) is the dominant factor.
This comparison has been included to act as a warning against naive use of interference drag factors and toencourage the hope that by attention to detail and with the benefit of the theoretical calculatlo- s thatwill be possible in the future, adverse interference can be alleviated.
3.2 Store Depth below the Wing
Variou: investigations, eg Refs 1,9,10,11 have specifically considered the effects of the vertical positionof a store below the wing. All have confired that this can be an important parameter but it is difficultto draw simple generalised conclusions. When the flow is entirely subcritical, an increase in the lengthand hence, surface area of the pylon will increase the pylon profile drag but will generally tend to reducethe interference drag. There is however a fair amount of evidence indicating that when the flow issupercritical the adverse interference first increases with store depth before it starts to decrease. Oilflow tests and pressure plotting measurements have shown that with a longer pylon, the flow separations inthe wing-pylon junctions can be less severe. The channel between wing and pylon is therefore lessconstricted and the flow can expand to a higher local Mach number. The shock as well as being longer inextent, is stronger and there are therefore two reasons why the wave drag is increased.
An example of the effect of store depth is shown by the drdg rebults in Fig 2b. A missile-type store wasmounted at two vertical positions below the wing of a 250 sweptback wing research model in the ARA transonictunnel [11). At low Mach number, at both CL = 0 and 0.3, the drag increment was higher with H/D = 0.88 thanwith H/D = 1.23, thus showing that in this particular case, the reduction in interference as the store andwing were moved apart more than offset the extra pylon profile drag. Above M = 0.75, however, the dragincrement increased with Mach number more rapidly with H/D = 1.25, thus supporting the hypothesis of extrawave drag when the wing and store are further apart.
Quantitatively, the results could well be different with other stores on other wings and the correct choiceof pylon length will depend on the aircraft requirements. It seems possible that in many cases, acompromise will have to be made between a short pylon to improve the dash capability with barepylons and along pylon to minimise the drag and usable lift penalties at high CL (a point not illustrated in this lecture).
3.3 Spacing of Pylons across the Span
In 2, 3.1, 3.2, we have been concerned with the carriage of a single store per wing panel. In practice,however, it is likely that current and future aircraft will be designed to carry a heavy store loadrequiring 2, 3 or even as many as 5 pylons per side. Tests have been made 18) to show whether the dragincrements for a 3-pylon load of 3 stores on wing A of the previous example are sensitive to the spanwisespacing of the pylons. Three alternative spacings were compared, the widest and narrowest spacings beingindicated by the photographs of Fig 2c. The graph shows the variation with Mach number of A(ACDi)where A(ACDi) = (ACDi)narrow - (LCD)wide
and ACD i is defined as in the example in §3.1.

12.4
The figure shows that as might have been expected, bringing the stores closer together increases theinterference drag at low and moderate Mach numbers, the maximum changes being as much as 4(ACDI) z 0.0030or perhaps 15" of the drag of the clean aircraft. At high subsonic speeds, the trend begins to reverseuntil ultimately, the drag increment is less with tbe narrow spacing. The Mach number for the crossoverincreases with CL.
The oil flow patterns in Fig 2c offer a partial explanation for the change in sign of A(ACD,) between lowand high Mach number, eg between M = 0.75 and 0.80 at CL = 0. Irrespective of the spacing, the mainfeature of these flow patterns is the near-unswept shock below the wing between the pylons. With thenarrow spacing, this quasi-one-dimensional flow is already established at M - 0.75 with the terminal shocksand flow separations behind the shock extending from one pylon to the next. With the wide spacing, thistype of pattern does not become fully established until M z 0.80 but then, the shock waves in the widergullies between the stores appear to be stronger. The pictures therefore help to explain why ACD increasesmore rapidly above M = 0.75 with the wide spacing, the increase being .icient to give higher RD, thanwith the narrow spacing above M - 0.80. There is an obvious similarity between these effects of spacingand the effects of store depth as already described.
For configurations of the type discussed here, store spacing is clearly a significant parameter, the optimumvalue would depend on the aircraft operating requirements. It is possible however to envisage how theadverse interference, ie the values of ACDi might be reduced by either changes in pylon design or storerelative longitudinal position, ie store stagger. In the present case, the pylons were of simple designwith symmetrical slab-sided sections; the shocks between the pylons tended to be unswept because theyextended from the peak suction on the outboard side of the inner pylon (aft of its maximum thickness) to thepeak suction on the inboard side of the outer pylon (ahead of its maximum thickness), changes in design mightimprove the shock sweep. The store longitudinal positions were chosen with the aim of minimising the cg shiftsfor partial and full store loads; these considerations may be less vital in the future with the advent ofactive controls and acceptance of relaxed stability.
3.4 Effect cf Wing Design: Multiple Carriage on Separate Pylons
The influence of wing design has already been discussed in S2 with reference to the drag incrcm ents for anunderwing tank installation on wings A and B (same planform, different sections, Fig Id). Comparativetests were also mizde [7) on these wings and three stores of shape Y mounted on three separate pylons.Results and oil flow petterns from these tests are presented in Fig 3. The upper gaphs com pare the CD - Mvariation for CL = 0.2 for (a) the clean wings, (b) the wings with 3 bare pylons per wing and (c) the fullyloaded configurations. It should be noted that the false zeros on the ordinate scales have been staggeredby amounts corresponding to the estimated low speed profile drag of respectively, the pylons and the pylonsplus stores: in other words, if there were no interference drag, the three pairs of curves would start atlow Mach number at the same levels.
The addition of the pylons and then the stores reduces the drag-rise Mach number and by implication, thepenetration speed by significant amounts, at least 0.1 in Mach number. This is only to be expected and tosome extent at least, is an inevitable consequence of carrying a heavy store load underwing in what hasgenerally been accepted as a 'standard' arrangement. In passing, it should be noted that in this andsucceeding sections up to §4.2, we are only concerned with the multiple carriage of stores on separatepylons at different stations across the span. 'Standard' underwing carriage of a mu'*iple store load canin practice imply the use of a triple carrier, eg as on the F-4 Phantom, or a twin carrier as on the Harrierbut these cases are not considered here because of the difficulty of separating the store-wing interferencefrom the interference within the multiple carrier.
It is clear that the relative assessment of wings A and B depends on whether the pylons/stores are fittedor not. Clean, the reduction in the Mach number for the steep drag-rise for wing B relative to wing A isabout AM = 0.035 but with pylons, it is as much as AM = 0.06 and with pylons/stores, about AM = 0.055. Theunexpected feature of these results is the striking effect of the bare pylons. This is a significantconclusion because the aircraft will still be carrying its pylons on the return from the target and hencethis is a configuration that should if possible be optimised. Also, the shape of a pylon is probably lesssacrosanct - or less constrained by other factors - than the shape of most stores.
Fig 3 also shows the wing lower surface pressure distributions for stations at 0.60 and 0,72 x semi-span onwing A and at 0.64 and 0.74 x semi-span on wing B, for CL = 0.2, M = Mx. The stations are between themiddle and outer pylons, the outer stations being very close to the outer pylons. For the clean wings, theflow is subcritical in both cases although it is significant that the val..es of (-Cp) near 0.3c are almosttwice as great for wing B as for wing A. Adding the pylons on wing A leads to a local supersonic regioninboard of the outer pylon while on wing B, this region appears to extend across the whole panel to themiddle pylon. Adding the stores produces a strong shock wave in the gully between the stores as alreadyseen in Fig 2c with poor flow behind the shock particularly on wing B. Near the outer pylon on wing B, theseparation is already sufficient to degrade the ,upersonic region, this is hardly surprising bearing in mindthat H = Mx, CL = 0.2 is far up the drag-rise for this configuration.
These pressure distributions do not however tell the full story. Fig 3 also contains photographs of oilflow patterns for M = Mx, CL 0.2 for wings A and B with three bare pylons. Weak shocks and fairly narrowpylon wakes are evident in the picture for wing A but generally, the flow is relatively well behavedcompared with wing B where there are substantial flow separations both inboard of the outer pylon anddownstream and outboard of the inner and middle pylons. These pictures suggest that the drag creep in theresults for wing B with bare pylons must be largely associated not with premature wave drag but with grossviscous effects particularly downstream of the pylons.
The full assessments of wings A and B including factors not discussed here could still favour wing B. It isa more advanced wing with notable advantages in usable lift and fuel volume. In designing wing B, it wasaccepted that there would be some loss in drag rise Mach number at low C , a reduction of 0.03 was deemedacceptable. It must be emphasised strongly tha, the fact that the reduction is about 0.06 with pylons fitteddoes not desLroy the concept of the advanced wino' design. It merely shows that one should design the wing-pylof'-r'd if possible, the wing-pylons-stores as ,in entity. The simple pylons that were adequate on wing A
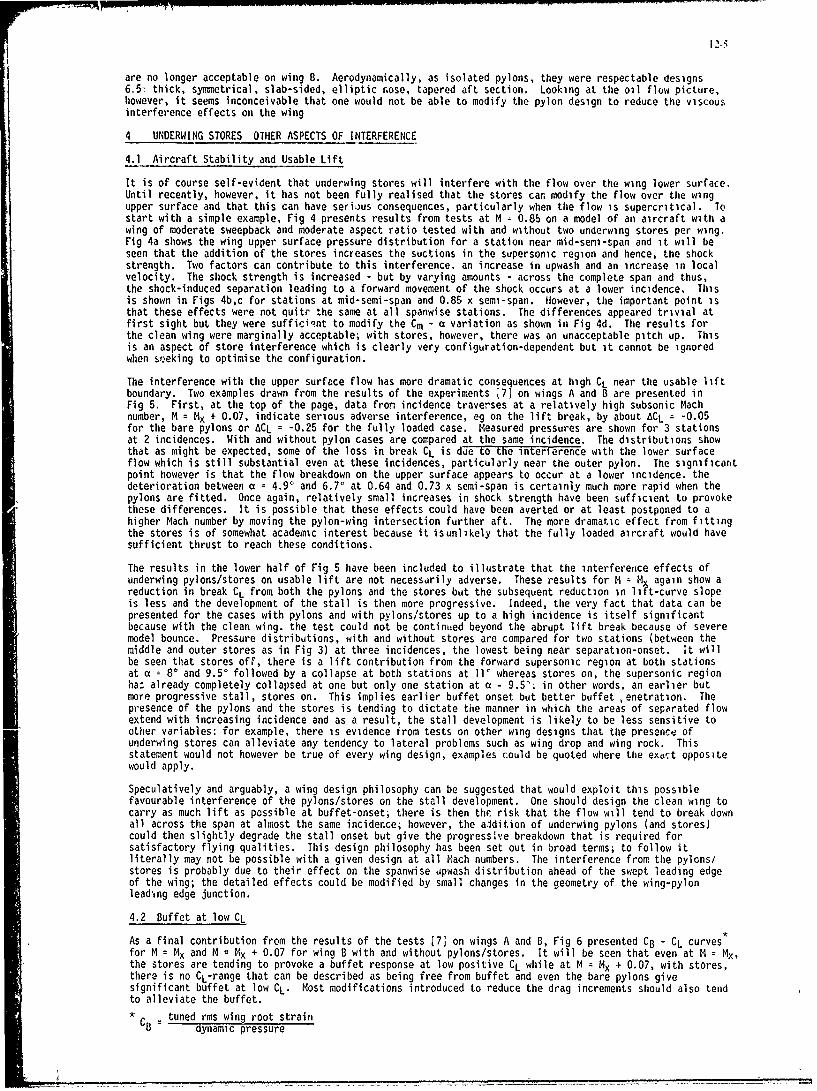
are no longer acceptable on wing B. Aerodynamically, as isolated pylons, they were respectable designs6.5c thick, syrmetrical, slab-sided, elliptic nose, tapered aft section. Looking at the oil flow picture,however, it seems inconceivable that one would not be able to modify the pylon design to reduce the viscousinterference effects on the wing
4 UNDERWING STORES OTHER ASPECTS OF INTERFERENCE
4.1 Aircraft Stability and Usable Lift
It is of course self-evident that underwing stores will interfere with the flow over the wing lower surface.Until recently, however, it has not been fully realised that the stores car. modify the flow over the wingupper surface and that this can have serious consequences, particularly when the flow is supercritical. Tostart with a simple example, Fig 4 presents results from tests at M - 0.85 on a model of an aircraft with awing of moderate sweepback and moderate aspect ratio tested with and without two underwing stores per wing.Fig 4a shows the wing upper surface pressure distribution for a station near mid-seni-span and it will beseen that the addition of the stores increases the suctions in the supersonic region and hence, the shockstrength. Two factors can contribute to this interference, an increase in upwash and an increase in localvelocity. The shock strength is increased - but by varying amounts - across the complete span and thus,the shock-induced separation leading to a forward movement of the shock occurs at a lower incidence. Thisis shown in Figs 4b,c for stations at mid-semi-span and 0.85 x semi-span. However, the important point isthat these effects were not quite the same at all spanwise stations. The differences appeared trivial atfirst sight but they were sufficiint to modify the Cm - a variation as shown in Fig 4d. The results forthe clean wing were marginally acceptable; with stores, however, there was an unacceptable pitch up. Thisis an aspect of store interference which is clearly very configuration-dependent but it cannot be ignoredwhen se eking to optimise the configuration.
The interference with the upper surface flow has more dramatic consequences at high CL near the usable liftboundary. Two examples drawn from the results of the experiments 7 on wings A and B are presented inFig 5. First, at the top of the page, data fron incidence traverses at a relatively high subsonic Machnumber, M = Mx + 0.07, indicate serious adverse interference, eg on the lift break, by about ACL -0.05for the bare pylons or ACL= -0.25 for the fully loaded case. Measured pressures are shown for 3 stationsat 2 incidences. With and without pylon cases are compared at the same incidence. The distributions showthat as might be expected, some of the loss in break CL is ddie to the interterence with the lower surfaceflow which is still substantial even at these incidences, particularly near the outer pylon. The significantpoint however is that the flow breakdown on the upper surface appears to occur at a lower incidence. thedeterioration between a = 4.90 and 6.70 at 0.64 and 0.73 x semi-span is certainly much more rapid when thepylons are fitted. Once again, relatively small increases in shock strength have been sufficient to provokethese differences. It is possible that these effects could have been averted or at least postponed to ahigher Mach number by moving the pylon-wing intersection further aft. The more dramatic effect from fittingthe stores is of somewhat academic interest because it isunlikely that the fully loaded aircraft would havesufficient thrust to reach these conditions.
The results in the lower half of Fig 5 have been included to illustrate that the interference effects ofunderwing pylons/stores on usable lift are not necessdrily adverse. These results for M = Mx again show areduction in break CL from both the pylons and the stores but the subsequent reduction in lift-curve slopeis less and the development of the stall is then more progressive. Indeed, the very fact that data can bepresented for the cases with pylons and with pylons/stores up to a high incidence is itself significantbecause with the clean wing. the test could not be continued beyond the abrupt lift break because of severemodel bounce. Pressure distributions, with and without stores are compared for two stations (between themiddle and outer stores as in Fig 3) at three incidences, the lowest being near separation-onset. It willbe seen that stores off, there is a lift contribution from the forward supersonic region at both stationsat a t 8' and 9.5* followed by a collapse at both stations at 11' whereas stores on, the supersonic regionha: already completely collapsed at one but only one station at a z 9.5°; in other words, an earlier butmore progressive stall, stores on. This implies earlier buffet onset but better buffet ,enetration. Thepresence of the pylons and the stores is tending to dictate the manner in which the areas of separated flowextend with increasing incidence and as a result, the stall development is likely to be less sensitive toother variables: for example, there is evidence from tests on other wing designs that the presence ofunderwing stores can alleviate any tendency to lateral problems such as wing drop and wing rock. Thisstatement would not however be true of every wing design, examples could be quoted where the exdlt oppositewould apply.
Speculatively and arguably, a wing design philosophy can be suggested that would exploit this possiblefavourable interference of the pylons/stores on the stall development. One should design the clean wing tocarry as much lift as possible at buffet-onset; there is then the risk that the flow will tend to break downall across the span at almost the same incidence; however, the aidition of underwing pylons (and stores)could then slightly degrade the stall onset but give the progressive breakdown that is required forsatisfactory flying qualities. This design philosophy has been set out in broad terms; to follow itliterally may not be possible with a given design at all Mach numbers. The interference from the pylons/stores is probably due to their effect on the spanwise upwash distribution ahead of the swept leading edgeof the wing; the detailed effects could be modified by small changes in the geometry of the wing-pylonleading edge junction.
4.2 Buffet at low CL
As a final contribution from the results of the tests [7] on wings A and B, Fig 6 presented CB - CL curvesfor M = Mx and M = Mx + 0.07 for wing B with and without pylons/stores. It will be seen that even at M = Mx,the stores are tending to provoke a buffet response at low positive CL while at M Mx + 0.07, with stores,there is no CL-range that can be described as being free from buffet and even the bare pylons givesignificant buffet at low CL. Most modifications introduced to reduce the drag increments should also tendto alleviate the buffet.* C B _tuned rms wing root strain
dynamic pressure
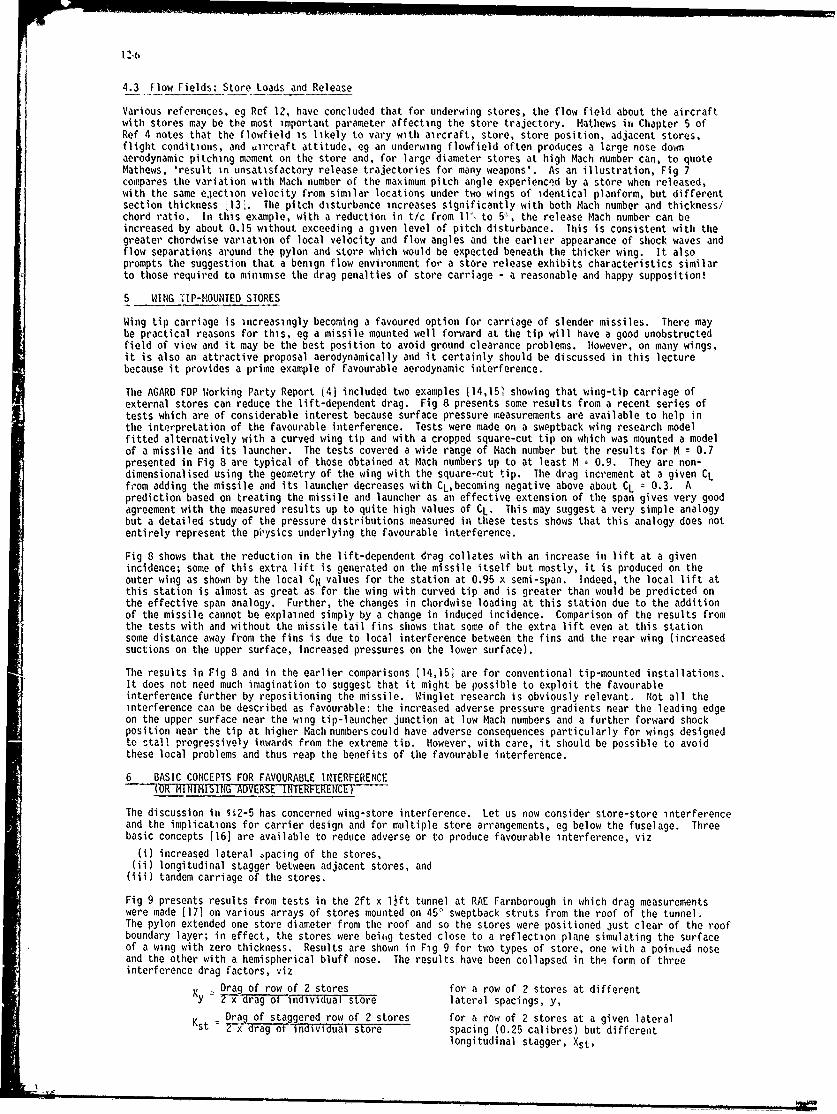
4.3 Flow Fields: Store Loads and Release
Various references, eg Ref 12, have concluded that for underwing stores, the flow field about the aircraftwith stores may be the most important parameter affecting the store trajectory. Mathews in Chapter 5 ofRef 4 notes that the flowfield is likely to vary with aircraft, store, store position, adjacent stores,flight conditions, and oircraft attitude, eg an underwing flowfield often produces a large nose downaerodynamic pitching moment on the store and, for large diameter stores at high Mach number can, to quoteMathews, 'result in unsatisfactory release trajectories for many weapons'. As an illustration, Fig 7compares the variation with Mach number of the maximum pitch angle experienced by a store when released,with the same ejection velocity from similar locations under two wings of identical planform, but differentsection thickness 131. The pitch disturbance increases significantly with both Mach number and thickness/chord ratio. In this example, with a reduction in t/c from ll to 5,', the release Mach number can beincreased by about 0.15 without exceeding a given level of pitch disturbance. This is consistent with thegreater chordwise variation of local velocity and flow angles and the earlier appearance of shock waves andflow separations around the pylon and store which would be expected beneath the thicker wing. It alsoprompts the suggestion that a benign flow environment for a store release exhibits characteristics similarto those required to minimise the drag penalties of store carriage - a reasonable and happy supposition!
5 WING dIP-MOUNTED STORES
Wing tip carriage is increasingly becoming a favoured option for carriage of slender missiles. There maybe practical reasons for this, eg a missile mounted well forward at the tip will have a good unobstructedfield of view and it may be the best position to avoid ground clearance problems. However, on many wings,it is also an attractive proposal aerodynamically and it certainly should be discussed in this lecturebecause it provides a prime example of favourable aerodynamic interference.
The AGARD FDP lorking Party Report (4] included two examples (14,151 showing that wing-tip carriage ofexternal stores can reduce the lift-dependent drag. Fig 8 presents some results from a recent series oftests which are of considerable interest because surface pressure measurements are available to help inthe interpretation of the favourable interference. Tests were made on a sweptback wing research modelfitted alternatively with a curved wing tip and with a cropped square-cut tip on which was mounted a modelof a missile and its launcher. The tests covered a wide range of Mach number but the results for M = 0.7presented in Fig 8 are typical of those obtained at Mach numbers up to at least M 0.9. They are non-dimensionalised using the geometry of the wing with the square-cut tip. The drag increment at a given CLfrom adding the missile and its launcher decreases with CL,becoming negative above about CL z 0.3. Aprediction based on treating the missile and launcher as an effective extension of the span gives very goodagreement with the measured results up to quite high values of CL. This may suggest a very simple analogybut a detailed study of the pressure distributions measured in these tests shows that this analogy does notentirely represent the pi'ysics underlying the favourable interference.
Fig 8 shows that the reduction in the lift-dependent drag collates with an increase in lift at a givenincidence; some of this extra lift is generated on the missile itself but mostly, it is produced on theouter wing as shown by the local CN values for the station at 0.95 x semi-span. Indeed, the local lift atthis station is almost as great as for the wing with curved tip and is greater than would be predicted onthe effective span analogy. Further, the changes in chordwise loading at this station due to the additionof the missile cannot be explained simply by a change in induced incidence. Comparison of the results fromthe tests with and without the missile tail fins shows that some of the extra lift even at this stationsome distance away from the fins is due to local interference between the fins and the rear wing (increasedsuctions on the upper surface, increased pressures on the lower surface).
The results in Fig 8 and in the earlier comparisons 114,151 are for conventional tip-mounted installations.It does not need much imagination to suggest that it might be possible to exploit the favourableinterference further by repositioning the missile. Winglet research is obviously relevant. Not all theinterference can be described as favourable: the increased adverse pressure gradients near the leading edgeon the upper surface near the wing tip-launcher junction at low Mach numbers and a further forward shockposition near the tip at higher Mach numberscould have adverse consequences particularly for wings designedto stall progressively inwards from the extreme tio. However, with care, it should be possible to avoidthese local problems and thus reap the benefits of the favourable interference.
6 BASIC CONCEPTS FOR FAVOURABLE INTERFERENCEF-mR-7 TM I 1DESE I ERENCE -
The discussion in §S2-5 has concerned wing-store interference. Let us now consider store-store interferenceand the implications for carrier design and for multiple store arrangements, eg below the fuselage. Threebasic concepts [16) are available to reduce adverse or to produce favourable interference, viz
(i) increased lateral 3pacing of the stores,(ii) longitudinal stagger between adjacent stores, and
(iii) tandem carriage of the stores.
Fig 9 presents results from tests in the 2ft x lft tunnel at RAE Farnborough in which drag measurementswere made (171 on various arrays of stores mounted on 45' sweptback struts from the roof of the tunnel.The pylon extended one store diameter from the roof and so the stores were positioned just clear of the roofboundary layer; in effect, the stores were being tested close to a reflection plane simulating the surfaceof a wing with zero thickness. Results are shown in Fig 9 for two types of store, one with a poiritd noseand the other with a hemispherical bluff nose. The results have been collapsed in the form of threeinterference drag factors, viz
K Drag of row of 2 stores for a row of 2 stores at differenty T_'-drag of individual store lateral spacings, y,
Drag of staggered row of 2 stores for a row of 2 stores at a given lateralKst 2 x drag of -ianvluaistore spacing (0.25 calibres) but differentlongitudinal stagger, Xst,
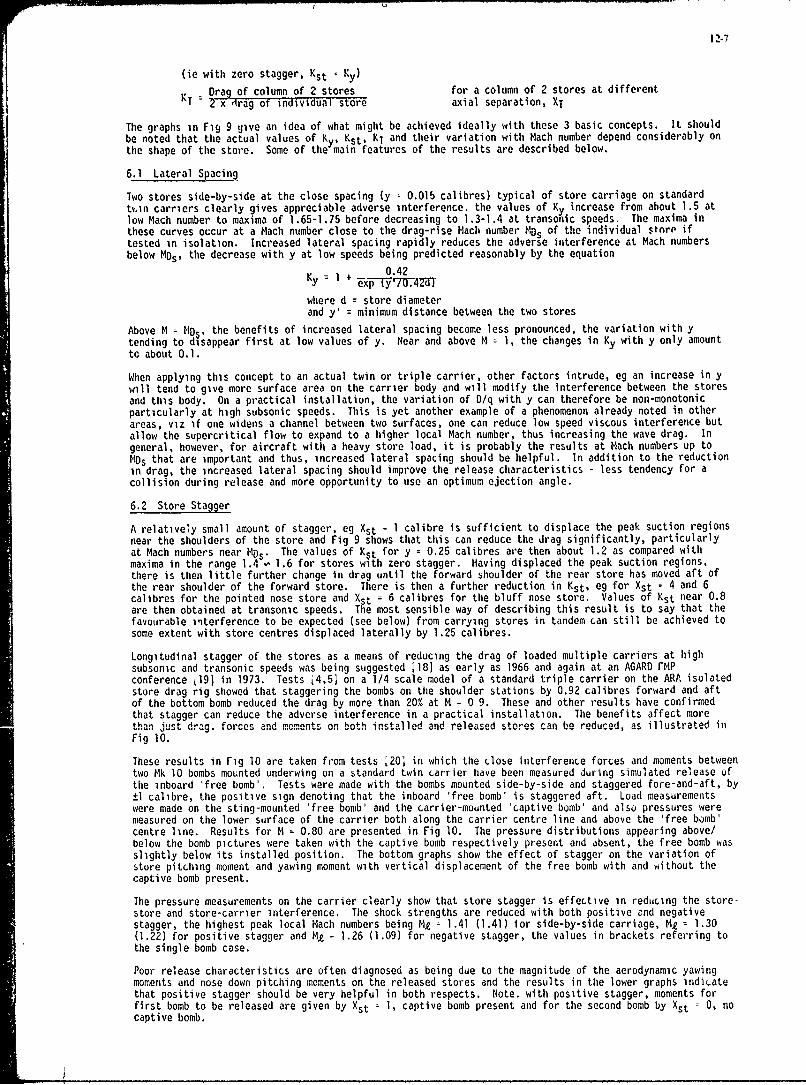
12-7
(ie with zero stagger, Kst KY)Drag of column of 2 stores for a column of 2 stores at different
KT = 2 x Arag of ind-iidual store axial separation, XT
The graphs in Fig 9 give an idea of what might be achieved ideally with these 3 basic concepts. It shouldbe noted that the actual values of Ky, Kst, KT and their variation with Mach number depend considerably onthe shape of the store. Some of the main features of the results are described below.
6.1 Lateral Spacing
Two stores side-by-side at the close spacing (y 0.015 calibres) typical of store carriage on standardtv.in carriers clearly gives appreciable adverse interference, the values of Ky increase from about 1.5 atlow Mach number to maxima of 1.65-1.75 before decreasing to 1.3-1.4 at transonic speeds. The maxima inthese curves occur at a Mach number close to the drag-rise Mach number HMs of the individual store iftested in isolation. Increased lateral spacing rapidly reduces the adverse interference at Mach numbersbelow NDs, the decrease with y at low speeds being predicted reasonably by the equation
0.42KY e xp iy'/O.4Md
where d store diameterand y' minimum distance between the two stores
Above M - M$,, the benefits of increased lateral spacing become less pronounced, the variation with ytending to disappear first at low values of y. Near and above M z 1, the changes in Ky with y only amountto about 0.1.
When applying this concept to an actual twin or triple carrier, other factors intrude, eg an increase in ywill tend to give more surface area on the carrier body and will modify the interference between the storesand this body. On a practical installation, the variation of D/q with y can therefore be non-monotonicparticularly at high subsonic speeds. This is yet another example of a phenomenon already noted in otherareas, viz if one widens a channel between two surfaces, one can reduce low speed viscous interference butallow the supercritical flow to expand to a higher local Mach number, thus increasing the wave drag. Ingeneral, however, for aircraft with a heavy store load, it is probably the results at Mach numbers up toMos that are important and thus, increased lateral spacing should be helpful. In addition to the reductionin drag, the increased lateral spacing should improve the release characteristics - less tendency for acollision during release and more opportunity to use an optimum ejection angle.
6.2 Store Stagger
A relatively small amount of stagger, eg Xst z1 calibre is sufficient to displace the peak suction regionsnear the shoulders of the store and Fig 9 shows that this can reduce the drag significantly, particularlyat Mach numbers near MDs. The values of K~t for y z 0.25 calibres are then about 1.2 as compared withmaxima in the range 1.4 - 1.6 for stores with zero stagger. Having displaced the peak suction regions,there is then little further change in drag until the forward shoulder of the rear store has moved aft ofthe rear shoulder of the forward store. There is then a further reduction in Kst, eg for Xst = 4 and 6calibres for the pointed nose store and Xst z 6 calibres for the bluff nose store. Values of Kst near 0.8are then obtained at transonic speeds. The most sensible way of describing this result is to say that thefavourable interference to be expected (see below) from carrying stores in tandem can still be achieved tosome extent with store centres displaced laterally by 1.25 calibres.
Longitudinal stagger of the stores as a means of reducing the drag of loaded multiple carriers at highsubsonic and transonic speeds was being suggested [181 as early as 1966 and again at an AGARD FMPconference j19] in 1973. Tests J4,5; on a 1/4 scale model of a standard triple carrier on the ARA isolatedstore drag rig showed that staggering the bombs on the shoulder stations by 0.92 calibres forward and aftof the bottom bomb reduced the drag by more than 20% at M - 0 9. These and other results have confirmedthat stagger can reduce the adverse interference in a practical installation. The benefits affect morethan just drag. forces and moments on both installed and released stores can be reduced, as illustrated inFig 10.
These results in Fig 10 are taken from tests [20; in which the close interference forces and moments betweentwo Mk 10 bombs mounted underwing on a standard twin carrier have been measured during simulated release ofthe inboard 'free bomb'. Tests were made with the bombs mounted side-by-side and staggered fore-and-aft, by±1 calibre, the positive sign denoting that the inboard 'free bomb' is staggered aft. Load measurementswere made on the sting-mounted 'free bomb' and the carrier-mounted 'captive bomb' and also pressures weremeasured on the lower surface of the carrier both along the carrier centre line and above the 'free bomb'centre line. Results for M 0.80 are presented in Fig 10. The pressure distributions appearing above/below the bomb pictures were taken with the captive bomb respectively present and absent, the free bomb wasslightly below its installed position. The bottom graphs show the effect of stagger on the variation ofstore pitching moment and yawing moment with vertical displacement of the free bomb with and without thecaptive bomb present.
The pressure measurements on the carrier clearly show that store stagger is effective in reducing the store-store and store-carrier interference. The shock strengths are reduced with both positive end negativestagger, the highest peak local Mach numbers being M1 = 1.41 (1.41) for side-by-side carriage, Me = 1.30(1.22) for positive stagger and Me - 1.26 (1.09) for negative stagger, the values in brackets referring tothe single bomb case.
Poor release characteristics are often diagnosed as being due to the magnitude of the aerodynamic yawingmoments and nose down pitching moments on the released stores and the results in the lower graphs indicatethat positive stagger should be very helpful in both respects. Note. with positive stagger, moments forfirst bomb to be released are given by Xst 1 1, captive bomb present and for the second bomb by Xst 0 0, nocaptive bomb.

12-8
Mathews in Ref 4 also quotes an example where staggering the stores on an HER was found to reduce theinstalled pitching moments. He draws the conclusion that 'store staggering appears to offer considerablepotential for both drag reductions and store separation improvements and that additional research in thisarea is highly recommended.'
6.3 Tandem Carriage
Returning to Fig 9, the bottom pair of graphs illustrate that carrying stores in tandem is a powerful methodof obtaining favourable interference, particularly with bluff-rose stores. If the stores are virtuallynase-to-tail, ie XT 0.005 calibres, the reduction in overall drag for a column of two stores amounts toabout 30% near M 1.0 for the bluff nose and 20% for pointed nose stores; even at a separation of 3calibres, these figures are 20% and 15%. In inviscid subcritial flow, one would predict compensatingbuoyancy effects decreasing the drag of the front store and incv'easing the drag of the aft store. Theactual measurements showed that with the stores close together, these opposing trends were present atM < MDs but the increase in drag of the rear store was not sufficient to offset the reduction in drag ofthe forward store. At high Mach number near M = 1.0, the drag of even the rear store could be less thanthe drag of the store in isolation. Five mechanisms for drag reduction in a tandem arrangement were listedin Ref 4, viz
(i) the rear store is in a stream of reduced mean dynamic pressure,
(ii) at very small spacings, the nose of the rear store is in an essentially dead-air region behind thebase of the forward store (this applies to stores with large effective base area),
(iii) the wake of the forward store can modify the flow separation characteristics from the nose of arelatively bluff rear store,
(iv) the rear store is in a stream of reduced Mach number and thus, the onset of wave drag from the rearstore is delayed and also, the shock wave on the forward store is probably moved forward thusreducing the wave drag of this store, and
(v) the longitudinal cross-sectiinal area distribution of the combination is better than for the forwardor rear stores in isolation and thus, the wave drag at transonic speeds will be less.
Once again, the concept of tandem carriage is not new. Ref 4 quotes results obtained 118] in 1966 at CALshowing that the drag increments due to adding 3 stores to the rear station of an HER was appreciably lessthan that from adding the first 3 stores to the empty carrier - by 15% at M = 0.8 or more than 40% atH z 1.2. Drag results for tandem carriers [3] and for tandem arrangements [21] of stores under a fuselageare also quoted in Ref 4; all show large drag reductions broadly consistent with Fig 9, the improvementsbeing frequently about 40% at transonic speeds and particularly noticeable for stores with a completelybluff nose. Methods for the quantitative prediction of these effects are being developed.
In addition to the drag improvements, tandem carriage can also lead to better release speeds. Tests on amodel of the Phantom showed that the store installed loads for tandem carriers were of the same order asfor a standard twin carrier; the moments were in fact somewhat smaller. Even with the same loads, releasefrom a tandem carrier could be preferable because sideways movement during release does not have to belimited because of the proximity of an adjacent store as with a twin carrier. Cases have however beenreported where tandem carriage has introduced additional release problems.The general case for tandem carriage on grounds of drag and store release is very strong and the conceptshould be exploited whenever possible. It is appreciated that carrier flexibility, CG/stabilityconsiderations can raise problems but it is hoped that the latter will be less serious on future aircraftequipped with active control technology.
7 FEASIBLE DRAG IMPROVEMENTS FOR PRACTICAL STORE ARRANGEMENTS
Research over the past 10 years has shown that large improvements in the drag of multiple external storearrangements are feasible. The improvements are achieved by judicious application of the concepts discussedin §6 and by refining the general aerodynamic cleanliness of the assemblies, eg by fairing of external swaybraces. The reductions in drag imply less adverse interference, better flow, weaker shocks, less extensiveseparations and so in many cases, the reductions in drag should be accompanied by smaller installed luddhand better and more predictable release characteristics. Figs l1a-c,e,f, illustrate the reductions in dragthought to be feasible; in all cases, present in-service equipment is taken as the datum for comparison.in most cases the curves labelled 'feasible', 'bestconventional' or 'radical' are based on actual test dataand are for arrangements that it is thought, could be engineered in practice, eg the carriers were designedto allow space for the ejector release units and are not idealised configurations.
7.1 Carriers
The scales of all the graphs are the same, the stores in all cases are Hk 10, 454 kg bombs. To this extent,the results are specific but the gains are so large that hopefully, this is of little consequence.Summarising the results for say, M = 0.85:
(i) the drag of the fully loaded triple carrier, Fig lla, can be reduced to only about 33% of the fullyloaded standard LuTE. As a measure of the achievement, the drag of the feasible triple carrier atthis Mach number is only about 20% greater than the simple sum of the isolated drags of threeseparate bombs and the empty carrier. Three bombs can be carried for less drag than a single bombon the present in-service triple carrier or two bombs on the present in-service twin carrier,
(ii) the drag of the empty triple carrier, Fig llb, can be reduced to less than 25% of the drag of theempty standard triple carrier and in isolation, the drag-rise can be postponed to about M 0.98,
(iii) the drag of the loaded twin carrier, Fig llc, can be reduced to less than 60% of that of thestandard twin carrier of the type shown. Relative to the practice adopted on some aircraft ofcarrying two stores on a standard triple carrier, the figure is less than 30%.

12-9
These figures are for carriers in isolation. The improvements may be even larger if the carrier is mountedunderwing but might not be as great if a number of carriers are installed close together underfuselage(unless the whole array was then designed as a unit).
Many factors enter into the design of a good twin carrier. These include the lateral spacing of the stores,the store ejection angle, the longitudinal stagger of the stores, the surface area, fineness ratio andshape of the carrier itself. The standard twin carrier has a body in the form of a thick faired plate oflow aspect ratio but various other possible types of twin carrier can be envisaged as shown in Fig lid.Oil flow patterns (4] from 1/4 scale model tests at ARA have shown that with poor twin carrier designs
(a) there can be considerable outflow over the bomb nose, rolling up to form a vortex over the top ofthe bomb with a clearly defined secondary separation line,
(b) the flow diverts downwards and accelerates over the bomb nose leading to a shock in the entry tothe bomb-carrier passage, this shock being strong enough to induce a local flow separation,
(c) air is sucked through the gaps between the bombs and carrier body near and between the fixationbolts, thus adding to the confused flow situation further aft.
With a good twin carrier design, however, these features are much less pronounced and indeed, the flow over
the bombs can appear to be relatively innocuous [4[.
7.2 Underwing Stores
Fig lle compares four different methods of carrying three underwing stores. The measured data on which thecurves are based were actually obtained from tests on more than one wing but they have been converted in anapproximate but realistic manner to allow for the effects of wing design and so, Fig Ile can be assumed tobe a genuine comparison for a given wing. The four curves refer respectively, in order of increasingmerit, to
(i) conventional carriage or a standard in-service t-iple carrier as on for example, the F-4 Phantom,
(ii) conventional carriage with the same three stores mounted on three separate pylons as in thearrangements discussed earlier in $s3,4,
(iii) 'best conventional' carriage with the stores mounted on a mix of improved carriers and pylons, and
(iv) a 'radical' arrangement based on recent research.
The comparison in Fig Ile is dramatic. For example, at a likely operational Mach number, even the 'bestconventional' arrangement is capable of reducing the drag increment to less than 65% of the value for thesimple arrangement on three separate pylons and less than 40% of that of the in-service arrangement with astandard triple carrier. The drag increment for the 'radical' arrangement at low Mach number is less thanhalf that with the 'best conventional' arrangement and shows little change with Mach number up to a valuefar in excess of the incremental drag-rise Mach number with any of the other arrangements.
7.3 Underfuselage Stores
Fig llf presents a similar comparison for multiple arrangements of bombs underfuselage. The three curvesrelate to
(i) 'current practice' with the bombs mounted on standard multiple carriers,
(ii) a 'best conventional' arrangement in which the store array is designed to exploit stagger and tandemcarriage, and
(iii) a radical arrangement exploiting all possible features of conformal carriage (see 8 below).
It should be noted that the model chosen for this comparison is not the same as for the underwing storecomparison and to that extent, it may be misleading to present the two figures side-by-side. Nevertheless,the implication that it is preferable to carry a heavy store load in arrays under the fuselage rather thanunderwing can be accepted as a Valid LurIlusioll (although the differences are much less if one can succeedon a new aircraft to adopt a radical approach to underwing carriage). Other examples supporting thisconclusion and drawn from US research [21,23] are to be found in Ref 4.
Fig Ilf suggests that relative to (i), it is possible with (ii) to reduce the drag by almost 40% and toachieve a gain in drag-rise Mach number of about 0.2. With the radical underfuselage arrangement, the dragincrement is less than half that obtained with (ii). With both (ii) and (iii), the drag increment at highsubsonic and transonic speeds is less than the free-air drag of the bombs in isolation, ie with (iii), lessthan half the free-air drag: an outstanding example of configuration optimisation if indeed, the researchworker is correct in claiming that the radical approach which produced these results could be engineered inpractice. Some radical concepts are described in Ref 22. Ideally, the stores should be mounted tangentially(or semi-submerged if the penalties of empty cavities after the stores have been dropped [231 can beminimised) in tandem with close longitudinal spacing, with due regard to the longitudinal distribution ofcross-sectional area for the complete configuration and with the ejector units and indeed, the stores hiddenor partially hidden within the fuselage or behind a specially devised fairing. We have therefore nowarrived at the theme of conformal carriage which is cloarly the prime approach for mounting stores in a waythat will exploit favourable aerodynamic interferenc
8 CONFORMAL CARRIAGE
The air, with conformal carriage is to carry the external stores as closely as possible to the externalsurface of the aircraft. The best way of accomplishing this is to either extend the surface of t'ieaircraft to meet the stores or to enclose the mounting racks within the aircraft so that the stores meetthe surface. The primary emphasis to date has been on fuselage mounted arrangements, the advantages ofwhich have been demonstrated in flight on at least the F-4 and F-15 aircraft in the United States. It seemsprobable that wing-mounted conformal arrangements could also be developed. To date, slipper tanks have beenthe only common example of this approach.
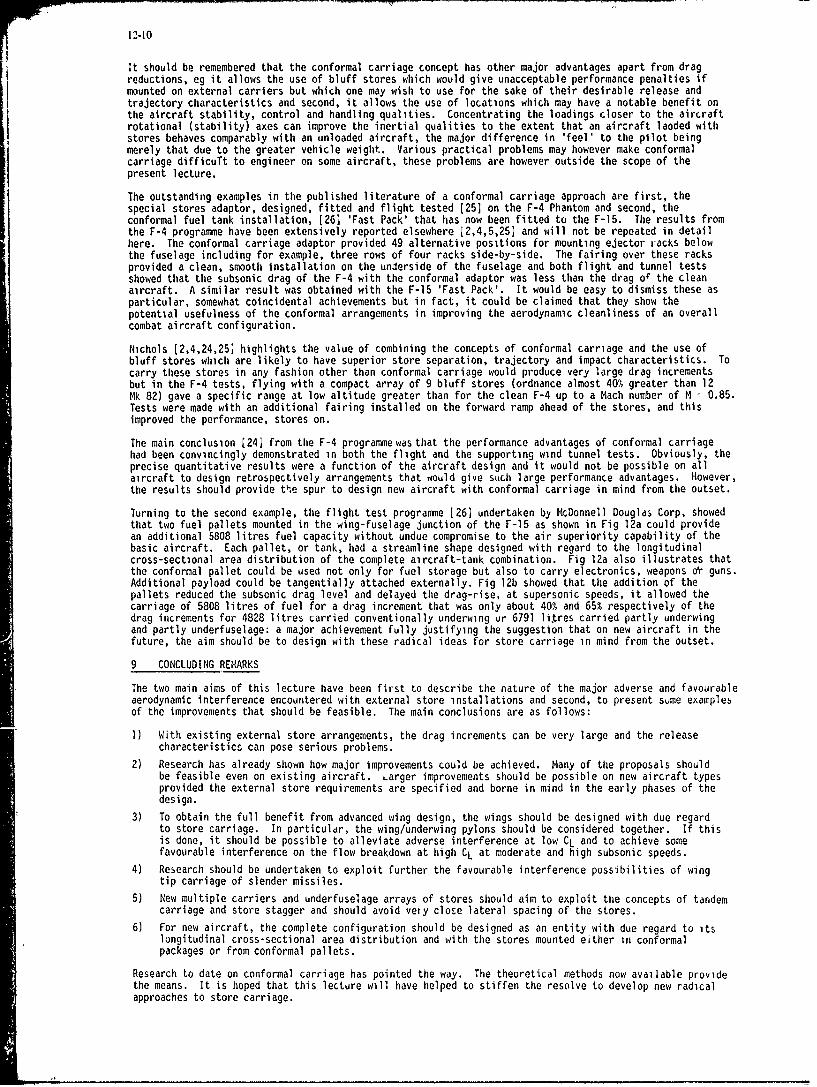
12-10
It should be remembered that the conformal carriage concept has other major advantages apart from dragreductions, eg it allows the use of bluff stores which would give unacceptable performance penalties ifmounted on external carriers but which one may wish to use for the sake of their desirable release andtrajectory characteristics and second, it allows the use of locations which may have a notable benefit onthe aircraft stability, control and handling qualities. Concentrating the loadings closer to the aircraftrotational (stability) axes can improve the inertial qualities to the extent that an aircraft laoded withstores behaves comparably with an unloaded aircraft, the major difference in 'feel' to the pilot beingmerely that due to the greater vehicle weight. Various practical problems may however make conformalcarriage difficuTt to engineer on some aircraft, these problems are however outside the scope of thepresent lecture.
The outstanding examples in the published literature of a conformal carriage approach are first, thespecial stores adaptor, designed, fitted and flight tested [25) on the F-4 Phantom and second, theconformal fuel tank installation, [261 'Fast Pack' that has now been fitted to the F-15. The results fromthe F-4 programme have been extensively reported elsewhere J2,4,5,25] and will not be repeated in detailhere. The conformal carriage adaptor provided 49 alternative positions for mounting ejector racks belowthe fuselage including for example, three rows of four racks side-by-side. The fairing over these racksprovided a clean, smooth installation on the underside of the fuselage and both flight and tunnel testsshowed that the subsonic drag of the F-4 with the conformal adaptor was less than the drag o4 the cleanaircraft. A similar result was obtained with the F-15 'Fast Pack'. It would be easy to dismiss these asparticular, somewhat coincidental achievements but in fact, it could be claimed that they show thepotential usefulness of the conformal arrangements in improving the aerodynamic cleanliness of an overallcombat aircraft configuration.
Nichols [2,4,24,25] highlights the value of combining the concepts of conformal carriage and the use ofbluff stores which are likely to have superior store separation, trajectory and impact characteristics. Tocarry these stores in any fashion other than conformal carriage would produce very large drag incrementsbut in the F-4 tests, flying with a compact array of 9 bluff stores (ordnance almost 401 greater than 12Mk 82) gave a specific range at low altitude greater than for the clean F-4 up to a Mach number of M 0.85.Tests were made with an additional fairing installed on the forward ramp ahead of the stores, and thisimproved the performance, stores on.
The main conclusion [24; from the F-4 programme was that the performance advantages of conformal carriagehad been convincingly demonstrated in both the flight and the supporting wind tunnel tests. Obviously, theprecise quantitative results were a function of the aircraft design and it would not be possible on allaircraft to design retrospectively arrangements that would give such large performance advantages. However,the results should provide t-e spur to design new aircraft with conformal carriage in mind from the outset.
Turning to the second example, the flight test programme 126; undertaken by McDonnell Douglas Corp, showedthat two fuel pallets mounted in the wing-fuselage junction of the F-15 as shown in Fig 12a could providean additional 5808 litres fuel capacity without undue compromise to the air superiority capability of thebasic aircraft. Each pallet, or tank, had a streamline shape designed with regard to the longitudinalcross-sectional area distribution of the complete aircraft-tank combination. Fig 12a also illustrates thatthe conformal pallet could be used not only for fuel storage but also to carry electronics, weapons or guns.Additional payload could be tangentially attached externally. Fig 12b showed that the addition of thepallets reduced the subsonic drag level and delayed the drag-rise, at supersonic speeds, it allowed thecarriage of 5808 litres of fuel for a drag increment that was only about 40% and 65% respectively of thedrag increments for 4828 litres carried conventionally underwing ur 6791 fitres carried partly underwingand partly underfuselage: a major achievement fully justifying the suggestion that on new aircraft in thefuture, the aim should be to design with these radical ideas for store carriage in mind from the outset.
9 CONCLUDING REMARKS
The two main aims of this lecture have been first to describe the nature of the major adverse and favourableaerodynamic interference encountered with external store installations and second, to present sume examplesof the improvements that should be feasible. The main conclusions are as follows:
1) With existing external store arrangements, the drag increments can be very large and the releasecharacteristics can pose serious problems.
2) Research has already shown how major improvements could be achieved. Many of the proposals shouldbe feasible even on existing aircraft. Larger improvements should be possible on new aircraft typesprovided the external store requirements are specified and borne in mind in the early phases of thedesign.
3) To obtain the full benefit from advanced wing design, the wings should be designed with due regardto store carriage. In particuldr, the wing/underwing pylons should be considered together. If thisis done, it should be possible to alleviate adverse interference at low CL and to achieve somefavourable interference on the flow breakdown at high CL at moderate and high subsonic speeds.
4) Research should be undertaken to exploit further the favourable interference possibilities of wingtip carriage of slender missiles.
5) New multiple carriers and underfuselage arrays of stores should aim to exploit the concepts of tandemcarriage and store stagger and should avoid veiy close lateral spacing of the stores.
6) For new aircraft, the complete configuration should be designed as an entity with due regard to itslongitudinal cross-sectional area distribution and with the stores mounted either in conformalpackages or from conformal pallets.
Research to date on conformal carriage has pointed the way. The theoretical methods now available providethe means. It is hoped that this lecture will have helped to stiffen the resolve to develop new radicalapproaches to store carriage.
12-I
10 ACKNOWLEDGEMENTS
The author wishes to thank MOD(PE) and RAE for permission to use some of the material contained in thislecture. Most of the results of tests in the ARA transonic tunnel quoted in the lecture were obtained inresearch funded under MOD(PE) research contracts. Parts of this lecture are based directly on Chapter 2of the AGARD FDP Working Party Report 14] on 'Drag and Other Aerodynamic Effects of External Stores', forwhich Mr J H Nichols Jr of DTNSRDC and the present author were joint editors.
REFERENCES
1 Haines, A B, The reduction of the installed drag of multiple store carriers, 1975, Paper no 7, JTCGAircraft/Stores Compatibility Symposium Proceedings, Arlington.
2 Evaluation of the conformal carriage concept on the performance and basic static longitudinal stabilityof the F-4E aircraft, 1971, AFATL-TR-71-76.
3 Haines, A B, Drag of external stores: present standards and possibilities for reduction, 1975, ARAReport 40.
4 Drag and other aerodynamic effects of external stores, 1977, AGARD-AR-107.5 Haines, A B, Prospects for exploiting favourable and minimising adverse aerodynamic interference in
external store installations, 1980, Paper no 5, AGARD CP 285.6 Whoric, J N, Effect of various external stores on the static longitudinal stability, longitudinal
control, and drag characteristics of the model F-4C airplane, 1973, AEDC-TR-73-186.7 Berry, J B, Stanniland, D R, Haines, A B, The implications of wing/store interference on wing design,
Unpublished ARA communication.8 Day, J, Berry, J B, Measurements of the incremental drag due to various combinations of Mk 10 1000 lb
bombs installed on the Z29/2 combat aircraft wing research model, Unpublished ARA communication.9 Berry, J B, Hutton, P G, Haines, A B, The drag of external stores. An analysis of some experimental
data and a proposed framework for the prediction of installed drag increments, 1969, ARA Report 11.10 Ottensoser, J, Some effects of longitudinal and vertical store position variation on a 0.10-scale F-8
aircraft model, 1968, NSRDC Test Report AL-46.11 Berry, J B, Pressure plotting and drag measurements on store-pylon installation on a swept wing half
model, 1978, ARA Report 47.12 Marshall, J B, Summers, W E, An analysis of the relative importance of parameters required for the
simulation of store separation trajectories, 1971, Vol 2, JTCG Aircraft/Store Compatibility SymposiumProceedings, Dayton, Ohio.
13 Wood, M E, ARA unpublished communication.14 Silvers, H N, King, T J Jr, Investigation at high subsonic speeds of bodies mounted from the wing of
an unswept-wing-fuselage model, 1952, NASA RM L52J08.15 Bucciantini, G, Private communication, 1975.16 Hoerner, J F, Fluid-dynamic drag, New York, Hoerner, 1965.17 Lee, P, Drag measurements at transonic speeds of individual stores within multiple store arrangements,
Unpublished RAE memo.18 Analysis of high speed wind tunnel tests on single and multiple carriage bomb racks, 1966, Douglas
Aircraft Co Inc Report No LB-32647.19 Pugh, P G, Hutton, P G, Aerodynamic drag, 1973, Paper no 19, AGARD CP 124.20 Jordan, R, Measurement of close interference forces between bombs on a twin carrier during simulated
release. Effects of stagger and bomb incidence, Unpublished ARA cornunication.21 Ottensoser, J, Drag effects of various methods of carrying fuselage mounted stores, 1968, NSRDC Aero
Report 1150.22 Gough, M N, Carlson, D R, Advanced weapons carriage concepts through integrated design, 1979, AIAA
Paper 79-0092.23 Furey, R J, Martin, C J, A study of captive flight drag and separation characteristics of lifting body
(half-bomb and half-pod) store configurations, 1970, AGARD CP 71.24 Nichols, J H Jr, Martin, C J, Conformal weapons carriage - Joint Service Development Program, 1971,
DTNSRDC Report 4027, AL-1188.25 Nichols, J H Jr, The conformal carriage Joint Service Development Program, 1973, JTCG Aircraft/Stores
Compatibility Symposium, Sacramento.26 F-15 weapon/fuel carriage improvements with Fast Pack conformal pallets, 1975, McDonnell Douglas Report
MDC A 3507.
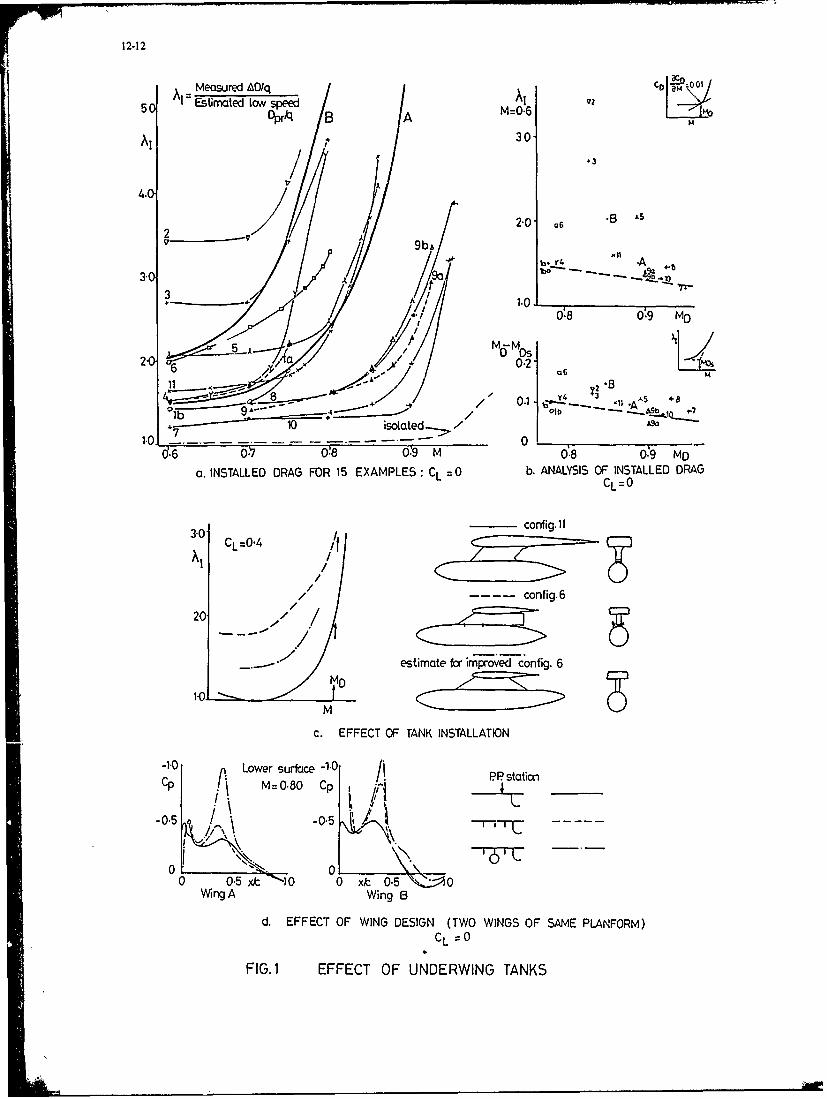
12-12
5 Estimated tow speedDprA B A M
A1 3
4. 3 1
2 v 9b,&
3. /0.8 0'.9 M0
25 A a M " M O S
2) '1 0.2~0.2 06 1A
8I/ 0.1 !*44_ '
9. 0 blb10 isotated ...-
- 017-0,8 0:9 M 0.8 09 MD
a. INSTALLED DRAG FOR 15 EXAMPLES: CL 0 b. ANALYSIS OF INSTALLED DRAGCL=O
config.1130 ' it/ -CL
/
/
20 -7 /--.- -" / (C--/>
estimate for improved config. 6
MD
c. EFFECT OF TANK INSTALLATION
-1.0 Lower surface -1.0 PP station
cpC M.80 Cp
-0.5 -0.5 -77-r -1:
0 0-'0 0.5 -10 0 xA 0.5 'k"0
Wing A Wing B
d. EFFECT OF WING DESIGN (TWO WINGS OF SAME PLANFORM)CL =0
FIG.1 EFFECT OF UNDERWING TANKS

A(; Installed CD- Isolated C: -)c wae
0002 ----- - - j
0 __ _ __ _ __ _ __ _
0 6 0.7 A~ M 0,9a. EFFECT OF STORE SHAPE
H/0=0-88., A(Acod - CL=
- ,.- ~0.002/ - ' 0, J"D1,2 '
-
00
0*6 6-7 M 0:8 6Z6 .7 M 0'8-02b. EFFECT OF STORE VERTICAL POSITION
*.Minimum spacing Minimum spacing
Maximm spcingMaximum spacingM 0.75MO0.80
c. EFFECT OF LATERAL SPACING (3 STORES ON SEPARATE PYLONS)
FIG 2. EFFECT OF UNDERWING STORES AT LOW C1.

12-14
With 3 pylons /stores YWith 3 bore pylons CO (see Fig. 40)
Cla wn C I Win B/i o/ Wing B / I ')y-(.,-Clean Wing CWiWing gA
Wing-
WingWing A
Mx M Mx M Mx MCD-M AT CL=02
WINQ A WING B-40 40 f\ -1.0 P -I0
c Q0.60 Cp \ 0-72 C =G"r:64 Cp 0,7p p :0 P
--1 -5 -05 &/i -05
-/,',\ 7,J- ,\
0" ,0 t0 0x~c -,j0 Jo 0_ 1 ,'LOWER SURFACE PRESSURES AT CL=0 2 , M=Mx
it
OIL FLOW PATTERNS AT CL.O, 2 , =Mx
FIG.3. INFLUENCE OF WING DESIGN ON UNDERWING STORESJPYLONS AT LOW CL
Mid-semi-span Mid-semi-span 0^ 80% semi-span 0.S 0o0.25 Xs
Cp 06 Cm
05 0-60.4i
x c .0 - 2 o 2 Oo 4 2 - 4
clean wing; ---- with 2 underwing pylons; - with 2 underwing pytons/stores
FIG.4. EFFECT OF UNDERWING STORES ON UPPER SURFACE FLOW
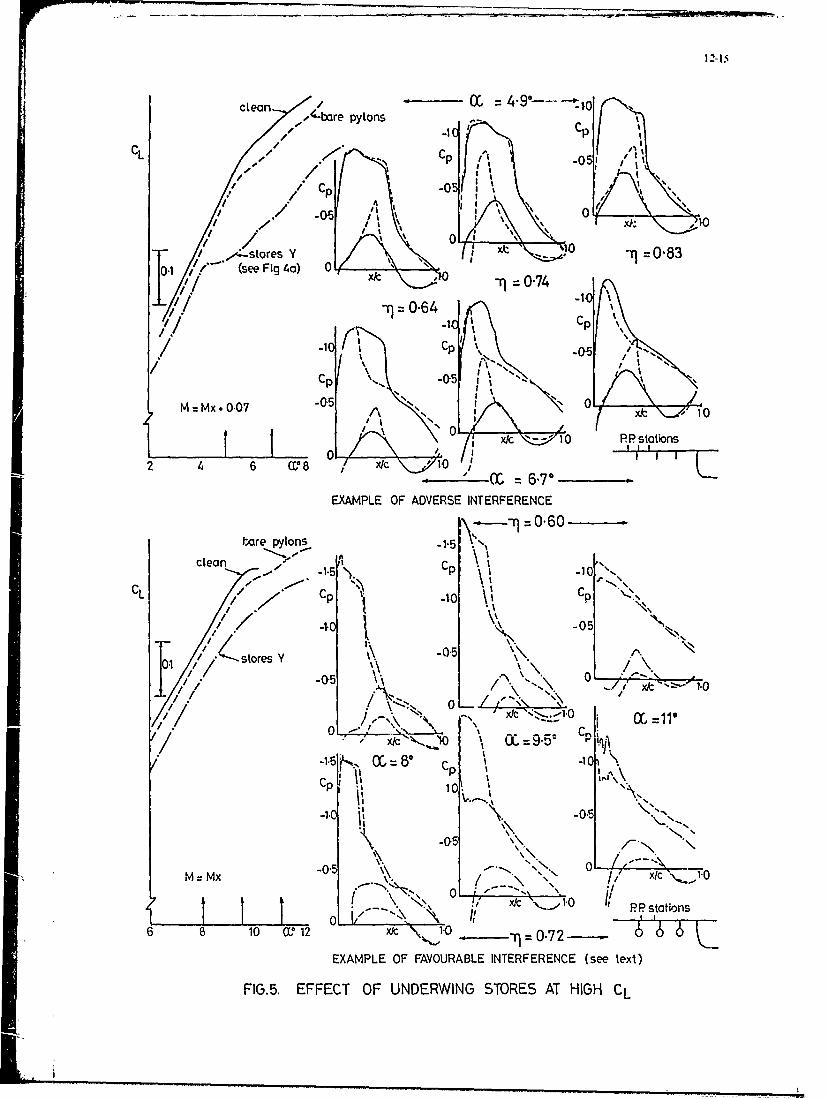
clan / - 49°-- - 0,,.,'-'bre pylons
CL ,//
"'-* Cp
-05
"-1 C -
C C
/ / ' I
' I'q
Ate na-T
O
-' 0.(see
Fig I
4 a) 0.
-
q =0 8
" /1q
0. 4
1
C [DCp
%0
- 5-05
0
%
M
i
x.007 Ao
o~ 0
I
,
' ' 10
2 4 6
?8 YI
'0 , = 6'
"-
rt e
Y
EXAMPLE OF ADVERSE
INTERFERENCE
I a~re py tons
-1.5 k -- '" 0 6
clean
10
,L
/
-
)
--
4-stores v
=0 -83
1.1 /'
/(see
0ig 10
/ '-
"
\ **-,,
/ I ,"'
/
// " 0
'l"%"
: ," x : ,., o
;95" Cp 1
-95 0.6 ° p
.10 1-0
C I
10
o Ii
0
-05
M =-Mx
-0-5
0
.
0
0 A0 J p
/1 x ~ 10 P stations
6 10 12
xc \
1 1
I 'I'-', ,M 6-,
EXAMPLE OF FAVOURABLE
INTERFERENCE
(see text)
FIG. 5 EFFECT OF UNDERWING STORES AT HIGH CL
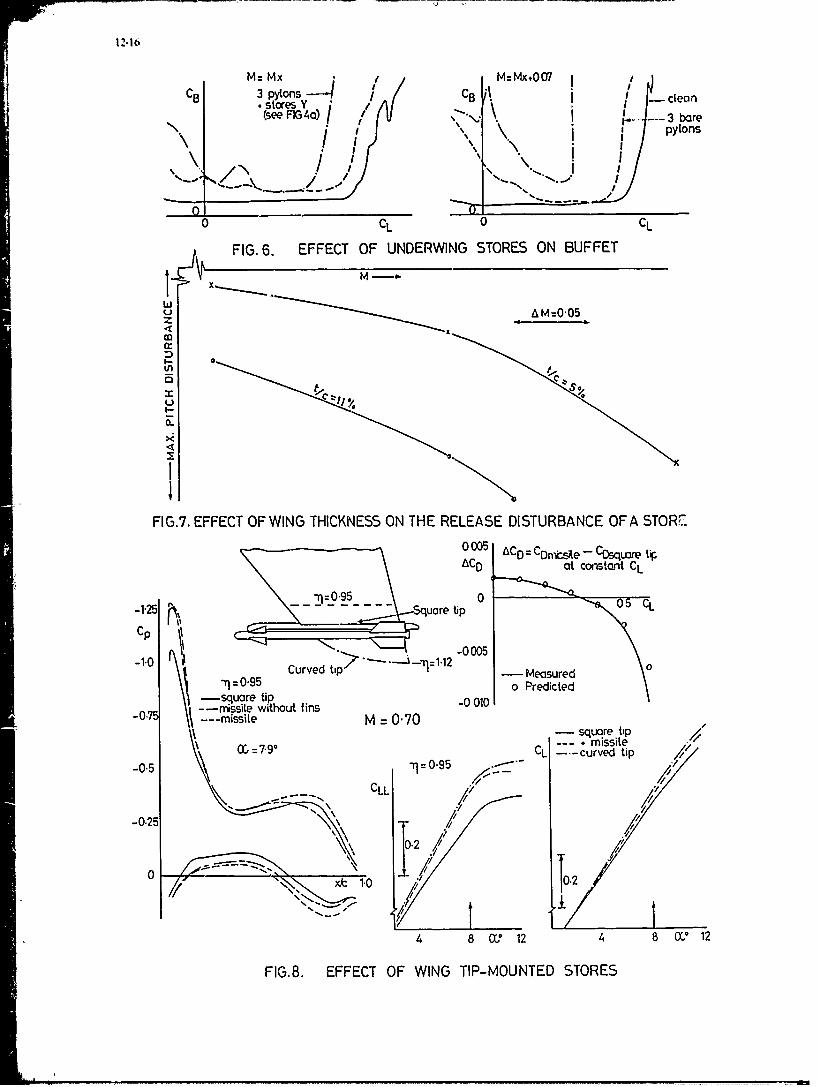
M= Mx /M=Mx+0O17I
C8 3 pyons-f_ I C8 \j I -clean
(see FIG 4a)soe Y/ / Q".* I-3 bareN \ j pylonis
/ N
0 CL 0 CL
FIG. 6. EFFECT OF UNDERWING STORES ON BUFFET
wM
U
FIG.7. EFFECT OF WING THICKNESS ON THE RELEASE DISTURBANCE OFA STORE
0005 tiC0 C()ntge - Cosquore tipAC0) at cotr-tant CL
-1-25 -q=095-Square tip 005 C
-1.0 09 Curved ti -l~.2-Measured0o Predicted
s sqer tipCL - - mis il
cured tip
-0.5 -9 0.95
CLLA
-0.257
0 10/ x~10
4 8 W 12 4 8 1X0 12
FIG.8. EFFECT OF WING TIP-MOUNTED STORES
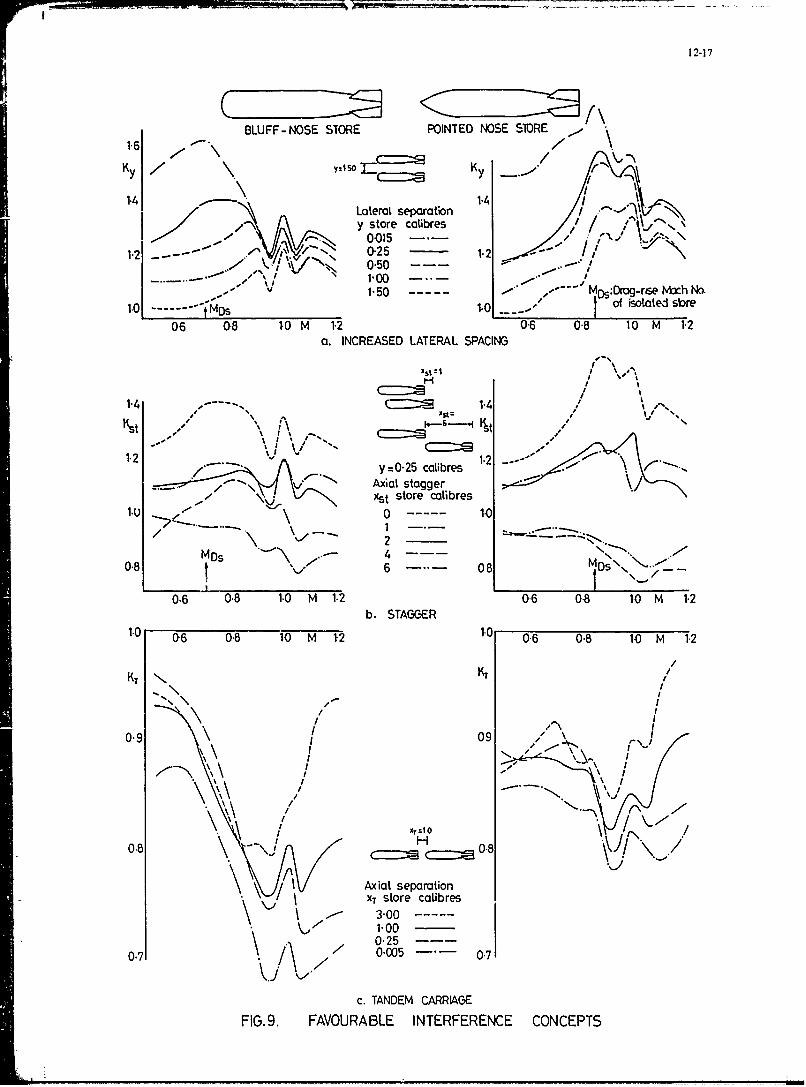
12-17
BLUFF-NOSE STORE POINTED NOSE SlORE
1.4 / \ 1/4Lateral separationy store calibres",-/ , 00is . i ,/" 0015-
1. )0-, 25 -- 1.2
. V/ ,/'N. 050 .
" ,,.'V 1-50 MDs:Drag-rse Mach No.
1.0 ---------- 1.01 of isolated sbre
06 08 10 M 1"2 0'6 0"8 10 M 1"2a. INCREASED LATERAL SPACING
H /
1'4 C". . 14t 1 , 0 S
-2 1.2 -
y=0.25 calibresAxial stagger
xst store calibres.U 0 10
0.8 6 08 Ds
0.6 0.8 1.0 M 1.2 0'6 0,8 10 M 1.2b. STAGGER
1.0 06 08 10 M 12 1.0 06 0.8 10 M 12
KT ' KT
-I
0.9 9 09 ,' , \ \J
/ 'I
I ./ ./ /
/ ,y1 \"I '\
0.8 H- ___ 0.8
Axial separationXT store calibres
\ - 3.001.000.25
0.7 0-005 0.7-
c. TANDEM CARRIAGE
FIG.9. FAVOURABLE INTERFERENCE CONCEPTS

12-18
fre cative Longitudinal, staggerfree capive reebomb relative to captive bombXst= !-10
WITH CAPTIVE BOMB
-10 -10 abve.0+1n carrier aboveefre
-0.5 /0 -0.
00
-0-10 11-10IICP CID CIDI
-0.5 /-0.5 -0-5 ~
I 0
n Wihucatv bo----- - -
0.5
0 ----- -----0.5 10 15 ZID ,' Without captive bomb
2-0 With captive bomb 0 0.5 10 1-5 ZDO
Cm X 5 .D.---
0 _ ___ ___ ___With captive bomb01 0.5 10 1.5 ZTD -2
FREE BOMB RESULTS
FIG.10 EFFECT OF STAGGER ON STORE RELEASELOADS FROM TVWIN CARRIER :M=0-80

a.LOADEO TRIPLE CARRIERS c. LOADED TWINJ CARRIERS
O/q in servc-e
01q - In service
Feasible
Feasible
0-4 06 08 M 10 0.4 0.6 05 1-1 Mb-EMPTY TRIPLE CARRIERS
In serviceI ~ ~~Feasible -OOO
G~4 06 08 M 1.0 Id. POSSIBLE NEW TWIN CARRIERS
e. UNDERWING jTriplecarrier
ALQD qper
store
3 separatepylIons
best f. UNDERFUSELAGEconventional
LAD/q Current practiceper
Current practice sto besconventional
radicalrail
0~0
FIG. 11. FEASIBLE DRAG IMPROVEMENTS

12-20
i.I
Etectgoccs %VeapofS Others-'
sWO area ioddtates tuetI PA' VAh.S
FAST PACK/I MI~bION CAPABILITIES
FUEL/: '--- e. -. .--... _ -'"
FUEL FUEL
Mk 8?82t
I "" Z'Mk 82 601t
a. POSSIBLE FUELISTORE ARRANGEMENTS
12fu't scale
O m/ 4- 3- 2264 itre Tanks (6791 litres)
(2 wing,1 fuselage ( )
0.602-2264
litre Tanks (14528 titres)(2 wing)
2 Conformat Fast Pack(5808 Litres)
0I&1 1.4 M 1.8
b. TYPICAL REDUCTIONS IN DRAG INCREMENT
FIG.12 F15 - CONFORMAL CARRIAGE STUDY

i d I I I | ! I i3.1
INTERFERENCE PROBLEMS IN AIRCRAFT DESIGN
I. H. RettieUnit Chief Aero Research and DevelopmentThe Boeing Commercial Airplane Company
P.O. Box 3707 M/S 79-93Seattle, Washington, 98124 - U.S.A.
SUMMARY
The nature of aerodynamic interference among the components of an aircraft isexamined. Some of the flow mechanisms involved are studied with the help of theoreticalflow models with the objective of identifying design guidelines for the avoidance ofperformance or other penalties. The possible achievement of favorable interference insome cases is also discussed. Emphasis is placed upon the growing capability ofcomputational methods which allow the designer to explore interference effects during theearly phase of a design prior to wind tunnel tests.
INTRODUCTION
Interference flows in aerodynamics represent both a source of major developmentproblems and an opportunity for performance improvement. To take appropriate action, thedesigner requires in both cases a good physical understanding of the flow processesinvolved and also an adequate theoretical model of the flow so that quantitativemodifications can be made. The recent developments in high-speed digital computingenable the modelling of quite complex flows including many viscous flow phenomena. It istherefore very timely to review current experience of interference flow phenomena and toexplore the ways in which Computational Fluid Dynamics (CFD) has been used to understand,cure and exploit the situation as required in each case.
Each type of air vehicle exhibits its own class of interference problem. Basically,however, these are of the same nature. Flow direction and velocity over one component isaffected by the flow field of another. In supersonic flows the interference effects areusually very evident from the patterns of shocks and other waves. At high supersonicMach numbers the effects can become very localized and the opportunities for favorableinterference are clearly seen from, for example, the impingement of compression wavesfrom an engine air inlet cowl on the aft facing surface of a rear fuselage. At subsonicspeeds the effects are more subtle, but fundamentally similar and it is often the casethat an aerodynamicist trained in supersonic flow design work will find it easier thanmost to appreciate the interference mechanisms involved. In general, the so-called "arearule" approach is a valuable tool at all speeds, but away from a Mach number of unity inboth directions (subsonic and supersonic) the spacial relationship of components isimportant.
An important type of interference occurs as a result of vortex flows. These are, ofcourse, very important in the wake of an aircraft and separation minimums are nowrequired in landing patterns particularly when a small aircraft is following a jumbojet. Aircraft designers are today much more aware of the effects of part-span vorticesfrom the wing on the horizontal tail. Recently a great deal of attention has been drawnto the handling characteristics of commercial aircraft in conditions beyond normalattitudes in the region of buffet onset and mild buffet. In some cases, vortices shedfrom components such as engine nacelles can be controlled so as to enhance the wingflow. In other cases small vortices can be created in the flow so as to inhibitseparation of the boundary layer. Small vortex generators are frequently mounted on theupper surfaces of wings and on aft bodies. On the Short Bros. and Harland BelfastFreighter, vanes were used on the highly upswept body. On most recent jetliners withlarge, high-bypass-ratio engines, "ears" can be seen on the upper nacelle cowls whichdirect the vortices to pass low over the wing upper surface and so avoid premature flowseparation. The inboard ear can in fact be tuned so as to allow separation at a givenlift coefficient in order to improve handling characteristics at incidences near stall.
A good example of an aircraft design in which interference problems had to becarefully investigated at all stages of the design is the Boeing YCI4 prototype militaryfreighters (Figure 1). The flow over the inboard wing is dominated by the effects ofupwash generated by the body and nacelles. At low speeds the suction induced by theengine air inlet has an important effect. For this reason, care was taken during thedevelopment program to represent the inlet flow in wind tunnel tests by means of turbinepowered simulators. In most other testing, the nacelle was domed over and the exhaustflow simulated by blowing. The reasons for this are the greater accuracy of the blownnacelle and the unreliability of turbine powered simulators. This latter problem is onewhich is now being satisfactorily resolved as a result of design development.
The interference between the nacelle exhaust flow and the wing trailing edge isreally a very wide issue which will not be explored here in detail. Attachment of theengine exhaust flow to the wing trailing edge skin and flap system (the "Coanda" effect)enhances the lift of the wing at all forward speeds. Another important effect on the

13.2
Figure 1: Boeing YC-14
wing, particularly in cruise, is that of the landing gear fairings on the lower -ornersof the body. Such interference may be expected to be adverse simply on the basis of anarea rule computation. In fact, what happens is that the acceleration of the flowinduced by the landing gear fairings reduces the levels of pressure on the lower surfaceof the wing thus causing a loss of lift. Attitude has to be increased in order torecover this, resulting in an increase of drag.
Perhaps the most obvious aerodynamic interference flow in a conventionalconfiguration is the downwash associated with the wing wake over the horizontal tdil andaft body. The effect on the horizontal tail is well known from elementary stabilitytheory. At first sight, the effect on the aft body appears favorable since the downwashtends to offset the crossflow over the aft body caused by body incidence. However,particularly in the case of an upswept aft body with the generally flattened underbellytypical of a military transport, the flow along the keel line is relatively unaffected bythe downwash. This flow and the flow along the side of the body are bounded by aseparation line on the lower part of the body side. From this line, vortex flows emanatewhich contain significant amounts of energy or drag. StraKes such as those referred toearlier on the Short Belfast are effective in controlling and reducing the drag of thesevortices.
Figure 2 shows a typical flow problem on a more conventional aft body. There arethree flow mechanisms: the basic flow over the body at incidence, the wing downwash andthe junction flow between the body and the horizontal tail. Such junction problems areusually suppressed by a small strakelet at the leading edge. This does not eliminate thejunction vortex which is determined by the span loading, but it reduces consequentialeffects by improving smoothness of the flow.
S FLOW
.. CONGESTION-.
JUNCTION--
FLOW SEPARATION BENEATH THE HORIZONTAL TAIL" INCREASES DRAG" REDUCES TAIL EFFECTIVENESS
Figure 2: Typical Aft Body Flow Problem

13-3
WING INTERFERENCE SITUATIONS
Interference with wing flow characteristics provides some of the most noteworthy examplesupon which to draw for a talk of this nature. Consider first the effect of a verticalsurface such as a nacelle side or a strut. A good example is an overwing nacelleinSLallation similar to that of the YCI4, but on a swept wing. Figure 3 shows a typicalinstallation. It has been studied extensively on transport aircraft to provide jet noiseshielding or improved ground clearance, for example with a turboprop installation. Aforward location of the nacelle places the boat-tailling so that its effect can be offsetby the acceleration of flow around the leading edge of the wing. Thus the peak suctionon the wing can be locally reduced. However, the plan view shows the problem of flowconstriction which occurs in the inboard junction. This must be relieved by adjustingthe inboard nacelle lines in the region of the wing leading edge so as to regain astreamline flow similar to that of the wing alone. The principles involved are explainedin Figure 4. Typical wing upper surface pressure gradients are shown to deflect anapproaching streamline in a manner different to that of the lower surface pressuregradients. Figure 4 illustrates the effect on the flow field of adding an infinitevertical plate aligned with the freestream approaching an infinite swept wing. Beforethe plate is added, two undisturbed streamlines approach the wing and follow the pathsindicated on the upper and lower wing surfaces. If the plate is then added midwaybetween these two approaching streamlinLs, the wing span load distribution is perturbedas shown in the lower half of the figure. The portion of the plate over the wing uppersurface is at an angle of attack to the flow of the undisturbed streamlines. Negativepressures develop on the left side of the plate and positive pressures on the rightside. On the wing lower surface, the effect of the plate is not as pronounced, since itsangle of -ttack to the undisturbed lower surface streamlines is much smaller. Therefore,the wing loading is increased to the left of the plate and decreased to the right. Fromconsideration of the plate as one side of a fuselage or of a nacelle, it is apparent thatfailure to streamline-countour such a surface would result in undesirable changes in thechordwise and spanwise pressure distributions. The deterioration would include isobarand shock unsweeping and more adverse pressure levels, pressure gradients, and loaddistribution.
800 [
700
600 ---- -
500- WL
30WBL 400 - ~ 3 .200[
300 -A A 2001rE _B 150 1 ' 4300 400
200 ---- --- A-A B-B
00 --- r---- 4 ,------
700 800 900 1,000 1,200 1,400BODY STATION
Figure 3: Overwing Engine Configuration Geometry
STREAMLINES UNDISTURBED
BY VERTICAL PLATE
UPPER SURFACE VERTICAL PLATESTREAMLINE- / STREAMLINES PARALLEL
'q TO VERTICAL PLATESWEPTWINGDIRECTION OF FORCE DUE
UPPER SURFACE (PLAN VIE0- TO PRESSURE GRADIENTS
STREAMLINE- - /-ISOBARS
I-LOWER SURFACE---- S STREAMLINE
LOWER SURFACE -WING AND VERTICAL PLATESTREAMLINE
WING SPAN QADDISTRIBUTION /WING ALONE
WING SPAN
Figure 4: Effect of a Vertical Plate on the Flow Field of a Swept Wing
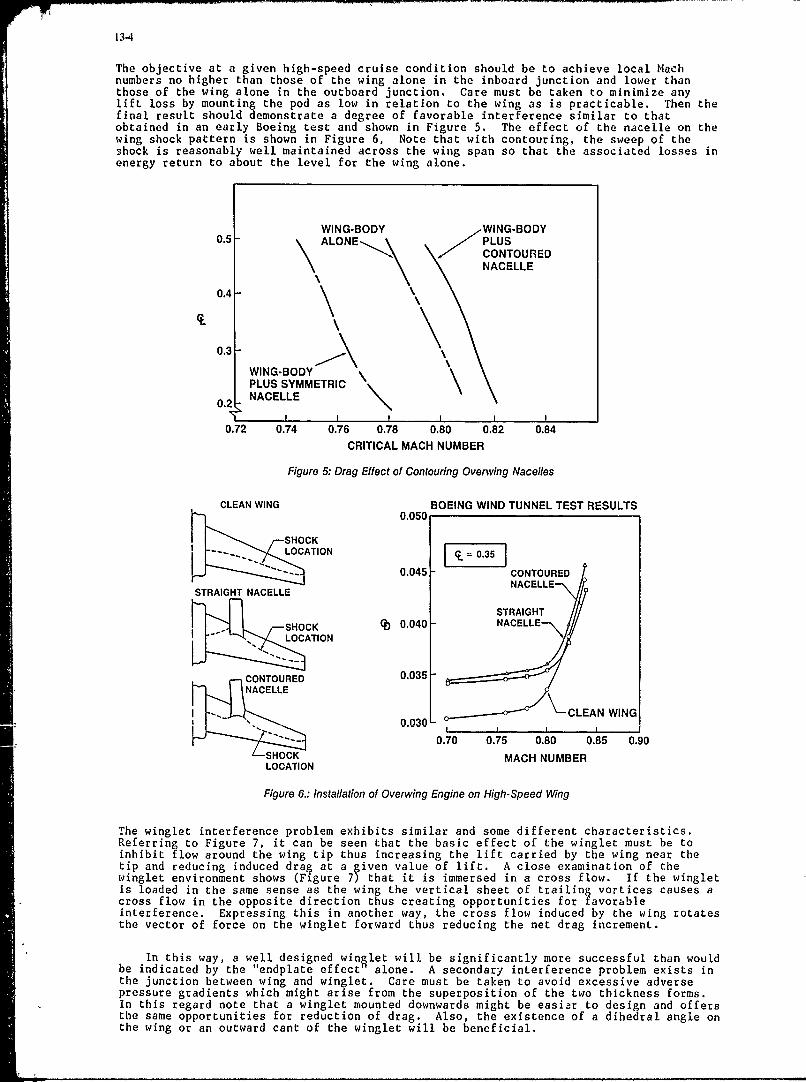
13-4
The objective at a given high-speed cruise condition should be to achieve local Machnumbers no higher than those of the wing alone in the inboard junction and lower thanthose of the wing alone in the outboard junction. Care must be taken to minimize anylift loss by mounting the pod as low in relation to the wing as is practicable. Then thefinal result should demonstrate a degree of favorable interference similar to thatobtained in an early Boeing test and shown in Figure 5. The effect of the nacelle on thewing shock pattern is shown in Figure 6, Note that with contouring, the sweep of theshock is reasonably well maintained across the wing span so that the associated losses inenergy return to about the level for the wing alone.
WING-BODY WNB0.5- ALONE,. PLUS
CONTOUREDNACELLE
0.4-
\N
0.3-WING-1ODYPLUS SYMMETRIC
0.2 NACELLE
0.72 0.74 0.76 0.78 0.80 0.82 0.84
CRITICAL MACH NUMBER
Figure 5: Drag Effect of Contouring Overwing Nacelles
CLEAN WING BOEING WIND TUNNEL TEST RESULTS0.050
SHOCKLOCATION I ~.0.35 I
0.045 CONTOUREDNACELLE
STRAIGHT NACELLE
STRAIGHTSHOCK q) 0.040 NACELLE
LOCATION
CONTOURED 0.035NACELLE 7
IELLE0.030 - CLEAN WINGI "- ,0.030 -
0.70 0.75 0.80 0.85 0.90SHOCK MACH NUMBERLOCATION
Figure 6.: Installation of Overwing Engine on High-Speed Wing
The winglet interference problem exhibits similar and some different characteristics.Referring to Figure 7, it can be seen that the basic effect of the winglet must be toinhibit flow around the wing tip thus increasing the lift carried by the wing near thetip and reducing induced drag at a given value of lift. A close examination of thewinglet environment shows (Figure 7) that it is immersed in a cross flow. If the wingletis loaded in the same sense as the wing the vertical sheet of trailing vortices causes across flow in the opposite direction thus creating opportunities for favorableinterference. Expressing this in another way, the cross flow induced by the wing rotatesthe vector of force on the winglet forward thus reducing the net drag increment.
In this way, a well designed winlet will be significantly more successful than wouldbe indicated by the "endplate effect alone. A secondary interference problem exists inthe junction between wing and winglet. Care must be taken to avoid excessive adversepressure gradients which might arise from the superposition of the two thickness forms.In this regard note that a winglet mounted downwards might be easier to design and offersthe same opportunities for reduction of drag. Also, the existence of a dihedral angle onthe wing or an outward cant of the winglet will be beneficial.

13-5
WINGLET
SUCTION
P U CIRCULATIONPRESSURE
Figure 7: Winglet Flow Environment
Comparisons between winglets and wing tip extensions involve the completeaerodynamic and structural design of the wing. On the basis of purely aerodynamicconsiderations the increase in span will probably always be superior. Wing bendingmoments may, however, be greater for a given performanze improvement. Note that thebending moment induced by the lateral force on the winglet is relatively small,particularly over the inboard part of the wing. Trade studies of the aerodynamic andstructural effects have led to consideration of winglets canted in front elevation inorder to determine the best compromise between the penalty in wing bending moment and theimprovement in induced drag.
The application of winglets to existing airplanes as product improvement items isobviously very important since in such cases the tolerable increases in wing beniingmoments are strictly limited. Careful design may therefore maximize the performancebenefits available within a given wing strength.
A typical result of winglet studies is shown in Figure 8. This shows the tradebetween tip extension and winglet. Tip extensions and winglets of equal area and lengthare compared on the basis of performance improvement and bending moment increase. Figure8 shows that for a given reduction in induced drag the winglet produces a significantlylower increment in bending moment. In any study of this nature care must be taken toidentify all the elements of the trade and to undertake an exact bookkeeping of theireffects. In the winglet case the breakdown of performance effects is shown in Figure 9.
8 1Cmx 31.0% "/TIP EXTENSION
0.426 - - 1'eicmx4----- WINGLET
o
.4b/PERCENTAGE IOF CHANGE 8B
-12 9. .
-16\ \ CI20 W IINGLET
-20\
TIP EXTENSION-24 1 1 1, I 1
0 0.04 0.08 0.12 0.16 0.20
Figure 8: Comparison of Induced Drag and Wing-Root Bending MomentIncrements Between Winglets and Tip Extensions
USE OF CFD IN INTERFERENCE PROBLEMS
Modern high-speed computers are capable of describing flows over very complexconfigurations. Two basic approaches are used. At low speeds singular solutions to theLaplace equation (i.e. source, doublet and vortex singularities) are distributed so as tosatisfy the condition of zero flow through the prescribed surface of the body or vehiclebeing studied. Compressibility corrections are made by the Prandtl-Glauert or other ruleso that this approach can be used in flows where the free stream Mach number is of theorder of 0.7/0.8. This approach can also be used at supersonic speeds with equivalentformulation of the flow due to singularities. At transonic speeds the compressibilityeffects must be included correctly in the basic flow equation. Here what are called theFull Potential Equations are commonly used today. They are solved by relaxation tech-niques using a three-dimensional grid which is fitted to the surface of the body and mustbe defined throughout the flow field. Construction of these grids is a real barrier tothe study of complicated shapes. The tendency is, therefore, to use the panel methodsunless the definition of shock strength and location is important.

13-6
Four examples of the use of CFD are shown in Figure 10. Two are taken from studiesassociated with the modification of a 747 for carriage of the NASA Space Shuttle. One isa study of mounting systems in a wind tunnel. The fourth is an analysis of forces on aweapon during the initial stages of its trajectory after release.
ACDNET AICDiwlngiets CDparasite + CDproflie + '%CDtrim * - Wtwinglets D
winglets airplane
where
ACDNET Total drag change due to wlnglets Including weight penalty
ACDiwlnglets Change In wing Induced drag due to the addition of winglets
CDparaslte Winglet parasite drag (skin friction, form drag
w!nglets and Interference drag)
ACDprofil e The change In airplane drag (less the airplaneairplane Induced drag) due to a change in airplane angle of attack
ACDtrim Change In trim drag due to the addition of winglets
AWtwinglets Total winglet plus wing Installation weight penalty
" - Drag-weight trade factor for equal fuel burnedAwl
Figure 9: Breakdown of Performance Effects of Winglets
STORE SEPARATION
ON~EWEAPONEAINSON AIRCRAFT 757 WITH 200 FT 2 HORIZONTAL TIP FINS
DIFFERENT WEAPONPOSITIONS ANALYZED - EXPERIMENT
1.2 STABILITY AXES -- PANEL METHODIA N 747 + HOR. TIP FINS
.8 . AIRCRAFT 2SOEG• **=WEAPON $DEG
E EXPERUENT CN.4 - PANAIR
0 A47 ALONE
0 10 20 310 40
BODY STATION, INCHES
727 + ORBITER AT 50
TRIMMED DATA CITAIL BASELINECLTOT-O -.3 UPPER STRUT
,/ - 747 ALONE - ---- LOWER STRUT
Z'-747 CONTRIBUTION -.2 - -A502 RESULTSM% 0.8H ,,,. ,, (1FUS 2.00
,___ \-..ORBITER ALONE -.1 IT =-1.0°. . -ORBITER CONTRIBUTION
0Ow .5 1.0
nTAILFigure 10.: Use of CFD to Investigate Interference Problems

13-7
The first 747 study concerned the lifting capability of the 747/Orbitercombination. One purpose was to suggest a suitable attitude for the orbiter. Thecalculations are shown with the orbiter at five degrees to the body axis of the 747. Thetotal lift is increased, but is less than the sum of the two bodies taKen separately.The second 747 study arose from a deficiency which was observed during initial windtunnel studies of the combination. One effect of the orbiter was a shielding of thevertical tail of the 747 which led to insufficient lateral stability. Several possiblemodifications were studied on the computer leading to the selection of the horizontal tipfins shown in the figure. Wind tunnel tests confirmed the predicted effectiveness ofthese. This is a case where the use of the computer provided a good solution morequickly and less expensively than would havL the wind tunnel.
The mounting strut interference study was undertaken to indicate which type of mountand what design should be used for particular purposes. In general, the lower strut isnot good for drag because of interference with the aft body. The upper strut isdifficult for control and stability tests because it provides a poor model of thevertical tail and because it does not properly represent inteference effects on thehorizontal tail.
The store separation problem is one which has been studied in many ways. The objectis to avoid an untoward maneuver on the part of the weapon while in the flow field of theairplane. The chart shows the capability of the panelling approach in predicting forcesand moments on the weapon. Supersonic studies have also been accomplished with similargood agreement.
Examples of the use of the transonic Full Potential Equations are discussed below inrelation to nacelle inteference studies.
USE OF FLOW VISUALIZATION IN INTERFERENCE PROBLEMS
While some viscous effects are included in CFD calculations (e.g. boundary layerdisplacement thickness) we are many years from a realistic capability of describingseparated or vortex flows. This is one area in which wind tunnel test techniques arebeing improved to enable us to explore and understand interference effects. A techniquedeveloped at Boeing is known as the Wake Imaging System (WIS). It is a device whichrecords variations in total pressure and converts them to a colour coded light output.By traversing the wake of a separated or vortex flow, a picture ir colour of thegradation of total pressure can be compiled and printed.
Two examples of this technique are shown in Figures 11 and 12. The first shows theclear imprint of the nacelle wakes at a incidence of four degrees on the 747 aircraft.At eight degrees it shows a fairly large separation on the outboard wing which isapparently controlled to a large degree by the addition of the outboard nacelle.Presumably, the strut of the nacelle installation interupts the spanwise flow on theupper wing surface causing a part span vortex which collects the bulk of the boundarylayer and leaves a relatively cleaner flow over the outer wing.
M - .88
RN 4 MILLION- 4 DEGREES a - 8 DEGREES
CLEAN WING 90M
WING &NACELLES
Figure 11: Wake Imaging Results
The second example is from the re-engining of the Boeing 737. This was described inmy previous talk on Aerodynamic Design. The CFM-56 engine is housed in a nacelle mountedunder the wing. This replaces the more integrated installation of the current JT8Dengine. A difficulty of the new installation was the presence of a vortex flow emanatingfrom the inboard side of the nacelle which would cause an early separation of the inboard

13-8
wing. By attaching a large vane or "ear" to the nacelle, the vortex was brought downcloser to the wing and the separation was delayed. The vane is commonly referred to as aVortex Control Device (VCD).
VCD OFF VCD ON
- VCD OFFVCD ON "B -160
35q% / 60r% (XIC)
16
Figure 12: Effect of Vottex Control Device
Further development of the WIS will increase its capability of traversing the flowfield both in the wake behind the model and forward on to the surface of the wing. Thoaim is to be able to visualize not only the downstream effects of vortex or separatedflows, but also to help understand and modify the configuration features which give riseto them. The system is particularly useful in exploring the flow field around horizontaland vertical stabilizers. It affords a valuable means of identifying and correcting thecauses of undesirable stability characteristics.
NACELLE INTERFERENCE PROBLEMS
Nacelle installations are notoriously fraught with interference problems. These arisefrom spillage around the engine air inlet, flow problems in channels formed by a nacelle,strut and the airplane wing or body, scrubbing of the airplane structure by the engineexhaust and interference between the exhaust plume and, for example, the wing. This lasteffect has received particular attention in recent years because of the trend towardstwin engine transport installations with high bypass ratio engines. In order to maintainground clearance and avoid severe penalties in landing gear weight, there is pressure onthe aerodynamicist and installation engineer to reduce the separation between the nacelleand the wing. Because of the channel flow problem mentioned above the nacelle is usuallymounted on a strut forward of the wing. The variety of installations analyzed at Boeingin recent years is indicated on Figure 13. Of these probably the most critical is the737-300/CFM-56 where the necessity to keep modifications of the airplane to a minimum,forced the fan cowl exit very close indee' to the leading edge of the wing. Some upwardtilt and a flattening of the lower surfact of the nacelle are also evident.
707/CFM56.2 757-2001RB211-535C
737-300/CFM56-2 767-2001JT9D-7R4
747-200/JT9D-70 RESEARCH
Figure 13: Variations of Engine Insrallation Scaled to Constant Chord

13-9
Wind tunnel tests of nacelle installations to measure drag penalties have to be donewith great care and, with proper simulation of the power effects, can be very costly.Iney are therefore seldom completed before the final stages of project design when it istoo late to make many changes. Therefore, the use of CFD for early analysis andprediction of flow phenomena is very valuable In this instance. Typically, calculationsare accomplished using the Full Potential Equations since supersonic flows on the wingsurface are important. A surface fitted grid is used as shown in Figure 14 and the plumeis represented by a prescribed solid shape. Now the physics of the plume flow are verycomplex involving as they do viscous effects at the interface between the core and fanflows and between the fan and external flows (see Figure 15). A separate model of theplume is therefore usually constructed and iterated with the model qhown in Figure 14 tcobtain consistent solutions. At the time of writing at Boeing, a complete viscous,non-axisymmetric plume model is being developed and should be iperational early in 1983.
BOUNDARY CONDITIONS
INLET. NACELLE, STRUT, PLUME: q" nWAKE: KUTTA CONDITION. PRESSURE CONTINUOUS
INLET I 1 PRESCRBED SOLpID\ I II PLUME SHAPE
I-ACELLE--I EX'UST PLUME
Figure 14: Twin Engine Transport - Surface Grid
BOUNDARY LAYERs - ... - - - --SHOCK
TRANSONIC FLOW r WIN
NA EBOUNDARYLAYERS
-AND WAKES
Figure 15: Physics of the Real Flow
In gener.l, experience with this computing model has been very good. Figure 16shows the effect of the nacelle on the wing lower surface pressure. Note the highsuction peak just inboard of the nacelle. Figure 17 shows a case where agreement withtheory is less than perfect. Addition of the cowl boundary layer provided betterprediction of the suction peak on the lower surface, but did not move the peak forward tothe location it had in the experiment. It is hoped that a plume model will better helpimprove this case where the cowl exhaust is some distance aft of the leading edge of thewing. Figure 18 shows an interesting effect of core cowl shape where the suction on thecowl geometry is modified by interaction between the core cowl and the underwing surface.
Data such as are shown in these last few figures allow the aerodynamicist to judgethe presence and possible magnitude of blowing drag. This is defined as the installationpenalty associated with power effects which has to be added to the installation penaltymeasured with flow-through nacelles. It is an item which requires expensive simulationin the wind tunnel. Either blown nacelles or turbo-powered simulators are used andcalibration is very critical in each case. The blowing drag arises from a strengtheningof the shock on the underwing surface, from increased suction on the aft facing surfacesof the fan and core cowls and from increased flow velocities over the strut surface.
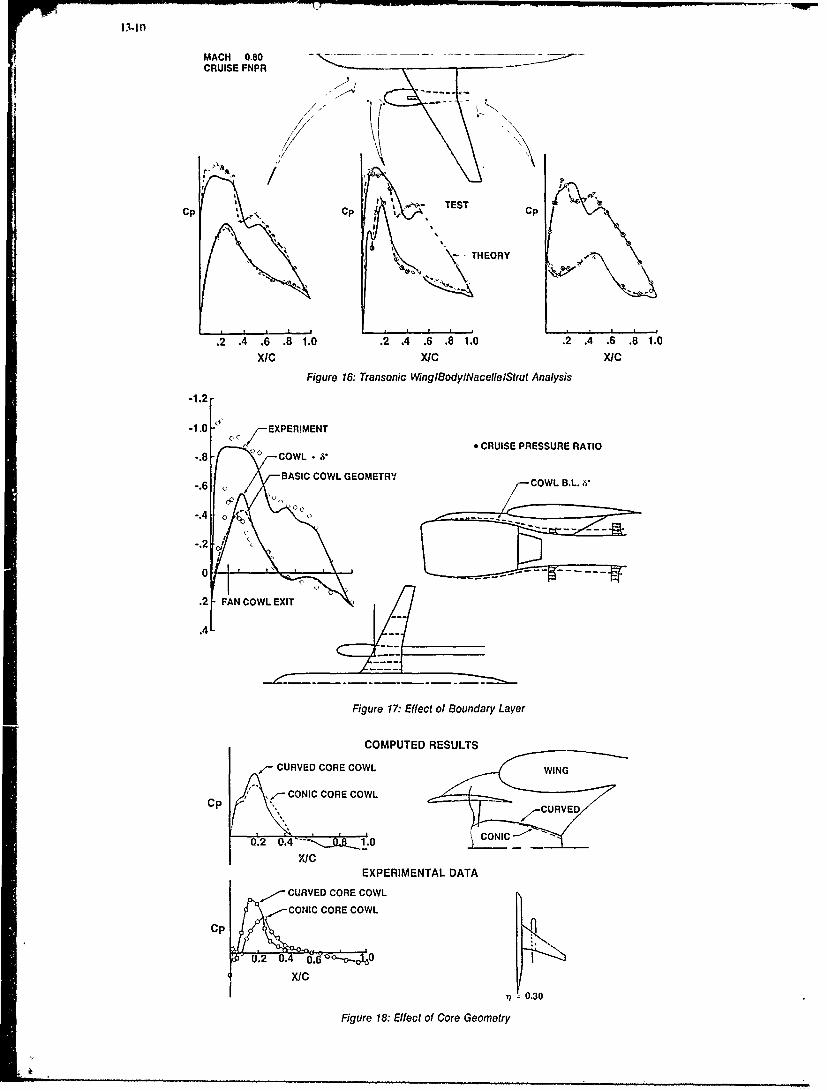
MACH 0.80 --
CRUISE FNPR
~'- TESTCp Cp Cp
-TEORY
.2 .4.6.81.0 .2 .4 .6.81.0 .2 .4.6 .81.0
xIC x~c X/cFigure 16: Transonic Win glodylNacelle/Strut Analysis
-10 /EXPERIMENT
-. 8- 0 COL - . CRUISE PRESSURE RATIO
-.6 0OW COWL.S*
-.4 o
-.2 o
0~~ C7
.2 FAN COWL EXIT
.4
Figure 17:- Effect of Boundary Layer
COMPUTED RESULTS
~-CURVED CORE COWL WN
Cp *' ~-CONIC CORE COWL
0.2 0.410
xICEXPERIMENTAL DATA
CURVED CORE COWL
I ' -CONIC CORE COWL
Op
0.2 0.4
XIC0.30
Figure 18: Effect of Core Geometry

14-1
ENGINE / AIRFRAME INTERFERENCEby
G. KrenzMBB / Vereinigte Flugtechnische Werke GmbH
D Zuu BremenGermany
SUM MARY
The history of airframelengine integration snows quite different aircraft configuration deign, espe-cially since the turbojet engines entered the markeL of civil aviation. The present paper, therefore startswith a short review about typical aircraft representatives with different types of engine housing and dis-cusses the reasons why current comtiercial transport aircraft designed for the transonic flight regime preferconventional engine locations under the wing. On first sight this type of configurations has rarely changedover the past Z5 years, however, the strength of flow interference has been increased considerably due to therapid progress in engine as well as wing technology. On the engine side mainly the enlarged massflow and fandiameter contribute to the stronger interaction, while the wing tends to thicker, higher loaded designs withsupercritical flow in the transonic flight regime. The increasing effects of wing. engine interference arestudied by MBB/VFW in several transonic wind-tunnels like the NLR-HST in Amsterdam and the ONERA S1 MA inMlodane. Results including those of varying engine distances from the transonic wing are presented.
The wind-cunnel measurements employing through flow nacelles and partially plug nozzles to edapt the de-sired mass flow of the pod are conducted without adequately simulating the real engine jet. For better enginerepresentation, therefore the turbine powered simulat(,s (TPS) should be used. This is done during Airbusdesign and developnent studies by Aerospatiale and British Aerospace for cruise flight conditions. Howeve,,it was four.d from flight tests that at low speeds there is also a strong demand for proper engine simulation.Therefore the TPS-test technique was introduced in the MBBVFW Low Speed Tunnel in Bremen. Tests were per-formed with different engine types and configurations to evaluate the one engine out second segment climbperformance. Measurements of forces and pressuAres on the wing as well as in the wake at several stations be-hind the nacelle in the area of wing-pylon-engine were carried out. These results are discussed in the presentpaper.
The wind-tunnel measurements hith turbine powered simulators require a tremendous amount of working timeand vpenses in the model-shops and wind-tunnel fcilities. Hence there is a need for theoretical acrodynam-ic , to reduce the numerous engine positions, pylon shapes and junctions to be studied during an aircraft de-sign. However, wing-fuselage-pylon-nacelle just represents the configuration, for which the designer has toknow the aerodynamic characteristics, and is most complex and difficult regarding the theoretical approach.Therefore at 1,BB,VFW a simplified method was developed, to calculate the potential flow at transonic speedsaround complex configurations including pylon and engine. Results obtained with the method are shown in com-parison with wind-tunnel test data.
Although today the conventional aircraft configuration with under-the-wing engine mounting is still infavour forcomnercial transport aircraft, many other designs with sometimes exotic engine positions were in-vestigated and built to fulfil stringent design requirements or to impouve aircraft performance with respectto airframe-engine interference. One concept was the VFW 614, so far the only civil aircraft flying with en-gines mounted to the upper wing side. Some specific flow characteristics, resulting in a limited cruise flightlach number due to increasing interference effects, are presented. Since the VFW 614 extensive studies havebeen carried out concerning different engine positions above the wing. As a result it was found that thereis no engine location on the upper wing surface without penalties. Ho.ever, when the engine above the winqwas not connected to the wing, high imrovements in the low speed regime were experienced. Also wind-tunnelmeasurements with a metric nacelle were conduc*d, ising a typical transport aircraft semi-span model wherethe engine was represented by a turbine powerec simu',tor supported on a canard type of wing. Results arepresented in the paper showing improvements in low speed performance characteristics.
LIST OF SYMBOLS
C0 drag coefficient 11 spainwise coordinate in relation to half
CL lift coefficient wing span
C pressure coefficient (p-po )/q Abbreviations
c (1) local wing chord I/B inboard
D nozzle diameter O/B outbord
h distance from wing lower surface I.e. leading edgeto fancowl upper side I/s lower side
M Mach number u/s upper side
p local static pressure MTO maximum take-off power
q dynamic pressure TFN through flow nacelle
RN Reynolds number Subscripts
v velocity j jet
vN normal velocity t total (local)
x, y, z body axis system to total (indefinite)
xT distance from nozzle exit to wing G indefiniteleading edge lsonic condition
CL incidence angle

14-2
1. INTRODUCTION
The history of engine-airframe integration sin.e turbojets entered the market of commercial transportaircraft reflects a large amount of ideas and w~,k spent in aeronautical research and engineering to f-ndthe best engine housing and, the story is not at the end. - The reason is the tremendous progress of bothengine and airframe technology with changes in geometry, materials and flow characteristics. The stronginterest in these problems is explained by the demand for improved ecconomy. Thus the cruise flight had tobe limited to high subsonic Mach numbers in the course of increasing fuel prices and this focussed theaerodynamic work - as far as commercial airplanes are concerned - to a number of major subjects, two ofthem being presented in the present lecture series: "Transonic Configuration Design" and "Engine-AirframeInterference".
FIG. I snows some basic concepts of engine housing since the appearance of turbojets. The designersof Comet presumably did not expect an aircraft family concept with large turbofan engines since the air-frame does not provide enough voluwe at the wing root. The French Caravelle and the B 707 coming into oper-ation 25 years ago are representatives of current aircraft design as tar as the engine location is concerned.FIG. 2 presents some newer concepts with engines sitting above the wing. The Sabre Liner being in service,is not far away from the Caravelle concept, but the VFW 614, designed as c short haul aircraft to operatefrom undeveloped runways, is an exotic configuration with respect to the engine position. A limitation ofcruise Mach number is obviously due to the increase of wing-engine ,nterference with speed. The BoeingAMST YC 14 presents a big step in the USA towards advanced configurations with respect to engine housingtested in wind-tunnel and flight. Some problems and merits of the configuration are reported in 1 I.
Regarding the different engine-airframe concepts, shown in FIG. I and FIG. 2, we can recognize thatfor commercial transports two solutions for fitting the enginges to the airframe are still in favour, theseare the positions under the wing and at the rear fuselage. - They fulfil more than others basic conditionsfor todays commercial aircraft design:
- The flow interaction of both components, engine and airframe, is relatively low and hence isapplicable without majoc technical problems.
- The possibility to install engines of different manufacturers at the same location, if feasibleat the same common pylon.
- Taking advantage of improved engine technology, i.e. with changes in geometry and flow character-istics, without penalties for the aircraft which may result from increased engine-airframe inter-ference.
These conditions are more than ever before vit:; for an aircraft manufacturer because, the airlinesdecide which engine they want to operate, the engine manufacterer Lontinously offers improvements resultingin changes of engine geometry and flow characteristics and, the airframe manufacturer develops a family con-cept with commonality among the many airframe parts as far as possible.
2. WING-ENGINE INTERACTION OF COMMERCIAL TRANSPORT AIRCRAFT
2.1 Overall design aspects
The large transport aircrafts like the Airbus, seen in FIG. 3, or the Boeing 767 prefer engine posi-tions under the wing. For long range aircraft the number of engines have to be increased to four as for theBoeing 747 or to three like the Mc Donnell Douglas DC 10 or Lockheed 1011. Regarding the wing-engine inter-action the problems are basically the same.
Some general design aspects can be mentioned for this classical engine position, see FIG. 4. The ver-tical distance 'z' between wing and engine is often a comprimise between ground and wing clearance for theengine, connected with the main landing gear height. One meter distance from the lower engine side to ground,as we have for the Airbus, ensures reliable operation. The distance from the wing depends on the forwardengine position as well ob u, the pylon and wing shape, and hence is the result of eytensive design studi Sincluding wind-tunnel measurements. Some solutions for new transonic aircrafts like A 300, B 767 and B 757are shown in FIG. 5. We see differences in x/z position as well as in pylon planform. The pylon leading edgeand its intersection with the wing leading edge is a specific design task in the transonic cruise flight re-gime and at take-off and landing as well, where the interference with the leading edge devices has to be
ken into consideration.
The main target during the engine installation design and development process is to avoid drag in-crease either on the wing or on the pylon and engine by interference between those components. The directcontribution of the engine to the aircral, lift is negligible at cruise speed. However, unfavourable flowacross the area of wing-pylon-engine junction can increase the drag and decreasu the lift as shown in FIG. 6.These results we found in the Civil Component Research Programme (ZKP) when testing through-flow nacelleson a transonic wing. The lift loss produces additional drag, an experience we always had to make when westarted with a proper wing design and added pod/pylons or flap-track fairings inducing lift losses. Thereare convincing explanations about the flow mechanism, but a simple rule for the daily work in the wind-tunnel is, that for the recovery of lift loss the angle of attack has to be increased and this is associatedwith higher drag.
2.2 Wing-engine interference at transonic speed
One of our main tasks from the beginning of the Research Programme ZKP, sponsored by the GermanMinistry of Research and Technology, was the propulsion-wing integration as sketched in FIG. 7. For accurateperformance evaluations in a specific aircraft development programme, the "turbo powered simulator (TPS)"technique is the most reliable tool in todays wind-tunnel work. However it is laborious, time consuming andexpensive and therefore has to be connected to and supported by other techniques like ejector engine andthrough-flow nacelle simulation. Especially testing the effect of different engine positions on wing aero-

14-3
dynamics is difficult and costly employing the TPS technique, and therefore we measured some of those ef-fects with through-flow nacelles on a large scale half model in the ONERA Si MA and with complete modelsat the NLR-HST. In FIG. 8 test results obtained in the NLR with double-body nacelles and research wings arepresented. Forces and static wing pressures on both sides of the pylon were measured at a Reynolds numberof 2.5 • 106 in the range 0.3 : M 0.86. The lower wing surface inboard of the engine is considerably ef-fected while outboard the engine pod both surfaces are inflienced. In order to separate the combined pylon-nacelle effects, test were conducted with the large ZKP-model at ONERA SI MA, where the nacelle was mounted,n a sting at tile tunnel floor. The results in FIG. 9 show, that the main influence on the upper wing pres-sure distribution is induced by the pod alone. Therefcre the change of pod position relative to the wingcan be taken as measure for the change of pressure distribution on the upper wing surface, which is impor-tant for the wing design. FIG. 10 shows the corresponding results for a more rearward and slightly lowernacelle position. The effect is quite similar though slightly smaller. Starting from this position the na-celle was moved closer to the wing in three steps with the results presented in FIG. 11. The Acp over thewing chord upstream the shock location is recorded as difference of the pressure at the new positions 2),
(1, @ and the pressure at position (D . At the shock, A cp increases strongly with small changes of theshock position and is therefore not representative for nacelle-wing interference. Aft of the shock region,the change of the wing pressure distribution caused by the nacelle is small and is therefore omitted inFIG. 11. A comparison with FIG. 10 shows, that the main effect on the forward part of the wing, s the in-crease of upper surface pressure by the same order of magnitude (10 ).as produced by the pod in its lowestposition. The maximum vertical shift in nacelle position from (B) to is one half of the wing thickness
at the pod station. Although this leads to a rather close engine position of 5 , fan diameter to the winglower side, local modifications in the wing-pylon-nacelle area may be sufficient to compensate for adverseinterference effects.
For better engine representation, jet simulation has to be included. For the transonic flight regimethis is the responsibility of our partners Aerospatiale and British Aerospace during the design process foractual Airbus programmes. At VFW we concentrate on more accurate tests and better understanding of engine-airframe interference during take-off and landing. Therefore we developed in our Bremen wind-tunnel thelow speed TPS-technique. Some results and the experience gained with this technique will be presented inthe next chapter.
2.3 Low speed wing-engine interference of transport aircraft
Development and flight testing during the last years have clearly shown the importance of interferenceeffects at take-off and landing conditions of conercial transport aircraft. In case of twin-engined air-craft the one engine out second segment climb performance is a dominant design case with large effect onoverall aircraft economy. As different engines mounted to the same aircraft and different nozzles, i.e. longand short core fan nozzles, resulted in changes of the take-off performance, the decision was made at AirbusIndustrie, to introduce more accurate test techniques for clarification of the discrepancies. Hence the TPS,developed by Tech Development Inc. Dayton Ohio, was introduced in the VFW low speed wind-tunnel at Bremen.Here the first steps with the new technique were done within the ZKP research programme. Up to that time TPSwere never used for testing low speed configurations because
- engine interference effects were considered to be less important for low speed performance;
- the relation between the large simulator thrust (to be caliorated) and tile small interferencedrag increments (to be evaluated) is much more unfavourable at take-off than at transonic cruiseflight in the sense that it is more difficult to achieve accurate test results at low speed.
The different engines at the Airbus leading to scattered low speed performance data and the appearanceof TPS in Europe have changed the attitude toward low speed wing-engine interference. Some results, partiallyobtained in comparison with flight test data are presented in the following chapters[2].
Z.3.1 Low speed Irb-test in the Bremen wind-tunnel
The basic test set-up in the VFW wind-tunnel is shown in FIG. 12. The model is a half model of tileAirbus A 300 B4, the model scale is 1 : 16. The model Is mounted to the overhead mechanical balance, whichis equipped with a force free air supply bridge.
FIG. 13 shows the simulator without cowling. ThL simulator is equipped with measuring rakes behindthe fan and behind the turbine which gather all data necessary for thrust calibration and evaluation. Thethrust calibration is achieved by a simple static thrust measurement: the test set-up is shown in FIG. 14.The concept of this calibration without the use of the conventional tank is outlined in Ref. [31 and [4)
Some general problems with TPS engine simulation are:
- More staff is needed for the operation of the engine.
- Additional energy is needed to drive TPS.
- The high loaded bearings of the TPS must be changed in certain intervals to avoid a distructionof the system.
- To overcome the problem of ice build-up on tile outer and inner contours of the engine due to thevery low temperatures in the primary core (a consequence of the expansion of the compressed driveair in the turbine), the dryer for the drive air was replaced by an improved system allowing longertesting periods. Further on, the cowls for the primary core which were made of aluminium alloy wereprovided with heating wires or exchanged by pieces made of other materials (phenolic resin or glassfibre plastics). Further on, a purging system wis installed to keep the pressure tubes in primarycore and the static orifices on the outer side of the core cowl and plug free of ice and lubrica-

14-4
tion oil.- During the first test periods, a manifolding system of pressure orifices was used on the fan rake.
Three orifices on one radius (I/B or O/B-halfcircle) each were connected to one scani part at thebeginning (FIG. 15). The disadvantage of that system was, that it was impossible to detect a leak-age or blockage of a single orifice.
- Due to aerodynamic instabilities, oscillations of the tunnel balance and small thrust variationsduring the data acquisition time of one test point, a certain scatter band of test results is un-avoidable. To be able to draw a mean line through the scattering data points, each point isgathered three times, before the test condition is changed (e. g. incidence angle). To shortenthe time for this procedure, each orifice of the TPS pressure-rakes was connected to three dif-ferent ports on one scanivalve (I between port 1 and 16, a second between port 17 and 32 and athird between port 33 and 48). So, it is possible to registrate 3 data points with all pressure,temperature and balance signals during one turnaround of the scanivalve.
- The pressure and temperatures, which are used for the TPS thrust calculation, are shown on an on-line display in the tunnel control room. So, a failure in the data acquisition system can imedi-ately be seen and test points can be repeated or - if necessary - a repair can be initiated.
- Additional TPS-data (static pressures behind the fan and turbine) are registrated in order tohave a better control of the main data and to have a back-up system for the thrust calculationif necessary.
- Finally, several improvements of the computer programme have been made in order to accelerate thedata reduction and test analysis.
2.3.2 Some test results and comparison with flight tests
In order to get as much information as possible from the wind tunnel tests, all available and usefultest methods have been used, i. e.
- oilflow-visualizations on wing, pylon and engine
- force measurements
- measurements of static pressure distributions on wing and nacelle
- wake flow investigations behind the engine using a total pressure rake.
In the following sections, some characteristic results of these different test techniques and - as faras possible - their comparison with flight test results will be shown. Most of the tests done so far at VFWwere concentrating on jet effects during take-off and second-segment climb of tie aircraft, i.e. with oneengine failed and one at MTO-power. These tests proved as very useful to show the areas of power effects,to predict the magnitude of modifications in these areas and to compare the jet induced drag effects of dif-ferent aircrafts under similar conditions.
2.3.2.1 Oilflow visualizations
A zone of major power effects found during 2nd segment climb investigations was the upper side ofthe fan cowl. FIG. 16 shows the very small area of flow unsteadiness on the I/B-side, while under GroundIdle conditions (FIG. 17) - which would be a typical condition, if a through flow nacelle would be used -two zones of larger dimensions I/B and O/B of the pylon can be seen. An other zone of major jet effectsare the I/B and O/B-sides of the pylon. FIG. 18 and 19 show the behaviour during a wind-tunnel test.
The good agreement between the flow visualizations in the wind tunnel and the full scale A/C areshown on FIG. 20 - 22. On FIG. 20 the cross flow over the pylon and the field of flow unsteadiness on thefan cowl at MTO-power setting can be seen which is identical witf. the model test (FIG. 16). The result ofthe W/T-test showing the pylon flowfield is the same as on FIG. 21 and FIG. 22 for the A/C.
These examples show,
- that the TPS is useful to simulate a representative flowfield and
- the use of other engine simulation techniques (e. g. through flow nacelles or blown nacelleswith blocked intakes) may lead to wrong predictions for the full scale aircraft.
2.3.2.2 Force measurements
An example for the importance of a proper jet simulation even in the low speed region is shown onFIG. 23. The diagram shows the drag differences due to a modification in the pylon nacelle area for engineconditions Windmill, Ground Idle and MTO. Assuming, this test would have been done wit. a through flownacelle only (mass flow ratio normally corresponding with TPS running at Ground Idle), it would have beenconcluded, that the modification were uneffective. The result with MTO-power simulation by a TPS, however,shows the contrary. So, taking into account the second segment climb case with one engine running at MTO-power and one windmilling, the TPS-test leads to the prediction, that the modification will have a favour-able effect on drag. A corresponding flight test proved not only this tendency, but also the amount of dragreduction was very similar.
An other task is the prediction of jet induced drag effects for the second segment climb performances.Using the reference method the prediction of second segment jet interference drag for a AC no. 2 can bemade by a comparison with the wind-tunnel results of A/C no. 1. An example for this is given on FIG. 24.This diagram shows the wind-tunnel results of jet induced drag for the relevant lift coefficients and corre-sponding slat/flap settings for A/C no. 1, whose relation to full scale results is known. The wind-tunnel

14-5
results for the new A/C no. 2 are also shown, and the difference between these two sets of curves is usedto predict the behaviour of A/C no. 2.
One more field for jet effects on drag is e. g. the influence of different engine configurations.Even here the TPS-tests at VFW showed an agreement with full scale conditions, which could not be shownwith other types of engine simulation, neither with through flow nacelles nor with blown nacelles. It shouldbe noted here, however, that successful force measurements with TPS engine simulators in the low speedregion can only be achieved, if the whole data acquisition and reduction system is built up on the basisof highestpossible accuracies. We retained a repeatability of _ 4 counts in the take-off test range.
2.3.2.3 Static pressure distributions
These tests, as well as flow visualizations and the wake flow measurements, desLribed below, mainlywere done to get more details about the very complex flow field in the wing/pylon/nacelle region. Staticpressure orifices were located on the wing I/B and O/B of the pylon and on the nacelle. The locations areshown in FIG. 25.
A typical result for the jet influence on the wing pressurp distribution is shown on FIG. 26. Fromthis it can be seen, that due to influencv of the fan nozzle jet the static pressure on the wing lower sideis increasing. This increase is more pregnant on the O/B side of the pylon than on the I/'B side. This re-sult is astonishing on the first view, because one would expect, that the fan jet velocity is higher thanthe Mach number and correspondingly a suction effect should exist leading to lI)wer pressures under the wing.This mystery found its explanation in the results of the wake flow measurements, described below, from whichit can be seen, that the velocity of the fan jet close to the pylon is much closer to tunnel velocity thanexpected. So, there is no suction due to the jet, while the massflow in the wing/pylon/nacelle area is in-creasing with increasing engine thrust. These two effects together may indeed lead to increasing pressuresbelow the wing, as the test results show.
FIG. 27 gives an example of static pressures on the core cowl of the engine at MTO-power setting.This diagram gives an impression of the influence of the fuselage and wing flowfield on the nacelle pres-sures. Comparing the results for a = 0 and 110 it can be seen, that with increasing angle the static pres-sures on the core cowl I/B of the pylon are increasing, while those of O/B and on the bottom of the nacelleare not influenced. From this result the conclusion may be drawn, that the jet is not to be assumed as afixed wall, like this is done if a socalled "skirted" through flow nacelle is used. Summarizing the resultsof the static pressure measurements, it must be stated as from the force measurements, that representativewing/pylon/nacelle interferences will not be got unless a proper jet simulation is used.
2.3.2.4 Wake flow investigations
The wake flow investigations mainly were done, to get more detailed informations about the flowfieldof the model jet and its behaviour under different conditions, such as changes due to
- variation of incidence angle,- different power settings,
- modifications of the nacelle geometry or
- increasing distance from the nozzle exit.
Comparing the TPS results with a real engine, it is to be noticed, that the temperature and hencethe velocity of the primary flow are much lower for the TPS (due to expansion of pressurized air in theTurbine), while the pressure ratio of the primary nozzle is comparable to full scale. The more importantpoint, however, is that the TPS can completely simulate the fan flow (i. e. pressures, temperatures, ve-locities, mass flow and - to a certain distinct - also swirl), which is responsible for the interferencewith wing, pylon and tailpldnie.Su, tLhe behdiviuur uf thv fdII flowfield of the TPS can also be used as aninput for the development of theoreti~al 3-D-computer programmes including jet effects.
For the wakeflow investigations in the tunnel a rake with pitot pressure orifices was used. Someexamples in FIG. 28 to FIG. 31 show the behaviour of the jet at different power settings and various dis-tances from the nozzle exit. Each diagramme shows the isobaric lines of total pressure ratios in the meas-uring plane and the corresponding 3-D total pressure ratio mountain.
These diagrammes show, that - except for the well known increasing size of the flowfield and the de-caying pressure ratio - at a position where the tailplane may be located, the mixing of fan and primaryflow has resulted in a flowfield showing no more unsymmetries, neither due to the pylon nor due to the lowerpressure of the primary flow.
2.3.3 Low speed TPS testing in DNW
To overcome the disadvantage of low Reynolds number and lacking asymmetric effects as mentioned above,the concept of complete model TPS testing in the DNW (German/Dutch Low Speed Tunnel) was developed. Thetypical model scale of Airbus type aircraft in this tunnel is about I : 10. FIG. 32 shows the tail stinginstallation of an A 300 B4 model in 6 x 8 m' test section of this tunnel. The Reynolds number for thesetests is R% = 3. 106.
For the model turbine driven simulators have been developed and delivered to DNW by Tech Development,Dayton (Ohio).
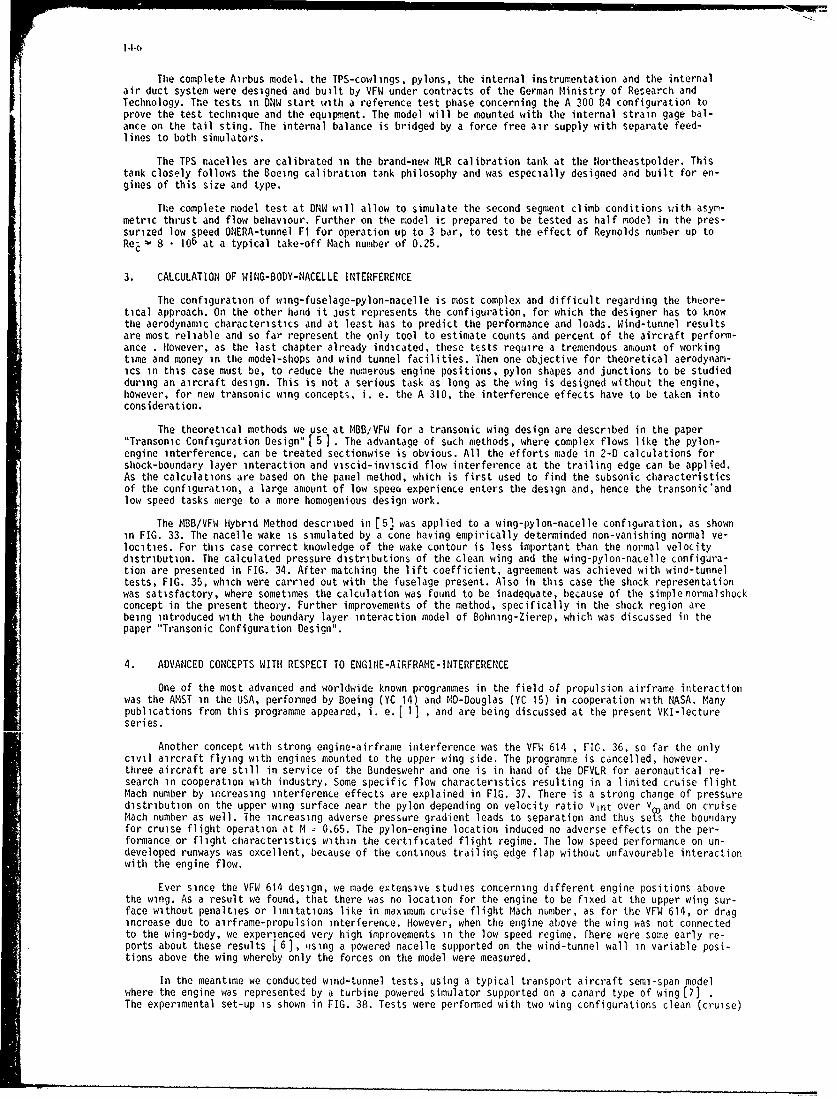
14-6
The complete Airbus model, the TPS-cowlings, pylons, the internal instrumentation and the internalair duct system were designed and built by VFW under contracts of the German Ministry of Research andTechnology. The tests in DNW start with a reference test phase concerning the A 300 B4 configuration toprove the test technique and the equipment. The model will be mounted with the internal strain gage bal-ance on the tail sting. The internal balance is bridged by a force free air supply with separate feed-lines to both simulators.
The TPS nacelles are calibrated in the brand-new NLR calibration tank at the Northeastpolder. Thistank closely follows the Boeing calibration tank philosophy and was especially designed and built for en-gines of this size and type.
The complete model test at DNW will allow to simulate the second segment climb conditions with asym-metric thrust and flow behaviour. Further on the model is prepared to be tested as half model in the pres-surized low speed ONERA-tunnel Fl for operation up to 3 bar, to test the effect of Reynolds number up toRez - 8 106 at a typical take-off Mach number of 0.25.
3. CALCULATION OF WING-BODY-NACELLE INTERFERENCE
The configuration of wing-fuselage-pylon-nacelle is most complex and difficult regarding the theore-tical approach. On the other hand it just represents the configuration, for which the designer has to knowthe aerodynamic characteristics and at least has to predict the performance and loads. Wind-tunnel resultsare most reliable and so far represent the only tool to estimate counts and percent of the aircraft perform-ance . However, as the last chapter already indicated, these tests require a tremendous amount of workingtime and money in the model-shops and wind tunnel facilities. Then one objective for theoretical aerodynam-ics in this case must be, to reduce the numerous engine positions, pylon shapes and junctions to be studiedduring an aircraft design. This is not a serious task as long as the wing is designed without the engine,however, for new transonic wing concepts, i. e. the A 310, the interference effects have to be taken intoconsideration.
The theoretical methods we use at MBB/VFW for a transonic wing design are described in the paper"Transonic Configuration Design" 5] . The advantage of such methods, where complex flows like the pylon-engine interference, can be treated sectionwise is obvious. All the efforts made in 2-D calculations forshock-boundary layer interaction and viscid-inviscid flow interference at the trailing edge can be applied.As the calculations are based on the panel method, which is first used to find the subsonic characteristicsof the configuration, a large amount of low speeo experience enters the design and, hence the transonic'andlow speed tasks merge to a more homogenious design work.
The MBB/VFW Hybrid Method described in (51 was applied to a wing-pylon-nacelle configuration, as shownin FIG. 33. The nacelle wake is simulated by a cone having empirically determinded non-vanishing normal ve-locities. For this case correct knowledge of the wake contour is less important than the normal velocitydistribution. The calculated pressure distributions of the clean wing and the wing-pylon-nacelle configura-tion are presented in FIG. 34. After matching the lift coefficient, agreement was achieved with wind-tunneltests, FIG. 35, which were carried out with the fuselage present. Also in this case the shnck representationwas satisfactory, where sometimes the calculation was found to be inadequate, because of the simplenormalshockconcept in the present theory. Further improvements of the method, specifically in the shock region arebeing introduced with the boundary layer interaction model of Bohning-Zierep, which was discussed in thepaper "Transonic Configuration Design".
4. ADVANCED CONCEPTS WITH RESPECT TO ENGINE-AIRFRAME-INTERFERENCE
One of the most advanced and worldwide known programmes in the field of propulsion airframe interactionwas the AMST in the USA, performed by Boeing (YC 14) and MD-Douglas (YC 15) in cooperation with NASA. Manypublications from this progranmme appeared, i. e.[ 13 , and are being discussed at the present VKI-lectureseries.
Another concept with strong engine-airframe interference was the VFW 614 , FIG. 36, so far the onlycivil aircraft flying with engines mounted to the upper wing side. The programme is cancelled, however.three aircraft are still in service of the Bundeswehr and one is in hand of the DFVLR for aeronautical re-search in cooperation with industry. Some specific flow characteristics resulting in a limited cruise flightMach number by increasing interference effects are explained in FIG. 37. There is a strong change of pressuredistribution on the upper wing surface near the pylon depending on velocity ratio Vint over v and on cruiseMach number as well. The increasing adverse pressure gradient leads to separation and thus ses the boundaryfor cruise flight operation at M = 0.65. The pylon-engine location induced no adverse effects on the per-formance or flight characteristics within the certificated flight regime. The low speed performance on un-developed runways was excellent, beLause of the continous trailing edge flap without unfavourable interactionwith the engine flow.
Ever since the VFW 614 design, we made extensive studies concerning different engine positions abovethe wing. As a result we found, that there was no location for the engine to be fixed at the upper wing sur-face without penalties or limitations like in maximum cruise flight Mach number, as for the VFW 614, or dragincrease due to airframe-propulsion interference. However, when the engine above the wing was not connectedto the wing-body, we experienced very high improvements in the low speed regime. fhere were some early re-ports about these results [ 63, using a powered nacelle supported on the wind-tunnel wall in variable posi-tions above the wing whereby only the forces on the model were measured.
In the meantime we conducted wind-tunnel tests, using a typical transport aircraft semi-span modelwhere the engine was represented by a turbine powered simulator supported on a canard type of wing [7] .The experimental set-up is shown in FIG. 38. Tests were performed with two wing configurations clean (cruise)
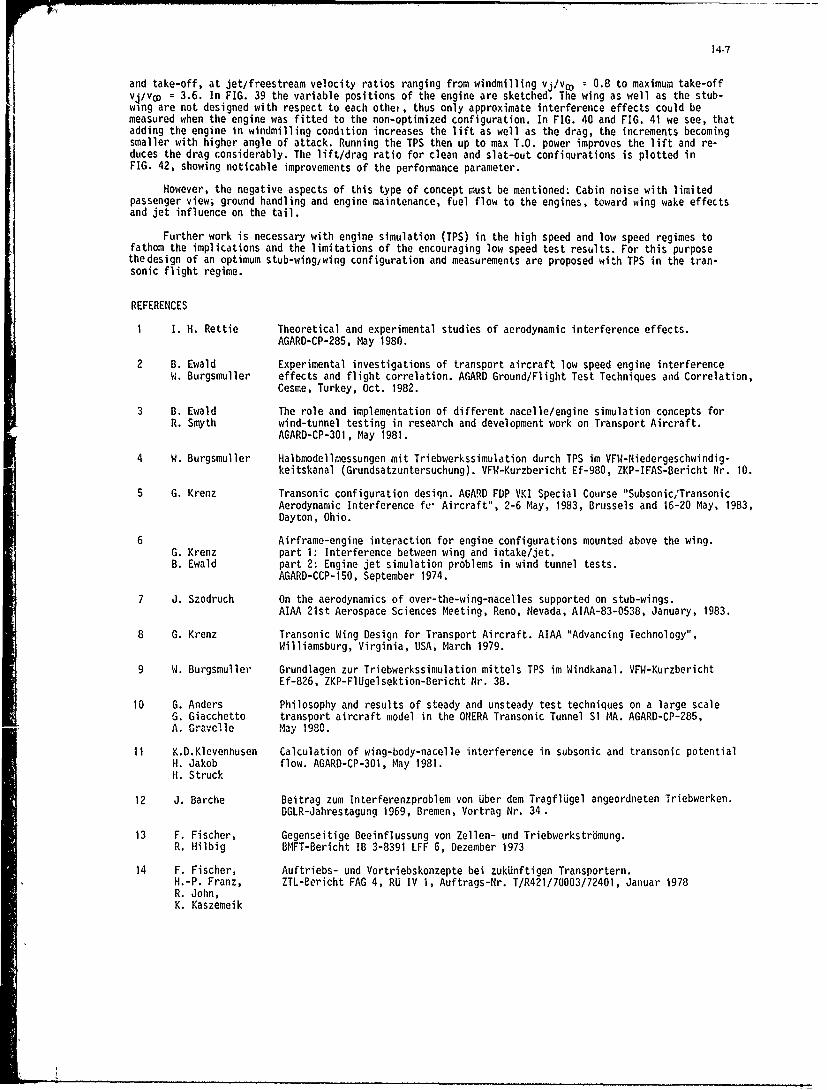
14-7
and take-off, at jet/freestream velocity ratios ranging from windmilling vj/vo, = 0.8 to maximum take-offvj/voD = 3.6. In FIG. 39 the variable positions of the engine are sketched. The wing as well as the stub-wing are not designed with respect to each othet, thus only approximate interference effects could bemeasured when the engine was fitted to the non-optimized configuration. In FIG. 40 and FIG. 41 we see, thatadding the engine in windmilling condition increases the lift as well as the drag, the increments becomingsmaller with higher angle of attack. Running the TPS then up to max T.O. power improves the lift and re-duces the drag considerably. The lift/drag ratio for clean and slat-out confiqurations is plotted inFIG. 42, showing noticable improvements of the performance parameter.
However, the negative aspects of this type of concept must be mentioned: Cabin noise with limitedpassenger view; ground handling and engine maintenance, fuel flow to the engines, toward wing wake effectsand jet influence on the tail.
Further work is necessary with engine simulation (TPS) in the high speed and low speed regimes tofathom the implications and the limitations of the encouraging low speed test results. For this purposethedesign of an optimum stub-wing/wing configuration and measurements are proposed with TPS in the tran-sonic flight regime.
REFERENCES
1 I. H. Rettie Theoretical and experimental studies of aerodynamic interference effects.AGARD-CP-285, May 1980.
2 B. Ewald Experimental investigations of transport aircraft low speed engine interferenceW. Burgsmuller effects and flight correlation. AGARD Ground/Flight Test Techniques and Correlation,
Cesme, Turkey, Oct. 1982.
3 B. Ewald The role and implementation of different nacelle/engine simulation concepts forR. Smyth wind-tunnel testing in research and development work on Transport Aircraft.
AGARD-CP-301, May 1981.
4 W. Burgsmuller Halbmodellmessungen mit Triebwerkssimulation durch TPS im VFW-Niedergeschwindig-keitskanal (Grundsatzuntersuchung). VFW-Kurzbericht Ef-980, ZKP-IFAS-Bericht Hr. 10.
5 G. Krenz Transonic configuration desiqn. AGARD FDP VKI Special Course "Subsonic,'TransonicAerodynamic Interference fe- Aircraft", 2-6 May, 1983, Brussels and 16-20 May, 1983,Dayton, Ohio.
6 Airframe-engine interaction for engine configurations mounted above the wing.G. Krenz part 1: Interference between wing and intake/jet.B. Ewald part 2: Engine jet simulation problems in wind tunnel tests.
AGARD-CCP-150, September 1974.
7 J. Szodruch On the aerodynamics of over-the-wing-nacelles supported on stub-wings.AIAA 21st Aerospace Sciences Meeting, Reno, Nevada, AIAA-83-0538, January, 1983.
8 G. Krenz Transonic Wing Design for Transport Aircraft. AIAA "Advancing Technology",Williamsburg, Virginia, USA, March 1979.
9 W. Burgsmuller Grundlagen zur Triebwerkssimulation mittels TPS im Windkanal. VFW-KurzberichtEf-826, ZKP-FlUgelsektion-Bericht Hr. 38.
10 G. Anders Philosophy and results of steady and unsteady test techniques on a large scaleG. Giacchetto transport aircraft model in the ONERA Transonic Tunnel SI MA. AGARD-CP-285,A. Gravelle May 1980.
11 K.D.Klevenhusen Calculation of wing-body-nacelle interference in subsonic and transonic potentialH. Jakob flow. AGARD-CP-301, May 1981.H. Struck
12 J. Barche Beitrag zum Interferenzproblem von Uber dem TragflUgel angeordneten Triebwerken.DGLR-Jahrestagung 1969, Bremen, Vortrag Nr. 34.
13 F. Fischer, Gegenseitige Beeinflussung von Zellen- und Triebwerkstrbmung.R. Hilbig BMFT-Bericht IB 3-8391 LFF 6, Dezember 1973
14 F. Fischer, Auftriebs- und Vortriebskonzepte bei zukUnftigen Transportern.H.-P. Franz, ZTL-Bericht FAG 4, RU IV 1, Auftrags-Nr. T/R421/70003/72401, Januar 1978R. John,K. Kaszemeik

14-8
Comet 8oemg 707 Caroytelt
Fig. I, Different Concepts of EngineLocation
Sobrefiner VFW 614 0Ceng YC-u
Fig. 2s Aircraft with Einginesabove the Wing
Fig. 31 Airbus A300-B4 on Ground

14-9
NO'L Wg 14C0m a4 py lom OtmsMum ory 0o ovigh oatlme
FRONT SPAR REAR SPAR
A 300
ENGINE -I GEAR
* m ROUND CLEARANCE ®B 767___
0B757
Fig. 4o General Design Aspects of Fig. So Pylon Planform and
Engine Position Nlacelle Position
o.58 THROUGH FLOW NACELLE
050 ,/
CL/
/.L WIT PDPYLON Aerofoii Improvemento O - - Q Wing Root
0 2 "i// -7--Opimizoion
0 1 2 jo 13 - -
.o 4 LI //
C Propusioo-Wing
0 4 Integration
2 AieronlSpoiter
0 Q2 04 06CL 08 Effectiveness001 Airo/p~e0 2 a.I I
Fig. G Effect of Pod/Pylon on Fig. 7, Future Research in Transonic
Lift and Drag Aerodynamics
M- 78 CL 51
p pl sect-ows RN .25 10'
o----o wth pyton/nacelle
.12 n-033 n!OQ3S -12 q-041
Cp 3 Cp
-0A A -08
a,, toto ,
OS x 0 5 XiC
04 CIA
0Q8 0,8
Fig. 8 Windtunnel Tests at NLR-HST,Wing B10.3U
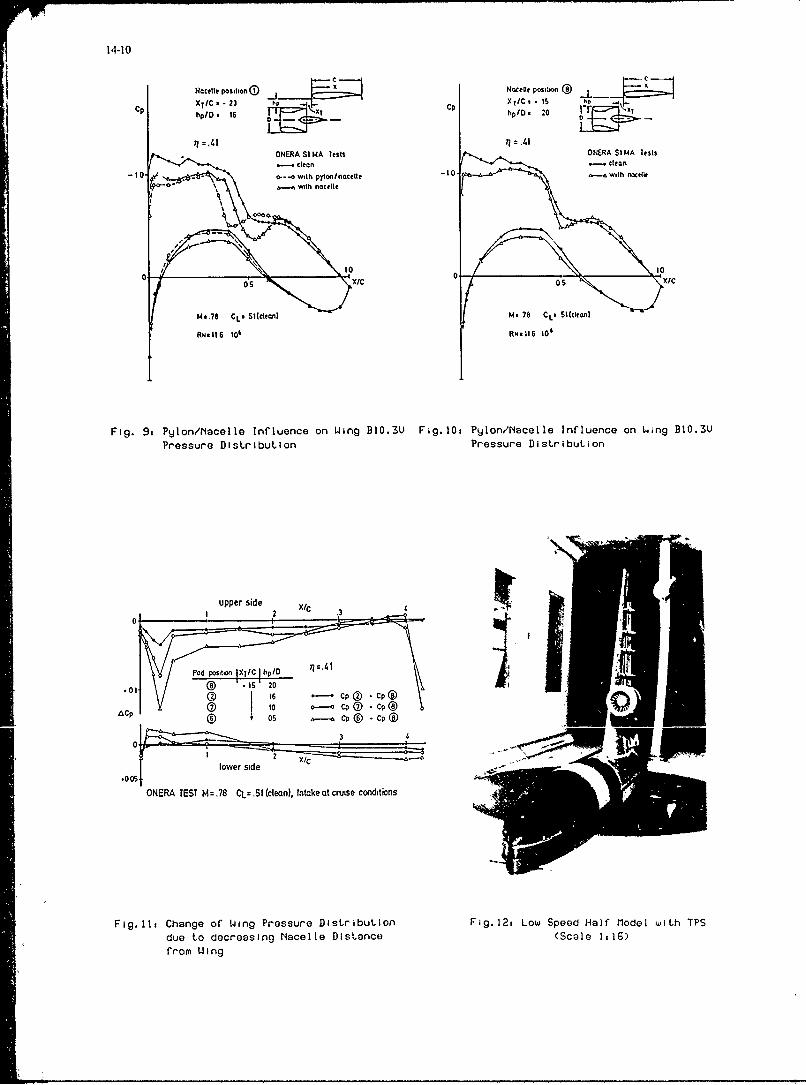
14-10
Nacelle position (D ) Nacelle positionx
CpXTIC. - 23 XrICs 1 hCp hplO . 16 D XT Cp hpIO* 20 f~-
ONERA SI MA tests ONERA SIMA Teas- Clean- Clean
10 o.-owith pyo/eill e -to it nacelle
to 1000XI
M. 8 L 'SidecniM- 76 CL. Sllciranl
RN-11 106RN.116 10'
Fig. 9, Pylon/Nlacelle Influence on Wing BIO.3V Fig.1Oa Pylon/rNacelle Influence on Wing BIO.3UPressure Distribution Pressure Distribution
I upper side 2 X/c
10 .15 20.01 I6 *- @p *Cp®(
ACP IT jG7 :0 0-a D p@05 CP Cp® *Cp0
3
lower side2 C
.005
ONERA TEST M .78 CV .51 (Clean)l, Intake at cruise conditions
Fig.l1z Change of Wing Pressure Distribution Fig.12t Low Speed Half Mlodel with TPSdue to decreasing N~acelle Distance (Scale 1,16)
from Wing

14-11
Fig. 13. Turbine Powered Simulator Fig.14i Static Thrust Calibration of TPS
to Sconivalve
Fiao.ISi (anifoldinq of Pressure Orifices
Fig.16. Oilflow on Fan Cowl u/s at F19.171 Oilflow on Fan Cowl uls atIITO-Power Cond. (WIT-Test) Ground-Idle-Power Cond.
(W/T-Test)

C- Vo4 CIo
Po e u d tr ,rlI )
Ig?1 ght Test wth Tufts on lip Sde i.? q.gtA lest WAP T; .tca ur, lip 3./It
of PylIo (NT U- Power ondt ,on) of ly I r) k r~ncrr C Lorndt on

14-13
-T "Col "O.CTo 1c.1, .lale(IFN)'b'~CO%.modrrtedCO 3ludfrd I--- ~ #- ~ ***~*
&A/ 1-2
0 2 -
ITFNj IC
cl. CL
Fig.23i Influences of Power Setting on F1g.241 Comparison of Jet Induced DragModification in the Wing-Pyglon for Similar SIC-Configurations
-- C.,, 9 900 0
___ too*11 0 Ground
lie of C P _ldIt towerPylon -- Surface
IEL 0, Ground
010 C1 -P lo.' wer0)8 Pylon ,TOsulloce
Fig.25, Pressure Points on Wing and Fig.26, Jet Effects on Wing PressuresNacelle for WIT-Test (WIT-Test)
C
40 i/B 400/8
0 0018
1800Ol Ii /
Engine corrdtion MTO
Fig.2'j Influence of Incidence Angleon Nacelle Pressures(WIT-Test)
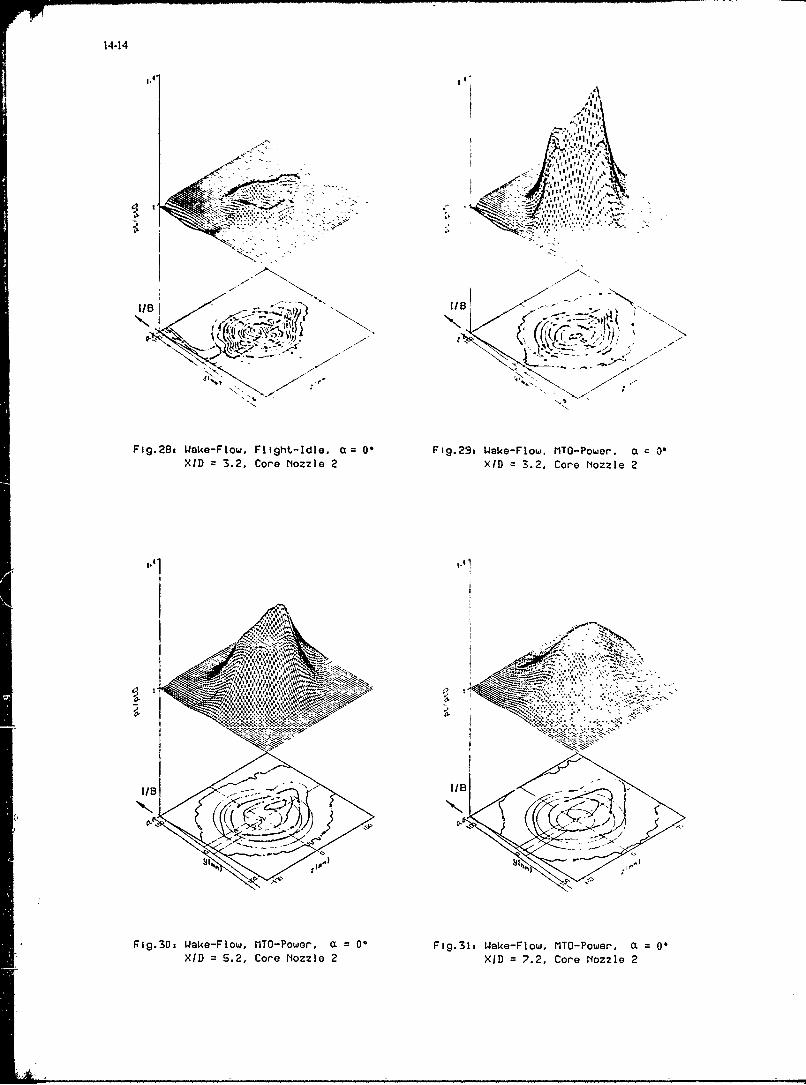
14-14
4e_!I
Z oe"2
I/B I/Bf
-. ~ k. kA~
Nzqi
I/B IN
0..18
% r
f(g.0,Wa e-lo , r O Po er O 0 F g.1 Wak -Fl w, T-Po e OL~
Fig.2= SaeFo. FlrehNozzle. 2 OI =i.9 2.2, Clrw NIO-ozzle

ago 'Asa,
Fig.36a Shorthaul Aircraft UFWJ 614
"ACI
P O PEC LN TTP~OAT11 0 22-PYO
00 A 3-A1Oi~ ~~~~~~ 0.EWb 0 II 0 4 6 08 I
VERTCAL SIMiONO
82 a=2 .1 0
CP~~O IS072 Cnav 2
Fi.31 al rodl ith verteWn Mi.9 =vrteLn Q6e5l lollion0ae~e Intale in &F n oodnt Sse.ora e
L o.pe d 0 n T n e i t o- - a E I t i m e e

14-16
20 ----- -- -4
.02
0 S to (oEG] IS 0 DEG
a) X/0.0.25, ZIO.0.8i
20 - --- -- 3
200
10 ~.0, C
.02
0 .03 X/D = 2.0
c< OEG) 0 t o [ Isce [EG)
b) XID.2.0, ZID=0.l
Fig.40, Influence of Engine Simulator Flg.41 Influence of Engine Simulator
on Lift on Drag
X/iD 0,25
15_ NJ/vlV 3 6)
=TAK<EOFF(slot 150)
x
I 'V 17)
1(clean)-J
-10 -
, o Z/D 15
Flg.42! Lift-Drag Ratio for DifferentVertical Nacelle Positions

14-17
Oki,
Fig.32i A300-B4 Model I% DINW
(Scale 1,9.S)
NACELLE VNO 0
ITT~7N1 Al P~
FIg.33 WinglNacelleIPylon Configuration
Panel Half Span Model
Test at NLR-HST
Re=2 5 iU6 Tr 7/7%
2 5 .. . wn l,, e -25 Wing-Body
- Wing - Noctile W ng-Body -Noceiie-Pyion
-20 -20
CP Cp
-10 - 0
CP Cp
.05 -05
0 0
05 05
o 02 0 06 08x I 10 0 02 0/ 06 8 x t 1 0
Fig.34, WJingIacelle Intererence Fig.3S, Comparison of Pressure
Calculation Hybrid Method Distributions Experiment(L =0.4 ° , M. = 0. 7S) a 0=0.40, M. = 0.7S)

M2IGINE - AIRFRAME IN 1ERFERENCE EFFECTSBY
Alan VintPrincipal Aerodynamicist
British Aerospace PLCWarton Division
Preston, LancashireEngland
SUMMARY
The various types of interference between a turbo-jet or turbo-fan engine and the airframe asapplicable to military aircraft are described in detail. Examples of the effects on overallaircraft aerodynamics are given, including, where possible, simple mwans for their evaluation. Itis shown that the interference may give either significant benefits or penalties and that relativelyminor geometric changes can have profound effects. Above all it is shown that the effects of allaspects of engine airframe interference mst be known early in the design process so that pitfallscan be avoided or beneficial effects included in the initial aircraft design.
1. INRDCION
Aerodynamic interference between the jet engine and the airframe of military aircraft haslong been recognised as playing a major role in overall vehicle performance. As a resultconsiderable research has been conducted over the years, see for example ref. 1, aimed atachieving optimum engire installation by enabling detailed consideration of the variouseffects to be carried out early in the design stage.
First consideration, after the size and number of power plants required has beenestablished, is: where best to put the engine? The choice is by no means easy due firstlyto the number of locations available and secondly, to the various inter-related yetdifferent effects associated with each. Most locations have in fact been tried: infuselage (Tornado fig. 1), over fuselage (Vl fig. 2), fuselage mounted semi-podded(Alpha-jet fig. 3), rear fuselage podded (A10 - fig. 4), fin mounted (DCl0 fig. 5),under-wing podded (B58 fig. 6), under wing integrated (YC 15, fig. 7), mid wing (Canberrafig. 8) and wing tip mounted (VJl01, fig. 9). It remains to be seen if designers can findgood reason for placing engines in the few remaining spaces which have not so far been usede.g. podded on tailplanel
Aerodynamic interference aspects would appear to play a small part in the final choice ofengine position (fig. 10). However the designer must be kept fully aware of theaerodynamic implications of each particular contender. Only then can a position be chosenwhich results in an optimum installation for a particular aircraft role, or, at the veryleast, a satisfactory overall compromise.
Once the engine location has been established the task of evaluating the associatedaerodynamic interference effects starts in earnest. Broadly the sources of interferencecan be divided into three groups (fig. 11):
a) the installation bulk - obvious for podded installations but still present forengines buried in fuselage or wing,
b) the intake
and c) the exhaust.
Each of these sources influences the cnginc/airframe interference in a variety of ways, andthe paper will attempt to deal with them in turn, listing the detaileu sources ofinterference in each group and giving, where possible, simple means by which theinterference effects may be evaluated. Areas which in general have significant developmentrisks are highlighted as well as those which can lead to significant beneficial effects.An example of a possible aircraft deliberately configured to take maximum benefit ofengine/airframe interference is given along with an evaluation of one aspect of theperformance improvements achieved.
2. ENGINE AIRFRAME INTERFERENCE DUE TO BULK
2.1 Buried Installations
Buried installations may or may not be seen as giving rise to engine/airframe interferencein the true sense. For the purposes of this paper however a short discussion is inc1,ldedprimarily to show that the choice of buried as against podded - which does give rise totrue aerodynamic interference - still has significant aerodynamic effects.
2.2 Buried In Fuselage
The primary effect of burying the engine in the fuselage is the increase in fuselage sizerequired to envelop the complete engine installation, generally resulting in a very large
pJ4EOEDING PAGE BLANK-NOT FI]1 D
t - --- . - - --- ---t --- ---
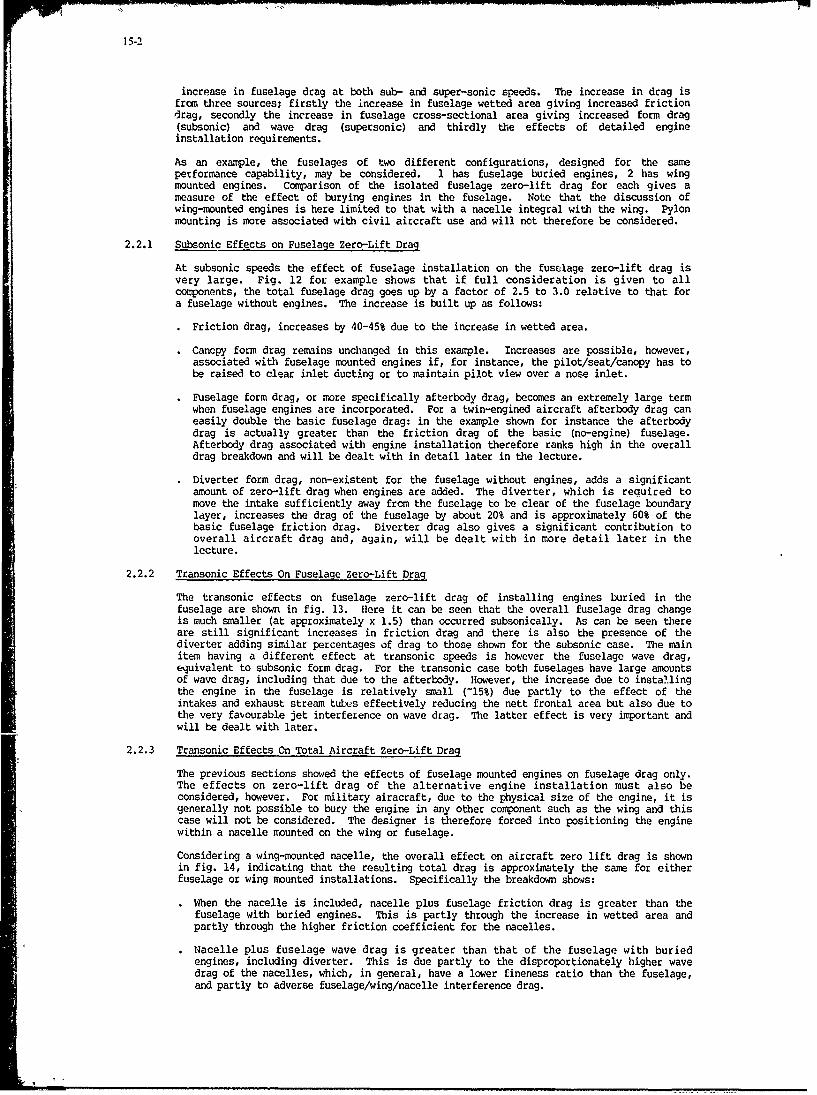
15-2
increase in fuselage drag at both sub- and super-sonic speeds. The increase in drag isfram three sources; firstly the increase in fuselage wetted area giving increased frictiondrag, secondly the increase in fuselage cross-sectional area giving increased form drag(subsonic) and wave drag (supersonic) and thirdly the effects of detailed engineinstallation requirements.
As an example, the fuselages of two different configurations, designed for the sameperformance capability, may be considered. 1 has fuselage buried engines, 2 has wingmounted engines. Comparison of the isolated fuselage zero-lift drag for each gives ameasure of the effect of burying engines in the fuselage. Note that the discussion ofwing-mounted engines is here limited to that with a nacelle integral with the wing. Pylonmounting is more associated with civil aircraft use and will not therefore be considered.
2.2.1 Subsonic Effects on Fuselage Zero-Lift Drag
At subsonic speeds the effect of fuselage installation on the fuselage zero-lift drag isvery large. Fig. 12 for example shows that if full consideration is given to allcomponents, the total fuselage drag goes up by a factor of 2.5 to 3.0 relative to that fora fuselage without engines. The increase is built up as follows:
Friction drag, increases by 40-45% due to the increase in wetted area.
Cancpy form drag remains unchanged in this example. Increases are possible, however,associated with fuselage mounted engines if, for instance, the pilot/seat/canopy has tobe raised to clear inlet ducting or to maintain pilot view over a nose inlet.
Fuselage form drag, or more specifically afterbody drag, becomes an extremely large termwhen fuselage engines are incorporated. For a twin-engined aircraft afterbody drag caneasily double the basic fuselage drag: in the example shown for instance the afterbodydrag is actually greater than the friction drag of the basic (no-engine) fuselage.Afterbody drag associated with engine installation therefore ranks high in the overalldrag breakdown and will be dealt with in detail later in the lecture.
Diverter form drag, non-existent for the fuselage without engines, adds a significantamount of zero-lift drag when engines are added. The diverter, which is required tomove the intake sufficiently away from the fuselage to be clear of the fuselage boundarylayer, increases the drag of the fuselage by about 20% and is approximately 60% of thebasic fuselage friction drag. Diverter drag also gives a significant contribution tooverall aircraft drag and, again, will be dealt with in more detail later in thelecture.
2.2.2 Transonic Effects On Fuselage Zero-Lift Drag
The transonic effects on fuselage zero-lift drag of installing engines buried in thefuselage are shown in fig. 13. Here it can be seen that the overall fuselage drag changeis much smaller (at approximately x 1.5) than occurred subsonically. As can be seen thereare still significant increases in friction drag and there is also the presence of thediverter adding similar percentages of drag to those shown for the subsonic case. The mainitem having a different effect at transonic speeds is however the fuselage wave drag,equivalent to subsonic form drag. For the transonic case both fuselages have large amountsof wave drag, including that due to the afterbody. However, the increase due to installingthe engine in the fuselage is relatively small (-15%) due partly to the effect of theintakes and exhaust stream tubes effectively reducing the nett frontal area but also due tothe very favourable jet interference on wave drag. The latter effect is very important andwill be dealt with later.
2.2.3 Transonic Effects On Total Aircraft Zero-Lift Drag
The previous sections showed the effects of fuselage mounted engines on fuselage drag only.The effects on zero-lift drag of the alternative engine installation must also beconsidered, however. For military airacraft, due to the physical size of the engine, it isgenerally not possible to bury the engine in any other component such as the wing and thiscase will not be considered. The designer is therefore forced into positioning the enginewithin a nacelle mounted on the wing or fuselage.
Considering a wing-mounted nacelle, the overall effect on aircraft zero lift drag is shownin fig. 14, indicating that the resulting total drag is approximately the same for eitherfuselage or wing mounted installations. Specifically the breakdown shows:
When the nacelle is included, nacelle plus fuselage friction drag is greater than thefuselage with buried engines. This is partly through the increase in wetted area andpartly through the higher friction coefficient for the nacelles.
Nacelle plus fuselage wave drag is greater than that of the fuselage with buriedengines, including diverter. This is due partly to the disproportionately higher wavedrag of the nacelles, which, in general, have a lower fineness ratio than the fuselage,and partly to adverse fuselage/wing/nacelle interference drag.

15-3
For the nacelle case, part of the wing is masked leading to a reduction of exposed wingwave and friction drag.
Moreover note that, with respect to zero-lift interference wave drag at transonic andsupersonic speeds, significant benefits may be achieved by the use of area-ruling. Thearea-ruling concept, discovered many years ago (refs. 1 to 3), basically requires thatfor minimum drag of an aircraft configuration the total area distribution Tust be smoothand of the lowest possible cross-sectional area. These points are shown in figs. 15 and16:
Cuts are taken through the complete aircraft using planes at angle (the Mach angle)relative to freestream. The total area of the configuration intersected by the plane isthen calculated and given as a distribution in he X-direction. The excercise isrepeated for small rotation angles up to = 360 , and a series of area distributionsformed. The drag of each area distrit~ition is calculated, using in this case slenderbody theory. The wave drag of the configuration is then the mean value of the dragscalculated for each area distribution. An example of the technique applied to a nacelleon wing configuration is shown in fig. 16 indicating the significant "waisting" requiredin the fuselage area distribution to allow for the effect of the nacelle to minimisetotal wave drag. The benefits which can be gained are shown in fig. 17: the reductionin zero-lift wave drag at a low supersonic Mach number was found to be approximately 15%for the case studied.
2.2.4 Effect of Wing-Mounted Nacelle On Sub- And Trans-Sonic Drag Due to Lift
The effects dealt with so far have been restricted to comparisons of the effects onzero-lift drag of fuselage with buried engines relative to wing-mounted nacelles. Afurther effect which fuselage buried engines do not have (apart from that due to theincreased fuselage width) is that of interference with the lifting wing.
Recent measurements made at BAe Warton at low speed indicated significant increases ininduced drag, due to the presence of a wing mounted nacelle. Fig. 18 illustrates theeffects obtained. The expected increase in drag due to lift is approximated by the amountof exposed wing leading edge masked by the nacelle, as indicated. The measurements show,however, that at low lift the penalty on induced drag is lower than expected.
At higher lift coefficients (X.55, C,2 0.3) the presence of the nacelle increases theinduced drag by a much greater akount thNn that expected. The reason for this can be foundfrom consideration of the surface flow patterns obtained (fig. 19). It can be seen that onthe inboard side of the nacelle the flow becomes almost perpendicular to the free streamwind direction presenting impossible local angles of attack for the wing leading edge inthat region. The flo thus separates from the upper wing surface at the inboardnacelle/wing junction creating a large vortex and region of flow separation. Addition of alarge amount of wing leading edge droop locally (fig. 19) has a significant beneficialeffect (fig. 20) giving, in this case, of the order of 6% improvement in induced drag andreturning the penalty at moderate to high lift coefficients to the value expected (fig.18). Significant improvements may therefore be obtained by altering the wing leading edgegeometry over only a relatively small region.
At transonic speeds, minimisation of induced drag penalties at relatively low lift andhence low angles of attack requires great care in positioning and local shaping of thenacelle in relation to the wing. As an example fig. 21 shows a typical nacelle-winginstallation along with the isolated and combined pressure distributions obtained,calculated using a 3D-subsonic panel program (ref. 4). It can be seen that both nacelleand wing have strong suction peaks close to their respective leading edges. The nacellemust therefore bc positioned such that the pressure distributions are staggered, minimisingboth the coalescence of the suction peaks and the local Mach numbers. Even with staggersignificant interference between nacelle and wing leading edge will still be found whichcan only be alleviated by detail shape changes at the wing leading edge nacelle junction(fig. 21). At present it is necessary to use an iterative procedure of shape changefollowed by panel program calculation until satisfactory pressure distributions areachieved.
3. ENGINE/AIRFRAME INTERFERENCE DUE 70 INTAKE
The interference between the engine intake and the airframe can be divided into thefollowing sub-groups:
DIVERTER EFFECTS ) T1 AIRFRAMESPILLAGE EFFECTS
ENGINE FACE FLOW DISTORTION)ENGINE FACE FLOW SWIRL ) AIRFRAME '10 ENGINE VIA INTAKEENGINE FACE PRESSURE RECOVERY)

15.4
Of these sub-groups the last three come more under the heading of intake/enginecopatability than engine/airframe interference. Although the external aircraftaerodynamics can give significant effects on the intake flow, in general, specific designmodifications to the intake will attenuate their effects considerably. Inlet design forengine cempatibility is a large subject in its own right and will not be dealt with hereapart from one or two observations concerning type and position. Diverter and spillageeffects on the airframe which can be easily recognised as true engine/airframe interferenceeffects will be dealt with in some detail. The effects are significantly influenced bychoice of intake type and choice of intake location.
3.1 Choice of Intake Type
For military aircraft the choice of intake type is in general determined by the Mach numberrange of the aircraft and the emphasis required on supersonic performance. For a purelysubsonic aircraft or one with limited supersonic capability a pitot type of inlet isgenerally acceptable (Fig. 22). For higher Mach numbers increasingly complex intake typesmay be chosen depending on the emphasis placed on supersonic operation. (fig. 23). Theactual choice is governed by an acceptable compromise between engine covpatability,external effects, cost, weight etc. The external effects are in general due to spillageand the associated cowl bluffness and will be dealt with later.
3.2 Choice of Intake Location
The dominant locations available for the intake are:
a. fuselage side
b. underfuselage (CHIN)fig. 24
c. overfuselage (DORSAL)
d. nacelle
Though other positions have been used e.g. at junction between fuselage and lower wingsurface (Armpit), these are generally only small variations on the above.
Each location has associated with it many different non-aerodynamic effects e.g. adversepilot view for a and c, increased height of cockpit above ground/reduced wheelbase for betc. There are, however, several major aerodynamic effects which must be considered:
3.3 Airframe to Inlet Interference Gross Effects
3.3.1 Side Inlet
In general the side fuselage position gives reasonable overall characteristics for normalintake operation. Providing care is taken to avoid very bad fuselage shaping or largeexcrescences ahead of the inlet then few problems are likely to occur.
This is, however, only true for up to moderate incidences: as incidence increases two
effects are apparent from flow vizualisation studies (fig. 25).
body upwash increases the incidence on the lower cowl, as shown in fig. 26.
body outwash increases the "incidence" on the inner cowl. side, also shown in tig. 2b,
exacerbated by sideslip.
The effect of body upwash on the lower cowl can in general be dealt with by reducing theloading on the intake lower lip e.g. by scarfing, by drooping of the lower lip, or even byrotating the whole of the front of the inlet as on F15. Any of these measures providessignificant alleviation of the adverse body upwash effects.
Body side-wash effects are much more difficult to alleviate, however. The proper choice ofvertical location of the intake combined with careful design of the lower fuselagecross-sectional shape are means of achieving satisfactory overall performance.
3.3.2 Chin Inlet
The underfuselage or chin position offers an aerodynamically favourable location though canbe constraining on general configuration layouts. Primarily this is due to the beneficialeffect of the fuselage in "shielding" the inlet from incidence effects (figs 25, 26) whilstgiving little amplification of sideslip.
Adverse effects can become apparent at transonic speeds and low incidence, however,especially if the aicraft incorporates a drooped radome to maintain pilot view. As speedincreases towards M = 1 the suction peak at the lower shoulder increases until eventually alocal pocket of supersonic flow occurs. At some stage a shock wave will form, and giverise to a significant increase in boundary layer thickness or, in extreme cases, tocomplete flow separation (fig. 27). Either of these, if ingested by the intake, can leadto significant losses of engine thrust and care must be taken during design to avoid thesituation.

3.3.3 Overfuselage Inlet (Dorsal)
Dorsal inlets would appear at first sight to offer little if any benefits over the previoustwo configurations, on the grounds that even at moderate incidence the thickening andpossible separation of the fuselage boundary layer aft of the canopy would result insignificant loss of pressure recovery at the inlet face. However the location offers suchsignificant benefit in other areas e.g. large reduction in hot gas reingestion effects forV/STOL operation, masking of inlet from lower front quadrant with respect to radarreflections etc, that it is worth further consideration of the actual aerodynamic effects.
A recent study (ref. 6) suggests that the suspected adverse effects of incidence may not infact be present and, indeed, that at the higher incidences the Dorsal intake may give someadvantages. The possible reason for this is shown in fig. 28, illustrating that thefuselage vortex flow, augmented perhaps by strake vortices, sweeps away the boundary layerfrom the fuselage top surface, allowing clean flow to enter the intake. However, thepossible adverse effects of low incidence boundary layer thickening or separation attransonic speeds, similar to those encountered for the chin inlet configuration (fig. 27)still exist and must be seriously considered prior to final intake location selection.
3.3.4 Nacelle Inlet
The interference at the nacelle inlet is obviously dependent on nacelle position.Positioning close to the fuselage will result in the interference types illustrated above.For the case of a wing mounted nacelle the inlet can be taken to be free of interference toa first order, ie. acting as an isolated intake. Achievement of the required performancethen rests on localised design of the inlet itself and will not be considered here.
3.3.5 Overall Effects Of Inlet Location On Inlet Performance
Demonstration of the overall effects of airframe interference on intake performance maybest be done by consideration of the pressure recoveries which may be achieved by intakesat each of the positions described above. The effects at high subsonic speeds are shown infig. 29 which combines data from BAe Warton in-house studies (side, chin and isolated) withthose of reference 6 (dorsal or top-mounted).
It can be seen that, at the conditions chosen, all the inlets give similar performance atlow incidence. As incidence increases the performance of the inlet improves: from sid8location, to isolated, to chin, to dorsal. In fact, but for the "bucket" at around 10for the dorsal intake where the thick/separated boundary layer effects have not yet beeneliminated by the beneficial vortices, the dorsal inlet would appear, perhaps surprisingly,to be the best location.
The effects shown are typical of those normally associated with the choice of inletlocation. Significant changes in the order of ranking are possible through careful inletdesign, however, so the effects shown must not be considered definitive. Many examples aregiven in the literature and it is up to the student of engine/airframe installationaerodynamics to judge each intake type/location combination on its own merits. In additiona large amount of dedicated wind tunnel testing and development must take place to ensuresatisfactory engine-intake compatibility over the whole of the required flight envelope.
3.4 Intake to Airframe Interference
3.4.1 Diverter Flow
Intake diverters are normally used, rather than internal bleed, whenever the intake is inclcse proximity to an upstream surface, in order to stand the intake a sufficient distanceaway to ensure the surface boundary layer is not ingested into the engine. The presence ofthe diverter has two effects on the airframe: the primary one of increased drag, thesecondary one of diverter vortex formation which may have a significant influence if itimpinges or comes close to downstream surfaces such as the vertical tail fin. The lattereffect is extremely configuration dependent however and will not be considered here.
The primary effect of the diverter, ie increased drag, is very significant, however, (figs.12 and 13) and is only amenable to alleviation at supersonic speeds. At subsonic speedsthe drag coefficient of the diverter is essentially fixed at approximately 0.25 based onfrontal area, though minor reductions are possible (down to CD of 0.2) with well roundedshapes (ref. 7).
At transonic and supersonic speeds the diverter drag coefficient based on frontal area is astrong function of the wedge angle and of Mach number (fig. 30), with increasing Machnumber or reducing wedge angle giving significant reductions. The importance of reducingwedge angle is clear but it should be noted that the more slender the diverter the moredifficult it becomes to shape the inlet duct to pass in to the main fuselage. From aconstruction point of view the tendency is to high diverter angles and hence high diverterdrag.

15-6
3.4.2 Spillage
Spillage effects occur because the engine intake is sized for maximum entry streamtubewhich, in general, occurs at transonic speeds. At sub- or super-sonic speeds, or atreduced power settings the engine non-dimensional mass flow requirements reduce. Theexcess air which the intake is capable of delivering is then "spilled" around the intakecowl lips (fig. 31) giving rise to primary (drag) and secondary (vortex) effects similar insome ways to those for diverter flow.
.4.2.1 Spillage Drag
The term spillage drag is actually introduced to balance the accounting between externaland internal flow. Engine thrust is conventionally defined as the difference betweennozzle gross thrust and ram drag, the latter being calculated in the free stream ahead ofthe intake (As fig. 31) rather than at the structural entry. There is therefore aso-called pre-entry force equal to the stream-force change between free-stream and theintake which has to be accounted in the basic aircraft drag. However, when spillageoccurs, there is a change in the flow over the external surface of the intake cowlproducing a thrust which can completely offset the pre-entry force, if the inlet cowl isbluff. For military aircraft, with some emphasis on supersonic performance, a compromisehas to be reached. In general, a relatively thin cowl is used in order to give low wavedrag; full cowl force is not developed and the net result is spillage drag.
Calculation of spillage drag is relatively straight forward for a pitot intake (fig. 32).Pre-entry force may be calculated as shown fig. 32 and 33. The spillage drag may then beobtained by applying a factor (K ) to the pre-entry drag which is a function primarily ofthe cowl bluffness. In general-erms a shallow cowl such as that used for a militaryaircraft will have a K of approximately 0.6 whilst that designed for subsonic operationmay have 1K of 0.2 cbled with a critical mass flow (Ao/Ac fig. 32) above which nospillage &% is incurred. Further guidance on values for KA 'ay be obtained from ref.9; example of spillage drag effects at sub-, trans-, and su rsonic speeds are given inref. 10. For a fuller disertation on spillage drag and its prediction at transonic speedssee ref. 18, though note that spillage drag values for a pitot intake at trans- andsuper-sonic speeds are given in Fig. 33.
3.4.2.2 Other Spillage And Mass Flow Effects
There are two causes of the secondary spillage and mass flow effects ie. cowl separationand/or vortex production at high spillage, and the change in local flow directions at theother components of the aircraft due to changes in engine mass flow.
Of the two, the former ie. cowl separation and/or vortex production is by far thepotentially more serious but is very dependent on inlet location if precise effects are tobe determined. With an underfuselage inlet, for instance, if the upper cowl lip is outsidethe fuselage side, spill vortices can interact with the wing leading edge flow to produceunusual effects. As an example fig. 34 shows the different sideslip characteristics of aconfiguration having an underfuselage but only semi-shielded inlet with and withoutspillage present. It can be seen that the0spillage leads to an adverse change in therolling moment due to sideslip above about 25 .
Other examples may be quoted but in general it is best that the aerodynamicist is aware ofthe potential influences so that thorough investigation, preferably in the wind tunnel, canbe carried out early in the aircraft design process.
The effects of mass flow changes on flow directions around the aircraft are, apart fromseparation effects, generally quite small giving only minor changes in the forces from,say, a foreplane close to the inlet face. At high speed (M > approx. 0.5) the effects arein fact completely negligible with respect to torces on surtaces in close proximity.
However, recent improvements in flight control systems such that the aerodynamic benefitsof increased aircraft instability may be realised has led to increased emphasis onobtaining very accurate aircraft incidence and sideslip data. At present the informationis obtained from flow direction detectors in general mounted on the front fuselage somedistance from the inlet. Recent tests carried out at Warton have shown that even fordistances of 1 to 2 metres in front of the inlet the mass flow effects at the air directiondetector positions are significant at low speed (fig. 35) and must be accounted for ifoptimum aircraft control is to be realised.
4. ENGINE/AIRFRAME INTERFERENCE DUE TO EXHAUST
The interference between the engine exhaust and the airframe can be divided into twodifferent but closely related groups:
NOZZLE INSTALLATION EFFECTS
J INTERFERENCE
Influences from the aircraft into the exhaust affecting basic engine thrust are, ingeneral, negligible on military aircraft due to the high jet pressre ratios ie. nozzlechoked, even at cruise conditions. The interference of the exhaust f-ow with the airframecan be very large, however, and is significantly influenced by the nozzle type, locationand deflection as well as the basic jet characteristics themselves.

15-7
4.1 Nozzle Type
Many types of nozzle now exist or have been considered for reheated military aircraftengines and a few are illustrated in fig. 36, showing the means by which the area variationrequired for reheat operation is obtained. The more important types, at present, are theconvergent moving shroud nozzle (fig. 37), the translating iris nozzle - either convergent(fig. 38) or con-di - and the aerodynamic or variable flap ejector nozzle (fig. 39). Eachof these is currently in use on production engines and each has advantages anddisadvantages relative to the others in terms of weight, cost, complexity as well asinternal and external performance.
The final choice of nozzle type has to be by a thorough consideration of all factors,however, and is generally a lengthy and complex business. For example early in the designprocess for Tornado two contender nozzle types had been identified as the simple movingshroud and the iris nozzle. A study was put in hand to identify the overall effects on oneof the proposed missions ie. low level interdiction, involving high speed flight at lowlevel. The results of the trade study are illustrated in fig. 40 and show that althoughthe iris nozzle gave significant reductions in installed drag, the effect of the highermass resulted in no overall advantage relative to the moving shroud nozzle. In view of theextra cost and complexity of the iris nozzle and because no overall benefit could beidentified the moving shroud nozzle was seen as the best choice - in fact thorough studiesexamining all contender nozzles showed similar effects and as a result led to the adoptionof the moving shroud nozzle for Tornado.
In the following paragraphs the external characteristics of the different nozzles will bedealt with in more detail through the primary effect on drag. It should be noted, however,that other external effects can be very significant. Internal effects ie. the effect ofnozzle type on the gross engine thrust, are given in general terms (fig. 41) to allow thereader to balance in his own mind the overall performance effects of each.
4.2 Interference Effects Of Nozzle Installation : Base Area
The effect of base area on nozzle installation drag can Lest be appreciated by examinationof typical subsonic boattail pressure distributions (fig. 42). Here several effects can beseen:
at the start of the boattailing there is a negative pressure peak giving a large axialforce contribution in the "drag" direction.
as distance downstream increases, the flow recompresses giving a large axial forcecontribution in the thrust sense.
due to real effects of the boundary layer the actual pressures achived are less negativeat the start of the boattailing but also less positive at the rear or base region.
if flow separation occurs the pressure at the base is dramatically reduced.
Overall the drag of the afterbody is a balance between the thrust and drag components ofthe boattail axial force in addition to the base force. In fact the total afterbody dragcan be correlated very well against effective base area as shown in fig. 43 which showsthat, at subsonic speeds the afterbody drag coefficient is approximately 0.13 of the baseto maximum area ratio. The data used in the correlation is for several types of nozzleinstallation (single, twin at rear, twin part way along fuselage) indicating that thecorrelation may be regarded as very general.
The only difficulty in using the correlation is in the determination of the separated flowarea associated with any particular nozzle installation. Normally, iris nozzles, when setat their smallest (dry engine) area, have high boattail angles which gend to cause largeareas of separated flow on the nozzles themselves. Of the order of 15 of boattail anglefor high speed (M up to 0.9) operation is the maximum which can normally be tolerated onthe reat fuselage/nozzle of axisyrrmetric type bodies before significant areas of separatedflow form. In the gully regions associated with the space between the nozzles ontwin-engined aircraft the maximum angle is much reduced and can be 10 or even lower.
if the above limiting angles are exceeded flow separation will appear. Determination ofthe actual area of separation is practically impossible at this stage however due to theextreme complexity of the flow field in the rear fuselage region. In addition, otheradverse effects of rear fuselage flow separation at subsonic speeds - primarily vibration,but including reduced fin power etc - are so severe that it is far better to design for noseparated flow at all. Theoretical methods to allow the design of the rear fuselage toenable separation free flow combined with low installed nozzle drag are likely to beavailable in the not too distance future. Until such time as the methods have been proven,however, great reliance has to be placed on proper wind tunnel model testing, though eventhen full simulation is not yet possible and developffent during flight tests may still berequired.
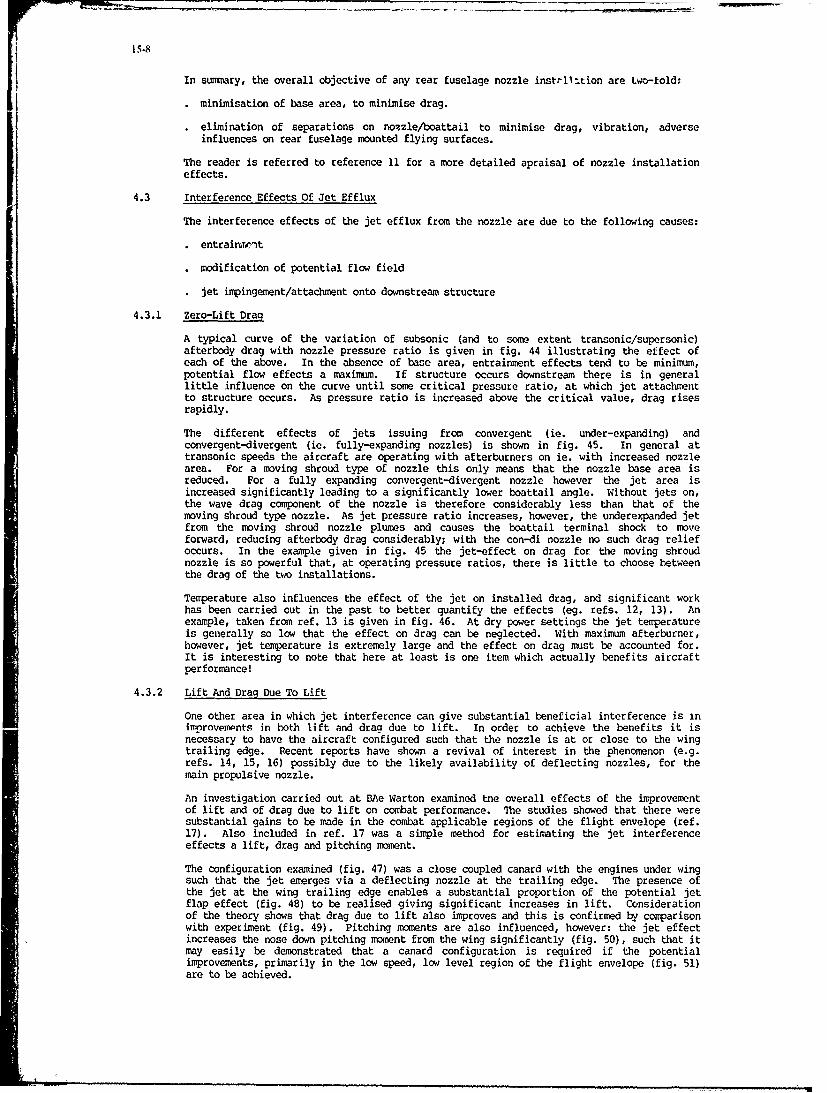
'i 15.8
In summary, the overall objective of any rear fuselage nozzle instrl1tion are two-told:
minimisation of base area, to minimise drag.
elimination of separations on nozzle/boattail to minimise drag, vibration, adverseinfluences on rear fuselage mounted flying surfaces.
The reader is referred to reference 11 for a more detailed apraisal of nozzle installationeffects.
4.3 Interference Effects Of Jet Efflux
The interference effects of the jet efflux from the nozzle are due to the following causes:
entrainerwit
modification of potential flow field
. jet impingement/attachment onto downstream structure
4.3.1 Zero-Lift Drag
A typical curve of the variation of subsonic (and to some extent transonic/supersonic)afterbody drag with nozzle pressure ratio is given in fig. 44 illustrating the effect ofeach of the above. In the absence of base area, entrainment effects tend to be minimum,potential flow effects a maximum. If structure occurs downstream there is in generallittle influence on the curve until some critical pressure ratio, at which jet attachmentto structure occurs. As pressure ratio is increased above the critical value, drag risesrapidly.
The different effects of jets issuing from convergent (ie. under-expanding) andconvergent-divergent (ie. fully-expanding nozzles) is shown in fig. 45. In general attransonic speeds the aircraft are operating with afterburners on ie. with increased nozzlearea. For a moving shroud type of nozzle this only means that the nozzle base area isreduced. For a fully expanding convergent-divergent nozzle however the jet area isincreased significantly leading to a significantly lower boattail angle. Without jets on,the wave drag component of the nozzle is therefore considerably less than that of themoving shroud type nozzle. As jet pressure ratio increases, however, the underexpanded jetfrom the moving shroud nozzle plumes and causes the boattail terminal shock to moveforward, reducing afterbody drag considerably; with the con-di nozzle no such drag reliefoccurs. In the example given in fig. 45 the jet-effect on drag for the moving shroudnozzle is so powerful that, at operating pressure ratios, there is little to choose betweenthe drag of the two installations.
Temperature also influences the effect of the jet on installed drag, and significant workhas been carried out in the past to better quantify the effects (eg. refs. 12, 13). Anexample, taken from ref. 13 is given in fig. 46. At dry power settings the jet temperatureis generally so low that the effect on drag can be neglected. With maximum afterburner,however, jet temperature is extremely large and the effect on drag must be accounted for.It is interesting to note that here at least is one item which actually benefits aircraftperformance!
4.3.2 Lift And Drag Due To Lift
One other area in which jet interference can give substantial beneficial interference is inimprovements in hoth lift and drag due to lift. In order to achieve the benefits it isnecessary to have the aircraft configured such that the nozzle is at or close to the wingtrailing edge. Recent reports have shown a revival of interest in the phenomenon (e.g.refs. 14, 15, 16) possibly due to the likely availability of deflecting nozzles, for themain propulsive nozzle.
An investigation carried out at BAe Warton examined tne overall effects of the improvementof lift and of drag due to lift on combat performance. The studies showed that there weresubstantial gains to be made in the combat applicable regions of the flight envelope (ref.17). Also included in ref. 17 was a simple method for estimating the jet interferenceeffects a lift, drag and pitching moment.
The configuration examined (fig. 47) was a close coupled canard with the engines under wingsuch that the jet emerges via a deflecting nozzle at the trailing edge. The presence ofthe jet at the wing trailing edge enables a substantial proportion of the potential jetflap effect (fig. 48) to be realised giving significant increases in lift. Considerationof the theory shows that drag due to lift also improves and this is confirmed by comparisonwith experiment (fig. 49). Pitching moments are also influenced, however: the jet effectincreases the nose down pitching moment from the wing significantly (fig. 50), such that itmay easily be demonstrated that a canard configuration is required if the potentialimprovements, primarily in the low speed, low level region of the flight envelope (fig. 51)are to be achieved.

1 5.()
4.3.3 Other Jet Interference Effects
Jet interference effects can be many and unexpected and are very much configurationdependent. The engine installation designer must at all times be aware of the possibleinfluences of the jet when located in certain positions. Reference must be made to theavailable literature to identify if the proposed installation has been previouslyconsidered, and literature surveys similar to ref. I are invaluable in this respect.
It mrist also be borne in mind that any new aircraft design will have a unique rear fuselagenozzle installation and early wind tunnel testing of a detailed facsimile of the aircraftare required to ensure that there are no major adverse effects. Only with the model dataavailable can the designer feel reasonably sure that such effects are unlikely to appear inflight. Even if difficulties are encountered, significant assistance as to necessarymodifications for their alleviation can normally be quickly generated by properly conductedtesting.
Some unexpected jet effects that have been encountered during model and flight testing are
sudden change in tailplane jack loads with application of reheat.
power dependence of yawing moment due to sideslip such that at maximum power aircraftdirectionally stable with fin OFF.
reduced longitudinal stability due to effect of jet on downwash flow field.
Many other different effects will have been encountered at some stage with differentaircraft designs. It must be c-phasised that only through designer awareness of thelikelihood of such effects can their possible presence be anticipated and avoided, ifnecessary, in the early design stages.
5. CONCLUDING REMARKS
The various aspects of engine airframe interference effects have been dealt with in somedetail in the report, including simple estimating procedures where possible. The effectshave been shown in many cases to be far reaching. Emphasis has been put on designerawareness coupled with early model testing as a means of reducing the risk of one or moreof the many avoidable adverse effects carrying through on to a production aircraft;similarly for the exploitation of beneficial interference effects which are, as may beexpected, rather limited in number.
REFERENCES
1. NICHOLS, M. R. Bibliography on Aerodynamics of airframe/engineNASA TM 81814 integration of high speed turbine poweredNOVEMBER 1980 aircraft.
2. HARRIS, R. V An analysis and correlation of aicraft wave7MX 947 drag.MARCH 1964
3. WITO0MB, R. T. The study of zero-lift drag rise characteristicsNACA 1273 of wing-body combinations near the speed of1956 sound.
4. WHITCOMB, R. T. and Development of a supersonic area rule and anFICHETI, T. L. application to the design of a wing bodyNACA TIB 3912 combination having high-lift to drag ratios.
5. BUTTER, D. J., A survey on boundary integral methodsHUNT, B., & (Numerical Methods in Aeronautical FluidHARGREAVES, G. R Dynamics - Roe, P. L. 1982)
6. WILLIAMS, T. L. et al Top-mounted inlet system feasiblity forPAPER 2 transonic-supersonic fighter aircraft.AGARDORAPH CP301MAY 1981
7. DAVENPORT, C. A further investigation of the drag at subsonicS&T MEMO 7/68 speeds of side intake boundary layer diverters.SEPTEMBER 1968
8. PEAKE, D. J. and The drag resulting from 3D separations causedRAINBIRD, W. J. by boundary layer diverters and nacelles inPAPER 18 subsonic and supersonic flow.AGARD CP124APRIL 1973

15-10
'p 9. MOJNT, J. S. Effects of inlet additive drag on aircraft
AGARIDORAPH 103 performance.~1965
10. HANXINS, J. E. YF16 Inlet design and performance.JOURNAL OF AIRCRAFTVOL 13 NO 6, 1976
11. LEYLAND, D. C. Some aspects of nozzle installation.NOVEMBER 1979 (Proceedings of the 4th Seminar on Gas Turbines held
in Bangalor during November 1979. ARB-PRCC-703).
12. KENNEDY, T. L. An evaluation of wind tunnel test techniquesAEDC TR-80-8 for aircraft nozzle afterbody testing atNOVEMBER 1980 transonic Mach numbers.
13. HENRY, B. Z. and Additional results of an investigation atCAUN, M. S. transonic speeds to determine the effects of aNACA/TIL/5250 heated propulsive jet on the dragJUNE 1956 characteristics of a related series of afterbodies.
14. BOWER, D. L. and An investigation of the induced aerodynamicBUCHAN, F. effects of a vectored non-axisymetric exhaustAIAA 78-1082 nozzle.JULY 1978
15. TMOMAS, J. L., Deflectcd thrust effects on a close-coupledPAULSON, J. W. and canard configuration.YIP, L. P.JOURNAL OF AIRCRAFTMAY 1978
16. HUTCHINSON, R. A. Investigation of advanced thrust vectoringCAPONE, F. J., and exhaust systems for high speed propulsive lift.WHITAKER, R. W.AIAA 80-1159JULY 1980
17. VINT, A. Jet-wing interaction to give improved combatAGARD CP 285 performance.MAY 1980
18. MIDAP STUDY GROUP Guide to in-flight thrust measurement of turbo-AGARDOGRAPH 237 jet and turbo-fan engines, AGARD 237.JANUARY 1979
ACKNOWLEDGEMENTS
The author would like to take this opportunity to formally thank his colleagues at BAe Warton fortheir help and advice during the preparation of this paper, with special thanks to MR. M. J. BRIERSfor the contribution of certain figures and guidance on part of text.

A -v . . . . . . .- - -
151
\
-4.,
FIG. 1 T'MRNADO ADV FIG. 6 B58
FIG. 2 VI DOODLE BUGPISOFIG. 7 YC15
FIG. 3 ALPHA-J"
FIG. 8 CANBERRA
44
G .4 A 10-W
W
. ........... FIG. 9 VJIOI
FIG. 5 DCO
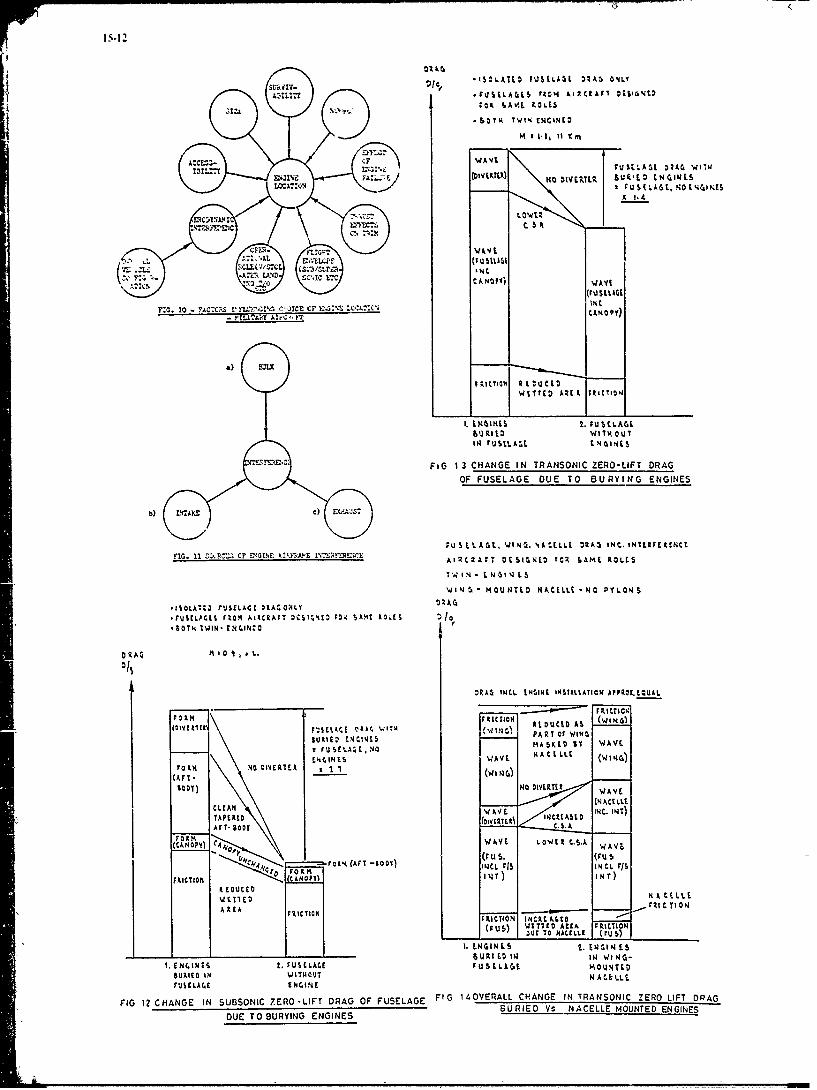
Vic -ISOLATED iFUMAlit *IAt ONLY
I rO' SAME LL.S&OI AV1 TWNNCINto
M14 1- ItI cI m
r~.i ACCS CF L C.IC
1~ VUSLA1jD2G A ~
r-NalvE FAOF FUSEtKLAGE DUNO ;RBUYIG ENGINES
1'. N-RSI 1 .5(sNO ;,m MOWNCNACL O YO
.50T.; INC-IN .I
FO Ra TION 2E^1(1 1 1 1W T T E
* & W T 4' P A R E A OF W1aNCNI
6UAVL HACILLEl
FORNN FUELG ENGINES1 wIo'
b)~ ~~TP ArAK 0 0IA
A;T*&LWISh~EL DRG OOTTEFRSC
A& ~ TI-COCCO
FORM FRCTONRCUCDIONWIG
SUBSONIC~ ~ F.US$AESURIN NliN
ZER 4-IFT S DRGOWUEAGAlGIC VEL CHNG IN C RN I ZER LFT DRAGG
BURIED Vs NA CELL ONEL NIEDEA WAO BURYINGE ENGINES7
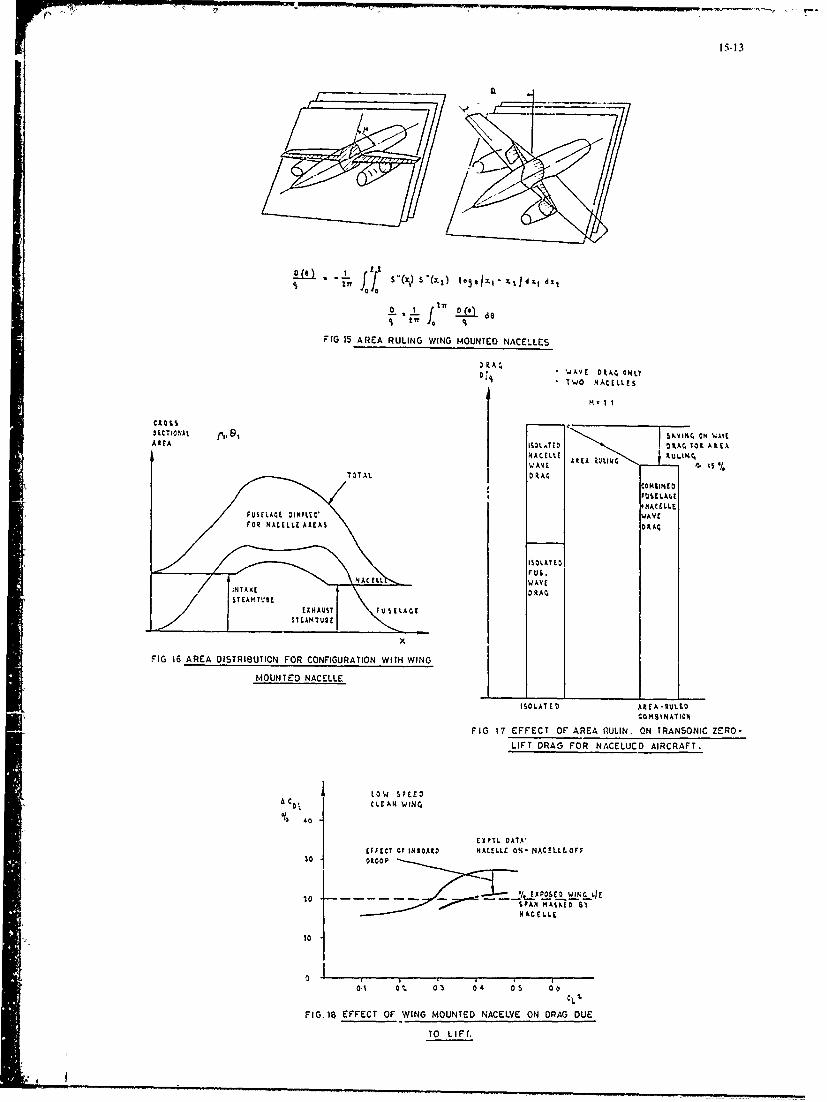
15-13
fj S lx) S "X1 ) 4034I%, X AI4%, dit
-L ITT fo._ I doI f l
FIG 15 AREA RULING WING MOUNTED NACELLES
AVE 'WAE OAA ONLY
• IWO NACELLES
M-11
SECTIONAL ISk1 I L VAREA ISLTo R rtA E
NACELLE AREA RULIN4 LIG~WAVE 'I- 15 /
COANINED
. AC&LLEFWAVC
FOq NACELLE AREAS RA
DRAG
'I. A? 0
NACILLWAVEINIAXE D RAQ
,= ~ STEIAMTUIE |HA
| FAMIU'E
FIG 16 AREA DISTRIBUTION FOR CONFIGURATION WITH WING
MOUNTED NACELLE
$SOLA1 E 0 AREA RULEDCOMBINATI10
FIG 17 EFFECT OF AREA RULIN. ON TRANSONIC ZERO-LIFT DRAG FOR NACELUCD AIRCRAFT.
LOW SPEED
a COLCLEAN WIN 404
EIpYL O A'T,%
EFFECT OF INSOAID NACELLE ON- NACLLEOFF30 DROOP
__0 yt EPOSED WANOLIE.-- PAM P 61
N A CELLE
001l 0. IL al 05 01
FIG 16 EFFECT OF WING MOUNTED NACELVE ON DRAG DUE
TO LIFf.

15-14
|C ¢ I TICAI A EF ON wliN,N PtLOF,.[
NACELLE
LA0qt VORTEX tOANEt AT
t L A T I Y ! . L O I N C I O D N C E N A C L L
FFONKLACE SIDETCC O LN~A1 ANE.tIUNI.II'IE '
OIL FLOW PATTE!!, UPP R Sv' ,€[No OOP ADVERSE INFLUENCEM IHMISEO B"
% h N~ l.P0 OC .AN CALCU LATION j
IU ,,*1 01
OtO rLOW ATTEN ON INSO. Ik IOT OA IA CLE N AC LILT
FIG FLOW PATTERN FFECTS OF NACELL"
OF WING FIG 21 TRANSONIC WING-NACELL EFFECTS
OW* SUN SONIC. L.OW AU'RONIC APPL.A0N A
O 0* COOT AUOoNIC PERPO0 ,ANCC0 06 * INTERNAL. P ER,|ORMAICS INCRE.ARINCLY FOOT
ALONE W2'. ALON
O 01
NACELLEOTI.CNACELLEC
PNOCUCTIONO 03 00! TO TOCOPM 0 WIN
0 02
S0t ,L S S PERS NIC APLICT/O/
0ACE I.c0! OO WINON IE PEFRAC004 N WtIO ENACLLLA INSOAR,
IJNCTION SIO PLAIR HOUCI OORM
• ./ AFETO5 0% POOR TOTAL, PRE. $UTE
0 ,- , . CO VLAY .
o t 0L 00 04 OS 00
0 OsDEODRO @wl
FIG 20 INF.UENCE OF LOCAL IBOARD NACELLE WING JUNCTION FIG. 2 2 PITOT INLET
L/E DROOP O O INDUCED DRAG.0 f0WN4-A L NOR
JUCIN'NCEPANsmc OM

15-15
I OALIU I. P.AIN * SU&SONIC
mOtt ImptOVII - ARIOWS GIVt GNI EiIOt AND OIECTION
RECOV[ERY AT 414H. RELATIVE To FREE STIEAI
MAC.K No - MODERATE INCIOENCt,IEO SIOES1.0
7 INCREASIN4
EMPHASIS ONSQ P E RSONIC
P EItrOIMANC E
rUSELACL SIO INLET
m. CONtCAL (F IXtO O TRANILATIN,)
I
TWO 06LIQUi tPLAIN SHOCK
FURTER|MPIV?gURCII
IN PREC II RECOVERY
b. TWO OR THREE i HO0CK WEOQE.
UP WAS11
?I LOWER.COWL
OIEISUA C K IOTM OEOUCED AtWA
IN S E RT A OP I C t A N IN N E R I O P L A T E
UNDER FUS!LACE
MULTI- SOC.X WEOXCE FIG.25EFFECT OF FUSELAGE FLOW ON SIDE INLET LOCAL
FIG 23 INTAKES FOR SUPERSONIC OPERATION INCIDENCE
FOSII..A! SIDE
' 10
ot , I0
FIG 26 VARIATION IN LOCAL FLOW DIRECTION FOR SIDE AND
OUNDERFUSELAGE IN TAKES
FIG 2 b IN TAKE LOCATIONS ON FUSELAGE
-. 4ME
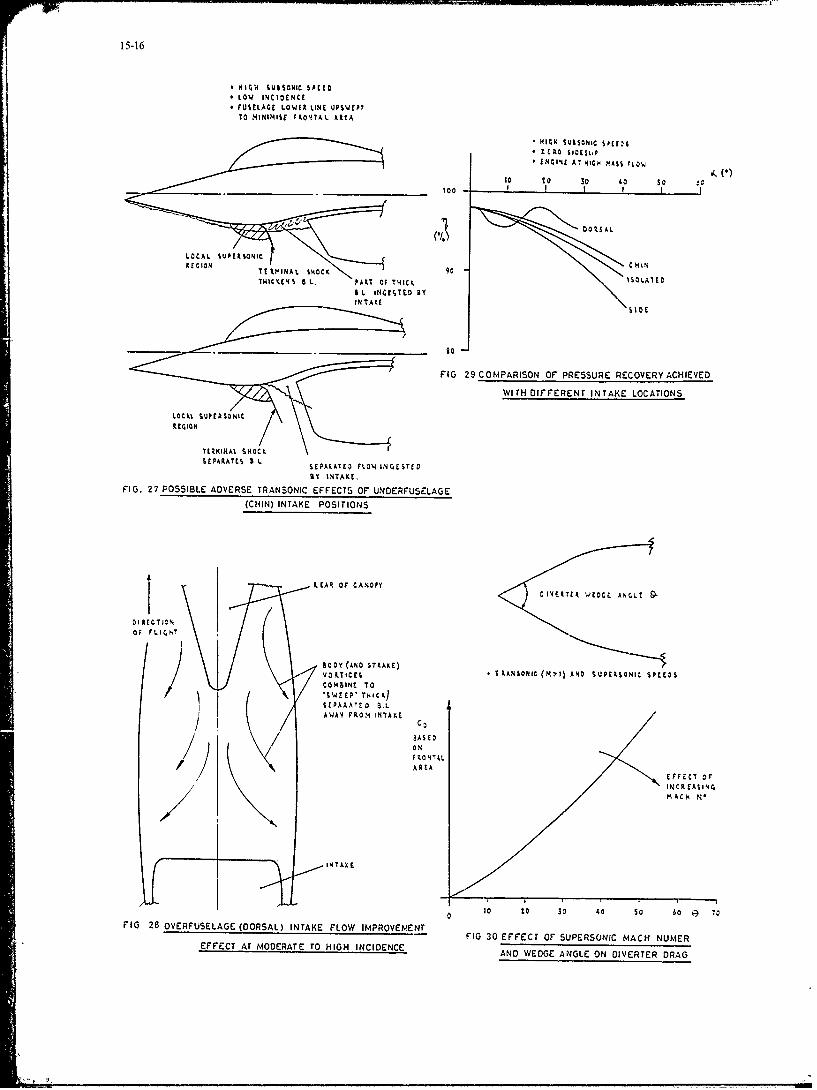
15-16
141 SII UBSONIC SPEED*LOW INCIDENCEr USELACE LOWER LINE UPSWfPTTO MININISE FRtONTAL. AREA
I'll"N SUBSONIC SPECO'sz c R O slotsi.pINEN1I1 AT HIGH mAIS rIOW.
100 10 30 40 5 o
I.. DOR.SAL
LOCAL %UPERONIcircNIom T MNN U 90 CHIN
I L iNGESTED BY
to
FIG 29 COMPARISON OF PRESSURE RECOVERY ACHIEVED
WITH DIFFERENT INTAKE LOCATIONS
SEPARATS I L SPARATED F'LOW INQESTEOBY INTAXE.
FIG. 27 POSSIBLE ADVERSE TRANSONIC EFFECTS OF UNOERFUSELAGE(CHIN) INTAKE POSITIONS
KE AR OF CANOPY
DIRAECT IONOF FLIC.HT
OY(N STAE
NO ALTICES I R4NSONIC (H TI) AND NA PEkSONIC SEOC SCOMBOINE TO
SWEEP" TIICK)CEPARA'tO 0 5.1) (AWAY FR.OM INTAKE
EFFECT OFINC 0. A N MACH N-
INTAX C
0 1 0 1 20 3 0 40 SO 6 0 l -7 1FIG 28 OVERFUSELAGE (DORSAL) INTAKE FLOW IMPROVEMENT
FG30 EFFECT OF SUPERSONIC MACH NUMEREFFECT AT MODERATE TO HIGH INCIDENCE AND WEDGE ANGLE ON DIVERTER DRAG
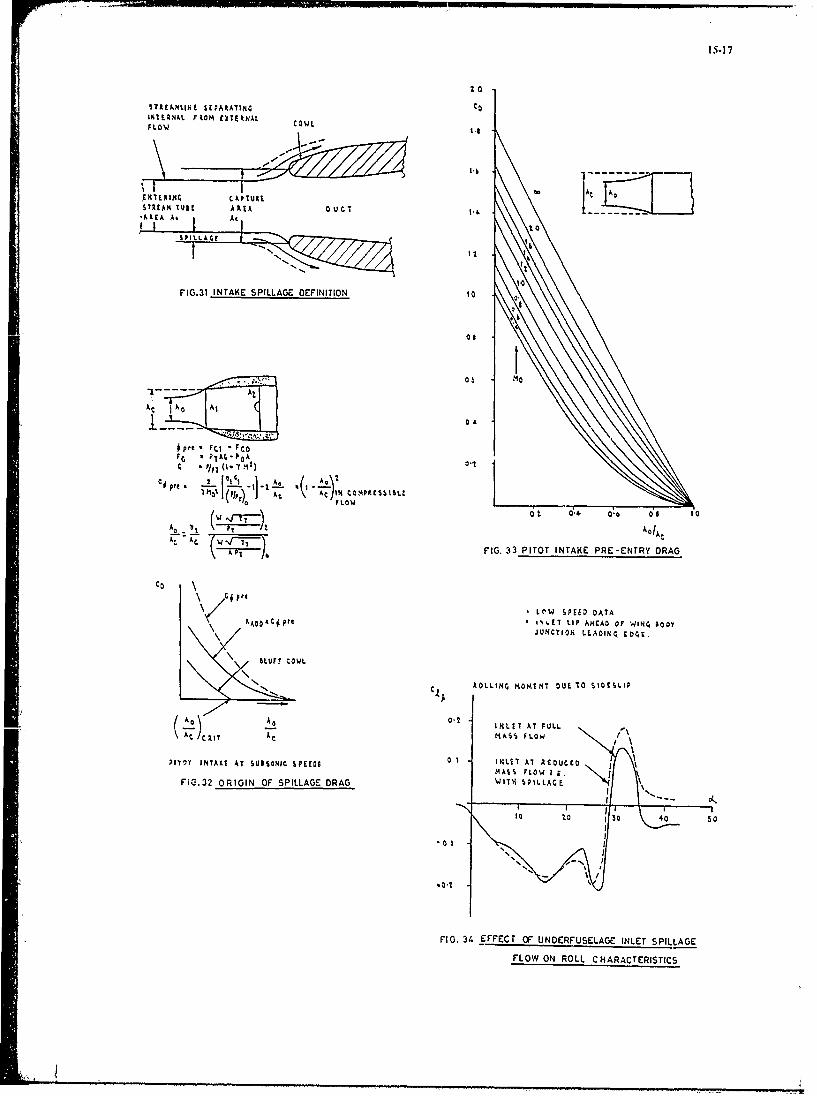
15-17
20
STAREAMLIN StPAAATINC t0INTENA. FROM CXTRNAL COWLFLOW 14W
l-b - ---
w AtT. AD{ 'IN E I N C A P I U I I A
STREAM TUi APtA 0 UrT ,t..AkEA A. At
L to
N It
- -- . . . .t
10FIG.3i INTAKE SPILLAGE DEFINITION 10
OR
05
At
A O ., At, A " ;¢0
F& - PkT; - P/A
IFIG. 33 PITOT INTAKE PRE-ENTRY ORAG
CO
* O.W SPEED OATAET *. LIP AHEAD OF WING 6OY
\ \ L LUFCOWLJ UNCTION LEADIt E04E.
SOLLIN MOMENT DUE TO SIDESlIP
(A.) \- INLE A UL\At CkI A0 4ASFO
Pl111T INTAKI AT SUBSONIC SPEED$ 0 1 1NI1 I AT RE UCEDMASS• FLOW' I j.
FIG.32 ORIGIN OF SPILLAGE DRAG WITH SPLLA E c \
FIG, 34 EFFECT OF UNOERFUSELAGE INLET SPILLAGE
FLOW ON ROLL CHARACrERISTICS

15-18
* LOW %PLtO MOOLODATA
*IN4LET 5 EUIVALE.N! DIAMETER$0oNw T tAm OF pItal
LOtAL FLOW DILCtIIONAl ADO PlOht
10 ° SOATAIL LONE, TRAVE. %EQUI3t0
FOlk JAC.
JAC% REHEAJT POSITION
20 ,_ZLE PE TS
,t l POSIT
t),I t INTERtNAL, PRESSURES
.A D i N C T O I.A X C E O P E A T INNINCtEAS0I14 OCES AND LARE MOMENTS- PILI; t HON A1kFkAML IJET PPE
FIG 38 TRANSLATING IRIS NOZZLE
5.. 00
O' S 146 1p 1 I0 '
rttl STREAM 40C4Mj4 M.IINL ET u e-T MACH N4
FIG. 35 EFFECTS OF ENGINE INLET MASS FLOW ON AIRFLOW
DIRECTION AT AIR DATA PROBE POSITIONS
SRoRI
- -.IS CON - 0. R IS
SINFLO litclot FULLY VA I~ll I ICCICO &LOWJ N 0000 JECTOS
PLUC ISSNOlOPtc C0mpFIG 39 VARIABLE FLAP EJECTOR NOZZLC
FIG. 36 TYPICAL NOZZLE TYPES FOR REHEATED MILITAP' ENGINES'5 MOYIOC SO LOUD US 51,0
INtR M N tA . T 4'StAtAl Off 7kALL Off ixtkEMETrAs.L ~ LO O LEVEL 1 %IRK tAl~itll
FIXo EXTERNAL SKIN WEI48 NC LUt.
1000
MOVINC SHRUD40000CI
CO0 I 1 .
JAC W h% E EL0%So
T PIP CAN TRC 'LE
IIANSLATINC
Ai %Kl____ -ISA
FIG. 37 SCHEMATIC OF MOVING SHROUD NOZZLE -10oo
FIG 40 CHOICE OF NOZZLE STUDY

15-19
* ALL NOZZLES ARl SIMPLE YAIMATIONS OF THOSE $at WHICd 7E
THRUST CHARACTERISTICS ARE C.1IV
( 1003$ ,NAJST
Ito -i00$ THaUST CONVi O,[CM N0I.AC AClUAL COkfA
ill 0 04 042 Aktj AMAl
0031100. 0.1 il ~~ p
Ito IDEAL CON-0 4I 4. 0 02 0 314(11. JE.T
0 TWIN dETTYPICAL, REAL CCN-01 TONAO YP
J A C UAX YP
7 SATC RESUE ATO0 a 02 023s 0.1 01 0,152tI 40.14 MAX100 ~~ ~ 1 1%./ / .. ,4lAP
Olt. ZASEr
Is EJECTOR -NOTE OCCONOARY IcFLOW HAS LAKCE CFFIECT ONl SEPARATEO FLOW
NCREASE C HARACT ElISTICS
SSECONDARY % IOATTAIL 6AS
FLOW
FIG 41 GROSS THRUST EFFECTS OF DIFFERENT NOZZLE TYPES ,LPAATIO4 AT "A0" C r
BOAT- TAIL
SlPARATION
P IS UAE COFFICtENT 8432C?
AFT EIO . . E SPA RIAtJ&ATAI SURPC~t t!
POTENTIALL;LO
*OA I
-0 as E~AFTC$OOY SEPACATIO FLOW
-0.2
FIG 42 TYPICAL SUBSONIC BOAT -TAIL FIG 43EFFECT OF EFFECTIVE BASE AREA ON MEASURED AFTERBODY
PRESSURE DISTRIBUTION FORCE
C3 A13 EFFCT OF INCREASED 6AS AREA
O 025
IMOINC,{MENI ON
O 00 JET Ort DOWNSTREAMSTR UCTURE
0 ols
0 010
NOOTLE TOTAL 7O FREEt309142 STATIC PRESSURE
I *as4 2
-0 01
FIG. 44 INFLUENCE OP .ET PRESSURE RATIO ON SUBSONIC
APTt7RBODY DRAG
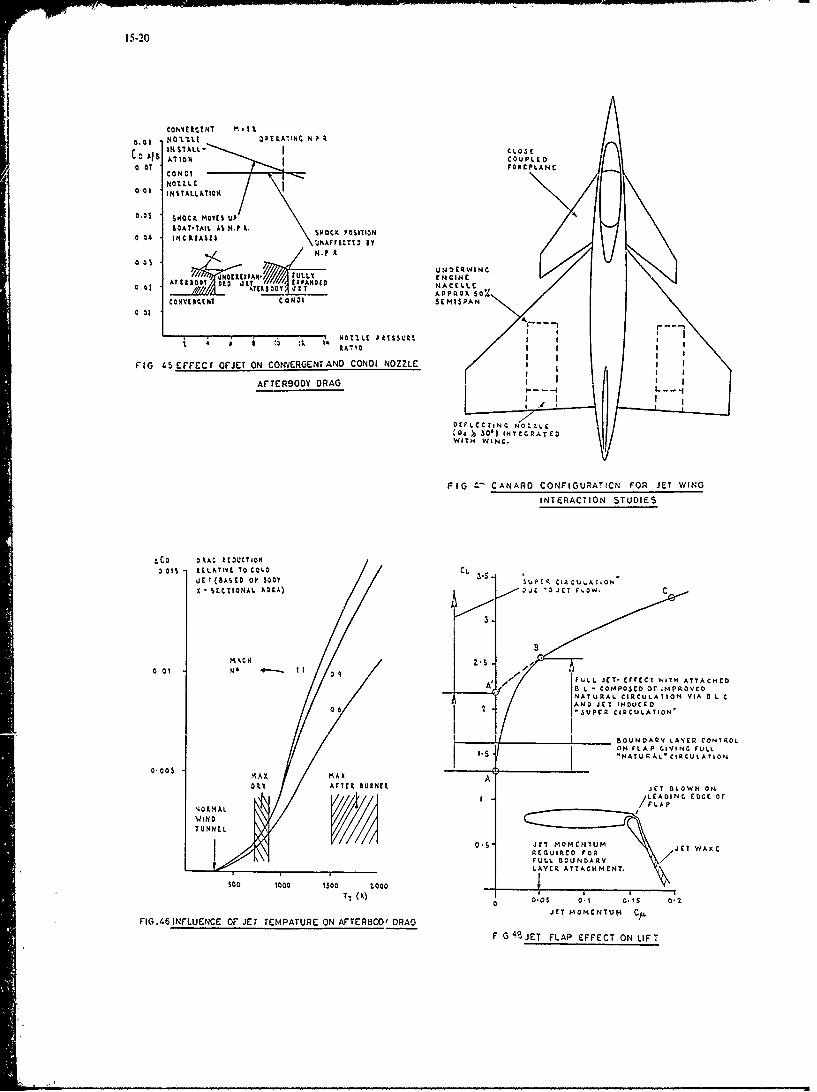
15-20
CINIANT I IOSE
0?o FOAuPLACCON 01NOZULINSTALLA1I0
o.oi oc MOVES UP&OAT*TAIL AS N.? k, $00tlt POSITION
OCA. INCREASES UNAFCTED ITN~ .P A I
001UNoCOWINc
'I[//II
NCIN
AT0.11 050 .11? 1 A// 1O NACELLEAPPROx so%
CONER00 hl CON0l SCMISPAN
001
RATIOIjI
FIG 45 EFFECT OFJET ON CONVERGENT AND CONDI NOZZLE
AFTERSODY DRAG
BEr CC¢TINC NOt ZLC
WITH WINC.
FIG _- CANARD CONFIGURATICN FOR JET WING
INTERACTION STUDIES
ac, OAC REDUCTIONO0 0sA RLATIVE TO Cot-* CL
J, TA ?(SASO 0OO 00 CRCULATAONOX SECTIONAL A2EA) U JE owC
B
DFULL JET-! EFFE[ CT WN AT A HE0 0T 0 .-. I
U L COMPOSED or IMPROVE
0 6 '3UPEB CIRCULATION'
uBOUNDARY LAYER CONTROL2N FLAP C.IVINCG FULL
0.00 ARA_______ - NAT URAL, CIRCULATION
JMAT MAX~tTU A'
DRY1AFTER BURNER JET BLOWN ON" T/LAOINf COCT or
P401MAL t//FLAP
TUNNLI0. JUT MOMENTUM JET WAILCREQUIREDO FtFULL BOUNOARYLAYCR ATTACHMCNT.
S00 1000 is500 1000 _____________________
Ty (X)0 0.05 0.1 0-tS 0,2
FIG.46 INFLUENCE OF JET TEMPATURE ON AFTER1300e DRAG JTMMNU I
F G' JET FLAP EFFECT ON LIFT

i 15.21
0 5 10 Is to Z.S 30 3sCOTOT THRUST r[MOVED. -- I 2 0 : 3 1
4 2, -0.0$. cV THRUST REMOVED
0- PRA OICTION (JCT 0 . 30
OFF (CAPT) t
CALCULATIO JETI HOUC CO CL, CO
1.0 INCRCMHCNIS.'J
10. Nc ccBs
JET OP( -0'2
0-6 C'T ON (CAPT)
0-4-
: 0.' "Q-0.3
0.2-
0 ' PRCOICTION FOR, JET ON, , USINC ExPIL. JET oFr
oS 1.0 - ,S 2.0 2.5 3.0 PLUS CALCULATED JCTC AERO INoUCEo cm INCREMENT
riG9 COMPARISON OF PREDICTED AND MEASURED JET INUCFD FiG. O COMPARISON OF PREDICTED AND MEASURED
EFFECTS ON INDUCED DRAG POLAR JET INfDUCE PITCHING MOMENT
-- = H 'S$ 0C*
A ATC" OJ 230e
WITH JET rrFcrsT
,O" 0' O N O J rET IAc F ¢
./ N//
g, / ,=, 30' WITH J TT FI$
0, 0 0 J IT C JrE¢T$ C
o.L 03 0.'4 O S 0:6 0:7 0.6 0.
MACK NO
FIG51 PREDICTED EFFECT OF JET
ENHANCEMENT ON SUBTAI,OIATTAINEO TURN RATE

16-1
IDEES NOUVELLES POUR LA CONCEPTION D'AVIONS FUTURS
par
Pli.Poissori-QuintonON ERA
29 Ave de la Division Leclerc92320 Chitillon, France
RESUME
Dans t..otte introdut-iun pr~liminaire a la table rondo prtivue sur la re-dicr.he do Lnfiguratiuns nouivdlls bt1n1fkantd'interfulrentes atdrody~namiques favorables, onl pab., enl revue quelquos fonnules nouvelles d~av iuns sub.-eptibles d'&tcdidvcloppdes avoc succ~s danis les prochainos arnde~s.
Ceswr.ofigurations nouvelles bt~dilioront Joe progres majeurs reaisds non sculcuient en acrody nailliluc: nais Zgalcniont dans Ics autres disciplines intt~ressant l'Aviation:
- Propulsion: mocillouro intdgration (ii motour A la collulo,-Structures/Mat~riaux: prilse en conipto do deformnations ai~rodlastiques favorables,
Eledronique. introdu-tion du contr6le actif pour 'lptimisation doe la wrnfiguraition lcensible die sa issionl.
Ces progr~s seront appliqiuds poor des objeLtifs diffdrents suivant qu'il s~agit d'un av. in doe transport (optimilsation ail'dconomio du vol) oti do combat (recherche do ]a inanoctivrabilit6 et do l'efficacit6 militaite).
Eni cc qui concorno la forme gtoindiriquc de I'avion:
l'titilisation d'un plan Canard protlice l a voilure porniet dtJA doe bWn~Cir d'une inmorattiun tourbilloninairefavorable aul vol A grande iniiidence pour tin avion doe combat, soil r6le sera dtendui aux -ontroles diredtes dicportance et do force latdrale;
]a mise en fltuch iuversde tic ]a voiluro periettra egalenient doe incilleurs perfurman,.CS aux grands angles, le niskiucdoe divergence stnicturale tant t vitt6 par l'oinploi doe iatriaux L.orposites fibrotix wonvonableawnt orient~s,
cette adaptatior. aeroelastique pernlise pair los niatdriaux winplosites sera Idillotirs CteondUC1 i*1 t op11 isatio o iccambrure et do vrillage, aussi bion pour l'aile tdlaiw3e d'un avion doe woinbat (fuo pour ,tlI J,. gtad il igLilicuilstir oin avion doe transport, simultandinent le risque dio flottemient Stittural sera wnitr-6W par Vo0et aLtif Ui il'ordlinateur do bord;
l'application doe cc contr6le actif i ]a stabilisation artificielle doe l'avion en longitudinal et en transversal vaperinettre doe r&IUire sensibleinent la dimension des einponnages oul ti dt~elopper la formiulo "aiilcs volantLS"d'oii rdduttion des traindes parasites ot doe frottLinonit, pour des tonnages implortaints. il dcv ient intiressaint derendre cette ailo volante habitable, avCL title repartition dotic laiargo utile Ie lorg doc 1'emcrguro, dotlu ione sensiblereduction do sa mrasse structuralo;
la formeC et l'eompla1Lolont des p~rises d'air, on lpartittilier pour los avions doe woihat nanoeivr-ats, influenttoonsidirablement sur loors performiantes et elles sont dirocteintcnt interattionnics par iL Jhamp dec Il'o et,'Ou dofuselage, des oniplaceicnrts inhiabituols (ot atdrodynarniqoeint d~licats) sont 6todi~s pour los rundirk momilssensibles i la d~tcction par l'advorsairo.
En Lc qui woncerne lintegration du propudseur a la (ellule, doe tr~s nonibreusos rethcrclies sunt actuellenlcnt onitrc-prises pur rt~duire los interattions d~favurables, nilais aUSSI potir bWntifmcmr d'inltoractionls favurablcs lices a l'orientatmull
iable du jot propulsif (effet "jet flap" pour l'hyporsustentation).
Dans Ic domiaine dos avions doe transport, il s'agit doe Jhoisir des oniplatcints Lie nacolles do turbo-famis Lim noeprovoquent pas d'interat-tions a~rody nainiques d~favorables avc P'aile en ,ruisiere transsoniquo, tiut onl bcncficm1int JLcot offot "jet flap" pour rdiirc los vitosses do d~collage et d'atterrissage.
Un autre .as diffitile d'interaction at~rodynaiiiquc apparait t6galement lorstit'il faut t6tudor Ia imist: eln platc d'ilimcs"transsoniques" adapt~us au Vol doe .roisi~re rapidc (Mathlie 0,7 A 0,8). los survitesses induites par leor flux sur li sombredoivent &cr ninimisies 1i partir dl' tudes thdoriques ct cxperimnntales soplmstitqutes, par ailleurs, l'l-Cmc INAmissuAKILILmnultipales Wrs chargtio pose ties probilb d'adrodynaiiqtie ot J'a~ro,1stct.,t comlplexes nslcossit.."' does tittmdes
pRECEDING PACZ BLANK-NqOT nYW)

16-2
phiridiscipimaires approfonldies (adrodlyniamiqu.'/acotustiquce, structurceniatiriaux). Cependant, le cocitfefficacitt, durd'dveloppement d'unc notivelle gu~nidration d'avions A~ li.lices, tr~s u&onomique d'titilisation, peut apparaitre int~ressant allcotirs die la prociraine (kCulcenie.
Uir second doinaine die l'iitdgrtioi dui propulseur ai la ceihule concerne les avions die combat manoctivrant, ofi lineorientation variable die jet propulsif perinet die faire participer le nioteur A la sustentation die I'avion (et gaknient 5 qonfreinage par inversion die pouissde).
lei encore onl retrouve des problnics die fo rtes interactions a~rodynanriques avec les diff~rentes parties die I'avionl.dont l'ttude thdonque est encore peu avanece ct l'exjpdriinentation difficile, mais les avantages atrodynamiques; apport~spar ce concept peuvent tre considd!rables, en particulier, Iorsque le jet propulsif tdbouclre i I'arri~e tie la voiltire. onlbUndficic d'une forte lryperstistentation par effet "jet-flap" pernnettant d'amindiorer Ics performances A basse vitesse(capacitd STOL) et 5i grand vitesse (inanoctivrabilitdt accruec).
Un dernier aspect die l'utilisation d'un jet A l'ainlioration (ic N'coulenient atdrodynanrique est le souftiage transversalipar tin jet onentd suivant I'envergure die I'aile qui perint d'engendrer line nappe tourbillonnaire hien organis&~ atu-dessusdie l'aile, creant ainsi line portance supplthiientalire et retardant le d~col 1ineit gcniiirais ti e ha voilure aux granldeinicidences. cc concept petit d'ailletirs Wte avantageusenrent utilis6 cIhaquc fois qti'iI y a des zones d'L&oulement dk~oWkdifficiles ai rt~sorber (diffuseurs (ie priscs d'air. retieints, etc.).
IA

i I.
REPORT DOCUMENTATION PAGE
I.Recipient's Reference 2.Originator's Reference 3.Further Reference 4.Security Classificationof Document
AGARD-R-712 ISBN 92-835-0332-5 UNCLASSIFIED
5.Origintor Advisory Group for Aerospace Research and Development
North Atlantic Treaty Organization7 rue Anceile, 92200 Neuilly sur Seine, France
6. Title SPECIAL COURSE ON SUBSONIC/TRANSONIC AERODYNAMICINTERFERENCE FOR AIRCRAFT
7.Presented at
8. Author(s)/Editor(s) 9. Date
Various July 1983
10.Author's/Editor's Address 11. Pages
Various 294
12.Distribution Statement This document is distributed in accordance with AGARD
policies and regulations, which are outlined on theOutside Back Cov.rs of all AGARD publications.
13. Keywords/Descriptors
Aerodynamics Aerodynamic configurationsSubsonic characteristics Commercial aircraftTransonic characteristics Military aircraft
14.AbstractThe present Special Course was a follow-up of an AGARD Fluid Dynamics Panel Symposiumon Subsonic/Transonic Configuration Aerodynamics held in Neubiberg (Munich) in May 1980.The emphasis of the course was on the configuration optimization in the transonic regimewere both military and commercial aircraft must cruise efficiently and where military aircraftmust maneuver in an agile but stable manner. The course material has been updated and waspresented in a more structured fashion emphasizing the fluid dynamic interference mechanismsthat are the keys to the optimization. In addition some aspects of subcritical interference werealso covered including those arising in the takeoff and landing phase of the flight with high liftdevices deployed.
Lectures 1 to 5 form background material describing the computational and testing tools.
Lectures 6 to 14 cover the whole range of interference phenomena arising in the optimizationof both military and commercial aircraft starting from the simple airfoil and wing andextending to the complete configuration.
The material assembled in this book was prepared under the combined sponsorship of theFluid Dynamics Panel, the von Kfirmin Institute and the Consultant and Exchange Programof AGARD and was presented as an AGARD Special course at the von Kirmin Institute,Rhode-St-Gen~se, Belgium on 2-6 May 1983 and at the Wright-Patterson Air Force Base, Ohioon 16-20 May 1983.
F -- q__
M~ U~u 0~0C
0 0 C 0 0
0 0 E' 0 * C L5. 0
z <
~a C
F0-0- L-
Z. LL :3 ' - m--).
_W -- -oj ~ 0 W
0) t- (n 0 .Z;~ >
UU
0Crj U
I* -
C.~ ~ ~ ~ w z Cu, JpC
00.
C3I
t. Li .5C) e C)r t) 03 r
u .2 'a~C 2~<~C 0
C) -CZ . .-. , 0U
Vl u Zi~U U2 rc

0 02~ ~C-) w.
o C3
21. -a 2 -j"
t o
r oZ6
Q E-
0 001 0 r a
--. =~U. :* N Z
C4 0 Z 0-w~ u V, r- . -
-1 UH o (
IV Z. 0 r- 00~o< C", ~oL.* - -- Z
0 -0 '=;
u LA
o~" 0 C.oO~-
00000zo2 .- -6< :
_____L_________m___

-0 'r;
CO C, - CO,
60 X (0.. 0 - .
.00 NC ~ u V, ~ 0000(
0 C- ~ ( 0 E
t~-c. w~ 10 C0L C. (L
-1 0- F "L-. .9-( _ _-
C, C.WM o -. . -,C , , oE
0 ;;n - ;n C,- c- 00!02 r- rj
ZCO ~ - ;00 kA~o
00 0 C,-O 0~~-
n<~ Co r- r-nC)~~ (00.9 =
I E; no -. i.
r- P0 -
( 0 (0 E X0 'C-)-n 0~ 0 - =00 N2 l< Z5 =-00
E,(=~ ' 0 = tha0- = n =0. - -. 0 2
Z 0 000 0 -
-- Z5 C)', ~6 4'*0 0i 0 6 0
0. n U) j0 - ~ o-~00 m U;(0 !2 E:g=0~ E 0
" ( 0: r
o M. o~ 0 r- o 0 . 07- z 0 rn
00 . p O . 0 ~0
>I0(~ C\ 00 00 o CN' (
00 CO. V .0 -~ a0 o
0.....9 E;(R
rc "Z 0. 5'( g 0
oo 0~0( 0 5
-j 0 00 :3 ,' 0
(0 CA 0 . O C
0 l* - 00 o
c 00* 5 ( 00 000 00j :3 (0000 0 .D EL 0. 0 D0.(

NATO OTAN
DISTRIBUTION OF UNCLASSIFIED7 RUE ANCELLE . 92200 NEUILLY-SUR-SEINE AGARD PUBLICATIONSFRANCE
Telephone 745.08.10 • Telex 610176
AcjARD does NOT hold stocks of AGARD publications at the above address for general distribution. Initial distribution of AG4%RDpublications is made to AGARD Member Nations through the following National Distribution Centres. rurther copies are sometimesavailable from tl" - rntres, but if not may be purchased in Microfide or Photo%.opy form from the Purchase Agencies listed below
NATIONAL DISTRIBUTION CENTRESBELGIUM 01=1 ITALY
Coordonm A'ronautica MilitateEtat-Majo ' * ,-'onto Nazionale alI'AGARDQuartier! Nationat ACrona• icRue d'Ev SPace Ad ics and N. o F"" P
CANADA Vashngto '" t t 1. CDefence 20546 D.C. SPECIAL .OU 00C4 BUS,Departr IOttaa CA ORTCLASS MAIL. Oil4,= us,OttawaBOKw 't ,t So
DENMARK 12 4Danisl Jkt'H1' 2 - 4
Qsterl J 4.L. ,1Cope AITC '4CAL ,( hm2on
FRANCE CA4A-L'[ i-AL- 2 -,| hmentO.N .. 1Vi IIC vv.. . .I¢j h "29, A Ll fj A ,r , . I i9 23 i j f V Aq 2 2 -3 1 4
GERMAFaPhyr.....Kernforschungszcm...D.7514 Eggenstein.Leopoldshac.,
GREECEHellenic Air Force General Staff D ti .... RResearch and Development Directorate Department N aelopment (ARGE)Holargos, Athens Ministry of National De)h., Ankara
UNITED KINGDOMICELAND Defence Research Information Centre
Director of Aviatiou Station Square [lousec/o Flugrad St. Mary CrayReykjavik Orpington, Kent BR5 3RE
UNITED STATESNational Aeronautics and Space Administration (NASA)Langley Field, Virginia 23365Attn: Report Distribution and Storage Unit
THE UNITED STATES NATIONAL DISTRIBUTION CENTRE (NASA) DOES NOT HOLDSTOCKS OF AGARD PUBLICATIONS, AND APPLICATIONS FOR COPIES SHOULD bl MADLDIRECT TO THE NATIONAL TECHNICAL INFORMATION SERVICE (NTIS) AT THE ADDRESS BELOW.
PURCHASE AGENCIESMicr "fiche or Photocopy Microfiche Microfiche or PitotocopyNational Technical Space Documentation Service Bitish Library LendingInformation Service (NTIS) European Space Agency Division5285 Port Royal Road 10, rue Mario Nikis Boston Spa, WetherbySpringfield 75015 Paris, France West Yorkshire LS23 7BQVirginia 22161, USA England
Requests for microfiche or photocopies of AGARD documents should include the AGARD serial number, title, author ot editor, andpublication date. Requests to NTIS should include the NASA accessiun report number. Full bibliographital references and abstra,.ts
of AGARD publications are given in the following journals:
Scientific and Technical Aerospace Reports (STAR) Government Reports Announcements (GRA)published by NASA Scientific and Technical published by the National TechnicalInformation Facility Information Services, SpringfieldPost Office Box 8757 Virginia 22161, USABaltimore/Washington Interfiatoial Alip'itp -Maryland 21240, USA
Printed by Speciallsed Printing Services Limited40 Chlgwell Lane, Loughton, Essex IGJO 3TZ
:!~ 9 3 0g
Related Documents