AD-A279 100 I lIl~l lll lillllESL-TR-89O 1 AIRCRAFT TIRE/PAVEMENT * PRESSURE DISTRIBUTION V i J.T. TIELKING TEXAS A&M UNIVERSITY TEXAS TRANSPORTATION INSTITUTE TEXAS A&M UNIVERSITY COLLEGE STATION TX 77843 JUNE 1989 DTIC FINAL REPORT ELECTE• JULY 1988 JANUARY 1989" j9 I E'APPROVED FOR PUBLIC, R~EUASE :" DSTRIBUTION UNLIMIED~ S AIR FORCE ENGINEERING & SERVICES CENTER ENGINEERING & SERVICES LABORATORY TYNDALL AIR FORCE BASE, FLORIDA 32403 1194 50063

Welcome message from author
This document is posted to help you gain knowledge. Please leave a comment to let me know what you think about it! Share it to your friends and learn new things together.
Transcript

AD-A279 100I lIl~l lll lillllESL-TR-89O 1
AIRCRAFT TIRE/PAVEMENT* PRESSURE DISTRIBUTION
V i J.T. TIELKING
TEXAS A&M UNIVERSITYTEXAS TRANSPORTATION INSTITUTETEXAS A&M UNIVERSITYCOLLEGE STATION TX 77843
JUNE 1989 DTICFINAL REPORT ELECTE•
JULY 1988 JANUARY 1989" j9 I
E'APPROVED FOR PUBLIC, R~EUASE :"
DSTRIBUTION UNLIMIED~
SI%3 AIR FORCE ENGINEERING & SERVICES CENTERENGINEERING & SERVICES LABORATORYTYNDALL AIR FORCE BASE, FLORIDA 32403
1194 50063
NOTICE
PLEASE DO NOT REQUEST COPIES OF THIS REPORT FROM
HQ AFESC/RD (ENGINEERING AND SERVICES LABORATORY).
ADDITIONAL COPIES MAY BE PURCHASED FROM:
NATIONAL TECHNICAL INFORMATION SERVICE
5285 PORT ROYAL ROAD
SPRINGFIELD, VIRGINIA 22161
FEDERAL GOVERNMENT AGENCIES AND THEIR CONTRACTORS
REGISTERED WITH DEFENSE TECHNICAL INFORMATION CENTER
SHOULD DIRECT REQUESTS FOR COPIES OF THIS REPORT TO:
DEFENSE TECHNICAL INFORMATION CENTER
CAMERON STATION
ALEXANDRIA, VIRGINIA 22314
UNCLASSIFIED
SECURITY CLASSIFICATION OF THIS PAGEForm Approved
REPORT DOCUMENTATION PAGE 0MB No. 0704-01U
la. REPORT SECURITY CLASSIFICATION lb. RESTRICTIVE MARKINGSUnclassified
2a. SECURITY CLASSIFICATION AUTHORITY 3. DISTRIBUTION/AVAILABILITY OF REPORTApproved for Public Release
2b. DECLASSIFICATION /DOWNGRADING SCHEDULE Distribution Unlimited
4. PERFORMING ORGANIZATION REPORT NUMBER(S) S. MONITORING ORGANIZATION REPORT NUMBER(S)
ESL-TR-89-01
6a. NAME OF PERFORMING ORGANIZATION 6b. OFFICE SYMBOL 7a. NAME OF MONITORING ORGANIZATION(if applicable)
Texas A&M University Air Force Engineering and Services Center
6c. ADDRESS (City, State, and ZIP Code) 7b. ADDRESS (City, State, and ZIP Code),Texas Transportation Institute
Texas A&M University HQ AFESC/RDCPCollege Station TX 77843 Tyndall AFB FL 32403-6001
n a. NAME OF FUNDING/SPONSORING 8b. OFFICE SYMBOL 9 PROCUREMENT INSTRUMENT IDENTIFICATION NUMBERORGANIZATION (If applicable) Contract #
I _ F08635-88-C0241
Sc. ADDRESS (City, State, and ZlPCode) 10 SOURCE OF FUNDING NUMBERSPROGRAM PROJECT TASK WORK UNITELEMENT NO. NO. NO ACCESSION NO.
63723F 2104 10 43
11. TITLE (Include Security Classification)
Aircraft Tire/Pavement Pressure Distribution
12. PERSONAL AUTHOR(S)Tielking, John T.
13a. TYPE OF REPORT 13b. TIME COVERED 14. DATE OF RFPORT (Year, Month, Day) 15. PAGE COUNTFinal FROM I Jul 8 8 TO 31 Jan 9 June 1989 53
16. SUPPLEMENTARY NOTATION
Availability of this report is specified on reverse of the front cover.
17. COSATI CODES 18, SUBJECT TERMS (Continue on reverse if necessary and identify by block number)
FIELD GROUP SUB-GROUP Pavements Design Tire Model
13 02 Contact Pressure Aircraft Tires
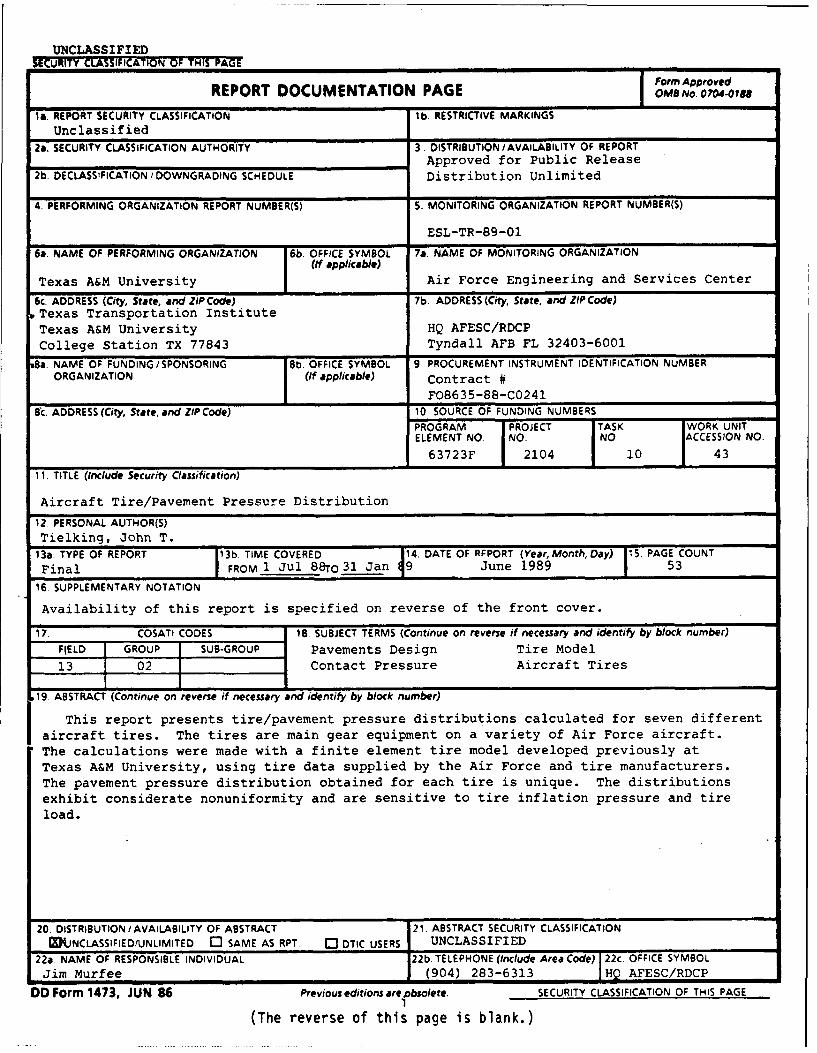
19. ABSTRACT (Continue on reverse if necessary and identify by block number)
This report presents tire/pavement pressure distributions calculated for seven differentaircraft tires. The tires are main gear equipment on a variety of Air Force aircraft.The calculations were made with a finite element tire model developed previously atTexas A&M University, using tire data supplied by the Air Force and tire manufacturers.The pavement pressure distribution obtained for each tire is unique. The distributionsexhibit considerate nonuniformity and are sensitive to tire inflation pressure and tireload.
20. DISTRIBUTION/AVAILABILITY OF ABSTRACT 21. ABSTRACT SECURITY CLASSIFICATION4JNCLASSIFIED/UNLIMITED 0 SAME AS RPT. [3 DTIC USERS UNCLASSIFIED
22a. NAME OF RESPONSIBLE INDIVIDUAL 22b. TELEPHONE (Include Area Code) 22c OFFICE SYMBOLJim Murfee (904) 283-6313 HQ AFESC/RDCP
DD Form 1473, JUN 86 Previous editions are obsolete. SECURITY CLASSIFICATION OF THIS PAGEI
(The reverse of this page is blank.)

PREFACE
This report was prepared by the Texas Transportation Institute of TexasA&N University, funded under Contract Number F03635-88-C-0241 by the Air ForceCivil Engineering Support Agency, Civil Engineering Laboratory, Tyndall AirForce Base, Florida 32403-5319.
This report covers work performed between 1 July 1988 and 31 January1989. The AFCESA/RD project officer was Jim Murfee.
This report has been reviewed by the Public Affairs Office and isreleasable to the National Technical Information Service (NTIS). At NTIS, itwill be available to the general public, including foreign nationals.
This technical report has been reviewed and is approved for publication.
FURFEE, GS 1~ FELIX T. UHLIK III, Lt Col, USAFroject ffice Chief, Air Base Systems Branch
EDWF. ALEXANDER, M1
Chief, Air Base Operability andRepair Section
Acession For
-. A TI I I [•?/DTI:' E-
By ......-------
tctd Avi]h c--othd!0lrDist cal
(The reverse of this page is blank)

TABLE OF CONTENTS
Section Title -Page
I INTRODUCTION ......................................... 1
A. OBJECTIVE ....................................... 1B. BACKGROUND ....................................... 1C. SCOPE/APPROACH ................................... 2
II CALCULATED RESULTS ................................... 4
A. PRESSURE DISTRIBUTIONS ........................... 4B. DEFLECTION-LOAD PLOTS ............................ 4C. TABULAR DATA ..................................... 12D. EFFECT OF INFLATION PRESSURE AND TIRE LOAD ....... 36
III CONCLUSIONS AND RECOMMENDATIONS ....................... 41
A. CONCLUSIONS ....................................... 41B. RECOMMENDATIONS .................................. 42
REFERENCES ........................................... 43
APPENDIX
A TIRE DATA AND PROFILES ................................ 45
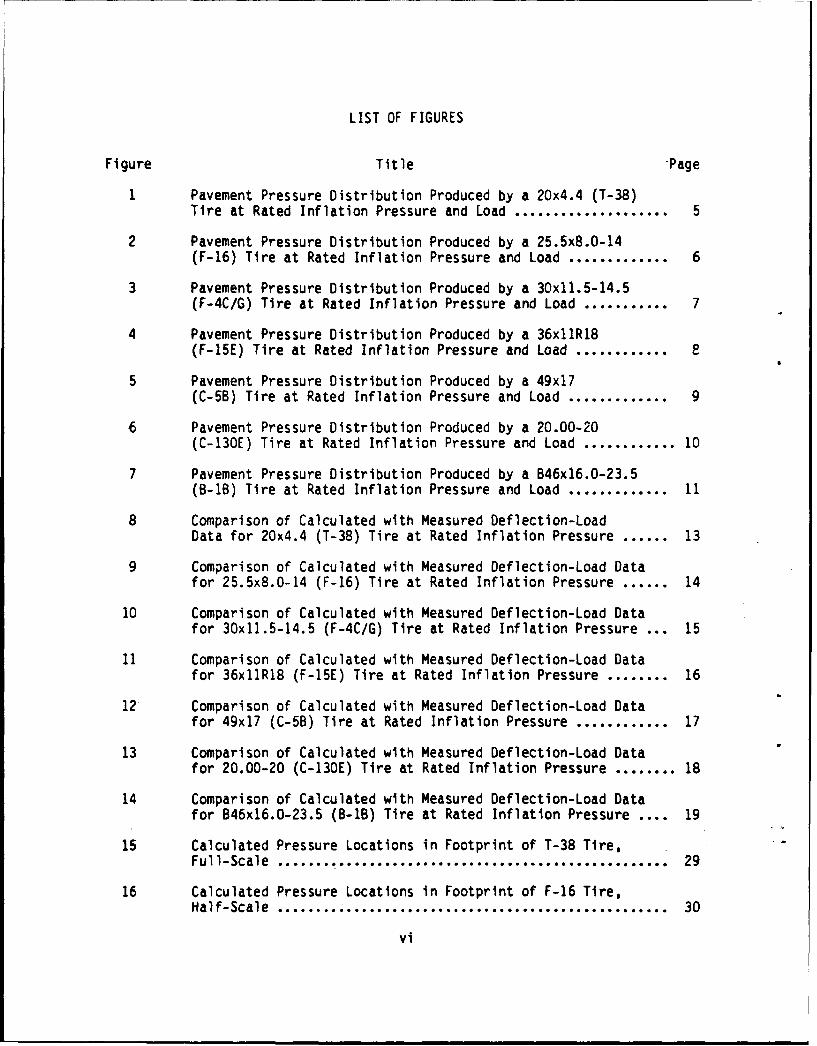
LIST OF FIGURES
Figure Title Page
1 Pavement Pressure Distribution Produced by a 20x4.4 (T-38)Tire at Rated Inflation Pressure and Load .................... 5
2 Pavement Pressure Distribution Produced by a 25.5x8.0-14(F-16) Tire at Rated Inflation Pressure and Load ............. 6
3 Pavement Pressure Distribution Produced by a 30x11.5-14.5(F-4C/G) Tire at Rated Inflation Pressure and Load ............ 7
4 Pavement Pressure Distribution Produced by a 36x11R18(F-15E) Tire at Rated Inflation Pressure and Load ........... .
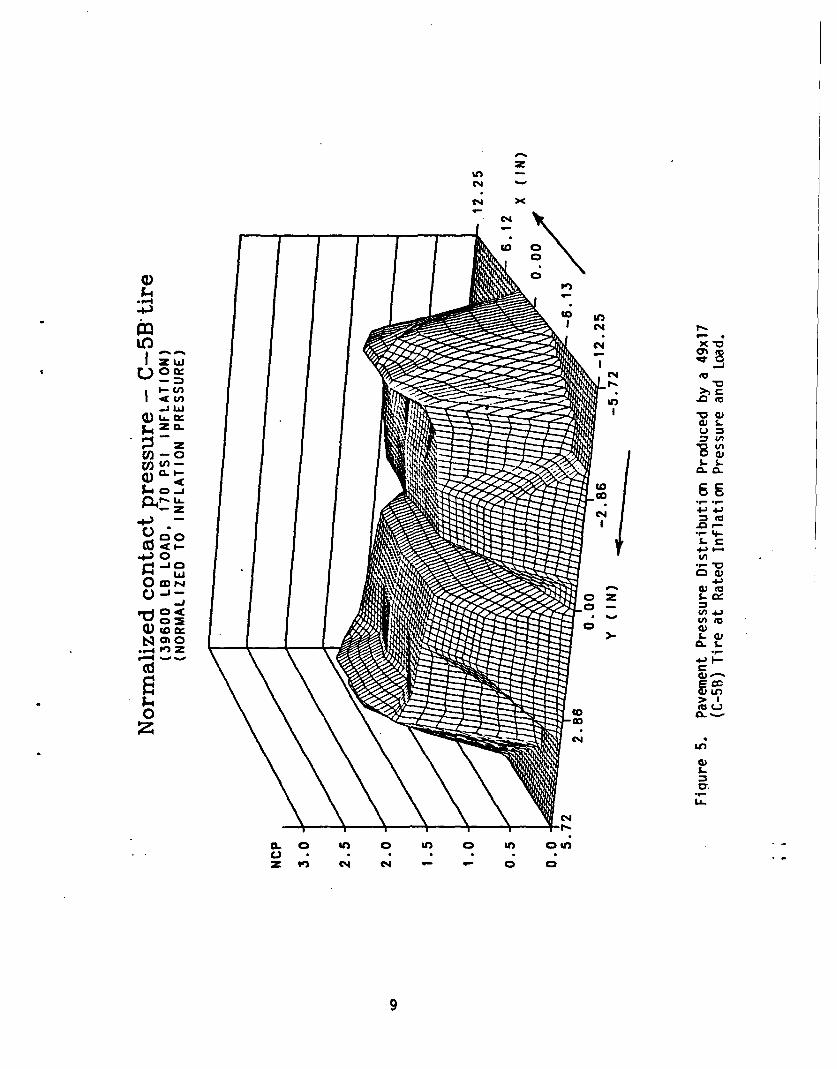
5 Pavement Pressure Distribution Produced by a 49x17(C-5B) Tire at Rated Inflation Pressure and Load ............. 9
6 Pavement Pressure Distribution Produced by a 20.00-20(C-130E) Tire at Rated Inflation Pressure and Load ............ 10
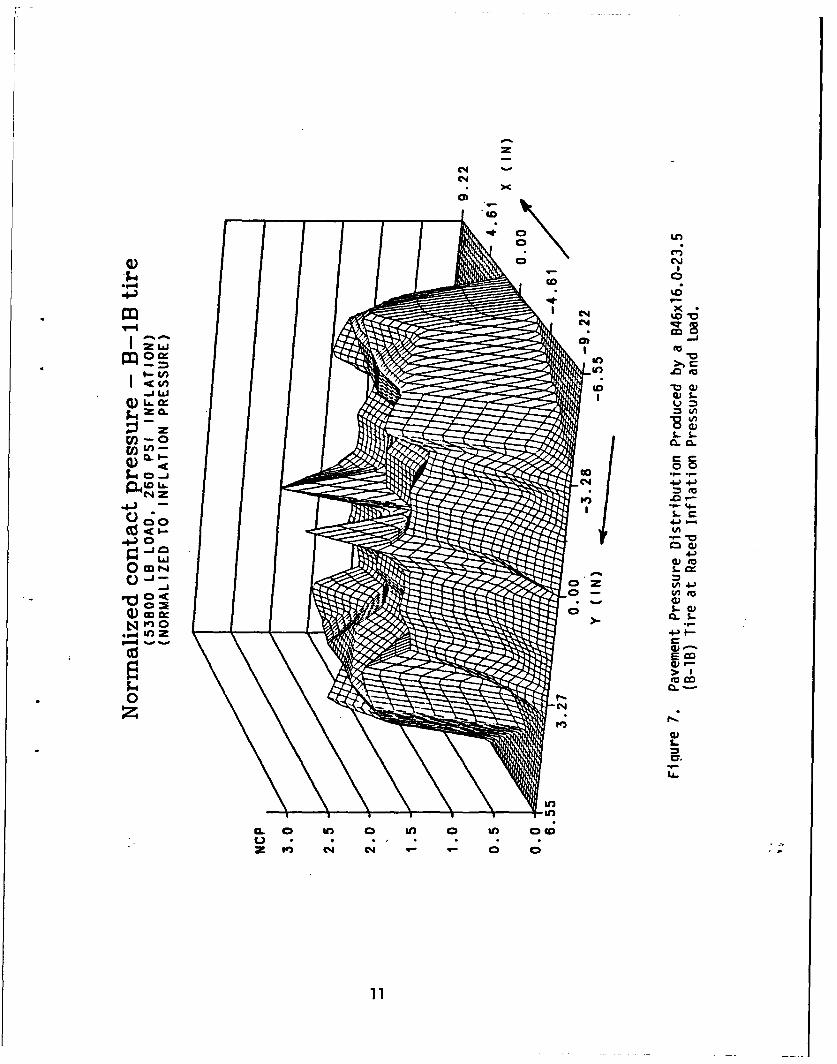
7 Pavement Pressure Distribution Produced by a B46x16.0-23.5(B-1B) Tire at Rated Inflation Pressure and Load ............ 11
8 Comparison of Calculated with Measured Deflection-LoadData for 20x4.4 (T-38) Tire at Rated Inflation Pressure ...... 13
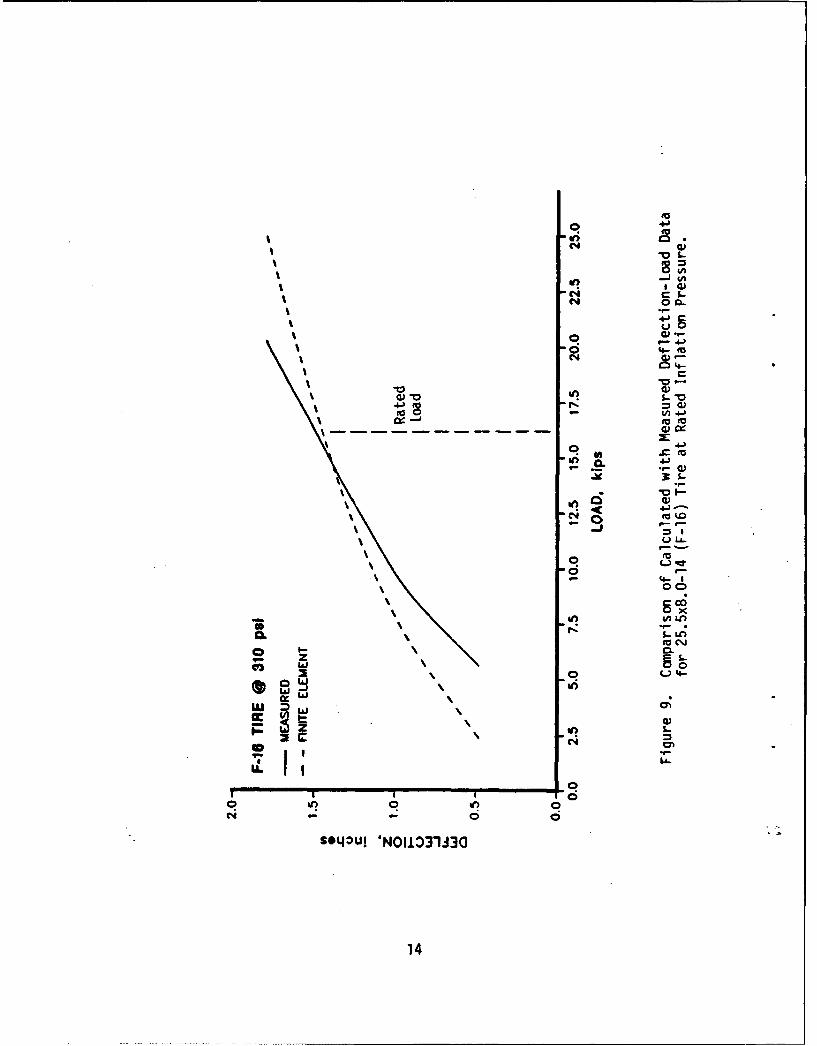
9 Comparison of Calculated with Measured Deflection-Load Datafor 25.5x8.0-14 (F-16) Tire at Rated Inflation Pressure ...... 14
10 Comparison of Calculated with Measured Deflection-Load Datafor 30x11.5-14.5 (F-4C/G) Tire at Rated Inflation Pressure ... 15
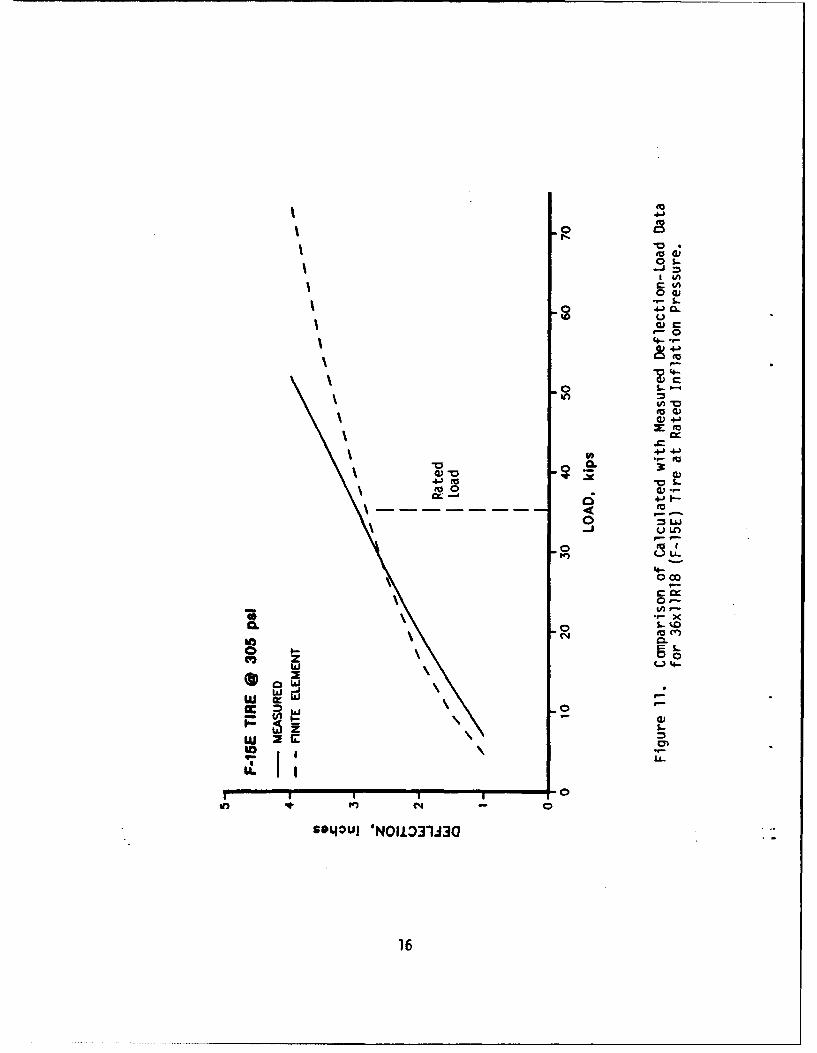
11 Comparison of Calculated with Measured Deflection-Load Datafor 36x11R18 (F-15E) Tire at Rated Inflation Pressure ........ 16
12 Comparison of Calculated with Measured Deflection-Load Datafor 49x17 (C-SB) Tire at Rated Inflation Pressure ............ 17
13 Comparison of Calculated with Measured Deflection-Load Datafor 20.00-20 (C-130E) Tire at Rated Inflation Pressure ........ 18
14 Comparison of Calculated with Measured Deflection-Load Datafor B46x16.0-23.5 (B-1B) Tire at Rated Inflation Pressure .... 19
15 Calculated Pressure Locations in Footprint of T-38 Tire,Full-Scale ................................................... 29
16 Calculated Pressure Locations in Footprint of F-16 Tire,Half-Scale ................................................... 30
vi
LIST OF FIGURES(CONCLUDED)
Figure Title Page
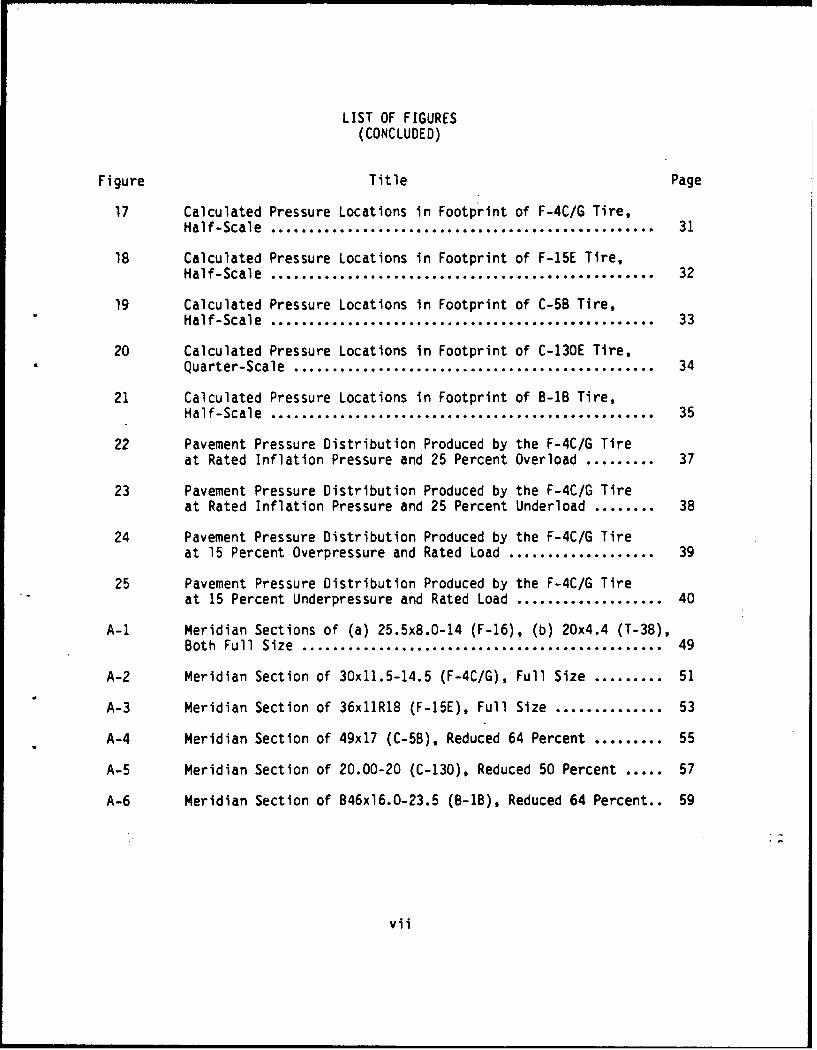
17 Calculated Pressure Locations in Footprint of F-4C/G Tire,Half-Scale .................................................. 31
18 Calculated Pressure Locations in Footprint of F-15E Tire,Half-Scale .................................................. 32
19 Calculated Pressure Locations in Footprint of C-5B Tire,"Half-Scale ............................................... .. 33
20 Calculated Pressure Locations in Footprint of C-130E Tire,Quarter-Scale ............................................... 34
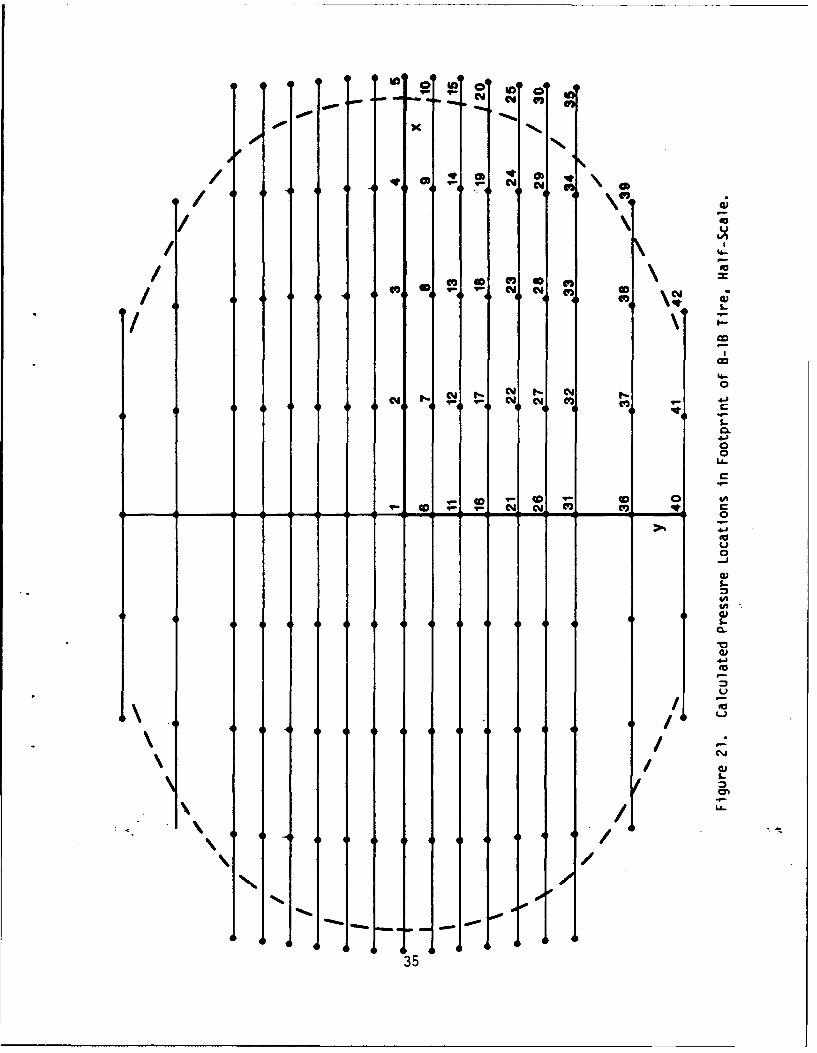
21 Calculated Pressure Locations in Footprint of B-1B Tire,Half-Scale .................................................. 35
22 Pavement Pressure Distribution Produced by the F-4C/G Tireat Rated Inflation Pressure and 25 Percent Overload ......... 37
23 Pavement Pressure Distribution Produced by the F-4C/G Tireat Rated Inflation Pressure and 25 Percent Underload ........ 38
24 Pavement Pressure Distribution Produced by the F-4C/G Tireat 15 Percent Overpressure and Rated Load ................... 39
25 Pavement Pressure Distribution Produced by the F-4C/G Tireat 15 Percent Underpressure and Rated Load ................... 40
A-i Meridian Sections of (a) 25.5x8.0-14 (F-16), (b) 20x4.4 (T-38),
Both Full Size ............................................... 49
A-2 Meridian Section of 30x11.5-14.5 (F-4C/G), Full Size ......... 51
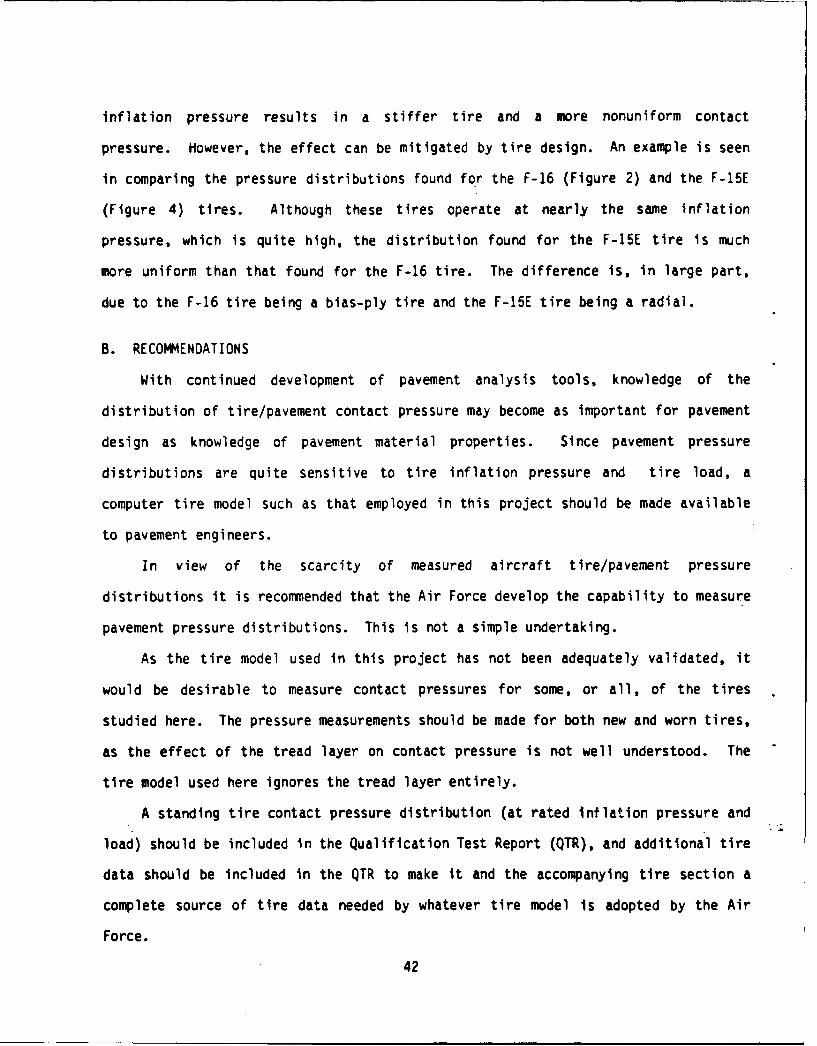
A-3 Meridian Section of 36x11R18 (F-15E), Full Size .............. 53
A-4 Meridian Section of 49x17 (C-SB), Reduced 64 Percent ......... 55
A-5 Meridian Section of 20.00-20 (C-130), Reduced 50 Percent ..... 57
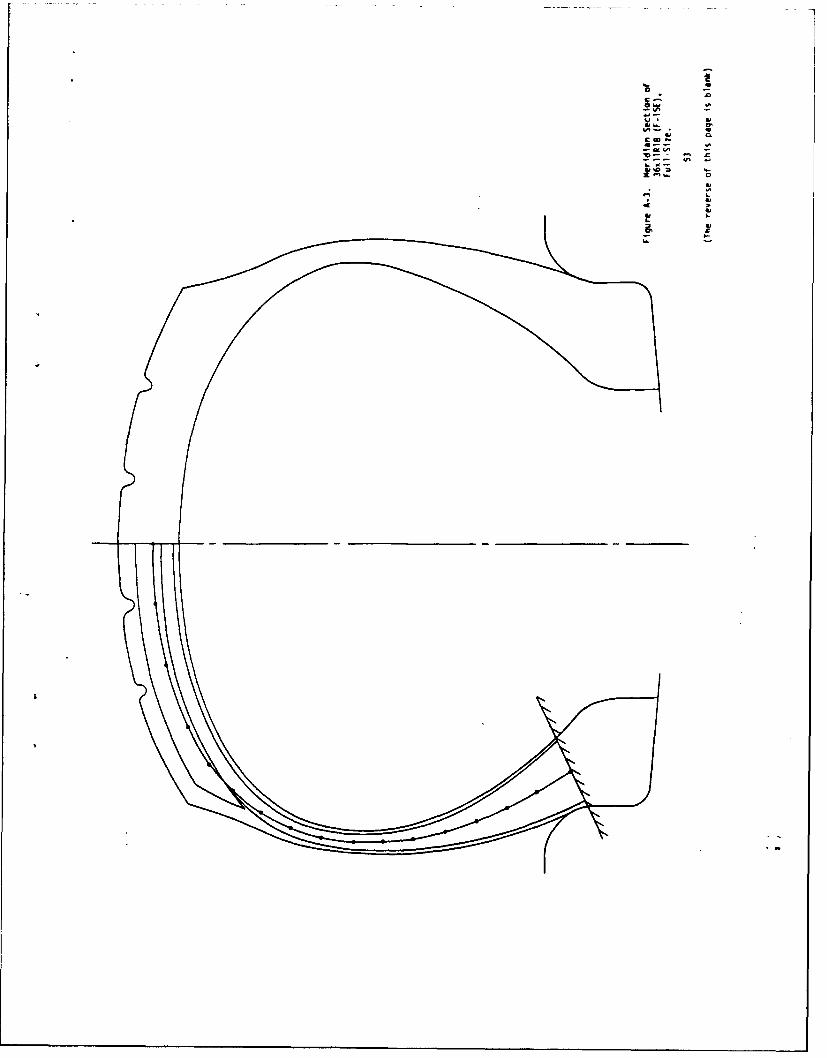
A-6 Meridian Section of B46x06.0-23.5 (B-1B), Reduced 64 Percent.. 59
vii

LIST OF TABLES
Table Title Page
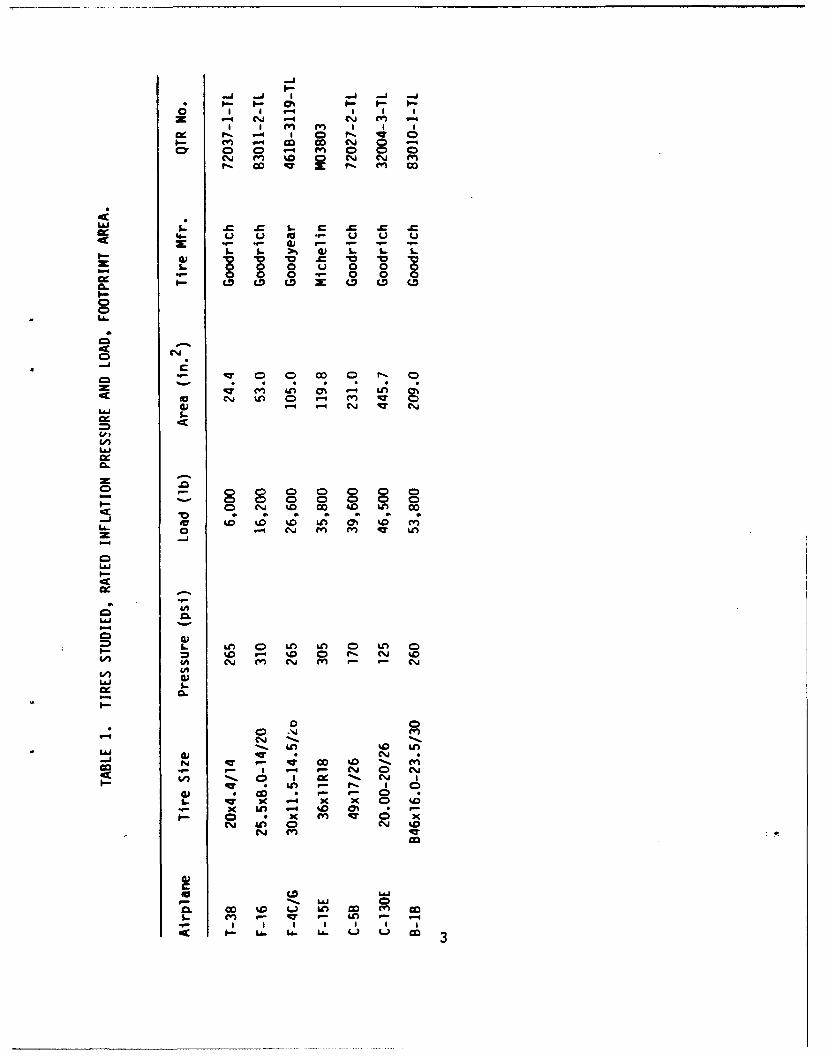
1 TIRES STUDIED, RATED INFLATION PRESSURE AND LOAD, FOOTPRINTAREA .............................. ...................... 3
2 CONTACT PRESSURES, p, IN FOOTPRINT OF 20X4.4 (T-38) TIREWITH 265 PSI INFLATION PRESSURE AND 6,000 POUND LOAD ......... 20
3 CONTACT PRESSURES, p, IN FOOTPRINT OF 25.5X8.0-14 (F16) TIREWITH 310 PSI INFLATION PRESSURE AND 16,200 POUND LOAD ........ 21
4 CONTACT PRESSURES. D. IN FOOTPRINT OF 30X11.5-14.5 (F-4C/G)TIRE WITH 265 PSI INFLATION PRESSURE AND 26,000 POUND LOAD.. 22
5 CONTACT PRtSSURES, p, IN FOOTPRINT OF 36X11R18 (F15E) TIREWITH 305 PSI INFLATION PRESSURE AND 35,700 POUND LOAD ........ 23
6 CONTACT PRESSURES, p, IN FOOTPRINT OF 49X17 (C-5B) TIREWITH 170 PSI INFLATION PRESSURE AND 39,600 POUND LOAD ........ 24
7 CONTACT PRESSURES, p, IN FOOTPRINT OF 20.00-20 (C-130E) TIREWITH 125 PSI INFLATION PRESSURE AND 46,500 POUND LOAD ........ 25
8 CONTACT PRESSURES, p, IN FOOTPRINT OF B46X16.O-23.5 (B-1B)TIRE WITH 260 PSI INFLATION PRESSURE AND 53,800 POUND LOAD ... 27
viii

SECTION I
INTRODUCTION
A. OBJECTIVE
The primary purpose of the work reported here was to determine the
pavement pressure distribution produced by a variety of aircraft tires used by
the Air Force. The tire/pavement pressure distributions are needed by
airfield pavement engineers concerned with the design of thin flexible
pavements for aircraft using high pressure tires to carry heavy loads.
B. BACKGROUND
Pavement design has traditionally been based on the assumptions that a
tire's footprint is circular and exerts a uniform pressure on the pavement
surface. The magnitude of the pressure is often taken as equal to the
inflation pressure although other values have been specified which are related
to the expected footprint area (Reference 1). Although the assumption of
uniform tire/pavement contact pressure has led to successful airfield pavement
design for many years, modern aircraft with high-pressure tires to carry heavy
loads are creating new demands for pavement performance.
Modern pavement models, based on the finite element method, can account
for nonuniformity in the surface pressure produced by a tire. It has been
established that, for a truck tire, the shape of the tire/pavement pressure
distribution has a significant effect on strains in a flexible highway
pavement (Reference 2). The actual shape of the aircraft tire/pavement
pressure distribution is thus+becoming of considerable interest to airfield
pavement engineers.

In view of the lack of measurement of aircraft tire/pavement pressure
distributions, and the expense of making such measurements, the present
project was initiated to calculate representative pressure distributions using
a computer tire model.
C. SCOPE/APPROACH
As few previous studies of aircraft tire/pavement pressure distributions
exist, the project was begun by developing a list of tires that would include
a wide range of tire sizes, inflation pressures, and tire loads. This list is
given in Table 1, and the tires are arranged according to their rated loads.
All of the tires are main gear tires, for the aircraft identified in Table
1. Only one radial tire (for the F-15E airplane) is included in the study as
virtually all aircraft tires today are of conventional bias-ply design. The
relative sizes of the tires can be seen by turning to Appendix A where
meridian profile plots are shown.
The tire/pavement pressure distributions were made with a finite element
tire model developed previously at Texas A&M University (Reference 3). This
model utilizes a relatively comprehensive description of a tire's geometry and
material properties, without requiring an excessive amount of computer time.
Most of the calculations were made with a VAXstation 2000 workstation-class
computer. The 3-D plots shown in the next section were made with the SAS
graphics package on a mainframe computer.
Input data describing a tire to the tire model were obtained from various
sources, including the tire Qualification Test Report (QTR), the tire
manufacturer, and a physical section of the tire. Tire sections for this
project were provided by Mr. Jack Passey and Mr. Brian Chatterton of Hill AFB,
Utah; Mr. Bob Fitzharris of Wright-Patterson AFB, Ohio; and Mr. H.G.
Herchenroether of B.F. Goodrich Aerospace and Defense. A detailed description
of the input data needed by the tire model is given in Appendix A.
2
r - CI 01rf, m c
u a ULiL
cz 4- v to . u u
000u 0 0 00 0' 0 0 0
C6 cm LD coZ
tool
(LI.AOJ - L
La4a
C-
C)- 0 0 0 0D 0D 0
CD C 0 0 0 C 0
4D %D0 %D Ln M~ '0 mL-0 -T c.j r. ')q a
LijI.-
La 0
Lc ) L) C -S..-. ko 0 0lA 0 a
LL&JQ.-
CC',
ca- F-CD -~
a.'. C0: C'..
* u*) 9- - I 0COD r 9- 0
4.. x K 4 K x 0CDK U-) .4 '0 0%
9- 0 0 K m~ 4g0 xc%j LO C0 C.j %D0
C"j 4T
0 CD Li.)9- S. Li) 0D0. co %0 Lc c I
C V ) i- L .. L . L n L .-
SECTION II
CALCULATED RESULTS
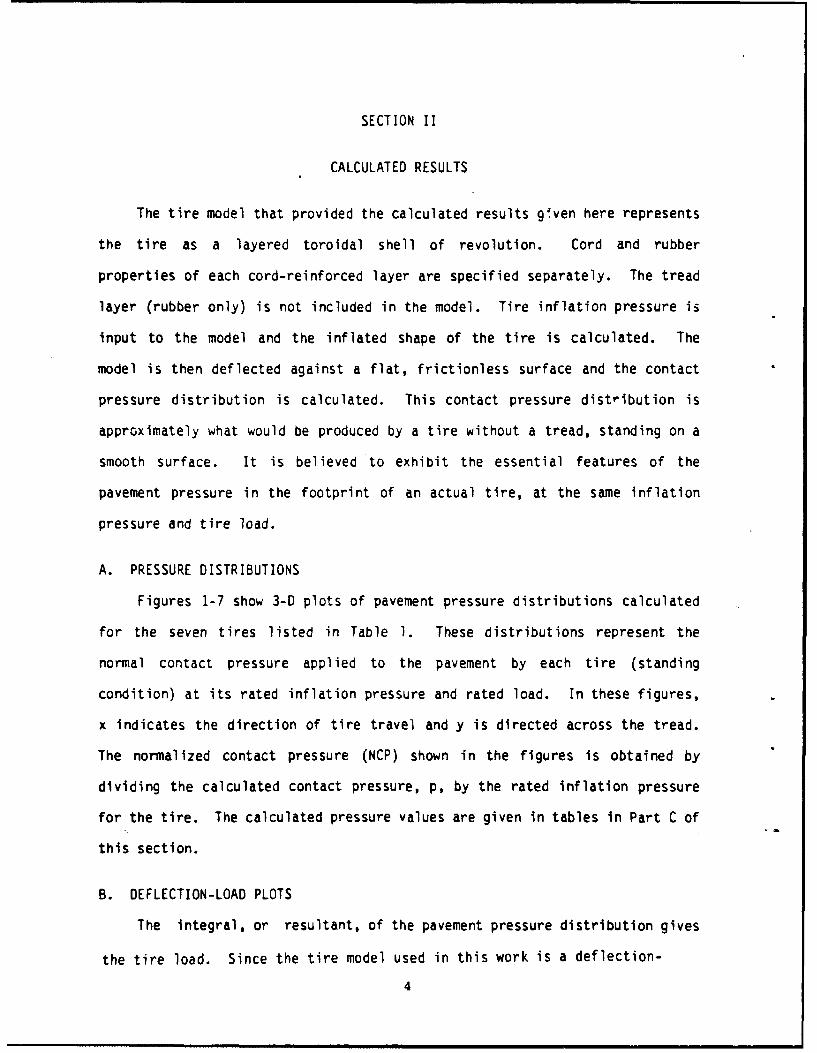
The tire model that provided the calculated results given here represents
the tire as a layered toroidal shell of revolution. Cord and rubber
properties of each cord-reinforced layer are specified separately. The tread
layer (rubber only) is not included in the model. Tire inflation pressure is
input to the model and the inflated shape of the tire is calculated. The
model is then deflected against a flat, frictionless surface and the contact
pressure distribution is calculated. This contact pressure distribution is
approximately what would be produced by a tire without a tread, standing on a
smooth surface. It is believed to exhibit the essential features of the
pavement pressure in the footprint of an actual tire, at the same inflation
pressure and tire load.
A. PRESSURE DISTRIBUTIONS
Figures 1-7 show 3-D plots of pavement pressure distributions calculated
for the seven tires listed in Table 1. These distributions represent the
normal contact pressure applied to the pavement by each tire (standing
condition) at its rated inflation pressure and rated load. In these figures,
x indicates the direction of tire travel and y is directed across the tread.
The normalized contact pressure (NCP) shown in the figures is obtained by
dividing the calculated contact pressure, p, by the rated inflation pressure
for the tire. The calculated pressure values are given in tables in Part C of
this section.
B. DEFLECTION-LOAD PLOTS
The integral, or resultant, of the pavement pressure distribution gives
the tire load. Since the tire model used in this work is a deflection-
4

430
C..;
w _Go
ccJ0.
S- %S%
"IL
V))
C4 S-
C)L f) 0 U 0 I) 0C.C)
Z. Cc 4-)C -0
5-

U')V
0v a~
U.;020
EnnWn u
C))
rrj-
41
LLeU 4-)
S- (C c)
IL
6 1)L

kn
X LLJ
CAL
cxc
0-
0I4 Zn
LMaco C3 0
0 LL0
-o 0 z S,
L4.J
0 LL
OjLL.
40 in 0 n 0 o0CDtW- C4 C4
7ULA.

z
Wzco
1-c
1-4 0 #ý -
00:rZ4
-QJ LJ
z-$ .LA
0cn -
-C 4-
In 0 4-) M ~ 0 Sf
co~z~~~0 ") cL ,I '
r--4 8
N
Q4)
mm
z OL
CJLi
-z r~ 4-
o
-JS
co- zE
C.)) Lc)
0 939

0*
00
0 )
r0-
cr*)00
crt-
'-4-
*10
kJ U-
ulUa~t4
C)1
C~4Cd
"
0)n
044 0
M :I-,
z0.)
a)a-~ .1- t4.
oco wC
CI-S
1.4L00
Lca)
0. 0 in 0 Si) 0 Si) Q(z n C C UC

specified model*, comparing the calculated tire load with the load measured at
the same tire deflection indicates validity of the tire model.
Figures 8-14 show a comparison of measured deflection-load data, taken
from the tire QTR, with calculated deflection-load data for each tire at its
rated inflation pressure. The comparison is fairly good in the
neighborhood of each tire's rated load. In all cases, however, the slope of
the calculated data is less than the slope of the measured data. This
indicates that the tire model is somewhat stiffer than the tire being modeled.
Consequently, the calculated pavement pressures may be more nonuniform than
the actual pavement pressures.
C. TABULAR DATA
Tables 2-8 give the locations and numerical values of contact pressure,
p, calculated in the footprint of each tire at rated inflation pressure and
rated load. As the tire model footprint has two axes of symmetry, contact
pressures in one quarter of the footprint are calculated. The location of
each point where a pressure is found is given by Cartesian coordinates, x and
y, which originate at the center of the footprint. For example, Figure 15
shows the complete set of points where contact pressures are obtained for the
20x4.4 (T-38) tire. The tire model calculates pressures at points I through
21 (Table 2 and Figure 15) for the T-38 tire. The pressures at the unnumbered
points in Figure 15 are identified by reflection across the footprint axes of
symmetry (the x and y axes). The footprint locations of contact pressures for
the other tires (Tables 3-8 and Figures 16-21) are similarly determined. The
*With this model, a tire deflection is specified as input data and theconsequent load is obtained by integrating the calculated contact pressuredistribution.
12

4J 0
4-)MU
0
a 4J
4-) I
4-) 4-
EU -
S.C)
Lai)
aU :) 0
0. 1. 002040ul~E C"J1313
go1-
4-)
N CL
4N
-4-
if)
*~ ~ ~ 4-)* t
U LI..
r-
0 C
060
~ L '4-I
w0f) flLt
ID I4
~~LA-
C! 1
S*40uJ 'NoI1D3313a
14

ut4,-
W -o
a 4 J
U,to U-)
C)tVI
*CL
Wa -JWd'vU
P a:a
$040ul 'O1134-3-
15I
00
4-I
to m
4-
C.) 4-)m
-o0
0 e i
LC)L
0-
a. 0 S.. 1.
C1 to-e
-
0-
LLJJW -J0: W
z S
i~Ll.
$0Lpuj 'NOh±3ITWQ
16

4-)
0)a
- m80r
0
C-) 4fl
p..
4J 4-)
-9u 4-)
CC4-)
pr_
0 04
W -J oa;
p..
LA-
40 .0
9*4*u 'NOI03113
170 4-

4-
ot
U-0
'4--00
0 i
1--,
0 4) 4-)-CZt
0)
Q)4
~~CL)
0 C
4-(fl 00
0.0
LIJ 2
I--
018

-0 4A
*0 wf
0 ~00.4J ,-
.9- 0-
4) 4-'
4-)
ot
Nt w
cc a
0NU
19\
.. .......

TABLE 2. CONTACT PRESSURES, p, IN FOOTPRINT OF 20x4.4 (T-38) TIRE
WITH 265 PSI INFLATION PRESSURE AND 6,000 POUND LOAD.
Point x (in) y (in) p (psi) NCP
1 0.0 0.0 134.4 0.512 0.99 0.0 146.5 0.553 1.98 0.0 160.1 0.604 2.97 0.0 135.9 0.515 3.96 0.0 0.0 0.0
6 0.0 0.40 426.9 1.617 0.98 0.40 383.9 1.458 1.97 0.40 370.4 1.409 2.95 0.40 314.2 1.18
10 3.94 0.40 0.0 0.0
11 0.0 0.82 512.3 1.9312 0.97 0.82 468.2 1.7713 1.93 0.82 559.3 2.1114 2.90 0.82 0.0 0.0
15 0.0 1.27 787.1 2.9716 0.94 1.27 700.6 2.6417 1.87 1.27 46.6 0.1818 2.81 1.27 0.0 0.0
19 0.0 1.47 0.0 0.020 0.92 1.47 0.0 0.021 1.83 1.47 0.0 0.0
20

TABLE 3. CONTACT PRESSURES, p, IN FOOTPRINT OF 25.5X8.0-14 (F-16) TIRE
WITH 310 PSI INFLATION PRESSURE AND 16,200 POUND LOAD.
Point x (in) y (in) p (psi) NCP
1 0.0 0.0 49.3 0.162 1.28 0.0 72.6 0.233 2.56 0.0 112.7 0.364 3.84 0.0 62.6 0.205 5.12 0.0 0.0 0.0
6 0.0 0.50 604.3 1.957 1.28 0.50 576.3 1.868 2.56 0.50 606.6 1.969 3.84 0.50 473.2 1.53
10 5.12 0.50 0.0 0.0
11 0.0 1.00 349.2 1.1312 1.27 1.00 232.9 0.7513 2.54 1.00 328.2 1.0614 3.81 1.00 16.6 0.0515 5.09 1.00 0.0 0.0
16 0.0 1.50 572.0 1.8517 1.26 1.50 400.0 1.2918 2.52 1.50 716.7 2.3119 3.78 1.50 0.0 0.0
20 0.0 2.00 581.3 1.8821 1.23 2.00 775.4 2.5022 2.46 2.00 504.7 1.6323 3.69 2.00 0.0 0.0
24 0.0 2.42 979.7 3.1625 1.20 2.42 563.8 1.8226 2.41 2.42 0.0 0.0
27 0.0 2.75 0.0 0.028 1.18 2.75 0.0 0.0
21

TABLE 4. CONTACT PRESSURES, p, IN FOOTPRINT OF 30X11.5-14.5 (F-4C/G)
TIRE WITH 265 PSI INFLATION PRESSURE AND 26,600 POUND LOAD.
Point x (in) y (in) p (psi) NCP
1 0.0 0.0 141.9 0.542 1.53 0.0 149.1 0.563 3.05 0.0 146.9 0.554 4.58 0.0 149.9 0.575 6.10 0.0 0.0 0.0
6 0.0 1.00 367.2 1.397 1.52 1.00 344.1 1.308 3.04 1.00 338.8 1.289 4.56 1.00 298.8 1.13
10 6.08 1.00 0.0 0.0
11 0.0 2.00 328.6 1.2412 1.50 2.00 305.0 1.1513 3.00 2.00 307.1 1.1614 4.50 2.00 241.4 0.9115 5.99 2.00 0.0 0.0
16 0.0 3.00 462.2 1.7417 1.46 3.00 423.9 1.6018 2.92 3.00 512.8 1.9419 4.39 3.00 197.7 0.7520 5.85 3.00 0.0 0.0
21 0.0 3.52 387.5 1.4622 1.43 3.52 451.2 1.7023 2.87 3.52 451.3 1.7024 4.30 3.52 0.0 0.0
25 0.0 4.06 558.0 2.1026 1.40 4.06 490.7 i.8527 2.80 4.06 0.0 0.0
28 0.0 4.65 0.0 0.029 1.35 4.65 0.0 0.0
22

TABLE 5. CONTACT PRESURES, p, IN FOOTPRINT OF 36X11R18 (F-15E) TIRE
WITH 305 PSI INFLATION PRESSURE AND 35,800 POUND LOAD.
Point x (in) y (in) p (psi) NCP
1 0.0 0.0 186.6 0.612 2.39 0.0 191.4 0.633 4.78 0.0 191.0 0.634 7.17 0.0 156.1 0.515 9.56 0.0 0.0 0.0
6 0.0 1.00 407.6 1.347 2.37 1.00 402.3 1.328 4.75 1.00 383.4 1.269 7.12 1.00 355.5 1.17
10 9.50 1.00 0.0 0.0
11 0.0 2.00 449.5 1.4712 2.32 2.00 435.0 1.4313 4.65 2.00 456.0 1.5014 6.97 2.00 274.4 0.9015 9.30 2.00 0.0 0.0
16 0.0 3.00 769.5 2.5217 2.24 3.00 632.8 2.0718 4.48 3.00 146.7 0.4819 6.72 3.00 0.0 0.0
20 0.0 3.61 0.0 0.021 2.18 3.61 0.0 0.022 4.36 3.61 0.0 0.0
23

TABLE 6. CONTACT PRESSURES, p. IN FOOTPRINT OF 49X17 (C-5B) TIRE
WITH 170 PSI INFLATION PRESSURE AND 39,600 POUND LOAD.
Point x (in) y (in) p (psi) NCP
1 0.0 0.0 68.6 0.402 3.06 0.0 66.0 0.393 6.12 0.0 70.6 0.414 9.19 0.0 44.4 0.265 12.25 0.0 0.0 0.0
6 0.0 0.70 229.6 1.357 3.06 0.70 219.6 1.298 6.12 0.70 217.5 1.289 9.19 0.70 140.3 0.83
10 12.25 0.70 0.0 0.0
11 0.0 2.10 244.2 1.4412 3.03 2.10 233.2 1.3713 6 06 2.10 233.3 1.3714 9.09 2.10 153.1 0.9015 12.12 2.10 0.0 0.0
16 0.0 3.51 241.7 1.4217 2.97 3.51 224.5 1.3218 5.94 3.51 245.4 1.4419 8.90 3.51 3.6 0.0220 11.88 3.51 0.0 0.0
21 0.0 4.23 323.9 1.9122 2.92 4.23 326.0 1.9223 5.85 4.23 282.0 1.6624 8.77 4.23 0.0 0.0
25 0.0 5.00 275.3 1.6226 2.87 5.00 201.3 1.1827 5.74 5.00 0.0 0.0
28 0.0 5.72 0.0 0.029 2.80 5.72 0.0 0.0
24

TABLE 7. CONTACT PRESSURES, p, IN FOOTPRINT OF 20.00-20 (C-130E) TIRE
WITH 125 PSI INFLATION PRESSURE AND 46,500 POUND LOAD.
Point x (in) y (in) p (psi) NCP
1 0.0 0.0 74.2 0.592 3.52 0.0 223.1 1.783 7.03 0.0 65.1 0.524 10.55 0.0 66.2 0.535 14.07 0.0 0.0 0.0
6 0.0 0.70 150.3 1.207 3.51 0.70 148.1 1.188 7.03 0.70 136.5 1.099 10.54 0.70 107.5 0.86
10 14.05 0.70 0.0 0.0
11 0.0 1.40 167.9 1.3412 3.50 1.40 166.3 1.3313 7.01 1.40 158.3 1.2714 10.51 1.40 128.7 1.0315 14.02 1.40 0.0 0.0
16 0.0 2.10 177.3 1.4217 3.49 2.10 171.1 1.3718 6.98 2.10 161.5 1.2919 10.46 2.10 122.7 0.9820 13.95 2.10 0.0 0.0
21 0.0 3.50 203.6 1.6322 3.44 3.50 197.3 1.5823 6.87 3.50 193.3 1.5524 10.31 3.50 133.3 1.0725 13.74 3.50 0.0 0.0
26 0.0 4.21 192.1 1.5427 3.40 4.21 179.5 1.4428 6.79 4.21 169.5 1.3629 10.19 4.21 0.0 0.0
30 0.0 4.93 237.5 1.9031 3.35 4.93 210.8 1.6932 6.70 4.93 302.2 2.4233 10.06 4.93 0.0 0.0
25

TABLE 7. CONTACT PRESSURES, p, IN FOOTPRINT OF 20.00-20 (C-130E) TIREWITH 125 PSI INFLATION PRESSURE AND 46,500 POUND LOAD(CONCLUDED).
Point x (in) y (in) p (psi) NCP
34 0.0 5.68 321.4 2.5735 3.30 5.68 373.4 2.9936 6.60 5.68 61.6 0.4937 9.89 5.68 0.0 0.0
38 0.0 6.47 229.3 1.8339 3.23 6.47 66.9 0.5440 6.47 6.47 0.0 0.0
41 0.0 7.16 0.0 0.042 3.17 7.16 0.0 0.0
26

TABLE 8. CONTACT PRESSURES, p, IN FOOTPRINT OF B46X16.0-23.5 (8-IB)
TIRE WITH 260 PSI INFLATION PRESSURE AND 53,800 POUND LOAD.
Point x (in) y (in) p (psi) NCP
1 0.0 0.0 143.2 0.552 2.30 0.0 665.7 2.563 4.61 0.0 459.1 1.764 6.91 0.0 80.2 0.315 9.22 0.0 0.0 0.0
6 0.0 0.60 363.1 1.407 2.30 0.60 325.9 1.258 4.61 0.60 383.3 1.479 6.91 0.60 164.4 0.63
10 9.22 0.60 0.0 0.0
11 0.0 1.20 361.2 1.3912 2.30 1.20 314.5 1.2113 4.61 1.20 377.3 1.4514 6.91 1.20 150.6 0.5815 9.22 1.20 0.0 0.0
16 0.0 1.80 375.2 1.4417 2.29 1.80 323.9 1.2518 4.58 1.80 389.2 1.5019 6.88 1.80 157.9 0.6120 9.17 1.80 0.0 0.0
21 0.0 2.40 324.5 1.2522 2.28 2.40 270.3 1.0423 4.57 2.40 350.4 1.3524 6.85 2.40 81.2 0.3125 9.13 2.40 0.0 0.0
26 0.0 3.00 340.7 1.3127 2.27 3.00 291.7 1.1228 4.54 3.00 335.5 1.2929 6.81 3.00 155.0 0.6030 9.08 3.00 0.0 0.0
31 0.0 3.60 424.2 1.6332 2.25 3.60 344.7 1.3333 4.51 3.60 491.2 1.8934 6.76 3.60 55.3 0.2135 9.02 3.60 0.0 0.0
27

TABLE 8. CONTACT PRESSURES, p, IN FOOTPRINT OF 846X16.0-23.5 (8-18)TIRE WITH 260 PSI INFLATION PRESSURE AND 53,800 POUND LOAD(CONCLUDED).
Point x (in) y (in) p (psi) NCP
36 0.0 4.81 452.3 1.7437 2.20 4.81 465.7 1.7938 4.41 4.81 446.4 1.7239 6.61 4.81 0.0 0.0
40 0.0 5.98 497.5 1.9141 2.13 5.98 343.1 1.3242 4.27 5.98 0.0 0.0
43 0.0 6.55 0.0 0.044 2.09 6.55 0.0 0.0
28

0
0
0~ 0
0
29£

Jl.J
I-- N,
oe 1o-r
O C4 k--,4- cy
'0
0 CY I I I
oil
0
III-l
4A'
300
I -
4 4)
'I-
.I-.
3OI

x
0,0
0
U
CY 0
I.Cq I.-
! i
CA
cy
u
/ 1-
4J
"0
o + 41 • •4 1
LL.
31 ~ ~
. . . .. .. . ..

au
40I "q
9-i
/ \
U
044
I I-*1
II I'.I
o
II LaI'
coocot CMI. I C1
0
0
32 I'a
II
a)-
\ U
/
N /
32

*~
cli 0
1~4 0
9A-
A (A
gN 0
CA
0.-
I33

x
U
qI-C0J
4 J
q ~ 0
V- C-
N m 0O U
00
C;
N o N N00
N340 ~ 0
ooo x 1
00 OF U I-
\C
C04J
so t- 0Y 0
4 - - V-4 -* - -O 9- r_
0
0
4A-
/ C..1
35

zero pressure points are included in the tables so that the footprint boundary
can be approximately located, as shown by the dashed curve in Figure 15.
The contact pressures are not calculated on a rectangular grid in the
footprint because finite elements of unequal length are used to model the tire
and the point spacing along a finite element node depends on the radius of the
node. The nodes in the tire footprint are parallel to the x-axis; pressure
points are equally spaced along an individual node.
D. EFFECT OF INFLATION PRESSURE AND TIRE LOAD
The 3-D plots shown in Figures 22-25 were made to show the influence of
inflation pressure and load on the pavement pressure distribution. These
plots are all of pressures produced by the F-4C/G tire, and should be compared
with Figure 3 which shows the pressure distribution for this tire at the rated
inflation pressure and rated load.
Figures 22 and 23 show the distributions obtained at rated inflation
pressure and loads that are 25 percent above and 25 percent below the rated
load. In both cases, a more nonuniform pressure distribution was obtained,
compared with that seen in Figure 3. Figures 24 and 25 show the effect of
increasing or reducing the inflation pressure by 15 percent while holding the
load fixed at the rated value. In these cases, also, more nonuniform pressure
distributions were found. It appears, for the F-4 tire modeled here, that the
most uniform tire/pavement pressure distribution is developed when the tire is
operated at its rated inflation pressure and rated load. Ability to operate
with as uniform a pavement pressure as possible is one of the goals of tire
design.
36

C4,
W3-
G))00
z I
O0wO
CL,
w0
1J-
n 0n a e n con Z l ' '
37 4

z
X
C;
-Li 'U
S.4U C
I----*4 Z
0 c
_j
U.-4'toto-
.P.4 O.4oo C 'Z
C%j
00zL
38

z
40
-j L-
Q) 04-
i~n
0.G
C~o 4J (A
001ý
coc
_0
0 to
La-
0. 0 in o n a0 In caZ W) C4 C4 ; 0 0
39

z z
00
-i w 0
CLi
.1.
5.41 4Za
0 wC)o
GA 4.)
ccI 01uN Z I
0 I
z 0)
A.a n 0 An i n oz W C4 C~4 C. C.ý
40

SECTION III
CONCLUSIONS AND RICOPMENDATIONS
A. CONCLUSIONS
The calculated results shown in the previous section represent contact
pressures for a standing tire, deflected against a frictionless surface.
Studies of passenger car tires (Reference 4) show that surface friction has
little effect on the pavement pressure developed by a standing or
freely-rolling tire. Centrifugal force stiffening occurs in a rolling tire,
but the effect on pavement pressure is negligible except at extremely high
speeds. The conjecture may be made that pavement pressure of a taxiing
airplane will be essentially the same as the pavement pressure when the plane
is parked, regardless of the nature of the pavement surface.
The calculated pavement pressure distributions shown in this report
should be regarded as approximate, because of the many engineering
approximations embodied in the tire model. However, the calculated
distributions are sensitive to basic tire design parameters and also to tire
operating variables (inflation pressure and load). They appear to be
qualitatively correct.
Although rudimentary and empirical tire models can reproduce tire
deflection-load data much closer than the tire model here does (Figure 8-14),
these models are incapable of calculating a tire/pavement pressure
distribution.
Tire stiffness is primarily responsible for nonuniformity in the pavement
pressure distribution. The distributions found here are all characterized by
reduced pressure along the central portion of the tread, and highest pressure
in the shoulder region (near the edges of the tread). Generally higher
41
inflation pressure results in a stiffer tire and a more nonuniform contact
pressure. However, the effect can be mitigated by tire design. An example is seen
in comparing the pressure distributions found for the F-16 (Figure 2) and the F-15E
(Figure 4) tires. Although these tires operate at nearly the same inflation
pressure, which is quite high, the distribution found for the F-15E tire is much
more uniform than that found for the F-16 tire. The difference is, in large part,
due to the F-16 tire being a bias-ply tire and the F-15E tire being a radial.
B. RECOMMENDATIONS
With continued development of pavement analysis tools, knowledge of the
distribution of tire/pavement contact pressure may become as important for pavement
design as knowledge of pavement material properties. Since pavement pressure
distributions are quite sensitive to tire inflation pressure and tire load, a
computer tire model such as that employed in this project should be made available
to pavement engineers.
In view of the scarcity of measured aircraft tire/pavement pressure
distributions it is recommended that the Air Force develop the capability to measure
pavement pressure distributions. This is not a simple undertaking.
As the tire model used in this project has not been adequately validated, it
would be desirable to measure contact pressures for some, or all, of the tires
studied here. The pressure measurements should be made for both new and worn tires,
as the effect of the tread layer on contact pressure is not well understood. The
tire model used here ignores the tread layer entirely.
A standing tire contact pressure distribution (at rated inflation pressure and
load) should be included in the Qualification Test Report (QTR), and additional tire
data should be included in the QTR to make it and the accompanying tire section a
complete source of tire data needed by whatever tire model is adopted by the Air
Force.
42

REFERENCES
1. Holliway, R., Aircraft Characteristics for Airfield Pavement Design and
Evaluation, Air Force Engineering and Services Center, Tyndall AFB,
Florida, May 1988.
2. Tielking, J.T., and Roberts, F.L., "Tire Contact Pressure and Its
Effect on Pavement Strain," ASCE Journal of Transportation Engineering,
Vol. 113, No. 1, pp. 56-71, 1987.
3. Tielking, J.T., "A Finite Element Tire Model," Tire Science and
Technology, Vol. 11, Nos. 1-4, pp. 50-63, 1983.
4. Clark, S.K., Editor, Mechanics of Pneumatic Tires, DOT HAS 805 952,
U.S. Department of Transportation, National Highway Traffic Safety
Administration, Washington, D.C., August 1981.
43
(The reverse of this page is blank)

APPENDIX A
TIRE DATA AND PROFILES
45

A. TIRE DATA
The finite element tire model used in this project requires input data
describing the geometry of the tire section (meridian profile), the carcass
structure, and material properties of the tire carcass constitutients (cord
and rubber). The mounted meridian profile of each of the tires in this
project is shown in Figures A-1 through A-6, where the finite element model is
the dotted curve shown in the left half of each profile. The tires are
considered to have a plane of geometric symmetry for modeling purposes, so
only one-half of the profile is modeled. Each dot in the finite element curve
is a connection (node) between finite elements, of which the Cartesian
coordinates and slope are input to the computer program. This describes the
tire's basic geometry in the mounted, uninflated configuration.
Another section of tire model input data describes the structure of, and
material properties in, the tire carcass. The following carcass data are
needed:
(1) Ply Count and Thickness of Each Ply
(2) Cord Diameter (in each ply)
(3) Cord End Count (in each ply, at each finite element node)
(4) Cord Angle (wrt meridian, in each ply, at each node)
(5) Cord Moduli
(6) Rubber Moduli
As nylon 66 tire cord is used in all of the tires considered here, the
cord extension modulus 200,000 psi was used for all calculations. The cord is
treated as being transversely isotropic, with Poisson ratio 0.70 and shear
modulus 700 psi. Rubber is considered to be Isotropic with Young's modulus
1000 psi and Poisson ratio 0.493 for all of the tires.
46

Cord diameters vary with tire size, and may differ in different plies of
the same tire. This information, together with end counts and angles, was
provided upon special request to the tire manufacturers. Only the cord count
in the crown is provided in the tire Qualification Test Report (item Q).
A physical section was obtained for each tire modeled. The section is
used in laying out the meridian profile, locating carcass features such as
turnups and belts (in the case of a radial tire), and measurement of ply
thicknesses.
47
(The reverse of this page is blank.)

" : i4 a
Si I
00
Xm 4
t;t

C6o�.) -
W
0
0-w �C *�0u�-
--- U, -
�
0L
* 06/
* S.S.
6/0'
S
9
V
i=6,
&

40.

c 0.2ý C:-
z . c
a'
4.1
C* U
C .0� U
,�-4J -U� U
�O. U
� zCCU *U *'
�-U U' £
0
U
'0 L
U
UL
UU,
.4
e
I
Related Documents

![Lil Wayne[1]](https://static.cupdf.com/doc/110x72/577d38391a28ab3a6b97570d/lil-wayne1.jpg)