AD-A177 590 David W. Taylor Naval Ship Research and Development Center Bethesda, MD 20084-5000 DTNSRDC/SPD-1180-01 December 1986 Ship Performance Department Departmental Report 0 MEASUREMENTS OF PROPELLER-INDUCED UNSTEADY ~SURFACE FORCE AND PRESSURES by E-4 Michael B. Wilson nJohn McHugh z 1 C14 0 DT C N3 " MAR 0 4 1987 0 0 F Approved for Public Release: Distribution Unlimited 87 3 2 0027

Welcome message from author
This document is posted to help you gain knowledge. Please leave a comment to let me know what you think about it! Share it to your friends and learn new things together.
Transcript

AD-A177 590David W. Taylor Naval Ship Research and Development CenterBethesda, MD 20084-5000
DTNSRDC/SPD-1180-01 December 1986
Ship Performance Department
Departmental Report
0
MEASUREMENTS OF PROPELLER-INDUCED UNSTEADY
~SURFACE FORCE AND PRESSURES
by
E-4 Michael B. Wilson
nJohn McHugh
z
1
C14
0 DT CN3" MAR 0 4 1987
0
0 FApproved for Public Release: Distribution Unlimited
87 3 2 0027
COMMANDER 00°t i I
TECHNICAL DIRECTOR 01A
OFFICER IN CHARGE OFFICER IN CHARGECARDEROCK 05 04 ANNAPOLIS
SHIP SYSTEMS INTEGRATION PROPULSION AND AUXILIARYDEPARTMENT 12 27 SYSTEMS DEPARTMENT
SHIP PERFORMANCE SHIP MATERIALS ENGINEERINGDEPARTMENT 15 28 DEPARTMENT
AVIATION AND SURFACEEFFECTS DEPARTMENT 16
STRUCTURES DEPARTMENT 17
COMPUTATION, MATHEMATICS& LOGISTICS DEPARTMENT 18
SHIP ACOUSTICS DEPARTMENT 19
CENTRAL INSTRUMENTATIONDEPARTMENT 29
DESTRUCTION NOTICE - For classified documents, follow the procedures in DODo220.22M, Industrial Security Manual, Section 11.9, or DOD 5200.1-R, InformationSecurity Program Regulation, Chapter IX. For unclassified, limited documents,destroy by any method that will prevent disclosure of contents or reconstruction ofthe document.
MrfWrM~ff rrnqixn IQ- A A

UNCLASSIFIED
RMIT CLSSIFIArION OF THIS PAW3 A~.ry)~ 4_ _ _ _I__ _ _ _ _ _ _ _ _ _ I
REPORT DOCUMENTATION PAGEIa. REPORT SECURITY CLASSIFICATION lb. RESTRICTIVE MARKINGS
UNCLASSIFIED II
Za SECURITY CLASSIFICATION AUTHORITY 3 DISTRIBUTION IAVAILABILITY OF REPORT
Zb. DECLASSIFICATION I DOWNGRADING SCHEDULE
4 PERFORMING ORGANIZATION REPORT NUMBER(S) 5. MONITORING ORGANIZATION REPORT NUMBER(S)DTNSRDC/SPD-II80-OI
6a NAME OF PERFORMING ORGANIZATION 6b OFFICE SYMBOL 7a. NAME OF MONITORING ORGANIZATIONDavid Taylor Naval Ship R&D (f applicable)
Center I_ Code 1522
6c ADDRESS (City, State, and ZIP Code) 7b. ADDRESS (City, State, and ZIP Code)
Bethesda, Maryland 20084
Sa NAME OF FUNDING/SPONSORING 8b. OFFICE SYMBOL 9. PROCUREMENT INSTRUMENT IDENTIFICATION NUMBERORGANIZATION (if applicablo)•Naval Sea Systems Command SEA 05R
B" ADDRESS (City, State, and ZIP Code) 10 SOURCE .F FUNDING NUMBERSPROGRAM PROJECT TASK WORK UNIT
Washington, D.C. 20360 ELEMENT NO. NO NO. ACCESSION NO62543N SF43421 SF43421 DN178067
1 ITIT LE (Include Security Classification)
MEASUREMENTS OF PROPELLER-INDUCED UNSTEADY SURFACE FORCES AND PRESSURES
2 PFSONAL AUTHOR(S)Michael B. Wilson and John McHugh
13a TYPE OF REPORT 13b TIME COVERED 14. DATE OF REPORT (Year, Month, Day) S. PAGE COUNTFinal FROM TO December 1986 ix+77
16 SUPPLEMENTARY NOTATION °. ,,, s
I?1 COSATI COD S 18. SUBJECT TERMS (Continue on reverse if necesary and identify by block number)
FIELD GROUP SUB-GROUP Pressure amplitude; Reciprocity experiment'Surface force; Cavity volume velocity;Propeller excitation" C c:...,, S4%J is
19 A TRACT (Contiuue on reverse of necessary and identify by block number)
\Results of an experimental investigation carried out in the 24-inch water tunnel
atDINSRDeare presented for the cavitating propeller-induced surface pressures and a
reference-area surface force measured on a flat plate boundary representation of a
nearby ship hull. Newly designed apparatus for the measurement of surface force on an
instrumented disc is described in detail. It involves special dynamometry that can be
used in a reverse mode so that the force disc can be driven as a mechanical shaker-,,
Reciprocity calibration measurements were made wftEb this equipment and tfSe resuiting
pressure-to-acceleration transfer function was used to make estimates of cavity volume
velocity.', A model of a seven-bladed propeller was run in a screen-generated simulation
of the steep axial wake velocity distribution for a single screw ship. Results are
displayed for the longitudinal and transverse distribution of the first three blade
rate harmonic components of the unsteady pressure amplitudes and the unsteady disc-)V
20 DISTRIBUTION/AVAILABILITY OF ABSTRACT 21 ABSTRACT SECURITY CLASSIFICATION
OUNCLASSIFIED/UNLIMITED 91 SAME AS RPT COTIC USERS UNCLASSIFIED
22a NAME OF RESPONSIBLE INDIVIDUAL 22b TELEP iONE (include Area Code) 22c OfFICE SYMBOL
Michael B. Wilson and John McHugh (202) 227-1697 Code 1522
D FORM 1473. 84 MAR 8 83 APR edition may be used until exhausted SECURITY CLASSIFICATION OF THIS PAGE

UNCLASSIFIED
SECURITY CLASSIFICATION OF THIS PAGE
Block 19 (Continued)
lforce amplitudes at the blade tip clearances of 0.2 6D and 0.41D, over a range of cavi-tation numbers. The unsteady pressure pulse amplitudes obtained in this work comparereasonably well with measured values obtained previously in a large water tunnelexperiment using a complete scale model of the ship hull. The experimentally inferredblade rate harmonic component of cavity volume velocity from the reciprocity measure-ment agrees approximately with the prediction by the PUF-3 propeller analysis scheme.
UNCLASSIFIED

TABLE OF CONTENTS
Page
LIST OF FIGURES .......................... ....... *..*.......*........ iii
LIST OF TABLES ................... o .. .. .. .... ................. . ...... vi
NOTATION ............................................... ........ vii
ABSTRACT ............... *.......*..**.*............... .... .. 1ADMINISTRATIVE INFORMATION ................ o .. *.... .... . . . . . . .
INTRODUCTION .... ........... ..... *....... . . . . . . . . . . . . . . . .
BACKGROUND ...o.............. .. ... .... .... ....so#....... 4
CHARACTERIZING EXCITATION .. ........ *..... .... ........ .. ....... 5
REVIEW OF EXPERIMENTS .o .............. ... .... ................... 9
APPARATUS AND INSTRUMENTATION ........... ...... ....................... 13
FACILITY ........................................................ 13
MOUNTING PLATE AND INSTRUMENTATION ............................. 14
CALIBRATIONS ................... . . . . . . ..... .. ... . ..... 15
EXCITATION EXPERIMENTS WITH MODEL PROPELLER ............................. 18
PROPELLER ....... ...................... .... *. .... ...... .. 18
EXPERIMENTAL PROCEDURE ................................. 18R E S U L T S ... ... .. .s t ..o o o o .....s o.. ... * e s **.. ..... . . . . .. . . . . .. . . . . 2 3
DISCUSSION AND RECOMMENDATIONS ..................................... 28
ACKNOWLEDGMENT .... ....... .... ..... ... .......... .. . .. . ...... ..... 30
1RE FERENCES .......................... o.... .......... ... .. s....... ... ... 3 1
APPENDIX A - RECIPROCITY CONCEPT AND APPLICATION ........................ 72
APPENDIX B - CAVITY VOLUME MEASUREMENTS AND COMPARISONS ................. 75
Accession For
NTIS GRA&IDTIC T,'3
D - t ,' .. ]'j L
tKit
LIST OF FIGURES
Page
1 - Definition Sketch of Rotating Pressure Field Near an OperatingPropeller . . . . . . . . . . . . . . .. . . . . .. . . . . . . . .. 37
2 - Schematic of Force Measuring Device Installed in the 24-Inch WaterTunnel Open Jet Test Section .......................................... 38
3 - Flat Boundary Plate, Force Disc, and Pressure Gauge Locations ......... 39
4 - Calibrated Dynamic Response Curve for Force Measuring Device .......... 40
5 - Reciprocity Calibration for the Driven Force Disc: Pressure-to-Acceleration Transfer Function versus Frequency ....................... 41
6 - Drawings of Propeller Model 4677 ..................................... 42
7 - Open Water Characteristics of Propeller Model 4677 .................... 43
8 - Circumferential Distribution of Axial Wake Velocity Ratio, Comparisonof Measurements in Water Tunnel and Towing Basin, at r/R - 0.557 ...... 44
9 - Circumferential Distribution of Axial Wake Velocity Ratio, Comparisonof Measurements in Water Tunnel and Towing Basin at r/R - 0.774 ....... 45
10 - Circumferential Distribution of Axial Wake Velocity Ratio, Comparisonof Measurements in Water Tunnel and Towing Basin at r/R = 1.178 ....... 46
11 - Three Blade Rate Harmonics of Measured Pressure Amplitude CoefficientsTaken at the Disc Center with az/D - 0.26 ............................. 47
12 - Three Blade Rate Harmonics of Measured Pressure Amplitude CoefficientsTaken at the Disc Center with az/D - 0.41 ........... 0.0o..0.9..40..... 48
13 - Blade Rate Harmonic of Measured Pressure Amplitude Coefficient versusLongitudinal Position for Five Cavitation Numbers, with az/D = 0.26 ... 49
14 - Twice Blade Rate Harmonic of Measured Pressure Amplitude Coefficientversus Longitudinal Position for Several Cavitation flumbers, withaz/D = 0.26 .. . ... ... .. . .. ... ... .... s.. . .... .... .. 50
15 - Thrice Blade Rate Harmonic of Measured Pressure Amplitude Coefficientversus Longitudinal Position for Five Cavitation Numbers, withaz/D = 0.26 ...................... .. .. . . . .. . . . . .. . . ...... 51
16 - Blade Rate Harmonic of Measured Pressure Amplitude Coefficient versusLongitudinal Position for Five Cavitation Numbers, with az/D = 0.41 .... 52
iv
Page
17 - Twice Blade Rate Harmonic of Measured Pressure Amplitude Coefficient
versus Longitudinal Position for Five Cavitation Numbers, with
az/D - 0.41 .......................... .... ... 53
18 - Thrice Blade Rate Parmonic of Measured Pressure Amplitude Coefficient
versus Longitudinal Position for Five Cavitation Numbers, withaz/D - 0.41 5.4................. . .......
19 - Blade Rate Harmonic of Measured Pressure Amplitude Coefficient versus
Transverse Position for Five Cavitation Numbers, with az/D - 0.26 ..... 55
20 - Twice Blade Rate Harmonic of Measured Pressure Amplitude Coefficient
versus Transverse Position for Several Cavitation Numbers, with
az/D - 0.26.. .... .. ... o .......................................... .. 56
21 - Thrice Blade Rate Harmonic of Measured Pressure Amplitude
Coefficient versus Transverse Position for Five Cavitation Numbers,with az/D - 0.26 .......................*** *a**.****..*............. 57
22 - Blade Rate Harmonic of Measured Pressure Amplitude Coefficient versus
Transverse Position for Five Cavitation Numbers, with ae/D - 0.41 ..... 58
23 - Twice Blade Rate Harmonic of Measured Presssure Amplitude Coefficient
versus Transverse Position for Five Cavitation Number3, withazD o . 1. . . . . . . . . . . . . .. . . . . . . . . . . . . . . . . 59
24 - Thrice Blade Rate Harmonic of Measured Pressure Amplitude Cot'ficient
versus Transverse Position for Five Cavitation Numbers, with
az/D - 0.41 ................................... ............ 60
25 - Three Blade Rate Harmonics of Measured Disc Force Coefficient withaz/D - 0.26 ........................................................... 61
26 - Three Blade Rate Harmonics of Measured Disc Force Coefficient with
az/D = 0.41 ..................................... .... ..... 62
27 - Blade Rate Harmonics of Disc Force Coefficient versus Cavitation
Number, Comparison Between Measured Force and Integrated Pressure,
with az/D = 0.26 ................................................... 63
28 - Blade Rate Harmonic of Disc Force Coefficient versus CavitationNumber, Comparison Between Measured Force and Integrated Pressure,
with a,/D = 0.41. ................................................ .... 64
29 - Twice Blade Rate Harmonic of Disc Force Coefficient versus
Cavitation Number, with az/D = 0.26 ............... . ......... 65
V
Page
30 - Twice Blade Rate Harmonic of Disc Force Coefficient versusCavitation Number, with az/D.- 0.41 ................................. 65
31 - Thrice Blade Rate Harmonic of Disc Force Coefficient versus CavitationNumber, with az/D - 0.26 ...................... 66
32 - Thrice Blade Rate Harmonic of Disc Force Coefficient versusCavitation Number, with az/D - 0.41 ............... ........ eo..oes 66
33 - Comparison of Measured Blade Rate Pressure Amplitude LongitudinalDistribution ........ ........................... 67
34 - Comparison of Blade Rate Pressure Amplitude Coefficient Over thePropeller versus Cavitation Number .................................... 68
35 - Schematic of the Measurement of Cavity Volume Velocity by ReciprocalMethod ... o... .. ... . 0.. . .0.. 0 .. 0 ....*000.00.00.00 ............. 69
B.1- Comparison of Measured and Calculated Blade Rate Cavity VolumeVelocity versus Cavitation Number.................................... 77
LIST OF TABLES
Page
1 - Summary of Instrumentation Characteristics ............................ 70
2 - Geometric Characteristics of AO-177 Class Auxiliary Oiler HighlySkewed Propeller Design .. .............. ........ ...... ..... ..... 71
B.1- Estimate of Blade Rate Cavity Volume Velocity Using ReciprocalMeasurements ....... ..... ...... ... ..... ...... .... ..... .... . 76
vi
NOTATIONUnits*
A, Fourier cosine coefficient of the mth harmonic
a Measured level of acceleration L/T2
a. Vertical clearance between blade tip and nearby surface L
Bm Fourier sine coefficient of the mth harmonic
Cth Thrust loading coefficient; 8KT/wJ2
D Propeller diameter L
FS Unsteady force amplitude on hull or boundary element ML/T2
(Fs)m Unsteady surface normal force amplitude on disc,mth harmonic component ML/T2
i Complex number, "'-1
J Advance coefficient; VA/nD
(Kp)m Pressure amplitude coefficient of mth harmonic;
(Ap)m/pn2D2
(KF)m Disc force amplitude coefficient of mth harmonic;(Fs)m/Pn
2D4
KT Propeller thrust coefficient; T/.2D4
m Index for harmonic component, m - VZ
N Propeller rate of revolution (RPM) rev/T
n Propeller rate of revolution (rps) rev/T
Pm Total amplitude of mth harmonic of unsteady pressure F/L2
Unsteady fluid pressure F/L2
Po Fluid static pressure at propeller center F/L2
Pv Vapor pressure of water F/L2
T(and T) Propeller mean thrust force F
t Time T
*M - mass, L = Length, T = time, F = force = ML/T2
vii
Units
tu Blade section maximum thi :kness L
Time rate of change of volume (volume velocity), general L3/T
$c Time rate of change of blade cavity volume L3/T
V Free stream vwlocity L/T
VA Speed of advan,!e; V(l-wT) L/T
VX Axial component of nominal wake velocity into propellerplane L/T
wT Wake fraction based on thrust identity
xpC Longitudinal coordinate measured from propeller center,positive upstream L
y Transverse coordinate measured from propeller center,positive to starboard, looking upstream L
Z Number of propeller blades
Om Harmonic phase angle of the mth harmonic component ofdisc force deg
YM Harmonic phase angle of the mth harmonic _)mponent of
unsteady pressure deg
Ap Unsteady pressure amplitude, general F/L2
(Ap)m Unsteady pressure amplitude, mth harmonic component F/L2
e Circumferential position angle for wake velocity,measured positive counterclockwise from 12 o'clock,looking upstream deg
ii Index for harmonic component of blade rate, P - m/Z -
P Fluid mass density M/L3
an Cavitation number; (Po - Pv)/1/2pn 2D2
OVA Cavitation number; (Po - Pv)/1/2PVA2
Om Spatial phase angle of mth harmonic component of pressure deg
*Position angle measured clockwise from 12 o'clock lookingupstream; wt deg
viii

u1nits
w Shaft circular frequency; 2rn rad/T
ABBREVIATIONS
DTNSRDC David Taylor Naval Ship Research and Development Center
SSPA (Statens Skeppsprovninganstalt) Maritime Research andConsulting, Goteborg Sweden
BR Blade rate frequency
MARIN Maritime Research Institute Nntherlands
PUF-3 Propeller Unsteady Force Comr.uter Code 0eveloped at MIT
MIT Massachusetts Institute of Technology
i
ix

4~
i
x

ABSTRACT
Results of an experimental investigation carried out in the24-inch water tunnel at DTNSRDC are presented for the cavitatingpropeller-induced surface pressures and a reference-area surfaceforce measured on a flat plate boundary representation of anearby ship hull. Newly designed apparatus for the measurementof surface force on an instrumented disc is described in detail.It involves special dynamometry that can be used in a reversemode so that the force disc can be driven as a mechanical shaker.Reciprocity calibration measurements were made with this equip-
mant and the resulting pressure-to-acceleration transfer functionwas used to make estimates of cavity volume velocity. A model ofa seven-bladed propeller was run in a screen-generated simulationof the steep axial wake velocity distribution for a single screw
ship. Results are displayed for the longitudinal and transversedistribution of the first three blade rate harmonic components ofthe unsteady pressure amplitudes and the unsteady disc forceamplitudes at the blade tip clearances of 0.26D and 0.41D, over arange of cavitation numbers. The unsteady pressure pulse ampli-tudea obtained in this work compare reasonably well with measuredvalues obtained previously in a large water tunnel experimentusing a complete scale model of the ship hull. The experimen-tally inferred blade rate harmonic component of cavity volumevelocity from the reciprocity measurement agrees approximatelywith the prediction by the PUF-3 propeller analysis scheme.
ADMINISTRATIVE INFORMATION
This work was funded by the Naval Sea Systems Command under the Ships, Subs,
and Boats Program, Program Element 62543N, Task Area SF43421, and was carried
out by the Ship Performance Department under Work Units 1506-102 and 1506-103.
INTRODUCTION
Propeller-excitation has long been known as a major source of vibration and
noise on ships. Problems arise in the form of excessive hull girder vibrations
in the stern area and at the upper levels of deckhouses; unacceptable localized
vibrations in important aft end spaces; fatigue damage to hull plating, internal
stiffeners, appendages, or other structures near the propeller; high levels of
inboard airborne noise; and general crew nuisance. Any one or all of these
symptoms could lead to the imposition of speed restrictions, limitations on cer-
tain maneuvers, or avoidance of certain propeller RPM regimes. Understanding
the hydrodynamic source of fluctuating forces and unsteady pressures is crucial
for the eventual prediction of the magnitudes and spatial extent of the
excitation. Thus an important aspect of the design of the propeller-hull

arrangement, in addition to satisfactory steady propulsive performance, is the
proper accounting for the propeller-induced unsteady forces, moments, and
periodic hull pressure fluctuations.
There are two main categories of propeller excitation. Both are concerned
with the interaction of the propeller blade elements operating in the nonuniform
velocity wake inflow conditions. (1) Unsteady shaft-transmitted loads (bearing
1. ds) are forces and moments developed on the propeller ard transmitted to the
hull through the thrust bearing foundation and reduction gearing system and the
aftermost shaft bearing. The most important class of problems involving unsteady
bearing loads are those associated with the longitudinal shafting vibration
excited by the unsteady thrust and torque. (2) Unsteady hull surface loads or
pressure-transmitted loads are forces and moments that arise from the spatially
integrated effect of tae fluctuating pressure field induced by the propeller
blades passing through a varying inflow velocity pattern. The presence of inter-
mittent blade cavitation causes further magnified pressure fluctuations due to a
monopole behavior of the unsteady cavity volume. U.ader the worst conditions,
periodic pressure pulses having nearly constant phase angle may act over a wide
expanse of hull surface and on nearby appendages. In this situation, integrated
surface forces of very substantial magnitude can be delivered to the hull.
Presently, methods for prediction of tie exciting loads are different for
each of the categories. In the area of unsteady bearing loads, prediction capa-
bility has been available for some time and it has been well integrated into the
propeller design process in the U.S. Navy. Notable examples of analysis and
design methods and verification of the prediction accuracy are provided by
Boswell and Cox I*, Valentine and Dashnaw2, Boswell, et a13 , and Boswell, et a14 ,
and in the numerous fundamental references listed in these works. A Z-bladed
propeller acts as effective mechanical filter that picks out only certain wake
velocity harmonic components and their radial distributions for the excitation of the
various unsteady bearing load components (Z th harmonic for fluctuating thrust and
torque, and the Z-1, Z+l harmonics for the transverse components of fluctuating for-
ces and moments). The application of bearing load analyses to design has been rather
successful because of the development of specific design modifications such as blade
skew, warp, etc for reducing excessive unsteady blade loads.
*A complete listing of references is given on page 31.
2

Capability for the analytical prediction of unsteady pressure pulses and
distributed surface forces, on the other hand, has just emerged. There is a vast
and growing literature on this subject by now, largely stemming from work in the
early 1970's after it became clear that unsteady variations of cavity volume in
conjunction with large wake ,elocity gradients could significantly magnify the
blade fanning pressures caused by a propeller operating near a boundary. A
sampling of imoortant references concerned with prediction of unsteady surface
forces and/or periodic hull pressure amplitudes includes Huse5 , Noordzij,6
Vorus, et a17 Fitzsimmons,8 Kaplan et %19 , Hoshino,10 Kaplan, et al,1 1 Breslin,
et a11 2 , and Huse and Guoqiang.1 3
The U.S. Nevy has been fortunate over many years to have relatively few
experiences with the severe vibration and noise problems that can be attributed
to murface force excitation. Typically, the merchant ship designs displaying
problems (tankers, product carriers, Ro-Ro, ferries, LNG ships) have tended to
exacerbate the difficulties because of high installed power (increasing dramati-
cally through the late 1960's and 1970's) and restrictive propelle-hull
arrangements, giving rise to steep and deep wake patterns. In contrast, the
open stern arrangements of most Naval combatants and many auxiliary ships have
wake distributions for which simple vertical tip clearance allowances, such
as he values recommended by Navy customary practice, have generally been satis-
factory.
Problems of excessive interior noise, early stage blade surface erosion,
and heavy localized vibration encountered on the first of the class U.S. Navy
Auxiliary Oiler AO-177 have been described by Wilson, et al, 14 and illustrate a
case where the neglect of surface force excitation in the original design con-
sideration led to an unsatisfactory mismatch of propeller and hull shape (wake).
In this case, intermittent blade cavitation resulted in excessive unsteady
pressure pulses over a wide area nf the stern near the propeller and unstable
cavity flow behavior near the blade tips and trailing edge (cloud cavitation).
Among the many lessons learned froka the experimental and analytical investiga-
tions carried out for the AO-177 project was the observation of how such subtle
changes of the blade cavitation extent and appearance could produce improvements
in the excitation magnitude. Ar important result of the improved wake achieved
by use of a fin on the A0) 177 was a significant reduction of magnitudes of unsteady
pressure pulse amplitudes distributed nearby and away from the propeller plane.
3

The hydrodynamics of the blade cavity behavior (thickness, total cavity volume
variation, and interaction with tip vortex cavity) appeared to be crucial to
understanding the magnitudes and character of these changes.
Experiments are essential for providing better understanding and as the
source of empirical estimates of realistic excitation magnitudes, and will con-
tinue to be important because:
a) There is difficulty and uncertainty in predicting analytically detailed
unsteady blade cavity flows. This is because of the complex three-dimensional
tip flow around propeller blades involving boundary layer, turbulent and tip
vortex flow effects coupled with the unsteady sheet cavity and its break-up into
a bubbly wake flow.
b) There is a need to predict cavity volume velocity at all interesting
harmonics, not only at the blade rate value.
c) There is a need for studying other important physical effects such as
the influence of wake temporal velocity fluctuations on the cavity behavior and
coincident propulsor-induced pressures and forces on nearby surfaces.
The purpose of the present project was to design and build an experimental
system to be used in the existing water tunnels at DTNSRDC that could be of use
in obtaining some of the basic information desired and provide a possible test-
bed for design assebsmenL. It was intended to include enough adaptability to
cover standard propeller-excitation experiments, as well as new investigations.
The set-up was also directed to provide some measure of interim capability and
development of experimental skills for propeller-hull interaction studies,
before the advent of a planned new large facility1 5 . This report covers the
background of model testing on propeller-excitation, the requirements and
details of the experimental set up, and future plans for the system.
BACKGROUND
Model experiments are very important to the study of propeller-excitation
characteristics that can give rise to ship vibration and inboard noise. Many
of the significant milestones in our understanding of the phenomena involved
and in the estimation of unsteady loadings for full scale designs of propellers
and shafting systems have been achieved through model testing in a variety of
4
experimental facilities. It is anticipated that this will continue to be true as
long as the large deficiencies persist in the reliability (or absence) of analy-
tical predictions of such features as nominal and apparent wake velocity pat-
terns, sheet cavity and tip vortex cavity geometry and volume dynamics, and
interaction of hull-propulsor-wake-cavity flows.
Full scale experiments are also essential for correlations with model
results, for observing flow features, and for crucial data on important measured
ship responses such as localized and girder vibration and inboard noise.
CHARACTERIZING EXCITATION
If we confine our attention to the category of surface pressure/surface
force and moment excitation, we can characterize the propeller exciting magni-
tudes by considering several main features.
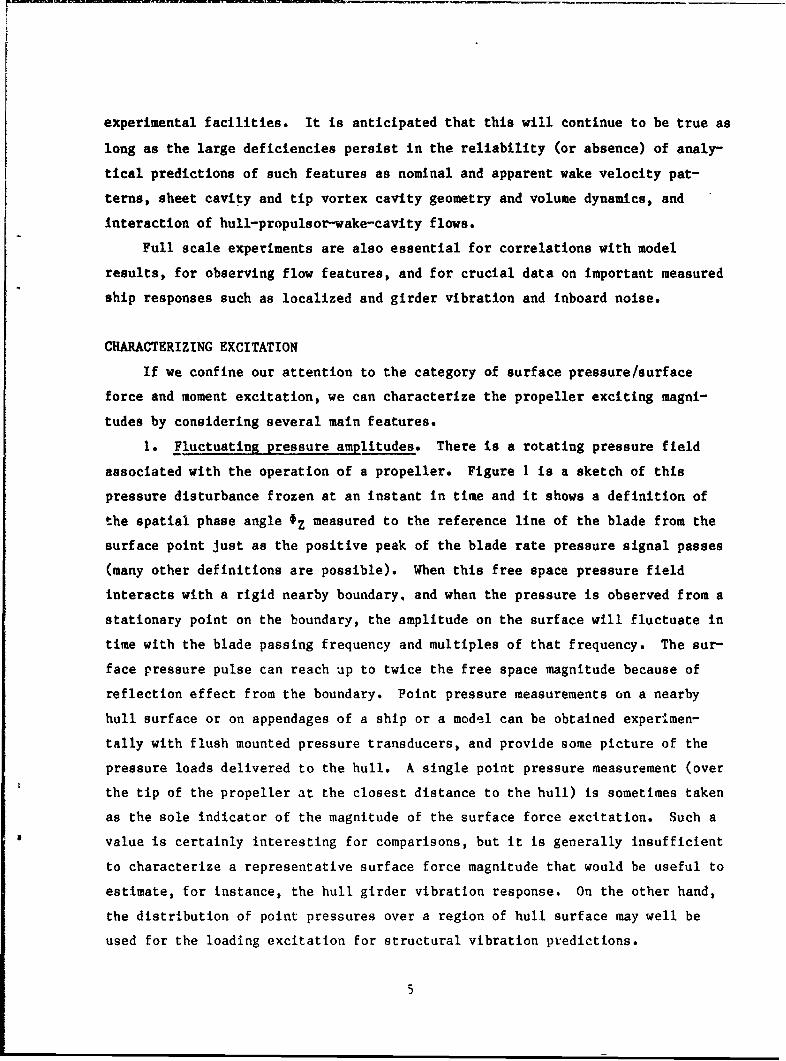
1o Fluctuating pressure amplitudes. There is a rotating pressure field
associated with the operation of a propeller. Figure 1 is a sketch of this
pressure disturbance frozen at an instant in time and it shows a definition of
the spatial phase angle OZ measured to the reference line of the blade from the
surface point just as the positive peak of the blade rate pressure signal passes
(many other definitions are possible). When this free space pressure field
interacts with a rigid nearby boundary, and when the pressure is observed from a
stationary point on the boundary, the amplitude on the surface will fluctuate in
time with the blade passing frequency and multiples of that frequency. The sur-
face pressure pulse can reach up to twice the free space magnitude because of
reflection effect from the boundary. Point pressure measurements on a nearby
hull surface or on appendages of a ship or a model can be obtained experimen-
tally with flush mounted pressure transducers, and provide some picture of the
pressure loads delivered to the hull. A single point pressure measurement (over
the tip of the propeller at the closest distance to the hull) is sometimes taken
as the sole indicator of the magnitude of the surface force excitation. Such a
value is certainly interesting for comparisons, but it is generally insufficient
to characterize a representative surface force magnitude that would be useful to
estimate, for instance, the hull girder vibration response. On the other hand,
the distribution of point pressures over a region of hull surface may well be
used for the loading excitation for structural vibration predictions.
5
In any case, point pressure pulses should be obtained at several locations for-
ward and aft of the propeller plane and laterally off centerline to have an idea
of the character and extent of the loading.
Some example of measured propeller-induced pressure pulse distributions are
provided by Denny1 6 on the model scale and by Taniguchi and Ohtaka1 7 for a full
scale destroyer.
2. Reference-area surface force amplitudes. The periodic surface force
experienced by a patch of area of the nearby hull boundary represents a net or
integrated effect of the distributed pressure pulses exerted on the surface.
Such a quantity can be obtained experimentally with an instrumented surface
segment (ee for example, Kerwin, et a118 ) or by integrating measured point
pressures over the desired area, accounting for the spatial and temporal (phase
angle) variations. A manageable size of the reference area might be on the order
of the propeller disc area.
3. Surface force density. The longitudinal distribution of the induced
surface force-per-unit length is called force density. It is a convenient way
to represent the fluctuating loading imposed on the hull girder, especially in
relation to excitation of overall girder vibration. It cannot be determined by
direct measurement, but can be approximated by performing girthwise integration of
measured point pressures resolved as vertical or other force components at each
section down the length of the hull shape. It is noted here because it is espe-
cially useful for displaying the rate of change of exciting surface force as a
function of distance in the vicinity of the propeller, and away from it as well.
4. Net surface force amplitude. In principle, the total integrated or net
surface force amplitudes induced by the propeller can be determined approxima-
tely from area integrations of measured point rfassure amplitudes. There has
never been a direct model experimental measurement made of the total induced
vertical surface force (separated from any moment effects), and none
accomplished on a full scale ship. The net force magnitude, at various blade rate
harmonics, would represent the most condensed parameter for measuring excitation
level important to girder vibration, although of less impurtance to inboard
noise. The net vertical force is not likely to act exactly at the propeller
plane location because of asymmetries in the longitudinal distribution of force
density.
6

Example discusRions of vertical surface force values obtained either from
distribution of measured pressure amplitudes or by calculation using computed
distributions of pressure pulses can be found in references by Hylarides,19
Skaar and Raestad2 0 , and Huse.13 Recommendations on the levels of vertical
force ratio (total surface force-to-mean propeller thrust) that could cause hull
girder vibration problems could be inferred from each of these references, but
there is no agreement among them. Recommended ratios for the critical value of
surface force-to-thrust ratio for the onset of unacceptable vibration excitation
seem to range from about 7 percent to 30 percent. Occasionally values well
above 100 percent have been predicted with no report of excessive ship vibra-
tion on the ship itself. There is considerable need for improvement on how to
interpret and use estimated values of net surface force amplitude.
5. Cavity volume pulsation strength. Fir a propeller operating with inter-
mittent blade cavitation in a nonuniform flow, the resultant pressure amplitudes
are typically increased noticeably over noncavitating levels. The increase is
relatively even greater for the corresponding amplitudes of, say, the vertical
surface force density or the total surface force because they are area-
integrated quantities of pressure fluctuations having nearly constant phase
angles everywhere. The dominating feature is the monopole-like pressure source
behavior of the fluctuating cavity volume of each blade sheet cavity. Although
the primary characteristic of a typical sheet cavity volume variation is similar
to that of a pulsating spherical bubble, 1 2 there are coitributions from cavi-
tating tip vortices2 1 and possibly significant contributions from bulging tip
vortices.2 2 The term cavity vclume variation refers to the total volume within
the blade cavities plotted as a function of the circumferential position angle.
A useful representation of the main physical mechanism involved with
exciting pressures from cavity pulsation is given in a simple expression for the
pressure fluctuation produced at a distance r from the center of a pulsating
spherical bubble
p d 247r c (1)4,fr dt2
7

where the cavity volume variation is given by tc(t). This shows that the spa-
tial rate of decay of the induced pressure amplitude is r'- and that the pulsation
strength is proportional to the cavity volume accelerationlfc (or W4 for harmo-
nic variations). An important difficulty in making use of this type of rela-
tionship is obtaining accurate determination of the cavity volume variation,
either by analytical prediction or by experiment.
It is possible to determine cavity volume pulsation strengch experimentally
by an indirect means involving the concept of reciprocal measurements. From the
reciprocity principle for linear dynamic systems, a simplified expression is
available (see Appendix) to cover the case of the unsteady force on a body or a
body surface element fixed in position relative to a fluctuating point source.
Then, in a water tunnel or full scale test environment, the "volume velocity" of a
fluctuating blade sheet cavity can be approximated by
F2 (2)c i (P1 /a2)
where ic - time rate of change of cavity volume
F2 - amplitude of measured unsteady force on a body or body element,harmonic component corresponding to the frequency W
= circular frequency
(pl/a2) - transfer function, measured ratio of pressure amplitude atpropeller location to the acceleration amplitude at the body
i -(-1)
All the quantities in this formula except w are regarded as complex. A
discussion of this expression and related forms is given in the Appendix.
To implement the reciprocity technique, there are two phases of measure-
ments. During the calibration phase, the body element is forced to oscillate
through a range of frequencies of interest. The transfer function ratio (pl/a2)
is formed for each frequency from the simultaneous measurement of the pressure
Pl measured at a position in the fluid representing the approximate center of
cavitation and the vertical acceleration a2 of the forcing body element. The
final measurement phase is run with excitation from the cavitating propeller.
8
Then once the cavitation-dependent component of the vertical surface force blade
rate amplitude (Fs)Z on the body element is determined, the resulting blade rate
comiponent of volume velocity caq be evaluated from the expression given above.
REVIEW OF EXPERIMENTS
It is useful to outline the scope of some examplc model experimental
investigations that have been used to explore various features of propeller-
induced surface pressure/surface force excitation.
Early Experiments on Exciting Loads and Induced Pressures.
The earliest work that showed an appreciation of the presence of propeller-
induced surface forces in addition to the bearing loads was that of Lewis23 ,24.
An experimental scheme was devised for testing rigid ship models in a towing
basin, where the model vibration response was used to determine the exciting
forces under self-propelled conditions by comparing the response to that pro-
duced by a calibration vibration exciter located in the sterr that delivered
known oscillating force levels. Lewis was able to decide that the major contri-
bution to the measured propeller-induced effective vertical force on the hull,
for example, was due to the surface force. Similar measurements were made on a
model of a cargo ship form and reported by Lewis and Tachmindji. 25 Continuing
with an improved rigid model approach, but with smaller models, Lewis presented
a summary of results of such experiments for several different examples.26
Unsteady blade cavitation played no role in these model basin studies, and was
not suspected as being important until many years later.
An experimental program to measure the aft end vibratory surface loads and
inferred bearing loads was presented by Stuntz, et a127 . In this case, the
stern end of the ship model was mounted on flexures and instrumented to measure
the vertical, horizontal, and torsional unsteady loads induced by the operating
propeller as tested in a towing basin. No conditions involving intermittent
blade cavitation could be considered.
Early experiments conducted in water to measure the periodic pressure
disturbances ahead of, behind, and leside an operating propeller have been
presented in reports by Tachmindji and Dickerson28 ,29 on the free space
pressure pulses near a propeller running in uniform flow and behind a strut; by
9

Pohl30 on the fluctuating pressures induced on a flat plate surface mounted
parallel to the propeller axis in a water channel and on the pressure pulses
acting on the hull surface of a model ship in a towing basin; by Taniguchi3 1 on
the pressures induced on a flat plate; and biy Weitendorf32 on'the variations of
fluctuating pressures induced on flat and concave curved plates at various tip
clearance ratios, on pressure pulses on flat plates with various elastic moun-
tings, and on pressure pulses at locations near the propeller on the hull surface
of surface ship models. All these early tests involved non-cavitating flow
conditions. Experiments by Nelka33 were also concerned with the induced
pressure amplitudes on a flat plate boundary near a propeller and showed the
effects of tip clearance ratio with a series of propellers with increasing blade
skew angles and blade warp angles and the effect of nonuniform inflow velocity
pattern.
Examples of complete ship model experimental results obtained in towing
basin tests for propeller-induced vibratory pressure amplitudes on the hull sur-
face near the propeller have been reported by Keil 34 for an oceanographic
ship; by Huse35 for a tanker form; by Weitendorf32 for semi-tunnel tunnel stern
combatant form; and by Jacobs, et a136 for a destroyer hull form. All these
have been conducted under nonuniform inflows, but noncavitating conditions, so
that crucial interaction between nonuniform inflow and intermittent cavity
volume variation is missing in each of these investigations.
Experiments with Cavitating Propellers and Modelled Wake Inflow
Simple Boundary Arrangements. Early water tunnel experiments were carried
out by Dennyl6 , who made extensive measurements of the propeller-induced
periodic pressure amplitudes on a flat plate boundary. A number of important
effects were studied, including tip clearance ratio, propeller loading, nonuniform
inflow, propeller geometry (expanded area ratio and blade skew angle), and cavi-
tation in uniform flow. Extensive comparisons were made with theoretical
predictions available at the time, and these were used to check the separate
contributions of loading and thickness. It is interesting that Denny was the
first to note that blade cavitation served to accentuate the magnitudes of the
induced pressure pulses in the case of uniform inflow and extensive sheet cavi-
tation. The increases of pressure pulse level in the steady cavitating flow were
10

comparable to the increases caused by noncavitating operation in certain
of the wake patterns tested. However, the crucial combination of nonuniform
flow with blade sheet cavitation was not included by Denny, so the important
influence of intermittent blade cavitation was not revealed in these
experiments.
The pivotal paper by Takahashi and Ueda3 7 describes measurements of
propeller-induced pressure amplitudes on a flat plate in both noncavitating and
cavitating conditions and in both uniform and nonuniform wake flow. It is this
work that is often credited with first providing the experimental motivation of
the connection between intermittent blade cavitation and exaggerated pressure
pulses that arise in operation in nonuniform flow.
Other water tunnel experiments concerned with distributions of fluctuating
pressure amplitudes induced on a flat plate boundary by a cavitating model
propeller in nonuniform flow have been carried out and reported by
Weitendorf3 8 ,3 9 Takahashi,4 0 Chiba and Hoshino,4 1 Sasajima,4 2 , Takekuma,4 3 and
Weitendorf2 l who provides a summary discussion of a number of different effects.
Water tunnel experiments involving measurement of the localized propeller-
induced excitation levels on somewhat more complicated boundaries have been
carried out, for example, by Nelka4 4 on the pressure pulses produced on the
inside surface of a duct of an ducted propeller system, and by Peck4 5 on the
pressure pulses at points on the centerline of a tunnel enclosing 65 percent of
the diameter of two different propellers. Kerwin, et a11 8 presented results on
the levels of propeller-excited unsteady normal surface force measured on a flat
force disc imbedded flush with a flat boundary, for a series of propellers.
Partial Stern (Dummy Model) Experiments. The use of foreshortened ship
hull models, often termed dummy models, in veriable pressure water tunnel
experiments with operating propellers has long provided a practical approach to
the problem of attempting to model the proper three dimensional wake velocity
patterns for model propeller cavitation tests. Since the early 1970's, dummy
models have also been used in many laboratories around the world to try to sur-
vey the propeller-induced periodic pressures at points near the propeller, with
approximate representation of the wake velocities, hull boundary shape, and
cavitation number environment.
11

Some early published investigations using foreshortened hull models in the
determination of cavitating propeller-induced pressure pulses include van Manen,46
Huse,47 van Oossanen and van der Kooij,48 and van der Kooij and Jonk.49
Examples of more recent publications that have either made use of results from
dummy model tests or mention this test technique in some fashion are Hylarides,50
Glover, et al, 51 Glover and Patience,52 Lover and Wills,53 Chiba, et al, 54
Reed, et al, 55 Lovik,5 6 Munk, et al,57 and Hadler, et a158 .
Useful and informative work on the test techniques and interpretive problems
of dummy model testing in water tunnels has been reported on by English 59 and by
Larsen.60
Complete Model Experiments. Because of the importance of the wake velocity
pattern to the correct modelling of the intermittent blade cavitation, the idea
of using complete ship hull models for cavitation experiments is very appealing.
The idea is that, at least on the model scale, the correct wake pattern is
represented closely by using the geometrically scaled hull form. There are two
prominent facilities actively used for research and engineering assessments of
ship propulsion systems using complete ship hull models: the MARIN
Depressurized Towing Tank in Wageningen Netherlands, which provides for the
simultaneous satisfaction of the Froude number and the cavitation number; and
the large cavitation tunnel (Tunnel No. 2) at SSPA in Sweden which provides no
free surface boundary at the model waterline, but employs typical free stream
velocities that lead to relatively high model blade Reynolds numbers. Good sum-
maries of some experimental results and discussions of testing techniques, data
analyses, and comparison studies are given by van der Kooij6 I on the
Depressurized Towing Tank, by Lindgren and Bjarne62 on the large cavitation tun-
nel at SSPA, and by Dyne and Hoekstra63 on comparisons of results between the
two.
Reciprocity Experiments. Application of a simplified form of the reciprocity
principle to shipboard measurement of the propeller source strength (volume velo-
city) was developed in References 64 and 65, with particular reference to the
problem of inboard noise transmitted by means of ship structure vibration
excited by the propeller. The basic ideas for this approach are discussed in
the Appendix. Gray 66 has also demonstrated the use of the reciprocity concept
12

in determining the source strength of cavity pulsation and the estimate of
oscillating hull pressure amplitudes on full scale ships. Van der Kooij 61 has
indicated that the same ideas have been used to measure the model scale cavity
source strength from model tests in the NSMB Depressurized Towing Basin.
Vorus in a discussion of a ?aper given by Kerwin, et a118 proposed in
experimental/analytical method for estimating the unsteady force on a body (any
shape) located near a fluctuating point source by exploiting the results of a
reciprocity experiment conducted with very simple model geometry in a water tun-
nel. This suggestion was subsequently followed by experiments carried out with
the instrumented force disc described in Reference 18, using a model of a
destroyer propeller. The calibration experiment to determine the acceleration-
to-pressure transfer function is described by Whalen, et al. 6 7 Description of
the wake simalation tests and results of the measurement of the disc force
amplitude leading to the determination oi cavity volume velocity are presented
by Whalen, et a16 8. Application of these results to determine the effect of
blade tip clearance on the propeller-induced vertic-1 hull surface force for the
DD 963 has been summarized by Vorus.6 9
An attempt to exploit a more complete statement of the reciprocity principle
has been carried out by des Moutis 70 in the M.I.T. water tunnel for the experi--
mental determination of cavity volume velocity as well as the six unsteady
propeller bearing force and moment amplitudes.
APPARATUS AND INSTRUMENTATION
FACILITY
The particular experimental equipment developed for this work was designed
for use in the 24-inch Variable Pressure Water Tunnel at DTNSRDC. This facility
provides the basic propeller dynamometry, adjustable ambient tunnel pressure to
simulate cavitating flow conditions, and an access chambec on the top side of
the open jet section which provides space for the force measuring apparatus.
MOUNTING PLATE AND INSTRUMENTATION
A one-inch thick, aluminum flat plate insert was positioned horizontally
and parallel to the axis of the open jet test section of the water tunnel. This
functioned as the representative boundary surface for the initial experiments.
13

With the propeller installed along the tunnel centerline on the downstream
shaft, the vertical position of the plate can be varied from 7.5 in.(19.1 cm) to
9.0 in (22.9 cm) from the centerline to provide vertical tip clearances in the
range of a./D = 0.25 to 0.4 for a nominal 10-inch (25.4 cm) diameter model pro-
peller. The upstream end of the plate was faired into the tunnel convergence with a
flexible nylon sheet joining the plate to a nose piert fastened to the tunnel
wall. This allowed a simple adjustment of the vertical position of the plate
boundary.
Force Measuring Apparatus
The surface force measuring device is shown in the sketch of Figure 2. It
consists of an instrumented force disc connected to a robust inner plate and
backup support structure. The entire support system is connected to the water
tunnel structure through the flexures of two block gauges.
The force disc itself is a circular aluminum plate with a diameter of 10 in.
(25.4 cm) and thickness of I in.(2.54 cm) mounted flush with the flat plate
boundary. An U-ring was fitted in the gap between the disc and the hole in the
mounting plate. The disc is attaci.d to the inner support plate by a tripod
arrangement of three piezoelectric force gauges. The particular force gauge
(Wilcoxon Model LIO) was chosen because it satisfies several important require-
ments: (a) accurate measurement of oscillatory force levels with amplitudes expe-
cted in the range of 5 x 10⁻² to 5 lbf (0.22 to 22 N) in a frequency range possibly
up to 1500 Hz, (b) large value of effective spring stiffness constant, and (c)
capability of being driven electrically in a reverse mode in order to be used as a
force excitor by placing an oscillatory voltage signal at the input.
Various masses and support stiffnesses of the elements of the force
measuring device were chosen to obtain a flat dynamic response characteristic of
the force disc in the range of frequency covering the first three harmonics of
the blade rate. The force disc mass plus its added mass is about I slug (14.6
kg) mounted on the force gauges having a combined spring stiffness of 15 x106
lb/in. (26.3 x 10⁶ N/cm). The massive support structure includes two stacks of
weights and was sized to provide a large inertial mass of about 550 lb (17.1
slug or 249 kg) suspended on the flexures having an effective stiffness of I x 105
lb/in (1.75 x 10⁵ N/cm). The system was designed to accommodate the exciting fre-
14

quency range of 50 Hz to 650Hz which brackets the range of the first three blade
rate harmonics for any model propellers of interest, operating at the necessary
rates of rotation (14 <n< 25 rps).
The force disc could be instrumented with as many as three accelerometers
mounted on the top side in order to measure the vertical vibration levels of the
disc either during various calibrations or during an excitation experiment with
a propeller running in the tunnel. Watcrproofing of the accelerometers and all the
force gauges was provided by coating them with standard potting material. Some
details of instrumentation characteristics are given in Table 1.
Surface Pressures
Mounting holes for flush-mounted pressure gauges were arranged in the pattern
shown in Figure 3 in the flat mounting plate and the force disc. There are 52
positions on the flat plate and 13 on the force disc. These provide the possi-
bility of obtaining a comprehensive picture of the distribution of surface
pressure amplitudes at points within a rectangle of dimension 1.LD by 2D in the
vicinity of the propeller, for a normal 10-inch (25.4 cm) diameter. Special
threaded adaptor fittings permitted the use of either of the two different types
of pressure gauges available for the experiments. The expected range of maximum
fluctuating pressure amplitude at points closest to the tip at the blade rate
frequency or any of its higher multiples was on the order of +1 psi (6.9 kPa).
The two types of gauges used were the Kulite XTM-190 and the CEC 4-312, with
nominal operating ranges of +10 psi (69 kPa) and +25 psi (172 kPa), respec-
tively. Both gauges are of the strain gauged diaphram type. Some further details
on the pressure gauges are given in Table 1.
* CALIBRATIONS
The pressure gauges were calibrated in a static pressure test stand to deter-
* mine the sensitivity (slope = pressure/volt) for each gauge. These slopes were
also checked at intervals throughout the experimental program, using tunnel
pressure.
Extensive calibrations were performed on the surface force measuring device
in order to establish its characteristics as an unsteady dynamometer and for its
application in a reciprocity experiment.
15
I, sn , sn m , m ,

It was necessary to establish the correct force slope factors for the three
force gauges and to determine the frequency response characteristic for the force
disc* An unsteady force was applied to the disc by means of an electrodynamic
shaker. The force applied to the disc was measured independently with a pre-
calibrated piezoelectric force gauge. For the case of the tunnel full of water and
with the O-ring in place around the edge of the disc, the measured dynamic
response is shown in Figure 4, displaying the ratio force output-to-force input
plotted versus frequency of excitation. The frequency response curve is essen-
tially flat to around 650 Hz where it begins to rise toward a natural resonance
frequency at 930 Hz. This indicates that the desired level response characteristic
holds satisfactorily out to frequencies well beyond the third blade rate harmonic
for model propellers with as many as seven blades. The flat force response also
permitted the final determination of the calibration slopes for the three
piezoelectric force gauges with the fully assembled dynamometer.
The second major function of the force disc apparatus is to provide the
possibility of determining the characteristic cavity volume variation of a cavi-
tating propeller in nonuniform inflow by meas of the indirect method exploiting
the reciprocity principle. To make this type of measurement it is necessary
first to perform a reciprocity calibration which determines the transfer function
relating the fluid pressure response at a field point to the magniL,+. of ver-
tical vibration of the surface area element (force disc). The reciprocity calibra-
tion was carried out by oscillating the force disc vertically along its axis
(normal to the surface) by means of a sinusoidally varying voltage placed across
the three piezoelectric force gauges hich support th disc. This effectively
drove the force gauges in a reverse mode so that the disc was itself the
electrodynamic shaker for the calibration phase. Exitation frequency covered a
wide range from about 70 Hz to 1000 Hz in order to include the frequency
variation up to the third harmonic of blade rate. The vertical acceleration of
the disc was measu'ed with accelerometers mounted on the back side of the disc.
Pressure response in the fluid was measured in the absence of the propeller
using a hydrophone located at a point in the 12 o'clock position at a distance
0.9 R from the axis. This location corresponds roughly to the expected center
of the largest blade cavity volume determined from visual obseruation.
The resulting calibrated transfer function is shown in Figure 5 as the curve
of the logarithm of the ratio of pressure amplitude-to-vertical arceleration
16
(p/a) plotted versus frequency. There in a variation with frequency apparent
in this empirical function, with a local peak occurring at around 500 Hz, and a
relative flattening beyond 800 Hz.
For frequencies below 300 Hz the measured values of the transfer function
for (p/a) were found to display a temporal variation. Since the reciprocity
calibration was obtained from a long analog tape record of the simultaneous
measurement of fluid pressure and disc acceleration taken during the same
calibration session, several values of (p/a) at a given frequency could be
calculated from several different segments of the tape. For the data displayed,
each segment consisted of a frequency sweep through the range of interest. This
provides a check on repeatability and shows that the values of (p/a) were reliably
repeatable for the frequency regime higher than 300 Hz. Below 300 Hz, however,
there was a range of values computed for (p/a) at any one frequency, indicating
that the transfer function varied with time. In Figure 5, the shaded region
shows the range of values of the transfer function computed from several dif-
ferent segments of the measured record.
At this time, there is no conclusive explanation for the variability of the
measured transfer function in the low frequency range. One possibility is that
under unsteady excitation, there are pressure reflections from structural ele-
ments inside the tunnel and test section, such as the nozzles or the installed
flat plate. There could be interferring unsteady pressures set up by induced
vibrations of the tunnel walls and model structure. A likely contributor to the
problem could be poor signal-to-noise ratio for the pressure response to the
disc oscillation. This is expected to be worse at the low frequencies because
of the very small acceleration levels being produced by the mechanical system in
the frequency range involved. It is not likely that the variability of the
(p/a) ratio is attributable to changing local properties such as temperature or
ambient pressure, because the time scales of these changes are much longer than
characteristic time involved with the changes of the transfer function magni-
tude. This problem requires further study.
For the model propeller experiments reported on here, the blade rate fre-
quency at the convenient operating speed was 98 Hz. At this frequency, the
variability of the (p/a) involves a range of about +34 percent.
17

EXCITATION EXPERIMENTS WITH MODEL PROPELLER
PROPELLER
For comparison purposes, it was decided to use the 9.812-in. (24.92 cm)
diameter DTNSRDC model propeller number 4677 which represents the 21-ft, seven-
bladed, skewed propeller for the single screw Naval Auxiliary Oiler AO-177 with
the scale ratio 25.682. The wake adapted design of this propeller is described by
Valentine and Chase.7 1 Table 2 is a summary of the particulars of the propeller
geometry. Drawings of the blade shape are given in Figure 6. Figure 7 shows
the propeller open water characteristics presented by Hendrican and Remmers7 2.
Appropriate operating conditions for the propeller were selected on the basis of
the model powering experiments reported in Reference 72.
EXPERIMENTAL PROCEDURE
Wake Simulation
All the experiments shown here were carried out in a non-uniform flow in the
tunnel produced by a wake screen which provides for control of the axial velo-
city component only. The wake screen was designed to simulate the nominal wake
distribution VX/V produced by the AO-177 as determined from a towing basin wake
survey with a scaled model of the ship hull. Wake surveys were conducted in the
tunnel with the screen-generated flow using a rake of five, 5-hole spherically-
headed pitot tubes. The flat plate boundary was set at two locations
corresponding to propeller tip clearances of az/D - 0.26 and 0.41. Figures 8,
9, and 10 are example comparisons of the measured axial velocity ratio VX/V ver-
sus e for r/R - 0.557, 0.774, and 1.178 respectively, showing data obtained from
a towing basin wake survey7 3,7 4 and the tunnel wake surveys. Definition of the
position angle 6 is given in the figures. These comparisons show that the VX/V
flow patterns behind the wake screen for the two different plate locations are
generally similar to the target nominal velocity distributions, but are not
identical. One noticeable feature is that there are differences in the level of
the Vx/V values when the position angle 0 is outside the main velocity defect
region (which is contained inside -90 deg < 6 < 90 deg). The relatively higher
values for the case az/D = 0.26 are attributable to relatively increased average
flow velocity caused by the smaller flow cross section area. This speed-up
influence is less pronounced for the case of az/D = 0.41, because the flow area
18

blockage is less. The narrow velocity defect from the lower skeg region, cen-
tered about the position angle 0 - 180 deg, and seen clearly in the towing basin
velocity distribution, was not reproduced in the wake screen velocity pattern.
The skeg wake velocity feature in this case is much less important than the main
hull wake characteristic because there is no known blade cavitation that occurs
in that region. For this reason, dense screen material was not applied along the
centerline of the lower disc area of the wake screen used for the present
experiments.
There are important similarities between the wake screen velocity patterns
and the towing basin velocity distributions (the target wake). The values of
the minimum VX/V ratio in the vicinity of 0 are nearly the same in the two
wake screen distributions as in the target wake, although the precise angular
positions may be offset somewhat for the wake screen cases. More importantly,
the relative slopes of the main velocity defect with respect to the circumferen-
tial angle, denoted by d(VX/V)/dO, are approximately the same for the target
distribution and the wake screen distributions along the rays, say 0 - 40 deg
and 0 320 deg. These similarities are concerned w1th teatures of the wake that
are most important to the production of unsteady pressures due to cavity volume
variation, as noted, for instance in Reference 75. It is concluded that pro-
peller blade cavities should reach approximately the same size at about the same
circumferential position, and should grow and diminish at about the same rate in
either of the two wake screen velocity patterns as in the towing basin velocity
distribution. Since the dominant contribution to the propeller unsteady
pressures and surface force comes from the unsteady cavity volume variation,
experiments in the wake screen velocity patterns described above could be
expected to provide excitation characteristics generally meaningful to the case
of the AO-177 propeller and wake combination.
Unsteady Pressures and Disc Surface Force
Measurements have been carried out in the 24-inch water tunnel using the newly
developed apparatus and propeller Model 4677. The propeller was mounted on the
downstream she2t, with the boundary plate arranged parallel to the axis.
Pressure gauge measurements were taken at 11 of the locations on the disc and at
many locations on the surrounding boundary plane, concentrating on the points
19
along the longitudinal and transverse centerlines (XpC and y axes, respectively)
as depicted in Figure 3. The propeller reference center identified in Figure 6
was placed at the longitudinal position of the transverse axis, xpc 0 0. Thus,
the location of a plane through the blade tips was at a distance 0.115D
downstream of the xpc - 0 position.
Unsteady disc force measurements were made with the three piezoelectric
force gauges in place, and in some cases, simultaneously with pressure gauge
measurements.
All the experiments conducted for this work were performed at the loading
condition corresponding to the advance coefficient J - 0.79 and thrust coef-
ficient KT - 0.295, producing a thrust coefficient of CTh - 1.2. Test section
velocity was set for the target J by using the thrust identity method from the open-
water characteristics. This was accomplished by setting the shaft rotation speed
for the desired advance coefficient and adjusting the tunnel water speed until
the thrust coefficient matched the open-water thrust coefficient. The velocity
calibrated in this way was held constant and the tunnel pressure varied to change
the cavitation number. Shaft rotation speed was maintained at 14 rps for all the
conditions tested. The Reynolds number based on chordlength at the 0.7R and the
approximate total velocity was 0.51 x 10⁶.The range of cavitation numbers included 0n = 17.86 to 8.36 (OVA - 28.6 to
13.4) which covered non-cavitating reference conditions as well as conditions
with mixed tip vortex and sheet cavitation characteristic for this propeller. The
minimum cavitation number used here was limited by a tunnel flow speed that would
not damage the wake screen. With the loading conditions held the same
throughout the range of On, the effects of different blade cavitation patterns on
the unsteady pressures and disc force could be studied independent of the
propeller loading condition.
Total air content of the tunnel water, measured with a Van Slyke apparatus,
was held in the range of 24 to 35 percent of saturation at atmospheric pressure,
mainly to provide clear visibility. Water temperature varied from 690 to 740 F
(20.60 to 23.30 C).
Measurements of both the pressure fluctuations and disc unsteady force were
obtained with the flat plate boundary positioned at two different locations
corresponding to propeller tip clearance ratios az/D - 0.26 and 0.41. The ver-
tical tip clearance ratio on the AO-177 ship is az/D = 0.292.
20

The test procedure consisted of recording the pressure and force transducer
signals for several minutes at a particular cavitation number, with the simulta-
neous recording of the data onto magnetic tape. Throughout most of the test
conditions, the pressure and force signals were checked online with a time
series analyzer to review the character of the pressue and force spectra and the
relative contributions at the blade rate frequency and its higher harmonics.
Taped pressure and force gauge records consisted of a recorded digitized signal
at 256 points around each shaft rotation as triggered from a shaft encoder
attached to the prooeller shaft. A timing channel, recorded simultaneously with
the pressure and force signals, provided a single pulse per shaft rotation that
was arranged to indicate the passage of a blade reference line past the 12
o'clock position (point of closest approach to the flat boundary). It was used
for the measured phase analysis.
After the recording sessions, the data were analyzed using a Model 70
Interdata computer to provide the Fourier Series tarmonic components over a con-
venient specified time interval, usually 10 seconc's. Thus a typical analysis
record for these experiments covered 140 propellet revolutions.
It was clear from the harmonic analysis and f "m the time series analyzer
spectra that the signals of the surface pressures and disc force were dominated
by the blade rate frequency. Amplitudes of higher multiples of blade rate were
always smaller than the blade rate itself, but not necessarily with magnitude
decreasing strictly with increasing harmonic order.
Data Analysis
The unsteady behavior of the pressure measured at any location is a periodic
fluctuation p(t) and can be represented by the Fourier series.
p(t) = ( A cos mwt + B sin mwt ) (3)m mm= 1
rewritten in a form to display total amplitude and phase angle as
21

P. Psin m (4)
where w - 't is the position angle taken positive clockwise from 12 o'clock,
looking upstream
w - 2wn - shaft circular frequency
Pm - (Am2 + Bm2)l/ - total amplitude of the mth harmonic component of the
pressure fluctuation
m M tanl (-Am/Bm) - harmonic phase angle of the mth pressure harmonic
The positive peak (maximun positive value) of the mth harmonic component of
pressure fluctuation occurs when
0 -Y 2 (5)
Thus the spatial phase angle at which, say, the Zth or blade rate harmonic of
pressure reaches a maximum positive value is
= ( YZ+2) (6)
This phase angle is the angular location of the blade reference line when the
blade rate pressure positive peak occurs, measured clockwise looking upstream
(see Figure 1).
The amplitude of the mth harmonic pressure component (Ap)m = Pm is made non-
dimensional in the following definition
P
(K) = m (7)
22

In the present work, we confine our interest to the results for the first three
blade rate harmonics, with m = 11Z
m - Z, 2Z, 3Z
so that p = 1, 2, 3
Similarly, the unsteady reference area surface force on the disc can be
expressed in terms of its Fourier series
CO
Fs(t) = I (Fs)m sin (m -
m=l (8)
where wt is the position angle(Fs)m = total amplitude of the mth harmonic component of
fluctuating disc force (obtained from the sum of the
three force gauge signals)
m = harmonic phase angle of the mth disc force componentm
The nondimensional form of the disc force amplitude for the mth harmonic is
(Fs)m(KF)m = 2(9
pn2D (9)
Using this, the ratio of the unsteady force amplitude to propeller mean thrust,
say at blade rate frequency, is the ratio of the coefficients
(FS) 7 (KF)z
T KT (10)
RESULTS
Propeller Cavitation
Visual observation of the propeller operated under the test conditions
described earlier showed that tip vortex cavitation springing from the blade tips
23

appeared at around an 13. As the cavitation number was decreased from this
value, the tip vortex increased in size. Sheet cavitation began forming on the
suction side near the blade tips at On near 12. At On - 10.5 there was substan-
tial sheet cavitation on each blade. For the cavitation number On = 8.36, the
lowest value achieved in this test series, the sheet cavity on each blade
covered a portion of the outer 25 percent of the propeller radius. The circum-
ferential extent of the blade sheet cavitation wae from about 900 before 12
o'clock around to 600 beyond the top-dead-center position.
Unsteady Pressures
Figures 11 and 12 show the variation of pressure coefficient values Kp versus
cavitation number for the amplitudes of fluctuating pressure acting at the center
of the disc (directly over the propeller center) for the first three harmonics of
blade rate. Figure 11 shows data for the tip clearance ratio az/D - 0.26, with
Figure 12 applicable to the larger tip clearance az/D - 0.41. The pressure ampli-
tude curves are flat in the non-cavitating regime of large One For values of On
< 12, the pressure amplitude characteristics start to rise with decreasing cavi-
tation number. The noticeable increase in the levels of all the (Kp)m values
coincides with the appearance and growth in size of blade sheet cavities, a fact
that confirms our general understanding of the importance of unsteady cavity
volume variation to the pressure excitation.
For both tip clearances, the blade rate harmonic component is typically
larger than the second and third blade rate contributions. The differences are
clearl, dependent on the tip clearance ratio. At the smallest tip clearance of
az/D ' 0.26 the blade rate amplitudes exceed the higher harmonics by a factor of
more 'han 2.5. For the larger az/D - 0.41, the higher harmonic amplitude values
are -omparable to the fundamental blade ra.e amplitude.
In a comparison of the results of magnitudes of the blade rate component for
the wo tip clearance ratios, there appears to be a large influence of tip
cleatance. The smaller tip clearance produces the larger (Kp)Z levels in both
the ncn-cavitating and cavitating regimes. This is certainly consistent with
previouo experimental findings. Some of the difference iL, pressure amplitudes
between the two tip clearance cases may be attributed to differences in the
screen-generated nominal wakes for the two tip clearance ratios, as seen in
24
7- __
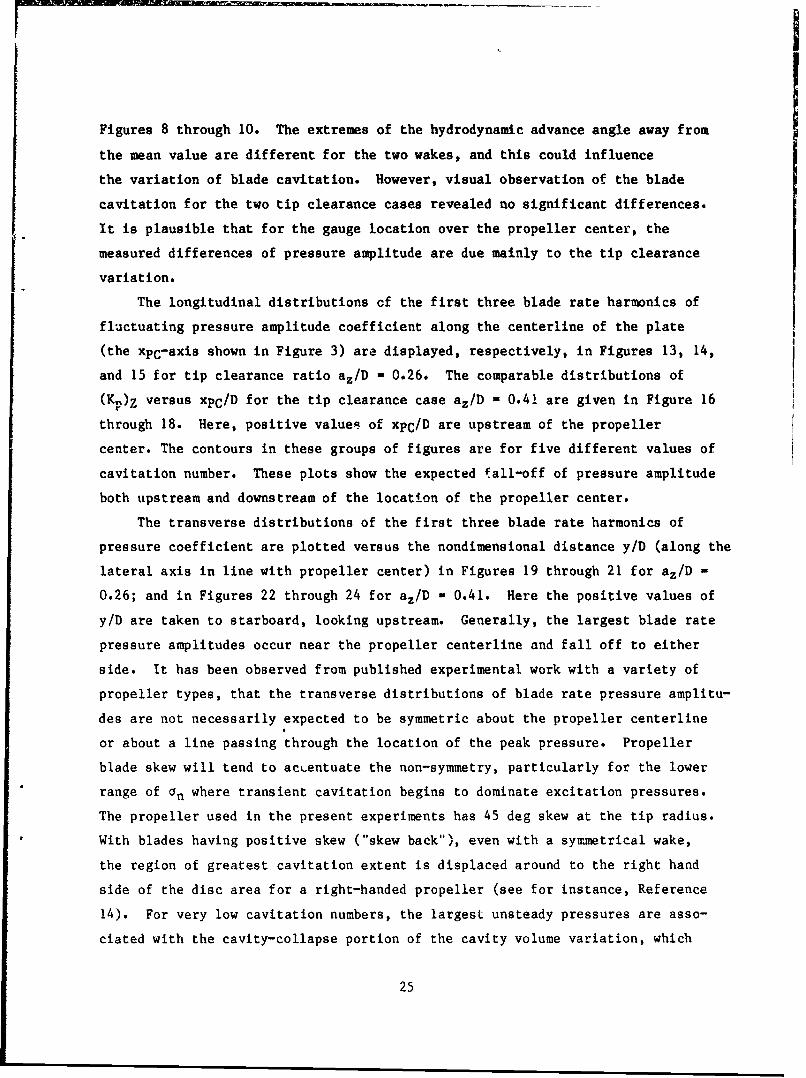
IIFigures 8 through 10. The extremes of the hydrodynamic advance angle away from
the mean value are different for the two wakes, and this could influence
the variation of blade cavitation. However, visual observation of the blade
cavitation for the two tip clearance cases revealed no significant differences.
It is plausible that for the gauge location over the propeller center, the
measured differences of pressure amplitude are due mainly to the tip clearancevariation.
The longitudinal distributions of the first three blade rate harmonics of
fluctuating pressure amplitude coefficient along the centerline of the plate
(the xpc-axis shown in Figure 3) are displayed, respectively, in Figures 13, 14,
and 15 for tip clearance ratio az/D - 0.26. The comparable distributions of
(K,)Z versus xpc/D for the tip clearance case az/D - 0.4! are given in Figure 16
through 18. Here, positive values of xpC/D are upstream of the propeller
center. The contours in these groups of figures are for five different values of
cavitation number. These plots show the expected fall-off of pressure amplitude
both upstream and downstream of the location of the propeller center.
The transverse distributions of the first three blade rate harmonics of
pressure coefficient are plotted versus the nondimensional distance y/D (along the
lateral axis in line with propeller center) in Figures 19 through 21 for az/D -
0.26; and in Figures 22 through 24 for az/D - 0.41. Here the positive values of
y/D are taken to starboard, looking upstream. Generally, the largest blade rate
pressure amplitudes occur near the propeller centerline and fall off to either
side. It has been observed from published experimental work with a variety of
propeller types, that the transverse distributions of blade rate pressure amplitu-
des are not necessarily expected to be symmetric about the propeller centerline
or about a line passing through the location of the peak pressure. Propeller
blade skew will tend to acLentuate the non-symmetry, particularly for the lower
range of an where transient cavitation begins to dominate excitation pressures.
The propeller used in the present experiments has 45 deg skew at the tip radius.
With blades having positive skew ("skew back"), even with a symmetrical wake,
the region of greatest cavitation extent is displaced around to the right hand
side of the disc area for a right-handed propeller (see for instance, Reference
14). For very low cavitation numbers, the largest unsteady pressures are asso-
ciated with the cavity-collapse portion of the cavity volume variation, which
25

occurs over in the right-hand quadrant of the propeller disc rather than at the
12 o'clock position where the tip clearance is smallest. The displacement and
distortion of cavity volume due to effects of skew can influence the higher har-
monics of the surface pressure in non-trivial ways as well. In the present
experiments, carried out at intermediate values of cavitation number, the loca-
tion of the peak blade rate pressure amplitude is apparently influenced most by
the effect of tip proximity, and occurs at or near the position of closest
approach of the blade tip.
For higher harmonics of blade rate, the curves of pressure amplitudes at
constant an - values are sometimes skewed to one side, or may show some slightly
mixed trend with respect to cavitation number on one side of the centerline that
differs from the opposite side. (See, for instance, Figures 17, 20, 21, 23, and
24). These are the manifestations of a combination of higher harmonic distortion
by a skewed cavitation extent (noted above) and scatter and inaccuracy asso-
ciated with the relatively low levels of pressure magnitude of the higher har-
monic components compared with the blade rate contributions.
Unsteady Disc Force
The measured fluctuating disc force amplitude coefficients for the first
three blade rate harmonics are shown plotted versus cavitation number for az/D
0.26 in Figure 25, and for az/D - 0.41 in Figure 26. The symbols plotted in
these graphs represent the average values for two or three data spots at each of
the tested cavitation numbers. Similar to the trends of the pressure amplitu-
des, the disc force amplitude curves are flat for an larger than about 12, then
there are noticeable increases as the cavitation number is decreased. This
characteristic is linked to the appearance and growth of blade sheet cavities.
When comparing the first blade rate harmonic of disc force for the two dif-
ferent tip clearance cases, the force amplitude for a /D = 0.26 is about 20 per-
cent larger than the force amplitude for az/D = 0.41. This relative difference
of force amplitude is considerably less than that for the pressure amplitude at
the disc center for the same tip clearance ratios. For instance, from data
displayed in Figures 11 and 12, at On = 8.36, the blade rate pressure amplitude
for the smaller tip clearance ratio is 170 percent larger than that for az/D
0.41. Thus, the variation of pressure pulse amplitude versus cavitation number
26
measured At one surface point location is not necessarily indicative of the
magnitude of force amplitude variation acting on a surrounding reference area
for this propeller and wake.
Simultaneously with the disc force measurements, pressure amplitude and
phase angle measurements were obtained at 11 locations on the disc. For the
first three blade rate harmonics components, the measured preqsure values were
integrated over the surface of the flat disc to determine a net normal force
estimate on the disc area. Proper account was made for the variation of phase
angle for each transducer location, so that the presence of transverse asym-
metries of pressure amplitude distributions should not affect the accuracy of
the integrated pressure results. The results provide interesting comparisons
with the measured force amplitudes at various cavitation numbers at the two dif-
ferent tip clearances.
Figures 27 and 28 compare the blade rate harmonic force coefficient values
of measured force and integrated pressure force for the tip clearance ratios
az/D - 0.26 and 0.41, respectively. The comparisons of twice blade rate harmonic
force coefficients for the two tip clearances are given in Figures 29 and 30;
and the three times blade rate amplitude coefficients are displayed in Figures
31 and 32, for az/D = 0.26 and 0.41, respectively. In each of the comparisons,
for all the harmonic components, the integrated pressure force amplitudes exceed
the actual measured disc force amplitudes. The *iscrepancy is larger for the
blade rate harmonic components than for the higher harmonics. This serves as
another indication that a single point surface pressure amplitude is not
necessally an accurate represen:ation of the net force acting over a reference
area surrounding the point.
Comparison with Previous Results
Experimental results for the pressure pulse excitation were obtained pre-
viously for propeller model 4677 in the large cavitation tunnel at SSPA,7 6 where
a complete scale model of the AO-177 hull with appendages was installed in order
to produce the desired model wake. Unsteady pressure amplitude measurements were
recorded at several locations on the hull surface near the propeller. The
nominal wake in the water tunnel flow behind the AO-177 model was not measured,
but was assumed to match sufficiently well the nominal wake measured in a towing
basin behind a model having the same scale.
27

Figure 33 shows a comparison of the longitudinal distribution of the blade
rate pressure amplitude coefficients along the flat surface from the present
24-inch water tunnel results and along the hull surface from the complete model
hull tests in the SSPA tunnel. Although this is not completely consistent
because of the difference between the flat plate bourdary and the actual hull
shape and the mismatch of pressure gauge locations, it does provide an approxi-
mate comparison of the general trend of the longitudinal distribution of
pressure pulse amplitudes. Measurements taken on the flat plate boundary posi-
tioned with tip clearance ratios az/D - 0.26 and 0.41 are shown in Figure 33
together with measurements obtained with the model hull shape with the vertical
tip clearance of az/D - 0.292, all with the same cavitatioui number an - 8.36.
The values from the actual hull shape with az/D - 0.292 fall generally between
the values obtained with the flat plate at the two different tip clearances.
This indicates that the measurements on a flat plate represent a good order of
magnitude approximation for the measurements along the hull. However, the shape
of the curve of the (Kp)Z values versus xpC/D is not the same for the flat plate
cases and the hull, and the details of differences are attributable to the dif-
ference in wake and boundary geometry (hull shape).
The variations wit' respect to cavitation number of the blade rate com-
ponent of pressure amplitudes at or near the tip plane are shown in Figure 34.
The values measured on the complete hull shapu model were taken over the pro-
peller tip and the values measured on the flat plate boundary were obtained in
line with the propeller center. The curves compare favorably in an approximate
way, considering the differences in boundary shape and tip clearances.
DISCUSSION
Useful measurements are described for three blade rate harmonics of the
unsteady excitating force and pressures on a reference-area disc mounted in a
flat boundary above a cavitating propeller operating in a screen-generated wake
in the 24-inch variable pressure water tunnel at DTNSRDC. The inflow velocity
distribution was intended to simulate the axial velocity pattern of a very
severe single-screw ship type of wake, similar to that of the AO-177. Results
of measurements are presented for a range of cavitation numbers covering
28

non-cavitating and cavitating conditions and for two different tip clearances.
Comparisons are provided between the measured disc force and the force obtained
by integrating the pressures over the disc area. The integrated pressure force
values are always somewhat larger than the measured force values, principally
because of the lack of sufficient detail in defining the variation of phase
angles for the pressures over the disc.
Measured results from the complete array of pressure transducers over the
flat plate boundary show the longitudinal and transverse centerline distribu-
tions ok pressure pulse amplitudes in the region around the propeller. In general
these show that the largest pressure excitation amplitudes occur near the pro-
peller center.
All th! computed harmonics of unsteady disc force and pressures show a
noticeable increase with decreasing cavitation number, particularly below the
onset of visible blade sheet cavitation at around an = 12. Unsteady force and
pressure amplitudes are largest for the smaller of the two tip clearance values.
A reciprocity experiment was performed to measure the pressure-to-accelera-
tion transfer function (p/a), needed to estimate the time rate of change of
cavity volume. The transfer function was found to have a noticeable variability
at frequencies below about 300 Hz, and this was judged to represent an uncer-
tainty in the capability to approximate the value of cavity volume velocity. As
seen in Appendix B, the estimated blade rate cavity volume velocity inferred
from reciprocity measurements and the calculated values agree in order of magni-
tude and trend with on-variation. The experimental values are higher than the
theory, and this could be due to the role of unsteady tip vortex cavitation,
which is not accounted for. It is not possible at this time to sort out the
magnitude of this effect on the discrepancy, which includes the combined
uncertainty of the experimental calibrations and the sensitivity of computed
cavity volume to the propeller inflow.
Comparisons between the present measured unsteady pressure amplitudes pro-
duced with the AO-177 model propeller on a flat plate boundary and those obtained
previously on a complete scale model hull at SSPA show reasonable correlation
with respect to the effect of tip clearance at comparable cavitation numbers.
The differences between the results in terms of spatial distribution and
variation with cavitation number are associated with the detailed differences in
wake and boundary geometry.
29

It should be noted that with the capability developed here, propeller
excitation experiments could be carried out with partial stern or dummy model
representations of the near-propeller hull geometry that include charac-
terizations of the reference-area unsteady vertical surface force as well as
surface pressures. The disc force measuring system described here could be used
to measure the vertical surface force amplitudes on a shaped element imbedded in
the surface of a foreshortened hull model. Pressure gauges could be installed
flush with the shaped surface as usual. The use of a partial body would provide
some help with the simulation of a desirqd wake configuration, and it could be
made less subject to low tunnel speed restrictions imposed by the use of wake
screens al one.
ACKNOWLEDGMENTS
The authors gratefully acknowledge the work of Mr. George Gilbert for the
careful design of the disc force measuring apparatus and Mr. Steve McQuigan for
the computer system used in the data acquisition and analysis.
30
30

REFERENCES
1. Boswell, R.J. and G. G. Cox, "Design and Model Evaluation of a Highly-SkewedPropeller for a Cargo Ship," Marine Technology, Vol. 11, No. 1, pp. 73-89(Jan 1974).
2. Valentine, D.T. and F.J. Dashnaw," Highly Skewed Propeller for San ClementeClass Ore/Bulk/Oil Carrier Design Considerations, Model and Full ScaleEvaluation," First Ship Technology and Research (STAR) Symposium, SNAME(1975).
3. Boswell, R.J., S. D. Jessup, and K-H Kim, "Periodic Blade Loads onPropellers in Tangential and Longitudinal Wakes," SNAME Propellers '81Symposium, Virginia Beach (May 1981); also Report DTNSRDC-81/054 (June1981).
4. Boswell, R.J., K.H. Kim, S. Jessup, and G.F. Lin, "Practical Methods forPredicting Periodic Propeller Loads," Second Intern. Symp on PracticalDesign in Shipbuilding (PRADS 83), Tokyo and Seoul (Oct. 1983).
5. Huse, E., "Pressure Fluctuations on the Hull Induced by CavitatingPropellers," Norwegian Ship Model Experimental Tank Publ. No. Ill (March1972).
6. Noordzij, L., "Pressure Field Induced by a Cavitating Propeller,"International Shipbuilding Progress, Vol. 23, No. 260 (April 1976).
7. Vorus, W.S., J.P. Breslin, and Y.S. Tein, "Calculation and Comparison ofPropeller Unsteady Pressure Forces on Ships," Ship Vibration Symposium, SNAME(Oct 1978).
8. Fitzsimmons, P.A., "Cavitation Induced Hull Pressures: A Comparison ofAnalytical Results, Ship and Model Measurements," RINA Symposium onPropeller Induced Ship Vibration, London (Dec 1979).
9. Kaplan, P., J. Bentson, and J.P. Breslin, "Theoretical Analysis of PropellerRadiated Pressure and Blade Forces due to Cavitation," RINA Symposium onPropeller Induced Ship Vibration, London (Dec 1979).
10. Hoshino, T., "A Method to Predict Fluctuating Pressures Induced by aCavitating Propeller," Mitsubishi Technical Bulletin No. 150 (May 1982).
11. Kaplan, P., J. Bentson, and M. Benatar, "Analytical Prediction of Pressures
and Forces on a Ship Hull Due to Cavitating Propellers," 14th CNR Symposium onNaval Hydrodynamics, The University of Michigan (Aug 1982).
12. Breslin, J.P., et al, "Theoretical and Experimental Propeller-Induced HullPressures Arising from Intermittent Blade Cavitation, Loading, and Thickness,"Trans. SNAME, Vol. 90 (1982).
13. Huse, E. and W. Guoqiang, "Cavitation-Induced Excitation Forces on the Hull,"Trans. SNAME, Vol. 90 (1982).
31

14. Wilson, M.B. et al., "Causes and Corrections for Propeller-ExcitedAirborne Noise on a Naval Auxiliary Oiler," Trans. SNAME, Vol. 90 (1982).
15. Rothblum, R.S. and J.H. Pattison, "A New Large Cavitation Channel forIntegrated Hull-Propulsor-Appendage Research Development Test and Evaluation,"NAVSEA Association for Senior Engineers Conference (Mach 1983).
16. Denny, S., "Comparisons of Experimentally Determined and TheoreticallyPredicted Pressures in the Vicinity of a Marine Propeller," NSRDC Report 2349(May 1967).
17. Taniguchi, K. and K. Ohtaka, "Measurements of the Propeller-Induced VibratoryForces on a Destroyer," Journ. of Society of Naval Architects of Japan, Vol.114, pp. 138-147 (1963).
18. Kerwin, J., S. Lewis, and S. Kobayashi," Systematic Experiments to Determinethe Influence of Skew and Rake on Hull Vibratory Excitation Due to TransientCavitation," Ship Vibration Symposium, Arlington Va., SNAME (1978).
19. Hylarides, S, "Some Hydrodynamic Considerations of Propeller-Induced ShipVibrations," Ship Vibration Symposium, Arlington Va, SNAME (1978).
20. Skaar, K. and A. Raestad," The Relative Importance of Ship VibrationExcitation Forces," RINA Symposium on Propeller Induced Ship Vibration,London (Dec 1979).
21. Weitendorf, E., "Cavitation and Its Influence on Induced Hull PressureAmplitudes," Symposium on Hydrodynamics of Ship and Offshore PropulsionSystems, Oslo Norway (Mach 1977)
22. English, J., "Cavitation Induced Hull Surface Pressures--Measurements inWater Tunnels," RINA Symposium on Propeller Induced Ship Vibration, London (Dec1979).
23. Lewis, F.M., "Propeller Vibration," Trans SNAME, Vol. 43, pp. 252-285 (1935)
24. Lewis, F.M., "Propeller Vibration," Trans SNAME, Vol. 44, pp. 501-519 (1936).
25. Lewis, F.M. and A.J. Tachmindji, "Propeller Forces Exciting Hull Vibration,"Trans. SNAME Vol. 62 (1954).
26. Lewis, F.M., "Propeller Vibration Forces in Single Screw Ships," Trans.SNAME, Vol. 77 (1969).
27. Stuntz, G.R, et al., "Series 60 - The effect of Variations in the AfterbodyShape Upon Resistance, Power, Wake Distribution, and Propeller ExcitedVibratory Forces," Trans SNAME, Vol. 68 (1960).
28. Tachmindji, A.J. and M.C. Dickerson, "The Measurement of OscillatingPressures in the Vicinity of Propellers," DTNSRDC Report No. 1130 (Apr 1957).
32

29. Tachmindji, A.J. and M.C. Dickerson, "The Measurement of Thrust Fluctuation
and Free Space Oscillating Pressures for a Propeller," DTNSRDC Report No.1107 (Jan 1957).
30. Pohl, K., "Die durch eine Schiffschraube auf benachbarten Platten erzeugtenperiodischen hydrodynamischen Drucke," (in German) Schiffstechnik Vol. 7,No. 35, pp 5-18 (1960).
31. Taniguchi, K., "On the Pressure Fluctuation in the Vicinity of Propellers," (inJapanese), Journ of Society of Naval Architects of West-Japan, No. 16 (1958).
32. Weitendorf, E-A., "Experimental Investigations of the Periodic PressureVariations Produced by Propellers on the Outer Skin," Schiff und Hafen, Vol.22, No. 1 pp. 11-22 (1970).
33. Nelka, J., "Experimental Evaluation of a Series of Skewed Propellers withForward Rake: Open-Water Performance, Cavitation Performance, Field-PointPressures, and Unsteady Propeller Loading," NSRDC Report 4113 (Jul 1974).
34. Keil, H., "Messung der vom Propeller induzierten Druckschwankungen umForschungsschiff 'Meteor' und Vergleich mit dem Modellversuch," Vol. 59 pp.368-377 (1965).
35. Huse, E., "The Magnitude and Distributon of Propeller-Induced Surface Forces ona Single-Screw Ship Model," Norwegian Ship Model Experimental TankPublication No. 100 (Dec 1968)
36. Jacob, W.R., J. Mercier, and S. Tsakonas, "Theory and Measurements of thePropeller-Induced Vibratory Pressure Field," Journal of Ship Research, Vol.16, No. 2 (1972).
37. Takahashi, H. and T. Ueda, "An Experimental Investigation into the Effect ofCavitation on Fluctuating Pressures Around a Marine Propeller," Proceedings12th I.T.T.C., Rome (1969).
38. Weitendorf, E-A., "Vergleich von propellererregten Druckschwankungen furModell and Grossausfuhrung am Beispiel des Frachtschiffes MS 'Hornmeer',"Schif und Hafen, Vol. 25, Part 5, pp. 423-428 (May 1973).
39. Weitendorf, E-A., "Experimentalle Untersuchungen der durch kavitierendePropeller erzeugten Druckschwankungen," (Experimental tnvestigations on th&pressure fluctuations caused by cavitating propeller), Schiff und Hafen,Vol, 25, Part 11 (Nov 1973).
40. Takahashi, H., "A Consideration on the Effect of the Propeller Cavitationupon the Surface Force," (in Japanese), Trans. of West-Japan Society ofNaval Architects, No. 49 (1975).
41. Chiba, N, and T. Hoshiao, "Effect of Unsteady Cavity on Propeller-InducedHydrodynamic Pressure," Journal of Society of Naval Architects of Japan,Vol. 139 (1976).
33

42. Sasajima, T., "Application of Noise Measurements for Studying Unsteady
Cavitation in Cavitation Tunnel," Proc. ASME Symposium on Cavitation Noise,Phoenix (1982).
43. Takekuma, K., "Effect of Air Bubbles Entrained from Bow on Propeller-InducedPressure fluctuation," Mitsubishi Technical Bulletin No. 140 (June 1980);(see also RINA Symposium on Propeller Induced Ship Vibration, London 1979).
44. Nelka, J.J., "Induced Field-Point Pressures of a Ducted Propeller System,"Naval Ship Research and Development Center Report 4270 (Oct 1974)
45. Peck, J.G., "Tunnel Hull Cavitation and Propeller Induced PressureInvestigation," Naval Ship Research and Development Center DepartmentalReport SPD-597-01 (Nov 1974).
46. van Manen, J.D., "The Effect of Cavitation on the Interaction BetweenPropeller and Ship's Hull, "International Shipbuilding Progress, Vol. 19,No. 209 (Jan 1972).
47. Huse, E., "Trykkimpulser fra kaviterende propell," paper presented atNordisk Skipsteknisk Mote, Xbo Finland (1971)
48. van Oossanen, P. and J. van der Kooij, "Vibratory Hull Forces Induced byCavitating Propellers," Trans. RINA (1973)
49. van der Kooij, J. and A. Jonk, "Propeller-Induced Hydrodynamic Hull Forces ona Great Lakes Bulk Carrier. Results of Model Tests and Full ScaleMeasurements," Symposium on High Powered Propulsion of Large Ships, NSMBPublication No. 490, Part 2 (Dec 1974).
50. Hylarides, S., "Some Hydrodynamic Considerations of Propeller-Induced ShipVibrations," Ship Vibration Symposium, SNAME (Oct 1978).
51. Glover, E.J., J.F. Thorn, and L. Hawdon, "Propeller Design or Minimum HullExcitation," The Naval Architect, pp. 267-275 (Nov 1979).
52. Glover, E.J. and G. Patience, "Aspects of the Design and Application of
Off-Loaded Tip Propellers," RINA Symposium on Propeller Induced ShipVibration, London (Dec 1979).
53. Lover, E.P. and C.B. Wills, "Cavitation Tunnel Testing for the Royal Navy,"Stone Manganese Marine/Newcastle University Conference (1979).
54. Chiba, N., T. Sasajima, and T. Hoshino, "Prediction of Propeller-InducedFluctuating Pressures and Correlation with Full Scale Data," 13th Symposiumon Naval Hydrodynamics, Tokyo (Oct 1980).
55. Reed, F.E., N.L. Bassett, and J.A. Norton, "Effects of Hull and PropellerDesign Changes on the Vibration of a Lakes Freighter," Trans. SNAME, Vol. 89(1981).
34

56. Lovik, A., "Scaling of Propeller Cavitation Noise," Paper D in Noise Sourcesin Ships I: Propellers, Edited by A. Nilsson and N. Tyvland, Nordforsk(1981).
57. Munk, T., J. Romeling, S. Spangenberg, and C. Aage," Noise and PressureImpulses form Cavitating Propellers. A comparative Study on Two Ships in FullScale and Model Scale," Danish Ship Research Laboratory, Bulletin No. 47(April 1982).
58. Hadler, J.B., J.W. English, and S.K. Gupta, "Program to MinimizePropeller-Induced Vibration on Converted Maersk 'E' Class Ships, " Trans.SNAME, Vol. 92 (1984).
59. English, J. "Cavitation Induced Hull Surface Pressures--- Measurements in aWater Tunnel, "RINA Symposium on Propeller Induced Ship Vibration, London (Dec1979).
60. Larsen, A., "Prediction of Propeller Induced Hull Pressures by Means of aMedium-Size Cavitation Tunnel," Danish Ship Research Laboratory Report(April 1982).
61. van der KooliJ, J., "Experimental Determination of Propeller-InducedHydrodynamic Hull Forces in the NSMS Depressurized Towing Tank," RINASyposium on Propeller Induced Ship Vibration, London (Dec 1979).
62. Lindgren, H. and E. Bjgrne, "Ten Years of Research in the SSPA LargeCavit.,tion Tunnel," Stone Manganese Marine/Newcastle University Conference(1979); also SSPA Publication No. 86 (1980).
63. Dyne, G. and M. Hoekstra, "Propulsion, Cavitation and Propeller-induced PressureFluctuations of a Tanker," SNAME Spring Meeting Transactions (June 1976).,
64. Steenhoek, H.F. and T. Ten Wolde, "The Reciprocal Measurement ofMechanical-Acoustical Transfer Functions," ACUSTICA, Vol. 23, No. 5, pp.301-305 (Nov 1970).
65. Ten Wolde, T. and A. de Bruljn, " A New Method for Measurement of theAcoustical Source Strength of Cavitating Ship Propellers," InternationalShipbuilding Progress, Vol. 22, No. 25 (Nov 1975).
66. Gray, L.M., "Investigation into Modelling and Measurement of PropellerCavitation Source Strength at Blade Rate on Merchant Ships," SNAMEPropellers'81 Symposium Virginia Beach (May 1981).
67. Whalen, M., R.J. Van Houten, and J.E. Kerwin, "A Calibration Procedure toEnable the Derivation of Propeller Cavity Volume from Water TunnelMeasurements," Draft of M.I.T. Ocean Engineering Report to SNAME PurchaseOrder 6317 (May 1982).
68. Whalen, M., J.E. Kerwin, and R.J. Van Houten, "Experimental Determination ofthe Influence of Tip Clearance on Unsteady Propeller Cavitation," M.I.T.Department of Ocean Engineering Report 82-6 (May 1982).
35

69. Vorus, W.S., "An Analysis of the Vibratory Excitation of a Naval Ship withVariation of Blade Tip to Hull Clearance," Vorus and Associates Inc. ReportNo. 84-004 (Sept 1984).
70. des Moutis, E., "Reciprocity Measurements of Dynamic Source Characteristicsof Cavitating Propellers Including the Effect of Air Content," M.I.T. ReportNo. 87620-1 (July 1981).
71. Valentine, D.T. and A. Chase, "Highly Skewed Propeller Design for a NavalAuxiliary Oiler (AO 177)," DTNSRDC Departmental Report SPD-544-12 (Sept1976).
72. Hendrican, A. and K. Remmers," Powering and Cavitation Performance for aNaval Fleet Oiler, AO-177 Class (Model 5326 and Propeller 4677), "DTNSRDCDepartmental Report SPD-544-14 (Jan 1976).
73. Hampton, G., "Analysis of Wake Survey for Tunnel-Fin and Accelerating FinConfigurations for the Naval Auxiliary Oiler (AO 177) Represented by Model5326-1," DTNSRDC Departmental Report SPD-0544-18 (April 1981).
74. Wilson, M.B. and G.A. Hampton, "Measurements of the Effect of Trim on theNominal Wake of the Naval Auxiliary Oiler AO-177," DTNSRDC SPD-0544-19(March 1981).
75. Odabasi, A.Y. and P.A. Fitzsimmons, "Alternate Methods for Wake QualityAssessment," International Shipbuilding Progress, Vol. 25, No. 282 (Feb1978).
76. BjArne, E., "US Navy Oiler AO 177 Class-Model Tests in SSPA CavitationTunnel No. 2," Swedish Maritime Research Centre (SSPA) Report No. 2564-1(Nov 1980).
77. Chertock, G., "General Reciprocity Relation," Journal of Acoustical Society
of America, Vol. 34, p. 989 (1962).
78. Lee, C-S., "Prediction of the Transient Cavitation on Marine Propellersby Numerical Lifting Surface Theory," Thirteenth Symposium on NavalHydrodynamics, Tokyo (Oct 1980).
79. Kerwin, J., S. Kinnas, M.B. Wilson, and J. McHugh, "Experimental andAnalyticel Techniques for the Study of Unsteady Propeller SheetCavitation," Sixteenth Symposium on Naval Hydrodynamics, Berkeley(July 1986).
36
L!

Figu e ~ De init 0~ ketc o rtat ngu re ss r
Field ear an O~era ingoPr peile
Prssr2ll
37

I ,IS(OLATION
U FLEXURES
(BLOCK
INERTIAL MASS/SUPPORTSTRUCTURE(WEIGHTS ANDCENTRAL SHAFT)
INNER
SUPPORT
FLAT BOUNDARY PLATE
FLEXIBLE FAIRING FORCE MEASUREMENT
DISC
FLOW THREEFORCE
GAUGES
EE N TT R ANN C EEEXIT
NOZZLE NOZZLE
Figure 2 - Schematic of Force Measuring Device Installed inthe 24-Inch Water Tunnel Open Jet Test Section
38
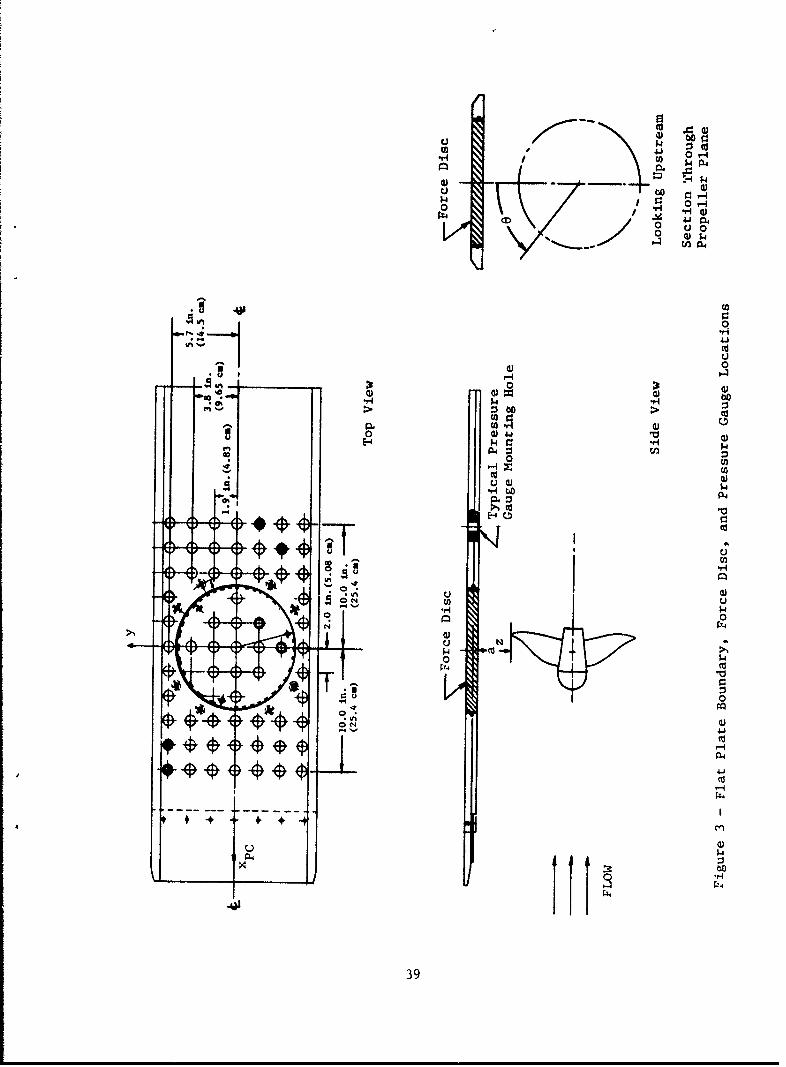
0 V4
*r4 00U 0
0
01 0)
00
u 0)4P
I U)
kn u0
Ii I ~
004T
ON
-4
- - - -- - -
00
______ 11I 0
39

.0
ci
cci
0
0041-4
o ac3 co
O01
-W -0
0 c0
0 -HI
1-41
400
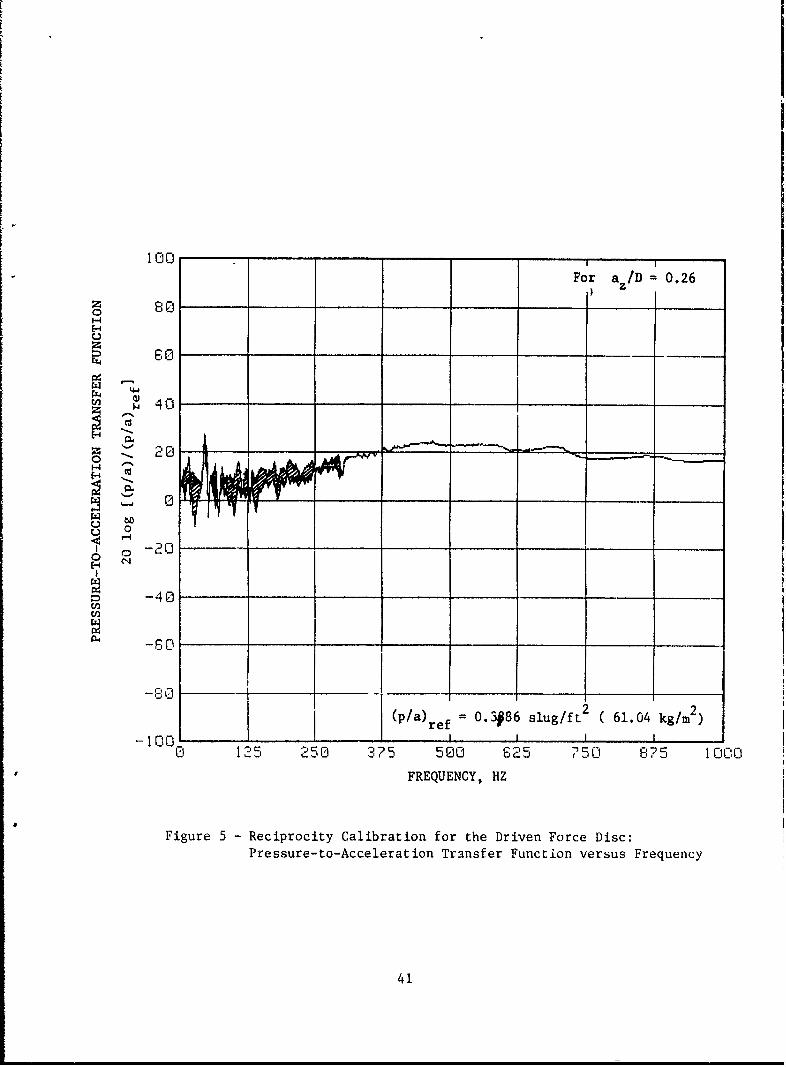
100For a zID 0.26
o 80
00
40
40
-0
-0 1
II(p/a) 0.3#86 slug/ft 2 C61.04 kg/rn2)I ref
00 12 5 50 35 500 625 (5 0 E875 1000
FREQUENCY, HZ
Figure 5 - Reciprocity Calibration for the Driven Force Disc:Pressure-to-Acceleration Transfer Function versus Frequency
41
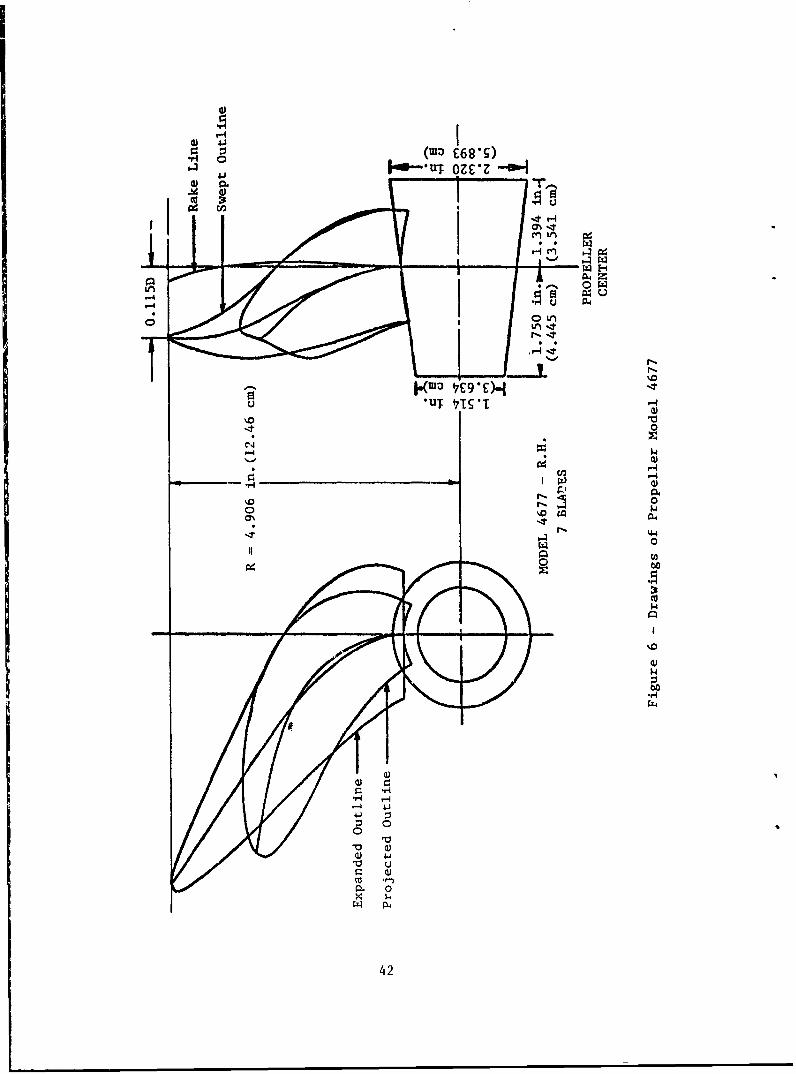
Giir4. w
w H
0 L0
'-4-
0
0
N-#4-40
oC00
42-
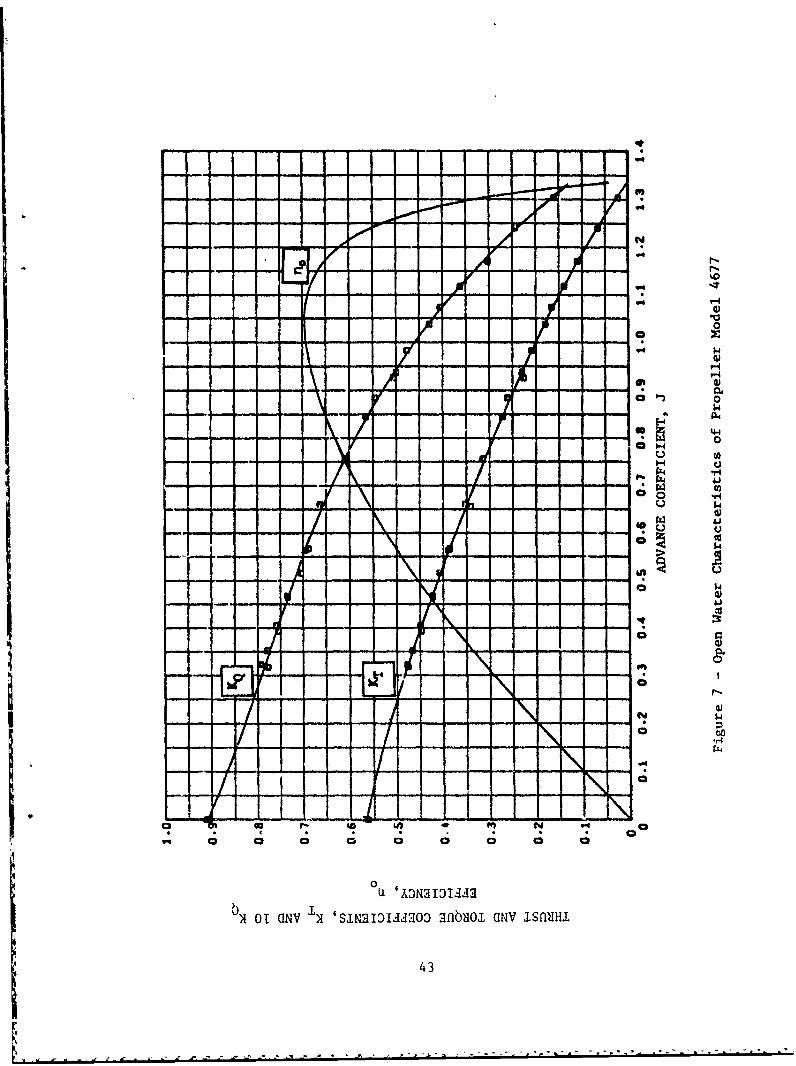
.44
.4j
r7.4n
4
1.a
[4
C; C
N 1 (IVIN0ISD~HO O0 N S H
43.
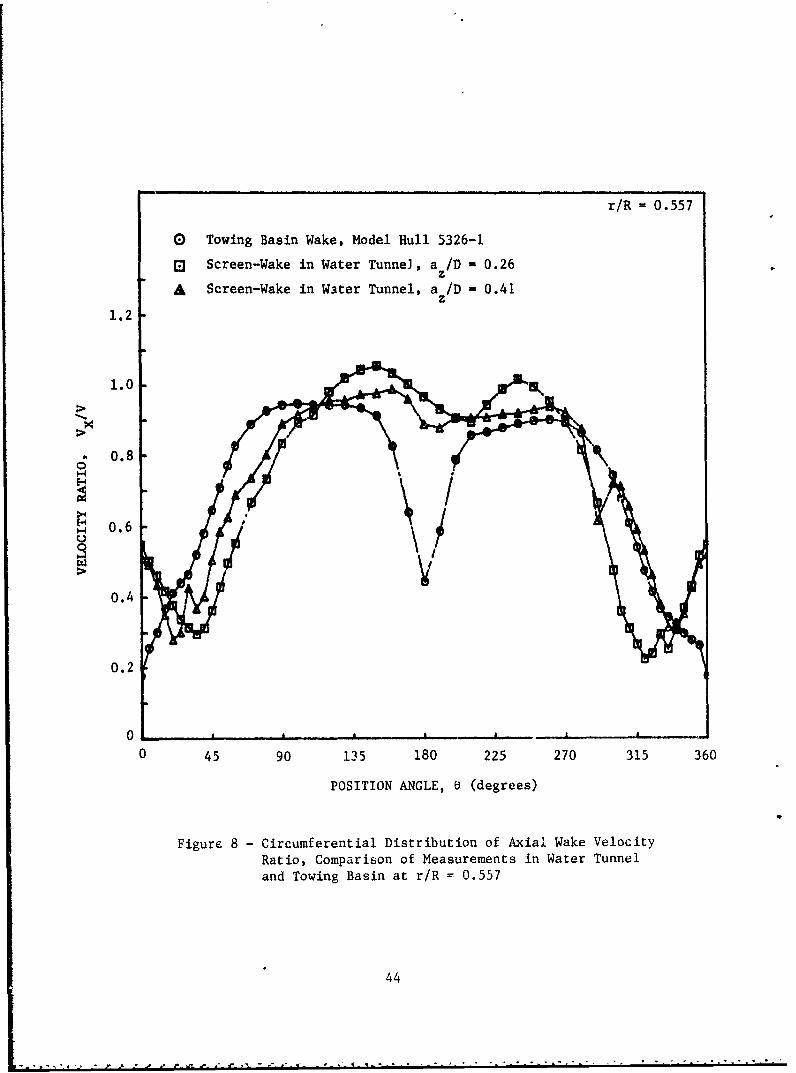
r/R = 0.557
0 Towing Basin Wake, Model Hull 5326-1
Screen-Wake in Water TunneJ, a /D - 0.26z
A Screen-Wake in Water Tunnel, a /D - 0.41z
1.2
1.0
.8
0.6
0.4
0.2
0 -.- -
0 45 90 135 180 225 270 315 360
POSITION ANGLE, 0 (degrees)
Figure 8 - Circumferential Distribution of Axial Wake VelocityRatio, Comparison of Measurements in Water Tunneland Towing Basin at r/R 0.557
44
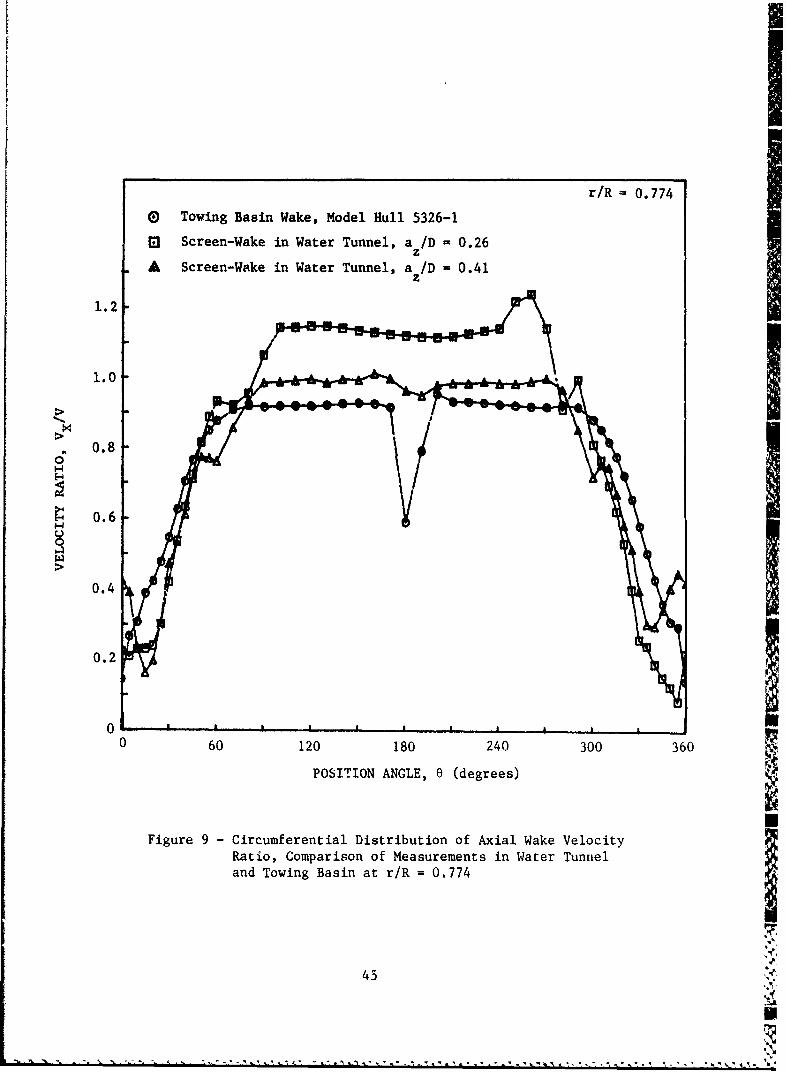
r/R 0.774
0 Towing Basin Wake, Model Hull 5326-1
m Screen-Wake in Water Tunnel, a /D = 0.26zA Screen-Wake in Water Tunnel, a /D = 0.41z
1.2
1.0
C7 0.8
S 0.6
0.2
0 p
0 60 120 180 240 300 360
POSITION ANGLE, 0 (degrees)
Figure 9 - Circumferential Distribution of Axial Wake VelocityRatio, Comparison of Measurements in Water Tunneland Towing Basin at r/R = 0.774 I
45
AN
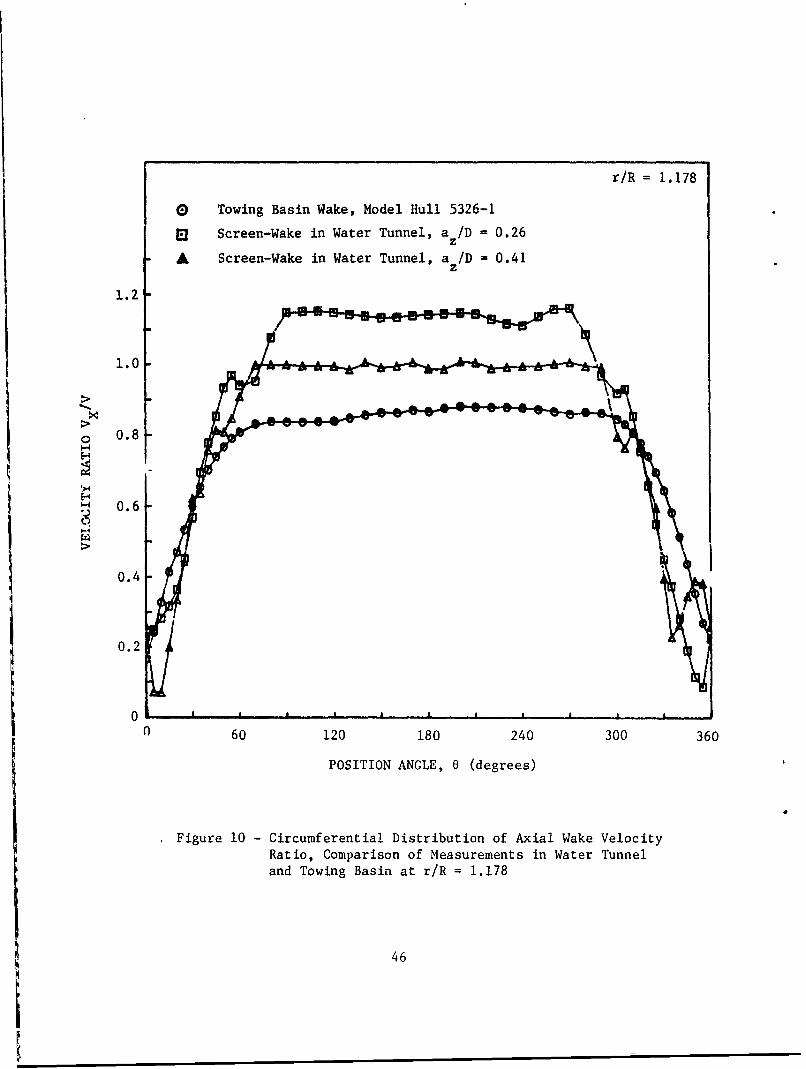
r/R = 1.178
0 Towing Basin Wake, Model Hull 5326-1
E Screen-Wake in Water Tunnel, a /D = 0.26z
A Screen-Wake in Water Tunnel, a /D = 0.41z
1.2
1.0
>
o 0.8
H 0.6
0.4
0.2
0
0 60 120 180 240 300 360
POSITION ANGLE, 6 (degrees)
Figure 10 - Circumferential Distribution of Axial Wake VelocityRatio, Comparison of Measurements in Water Tunneland Towing Basin at r/R = 1.178
46

a /D 0.26
0.04
0 First BR Harmonic (P-1)ER/ Second BR Harmonic (p -2)
A Third BR Harmonic (v=3)
0.03
1-4r4
0
0.02
i0 01
6 8 10 12 14 16 18
CAVITATION NUMBER, a
n!
Figure 11 - Three Blade Rate Harmonics of Measured Pressure AmplitudeCoefficients Taken at the Disc Center with a /D = 0.26z
47
p

a /D = 0.41
0.04-
N
G First BR Harmonic (V=l)E) Second BR Harmonic (-2)
0.03 A Third BR Harmonic (pi3)
C.-'
r4
0.o
S0.02
6 8 10 12 14 16 18
CAVITATION NUMBER,an
Figure 12 -Three Blade Rate Harmonics of Measured Pressure Amplitude
Coefficients Taken at the Disc Center with a /D = 0.41
48

a z/D = 0.26S 0.05 -
N
n0.04 0 17.86
4 E 10.58A 10.03+ 9.47c 8.36/
0.03
0.02
0.01
-0.8 -0.4 0 0.4 0.8
LONGITUDINAL, XpC/D (UPSTREAM)
Figure 13 - Blade Rate Harmonic of Measured Pressure AmplitudeCoefficient versus Longitudinal Position for FiveCavitation Numbers, with a /D = 0.26
z
49
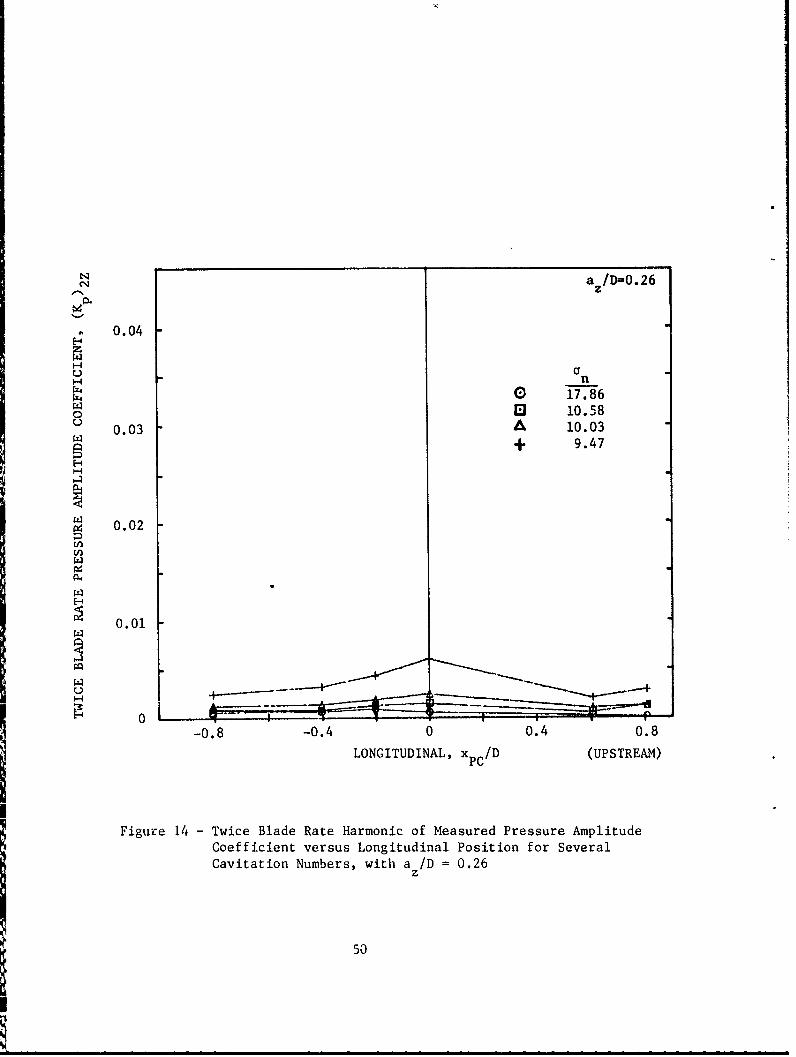
a /D=0.261
z
0.04
- an0 17.86
0 10.58C 0.03 A 10.03
+ 9.47
0.02
0.01
00-0.8 -0.4 0 o.4 0.8
LONGITUDINAL, XPC /D (UPSTREAM)
Figure 14 - Twice Blade Rate Harmonic of Measured Pressure Amplitude
Coefficient versus Longitudinal Position for Several
Cavitation Numbers, with a /D = 0.26z
50
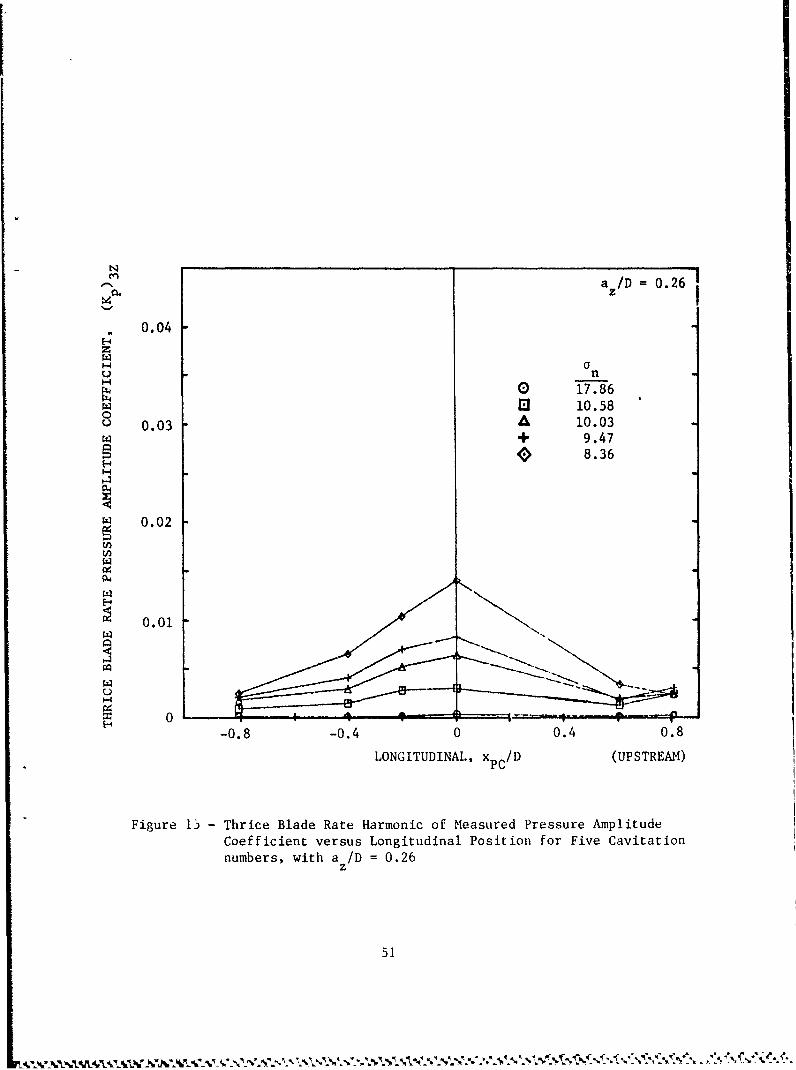
N
a /D =0.26z
0.04
zH-. a
C.) nH0 17.86
0 10.58) 0.03 A 10.03
+ 9.478.36
S 0.02
)0.0
-0.8 -0.4 0 0.4 0.8
LONGITUDINAL, x PC/D (UPSTREAM)
Figure 15 - Thrice Blade Rate Harmonic of Measured Pressure AmplitudeCoefficient versus Longitudinal Position for Five Cavitationnumbers, with a /D = 0.26
z
51
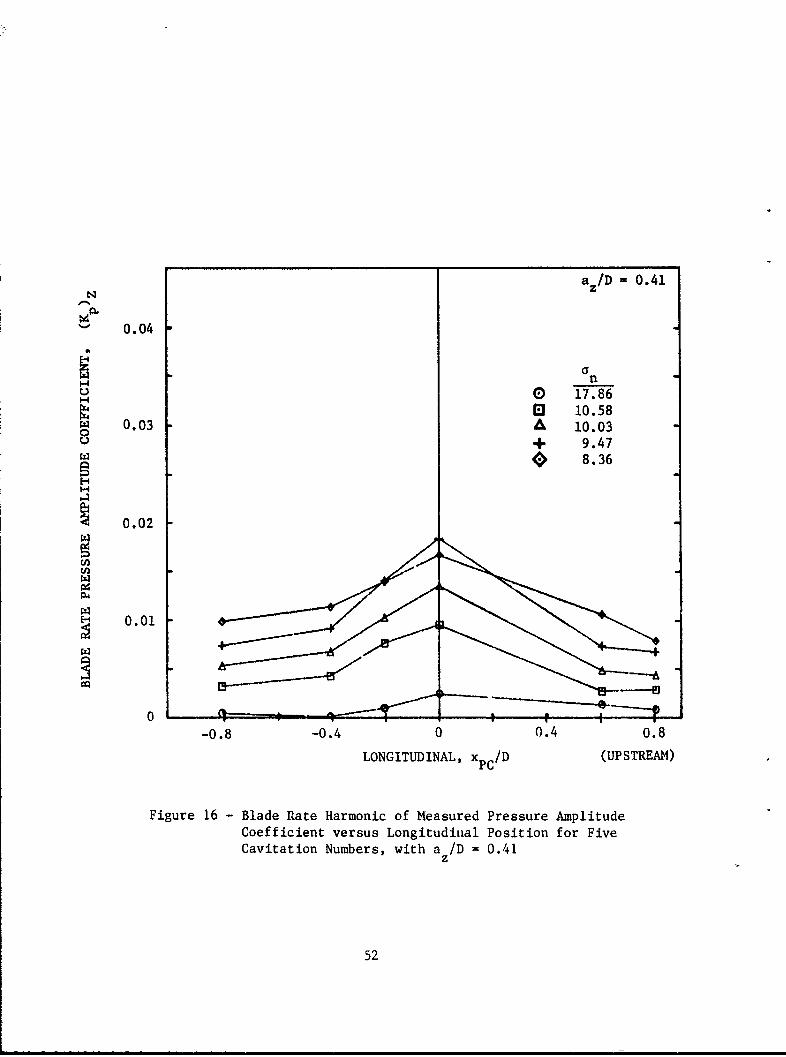
a z/D =0.41
' ~0.04
a
0 17.86El 10.58
N 0.03 A 10.03+ 9.47
N ~ 8.36
S 0.02
0.01
-0.8 -0.4 0 0.4 0.8
LONGITUDINAL, x PCID (UPSTREAM)
Figure 16 - Blade Rate Harmonic of Measured Pressure AmplitudeCoefficient versus Longitudinal Position for FiveCavitation Numbers, with a I D = 0.41
52

a z/D 0.41
0. 04N
0 17.86E0 10.58
0.03 A 10.03
N+ 9.478.36
N 0.02
0.01
N
0-0.8 -0.'4 0 0.4 0.8
LONGITUDINAL, x PC/D (UPSTREAM)
Figure 17 -Twice B1ad &4E : Harmonic of'Measured Pressure AmplitudeCoeffi-kient Longitudinal Position for FiveCavitation Nupmberb. ,'Ith a I D =0.41
53
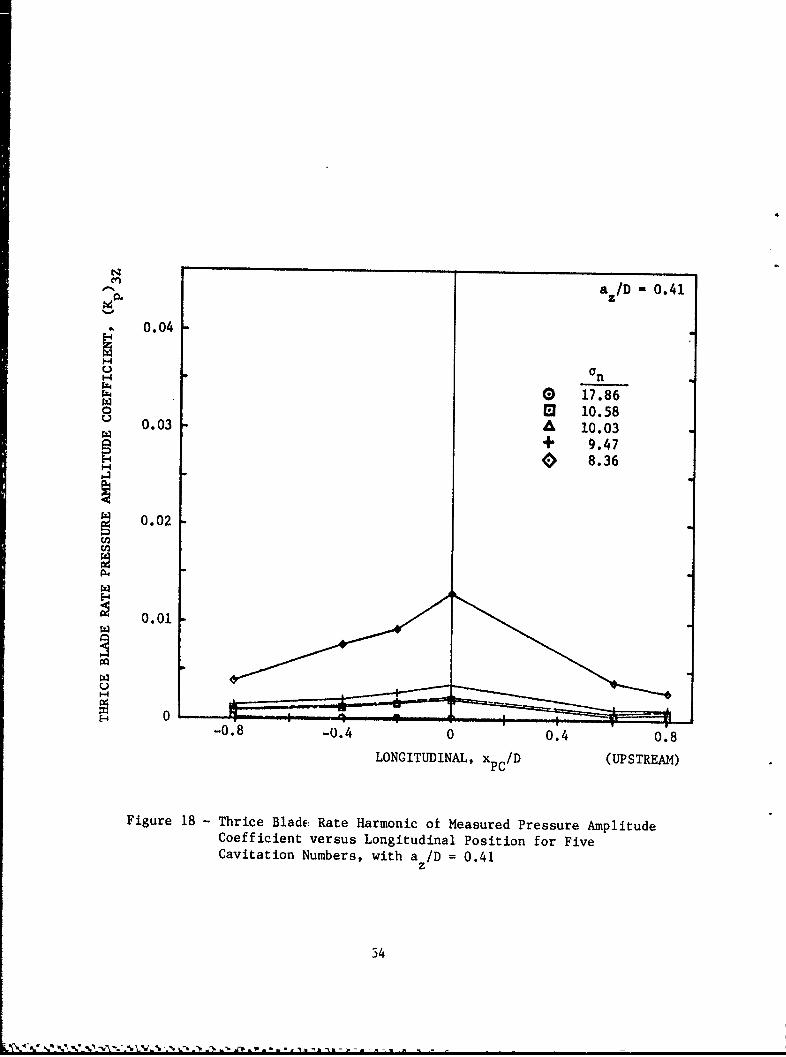
a /D- 0.41z
oCo)
H n
0 17.8600 10.58
C) 0.03 A 10.03N + 9.47
0 8.36
S 0.02
0.01
0-o.8 o.4 0.40.8
LONGITUDINAL, x PCID (UPSTREAM)
Figure 18 -Thrice BladfE Rate Harmonic ot Measured Pressure AmplitudeCoefficient versus Longitudinal Position for FiveCavitation Numbers, with a I D =0.41
34
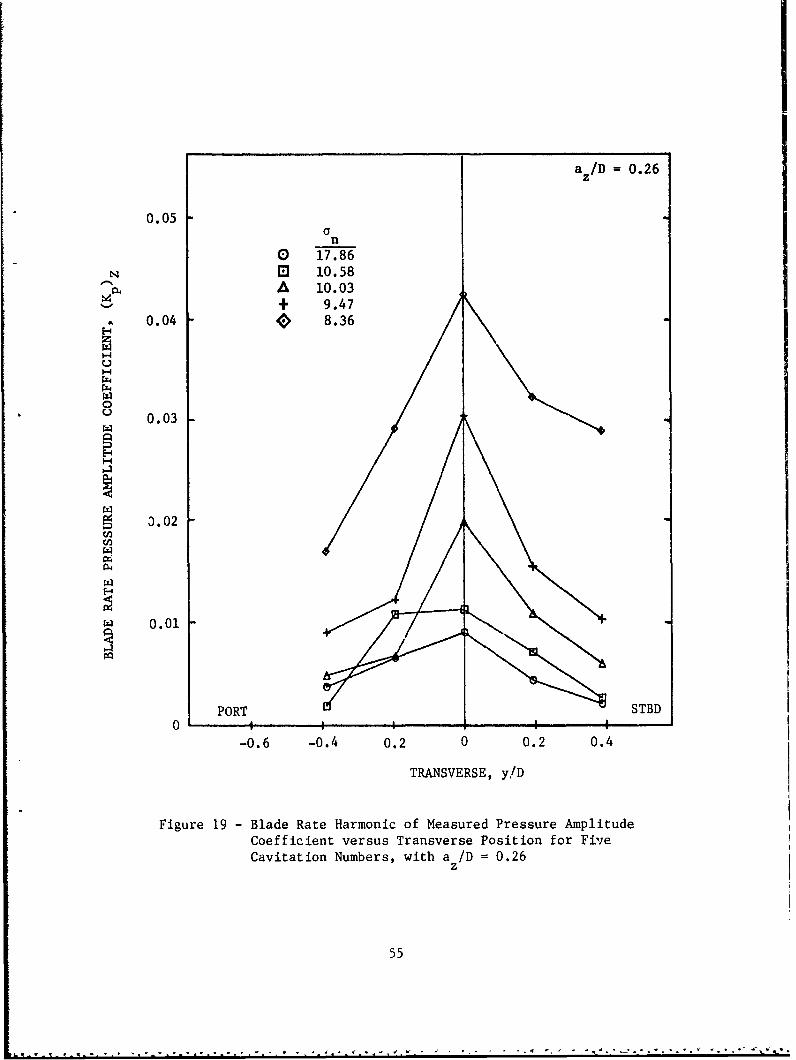
a /D =0.26
0.05n
0 17.86N 0 10.580-. A 10.03
+ 9.47S 0.04 ' ~8.36
8 0.03
3.02
0.01
PORT STBD
-0.6 -0.4 0.2 0 0.2 0.4
TRANSVERSE, y!D
Figure 19 -Blade Rate Harmonic of Measured Pressure AmplitudeCoefficient versus Transverse Position for FiveCavitation Numbers, with a /D =0.26
55

N a /D- 0. 26
0.04
M n0 17.86
8 M 10.580.03 A 10.03N+ 9.47
S 0.02
0.01
0 PORT STBD
-0.6 -0.4 -0.2 0 0.2 0.4
TRANSVERSE, y/D
Figure 20 - Twice Blade Rate Harmonic of Measured Pressure AmplitudeCoefficient versus Transverse Poition for SeveralCavitation Numbers, with a /D = 0.26
z
56

N
a /D 0. 26
0.04
n17.8610.58oA 1t 0.03
0.03 + 9.47S 8.36
S 0.02
.i
0.01
PORT STBD
-0.6 -0.4 -0.2 0 0.2 o.4
TRANSVERSE, y/D
Figure 21 - Thrice Blade Rar Harmonic of Measured Pressure AmplitudeCoefficient versus Transverse Position for FiveCavitation Numbers, with a /D = 0.26z
57

a I/D -0. 41
W.C 0.04
0 17.86W 10.58
A 10.03W 0.03 + 9.47
8 ' 8.36
S 0.02
E4 0.01
PORT STBD0 i 4
-0.6 -0.4 -0.2 0 0.2 0.4
TRANSVERSE, y/D
Figure 22 -Blade Rate Harmonic of Measured Pressure AmplitudeCoefficient versus Transverse Position for FiveCavitation Numbers, with a~ I D = 0.41
58

N
a /D = 0.41
S 0.04
~n a I0 17.86
10.58A 10.03
C 0.03 + 9.47
3.36H
0.02
0.01
) PORT STBD
-0.6 -0.4 -0.2 0 0.2 0.4
TRANSVERSE, y/D
Figure 23 - Twice Blade Rate Harmonic of Measured Pressure AmplitudeCoefficient versus Transverse Position for FiveCavitation Numbers, with a /D 0.41
z
59

M a /D- 0.41z
0.04n
H 0 17.86
M 10.580.0 A 10.03010.0
+ 9.478.36
0.02
0.01
1-4 PORT STBD
-0.6 -0.4 -0.2 0 0.2 0.4
TRANSVERSE, y/D
Figure 24 - Thrice Blade Rate Harmonic of Measured Pressure AmplitudeCoefficient versus Transverse Position for FiveCavitation Numbers, with a /D = 0.41
z
60
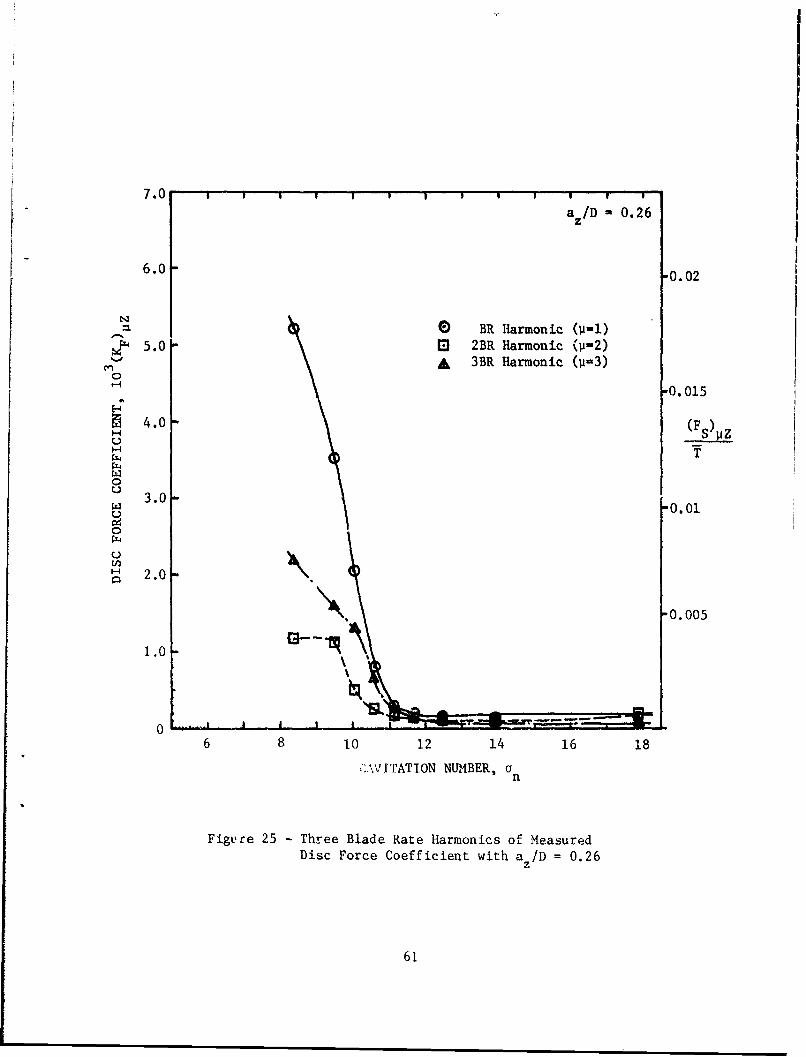
7 .0 "' 'i I '
a /D 0.26
6.0 -0.02
N 0) BR Harmonic (P-1)
5.0 [] 2BR Harmonic (-2)jA 3BR Harmonic (U-3)
0 o-0. 015
4.0 (Fs)z
0 3.0
C-0.01
0
H 2.0
,0.005
1.0 \
06 8 10 12 14 16 18
":,oVWTATION NUMBER, an
Figu're 25 - Three Blade Rate Harmonics of MeasuredDisc Force Coefficient with az /D = 0.26
61

7.0a /D , 0.41
6.0 -0.02
0 BR Harmonic (P-I)c 5.0 W 2BR Harmonic (P-2)o A 3BR harmonic (P-3)
0. 015
4.0 -(Fs)
T
64 3. I01 4 61
0 00
2 .0 0.0
2.0 It,0.005
1.0
6' 8 10 12 14 16 18
CAVITATION NUMBER, an
Figure 26 - Three Blade Rate Harmonics of MeasuredDisc Force Coefficient with a /D = 0.41
z
62
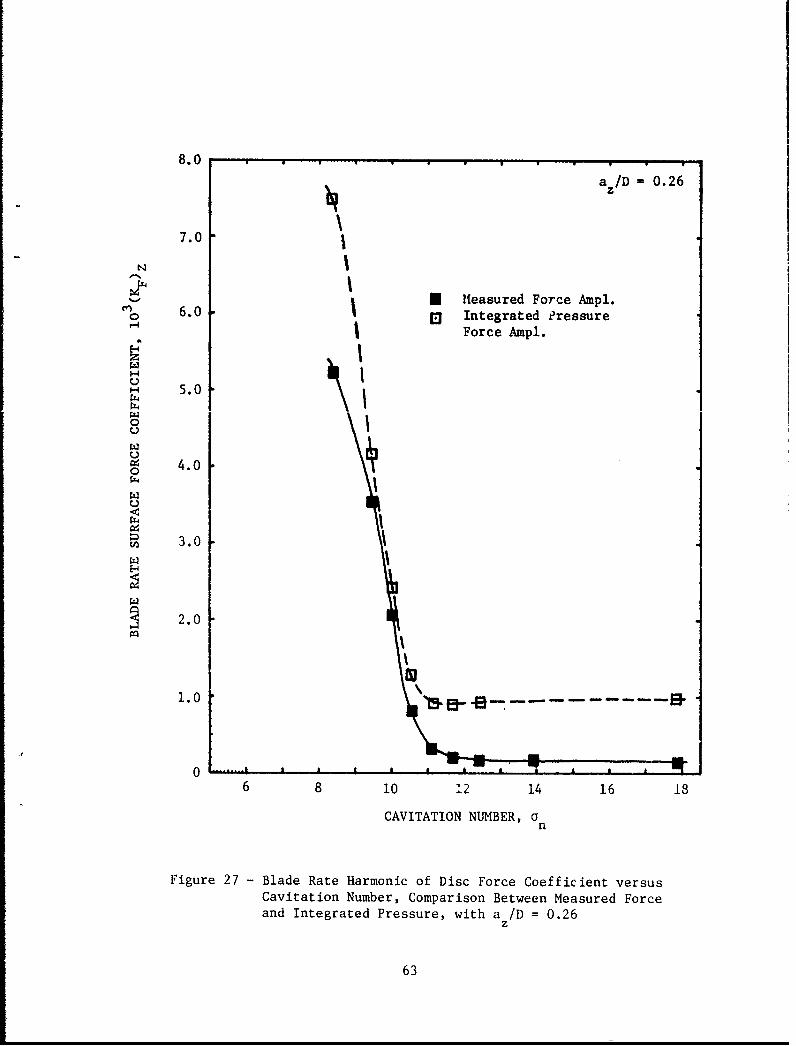
8.0 ' I
az/D = 0.26
7.0
6.0 0 Measured Force Ampl.o Integrated Pressure
Force Ampl.
H 5.0
4.00
3.0
W 2.o
0b
1.0 a --
06 8 10 2 14 16 18
CAVITATION NUMBER, an
Figure 27 - Blade Rate Harmonic of Disc Force Coefficient versusCavitation Number, Comparison Between Measured Forceand Integrated Pressure, with a /D = 0.26
z
63

7.0a /D = 0.41
W 6.0
0 Measured Force Ampl.0 Integrated Pressure
PForce Ampl.5.0
S 4.0
W 3.0U
I
2.0
1.0
0 -
6 8 10 12 14 16 18
CAVITATION NUMBER, an
Figure 28 - Blade Rate Harmonic of Disc Force Coefficient versusCavitation Number, Comparison Between Measured Forceand Integrated Pressure, with a /D = 0.41
Z
64

4.0 ." .
a /Di 0.26
3.0
S Measured Force Ampl.O Integrated Pressure
Force Amplitude
r 2.3
1.0
06 8 10 12 14 16 18
Un
Figure 29 - Twice Blade Rate Harmonic of Disc Force Coefficientversus Cavitation Number, with a z/D u 0.26
4.0a /D = 0.41
3.0• * Measured Force Ampl.
0 Integrated Pressure_ Force Ampl.
I 2.0
1.0
6 8 1O 12 14 16 18
n
Figure 30 - Twice Blade Rate Harmonic of Disc Force Coefficientversus Cavitation Number, with a /D = 0.41
z
65

4.0 ' * , u ' uaz D - 0.26
N 3.0 bNMeasured Force Ampl.
03 Integrated PressureForce Ampl.
,- 2.0
1.0
0 1 -6 8 10 12 14 16 18
n
Figure 31 - Thrice Blade Rate Harmonic of Disc Force Coefficientversus Cavitation Number, with a /D - 0.26
z
4.0a z/D - 0.41
3.0,0 Measured Force Ampl.0- Integrated Pressure
Force
2.0
1.0
6 8 10 12 14 16 18an
Figure 32 - Thrice Blade Rate Harmonic of Disc Force Coefficientversus Cavitation Number, with a /D = 0.41
IZ 66
. .. . . .. - -_

A SSPA Data for AO-177, a z/D = 0.292.:Ft a R:0.
Present Flat Plate Results, a /D -0.26
p p p P I I ' I
S= 8.36
vA7 13.1
4 0.0504
*~0.04
0.03
wnz
4 0.02 -
IN
PQ 0.01 -u
DOWNSTREAM UPSTREAM
0 I I i i-0.8 -0.4 0 0.4 0.8
X PC/D
Figure 33 - Comparison of Measured Blade Rate PressureAmplitude Longitudinal Distribution
67

0 .10 . " ' ' ' I * I
N
0.0 SSPA Results, Complete Hull Model, a z/D - 0.2920Present Data, Flat Plate, a/D - 0.26
0Present Data, Flat Plate, a/D - 0.41~z
0.06 .
0.04
a 0.02
4 6 8 10 12 14' 16 18
CAVITATION NUMBER, a
Figure 34 - Comparison of Blade Rate Pressure Amplitude CoefficientAbove the Propeller versus Cavitation Number
668'

0
.0
0 0
>I 0
-. 05 41Cd C3 c
Ia. 41 -4to 0
'a Icece
".4 4
0- C1 4
0
H LH
C.))
--
U - I~ ~69

TABLE 1 - SUMMARY OF INSTRUMENTATION CHARACTERISTICS
ForceGauges Accelerometer Pressure Gauges
Make/Type Wilcoxon Edevco CEC KuliteModel L10 Model 2217E Type 4-312 XTM-190Piezoelectric Strain gauged Strain gauged
diaphragm
Range down to 10- 4 lb to 250g to 25 psi to 10 psi
(172 kPa) (69 ..,
Signal Gilmore Gilmore Vishay VishayCondition- Zero Drive Zero Driveing Model N400
Filter 1000 Hz 5 kHz 1000 Hz
70

v2 is made at point 2 in the same direction as the calibration drive force,
with the cavitating propeller running as the system excitation. The volume velo-
city of the cavity at point 1 is thus obtained as
F2
1 p1 (A .4)
For harmonic ocillations of the system, the acceleration at point 2 in
the same direction as the velocity v2 is
a2 " iv2 (A.5)
Thus, another version of the basic reciprocity relationship is expressed as
F2 a2+1 - P (A.6)
Note that the variables measured for the calibration and final measurement phases
can be rearranged for convenience. For example, suppose thet during the calibra-
tion phase the acceleration a2 at the drive point is measured as well the cor-
responding fluid pressure Pl. In this case, the appropriate transfer function
is the ratio (pl/a2). Then the run measurement of F2 (in the same direction as
the calibrating drive acceleration) leads to the determination of the cavity
volume velocity 41 from Equation (A.6). In either of che forms, the calibrated
transfer function is a complex function of the real-valued frequency W. The
other measured quantities involved must also be treated as complex.
The basic form of the simplified reciprocity relationshfp of Equation (A.4)
or (A.6) can be derived in a formal way using the second Green theorem following
concepts discussed by Chertock.77
74

I
APPENDIX A
RECIPROCITY CONCEPT AND APPLICATION
The reciprocity principle states that for a linear system, there is a
reciprocal relationship between the force applied and the system response at any
two points. That is, the system vibration velocity response v, say, at point a
due to a force applied at point 2 is the same as the response at point 2 dule to a
force at point 1. Thus,
v I v 2
F2 F1 (A.1)
or v 1 F1 = v2F2 (A.2)
For the assumed linear system, the resulting flow of power monitored at the check
points cart be expressed in terms of other conjugate variables, for example,
volume velocity4-times fluid acoustic pressure p.
Then
4-1 P = F2 v 2 (A.3)
Figure 35 provides a definition sketch and outline for the experiments needed to
make the reciprocity calibration and to provide one of several interpretations
of the expression given above.
For the calibration phase, a mechanical shaker can be used to provide an
input force at point 2 on a body surface element (or within the hull of a
complete body). The fluid pressure is measured simultaneotsly, at point 1 in
the propeller plane where the center of the unsteady cavitation volume is
expected to occur. A transfer function is formed from the ratio (F2/P1 ) and this
remains as a property of the system. Then the measurement of vibration velocity
73

TABLE 2 - GEOMETRIC CHARACTERISTICS OF AO-177 CLASS AUXILIARYOILER HIGHLY SKEWED PROPELLER DESIGN
blade chord pitch skew thickness camber rakediameter diameter angle chord chord diameter
r/R c/D P/D Os(deg) tm/c fm/c total
0.2 0.207 1.125 0.0 0.20 0.0490 0.0
0.3 0.2456 1.223 2.2 0.1625 0.0444 0.0058
0.4 0.2722 1.288 7.1 0.1325 0.0367 0.021
0.5 0.2817 1.318 13.1 0.1080 0.0314 0.041
0.6 0.2684 1.309 20.0 0.0880 0.030 0.065
0.7 0.2320 1.250 27.7 0.0715 0.0295 0.0913
0.8 0.1815 1.140 34.5 0.0590 0.0281 0.109
0.9 0.1180 0.970 40.3 0.0500 0.0263 0.1168
1.0 0.0 0.722 45.0 0.045 0.0240 0.1148
Number of blades 7Section meanline a-0.8Section thickness distribution NACA 66 ModifiedExpanded area ratio 0.77Mean width ratio 0.216Blade thickness fraction 0.062Projected skew at tip 45 degModel diameter 9.812 in.(24.92 cm)Full scale diameter 21 ft (6.401 m)
71

72

APPENDIX B
CAVITY VOLUME VELOCITY MEASUREMENTS AND COMPARISONS
Disc force measurements obtained with excitation from the operating pro-
peller, together with the calibrated transfer function (p/a) shown in Figure 5
have been used to make estimates of the cavity volume velocity harmonic from the
expression in Equation (2). The unsteady disc force due to the effect of cavity
volume variation must be isolated from the measured total force variation
by vectorially subtracting away the noncavitating or reference force, taking
proper account of amplitude and phase. At the blade rate frequency of 98 Hz for
the seven-bladed propeller, an average value of the pressure-to-acceleration
transfer function was determined to ue
(p/a) - 0.6747 slug/ft2 (105.99 kg/r)
This is for the case of az/D - 0.26, for which the calibrated transfer function
of Figure 5 applies.
The blade rate disc force amplitude coefficient and phase angle for the
noncavitating propeller at az/D - 0.26 were found to be (103)KFnc - 0.1622 and
*nc - 1.90. Then Table B.1 provides the amplitude and phase data for the disc
force characteristics used to obtain the inferred blade rate harmonic of cavity
volume velocity given in nondimensional form.
Measured and computed blade rate results for volume velocity coefficient versus
cavitation number are compared in Figure B.1, where calculated values from two
versions of the propeller analysis scheme PUF-3 are displayed. The original M.I.T.
cavitating propeller analysis program developed by Lee 78 is designated here as
PUF-3(OLD). Imprvements and non-linear leading edge corrections to the linear
cavitating blade tection analysis have been incorporated into the original com-
putation scheme, ai outlined in the paper by Kerwin, Kinnas, Wilson, and McIugh.79
Results of the impioved analysis are denoted by PUF-3(NEW). It can be seen that the
revised theory predtcts smaller sheet cavity volumes than does the original calcula-
tion. Thi3 coincid, s with the prediction of shorter cavity lengths as well. The
measured values of cavity volume also include the effect of substantial fluctuating
tip vortex cavitation, a contribution not included in the analytical result.
Considering the various approximations and experimental uncertainties involved, the
comparison shown in Figure B.1 is reasonable.
75

TABLE B.1 - ESTIMATE OF BLADE RATE CAVITY VOLUME VELOCITYUSING RECIPROCAL MEASUREMENTS
Total Force Cavitating Force Cavity VolumeCoeff Phase Coeff Phase Velocity Coeff.
yn (103)K FT *T(deg) (103)KFc *c(deg) (4c)Z/nR3
10.03 2.052 -16.37 1.899 17.91 0.00081
9.47 3.538 40.6 3.414 42.3 0.00146
8.36 5.22 -4.3 5.06 4.46 0.00216
76
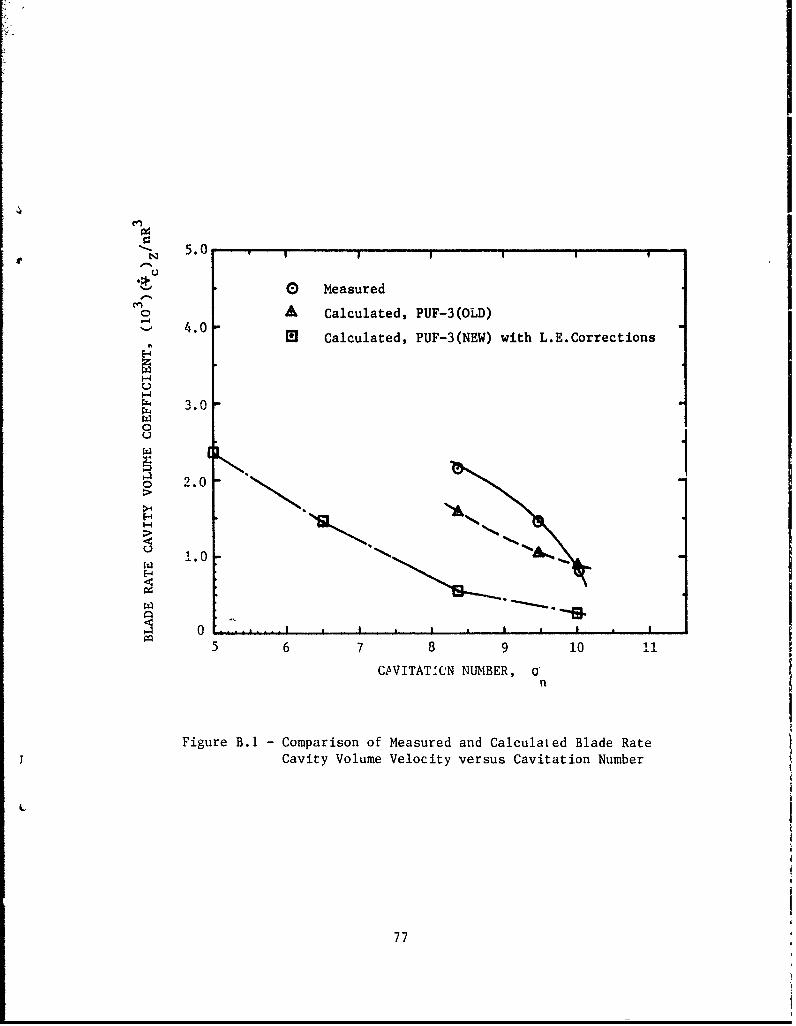
~- 5.0
0 Measured
0A Calculated, PUF-3(OLD)
~' 4.0 Calculated, PUF-3(NEW) with L.E.Corrections
rZI0
0 2.0
0 E.: I p I
5 6 7 8 9 10 I
CAVITAT'CN NUMBER, 0
Figure B.1 -Comparison of Measured and Calculated Blade RateCavity Volume Velocity versus Cavitation Number
77
1. DYS r -pntos, a bi sefN, cr, ntin Information of permanent technicalvalue. They carry a consecutive numerical Identiflation regardless of their claifiction
or the originating department.
2. Dpwtmntal rspois, a wesn soft, contain information of a preliminary,tmporary, or proprietary nature or of limited Interest or significance. They carry a
departmental lphanumerical Identification.
3. ThnkWmar s, m hifonn eiese, contain technical documentation oflimited use and interest. They are primarily working papers intended for internal use.They carry an tifying number which Indicates their type and the numerical code ofthe originating department. Any distribution outside DTNSRDC must be approved bythe head of to originating department on a case-by-case basis.
Related Documents