ACWQ Austin Canopy & Water Quality Proposal: Austin Tree- Canopy Resource, Phase II Spring 2012, Geography 4427, Texas State University February 22, 2012 Urban Forestry Program and Urban Forestry Board, City of Austin, Texas

ACWQ Austin Canopy & Water Quality Proposal: Austin Tree- Canopy Resource, Phase II Spring 2012, Geography 4427, Texas State University February 22, 2012.
Dec 18, 2015
Welcome message from author
This document is posted to help you gain knowledge. Please leave a comment to let me know what you think about it! Share it to your friends and learn new things together.
Transcript

ACWQAustin Canopy & Water Quality
Proposal: Austin Tree-Canopy Resource, Phase II
Spring 2012, Geography 4427, Texas State University
February 22, 2012
Urban Forestry Program and Urban Forestry Board, City of Austin, Texas

SummaryMain goal is to define the percentage of
tree canopy within the buffer by stream reach.
In addition, the team will relate soil, vegetation, and impervious cover to water quality.
Time permitting we will analyze the accuracy of the 2006 canopy layer against a more recent aerial photo.
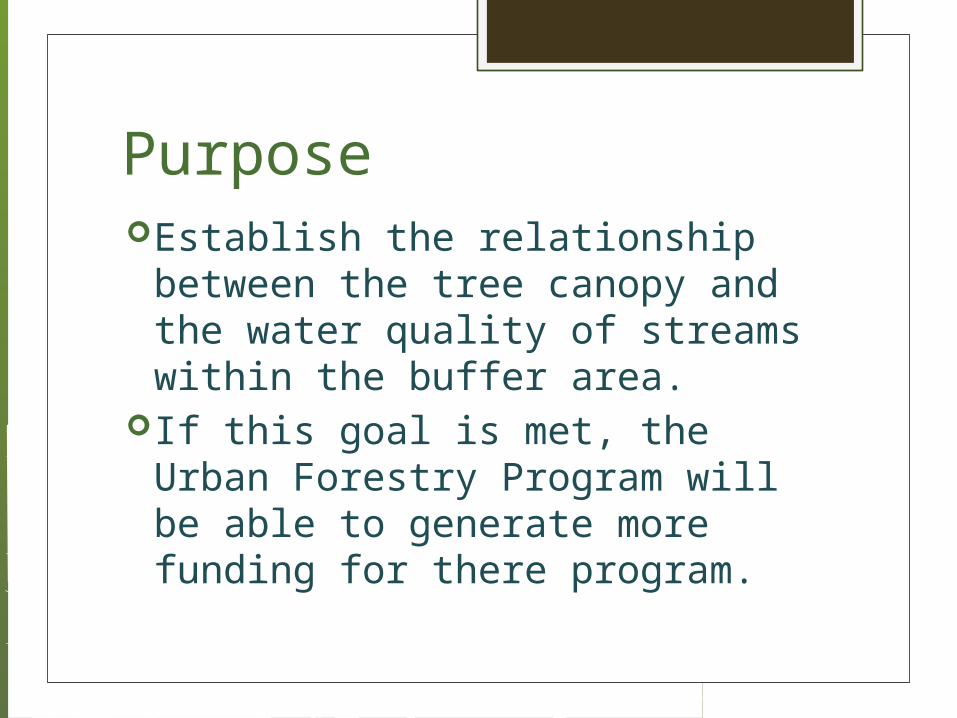
PurposeEstablish the relationship between the
tree canopy and the water quality of streams within the buffer area.
If this goal is met, the Urban Forestry Program will be able to generate more funding for there program.
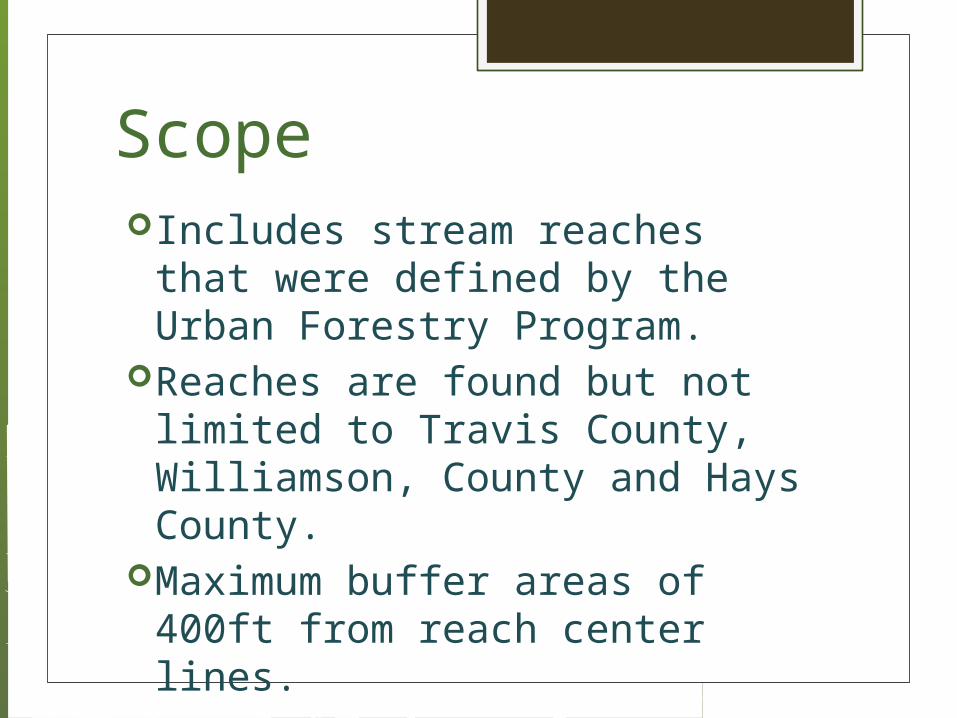
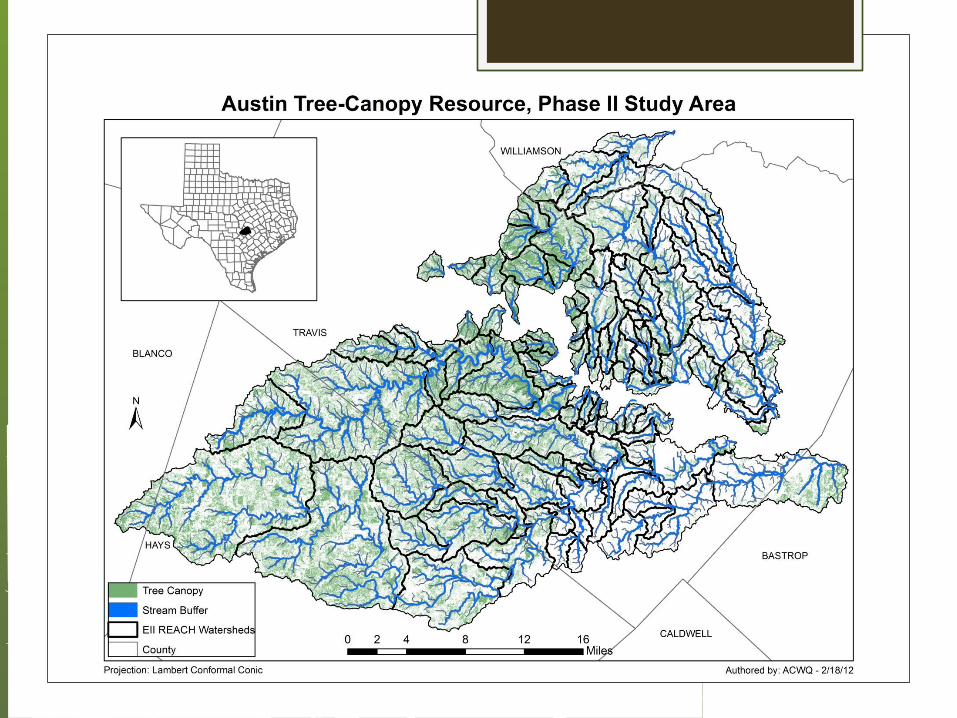
ScopeIncludes stream reaches that were
defined by the Urban Forestry Program.
Reaches are found but not limited to Travis County, Williamson, County and Hays County.
Maximum buffer areas of 400ft from reach center lines.
Literature ReviewWater Quality
Lowell HughesVegetation
Ashley Zavala
SoilEli Pruitt
Tree Shade in Pavement LongevityDuane Massa

Water Quality
Tree canopies intercept rainfall, thereby reducing peak discharge into stormwater sewers which decreases the incidence and severity of flooding
This interception allows for: Groundwater recharge Filters toxins and impurities Reduces the cost of stormwater disposal Averts flooding Reduces sedimentation of waterways
Water Quality continued
Trees capture rain on their leaves and branches, the water is then put back into the water cycle via evapotranspiration
Trees absorb water pollutants and other water filtrates into the soil for a gradual release into streams, rather than running off the land, extending water availability into dry months
Water Quality continued
A single large-sized tree can release 400 gallons of water into the atmosphere a day.
One acre of trees produces enough oxygen for 18 people every day
One acre of tree absorbs enough carbon dioxide per year to match that emitted by driving a car 26,000 miles
Planting a tree can keep water clean and drinkable
Vegetation
An assessment performed by the University of Tirana, Albania analyzes vegetation cover and its watershed at Prespa lakes.
Economic development
Vegetation types Forest VegetationResults

Soil According to Soil Quality for Environmental
Health there is a definite correlation between soil and water quality.
Runoff Eutrophication Soil erosion is caused by a lack of vegetation
which when there, holds the soil together. This would suggest that soil and water quality can be tied to the tree canopy.
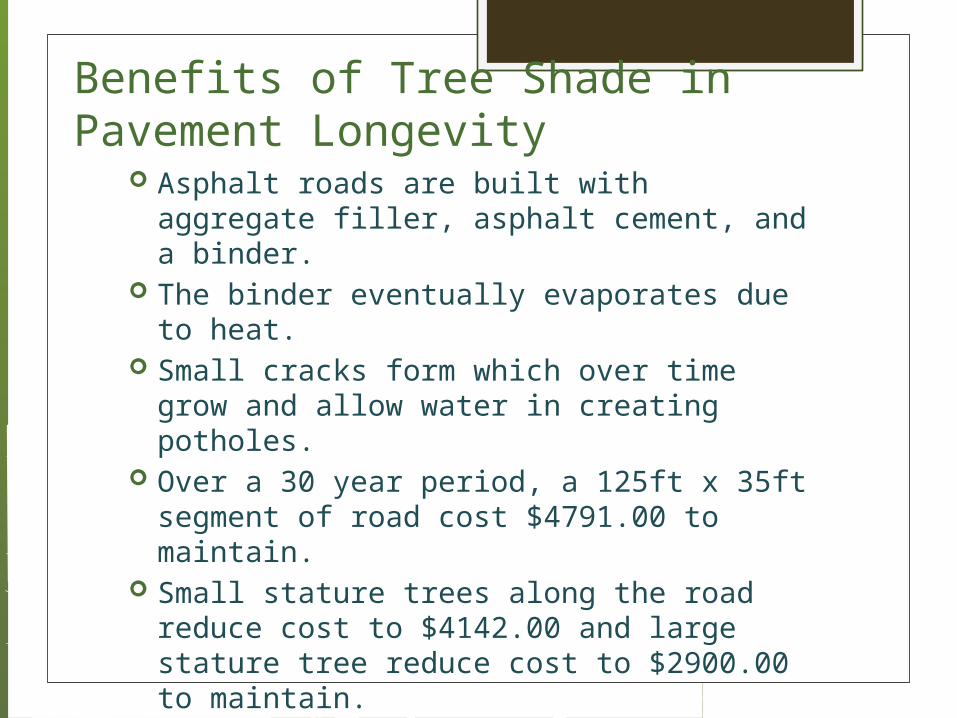
Benefits of Tree Shade in Pavement Longevity Asphalt roads are built with aggregate filler, asphalt
cement, and a binder. The binder eventually evaporates due to heat. Small cracks form which over time grow and allow
water in creating potholes. Over a 30 year period, a 125ft x 35ft segment of road
cost $4791.00 to maintain. Small stature trees along the road reduce cost to
$4142.00 and large stature tree reduce cost to $2900.00 to maintain.
For small stature trees it is a 17% reduction in maintenance cost and large stature trees is a 58% reduction over a 30 year period.

Data
ESRI ArcGIS, a geographic information system, will be used to evaluate selected benefits provided by the tree canopy in the City of Austin, Texas.
The GIS datasets required to develop tree canopy indices for stream reach segments in Austin was provided by the City of Austin’s Urban Forestry Program, and by downloading the essential datasets from agency websites.
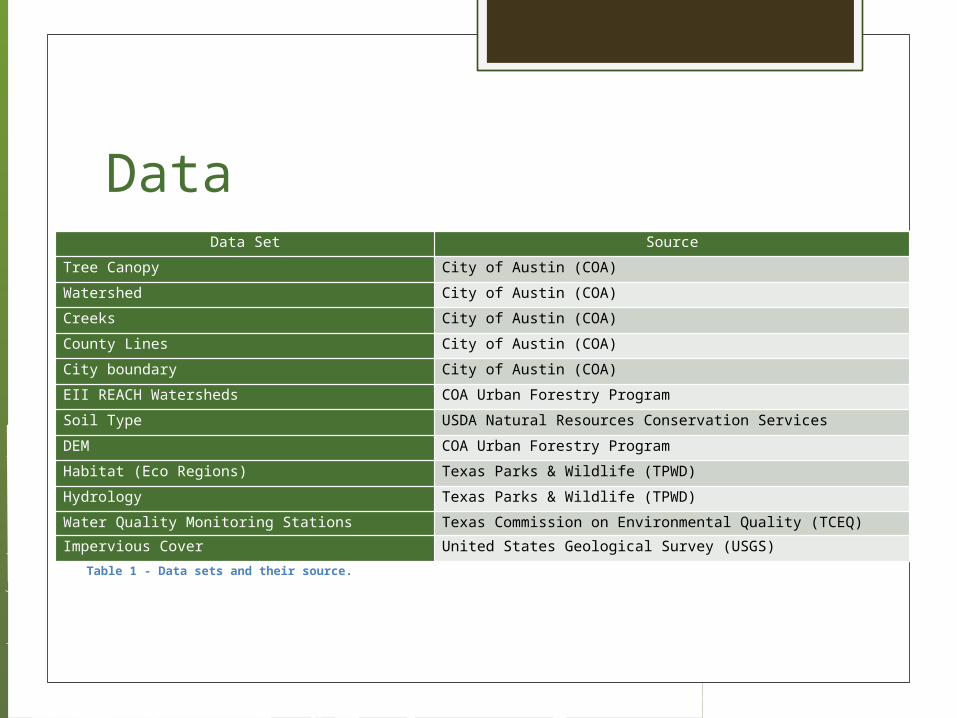
Data Set Source
Tree Canopy City of Austin (COA)
Watershed City of Austin (COA)
Creeks City of Austin (COA)
County Lines City of Austin (COA)
City boundary City of Austin (COA)
EII REACH Watersheds COA Urban Forestry Program
Soil Type USDA Natural Resources Conservation Services
DEM COA Urban Forestry Program
Habitat (Eco Regions) Texas Parks & Wildlife (TPWD)
Hydrology Texas Parks & Wildlife (TPWD)
Water Quality Monitoring Stations Texas Commission on Environmental Quality (TCEQ)
Impervious Cover United States Geological Survey (USGS)
Table 1 - Data sets and their source.
Data

Methodology
Tools such as GIS allow for large-scale assessments for tree canopy planning that can include parks, forests, and possible green-space linkages
These spatial analyses and inventories provide current, comprehensive information vital to tree canopy decision-making

Methodology Continued
The procedures necessary for defining the quantity and distribution of tree canopy along specific stream reach segments, and identifying the impact that the tree canopy can have on water quality as it relates to soil, impervious cover, and vegetation.
Phase I – Literature Research and Review Phase II – Data Gathering and Preparation Phase III – Manipulate and Analyze the Data Phase IV – Interpret Results and Finalize Deliverables
Methodology Continued
Phase I: Literature Research and Review
Tree canopy analysis initially involves research and analysis of literature that is relevant and potentially beneficial in assisting in the development and interpretation of the geospatial data
Methodology Continued
Phase II: Data Gathering and Preparation
Data will be collected using a variety of methods; primary datasets will be provided by The City of Austin’s Urban Forestry Program, and downloaded from various state and federal agencies

Methodology Continued
Phase III: Manipulate and Analyze the Data The primary datasets for the project, include the tree
canopy layer, clipped by watershed reach designation EII, and a stream buffer dataset approximately two hundred feet either side from centerline of stream.
The Raster Calculator provides a powerful tool for performing multiple tasks. Performing mathematical calculations using operators and functions, allow for detailed spatial analysis providing the quantity and distribution of canopy within the stream buffer.

Methodology Continued
Phase IV: Interpret Results and Finalize Deliverables
Upon completion of this project the ACWQ will have defined the quantity and distribution of tree canopy along specific stream reach segments throughout the greater Austin area
Analyses will show the amount of area occupied by other urban surfaces that impede or facilitate planting, such as buildings, pavement, water, grass, and bare soils
The tree canopy data will indicate the potential for new tree plantings in sparse areas along the specific stream reach segments
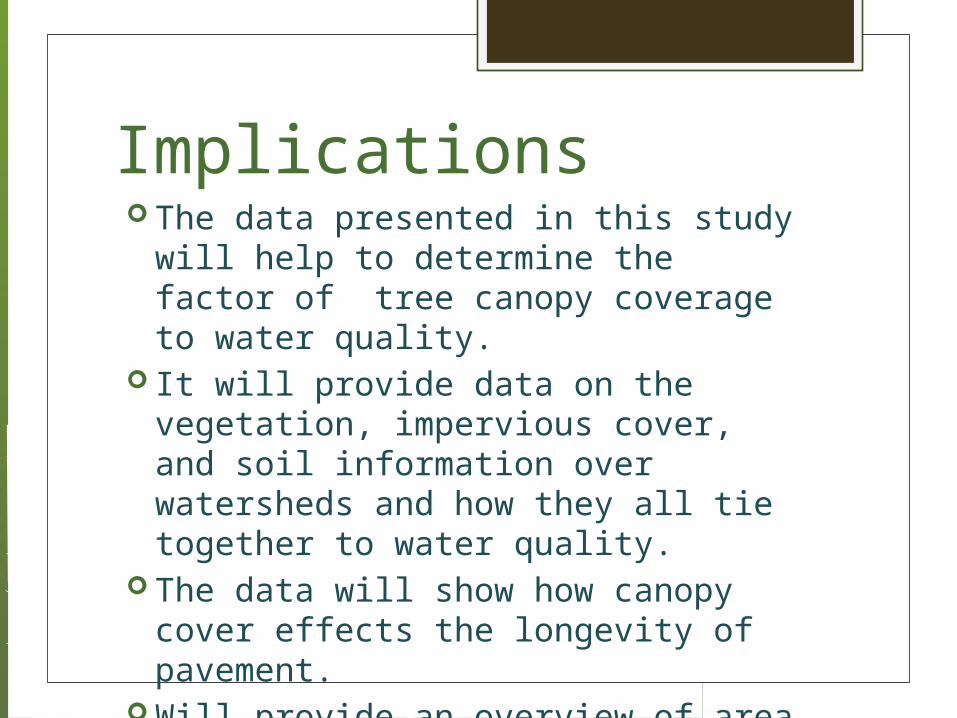
Implications The data presented in this study will help to
determine the factor of tree canopy coverage to water quality.
It will provide data on the vegetation, impervious cover, and soil information over watersheds and how they all tie together to water quality.
The data will show how canopy cover effects the longevity of pavement.
Will provide an overview of area where more trees can be planted.
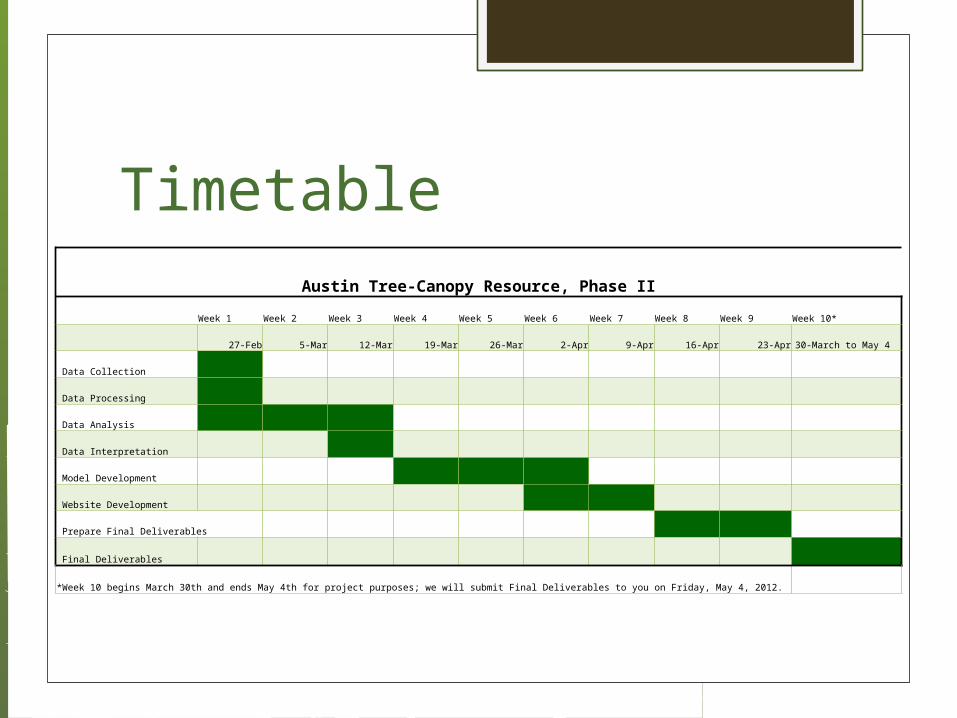
TimetableAustin Tree-Canopy Resource, Phase II
Week 1 Week 2 Week 3 Week 4 Week 5 Week 6 Week 7 Week 8 Week 9 Week 10*
27-Feb 5-Mar 12-Mar 19-Mar 26-Mar 2-Apr 9-Apr 16-Apr 23-Apr 30-March to May 4
Data Collection
Data Processing
Data Analysis
Data Interpretation
Model Development
Website Development
Prepare Final Deliverables
Final Deliverables
*Week 10 begins March 30th and ends May 4th for project purposes; we will submit Final Deliverables to you on Friday, May 4, 2012.
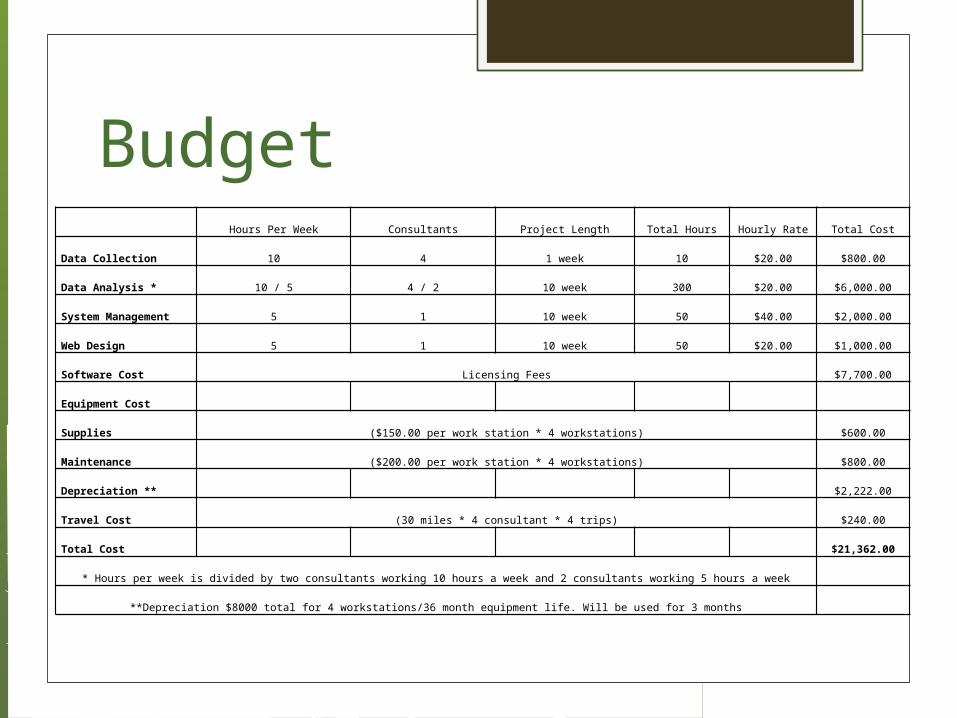
Budget Hours Per Week Consultants Project Length Total Hours Hourly Rate Total Cost
Data Collection 10 4 1 week 10 $20.00 $800.00
Data Analysis * 10 / 5 4 / 2 10 week 300 $20.00 $6,000.00
System Management 5 1 10 week 50 $40.00 $2,000.00
Web Design 5 1 10 week 50 $20.00 $1,000.00
Software Cost Licensing Fees $7,700.00
Equipment Cost
Supplies ($150.00 per work station * 4 workstations) $600.00
Maintenance ($200.00 per work station * 4 workstations) $800.00
Depreciation ** $2,222.00
Travel Cost (30 miles * 4 consultant * 4 trips) $240.00
Total Cost $21,362.00
* Hours per week is divided by two consultants working 10 hours a week and 2 consultants working 5 hours a week
**Depreciation $8000 total for 4 workstations/36 month equipment life. Will be used for 3 months
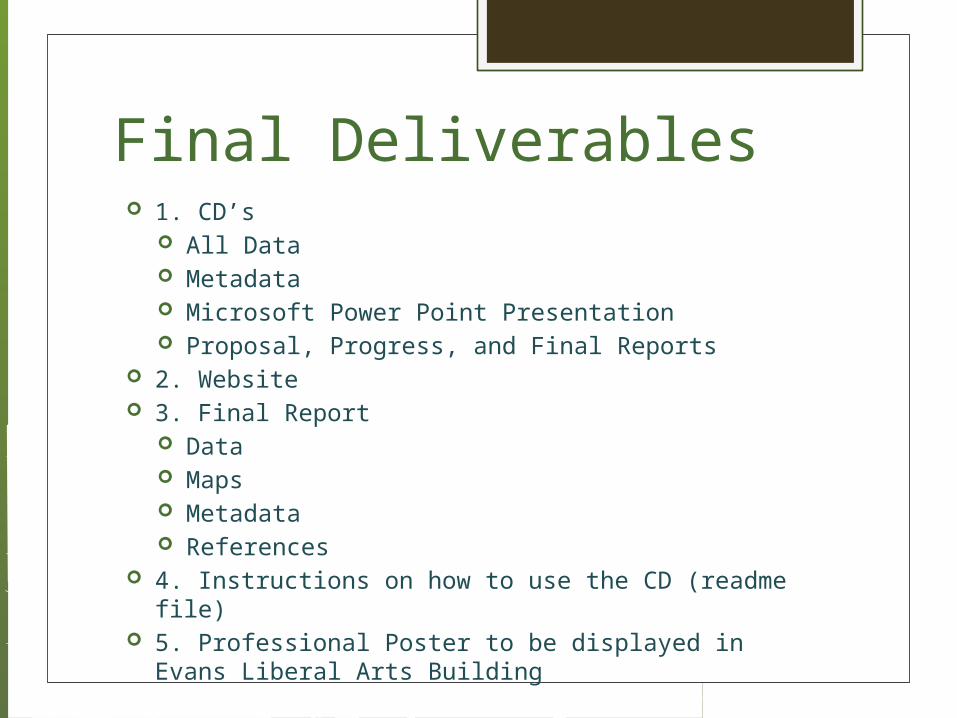
Final Deliverables 1. CD’s
All Data Metadata Microsoft Power Point Presentation Proposal, Progress, and Final Reports
2. Website 3. Final Report
Data Maps Metadata References
4. Instructions on how to use the CD (readme file) 5. Professional Poster to be displayed in Evans Liberal Arts
Building
Conclusion Once again the overall purpose of this project is to
define the percentage of tree canopy within the buffer areas of the stream reaches. This information will allow ACWQ to establish a relationship between the canopy and the water quality of the streams.
Successful completion of the project will allow the Urban Forestry Program to apply for more funding that is set aside specifically for water quality.

Questions?
References Agroforestry. Working Trees for Water Quality. USDA National Agroforest Center. 2004. web. 11 Feb
2012. Center for Urban Forest Research. Why Shade Streets? The Unexpected Benefit. USDA ,n.d. web. 10
Feb 2012. E. Gregory McPherson, Paula J. Pepper, Klaus I. Scott, Qingu Xiao. Tree Guidelines for Coastal
Southern California Committee. Jan 2000. web. 11 Feb 2012. Jamarber Malltezi, Mersin Mersinllari, Lulezim Shuka, Llir Vardhami. Dynamics of Vegetation Cover
of Prespa Lakes and its Watersheds'. Department of Biology, Faculty of Natural Sciences, University of Tirana, Albania. 2007. web. 15 Feb 2012
NRCS East National Technology Support Center, NCRS National Soil Survey, ARS National Laboratory for Agriculture and the Environment, NCERA - 59 Scientist Dept. of Natural Resources and Environmental Science, University of Illinois. Soil Quality for the Environment. Soil Quality.org Sept 19 2011. Web. 12 Feb 2012.
The City of San Diego, Urban Forestry. Benefits of Trees. San Diego Government. n.d. web. 11 Feb 2012.
The Purdue OWL. Purdue U Writing Lab, 2010. Web. 18 Feb 2012. USDA Natural Resources Conservation Service. Water Quality Issue Brief. USDA. March 1996. web.
11 Feb 2012.
Related Documents