University of Wollongong University of Wollongong Research Online Research Online Illawarra Health and Medical Research Institute Faculty of Science, Medicine and Health January 2015 Acute effects of oral olanzapine treatment on the expression of fatty acid Acute effects of oral olanzapine treatment on the expression of fatty acid and cholesterol metabolism-related gene in rats and cholesterol metabolism-related gene in rats Xuemei Liu Chongqing University, [email protected] Chao Deng University of Wollongong, [email protected] Shuang Cao Southwest University Jingwen Gong Southwest University Bo-Chu Wang Chongqing University See next page for additional authors Follow this and additional works at: https://ro.uow.edu.au/ihmri Part of the Medicine and Health Sciences Commons Recommended Citation Recommended Citation Liu, Xuemei; Deng, Chao; Cao, Shuang; Gong, Jingwen; Wang, Bo-Chu; and Hu, Chang-Hua, "Acute effects of oral olanzapine treatment on the expression of fatty acid and cholesterol metabolism-related gene in rats" (2015). Illawarra Health and Medical Research Institute. 525. https://ro.uow.edu.au/ihmri/525 Research Online is the open access institutional repository for the University of Wollongong. For further information contact the UOW Library: [email protected] brought to you by CORE View metadata, citation and similar papers at core.ac.uk provided by Research Online

Welcome message from author
This document is posted to help you gain knowledge. Please leave a comment to let me know what you think about it! Share it to your friends and learn new things together.
Transcript
University of Wollongong University of Wollongong
Research Online Research Online
Illawarra Health and Medical Research Institute Faculty of Science, Medicine and Health
January 2015
Acute effects of oral olanzapine treatment on the expression of fatty acid Acute effects of oral olanzapine treatment on the expression of fatty acid
and cholesterol metabolism-related gene in rats and cholesterol metabolism-related gene in rats
Xuemei Liu Chongqing University, [email protected]
Chao Deng University of Wollongong, [email protected]
Shuang Cao Southwest University
Jingwen Gong Southwest University
Bo-Chu Wang Chongqing University
See next page for additional authors
Follow this and additional works at: https://ro.uow.edu.au/ihmri
Part of the Medicine and Health Sciences Commons
Recommended Citation Recommended Citation Liu, Xuemei; Deng, Chao; Cao, Shuang; Gong, Jingwen; Wang, Bo-Chu; and Hu, Chang-Hua, "Acute effects of oral olanzapine treatment on the expression of fatty acid and cholesterol metabolism-related gene in rats" (2015). Illawarra Health and Medical Research Institute. 525. https://ro.uow.edu.au/ihmri/525
Research Online is the open access institutional repository for the University of Wollongong. For further information contact the UOW Library: [email protected]
brought to you by COREView metadata, citation and similar papers at core.ac.uk
provided by Research Online
Acute effects of oral olanzapine treatment on the expression of fatty acid and Acute effects of oral olanzapine treatment on the expression of fatty acid and cholesterol metabolism-related gene in rats cholesterol metabolism-related gene in rats
Abstract Abstract AimsAims Second-generation antipsychotic drugs (SGAs) have a high risk for serious metabolic side-effects including dyslipidemia. This study aimed to investigate the acute effects of oral olanzapine treatment on the expression of genes for fatty acid and cholesterol biosynthesis in rats. Main methodsMain methods Female Sprague-Dawley rats were treated orally with olanzapine (1 mg/kg, equivalent to a human clinical dose of 10 mg) via self-administration aimed to measure pharmacokinetics. Based on the pharmacokinetic analysis, the acute effects of olanzapine on sterol regulatory element binding protein (SREBP)-related fatty acid/cholesterol metabolism genes were investigated in the liver and perirenal white adipose tissue (WAT) by Real-time quantitative PCR. Key findingsKey findings A pharmacokinetic analysis demonstrated that the maximum concentration of olanzapine in plasma (Cmax) occurred at 6 h with a peak concentration of 276.5 ng/ml after a single oral treatment and with a plasma elimination half-life of 3.5 h after peak. The mRNA expression of SREBP-2 and target genes for cholesterol synthesis and transport was increased 1.9 8.8 fold compared with the control at 6 h after olanzapine administration but returned to basal level at 12 h post-treatment, while the increased mRNA expression of SREBP-1c and its targeted fatty acid-related genes appeared at both 6 h and 12 h post-treatment. SignificanceSignificance The present study provided evidence that olanzapine at a clinically-relevant dose caused abnormal expression of genes involved in lipid metabolism in the liver and WAT. These results suggest that olanzapine may cause dyslipidemia side-effects through direct effects on lipid biosynthesis and efflux genes associated with SREBP-stimulated transcriptional changes.
Disciplines Disciplines Medicine and Health Sciences
Publication Details Publication Details Liu, X., Deng, C., Cao, S., Gong, J., Wang, B. & Hu, C. (2015). Acute effects of oral olanzapine treatment on the expression of fatty acid and cholesterol metabolism-related gene in rats. Life Sciences, 128 72-78.
Authors Authors Xuemei Liu, Chao Deng, Shuang Cao, Jingwen Gong, Bo-Chu Wang, and Chang-Hua Hu
This journal article is available at Research Online: https://ro.uow.edu.au/ihmri/525
1
Title: Acute effects of oral olanzapine treatment on the expression of fatty acid and
cholesterol metabolism-related gene in rats
Authors: Xuemei Liu1, 2, Chao Deng3, Shuang Cao2, Jingwen Gong2, Bo-Chu Wang*1,
Chang-Hua Hu*2,4
1: Key Laboratory of Biorheological Science and Technology, Ministry of Education,
College of Bioengineering, Chongqing University, Chongqing 400030, PR China.
2: School of Pharmaceutical Sciences, Southwest University, Chongqing 400715, PR China
3: Antipsychotic Research Laboratory, School of Medicine, and Illawarra Health and Medical
Research Institute, University of Wollongong, Wollongong, 2522, NSW, Australia
4: Engineer Research Center of Chongqing Pharmaceutical Process and Quality Control,
Chongqing 400715, PR China
*Corresponding authors:
Prof Chang-Hua Hu, Mailing address: School of Pharmaceutical Sciences, Southwest
University, Chongqing 400715, PR China
E-mail: [email protected], Tel: (+86) 23 68250520, Fax: (+86) 23 68251225
Prof Bo-Chu Wang, Mailing address: Bioengineering College, Chongqing University, No.
174 Shapingba Main Street, Chongqing 400030, PR China.
E-mail: [email protected]. Tel: (+86) 23 65112840. Fax: (+86) 23 65112877
2
Highlights
•In vivo pharmacokinetics of oral olanzapine treatment in rats
•Olanzapine activates the SREBP-1c-controlling transcription system leading to an increased
expression of the key genes involved in fatty acid synthesis
•Olanzapine induces a rapid and transient transcriptional upregulation of genes involved in
cholesterol synthesis via modulation of the expression of SREBP-2
3
Abstract
Aims:
Second-generation antipsychotic drugs (SGAs) have a high risk for serious metabolic side-
effects including dyslipidemia. This study aimed to investigate the acute effects of oral
olanzapine treatment on the expression of genes for fatty acid and cholesterol biosynthesis in
rats.
Main methods:
Female Sprague–Dawley rats were treated orally with olanzapine (1 mg/kg, equivalent to
human clinical dose of 10 mg) via self-administration aimed to measure pharmacokinetics.
Based on the pharmacokinetic analysis, the acute effects of olanzapine on SREBP-related
fatty acid/cholesterol metabolism genes were investigated in the liver and perirenal white
adipose tissue (WAT) by Real-time quantitative PCR.
Key findings:
A pharmacokinetic analysis demonstrated that the maximum concentration of olanzapine in
plasma (Cmax) occurred at 6 h with peak concentration of 276.5 ng/ml after a single oral
treatment, with a plasma elimination half-life of 3.5 h after peak. The mRNA expression of
SREBP-2 and target genes for cholesterol synthesis and transport was increased 1.9 8.8 fold
compared with the control at 6 h after olanzapine administration but returned to basal level at
12 h post-treatment, while the increased mRNA expression of SREBP-1c and its targeted
fatty acid-related genes appeared at both 6 h and 12 h post-treatment.
Significance:
The present study provided evidence that olanzapine at a clinically-relevant dose caused
abnormal expression of genes involved in lipid metabolism in the liver and WAT. These
results suggest that olanzapine may cause dyslipidemia side-effects through direct effects on
lipid biosynthesis and efflux genes associated with SREBPs-stimulated transcriptional
4
changes.
Keywords : Olanzapine; Pharmacokinetics; dyslipidemia; SREBPs
5
Abbreviations
SREBPs: sterol regulatory element-binding proteins
SGAs: second-generation antipsychotic drugs
WAT: white adipose tissue
Cmax: the maximum concentration of olanzapine in plasma
AUC: the area under the concentration-time curve
kel: the elimination rate constant
t1/2: the elimination half-life
ALT: alanine aminotransferase
AST: aspartate aminotransferase
ALP: alkaline phosphatase
TG: triglyceride
TC: total cholesterol
HDL-C: high density lipoprotein cholesterol
LDL-C: low density lipoprotein cholesterol
acc1: acetyl-CoA carboxylase
fasn: fatty acid synthetase
scd1: stearoyl-CoA desaturase-1
ldlr: the low density lipoprotein receptor
abca1: ATP-binding cassette transporter 1
soat: sterol o-acyltransferase
hmgcr: 3-hydroxy-3-methyl-glutaryl- Coenzyme A reductase
hmgcs: 3-hydroxy-3-methylglutaryl-Coenzyme A synthase
6
1. Introduction
Second-generation antipsychotic drugs (SGAs), such as olanzapine, have been reported to be
better tolerated and have improved efficacy in schizophrenia patients; they are widely used as
first line therapy to control schizophrenia symptoms and other psychotic disorders (Meltzer
2013). However, olanzapine have the highest risk for serious metabolic side-effects, such as
obesity, dyslipidemia, and even diabetes (Allison et al 2009; Deng 2013). These metabolic
side-effects increase risk for cardiovascular disease and premature death (Stahl et al 2009).
While much of the literature has focused on severe weight gain and glucose intolerance, the
mechanisms underlying SGA-induced dyslipidemia are far from clear. Accumulated evidence
demonstrated that the sterol regulatory element binding proteins (SREBPs) and target genes
were thought to be one of possible pathways involved in SGA-induced dyslipidemia (Fernø
et al 2011; Raeder et al 2006). SREBPs exist as two homologous proteins: SREBP-1 (with
the splice variants SREBP-1a and SREBP-1c) and SREBP-2. SREBP-1 is known as a key
regulator of fatty acid synthesis and a molecular link between lipid metabolism, insulin action
and obesity at the gene regulatory level (Kotzka & Muller-Wieland 2004), while SREBP-2 is
the main regulator of cholesterol metabolism (Shimano 2001). Clozapine and olanzapine
induce upregulated expression of SREBPs and target genes in several cell lines, primary rat
hepatocytes and in vivo 2-week treatment study (Fernø et al 2005; Skrede et al 2012; Yang et
al 2007). However, in contrast to the findings, acute studies in female rats found that a single
intraperitoneal (i.p.) injection of clozapine (25 or 50 mg/kg) or olanzapine (5 mg/kg) causes
an initial upregulation of lipogenic SREBP target genes followed by a marked and sustained
downregulation of these genes in the liver and WAT (Fernø et al 2009; Jassim et al 2012).
Although the unexpected biphasic expression pattern of lipogenic SREBP target genes may
be partly explained by its parallel with the peak serum concentrations of clozapine and short
7
half-life of these SGAs (Jassim et al 2012), considering the high dosages of clozapine and
olanzapine used in these studies, the biphasic expression pattern is more likely a non-
physiological activation followed by a compensatory rebound effect. Therefore, it is
necessary to investigate the acute effects of these SGAs at a clinical equivalent dosage on the
expression of SREBPs and their target genes in relation to lipogenesis/cholesterogenesis in
the liver and WAT.
It should also be noted that olanzapine may have different pharmacokinetics between i.p.
injection and oral treatment in rats. Since limited information is available regarding the
pharmacokinetics of olanzapine in rats, particularly following oral treatment, the
pharmacokinetics of a single oral olanzapine treatment at a clinically relevant dose (1 mg/kg;
equivalent to 10 mg in humans at 60 kg body weight) was investigated in this study. Based on
the pharmacokinetic analysis, the immediate effects of olanzapine (a single oral dose at
1mg/kg) on SREBP-related fatty acid/cholesterol metabolism genes were investigated in the
liver and WAT of female rats.
2. Materials and Methods
2.1. Animals and Housing
Female Sprague-Dawley (SD) rats (200-220 g) were obtained from the Animal Resource
Centre (South-West Hospital, Chongqing, China). After one week of environmental
familiarization, they were housed in individual cages and allowed ad libitum access to water
and a standard laboratory chow diet (3.9 kcal/g; 10% fat, 74% carbohydrate and 16% protein)
under environmentally controlled conditions (22°C, with light cycle from 07:00-19:00 and
dark cycle from 19:00-07:00) throughout the experimental period. Prior to drug treatment,
8
rats were trained to self-administer a sweet cookie dough pellet (0.3 g, including 30.9%
cornstarch, 30.9% sucrose, 6.3% gelatine, 15.5% casein, 6.4% fibre, 8.4% minerals and 1.6%
vitamins) without drugs twice daily (b.i.d.) for one week (Deng et al 2012; Lian et al 2013)
and were randomly assigned to one of following experiments (n=6/group). All animal
experiments were conducted in accordance with the National Institute of Health Guide for the
Care and Use of Laboratory Animals (Publication No. 85-23, revised 1985), with the
approval of the Scientific Investigation Board of Southwest University, Chongqing.
2.2. Pharmacokinetic study in rats treated with a single oral dose of olanzapine
2.2.1. Sample preparation and analysis
Six rats were fasted overnight and treated with a single oral dose of olanzapine (1 mg/kg
body weight; Eli Lilly, USA) via a cookie dough pill at ~09:00 am. Immediately following
dosing, orbital blood samples were collected at 0, 0.25, 0.5, 1, 2, 4, 6, 8, 10, 12, and 24 h in
heparinized tubes, then centrifuged (1000 g,10 min, 4 °C) to separate the plasma which was
stored at -80°C until assay. A 0.1 ml sample of plasma was extracted using 0.5 ml butyl
acetate: dichloromethane (4:1) adding 2 μl 10% (m/v) vitamin C. The sample mixture was
mixed on a vortex mixer for 1 min, and centrifuged for 10 min (16000 g). The upper organic
layer was separated, dried under N2 flow, and then dissolved again in a total volume of 50 μl
of HPLC grade methanol. The olanzapine assay was developed on an Agilent Eclipse XDB-
C18 column (4.6 mm × 250 mm, 5 µm). Mobile phase A was 0.3% triethylamine in water
with the pH adjusted to 3.73 by acetic acid, with methanol as mobile phase B (Morin et al
2005). The flow rate of the mobile phase was maintained at 1ml/min, while elution was
conducted in gradient mode as shown in Table S1 (available online). The detection was
carried out by UV detector at 254 nm (Cui et al 2011).
9
Standard stock solutions were prepared by dissolving olanzapine in methanol to yield a
nominal concentration of 1 mg/ml. The solutions were subsequently further diluted in
methanol to produce working standards. Calibration samples of olanzapine (0.1, 0.2, 0.4, 1, 2,
4, 10 and 20 μg/ml) were prepared by spiking blank plasma with appropriate quantities of
working standard solutions. Calibration curves in the 0.1-20 µg/ml range were constructed by
plotting the ratios of peak area against concentration. The concentrations of olanzapine in the
test samples were calculated using regression parameters obtained from the standard curve.
2.2.2. Pharmacokinetic analysis
All pharmacokinetic parameters of olanzapine were calculated from the plasma concentration
versus time using the Data Analysis Pharmacokinetic software DAS 2.0 (Mathematical
Pharmacology Professional Committee of China, Shanghai, China). A non-compartmental
model was used to determine the pharmacokinetic parameters of olanzapine. Maximum
concentration (Cmax) of the drug in plasma after a single oral dose (1 mg/kg) was calculated
from the recorded data. The area under the concentration-time curve (AUC) was calculated
by using the log-linear trapezoidal rule. The elimination rate constant (kel) was derived from a
linear regression of the terminal log-linear disposition phase of the concentration-time curve.
The elimination half-life (t1/2) was calculated as ln2/kel (Aravagiri et al 1999).
2.3. Acute effects of olanzapine on SREBP-controlled genes in relation to lipogenesis and
cholesterogenesis
2.3.1. Animal treatment
Twenty-four rats were fasted overnight, and administered a single oral treatment of
olanzapine (1 mg/kg) or vehicle (n=12) at ~09:00 am as described above. Based on the
findings in the pharmacokinetic study, treated and control rats were sacrificed by carbon
10
dioxide asphyxiation at 6 h (n=6/group) or 12 h (n=6/group) after drug treatment. The liver
and perirenal WAT were collected and frozen in liquid nitrogen immediately followed by
storage in a -80 °C freezer until further analysis. Cardiac blood was collected in procoagulant
tubes, left at 37°C for 30 min and centrifuged at 1000 g for 10 min. Serum was transferred to
pre-cooled Eppendorf tubes immediately after centrifugation and stored at -20 °C.
2.3.2. Measurements of liver enzymes and serum lipids
Liver enzymes, biochemical parameters (the serum levels of TG, total cholesterol, LDL-C
and HDL-C) were measured by colorimetric method using an Olympus AU400 chemistry
analyser (Olympus, Tokyo, Japan).
2.3.3. RNA extraction, cDNA synthesis, and gene expression analysis
Total RNA of liver or perirenal WAT was extracted using an RNAsimple Total RNA Kit
(DP419) (TianGen, China). To avoid amplification of contaminating genomic DNA, RNA
samples were digested with DNase I (Takara, Dalian, China). First strand cDNA was
synthesized using the cDNA synthesis kit (DingGuo, China). Cycles were set as follows: 60
min at 42°C, and 5 min at 95 °C, 5 min at 4 °C. Quantitative PCR was performed in a Bio-rad
CFX Connect™ Real-Time PCR Detection System using 96-well microliter plates with a
final volume of 20 μl mix [composed of 2×10⁻³ nM of specific primers (Invitrogen, China), 8
μl of water, 10 μl of the SYBR® GreenER™ qPCR SuperMix from Invitrogen™, and 2 μl of
diluted cDNA]. Thermal cycling parameters were 2 min at 95 °C, followed by 40 cycles each
containing 30 s at 94 °C, 30 s at 60 °C , and 30 s at 72 °C. Based on the previous report
(Skrede et al 2012), primers (see Table S2) (available online) were designed from sequences
in the Genbank databases using Primer 5 software. Each primer pair was then validated by an
efficacy ≥95%. All samples were analysed in duplicate. In a pre-experiment, all genes
11
expression levels were normalized relative to two endogenous controls, β -actin
(Actb) and glyceraldehyde-3-phosphate dehydrogenase (Gapdh), which showed stable
and similar results with both housekeeping genes. Since Gapdh was more strongly
expressed and showed the higher level of accuracy in Ct value than Actb in the pre-
experiment, Gapdh was chosen as the endogenous control gene in this study. Results
were expressed in relative expression using the comparative 2-ÄÄCt method. The mean value
of the control group was set at 1 and all data were normalized versus control group.
2.4. Statistical analysis
Data were expressed as mean ± SEM, and all data were analysed using the SPSS program
(IBM version 19.0, SPSS Inc., USA). Due to the small sample size (6 rats/group), data were
analysed using the Kruskal–Wallis H test, followed by a post-hoc Mann-Whitney U test at
each time point. Statistical significance was accepted when p<0.05.
3. Results
3.1. Pharmacokinetic parameters of a single oral dose olanzapine
The calibration curve was linear within the concentration range assayed. The mean regression
value of the calibration curve was y = 27.06x -1.2095 (r2 = 0.9973) for olanzapine. After
olanzapine was orally self-administered via cookie dough to the rats, the plasma
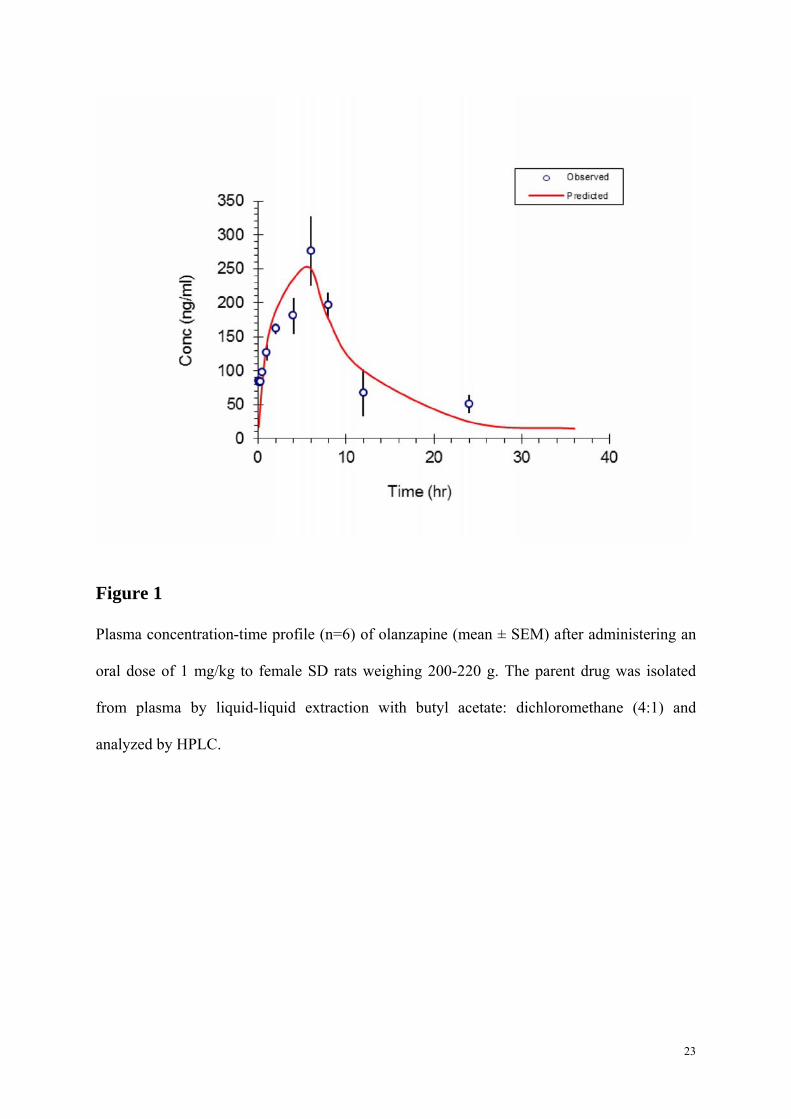
concentration versus time profile was shown in Fig.1. The Cmax occurred at 6 h after oral
administration and the elimination half-life (t1/2) was 3.5 h after the peak. The major
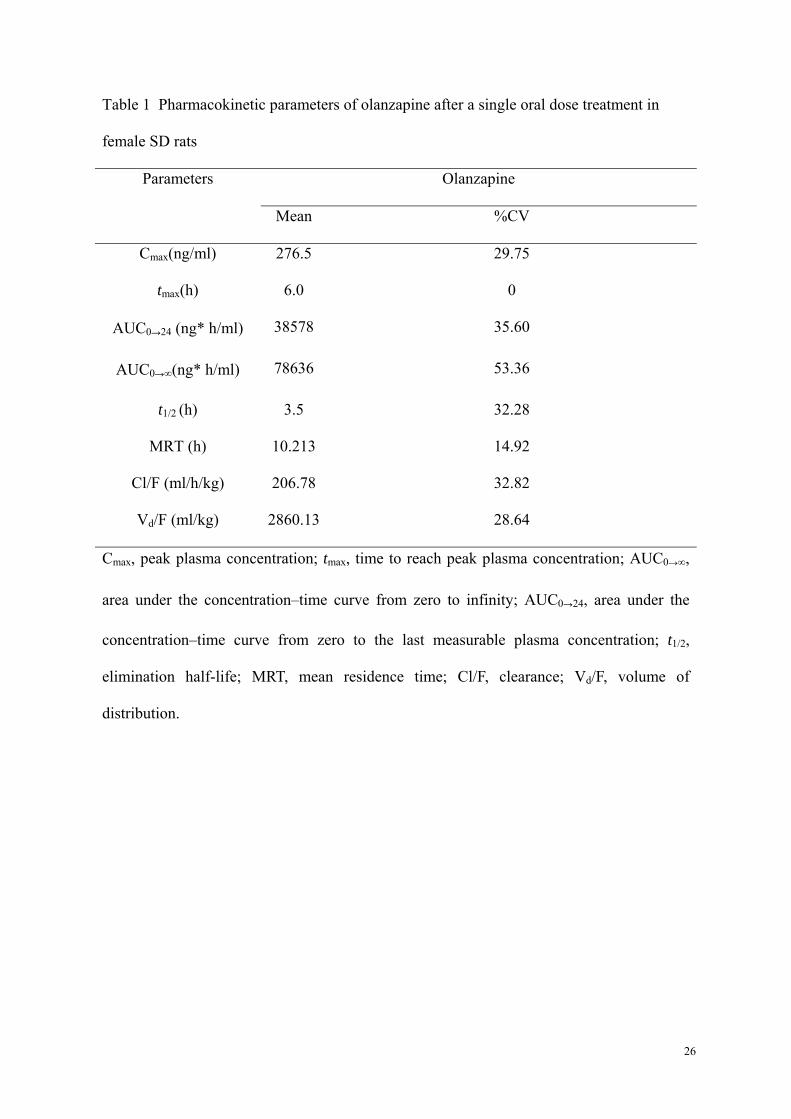
pharmacokinetic parameters of olanzapine are listed in Table 1.
3.2. Serum biochemical parameters
12
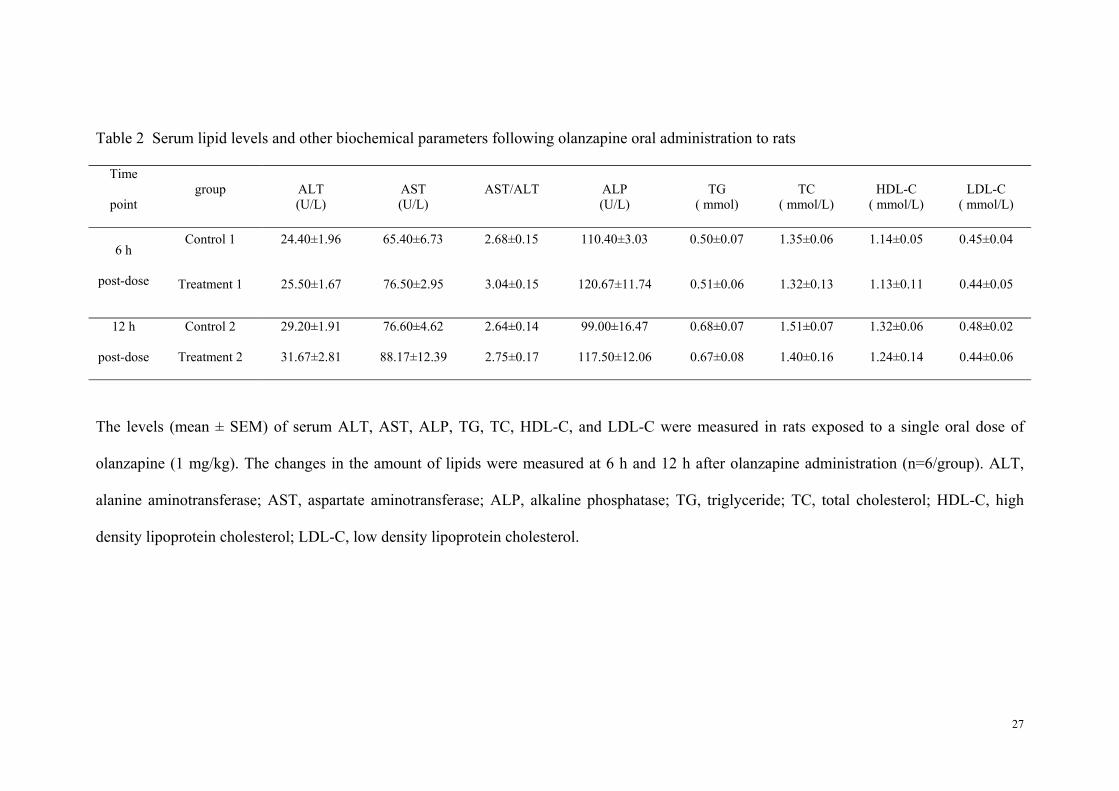
Table 2 presents the levels of TG, total cholesterol, HDL-C, LDL-C, alanine aminotransferase,
aspartate aminotransferase, and alkaline phosphatase at 6 h or 12 h after a single oral dose of
olanzapine. Compared with the control group, there was only a tendency for increase in liver
aspartate aminotransferase levels (115±16%, p=0.091), while in the plasma lipid there were
no significant changes at any time point after a single oral olanzapine treatment.
3.3 mRNA expression levels of fatty acid synthesis-related genes in the liver and WAT
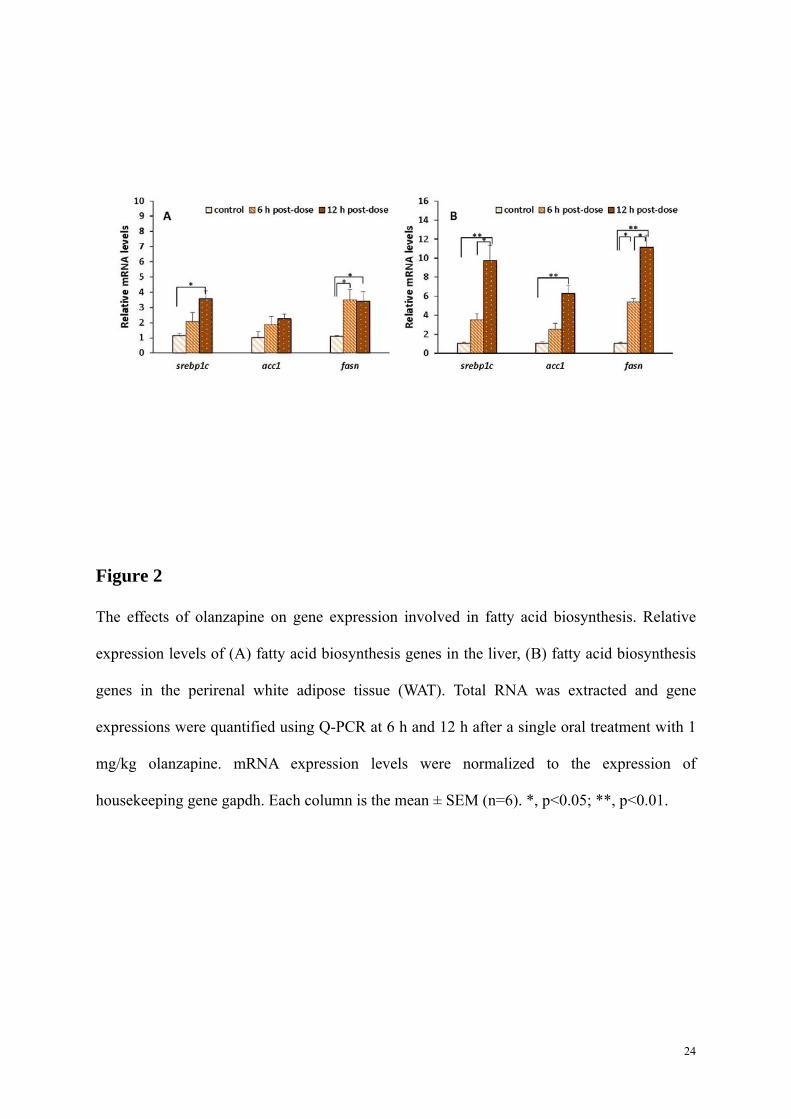
As shown in Fig. 2A, there was upregulation of SREBP-1c mRNA expression in the liver at
both examined time points compared to controls (2.1-fold at 6 h, and 3.5-fold at 12 h, p<0.05).
Consistent with the alteration of srebp-1c, fatty acid synthetase (fasn) mRNA expression was
significantly higher at the time points in the treatment group after the single oral olanzapine
dose (4.7-fold at 6 h and 3.4-fold at 12 h respectively, all p<0.05). However, there was no
significant difference observed between the olanzapine and control groups in the acetyl-CoA
carboxylase (acc1) expression level after drug treatment.
Similar to the liver, srebp-1c, acc1 and fasn involved in fatty acid biosynthesis were over-
expressed in viceral WAT after one oral dose treatment of olanzapine (Figs. 2A and 2B).
However, unlike the liver, there was a stronger upregulation of the mRNA expression for
these genes at 12 h than at 6 h post-treatment. In particular, the srebp-1c expression level was
significantly increased (up to 9.7-fold) at 12 h (p<0.01). The maximal upregulated response
was recorded for the expression of fasn gene at 12 h post-treatment (11.13-fold, p<0.01; Fig.
2B).
3.4 mRNA expression levels of cholesterol biosynthesis and transport-related genes in the
liver and WAT
13
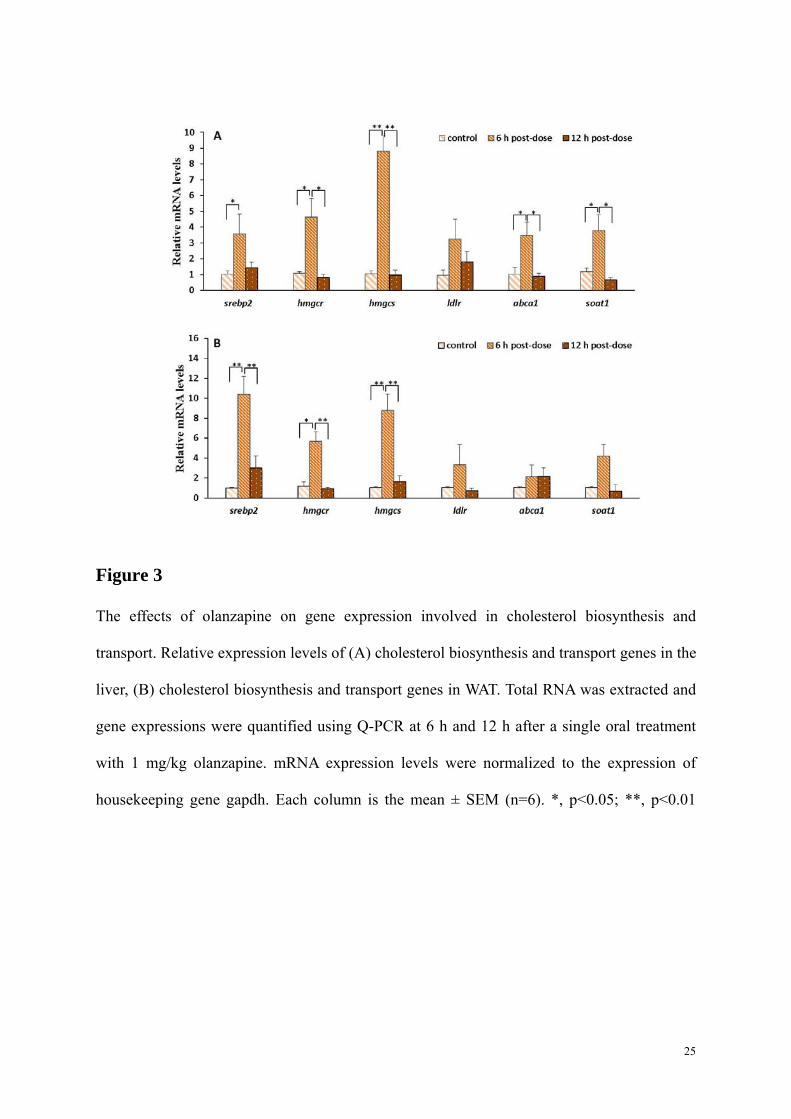
As presented in Fig. 3A, olanzapine affected mRNA expression of SREBP-2 and its target
genes, with a significant difference between expression at 6 h and 12 h after oral treatment.
The mRNA levels of these genes were significantly increased at 6 h, followed by a sharp
decrease, and a return to baseline (the control level) at 12 h. In the observed period, srebp-2
(3.57-fold increase, p<0.05) and its target genes hmgcs (4.64-fold increase, p<0.01) and
hmgcr (8.82-fold increase, p<0.05) were significantly stimulated only at 6 h after drug
administration when the plasma concentration of olanzapine peaked at 276.5 ng/ml. For ATP-
binding cassette transporter 1 (ABCA1), a cholesterol efflux pump in the cellular lipid
removal pathway (Schmitz & Langmann 2001), its mRNA was found to be overexpressed in
the liver, leading to a 3.48-fold increase (p<0.05). For sterol o-acyltransferase (SOAT), a key
enzyme in controlling cholesterol absorption, the up-regulated expression of mRNA appeared
only at 6 h after drug administration (p<0.05; Fig.3A).
In visceral WAT from olanzapine-treated rats, similar to the pattern in the liver, a drug-
induced increase of cholesterol biosynthesis-related genes was observed only at 6 h post-
treatment (Figs. 3A and 3B). The maximal upregulated response was recorded for the
expression of srebp-2 at 6 h post-treatment (10.42-fold; p<0.01). However, 12 h after oral
treatment of olanzapine, all genes examined returned to the baseline.
4. Discussion
In this study, we examined the direct effect of olanzapine (1mg/kg) in inducing
transcriptional activation of SREBPs and SREBP-controlled lipid-related genes in female rats
after a single oral treatment. Pharmacokinetic analysis showed that the Cmax and elimination
half-life of olanzapine were 276.5 ng/ml and 3.5 h, respectively. Further analysis of the gene
expression showed that olanzapine activated the SREBP-1c-controlling transcription system,
14
and then led to a continuous stimulation of the key genes involved in fatty acid synthesis until
at least 12 h after treatment, while, a rapid and transient transcriptional upregulation of the
genes involved in cholesterol metabolism was observed at 6 h post-treatment and returned to
normal via modulation of the expression of SREBP-2 after 12 hours of treatment. Our data
provide further evidence that transcriptional deregulation via upregulation of mRNA of
SREBPs transcription factors may contribute to olanzapine-induced disturbance in lipid
metabolisms.
Although olanzapine oral administration is frequently used in clinics, a majority of previous
studies in animals were through intraperitoneal (i.p.) injection (Fell et al 2008; Fernø et al
2009; Jassim et al 2012) or continuous delivery via a minipump (Mann et al 2013; van der
Zwaal et al 2008). Neither i.p. injection nor minipump delivery closely mimic clinical oral
treatment conditions, because they may have different pharmacokinetics from oral
administration in rats. The oral dose of 1 mg/kg olanzapine is equal to about 10 mg in human
(60 kg body weight) according to dosage translation between species based on body surface
area following the FDA guideline (FDA 2005; Reagan-Shaw et al 2008), and this is among
the recommended clinical dosages for treating schizophrenia patients (Kantrowitz & Citrome
2008). Although our previous studies have successfully established a female rat model for
olanzapine-induced metabolic side-effects using oral treatment of 1mg/kg olanzapine (Lian et
al 2014; Weston-Green et al 2011; Weston-Green et al 2012), to better understand the
mechanism of dyslipidmia, it is important in further studies to employ multiple doses for
investigating the dose-response effects on gene transcription.
In this study, the maximum plasma concentration was 276.5 ng/ml at 6 hours after one oral
administration of 1mg/kg olanzapine in cookie dough. The observation was not consistent
15
with previous findings in the peak time. In an earlier study, a rapid absorption was observed
and the peak appeared within 45 min after an oral gavage of 6 mg/kg olanzapine (Aravagiri et
al 1999). In another study, after a single intraperitoneal dose of 5 mg/kg, the serum level of
olanzapine peaked at 1 h after injection (Jassim et al 2012). Since olanzapine was prepared
with the cookie dough in this study, a most likely explanation for the delay of drug absorption
was due to a prolonged release of olanzapine from the cookie mix and/or delayed
gastrointestinal absorption (Mauri et al., 2007). Another explanation is that olanzapine could
be absorbed faster at the higher dose (5-6 mg/kg) used in previous reports (Aravagiri et al
1999; Jassim et al 2012). In the current study, the volume of distribution and clearance
characteristics of olanzapine resulted in an elimination half-life of 3.5 h, which was slightly
longer than the 2.5 h reported in male rats by Aravagiri (Aravagiri et al 1999). This is
probably because of the differences in metabolic capacity of the cytochrome P450 (CYP450)
isoenzyme system between male and female rats. It is well recognized that CYP450 mediated
oxidation is the primary metabolic pathway for olanzapine (Azzaro et al 2007; Sheehan et al
2010). Interestingly, clearance of olanzapine has been reported to be approximately 30%
higher in men than women, due to the differences in metabolic capacity of CYP450 beteween
males and females (Gervasini et al 2013; Kelly et al 1999). Therefore, elimination half-life of
olanzapine in females might be slightly longer than those in males. Finally, based on a 3.5 h
elimination half-life of olanzapine, 6-h and 12-h time points after a single oral-administration
were chosen to detect the effects of olanzapine on mRNA expression of hepatic and WAT
genes.
Olanzapine was observed to induce a direct transcriptional upregulation of SREBPs and its
target genes in the liver in the present study. At 6 h post-treatment, olanzapine caused a
significant increase in the expression of both srebp-1c and its downstream target genes (e.g.
16
acc1 and fasn), as well as srebp-2 and its downstream cholesterogenic genes (e.g. hmgcs,
hmgcr and ldlr). Our current data confirmed the previous in vitro findings of a direct
antipsychotic drug effect on expression of genes including de novo lipogenesis and
cholesterogenesis. Studies in rat primary hepatocytes (Lauressergues et al 2010; Oh et al
2011), or liver cell lines of THLE-3and HepG2 (Raeder et al 2006; Yang et al 2007) have
shown upregulation of the transcription factors srebp-1 and/ or srebp-2 after clozapine or
olanzapine treatment. Since olanzapine did not promote significant changes in blood TC, TG,
HDL-C, LDL-C after 6 or 12 hours of a single treatment in this study, these mRNA changes
observed should not be a feedback effect of dyslipidemia. Therefore, these data suggest that
olanzapine-mediated transcriptional upregulation of SREBPs and their target genes might be
a direct treatment effect. Once activated by olanzapine, SREBPs may start to induce de novo
lipogenesis and cholesterogenesis. This could lead to a sequence of steps stimulating an
abnormal production of fatty acid and cholesterol under chronic treatment of olanzapine.
In the present study, responding to olanzapine treatment, transcriptional activation patterns
were different between lipogenic genes and cholesterogenic genes. As shown in Figs. 2 and
3, there was a clear trend in the transient changes in the expression of SREBP-2-controlled
cholesterol metabolism genes following olanzapine treatment: the initial upregulation was
followed by a marked return to the basal level at 12 h after olanzapine treatment,
corresponding with a peak serum concentration of olanzapine at 6 h followed by a rapidly
declining serum drug concentration. In contrast, srebp-1 and target lipogenic genes such as
fasn and acc1 showed a different expression pattern: an early upregulation was followed by a
sustained activation of transcription at 12 h after olanzapine treatment in both the liver and
visceral WAT (Figs. 2A and 2B), which suggested that the expression of srebp-1 and its
target lipogenic genes was not affected by the decline in serum olanzapine concentration at
17
12 h post-treatment. However, it is very interesting that a different (biphasic) expression
pattern of lipogenic genes and cholesterol metabolism genes was reported previously in
female rats: an i.p. injection of olanzapine (5mg/kg) or clozapine (25mg/kg or 50mg/kg)
induced an initial upregulation of SREBP-controlled gene expression followed (at around 1 h
post-treatment) by a marked downregulation of SREBPs target genes in rats (Fernø et al
2009; Jassim et al 2012). Although the initial upregulated expression of SREBPs target genes
may be explained by the parallel peak concentration of serum drug concentration observed in
these studies, the following downregulation could not be well explained by the serum drug
concentration. Given the high dosages of clozapine and olanzapine used in these studies, the
biphasic expression pattern is more likely a non-physiological activation followed by a
compensatory rebound effect (Fernø et al 2009; Jassim et al 2012). Therefore, the gene
expression patterns observed in the current study are most likely physiological responses to
olanzapine treatment at a clinical equivalent dosage. Since srebp-1c and its downstream
target fatty acids biosynthesis genes (e.g. acc1 and fasn) showed a consistent expression
pattern compared to srebp-2 and its downstream cholesterogenic genes (e.g. hmgcs, hmgcr
and ldlr), our findings should be one possible explanation for the clinical feature that
dyslipidemia in the form of hypertriglyceridemia occurs more frequently than
hypercholesterolemia in patients treated with SGAs (Birkenaes et al 2008; Sadibasic et al
2014).
Our study revealed that the expression of srebp-1, srebp-2 and their target genes in WAT
displayed a similar pattern as in the liver after one single oral treatment of olanzapine.
Consistently with this, a previous study reported an upregulation of srebp-1 and SREBP-1-
related adipogenesis in the 3T3-L1 adipocyte cell line (Yang et al 2007). However, an in vivo
study has reported that, following one i.p. injection of olanzapine (5mg/kg), a non-significant
18
initial upregulation of lipid-related genes was observed in mesenteric WAT, although a
significant upregulation was caused in the liver with the same treatment (Jassim et al 2012).
Of note, in this study, a greater expression of srebp-1c and fatty acid biosynthesis-related
genes (acc1 and fasn) was observed in WAT than in the liver, particularly at 12 h (Fig. 2). It
was not clear what factor(s) caused the greater effect on gene expression in WAT. However,
several lines of evidence have proved that the WAT played a more important role in de novo
lipogenesis than the liver (Pearce 1983; Swierczynski et al 2000). Parasympathetic inputs to
adipose tissue modulates glucose uptake and free fatty acid metabolis (Kreier et al 2002) and
has selective effects on local hormone synthesis controlling the specific activities of lipogenic
enzymes (Fliers et al 2003). Cholinergic muscarinic receptors are present in WAT (Yang et al
2009). Therefore, it is possible that the greater expression of fatty acid-related genes in the
WAT was induced by olanzapine through activation of parasympathetic nerves. Although our
present knowledge on the regulation of srebp-1 expression in the WTA is far from complete,
it has been shown that tissue-specific expression of SREBP-1 is responsible for the
differential expressions of lipogenic genes between the liver and adipose tissue (Foretz et al
1999). In addition, the SREBP-1 may play additional roles in adipose tissue. For example,
overexpression of SREBP-1 in cultured 3T3-L1 preadipocytes was shown to promote
adipocyte differentiation induced by activation of peroxisome proliferator-activated receptor-
gamma (PPARγ), a known activator of adipocyte differentiation (Kim & Spiegelman 1996;
Sertie et al 2011). Indeed, antipsychotic treatments alter the gene expression patterns in
adipocytes in coordinated fashion (Sarvari et al 2014). Hence, it is important to further
investigate the roles of SREBP in adipogenesis.
One limitation of this study was that only olanzapine was examined in this study.
Interestingly, it was recently demonstrated that clozapine and risperidone elicited significant
19
inductions of SREBP-1 maturation and FASN mRNA expression in primary cultures of rat
hepatocytes and 3T3-L1 cells associated with an increase of triacylglycerol (Hu et al 2010;
Lauressergues et al 2011). Therefore, it is also important in further study to compare the
effects of these antipsychotics on inducing SREBP-controlled transcriptional activation of
lipogenesis in the liver and WAT.
In summary, olanzapine can directly affect the expression of lipid metabolism genes through
regulation of SREBP in the liver and WAT. In addition, SGAs have high binding affinities
with multiple neurotransmitter receptors, such as the 5-HT2C (5-HT2CR), histamine H1 (H1R)
and muscarinic M3 receptor (M3R) (Correll 2010), which are associated with SGA-induced
metabolic side-effects such as weight gain and diabetes (Correl et al 2012; Deng 2013;
Nasrallah 2008). Further research is important to identify the role of these peripheric
neurotransmitter receptors in SGA-induced dyslipidemia. If these relationships can be fine-
tuned, the genes involved in lipid metabolism might be promising targets for pharmacological
intervention to control the metabolic-side effects caused by SGAs.
Supplementary Material
Supplementary Material includes two tables and can be found with this article at Web version
on PubMed Central.
Acknowledgements
This work was supported by grants from the Fundamental Research Funds for the Central
Universities, P. R. China (XDJK2011C049) and the Key Program of Chongqing Science and
20
Technology Research Project(cstc2013jcsf10002). We would like to thank Ms Diane Walton
for her help in proof-reading of this manuscript.
Conflict of Interest
The authors have no conflicts of interest to disclose.
21
References
Allison DB, Newcomer JW, Dunn AL, Blumenthal JA, Fabricatore AN, et al. 2009. Obesity Among Those with Mental Disorders: A National Institute of Mental Health Meeting Report. American Journal of Preventive Medicine 36:341-50
Aravagiri M, Teper Y, Marder SR. 1999. Pharmacokinetics and tissue distribution of olanzapine in rats. Biopharm Drug Dispos 20:369-77
Azzaro AJ, Ziemniak J, Kemper E, Campbell BJ, VanDenBerg C. 2007. Selegiline transdermal system: an examination of the potential for CYP450-dependent pharmacokinetic interactions with 3 psychotropic medications. J Clin Pharmacol 47:146-58
Birkenaes AB, Birkeland KI, Engh JA, Faerden A, Jonsdottir H, et al. 2008. Dyslipidemia independent of body mass in antipsychotic-treated patients under real-life conditions. J Clin Psychopharmacol 28:132-7
Correl C, de Hert M, Detraux J, Van Winkel R, Yu W. 2012. Metabolic and cardiovascular adverse effects associated with antipsychotic drugs. Nature Reviews Endocrinology 8:114
Correll CU. 2010. From receptor pharmacology to improved outcomes: individualising the selection, dosing, and switching of antipsychotics. European Psychiatry 25, Supplement 2:S12-S21
Cui D, Li Y, Lian M, Yang F, Meng Q. 2011. Development of a simple and stability-indicating RP-HPLC method for determining olanzapine and related impurities generated in the preparative process. Analyst 136:3149-56
Deng C. 2013. Effects of antipsychotic medications on appetite, weight, and insulin resistance. Endocrinol Metab Clin North Am 42:545-63
Deng C, Lian J, Pai N, Huang XF. 2012. Reducing olanzapine-induced weight gain side effect by using betahistine: a study in the rat model. J Psychopharmacol 26:1271-9
FDA. 2005. Estimating the Maximum Safe Starting Dose in Initial Clinical Trials for Therapeutics in Adult Healthy Volunteers. http://www.fda.gov/cder/guidance/index.htm
Fell MJ, Neill JC, Anjum N, Peltola LM, Marshall KM. 2008. Investigation into the influence of a high fat diet on antipsychotic-induced weight gain in female rats. J Psychopharmacol 22:182-6
Fernø J, Raeder MB, Vik-Mo AO, Skrede S, Glambek M, et al. 2005. Antipsychotic drugs activate SREBP-regulated expression of lipid biosynthetic genes in cultured human glioma cells: a novel mechanism of action? Pharmacogenomics J 5:298-304
Fernø J, Skrede S, Vik-Mo AO, Jassim G, Le Hellard S, Steen VM. 2011. Lipogenic effects of psychotropic drugs: focus on the SREBP system. Front Biosci (Landmark Ed) 16:49-60
Fernø J, Vik-Mo AO, Jassim G, Havik B, Berge K, et al. 2009. Acute clozapine exposure in vivo induces lipid accumulation and marked sequential changes in the expression of SREBP, PPAR, and LXR target genes in rat liver. Psychopharmacology (Berl) 203:73-84
Fliers E, Kreier F, Voshol PJ, Havekes LM, Sauerwein HP, et al. 2003. White adipose tissue: getting nervous. J Neuroendocrinol 15:1005-10
Foretz M, Pacot C, Dugail I, Lemarchand P, Guichard C, et al. 1999. ADD1/SREBP-1c is required in the activation of hepatic lipogenic gene expression by glucose. Mol Cell Biol 19:3760-8
Gervasini G, Caballero MJ, Carrillo JA, Benitez J. 2013. Comparative cytochrome p450 in vitro inhibition by atypical antipsychotic drugs. ISRN Pharmacol 2013:792456
Hu Y, Kutscher E, Davies GE. 2010. Berberine inhibits SREBP-1-related clozapine and risperidone induced adipogenesis in 3T3-L1 cells. Phytother Res 24:1831-8
Jassim G, Skrede S, Vazquez MJ, Wergedal H, Vik-Mo AO, et al. 2012. Acute effects of orexigenic antipsychotic drugs on lipid and carbohydrate metabolism in rat. Psychopharmacology (Berl) 219:783-94
Kantrowitz JT, Citrome L. 2008. Olanzapine: review of safety 2008. Expert Opin Drug Saf 7:761-9 Kelly DL, Conley RR, Tamminga CA. 1999. Differential olanzapine plasma concentrations by sex in a fixed-
dose study. Schizophr Res 40:101-4 Kim JB, Spiegelman BM. 1996. ADD1/SREBP1 promotes adipocyte differentiation and gene expression linked
to fatty acid metabolism. Genes Dev 10:1096-107 Kotzka J, Muller-Wieland D. 2004. Sterol regulatory element-binding protein (SREBP)-1: gene regulatory target
for insulin resistance? Expert Opin Ther Targets 8:141-9 Kreier F, Fliers E, Voshol PJ, Van Eden CG, Havekes LM, et al. 2002. Selective parasympathetic innervation of
subcutaneous and intra-abdominal fat--functional implications. J Clin Invest 110:1243-50 Lauressergues E, Martin F, Helleboid A, Bouchaert E, Cussac D, et al. 2011. Overweight induced by chronic
risperidone exposure is correlated with overexpression of the SREBP-1c and FAS genes in mouse liver. Naunyn Schmiedebergs Arch Pharmacol 383:423-36
Lauressergues E, Staels B, Valeille K, Majd Z, Hum DW, et al. 2010. Antipsychotic drug action on SREBPs-related lipogenesis and cholesterogenesis in primary rat hepatocytes. Naunyn Schmiedebergs Arch Pharmacol 381:427-39
22
Lian J, Huang XF, Pai N, Deng C. 2013. Effects of olanzapine and betahistine co-treatment on serotonin transporter, 5-HT2A and dopamine D2 receptor binding density. Prog Neuropsychopharmacol Biol Psychiatry 47:62-8
Lian J, Huang XF, Pai N, Deng C. 2014. Betahistine ameliorates olanzapine-induced weight gain through modulation of histaminergic, NPY and AMPK pathways. Psychoneuroendocrinology 48:77-86
Mann S, Chintoh A, Giacca A, Fletcher P, Nobrega J, et al. 2013. Chronic olanzapine administration in rats: effect of route of administration on weight, food intake and body composition. Pharmacol Biochem Behav 103:717-22
Meltzer HY. 2013. Update on typical and atypical antipsychotic drugs. Annu Rev Med 64:393-406 Morin C, Proteau S, Rousseau E, Brayden J. 2005. Organ-cultured airway explants: a new model of airway
hyperresponsiveness. Exp Lung Res 31:719-44 Nasrallah HA. 2008. Atypical antipsychotic-induced metabolic side effects: insights from receptor-binding
profiles. Mol Psychiatry 13:27-35 Oh KJ, Park J, Lee SY, Hwang I, Kim JB, et al. 2011. Atypical antipsychotic drugs perturb AMPK-dependent
regulation of hepatic lipid metabolism. Am J Physiol Endocrinol Metab 300:E624-32 Pearce J. 1983. Fatty acid synthesis in liver and adipose tissue. Proc Nutr Soc 42:263-71 Raeder MB, Ferno J, Vik-Mo AO, Steen VM. 2006. SREBP activation by antipsychotic- and antidepressant-
drugs in cultured human liver cells: relevance for metabolic side-effects? Mol Cell Biochem 289:167-73
Reagan-Shaw S, Nihal M, Ahmad N. 2008. Dose translation from animal to human studies revisited. Faseb J 22:659-61
Sadibasic B, Macic-Dzankovic A, Sabic A, Torlak B, Lastric G, Custovic A. 2014. The incidence of dyslipidemia (hypertriglyceridemia and hypercholesterolemia) in patients treated with the new generation of antipsychotic drugs compared to conventional therapy. Med Glas (Zenica) 11:350-5
Sarvari AK, Vereb Z, Uray IP, Fesus L, Balajthy Z. 2014. Atypical antipsychotics induce both proinflammatory and adipogenic gene expression in human adipocytes in vitro. Biochem Biophys Res Commun 450:1383-9
Schmitz G, Langmann T. 2001. Structure, function and regulation of the ABC1 gene product. Curr Opin Lipidol 12:129-40
Sertie AL, Suzuki AM, Sertie RA, Andreotti S, Lima FB, et al. 2011. Effects of antipsychotics with different weight gain liabilities on human in vitro models of adipose tissue differentiation and metabolism. Prog Neuropsychopharmacol Biol Psychiatry 35:1884-90
Sheehan JJ, Sliwa JK, Amatniek JC, Grinspan A, Canuso CM. 2010. Atypical antipsychotic metabolism and excretion. Curr Drug Metab 11:516-25
Shimano H. 2001. Sterol regulatory element-binding proteins (SREBPs): transcriptional regulators of lipid synthetic genes. Prog Lipid Res 40:439-52
Skrede S, Ferno J, Vazquez MJ, Fjaer S, Pavlin T, et al. 2012. Olanzapine, but not aripiprazole, weight-independently elevates serum triglycerides and activates lipogenic gene expression in female rats. Int J Neuropsychopharmacol 15:163-79
Stahl SM, Mignon L, Meyer JM. 2009. Which comes first: atypical antipsychotic treatment or cardiometabolic risk? Acta Psychiatr Scand 119:171-9
Swierczynski J, Goyke E, Wach L, Pankiewicz A, Kochan Z, et al. 2000. Comparative study of the lipogenic potential of human and rat adipose tissue. Metabolism 49:594-9
van der Zwaal EM, Luijendijk MC, Adan RA, la Fleur SE. 2008. Olanzapine-induced weight gain: chronic infusion using osmotic minipumps does not result in stable plasma levels due to degradation of olanzapine in solution. Eur J Pharmacol 585:130-6
Weston-Green K, Huang XF, Deng C. 2011. Olanzapine treatment and metabolic dysfunction: a dose response study in female Sprague Dawley rats. Behavioural Brain Research 217:337-46
Weston-Green K, Huang XF, Lian J, Deng C. 2012. Effects of olanzapine on muscarinic M3 receptor binding density in the brain relates to weight gain, plasma insulin and metabolic hormone levels. Eur Neuropsychopharmacol 22:364-73
Yang LH, Chen TM, Yu ST, Chen YH. 2007. Olanzapine induces SREBP-1-related adipogenesis in 3T3-L1 cells. Pharmacol Res 56:202-8
Yang TT, Chang CK, Tsao CW, Hsu YM, Hsu CT, Cheng JT. 2009. Activation of muscarinic M-3 receptor may decrease glucose uptake and lipolysis in adipose tissue of rats. Neurosci Lett 451:57-9
23
Figure 1
Plasma concentration-time profile (n=6) of olanzapine (mean ± SEM) after administering an
oral dose of 1 mg/kg to female SD rats weighing 200-220 g. The parent drug was isolated
from plasma by liquid-liquid extraction with butyl acetate: dichloromethane (4:1) and
analyzed by HPLC.
24
Figure 2
The effects of olanzapine on gene expression involved in fatty acid biosynthesis. Relative
expression levels of (A) fatty acid biosynthesis genes in the liver, (B) fatty acid biosynthesis
genes in the perirenal white adipose tissue (WAT). Total RNA was extracted and gene
expressions were quantified using Q-PCR at 6 h and 12 h after a single oral treatment with 1
mg/kg olanzapine. mRNA expression levels were normalized to the expression of
housekeeping gene gapdh. Each column is the mean ± SEM (n=6). *, p<0.05; **, p<0.01.
25
Figure 3
The effects of olanzapine on gene expression involved in cholesterol biosynthesis and
transport. Relative expression levels of (A) cholesterol biosynthesis and transport genes in the
liver, (B) cholesterol biosynthesis and transport genes in WAT. Total RNA was extracted and
gene expressions were quantified using Q-PCR at 6 h and 12 h after a single oral treatment
with 1 mg/kg olanzapine. mRNA expression levels were normalized to the expression of
housekeeping gene gapdh. Each column is the mean ± SEM (n=6). *, p<0.05; **, p<0.01
26
Table 1 Pharmacokinetic parameters of olanzapine after a single oral dose treatment in
female SD rats
Parameters Olanzapine
Mean %CV
Cmax(ng/ml) 276.5 29.75
tmax(h) 6.0 0
AUC0→24 (ng* h/ml) 38578 35.60
AUC0→∞(ng* h/ml) 78636 53.36
t1/2 (h) 3.5 32.28
MRT (h) 10.213 14.92
Cl/F (ml/h/kg) 206.78 32.82
Vd/F (ml/kg) 2860.13 28.64
Cmax, peak plasma concentration; tmax, time to reach peak plasma concentration; AUC0→∞,
area under the concentration–time curve from zero to infinity; AUC0→24, area under the
concentration–time curve from zero to the last measurable plasma concentration; t1/2,
elimination half-life; MRT, mean residence time; Cl/F, clearance; Vd/F, volume of
distribution.
27
Table 2 Serum lipid levels and other biochemical parameters following olanzapine oral administration to rats
Time
point group ALT
(U/L) AST (U/L)
AST/ALT ALP (U/L)
TG ( mmol)
TC ( mmol/L)
HDL-C ( mmol/L)
LDL-C ( mmol/L)
6 h
post-dose
Control 1 24.40±1.96 65.40±6.73 2.68±0.15 110.40±3.03 0.50±0.07 1.35±0.06 1.14±0.05 0.45±0.04
Treatment 1 25.50±1.67 76.50±2.95 3.04±0.15 120.67±11.74 0.51±0.06 1.32±0.13 1.13±0.11 0.44±0.05
12 h
post-dose
Control 2 29.20±1.91 76.60±4.62 2.64±0.14 99.00±16.47 0.68±0.07 1.51±0.07 1.32±0.06 0.48±0.02
Treatment 2 31.67±2.81 88.17±12.39 2.75±0.17 117.50±12.06 0.67±0.08 1.40±0.16 1.24±0.14 0.44±0.06
The levels (mean ± SEM) of serum ALT, AST, ALP, TG, TC, HDL-C, and LDL-C were measured in rats exposed to a single oral dose of
olanzapine (1 mg/kg). The changes in the amount of lipids were measured at 6 h and 12 h after olanzapine administration (n=6/group). ALT,
alanine aminotransferase; AST, aspartate aminotransferase; ALP, alkaline phosphatase; TG, triglyceride; TC, total cholesterol; HDL-C, high
density lipoprotein cholesterol; LDL-C, low density lipoprotein cholesterol.
Related Documents


