0 2000 4000 6000 8000 10000 12000 14000 1998 2000 2002 2004 2006 2008 2010 2012 2014 2016 2018 P roduction (P etajoules) actual forecast NGLs Coalbed methane Hydro, wind, and other renewables Conventional natural gas Mined and in situ bitumen Conventional heavy oil Conventional L&M oil Coal Total energy production in Alberta Figure 1

Actual forecast NGLs Coalbed methane Hydro, wind, and other renewables Conventional natural gas Mined and in situ bitumen Conventional heavy oil Conventional.
Dec 14, 2015
Welcome message from author
This document is posted to help you gain knowledge. Please leave a comment to let me know what you think about it! Share it to your friends and learn new things together.
Transcript

0
2000
4000
6000
8000
10000
12000
14000
1998 2000 2002 2004 2006 2008 2010 2012 2014 2016 2018
Pro
du
cti
on
(P
eta
jou
les
)
actual forecast
NGLs
Coalbed methaneHydro, wind, and other renewables
Conventional natural gas
Mined and in situ bitumen
Conventional heavy oil
Conventional L&M oil
Coal
Total energy production in AlbertaFigure 1


Figure 3. Alberta supply of crude oil and equivalent
0
100
200
300
400
500
600
1999
2000
2001
2002
2003
2004
2005
2006
2007
2008
2009
2010
2011
2012
2013
2014
2015
2016
2017
2018
Sup
ply
(10
3 m3 /d
)
actual forecast
Non upgraded bitumen
Light-medium
SCO
Pentanes plusHeavy

0
50
100
150
200
1999
2000
2001
2002
2003
2004
2005
2006
2007
2008
2009
2010
2011
2012
2013
2014
2015
2016
2017
2018
Pro
duct
ion
and
Dem
and
(10
9 m3 )
Residential demand Commercial demand Other Alberta demand Alberta gas removals
actual forecast
Figure 4 Total marketable gas production and demand
23% 26% 33% 44% 58%

0
5000
10000
15000
20000
25000
19
48
19
53
19
58
19
63
19
68
19
73
19
78
19
83
19
88
19
93
19
98
20
03
20
08
nu
mb
er
of
we
lls d
rille
d
Crude Oil Bitumen* Gas** Other***
Figure 5. Drilling Activity in Alberta, 1948 – 2008
Bitumen* - includes producing and evaluation wellsGas** - includes CBM wellsOther *** - includes unsuccessful, service, and suspended wells
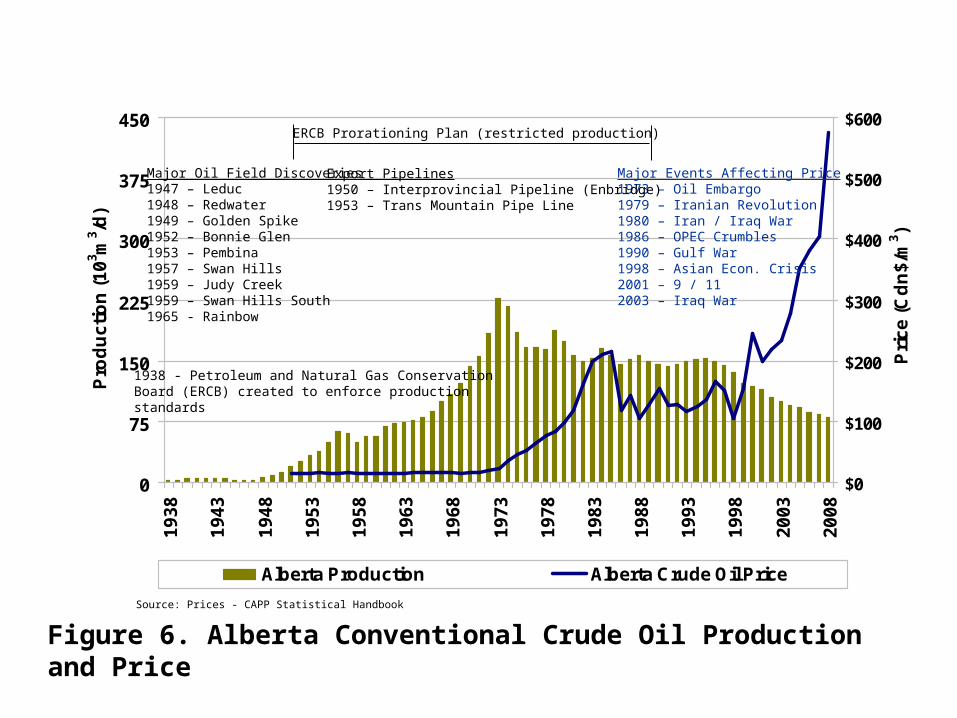
Figure 6. Alberta Conventional Crude Oil Production and Price
0
75
150
225
300
375
450
19
38
19
43
19
48
19
53
19
58
19
63
19
68
19
73
19
78
19
83
19
88
19
93
19
98
20
03
20
08
Pro
du
ctio
n (
10
3 m3 /d
)
$0
$100
$200
$300
$400
$500
$600
Pri
ce
(C
dn
$/m
3 )
Alberta Production Alberta Crude Oil Price
Source: Prices - CAPP Statistical Handbook
ERCB Prorationing Plan (restricted production)
Major Oil Field Discoveries1947 – Leduc1948 – Redwater1949 – Golden Spike1952 – Bonnie Glen1953 – Pembina1957 – Swan Hills1959 – Judy Creek1959 – Swan Hills South1965 - Rainbow
Major Events Affecting Price1973 – Oil Embargo1979 – Iranian Revolution1980 – Iran / Iraq War1986 – OPEC Crumbles1990 – Gulf War1998 – Asian Econ. Crisis2001 – 9 / 112003 – Iraq War
1938 - Petroleum and Natural Gas ConservationBoard (ERCB) created to enforce productionstandards
Export Pipelines1950 – Interprovincial Pipeline (Enbridge)1953 – Trans Mountain Pipe Line
0
20
40
60
80
100
120
140
1967
1969
1971
1973
1975
1977
1979
1981
1983
1985
1987
1989
1991
1993
1995
1997
1999
2001
2003
2005
2007
Pro
du
cti
on
(103 m
3 /d)
$0
$100
$200
$300
$400
$500
$600
$700
Pri
ce (
Cd
n$/m
3 )
Mined Bitumen SCO Production SCO Price
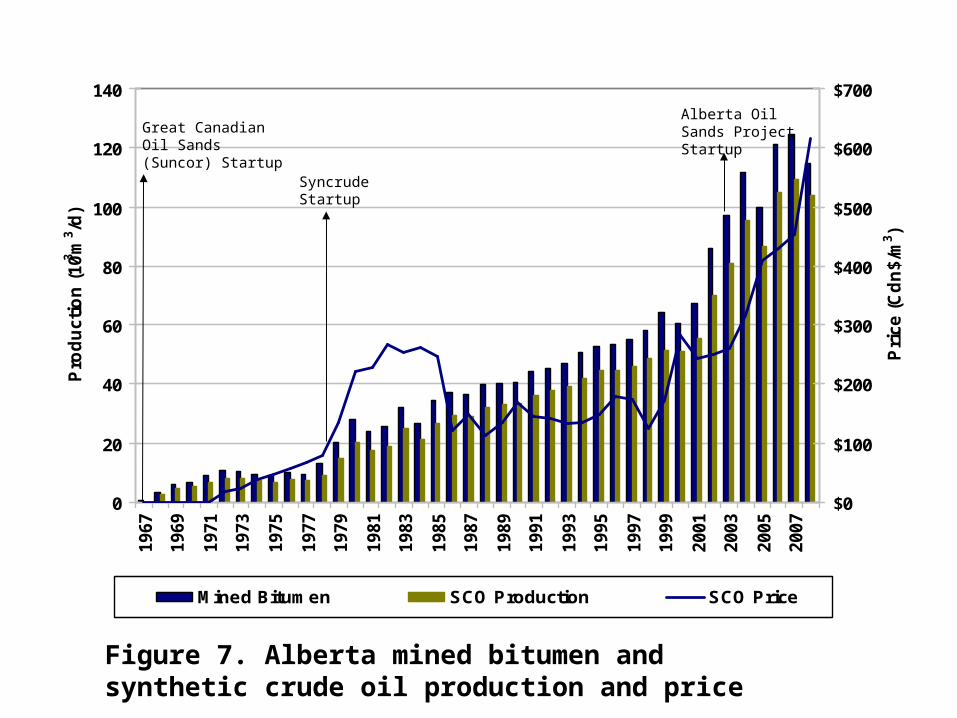
Figure 7. Alberta mined bitumen and synthetic crude oil production and price
Great Canadian Oil Sands (Suncor) Startup
Syncrude Startup
Alberta Oil Sands Project Startup
0
25
50
75
100
125
1967
1969
1971
1973
1975
1977
1979
1981
1983
1985
1987
1989
1991
1993
1995
1997
1999
2001
2003
2005
2007
Pro
du
ctio
n (1
03 m
3 /d)
0
100
200
300
400
500
Pri
ce (C
dn
$/m
3 )
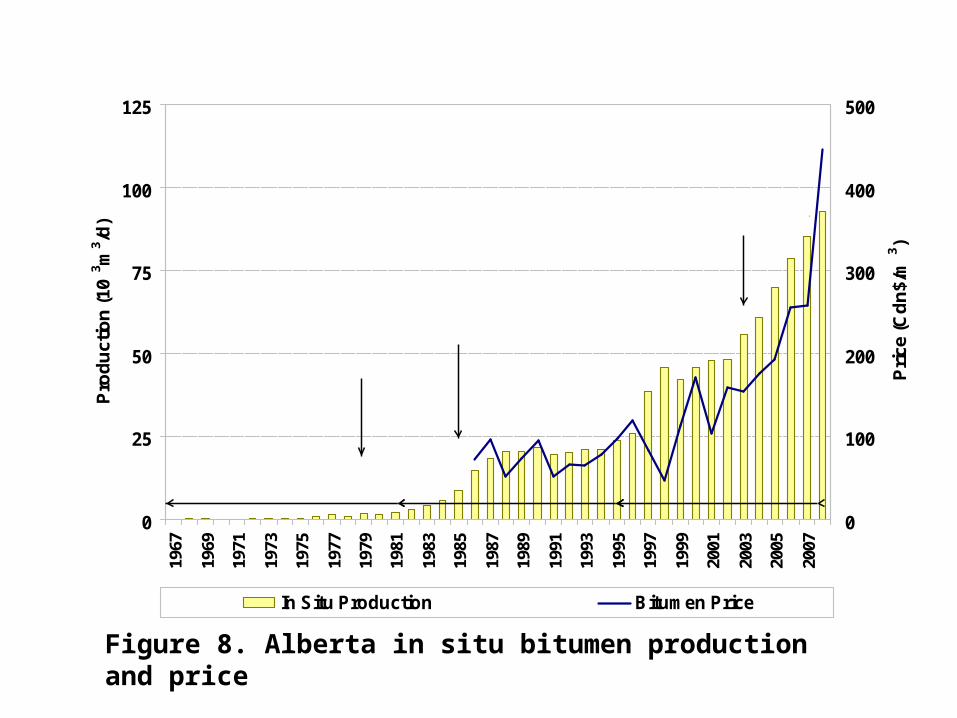
In Situ Production Bitumen Price
Cold Lake Pilot Production Cold Lake Phases 1-6 Cold Lake Phases 7-13
Shell Peace River Startup
First SAGD ProductionAEC (EnCana) Foster Ck.
Amoco (CNRL)Wolf Lake &Primrose Startup
Figure 8. Alberta in situ bitumen production and price

Figure 9 Historical natural gas production and price
0
50
100
150
200
250
1963
1966
1969
1972
1975
1978
1981
1984
1987
1990
1993
1996
1999
2002
2005
2008
Pro
du
ctio
n (1
09 m
3 )
$0
$2
$4
$6
$8
$10
Pri
ce (C
dn
$/G
J)
Gas production Alberta plant gate price
Gas prices as a by-product of oil production. Price less than replacement cost
Arbitration awardsprice increase
Regulated gas pricetied to oil prices;Surplus built up
Price deregulation
Surplus gas drivesdown prices
PGT expansion
Northern Border pipeline expansion
Hurricanes Katrina and Ritahit U.S. Gulf Coast
Foothills Pipe Lines built for gas exports to California and the mid-western U.S.
Alliance Pipeline on stream

0
5
10
15
20
25
1971 1976 1981 1986 1991 1996 2001 2006
Inven
tory
(m
illi
on
to
nn
es)
0
20
40
60
80
100
120
140
160
180
200
Pri
ce (
US
$/t
on
ne)
Gas Processing Plants Oil Sands Plants FOB Vancouver (US$/tonne)
Figure 10 Sulphur closing inventories in Alberta and price
Prices reached highs in theUS$650-$840/tonne rangein 2008
0
10
20
30
40
50
60
70
80
1882
1892
1902
1912
1922
1932
1942
1952
1962
1972
1982
1992
2002
Prod
uctio
n (m
illio
n to
nnes
)
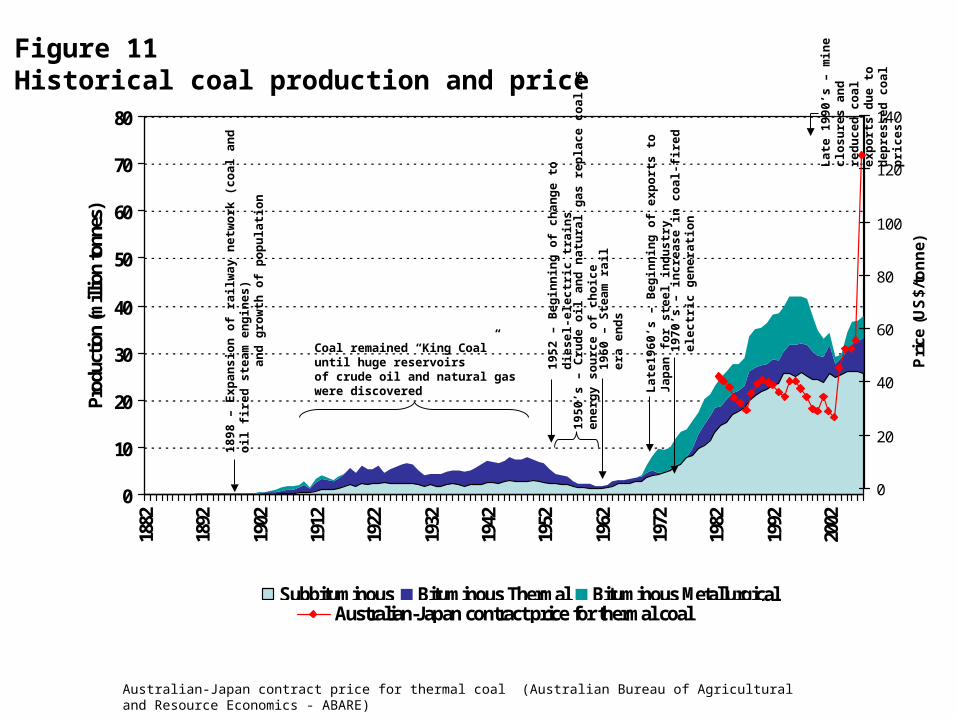
Subbituminous Bituminous Thermal Bituminous Metallurgical
1898
– E
xpan
sion
of r
ailw
ay n
etw
ork
(coa
l and
oil
fired
ste
am e
ngin
es)
and
grow
th o
f pop
ulat
ion
1952
– B
egin
ning
of c
hang
e to
die
sel-e
lect
ric tr
ains
1960
– S
team
rail
era
ends
Late
1960
’s –
Beg
inni
ng o
f exp
orts
to J
apan
for s
teel
indu
stry
1970
’s –
incr
ease
in c
oal-f
ired
elec
tric
gen
erat
ion
1950
’s –
Cru
de o
il an
d na
tura
l gas
repl
ace
coal
as
ener
gy s
ourc
e of
cho
ice
Coal remained “King Coal” until huge reservoirsof crude oil and natural gas were discovered
0
20
40
60
80
100
120
140
Pri
ce (
US
$/to
nn
e)
Australian-Japan contract price for thermal coal
Figure 11Historical coal production and price
Australian-Japan contract price for thermal coal (Australian Bureau of Agricultural and Resource Economics - ABARE)
Late
199
0’s
– m
ine
clos
ures
an
d re
duce
d co
al e
xpor
ts
due
to d
epre
ssed
coa
l pric
es

Figure 1.1 OPEC crude basket reference price 2008
50
55
60
65
70
75
80
85
90
Jan Feb Mar Apr May Jun Jul Aug Sep Oct Nov Dec
$US
/bb
l
Source: OPEC
0
20
40
60
80
100
120
140
160
Jan Feb Mar Apr May Jun Jul Aug Sep Oct Nov Dec
US
$/b
bl


Figure 1.3 Price of WTI at Chicago
0
40
80
120
160
1990 1992 1994 1996 1998 2000 2002 2004 2006 2008 2010 2012 2014 2016 2018
Pri
ce (
US
$/b
bl)
0
200
400
600
800
1000
Pri
ce (
US
$/m
3 )
actual forecast
High
Low
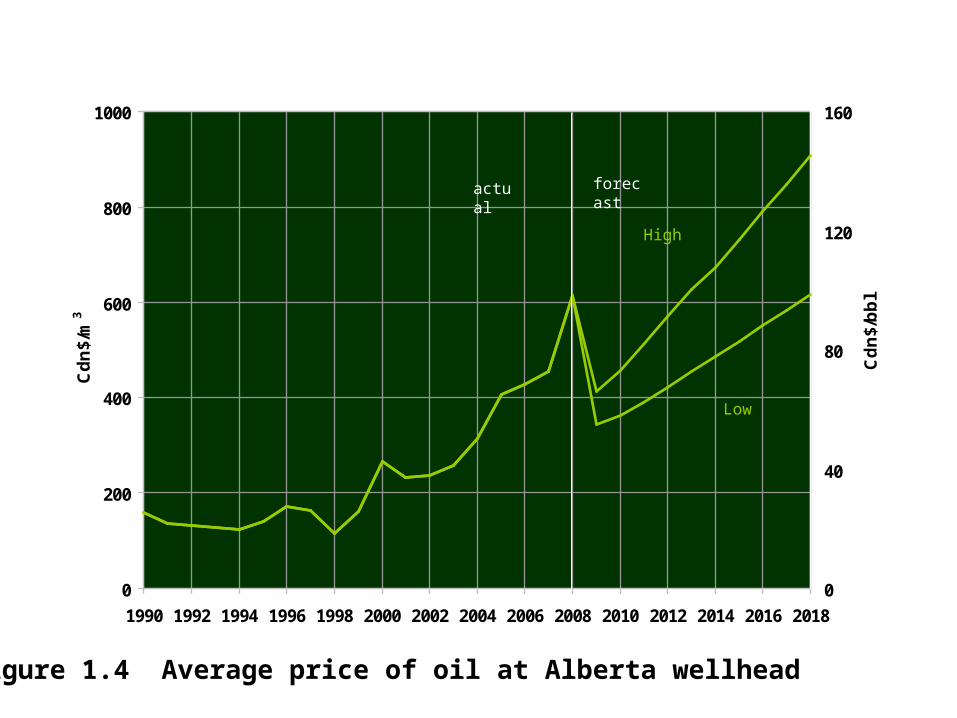
Figure 1.4 Average price of oil at Alberta wellhead
0
200
400
600
800
1000
1990 1992 1994 1996 1998 2000 2002 2004 2006 2008 2010 2012 2014 2016 2018
Cd
n$/
bb
l
0
40
80
120
160
Cd
n$/
m3
actual forecast
High
Low
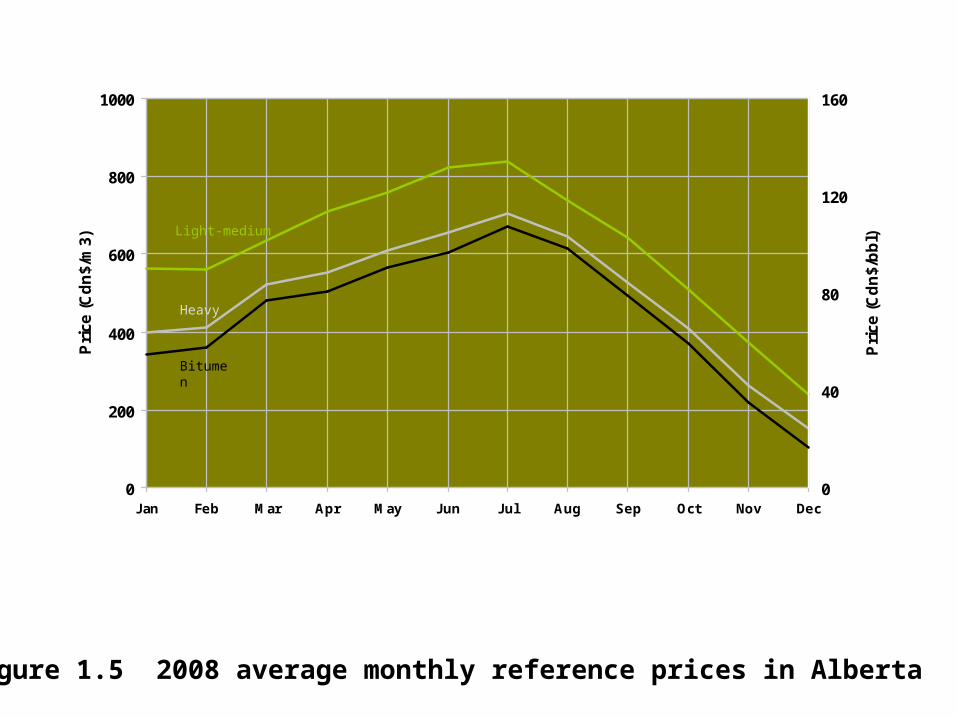
Figure 1.5 2008 average monthly reference prices in Alberta
0
200
400
600
800
1000
Jan Feb Mar Apr May Jun Jul Aug Sep Oct Nov Dec
Pri
ce (
Cd
n$/
bb
l)
0
40
80
120
160P
rice
(C
dn
$/m
3)
Light-medium
Heavy
Bitumen

Figure 1.7 Average price of natural gas at plant gate
0
2
4
6
8
10
12
1998 2000 2002 2004 2006 2008 2010 2012 2014 2016 2018
Pri
ce
(C
dn
$/G
J)
actual forecasthigh
low

Figure 1.8 Alberta Wholesale Electricity Prices
0
25
50
75
100
125
150
2000 2002 2004 2006 2008 2010 2012 2014 2016 2018
Pri
ce
(C
dn
$/M
Wh
)
actual forecast


67.367.5 67.3 64.6 63.7
71.677.0
82.588.2 93.5 94.3
6065707580859095
100
1998 1999 2000 2001 2002 2003 2004 2005 2006 2007 2008
Ce
nts
1.95.2
4.15.5
1.82.9
3.1 3.1 2.8 2.7
0.5
6.56.06.87.67.7
7.6 7.2 7.28.3
6.8 6.3
0
2
4
6
8
10
12
1998 1999 2000 2001 2002 2003 2004 2005 2006 2007 2008
Pe
rce
nta
ge
2.8
2.7
1.01.8
2.5 2.2
1.9 2.22.0 2.2 2.3
4.76.1
4.44.74.2
6.45.8
4.0
6.67.3 5.8
0
2
46
8
10
12
1998 1999 2000 2001 2002 2003 2004 2005 2006 2007 2008
Pe
rce
nta
ge
Figure 1.10 Canadian economic indicatorsSource: Statistics Canada, Bank of Canada
Exchange Rate
Prime rate on Loans
Inflation rate
Prime vs. inflation
Unemployment vs. GDP growth
Unemployment rate
Real GDP growth
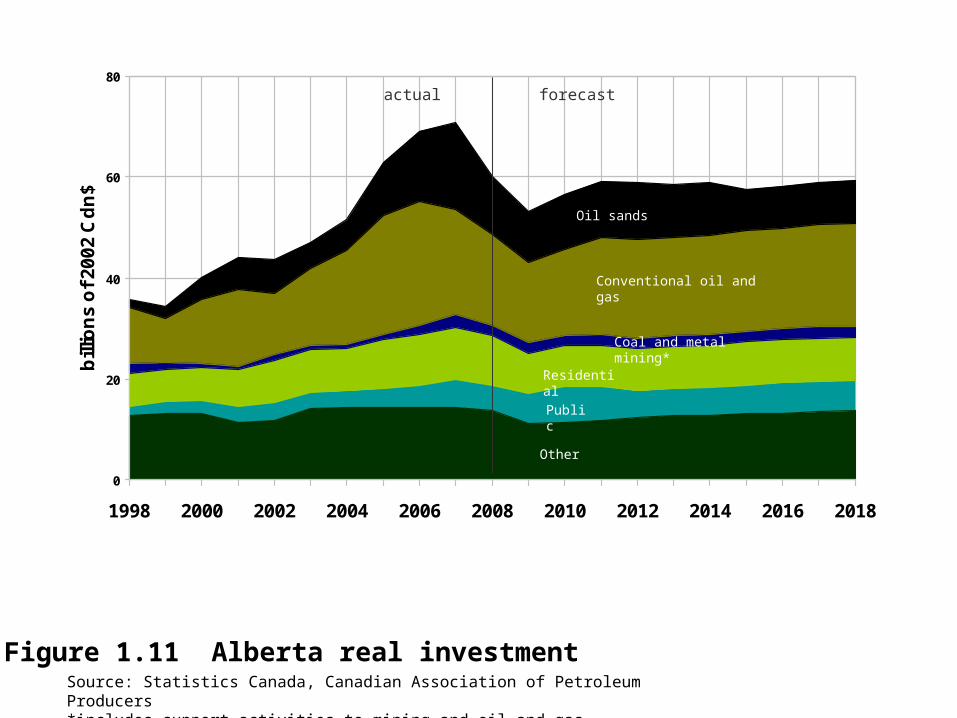
Figure 1.11 Alberta real investment
0
20
40
60
80
1998 2000 2002 2004 2006 2008 2010 2012 2014 2016 2018
bill
ion
s o
f 2
00
2 C
dn
$actual forecast
Source: Statistics Canada, Canadian Association of Petroleum Producers*includes support activities to mining and oil and gas extraction
Other
Public
Residential
Coal and metal mining*
Conventional oil and gas
Oil sands

2007 - 2008 Value of Production in Alberta
$0
$10
$20
$30
$40
NaturalGas
NaturalGas
Liquids
Crude Oil SCO andBitumen
Sulphur Coal
bill
ion
s o
f C
dn
$
2007 2008
N/A

0
500
1000
1500
2000
2500
3000
3500
4000
4500
5000
1984 1986 1988 1990 1992 1994 1996 1998 2000 2002 2004 2006 2008
Re
se
rve
s (
10
6 m3
)
0
5
10
15
20
25
30
Re
se
rve
s (
bill
ion
ba
rre
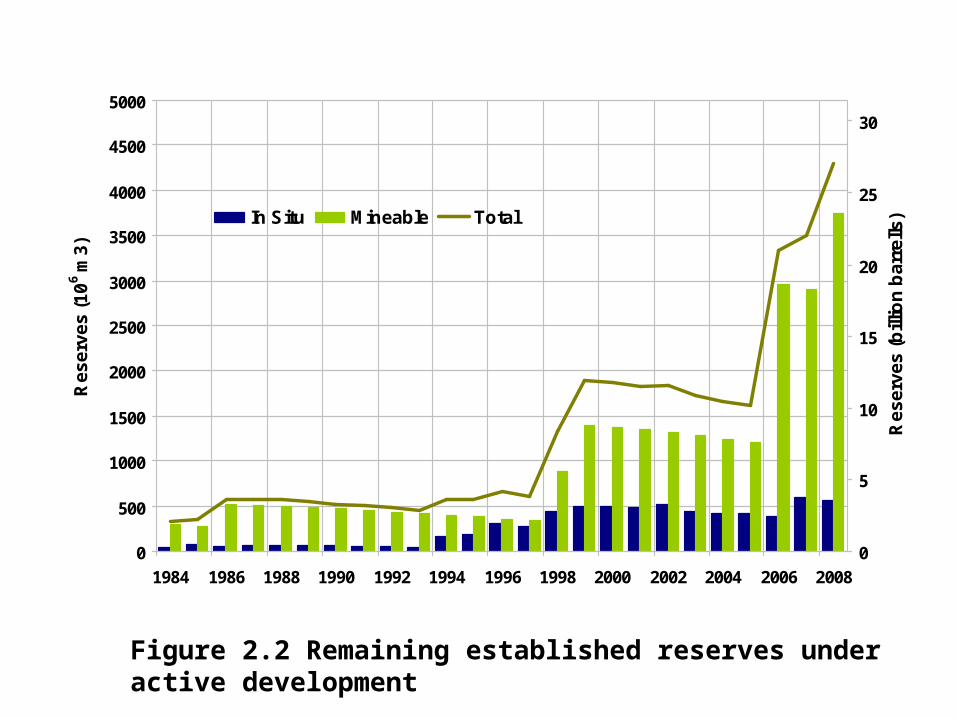
lls)In Situ Mineable Total
Figure 2.2 Remaining established reserves under active development


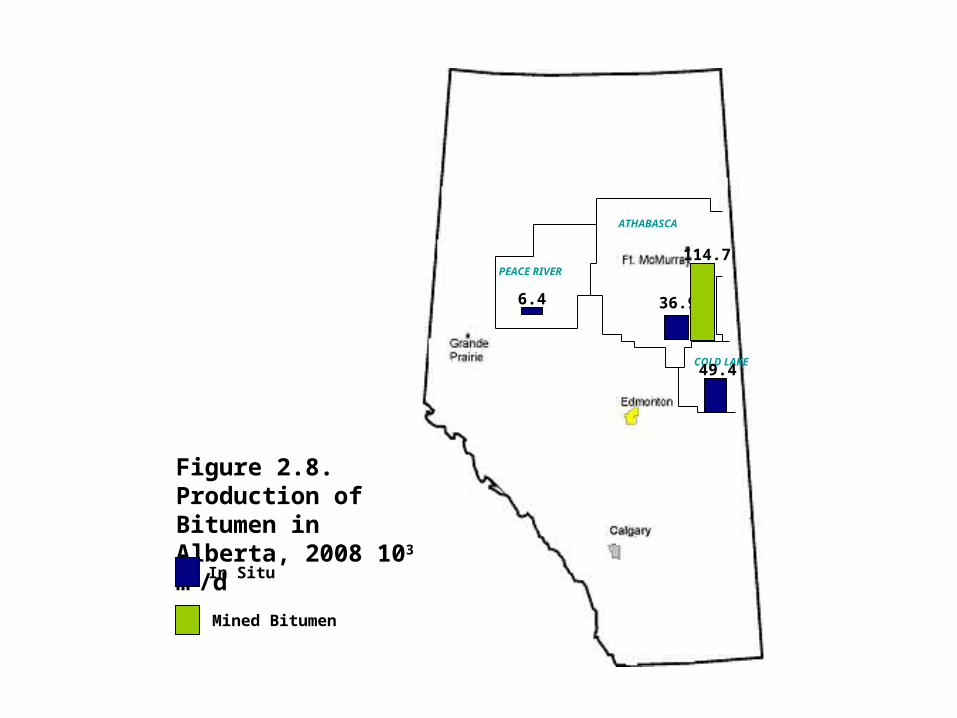
ATHABASCA
COLD LAKE
PEACE RIVER
6.4 36.9
49.4
114.7
Figure 2.8.Production of Bitumen in Alberta, 2008 103 m3/d
Mined Bitumen
In Situ
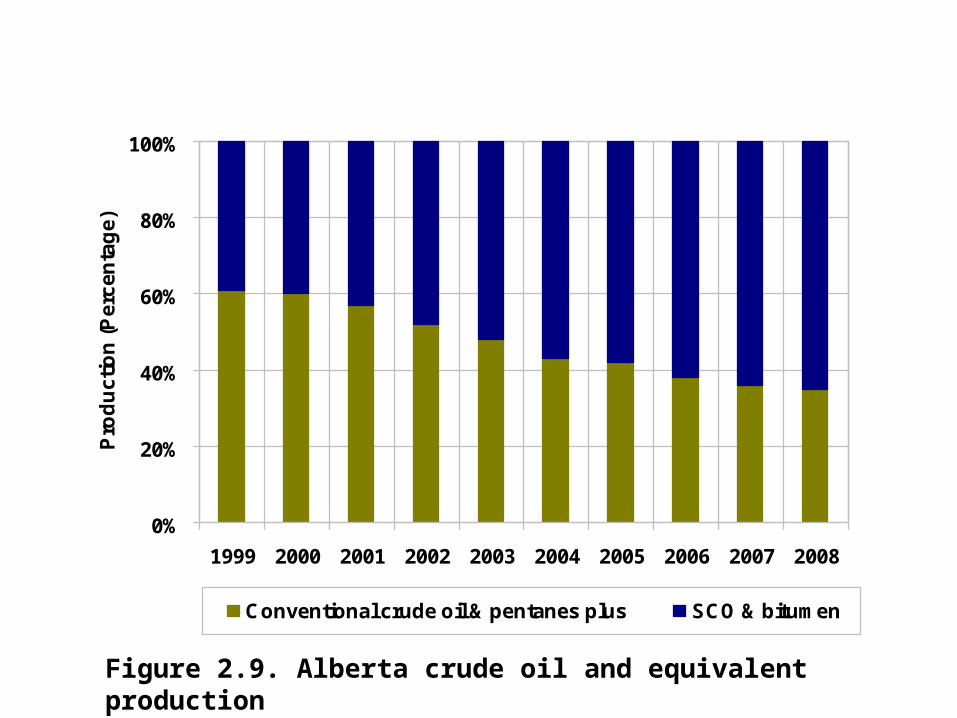
0%
20%
40%
60%
80%
100%
1999 2000 2001 2002 2003 2004 2005 2006 2007 2008
Pro
du
cti
on
(P
erc
en
tag
e)
Conventional crude oil & pentanes plus SCO & bitumen
Figure 2.9. Alberta crude oil and equivalent production
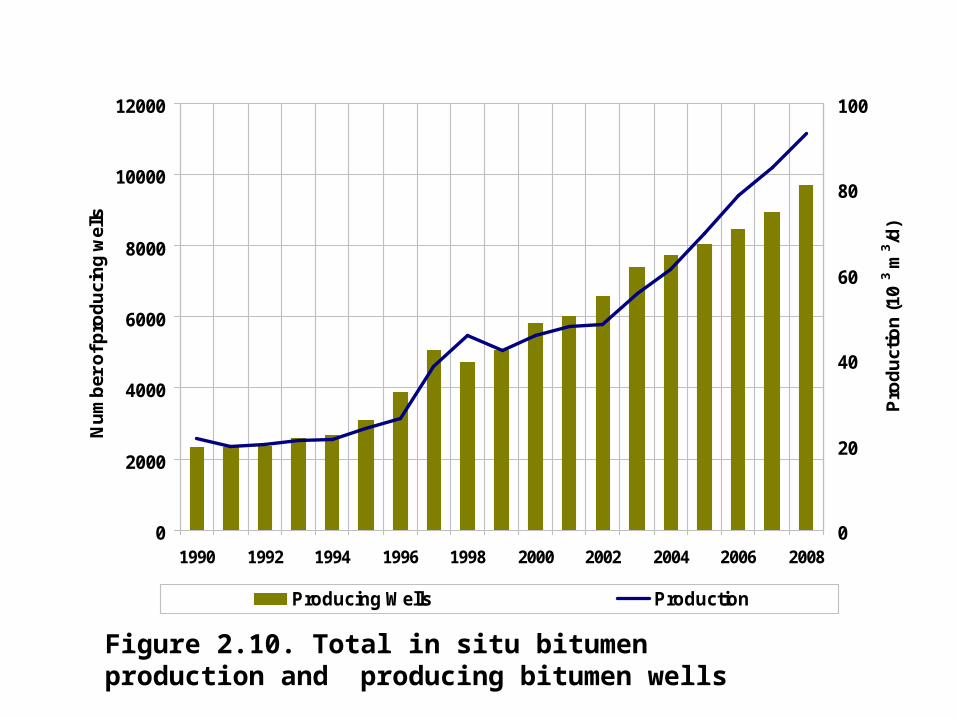
0
2000
4000
6000
8000
10000
12000
1990 1992 1994 1996 1998 2000 2002 2004 2006 2008
Nu
mb
er o
f pro
du
cin
g w
ells
0
20
40
60
80
100
Pro
du
ctio
n (1
03 m
3 /d)
Producing Wells Production
Figure 2.10. Total in situ bitumen production and producing bitumen wells
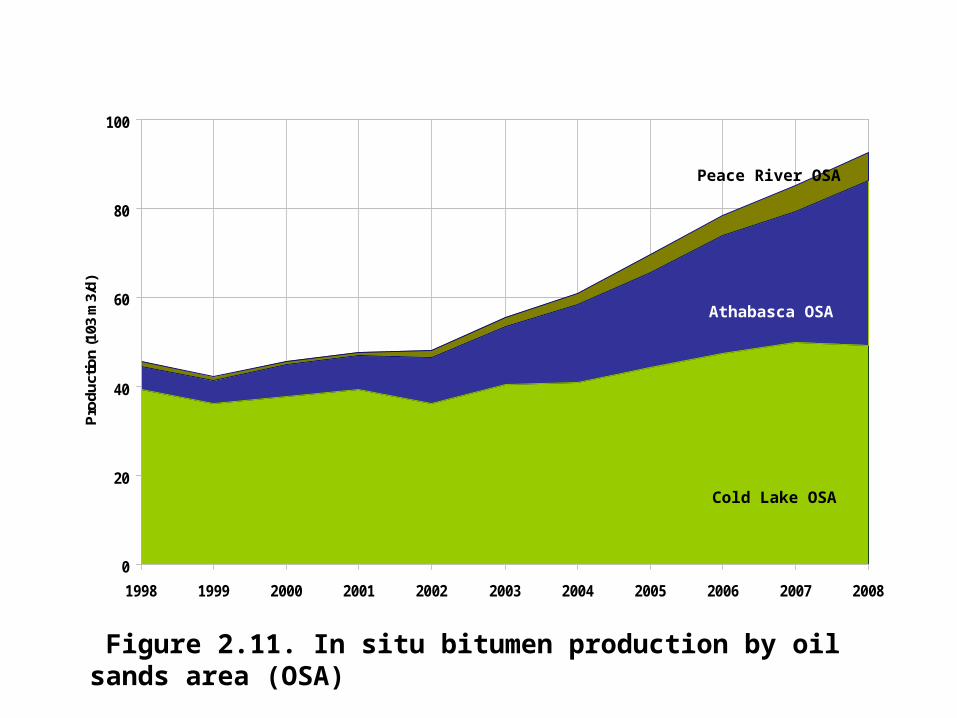
Figure 2.11. In situ bitumen production by oil sands area (OSA)
Synthetic Crude Oil
0
20
40
60
80
100
1998 1999 2000 2001 2002 2003 2004 2005 2006 2007 2008
Pro
duct
ion
(103
m3/
d)
Cold Lake OSA
Athabasca OSA
Peace River OSA
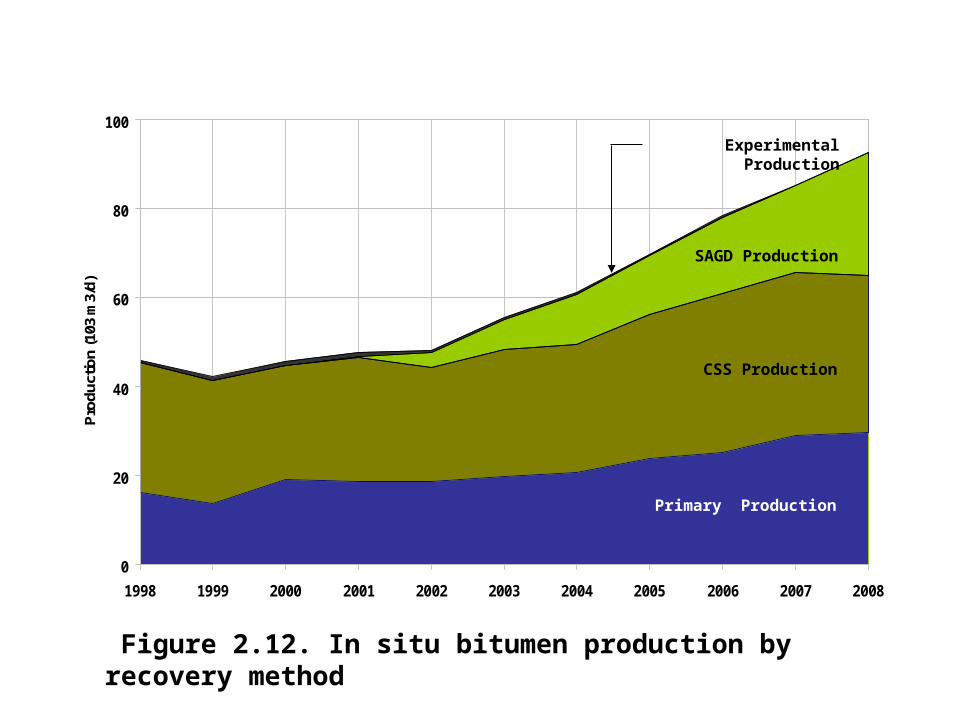
Figure 2.12. In situ bitumen production by recovery method
Synthetic Crude Oil
0
20
40
60
80
100
1998 1999 2000 2001 2002 2003 2004 2005 2006 2007 2008
Pro
duct
ion
(103
m3/
d)
Primary Production
CSS Production
SAGD Production
Experimental Production

Figure 2.13. Alberta crude bitumen production
0
100
200
300
400
500
600
1999 2001 2003 2005 2007 2009 2011 2013 2015 2017
Pro
duct
ion
(10
3 m3 /d
)
Surface mining
In situ
actual forecast

Figure 2.14. Alberta synthetic crude oil production
Synthetic Crude Oil
0
100
200
300
400
1999 2000 2001 2002 2003 2004 2005 2006 2007 2008 2009 2010 2011 2012 2013 2014 2015 2016 2017 2018
Pro
duct
ion
(103
m3/
d)
Synthetic crude oil
actual forecast

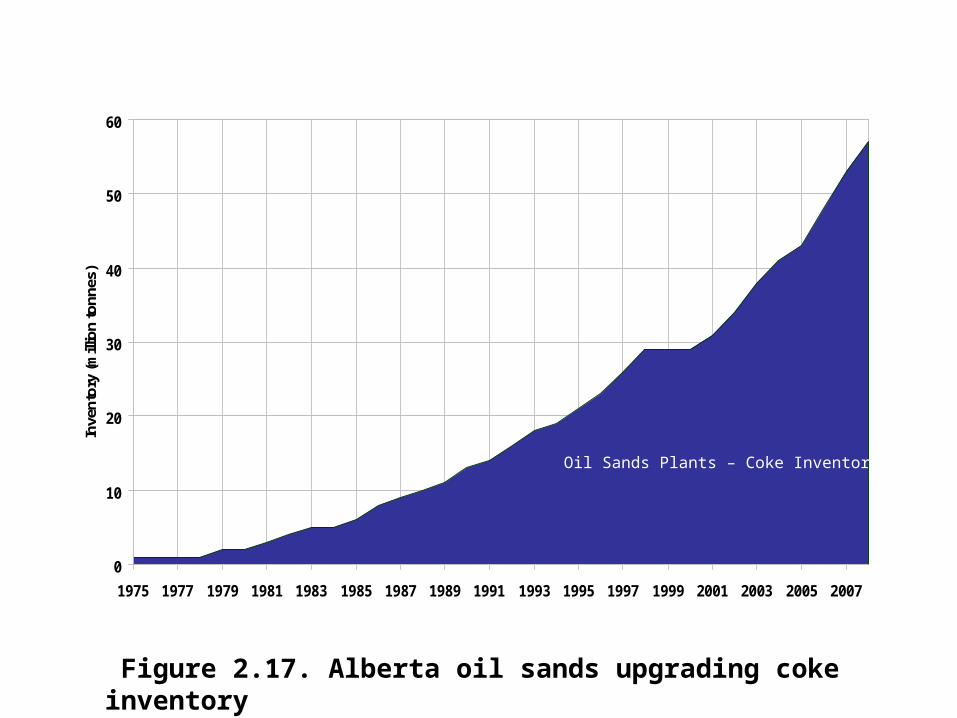
Figure 2.17. Alberta oil sands upgrading coke inventory
Synthetic Crude Oil
0
10
20
30
40
50
60
1975 1977 1979 1981 1983 1985 1987 1989 1991 1993 1995 1997 1999 2001 2003 2005 2007
Inve
ntor
y (m
illio
n to
nnes
)
Oil Sands Plants – Coke Inventory
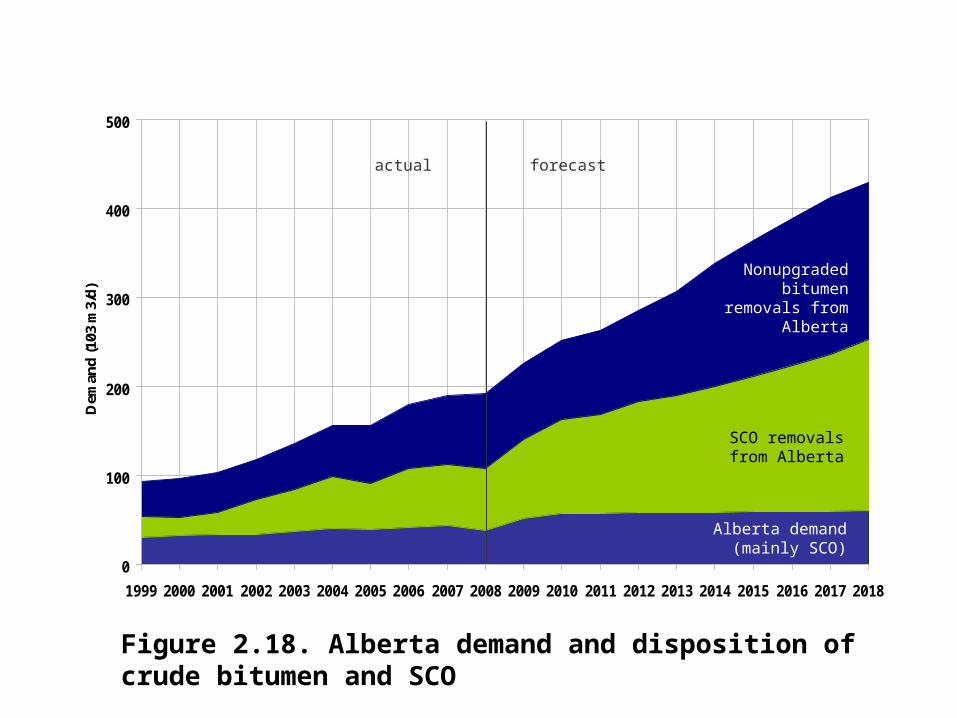
Figure 2.18. Alberta demand and disposition of crude bitumen and SCO
Synthetic Crude Oil
0
100
200
300
400
500
1999 2000 2001 2002 2003 2004 2005 2006 2007 2008 2009 2010 2011 2012 2013 2014 2015 2016 2017 2018
Dem
and
(103
m3/
d)
Alberta demand (mainly SCO)
actual forecast
SCO removals from Alberta
Nonupgraded bitumen removals
from Alberta

0
100
200
300
400
500
600
700
800
1980 1982 1984 1986 1988 1990 1992 1994 1996 1998 2000 2002 2004 2006 2008
Re
se
rve
s (
10
6 m3
)
Figure 3.1 Remaining established reserves of crude oil
Heavy
Light-medium

Figure 3.2 Annual changes in conventional crude oil reserves
-30
-20
-10
0
10
20
30
40
50
1990 1991 1992 1993 1994 1995 1996 1997 1998 1999 2000 2001 2002 2003 2004 2005 2006 2007 2008
Re
se
rve
Ch
an
ge
s (
10
6 m3 )
Additions Revisions

Figure 3.3 Annual changes to waterflood reserves
-10
-5
0
5
10
15
20
25
1990 1992 1994 1996 1998 2000 2002 2004 2006 2008
Re
se
rve
Ch
an
ge
s (
10
6 m
3)
New waterflood Waterflood revisions
`

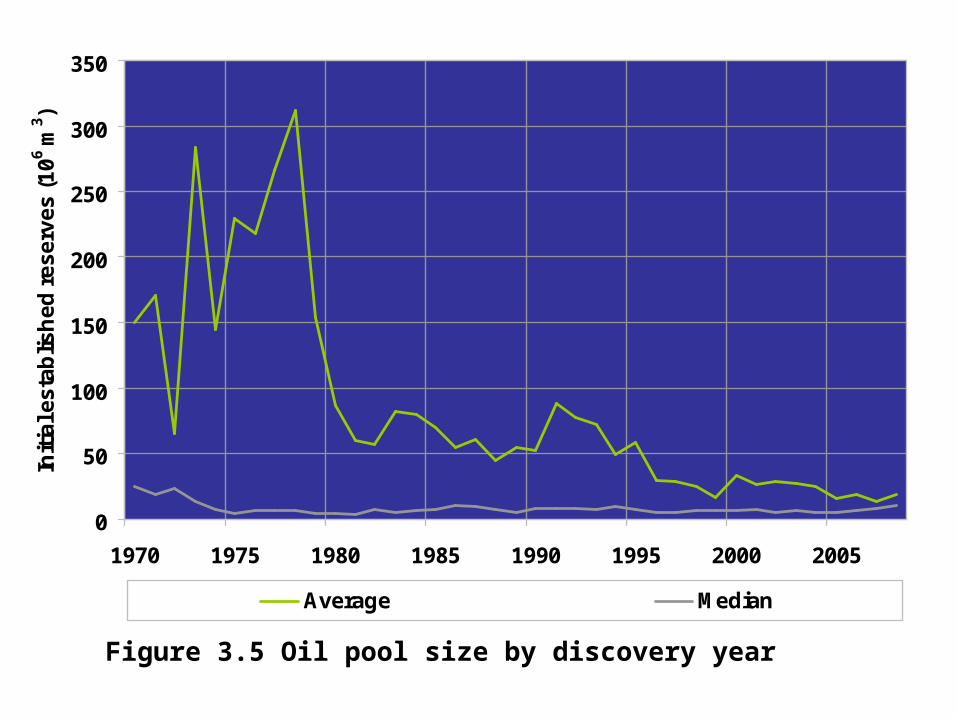
Figure 3.4 Distribution of oil reserves by size
Remaining reserves
(103m3)
Total number of pools Initial reserves
(103m3)
(103 m3)
0
50
100
150
200
250
300
350
1970 1975 1980 1985 1990 1995 2000 2005
Init
ial e
sta
blis
he
d r
es
erv
es
(1
06 m3 )
Average Median
Figure 3.5 Oil pool size by discovery year

Figure 3.7 Geological distribution of reserves of conventional crude oil
0
200
400
600
800
1000
1200R
eser
ves
(10
6 m3 )
Initial established reserves Remaining established reserves
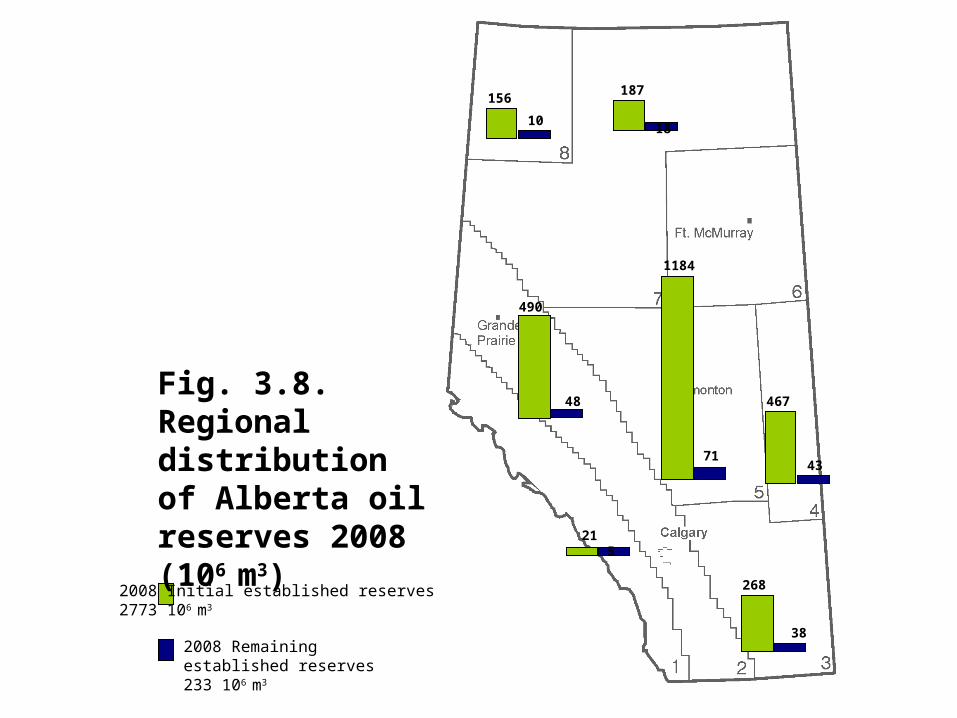
2008 Initial established reserves2773 106 m3
2008 Remaining established reserves233 106 m3
Fig. 3.8. Regional distribution of Alberta oil reserves 2008 (106 m3)
268
21
490
48
1184
71
467
43
187
10
156
38
5
18
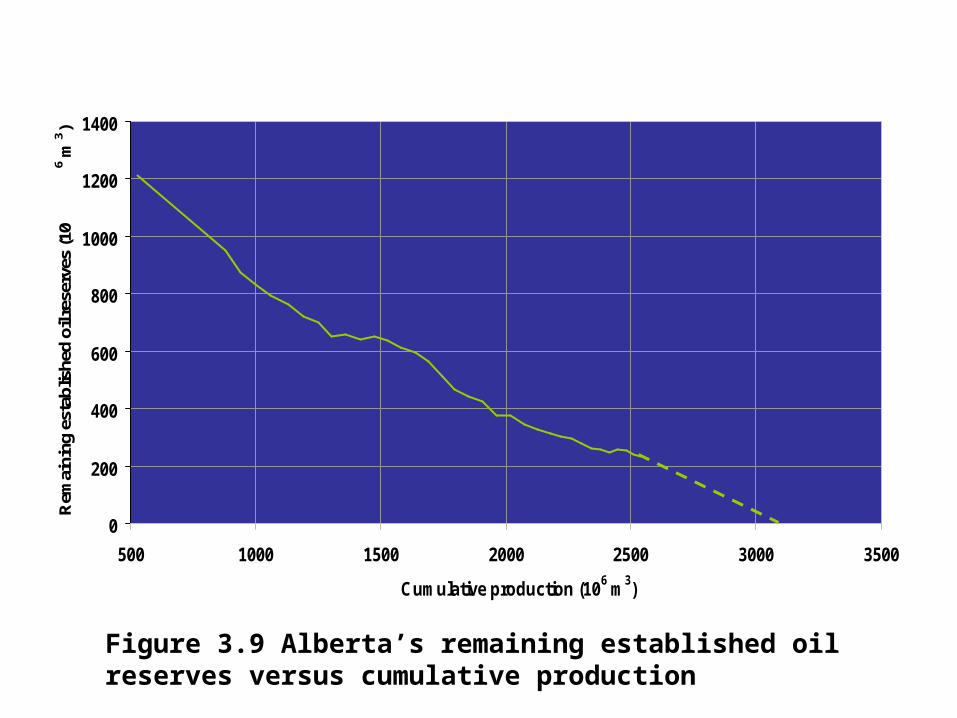
Figure 3.9 Alberta’s remaining established oil reserves versus cumulative production
0
200
400
600
800
1000
1200
1400
500 1000 1500 2000 2500 3000 3500
Cumulative production (106 m3)
Rem
aini
ng e
stab
lishe
d oi
l res
erve
s (1
06 m
3 )
Year 1970

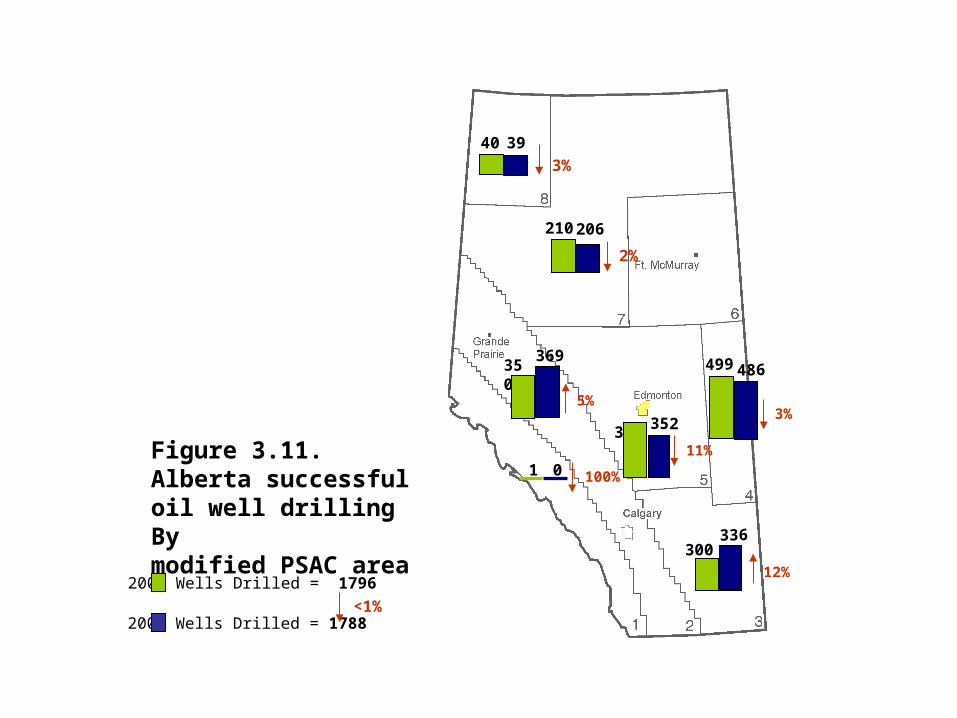
Figure 3.11.Alberta successful oil well drilling Bymodified PSAC area
2007 Wells Drilled = 1796
2008 Wells Drilled = 1788
40
396
499
1
39
350369
352
0
486
210 206
300336
3%
2%
5%
11%
3%
100%
<1%
12%
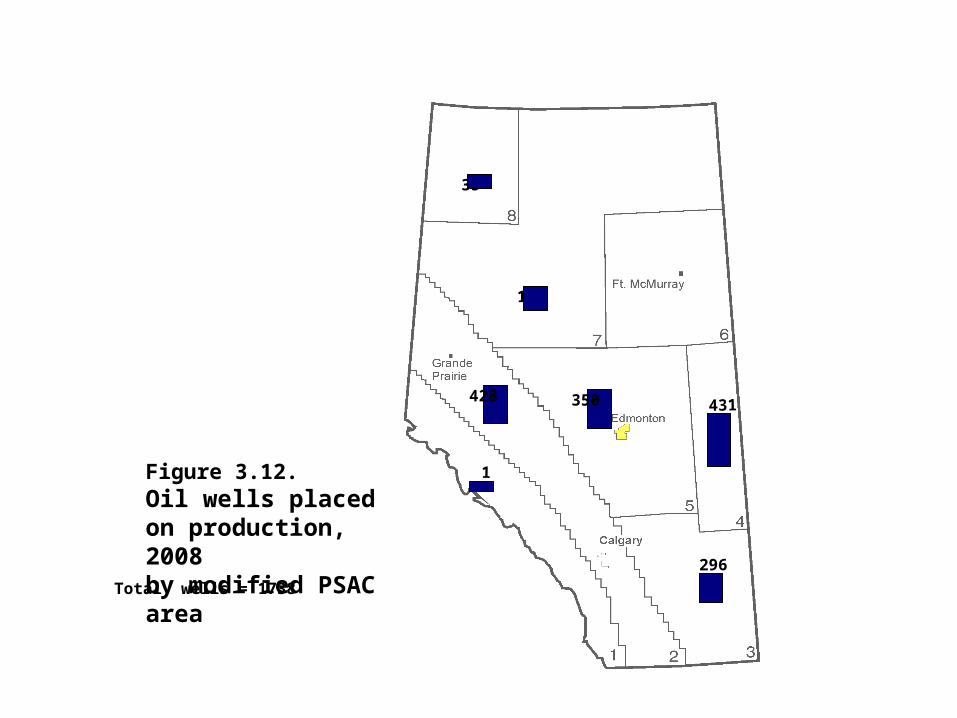
Total wells = 1738
Figure 3.12.Oil wells placedon production, 2008by modified PSAC area 296
1
428 350
431
197
35
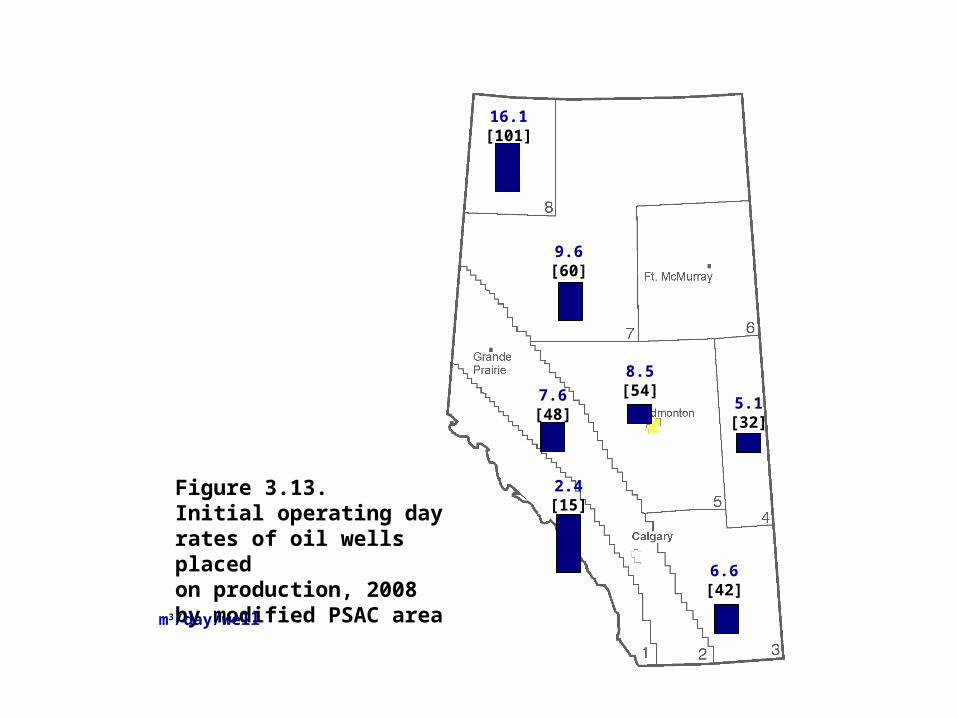
Figure 3.13. Initial operating dayrates of oil wells placed on production, 2008by modified PSAC aream3/day/well
16.1[101]
9.6[60]
8.5[54]
5.1[32]
7.6[48]
2.4[15]
6.6[42]
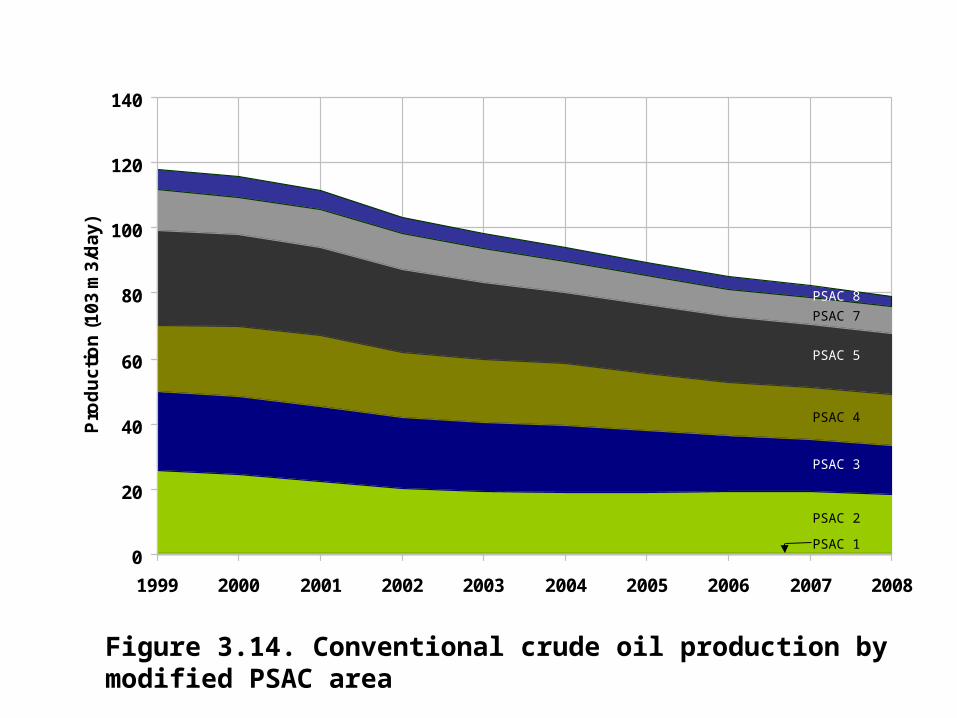
Figure 3.14. Conventional crude oil production by modified PSAC area
0
20
40
60
80
100
120
140
1999 2000 2001 2002 2003 2004 2005 2006 2007 2008
Pro
du
cti
on
(1
03
m3
/da
y)
PSAC 8
PSAC 7
PSAC 5
PSAC 3
PSAC 4
PSAC 2
PSAC 1
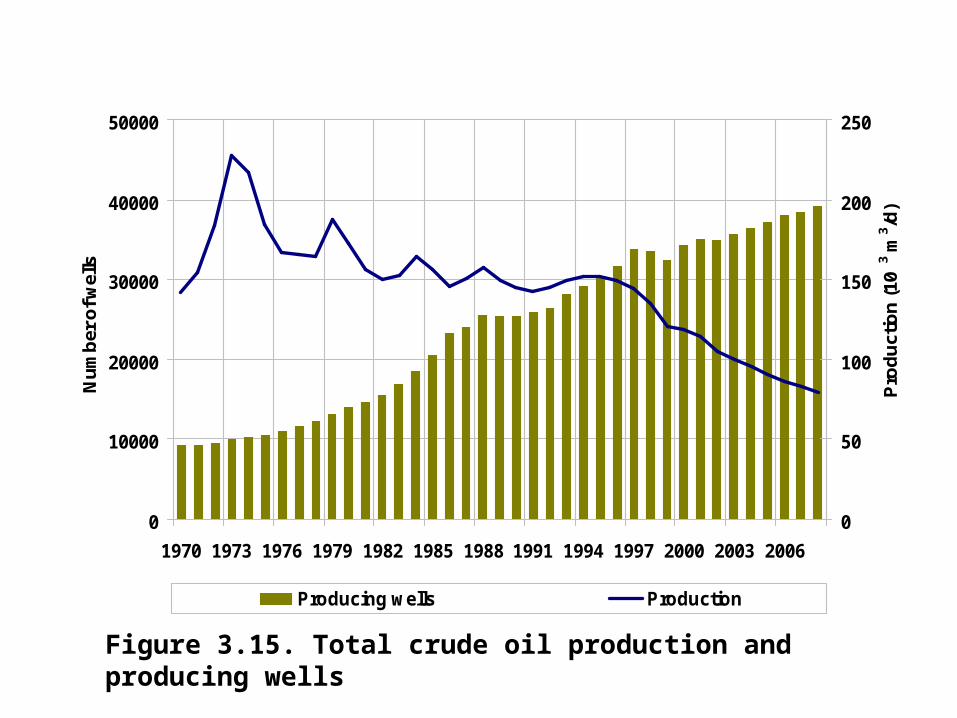
0
10000
20000
30000
40000
50000
1970 1973 1976 1979 1982 1985 1988 1991 1994 1997 2000 2003 2006
Nu
mb
er o
f wel
ls
0
50
100
150
200
250
Pro
du
ctio
n (1
03 m
3 /d)
Producing wells Production
Figure 3.15. Total crude oil production and producing wells

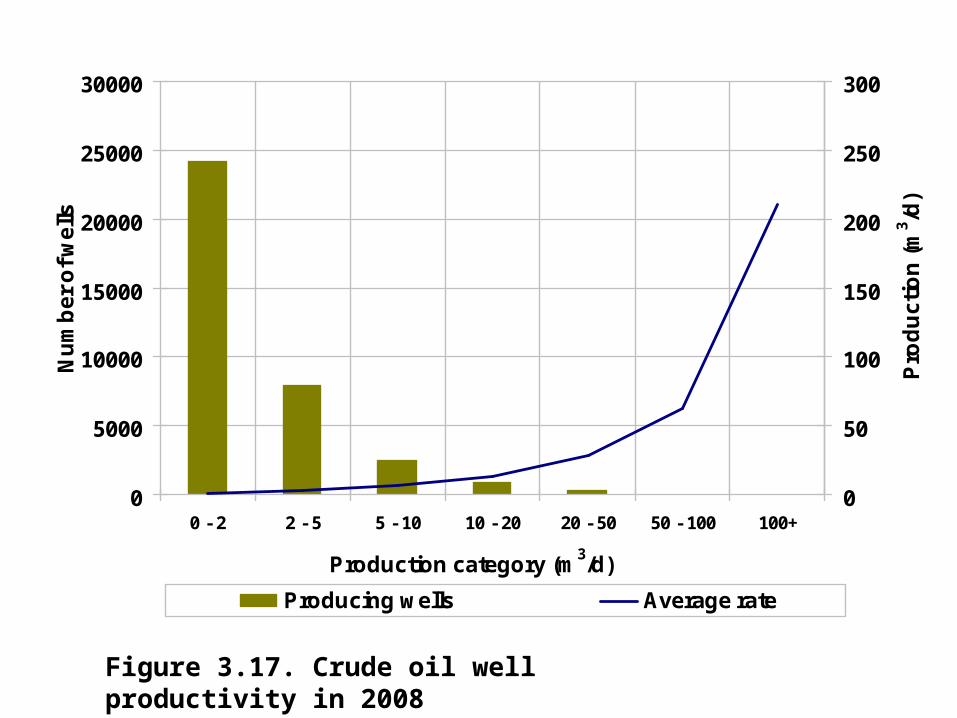
0
5000
10000
15000
20000
25000
30000
0 - 2 2 - 5 5 - 10 10 - 20 20 - 50 50 - 100 100+
Production category (m3/d)
Nu
mb
er
of
we
lls
0
50
100
150
200
250
300
Pro
du
cti
on
(m
3 /d)
Producing wells Average rate
Figure 3.17. Crude oil well productivity in 2008

Figure 3.18. Total conventional crude oil production by drilled year
% of totalproduction from oil wells
0
20
40
60
80
100
120
140
1999 2000 2001 2002 2003 2004 2005 2006 2007 2008
Pro
du
cti
on
(1
03 m
3 /d)
Pre-1999 20082007
20062005
20032004
20022001
20001999
9%
48%
7%
3%
4%2%
5%
3%
5%
6%
8%

0
500
1000
1500
2000
2500
3000
3500
4000
1950 1955 1960 1965 1970 1975 1980 1985 1990 1995 2000 2005
Pro
du
cti
on
(1
03 b
bl/d
)
Figure 3.19. Comparison of crude oil production
Texas onshore
Louisiana onshore
Alberta crude oil

Figure 3.20. WTI crude oil price and well activity
0
1000
2000
3000
4000
1999 2001 2003 2005 2007 2009 2011 2013 2015 2017
Nu
mb
er
of
we
lls
$0
$40
$80
$120
$160
Pri
ce
(U
S$
/bb
l)
Wells placed on production WTI @ Chicago
actual forecast

0
30
60
90
120
150
180
1999 2000 2001 2002 2003 2004 2005 2006 2007 2008 2009 2010 2011 2012 2013 2014 2015 2016 2017 2018
Pro
duct
ion
(10
3 m3 /d
)
actual forecast
Figure 3.21. Alberta average daily production of crude oil
Heavy
Light-medium

Figure 3.22. Capacity and location of Alberta refineries
0
5000
10000
15000
20000
25000
30000
35000
Imperial Edmonton
Petro-Canada Edmonton
Shell Scotford
Husky Lloydminster
Parkland Bowden
Ref
iner
y ca
paci
ties
(m3/d
)
0
30
60
90
120
150
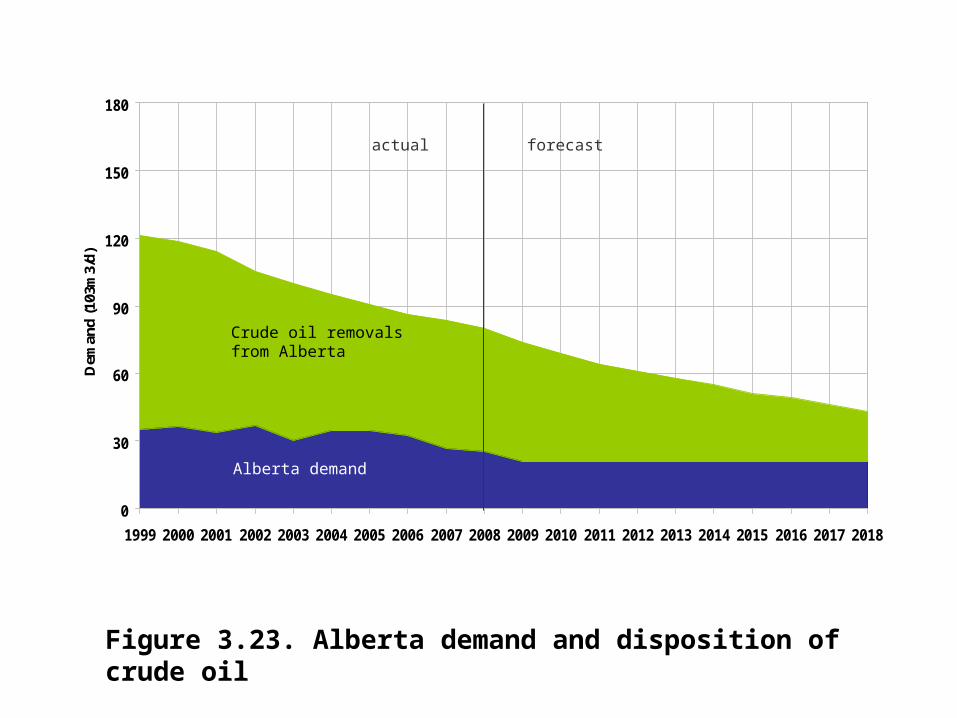
180
1999 2000 2001 2002 2003 2004 2005 2006 2007 2008 2009 2010 2011 2012 2013 2014 2015 2016 2017 2018
Dem
and
(103
m3/
d)
actual forecast
Figure 3.23. Alberta demand and disposition of crude oil
Crude oil removals from Alberta
Alberta demand
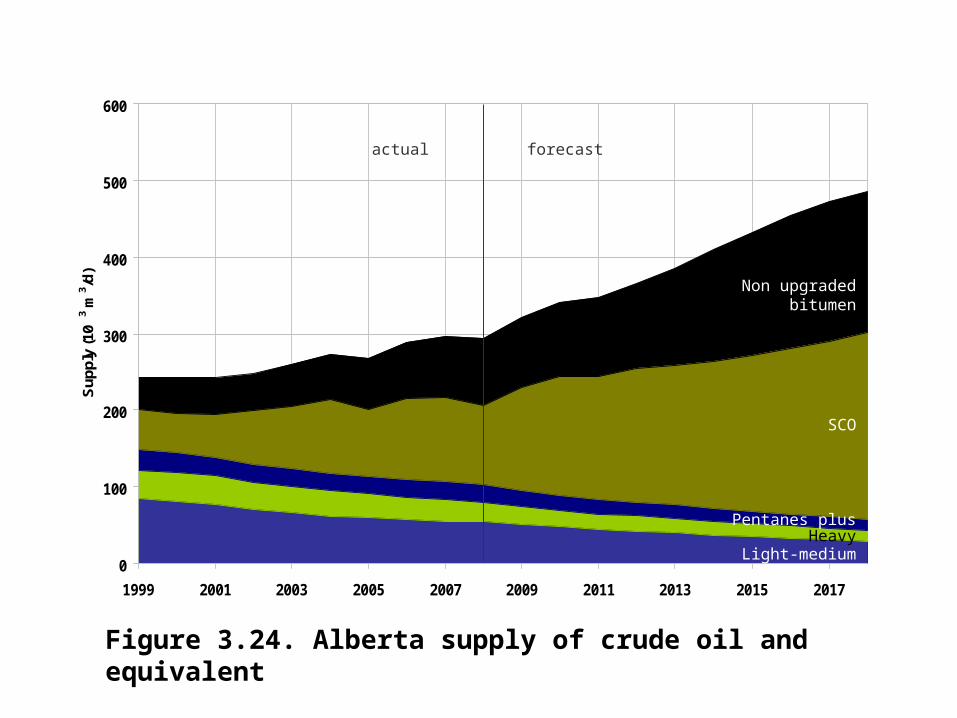
Figure 3.24. Alberta supply of crude oil and equivalent
0
100
200
300
400
500
600
1999 2001 2003 2005 2007 2009 2011 2013 2015 2017
Sup
ply
(10
3 m3 /d
)
actual forecast
Non upgraded bitumen
Light-medium
SCO
Pentanes plusHeavy

Figure 3.25. Alberta crude oil and equivalent production
0%
20%
40%
60%
80%
100%
1999 2001 2003 2005 2007 2009 2011 2013 2015 2017
Pro
du
cti
on
(P
erc
en
tag
e)
Conventional crude oil & pentanes plus SCO & bitumen
actual forecast


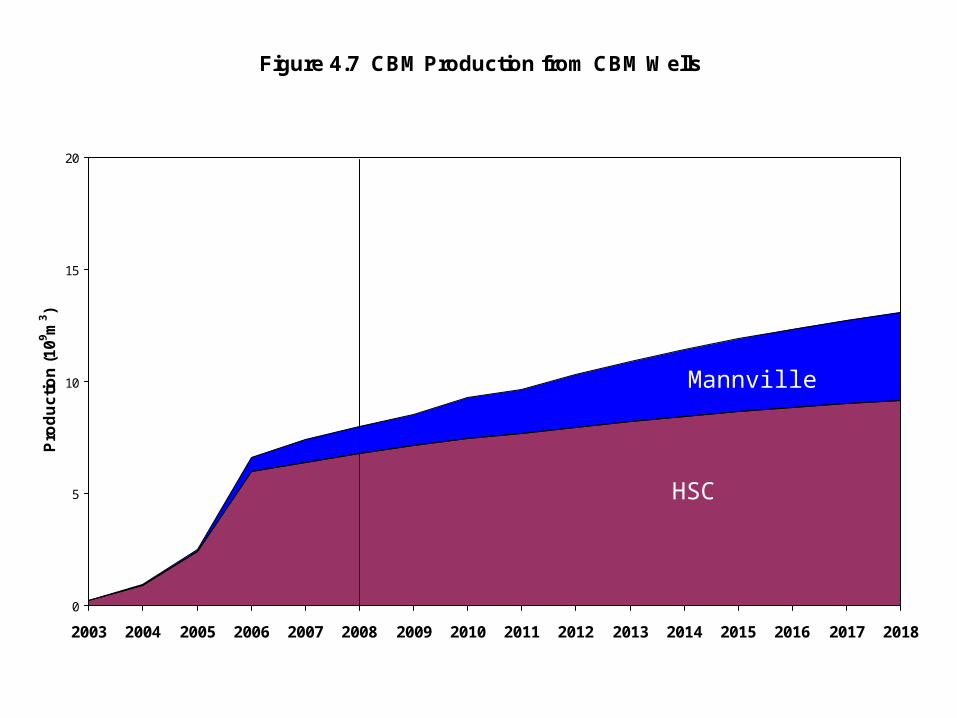
Figure 4.7 CBM Production from CBM Wells
0
5
10
15
20
2003 2004 2005 2006 2007 2008 2009 2010 2011 2012 2013 2014 2015 2016 2017 2018
Pro
du
cti
on
(1
09 m3 )
actual forecast
HSC
Mannville

0
20
40
60
80
100
120
140
160
180
19
75
19
78
19
81
19
84
19
87
19
90
19
93
19
96
19
99
20
02
20
05
20
08
Re
se
rve
Ad
dit
ion
s a
nd
Pro
du
cti
on
(1
09 m3 )
Additions Production
Figure 5.1 Annual reserves additions and production of conventional marketable gas

0
400
800
1200
1600
2000
1975
1978
1981
1984
1987
1990
1993
1996
1999
2002
2005
2008
Rem
ain
ing
Res
erve
s (1
09 m
3 )
Figure 5.2 Remaining conventional marketable gas reserves

-60
-40
-20
0
20
40
60
80
100
120
140
1999 2000 2001 2002 2003* 2004* 2005* 2006* 2007* 2008
Res
erve
Ch
ang
es (1
09 m
3 )
New Development Revisions
Figure 5.3 New, development, and revisions to conventional marketable gas reserves
* Distribution of changes revised in 2008


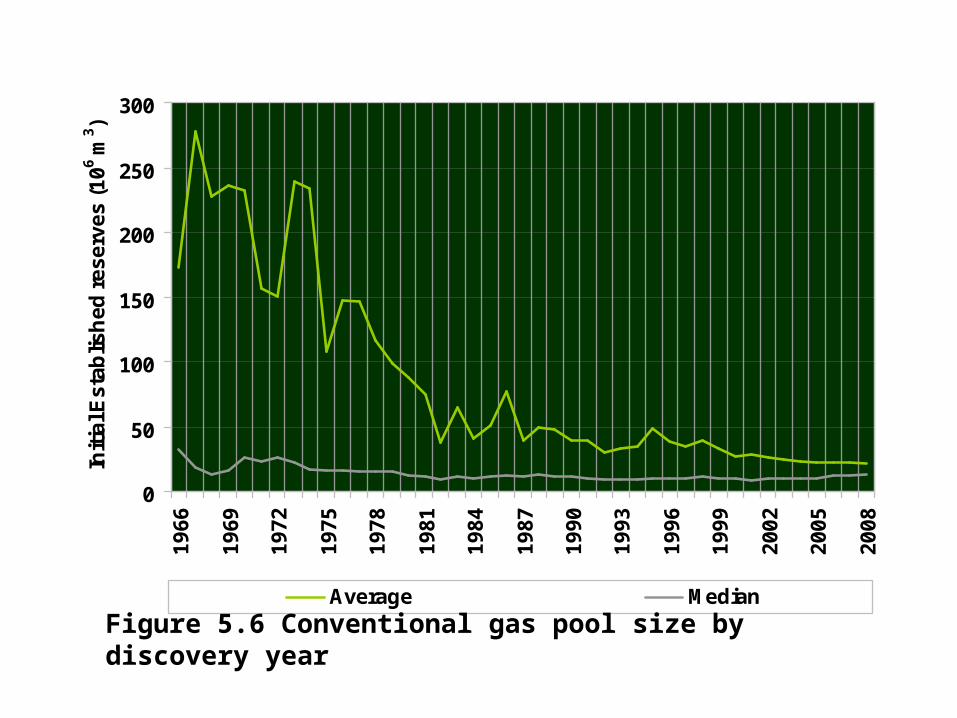
Figure 5.5 Distribution of conventional gas reserves by size
Remaining reserves
(109m3)
Total number of pools
(106m3)
Initial reserves
(109m3)
0
50
100
150
200
250
300
19
66
19
69
19
72
19
75
19
78
19
81
19
84
19
87
19
90
19
93
19
96
19
99
20
02
20
05
20
08
Init
ial E
sta
blis
he
d r
es
erv
es
(1
06 m
3 )
Average Median
Figure 5.6 Conventional gas pool size by discovery year
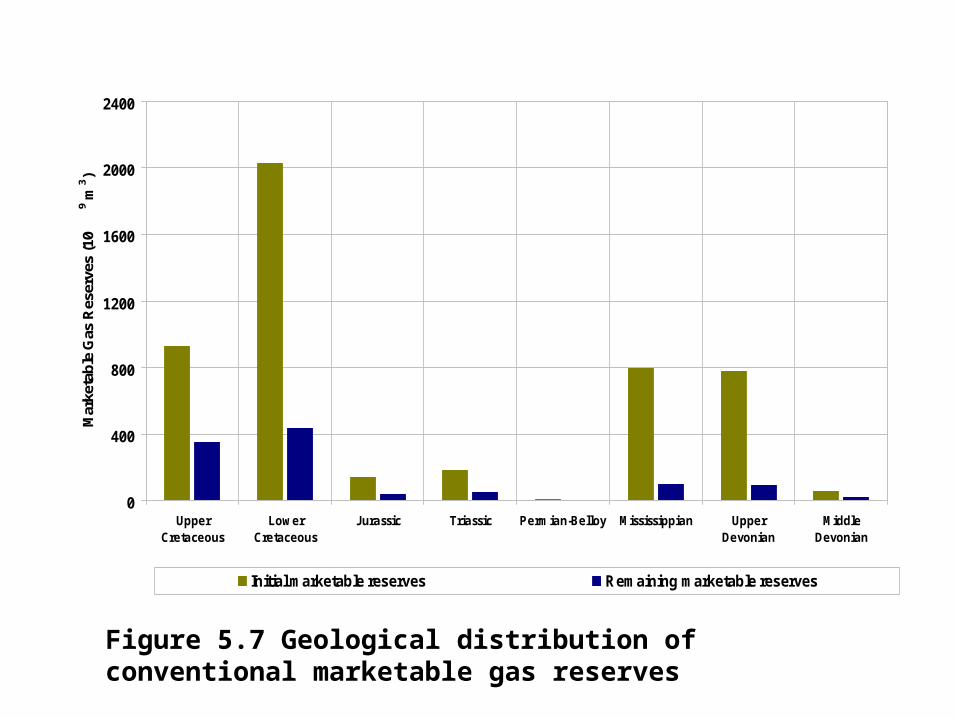
0
400
800
1200
1600
2000
2400
UpperCretaceous
LowerCretaceous
Jurassic Triassic Permian-Belloy Mississippian UpperDevonian
MiddleDevonian
Mar
keta
ble
Gas
Res
erve
s (1
09 m
3 )
Initial marketable reserves Remaining marketable reserves
Figure 5.7 Geological distribution of conventional marketable gas reserves

0
400
800
1200
1600
2000
1984 1986 1988 1990 1992 1994 1996 1998 2000 2002 2004 2006 2008
Rem
aini
ng R
eser
ves
(10
9 m3 )
Figure 5.8 Remaining conventional marketable reserves of sweet and sour gas
Sweet natural gas
Sour natural gas

25
50
60
9040
35
30
10
100
35
15
10
0%
20%
40%
60%
80%
100%
Methane Ethane Propane Butanes Pentanes plus
Per
cent
age
of c
ompo
nent
Removed at field plants Removed at straddle plants Marketable gas
Figure 5.9 Expected recovery of conventional natural gas components

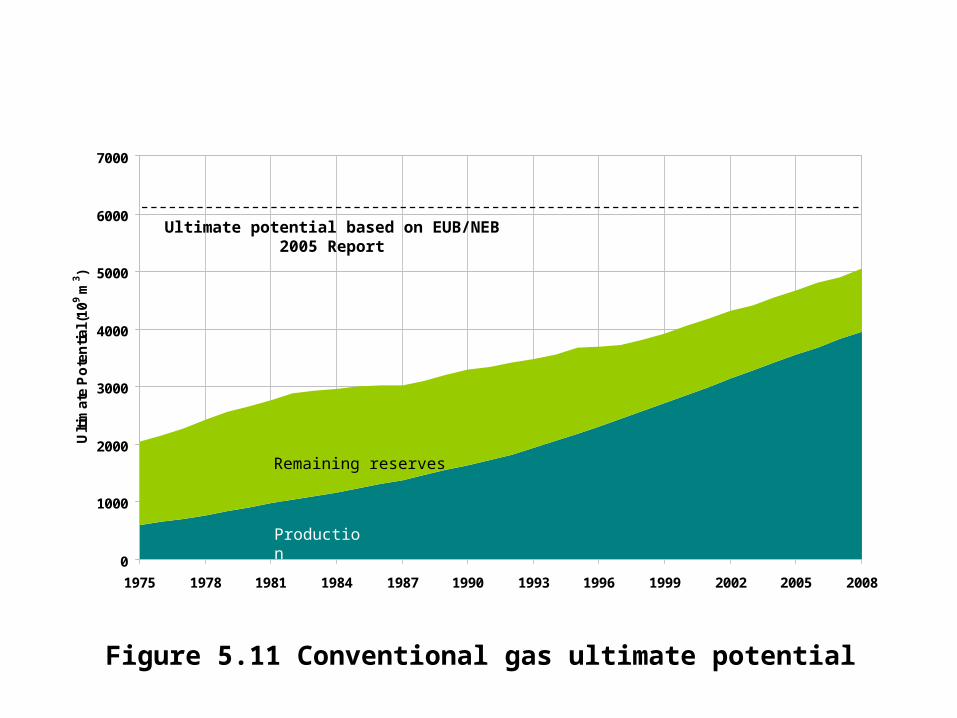
Figure 5.11 Conventional gas ultimate potential
0
1000
2000
3000
4000
5000
6000
7000
1975 1978 1981 1984 1987 1990 1993 1996 1999 2002 2005 2008
Ult
ima
te P
ote
nti
al (
109 m
3 )
Ultimate potential based on EUB/NEB 2005 Report
Remaining reserves
Production


0
500
1000
1500
2000
2500
3000
3500
4000
4500
UpperCretaceous
LowerCretaceous
Jurassic Triassic Mississippian Upper Devonian
Gas
in p
lace
(10
9 m3 )
Ultimate gas in place Discovered gas in place
Figure 5.13 Conventional gas in place by geological period

Figure 5.14Alberta successful gaswell drilling (conventional)by modified PSAC area
95
111
1248
308
4959
91
61
43288152
2128 2106
986
56
302
3604
36%
38%
47%
61%
27%
2%
21% 1%
2007 wells drilled = 9228 21%
2008 wells drilled = 7310
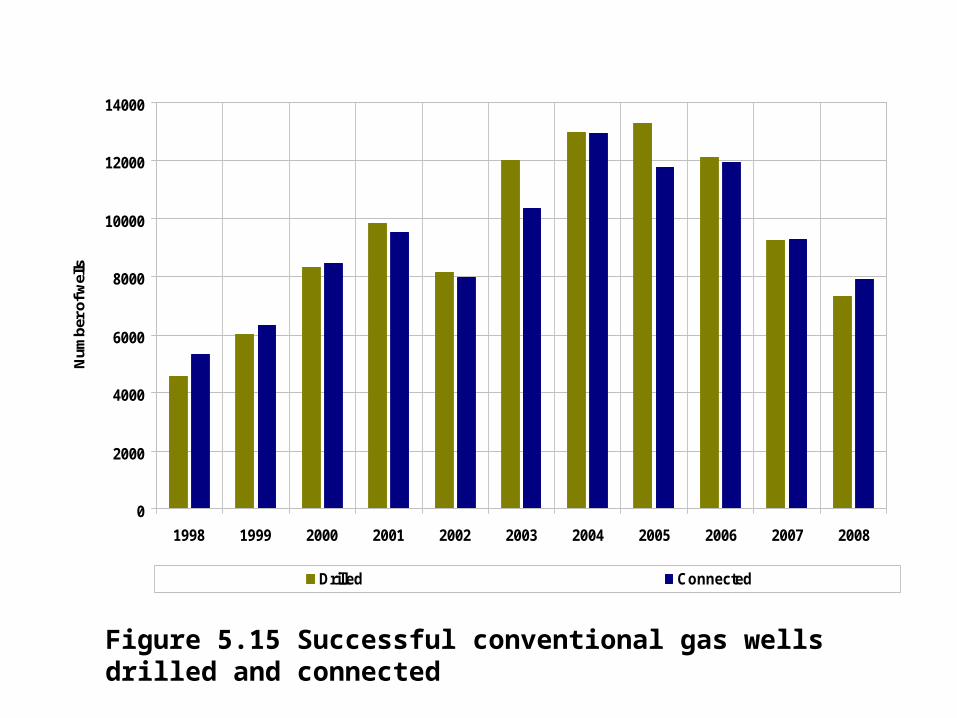
0
2000
4000
6000
8000
10000
12000
14000
1998 1999 2000 2001 2002 2003 2004 2005 2006 2007 2008
Num
ber o
f wel
ls
Drilled Connected
Figure 5.15 Successful conventional gas wells drilled and connected

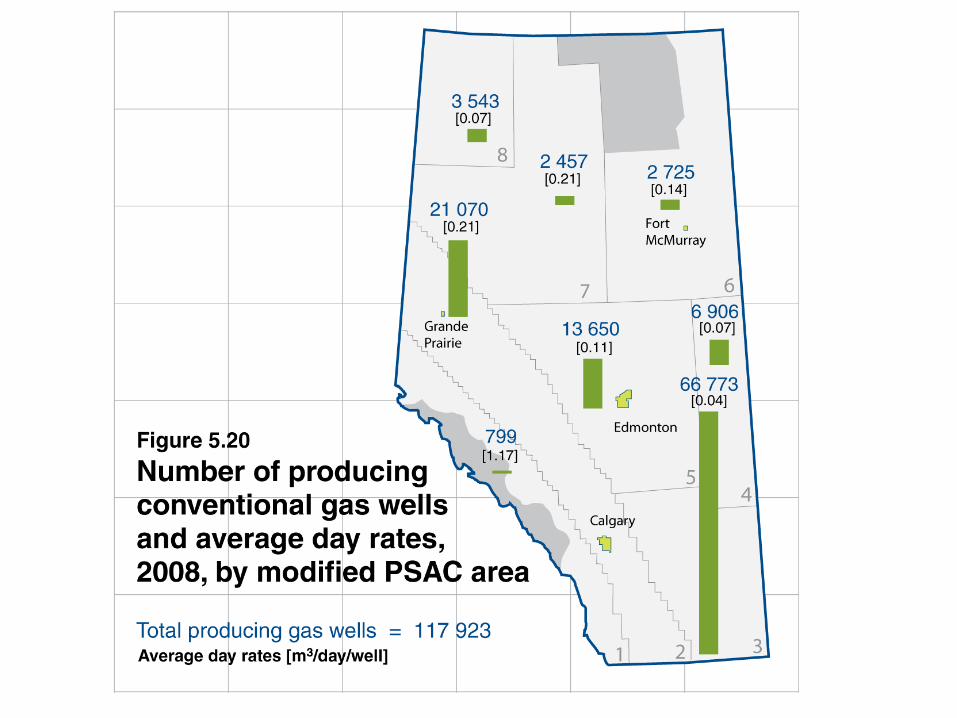
Figure 5.16 Conventional gaswell connectionsby modified PSAC area
119
168
1427477
4557100
96
84
270 193
2168 2004
1213
70
378
3869
2007 WellsTotal Wells connected = 9286
2008 WellsTotal Wells connected = 7907

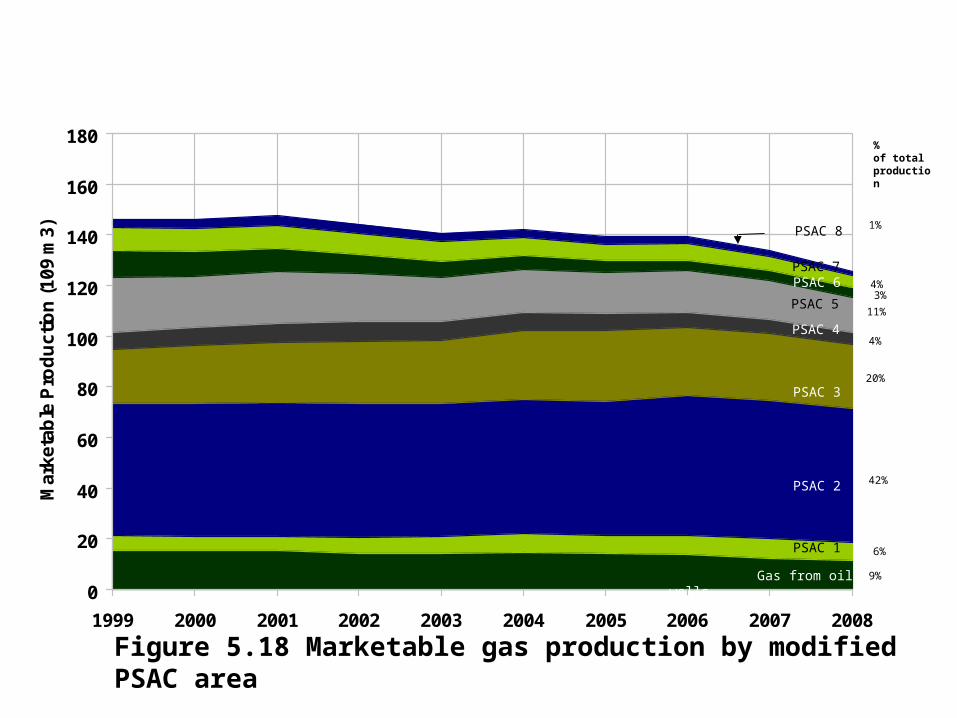
Figure 5.18 Marketable gas production by modified PSAC area
0
20
40
60
80
100
120
140
160
180
1999 2000 2001 2002 2003 2004 2005 2006 2007 2008
Ma
rke
tab
le P
rod
uc
tio
n (
10
9 m
3)
PSAC 6
PSAC 4
PSAC 5
PSAC 2
PSAC 3
PSAC 1
Gas from oil wells
PSAC 7
PSAC 8
% of totalproduction
1%
4% 3%
11%
4%
20%
42%
6%
9%

0
20000
40000
60000
80000
100000
120000
1990 1992 1994 1996 1998 2000 2002 2004 2006 2008
Nu
mb
er o
f pro
du
cin
g w
ells
0
50
100
150
200
250
300
Pro
du
ctio
n (1
09 m
3 )
Producing wells Production
Figure 5.19 Conventional marketable gas production and number of producing wells
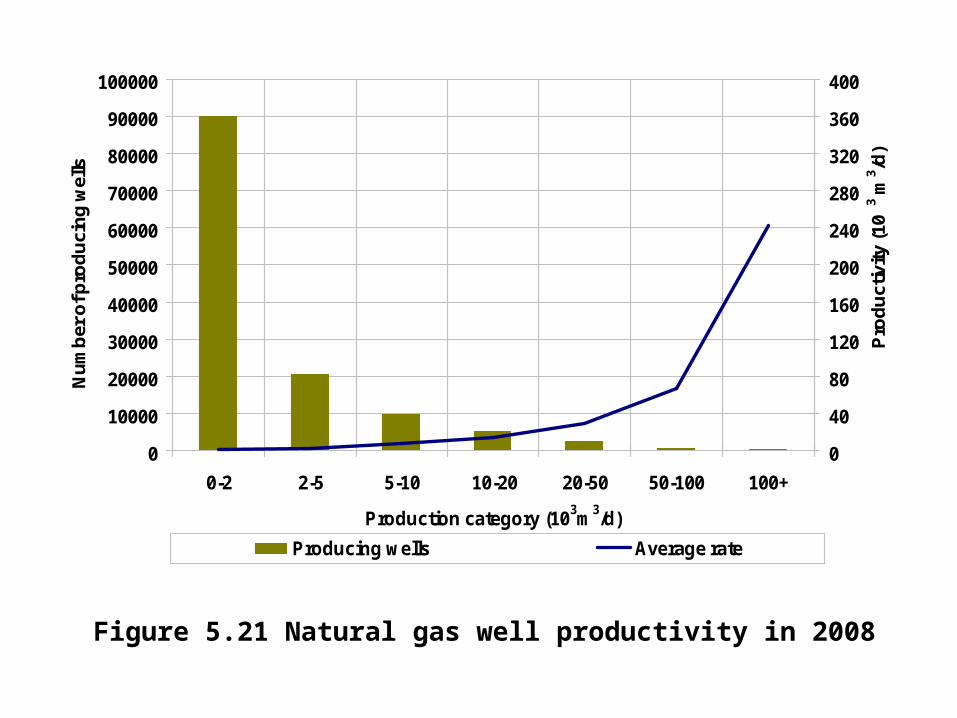
0
10000
20000
30000
40000
50000
60000
70000
80000
90000
100000
0-2 2-5 5-10 10-20 20-50 50-100 100+
Production category (103m3/d)
Nu
mb
er o
f pro
du
cin
g w
ells
0
40
80
120
160
200
240
280
320
360
400
Pro
du
ctiv
ity (1
03 m
3 /d)
Producing wells Average rate
Figure 5.21 Natural gas well productivity in 2008

0
20
40
60
80
100
120
140
160
180
200
1999 2000 2001 2002 2003 2004 2005 2006 2007 2008
Pro
du
cti
on
(1
09 m
3 )
Pre - 1999
20082007
20062005
20032004
20022001
2000
1999
Gas from oil wells
Figure 5.22 Raw gas production by connection year
% of totalproduction from gas wells
5
Connection year
3 4
27
8
11
9
13
6
5
9
0
50
100
150
200
1999 2000 2001 2002 2003 2004 2005 2006 2007 2008
Pro
du
ctio
n (
109
m3)
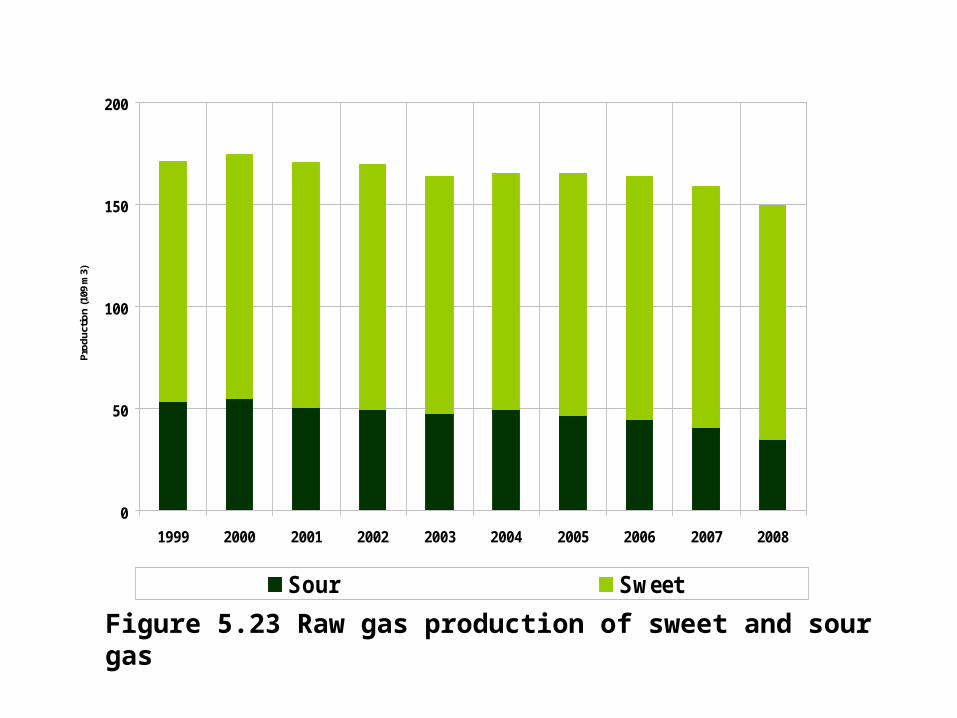
Sour Sweet
Figure 5.23 Raw gas production of sweet and sour gas
0
5
10
15
20
25
1958 1963 1968 1973 1978 1983 1988 1993 1998 2003 2008
Tc
f
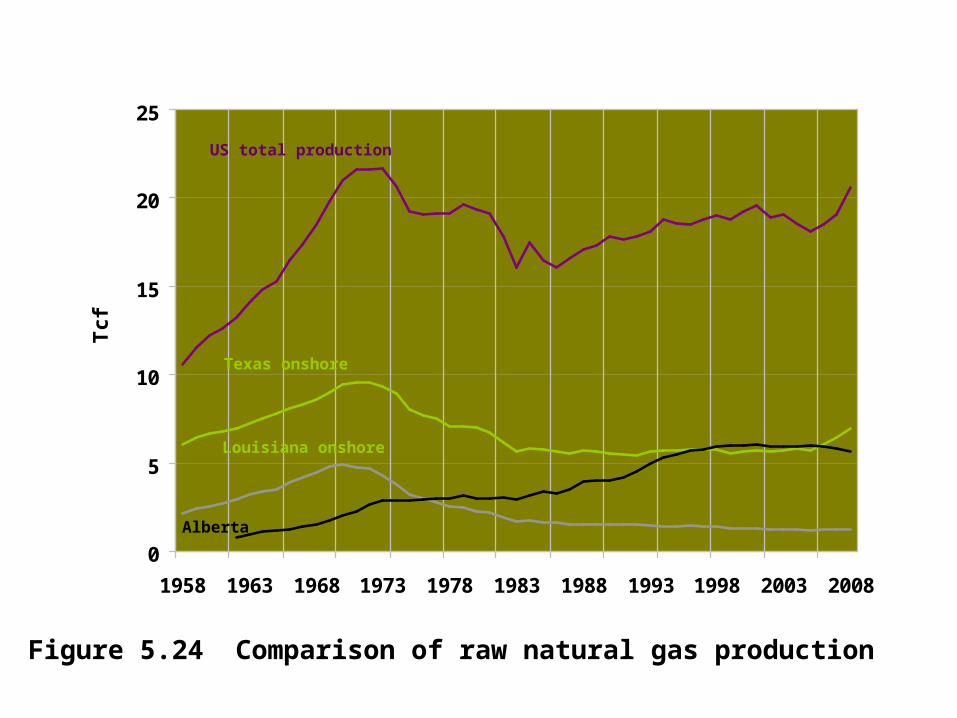
Figure 5.24 Comparison of raw natural gas production
Texas onshore
Louisiana onshore
Alberta
US total production

0.0
5.0
10.0
15.0
20.0
25.0
30.0
1999 2000 2001 2002 2003 2004 2005 2006 2007
Pro
du
cti
vit
y (
103
m3 /d
)
AlbertaAlberta excluding PSAC Area 3PSAC Area 3 (Southeastern Alberta)
Figure 5.25 Average initial natural gas well productivity in Alberta

Figure 5.26 Alberta natural gas well activity and price
0
4000
8000
12000
16000
20000
1998 2000 2002 2004 2006 2008 2010 2012 2014 2016 2018
Nu
mb
er o
f wel
ls
$0
$2
$4
$6
$8
$10
Pri
ce ($
Cd
n/G
J)
New well connections Alberta plant gate price
actual forecast

Figure 5.27 Conventional marketable gas production
0.0
30.0
60.0
90.0
120.0
150.0
180.0
1999 2001 2003 2005 2007 2009 2011 2013 2015 2017
Pro
du
ctio
n (1
09 m
3 )
actual forecast

Figure 5.28 Gas production from bitumen upgrading and bitumen wells used for oil sands operations
0
2
4
6
8
10
12
14
16
1999
2000
2001
2002
2003
2004
2005
2006
2007
2008
2009
2010
2011
2012
2013
2014
2015
2016
2017
2018
Pro
duct
ion
(10
9 m3 )
Process gas from upgrading bitumen Gas from bitumen wells
actual forecast
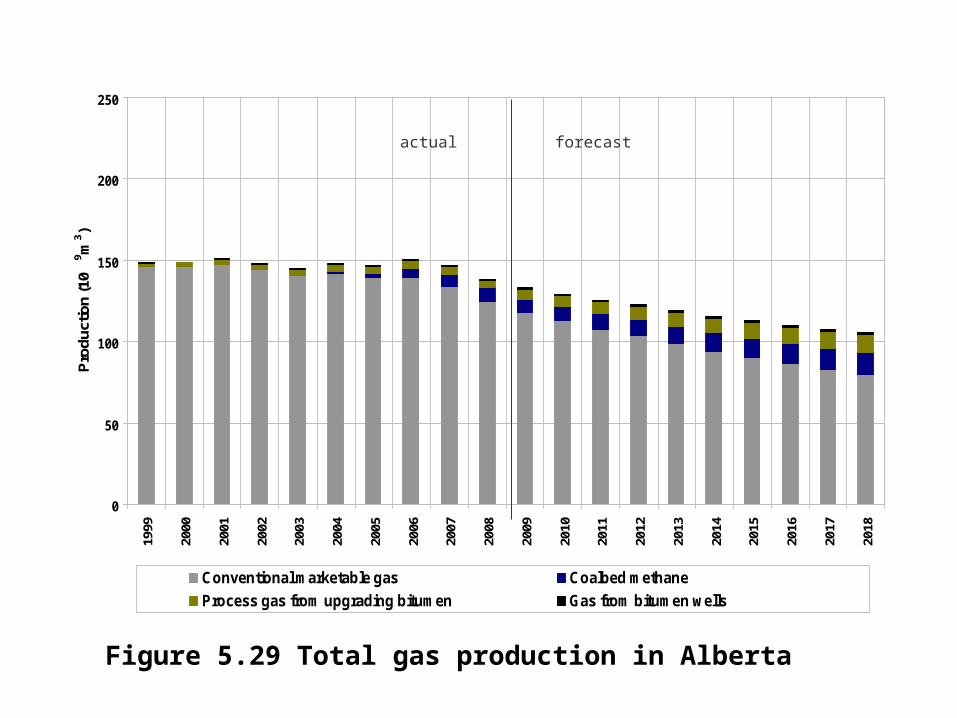
Figure 5.29 Total gas production in Alberta
0
50
100
150
200
250
1999
2000
2001
2002
2003
2004
2005
2006
2007
2008
2009
2010
2011
2012
2013
2014
2015
2016
2017
2018
Pro
duct
ion
(10
9 m3 )
Conventional marketable gas Coalbed methane
Process gas from upgrading bitumen Gas from bitumen wells
actual forecast

Figure 5.30 Alberta natural gas storage injection/withdrawal volumes
-2000
-1500
-1000
-500
0
500
1000
1500
2000
Inje
ctio
ns/
With
dra
wal
s (1
06m
3)
Jan Feb Mar Apr May Jun Jul Aug Sep Oct Nov Dec
2006 2007 2008


0
10
20
30
40
50
601
99
9
20
00
20
01
20
02
20
03
20
04
20
05
20
06
20
07
20
08
20
09
20
10
20
11
20
12
20
13
20
14
20
15
20
16
20
17
20
18
De
ma
nd
(1
09 m
3 )
Figure 5.33 Alberta marketable gas demand by sector
Reprocessing plant shrinkage
Transportation
Electricity generation
Other industrial
Industrial - petrochemical
Industrial – oil sands
Residential
Commercial
actual forecast
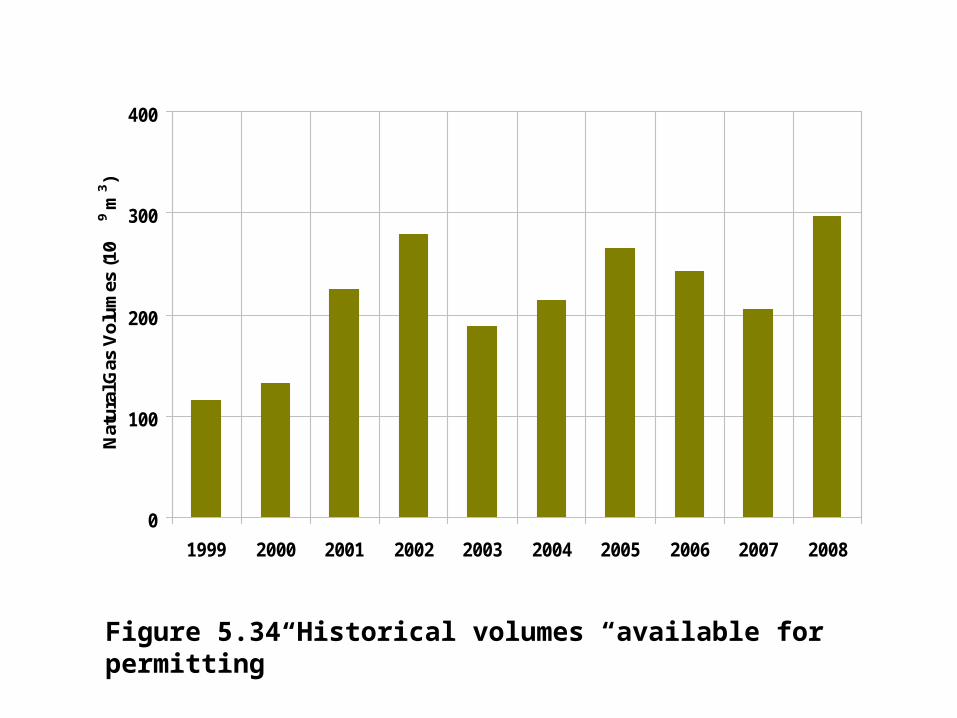
0
100
200
300
400
1999 2000 2001 2002 2003 2004 2005 2006 2007 2008
Nat
ura
l Gas
Vo
lum
es (1
09 m
3 )
Figure 5.34 Historical volumes “available for permitting”

0
5
10
15
20
25
30
19
99
20
00
20
01
20
02
20
03
20
04
20
05
20
06
20
07
20
08
20
09
20
10
20
11
20
12
20
13
20
14
20
15
20
16
20
17
20
18
De
ma
nd
(1
09 m3 )
actual forecast
Mining and Upgrading
In Situ
In Situ Cogeneration
Mining and Upgrading Cogeneration
Figure 5.35 Purchased natural gas demand for oil sands operations

Figure 5.36 Gas demand for bitumen recovery and upgrading
0
5
10
15
20
25
30
351
99
9
20
00
20
01
20
02
20
03
20
04
20
05
20
06
20
07
20
08
20
09
20
10
20
11
20
12
20
13
20
14
20
15
20
16
20
17
20
18
De
ma
nd
(1
09 m
3 )
actual forecast
Purchased gas
Produced gas from bitumen
Process gas from upgrading*
* Does not included process gas for electricity generation.
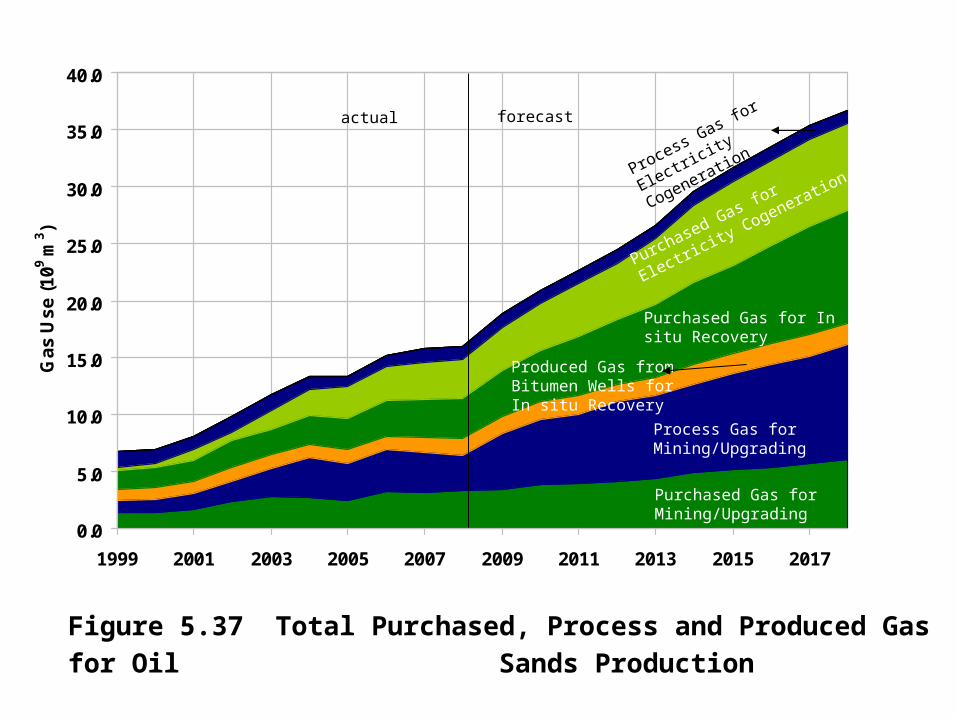
0.0
5.0
10.0
15.0
20.0
25.0
30.0
35.0
40.0
1999 2001 2003 2005 2007 2009 2011 2013 2015 2017
Ga
s U
se
(1
09 m3 )
actual forecast
Process Gas for Mining/Upgrading
Produced Gas from Bitumen Wells for In situ Recovery
Purchased Gas for In situ Recovery
Purchased Gas for
Electricity Cogeneration
Purchased Gas for Mining/Upgrading
Process Gas for
Electricity Cogeneration
Figure 5.37 Total Purchased, Process and Produced Gas for Oil
Sands Production

0
50
100
150
200
1999 2001 2003 2005 2007 2009 2011 2013 2015 2017
Pro
duct
ion
and
dem
and
(10
9 m3 )
Residential demand Commercial demand Other Alberta demand Alberta gas removals
actual forecast
Figure 5.38 Total marketable gas production and demand
23% 26% 33% 44% 58%

Figure 6.1 Remaining established NGL reserves expected to be extracted from conventional gas and annual production
0
30
60
90
120
150
Ethane Propane Butanes Pentanes Plus
Liq
uid
vo
lum
e (
10
6 m3 )
Reserves Annual production

Figure 6.2 Remaining established reserves of conventional natural gas liquids
0
50
100
150
200
250
1994 1995 1996 1997 1998 1999 2000 2001 2002 2003 2004 2005 2006 2007 2008
Es
tab
lish
ed
re
se
rve
s (
10
6 m3 )
Ethane Propane Butanes Pentanes plus


Figure 6.4. Ethane supply and demand
0
20
40
60
80
100
1999 2001 2003 2005 2007 2009 2011 2013 2015 2017
Su
pp
ly a
nd
Dem
an
d (
10
3 m3 /d
)
Ethane Supply Alberta Demand*
Potential supply from conventional gas Potential supply from oil sands off-gas
* excludes solvent flood volumes
actual forecast

Figure 6.5. Propane supply from natural gas and demand
0
10
20
30
40
Su
pp
ly a
nd
Dem
and
(10
3m3/
d)
actual forecast
* excludes solvent flood volumes
Alberta Demand*
Supply

Figure 6.6. Butanes supply from natural gas and demand
0
5
10
15
20
25
Su
pp
ly a
nd
Dem
and
(10
3 m
3 /d)
actual forecast
* excludes solvent flood volumes
Alberta Demand*
Supply

Figure 6.7. Pentanes supply from natural gas and demand for diluent
0
10
20
30
40
50
1998 2000 2002 2004 2006 2008 2010 2012 2014 2016 2018
Su
pp
ly a
nd
Dem
and
(10
3 m
3 /d)
actual forecast
* excludes solvent flood volumes
demand met by alternative sources and types of diluent
Alberta Demand*
Supply

0
2
4
6
8
1966 1969 1972 1975 1978 1981 1984 1987 1990 1993 1996 1999 2002 2005 2008
Pro
du
cti
on
(1
06 t)
Figure 7.1 Sulphur production from gas processing plants in Alberta

0
200
400
600
800
1000
2003 2004 2005 2006 2007 2008
Pro
du
cti
on
(1
03 t
)
Syncrude Suncor Shell
Figure 7.2 Sulphur production from oil sands
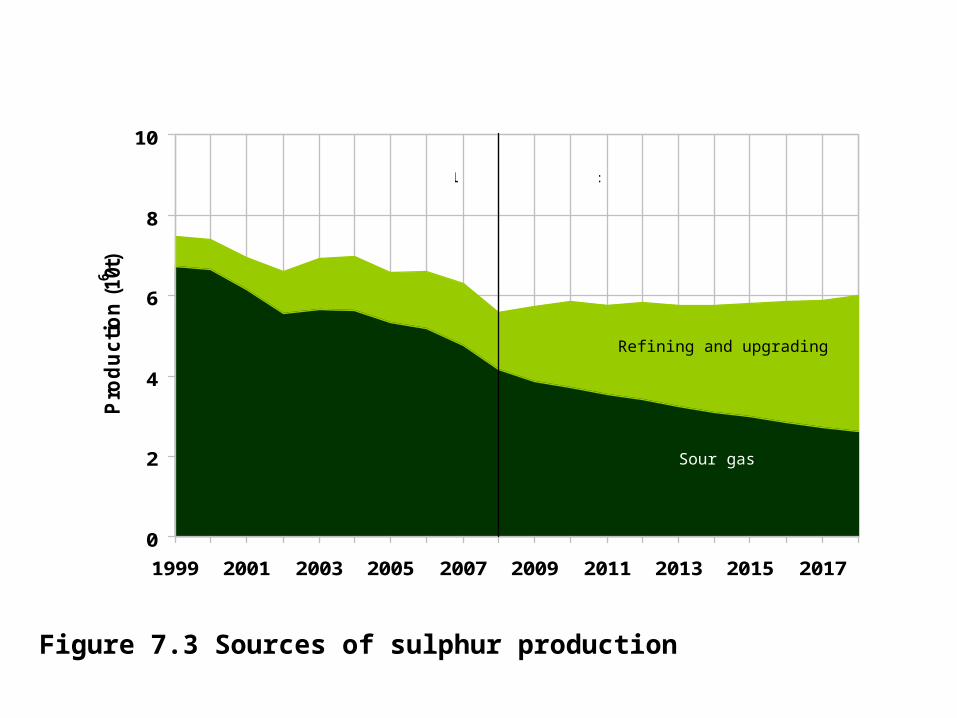
0
2
4
6
8
10
1999 2001 2003 2005 2007 2009 2011 2013 2015 2017
Pro
du
cti
on
(1
06 t)
actual forecast
Figure 7.3 Sources of sulphur production
Sour gas
Refining and upgrading

0
1000
2000
3000
4000
5000
Australia Brazil China NewZealand
SouthAfrica
Others
Ex
po
rts
(1
03
t)
2003 2004 2005 2006 2007 2008
Figure 7.4 Canadian sulphur offshore exports

0
1
2
3
4
5
6
7
8
9
Su
pp
ly/D
em
an
d (
10
6 t)
Alberta Demand
Removed from Alberta
Stockpile WithdrawalsStockpile
Total Demand
Production
actual forecast
Figure 7.5 Sulphur demand and supply in Alberta
0
10
20
30
40
50
1999
2000
2001
2002
2003
2004
2005
2006
2007
2008
2009
2010
2011
2012
2013
2014
2015
2016
2017
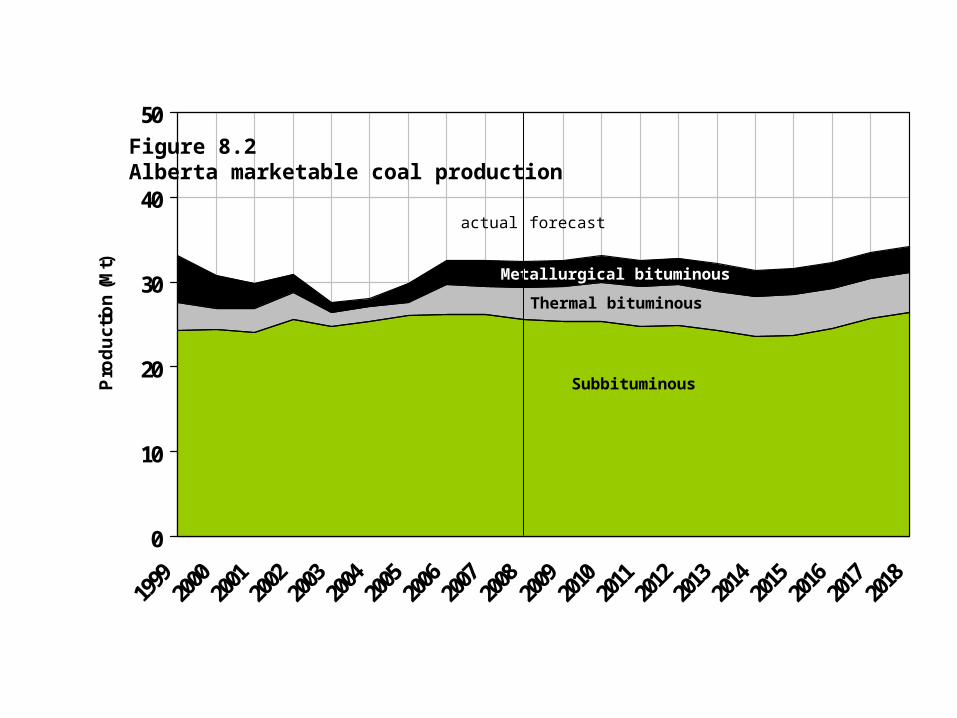
2018
Pro
du
cti
on
(M
t)
Subbituminous
Thermal bituminous
Metallurgical bituminous
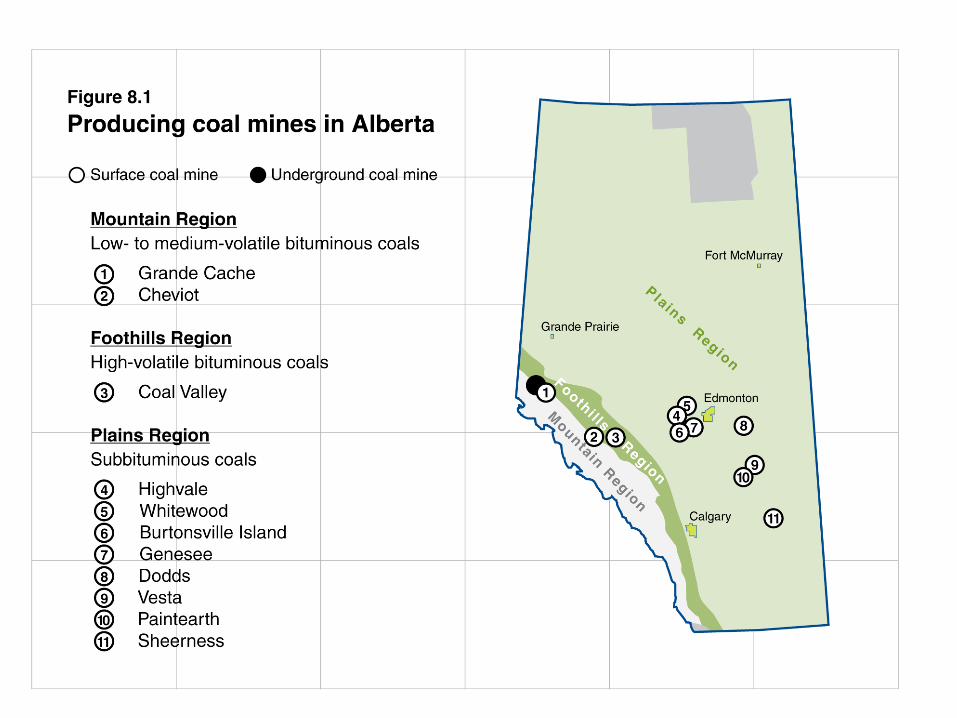
Figure 8.2Alberta marketable coal production
actual forecast

0
5
10
15
20
1999 2001 2003 2005 2007 2009 2011 2013 2015 2017
Ge
ne
rati
ng
Ca
pa
cit
y (
103
MW
)
Coal Natural Gas Hydro Other
actual forecast
Figure 9.1. Alberta electricity generating capacity

Figure 9.2. Alberta electricity generation
0
25
50
75
100
1999 2001 2003 2005 2007 2009 2011 2013 2015 2017
Ge
ne
rati
on
(1
03 GW
h)
Coal Natural Gas Hydro Other
actual forecast
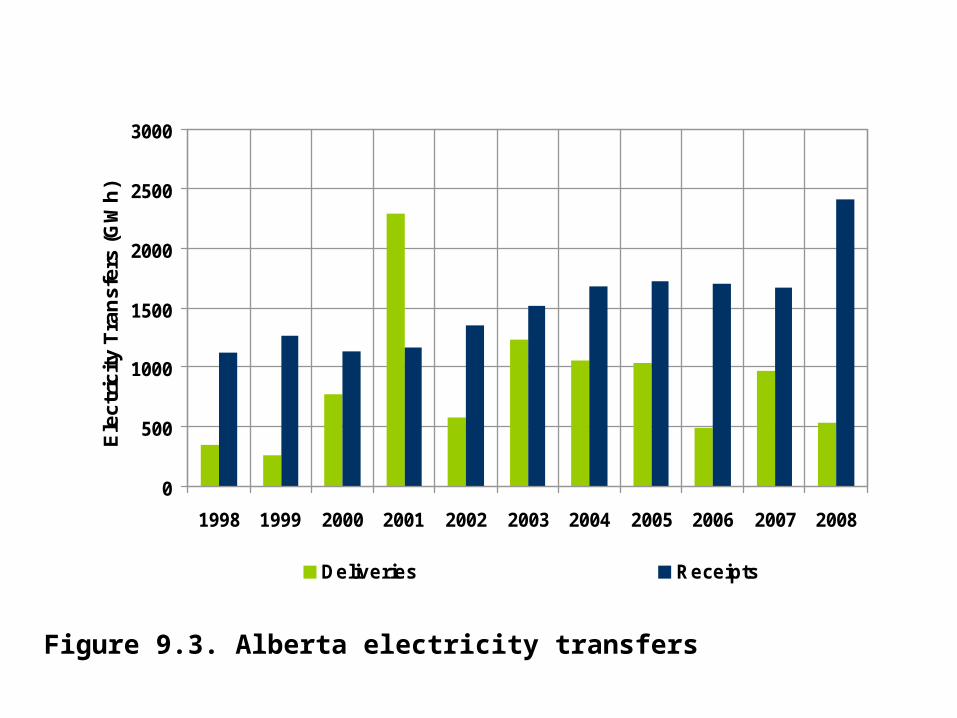
Figure 9.3. Alberta electricity transfers
0
500
1000
1500
2000
2500
3000
1998 1999 2000 2001 2002 2003 2004 2005 2006 2007 2008
Ele
ctr
icit
y T
ran
sfe
rs (
GW
h)
Deliveries Receipts

Figure 9.4. Alberta electricity consumption by sector
0
25
50
75
100
2017
AIL
0
25
50
75
100
1999 2001 2003 2005 2007 2009 2011 2013 2015 2017
Co
ns
um
pti
on
(1
03 GW
h)
Industrial Industrial on site Direct ConnectCommercial Residential Agriculture
actual forecast

9.5. Alberta oil sands electricity generation and demand
0
5
10
15
20
25
30
1998
1999
2000
2001
2002
2003
2004
2005
2006
2007
2008
2009
2010
2011
2012
2013
2014
2015
2016
2017
2018
Ge
ne
rati
on
an
d D
em
an
d (
103 G
Wh
)
actual forecast
Electricity Generation
Demand
Related Documents