JJMIE Volume 6, Number 1, Feb. 2012 ISSN 1995-6665 Pages 75 - 86 Jordan Journal of Mechanical and Industrial Engineering Activity-Based Cost Estimation Model for Foundry Systems Producing Steel Castings Mohammad D. Al-Tahat* ,a and Al-Refaie Abbas a a Industrial Engineering Department, University of Jordan, Amman 11942 – Jordan * Corresponding author.e-mail: [email protected] Abstract Attention in this work is directed to estimate the manufacturing costs by using Activity-Based Costing (ABC) method for the castings that are produced by steel foundry. ABC is a cost accounting method that can overcome many of the limitations of Traditional Cost Accounting (TCA) methods. Cost rates for each department in the foundry are estimated by engineering procedures. Consequently, cost- estimating relationship model that mathematically describes the cost of final castings as a function of all consumable resources is constructed. A Work-In-Process (WIP) flow through the different production centers is analyzed and costs of available resources are allocated for all foundry centers, cost rates are derived, accordingly the ABC method for estimating production cost is discussed and presented. Comparison between the results of ABC method and the results of TCA method has been carried out. Finally results are discussed, recommendations are presented, and avenues for related future works are proposed. © 2012 Jordan Journal of Mechanical and Industrial Engineering. All rights reserved Keywords: ABC; Manufacturing cost; Foundry cost; Activity-based management; Casting technology. 1. Introduction Manufacturing organizations are looking to produce high-quality products more quickly and with the lowest possible cost. To achieve that, companies are required to become more productive, integrated, highly flexible, and to have a realistic and more precise cost estimation approach. Managers need to fully understand the cost, time, and quality of activities performed by employees or machines throughout an entire organization. Traditionally direct labor was typically chosen as the base for assigning overhead cost to products and there was a high correlation in most foundries between direct labor and the incurrence of overhead cost. Presently automation has greatly decreased the amount of direct labor required, and a total overhead cost has increased to the point that a correlation no longer exists between it and direct labor. Wherever these changes have exist, foundries that have continued to use direct labor as a basis for overhead assignment has experienced major distortions in unit costs. In order to overcome these problems some foundries can use Activity Based Costing (ABC) method. ABC involves a two-stage allocation process, with the first stage overhead costs are assigned to cost centers, the centers represent a set of activities, such as casting design, drawing, measurement, prototyping, pattern making, quality control, melting, molding, etc. In the second stage, cost rates are assigned to jobs according to the nature of activities required. The roots of ABC approach were introduced in 1984 by respected professor, Dr. Robert Kaplan of Harvard Business School who began to expound the shortcomings of TCA method, and who developed the new ABC method [1, 2, 3]. From these beginnings, ABC gained attention and spread widely over the world. ABC models the relationships between products and the resources used in their production at all production centers that enable managers to cost out measurements to business simplification and process improvement. ABC provides a more accurate and consistent way of calculating manufacturing costs [4, 5] Costing systems accumulate data and aggregate them into information for financial reporting and managerial decision-making. It is important, therefore, that the definitions of costing parameters are understood by industrial engineers and production managers to make accurate decision. ABC method attempts to provide an accurate interpretation of factors generating all the cost. Improper classification of costs can distort management's perception of the process and lead to poor decision- making, therefore, decision-makers must be careful when using costing data to know precisely what is included and how the data relate to their engineering choices [6]. Recently, the remarkable success implementations of ABC introduced a new paradigm to literature of the manufacturing cost accounting and, ABC has been increasingly used in multi-level complex manufacturing organizations. A number of sources about ABC are available on [7, 8, 9, 10]. Several researchers applied ABC in different real life application can be found in the literature, among these [11, 12, 13, 14, 15]. Ginoglou D., 2002 [1] addressed that ABC improves the costing system of organizations in the following ways: ABC increases the number of cost pools used to accumulate overhead costs. Rather than accumulating all overhead costs in a single, company wide pool, or

Welcome message from author
This document is posted to help you gain knowledge. Please leave a comment to let me know what you think about it! Share it to your friends and learn new things together.
Transcript
JJMIE Volume 6, Number 1, Feb. 2012
ISSN 1995-6665
Pages 75 - 86
Jordan Journal of Mechanical and Industrial Engineering
Activity-Based Cost Estimation Model for Foundry Systems
Producing Steel Castings
Mohammad D. Al-Tahat*,a and Al-Refaie Abbas
a
aIndustrial Engineering Department, University of Jordan, Amman 11942 – Jordan
* Corresponding author.e-mail: [email protected]
Abstract
Attention in this work is directed to estimate the manufacturing costs by using Activity-Based Costing (ABC) method for the castings that are produced by steel foundry. ABC is a cost accounting method that can overcome many of the limitations of Traditional Cost Accounting (TCA) methods. Cost rates for each department in the foundry are estimated by engineering procedures. Consequently, cost- estimating relationship model that mathematically describes the cost of final castings as a function of all consumable resources is constructed. A Work-In-Process (WIP) flow through the different production centers is analyzed and costs of available resources are allocated for all foundry centers, cost rates are derived, accordingly the ABC method for estimating production cost is discussed and presented. Comparison between the results of ABC method and the results of TCA method has been carried out. Finally results are discussed, recommendations are presented, and avenues for related future works are proposed.
© 2012 Jordan Journal of Mechanical and Industrial Engineering. All rights reserved
Keywords: ABC; Manufacturing cost; Foundry cost; Activity-based management; Casting technology.
1. Introduction
Manufacturing organizations are looking to produce
high-quality products more quickly and with the lowest
possible cost. To achieve that, companies are required to
become more productive, integrated, highly flexible, and
to have a realistic and more precise cost estimation
approach. Managers need to fully understand the cost,
time, and quality of activities performed by employees or
machines throughout an entire organization. Traditionally
direct labor was typically chosen as the base for assigning
overhead cost to products and there was a high correlation
in most foundries between direct labor and the incurrence
of overhead cost. Presently automation has greatly
decreased the amount of direct labor required, and a total
overhead cost has increased to the point that a correlation
no longer exists between it and direct labor. Wherever
these changes have exist, foundries that have continued to
use direct labor as a basis for overhead assignment has
experienced major distortions in unit costs.
In order to overcome these problems some foundries
can use Activity Based Costing (ABC) method. ABC
involves a two-stage allocation process, with the first stage
overhead costs are assigned to cost centers, the centers
represent a set of activities, such as casting design,
drawing, measurement, prototyping, pattern making,
quality control, melting, molding, etc. In the second stage,
cost rates are assigned to jobs according to the nature of
activities required. The roots of ABC approach were
introduced in 1984 by respected professor, Dr. Robert
Kaplan of Harvard Business School who began to expound
the shortcomings of TCA method, and who developed the
new ABC method [1, 2, 3]. From these beginnings, ABC
gained attention and spread widely over the world. ABC
models the relationships between products and the
resources used in their production at all production centers
that enable managers to cost out measurements to business
simplification and process improvement. ABC provides a
more accurate and consistent way of calculating
manufacturing costs [4, 5] Costing systems accumulate
data and aggregate them into information for financial
reporting and managerial decision-making. It is important,
therefore, that the definitions of costing parameters are
understood by industrial engineers and production
managers to make accurate decision. ABC method
attempts to provide an accurate interpretation of factors
generating all the cost. Improper classification of costs can
distort management's perception of the process and lead to
poor decision- making, therefore, decision-makers must be
careful when using costing data to know precisely what is
included and how the data relate to their engineering
choices [6]. Recently, the remarkable success
implementations of ABC introduced a new paradigm to
literature of the manufacturing cost accounting and, ABC
has been increasingly used in multi-level complex
manufacturing organizations. A number of sources about
ABC are available on [7, 8, 9, 10]. Several researchers
applied ABC in different real life application can be found
in the literature, among these [11, 12, 13, 14, 15].
Ginoglou D., 2002 [1] addressed that ABC improves
the costing system of organizations in the following ways:
ABC increases the number of cost pools used to
accumulate overhead costs. Rather than accumulating
all overhead costs in a single, company wide pool, or
© 2012 Jordan Journal of Mechanical and Industrial Engineering. All rights reserved - Volume 6, Number 1 (ISSN 1995-6665) 76
accumulating them in departmental pools, costs are
accumulated by activity.
ABC changes the base used to assign overhead costs
to products. Rather than assigning costs on a basis of
direct labor or some other inaccurate measure of
volume, costs are assigned on a basis of the portion of
cost-driving activities that can be traced to the
products.
ABC changes also a manager’s perception of many
overhead costs in that costs that were formerly
thought to be indirect (such as power, inspections and
machine setup) are identified with specific activities
and therefore are recognized as being traceable to
individual products.
As a result of having more accurate product costs,
managers are in position to make better decisions
relating to product retention, marketing strategy,
product profitability and so forth
Moreover ABC leads to better-cost control because it
eliminates distortions that are caused by the labor-
based costing systems and also helps investment
decisions. Labor-based cost systems under cost
capital intense processes, while over costing labor
intense processes. ABC provides more accurate
process cost information, which lays the foundation
for better capital justification. Using activity-based
costing, companies not only know what each process’
real overhead amounts to, but what it consists of. The
system tells management how much tooling,
maintenance and utilities each process consumes.
These costs can be used in capital justifications or as
targets in cost reduction programs.
The primal objective of this paper is to present a
costing model that uses ABC to estimate the production
costs of steel castings an experimental case study will be
conducted to demonstrate the costs calculation under
specific production conditions to gain an insight into the
effects of production parameters on costs. The output of
the ABC model will be considered separately in order to
be distinguished and to be compared with the result
obtained by TCA under the same production environment.
2. Modeling of Foundry Activities Resources
Consumption
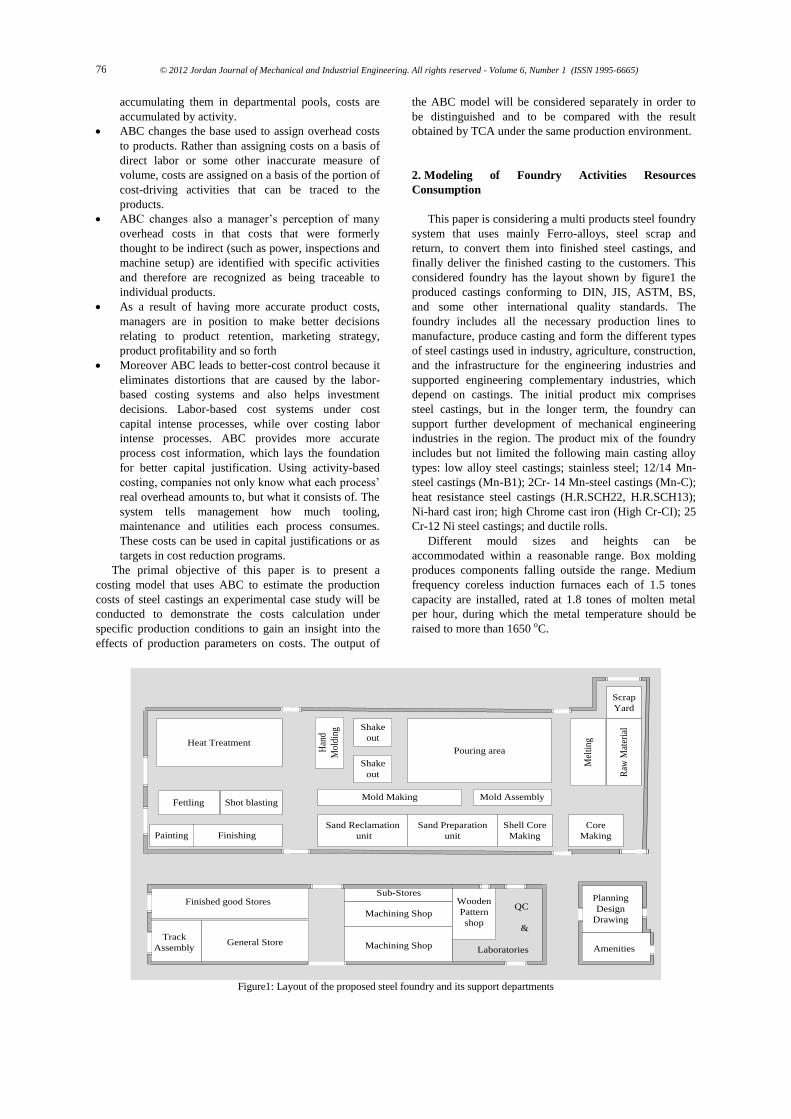
This paper is considering a multi products steel foundry
system that uses mainly Ferro-alloys, steel scrap and
return, to convert them into finished steel castings, and
finally deliver the finished casting to the customers. This
considered foundry has the layout shown by figure1 the
produced castings conforming to DIN, JIS, ASTM, BS,
and some other international quality standards. The
foundry includes all the necessary production lines to
manufacture, produce casting and form the different types
of steel castings used in industry, agriculture, construction,
and the infrastructure for the engineering industries and
supported engineering complementary industries, which
depend on castings. The initial product mix comprises
steel castings, but in the longer term, the foundry can
support further development of mechanical engineering
industries in the region. The product mix of the foundry
includes but not limited the following main casting alloy
types: low alloy steel castings; stainless steel; 12/14 Mn-
steel castings (Mn-B1); 2Cr- 14 Mn-steel castings (Mn-C);
heat resistance steel castings (H.R.SCH22, H.R.SCH13);
Ni-hard cast iron; high Chrome cast iron (High Cr-CI); 25
Cr-12 Ni steel castings; and ductile rolls.
Different mould sizes and heights can be
accommodated within a reasonable range. Box molding
produces components falling outside the range. Medium
frequency coreless induction furnaces each of 1.5 tones
capacity are installed, rated at 1.8 tones of molten metal
per hour, during which the metal temperature should be
raised to more than 1650 oC.
Sand Preparation
unit
Sand Reclamation
unit
Shell Core
Making
Core
Making
Mold Making Mold Assembly
Shake
out
Shake
out
Pouring area
Scrap
Yard
Raw
Mat
eria
l
Han
d
Mol
ding
Heat Treatment
Shot blastingFettling
FinishingPainting
Finished good Stores
General StoreTrack
Assembly Machining Shop
Machining Shop
Sub-StoresWooden
Pattern
shop
Planning
Design
Drawing
Amenities
QC
&
Laboratories
Mel
ting
Figure1: Layout of the proposed steel foundry and its support departments
© 2012 Jordan Journal of Mechanical and Industrial Engineering. All rights reserved - Volume 6, Number 1 (ISSN 1995-6665) 77
Pouring operations on pattern flow molding section is
utilizing crane ¬suspended ladles suitable for bottom
pouring. In the site plan, the plant occupies one separate
manufacturing building for melting, molding, pouring
operations, and casting cleaning and finishing operations.
New silica sand handling, chemically bonded sand
reclamation plant, and core shop facilities are housed in
the ancillary production bay alongside the main casting
production building. Other service departments, such as
laboratories, garage, pattern shop, general stores,
maintenance department, compressor house, and electrical
sub-station are established in separate buildings on the site.
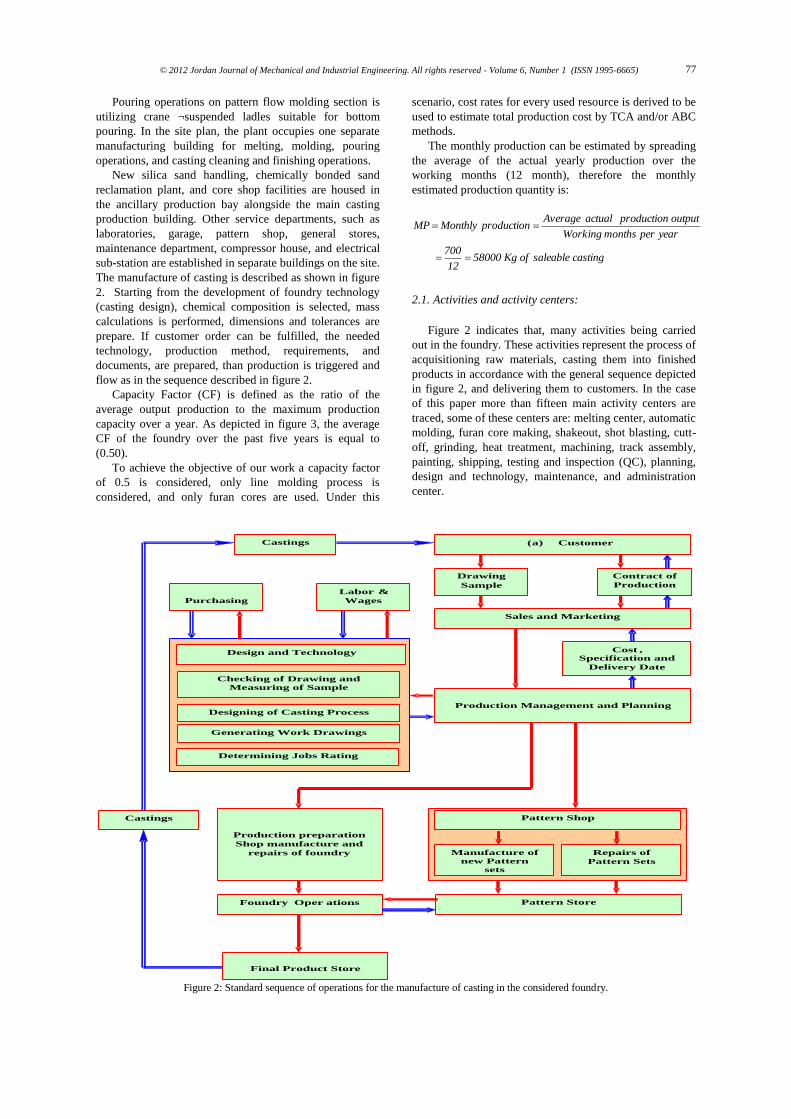
The manufacture of casting is described as shown in figure
2. Starting from the development of foundry technology
(casting design), chemical composition is selected, mass
calculations is performed, dimensions and tolerances are
prepare. If customer order can be fulfilled, the needed
technology, production method, requirements, and
documents, are prepared, than production is triggered and
flow as in the sequence described in figure 2.
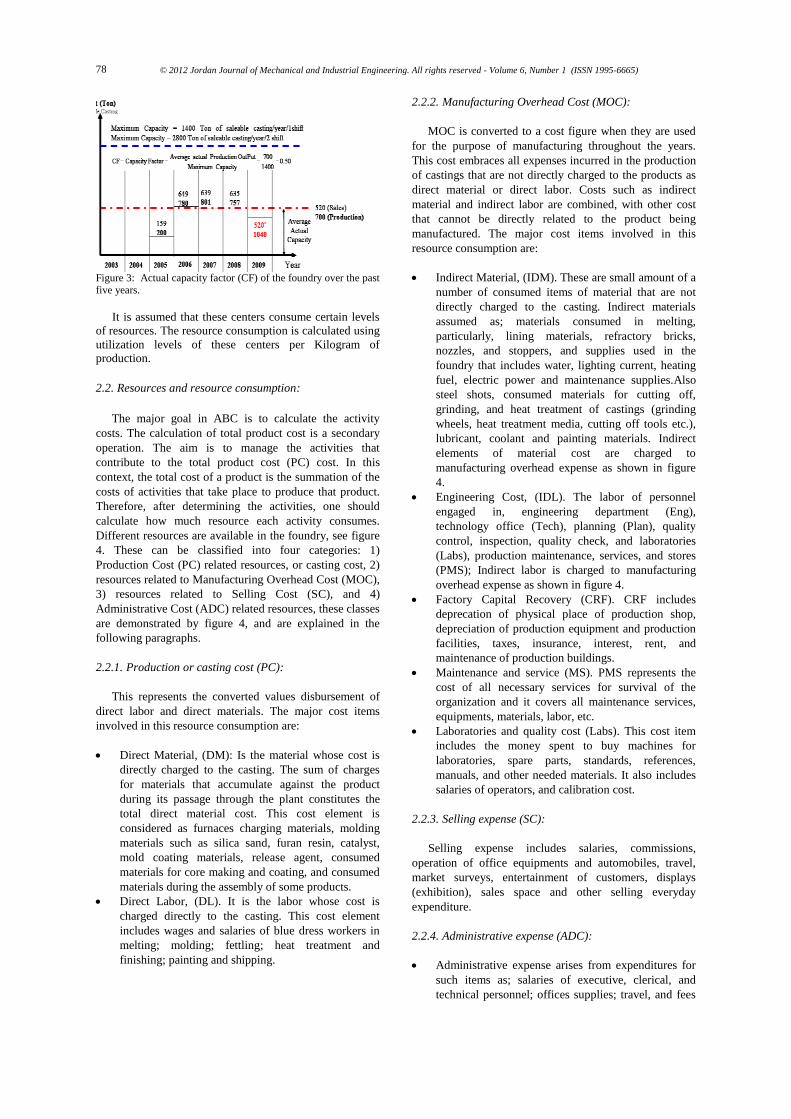
Capacity Factor (CF) is defined as the ratio of the
average output production to the maximum production
capacity over a year. As depicted in figure 3, the average
CF of the foundry over the past five years is equal to
(0.50).
To achieve the objective of our work a capacity factor
of 0.5 is considered, only line molding process is
considered, and only furan cores are used. Under this
scenario, cost rates for every used resource is derived to be
used to estimate total production cost by TCA and/or ABC
methods.
The monthly production can be estimated by spreading
the average of the actual yearly production over the
working months (12 month), therefore the monthly
estimated production quantity is:
casting saleableof Kg 5800012
700
year per months Working
output production actual Average production Monthly MP
2.1. Activities and activity centers:
Figure 2 indicates that, many activities being carried
out in the foundry. These activities represent the process of
acquisitioning raw materials, casting them into finished
products in accordance with the general sequence depicted
in figure 2, and delivering them to customers. In the case
of this paper more than fifteen main activity centers are
traced, some of these centers are: melting center, automatic
molding, furan core making, shakeout, shot blasting, cutt-
off, grinding, heat treatment, machining, track assembly,
painting, shipping, testing and inspection (QC), planning,
design and technology, maintenance, and administration
center.
Drawing
Sample
Contract of
Production
Cost ,
Specification and
Delivery Date
Castings
Castings (a) Customer
Sales and Marketing
Production Management and Planning
Design and Technology
Checking of Drawing and
Measuring of Sample
Designing of Casting Process
Generating Work Drawings
Determining Jobs Rating
Purchasing
Labor &
Wages
Pattern StoreFoundry Oper ations
Final Product Store
Pattern Shop
Manufacture of
new Pattern
sets
Repairs of
Pattern Sets
.
Production preparation
Shop manufacture and
repairs of foundry
Figure 2: Standard sequence of operations for the manufacture of casting in the considered foundry.
© 2012 Jordan Journal of Mechanical and Industrial Engineering. All rights reserved - Volume 6, Number 1 (ISSN 1995-6665) 78
Figure 3: Actual capacity factor (CF) of the foundry over the past five years.
It is assumed that these centers consume certain levels
of resources. The resource consumption is calculated using
utilization levels of these centers per Kilogram of
production.
2.2. Resources and resource consumption:
The major goal in ABC is to calculate the activity
costs. The calculation of total product cost is a secondary
operation. The aim is to manage the activities that
contribute to the total product cost (PC) cost. In this
context, the total cost of a product is the summation of the
costs of activities that take place to produce that product.
Therefore, after determining the activities, one should
calculate how much resource each activity consumes.
Different resources are available in the foundry, see figure
4. These can be classified into four categories: 1)
Production Cost (PC) related resources, or casting cost, 2)
resources related to Manufacturing Overhead Cost (MOC),
3) resources related to Selling Cost (SC), and 4)
Administrative Cost (ADC) related resources, these classes
are demonstrated by figure 4, and are explained in the
following paragraphs.
2.2.1. Production or casting cost (PC):
This represents the converted values disbursement of
direct labor and direct materials. The major cost items
involved in this resource consumption are:
Direct Material, (DM): Is the material whose cost is
directly charged to the casting. The sum of charges
for materials that accumulate against the product
during its passage through the plant constitutes the
total direct material cost. This cost element is
considered as furnaces charging materials, molding
materials such as silica sand, furan resin, catalyst,
mold coating materials, release agent, consumed
materials for core making and coating, and consumed
materials during the assembly of some products.
Direct Labor, (DL). It is the labor whose cost is
charged directly to the casting. This cost element
includes wages and salaries of blue dress workers in
melting; molding; fettling; heat treatment and
finishing; painting and shipping.
2.2.2. Manufacturing Overhead Cost (MOC):
MOC is converted to a cost figure when they are used
for the purpose of manufacturing throughout the years.
This cost embraces all expenses incurred in the production
of castings that are not directly charged to the products as
direct material or direct labor. Costs such as indirect
material and indirect labor are combined, with other cost
that cannot be directly related to the product being
manufactured. The major cost items involved in this
resource consumption are:
Indirect Material, (IDM). These are small amount of a
number of consumed items of material that are not
directly charged to the casting. Indirect materials
assumed as; materials consumed in melting,
particularly, lining materials, refractory bricks,
nozzles, and stoppers, and supplies used in the
foundry that includes water, lighting current, heating
fuel, electric power and maintenance supplies.Also
steel shots, consumed materials for cutting off,
grinding, and heat treatment of castings (grinding
wheels, heat treatment media, cutting off tools etc.),
lubricant, coolant and painting materials. Indirect
elements of material cost are charged to
manufacturing overhead expense as shown in figure
4.
Engineering Cost, (IDL). The labor of personnel
engaged in, engineering department (Eng),
technology office (Tech), planning (Plan), quality
control, inspection, quality check, and laboratories
(Labs), production maintenance, services, and stores
(PMS); Indirect labor is charged to manufacturing
overhead expense as shown in figure 4.
Factory Capital Recovery (CRF). CRF includes
deprecation of physical place of production shop,
depreciation of production equipment and production
facilities, taxes, insurance, interest, rent, and
maintenance of production buildings.
Maintenance and service (MS). PMS represents the
cost of all necessary services for survival of the
organization and it covers all maintenance services,
equipments, materials, labor, etc.
Laboratories and quality cost (Labs). This cost item
includes the money spent to buy machines for
laboratories, spare parts, standards, references,
manuals, and other needed materials. It also includes
salaries of operators, and calibration cost.
2.2.3. Selling expense (SC):
Selling expense includes salaries, commissions,
operation of office equipments and automobiles, travel,
market surveys, entertainment of customers, displays
(exhibition), sales space and other selling everyday
expenditure.
2.2.4. Administrative expense (ADC):
Administrative expense arises from expenditures for
such items as; salaries of executive, clerical, and
technical personnel; offices supplies; travel, and fees
© 2012 Jordan Journal of Mechanical and Industrial Engineering. All rights reserved - Volume 6, Number 1 (ISSN 1995-6665) 79
for legal, technical and auditing services that are
necessary to direct the enterprise as a whole.
Capital Recovery (CRA). CRA is considered to be
independent of production volume, it represent the
depreciation on such equipments as cars, land,
offices, Computer hardware and software systems
used, and other facilities belong to the company but
not related directly to the production, CRA can be
nominated as Indirect capital recovery.
Total Capital Recovery (CR) which is the summation
of CRF and CRA.
3. Cost of Resources and Cost of Activity Centers
Based on ABC Method
An activity cost is the summation of costs of resources
that are used by that center. The determination of which
activity consumed which resource and how much of the
resource is used by that activity is the means by which
activity cost can be estimated.
Production cost consists of direct materials like
charging materials, molding materials, consumed materials
for core making and coating, consumed materials for
assembly, and direct wages and salaries of blue dress
workers in melting; molding; fettling; heat treatment and
finishing; painting; shipping; and all other working
centers. Manufacturing overhead cost consists of indirect,
indirect labor cost, depreciation on factory equipments,
tools, and devices, maintenance and storing cost, and
quality cost. Selling cost includes salaries, commissions,
operation of office equipments and automobiles, travel,
market surveys, entertainment of customers, etc.
Administrative cost includes of executive, clerical, and
technical personnel; capital recovery of land, cars, office
equipments and depreciation on such equipments as cars,
land, offices, computer hardware and software systems
used, and other facilities belong to the company but not
related directly to the production, CR can be nominated as
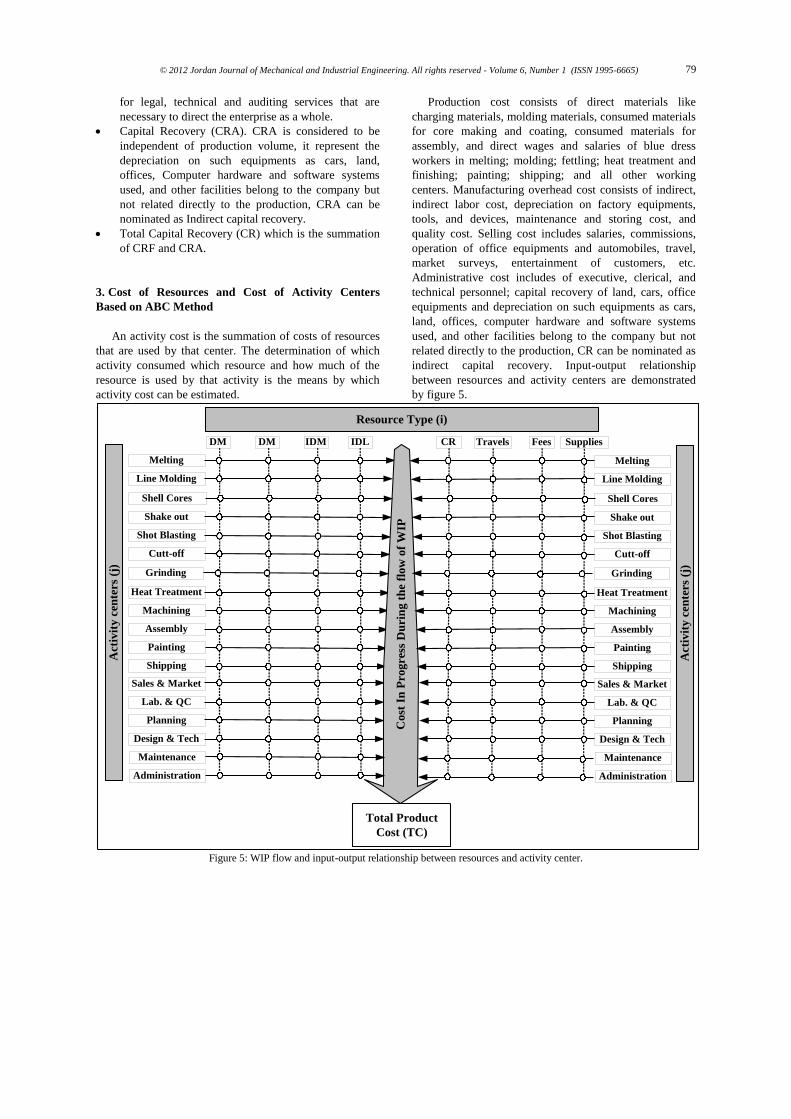
indirect capital recovery. Input-output relationship
between resources and activity centers are demonstrated
by figure 5.
Melting
Line Molding
DM
Shake out
DM
Shot Blasting
Cutt-off
IDM
Heat Treatment
Machining
IDL
Assembly
CR
Painting
Shipping
Sales & Market
Lab. & QC
Planning
Design & Tech
Travels Fees
Co
st I
n P
ro
gre s
s D
uri
ng
th
e fl
ow
of
WIP
Total Product
Cost (TC)
Resource Type (i)
Act
ivit
y c
ente
rs
(j)
Shell Cores
Grinding
Supplies
Maintenance
Administration
Melting
Line Molding
Shake out
Shot Blasting
Cutt-off
Heat Treatment
Machining
Assembly
Painting
Shipping
Sales & Market
Lab. & QC
Planning
Design & Tech
Acti
vit
y c
en
ters
(j)
Shell Cores
Grinding
Maintenance
Administration
Figure 5: WIP flow and input-output relationship between resources and activity center.

© 2012 Jordan Journal of Mechanical and Industrial Engineering. All rights reserved - Volume 6, Number 1 (ISSN 1995-6665) 80
Figure 5 shows that the cost of castings is accounted for as
casting’s components physically move from activity center
to the other through the deferent department of the
foundry. The production cost of final products reflects
summery data indicating the Work-In-Process (WIP)
inventory cost accounts at each activity center of the
foundry [16].
4. Activity Based Calculation (ABC) of Total Product
Cost
The following notation is used to describe the
mathematical expression built to calculate the total product
cost,TC, based on ABC:
TC Total product cost of a considered product
($/product)
W Saleable weight of the product (Kg)
I Total available number of resources
i Resource index (i = 1, 2. . . . I)
J Total available number of activity centers
j Activity center index (j = 1, 2 . . . . J)
Rij Cost rate of consuming the ith resource at the jth
activity center for producing a product of one
Kilogram weight ($/1Kg)
I
1i
J
1j
ijRWTC (1)
The flow of WIP represented by figure 5 is a general
illustration for any type of casting. For a specific casting
type some modifications are needed. For example some
castings are requested by the customer to be used as cast –
without machining- therefore this type of casting is not
pass through the machining center and hence the allocated
machining cost that will be added to the summation in
equation (1) is zero. Also few castings pass through the
assembly activity; therefore a value of assembly cost equal
to zero will be allocated for most of the products.
4.1. ABC cost rates:
The main concern of this paper is to estimate the
manufacturing costs by using ABC method then to
compare that with the cost obtained by TCA; therefore the
work will not consider the detailed explanation of how the
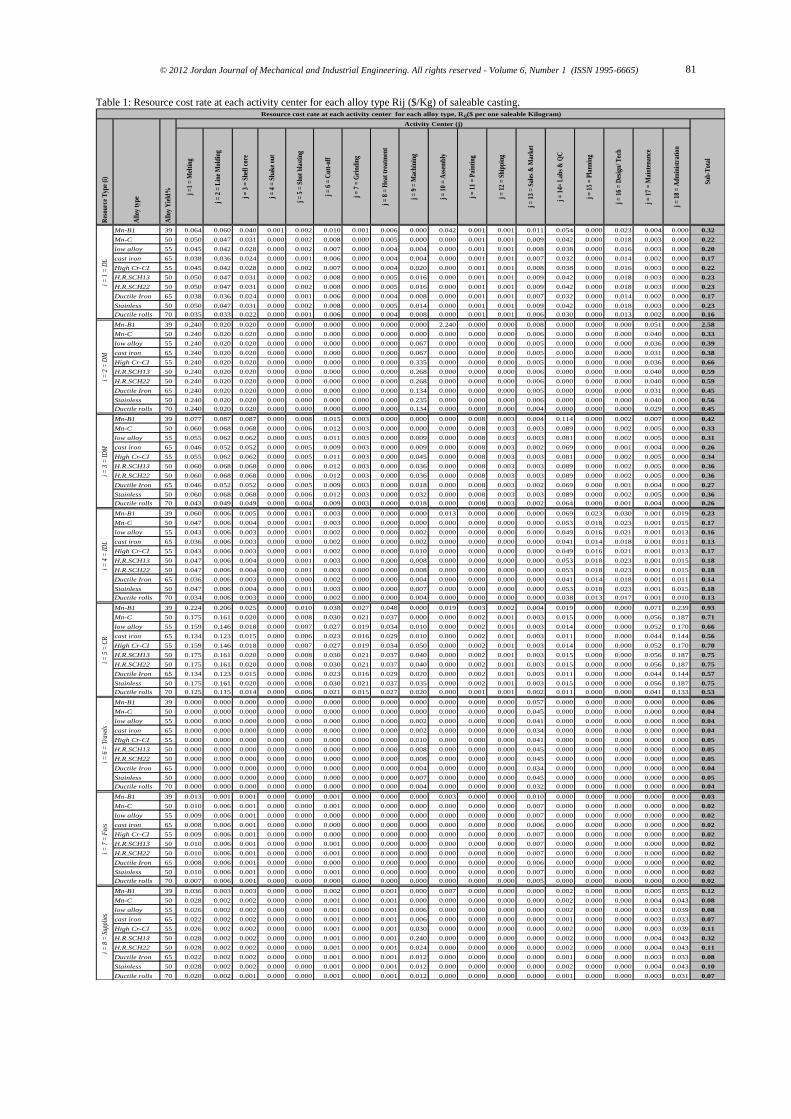
rates (Rij) are derived. ABC cost rates for each consumed
resources at each work center are computed by engineering
procedures method at a low level of detail. The
computation of these rates is highly depending on the
skills and on the experience of the industrial engineers of
the foundry. As a result of this work phase cost rates are
presented in table 1. These cost rates covering the whole
range of the product mix which represented by 10 family
groups as indicated previously in section two of this paper.
4.2. ABC calculations:
Using the cost information given in table 1 and the
activity-resource relationships shown in figure 5
Total production cost for any casting type can be
calculated by the mathematical expression presented in
equation (1). This equation states that the total production
cost of a casting is the sum of the allocated costs for each
activity center the part undergoes in its production process.
Consider a product of a weight equal to 12 Kilogram made
from Mn-B1 alloy type. The total production cost of this
item is the summation of cost for all consumed resources.
As it is shown in table 2 total production cost covers
direct and indirect material cost, indirect and indirect labor
cost, depreciation cost, travels and transportation cost, fees
and insurances cost, and cost of consumed supplies.
The allocation of cost to the considered casting from all
the resource areas associated with its production is shown
in figure 6. The allocation has been shown as a percentage
of the total production cost for clarity.
© 2012 Jordan Journal of Mechanical and Industrial Engineering. All rights reserved - Volume 6, Number 1 (ISSN 1995-6665) 81
Table 1: Resource cost rate at each activity center for each alloy type Rij ($/Kg) of saleable casting.
j =
1 =
Mel
tin
g
j =
2 =
Lin
e M
old
ing
j =
3 =
Sh
ell c
ore
j =
4 =
Sh
ake
out
j =
5 =
Sh
ot b
last
ing
j =
6 =
Cu
tt-o
ff
j =
7 =
Gri
nd
ing
j =
8 =
Hea
t tr
eatm
ent
j =
9 =
Mac
hin
ing
j =
10
= A
ssem
bly
j =
11
= P
ain
tin
g
j =
12
= S
hip
pin
g
j =
13
= S
ales
& M
ark
et
j =
14=
Lab
s &
QC
j =
15
= P
lan
nin
g
j =
16
= D
esig
n/ T
ech
j =
17
= M
ain
ten
ance
j =
18
= A
dm
inis
trat
ion
Mn-B1 39 0.064 0.060 0.040 0.001 0.002 0.010 0.001 0.006 0.000 0.042 0.001 0.001 0.011 0.054 0.000 0.023 0.004 0.000 0.32
Mn-C 50 0.050 0.047 0.031 0.000 0.002 0.008 0.000 0.005 0.000 0.000 0.001 0.001 0.009 0.042 0.000 0.018 0.003 0.000 0.22
low alloy 55 0.045 0.042 0.028 0.000 0.002 0.007 0.000 0.004 0.004 0.000 0.001 0.001 0.008 0.038 0.000 0.016 0.003 0.000 0.20
cast iron 65 0.038 0.036 0.024 0.000 0.001 0.006 0.000 0.004 0.004 0.000 0.001 0.001 0.007 0.032 0.000 0.014 0.002 0.000 0.17
High Cr-CI 55 0.045 0.042 0.028 0.000 0.002 0.007 0.000 0.004 0.020 0.000 0.001 0.001 0.008 0.038 0.000 0.016 0.003 0.000 0.22
H.R.SCH13 50 0.050 0.047 0.031 0.000 0.002 0.008 0.000 0.005 0.016 0.000 0.001 0.001 0.009 0.042 0.000 0.018 0.003 0.000 0.23
H.R.SCH22 50 0.050 0.047 0.031 0.000 0.002 0.008 0.000 0.005 0.016 0.000 0.001 0.001 0.009 0.042 0.000 0.018 0.003 0.000 0.23
Ductile Iron 65 0.038 0.036 0.024 0.000 0.001 0.006 0.000 0.004 0.008 0.000 0.001 0.001 0.007 0.032 0.000 0.014 0.002 0.000 0.17
Stainless 50 0.050 0.047 0.031 0.000 0.002 0.008 0.000 0.005 0.014 0.000 0.001 0.001 0.009 0.042 0.000 0.018 0.003 0.000 0.23
Ductile rolls 70 0.035 0.033 0.022 0.000 0.001 0.006 0.000 0.004 0.008 0.000 0.001 0.001 0.006 0.030 0.000 0.013 0.002 0.000 0.16
Mn-B1 39 0.240 0.020 0.020 0.000 0.000 0.000 0.000 0.000 0.000 2.240 0.000 0.000 0.008 0.000 0.000 0.000 0.051 0.000 2.58
Mn-C 50 0.240 0.020 0.020 0.000 0.000 0.000 0.000 0.000 0.000 0.000 0.000 0.000 0.006 0.000 0.000 0.000 0.040 0.000 0.33
low alloy 55 0.240 0.020 0.020 0.000 0.000 0.000 0.000 0.000 0.067 0.000 0.000 0.000 0.005 0.000 0.000 0.000 0.036 0.000 0.39
cast iron 65 0.240 0.020 0.020 0.000 0.000 0.000 0.000 0.000 0.067 0.000 0.000 0.000 0.005 0.000 0.000 0.000 0.031 0.000 0.38
High Cr-CI 55 0.240 0.020 0.020 0.000 0.000 0.000 0.000 0.000 0.335 0.000 0.000 0.000 0.005 0.000 0.000 0.000 0.036 0.000 0.66
H.R.SCH13 50 0.240 0.020 0.020 0.000 0.000 0.000 0.000 0.000 0.268 0.000 0.000 0.000 0.006 0.000 0.000 0.000 0.040 0.000 0.59
H.R.SCH22 50 0.240 0.020 0.020 0.000 0.000 0.000 0.000 0.000 0.268 0.000 0.000 0.000 0.006 0.000 0.000 0.000 0.040 0.000 0.59
Ductile Iron 65 0.240 0.020 0.020 0.000 0.000 0.000 0.000 0.000 0.134 0.000 0.000 0.000 0.005 0.000 0.000 0.000 0.031 0.000 0.45
Stainless 50 0.240 0.020 0.020 0.000 0.000 0.000 0.000 0.000 0.235 0.000 0.000 0.000 0.006 0.000 0.000 0.000 0.040 0.000 0.56
Ductile rolls 70 0.240 0.020 0.020 0.000 0.000 0.000 0.000 0.000 0.134 0.000 0.000 0.000 0.004 0.000 0.000 0.000 0.029 0.000 0.45
Mn-B1 39 0.077 0.087 0.087 0.000 0.008 0.015 0.003 0.000 0.000 0.000 0.008 0.003 0.004 0.114 0.000 0.002 0.007 0.000 0.42
Mn-C 50 0.060 0.068 0.068 0.000 0.006 0.012 0.003 0.000 0.000 0.000 0.008 0.003 0.003 0.089 0.000 0.002 0.005 0.000 0.33
low alloy 55 0.055 0.062 0.062 0.000 0.005 0.011 0.003 0.000 0.009 0.000 0.008 0.003 0.003 0.081 0.000 0.002 0.005 0.000 0.31
cast iron 65 0.046 0.052 0.052 0.000 0.005 0.009 0.003 0.000 0.009 0.000 0.008 0.003 0.002 0.069 0.000 0.001 0.004 0.000 0.26
High Cr-CI 55 0.055 0.062 0.062 0.000 0.005 0.011 0.003 0.000 0.045 0.000 0.008 0.003 0.003 0.081 0.000 0.002 0.005 0.000 0.34
H.R.SCH13 50 0.060 0.068 0.068 0.000 0.006 0.012 0.003 0.000 0.036 0.000 0.008 0.003 0.003 0.089 0.000 0.002 0.005 0.000 0.36
H.R.SCH22 50 0.060 0.068 0.068 0.000 0.006 0.012 0.003 0.000 0.036 0.000 0.008 0.003 0.003 0.089 0.000 0.002 0.005 0.000 0.36
Ductile Iron 65 0.046 0.052 0.052 0.000 0.005 0.009 0.003 0.000 0.018 0.000 0.008 0.003 0.002 0.069 0.000 0.001 0.004 0.000 0.27
Stainless 50 0.060 0.068 0.068 0.000 0.006 0.012 0.003 0.000 0.032 0.000 0.008 0.003 0.003 0.089 0.000 0.002 0.005 0.000 0.36
Ductile rolls 70 0.043 0.049 0.049 0.000 0.004 0.009 0.003 0.000 0.018 0.000 0.008 0.003 0.002 0.064 0.000 0.001 0.004 0.000 0.26
Mn-B1 39 0.060 0.006 0.005 0.000 0.001 0.003 0.000 0.000 0.000 0.013 0.000 0.000 0.000 0.069 0.023 0.030 0.001 0.019 0.23
Mn-C 50 0.047 0.006 0.004 0.000 0.001 0.003 0.000 0.000 0.000 0.000 0.000 0.000 0.000 0.053 0.018 0.023 0.001 0.015 0.17
low alloy 55 0.043 0.006 0.003 0.000 0.001 0.002 0.000 0.000 0.002 0.000 0.000 0.000 0.000 0.049 0.016 0.021 0.001 0.013 0.16
cast iron 65 0.036 0.006 0.003 0.000 0.000 0.002 0.000 0.000 0.002 0.000 0.000 0.000 0.000 0.041 0.014 0.018 0.001 0.011 0.13
High Cr-CI 55 0.043 0.006 0.003 0.000 0.001 0.002 0.000 0.000 0.010 0.000 0.000 0.000 0.000 0.049 0.016 0.021 0.001 0.013 0.17
H.R.SCH13 50 0.047 0.006 0.004 0.000 0.001 0.003 0.000 0.000 0.008 0.000 0.000 0.000 0.000 0.053 0.018 0.023 0.001 0.015 0.18
H.R.SCH22 50 0.047 0.006 0.004 0.000 0.001 0.003 0.000 0.000 0.008 0.000 0.000 0.000 0.000 0.053 0.018 0.023 0.001 0.015 0.18
Ductile Iron 65 0.036 0.006 0.003 0.000 0.000 0.002 0.000 0.000 0.004 0.000 0.000 0.000 0.000 0.041 0.014 0.018 0.001 0.011 0.14
Stainless 50 0.047 0.006 0.004 0.000 0.001 0.003 0.000 0.000 0.007 0.000 0.000 0.000 0.000 0.053 0.018 0.023 0.001 0.015 0.18
Ductile rolls 70 0.034 0.006 0.003 0.000 0.000 0.002 0.000 0.000 0.004 0.000 0.000 0.000 0.000 0.038 0.013 0.017 0.001 0.010 0.13
Mn-B1 39 0.224 0.206 0.025 0.000 0.010 0.038 0.027 0.048 0.000 0.019 0.003 0.002 0.004 0.019 0.000 0.000 0.071 0.239 0.93
Mn-C 50 0.175 0.161 0.020 0.000 0.008 0.030 0.021 0.037 0.000 0.000 0.002 0.001 0.003 0.015 0.000 0.000 0.056 0.187 0.71
low alloy 55 0.159 0.146 0.018 0.000 0.007 0.027 0.019 0.034 0.010 0.000 0.002 0.001 0.003 0.014 0.000 0.000 0.052 0.170 0.66
cast iron 65 0.134 0.123 0.015 0.000 0.006 0.023 0.016 0.029 0.010 0.000 0.002 0.001 0.003 0.011 0.000 0.000 0.044 0.144 0.56
High Cr-CI 55 0.159 0.146 0.018 0.000 0.007 0.027 0.019 0.034 0.050 0.000 0.002 0.001 0.003 0.014 0.000 0.000 0.052 0.170 0.70
H.R.SCH13 50 0.175 0.161 0.020 0.000 0.008 0.030 0.021 0.037 0.040 0.000 0.002 0.001 0.003 0.015 0.000 0.000 0.056 0.187 0.75
H.R.SCH22 50 0.175 0.161 0.020 0.000 0.008 0.030 0.021 0.037 0.040 0.000 0.002 0.001 0.003 0.015 0.000 0.000 0.056 0.187 0.75
Ductile Iron 65 0.134 0.123 0.015 0.000 0.006 0.023 0.016 0.029 0.020 0.000 0.002 0.001 0.003 0.011 0.000 0.000 0.044 0.144 0.57
Stainless 50 0.175 0.161 0.020 0.000 0.008 0.030 0.021 0.037 0.035 0.000 0.002 0.001 0.003 0.015 0.000 0.000 0.056 0.187 0.75
Ductile rolls 70 0.125 0.115 0.014 0.000 0.006 0.021 0.015 0.027 0.020 0.000 0.001 0.001 0.002 0.011 0.000 0.000 0.041 0.133 0.53
Mn-B1 39 0.000 0.000 0.000 0.000 0.000 0.000 0.000 0.000 0.000 0.000 0.000 0.000 0.057 0.000 0.000 0.000 0.000 0.000 0.06
Mn-C 50 0.000 0.000 0.000 0.000 0.000 0.000 0.000 0.000 0.000 0.000 0.000 0.000 0.045 0.000 0.000 0.000 0.000 0.000 0.04
low alloy 55 0.000 0.000 0.000 0.000 0.000 0.000 0.000 0.000 0.002 0.000 0.000 0.000 0.041 0.000 0.000 0.000 0.000 0.000 0.04
cast iron 65 0.000 0.000 0.000 0.000 0.000 0.000 0.000 0.000 0.002 0.000 0.000 0.000 0.034 0.000 0.000 0.000 0.000 0.000 0.04
High Cr-CI 55 0.000 0.000 0.000 0.000 0.000 0.000 0.000 0.000 0.010 0.000 0.000 0.000 0.041 0.000 0.000 0.000 0.000 0.000 0.05
H.R.SCH13 50 0.000 0.000 0.000 0.000 0.000 0.000 0.000 0.000 0.008 0.000 0.000 0.000 0.045 0.000 0.000 0.000 0.000 0.000 0.05
H.R.SCH22 50 0.000 0.000 0.000 0.000 0.000 0.000 0.000 0.000 0.008 0.000 0.000 0.000 0.045 0.000 0.000 0.000 0.000 0.000 0.05
Ductile Iron 65 0.000 0.000 0.000 0.000 0.000 0.000 0.000 0.000 0.004 0.000 0.000 0.000 0.034 0.000 0.000 0.000 0.000 0.000 0.04
Stainless 50 0.000 0.000 0.000 0.000 0.000 0.000 0.000 0.000 0.007 0.000 0.000 0.000 0.045 0.000 0.000 0.000 0.000 0.000 0.05
Ductile rolls 70 0.000 0.000 0.000 0.000 0.000 0.000 0.000 0.000 0.004 0.000 0.000 0.000 0.032 0.000 0.000 0.000 0.000 0.000 0.04
Mn-B1 39 0.013 0.001 0.001 0.000 0.000 0.001 0.000 0.000 0.000 0.003 0.000 0.000 0.010 0.000 0.000 0.000 0.000 0.000 0.03
Mn-C 50 0.010 0.006 0.001 0.000 0.000 0.001 0.000 0.000 0.000 0.000 0.000 0.000 0.007 0.000 0.000 0.000 0.000 0.000 0.02
low alloy 55 0.009 0.006 0.001 0.000 0.000 0.000 0.000 0.000 0.000 0.000 0.000 0.000 0.007 0.000 0.000 0.000 0.000 0.000 0.02
cast iron 65 0.008 0.006 0.001 0.000 0.000 0.000 0.000 0.000 0.000 0.000 0.000 0.000 0.006 0.000 0.000 0.000 0.000 0.000 0.02
High Cr-CI 55 0.009 0.006 0.001 0.000 0.000 0.000 0.000 0.000 0.000 0.000 0.000 0.000 0.007 0.000 0.000 0.000 0.000 0.000 0.02
H.R.SCH13 50 0.010 0.006 0.001 0.000 0.000 0.001 0.000 0.000 0.000 0.000 0.000 0.000 0.007 0.000 0.000 0.000 0.000 0.000 0.02
H.R.SCH22 50 0.010 0.006 0.001 0.000 0.000 0.001 0.000 0.000 0.000 0.000 0.000 0.000 0.007 0.000 0.000 0.000 0.000 0.000 0.02
Ductile Iron 65 0.008 0.006 0.001 0.000 0.000 0.000 0.000 0.000 0.000 0.000 0.000 0.000 0.006 0.000 0.000 0.000 0.000 0.000 0.02
Stainless 50 0.010 0.006 0.001 0.000 0.000 0.001 0.000 0.000 0.000 0.000 0.000 0.000 0.007 0.000 0.000 0.000 0.000 0.000 0.02
Ductile rolls 70 0.007 0.006 0.001 0.000 0.000 0.000 0.000 0.000 0.000 0.000 0.000 0.000 0.005 0.000 0.000 0.000 0.000 0.000 0.02
Mn-B1 39 0.036 0.003 0.003 0.000 0.000 0.002 0.000 0.001 0.000 0.007 0.000 0.000 0.000 0.002 0.000 0.000 0.005 0.055 0.12
Mn-C 50 0.028 0.002 0.002 0.000 0.000 0.001 0.000 0.001 0.000 0.000 0.000 0.000 0.000 0.002 0.000 0.000 0.004 0.043 0.08
low alloy 55 0.026 0.002 0.002 0.000 0.000 0.001 0.000 0.001 0.006 0.000 0.000 0.000 0.000 0.002 0.000 0.000 0.003 0.039 0.08
cast iron 65 0.022 0.002 0.002 0.000 0.000 0.001 0.000 0.001 0.006 0.000 0.000 0.000 0.000 0.001 0.000 0.000 0.003 0.033 0.07
High Cr-CI 55 0.026 0.002 0.002 0.000 0.000 0.001 0.000 0.001 0.030 0.000 0.000 0.000 0.000 0.002 0.000 0.000 0.003 0.039 0.11
H.R.SCH13 50 0.028 0.002 0.002 0.000 0.000 0.001 0.000 0.001 0.240 0.000 0.000 0.000 0.000 0.002 0.000 0.000 0.004 0.043 0.32
H.R.SCH22 50 0.028 0.002 0.002 0.000 0.000 0.001 0.000 0.001 0.024 0.000 0.000 0.000 0.000 0.002 0.000 0.000 0.004 0.043 0.11
Ductile Iron 65 0.022 0.002 0.002 0.000 0.000 0.001 0.000 0.001 0.012 0.000 0.000 0.000 0.000 0.001 0.000 0.000 0.003 0.033 0.08
Stainless 50 0.028 0.002 0.002 0.000 0.000 0.001 0.000 0.001 0.012 0.000 0.000 0.000 0.000 0.002 0.000 0.000 0.004 0.043 0.10
Ductile rolls 70 0.020 0.002 0.001 0.000 0.000 0.001 0.000 0.001 0.012 0.000 0.000 0.000 0.000 0.001 0.000 0.000 0.003 0.031 0.07
i = 5
= C
Ri =
6 =
Tra
vels
i = 7
= F
ees
i = 8
= S
uppl
ies
i = 1
= D
Li =
2 =
DM
i = 3
= I
DM
i = 4
= I
DL
Resource cost rate at each activity center for each alloy type, Rij($ per one saleable Kilogram)
Res
ourc
e T
ype
(i)
All
oy t
ype
All
oy Y
ield
%
Activity Center (j)
Su
b-T
otal

© 2012 Jordan Journal of Mechanical and Industrial Engineering. All rights reserved - Volume 6, Number 1 (ISSN 1995-6665) 82
Table 2: Computations of total production cost ($) for a 12 Kg Mn-B1 alloy casting.
j =
1:
Melt
ing
j =
2:
Lin
e M
old
ing.
j =
3:
Shell
core
j =
4:
Shake o
ut
j =
5:
Shot
bla
stin
g
j =
6:
Cutt
-off
j =
7:
Gri
ndin
g
j =
8:
Heat
treatm
ent
j =
9:
Machin
ing.
j =
10:
Ass
em
bly
j =
11:
Pain
ting
j =
12:
Ship
pin
g
j =
13:
Sale
s &
Mark
et
j =
14:
Labs
& Q
C
j =
15:
Pla
nnin
g
j =
16:
Desi
gn=
tech
j =
17:
Main
tenance
j =
18:
Adm
inis
trati
on
DL Mn-B1 39 0.064 0.060 0.040 0.001 0.002 0.010 0.001 0.006 0.000 0.042 0.001 0.001 0.011 0.054 0.000 0.023 0.004 0.000 0.32
DM Mn-B1 39 0.240 0.020 0.020 0.000 0.000 0.000 0.000 0.000 0.000 2.240 0.000 0.000 0.008 0.000 0.000 0.000 0.051 0.000 2.58
IDM Mn-B1 39 0.077 0.087 0.087 0.000 0.008 0.015 0.003 0.000 0.000 0.000 0.008 0.003 0.004 0.114 0.000 0.002 0.007 0.000 0.42
IDL Mn-B1 39 0.060 0.006 0.005 0.000 0.001 0.003 0.000 0.000 0.000 0.013 0.000 0.000 0.000 0.069 0.023 0.030 0.001 0.019 0.23
CR Mn-B1 39 0.224 0.206 0.025 0.000 0.010 0.038 0.027 0.048 0.000 0.019 0.003 0.002 0.004 0.019 0.000 0.000 0.071 0.239 0.93
Travels Mn-B1 39 0.000 0.000 0.000 0.000 0.000 0.000 0.000 0.000 0.000 0.000 0.000 0.000 0.057 0.000 0.000 0.000 0.000 0.000 0.06
Fees Mn-B1 39 0.013 0.001 0.001 0.000 0.000 0.001 0.000 0.000 0.000 0.003 0.000 0.000 0.010 0.000 0.000 0.000 0.000 0.000 0.03
Supplies Mn-B1 39 0.036 0.003 0.003 0.000 0.000 0.002 0.000 0.001 0.000 0.007 0.000 0.000 0.000 0.002 0.000 0.000 0.005 0.055 0.12
4.6779
12 Kg 56
Resource cost rate at each activity center (Rij) for Mn-B1 alloy type ($ per one saleable Kilogram)
Reso
urce T
yp
e (
i)
All
oy t
ype
All
oy Y
ield
%
Activity Center (j)
Su
b-T
ota
l
Total cost ($/Kilogram) =
For a casting of wieght, W = Total Production Cost, TC($) =
Mn-B1 Item Cost
Fees
1%Travels
1%
Supplies
3% Direct Labor
7%Depreciation
20%
Indirect Labor
5%
Indirect
Materials
9%
Direct Materials
54%
Figure 6: Division of the contributing costs of Mn-B1 Item cost.
5. Traditional Calculation of Total Cost
The following notation is used to describe the
mathematical expressions built to calculate the total
product cost based on TCA:
W Saleable weight of a product (Kg)
MC Total manufacturing related cost ($/Kg)
NMC Total non-manufacturing related cost
($/Kg)
PC Production (casting) cost of a product of
one Kilogram weight ($/Kg)
DM Direct material cost for a product of one
Kilogram weight ($/Kg)
DL Direct labor cost for a product of one
Kilogram weight ($/Kg)
IDM Indirect material cost for a product of one
Kilogram weight ($/Kg)
MP Monthly production (Kg)
IDL Indirect labor cost for one month of
production ($/Month)
IDL2 Indirect management cost for one month
($/Month)
CRF Monthly depreciation cost of foundry
equipments ($/Month)
CRA Monthly depreciation cost of
administration facilities ($/Month)
MS Maintenance cost for one month of
production ($/Month)
SC Selling cost for one month of production
($/Month)
QC Laboratories and QC cost for one month of
production ($/Month)
MOC Manufacturing overhead cost for one
month of production ($/Month)
Supplies Electricity, oil, diesel, water, and other
material cost consumed by administration
during a one month of production
($/Month).
Engineering Engineering cost for one month of
production ($/Month).
Technology Technology and design cost for one month
of production ($/Month).
Plan Planning cost for one month of production
($/Month)
Travels Transportation and traveling cost for one
month ($/Month)
NMCMCTC (2)
MOCPCMC (3)
DLDMPC (4)
SuppliesQCCRFIDLIDMMOC (5)
PlanningTechnologygEngineerinIDL (6)
SCADCNMC (7)
TravelsCRASUPIDL2ADC (8)
5.1. TCA cost rates:
Total production cost is split into two categories:
manufacturing related and non-manufacturing related cost.
Manufacturing related costs include the cost of operating
processes on several work centers that relate directly to the
produced products like melting cost, molding cost, and
core making cost, shake out cost, and others as shown in
table 3.
© 2012 Jordan Journal of Mechanical and Industrial Engineering. All rights reserved - Volume 6, Number 1 (ISSN 1995-6665) 83
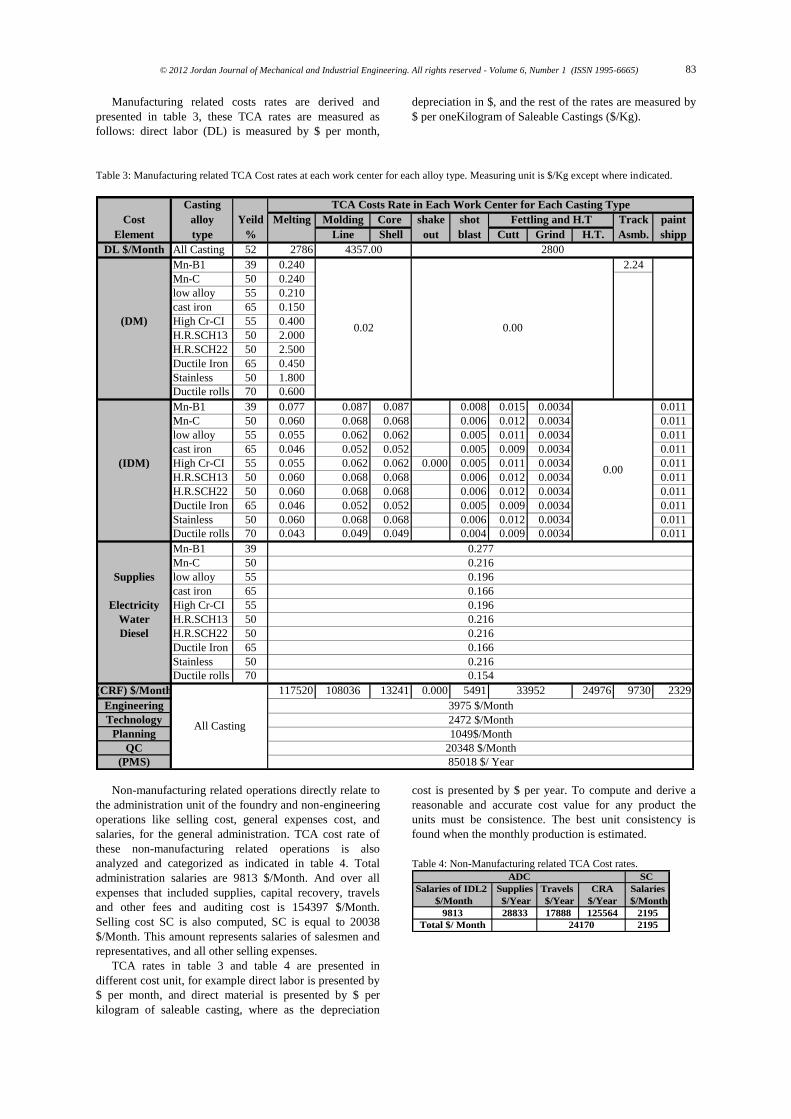
Manufacturing related costs rates are derived and
presented in table 3, these TCA rates are measured as
follows: direct labor (DL) is measured by $ per month,
depreciation in $, and the rest of the rates are measured by
$ per oneKilogram of Saleable Castings ($/Kg).
Table 3: Manufacturing related TCA Cost rates at each work center for each alloy type. Measuring unit is $/Kg except where indicated.
Casting TCA Costs Rate in Each Work Center for Each Casting Type
Cost alloy Yeild Melting Molding Core shake shot Fettling and H.T Track paint
Element type % Line Shell out blast Cutt Grind H.T. Asmb. shipp
DL $/Month All Casting 52 2786 2800
Mn-B1 39 0.240 2.24
Mn-C 50 0.240
low alloy 55 0.210
cast iron 65 0.150
(DM) High Cr-CI 55 0.400
H.R.SCH13 50 2.000
H.R.SCH22 50 2.500
Ductile Iron 65 0.450
Stainless 50 1.800
Ductile rolls 70 0.600
Mn-B1 39 0.077 0.087 0.087 0.008 0.015 0.0034 0.011
Mn-C 50 0.060 0.068 0.068 0.006 0.012 0.0034 0.011
low alloy 55 0.055 0.062 0.062 0.005 0.011 0.0034 0.011
cast iron 65 0.046 0.052 0.052 0.005 0.009 0.0034 0.011
(IDM) High Cr-CI 55 0.055 0.062 0.062 0.000 0.005 0.011 0.0034 0.011
H.R.SCH13 50 0.060 0.068 0.068 0.006 0.012 0.0034 0.011
H.R.SCH22 50 0.060 0.068 0.068 0.006 0.012 0.0034 0.011
Ductile Iron 65 0.046 0.052 0.052 0.005 0.009 0.0034 0.011
Stainless 50 0.060 0.068 0.068 0.006 0.012 0.0034 0.011
Ductile rolls 70 0.043 0.049 0.049 0.004 0.009 0.0034 0.011
Mn-B1 39 0.277
Mn-C 50 0.216
Supplies low alloy 55 0.196
cast iron 65 0.166
Electricity High Cr-CI 55 0.196
Water H.R.SCH13 50 0.216
Diesel H.R.SCH22 50 0.216
Ductile Iron 65 0.166
Stainless 50 0.216
Ductile rolls 70 0.154
(CRF) $/Month 117520 108036 13241 0.000 5491 33952 24976 9730 2329
Engineering 3975 $/Month
Technology 2472 $/Month
Planning 1049$/Month
QC 20348 $/Month
(PMS) 85018 $/ Year
All Casting
4357.00
0.000.02
0.00
Non-manufacturing related operations directly relate to
the administration unit of the foundry and non-engineering
operations like selling cost, general expenses cost, and
salaries, for the general administration. TCA cost rate of
these non-manufacturing related operations is also
analyzed and categorized as indicated in table 4. Total
administration salaries are 9813 $/Month. And over all
expenses that included supplies, capital recovery, travels
and other fees and auditing cost is 154397 $/Month.
Selling cost SC is also computed, SC is equal to 20038
$/Month. This amount represents salaries of salesmen and
representatives, and all other selling expenses.
TCA rates in table 3 and table 4 are presented in
different cost unit, for example direct labor is presented by
$ per month, and direct material is presented by $ per
kilogram of saleable casting, where as the depreciation
cost is presented by $ per year. To compute and derive a
reasonable and accurate cost value for any product the
units must be consistence. The best unit consistency is
found when the monthly production is estimated.
Table 4: Non-Manufacturing related TCA Cost rates.
ADC SC
Salaries of IDL2 Supplies Travels CRA Salaries
$/Month $/Year $/Year $/Year $/Month
9813 28833 17888 125564 2195
Total $/ Month 219524170
© 2012 Jordan Journal of Mechanical and Industrial Engineering. All rights reserved - Volume 6, Number 1 (ISSN 1995-6665) 84
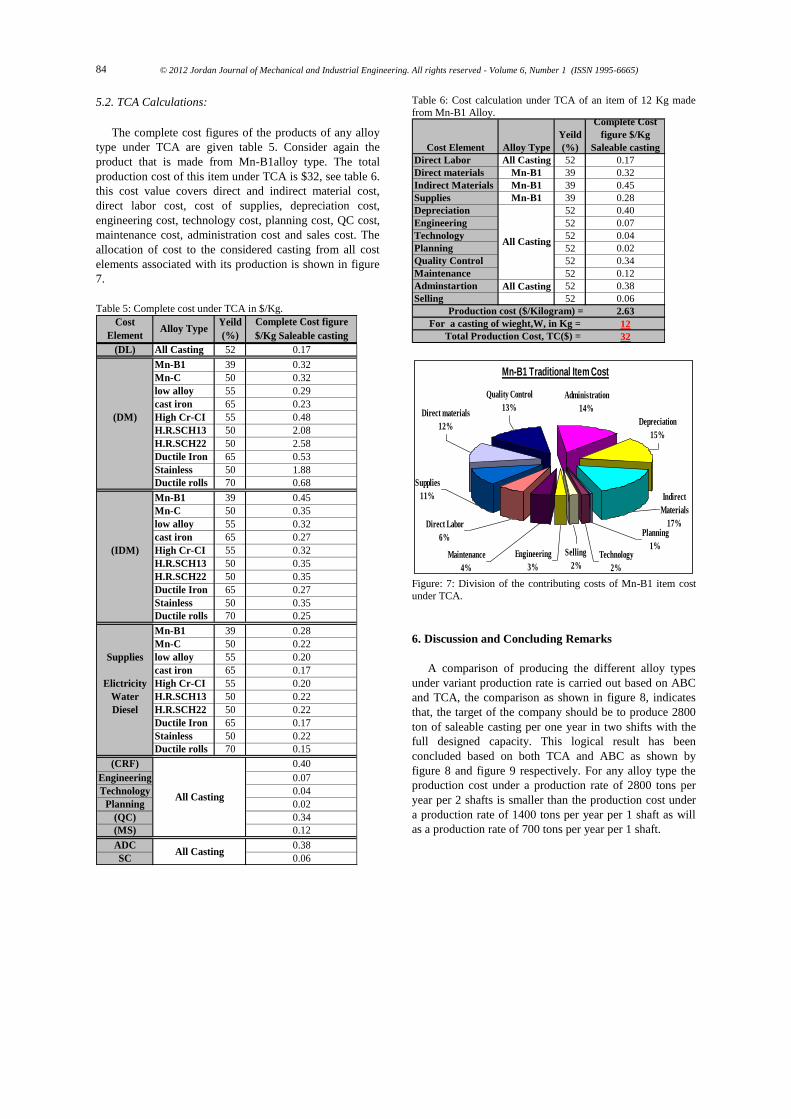
5.2. TCA Calculations:
The complete cost figures of the products of any alloy
type under TCA are given table 5. Consider again the
product that is made from Mn-B1alloy type. The total
production cost of this item under TCA is $32, see table 6.
this cost value covers direct and indirect material cost,
direct labor cost, cost of supplies, depreciation cost,
engineering cost, technology cost, planning cost, QC cost,
maintenance cost, administration cost and sales cost. The
allocation of cost to the considered casting from all cost
elements associated with its production is shown in figure
7.
Table 5: Complete cost under TCA in $/Kg.
Complete Cost figure
$/Kg Saleable casting
(DL) All Casting 52 0.17
Mn-B1 39 0.32
Mn-C 50 0.32
low alloy 55 0.29
cast iron 65 0.23
(DM) High Cr-CI 55 0.48
H.R.SCH13 50 2.08
H.R.SCH22 50 2.58
Ductile Iron 65 0.53
Stainless 50 1.88
Ductile rolls 70 0.68
Mn-B1 39 0.45
Mn-C 50 0.35
low alloy 55 0.32
cast iron 65 0.27
(IDM) High Cr-CI 55 0.32
H.R.SCH13 50 0.35
H.R.SCH22 50 0.35
Ductile Iron 65 0.27
Stainless 50 0.35
Ductile rolls 70 0.25
Mn-B1 39 0.28
Mn-C 50 0.22
Supplies low alloy 55 0.20
cast iron 65 0.17
Elictricity High Cr-CI 55 0.20
Water H.R.SCH13 50 0.22
Diesel H.R.SCH22 50 0.22
Ductile Iron 65 0.17
Stainless 50 0.22
Ductile rolls 70 0.15
(CRF) 0.40
Engineering 0.07
Technology 0.04
Planning 0.02
(QC) 0.34
(MS) 0.12
ADC 0.38
SC 0.06All Casting
All Casting
Cost
ElementAlloy Type
Yeild
(%)
Table 6: Cost calculation under TCA of an item of 12 Kg made
from Mn-B1 Alloy.
Direct Labor All Casting 52 0.17
Direct materials Mn-B1 39 0.32
Indirect Materials Mn-B1 39 0.45
Supplies Mn-B1 39 0.28
Depreciation 52 0.40
Engineering 52 0.07
Technology 52 0.04
Planning 52 0.02
Quality Control 52 0.34
Maintenance 52 0.12
Adminstartion All Casting 52 0.38
Selling 52 0.06
2.63
12
32
Complete Cost
figure $/Kg
Saleable casting
For a casting of wieght,W, in Kg =
Total Production Cost, TC($) =
All Casting
Cost Element Alloy Type
Yeild
(%)
Production cost ($/Kilogram) =
Mn-B1 Traditional Item Cost
Supplies
11%
Administration
14%
Depreciation
15%
Indirect
Materials
17%Planning
1%Engineering
3%
Quality Control
13%Direct materials
12%
Technology
2%
Maintenance
4%
Direct Labor
6%
Selling
2%
Figure: 7: Division of the contributing costs of Mn-B1 item cost
under TCA.
6. Discussion and Concluding Remarks
A comparison of producing the different alloy types
under variant production rate is carried out based on ABC
and TCA, the comparison as shown in figure 8, indicates
that, the target of the company should be to produce 2800
ton of saleable casting per one year in two shifts with the
full designed capacity. This logical result has been
concluded based on both TCA and ABC as shown by
figure 8 and figure 9 respectively. For any alloy type the
production cost under a production rate of 2800 tons per
year per 2 shafts is smaller than the production cost under
a production rate of 1400 tons per year per 1 shaft as will
as a production rate of 700 tons per year per 1 shaft.

© 2012 Jordan Journal of Mechanical and Industrial Engineering. All rights reserved - Volume 6, Number 1 (ISSN 1995-6665) 85
0.00
0.50
1.00
1.50
2.00
2.50
3.00
3.50
4.00
4.50
5.00
Mn-B
1
Mn-C
low
allo
y
cast iron
Hig
h C
r-C
I
H.R
.SC
H13
H.R
.SC
H22
Ductil
e Iro
n
Sta
inle
ss
Ductil
e r
olls
Avera
ge
Cost $/K
g
2800000 Kg/Year/ 2 Shafts (CF = 1)
1400000 Kg/Year/1Shift (CF = 1)
700000 Kg/Year (CF = 0.5) = Actual rate
Figure 8: A comparison of cost of different alloy types under
variant production rate based on ABC.
0.00
0.50
1.00
1.50
2.00
2.50
3.00
3.50
4.00
4.50
5.00
Mn-B
1
Mn-C
low
allo
y
cast iron
Hig
h C
r-C
I
H.R
.SC
H13
H.R
.SC
H22
Ductil
e Iro
n
Sta
inle
ss
Ductil
e r
olls
Avera
ge
Co
st $
/Kg
2800000 Kg/Year/ 2 Shafts (CF = 1)
1400000 Kg/Year/1Shift (CF = 1)
700000 Kg/Year (CF = 0.5) = Actual rate
Figure 9: A comparison of cost of different alloy under variant production rate based on TCA.
Based on ABC, the most expensive alloy in all
scenarios is Mn-B1 that accurately reflects the cost of the
assembly center, while the cheapest alloy is the cast iron
alloy. Based on TCA, the most expensive alloy in all
scenarios is H.R.SCH22 alloy, while the cheapest one is
cast iron alloy. One advantage for ABC over TCA is that
ABC can be used as a continuous improvement tool for
internal cost reduction; ABC results can provide
quantitative figures to determine the cost effectiveness of
the foundry and to justify strategic production policies. It
can be used to investigate the effectiveness of consuming
the available resources by every activity center
independently. These advantages relate to the way the
costing process is assessed and the improved visibility of
cost items. ABC improves the visibility of costs and shows
how costs are passed down to products by activities as
depicted by figure 10, which shows the allocation of cost
as a percentage to a stainless steel casting from all
available resources areas associated with every activity
center.
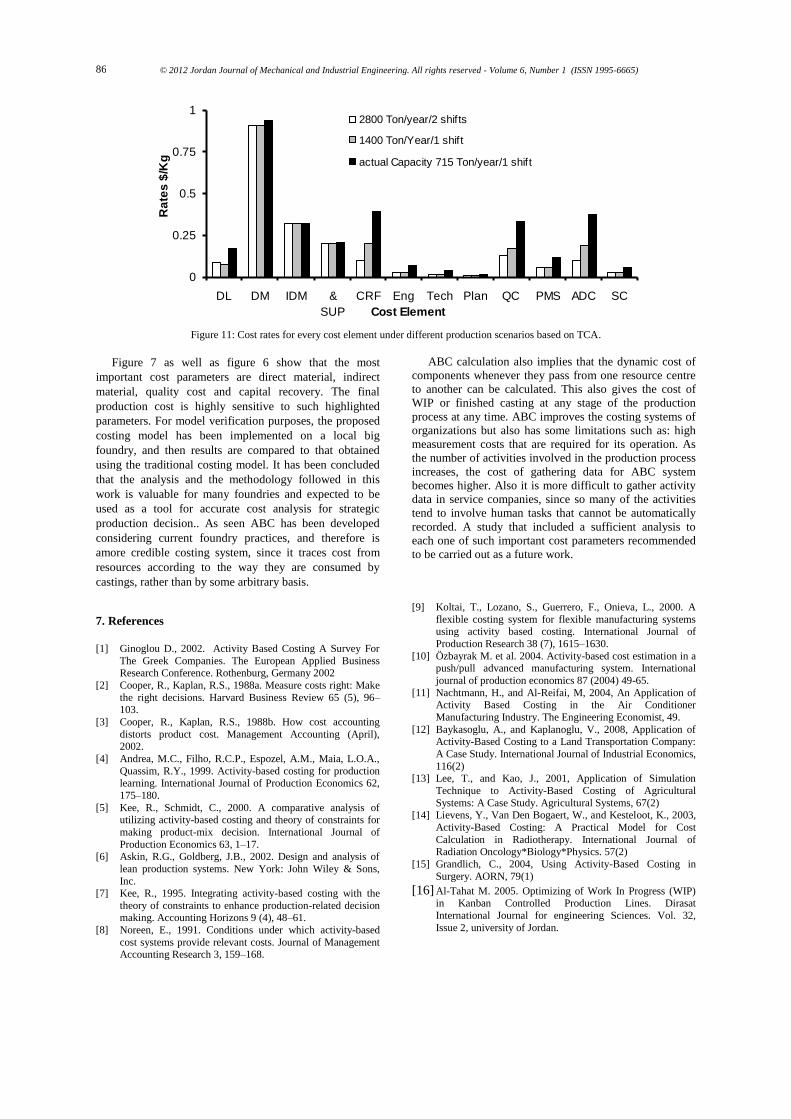
The process of allocating cost from resources to
activities is a second benefit of ABC. By understanding the
hierarchy of costs and the way products consume the lower
cost items, the visibility of overhead cost is improved.
Under TCA, the attention of management would be drawn
only to the higher cost elements, which in this case as
shown in figure 11, are the direct and direct materials,
capital recovery, supplies and quality cost.
Melting
27%
Administration
11%
Maintenance
5%Line Molding
14%
Shot blasting
1%
Shell core
6%
Shake out
0%
Heat treatment
2%
Grinding
1%Cutt-off
2% Machining
15%
Shipping
0%
Sales & Market
3%
Painting
1%
Assembly
0%
Design
2%
Planning
1%
Labs & QC
9%
Figure 10: Resources consumption % by activity centers under ABC for stainless steel.
© 2012 Jordan Journal of Mechanical and Industrial Engineering. All rights reserved - Volume 6, Number 1 (ISSN 1995-6665) 86
0
0.25
0.5
0.75
1
DL DM IDM &
SUP
CRF Eng Tech Plan QC PMS ADC SC
Cost Element
Ra
tes
$/K
g
2800 Ton/year/2 shifts
1400 Ton/Year/1 shift
actual Capacity 715 Ton/year/1 shift
Figure 11: Cost rates for every cost element under different production scenarios based on TCA.
Figure 7 as well as figure 6 show that the most
important cost parameters are direct material, indirect
material, quality cost and capital recovery. The final
production cost is highly sensitive to such highlighted
parameters. For model verification purposes, the proposed
costing model has been implemented on a local big
foundry, and then results are compared to that obtained
using the traditional costing model. It has been concluded
that the analysis and the methodology followed in this
work is valuable for many foundries and expected to be
used as a tool for accurate cost analysis for strategic
production decision.. As seen ABC has been developed
considering current foundry practices, and therefore is
amore credible costing system, since it traces cost from
resources according to the way they are consumed by
castings, rather than by some arbitrary basis.
ABC calculation also implies that the dynamic cost of
components whenever they pass from one resource centre
to another can be calculated. This also gives the cost of
WIP or finished casting at any stage of the production
process at any time. ABC improves the costing systems of
organizations but also has some limitations such as: high
measurement costs that are required for its operation. As
the number of activities involved in the production process
increases, the cost of gathering data for ABC system
becomes higher. Also it is more difficult to gather activity
data in service companies, since so many of the activities
tend to involve human tasks that cannot be automatically
recorded. A study that included a sufficient analysis to
each one of such important cost parameters recommended
to be carried out as a future work.
7. References
[1] Ginoglou D., 2002. Activity Based Costing A Survey For
The Greek Companies. The European Applied Business Research Conference. Rothenburg, Germany 2002
[2] Cooper, R., Kaplan, R.S., 1988a. Measure costs right: Make
the right decisions. Harvard Business Review 65 (5), 96–103.
[3] Cooper, R., Kaplan, R.S., 1988b. How cost accounting
distorts product cost. Management Accounting (April), 2002.
[4] Andrea, M.C., Filho, R.C.P., Espozel, A.M., Maia, L.O.A.,
Quassim, R.Y., 1999. Activity-based costing for production learning. International Journal of Production Economics 62,
175–180.
[5] Kee, R., Schmidt, C., 2000. A comparative analysis of utilizing activity-based costing and theory of constraints for
making product-mix decision. International Journal of
Production Economics 63, 1–17. [6] Askin, R.G., Goldberg, J.B., 2002. Design and analysis of
lean production systems. New York: John Wiley & Sons,
Inc. [7] Kee, R., 1995. Integrating activity-based costing with the
theory of constraints to enhance production-related decision making. Accounting Horizons 9 (4), 48–61.
[8] Noreen, E., 1991. Conditions under which activity-based
cost systems provide relevant costs. Journal of Management Accounting Research 3, 159–168.
[9] Koltai, T., Lozano, S., Guerrero, F., Onieva, L., 2000. A
flexible costing system for flexible manufacturing systems using activity based costing. International Journal of
Production Research 38 (7), 1615–1630.
[10] Özbayrak M. et al. 2004. Activity-based cost estimation in a push/pull advanced manufacturing system. International
journal of production economics 87 (2004) 49-65.
[11] Nachtmann, H., and Al-Reifai, M, 2004, An Application of Activity Based Costing in the Air Conditioner
Manufacturing Industry. The Engineering Economist, 49.
[12] Baykasoglu, A., and Kaplanoglu, V., 2008, Application of Activity-Based Costing to a Land Transportation Company:
A Case Study. International Journal of Industrial Economics,
116(2) [13] Lee, T., and Kao, J., 2001, Application of Simulation
Technique to Activity-Based Costing of Agricultural
Systems: A Case Study. Agricultural Systems, 67(2) [14] Lievens, Y., Van Den Bogaert, W., and Kesteloot, K., 2003,
Activity-Based Costing: A Practical Model for Cost
Calculation in Radiotherapy. International Journal of Radiation Oncology*Biology*Physics. 57(2)
[15] Grandlich, C., 2004, Using Activity-Based Costing in
Surgery. AORN, 79(1)
[16] Al-Tahat M. 2005. Optimizing of Work In Progress (WIP) in Kanban Controlled Production Lines. Dirasat
International Journal for engineering Sciences. Vol. 32,
Issue 2, university of Jordan.
Related Documents