ACTIVITY AND MECHANISM OF ASCOPHYLLUM NODOSUM EXTRACT INDUCED SALINITY TOLERANCE IN TOMATO by Abhinandan Kumar Submitted in partial fulfilment of the requirements for the degree of Master of Science at Dalhousie University Halifax, Nova Scotia June 2014 © Copyright by Abhinandan Kumar, 2014

Welcome message from author
This document is posted to help you gain knowledge. Please leave a comment to let me know what you think about it! Share it to your friends and learn new things together.
Transcript
ACTIVITY AND MECHANISM OF ASCOPHYLLUM NODOSUM EXTRACT INDUCED SALINITY TOLERANCE IN TOMATO
by
Abhinandan Kumar
Submitted in partial fulfilment of the requirements for the degree of Master of Science
at
Dalhousie University Halifax, Nova Scotia
June 2014
© Copyright by Abhinandan Kumar, 2014

ii
I dedicate this thesis to my family who has always been the nearest reserves for motivation whenever I was down. Their unconditional love has always motivated me to set higher goals. I also dedicate this thesis to my friend, Palaniappan Ramanathan, who was nearest to me, all through my stay, like a brother.
iii
TABLE OF CONTENTSLIST OF TABLES ..............................................................................................viLIST OF FIGURES ........................................................................................... viiABSTRACT ........................................................................................................ xLIST OF ABBREVIATIONS USED ....................................................................xiACKNOWLEDGEMENTS ................................................................................ xivCHAPTER 1 Introduction .............................................................................. 1CHAPTER 2 Review of Literature ................................................................. 4
2.1 Soil salinity: a major environmental stress to plants ............................ 42.2 Effect of soil salinity on plant growth ................................................... 62.3 Effect of salinity on physiological and biochemical characteristics ...... 9
Osmotic (water deficit) and ionic dis-equilibrium ...................... 9Changes in cell membrane, organelle ultrastructure and leaf
anatomy… ............................................................................................. 11Changes in photosynthesis and production of reactive oxygen
species…. .............................................................................................. 122.4 Mechanisms of salinity tolerance ...................................................... 15
Ion regulation ......................................................................... 18Induced biosynthesis of compatible solutes and antioxidative
enzymes.. .............................................................................................. 20Role of plant hormones in stress tolerance ............................ 24
2.5 Recent approaches in mitigation of salinity stress in plants .............. 262.6 Tomato, salinity and model for crop plant studies ............................. 272.7 Ascophyllum nodosum (L.) Le Jol. and plant stress alleviation ......... 28
CHAPTER 3 Material and methods ............................................................ 313.1 In vitro effect of ethyl acetate organic fraction of Ascophyllum nodosum on salinity tolerance in tomato seedlings ....................................... 31
Preparation of organic sub fractions from Ascophyllum nodosum extract .................................................................................... 31
Tomato plant seedling establishment for in vitro experiments 31Experimental setup and plant phenotype data collection and
analysis… .............................................................................................. 323.2 Biochemical analysis of Ascophyllum nodosum induced salinity tolerance in tomato seedlings in in vitro ........................................................ 33
Crude enzyme extract preparation ......................................... 33
iv
Estimation of total protein ...................................................... 34Estimation of catalase activity ................................................ 34Estimation of guaiacol peroxidase activity ............................. 35Estimation of proline .............................................................. 35Estimation of total chlorophyll ................................................ 36Estimation of Na+ concentration ............................................. 36
3.3 Molecular analysis of Ascophyllum nodosum induced salinity tolerance in tomato seedlings in vitro ............................................................ 37
RNA isolation and cDNA synthesis ........................................ 37Quantitative Real Time PCR Analyses .................................. 38
3.4 The effect of commercial extract of Ascophyllum nodosum extract on salinity tolerance in tomato seedlings in greenhouse .................................... 39
Tomato plant seedling establishment for greenhouse experiments ........................................................................................... 39
Experimental setup and plant phenotype data collection ....... 39Determination of Na+and K+ concentration in leaf tissue of
plants grown in greenhouse by atomic absorption spectrophotometry .. 413.5 Effect of EtOAc-ANE and commercial extract of Ascophyllum nodosum on tomato fruit number, yield and biomass in the greenhouse ...... 42
Effect of EtOAc-ANE on tomato fruit number, yield and biomass… .............................................................................................. 42
Effect of commercial extract of Ascophyllum nodosum on tomato fruit number, yield and biomass ................................................. 42
CHAPTER 4 Results ................................................................................... 434.1 In vitro experiments using ethyl acetate fraction of Ascophyllum nodosum extract ............................................................................................ 43
Effect of EtOAc-ANE on leaf area, root length and root area of tomato plants ......................................................................................... 43
Determination of biochemical changes in the leaves of tomato plants grown in vitro salinity stress studies ............................................ 47
4.1.2.1 Estimation of catalase activity in the leaves of tomato plants….. ....................................................................................... 47
Estimation of Guaiacol peroxidase activity in the leaves of tomato plants ......................................................................................... 48
4.1.3.1 Estimation of proline content in the leaves of tomato plants….. ....................................................................................... 494.1.3.2 Estimstion of MDA content in the leaves ......................... 50

v
Estimation of chlorophyll content in the leaves ...................... 514.1.4.1 Estimation of chlorophyll a in the leaves ......................... 514.1.4.2 Estimation of chlorophyll b in the leaves ......................... 524.1.4.3 Chlorophyll a/b Ratio ....................................................... 544.1.4.4 Estimation of carotenoids in the leaves ........................... 54
Estimation of Na+ concentration in in vitro growth medium .... 56Molecular analysis of Ascophyllum nodosum extract induced
salinity tolerance .................................................................................... 574.2 Greenhouse experiments with commercial Ascophyllum nodosum extract (ANE) ................................................................................................. 60
Effect of commercial Ascophyllum nodosum extract on leaf area, root length, root area and fresh weight of tomato plant ................. 60
Effect of commercial Ascophyllum nodosum extract on Na+ and K+ content of tomato leaves tissue at 6, 24 and 72 h after treatment ..... 71
4.3 Effect of EtOAc-ANE and commercial Ascophyllum nodosum extract fruit number, yield and biomass of the plants in greenhouse ........................ 74
Effect of EtOAc-ANE on fruit number, yield, fresh weight of plants and total biomass of plant ........................................................... 74
Effect of commercial Ascophyllum nodosum extract on fruit number, yield, fresh weight of plants and total biomass of plant in greenhouse ............................................................................................ 78
CHAPTER 5 Discussion .............................................................................. 835.1 EtOAc-ANE improved tomato plant phenotype under salinity stress invitro….. .......................................................................................................... 835.2 EtOAc-ANE regulates enzymatic activities, metabolites and differential gene expression in tomato plants under salinity stress in vitro ...................... 855.3 EtOAc-ANE treatment significantly decreased sodium accumulation in tomato plants under salinity stress in vitro..................................................... 905.4 Commercial Ascophyllum nodosum extract (ANE) showed complex interaction with NaCl and altered K+/Na+ ratio in leaves in the greenhouse .. 925.5 Effects of ethyl acetate organic fraction (EtOAc-ANE) and Ascophyllum nodosum extracts (ANE) on tomato yield ................................. 94
CHAPTER 6 Conclusion and Summary ...................................................... 96References ...................................................................................................... 98Appendix I: Organic Sub-fractionation of ANE ............................................... 119Appendix II: Analysis of Variance .................................................................. 120Appendix III: Mineral composition of Long Ashton Solution (LANS) and
Inorganic control ............................................................................. 124

vi
LIST OF TABLES
Table 2.1: Classification of salt-affected soils (Brady, 2002) ............................. 6Table 3.1: Gene specific primers ..................................................................... 39

vii
LIST OF FIGURES
Figure 2.1: Glycophytes- crop tolerance to salinity (Tanji and Kielen, 2002) .... 7Figure 2.2: Effects of salinity on plant growth (reproduced from Pasternak,
1987) ................................................................................................... 8Figure 2.3: Physiological changes in plants due to high salinity ..................... 11Figure 2.4: A generic response pathway of plants under Stress ..................... 16Figure 2.5: Mechanism of salinity tolerance .................................................... 18Figure 2.6: Response of plants to ROS .......................................................... 24Figure 2.7: Effects of seaweed on plant fitness .............................................. 30Figure 3.1: Experimental setup in the greenhouse ......................................... 40Figure 3.2: a) Detached leaves for measurement of leaf area, b) Washed root
for measurement of root length and root area ................................... 41Figure 4.1.1.1 Asocphyllum nodosum induce salinity tolerance in in vitro grown
tomato plants. The changes in leaf area of plants after 14 days, in 100 mM NaCl, with and without EtOAc-ANE supplementation. ............... 44
Figure 4.1.1.2 Asocphyllum nodosum induce salinity tolerance in in vitro grown tomato plants. The changes in root length of plants are after 14 days in 100 mM NaCl, with and without EtOAc-ANE supplementation ...... 45
Figure 4.1.1.3 Changes in root surface area of plants after 14 days, in 100 mM NaCl, with and without EtOAc-ANE supplementation. ...................... 46
Figure 4.1.2.1 Changes in catalase activity of tomato leaves determined at 24 h and 96 h after treatments in 100 mM NaCl, with and without EtOAc-ANE supplementation.........................................................................48
Figure 4.1.2.2 Changes in guaiacol peroxidase activity of the leaves of tomato plants determined at 24 h and 96 h following treatments in 100 mM NaCl, with and without EtOAc-ANE supplementation. ...................... 49
Figure 4.1.2.3 Changes in proline content of the leaves of tomato plants determined at 24 h and 96 h following treatments in 100 mM NaCl, with and without EtOAc-ANE supplementation. ................................ 50
Figure 4.1.2.4 Changes in MDA (malondialdehyde) content of the leaves of tomato plants determined at 24 h and 96 h following treatments in 100 mM NaCl, with and without EtOAc-ANE supplementation. ............... 51
Figure 4.1.3.1 Changes in chlorophyll a content of the leaves of tomato plants determined at 24 h and 96 h following treatments in 100 mM NaCl, with and without EtOAc-ANE supplementation. ................................ 52
Figure 4.1.3.2 Changes in chlorophyll b content of the leaves of tomato plants determined at 24 h and 96 h following treatments in 100 mM NaCl, with and without EtOAc-ANE supplementation. ................................ 53
viii
Figure 4.1.3.3 Changes in Chlorophyll a/b ratio of the leaves of tomato plants determined at 24 h and 96 h following treatments in 100 mM NaCl, with and without EtOAc-ANE supplementation ................................. 54
Figure 4.1.3.4 Changes in carotenoid content of the leaves of tomato plants determined at 24 h and 96 h following treatments in 100 mM NaCl, with and without EtOAc-ANE supplementation. ................................ 55
Figure 4.1.4 Changes in Na+ in 100 mM NaCl, with and without EtOAc-ANE supplementation are shown. ............................................................. 56
Figure 4.1.5.1 Changes in catalase-2 gene expression in the leaves of tomato plants determined at 24 h and 96 h following treatments in 100 mM NaCl, with and without EtOAc-ANE supplementation. ...................... 57
Figure 4.1.5.2 Changes in tompro-2 gene expression in the leaves of tomato plants determined at 24 h and 96 h following treatments in 100 mM NaCl, with and without EtOAc-ANE supplementation. ...................... 58
Figure 4.1.5.3 Changes in nhx-1 gene expression in the leaves of tomato plants determined at 24 h and 96 h following treatments in 100 mM NaCl, with and without EtOAc-ANE supplementation. ...................... 59
Figure 4.1.5.4 Changes in nhx-3 gene expression in the leaves of tomato plants determined at 24 h and 96 h following treatments in 100 mM NaCl, with and without EtOAc-ANE supplementation. ...................... 60
Figure 4.2.1.1: Changes in leaf area of tomato plants determined after 2 weeks of treatments with NaCl and commercial Ascophyllum nodosum extract in greenhouse. ...................................................................... 62
Figure 4.2.1.1a: Linear slope of NaCl, concentrations and its effect on leaf area .......................................................................................................... 63
Figure 4.2.1.1b: Interaction of quadratic slope of ANE and linear slope of Salt at different levels on leaf area ........................................................... 64
Figure 4.2.1.2: Changes in root length of tomato plants determined after 2 weeks of treatments with NaCl and commercial Ascophyllum nodosum extract in greenhouse. ....................................................... 65
Figure 4.2.1.2a: Linear slope of NaCl concentrations and its effect on root length ................................................................................................ 66
Figure 4.2.1.3: Changes in root surface area of tomato plants determined after 2 weeks of treatments with NaCl and commercial Ascophyllum nodosum extract in greenhouse. ....................................................... 67
Figure 4.2.1.3a: Linear slope of NaCl concentrations and its effect on root length ................................................................................................ 68
Figure 4.2.1.4: Changes in fresh weight of tomato plants determined after 2 weeks of treatments with NaCl and commercial Ascophyllum nodosum extract in greenhouse. ....................................................... 69
ix
Figure 4.2.1.4a: Linear slope of NaCl concentrations and its effect on fresh weight (g) .......................................................................................... 70
Figure 4.2.2.1: Changes in Na+ content of the leaves of four week old tomato plants determined at 6 h, 24 h and 72 h following treatments in 200 mM NaCl, with and without ANE supplementation. ........................... 72
Figure 4.2.2.2: Changes in K+ content of the leaves of four week old tomato plants determined at 6 h, 24 h and 72 h following treatments in 200 mM NaCl, with and without ANE supplementation. ........................... 73
Figure 4.2.2.3: Changes in K+/Na+ ratio of the leaves of four week old tomato plants determined at 6 h, 24 h and 72 h following treatments in 200 mM NaCl, with and without ANE supplementation. ........................... 74
Figure 4.3.1.1 Effect of EtOAc-ANE on fruit yield of plants determined at the end of fruiting in greenhouse condition. ............................................ 75
Figure 4.3.1.2 Effect of EtOAc-ANE on number of fruits produced during the study period in greenhouse condition ............................................... 76
Figure 4.3.1.3 Effect of EtOAc-ANE on fresh weight of plants at the end of the study period. ..................................................................................... 77
Figure 4.3.1.4 Effect of EtOAc-ANE on total aboveground biomass produced during the study period ..................................................................... 78
Figure 4.3.2.1: Effect of commercial Ascophyllum nodosum extract on number of fruits per plants determined at the end of fruiting in greenhouse condition............................................................................................ 79
Figure 4.3.2.2: Effect of commercial Ascophyllum nodosum extract on fruits yield determined at the end of fruiting period in greenhouse condition. .......................................................................................................... 80
Figure 4.3.2.3 Effect of commercial Ascophyllum nodosum extract on fresh weight of plants determined at the end of study. ............................... 81
Figure 4.3.2.4: Effect of commercial Ascophyllum nodosum extract on total aboveground biomass (fruit yield and fresh weight) determined at the end of study. ..................................................................................... 82
x
ABSTRACT
Salinity affects crop production worldwide. Ascophyllum nodosum, a brown marine alga, has been used for decades as a bio-stimulant to promote plant growth and impart tolerance to biotic and abiotic stresses. However, the mechanism(s) of the bio-stimulatory activity of A. nodosum extract (ANE) is not well understood. In vitro experiments were conducted to study the effect of the ethyl acetate fraction of ANE on two week old tomato plants (cv Scotia) grown under salinity stress (100 mM NaCl). The ethyl acetate fraction significantly improved seedling growth and development under salinity stress, i.e. the leaf area and root length of the treated plants improved while the in-planta sodium ion concentration decreased. Stimulated seedlings had higher catalase enzyme activity and recorded higher chlorophyll (chla, chlb and carotenoids) content than non-supplemented stressed plants. Moreover, when tested on four week old tomato plants in a greenhouse, ANE treated plants showed higher concentrations of potassium ions compared to controls. The results shed light on the complex nature of ANE.
xi
LIST OF ABBREVIATIONS USED
ANE Ascophyllum nodosum Extract
EtOAc-ANE Ethyl acetate fraction of Ascophyllum nodosum Extract
H2O Water
CO2 Carbon dioxide
FAO Food and Agriculture Organization
NaCl Sodium Chloride
Cl¯ Chloride ion
SO43- Sulphate ion
NO3 ¯ Nitrate ion
HCO3¯ Bicarbonate ion
Na+ Sodium ion
Ca2+ Calcium ion
Mg2+ Magnesium ion
K+ Potassium ion
ROS Reactive oxygen species
DNA Deoxyribonucleic acid
1O2 Singlet oxygen
¯O2 Superoxide radical
H2O2 Hydrogen peroxide
OH Hydroxyl Radical
PCD Programmed cell death
CO3 ¯ Carbonate Radical
xii
CO2 ¯ Carbon dioxide anion radical
RO Mineral oxide
RO2 Mineral dioxide
HOCl Hypochlorite
O3 Ozone molecule
ONOO¯ Peroxynitrite ion
O2NOO¯ Peroxynitric ion
RO2 Mineral dioxide radical
HOOCO2¯ Peroxymonocarbonate ion
ONOOH Peroxynitrous acid
RLK Receptor-like kinases
GPCR G-protein coupled receptors in plant
InsP Inositol phosphate
ABA Abscisic acid
HKT High-affinity Potassium Transporters
KIRC K+ inward-rectifying channel
NSCC Non-specific cation channels
KORC K+ outward-rectifying channel
V-ATPase Vacuolar type H+ ATPase
V-PPase Vacuolar type pyrophosphatase
PIPB Phosphatidylinositol bisphosphate
SOS Salt overly sensitive
CBL Calcineurin B-like protein
xiii
NHX Na+/H+ antiporter
PDH45 Pea DNA helicase 45
RD29A Desiccation-responsive protein 29A
P5CS 1-pyrroline-5-carboxylate synthetase
EC Electrical conductivity
GC Gas Chromatography
HPLC High performance liquid chromatography
MS Mass spectrometry
NMR Nuclear magnetic resonance
IAA Indole-3-acetic acid
MeOH methanol
ANOVA Analysis of Variance
SAS Statistical Analysis System
HSD Honestly significant difference
KH2PO4 Monopotassium phosphate
K2HPO4 Dipotassium phosphate
PVP Polyvinylpyrrolidone
EDTA Ethylenediaminetetraacetic acid
BSA Bovine serum albumin
OD Optical density
DMSO Dimethyl sulfoxide
RNA Ribonucleic acid
RNase Ribonuclease

xiv
ACKNOWLEDGEMENTS
First, I would like to thank my supervisor, Dr. Balakrishnan Prithiviraj, for his
guidance, encouragement and patience over the last few years. Thank you for
teaching me some of the skills of being a researcher and the responsibilities of
graduate student life. Listening to you in the lab meets was motivating. Thank
you for the support, guidance and encouragement throughout my thesis project. I
would like to thank my committee members, Dr. Yousef Papadopoulos and Dr.
Bernhard Benkel, for their continuous encouragement and constructive feedback
during my thesis writing.
I would like to acknowledge the Natural Science and Engineering Research
Council of Canada (NSERC) for granting the IPS scholarship for this project. I
would like to mention the enormous contribution from Dr. Prithiviraj, Dr. Alan T.
Critchley (Acadian Seaplants Limited) and Heather Hughes (Research Services)
in procuring this prestigious award.
I would like to extend my gratitude to Dr. Alan T. Critchley, Mr. Will Niely, Mrs.
Laurel Shishkov, Mr. Jef Archibald, Dayna, Katy Griegoschewski, Leah and Josie
for being such wonderful hosts during my stay in Cornwallis, NS. Thank you, Dr.
Wally Shishkov, for sharing your enlightening thoughts, whenever we met.
There are so many wonderful people around me to thank, who have touched my
life and have made my stay fun filled. I would like to extend my appreciation to
my lab members from Marine Bioproducts research laboratory. Thank you, Dr.
Saveetha for always being a friend as well as a vital critique. I would like to thank
Dr. Jatinder, Dr. Julia and Dr. Tan for giving me learning experience whenever I
talked to you. A huge appreciation for the learning experiences I had with my lab
mates, Sridhar, Garima, Pramod, Swati, Gayathri and Mullai, whenever I worked
with you. Thank you Nadun for the wonderful experience we had working
together.
This note would be incomplete if I do not mention Margie, Anne, Daryl, Paul and
Gisele for their unconditional assistance whenever I needed it. My heartfelt

xv
appreciations to Mrs. Marg Rovers and Rosalie Madden, who helped me, make
sense out of my English.
I would like to thank Mrs. Kalyani Prithiviraj for the delicious food when I was
bedridden for months. I will never forget Palaniappan Ramanathan, without
whose dedication to see me in good health, I would never have had the chance
to finish this thesis sooner. Major thanks to Parmender Singh, Kaushikan
Ganesan and Ashok Somalraju for the loyal company which I had with you, at all
stages of my stay.
I bow to the Almighty, to my parents, and to everyone who have given me a
lesson to learn in life. Everything which seems to be free, costs time. And thus, I
owe to everyone who has agreed to spend a little time with me. I would like to
acknowledge their anonymous presence in my life. Thank you all.
1
CHAPTER 1 Introduction
All living organisms on the earth have specific requirements for optimum growth.
Life is an outcome of the homeostasis between the internal and external
environments. The environments change frequently and unpredictably,
perturbing this delicate balance that might lead to “stress”, a term which is not
precise but has general connotations (Osmond et al., 1987).
An environmental condition can be optimum for one organism and stressful for
another. The crop plants are frequently exposed to environmental stresses such
as variation in temperature, soil water deficit, soil mineral deficiencies, and soil
salinity. Other stresses include interactions with biotic factors, such as
pathogens, insects, weeds and herbivores. Thus, tolerance to various
environmental stresses gives a measure of a plant’s primary assimilation
processes (CO2 and mineral uptake), growth (biomass accumulation), survival
and yield (Taiz and Zeigler, 2002).
Soil salinity is one of the most commonly faced challenges in present agriculture.
Many cultivated crops are sensitive to low salinity levels. Crop plants cultivated
on saline soils have reduced growth and yield. The plants are usually challenged
to achieve field yield potential under such conditions. Soil salinity is a dynamic
characteristic, largely depending on soil inherent mineral and chemical
composition. It is affected by fluctuations in water profile and ion influxes of both
edaphic and anthropogenic origins. Thus, the ionic profile of soil has been used
as an indicator of soil health (Haberern, 1992), and as a measure of suitability
for cultivation. The ionic profile guides the adoption of various agricultural soil

2
management practices followed in cropping systems. Although, crop plants differ
in their ability to tolerate salinity stress, it has been difficult to precisely measure
salt tolerance in long duration yield studies, which are often associated with
unpredictable environmental constraints that could affect the final outcome.
Therefore, a range of indices have been developed to assess the level of plant
tolerance to such stresses. Some of the methods of determining a plant’s ability
to tolerate salinity are to measure germination percentage, leaf area changes,
root characteristics (length and area), and biomass accumulation under saline
conditions (Munns, 2002).
Plants, being sessile, have developed complex mechanisms to deal with various
environmental stresses. Research in plant mineral nutrition began more than 150
years ago (Kochian and Lucas, 2014), and several aspects of plant nutrient
acquisition, its interaction with other nutrients and their assimilation inside plants
are still under investigation. Challenges on improving plant salt tolerance have
led to the development of strategies which include engineering (improve
drainage, irrigation), genetic improvement (genetic engineering and breeding)
and the application of soil amendments (chemical or organic).
For centuries, whole seaweed, or processed or purified concentrates of
seaweeds, have been used in agriculture to improve stress tolerance (Crouch et
al., 1990) in plants and animals. Ascophyllum nodosum and many other types of
seaweed, such as Laminaria, Fucus and Ecklonia, are commonly used. Their
growth promoting effects are contributed by naturally occurring bio-stimulatory
components, which include essential micronutrients, traces of vitamins, and

3
complex organic molecules. These molecules have similar functional effects as
hormones found in terrestrial plants (Craigie, 2011; Stirk et al., 2003).
The present study builds upon the knowledge and long history of the use of
seaweeds, especially Ascophyllum nodosum, as organic amendments under
various environmental stresses. The project investigated the potential use of
Ascophyllum nodosum extract to impart salinity tolerance to plants, using tomato
as a model.
4
CHAPTER 2 Review of Literature
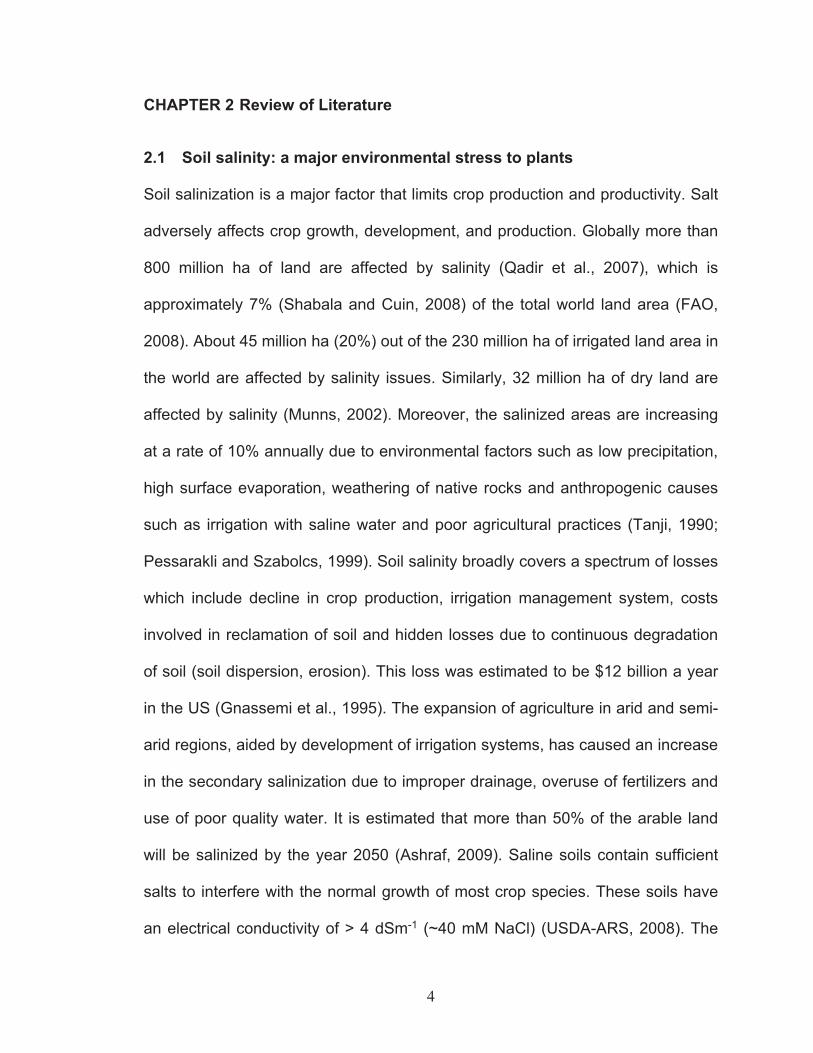
2.1 Soil salinity: a major environmental stress to plants
Soil salinization is a major factor that limits crop production and productivity. Salt
adversely affects crop growth, development, and production. Globally more than
800 million ha of land are affected by salinity (Qadir et al., 2007), which is
approximately 7% (Shabala and Cuin, 2008) of the total world land area (FAO,
2008). About 45 million ha (20%) out of the 230 million ha of irrigated land area in
the world are affected by salinity issues. Similarly, 32 million ha of dry land are
affected by salinity (Munns, 2002). Moreover, the salinized areas are increasing
at a rate of 10% annually due to environmental factors such as low precipitation,
high surface evaporation, weathering of native rocks and anthropogenic causes
such as irrigation with saline water and poor agricultural practices (Tanji, 1990;
Pessarakli and Szabolcs, 1999). Soil salinity broadly covers a spectrum of losses
which include decline in crop production, irrigation management system, costs
involved in reclamation of soil and hidden losses due to continuous degradation
of soil (soil dispersion, erosion). This loss was estimated to be $12 billion a year
in the US (Gnassemi et al., 1995). The expansion of agriculture in arid and semi-
arid regions, aided by development of irrigation systems, has caused an increase
in the secondary salinization due to improper drainage, overuse of fertilizers and
use of poor quality water. It is estimated that more than 50% of the arable land
will be salinized by the year 2050 (Ashraf, 2009). Saline soils contain sufficient
salts to interfere with the normal growth of most crop species. These soils have
an electrical conductivity of > 4 dSm-1 (~40 mM NaCl) (USDA-ARS, 2008). The
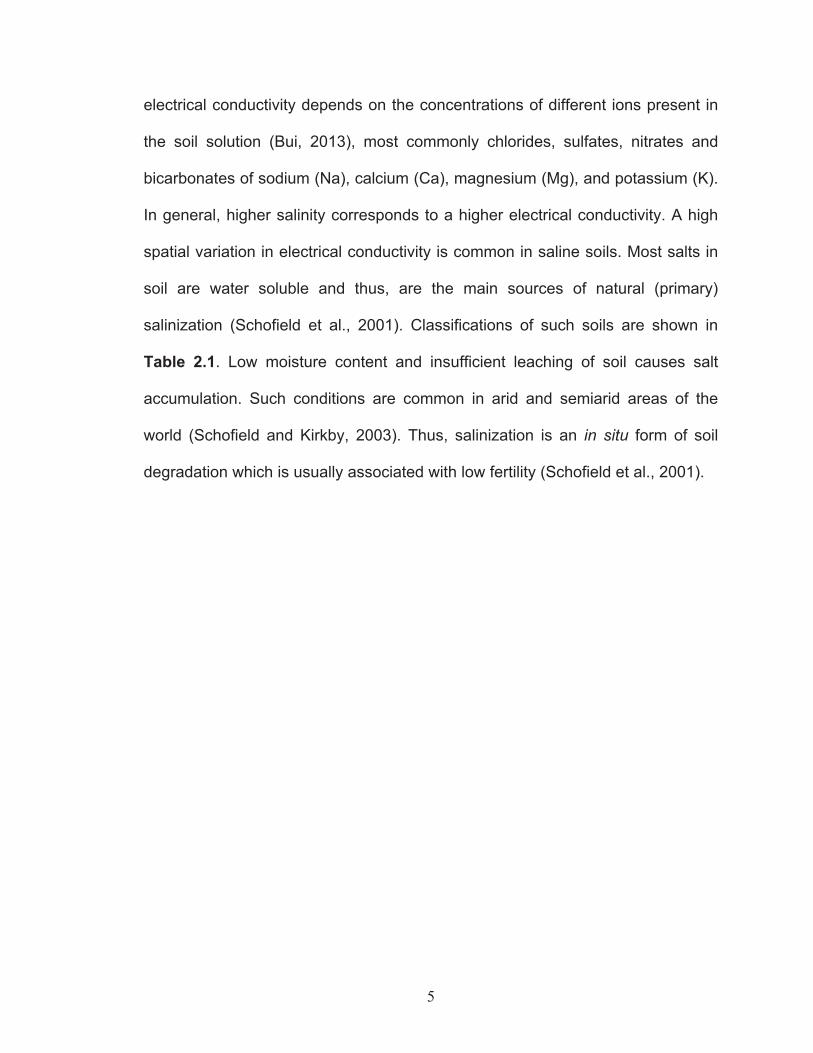
5
electrical conductivity depends on the concentrations of different ions present in
the soil solution (Bui, 2013), most commonly chlorides, sulfates, nitrates and
bicarbonates of sodium (Na), calcium (Ca), magnesium (Mg), and potassium (K).
In general, higher salinity corresponds to a higher electrical conductivity. A high
spatial variation in electrical conductivity is common in saline soils. Most salts in
soil are water soluble and thus, are the main sources of natural (primary)
salinization (Schofield et al., 2001). Classifications of such soils are shown in
Table 2.1. Low moisture content and insufficient leaching of soil causes salt
accumulation. Such conditions are common in arid and semiarid areas of the
world (Schofield and Kirkby, 2003). Thus, salinization is an in situ form of soil
degradation which is usually associated with low fertility (Schofield et al., 2001).

6
Table 2.1: Classification of salt-affected soils (Brady and Weil, 2010)
2.2 Effect of soil salinity on plant growth
Soil salinity adversely affects plants’ physiological processes, resulting in slow
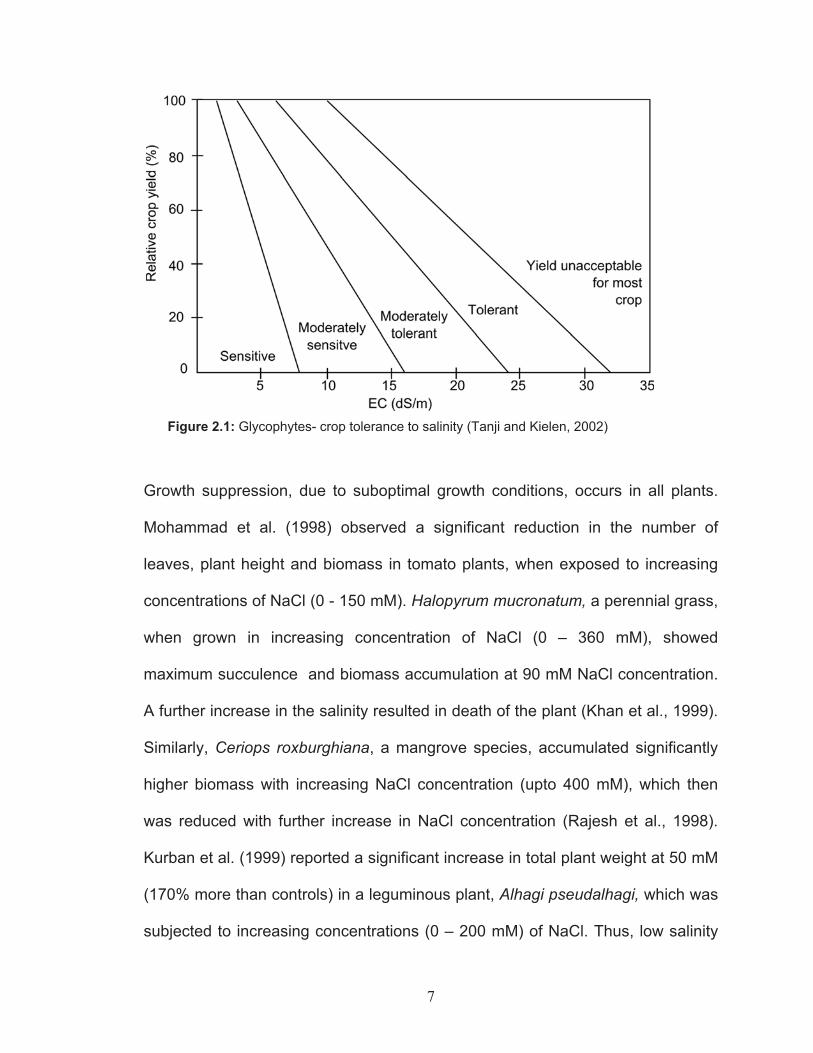
growth. Based on tolerance to soil salinity, terrestrial plants have been classified
into two groups; halophytes and glycophytes (non-halophytes). Although, only
2% of the terrestrial plant species are halophytes, this class includes a large
diversity of plants with members from half of all higher plant families (Glenn et al.,
1999). Halophytes have evolved adaptive modifications, such as the presence of
salt excreting glands, bladders and succulence. The glycophytes have been
further classified as sensitive, moderately sensitive, moderately tolerant and
tolerant species. All terrestrial crops fit into a classification in each of these
groups (Figure 2.1).
Classification
Electrical Conductivity (dS/m)
Soil pH
Sodium Adsorption Ratio
Soil Physical Condition
Saline > 4.0 < 8.5 < 13 Normal Saline-sodic > 4.0 < 8.5 > 13 Normal Sodic < 4.0 > 8.5 > 13 Poor
7
Figure 2.1: Glycophytes- crop tolerance to salinity (Tanji and Kielen, 2002)
Growth suppression, due to suboptimal growth conditions, occurs in all plants.
Mohammad et al. (1998) observed a significant reduction in the number of
leaves, plant height and biomass in tomato plants, when exposed to increasing
concentrations of NaCl (0 - 150 mM). Halopyrum mucronatum, a perennial grass,
when grown in increasing concentration of NaCl (0 – 360 mM), showed
maximum succulence and biomass accumulation at 90 mM NaCl concentration.
A further increase in the salinity resulted in death of the plant (Khan et al., 1999).
Similarly, Ceriops roxburghiana, a mangrove species, accumulated significantly
higher biomass with increasing NaCl concentration (upto 400 mM), which then
was reduced with further increase in NaCl concentration (Rajesh et al., 1998).
Kurban et al. (1999) reported a significant increase in total plant weight at 50 mM
(170% more than controls) in a leguminous plant, Alhagi pseudalhagi, which was
subjected to increasing concentrations (0 – 200 mM) of NaCl. Thus, low salinity
8
might contribute to stimulatory growth effects, indicating the complex
physiochemical pathways involved in plant nutrient acquisition and assimilation,
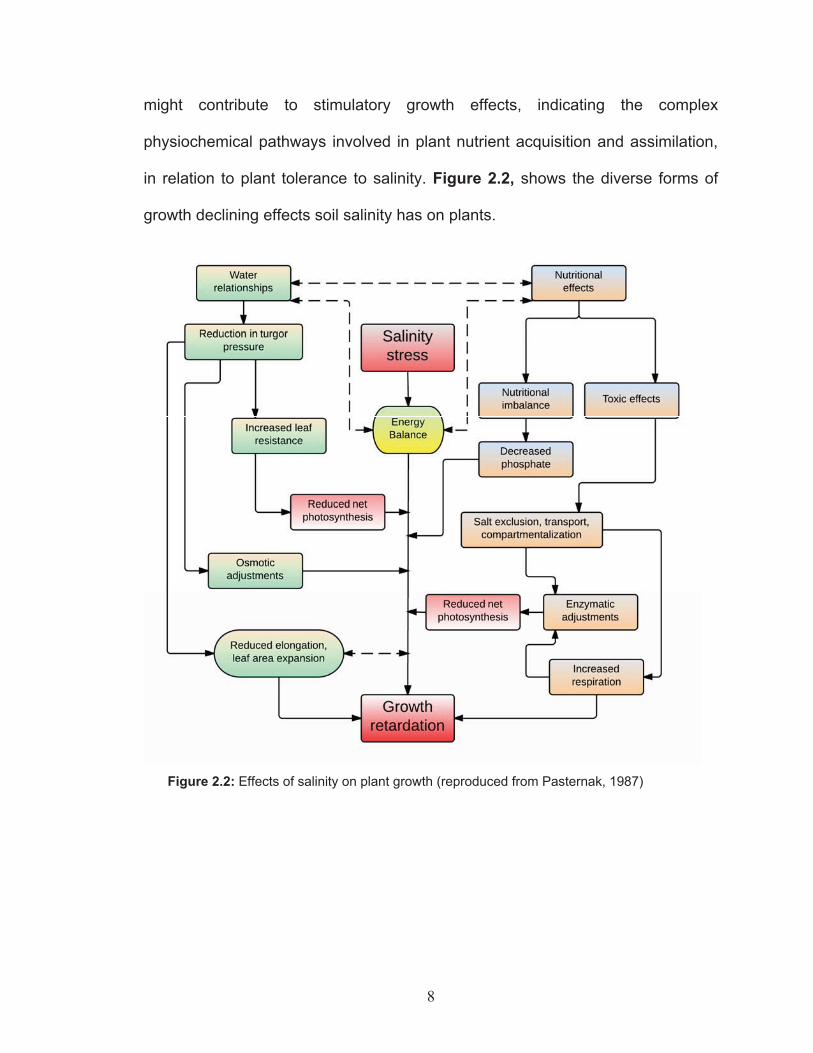
in relation to plant tolerance to salinity. Figure 2.2, shows the diverse forms of
growth declining effects soil salinity has on plants.
Figure 2.2: Effects of salinity on plant growth (reproduced from Pasternak, 1987)
9
2.3 Effect of salinity on physiological and biochemical characteristics
Osmotic (water deficit) and ionic dis-equilibrium
The movement of water and nutrients (ions) from soil solution into roots is an
electrochemical phenomenon working on the principle of mass flow, osmosis and
active acquisition. A large difference in water potential at the soil-plant interface
is undesirable. A high concentration of salts in the root zone results in reduced
water potential, making it difficult for plants to absorb water. Plants’ responses to
salinity consist of two physiological phases; the initial phase is the osmotic stress
response and this is followed by a specific ion toxicity phase (accumulation of
Na+ and/or Cl¯). The osmotic phase starts immediately after the development of
a negative water potential in the rhizosphere.
Water deficit induces abscisic acid (ABA) production, which is primarily involved
in regulating stomatal aperture and conductance. Water deficit directly affects net
carbon assimilation and photosynthesis (Schroeder et al., 2001; Smith and Stitt,
2007; Kim et al., 2010; Tardieu et al., 2011). Reduced stomatal apertures lower
the transpiration rates, which decrease nutrient uptake and increase leaf
temperature (Wilkinson and Davies, 2002; Christmann et al., 2007; Kim et al.,
2010). A drop in osmotic pressure of the cells is an immediate response to high
salt concentration. In barley, short term exposure to high salinity leads to an
immediate and significant drop in stomatal conductance, due to osmotic stress
and local synthesis of ABA (Fricke et al., 2004; 2006). Low availability of soil
water leads to a transient loss of turgor in plants. It reduces cell elongation, which
causes a reduction in leaf expansion, as well as other plant parts, ultimately

10
leading to stunting of the plants (Hernandez et al., 1999). Saline soil, with an EC
value of 4 dS/m, generates an osmotic pressure equivalent to 0.2 MPa. A similar
osmotic pressure is caused by 40 mM NaCl solution (USDA-ARS. 2008). The
growth of most crop plants is hindered beyond this threshold salinity.
Plant have evolved mechanisms to take up essential nutrients such as NO3¯, K+,
and many other essential micronutrients under unfavorable and disturbed ionic
regime commonly encountered in saline soil (Munns and Tester, 2008). NaCl
dominates saline soils. High salt concentration destabilizes the membrane
polarity of plant cells. It affects selective nutrient absorption and creates ionic
imbalances. High Na+ in soil solution causes intracellular K+ deficiency due to
competition and leads to K+/Na+ disequilibrium (Kronzucker and Britto, 2008;
Pardo and Rubio, 2011). High concentration of NaCl caused reductions in Ca2+
and Mg2+ levels in a number of plants (Khan et al., 1999, 2000).
Some woody species, such as Citrus and Vitis (grapevine), show toxic effects of
chloride accumulation (White and Broadley, 2001). However, most of the studies
have focused on Na+ acquisition and assimilation, including transport and
distribution in plants. Munns and Tester (2008) reported a critical cytosolic
threshold level of 100 mM for Na+ that is detrimental and toxic to most of the
enzymes (Flowers and Dalmond, 1992; Tester and Davenport, 2003), although,
the range is quite large and based on different methods used for determination of
cytosolic concentrations.

11
Figure 2.3: Physiological changes in plants due to high salinity
Changes in cell membrane, organelle ultrastructure and leaf anatomy
The plasma membrane of a cell is the first site of cellular interaction with
incoming ion fluxes. Ionic movement across membranes is selectively regulated
by ion channels and carrier molecules embedded in the membranes. High
salinity has been correlated with cell membrane damage leading to leaky cells.
Mansour and Stadelmann (1994) reported characteristic changes in membrane
permeability of Hordeum vulgare cultivars under high salinity conditions (100 mM
NaCl). Interestingly, studies on Hordeum and Triticum showed decreased
cytoplasmic viscosity in salt sensitive cultivars which further decreased with an
increase in salinity level. In contrast, tolerant lines maintained higher cytoplasmic
viscosity even at higher salinity. Thus cytoplasmic characteristics such as
permeability and viscosity are important in deciding salt tolerance and vary
widely among crop species (Mansour et al., 1993). Cellular organelles show
12
irreversible morphological changes due to high salinity. Tomato plants exposed
to 100 mM exhibited aggregation of chloroplast and loss of thylakoid structures
(Khavari-Nejad and Mostofi, 1998). Mitsuya et al. (2000) reported swelling of
thylakoid membranes, mitochondria and fragmentation of the tonoplast in sweet
potato leaves under 80 mM of NaCl. Similar observations were reported in salt
stressed potato plants which resulted in accumulation of large starch grains
inside chloroplasts (Bruns and Hecht-Buchholz, 1990). Thus, plants display
damage symptoms due to exposure to high salinity. Salinity alters plant
physiological processes which lead to characteristics changes in leaf anatomy.
The effects of salinity stress on leaf anatomy differ with plant species and specific
cell types. Longstreth and Nobel (1979) reported an increase in the thickness of
both epidermal and mesophyll cells in Atriplex under salinity stress. However,
high salinity resulted in a significant decrease in the thickness of mesophyll cells
and disorganization of the thylakoids in the leaves of a mangrove, Bruguiera
parviflora (Parida et al., 2003, 2004). Similarly, spinach leaves were shown to
have reduced intercellular space due to salinity. A significant decrease in the
stomatal density of tomato plants was recorded when treated with 70 mM of NaCl
in a sand culture experiment (Romero-Aranda et al., 2001).
Changes in photosynthesis and production of reactive oxygen species
Photosynthesis is one of the most important physiological processes in the plant.
Several external and internal factors affect photosynthetic efficiency. Biomass
accumulation in plants is a function of net photosynthesis. Salinity stress impacts
growth and developmental processes of plants and directly affects net

13
photosynthesis. Iyengar and Reddy (1996) explained several factors contributing
to decline in photosynthetic rate. A physiological water deficit and a reduction in
water potential lowers the photosynthetic efficiency of plants under salinity stress,
thus lowering the net carbon assimilation rate. Many reports have indicated
reduced photosynthesis under increasing concentrations (0 mM - 100 mM) of
NaCl (Romeroaranda et al., 2001; Soussi et al., 1998). A significant decline in the
net photosynthesis is an immediate effect of stomatal closure coupled with
photorespiration in plants exposed to high salinity stress. This short term
response to salinity exposure lasts for 24 – 48 h and completely ceases
photosynthesis (Parida et al., 2005).
The long-term effect on net photosynthesis is caused by the accumulation of
salts in the growing parts of the plant. High cytosolic concentrations of Na+ and
Cl¯ interfere with the optimum activity of several enzymes involved in the carbon
assimilation (Munns and Termatt, 1986). Reddy et al. (1992) reported a
significant reduction in stomatal conductance and CO2 assimilation rate in salt
stressed Salicornia brachiata Roxb. plants which prevented optimal activities of
several enzymes in Calvin cycle. Similarly, salt stress aggravated photo-inhibition
and delayed recovery of photosynthetic apparatus in wheat cultivars (Mishra et
al., 1991). As reviewed by Paul and Foyer (2001), for conservation of the
resources and energy, feedback signaling may regulate the rate of photosynth-
esis due to growth inhibition, and the balance between sources and sinks.
Prolonged exposure to salinity adversely affects the chlorophyll and carotenoid
content of leaves. Salinity stress affects the process of chlorophyll synthesis
14
resulting in chlorophyll being directed to its degradation pathways (Hörtensteiner,
2006). The symptoms of salinity damage include leaf chlorosis (loss of
chlorophyll). In most crops, salinity induced chlorosis is first observed in the older
leaves (Hernandez et al., 1999). For example, tomato and alfalfa leaves showed
a significant reduction in total chlorophyll content, when exposed to salinity levels
of 100 mM of NaCl (Khavarinejad and Mostofi, 1998).
Salt stress impairs electron transport processes in organelles, such as
chloroplasts and mitochondria, as well as other biochemical pathways. Reactive
oxygen species (ROS) are immediately and locally formed charged naïve
molecular entities, which are produced within the metabolic pathways of all living
organisms. The mitochondria and chloroplast are the most potent sites of ROS
production. ROS are the major by-products of the processes involved in
quenching and circulation of high energy photons, during low photosynthesis
periods and/or unfavorable environmental conditions. ROS are a result of
molecular interactions or charge transfers between ionic species. Mittler (2002)
and Polle (2001) reported that under normal growth conditions, the ROS
concentration in a cell is as low as 240 μMS-1 of superoxide, whereas, the steady
state level of H2O2 in chloroplast is 0.5 μM. Under salinity stress, the ROS level
increased three times and the H2O2 level increased by 30 times. Thus ROS has
been related to many adverse cellular changes. ROS induce autoxidation of fatty
acids, proteolysis, peptide fragmentation, amino acid modification and DNA
lesions (Smirnoff, 2000; Ahmad et al., 2008; Tuteja et al., 2009). ROS alter
membrane fluidity, permeability and susceptibility to damage due to shifting ionic
15
charges. These changes affect the performance of the plant under various
stresses. Environmental stresses, biotic (insects, pathogens) and abiotic
(drought, salinity, temperature, light) trigger the production of reactive oxygen
species such as singlet oxygen (1O2), superoxide radical (-O2 ), hydrogen
peroxide (H2O2) and hydroxyl radical (OH ). Photosynthesis, photorespiration and
CO2 assimilation require a basal level of ROS scavenging (Ahmad et al., 2008).
Light stress (changing light intensities) produces frequent and rapid changes in
the rates of production and consumption of ROS. However, abrupt changes in
ROS levels in plants under salinity stress are less distinct (Munns and Tester,
2008), and so plants are able to adjust to slow changes in ROS levels, thereby
regaining photosynthesis after a certain period of salt stress imposition. Mansour
and Stadelmann (1994) identified genotypic differences in the membrane
permeability, including membrane damage or lipid peroxidation due to ROS, of
barley cultivars, suggesting possible differences in their inherent tolerance to
salts due to genotypic differences (Munns and Tester, 2008).
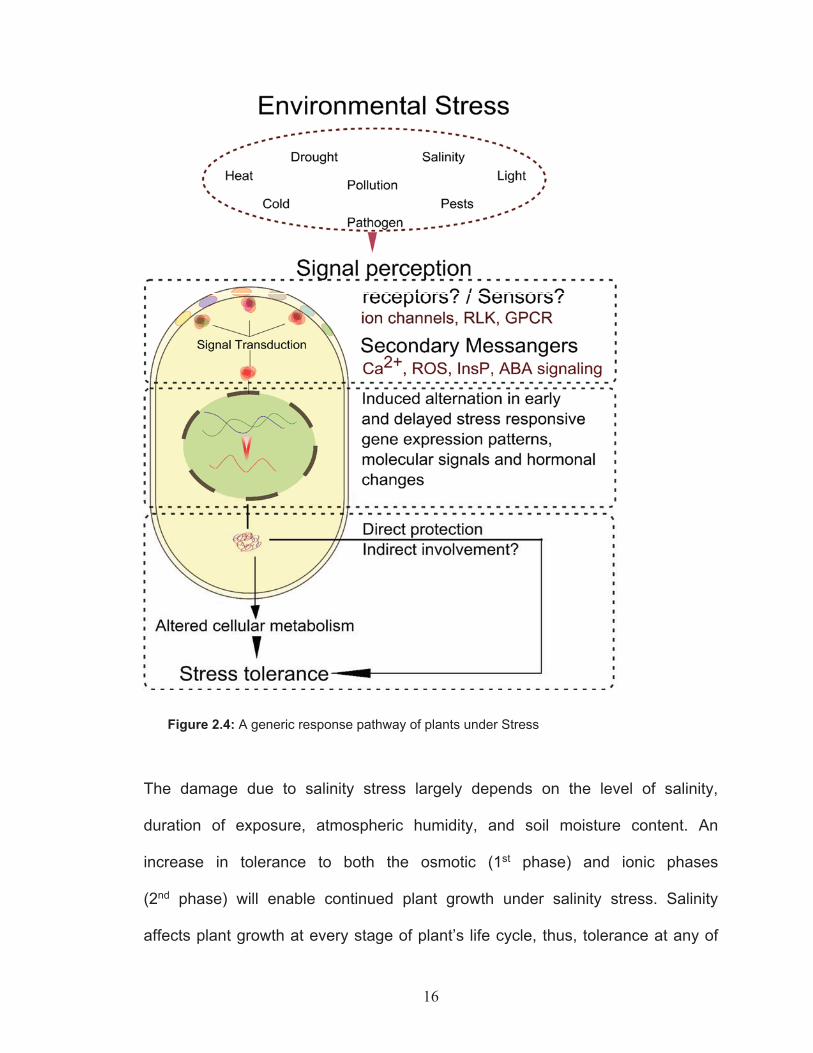
2.4 Mechanisms of salinity tolerance
Plants are sessile organisms that have evolved sophisticated biochemical and
molecular mechanisms to cope with various environmental stresses. Such
mechanisms are tightly regulated and coordinated through various signaling
pathways. A general approach in response to stimulus or stress conditions is
outlined in the Figure 2.4.
16
Figure 2.4: A generic response pathway of plants under Stress
The damage due to salinity stress largely depends on the level of salinity,
duration of exposure, atmospheric humidity, and soil moisture content. An
increase in tolerance to both the osmotic (1st phase) and ionic phases
(2nd phase) will enable continued plant growth under salinity stress. Salinity
affects plant growth at every stage of plant’s life cycle, thus, tolerance at any of

17
the stages, such as seedling, vegetative, flowering or fruiting, would boost
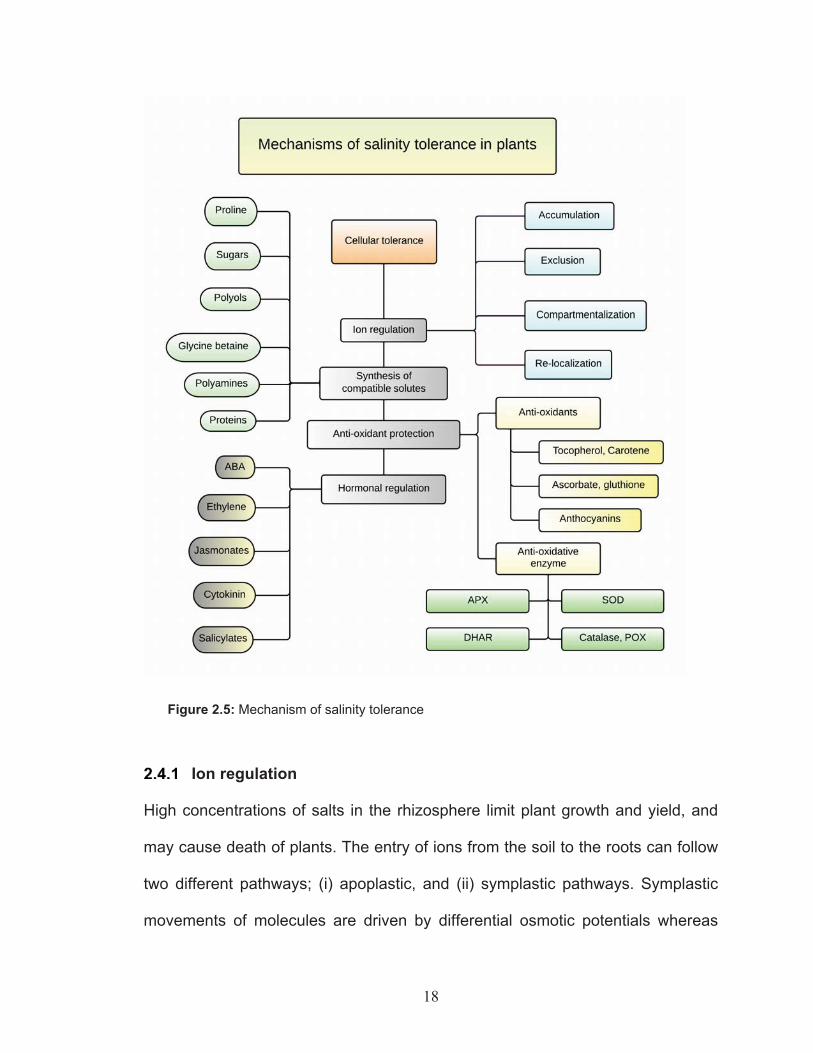
adaptability in salinity stress conditions. Parida et al. (2005) have listed such
biochemical mechanisms as: i) the ion regulation phase, which includes
accumulation/ exclusion/ compartmentalization or translocation of ions within the
plant; and ii) the synthesis phase, which includes synthesis of compatible solutes
and alterations in various biochemical pathways leading to salinity tolerance. The
outline of the mechanisms involved in salinity tolerance is shown in Figure 2.5.
18
Figure 2.5: Mechanism of salinity tolerance
Ion regulation
High concentrations of salts in the rhizosphere limit plant growth and yield, and
may cause death of plants. The entry of ions from the soil to the roots can follow
two different pathways; (i) apoplastic, and (ii) symplastic pathways. Symplastic
movements of molecules are driven by differential osmotic potentials whereas
19
apoplastic movements do not require energy for entry. Sodium enters plant cells
passively (negative membrane potential) and apoplastically (transpiration pull)
(Yeo, 1999), as well as through selective ion transporters, such as High-affinity
Potassium Transporters (HKT) and non-selective (cation) channels (Maser et al.,
2002; Amtmann and Sanders, 1998).
The mechanism of tolerance during the ionic phase can be further divided into
two categories: i) sodium exclusion from leaf blades and, ii) sodium
compartmentalization or tissue tolerance to accumulated sodium. Under high
salinity, plants sequester the excess ions in subcellular structures such as
vacuoles (Iyengar and Reddy, 1996; Reddy et al., 1993). The ion channels
regulate the entry of Na+ or K+ ions and the competition for an active site
increases based on the ionic radii, ionic charges and hydration energies of the
molecules. Garciadebleas et al. (2003) demonstrated that, in rice, Ba2+ blocked
selective entry of Na+ but not K+ and that different transporter were involved in
Na+ and K+ entry into the cells.
The High-affinity Potassium Transporters (HKT) and K+ inward-rectifying channel
(KIRC) have a higher selectivity for K+ than Na+ and are involved in K+ influx.
Some nonspecific cation channels (NSCC) and K+ outward-rectifying channel
(KORC) may lead to the accumulation of sodium ions in the cytosol during
depolarization. The vacuolar type H+ ATPase (V-ATPase) and pyrophosphatase
(V-PPase) are two electrogenic H+ pumps which coexist at the plasma
membranes of the plants (Dietz et al., 2001). The enzyme, V-ATPase, is an

20
active, dominant and indispensable H+ pump, and it is found in the
endomembranes of most plants.
Calcium signaling plays an indispensable role in attaining and maintaining stress
tolerance. Cytosolic Ca2+ increases during salinity stress. The sources for Ca2+
can be of apoplastic origin or a hydrolysis product of PIPB (phosphatidylinositol
bisphosphate), mediated by phospholipase C. The characterization of salt overly
sensitive (SOS) mutants (SOS1, SOS2, SOS3) (Wu et al., 1996) in Arabidopsis
were a result of the identification of calcium binding proteins such as CBL
(calcineurin B-like protein/ SOS3). A loss in function of CBL turns the plants
hypersensitive to salts (Zhu, 2002). SOS pathways regulate ion homeostasis.
The presence of salt activates SOS pathways which remove excess Na+ from the
cell (Zhang et al., 2004; Zhu, 2002) and also work with the NHX pumps to
compartmentalize Na+ into the vacuoles before Na+ reaches to toxic level for
normal enzymatic activities (Blumwald et al., 2000). The vacuolar Na+/H+ pumps
sequester excess Na+ into the vacuoles. Compartmentalization of Na+ in the
vacuoles from the cytoplasm is carried out the by salt-inducible Na+/H+ antiporter
system (Apse et al., 1999). Staal et al. 1991 reported relatively higher Na+/H+
antiporter activity in salt tolerant species than sensitive species of Plantago.
nhx-1 overexpression increased salinity tolerance in Arabidopsis (Apse et al.,
1999) and in tomato (Zhang and Blumwald, 2001).
Induced biosynthesis of compatible solutes and antioxidative enzymes
Compatible solutes accumulate to high concentrations without affecting
intracellular physiology (Bohnert and Jensen, 1996). These compounds have a
21
minimal effect on the pH or charge balance of the cytosol. The compatible
solutes include amino acids such as proline (Singh et al., 2000) and ecotine
(Lippert and Galinski, 1992), quaternary amines such as glycine betaine (GB)
(Rhodes and Hanson, 1993; Wang and Nii, 2000), sugars such as glucose and
fructose (Kerepesi and Galiba, 2000; Bohnert and Jensen, 1996) and polyols
such as mannitols (Ford, 1984; Popp et al., 1985; Orthen et al., 1994). These
molecules do not inhibit or interfere with normal enzymatic activities even at
relatively higher concentrations (Johnson et al., 1968; Hasegawa et al., 2000).
Proline, as an osmolyte, is widely distributed across various kingdoms and
genera (Mc Cue and Hanson, 1990). It is an important compatible solute found in
many halophytes as well as glycophytes (Stewart and Lee, 1974; McCree, 1986).
Rice and alfalfa plants exposed to high salinity accumulated higher levels of
proline than control plants (Lutts et al., 1999; Ginzberg et al., 1999). Similarly,
wheat plants transformed with proline biosynthesis genes showed improved
tolerance to salinity (Sawahel and Hassan, 2002). In durum wheat (Triticum
durum), Mattioni et al. (1997) reported that the concentration of proline increased
when exposed to salinity stress. Proline, glycine betaine and other sulphonium
compounds are charge neutral (zwitterion) at physiological pH which make them
ideal candidate for osmoprotection under stress conditions. Proline and most
other osmolytes are localized in higher amounts in cytoplasm than in vacuoles
(Aubert et al., 1999).
The concentration of glycine betaine (GB) increases under salinity stress in many
plant species (Saneoka et al., 1999; Wang and Nii, 2000). Genetic transformat-

22
ions of plants with genes synthesizing GB have shown significant protection
against salinity stress. Arabidopsis plants over-expressing codA gene, derived
from bacteria, were shown to tolerate higher concentrations of NaCl (Hayashi et
al., 1997). Similar transformations with GB synthesizing genes in Brassica, rice,
tomatoes and sweet potato improved plant performance under salinity stress
(Prasad et al., 2000; Mohanty et al., 2002; Zhou et al,. 2007).
Carbohydrates, such as sugars (reducing and nonreducing) and starch,
accumulate under salt stress (Parida et al., 2002). Their major functions include
osmoprotection, osmotic adjustment and radical scavenging. Salt stress leads to
increase in concentration of reducing sugars (glucose, fructose), sucrose, and
fructans in a number of plants (Khatkar and Kuhad, 2000). NaCl stress
significantly increased soluble sugar, saccharides and starch content in the
leaves of tomato plants (Khavari-Nejad and Mostofi, 1998). Trehalose, a non
reducing sugar, was shown to have protective effects against desiccation. Over-
expression of trehalose in rice protected plants from multiple abiotic stresses
(Garg et al., 2002).
Salt stress in plants induces the production of Reactive Oxygen Species. ROS
has diverse functions. It is involved in protective and signaling pathways. A basal
level of ROS is required for such processes. ROS level depends on a delicate
equilibrium between its production and scavenging. ROS damage due to such
ionic imbalance are largely local initially but spread as time proceeds (Ahmad et
al., 2010). Plants have developed an inclusive antioxidant defense to protect
from damages due to ROS. The metalloenzyme superoxide dismutase (SOD)
23
converts O2˙¯ (superoxide radical) to H2O2 and molecular oxygen (Hernandez et
al., 1995). The H2O2 detoxification reaction is catalyzed by ascorbate specific
peroxidase, which is present in high concentrations in chloroplast (Chen and
Asada, 1989), through the ascorbate–glutathione cycle (Halliwell and Gutteridge,
1985; Asada, 1992).

24
Figure 2.6: Response of plants to ROS
Role of plant hormones in stress tolerance
Plant hormones play a key role in regulating growth and development in plants.
The major growth regulators are auxins, cytokinin (CK), gibberellin (GA), abscisic
25
acid (ABA), ethylene, jasmonic acid and brassinosteroids. Several physiological
and developmental processes are under direct regulation of cytokinins. For
example, cytokinins regulate cell division, chloroplast development and
differentiation, and delay senescence. Cytokinin is also involved in nutrient
mobilization (Mok and Mok, 2001). The role of ABA, ethylene, and jasmonates
are pronounced mainly under biotic and abiotic stresses. Stresses limit plant
growth and yield, and trigger early senescence. The involvement of abscisic acid
(ABA) in salinity tolerance was described by Xiong et al. (2001). Arabidopsis
mutants deficient in ABA were significantly affected by salinity stress. Popova et
al. (1995) reported that ABA alleviated the inhibitory effect of NaCl on
photosynthesis, growth and the translocation of assimilates. The concentrations
of ABA and cytokinin increased under high salt concentration in
Mesembryanthemum crystallinum and rice respectively (Thomas et al., 1992;
Vaidyanathan et al., 1999). GomezCadenas et al. (1998 & 2002), reported
increased levels of ABA and ethylene in salt stressed citrus plants, resulting in
reduced injury due to toxic levels of Cl ions in the leaves. ABA regulates
stomatal closure during water deficit periods and increases water use efficiency.
ABA has been used in pretreatment or priming of seedlings to increase stress
tolerance. Salt acclimation under gradual increase of salt concentrations is
regulated by ABA (Noaman et al., 2002). Moreover, jasmonates, another group
of plant hormone, also plays an important role in salt tolerance. Jasmonates
mediate signaling, including activation of defense responses, flowering, and
26
senescence. Experimental evidence shows that salt tolerant tomato cultivars
have higher levels of jasmonates than salt-sensitive cultivars (Hilda et al., 2003).
2.5 Recent approaches in mitigation of salinity stress in plants
Most crop plants are glycophytes and are not capable of growing in soil that has
high concentrations of salts. Attempts to improve salt tolerance through
conventional breeding, have met with limited success, primarily because salt
tolerance is a multigenic trait (Flowers, 2004). Flowers and Yeo (1995) proposed
five possible genetic procedures to improve crop productivity under saline
conditions; i) deployment of halophytes as alternative crops, ii) exploitation of
genetic variation for salt tolerance already present in existing crop species iii) use
of interspecific hybridization to increase salt tolerance of current commercial
cultivars, iv) generation of variation within existing crops via genetic mutation,
and v) breeding for higher yield, rather than salt tolerance. All of these strategies
are still under development and evaluation. Because of the present status of
limited crop productivity under saline conditions, the development of new
methodologies and strategies is essential. The application of seaweed and
seaweed products has been documented to alleviate a wide range of stresses
(Craigie, 2011). These useful seaweeds include Ascophyllum nodosum, which is
discussed in Section 2.6.
27
2.6 Tomato, salinity and model for crop plant studies
Tomato (Solanum lycopersicum Mill.) is an important vegetable crop (Cantore et
al., 2005). Tomato has also been widely used as a model system to study
physiological and molecular basis of fruit development (The Tomato Genome
Consortium, 2012). Tomato is consumed in a number of ways; ripe fruit is served
fresh, cooked, or processed (canning, juice, pulp, paste, sauce or even dried).
The cultivated tomato is adapted to different climates, though production is
greatest in dry Mediterranean areas with adequate irrigation (Cuartero and
Fernandez-Munoz, 1998). Tomato is moderately sensitive to salinity (Foolad,
2004). Low salinity levels reduce tomato seed germination rate and also lengthen
the time needed to complete full germination (Ayers et al, 1952). Soils with
electrical conductivities close to 4-6 dS/m limit optimum growth of tomato and EC
above 6 dS/m significantly reduces root growth (Nanawati and Maliwal, 1974;
Papadopoulos and Rendig, 1983). A strong inverse relationship was observed
between EC and water uptake. High soil salinity led to non-competitive inhibition
of the nitrate ions due to membrane depolarization (Cram, 1983; Suhayda et al.,
1990; Hawkins and Lewis, 1993). Saline conditions decrease the relative
proportions of other essential ions like K+, Ca2+, Mg2+ and NO3¯ and aggravate
the toxic effects of Na+ and Cl¯ ions. Tomato plants are more susceptible to
salinity at the seedling stage as compared to flowering and fruit development
stages (Dumbroff and Cooper, 1974).
28
2.7 Ascophyllum nodosum (L.) Le Jol. and plant stress alleviation
Ascophyllum nodosum, a large brown alga, is perennial seaweed confined to the
intertidal zone of the North Atlantic Ocean. A maximum temperature of these
coastal zones is ~ 27 ºC (Keser et al., 2005). Shoots of this seaweed arise from a
holdfast and develop a complex structure of dichotomous lateral branches.
Bladders are centrally located on long flattened strap-like fronds which hang
down, draping intertidal rocks. Many fronds grow from the base and new fronds
are regenerated from the base when the larger fronds are damaged (Ugarte and
Sharp, 2001).
Kohlmeyer and Kohlmeyer (1972) proposed a lichenous relationship of
Ascophyllum nodosum with an ascomycete, Mycophycias ascophylli, which has
been intensively studied in the recent years. Interestingly, all Ascophyllum
collected in nature are infected or associated with this fungus. No cellular
invasion or penetration has been recorded on Ascophyllum by the fungus,
allowing for an obligate and mutualistic symbiosis (Garbary and Gautam, 1989;
Garbary and Deckert, 2001; Xu et al., 2008). This form of species interaction was
termed as symbiotum by Deckert and Garbary (2005).
A. nodosum has been extensively used in agriculture as plant biostimulant
(Craige, 2011). Ascophyllum nodosum extract (ANE), when applied to plants,
stimulates shoot growth and branching (Temple and Bomke, 1989),increases
lateral root development (Metting et al., 1990), and improves nutrient uptake
(Yan, 1993). ANE has also been reported to improve plants’ tolerance to
environmental stresses such as drought, salinity and frost (Nabati, 1991; Nabati
29
et al., 1994). Application of A. nodosum extract has also been shown to impart
stress tolerance in sensitive crop plants. Studies on citrus, grapes, Bermuda
grass and Kentucky blue grass have demonstrated that ANE improved abiotic
stress tolerance (Zhang, 1997; Zhang and Schmidt, 1999; Fike et al., 2001).
Several bioactive compounds, including betaines (like -aminobutyric acid
betaine, -aminovaleric acid betaine, laminine (N6, N6, N6-trimethyl lysine), and
glycine-betaine have been detected in A. nodosum and in the commercial
products of A. nodosum (Blunden et al., 1985).
The goal of this research was to investigate the level of tolerance that
Ascophyllum nodosum industrial organic extract (hereafter used as ANE)
provides against salinity stress in tomatoes. The objectives of the research were:
i) To determine the level of protection A. nodosum extracts (ANE) offer against
salinity stress in tomato; ii) To study the biochemical basis of ANE mediated
salinity tolerance in tomato; and iii) To elucidate the genetic basis of ANE
mediated salinity tolerance in tomato by studying the differential regulation of
some of the stress response genes, using quantitative polymerase chain
reaction.
30
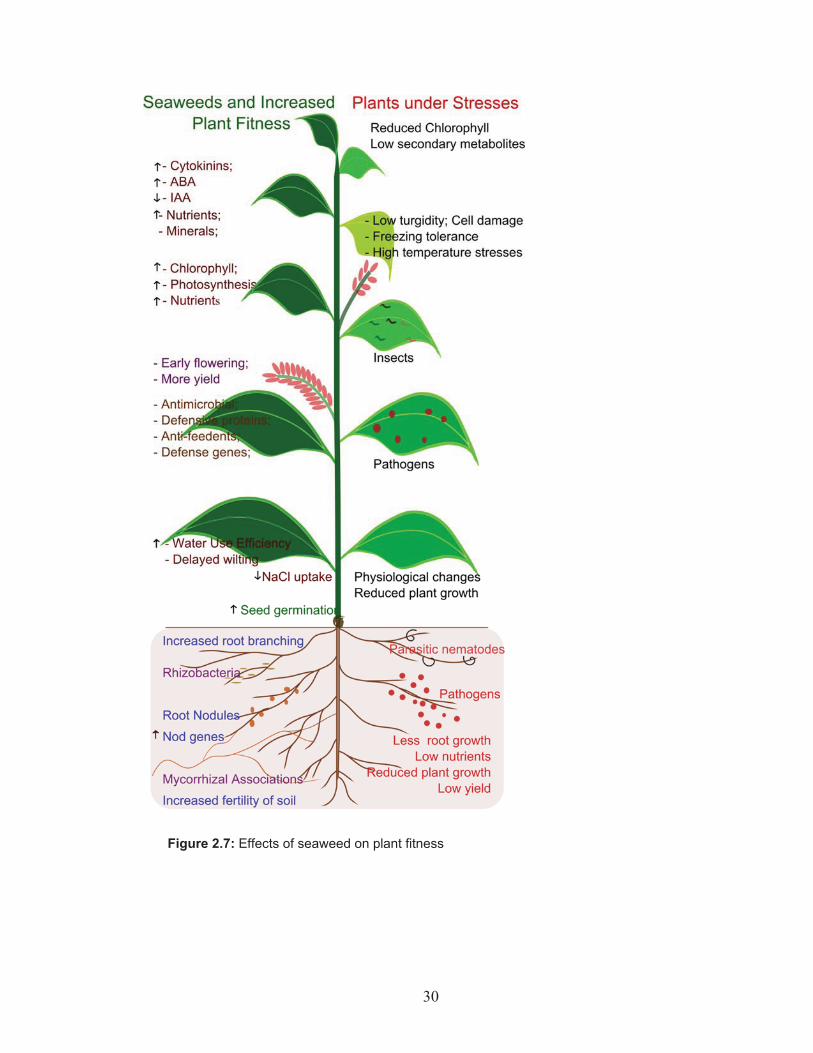
Figure 2.7: Effects of seaweed on plant fitness
31
CHAPTER 3 Material and methods
3.1 In vitro effect of ethyl acetate organic fraction of Ascophyllumnodosum on salinity tolerance in tomato seedlings Preparation of organic sub fractions from Ascophyllum nodosum
extract
All glassware used were washed and rinsed with 95% methanol. A methanol
fraction of Ascophyllum nodosum extract (ANE) was obtained by suspending 20
g of solid ANE (water soluble concentrate), in 200 mL of absolute methanol, with
occasional vigorous shaking by hand, for 10 minutes. The mixture obtained was
filtered and dried under a continuous stream of N2 and suspended in 50 mL of
ultrapure Milli-Q® water. Subsequently, organic fractions were prepared by
adding 150 mL of HPLC grade hexane (C6H14), chloroform (CHCl3) and ethyl
acetate (C4H8O2) (Fisher Scientific) respectively to the methanol water extract.
The three (hexane, chloroform and ethyl acetate) sub-fractions obtained were
dried under a continuous stream of N2, re-suspended in 10 mL of methanol and
stored at 10 °C after every use (Appendix 7.1). The ethyl acetate fraction of
Ascophyllum nodosum extract (EtOAc-ANE) was used in all the in vitro
experiments.
Tomato plant seedling establishment for in vitro experiments
Tomato seeds (variety- Scotia), were surface sterilized in a sterile 15 mL tube for
2 minutes in two volumes of 70% ethanol, decanted and followed by two volumes
of commercial bleach for 10 minutes, with frequent vortexing. The seeds were
washed five times with sterile distilled water to remove the bleach residues.
Subsequently seeds were transferred on the plates containing half strength

32
Murashige and Skoog 1962 (MS) basal medium supplemented with 10 g/L
sucrose and 3 g/L Gelzan as solidifying agent. The plates were incubated at
room temperature in the dark. After germination (~3 days), seedlings were
transferred to Petri dish containing half strength MS medium (Murashige and
Skoog, 1962) and placed under fluorescent light (100 mol photons m 2s 1) with a
16:8 h photoperiod at 25 ± 2 °C for 4 days. Uniform plants (approximately 5 cm
long), with well differentiated roots and shoots, were used in the experiment.
Experimental setup and plant phenotype data collection and analysis
The experiment was set up as a completely randomized design where each
treatment was applied on three plants per replication. This experiment was
repeated three times.
Treatments constituted two NaCl levels [No salt (control), 100 mM] and two
levels of Ascophyllum nodosum extract [No ANE (methanolic control or MeOH),
1 g/L ~ANE ethyl acetate fraction (hereafter EtOAc)]. Half strength liquid MS
medium with and without 100 mM NaCl and EtOAc-ANE, treatments were
prepared (EtOAc-ANE fractions were added post autoclaving). Uniform seedlings
were then aseptically transferred to 15 mL autoclaved glass test tubes containing
10 mL of half strength liquid MS medium containing respective treatments and
placed on the shelves under cool fluorescent light (100 mol photons m 2s 1) with
a 16:8 h photoperiod at 25 ± 2 °C. The water levels in the tubes were maintained
to avoid changes in the concentration of the treatments due to
evapotranspiration. Fourteen days later the plants were harvested to measure
leaf area, root length and root area. The leaves were scanned using Epson

33
Expression 10000 XL (Epson Canada Ltd., Markham, ON. Canada) and the
images were analyzed using WinRHIZO and WinFOLIA Software packages
(Regent Instruments Canada Inc, 2008). The average leaf area, root length and
root area were calculated for each plant.
Data was analyzed with a one way ANOVA using Proc MIXED procedure, with
Statistical Analysis Software (SAS 9.3,SAS Institute, Cary, C, USA) at p= 0.05.
The Tukey’s honestly significant difference (HSD) post hoc test was performed
in cases of significance (p= 0.05) to further separate the means per treatment.
3.2 Biochemical analysis of Ascophyllum nodosum induced salinity
tolerance in tomato seedlings in in vitro
Crude enzyme extract preparation
A similar experimental setup was used as described in previous section. Leaf
tissues (~ 1 g/ sampling time) collected at 0 h (before treatment application), 2, 6,
24 and 96 h were snap frozen in liquid nitrogen, freeze dried (Freezone 6,
Labconco, Kansas, USA) and stored at -80 °C until use.
Crude enzyme extract was prepared from 10 mg lyophilized leaf tissue. The leaf
samples were pulverized in a 2 mL microfuge tube with 3 mm silicon beads in a
MINI-BEADBEATERTM (Biospec Products) for 20 seconds. 1 mL of cold enzyme
extraction buffer [0.1 M KH2PO4 / K2HPO4 buffer (pH 7.5), 0.5%
polyvinylpyrrolidone (PVP), and 3 mM Ethylenediaminetetraacetic acid (EDTA)]
was added to the tubes and mixed well. The extracts were maintained at 4 °C on
ice, throughout the experiment. The buffered samples were then centrifuged at
34
12,000 g for 20 min at 4 °C. The supernatant was pipetted into a clean 1.5 mL
microfuge tube and was used for enzyme and biochemical analyses.
Estimation of total protein
The soluble protein in the crude enzyme extract was determined (Bradford, 1976)
by reacting 40 L of sample (5 L of crude enzyme extract + 35 L water)
(section 2.2.2) with 200 L Coomassie Plus-the Better BradfordTM Assay Kit
(Pierce, Rockford, IL, USA) reagent in a 96 well microtiter plate (BioLite, Thermo
Fisher Scientific). The bovine serum albumin (BSA) standards (125-2000 μg/mL)
were loaded along with the samples and the absorbance at 595 nm was
recorded using BioTek Power XS2 microplate reader (Bio-Tek, VT, USA) with
Gen5™ software. Three technical replicates were performed and the amount of
protein per sample was calculated using the BSA standard curve.
Estimation of catalase activity
The method described by Sarkar et al. (2009) was adapted with slight
modification to fit microplate reader format. The catalase activity (CAT) was
determined by reacting 5 L of sample (1 L of crude enzyme extract + 5 L
water) (section 2.2.2) with 200 L 0.059 M hydrogen peroxide (BioShop®
Canada Inc., Burlington, ON) in 0.05 M KH2PO4 / K2HPO4 buffer pH 7.0. The
absorbance at 240 nm at intervals of 20 seconds for 2-3 minutes was recorded
using BioTek Power XS2 microplate reader (VT, USA) with Gen5™ software.
The rate of disappearance of H2O2 is followed by observing the rate of decrease
in the absorbance at 240 nm. The change in absorbance OD240 /min from the
initial linear portion of the curve was calculated. Thus, one unit of catalase will
35
decompose 1.0 μM of H2O2 per minute at pH 7.0 at 25 °C. Catalase activity was
calculated using the following formula:
Estimation of guaiacol peroxidase activity
Crude enzyme extracts were prepared as described in Section 2.2.2. A method
described by Rahman and Punja (2005) was used with minor modifications. In
brief, 0.05 M guaiacol solution was prepared in 25 mM sodium acetate buffer at
pH 5.0. Crude extract (5 L) was added to the 205 L reaction mixture (200 L +
5 L) containing 8.8 mM hydrogen peroxide. The absorbance of the solution was
recorded at 470 nm every 15 s for 2 min using a BioTek Power XS2 microplate
reader (VT, USA) with Gen5™ software. All samples were run in triplicate. The
change in the absorbance OD470 /min was calculated and the guaiacol
peroxidase activity was expressed as OD470 /min/mg protein.
Estimation of proline
A modified microplate method (Carillo et al., 2011) was adopted. Lyophilized leaf
tissue (~ 10 mg) was pulverized in a 2 mL microfuge tube followed by addition of
1 mL of 70% ethanol and vortexed. An aliquot of 200 L of the ethanol extract
was mixed with 400 L of a reaction mixture containing ninhydrin 1% (w/v) in
acetic acid 60% (v/v) and ethanol 20% (v/v). The tubes containing the reaction
mixture were mixed, sealed and heated at 95 °C in a water bath for 20 minutes.
The reaction was stopped at room temperature and an aliquot of 200 L was run
36
in triplicate and read at 520 nm, using a BioTek Power XS2 microplate reader
(VT, USA) with Gen5™ software. The proline content was expressed as:
Estimation of total chlorophyll
A modified DMSO (Dimethyl Sulphoxide) method of chlorophyll pigment
extraction (Hiscox and Israelstam, 1978) was used. Lyophilized leaf tissue (~10
mg) was pulverized in 2 mL microfuge tube with 3 mm silicon beads in a MINI-
BEADBEATERTM (Biospec Products) for 20 seconds. DMSO (1 mL) was added
to the samples and kept on a heat block maintained at 65 °C for 5 minutes. The
samples were centrifuged at 12000 x g for 5 minutes after which 200 μL of the
supernatant was transferred to a microplate in triplicate (technical replicates).
The absorbance was recorded at 663 nm and 645 nm using a BioTek Power XS2
microplate reader (VT, USA) with Gen5™ software. Chlorophyll a, b was
calculated using the formula:
Estimation of Na+ concentration
An alternative method was adopted to determine the change in the amount of
sodium ion concentration in the growth medium (liquid half MS solution) after two
37
weeks of seedling growth. The seedlings were removed from their respective
liquid half MS growth medium and were diluted with ultrapure Milli-Q® water to
equal final volumes and used in atomic absorption unit to determine Na+
concentration. The data were used to determine the amount of Na+ absorbed by
the tomato seedlings in two weeks.
3.3 Molecular analysis of Ascophyllum nodosum induced salinity tolerance in tomato seedlings in vitro
RNA isolation and cDNA synthesis
Total RNA was isolated using a modified single step TRIzol® method
(Chomczynski and Sacchi, 1987). RNase free labware (tips, microfuge tubes)
were used. Briefly, 10 mg (~100 mg fresh weight) of lyophilized leaf tissue was
pulverized in a 2 mL microfuge tube with 3 mm silicon beads in a MINI-
BEADBEATERTM (Biospec Products) for 20 seconds. TRIzol® (1 mL) was added
to the tissue and kept for 5 minutes at room temperature. Subsequently, 200 μL
of chloroform/ 1 mL of TRIzol® was added to the mixture and shaken vigorously
for 15 seconds. The samples were centrifuged at 12000 x g for 15 minutes at 4
°C and the aqueous phase (supernatant) thus obtained was transferred to
another microfuge tube by gentle pipetting, avoiding the interphase slurry. RNA
was precipitated by adding 0.5 mL of 100% isopropanol per 1 mL of TRIzol® for
10 minutes and the samples were centrifuged at 12000 x g for 10 minutes at 4
°C. After decanting isopropanol, the pellet was washed with 1 mL of 75% ethanol
and briefly centrifuged at 10000 x g for 5 minutes at 4 °C. Total RNA was
suspended in RNase-free water and stored at -80 °C for further use.
38
RNA quantification was performed using a NanoDrop 2000 spectrophotometer
(Thermo Scientific, USA) and the integrity of RNA was checked by visualizing the
RNA bands on 1% agarose gel.
The RNA was treated with RQ1 DNAse (Promega Inc., USA) following the
instructions provided by the manufacturer. The purified RNA thus obtained was
reverse transcribed using a high capacity cDNA reverse transcript kit (Applied
Biosystems, ON, Canada), according to manufacturer’s instructions.
Quantitative Real Time PCR Analyses
A ten microliter reaction mixture was set up (cDNA, gene specific primers, 5 L of
2X SYBR green reagent and 2.5 L DEPC water) in a StepOne™ Real-Time
PCR System (Applied Biosystems, CA). The Actin (act) gene was used to
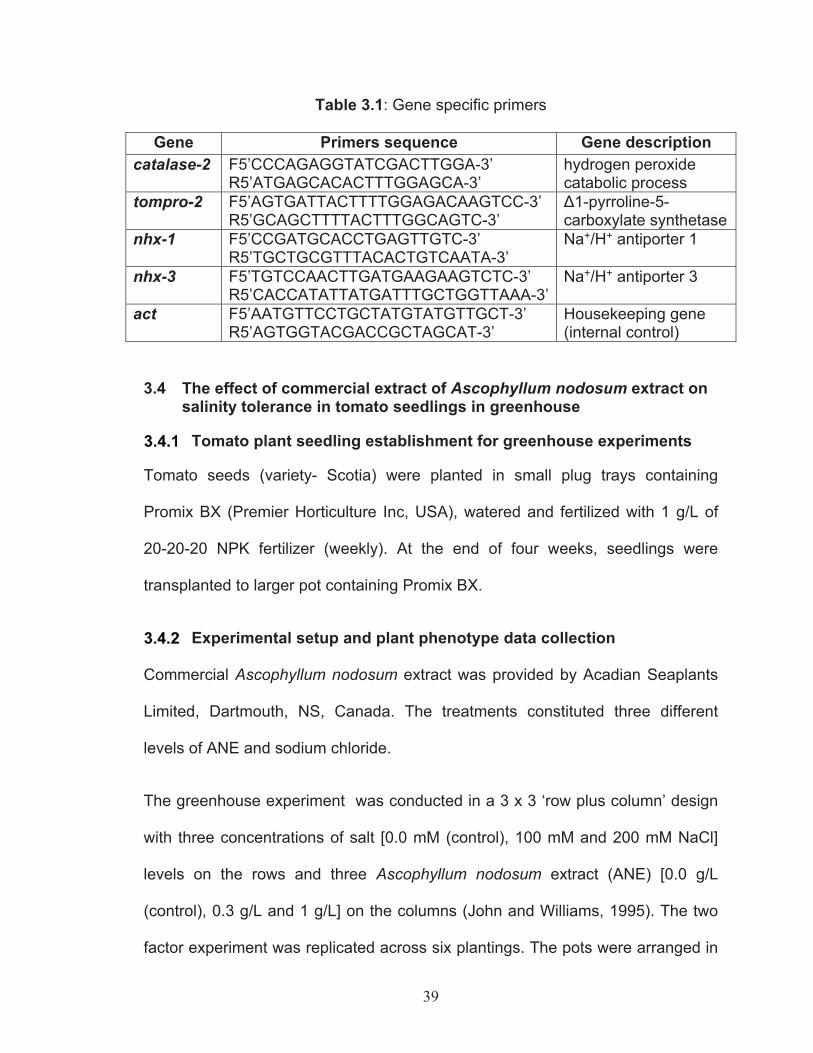
normalize transcript abundance. The following genes were used in this study;
Catalase-2, tompro-2, nhx-1 and nhx-3. The details of genes and the gene
specific primer sets are presented in Table 3.1. The PCR conditions used were
as specified in the manufacturer’s instructions manual, including heat activation-
95 °C, 10 minutes, denaturation- 95 °C for 15 seconds, annealing and final
extension at 60 °C for 1 minutes followed by 40 cycles. Relative transcript levels
were analyzed using the 2- Ct method (Livak and Schmittgen, 2001) which
calculates the difference in transcript levels compared to control.
39
Table 3.1: Gene specific primers
Gene Primers sequence Gene description catalase-2 F5’CCCAGAGGTATCGACTTGGA-3’
R5’ATGAGCACACTTTGGAGCA-3’ hydrogen peroxide catabolic process
tompro-2 F5’AGTGATTACTTTTGGAGACAAGTCC-3’ R5’GCAGCTTTTACTTTGGCAGTC-3’
1-pyrroline-5-carboxylate synthetase
nhx-1 F5’CCGATGCACCTGAGTTGTC-3’ R5’TGCTGCGTTTACACTGTCAATA-3’
Na+/H+ antiporter 1
nhx-3 F5’TGTCCAACTTGATGAAGAAGTCTC-3’ R5’CACCATATTATGATTTGCTGGTTAAA-3’
Na+/H+ antiporter 3
act F5’AATGTTCCTGCTATGTATGTTGCT-3’ R5’AGTGGTACGACCGCTAGCAT-3’
Housekeeping gene (internal control)
3.4 The effect of commercial extract of Ascophyllum nodosum extract on salinity tolerance in tomato seedlings in greenhouse
Tomato plant seedling establishment for greenhouse experiments
Tomato seeds (variety- Scotia) were planted in small plug trays containing
Promix BX (Premier Horticulture Inc, USA), watered and fertilized with 1 g/L of
20-20-20 NPK fertilizer (weekly). At the end of four weeks, seedlings were
transplanted to larger pot containing Promix BX.
Experimental setup and plant phenotype data collection
Commercial Ascophyllum nodosum extract was provided by Acadian Seaplants
Limited, Dartmouth, NS, Canada. The treatments constituted three different
levels of ANE and sodium chloride.
The greenhouse experiment was conducted in a 3 x 3 ‘row plus column’ design
with three concentrations of salt [0.0 mM (control), 100 mM and 200 mM NaCl]
levels on the rows and three Ascophyllum nodosum extract (ANE) [0.0 g/L
(control), 0.3 g/L and 1 g/L] on the columns (John and Williams, 1995). The two
factor experiment was replicated across six plantings. The pots were arranged in
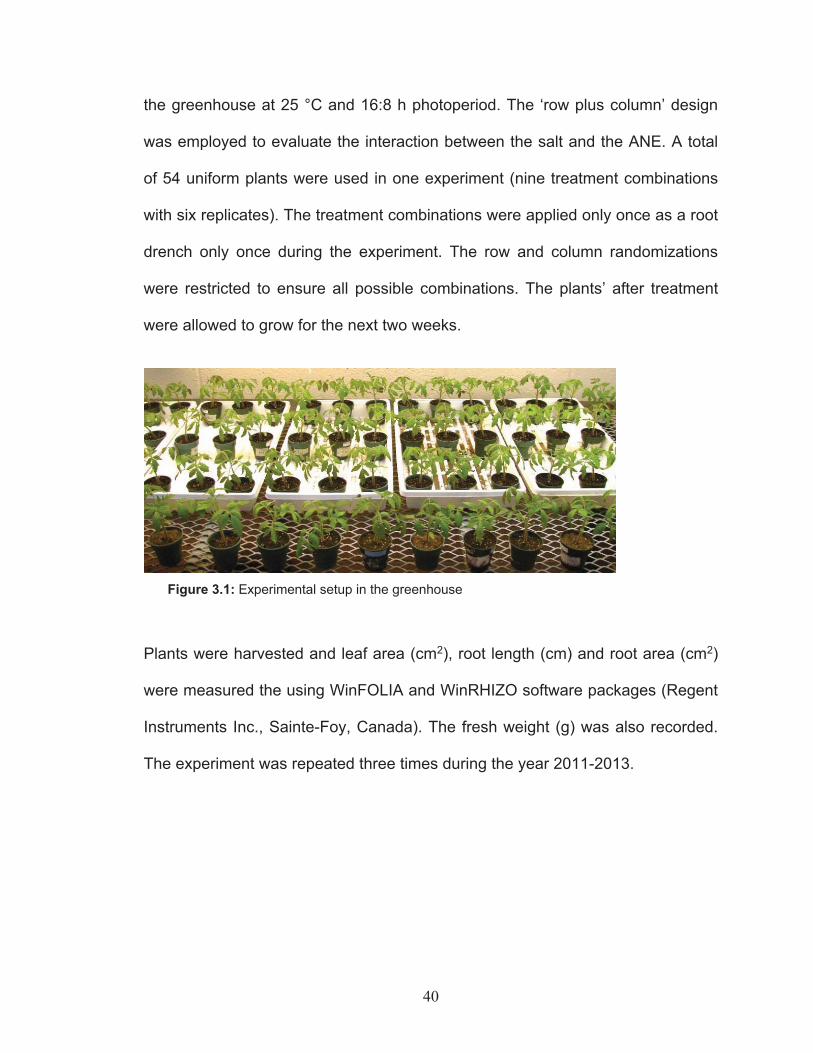
40
the greenhouse at 25 °C and 16:8 h photoperiod. The ‘row plus column’ design
was employed to evaluate the interaction between the salt and the ANE. A total
of 54 uniform plants were used in one experiment (nine treatment combinations
with six replicates). The treatment combinations were applied only once as a root
drench only once during the experiment. The row and column randomizations
were restricted to ensure all possible combinations. The plants’ after treatment
were allowed to grow for the next two weeks.
Figure 3.1: Experimental setup in the greenhouse
Plants were harvested and leaf area (cm2), root length (cm) and root area (cm2)
were measured the using WinFOLIA and WinRHIZO software packages (Regent
Instruments Inc., Sainte-Foy, Canada). The fresh weight (g) was also recorded.
The experiment was repeated three times during the year 2011-2013.
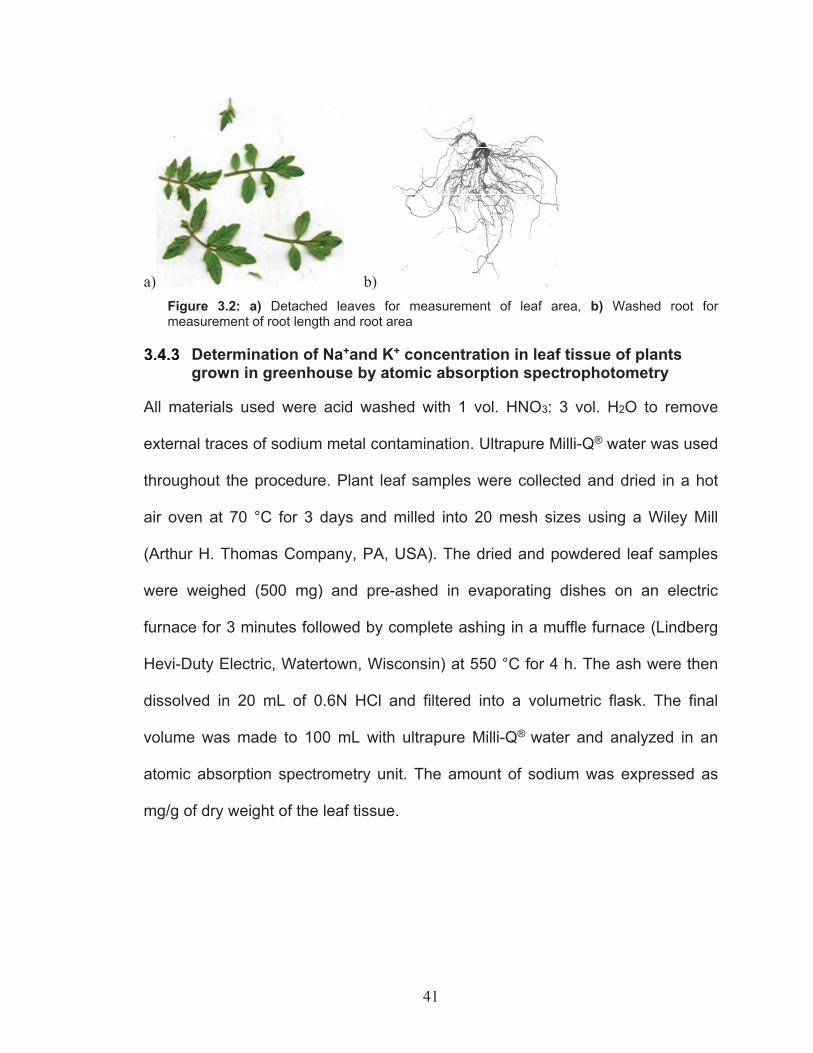
41
a) b) Figure 3.2: a) Detached leaves for measurement of leaf area, b) Washed root for measurement of root length and root area
Determination of Na+and K+ concentration in leaf tissue of plants grown in greenhouse by atomic absorption spectrophotometry
All materials used were acid washed with 1 vol. HNO3: 3 vol. H2O to remove
external traces of sodium metal contamination. Ultrapure Milli-Q® water was used
throughout the procedure. Plant leaf samples were collected and dried in a hot
air oven at 70 °C for 3 days and milled into 20 mesh sizes using a Wiley Mill
(Arthur H. Thomas Company, PA, USA). The dried and powdered leaf samples
were weighed (500 mg) and pre-ashed in evaporating dishes on an electric
furnace for 3 minutes followed by complete ashing in a muffle furnace (Lindberg
Hevi-Duty Electric, Watertown, Wisconsin) at 550 °C for 4 h. The ash were then
dissolved in 20 mL of 0.6N HCl and filtered into a volumetric flask. The final
volume was made to 100 mL with ultrapure Milli-Q® water and analyzed in an
atomic absorption spectrometry unit. The amount of sodium was expressed as
mg/g of dry weight of the leaf tissue.
42
3.5 Effect of EtOAc-ANE and commercial extract of Ascophyllumnodosum on tomato fruit number, yield and biomass in the greenhouse
Effect of EtOAc-ANE on tomato fruit number, yield and biomass
A greenhouse study was conducted to test the effect of EtOAc-ANE on tomato
plant biomass, fruit number and yield. A completely randomized design was
adopted and three treatments (control, 200 mM NaCl, EtOAc-ANE-200 mM
NaCl) were used. Three replicates per treatment were used. The total number of
fruits, fruit yield and aboveground fresh biomass of the plants were recorded after
the plants stopped bearing new flowers and fruits. Data were analyzed with one
way ANOVA using Proc MIXED procedure in SAS 9.3, (SAS Institute, Cary, C,
USA) at p= 0.05 to determine significant difference between treatments.
Effect of commercial extract of Ascophyllum nodosum on tomato fruit number, yield and biomass
A completely randomized design was adopted. The treatments were Control,
Long Ashton Nutrient Solution (LANS), ANE, 200 mM NaCl, LANS-200 mM
NaCl, ANE-200 mM NaCl where LANS is the inorganic control to mimic the
inorganic nutrient constitution of commercial ANE. Statistical analysis was
performed as explained in previous section.

43
CHAPTER 4 Results
The ethyl acetate fraction of Ascophyllum nodosum extract (EtOAc-ANE) was
used in the in vitro experiments while commercial Ascophyllum nodosum extract
(ANE) (Acadian™, Acadian Seaplants Limited, Nova Scotia, Canada) was used
in greenhouse experiments to understand the effect of A. nodosum extract on
tomato plants under salinity.
Two week old tomato plants were used in in vitro experiments whereas four
weeks old plants were used in greenhouse studies.
Biochemical and molecular analysis were only performed with leaf samples
collected from the in vitro experiments.
LANS (Long Ashton Nutrient Solution) was used as an inorganic control during
analysis of the sodium and potassium content of the leaf tissues as well as yield
experiments with the commercial ANE.
4.1 In vitro experiments using ethyl acetate fraction of Ascophyllumnodosum extract Effect of EtOAc-ANE on leaf area, root length and root area of tomato
plants Supplementation of 100 mM NaCl with EtOAc-ANE improved the growth and
development of tomato plant. The treated plants recorded significantly higher (p=
0.0034) leaf area as compared to the 100 mM NaCl control (Figure 4.1.1.1). On
an average, a ~25% increase in mean leaf area was observed in EtOAc- ANE-
100 mM NaCl treated plants.
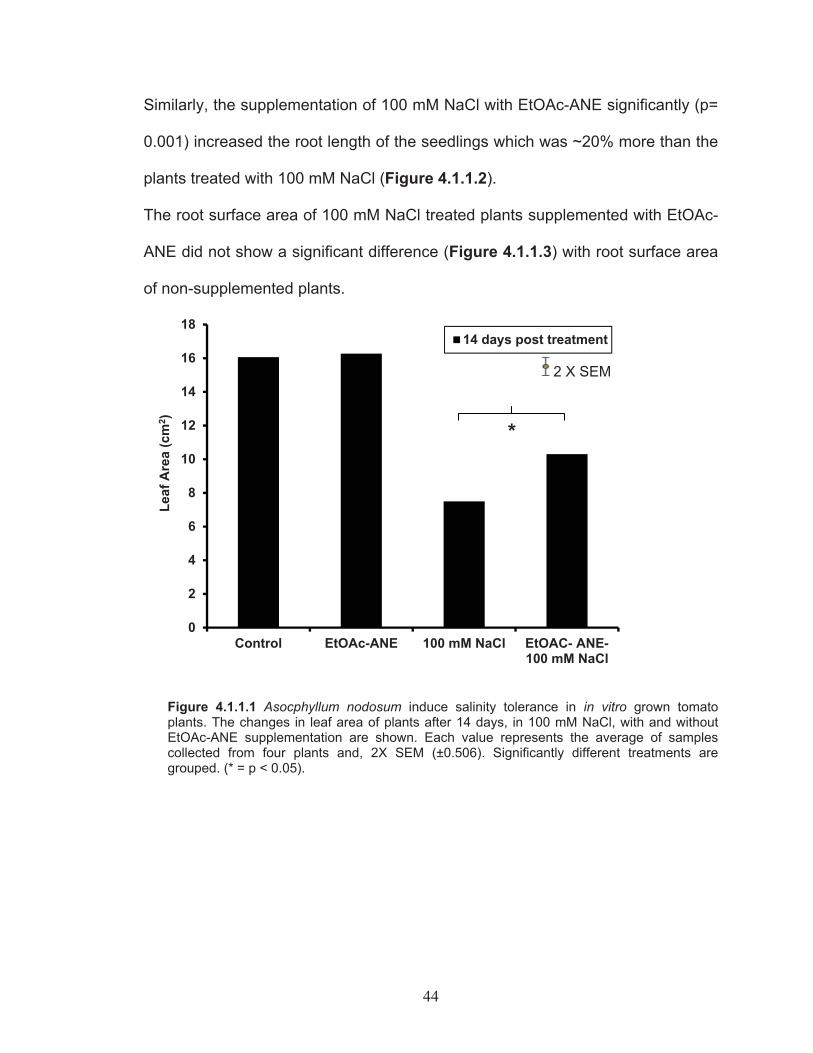
44
Similarly, the supplementation of 100 mM NaCl with EtOAc-ANE significantly (p=
0.001) increased the root length of the seedlings which was ~20% more than the
plants treated with 100 mM NaCl (Figure 4.1.1.2).
The root surface area of 100 mM NaCl treated plants supplemented with EtOAc-
ANE did not show a significant difference (Figure 4.1.1.3) with root surface area
of non-supplemented plants.
Figure 4.1.1.1 Asocphyllum nodosum induce salinity tolerance in in vitro grown tomato plants. The changes in leaf area of plants after 14 days, in 100 mM NaCl, with and without EtOAc-ANE supplementation are shown. Each value represents the average of samples collected from four plants and, 2X SEM (±0.506). Significantly different treatments are grouped. (* = p < 0.05).
0
2
4
6
8
10
12
14
16
18
Control EtOAc-ANE 100 mM NaCl EtOAC- ANE-100 mM NaCl
Leaf
Are
a (c
m2 )
14 days post treatment
2 X SEM
*
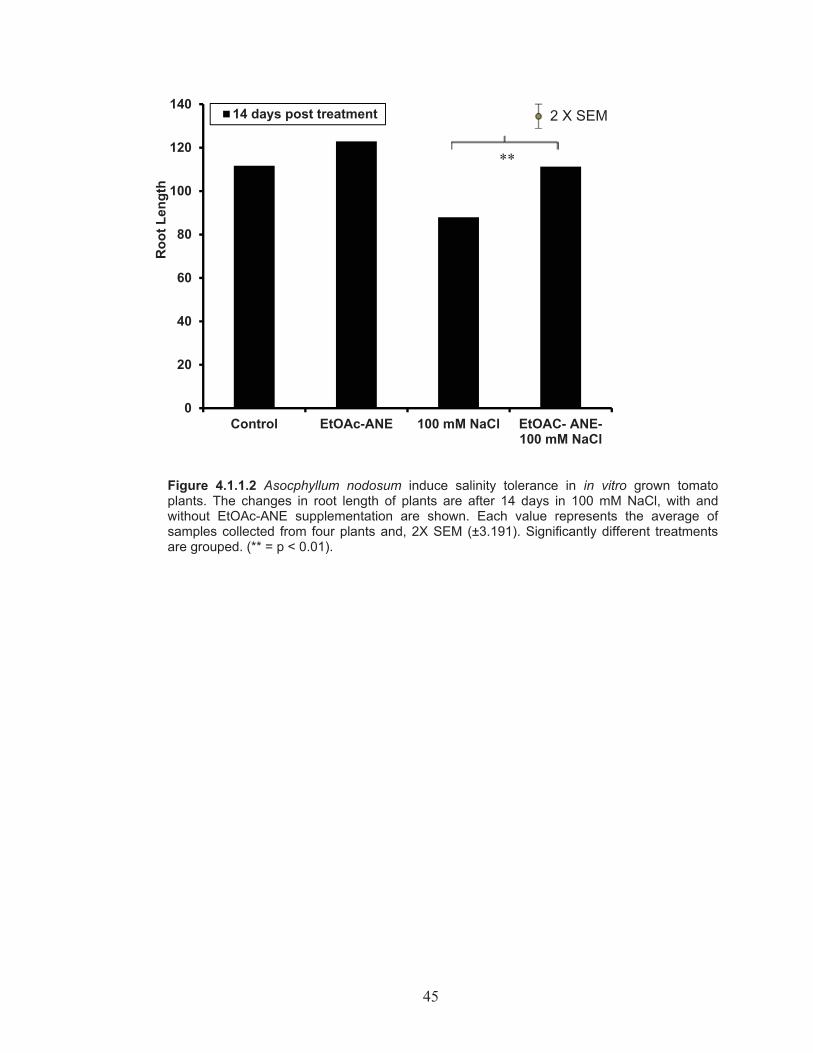
45
Figure 4.1.1.2 Asocphyllum nodosum induce salinity tolerance in in vitro grown tomato plants. The changes in root length of plants are after 14 days in 100 mM NaCl, with and without EtOAc-ANE supplementation are shown. Each value represents the average of samples collected from four plants and, 2X SEM (±3.191). Significantly different treatments are grouped. (** = p < 0.01).
0
20
40
60
80
100
120
140
Control EtOAc-ANE 100 mM NaCl EtOAC- ANE-100 mM NaCl
Roo
t Len
gth
14 days post treatment 2 X SEM
**
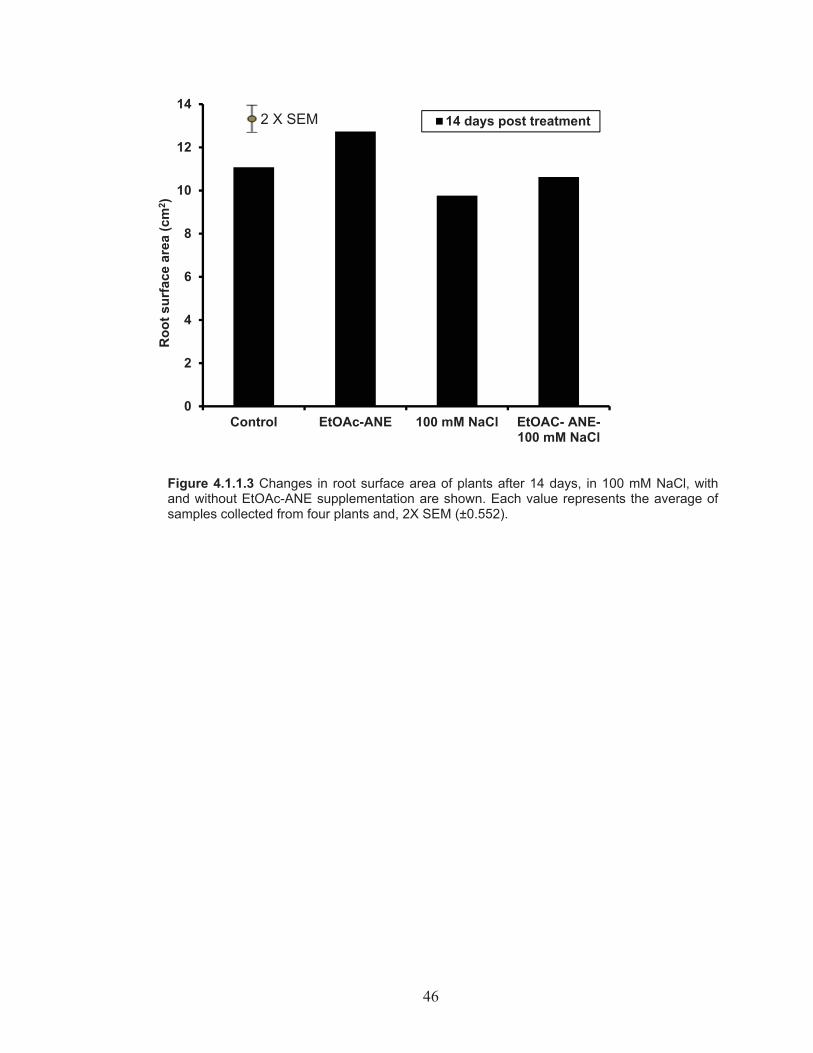
46
Figure 4.1.1.3 Changes in root surface area of plants after 14 days, in 100 mM NaCl, with and without EtOAc-ANE supplementation are shown. Each value represents the average of samples collected from four plants and, 2X SEM (±0.552).
0
2
4
6
8
10
12
14
Control EtOAc-ANE 100 mM NaCl EtOAC- ANE-100 mM NaCl
Roo
t sur
face
are
a (c
m2 )
14 days post treatment2 X SEM

47
Determination of biochemical changes in the leaves of tomato plants grown in vitro salinity stress studies
4.1.2.1 Estimation of catalase activity in the leaves of tomato plants The catalase activity was meausred at 24 h and 96 h after the plants were
treated with 100 mM NaCl, with and without EtOAc supplementation. The data
was analysed in repeated measures in SAS 9.3, using PROC MIXED ( = 0.05),
followed by Tukey’s (HSD) test. This was necessary to identify the effects due to
treatment and time or their interactions (time x treatment). The catalase activity
was 33% higher at 96 h post treatment in EtOAc-ANE-100 mM NaCl group.
However, no significant difference was observed due to large variation within the
groups (Figure 4.1.2.1). No significant difference was observed among 100 mM
NaCl and EtOAc-ANE-100 mM NaCl groups between 24 h and 96 h. There was
no significant effect of treatment or time, although a nearly significant interaction
between the treatment and the time (p= 0.0679) was observed.
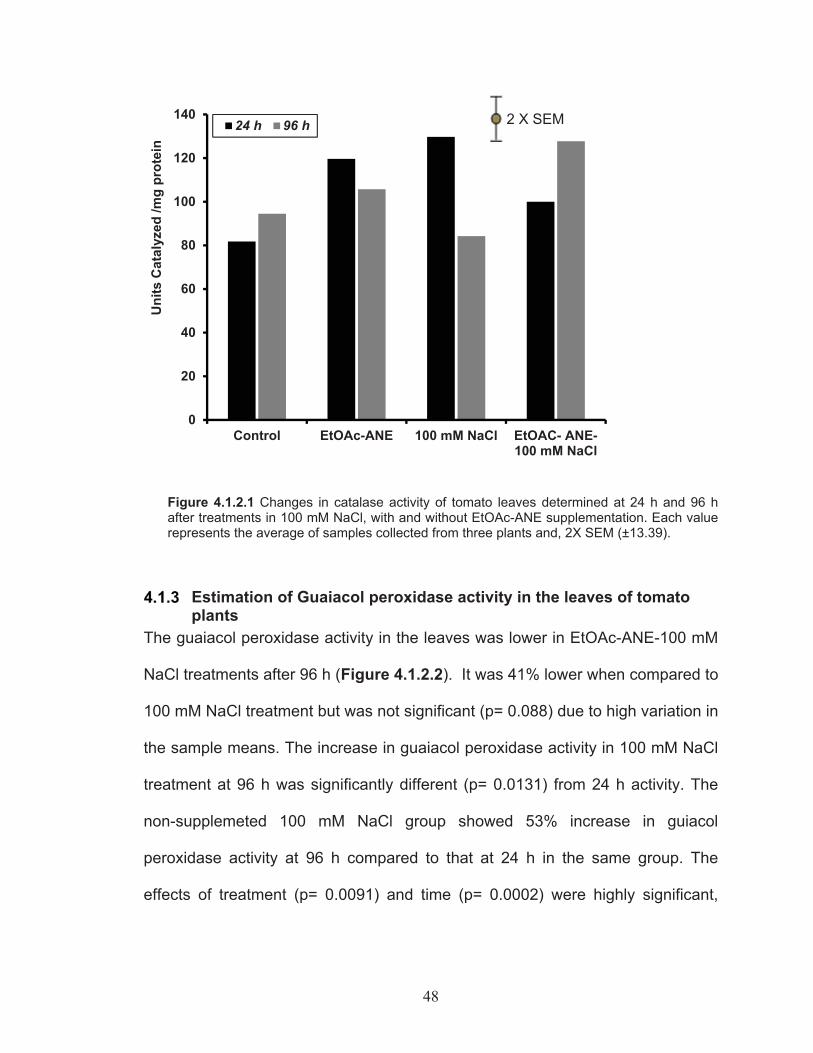
48
Figure 4.1.2.1 Changes in catalase activity of tomato leaves determined at 24 h and 96 h after treatments in 100 mM NaCl, with and without EtOAc-ANE supplementation. Each value represents the average of samples collected from three plants and, 2X SEM (±13.39).
Estimation of Guaiacol peroxidase activity in the leaves of tomato plants
The guaiacol peroxidase activity in the leaves was lower in EtOAc-ANE-100 mM
NaCl treatments after 96 h (Figure 4.1.2.2). It was 41% lower when compared to
100 mM NaCl treatment but was not significant (p= 0.088) due to high variation in
the sample means. The increase in guaiacol peroxidase activity in 100 mM NaCl
treatment at 96 h was significantly different (p= 0.0131) from 24 h activity. The
non-supplemeted 100 mM NaCl group showed 53% increase in guiacol
peroxidase activity at 96 h compared to that at 24 h in the same group. The
effects of treatment (p= 0.0091) and time (p= 0.0002) were highly significant,
0
20
40
60
80
100
120
140
Control EtOAc-ANE 100 mM NaCl EtOAC- ANE-100 mM NaCl
Uni
ts C
atal
yzed
/mg
prot
ein
24 h 96 h 2 X SEM
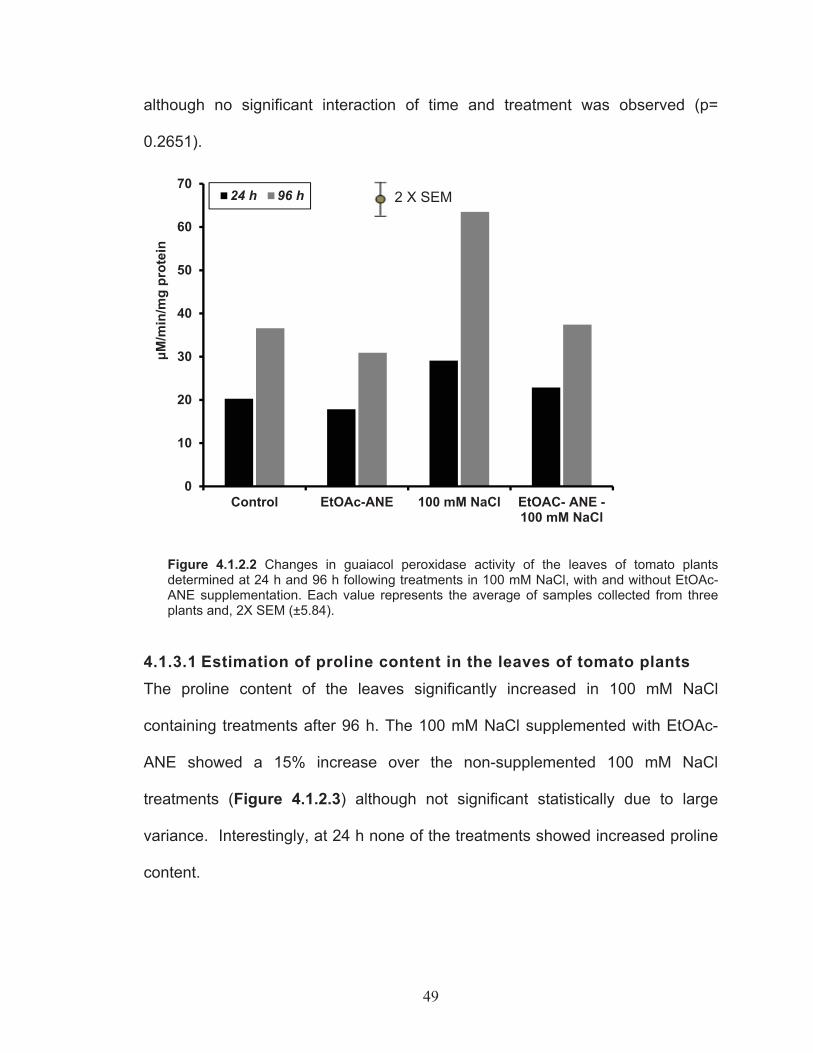
49
although no significant interaction of time and treatment was observed (p=
0.2651).
Figure 4.1.2.2 Changes in guaiacol peroxidase activity of the leaves of tomato plants determined at 24 h and 96 h following treatments in 100 mM NaCl, with and without EtOAc-ANE supplementation. Each value represents the average of samples collected from three plants and, 2X SEM (±5.84).
4.1.3.1 Estimation of proline content in the leaves of tomato plants The proline content of the leaves significantly increased in 100 mM NaCl
containing treatments after 96 h. The 100 mM NaCl supplemented with EtOAc-
ANE showed a 15% increase over the non-supplemented 100 mM NaCl
treatments (Figure 4.1.2.3) although not significant statistically due to large
variance. Interestingly, at 24 h none of the treatments showed increased proline
content.
0
10
20
30
40
50
60
70
Control EtOAc-ANE 100 mM NaCl EtOAC- ANE -100 mM NaCl
M/m
in/m
g pr
otei
n
24 h 96 h 2 X SEM
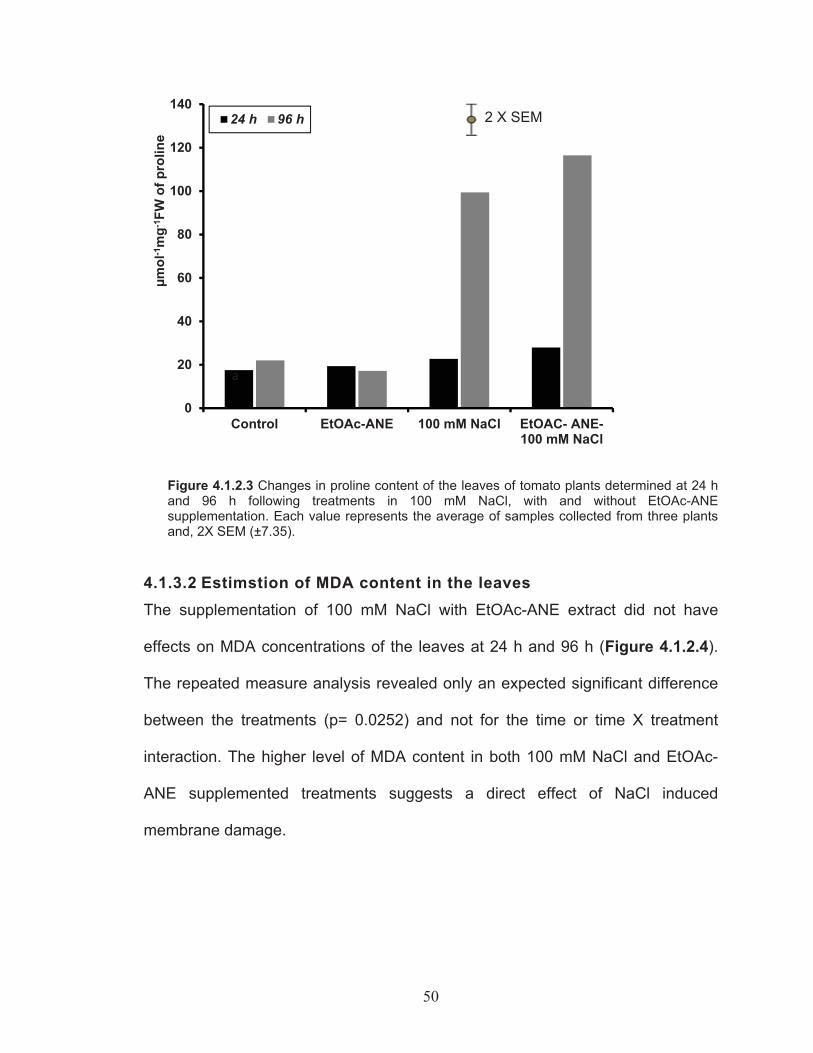
50
Figure 4.1.2.3 Changes in proline content of the leaves of tomato plants determined at 24 h and 96 h following treatments in 100 mM NaCl, with and without EtOAc-ANE supplementation. Each value represents the average of samples collected from three plants and, 2X SEM (±7.35).
4.1.3.2 Estimstion of MDA content in the leaves The supplementation of 100 mM NaCl with EtOAc-ANE extract did not have
effects on MDA concentrations of the leaves at 24 h and 96 h (Figure 4.1.2.4).
The repeated measure analysis revealed only an expected significant difference
between the treatments (p= 0.0252) and not for the time or time X treatment
interaction. The higher level of MDA content in both 100 mM NaCl and EtOAc-
ANE supplemented treatments suggests a direct effect of NaCl induced
membrane damage.
0
20
40
60
80
100
120
140
Control EtOAc-ANE 100 mM NaCl EtOAC- ANE-100 mM NaCl
μmol
-1m
g-1 F
W o
f pro
line
24 h 96 h
a
2 X SEM

51
Figure 4.1.2.4 Changes in MDA (malondialdehyde) content of the leaves of tomato plants determined at 24 h and 96 h following treatments in 100 mM NaCl, with and without EtOAc-ANE supplementation. Each value represents the average of samples collected from three plants and, 2X SEM (±0.0128).
Estimation of chlorophyll content in the leaves
4.1.4.1 Estimation of chlorophyll a in the leaves
The Chlorophyll a content was significantly (p =0.030) higher (~25%) in 100 mM
NaCl treatment as compared to EtOAc-ANE treatment at 24 h. However, a
significant decrease (p= 0.015) in chlorophyll a was observed at 96 h in non
supplemented 100 mM NaCl treatments (Figure 4.1.3.1). The EtOAc-ANE- 100
mM NaCl at 96 h showed a significant (p= 0.029) increase over the 100 mM NaCl
treated group at 96 h. No significant decrease in chlorophyll a content was
recorded in EtOAc-ANE supplemented 100 mM NaCl treatments at 96 h.
0
0.02
0.04
0.06
0.08
0.1
0.12
Control EtOAc-ANE 100 mM NaCl EtOAC- ANE-100 mM NaCl
MD
A (n
m-1
g Fr
esh
Wei
ght)
24 h 96 h 2 X SEM

52
Figure 4.1.3.1 Asocphyllum nodosum induce salinity tolerance in in vitro grown tomato plants. Changes in chlorophyll a content of the leaves of tomato plants determined at 24 h and 96 h following treatments in 100 mM NaCl, with and without EtOAc-ANE supplementation. Each value represents the average of samples collected from three plants and, 2X SEM (±0.47). Significantly different treatments are grouped. (* = p < 0.05).
4.1.4.2 Estimation of chlorophyll b in the leaves The change in chlorophyll b content in 100 mM NaCl treatment at 24 h and 96 h
was significant (p= 0.0058) and larger than the decrease in chlorophyll a content
(36%), at similar time points, as shown in Figure 4.1.3.2. The increase in
chlorophyll b content at 96 h between 100 mM NaCl and EtOAc-ANE
supplemented 100 mM NaCl group showed a weak statistical significance at p=
0.079.
0
1
2
3
4
5
6
7
8
9
Control EtOAc-ANE 100 mM NaCl EtOAC- ANE-100 mM NaCl
Chl
orop
hyll
am
g/m
L
24 h 96 h 2 X SEM*
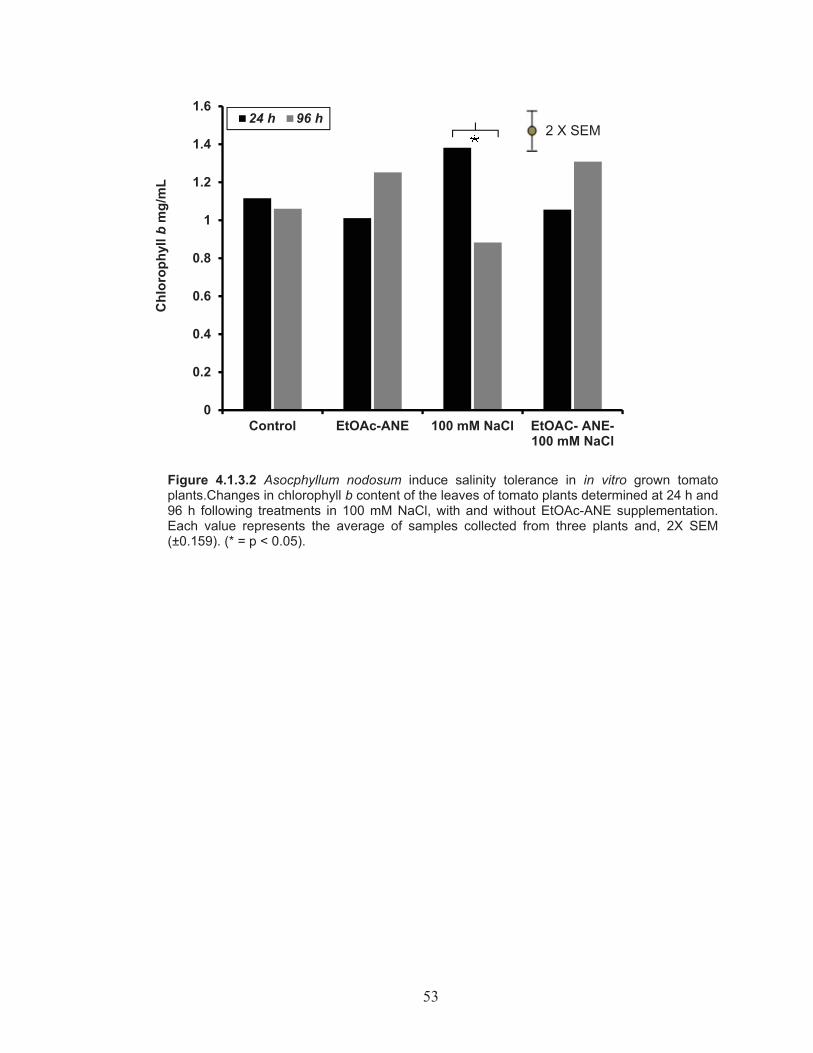
53
Figure 4.1.3.2 Asocphyllum nodosum induce salinity tolerance in in vitro grown tomato plants.Changes in chlorophyll b content of the leaves of tomato plants determined at 24 h and 96 h following treatments in 100 mM NaCl, with and without EtOAc-ANE supplementation. Each value represents the average of samples collected from three plants and, 2X SEM (±0.159). (* = p < 0.05).
0
0.2
0.4
0.6
0.8
1
1.2
1.4
1.6
Control EtOAc-ANE 100 mM NaCl EtOAC- ANE-100 mM NaCl
Chl
orop
hyll
bm
g/m
L
24 h 96 h2 X SEM

54
4.1.4.3 Chlorophyll a/b Ratio
Figure 4.1.3.3 Changes in Chlorophyll a/b ratio of the leaves of tomato plants determined at 24 h and 96 h following treatments in 100 mM NaCl, with and without EtOAc-ANE supplementation. Each value represents the average of samples collected from three plants and, 2XSEM (±0.4287).
The chlorophyll a/b ratio was consistent among the groups, ranging from 5-7. No
significant difference was observed as effects of time, treatment or their
interactions.
4.1.4.4 Estimation of carotenoids in the leaves
A significant decrease (p=0.019) was recorded in non-supplemented 100 mM
treatment groups from 24 h to 96 h post treatment. No differences were recorded
between the treatments at 96 h (Figure 4.1.3.4). The EtOAC- ANE treatments
did not show any difference in carotenoid content, irrespective of the treatment
and the duration of the treatment. Interestingly, the fixed effects of time (p=
0.0263) and treatment X time (p= 0.0321) were significant which shows that the
4.8
5
5.2
5.4
5.6
5.8
6
6.2
6.4
6.6
Control EtOAc-ANE 100 mM NaCl EtOAC- ANE-100 mM NaCl
Chl
orop
hyll
a/b
ratio
24 h 96 h 2 X SEM
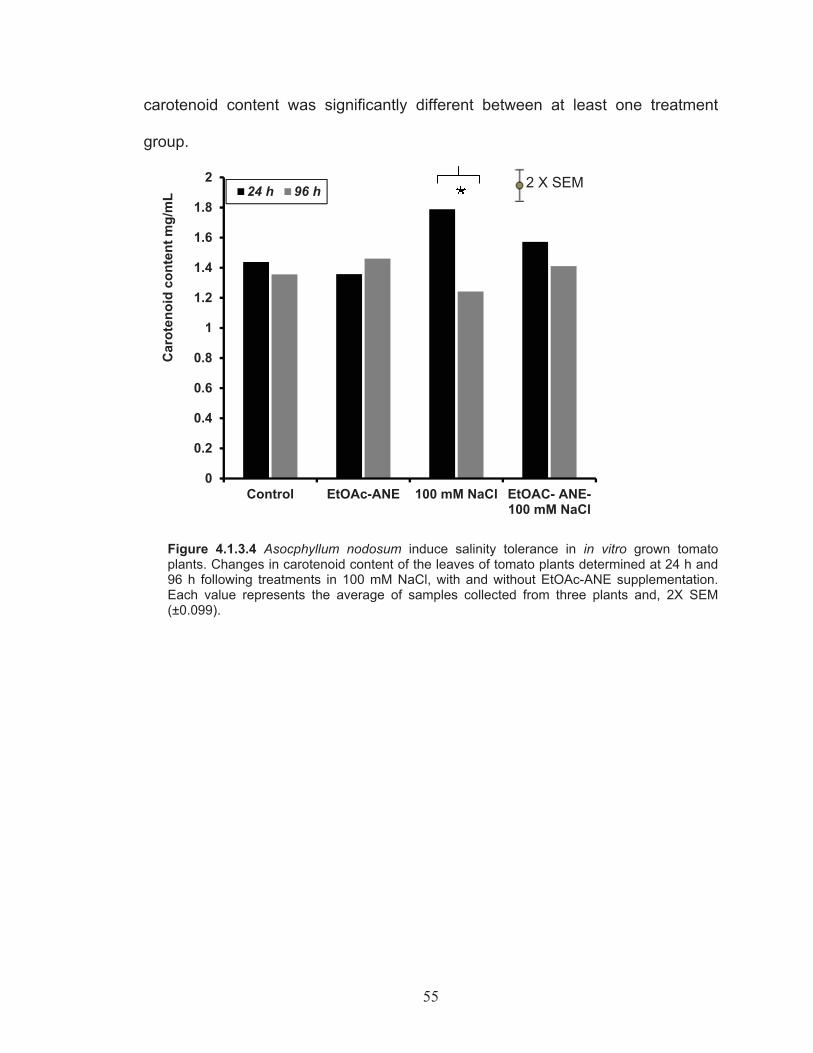
55
carotenoid content was significantly different between at least one treatment
group.
Figure 4.1.3.4 Asocphyllum nodosum induce salinity tolerance in in vitro grown tomato plants. Changes in carotenoid content of the leaves of tomato plants determined at 24 h and 96 h following treatments in 100 mM NaCl, with and without EtOAc-ANE supplementation. Each value represents the average of samples collected from three plants and, 2X SEM (±0.099).
0
0.2
0.4
0.6
0.8
1
1.2
1.4
1.6
1.8
2
Control EtOAc-ANE 100 mM NaCl EtOAC- ANE-100 mM NaCl
Car
oten
oid
cont
ent m
g/m
L 24 h 96 h 2 X SEM
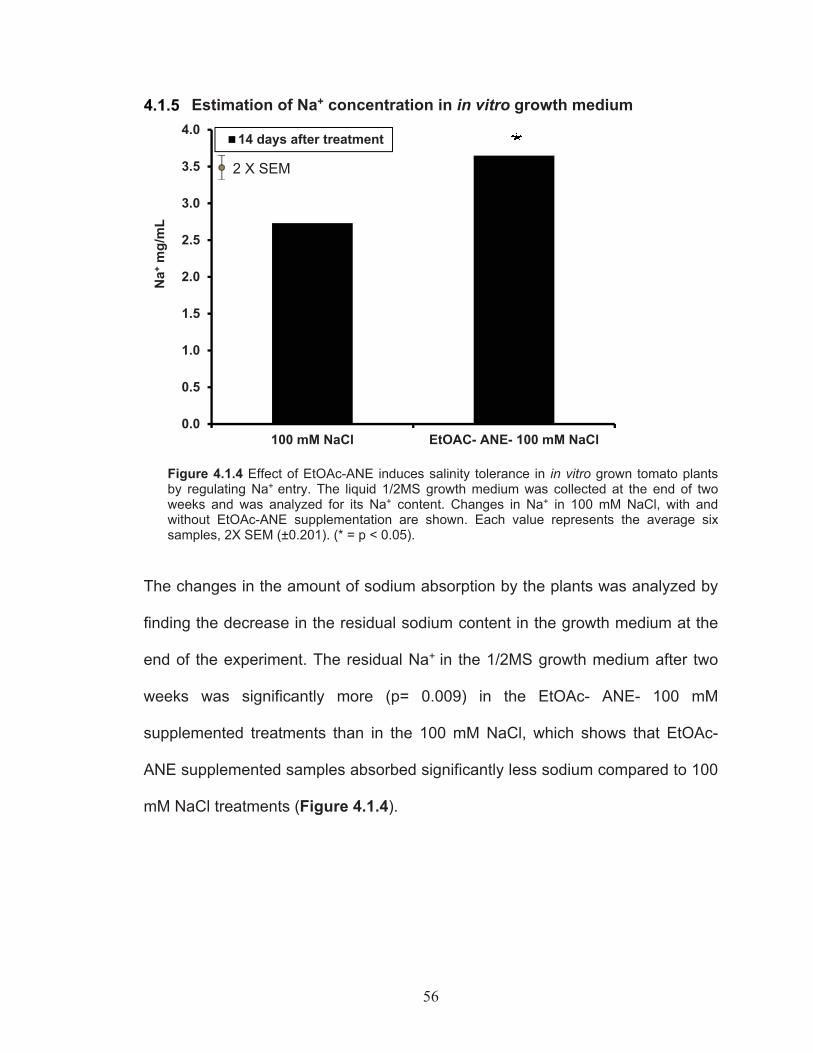
56
Estimation of Na+ concentration in in vitro growth medium
Figure 4.1.4 Effect of EtOAc-ANE induces salinity tolerance in in vitro grown tomato plants by regulating Na+ entry. The liquid 1/2MS growth medium was collected at the end of two weeks and was analyzed for its Na+ content. Changes in Na+ in 100 mM NaCl, with and without EtOAc-ANE supplementation are shown. Each value represents the average six samples, 2X SEM (±0.201). (* = p < 0.05).
The changes in the amount of sodium absorption by the plants was analyzed by
finding the decrease in the residual sodium content in the growth medium at the
end of the experiment. The residual Na+ in the 1/2MS growth medium after two
weeks was significantly more (p= 0.009) in the EtOAc- ANE- 100 mM
supplemented treatments than in the 100 mM NaCl, which shows that EtOAc-
ANE supplemented samples absorbed significantly less sodium compared to 100
mM NaCl treatments (Figure 4.1.4).
0.0
0.5
1.0
1.5
2.0
2.5
3.0
3.5
4.0
100 mM NaCl EtOAC- ANE- 100 mM NaCl
Na+
mg/
mL
14 days after treatment
2 X SEM

57
Molecular analysis of Ascophyllum nodosum extract induced salinity tolerance
The expression of key genes associated with salinity tolerance such as catalase,
tompro2, nhx-1 and nhx-3 were investigated at two different time intervals of 24 h
and 96 h after exposure to treatment.
The relative changes in the transcript abundance at 24 h were similar in all the
treatments. There was ~ 0.65-fold downregulation of transcripts of the catalase-2
gene at 96 h in both 100 mM NaCl and 100 mM NaCl-EtOAc-ANE treatments
(Figure 4.1.5.1)
Figure 4.1.5.1 Changes in catalase-2 gene expression in the leaves of tomato plants determined at 24 h and 96 h following treatments in 100 mM NaCl, with and without EtOAc-ANE supplementation. Each value represents the average of two biological replicates and vertical bars represent 2XSE of individual mean within the specific treatment.
0
0.2
0.4
0.6
0.8
1
1.2
1.4
1.6
Control EtOAc-ANE 100 mM NaCl EtOAC- ANE-100 mM NaCl
Rel
ativ
e Ex
pres
sion
24 h-cat-2 96 h-cat-2
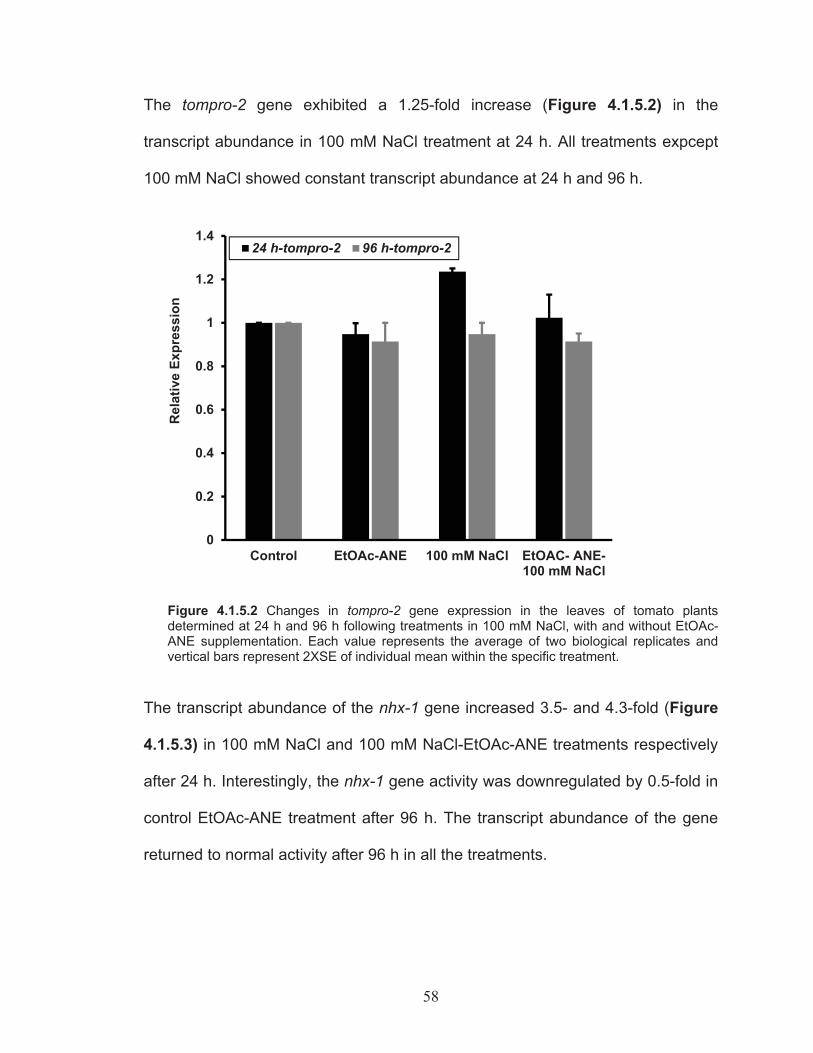
58
The tompro-2 gene exhibited a 1.25-fold increase (Figure 4.1.5.2) in the
transcript abundance in 100 mM NaCl treatment at 24 h. All treatments expcept
100 mM NaCl showed constant transcript abundance at 24 h and 96 h.
Figure 4.1.5.2 Changes in tompro-2 gene expression in the leaves of tomato plants determined at 24 h and 96 h following treatments in 100 mM NaCl, with and without EtOAc-ANE supplementation. Each value represents the average of two biological replicates and vertical bars represent 2XSE of individual mean within the specific treatment.
The transcript abundance of the nhx-1 gene increased 3.5- and 4.3-fold (Figure
4.1.5.3) in 100 mM NaCl and 100 mM NaCl-EtOAc-ANE treatments respectively
after 24 h. Interestingly, the nhx-1 gene activity was downregulated by 0.5-fold in
control EtOAc-ANE treatment after 96 h. The transcript abundance of the gene
returned to normal activity after 96 h in all the treatments.
0
0.2
0.4
0.6
0.8
1
1.2
1.4
Control EtOAc-ANE 100 mM NaCl EtOAC- ANE-100 mM NaCl
Rel
ativ
e Ex
pres
sion
24 h-tompro-2 96 h-tompro-2
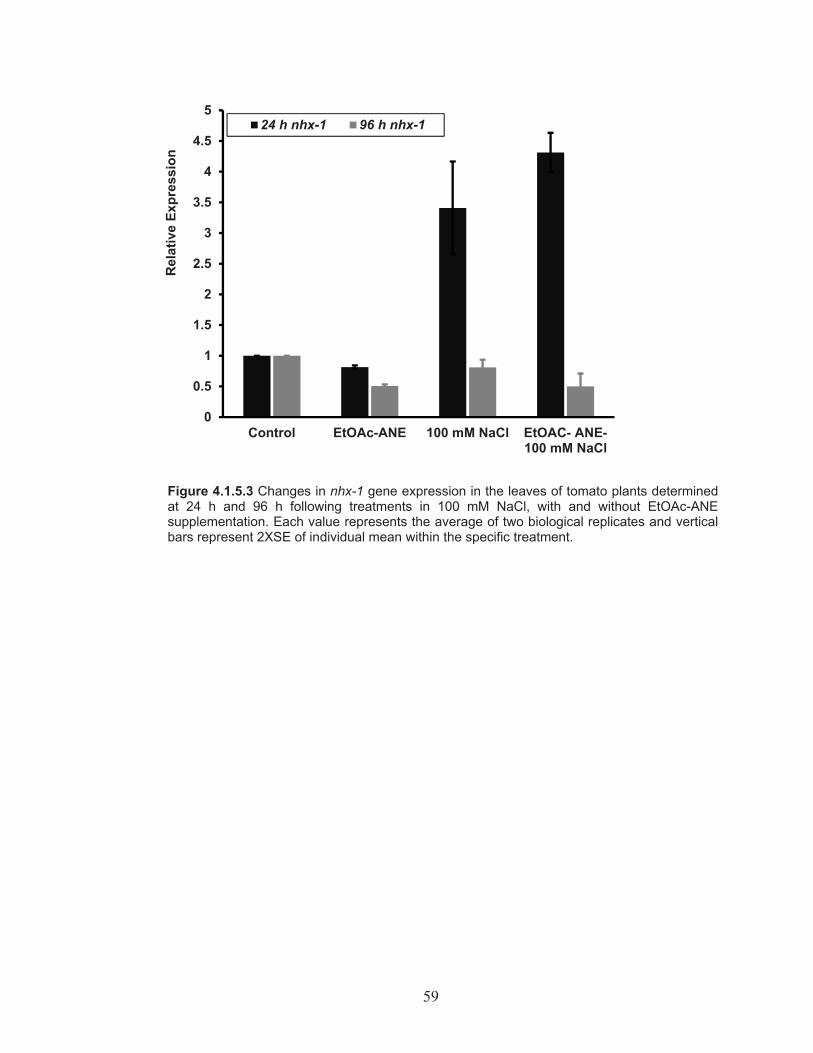
59
Figure 4.1.5.3 Changes in nhx-1 gene expression in the leaves of tomato plants determined at 24 h and 96 h following treatments in 100 mM NaCl, with and without EtOAc-ANE supplementation. Each value represents the average of two biological replicates and vertical bars represent 2XSE of individual mean within the specific treatment.
0
0.5
1
1.5
2
2.5
3
3.5
4
4.5
5
Control EtOAc-ANE 100 mM NaCl EtOAC- ANE-100 mM NaCl
Rel
ativ
e Ex
pres
sion
24 h nhx-1 96 h nhx-1
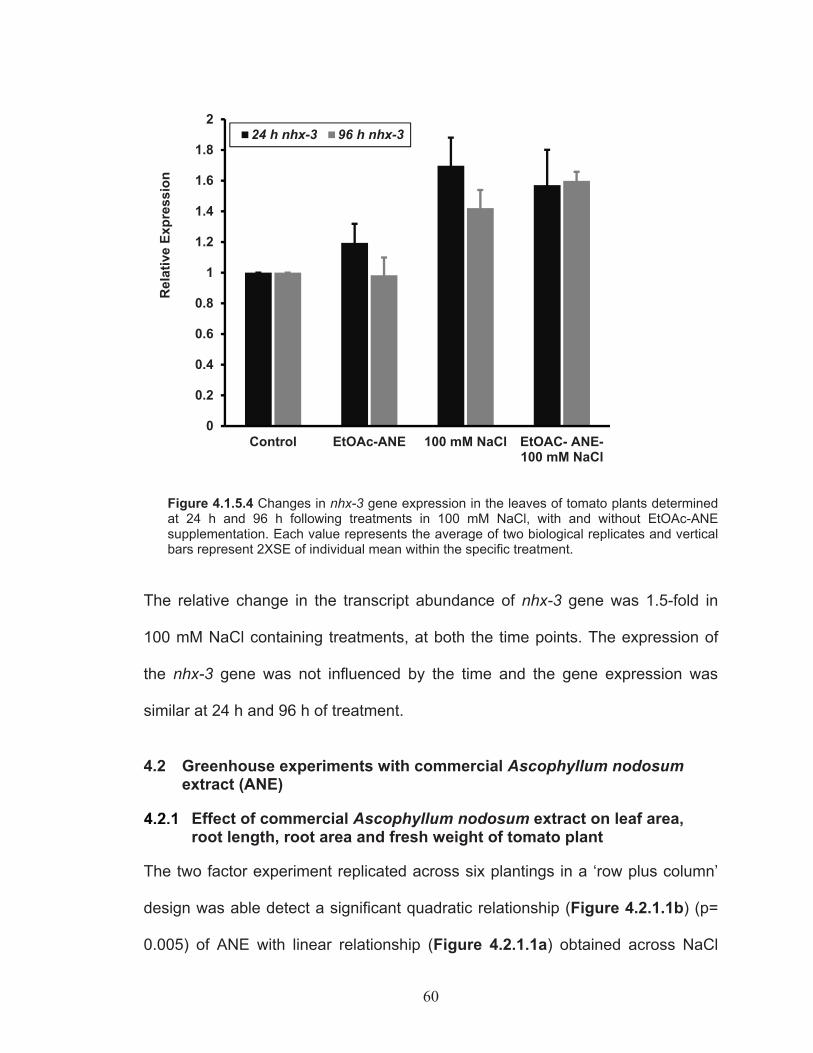
60
Figure 4.1.5.4 Changes in nhx-3 gene expression in the leaves of tomato plants determined at 24 h and 96 h following treatments in 100 mM NaCl, with and without EtOAc-ANE supplementation. Each value represents the average of two biological replicates and vertical bars represent 2XSE of individual mean within the specific treatment.
The relative change in the transcript abundance of nhx-3 gene was 1.5-fold in
100 mM NaCl containing treatments, at both the time points. The expression of
the nhx-3 gene was not influenced by the time and the gene expression was
similar at 24 h and 96 h of treatment.
4.2 Greenhouse experiments with commercial Ascophyllum nodosum extract (ANE)
Effect of commercial Ascophyllum nodosum extract on leaf area, root length, root area and fresh weight of tomato plant
The two factor experiment replicated across six plantings in a ‘row plus column’
design was able detect a significant quadratic relationship (Figure 4.2.1.1b) (p=
0.005) of ANE with linear relationship (Figure 4.2.1.1a) obtained across NaCl
0
0.2
0.4
0.6
0.8
1
1.2
1.4
1.6
1.8
2
Control EtOAc-ANE 100 mM NaCl EtOAC- ANE-100 mM NaCl
Rel
ativ
e Ex
pres
sion
24 h nhx-3 96 h nhx-3

61
treatments. NaCl treatments showed significant differences with increasing
concentrations of NaCl (p= 0.001). No linear effects were found with increasing
concentrations of ANE. A decrease of 11% and 20% in the total leaf area was
recorded when the salinity levels increased from 100 to 200 mM NaCl. No
significant increase in the measured parameter was observed at similar levels of
treatment controls or combinations of 0 mM, 100 mM and 200 mM of NaCl with 0
g/L, 0.3 g/L and 1.0 g/L of ANE.
A significant negative linear relationship (Figure 4.2.1.2a) was detected due to
the reduction in the root length as salt concentration increased. No positive
linearity was observed with increased concentrations of ANE. No significant
increase was observed at similar levels of treatment control or combinations of 0
mM, 100 mM and 200 mM of NaCl with 0 g/L, 0.3 g/L and 1.0 g/L of ANE.
The decrease in the root surface area was similar to root length with a negative
linear relationship (Figure 4.2.1.3a). No significant increase was observed at
similar levels of treatment control or combinations of 0 mM, 100 mM and 200 mM
of NaCl with 0 g/L, 0.3 g/L and 1.0 g/L of ANE. Similarly no significant increase in
the fresh weight of the plants was observed at similar level of treatment controls
and combinations of 0 mM, 100 mM and 200 mM of NaCl with 0 g/L, 0.3 g/L and
1.0 g/L of ANE (Figure 4.2.1.4a).
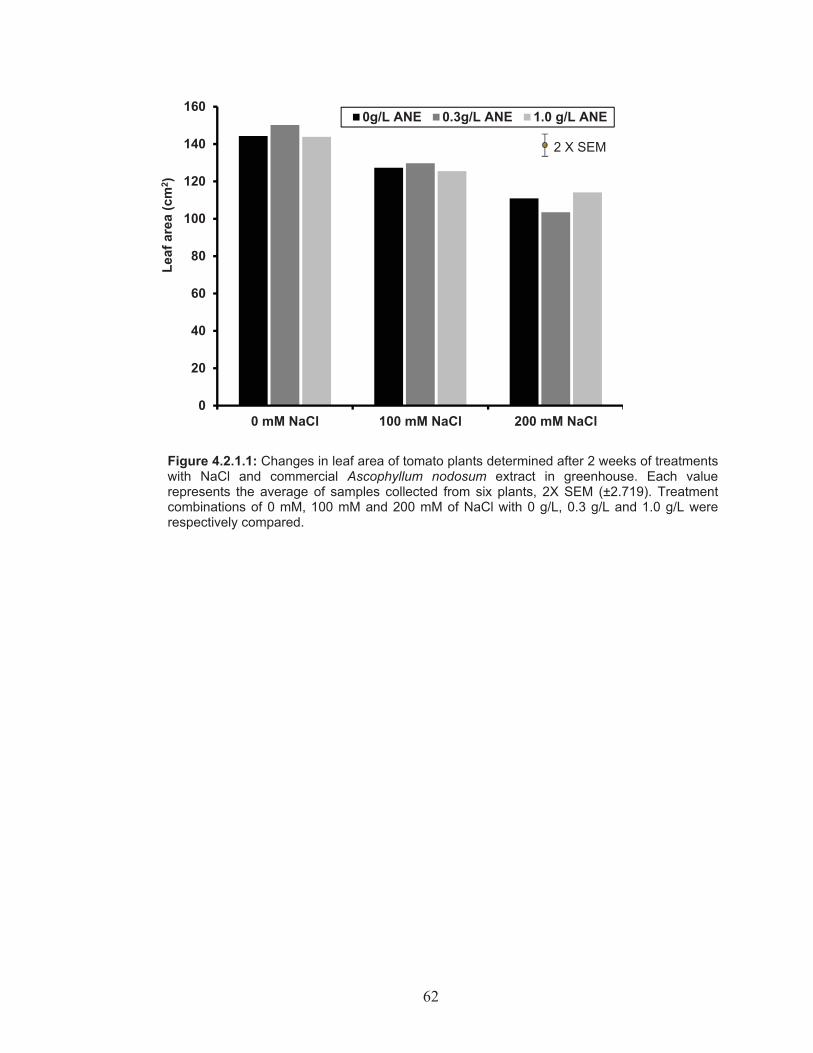
62
Figure 4.2.1.1: Changes in leaf area of tomato plants determined after 2 weeks of treatments with NaCl and commercial Ascophyllum nodosum extract in greenhouse. Each value represents the average of samples collected from six plants, 2X SEM (±2.719). Treatment combinations of 0 mM, 100 mM and 200 mM of NaCl with 0 g/L, 0.3 g/L and 1.0 g/L were respectively compared.
0
20
40
60
80
100
120
140
160
0 mM NaCl 100 mM NaCl 200 mM NaCl
Leaf
are
a (c
m2 )
0g/L ANE 0.3g/L ANE 1.0 g/L ANE
2 X SEM
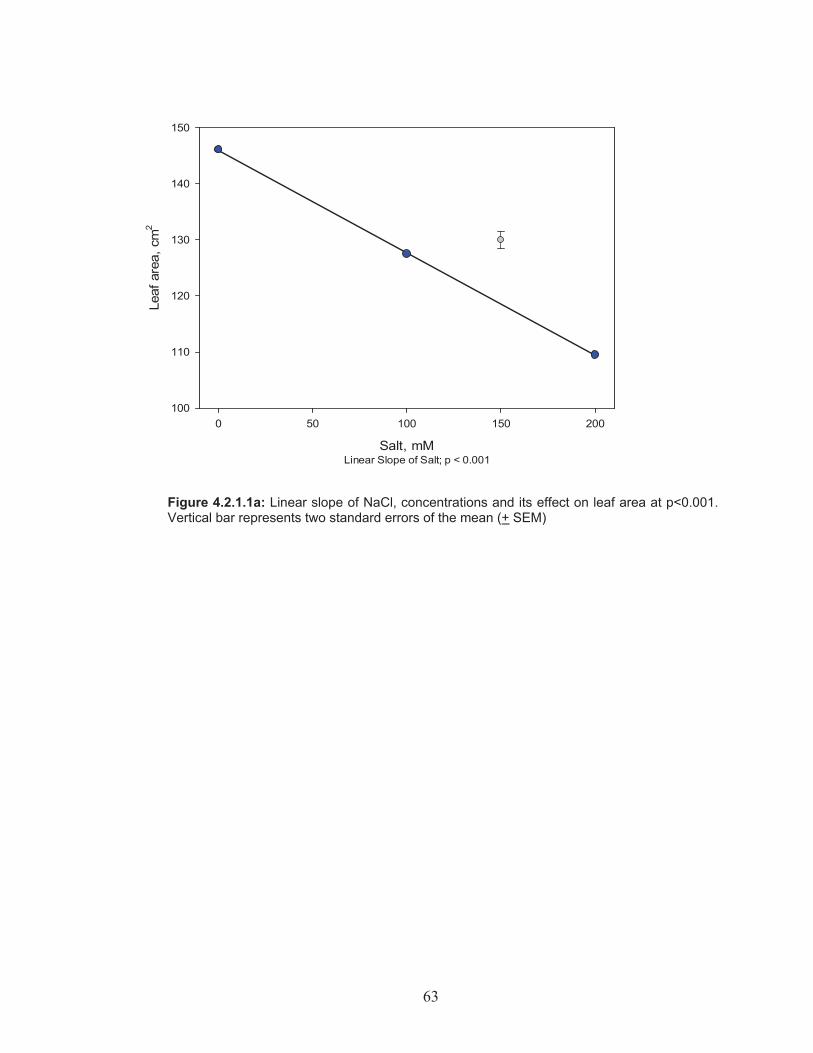
63
Salt, mM
0 50 100 150 200
Leaf
are
a, c
m2
100
110
120
130
140
150
Linear Slope of Salt; p < 0.001
Figure 4.2.1.1a: Linear slope of NaCl, concentrations and its effect on leaf area at p<0.001. Vertical bar represents two standard errors of the mean (+ SEM)

64
Salt, mM
0 50 100 150 200
Leaf
are
a, c
m2
100
110
120
130
140
150
160
Quad Slope of ANE x Linear Slope of Salt; p = 0.005
Figure 4.2.1.1b: Interaction of quadratic slope of ANE and linear slope of Salt at different levels on leaf area (p= 0.005). Vertical bar represents two standard errors of the mean (+ SEM).
Salt levels against 0 g/l ANE Salt levels against 0.3 g/L ANE Salt levels against 1.0 g/L ANE
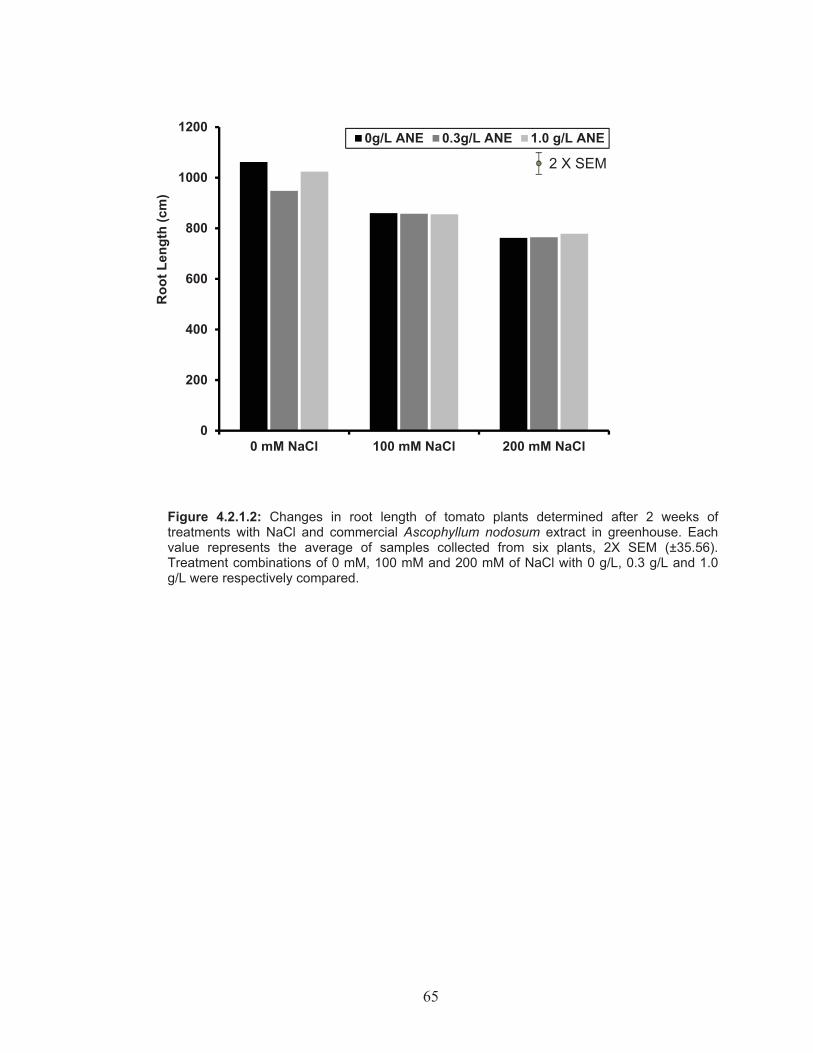
65
Figure 4.2.1.2: Changes in root length of tomato plants determined after 2 weeks of treatments with NaCl and commercial Ascophyllum nodosum extract in greenhouse. Each value represents the average of samples collected from six plants, 2X SEM (±35.56). Treatment combinations of 0 mM, 100 mM and 200 mM of NaCl with 0 g/L, 0.3 g/L and 1.0 g/L were respectively compared.
0
200
400
600
800
1000
1200
0 mM NaCl 100 mM NaCl 200 mM NaCl
Roo
t Len
gth
(cm
)
0g/L ANE 0.3g/L ANE 1.0 g/L ANE
2 X SEM
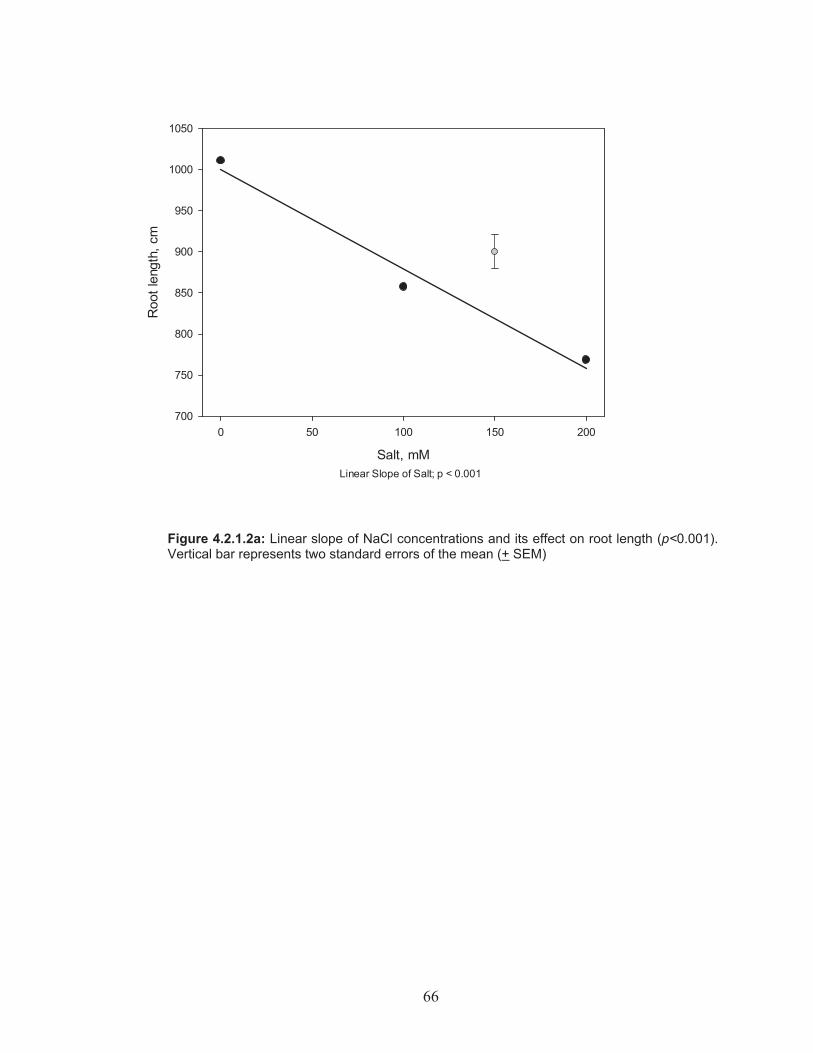
66
Salt, mM
0 50 100 150 200
Roo
t len
gth,
cm
700
750
800
850
900
950
1000
1050
Linear Slope of Salt; p < 0.001
Figure 4.2.1.2a: Linear slope of NaCl concentrations and its effect on root length (p<0.001). Vertical bar represents two standard errors of the mean (+ SEM)

67
Figure 4.2.1.3: Changes in root surface area of tomato plants determined after 2 weeks of treatments with NaCl and commercial Ascophyllum nodosum extract in greenhouse. Each value represents the average of samples collected from six plants, 2X SEM (±2.635). Treatment combinations of 0 mM, 100 mM and 200 mM of NaCl with 0 g/L, 0.3 g/L and 1.0 g/L were respectively compared.
0
20
40
60
80
100
120
140
160
0 mM NaCl 100 mM NaCl 200 mM NaCl
Roo
t sur
face
are
a (c
m2 )
0g/L ANE 0.3g/L ANE 1.0 g/L ANE
2 X SEM
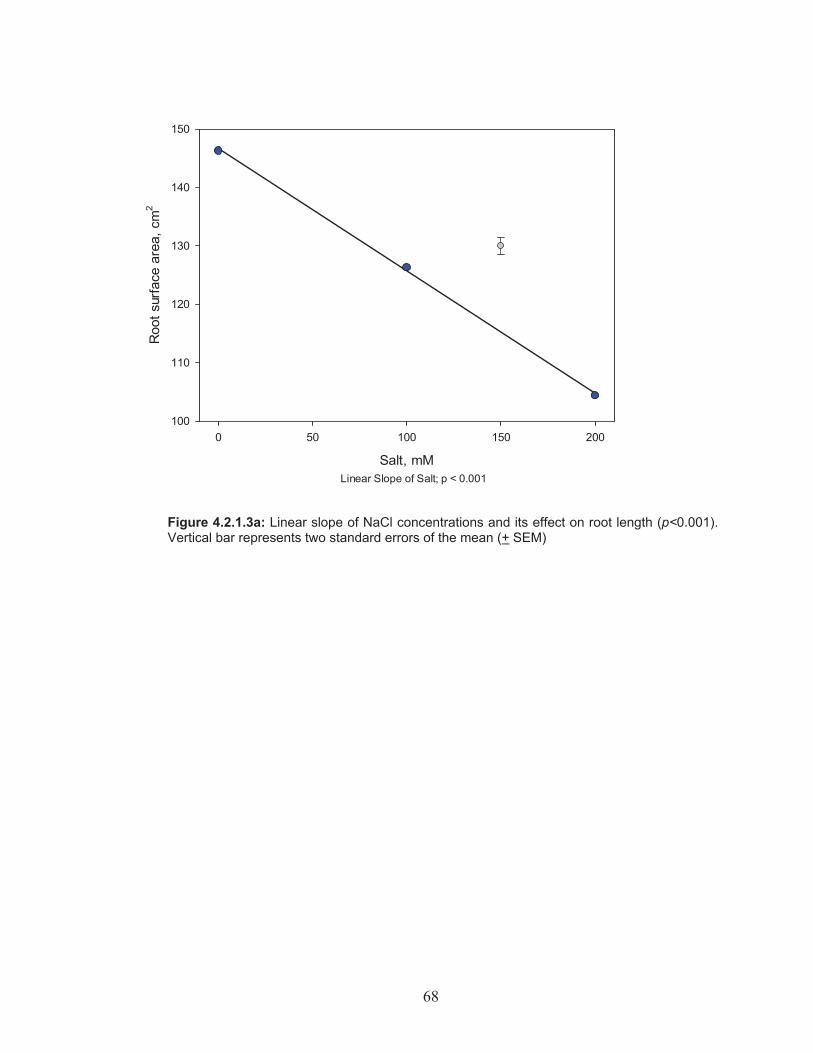
68
Salt, mM
0 50 100 150 200
Roo
t sur
face
are
a, c
m2
100
110
120
130
140
150
Linear Slope of Salt; p < 0.001
Figure 4.2.1.3a: Linear slope of NaCl concentrations and its effect on root length (p<0.001). Vertical bar represents two standard errors of the mean (+ SEM)
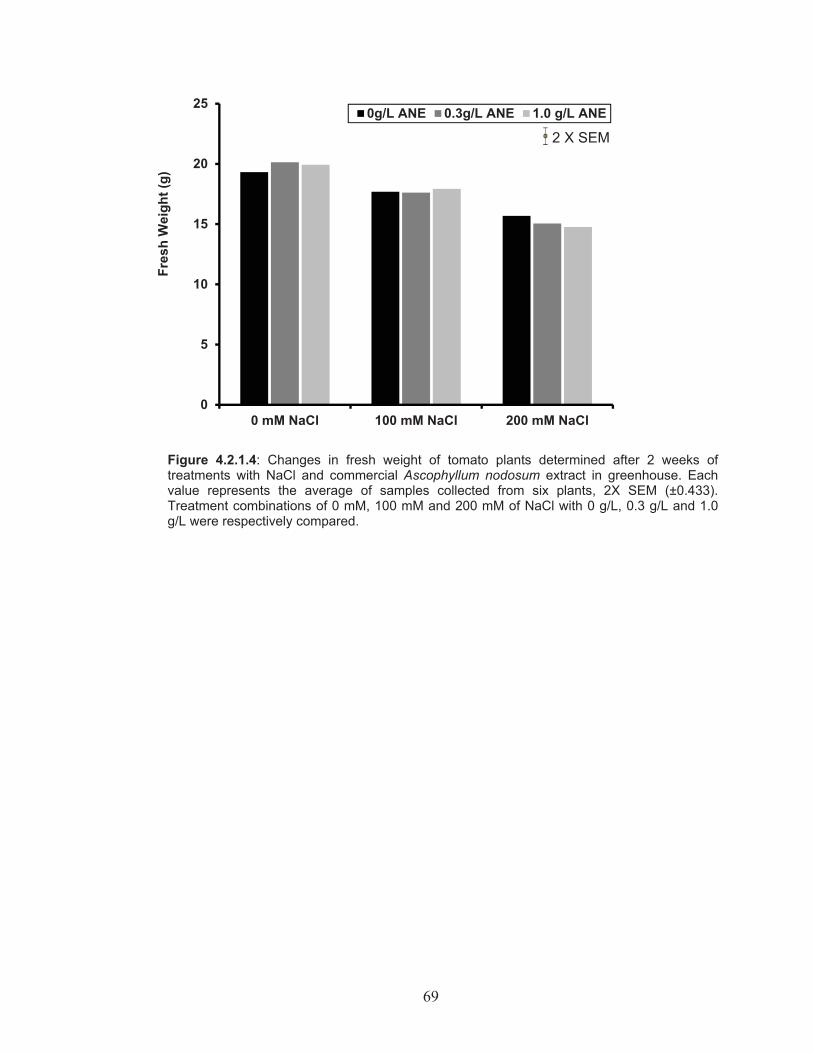
69
Figure 4.2.1.4: Changes in fresh weight of tomato plants determined after 2 weeks of treatments with NaCl and commercial Ascophyllum nodosum extract in greenhouse. Each value represents the average of samples collected from six plants, 2X SEM (±0.433). Treatment combinations of 0 mM, 100 mM and 200 mM of NaCl with 0 g/L, 0.3 g/L and 1.0 g/L were respectively compared.
0
5
10
15
20
25
0 mM NaCl 100 mM NaCl 200 mM NaCl
Fres
h W
eigh
t (g)
0g/L ANE 0.3g/L ANE 1.0 g/L ANE
2 X SEM
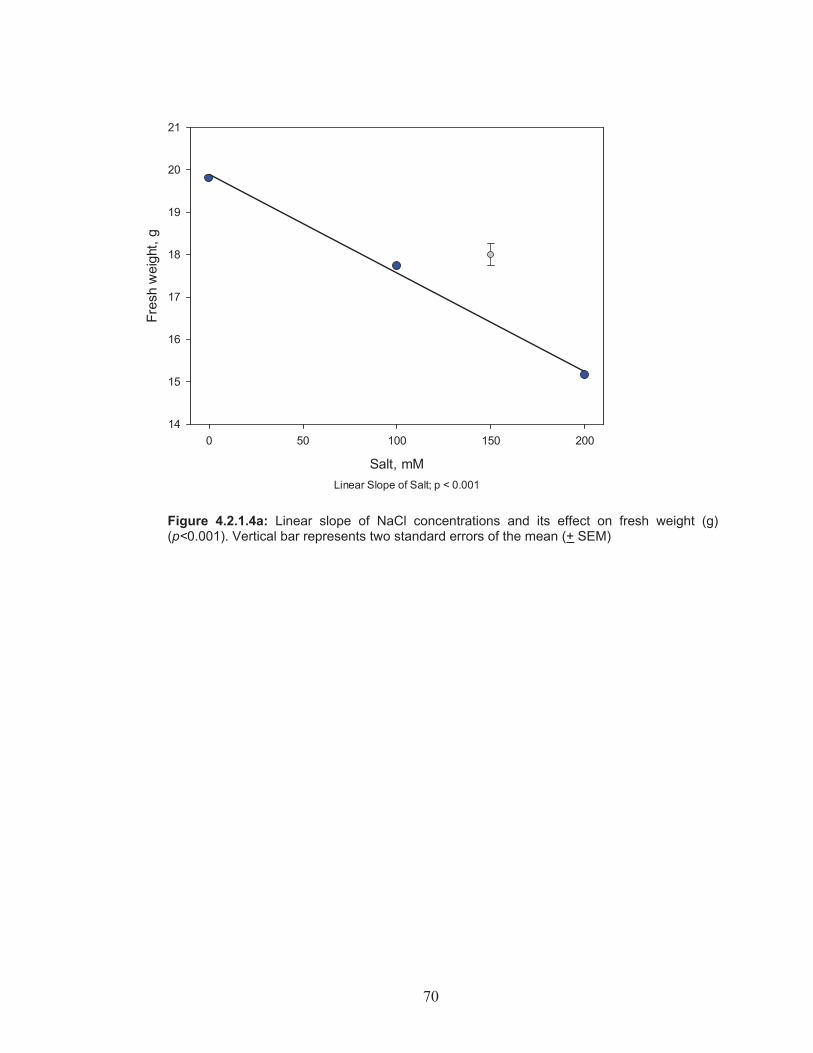
70
Salt, mM
0 50 100 150 200
Fres
h w
eigh
t, g
14
15
16
17
18
19
20
21
Linear Slope of Salt; p < 0.001
Figure 4.2.1.4a: Linear slope of NaCl concentrations and its effect on fresh weight (g) (p<0.001). Vertical bar represents two standard errors of the mean (+ SEM)

71
Effect of commercial Ascophyllum nodosum extract on Na+ and K+ content of tomato leaves tissue at 6, 24 and 72 h after treatment
The Na+ and K+ content of the leaves were analyzed at 6 h, 24 h and 72 h after
application of the treatments. There was no significant difference observed
among the six treatments sampled after 6 h. A significant increase in Na+ level
was recorded in 200 mM NaCl treated plants, although no difference was
identified between the comparable samples (200 mM NaCl, LANS- 200 mM NaCl
and ANE- 200 mM NaCl). All the treatments containing 200 mM NaCl were
significantly different at 72 h when compared with 6 h samples. As well, a
constant decrease in the concentration of Na+ was detected in control plants not
treated with NaCl, but not with ANE alone, which did not received any NaCl. The
test for fixed effects with repeated measures analysis showed significant
differences, based on treatment (p= 0.0001), time (p= 0.0696) and the interaction
of time X treatment (p= 0.0143).
The amount of K+ ion absorbed at 6 and 24 h did not show any significant
difference between the samples. However, it was significantly higher in the
samples containing ANE (ANE alone, ANE-200 mM NaCl) at 72 h. The results for
the test for fixed effects were significant for treatment (p= 0.0001), time (p=
0.0001) and time X treatment interaction (p= 0.0378).
It is clear that the NaCl treatments resulted in a higher K+/Na+ level at the
beginning which decreased as Na+ content in leaves increased after 72 h. The
ANE supplemented NaCl treatments resulted in a higher K+/ Na+ ratio at 72 h.

72
Figure 4.2.2.1: Changes in Na+ content of the leaves of four week old tomato plants determined at 6 h, 24 h and 72 h following treatments in 200 mM NaCl, with and without ANE supplementation. Each value represents the average of Na+ content from three replicates and, 2X SEM (±0.208). LANS- Long Ashton Nutrient Solution that contains inorganic ions present in the ANE.
0
1
2
3
4
5
6
7
LANS ANE LANS-200 mMNaCl
200 mM NaCl ANE-200 mMNaCl
Sodi
um io
n (m
g/g)
Dry
Wei
ght 6 h 24 h 72 h 2 X SEM
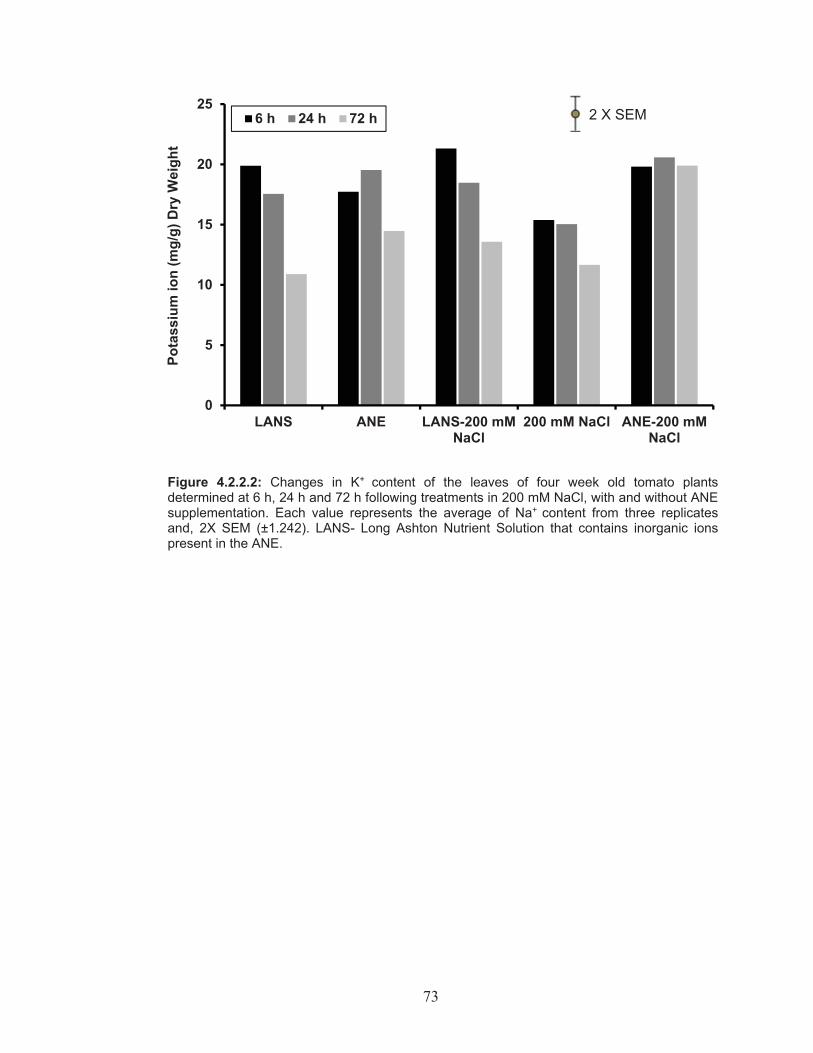
73
Figure 4.2.2.2: Changes in K+ content of the leaves of four week old tomato plants determined at 6 h, 24 h and 72 h following treatments in 200 mM NaCl, with and without ANE supplementation. Each value represents the average of Na+ content from three replicates and, 2X SEM (±1.242). LANS- Long Ashton Nutrient Solution that contains inorganic ions present in the ANE.
0
5
10
15
20
25
LANS ANE LANS-200 mMNaCl
200 mM NaCl ANE-200 mMNaCl
Pota
ssiu
m io
n (m
g/g)
Dry
Wei
ght
6 h 24 h 72 h 2 X SEM
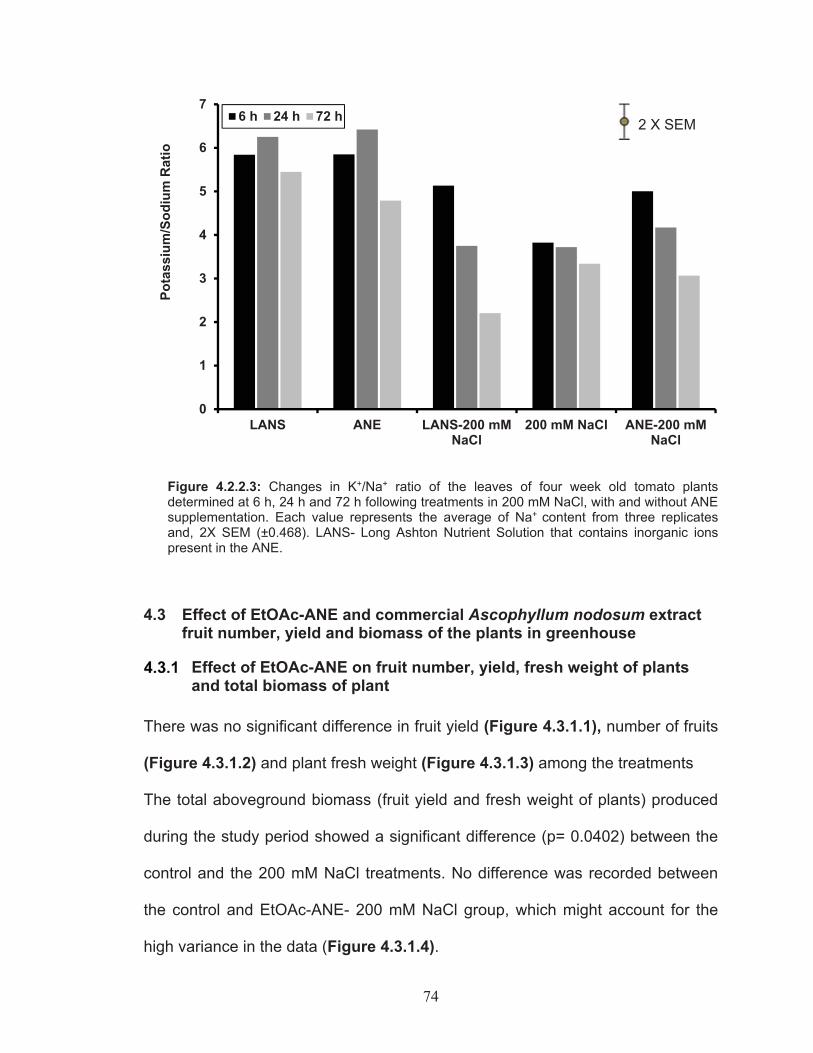
74
Figure 4.2.2.3: Changes in K+/Na+ ratio of the leaves of four week old tomato plants determined at 6 h, 24 h and 72 h following treatments in 200 mM NaCl, with and without ANE supplementation. Each value represents the average of Na+ content from three replicates and, 2X SEM (±0.468). LANS- Long Ashton Nutrient Solution that contains inorganic ions present in the ANE.
4.3 Effect of EtOAc-ANE and commercial Ascophyllum nodosum extract fruit number, yield and biomass of the plants in greenhouse
Effect of EtOAc-ANE on fruit number, yield, fresh weight of plants and total biomass of plant
There was no significant difference in fruit yield (Figure 4.3.1.1), number of fruits
(Figure 4.3.1.2) and plant fresh weight (Figure 4.3.1.3) among the treatments
The total aboveground biomass (fruit yield and fresh weight of plants) produced
during the study period showed a significant difference (p= 0.0402) between the
control and the 200 mM NaCl treatments. No difference was recorded between
the control and EtOAc-ANE- 200 mM NaCl group, which might account for the
high variance in the data (Figure 4.3.1.4).
0
1
2
3
4
5
6
7
LANS ANE LANS-200 mMNaCl
200 mM NaCl ANE-200 mMNaCl
Pota
ssiu
m/S
odiu
m R
atio
6 h 24 h 72 h 2 X SEM

75
Figure 4.3.1.1 Effect of EtOAc-ANE on fruit yield of plants determined at the end of fruiting in greenhouse condition. Each value represents the average of weights of fruits collected from three replicates, 2X SEM (±17.14). Treatment combinations of 0 mM, 200 mM with and without EtOAC-ANE supplementation were compared.
0.0
50.0
100.0
150.0
200.0
250.0
Control 200 mM NaCl EtOAC- ANE- 200 mMNaCl
Frui
t yie
ld (g
) / p
lant
2 X SEM

76
Figure 4.3.1.2 Effect of EtOAc-ANE on number of fruits produced during the study period in greenhouse condition. Each value represents the average of fruits collected from three replicates, 2X SEM (±0.894). Treatment combinations of 0 mM, 200 mM with and without EtOAC-ANE supplementation were compared.
0.0
1.0
2.0
3.0
4.0
5.0
6.0
7.0
8.0
9.0
Control 200 mM NaCl EtOAC- ANE- 200mM NaCl
Num
ber o
f fru
it/pl
ant
2 X SEM
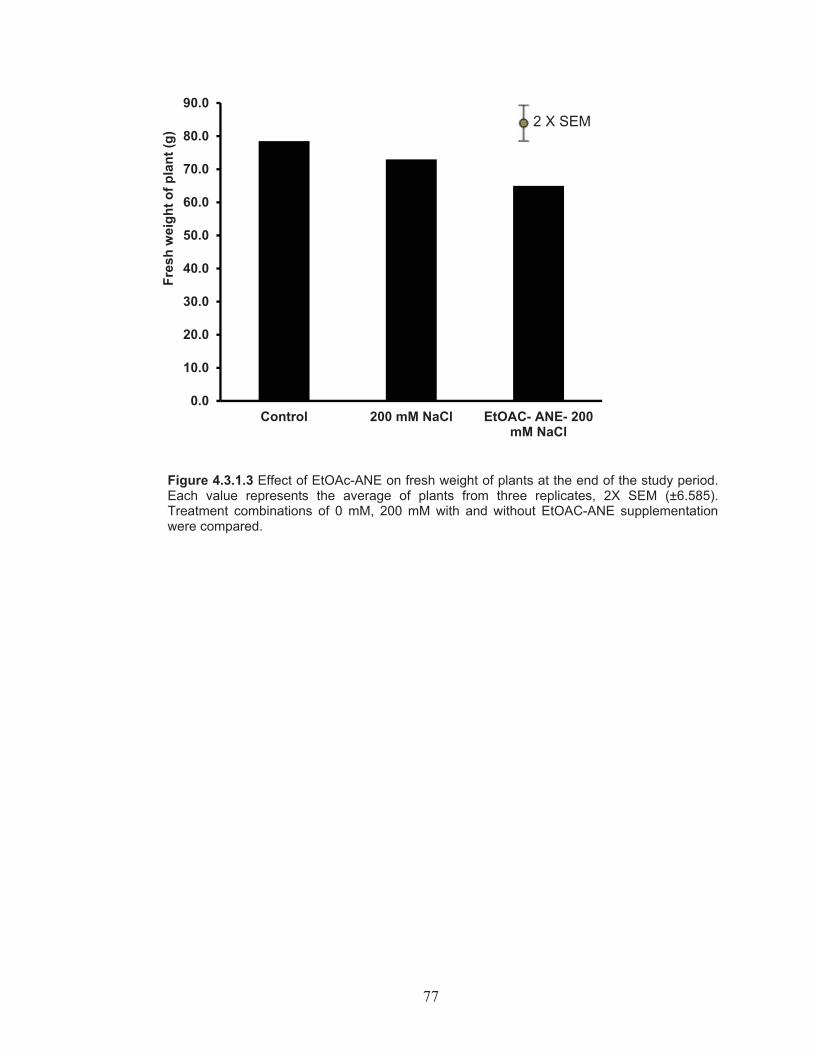
77
Figure 4.3.1.3 Effect of EtOAc-ANE on fresh weight of plants at the end of the study period. Each value represents the average of plants from three replicates, 2X SEM (±6.585). Treatment combinations of 0 mM, 200 mM with and without EtOAC-ANE supplementation were compared.
0.0
10.0
20.0
30.0
40.0
50.0
60.0
70.0
80.0
90.0
Control 200 mM NaCl EtOAC- ANE- 200mM NaCl
Fres
h w
eigh
t of p
lant
(g)
2 X SEM

78
Figure 4.3.1.4 Effect of EtOAc-ANE on total aboveground biomass produced during the study period. Each value represents the average of plants from three replicates, 2X SEM (±14.55). Treatment combinations of 0 mM, 200 mM with and without EtOAC-ANE supplementation were compared. (* = p < 0.05).
Effect of commercial Ascophyllum nodosum extract on fruit number, yield, fresh weight of plants and total biomass of plant in greenhouse
There was no significant difference recorded in the number of fresh fruits
obtained per plant. This data were also close to the number of fruits obtained in
greenhouse study using EtOAc- ANE application. LANS treatment was used as
an internal inorganic control for ANE.
Interestingly, the mean fresh weight in ANE was similar to that of the EtOAc
treatments. A significant difference in the fresh weight of the plants at the end of
the experiments was reported. Both salt treated groups (200 mM and 1 g/L ANE-
200 mM NaCl) were significantly lower from the controls.
210.0
220.0
230.0
240.0
250.0
260.0
270.0
280.0
Control 200 mM NaCl EtOAC- ANE-200 mM NaCl
Tota
l abo
vegr
ound
bio
mas
s (g
) 2 X SEM
*

79
Similarly, no significant difference was observed in the mean fruit yield among
the treatments, as seen in the previous parameters.
Figure 4.3.2.1: Effect of commercial Ascophyllum nodosum extract on number of fruits per plants determined at the end of fruiting in greenhouse condition. Each value represents the average of fruits collected from three replicates, 2X SEM (±1.87). Treatment combinations of 0 mM, 200 mM with and without ANE were compared. ANE- Ascophyllum nodosum extract, LANS- Long Ashton Nutrient Solution that contains equivalent inorganic ions present in the ANE.
0.0
1.0
2.0
3.0
4.0
5.0
6.0
7.0
8.0
9.0
10.0
LANS ANE LANS-200mM NaCl
200 mMNaCl
ANE-200 mMNaCl
Num
ber o
f fru
it/pl
ant
2 X SEM
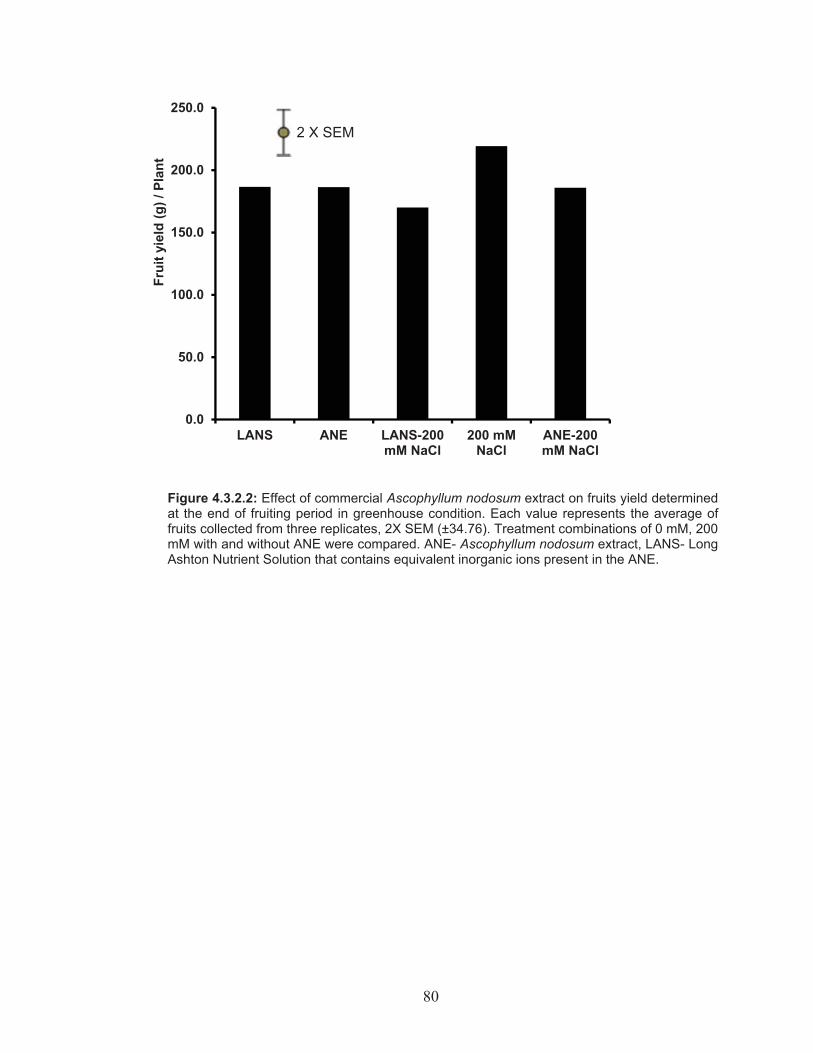
80
Figure 4.3.2.2: Effect of commercial Ascophyllum nodosum extract on fruits yield determined at the end of fruiting period in greenhouse condition. Each value represents the average of fruits collected from three replicates, 2X SEM (±34.76). Treatment combinations of 0 mM, 200 mM with and without ANE were compared. ANE- Ascophyllum nodosum extract, LANS- Long Ashton Nutrient Solution that contains equivalent inorganic ions present in the ANE.
0.0
50.0
100.0
150.0
200.0
250.0
LANS ANE LANS-200mM NaCl
200 mMNaCl
ANE-200mM NaCl
Frui
t yie
ld (g
) / P
lant
2 X SEM
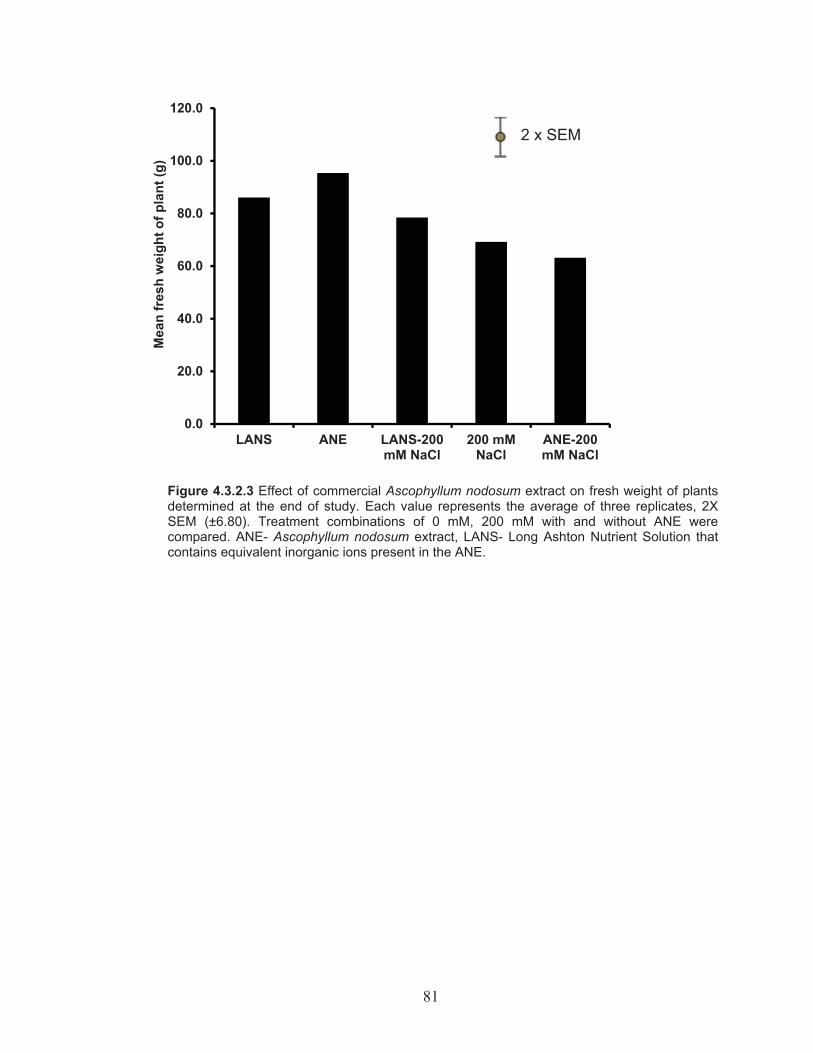
81
Figure 4.3.2.3 Effect of commercial Ascophyllum nodosum extract on fresh weight of plants determined at the end of study. Each value represents the average of three replicates, 2X SEM (±6.80). Treatment combinations of 0 mM, 200 mM with and without ANE were compared. ANE- Ascophyllum nodosum extract, LANS- Long Ashton Nutrient Solution that contains equivalent inorganic ions present in the ANE.
0.0
20.0
40.0
60.0
80.0
100.0
120.0
LANS ANE LANS-200mM NaCl
200 mMNaCl
ANE-200mM NaCl
Mea
n fr
esh
wei
ght o
f pla
nt (g
)2 x SEM
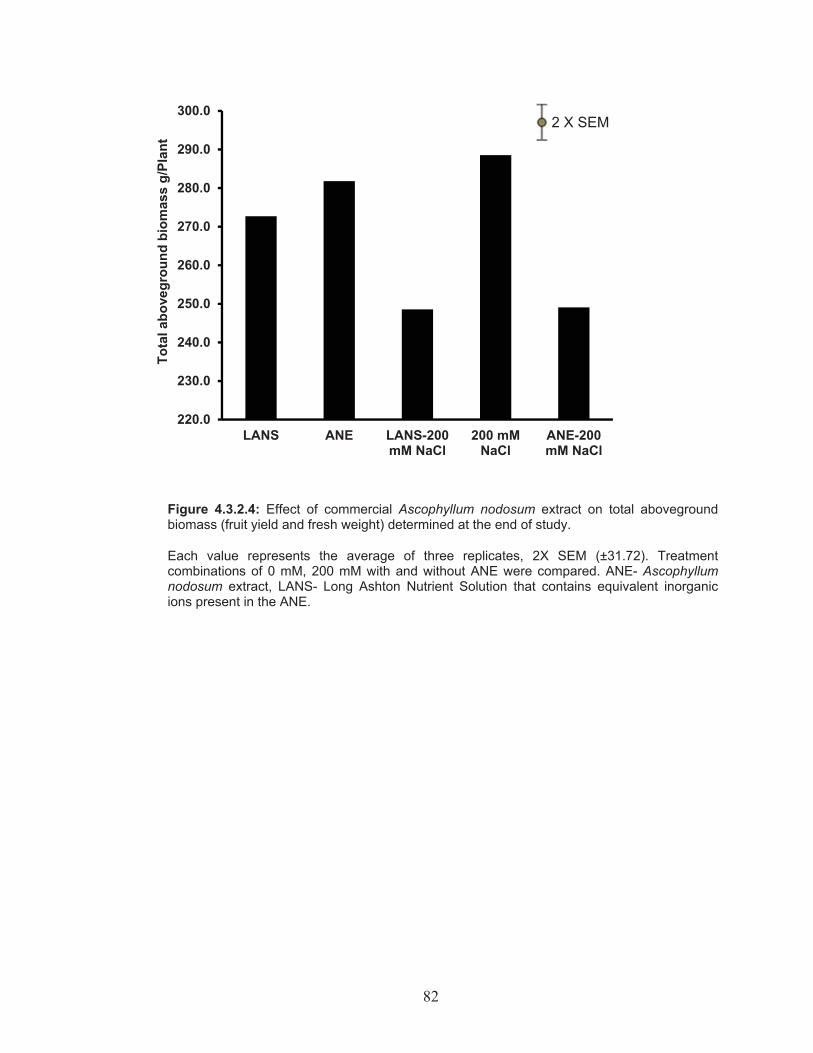
82
Figure 4.3.2.4: Effect of commercial Ascophyllum nodosum extract on total aboveground biomass (fruit yield and fresh weight) determined at the end of study.
Each value represents the average of three replicates, 2X SEM (±31.72). Treatment combinations of 0 mM, 200 mM with and without ANE were compared. ANE- Ascophyllum nodosum extract, LANS- Long Ashton Nutrient Solution that contains equivalent inorganic ions present in the ANE.
220.0
230.0
240.0
250.0
260.0
270.0
280.0
290.0
300.0
LANS ANE LANS-200mM NaCl
200 mMNaCl
ANE-200mM NaCl
Tota
l abo
vegr
ound
bio
mas
s g/
Plan
t
2 X SEM
83
CHAPTER 5 Discussion
Tomato growth is affected by salts of sodium (NaCl, Na2CO3, Na2SO4), calcium
(Ca2SO4), magnesium (MgSO4, MgCl2) and potassium (KCl) (Cuartero et al.,
2006; Foolad, 2004; Munns and Tester, 2008; Rengasamy, 2002;). NaCl is the
most common salt in saline soils and high concentrations of Na+ and Cl¯
decrease the availability of essential nutrients, such as K+, Ca2+, Mg2+ and NO3¯.
Furthermore, high soil salinity induces osmotic stress in the root zone and
reduces the ability of roots to absorb water, leading to a water deficit in the plant.
High concentrations of Na+ and Cl¯ affect biochemical processes, inhibit plant
growth, and promote early senescence. Extended exposure to high concentra-
tions of Na+ and Cl¯ leads to irreversible cellular damage. Research indicates
that sodium ion influx and efflux is related to plants’ ability to efficiently
compartmentalize and mobilize Na+ in crop plants such as wheat, rice, barley,
beans and tomato (Tester and Davenport, 2003; Apse and Blumwald, 2007).
5.1 EtOAc-ANE improved tomato plant phenotype under salinity stress invitro
Tomato plants, when supplemented with EtOAc-ANE for two weeks, displayed a
significant increase in leaf area over the non-supplemented 100 mM NaCl
treatments (Figure 4.1.1.1). Leaf area is one of the important criteria for
screening plants for tolerance to salinity (Romero-Aranda et al., 2001; Munns,
2002; Cuartero et al., 2006; Munns et al., 2006; Munns and Tester, 2008; Villalta
et al., 2008; Albacete et al., 2009). The reduction in leaf area as an effect of high
salinity (35 mM – 200 mM) on tomato plants, are similar to other studies on
84
tomatoes (Li and Stanghellini, 2001; Romero-Aranda et al., 2001; Maggio et al.,
2007) and other crop plants such as soybean (Tuncturk et al., 2011), Phaseolus
vulgaris L. (Seemann and Critchley, 1985), tree species such as olives (Kchaou
et al., 2010) and halophytes including Sesuvium portulacastrum (Wang et al.,
2012).
The reduction in plant growth rate depends on plant species, age, and duration of
stress (Munns, 2002). Tomato plants are more susceptible at a younger stage,
compared to the flowering and fruiting stages (Dumbroff and Cooper, 1974). Six-
week-old tomato plants showed an 8% decrease in total leaf area for every 10
mM NaCl exceeding 65 mM NaCl concentration (Li and Stanghellini, 2001). The
present in vitro study, with NaCl treatments, has shown an even greater
decrease of 12% with every 10 mM increase in salinity levels, which can be
explained with the young age (2 weeks) of the plants used in the present in vitro
study. A number of studies with tomatoes and other crops have used four to six
week old plants (Torrecillas et al., 1995; Maiale et al., 2004; Estañ et al., 2005;
Juan et al., 2005; Cuartero et al., 2006) and used priming with low levels of salt
concentrations (Zapata et al., 2007) before transplanting. Pre-treating plants, or
priming seedlings, helps in overcoming the sudden shock injury due to
transplants and also imparts tolerance to a number of abiotic stresses (Shannon,
1997; Foolad, 2004; Maurel et al., 2008; Qiu and Yu, 2009; Chen and Polle,
2010; Jones et al., 2012; Nair et al., 2012). The addition of NaCl reduces plant
growth rate, which remains lower than that of the unstressed (control) plants
(Munns, 2002). It has been observed that plants under salinity stress have
85
smaller and thicker (succulence) leaves. In the present study, a reduction in plant
growth rate was visible after 96 h of salinity imposition, and damage symptoms
were clearly visible within a week. Plants were extensively damaged after 14
days of salt exposure which is associated with ion toxicity caused due to
accumulation (Figure 4.1.4) of ions in the leaves and other parts of the plant
(Munns, 2005).
EtOAc-ANE supplementation in 100 mM NaCl treatements significantly increased
root length compared to 100 mM NaCl alone (Figure 4.1.1.2). Plant roots is the
first site within the plant to be impacted by osmotic changes in the soil
environment. Soil water deficit or fluctuations in the ionic profile of the root zone
are important factors controlling water movement in the plant root. Thus,
monitoring the inhibition of root growth is an important screening criteria for
tolerance to salinity (Borsani et al., 2001). Munns, (1993) reported that the extent
of root damage is comparatively less than the damage to leaf growth. The
present in vitro study reported similar findings where the reduction in root length
was only 25% (Figure 4.1.1.2) compared to the 50% reduction in leaf area when
compared to control treatments without NaCl (Figure 4.1.1.1). Several reports
which used seaweed extracts have found similar enhancement in the root growth
under abiotic stress (Zhang and Schmidt, 1999; Rayorath et al., 2008; Khan et
al., 2009; Wally et al., 2012).
5.2 EtOAc-ANE regulates enzymatic activities, metabolites and differential gene expression in tomato plants under salinity stress in vitro
Abiotic stress affects many important enzymes in plants such as catalase,
peroxidase and superoxide dismutases. These are antioxidative enzymes that

86
break down H2O2 produced in response to drought, salinity and diseases.
Therefore, these enzymes are target molecules for determining stress tolerance
and their regulation under stress which have been reviewed extensively
(Deisseroth and Dounce, 1970; Scandalios et al., 1997; Mittler et al., 1999; Dat et
al., 2000; Yang and Poovaiah, 2002; Mittova et al., 2004; Munns and Tester,
2008; Gill and Tuteja, 2010; Rai et al., 2011; Ma et al., 2013). High
concentrations of toxic ions result in oxidative stress in cells (Bohnert and
Jensen, 1996). The EtOAc-ANE supplemented 100 mM NaCl treatments
reported a 33% increase in catalase activity over the control group (100 mM
NaCl) at 96 h (Figure 4.1.2.1). Interestingly, catalase activity at 96 h was lowered
by 34% in control group (100 mM NaCl), when compared to 24 h activity within
the same group. This relative decrease in catalase activity in the control plants
(100 mM NaCl), compared to the supplemented plants (EtOAc-ANE-100 mM
NaCl), suggests that the supplementation of 100 mM NaCl with EtOAc-ANE
helped the plants to maintain higher levels of catalase activity in the leaves,
protecting from damaging effects of high salt concentration.
This study investigated the transcript abundance of some of the key genes which
are differentially regulated by salinity stress imposition in in vitro grown tomato
plants. The change in transcript abundance of the catalase gene (catalase-2)
was measured by quantitative real time PCR (Figure 4.1.5.1). A positive
correlation of transcript abundance to the enzyme activity was not found and did
not correspond to the biochemical activity shown at 24 h or 96 h of treatment
(Figure 4.1.2.1). The lower relative quantity can be attributed to the low initial

87
transcript levels in the samples. Such correlation between the transcript level and
protein activity are a center of discussion. The correlation between transcript
abundance and protein can be as low as 40% (Hargrove and Schmidt, 1989;
Vogel and Marcotte, 2012). Therefore it is possible that the transcript abundance
at 96 h post treatment might not correspond to the actual cumulative activity of
catalase enzyme (Figure 4.1.2.1). Greenbaum et al. (2003), have stated three
reasons for such poor correlation in mRNA and protein levels, which includes
complicated numerous post transcriptional modifications to form the final
functional protein, substantial difference in the in vivo half life and finally a
siginificantly large error in mapping these two different cellular mechanisms.
Ascophyllum nodosum extracts have been shown to affect the expression of a
number of stress responsive genes and activity of anti-stress enzymes (Rayorath
et al., 2008; Subramanian et al., 2011; Wally et al., 2012). The activity of
Guaiacol peroxidase was reduced in the EtOAc-ANE-100 mM NaCl treatments
(Figure 4.1.2.2). Studies have shown similar trends of reduced activity of
guaiacol peroxidase, superoxide dismutase and other ROS scavenging enzymes
in the root system of tomatoes subjected to high salinity levels (Mittova et al.,
2004). ROS damages carbohydrates, DNA, lipids and membrane systems,
leading to aberrant signaling. The degree of lipid peroxidation increased equally
in both non-treated and EtOAc-ANE supplemented samples. It is possible that
the effects of EtOAc-ANE on lipid peroxidation are not observed within the first
few days of treatment (Figure 4.1.2.4) and another but extended sampling time
point such as; seven days will give more insight about the extent of protection
88
provided by EtOAc-ANE. Interestingly, the rate at which the malondialdehyde
(MDA) level increased in control samples was significantly more than NaCl
treated plants (Figure 4.1.2.4). EtOAc-ANE supplementation of 100 mM NaCl did
not show any change in the MDA content even after 96 h.
Proline, a compatible solute, plays an important role in osmoregulation during
water and ionic stress. The effect of ANE-EtOAc on the concentration of proline
in tomato leaves was investigated. The stress alleviating effect of proline is well
documented in several studies on abiotic stress (Torrecillas et al., 1995; Bohnert
and Jensen, 1996; Zhu et al., 1997; Wei et al., 2000; Apse and Blumwald, 2002;
Munns, 2002; Ashraf, 2004; Foolad, 2004; Maiale et al., 2004; Mittova et al.,
2004; Claussen, 2005; Mahajan and Tuteja, 2005; Parida and Das, 2005;
Yamaguchi and Blumwald, 2005; Chen et al., 2009; Khan et al., 2009; Nair et al.,
2012). The present in vitro study reported 80% increase in the proline content of
treatments containing 100 mM NaCl after 96 h (Figure 4.1.2.3). The EtOAc-ANE
supplemented 100 mM NaCl treated plants accumulated 15% more proline. This
is three-fold less than reported by Rayorath et al. (2008), where studies with
freezing tolerance using similar extracts on Arabidopsis recorded a 50% increase
in proline content after 24 h at -2 ºC. This research has obtained similar results to
those reported in the previously described studies. However, the transcript
abundance of tompro-2 gene, which codes for 1-pyrroline-5-carboxylate
synthetase was low and a correlation could not be established for the bio-
chemical abundance at 96 h after treatment.
89
Salinity stress affects most of the physiological process in plants. Chlorophyll
content is one of these important factors. This study estimated the chlorophyll
content of salinized plants with similar findings (decrease in treatments without
EtOAc-ANE supplementation), as reported by others (Longstreth et al., 1984;
Romero-Aranda et al., 2001; Ghanem et al., 2008; Tavakkoli et al., 2010;
Tavakkoli et al., 2011). Chlorophyll a (Figure 4.1.3.1), chlorophyll b (Figure
4.1.3.2) and carotenoids were investigated to analyze the underlying
mechanisms involved in the rise of chlorophyll levels. Under stress, the
degradation of chlorophyll occurs faster than its synthesis. This study reports
similar trends in chlorophyll degradation pathways as depicted by Hörtensteiner
(2006). An expected increase in chlorophyll a concentration at 24 h post 100 mM
NaCl treatments (Figure 4.1.3.1) was due to chlorophyll b degradation (Figure
4.1.3.2) (chlorophyll b degrades to chlorophyll a); conversely chlorophyll b, if
degraded, was converted to chlorophyll a. A significant decrease of chlorophyll a
after 96 h was observed in plants that did not receive EtOAc-ANE
supplementation. Thus, EtOAc-ANE treatments provide significant protection
against degradation as no significant changes were observed from 24 h to 96 h
after treatment.
The positive effects of Ascophyllum nodosum extracts on chlorophyll have been
well documented in recent studies (Khan et al., 2009; Khan et al., 2011; Wally et
al., 2012; Weeraddana, 2012). A similar chlorophyll a/b ratio of (6-7:1) (Figure
4.1.3.3) was also observed in this study. This was slightly higher than was
reported by (Hendry et al., 1987) which is 4-5:1.
90
5.3 EtOAc-ANE treatment significantly decreased sodium accumulation in tomato plants under salinity stress in vitro
Sodium competes with potassium for binding sites and hampers metabolism by
inactivating enzymes and essential cellular functions. Thus, crop growth in salt
stress results in injury due to high Na+ and low K+ concentrations (Munns and
Tester, 2008; Tester and Davenport, 2003). Physiological and biochemical
changes occur due to the absorption of toxic levels of sodium, the effects of
which have been reviewed extensively (Bernstein, 1975; Shannon, 1997;
Shannon and Grieve, 1998; Munns, 2002; Zhu, 2003; Mansour and Salama,
2004; Parida and Das, 2005; Munns and Tester, 2008; Kronzucker and Britto,
2011; Bazihizina et al., 2012; Shahbaz et al., 2012). Cultivated crops are affected
to varying degrees by salt stress. This study also reports a decrease in plant
growth attributes under salinity stress (Figure 4.1.1.1; Figure 4.1.1.2) suggesting
that there are negative effects associated with the accumulation of sodium and
the time of exposure to salinity. Several studies have reported that genetic
transformation (Zhang and Blumwald, 2001; Ouyang et al., 2007; Olias et al.,
2009; Belver et al., 2012; Huertas et al., 2012), grafting and rootstock mediation
(Estan et al., 2005; Albacete et al., 2009; Asins et al., 2010; Ghanem et al., 2011)
can alter the sodium acquisition process, providing tolerance to the plant. A wide
range of tomato breeding programs have developed salinity tolerant varieties,
focused on pyramiding tolerant traits.
EtoAC-ANE treated plants accumulated significantly less Na+ 14 days post
treatment (Figure 4.1.4), as evidenced by the increase in leaf area and root
length (Figure 4.1.1.1; Figure 4.1.1.2). The mechanism of entry of ions (mostly,
91
K+ and Na+) into the root space, xylem loading and unloading, overall sodium ion
distribution and its compartmentalization in the plant system, have been studied
extensively (Niu et al., 1995; Horie and Schroeder, 2004; Cuin and Shabala,
2006; Munns and Tester, 2008; Shabala and Cuin, 2008; Zhang et al., 2009;
Craig Plett and Moller, 2010; Hauser and Horie, 2010; Kronzucker and Britto,
2011; Hedrich, 2012). Ions in solution, such as Na+ and K+, are hydrated, which
prevents easy movement across the hydrophobic lipid bilayer of membranes.
Thus, transport proteins are important for ionic fluxes which is guided by the
electrical gradient and membrane potential across the membranes. High
extracellular Na+ concentration increases the electrochemical gradient at the
membrane and thus, favors passive transport. However, interpreting the effect of
EtOAc-ANE is difficult as currently there is little evidence on the direct
involvement of a specific class of molecules in the regulation of ion selectivity in
plants. Recent experiments with ANE suggest that the chemical components of
Ascophyllum nodosum extract elicited endogenous biosynthesis of plant
hormones (Rayorath et al., 2007; Rayorath et al., 2008; Wally et al., 2012). The
presence of NaCl in the growth medium induces ABA in plant systems
(Mulholland et al., 2003). Although, hormonal analyses of the plants were not
performed, the present research suggests involvement of such plant stress
hormones. This present experiment suggests that the induction of stress
hormones such as ABA by the application of EtOAc-ANE might have regulated
stomatal conductance and thereby, the transpirational pull, which largely
contributes to the absorption of water and thus, nutrients and other ions.

92
5.4 Commercial Ascophyllum nodosum extract (ANE) showed complex interaction with NaCl and altered K+/Na+ ratio in leaves in the greenhouse
The commercial Ascophyllum nodosum extract (ANE) (Acadian, Acadian
Seaplants Ltd.) (Section 3.4) was used in greenhouse studies on 4 week old
tomato plants. Similar and comparable decreases in the leaf area, root length
and root surface area were recorded with an increase in salinity from 100 mM to
200 mM NaCl. However, positive effects of ANE on leaf area and root length
(Figure 4.2.1.1; 4.2.1.2; 4.2.1.3), in contrast to those seen in EtOAc-ANE
supplemented in vitro experiments (Figure 4.1.1.1; 4.1.1.2), could not be
obtained under greenhouse conditions. Commercial ANE has high ionic
(potassium ~ 5%) concentrations which could have increased the threshold
levels of sodium absorption, as discussed previously (Section 5.3). A definite
linear decrease in plant growth parameters suggested that NaCl had a growth
retarding effect in spite of increased applications of ANE. The present
greenhouse study detected the interaction of ANE with NaCl and no linear
increase in leaf area was recorded, with increasing concentrations of ANE,
without NaCl (Figure 4.2.1.1.). The Ascophyllum nodosum extracts (ANE) have
been used for centuries to alleviate stress periods in plants (Blunden et al., 1985;
Hurtado et al., 2009; Subramanian, 2008; Khan et al., 2009; Rayirath, 2009;
Craigie, 2011; Fan, 2010; Subramanian et al., 2011; Nair et al., 2012; Wally et
al., 2012). The presence of a diverse group of organic compounds in seaweed
extracts, and their interactions, have been correlated to such stress tolerance

93
(Blunden et al., 1985; Craigie et al., 2008; MacKinnon et al., 2009; Craigie,
2011).
The leaf tissues were sampled at different time intervals (6 h, 24 h, and 72 h)
from the plants grown in the greenhouse. The samples were analyzed for
presence of Na+ and K+. The results obtained in this greenhouse experiment are
unique as there was no decrease in the concentration of Na+ in the leaves of
plants from 6 h – 72 h, when only ANE was applied as treatment (Figure
4.2.2.1). It is suggested that the leaf expansion of these plants containing ANE,
was halted, or slowed significantly (Figure 4.2.2.1). This observation was similar
to the treatment group containing 200 mM NaCl. In plants containing LANS as a
treatment, a consistent decrease in the Na+ content was recorded because of the
plants’ continuous growth, which diluted the ion concentration per gram dry
weight. The supplementation of plants with ANE and LANS, with 200 mM NaCl,
made it difficult for plants to respond to ionic changes, as both treatments (ANE
and LANS) contained higher potassium (~5%), due to the alkaline nature of the
commercial product used. Thus, the high potassium (Figure 4.2.2.2) in the
treatments containing ANE or LANS might have increased the threshold levels of
Na+ intake, and disturbed the stress signaling pathways, thereby, damaging
plants in the long run. This is because, the potassium ion is easily translocated to
different growing parts of the plant, leading to an unbalanced cellular ionic state.
This would eventually lead to cellular damage. Interestingly, the K+ content
remained at the same level for treatment containing ANE-200 mM NaCl (Figure
4.2.2.2), which points that application of ANE contributed to maintainance of high
94
K+ levels for at least 72 h post treatment. Under normal plant growth conditions, a
high cytosolic K+/Na+ was maintained, which varied from (100-200 mM K+) / (1-10
mM Na+). This study reported lower K+/Na+ ratio, the maximum of which was ~6
observed in ANE treatments and ~2.5 in LANS treatments, emphasizing that the
external concentration of NaCl used in the study was very high, with respect to
normal growing conditions.
5.5 Effects of ethyl acetate organic fraction (EtOAc-ANE) and Ascophyllum nodosum extracts (ANE) on tomato yield
Yield is an important factor in choosing a crop variety for cultivation. Most of the
research related to salinity stress aims to improve crop yield. Several
researchers have reported a decrease in yield, even at low sodium ion
concentrations (Cuartero and Fernández-Muñoz, 1998; Balibrea et al., 2000; Li
and Stanghellini, 2001; Zhang and Blumwald, 2001; Estan et al., 2005; Albacete
et al., 2009; Estan et al., 2009; Lu et al., 2010; Ghanem et al., 2011; Lovelli et al.,
2012). The yield studies were conducted in the summer months when the
greenhouses had high temperatures (30-35 °C). Interestingly, no differences
were observed in the salinized plants, which performed at par with the control
plants (Section 4.3.1; 4.3.2). A recent study (Rivero et al., 2013) revealed a
specific physiological, biochemical and molecular response in tomato plants
when triggered by the combined effects of salinity and heat. This experiment
could be summarized as the outcome of the sum of all different factors leading to
salinity tolerance. Rivero et al. (2013) reported that the accumulation of betaine
and trehalose was directly correlated to the maintenance of a high potassium to
sodium ion ratio. The present greenhouse experiment has empirical similarities to

95
long periods of high temperature stress, coupled with high salinity stress as
shown by Rivero et al. (2013).

96
CHAPTER 6 Conclusion and Summary
Soil salinity is one of the widely faced challenges in present agriculture. The
reduced productivity of crops under saline growth conditions are functions of
growth attributes such as germination, growth rate, photosynthetic efficiency and
biomass accumulation and are extensively researched in most abiotic stress
related crop studies. The application of seaweed and seaweed products has
been documented to alleviate a wide range of abiotic stresses. Ascophyllum
nodosum is used in agriculture as plant biostimulant (Craige, 2011). A. nodosum
extract (ANE), stimulates shoot growth and branching, and improves nutrient
uptake.
The findings of the present study confirmed that the supplementation of ethyl
acetate subfractions of the Ascophyllum nodosum extract significantly increased
leaf area and root length of two week old plants, grown in 100 mM NaCl, in in
vitro conditions. The application of EtOAc-ANE also reduced in-planta
concentration of Na+ in the plants. Further research will be required to establish
the molecular basis of such ion selectivity. The seedlings showed higher catalase
activity than the non supplemented 100 mM NaCl control plants. Moreover, the
supplemented samples retained significantly higher chlorophyll (chla, chlb and
carotenoids) than non-supplemented stressed plants after 96 h of exposure to
treatments. An increase of 15% in proline level was also recorded 100 mM NaCl-
EtOAc-ANE treated plants compared to the 100 mM NaCl control.
The greenhouse studies with the commercial Ascophyllum nodosum extract
(ANE) (Acadian™, Acadian Seaplants Limited, Nova Scotia, Canada) showed
97
interaction with the salt concentartions used in the study (100 mM and 200 mM
NaCl). The increasing NaCl concentration, irrespective of the concentartion of
ANE used, showed significant linear decrease in the plant phenotypic characters
(leaf area, root length, root area, fresh weight) studied. Also, no increase in the
such charactersistics were recorded when only ANE was applied which confirms
that the ionic composition of ANE were not sufficient to produce any phentotypic
changes but significantly affected the ionic balance of Na+ and K+. The ANE
treated plants were able to maintain higher K+ content at all the sampling time
points. The older leaves showed faster yellowing (loss of chlorophyll) than non
ANE treated leaves possibly as an after effect of accumulation of higher Na+
content.
The greenhouse studies conducted to study the affect of EtOAc-ANE and
Acadian™ on fruit number, yield and plant biomass, did not show any significant
diffecrence. The experiment was conducted in the summer months when the
greenhouses had high temperatures (30-35 °C). This greenhouse study was
similar to a recent research (Rivero et al., 2013) which revealed tomato plants
when triggered by the combined effects of salinity and heat, were able to perform
as par as control plants.
98
REFERENCES
Ahmad, P., Jaleel, C. A., Salem, M. A., Nabi, G., Sharma, S. 2010. Roles of enzymatic and nonenzymatic antioxidants in plants during abiotic stress. Crit. Rev. Biotechnol. 30(3): 161-175.
Ahmad, P., Sarwat, M., Sharma, S. 2008. Reactive oxygen species, antioxidants and signaling in plants. Journal of Plant Biology 51(3): 167-173.
Albacete, A., Martínez Andújar, C., Ghanem, M. E., Acosta, M., Sánchez Bravo, J., Asins, M. J., Cuartero, J., Lutts, S., Dodd, I. C., Pérez Alfocea, F. 2009. Rootstock mediated changes in xylem ionic and hormonal status are correlated with delayed leaf senescence, and increased leaf area and crop productivity in salinized tomato. Plant, Cell Environ. 32(7): 928-938.
Amtmann, A. and Sanders, D. 1998. Mechanisms of Na+ uptake by plant cells. Adv. Bot. Res. 29: 75-112.
Apse, M. P. and Blumwald, E. 2002. Engineering salt tolerance in plants. Curr. Opin. Biotechnol. 13(2): 146-150.
Apse, M. P., Aharon, G. S., Snedden, W. A., Blumwald, E. 1999. Salt tolerance conferred by over-expression of a vacuolar Na /H antiport in Arabidopsis. Science 285(5431): 1256-1258.
Asada, K. 1992. Ascorbate peroxidase–a hydrogen peroxide scavenging enzyme in plants. Physiol. Plantarum 85(2): 235-241.
Ashraf, M. 2009. Biotechnological approach of improving plant salt tolerance using antioxidants as markers. Biotechnol. Adv. 27(1): 84-93.
Ashraf, M. 2004. Some important physiological selection criteria for salt tolerance in plants. Flora-Morphology, Distribution, Functional Ecology of Plants 199(5): 361-376.
Asins, M., Bolarín, M., Pérez-Alfocea, F., Estan, M., Martínez-Andújar, C., Albacete, A., Villalta, I., Bernet, G., Dodd, I. C., Carbonell, E. 2010. Genetic analysis of physiological components of salt tolerance conferred by solanum rootstocks. What is the rootstock doing for the scion? Theor. Appl. Genet. 121(1): 105-115.
Aubert, S., Hennion, F., Bouchereau, A., Gout, E., Bligny, R., Dorne, A. 1999. Subcellular compartmentation of proline in the leaves of the subantarctic kerguelen cabbage Pringlea antiscorbutica R. br. in vivo 13C NMR study. Plant, Cell Environ. 22(3): 255-259.

99
Ayers, A. D., Brown, J., Wadleigh, C. 1952. Salt tolerance of barley and wheat in soil plots receiving several salinization regimes. Agron. J. 44(6): 307-310.
Balibrea, M. E., Dell'Amico, J., Bolarín, M. C., Pérez Alfocea, F. 2000. Carbon partitioning and sucrose metabolism in tomato plants growing under salinity. Physiol. Plantarum 110(4): 503-511.
Bazihizina, N., Barrett-Lennard, E. G., Colmer, T. D. 2012. Plant growth and physiology under heterogeneous salinity. Plant Soil 354(1-2): 1-19.
Belver, A., Olías, R., Huertas, R., Rodríguez-Rosales, M. P. 2012. Involvement of SlSOS2 in tomato salt tolerance. Bioengineered 3(5): 298-302.
Bernstein, L. 1975. Effects of salinity and sodicity on plant growth. Annu. Rev. Phytopathol. 13(1): 295-312.
Blumwald, E., Aharon, G. S., Apse, M. P. 2000. Sodium transport in plant cells. Biochimica Et Biophysica Acta (BBA)-Biomembranes 1465(1): 140-151.
Blunden, G., Gordon, S. M., Smith, B. E., Fletcher, R. L. 1985. Quaternary ammonium compounds in species of the fucaceae (phaeophyceae) from Britain. British Phycological Journal 20(2): 105-108.
Bohnert, H. J. and Jensen, R. G. 1996. Strategies for engineering water-stress tolerance in plants. Trends Biotechnol. 14(3): 89-97.
Borsani, O., Cuartero, J., Fernández, J. A., Valpuesta, V., Botella, M. A. 2001. Identification of two loci in tomato reveals distinct mechanisms for salt tolerance. The Plant Cell Online 13(4): 873-887.
Bradford, M. M. 1976. A rapid and sensitive method for the quantitation of microgram quantities of protein utilizing the principle of protein-dye binding. Anal. Biochem. 72(1): 248-254.
Brady, N. C. and Weil, R. R. 2010. Elements of the nature and properties of soils. Pearson Educational International. Upper Saddle River, NJ
Bruns, S. and Hecht-Buchholz, C. 1990. Light and electron microscope studies on the leaves of several potato cultivars after application of salt at various development stages. Potato Res. 33(1): 33-41.
Bui, E. 2013. Soil salinity: A neglected factor in plant ecology and biogeography. J. Arid Environ. 92: 14-25.
Cantore, V., Boari, F. and Pace, B. 2005. Salinity effects on tomato. XV meeting of the EUCARPIA tomato working group 789.
100
Chen, G. and Asada, K. 1989. Ascorbate peroxidase in tea leaves: Occurrence of two isozymes and the differences in their enzymatic and molecular properties. Plant and Cell Physiology 30(7): 987-998.
Chen, S. and Polle, A. 2010. Salinity tolerance of populus. Plant Biology 12(2): 317-333.
Chen, S., Gollop, N., Heuer, B. 2009. Proteomic analysis of salt-stressed tomato (Solanum lycopersicum) seedlings: Effect of genotype and exogenous application of glycinebetaine. J. Exp. Bot. 60(7): 2005-2019.
Chomczynski, P. and Sacchi, N. 1987. Single-step method of RNA isolation by acid guanidinium thiocyanate-phenol-chloroform extraction. Anal. Biochem. 162(1): 156-159.
Christmann, A., Weiler, E. W., Steudle, E., Grill, E. 2007. A hydraulic signal in root to shoot signaling of water shortage. The Plant Journal 52(1): 167-174.
Claussen, W. 2005. Proline as a measure of stress in tomato plants. Plant Science 168(1): 241-248.
Craig Plett, D. and Møller, I. S. 2010. Na transport in glycophytic plants: What we know and would like to know. Plant, Cell Environ. 33(4): 612-626.
Craigie, J. S. 2011. Seaweed extract stimuli in plant science and agriculture. J. Appl. Phycol. 23(3): 371-393.
Craigie, J. S., MacKinnon, S. L., Walter, J. A. 2008. Liquid seaweed extracts identified using 1H NMR profiles. J. Appl. Phycol. 20(5): 665-671.
Cram, W. 1983. Chloride accumulation as a homeostatic system: Set points and perturbations the physiological significance of influx isotherms, temperature effects and the influence of plant growth substances. J. Exp. Bot. 34(11): 1484-1502.
Crouch, I., Beckett, R., Van Staden, J. 1990. Effect of seaweed concentrate on the growth and mineral nutrition of nutrient-stressed lettuce. J. Appl. Phycol. 2(3): 269-272.
Cuartero, J. and Fernández-Muñoz, R. 1998. Tomato and salinity. Scientia Horticulturae 78(1): 83-125.
Cuartero, J., Bolarin, M., Asins, M., Moreno, V. 2006. Increasing salt tolerance in the tomato. J. Exp. Bot. 57(5): 1045-1058.

101
Cuin, T. A. and Shabala, S. 2006. Potassium homeostasis in salinized plant tissues. Pages 287-317 in: Plant electrophysiology. Springer Berlin Heidelberg.
Dat, J., Vandenabeele, S., Vranova, E., Van Montagu, M., Inzé, D., Van Breusegem, F. 2000. Dual action of the active oxygen species during plant stress responses. Cellular and Molecular Life Sciences CMLS 57(5): 779-795.
De Bruxelles, G., Peacock, W. J., Dennis, E. S., Dolferus, R. 1996. Abscisic acid induces the alcohol dehydrogenase gene in Arabidopsis. Plant Physiol. 111(2): 381-391.
Deckert, R. and Garbary, D. 2005. Ascophyllum and its symbionts. VI. Microscopic characterization of the Ascophyllum nodosum (phaeophyceae), Mycophycias ascophylli (ascomycetes) symbiotum. Algae-Inchon- 20(3): 225.
Deisseroth, A. and Dounce, A. 1970. Catalase: Physical and chemical properties, mechanism of catalysis, and physiological role. Physiol. Rev. 50(3): 319-375.
Dietz, K., Tavakoli, N., Kluge, C., Mimura, T., Sharma, S., Harris, G., Chardonnens, A., Golldack, D. 2001. Significance of the V type ATPase for the adaptation to stressful growth conditions and its regulation on the molecular and biochemical level. J. Exp. Bot. 52(363): 1969-1980.
Dumbroff, E. and Cooper, A. 1974. Effects of salt stress applied in balanced nutrient solutions at several stages during growth of tomato. Botanical Gazette: 219-224.
Epstein, E. 1966. Dual pattern of ion absorption by plant cells and by plants. .
Estañ, M. T., Martinez-Rodriguez, M. M., Perez-Alfocea, F., Flowers, T. J., Bolarin, M. C. 2005. Grafting raises the salt tolerance of tomato through limiting the transport of sodium and chloride to the shoot. J. Exp. Bot. 56(412): 703-712.
Estañ, M., Villalta, I., Bolarín, M., Carbonell, E., Asins, M. 2009. Identification of fruit yield loci controlling the salt tolerance conferred by solanum rootstocks. Theor. Appl. Genet. 118(2): 305-312.
Fan, D. 2010. Ascophyllum nodosum extracts improve shelf life and nutritional quality of spinach (spinacia oleracea L.). http://dalspace.library.dal.ca/handle/10222/13120
102
Fike, J., Allen, V., Schmidt, R., Zhang, X., Fontenot, J., Bagley, C., Ivy, R., Evans, R., Coelho, R., Wester, D. 2001. Tasco-forage: I. influence of a seaweed extract on antioxidant activity in tall fescue and in ruminants. J. Anim. Sci. 79(4): 1011-1021.
Flowers, T. and Yeo, A. 1995. Breeding for salinity resistance in crop plants: Where next? Functional Plant Biology 22(6): 875-884.
Flowers, T. and Dalmond, D. 1992. Protein synthesis in halophytes: The influence of potassium, sodium and magnesium in vitro. Plant Soil 146(1-2): 153-161.
Flowers, T. J. 2004. Improving crop salt tolerance. J. Exp. Bot. 55(396): 307-319.
Foolad, M. 2004. Recent advances in genetics of salt tolerance in tomato. Plant Cell, Tissue and Organ Culture 76(2): 101-119.
Ford, C. W. 1984. Accumulation of low molecular weight solutes in water-stressed tropical legumes. Phytochemistry 23(5): 1007-1015.
Fricke, W., Akhiyarova, G., Veselov, D., Kudoyarova, G. 2004. Rapid and tissue specific changes in ABA and in growth rate in response to salinity in barley leaves. J. Exp. Bot. 55(399): 1115-1123.
Fricke, W., Akhiyarova, G., Wei, W., Alexandersson, E., Miller, A., Kjellbom, P. O., Richardson, A., Wojciechowski, T., Schreiber, L., Veselov, D. 2006. The short-term growth response to salt of the developing barley leaf. J. Exp. Bot. 57(5): 1079-1095.
Fujita, T., Maggio, A., Garcia-Rios, M., Bressan, R. A., Csonka, L. N. 1998. Environmental and stress physiology-comparative analysis of the regulation of expression and structures of two evolutionarily divergent genes for D1-pyrroline-5-carboxylate synthetase from tomato. Plant Physiol. 118(2): 661-674.
Garbary, D. and Deckert, R. 2004. Three part harmony—Ascophyllum and its symbionts. Pages 309-321 in: Symbiosis. Springer Netherlands.
Garciadeblas, B., Senn, M. E., Banuelos, M. A., Rodríguez Navarro, A. 2003. Sodium transport and HKT transporters: The rice model. The Plant Journal 34(6): 788-801.
Garbary, D. and Gautam, A. 1989. The Ascophyllum, polysiphonia, mycosphaerella symbiosis. I. population ecology of Mycosphaerella from Nova Scotia. Bot. Mar. 32(2): 181-186.

103
Garg, A. K., Kim, J. K., Owens, T. G., Ranwala, A. P., Choi, Y. D., Kochian, L. V., Wu, R. J. 2002. Trehalose accumulation in rice plants confers high tolerance levels to different abiotic stresses. Proc. Natl. Acad. Sci. U. S. A. 99(25): 15898-15903.
Ghanem, M. E., Albacete, A., Martínez-Andújar, C., Acosta, M., Romero-Aranda, R., Dodd, I. C., Lutts, S., Pérez-Alfocea, F. 2008. Hormonal changes during salinity-induced leaf senescence in tomato (Solanum lycopersicum L.). J. Exp. Bot. 59(11): 3039-3050.
Ghanem, M. E., Albacete, A., Smigocki, A. C., Frébort, I., Pospíšilová, H., Martínez-Andújar, C., Acosta, M., Sánchez-Bravo, J., Lutts, S., Dodd, I. C. 2011. Root-synthesized cytokinins improve shoot growth and fruit yield in salinized tomato (Solanum lycopersicum L.) plants. J. Exp. Bot. 62(1): 125-140.
Ghassemi, F., Jakeman, A.J., and Nix, H.A. 1995. Stalinization of Land and Water Resources. University of New South Wales Press Ltd, Canberra, Australia.
Gill, S. S. and Tuteja, N. 2010. Reactive oxygen species and antioxidant machinery in abiotic stress tolerance in crop plants. Plant Physiology and Biochemistry 48(12): 909-930.
Ginzberg, I., Stein, H., Kapulnik, Y., Szabados, L., Strizhov, N., Schell, J., Koncz, C., Zilberstein, A. 1998. Isolation and characterization of two different cDNAs of 1-pyrroline-5-carboxylate synthase in Alfalfa, transcriptionally induced upon salt stress. Plant Mol. Biol. 38(5): 755-764.
Glenn, E. P., Brown, J. J., Blumwald, E. 1999. Salt tolerance and crop potential of halophytes. Crit. Rev. Plant Sci. 18(2): 227-255.
Gómez Cadenas, A., Tadeo, F., Primo Millo, E., Talon, M. 1998. Involvement of abscisic acid and ethylene in the responses of citrus seedlings to salt shock. Physiol. Plantarum 103(4): 475-484.
Gómez-Cadenas, A., Arbona, V., Jacas, J., Primo-Millo, E., Talon, M. 2002. Abscisic acid reduces leaf abscission and increases salt tolerance in citrus plants. J. Plant Growth Regul. 21(3): 234-240.
Greenbaum, D., Colangelo, C., Williams, K., Gerstein, M. 2003. Comparing protein abundance and mRNA expression levels on a genomic scale. Genome Biol. 4(9): 117.
Greenway, H. and Munns, R. 1980. Mechanisms of salt tolerance in nonhalophytes. Annual Review of Plant Physiology 31(1): 149-190.

104
Haberern, J. 1992. A soil health index. J. Soil Water Conserv. 47(1): 6.
Halliwell, B. and Gutteridge, J. 1985. Free Radicals in Biology and Medicine. Clarendon Press (Oxford and New York).
Hargrove, J. L. and Schmidt, F. H. 1989. The role of mRNA and protein stability in gene expression. The FASEB Journal 3(12): 2360-2370.
Hasegawa, M., Bressan, R., Pardo, J. M. 2000. The dawn of plant salt tolerance genetics. Trends Plant Sci. 5(8): 317-319.
Hauser, F. and Horie, T. 2010. A conserved primary salt tolerance mechanism mediated by HKT transporters: A mechanism for sodium exclusion and maintenance of high K /Na ratio in leaves during salinity stress. Plant, Cell Environ. 33(4): 552-565.
Hawkins, H. and Lewis, O. 1993. Combination effect of NaCl salinity, nitrogen form and calcium concentration on the growth, ionic content and gaseous exchange properties of Triticum aestivum L. cv. gamtoos. New Phytol. 124(1): 161-170.
Hayashi, H., Mustardy, L., Deshnium, P., Ida, M., Murata, N. 1997. Transformation of Arabidopsis thaliana with the codA gene for choline oxidase; accumulation of glycinebetaine and enhanced tolerance to salt and cold stress. The Plant Journal 12(1): 133-142.
Hedrich, R. 2012. Ion channels in plants. Physiol. Rev. 92(4): 1777-1811.
Hernandez, J., Campillo, A., Jimenez, A., Alarcon, J., Sevilla, F. 1999. Response of antioxidant systems and leaf water relations to NaCl stress in pea plants. New Phytol. 141(2): 241-251.
Hernandez, J., Campillo, A., Jimenez, A., Alarcon, J., Sevilla, F. 1999. Response of antioxidant systems and leaf water relations to NaCl stress in pea plants. New Phytol. 141(2): 241-251.
Hendry, G. A., Houghton, J. D., Brown, S. B. 1987. Tansley review no. 11. The degradation of chlorophyll-a biological enigma. New Phytol. : 255-302.
Hiscox, J. and Israelstam, G. 1979. A method for the extraction of chlorophyll from leaf tissue without maceration. Canadian Journal of Botany 57(12): 1332-1334.
Horie, T. and Schroeder, J. I. 2004. Sodium transporters in plants. Diverse genes and physiological functions. Plant Physiol. 136(1): 2457-2462.

105
Hörtensteiner, S. 2006. Chlorophyll degradation during senescence. Annu.Rev.Plant Biol. 57: 55-77.
Huertas, R., Olias, R., Eljakaoui, Z., Gálvez, F. J., Li, J., De Morales, P. A., Belver, A., Rodríguez Rosales, M. P. 2012. Overexpression of SlSOS2 (SlCIPK24) confers salt tolerance to transgenic tomato. Plant, Cell Environ. 35(8): 1467-1482.
Hurtado, A. Q., Yunque, D. A., Tibubos, K., Critchley, A. T. 2009. Use of Acadian marine plant extract powder from Ascophyllum nodosum in tissue culture of kappaphycus varieties. J. Appl. Phycol. 21(6): 633-639.
Iyengar, E. and Reddy, M. 1996. Photosynthesis in highly salt tolerant plants. Handbook of Photosynthesis. Marshal Dekar, Baten Rose, USA 909.
John, J. A and Williams, E. R. 1995. Cyclic and Computer Generated Designs, 2nd Edition, Chapman & Hall, 2-6 Boundary Row, London SE1 8HN, UK
Johnson, M. K., Johnson, E. J., MacElroy, R. D., Speer, H. L., Bruff, B. S. 1968. Effects of salts on the halophilic alga dunaliella viridis. J. Bacteriol. 95(4): 1461-1468.
Jones, D. L., Hodge, A., Kuzyakov, Y. 2004. Plant and mycorrhizal regulation of rhizodeposition. New Phytol. 163(3): 459-480.
Juan, M., Rivero, R. M., Romero, L., Ruiz, J. M. 2005. Evaluation of some nutritional and biochemical indicators in selecting salt-resistant tomato cultivars. Environ. Exp. Bot. 54(3): 193-201.
Kchaou, H., Larbi, A., Gargouri, K., Chaieb, M., Morales, F., Msallem, M. 2010. Assessment of tolerance to NaCl salinity of five olive cultivars, based on growth characteristics and Na+ and Cl¯ exclusion mechanisms. Scientia Horticulturae 124(3): 306-315.
Kerepesi, I. and Galiba, G. 2000. Osmotic and salt stress-induced alteration in soluble carbohydrate content in wheat seedlings. Crop Sci. 40(2): 482-487.
Keser, M., Swenarton, J. T., Foertch, J. F. 2005. Effects of thermal input and climate change on growth of Ascophyllum nodosum (fucales, phaeophyceae) in eastern long island sound (USA). J. Sea Res. 54(3): 211-220.
Khan, M. A., Ungar, I. A., Showalter, A. M. 1999. Effects of salinity on growth, ion content and osmotic relations in Halopyrum mucronatum (L.) stapf. J. Plant Nutr. 22(1): 191-204.
106
Khan, M. A., Ungar, I. A., Showalter, A. M. 2000. Effects of salinity on growth, water relations and ion accumulation of the subtropical perennial halophyte, Atriplex griffithii var. stocksii. Annals of Botany 85(2): 225-232.
Khan, W., Hiltz, D., Critchley, A. T., Prithiviraj, B. 2011. Bioassay to detect Ascophyllum nodosum extract-induced cytokinin-like activity in Arabidopsis thaliana. J. Appl. Phycol. 23(3): 409-414.
Khan, W., Rayirath, U. P., Subramanian, S., Jithesh, M. N., Rayorath, P., Hodges, D. M., Critchley, A. T., Craigie, J. S., Norrie, J., Prithiviraj, B. 2009. Seaweed extracts as biostimulants of plant growth and development. J. Plant Growth Regul. 28(4): 386-399.
Khatkar, D. and Kuhad, M. 2000. Short-term salinity induced changes in two wheat cultivars at different growth stages. Biol. Plant. 43(4): 629-632.
Khavari-Nejad, R. and Mostofi, Y. 1998. Effects of NaCl on photosynthetic pigments, saccharides, and chloroplast ultrastructure in leaves of tomato cultivars. Photosynthetica 35(1): 151-154.
Kim, T. H., Bohmer, M., Hu, H., Nishimura, N., Schroeder, J. I. 2010. Guard cell signal transduction network: Advances in understanding abscisic acid, CO2, and Ca2+ signaling. Annu. Rev. Plant. Biol. 61: 561-591.
Kochian, L. V. and Lucas, W. J. 2014. Plant mineral nutrient sensing and signaling. Journal of Integrative Plant Biology 56(3): 190-191.
Kohlmeyer, J. and Kohlmeyer, E. 1972. Is Ascophyllum nodosum lichenized? Bot. Mar. 15(2): 109-112.
Kronzucker, H. J. and Britto, D. T. 2011. Sodium transport in plants: A critical review. New Phytol. 189(1): 54-81.
Kurban, H., Saneoka, H., Nehira, K., Adilla, R., Premachandra, G. S., Fujita, K. 1999. Effect of salinity on growth, photosynthesis and mineral composition in leguminous plant Alhagi pseudoalhagi (bieb.). Soil Sci. Plant Nutr. 45(4): 851-862.
Li, Y. L. and Stanghellini, C. 2001. Analysis of the effect of EC and potential transpiration on vegetative growth of tomato. Scientia Horticulturae 89(1): 9-21.
Lippert, K. and Galinski, E. A. 1992. Enzyme stabilization by ectoine-type compatible solutes: Protection against heating, freezing and drying. Appl. Microbiol. Biotechnol. 37(1): 61-65.
107
Livak, K. J. and Schmittgen, T. D. 2001. Analysis of relative gene expression data using real-time quantitative PCR and the 2 CT method. Methods 25(4): 402-408.
Longstreth, D. J. and Nobel, P. S. 1979. Salinity effects on leaf anatomy consequences for photosynthesis. Plant Physiol. 63(4): 700-703.
Longstreth, D. J., Bolaños, J. A., Smith, J. E. 1984. Salinity effects on photosynthesis and growth in Alternanthera philoxeroides (mart.) griseb. Plant Physiol. 75(4): 1044-1047.
Lovelli, S., Scopa, A., Perniola, M., Di Tommaso, T., Sofo, A. 2012. Abscisic acid root and leaf concentration in relation to biomass partitioning in salinized tomato plants. J. Plant Physiol. 169(3): 226-233.
Lu, C., Li, Y., Chen, A., Li, L., Zuo, J., Tian, H., Luo, Y., Zhu, B. 2010. LeERF1 improves tolerance to drought stress in tomato (Lycopersicon esculentum) and activates downstream stress-responsive genes. African Journal of Biotechnology 9(38): 6294-6300.
Lutts, S., Majerus, V., Kinet, J. 1999. NaCl effects on proline metabolism in rice (Oryza sativa) seedlings. Physiol. Plantarum 105(3): 450-458.
Ma, N., Zuo, Y., Liang, X., Yin, B., Wang, G., Meng, Q. 2013. The multiple stress responsive transcription factor SlNAC1 improves the chilling tolerance of tomato. Physiol. Plantarum 149(4): 474-486.
McCree, K. 1986. Whole-plant carbon balance during osmotic adjustment to drought and salinity stress. Functional Plant Biology 13(1): 33-43.
MacKinnon, S. L., Hiltz, D., Ugarte, R., Craft, C. A. 2010. Improved methods of analysis for betaines in Ascophyllum nodosum and its commercial seaweed extracts. J. Appl. Phycol. 22(4): 489-494.
McCue, K. F. and Hanson, A. D. 1992. Salt-inducible betaine aldehyde dehydrogenase from sugar beet: CDNA cloning and expression. Plant Mol. Biol. 18(1): 1-11.
Magdy, M., Mansour, F., Hasselt, P. R., Kuiper, P. J. 1994. Plasma membrane lipid alterations induced by NaCl in winter wheat roots. Physiol. Plantarum 92(3): 473-478.
Mahajan, S. and Tuteja, N. 2005. Cold, salinity and drought stresses: An overview. Arch. Biochem. Biophys. 444(2): 139-158.
108
Maiale, S., Sánchez, D. H., Guirado, A., Vidal, A., Ruiz, O. A. 2004. Spermine accumulation under salt stress. J. Plant Physiol. 161(1): 35-42.
Mansour, M. and Stadelmann, E. 1994. NaCl induced changes in protoplasmic characteristics of Hordeum vulgare cultivars differing in salt tolerance. Physiol. Plantarum 91(3): 389-394.
Mansour, M. M. F. and Salama, K. H. 2004. Cellular basis of salinity tolerance in plants. Environ. Exp. Bot. 52(2): 113-122.
Mäser, P., Eckelman, B., Vaidyanathan, R., Horie, T., Fairbairn, D. J., Kubo, M., Yamagami, M., Yamaguchi, K., Nishimura, M., Uozumi, N. 2002. Altered shoot/root Na+ distribution and bifurcating salt sensitivity in Arabidopsis by genetic disruption of the Na+ transporter AtHKT1. FEBS Lett. 531(2): 157-161.
Mattioni, C., Lacerenza, N., Troccoli, A., Leonardis, A. d., Fonzo, N. d. 1997. Water and salt stress induced alterations in proline metabolism of Triticum durum seedlings. Physiol. Plantarum 101(4): 787-792.
Maurel, C., Verdoucq, L., Luu, D., Santoni, V. 2008. Plant aquaporins: Membrane channels with multiple integrated functions. Annu.Rev.Plant Biol. 59: 595-624.
Metting, B., Zimmerman, W. J., Crouch, I., van Staden, J. 1990. Agronomic uses of seaweed and microalgae. Introduction of Applied Phycology.SPB, The Hague, 589-627.
Mishra, S. K., Subrahmanyam, D., Singhal, G. S. 1991. Interrelationship between salt and light stress on primary processes of photosynthesis. J. Plant Physiol. 138(1): 92-96.
Mitsuya, S., Takeoka, Y., Miyake, H. 2000. Effects of sodium chloride on foliar ultrastructure of sweet potato (Ipomoea batatas lam.) plantlets grown under light and dark conditions in vitro. J. Plant Physiol. 157(6): 661-667.
Mittler, R. 2002. Oxidative stress, antioxidants and stress tolerance. Trends Plant Sci. 7(9): 405-410.
Mittler, R., Herr, E. H., Orvar, B. L., Van Camp, W., Willekens, H., Inzé, D., Ellis, B. E. 1999. Transgenic tobacco plants with reduced capability to detoxify reactive oxygen intermediates are hyper-responsive to pathogen infection. Proceedings of the National Academy of Sciences 96(24): 14165-14170.
109
Mittova, V., Guy, M., Tal, M., Volokita, M. 2004. Salinity up regulates the antioxidative system in root mitochondria and peroxisomes of the wild salt tolerant tomato species Lycopersicon pennellii. J. Exp. Bot. 55(399): 1105-1113.
Mohammad, M., Shibli, R., Ajlouni, M., Nimri, L. 1998. Tomato root and shoot responses to salt stress under different levels of phosphorus nutrition. J. Plant Nutr. 21(8): 1667-1680.
Mohanty, A., Kathuria, H., Ferjani, A., Sakamoto, A., Mohanty, P., Murata, N., Tyagi, A. 2002. Transgenics of an elite indica rice variety pusa basmati 1 harbouring the codA gene are highly tolerant to salt stress. Theor. Appl. Genet. 106(1): 51-57.
Mok, D. W. and Mok, M. C. 2001. Cytokinin metabolism and action. Annual Review of Plant Biology 52(1): 89-118.
Mulholland, B. J., Taylor, I. B., Jackson, A. C., Thompson, A. J. 2003. Can ABA mediate responses of salinity stressed tomato? Environ. Exp. Bot. 50(1): 17-28.
Munns, R. 2002. Comparative physiology of salt and water stress. Plant, Cell Environ. 25(2): 239-250.
Munns, R. 1993. Physiological processes limiting plant growth in saline soils: Some dogmas and hypotheses. Plant, Cell Environ. 16(1): 15-24.
Munns, R. 2005. Genes and salt tolerance: Bringing them together. New Phytol. 167(3): 645-663.
Munns, R. and Tester, M. 2008. Mechanisms of salinity tolerance. Annu.Rev.Plant Biol. 59: 651-681.
Munns, R. and Termaat, A. 1986. Whole-plant responses to salinity. Functional Plant Biology 13(1): 143-160.
Munns, R., James, R. A., Läuchli, A. 2006. Approaches to increasing the salt tolerance of wheat and other cereals. J. Exp. Bot. 57(5): 1025-1043.
Murashige, T. and Skoog, F. 1962. A revised medium for rapid growth and bio assays with tobacco tissue cultures. Physiol. Plantarum 15(3): 473-497.
Nabati, D., Schmidt, R., Parrish, D. 1994. Alleviation of salinity stress in Kentucky bluegrass by plant growth regulators and iron. Crop Sci. 34(1): 198-202.
110
Nabati, D. A. 1991. Responses of Two Grass Species to Plant Growth Regulators, Fertilizer N, Chelated Fe, Salinity and Water Stress. Ph.D thesis.
Nair, P., Kandasamy, S., Zhang, J., Ji, X., Kirby, C., Benkel, B., Hodges, M. D., Critchley, A. T., Hiltz, D., Prithiviraj, B. 2012. Transcriptional and metabolomic analysis of Ascophyllum nodosum mediated freezing tolerance in Arabidopsis thaliana. BMC Genomics 13(1): 1-23.
Nanawati, G. and Maliwal, G. 1974. Note on the effect of salts on the growth, mineral nutrition and quality of tomato (Lycopersicon esculentum mill.). Indian J. Agric. Sci. 43: 612-614.
Niu, X., Bressan, R. A., Hasegawa, P. M., Pardo, J. M. 1995. Ion homeostasis in NaCl stress environments. Plant Physiol. 109(3): 735.
Noaman, M. M., Dvorak, J., Dong, J. 2002. Genes inducing salt tolerance in wheat, lophopyrum elongatum and amphiploid and their responses to ABA under salt stress. Pages 139-144 in: Prospects for saline agriculture. Springer.
Olias, R., Eljakaoui, Z., Li, J., de Morales, P. A., Marín Manzano, M. C., Pardo, J. M., Belver, A. 2009. The plasma membrane Na /H antiporter SOS1 is essential for salt tolerance in tomato and affects the partitioning of Na between plant organs. Plant, Cell Environ. 32(7): 904-916.
Orthen, B., Popp, M., Smirnoff, N. 1994. Hydroxyl radical scavenging properties of cyclitols. Proceedings-Royal Society of Edinburgh b 102: 269-269.
Osmond, C., Austin, M., Berry, J., Billings, W., Boyer, J., Dacey, J., Nobel, P., Smith, S., Winner, W. 1987. Stress physiology and the distribution of plants. Bioscience 37(1): 38-48.
Ouyang, B., Yang, T., Li, H., Zhang, L., Zhang, Y., Zhang, J., Fei, Z., Ye, Z. 2007. Identification of early salt stress response genes in tomato root by suppression subtractive hybridization and microarray analysis. J. Exp. Bot. 58(3): 507-520.
Papadopoulos, I. and Rendig, V. 1983. Interactive effects of salinity and nitrogen on growth and yield of tomato plants. Plant Soil 73(1): 47-57.
Parida, A., Das, A. B., Das, P. 2002. NaCl stress causes changes in photosynthetic pigments, proteins, and other metabolic components in the leaves of a true mangrove, Bruguiera parviflora, in hydroponic cultures. Journal of Plant Biology 45(1): 28-36.
111
Parida, A. K. and Das, A. B. 2005. Salt tolerance and salinity effects on plants: A review. Ecotoxicol. Environ. Saf. 60(3): 324-349.
Parida, A. K., Das, A., Mittra, B. 2004. Effects of salt on growth, ion accumulation, photosynthesis and leaf anatomy of the mangrove, Bruguiera parviflora. Trees 18(2): 167-174.
Pardo, J. M. and Rubio, F. 2010. Naþ and Kþ transporters in plant signaling. Transporters and Pumps in Plant Signaling 7: 65.
Pasternak, D. 1987. Salt tolerance and crop production-a comprehensive approach. Annu. Rev. Phytopathol. 25(1): 271-291.
Paul, M. J. and Foyer, C. H. 2001. Sink regulation of photosynthesis. J. Exp. Bot. 52(360): 1383-1400.
Pedranzani, H., Racagni, G., Alemano, S., Miersch, O., Ramírez, I., Peña-Cortés, H., Taleisnik, E., Machado-Domenech, E., Abdala, G. 2003. Salt tolerant tomato plants show increased levels of jasmonic acid. Plant Growth Regulation 41(2): 149-158.
Pessarakli M, Szabolcs I, 1999. Soil salinity and sodicity as particular plant/crop stress factors. In: Pessarakli M (Ed) Handbook of plant and crop stress. Dekker, New York, pp 1–16.
Polle, A. 2001. Dissecting the superoxide dismutase-ascorbate-glutathione-pathway in chloroplasts by metabolic modeling. Computer simulations as a step towards flux analysis. Plant Physiol. 126(1): 445-462.
Popova, L. P., Stoinova, Z. G., Maslenkova, L. T. 1995. Involvement of abscisic acid in photosynthetic process in Hordeum vulgare L. during salinity stress. J. Plant Growth Regul. 14(4): 211-218.
Popp, M., Larher, F., Weigel, P. 1985. Osmotic adaption in Australian mangroves. Pages 247-253 in: Ecology of coastal vegetation. Springer,
Prasad, S., Bagali, P., Hittalmani, S., Shashidhar, H. 2000. Molecular mapping of quantitative trait loci associated with seedling tolerance to salt stress in rice (oryza sativa L.). Curr. Sci. 78(2): 162-164.
Qadir, M., Oster, J., Schubert, S., Noble, A., Sahrawat, K. 2007. Phytoremediation of sodic and Saline Sodic soils. Adv. Agron. 96: 197-247.
Qiu, Y. and Yu, D. 2009. Over-expression of the stress-induced OsWRKY45 enhances disease resistance and drought tolerance in Arabidopsis. Environ. Exp. Bot. 65(1): 35-47.
112
Rahman, M. and Punja, Z. K. 2005. Biochemistry of ginseng root tissues affected by rusty root symptoms. Plant Physiology and Biochemistry 43(12): 1103-1114.
Rai, A., Tripathi, P., Dwivedi, S., Dubey, S., Shri, M., Kumar, S., Tripathi, P. K., Dave, R., Kumar, A., Singh, R. 2011. Arsenic tolerances in rice (Oryzasativa) have a predominant role in transcriptional regulation of a set of genes including sulphur assimilation pathway and antioxidant system. Chemosphere 82(7): 986-995.
Rajesh, A., Arumugam, R., Venkatesalu, V. 1998. Growth and photosynthetic characteristics of Ceriops roxburghiana under NaCl stress. Photosynthetica 35(2): 285-287.
Rayorath, P., Jithesh, M. N., Farid, A., Khan, W., Palanisamy, R., Hankins, S. D., Critchley, A. T., Prithiviraj, B. 2008. Rapid bioassays to evaluate the plant growth promoting activity of Ascophyllum nodosum (L.) le jol. using a model plant, Arabidopsis thaliana (L.) heynh. J. Appl. Phycol. 20(4): 423-429.
Reddy, M., Sanish, S., Iyengar, E. 1992. Photosynthetic studies and compartmentation of ions in different tissues of Salicornia brachiata under saline conditions. Photosynthetica 26.
Reddy, M., Sanish, S., Iyengar, E. 1993. Compartmentation of ions and organic compounds in Salicornia brachiata roxb. Biol. Plant. 35(4): 547-553.
Rengasamy, P. 2002. Transient salinity and subsoil constraints to dryland farming in Australian sodic soils: An overview. Animal Production Science 42(3): 351-361.
Rhodes, D. and Hanson, A. 1993. Quaternary ammonium and tertiary sulfonium compounds in higher plants. Annual Review of Plant Biology 44(1): 357-384.
Rivero, R. M., Mestre, T. C., Mittler, R., Rubio, F., Garcia Sanchez, F., Martinez, V. 2013. The combined effect of salinity and heat reveals a specific physiological, biochemical and molecular response in tomato plants. Plant, Cell Environ.
Romero-Aranda, R., Soria, T., Cuartero, J. 2001. Tomato plant-water uptake and plant-water relationships under saline growth conditions. Plant Science 160(2): 265-272.
Saneoka, H., Shiota, K., Kurban, H., Chaudhary, M. I., Premachandra, G. S., Fujita, K. 1999. Effect of salinity on growth and solute accumulation in two wheat lines differing in salt tolerance. Soil Sci. Plant Nutr. 45(4): 873-880.
113
Sawahel, W. A. and Hassan, A. H. 2002. Generation of transgenic wheat plants producing high levels of the osmoprotectant proline. Biotechnol. Lett. 24(9): 721-725.
Sarkar, D., Bhowmik, P. C., Kwon, Y., Shetty, K. 2009. Clonal response to cold tolerance in creeping bentgrass and role of proline-associated pentose phosphate pathway. Bioresour. Technol. 100(21): 5332-5339.
Scandalios, J. G., Guan, L., Polidoros, A. N. 1997. Catalases in plants: Gene structure, properties, regulation, and expression. Cold Spring Harbor Monogr. Ser. 34: 343-406.
Schofield, R., Thomas, D., Kirkby, M. 2001. Causal processes of soil salinization in Tunisia, Spain and Hungary. Land Degrad. Dev. 12(2): 163-181.
Schofield, R. and Kirkby, M. 2003. Application of salinization indicators and initial development of potential global soil salinization scenario under climatic change. Global Biogeochem. Cycles 17(3).
Schroeder, J. I., Kwak, J. M., Allen, G. J. 2001. Guard cell abscisic acid signalling and engineering drought hardiness in plants. Nature 410(6826): 327-330.
Schroeder, J. I., Allen, G. J., Hugouvieux, V., Kwak, J. M., Waner, D. 2001. Guard cell signal transduction. Annual Review of Plant Biology 52(1): 627-658.
Seemann, J. R. and Critchley, C. 1985. Effects of salt stress on the growth, ion content, stomatal behaviour and photosynthetic capacity of a salt-sensitive species, phaseolus vulgaris L. Planta 164(2): 151-162.
Singh, S., Sharma, H., Goswami, A., Datta, S., Singh, S. 2000. In vitro growth and leaf composition of grapevine cultivars as affected by sodium chloride. Biol. Plant. 43(2): 283-286.
Shabala, S. and Cuin, T. A. 2008. Potassium transport and plant salt tolerance. Physiol. Plantarum 133(4): 651-669.
Shahbaz, M., Ashraf, M., Al-Qurainy, F., Harris, P. 2012. Salt tolerance in selected vegetable crops. Crit. Rev. Plant Sci. 31(4): 303-320.
Shannon, M. C. 1997. Adaptation of plants to salinity. Adv. Agron. 60: 75-120.
Shannon, M. and Grieve, C. 1998. Tolerance of vegetable crops to salinity. Scientia Horticulturae 78(1): 5-38.
114
Shinozaki, K. and Yamaguchi-Shinozaki, K. 1997. Gene expression and signal transduction in water-stress response. Plant Physiol. 115(2): 327.
Smirnoff, N. 2000. Ascorbic acid: Metabolism and functions of a multi-faceted molecule. Curr. Opin. Plant Biol. 3(3): 229-235.
Smith, A. M. and Stitt, M. 2007. Coordination of carbon supply and plant growth. Plant, Cell Environ. 30(9): 1126-1149.
Soussi, M., Ocana, A., Lluch, C. 1998. Effects of salt stress on growth, photosynthesis and nitrogen fixation in chick-pea (Cicer arietinum L.). J. Exp. Bot. 49(325): 1329-1337.
Staal, M., Maathuis, F. J., Elzenga, J. T. M., Overbeek, J. H. M., Prins, H. 1991. Na /H antiport activity in tonoplast vesicles from roots of the salt tolerant plantago maritima and the salt sensitive plantago media. Physiol. Plantarum 82(2): 179-184.
Stewart, G. and Lee, J. 1974. The role of proline accumulation in halophytes. Planta 120(3): 279-289.
Stirk, W., Novák, O., Strnad, M., Van Staden, J. 2003. Cytokinins in macroalgae. Plant Growth Regulation 41(1): 13-24.
Subramanian, S. 2008. Studies on Ascophyllum nodosum extract elicited disease resistance in Arabidopsis thaliana against Pseudomonas syringae pv. tomato DC3000. Dalhousie University (Canada), Master Thesis.
Subramanian, S., Sangha, J. S., Gray, B. A., Singh, R. P., Hiltz, D., Critchley, A. T., Prithiviraj, B. 2011. Extracts of the marine brown macroalga, Ascophyllum nodosum, induce jasmonic acid dependent systemic resistance in Arabidopsis thaliana against Pseudomonas syringae pv. tomato DC3000 and Sclerotinia sclerotiorum. Eur. J. Plant Pathol. 131(2): 237-248.
Suhayda, C. G., Giannini, J. L., Briskin, D. P., Shannon, M. C. 1990. Electrostatic changes in Lycopersicon esculentum root plasma membrane resulting from salt stress. Plant Physiol. 93(2): 471-478.
Taiz, L. and Zeiger, E. 2002. Plant physiology. EE.UU.California: Sinauer, 3rd Ed: 41-99.
Tanji, K.K. and Kielen, N.C. 2002. Agricultural drainage water management in arid and semi-arid areas: FAO Irrigation and Drainage Paper 6. Food and Agriculture Organization of the United Nations, Rome.
115
Tanji, K. K. 1990. Agricultural salinity assessment and management. Amer Society of Civil Engineers, 71.
Tardieu, F., Granier, C., Muller, B. 2011. Water deficit and growth. co-ordinating processes without an orchestrator? Curr. Opin. Plant Biol. 14(3): 283-289.
Tavakkoli, E., Rengasamy, P., McDonald, G. K. 2010. High concentrations of Na+ and Cl¯ ions in soil solution have simultaneous detrimental effects on growth of faba bean under salinity stress. J. Exp. Bot. 61(15): 4449-4459.
Tavakkoli, E., Fatehi, F., Coventry, S., Rengasamy, P., McDonald, G. K. 2011. Additive effects of Na+ and Cl¯ ions on barley growth under salinity stress. J. Exp. Bot. 62(6): 2189-2203.
Temple, W. and Bomke, A. 1989. Effects of kelp (Macrocystis integrifolia and Ecklonia maxima) foliar applications on bean crop growth. Plant Soil 117(1): 85-92.
Tester, M. and Davenport, R. 2003. Na+ tolerance and na+ transport in higher plants. Ann. Bot. 91(5): 503-527.
Thomas, J. C., McElwain, E. F., Bohnert, H. J. 1992. Convergent induction of osmotic stress-responses abscisic acid, cytokinin, and the effects of NaCl. Plant Physiol. 100(1): 416-423.
Tomato Genome Consortium. 2012. The tomato genome sequence provides insights into fleshy fruit evolution. Nature 485(7400): 635-641.
Torrecillas, A., Guillaume, C., Alarcón, J. J., Ruiz-Sánchez, M. C. 1995. Water relations of two tomato species under water stress and recovery. Plant Science 105(2): 169-176.
Tunçtürk, M., Tunçtürk, R., Yildirim, B., Çiftçi, V. 2011. Changes of micronutrients, dry weight and plant development in canola (Brassica napus L.) cultivars under salt stress. African J Biotechnol 10: 3726-3730.
Tuteja, N., Ahmad, P., Panda, B. B., Tuteja, R. 2009. Genotoxic stress in plants: Shedding light on DNA damage, repair and DNA repair helicases. Mutation Research/Reviews in Mutation Research 681(2): 134-149.
Ugarte, R. A. and Sharp, G. 2001. 6. A new approach to seaweed management in eastern Canada: The case of Ascophyllum nodosum. Cah. Biol. Mar. 42(1/2): 63-70.
116
USDA-ARS. 2008. Research Databases. Bibliography on Salt Tolerance. George E. Brown, Jr. Salinity Lab. US Dep. Agric., Agric. Res. Serv. Riverside, CA. http://www.ars.usda.gov/Services/docs.htm?docid=8908
Vaidyanathan, R., Kuruvilla, S., Thomas, G. 1999. Characterization and expression pattern of an abscisic acid and osmotic stress responsive gene from rice. Plant Science 140(1): 21-30.
Villalta, I., Reina-Sánchez, A., Bolarín, M., Cuartero, J., Belver, A., Venema, K., Carbonell, E., Asins, M. 2008. Genetic analysis of Na and K concentrations in leaf and stem as physiological components of salt tolerance in tomato. Theor. Appl. Genet. 116(6): 869-880.
Vogel, C. and Marcotte, E. M. 2012. Insights into the regulation of protein abundance from proteomic and transcriptomic analyses. Nature Reviews Genetics 13(4): 227-232.
Wally, O. S., Critchley, A. T., Hiltz, D., Craigie, J. S., Han, X., Zaharia, L. I., Abrams, S. R., Prithiviraj, B. 2013. Regulation of phytohormone biosynthesis and accumulation in Arabidopsis following treatment with commercial extract from the marine macroalga Ascophyllum nodosum. J. Plant Growth Regul. 32(2): 324-339.
Wang, D., Wang, H., Han, B., Wang, B., Guo, A., Zheng, D., Liu, C., Chang, L., Peng, M., Wang, X. 2012. Sodium instead of potassium and chloride is an important macronutrient to improve leaf succulence and shoot development for halophyte Sesuvium portulacastrum. Plant Physiology and Biochemistry 51: 53-62.
Wang, Y. and Nii, N. 2000. Changes in chlorophyll, ribulose bisphosphate carboxylase-oxygenase, glycine betaine content, photosynthesis and transpiration in amaranthus tricolor leaves during salt stress. Journal of Horticultural Science and Biotechnology 75(6): 623-627.
Weeraddana, C. D. S. 2012. Extracts of the Brown Seaweed, Ascophyllum nodosum, Effect Arabidopsis thaliana–Myzus persicae Interaction. Master Thesis.
Wei, J., Tirajoh, A., Effendy, J., Plant, A. L. 2000. Characterization of salt-induced changes in gene expression in tomato (Lycopersicon esculentum) roots and the role played by abscisic acid. Plant Science 159(1): 135-148.
White, P. J. and Broadley, M. R. 2001. Chloride in soils and its uptake and movement within the plant: A review. Annals of Botany 88(6): 967-988.

117
Wilkinson, S. and Davies, W. J. 2002. ABA based chemical signaling: The co ordination of responses to stress in plants. Plant, Cell Environ. 25(2): 195-210.
Wu, S., Ding, L., Zhu, J. 1996. SOS1, a genetic locus essential for salt tolerance and potassium acquisition. The Plant Cell Online 8(4): 617-627.
Xiong, L., Ishitani, M., Lee, H., Zhu, J. 2001. The Arabidopsis LOS5/ABA3 locus encodes a molybdenum cofactor sulfurase and modulates cold stress–and osmotic stress–responsive gene expression. The Plant Cell Online 13(9): 2063-2083.
Xu, H., Deckert, R. J., Garbary, D. J. 2008. Ascophyllum and its symbionts. X. ultrastructure of the interaction between A. nodosum (phaeophyceae) and Mycophycias ascophylli (ascomycetes). Botany 86(2): 185-193.
Yamaguchi, T. and Blumwald, E. 2005. Developing salt-tolerant crop plants: Challenges and opportunities. Trends Plant Sci. 10(12): 615-620.
Yan, J. 1993. Influence of Plant Growth Regulators on Turfgrass Polar Lipid Composition, Tolerance to Drought and Salinity Stresses, and Nutrient Efficiency. PhD Thesis.
Yang, T. and Poovaiah, B. 2002. Hydrogen peroxide homeostasis: Activation of plant catalase by calcium/calmodulin. Proceedings of the National Academy of Sciences 99(6): 4097-4102.
Yeo, A., Flowers, S., Rao, G., Welfare, K., Senanayake, N., Flowers, T. 1999. Silicon reduces sodium uptake in rice (Oryza sativa L.) in saline conditions and this is accounted for by a reduction in the transpirational bypass flow. Plant, Cell Environ. 22(5): 559-565.
Zapata, P. J., Botella, M. Á., Pretel, M. T., Serrano, M. 2007. Responses of ethylene biosynthesis to saline stress in seedlings of eight plant species. Plant Growth Regulation 53(2): 97-106.
Zhang, H. and Blumwald, E. 2001. Transgenic salt-tolerant tomato plants accumulate salt in foliage but not in fruit. Nat. Biotechnol. 19(8): 765-768.
Zhang, J. Z., Creelman, R. A., Zhu, J. 2004. From laboratory to field. Using information from Arabidopsis to engineer salt, cold, and drought tolerance in crops. Plant Physiol. 135(2): 615-621.
118
Zhang, L., Tian, L. H., Zhao, J. F., Song, Y., Zhang, C. J., Guo, Y. 2009. Identification of an apoplastic protein involved in the initial phase of salt stress response in rice root by two-dimensional electrophoresis. Plant Physiol. 149(2): 916-928.
Zhang, X. 1997. Influence of Plant Growth Regulators on Turfgrass Growth, Antioxidant Status, and Drought Tolerance. Ph.D Thesis.
Zhang, X. and Schmidt, R. 1999. Antioxidant response to hormone-containing product in Kentucky bluegrass subjected to drought. Crop Sci. 39(2): 545-551.
Zhu, J. 2003. Regulation of ion homeostasis under salt stress. Curr. Opin. Plant Biol. 6(5): 441-445.
Zhou, J., Wang, X., Jiao, Y., Qin, Y., Liu, X., He, K., Chen, C., Ma, L., Wang, J., Xiong, L. 2007. Global genome expression analysis of rice in response to drought and high-salinity stresses in shoot, flag leaf, and panicle. Plant Mol. Biol. 63(5): 591-608.
Zhu, J. 2002. Salt and drought stress signal transduction in plants. Annual Review of Plant Biology 53: 247.
Zhu, J., Hasegawa, P. M., Bressan, R. A., Bohnert, H. J. 1997. Molecular aspects of osmotic stress in plants. Crit. Rev. Plant Sci. 16(3): 253-277.
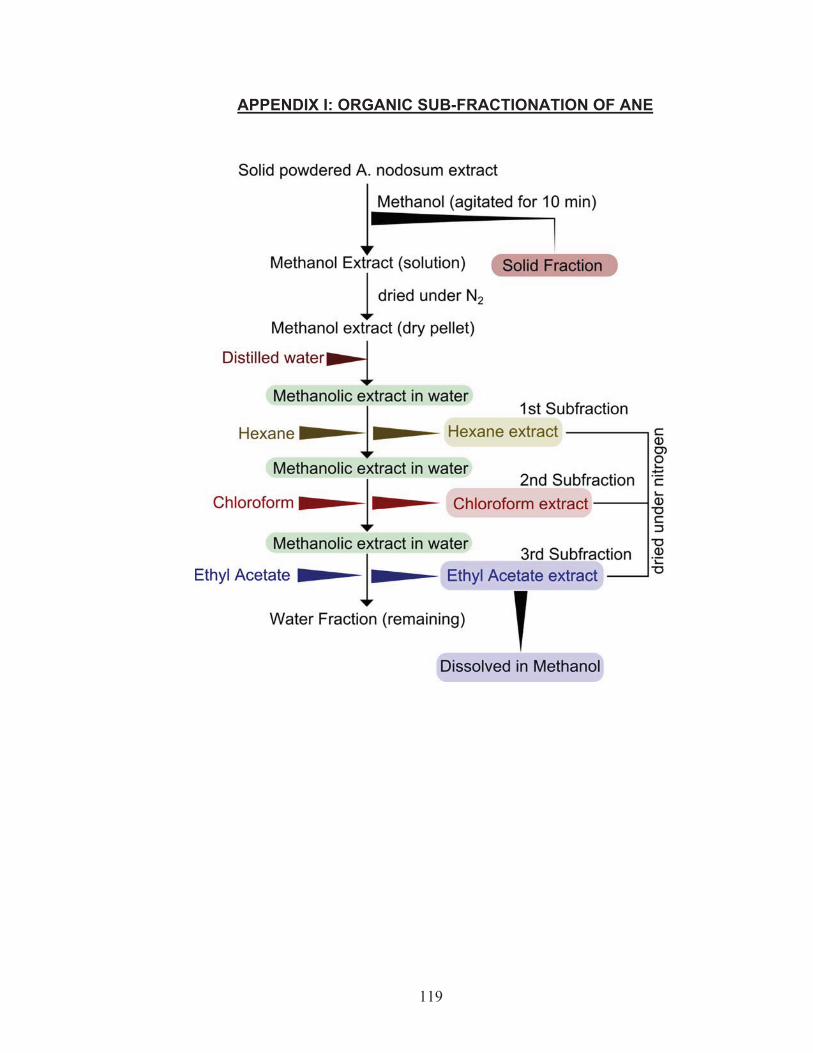
119
APPENDIX I: ORGANIC SUB-FRACTIONATION OF ANE
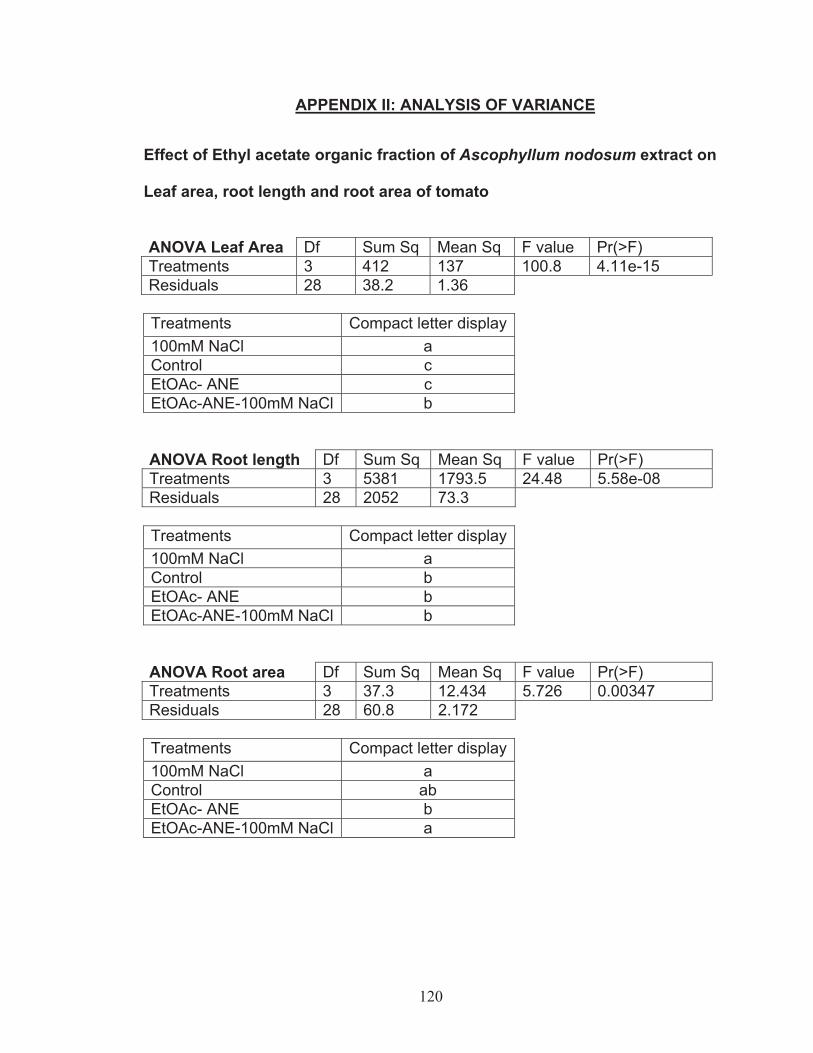
120
APPENDIX II: ANALYSIS OF VARIANCE
Effect of Ethyl acetate organic fraction of Ascophyllum nodosum extract on
Leaf area, root length and root area of tomato
ANOVA Leaf Area Df Sum Sq Mean Sq F value Pr(>F) Treatments 3 412 137 100.8 4.11e-15 Residuals 28 38.2 1.36
Treatments Compact letter display100mM NaCl a Control c EtOAc- ANE c EtOAc-ANE-100mM NaCl b
ANOVA Root length Df Sum Sq Mean Sq F value Pr(>F) Treatments 3 5381 1793.5 24.48 5.58e-08 Residuals 28 2052 73.3
Treatments Compact letter display100mM NaCl a Control b EtOAc- ANE b EtOAc-ANE-100mM NaCl b
ANOVA Root area Df Sum Sq Mean Sq F value Pr(>F) Treatments 3 37.3 12.434 5.726 0.00347 Residuals 28 60.8 2.172
Treatments Compact letter display100mM NaCl a Control ab EtOAc- ANE b EtOAc-ANE-100mM NaCl a
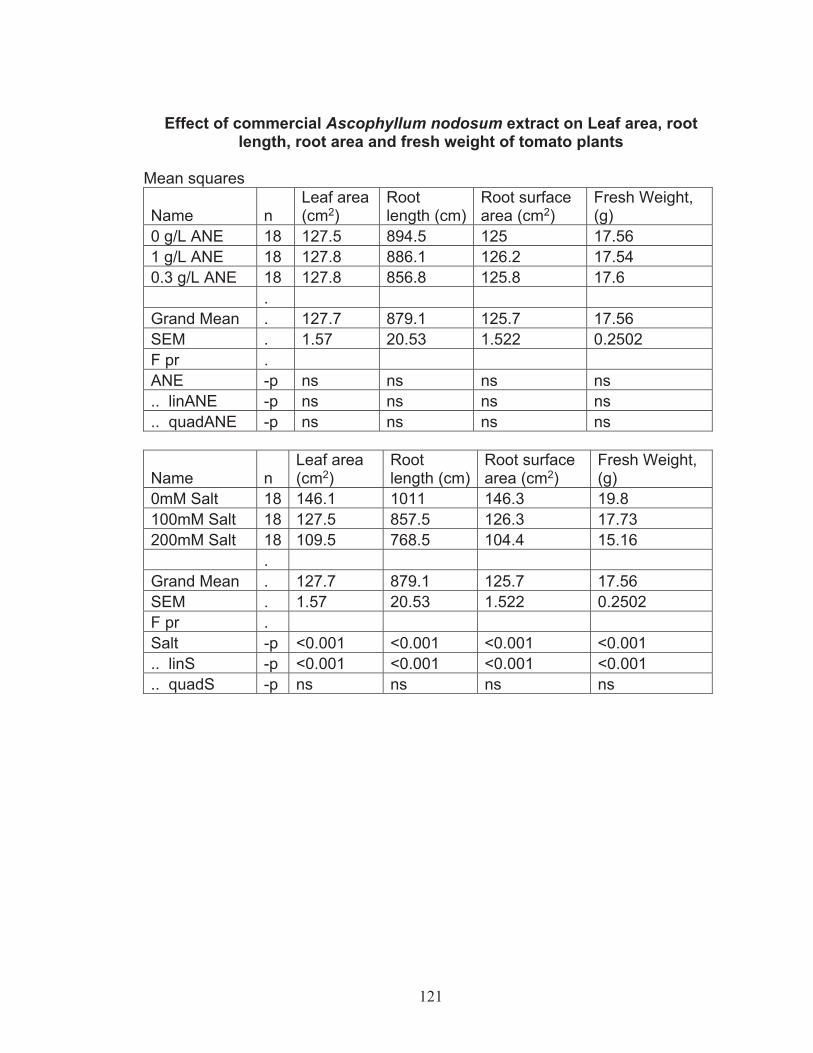
121
Effect of commercial Ascophyllum nodosum extract on Leaf area, root
length, root area and fresh weight of tomato plants Mean squares
Name n Leaf area (cm2)
Root length (cm)
Root surface area (cm2)
Fresh Weight, (g)
0 g/L ANE 18 127.5 894.5 125 17.56 1 g/L ANE 18 127.8 886.1 126.2 17.54 0.3 g/L ANE 18 127.8 856.8 125.8 17.6
. Grand Mean . 127.7 879.1 125.7 17.56 SEM . 1.57 20.53 1.522 0.2502 F pr . ANE -p ns ns ns ns .. linANE -p ns ns ns ns .. quadANE -p ns ns ns ns
Name n Leaf area (cm2)
Root length (cm)
Root surface area (cm2)
Fresh Weight, (g)
0mM Salt 18 146.1 1011 146.3 19.8 100mM Salt 18 127.5 857.5 126.3 17.73 200mM Salt 18 109.5 768.5 104.4 15.16
. Grand Mean . 127.7 879.1 125.7 17.56 SEM . 1.57 20.53 1.522 0.2502 F pr . Salt -p <0.001 <0.001 <0.001 <0.001 .. linS -p <0.001 <0.001 <0.001 <0.001 .. quadS -p ns ns ns ns
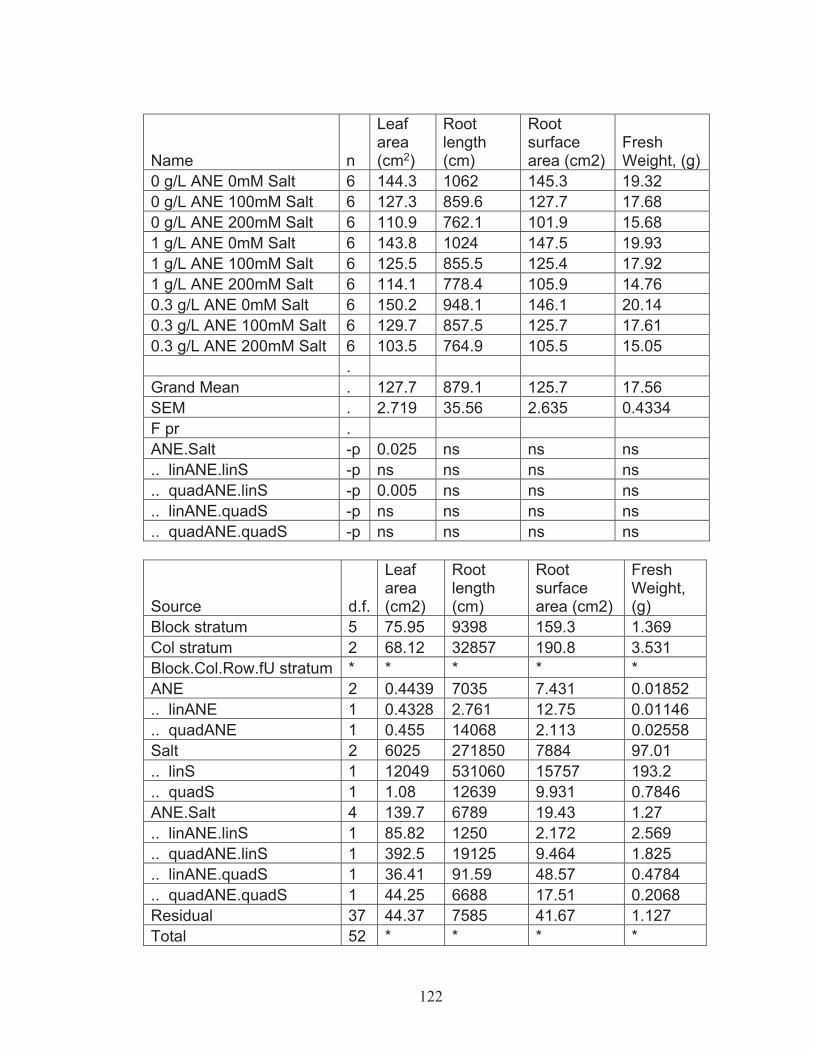
122
Name n
Leaf area (cm2)
Root length (cm)
Root surface area (cm2)
Fresh Weight, (g)
0 g/L ANE 0mM Salt 6 144.3 1062 145.3 19.32 0 g/L ANE 100mM Salt 6 127.3 859.6 127.7 17.68 0 g/L ANE 200mM Salt 6 110.9 762.1 101.9 15.68 1 g/L ANE 0mM Salt 6 143.8 1024 147.5 19.93 1 g/L ANE 100mM Salt 6 125.5 855.5 125.4 17.92 1 g/L ANE 200mM Salt 6 114.1 778.4 105.9 14.76 0.3 g/L ANE 0mM Salt 6 150.2 948.1 146.1 20.14 0.3 g/L ANE 100mM Salt 6 129.7 857.5 125.7 17.61 0.3 g/L ANE 200mM Salt 6 103.5 764.9 105.5 15.05
. Grand Mean . 127.7 879.1 125.7 17.56 SEM . 2.719 35.56 2.635 0.4334 F pr . ANE.Salt -p 0.025 ns ns ns .. linANE.linS -p ns ns ns ns .. quadANE.linS -p 0.005 ns ns ns .. linANE.quadS -p ns ns ns ns .. quadANE.quadS -p ns ns ns ns
Source d.f.
Leaf area (cm2)
Root length (cm)
Root surface area (cm2)
Fresh Weight, (g)
Block stratum 5 75.95 9398 159.3 1.369 Col stratum 2 68.12 32857 190.8 3.531 Block.Col.Row.fU stratum * * * * * ANE 2 0.4439 7035 7.431 0.01852 .. linANE 1 0.4328 2.761 12.75 0.01146 .. quadANE 1 0.455 14068 2.113 0.02558 Salt 2 6025 271850 7884 97.01 .. linS 1 12049 531060 15757 193.2 .. quadS 1 1.08 12639 9.931 0.7846 ANE.Salt 4 139.7 6789 19.43 1.27 .. linANE.linS 1 85.82 1250 2.172 2.569 .. quadANE.linS 1 392.5 19125 9.464 1.825 .. linANE.quadS 1 36.41 91.59 48.57 0.4784 .. quadANE.quadS 1 44.25 6688 17.51 0.2068 Residual 37 44.37 7585 41.67 1.127 Total 52 * * * *

123
ANOVA
Source d.f.Leaf area (cm2)
Root length (cm)
Root surface area (cm2)
Fresh Weight, (g)
Block stratum 5 . . . . Col stratum 2 . . . . Block.Col.Row.fU stratum * . . . . ANE 2 ns ns ns ns .. linANE 1 ns ns ns ns .. quadANE 1 ns ns ns ns Salt 2 <0.001 <0.001 <0.001 <0.001 .. linS 1 <0.001 <0.001 <0.001 <0.001 .. quadS 1 ns ns ns ns ANE.Salt 4 0.025 ns ns ns .. linANE.linS 1 ns ns ns ns .. quadANE.linS 1 0.005 ns ns ns .. linANE.quadS 1 ns ns ns ns .. quadANE.quadS 1 ns ns ns ns Residual 37 . . . . Total 52 . . . .

124
APPENDIX III: MINERAL COMPOSITION OF LONG ASHTON SOLUTION (LANS) AND INORGANIC CONTROL
Compound LANS 0.1x Modified LANS (inorganic control) 0.1x
Final conc’n Final conc’n (ppm=mg/L) (ppm=mg/L)
KNO3 K = 15.6 K = 15.6 N = 5.6 N = 5.6
Ca(NO3)2 4H2O Ca = 16.6 Ca = 3.3
N = 11.2 N = 2.2 MgSO4 7H2O Mg = 3.6 Mg = 3.6
S = 4.8 S = 4.8 NaH2PO4 H2O P = 4.1 P = 4.1
Na = 3.1 Na = 3.1 Fe-citrate H2O Fe = 0.28 Fe = 0.28
MnSO4 H2O Mn = 0.05 Mn = 0.05 CuSO4 5H2O Cu = 0.003 Cu = 0.003 ZnSO4 7H2O Zn = 0.013 Zn = 0.013 H3BO3 B = 0.032 B = 0.032 Na2MoO4 2H2O Mo = 0.005 Mo = 0.005 NaCl Cl = 0.36 Cl = 0.36
Na = 0.23 Na = 0.23 CoSO4 7H2O Co = 0.0012 Co = 0.0012 KCl - K = 65
Cl = 60 KOH - K = 65
Source: Acadian Seaplants Limited, Canada
Related Documents