ACTIVE LEARNING IN TRANSPORTATION ENGINEERING EDUCATION by Jennifer Anne Weir A Dissertation Submitted to the Faculty of the WORCESTER POLYTECHNIC INSTITUTE in partial fulfillment of the requirements for the Degree of Doctor of Philosophy in Civil Engineering December 16, 2004 APPROVED:

Welcome message from author
This document is posted to help you gain knowledge. Please leave a comment to let me know what you think about it! Share it to your friends and learn new things together.
Transcript

ACTIVE LEARNING IN
TRANSPORTATION ENGINEERING EDUCATION
by
Jennifer Anne Weir
A Dissertation
Submitted to the Faculty
of the
WORCESTER POLYTECHNIC INSTITUTE
in partial fulfillment of the requirements for the
Degree of Doctor of Philosophy
in
Civil Engineering
December 16, 2004
APPROVED:

ii
ABSTRACT
The objectives of this research were (1) to develop experimental active-based-
learning curricula for undergraduate courses in transportation engineering and (2) to
assess the effectiveness of an active-learning-based traffic engineering curriculum
through an educational experiment. The researcher developed a new highway design
course as a pilot study to test selected active-learning techniques before employing them
in the traffic engineering curriculum. Active-learning techniques, including multiple-
choice questions, short problems completed by individual students or small groups, and
group discussions, were used as active interludes within lectures. The researcher also
collected and analyzed student performance and attitude data from control and
experimental classes to evaluate the relative effectiveness of the traditional lecture
(control) approach and the active-learning (experimental) approach.
The results indicate that the active-learning approach adopted for the experimental
class did have a positive impact on student performance as measured by exam scores.
The students in the experimental class also indicated slightly more positive attitudes at
the end of the course than the control class, although the difference was not significant.
The author recommends that active interludes similar to those in the experimental
curricula be used in other courses in civil engineering.

iii
ACKNOWLEDGEMENTS
I thank God, my Provider, for the many gifts of people, resources, and
opportunities needed to successfully complete this work. I probably would not have
pursued a PhD if it were not for Malcolm Ray, who gave me a wonderful opportunity,
and my husband, Bill Weir, who convinced me to take that opportunity and has continued
to encourage me along the way. I am thankful for their help and support. I am also
grateful to Fred Hart and the rest of the Civil & Environmental Engineering Department
at WPI, including my students, for the teaching experiences of the last few years. Lastly,
my dissertation project and this report owe much to the advice and editing of my
committee members, Professors Judy Miller and Len Albano.

iv
TABLE OF CONTENTS
Abstract…ii Acknowledgements…iii List of Tables…vi List of Figures…vii I. Introduction… 1 II. Literature Review… 3
2.1. Learning Theory… 3 2.1.1 Constructivism… 3 2.1.2 Kolb’s Learning Cycle… 4 2.1.3 Thinking Processes… 7 2.1.4 Learning Engineering… 10
2.2. Active Learning… 14 2.2.1 Active Learning Studies… 15 2.2.2 Active Learning Experiments in Engineering Education… 16 2.2.3 Specific Techniques… 19
2.3. Structuring Active Learning… 21 2.3.1 Course Structure… 21 2.3.2 Guidelines for Active Learning Exercises… 22
2.4. Learning Outcomes… 23 2.5. Summary & Hypothesis… 25
III. Experimental Approach… 27 3.1. Scope… 27 3.2. Participants… 27 3.3. Procedures… 28 3.4. Instruments… 29
IV. CE405X Highway Design: Pilot Course… 30 4.1. Curriculum Development… 30
4.1.1 Selection of Content… 30 4.1.2 Teaching Methods… 31 4.1.3 Assessment… 36
4.2. Student Profile… 36 4.3. Performance Data… 37 4.4. Student Feedback & Lessons Learned… 38
4.4.1 Student Surveys… 38 4.4.2 Reflections on Teaching Methods… 41

v
V. CE3050 Introduction to Transportation Engineering: Control and Experimental Classes… 45
5.1. Curriculum Development… 45 5.1.1 Course Content… 45 5.1.2 Teaching Methods… 46 5.1.3 Assessment… 48
5.2. Student Profile… 49 5.3. Assessment Data… 51 5.4. Attitudinal Data… 54
VI. Analysis of Data from CE3050 Classes… 62 6.1. Pre-test and Post-test Scores… 62
6.1.1 Initial Knowledge… 62 6.1.2 Change in Knowledge During Course… 64 6.1.3 Achievement of Learning Objectives… 64
6.2. Attitudinal Measures… 69 6.2.1 Initial Attitudes… 70 6.2.2 Change in Attitudes During Course… 70 6.2.3 End-of-course Attitude Measures… 72
6.3. Student Feedback… 74
VII. Conclusions… 76 7.1. Summary of Experimental Results… 76 7.2. Curriculum Recommendations… 77 7.3. Further Research… 78
VIII. References… 80 Appendix A: CE405X Course Materials Appendix B: CE3050 Course Materials Appendix C: Detailed Performance Data

vi
LIST OF TABLES
Table 2.1. Thinking Processes in Higher Education.[4]… 9 Table 2.2. Disciplinary Selection of Learning Objectives (Percent of Classes Selecting
Objectives as Essential or Important) on IDEA Student Ratings.[12]… 13 Table 4-1. Pilot Class Performance on Quizzes… 37 Table 4-2. Student Responses to Teaching Methods in Highway Design… 39 Table 4-3. IDEA Score Summary for Pilot Highway Design Class… 41 Table 5-1. Characteristics of Students in Control and Experimental Classes… 50 Table 5-2. Characteristics of Civil Engineering Juniors and Seniors… 51 Table 5-3. Summary of Responses to Pre-test Questions… 52 Table 5-4. Summary of Performance on Exam 1… 53 Table 5-5. Summary of Performance on Exam 2… 53 Table 5-6. Summary of Exam Performance by Objective… 54 Table 5-7. Student Expectations Regarding CE3050… 55 Table 5-8. Initial Student Attitudes Toward Transportation Engineering… 56 Table 5-9. End-of-Course Self-Assessment Versus Grading Assessment (based on exam
scores converted to a five-point scale)… 58 Table 5-10. IDEA Score Summaries for CE3050… 59 Table 5-11. Student Expectations and Reactions (based on surveys)… 60 Table 6-1. Descriptive Statistics for Pre-test and Post-test Scores… 62 Table 6-2. Thinking Processes Used in CE3050 Learning Objectives… 68 Table 6-3. Descriptive Statistics for Pre-Survey Attitude Scores… 69 Table 6-4. Descriptive Statistics for IDEA Post-Survey Attitude Scores… 69 Table 6-5. Descriptive Statistics for IDEA Summary Scores… 73

vii
LIST OF FIGURES Figure 2.1. The 4MAT System Model.[8]… 6 Figure 2.2. Characteristics of Disciplines: Hard v. Soft, Pure v. Applied.[11]… 11 Figure 6-1. Pre-test Scores for Objective Set 1… 63 Figure 6-2. Pre-test Scores for Objective Set 2… 63 Figure 6-3. Post-test Scores on Objective Set 1… 65 Figure 6-4. Post-test Scores on Objective Set 2… 65 Figure 6-5. Initial Attitude Scores… 70 Figure 6-6. Before and After Attitude Scores for Control Class… 71 Figure 6-7. Before and After Attitude Scores for Experimental Class… 71 Figure 6-8. End-of-Course Attitude Scores… 73

1
I. INTRODUCTION
Engineering is an applied science. According to the 2003-2004 Accreditation
Board for Engineering and Technology (ABET) requirements for engineering programs,
graduates of such programs must demonstrate “an ability to apply knowledge of
mathematics, science, and engineering” (criterion 3a) and “an ability to use the
techniques, skills, and modern engineering tools necessary for engineering practice”
(criterion 3k).[1] An engineering graduate who cannot apply what he or she has learned
in school to actual practice is of little use to an employer. In theory, the best way to learn
to apply one’s knowledge is to acquire or learn it in a realistic context. One method to
encourage students to apply their knowledge to “real-life” problems is to include
opportunities for such application within the curriculum. For example, students at
Northeastern University alternate semesters between the classroom and “cooperative
education” at engineering companies, and students at Worcester Polytechnic Institute
complete a series of projects in addition to coursework. Knowledge that has not been
acquired, however, cannot be applied. Engineering courses should provide students with
the necessary knowledge. The knowledge, techniques, and skills referred to in the ABET
requirements must be learned and understood satisfactorily in order to be able to use them
in practice.
In current educational theory, learning is seen as an active process, in which
students must interact with information in order to understand it.[2, 3, 4] In a typical
engineering course, the “active” part of learning takes place outside of the classroom, in
the form of solving homework problems or conducting course projects, while the time in
the classroom is more passive, in the form of listening to lectures. Thus, the students
interact with the course material - and gain understanding of it – primarily in the absence
of the instructor.
Teaching methods have been explored in previous research that encourage
students to interact with course material inside the classroom, under the supervision of
the instructor. In past studies, such methods, termed “active learning methods,” appeared
to result in improved understanding and more positive student responses to course
material, compared to lectures alone. The relevant literature is discussed in more detail in

2
Chapter II of this document.
Although a number of researchers have experimented with active learning
methods, most of them focused on courses in the sciences and social sciences, rather than
engineering. Disciplinary differences may affect the applicability and effectiveness of
the teaching methods. Most of the available studies also lack thorough assessment of the
effectiveness of the teaching methods. In many cases, several changes were made to a
course simultaneously, which complicates analysis of any one factor.
The objectives of this research were (1) to develop active-learning-based curricula
for undergraduate transportation engineering courses and (2) to assess the effectiveness
of the experimental traffic engineering curriculum through an educational experiment.
Selected active techniques were tested in the experimental curriculum and their
effectiveness compared with that of the lecture approach. The results were assessed both
quantitatively in terms of the students’ mastery of the course objectives and their attitudes
toward the course and area of study.
The courses used to conduct this research were undergraduate transportation
engineering courses at Worcester Polytechnic Institute (WPI). Transportation
engineering is an area of study within civil engineering that includes both abstract
theories and practical skills. Students need to learn the basic concepts and vocabulary
used to understand and describe traffic, and they need to be able to apply these concepts
to perform engineering studies. Traditionally, undergraduate students have been taught
about transportation engineering through lectures and readings. Some courses include
separate lecture and laboratory sessions, while others are lecture-based with assigned
activities outside of class. Active-learning methods within the classroom are a different
approach that had not been tested in this context.
The results of this project will contribute to the knowledge base of activities that
enhance student learning in undergraduate engineering courses, as well as improving the
undergraduate education of civil and transportation engineers at WPI and other
universities.

3
II. LITERATURE REVIEW
One of the first tasks in this project was to identify relevant sources of
information for use in defining the project focus and developing an experimental
curriculum. This chapter reviews the available literature in the areas of learning theory,
active learning, and assessment.
2.1. Learning Theory
Epistemology, or the study of knowledge, encompasses a broad range of theories
and topics. This section will focus on some current theories about learning. It is not
intended to be a thorough review of the literature in this area, but to provide an adequate
background for understanding the context of this dissertation.
2.1.1 Constructivism
Constructivism, or the constructivist view of learning, is that students construct
their own knowledge as they attempt to make sense of information or environments.[2]
Unlike some other theories of learning such as behaviorism, constructivism says that
knowledge cannot be simply transferred from teacher to learner. Learners must actively
interpret and develop understanding from the information given to them.[3] Their
understanding of the new information is built upon their prior knowledge. Donald
describes the constructivist view in this way: “The view that knowledge is constructed
carries dangers – it could be interpreted to mean that truth is dead and therefore chaos
reigns. A more measured perspective is that we each construct our own understanding of
the large bodies of organized public knowledge that the disciplines represent.”[4] In
engineering, “understanding occurs as a result of joining concepts to actions.”[4] Most
relevant to the college classroom, social constructivism asserts that “learners arrive at
what they know mainly through participating in the social practice of the classroom and
through course projects and assignments.”[3] These activities could include discussions,
group projects, or group work on homework assignments, depending on the course.

4
2.1.2 Kolb’s Learning Cycle
Kolb developed a four-step model learning cycle for complete, long-term
learning. The steps are termed concrete experience, reflective observation, abstract
conceptualization, and active experimentation. Courses that include all these steps
should result in better retention of material by the students.[2, 5] “Students who are
guided through the learning cycle are exposed to a wider variety of learning experiences
and increased opportunities for self discovery and independent thinking.”[6] Kolb also
developed a learning style inventory based on the idea that people have different learning
styles, or preferences for different steps in the learning cycle. Kolb’s theory, known as
“experiential learning theory,” has been studied and written about extensively, but its
effects on learning have been inconclusive, largely due to lack of data. Several meta-
analyses in the 1990s concluded that a majority of the studies in the literature up to that
time support the use of experiential learning theory and Kolb’s learning style
inventory.[7] Harb comments that “although we have observed positive results from the
use of the learning cycle in the engineering classroom, it is difficult to make a
quantitative evaluation of the effectiveness of these techniques.”[6] This problem is not
unique to Kolb’s learning cycle, but seems to be a common issue in assessing learning
theories.
McCarthy combined Kolb’s learning cycle with other learning theories such as
right and left-brain dominance and learning styles to develop a modified learning cycle
known as the 4MAT system.[8] She focused on the use of the learning cycle in teaching.
Harb et al. [6] and Todd [9], among others, have applied this system to engineering
classes. It is represented by four quadrants as shown in Figure 2.1. An instructor may
begin by providing students with a “concrete experience,” such as a hands-on
demonstration. In quadrant one, moving from concrete experience to reflective
observation, the instructor introduces the material and helps students understand why
learning the material is important. The students next move from reflective observation to
abstract conceptualization, learning concepts through lectures or other activities, in
quadrant two. “Information transfer (quadrant two) remains an essential function of the
engineering professor.”[6] In quadrant three, they move from abstract conceptualization

5
to active experimentation, actively doing something with the concepts to learn how they
work or how to solve problems. The instructor acts as a coach, providing a guided
learning experience for the students. Finally, the students apply what they have learned
to new problems and “real life,” or concrete experience, in quadrant four.[2, 6]

6
Figure 2.1. The 4MAT System Model.[8] Reprinted with permission of Bernice McCarthy.

7
2.1.3 Thinking Processes
Donald has described a number of thinking processes that are expected and
developed in higher education, shown in Table 2.1. This model was developed “by
creating a comprehensive list of thinking processes from the postsecondary literature,
then having instructional experts group the definitions on the basis of similarity and
describe the basis of their grouping.”[4] These processes of thinking and learning are
emphasized and valued differently in different disciplines. She defines a discipline as “a
body of knowledge with a reasonably logical taxonomy, a specialized vocabulary, an
accepted body of theory, a systematic research strategy, and techniques for replication
and validation.”[4]
Donald’s discussion of disciplinary differences treats all the branches of
engineering together due to their similarities. All the categories of thinking processes in
Table 2.1 are important in engineering courses and generally receive attention.
Engineering is comprised primarily of problem solving and design. Descriptive and
selective thinking processes are important because students must learn to handle open-
ended problems in which there may be either a great deal of information or missing
information. Problem solving makes extensive use of representation, which includes
diagrams, formulas, laws, and designs.[4] Chase and Chi found that problem-solving
skills require “extensive practice to build up [a] long-term knowledge base” on which to
draw in solving a particular problem. This knowledge base includes “lexical
knowledge,” i.e., patterns or lexicons, and procedural knowledge, a set of strategies or
procedures for use with the patterns. “A fast action pattern recognition system … greatly
reduces processing load and serves as a retrieval aid for alternative courses of
action.”[10] Inference is used during problem-solving to think about the implications of
facts or calculations.[4]
Design focuses on synthesis and verification. Engineering programs attempt to
“produce creative, independent, flexible, and critically thinking individuals” who can
both solve problems and design solutions.[4] Donald notes that students in engineering
programs are trained to synthesize: “students start out with guided synthesis, rather than
self-generated synthesis, and their labs are intended to nurture these skills…. students

8
have the design process modeled for them and then are given more leeway with greater
responsibility in projects. Projects are the primary means of developing synthesis.”[4]
Verification is critical because (1) engineering problems often require assumptions and
approximations and (2) professional liability encourages engineers to limit risk as much
as possible.[4]

9
Table 2.1. Thinking Processes in Higher Education.[4] Reprinted with permission of John Wiley & Sons, Inc.
DESCRIPTION (PS, SM) Identify context (E) State conditions State facts State functions State assumptions (CT) State goal
Delineation or definition of a situation or form of a thing. Establish surrounding environment to create a total picture. State essential parts, prerequisites, or requirements. State known information, events that have occurred. State normal or proper activity of a thing or specific duties. State suppositions, postulates, or propositions assumed. State the ends, aims, objectives.
SELECTION (PS) Choose relevant information (E) Order information in importance Identify critical elements Identify critical relations
Choice in preference to another or others. Select information that is pertinent to the issue in question. Rank, arrange in importance or according to significance. Determine units, parts, components that are important. Determine connections between things that are important.
REPRESENTATION (PS) Recognize organizing principles Organize elements and relations Illustrate elements and relations Modify elements and relations
Description or portrayal through enactive, iconic, or symbolic means.
Identify laws, methods, rules that arrange in a systematic whole.
Arrange parts, connections between things into a systematic whole.
Make clear by examples the parts, connections between things. Change, alter, or qualify the parts, connections between things.
INFERENCE (E, H, CT, PS) Discover new relations between
elements Discover new relations between
relations Discover equivalences Categorize Order Change perspective Hypothesize
Act or process of drawing conclusions from premises or evidence.
Detect or expose connections between parts, units, components.
Detect or expose connections between connections of things. Detect or expose equality in value, force, or significance. Classify, arrange into parts. Rank, sequence, arrange methodically. Alter view, vista, interrelations, significance of facts or
information. Suppose or form a proposition as a basis for reasoning.
SYNTHESIS (PS) Combine parts to form a whole Elaborate Generate missing links Develop course of action
Composition of parts or elements into a complex whole. Join, associate elements, components into a system or pattern. Work out, complete with great detail, exactness, or
complexity. Produce or create what is lacking in a sequence; fill in the gap. Work out or expand the path, route, or direction to be taken.
VERIFICATION (E, H, CT, PS, SM) Compare alternative outcomes Compare outcome to standard Judge validity Use feedback Confirm results
Confirmation of accuracy, coherence, consistency, correspondence.
Examine similarities or differences of results, consequences. Examine similarities, differences of results based on a
criterion. Critically examine soundness, effectiveness, by actual fact. Employ results to regulate, adjust, adapt. Establish or ratify conclusions, effects, outcomes, products.
E: expertise; H: hermeneutics; CT: critical thinking; PS: problem solving; SM: scientific method

10
2.1.4 Learning Engineering
According to Donald, “engineering programs … provide a learning environment
that is in marked contrast to many other undergraduate programs.”[4] Differences
among areas of study and the ramifications of these differences have been the focus of
much research and discussion.
Biglan studied a number of disciplines and described engineering (i.e., civil,
mechanical, ceramic, and nuclear engineering), science (e.g., astronomy, physics, and
chemistry), math, computer science, and agriculture (i.e., horticulture, dairy science, and
agronomy) disciplines as “hard.” A hard discipline is “logically structured … and has an
acknowledged methodology” or paradigm, while a “soft” discipline is characterized by a
lack of consensus about content and method.[4, 11] According to Biglan, extremely soft
disciplines include humanities and education areas. Social sciences and business areas
are also considered soft, but less so; he characterized these as “fields that strive for a
paradigm; but have yet to achieve one.”[11] Biglan also distinguished between “pure”
and “applied” disciplines. A pure discipline focuses on principles and theories, while an
applied discipline is concerned with application to practical problems. He described
education, engineering, and accounting/finance disciplines as strongly applied and also
considered agriculture and computer science applied. Pure disciplines include the
“physical sciences, mathematics, social sciences, languages, history, and
philosophy.”[11] Figure 2.2 summarizes these disciplinary attributes. The horizontal
axis of the figure represents the hard-soft nature of the discipline, where the hardest
disciplines are located farthest to the left. The vertical axis represents the pure-applied
nature, where the purest disciplines are located closest to the bottom. Note that the
engineering, agriculture, and computer science disciplines are the only areas of study that
are both hard and applied; engineering and agriculture are the most similar in terms of
these characteristics.

11
Figure 2.2. Characteristics of Disciplines: Hard v. Soft, Pure v. Applied.[11] Copyright 1973 by the American Psychological Association. Reproduced with permission.
Much research in higher education has focused on the sciences. These disciplines
do share some similarities with engineering courses, but as Biglan’s findings imply, they
have some differences as well. As noted in Section 2.1.3, engineering includes problem
solving and design. These abilities require a familiarity with and understanding of many
concepts from mathematics and physical science courses, but also a number of thinking
processes that are not emphasized in such courses. “Throughout their training,
[engineering] students are being inducted into a profession that values hard thinking
applied to unstructured problems.”[4] Inference is important in chemistry and biology as
in engineering, but in these sciences it is in conjunction with inductive rather than
Hard Soft
Applied
Pure

12
deductive reasoning. Physics is structured and process-oriented like engineering, but does
not emphasize descriptive and selective thinking processes.[4,5] The physical sciences
are also oriented primarily toward declarative knowledge, while engineering courses are
concerned with procedural knowledge. Declarative knowledge includes facts and
principles; procedural knowledge includes “knowledge about our knowledge and how to
apply it.” One professor describes it this way: “the real value in engineering is being able
to think and apply these fundamentals to new problems you have not seen before…. If the
answer is already known, no one is going to pay someone to answer it again.”[4]
Disciplines may also be characterized by the objectives of their courses. The
IDEA Center at Kansas State University has created student rating-of-instruction forms
that ask about progress on twelve general course learning objectives, intended to be
applicable to a broad range of disciplines. The course instructors provide information
about the importance of each of the learning objectives to the course. According to an
analysis of recent course results, the four objectives most often identified as “essential” or
“important” by instructors of engineering courses were “gaining factual knowledge”
(objective 1); “learning fundamental principles, generalizations, and theories” (objective
2); “learning to apply course material” (objective 3); and “developing specific skills,
competencies, and points of view needed by professionals in the field most closely
related to this course” (objective 4).[12] Over eighty percent of the instructors chose
each of the first three objectives as essential or important, and 73 percent chose the last
objective as essential or important. Instructors in a number of disciplines chose these
four objectives, as shown in Table 2.2. The entire list of objectives is not shown here for
space and clarity.

13
Table 2.2. Disciplinary Selection of Learning Objectives (Percent of Classes Selecting Objectives as Essential or Important) on IDEA Student Ratings.[12]
Objective
Discipline Factual knowledge
Principles & theories
Apply course material
Specific skills
Accounting 96 91 83 75 Adm/Management 80 82 87 67 Art 63 61 57 68 Biology/Life Science 93 90 64 47 Business 85 80 83 65 Chemistry 91 89 81 52 Computer Science 93 77 80 83 Design/Applied Art 82 80 83 86 Economics 91 96 84 33 Education 78 76 83 84 Engineering 83 82 88 73 English Literature 36 35 48 28 Fine/Applied Arts 75 75 69 74 Foreign Language 77 50 38 39 History 94 56 43 25 Health Professions & Related Sciences 83 75 82 74
Liberal Arts/Science 62 61 66 23 Math/Statistics 94 94 92 46 Music 70 57 45 66 Nursing 77 75 88 77 Philosophy 52 82 62 15 Physical/Health/ Safety Education 89 76 77 60
Physics 89 96 83 41 Political Science 84 83 62 28 Psychology 87 87 75 43 Religion 81 79 55 29 Sociology 87 82 70 35
14
The choice of “learning to apply course material” by math, physics, and chemistry
instructors appears to contradict Biglan’s characterization of these as pure disciplines, but
the instructors may be interpreting the IDEA objective differently from Biglan’s
definition. Disciplines in which the same objectives as those in engineering were chosen
by over 70 percent of instructors were: accounting, computer science, design/applied art,
education, health professions, and nursing.[12] According to an IDEA group summary
report for “agricultural business and production and agricultural sciences,” the
agriculture-related courses also shared similar results, with 87 percent of instructors
choosing objective 1, 79 percent objective 2, 71 percent objective 3, and 68 percent
objective 4.[13] The dissimilarities among these disciplines implies that the objectives
are, as they are designed to be, widely applicable regardless of discipline, due to the
vague way in which they are worded.
2.2. Active Learning
Most engineering courses in the U.S. are taught primarily in a lecture mode,
although a number of professors use discussion or lab sessions to complement the
lectures. Of 3276 engineering courses rated using the IDEA forms between December
2001 and August 2003, instructors reported using “lecture” as the primary instructional
approach in 66 percent and as the secondary approach in 13 percent. “Laboratory” was
the secondary approach in 16 percent of the classes, and “discussion/recitation” was the
secondary approach in 19 percent.[13] Teaching approaches in other countries may
differ. For example, a recent study of engineering professors teaching first-year courses
at a small engineering college in the Netherlands found that about 25 percent of the
professors had a “teacher-centered conception,” in which the teacher was viewed as an
expert who “imparts information to students,” and 67 percent had a “student-directing
conception of teaching.” The student-directing view was characterized by a desire to
“stimulate and support student learning.” The professors planned and controlled a variety
of learning activities to engage the students and “cover a fixed amount of subject matter.”
The student-directing conception of teaching retains much instructor control but involves
the students more actively than lecturing alone.[14]

15
The Kolb learning cycle model emphasizes the need for students to interact with
course content in different ways in order to understand and retain it. “Students are …
more likely to internalize, understand, and remember material learned through active
engagement in the learning process.”[15] The effectiveness of a more active approach to
learning, referred to as active learning, has been demonstrated in numerous research
studies. Teaching methods promoting active learning are “instructional activities
involving students in doing things and thinking about what they are doing.”[16] Active
learning techniques have been used effectively in a number of disciplines, including in
several types of engineering courses, to improve student attitudes and learning. These
techniques vary widely, from using flashcards and “muddiest point” surveys to fully
student-centered studio classes. What they have in common is that students must take a
more active role in the learning process than simply listening and taking notes during a
lecture. In most cases, the focus is on in-class active methods rather than activities
outside of class.
2.2.1 Active Learning Studies
Active learning techniques have been used in many disciplines, including the
sciences, management, computer science, and engineering. Some examples are the use of
in-class cooperative learning exercises in a management course, and discussions, surveys,
and group activities in an upper-level computer science course.[17, 18] In most cases,
the focus of the articles is the methods used and the qualitative responses of the students,
without much attention to quantitative assessment of the results. Since most of the
instructors were trying to improve a course, they often included several methods and
changed exams and even course objectives. This makes the effectiveness of the
individual methods difficult to assess. Bonwell commented in 1991 that “most published
articles on active learning have been descriptive accounts rather than empirical
investigations,” and it does not appear that this situation has changed significantly.[16]
Miller and Cooper did attempt to assess student learning by giving an identical exam to
two parallel classes, one traditional and one non-traditional, but a number of data-
skewing factors complicated the analysis.[19]

16
Undergraduate science courses, particularly basic and non-major courses, were
the subject of many of these active learning studies. For example, Miller and Groccia
found that cooperative learning compared favorably with the traditional lecture approach
for introductory biology, in terms of “student satisfaction, the ability to find information
on one’s own, the acquisition of factual knowledge, and the ability to work with
others.”[20] McClanahan and McClanahan found that using active learning techniques
in a non-majors biology class helped the students “focus on and understand key concepts
of the course.”[21] Other studies were performed in basic courses in engineering, such
as mechanics and introductory design.[19, 22]
Some of the studies focused on particular methods, such as Mehta’s “flashcard”
method [23] or studio approaches, [22, 24, 25] or on combinations of methods.[19, 26,
27, 28, 29] These methods are discussed in more detail in Section 2.2.3. In general, the
student response to these methods was positive. For example, all the students in Mehta’s
study rated his method as “effective” or “very effective” in improving their learning in
the classroom.[23] As Felder points out in a summary of one study, “the results suggest
that active and cooperative learning methods facilitate both learning and a variety of
interpersonal and thinking skills, and that while these methods may initially provoke
student resistance, the resistance can be overcome if the methods are implemented with
care.”[30] In general, the literature suggests that active-learning methods are probably
effective, but data are lacking.
2.2.2 Active Learning Experiments in Engineering Education
The content of engineering courses places some constraints on the applicability of
active learning techniques. For example, unlike in humanities and social sciences, “much
of the basic content of engineering courses is not a matter of opinion,” and the student’s
reflections or emotional reactions are not relevant.[27] Unlike in the sciences, hands-on
laboratory experiments are often inappropriate or impractical. This section describes
active learning experiments that have been conducted in engineering courses.
Felder and others wrote a number of papers about a longitudinal study in chemical
engineering. In 1990-1991, he taught five consecutive undergraduate chemical
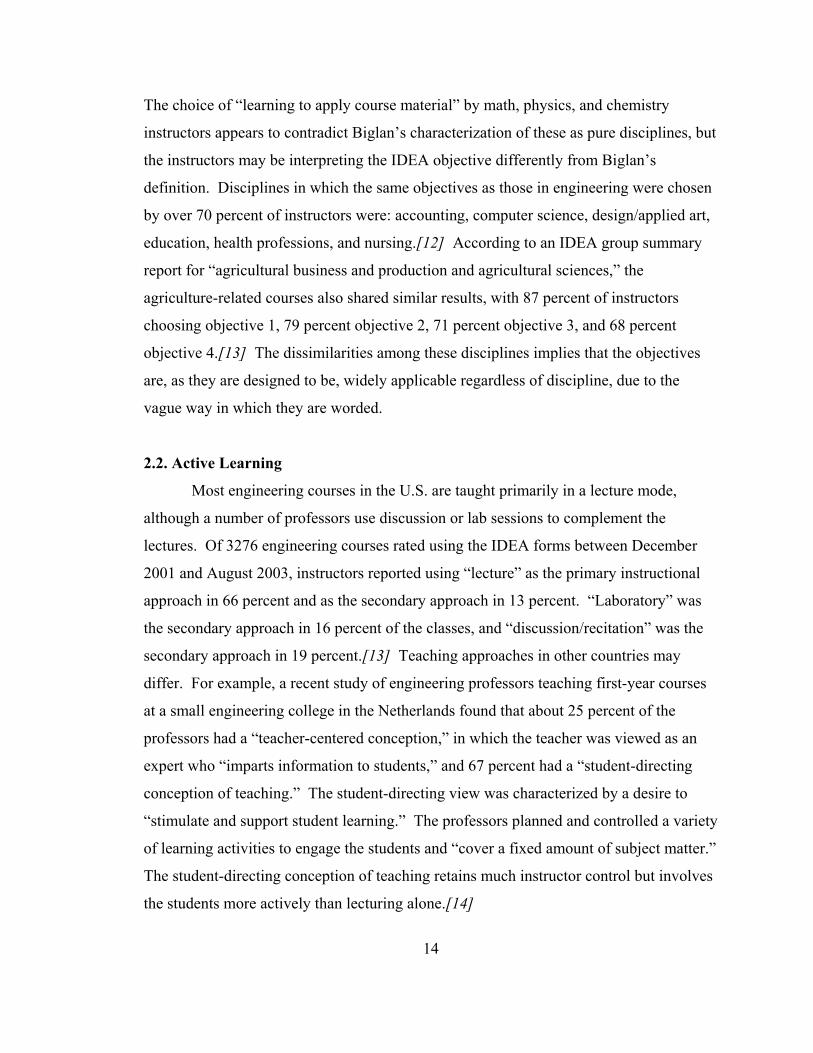
17
engineering courses using cooperative learning and other methods designed to address
different learning styles. One of those instructional methods was “extensive active and
cooperative learning.”[30] Each class session included lecture, problem-solving, and
small group exercises. The group exercises consisted of a variety of activities in two to
four-person groups, such as recall or response questions, parts of problems, derivations,
critical thinking questions, or question generation. Most of the exercises were five
minutes or less, although some were longer activities. In general, students responded
positively to Felder’s methods. The student ratings were “consistently and
overwhelmingly positive,” and their grade distribution was “markedly skewed toward
higher grades.”[27] The students in the experimental classes “outperformed the
comparison group on a number of measures, including retention and graduation in
chemical engineering.”[30] It is important to note, however, that Felder was not
assessing active learning alone, but in conjunction with other course improvements,
including “multidisciplinary problem and solution exercises” and “criterion-referenced
grading.”[30]
Blackwell used group discussion techniques in an upper-level course,
”Biomedical Electrical Systems.” Student groups of four or five chose four topics from a
list, read and discussed articles, answered questions, and completed an essay and problem
exam. This method allowed the class to cover material of interest to each group of
students in a collaborative fashion. The instructor found that the average grades in the
class improved by 13% and classroom participation increased.[31]
Todd developed an introductory course in manufacturing processes using a
variety of active techniques designed to appeal to all of Kolb’s learning styles. The
techniques included group presentations, lab work, team projects, and case studies. No
assessment of the results was provided.[9]
Several faculty at Harvey Mudd College experimented with a first-year course,
“Introduction to Engineering Design.” While always a project-based course, it was
redesigned for two semesters as an engineering design studio course in which the
students essentially taught themselves in groups through design problems, with the
instructors acting as facilitators and resources. They concluded that the studio method
18
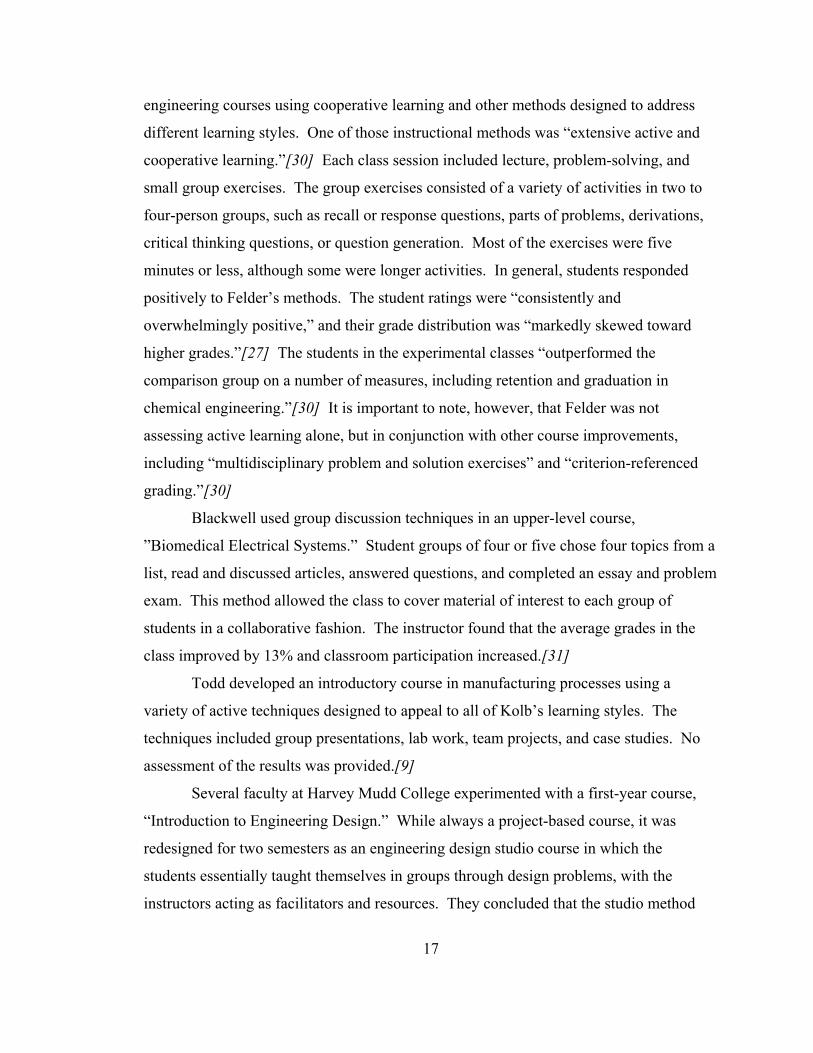
was effective in teaching design, but the students needed clear communication about
course expectations and grades since the format was unfamiliar to them.[22]
Faculty at the University of Washington developed new course materials to
incorporate design into a sophomore-level engineering mechanics of materials course that
had previously had no design component. These materials included hands-on activities,
computer simulations, and multimedia tools. The materials were used in an experimental
section with a new course approach involving design projects, group work, and
competency exams. The students completed open-ended group design projects, resulting
in written reports and oral presentations. There was no significant difference between the
performance of a “traditional” section of the course and this experimental section on an
identical final exam, and student responses to the new approach were positive. The
authors concluded that design concepts were successfully integrated into the mechanics
course without loss of effectiveness or content coverage.[19]
Faculty in MIT’s Aeronautics and Astronautics Department have increasingly
adopted active learning techniques within a lecture-based, sophomore-level course,
“Unified Engineering.” Student responses to the teaching methods on mid-term and end-
of-semester evaluations “reflected an overall positive attitude towards the active learning
techniques.” They gave high ratings to the effectiveness of in-class exercises, such as
concept tests and “turn-to-partner” exercises, and commented on the positive social
dynamics within the class.[28] No assessment of student performance was discussed in
the article, which focused on the process of adopting these teaching methods.
Koehn discussed the use of collaborative learning in a civil/construction
engineering course over ten years. The course used a combination of lectures, student
seminars, and a team design project. Results of student surveys indicated that students
preferred “thought-provoking questions and discussion” and “group interaction” to the
traditional teaching methods, although discussion was difficult to initiate at times. The
students appeared to have accepted and enjoyed the collaborative learning activities.[32]
In 2002, a senior-level Electrical Engineering course at Worcester Polytechnic
Institute that had previously involved lecture and lab sessions was offered in a new studio
format. The studio format included 25-minute lectures followed by either a lab exercise
19
or a simulation. Student feedback was positive, and initial results suggested that students
learned the material covered in the studio sections of the class better than they learned the
material covered in the lectures.[24]
2.2.3 Specific Techniques
Active learning can be accomplished inside or outside the classroom. Out-of-
class activities usually consist of homework or project assignments. Where instructors do
not explicitly provide activities, students often create their own, such as working on
homework in informal groups. In most cases the instructor has no supervision or control
over such activities.
Researchers have also developed or used a variety of techniques inside the
classroom to encourage active learning. The many in-class active learning techniques
found in the literature can be grouped into three categories based on the predominant
teaching format used: active interludes, which are brief student activities within a lecture;
class activities, such as discussions, that occupy a substantial portion of the class session;
and student-centered classes, which are primarily based on self or peer instruction.
An active interlude can be any brief activity included before, within, or after a
lecture. This format has also been described as an “enhanced lecture.”[15] The usual
purposes of an active interlude are to maintain or recapture student attention and
engagement, to provide feedback about student comprehension, or to provide feedback
about instructional methods. The simplest technique is to pause for approximately two
minutes at intervals during the lecture, to allow students to think about what has been
presented.[16, 33] Extensions of this idea include “reflective pauses,” in which students
answer a question or solve a problem related to the lecture,[34] and having students
compare notes during longer pauses.[33] Students can also be involved directly in the
lecture through brief, interactive demonstrations [16, 28, 35] or working at the
blackboard.[33] Feedback on student comprehension can be obtained through individual
activities such as reading quizzes [28, 33] or through whole-class activities such as
multiple-choice questions with some type of response system (e.g., flashcards, finger
signals).[23, 28, 33] Other individual activities include short writing exercises, partial

20
outlines, critical thinking questions, reading reflection, affective response, one-minute
papers, brainstorming, lists, matrices, and concept mapping.[16, 21, 27, 33, 35, 36]
These activities also make good starting points for small-group or whole-class
discussions. Techniques intended for pairs or small groups include “think, pair, share,”
debriefing, and thinking-aloud pair problem solving (TAPPS).[21, 26, 27, 35] Finally,
student responses to the class session can be solicited using “Plus/Delta charts,”
“muddiest-point” submissions, and of course formal student assessments of instructional
strategies.[21, 26, 28, 33]
Class activities are alternatives to lectures. They can substitute for a lecture or
accompany a shorter, “mini” lecture. Class activities discussed in the literature include
discussions, group work, interactive multimedia, and other exercises. Discussions can
focus on readings, case studies, individual assignments or group projects.[16, 33, 35, 36,
37] Small groups or individuals can use tools such as interactive computer programs or
multimedia workstations,[25, 36] do in-class “writing across disciplines,”[16] or work on
assignments with supervision.[34] Students can work on entire problems in groups or do
“jigsaw” group projects in which new groups are formed partway through the exercise to
become expert in specific topics, then reassemble with their original groups to continue
the exercise.[33, 36] Activities in some disciplines may include debates, drama, role-
playing, simulation, and games.[16, 33] Other disciplines are more conducive to pre-lab
or hands-on activities, or to modeling of skills by the instructor.[24, 29, 38] All
disciplines can benefit from active review sessions or practice tests before exams.[29, 33]
Two other techniques that are described in the literature are “just-in-time” teaching,
which involves instructors responding to student questions or topics, and the Osterman
feedback lecture, which is a structured series of mini-lectures with an accompanying
study guide for self-directed learning.[27, 34]
Student-centered classes turn the focus away from the instructor to the student.
The instructor’s role in the entire course becomes that of an observer or facilitator. Types
of student-centered classes discussed in the literature include cooperative learning,[16,
33, 35, 36] guided design,[16] mini-problem-based learning,[21] team learning,[27] peer
teaching,[16] and an engineering design studio format.[22]

21
Each of these categories contains some activities that are appropriate in
engineering courses. The “hard” nature of these courses, discussed in Section 2.1.4,
renders activities focusing on opinions or emotions, such as debates and affective
response, less useful. Many of the activities are well-suited to the “applied” nature of
engineering, since they focus on using the course material rather than simply memorizing
it. The choice of techniques for a particular course depends on the material that is to be
learned as well as any constraints on resources such as time and money.
2.3. Structuring Active Learning
2.3.1 Course Structure
While lecture-based courses are intrinsically highly structured and controlled by
the instructor, the structure of a course using active learning techniques requires more
planning. Courses intended for first-year students or introducing students to a discipline
need more structure than advanced courses, since both the content and the format are
unfamiliar. “Such structure may take the form of more lecture time, more quizzes and
other forms of interim feedback, more explicit and fewer open-ended tasks, and more
face-to-face support from course staff when doing long-term out-of-class projects.”[15]
Determining the activities to be completed inside and outside of class is one
important aspect of designing course structure. Walvoord identified three components of
learning: “first exposure,” “process,” and “response.”[39] First exposure activities
introduce students to course material, in the form of “new information, concepts, or
procedures;” process activities are those in which students analyze, synthesize, and apply
this material.[39] Response activities are those in which the teacher or other students
“respond to the student’s attempts at synthesis, analysis, problem-solving, or
application.”[39] Active learning methods would be considered process activities.
Traditionally, classroom time has been used for first exposure activities, primarily
lecturing, and process and response activities have taken place outside the classroom.
The result is a need for out-of-class support by the instructor or teaching assistant, since
students often need “explicit coaching” in problem-solving and application.[15] In other
words, they need to approach the problem or use the skill with knowledgeable guidance.

22
In classes of more than thirty students, it can be difficult for the instructor to provide
adequate support for activities outside the classroom. In these cases, more of the process
activities should be done during class time.[15] Walvoord and Pool suggest that teaching
can be more cost-effective if first exposure activities are largely completed outside of the
classroom and classroom time is used for process and response activities.[39] If the class
time is filled with process activities, there may be little time available for the instructor to
cover basic course content, so the responsibility for reading and understanding the
textbook and other resources (i.e., first exposure) falls heavily on the student. While this
might be acceptable in some courses, such as literature, where the emphasis is on analysis
and discussion of the reading, engineering students often need more guidance in and
explanation of important concepts and procedures than is offered by a textbook.
Computer software and other resources may be useful in this regard. Most importantly,
some combination of in-class and out-of-class activities that is acceptable to the instructor
and students should be sought.
Since most undergraduate students are less comfortable and familiar with active
learning techniques than with traditional lectures, it is important to communicate the
course format and expectations to them at the beginning of the course and to consistently
reinforce them. The course syllabus can be used to explain the course format, discuss the
responsibilities of students and instructor, and identify what is expected of students.[40]
2.3.2 Guidelines for Active Learning Exercises
“Nothing is gained by simply having students talk, listen, write, read, or reflect –
unless those activities are well structured and guided by teachers.”[40] To be effective,
guidelines must be established for the active learning exercise to structure it
appropriately.
Active learning methods that utilize small groups are often well-suited for
problem-solving and discussion. Simply putting students in groups, however, does not
help them learn. “How well small groups operate depends on the clarity of their
objectives, the parameters of the activity, and the guidelines agreed upon for
interaction.”[40] Students need to understand why they are doing the activity, what they
23
are supposed to do, and how they should behave as a group. Behavior guidelines can
vary from simple discussion rules to detailed assigned roles. For informal activities,
guidelines can include general points, e.g., one student should talk at a time, and the
others should listen. For larger groups or longer exercises, specific roles can be identified
and assigned to each member of the group.[40] Cooperative learning groups, for
example, may include a leader, a recorder, and an encourager. The responsibilities of
each role should be carefully spelled out.[17] In this way, the cooperation among
students is more structured and more likely to be effective.
Discussion guidelines are discussed by Meyers in the context of different
strategies: informal small groups, cooperative student projects, simulations, and case
studies.[40] The Institute for Learning at the University of Pittsburgh also addresses this
issue with the concept of “accountable talk.” Accountable talk is discussion that
promotes learning. Although developed for K-12 teaching, it has application to
undergraduates as well. This concept says that discussion should be held accountable “to
the learning community, to accurate and appropriate knowledge, and to rigorous
thinking.” Participants should listen to each other and respond to and further develop
what others say; their contributions should be accurate and supportable; and they should
use sound reasoning.[41] Such expectations should be clearly communicated to the
students, through the syllabus or in the exercises themselves.
2.4. Learning Outcomes
Assessment of student learning in higher-education programs in the engineering
fields, as well as in applied science, computing, and technology, is guided by the
accreditation requirements of the Accreditation Board of Engineering & Technology
(ABET). ABET’s 2004-05 criterion 3 for engineering programs specifies that graduates
must demonstrate:
a. an ability to apply knowledge of mathematics, science, and engineering;
b. an ability to design and conduct experiments, as well as to analyze and
interpret data;
c. an ability to design a system, component, or process to meet desired needs;
24
d. an ability to function on multi-disciplinary teams;
e. an ability to identify, formulate, and solve engineering problems;
f. an understanding of professional and ethical responsibility;
g. an ability to communicate effectively;
h. the broad education necessary to understand the impact of engineering
solutions in a global and societal context;
i. a recognition of the need for, and an ability to engage in life-long learning;
j. a knowledge of contemporary issues; and
k. an ability to use the techniques, skills, and modern engineering tools
necessary for engineering practice.[1]
Individual ABET-accredited engineering programs expand on these general
outcomes in discipline-specific, measurable “program outcomes.” For example, WPI’s
Department of Civil and Environmental Engineering has developed a set of eleven
program outcomes by which it assesses student learning within the civil engineering
program:
1. Preparation for civil engineering practice, including the technical,
professional, and ethical components.
2. Preparation for the future changes in civil engineering.
3. A solid understanding of basic principles of civil engineering (i.e., computers /
information technology, geographic positioning & measurements, solid /
structural mechanics, soil mechanics, fluid mechanics / hydrology, design &
problem-solving, construction materials, systems analysis & modeling,
engineering economics & risk management).
4. An understanding of appropriate scientific concepts, and an ability to apply
them to civil engineering.
5. An understanding of the engineering design process and an ability to perform
engineering design, which includes the multidisciplinary aspects of the design
process, the need for collaboration and communication skills, and the
importance of cost and time management.

25
6. An ability to set up experiments, gather and analyze data, and apply the data
to practical engineering problems.
7. In-depth understanding of at least one specialty within civil engineering.
8. Understanding of options for careers and further education, and the
educational preparation necessary to pursue those options.
9. An ability to learn independently.
10. The broad education envisioned by the WPI Plan, and described by the Goal
and Mission of WPI.
11. An understanding of the civil engineering profession in a societal and global
context.[42]
Transportation engineering is considered a “specialty” or concentration within
civil engineering. During the 2003-04 and 2004-05 academic years, courses in this area
included CE3050 Introduction to Transportation Engineering; CE3051 Introduction to
Pavement Materials, Design and Management; CE3054 Asphalt Technology; and
CE405X Highway Design. Learning objectives are developed for each course and
mapped to appropriate departmental measured outcomes. For example, for CE3050, the
learning objectives relate primarily to technical components of civil engineering practice;
basic principles of civil engineering (computers, problem-solving, and systems analysis
& modeling); an ability to gather, analyze, and apply data; in-depth understanding of a
civil engineering specialty (transportation engineering); and options for careers and
further education. The learning objectives identified for CE405X relate primarily to
basic principles of civil engineering (geographic positioning, design and problem-
solving); understanding of the design process and ability to perform design; in-depth
understanding of a civil engineering specialty (transportation engineering); and
understanding of the profession in a societal context.
2.5. Summary & Hypothesis
Current learning theory represents learning as an active process in which students
must do something with information in order to understand it. Students who encounter

26
different ways of interacting with the material, such as the steps in the Kolb learning
cycle, learn it more thoroughly. The idea of using active learning methods, now widely
accepted, grew out of these theories. In past studies, active learning methods have
seemed to result in greater understanding and more positive student responses to course
material, in comparison to traditional lectures. Most of these studies focused on courses
in the sciences and social sciences, and disciplinary differences may affect the objectives
and applicability of some methods.
While the uses and apparent success of active learning in other disciplines have
been discussed in many studies, the assessment of the effects of the techniques used has
often been incomplete or missing entirely. One way to assess the effectiveness of
different teaching methods is to evaluate how well the students demonstrate their mastery
of the course learning objectives.
The hypothesis of this research is that the use of in-class, active-learning methods
is significantly more effective in student achievement of some or all learning objectives
in a transportation engineering course than the traditional lecture and out-of-class group
activities. Assessment of the effectiveness of different teaching approaches, i.e., active-
learning methods and lecture methods, is a crucial part of the research presented in this
dissertation, and represents its primary contribution.

27
III. EXPERIMENTAL APPROACH
3.1. Scope
The literature reviewed in Chapter II indicates that active-learning methods are
likely to be effective in transportation engineering classes, but that prior studies have not
resulted in much quantitative assessment data. The objectives of this research were (1) to
develop experimental active-learning-based undergraduate curricula for highway design
and introductory traffic engineering courses, and (2) to assess the effectiveness of the
experimental traffic engineering curriculum through an educational experiment. The
project included the implementation of the experimental curricula and the collection and
analysis of student performance and attitude data from control and experimental classes.
A new course, CE405X Highway Design, was developed as a pilot study to test selected
active-learning techniques.
The primary research focus was CE3050 Introduction to Transportation
Engineering. Since the typical class size for CE3050 is 15 to 30 students, it was not
feasible to divide students enrolled in one offering of the course into control and
experimental groups. As a result, the experimental design used was quasi-experimental,
meaning it did not involve random assignment of students to groups. The nonequivalent
control group design was chosen, in which two treatment groups are pre-tested,
administered a treatment, and post-tested. The two groups were students enrolled in two
separate offerings of CE3050, and the two treatments were the control curriculum and the
experimental curriculum.
One variation from a conventional nonequivalent control group design was that
rather than administering the treatments to the two groups simultaneously, they were
treated consecutively, in two course offerings one year apart. To avoid influencing
student enrollment in the second group by changing the course format in the first
iteration, the experimental treatment was administered to the second group of students.
3.2. Participants
The subjects of this study were all undergraduate students enrolled in CE3050
28
during the 2003-04 and 2004-05 academic years and all undergraduate students enrolled
in CE405X during the 2003-04 academic year. The study included the initial offering of
CE405X and two offerings of CE3050, for a total of 84 participants in three groups (each
class was a group). The groups were self-formed by students’ enrollment in the courses.
3.3. Procedures
The primary objective of this research was to implement an experimental
curriculum for CE3050 and compare the resulting data to the data acquired in the control
class of CE3050. The control and experimental classes of CE3050 are described in more
detail in Chapter V.
All students in each CE3050 class completed a pre-test at the beginning of the
term to assess their initial knowledge of the subject matter and initial attitudes toward
transportation engineering. Both classes were guided by the same objectives, taught by
the same instructor, and used the same textbook. During the first offering of CE3050, in
fall 2003, I taught the class using the traditional lecture method with out-of-class reading
and homework assignments and traffic study “laboratory” activities. This is referred to in
this document as the “control class.” During the second offering, I used an active-
learning-based method along with lectures and out-of-class activities. This is referred to
in this document as the “experimental class.” The students in both classes took an exam
covering half of the learning objectives at mid-term, and on the other half of the learning
objectives at the end of the term. Near the end of the term, they also completed the IDEA
student ratings of instruction form and an attitudinal survey.
While developing the experimental CE3050 curriculum, I also developed and
taught a new undergraduate course in highway design, CE405X, using some of the active
learning techniques suggested by the literature review. That course is referred to in this
document as the “pilot course.” I used student feedback and data from CE405X in
developing the experimental CE3050 curriculum. Students in CE405X took a series of
quizzes based on the learning objectives, worked on a group design project, and
completed attitudinal pre- and post-surveys. The course is discussed in more detail in
Chapter IV.
29
3.4. Instruments
There are no standard instruments for measuring transportation engineering
knowledge or attitudes. I developed instruments for use in this study with the assistance
of WPI’s Center for Educational Development, Technology and Assessment (CEDTA).
Appendix A contains copies of the instruments used in CE405X, and Appendix B
contains copies of the instruments used in CE3050.
For both the control and experimental classes of CE3050, achievement of the
course learning objectives was assessed by a pre-test and two exams administered during
the course. Each exam addressed six of the twelve course learning objectives, which are
enumerated in Chapter IV. Student attitudes toward the course and toward transportation
engineering were assessed by pre- and post-surveys, supplemented by the IDEA student
ratings of instruction short form with ten additional questions.
For CE405X, achievement of the course learning objectives (enumerated in
Chapter IV) was assessed by a series of five quizzes and a group design project report.
Student attitudes were assessed by a pre-survey and an end-of-course teaching methods
survey, supplemented by the IDEA short form with no additional questions.
On the IDEA short form, students rate their progress on each of twelve general
objectives using a five-point scale on which 1 is “low” and 5 is “high.” The instructor
designates a subset of these objectives as “essential” or “important” for reporting
purposes. The student also responds to questions about his or her background, effort in
the course, desire to take the course, attitude toward the field of study, quality of the
instructor, and quality of the course. The IDEA Center reports both raw scores and
adjusted scores; the adjusted scores take into account student work habits, desire to “take
the course regardless of who taught it,” and class size.
30
IV. CE405X HIGHWAY DESIGN: PILOT COURSE
4.1. Curriculum Development
I designed CE405X as a new course in transportation engineering in which
students learn the basics of highway design. Although WPI’s civil engineering courses
do not have prerequisites, the suggested background is a surveying course and CE3050.
The course syllabus that I developed is included in Appendix A.
4.1.1 Selection of Content
The first step was to develop learning objectives based on the desired course
topics, which were to include the highway design process, horizontal and vertical
alignment, and cross-section elements. The objectives selected were that the students
would be able to:
• Choose or determine appropriate design controls (design vehicle, speed, volume, etc.).
• Design a roadway cross-section.
• Estimate earthwork volumes.
• Calculate required sight distances for road segments and intersections.
• Design a vertical curve.
• Design a horizontal curve.
• Design a bicycle lane, sidewalk, and/or crosswalk.
For textbooks, I chose an American Association of State Highway and
Transportation Officials (AASHTO) publication, A Policy on Geometric Design of
Highways and Streets, and a Federal Highway Administration (FHWA) publication,
Flexibility in Highway Design. The AASHTO book is the primary source of U.S.
highway design guidelines, and the FHWA publication encourages design engineers to
understand and utilize the flexibility inherent in those guidelines.

31
4.1.2 Teaching Methods
I used the learning objectives and the content of the textbooks to define the basic
outline of the course. The next task was to select appropriate teaching methods that fit
the objectives of the course and would provide useful feedback for the experimental
CE3050 curriculum. The literature review provided an extensive list of active-learning
methods, summarized in Section 2.2.3 of this report, which I narrowed down using
several criteria.
The criteria for selecting teaching methods were based on my teaching philosophy
and the practical constraints of the academic environment. My teaching approach shares
the responsibility of learning between the instructor and the students; I focus on helping
students learn where to find information, how to approach engineering problems, and
how to design solutions. Criteria developed from this philosophy were that teaching
methods must be appropriate for the content and discipline of the course, provide
opportunities for active participation by all students, and share active roles and
responsibility between the instructor and the students. The academic environment is
characterized by a desire to cover much course material in a short period of time at no
unnecessary expense. At WPI, undergraduate courses are completed in seven-week
terms, usually in 50-minute class sessions about four times a week, and students take
three courses per term. Criteria based on these factors were that teaching methods must
show potential for effectiveness, require a reasonable workload for both the students and
the instructor, and require little or no capital cost. In summary, the selection criteria
chosen were:
• appropriateness (i.e., for content, discipline, and audience),
• accessibility (i.e., opportunity for active participation by all students),
• potential for effectiveness (based on research literature),
• time efficiency (i.e., reasonable workload for students and instructor),
• shared responsibility (i.e., active roles and responsibility shared between
instructor and students), and
• low capital cost.

32
Appropriateness
The selected techniques were to be appropriate for both CE405X and CE3050,
since CE405X was serving as a pilot course to evaluate techniques for use in CE3050.
Both are undergraduate courses within civil engineering and emphasize facts, skills, and
application of knowledge. As described elsewhere in this document, both courses are
aimed primarily at juniors and seniors majoring in civil engineering, but there are no
prerequisite courses. CE3050 focuses on traffic engineering, and CE405X focuses on the
design of roadways.
Active interludes would be appropriate in both of these courses. These could
include pauses, reflective pauses, or note comparison; multiple-choice questions or
concept tests (with flashcards); brief interactive demonstrations or work at the
blackboard; reading quizzes; and short individual or group exercises. The exercises
could include “think, pair, share,” brainstorming, visual lists, sample problems, thinking-
aloud pair problem solving (TAPPS), matrix, critical thinking questions, or one-minute
papers. Some other activities mentioned in the literature, such as short writing exercises,
partial outlines, reading reflection, affective response, and concept mapping could be
appropriate in some sessions but probably not useful on a regular basis.
Class activities that may be appropriate include discussion of assignments or
group projects, supervised individual or group work, interactive computer programs or
multimedia workstations, modeling of skills by the instructor, active review sessions, and
the Osterman feedback lecture. Activities such as debates, drama, and role-playing have
little application within the course topics, and most topics are not conducive to hands-on
activities.
All the student-centered methods discussed in the literature could be appropriate.
These include mini-problem-based learning, guided design, cooperative learning, peer
teaching, team learning, and an engineering design studio.
Accessibility
All the methods mentioned above can be made accessible to all students. For
example, while class discussion can be dominated by a few vocal students, the instructor
33
can involve other students by techniques such as calling on students at random or grading
participation.
Potential for effectiveness
All the methods mentioned have potential for effectiveness, based on the literature
review. Some methods have been tested more thoroughly than others, but they all appear
to have some promise. The class activities and student-centered methods require careful
planning and facilitation to ensure that the class time is used effectively. Bringing these
types of activities into class rather than assuming they will occur outside of class will
allow instructor observation and guidance. “Ground rules” such as the guidelines for
accountable talk would be critical in these types of activities.
Time efficiency
All the techniques would require some out-of-class reading or work by the
students, based on the quantity and content of the material to be learned. Active
interludes require the least student time outside of class, and student-centered methods
probably require the most time.
The instructor workload is much more sensitive to teaching format than the
student workload. No or little additional instructor time is needed to incorporate pauses,
note comparison, or work at the blackboard into lectures, or to facilitate discussion of
group projects and assignments or supervised individual or group work. Some additional
instructor time is required to prepare multiple-choice questions, reading quizzes, concept
tests, brief interactive demonstrations, or short exercises. Pre-packaged interactive
computer programs, modeling of skills, and active review sessions are class activities that
require some additional instructor time as well. The instructor time requirements of
student-centered methods can be quite different from lecture-based classes, with much
time consumed in course planning and less in teaching. Developing study guides for
Osterman feedback lectures, new computer software, or multimedia presentations would
add greatly to an instructor’s workload, especially for the initial course offering, and thus
these methods were removed from consideration.

34
Shared active roles and responsibility
This criterion means that the instructor and the students should both have active,
meaningful roles in the class, and the responsibility for student learning should be shared
between them. Several methods were discarded from consideration because they did not
meet this criterion. Pauses alone do not involve the students actively, and interactive
demonstrations and student work at the blackboard usually involve only a few students.
On the other hand, supervised work and all the student-centered methods are heavily
weighted toward student activity and responsibility. The remaining methods strike more
of a balance between student and instructor activity and responsibility.
Little or no capital cost
None of the methods add substantial capital costs except interactive computer
software and multimedia workstations. These two methods were removed from
consideration.
Refined list of possible techniques
From the selection criteria and process described above, several techniques were
considered the most suitable for use in this research:
Active interlude methods:
• Note comparison
• Multiple-choice questions or concept tests (with flashcards)
• Short exercises/problems (think, pair, share or small group); could include
brainstorming, visual lists, sample problems, TAPPS, matrix, critical
thinking questions, one-minute paper
Class activity methods:
• Discussion of group projects / assignments
• Modeling of skills
• Active review sessions

35
I chose three of these methods for use in the pilot course: multiple-choice
questions, short exercises/problems, and discussion of group projects and assignments.
Several studies discussed in the literature review used similar methods, but none of those
studies quantified the relative effectiveness of the methods.[23, 27, 29]
Multiple-choice questions were used at the beginning of class sessions to
encourage completion of the reading assignments and to check comprehension of
concepts. Example questions are included in Appendix A. I printed each question on a
transparency and displayed it for the class. After allowing a few moments for thought, I
asked for raised-hand or oral responses. The responses were discussed but not graded.
Such questions were used in six class sessions, primarily in the first two weeks.
Most class sessions were lecture-based. Short exercises, primarily problem-
solving, were used as “active interludes” within the lectures. Rather than watching me
solve example problems, students attempted to solve problems individually and in small
groups.
I also created a design project and broke it down into numerous small pieces on
which student groups worked during class sessions. For example, after a mini-lecture on
design controls, each group selected an appropriate design speed and vehicle for its
roadway, and then the two groups compared and discussed their choices. Some
assignments were completed in class, while others were assigned as homework and
discussed during the following session. Guidelines for effective discussions, based
largely on the principles of accountable talk (see Section 2.3.2), were given out to the
students as part of the syllabus (included in Appendix A) and presented briefly during the
first class.
By combining these teaching methods, the course included the four steps in the
Kolb and 4MAT learning cycles, discussed in Section 2.1.2. The reading assignments
and, to some extent, the lectures provided the students with opportunities for reflective
observation. The lectures primarily served the purpose of conceptualization, since their
focus was on highway design concepts. The active interludes allowed the students to
actively experiment with the concepts by solving small problems. Finally, the design

36
project work and discussion provided “real-life” experience with the application of the
concepts.
4.1.3 Assessment
Student learning was assessed through a series of quizzes addressing the course
learning objectives and a group design project report. Each quiz consisted of four
multiple-choice questions and was intended to be completed in ten to twenty minutes.
The quizzes were closed-book, with the necessary tables and equation sheets provided,
similar to the format of the Fundamentals of Engineering exam.[43] The project reports
presented and discussed the design project that the student groups had worked on during
the course. The quizzes and project report guidelines and grading rubric are included in
Appendix A. The students also received grades for attendance and participation.
4.2. Student Profile
Six students participated in this course, including four seniors and one junior from
within the civil engineering department and one out-of-major junior. There were two
students, one male and one female, with a concentration in transportation; one female
with a concentration in environmental engineering; two males with a concentration in
structural engineering; and one male management engineering major. Four of the six
students had taken CE3050, one in term A02 (i.e., prior to this study) and three in term
A03 (i.e., the control class). Three had taken one or two courses related to pavements;
only one, the environmental engineering student, had taken a course in hydraulics. Five
had taken a course in AutoCAD, and at least two had taken a course in urban planning.
The CEE classes of 2004 and 2005 consisted of 41 and 54 students, respectively.
According to the class rankings as of March 2004, the highway design class included one
student ranked in the top 25% of the class; one in the second 25%; two in the third 25%;
and one in the last 25%. While WPI does not use grade point average (GPA) as a
measure of student performance due to the students’ ability to “NR” a course (i.e., have
no record of a failing grade), a GPA equivalent can be calculated by considering an A to
be worth four points, a B three points, and a C two points. The GPA equivalent for the

37
students in CE405X ranged from 2.62 to 3.65 as of March 2004.
4.3. Performance Data
The students completed five quizzes during the course to assess their
comprehension of the course material. Each quiz contained four multiple-choice
questions, and Quiz 5 also had a bonus question worth an extra 25 percent. All students
took Quizzes 1, 2, 3, and 5, and five students took Quiz 4. Individual scores on the
quizzes, shown in Table 4-1, ranged from 50 to 100 percent, with mean class scores
ranging from 83 percent on Quiz 5 to 92 percent on Quiz 2. The mean class score for
Quiz 4 was the average of five individual scores rather than six.
Table 4-1. Pilot Class Performance on Quizzes.
Quiz Scores (%) Student 1 2 3 4 5 Mean 1 75 100 100 75 75 85 2 75 50 75 N/A 75 69 3 100 100 100 75 100 95 4 75 100 75 100 50 80 5 100 100 100 100 125 105 6 100 100 75 100 75 90
Mean 88 92 88 90 83 87
The students submitted written reports in groups of three after completing their
class design projects. Qualitatively, these reports demonstrated a reasonably good
understanding of the course objectives. They were graded according to the rubric shown
in Appendix A and received scores of 88 and 99 percent.
Student performance was also assessed by their participation in in-class activities
and discussions. In the 28 classroom sessions, no student was absent more than twice;
there was a total of nine absences, four of which were discussed with me prior to class.
The students received participation scores of 90 to 100 percent, with a mean of 96
percent. When present, they all participated satisfactorily in the in-class activities.
Participation in discussion varied; sometimes the students became so interested and
involved in the discussion that it was necessary to intervene in order to move on to

38
another topic, while at other times much prompting from me was required to have any
discussion at all. Factors that appeared to discourage discussion included the time of day
(3 PM), warmth of the classroom, amount of work in other courses and projects, and
occasionally lack of preparatory reading.
4.4. Student Feedback & Lessons Learned
4.4.1 Student Surveys
The six students completed a short pre-survey, included in Appendix A, during
the first class session. In addition to basic demographic information (i.e., name, major
and concentration, and class year), the survey contained questions about course
background and interest in working in transportation engineering. The demographic
information and course background were discussed in the previous section. Four of the
six indicated that they were interested in working in the field of transportation
engineering; these included two concentrating in transportation, one in structural, and one
in management engineering.
During the last class session, the six students completed another survey focusing
on the teaching methods used in the course, also included in Appendix A. This survey
contained questions about whether each method was helpful in understanding the course
material and/or in assessing the student’s understanding, and whether the student enjoyed
the methods. Five or six students agreed that each of the following methods helped them
understand the course material: textbooks, other reading assignments, lectures, multiple-
choice questions in lectures, quizzes, discussion of quizzes, in-class activities, in-class
discussion, and group project work outside of class. Five or six students also agreed that
each of the following helped them assess their understanding of the course material:
multiple-choice questions in lectures, quizzes, discussion of quizzes, in-class activities,
in-class discussion, and group project work outside of class. Responses were mixed with
regard to the most helpful methods in both cases. The students were also asked which of
the teaching methods encouraged them to read the reading assignments before class. Five
agreed that lectures, quizzes, in-class activities, and in-class discussion encouraged them
to read; four indicated that group project work outside of class encouraged reading; and

39
three indicated that multiple-choice questions in the lectures encouraged reading. Five
students indicated that they “usually” read the assignment before class, and the other one
chose both “sometimes” and “usually,” apparently meaning something between the two
choices.
Since there were only six students in the class, it may be useful to look at
differences among the individual responses to the teaching methods. The students were
asked which methods were most helpful to them in understanding the course material and
assessing their understanding, as well as which methods most encouraged them to read
the assignments. Table 4-2 summarizes their responses and shows some demographic
information as well. Based on the student comments (not shown in the table), students #3
and #5 were particularly fond of the in-class activities. Both were male; one was a civil
engineering major specializing in transportation and one was a management engineering
major whose engineering concentration was civil/transportation.
Table 4-2. Student Responses to Teaching Methods in Highway Design.
ID Gender Area of study Class year
Understanding helped by
Assessing helped by
Reading encouraged by
1 Male Structural Junior Lectures Quizzes Quizzes 2 Female Environmental Senior Project (in &
out of class) Project work Lectures
3 Male Management engineering Junior Lectures Quizzes Reading
assignments 4 Male Structural Senior Lectures In-class
activities Quizzes
5 Male Transportation Senior Project (in & out of class)
Project work
In-class discussion
6 Female Transportation Senior Reading assignments
In-class discussion Lectures
Students’ teaching method preferences could possibly be related to their GPA
equivalent or class ranking. The students who chose project activities as most helpful to
understanding were ranked 6th and 40th in their class of 41 students, with GPA
equivalents of 3.65 and 2.62. The students who chose lectures as most helpful to
understanding were ranked at the middle of their classes and had GPA equivalents

40
ranging from 2.64 to 2.95.
All six students agreed that the textbooks used were well-suited to the course and
would be useful references after the course. Regarding classroom methods, none of the
students agreed with the statement, “The instructor lectured too much.” They all
indicated that they enjoyed the discussions and liked working on project-related activities
in class, and disagreed with the statement, “I think the in-class activities were a waste of
class time.” The suggestions for improvement included:
• More interactive work during class
• More actual examples of roads
• Site visit
• Guest speakers
• Bullet lists of methods and ideas for project
• Use of relevant software in class and maybe as homework
• Change class time to earlier in the day
The survey also asked, “How has your interest in working in highway design changed
after taking this course?” Interestingly, all six students chose the response, “more
interested now.”
All six students completed the short form of the IDEA student rating of
instruction. The IDEA report summarizing the results of the survey is included in
Appendix A. Table 4-3 shows the raw and adjusted scores for the measures of
effectiveness used, based on a five-point scale. I had designated one objective as
essential, “developing specific skills, competencies, and points of view needed by
professionals in the field most closely related to this course;” and two as important,
“gaining factual knowledge” and “learning to apply course material.” Students also rated
highly their progress on three objectives that I had not designated as essential or
important: “learning fundamental principles, generalizations, or theories;” “acquiring
skills in working with others as a member of a team;” and “acquiring an interest in
learning more by asking my own questions and seeking answers;” with raw scores of 4.8,
4.7, and 4.0 respectively. The objectives of “developing creative capacities” and

41
“learning how to find and use resources for answering questions or solving problems”
received raw scores of 3.5 and 3.7. All other objectives that I had not designated as
relevant scored well below 3.5.
Table 4-3. IDEA Score Summary for Pilot Highway Design Class.
Measure of Effectiveness or Progress Raw Score
Adjusted Score
Progress on essential objectives: Professional skills, viewpoints 4.5 4.1 Progress on important objectives: Factual knowledge 4.5 4.2 Apply course material 4.8 4.5 Improved student attitude 5.0 4.6 Overall excellence of teacher 4.7 4.4 Overall excellence of course 4.5 3.9
The “improved student attitude” measure was above the IDEA average for both raw and
adjusted scores. This measure is based on the survey statement, “As a result of taking
this course, I have more positive feelings toward this field of study,” to which all six
students responded, “definitely true.” The score supports the positive results of the exit
survey question, “How has your interest in working in highway design changed after
taking this course?”
4.4.2 Reflections on Teaching Methods
Three active-learning-based teaching methods were tested in this highway design
course: multiple-choice questions, short exercises/problems, and discussion of group
projects and assignments. The multiple-choice questions were intended primarily to
encourage and check completion of assigned reading. Since the content of the mini-
lectures often presumed that the students had read the assigned pages in their textbooks or
handouts, it was important to assess whether they had in fact done so. These types of
questions were used fairly regularly in the first weeks of the course, but it soon became
apparent that (1) the students were usually reading the assignments and thus found the
questions very easy, and (2) on the occasions when one or more students had not read the
assignment, they did not seem affected by whether they answered the questions correctly

42
or not. I had expected that answering an easy multiple-choice question incorrectly in the
presence of peers would be a negative stimulus that would encourage a student to read
the next assignment, but this did not seem to be the case. Probably these six students
were comfortable enough with one another that none were particularly embarrassed by
having the others witness their mistakes. A lack of such embarrassment was also evident
in the class discussions that followed each quiz. On the teaching methods survey, only
three of the six students indicated that multiple-choice questions in the lectures
encouraged reading, and none chose this method as the one that most encouraged them to
read.
Short exercises were used in almost every class session. Although presented as
small-group exercises, in most cases the students worked individually and then compared
answers within the small groups. This method appeared to be quite effective. Actually
solving a problem or choosing a design value in class often revealed complexities that
neither the reading or the mini-lecture had fully discussed. On several occasions, I
provided assistance or pointed out mistakes in students’ work, and the students
commented that they were glad to be helped at that time rather than receiving a graded
homework assignment with many corrections. The student response to this method on
the teaching methods survey was overwhelmingly positive. All six students indicated
that the in-class activities helped them understand the course material (five “strongly
agreed” and one “agreed”), and two students chose “project (in and out of class)” as the
most helpful methods in this regard; all six also agreed that these activities helped them
assess their understanding of the material (four “strongly agreed” and two “agreed”), and
one student indicated that the in-class activities were the most helpful method in such
self-assessment. All six agreed that they liked working on the project activities in class,
with three “strongly agreeing,” and all disagreed that it was a waste of class time, with
four “strongly disagreeing.” As discussed in Section 4.4.1, the two male students most
interested in working in transportation (one in civil engineering and one in management
engineering) were particularly pleased with the in-class activities.
Whole-class discussions were also used in almost every class session. After most
small-group exercises, each group reported back to the class (i.e., the other group and me)

43
and time was allowed for discussion. Although both groups were working on the same
basic roadway design scenario, their routes and design choices differed, so in most cases
there were two answers or choices to compare and discuss. Several class sessions near
the end of the course were also set aside for discussions of a series of case studies found
in one of the course textbooks. The discussion technique appeared to be effective in that
it provided opportunities to see some of the unforeseen effects of previous design
decisions and also to hear different perspectives. The student response to in-class
discussions was not as enthusiastic as the response to in-class activities. On the teaching
methods survey, all six students agreed that the in-class discussions helped them
understand the course material, but only one “strongly agreed” and none found this
method the most helpful; five students agreed that the discussions helped them assess
their understanding of the material, with three “strongly agreeing,” and one chose this
method as the most helpful in that regard. All six agreed that they enjoyed the
discussions, but only one “strongly agreed;” there were no comments about the
discussions, either positive or negative.
Discussions also occurred after each quiz so that all the students would know and
understand the correct answers to the quiz questions. Although they often became
instructor explanations rather than true discussions, this method appeared to be effective;
before moving on to a new topic, I waited for all the students to indicate that they
understood the correct answer and, where appropriate, the solution method. In most
cases that happened very quickly, sometimes simply by revealing the correct answer and
allowing the students to rethink the problem, so there was not much discussion required.
On the teaching method survey, five students agreed that this discussion of quizzes was
helpful in understanding the course material (two “strongly agreed”) and all six agreed
that it was helpful in assessing their understanding (one “strongly agreed”), but none of
them chose this method as the most helpful in either regard.
In summary, the in-class short exercises and discussions used in this course
seemed to be effective and well-received by the students. Students tended to view the
exercises as more helpful overall in understanding the course material and assessing their
understanding, while discussions were helpful primarily in assessing understanding. The

44
multiple-choice questions were not as useful as expected because they did not seem to
have a major impact on whether the students prepared for class by completing their
assigned reading; the lectures and quizzes were more likely to encourage the students to
read.
45
V. CE3050 INTRODUCTION TO TRANSPORTATION ENGINEERING: CONTROL AND EXPERIMENTAL CLASSES
One of the objectives of this research was to assess the effectiveness of an
experimental active-learning-based traffic engineering curriculum through an educational
experiment. The course used for this experiment was CE3050 Introduction to
Transportation Engineering. I taught a control class using the existing curriculum in A-
term (i.e., the first quarter) of 2003, and an experimental class using the active-learning-
based curriculum one year later, in A-term of 2004.
5.1. Curriculum Development
5.1.1 Course Content
In order to assess the effectiveness of the teaching methods independently of the
course content, the learning objectives and topics covered were kept the same for the
control and experimental classes. The course syllabi for both classes, which are
substantially the same, are included in Appendix B, including topic outlines and course
learning objectives. Topics covered in the course included an overview of transportation
modes, organizations and careers; characteristics affecting operations; transportation
networks and planning; functional classification of roads; traffic flow, capacity, and level
of service concepts; traffic engineering studies; sign and signal warrants; signal timing;
and traffic safety. The learning objectives that the students were expected to accomplish
were to be able to:
1. Identify organizations and careers involved in the design, construction and maintenance of transportation systems.
2. Explain how characteristics of people and vehicles affect transportation operations.
3. Determine the functional classification of a road.
4. Collect and analyze traffic data.
5. Apply the travel demand forecasting process to a basic planning scenario.
6. Use traffic flow models to illustrate the relationships among volume, speed and capacity.

46
7. Identify data needed to determine the level of service of a basic highway or freeway segment; describe or perform a level-of-service analysis.
8. Choose an appropriate control type for an intersection.
9. Develop a signal timing plan for a signalized intersection.
10. Determine the capacity of lane groups at a signalized intersection.
11. Identify data needed to determine the level of service of a signalized intersection; describe or perform a level-of-service analysis.
12. Use data to assess safety at an existing roadway segment or intersection.
The textbook used was Nicholas J. Garber and Lester A. Hoel’s Traffic and Highway
Engineering, Third Edition, 2002 (ISBN 0-534-38743-8).
5.1.2 Teaching Methods
Sessions for both the control and experimental classes were held from 3:00 to
3:50 PM, four days a week (Monday – Thursday), during the first seven-week term of the
school year (September – October). Both met in Room 116 of Kaven Hall at WPI.
For the control class, sessions consisted entirely of lectures, with the exception of
exams. In each class session, one or two learning objectives were addressed. These
learning objectives, along with a brief outline of the lecture, were displayed at the
beginning of the session. Lectures were primarily oral, with PowerPoint or transparency
slides and a chalkboard used to emphasize or illustrate important points or work
problems. Lectures followed a detailed outline that was available to students after class
on myWPI (campus Blackboard software) along with any PowerPoint slides. Student
interaction was in the form of responses to my prompting for questions or answers, as
well as a few group-building exercises near the beginning of the course.
For the experimental class, based on the experience with and feedback from the
pilot course discussed in Chapter IV, I decided to use a lecture-based format with active
interludes (i.e., exercises) and discussions. There were some differences between the
pilot and experimental classes that had to be considered. The experimental class was
expected to be much larger than the pilot class (i.e., over 30 students rather than six), and

47
due to limited equipment the lab groups would consist of four or five students, larger than
the three-person project groups in CE405X. Also, although both courses included
components of analysis and design, the topics in CE3050 were broader in scope and were
not well-suited to a coherent design project that could be broken down into in-class
exercises and discussion topics.
As a result of these differences, the format of the exercises and discussions was
altered somewhat. Most of the exercises were short problems to be solved by individuals
or pairs of students and then briefly discussed by the instructor. Other longer tasks were
related to the lab exercises and completed by the lab groups. Since the class was
expected to be larger, fewer opportunities for whole-class discussion were included,
replaced by discussion in small groups (i.e., two to five students) followed by debriefing.
I developed a series of exercises and discussion topics for the experimental class
to be incorporated into the lectures (included in Appendix B). For example, during the
third lecture, the following discussion topic was given:
A city engineer plans to install a stop sign at a 4-way intersection. The speed
limit on the approach is 40 mph, and the approach is on a +5% grade. What
affects the minimum distance from which the driver must be able to see the
stop sign in order to stop?
After taking suggestions and discussing possible factors, I introduced the class to the
standard equation for stopping sight distance and showed them how it was developed.
Then, instead of showing them an example, I gave them an exercise:
Calculate the total stopping distance required for the previous example and
compare your answer with a person beside you.
An outline of the lecture topics is also included in Appendix B. These topics
changed very little from the control class. Since the lecture time was somewhat less than
in the control class, I expected the students to have completed their reading assignments
prior to class. Rather than spending class time defining terms, I provided students with a
handout of important terms and definitions at the beginning of most class sessions to help
them recall the vocabulary used in the reading assignments. Thus, part of the “reflective
observation” in the Kolb learning cycle was moved outside of the classroom, and “active
48
experimentation” was added into the classroom in the form of the exercises and
discussions. As in the control class, lectures were primarily oral, with PowerPoint or
transparency slides and a chalkboard used to emphasize or illustrate important points or
work problems, and they followed a detailed outline that was available to students after
class on myWPI (campus Blackboard software) along with any PowerPoint slides. The
exercises and discussions were placed inside the lectures as active interludes or, in some
cases, occurred at the beginning or end of the class session.
5.1.3 Assessment
The assessment of student performance was the same for the control and
experimental classes, to allow comparisons between them. Assessment tools consisted of
a pre-test and two exams. The students also completed graded homework assignments
and group laboratory activities.
The pre-test was in the form of a knowledge survey, a tool suggested by Nuhfer
and Knipp for assessing “changes in specific content learning and intellectual
development.”[44] The students were given a set of fifteen sample final exam questions,
compiled from previous exams and course content, and asked to rate how confident they
were in their ability to answer the questions with their “present” (pre-course) knowledge.
The possible answers for each pre-test question were A, B, and C. Based on their current
knowledge, students were instructed to choose A if they were “confident that [they could]
now answer the question sufficiently for graded test purposes;” B if they could “answer at
least 50% of the question” or knew “precisely where [they] could quickly find the
necessary information and could then completely answer the question;” and C if they
were “not confident that [they] could adequately answer the question.” For analysis
purposes, responses A, B, and C were converted to numerical scores of 10, 5, and 0
respectively. Questions 1-5, 7-8, and 14-15 dealt with the first six learning objectives;
the other questions dealt with the remaining six objectives. The pre-test is included in
Appendix B.
Homework problems were assigned and due twice a week, on Tuesdays and
Thursdays. Most homework assignments consisted of two to three problems from the

49
textbook, although some were handouts that I created. Each assignment addressed one or
more of the course’s learning objectives. The homework assignments in the experimental
class were the same as for the control class.
Two laboratory activities (traffic data collection and analysis) were also assigned
for student groups to complete outside of class. These assignments are included in
Appendix B. In the first activity, each student group conducted a 24-hour traffic volume
count of a road segment, using an automatic data recorder (Jamar’s Trax I or NuMetrics’
Hi-Star NC-97), and a two-hour turning-movement and pedestrian volume count of an
intersection. The groups then produced reports and graphs of the data using appropriate
software. In the second activity, the student groups used the data collected in the first
laboratory to complete a preliminary study of the signalization of an intersection,
including performing a signal warrant analysis, developing a preliminary signal timing
plan, and performing a level-of-service analysis based on the timing plan. The students
in the control class completed all laboratory work outside of the classroom; for the
experimental class, some of the data analysis tasks for the lab assignments were begun
and discussed in the classroom. In both cases, the student groups submitted written
reports.
The students took two exams, one at approximately the middle of the term and the
other on the last day of the course. The exams were identical for the control and
experimental classes. The two exams were problem sets, each intended to assess six of
the twelve course learning objectives. Students were given approximately one hour to
complete each exam in class, and they were allowed to use any reference materials,
including textbooks and class notes. The exams are included in Appendix B.
5.2. Student Profile
Students enrolling in CE3050 are primarily juniors or seniors majoring in civil
engineering (CE). The characteristics of students enrolled in the control and
experimental classes are summarized in Table 5-1. The control class included 33 juniors
and seniors and one sophomore majoring in CE; their concentrations within CE included
construction project management, environmental engineering, structural engineering, and

50
transportation engineering. The other three students were a management engineering
junior, an actuarial math junior, and a mechanical / fire protection engineering senior.
The students in the experimental class were all CE majors, including 33 juniors and
seniors, two transfer students, and six sophomores; their concentrations within CE
included construction project management, environmental engineering, structural
engineering, and transportation engineering, with over half focusing on structural
engineering.
The class rankings are also shown in Table 5-1 for the juniors and seniors
majoring in CE. These rankings represent the students’ performance compared to other
students in the same class year within the WPI Department of Civil and Environmental
Engineering. The ranking information was updated in March 2004 for the control class
and November 2004 for the experimental class. The experimental class also included six
CE sophomores, two ranked in the top quarter of their class, one in the second quarter,
one in the third quarter, and two in the last quarter.
Table 5-1. Characteristics of Students in Control and Experimental Classes.
Control Class (A2003) Experimental Class (A2004)Gender 27 male
10 female 34 male 7 female
Year of study 20 seniors 16 juniors 1 sophomore
15 seniors 18 juniors 6 sophomores
Major field of study & concentration
34 Civil Engineering - 8 project management - 4 environmental - 11 structural - 4 transportation - 6 undecided / other - 1 unknown
1 Management Engineering 1 Actuarial Math 1 Mechanical / Fire
Protection Engineering
41 Civil Engineering - 6 project management - 5 environmental - 21 structural - 4 transportation - 5 undecided / other
Class rankings within department (CE juniors and seniors only)
8 in top 25% 11 in second 25% 6 in third 25% 6 in lowest 25%
8 in top 25% 8 in second 25% 6 in third 25% 11 in lowest 25%

51
The control and experimental classes contained fairly representative samples of
the juniors and seniors majoring in CE at WPI during the study period, as shown in Table
5-2. This table compares the two classes to the CE classes of 2005 and 2006 in terms of
gender, class year, and GPA equivalent.
Table 5-2. Characteristics of Civil Engineering Juniors and Seniors. CE Juniors and Seniors In Control Class
(as of Mar 2004) In Experimental Class
(as of Nov 2004)
All Students in CE Classes of 2005 & 2006
(as of Nov 2004) Gender 73% male
27% female 83% male
17% female 77% male
23% female Year of study 58% seniors
42% juniors 45% seniors 55% juniors
48% seniors 52% juniors
GPA Equivalent Mean Range
3.10
2.48-3.92
2.95
2.13-4.00
3.03
2.13-4.00 5.3. Assessment Data
The students completed the pre-test during the first class session of the term.
Thirty-three of the 37 students in the control class and all 41 students in the experimental
class participated in the pre-testing; the others were absent or had not yet joined the class.
For the control class, mean scores on the test items ranged from two percent on questions
9 and 13 to 47 percent on question 11, and student scores for the entire pre-test ranged
from zero to 43 percent, with a mean of 21 percent and standard deviation of 12 percent.
For the experimental class, mean scores on the test items ranged from one percent on
questions 9 and 13 to 45 percent on question 1, and individual scores for the entire pre-
test ranged from 3 to 77 percent, with a mean of 21 percent and standard deviation of 15
percent. The mean scores and standard deviation for each question, for the two objective
sets, and for the entire test are shown in Table 5-3; detailed data are included in Appendix
C as Tables C-1 and C-2.

52
Table 5-3. Summary of Responses to Pre-test Questions.
Control Class Experimental Class Difference Mean
(%) Std Dev
(%) Mean (%)
Std Dev (%)
in Means (%)
Q1 44 24 45 31 +1 Q2 42 40 43 37 +1 Q3 32 35 20 31 -12 Q4 17 30 22 31 +5 Q5 17 30 17 28 0 Q6 14 29 21 28 +7 Q7 14 29 22 28 +8 Q8 41 34 41 33 0 Q9 2 9 1 9 -1 Q10 23 33 24 29 +1 Q11 47 39 38 30 -9 Q12 5 15 6 23 +1 Q13 2 9 1 9 +7 Q14 6 17 9 22 +3 Q15 8 18 11 26 +3 Pre-test Total 21% 12% 21% 15% 0% Objective Set 1 24% 14% 25% 15% +1% Objective Set 2 15% 13% 15% 12% 0%
At about the middle of the seven-week term, the students took the first exam. The
control class scores ranged from 59 to 97 percent, with a mean of 80 percent and standard
deviation of 11 percent. The experimental class scores ranged from 69 to 100 percent,
with a mean of 85 percent and standard deviation of 8.3 percent. Table 5-4 summarizes
the scores for each test question; detailed data are included in Tables C-3 and C-4 in
Appendix C.
During the last day of class, the students took the second exam. The control class
scores ranged from 19 to 93 percent, with a mean of 70 percent and standard deviation of
17 percent. The experimental class scores ranged from 15 to 104 percent, with a mean of
65 percent and standard deviation of 17 percent. Table 5-5 summarizes the scores for
each test question; detailed data are included in Tables C-5 and C-6 in Appendix C.

53
Table 5-4. Summary of Performance on Exam 1.
Control Class Experimental Class Difference Mean Std Dev Mean Std Dev in Means Q1 80% 14% 79% 18% -1 Q2 89% 18% 91% 15% +2 Q3 57% 27% 65% 29% +8 Q4 78% 28% 91% 12% +13 Q5 94% 23% 92% 26% -2 Q6 95% 10% 97% 11% +2 Q7 88% 20% 95% 22% +7 Q8 77% 22% 74% 22% -3 Total 80% 11% 85% 8% +5
Table 5-5. Summary of Performance on Exam 2.
Control Class Experimental Class Difference Mean Std Dev Mean Std Dev in Means Q1 50% 40% 40% 42% -10 Q2 48% 33% 28% 40% -20 Q3 80% 16% 81% 25% +1 Q4 88% 29% 92% 22% +4 Q5 77% 26% 80% 22% +3 Q6 66% 38% 42% 47% -24 Q7 67% 30% 72% 35% +5 Q8 88% 29% 89% 29% +1 Total 70% 17% 65% 17% -5
Each exam assessed student knowledge of six of the course learning objectives.
The student exam scores for each objective are summarized in Table 5-6; detailed data
are included in Tables C-7 and C-8 in Appendix C.

54
Table 5-6. Summary of Exam Performance by Objective.
Control Class Experimental Class Difference Objective Mean Std Dev Mean Std Dev in Means
1 77% 22% 74% 22% -3 2 95% 10% 97% 11% +2 3 80% 15% 79% 18% -1 4 89% 18% 91% 15% +2 5 57% 27% 65% 29% +8 6 82% 20% 92% 11% +10 7 80% 16% 79% 26% -1 8 48% 33% 25% 38% -23 9 77% 26% 80% 25% +3 10 77% 26% 66% 27% -11 11 74% 24% 78% 28% +4 12 50% 40% 41% 42% -9
Student performance on homework and laboratory assignments was not included
in the analyses. These activities were completed outside of class and were unsupervised.
Not all the students completed every homework assignment, and the assignments were
graded by a different teaching assistant for each class. I graded the laboratory
assignments, but they were group assessments rather than measures of individual
performance.
5.4. Attitudinal Data
Student attitudes toward the course and toward transportation engineering were
assessed by a pre-survey and a post-survey, supplemented by the IDEA student rating of
instruction form.
The pre-survey consisted of five multiple-choice questions and seven statements
for which the students were to indicate whether they agreed or disagreed. It was
completed by 34 of the 37 students in the control class and 40 of the 41 students in the
experimental class as part of their first homework assignment, using the myWPI survey
feature. Since surveys on myWPI are anonymous, the results were reported on an
aggregate basis. Based on the data from the survey and other sources, the students in the
control class who did not respond to the survey were one senior and two juniors majoring

55
in civil engineering, and in the experimental class, one sophomore majoring in civil
engineering. In the experimental class, three students who later dropped the course also
took this survey, and due to the fact that the survey results could not be disaggregated,
their responses had to be included in the analysis.
Part of the survey focused on expectations about the course. The responses to
these questions are summarized in Table 5-7. The most common response to the
question, “Which of the following affected your decision to take this course?” was
“curiosity about transportation engineering,” which supports the department’s treatment
of this course as a “breadth course,” one which students take to explore an area of civil
engineering.
Table 5-7. Student Expectations Regarding CE3050.
Survey Item Control Class Experimental Class Which of the following affected your decision to take this course? (Choose all that apply.)
79% (26): Curiosity about transportation engineering
38% (13): Interest in transportation engineering as a career option
29% (11): Course reputation for being fun/interesting
26% (9): Interesting course description in the course catalog
9% (3): Good instructor reputation
6% (2): Course reputation for being easy
6% (2): Good student course evaluation results
67% (29): Curiosity about transportation engineering
33% (14): Interest in transportation engineering as a career option
16% (7): Course reputation for being fun/interesting
16% (7): Interesting course
description in the course catalog
16% (7): Good instructor reputation
9% (4): Course reputation for being easy
2% (1): Good student course evaluation results
I expect this course to be boring.
79% (27) disagreed 21% (7) neutral 0% (0) agreed
65% (28) disagreed 35% (15) neutral 0% (0) agreed
I expect this course to be challenging.
0% (0) disagreed 68% (23) neutral 32% (11) agreed
2% (1) disagreed 68% (61) neutral 29% (37) agreed
I expect the material covered in this course to be useful in my career.
3% (1) disagreed 15% (5) neutral 82% (28) agreed
0% (0) disagreed 23% (10) neutral 77% (33) agreed
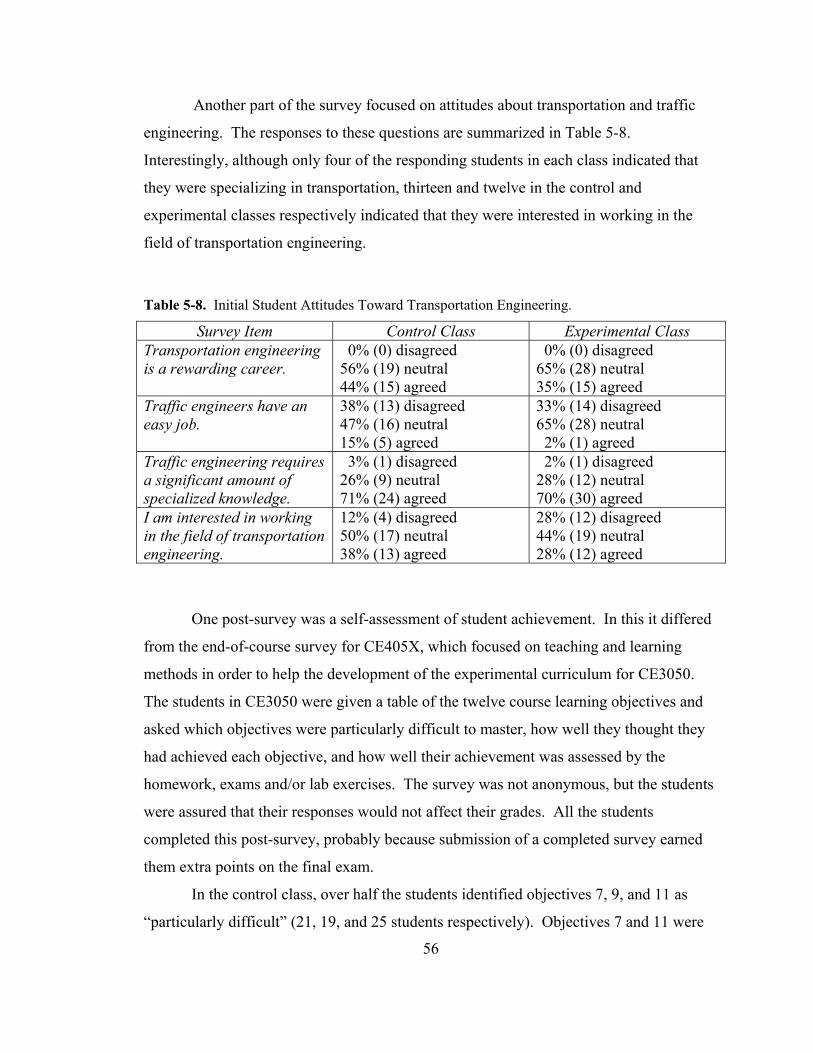
56
Another part of the survey focused on attitudes about transportation and traffic
engineering. The responses to these questions are summarized in Table 5-8.
Interestingly, although only four of the responding students in each class indicated that
they were specializing in transportation, thirteen and twelve in the control and
experimental classes respectively indicated that they were interested in working in the
field of transportation engineering.
Table 5-8. Initial Student Attitudes Toward Transportation Engineering.
Survey Item Control Class Experimental Class Transportation engineering is a rewarding career.
0% (0) disagreed 56% (19) neutral 44% (15) agreed
0% (0) disagreed 65% (28) neutral 35% (15) agreed
Traffic engineers have an easy job.
38% (13) disagreed 47% (16) neutral 15% (5) agreed
33% (14) disagreed 65% (28) neutral 2% (1) agreed
Traffic engineering requires a significant amount of specialized knowledge.
3% (1) disagreed 26% (9) neutral 71% (24) agreed
2% (1) disagreed 28% (12) neutral 70% (30) agreed
I am interested in working in the field of transportation engineering.
12% (4) disagreed 50% (17) neutral 38% (13) agreed
28% (12) disagreed 44% (19) neutral 28% (12) agreed
One post-survey was a self-assessment of student achievement. In this it differed
from the end-of-course survey for CE405X, which focused on teaching and learning
methods in order to help the development of the experimental curriculum for CE3050.
The students in CE3050 were given a table of the twelve course learning objectives and
asked which objectives were particularly difficult to master, how well they thought they
had achieved each objective, and how well their achievement was assessed by the
homework, exams and/or lab exercises. The survey was not anonymous, but the students
were assured that their responses would not affect their grades. All the students
completed this post-survey, probably because submission of a completed survey earned
them extra points on the final exam.
In the control class, over half the students identified objectives 7, 9, and 11 as
“particularly difficult” (21, 19, and 25 students respectively). Objectives 7 and 11 were

57
to “identify data needed to determine the level of service of a basic highway or freeway
segment (7) and a signalized intersection (11) and describe or perform a level-of-service
analysis;” objective 9 was to “develop a signal timing plan for a signalized intersection.”
Not surprisingly, the class as a whole rated their achievement of these three objectives
most poorly as well. In the experimental class, over half the students identified
objectives 9, 10, and 11 as “particularly difficult” (29, 24, and 26 students respectively).
These objectives were closely related: to “develop a signal timing plan for a signalized
intersection” (9), “determine the capacity of lane groups at a signalized intersection” (10),
and “identify data needed to determine the level of service of a signalized intersection
and describe or perform a level-of-service analysis” (11). This class as a whole rated
their achievement of these three objectives most poorly. The objectives rated by both
classes as “particularly difficult” were relatively complex tasks, requiring a number of
steps to solve a problem. The intersection-related objectives were also included in the
second laboratory assignment, and the challenge of applying the concepts and procedures
to a real-life problem may have magnified their difficulty in the eyes of the students.
In the control class, the students’ average rating of their own achievement ranged
from 2.7 to 4 (on a numerical scale of 1 to 4, 4 being the highest score), and the average
ratings for objectives 7, 9, and 11 were 2.8, 2.9, and 2.7 respectively. In the experimental
class, the students’ average rating of their own achievement ranged from 2.6 to 4, and the
average ratings for objectives 9, 10, and 11 were 2.7, 2.8, and 2.6 respectively.
Interestingly, in both classes the students’ self-assessment of achievement of the
objectives varied considerably from the apparent achievement based on homework, lab,
and exam grades, as shown in Table 5-9. The students’ average rating of the quality of
the assessment tools (i.e., labs and exams) for each objective ranged from 3.1 to 3.7 on
the same scale in the control class, and from 2.8 to 3.5 in the experimental class; the
overall average ratings were 3.4 and 3.2, respectively.
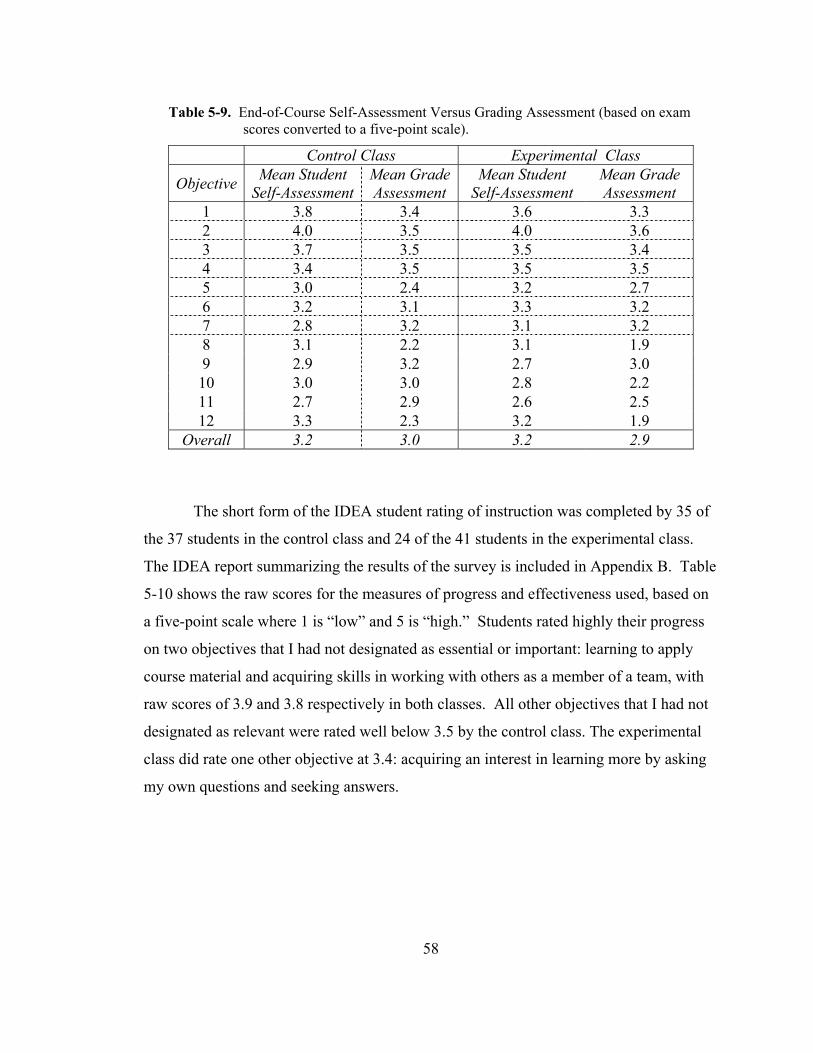
58
Table 5-9. End-of-Course Self-Assessment Versus Grading Assessment (based on exam scores converted to a five-point scale).
Control Class Experimental Class
Objective Mean Student Self-Assessment
Mean Grade Assessment
Mean Student Self-Assessment
Mean Grade Assessment
1 3.8 3.4 3.6 3.3 2 4.0 3.5 4.0 3.6 3 3.7 3.5 3.5 3.4 4 3.4 3.5 3.5 3.5 5 3.0 2.4 3.2 2.7 6 3.2 3.1 3.3 3.2 7 2.8 3.2 3.1 3.2 8 3.1 2.2 3.1 1.9 9 2.9 3.2 2.7 3.0 10 3.0 3.0 2.8 2.2 11 2.7 2.9 2.6 2.5 12 3.3 2.3 3.2 1.9
Overall 3.2 3.0 3.2 2.9
The short form of the IDEA student rating of instruction was completed by 35 of
the 37 students in the control class and 24 of the 41 students in the experimental class.
The IDEA report summarizing the results of the survey is included in Appendix B. Table
5-10 shows the raw scores for the measures of progress and effectiveness used, based on
a five-point scale where 1 is “low” and 5 is “high.” Students rated highly their progress
on two objectives that I had not designated as essential or important: learning to apply
course material and acquiring skills in working with others as a member of a team, with
raw scores of 3.9 and 3.8 respectively in both classes. All other objectives that I had not
designated as relevant were rated well below 3.5 by the control class. The experimental
class did rate one other objective at 3.4: acquiring an interest in learning more by asking
my own questions and seeking answers.

59
Table 5-10. IDEA Score Summaries for CE3050.
Measure of Progress/Effectiveness Raw Scores for Control Class
Raw Scores for Experimental Class
Progress on essential objectives: Factual knowledge 4.0 4.1 Principles and theories 3.9 3.9 Progress on important objectives: Professional skills, viewpoints 3.9 4.0 Use of resources to answer questions 3.5 3.6 Improved student attitude 3.6 3.8 Overall excellence of teacher 3.4 3.9 Overall excellence of course 3.6 3.5
The ten “extra questions” that I developed for the IDEA form are included in
Appendix B. Seven of the additional questions were agree/disagree statements similar to
the ones on the pre-survey, two were questions about the learning activities used in the
course, and one identified the student’s area of concentration within civil engineering to
help match the responses to the pre-surveys. Unfortunately, only 18 of the students in the
experimental class responded to these extra questions, probably due to lack of time.
The students were first asked to choose one item from a list as the most helpful in
learning the course material. In the control class, 47 percent of the respondents chose
homework, 35 percent chose lecture notes and slides on MyWPI, fifteen percent chose
lectures, and three percent chose lab exercises. In the experimental class, 67 percent
chose homework, 22 percent chose lecture notes and slides on MyWPI, six percent chose
lectures, and six percent chose lab exercises.
The students were also asked to agree or disagree, on a scale of 1 to 5, with eight
statements. Seven of the statements were similar to those on the pre-survey, and the
results are compared in Table 5-11. Responses of 1 or 2 (“strongly disagree” or
“disagree”) were grouped together as “no;” responses of 4 or 5 (“agree” or “strongly
agree”) were grouped as “yes;” responses of 3 were neutral and are not included in the
table. Overall, the student responses in the control class indicated a less positive attitude
toward transportation engineering in general and this course in particular after the course
than before it. In the experimental class, the student responses indicated a less positive

60
attitude toward the course but slightly more positive attitudes toward transportation
engineering in general. The majority of the students in both classes indicated that they
did not read the reading assignments on a regular basis.
Table 5-11. Student Expectations and Reactions (based on surveys).
Pre-Survey IDEA Form Summary of Statement Control Experimental Control Experimental I expect this course to be boring. (This course was boring.)
0% yes 79% no
0% yes 65% no
49% yes 14% no
17% yes 44% no
The material covered in this course will be useful to me in my career.
82% yes 3% no
77% yes 0% no
20% yes 63% no
39% yes 28% no
I expect this course to be challenging. (This course was challenging.)
32% yes 0% no
29% yes 2% no
26% yes 31% no
33% yes 11% no
Transportation engineering is a rewarding career.
44% yes 0% no
35% yes 0% no
29% yes 23% no
44% yes 11% no
Traffic engineers have an easy job. 15% yes 38% no
2% yes 33% no
23% yes 23% no
6% yes 67% no
Traffic engineering requires significant specialized knowledge.
71% yes 3% no
70% yes 2% no
43% yes 14% no
78% yes 12% no
I am interested in working in the field of transportation engineering.
38% yes 12% no
28% yes 28% no
14% yes 37% no
17% yes 55% no
I read the reading assignments on a regular basis. N/A N/A 17% yes
60% no 12% yes 50% no
All the student comments written on the IDEA form are included in Appendix B.
Most comments were suggestions for improvement in the course. Comments about
teaching methods from the control class included:
• “While I liked the course and did find it challenging, I often found myself
day-dreaming during class and never felt compelled to listen in lecture. I
would suggest that lecture be more engaging and require the participation of
students.”
• “I think that this course could have been more useful and fun had we seen
more real world application examples.”
61
• “There could have been something to make the class more interesting. A field
trip / videos would have been helpful.”
• “Method of teaching was frustrating – I often felt like I was learning more
from notes online and book despite going to class everyday. Labs and such
could have been really fun (overall material is interesting, just presentation is
so dry and full of calculations), but weren’t. Prof seems excited and interested
in topics, but couldn’t really share her enthusiasm.”
Comments about teaching methods from the experimental class included:
• teaching methods: “Good!”
• “Labs were helpful – need more!!”
• “Suggestion: more field work. Teaching methods: maybe class time could be
more upbeat and interesting with people getting involved in discussion.”
• “In class exercises not useful.”
• “No improvements. I enjoyed the [teaching] methods she used.”

62
VI. ANALYSIS OF DATA FROM CE3050 CLASSES
6.1. Pre-test and Post-test Scores
The datasets from the control and experimental classes consist of: pre-test scores
for objective sets 1 and 2; post-test scores for objective set 1 (mid-term exam) and
objective set 2 (final exam); pre- and post-survey questions; and summary scores from
the IDEA forms. Objective set 1 is comprised of the first six CE3050 course objectives,
while objective set 2 is the remaining six objectives. Table 6-1 shows descriptive
statistics for each pre-test and post-test: mean scores, standard deviations (“SD”), and
skewness (“skew”). Skewness is a measure of the lack of symmetry in the score
distribution; a negative skewness value indicates that the data is skewed to the right of the
normal distribution.
Table 6-1. Descriptive Statistics for Pre-test and Post-test Scores.
Control Class Experimental Class Test Mean SD Skew Mean SD Skew Pre-test: objective set 1 24.5 14.0 0.36 25.5 14.9 1.76 Pre-test: objective set 2 15.1 13.1 0.47 15.2 12.1 2.25 Post-test: objective set 1 80.5 10.5 -0.18 84.8 8.3 0.09 Post-test: objective set 2 70.9 16.4 -1.15 64.8 17.0 -0.55
6.1.1 Initial Knowledge
Figures 6-1 and 6-2 compare the control and experimental classes’ pre-test scores
for each objective set. Pretest scores of the two groups were compared using the t-test for
independent samples (see Equation 1). A t-value of at least ±1.9960 would indicate a
significant difference between the two groups at a 95 percent confidence level. For the
pretest scores on the first set of objectives, t = -0.2877, and for the second set of
objectives, t = -0.0256. These values indicate that there was not a significant difference
between the two groups’ average initial perception of their knowledge of course content.

63
Equation 1. T-test for independent samples.
,11
21
21
21
+
+
−=
nndfSSSS
XXt where
( )
( )∑ ∑
∑ ∑
−=
−=
2
222
22
1
212
11 ,
nX
XSS
nX
XSS
221 −+= nndf
Pre-Test Scores: Set 1
0%5%
10%15%20%25%30%35%
0-10 11-20 21-30 31-40 41-50 51-60 61-70 71-80 81-90 91-100
Score
% o
f cla
ss
ControlExperimental
Figure 6-1. Pre-test Scores for Objective Set 1.
Pre-Test Scores: Set 2
0%10%20%30%40%50%60%
0-10 11-20 21-30 31-40 41-50 51-60 61-70 71-80 81-90 91-100
Score
% o
f cla
ss ControlExperimental
Figure 6-2. Pre-test Scores for Objective Set 2.

64
6.1.2 Change in Knowledge During Course
Scores from the mid-term exam, representing achievement of one set of learning
objectives, were compared to the pre-test scores on objective set 1 using the t-test for
non-independent samples (see Equation 2). The same test was used to assess changes in
knowledge of the second set of objectives based on the end-of-term exam.
Equation 2. T-test for non-independent samples.
, where D = difference between matched pairs, N = number of pairs (15), and
df = N-1
For the control class, the dataset included 33 sets of scores, since four students did
not take the pretest; thus a t-value of at least ±2.038 would indicate a significant
difference between the pretest and posttest scores at 95 percent confidence. The actual t-
values for objective sets 1 and 2 were 15.77 and 15.92, respectively. These values
indicated a positive change that was significant at 99.9 percent confidence.
For the experimental class, the dataset included 41 sets of scores; thus a t-value of
at least ±2.021 would indicate a significant difference at 95 percent confidence. The
actual t-values for objective sets 1 and 2 were 20.19 and 19.33, respectively, which
indicated a positive change significant at 99.9 percent confidence.
Clearly, both the control and experimental treatment (teaching methods) resulted
in student learning.
6.1.3 Achievement of Learning Objectives
The main question in this study was whether the method of instruction affected
the students’ learning or attitudes. The post-test scores for each class are shown in
Figures 6-3 and 6-4.
( )dfN
NDD
Dt
×
−
=∑∑
22

65
Post-test: Set 1
0.05.0
10.015.020.025.030.035.040.0
0-10 11-20 21-30 31-40 41-50 51-60 61-70 71-80 81-90 91-100
Score
% o
f cla
ss ControlExperimental
Figure 6-3. Post-test Scores on Objective Set 1.
Post-test: Set 2
0.0
5.0
10.0
15.0
20.0
25.0
30.0
0-10 11-20 21-30 31-40 41-50 51-60 61-70 71-80 81-90 91-100
Score
% o
f cla
ss ControlExperimental
Figure 6-4. Post-test Scores on Objective Set 2.
The mean scores of each class on the post-tests were compared using the t-test for
independent samples (Equation 1). A t-value of at least ±1.9947 would indicate a
significant difference between the classes at a 95 percent confidence level. For the post-
test covering the first set of objectives, the t-value was –1.9996; for the test on the second
set of objectives, the t-value was –1.6113. These values reveal that overall the results
were favorable. The experimental class performed significantly better than the control
class on the first set of objectives, which means that the experimental treatment (teaching

66
method) had a positive effect. The score distributions in Figure 6-3 illustrate this effect
by a shift to the right from the control to the experimental classes. The fact that there was
no significant difference between the groups on the second set of objectives means that
the variation between them can be explained by chance rather than by effects of the
treatments. The score distributions in Figure 6-4 show quite a bit of variation within each
class.
Similar analyses were conducted to compare the post-test scores of several sub-
groups. The scores of males and females taken separately showed no significant
differences even at 90 percent confidence. The scores of CE juniors and seniors followed
the same pattern as those of the entire classes; at 95 percent confidence, those in the
experimental class performed significantly better on the post-test of objective set 1 and
showed no significant difference in performance on the post-test of objective set 2. The
CE juniors and seniors were also analyzed in two subgroups: students in the top half of
their class and those in the bottom half. The differences between the mean scores for the
students in the bottom half of their classes were not statistically significant even at 90
percent confidence, but of the students ranked in the top half of their classes, those in the
experimental class did perform significantly better (at 95 percent confidence) on the post-
test of objective set 1 than those in the control class.
Since the effects of the experimental treatment appeared to vary between the two
sets of objectives, I examined the objectives more closely to identify differences. As in
many courses, the objectives taught later in the course (i.e., set 2) tended to be more
complex, building on what was taught earlier in the course (i.e., set 1). The differences in
the effectiveness of the approach could possibly be explained by the level of complexity
associated with the objectives; perhaps the exercises and discussions were more valuable
in learning the less complex tasks of objective set 1. Another factor that I suspect may
have been more important is the level of student participation in the in-class exercises and
discussions. As the term progressed, the students seemed to be increasingly tired in
general and less likely to be actively involved in class. I did not collect data on the level
of participation, but I did notice that in the last half of the term, more students simply

67
waited for me to show them how to do the exercise rather than doing it themselves; this
would negate the purpose of the active learning exercise.
One other possibility is that the thinking processes involved in the objectives
were a factor in the effects of the teaching approach. Table 6-2 summarizes the
objectives and the thinking processes involved in them, based on the stated objective and
the related exam questions. These thinking processes were discussed in the literature
review. The table also shows the differences between the experimental and control
classes in terms of mean scores on the exam questions related to each objective.
Description was used for three objectives in set 1 and one objective in set 2; the score
differences were minimal except for objective 11, where description was combined with
selection and inference. Selection was used for two objectives in set 1 and four
objectives in set 2; the score differences tended to be negative (i.e., the control class
performed better) where selection was combined with inference and positive where it was
combined with synthesis. Representation was used for two objectives in set 1 and none
in set 2; in both cases the experimental class performed better. Inference was used for
two objectives in set 1 and three in set 2; in all cases except where combined with
representation, the control class performed better than the experimental class. Synthesis
was used for one objective in set 1 and three in set 2; the differences were small.
Verification was used only for one objective in set 2, combined with inference, and the
control class performed better in that case. It seems that the experimental treatment had a
positive effect for learning objectives involving representation or a combination of
selection and synthesis, and a negative effect for objectives involving inference.

68
Table 6-2. Thinking Processes Used in CE3050 Learning Objectives.
Set Learning Objective Thinking Processes
Difference in Mean Scores
(Exp’l – Control)
Identify organizations and careers involved in the design, construction and maintenance of transportation systems.
Description -3
Explain how characteristics of people and vehicles affect transportation operations.
Description Selection +2
Determine the functional class of a road. Inference -1
Collect and analyze traffic data. Description +2
Apply the travel demand forecasting process to a basic planning scenario.
Selection Representation
Synthesis +8
1
Use traffic flow models to illustrate the relationships among volume, speed and capacity.
Representation Inference +10
Identify data needed to determine the level of service (LOS) of a basic highway or freeway segment; describe or perform an LOS analysis.
Selection Synthesis -1
Choose an appropriate control type for an intersection.
Selection Inference -23
Develop a signal timing plan for a signalized intersection. Synthesis +3
Determine the capacity of lane groups at a signalized intersection.
Description Selection Inference
-11
Identify data needed to determine the LOS of a signalized intersection; describe or perform an LOS analysis.
Selection Synthesis +4
2
Use data to assess safety at an existing roadway segment or intersection.
Inference Verification -9
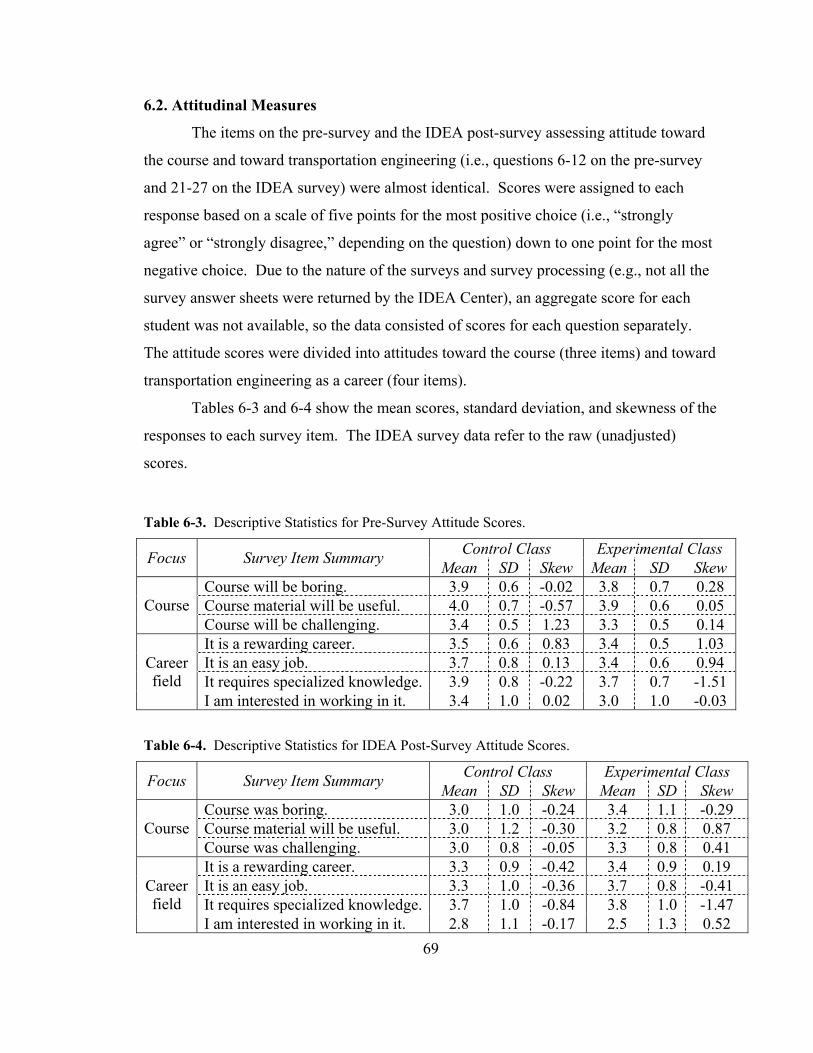
69
6.2. Attitudinal Measures
The items on the pre-survey and the IDEA post-survey assessing attitude toward
the course and toward transportation engineering (i.e., questions 6-12 on the pre-survey
and 21-27 on the IDEA survey) were almost identical. Scores were assigned to each
response based on a scale of five points for the most positive choice (i.e., “strongly
agree” or “strongly disagree,” depending on the question) down to one point for the most
negative choice. Due to the nature of the surveys and survey processing (e.g., not all the
survey answer sheets were returned by the IDEA Center), an aggregate score for each
student was not available, so the data consisted of scores for each question separately.
The attitude scores were divided into attitudes toward the course (three items) and toward
transportation engineering as a career (four items).
Tables 6-3 and 6-4 show the mean scores, standard deviation, and skewness of the
responses to each survey item. The IDEA survey data refer to the raw (unadjusted)
scores.
Table 6-3. Descriptive Statistics for Pre-Survey Attitude Scores.
Control Class Experimental Class Focus Survey Item Summary Mean SD Skew Mean SD Skew Course will be boring. 3.9 0.6 -0.02 3.8 0.7 0.28 Course material will be useful. 4.0 0.7 -0.57 3.9 0.6 0.05 Course Course will be challenging. 3.4 0.5 1.23 3.3 0.5 0.14 It is a rewarding career. 3.5 0.6 0.83 3.4 0.5 1.03 It is an easy job. 3.7 0.8 0.13 3.4 0.6 0.94 It requires specialized knowledge. 3.9 0.8 -0.22 3.7 0.7 -1.51
Career field
I am interested in working in it. 3.4 1.0 0.02 3.0 1.0 -0.03 Table 6-4. Descriptive Statistics for IDEA Post-Survey Attitude Scores.
Control Class Experimental Class Focus Survey Item Summary Mean SD Skew Mean SD Skew Course was boring. 3.0 1.0 -0.24 3.4 1.1 -0.29 Course material will be useful. 3.0 1.2 -0.30 3.2 0.8 0.87 Course Course was challenging. 3.0 0.8 -0.05 3.3 0.8 0.41 It is a rewarding career. 3.3 0.9 -0.42 3.4 0.9 0.19 It is an easy job. 3.3 1.0 -0.36 3.7 0.8 -0.41 It requires specialized knowledge. 3.7 1.0 -0.84 3.8 1.0 -1.47
Career field
I am interested in working in it. 2.8 1.1 -0.17 2.5 1.3 0.52

70
6.2.1 Initial Attitudes
Figure 6-5 shows the mean scores for the pre-survey items. As for the pre-test,
the attitude scores from the pre-survey were compared between classes using the t-test for
independent samples (see Equation 1). With a total of 77 student responses, a t-value of
at least ±1.995 would indicate a significant difference between the classes at a 95 percent
confidence level; the actual values for the individual questions ranged from -0.527 to
–0.005. These values indicate that there was no significant difference between the two
classes in terms of their initial attitude toward the course and the career field. The mean
scores varied between the classes by 0.4 or less on a scale of 1 to 5.
Initial Attitudes
0
1
2
3
4
Course:boring
Course:useful incareer
Course:challenging
Career:rewarding
Career: easy Career:requiring
knowledge
Career:interested in
fieldSurvey item
Mea
n Sc
ore
ControlExperimental
Figure 6-5. Initial Attitude Scores.
6.2.2 Change in Attitudes During Course
The change in attitudes from the pre-survey to the IDEA post-survey was assessed
by the t-test for non-independent variables (see Equation 2). For the control class, with a
total of 68 student responses on the two surveys, a t-value of at least ±1.998 would
indicate a significant change at a 95 percent confidence level; the actual values for the
individual questions ranged from –1.173 to –0.184. For the experimental class, with a
total of 61 student responses on the two surveys, a t-value of at least ±2.001 would
indicate a significant change at 95 percent confidence level; the actual values ranged

71
from –0.672 to 0.349. These values indicate that the changes in students’ attitudes
toward the course and career field were not significant.
It is interesting to note, however, the trends in the attitude changes. Figures 6-6
and 6-7 show the attitude scores on the pre-survey and those on the IDEA post-survey for
the control class and experimental class, respectively.
Change in Attitudes (Control)
0
1
2
3
4
Course:boring
Course:useful incareer
Course:challenging
Career:rewarding
Career:easy
Career:requiring
knowledge
Career:interested in
field
Survey items
Mea
n sc
ore
BeforeAfter
Figure 6-6. Before and After Attitude Scores for Control Class.
Change in Attitudes (Experimental)
0
1
2
3
4
Course:boring
Course:useful incareer
Course:challenging
Career:rewarding
Career:easy
Career:requiring
knowledge
Career:interested
in field
Survey items
Mea
n sc
ore
BeforeAfter
Figure 6-7. Before and After Attitude Scores for Experimental Class.
72
Both classes had less positive attitudes toward the course after completing it. The
attitude changes toward the career field differed between the two classes; the students in
the control class had less positive responses to the first three items regarding the career
field after taking the course, while the students in the control class had slightly more
positive responses after taking the course. In both classes, the less positive responses to
the survey item “interested in working in this field” after taking the course probably
reflect the fact that many students initially did not know enough about transportation
engineering to decide if they were interested in working in this career field, so they
responded neutrally or somewhat positively.
6.2.3 End-of-course Attitude Measures
Figure 6-8 shows the mean end-of-course attitude scores for the control and
experimental classes. These scores were compared using the t-test for independent
samples (see Equation 1). With 52 student responses in the two classes, a t-value of at
least ±2.011 would indicate a significant difference between the classes at a 95 percent
confidence level; the actual values for the individual questions ranged from –0.306 to
0.414. Although the experimental class responded slightly more positively to the first six
survey items and slightly less positively to the last question, the t-values indicate that the
differences between the two classes were not significant, or in other words, that they
could be explained by chance variations rather than by the treatments.
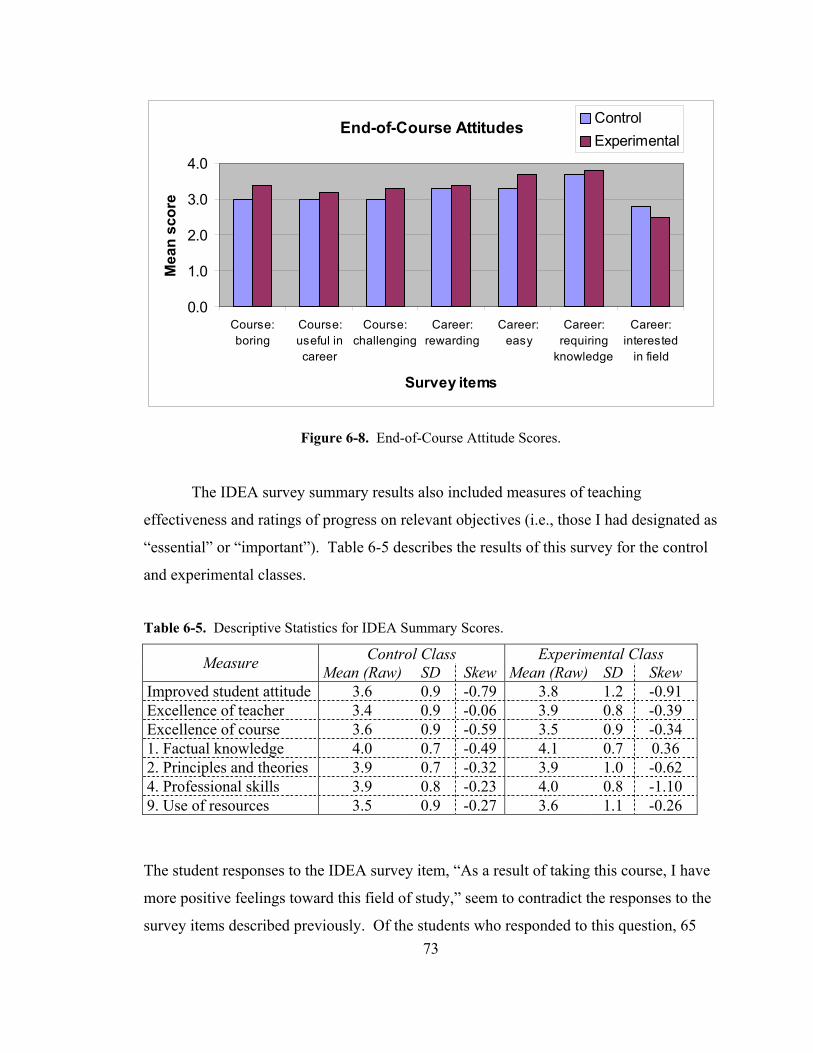
73
End-of-Course Attitudes
0.0
1.0
2.0
3.0
4.0
Course:boring
Course:useful incareer
Course:challenging
Career:rewarding
Career:easy
Career:requiring
knowledge
Career:interested
in field
Survey items
Mea
n sc
ore
ControlExperimental
Figure 6-8. End-of-Course Attitude Scores.
The IDEA survey summary results also included measures of teaching
effectiveness and ratings of progress on relevant objectives (i.e., those I had designated as
“essential” or “important”). Table 6-5 describes the results of this survey for the control
and experimental classes.
Table 6-5. Descriptive Statistics for IDEA Summary Scores.
Control Class Experimental Class Measure Mean (Raw) SD Skew Mean (Raw) SD Skew Improved student attitude 3.6 0.9 -0.79 3.8 1.2 -0.91 Excellence of teacher 3.4 0.9 -0.06 3.9 0.8 -0.39 Excellence of course 3.6 0.9 -0.59 3.5 0.9 -0.34 1. Factual knowledge 4.0 0.7 -0.49 4.1 0.7 0.36 2. Principles and theories 3.9 0.7 -0.32 3.9 1.0 -0.62 4. Professional skills 3.9 0.8 -0.23 4.0 0.8 -1.10 9. Use of resources 3.5 0.9 -0.27 3.6 1.1 -0.26
The student responses to the IDEA survey item, “As a result of taking this course, I have
more positive feelings toward this field of study,” seem to contradict the responses to the
survey items described previously. Of the students who responded to this question, 65

74
percent in the control class and 71 percent in the experimental class chose answer 4,
“more true than false,” or 5, “definitely true.” For the control class, this item implies that
in general the students were more positive about the field after taking the class, while the
other items imply that they were less positive about the field. Perhaps the students’
interpretation of the IDEA survey item differed from their interpretation of the other
attitude survey items.
In general, the control and experimental classes responded very similarly to the
items summarized in Table 6-5. The only item on which there was a difference between
the classes of more than 0.2 points was the rating of “this instructor as an excellent
teacher,” to which the experimental class responded more positively.
6.3. Student Feedback
Several of the students in the control class felt that the teaching methods needed
improvement, based on their comments on the IDEA survey. A startling 49 percent of
them agreed that the course was boring, according to Table 5-11, and only 14 percent
disagreed. Of the students in the experimental class who completed the extra questions
on the IDEA survey, only seventeen percent agreed that the course was boring, and 44
percent disagreed. While the percentage of students completing these questions was not
large enough to be very confident in the overall responses, it is a much more positive
trend than that of the control class.
The survey comments from the experimental class regarding teaching methods
were generally positive, although one student expressed the opinion that the in-class
exercises were not helpful. On the mid-term exam, I also included two bonus questions
which asked the students to agree or disagree with two statements about the in-class
exercises: (1) “the exercises in class (during lectures) help me understand the course
material,” and (2) “the in-class exercises are a waste of class time.” Twenty-three percent
of the students strongly agreed that the exercises were helpful, and 60 percent agreed,
while only three percent (i.e., one student) disagreed. Similarly, 30 percent strongly
disagreed that the exercises were a waste of time, and 55 percent disagreed, while five
percent agreed. In other words, halfway through the course, a large majority indicated

75
that the exercises were both useful and not a waste of class time. This informal survey
was, of course, part of an exam and thus may have been skewed toward more positive
responses.

76
VII. CONCLUSIONS
The objectives of this research project have been met. I developed and tested
experimental undergraduate curricula for highway design and traffic engineering using
active-learning methods. I also collected data in an educational experiment that enabled
me to assess the relative effectiveness of two teaching methods, the traditional lecture and
the lecture with active-learning interludes, with regard to student performance and
attitudes. In an attempt to conduct a scientifically valid experiment with clear results, the
changes made to the curriculum in CE3050 were purposefully minor. The only
difference between the control curriculum and the experimental curriculum was that the
experimental curriculum included short exercises and discussions as active interludes
within the lectures. It is encouraging that these minor changes appear to have had a
positive effect on student learning. Students in both CE3050 and CE405X responded
positively – in some cases enthusiastically – to the experimental active-learning
approach.
7.1. Summary of Experimental Results
The results of the experiment in CE3050 indicate that the active-learning
approach adopted in the experimental class did have a positive impact on student
performance as measured by exam scores. The experimental treatment appeared to have
a positive effect on the post-test scores for the first set of learning objectives. Although
the mean score on the post-test for the second set of objectives was lower for the
experimental class than for the control class, the difference was attributable to chance
variation rather than an effect of the treatment.
It appears that the thinking processes associated with course learning objectives
may be a factor in the relative effectiveness of the experimental teaching methods. The
methods seemed to be most effective with objectives involving representation or a
combination of selection and synthesis. Since most objectives in CE3050 involved more
than one type of thinking process, this conclusion is tentative and should probably be
examined further. Another explanation is that the level of participation dropped from the

77
first half of the course to the second half of the course.
No differences in the effects of the teaching methods were apparent between
genders, although both classes were both comprised primarily of male students; females
made up 22 percent of the combined classes. The majority of the students (33 in each
class, or 85 percent of the total) were juniors and seniors majoring in civil engineering,
and their performance appears to have been affected positively by the experimental
teaching approach. It is interesting to note that of the students ranked in the top half of
their class, those in the experimental class performed better than their counterparts in the
control class, while there was no significant difference in the performance of the students
ranked in the bottom half of their class. This implies that the better students were also
more responsive to active learning methods. It is difficult to say whether their
performance was more affected because they participated more in the active learning
exercises or because the exercises were more useful to them than to the other students.
The results in terms of student attitudes toward transportation engineering did not
show a significant difference between the control and experimental classes. The students
in the experimental class did indicate slightly more positive attitudes at the end of the
course than the control class, however, and when grouped into yes and no answers
(instead of a five-point scale), the differences are more pronounced.
7.2. Curriculum Recommendations
There were no obvious drawbacks to the experimental curricula that were
developed for CE405X and CE3050. The exercises and discussion topics were not
difficult to develop or to use; in several cases, examples that I presented to the control
class were easily modified into active interludes for the experimental class. Exercises
and discussions generally required more class time than lecturing alone, but not to such
an extent that content was removed from the course. The exercises also did not require
additional technology or much instructor time.
On the positive side, the active-learning-based approach appears to have
improved overall student performance. Students were also less frustrated by this
approach than by lecturing alone, based on the survey results, and a large majority of the
78
students in the experimental course indicated at mid-term that the in-class exercises were
useful and not a waste of class time.
I recommend that exercises and discussions similar to those in the experimental
curricula be used in other civil engineering courses. Although this study focused on
transportation engineering classes, the students were representative of the upper-class
civil engineering majors at WPI, so active-learning exercises would probably be
successful in other types of civil engineering courses as well.
One improvement that should be made to the teaching approach taken in this
project is to reward participation in some way so that students are encouraged to take part
in the exercises and discussions. For example, an instructor could occasionally assign
participation grades by calling on a student at random or collecting student papers after
an exercise. The emphasis would need to be on active participation, not necessarily
correct solutions.
7.3. Further Research
As with most research studies, the results have led to additional questions. In this
case, questions that might merit further study include:
• Is an active-learning approach more effective for particular types of
objectives, topics, or thinking processes?
• Do certain subsets of a class respond better to the active-learning approach,
i.e., are there differences between genders, among class years or majors, or
among personality types?
• Is the difference in the effectiveness of the active-learning approach between
students in the top and bottom halves of their classes due to the students’
level of participation in the exercises or to some other factor?
• How can the ideal amount of in-class active learning be determined for a
particular course, to maximize student learning and positive attitudes? We

79
intuitively know that there must be some balance between lecturing and
interaction, but assessing that balance is still somewhat of a mystery.

80
VIII. REFERENCES 1. “Criteria for Accrediting Engineering Programs: Effective for Evaluations During the
2004-2005 Accreditation Cycle.” ABET, Inc. (2003) 23 pp. Available at www.abet.org.
2. Wankat, P. and Oreovicz, F. S., Teaching Engineering. McGraw-Hill (1993) 370 pp.
(Out of print – available at https://engineering.purdue.edu/ChE/News_and_Events/Publications/teaching_engineering/index.html.)
3. Stage, F. K., Muller, P. A., Kinzie, J. and Simmons, A., “Creating Learning Centered
Classrooms: What Does Learning Theory Have to Say?” ASHE-ERIC Higher Education Report Volume 26, No. 4. George Washington University Graduate School of Education and Human Development, Washington, D.C. (1998) 156 pp.
4. Donald, J., Learning to Think: Disciplinary Perspectives. Jossey-Bass Publishers
(2002) 330 pp. 5. Kolb, D. A., Experiential Learning: Experience as The Source of Learning and
Development. Prentice-Hall (1984) 288 pp. 6. Harb, J. N., Durrant, S. O., and Terry, R. E., “Use of the Kolb Learning Cycle and the
4MAT System in Engineering Education.” Journal of Engineering Education, Vol. 82, No. 2 (1993) pp. 70-77.
7. Kolb, D. A., Boyatzis, R. E., and Mainemelis, C., “Experiential Learning Theory:
Previous Research and New Directions.” In Sternberg, R. J. and Zhang, L. F. (Eds.), Perspectives on Thinking, Learning, and Cognitive Styles, Lawrence Erlbaum Associates, Inc. (2001) pp. 227-248.
8. McCarthy, B., The 4MAT System. Teaching to Learning Styles with Right/Left Mode
Techniques. EXCEL, Inc. (1980) 220 pp. 9. Todd, R. H., “The how and why of teaching an introductory course in manufacturing
processes.” ASEE/IEEE Frontiers in Education Conference, Proceedings (1991) p. 460.
10. Chase, W. G. and Chi, M. T. H., “Cognitive Skill: Implications for Spatial Skill in
Large-Scale Environments.” In John H. Harvey (Ed.), Cognition, social behavior, and the environment, Lawrence Erlbaum Associates, Inc. (1980) pp. 111-136.
11. Biglan, A., “The characteristics of subject matter in different academic areas.”
Journal of Applied Psychology, Vol. 57, No. 3 (1973) pp. 195-203.

81
12. IDEA Center, Kansas State University. “Disciplinary Selection of Learning Objectives.” www.idea.ksu.edu/StudentRatings/DisciplinaryLearningObjectives.htm, April 2002.
13. IDEA Center, Kansas State University. “Engineering – IDEA Group Summary
Report.” www.idea.ksu.edu/StudentRatings/GSRs/GSR1400.pdf, January 2004. 14. Van Driel, J. H., Verloop, N., Van Werven, H. I., and Dekkers, H., “Teachers’ craft
knowledge and curriculum innovation in higher engineering education.” Higher Education, Vol. 34, No. 1 (1997) pp.105-122.
15. Sutherland, T. E. and Bonwell, C. C., eds., “Using Active Learning in College
Classes: A Range of Options for Faculty.” New Directions in Teaching and Learning, No. 67. Jossey-Bass Publishers, San Francisco, CA (1996) 138 pp.
16. Bonwell, C. C. and Eison, J. A., “Active Learning: Creating Excitement in the
Classroom.” ASHE-ERIC Higher Education Report No. 1. The George Washington University Graduate School of Education and Human Development, Washington, D.C. (1991) 124 pp.
17. Siciliano, J. I., “How to Incorporate Cooperative Learning Principles in the
Classroom: It’s More than Just Putting Students in Teams.” Journal of Management Education, Vol. 25, No. 1 (2001) pp. 8-20.
18. Timmerman, B. and Lingard, R., “Assessment of Active Learning with Upper
Division Computer Science Students.” 33rd ASEE/IEEE Frontiers in Education Conference, Boulder, CO (Nov. 2003) Session S1D.
19. Miller, G. R. and Cooper, S. C., “Something Old, Something New: Integrating Engineering Practice into the Teaching of Engineering Mechanics.” Journal of Engineering Education, Vol. 84, No. 2 (1995) pp. 105-115.
20. Miller, J.E. and Groccia, J.E., “Are four heads better than one? A comparison of cooperative and traditional teaching formats in an introductory biology course.” Innovative Higher Education, Vol. 21, No. 4 (1997) pp. 253-273.
21. McClanahan, E. B. and McClanahan, L. L., “Active Learning in a Non-Majors Biology Class: Lessons Learned.” College Teaching, Vol. 50, No. 3 (2002) pp. 92-96.
22. Little, P. and Cardenas, M., “Use of ‘Studio’ Methods in the Introductory Engineering Design Curriculum.” Journal of Engineering Education, Vol. 90, No. 3 (2001) pp. 309-318.
23. Mehta, S., “A Method for Instant Assessment and Active Learning.” Journal of Engineering Education, Vol. 84, No. 3 (1995) pp. 295-298.

82
24. McNeill, J. and Keenaghan, K., “Transitioning an Engineering Course to Studio Format.” 32nd ASEE/IEEE Frontiers in Education Conference, Proceedings (2002) S3E-10.
25. Starrett, S. K. and Morcos, M. M., “Hands-On, Minds-On Electric Power Education.”
Journal of Engineering Education, Vol. 90, No. 1 (2001) pp. 93-99. 26. Felder, R. M., “A Longitudinal Study of Engineering Student Performance and
Retention. IV. Instructional Methods and Student Responses to Them.” Journal of Engineering Education, Vol. 84, No. 4 (1995) pp. 361-367.
27. Felder, R. M., Woods, D. R., Stice, J. E., and Rugarcia, A., “The Future of
Engineering Education: II. Teaching Methods That Work.” Chemical Engineering Education, Vol. 34, No. 1 (2000) pp. 26-39.
28. Hall, S. R., Waitz, I., Brodeur, D. R., Soderholm, D. H., and Nasr, R., “Adoption of
Active Learning in a Lecture-based Engineering Class.” 32nd ASEE/IEEE Frontiers in Education Conference, Proceedings (2002) T2A-9 to T2A-15.
29. Scrivener, S., Fachin, K., and Storey, G. R., “Treating the All-Nighter Syndrome:
Increased Student Comprehension Through an Interactive In-Class Approach.” Journal of Engineering Education, Vol. 83, No. 2 (1994) pp. 152-155.
30. Felder, R. M., Felder, G. N., and Dietz, E. J., “A Longitudinal Study of Engineering
Student Performance and Retention. V. Comparisons with Traditionally-Taught Students.” Journal of Engineering Education, Vol. 87, No. 4 (1998) pp. 469-480.
31. Blackwell, G., “Group Discussion Techniques in a Technical Course.” ASEE/IEEE
Frontiers in Education Conference, Proceedings (1991) pp. 430-432. 32. Koehn, E., “Assessment of Communications and Collaborative Learning in Civil
Engineering Education.” Journal of Professional Issues in Engineering Education and Practice, Vol. 127, No. 4 (2001) pp. 160-165.
33. Paulson, D. R. and Faust, J. L., “Active Learning for the College Classroom.”
http://chemistry.calstatela.edu/Chem&BioChem/active/main.htm (29 Aug 2003). 34. Astrachan, O. L., Duvall, R. C., Forbes, J., and Rodger, S. H., “Active Learning in
Small to Large Courses.” 32nd ASEE/IEEE Frontiers in Education Conference, Proceedings (2002).
35. DiBiasio, D. and Groccia, J. E., “Active and Cooperative Learning in an Introductory
Chemical Engineering Course.” ASEE/IEEE Frontiers in Education ’95 Conference, Proceedings (1995).

83
36. Stalheim-Smith, A., “Focusing on Active, Meaningful Learning.” IDEA Paper No. 34, IDEA Center, Kansas State University (Feb 1998).
37. Cashin, W. E. and McKnight, P. C., “Improving Discussions.” IDEA Paper No. 15,
Center for Faculty Evaluation and Development, Kansas State University (Jan 1986). 38. Stout, J. C. “Radical Course Revision: A Case Study.” The National Teaching &
Learning Forum, Vol. 10, No. 4 (2001) pp. 1-5. 39. Walvoord, B. E. and Pool, K. J., “Enhancing Pedagogical Productivity.” In Groccia,
J. E. and Miller, J. E., eds., “Enhancing Productivity: Administrative, Instructional, and Technological Strategies,” New Directions for Higher Education, No. 103 (1998) pp. 35-48.
40. Meyers, C. and Jones, T. B., Promoting Active Learning: Strategies for the College
Classroom. Jossey-Bass Publishers (1993) 224 pp. 41. Michaels, S., O’Connor, M. C., and Hall, M. W., Accountable Talk: Classroom
Conversation That Works. University of Pittsburgh (2002) CD-ROM. 42. Department of Civil and Environmental Engineering, Worcester Polytechnic Institute.
“ABET Self-Study Report WebSite,” www.wpi.edu/Academics/Depts/CEE/ABET/index.html. (19 January 2004)
43. National Council of Examiners for Engineering and Surveying (NCEES) website,
http://www.ncees.org/exams/fundamentals (December 2003); equation sheets modified from NCEES, Fundamentals of Engineering (FE) Supplied-Reference Handbook, 6th Edition (2003).
44. Nuhfer, Edward and Knipp, Delores, “The Knowledge Survey: A Tool for All
Reasons,” To Improve the Academy, v. 21, pp. 59-78, 2003.
Related Documents